


Bahasa
Halaman
Hukum


Environmental Assessment of a
Marine Geophysical Survey by the R/V Melville
in the Pacific Ocean off Central and South America,
October–November 2010
Prepared for
Scripps Institution of Oceanography
8602 La Jolla Shores Drive
La Jolla, CA. 92037
and
National Science Foundation
Division of Ocean Sciences
4201 Wilson Blvd., Suite 725
Arlington, VA 22230
by
LGL Ltd., environmental research associates
22 Fisher St., POB 280
King City, Ont. L7B 1A6
25 May 2010
Revised 13 July and 16 September 2010
LGL Report TA4902-1

Table of Contents
Environmental Assessment for SIO ETP Cruise, 2010 Page iii
TABLE OF CONTENTS Page
ABSTRACT.................................................................................................................................................. vi
LIST OF ACRONYMS .................................................................................................................................. vii
I. PURPOSE AND NEED ................................................................................................................................ 1
II. ALTERNATIVES INCLUDING PROPOSED ACTION .................................................................................... 2
Proposed Action ............................................................................................................................... 2
(1) Project Objectives and Context ......................................................................................... 2
(2) Proposed Activities ........................................................................................................... 2
(3) Monitoring and Mitigation Measures................................................................................ 7
Alternative Action: Another Time .................................................................................................. 12
No Action Alternative .................................................................................................................... 12
III. AFFECTED ENVIRONMENT .................................................................................................................. 12
Protected Areas............................................................................................................................... 12
(1) Cocos Island National Park, Costa Rica ......................................................................... 12
(2) Coiba National Park and its Special Zone of Marine Protection, Republic of
Panama....................................................................................................................... 13
(3) Malpelo Fauna and Flora Sanctuary, Colombia .............................................................. 13
(4) Galápagos Biological Marine Resources Reserve ........................................................... 14
Marine Mammals ........................................................................................................................... 14
(1) Mysticetes ....................................................................................................................... 17
(2) Odontocetes .................................................................................................................... 22
(3) Pinnipeds ........................................................................................................................ 36
Sea Turtles ...................................................................................................................................... 37
(1) Leatherback Turtle .......................................................................................................... 38
(2) Loggerhead Turtle .......................................................................................................... 39
(3) Green Turtle.................................................................................................................... 40
(4) Hawksbill Turtle ............................................................................................................. 41
(5) Olive Ridley Turtle ......................................................................................................... 42
IV. ENVIRONMENTAL CONSEQUENCES .................................................................................................... 44
Proposed Action ............................................................................................................................. 44
(1) Direct Effects on Marine Mammals and Sea Turtles and Their Significance .................. 44
(2) Mitigation Measures ....................................................................................................... 58
(3) Numbers of Marine Mammals that could be Exposed to Various Received Sound
Levels ........................................................................................................................ 58
(4) Conclusions for Marine Mammals and Sea Turtles ........................................................ 63
(5) Direct Effects on Fish and Their Significance ................................................................ 64
(6) Direct Effects on Invertebrates and Their Significance ................................................... 66
(7) Indirect Effects on Marine Mammals, Sea Turtles, and Their Significance .................... 68
(8) Cumulative Effects ......................................................................................................... 68
(9) Unavoidable Impacts ...................................................................................................... 76
(10) Coordination with Other Agencies and Processes ......................................................... 76

Table of Contents
Environmental Assessment for SIO ETP Cruise, 2010 Page iv
Alternative Action: Another Time .................................................................................................. 77
No Action Alternative .................................................................................................................... 77
V. LIST OF PREPARERS ............................................................................................................................. 78
VI. LITERATURE CITED ............................................................................................................................ 79
Marine Mammals and Acoustics .................................................................................................... 79
Sea Turtles, Fish, and Other ........................................................................................................... 99
APPENDIX A: REVIEW OF THE EFFECTS OF AIRGUN SOUNDS ON MARINE MAMMALS......................... 109
1. Categories of Noise Effects ..................................................................................................... 109
2. Hearing Abilities of Marine Mammals .................................................................................... 109
2.1 Toothed Whales............................................................................................................ 110
2.2 Baleen Whales .............................................................................................................. 111
2.3 Seals and Sea Lions ...................................................................................................... 111
2.4 Manatees and Dugong .................................................................................................. 112
2.5 Sea Otter and Polar Bear .............................................................................................. 112
3. Characteristics of Airgun Sounds ............................................................................................ 112
4. Masking Effects of Airgun Sounds .......................................................................................... 114
5. Disturbance by Seismic Surveys .............................................................................................. 116
5.1 Baleen Whales .............................................................................................................. 117
5.2 Toothed Whales............................................................................................................ 123
5.3 Pinnipeds ...................................................................................................................... 129
5.4 Sirenians, Sea Otter and Polar Bear .............................................................................. 131
6. Hearing Impairment and Other Physical Effects of Seismic Surveys ...................................... 131
6.1 Temporary Threshold Shift .......................................................................................... 132
6.2 Permanent Threshold Shift ........................................................................................... 137
6.3 Strandings and Mortality .............................................................................................. 139
6.4 Non-Auditory Physiological Effects ............................................................................. 141
7. Literature Cited ........................................................................................................................ 141
APPENDIX B: REVIEW OF THE EFFECTS OF AIRGUN SOUNDS ON SEA TURTLES ................................... 157
1. Sea Turtle Hearing ................................................................................................................... 157
2. Effects of Airgun Pulses on Behavior and Movement ............................................................. 159
3. Possible Effects of Airgun Sounds on Distribution .................................................................. 162
4. Possible Impacts of Airgun Sounds on Hearing ....................................................................... 163
5. Other Physical Effects ............................................................................................................. 165
6. Conclusions ............................................................................................................................. 165
7. Literature Cited ........................................................................................................................ 165
APPENDIX C: REVIEW OF THE EFFECTS OF AIRGUN SOUNDS ON FISHES ............................................. 170
1. Acoustic Capabilities ............................................................................................................... 170
2. Potential Effects on Fishes ....................................................................................................... 172
2.1 Marine Fishes ............................................................................................................... 172

Table of Contents
Environmental Assessment for SIO ETP Cruise, 2010 Page v
2.2 Freshwater Fishes ......................................................................................................... 175
2.3 Anadromous Fishes ...................................................................................................... 176
3. Indirect Effects on Fisheries .................................................................................................... 176
4. Literature Cited ........................................................................................................................ 177
APPENDIX D: REVIEW OF THE EFFECTS OF AIRGUN SOUNDS ON MARINE INVERTEBRATES ............... 181

Abstract
Environmental Assessment for SIO ETP Cruise, 2010 Page vi
ABSTRACT
The Scripps Institution of Oceanography (SIO), with research funding from the National Science
Foundation (NSF), and in collaboration with Texas A&M University (TAMU), plans to conduct a seismic
survey, coring, and water sampling program with the R/V Melville in the eastern tropical Pacific Ocean (ETP)
off Costa Rica, Panama, Colombia, Ecuador, and Peru for ~25 days in October–November 2010. The
seismic survey will occur in water depths ranging from ~1000 m to ~4800 m. This project would be
conducted partly in the Exclusive Economic Zones (EEZs) of Costa Rica, Panama, Colombia, and
Ecuador. On behalf of SIO, the U.S. State Department will seek authorization from those governments
for clearance to work in their EEZs.
SIO is requesting an Incidental Harassment Authorization (IHA) from the National Marine
Fisheries Service (NMFS) to authorize the incidental, i.e., not intentional, harassment of small numbers of
marine mammals should this occur during the seismic survey. The information in this Environmental
Assessment (EA) supports the IHA application process and provides information on marine species that
are not addressed by the IHA application, notably sea turtles, which are listed under the U.S. Endangered
Species Act (ESA). The EA addresses the requirements of Executive Order 12114, ―Environmental
Effects Abroad of Major Federal Actions‖. Alternatives addressed in this EA consist of a corresponding
program at a different time, along with issuance of an associated IHA; and the no action alternative, with
no IHA and no seismic survey.
Numerous species of cetaceans and pinnipeds inhabit the ETP. Several of these species are listed
as endangered under the ESA, including the humpback, sei, fin, blue, and sperm whales. Other species
of special concern that could occur in the study area are the endangered leatherback and hawksbill turtles
and threatened loggerhead, green, and olive ridley turtles.
Potential impacts of the seismic survey on the environment would be primarily a result of the oper-
ation of the GI airguns. A multibeam echosounder and sub-bottom profiler will also be operated.
Impacts would be associated with increased underwater noise, which could result in avoidance behavior
of marine mammals, sea turtles, and fish, and other forms of disturbance. An integral part of the planned
survey is a monitoring and mitigation program designed to minimize impacts of the proposed activities on
marine animals present during the proposed research, and to document as much as possible the nature and
extent of any effects. Injurious impacts to marine mammals and sea turtles have not been proven to occur
near airgun arrays, and also are not likely to be caused by the other types of sound sources to be used.
The planned monitoring and mitigation measures would minimize the possibility of such effects.
Protection measures designed to mitigate the potential environmental impacts to marine mammals
and turtles will include the following: minimum of one dedicated observer maintaining a visual watch
during all daytime seismic operations, two observers 30 min before and during start ups (and when
possible at other times), ramp ups, and shut downs when marine mammals or sea turtles are detected in or
about to enter designated exclusion zones. SIO and its contractors are committed to apply these measures
in order to minimize effects on marine mammals and other environmental impacts.
With the planned monitoring and mitigation measures, unavoidable impacts to each species of
marine mammal and turtle that could be encountered are expected to be limited to short-term, localized
changes in behavior and distribution near the seismic vessel. At most, effects on marine mammals may
be interpreted as falling within the U.S. Marine Mammal Protection Act (MMPA) definition of ―Level B
Harassment‖ for those species managed by NMFS. No long-term or significant effects are expected on
individual marine mammals, sea turtles, or the populations to which they belong, or on their habitats.

List of Acronyms
Environmental Assessment for SIO ETP Cruise, 2010 Page vii
LIST OF ACRONYMS
~ approximately
AAPA American Association of Port Authorities
ABS American Bureau of Shipping
Amver Atlantic Merchant Vessel Emergency Reporting
CIA Central Intelligence Agency
CITES Convention on International Trade in Endangered Species
CPA Closest Point of Approach
CPUE Catch per Unit Effort
CV Coefficient of Variation
DFO Fisheries and Oceans Canada
E east
EA Environmental Assessment
EEZ Exclusive Economic Zone
EIA Energy Information Administration
EOE Encyclopedia of Earth
EPO eastern Pacific Ocean
ESA (U.S.) Endangered Species Act
ETP eastern tropical Pacific Ocean
EZ Exclusion Zone
FAO Food and Agriculture Organization
FM frequency modulated
GI Generator-Injector
GIS Geographic Information System
h hour
hp horsepower
ha hectares
IHA Incidental Harassment Authorization (under MMPA)
in inch
IAGC International Association of Geophysical Contractors
IATTC Inter-American Tropical Tuna Commission
IMO International Maritime Organization
IUCN International Union for the Conservation of Nature
IWC International Whaling Commission
kJ kiloJoule
kt knot
L-DEO Lamont-Doherty Earth Observatory
m meter
MBES Multibeam echosounder
min minute
MMO Marine Mammal Observer
MMPA (U.S.) Marine Mammal Protection Act
ms millisecond
MTTS Masked Temporary Threshold Shift
n.mi. nautical mile
NATO North Atlantic Treaty Organization
NEPA (U.S.) National Environmental Policy Act
NMFS (U.S.) National Marine Fisheries Service

List of Acronyms
Environmental Assessment for SIO ETP Cruise, 2010 Page viii
NOAA National Oceanographic and Atmospheric Administration
NRC (U.S.) National Research Council
NSF National Science Foundation
NVD Night Vision Device
ONR (U.S.) Office of Naval Research
PAM Passive Acoustic Monitoring
pk peak
PNNC Colombia Natural National Parks System
ppt parts per thousand
psi pounds per square inch
PTS Permanent Threshold Shift
rms root-mean-square
RP reproductive patch
rpm rotations per minute
s second
SBP sub-bottom profiler
SE southeast
SEL sound energy level
SERDP Department of Defense Strategic Environmental Research and Development
Program
SL source level
SMM Safety Management Manual
SPL sound pressure level
SOSUS Sound Surveillance System
SWFSC Southwest Fisheries Science Center
TAMU Texas A&M University
TEU twenty-foot equivalent unit
TTS Temporary Threshold Shift
UNEP United Nations Environment Programme
UNESCO United Nations Educational, Scientific and Cultural Organisation
U.S. United States of America
USCG United States Coast Guard
USFWS U.S. Fish and Wildlife Service
USN U.S. Navy
vs. versus
W west
WCMC World Conservation Monitoring Centre

1. Purpose and Need
Environmental Assessment for SIO ETP Cruise, 2010 Page 1
I. PURPOSE AND NEED
Scripps Institution of Oceanography (SIO), a part of the University of California, operates the oceano-
graphic research vessel R/V Melville under a charter agreement with the U.S. Office of Naval Research
(ONR). The title of the vessel is held by the U.S. Navy. SIO, in collaboration with Texas A&M University
(TAMU), plans to conduct a seismic survey, coring, and water sampling program with the R/V Melville in the
Pacific Ocean off Costa Rica, Panama, Colombia, Ecuador, and Peru for ~25 days in October–November
2010. The National Science Foundation (NSF) is the agency of the U.S. Government that is providing the
funding to support the research to be undertaken on this research cruise. The marine seismic survey, coring,
and water sampling will take place in water depths ranging from ~1000 m to 4800 m in International
Waters and in the EEZs of Costa Rica, Panama, Colombia, and Ecuador. On behalf of SIO, the U.S. State
Department will seek authorization from those governments for clearance to work in their EEZs.
The purpose of this project is to better understand how marine sediments record paleo-
oceanographic information. The deposition of sediments in the upper 500 m of the sediment column will
be studied using known seismic horizons in the sediment column to estimate rates of deposition
downstream from potential sediment sources on the topographic highs, and to estimate loss from the
ridges. The seismic survey and associated coring and water sampling will allow comparisons of
geophysical estimates of the level of erosion from marine ridges and highs with geochemical estimates of
sediment focusing based upon the distribution of Th-230, a particle-reactive isotope produced by the
decay of dissolved uranium in the water column. In addition, the study will examine whether there are
sediment sources for Th-230 in slowly-accumulating sediments.
Numerous species of cetaceans and pinnipeds occur in the eastern tropical Pacific Ocean (ETP).
Several of these species are listed as endangered under the U.S. Endangered Species Act (ESA),
including the humpback, sei, fin, blue, and sperm whale. Other species of concern that could occur in the
study area are the endangered leatherback and hawksbill turtles and threatened loggerhead, green, and
olive ridley turtles.
The purpose of this Environmental Assessment (EA) is to provide the information needed to assess
the potential environmental impacts associated with the use of the GI airguns during the proposed study.
The EA was prepared under Executive Order 12114, ―Environmental Effects Abroad of Major Federal
Actions‖. The EA addresses potential impacts of the proposed seismic survey on marine mammals, as
well as other species of concern in the study area, notably sea turtles. The EA also provides useful
information in support of an application for an Incidental Harassment Authorization (IHA) from the
National Marine Fisheries Service (NMFS). The requested IHA would, if issued, allow the non-
intentional, non-injurious ―take by harassment‖ of small numbers of marine mammals during the
proposed seismic survey by SIO in the ETP during October–November 2010.
To be eligible for an IHA, the proposed ―taking‖ (with mitigation measures in place) must not
cause serious physical injury or death of marine mammals, must have negligible impacts on the species
and stocks, must ―take‖ no more than small numbers of those species or stocks, and must not have an un-
mitigable adverse impact on the availability of the species or stocks for legitimate subsistence uses.
Protection measures designed to mitigate the potential environmental impacts are also described in
this EA as an integral part of the planned activities. With these mitigation measures in place, any impacts
on marine mammals and sea turtles are expected to be limited to short-term, localized changes in behavior
of small numbers of animals. No long-term or significant effects are expected on individual mammals,
turtles, or populations.

II. Alternatives Including Proposed Action
Environmental Assessment for SIO ETP Cruise, 2010 Page 2
II. ALTERNATIVES INCLUDING PROPOSED ACTION
Three alternatives are evaluated: (1) the proposed seismic survey and issuance of an associated
IHA, (2) a corresponding seismic survey at an alternative time, along with issuance of an associated IHA,
and (3) no action alternative.
Proposed Action
The project objectives and context, activities, and mitigation measures for SIO‘s planned seismic
survey are described in the following subsections.
(1) Project Objectives and Context
SIO plans to conduct a seismic survey in the ETP as part of an integrated geophysical and
geochemical study. The deposition of sediments in the upper 500 m of the sediment column will be
studied using known seismic horizons in the sediment column to estimate rates of deposition downstream
from potential sediment sources on the topographic highs, and to estimate loss from the ridges. The
seismic survey and associated coring and water sampling will allow comparisons of geophysical estimates
of the level of erosion from marine ridges and highs with geochemical estimates of sediment focusing
based upon the distribution of Th-230, a particle-reactive isotope produced by the decay of dissolved
uranium in the water column. In addition, the study will examine whether there are sediment sources for
Th-230 in slowly-accumulating sediments.
(2) Proposed Activities
(a) Location of the Activities
The survey will encompass the area ~8ºN–12°S, ~80–91°W, off the coasts of Costa Rica, Panama,
Colombia, Ecuador, and Peru (Fig. 1). Water depths in the survey area range from ~1000 m to ~4800 m.
The seismic survey will be conducted in International Waters and in the EEZs of Costa Rica, Panama,
Colombia, and Ecuador, and is scheduled to occur for ~25 days in October–November 2010. Some minor
deviation from these dates is possible, depending on logistics and weather.
(b) Description of the Activities
The survey will involve one source vessel, the R/V Melville. For the seismic component of the
research program, the source vessel will deploy a pair of low-energy Sercel Generator-Injector (GI)
airguns as an energy source (each with a discharge volume of 45 in3), plus either of two towed hydro-
phone streamers, one 725 m long with 40 channels, and the other 350 m long with 16 channels. The
energy to the airguns is compressed air supplied by compressors on board the source vessel. As the
airguns are towed along the survey lines, the hydrophone streamer will receive the returning acoustic
signals and transfer the data to the on-board processing system.
The program will consist of ~5475 km of surveys, including turns (Fig. 1). Water depths within the
seismic survey areas are ~1000–4800 m. The GI airguns will be operated on a small grid (see inset in
Fig. 1) for ~45 h at each of four sites (depicted with black boxes in Fig. 1), where the 40-channel streamer
will be used, and for most of the time during transits between the sites, to the first site, and after the last
site (see red seismic line depicted in Fig. 1), where the 16-channel streamer will be used. There will be
additional seismic operations associated with equipment testing, startup, and possible line changes or
repeat coverage of any areas where initial data quality is sub-standard. Those additional operations are
allowed for in the estimated total line km used for calculations in § IV(3).

II. Alternatives Including Proposed Action
Environmental Assessment for SIO ETP Cruise, 2010 Page 3
FIGURE 1. Proposed study areas for the survey in the ETP, October–November 2010.

II. Alternatives Including Proposed Action
Environmental Assessment for SIO ETP Cruise, 2010 Page 4
At each of the sites and along the transects between sites, water samples and cores from the
seafloor will be collected at stations whose exact locations are determined by results of the seismic
surveys. At each station, the GI airguns will be shut down and 1–2 d will be spent collecting water
samples and cores. The piston coring system consists of (1) a piston core with a 10-cm diameter steel
barrel up to ~18 m long with a 2300-kg weight and (2) a trigger core with a 10-cm diameter PVC plastic
barrel 3 m long with a 230-kg weight, which are lowered concurrently into the ocean floor with 1.4-cm
diameter steel cables. Both cores are recovered and the ocean sediment is extruded onboard, cut into 1.5-
m sections, capped, and stored in a refrigerator.
In addition to the GI airguns, a multibeam echosounder (MBES) and a sub-bottom profiler (SBP)
will be used throughout the cruise except while at water/core stations to help verify seafloor conditions at
possible coring sites and to collect additional seafloor bathymetric data. Passive geophysical sensors (a
gravimeter and a magnetometer) will also be operated continuously throughout the entire cruise.
All planned geophysical and geochemical data acquisition activities will be conducted by SIO with
on-board assistance by the scientists who have proposed the study. The Principal Investigator is Dr.
Franco Marcantonio and the Co-principal Investigator is Dr. Mitchell Lyle, both of Texas A&M Univer-
sity. The vessel will be self-contained, and the crew will live aboard the vessel for the entire cruise.
(c) Schedule
The R/V Melville is expected to depart Puntarenas, Costa Rica, on 19 October 2010 and spend ~15
days conducting seismic surveys, 10 days collecting water and core samples, and ~2 days in transit, arriving
at Arica, Chile, on 14 November 2010. At each of the four sites, seismic operations will be conducted for
~2 days, and each water sampling and coring station will be occupied for 1–2 days. The exact dates of the
activities depend on logistics, weather conditions, and the need to repeat some lines if data quality is
substandard.
(d) Source Vessel Specifications
The R/V Melville has a length of 85 m, a beam of 14.0 m, and a maximum draft of 5.0 m. The ship is
powered by two 1385-hp Propulsion General Electric motors and a 900-hp retracting Azimuthing bow thrus-
ter. Operation speeds of ~11 km/h (6 knots) and 15–18.5 km/h (8–10 knots) will be used during seismic
acquisition within the survey areas and between the areas and stations, respectively. When not towing seismic
survey gear, the R/V Melville cruises at 21.7 km/h (11.7 knots) and has a maximum speed of 25.9 km/h
(14 knots). It has a normal operating range of ~18,630 km.
The R/V Melville will also serve as the platform from which vessel-based marine mammal
observers will watch for marine mammals and sea turtles before and during airgun operations, as
described in § II(3), below.
Other details of the R/V Melville include the following:
Owner: U.S. Navy
Operator: Scripps Institution of Oceanography of the University of
California
Flag: United States of America
Date Built: 1969
Gross Tonnage: 2516
Compressors for Air Guns: 1850 psi
Accommodation Capacity: 23 crew plus 38 scientists

II. Alternatives Including Proposed Action
Environmental Assessment for SIO ETP Cruise, 2010 Page 5
The R/V Melville complies with International Maritime Organization (IMO) guidelines and United
States Coast Guard (USCG) regulations for Ballast Water Management. The R/V Melville‘s procedures are
documented in the SIO Marine Facility‘s Safety Management Manual (SMM) in Section 256, ―Ballast
Water Management Plan.‖ These procedures are in place and approved by the American Bureau of
Shipping (ABS), which acts for USCG to approve and verify compliance with approved procedures. These
procedures are audited internally annually and externally every 2.5 years. The loading and discharging of
ballast water is recorded in the ship‘s Ballast Water Management Log and in the ship‘s official log located
on the bridge. In short, the R/V Melville meets all international and U.S. requirements for handling ballast
water and U.S. requirements for reporting carriage and discharge of ballast water in U.S. ports.
(e) Airgun Description
The R/V Melville will tow a pair of 45-in3 Sercel GI airguns and a streamer containing hydro-
phones along predetermined lines. Seismic pulses will be emitted at intervals of 8–10 seconds. At speeds
of ~11–18.5 km/h, the 8–10 s spacing corresponds to shot intervals of ~25–50 m.
The generator chamber of each GI airgun, the one responsible for introducing the sound pulse into
the ocean, is 45 in3. The larger (105-in
3) injector chamber injects air into the previously-generated bubble
to maintain its shape, and does not introduce more sound into the water. The two 45-in3 GI airguns will
be towed 8 m apart side by side, 21 m behind the Melville, at a depth of 2 m. The sound pressure field of
that GI airgun variation has not been modeled, but that for two 45-in3 Nucleus G airguns has been
modeled by Lamont-Doherty Earth Observatory (L-DEO) in relation to distance and direction from the
airguns (see ―Mitigation Measures‖ below).
As the GI airgun is towed along the survey line, the towed hydrophone array in the streamer
receives the reflected signals and transfers the data to the on-board processing system. Given the relative-
ly short streamer length behind the vessel, the turning rate of the vessel while the gear is deployed is
much higher than the limit of five degrees per minute for a seismic vessel towing a streamer of more
typical length (>>l km). Thus, the maneuverability of the vessel is not limited much during operations.
GI Airgun Specifications
Energy Source Two GI airguns of 45 in3
Source output (downward) 0-pk is 3.4 bar-m (230.6 dB re 1 μPa·m);
pk-pk is 6.2 bar-m (235.8 dB re 1 μPa·m)
Towing depth of energy source 2 m
Air discharge volume ~90 in3
Dominant frequency components 0–188 Hz
Gun positions used Two side by side airguns 8 m apart
Gun volumes at each position (in3) 45, 45
The nominal downward-directed source levels indicated above do not represent actual sound levels
that can be measured at any location in the water. Rather, they represent the level that would be found
1 m from a hypothetical point source emitting the same total amount of sound as is emitted by the
combined GI airguns. The actual received level at any location in the water near the GI airguns will not
exceed the source level of the strongest individual source. In this case, that will be about 224.6 dB re
1μPa-m peak, or 229.8 dB re 1μPa-m peak-to-peak. Actual levels experienced by any organism more
than 1 m from either GI airgun will be significantly lower.
II. Alternatives Including Proposed Action
Environmental Assessment for SIO ETP Cruise, 2010 Page 6
A further consideration is that the rms1 (root mean square) received levels that are used as impact
criteria for marine mammals are not directly comparable to the peak (p or 0–p) or peak to peak (p–p) values
normally used to characterize source levels of airgun arrays. The measurement units used to describe airgun
sources, peak or peak-to-peak decibels, are always higher than the rms decibels referred to in biological
literature. A measured received level of 160 dB re 1 µParms in the far field would typically correspond to
~170 dB re 1 Pap, and to ~176–178 dB re 1 μPap-p, as measured for the same pulse received at the same
location (Greene 1997; McCauley et al. 1998, 2000). The precise difference between rms and peak or peak-
to-peak values depends on the frequency content and duration of the pulse, among other factors. However,
the rms level is always lower than the peak or peak-to-peak level for an airgun-type source.
Additional discussion of the characteristics of airgun pulses is included in Appendix A (3).
(i) Multibeam Echosounder and Sub-bottom Profiler Descriptions
Along with the seismic operations, two additional acoustical data acquisition systems will be operated
continuously during the cruise except when the R/V Melville is on water sampling and coring stations.
Kongsberg EM 122 Multi-beam Echo Sounder.—The Kongsberg EM 122 MBES operates at
10.5–13 (usually 12) kHz and is hull-mounted on the Melville. The transmitting beamwidth is 1° fore–aft
and 150° athwartship. The maximum source level is 242 dB re 1 μPa · mrms. Each ―ping‖ consists of
eight (in water >1000 m deep) or four (<1000 m) successive fan-shaped transmissions, each ensonifying a
sector that extends 1° fore–aft. Continuous-wave (CW) pulses increase from 2 to 15 ms long in water
depths up to 2600 m, and FM chirp pulses up to 100 ms long are used in water >2600 m. The successive
transmissions span an overall cross-track angular extent of about 150°, with 2-ms gaps between the pulses
for successive sectors.
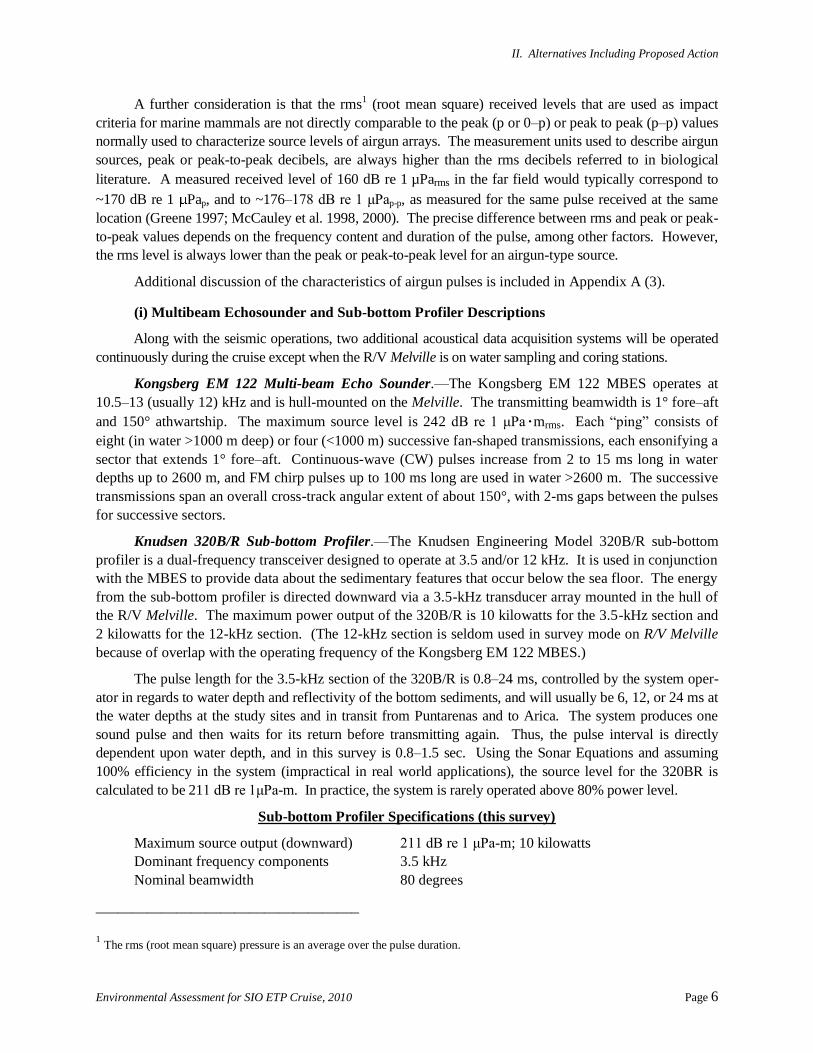
Knudsen 320B/R Sub-bottom Profiler.—The Knudsen Engineering Model 320B/R sub-bottom
profiler is a dual-frequency transceiver designed to operate at 3.5 and/or 12 kHz. It is used in conjunction
with the MBES to provide data about the sedimentary features that occur below the sea floor. The energy
from the sub-bottom profiler is directed downward via a 3.5-kHz transducer array mounted in the hull of
the R/V Melville. The maximum power output of the 320B/R is 10 kilowatts for the 3.5-kHz section and
2 kilowatts for the 12-kHz section. (The 12-kHz section is seldom used in survey mode on R/V Melville
because of overlap with the operating frequency of the Kongsberg EM 122 MBES.)
The pulse length for the 3.5-kHz section of the 320B/R is 0.8–24 ms, controlled by the system oper-
ator in regards to water depth and reflectivity of the bottom sediments, and will usually be 6, 12, or 24 ms at
the water depths at the study sites and in transit from Puntarenas and to Arica. The system produces one
sound pulse and then waits for its return before transmitting again. Thus, the pulse interval is directly
dependent upon water depth, and in this survey is 0.8–1.5 sec. Using the Sonar Equations and assuming
100% efficiency in the system (impractical in real world applications), the source level for the 320BR is
calculated to be 211 dB re 1μPa-m. In practice, the system is rarely operated above 80% power level.
Sub-bottom Profiler Specifications (this survey)
Maximum source output (downward) 211 dB re 1 μPa-m; 10 kilowatts
Dominant frequency components 3.5 kHz
Nominal beamwidth 80 degrees
____________________________________
1 The rms (root mean square) pressure is an average over the pulse duration.

II. Alternatives Including Proposed Action
Environmental Assessment for SIO ETP Cruise, 2010 Page 7
Pulse interval 0.8–1.5 sec
Pulse duration 0.8–24 ms
(3) Monitoring and Mitigation Measures
Marine mammals and sea turtles are known to occur in the proposed study area. To minimize the
likelihood that impacts will occur to the species and stocks, seismic operations will be conducted in ac-
cordance with regulations by the National Marine Fisheries Service (NMFS) under the Marine Mammal
Protection Act (MMPA) and the Endangered Species Act (ESA), including obtaining permission for
incidental harassment or incidental ‗take‘ of marine mammals and other endangered species. The
proposed seismic activities will take place in International Waters and in the EEZs of Costa Rica,
Panama, Colombia, and Ecuador. The U.S. State Department will seek authorization from those govern-
ments for clearance to work in their EEZs. All national and international environmental regulations iden-
tified through these processes will be met.
The following subsections provide more detailed information about the monitoring and mitigation
measures that are an integral part of the planned activities. The procedures described here are based on
protocols used during previous SIO seismic research cruises as approved by NMFS, and on best practices
recommended in Richardson et al (1995), Pierson et al. (1998), and Weir and Dolman (2007).
(a) Visual Monitoring
Vessel-based marine mammal observers (MMOs) will be based on board the seismic source vessel,
and they will watch for marine mammals and turtles near the vessel during seismic operations. MMOs will
also watch for marine mammals and turtles near the seismic vessel for at least 30 minutes prior to the start of
seismic operations after an extended shutdown. When feasible, MMOs will also make observations during
daytime periods when the seismic system is not operating for comparison of animal abundance and
behavior. Based on MMO observations, the seismic source will be shut down when marine mammals are
observed within or about to enter a designated exclusion zone (EZ) [see section (e) below]. The EZ is a
region in which a possibility exists of adverse effects on animal hearing or other physical effects.
MMOs will be appointed by the academic institution conducting the research cruise, with NMFS
Office of Protected Resources concurrence. At least one MMO will monitor the EZ during seismic oper-
ations. MMOs will normally work in shifts of 4-hour duration or less. The vessel crew will also be in-
structed to assist in detecting marine mammals and turtles.
Standard equipment for marine mammal observers will be 7 x 50 reticule binoculars and optical
range finders. At night, night-vision equipment will be available. The observers will be in wireless
communication with ship‘s officers on the bridge and scientists in the vessel‘s operations laboratory, so
they can advise promptly of the need for avoidance maneuvers or seismic source shut down.
(b) MMO Data and Documentation
MMOs will record data to estimate the numbers of marine mammals and turtles exposed to various
received sound levels and to document apparent disturbance reactions or lack thereof. Data will be used
to estimate numbers of animals potentially ‗taken‘ by harassment (as defined in the MMPA). They will
also provide information needed to order a shutdown of the seismic source when a marine mammal or sea
turtle is within or near the EZ.
When a sighting is made, the following information about the sighting will be recorded:

II. Alternatives Including Proposed Action
Environmental Assessment for SIO ETP Cruise, 2010 Page 8
1. Species, group size, age/size/sex categories (if determinable), behavior when first sighted and
after initial sighting, heading (if consistent), bearing and distance from seismic vessel, sighting
cue, apparent reaction to the seismic source or vessel (e.g., none, avoidance, approach,
paralleling, etc.), and behavioral pace.
2. Time, location, heading, speed, activity of the vessel, sea state, visibility, and sun glare.
The data listed under (2) will also be recorded at the start and end of each observation watch, and
during a watch whenever there is a change in one or more of the variables.
All observations, as well as information regarding seismic source shutdown, will be recorded in a
standardized format. Data accuracy will be verified by the MMOs at sea, and preliminary reports will be
prepared during the field program and summaries forwarded to the operating institution‘s shore facility
and to NSF weekly or more frequently. MMO observations will provide the following information:
1. The basis for decisions about shutting down the seismic source.
2. Information needed to estimate the number of marine mammals and sea turtles potentially
‗taken by harassment‘. These data will be reported to NMFS and/or USFWS per terms of
MMPA authorizations or regulations.
3. Data on the occurrence, distribution, and activities of marine mammals and turtles in the area
where the seismic study is conducted.
4. Data on the behavior and movement patterns of marine mammals and turtles seen at times with
and without seismic activity.
(d) Reporting
A report will be submitted to NMFS within 90 days after the end of the cruise. The report will des-
cribe the operations that were conducted and sightings of marine mammals and turtles near the operations.
The report will be submitted to NMFS, providing full documentation of methods, results, and interpret-
ation pertaining to all monitoring. The 90-day report will summarize the dates and locations of seismic
operations, and all marine mammal and turtle sightings (dates, times, locations, activities, associated seis-
mic survey activities). The report will also include estimates of the amount and nature of any potential
―take‖ of marine mammals and sea turtles by harassment or in other ways. After acceptance by NMFS,
the report will be publicly available on the NSF website.
(e) Proposed Exclusion Zones
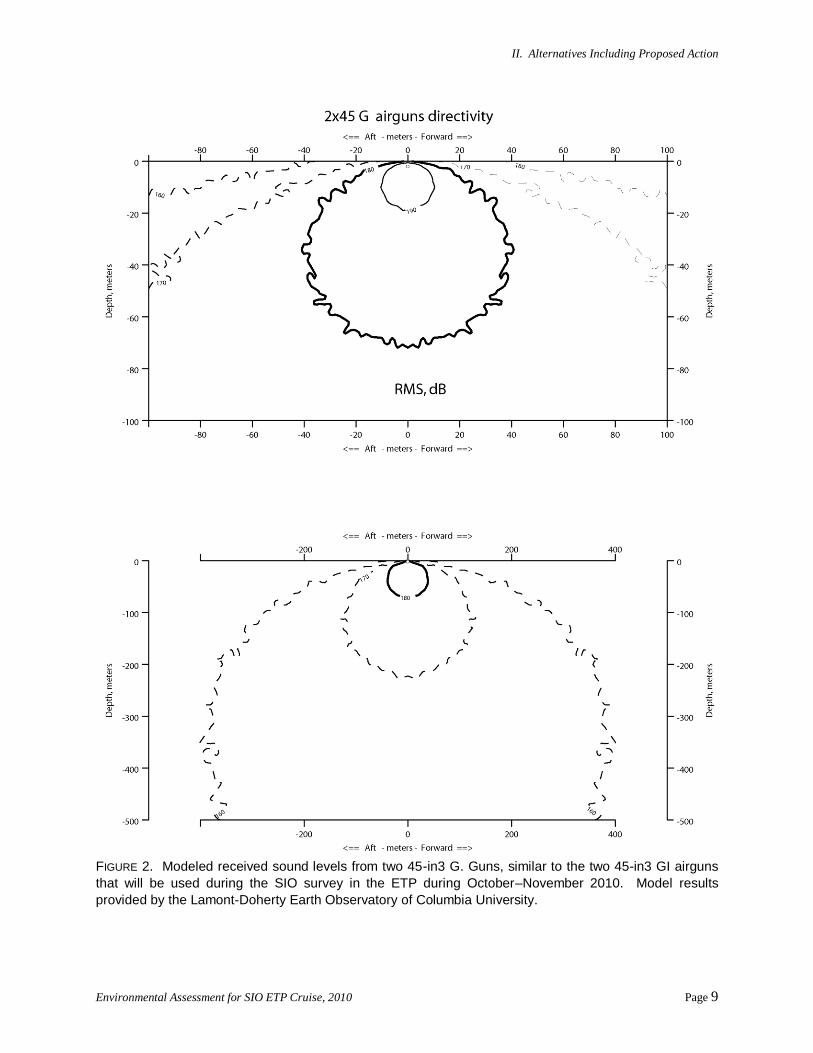
Received sound levels have been modeled by Lamont-Doherty Earth Observatory of Columbia
University (L-DEO) for a number of airgun configurations, including two 45-in3 Nucleus G. Guns, in
relation to distance and direction from the airguns (Fig. 2). The model does not allow for bottom
interactions, and is most directly applicable to deep water. Based on the modeling, estimates of the
maximum distances from the GI airguns where sound levels of 190, 180, 170, and 160 dB re 1 μPa (rms)
are predicted to be received in deep (>1000-m) water are shown in Table 1. Because the model results
are for G. Guns, which have more energy than GI airguns of the same size, those distances overestimate
the distances for the 45-in3 GI airguns.
II. Alternatives Including Proposed Action
Environmental Assessment for SIO ETP Cruise, 2010 Page 9
FIGURE 2. Modeled received sound levels from two 45-in3 G. Guns, similar to the two 45-in3 GI airguns
that will be used during the SIO survey in the ETP during October–November 2010. Model results
provided by the Lamont-Doherty Earth Observatory of Columbia University.

II. Alternatives Including Proposed Action
Environmental Assessment for SIO ETP Cruise, 2010 Page 10
TABLE 1. Distances to which sound levels 190, 180, 170, and 160 dB re 1 μPa (rms) might be received
from two 45-in3 G. Guns, similar to the two 45-in
3 GI airguns that will be used during the seismic surveys
in the ETP during October–November 2010. Distances are based on model results provided by L-DEO.
Water depth
Estimated Distances at Received Levels (m)
190 dB 180 dB 170 dB 160 dB
>1000 m 10 40 125 400
Empirical data concerning the 180-, 170-, and 160-dB distances have been acquired based on
measurements during the acoustic verification study conducted by L-DEO in the northern Gulf of Mexico
from 27 May to 3 June 2003 (Tolstoy et al. 2004). Although the results are limited, the data showed that
radii around the airguns where the received level would be 180 dB re 1 μPa (rms), the safety criterion
applicable to cetaceans (NMFS 2000), vary with water depth. Similar depth-related variation is likely in
the 190-dB distances applicable to pinnipeds. Correction factors were developed for water depths 100–
1000 m and <100 m. The proposed survey will occur in depths ~1000–4800 m, so the correction factors
for shallow water are not relevant here. All of seismic operations will be in depths >1000 m.
The empirical data indicate that, for deep water (>1000 m), the L-DEO model tends to
overestimate the received sound levels at a given distance (Tolstoy et al. 2004). However, to be
precautionary pending acquisition of additional empirical data, it is proposed that safety radii during
airgun operations in deep water will be the values predicted by L-DEO‘s model (Table 1). Therefore, the
assumed 180- and 190-dB radii are 40 m and 10 m, respectively.
Table 1 shows the distances at which four rms sound levels are expected to be received from the GI
airguns. The 180- and 190-dB re 1 μParms distances are the safety criteria as specified by NMFS (2000)
and are applicable to cetaceans and pinnipeds, respectively. The 180-dB distance will also be used as the
exclusion zone for sea turtles, as required by NMFS in most other recent seismic projects (e.g., Smultea et
al. 2004; Holst et al. 2005a; Holst and Beland 2008; Holst and Smultea 2008). If marine mammals or sea
turtles are detected within or about to enter the appropriate exclusion zone, the airguns will be powered
down (or shut down if necessary) immediately.
Southall et al. (2007) made detailed recommendations for new science-based noise exposure
criteria. SIO will be prepared to revise its procedures for estimating numbers of mammals ―taken‖,
exclusion zones, etc., as may be required by any new guidelines that result. However, currently the
procedures are based on best practices noted by Pierson et al. (1998) and Weir and Dolman (2007). As
yet, NMFS has not specified a new procedure for determining exclusion zones.
(e) Mitigation During Operations
In addition to marine mammal monitoring, the following mitigation measures will be adopted during
the proposed seismic program, provided that doing so will not compromise operational safety requirements.
Although power-down procedures are often standard operating practice for seismic surveys, they will not be
used here because powering down from two airguns to one airgun would make only a small difference in the
180- or 190-dB radius—probably not enough to allow continued one-airgun operations if a mammal or turtle
came within the safety radius for two airguns. Mitigation measures that will be adopted are

II. Alternatives Including Proposed Action
Environmental Assessment for SIO ETP Cruise, 2010 Page 11
1. speed or course alteration;
2. shut-down procedures; and
3. ramp-up procedures.
Speed or course alteration
If a marine mammal or sea turtle is detected outside the exclusion zone and, based on its position
and the relative motion, is likely to enter the exclusion zone, the vessel‘s speed and/or direct course could
be changed. This would be done if operationally practicable while minimizing the effect on the planned
science objectives. The activities and movements of the marine mammal or sea turtle (relative to the
seismic vessel) will then be closely monitored to determine whether the animal is approaching the
applicable exclusion zone. If the animal appears likely to enter the exclusion zone, further mitigative
actions will be taken, i.e., either further course alterations or a shut down of the seismic source.
Typically, during seismic operations, the source vessel is unable to change speed or course and one or
more alternative mitigation measures (see below) will need to be implemented.
Shut-down procedures
If a marine mammal or turtle is detected outside the exclusion zone but is likely to enter the ex-
clusion zone, and if the vessel‘s speed and/or course cannot be changed to avoid having the animal enter
the exclusion zone, the GI airguns will be shut down before the animal is within the exclusion zone.
Likewise, if a mammal or turtle is already within the safety zone when first detected, the seismic source
will be shut down immediately.
Following a shut down, seismic activity will not resume until the marine mammal or turtle has
cleared the exclusion zone. The animal will be considered to have cleared the exclusion zone if it
is visually observed to have left the exclusion zone, or
has not been seen within the zone for 15 min in the case of small odontocetes and pinnipeds, or
has not been seen within the zone for 30 min in the case of mysticetes and large odontocetes, in-
cluding sperm, pygmy sperm, dwarf sperm, and beaked whales, or
the vessel has moved outside the exclusion zone for turtles, i.e., <1 min based on the length of
time it would take the vessel to leave the modeled exclusion zones of 40 m with speeds of 11–
18.5 km/h.
Ramp-up procedures
A ramp-up procedure will be followed when the GI airguns begin operating after a specified period
without GI airgun operations. It is proposed that, for the present cruise, this period would be ~1–2 min.
This period is based on the 180-dB radii for the GI airguns (see Table 1) in relation to the planned speed
of the Melville while shooting (see above).
Ramp up will begin with a single GI airgun (45 in3). The second GI airgun (45 in
3) will be added
after 5 min. During ramp up, the MMOs will monitor the exclusion zone, and if marine mammals or
turtles are sighted, a shut down will be implemented as though both GI airguns were operational.
If the complete exclusion zone has not been visible for at least 30 min prior to the start of oper-
ations in either daylight or nighttime, ramp up will not commence. If one GI airgun has operated, ramp
up to full power will be permissible at night or in poor visibility, on the assumption that marine mammals
and turtles will be alerted to the approaching seismic vessel by the sounds from the single GI airgun and
could move away if they choose. A ramp up from a shut down may occur at night, but only where the

II. Alternatives Including Proposed Action
Environmental Assessment for SIO ETP Cruise, 2010 Page 12
safety radius is small enough to be visible. Ramp up of the GI airguns will not be initiated if a sea turtle
or marine mammal is sighted within or near the applicable exclusion zones during day or night.
Alternative Action: Another Time
An alternative to issuing the IHA for the period requested and to conducting the project then, is to issue
the IHA for another time and to conduct the project at that alternative time. The proposed time for the cruise in
October–November 2010 is the most suitable time logistically for the Melville and the participating scientists.
If the IHA is issued for another period, it could result in significant delay and disruption not only of this cruise,
but of additional geophysical studies that are planned by SIO for 2010 and beyond. An evaluation of the
effects of this alternative action is given in § IV.
No Action Alternative
An alternative to conducting the proposed activities is the ―No Action‖ alternative, i.e., do not issue
an IHA and do not conduct the research operations. If the research is not conducted, the ―No Action‖
alternative would result in no disturbance to marine mammals due to the proposed activities.
The purpose of this project is to better understand how marine sediments record paleo-
oceanographic information. The deposition of sediments in the upper 500 m of the sediment column will
be studied using known seismic horizons in the sediment column to estimate rates of deposition
downstream from potential sediment sources on the topographic highs, and to estimate loss from the
ridges. The seismic survey and associated coring and water sampling will allow comparisons of geophys-
ical estimates of the level of erosion from marine ridges and highs with geochemical estimates of sedi-
ment focusing based upon the distribution of Th-230, a particle-reactive isotope produced by the decay of
dissolved uranium in the water column. In addition, the study will examine whether there are sediment
sources for Th-230 in slowly-accumulating sediments. Under the ―No Action‖ alternative, this valuable
scientific information would not become available.
The ―No Action‖ alternative could also, in some circumstances, result in significant delay of other
geophysical studies that are planned by SIO for 2010 and beyond, depending on the timing of the decision.
Not conducting this cruise (no action) would result in less data and support for the academic institutions
involved. Data collection is an essential first step for a much greater effort to analyze and report information
for the significant topics indicated. The ~25 days of field effort provides material for years of analyses
involving multiple professors, students, and technicians. The lost opportunity to collect valuable scientific
information is compounded by lost opportunities for support of research infrastructure, training, and
professional career growth.
III. AFFECTED ENVIRONMENT
Protected Areas
(1) Cocos Island National Park, Costa Rica
Cocos Island National Park is located 530 km southwest of the coast of Costa Rica, in the
southwest corner of the Cocos Ridge survey area, at 5.52°N, 87.07°W. The 2390-ha island was desig-
nated a National Park by the Government of Costa Rica in 1978, and extended in 1984 to include all
marine ecosystems within 15 km of the island in the Cocos Island Marine and Terrestrial Conservation
Area. It was inscribed on the World Heritage List by UNESCO in 1997, designated a Wetland of Inter-

III. Affected Environment
Environmental Assessment for SIO ETP Cruise, 2010 Page 13
national Importance under the Ramsar Convention in 1998, and subsequently extended by 100,000 ha in
2002 to include the marine area 22 km from shore (UNEP-WCMC 2008a). The Park is managed by the
National Park Service within the Ministry of Environment and Energy, and the site including its 22-km
buffer zone has absolute protection; extraction of marine resources, and any commercial, industrial, or
agricultural activities are banned.
Isla del Cocos is the only major oceanic island of the ETP with wet rainforest and, above 500m, a
cloud forest. It also possesses the most diverse and extensive coral reef in the eastern Pacific Ocean, and
rich surrounding waters with unusually large numbers of pelagic species, especially sharks. There are
numerous endemic species, including 3 of 13 resident bird species, 65 of 362 insect species, 2 of 5 terres-
trial reptiles, and 35 of 557 crustacean and mollusc species on the fringing reefs (UNEP-WCMC 2008a).
Rodríguez-Fonseca (2001) identified the waters of Isla del Cocos as an important area off western Costa
Rica for Cuvier‘s beaked whale, bottlenose dolphins, Fraser‘s dolphins, and false killer whales, although
the study of May-Collado et at (2005) ―did not show patterns to support‖ the importance of Isla del Cocos
for Cuvier‘s beaked whale or the false killer whale.
The proposed seismic surveys and water sampling and coring operations will occur well outside of
the protected waters of Cocos Island National Park.
(2) Coiba National Park and its Special Zone of Marine Protection, Republic of Panama
Coiba National Park comprises a group of 38 islands lying at the south end of the Gulf of Chiriquí
10–55 km off the southwest coast of Panama at 7.16–7.89ºN, 81.54–81.94ºW, ~250 km from the survey
line between the Cocos Ridge and Malpelo Ridge survey areas. Created in 1991, it was enlarged and
designated a National Park with a Special Zone of Marine Protection in 2004. It was inscribed on the
World Heritage List by UNESCO in 2005. The park is administered by the National Authority for the
Environment. The terrestrial sector, marine sector, and special zone of marine protection comprise
53,625 ha, 216,500 ha, and 160,700 ha, respectively. Agriculture, tree-felling, mining, oil prospecting,
and the development of infrastructure except for Park use are prohibited in the National Park. In the
Special Zone, regulated traditional fishing is permitted but commercial fishing and the use of long-line
and nylon gill-nets were to be prohibited in 2005 (UNEP-WCMC 2005).
(3) Malpelo Fauna and Flora Sanctuary, Colombia
Malpelo Fauna and Flora Sanctuary is located ~500 km west of the coast of Colombia, near the
middle of the Malpelo Ridge survey area, at 3.98°N, 81.58°W. Malpelo Island, with an area of 350 ha,
was designated a Flora and Fauna Sanctuary by the Government of Colombia in 1995. The sanctuary was
extended to include marine waters out to ~11 km in 1996, and further extended in 2005 to include
857,150 ha of the surrounding marine environment (UNEP-WCMC 2006). The International Maritime
Organisation declared the sanctuary a Particularly Sensitive Sea Area in 2003, and it was inscribed on the
World Heritage List by UNESCO in 2006. The sanctuary is administered by the Special Administrative
Unit of the Natural National Parks System (PNNC) of the Ministry of the Environment. The extended
protected area around Malpelo was declared a no fish-take area by PNNC in 2005, and it is the largest no-
fishing zone in the ETP (UNESCO 2010).
Malpelo is an isolated basaltic seamount with sheer cliffs rising 4000 m above the ocean floor and a
maximum elevation of 376 m above sea level. The island is a mostly barren oceanic rock, with sparse
vegetation dependent on guano. It has 17 marine mammal species, 5 terrestrial and 7 marine reptile
species, 61 species of birds, 394 species of fish, and 340 species of molluscs. Malpelo has the world‘s
III. Affected Environment
Environmental Assessment for SIO ETP Cruise, 2010 Page 14
largest colony of the masked booby (UNEP-WCMC 2006). It is known for its sharks, giant grouper, and
billfish; it is one of the few places in the world where sightings of the short-nosed ragged-toothed shark, a
deepwater shark, have been confirmed. It is widely recognized as one of the top diving sites in the world
because of steep walls and caves, and important populations of large predators and pelagic species, e.g.,
aggregations of <200 hammerhead sharks and <1000 silky sharks (UNESCO 2010).
The proposed seismic surveys will be carried out in only a small part of the Malpelo Ridge survey
area shown in Figure 1 (see scale in inset), and the surveys and water sampling and coring operations will
occur well outside of the protected waters of Malpelo Fauna and Flora Sanctuary.
(4) Galápagos Biological Marine Resources Reserve
The Galápagos National Park was first established in 1936, and a marine reserve baseline of
7,990,000 ha joining the outmost points of the Islands was ratified in 1971. The Galápagos Biological
Marine Resources Reserve was established in 1986 to include all waters within 15 nmi. (27.8 km) of the
baseline, and in 1998 the reserve was extended to 40 nmi. (74 km) from the baseline. The park was
inscribed on the World Heritage List by UNESCO in 1978, one of the first four natural heritage sites to be
established, and the site was extended by inclusion of the Galápagos Biological Marine Resources
Reserve in 2001. In 2007, it was listed as a World Heritage Site in Danger because of invasive species,
increasing tourism, and immigration. The archipelago was also designated a Biosphere Reserve under the
UNESCO Man and Biosphere Programme in 1984. The reserve is administered by a tripartite com-
mission of the Galapagos National Park Service of the Ministry of the Environment, the National Fisher-
ies Department and the Navy, and includes four marine zones: a General Use Zone for sustainable use of
the reserve; Artisanal and Recreational Fishing zones for the benefit of residents; National Marine Park
zones for human activities where natural resources are neither damaged nor removed; and Strict Nature
Reserves where human access is not permitted (UNEP-WCMC 2008b).
The volcanic islands of the Galápagos and the surrounding marine reserve are the ―largest, most
diverse almost pristine archipelago remaining in the world, a natural museum for the study of geological,
ecological and evolutionary processes‖ (UNEP-WCMC 2008b). The Galápagos has one of the highest
concentrations of endemic species in the world, including land and marine iguanas, giant tortoises, and
the many types of finch that inspired Darwin‘s theory of evolution. One-third of the archipelago‘s
vascular land plants are endemic, as are nearly all the reptiles, half the breeding land birds, and almost
30% of the species in the waters around the archipelago (UNEP-WCMC 2008b).
Marine Mammals
Forty-three species of marine mammals, including 29 odontocetes, 7 mysticetes, 6 pinnipeds, and the
marine sea otter are known to occur in the ETP. Of those, 27 cetacean species may occur in the proposed
survey areas in the ETP (Table 2). Five of the 27 cetacean species are listed under the Endangered Species
Act (ESA) as Endangered: the sperm, humpback, blue, fin, and sei whales. Nine cetacean species, although
present in the wider ETP, likely would not be found in the proposed seismic survey areas because their ranges
do not extend that far south or north. Pacific white-sided dolphins (Lagenorhynchus obliquidens) and Baird's
beaked whales (Berardius bairdii) are seen very occasionally in the northernmost portions of the ETP (Fer-
guson and Barlow 2001). Southern right whales are seen on rare occasions off the coasts of Peru and Chile
(Aguayo et al. 1992, Santillan et al. 2004). Gray's beaked whales (Mesoplodon grayi) are distributed in the
southernmost portions of the ETP and off the coast of southern Peru (Culik 2010). Long-beaked common
dolphins (Delphinus capensis) are known to occur in the northernmost areas of the ETP off Baja California,
Mexico, and off the coast of Peru (Heyning and Perrin 1994). Dusky dolphins (Lagenorhynchus obscurus),

III. Affected Environment
Environmental Assessment for SIO ETP Cruise, 2010 Page 15
TABLE 2. The habitat, regional abundance, and conservation status of marine mammals that could occur
in or near the proposed seismic survey areas in the ETP.
Species
Occurrence in survey
area during Oct–Nov Habitat
Abundance in the
ETP1 ESA2 IUCN3 CITES4
Nature
Serve5
Mysticetes Humpback whale Very rare
Mainly nearshore waters and banks
NE Pacific 13926; SE Pacific 29007 EN LC I G4
Common minke whale Rare Coastal N.A. NL LC I G5
Bryde’s whale Uncommon Pelagic and coastal 13,0008 NL DD I G4
Sei whale Very rare Mostly pelagic N.A. EN EN I G3
Fin whale Very rare Slope, mostly pelagic 26366 EN EN I G3G4
Blue whale Uncommon Pelagic and coastal 14159 EN EN I G3G4
Odontocetes Sperm whale Common
Usually deep pelagic, steep topography 26,05310 EN VU I G3G4
Pygmy sperm whale Rare Deep waters off shelf N.A.11 NL DD II G4
Dwarf sperm whale Very rare Deep waters off shelf 11,20012 NL DD II G4
Cuvier’s beaked whale Common Slope and pelagic 20,0009
NL LC II G4
Longman's beaked whale Very rare Pelagic 29113 NL DD II N.A.
Pygmy beaked whale Uncommon Pelagic 25,30014 NL DD II GNR
Ginkgo-toothed beaked whale Very rare Pelagic 25,30014 NL DD II G3
Blainville’s beaked whale Uncommon Pelagic 25,30014 NL DD II G4
Rough-toothed dolphin Common Mainly pelagic 107,633 NL LC II G4
Bottlenose dolphin Very common Coastal, shelf, pelagic 335,834 NL LC II G5
Pantropical spotted dolphin Very common Coastal and pelagic 857,884 NL LC II G5
Spinner dolphin Very common Coastal and pelagic 1,797,716 NL DD II G5
Striped dolphin Very common Off continental shelf 964,362 NL LC II G5
Fraser's dolphin Common Pelagic 289,3009 NL LC II G4
Short-beaked common dolphin Very common Shelf, pelagic, high relief 3,127,203 NL LC II G5
Risso’s dolphin Very common Shelf, slope, seamounts 110,457 NL LC II G5
Melon-headed whale Common Pelagic 45,4009 NL LC II G4
Pygmy killer whale Uncommon Pelagic 38,9009 NL DD II G4
False killer whale Uncommon Pelagic 39,8009 NL DD II G4
Killer whale Uncommon Widely distributed 850015 NL DD II G4G5
Short-finned pilot whale Common Mostly pelagic, high-relief 589,31516 NL DD II G5
Pinnipeds California sea lion Very rare Coastal, shelf 238,00017 NL LC NL G5
Galápagos sea lion Very rare Coastal 14,000-16,00018 NL EN NL GNR
South American sea lion Very rare Coastal, shelf 150,00019 NL LC NL NL
Galápagos fur seal Very rare Coastal 6000-800018 NL EN II NL
South American fur seal Very rare Coastal, shelf 41,40020 NL LC II NL
Guadalupe fur seal Very rare Coastal, shelf 7,40821 T NT I G1
N.A. Not available or not assessed. 1
Abundance from Gerrodette et al. (2008) unless otherwise stated. 2
U.S. Endangered Species Act: EN = Endangered, T = Threatened, NL = Not listed
3 Codes for IUCN classifications: EN = Endangered; VU = Vulnerable; NT = Near Threatened; LC = Least Concern; DD = Data
Deficient. Classifications are from the 2010 IUCN Red List of Threatened Species (IUCN 2010). 4 Convention on International Trade in Endangered Species of Wild Fauna and Flora (UNEP-WCMC 2010); NL = Not listed.
5 NatureServe Status (NatureServe 2009); GNR = unranked, G2 = Imperiled, G3 = Vulnerable, G4 = Apparently secure; G5 =
Secure. 6
U.S. west coast (Carretta et al. 2010) 7 Southeast Pacific; Félix et al. (2005)
8 This estimate is mainly for Balaenoptera edeni but may include some B. borealis.
9 ETP (Wade and Gerrodette 1993)
10 Eastern temperate North Pacific (Whitehead 2002)
11 California/Oregon/Washington (Carretta et al. 2010).
12 This abundance estimate is mostly for K. sima but may also include some K. breviceps.
13 ETP (Ferguson and Barlow 2001).
14 This estimate includes all species of the genus Mesoplodon in the ETP (Ferguson and Barlow 2001).
15 ETP (Ford 2002).
16 This estimate is for G. macrorhynchus and G. melas in the ETP (Gerrodette and Forcada 2002)
17 U.S. stock (Carretta et al. 2010)

III. Affected Environment
Environmental Assessment for SIO ETP Cruise, 2010 Page 16
18 Galapagos Islands (Alava and Salazar 2006).
19 Peru and Chile (Campagna 2008a).
20 Peru and Chile (Campagna 2008b).
21 Mexico (Gallo 1994 in Carretta et al. 2010).
southern right whale dolphins (Lissodelphis peronii), Burmeister's porpoises (Phocoena spinipinnis), and
long-finned pilot whales (Globicephala melas) also occur near the Peruvian coast (Leatherwood et al. 1991;
Van Waerebeek et al. 1991; Brownell and Clapham 1999; Olson and Reilly 2002).
Six species of pinnipeds are known to occur in the ETP: the Guadalupe fur seal (Arctocephalus
townsendi), California sea lion (Zalophus californianus), Galápagos sea lion (Z. wollebaeki), Galápagos
fur seal (A. galapagoensis), southern sea lion (Otaria flavescens), and the South American fur seal (A.
australis). Ranges of the first two are substantially north of the proposed seismic survey areas, and the
last four species are not expected to occur in the offshore waters of the study areas. The marine sea otter
(Enhydra lutris) is a costal species and does not occur in offshore waters.
The ETP is a biologically productive area that supports a variety of cetacean species (Au and
Perryman 1985). Several studies of marine mammal distribution and abundance have been conducted in
the wider ETP. The most extensive regional distribution and abundance data that encompass the study
area come primarily from multi-year vessel surveys conducted in the wider ETP by the NMFS Southwest
Fisheries Science Center (SWFSC). Information on the distribution of cetaceans inhabiting the ETP has
been summarized in several studies (e.g., Polacheck 1987; Wade and Gerrodette 1993; Ferguson and
Barlow 2001; Gerrodette et al. 2008). However, for some species, abundance in the proposed seismic
survey area could be quite different from that of the wider ETP, depending on local oceanographic varia-
bilities. In addition, procedures used during the various surveys that are cited have differed somewhat,
and those differences could affect the results. For example, Ferguson and Barlow (2001) calculated
cetacean densities in the ETP based on summer/fall research surveys in 1986–1996. Their densities are
corrected for both changes in detectability of species with distance from the survey track line [f(0)], and
for perception and availability bias [g(0)]. Gerrodette et al. (2008) calculated dolphin abundance in the
ETP based on summer/fall research surveys in 1986–1990, 1998-2000, 2003, and 2006. Their estimates
are corrected for f(0) but not g(0).
Additional sighting records are available from recent surveys in the ETP. Jackson et al. (2008)
described cetacean sightings data collected during a survey from 28 July to 7 December 2006. The
survey area extended from 30ºN to 18ºS from the coastline to 153ºW, overlapping with the proposed
seismic survey area. Rasmussen et al. (2004) and Calambokidis et al. (2010) described cetacean sightings
resulting from humpback whale surveys off Costa Rica and surrounding waters from January to March in
1996–2003 and 2010. Recent at-sea monitoring for Lamont-Doherty Earth Observatory in the ETP also
provided sighting records for cetaceans during seismic programs. Seismic monitoring programs took
place at the Hess Deep in July 2003, ~1100 km west of the Galapagos Islands (Smultea and Holst 2003);
from Costa Rica to El Salvador in November–December 2004, mainly within ~100 km of the coast in
water depths extending to 5000 m (Holst et al. 2005b); from Costa Rica to Nicaragua in March–April
2008, up to ~200 km from the coast in water depths extending to 5000 m (Holst and Smultea 2008); and
~1600–1900 km west of the study area in April–August 2008 (Hauser et al. 2008).
Information on the occurrence, distribution, population size, and conservation status for each of the
27 cetacean species and 6 pinniped species that may occur in the proposed project area is presented in
Table 2. The status of these species is based on the U.S. ESA, the IUCN Red List, the Convention on

III. Affected Environment
Environmental Assessment for SIO ETP Cruise, 2010 Page 17
International Trade in Endangered Species (CITES), and NatureServe (an international network of
biological inventories that provides conservation status ranks for Latin America).
(1) Mysticetes
Humpback Whale (Megaptera novaeangliae)
The humpback whale is listed as Endangered under the U.S. ESA and Least concern on the 2010
IUCN Red List of Threatened Species (IUCN 2010), and is listed in CITES Appendix I (UNEP-WCMC
2009). The worldwide population of humpback whales is divided into various northern and southern
ocean populations (Mackintosh 1965). Geographical overlap of these populations has been documented
only off Central America (Acevedo and Smultea 1995; Rasmussen et al. 2004, 2007). The humpback
whale is one of the most abundant cetaceans off the Pacific coast of Costa Rica during the winter breeding
season of northern hemisphere humpbacks, and off the coasts of Ecuador, Columbia, and Panama during
the winter breeding period for southern hemisphere humpbacks (e.g., Rasmussen et al. 2004; May-
Collado et al. 2005, Félix and Haase 2005). The estimate of abundance for the California/Oregon/Wash-
ington humpback whale stock is 1392 (Carretta et al. 2010) and the estimated abundance for the southeast
Pacific stock is ~2900 (Félix et al. 2005)
Humpback whales occur worldwide, migrating from tropical breeding areas to polar or sub-polar
feeding areas (Jefferson et al. 2008). Although the humpback whale is considered mainly a coastal
species, it often traverses deep pelagic areas while migrating (Clapham and Mattila 1990; Norris et al.
1999; Calambokidis et al. 2001). Some males occur in waters >3000 m deep and up to 57 km from the
coast in the Caribbean (Swartz et al. 2003).
Humpback whales are often sighted singly or in groups of two or three, but while on breeding and feed-
ing grounds they may occur in groups of >20 (Leatherwood and Reeves 1983; Jefferson et al. 2008). Based on
NMFS vessel-based surveys in the ETP in July–December 2006, Jackson et al. (2008) reported a mean group
size of 1.5 (n = 11). The diving behavior of humpback whales is related to time of year and whale activity
(Clapham and Mead 1999). In summer feeding areas, humpbacks typically forage in the upper 120 m of the
water column, with a maximum recorded dive depth of 500 m (Dolphin 1987; Dietz et al. 2002). On winter
breeding grounds, humpback dives have been recorded at depths >100 m (Baird et al. 2000).
Rasmussen et al. (2007) reported 207 humpback whale sightings off Central America during
surveys in the austral winters of 2001–2004. Based on eight years (1996–2003) of survey effort off Costa
Rica from January to March and three years (2001–2003) off Panama, Rasmussen et al. (2004) reported
177 sightings. Calambokidis et al. (2010) recorded 56 sightings during a two-week survey along the Osa
Peninsula, Costa Rica in January–February 2010. May-Collado et al. (2005) reported 186 sightings of
246 humpbacks in 1979–2001 off Costa Rica during January–March, all close to shore and concentrated
around Osa Peninsula. Acevedo-Gutiérrez and Smultea (2005) reported sightings off Isla del Cocos in
August 1992 and January 1993. Humpback whales were also observed off the coasts of Columbia,
Ecuador and Peru, and occasionally in offshore waters >200 km from the coast (Félix and Haase 2005).
Eleven groups of 16 humpbacks were seen during an L-DEO seismic survey off Costa Rica and
Nicaragua in November–December 2004 (Holst et al. 2005b). Two of these individuals were also recor-
ded singing, a behavior associated predominantly with the winter breeding season. Small concentrations
of humpbacks were seen in the same region later that winter in 2005 (J. Calambokidis, pers. comm. to
LGL, Dec. 2005). Three sightings of individual humpback whales were observed during an L-DEO seis-
mic program off Costa Rica and Nicaragua in February–March 2008 (Holst and Smultea 2008). No
humpback whales were seen during L-DEO seismic programs in the Hess Deep ~1100 km west of the

III. Affected Environment
Environmental Assessment for SIO ETP Cruise, 2010 Page 18
Galapagos Islands in July 2003 (Smultea and Holst 2003) or 1600–1950 km west of the proposed survey
area in April–August 2008 (Hauser et al. 2008).
Systematic vessel-based surveys of the ETP have been conducted during July–December. No
humpback whales were found in the proposed project region over a 10-year period by Ferguson and
Barlow (2001) or by Jackson et al. (2008) in 2006. Humpback whales were reported in more coastal
waters off the coast of Ecuador (Ferguson and Barlow 2001) and sightings were observed by Jackson et
al. (2008) in the coastal waters of Costa Rica and Panama. One sighting was recorded near the study area
in offshore waters north of the Galápagos Islands. Humpback whales are unlikely to occur in the planned
offshore seismic survey areas between mid-October and mid-November.
Minke Whale (Balaenoptera acutorostrata)
The minke whale inhabits all oceans of the world from the high latitudes to near the equator (Jeffer-
son et al. 2008). In the Northern Hemisphere, minke whales are usually seen in coastal areas but can be
seen in pelagic waters during northward migrations in spring and summer and southward migration in
autumn (Stewart and Leatherwood 1985). There is no estimate of abundance available for the ETP.
Minke whales are relatively solitary, but may occur in aggregations of up to 100 when food
resources are concentrated (Jefferson et al. 2008). Based on SWFSC vessel surveys from 1991 to 2005,
Barlow and Forney (2007) reported mean group sizes of 1.6 (n = 4) off southern California. No mean
group size information is available for the ETP. Little is known about the diving behavior of minke
whales, but they are not known to make prolonged deep dives (Leatherwood and Reeves 1983).
The general distribution of minke whales includes the offshore waters of the study area (e.g.,
Reeves et al. 2002). However, minke whales are likely to be rare in the survey area. This species has
been found off the coast of Costa Rica on occasion (Rodríguez-Herrera et al. 2002). No minke whales
were found in the proposed project region during July–December surveys during 1986–1996 by Ferguson
and Barlow (2001) or in 2006 by Jackson et al. (2008). Rasmussen et al. (2004) did not report seeing any
minke whales in eight years of surveys (1996–2003) off Costa Rica or in 2001–2003 off Panama. May-
Collado et al. (2005) also did not report any minkes based on compiled sightings off Costa Rica during
1979–2001, nor have minkes been reported among compiled strandings off Costa Rica (Rodríguez-
Fonseca and Cubero-Pardo 2001).
One probable minke was observed off west-central Panama in waters <2000 m deep during an
L-DEO seismic survey in November–December 2004 (Holst et al. 2005b). No minke whales were obser-
ved during L-DEO seismic surveys in the Hess Deep ~1100 km west of the Galapagos Islands in July
2003, off Costa Rica and Nicaragua in February–March 2008, or 1600–1950 km west of the proposed
survey area in April–August 2008 (Smultea and Holst 2003; Holst and Smultea 2008; Hauser et al. 2008).
Minke whales are unlikely to occur in the planned survey areas.
Bryde’s Whale (Balaenoptera edeni)
Bryde‘s whale occurs in tropical and subtropical waters, generally between 40°N and 40°S (Jeffer-
son et al. 2008). It is common throughout the ETP, with a concentration near the equator east of 110ºW,
decreasing west of 140ºW (Lee 1993; Wade and Gerrodette 1993). Wade and Gerrodette (1993) estim-
ated Bryde‘s whale population size in the ETP at 13,000, based on data collected during 1986–1990. This
species has also been sighted off Columbia and Ecuador (Gallardo et al. 1983), and may occur around the
Galápagos Islands (Clarke and Aguayo 1965 in Gallardo et al. 1983). The International Whaling Com-
mission (IWC) recognizes a cross-equatorial or Peruvian stock of Bryde‘s whale (Donovan 1991).
III. Affected Environment
Environmental Assessment for SIO ETP Cruise, 2010 Page 19
Bryde‘s whales are known to occur in both shallow coastal and deeper offshore waters (Jefferson et
al. 2008). It does not undertake long migrations, although there is a general pattern of movement toward
the equator in winter and toward higher latitudes in summer (Kato 2002). Bryde‘s whales are usually
solitary or in pairs, although groups of 10–20 are known from feeding grounds (Jefferson et al. 2008).
Romero et al. (2001) reported that 78% of all sightings off Venezuela were of single animals. Wade and
Gerrodette (1993) reported a mean group size of 1.7 (n = 109) for the ETP. The durations of Bryde‘s
whale dives are 1–20 min (Cummings 1985).
Based on the SWFSC surveys and model used to calculate densities in the study area in § IV(3),
Bryde‘s whale is the most common mysticete in the survey area. Off Costa Rica, May-Collado et al.
(2005) reported at least 16 and possibly up to 24 sightings of at least 32 (possibly up to 43) Bryde‘s
whales in 1979–2001; these numbers are uncertain because it is now surmised that early reports of
Bryde‘s/sei whales in this region were most likely Bryde‘s whales. Both categories of sightings occurred
from coastal to oceanic waters off Costa Rica. Rasmussen et al. (2004) reported one sighting of a Bryde‘s
whale in January–March in eight years of surveys (1996–2003) off Costa Rica and from 2001 to 2003 off
Panama. Jackson et al. (2008) also encountered two Bryde‘s whales near the study area during July–
December 2006 surveys; one in the offshore waters of Ecuador and one in the offshore waters of northern
Peru. One Bryde‘s whale stranding on the central Pacific coast at Playa Bandera was reported during 1966–
1999 (Rodríguez-Fonseca and Cubero-Pardo 2001).
One Bryde‘s whale was sighted in transit to the L-DEO seismic survey area 1600–1950 km west of
the proposed survey area in April–August 2008 (Hauser et al. 2008). No Bryde‘s whales were sighted
during L-DEO seismic surveys off Costa Rica or Nicaragua in November–December 2004 or February–
March 2008 (Holst et al. 2005b; Holst and Smultea 2008), or in the Hess Deep ~1100 km west of the
Galápagos Islands in July 2003 (Smultea and Holst 2003).
Sei Whale (Balaenoptera borealis)
The sei whale is listed as Endangered under the U.S. ESA and on the 2010 IUCN Red List of
Threatened Species (IUCN 2010), and is listed in CITES Appendix I (UNEP-WCMC 2009). Sei whale
current status is generally uncertain (Horwood 1987) and the global population size is unknown but
thought to be small.
The sei whale has a nearly cosmopolitan distribution, with a marked preference for temperate
oceanic waters, and is rarely seen in coastal waters (Gambell 1985a). In the open ocean, sei whales
generally migrate from temperate zones occupied in winter to higher latitudes in the summer, where most
feeding takes place (Gambell 1985a). Sei whales appear to prefer regions of steep bathymetric relief such
as the continental shelf break, seamounts, and canyons (Kenney and Winn 1987; Gregr and Trites 2001).
On feeding grounds, they associate with oceanic frontal systems (Horwood 1987) such as the cold eastern
currents in the North Pacific (Perry et al. 1999).
Sei whales are frequently seen in groups of 2–5 (Leatherwood et al. 1988; Jefferson et al. 2008),
although larger groups sometimes form on feeding grounds (Gambell 1985a). Based on NMFS vessel
surveys in the ETP during July–December 2006, Jackson et al. (2008) reported mean group sizes for
tentative sei whale sightings (may have been Bryde‘s whales, see above) of 1.3 (n = 21). Sei whales
generally do not dive deeply, and dive durations are 15 min or longer (Gambell 1985a).
Sei whales may have been sighted during surveys in the ETP (Wade and Gerrodette 1993; Kinzey et al.
1999, 2000, 2001); however, it is difficult to distinguish sei whales from Bryde‘s whales at sea. Because sei
whales generally have a more northerly and temperate distribution (Leatherwood et al. 1988), Wade and

III. Affected Environment
Environmental Assessment for SIO ETP Cruise, 2010 Page 20
Gerrodette (1993) classified any tentative sei whale observations in the ETP as Bryde‘s whale sightings. Sei
whales may also have been sighted near the Galápagos Islands (Clarke 1962 in Gallardo et al. 1983), although
Clarke and Aguayo (1965 in Gallardo et al. 1983) suggested that those sightings could have been Bryde‘s
whales. Although the occurrence of sei whale is documented off Costa Rica (Rodríguez-Herrera et al.
2002), the reliability of the identification is uncertain.
Sei whales are likely to be very rare in the survey area. Neither Ferguson and Barlow (2001) or
Jackson et al. (2008) positively identified sei whales in or near the proposed project area during surveys
conducted during July–December. Similarly, Rasmussen et al. (2004) did not report sei whales in eight
years of surveys off Costa Rica or Panama. No sei whales were detected during L-DEO seismic surveys
off Costa Rica or Nicaragua in November–December 2004 or February–March 2008 (Holst et al. 2005b;
Holst and Smultea 2008), in the Hess Deep ~1100 km west of the Galapagos Islands in July 2003
(Smultea and Holst 2003), or 1600–1950 km west of the proposed survey area in April–August 2008
(Hauser et al. 2008).
Fin Whale (Balaenoptera physalus)
The fin whale is listed as Endangered under the U.S. ESA and on the 2010 IUCN Red List of
Threatened Species (IUCN 2010), and is listed in CITES Appendix I (UNEP-WCMC 2009). Based on
2001 and 2005 surveys, the California/Oregon/Washington Stock of fin whales was estimated at 2636
(Caretta et al. 2010).
Fin whales are widely distributed in all the world‘s oceans in coastal, shelf, and oceanic waters, but
typically occur in temperate and polar regions (Gambell 1985b; Perry et al. 1999; Gregr and Trites 2001;
Jefferson et al. 2008). The North Pacific population summers from the Chukchi Sea to California, and winters
from California southward (Gambell 1985b). Fin whales from the Southern Hemisphere are usually
distributed south of 50ºS in the austral summer (Gambell 1985b). The Chile–Peruvian stock of the Southern
Hemisphere fin whale population winters west of northern Chile and Peru from 110ºW to 60ºW (Gambell
1985b). If fin whales occurred in the project area, they would probably be from the North Pacific population.
The species appears to have complex seasonal movements, and is likely a seasonal migrant: mating
and calving occurs in temperate waters during winter, followed by migration to northern latitudes to feed
during the summer (Mackintosh 1966; Gambell 1985b; Jefferson et al. 2008). However, some evidence
suggests that there is a resident population of fin whales in the Gulf of California (Tershy et al. 1993).
Thus, some individuals or populations may not undertake the typical long-distance migrations that charac-
terize this species. Sergeant (1977) suggested that fin whales tend to follow steep slope contours, either
because they detect them readily or because biological productivity is high along steep contours because
of tidal mixing and perhaps current mixing.
Fin whales are typically observed alone or in pairs, but also in groups of up to seven or more, with
the largest aggregations occurring on feeding grounds (Jefferson et al. 2008). Based on NMFS vessel-
based surveys in the ETP in July–December 2006, Jackson et al. (2008) reported a mean group size of 1.2
(n = 8); all sightings were near Baja California. Croll et al. (2001) reported a mean dive depth and time of
98 m and 6.3 min for foraging fin whales, and a mean dive depth and time of 59 m and 4.2 min for non-
foraging individuals. Dive depths of >150 m coinciding with the diel migration of krill were reported by
Panigada et al. (1999).
Fin whales are considered very rare in the proposed survey area. No confirmed fin whale sightings
were made in the proposed study area during 10 years of survey effort in July–December by Ferguson and
Barlow (2001) or by Jackson et al. (2008) during July–December surveys in 2006. Despite >30 years of

III. Affected Environment
Environmental Assessment for SIO ETP Cruise, 2010 Page 21
SWFSC and other surveys and stranding records from the Pacific coast of Costa Rica, there have been no
confirmed records of fin whales (May-Collado et al. 2005). A possible sighting of a fin whale in this
region occurred off the Osa Peninsula in 1997; however, the species was not confirmed (May-Collado et
al. 2005). Rodríguez-Herrera et al. (2002) list the fin whale as having been documented off Costa Rica.
No fin whales were detected during L-DEO seismic surveys off Costa Rica or Nicaragua in
November–December 2004 or February–March 2008 (Holst et al. 2005b; Holst and Smultea 2008), in the
Hess Deep ~1100 km west of the Galapagos Islands in July 2003 (Smultea and Holst 2003), or 1600–
1950 km west of the proposed survey area in April–August 2008 (Hauser et al. 2008).
Blue Whale (Balaenoptera musculus)
The blue whale is listed as Endangered under the U.S. ESA and on the 2010 IUCN Red List of
Threatened Species (IUCN 2010), and is listed in CITES Appendix I (UNEP-WCMC 2009). The world-
wide population has been estimated at 15,000, with 10,000 in the Southern Hemisphere (Gambell 1976), and
3500 in the North Pacific Ocean (NMFS 1998). Blue whale calls monitored from the U.S. Navy Sound
Surveillance System (SOSUS) and other offshore hydrophones suggest that separate populations occur in the
eastern and western North Pacific (Stafford et al. 1999a, 1999b, 2001, 2007; Watkins et al. 2000; Stafford
2003). The blue whale population in the ETP in the summer/fall was estimated at 1415 (Wade and
Gerrodette 1993).
The blue whale is widely distributed throughout most of the world‘s oceans, occurring in coastal, shelf,
and pelagic waters (Jefferson et al. 2008), and are most often found in cool, productive waters where
upwelling occurs (Reilly and Thayer 1990). Generally, blue whales are seasonal migrants between high
latitudes in the summer, where they feed, and low latitudes in winter, where they mate and give birth
(Lockyer and Brown 1981). Little is known about the movements and wintering grounds of the stocks (Miz-
roch et al. 1984). Some individuals may stay in low or high latitudes throughout the year (Reilly and
Thayer 1990; Watkins et al. 2000). Broad-scale acoustic monitoring indicates that blue whales of the Eastern
North Pacific Stock may range from the eastern tropical Pacific Ocean along the coast of North America to
Canada, and offshore at least 500 km (Stafford et al. 2001).
Blue whales are typically found singly or in groups of two or three (Yochem and Leatherwood
1985; Jefferson et al. 2008). They commonly form scattered aggregations on feeding grounds (Jefferson
et al. 2008) and apparent single whales are likely part of a large, dispersed group (Wade and Friedrichsen
1979). Based on NMFS vessel surveys in the ETP in July–December 2006, Jackson et al. (2008) reported
a mean group size of 1.9 (n = 57). Four satellite-radio-tagged blue whales in the northeast Pacific Ocean
spent 94% of their time underwater, 72% of dives were <1 min long, and ―true‖ dives (>1 min) were 4.2–
7.2 min long. Shallow (<16-m) dives were most common (75%), and the average depth of deep (>16-m)
dives was 105 m (Lagerquist et al. 2000). Croll et al. (2001) reported mean dive depths and times of
140 m and 7.8 min for foraging blue whales, and 68 m and 4.9 min for non-foraging individuals. Dives
of up to 300 m were recorded for tagged blue whales (Calambokidis et al. 2003).
In the ETP, blue whales have been sighted near Costa Rica, particularly the Costa Rica Dome
(CRD), at and near the Galápagos Islands, and along the coasts of Ecuador and northern Peru throughout
the year (Aguayo 1974; Wade and Friedrichsen 1979; Donovan 1984; Reilly and Thayer 1990; Mate et al.
1999; Palacios 1999; Chandler and Calambokidis 2004; Palacios et al. 2005; Branch et al. 2006).
Palacios (1999) reported that blue whales were distributed to the west and southwest of the Galápagos
Islands where the water is enriched.

III. Affected Environment
Environmental Assessment for SIO ETP Cruise, 2010 Page 22
Reilly and Thayer (1990) suggested that blue whales that occur in the CRD may be migrant
animals from the northern or southern hemispheres or they may be a resident population. Reilly and
Thayer (1990) also suggested that the whales seen along the equator are likely part of the southeast
Pacific population, which occupies the coastal shelf of South America and the Antarctic (Mackintosh
1966). However, the whales could also be resident in the area, exploiting food resources in the CRD and
near the South American coastline (Mate et al. 1999; Palacios 1999). Based on call similarities, Stafford
et al. (1999b) linked the whales near the CRD to the population that feeds off California at the same time
of year. A recent satellite-tag study confirmed that some blue whales off California migrate south in the
fall to an area west of the CRD at 9ºN; the area is considered an important winter feeding area for blue
whales (Bailey et al. 2009).
Sightings of blue whales in the ETP, including equatorial waters, may include the pygmy blue
whale (Berzin 1978; Donovan 1984). Berzin (1978) reported that the distribution of the pygmy blue
whale is much wider than previously thought; however, this subspecies is difficult to distinguish from the
larger blue whale (Donovan 1984).
The number of sightings of blue whales in the proposed project area is low, with sightings having
only been reported off the coast of Costa Rica and near the coast of Ecuador as observed during surveys
in July–December (Ferguson and Barlow 2001). May-Collado et al. (2005) reported three groups of four
blue whales off Costa Rica based on compiled sightings from 1979–2001. Both sightings were in deep
oceanic waters. Jackson et al. (2008) also sighted two blue whales near the study area during surveys in
July–December 2006: one to the southeast of the Galápagos Islands and one ~400 km off the coast of
central Peru.
No blue whales were detected during L-DEO seismic surveys off Costa Rica or Nicaragua in
November–December 2004 or February–March 2008 (Holst et al. 2005b; Holst and Smultea 2008), in the
Hess Deep ~1100 km west of the Galapagos Islands in July 2003 (Smultea and Holst 2003), or 1600–
1950 km west of the proposed survey area in April–August 2008 (Hauser et al. 2008).
(2) Odontocetes
Sperm Whale (Physeter macrocephalus)
The sperm whale is listed as Endangered under the U.S. ESA and as Vulnerable on the 2010
IUCN Red List of Threatened Species (IUCN 2010), and is listed in CITES Appendix I (UNEP-WCMC
2009). Wade and Gerrodette (1993) estimated sperm whale abundance in the ETP at 22,666. Whitehead
(2002) updated that estimate to 26,053.
It is not clear whether sperm whales seen in the ETP are part of the Northern or Southern Hemi-
sphere stocks, or whether they should be considered a separate stock (Rice 1998). Sperm whales
occurring off the Galápagos Islands and near the coast of Ecuador are thought to belong to two different
populations (Dufault and Whitehead 1995). Whitehead and Waters (1990) suggested that those in the
Galápagos may be part of the Northern Hemisphere stock, and the Ecuador whales part of the Southern
Hemisphere stock, based on the timing of their breeding seasons. Both populations are considered part of
the Southern Hemisphere stock for management purposes (Donovan 1991).
Sperm whales range between the northern and southern edges of the polar pack ice, although they are
most abundant in tropical and temperate waters >1000 m deep over the continental shelf edge and slope, and
in pelagic waters (e.g., Rice 1989; Gregr and Trites 2001; Waring et al. 2001). Adult females and juveniles
generally occur year-round in tropical and subtropical waters, whereas males often move to higher latitudes

III. Affected Environment
Environmental Assessment for SIO ETP Cruise, 2010 Page 23
outside the breeding season to forage (Best 1979; Watkins and Moore 1982; Arnbom and Whitehead 1989;
Whitehead and Waters 1990). Sperm whales often associate with areas of high secondary productivity and
steep underwater topography, such as volcanic islands (Jacquet and Whitehead 1996). Adult males may
occur in water depths <100 m and as shallow as 40 m (Whitehead et al. 1992; Scott and Sadove 1997).
Females almost always occur in water depths >1000 m (Whitehead 2002).
Sperm whales undertake some of the deepest-known dives for the longest durations among cetaceans.
They can dive as deep as ~2 km and possibly deeper on rare occasions, for periods of over 1 h; however,
most of their foraging occurs at depths of ~300–800 m for 30–45 min (Whitehead 2003). A recent study of
tagged male sperm whales off Norway found that foraging dives extended to highly variable maximum
depths, ranging from 14 to 1860 m and with median 175 m (Teloni et al. 2008). During a foraging dive,
sperm whales typically travel ~3 km horizontally and 0.5 km vertically (Whitehead 2003). At the
Galápagos Islands, sperm whales typically forage at depths of ~400 m (Papastavrou et al. 1989; Whitehead
1989; Smith and Whitehead 2000). Whales typically dove for ~40 min and then spent 10 min at the surface
(Papastavrou et al. 1989).
Sperm whales occur singly (older males) or in groups, with mean group sizes of 20–30 but as many
as 50 (Whitehead 2003; Jefferson et al. 2008). May-Collado et al. (2005) reported a mean group size of
9.9 whales off Costa Rica. Based on NMFS vessel surveys in the ETP in 2006, Jackson et al. (2008)
reported a mean group size of 6.1 (n = 24).
Sperm whales commonly occur in the proposed study area according to surveys conducted in July–
December (Ferguson and Barlow 2001). Jackson et al. (2008) also recorded two sperm whale sightings in
or near the study area during surveys in July–December 2006: one ~100 km off the coast of Ecuador and
one in deep, offshore waters of the coast of central Peru.
Polacheck (1987) and Wade and Gerrodette (1993) reported that during surveys in the summer and
fall, sperm whales were widely distributed in the ETP, although they were generally more abundant in
deep ―nearshore‖ waters than far offshore. May-Collado et al. (2005) reported sperm whale sightings
primarily in deep offshore waters; sightings were concentrated off southeast Costa Rica, including waters
near Isla del Cocos (May-Collado et al. 2005). Rasmussen et al. (2004) reported one sperm whale
sighting in eight years of surveys (1996–2003) off Costa Rica and Panama.
Rodríguez-Fonseca and Cubero-Pardo (2001) reported that the sperm whale is the cetacean species
with the highest frequency of strandings in Costa Rica, with a reported seven strandings on the Pacific
coast during a 33-year period. Twenty sperm whale strandings were also reported off the coast of
Ecuador between 1987 and 1994 (Haase and Félix 1994).
No sperm whales were detected between Puntarenas, Costa Rica, and southern El Salvador during
an L-DEO seismic survey in November–December 2004, during which >3500 km of daytime visual effort
and 5200 km of 24-h PAM (Passive Acoustic Monitoring) effort took place (Holst et al. 2005b).
Similarly, no sperm whales were detected during L-DEO seismic surveys off Costa Rica or Nicaragua in
February–March 2008 (Holst and Smultea 2008) or in the Hess Deep ~1100 km west of the Galapagos
Islands in July 2003 (Smultea and Holst 2003). However, 5 sightings of 12 sperm whales, including 1
sighting of 7, were made during L-DEO seismic surveys 1600–1950 km west of the proposed survey area
in April–August 2008 (Hauser et al. 2008).
Dwarf and Pygmy Sperm Whale (Kogia sima and K. breviceps)
Pygmy sperm whales (Kogia breviceps) and dwarf sperm whales (Kogia sima) are distributed
widely throughout tropical and temperate seas, but their precise distributions are unknown because much

III. Affected Environment
Environmental Assessment for SIO ETP Cruise, 2010 Page 24
of what we know of the species comes from strandings (McAlpine 2002). They are difficult to sight at
sea, because of their dive behavior and perhaps because of their avoidance reactions to ships and behavior
changes in relation to survey aircraft (Würsig et al. 1998). The two species are often difficult to
distinguish from one another when sighted (McAlpine 2002). Wade and Gerrodette (1993) estimated that
the population of dwarf sperm whales in the ETP was 11,200.
Both Kogia species are sighted primarily along the continental shelf edge and slope and over deeper
waters off the shelf (Hansen et al. 1994; Davis et al. 1998; Jefferson et al. 2008). Several studies have
suggested that pygmy sperm whales live mostly beyond the continental shelf edge, whereas dwarf sperm
whales tend to occur closer to shore, often over the continental shelf (Rice 1998; Wang et al. 2002;
MacLeod et al. 2004). Barros et al. (1998), on the other hand, suggested that dwarf sperm whales might
be more pelagic and dive deeper than pygmy sperm whales. Another suggestion is that the pygmy sperm
whale is more temperate, and the dwarf sperm whale more tropical, based at least partially on live
sightings at sea from a large database from the ETP (Wade and Gerrodette 1993). This idea is also
supported by the distribution of strandings in South American waters (Muñioz-Hincapié et al. 1998).
Pygmy and dwarf sperm whales are usually found singly or in groups of less than six (Jefferson et
al. 2008). Based on NMFS vessel-based surveys in the ETP, Jackson et al. (2008) reported a mean group
size of 1.6 (n = 31) for dwarf sperm whales. In the Gulf of California, median dive and surface times for
dwarf or unidentified Kogia sp. were 8.6 min and 1.2 min, and dives of up to 25 min and surface times up
to 3 min were common (J. Barlow, pers. comm. in Willis and Baird 1998). Little is known about dive
depths of Kogia spp. A satellite-tagged pygmy sperm whale released off Florida made longer dives (> 8
min and up to ~18 min) at night and on overcast days, and shorter dives (usually 2–5 min) on clear days,
probably because of the distribution of their prey, vertically-migrating squid (Scott et al. 2001).
Both Kogia species occur in the proposed survey area, although dwarf sperm whales are likely to
be very rare and pygmy sperm whales are likely to be rare. Rodríguez-Fonseca (2001) reported the
presence of Kogia sp. off Costa Rica, but only the dwarf sperm whale has been positively identified as
occurring in that area (Ferguson and Barlow 2001; Jackson et al. 2008; May-Collado et al. 2005).
Similarly, the dwarf sperm whale was the only confirmed Kogia species off Costa Rica based on sightings
compiled from 1979 to 2001 by May-Collado et al. (2005). Most of the 34 groups of Kogia sp. occurred
in offshore waters, with frequent sightings ~90–100 km southwest of the Osa Peninsula. Rodríguez-
Fonseca and Cubero-Pardo (2001) reported a stranding of six K. simus in 1993 on the Pacific coast.
Neither species of Kogia was reported in the survey area during July–December 2006 surveys (Jackson et
al. 2008). However, Gerrodette reported at least three dwarf sperm whale sightings in or near the
proposed survey area (Gerrodette et al. 1993).
No Kogia sp. were detected during L-DEO seismic surveys off Costa Rica and Nicaragua in
November–December 2004 (Holst et al. 2005b) or in the Hess Deep ~1100 km west of the Galapagos
Islands in July 2003 (Smultea and Holst 2003). One sighting of a dwarf sperm whale and one sighting of
two pygmy sperm whales were observed off the coast of Costa Rica in waters ~2000 and 3500 m deep,
respectively, during an L-DEO seismic survey off Costa Rica and Nicaragua in February–March 2008
(Holst and Smultea 2008), and one unidentified Kogia sp. was sighted during L-DEO seismic surveys
1600–1950 km west of the proposed survey area in April–August 2008 (Hauser et al. 2008).
Cuvier's Beaked Whale (Ziphius cavirostris)
Cuvier‘s beaked whale is probably the most widespread of the beaked whales, although it is not
found in high-latitude polar waters (Heyning 1989). There are an estimated 20,000 Cuvier‘s beaked
whales in the ETP (Wade and Gerrodette 1993).

III. Affected Environment
Environmental Assessment for SIO ETP Cruise, 2010 Page 25
Cuvier‘s beaked whale is found in deep water, but it appears to prefer steep continental slope waters
(Jefferson et al. 2008), and is most common in water depths >1000 m (Heyning 1989). Ferguson et al.
(2006a) reported that in the ETP, the mean water depth where Cuvier‘s beaked whales were sighted was
~3.4 km. It is most commonly seen in groups of 2–7 but also up to 15, with a reported mean group size of
2.3 (MacLeod and D‘Amico 2006; Jefferson et al. 2008). In the ETP, group sizes range from one to
seven animals (Heyning 1989); Wade and Gerrodette (1993) reported a mean group size of 2.2 (n = 91)
and Jackson et al. (2008) reported a mean group size of 1.8 (n = 16). Cuvier‘s beaked whales make long
(30–60 min), deep dives with reported maximum depths of 1267 m (Johnson et al. 2004) and 1450 m
(Baird et al. 2006).
Cuvier‘s beaked whales are likely to be common in the survey area. During surveys conducted
during July–December, Cuvier‘s beaked whales were only observed in the northern portion of the
proposed study area (Ferguson and Barlow 2001). Jackson et al. (2008) encountered ziphiids near the
study area, in waters near the coast of Costa Rica and ~100 km off the coast of Ecuador, during July–
December 2006 surveys. Cuvier‘s beaked whale was the most frequent beaked whale identified to species
off Costa Rica as reported by May-Collado et al. (2005) for 1979–2001. They reported that 14 of 47
groups of beaked whale sightings were Cuvier‘s beaked whales; an additional 15 groups were recorded as
unidentified beaked whales. Beaked whales occurred primarily in offshore deep waters (May-Collado et
al. 2005). Rodríguez-Fonseca (2001) identified the waters by Isla del Cocos, and Isla del Caño and the
outer part of the Osa Peninsula, as two important areas off W Costa Rica for the species, although the
study of May-Collado et al. (2005) ―did not show patterns to support‖ the importance of Isla del Cocos
for Cuvier‘s beaked whale.
No Cuvier‘s beaked whales or other beaked whales were detected during L-DEO seismic surveys
off Costa Rica or Nicaragua in November–December 2004 or February–March 2008 (Holst et al. 2005b;
Holst and Smultea 2008), in the Hess Deep ~1100 km west of the Galapagos Islands in July 2003
(Smultea and Holst 2003), or 1600–1950 km west of the proposed survey area in April–August 2008
(Hauser et al. 2008).
Longman's Beaked Whale / Tropical Bottlenose Whale (Indopacetus pacificus)
Longman‘s beaked whale, also known as the tropical bottlenose whale, is considered rare in the
ETP. Although widespread throughout the tropical Pacific, the species is considered rare because of a
scarcity of sightings despite a great deal of survey effort (Pitman et al. 1999). Until very recently,
Longman's beaked whale was known only from two skulls (Pitman et al. 1987). Recent morphometric
and genetic analyses of those two original specimens and an additional four specimens have allowed a
more detailed characterization of the species (Dalebout et al. 2003). Some authorities place the species in
the genus Mesoplodon, but there now seems to be sufficient information to afford it status as a separate
genus (Dalebout et al. 2003). The estimate of abundance for Longman's beaked whale in the ETP is 291
(Ferguson and Barlow 2001).
These whales are thought to prefer warmer waters with temperatures >26ºC, and have been seen in
the tropics every month of the year except June, indicating year-round residency (Pitman et al. 1999).
Tropical bottlenose whales have been seen in groups of up to 100, with an average group size of 19.4
(MacLeod and D‘Amico 2006). Pitman et al. (1999) reported a mean group size of 18.5 in the tropics;
however, they also reported that group sizes were significantly smaller in the ETP, with an average of only
8.6. Dives last 18–25 min (Reeves et al. 2002).
Pitman et al. (1999) suggested that several sightings of Hyperoodon spp. in the ETP were actually
misidentifications (e.g., Wade and Gerrodette 1993) and were, in fact, sightings of tropical bottlenose

III. Affected Environment
Environmental Assessment for SIO ETP Cruise, 2010 Page 26
whales. In the ETP, most tropical bottlenose whale sightings have been made between 3ºN and 10ºN
(Pitman et al. 1999). Kinzey et al. (2001) reported one sighting of I. pacificus in the ETP at about 135ºW.
Jackson et al. (2008) also reported I. pacificus in the ETP well to the west of the proposed study area. No
Longman‘s (or tropical bottlenose) beaked whales were reported by May-Collado et al. (2005) based on
compiled sightings off Costa Rica from 1979–2001.
The species is very rare in the study area.
Mesoplodont Beaked Whales (Mesoplodon spp.)
Mesoplodont beaked whales (Mesoplodon spp.) are difficult to distinguish in the field, and confirmed
at-sea sightings are rare (Mead 1989; Caretta et al. 2010; Jefferson et al. 2008). Until better methods are
developed for distinguishing the different Mesoplodon species from one another, the management unit is
defined to include all Mesoplodon populations (Caretta et al. 2010). Wade and Gerrodette (1993)
estimated a population size of Mesoplodont beaked whales at 25,300 for the ETP.
Mesoplodonts are distributed primarily in deep waters (>2000 m) and along continental slopes at
depths 200–2000 m, and are rarely found in continental shelf waters (Pitman 2002). Most mesoplodonts
identified to species are known from strandings involving single individuals (Jefferson et al. 2008), thus it is
not possible to identify spatial or seasonal patterns in their distribution (Caretta et al. 2010). Dive depths of
most of these species are undocumented.
Mean group sizes are unknown for many of the Mesoplodon spp. For the ETP, Wade and Gerrodette
(1993) reported a mean group size of 3.0 (n = 128) and Jackson et al. (2008) reported a mean group size of
2.4 (n = 30) during July–December surveys in 2006.
Jackson et al. (2008) reported four sightings of Mesoplodon spp. near the northern portion of the
study area during July–December surveys in 2006; two near the coast of Costa Rica and two in offshore
waters north of the Galápagos Islands.
MacLeod and Mitchell (2006) identified the ETP as a key area for beaked whales. Three species
are known to occur in or near the survey area: the pygmy, gingko-toothed and Blainville's beaked whale.
Pygmy Beaked Whale (M. peruvianus)
Information on the pygmy beaked whale is based on scattered sightings in the ETP and a small number
of strandings (Jefferson et al. 2008). The pygmy beaked whale is thought to occur between latitudes of ~28°N
and 30°S, from Baja California to Peru and Chile (Urbán-Ramírez and Aurioles-Gamboa 1992; Pitman and
Lynn 2001; Jefferson et al. 2008). Reyes et al. (1991) reported 10 records of this species in south-central
Peru. Pitman and Lynn (2001) reported that the species may have been known previously as Mesoplodon
sp. ―A‖. The pygmy beaked whale is now believed to be widespread in the ETP, but concentrated off
central Mexico (Pitman and Lynn 2001). Wade and Gerrodette (1993) reported several sightings for M.
peruvianus as well as Mesoplodon sp. ―A‖ in the ETP.
This species is known to inhabit deep warm temperate waters beyond the continental shelf (Jefferson et
al. 2008). Most sightings have consisted of two but as many as five animals, with a mean group size of 2.3
(Jefferson et al. 2008).
Ferguson and Barlow (2001) did not report any pygmy beaked whale sightings in the study area
during 10 years of surveys conducted in July–December, but their ―small beaked whale‖ category
included pygmy and Blainville‘s beaked whales and Mesoplodon sp. ―A‖; the category was relatively
common (1.0–9.9/1000 m2) in the proposed study area. No pygmy (or M. sp ―A‖) beaked whales were

III. Affected Environment
Environmental Assessment for SIO ETP Cruise, 2010 Page 27
reported off Costa Rica by May-Collado et al. (2005) or Rodríguez-Fonseca and Cubero-Pardo (2001)
based on compiled sightings from 1979–2001 and strandings from 1966–1999, respectively. Jackson et
al. (2008) reported two sightings of M. peruvianus within the ETP, both to the northwest of the study
area, during July–December surveys in 2006.
Ginkgo-toothed Beaked Whale (M. ginkgodens)
The ginkgo-toothed beaked whale is only known from stranding records (Mead 1989). Strandings have
been reported for the western and eastern North Pacific, South Pacific, and Indian oceans, and from the
Galápagos Islands (Palacios 1996a). Two of the total 13 records reported by Mead (1989) were from the east-
ern North Pacific, one from Del Mar, California, and one from Baja California. The species is hypothesized to
occupy relatively cool areas in the temperate and tropical Pacific, where upwelling is known to occur, such as
in the California and Peru Currents and the equatorial front (Palacios 1996a).
Jackson et al. (2008) reported four sightings of Mesoplodon spp. near the northern portion of the
study area during July–December surveys in 2006; two near the coast of Costa Rica and two in offshore
waters north of the Galápagos Islands. No ginkgo-toothed beaked whales were reported off Costa Rica
by May-Collado et al. (2005) based on compiled sightings from 1979–2001, or by Rodríguez-Fonseca
and Cubero-Pardo (2001) using stranding records from 1966–1999. However, May-Collado et al. (2005)
documented 17 sightings of Mesoplodon spp. during that period.
Blainville’s Beaked Whale (M. densirostris)
Blainville‘s beaked whale is the most widely distributed Mesoplodon species (Mead 1989), although it
is generally limited to pelagic tropical and warmer temperate waters (Jefferson et al. 2008). Occasional
occurrences in cooler, higher-latitude waters are presumably related to warm-water incursions (Reeves et al.
2002). Long-term habitat studies in the northern Bahamas found that Blainville‘s beaked whales preferred
continental slope waters 200–1000 m deep characterized by intermediate depth gradients (MacLeod and Zuur
2005), where they spent most of their time along a canyon wall in waters <800 m deep (Claridge 2003;
MacLeod et al. 2004; MacLeod and Zuur 2005). Studies elsewhere indicate that Blainville‘s beaked
whales most frequently occurred in waters 300–1400 m deep (Society Islands, Gannier 2000) and 100–
500 m deep (Canary Islands, Ritter and Brederlau 1999). This species may also occur in coastal areas,
particularly where deep water gullies come close to shore (Jefferson et al. 2008).
The most commonly observed group size for this species is 1–2 individuals, with a maximum of 9 off
Hawaii (Baird et al. 2004; Jefferson et al. 2008). MacLeod and D‘Amico (2006) reported a mean group size
of 3.5 (n = 31), and Ritter and Brederlau (1999) reported a mean group size of 3.4. The maximum known
dive depth of tagged Blainville‘s beaked whales is 1408 m off Hawaii (Baird et al. 2006).
In the ETP, Blainville's beaked whales have been sighted in offshore as well as nearshore areas of
Central and South America (Pitman et al. 1987; Pitman and Lynn 2001). As noted above, the species was
included in the ―small beaked whale‖ category of Ferguson and Barlow (2001), which was relatively
common in the proposed study area. Off Costa Rica, May-Collado et al. (2005) reported one sighting of
three Blainville‘s beaked whales in deep offshore waters based on compiled sightings from 1979 to 2001.
Rough-toothed Dolphin (Steno bredanensis)
The rough-toothed dolphin is distributed worldwide in tropical, subtropical, and warm temperate
waters (Miyazaki and Perrin 1994). Wade and Gerrodette (1993) estimated rough-toothed dolphin
abundance in the ETP at 145,900 based on data collected during 1986–1990. For 2006, the abundance
estimate was 107,633 (Gerrodette et al. 2008).

III. Affected Environment
Environmental Assessment for SIO ETP Cruise, 2010 Page 28
Rough-toothed dolphins are generally seen in deep water and in shallower waters around islands.
They are typically found in groups of 10–20 animals, but groups of up to 300 have been seen (Jefferson
2002). They are deep divers and can dive for up to 15 min (Reeves et al. 2002).
In the ETP, sightings of rough-toothed dolphins have been reported by Perrin and Walker (1975),
Pitman and Ballance (1992), Wade and Gerrodette (1993), Kinzey et al. (1999, 2000, 2001), Ferguson and
Barlow (2001), Jackson et al. (2008), and May-Collado et al. (2005). The mean group size is 15.46
(Ferguson et al. 2006b).
Rough-toothed dolphins are common in the proposed survey area. May-Collado et al. (2005)
documented 28 sightings of 513 individuals based on sightings compiled off Costa Rica from 1979–2001.
These sightings were distributed from nearshore to far offshore. Rasmussen et al. (2004) reported three
sightings of rough-toothed dolphins in eight years of surveys (1996–2003) off Costa Rica and from 2001
to 2003 off Panama: one in each of 1998, 2000, and 2002. Jackson et al. (2008) also reported multiple
sightings of rough-toothed dolphins off the coasts of Costa Rica and Panama, in both shallow and deep
waters, during July–December surveys in 2006. Several sightings were within the northern portion of the
proposed survey area.
No rough-toothed dolphins were detected during L-DEO seismic surveys off Costa Rica or
Nicaragua in November–December 2004 or February–March 2008 (Holst et al. 2005b; Holst and Smultea
2008), in the Hess Deep ~1100 km west of the Galapagos Islands in July 2003 (Smultea and Holst 2003),
or 1600–1950 km west of the proposed survey area in April–August 2008 (Hauser et al. 2008).
Bottlenose Dolphin (Tursiops truncatus)
The bottlenose dolphin occurs throughout the world‘s tropical, subtropical, and temperate waters, most
commonly in coastal and continental shelf waters (Jefferson et al. 2008). Gerrodette et al. (2008) estimated
the abundance of bottlenose dolphins in the ETP at 335,834 for 2006.
There are two distinct bottlenose dolphin types: a shallow water type mainly found in coastal
waters and a deepwater type mainly found in oceanic waters (Duffield et al. 1983; Hoelzel et al. 1998;
Walker et al. 1999). The nearshore dolphins usually inhabit shallow waters along the continental shelf
and upper slope, at depths <200 m (Davis et al. 1998). Klatsky et al. (2007) reported that offshore
dolphins show a preference for water <2186 m deep. Bottlenose dolphins are reported to regularly dive to
depths >450 m for periods of >5 min, and even down to depths of 600–700 m for up to 12 min (Klatsky et
al. 2007). Bottlenose dolphins usually occur in groups of 2–20, although groups of >100 are occasionally
seen in offshore areas (Shane et al. 1986; Jefferson et al. 2008). Off Costa Rica, May-Collado et al.
(2005) reported a mean group size of 21.5 individuals based on sightings from 1979–2001. For the ETP,
Ferguson et al. (2006b) reported a mean group size of 24.1 and Jackson et al. (2008) reported a mean
group size of 24.2 (n = 149).
In the ETP, bottlenose dolphins tend to be more abundant close to the coasts and islands (Scott and
Chivers 1990); they also seem to occur more inshore than other dolphin species (Wade and Gerrodette
1993). Polacheck (1987) reported that the highest encounter rates for bottlenose dolphins in the ETP
tended to be in nearshore areas.
Bottlenose dolphins are very common in the proposed survey area; based on the SWFSC surveys
and model used to calculate densities in the study area in § IV(3), they are the third-ranked species there.
Jackson et al. (2008) reported sightings of bottlenose dolphins in all regions of the survey area, with the
highest concentrations of sightings occurring off the coasts of Costa Rica and Panama. May-Collado et
al. (2005) found this species concentrated primarily in coastal waters but also in offshore oceanic waters.

III. Affected Environment
Environmental Assessment for SIO ETP Cruise, 2010 Page 29
Rasmussen et al. (2004) reported 49 sightings of bottlenose dolphins in eight years of surveys (1996–
2003) off Costa Rica and from 2001 to 2003 off Panama. Three sightings of bottlenose whales were
reported during a two-week survey off Costa Rica in January–February 2010 (Calambokidis et al. 2010).
Smith and Whitehead (1999) reported that bottlenose dolphins were frequently seen near the Galápagos
Islands. Rodríguez-Fonseca (2001) identified Isla del Cocos as one of four important areas in Pacific
Costa Rican waters for the species.
Eight groups of 69 bottlenose dolphins and five groups of 19 bottlenose dolphins were identified off
Costa Rica and Nicaragua during L-DEO seismic surveys in November–December 2004 and February–March
2008, respectively (Holst et al. 2005b; Holst and Smultea 2008). The majority of these bottlenose dolphin
sightings occurred in relatively shallow waters <1000 m deep. None were observed during L-DEO seismic
surveys in the Hess Deep ~1100 km west of the Galapagos Islands in July 2003 (Smultea and Holst 2003) or
1600–1950 km west of the proposed survey area in April–August 2008 (Hauser et al. 2008).
Pantropical Spotted Dolphin (Stenella attenuata)
In the eastern Pacific, the pantropical spotted dolphin ranges from 25ºN off Baja California,
Mexico, to 17ºS off southern Peru (Perrin and Hohn 1994). Au and Perryman (1985) reported that the
species occurs primarily north of the equator, off southern Mexico, and westward along 10ºN. They also
reported its occurrence in seasonal tropical waters south of the Galápagos Islands.
There was an overall stock decline of spotted dolphins during 1960–1980 because of the purse-
seine tuna fishery (Allen 1985). Gerrodette and Forcada (2005) reported that the population of offshore
northeastern spotted dolphins has not yet recovered from the earlier population declines. For 1986–1990,
Wade and Gerrodette (1993) reported a population estimate of 2.1 million based on data collected during
1986–1990. The abundance estimate of spotted dolphins in the ETP for 2006 was 857,884 (Gerrodette et
al. 2008).
Wade and Gerrodette (1993) identified three stocks of spotted dolphins in the ETP: the coastal
stock (S. a. grafmani) and two offshore (S. a. attenuata) stocks (the northeast and the west/south stock)
However, recent genetic evidence suggests that there may be nine genetically distinct stocks of this
species in coastal areas from Baja California south to Ecuador (Rosales and Escorza-Trefiño 2005).
Spotted dolphins from the northeast offshore stock are most likely to occur in the proposed study area.
For the ETP, Ferguson et al. (2006b) reported mean group sizes of 131 and 186 for offshore and
unidentified subspecies of pantropical spotted dolphins, respectively, and Gerrodette and Forcada (2005)
estimated a mean group size of 114 for the offshore stock. Off Costa Rica, May-Collado et al. (2005)
reported a mean group size of 29.4 based on sightings during 1979–2001.
Pantropical spotted dolphins are very common in the proposed survey area; based on the SWFSC
surveys and model used to calculate densities in the study area (see § IV[3]), they are the fourth-ranked
species there. Jackson et al. (2008) reported three sightings of pantropical spotted dolphins near the study
area during July–December surveys in 2006. These sightings were in deep waters offshore from
Columbia and Ecuador. The majority of pantropical spotted dolphin sightings during the 2006 survey
were to the northwest of the proposed study area (Jackson et al. 2008). Rodríguez-Fonseca (2001)
reported that the oceanic spotted dolphin was less common than the coastal spotted dolphin in Costa
Rican waters. May-Collado et al. (2005) found this species concentrated primarily in coastal waters but
also in offshore oceanic waters. Rasmussen et al. (2004) reported 381 sightings of spotted dolphins in
eight years of surveys during 1996–2003 off Costa Rica and during 2001–2003 off Panama. Thirty-one
sightings of spotted dolphins were also recorded by Calambokidis et al. (2010) during a two-week survey

III. Affected Environment
Environmental Assessment for SIO ETP Cruise, 2010 Page 30
off Costa Rica in January–February 2010. Two spotted dolphin strandings on the Pacific coast were
included in a list of strandings for Costa Rica during 1966–1999 (Rodríguez-Fonseca and Cubero-Pardo
2001).
Eight groups of >200 pantropical spotted dolphins and two groups of 290 pantropical spotted
dolphins were identified off Costa Rica and Nicaragua during L-DEO seismic surveys in November–
December 2004 and February–March 2008, respectively (Holst et al. 2005b; Holst and Smultea 2008).
All of the sightings occurred in relatively shallow waters of <1000 m, with the majority occurring in
waters <500 m deep. None were observed during an L-DEO seismic survey in the Hess Deep ~1100 km
west of the Galapagos Islands in July 2003 (Smultea and Holst 2003), and 4 single spotted dolphins were
sighted in transit to and from the L-DEO seismic survey areas 1600–1950 km west of the proposed survey
area in April–August 2008 (Hauser et al. 2008).
Spinner Dolphin (Stenella longirostris)
The spinner dolphin is distributed in oceanic and coastal waters and is associated with warm tropical
surface water (Au and Perryman 1985; Reilly 1990; Reilly and Fiedler 1994). The total population of spinner
dolphins in the ETP in 1979 was estimated at 0.8–0.9 million (Allen 1985). Wade and Gerrodette (1993)
reported an abundance estimate of 1.7 million for spinner dolphins in the ETP based on data collected
during 1986–1990. Gerrodette et al. (2008) estimated the abundance for spinner dolphins in the ETP for
2006 at 1,797,716.
In the ETP, three types of spinner dolphins have been identified and two of those are recognized as
subspecies: the eastern spinner dolphin, S. l. orientalis, considered an offshore species, the Central
American spinner, S. l. centroamericana (also known as the Costa Rican spinner), considered a coastal
species in Costa Rica (Perrin 1990; Dizon et al. 1991), and the ‗whitebelly‘ spinner, which is thought to
be a hybrid of the eastern spinner and Gray‘s spinner (S. l. longirostris). Although there is a great deal of
overlap between the ranges of eastern and whitebelly spinner dolphins, the eastern form generally occurs
in the northeastern portion of the ETP, whereas the whitebelly spinner occurs in the southern portion of
the ETP, ranging farther offshore (Wade and Gerrodette 1993; Reilly and Fiedler 1994). The Costa Rican
spinner dolphin is typically seen within 150 km from shore (ACS 2007).
Spinner dolphins in the ETP tend to occur in large groups compared to most other cetaceans.
Ferguson et al. (2006b) reported mean group sizes of 108.8, 82.5, and 147.7 for eastern, whitebelly, and
unidentified spinner dolphins, respectively, and Gerrodette and Forcada (2005) reported a mean group
size of 112 for the eastern stock. Off Costa Rica, May-Collado et al. (2005) reported a mean group size
of 97 based on sightings compiled from 1979–2001. Spinner dolphins usually dive to 600 m or deeper to
feed (Perrin and Gilpatrick 1994).
Both whitebelly and eastern spinner dolphins commonly occur in the proposed survey area.
Polacheck (1987) reported that the highest encounter rates in the ETP occurred southwest of the
Galápagos Islands, but spinner dolphins are thought to be rare visitors to the Galápagos Islands (Smith
and Whitehead 1999). Rasmussen et al. (2004) reported only one sighting of spinner dolphins in eight
years of surveys from 1996 to 2003 off Costa Rica and from 2001 to 2003 off Panama. May-Collado et
al. (2005) reported spinner dolphins primarily in oceanic waters off Costa Rica during 1979–2001, with
small numbers in coastal waters. Jackson et al. (2008) reported only one sighting of eastern spinner
dolphins near the study area during July–December surveys in 2006. This sighting was in offshore waters
almost halfway between Costa Rica and the Galápagos Islands.

III. Affected Environment
Environmental Assessment for SIO ETP Cruise, 2010 Page 31
During L-DEO seismic surveys off Costa Rica and Nicaragua, three groups of ~1350 spinner
dolphins (two groups off NW Costa Rica and one off Nicaragua, all in waters <1000 m deep) and two
groups of 90 spinner dolphins (one off Costa Rica in waters ~3500 m deep and one off Nicaragua in
waters ~200 m deep) were identified in November–December 2004 and February–March 2008,
respectively (Holst et al. 2005b; Holst and Smultea 2008). None were observed during an L-DEO seismic
survey in the Hess Deep ~1100 km west of the Galapagos Islands in July 2003 (Smultea and Holst 2003),
and a single spinner dolphin was sighted during L-DEO seismic surveys 1600–1950 km west of the
proposed survey area in April–August 2008 (Hauser et al. 2008).
Striped Dolphin (Stenella coeruleoalba)
The striped dolphin has a cosmopolitan distribution in tropical to warm temperate waters from ~50°N to
40°S (Perrin et al. 1994a; Jefferson et al. 2008). Wade and Gerrodette (1993) estimated that the population
in the ETP numbered 1.9 million based on data collected during 1986–1990. The population has
declined; Gerrodette et al. (2008) estimated the abundance of striped dolphins in the ETP at 964,362 for
2006.
The striped dolphin‘s preferred habitat seems to be cool, deep, oceanic waters (Davis et al. 1998) along
the edge and seaward of the continental shelf, particularly convergence zones and upwelling areas (Au and
Perryman 1985). Striped dolphin group sizes are typically several dozen to 500 animals, although groups of
thousands sometimes form (Jefferson et al. 2008). For the ETP, Wade and Gerrodette (1993) reported a mean
group size of 61, and Jackson et al. (2008) reported a mean group size of 51.8 (n = 137). Off Costa Rica,
May-Collado et al. (2005) reported a mean group size of 48.9. Striped dolphins are believed to be
capable of diving to depths of 200–700 m based on stomach content analyses (Archer and Perrin 1999).
The striped dolphin is expected to be one of the most abundant cetaceans in the proposed project
area; based on the SWFSC surveys and model used to calculate densities in the study area (see § IV[3]),
they are the second-ranked species there. Jackson et al. (2008) reported sightings of striped dolphins in
all regions of the study area during July–December surveys in 2006, with the highest concentrations of
sightings occurring off the coasts of Costa Rica and Panama. Multiple sightings were also recorded in
offshore waters off Ecuador and northern Peru, and to the southwest of the Galápagos Islands (Jackson et
al. 2008). Mayo-Collado et al. (2005) reported this species nearly exclusively from oceanic waters.
During L-DEO seismic surveys off Costa Rica and Nicaragua, one sighting of 40 striped dolphins
(off the coast of Costa Rica in waters ~2000 m deep) was made in February–March 2008 (Holst and
Smultea 2008), but none were observed in November–December 2004 (Holst et al. 2005b). None were
observed during L-DEO seismic surveys in the Hess Deep ~1100 km west of the Galapagos Islands in
July 2003 (Smultea and Holst 2003) or 1600–1950 km west of the proposed survey area in April–August
2008 (Hauser et al. 2008).
Fraser’s Dolphin (Lagenodelphis hosei)
Fraser's dolphin is a tropical species that rarely occurs in temperate regions, and then only in
relation to temporary oceanographic anomalies such as El Niño events (Perrin et al. 1994b). Wade and
Gerrodette (1993) reported a mainly equatorial distribution in the ETP, and estimated its abundance in the
area at 289,300 based on data collected during 1986–1990.
Fraser's dolphins typically occur in water at least 1000 m deep. They dive to depths of at least 250–500
m to feed (Dolar 2002). They travel in groups ranging from just a few animals to hundreds or even thousands
(Perrin et al. 1994c), often mixed with other species (Culik 2002). For the ETP, Wade and Gerrodette (1993)
reported a mean group size of 395, and Ferguson et al. (2006b) reported a mean group size of 440.

III. Affected Environment
Environmental Assessment for SIO ETP Cruise, 2010 Page 32
Fraser‘s dolphin may occasionally occur in the proposed study area, although its expected numbers
are low based on available data. Pitman and Ballance (1992) reported its occurrence in the ETP, and
Smith and Whitehead (1999) reported one sighting of 300 individuals in the Galápagos Islands. Off
Costa Rica, May-Collado et al. (2005) reported only one sighting of 158 Fraser‘s dolphins during 1979–
2001. Rodríguez-Fonseca (2001) identified Isla del Cocos as an important area in Pacific Costa Rican
waters for the species. No Fraser‘s dolphins were reported during July–December ETP surveys in 2006
(Jackson et al. 2008) or during eight years of surveys from 1996 to 2003 off Costa Rica and from 2001 to
2003 off Panama (Rasmussen et al. 2004).
No Fraser‘s dolphins were detected during L-DEO seismic surveys off Costa Rica or Nicaragua in
November–December 2004 or February–March 2008 (Holst et al. 2005b; Holst and Smultea 2008), in the
Hess Deep ~1100 km west of the Galapagos Islands in July 2003 (Smultea and Holst 2003), or 1600–
1950 km west of the proposed survey area in April–August 2008 (Hauser et al. 2008).
Short-beaked Common Dolphin (Delphinus delphis)
Common dolphins are found in tropical and temperate oceans around the world (Evans 1994).
There are two species of common dolphin, the more coastal long-beaked dolphin (Delphinus capensis) and the
more offshore short-beaked dolphin (D. delphis). The short-beaked common dolphin is widely distributed
compared to the long-beaked common dolphin (Heyning and Perrin 1994). Only the short-beaked
common dolphin is expected to occur in the ETP. Three stocks of D. delphis are recognized in the ETP:
northern, central, and southern (Perrin et al. 1985; Perryman and Lynn 1993). Individuals present in the
proposed study area would likely be from the central and southern stocks.
Gerrodette et al. (2005) reported an abundance estimate for short-beaked common dolphins of 1.1
million for 2003. However, abundance estimates of common dolphins have fluctuated from <1 million to
>3 million from 1986 to 2000 (Gerrodette and Forcada 2002). The abundance estimate for 2006 was
3,127,203 (Gerrodette et al. 2008).
The common dolphin‘s distribution is associated with prominent underwater topography, such as
sea mounts (Evans 1994). Short-beaked common dolphins are widely distributed from the coast to at
least 550 km from shore (Carretta et al. 2010). In the ETP, common dolphin distribution is associated
with cool, upwelling areas along the equator and off Baja California, Central America, and Peru (Au and
Perryman 1985; Reilly 1990; Reilly and Fiedler 1994). Reilly (1990) reported no seasonal changes in
common dolphin distribution, although Reilly and Fiedler (1994) observed interannual changes in
distribution that were likely attributable to El Niño events.
Common dolphins travel in group of ~10 to >10,000 (Jefferson et al. 2008). For the ETP, Ferguson et
al. (2006b) reported a mean group size of 230, and Jackson et al. (2008) reported a mean group size of
217 (n = 123). Off Costa Rica, May-Collado et al. (2005) reported a mean group size of 220.7. Most
dives of a radio-tagged common dolphin off southern California were to depths 9–50 m, and maximum depth
was ~200 m (Evans 1994).
This species is expected to be the most abundant cetacean in the study area; based on the SWFSC
surveys and model used to calculate densities in the study area (see § IV[3]), they are the first-ranked
species there, more than three times more abundant than the second-ranked species. Jackson et al. (2008)
reported numerous sightings of common dolphins near the study area during July–December surveys in
2006, with the highest concentrations of sightings occurring off the coasts of Costa Rica and Panama.
Three sightings were also recorded to the south of the Galápagos Islands (Jackson et al. 2008). May-
Collado et al. (2005) reported 82 sightings of 17,875 individuals during 1979–2001 off Costa Rica,

III. Affected Environment
Environmental Assessment for SIO ETP Cruise, 2010 Page 33
mostly in oceanic waters. Rasmussen et al. (2004) reported one sighting of common dolphins in eight
years of surveys from 1996 to 2003 off Costa Rica and from 2001 to 2003 off Panama.
During L-DEO seismic surveys off Costa Rica and Nicaragua, one group of 45 common dolphins
(off Costa Rica in waters ~2000 m deep) and six groups of 360 common dolphins (all off Costa Rica in
waters ≥2000 m deep) were identified in November–December 2004 and February–March 2008,
respectively (Holst et al. 2005b; Holst and Smultea 2008). None were observed during an L-DEO seismic
survey in the Hess Deep ~1100 km west of the Galapagos Islands in July 2003 (Smultea and Holst 2003),
and 2 groups of 50 were sighted during L-DEO seismic surveys 1600–1950 km west of the proposed
survey area in April–August 2008 (Hauser et al. 2008).
Risso’s Dolphin (Grampus griseus)
Risso‘s dolphin is primarily a tropical and mid-temperate species distributed worldwide between
60ºN and 60ºS, where surface water temperatures are ~10ºC (Kruse et al. 1999). Gerrodette et al. (2008)
reported an abundance estimate of 110,457 Risso‘s dolphins for the ETP.
Risso‘s dolphins usually occur over steeper sections of the upper continental slope in waters 400–
1000 m deep (Baumgartner 1997; Davis et al. 1998), and are known to frequent seamounts and escarp-
ments (Kruse et al. 1999; Baird et al. 2002a). Risso‘s dolphins occur individually or in small- to moderate-
sized groups, normally ranging in numbers from 10 to 100 but up to as many as 4000 (Jefferson et al. 2008).
May-Collado et al. (2005) reported a mean group size of 11.6 off Costa Rica. For the ETP, Ferguson et
al. (2006b) reported a mean group size of 18.64, and Jackson et al. (2008) reported a mean group size of
18.5 (n = 48). Risso‘s dolphin can remain underwater up to 30 min (Kruse et al. 1999).
Risso‘s dolphins are very common in the proposed survey area; based on the SWFSC surveys and
model used to calculate densities in the study area (see § IV[3]), they are the fifth-ranked species there.
Eight Risso‘s dolphins were reported during July–December ETP surveys in 2006 (Jackson et al. 2008).
Six of these sightings were reported off the coasts of Costa Rica and Panama, at various depths, and two
were reported in offshore waters between Ecuador and the Galápagos Islands. No Risso‘s dolphins were
reported during eight years of surveys from 1996 to 2003 off Costa Rica and from 2001 to 2003 off
Panama (Rasmussen et al. 2004).
During L-DEO seismic surveys off Costa Rica and Nicaragua, one sighting of 25 Risso‘s dolphins
(off the coast of Costa Rica in waters ~2000 m deep) was made in November–December 2004 (Holst et
al. 2005b), but none were observed in February–March 2008 (Holst and Smultea 2008). None were
observed during an L-DEO seismic survey in the Hess Deep ~1100 km west of the Galapagos Islands in
July 2003 (Smultea and Holst 2003), and 1 group of 20 was sighted during L-DEO seismic surveys 1600–
1950 km west of the proposed survey area in April–August 2008 (Hauser et al. 2008).
Melon-headed Whale (Peponocephala electra)
The melon-headed whale is a pantropical and pelagic species (Perryman 2002). It occurs mainly
between 20ºN and 20ºS; occasional occurrences in temperate regions are likely associated with warm
currents (Perryman 2002; Reeves et al. 2002). Au and Perryman (1985) and Perryman et al. (1994)
reported that the melon-headed whale occurs primarily in equatorial waters, although Wade and
Gerrodette (1993) reported its occurrence in non-equatorial waters. Wade and Gerrodette (1993)
estimated the abundance of this species in the ETP at 45,400 based on data collected during 1986–1990.
Melon-headed whales are oceanic and occur in offshore areas (Perryman 2002), as well as around
oceanic islands. Mullin et al. (1994) reported that they are usually sighted in water >500 m deep, and away

III. Affected Environment
Environmental Assessment for SIO ETP Cruise, 2010 Page 34
from the continental shelf. Melon-headed whales tend to travel in groups of 100–500, but have also been
seen in groups of 1500–2000. Ferguson et al. (2006b) reported the mean group size in the ETP as 257.7.
Off Costa Rica, May-Collado et al. (2005) reported two sightings of 445 animals in the period 1979–
2000. Three melon-headed whale strandings occurred on the Pacific coast during 1966–1999; >200
individuals stranded at Nicoya Peninsula in 1976, and two individual strandings occurred on the northern coast
in 1970 (Rodríguez-Fonseca and Cubero-Pardo 2001). No melon-headed whales were reported near the
proposed study area during July–December ETP surveys in 2006 (Jackson et al. 2008) or during eight years of
surveys from 1996 to 2003 off Costa Rica and from 2001 to 2003 off Panama (Rasmussen et al. 2004).
During L-DEO seismic surveys off Costa Rica and Nicaragua, two sightings of 55 melon-headed
whales were reported off the coast of Costa Rica in waters >3000 m deep in February–March 2008 (Holst
and Smultea 2008). None were observed there in November–December 2004 (Holst et al. 2005b), or
during L-DEO seismic surveys in the Hess Deep ~1100 km west of the Galapagos Islands in July 2003
(Smultea and Holst 2003) and 1600–1950 km west of the proposed survey area in April–August 2008
(Hauser et al. 2008).
Pygmy Killer Whale (Feresa attenuata)
The pygmy killer whale is pantropical (Ross and Leatherwood 1994; Rice 1998). The species has
been sighted in the ETP (Van Waerebeek and Reyes 1988; Pitman and Ballance 1992; Wade and
Gerrodette 1993) and appears to occur sporadically along the equator and the coast of Central America
(Wade and Gerrodette 1993). Wade and Gerrodette (1993) estimated the abundance of this species in the
ETP at 39,800 based on data collected during 1986–1990.
Pygmy killer whales tend to travel in groups of 15–50, although groups of a few hundred have been
sighted (Ross and Leatherwood 1994). In the ETP, Wade and Gerrodette (1993) reported a mean group
size of 28, and Ferguson et al. (2006b) reported a mean group size of 30. In warmer water, they are
usually seen close to the coast (Wade and Gerrodette 1993), but they are also found in deep waters.
Pygmy killer whales are uncommon in the study area. Jackson et al. (2008) reported one sighting
of pygmy killer whales in the study area, about 200 km south of the coast of Panama, during July–
December surveys in 2006. However, none were reported during eight years of surveys from 1996 to
2003 off Costa Rica and from 2001 to 2003 off Panama (Rasmussen et al. 2004). Off Costa Rica, May-
Collado et al. (2005) also reported no sightings of this species in 1979–2000. There has been a report of a
stranding on the coast of Ecuador (Félix et al. 1995).
During L-DEO seismic surveys off Costa Rica and Nicaragua, one sighting of 10 pygmy killer
whales (~150 km off the coast of Costa Rica) was reported in February–March 2008 (Holst and Smultea
2008), but none were observed in November–December 2004 (Holst et al. 2005b). None were observed
during an L-DEO seismic survey in the Hess Deep ~1100 km west of the Galapagos Islands in July 2003
(Smultea and Holst 2003), and 2 groups of 28 were sighted 1600–1950 km west of the proposed survey
area in April–August 2008 (Hauser et al. 2008).
False Killer Whale (Pseudorca crassidens)
The false killer whales is widely distributed, though not abundant anywhere (Jefferson et al. 2008).
It is found in all tropical and warmer temperate oceans, especially in deep offshore waters (Odell and
McClune 1999). Wade and Gerrodette (1993) estimated their abundance in the ETP at 39,800 based on
data collected during 1986–1990.

III. Affected Environment
Environmental Assessment for SIO ETP Cruise, 2010 Page 35
False killer whales have been sighted in the ETP, where they chase or attack Stenella and
Delphinus dolphins during tuna fishing operations (Perryman and Foster 1980). They travel in groups of
20–100 (Baird 2002b), although groups of several hundred are sometimes observed. For the ETP, Wade
and Gerrodette (1993) and Ferguson et al. (2006b) reported a mean group size of 11, and Jackson et al.
(2008) reported a mean group size of 11.8 (n = 16). Off Costa Rica, May-Collado et al. (2005) reported a
mean group size of 36.2, and Martínez-Fernandez et al. (2005) reported a mean group size of 13.2. False
killer whales are usually seen far offshore, although sightings have been reported for both shallow (<200
m) and deep (>2000 m) waters (Wade and Gerrodette 1983).
False killer whales are uncommon in the proposed study area. Jackson et al. (2008) reported one
sighting in the study area, to the southwest of the Galápagos Islands, during July–December surveys in
2006. Off Costa Rica, May-Collado et al. (2005) reported nine sightings of 253 animals in 1979–2000.
Martínez-Fernandez et al. (2005) observed four groups off Costa Rica during monthly strip-transect
surveys during December 2004–June 2005. Rasmussen et al. (2004) reported eight sightings of false
killer whales in eight years of surveys (1996–2003) off Costa Rica and in 2001–2003 off Panama.
Rodríguez-Fonseca (2001) identified Isla del Cocos as one of four important areas in Pacific Costa Rican
waters for the species, although the study of May-Collado et al. (2005) ―did not show patterns to support‖
the importance of the island.
During L-DEO seismic surveys off Costa Rica and Nicaragua, one sighting of 12 false killer
whales (off the coast of Nicaragua in waters <2000 m deep) in November–December 2004 (Holst et al.
2005b), but none were observed in February–March 2008 (Holst and Smultea 2008). None were
observed during L-DEO seismic surveys in the Hess Deep ~1100 km west of the Galapagos Islands in
July 2003 (Smultea and Holst 2003) or 1600–1950 km west of the proposed survey area in April–August
2008 (Hauser et al. 2008).
Killer Whale (Orcinus orca)
The killer whale is cosmopolitan and globally abundant; it has been observed in all oceans of the
world (Ford 2002). Killer whales are segregated socially, genetically, and ecologically into three distinct
groups: resident, transient, and offshore animals. Offshore whales do not appear to mix with the other
types of killer whales (Black et al. 1997; Dahlheim and Heyning 1999). The abundance of killer whales
in the ETP was estimated at 8500 (Ford 2002).
Groups sizes of killer whales are 1–75, though offshore transient groups generally contain <10
(Dahlheim et al. 1982; Jefferson et al. 2008). Off Costa Rica, May-Collado et al. (2005) reported that the
mean group size was the smallest among the delphinids seen, at 3.5. For the ETP, Ferguson et al. (2006b)
reported a mean group size of 5.5, and Jackson et al. (2008) reported a mean group size of 8.1 (n = 15).
The maximum depth to which seven tagged free-ranging killer whales dove off British Columbia was 228
m, but only an average of 2.4 % of their time was spent below 30 m in depth (Baird et al. 2003).
Killer whales are found throughout the ETP (Pitman and Ballance 1992; Wade and Gerrodette
1993), but are most densely distributed near the coast from 35ºN to 5ºS (Dahlheim et al. 1982). Dahlheim
et al. (1982) reported the occurrence of a cluster of sightings at two offshore locations in the ETP. One
location was bounded by 7–14ºN and 127–139ºW, and the other was within a band between the equator
and 5ºN and from the Galápagos Islands to 115ºW; both well to the west of the proposed study area.
Killer whales are uncommon in the study area. Jackson et al. (2008) reported four sighting of killer
whales near the study area during July–December surveys in 2006; one sighting was ~100 south of
Panama and the other three sightings were in the offshore waters of central Peru, to the southwest of the

III. Affected Environment
Environmental Assessment for SIO ETP Cruise, 2010 Page 36
Galápagos Islands. Off Costa Rica, May-Collado et al. (2005) reported seven sightings of 25 animals in
offshore oceanic waters in 1979–2000. Rasmussen et al. (2004) reported three sightings in eight years of
surveys (1996–2003) off Costa Rica and in 2001–2003 off Panama. A group of 20–22 was seen preying
on a blue whale calf in the CRD in 2003, ~230 km west of Nicaragua (Gilpatrick et al. 2005).
No killer whales were detected during L-DEO seismic surveys off Costa Rica or Nicaragua in
November–December 2004 or February–March 2008 (Holst et al. 2005b; Holst and Smultea 2008), in the
Hess Deep ~1100 km west of the Galapagos Islands in July 2003 (Smultea and Holst 2003), or 1600–
1950 km west of the proposed survey area in April–August 2008 (Hauser et al. 2008).
Short-finned Pilot Whale (Globicephala macrorhynchus)
The short-finned pilot whale typically inhabits pelagic tropical and warm temperate waters of ~1000 m
depth near the continental shelf edge but also slope waters (Davis et al. 1998; Jefferson et al. 2008). It is
generally nomadic, but resident populations have been reported in certain locations, including Hawaii and
California (Olson and Reilly 2002). The abundance of pilot whales in the ETP for 1998–2000 was
estimated at 589,315 (Gerrodette and Forcada 2002).
Pilot whales have a wide distribution throughout the ETP, but are most abundant in cold waters
where upwelling occurs (Wade and Gerrodette 1993). Polacheck (1987) reported that encounter rates for
pilot whales in the ETP were highest inshore; offshore concentrations may also occur, but at lower
densities. Pilot whales are usually seen in groups of 20–90, although groups of several hundred are also
seen (Olson and Reilly 2002; Jefferson et al. 2008). For the ETP, Wade and Gerrodette (1993) and
Ferguson et al. (2006b) reported a mean group size of 18, and Jackson et al. (2008) reported a mean group
size of 18.0 (n = 57). Off Costa Rica, May-Collado et al. (2005) reported a mean group size of 14.2.
Pilot whales outfitted with time-depth recorders dove to depths of up to 828 m, although most of their
time was spent above depths of 7 m (Heide-Jørgensen et al. 2002). The species‘ maximum recorded dive
depth is 971 m (Baird pers. comm. in DoN 2005).
Short-finned pilot whales are common in the proposed survey area. Jackson et al. (2008) reported
numerous sightings of short-finned pilot whales in the study area during July–December surveys in 2006,
with the highest concentrations of sightings occurring off the coasts of Costa Rica, Panama, and Peru at
various depths, including deep oceanic waters. May-Collado et al. (2005) reported 68 sightings of 967
animals off Costa Rica in 1979–2001; sightings were made primarily in offshore oceanic waters, but a fair
number also occurred in neritic waters.
During L-DEO seismic surveys off Costa Rica and Nicaragua, four group of 30 short-finned pilot
whales (off Costa Rica and Nicaragua) and three groups of 26 common dolphins (one off Costa Rica in
waters <2000 m deep and two off Nicaragua in waters ~3500 m deep) were identified in November–
December 2004 and February–March 2008, respectively (Holst et al. 2005b; Holst and Smultea 2008).
None were observed during an L-DEO seismic survey in the Hess Deep ~1100 km west of the Galapagos
Islands in July 2003 (Smultea and Holst 2003), and there were 12 sightings of 106 short-finned pilot
whales in and during transit to L-DEO seismic survey areas 1600–1950 km west of the proposed survey
area in April–August 2008 (Hauser et al. 2008).
(3) Pinnipeds
Six species of pinnipeds are known to occur within the ETP: the California sea lion (Zalophus
californianus), South American sea lion (Otaria flavescens), Galápagos sea lion (Zalophus wollebaeki),
Galápagos fur seal (Arctocephalus galapagoensis), Guadalupe fur seal (A. townsendi), and South American
fur seal (A. australis). Of the six species, four have the potential to occur within the survey area, although any

III. Affected Environment
Environmental Assessment for SIO ETP Cruise, 2010 Page 37
occurrence is likely to be rare as they are mainly coastal species. The ranges of the other two species, the
Guadalupe fur seal and the California sea lion, are considerably north of the proposed survey area;
Guadalupe fur seals occur only off California and Baja California, and California sea lions are distributed
from southern Mexico north to southwestern Canada, although the species has been documented off the
coast of Costa Rica on several occasions (Acevedo-Gutiérrez 1994, 1996; Cubero-Pardo and Rodríguez
2000; Rodríguez-Herrera et al. 2002). Although encounters with the species are possible in the proposed
study area, it is unlikely that they would be seen there because their rarity that far south of their normal
ranges.
Galápagos sea lions and Galápagos fur seals, both listed as Endangered on the 2010 IUCN Red
List of Threatened Species (IUCN 2010) and listed in CITES Appendix II (UNEP-WCMC 2009), occur
around the Galápagos Islands. However, Galápagos sea lions are seen occasionally along the coasts of
Colombia and Ecuador and as far north as Isla del Coco, Costa Rica, an island 500 km southwest of Costa
Rica (Acevedo-Gutiérrez 1994; Capella et al. 2002; Palacios 1996b; Palacios et al. 1997). A few
Galápagos fur seals have also been reported along the coast of South America (D. Palacios, Oregon State
University, pers. comm. to LGL Ltd.). Galápagos fur seals are not known to occur in Costa Rican waters
(Rodríguez-Fonseca 2001). Jackson et al. (2008) did not encounter any Galápagos sea lions or fur seals
during surveys in the ETP. Similarly, Galápagos sea lions or fur seals were not encountered during
L-DEO seismic surveys in the ETP (Smultea and Holst 2003; Holst et al. 2005b; Holst and Smultea 2008;
Hauser et al. 2008). Based on available survey data, it is unlikely that these two species would occur in
the survey area, although encounters could occur, especially in areas in or close to the Galápagos Islands
EEZ.
South American sea lions and South American fur seals are distributed along the coast of South
America. The northernmost breeding colony of South American sea lions occurs on the Peruvian coast
(Vaz-Ferreira 1981), but vagrant individuals have been seen along the coast of Colombia (Capella et al.
2002) and as far north as Panama (Méndez and Rodriguez 1984). The northernmost sighting of the South
American fur seal was recorded off the Colombian coast (Capella et al. 2002). Jackson et al. (2008) did
not encounter either of these species in offshore waters of the proposed survey area, but did encounter
South American seal lions near the Peruvian coast. South American sea lions and fur seals were not
encountered during L-DEO seismic surveys in the ETP (Smultea and Holst 2003; Holst et al. 2005b;
Holst and Smultea 2008; Hauser et al. 2008). Campagna et al. (2001) used satellite tracking to examine
the foraging behaviour of lactating females and pre-breeding males in the southwest Atlantic Ocean.
Although mean foraging trips covered an average of 206 km in the case of females and 591 km in the case
of males, tagged animals remained on the continental shelf and never ventured in waters deeper than 150
m. As the survey area is mainly well offshore of their most common coastal habitat, sightings in the
study area are not expected, although rare encounters could occur.
Sea Turtles
Of the world‘s seven species of sea turtles, five could be found in the proposed study area: the
leatherback, loggerhead, green, hawksbill, and olive ridley turtles. Mostly foraging or migrating
individuals would be encountered. At the time of the proposed surveys, three species nest in the area in
considerable numbers: leatherbacks in Mexico and Costa Rica, green turtles from Mexico to Colombia,
mostly in Mexico (nesting in the Galapagos occurs during December–May), and olive ridleys from
Mexico to Peru, mostly in southern Mexico and northern Costa Rica. No major nesting sites for
hawksbill turtles occur on the Pacific coast of Central America, and loggerheads do not nest in the eastern
Pacific. The proposed survey is scheduled near the start of the peak nesting periods for leatherbacks

III. Affected Environment
Environmental Assessment for SIO ETP Cruise, 2010 Page 38
(October–March), green turtles (October–November), and olive ridleys (September–December). Given
incubation periods of ~2 months, few hatchlings would be encountered.
(1) Leatherback Turtle (Dermochelys coriacea)
The leatherback turtle is listed as Endangered under the U.S. ESA and Critically Endangered on
the 2010 IUCN Red List of Threatened Species (IUCN 2010), and is listed in CITES Appendix I (UNEP-
WCMC 2009). The world leatherback turtle population is estimated at 35,860 females (Spotila 2004).
The leatherback is the largest and most widely distributed sea turtle, ranging far from its tropical and
subtropical breeding grounds. It has the most extensive range of any adult, 71ºN to 47ºS (Eckert 1995; NMFS
and USFWS 1998a). Leatherbacks are highly pelagic and approach coastal waters only during the reproduc-
tive season (EuroTurtle 2006a). This species is one of the deepest divers in the ocean, with dives deeper than
4000 m (Spotila 2004). The leatherback dives continually and spends short periods of time on the surface bet-
ween dives (Eckert et al. 1986; Southwood et al. 1998). Off St. Croix, 6 inter-nesting females dove to a
mean depth of 61.6 m for an average of 9.9 min/dive, and post-dive surfacing intervals averaged 4.9 min
(Eckert et al. 1989). During shallow-water diving in the South China Sea, typical dive durations averaged
6.9–14.5 min, with a maximum of 42 min (Eckert et al. 1996). Off central California, leatherbacks dove to
20–30 m with a maximum of 92 m, corresponding to the vertical distribution if their prey, and mean dive and
surface durations were 2.9 and 2.2 min, respectively (Harvey et al. 2006). During migrations or long distance
movements, leatherbacks maximize swimming efficiency by traveling within 5 m of the surface (Eckert 2002).
Hatchling leatherbacks are pelagic, but nothing is known about their distribution for the first four
years (Musick and Limpus 1997). Post-nesting adult leatherbacks appear to migrate along bathymetric
contours from 200 to 3500 m (Morreale et al. 1994). Leatherbacks are highly migratory, feeding in con-
vergence zones and upwelling areas in the open ocean, along continental margins, and in archipelagic
waters (Morreale et al. 1994; Eckert 1995). There is evidence that leatherbacks are associated with
oceanic front systems, such as shelf breaks and the edges of oceanic gyre systems where their prey is con-
centrated (Lutcavage 1996).
In the Pacific Ocean, leatherbacks nest along the west coast of Mexico and in Central America,
particularly in Costa Rica, from October to March (Spotila 2004). Females may lay up to nine clutches in
a season (although six is more common), and the incubation period is 58–65 days. At Playa Grande,
Costa Rica, and in French Guiana, the mean internesting period is 9 days (Lux et al. 2003).
In Costa Rica, leatherbacks nest at Playa Naranjo in Santa Rosa National Park, the second-most
important nesting beach on the Pacific coast (Yañez et al. 2010), Rio Oro on the Osa Peninsula, and at
various beaches in Las Baulas National Park, which includes Playa Langosta and Playa Grande and
contains the largest colony of leatherbacks in the Pacific (Spotila 2004). The number of leatherback
turtles nesting in Las Baulas National Park declined steadily during the 1990s, from ~1500 females during
the 1988–89 nesting season, to ~800 in 1990–91 and 1991–92, 193 in 1993–94 (Williams et al. 1996) and
117 in 1998–99 (Spotila 2000 in NMFS 2002). Spotila (2004) reported that between 59 and 435 leather-
backs nest at Las Baulas each year depending on the El Niño–La Niña cycle.
Telemetry studies suggest that post-nesting females from eastern Pacific populations in Mexico and
Central America migrated southward to equatorial and Southern Hemisphere waters (Dutton et al. 2006).
Female leatherbacks tagged at Playa Grande migrated southward along a well-defined corridor from
Costa Rica past the Galapagos, and then dispersed south of 10ºS (Shillinger et al. 2010). Leatherback
turtles are rare in the waters of Galapagos (Zárate et al. 2010a). Among longline fisheries in the ETP,
leatherbacks were the most frequent bycatch only in the Chilean swordfish fishery, which had the lowest

III. Affected Environment
Environmental Assessment for SIO ETP Cruise, 2010 Page 39
bycatch rate of longline fisheries from Chile to Baja California. Among gillnet fisheries, leatherbacks
were virtually the only species in the bycatch of the Chilean gillnet swordfish fishery, and were included
with other species in the bycatch of driftnets targeting sharks and rays off Peru (Kelez et al. 2010).
Leatherbacks recovered from Chilean fishing vessels are from populations nesting both in the eastern and
western Pacific Ocean (Donoso et al. 2000).
During L-DEO marine seismic surveys in the ETP off Honduras, Nicaragua, and Costa Rica in
November–December 2004 and off Nicaragua and Costa Rica in March–April 2008, only one of ~179
turtle sightings and none of 341 turtle sightings, respectively, was identified as a leatherback turtle (Holst
et al. 2005b; Holst and Smultea 2008). Two of six sea turtles sighted during an L-DEO seismic survey in
the Hess Deep ~1100 km west of the Galapagos Islands in July 2003 were leatherbacks (Smultea and
Holst 2003), but none of the 171 sea turtles sighted during L-DEO seismic surveys 1600–1950 km west
of the proposed survey area in April–August 2008 were leatherbacks (Hauser et al. 2008).
(2) Loggerhead Turtle (Caretta caretta)
The loggerhead turtle is listed as Threatened under the U.S. ESA throughout its range and Endan-
gered on the 2010 IUCN Red List of Threatened Species (IUCN 2010), and is listed in CITES Appendix I
(UNEP-WCMC 2009). The global population of loggerhead turtles is estimated at 43,320–44,560 nesting
females (Spotila 2004).
The loggerhead is a widely distributed species, occurring in coastal tropical and subtropical waters
around the world. On average, loggerheads turtles spend over 90% of their time underwater (Byles 1988;
Renaud and Carpenter 1994). In the North Pacific Ocean, two loggerheads tagged with satellite-linked
depth recorders spent about 40% of their time in the top meter and virtually all their time shallower than
100 m; 70% of the dives were no deeper than 5 m (Polovina et al. 2003). Off Japan, virtually all the dives
of two loggerheads between nesting were shallower than 30 m (Sakamoto et al. 1993). Routine dives can
last 4–172 min (Byles 1988; Sakamoto et al. 1990; Renaud and Carpenter 1994). Small juvenile logger-
heads live at or near the surface; for the 6–12 years spent at sea as juveniles, they spend 75% of their time
in the top 5 m of water (Spotila 2004). Juveniles spend more time on the surface in deep, offshore areas
than in shallow, nearshore waters (Lutcavage and Lutz 1997).
Nesting in the Pacific Ocean basin is restricted to the western region, primarily Japan and Australia
(NMFS and USFWS 1998b). The nesting season is typically from May to August. The size structure of
loggerheads in coastal and nearshore waters of the eastern and western Pacific Ocean suggest that hatch-
ling loggerheads in the Pacific Ocean have a pelagic stage similar to that in the Atlantic (NMFS 2002),
where they spend the first 2–6 years of their lives at sea. Telemetry studies, mark-recapture data, demo-
graphics, diet analysis, and oceanographic patterns suggest that North Pacific loggerhead turtles, mostly
born in southern Japan, are transported as hatchlings and juveniles to the North Pacific by the Kuroshio
Current, then spend the next 2–6 years moving from west to east, feeding along convergence and frontal
zones. They arrive at the U.S. west coast as juveniles, and feed along the Baha California coast on
pelagic red crabs, which are extremely abundant there in spring and early summer. When mature, they
migrate back to natal beaches in Japan and remain in the western Pacific, migrating annually between
nesting beaches and feeding grounds in the South and East China Seas (Nichols et al. 2000; Nichols 2005;
Parker et al. 2005). Recently, adult loggerheads and mating behaviour have been reported in the waters of
the Pacific coast of Baha California Sur (Rossi et al. 2010).
In the eastern Pacific, the loggerhead‘s distribution ranges from Alaska to Chile (NMFS and
USFWS 1998b). Sightings are typically confined to the summer months in the eastern Pacific, peaking in

III. Affected Environment
Environmental Assessment for SIO ETP Cruise, 2010 Page 40
July–September off southern California and southwestern Baja California (Stinson 1984; NMFS and
USFWS 1998b). During L-DEO seismic surveys in the ETP off Honduras, Nicaragua, and Costa Rica in
November–December 2004 and off Nicaragua and Costa Rica in March–April 2008, none of the ~179
and 341 turtle sightings, respectively, was identified as a loggerhead turtle (Holst et al. 2005b; Holst and
Smultea 2008). None of six sea turtles sighted during an L-DEO seismic survey in the Hess Deep ~1100
km west of the Galapagos Islands in July 2003 were loggerheads (Smultea and Holst 2003), and only 1 of
171 sea turtles sighted during L-DEO seismic surveys 1600–1950 km west of the proposed survey area in
April–August 2008 were loggerheads (Hauser et al. 2008).
Loggerheads are rare in Chilean waters (Donoso et al. 2000), but are relatively common in the
waters off southern Peru (Alfaro-Shigueto et al. 2004). Juvenile loggerheads, tagged with satellite trans-
mitters and released after being captured incidentally by artisanal longline fishing vessels from central or
southern Peru all moved offshore beyond the continental shelf, and most remained within 100 km of the
coast of Peru, suggesting that loggerheads are year-round residents there (Mangel et al. 2010). Logger-
heads are also present in small numbers off the mainland of Ecuador, and there were a considerable
number of observations made by Inter-American Tropical Tuna Commission (IATTC) observers during
1993–2002 along the northwest coast of Ecuador and in international waters between 3ºN and 10 ºN in
July–September (Alava 2008).
(3) Green Turtle (Chelonia mydas)
The green turtle is listed as Threatened under the ESA throughout its Pacific range, except for the
Endangered population nesting on the Pacific coast of Mexico. It is listed as Endangered on the 2010
IUCN Red List of Threatened Species (IUCN 2010) and is listed in CITES Appendix I (UNEP-WCMC
2009). The worldwide green turtle population is estimated at ~110,000–150,000 nesting females per year
(NMFS and USFWS 2007). The worldwide population has declined 50–70% since 1900 (Spotila 2004).
The green turtle is widely distributed in tropical and subtropical waters near continental coasts and
around islands. Green turtles typically migrate along coastal routes from rookeries to feeding grounds, al-
though some populations conduct trans-oceanic migrations (e.g., Ascension Island–Brazil; Carr 1975).
Females typically show nest-site fidelity, and nest repeatedly in the same spot, or at least on the same
beach from which they hatched. Hatchlings are epipelagic (surface dwelling in the open sea) for ~1–3
years. Subsequently, they live in bays and along protected shorelines, and feed during the day on seagrass
and algae (Bjorndal 1982). Juvenile and sub-adult green turtles may travel thousands of kilometers before
they return to breeding and nesting grounds (Carr et al. 1978). Juveniles have been observed by research
vessels operating thousands of miles from land in the southeastern Pacific Ocean (NMFS and USFWS
1998c).
Green turtles typically make dives shallower than 30 m (Hochscheid et al. 1999; Hays et al. 2000),
although they have been observed diving to 73–110 m in the eastern Pacific Ocean (Berkson 1967). The
maximum dive time recorded for a juvenile green turtle off Hawaii was 66 min, and routine dive times
were 9–23 min (Brill et al. 1995). During a breeding migration in the Hawaiian Islands, three adult green
turtles made shallow (1–4 m) and short (1–18 min) dives during the day and deeper (mean maximum of
35–55 m) and longer (35–44 min) dives at night (Rice and Balazs 2010).
In the eastern Pacific, green turtles nest at several locations on the Mexican mainland, Central
America, and off the coast of Colombia and Ecuador. The primary nesting grounds are located in
Michoacán, Mexico, with an estimated 1395 nesting females per year, and the Galápagos Islands,
Ecuador, with an estimated 1650 nesting females per year (NMFS and USFWS 2007). Nesting occurs in

III. Affected Environment
Environmental Assessment for SIO ETP Cruise, 2010 Page 41
Michoacán between August and January, with a peak in October–November, and on the Galápagos
Islands between December and May with a peak in February–March (Alvarado and Figueroa 1995; Green
and Ortiz-Crespo 1995). Nesting at the four main nesting beaches in the Galápagos—Quinta Play and
Bahía Barahona (Isabela Island), Las Salinas (Baltras Island), and Las Bachas (Santa Cruz Island)—has
been stable or slightly increasing since the late 1970s (NMFS and USFWS 2007). Green turtles nesting at
those beaches during 2002–2007 showed a high degree of nesting beach fidelity, as to green turtles from
other populations (Zárate et al 2010b). In Central America, small numbers of green turtles nest at major
nesting sites of other species, primarily olive ridleys, in Nicaragua (Ocean Resources Foundation 1998)
and in Costa Rica (NMFS and USFWS 1998c). Green turtles also nest in very small numbers in El
Salvador (Hasbún and Vásquez 1999).
In the eastern Pacific, the species has been documented as far north as southern Alaska and as far
south as Desolation Island, Chile (NMFS and USFWS 1998c). Based on tag-recovery information, the
feeding grounds of the Mexican breeding population are restricted to Mexico and Central America,
whereas the Galapagos breeding population forages from Costa Rica south to Peru (NMFS and USFWS
1998c). Algal beds around the Islands of Ferdinanda e Isabel in the Galapagos archipelago are an
important feeding ground for the green turtles nesting in the islands (Green and Ortiz-Crespo 1995).
During L-DEO seismic surveys in the ETP off Honduras, Nicaragua, and Costa Rica in November–
December 2004 and off Nicaragua and Costa Rica in March–April 2008, 2 of the ~179 turtle sightings
and 5 of 341 turtle sightings, respectively, were identified as green turtles (Holst et al. 2005b; Holst and
Smultea 2008). Two of six sea turtles sighted during an L-DEO seismic survey in the Hess Deep ~1100
km west of the Galapagos Islands in July 2003 were probable green turtles (Smultea and Holst 2003), and
17 of 171 sea turtles sighted during L-DEO seismic surveys 1600–1950 km west of the proposed survey
area in April–August 2008 were green turtles (Hauser et al. 2008).
(4) Hawksbill Turtle (Eretmochelys imbricata)
The hawksbill turtle is listed as Endangered under the U.S. ESA and Critically Endangered on the
2010 IUCN Red List of Threatened Species (IUCN 2010), and is listed in CITES Appendix I (UNEP-
WCMC 2009). The hawksbill is a solitary nester, and population trends or estimates are difficult to
determine. However, a minimum of 20,000–26,000 females are thought to nest annually (Spotila 2004);
as females nest once every three years, the total adult female population is estimated at 60,000–78,000
(Spotila 2004).
The hawksbill is the most tropical of all sea turtles; nesting is confined to areas where water temper-
ature is 25º–35ºC (EuroTurtle 2006b), between ~30ºN and ~30ºS (Eckert 1995). Hawksbill turtles are
observed in shallow waters with seagrass or algal meadows, and are most common where reef formations
are present. They live in clear, littoral waters of mainland and island shelves. Posthatchlings are believed to
be pelagic, taking shelter in weed lines around convergence zones, and they re-enter coastal waters once
attaining a length of ~20–25 cm. Coral reefs are the foraging grounds for juveniles, subadults, and adults.
They nest on low and high-energy beaches, often sharing high-energy locations with green turtles. Hawks-
bill turtles most commonly perform short-distance movements between nesting beaches and offshore
feeding banks, although long-distance movements are also known.
Hawksbills have very long routine dive times. For inter-nesting females in St. Croix, Starbird et al.
(1999) reported dive times averaging 56 min, a maximum dive time of 73.5 min, and an average surface
interval of ~2 min. Average day and night dive times were 34–65 and 42–74 min, respectively. Based on

III. Affected Environment
Environmental Assessment for SIO ETP Cruise, 2010 Page 42
time-depth recorder studies in Puerto Rico, foraging dives of immature hawksbills were 8.6–14 min to a
mean depth of 4.7 m (van Dam and Diez 1996).
No major nesting sites for hawksbill turtles occur on the Pacific coast of Central America (Euro-
Turtle 2006b), although a few hawksbills are known to nest at the La Flor National Wildlife Refuge in
Nicaragua (Ocean Resource Foundation 1998) and at Punta Banco, Caña Blanca, and Playa Caletas in
Costa Rica (Gaos et al. 2006). Chiriqui Beach in western Panama was once famous for its huge nesting
colony of hawksbill turtles (Spotila 2004), but was essentially abandoned by 1990 because of overhar-
vesting. Efforts to restore the beach have progressed and in recent years several hundred nests have been
observed (Spotila 2004). Hawksbill turtles are reportedly common in the waters of the Galapagos,
restricted in some years to the central archipelago but most common around Darwin and Wolf islands
(Zárate et al 2010a). In a regional review of sea turtle bycatch in the eastern Pacific (Kelez et al. 2010),
hawksbill turtles are only mentioned as a secondary species in shrimp trawls off Costa Rica.
During L-DEO seismic surveys in the ETP off Honduras, Nicaragua, and Costa Rica in November–
December 2004 and off Nicaragua and Costa Rica in March–April 2008, none of the ~179 and 341 turtle
sightings, respectively, was identified as a hawksbill turtle (Holst et al. 2005b; Holst and Smultea 2008).
Hawksbills were not identified among the six sea turtles sighted during an L-DEO seismic survey in the
Hess Deep ~1100 km west of the Galapagos Islands in July 2003 (Smultea and Holst 2003) or the 171 sea
turtles sighted during L-DEO seismic surveys 1600–1950 km west of the proposed survey area in April–
August 2008 (Hauser et al. 2008).
(5) Olive Ridley Turtle (Lepidochelys olivacea)
The olive ridley is the most abundant sea turtle in the world, but olive ridley populations on the
Pacific coast of Mexico are listed as Endangered under the U.S. ESA; all other populations are listed as
Threatened. The olive ridley is categorized as Vulnerable on the 2010 IUCN Red List of Threatened
Species (IUCN 2010) and is listed in CITES Appendix I (UNEP-WCMC 2009). The worldwide popula-
tion of olive ridley turtles is estimated at ~2 million nesting females (Spotila 2004). Worldwide, olive
ridleys are in serious decline (Spotila 2004).
The olive ridley has a large range in tropical and subtropical regions in the Pacific, Indian, and south
Atlantic oceans, and is generally found between 40ºN and 40ºS. Most olive ridley turtles lead a primarily
pelagic existence. The Pacific Ocean population migrates throughout the Pacific Ocean, from nesting grounds
in Mexico and Central America to the North Pacific Ocean (NMFS 2002). The post-nesting migration routes
of olive ridleys tracked via satellite from Costa Rica traversed thousands of kilometers of deep oceanic waters
ranging from Mexico to Peru, and more than 3000 kilometers out into the central Pacific Ocean (Plotkin et al.
1994a). The olive ridley is the most abundant sea turtle in the open ocean waters of the ETP (Pitman 1990),
where it forages, often in large groups, or flotillas (NMFS 2002).
Olive ridleys can dive and feed at considerable depths (80–300 m), although ~90% of their time is spent
at depths <100 m (Eckert et al. 1986; Polovina et al. 2003). In the ETP, at least 25% of their total dive time is
spent in the permanent thermocline, located at 20–100 m (Parker et al. 2003). Olive ridleys spend considerable
time at the surface basking, presumably in an effort to speed their metabolism and digestion after a deep dive
(Spotila 2004). In the open ocean of the eastern Pacific Ocean, olive ridley turtles are often seen near flotsam,
possibly feeding on associated fish and invertebrates (Pitman 1992). In the North Pacific Ocean, two olive rid-
leys tagged with satellite-linked depth recorders spent about 20% of their time in the top meter and about 10%
of their time deeper than 100 m; 70% of the dives were no deeper than 5 m (Polovina et al. 2003).

III. Affected Environment
Environmental Assessment for SIO ETP Cruise, 2010 Page 43
Females and males begin to aggregate near their nesting beaches two months before the nesting
season, and most mating likely occurs near the nesting beaches (NMFS 2002). However, Pitman (1990)
observed olive ridleys mating at sea, as far as 1850 km from the nearest mainland, during every month of the
year except March and December. There was a sharp peak in offshore mating activity during August and
September, corresponding with peak breeding activity in mainland populations. Turtles observed during
NMFS/SWFC dolphin surveys during July–December 1998 and 1999 were captured; 50 of 324 were involved
in mating (Kopitsky et al. 2002).
In the eastern Pacific, the largest nesting concentrations occur in southern Mexico and northern
Costa Rica, with stragglers nesting as far north as southern Baja California (Fritts et al. 1982) and as far
south as Peru (Brown and Brown 1982; Kelez et al. 2009). Most olive ridleys nest synchronously in huge
colonies called ―arribadas‖, with several thousand females nesting at the same time; others nest alone, out
of sequence with the arribada (Kalb and Owens 1994). The arribadas usually last from three to seven
nights (Aprill 1994). Most females lay two clutches of eggs with an inter-nesting period of 1–2 months
(Plotkin et al. 1994b). Incubation usually takes from 50 to 60 days (NMFS and USFWS 1998d). Radio-
tracking studies showed that females that nested in arribadas remain within 5 km of the beach most of the
time during the inter-nesting period (Kalb and Owens 1994). Olive ridleys nest throughout the year in the
eastern Pacific with peak months, including major arribadas, occurring from September through
December (NMFS and USFWS 1998d). There is no known nesting on the U.S. west coast.
Outside of the breeding season, the turtles disperse, but little is known of their behavior. Neither
males nor females migrate to one specific foraging area, but exhibit a nomadic movement pattern and oc-
cupy a series of feeding areas in oceanic waters (Plotkin et al. 1994a,b). Aggregations of turtles2, some-
times >100 individuals, have been observed as far offshore as 120°W, ~3000 km from shore (Arenas and Hall
1991), however movements of turtles tagged in Central America were highly dissociated from each other, indi-
cating that olive ridleys are ―nomadic epipelagic foragers that prey on patchily distributed food‖ (Morreale et
al. 2007:220).
In the ETP, olive ridleys range from the U.S. to central Chile, but are most common off Mexico
and Central America; in Peru, they can be found along the entire coast but are most common in the north
(Kelez et al. 2009). Olive ridley turtles are rare in the waters of Galapagos (Zárate et al. 2010a). Among
longline fisheries in the ETP, olive ridleys were the most frequent bycatch off northern Peru, Ecuador,
and Central America; bycatch rates there were higher than those further south, but lower than those off
Mexico. Among gillnet fisheries, olive ridleys were rare in the bycatch of the Chilean gillnet swordfish
fishery, were included with other species in the bycatch of driftnets targeting sharks and rays off Peru,
and were the species most frequently captured during shrimp trawling off Costa Rica (Kelez et al. 2010).
The olive ridley turtle was the most common species encountered during L-DEO seismic surveys in
the ETP off Honduras, Nicaragua, and Costa Rica in November–December 2004 and off Nicaragua and
Costa Rica in March–April 2008; 84 of the ~179 turtle sightings and 204 of 341 turtle sightings,
respectively, were identified as olive ridleys (Holst et al. 2005b; Holst and Smultea 2008). Two of six sea
turtles sighted during an L-DEO seismic survey in the Hess Deep ~1100 km west of the Galapagos
Islands in July 2003 were olive ridleys (Smultea and Holst 2003), and 81 of 171 sea turtles sighted during
L-DEO seismic surveys 1600–1950 km west of the proposed survey area in April–August 2008 were
olive ridleys (Hauser et al. 2008).
____________________________________
2 Of sea turtles observed at sea, 75% were olive ridleys.

IV. Environmental Consequences
Environmental Assessment for SIO ETP Cruise, 2010 Page 44
IV. ENVIRONMENTAL CONSEQUENCES
Proposed Action
(1) Direct Effects on Marine Mammals and Sea Turtles and Their Significance
The material in this section includes a summary of the anticipated effects (or lack thereof) on
marine mammals and sea turtles of the airgun system to be used by SIO. A more detailed review of air-
gun effects on marine mammals appears in Appendix A. That Appendix is similar to corresponding parts
of previous EAs and associated IHA applications concerning other SIO and L-DEO seismic surveys since
2003, but was updated in 2009. Appendix B contains a general review of the effects of seismic pulses on
sea turtles. This section also includes a discussion of the potential impacts of operations by SIO‘s multi-
beam echosounder (MBES) and sub-bottom profiler (SBP).
Finally, this section includes estimates of the numbers of marine mammals that could be affected
by the proposed activity during the seismic survey scheduled to occur during October–November 2010.
A description of the rationale for SIO‘s estimates of the numbers of exposures to various received sound
levels that could occur during the planned seismic program is also provided.
(a) Summary of Potential Effects of Airgun Sounds
The effects of sounds from airguns could include one or more of the following: tolerance, masking
of natural sounds, behavioral disturbance, and at least in theory, temporary or permanent hearing impair-
ment, or non-auditory physical or physiological effects (Richardson et al. 1995; Gordon et al. 2004;
Nowacek et al. 2007; Southall et al. 2007). Permanent hearing impairment, in the unlikely event that it
occurred, would constitute injury, but temporary threshold shift (TTS) is not an injury (Southall et al.
2007). Although the possibility cannot be entirely excluded, it is unlikely that the project would result in
any cases of temporary or especially permanent hearing impairment, or any significant non-auditory
physical or physiological effects. Some behavioral disturbance is expected, but this would be localized
and short-term.
Tolerance.―Numerous studies have shown that pulsed sounds from airguns are often readily
detectable in the water at distances of many kilometers. For a summary of the characteristics of airgun
pulses, see Appendix A (3). Several studies have shown that marine mammals at distances more than a
few kilometers from operating seismic vessels often show no apparent response—see Appendix A (5).
That is often true even in cases when the pulsed sounds must be readily audible to the animals based on
measured received levels and the hearing sensitivity of that mammal group. Although various baleen
whales, toothed whales, and (less frequently) pinnipeds have been shown to react behaviorally to airgun
pulses under some conditions, at other times mammals of all three types have shown no overt reactions.
In general, pinnipeds usually seem to be more tolerant of exposure to airgun pulses than are cetaceans,
with the relative responsiveness of baleen and toothed whales being variable. During active seismic
surveys, sea turtles typically do not show overt reactions to airgun pulses.
Masking.―Masking effects of pulsed sounds (even from large arrays of airguns) on marine
mammal calls and other natural sounds are expected to be limited, although there are very few specific
data on this. Because of the intermittent nature and low duty cycle of seismic pulses, animals can emit
and receive sounds in the relatively quiet intervals between pulses. However, in exceptional situations,
reverberation occurs for much or all of the interval between pulses (e.g., Simard et al. 2005; Clark and
Gagnon 2006) which could mask calls. Some baleen and toothed whales are known to continue calling in

IV. Environmental Consequences
Environmental Assessment for SIO ETP Cruise, 2010 Page 45
the presence of seismic pulses, and their calls usually can be heard between the seismic pulses (e.g.,
Richardson et al. 1986; McDonald et al. 1995; Greene et al. 1999a,b; Nieukirk et al. 2004; Smultea et al.
2004; Holst et al. 2005a,b, 2006; Dunn and Hernandez 2009). However, Clark and Gagnon (2006)
reported that fin whales in the northeast Pacific Ocean went silent for an extended period starting soon
after the onset of a seismic survey in the area. Similarly, there has been one report that sperm whales
ceased calling when exposed to pulses from a very distant seismic ship (Bowles et al. 1994). However,
more recent studies found that sperm whales continued calling in the presence of seismic pulses (Madsen
et al. 2002; Tyack et al. 2003; Smultea et al. 2004; Holst et al. 2006; Jochens et al. 2008). Dolphins and
porpoises commonly are heard calling while airguns are operating (e.g., Gordon et al. 2004; Smultea et al.
2004; Holst et al. 2005a,b; Potter et al. 2007). The sounds important to small odontocetes are predom-
inantly at much higher frequencies than are the dominant components of airgun sounds, thus limiting the
potential for masking. In general, masking effects of seismic pulses are expected to be minor, given the
normally intermittent nature of seismic pulses. Masking effects on marine mammals are discussed further
in Appendix A (4). We are not aware of any information concerning masking of hearing in sea turtles.
Disturbance Reactions.―Disturbance includes a variety of effects, including subtle to conspicuous
changes in behavior, movement, and displacement. Based on NMFS (2001, p. 9293), NRC (2005), and
Southall et al. (2007), we assume that simple exposure to sound, or brief reactions that do not disrupt
behavioral patterns in a potentially significant manner, do not constitute harassment or ―taking‖. By
potentially significant, we mean ―in a manner that might have deleterious effects to the well-being of
individual marine mammals or their populations‖.
Reactions to sound, if any, depend on species, state of maturity, experience, current activity, repro-
ductive state, time of day, and many other factors (Richardson et al. 1995; Wartzok et al. 2004; Southall
et al. 2007; Weilgart 2007). If a marine mammal does react briefly to an underwater sound by changing
its behavior or moving a small distance, the impacts of the change are unlikely to be significant to the
individual, let alone the stock or population. However, if a sound source displaces marine mammals from
an important feeding or breeding area for a prolonged period, impacts on individuals and populations
could be significant (e.g., Lusseau and Bejder 2007; Weilgart 2007). Given the many uncertainties in
predicting the quantity and types of impacts of noise on marine mammals, it is common practice to
estimate how many mammals would be present within a particular distance of industrial activities and/or
exposed to a particular level of industrial sound. In most cases, this approach likely overestimates the
numbers of marine mammals that would be affected in some biologically-important manner.
The sound criteria used to estimate how many marine mammals might be disturbed to some
biologically-important degree by a seismic program are based primarily on behavioral observations of a
few species. Detailed studies have been done on humpback, gray, bowhead, and sperm whales. Less
detailed data are available for some other species of baleen whales, small toothed whales, and sea otters,
but for many species there are no data on responses to marine seismic surveys.
Baleen Whales
Baleen whales generally tend to avoid operating airguns, but avoidance radii are quite variable.
Whales are often reported to show no overt reactions to pulses from large arrays of airguns at distances
beyond a few kilometers, even though the airgun pulses remain well above ambient noise levels out to
much longer distances. However, as reviewed in Appendix A (5), baleen whales exposed to strong noise
pulses from airguns often react by deviating from their normal migration route and/or interrupting their
feeding and moving away. In the cases of migrating gray and bowhead whales, the observed changes in
behavior appeared to be of little or no biological consequence to the animals. They simply avoided the

IV. Environmental Consequences
Environmental Assessment for SIO ETP Cruise, 2010 Page 46
sound source by displacing their migration route to varying degrees, but within the natural boundaries of
the migration corridors.
Studies of gray, bowhead, and humpback whales have shown that seismic pulses with received levels
of 160–170 dB re 1 µParms seem to cause obvious avoidance behavior in a substantial fraction of the
animals exposed (Richardson et al. 1995). In many areas, seismic pulses from large arrays of airguns
diminish to those levels at distances ranging from 4 to 15 km from the source. A substantial proportion of
the baleen whales within those distances may show avoidance or other strong behavioral reactions to the
airgun array. Subtle behavioral changes sometimes become evident at somewhat lower received levels, and
studies summarized in Appendix A (5) have shown that some species of baleen whales, notably bowhead
and humpback whales, at times show strong avoidance at received levels lower than 160–170 dB re
1 µParms.
Responses of humpback whales to seismic surveys have been studied during migration, on summer
feeding grounds, and on Angolan winter breeding grounds; there has also been discussion of effects on
the Brazilian wintering grounds. McCauley et al. (1998, 2000a) studied the responses of humpback
whales off Western Australia to a full-scale seismic survey with a 16-airgun, 2678-in3 array, and to a
single 20-in3 airgun with source level 227 dB re 1 µPa·mp–p. McCauley et al. (1998) documented that
avoidance reactions began at 5–8 km from the array, and that those reactions kept most pods ~3–4 km
from the operating seismic boat. McCauley et al. (2000a) noted localized displacement during migration
of 4–5 km by traveling pods and 7–12 km by more sensitive resting pods of cow-calf pairs. Avoidance
distances with respect to the single airgun were smaller but consistent with the results from the full array
in terms of the received sound levels. The mean received level for initial avoidance of an approaching
airgun was 140 dB re 1 µParms for humpback pods containing females, and at the mean closest point of
approach (CPA) distance the received level was 143 dB re 1 µParms. The initial avoidance response
generally occurred at distances of 5–8 km from the airgun array and 2 km from the single airgun. How-
ever, some individual humpback whales, especially males, approached within distances of 100–400 m,
where the maximum received level was 179 dB re 1 µParms.
Humpback whales on their summer feeding grounds in SE Alaska did not exhibit persistent avoid-
ance when exposed to seismic pulses from a 1.64-L (100-in3) airgun (Malme et al. 1985). Some hump-
backs seemed ―startled‖ at received levels of 150–169 dB re 1 Pa. Malme et al. (1985) concluded that
there was no clear evidence of avoidance, despite the possibility of subtle effects, at received levels up to
172 re 1 Pa on an approximate rms basis.
It has been suggested that South Atlantic humpback whales wintering off Brazil may be displaced
or even strand upon exposure to seismic surveys (Engel et al. 2004). The evidence for this was circum-
stantial and subject to alternative explanations (IAGC 2004). Also, the evidence was not consistent with
subsequent results from the same area of Brazil (Parente et al. 2006), or with direct studies of humpbacks
exposed to seismic surveys in other areas and seasons. After allowance for data from subsequent years,
there was ―no observable direct correlation‖ between strandings and seismic surveys (IWC 2007:236).
There are no data on reactions of right whales to seismic surveys, but results from the closely-
related bowhead whale show that their responsiveness can be quite variable depending on their activity
(migrating vs. feeding). Bowhead whales migrating west across the Alaskan Beaufort Sea in autumn, in
particular, are unusually responsive, with substantial avoidance occurring out to distances of 20–30 km
from a medium-sized airgun source at received sound levels of around 120–130 dB re 1 µParms [Miller et
al. 1999; Richardson et al. 1999; see Appendix A (5)]. However, more recent research on bowhead

IV. Environmental Consequences
Environmental Assessment for SIO ETP Cruise, 2010 Page 47
whales (Miller et al. 2005; Harris et al. 2007) corroborates earlier evidence that, during the summer
feeding season, bowheads are not as sensitive to seismic sources. Nonetheless, subtle but statistically
significant changes in surfacing–respiration–dive cycles were evident upon analysis (Richardson et al.
1986). In summer, bowheads typically begin to show avoidance reactions at received levels of about
152–178 dB re 1 µParms (Richardson et al. 1986, 1995; Ljungblad et al. 1988; Miller et al. 2005).
Reactions of migrating and feeding (but not wintering) gray whales to seismic surveys have been
studied. Malme et al. (1986, 1988) studied the responses of feeding eastern Pacific gray whales to pulses
from a single 100-in3 airgun off St. Lawrence Island in the northern Bering Sea. They estimated, based
on small sample sizes, that 50% of feeding gray whales stopped feeding at an average received pressure
level of 173 dB re 1 Pa on an (approximate) rms basis, and that 10% of feeding whales interrupted
feeding at received levels of 163 dB re 1 Parms. Those findings were generally consistent with the results
of experiments conducted on larger numbers of gray whales that were migrating along the California
coast (Malme et al. 1984; Malme and Miles 1985), and western Pacific gray whales feeding off Sakhalin
Island, Russia (Würsig et al. 1999; Gailey et al. 2007; Johnson et al. 2007; Yazvenko et al. 2007a,b),
along with data on gray whales off B.C., Canada (Bain and Williams 2006).
Various species of Balaenoptera (blue, sei, fin, and minke whales) have occasionally been seen in
areas ensonified by airgun pulses (Stone 2003; MacLean and Haley 2004; Stone and Tasker 2006), and
calls from blue and fin whales have been localized in areas with airgun operations (e.g., McDonald et al.
1995; Dunn and Hernandez 2009). Sightings by observers on seismic vessels off the United Kingdom
from 1997 to 2000 suggest that, during times of good sightability, sighting rates for mysticetes (mainly
fin and sei whales) were similar when large arrays of airguns were shooting vs. silent (Stone 2003; Stone
and Tasker 2006). However, these whales tended to exhibit localized avoidance, remaining significantly
further (on average) from the airgun array during seismic operations compared with non-seismic periods
(Stone and Tasker 2006). In a study off Nova Scotia, Moulton and Miller (2005) found little difference in
sighting rates (after accounting for water depth) and initial sighting distances of balaenopterid whales
when airguns were operating vs. silent. However, there were indications that these whales were more
likely to be moving away when seen during airgun operations. Similarly, ship-based monitoring studies
of blue, fin, sei and minke whales offshore of Newfoundland (Orphan Basin and Laurentian Sub-basin)
found no more than small differences in sighting rates and swim directions during seismic vs. non-seismic
periods (Moulton et al. 2005, 2006a,b).
Data on short-term reactions by cetaceans to impulsive noises are not necessarily indicative of
long-term or biologically significant effects. It is not known whether impulsive sounds affect repro-
ductive rate or distribution and habitat use in subsequent days or years. However, gray whales have
continued to migrate annually along the west coast of North America with substantial increases in the
population over recent years, despite intermittent seismic exploration (and much ship traffic) in that area
for decades (Appendix A in Malme et al. 1984; Richardson et al. 1995; Angliss and Allen 2009). The
western Pacific gray whale population did not seem affected by a seismic survey in its feeding ground
during a previous year (Johnson et al. 2007). Similarly, bowhead whales have continued to travel to the
eastern Beaufort Sea each summer, and their numbers have increased notably, despite seismic exploration
in their summer and autumn range for many years (Richardson et al. 1987; Angliss and Allen 2009).
Toothed Whales
Little systematic information is available about reactions of toothed whales to noise pulses. Few
studies similar to the more extensive baleen whale/seismic pulse work summarized above and (in more
detail) in Appendix A have been reported for toothed whales. However, there are recent systematic

IV. Environmental Consequences
Environmental Assessment for SIO ETP Cruise, 2010 Page 48
studies on sperm whales (e.g., Gordon et al. 2006; Madsen et al. 2006; Winsor and Mate 2006; Jochens et
al. 2008; Miller et al. 2009). There is an increasing amount of information about responses of various
odontocetes to seismic surveys based on monitoring studies (e.g., Stone 2003; Smultea et al. 2004; Moul-
ton and Miller 2005; Bain and Williams 2006; Holst et al. 2006; Stone and Tasker 2006; Potter et al.
2007; Hauser et al. 2008; Holst and Smultea 2008; Weir 2008; Barkaszi et al. 2009; Richardson et al.
2009).
Seismic operators and marine mammal observers on seismic vessels regularly see dolphins and
other small toothed whales near operating airgun arrays, but in general there is a tendency for most
delphinids to show some avoidance of operating seismic vessels (e.g., Goold 1996a,b,c; Calambokidis
and Osmek 1998; Stone 2003; Moulton and Miller 2005; Holst et al. 2006; Stone and Tasker 2006; Weir
2008; Richardson et al. 2009; see also Barkaszi et al. 2009). Some dolphins seem to be attracted to the
seismic vessel and floats, and some ride the bow wave of the seismic vessel even when large arrays of air-
guns are firing (e.g., Moulton and Miller 2005). Nonetheless, small toothed whales more often tend to
head away, or to maintain a somewhat greater distance from the vessel, when a large array of airguns is
operating than when it is silent (e.g., Stone and Tasker 2006; Weir 2008). In most cases the avoidance
radii for delphinids appear to be small, on the order of 1 km less, and some individuals show no apparent
avoidance. The beluga is a species that (at least at times) shows long-distance avoidance of seismic
vessels. Aerial surveys conducted in the southeastern Beaufort Sea during summer found that sighting
rates of beluga whales were significantly lower at distances 10–20 km compared with 20–30 km from an
operating airgun array, and observers on seismic boats in that area rarely see belugas (Miller et al. 2005;
Harris et al. 2007).
Captive bottlenose dolphins and beluga whales exhibited changes in behavior when exposed to
strong pulsed sounds similar in duration to those typically used in seismic surveys (Finneran et al. 2000,
2002, 2005). However, the animals tolerated high received levels of sound before exhibiting aversive
behaviors.
Results for porpoises depend on species. The limited available data suggest that harbor porpoises
show stronger avoidance of seismic operations than do Dall‘s porpoises (Stone 2003; MacLean and Koski
2005; Bain and Williams 2006; Stone and Tasker 2006). Dall‘s porpoises seem relatively tolerant of
airgun operations (MacLean and Koski 2005; Bain and Williams 2006), although they too have been
observed to avoid large arrays of operating airguns (Calambokidis and Osmek 1998; Bain and Williams
2006). This apparent difference in responsiveness of these two porpoise species is consistent with their
relative responsiveness to boat traffic and some other acoustic sources (Richardson et al. 1995; Southall et
al. 2007).
Most studies of sperm whales exposed to airgun sounds indicate that the sperm whale shows
considerable tolerance of airgun pulses (e.g., Stone 2003; Moulton et al. 2005, 2006a; Stone and Tasker
2006; Weir 2008). In most cases the whales do not show strong avoidance, and they continue to call (see
Appendix A for review). However, controlled exposure experiments in the Gulf of Mexico indicate that
foraging behavior was altered upon exposure to airgun sound (Jochens et al. 2008; Miller et al. 2009;
Tyack 2009).
There are almost no specific data on the behavioral reactions of beaked whales to seismic surveys.
However, some northern bottlenose whales remained in the general area and continued to produce high-
frequency clicks when exposed to sound pulses from distant seismic surveys (Gosselin and Lawson 2004;
Laurinolli and Cochrane 2005; Simard et al. 2005). Most beaked whales tend to avoid approaching
vessels of other types (e.g., Würsig et al. 1998). They may also dive for an extended period when
IV. Environmental Consequences
Environmental Assessment for SIO ETP Cruise, 2010 Page 49
approached by a vessel (e.g., Kasuya 1986), although it is uncertain how much longer such dives may be
as compared to dives by undisturbed beaked whales, which also are often quite long (Baird et al. 2006;
Tyack et al. 2006). In any event, it is likely that most beaked whales would also show strong avoidance
of an approaching seismic vessel, although this has not been documented explicitly.
There are increasing indications that some beaked whales tend to strand when naval exercises
involving mid-frequency sonar operation are ongoing nearby (e.g., Simmonds and Lopez-Jurado 1991;
Frantzis 1998; NOAA and USN 2001; Jepson et al. 2003; Hildebrand 2005; Barlow and Gisiner 2006; see
also the ―Strandings and Mortality‖ subsection, later). These strandings are apparently at least in part a
disturbance response, although auditory or other injuries or other physiological effects may also be
involved. Whether beaked whales would ever react similarly to seismic surveys is unknown (see ―Strand-
ings and Mortality‖, below). Seismic survey sounds are quite different from those of the sonars in
operation during the above-cited incidents.
Odontocete reactions to large arrays of airguns are variable and, at least for delphinids and Dall‘s
porpoises, seem to be confined to a smaller radius than has been observed for the more responsive of the
mysticetes, belugas, and harbor porpoises (Appendix A). A 170 dB re 1 μPa disturbance criterion
(rather than 160 dB) is considered appropriate for delphinids (and pinnipeds), which tend to be less
responsive than the more responsive cetaceans.
Pinnipeds
Pinnipeds are not likely to show a strong avoidance reaction to the airgun array. Visual monitoring
from seismic vessels has shown only slight (if any) avoidance of airguns by pinnipeds, and only slight (if
any) changes in behavior—see Appendix A (5). In the Beaufort Sea, some ringed seals avoided an area
of 100 m to (at most) a few hundred meters around seismic vessels, but many seals remained within 100–
200 m of the trackline as the operating airgun array passed by (e.g., Harris et al. 2001; Moulton and
Lawson 2002; Miller et al. 2005). Ringed seal sightings averaged somewhat farther away from the
seismic vessel when the airguns were operating than when they were not, but the difference was small
(Moulton and Lawson 2002). Similarly, in Puget Sound, sighting distances for harbor seals and Califor-
nia sea lions tended to be larger when airguns were operating (Calambokidis and Osmek 1998). Previous
telemetry work suggests that avoidance and other behavioral reactions may be stronger than evident to
date from visual studies (Thompson et al. 1998). Even if reactions of any pinnipeds that might be
encountered in the present study area are as strong as those evident in the telemetry study, reactions are
expected to be confined to relatively small distances and durations, with no long-term effects on pinniped
individuals or populations. As for delphinids, a 170 dB disturbance criterion is considered appropriate
for pinnipeds, which tend to be less responsive than many cetaceans.
Sea Turtles
The limited available data indicate that sea turtles will hear airgun sounds and sometimes exhibit
localized avoidance (see Appendix B). Based on available data, it is likely that sea turtles will exhibit
behavioral changes and/or avoidance within an area of unknown size near a seismic vessel (e.g., Holst et
al. 2005a, 2006; Holst and Smultea 2008). Observed responses of sea turtles to airguns are reviewed in
Appendix B. To the extent that there are any impacts on sea turtles, seismic operations in or near areas
where turtles concentrate are likely to have the greatest impact. There are no specific data that demon-
strate the consequences to sea turtles if seismic operations with large or small arrays of airguns occur in
important areas at biologically important times of year.

IV. Environmental Consequences
Environmental Assessment for SIO ETP Cruise, 2010 Page 50
Additional details on the behavioral reactions (or the lack thereof) by all types of marine mammals
to seismic vessels can be found in Appendix A (5). Corresponding details for sea turtles can be found in
Appendix B.
Hearing Impairment and Other Physical Effects.―Temporary or permanent hearing impairment
is a possibility when marine mammals are exposed to very strong sounds. TTS has been demonstrated
and studied in certain captive odontocetes and pinnipeds exposed to strong sounds (reviewed in Southall
et al. 2007). However, there has been no specific documentation of TTS let alone permanent hearing
damage, i.e., permanent threshold shift (PTS), in free-ranging marine mammals exposed to sequences of
airgun pulses during realistic field conditions. Current NMFS policy regarding exposure of marine
mammals to high-level sounds is that cetaceans and pinnipeds should not be exposed to impulsive sounds
with received levels 180 dB and 190 dB re 1 µParms, respectively (NMFS 2000). Those criteria have
been used in establishing the exclusion (=shut-down) zones planned for the proposed seismic survey.
However, those criteria were established before there was any information about minimum received
levels of sounds necessary to cause auditory impairment in marine mammals. As discussed in Appendix
A (6) and summarized here,
the 180-dB criterion for cetaceans is probably quite precautionary, i.e., lower than necessary to
avoid temporary auditory impairment let alone permanent auditory injury, at least for delphinids.
TTS is not injury and does not constitute ―Level A harassment‖ in U.S. MMPA terminology.
the minimum sound level necessary to cause permanent hearing impairment (―Level A harass-
ment‖) is higher, by a variable and generally unknown amount, than the level that induces barely-
detectable TTS.
the level associated with the onset of TTS is often considered to be a level below which there is
no danger of permanent damage. The actual PTS threshold is likely to be well above the level
causing onset of TTS (Southall et al. 2007).
Recommendations for new science-based noise exposure criteria for marine mammals, frequency-
weighting procedures, and related matters were published recently (Southall et al. 2007). Those recom-
mendations have not, as of early 2010, been formally adopted by NMFS for use in regulatory processes
and during mitigation programs associated with seismic surveys. However, some aspects of the recom-
mendations have been taken into account in certain environmental impact statements and small-take
authorizations. NMFS has indicated that it may issue new noise exposure criteria for marine mammals
that account for the now-available scientific data on TTS, the expected offset between the TTS and PTS
thresholds, differences in the acoustic frequencies to which different marine mammal groups are sensitive
(e.g., M-weighting or generalized frequency weightings for various groups of marine mammals, allowing
for their functional bandwidths), and other relevant factors. Preliminary information about possible
changes in the regulatory and mitigation requirements, and about the possible structure of new criteria,
was given by Wieting (2004) and NMFS (2005).
Several aspects of the planned monitoring and mitigation measures for this project are designed to
detect marine mammals occurring near the airgun array, and to avoid exposing them to sound pulses that
might, at least in theory, cause hearing impairment (see § II, ―Monitoring and Mitigation Measures‖). In
addition, many cetaceans and (to a limited degree) sea turtles show some avoidance of the area where
received levels of airgun sound are high enough such that hearing impairment could potentially occur. In
those cases, the avoidance responses of the animals themselves will reduce or (most likely) avoid any
possibility of hearing impairment.

IV. Environmental Consequences
Environmental Assessment for SIO ETP Cruise, 2010 Page 51
Non-auditory physical effects may also occur in marine mammals exposed to strong underwater
pulsed sound. Possible types of non-auditory physiological effects or injuries that might (in theory) occur
in mammals close to a strong sound source include stress, neurological effects, bubble formation, and
other types of organ or tissue damage. It is possible that some marine mammal species (i.e., beaked
whales) may be especially susceptible to injury and/or stranding when exposed to strong transient sounds.
However, as discussed below, there is no definitive evidence that any of these effects occur even for
marine mammals in close proximity to large arrays of airguns. It is unlikely that any effects of these
types would occur during the present project given the brief duration of exposure of any given mammal
and the planned monitoring and mitigation measures (see below). The following subsections discuss in
somewhat more detail the possibilities of TTS, PTS, and non-auditory physical effects.
Temporary Threshold Shift
TTS is the mildest form of hearing impairment that can occur during exposure to a strong sound
(Kryter 1985). While experiencing TTS, the hearing threshold rises and a sound must be stronger in order
to be heard. At least in terrestrial mammals, TTS can last from minutes or hours to (in cases of strong
TTS) days. For sound exposures at or somewhat above the TTS threshold, hearing sensitivity in both
terrestrial and marine mammals recovers rapidly after exposure to the noise ends. Few data on sound
levels and durations necessary to elicit mild TTS have been obtained for marine mammals, and none of
the published data concern TTS elicited by exposure to multiple pulses of sound. Available data on TTS
in marine mammals are summarized in Southall et al. (2007). Based on these data, the received energy
level of a single seismic pulse (with no frequency weighting) might need to be ~186 dB re 1 µPa2 · s (i.e.,
186 dB SEL or ~196–201 dB re 1 µParms) in order to produce brief, mild TTS3. Exposure to several
strong seismic pulses that each have received levels near 190 dB re 1 µParms might result in cumulative
exposure of ~186 dB SEL and thus slight TTS in a small odontocete assuming the TTS threshold is (to a
first approximation) a function of the total received pulse energy; however, this ‗equal-energy‘ concept is
an oversimplification. The distances from the Melville‘s airguns at which the received energy level (per
pulse, flat-weighted) would be expected to be 190 dB re 1 µParms are estimated in Table 1. Levels 190
dB re 1 µParms are expected to be restricted to radii no more than 15 m (Table 1). For an odontocete
closer to the surface, the maximum radius with 190 dB re 1 µParms would be smaller.
The above TTS information for odontocetes is derived from studies on the bottlenose dolphin and
beluga. For the one harbor porpoise tested, the received level of airgun sound that elicited onset of TTS
was lower (Lucke et al. 2009). If these results from a single animal are representative, it is inappropriate
to assume that onset of TTS occurs at similar received levels in all odontocetes (cf. Southall et al. 2007).
Some cetaceans apparently can incur TTS at considerably lower sound exposures than are necessary to
elicit TTS in the beluga or bottlenose dolphin.
For baleen whales, there are no data, direct or indirect, on levels or properties of sound that are
required to induce TTS. The frequencies to which baleen whales are most sensitive are assumed to be
lower than those to which odontocetes are most sensitive, and natural background noise levels at those
low frequencies tend to be higher. As a result, auditory thresholds of baleen whales within their
frequency band of best hearing are believed to be higher (less sensitive) than are those of odontocetes at
____________________________________
3 If the low frequency components of the watergun sound used in the experiments of Finneran et al. (2002) are
downweighted as recommended by Miller et al. (2005) and Southall et al. (2007) using their Mmf-weighting curve,
the effective exposure level for onset of mild TTS was 183 dB re 1 μPa2 · s (Southall et al. 2007).
IV. Environmental Consequences
Environmental Assessment for SIO ETP Cruise, 2010 Page 52
their best frequencies (Clark and Ellison 2004). From this, it is suspected that received levels causing
TTS onset may also be higher in baleen whales (Southall et al. 2007). In any event, no cases of TTS are
expected given the strong likelihood that baleen whales would avoid the approaching airguns (or vessel)
before being exposed to levels high enough for TTS to occur, as well as the mitigation measures that are
planned.
In pinnipeds, TTS thresholds associated with exposure to brief pulses (single or multiple) of under-
water sound have not been measured. Initial evidence from more prolonged (non-pulse) exposures sug-
gested that some pinnipeds (harbor seals in particular) incur TTS at somewhat lower received levels than
do small odontocetes exposed for similar durations (Kastak et al. 1999, 2005; Ketten et al. 2001). The
TTS threshold for pulsed sounds has been indirectly estimated as being an SEL of ~171 dB re 1 μPa2 ∙ s
(Southall et al. 2007), which would be equivalent to a single pulse with received level ~181–186 dB re
1 μParms, or a series of pulses for which the highest rms values are a few dB lower. Corresponding values
for California sea lions and northern elephant seals are likely to be higher (Kastak et al. 2005).
NMFS (1995, 2000) concluded that cetaceans and pinnipeds should not be exposed to pulsed under-
water noise at received levels exceeding, respectively, 180 and 190 dB re 1 µParms. Those sound levels are
not considered to be the level above which TTS might occur. Rather, they were the received levels above
which, in the view of a panel of bioacoustics specialists convened by NMFS before TTS measurements for
marine mammals started to become available, one could not be certain that there would be no injurious
effects, auditory or otherwise, to marine mammals. As summarized above and in Southall et al. (2007), data
that are now available imply that TTS is unlikely to occur in most odontocetes (and probably mysticetes as
well) unless they are exposed to a sequence of several airgun pulses stronger than 190 dB re 1 µParms. For
the harbor seal and any species with similarly low TTS thresholds, TTS may occur upon exposure to one or
more airgun pulses whose received level equals the NMFS ―do not exceed‖ value of 190 dB re 1 μParms.
That criterion corresponds to a single-pulse SEL of 175–180 dB re 1 μPa2 ∙ s in typical conditions, whereas
TTS is suspected to be possible (in harbor seals) with a cumulative SEL of ~171 dB re 1 μPa2 ∙ s.
Permanent Threshold Shift
When PTS occurs, there is physical damage to the sound receptors in the ear. In severe cases, there
can be total or partial deafness, whereas in other cases, the animal has an impaired ability to hear sounds
in specific frequency ranges (Kryter 1985).
There is no specific evidence that exposure to pulses of airgun sound can cause PTS in any marine
mammal, even with large arrays of airguns. However, given the possibility that mammals close to an
airgun array might incur at least mild TTS, there has been further speculation about the possibility that
some individuals occurring very close to airguns might incur PTS (e.g., Richardson et al. 1995, p. 372ff;
Gedamke et al. 2008). Single or occasional occurrences of mild TTS are not indicative of permanent
auditory damage, but repeated or (in some cases) single exposures to a level well above that causing TTS
onset might elicit PTS.
Relationships between TTS and PTS thresholds have not been studied in marine mammals, but are
assumed to be similar to those in humans and other terrestrial mammals. PTS might occur at a received
sound level at least several decibels above that inducing mild TTS if the animal were exposed to strong
sound pulses with rapid rise time—see Appendix A (6). Based on data from terrestrial mammals, a pre-
cautionary assumption is that the PTS threshold for impulse sounds (such as airgun pulses as received
close to the source) is at least 6 dB higher than the TTS threshold on a peak-pressure basis, and probably
>6 dB (Southall et al. 2007). On an SEL basis, Southall et al. (2007:441-4) estimated that received levels

IV. Environmental Consequences
Environmental Assessment for SIO ETP Cruise, 2010 Page 53
would need to exceed the TTS threshold by at least 15 dB for there to be risk of PTS. Thus, for cetaceans
they estimate that the PTS threshold might be an M-weighted SEL (for the sequence of received pulses)
of ~198 dB re 1 μPa2 ∙ s (15 dB higher than the Mmf-weighted TTS threshold, in a beluga, for a watergun
impulse), where the SEL value is cumulated over the sequence of pulses. Additional assumptions had to
be made to derive a corresponding estimate for pinnipeds, as the only available data on TTS-thresholds in
pinnipeds pertain to non-impulse sound. Southall et al. (2007) estimate that the PTS threshold could be a
cumulative Mpw-weighted SEL of ~186 dB re 1 μPa2 ∙ s in the harbor seal exposed to impulse sound. The
PTS threshold for the California sea lion and northern elephant seal the PTS threshold would probably be
higher, given the higher TTS thresholds in those species.
Southall et al. (2007) also note that, regardless of the SEL, there is concern about the possibility of
PTS if a cetacean or pinniped received one or more pulses with peak pressure exceeding 230 or 218 dB re
1 μPa (peak), respectively. Thus, PTS might be expected upon exposure of cetaceans to either SEL ≥198
dB re 1 μPa2 ·
s or peak pressure ≥230 dB re 1 μPa. Corresponding proposed dual criteria for pinnipeds
(at least harbor seals) are ≥186 dB SEL and ≥ 218 dB peak pressure (Southall et al. 2007). These
estimates are all first approximations, given the limited underlying data, assumptions, species differences,
and evidence that the ―equal energy‖ model is not be entirely correct. A peak pressure of 230 dB re 1 μPa
(3.2 bar · m, 0-pk) would only be found within less than a meter from a GI gun, which has a peak pressure
of 224.6 dB re 1μPa · m. A peak pressure of 218 dB re 1 μPa could be received somewhat farther away;
to estimate that specific distance, one would need to apply a model that accurately calculates peak
pressures in the near-field around an array of airguns.
Given the higher level of sound necessary to cause PTS as compared with TTS, it is considerably
less likely that PTS would occur. Baleen whales generally avoid the immediate area around operating
seismic vessels, as do some other marine mammals and sea turtles. The planned monitoring and
mitigation measures, including visual monitoring, ramp ups, and shut downs of the airguns when
mammals are seen within or approaching the ―exclusion zones‖, will further reduce the probability of
exposure of marine mammals to sounds strong enough to induce PTS.
Strandings and Mortality
Marine mammals close to underwater detonations of high explosives can be killed or severely
injured, and the auditory organs are especially susceptible to injury (Ketten et al. 1993; Ketten 1995).
However, explosives are no longer used for marine waters for commercial seismic surveys or (with rare
exceptions) for seismic research; they have been replaced entirely by airguns or related non-explosive
pulse generators. Airgun pulses are less energetic and have slower rise times, and there is no specific
evidence that they can cause serious injury, death, or stranding even in the case of large airgun arrays.
However, the association of strandings of beaked whales with naval exercises and, in one case, an L-DEO
seismic survey (Malakoff 2002; Cox et al. 2006), has raised the possibility that beaked whales exposed to
strong ―pulsed‖ sounds may be especially susceptible to injury and/or behavioral reactions that can lead to
stranding (e.g., Hildebrand 2005; Southall et al. 2007). Appendix A (6) provides additional details.
Specific sound-related processes that lead to strandings and mortality are not well documented, but
may include (1) swimming in avoidance of a sound into shallow water; (2) a change in behavior (such as
a change in diving behavior) that might contribute to tissue damage, gas bubble formation, hypoxia,
cardiac arrhythmia, hypertensive hemorrhage or other forms of trauma; (3) a physiological change such as
a vestibular response leading to a behavioral change or stress-induced hemorrhagic diathesis, leading in
turn to tissue damage; and (4) tissue damage directly from sound exposure, such as through acoustically
mediated bubble formation and growth or acoustic resonance of tissues. Some of these mechanisms are

IV. Environmental Consequences
Environmental Assessment for SIO ETP Cruise, 2010 Page 54
unlikely to apply in the case of impulse sounds. However, there are increasing indications that gas-bubble
disease (analogous to ―the bends‖), induced in supersaturated tissue by a behavioral response to acoustic
exposure, could be a pathologic mechanism for the strandings and mortality of some deep-diving
cetaceans exposed to sonar. The evidence for this remains circumstantial and associated with exposure to
naval mid-frequency sonar, not seismic surveys (Cox et al. 2006; Southall et al. 2007).
Seismic pulses and mid-frequency sonar signals are quite different, and some mechanisms by
which sonar sounds have been hypothesized to affect beaked whales are unlikely to apply to airgun pul-
ses. Sounds produced by airgun arrays are broadband impulses with most of the energy below 1 kHz.
Typical military mid-frequency sonars emit non-impulse sounds at frequencies of 2–10 kHz, generally
with a relatively narrow bandwidth at any one time. A further difference between seismic surveys and
naval exercises is that naval exercises can involve sound sources on more than one vessel. Thus, it is not
appropriate to assume that there is a direct connection between the effects of military sonar and seismic
surveys on marine mammals. However, evidence that sonar signals can, in special circumstances, lead (at
least indirectly) to physical damage and mortality (e.g., Balcomb and Claridge 2001; NOAA and USN
2001; Jepson et al. 2003; Fernández et al. 2004, 2005; Hildebrand 2005; Cox et al. 2006) suggests that
caution is warranted when dealing with exposure of marine mammals to any high-intensity ―pulsed‖
sound.
There is no conclusive evidence of cetacean strandings or deaths at sea as a result of exposure to
seismic surveys, but a few cases of strandings in the general area where a seismic survey was ongoing
have led to speculation concerning a possible link between seismic surveys and strandings. Suggestions
that there was a link between seismic surveys and strandings of humpback whales in Brazil (Engel et al.
2004) were not well founded (IAGC 2004; IWC 2007). In September 2002, there was a stranding of two
Cuvier‘s beaked whales in the Gulf of California, Mexico, when the L-DEO vessel R/V Maurice Ewing
was operating a 20-airgun, 8490-in3 airgun array in the general area. The link between the stranding and
the seismic surveys was inconclusive and not based on any physical evidence (Hogarth 2002; Yoder
2002). Nonetheless, the Gulf of California incident plus the beaked whale strandings near naval exercises
involving use of mid-frequency sonar suggests a need for caution in conducting seismic surveys in areas
occupied by beaked whales until more is known about effects of seismic surveys on those species
(Hildebrand 2005). No injuries of beaked whales are anticipated during the proposed study because of
(1) the high likelihood that any beaked whales nearby would avoid the approaching vessel before being
exposed to high sound levels, (2) the proposed monitoring and mitigation measures, and (3) differences
between the sound sources operated by L-DEO and those involved in the naval exercises associated with
strandings.
Non-auditory Physiological Effects
Non-auditory physiological effects or injuries that theoretically might occur in marine mammals
exposed to strong underwater sound include stress, neurological effects, bubble formation, resonance, and
other types of organ or tissue damage (Cox et al. 2006; Southall et al. 2007). Studies examining such
effects are limited. However, resonance effects (Gentry 2002) and direct noise-induced bubble formation
(Crum et al. 2005) are implausible in the case of exposure to an impulsive broadband source like an
airgun array. If seismic surveys disrupt diving patterns of deep-diving species, this might perhaps result
in bubble formation and a form of ―the bends‖, as speculated to occur in beaked whales exposed to sonar.
However, there is no specific evidence of this upon exposure to airgun pulses.
In general, very little is known about the potential for seismic survey sounds (or other types of
strong underwater sounds) to cause non-auditory physical effects in marine mammals. Such effects, if
IV. Environmental Consequences
Environmental Assessment for SIO ETP Cruise, 2010 Page 55
they occur at all, would presumably be limited to short distances and to activities that extend over a
prolonged period. The available data do not allow identification of a specific exposure level above which
non-auditory effects can be expected (Southall et al. 2007), or any meaningful quantitative predictions of
the numbers (if any) of marine mammals that might be affected in those ways. Marine mammals that
show behavioral avoidance of seismic vessels, including most baleen whales, some odontocetes, and
some pinnipeds, are especially unlikely to incur non-auditory physical effects. Also, the planned
mitigation measures [§ II (3)], including shut downs of the airguns, will reduce any such effects that
might otherwise occur.
Sea Turtles
The limited available data indicate that the frequency range of best hearing sensitivity by sea turtles
extends from roughly 250–300 Hz to 500–700 Hz. Sensitivity deteriorates as one moves away from that
range to either lower or higher frequencies. However, there is some sensitivity to frequencies as low as
60 Hz, and probably as low as 30 Hz. Thus, there is substantial overlap in the frequencies that sea turtles
detect vs. the frequencies in airgun pulses. We are not aware of measurements of the absolute hearing
thresholds of any sea turtle to waterborne sounds similar to airgun pulses. In the absence of relevant
absolute threshold data, we cannot estimate how far away an airgun array might be audible. Moein et al.
(1994) and Lenhardt (2002) reported TTS for loggerhead turtles exposed to many airgun pulses
(Appendix B). This suggests that sounds from an airgun array might cause temporary hearing impairment
in sea turtles if they do not avoid the (unknown) radius where TTS occurs. However, exposure duration
during the planned surveys would be much less than during the aforementioned studies. Also, recent
monitoring studies show that some sea turtles do show localized movement away from approaching
airguns (Holst et al. 2005a, 2006; Holst and Smultea 2008). At short distances from the source, received
sound level diminishes rapidly with increasing distance. In that situation, even a small-scale avoidance
response could result in a significant reduction in sound exposure.
As noted above, the MMOs stationed on the Melville will also watch for sea turtles, and airgun
operations will be powered down (or shut down if necessary) when a turtle enters the designated
exclusion zone.
(b) Possible Effects of Multibeam Echosounder Signals
The Kongsberg EM 122 MBES will be operated from the source vessel during the planned study.
Information about this equipment was provided in § II. Sounds from the MBES are very short pings,
occurring for 2–15 ms once every 5–20 s, depending on water depth; at depths>2600 m, FM chirp pulses
up to 100 ms long are used. Most of the energy in the sound emitted by this MBES is at frequencies near
12 kHz, and the maximum source level is 242 dB re 1 μPa · mrms. The beam is narrow (1º) in the fore-aft
extent and wide (150º) in the cross-track extent. Each ping consists of eight (in water >1000 m deep) or
four (<1000 m deep) successive fan-shaped transmissions (segments) at different cross-track angles. Any
given mammal at depth near the trackline would be in the main beam for only one or two of the nine
segments. Also, marine mammals that encounter the Kongsberg EM 122 are unlikely to be subjected to
repeated pings because of the narrow fore–aft width of the beam and will receive only limited amounts of
energy because of the short pings. Animals close to the ship (where the beam is narrowest) are especially
unlikely to be ensonified for more than one 2–15-ms ping or 100-ms chirp (or two pings or chirps if in the
overlap area). Similarly, Kremser et al. (2005) noted that the probability of a cetacean swimming through
the area of exposure when an MBES emits a ping is small. The animal would have to pass the transducer
at close range and be swimming at speeds similar to the vessel in order to receive the multiple pings that
might result in sufficient exposure to cause TTS.

IV. Environmental Consequences
Environmental Assessment for SIO ETP Cruise, 2010 Page 56
Navy sonars that have been linked to avoidance reactions and stranding of cetaceans (1) generally
have a longer signal duration than the Kongsberg EM 122, and (2) are often directed close to horizontally
vs. more downward for the MBES. The area of possible influence of the MBES is much smaller—a
narrow band below the source vessel. The duration of exposure for a given marine mammal can be much
longer for a naval sonar. During L-DEO‘s operations, the individual pings will be very short, and a given
mammal would not receive many of the downward-directed pings as the vessel passes by. Possible
effects of an MBES on marine mammals are outlined below.
Masking.—Marine mammal communications will not be masked appreciably by the MBES signals
given the low duty cycle of the echosounder and the brief period when an individual mammal is likely to
be within its beam. Furthermore, in the case of baleen whales, the MBES signals (12 kHz) do not overlap
with the predominant frequencies in the calls, which would avoid any significant masking.
Behavioral Responses.—Behavioral reactions of free-ranging marine mammals to sonars,
echosounders, and other sound sources appear to vary by species and circumstance. Observed reactions
have included silencing and dispersal by sperm whales (Watkins et al. 1985), increased vocalizations and
no dispersal by pilot whales (Rendell and Gordon 1999), and the previously mentioned beachings by
beaked whales. During exposure to a 21–25 kHz ―whale-finding‖ sonar with a source level of 215 dB re
1 μPa · m, gray whales reacted by orienting slightly away from the source and being deflected from their
course by ~200 m (Frankel 2005). When a 38-kHz echosounder and a 150-kHz acoustic Doppler current
profiler were transmitting during studies in the ETP, baleen whales showed no significant responses,
while spotted and spinner dolphins were detected slightly more often and beaked whales less often during
visual surveys (Gerrodette and Pettis 2005).
Captive bottlenose dolphins and a white whale exhibited changes in behavior when exposed to 1-s
tonal signals at frequencies similar to those that will be emitted by the MBES used by SIO, and to shorter
broadband pulsed signals. Behavioral changes typically involved what appeared to be deliberate attempts
to avoid the sound exposure (Schlundt et al. 2000; Finneran et al. 2002; Finneran and Schlundt 2004).
The relevance of those data to free-ranging odontocetes is uncertain, and in any case, the test sounds were
quite different in duration as compared with those from an MBES.
Very few data are available on the reactions of pinnipeds to echosounder sounds at frequencies
similar to those used during seismic operations. Hastie and Janik (2007) conducted a series of behavioral
response tests on two captive gray seals to determine their reactions to underwater operation of a 375-kHz
multibeam imaging echosounder that included significant signal components down to 6 kHz. Results
indicated that the two seals reacted to the signal by significantly increasing their dive durations. Because
of the likely brevity of exposure to the MBES sounds, pinniped reactions are expected to be limited to
startle or otherwise brief responses of no lasting consequence to the animals.
Hearing Impairment and Other Physical Effects.—Given recent stranding events that have been
associated with the operation of naval sonar, there is concern that mid-frequency sonar sounds can cause
serious impacts to marine mammals (see above). However, the MBES proposed for use by SIO is quite
different than sonars used for navy operations. Ping duration of the MBES is very short relative to the
naval sonars. Also, at any given location, an individual marine mammal would be in the beam of the
MBES for much less time given the generally downward orientation of the beam and its narrow fore-aft
beamwidth; navy sonars often use near-horizontally-directed sound. Those factors would all reduce the
sound energy received from the MBES rather drastically relative to that from the sonars used by the navy.

IV. Environmental Consequences
Environmental Assessment for SIO ETP Cruise, 2010 Page 57
Given the maximum source level of 242 dB re 1 Pa · mrms (see § II), the received level for an
animal within the MBES beam 100 m below the ship would be ~202 dB re 1 Parms, assuming 40 dB of
spreading loss over 100 m (circular spreading). Given the narrow beam, only one ping is likely to be
received by a given animal as the ship passes overhead. The received energy level from a single ping of
duration 15 ms would be about 184 dB re 1 Pa2 · s, i.e., 202 dB + 10 log (0.015 s). That is below the
TTS threshold for a cetacean receiving a single non-impulse sound (195 dB re 1 μPa2 · s) and even further
below the anticipated PTS threshold (215 dB re 1 μPa2 · s) (Southall et al. 2007). In contrast, an animal
that was only 10 m below the MBES when a ping is emitted would be expected to receive a level ~20 dB
higher, i.e., 204 dB re 1 μPa2 · s in the case of the EM 122. That animal might incur some TTS (which
would be fully recoverable), but the exposure would still be below the anticipated PTS threshold for
cetaceans. As noted by Burkhardt et al. (2008), cetaceans are very unlikely to incur PTS from operation
of scientific sonars on a ship that is underway.
In the harbor seal, the TTS threshold for non-impulse sounds is about 183 dB re 1 μPa2 · s, as
compared with ~195 dB re 1 μPa2 · s in odontocetes (Kastak et al. 2005; Southall et al. 2007). TTS onset
occurs at higher received energy levels in the California sea lion and northern elephant seal than in the
harbor seal. A harbor seal as much as 100 m below the Melville could receive a single MBES ping with
received energy level of ≥184 dB re 1 Pa2 · s (as calculated in the toothed whale subsection above) and
thus could incur slight TTS. Species of pinnipeds with higher TTS thresholds would not incur TTS
unless they were closer to the transducers when a ping was emitted. However, the SEL criterion for PTS
in pinnipeds (203 dB re 1 Pa2 · s) might be exceeded for a ping received within a few meters of the
transducers, although the risk of PTS is higher for certain species (e.g., harbor seal). Given the inter-
mittent nature of the signals and the narrow MBES beam, only a small fraction of the pinnipeds below
(and close to) the ship would receive a ping as the ship passed overhead.
Sea Turtles.—It is unlikely that MBES operations during the planned seismic survey would
significantly affect sea turtles through masking, disturbance, or hearing impairment. Any effects would
likely be negligible given the brief exposure and the fact that the MBES frequency is far above the range
of optimal hearing by sea turtles (see Appendix B).
(c) Possible Effects of the Sub-bottom Profiler Signals
A sub-bottom profiler will be operated from the source vessel during the planned study. Details about
this equipment were provided in § II. Sounds from the sub-bottom profiler are very short pulses, occurring
for 6–24 ms once every second or so. Most of the energy in the sound pulses emitted by the sub-bottom
profiler is at 3.5 kHz, and the beam is directed downward. The sub-bottom profiler on the R/V Melville has a
maximum source level of 211 dB re 1 µPa·m (see § II). Kremser et al. (2005) noted that the probability of a
cetacean swimming through the area of exposure when a bottom profiler emits a pulse is small, and―even
for an SBP more powerful than that on the R/V Melville―if the animal was in the area, it would have to pass
the transducer at close range and in order to be subjected to sound levels that could cause TTS.
Masking.—Marine mammal communications will not be masked appreciably by the SBP sounds
given the directionality of the signal and the brief period when an individual mammal is likely to be
within its beam. Furthermore, in the case of most baleen whales, the SBP signals do not overlap with the
predominant frequencies in the calls, which would avoid significant masking.
Behavioral Responses.—Marine mammal behavioral reactions to other sound sources are
discussed above, and responses to the SBP are likely to be similar to those for other non-impulse sources
if received at the same levels. However, the signals from the SBP are considerably weaker than those

IV. Environmental Consequences
Environmental Assessment for SIO ETP Cruise, 2010 Page 58
from the MBES. Therefore, behavioral responses are not expected unless marine mammals are very close
to the source.
Hearing Impairment and Other Physical Effects.—It is unlikely that the SBP produces sound levels
strong enough to cause hearing impairment or other physical injuries even in an animal that is (briefly) in a
position near the source. The SBP is usually operated simultaneously with other higher-power acoustic
sources. Many marine mammals will move away in response to the approaching higher-power sources or
the vessel itself before the mammals would be close enough for there to be any possibility of effects from
the less intense sounds from the SBP. In the case of mammals that do not avoid the approaching vessel and
its various sound sources, mitigation measures that would be applied to minimize effects of other sources
[see § II(3)] would further reduce or eliminate any minor effects of the SBP.
Sea Turtles.—It is very unlikely that SBP operations during the planned seismic survey would
significantly affect sea turtles through masking, disturbance, or hearing impairment. Any effects likely
would be negligible given the brief exposure and relatively low source level. Also, the frequency of the
SBP sounds is higher than the frequency range of best hearing by sea turtles.
(2) Mitigation Measures
Several mitigation measures are built into the proposed seismic survey as an integral part of the
planned activities. These measures include the following: ramp ups, minimum of one dedicated observer
maintaining a visual watch during all daytime airgun operations, two observers for 30 min before and
during ramp ups during the day and at night (and when possible at other times), and shut downs when
mammals or turtles are detected in or about to enter designated exclusion zones. These mitigation meas-
ures are described earlier in this document, in § II(3). The fact that the GI airgun, as a result of its design,
directs the majority of the energy downward, and less energy laterally, is also an inherent mitigation
measure.
Previous and subsequent analysis of the potential impacts take account of these planned mitigation
measures. It would not be meaningful to analyze the effects of the planned activities without mitigation,
as the mitigation (and associated monitoring) measures are a basic part of the activities.
(3) Numbers of Marine Mammals that could be Exposed to Various Received Sound Levels
All anticipated takes would be ―takes by harassment‖, involving temporary changes in behavior.
The mitigation measures to be applied will minimize the possibility of injurious takes. (However, as
noted earlier, there is no specific information demonstrating that injurious ―takes‖ would occur even in
the absence of the planned mitigation measures.) In the sections below, we describe methods to estimate
the number of potential exposures to various received sound levels, and present estimates of the numbers
of marine mammals that could be affected during the proposed seismic program. The estimates are based
on consideration of the number of marine mammals that could be disturbed appreciably by ~5475 km of
seismic surveys in the ETP. The main sources of distributional and numerical data used in deriving the
estimates are described in the next subsection.
It is assumed that, during simultaneous operations of the seismic sources and the other sources, any
marine mammals close enough to be affected by the MBES or SBP would already be affected by the seis-
mic sources. However, whether or not the seismic sources are operating simultaneously with the other
sources, marine mammals are expected to exhibit no more than short-term and inconsequential responses
to the MBES and SBP given their characteristics (e.g., narrow downward-directed beam) and other con-
siderations described in § II and IV(1)(b and c), above. Such reactions are not considered to constitute

IV. Environmental Consequences
Environmental Assessment for SIO ETP Cruise, 2010 Page 59
―taking‖ (NMFS 2001). Therefore, no additional allowance is included for animals that might be affected
by sound sources other than airguns.
(a) Basis for Estimating Exposure to Various Received Sound Levels
Extensive systematic ship-based surveys have been conducted by NMFS SWFSC for marine
mammals in the ETP. We used densities from two sources: (1) SWFSC has recently developed habitat
modeling as a method to estimate cetacean densities on a finer spatial scale than traditional line-transect
analyses by using a continuous function of habitat variables, e.g., sea surface temperature, depth, distance
from shore, and prey density (Barlow et al. 2009). For the ETP, the models are based on data from 12
SWFSC ship-based cetacean and ecosystem assessment surveys conducted during July–December from
1986 to 2006. The models have been incorporated into a web-based Geographic Information System (GIS)
developed by Duke University‘s Department of Defense Strategic Environmental Research and
Development Program (SERDP) team in close collaboration with the SWFSC SERDP team (Read et al.
2009). We used the GIS to obtain densities for the 11 cetacean species in the model in each 8 areas: the four
proposed survey areas shown in Figure 1, and corridors 1º wide and centered on the tracklines between the
survey areas and from the southernmost survey area to the EEZ of Peru. Those areas included 4061 km of
survey effort. (2) For species sighted in SWFSC surveys whose sample sizes were too small to model
density, we used densities from the surveys conducted during summer and fall 1986–1996, as summarized
by Ferguson and Barlow (2001). Densities were calculated from Ferguson and Barlow (2003) for 5° x 5°
blocks that include the proposed survey areas and corridors: Blocks 139, 159, 160, 200, 201, 202, 212, 213,
and 219. Those blocks included 27,275 km of survey effort in Beaufort sea states 0–5, and 2564 km of
survey effort in Beaufort sea states 0–2. Densities were obtained for an additional 8 species that were
sighted in one or more of those blocks.
For two endangered species for which there are only unconfirmed sightings in the region, the sei
and fin whales, arbitrary low densities (equal to the density of the species with the lowest calculated
density) were assigned.
Oceanographic conditions, including occasional El Niño and La Niña events, influence the distri-
bution and numbers of marine mammals present in the ETP, resulting in considerable year-to-year
variation in the distribution and abundance of many marine mammal species (e.g., Escorza-Treviño
2009). Thus, for some species the densities derived from recent surveys may not be representative of the
densities that will be encountered during the proposed seismic survey.
Table 3 gives the estimated densities for each cetacean species likely to occur in the study area, i.e.,
species for which we obtained or assigned densities. The densities have been corrected for both
detectability and availability bias by the authors. Detectability bias is associated with diminishing sight-
ability with increasing lateral distance from the trackline [f(0)]. Availability bias refers to the fact that
there is less-than-100% probability of sighting an animal that is present along the survey trackline, and it
is measured by g(0).
There is some uncertainty about the representativeness of the data and the assumptions used in the
calculations below. However, the approach used here is believed to be the best available approach. Also,
to provide some allowance for these uncertainties, ―maximum estimates‖ as well as ―best estimates‖ of
the densities present and numbers potentially affected have been derived. Best estimates of density are
the mean densities weighted by effort in the eight survey areas or corridors from Read et al. (2009) or the
nine 5° x 5° blocks from Ferguson and Barlow (2001, 2003), whereas maximum estimates of density are
the highest densities in any of those survey areas/corridors or blocks.

IV. Environmental Consequences
Environmental Assessment for SIO ETP Cruise, 2010 Page 60
TABLE 3. Densities of marine mammals in the ETP near the proposed survey area. Cetacean densities are
based on NMFS SWFSC ship transect surveys conducted in 1986–2006 from predictive modeling (Barlow
et al. 2009; Read et al. 2009) or in 1986–1996 from Ferguson and Barlow (2003). See text for details.
Densities are corrected for f(0) and g(0). Species listed as "Endangered" under the ESA are in italics.
Density (#/1000 km2)
Species¹ Best (mean) Maximum
Source
Mysticetes
Bryde's whale 0.53 1.15 Read et al. (2009)
Sei whale 0.01 0.01 Arbitrary low
Fin whale 0.01 0.01 Arbitrary low
Blue whale 0.13 0.23 Read et al. (2009)
Odontocetes
Sperm whale 3.95 15.20 Ferguson and Barlow (2003)
Pygmy and dwarf sperm whales 0.01 0.02 Read et al. (2009)
Cuvier’s beaked whale 1.83 3.70 Ferguson and Barlow (2003)
Mesoplodon spp. 0.21 0.37 Read et al. (2009)
Rough-toothed dolphin 1.60 2.34 Read et al. (2009)
Bottlenose dolphin 15.14 23.09 Read et al. (2009)
Pantropical spotted dolphin 12.43 22.53 Read et al. (2009)
Spinner dolphin 3.81 5.74 Read et al. (2009)
Striped dolphin 35.23 53.67 Read et al. (2009)
Fraser's dolphin 1.03 5.60 Ferguson and Barlow (2003)
Short-beaked common dolphin 143.21 242.80 Read et al. (2009)
Risso’s dolphin 10.21 37.40 Ferguson and Barlow (2003)
Melon-headed Whale 2.80 9.30 Ferguson and Barlow (2003)
Pygmy killer whale 0.60 1.80 Ferguson and Barlow (2003)
False killer whale 0.39 2.10 Ferguson and Barlow (2003)
Killer whale 0.85 4.00 Ferguson and Barlow (2003)
Short-finned pilot whale 6.29 11.74 Read et al. (2009)
¹ With the exception of sei and fin whales, includes only species for which density estimates are available. Densities
of other species included in Table 2 (humpback, minke, and Longman’s beaked whale) presumably would be lower
than the lowest density in this table.
The estimated numbers of individuals potentially exposed are presented below based on the 160-dB
re 1 μParms criterion for all cetaceans, and the 170-dB re 1 μParms criterion for delphinids. It is assumed
that marine mammals exposed to airgun sounds that strong might change their behavior sufficiently to be
considered ―taken by harassment‖.
It should be noted that the following estimates of exposures to various sound levels assume that the
surveys will be fully completed; in fact, the planned number of line-kilometers has been increased by 25%
to accommodate lines that may need to be repeated, equipment testing, etc. As is typical during ship sur-
veys, inclement weather and equipment malfunctions are likely to cause delays and may limit the number of
useful line-kilometers of seismic operations that can be undertaken. Furthermore, any marine mammal
sightings within or near the designated exclusion zone will result in the shut down of seismic operations as a
mitigation measure. Thus, the following estimates of the numbers of marine mammals potentially expose to
160- or 170-dB re 1 µParms sounds are precautionary, and probably overestimate the actual numbers of
marine mammals that might be involved. These estimates assume that there will be no weather, equipment,
or mitigation delays, which is highly unlikely.

IV. Environmental Consequences
Environmental Assessment for SIO ETP Cruise, 2010 Page 61
(b) Potential Number of Marine Mammals Exposed to 160 and 170 dB
Number of Cetaceans that could be Exposed to 160 dB
The number of different individuals that could be exposed to GI-airgun sounds with received levels
160 dB re 1 µParms on one or more occasions can be estimated by considering the total marine area that
would be within the 160-dB radius around the operating seismic source on at least one occasion, along
with the expected density of animals in the area. The proposed seismic lines do not run parallel to each
other in close proximity, which minimizes the number of times an individual mammal may be exposed
during the survey; in this case, an individual could be exposed 1.01 times on average.
The numbers of different individuals potentially exposed to 160 dB re 1 µParms were calculated
by multiplying the expected species density, either ―mean‖ (i.e., best estimate) or ―maximum‖, times the
anticipated area to be ensonified to that level during GI-airgun operations.
The area expected to be ensonified was determined by entering the planned survey lines into a
MapInfo GIS, using the GIS to identify the relevant areas by ―drawing‖ the applicable 160-dB (or, in the
next subsection, 170-dB) buffer (see Table 1) around each seismic line, and then calculating the total area
within the buffers. Areas where overlap occurred (because of crossing lines) were included only once
when estimating the number of individuals exposed.
Applying the approach described above, ~4340 km2 would be within the 160-dB isopleth on one or
more occasions during the surveys, not including the 25% contingeny added before calculating estimated
numbers exposed. Because this approach does not allow for turnover in the mammal populations in the study
area during the course of the survey, the actual number of individuals exposed may be underestimated,
although the conservative (i.e., probably overestimated) line-kilometer distances used to calculate the area may
offset this. Also, the approach assumes that no cetaceans will move away or toward the trackline as the R/V
Melville approaches in response to increasing sound levels prior to the time the levels reach 160 dB. Another
way of interpreting the estimates that follow is that they represent the number of individuals that are expected
(in the absence of a seismic program) to occur in the waters that will be exposed to 160 dB re 1 µParms.
Table 4 shows the best and maximum estimates of the number of different individual marine mammals
that potentially could be exposed to ≥160 dB re 1 μParms during the seismic survey if no animals moved away
from the survey vessel. The Requested Take Authorization, given in the far right column of Table 4, is based
on the best estimates rather than the maximum estimates of the numbers of individuals exposed because the
survey coverage of the area and data quality are good. For endangered species, the Requested Take
Authorization has been increased to the mean group size in the ETP (Jackson et al. 2008) for the particular
species in cases where the calculated number of individuals exposed was between 0.05 and the mean group
size (i.e., for sei, fin, and blue whales). For non-listed species, the Requested Take Authorization has been
increased to the mean group size in the ETP (Ferguson et al. 2006) for the particular species in cases where the
calculated number of individuals exposed was between 1 and the mean group size.
The best estimate of the number of individual cetaceans that could be exposed to seismic sounds
with received levels ≥160 dB re 1 µParms during the survey is 1304 (Table 4). That total includes 22
endangered whales: 1 blue whale (0.05%), and 21 sperm whales (0.08%) (Table 4). Most (97.2%) of the
cetaceans potentially exposed are delphinids; short-beaked common, striped, pantropical spotted, bottle-
nose, and Risso‘s dolphins and short-finned pilot whales are estimated to be the most common species in
the area, with best estimates of 777 (0.02% of the regional population), 191 (0.02%), 67 (0.01%), 82
(0.02%), 55 (0.05%), and 34 (0.01%) exposed to ≥160 dB re 1 μParms, respectively. However, a more
meaningful estimate is the one for sound levels 170 dB (see below).

IV. Environmental Consequences
Environmental Assessment for SIO ETP Cruise, 2010 Page 62
TABLE 4. Estimates of the possible numbers of different individuals that might be exposed, during SIO’s
proposed seismic survey in ETP in October–November 2010. The proposed sound source consists of a
pair of 45-in3 GI airguns. Received levels of seismic sounds are expressed in dB re 1 µPa (rms,
averaged over pulse duration), consistent with NMFS’ practice. Not all marine mammals will change their
behavior when exposed to these sound levels, but some may alter their behavior when levels are lower
(see text). Delphinids are unlikely to react to levels below 170 dB. Species in italics are listed under the
ESA as endangered or threatened. The column of numbers in boldface shows the numbers of "takes" for
which authorization is requested.
Species
Number of Individuals Exposed to Sound Levels >160 dB (>170 dB, Delphinids)
Best Estimate¹
Maximum Estimate¹
Requested Take Authorization
Number
% of Regional
Pop'n²
Balaenopteridae
Bryde's whale 3 0.02 6 3
Sei whale 0 NA 0 0
Fin whale 0 0.00 0 0
Blue whale 1 0.05 1 2
Physeteridae
Sperm whale 21 0.08 82 21
Pygmy/dwarf sperm whales 0 0.00 0 0
Ziphiidae
Cuvier’s beaked whale 10 0.05 20 10
Mesoplodon sp. (unidentified) 1 <0.01 2 1
Delphinidae
Rough-toothed dolphin 9 (3) 0.01 13 (4) 15
Bottlenose dolphin 82 (26) 0.02 125 (39) 82
Pantropical spotted dolphin 67 (21) 0.01 122 (38) 131
Spinner dolphin 21 (6) <0.01 31 (10) 109
Striped dolphin 191 (60) 0.02 291 (92) 191
Fraser's dolphin 6 (2) <0.01 30 (10) 440
Short-beaked common dolphin 777 (244) 0.02 1317 (414) 777
Risso’s dolphin 55 (17) 0.05 203 (64) 55
Melon-headed Whale 15 (5) 0.03 50 (16) 258
Pygmy killer whale 3 (1) 0.01 10 (3) 30
False killer whale 2 (1) 0.01 11 (4) 11
Killer whale 5 (1) 0.05 22 (7) 5
Short-finned pilot whale 34 (11) 0.01 64 (20) 34
¹ Best and maximum estimates are based on densities from Table 3, and therefore takes are not anticipated for humpback, minke,
and Longman’s beaked whale.
² Regional population size estimates are from Table 2; NA means not available.

IV. Environmental Consequences
Environmental Assessment for SIO ETP Cruise, 2010 Page 63
Number of Delphinids that could be Exposed to 170 dB
The 160-dB criterion, on which the preceding estimates are based, was derived from studies of
baleen whales. Odontocete hearing at low frequencies is relatively insensitive, and delphinids generally
appear to be more tolerant of strong low-frequency sounds than are many baleen whales. As summarized
in Appendix A (5), delphinids commonly occur within distances where received levels would be expected
to exceed 160 dB re 1 µParms. There is no generally accepted alternative ―take‖ criterion for delphinids
exposed to airgun sounds. However, the estimates in this subsection assume that only those individuals
exposed to ≥170 dB re 1 µParms, on average, would be affected sufficiently to be considered ―taken by
harassment‖. (―On average‖ means that some individuals might react significantly upon exposure to
levels somewhat <170 dB, but others would not do so even upon exposure to levels somewhat >170 dB.)
The area ensonified by levels 170 dB was determined (as described above for levels 160 dB) and was
multiplied by the marine mammal density in order to obtain best and maximum estimates.
The area ensonified by levels 170 dB was estimated to be 1365 km2 (as described above for levels
160 dB), and the estimated area, including overlap, is 1377 km2. Thus, an average individual marine
mammal could be exposed to ≥170 dB slightly more than once during the survey. The best and maximum
estimates of the numbers of delphinids that could be exposed to 170 dB during the surveys are 399 and
720, respectively (Table 4), and the corresponding estimates for the short-beaked common dolphin are
244 and 414 (Table 4). The estimates are based on the predicted 170-dB radii around the seismic source
to be used during the study and are considered to be more realistic estimates of the number of individual
delphinids that could be affected.
(4) Conclusions for Marine Mammals and Sea Turtles
The proposed seismic project will involve towing a pair of GI airguns that introduce pulsed sounds
into the ocean, along with, at times, simultaneous operation of an MBES and an SBP. Routine vessel
operations, other than the proposed seismic operations, are conventionally assumed not to affect marine
mammals sufficiently to constitute ―taking‖. No ―taking‖ of marine mammals is expected in association
with echosounder operations given the considerations discussed in § IV(1)(b and c), i.e., sounds are
beamed downward, the beam is narrow, and the pulses are extremely short.
(a) Cetaceans
Several species of mysticetes show strong avoidance reactions to seismic vessels at ranges up to 6–
8 km and occasionally as far as 20–30 km from the source vessel when medium-large airgun arrays have
been used. However, reactions at the longer distances appear to be atypical of most species and
situations. If mysticetes are encountered, the numbers estimated to occur within the 160-dB isopleth in
the survey area are expected to be low.
Odontocete reactions to seismic pulses, or at least the reactions of delphinids and Dall‘s porpoises,
are expected to extend to lesser distances than are those of mysticetes. Odontocete low-frequency hearing
is less sensitive than that of mysticetes, and delphinids are often seen from seismic vessels. In fact, there
are documented instances of dolphins approaching active seismic vessels. However, delphinids as well as
some other types of odontocetes sometimes show avoidance responses and/or other changes in behavior
near operating seismic vessels.
Taking into account the mitigation measures that are planned (see § II), effects on cetaceans are
generally expected to be limited to avoidance of the area around the seismic operation and short-term
changes in behavior, falling within the MMPA definition of ―Level B harassment‖. Furthermore, the esti-

IV. Environmental Consequences
Environmental Assessment for SIO ETP Cruise, 2010 Page 64
mated numbers of animals potentially exposed to sound levels sufficient to cause appreciable disturbance
are generally low percentages of the regional population sizes. The best estimate of the number of indi-
viduals that would be exposed to sounds 160 dB re 1 μParms represent, for all species, <0.1% of the
regional populations (Table 4).
Varying estimates of the numbers of marine mammals that could be exposed to strong airgun
sounds during the proposed program have been presented, depending on the specific exposure criteria
( 160 or 170 dB) and density criterion used (best or maximum). The requested ―take authorization‖ for
each species is based on the estimated best number of individuals that could be exposed to 160 dB re
1 µParms. That figure likely overestimates the actual number of animals that will be exposed to and will
react to the seismic sounds. The reasons for that conclusion are outlined above. The relatively short-term
exposures are unlikely to result in any long-term negative consequences for the individuals or their
populations.
The many cases of apparent tolerance by cetaceans of seismic exploration, vessel traffic, and some
other human activities show that co-existence is possible. Mitigation measures such as controlled speed,
course alternation, look outs, non-pursuit, and shut downs when marine mammals are seen within defined
ranges should further reduce short-term reactions, and avoid or minimize any auditory effects. In all
cases, the effects are expected to be short-term, with no lasting biological consequence.
(b) Sea Turtles
Five species―the leatherback, loggerhead, green, hawksbill, and olive ridley turtles―could be
encountered in the study area. Mostly foraging or migrating individuals would occur. At the time of the
proposed surveys, three species nest in the area in considerable numbers, leatherback, green, and olive
ridley turtles, mostly in Mexico and Costa Rica; nesting females would be on or near nesting beaches.
The proposed survey is scheduled near the start of the peak nesting periods for leatherbacks (October–
March), green turtles (October–November), and olive ridleys (September–December). Given incubation
periods of ~2 months, few hatchlings would be encountered at sea. Although it is possible that some
turtles will be encountered during the survey, it is anticipated that the proposed seismic survey will have,
at most, a short-term effect on behavior and no long-term impacts on individual sea turtles or their
populations.
(5) Direct Effects on Fish and Their Significance
One reason for the adoption of airguns as the standard energy source for marine seismic surveys is
that, unlike explosives, they have not been associated with large-scale fish kills. However, existing infor-
mation on the impacts of seismic surveys on marine fish populations is very limited (see Appendix C).
There are three types of potential effects of exposure to seismic surveys: (1) pathological, (2) physiological,
and (3) behavioral. Pathological effects involve lethal and temporary or permanent sub-lethal injury.
Physiological effects involve temporary and permanent primary and secondary stress responses, such as
changes in levels of enzymes and proteins. Behavioral effects refer to temporary and (if they occur) per-
manent changes in exhibited behavior (e.g., startle and avoidance behavior). The three categories are inter-
related in complex ways. For example, it is possible that certain physiological and behavioral changes could
potentially lead to an ultimate pathological effect on individuals (i.e., mortality).
The specific received sound levels at which permanent adverse effects to fish potentially could occur
are little studied and largely unknown. Furthermore, the available information on the impacts of seismic
surveys on marine fish is from studies of individuals or portions of a population; there have been no studies
at the population scale. Thus, available information provides limited insight on possible real-world effects

IV. Environmental Consequences
Environmental Assessment for SIO ETP Cruise, 2010 Page 65
at the ocean or population scale. This makes drawing conclusions about impacts on fish problematic
because ultimately, the most important aspect of potential impacts relates to how exposure to seismic survey
sound affects marine fish populations and their viability, including their availability to fisheries.
The following sections provide a general synopsis of available information on the effects of
exposure to seismic and other anthropogenic sound as relevant to fish. The information comprises results
from scientific studies of varying degrees of rigor plus some anecdotal information. Some of the data
sources may have serious shortcomings in methods, analysis, interpretation, and reproducibility that must
be considered when interpreting their results (see Hastings and Popper 2005). Potential adverse effects of
the program‘s sound sources on marine fish are then noted.
(a) Pathological Effects
The potential for pathological damage to hearing structures in fish depends on the energy level of
the received sound and the physiology and hearing capability of the species in question (see Appendix C).
For a given sound to result in hearing loss, the sound must exceed, by some specific amount, the hearing
threshold of the fish for that sound (Popper 2005). The consequences of temporary or permanent hearing
loss in individual fish on a fish population is unknown; however, it likely depends on the number of
individuals affected and whether critical behaviors involving sound (e.g. predator avoidance, prey
capture, orientation and navigation, reproduction, etc.) are adversely affected.
Little is known about the mechanisms and characteristics of damage to fish that may be inflicted by
exposure to seismic survey sounds. Few data have been presented in the peer-reviewed scientific literature.
As far as we know, there are only two valid papers with proper experimental methods, controls, and careful
pathological investigation implicating sounds produced by actual seismic survey airguns with adverse
anatomical effects. One such study indicated anatomical damage and the second indicated TTS in fish
hearing. The anatomical case is McCauley et al. (2003), who found that exposure to airgun sound caused
observable anatomical damage to the auditory maculae of ―pink snapper‖ (Pagrus auratus). This damage in
the ears had not been repaired in fish sacrificed and examined almost two months after exposure. On the
other hand, Popper et al. (2005) documented only TTS (as determined by auditory brainstem response) in
two of three fishes from the Mackenzie River Delta. This study found that broad whitefish (Coregonus
nasus) that received a sound exposure level of 177 dB re 1 µPa2·s showed no hearing loss. During both
studies, the repetitive exposure to sound was greater than would have occurred during a typical seismic
survey. However, the substantial low-frequency energy produced by the airgun arrays [less than ~400 Hz in
the study by McCauley et al. (2003) and less than ~200 Hz in Popper et al. (2005)] likely did not propagate
to the fish because the water in the study areas was very shallow (~9 m in the former case and <2 m in the
latter). Water depth sets a lower limit on the lowest sound frequency that will propagate (the ―cutoff
frequency‖) at about one-quarter wavelength (Urick 1983; Rogers and Cox 1988).
Wardle et al. (2001) suggested that in water, acute injury and death of organisms exposed to seis-
mic energy depends primarily on two features of the sound source: (1) the received peak pressure and (2)
the time required for the pressure to rise and decay. Generally, as received pressure increases, the period
for the pressure to rise and decay decreases, and the chance of acute pathological effects increases.
According to Buchanan et al. (2004), for the types of seismic airguns and arrays involved with the pro-
posed program, the pathological (mortality) zone for fish would be expected to be within a few meters of
the seismic source. Numerous other studies provide examples of no fish mortality upon exposure to seis-
mic sources (Falk and Lawrence 1973; Holliday et al. 1987; La Bella et al. 1996; Santulli et al. 1999;
McCauley et al. 2000a,b, 2003; Bjarti 2002; Hassel et al. 2003; Popper et al. 2005).

IV. Environmental Consequences
Environmental Assessment for SIO ETP Cruise, 2010 Page 66
Some studies have reported, some equivocally, that mortality of fish, fish eggs, or larvae can occur
close to seismic sources (Kostyuchenko 1973; Dalen and Knutsen 1986; Booman et al. 1996; Dalen et al.
1996). Some of the reports claimed seismic effects from treatments quite different from actual seismic
survey sounds or even reasonable surrogates. However, Payne et al. (2009) reported no statistical
differences in mortality/morbidity between control and exposed groups of capelin eggs or monkfish
larvae. Saetre and Ona (1996) applied a ‗worst-case scenario‘ mathematical model to investigate the
effects of seismic energy on fish eggs and larvae. They concluded that mortality rates caused by exposure
to seismic surveys are so low, as compared to natural mortality rates, that the impact of seismic surveying
on recruitment to a fish stock must be regarded as insignificant.
(b) Physiological Effects
Physiological effects refer to cellular and/or biochemical responses of fish to acoustic stress. Such
stress potentially could affect fish populations by increasing mortality or reducing reproductive success.
Primary and secondary stress responses of fish after exposure to seismic survey sound appear to be
temporary in all studies done to date (Sverdrup et al. 1994; McCauley et al. 2000a,b). The periods
necessary for the biochemical changes to return to normal are variable, and depend on numerous aspects
of the biology of the species and of the sound stimulus (see Appendix C).
(c) Behavioral Effects
Behavioral effects include changes in the distribution, migration, mating, and catchability of fish
populations. Studies investigating the possible effects of sound (including seismic survey sound) on fish
behavior have been conducted on both uncaged and caged individuals (Chapman and Hawkins 1969;
Pearson et al. 1992; Santulli et al. 1999; Wardle et al. 2001; Hassel et al. 2003). Typically, in these
studies fish exhibited a sharp ―startle‖ response at the onset of a sound followed by habituation and a
return to normal behavior after the sound ceased.
There is general concern about potential adverse effects of seismic operations on fisheries, namely
a potential reduction in the ―catchability‖ of fish involved in fisheries. Although reduced catch rates have
been observed in some marine fisheries during seismic testing, in a number of cases the findings are con-
founded by other sources of disturbance (Dalen and Raknes 1985; Dalen and Knutsen 1986; Løkkeborg
1991; Skalski et al. 1992; Engås et al. 1996). In other airgun experiments, there was no change in catch
per unit effort (CPUE) of fish when airgun pulses were emitted, particularly in the immediate vicinity of
the seismic survey (Pickett et al. 1994; La Bella et al. 1996). For some species, reductions in catch may
have resulted from a change in behavior of the fish, e.g., a change in vertical or horizontal distribution, as
reported in Slotte et al. (2004).
In general, any adverse effects on fish behavior or fisheries attributable to seismic testing may
depend on the species in question and the nature of the fishery (season, duration, fishing method). They
may also depend on the age of the fish, its motivational state, its size, and numerous other factors that are
difficult, if not impossible, to quantify at this point, given such limited data on effects of airguns on fish,
particularly under realistic at-sea conditions.
(6) Direct Effects on Invertebrates and Their Significance
The existing body of information on the impacts of seismic survey sound on marine invertebrates is
very limited. However, there is some unpublished and very limited evidence of the potential for adverse
effects on invertebrates, thereby justifying further discussion and analysis of this issue. The three types of
potential effects of exposure to seismic surveys on marine invertebrates are pathological, physiological,

IV. Environmental Consequences
Environmental Assessment for SIO ETP Cruise, 2010 Page 67
and behavioral. Based on the physical structure of their sensory organs, marine invertebrates appear to be
specialized to respond to particle displacement components of an impinging sound field and not to the
pressure component (Popper et al. 2001; see also Appendix D).
The only information available on the impacts of seismic surveys on marine invertebrates involves
studies of individuals; there have been no studies at the population scale. Thus, available information
provides limited insight on possible real-world effects at the regional or ocean scale. The most important
aspect of potential impacts concerns how exposure to seismic survey sound ultimately affects invertebrate
populations and their viability, including availability to fisheries.
Literature reviews of the effects of seismic and other underwater sound on invertebrates were
provided by Moriyasu et al. (2004) and Payne et al. (2008). The following sections provide a synopsis of
available information on the effects of exposure to seismic survey sound on species of decapod
crustaceans and cephalopods, the two taxonomic groups of invertebrates on which most such studies have
been conducted. The available information is from studies with variable degrees of scientific soundness
and from anecdotal information. A more detailed review of the literature on the effects of seismic survey
sound on invertebrates is provided in Appendix D.
(a) Pathological Effects
In water, lethal and sub-lethal injury to organisms exposed to seismic survey sound could depend on
at least two features of the sound source: (1) the received peak pressure, and (2) the time required for the
pressure to rise and decay. Generally, as received pressure increases, the period for the pressure to rise and
decay decreases, and the chance of acute pathological effects increases. For the type of seismic source
planned for the proposed program, the pathological (mortality) zone for crustaceans and cephalopods is
expected to be within a few meters of the seismic source; however, very few specific data are available on
levels of seismic signals that might damage these animals. This premise is based on the peak pressure and
rise/decay time characteristics of seismic airgun arrays currently in use around the world.
Some studies have suggested that seismic survey sound has a limited pathological impact on early
developmental stages of crustaceans (Pearson et al. 1994; Christian et al. 2003; DFO 2004). However, the
impacts appear to be either temporary or insignificant compared to what occurs under natural conditions.
Controlled field experiments on adult crustaceans (Christian et al. 2003, 2004; DFO 2004) and adult
cephalopods (McCauley et al. 2000a,b) exposed to seismic survey sound have not resulted in any significant
pathological impacts on the animals. It has been suggested that exposure to commercial seismic survey
activities has injured giant squid (Guerra et al. 2004), but there is no evidence to support such claims.
(b) Physiological Effects
Physiological effects refer mainly to biochemical responses by marine invertebrates to acoustic
stress. Such stress potentially could affect invertebrate populations by increasing mortality or reducing
reproductive success. Primary and secondary stress responses (i.e., changes in haemolymph levels of
enzymes, proteins, etc.) of crustaceans have been noted several days or months after exposure to seismic
survey sounds (Payne et al. 2007). The periods necessary for these biochemical changes to return to
normal are variable and depend on numerous aspects of the biology of the species and of the sound
stimulus.
(c) Behavioral Effects
There is increasing interest in assessing the possible direct and indirect effects of seismic and other
sounds on invertebrate behavior, particularly in relation to the consequences for fisheries. Changes in

IV. Environmental Consequences
Environmental Assessment for SIO ETP Cruise, 2010 Page 68
behavior could potentially affect such aspects as reproductive success, distribution, susceptibility to
predation, and catchability by fisheries. Studies investigating the possible behavioral effects of exposure
to seismic survey sound on crustaceans and cephalopods have been conducted on both uncaged and caged
animals. In some cases, invertebrates exhibited startle responses (e.g., squid in McCauley et al. 2000a,b).
In other cases, no behavioral impacts were noted (e.g., crustaceans in Christian et al. 2003, 2004; DFO
2004). There have been anecdotal reports of reduced catch rates of shrimp shortly after exposure to
seismic surveys; however, other studies have not observed any significant changes in shrimp catch rate
(Andriguetto-Filho et al. 2005). Any adverse effects on crustacean and cephalopod behavior or fisheries
attributable to seismic survey sound depend on the species in question and the nature of the fishery
(season, duration, fishing method).
(7) Indirect Effects on Marine Mammals, Sea Turtles, and Their Significance
The proposed seismic operations will not result in any permanent impact on habitats used by
marine mammals or sea turtles, or to the food sources they use. The main impact issue associated with
the proposed activities will be temporarily elevated noise levels and the associated direct effects on
marine mammals and sea turtles, as discussed above.
During the seismic study, only a small fraction of the available habitat would be ensonified at any
given time. Disturbance to fish species and invertebrates would be short-term, and fish would return to
their pre-disturbance behavior once the seismic activity ceased [see § IV(5) and § IV(6), above]. Thus,
the proposed survey would have little impact on the abilities of marine mammals or sea turtles to feed in
the area where seismic work is planned.
Some mysticetes feed on concentrations of zooplankton. A reaction by zooplankton to a seismic
impulse would only be relevant to whales if it caused a concentration of zooplankton to scatter. Pressure
changes of sufficient magnitude to cause that type of reaction would probably occur only very close to the
source. Impacts on zooplankton behavior are predicted to be negligible, and that would translate into neg-
ligible impacts on those mysticetes that feed on zooplankton.
(8) Cumulative Effects
Cumulative effects refer to the impacts on the environment that result from a combination of past,
existing, and reasonably foreseeable projects and human activities. Causal agents of cumulative effects
can include multiple causes, multiple effects, effects of activities in more than one locale, and recurring
events. Human activities in the region of the proposed seismic survey in and near the proposed survey
areas include commercial and recreational vessel traffic, fishing, subsistence whaling, and oil and gas
exploration and production.
(a) Collisions with Vessels and Vessel Noise
Vessel traffic in the proposed study area will consist of fishing vessels, as well as other commercial
(cargo), cruise, and pleasure vessels. Vessel noise could affect marine animals in the proposed study area.
Shipping noise generally dominates ambient noise at frequencies from 20 to 300 Hz (Richardson et al.
1995). Baleen whales are thought to be more sensitive to sound at these low frequencies than are toothed
whales. There may be some localized avoidance by marine mammals of commercial ships operating
routinely in and near the proposed seismic survey area. On infrequent occasions, whales and ships
collide, resulting in injury or death to the animal (Laist et al. 2001; Moore and Clarke 2002).

IV. Environmental Consequences
Environmental Assessment for SIO ETP Cruise, 2010 Page 69
Large Vessel Traffic
Port container traffic is high along the coastline due east of the study area. At least 10 important
ports occur between 10°N and 10°S with overall port container traffic of more than 5.3 million twenty-
foot equivalent units (TEUs) recorded in 2008 (Table 5). The most important ports are Balboa, Panama,
and Callao, Peru.
TABLE 5. Port container traffic for 2008 based on twenty-foot equivalent units
(TEUs). TEU is a standard linear measurement used in quantifying container
traffic flows. Source: AAPA (2010).
Port (Country) Latitude; longitude TEUs
Caldera (Costa Rica) 9°58′ N; 84°50′W 169,827
Balboa (Panama) 8°57′N; 79°34′W 2,167,977
Buenaventura (Colombia) 3°53′N; 77°02′W 743,295
Manta (Ecuador) 0°57′S; 80°43′W 1,650
Guayaquil (Ecuador) 2°11′S; 79°53′W 874,955
Puerto Bolivar (Ecuador) 3°16′S; 79°59′W 48,101
Paita (Peru) 5°5′S; 81°6′W 138,993
Salaverry (Peru) 8°14′S; 78°58'W 13,112
Chimbote (Peru) 9°8′28′S; 78°36′W 2,004
Callao (Peru) 12°2′S; 77°8′W 1,203,315
Total 5,363,229
The port activity reflects the importance of the area for international trade. Several major
international marine trade routes pass through the study area, leading to and from the Panama Canal,
which connects the Pacific with the Atlantic Ocean. The Panama Canal is one of the world's major
shipping routes and is a significant focus for marine shipping to Central America (Rodrigue et al. 2009).
Vessel traffic in the proposed study area will include bulk vessels, oil tankers, and container
vessels. The most important vessel traffic will consist of bulk carrier vessels, which comprise 40% of the
world‘s merchant fleets and range in size from single-hold mini-bulkers to ships able to carry 365,000
metric tons of deadweight. The Amver (from its original name Atlantic Merchant Vessel Emergency
Reporting) system, a computer-based and voluntary global ship reporting system used worldwide by
search and rescue authorities used by some 12,000 participating ships from over 140 nations (USCG
2010), gives an indication of the merchant ship traffic (over 100 gross tons) in the study area during the
period of interest. Based on Amver monthly plots, ship density in the area during October and November
would consist of 15–49 vessels per month in the northern part of the study area and a maximum of 4
vessels per month in the southern part of the study area (Fig. 3).
Recreational Vessel Traffic
Cocos Island, a National Park located 530 km off Costa Rica, is visited by ~1100 people annually,
mainly between March and May. The island can be reached by commercial launch or small boat from the
port of Puntarenas (UNEP-WCMC 2008a). Cocos Island is also a frequented dive site. Two vessel
operators visit Cocos regularly; at least 12 diving locations are located around the islands (Dive Global
2007). Four different live-aboard dive vessels are involved, operating every month of the year; one
operator with three vessels 28–39 m long capable of carrying 14–18 passengers has averaged 42 trips

IV. Environmental Consequences
Environmental Assessment for SIO ETP Cruise, 2010 Page 70
annually during 2004–2009 (Undersea Hunter Group 2010), and the other operator‘s 33-m vessel has 35
trips to Cocos scheduled for 2010 (Aggressor Fleet 2010).
FIGURE 3. Amver monthly density plot for October (left) and November (right) 2009. Each colored dot
displayed on the chart approximates a one-degree cell. Purple cells: 4 or fewer vessels; green cells: 5–
14 vessels; orange cells: 15–49 vessels; red cells: >50 vessels. Source: USCG (2010).
Malpelo Island, a Flora and Fauna Sanctuary located ~500 km off the coast of Colombia, is visited
by ~500 people annually, almost entirely from diving boats (UNEP-WCMC 2006). The area is a top
diving destination, and two dive vessel operators make frequent trips to several dive sites around the
island. One operator has made 4–8 dive trips annually during 2004–2009, all from March to August
(Undersea Hunter Group 2010), and another has made 8–12 trips annually during 2004–2009, throughout
the year (Inula 2010). Two boats are used to control illegal fishing around the Malpelo marine area. A
small Colombian Navy garrison is in place and patrols the surrounding waters every month (UNEP-
WCMC 2006).
Galapagos Islands attracted an annual average of 62,000 tourists from 1995 to 1999. Of those, 76%
were foreign travelers who arrived in 95 tourist vessels (McFarland and Cifuentes 1996 in UNEP-WCMC
2008b). Vessels include up to 500-passenger cruise ships and 6 or 12-passenger tour boats. Ship traffic
increased by 15% in 2006 (UNESCO/IUCN 2007 in UNEP-WCMC 2008b).
(b) Fisheries
The primary contributions of fishing to potential cumulative impacts on marine mammals and sea
turtles involve direct removal of prey items, vessel noise, potential entanglement, and bycatch. There
may be some localized avoidance by marine mammals of fishing vessels near the seismic area. Also,
bycatch and entanglement in fishing gear can lead to mortality of marine mammals and sea turtles (see
below). Commercial fishing in the ETP takes place in two Food and Agriculture Organization (FAO)
areas: the eastern central Pacific and the southeast Pacific.
Commercial Fisheries
The most important fisheries in the southeast Pacific in terms of catch volume is the tuna fishery,
with purse seiners of the international fleet operating in EEZ waters under a license system. The total
catch from purse seine fisheries represents more than half of landings, from commercial fisheries from the
four countries of interest (Costa Rica, Panama, Colombia and Ecuador; Table 6). The project area does
not include the EEZ of Peru, so fishing activities there are not considered.

IV. Environmental Consequences
Environmental Assessment for SIO ETP Cruise, 2010 Page 71
The Ecuadorian EEZ waters sustain important pelagic fisheries primarily directed at tuna, small
pelagic fish, demersal species, and shrimp. Approximately 80% (595, 130 t) of all reported commercial
landings in the EEZs of the four countries in 2006 occurred in combined mainland Ecuador and
Galapagos Islands EEZs (Table 6). In 2002, 106 vessels were registered in the tuna fisheries fleet in
Ecuador and 205 vessels were registered for whitefish fisheries (snapper, grouper, and wreckfish) using
purse seines and longlines. In 1994–1998, 193–194 vessels were registered for pelagic fisheries occurring
up to 70 nm offshore in vessels of 1–106 registered tons (FAO 2010a). Shrimp fisheries occur in waters
2–360 m depth; 215 vessels were registered in 2008.
The artisanal fisheries (small-scale, decentralized operations) in Ecuador capture 39,000–70,000
tonnes per year using small sea-faring vessels (FAO 2010a). Artisanal fisheries, regulated by the Parque
Nacional Galapagos, occur around the Galapagos Islands. In 2000, 367 fishing vessels were registered to
artisanal fishers targeting tuna, codfish, smooth fish, lobster, and sea cucumbers (FAO 2010a).
About 95% of fishing activity in Panama occurs off the Pacific coast (FAO 2002), and purse seine
fisheries account for ~82% (84, 078 t) of landed catches in the country (Table 6). In 2002, a total of 4959
fishing vessels were registered in Panama; they included a wide variety, from canoes and small boats to
larger fishing vessels. Approximately 232 vessels are registered for the shrimp fishery in Panama. The
TABLE 6. Commercial fisheries landings (tons) in 2006 by gear-type for the Pacific EEZs of Costa Rica,
Panama, Columbia, and Ecuador. Source: Sea Around Us (2009).
EEZ Total Purse seines
Shrimp trawls
Hooks, gorges¹
Bottom trawls Gillnets
Mid-water trawls
Seine nets Other
Costa Rica 10274 3857 1229 2189 847 364 152 267 1369
Panama 102493 84078 4412 475 2135 2032 1646 1844 5871
Colombia 34528 22425 2011 866 922 1188 2346 1950 2820
Ecuador² 595130 278625 0 45670 20134 51326 65589 53823 79963
Total 742425 388985 7652 49200 24038 54910 69733 57884 90023
¹ Includes squid hooks but not longlines
² Includes mainland and Galapagos
vessels consist of trawlers 18–20 m in length. Fishers use beam trawls and operate in surface waters or
waters up to 200 m deep (FAO 2002). In 2002, 30 fishing vessels were registered for the anchovy and
herring fisheries in Panama waters. However, the fishing season takes place from April to September
(FAO 2002) so it is unlikely to be encountered during the proposed survey period.
Columbia‘s marine fisheries target a wide variety of resources, but catches of each are small (FAO
2010b; Table 6). In 2001, 62% of the licensed fishing fleet of Columbia occurred off the Pacific coast.
The Columbian Pacific fleet consisted of 367 vessels registered for the small pelagic (11 vessels), tuna
(68), whitefish (180), deep-water shrimp (36), and shallow-water shrimp (70) fisheries (INPA 2001 in
FAO 2010b). Most small-scale fishers make day trips and operate within ~10 km of the coast. However,
fishers with motorboats and navigation systems undertake trips further offshore of one to two weeks.
Reported landings in Costa Rica waters are small (Table 6). The largest catch is the tuna fishery,
with ~24 purse-seiners from the international fleet operating in Costa Rica‘s EEZ. The second largest-
volume fisheries in Costa Rica involve 588 registered longline vessels of various sizes fishing beyond the
12-mi territorial water limit, with larger vessels up to 24 m in length usually fishing beyond Costa Rica‘s

IV. Environmental Consequences
Environmental Assessment for SIO ETP Cruise, 2010 Page 72
EEZ. There are 2421 officially registered vessels involved in the small-scale coastal demersal and pelagic
fishery, but more boats probably operate illegally (FAO 2004). About 65 vessels are involved in the
shrimp fishery using bottom trawlers, although the decline in catches caused by over-fishing, and
increased fuel prices have forced a number of them to remain in port. Only two purse seiners fish for
sardine in the coastal zone.
Recreational Fisheries
Sport fishing for billfish and tuna are pursued in most Latin American coastal nations. Panama,
Costa Rica, and Ecuador have some of the largest fleets of sport fishing boats.
Recreational fishing for demersal and pelagic species is of growing importance in Costa Rica.
Sport fishing‘s target species include sailfish, marlin, tuna, snook, tarpon, wahoo, dolphinfish, snapper,
and barracuda. Approximately 98 vessels, mainly fiberglass, measuring up to 15 m. in length and fitted
with inboard motors, operate in this fishery (FAO 2004).
The Gulf of Panama and the Tuna Coast of Panama include vast areas where there are numerous
pelagic sport fishing trips seasonally. The main target species include snapper, grouper, marlin, sailfish,
dolphinfish, wahoo, tuna, amberjack, roosterfish, and sierra mackerel. The main fishing area encompas-
ses over 100 volcanic tropical offshore islands including the Archipelago Las Perlas (8.33 N, 79.12 W)
~50 km offshore. The deep-sea fishing season is from late May to early December (Panama Fishing and
Catching 2008).
Catches resulting from sport fishing in Colombia are small, and the fishery authorities of Columbia
do not record statistical data. A number of sport fishing events do take place off the Pacific coast of
Colombia, including the international marine sport fishing competitions held every year in Solano Bay of
Bahia Solano (6.22 N, 77.4 W) between April and June (FAO 2010b).
In Ecuador, recreational fishing occurs in coastal waters, in the Puntilla de Santa Elena marine
reserve off Salinas at 2.22 S, 80.95 W, and around Isla La Plata in the Machalilla National Park at 1.28°S,
81.07 W (FAO 2010a). Sport fishing is illegal in the Galapagos Islands. Instead, licenses are issued
under the umbrella of ―experiential‖ artisanal fishing, where tourists accompany artisanal fishers to
appreciate the traditional art of fishing. There are currently 24 vessels licensed for experiential artisanal
fishing (DGNP 2009).
SIO‘s seismic operations in the study area are expected to have a negligible contribution to
cumulative impacts in the study area when compared to that of commercial and recreational fisheries
activities.
(c) Oil and Gas Activities
In most Latin American countries, hydrocarbons are an asset of the state, and state-owned oil and
gas companies are responsible for conducting extraction and development activities. In recent years,
however, several countries have introduced regulatory reforms to allow for increased participation of the
private sector in oil and gas production activities.
Costa Rica, despite establishing oil and gas licensing blocks in 1994 and opening them to bid to
foreign companies in 1997, effectively produces no oil. In 2002, the then-newly-elected President Abel
Pacheco de la Espriella essentially declared Costa Rica free of oil exploration and development. The
election of President Oscar Arias Sanchez in 2006 has not changed this de facto policy.

IV. Environmental Consequences
Environmental Assessment for SIO ETP Cruise, 2010 Page 73
Despite the fact that Panama has no oil production and no proven reserves (CIA 2010a), the region
is a major avenue for oil transportation because of the Panama Canal. In 1997, 32 million tonnes of oil
products passed through the canal for dispersal at points in North and South America and across the
Pacific; approximately 0.6 Mb/d pass through the Panama Canal (Rodrigue 2007).
Colombia has seen an increase in oil production in recent years. The country produced an
estimated 680,000 bbl/d in 2009, mostly from Andes foothills and the eastern Amazonian jungles. In
early 2010 the country conducted its latest round of oil sector bidding, including exploratory offshore
blocks in the Pacific Ocean (EIA 2010). Reliance Exploration and Production DMCC and Ecopetrol SA
(the partially privatized state oil company) are set to develop two deepwater blocks that collectively
extend across 8000 km2, in water depths 60–1500 m. To date, ~3000 line km of 2D seismic data have
been acquired. The first well is scheduled for drilling in 2010 (Offshore 2010).
More than half of Ecuador‘s national budget is funded by oil earnings, and continued oil
exploration and production is thought to be necessary to ensure the countries‘ well being. The country‘s
oil exports totaled 327,600 bbl/day in 2009 (CIA 2010b). In 2007, the government issued legislation
forcing private investors in oil and gas ventures into service contracts under which the Ecuadorean state
would own all hydrocarbons and pay private investors an extraction fee. In December 2008, a contract
was awarded to SCAN Geophysical to acquire a major 2D seismic program offshore from Ecuador in
support of the government‘s plan to develop hydrocarbon prospects in this region. The survey will cover
most of the Ecuadorian coast and comprise ~10,000 km of 2D seismic marine acquisition (Subsea World
2008). On 18 April 2010, President Rafael Correa (the Ecuadorean government) has threatened to take
over foreign oil concessions if the companies resist growing state control of the industry (BBC News
2010). The immediate consequence of the announcement on foreign exploration and production activities
in the country is unknown.
Peru‘s crude oil production is concentrated in the Tumbes-Progreso and Talara basins off the
northern coast of the country (Fig. 4). In June 2005, Petro-Tech announced Peru‘s first offshore oil
discovery, located in Block Z-2B. The well had initial production of 1200 bbl/d. Drilling of additional
wells is planned in order to increase production to 11,000 bbl/d. (EOE 2008). Block Z-2B is Petro-Tech's
main production asset, and is producing both oil and gas. In March 2010, the company announced its
intention to increase production and engage in new exploration activities. In particular, PetroTech will
drill around 500 wells and install 40 new platforms, and expand production facilities (Ecopetrol 2010)
The northernmost concession block Z-1 borders Ecuador. Five additional oil development wells
are planned in the concession. Under this development plan, the company hopes to double production.
Oil production in 2009 was 12,000 bbl/d (Offshore 2009b).
Block Z-38 located to the west of block Z-1, in the Tumbes Basin. The area is experiencing
renewed exploration and appraisal activity. In February–March 2009, 2000 km of 2D seismic was
acquired in Block Z-38. The area is hydrocarbon rich, with each of the main prospects having a
prospective resource in the 100–300 million bbl range (OilVoice 2009). Recently there have been
successful exploration programs in blocks adjoining Z-38. In June 2009, SCAN Geophysical completed
the acquisition of ~2000 km of 2D data over block Z34. The block is 3713 sq km and located in the
Talara Basin to the south of the Tumbes basin (Offshore 2009a). The Talara Basin has produced more
than 1 billion barrels of oil (OilVoice 2009).

IV. Environmental Consequences
Environmental Assessment for SIO Santa Barbara Channel Cruise, 2008 Page 74
FIGURE 4. Petroleum exploration and development titles in Peru. Source: Perupetro (2010).

IV. Environmental Consequences
Environmental Assessment for SIO ETP Cruise, 2010 Page 75
(d) Hunting and Incidental Mortality
Costa Rica, Panama, Ecuador, and Peru are members of the International Whaling Commission;
Columbia is not a member (IWC 2010). None of those nations are whaling countries that take part in
commercial whaling. However, subsistence whaling of several species of small cetaceans, including the
bottlenose dolphin, takes place in territorial coastal waters of Peru (Read et al. 1998). This hunt is mainly
for human consumption and uses gill nets, purse seines, and harpoons. Read et al. (1998) estimated that
approximately 10,000 dolphins and porpoises were landed in Peru in 1985.
The fishing industry has adverse effects on marine mammals and sea turtles. For example, the
average annual mortality of dolphins as bycatch in the eastern Pacific Ocean (EPO) during 2000–2005
was 1550 (IATTC 2008). This estimate decreased to an average bycatch of 862 dolphins in 2006–2007,
but increased slightly to 1169 dolphins in 2008 (IATTC 2008). At its peak in 1986, the annual estimate
of dolphin mortality through bycatch in the EPO was 132,169 (IATTC 2008). Initial systematic studies
of cetaceans in the ETP were prompted by the incidental killing of dolphins in the purse-seine fishery for
yellowfin tuna, Thunnus albacares, in the area (Smith 1983). The main cetacean species that have been
affected by the fishery are pantropical spotted dolphins and spinner dolphins (Smith 1983). Short-beaked
common dolphins, striped dolphins, bottlenose dolphins, Fraser‘s dolphins, rough-toothed dolphins, and
short-finned pilot whales have also been killed in the fishery (e.g., Hall and Boyer 1989). Despite a
reduction in bycatch in recent years (IATTC 2008), populations of offshore spotted dolphins and eastern
spinner dolphins have not yet recovered (Gerrodette and Forcada 2005). Wade et al. (2007) proposed that
the lack of recovery of the pantropical spotted and spinner dolphins was as likely caused by the fishery as
it was by changes in the ecosystem, and warned that the purse-seine fishery could impact dolphin stocks
beyond what can be observed through the analysis of fishery mortality.
Commercial fisheries may also accidentally entangle and drown or injure other cetacean species during
fishing operations or by lost and discarded fishing gear (e.g., Northridge and Hofman 1999). Humpback
whales, perhaps because of their abundance in coastal waters where nets are commonly used or because of the
many barnacles they carry, seem to be extremely vulnerable to entanglement in fishing gear (Lien 2002).
Trites et al. (1997) suggested that fisheries might indirectly compete with cetaceans by reducing the amount of
primary production accessible to cetaceans, thereby negatively affecting their numbers.
Incidental catch in fisheries is also widely recognized as a major mortality factor for sea turtles.
An estimated average of 37 sea turtles died as a result of their incidental capture by purse-seine fishing
vessels in the EPO during 2001–2008 (IATTC 2008). Sea turtle bycatch in longline fishing operations
was evaluated off the Pacific coast of Costa Rica from October 1991–February 1992 (Segura and Arauz
1995). A total of 31 sea turtles were caught during 13 of 27 longline deployments, 29 of which were
olive ridleys and 2 were green turtles (Segura and Arauz 1995). The mortality rate of olive ridleys was
10.3% (Segura and Arauz 1995).
During an observer program on shrimp trawlers along the Pacific coast of Costa Rica, 281 turtles
were caught in nets during 2557 h of observation (Arauz et al. 1998). Most of the captured turtles were
olive ridleys (90%), followed by green turtles (9.6%), and hawksbills (0.4%). Arauz et al. (1998)
estimated the mortality rates attributable to shrimp nets to be 37.6% for olive ridleys and 50% for green
turtles. Along the Pacific coast of Costa Rica alone, the annual incidental catch of turtles by the shrimp
fleet is estimated at 15,631 turtles. Arauz et al. (1998) noted that Costa Rica has the highest recorded
average CPUE rate for sea turtles in the world, and suggested that countries in the ETP use Turtle
Excluder Devices to reduce turtle bycatch.

IV. Environmental Consequences
Environmental Assessment for SIO ETP Cruise, 2010 Page 76
Off northern Peru, Ecuador, and Central America, olive ridleys were the most frequently entrapped
sea turtles, compared to loggerhead and green turtles off of southern and central Peru (Kelez et al. 2010).
In Peru, olive ridley, green, and leatherback turtles were captured in driftnets targeting rays and sharks,
whereas the Chilean gillnet swordfish fishery captured almost exclusively leatherback turtles (Kelez et al.
2010). Alava (2008) noted that loggerheads were uncommonly caught off the coast of Ecuador; no
bycatch records exist and only 10 sightings were recorded in this region during 1993–2002. During the
same period, IATTC observers aboard tuna purse seine vessels recorded 383 sightings of loggerheads
(98% of which were alive) in the EPO (Alava 2008).
(d) Summary of Cumulative Impacts to Marine Mammals
Impacts of SIO‘s proposed seismic survey in the ETP are expected to be no more than a very minor
(and short-term) increment when viewed in light of other human activities within the study area. Unlike
some other ongoing and routine activities, SIO‘s activities are not expected to result in injuries or deaths
of marine mammals. Although the sounds from the seismic survey will have higher source levels than
those of some other human activities in the area, GI airgun operations will take place only for a total of
~15 days, in contrast to other noise-producing activities that occur continuously over extended periods.
(e) Cumulative Impacts to Sea Turtles
Major threats to sea turtles include hunting and poaching, the collection of eggs, coastal develop-
ment, increased tourism including beaches obstructed with lights and chairs, beach sand mining, pedes-
trian traffic, oil spills, ship strikes, entanglement in fishing gear, ingestion of plastic and marine garbage,
and destruction of feeding habitat in coral reefs and seagrass beds (Horrocks 1992; Marcovaldi et al.
2003). Unlike those activities, the low-energy seismic operations will not result in sea turtle injury or
mortality. Because only small numbers of foraging or migrating turtles would likely be encountered, and
given the planned mitigation measures, any short-term disturbance caused by the seismic surveys will be
a negligible contribution to cumulative impacts.
(9) Unavoidable Impacts
Unavoidable impacts to the species of marine mammals and turtles occurring in the proposed study
area will be limited to short-term, localized changes in behavior of individuals. For cetaceans, some of
the changes in behavior may be sufficient to fall within the MMPA definition of ―Level B Harassment‖
(behavioral disturbance; no serious injury or mortality). No long-term or significant impacts are expected
on any of these individual marine mammals or turtles, or on the populations to which they belong.
Effects on recruitment or survival are expected to be (at most) negligible.
(10) Coordination with Other Agencies and Processes
This document will be used as supporting documentation for an IHA application submitted by SIO
to NMFS, under the U.S. MMPA, for ―taking by harassment‖ (disturbance) of small numbers of marine
mammals during this proposed seismic project. Potential impacts to endangered species and critical
habitat have also been assessed in the document; therefore, it will be used to support the ESA Section 7
consultation process with NMFS.
SIO will work with the US Department of State to obtain the necessary approvals for operating in
the foreign EEZs of Costa Rica, Panama, Colombia, and Ecuador. SIO and NSF will coordinate the plan-
ned marine mammal monitoring program associated with the seismic survey with other parties that may

IV. Environmental Consequences
Environmental Assessment for SIO ETP Cruise, 2010 Page 77
have interest in this area. SIO and NSF have coordinated, and will continue to coordinate, with other
applicable Federal and State agencies as required, and will comply with their requirements.
Alternative Action: Another Time
An alternative to issuing the IHA for the period requested, and to conducting the project then, is to
issue the IHA for another time, and to conduct the project at that alternative time. The proposed dates for
the cruise (25 Days in October–November 2010) are the dates when the personnel and equipment
essential to meet the overall project objectives are available.
Marine mammals and sea turtles are expected to be found throughout the proposed study area and
throughout the time period during which the project may occur. A number of marine mammal species
(see Table 3) are year-round residents in the ETP, so altering the timing of the proposed project likely
would result in no net benefits for those species (see § III, above). The proposed survey is scheduled near
the start of the peak nesting periods for the three sea turtles that nest in the area, so few hatchlings would
be encountered at sea.
No Action Alternative
An alternative to conducting the proposed activities is the ―No Action‖ alternative, i.e. do not issue an
IHA and do not conduct the operations. If the research were not conducted, the ―No Action‖ alternative
would result in no disturbance to marine mammals or sea turtles attributable to the proposed activities,
however valuable data about the marine environment would be lost.
V. List of Preparers
Environmental Assessment for SIO ETP Cruise, 2010 Page 78
V. LIST OF PREPARERS
LGL Ltd., environmental research associates
William E. Cross, M.Sc., King City, Ont.*
Nathalie Patenaude, Ph.D., King City, Ont.*
Patrick Abgrall, Ph.D., King City, Ont.*
Meike Holst, M.Sc., Sidney, B.C.
John Christian, M.Sc., St. John's, Nfld.
Mark Fitzgerald, B.A.A., King City, Ont.
William R. Koski, M.Sc., King City, Ont.
W. John Richardson, Ph.D., King City, Ont.
Lamont Doherty Earth Observatory
John Diebold, Ph.D., Palisades, NY
Scripps Institution of Oceanography
Woody Sutherland, M.S., La Jolla, CA
National Science Foundation
Holly E. Smith, M.A., Arlington, VA
* Principal preparers of this specific document. Others listed above contributed to a lesser extent, or
contributed substantially to previous related documents from which material has been excerpted.

VI. Literature Cited
Environmental Assessment for SIO ETP Cruise, 2010 Page 79
VI. LITERATURE CITED
Marine Mammals and Acoustics
Acevedo, A. and M.A. Smultea. 1995. First records of humpback whales including calves at Golfo Dulce and Isla
del Coco, Costa Rica, suggesting geographical overlap of northern and southern hemisphere populations.
Mar. Mamm. Sci. 11(4):554-560.
Acevedo-Gutiérrez, A. 1994. First record of a sea lion, Zalophus californianus, at Isla del Coco, Costa Rica. Mar.
Mamm. Sci. 10(4):484-485.
Acevedo-Gutierrez, A. 1996. Lista de mamíferos marinos en Golfo Dulce e Isla del Coco, Costa Rica. Rev.
Biol.Trop. 44:933-934.
Acevedo, A. and M.A. Smultea. 1995. First records of humpback whales including calves at Golfo Dulce and Isla
del Coco, Costa Rica, suggesting geographical overlap of northern and southern hemisphere populations.
Mar. Mamm. Sci. 11(4):554-560.
ACS (American Cetacean Society). 2007. American Cetacean Society fact sheet: spinner dolphin, Stenella
longirostris. Accessed on 7 May 2010 at http://www.acsonline.org/factpack/SpinnerDolphin.htm
Aguayo, A.L. 1974. Baleen whales off continental Chile. p. 209-217 In: W.E. Schevill (ed.), The whale problem: a
status report. Harvard University Press, Cambridge, MA.
Aguayo, A., J. Cárdenas, and D. Torres. 1992. Análisis de los avistamientos de Eubalaena australis (Desmoulins,
1822) en aguas chilenas, desde 1983 hasta 1989. Seri. Cient. Inst. Antárt. Chileno 42:77-91.
Alava, J.J. and S. Salazar. 2006. Status and conservation of otariids in Ecuador and the Galápagos Islands. p. 495-
519 In: Sea lions of the world. Alaska Sea Grant College Program, AK-SG-06-01.
Allen, R.L. 1985. Dolphins and the purse-seine fishery for yellowfin tuna. p. 236-252 In: J.R. Beddington, R.J.H.
Beverton, and D.M. Lavigne (eds.), Marine mammals and fisheries. George Allen & Unwin, London, U.K.
354 p.
Archer, F.I., II and W.F. Perrin. 1999. Stenella coeruleoalba. Mamm. Species 603:1–9.
Arnbom, T. and H. Whitehead. 1989. Observations on the composition and behaviour of groups of female sperm
whale near the Galápagos Islands. Can. J. Zool. 67(1):1-7.
Au, D.K.W. and W.L. Perryman. 1985. Dolphin habitats in the eastern tropical Pacific. Fish. Bull. 83(4):623-643.
Bailey, H., B.R. Mate, D.M. Palacios, L. Irvine, S.J. Bograd and D.P. Costa. 2009. Behavioural estimation of blue
whale movements in the Northeast Pacific from state-space model analysis of satellite tracks. Endang.
Species Res. 10:93-106.
Bain, D.E. and R. Williams. 2006. Long-range effects of airgun noise on marine mammals: responses as a function
of received sound level and distance. Working Pap. SC/58/E35. Int. Whal. Comm., Cambridge, U.K. 13 p.
Baird, R.W., A.D. Ligon, and S.K. Hooker. 2000. Sub-surface and night-time behavior of humpback whales off
Maui, Hawaii: a preliminary report. Rep. prepared under Contract #40ABNC050729 from the Hawaiian
Islands Humpback Whale National Marine Sanctuary, Kihei, HI, to the Hawaii Wildlife Fund, Paia, HI.
Baird, R.W. 2002a. Risso‘s dolphin. p. 1037-1039 In: W.F. Perrin, B. Würsig and J.G.M. Thewissen (eds.),
Encyclopedia of marine mammals. Academic Press, San Diego, CA. 1414 p.
Baird, R.W. 2002b. False killer whale. p. 411-412 In: W.F. Perrin, B. Würsig and J.G.M. Thewissen (eds.),
Encyclopedia of marine mammals. Academic Press, San Diego, CA. 1414 p.
Baird, R.W., M.B. Hanson, E.A. Ashe, M.R. Heithaus, and G.J. Marshall. 2003. Studies of foraging in ―southern
resident‖ killer whales during July 2002: Dive depths, bursts in speed, and the use of a ―Crittercam‖ system

VI. Literature Cited
Environmental Assessment for SIO ETP Cruise, 2010 Page 80
for examining sub-surface behavior. Rep. for the National Marine Fisheries Service, National Marine
Mammal Laboratory, Seattle, WA.
Baird, R.W., D.L. Webster, D.J. McSweeney, A.D. Ligon, G.S. Schorr, and J. Barlow. 2006. Diving behaviour of
Cuvier‘s (Ziphius cavirostris) and Blainville‘s (Mesoplodon densirostris) beaked whales in Hawai'i. Can. J.
Zool. 84:1120-1128.
Balcomb, K.C., III and D.E. Claridge. 2001. A mass stranding of cetaceans caused by naval sonar in the Bahamas.
Bahamas J. Sci. 8(2):2-12.
Barkaszi, M.J., D.M. Epperson, and B. Bennett. 2009. Six-year compilation of cetacean sighting data collected
during commercial seismic survey mitigation observations throughout the Gulf of Mexico, USA. p. 24-25
In: Abstr. 18th Bienn. Conf. Biol. Mar. Mamm., Québec, Canada, Oct. 2009. 306 p.
Barlow, J. and K.A. Forney. 2007. Abundance and population density of cetaceans in the California Current eco-
system. Fish. Bull. 105(4):509-526.
Barlow, J. and R. Gisner. 2006. Mitigating, monitoring and assessing the effects of anthropogenic sound on beaked
whales. J. Cetac. Res. Manage. 7(3):239-249.
Barros, N.B., D.A. Duffield, P.H. Ostrom, D.K. Odell, and V.R. Cornish. 1998. Nearshore vs. offshore ecotype
differentiation of Kogia breviceps and K. simus based on hemoglobin, morphometric and dietary analyses.
Abstr. World Mar. Mamm. Sci. Conf., Monaco, 20–24 January 1998.
Barlow, J., M.C. Ferguson, E.A. Becker, J.V. Redfern, K.A. Forney, I.L. Vilchis, P.C. Fiedler, T. Gerrodette, and
L.T. Ballance. 2009. Predictive modeling of marine mammal densities in the eastern Pacific Ocean. NOAA
Tech. Memo. NOAA-TMNMFS-SWFSC-444. Southwest Fisheries Science Center, National Marine
Fisheries Service, La Jolla, CA. 206 p.
Baumgartner, M.F. 1997. The distribution of Risso‘s dolphin (Grampus griseus) with respect to the physiography
of the Northern Gulf of Mexico. Mar. Mamm. Sci. 13(4):614-638.
Berzin, A.A. 1978. Whale distribution in tropical eastern Pacific waters. Rep. Int. Whal. Comm. 28:173-177.
Best, P.B. 1979. Social organization in sperm whales, Physeter macrocephalus. p. 227-289 In: H.E. Winn and
B.L. Olla (eds.), Behavior of marine animals, Vol. 3. Plenum, New York, NY.
Black, N.A., A. Schulman-Janiger, R.L. Ternullo, and M. Guerrero-Ruiz. 1997. Killer whales of California and
western Mexico: A catalog of photo-identified individuals. NOAA Tech. Memo. NMFS-SWFSC-247.
Southwest Fisheries Science Center, National Marine Fisheries Service, La Jolla, CA. 174 p.
Bowles, A.E., M. Smultea, B. Würsig, D.P. DeMaster, and D. Palka. 1994. Relative abundance and behavior of
marine mammals exposed to transmissions from the Heard Island Feasibility Test. J. Acoust. Soc. Am.
96(4):2469-2484.
Branch, T.A., D.M. Palacios, K.M. Stafford, C. Allison, J.L. Bannister, C.L.K. Burton, K.C.S. Jenner, M-N.M.
Jenner, B. Maughan, T. Miyashita, M.G. Morrice, V.J. Sturrock, R.C. Anderson, A.N. Baker, P.B. Best, P.
Borsa, S. Childerhouse, K.P. Findlay, A.D. Ilangakoon, M. Joergensen, B. Kahn, B. Maughan, Y.A.
Mikhalev, Oman Whale and Dolphin Research Group, D. Thiele, D. Tormosov, K. Van Waerebeek, and
R.M. Warneke. 2006. Past and present distribution of blue whales in the Southern Hemisphere and northern
Indian Ocean. Working Pap. SC/58/SH16. Int. Whal. Comm., Cambridge, U.K. 27 p.
Brownell, R.L., Jr. and P.J. Clapham. 1999. Burmeister's porpoise Phocoena spinipinnis Burmeister, 1865. p. 393-
410 In: S.H. Ridgway and R. Harrison (eds.), Handbook of marine mammals, Vol. 6. The second book of
dolphins and the porpoises. Academic Press, San Diego, CA. 486 p.
Burkhardt, E., O. Boebel, H. Bornemann, and C. Ruholl. 2008. Risk assessment of scientific sonars. Bioacoustics
17:235-237.
VI. Literature Cited
Environmental Assessment for SIO ETP Cruise, 2010 Page 81
Calambokidis, J. and S.D. Osmek. 1998. Marine mammal research and mitigation in conjunction with air gun
operation for the USGS ‗SHIPS‘ seismic surveys in 1998. Rep. by Cascadia Research, Olympia, WA, for
U.S. Geol. Surv., Nat. Mar. Fish. Serv., and Minerals Manage. Serv.
Calambokidis, J., G.H. Steiger, J.M. Straley, L.M. Herman, S. Cerchio, D.R. Salden, J. Urbán R., J.K. Jacobsen, O.
von Ziegesar, K.C. Balcomb, C.M. Gabriele, M.E. Dahlheim, S. Uchida, G. Ellis, Y. Miyamura, P. Ladrón de
Guevara P., M. Yamaguchi, F. Sato, S.A. Mizroch, L. Schlender, K. Rasmussen, J. Barlow, and T.J. Quinn
II. 2001. Movements and population structure of humpback whales in the North Pacific. Mar. Mamm. Sci.
17:769–794.
Calambokidis, J. E. Oleson, M. McDonald, W. Burgess, J. Francis, and J. Hildebrand. 2003. Feeding and vocal
behavior of blue whales determined through suction-cup attached tags. Environmental Consequences of
Underwater Sound (ECOUS) Symposium. 12–16 May 2003, San Antonio, Texas.
Calambokidis, J., A. Gouglas, and F. Garita. 2010. Summary of 2010 humpback whale research along the Osa
Peninsula, Costa Rica. Oceanic Society Research Expeditions, Exploritas and Cascadia Research Collective.
Accessed on 11 May 2010 at http://www.cascadiaresearch.org/costarica/Summary%20of%20Southern%
20Costa%20Rica%20Jan-Feb%20mm%20surveys-FINAL-2010.pdf
Campagna, C. 2008a. Otaria flavescens. In: IUCN 2010. IUCN Red List of Threatened Species. Version 2010.1.
<www.iucnredlist.org>. Accessed on 11 May 2010 at www.iucnredlist.org.
Campagna, C. 2008b. Arctocephalus australis. In: IUCN 2010. IUCN Red List of Threatened Species. Version
2010.1. <www.iucnredlist.org>. Accessed on 11 May 2010 at www.iucnredlist.org.
Capella J.J., L. Flórez-González, P. Falk-Fernández, and D.M. Palacios. 2002. Regular appearance of otariid
pinnipeds along the Colombian Pacific coast. Mar. Mamm. Sci. 28(1):67-72.
Carretta, J.V., K.A. Forney, M.S. Lowry, J. Barlow, J. Baker, D. Johnston, B. Hanson, R.L Brownell Jr., J. Robbins,
D.K. Mattila, K. Ralls, M.M. Muto, D. Lynch, and L. Carswell. 2010. U.S. Pacific marine mammal stock
assessments: 2009. NOAA Tech. Memo. NMFS-SWFSC-453. Southwest Fisheries Science Center,
National Marine Fisheries Service, La Jolla, CA. 336 p.
Chandler, T.E. and J. Calambokidis. 2004. Costa Rica Dome blue whale cruise report. Unpublished report, 6 p.
Accessed on 11 May 2010 at http://www.cascadiaresearch.org/reports/CRUISE%20REPORT.pdf.
Clapham, P.J. and D.K. Mattila. 1990. Humpback whale songs as indicators of migration routes. Mar. Mamm.
Sci. 6:155160.
Clapham P.J and J.G. Mead. 1999. Megaptera novaeangliae. Mamm. Spec. 604:1-9.
Claridge, D.E. 2003. Examining distribution and habitat preferences of deep-diving cetaceans, including beaked
whales, in Northwest Providence Channel, the Bahamas, using geographic information system (GIS) map-
ping techniques. Presentation at the 15th Bienn. Conf. Biol. Mar. Mamm., Greensboro, NC.
Clark, C.W. and W.T. Ellison. 2004. Potential use of low-frequency sounds by baleen whales for probing the
environment: evidence from models and empirical measurements. p. 564-582 In: Thomas, J.A., C.F. Moss
and M. Vater (eds.) Echolocation in bats and dolphins. Univ. Chicago Press, Chicago, IL.
Clark, C.W. and G.C. Gagnon. 2006. Considering the temporal and spatial scales of noise exposures from seismic
surveys on baleen whales. Working Pap. SC/58/E9. Int. Whal. Comm., Cambridge, U.K. 9 p.
Cox, T.M., T.J. Ragen, A.J. Read, E. Vos, R.W. Baird, K. Balcomb, J. Barlow, J. Caldwell, T. Cranford, L. Crum,
A. D'Amico, G. D'Spain, A. Fernández, J. Finneran, R. Gentry, W. Gerth, F. Gulland, J. Hildebrand, D.
Houser, T. Hullar, P.D. Jepson, D. Ketten, C.D. MacLeod, P. Miller, S. Moore, D.C. Mountain, D. Palka, P.
Ponganis, S. Rommel, T. Rowles, B. Taylor, P. Tyack, D. Wartzok, R. Gisiner, J. Mead, and L. Benner.
2006. Understanding the impacts of anthropogenic sound on beaked whales. J. Cetac. Res. Manage.
7(3):177-187.

VI. Literature Cited
Environmental Assessment for SIO ETP Cruise, 2010 Page 82
Croll, D.A., A. AcevedoGutierrez, B.R. Tershy and J. UrbanRamirez. 2001. The diving behavior of blue and fin
whales: is dive duration shorter than expected based on oxygen stores? Comp. Biochem. Physiol. A
129:797-809.
Crum, L.A., M.R. Bailey, J. Guan, P.R. Hilmo, S.G. Kargl, and T.J. Matula. 2005. Monitoring bubble growth in
supersaturated blood and tissue ex vivo and the relevance to marine mammal bioeffects. Acoustic Res. Lett.
Online 6(3):214-220.
Cubero-Pardo, P. and J. Rodríguez F. 2000. Zalophus californianus (Pinnipedia:Otariidae) en Costa Rica. Rev.
Biol. Trop. 48(1):273.
Culik, B.M. 2002. Review on small cetaceans: distribution, behaviour, migration and threats. Compiled for the
Convention on Migratory Species (CMS). Bonn, Germany.
Culik, B.M. 2010. Odontocetes: the toothed whales: Mesoplodon grayi. UNEP/CMS Secretariat, Bonn, Germany.
Accessed on 10 May 2010 at http://www.cms.int/reports/small_cetaceans/index.htm.
Cummings, W. C. 1985. Bryde‘s whale. p. 137–154 In: S.H. Ridgway and R.J. Harrison (eds.), Handbook of
marine mammals, Vol. 3. The sirenians and baleen whales. Academic Press, London, U.K. 362 p.
Dahlheim, M.E. and J.E. Heyning. 1999. Killer whale Orcinus orca (Linnaeus, 1758). p. 281-322 In: S.H.
Ridgway and R. Harrison (eds.), Handbook of marine mammals, Vol. 6. The second book of dolphins and
the porpoises. Academic Press, San Diego, CA. 486 p.
Dahlheim, M.E., S. Leatherwood, and W.F. Perrin. 1982. Distribution of killer whales in the warm temperate and
tropical eastern Pacific. Rep. Int. Whal. Comm. 32:647-653.
Dalebout, M.L., G.J.B. Ross, C.S. Baker, R.C. Anderson, P.B. Best, V.G. Cockcroft, H.L. Hinsz, V. Peddemors, and
R.L. Pitman. 2003. Appearance, distribution, and genetic distinctiveness of Longman's beaked whale,
Indopacetus pacificus. Mar. Mamm. Sci. 19(3):421-461.
Davis, R.W., G.S. Fargion, N. May, T.D. Leming, M. Baumgartner, W.E. Evans, L.J. Hansen, and K. Mullin. 1998.
Physical habitat of cetaceans along the continental slope in the north-central and western Gulf of Mexico.
Mar. Mamm. Sci. 14(3):490-507.
Dietz, R., J. Teilmann, M.-P.H. Jørgensen, and M.V. Jensen. 2002. Satellite tracking of humpback whales in West
Greenland. Roskilde, Denmark: National Environmental Research Institute Technical Report 411.
Dizon, A.E., S.O. Southern, and W.F. Perrin. 1991. Molecular analysis of mtDNA types in exploited populations of
spinner dolphins (Stenella longirostris). Rep. Int. Whal. Comm. Spec. Iss. 13:183-202.
Dolar, M.L.L. 2002. Fraser‘s dolphin—Lagenodelphis hosei. p. 485-487 In: W.F. Perrin, B. Würsig, and J.G.M.
Thewissen (eds.), Encyclopedia of marine mammals. Academic Press, San Diego, CA. 1414 p.
Dolphin, W.F. 1987. Ventilation and dive patterns of humpback whales, Megaptera novaeangliae, on their Alaskan
feeding grounds. Can. J. Zool. 65(1): 83-90.
DoN (Department of the Navy). 2005. Marine resource assessment for the Northeast Operating Areas: Atlantic
City, Narragansett Bay, and Boston. Naval Facilities Engineering Command, Atlantic; Norfolk, VA.
Contract No. N62470-02-D-9997, Task Order No. 0018. Prepared by GeoMarine, Inc., Newport News, VA.
Donovan, G.P. 1984. Blue whales off Peru, December 1982, with special reference to pygmy blue whales. Rep.
Int. Whal. Comm. 34:473-476.
Donovan, G.P. 1991. A review of IWC stock boundaries. Rep. Int. Whal. Comm. Spec. Iss. 13:39-68.
Dufault, S. and H. Whitehead. 1995. The geographic stock structure of female and immature sperm whales in the
South Pacific. Rep. Int. Whal. Comm. 45:401-405.

VI. Literature Cited
Environmental Assessment for SIO ETP Cruise, 2010 Page 83
Duffield, D.A., S.H. Ridgway, and L.H. Cornell. 1983. Hematology distinguishes coastal and offshore forms of
dolphins (Tursiops). Can. J. Zool. 61(4):930-933.
Engel, M.H., M.C.C. Marcondes, C.C.A. Martins, F.O. Luna, R.P. Lima, and A. Campos. 2004. Are seismic
surveys responsible for cetacean strandings? An unusual mortality of adult humpback whales in Abrolhos
Bank, northeastern coast of Brazil. Working Paper SC/56/E28. Int. Whal. Comm., Cambridge, U.K. 8 p.
Escorza-Treviño, S. 2009. North Pacific marine mammals. p. 781-788 In: W.F. Perrin, B. Würsig, and J.G.M.
Thewissen (eds.), Encyclopedia of marine mammals, 2nd
edit. 1414 p.
Evans, W.E. 1994. Common dolphin, white-bellied porpoise Delphinus delphis Linnaeus, 1758. p. 191-224 In:
S.H. Ridgway and R. Harrison (eds.), Handbook of marine mammals, Vol. 5. The first Book of dolphins.
Academic Press, San Diego, CA. 416 p.
Félix F. and B. Haase. 2005. Distribution of humpback whales along the coast of Ecuador and management
implications. J. Cetacean Res. Manage. 7:21–31.
Félix, F., B. Haase, and J. Samaniego. 1995. [First record of pygmy killer whale Feresa attenuata (Cetacea,
Delphinidae) and dwarf sperm whale Kogia simus (Cetacea, Physeteridae) on the Ecuadorean continental
coast]. Estud. Oceanol. 14:77-85. [In Spanish].
Félix, F., C. Castro, B. Haase and M. Scheidat. 2005. New estimate of the Southeastern Pacific Humpback Whale
Stock. Abstr. 16th Bienn. Conf. Biol. Mar. Mamm., December 2005, San Diego, CA.
Ferguson, M.C. and J. Barlow. 2001. Spatial distribution and density of cetaceans in the Eastern Tropical Pacific
Ocean based on summer/fall research vessel surveys in 1986–96. Admin. Rep. LJ-01-04, Southwest
Fisheries Science Center, National Marine Fisheries Service, La Jolla, CA. 61 p.
Ferguson, M.C. and J. Barlow. 2003. Addendum: Spatial distribution and density of cetaceans in the Eastern
Tropical Pacific Ocean based on summer/fall research vessel surveys in 1986–96. Admin. Rep. LJ-01-04,
Southwest Fisheries Science Center, National Marine Fisheries Service, La Jolla, CA. 120 p.
Ferguson, M.C., J. Barlow, S.B. Reilly, and T. Gerrodette. 2006a. Predicting Cuvier‘s (Ziphius cavirostris) and
Mesoplodon beaked whale population density from habitat characteristics in the Eastern Tropical Pacific
Ocean. J. Cetacean Res. Manage. 7(3): 287-299
Ferguson, M.C., J. Barlow, P. Fiedler, S.B. Reilly, and T. Gerrodette. 2006b. Spatial models of delphinid (family
Delphinidae) encounter rate and group size in the eastern tropical Pacific Ocean. Ecol. Model. 193(3-
4):645-662.
Fernández, A., M. Arbelo, R. Deaville, I.A.P. Patterson, P. Castro, J.R. Baker, E. Degollada, H.M. Ross, P. Herráez,
A.M. Pocknell, E. Rodríguez, F.E. Howie, A. Espinosa, R.J. Reid, J.R. Jaber, V. Martin, A.A. Cunningham,
and P.D. Jepson. 2004. Pathology: whales, sonar and decompression sickness (reply). Nature 428(6984):1.
Fernández, A., J.F. Edwards, F. Rodriquez, A.E. de los Monteros, P. Herráez, P. Castro, J.R. Jaber, V. Martin, and
M. Arbelo. 2005. ―Gas and fat embolic syndrome‖ involving a mass stranding of beaked whales (Family
Ziphiidae) exposed to anthropogenic sonar signals. Vet. Pathol. 42(4):446-457.
Finneran, J.J. and C.E. Schlundt. 2004. Effects of intense pure tones on the behavior of trained odontocetes. TR
1913, SSC San Diego, San Diego, CA.
Finneran, J.J., C.E. Schlundt, D.A. Carder, J.A. Clark, J.A. Young, J.B. Gaspin, and S.H. Ridgway. 2000. Auditory
and behavioral responses of bottlenose dolphins (Tursiops truncatus) and beluga whale (Delphinapterus
leucas) to impulsive sounds resembling distant signatures of underwater explosions. J. Acoust. Soc. Am.
108(1):417-431.
Finneran, J.J., C.E. Schlundt, R. Dear, D.A. Carder, and S.H. Ridgway. 2002. Temporary shift in masked hearing
thresholds in odontocetes after exposure to single underwater impulses from a seismic watergun. J. Acoust.
Soc. Am. 111(6):2929-2940.

VI. Literature Cited
Environmental Assessment for SIO ETP Cruise, 2010 Page 84
Finneran, J.J., D.A. Carder, C.E. Schlundt, and S.H. Ridgway. 2005. Temporary threshold shift in bottlenose
dolphins (Tursiops truncatus) exposed to mid-frequency tones. J. Acoust. Soc. Am. 118(4):2696-2705.
Ford, J.K.B. 2002. Killer whale. p. 669-675 In: W.F. Perrin, B. Würsig, and J.G.M. Thewissen (eds.),
Encyclopedia of marine mammals. Academic Press, San Diego, CA. 1414 p.
Frankel, A.S. 2005. Gray whales hear and respond to a 21–25 kHz high-frequency whale-finding sonar. Abstr. 16th
Bienn. Conf. Biol. Mar. Mamm., 12–16 Dec. 2005, San Diego, CA.
Frantzis, A. 1998. Does acoustic testing strand whales? Nature 392(6671):29.
Gailey, G., B. Würsig, and T.L. McDonald. 2007. Abundance, behavior, and movement patterns of western gray
whales in relation to a 3-D seismic survey, northeast Sakhalin Island, Russia. Environ. Monit. Assess.
134(1-3):75-91. doi: 10.1007/s10661-007-9812-1.
Gallardo, V.A., D. Arcos, M. Salamanca, and L. Pastene. 1983. On the occurrence of Bryde's Whales
(Balaenoptera edeni Anderson, 1878) in an upwelling area off central Chile. Rep. Int. Whal. Comm.
33:481-488.
Gallo, J. P. 1994. Factors affecting the population status of Guadalupe fur seal, Arctocephalus townsendi (Merriam,
1897), at Isla de Guadalupe, Baja California, Mexico. Ph.D. Thesis, University of California, Santa Cruz.
199 p.
Gambell, R. 1976. World whale stocks. Mamm. Rev. 6:41-53.
Gambell, R. 1985a. Sei whale Balaenoptera borealis Lesson, 1828. p. 155-170 In: S.H. Ridgway and R. Harrison
(eds.), Handbook of marine mammals, Vol. 3. The sirenians and baleen whales. Academic Press, London,
U.K. 362 p.
Gambell, R. 1985b. Fin whale Balaenoptera physalus (Linnaeus, 1758). p. 171-192 In: S.H. Ridgway and R. Har-
rison (eds.), Handbook of marine mammals, Vol. 3. The sirenians and baleen whales. Academic Press,
London, U.K. 362 p.
Gannier, A. 2000. Distribution of cetaceans off the Society Islands (French Polynesia) as obtained from dedicated
surveys. Aquat. Mamm. 26(2):111-126.
Gedamke, J., S. Frydman, and N. Gales. 2008. Risk of baleen whale hearing loss from seismic surveys: preliminary
results from simulations accounting for uncertainty and individual variation. Working Pap. SC/60/E9. Int.
Whal. Comm., Cambridge, U.K. 10 p.
Gentry, R. (ed). 2002. Report of the workshop on acoustic resonance as a source of tissue trauma in cetaceans. 24-
25 April, NMFS, Silver Spring, MD. 19 p. Accessed on 11 May 2010 at: http://www.nmfs.noaa.gov/pr/
pdfs/acoustics/cetaceans.pdf.
Gerrodette, T., and J. Forcada. 2002. Estimates of abundance of northeastern offshore spotted, coastal spotted, and
eastern spinner dolphins in the eastern tropical Pacific Ocean. Admin. Rep. LJ-02-06, Southwest Fisheries
Science Center, National Marine Fisheries Service, La Jolla, CA. 43 p.
Gerrodette, T. and J. Forcada. 2005. Non-recovery of two spotted and spinner dolphin populations in the eastern
tropical Pacific Ocean. Mar. Ecol. Prog. Ser. 291:1-21.
Gerrodette, T. and J. Pettis. 2005. Responses of tropical cetaceans to an echosounder during research vessel
Surveys. p. 104 In: Abstr. 16th Bien. Conf. Biol. Mar. Mamm., 12–16 Dec. 2005, San Diego, CA.
Gerrodette, T., G. Watters, W. Perryman and L. Balance. 2008. Estimates of 2006 dolphin abundance in the
Eastern Tropical Pacific, with revised estimates from 1986-2003. Tech. Memo. NOAA-TM-NMFS-SWFSC-
422. Southwest Fisheries Science Center, National Marine Fisheries Service, La Jolla, CA. 39p.

VI. Literature Cited
Environmental Assessment for SIO ETP Cruise, 2010 Page 85
Gilpatrick, J.W., Jr., R.L. Pitman, L.T. Ballance, R. LeDuc, and H. Fearnbach. 2005. Killer whales prey upon a
blue whale calf on the Costa Rica Dome: genetics, morphometrics and composition of the herd. Abstr. 16th
Bienn. Conf. Biol. Mar. Mamm., 12–16 Dec. 2005, San Diego, CA.
Goold, J.C. 1996a. Acoustic assessment of common dolphins off the west Wales coast, in conjunction with 16th
round seismic surveying. Rep. from School of Ocean Sciences, Univ. Wales, Bangor, Wales, for Chevron
UK Ltd, Repsol Explor. (UK) Ltd., and Aran Energy Explor. Ltd. 22 p.
Goold, J.C. 1996b. Acoustic assessment of populations of common dolphin Delphinus delphis in conjunction with
seismic surveying. J. Mar. Biol. Assoc. U.K. 76:811-820.
Goold, J.C. 1996c. Acoustic cetacean monitoring off the west Wales coast. Rep. from School of Ocean Sciences,
Univ. Wales, Bangor, Wales, for Chevron UK Ltd, Repsol Explor. (UK) Ltd, and Aran Energy Explor. Ltd.
20 p.
Gordon, J., D. Gillespie, J. Potter, A. Frantzis, M.P. Simmonds, R. Swift, and D. Thompson. 2004. A review of the
effects of seismic surveys on marine mammals. Mar. Technol. Soc. J. 37(4):16-34.
Gordon, J., R. Antunes, N. Jaquet, and B. Würsig. 2006. An investigation of sperm whale headings and surface
behaviour before, during and after seismic line changes in the Gulf of Mexico. Working Pap. SC/58/E45.
Int. Whal. Comm., Cambridge, U.K. 10 p.
Gosselin, J.-F. and J. Lawson. 2004. Distribution and abundance indices of marine mammals in the Gully and two
adjacent canyons of the Scotian Shelf before and during nearby hydrocarbon seismic exploration program-
mes in April and July 2003. Res. Doc. 2004/133. Can. Sci. Advis. Secretariat, Fisheries & Oceans Canada.
24 p. Accessed on 11 May 2010 at www.dfo-mpo.gc.ca/csas/Csas/DocREC/2004/RES2004_133_e.pdf.
Greene, C.R., Jr. 1997. Physical acoustics measurements. p. 3-1 to 3-63 In: W.J. Richardson (ed.) Northstar
marine mammal monitoring program, 1996: marine mammal and acoustical monitoring of a seismic
program in the Alaskan Beaufort Sea. LGL Rep. 2121-2. Rep. from LGL Ltd., King City, Ont., and Greene-
ridge Sciences Inc., Santa Barbara, CA, for BP Explor. (Alaska) Inc., Anchorage, AK, and Nat. Mar. Fish.
Serv., Anchorage, AK, and Silver Spring, MD. 245 p.
Greene, C.R., Jr., N.S. Altman, and W.J. Richardson. 1999a. Bowhead whale calls. p. 6-1 to 6-23 In: Richardson,
W.J. (ed.) Marine mammal and acoustical monitoring of Western Geophysical's open-water seismic program
in the Alaskan Beaufort Sea, 1998. LGL Rep. TA2230-3. Rep. by LGL Ltd., King City, Ont., and
Greeneridge Sciences Inc., Santa Barbara, CA, for Western Geophysical, Houston, TX, and U.S. Nat. Mar.
Fish. Serv., Anchorage, AK, and Silver Spring, MD. 390 p.
Greene, C.R., Jr., N.S. Altman, and W.J. Richardson. 1999b. The influence of seismic survey sounds on bowhead
whale calling rates. J. Acoust. Soc. Am. 106(4, Pt. 2):2280 (Abstract).
Gregr, E.J. and A.W. Trites. 2001. Predictions of critical habitat for five whale species in the waters of coastal
British Columbia. Can. J. Fish. Aquat. Sci. 58: 1265-1285.
Haase, B. and F. Félix. 1994. A note on the incidental mortality of sperm whales (Physeter macrocephalus) in
Ecuador. Rep. Int. Whal. Comm. Spec. Iss. 15:481-483.
Hall, M.A. and S.D. Boyer. 1989. Estimates of incidental mortality of dolphins in the eastern Pacific fishery for
tropical tunas in 1987. Rep. Int. Whal. Comm. 39:321-322.
Hansen, L.J., K.D. Mullin, and C.L. Roden. 1994. Preliminary estimates of cetacean abundance in the U.S. Atlantic
Exclusive Economic Zone from 1992 vessel surveys. Southeast Fisheries Science Center, Miami Laboratory.
Contribution No. MIA-93/94-58.
Harris, R.E., G.W. Miller, and W.J. Richardson. 2001. Seal responses to airgun sounds during summer seismic
surveys in the Alaskan Beaufort Sea. Mar. Mamm. Sci. 17(4):795-812.

VI. Literature Cited
Environmental Assessment for SIO ETP Cruise, 2010 Page 86
Harris, R.E., T. Elliot, and R.A. Davis. 2007. Results of mitigation and monitoring program, Beaufort Span 2-D
marine seismic program, open water season 2006. LGL Ltd. LGL Rep. TA4319-1. Rep. from LGL Ltd.,
King City, Ont., for GX Technol., Houston, TX. 48 p.
Hastie, G.D. and V.M. Janik. 2007. Behavioural responses of grey seals to multibeam imaging sonars. In: Abstr.
17th Bien. Conf. Biol. Mar. Mamm., 29 Nov–3 Dec., Cape Town, South Africa.
Hauser, D.D.W., M. Holst, and V.D. Moulton. 2008. Marine mammal and sea turtle monitoring during Lamont-
Doherty Earth Observatory‘s marine seismic program in the Eastern Tropical Pacific, April-August 2008.
LGL Rep. TA4656/7-1. Rep. from LGL Ltd., King City, Ont., and St. John‘s, Nfld, for Lamont-Doherty
Earth Observatory, Palisades, NY, and Nat. Mar. Fish. Serv., Silver Spring, MD. 98 p.
Heide-Jørgensen, M.P., D. Bloch, E. Stefansson, B. Mikkelsen, L.H. Ofstad, and R. Dietz. 2002. Diving behaviour
of long-finned pilot whales Globicephala melas around the Faroe Islands. Wildl. Biol. 8:307-313.
Heyning, J.E. 1989. Cuvier‘s beaked whale Ziphius cavirostris G. Cuvier, 1823. p. 289-308 In: S.H. Ridgway and
R.J. Harrison (eds.), Handbook of marine mammals, Vol. 4. River dolphins and the larger toothed whales.
Academic Press, San Diego, CA. 444 p.
Heyning, J.E. and W.F. Perrin. 1994. Evidence for two species of common dolphins (genus Delphinus) from the
Eastern North Pacific. Contribut. Sci. 442:1-35.
Hildebrand, J.A. 2005. Impacts of anthropogenic sound. p. 101-124 In: J.E. Reynolds, W.F. Perrin, R.R. Reeves,
S. Montgomery, and T. Ragen (eds.), Marine mammal research: conservation beyond crisis. Johns Hopkins
Univ. Press, Baltimore, MD. 223 p.
Hoelzel, A.R., C.W. Potter, and P.B. Best. 1998. Genetic differentiation between parapatric ‗nearshore‘ and
‗offshore‘ populations of the bottlenose dolphin. Proc. R. Soc Lond. B 265:1177-1183.
Hogarth, W.T. 2002. Declaration of William T. Hogarth in opposition to plaintiff‘s motion for temporary restrain-
ing order, 23 October 2002. Civ. No. 02-05065-JL. U.S. District Court, Northern District of California, San
Francisco Div.
Holst, M. and J. Beland. 2008. Marine mammal and sea turtle monitoring during Lamont-Doherty Earth
Observatory‘s seismic testing and calibration study in the northern Gulf of Mexico, November 2007–
February 2008. LGL Rep. TA4295-2. Rep. from LGL Ltd., King City, Ont., for Lamont-Doherty Earth
Observatory of Columbia Univ., Palisades, NY, and Nat. Mar. Fish. Serv., Silver Spring, MD. 77 p.
Holst, M. and M.A. Smultea. 2008. Marine mammal and sea turtle monitoring during Lamont-Doherty Earth
Observatory‘s marine seismic program off Central America, February–April 2008. LGL Rep. TA4342-3.
Rep. from LGL Ltd., King City, Ont., for Lamont-Doherty Earth Observatory of Columbia Univ., Palisades,
NY, and Nat. Mar. Fish. Serv., Silver Spring, MD. 133 p.
Holst, M., M.A. Smultea, W.R. Koski, and B. Haley. 2005a. Marine mammal and sea turtle monitoring during
Lamont-Doherty Earth Observatory‘s marine seismic program off the Northern Yucatán Peninsula in the
Southern Gulf of Mexico, January–February 2005. LGL Rep. TA2822-31. Rep. by LGL Ltd., King City,
Ont., for Lamont-Doherty Earth Observatory of Columbia Univ., Palisades, NY, and Nat. Mar. Fish. Serv.,
Silver Spring, MD. 96 p.
Holst, M., M.A. Smultea, W.R. Koski, and B. Haley. 2005b. Marine mammal and sea turtle monitoring during
Lamont-Doherty Earth Observatory‘s marine seismic program in the Eastern Tropical Pacific Ocean off
Central America, November–December 2004. LGL Rep. TA2822-30. Rep. from LGL Ltd., King City, Ont.,
for Lamont-Doherty Earth Observatory of Columbia Univ., Palisades, NY, and Nat. Mar. Fish. Serv., Silver
Spring, MD. 125 p.
Holst, M., W.J. Richardson, W.R. Koski, M.A. Smultea, B. Haley, M.W. Fitzgerald, and M. Rawson. 2006. Effects
of large and small-source seismic surveys on marine mammals and sea turtles. Abstract. Presented at Am.

VI. Literature Cited
Environmental Assessment for SIO ETP Cruise, 2010 Page 87
Geophys. Union - Soc. Explor. Geophys. Joint Assembly on Environ. Impacts from Marine Geophys. &
Geological Studies - Recent Advances from Academic & Industry Res. Progr., Baltimore, MD, May 2006.
Horwood, J. 1987. The sei whale: population biology, ecology, and management. Croom Helm, Beckenham, Kent,
U.K. 375 p.
IAGC (International Association of Geophysical Contractors). 2004. Further analysis of 2002 Abrolhos Bank,
Brazil humpback whale strandings coincident with seismic surveys. Int. Assoc. Geophys. Contr., Houston,
TX.
Ireland, D., M. Holst, and W.R. Koski. 2005. Marine mammal monitoring during Lamont-Doherty Earth
Observatory‘s seismic program off the Aleutian Islands, Alaska, July–August 2005. LGL Report TA4089-3.
Rep. by LGL Ltd., King City, Ont., for Lamont-Doherty Earth Observatory of Columbia University,
Palisades, NY, and Nat. Mar. Fish. Serv., Silver Spring, MD.
IATTC (Inter-American Tropical Tuna Commission 0. 2008. Annual report of the Inter-American Tropical Tuna
Commission 2008. IATTC, La Jolla, CA. 100 p. Accessed on 11 May 2010 at
http://www.iattc.org/PDFFiles2/IATTC-Annual-Report-2008.pdf.
IUCN (The World Conservation Union). 2010. IUCN Red List of Threatened Species, Version 2010.1. Accessed
on 11 May 2010 at http://www.iucnredlist.org.
IWC (International Whaling Commission). 2007. Report of the standing working group on environmental
concerns. Annex K to Report of the Scientific Committee. J. Cetac. Res. Manage. 9 (Suppl.):227-260.
IWC (International Whaling Commission). 2010. IWC members and commissioners. Accessed on 11 May 2010 at
http://www.iwcoffice.org/commission/members.htm.
Jackson, A., T. Gerrodette, S. Chivers, M. Lynn, S. Rankin, and S. Mesnick. 2008. Marine mammal data collected
during a survey in the Eastern Tropical Pacific Ocean aboard the NOAA ships David Starr Jordan and
MacArthur II, July 28–December 7 2006. NOAA Tech. Memo. TM-NMFS-SWFSC-421. Southwest
Fisheries Science Center, National Marine Fisheries Service, La Jolla, CA. 45 p.
Jacquet, N. and H. Whitehead. 1996. Scale-dependent correlation of sperm whale distribution with environmental
features and productivity in the South Pacific. Mar. Ecol. Prog. Ser. 135(1-3):1-9.
Jefferson, T.A., M.A. Webber, and R.L. Pitman. 2008. Marine mammals of the world—A comprehensive guide to
their identification. Elsevier, Academic Press, Amsterdam, Holland. 573 p.
Jepson, P.D., M. Arbelo, R. Deaville, I.A.P. Patterson, P. Castro, J.R. Baker, E. Degollada, H.M. Ross, P. Herráez,
A.M. Pocknell, F. Rodríguez, F.E. Howie, A. Espinosa, R.J. Reid, J.R. Jaber, V. Martin, A.A. Cunningham,
and A. Fernández. 2003. Gas-bubble lesions in stranded cetaceans. Nature 425(6958):575-576.
Jochens, A., D. Biggs, K. Benoit-Bird, D. Engelhaupt, J. Gordon, C. Hu, N. Jaquet, M. Johnson, R. Leben, B. Mate,
P. Miller, J. Ortega-Ortiz, A. Thode, P. Tyack, and B. Würsig. 2008. Sperm whale seismic study in the Gulf
of Mexico: synthesis report. OCS Study MMS 2008-006. Rep. from Dep. Oceanogr., Texas A & M Univ.,
College Station, TX, for U.S. Minerals Manage. Serv., Gulf of Mexico OCS Reg., New Orleans, LA. 341 p.
Johnson, M., P.T. Madsen, W.M.X. Zimmer, N. Aguilar de Soto, and P.L. Tyack. 2004. Beaked whales echolocate
on prey. Proc. Royal Soc.Lond. Ser. B Suppl. 04BL0042.S1-S4.
Johnson, S.R., W.J. Richardson, S.B. Yazvenko, S.A. Blokhin, G. Gailey, M.R. Jenkerson, S.K. Meier, H.R.
Melton, M.W. Newcomer, A.S. Perlov, S.A. Rutenko, B. Würsig, C.R. Martin, and D.E. Egging. 2007. A
western gray whale mitigation and monitoring program for a 3-D seismic survey, Sakhalin Island, Russia.
Environ. Monit. Assess. 134(1-3):1-19. doi: 10.1007/s10661-007-9813-0.
Kastak, D., R.L. Schusterman, B.L. Southall, and C.J. Reichmuth. 1999. Underwater temporary threshold shift
induced by octave-band noise in three species of pinnipeds. J. Acoust. Soc. Am. 106(2):1142-1148.

VI. Literature Cited
Environmental Assessment for SIO ETP Cruise, 2010 Page 88
Kastak, D., B.L. Southall, R.J. Schusterman, and C. Reichmuth. 2005. Underwater temporary threshold shift in
pinnipeds: effects of noise level and duration. J. Acoust. Soc. Amer. 118(5):3154-3163.
Kato, H. 2002. Bryde‘s whales. . p. 171-176 In: W. F. Perrin, B. Würsig, and H. G. M. Thewissen (eds.),
Encyclopedia of marine mammals. Academic Press, San Diego, CA. 1414 p.
Kenney, R.D. and H.E. Winn. 1987. Cetacean high-use habitats of the northeast United States continental shelf.
Fish. Bull. 84:345-357.
Ketten, D.R. 1995. Estimates of blast injury and acoustic trauma zones for marine mammals from underwater
explosions. p. 391-407 In: Kastelein, R.A., J.A. Thomas, and P.E. Nachtigall (eds.), Sensory systems of
aquatic mammals. De Spil Publ., Woerden, Netherlands. 588 p.
Ketten, D.R., J. Lien, and S. Todd. 1993. Blast injury in humpback whale ears: evidence and implications. J.
Acoust. Soc. Am. 94(3, Pt. 2):1849-1850.
Ketten, D.R., J. O‘Malley, P.W.B. Moore, S. Ridgway, and C. Merigo. 2001. Aging, injury, disease, and noise in
marine mammal ears. J. Acoust. Soc. Am. 110(5, Pt. 2):2721.
Kinzey, D., T. Gerrodette, J. Barlow, A. Dizon, W. Perryman, P. Olson, and A. Von Saunder. 1999. Marine
mammal data collected during a survey in the eastern tropical Pacific Ocean aboard the NOAA ships
McArthur and David Starr Jordan and the UNOLS ship Endeavor July 31-December 9, 1998. NOAA Tech.
Memo. NOAA-TM-NMFS-SWFSC-283. Southwest Fisheries Science Center, National Marine Fisheries
Service, La Jolla, CA. 113 p.
Kinzey, D., T. Gerrodette, J. Barlow, A. Dizon, W. Perryman, and P. Olson. 2000. Marine mammal data collected
during a survey in the eastern tropical Pacific Ocean aboard the NOAA ships McArthur and David Starr
Jordan, July 28-December 9, 1998. NOAA Tech. Memo. NOAA-TM-NMFS-SWFSC-293. Southwest
Fisheries Science Center, National Marine Fisheries Service, La Jolla, CA. 89 p.
Kinzey, D., T. Gerrodette, A. Dizon, W. Perryman, P. Olson, and S. Rankin. 2001. Marine mammal data collected
during a survey in the eastern tropical Pacific Ocean aboard the NOAA ships McArthur and David Starr
Jordan, July 28-December 9, 2000. NOAA Tech. Memo. NOAA-TM-NMFS-SWFSC-303. Southwest
Fisheries Science Center, National Marine Fisheries Service, La Jolla, CA. 100 p.
Klatsky, L.J., R.S. Wells, and J.C. Sweeney. 2007. Offshore bottlenose dolphins (Tursiops truncatus): Movement
and dive behavior near the Bermuda Pedestal. J. Mamm. 88:59-66.
Kremser, U., P. Klemm, and W.D. Kötz. 2005. Estimating the risk of temporary acoustic threshold shift, caused by
hydroacoustic devices, in whales in the Southern Ocean. Antarctic Sci. 17(1):3-10.
Kruse, S., D.K. Caldwell, and M.C. Caldwell. 1999. Risso's dolphin Grampus griseus (G. Cuvier, 1812). p. 183-
212 In: S.H. Ridgway and R. Harrison (eds.), Handbook of marine mammals, Vol. 6. The mecond book of
dolphins and the porpoises. Academic Press, San Diego, CA. 486 p.
Kryter, K.D. 1985. The effects of noise on man, 2nd ed. Academic Press, Orlando, FL. 688 p.
Lagerquist, B.A., K.M. Stafford, and B.R. Mate. 2000. Dive characteristics of satellite-monitored blue whales
(Balaenoptera musculus) off the central California coast. Mar. Mamm. Sci. 16(2):375-391.
Laist, D.W., A.R. Knowlton, J.G. Mead, A.S. Collet, and M. Podesta. 2001. Collisions between ships and whales.
Mar. Mamm. Sci. 17:35–75.
Laurinolli, M.H. and N.A. Cochrane. 2005. Hydroacoustic analysis of marine mammal vocalization data from
ocean bottom seismometer mounted hydrophones in the Gully. p. 89-95 In: K. Lee, H. Bain and G.V. Hurley
(eds.) Acoustic monitoring and marine mammal surveys in The Gully and Outer Scotian Shelf before and
during active seismic surveys. Environ. Stud. Res. Funds Rep. 151. 154 p. Published 2007.

VI. Literature Cited
Environmental Assessment for SIO ETP Cruise, 2010 Page 89
Leatherwood, S. and R.R. Reeves. 1983. The Sierra Club handbook of whales and dolphins. Sierra Club, San
Francisco, CA.
Leatherwood, S., R.R. Reeves, W.F. Perrin, and W.E. Evans. 1988. Whales, dolphins and porpoises of the eastern
North Pacific and adjacent arctic waters. Dover Publications, New York, NY. 245 p.
Leatherwood, S., J.S. Grove, and A.E. Zuckerman. 1991. Dolphins of the genus Lagenorhynchus in the tropical
South Pacific. Mar. Mamm. Sci. 7(2):194-197.
Lee, T. 1993. Summary of cetacean survey data collected between the years of 1974 and 1985. NOAA Tech.
Memo. NMFS-SWFSC-181. National Marine Fisheries Service, Southwest Fisheries Science Center, La
Jolla, CA. 184 p.
Lien, J. 2002. Entrapment and entanglement. p. 394-395 In: W.F. Perrin, B. Würsig, and J.G.M. Thewissen (eds.),
Encyclopedia of marine mammals. Academic Press, San Diego, CA. 1414 p.
Ljungblad, D.K., B. Würsig, S.L. Swartz, and J.M. Keene. 1988. Observations on the behavioral responses of
bowhead whales (Balaena mysticetus) to active geophysical vessels in the Alaskan Beaufort Sea. Arctic
41(3):183-194.
Lockyer, C.H. and S.G. Brown. 1981. The migration of whales. p. 105-137 In: D.J. Aidley (ed.), Animal
migration. Soc. Exp. Biol. Sem. Ser. 13, Cambridge University Press, London, U.K.
Lucke, K., U. Siebert, P.A. Lepper, and M.-A. Blanchet. 2009. Temporary shift in masked hearing thresholds in a
harbor porpoise (Phocoena phocoena) after exposure to seismic airgun stimuli. J. Acoust. Soc. Am.
125(6):4060-4070.
Lusseau, D. and L. Bejder. 2007. The long-term consequences of short-term responses to disturbance experience
from whalewatching impact assessment. Intern. J. Comp. Psych. 20(2-3):228-236.
Mackintosh, N.A. 1965. The stocks of whales. Fishing News, London.
Mackintosh, N.A. 1966. The distribution of southern blue and fin whales. p. 125-144 In: K.S. Norris (ed.),
Whales, dolphins and porpoises. University of California Press, Berkeley and Los Angeles, CA. 789 p.
MacLean, S.A. and B. Haley. 2004. Marine mammal monitoring during Lamont-Doherty Earth Observatory's
seismic study in the Støregga Slide area of the Norwegian Sea, August–September 2003. LGL Rep.
TA2822-20. Rep. from LGL Ltd., King City, Ont., for Lamont-Doherty Earth Observatory, Palisades, NY,
and Nat. Mar. Fish. Serv., Silver Spring, MD. 59 p.
MacLean, S.A. and W.R. Koski. 2005. Marine mammal monitoring during Lamont-Doherty Earth Observatory's
seismic program in the Gulf of Alaska, August–September 2004. LGL Rep. TA2822-28. Rep. by LGL Ltd.,
King City, Ont., for Lamont-Doherty Earth Observatory of Columbia Univ., Palisades, NY, and Nat. Mar.
Fish. Serv., Silver Spring, MD. 102 p.
MacLeod, C.D. and A. D‘Amico. 2006. A review of beaked whale behaviour and ecology in relation to assessing
and mitigating impacts of anthropogenic noise. J. Cetacean Res. Manage. 7(3): 211-221
MacLeod, C.D. and G. Mitchell. 2006. Known key areas for beaked whales around the world. J. Cetacean Res.
Manage. 7: 309-320.
MacLeod, C.D. and A.F. Zuur. 2005. Habitat utilization by Blainville's beaked whales off Great Abaco, northern
Bahamas, in relation to seabed topography. Mar. Biol. 147:1-11.
MacLeod, C.D., N. Hauser, and H. Peckham. 2004. Diversity, relative density and structure of the cetacean com-
munity in summer months east of Great Abaco, Bahamas. J. Mar. Biol. Assoc. U.K. 84:469-474.
Madsen, P.T., B. Møhl, B.K. Nielsen, and M. Wahlberg. 2002. Male sperm whale behavior during exposures to
distant seismic survey pulses. Aquat. Mamm. 28(3):231-240.

VI. Literature Cited
Environmental Assessment for SIO ETP Cruise, 2010 Page 90
Madsen, P.T., M. Johnson, P.J.O. Miller, N. Aguilar de Soto, J. Lynch, and P.L. Tyack. 2006. Quantitative mea-
sures of air gun pulses recorded on sperm whales (Physeter macrocephalus) using acoustic tags during
controlled exposure experiments. J. Acoust. Soc. Am. 120(4):2366–2379.
Malakoff, D. 2002. Suit ties whale deaths to research cruise. Science 298(5594):722-723.
Malme, C.I. and P.R. Miles. 1985. Behavioral responses of marine mammals (gray whales) to seismic discharges.
p. 253-280 In: G.D. Greene, F.R. Engelhardt, and R.J. Paterson (eds.), Proc. workshop on effects of
explosives use in the marine environment, Jan. 1985, Halifax, N.S. Tech. Rep. 5. Can. Oil & Gas Lands
Admin., Environ. Prot. Br., Ottawa, Ont. 398 p.
Malme, C.I., P.R. Miles, C.W. Clark, P. Tyack, and J.E. Bird. 1984. Investigations of the potential effects of
underwater noise from petroleum industry activities on migrating gray whale behavior/Phase II: January
1984 migration. BBN Rep. 5586. Rep. by Bolt Beranek & Newman Inc., Cambridge, MA, for U.S.
Minerals Manage. Serv., Anchorage, AK. Var. pag. NTIS PB86-218377.
Malme, C.I., P.R. Miles, P. Tyack, C.W. Clark, and J.E. Bird. 1985. Investigation of the potential effects of
underwater noise from petroleum industry activities on feeding humpback whale behavior. BBN Rep. 5851;
OCS Study MMS 85-0019. Rep. by BBN Labs Inc., Cambridge, MA, for U.S. Minerals Manage. Serv.,
Anchorage, AK. Var. pag. NTIS PB86-218385.
Malme, C.I., B. Würsig, J.E. Bird, and P. Tyack. 1986. Behavioral responses of gray whales to industrial noise:
feeding observations and predictive modeling. Outer Cont. Shelf Environ. Assess. Progr., Final Rep. Princ.
Invest., NOAA, Anchorage, AK 56(1988):393-600. BBN Rep. 6265. 600 p. OCS Study MMS 88-0048;
NTIS PB88-249008.
Malme, C.I., B. Würsig, J.E. Bird, and P. Tyack. 1988. Observations of feeding gray whale responses to controlled
industrial noise exposure. p. 55-73 In: Sackinger, W.M., M.O. Jeffries, J.L. Imm, and S.D. Treacy (eds.),
Port and ocean engineering under arctic conditions, Vol. II. Geophysical Inst., Univ. Alaska, Fairbanks, AK.
111 p.
Martínez-Fernández, D., A. Montero-Cordero and L. May-Collado. 2005. Occurrence of Pseudorca crassidens in
the pacific coastal waters of Costa Rica. Poster presentation. 16th Bien. Conf. Biol. Mar. Mamm., 12–16
December 2005, San Diego, CA.
Mate, B.R., B.A. Lagerquist, and J. Calambokidis. 1999. Movements of North Pacific blue whales during the
feeding season off southern California and their southern fall migration. Mar. Mamm. Sci. 15(4):1246-
1257.
May-Collado, L., T. Gerrodette, J. Calambokidis, K. Rasmussen, and I. Sereg. 2005. Patterns of cetacean sighting
distribution in the Pacific Exclusive Economic Zone of Costa Rica based on data collected from 1979-2001.
Rev Biol. Trop. 53:249-263.
McAlpine, D.F. 2002. Pygmy and dwarf sperm whales Kogia breviceps and K. sima. p. 1007-1009 In: W.F.
Perrin, B. Würsig, and J.G.M. Thewissen (eds.), Encyclopedia of marine mammals. Academic Press, San
Diego, CA. 1414 p.
McCauley, R.D., M.-N. Jenner, C. Jenner, K.A. McCabe, and J. Murdoch. 1998. The response of humpback whales
(Megaptera novaeangliae) to offshore seismic survey noise: preliminary results of observations about a
working seismic vessel and experimental exposures. APPEA (Austral. Petrol. Product. Explor. Assoc.) J.
38:692-707.
McCauley, R.D., J. Fewtrell, A.J. Duncan, C. Jenner, M.-N. Jenner, J.D. Penrose, R.I.T. Prince, A. Adhitya, J.
Murdoch, and K. McCabe. 2000a. Marine seismic surveys: analysis of airgun signals; and effects of air gun
exposure on humpback whales, sea turtles, fishes and squid. Rep. from Centre for Marine Science and
Technology, Curtin Univ., Perth, W.A., for Austral. Petrol. Prod. Assoc., Sydney, N.S.W. 188 p.

VI. Literature Cited
Environmental Assessment for SIO ETP Cruise, 2010 Page 91
McCauley, R.D., J. Fewtrell, A.J. Duncan, M.-N. Jenner, C. Jenner, R.I.T. Prince, A. Adhitya, K. McCabe, and J.
Murdoch. 2000b. Marine seismic surveys – a study of environmental implications. APPEA (Austral.
Petrol. Product. Explor. Assoc.) J. 40:692-708.
McDonald, M.A., J.A. Hildebrand, and S.C. Webb. 1995. Blue and fin whales observed on a seafloor array in the
Northeast Pacific. J. Acoust. Soc. Am. 98(2 Pt.1):712-721.
Mead, J.G. 1989. Beaked whales of the genus Mesoplodon. p. 349-430 In: S.H. Ridgway and R.J. Harrison (eds.),
Handbook of marine mammals, Vol. 4, River dolphins and the larger toothed whales. Academic Press, San
Diego, CA. 416 p.
Miller, G.W., R.E. Elliott, W.R. Koski, V.D. Moulton, and W.J. Richardson. 1999. Whales. p. 5-1 to 5-109 In:
Richardson, W.J. (ed.) Marine mammal and acoustical monitoring of Western Geophysical's open-water
seismic program in the Alaskan Beaufort Sea, 1998. LGL Rep. TA2230-3. Rep. by LGL Ltd., King City,
Ont., and Greeneridge Sciences Inc., Santa Barbara, CA, for Western Geophysical, Houston, TX, and U.S.
Nat. Mar. Fish. Serv., Anchorage, AK, and Silver Spring, MD. 390 p.
Miller, G.W., V.D. Moulton, R.A. Davis, M. Holst, P. Millman, A. MacGillivray, and D. Hannay. 2005.
Monitoring seismic effects on marine mammals—southeastern Beaufort Sea, 2001–2002. p. 511-542 In:
Armsworthy, S.L., P.J. Cranford, and K. Lee (eds.) Offshore oil and gas environmental effects
monitoring/Approaches and technologies. Battelle Press, Columbus, OH.
Miller, P.J.O., M.P. Johnson, P.T. Madsen, N. Biassoni, M. Quero, and P.L. Tyack. 2009. Using at-sea experiments
to study the effects of airguns on the foraging behavior of sperm whales in the Gulf of Mexico. Deep-Sea
Res. I 56(7):1168-1181.
Miyazaki, N. and W.F. Perrin. 1994. Rough-toothed dolphin Steno bredanensis (Lesson, 1828). p. 1-21 In: S.H.
Ridgway and R.J. Harrison (eds.), Handbook of marine mammals, Vol. 5: The first book of dolphins.
Academic Press, San Diego, CA. 416 p.
Mizroch, S.A., D.W. Rice, and J.M. Breiwick. 1984. The blue whale, Balaenoptera musculus. Mar. Fish. Rev.
46(4)15-19.
Moore, S.E. and J.T. Clarke. 2002. Potential impact of offshore human activities on gray whales. J. Cetac. Res.
Manage. 4(1):19-25.
Moulton, V.D. and J.W. Lawson. 2002. Seals, 2001. p. 3-1 to 3-48 In: Richardson, W.J. (ed.), Marine mammal
and acoustical monitoring of WesternGeco‘s open water seismic program in the Alaskan Beaufort Sea, 2001.
LGL Rep. TA2564-4. Rep. by LGL Ltd., King City, Ont., and Greeneridge Sciences Inc., Santa Barbara,
CA, for WesternGeco, Houston, TX, and Nat. Mar. Fish. Serv., Anchorage, AK, and Silver Spring, MD.
Moulton, V.D. and G.W. Miller. 2005. Marine mammal monitoring of a seismic survey on the Scotian Slope, 2003.
p. 29-40 In: Lee, K., H. Bain, and G.V. Hurley (eds.), Acoustic monitoring and marine mammal surveys in
the Gully and Outer Scotian Shelf before and during active seismic programs. Env. Stud. Res. Funds Rep.
No. 151. 154 p. + xx.
Moulton, V.D., B.D. Mactavish, and R.A. Buchanan. 2005. Marine mammal and seabird monitoring of Chevron
Canada Resources‘ 3-D seismic program on the Orphan Basin, 2004. LGL Rep. SA817. Rep. by LGL Ltd.,
St. John's, Nfld., for Chevron Canada Resources, Calgary, Alb., ExxonMobil Canada Ltd., St. John's, Nfld.,
and Imperial Oil Resources Ventures Ltd., Calgary, Alb. 90 p. + appendices.
Moulton, V.D., B.D. Mactavish, R.E. Harris, and R.A. Buchanan. 2006a. Marine mammal and seabird monitoring
of Chevron Canada Limited's 3-D seismic program on the Orphan Basin, 2005. LGL Rep. SA843. Rep. by
LGL Ltd., St. John's, Nfld., for Chevron Canada Resources, Calgary, Alb., ExxonMobil Canada Ltd., St.
John's, Nfld., and Imperial Oil Resources Ventures Ltd., Calgary, Alb. 111 p. + appendices.

VI. Literature Cited
Environmental Assessment for SIO ETP Cruise, 2010 Page 92
Moulton, V.D., B.D. Mactavish, and R.A. Buchanan. 2006b. Marine mammal and seabird monitoring of Conoco-
Phillips‘ 3-D seismic program in the Laurentian Sub-basin, 2005. LGL Rep. SA849. Rep. by LGL Ltd., St.
John‘s, Nfld., for ConocoPhillips Canada Resources Corp., Calgary, Alb. 97 p. + appendices.
Mullin, K.D., T.A. Jefferson, L.J. Hansen, and W. Hoggard. 1994. First sightings of melon-headed whales
(Peponocephala electra) in the Gulf of Mexico. Mar. Mamm. Sci. 10(3):342-348.
Muñoz-Hincapié, M.F., D.M. Mora-Pinto, D.M. Palacios, E.R. Secchi, and A.A. Mignucci-Giannoni. 1998. First
osteological record of the dwarf sperm whale in Colombia, with notes on the zoogeography of Kogia in
South America. Revista Acad. Colomb. Cien. 22(84):433-444.
NatureServe. 2009. NatureServe Explorer: An online encyclopedia of life [web application]. Version 7.1.
NatureServe, Arlington, VA. Accessed on 11 May 2010 at http://www.natureserve.org/explorer.
Nieukirk, S.L., K.M. Stafford, D.K. Mellinger, R.P. Dziak, and C.G. Fox. 2004. Low-frequency whale and seismic
airgun sounds recorded in the mid-Atlantic Ocean. J. Acoust. Soc. Am. 115(4):1832-1843.
NMFS (National Marine Fisheries Service). 1995. Small takes of marine mammals incidental to specified
activities; offshore seismic activities in southern California. Fed. Regist. 60(200, 17 Oct.):53753-53760.
NMFS (National Marine Fisheries Service). 1998. Recovery plan for the blue whale (Balaenoptera musculus).
Prepared by R.R. Reeves, P.J. Clapham, R.L. Brownell, Jr., and G.K. Silber for the National Marine Fisheries
Service, Silver Spring, MD. 42 p.
NMFS (National Marine Fisheries Service). 2000. Small takes of marine mammals incidental to specified
activities; marine seismic-reflection data collection in southern California/Notice of receipt of application.
Fed. Regist. 65(60, 28 Mar.):16374-16379.
NMFS (National Marine Fisheries Service). 2001. Small takes of marine mammals incidental to specified
activities; oil and gas exploration drilling activities in the Beaufort Sea/Notice of issuance of an incidental
harassment authorization. Fed. Regist. 66(26, 7 Feb.):9291-9298.
NMFS (National Marine Fisheries Service). 2005. Endangered fish and wildlife; notice of intent to prepare an
environmental impact statement. Fed. Regist. 70(7, 11 Jan.):1871-1875.
NOAA and USN (National Oceanographic and Atmospheric Administration and U.S. Navy). 2001. Joint interim
report: Bahamas marine mammal stranding event of 15–16 March 2000. U.S. Dep. Commer., Nat. Oceanic
Atmos. Admin., Nat. Mar. Fish. Serv., Sec. Navy, Assist. Sec. Navy, Installations and Environ. 51 p.
Accessed on 11 May 2010 at http://www.nmfs.noaa.gov/pr/pdfs/health/ stranding_bahamas2000.pdf.
Norris, T.F., M. McDonald, and J. Barlow. 1999. Acoustic detections of singing humpback whales (Megaptera
novaeangliae) in the eastern North Pacific during their northbound migration. J. Acoust. Soc. Am.
106(1):506-514.
Northridge, S.P. and R.J. Hofman. 1999. Marine mammal interactions with fisheries. p. 99-119 In: J.R. Twiss, Jr.
and R.R. Reeves (eds.), Conservation and management of marine mammals. Smithsonian Institution Press,
Washington, DC.
Nowacek, D.P., L.H. Thorne, D.W. Johnston, and P.L. Tyack. 2007. Responses of cetaceans to anthropogenic
noise. Mamm. Rev. 37(2):81-115.
NRC (National Research Council). 2005. Marine mammal populations and ocean noise/Determining when noise
causes biologically significant effects. U.S. Nat. Res. Counc., Ocean Studies Board, Committee on
Characterizing Biologically Significant Marine Mammal Behavior (Wartzok, D.W., J. Altmann, W. Au, K.
Ralls, A. Starfield, and P.L. Tyack). Nat. Acad. Press, Washington, DC. 126 p.
Odell, D.K. and K.M. McClune. 1999. False killer whale Pseudorca crassidens (Owen, 1846). p. 213-243 In: S.H.
Ridgway and R. Harrison (eds.), Handbook of marine mammals. Vol. 6. The second Book of dolphins and
the porpoises. Academic Press, San Diego, CA. 486 p.

VI. Literature Cited
Environmental Assessment for SIO ETP Cruise, 2010 Page 93
Olson, P.A. and S. B. Reilly. 2002. Pilot whales. p. 898-893 In: W.F. Perrin, B. Würsig, and J.G.M. Thewissen
(eds.), Encyclopedia of marine mammals. Academic Press, San Diego, CA. 1414 p.
Palacios, D.M. 1996a. On the specimen of the ginkgo-toothed beaked whale, Mesoplodon ginkgodens, from the
Galápagos Islands. Mar. Mamm. Sci. 12(3):444-446.
Palacios, D.M. 1996b. Earlier observations of presumed Galápagos sea lions, Zalophus californianus wollebaeki,
from coastal Ecuador [letter]. Mar. Mamm. Sci. 12(3):497.
Palacios, D.M. 1999. Blue whale (Balaenoptera musculus) occurrence off the Galápagos Islands, 1978-1995. J.
Cetac. Res. Manage. 1(1):41-51.
Palacios, D.M., F. Félix, L. Flórez-González, J.J. Cappela, D. Chiluiza, and B.J.M. Haase. 1997. Sightings of
Galápagos sea lions (Zalophus californianus wollebaeki) on the coasts of Colombia and Ecuador.
Mammalia 61(1):114-116.
Palacios, D.M. K.M. Stafford, and F.B. Schwing. 2005. Temporal variations in blue whale acoustic detections in
relation to environmental conditions in the northeastern tropical Pacific, 1996-2002. Abstr. 16th Bienn. Conf.
Biol. Mar. Mamm., 12–16 December 2005, San Diego, CA.
Panigada, S., M. Zanardelli, S. Canese and M. Jahoda. 1999. How deep can baleen whales dive? Mar. Ecol. Prog.
Ser. 187:309–311.
Papastavrou, V., S.C. Smith, and H. Whitehead. 1989. Diving behaviour of the sperm whale, Physeter
macrocephalus, off the Galápagos Islands. Can. J. Zool. 67(4):839-846.
Parente, C.L., M.C.C. Marcondes, and M.H. Engel. 2006. Humpback whale strandings and seismic surveys in
Brazil from 1999 to 2004. Working Pap. SC/58/E41. Int. Whal. Comm., Cambridge, U.K. 16 p.
Perrin, W.F. 1990. Subspecies of Stenella longirostris (Mammalia: Cetacea, Delphinidae). Proc. Biol. Soc. Wash.
103(2):453-463.
Perrin, W.F. and J.W. Gilpatrick, Jr. 1994. Spinner dolphin. p. 99-128 In: S.H. Ridgway and R. Harrison (eds.),
Handbook of marine mammals, Vol. 5. The first book of dolphins. Academic Press, San Diego, CA. 416 p.
Perrin, W.F. and A.A. Hohn. 1994. Pantropical spotted dolphin Stenella attenuata. p. 71-98 In: S.H. Ridgway and
R. Harrison (eds.), Handbook of marine mammals, Vol. 5. The first book of dolphins. Academic Press, San
Diego, CA. 416 p.
Perrin, W.F. and W.A. Walker. 1975. The rough-toothed porpoise, Steno bredanensis, in the eastern tropical
Pacific. J. Mammal. 56:905-907.
Perrin, W.F., M.D. Scott, G.J. Walker, and V.L. Cass. 1985. Review of geographical stocks of tropical dolphins
(Stenella spp. and Delphinus delphis) in the eastern Pacific. NOAA Tech. Rep. NMFS 28. 28 p.
Perrin, W.F., C.E. Wilson, and F.I. Archer II. 1994a. Striped dolphin Stenella coeruleoalba (Meyen, 1833). p. 129-
159 In: S. H. Ridgway and R. J. Harrison (eds.), Handbook of marine mammals, Vol. 5. The first book of
dolphins. Academic Press, San Diego, CA. 416 p.
Perrin, W.F., S. Leatherwood, and A. Collet. 1994b. Fraser's dolphin Lagenodelphis hosei Fraser, 1956. p. 225-
240 In: S.H. Ridgway and R. Harrison (eds.), Handbook of marine mammals, Vol. 5. The first book of
dolphins. Academic Press, London, U.K. 416 p.
Perry, S.L., D.P. DeMaster, and G.K. Silber. 1999. The great whales: history and status of six species listed as
endangered under the U.S. Endangered Species Act of 1973. Mar. Fish. Rev. 61:1-74.
Perryman, W.L. 2002. Melon-headed whale—Peponocephala electra. p. 733-735 In: W.F. Perrin, B. Würsig, and
J.G.M. Thewissen (eds.), Encyclopedia of marine mammals. Academic Press, San Diego, CA. 1414 p.

VI. Literature Cited
Environmental Assessment for SIO ETP Cruise, 2010 Page 94
Perryman, W.L. and T.C. Foster. 1980. Preliminary report of predation by small whales, mainly the false killer
whale, Pseudorca crassidens, on dolphins (Stenella spp. and Delphinus delphis) in the eastern tropical
Pacific. Admin. Rep. LJ-80-05. Southwest Fisheries Science Center, National Marine Fisheries Service, La
Jolla, CA. 9 p.
Perryman, W.L. and M.S. Lynn. 1993. Identification of geographic forms of common dolphin (Delphinus delphis)
from aerial photogrammetry. Mar. Mamm. Sci. 9(2):119-137.
Perryman, W.L., D.W.K. Au, S. Leatherwood, and T.A. Jefferson. 1994. Melon-headed whale Peponocephala
electra Gray, 1846. p. 363-386 In: S.H. Ridgway and R. Harrison (eds.), Handbook of marine mammals,
Vol. 5. The first book of dolphins. Academic Press, London, U.K. 416 p.
Pierson, M.O., J.P. Wagner, V. Langford, P. Birnie, and M.L. Tasker. 1998. Protection from, and mitigation of, the
potential effects of seismic exploration on marine mammals. Chapter 7 In: Tasker, M.L. and C. Weir (eds.),
Proceedings of the seismic and marine mammals workshop, 23–25 June 1998, London, U.K.
Pitman, R.L. 2002. Mesoplodont whales Mesoplodon spp. p. 738-742 In: W.F. Perrin, B. Würsig, and J.G.M.
Thewissen (eds.), Encyclopedia of marine mammals. Academic Press, San Diego, CA. 1414 p.
Pitman, R.L. and L.T. Ballance. 1992. Parkinson‘s petrel distribution and foraging ecology in the eastern tropical
Pacific: Aspects of an exclusive feeding relationships with dolphins. Condor 94(4):825-835.
Pitman, R.L. and M.S. Lynn. 2001. Biological observations of an unidentified Mesoplodont whale in the eastern
tropical Pacific and probable identity: Mesoplodon peruvianus. Mar. Mamm. Sci. 17(3): 648-657.
Pitman, R.L., A. Aguayo L., and J. Urbán R. 1987. Observations of an unidentified beaked whale (Mesoplodon sp.)
in the eastern tropical Pacific. Mar. Mamm. Sci. 3(4):345-352.
Pitman, R.L., D.M. Palacios, P.L.R. Brennan, B.J. Brennan, K.C. Balcomb, III, and T. Miyashita. 1999. Sightings
and possible identity of a bottlenose whale in the tropical Indo-Pacific: Indopacetus pacificus? Mar.
Mamm. Sci. 15(2): 513-518.
Polacheck, T. 1987. Relative abundance, distribution and inter-specific relationship of cetacean schools in the
Eastern Tropical Pacific. Mar. Mamm. Sci. 3(1):54-77.
Potter, J.R., M. Thillet, C. Douglas, M.A. Chitre, Z. Doborzynski, and P.J. Seekings. 2007. Visual and passive
acoustic marine mammal observations and high-frequency seismic source characteristics recorded during a
seismic survey. IEEE J. Oceanic Eng. 32(2):469-483.
Rasmussen, K., J. Calambokidis, and G.H. Steiger. 2004. Humpback whales and other marine mammals off Costa
Rica and surrounding waters, 1996-2003. Report of the Oceanic Society 2003 field season in cooperation
with elderhostel volunteers. Cascadia Research, Olympia, WA. 24 p.
Rasmussen, K., D.M. Palacios, J. Calambokidis, M.T. Saborio, L. Dalla Rosa, E.R. Secchi, G.H. Steiger, J.M. Allen,
and G.S. Stone. 2007. Southern Hemisphere humpback whales wintering off Central America: insights from
water temperature into the longest mammalian migration. Biol. Lett. 3:302-305.
Read, A.J., K. Van Waerebeek, J.C. Reyes, J.S. McKinnon, and L.C. Lehman. 1998. The exploitation of small
cetaceans in Coastal Peru. Biol. Conserv. 46:53-70.
Read, A.J., P.N. Halpin, L.B. Crowder, B.D. Best, and E. Fujioka (eds.). 2009. OBIS-SEAMAP: Mapping marine
mammals, birds and turtles. World Wide Web electronic publication. Accessed on 17 April 2010 at
http://seamap.env.duke.edu/prod/serdp/serdp_map.php.
Reeves, R.R., B.S. Stewart, P.J. Clapham, and J.A. Powell. 2002. Guide to marine mammals of the world.
Chanticleer Press, New York, NY. 527 p.
Reilly, S.B. 1990. Seasonal changes in distribution and habitat differences among dolphins in the eastern tropical
Pacific. Mar. Ecol. Prog. Ser. 66(1-2):1-11.

VI. Literature Cited
Environmental Assessment for SIO ETP Cruise, 2010 Page 95
Reilly, S.B. and V.G. Thayer. 1990. Blue whale (Balaenoptera musculus) distribution in the eastern tropical
Pacific. Mar. Mamm. Sci. 6:265-277.
Reilly, S.B. and P.C. Fiedler. 1994. Interannual variability of dolphin habitats in the eastern tropical Pacific. I:
Research vessel surveys, 1986–1990. Fish. Bull. 92(2):434-450.
Rendell, L.E. and J.C.D. Gordon. 1999. Vocal response of long-finned pilot whales (Globicephala melas) to
military sonar in the Ligurian Sea. Mar. Mamm. Sci. 15(1):198-204.
Reyes, J.C., J.G. Mead, and K. Van Waerebeek. 1991. A new species of beaked whale Mesoplodon peruvianus sp.
n. (Cetacea: Ziphiidae) from Peru. Mar. Mamm. Sci. 7(1):1-24.
Rice, D.W. 1989. Sperm whale Physeter macrocephalus Linnaeus, 1758. p. 177-233 In: S.H. Ridgway and R.
Harrison (eds.), Handbook of marine mammals, Vol. 4. River dolphins and the larger toothed whales.
Academic Press, San Diego, CA. 444 p.
Rice, D.W. 1998. Marine mammals of the world, systematics and distribution. Spec. Publ. 4. Soc. Mar. Mammal.,
Allen Press, Lawrence, KS. 231 p.
Richardson, W.J., B. Würsig, and C.R. Greene. 1986. Reactions of bowhead whales, Balaena mysticetus, to
seismic exploration in the Canadian Beaufort Sea. J. Acoust. Soc. Am. 79(4):1117-1128.
Richardson, W.J., R.A. Davis, C.R. Evans, D.K. Ljungblad, and P. Norton. 1987. Summer distribution of bowhead
whales, Balaena mysticetus, relative to oil industry activities in the Canadian Beaufort Sea, 1980–84. Arctic
40(2):93-104.
Richardson, W.J., C.R. Greene, Jr., C.I. Malme, and D.H. Thomson. 1995. Marine mammals and noise. Academic
Press, San Diego. 576 p.
Richardson, W.J., G.W. Miller, and C.R. Greene, Jr. 1999. Displacement of migrating bowhead whales by sounds
from seismic surveys in shallow waters of the Beaufort Sea. J. Acoust. Soc. Am. 106(4, Pt. 2):2281
(Abstract).
Richardson, W.J., M. Holst, W.R. Koski and M. Cummings. 2009. Responses of cetaceans to large-source seismic
surveys by Lamont-Doherty Earth Observatory. p. 213 In: Abstr. 18th Bienn. Conf. Biol. Mar. Mamm.,
October 2009, Québec City, Que. 306 p.
Ritter, F. and B. Brederlau. 1999. Behavioural observations of dense beaked whales (Mesoplodon densirostris) off
La Gomera, Canary Islands (1995–1997). Aquat. Mamm. 25(2):55-61.
Rodríguez-Fonseca, J. 2001. Diversity and distribution of Costa Rica's cetaceans (Cetacea: Delphinidae,
Physeteridae, Ziphiidae and Balaenopteridae). Rev. Biol. Trop. 49, Suppl. 2:135-143. (Spanish, Engl.
summ.)
Rodríguez-Fonseca, J. and P. Cubero-Pardo. 2001. Cetacean strandings in Costa Rica (1966-1999). Rev. Biol.
Trop. 49(2):667-672.
Rodríguez-Herrera, B., F.A. Chinchilla, and L.J. May-Collado. 2002. Lista de especies, endemismo y conservación
de los de mamiferos de Costa Rica. Rev. Mex. Mastozoologia 6:19-41.
Romero, A., A.I. Agudo, S.M. Green, and G. Notarbartolo di Sciara. 2001. Cetaceans of Venezuela: their distribu-
tion and conservation status. NOAA Tech. Rep. NMFS 151. U.S. Dep. Comm., Seattle, WA. 60 p.
Rosales, M.L. and S. Escorza-Trefiño. 2005. Population structure and sex biased dispersal of spotted dolphins
(Stenella attenuata) in the eastern tropical Pacific. 2005. Abstr. 16th Bienn. Conf. Biol. Mar. Mamm., 12–16
December 2005, San Diego, CA.
Ross, G. J.B. and S. Leatherwood. 1994. Pygmy killer whale Feresa attenuata Gray, 1874. p. 387-404 In: S.H.
Ridgway and R.J. Harrison (eds.), Handbook of marine mammals, Vol. 5. The first book of dolphins.
Academic Press, San Diego, CA. 416 p.

VI. Literature Cited
Environmental Assessment for SIO ETP Cruise, 2010 Page 96
Santillán L., M. Roca, M. Apaza, L. Rosa de Oliveira, and K. Ontón. 2004. New record of mother-calf pair of
southern right whale, Eubalaena australis, off the Peruvian coast. LAJAM 3: 83-84.
Schlundt, C.E., J.J. Finneran, D.A. Carder, and S.H. Ridgway. 2000. Temporary shift in masking hearing
thresholds of bottlenose dolphins, Tursiops truncatus, and white whales, Delphinapterus leucas, after
exposure to intense tones. J. Acoust. Soc. Am. 107(6):3496-3508.
Scott, M.D. and S.J. Chivers. 1990. Distribution and herd structure of bottlenose dolphins in the eastern tropical
Pacific Ocean. p. 387-402. In: S. Leatherwood and R.R. Reeves (eds.), The bottlenose dolphin. Academic
Press, San Diego, CA. 653 p.
Scott, M.D., A.A. Hohn, A.J. Westgate, J.R. Nicolas, B.R. Whitaker, and W.B. Cambell. 2001. A note on the
release and tracking of a rehabilitated pygmy sperm whale (Kogia breviceps). J. Cetac. Res. Manage. 3:87-
94.
Sergeant, D.E. 1977. Stocks of fin whales Balaenoptera physalus L. in the North Atlantic Ocean. Rep. Int. Whal.
Comm. 27:460-473.
Shane, S.H., R.S. Wells, and B. Würsig. 1986. Ecology, behavior and social organization of the bottlenose dolphin:
a review. Mar. Mamm. Sci. 2:34-63.
Simard, Y., F. Samaran, and N. Roy. 2005. Measurement of whale and seismic sounds in the Scotian Gully and
adjacent canyons in July 2003. p. 97-115 In: K. Lee, H. Bain, and C.V. Hurley (eds.), Acoustic monitoring
and marine mammal surveys in The Gully and Outer Scotian Shelf before and during active seismic surveys.
Environ. Stud. Res. Funds Rep. 151. 154 p (Published 2007).
Simmonds, M. P. and L.F. Lopez-Jurado. 1991. Whales and the military. Nature 351(6326):448.
Smith, S.D. and H. Whitehead. 1999. Distribution of dolphins in Galápagos waters. Mar. Mam. Sci. 15(2):550-
555.
Smith, S.C. and H. Whitehead. 2000. The diet of Galápagos sperm whales Physeter macrocephalus as indicated by
fecal sample analysis. Mar. Mamm. Sci. 16(2):315-325.
Smith, T.D. 1983. Changes in size of three dolphin (Stenella spp.) populations in the eastern tropical Pacific. Fish.
Bull. 81(1):1-13.
Smultea, M.A. and M. Holst. 2003. Marine mammal monitoring during Lamont-Doherty Earth Observatory's
seismic study in the Hess Deep area of the Eastern Equatorial Tropical Pacific, July 2003. LGL Rep.
TA2822-16. Rep. from LGL Ltd., King City, Ont., for Lamont-Doherty Earth Observatory, Palisades, NY,
and Nat. Mar. Fish. Serv., Silver Spring, MD. 68 p.
Smultea, M.A., M. Holst, W.R. Koski, and S. Stoltz. 2004. Marine mammal monitoring during Lamont-Doherty
Earth Observatory‘s seismic program in the Southeast Caribbean Sea and adjacent Atlantic Ocean, April–
June 2004. LGL Rep. TA2822-26. Rep. by LGL Ltd., King City, Ont., for Lamont-Doherty Earth
Observatory of Columbia Univ., Palisades, NY, and Nat. Mar. Fish. Serv., Silver Spring, MD. 106 p.
Southall, B.L., A.E. Bowles, W.T. Ellison, J.J. Finneran, R.L. Gentry, C.R. Greene Jr., D. Kastak, D.R. Ketten, J.H.
Miller, P.E. Nachtigall, W.J. Richardson, J.A. Thomas, and P.L. Tyack. 2007. Marine mammal noise
exposure criteria: initial scientific recommendations. Aquat. Mamm. 33(4):411-522.
Stafford, K.M. 2003. Two types of blue whale calls recorded in the Gulf of Alaska. Mar. Mamm. Sci. 19(4):682-
693.
Stafford, K.M., S.L. Nieukirk, and C.G. Fox. 1999a. Low-frequency whale sounds recorded on hydrophones
moored in the eastern tropical Pacific. J. Acoust. Soc. Am. 106(6):3687-3698.
Stafford, K.M., S.L. Nieukirk, and C.G. Fox. 1999b. An acoustic link between blue whales in the eastern tropical
Pacific and the Northeast Pacific. Mar. Mamm. Sci. 15(4):1258-1268.

VI. Literature Cited
Environmental Assessment for SIO ETP Cruise, 2010 Page 97
Stafford, K.M., S.L. Nieukirk, and C.G. Fox. 2001. Geographic and seasonal variation of blue whale calls in the
North Pacific. J. Cetac. Res. Manage. 3(1):65-76
Stafford, K.M., D.K. Mellinger, S.E. Moore, and C.G. Fox. 2007. Seasonal variability and detection range model-
ing of baleen whale calls in the Gulf of Alaska, 1999–2002. J. Acoust. Soc. Am. 122(6):3378-3390.
Stewart, B.S. and S. Leatherwood. 1985. Minke whale Balaenoptera acutorostrata Lacépède, 1804. p. 91-136 In:
S.H. Ridgway and R. Harrison (eds.), Handbook of marine mammals, Vol. 3. The sirenians and baleen
whales. Academic Press, London, U.K. 362 p.
Stone, C.J. 2003. The effects of seismic activity on marine mammals in UK waters 1998–2000. JNCC Report 323.
Joint Nature Conservancy, Aberdeen, Scotland. 43 p.
Stone, C.J. and M.L. Tasker. 2006. The effects of seismic airguns on cetaceans in UK waters. J. Cetac. Res.
Manage. 8(3):255-263.
Swartz, S.L., T. Cole, M.A. McDonald, J.A. Hildebrand, E.M. Oleson, A. Martinez, P.J. Clapham, J. Barlow, and
M. L. Jones. 2003. Acoustic and visual survey of humpback whale (Megaptera novaeangliae) distribution
in the eastern and southeastern Caribbean Sea. Caribb. J. Sci. 39(2):195-208.
Teloni, V., P.M. Johnson, P.J.O. Miller, and P.T. Madsen. 2008. Shallow food for deep divers: dynamic foraging
of male sperm whales. J. Exp. Mar. Biol. Ecol. 354(1):119-131.
Tershy B.R., J. Urbán- Ramírez, D. Breese, L. Rojas-B., and L.Y. Findley. 1993. Are fin whales resident to the
Gulf of California? Univ. Auton. Baja Calif. Sur., Rev. Invest. Cient. 1:69–71.
Thompson, D., M. Sjöberg, E.B. Bryant, P. Lovell, and A. Bjørge. 1998. Behavioural and physiological responses
of harbour (Phoca vitulina) and grey (Halichoerus grypus) seals to seismic surveys. Abstr. World Mar.
Mamm. Sci. Conf., Monaco.
Tolstoy, M., J. Diebold, S. Webb, D. Bohnenstiehl, and E. Chapp. 2004a. Acoustic calibration measurements.
Chapter 3 In: Richardson, W.J. (ed.), Marine mammal and acoustic monitoring during Lamont-Doherty Earth
Observatory's acoustic calibration study in the northern Gulf of Mexico, 2003. Revised ed. Rep. by LGL
Ltd., King City, ON, for Lamont-Doherty Earth Observ., Palisades, NY, and Nat. Mar. Fish. Serv., Silver
Spring, MD.
Tolstoy, M., J.B. Diebold, S.C. Webb, D.R. Bohenstiehl, E. Chapp, R.C. Holmes, and M. Rawson. 2004b. Broad-
band calibration of R/V Ewing seismic sources. Geophys. Res. Lett. 31:L14310. doi: 10.1029/
2004GL020234.
Trites, A.W., V. Christensen, and D. Pauly. 1997. Competition between fisheries and marine mammals for prey
and primary production in the Pacific Ocean. J. Northw. Atl. Fish. Sci. 22:173-187.
Tyack, P.L. 2009. Human-generated sound and marine mammals. Phys. Today 62(11, Nov.):39-44.
Tyack, P., M. Johnson, and P. Miller. 2003. Tracking responses of sperm whales to experimental exposures of
airguns. p. 115-120 In: A.E. Jochens and D.C. Biggs (eds.), Sperm whale seismic study in the Gulf of
Mexico/annual report: Year 1. OCS Study MMS 2003-069. Rep. by Texas A&M Univ., College Station,
TX, for U.S. Minerals Manage. Serv., Gulf of Mexico OCS Reg., New Orleans, LA.
Tyack, P.L., M. Johnson, N. Aguilar Soto, A. Sturlese, and P.T. Madsen. 2006. Extreme diving of beaked whales.
J. Exp. Biol. 209(21):4238-4253.
UNEP-WCMC (United Nations Environment Programme-World Conservation Monitoring Centre). 2009.
Convention on International Trade in Endangered Species of Wild Flora and Fauna. Appendices I, II, and II.
Valid from 22 May 2009. Accessed on 26 April 2010 at http://www.cites.org/eng/app/e-appendices.pdf.
Urbán-Ramírez, J. and D. Aurioles-Gamboa. 1992. First record of the pygmy beaked whale Mesoplodon
peruvianus in the North Pacific. Mar. Mamm. Sci. 8(4):420-425.

VI. Literature Cited
Environmental Assessment for SIO ETP Cruise, 2010 Page 98
Urick, R.J. 1983. Principles of underwater sound, 3rd
Ed. McGraw-Hill, New York, NY. 423 p.
Van Waerebeek, K. and J.C. Reyes. 1988. First record of the pygmy killer whale, Feresa attenuata Gray, 1975
from Peru, with a summary of distribution in the eastern Pacific. Z. Säugetierkunde 53:253-255.
Van Waerebeek, K., J. Canto, J. Gonzalez, J. Oporto, and J.L. Brito. 1991. Southern right whale dolphins,
Lissodelphis peronii off the Pacific coast of South America. Z. Säugetierkunde 56:284-295.
Wade, L.S. and G.L. Friedrichsen. 1979. Recent sightings of the blue whale, Balaenoptera musculus, in the
northeastern tropical Pacific. Fish. Bull. 76(4):915-919.
Wade, P.R. and T. Gerrodette. 1993. Estimates of cetacean abundance and distribution in the eastern tropical
Pacific. Rep. Int. Whal. Comm. 43:477-493.
Wade, P.R., G.M. Watters, T. Gerrodette, and S.B. Reilly. 2007. Depletion of spotted and spinner dolphins in the
eastern tropical Pacific: modeling hypotheses for their lack of recovery. Mar. Ecol. Prog. Ser. 343:1-14.
Walker, J.L., C.W. Potter, and S.A. Macko. 1999. The diets of modern and historic bottlenose dolphin populations
reflected through stable isotopes. Mar. Mamm. Sci. 15(2):335-350.
Wang, M.C., W.A. Walker, K.T. Shao, and L.S. Chou. 2002. Comparative analysis of the diets of pygmy sperm
whales and dwarf sperm whales in Taiwanese waters. Acta Zool. Taiwan. 13(2):53-62.
Waring, G.T., T. Hamazaki, D. Sheehan, G. Wood, and S. Baker. 2001. Characterization of beaked whale
(Ziphiidae) and sperm whale (Physeter macrocephalus) summer habitat in shelf-edge and deeper waters off
the northeast U.S. Mar. Mamm. Sci. 17:703-717.
Wartzok, D., A.N. Popper, J. Gordon, and J. Merrill. 2004. Factors affecting the responses of marine mammals to
acoustic disturbance. Mar. Technol. Soc. J. 37(4):6-15.
Watkins, W.A. and K.E. Moore. 1982. An underwater acoustic survey for sperm whales (Physeter catodon) and
other cetaceans in the southeast Caribbean. Cetology 46:1-7.
Watkins, W.A., K.E. Moore, and P. Tyack. 1985. Sperm whale acoustic behaviors in the southeast Caribbean.
Cetology 49:1-15.
Watkins, W.A., M.A. Daher, G.M. Reppucci, J.E. George, D.L. Martin, N.A. DiMarzio, and D.P. GWhitehead, H.
1989. Formations of foraging sperm whales, Physeter macrocephalus, off the Galápagos Islands. Can. J.
Zool. 67(9):2131-2139.
Watkins, W.A., M.A. Daher, G.M. Reppucci, J.E. George, D. L. Martin, N.A. DiMarzio, and D.P. Gannon. 2000.
Seasonality and distribution of whale calls in the North Pacific. Oceanogr. 13(1):62-67.
Weilgart, L.S. 2007. A brief review of known effects of noise on marine mammals. Intern. J. Comp. Psychol.
20:159-168.
Weir, C.R. 2008. Overt responses of humpback whales (Megaptera novaeangliae), sperm whales (Physeter macro-
cephalus), and Atlantic spotted dolphins (Stenella frontalis) to seismic exploration off Angola. Aquat.
Mamm. 34(1):71-83.
Weir, C.R. and S.J. Dolman. 2007. Comparative review of the regional marine mammal mitigation guidelines
implemented during industrial seismic surveys, and guidance towards a worldwide standard. J. Int. Wildl.
Law Policy 10(1):1-27.
Whitehead, H. 1989. Formations of foraging sperm whales, Physeter macrocephalus, off the Galápagos Islands.
Can. J. Zool. 67(9):2131-2139.
Whitehead, H. 2002. Estimates of the current global population size and historical trajectory for sperm whales.
Mar. Ecol. Prog. Ser. 242:295-304.

VI. Literature Cited
Environmental Assessment for SIO ETP Cruise, 2010 Page 99
Whitehead, H. 2003. Sperm whales: social evolution in the ocean. University of Chicago Press, Chicago, IL. 431
p.
Whitehead, H. and S. Waters. 1990. Social organization and population structure of sperm whales off the Galáp-
agos Islands, Ecuador (1985–1987). Rep. Int. Whal. Comm., Spec. Iss. 12:249-257.
Whitehead, H., S. Waters, and T. Lyrholm. 1992. Population structure of female and immature sperm whales
(Physeter macrocephalus) off the Galápagos Islands. Can. J. Fish. Aquatic Sci. 49(1):78-84.
Wieting, D. 2004. Background on development and intended use of criteria. p. 20 In: S. Orenstein, L. Langstaff, L.
Manning, and R. Maund (eds.), Advisory Committee on Acoustic Impacts on Marine Mammals, final meet.
summary. Second meet., April 28–30, 2004, Arlington, VA. Sponsored by the Mar. Mamm. Comm.
Willis, P.M. and R.W. Baird. 1998. Sightings and strandings of beaked whales on the west coast of Canada.
Aquat. Mamm. 24:21-25.
Winsor, M.H. and B.R. Mate. 2006. Seismic survey activity and the proximity of satellite tagged sperm whales.
Working Pap. SC/58/E16. Int. Whal. Comm., Cambridge, U.K. 8 p.
Würsig, B., S.K. Lynn, T.A. Jefferson, and K.D. Mullin. 1998. Behaviour of cetaceans in the northern Gulf of
Mexico relative to survey ships and aircraft. Aquat. Mamm. 24(1):41-50.
Würsig, B.G., D.W. Weller, A.M. Burdin, S.H. Reeve, A.L Bradford, S.A. Blokhin, and R.L Brownell, Jr. 1999.
Gray whales summering off Sakhalin Island, Far East Russia: July-October 1997. A joint U.S.-Russian
scientific investigation. Final Report. Rep. from Texas A&M Univ., College Station, TX, and Kamchatka
Inst. Ecol. & Nature Manage., Russian Acad. Sci., Kamchatka, Russia, for Sakhalin Energy Investment Co.
Ltd and Exxon Neftegaz Ltd, Yuzhno-Sakhalinsk, Russia. 101 p.
Yazvenko, S.B., T.L. McDonald, S.A. Blokhin, S.R. Johnson, S.K. Meier, H.R. Melton, M.W. Newcomer, R.M.
Nielson, V.L. Vladimirov, and P.W. Wainwright. 2007a. Distribution and abundance of western gray
whales during a seismic survey near Sakhalin Island, Russia. Environ. Monit. Assess. 134(1-3):45-73. doi:
10.1007/s10661-007-9809-9.
Yazvenko, S.B., T.L. McDonald, S.A. Blokhin, S.R. Johnson, H.R. Melton, and M.W. Newcomer. 2007b. Feeding
activity of western gray whales during a seismic survey near Sakhalin Island, Russia. Environ. Monit.
Assess. 134(1-3): 93-106. doi: 10.1007/s10661-007-9810-3.
Yochem, P.K. and S. Leatherwood. 1985. Blue whale. p. 193-240 In: S.H. Ridgway and R Harrison (eds.), Hand-
book of marine mammals, Vol. 3. The sirenians and baleen whales. Academic Press, New York, NY. 362
p.
Yoder, J.A. 2002. Declaration of James A. Yoder in opposition to plaintiff‘s motion for temporary restraining
order, 28 October 2002. Civ. No. 02-05065-JL. U.S. District Court, Northern District of California, San
Francisco Division.
Sea Turtles, Fish, and Other
AAPA (American Association of Port Authorities). 2010. Alliance of the ports of Canada, the Caribbean, Latin
America and the United States. Central and South America port container traffic (1999–2008). Accessed on 4
May 2010 at http://aapa.files.cms-plus.com/Statistics/CENTRAL%5FSOUTH%5FAMERICA%5FCONTAINER
%5FTRAFFIC.pdf
Alava, J.J. 2008. Loggerhead sea turtles (Caretta caretta) in marine waters off Ecuador: occurrence, distribution
and bycatch from the eastern Pacific Ocean. Mar. Turtle Newsl. 119:8-11.
Alfaro-Shigueto J., P.H. Dutton, J. Mangel, and D. Vega. 2004. First confirmed occurrence of loggerhead turtles in
Peru. Mar. Turtle Newsl. 103:7-11.

VI. Literature Cited
Environmental Assessment for SIO ETP Cruise, 2010 Page 100
Alvarado, J. and A. Figueroa. 1995. East Pacific green turtle, Chelonia mydas. p. 24-36 In: P.T. Plotkin (ed.),
National Marine Fisheries Service and U.S. Fish and Wildlife Service status reviews for sea turtles listed
under the Endangered Species Act of 1973. NMFS, Silver Spring, MD. 139 p.
Aprill, M. L. 1994. Visitation and predation of the olive ridley sea turtle, Lepidochelys olivacea, at nest sites in Os-
tional, Costa Rica. p. 3-6 In: K.A. Bjorndal, A.B. Bolten, D.A. Johnson and P.J. Eliazar (compilers), Proc.
14th Annu. Symp. Sea Turtle Biol. Conserv. NOAA Tech. Memo. NMFS-SEFSC-351. 323 p.
Arenas, P. and M. Hall. 1991. The association of sea turtles and other pelagic fauna with floating objects in the
eastern tropical Pacific Ocean. p. 7-10 In: M. Salmon and J. Wyneken (compilers), Proc. 11th Annu.
Workshop Sea Turtle Biol. Conserv. NOAA Tech. Mem. NMFS-SEFSC-302. 195 p.
Arauz, R.M., R. Vargas, I. Narango, and C. Gamboa. 1998. Analysis of the incidental capture and mortality of sea
turtles in the shrimp fleet of Pacific Costa Rica. p. 1-3 In: S.P. Epperly and J. Braun (comp.), Proc. 17th
Symp. Sea Turtle Biol. Conserv. NOAA Tech. Memo. NMFS-SEFSC-415. 294 p.
BBC News. 2010. Ecuadorean threat to oil giants. Published 18 April 2010. Accessed on 8 May 2010 at
http://news.bbc.co.uk/go/pr/fr/-/2/hi/americas/8627799.stm.
Berkson, H. 1967. Physiological adjustments to deep diving in the Pacific green turtle (Chelonia mydas agassizii).
Comp. Biochem. Physiol. 21:507-524.
Bjarti, T. 2002. An experiment on how seismic shooting affects caged fish. Faroese Fisheries Laboratory, Univer-
sity of Aberdeen. 41 p.
Bjorndal, K.A. 1982. The consequences of herbivory for the life history pattern of the Caribbean green turtle,
Chelonia mydas. p. 111-116 In: K.A. Bjorndal (ed.), Biology and conservation of sea turtles. Smithsonian
Inst. Press, Washington, D.C. 583 p.
Booman, C., J. Dalen, H. Leivestad, A. Levsen, T. van der Meeren, and K. Toklum. 1996. Effecter av luftkanon-
shyting på egg, larver og yngel. Fisken og Havet 1996(3):1-83. (Norwegian with English summary).
Brill, R.W., G.H. Balazs, K.N. Holland, R.K.C. Chang, S. Sullivan, and J.C. George. 1995. Daily movements,
habitat use, and submergence intervals of normal and tumor-bearing juvenile green turtles (Chelonia mydas
L.) within a foraging area in the Hawaiian Islands. J. Exp. Mar. Biol. Ecol. 185:203-218.
Brown, C.H. and W.M. Brown. 1982. Status of sea turtles in the southeastern Pacific: emphasis on Peru. p. 235-
240 In: K.A. Bjorndal (ed.), Biology and conservation of sea turtles. Smithsonian Inst. Press, Washington,
DC. 583 p.
Buchanan, R.A., J.R. Christian, V.D. Moulton, B. Mactavish, and S. Dufault. 2004. 2004 Laurentian 2-D seismic
survey environmental assessment. Rep. by LGL Ltd., St. John‘s, Nfld., and Canning & Pitt Associates, Inc.,
St. John's, Nfld., for ConocoPhillips Canada Resources Corp., Calgary, Alta. 274 p.
Byles, R.A. 1988. Behavior and ecology of sea turtles from Chesapeake Bay, Virginia. Ph.D. diss., College of
William and Mary, Williamsburg, VA.
Carr, A. 1975. The Ascension Island green turtle colony. Copeia 1975:574-555.
Carr, A., M.H. Carr, and A.B. Meylan. 1978. The ecology and migrations of sea turtles: the west Caribbean green
turtle colony. Bull. Am. Mus. Hist. 162(1):1-46.
Chapman, C.J. and A.D. Hawkins. 1969. The importance of sound in fish behaviour in relation to capture by
trawls. FAO Fish. Rep. 62:717-729.
Christian, J.R., A. Mathieu, D.H. Thomson, D. White, and R.A. Buchanan. 2003. Effect of seismic energy on snow
crab (Chionoecetes opilio). Rep. by LGL Ltd., St. John‘s, Nfld., for Environmental Studies Research Fund
(ESRF), Calgary, Alta. 56 p.

VI. Literature Cited
Environmental Assessment for SIO ETP Cruise, 2010 Page 101
Christian, J.R., A. Mathieu, and R.A. Buchanan. 2004. Chronic effects of seismic energy on snow crab (Chio-
noecetes opilio). Environmental Studies Research Funds Report No. 158, March 2004. Calgary, Alta. 45 p.
CIA (Central Intelligence Agency). 2010a. Central America and Caribbean: Panama, economy. The world
factbook. Accessed on 8 May 2010 at https://www.cia.gov/library/publications/the-world-factbook/geos/
pm.html.
CIA (Central Intelligence Agency). 2010b. South America: Ecuador, economy. The world factbook. Accessed on
8 May 2010 at https://www.cia.gov/library/publications/the-world-factbook/geos/ec.html.
Dalen, J. and G.M. Knutsen. 1986. Scaring effects in fish and harmful effects on eggs, larvae and fry by offshore
seismic explorations. p. 93-102 In: Merklinger, H.M. (ed.), Progress in underwater acoustics. Plenum, New
York, NY. 839 p.
Dalen, J. and A. Raknes. 1985. Scaring effects on fish from three dimensional seismic surveys. Inst. Mar. Res.
Rep. FO 8504/8505, Bergen, Norway. (In Norwegian, with an English summary).
Dalen, J., E. Ona, A.V. Soldal, and R. Saetre. 1996. Seismiske undersøkelser til havs: en vurdering av konsekvenser
for fisk og fiskerier [Seismic investigations at sea; an evaluation of consequences for fish and fisheries]. Fis-
ken og Havet 1996:1-26. (in Norwegian, with an English summary).
DFO (Fisheries and Oceans Canada). 2004. Potential impacts of seismic energy on snow crab. DFO Can. Sci.
Advis. Sec. Habitat Status Rep. 2004/003.
Donoso, M., P. Dutton, R. Serra, and J.L. Brito-Montero. 2000. Sea turtles found in waters off Chile. p. 218-219
In: H.J. Kalb and T. Wibbels (compilers), Proc. 19th Ann. Symp. Sea Turtle Biol. Conserv. NOAA Tech.
Memo. NMFS-SEFSC-443. 291 p.
Dutton, P., S.R. Benson, and S.A Eckert. 2006. Identifying origins of leatherback turtles from Pacific foraging
grounds off central California, U.S.A. p. 228 In: N.J. Pilcher (compiler), Proc. 23rd
Ann. Symp. Sea Turtle
Biol. Conserv. NOAA Tech. Mem. NMFS-SEFSC-536. 261 p.
Eckert, K.L. 1995. Leatherback sea turtle, Dermochelys coriacea. p. 37-75 In: P.T. Plotkin (ed.), National Marine
Fisheries Service and U.S. Fish and Wildlife Service status reviews of sea turtles listed under the Endangered
Species Act of 1973. Nat. Mar. Fish. Service, Silver Spring, MD. 139 p.
Eckert, S.A. 2002. Distribution of juvenile leatherback sea turtle Dermochelys coriacea sightings. Mar. Ecol.
Progr. Ser. 230:289-293.
Eckert, S.A., K.L. Eckert, and G.L. Kooyman. 1986. Diving patterns of two leatherback sea turtles (Dermochelys
coriacea) during the interesting intervals at Sandy Point, St. Croix, U.S. Virgin Islands. Herpetologica
42:381-388.
Eckert, S.A., K.L. Eckert, P. Ponganis, and G.L. Kooyman. 1989. Diving and foraging behaviour of leatherback
sea turtles (Dermochelys coriacea). Can J. Zool. 67:2834-2840.
Eckert, S.A., H.C. Liew, K.L. Eckert, and E.H. Chan. 1996. Shallow water diving by leatherback turtles in the
South China Sea. Chelonian Cons. Biol. 2:237-243.
EcoPetrol. 2010. Carta Petrolera No. 121 enero—marzo 2010. Accessed on 8 May 2010 at
http://www.ecopetrol.com.co/especiales/carta_petrolera121/ingles.htm.
EIA (Energy Information Administration). 2010. Country analysis briefs: Columbia. Accessed on 28 April 2010 at
http://www.eia.doe.gov/emeu/cabs/Colombia/pdf.pdf.
Engås, A, S. Løkkeborg, E. Ona, and A.V. Soldal. 1996. Effects of seismic shooting on local abundance and catch
rates of cod (G. morhua) and haddock (M. aeglefinus). Can. J. Fish. Aquat. Sci. 53:2238-2249.

VI. Literature Cited
Environmental Assessment for SIO ETP Cruise, 2010 Page 102
EOE (Encyclopedia of Earth). 2008. Energy profile of Peru. In Cutler J. Cleveland (eds.), The encyclopedia of
earth. Environmental Information Coalition, National Council for Science and the Environment,
Washington, D.C. Accessed on 6 May 2010 at http://www.eoearth.org/article/ Energy_profile_of_Peru.
EuroTurtle. 2006a. Species outlines. Leatherback turtle Dermochelys coriacea. Accessed on 28 April 2010 at
http://www.euroturtle.org/outline/leather4.htm.
EuroTurtle. 2006b. Species distribution: distribution and population estimates for the hawksbill turtle Eretmochelys
imbricata. Accessed on 28 April 2010 at http://www.euroturtle.org/outline/dhawks.htm.
Falk, M.R. and M.J. Lawrence. 1973. Seismic exploration: its nature and effect on fish. Fisheries and Marine Ser-
vice, Resource Management Branch, Fisheries Operations Directorate: Technical Report CENT-73-9.
FAO (Food and Agriculture Organization). 2002. Fisheries country profile: The Republic of Panama. Accessed on
6 May 2010 at http://www.fao.org/fi/oldsite/FCP/en/PAN/profile.htm.
FAO (Food and Agriculture Organization). 2004. Fisheries country profile: Republic of Costa Rica. Accessed on 6
May 2010 at http://www.fao.org/fi/oldsite/FCP/en/CRI/profile.htm.
FAO (Food and Agriculture Organization). 2010a. Perfiles sobre la pesca y la acuicultura por países: Ecuador.
Accessed on 6 May 2010 at http://www.fao.org/fishery/countrysector/FI-CP_EC/es.
FAO (Food and Agriculture Organization). 2010b. Fisheries and aquaculture country profiles: Columbia.
Accessed on 6 May 2010 at http://www.fao.org/fishery/countrysector/FI-CP_CO/en.
Fritts, T.H., M.L. Stinson, and R. Márquez. 1982. Status of sea turtle nesting in southern Baja California, Mexico.
Bull. South. Calif. Acad. Sci. 81:51-60.
Gaos, A., R. Arauz, and I. Yañez. 2006. Hawksbill turtles on the Pacific coast of Costa Rica. Mar. Turtle Newsl.
112:14.
Green, D. and F. Ortiz-Crespo. 1995. Status of sea turtle populations in the central eastern Pacific. p. 221-233 In:
K.A. Bjorndal (ed.), Biology and conservation of sea turtles. Rev. edit. Smithsonian Inst. Press,
Washington, DC. 615 p.
Guerra, A., A.F. González, and F. Rocha. 2004. A review of the records of giant squid in the north-eastern Atlantic
and severe injuries in Architeuthis dux stranded after acoustic explorations. ICES CM 2004/CC: 29.
Harvey, J., S. Benson, and T. Graham. 2006. Foraging ecology of leatherbacks in the California Current. p. 192 In:
M. Frick, A. Panagopoulou, A.F.Rees, and K. Williams (compilers), Book of abstracts, 26th Ann. Symp. Sea
Turtle Biol. Conserv. International Sea Turtle Society, Athens, Greece. 376 p.
Hasbún, C. R. and M. Vásquez. 1999. Sea turtles of El Salvador. Mar. Turtle Newsl. 85:7-9.
Hassel, A., T. Knutsen, J. Dalen, S. Løkkeborg, K. Skaar, Ø. Østensen, E.K. Haugland, M. Fonn, Å. Høines, and
O.A. Misund. 2003. Reaction of sandeel to seismic shooting: a field experiment and fishery statistics study.
Institute of Marine Research, Bergen, Norway.
Hastings, M.C. and A.N. Popper. 2005. Effects of sound on fish. Prepared for Jones & Stokes, Sacramento, CA,
for California Department of Transportation, Sacramento, CA. 28 January.
Hays, G.C., C.R. Adams, A.C. Broderick, B.J. Godley, D.J. Lucas, J.D. Metcalfe, and A.A. Prior. 2000. The diving
behaviour of green turtles at Ascension Island. Anim. Behav. 59:577-586.
Hochscheid, S., B.J. Godley, A.C. Broderick, and R.P. Wilson. 1999. Reptilian diving: highly variable dive
patterns in the green turtle Chelonia mydas. Mar. Ecol. Progr. Ser. 185:101-112.
Holliday, D.V., R.E. Piper, M.E. Clarke, and C.F. Greenlaw. 1987. The effects of airgun energy release on the
eggs, larvae, and adults of the northern anchovy (Engraulis mordax). American Petroleum Institute, Wash-
ington, DC. Tracer Applied Sciences.
VI. Literature Cited
Environmental Assessment for SIO ETP Cruise, 2010 Page 103
Holst, M. and M.A. Smultea. 2008. Marine mammal and sea turtle monitoring during Lamont-Doherty Earth
Observatory‘s marine seismic program off Central America, Feburary–April 2008. LGL Rep. TA4342-3.
Rep. from LGL Ltd., King City, Ont., for Lamont-Doherty Earth Observatory of Columbia Univ., Palisades,
NY, and Nat. Mar. Fish. Serv., Silver Spring, MD. 133 p.
Holst, M., M.A. Smultea, W.R. Koski, and B. Haley 2005a. Marine mammal and sea turtle monitoring during
Lamont-Doherty Earth Observatory‘s marine seismic program in the Eastern Tropical Pacific Ocean off
Central America, November–December 2004. LGL Rep. TA2822-30. Rep. from LGL Ltd., King City, Ont.,
for Lamont-Doherty Earth Observatory of Columbia Univ., Palisades, NY, and Nat. Mar. Fish. Serv., Silver
Spring, MD. 125 p.
IUCN (The World Conservation Union). 2010. IUCN Red List of Threatened Species, Version 2010.1. Accessed
on 26 April 2010 at http://www.iucnredlist.org.
Kalb, H. and D. Owens. 1994. Differences between solitary and arribada nesting olive ridley females during the in-
teresting period. p. 68 In: K.A. Bjorndal, A.B. Bolten, D.A. Johnson and P.J. Eliazar (compilers), Proc. 14th
Symp. Sea Turtle Biol. Conserv. NOAA Tech. Mem. NMFS-SEFSC-351. 323 p.
Kelez, S., X. Velez-Zuzzo, F. Angulo, and C. Manrique. 2009. Olive ridley Lepidochelys olivacea nesting in Peru:
the southernmost records in the eastern Pacific. Mar. Turtle Newsl. 126:5-9.
Kelez, S., B. Wallace, D. Dunn, W.J. Nichols, and L.B. Crowder. 2010. Sea turtle bycatch in the eastern Pacific: a
regional review (Abstract). p. 110 In: K. Dean and M.C. Lopez Castro (compilers), Proc. 28th Ann. Symp.
Sea Turtle Biol. Conserv. NOAA Tech. Mem. NMFS-SEFSC-602. 272 p.
Kopitsky, K., R.L. Pitman, and P.H. Dutton. 2002. Reproductive ecology of olive ridleys in the open ocean in the
eastern tropical Pacific. p. 90-91 In: A. Mosier, A. Foley, and B. Brost (compilers), Proc.20th Ann. Symp.
Sea Turtle Biol. Conserv. NOAA Tech. Mem. NMFS-SEFSC-477. 369 p.
Kostyuchenko, L.P. 1973. Effect of elastic waves generated in marine seismic prospecting on fish eggs on the
Black Sea. Hydrobiol. J. 9:45-48.
LaBella, G., C. Froglia, A. Modica, S. Ratti, and G. Rivas. 1996. First assessment of effects of air-gun seismic
shooting on marine resources in the central Adriatic Sea. Society of Petroleum Engineers, Inc. International
Conference on Health, Safety and Environment, 9–12 June 1996, New Orleans, LA.
Laist, D.W., A.R. Knowlton, J.G. Mead, A.S. Collet, and M. Podesta. 2001. Collisions between ships and whales.
Mar. Mamm. Sci. 17(1):35-75.
Lien, J. 2002. Entrapment and entanglement. p. 394-395 In: W.F. Perrin, B. Würsig, and J.G.M. Thewissen (eds.),
Encyclopedia of marine mammals. Academic Press, San Diego, CA. 1414 p.
Løkkeborg, S. 1991. Effects of geophysical survey on catching success in longline fishing. ICES CM B 40. 9 p.
Lutcavage, M.E. 1996. Planning your next meal: leatherback travel routes and ocean fronts. p. 174-178 In: J.A.
Keinath, D.E. Barnard, J.A. Musick, and B.A. Bell (compilers), Proc. 15th Ann. Symp. Sea Turtle Biol. Con-
serv. NOAA Tech. Memo. NMFS-SEFSC-351. 355 p.
Lutcavage, M.E., and P.L. Lutz. 1997. Diving physiology. p. 277-296 In: P.L. Lutz and J.A. Musick (eds.), The
biology of sea turtles. CRC Press, Boca Raton, FL. 432 p.
Lux, J., R.Reina, and L. Stokes. 2003. Nesting activity of leatherback turtles (Dermochelys coriacea) in relation to
tidal and lunar cycles at Playa Grande, Costa Rica. p. 215-216 In: J.A. Seminoff (comp.), Proc. 22nd
Annu.
Symp. Sea Turtle Biol. Conserv. NOAA Tech. Memo. NMFS-SEFSC-503. 308 p.
Mangel, J.C., J. Alfaro-Shigueto, M. Pajuelo, C.M. Caceres-Bueno, F. Bernedo, D.G. Foley, B. Godley, P.H.
Dutton, and J. Seminoff. 2010. Use of satellite telemetry to assess loggerhead turtle movements and
fisheries interactions off Peru (Abstract). p. 113-114 In: K. Dean and M.C. Lopez Castro (compilers), Proc.
28th Ann. Symp. Sea Turtle Biol. Conserv. NOAA Tech. Mem. NMFS-SEFSC-602. 272 p.

VI. Literature Cited
Environmental Assessment for SIO ETP Cruise, 2010 Page 104
McCauley, R.D., J. Fewtrell, A.J. Duncan, C. Jenner, M.-N. Jenner, J.D. Penrose, R.I.T. Prince, A. Adhitya, J. Mur-
doch, and K. McCabe. 2000a. Marine seismic surveys: Analysis of airgun signals; and effects of air gun ex-
posure on humpback whales, sea turtles, fishes, and squid. Rep. from Centre for Marine Science and Tech-
nology, Curtin Univ., Perth, W.A., for Austral. Petrol. Prod. Assoc., Sydney, N.S.W. 188 p.
McCauley, R.D., J. Fewtrell, A.J. Duncan, M.-N. Jenner, M-N., C. Jenner, R.I.T. Prince, A. Adhitya, K. McCabe,
and J. Murdoch. 2000b. Marine seismic surveys – a study of environmental implications. APPEA J.
40:692-708.
McCauley, R.D., J. Fewtrell, and A.N. Popper. 2003. High intensity anthropogenic sound damages fish ears. J.
Acoust. Soc. Am. 113(1):638-642.
Moore, S.E. and J.T. Clarke. 2002. Potential impact of offshore human activities on gray whales. J. Cetac. Res.
Manage. 4(1):19-25.
Moriyasu, M., R. Allain, K. Benhalima, and R. Claytor. 2004. Effects of seismic and marine noise on invertebrates:
A literature review. Fisheries and Oceans Canada, Science. Canadian Science Advisory Secretariat
Research Document 2004/126.
Morreale, S., E. Standora, F. Paladino, and J. Spotila. 1994. Leatherback migrations along deepwater bathymetric
contours. p.109 In: B.A. Schroeder and B.E. Witherington (compilers), Proc. 13th Annu. Symp. Sea Turtle
Biol. Conserv. NOAA Tech. Memo. NMFS-SEFSC-341. 281 p.
Morreale, S.J., P.T. Plotkin, D.J. Shaver, and H.J. Kalb. 2007. Adult migration and habitat utilization: ridley turtles
in their element. p. 213-229 In: P.T. Plotkin (ed.), Biology and conservation of ridley sea turtles. The Johns
Hopkins University Press, Baltimore, MD. 356 p.
Musick, J.A. and C.J. Limpus. 1997. Habitat utilization and migration in juvenile sea turtles. p. 137-163 In: P.L.
Lutz and J.A. Musick (eds.), The biology of sea turtles. CRC Press, Boca Raton, FL. 432 p.
Nichols, W.J. 2005. Following redwood logs, rubber ducks, and drift bottles: transoceanic developmental mig-
rations of loggerhead turtles in the North Pacific Ocean. p. 66 In: M.S. Coyne and R.D. Clark (compilers),
Proc. 21st Ann. Symp. Sea Turtle Biol. Conserv. NOAA Tech. Memo. NMFS-SEFSC-528. 368 p.
Nichols, W.J., A. Resendiz, and C. Mayoral-Russeau. 2000. Biology and conservation of loggerhead turtles
(Caretta caretta) in Baja California, Mexico. p. 169-171 In: H.J. Kalb and T. Wibbels (compilers), Proc. 19th
Annu. Symp. Sea Turtle Biol. Conserv. NOAA Tech. Memo. NMFS-SEFSC-443. 291 p.
NMFS (National Marine Fisheries Service). 2002. Endangered Species Act Section 7 Consultation Biological
Opinion: Authorization of pelagic fisheries under the Fishery Management Plan for pelagic fisheries of the
western Pacific region. National Marine Fisheries Service, Southwest Region, Pacific Islands Area Office.
365 p.
NMFS and USFWS (National Marine Fisheries Service and U.S. Fish and Wildlife Service). 1998a. Recovery plan
for U.S. Pacific populations of the leatherback turtle (Dermochelys coriacea). Nat. Mar. Fish. Service, Silver
Spring, MD. 66 p.
NMFS and USFWS (National Marine Fisheries Service and U.S. Fish and Wildlife Service). 1998b. Recovery plan
for U.S. Pacific populations of the loggerhead turtle (Caretta caretta). Nat. Mar. Fish. Service, Silver
Spring, MD. 66 p.
NMFS and USFWS (National Marine Fisheries Service and U.S. Fish and Wildlife Service). 1998c. Recovery plan
for U.S. Pacific populations of the green turtle (Chelonia mydas). Nat. Mar. Fish. Service, Silver Spring, MD.
84p.
NMFS and USFWS (National Marine Fisheries Service and U.S. Fish and Wildlife Service). 1998d. Recovery plan
for U.S. Pacific populations of the olive ridley turtle (Lepidochelys olivacea). Nat. Mar. Fish. Service, Silver
Spring, MD. 53 p.

VI. Literature Cited
Environmental Assessment for SIO ETP Cruise, 2010 Page 105
NMFS and USFWS (National Marine Fisheries Service and U.S. Fish and Wildlife Service). 2007. Green sea turtle
(Chelonia mydas) 5-year review: summary and evaluation. National Marine Fisheries Service, Silver Spring,
MD. 102 p. Accessed on 28 April 2010 at http://www.fws.gov/northflorida/SeaTurtles/2007-Reviews/2007-
green-turtle-5-year-review-final.pdf
Northridge, S.P. and R.J. Hofman. 1999. Marine mammal interactions with fisheries. p. 99-119 In: J.R. Twiss, Jr.
and R.R. Reeves (eds.), Conservation and management of marine mammals. Smithsonian Institution Press,
Washington, DC.
Ocean Resources Foundation. 1998. Construction on Playa La Flor National Wildlife Refuge-Nicaragua. Accessed
on 2 May 2008 at http://www.orf.org/currents001b.htm.
Offshore. 2009a. SCAN completes Peruvian survey. 1 Jun 2009. Accessed on 8 May 2010 at
http://www.offshore-mag.com/index/article-display/4701263039/articles/offshore/geology-geophysics/latin-
america/scan-completes_peruvian.html.
Offshore. 2009b. Brazil‘s presalt tops Latin American E&P plays: Peru. 1 May 2009. Accessed on 8 May 2010 at
http://www.offshore-mag.com/index/article-display/361016/articles/offshore/volume-69/issue-
5/international-report/brazilrsquos-presalt-tops-latin-american-eampp-plays.html.
Offshore. 2010. Global E&P. 1 Feb 2010. Accessed on 8 May 2010 at http://www.offshore-mag.com/index/article-
display/2412454512/articles/offshore/volume-70/issue-2/departments/global-e___p/global-e_amp_p.html.
Oilvoice. 2009. Karoon Gas announces Peru Block Z-38 2D marine seismic acquisition survey. 17 February 2009.
Accessed on 8 May 2010 at http://www.oilvoice.com/n/Karoon_Gas_Announces_Peru_Block_Z38_2D
Marine_Seismic_Acquisition_Survey/8c4fc39b.aspx
Parker, D.M., P.H. Dutton, K. Kopitsky, and R.L. Pitman. 2003. Movement and dive behavior determined by satel-
lite telemetry for male and female olive ridley turtles in the Eastern Tropical Pacific. p. 48-49 In: J.A. Sem-
inoff (compiler), Proc. 22nd
Ann. Symp. Sea Turtle Biol. Conserv. NOAA Tech. Mem. NMFS-SEFSC-503.
308 p.
Parker, D.M., P.H. Dutton, S. Eckert, D.R. Kobayashi, J.J. Polovina, D. Dutton, and G.H. Balazs. 2005. Trans-
pacific migration along oceanic fronts by loggerhead turtles released from Sea World San Diego. p. 280-281
In: M.S. Coyne and R.D. Clark (compilers), Proc. 21st Ann. Symp. Sea Turtle Biol. Conserv. NOAA Tech.
Memo. NMFS-SEFSC-528. 368 p.
Payne, J.F., C.A. Andrews, L.L. Fancey, A.L. Cook, and J.R. Christian. 2007. Pilot study on the effects of seismic
air gun noise on lobster (Homarus americanus). Can. Tech. Rep. Fish. Aquatic Sci. 2712.
Payne, J.F., C. Andrews, L. Fancey, D. White, and J. Christian. 2008. Potential effects of seismic energy on fish
and shellfish: An update since 2003. Canadian Science Advisory Secretariat Research Document 2008/060.
Department of Fisheries and Oceans Canada. Accessed on 8 May 2010 at www.dfo-
mpo.gc.ca/CSAS/Csas/Publications/ResDocs-DocRech/2008/2008_060_e.pdf. Lasted updated 26 November
2008. 16 p.
Payne, J.F., J. Coady, and D. White. 2009. Potential effects of seismic airgun discharges on monkfish eggs
(Lophius americanus) and larvae. Environmental Studies Research Funds Report No. 170. St. John‘s, NL.
35 p.
Pearson, W.H., J.R. Skalski, and C.I. Malme. 1992. Effects of sounds from a geophysical survey device on behav-
iour of captive rockfish (Sebastes spp.). Can. J. Fish. Aquat. Sci. 49(7):1343-1356.
Pearson, W., J. Skalski, S. Sulkin, and C. Malme. 1994. Effects of seismic energy releases on the survival and
development of zoeal larvae of Dungeness crab (Cancer magister). Mar. Environ. Res. 38:93-113.
Perupetro. 2010. Blocks distribution in northwest Peru. Accessed on 8 May 2010 at http://mirror.perupetro.
com.pe/exploracion02-e.asp

VI. Literature Cited
Environmental Assessment for SIO ETP Cruise, 2010 Page 106
Pickett, G.D., D.R. Eaton, R.M.H. Seaby, and G.P. Arnold. 1994. Results of bass tagging in Poole Bay during
1992. Lab. Leafl. 74, MAFF Direct. Fish. Res., Lowestoft, U.K. 12 p.
Pitman, R.L. 1990. Pelagic distribution and biology of sea turtles in the Eastern Tropical Pacific. p. 143-144 In:
T.H. Richardson, J.I. Richardson, and M. Donnelly (compilers), Proc. 10th Ann. Workshop Sea Turtle Biol.
Conserv. NOAA Tech. Mem. NMFS-SEFC-278. 286 p.
Pitman, R.L. 1992. Sea turtle associations with flotsam in the Eastern Pacific. p. 94 In: M. Salmon and J. Wyneken
(compilers), Proc. 11th Ann. Workshop Sea Turtle Biol. Conserv. NOAA Tech. Mem. NMFS-SEFSC-302.
195 p.
Plotkin, P.T., R.A. Byles, and D.W. Owens. 1994a. Post-breeding movements of male olive ridley sea turtles
Lepidochelys olivacea from a nearshore breeding area. p. 119 In: K.A. Bjorndal, A.B. Bolten, D.A. Johnson,
and P.J. Eliazar (compilers), Proc. 14th Symp. Sea Turtle Biol. Conserv. NOAA Tech. Mem. NMFS-SEFSC-
351. 323 p.
Plotkin, P.T., R.A. Byles, and D.W. Owens. 1994b. Migratory and reproductive behavior of Lepidochelys olivacea in
the eastern Pacific Ocean. p. 138 In: B.A. Schroeder and B.E. Witherington (compilers), Proc. 13th Ann. Symp.
Sea Turtle Biol. and Conserv. NOAA Tech. Mem. NMFS-SEFSC-341. 281 p.
Polovina, J.J., E. Howell, D.M. Parker, and G.H. Balazs. 2003. Dive-depth distribution of loggerhead (Caretta
caretta) and olive ridley (Lepidochelys olivacea) sea turtles in the central North Pacific: Might deep longline
sets catch fewer turtles? Fish. Bull. 101(1):189-193.
Popper, A.N. 2005. A review of hearing by sturgeon and lamprey. Report by A.N. Popper, Environmental Bio-
Acoustics, LLC, Rockville, MD, for U.S. Army Corps of Engineers, Portland District.
Popper, A.N., M. Salmon, and K.W. Horch. 2001. Acoustic detection and communication by decapod crustaceans.
J. Comp. Physiol. A 187:83-89.
Popper, A.N., M.E. Smith, P.A. Cott, B.W. Hanna, A.O. MacGilvray, M.E. Austin, and D.A. Mann. 2005. Effects
of exposure to seismic air gun use on hearing of three fish species. J. Acoust. Soc. Am. 117(6):3958-3971.
Renaud, M.L. and J.A. Carpenter. 1994. Movements and submergence patterns of loggerhead turtles (Caretta
caretta) in the Gulf of Mexico determined through satellite telemetry. Bull. Mar. Sci. 55:1-15.
Rice, M.R. and G.H. Balazs. 2010. Hawaiian green turtles dive to record depths during oceanic migrations
(Abstract). p. 61 In: K. Dean and M.C. Lopez Castro (compilers), Proc. 28th Ann. Symp. Sea Turtle Biol.
Conserv. NOAA Tech. Mem. NMFS-SEFSC-602. 272 p.
Richardson, W.J., C. .Greene, C.I. Malme, and D.H. Thomson. 1995. Marine mammals and noise. Academic
Press, San Diego, CA. 576 p.
Rodrigue, J-P., C. Comtois, and B. Slack. 2009. The Strategic space of international transportation. 2nd edition.
Taylor & Francis e-library. 352 p. Accessed on 5 May 2010 at http://people.hofstra.edu/
geotrans/eng/ch5en/conc5en/ch5c1en.html.
Rogers, P. and M. Cox. 1988. Underwater sound as a biological stimulus. p. 131-149 In: J. Atema., R.R. Fay, A.N.
Popper, and W.N. Tavolga (eds.), The sensory biology of aquatic animals. Springer-Verlag, New York, NY.
Rossi, N.A., S.H. Peckham, V. de la Toba, R. Ochoa, E. Flores, A.A. Aguirre, and W.J. Nichols. 2010. Size
distribution and reproductive status of loggerhead turtles at Baja California Sur, Mexico (Abstract). p. 140
In: K. Dean and M.C. Lopez Castro (compilers), Proc. 28th Ann. Symp. Sea Turtle Biol. Conserv. NOAA
Tech. Mem. NMFS-SEFSC-602. 272 p.
Saetre, R. and E. Ona. 1996. Seismike undersøkelser og på fiskeegg og -larver en vurdering av mulige effecter pa
bestandsniva. [Seismic investigations and damages on fish eggs and larvae; an evaluation of possible effects
on stock level]. Fisken og Havet 1996:1-17, 1-8. (In Norwegian, with an English summary).

VI. Literature Cited
Environmental Assessment for SIO ETP Cruise, 2010 Page 107
Sakamoto, W., I. Uchida, Y. Naito, K. Kureha, M. Tujimura, and K. Sato. 1990. Deep diving behavior of the
loggerhead turtle near the frontal zone. Nippon Suisan Gakkaishi 56(9):1435-1443.
Sakamoto, W., K. Sato, H. Tanaka, and Y. Naito. 1993. Diving patterns and swimming environment of two logger-
head turtles during internesting. Nippon Suisan Gakkaishi 59(7):1129-1137.
Santulli, La A., A. Modica, C. Messina, L. Ceffa, A. Curatolo, G. Rivas, G. Fabi, and V. D'Amelio. 1999. Bio-
chemical responses of European sea bass (Dicentrarchus labrax L.) to the stress induced by off shore exper-
imental seismic prospecting. Mar. Pollut. Bull. 38:1105-1114.
Segura, A. and R.M. Arauz. 1995. By-catch capture of sea turtles by two kinds of experimental longline gears in
Pacific Costa Rica waters. p. 125-127 In: J.I. Richardson and T.H. Richardson (comp.), Proc. 12th Ann.
Workshop Sea Turtle Biol. Conserv. NOAA Tech. Memo. NMFS-SEFSC-361. 274 p.
Sea Around Us. 2009. Sea Around Us Project. Fisheries, ecosystems and biodiversity: Exclusive Economic Zones
(EEZs). Accessed on 6 May 2010 at http://www.seaaroundus.org/eez/
Shillinger, G.L., D.M. Palacios, H. Bailey, S.J. Bograd, A.M. Swithenbank, J.R. Spotila, B.P. Wallace, F.V.
Paladino, S.A. Eckert, R. Piedra, and B.A. Block. 2010. Four years and fourty-six turtles: tracking the
movements and behaviors of leatherback sea turtles in the eastern Pacific (Abstract). p. 53 In: K. Dean and
M.C. Lopez Castro (compilers), Proc. 28th Ann. Symp. Sea Turtle Biol. Conserv. NOAA Tech. Mem.
NMFS-SEFSC-602. 272 p.
Skalski, J.R., W.H. Pearson, and C.I. Malme. 1992. Effects of sounds from a geophysical survey device on catch-
per-unit-effort in a hook-and-line fishery for rockfish (Sebastes spp). Can. J. Fish. Aquat. Sci. 49:1357-
1365.
Slotte, A., K. Hansen, J. Dalen, and E. Ona. 2004. Acoustic mapping of pelagic fish distribution and abundance in
relation to a seismic shooting area off the Norwegian west coast. Fish. Res. 67:143-150.
Southwood, A.L., R.D. Andrews, D.R. Jones, M.E. Lutcavage, F.V. Paladino, and N.H. West. 1998. Heart rate and
dive behaviour of the leatherback sea turtle during the interesting interval. p. 100-101 In: S.P. Epperly and J.
Braun (comp.), Proc. 17th
Ann. Symp. Sea Turtle Biol. Conserv. NOAA Tech. Memo. NMFS-SEFSC-415.
294 p.
Spotila, J.R. 2004. Sea turtles: a complete guide to their biology, behavior, and conservation. The Johns Hopkins
University Press and Oakwood Arts, Baltimore, MD. 227 p.
Starbird, C.H., Z. Hillis-Starr, J.T. Harvey, and S.A. Eckert. 1999. Internesting movements and behavior of
hawksbill turtles (Eretmochelys imbricata) around Buck Island Reef National Monument, St. Croix, U.S.
Virgin Islands. Chelonian Conserv. Biol. 3(2):237-243.
Stinson, M.L. 1984. Biology of sea turtles in San Diego Bay, California, and in the northeastern Pacific Ocean.
Master‘s Thesis, San Diego State University, San Diego, CA. 578 p.
Subsea World. 2008. SCAN Geophysical get contract for 2D seismic survey offshore Ecuador. 16 November
2008. Accessed on 8 May 2010 at http://www.subseaworld.com/contracts/scan-geophysical-get-contract-for-
2d-seismic-survey-offshore-ecuador-02558.html.
Sverdrup, A., E. Kjellsby, P.G. Krüger, R. Fløysand, F.R. Knudsen, P.S. Enger, G. Serck-Hanssen, and K.B. Helle.
1994. Effects of experimental seismic shock on vasoactivity of arteries, integrity of the vascular endothelium
and on primary stress hormones of the Atlantic salmon. J. Fish Biol. 45:973-995.
Trites, A.W., V. Christensen, and D. Pauly. 1997. Competition between fisheries and marine mammals for prey
and primary production in the Pacific Ocean. J. Northw. Atl. Fish. Sci. 22:173-187.
UNEP-WCMC (United Nations Environment Program-World Conservation Monitoring Centre). 2005. World
Heritage sites: Coiba National Park and its Special Zone of Marine Protection, Republic of Panama. 6 p.
Accessed on 10 May 2010 at http://www.unep-wcmc.org/sites/wh/pdf/COIBA%20PANAMA.pdf.

VI. Literature Cited
Environmental Assessment for SIO ETP Cruise, 2010 Page 108
UNEP-WCMC (United Nations Environment Program-World Conservation Monitoring Centre). 2006. World
Heritage sites: Malpelo Fauna and Flora Sanctuary, Colombia. 7 p. Accessed on 10 May 2010 at
http://www.unep-wcmc.org/sites/wh/pdf/MALPELO.pdf.
UNEP-WCMC (United Nations Environment Program-World Conservation Monitoring Centre). 2008a. World
Heritage sites: Cocos Island National Park, Costa Rica. 6 p. Accessed on 10 May 2010 at http://www.unep-
wcmc.org/sites/wh/pdf/Cocos%20I.pdf.
UNEP-WCMC (United Nations Environment Program-World Conservation Monitoring Centre). 2008b. World
Heritage sites: Galápagos Islands National Park and Marine Reserve, Ecuador. 15 p. Accessed on 10 May
2010 at http://www.unep-wcmc.org/sites/wh/pdf/Galapagos.pdf.
UNEP-WCMC (United Nations Environment Programme-World Conservation Monitoring Centre). 2009.
Convention on International Trade in Endangered Species of Wild Flora and Fauna. Appendices I, II, and II.
Valid from 22 May 2009. Accessed on 26 April 2010 at: http://www.cites.org/eng/app/e-appendices.pdf.
UNESCO (United Nations Educational, Scientific and Cultural Organisation). 2010. World Heritage: Malpelo
Fauna and Flora Sanctuary. Accessed on 10 May 2010 at http://whc.unesco.org/en/list/1216.Urick, R.J.
1983. Sound propagation in the sea. McGraw-Hill, New York, NY. 423 p.
USCG (United States Coast Guard). 2010. History of the Amver System. Accessed on 5 May 2010 at
http://www.amver.com/amverhistory.asp.
van Dam, R.P., and C.E. Diez. 1996. Diving behavior of immature hawksbills (Eretmochelys imbricata) in a
Caribbean cliff-wall habitat. Mar. Biol. 127:171-178.
Wardle, C.S., T.J. Carter, G.G. Urquhart, A.D.F. Johnstone, A.M. Ziolkowski, G. Hampson, and D. Mackie. 2001.
Effects of seismic air guns on marine fish. Cont. Shelf Res. 21(8-10):1005-1027.
Williams, K.L., A.C. Steyermark, C.C. Hurd, A.J. Schwandt, F.V. Paladino, and J.R. Spotila. 1996. Population
ecology , nesting and success of leatherback turtles, Dermochelys coriacea, at Las Baulas de Guanacaste
National Park, Costa Rica. p. 340 In: J.A. Keinath, D.E. Barnard, J.A. Musick, and B.A. Bell (complers),
Proc. 15th Ann. Symp. Sea Turtle Biol. Conserv. NOAA Tech. Memo. NMFS-SEFSC-351. 355 p.
Yañez, I.L., A.R. Gaos, and R.M. Aruaz. 2010. Eastern Pacific leatherback, green, and olive ridley sea turtle
nesting at Playa Naranjo; first census in eight years (Abstract). p. 193 In: K. Dean and M.C. Lopez Castro
(compilers), Proc. 28th Ann. Symp. Sea Turtle Biol. Conserv. NOAA Tech. Mem. NMFS-SEFSC-602. 272
p.
Zárate, P.M., M.A. Parra, M. Robles, P.H. Dutton, and J.A. Seminoff. 2010a. Sea turtle strandings and mortality in
the Galapagos Archipelago: causes and threats (Abstract). p. 126 In: K. Dean and M.C. Lopez Castro
(compilers), Proc. 28th Ann. Symp. Sea Turtle Biol. Conserv. NOAA Tech. Mem. NMFS-SEFSC-602. 272
p.
Zárate, P.M., M.A. Parra, M. Robles, and J.A. Seminoff. 2010b. Nesting site fidelity of green turtle in the
Galapagos Islands (Abstract). p. 64 In: K. Dean and M.C. Lopez Castro (compilers), Proc. 28th Ann. Symp.
Sea Turtle Biol. Conserv. NOAA Tech. Mem. NMFS-SEFSC-602. 272 p.

Appendix A: Impacts of Airgun Sounds on Marine Mammals
Environmental Assessment for SIO ETP Cruise, 2010 Page 109
APPENDIX A:
REVIEW OF THE EFFECTS OF AIRGUN SOUNDS ON MARINE MAMMALS4
The following subsections review relevant information concerning the potential effects of airguns
on marine mammals. Because this review is intended to be of general usefulness, it includes references to
types of marine mammals that will not be found in some specific regions.
1. Categories of Noise Effects
The effects of noise on marine mammals are highly variable, and can be categorized as follows
(adapted from Richardson et al. 1995):
1. The noise may be too weak to be heard at the location of the animal, i.e., lower than the prevail-
ing ambient noise level, the hearing threshold of the animal at relevant frequencies, or both;
2. The noise may be audible but not strong enough to elicit any overt behavioral response, i.e., the
mammal may tolerate it, either without or with some deleterious effects (e.g., masking, stress);
3. The noise may elicit behavioral reactions of variable conspicuousness and variable relevance to
the well being of the animal; these can range from subtle effects on respiration or other behaviors
(detectable only by statistical analysis) to active avoidance reactions;
4. Upon repeated exposure, animals may exhibit diminishing responsiveness (habituation), or distur-
bance effects may persist; the latter is most likely with sounds that are highly variable in charac-
teristics, unpredictable in occurrence, and associated with situations that the animal perceives as a
threat;
5. Any man-made noise that is strong enough to be heard has the potential to reduce (mask) the
ability of marine mammals to hear natural sounds at similar frequencies, including calls from
conspecifics, echolocation sounds of odontocetes, and environmental sounds such as surf noise or
(at high latitudes) ice noise. However, intermittent airgun or sonar pulses could cause strong
masking for only a small proportion of the time, given the short duration of these pulses relative
to the inter-pulse intervals;
6. Very strong sounds have the potential to cause temporary or permanent reduction in hearing
sensitivity, or other physical or physiological effects. Received sound levels must far exceed the
animal‘s hearing threshold for any temporary threshold shift to occur. Received levels must be
even higher for a risk of permanent hearing impairment.
2. Hearing Abilities of Marine Mammals
The hearing abilities of marine mammals are functions of the following (Richardson et al. 1995;
Au et al. 2000):
1. Absolute hearing threshold at the frequency in question (the level of sound barely audible in the
absence of ambient noise). The ―best frequency‖ is the frequency with the lowest absolute
threshold.
____________________________________
4 By W. John Richardson and Valerie D. Moulton, with subsequent updates (to Feb. 2010) by WJR and VDM
plus Patrick Abgrall, William E. Cross, Meike Holst, and Mari A. Smultea, all of LGL Ltd., environmental
research associates

Appendix A: Impacts of Airgun Sounds on Marine Mammals
Environmental Assessment for SIO ETP Cruise, 2010 Page 110
2. Critical ratio (the signal-to-noise ratio required to detect a sound at a specific frequency in the
presence of background noise around that frequency).
3. The ability to determine sound direction at the frequencies under consideration.
4. The ability to discriminate among sounds of different frequencies and intensities.
Marine mammals rely heavily on the use of underwater sounds to communicate and to gain
information about their surroundings. Experiments and monitoring studies also show that they hear and
may react to many man-made sounds including sounds made during seismic exploration (Richardson et
al. 1995; Gordon et al. 2004; Nowacek et al. 2007; Tyack 2008).
2.1 Toothed Whales (Odontocetes)
Hearing abilities of some toothed whales (odontocetes) have been studied in detail (reviewed in
Chapter 8 of Richardson et al. [1995] and in Au et al. [2000]). Hearing sensitivity of several species has
been determined as a function of frequency. The small to moderate-sized toothed whales whose hearing
has been studied have relatively poor hearing sensitivity at frequencies below 1 kHz, but extremely good
sensitivity at, and above, several kHz. There are very few data on the absolute hearing thresholds of most
of the larger, deep-diving toothed whales, such as the sperm and beaked whales. However, Cook et al.
(2006) found that a stranded juvenile Gervais‘ beaked whale showed evoked potentials from 5 kHz up to
80 kHz (the entire frequency range that was tested), with best sensitivity at 40–80 kHz. An adult Gervais‘
beaked whale had a similar upper cutoff frequency (80–90 kHz; Finneran et al. 2009).
Most of the odontocete species have been classified as belonging to the ―mid-frequency‖ (MF)
hearing group, and the MF odontocetes (collectively) have functional hearing from about 150 Hz to 160
kHz (Southall et al. 2007). However, individual species may not have quite so broad a functional
frequency range. Very strong sounds at frequencies slightly outside the functional range may also be
detectable. The remaining odontocetes―the porpoises, river dolphins, and members of the genera
Cephalorhynchus and Kogia―are distinguished as the ―high frequency‖ (HF) hearing group. They have
functional hearing from about 200 Hz to 180 kHz (Southall et al. 2007).
Airguns produce a small proportion of their sound at mid- and high-frequencies, although at pro-
gressively lower levels with increasing frequency. In general, most of the energy in the sound pulses
emitted by airgun arrays is at low frequencies; strongest spectrum levels are below 200 Hz, with
considerably lower spectrum levels above 1000 Hz, and smaller amounts of energy emitted up to ~150
kHz (Goold and Fish 1998; Sodal 1999; Goold and Coates 2006; Potter et al. 2007).
Despite the relatively poor sensitivity of small odontocetes at the low frequencies that contribute
most of the energy in pulses of sound from airgun arrays, airgun sounds are sufficiently strong, and con-
tain sufficient mid- and high-frequency energy, that their received levels sometimes remain above the
hearing thresholds of odontocetes at distances out to several tens of kilometers (Richardson and Würsig
1997). There is no evidence that most small odontocetes react to airgun pulses at such long distances.
However, beluga whales do seem quite responsive at intermediate distances (10–20 km) where sound
levels are well above the ambient noise level (see below).
In summary, even though odontocete hearing is relatively insensitive to the predominant low freq-
uencies produced by airguns, sounds from airgun arrays are audible to odontocetes, sometimes to dis-
tances of 10s of kilometers.

Appendix A: Impacts of Airgun Sounds on Marine Mammals
Environmental Assessment for SIO ETP Cruise, 2010 Page 111
2.2 Baleen Whales (Mysticetes)
The hearing abilities of baleen whales (mysticetes) have not been studied directly. Behavioral and
anatomical evidence indicates that they hear well at frequencies below 1 kHz (Richardson et al. 1995;
Ketten 2000). Frankel (2005) noted that gray whales reacted to a 21–25 kHz whale-finding sonar. Some
baleen whales react to pinger sounds up to 28 kHz, but not to pingers or sonars emitting sounds at 36 kHz
or above (Watkins 1986). In addition, baleen whales produce sounds at frequencies up to 8 kHz and, for
humpbacks, with components to >24 kHz (Au et al. 2006). The anatomy of the baleen whale inner ear
seems to be well adapted for detection of low-frequency sounds (Ketten 1991, 1992, 1994, 2000; Parks et
al. 2007b). Although humpbacks and minke whales (Berta et al. 2009) may have some auditory sensi-
tivity to frequencies above 22 kHz, for baleen whales as a group, the functional hearing range is thought
to be about 7 Hz to 22 kHz and they are said to constitute the ―low-frequency‖ (LF) hearing group
(Southall et al. 2007). The absolute sound levels that they can detect below 1 kHz are probably limited by
increasing levels of natural ambient noise at decreasing frequencies (Clark and Ellison 2004). Ambient
noise levels are higher at low frequencies than at mid frequencies. At frequencies below 1 kHz, natural
ambient levels tend to increase with decreasing frequency.
The hearing systems of baleen whales are undoubtedly more sensitive to low-frequency sounds
than are the ears of the small toothed whales that have been studied directly. Thus, baleen whales are
likely to hear airgun pulses farther away than can small toothed whales and, at closer distances, airgun
sounds may seem more prominent to baleen than to toothed whales. However, baleen whales have
commonly been seen well within the distances where seismic (or other source) sounds would be detect-
able and often show no overt reaction to those sounds. Behavioral responses by baleen whales to seismic
pulses have been documented, but received levels of pulsed sounds necessary to elicit behavioral
reactions are typically well above the minimum levels that the whales are assumed to detect (see below).
2.3 Seals and Sea Lions (Pinnipeds)
Underwater audiograms have been obtained using behavioral methods for three species of phocinid
seals, two species of monachid seals, two species of otariids, and the walrus (reviewed in Richardson et
al. 1995: 211ff; Kastak and Schusterman 1998, 1999; Kastelein et al. 2002, 2009). The functional hearing
range for pinnipeds in water is considered to extend from 75 Hz to 75 kHz (Southall et al. 2007), although
some individual species―especially the eared seals―do not have that broad an auditory range
(Richardson et al. 1995). In comparison with odontocetes, pinnipeds tend to have lower best frequencies,
lower high-frequency cutoffs, better auditory sensitivity at low frequencies, and poorer sensitivity at the
best frequency.
At least some of the phocid seals have better sensitivity at low frequencies ( 1 kHz) than do
odontocetes. Below 30–50 kHz, the hearing thresholds of most species tested are essentially flat down to
~1 kHz, and range between 60 and 85 dB re 1 µPa. Measurements for harbor seals indicate that, below
1 kHz, their thresholds under quiet background conditions deteriorate gradually with decreasing frequen-
cy to ~75 dB re 1 µPa at 125 Hz (Kastelein et al. 2009).
For the otariid (eared) seals, the high frequency cutoff is lower than for phocinids, and sensitivity at
low frequencies (e.g., 100 Hz) is poorer than for seals (harbor seal).

Appendix A: Impacts of Airgun Sounds on Marine Mammals
Environmental Assessment for SIO ETP Cruise, 2010 Page 112
2.4 Manatees and Dugong (Sirenians)
The West Indian manatee can apparently detect sounds and low-frequency vibrations from 15 Hz
to 46 kHz, based on a study involving behavioral testing methods (Gerstein et al. 1999, 2004). A more
recent study found that, in one Florida manatee, auditory sensitivity extended up to 90.5 kHz (Bauer et al.
2009). Thus, manatees may hear, or at least detect, sounds in the low-frequency range where most
seismic energy is released. It is possible that they are able to feel these low-frequency sounds using
vibrotactile receptors or because of resonance in body cavities or bone conduction.
Based on measurements of evoked potentials, manatee hearing is apparently best around 1–1.5 kHz
(Bullock et al. 1982). However, behavioral tests suggest that best sensitivities are at 6–20 kHz (Gerstein
et al. 1999) or 8–32 kHz (Bauer et al. 2009). The ability to detect high frequencies may be an adaptation
to shallow water, where the propagation of low frequency sound is limited (Gerstein et al. 1999, 2004).
2.5 Sea Otter and Polar Bear
No data are available on the hearing abilities of sea otters (Ketten 1998), although the in-air
vocalizations of sea otters have most of their energy concentrated at 3–5 kHz (McShane et al. 1995;
Thomson and Richardson 1995). Sea otter vocalizations are considered to be most suitable for short-
range communication among individuals (McShane et al. 1995). However, Ghoul et al. (2009) noted that
the in-air ―screams‖ of sea otters are loud signals (source level of 93–118 dB re 20 µPapk) that may be
used over larger distances; screams have a frequency of maximum energy ranging from 2 to 8 kHz. In-air
audiograms for two river otters indicate that this related species has its best hearing sensitivity at the
relatively high frequency of 16 kHz, with some sensitivity from about 460 Hz to 33 kHz (Gunn 1988).
However, these data apply to a different species of otter, and to in-air rather than underwater hearing.
Data on the specific hearing capabilities of polar bears are limited. A recent study of the in-air
hearing of polar bears applied the auditory evoked potential method while tone pips were played to
anesthetized bears (Nachtigall et al. 2007). Hearing was tested in ½ octave steps from 1 to 22.5 kHz, and
best hearing sensitivity was found between 11.2 and 22.5 kHz. Although low-frequency hearing was not
studied, the data suggested that medium- and some high-frequency sounds may be audible to polar bears.
However, polar bears‘ usual behavior (e.g., remaining on the ice, at the water surface, or on land) reduces
or avoids exposure to underwater sounds.
3. Characteristics of Airgun Sounds
Airguns function by venting high-pressure air into the water. The pressure signature of an individ-
ual airgun consists of a sharp rise and then fall in pressure, followed by several positive and negative
pressure excursions caused by oscillation of the resulting air bubble. The sizes, arrangement, and firing
times of the individual airguns in an array are designed and synchronized to suppress the pressure
oscillations subsequent to the first cycle. The resulting downward-directed pulse has a duration of only
10–20 ms, with only one strong positive and one strong negative peak pressure (Caldwell and Dragoset
2000). Most energy emitted from airguns is at relatively low frequencies. For example, typical high-
energy airgun arrays emit most energy at 10–120 Hz. However, the pulses contain significant energy up
to 500–1000 Hz and some energy at higher frequencies (Goold and Fish 1998; Potter et al. 2007). Studies
in the Gulf of Mexico have shown that the horizontally-propagating sound can contain significant energy
above the frequencies that airgun arrays are designed to emit (DeRuiter et al. 2006; Madsen et al. 2006;
Tyack et al. 2006a). Energy at frequencies up to 150 kHz was found in tests of single 60-in3 and 250-in
3
airguns (Goold and Coates 2006). Nonetheless, the predominant energy is at low frequencies.

Appendix A: Impacts of Airgun Sounds on Marine Mammals
Environmental Assessment for SIO ETP Cruise, 2010 Page 113
The pulsed sounds associated with seismic exploration have higher peak levels than other industrial
sounds (except those from explosions) to which whales and other marine mammals are routinely exposed.
The nominal source levels of the 2- to 36-airgun arrays used by Lamont-Doherty Earth Observatory
(L-DEO) from the R/V Maurice Ewing (now retired) and R/V Marcus G. Langseth (36 airguns) are 236–
265 dB re 1 µPap–p. These are the nominal source levels applicable to downward propagation. The
effective source levels for horizontal propagation are lower than those for downward propagation when
the source consists of numerous airguns spaced apart from one another. Explosions are the only man-
made sources with effective source levels as high as (or higher than) a large array of airguns. However,
high-power sonars can have source pressure levels as high as a small array of airguns, and signal duration
can be longer for a sonar than for an airgun array, making the source energy levels of some sonars more
comparable to those of airgun arrays.
Several important mitigating factors need to be kept in mind. (1) Airgun arrays produce inter-
mittent sounds, involving emission of a strong sound pulse for a small fraction of a second followed by
several seconds of near silence. In contrast, some other sources produce sounds with lower peak levels,
but their sounds are continuous or discontinuous but continuing for longer durations than seismic pulses.
(2) Airgun arrays are designed to transmit strong sounds downward through the seafloor, and the amount
of sound transmitted in near-horizontal directions is considerably reduced. Nonetheless, they also emit
sounds that travel horizontally toward non-target areas. (3) An airgun array is a distributed source, not a
point source. The nominal source level is an estimate of the sound that would be measured from a
theoretical point source emitting the same total energy as the airgun array. That figure is useful in
calculating the expected received levels in the far field, i.e., at moderate and long distances, but not in the
near field. Because the airgun array is not a single point source, there is no one location within the near
field (or anywhere else) where the received level is as high as the nominal source level.
The strengths of airgun pulses can be measured in different ways, and it is important to know
which method is being used when interpreting quoted source or received levels. Geophysicists usually
quote peak-to-peak (p-p) levels, in bar-meters or (less often) dB re 1 μPa · m. The peak (= zero-to-peak,
or 0-p) level for the same pulse is typically ~6 dB less. In the biological literature, levels of received
airgun pulses are often described based on the ―average‖ or ―root-mean-square‖ (rms) level, where the
average is calculated over the duration of the pulse. The rms value for a given airgun pulse is typically
~10 dB lower than the peak level, and 16 dB lower than the peak-to-peak value (Greene 1997; McCauley
et al. 1998, 2000a). A fourth measure that is increasingly used is the energy, or Sound Exposure Level
(SEL), in dB re 1 μPa2 · s. Because the pulses, even when stretched by propagation effects (see below),
are usually <1 s in duration, the numerical value of the energy is usually lower than the rms pressure
level. However, the units are different.5 Because the level of a given pulse will differ substantially
depending on which of these measures is being applied, it is important to be aware which measure is in
use when interpreting any quoted pulse level. In the past, the U.S. National Marine Fisheries Service
____________________________________
5 The rms value for a given airgun array pulse, as measured at a horizontal distance on the order of 0.1 km to 1–10
km in the units dB re 1 μPa, usually averages 10–15 dB higher than the SEL value for the same pulse measured in
dB re 1 μPa2
· s (e.g., Greene 1997). However, there is considerable variation, and the difference tends to be larger
close to the airgun array, and less at long distances (Blackwell et al. 2007; MacGillivray and Hannay 2007a,b). In
some cases, generally at longer distances, pulses are ―stretched‖ by propagation effects to the extent that the rms
and SEL values (in the respective units mentioned above) become very similar (e.g., MacGillivray and Hannay
2007a,b).

Appendix A: Impacts of Airgun Sounds on Marine Mammals
Environmental Assessment for SIO ETP Cruise, 2010 Page 114
(NMFS) has commonly referred to rms levels when discussing levels of pulsed sounds that might
―harass‖ marine mammals.
Seismic sound pulses received at any given point will arrive via a direct path, indirect paths that
include reflection from the sea surface and bottom, and often indirect paths including segments through
the bottom sediments. Sounds propagating via indirect paths travel longer distances and often arrive later
than sounds arriving via a direct path. (However, sound traveling in the bottom may travel faster than that
in the water, and thus may, in some situations, arrive slightly earlier than the direct arrival despite travel-
ing a greater distance.) These variations in travel time have the effect of lengthening the duration of the
received pulse, or may cause two or more received pulses from a single emitted pulse. Near the source,
the predominant part of a seismic pulse is ~10–20 ms in duration. In comparison, the pulse duration as
received at long horizontal distances can be much greater. For example, for one airgun array operating in
the Beaufort Sea, pulse duration was ~300 ms at a distance of 8 km, 500 ms at 20 km, and 850 ms at 73
km (Greene and Richardson 1988).
The rms level for a given pulse (when measured over the duration of that pulse) depends on the
extent to which propagation effects have ―stretched‖ the duration of the pulse by the time it reaches the
receiver (e.g., Madsen 2005). As a result, the rms values for various received pulses are not perfectly
correlated with the SEL (energy) values for the same pulses. There is increasing evidence that biological
effects are more directly related to the received energy (e.g., to SEL) than to the rms values averaged over
pulse duration (Southall et al. 2007).
Another important aspect of sound propagation is that received levels of low-frequency underwater
sounds diminish close to the surface because of pressure-release and interference phenomena that occur at
and near the surface (Urick 1983; Richardson et al. 1995; Potter et al. 2007). Paired measurements of
received airgun sounds at depths of 3 vs. 9 or 18 m have shown that received levels are typically several
decibels lower at 3 m (Greene and Richardson 1988). For a mammal whose auditory organs are within
0.5 or 1 m of the surface, the received level of the predominant low-frequency components of the airgun
pulses would be further reduced. In deep water, the received levels at deep depths can be considerably
higher than those at relatively shallow (e.g., 18 m) depths and the same horizontal distance from the
airguns (Tolstoy et al. 2004a,b).
Pulses of underwater sound from open-water seismic exploration are often detected 50–100 km
from the source location, even during operations in nearshore waters (Greene and Richardson 1988;
Burgess and Greene 1999). At those distances, the received levels are usually low, <120 dB re 1 Pa on
an approximate rms basis. However, faint seismic pulses are sometimes detectable at even greater ranges
(e.g., Bowles et al. 1994; Fox et al. 2002). In fact, low-frequency airgun signals sometimes can be
detected thousands of kilometers from their source. For example, sound from seismic surveys conducted
offshore of Nova Scotia, the coast of western Africa, and northeast of Brazil were reported as a dominant
feature of the underwater noise field recorded along the mid-Atlantic ridge (Nieukirk et al. 2004).
4. Masking Effects of Airgun Sounds
Masking is the obscuring of sounds of interest by interfering sounds, generally at similar freq-
uencies (Richardson et al. 1995). Introduced underwater sound will, through masking, reduce the
effective communication distance of a marine mammal species if the frequency of the source is close to
that used as a signal by the marine mammal, and if the anthropogenic sound is present for a significant
fraction of the time (Richardson et al. 1995). If little or no overlap occurs between the introduced sound
and the frequencies used by the species, communication is not expected to be disrupted. Also, if the
Appendix A: Impacts of Airgun Sounds on Marine Mammals
Environmental Assessment for SIO ETP Cruise, 2010 Page 115
introduced sound is present only infrequently, communication is not expected to be disrupted much if at
all. The duty cycle of airguns is low; the airgun sounds are pulsed, with relatively quiet periods between
pulses. In most situations, strong airgun sound will only be received for a brief period (<1 s), with these
sound pulses being separated by at least several seconds of relative silence, and longer in the case of
deep-penetration surveys or refraction surveys. A single airgun array might cause appreciable masking in
only one situation: When propagation conditions are such that sound from each airgun pulse reverberates
strongly and persists for much or all of the interval up to the next airgun pulse (e.g., Simard et al. 2005;
Clark and Gagnon 2006). Situations with prolonged strong reverberation are infrequent, in our experi-
ence. However, it is common for reverberation to cause some lesser degree of elevation of the back-
ground level between airgun pulses (e.g., Guerra et al. 2009), and this weaker reverberation presumably
reduces the detection range of calls and other natural sounds to some degree.
Although masking effects of pulsed sounds on marine mammal calls and other natural sounds are
expected to be limited, there are few specific studies on this. Some whales continue calling in the
presence of seismic pulses and whale calls often can be heard between the seismic pulses (e.g.,
Richardson et al. 1986; McDonald et al. 1995; Greene et al. 1999a,b; Nieukirk et al. 2004; Smultea et al.
2004; Holst et al. 2005a,b, 2006; Dunn and Hernandez 2009). However, there is one recent summary
report indicating that calling fin whales distributed in one part of the North Atlantic went silent for an
extended period starting soon after the onset of a seismic survey in the area (Clark and Gagnon 2006). It
is not clear from that preliminary paper whether the whales ceased calling because of masking, or whether
this was a behavioral response not directly involving masking. Also, bowhead whales in the Beaufort Sea
may decrease their call rates in response to seismic operations, although movement out of the area might
also have contributed to the lower call detection rate (Blackwell et al. 2009a,b). In contrast, Di Iorio and
Clark (2009) found evidence of increased calling by blue whales during operations by a lower-energy
seismic source―a sparker.
Among the odontocetes, there has been one report that sperm whales ceased calling when exposed
to pulses from a very distant seismic ship (Bowles et al. 1994). However, more recent studies of sperm
whales found that they continued calling in the presence of seismic pulses (Madsen et al. 2002; Tyack et
al. 2003; Smultea et al. 2004; Holst et al. 2006; Jochens et al. 2008). Madsen et al. (2006) noted that air-
gun sounds would not be expected to mask sperm whale calls given the intermittent nature of airgun
pulses. Dolphins and porpoises are also commonly heard calling while airguns are operating (Gordon et
al. 2004; Smultea et al. 2004; Holst et al. 2005a,b; Potter et al. 2007). Masking effects of seismic pulses
are expected to be negligible in the case of the smaller odontocetes, given the intermittent nature of
seismic pulses plus the fact that sounds important to them are predominantly at much higher frequencies
than are the dominant components of airgun sounds.
Pinnipeds, sirenians and sea otters have best hearing sensitivity and/or produce most of their
sounds at frequencies higher than the dominant components of airgun sound, but there is some overlap in
the frequencies of the airgun pulses and the calls. However, the intermittent nature of airgun pulses
presumably reduces the potential for masking.
A few cetaceans are known to increase the source levels of their calls in the presence of elevated
sound levels, shift their peak frequencies in response to strong sound signals, or otherwise modify their
vocal behavior in response to increased noise (Dahlheim 1987; Au 1993; reviewed in Richardson et al.
1995:233ff, 364ff; Lesage et al. 1999; Terhune 1999; Nieukirk et al. 2005; Scheifele et al. 2005; Parks et
al. 2007a, 2009; Di Iorio and Clark 2009; Hanser et al. 2009). It is not known how often these types of
responses occur upon exposure to airgun sounds. However, blue whales in the St. Lawrence Estuary

Appendix A: Impacts of Airgun Sounds on Marine Mammals
Environmental Assessment for SIO ETP Cruise, 2010 Page 116
significantly increased their call rates during sparker operations (Di Iorio and Clark 2009). The sparker,
used to obtain seismic reflection data, emitted frequencies of 30–450 Hz with a relatively low source level
of 193 dB re 1 μPapk-pk. If cetaceans exposed to airgun sounds sometimes respond by changing their vocal
behavior, this adaptation, along with directional hearing and preadaptation to tolerate some masking by
natural sounds (Richardson et al. 1995), would all reduce the importance of masking by seismic pulses.
5. Disturbance by Seismic Surveys
Disturbance includes a variety of effects, including subtle to conspicuous changes in behavior,
movement, and displacement. In the terminology of the 1994 amendments to the U.S. Marine Mammal
Protection Act (MMPA), seismic noise could cause ―Level B‖ harassment of certain marine mammals.
Level B harassment is defined as ―...disruption of behavioral patterns, including, but not limited to,
migration, breathing, nursing, breeding, feeding, or sheltering.‖
There has been debate regarding how substantial a change in behavior or mammal activity is
required before the animal should be deemed to be ―taken by Level B harassment‖. NMFS has stated that
―…a simple change in a marine mammal‘s actions does not always rise to the level of disruption
of its behavioral patterns. … If the only reaction to the [human] activity on the part of the marine
mammal is within the normal repertoire of actions that are required to carry out that behavioral
pattern, NMFS considers [the human] activity not to have caused a disruption of the behavioral
pattern, provided the animal‘s reaction is not otherwise significant enough to be considered
disruptive due to length or severity. Therefore, for example, a short-term change in breathing rates
or a somewhat shortened or lengthened dive sequence that are within the animal‘s normal range
and that do not have any biological significance (i.e., do no disrupt the animal‘s overall behavioral
pattern of breathing under the circumstances), do not rise to a level requiring a small take author-
ization.‖ (NMFS 2001, p. 9293).
Based on this guidance from NMFS, and on NRC (2005), simple exposure to sound, or brief reactions
that do not disrupt behavioral patterns in a potentially significant manner, do not constitute harassment or
―taking‖. In this analysis, we interpret ―potentially significant‖ to mean in a manner that might have
deleterious effects on the well-being of individual marine mammals or their populations.
Even with this guidance, there are difficulties in defining what marine mammals should be counted
as ―taken by harassment‖. Available detailed data on reactions of marine mammals to airgun sounds (and
other anthropogenic sounds) are limited to relatively few species and situations (see Richardson et al.
1995; Gordon et al. 2004; Nowacek et al. 2007; Southall et al. 2007). Behavioral reactions of marine
mammals to sound are difficult to predict in the absence of site- and context-specific data. Reactions to
sound, if any, depend on species, state of maturity, experience, current activity, reproductive state, time of
day, and many other factors (Richardson et al. 1995; Wartzok et al. 2004; Southall et al. 2007; Weilgart
2007). If a marine mammal reacts to an underwater sound by changing its behavior or moving a small
distance, the impacts of the change are unlikely to be significant to the individual, let alone the stock or
population. However, if a sound source displaces marine mammals from an important feeding or breed-
ing area for a prolonged period, impacts on individuals and populations could be significant (e.g., Lusseau
and Bejder 2007; Weilgart 2007). Also, various authors have noted that some marine mammals that show
no obvious avoidance or behavioral changes may still be adversely affected by noise (Brodie 1981; Rich-
ardson et al. 1995:317ff; Romano et al. 2004; Weilgart 2007; Wright et al. 2009). For example, some
research suggests that animals in poor condition or in an already stressed state may not react as strongly to
human disturbance as would more robust animals (e.g., Beale and Monaghan 2004).

Appendix A: Impacts of Airgun Sounds on Marine Mammals
Environmental Assessment for SIO ETP Cruise, 2010 Page 117
Studies of the effects of seismic surveys have focused almost exclusively on the effects on individ-
ual species or related groups of species, with little scientific or regulatory attention being given to broader
community-level issues. Parente et al. (2007) suggested that the diversity of cetaceans near the Brazil
coast was reduced during years with seismic surveys. However, a preliminary account of a more recent
analysis suggests that the trend did not persist when additional years were considered (Britto and Silva
Barreto 2009).
Given the many uncertainties in predicting the quantity and types of impacts of sound on marine
mammals, it is common practice to estimate how many mammals would be present within a particular
distance of human activities and/or exposed to a particular level of anthropogenic sound. In most cases,
this approach likely overestimates the numbers of marine mammals that would be affected in some
biologically important manner. One of the reasons for this is that the selected distances/isopleths are
based on limited studies indicating that some animals exhibited short-term reactions at this distance or
sound level, whereas the calculation assumes that all animals exposed to this level would react in a
biologically significant manner.
The definitions of ―taking‖ in the U.S. MMPA, and its applicability to various activities, were
slightly altered in November 2003 for military and federal scientific research activities. Also, NMFS is
proposing to replace current Level A and B harassment criteria with guidelines based on exposure
characteristics that are specific to particular groups of mammal species and to particular sound types
(NMFS 2005). Recently, a committee of specialists on noise impact issues has proposed new science-
based impact criteria (Southall et al. 2007). Thus, for projects subject to U.S. jurisdiction, changes in
procedures may be required in the near future.
The sound criteria used to estimate how many marine mammals might be disturbed to some
biologically significant degree by seismic survey activities are primarily based on behavioral observations
of a few species. Detailed studies have been done on humpback, gray, bowhead, and sperm whales, and
on ringed seals. Less detailed data are available for some other species of baleen whales and small
toothed whales, but for many species there are no data on responses to marine seismic surveys.
5.1 Baleen Whales
Baleen whales generally tend to avoid operating airguns, but avoidance radii are quite variable
among species, locations, whale activities, oceanographic conditions affecting sound propagation, etc.
(reviewed in Richardson et al. 1995; Gordon et al. 2004). Whales are often reported to show no overt
reactions to pulses from large arrays of airguns at distances beyond a few kilometers, even though the
airgun pulses remain well above ambient noise levels out to much longer distances. However, baleen
whales exposed to strong sound pulses from airguns often react by deviating from their normal migration
route and/or interrupting their feeding and moving away. Some of the major studies and reviews on this
topic are Malme et al. (1984, 1985, 1988); Richardson et al. (1986, 1995, 1999); Ljungblad et al. (1988);
Richardson and Malme (1993); McCauley et al. (1998, 2000a,b); Miller et al. (1999, 2005); Gordon et al.
(2004); Moulton and Miller (2005); Stone and Tasker (2006); Johnson et al. (2007); Nowacek et al.
(2007) and Weir (2008a). Although baleen whales often show only slight overt responses to operating
airgun arrays (Stone and Tasker 2006; Weir 2008a), strong avoidance reactions by several species of
mysticetes have been observed at ranges up to 6–8 km and occasionally as far as 20–30 km from the
source vessel when large arrays of airguns were used. Experiments with a single airgun showed that
bowhead, humpback and gray whales all showed localized avoidance to a single airgun of 20–100 in3
(Malme et al. 1984, 1985, 1986, 1988; Richardson et al. 1986; McCauley et al. 1998, 2000a,b).

Appendix A: Impacts of Airgun Sounds on Marine Mammals
Environmental Assessment for SIO ETP Cruise, 2010 Page 118
Studies of gray, bowhead, and humpback whales have shown that seismic pulses with received
levels of 160–170 dB re 1 Parms seem to cause obvious avoidance behavior in a substantial portion of the
animals exposed (Richardson et al. 1995). In many areas, seismic pulses from large arrays of airguns
diminish to those levels at distances ranging from 4–15 km from the source. More recent studies have
shown that some species of baleen whales (bowheads and humpbacks in particular) at times show strong
avoidance at received levels lower than 160–170 dB re 1 μParms. The largest avoidance radii involved
migrating bowhead whales, which avoided an operating seismic vessel by 20–30 km (Miller et al. 1999;
Richardson et al. 1999). In the cases of migrating bowhead (and gray) whales, the observed changes in
behavior appeared to be of little or no biological consequence to the animals—they simply avoided the
sound source by displacing their migration route to varying degrees, but within the natural boundaries of
the migration corridors (Malme et al. 1984; Malme and Miles 1985; Richardson et al. 1995). Feeding
bowhead whales, in contrast to migrating whales, show much smaller avoidance distances (Miller et al.
2005; Harris et al. 2007), presumably because moving away from a food concentration has greater cost to
the whales than does a course deviation during migration.
The following subsections provide more details on the documented responses of particular species
and groups of baleen whales to marine seismic operations.
Humpback Whales.—Responses of humpback whales to seismic surveys have been studied during
migration, on the summer feeding grounds, and on Angolan winter breeding grounds; there has also been
discussion of effects on the Brazilian wintering grounds. McCauley et al. (1998, 2000a) studied the
responses of migrating humpback whales off Western Australia to a full-scale seismic survey with a 16-
airgun 2678-in3 array, and to a single 20 in
3 airgun with a (horizontal) source level of 227 dB re
1 Pa · mp-p. They found that the overall distribution of humpbacks migrating through their study area
was unaffected by the full-scale seismic program, although localized displacement varied with pod
composition, behavior, and received sound levels. Observations were made from the seismic vessel, from
which the maximum viewing distance was listed as 14 km. Avoidance reactions (course and speed
changes) began at 4–5 km for traveling pods, with the closest point of approach (CPA) being 3–4 km at
an estimated received level of 157–164 dB re 1 µParms (McCauley et al. 1998, 2000a). A greater stand-off
range of 7–12 km was observed for more sensitive resting pods (cow-calf pairs; McCauley et al. 1998,
2000a). The mean received level for initial avoidance of an approaching airgun was 140 dB re 1 µPa rms
for humpback pods containing females, and at the mean CPA distance the received level was 143 dB re
1 µParms. One startle response was reported at 112 dB re 1 µParms. The initial avoidance response gener-
ally occurred at distances of 5–8 km from the airgun array and 2 km from the single airgun. However,
some individual humpback whales, especially males, approached within distances of 100–400 m, where
the maximum received level was 179 dB re 1 Parms. The McCauley et al. (1998, 2000a,b) studies show
evidence of greater avoidance of seismic airgun sounds by pods with females than by other pods during
humpback migration off Western Australia.
Humpback whales on their summer feeding grounds in southeast Alaska did not exhibit persistent
avoidance when exposed to seismic pulses from a 1.64-L (100 in3) airgun (Malme et al. 1985). Some
humpbacks seemed ―startled‖ at received levels of 150–169 dB re 1 Pa. Malme et al. (1985) concluded
that there was no clear evidence of avoidance, despite the possibility of subtle effects, at received levels
up to 172 re 1 Pa on an approximate rms basis.
Among wintering humpback whales off Angola (n = 52 useable groups), there were no significant
differences in encounter rates (sightings/hr) when a 24-airgun array (3147 in3 or 5085 in
3) was operating
vs. silent (Weir 2008a). There was also no significant difference in the mean CPA (closest observed point

Appendix A: Impacts of Airgun Sounds on Marine Mammals
Environmental Assessment for SIO ETP Cruise, 2010 Page 119
of approach) distance of the humpback sightings when airguns were on vs. off (3050 m vs. 2700 m,
respectively).
It has been suggested that South Atlantic humpback whales wintering off Brazil may be displaced
or even strand upon exposure to seismic surveys (Engel et al. 2004). The evidence for this was circum-
stantial and subject to alternative explanations (IAGC 2004). Also, the evidence was not consistent with
subsequent results from the same area of Brazil (Parente et al. 2006), or with direct studies of humpbacks
exposed to seismic surveys in other areas and seasons (see above). After allowance for data from subseq-
uent years, there was ―no observable direct correlation‖ between strandings and seismic surveys (IWC
2007, p. 236).
Bowhead Whales.—Responsiveness of bowhead whales to seismic surveys can be quite variable
depending on their activity (feeding vs. migrating). Bowhead whales on their summer feeding grounds in
the Canadian Beaufort Sea showed no obvious reactions to pulses from seismic vessels at distances of 6–
99 km and received sound levels of 107–158 dB on an approximate rms basis (Richardson et al. 1986);
their general activities were indistinguishable from those of a control group. However, subtle but statis-
tically significant changes in surfacing–respiration–dive cycles were evident upon statistical analysis.
Bowheads usually did show strong avoidance responses when seismic vessels approached within a few
kilometers (~3–7 km) and when received levels of airgun sounds were 152–178 dB (Richardson et al.
1986, 1995; Ljungblad et al. 1988; Miller et al. 2005). They also moved away when a single airgun fired
nearby (Richardson et al. 1986; Ljungblad et al. 1988). In one case, bowheads engaged in near-bottom
feeding began to turn away from a 30-airgun array with a source level of 248 dB re 1 μPa · m at a distance
of 7.5 km, and swam away when it came within ~2 km; some whales continued feeding until the vessel
was 3 km away (Richardson et al. 1986). This work and subsequent summer studies in the same region
by Miller et al. (2005) and Harris et al. (2007) showed that many feeding bowhead whales tend to tolerate
higher sound levels than migrating bowhead whales (see below) before showing an overt change in
behavior. On the summer feeding grounds, bowhead whales are often seen from the operating seismic
ship, though average sighting distances tend to be larger when the airguns are operating. Similarly, pre-
liminary analyses of recent data from the Alaskan Beaufort Sea indicate that bowheads feeding there dur-
ing late summer and autumn also did not display large-scale distributional changes in relation to seismic
operations (Christie et al. 2009; Koski et al. 2009). However, some individual bowheads apparently
begin to react at distances a few kilometers away, beyond the distance at which observers on the ship can
sight bowheads (Richardson et al. 1986; Citta et al. 2007). The feeding whales may be affected by the
sounds, but the need to feed may reduce the tendency to move away until the airguns are within a few
kilometers.
Migrating bowhead whales in the Alaskan Beaufort Sea seem more responsive to noise pulses from
a distant seismic vessel than are summering bowheads. Bowhead whales migrating west across the
Alaskan Beaufort Sea in autumn are unusually responsive, with substantial avoidance occurring out to
distances of 20–30 km from a medium-sized airgun source at received sound levels of around 120–130
dB re 1 µParms (Miller et al. 1999; Richardson et al. 1999; see also Manly et al. 2007). Those results came
from 1996–98, when a partially-controlled study of the effect of Ocean Bottom Cable (OBC) seismic
surveys on westward-migrating bowheads was conducted in late summer and autumn in the Alaskan
Beaufort Sea. At times when the airguns were not active, many bowheads moved into the area close to
the inactive seismic vessel. Avoidance of the area of seismic operations did not persist beyond 12–24 h
after seismic shooting stopped. Preliminary analysis of recent data on traveling bowheads in the Alaskan
Beaufort Sea also showed a stronger tendency to avoid operating airguns than was evident for feeding
bowheads (Christie et al. 2009; Koski et al. 2009).

Appendix A: Impacts of Airgun Sounds on Marine Mammals
Environmental Assessment for SIO ETP Cruise, 2010 Page 120
Bowhead whale calls detected in the presence and absence of airgun sounds have been studied
extensively in the Beaufort Sea. Early work on the summering grounds in the Canadian Beaufort Sea
showed that bowheads continue to produce calls of the usual types when exposed to airgun sounds,
although numbers of calls detected may be somewhat lower in the presence of airgun pulses (Richardson
et al. 1986). Studies during autumn in the Alaskan Beaufort Sea, one in 1996–1998 and another in 2007–
2008, have shown that numbers of calls detected are significantly lower in the presence than in the
absence of airgun pulses (Greene et al. 1999a,b; Blackwell et al. 2009a,b; Koski et al. 2009; see also
Nations et al. 2009). This decrease could have resulted from movement of the whales away from the area
of the seismic survey or a reduction in calling behavior, or a combination of the two. However, concur-
rent aerial surveys showed that there was strong avoidance of the operating airguns during the 1996–98
study, when most of the whales appeared to be migrating (Miller et al. 1999; Richardson et al. 1999). In
contrast, aerial surveys during the 2007–08 study showed less consistent avoidance by the bowheads,
many of which appeared to be feeding (Christie et al. 2009; Koski et al. 2009). The reduction in call
detection rates during periods of airgun operation may have been more dependent on actual avoidance
during the 1996–98 study and more dependent on reduced calling behavior during the 2007–08 study, but
further analysis of the recent data is ongoing.
There are no data on reactions of bowhead whales to seismic surveys in winter or spring.
Gray Whales.—Malme et al. (1986, 1988) studied the responses of feeding eastern gray whales to
pulses from a single 100-in3 airgun off St. Lawrence Island in the northern Bering Sea. They estimated,
based on small sample sizes, that 50% of feeding gray whales stopped feeding at an average received
pressure level of 173 dB re 1 Pa on an (approximate) rms basis, and that 10% of feeding whales inter-
rupted feeding at received levels of 163 dB re 1 Parms. Malme at al. (1986) estimated that an average
pressure level of 173 dB occurred at a range of 2.6–2.8 km from an airgun array with a source level of
250 dB re 1 µPapeak in the northern Bering Sea. These findings were generally consistent with the results
of studies conducted on larger numbers of gray whales migrating off California (Malme et al. 1984;
Malme and Miles 1985) and western Pacific gray whales feeding off Sakhalin, Russia (Würsig et al.
1999; Gailey et al. 2007; Johnson et al. 2007; Yazvenko et al. 2007a,b), along with a few data on gray
whales off British Columbia (Bain and Williams 2006).
Malme and Miles (1985) concluded that, during migration off California, gray whales showed
changes in swimming pattern with received levels of ~160 dB re 1 Pa and higher, on an approximate
rms basis. The 50% probability of avoidance was estimated to occur at a CPA distance of 2.5 km from a
4000-in³ airgun array operating off central California. This would occur at an average received sound
level of ~170 dB re 1 µParms. Some slight behavioral changes were noted when approaching gray whales
reached the distances where received sound levels were 140 to 160 dB re 1 µParms, but these whales
generally continued to approach (at a slight angle) until they passed the sound source at distances where
received levels averaged ~170 dB re 1 µParms (Malme et al. 1984; Malme and Miles 1985).
There was no indication that western gray whales exposed to seismic noise were displaced from
their overall feeding grounds near Sakhalin Island during seismic programs in 1997 (Würsig et al. 1999)
and in 2001 (Johnson et al. 2007; Meier et al. 2007; Yazvenko et al. 2007a). However, there were
indications of subtle behavioral effects among whales that remained in the areas exposed to airgun sounds
(Würsig et al. 1999; Gailey et al. 2007; Weller et al. 2006a). Also, there was evidence of localized redis-
tribution of some individuals within the nearshore feeding ground so as to avoid close approaches by the
seismic vessel (Weller et al. 2002, 2006b; Yazvenko et al. 2007a). Despite the evidence of subtle changes
in some quantitative measures of behavior and local redistribution of some individuals, there was no

Appendix A: Impacts of Airgun Sounds on Marine Mammals
Environmental Assessment for SIO ETP Cruise, 2010 Page 121
apparent change in the frequency of feeding, as evident from mud plumes visible at the surface (Yaz-
venko et al. 2007b). The 2001 seismic program involved an unusually comprehensive combination of
real-time monitoring and mitigation measures designed to avoid exposing western gray whales to
received levels of sound above about 163 dB re 1 μParms (Johnson et al. 2007). The lack of strong avoid-
ance or other strong responses was presumably in part a result of the mitigation measures. Effects
probably would have been more significant without such intensive mitigation efforts.
Gray whales in British Columbia exposed to seismic survey sound levels up to ~170 dB re 1 μPa
did not appear to be strongly disturbed (Bain and Williams 2006). The few whales that were observed
moved away from the airguns but toward deeper water where sound levels were said to be higher due to
propagation effects (Bain and Williams 2006).
Rorquals.—Blue, sei, fin, and minke whales (all of which are members of the genus Balaenoptera)
often have been seen in areas ensonified by airgun pulses (Stone 2003; MacLean and Haley 2004; Stone
and Tasker 2006), and calls from blue and fin whales have been localized in areas with airgun operations
(e.g., McDonald et al. 1995; Dunn and Hernandez 2009). Sightings by observers on seismic vessels dur-
ing 110 large-source seismic surveys off the U.K. from 1997 to 2000 suggest that, during times of good
sightability, sighting rates for mysticetes (mainly fin and sei whales) were similar when large arrays of
airguns were shooting vs. silent (Stone 2003; Stone and Tasker 2006). However, these whales tended to
exhibit localized avoidance, remaining significantly further (on average) from the airgun array during
seismic operations compared with non-seismic periods (P = 0.0057; Stone and Tasker 2006). The
average CPA distances for baleen whales sighted when large airgun arrays were operating vs. silent were
about 1.6 vs. 1.0 km. Baleen whales, as a group, were more often oriented away from the vessel while a
large airgun array was shooting compared with periods of no shooting (P <0.05; Stone and Tasker 2006).
In addition, fin/sei whales were less likely to remain submerged during periods of seismic shooting (Stone
2003).
In a study off Nova Scotia, Moulton and Miller (2005) found little difference in sighting rates (after
accounting for water depth) and initial average sighting distances of balaenopterid whales when airguns
were operating (mean = 1324 m) vs. silent (mean = 1303 m). However, there were indications that these
whales were more likely to be moving away when seen during airgun operations. Baleen whales at the
average sighting distance during airgun operations would have been exposed to sound levels (via direct
path) of about 169 dB re 1 μParms (Moulton and Miller 2005). Similarly, ship-based monitoring studies of
blue, fin, sei and minke whales offshore of Newfoundland (Orphan Basin and Laurentian Sub-basin)
found no more than small differences in sighting rates and swim directions during seismic vs. non-seismic
periods (Moulton et al. 2005, 2006a,b). Analyses of CPA data yielded variable results.6 The authors of
the Newfoundland reports concluded that, based on observations from the seismic vessel, some mysti-
cetes exhibited localized avoidance of seismic operations (Moulton et al. 2005, 2006a).
Minke whales have occasionally been observed to approach active airgun arrays where received
sound levels were estimated to be near 170–180 dB re 1 µPa (McLean and Haley 2004).
____________________________________
6 The CPA of baleen whales sighted from the seismic vessels was, on average, significantly closer during non-
seismic periods vs. seismic periods in 2004 in the Orphan Basin (means 1526 m vs. 2316 m, respectively; Moulton
et al. 2005). In contrast, mean distances without vs. with seismic did not differ significantly in 2005 in either the
Orphan Basin (means 973 m vs. 832 m, respectively; Moulton et al. 2006a) or in the Laurentian Sub-basin (means
1928 m vs. 1650 m, respectively; Moulton et al. 2006b). In both 2005 studies, mean distances were greater
(though not significantly so) without seismic.

Appendix A: Impacts of Airgun Sounds on Marine Mammals
Environmental Assessment for SIO ETP Cruise, 2010 Page 122
Discussion and Conclusions.—Baleen whales generally tend to avoid operating airguns, but
avoidance radii are quite variable. Whales are often reported to show no overt reactions to airgun pulses
at distances beyond a few kilometers, even though the airgun pulses remain well above ambient noise
levels out to much longer distances. However, studies done since the late 1990s of migrating humpback
and migrating bowhead whales show reactions, including avoidance, that sometimes extend to greater
distances than documented earlier. Avoidance distances often exceed the distances at which boat-based
observers can see whales, so observations from the source vessel can be biased. Observations over
broader areas may be needed to determine the range of potential effects of some large-source seismic
surveys where effects on cetaceans may extend to considerable distances (Richardson et al. 1999; Bain
and Williams 2006; Moore and Angliss 2006). Longer-range observations, when required, can sometimes
be obtained via systematic aerial surveys or aircraft-based observations of behavior (e.g., Richardson et
al. 1986, 1999; Miller et al. 1999, 2005; Yazvenko et al. 2007a,b) or by use of observers on one or more
support vessels operating in coordination with the seismic vessel (e.g., Smultea et al. 2004; Johnson et al.
2007). However, the presence of other vessels near the source vessel can, at least at times, reduce sight-
ability of cetaceans from the source vessel (Beland et al. 2009), thus complicating interpretation of
sighting data.
Some baleen whales show considerable tolerance of seismic pulses. However, when the pulses are
strong enough, avoidance or other behavioral changes become evident. Because the responses become
less obvious with diminishing received sound level, it has been difficult to determine the maximum
distance (or minimum received sound level) at which reactions to seismic become evident and, hence,
how many whales are affected.
Studies of gray, bowhead, and humpback whales have determined that received levels of pulses in
the 160–170 dB re 1 Parms range seem to cause obvious avoidance behavior in a substantial fraction of
the animals exposed. In many areas, seismic pulses diminish to these levels at distances ranging from 4
to 15 km from the source. A substantial proportion of the baleen whales within such distances may show
avoidance or other strong disturbance reactions to the operating airgun array. However, in other
situations, various mysticetes tolerate exposure to full-scale airgun arrays operating at even closer
distances, with only localized avoidance and minor changes in activities. At the other extreme, in
migrating bowhead whales, avoidance often extends to considerably larger distances (20–30 km) and
lower received sound levels (120–130 dB re 1 μParms). Also, even in cases where there is no conspicuous
avoidance or change in activity upon exposure to sound pulses from distant seismic operations, there are
sometimes subtle changes in behavior (e.g., surfacing–respiration–dive cycles) that are only evident
through detailed statistical analysis (e.g., Richardson et al. 1986; Gailey et al. 2007).
Mitigation measures for seismic surveys, especially nighttime seismic surveys, typically assume
that many marine mammals (at least baleen whales) tend to avoid approaching airguns, or the seismic
vessel itself, before being exposed to levels high enough for there to be any possibility of injury. This
assumes that the ramp-up (soft-start) procedure is used when commencing airgun operations, to give
whales near the vessel the opportunity to move away before they are exposed to sound levels that might
be strong enough to elicit TTS. As noted above, single-airgun experiments with three species of baleen
whales show that those species typically do tend to move away when a single airgun starts firing nearby,
which simulates the onset of a ramp up. The three species that showed avoidance when exposed to the onset
of pulses from a single airgun were gray whales (Malme et al. 1984, 1986, 1988); bowhead whales (Rich-
ardson et al. 1986; Ljungblad et al. 1988); and humpback whales (Malme et al. 1985; McCauley et al. 1998,
2000a,b). Since startup of a single airgun is equivalent to the start of a ramp-up (=soft start), this strongly
suggests that many baleen whales will begin to move away during the initial stages of a ramp-up.

Appendix A: Impacts of Airgun Sounds on Marine Mammals
Environmental Assessment for SIO ETP Cruise, 2010 Page 123
Data on short-term reactions by cetaceans to impulsive noises are not necessarily indicative of
long-term or biologically significant effects. It is not known whether impulsive sounds affect reproduc-
tive rate or distribution and habitat use in subsequent days or years. However, gray whales have
continued to migrate annually along the west coast of North America despite intermittent seismic
exploration (and much ship traffic) in that area for decades (Appendix A in Malme et al. 1984; Richard-
son et al. 1995), and there has been a substantial increase in the population over recent decades (Angliss
and Outlaw 2008). The western Pacific gray whale population did not seem affected by a seismic survey
in its feeding ground during a prior year (Johnson et al. 2007). Similarly, bowhead whales have contin-
ued to travel to the eastern Beaufort Sea each summer despite seismic exploration in their summer and
autumn range for many years (Richardson et al. 1987), and their numbers have increased notably (Angliss
and Outlaw 2008). Bowheads also have been observed over periods of days or weeks in areas ensonified
repeatedly by seismic pulses (Richardson et al. 1987; Harris et al. 2007). However, it is generally not
known whether the same individual bowheads were involved in these repeated observations (within and
between years) in strongly ensonified areas. In any event, in the absence of some unusual circumstances,
the history of coexistence between seismic surveys and baleen whales suggests that brief exposures to
sound pulses from any single seismic survey are unlikely to result in prolonged effects.
5.2 Toothed Whales
Little systematic information is available about reactions of toothed whales to noise pulses. Few
studies similar to the more extensive baleen whale/seismic pulse work summarized above have been
reported for toothed whales. However, there are recent systematic data on sperm whales (e.g., Gordon et
al. 2006; Madsen et al. 2006; Winsor and Mate 2006; Jochens et al. 2008; Miller et al. 2009). There is
also an increasing amount of information about responses of various odontocetes to seismic surveys based
on monitoring studies (e.g., Stone 2003; Smultea et al. 2004; Moulton and Miller 2005; Bain and
Williams 2006; Holst et al. 2006; Stone and Tasker 2006; Potter et al. 2007; Hauser et al. 2008; Holst and
Smultea 2008; Weir 2008a; Barkaszi et al. 2009; Richardson et al. 2009).
Delphinids (Dolphins and similar) and Monodontids (Beluga).—Seismic operators and marine
mammal observers on seismic vessels regularly see dolphins and other small toothed whales near
operating airgun arrays, but in general there is a tendency for most delphinids to show some avoidance of
operating seismic vessels (e.g., Goold 1996a,b,c; Calambokidis and Osmek 1998; Stone 2003; Moulton
and Miller 2005; Holst et al. 2006; Stone and Tasker 2006; Weir 2008a; Richardson et al. 2009; see also
Barkaszi et al. 2009). In most cases, the avoidance radii for delphinids appear to be small, on the order of
1 km or less, and some individuals show no apparent avoidance. Studies that have reported cases of small
toothed whales close to the operating airguns include Duncan (1985), Arnold (1996), Stone (2003), and
Holst et al. (2006). When a 3959 in3, 18-airgun array was firing off California, toothed whales behaved in
a manner similar to that observed when the airguns were silent (Arnold 1996). Some dolphins seem to be
attracted to the seismic vessel and floats, and some ride the bow wave of the seismic vessel even when a
large array of airguns is firing (e.g., Moulton and Miller 2005). Nonetheless, small toothed whales more
often tend to head away, or to maintain a somewhat greater distance from the vessel, when a large array
of airguns is operating than when it is silent (e.g., Stone and Tasker 2006; Weir 2008a).
Weir (2008b) noted that a group of short-finned pilot whales initially showed an avoidance
response to ramp up of a large airgun array, but that this response was limited in time and space.
Although the ramp-up procedure is a widely-used mitigation measure, it remains uncertain how effective
it is at alerting marine mammals (especially odontocetes) and causing them to move away from seismic
operations (Weir 2008b).

Appendix A: Impacts of Airgun Sounds on Marine Mammals
Environmental Assessment for SIO ETP Cruise, 2010 Page 124
Goold (1996a,b,c) studied the effects on common dolphins of 2D seismic surveys in the Irish Sea.
Passive acoustic surveys were conducted from the ―guard ship‖ that towed a hydrophone. The results
indicated that there was a local displacement of dolphins around the seismic operation. However, obser-
vations indicated that the animals were tolerant of the sounds at distances outside a 1-km radius from the
airguns (Goold 1996a). Initial reports of larger-scale displacement were later shown to represent a normal
autumn migration of dolphins through the area, and were not attributable to seismic surveys (Goold
1996a,b,c).
The beluga is a species that (at least at times) shows long-distance avoidance of seismic vessels.
Aerial surveys conducted in the southeastern Beaufort Sea in summer found that sighting rates of belugas
were significantly lower at distances 10–20 km compared with 20–30 km from an operating airgun array
(Miller et al. 2005). The low number of beluga sightings by marine mammal observers on the vessel
seemed to confirm there was a strong avoidance response to the 2250 in3 airgun array. More recent seis-
mic monitoring studies in the same area have confirmed that the apparent displacement effect on belugas
extended farther than has been shown for other small odontocetes exposed to airgun pulses (e.g., Harris et
al. 2007).
Observers stationed on seismic vessels operating off the U.K. from 1997 to 2000 have provided
data on the occurrence and behavior of various toothed whales exposed to seismic pulses (Stone 2003;
Gordon et al. 2004; Stone and Tasker 2006). Dolphins of various species often showed more evidence of
avoidance of operating airgun arrays than has been reported previously for small odontocetes. Sighting
rates of white-sided dolphins, white-beaked dolphins, Lagenorhynchus spp., and all small odontocetes
combined were significantly lower during periods when large-volume7 airgun arrays were shooting.
Except for the pilot whale and bottlenose dolphin, CPA distances for all of the small odontocete species
tested, including killer whales, were significantly farther from large airgun arrays during periods of
shooting compared with periods of no shooting. Pilot whales were less responsive than other small
odontocetes in the presence of seismic surveys (Stone and Tasker 2006). For small odontocetes as a
group, and most individual species, orientations differed between times when large airgun arrays were
operating vs. silent, with significantly fewer animals traveling towards and/or more traveling away from
the vessel during shooting (Stone and Tasker 2006). Observers‘ records suggested that fewer cetaceans
were feeding and fewer were interacting with the survey vessel (e.g., bow-riding) during periods with
airguns operating, and small odontocetes tended to swim faster during periods of shooting (Stone and
Tasker 2006). For most types of small odontocetes sighted by observers on seismic vessels, the median
CPA distance was ≥0.5 km larger during airgun operations (Stone and Tasker 2006). Killer whales
appeared to be more tolerant of seismic shooting in deeper waters.
Data collected during seismic operations in the Gulf of Mexico and off Central America show
similar patterns. A summary of vessel-based monitoring data from the Gulf of Mexico during 2003–2008
showed that delphinids were generally seen farther from the vessel during seismic than during non-
seismic periods (based on Barkaszi et al. 2009, excluding sperm whales). Similarly, during two NSF-
funded L-DEO seismic surveys that used a large 20 airgun array (~7000 in3), sighting rates of delphinids
were lower and initial sighting distances were farther away from the vessel during seismic than non-
seismic periods (Smultea et al. 2004; Holst et al. 2005a, 2006; Richardson et al. 2009). Monitoring
results during a seismic survey in the Southeast Caribbean showed that the mean CPA of delphinids was
991 m during seismic operations vs. 172 m when the airguns were not operational (Smultea et al. 2004).
____________________________________
7 Large volume means at least 1300 in
3, with most (79%) at least 3000 in
3.

Appendix A: Impacts of Airgun Sounds on Marine Mammals
Environmental Assessment for SIO ETP Cruise, 2010 Page 125
Surprisingly, nearly all acoustic detections via a towed passive acoustic monitoring (PAM) array,
including both delphinids and sperm whales, were made when the airguns were operating (Smultea et al.
2004). Although the number of sightings during monitoring of a seismic survey off the Yucatán
Peninsula, Mexico, was small (n = 19), the results showed that the mean CPA distance of delphinids there
was 472 m during seismic operations vs. 178 m when the airguns were silent (Holst et al. 2005a). The
acoustic detection rates were nearly 5 times higher during non-seismic compared with seismic operations
(Holst et al. 2005a).
For two additional NSF-funded L-DEO seismic surveys in the Eastern Tropical Pacific, both using
a large 36-airgun array (~6600 in3), the results are less easily interpreted (Richardson et al. 2009). During
both surveys, the delphinid detection rate was lower during seismic than during non-seismic periods, as
found in various other projects, but the mean CPA distance of delphinids was closer (not farther) during
seismic periods (Hauser et al. 2008; Holst and Smultea 2008).
During two seismic surveys off Newfoundland and Labrador in 2004–05, dolphin sighting rates
were lower during seismic periods than during non-seismic periods after taking temporal factors into
account, although the difference was statistically significant only in 2004 (Moulton et al. 2005, 2006a).
In 2005, the mean CPA distance of dolphins was significantly farther during seismic periods (807 vs.
652 m); in 2004, the corresponding difference was not significant.
Among Atlantic spotted dolphins off Angola (n = 16 useable groups), marked short-term and local-
ized displacement was found in response to seismic operations conducted with a 24-airgun array (3147 in3
or 5085 in3) (Weir 2008a). Sample sizes were low, but CPA distances of dolphin groups were
significantly larger when airguns were on (mean 1080 m) vs. off (mean 209 m). No Atlantic spotted
dolphins were seen within 500 m of the airguns when they were operating, whereas all sightings when
airguns were silent occurred within 500 m, including the only recorded ―positive approach‖ behaviors.
Reactions of toothed whales to a single airgun or other small airgun source are not well docu-
mented, but tend to be less substantial than reactions to large airgun arrays (e.g., Stone 2003; Stone and
Tasker 2006). During 91 site surveys off the U.K. in 1997–2000, sighting rates of all small odontocetes
combined were significantly lower during periods the low-volume8 airgun sources were operating, and
effects on orientation were evident for all species and groups tested (Stone and Tasker 2006). Results
from four NSF-funded L-DEO seismic surveys using small arrays (up to 3 GI guns and 315 in3) were
inconclusive. During surveys in the Eastern Tropical Pacific (Holst et al. 2005b) and in the Northwest
Atlantic (Haley and Koski 2004), detection rates were slightly lower during seismic compared to non-
seismic periods. However, mean CPAs were closer during seismic operations during one cruise (Holst et
al. 2005b), and greater during the other cruise (Haley and Koski 2004). Interpretation of the data was
confounded by the fact that survey effort and/or number of sightings during non-seismic periods during
both surveys was small. Results from another two small-array surveys were even more variable
(MacLean and Koski 2005; Smultea and Holst 2008).
Captive bottlenose dolphins and beluga whales exhibited changes in behavior when exposed to
strong pulsed sounds similar in duration to those typically used in seismic surveys (Finneran et al. 2000,
2002, 2005). Finneran et al. (2002) exposed a captive bottlenose dolphin and beluga to single impulses
from a water gun (80 in3). As compared with airgun pulses, water gun impulses were expected to contain
proportionally more energy at higher frequencies because there is no significant gas-filled bubble, and
____________________________________
8 For low volume arrays, maximum volume was 820 in
3, with most (87%) ≤180 in
3.

Appendix A: Impacts of Airgun Sounds on Marine Mammals
Environmental Assessment for SIO ETP Cruise, 2010 Page 126
thus little low-frequency bubble-pulse energy (Hutchinson and Detrick 1984). The captive animals some-
times vocalized after exposure and exhibited reluctance to station at the test site where subsequent
exposure to impulses would be implemented (Finneran et al. 2002). Similar behaviors were exhibited by
captive bottlenose dolphins and a beluga exposed to single underwater pulses designed to simulate those
produced by distant underwater explosions (Finneran et al. 2000). It is uncertain what relevance these
observed behaviors in captive, trained marine mammals exposed to single transient sounds may have to
free-ranging animals exposed to multiple pulses. In any event, the animals tolerated rather high received
levels of sound before exhibiting the aversive behaviors mentioned above.
Odontocete responses (or lack of responses) to noise pulses from underwater explosions (as
opposed to airgun pulses) may be indicative of odontocete responses to very strong noise pulses. During
the 1950s, small explosive charges were dropped into an Alaskan river in attempts to scare belugas away
from salmon. Success was limited (Fish and Vania 1971; Frost et al. 1984). Small explosive charges
were ―not always effective‖ in moving bottlenose dolphins away from sites in the Gulf of Mexico where
larger demolition blasts were about to occur (Klima et al. 1988). Odontocetes may be attracted to fish
killed by explosions, and thus attracted rather than repelled by ―scare‖ charges. Captive false killer
whales showed no obvious reaction to single noise pulses from small (10 g) charges; the received level
was ~185 dB re 1 Pa (Akamatsu et al. 1993). Jefferson and Curry (1994) reviewed several additional
studies that found limited or no effects of noise pulses from small explosive charges on killer whales and
other odontocetes. Aside from the potential for causing auditory impairment (see below), the tolerance to
these charges may indicate a lack of effect, or the failure to move away may simply indicate a stronger
desire to feed, regardless of circumstances.
Phocoenids (Porpoises).—Porpoises, like delphinids, show variable reactions to seismic oper-
ations, and reactions apparently depend on species. The limited available data suggest that harbor
porpoises show stronger avoidance of seismic operations than Dall‘s porpoises (Stone 2003; MacLean
and Koski 2005; Bain and Williams 2006). In Washington State waters, the harbor porpoise―despite
being considered a high-frequency specialist―appeared to be the species affected by the lowest received
level of airgun sound (<145 dB re 1 μParms at a distance >70 km; Bain and Williams 2006). Similarly,
during seismic surveys with large airgun arrays off the U.K. in 1997–2000, there were significant
differences in directions of travel by harbor porpoises during periods when the airguns were shooting vs.
silent (Stone 2003; Stone and Tasker 2006). A captive harbor porpoise exposed to single sound pulses
from a small airgun showed aversive behavior upon receipt of a pulse with received level above 174 dB re
1 μPapk-pk or SEL >145 dB re 1 μPa2 · s (Lucke et al. 2009). In contrast, Dall‘s porpoises seem relatively
tolerant of airgun operations (MacLean and Koski 2005; Bain and Williams 2006), although they too have
been observed to avoid large arrays of operating airguns (Calambokidis and Osmek 1998; Bain and
Williams 2006). The apparent tendency for greater responsiveness in the harbor porpoise is consistent
with their relative responsiveness to boat traffic and some other acoustic sources (Richardson et al. 1995;
Southall et al. 2007).
Beaked Whales.—There are almost no specific data on the behavioral reactions of beaked whales
to seismic surveys. Most beaked whales tend to avoid approaching vessels of other types (e.g., Würsig et
al. 1998). They may also dive for an extended period when approached by a vessel (e.g., Kasuya 1986),
although it is uncertain how much longer such dives may be as compared to dives by undisturbed beaked
whales, which also are often quite long (Baird et al. 2006; Tyack et al. 2006b). In any event, it is likely
that most beaked whales would also show strong avoidance of an approaching seismic vessel, regardless
of whether or not the airguns are operating. However, this has not been documented explicitly. Northern
bottlenose whales sometimes are quite tolerant of slow-moving vessels not emitting airgun pulses (Reeves

Appendix A: Impacts of Airgun Sounds on Marine Mammals
Environmental Assessment for SIO ETP Cruise, 2010 Page 127
et al. 1993; Hooker et al. 2001). The few detections (acoustic or visual) of northern bottlenose whales
from seismic vessels during recent seismic surveys off Nova Scotia have been during times when the
airguns were shut down; no detections were reported when the airguns were operating (Moulton and
Miller 2005; Potter et al. 2007). However, other visual and acoustic studies indicated that some northern
bottlenose whales remained in the general area and continued to produce high-frequency clicks when
exposed to sound pulses from distant seismic surveys (Gosselin and Lawson 2004; Laurinolli and Coch-
rane 2005; Simard et al. 2005).
There are increasing indications that some beaked whales tend to strand when military exercises
involving mid-frequency sonar operation are ongoing nearby (e.g., Simmonds and Lopez-Jurado 1991;
Frantzis 1998; NOAA and USN 2001; Jepson et al. 2003; Barlow and Gisiner 2006; see also the
―Strandings and Mortality‖ subsection, later). These strandings are apparently at least in part a distur-
bance response, although auditory or other injuries or other physiological effects may also be a factor.
Whether beaked whales would ever react similarly to seismic surveys is unknown. Seismic survey
sounds are quite different from those of the sonars in operation during the above-cited incidents. No
conclusive link has been established between seismic surveys and beaked whale strandings. There was a
stranding of two Cuvier‘s beaked whales in the Gulf of California (Mexico) in September 2002 when the
R/V Maurice Ewing was conducting a seismic survey in the general area (e.g., Malakoff 2002; Hilde-
brand 2005). However, NMFS did not establish a cause and effect relationship between this stranding
and the seismic survey activities (Hogarth 2002). Cox et al. (2006) noted the ―lack of knowledge regard-
ing the temporal and spatial correlation between the [stranding] and the sound source‖. Hildebrand
(2005) illustrated the approximate temporal-spatial relationships between the stranding and the Ewing‘s
tracks, but the time of the stranding was not known with sufficient precision for accurate determination of
the CPA distance of the whales to the Ewing. Another stranding of Cuvier‘s beaked whales in the
Galápagos occurred during a seismic survey in April 2000; however ―There is no obvious mechanism that
bridges the distance between this source and the stranding site‖ (Gentry [ed.] 2002).
Sperm Whales.—All three species of sperm whales have been reported to show avoidance reac-
tions to standard vessels not emitting airgun sounds (e.g., Richardson et al. 1995; Würsig et al. 1998;
McAlpine 2002; Baird 2005). However, most studies of the sperm whale Physeter macrocephalus expos-
ed to airgun sounds indicate that this species shows considerable tolerance of airgun pulses. The whales
usually do not show strong avoidance (i.e., they do not leave the area) and they continue to call.
There were some early and limited observations suggesting that sperm whales in the Southern
Ocean ceased calling during some (but not all) times when exposed to weak noise pulses from extremely
distant (>300 km) seismic exploration. However, other operations in the area could also have been a
factor (Bowles et al. 1994). This ―quieting‖ was suspected to represent a disturbance effect, in part
because sperm whales exposed to pulsed man-made sounds at higher frequencies often cease calling
(Watkins and Schevill 1975; Watkins et al. 1985). Also, there was an early preliminary account of
possible long-range avoidance of seismic vessels by sperm whales in the Gulf of Mexico (Mate et al.
1994). However, this has not been substantiated by subsequent more detailed work in that area (Gordon
et al. 2006; Winsor and Mate 2006; Jochens et al. 2008; Miller et al. 2009).
Recent and more extensive data from vessel-based monitoring programs in U.K. waters and off
Newfoundland and Angola suggest that sperm whales in those areas show little evidence of avoidance or
behavioral disruption in the presence of operating seismic vessels (Stone 2003; Stone and Tasker 2006;
Moulton et al. 2005, 2006a; Weir 2008a). Among sperm whales off Angola (n = 96 useable groups),
there were no significant differences in encounter rates (sightings/hr) when a 24-airgun array (3147 in3 or

Appendix A: Impacts of Airgun Sounds on Marine Mammals
Environmental Assessment for SIO ETP Cruise, 2010 Page 128
5085 in3) was operating vs. silent (Weir 2008a). There was also no significant difference in the CPA
distances of the sperm whale sightings when airguns were on vs. off (means 3039 m vs. 2594 m,
respectively). Encounter rate tended to increase over the 10-month duration of the seismic survey. These
types of observations are difficult to interpret because the observers are stationed on or near the seismic
vessel, and may underestimate reactions by some of the more responsive animals, which may be beyond
visual range. However, these results do seem to show considerable tolerance of seismic surveys by at
least some sperm whales. Also, a study off northern Norway indicated that sperm whales continued to
call when exposed to pulses from a distant seismic vessel. Received levels of the seismic pulses were up
to 146 dB re 1 μPap-p (Madsen et al. 2002).
Similarly, a study conducted off Nova Scotia that analyzed recordings of sperm whale
vocalizations at various distances from an active seismic program did not detect any obvious changes in
the distribution or behavior of sperm whales (McCall Howard 1999).
Sightings of sperm whales by observers on seismic vessels operating in the Gulf of Mexico during
2003–2008 were at very similar average distances regardless of the airgun operating conditions (Barkaszi
et al. 2009). For example, the mean sighting distance was 1839 m when the airgun array was in full
operation (n=612) vs. 1960 m when all airguns were off (n=66).
A controlled study of the reactions of tagged sperm whales to seismic surveys was done recently in
the Gulf of Mexico ―
the Sperm Whale Seismic Study or SWSS (Gordon et al. 2006; Madsen et al. 2006;
Winsor and Mate 2006; Jochens et al. 2008; Miller et al. 2009). During SWSS, D-tags (Johnson and
Tyack 2003) were used to record the movement and acoustic exposure of eight foraging sperm whales
before, during, and after controlled exposures to sound from airgun arrays (Jochens et al. 2008; Miller et
al. 2009). Whales were exposed to maximum received sound levels of 111–147 dB re 1 μParms (131–162
dB re 1 μPapk-pk) at ranges of ~1.4–12.8 km from the sound source (Miller et al. 2009). Although the tag-
ged whales showed no discernible horizontal avoidance, some whales showed changes in diving and
foraging behavior during full-array exposure, possibly indicative of subtle negative effects on foraging
(Jochens et al. 2008; Miller et al. 2009; Tyack 2009). Two indications of foraging that they studied were
oscillations in pitch and occurrence of echolocation buzzes, both of which tend to occur when a sperm
whale closes-in on prey. "Oscillations in pitch generated by swimming movements during foraging dives
were on average 6% lower during exposure than during the immediately following post-exposure period,
with all 7 foraging whales exhibiting less pitching (P = 0.014). Buzz rates, a proxy for attempts to
capture prey, were 19% lower during exposure…" (Miller et al. 2009). Although the latter difference was
not statistically significant (P = 0.141), the percentage difference in buzz rate during exposure vs. post-
exposure conditions appeared to be strongly correlated with airgun-whale distance (Miller et al. 2009:
Fig. 5; Tyack 2009).
Discussion and Conclusions.—Dolphins and porpoises are often seen by observers on active
seismic vessels, occasionally at close distances (e.g., bow riding). However, some studies near the U.K.,
Newfoundland and Angola, in the Gulf of Mexico, and off Central America have shown localized avoid-
ance. Also, belugas summering in the Canadian Beaufort Sea showed larger-scale avoidance, tending to
avoid waters out to 10–20 km from operating seismic vessels. In contrast, recent studies show little
evidence of conspicuous reactions by sperm whales to airgun pulses, contrary to earlier indications.
There are almost no specific data on responses of beaked whales to seismic surveys, but it is likely
that most if not all species show strong avoidance. There is increasing evidence that some beaked whales
may strand after exposure to strong noise from sonars. Whether they ever do so in response to seismic
Appendix A: Impacts of Airgun Sounds on Marine Mammals
Environmental Assessment for SIO ETP Cruise, 2010 Page 129
survey noise is unknown. Northern bottlenose whales seem to continue to call when exposed to pulses
from distant seismic vessels.
Overall, odontocete reactions to large arrays of airguns are variable and, at least for delphinids and
some porpoises, seem to be confined to a smaller radius than has been observed for some mysticetes.
However, other data suggest that some odontocetes species, including belugas and harbor porpoises, may
be more responsive than might be expected given their poor low-frequency hearing. Reactions at longer
distances may be particularly likely when sound propagation conditions are conducive to transmission of
the higher-frequency components of airgun sound to the animals‘ location (DeRuiter et al. 2006; Goold
and Coates 2006; Tyack et al. 2006a; Potter et al. 2007).
For delphinids, and possibly the Dall‘s porpoise, the available data suggest that a ≥170 dB re
1 µParms disturbance criterion (rather than ≥160 dB) would be appropriate. With a medium-to-large
airgun array, received levels typically diminish to 170 dB within 1–4 km, whereas levels typically remain
above 160 dB out to 4–15 km (e.g., Tolstoy et al. 2009). Reaction distances for delphinids are more
consistent with the typical 170 dB re 1 μParms distances. The 160 dB (rms) criterion currently applied by
NMFS was developed based primarily on data from gray and bowhead whales. Avoidance distances for
delphinids and Dall‘s porpoises tend to be shorter than for those two mysticete species. For delphinids
and Dall‘s porpoises, there is no indication of strong avoidance or other disruption of behavior at
distances beyond those where received levels would be ~170 dB re 1 μParms.
5.3 Pinnipeds
Few studies of the reactions of pinnipeds to noise from open-water seismic exploration have been
published (for review of the early literature, see Richardson et al. 1995). However, pinnipeds have been
observed during a number of seismic monitoring studies. Monitoring in the Beaufort Sea during 1996–
2002 provided a substantial amount of information on avoidance responses (or lack thereof) and
associated behavior. Additional monitoring of that type has been done in the Beaufort and Chukchi Seas
in 2006–2009. Pinnipeds exposed to seismic surveys have also been observed during seismic surveys
along the U.S. west coast. Some limited data are available on physiological responses of pinnipeds
exposed to seismic sound, as studied with the aid of radio telemetry. Also, there are data on the reactions
of pinnipeds to various other related types of impulsive sounds.
Early observations provided considerable evidence that pinnipeds are often quite tolerant of strong
pulsed sounds. During seismic exploration off Nova Scotia, gray seals exposed to noise from airguns and
linear explosive charges reportedly did not react strongly (J. Parsons in Greene et al. 1985). An airgun
caused an initial startle reaction among South African fur seals but was ineffective in scaring them away
from fishing gear (Anonymous 1975). Pinnipeds in both water and air sometimes tolerate strong noise
pulses from non-explosive and explosive scaring devices, especially if attracted to the area for feeding or
reproduction (Mate and Harvey 1987; Reeves et al. 1996). Thus, pinnipeds are expected to be rather tol-
erant of, or to habituate to, repeated underwater sounds from distant seismic sources, at least when the
animals are strongly attracted to the area.
In the U.K., a radio-telemetry study demonstrated short-term changes in the behavior of harbor
(=common) and gray seals exposed to airgun pulses (Thompson et al. 1998). Harbor seals were exposed
to seismic pulses from a 90-in3 array (3 30 in
3 airguns), and behavioral responses differed among
individuals. One harbor seal avoided the array at distances up to 2.5 km from the source and only
resumed foraging dives after seismic stopped. Another harbor seal exposed to the same small airgun
array showed no detectable behavioral response, even when the array was within 500 m. Gray seals

Appendix A: Impacts of Airgun Sounds on Marine Mammals
Environmental Assessment for SIO ETP Cruise, 2010 Page 130
exposed to a single 10-in3 airgun showed an avoidance reaction: they moved away from the source,
increased swim speed and/or dive duration, and switched from foraging dives to predominantly transit
dives. These effects appeared to be short-term as gray seals either remained in, or returned at least once
to, the foraging area where they had been exposed to seismic pulses. These results suggest that there are
interspecific as well as individual differences in seal responses to seismic sounds.
Off California, visual observations from a seismic vessel showed that California sea lions ―typic-
ally ignored the vessel and array. When [they] displayed behavior modifications, they often appeared to
be reacting visually to the sight of the towed array. At times, California sea lions were attracted to the
array, even when it was on. At other times, these animals would appear to be actively avoiding the vessel
and array‖ (Arnold 1996). In Puget Sound, sighting distances for harbor seals and California sea lions
tended to be larger when airguns were operating; both species tended to orient away whether or not the
airguns were firing (Calambokidis and Osmek 1998). Bain and Williams (2006) also stated that their
small sample of harbor seals and sea lions tended to orient and/or move away upon exposure to sounds
from a large airgun array.
Monitoring work in the Alaskan Beaufort Sea during 1996–2001 provided considerable informa-
tion regarding the behavior of seals exposed to seismic pulses (Harris et al. 2001; Moulton and Lawson
2002). Those seismic projects usually involved arrays of 6–16 airguns with total volumes 560–1500 in3.
Subsequent monitoring work in the Canadian Beaufort Sea in 2001–2002, with a somewhat larger airgun
system (24 airguns, 2250 in3), provided similar results (Miller et al. 2005). The combined results suggest
that some seals avoid the immediate area around seismic vessels. In most survey years, ringed seal
sightings averaged somewhat farther away from the seismic vessel when the airguns were operating than
when they were not (Moulton and Lawson 2002). Also, seal sighting rates at the water surface were
lower during airgun array operations than during no-airgun periods in each survey year except 1997.
However, the avoidance movements were relatively small, on the order of 100 m to (at most) a few hun-
dreds of meters, and many seals remained within 100–200 m of the trackline as the operating airgun array
passed by.
The operation of the airgun array had minor and variable effects on the behavior of seals visible at
the surface within a few hundred meters of the airguns (Moulton and Lawson 2002). The behavioral data
indicated that some seals were more likely to swim away from the source vessel during periods of airgun
operations and more likely to swim towards or parallel to the vessel during non-seismic periods. No
consistent relationship was observed between exposure to airgun noise and proportions of seals engaged
in other recognizable behaviors, e.g., ―looked‖ and ―dove‖. Such a relationship might have occurred if
seals seek to reduce exposure to strong seismic pulses, given the reduced airgun noise levels close to the
surface where ―looking‖ occurs (Moulton and Lawson 2002).
Monitoring results from the Canadian Beaufort Sea during 2001–2002 were more variable (Miller
et al. 2005). During 2001, sighting rates of seals (mostly ringed seals) were similar during all seismic
states, including periods without airgun operations. However, seals tended to be seen closer to the vessel
during non-seismic than seismic periods. In contrast, during 2002, sighting rates of seals were higher
during non-seismic periods than seismic operations, and seals were seen farther from the vessel during
non-seismic compared to seismic activity (a marginally significant result). The combined data for both
years showed that sighting rates were higher during non-seismic periods compared to seismic periods, and
that sighting distances were similar during both seismic states. Miller et al. (2005) concluded that seals
showed very limited avoidance to the operating airgun array.

Appendix A: Impacts of Airgun Sounds on Marine Mammals
Environmental Assessment for SIO ETP Cruise, 2010 Page 131
Vessel-based monitoring also took place in the Alaskan Chukchi and Beaufort seas during 2006–
2008 (Reiser et al. 2009). Observers on the seismic vessels saw phocid seals less frequently while airguns
were operating than when airguns were silent. Also, during airgun operations, those observers saw seals
less frequently than did observers on nearby vessels without airguns. Finally, observers on the latter ―no-
airgun‖ vessels saw seals more often when the nearby source vessels‘ airguns were operating than when
they were silent. All of these observations are indicative of a tendency for phocid seals to exhibit local-
ized avoidance of the seismic source vessel when airguns are firing (Reiser et al. 2009).
In summary, visual monitoring from seismic vessels has shown only slight (if any) avoidance of
airguns by pinnipeds, and only slight (if any) changes in behavior. These studies show that many pin-
nipeds do not avoid the area within a few hundred meters of an operating airgun array. However, based
on the studies with large sample size, or observations from a separate monitoring vessel, or radio telem-
etry, it is apparent that some phocid seals do show localized avoidance of operating airguns. The limited
nature of this tendency for avoidance is a concern. It suggests that one cannot rely on pinnipeds to move
away, or to move very far away, before received levels of sound from an approaching seismic survey
vessel approach those that may cause hearing impairment (see below).
5.4 Sirenians, Sea Otter and Polar Bear
We are not aware of any information on the reactions of sirenians to airgun sounds.
Behavior of sea otters along the California coast was monitored by Riedman (1983, 1984) while
they were exposed to a single 100 in3
airgun and a 4089 in3 airgun array. No disturbance reactions were
evident when the airgun array was as close as 0.9 km. Sea otters also did not respond noticeably to the
single airgun. These results suggest that sea otters may be less responsive to marine seismic pulses than
some other marine mammals, such as mysticetes and odontocetes (summarized above). Also, sea otters
spend a great deal of time at the surface feeding and grooming (Riedman 1983, 1984). While at the
surface, the potential noise exposure of sea otters would be much reduced by pressure-release and
interference (Lloyd‘s mirror) effects at the surface (Greene and Richardson 1988; Richardson et al. 1995).
Airgun effects on polar bears have not been studied. However, polar bears on the ice would be
largely unaffected by underwater sound. Sound levels received by polar bears in the water would be
attenuated because polar bears generally do not dive much below the surface and received levels of airgun
sounds are reduced near the surface because of the aforementioned pressure release and interference
effects at the water‘s surface.
6. Hearing Impairment and Other Physical Effects of Seismic Surveys
Temporary or permanent hearing impairment is a possibility when marine mammals are exposed to
very strong sounds. Temporary threshold shift (TTS) has been demonstrated and studied in certain
captive odontocetes and pinnipeds exposed to strong sounds (reviewed in Southall et al. 2007). However,
there has been no specific documentation of TTS let alone permanent hearing damage, i.e. permanent
threshold shift (PTS), in free-ranging marine mammals exposed to sequences of airgun pulses during
realistic field conditions. Current NMFS policy regarding exposure of marine mammals to high-level
sounds is that cetaceans and pinnipeds should not be exposed to impulsive sounds ≥180 and 190 dB re
1 Parms, respectively (NMFS 2000). Those criteria have been used in establishing the safety (=shut-
down) radii planned for numerous seismic surveys conducted under U.S. jurisdiction. However, those
criteria were established before there was any information about the minimum received levels of sounds
necessary to cause auditory impairment in marine mammals. As discussed below,
Appendix A: Impacts of Airgun Sounds on Marine Mammals
Environmental Assessment for SIO ETP Cruise, 2010 Page 132
the 180-dB criterion for cetaceans is probably quite precautionary, i.e., lower than necessary to
avoid temporary auditory impairment let alone permanent auditory injury, at least for delphinids.
TTS is not injury and does not constitute ―Level A harassment‖ in U.S. MMPA terminology.
the minimum sound level necessary to cause permanent hearing impairment (―Level A harass-
ment‖) is higher, by a variable and generally unknown amount, than the level that induces barely-
detectable TTS.
the level associated with the onset of TTS is often considered to be a level below which there is
no danger of permanent damage. The actual PTS threshold is likely to be well above the level
causing onset of TTS (Southall et al. 2007).
Recommendations for new science-based noise exposure criteria for marine mammals, frequency-
weighting procedures, and related matters were published recently (Southall et al. 2007). Those recom-
mendations have not, as of late 2009, been formally adopted by NMFS for use in regulatory processes and
during mitigation programs associated with seismic surveys. However, some aspects of the recommenda-
tions have been taken into account in certain EISs and small-take authorizations. NMFS has indicated
that it may issue new noise exposure criteria for marine mammals that account for the now-available
scientific data on TTS, the expected offset between the TTS and PTS thresholds, differences in the
acoustic frequencies to which different marine mammal groups are sensitive, and other relevant factors.
Preliminary information about possible changes in the regulatory and mitigation requirements, and about
the possible structure of new criteria, was given by Wieting (2004) and NMFS (2005).
Several aspects of the monitoring and mitigation measures that are now often implemented during
seismic survey projects are designed to detect marine mammals occurring near the airgun array, and to
avoid exposing them to sound pulses that might, at least in theory, cause hearing impairment. In addition,
many cetaceans and (to a limited degree) pinnipeds show some avoidance of the area where received
levels of airgun sound are high enough such that hearing impairment could potentially occur. In those
cases, the avoidance responses of the animals themselves will reduce or (most likely) avoid the possibility
of hearing impairment.
Non-auditory physical effects may also occur in marine mammals exposed to strong underwater
pulsed sound. Possible types of non-auditory physiological effects or injuries that might (in theory) occur
include stress, neurological effects, bubble formation, and other types of organ or tissue damage. It is
possible that some marine mammal species (i.e., beaked whales) may be especially susceptible to injury
and/or stranding when exposed to strong pulsed sounds. The following subsections summarize available
data on noise-induced hearing impairment and non-auditory physical effects.
6.1 Temporary Threshold Shift (TTS)
TTS is the mildest form of hearing impairment that can occur during exposure to a strong sound
(Kryter 1985). While experiencing TTS, the hearing threshold rises and a sound must be stronger in order
to be heard. It is a temporary phenomenon, and (especially when mild) is not considered to represent
physical damage or ―injury‖ (Southall et al. 2007). Rather, the onset of TTS is an indicator that, if the
animal is exposed to higher levels of that sound, physical damage is ultimately a possibility.
The magnitude of TTS depends on the level and duration of noise exposure, and to some degree on
frequency, among other considerations (Kryter 1985; Richardson et al. 1995; Southall et al. 2007). For
sound exposures at or somewhat above the TTS threshold, hearing sensitivity recovers rapidly after
exposure to the noise ends. In terrestrial mammals, TTS can last from minutes or hours to (in cases of

Appendix A: Impacts of Airgun Sounds on Marine Mammals
Environmental Assessment for SIO ETP Cruise, 2010 Page 133
strong TTS) days. Only a few data have been obtained on sound levels and durations necessary to elicit
mild TTS in marine mammals (none in mysticetes), and none of the published data concern TTS elicited
by exposure to multiple pulses of sound during operational seismic surveys (Southall et al. 2007).
Toothed Whales.—There are empirical data on the sound exposures that elicit onset of TTS in
captive bottlenose dolphins and belugas. The majority of these data concern non-impulse sound, but there
are some limited published data concerning TTS onset upon exposure to a single pulse of sound from a
watergun (Finneran et al. 2002). A detailed review of all TTS data from marine mammals can be found
in Southall et al. (2007). The following summarizes some of the key results from odontocetes.
Recent information corroborates earlier expectations that the effect of exposure to strong transient
sounds is closely related to the total amount of acoustic energy that is received. Finneran et al. (2005)
examined the effects of tone duration on TTS in bottlenose dolphins. Bottlenose dolphins were exposed
to 3 kHz tones (non-impulsive) for periods of 1, 2, 4 or 8 s, with hearing tested at 4.5 kHz. For 1-s
exposures, TTS occurred with SELs of 197 dB, and for exposures >1 s, SEL >195 dB resulted in TTS
(SEL is equivalent to energy flux, in dB re 1 μPa2 · s). At an SEL of 195 dB, the mean TTS (4 min after
exposure) was 2.8 dB. Finneran et al. (2005) suggested that an SEL of 195 dB is the likely threshold for
the onset of TTS in dolphins and belugas exposed to tones of durations 1–8 s (i.e., TTS onset occurs at a
near-constant SEL, independent of exposure duration). That implies that, at least for non-impulsive tones,
a doubling of exposure time results in a 3 dB lower TTS threshold.
The assumption that, in marine mammals, the occurrence and magnitude of TTS is a function of
cumulative acoustic energy (SEL) is probably an oversimplification. Kastak et al. (2005) reported prelim-
inary evidence from pinnipeds that, for prolonged non-impulse noise, higher SELs were required to elicit
a given TTS if exposure duration was short than if it was longer, i.e., the results were not fully consistent
with an equal-energy model to predict TTS onset. Mooney et al. (2009a) showed this in a bottlenose dol-
phin exposed to octave-band non-impulse noise ranging from 4 to 8 kHz at SPLs of 130 to 178 dB re
1 Pa for periods of 1.88 to 30 min. Higher SELs were required to induce a given TTS if exposure
duration short than if it was longer. Exposure of the aforementioned bottlenose dolphin to a sequence of
brief sonar signals showed that, with those brief (but non-impulse) sounds, the received energy (SEL)
necessary to elicit TTS was higher than was the case with exposure to the more prolonged octave-band
noise (Mooney et al. 2009b). Those authors concluded that, when using (non-impulse) acoustic signals of
duration ~0.5 s, SEL must be at least 210–214 dB re 1 μPa2 · s to induce TTS in the bottlenose dolphin.
On the other hand, the TTS threshold for odontocetes exposed to a single impulse from a watergun
(Finneran et al. 2002) appeared to be somewhat lower than for exposure to non-impulse sound. This was
expected, based on evidence from terrestrial mammals showing that broadband pulsed sounds with rapid
rise times have greater auditory effect than do non-impulse sounds (Southall et al. 2007). The received
energy level of a single seismic pulse that caused the onset of mild TTS in the beluga, as measured
without frequency weighting, was ~186 dB re 1 µPa2 · s or 186 dB SEL (Finneran et al. 2002).
9 The rms
level of an airgun pulse (in dB re 1 μPa measured over the duration of the pulse) is typically 10–15 dB
higher than the SEL for the same pulse when received within a few kilometers of the airguns. Thus, a
single airgun pulse might need to have a received level of ~196–201 dB re 1 µParms in order to produce
brief, mild TTS. Exposure to several strong seismic pulses that each has a flat-weighted received level
____________________________________
9 If the low-frequency components of the watergun sound used in the experiments of Finneran et al. (2002) are
downweighted as recommended by Southall et al. (2007) using their Mmf-weighting curve, the effective exposure
level for onset of mild TTS was 183 dB re 1 μPa2 · s (Southall et al. 2007).

Appendix A: Impacts of Airgun Sounds on Marine Mammals
Environmental Assessment for SIO ETP Cruise, 2010 Page 134
near 190 dBrms (175–180 dB SEL) could result in cumulative exposure of ~186 dB SEL (flat-weighted) or
~183 dB SEL (Mmf-weighted), and thus slight TTS in a small odontocete. That assumes that the TTS
threshold upon exposure to multiple pulses is (to a first approximation) a function of the total received
pulse energy, without allowance for any recovery between pulses.
The above TTS information for odontocetes is derived from studies on the bottlenose dolphin and
beluga. For the one harbor porpoise tested, the received level of airgun sound that elicited onset of TTS
was lower. The animal was exposed to single pulses from a small (20 in3) airgun, and auditory evoked
potential methods were used to test the animal‘s hearing sensitivity at frequencies of 4, 32, or 100 kHz
after each exposure (Lucke et al. 2009). Based on the measurements at 4 kHz, TTS occurred upon expo-
sure to one airgun pulse with received level ~200 dB re 1 μPapk-pk or an SEL of 164.3 dB re 1 µPa2 · s. If
these results from a single animal are representative, it is inappropriate to assume that onset of TTS
occurs at similar received levels in all odontocetes (cf. Southall et al. 2007). Some cetaceans may incur
TTS at lower sound exposures than are necessary to elicit TTS in the beluga or bottlenose dolphin.
Insofar as we are aware, there are no published data confirming that the auditory effect of a
sequence of airgun pulses received by an odontocete is a function of their cumulative energy. Southall et
al. (2007) consider that to be a reasonable, but probably somewhat precautionary, assumption. It is pre-
cautionary because, based on data from terrestrial mammals, one would expect that a given energy expo-
sure would have somewhat less effect if separated into discrete pulses, with potential opportunity for
partial auditory recovery between pulses. However, as yet there has been little study of the rate of recov-
ery from TTS in marine mammals, and in humans and other terrestrial mammals the available data on
recovery are quite variable. Southall et al. (2007) concluded that―until relevant data on recovery are
available from marine mammals―it is appropriate not to allow for any assumed recovery during the
intervals between pulses within a pulse sequence.
Additional data are needed to determine the received sound levels at which small odontocetes
would start to incur TTS upon exposure to repeated, low-frequency pulses of airgun sound with variable
received levels. To determine how close an airgun array would need to approach in order to elicit TTS, it
is necessary to determine the total energy that a mammal would receive as an airgun array approaches,
passes at various CPA distances, and moves away (e.g., Erbe and King 2009). At the present state of
knowledge, it is also necessary to assume that the effect is directly related to total received energy even
though that energy is received in multiple pulses separated by gaps. The lack of data on the exposure
levels necessary to cause TTS in toothed whales when the signal is a series of pulsed sounds, separated by
silent periods, remains a data gap, as is the lack of published data on TTS in odontocetes other than the
beluga, bottlenose dolphin, and harbor porpoise.
Baleen Whales.—There are no data, direct or indirect, on levels or properties of sound that are
required to induce TTS in any baleen whale. The frequencies to which mysticetes are most sensitive are
assumed to be lower than those to which odontocetes are most sensitive, and natural background noise
levels at those low frequencies tend to be higher. As a result, auditory thresholds of baleen whales within
their frequency band of best hearing are believed to be higher (less sensitive) than are those of odonto-
cetes at their best frequencies (Clark and Ellison 2004). From this, it is suspected that received levels
causing TTS onset may also be higher in mysticetes (Southall et al. 2007). However, based on prelim-
inary simulation modeling that attempted to allow for various uncertainties in assumptions and variability
around population means, Gedamke et al. (2008) suggested that some baleen whales whose closest point
of approach to a seismic vessel is 1 km or more could experience TTS or even PTS.

Appendix A: Impacts of Airgun Sounds on Marine Mammals
Environmental Assessment for SIO ETP Cruise, 2010 Page 135
In practice during seismic surveys, few if any cases of TTS are expected given the strong likeli-
hood that baleen whales would avoid the approaching airguns (or vessel) before being exposed to levels
high enough for there to be any possibility of TTS (see above for evidence concerning avoidance respon-
ses by baleen whales). This assumes that the ramp-up (soft-start) procedure is used when commencing
airgun operations, to give whales near the vessel the opportunity to move away before they are exposed to
sound levels that might be strong enough to elicit TTS. As discussed earlier, single-airgun experiments
with bowhead, gray, and humpback whales show that those species do tend to move away when a single
airgun starts firing nearby, which simulates the onset of a ramp up.
Pinnipeds.—In pinnipeds, TTS thresholds associated with exposure to brief pulses (single or
multiple) of underwater sound have not been measured. Two California sea lions did not incur TTS when
exposed to single brief pulses with received levels of ~178 and 183 dB re 1 µParms and total energy fluxes
of 161 and 163 dB re 1 μPa2 · s (Finneran et al. 2003). However, initial evidence from more prolonged
(non-pulse) exposures suggested that some pinnipeds (harbor seals in particular) incur TTS at somewhat
lower received levels than do small odontocetes exposed for similar durations (Kastak et al. 1999, 2005;
Ketten et al. 2001). Kastak et al. (2005) reported that the amount of threshold shift increased with
increasing SEL in a California sea lion and harbor seal. They noted that, for non-impulse sound, doubling
the exposure duration from 25 to 50 min (i.e., a +3 dB change in SEL) had a greater effect on TTS than an
increase of 15 dB (95 vs. 80 dB) in exposure level. Mean threshold shifts ranged from 2.9–12.2 dB, with
full recovery within 24 hr (Kastak et al. 2005). Kastak et al. (2005) suggested that, for non-impulse
sound, SELs resulting in TTS onset in three species of pinnipeds may range from 183 to 206 dB re
1 μPa2 ·
s, depending on the absolute hearing sensitivity.
As noted above for odontocetes, it is expected that—for impulse as opposed to non-impulse
sound—the onset of TTS would occur at a lower cumulative SEL given the assumed greater auditory
effect of broadband impulses with rapid rise times. The threshold for onset of mild TTS upon exposure of
a harbor seal to impulse sounds has been estimated indirectly as being an SEL of ~171 dB re 1 μPa2 ·
s
(Southall et al. 2007). That would be approximately equivalent to a single pulse with received level
~181–186 dB re 1 μParms, or a series of pulses for which the highest rms values are a few dB lower.
At least for non-impulse sounds, TTS onset occurs at appreciably higher received levels in Cal-
ifornia sea lions and northern elephant seals than in harbor seals (Kastak et al. 2005). Thus, the former
two species would presumably need to be closer to an airgun array than would a harbor seal before TTS is
a possibility. Insofar as we are aware, there are no data to indicate whether the TTS thresholds of other
pinniped species are more similar to those of the harbor seal or to those of the two less-sensitive species.
Sirenians, Sea Otter and Polar Bear.―There are no available data on TTS in sea otters and polar
bears. However, TTS is unlikely to occur in sea otters or polar bears if they are on the water surface,
given the pressure release and Lloyd‘s mirror effects at the water‘s surface. Furthermore, sea otters tend
to inhabit shallow coastal habitats where large seismic survey vessels towing large spreads of streamers
may be unable to operate. TTS is also considered unlikely to occur in sirenians as a result of exposure to
sounds from a seismic survey. They, like sea otters, tend to inhabit shallow coastal habitats and rarely
range far from shore, whereas seismic survey vessels towing large arrays of airguns and (usually) even
larger arrays of streamers normally must remain farther offshore because of equipment clearance and
maneuverability limitations. Exposures of sea otters and sirenians to seismic surveys are more likely to
involve smaller seismic sources that can be used in shallow and confined waters. The impacts of these
are inherently less than would occur from a larger source of the types often used farther offshore.

Appendix A: Impacts of Airgun Sounds on Marine Mammals
Environmental Assessment for SIO ETP Cruise, 2010 Page 136
Likelihood of Incurring TTS.—Most cetaceans show some degree of avoidance of seismic vessels
operating an airgun array (see above). It is unlikely that these cetaceans would be exposed to airgun
pulses at a sufficiently high level for a sufficiently long period to cause more than mild TTS, given the
relative movement of the vessel and the marine mammal. TTS would be more likely in any odontocetes
that bow- or wake-ride or otherwise linger near the airguns. However, while bow- or wake-riding,
odontocetes would be at the surface and thus not exposed to strong sound pulses given the pressure-
release and Lloyd Mirror effects at the surface. But if bow- or wake-riding animals were to dive
intermittently near airguns, they would be exposed to strong sound pulses, possibly repeatedly.
If some cetaceans did incur mild or moderate TTS through exposure to airgun sounds in this
manner, this would very likely be a temporary and reversible phenomenon. However, even a temporary
reduction in hearing sensitivity could be deleterious in the event that, during that period of reduced
sensitivity, a marine mammal needed its full hearing sensitivity to detect approaching predators, or for
some other reason.
Some pinnipeds show avoidance reactions to airguns, but their avoidance reactions are generally
not as strong or consistent as those of cetaceans. Pinnipeds occasionally seem to be attracted to operating
seismic vessels. There are no specific data on TTS thresholds of pinnipeds exposed to single or multiple
low-frequency pulses. However, given the indirect indications of a lower TTS threshold for the harbor
seal than for odontocetes exposed to impulse sound (see above), it is possible that some pinnipeds close to
a large airgun array could incur TTS.
NMFS (1995, 2000) concluded that cetaceans should not be exposed to pulsed underwater noise at
received levels >180 dB re 1 µParms. The corresponding limit for pinnipeds has been set by NMFS at 190
dB, although the HESS Team (HESS 1999) recommended a 180-dB limit for pinnipeds in California.
The 180 and 190 dB re 1 µParms levels have not been considered to be the levels above which TTS might
occur. Rather, they were the received levels above which, in the view of a panel of bioacoustics special-
ists convened by NMFS before TTS measurements for marine mammals started to become available, one
could not be certain that there would be no injurious effects, auditory or otherwise, to marine mammals.
As summarized above, data that are now available imply that TTS is unlikely to occur in various odonto-
cetes (and probably mysticetes as well) unless they are exposed to a sequence of several airgun pulses
stronger than 190 dB re 1 µParms. On the other hand, for the harbor seal, harbor porpoise, and perhaps
some other species, TTS may occur upon exposure to one or more airgun pulses whose received level
equals the NMFS ―do not exceed‖ value of 190 dB re 1 μParms. That criterion corresponds to a single-
pulse SEL of 175–180 dB re 1 μPa2 ·
s in typical conditions, whereas TTS is suspected to be possible in
harbor seals and harbor porpoises with a cumulative SEL of ~171 and ~164 dB re 1 μPa2 ·
s, respectively.
It has been shown that most large whales and many smaller odontocetes (especially the harbor por-
poise) show at least localized avoidance of ships and/or seismic operations (see above). Even when
avoidance is limited to the area within a few hundred meters of an airgun array, that should usually be
sufficient to avoid TTS based on what is currently known about thresholds for TTS onset in cetaceans. In
addition, ramping up airgun arrays, which is standard operational protocol for many seismic operators,
should allow cetaceans near the airguns at the time of startup (if the sounds are aversive) to move away
from the seismic source and to avoid being exposed to the full acoustic output of the airgun array (see
above). Thus, most baleen whales likely will not be exposed to high levels of airgun sounds provided the
ramp-up procedure is applied. Likewise, many odontocetes close to the trackline are likely to move away
before the sounds from an approaching seismic vessel become sufficiently strong for there to be any
potential for TTS or other hearing impairment. Therefore, there is little potential for baleen whales or
Appendix A: Impacts of Airgun Sounds on Marine Mammals
Environmental Assessment for SIO ETP Cruise, 2010 Page 137
odontocetes that show avoidance of ships or airguns to be close enough to an airgun array to experience
TTS. In the event that a few individual cetaceans did incur TTS through exposure to strong airgun
sounds, this is a temporary and reversible phenomenon unless the exposure exceeds the TTS-onset
threshold by a sufficient amount for PTS to be incurred (see below). If TTS but not PTS were incurred, it
would most likely be mild, in which case recovery is expected to be quick (probably within minutes).
6.2 Permanent Threshold Shift (PTS)
When PTS occurs, there is physical damage to the sound receptors in the ear. In some cases, there
can be total or partial deafness, whereas in other cases, the animal has an impaired ability to hear sounds
in specific frequency ranges (Kryter 1985). Physical damage to a mammal‘s hearing apparatus can occur
if it is exposed to sound impulses that have very high peak pressures, especially if they have very short
rise times. (Rise time is the interval required for sound pressure to increase from the baseline pressure to
peak pressure.)
There is no specific evidence that exposure to pulses of airgun sound can cause PTS in any marine
mammal, even with large arrays of airguns. However, given the likelihood that some mammals close to
an airgun array might incur at least mild TTS (see above), there has been further speculation about the
possibility that some individuals occurring very close to airguns might incur PTS (e.g., Richardson et al.
1995, p. 372ff; Gedamke et al. 2008). Single or occasional occurrences of mild TTS are not indicative of
permanent auditory damage, but repeated or (in some cases) single exposures to a level well above that
causing TTS onset might elicit PTS.
Relationships between TTS and PTS thresholds have not been studied in marine mammals, but are
assumed to be similar to those in humans and other terrestrial mammals (Southall et al. 2007). Based on
data from terrestrial mammals, a precautionary assumption is that the PTS threshold for impulse sounds
(such as airgun pulses as received close to the source) is at least 6 dB higher than the TTS threshold on a
peak-pressure basis, and probably >6 dB higher (Southall et al. 2007). The low-to-moderate levels of
TTS that have been induced in captive odontocetes and pinnipeds during controlled studies of TTS have
been confirmed to be temporary, with no measurable residual PTS (Kastak et al. 1999; Schlundt et al.
2000; Finneran et al. 2002, 2005; Nachtigall et al. 2003, 2004). However, very prolonged exposure to
sound strong enough to elicit TTS, or shorter-term exposure to sound levels well above the TTS
threshold, can cause PTS, at least in terrestrial mammals (Kryter 1985). In terrestrial mammals, the
received sound level from a single non-impulsive sound exposure must be far above the TTS threshold for
any risk of permanent hearing damage (Kryter 1994; Richardson et al. 1995; Southall et al. 2007). How-
ever, there is special concern about strong sounds whose pulses have very rapid rise times. In terrestrial
mammals, there are situations when pulses with rapid rise times (e.g., from explosions) can result in PTS
even though their peak levels are only a few dB higher than the level causing slight TTS. The rise time of
airgun pulses is fast, but not as fast as that of an explosion.
Some factors that contribute to onset of PTS, at least in terrestrial mammals, are as follows:
exposure to single very intense sound,
fast rise time from baseline to peak pressure,
repetitive exposure to intense sounds that individually cause TTS but not PTS, and
recurrent ear infections or (in captive animals) exposure to certain drugs.

Appendix A: Impacts of Airgun Sounds on Marine Mammals
Environmental Assessment for SIO ETP Cruise, 2010 Page 138
Cavanagh (2000) reviewed the thresholds used to define TTS and PTS. Based on this review and
SACLANT (1998), it is reasonable to assume that PTS might occur at a received sound level 20 dB or
more above that inducing mild TTS. However, for PTS to occur at a received level only 20 dB above the
TTS threshold, the animal probably would have to be exposed to a strong sound for an extended period,
or to a strong sound with rather rapid rise time.
More recently, Southall et al. (2007) estimated that received levels would need to exceed the TTS
threshold by at least 15 dB, on an SEL basis, for there to be risk of PTS. Thus, for cetaceans exposed to a
sequence of sound pulses, they estimate that the PTS threshold might be an M-weighted SEL (for the
sequence of received pulses) of ~198 dB re 1 μPa2 ·
s (15 dB higher than the Mmf-weighted TTS threshold,
in a beluga, for a watergun impulse). Additional assumptions had to be made to derive a corresponding
estimate for pinnipeds, as the only available data on TTS-thresholds in pinnipeds pertained to non-
impulse sound (see above). Southall et al. (2007) estimated that the PTS threshold could be a cumulative
Mpw-weighted SEL of ~186 dB re 1 μPa2 ·
s in the case of a harbor seal exposed to impulse sound. The
PTS threshold for the California sea lion and northern elephant seal would probably be higher given the
higher TTS thresholds in those species. Southall et al. (2007) also note that, regardless of the SEL, there
is concern about the possibility of PTS if a cetacean or pinniped received one or more pulses with peak
pressure exceeding 230 or 218 dB re 1 μPa, respectively. Thus, PTS might be expected upon exposure of
cetaceans to either SEL ≥198 dB re 1 μPa2 ·
s or peak pressure ≥230 dB re 1 μPa. Corresponding propos-
ed dual criteria for pinnipeds (at least harbor seals) are ≥186 dB SEL and ≥ 218 dB peak pressure (South-
all et al. 2007). These estimates are all first approximations, given the limited underlying data, assump-
tions, species differences, and evidence that the ―equal energy‖ model is not be entirely correct.
Sound impulse duration, peak amplitude, rise time, number of pulses, and inter-pulse interval are
the main factors thought to determine the onset and extent of PTS. Ketten (1994) has noted that the
criteria for differentiating the sound pressure levels that result in PTS (or TTS) are location and species-
specific. PTS effects may also be influenced strongly by the health of the receiver‘s ear.
As described above for TTS, in estimating the amount of sound energy required to elicit the onset
of TTS (and PTS), it is assumed that the auditory effect of a given cumulative SEL from a series of pulses
is the same as if that amount of sound energy were received as a single strong sound. There are no data
from marine mammals concerning the occurrence or magnitude of a potential partial recovery effect
between pulses. In deriving the estimates of PTS (and TTS) thresholds quoted here, Southall et al. (2007)
made the precautionary assumption that no recovery would occur between pulses.
The TTS section (above) concludes that exposure to several strong seismic pulses that each have
flat-weighted received levels near 190 dB re 1 μParms (175–180 dB re 1 μPa2 · s SEL) could result in
cumulative exposure of ~186 dB SEL (flat-weighted) or ~183 dB SEL (Mmf-weighted), and thus slight
TTS in a small odontocete. Allowing for the assumed 15 dB offset between PTS and TTS thresholds,
expressed on an SEL basis, exposure to several strong seismic pulses that each have flat-weighted
received levels near 205 dBrms (190–195 dB SEL) could result in cumulative exposure of ~198 dB SEL
(Mmf-weighted), and thus slight PTS in a small odontocete. However, the levels of successive pulses that
will be received by a marine mammal that is below the surface as a seismic vessel approaches, passes and
moves away will tend to increase gradually and then decrease gradually, with periodic decreases super-
imposed on this pattern when the animal comes to the surface to breathe. To estimate how close an
odontocete‘s CPA distance would have to be for the cumulative SEL to exceed 198 dB SEL (Mmf-
weighted), one would (as a minimum) need to allow for the sequence of distances at which airgun shots

Appendix A: Impacts of Airgun Sounds on Marine Mammals
Environmental Assessment for SIO ETP Cruise, 2010 Page 139
would occur, and for the dependence of received SEL on distance in the region of the seismic operation
(e.g., Erbe and King 2009).
It is unlikely that an odontocete would remain close enough to a large airgun array for sufficiently
long to incur PTS. There is some concern about bowriding odontocetes, but for animals at or near the
surface, auditory effects are reduced by Lloyd‘s mirror and surface release effects. The presence of the
vessel between the airgun array and bow-riding odontocetes could also, in some but probably not all
cases, reduce the levels received by bow-riding animals (e.g., Gabriele and Kipple 2009). The TTS (and
thus PTS) thresholds of baleen whales are unknown but, as an interim measure, assumed to be no lower
than those of odontocetes. Also, baleen whales generally avoid the immediate area around operating
seismic vessels, so it is unlikely that a baleen whale could incur PTS from exposure to airgun pulses. The
TTS (and thus PTS) thresholds of some pinnipeds (e.g., harbor seal) as well as the harbor porpoise may
be lower (Kastak et al. 2005; Southall et al. 2007; Lucke et al. 2009). If so, TTS and potentially PTS may
extend to a somewhat greater distance for those animals. Again, Lloyd‘s mirror and surface release
effects will ameliorate the effects for animals at or near the surface.
Although it is unlikely that airgun operations during most seismic surveys would cause PTS in
many marine mammals, caution is warranted given
the limited knowledge about noise-induced hearing damage in marine mammals, particularly
baleen whales, pinnipeds, and sea otters;
the seemingly greater susceptibility of certain species (e.g., harbor porpoise and harbor seal) to
TTS and presumably also PTS; and
the lack of knowledge about TTS and PTS thresholds in many species, including various species
closely related to the harbor porpoise and harbor seal.
The avoidance reactions of many marine mammals, along with commonly-applied monitoring and
mitigation measures (visual and passive acoustic monitoring, ramp ups, and power downs or shut downs
when mammals are detected within or approaching the ―safety radii‖), would reduce the already-low
probability of exposure of marine mammals to sounds strong enough to induce PTS.
6.3 Strandings and Mortality
Marine mammals close to underwater detonations of high explosives can be killed or severely
injured, and the auditory organs are especially susceptible to injury (Ketten et al. 1993; Ketten 1995).
However, explosives are no longer used in marine waters for commercial seismic surveys or (with rare
exceptions) for seismic research; they have been replaced by airguns and other non-explosive sources.
Airgun pulses are less energetic and have slower rise times, and there is no specific evidence that they can
cause serious injury, death, or stranding even in the case of large airgun arrays. However, the association
of mass strandings of beaked whales with naval exercises and, in one case, a seismic survey (Malakoff
2002; Cox et al. 2006), has raised the possibility that beaked whales exposed to strong ―pulsed‖ sounds
may be especially susceptible to injury and/or behavioral reactions that can lead to stranding (e.g.,
Hildebrand 2005; Southall et al. 2007). Hildebrand (2005) reviewed the association of cetacean strand-
ings with high-intensity sound events and found that deep-diving odontocetes, primarily beaked whales,
were by far the predominant (95%) cetaceans associated with these events, with 2% mysticete whales
(minke). However, as summarized below, there is no definitive evidence that airguns can lead to injury,
strandings, or mortality even for marine mammals in close proximity to large airgun arrays.

Appendix A: Impacts of Airgun Sounds on Marine Mammals
Environmental Assessment for SIO ETP Cruise, 2010 Page 140
Specific sound-related processes that lead to strandings and mortality are not well documented, but
may include (1) swimming in avoidance of a sound into shallow water; (2) a change in behavior (such as
a change in diving behavior that might contribute to tissue damage, gas bubble formation, hypoxia,
cardiac arrhythmia, hypertensive hemorrhage or other forms of trauma; (3) a physiological change such as
a vestibular response leading to a behavioral change or stress-induced hemorrhagic diathesis, leading in
turn to tissue damage; and (4) tissue damage directly from sound exposure, such as through acoustically
mediated bubble formation and growth or acoustic resonance of tissues. Some of these mechanisms are
unlikely to apply in the case of impulse sounds. However, there are increasing indications that gas-bubble
disease (analogous to ―the bends‖), induced in supersaturated tissue by a behavioral response to acoustic
exposure, could be a pathologic mechanism for the strandings and mortality of some deep-diving cetac-
eans exposed to sonar. The evidence for this remains circumstantial and associated with exposure to
naval mid-frequency sonar, not seismic surveys (Cox et al. 2006; Southall et al. 2007).
Seismic pulses and mid-frequency sonar signals are quite different, and some mechanisms by
which sonar sounds have been hypothesized to affect beaked whales are unlikely to apply to airgun pul-
ses. Sounds produced by airgun arrays are broadband impulses with most of the energy below 1 kHz.
Typical military mid-frequency sonars emit non-impulse sounds at frequencies of 2–10 kHz, generally
with a relatively narrow bandwidth at any one time (though the frequency may change over time). Thus,
it is not appropriate to assume that the effects of seismic surveys on beaked whales or other species would
be the same as the apparent effects of military sonar. For example, resonance effects (Gentry 2002) and
acoustically-mediated bubble-growth (Crum et al. 2005) are implausible in the case of exposure to broad-
band airgun pulses. Nonetheless, evidence that sonar signals can, in special circumstances, lead (at least
indirectly) to physical damage and mortality (e.g., Balcomb and Claridge 2001; NOAA and USN 2001;
Jepson et al. 2003; Fernández et al. 2004, 2005; Hildebrand 2005; Cox et al. 2006) suggests that caution
is warranted when dealing with exposure of marine mammals to any high-intensity ―pulsed‖ sound. One
of the hypothesized mechanisms by which naval sonars lead to strandings might, in theory, also apply to
seismic surveys: If the strong sounds sometimes cause deep-diving species to alter their surfacing–dive
cycles in a way that causes bubble formation in tissue, that hypothesized mechanism might apply to
seismic surveys as well as mid-frequency naval sonars. However, there is no specific evidence of this
upon exposure to airgun pulses.
There is no conclusive evidence of cetacean strandings or deaths at sea as a result of exposure to
seismic surveys, but a few cases of strandings in the general area where a seismic survey was ongoing
have led to speculation concerning a possible link between seismic surveys and strandings. • Suggestions
that there was a link between seismic surveys and strandings of humpback whales in Brazil (Engel et al.
2004) were not well founded (IAGC 2004; IWC 2007). • In Sept. 2002, there was a stranding of two
Cuvier‘s beaked whales in the Gulf of California, Mexico, when the L-DEO seismic vessel R/V Maurice
Ewing was operating a 20-airgun, 8490-in3 airgun array in the general area. The evidence linking the
stranding to the seismic survey was inconclusive and not based on any physical evidence (Hogarth 2002;
Yoder 2002). The ship was also operating its multibeam echosounder at the same time, but this had much
less potential than the aforementioned naval sonars to affect beaked whales, given its downward-directed
beams, much shorter pulse durations, and lower duty cycle. Nonetheless, the Gulf of California incident
plus the beaked whale strandings near naval exercises involving use of mid-frequency sonar suggest a
need for caution in conducting seismic surveys in areas occupied by beaked whales until more is known
about effects of seismic surveys on those species (Hildebrand 2005).

Appendix A: Impacts of Airgun Sounds on Marine Mammals
Environmental Assessment for SIO ETP Cruise, 2010 Page 141
6.4 Non-Auditory Physiological Effects
Based on evidence from terrestrial mammals and humans, sound is a potential source of stress
(Wright and Kuczaj 2007; Wright et al. 2007a,b, 2009). However, almost no information is available on
sound-induced stress in marine mammals, or on its potential (alone or in combination with other stres-
sors) to affect the long-term well-being or reproductive success of marine mammals (Fair and Becker
2000; Hildebrand 2005; Wright et al. 2007a,b). Such long-term effects, if they occur, would be mainly
associated with chronic noise exposure, which is characteristic of some seismic surveys and exposure
situations (McCauley et al. 2000a:62ff; Nieukirk et al. 2009) but not of some others.
Available data on potential stress-related impacts of anthropogenic noise on marine mammals are
extremely limited, and additional research on this topic is needed. We know of only two specific studies
of noise-induced stress in marine mammals. (1) Romano et al. (2004) examined the effects of single
underwater impulse sounds from a seismic water gun (source level up to 228 dB re 1 µPa · mp–p) and
single short-duration pure tones (sound pressure level up to 201 dB re 1 μPa) on the nervous and immune
systems of a beluga and a bottlenose dolphin. They found that neural-immune changes to noise exposure
were minimal. Although levels of some stress-released substances (e.g., catecholamines) changed
significantly with exposure to sound, levels returned to baseline after 24 hr. (2) During playbacks of
recorded drilling noise to four captive beluga whales, Thomas et al. (1990) found no changes in blood
levels of stress-related hormones. Long-term effects were not measured, and no short-term effects were
detected. For both studies, caution is necessary when extrapolating these results to wild animals and to
real-world situations given the small sample sizes, use of captive animals, and other technical limitations
of the two studies.
Aside from stress, other types of physiological effects that might, in theory, be involved in beaked
whale strandings upon exposure to naval sonar (Cox et al. 2006), such as resonance and gas bubble for-
mation, have not been demonstrated and are not expected upon exposure to airgun pulses (see preceding
subsection). If seismic surveys disrupt diving patterns of deep-diving species, this might perhaps result in
bubble formation and a form of ―the bends‖, as speculated to occur in beaked whales exposed to sonar.
However, there is no specific evidence that exposure to airgun pulses has this effect.
In summary, very little is known about the potential for seismic survey sounds (or other types of
strong underwater sounds) to cause non-auditory physiological effects in marine mammals. Such effects,
if they occur at all, would presumably be limited to short distances and to activities that extend over a
prolonged period. The available data do not allow identification of a specific exposure level above which
non-auditory effects can be expected (Southall et al. 2007), or any meaningful quantitative predictions of
the numbers (if any) of marine mammals that might be affected in these ways.
7. Literature Cited
Akamatsu, T., Y. Hatakeyama, and N. Takatsu. 1993. Effects of pulsed sounds on escape behavior of false killer
whales. Nipp. Suis. Gakkaishi 59(8):1297-1303.
Angliss, R.P. and R.B. Outlaw. 2008. Alaska marine mammal stock assessments, 2007. U.S. Dep. Commer.,
NOAA Tech. Memo. NMFS-AFSC-180. 252 p.
Anonymous. 1975. Phantom killer whales. S. Afr. Ship. News & Fishing Indus. Rev. 30(7):50-53.
Arnold, B.W. 1996. Visual monitoring of marine mammal activity during the Exxon 3-D seismic survey: Santa
Ynez unit, offshore California 9 November to 12 December 1995. Rep. from Impact Sciences Inc., San
Diego, CA, for Exxon Co., U.S.A., Thousand Oaks, CA. 20 p.
Au, W.W.L. 1993. The Sonar of Dolphins. Springer-Verlag, New York, NY. 277 p.

Appendix A: Impacts of Airgun Sounds on Marine Mammals
Environmental Assessment for SIO ETP Cruise, 2010 Page 142
Au, W.W.L., A.N. Popper, and R.R. Fay. 2000. Hearing by Whales and Dolphins. Springer Handbook of Auditory
Res. Vol. 12. Springer-Verlag, New York, NY. 458 p.
Au, W.W.L., A.A. Pack, M.O. Lammers, L.M. Herman, M.H. Deakos, and K. Andrews. 2006. Acoustic properties
of humpback whale songs. J. Acoust. Soc. Am. 120(2):1103-1110.
Backus, R.H. and W.E. Schevill. 1966. Physeter clicks. p. 510-528 in K.S. Norris (ed.), Whales, dolphins, and
porpoises. Univ. Calif. Press, Berkeley, CA. 789 p
Bain, D.E. and R. Williams. 2006. Long-range effects of airgun noise on marine mammals: responses as a function
of received sound level and distance. Paper SC/58/E35 presented to the IWC Scient. Commit., IWC Annu.
Meet., 1-13 June, St. Kitts.
Baird, R.W. 2005. Sightings of dwarf (Kogia sima) and pygmy (K. breviceps) sperm whales from the main
Hawaiian Islands. Pacific Sci. 59(3):461-466.
Baird, R.W., D.L. Webster, D.J. McSweeney, A.D. Ligon, G.S. Schorr, and J. Barlow. 2006. Diving behavior and
ecology of Cuvier‘s (Ziphius cavirostris) and Blainville‘s (Mesoplodon densirostris) beaked whales in
Hawaii. Can. J. Zool. 84(8):1120-1128.
Balcomb, K.C., III and D.E. Claridge. 2001. A mass stranding of cetaceans caused by naval sonar in the Bahamas.
Bahamas J. Sci. 8(2):2-12.
Barkaszi, M.J., D.M. Epperson, and B. Bennett. 2009. Six-year compilation of cetacean sighting data collected
during commercial seismic survey mitigation observations throughout the Gulf of Mexico, USA. p. 24-25
In: Abstr. 18th Bienn. Conf. Biol. Mar. Mamm., Québec, Canada, Oct. 2009. 306 p.
Barlow, J. and R. Gisiner. 2006. Mitigating, monitoring and assessing the effects of anthropogenic sound on beak-
ed whales. J. Cetac. Res. Manage. 7(3):239-249.
Bauer, G.B., J.C. Gaspard, K. Dziuk, A. Cardwell, L. Read, R.L. Reep, and D.A. Mann. 2009. The manatee
audiogram and auditory critical ratios. p. 27-28 In: Abstr. 18th Bienn. Conf. Biol. Mar. Mamm., Québec,
Canada, Oct. 2009. 306 p.
Beale, C.M. and P. Monaghan. 2004. Behavioural responses to human disturbance: a matter of choice? Anim.
Behav. 68(5):1065-1069.
Beland, J.A., B. Haley, C.M. Reiser, D.M. Savarese, D.S. Ireland and D.W. Funk. 2009. Effects of the presence of
other vessels on marine mammal sightings during multi-vessel operations in the Alaskan Chukchi Sea. p. 29
In: Abstr. 18th Bienn. Conf. Biol. Mar. Mamm., Québec, Oct. 2009:29. 306 p.
Berta, A., R. Racicot and T. Deméré. 2009. The comparative anatomy and evolution of the ear in Balaenoptera
mysticetes. p. 33 In: Abstr. 18th Bienn. Conf. Biol. Mar. Mamm., Québec, Oct. 2009. 306 p.
Blackwell, S.B., R.G. Norman, C.R. Greene Jr., and W.J. Richardson. 2007. Acoustic measurements. p. 4-1 to 4-
52 In: Marine mammal monitoring and mitigation during open water seismic exploration by Shell Offshore
Inc. in the Chukchi and Beaufort Seas, July-September 2006: 90-day report. LGL Rep. P891-1. Rep. from
LGL Alaska Res. Assoc. Inc., Anchorage, AK, and Greeneridge Sciences Inc., Santa Barbara, CA, for Shell
Offshore Inc., Houston, TX, Nat. Mar. Fish. Serv., Silver Spring, MD, and U.S. Fish & Wildl. Serv.,
Anchorage, AK. 199 p.
Blackwell, S.B., C.R. Greene, T.L. McDonald, C.S. Nations, R.G. Norman, and A. Thode. 2009a. Beaufort Sea
bowhead whale migration route study. Chapter 8 In: D.S. Ireland, D.W. Funk, R. Rodrigues, and W.R.
Koski (eds.). 2009. Joint Monitoring Program in the Chukchi and Beaufort seas, open water seasons,
2006-2007. LGL Alaska Rep. P971-2. Rep. from LGL Alaska Res. Assoc. Inc. (Anchorage, AK) et al. for
Shell Offshore Inc. (Anchorage, AK) et al. 485 p. plus appendices.
Blackwell, S.B., C.S. Nations, T.L. McDonald, A.M. Thode, K.H. Kim, C.R. Greene, and M.A. Macrander. 2009b.
Effects of seismic exploration activities on the calling behavior of bowhead whales in the Alaskan Beaufort
Sea. p. 35 In: Abstr. 18th Bienn. Conf. Biol. Mar. Mamm., Québec, Canada, 12-16 Oct. 2009. 306 p.
Bowles, A.E., M. Smultea, B. Würsig, D.P. DeMaster, and D. Palka. 1994. Relative abundance and behavior of
marine mammals exposed to transmissions from the Heard Island Feasibility Test. J. Acoust. Soc. Am.

Appendix A: Impacts of Airgun Sounds on Marine Mammals
Environmental Assessment for SIO ETP Cruise, 2010 Page 143
96(4):2469-2484.Bullock, T.H., T.J. Oshea, and M.C. McClune. 1982. Auditory evoked-potentials in the
West Indian manatee (Sirenia, Trichechus manatus). J. Comp. Physiol. 148(4):547-554.
Britto, M.K. and A. Silva Barreto. 2009. Marine mammal diversity registered on seismic surveys in Brazil,
between 2000 and 2008. p. 41 In: Abstr. 18th Bienn. Conf. Biol. Mar. Mamm., Québec, Oct. 2009. 306 p.
Brodie, P.F. 1981. Energetic and behavioural considerations with respect to marine mammals and disturbance from
underwater noise. p. 287-290 In: N.M. Peterson (ed.), The question of sound from icebreaker operations:
Proceedings of a workshop. Arctic Pilot Proj., Petro-Canada, Calgary, Alb. 350 p.
Bullock, T.H., T.J. O‘Shea, and M.C. McClune. 1982. Auditory evoked potentials in the West Indian manatee
(Sirenia: Trichechus manatus). J. Comp. Physiol. A 148(4):547-554.
Burgess, W.C. and C.R. Greene, Jr. 1999. Physical acoustics measurements. p. 3-1 to 3-63 In: W.J. Richardson
(ed.), Marine mammal and acoustical monitoring of Western Geophysical's open-water seismic program in
the Alaskan Beaufort Sea, 1998. LGL Rep. TA22303. Rep. from LGL Ltd., King City, Ont., and Greene-
ridge Sciences Inc., Santa Barbara, CA, for Western Geophysical, Houston, TX, and Nat. Mar. Fish. Serv.,
Anchorage, AK, and Silver Spring, MD. 390 p.
Calambokidis, J. and S.D. Osmek. 1998. Marine mammal research and mitigation in conjunction with air gun
operation for the USGS `SHIPS' seismic surveys in 1998. Rep. from Cascadia Res., Olympia, WA, for
U.S. Geol. Surv., Nat. Mar. Fish. Serv., and Minerals Manage. Serv.
Caldwell, J. and W. Dragoset. 2000. A brief overview of seismic air-gun arrays. Leading Edge 19(8):898-902.
Cavanagh, R.C. 2000. Criteria and thresholds for adverse effects of underwater noise on marine animals. AFRL-
HE-WP-TR-2000-0092. Rep. from Science Applications Intern. Corp., McLean, VA, for Air Force Res.
Lab., Wright-Patterson AFB, OH.
Christie, K., C. Lyons, W.R. Koski, D.S. Ireland, and D.W. Funk. 2009. Patterns of bowhead whale occurrence and
distribution during marine seismic operations in the Alaskan Beaufort Sea. p. 55 In: Abstr. 18th Bienn.
Conf. Biol. Mar. Mamm., Québec, Canada, 12-16 Oct. 2009.
Citta, J.J., L.T. Quakenbush, R.J. Small, and J.C. George. 2007. Movements of a tagged bowhead whale in the
vicinity of a seismic survey in the Beaufort Sea. Poster Paper, Soc. Mar. Mammal. 17th Bienn. Meet.,
Cape Town, South Africa.
Clark, C.W. and W.T. Ellison. 2004. Potential use of low-frequency sounds by baleen whales for probing the
environment: Evidence from models and empirical measurements. p. 564-589 In: J.A. Thomas, C.F. Moss
and M. Vater (eds.), Echolocation in Bats and Dolphins. Univ. Chicago Press, Chicago, IL. 604 p.
Clark, C.W. and G.C. Gagnon. 2006. Considering the temporal and spatial scales of noise exposures from seismic
surveys on baleen whales. Working Pap. SC/58/E9. Int. Whal. Comm., Cambridge, U.K. 9 p.
Cook, M.L.H., R.A. Varela, J.D. Goldstein, S.D. McCulloch, G.D. Bossart, J.J. Finneran, D. Houser, and A. Mann.
2006. Beaked whale auditory evoked potential hearing measurements. J. Comp. Physiol. A 192:489-495.
Cox, T.M., T.J. Ragen, A.J. Read, E. Vos, R.W. Baird, K. Balcomb, J. Barlow, J. Caldwell, T. Cranford, L. Crum,
A. D‘Amico, G. D‘Spain, A. Fernández, J. Finneran, R. Gentry, W. Gerth, F. Gulland, J. Hildebrand,
D. Houserp, R. Hullar, P.D. Jepson, D. Ketten, C.D. Macleod, P. Miller, S. Moore, D.C. Mountain, D.
Palka, P. Ponganis, S. Rommel, T. Rowles, B. Taylor, P. Tyack, D. Wartzok, R. Gisiner, J. Meads, and L.
Benner. 2006. Understanding the impacts of anthropogenic sound on beaked whales. J. Cetac. Res.
Manage. 7(3):177-187.
Crum, L.A., M.R. Bailey, J. Guan, P.R. Hilmo, S.G. Kargl, and T.J. Matula. 2005. Monitoring bubble growth in
supersaturated blood and tissue ex vivo and the relevance to marine mammal bioeffects. Acoustic Res.
Lett. Online 6(3):214-220.
Dahlheim, M.E. 1987. Bio-acoustics of the gray whale (Eschrichtius robustus). Ph.D. Dissertation, Univ. British
Columbia, Vancouver, BC. 315 p.
Appendix A: Impacts of Airgun Sounds on Marine Mammals
Environmental Assessment for SIO ETP Cruise, 2010 Page 144
DeRuiter, S.L., P.L. Tyack, Y.-T. Lin, A.E. Newhall, J.F. Lynch, and P.J.O. Miller. 2006. Modeling acoustic prop-
agation of airgun array pulses recorded on tagged sperm whales (Physeter macrocephalus). J. Acoust.
Soc. Am. 120(6):4100-4114.
Di Iorio, L. and C.W. Clark. 2010. Exposure to seismic survey alters blue whale acoustic communication. Biol.
Lett. 6(1):51-54.
Duncan, P.M. 1985. Seismic sources in a marine environment. p. 56-88 In: Proceedings of the Workshop on
Effects of Explosives Use in the Marine Environment, Jan. 1985, Halifax, N.S. Tech. Rep. 5. Can. Oil &
Gas Lands Admin., Environ. Prot. Branch, Ottawa, Ont.
Dunn, R.A. and O. Hernandez. 2009. Tracking blue whales in the eastern tropical Pacific with an ocean-bottom
seismometer and hydrophone array. J. Acoust. Soc. Am. 126(3):1084-1094.
Engel, M.H., M.C.C. Marcondes, C.C.A. Martins, F.O. Luna, R.P. Lima, and A. Campos. 2004. Are seismic
surveys responsible for cetacean strandings? An unusual mortality of adult humpback whales in Abrolhos
Bank, northeastern coast of Brazil. Paper SC/56/E28 presented to the IWC Scient. Commit., IWC Annu.
Meet., 19-22 July, Sorrento, Italy.
Erbe, C. and A.R. King. 2009. Modeling cumulative sound exposure around marine seismic surveys. J. Acoust.
Soc. Am. 125(4):2443-2451.
Fair, P.A. and P.R. Becker. 2000. Review of stress in marine mammals. J. Aquat. Ecosyst. Stress Recov. 7:335-
354.
Fernández, A., M. Arbelo, R. Deaville, I.A.P. Patterson, P. Castro, J.R. Baker, E. Degollada, H.M. Ross, P. Herráez,
A.M. Pocknell, E. Rodríguez, F.E. Howie, A. Espinosa, R.J. Reid, J.R. Jaber, V. Martin, A.A.
Cunningham, and P.D. Jepson. 2004. Pathology: whales, sonar and decompression sickness (reply).
Nature 428(6984, 15 Apr.). doi: 10.1038/nature02528a.
Fernández, A., J.F. Edwards, F. Rodriquez, A.E. de los Monteros, P. Herráez, P. Castro, J.R. Jaber, V. Martin, and
M. Arbelo. 2005. ―Gas and fat embolic syndrome‖ involving a mass stranding of beaked whales (Family
Ziphiidae) exposed to anthropogenic sonar signals. Veterin. Pathol. 42(4):446-457.
Finneran, J.J. and C.E. Schlundt. 2004. Effects of intense pure tones on the behavior of trained odontocetes. Tech.
Rep. 1913. Space and Naval Warfare (SPAWAR) Systems Center, San Diego, CA. 15 p.
Finneran, J.J., C.E. Schlundt, D.A. Carder, J.A. Clark, J.A. Young, J.B. Gaspin, and S.H. Ridgway. 2000. Auditory
and behavioral responses of bottlenose dolphins (Tursiops truncatus) and beluga whale (Delphinapterus
leucas) to impulsive sounds resembling distant signatures of underwater explosions. J. Acoust. Soc. Am.
108(1):417-431.
Finneran, J.J., C.E. Schlundt, R. Dear, D.A. Carder, and S.H. Ridgway. 2002. Temporary shift in masked hearing
thresholds in odontocetes after exposure to single underwater impulses from a seismic watergun. J.
Acoust. Soc. Am. 111(6):2929-2940.
Finneran, J.J., R. Dear, D.A. Carder, and S.H. Ridgway. 2003. Auditory and behavioral responses of California sea
lions (Zalophus californianus) to single underwater impulses from an arc-gap transducer. J. Acoust. Soc.
Am. 114(3):1667-1677.
Finneran, J.J., D.A. Carder, C.E. Schlundt, and S.H. Ridgway. 2005. Temporary threshold shift in bottlenose dol-
phins (Tursiops truncatus) exposed to mid-frequency tones. J. Acoust. Soc. Am. 118(4):2696-2705.
Finneran, J.J., D.S. Houser, B. Mase-Guthrie, R.Y. Ewing and R.G. Lingenfelser. 2009. Auditory evoked potentials
in a stranded Gervais' beaked whale (Mesoplodon europaeus). J. Acoust. Soc. Am. 126(1):484-490.
Fish, J.F. and J.S. Vania. 1971. Killer whale, Orcinus orca, sounds repel white whales, Delphinapterus leucas.
Fish. Bull. 69(3):531-535.
Fox, C.G., R.P. Dziak, and H. Matsumoto. 2002. NOAA efforts in monitoring of low-frequency sound in the
global ocean. J. Acoust. Soc. Am. 112(5, Pt. 2):2260 (Abstract).

Appendix A: Impacts of Airgun Sounds on Marine Mammals
Environmental Assessment for SIO ETP Cruise, 2010 Page 145
Frankel, A. 2005. Gray whales hear and respond to a 21-25 kHz high-frequency whale-finding sonar. p. 97 In:
Abstr. 16th Bienn. Conf. Biol. Mar. Mamm., San Diego, CA, Dec. 2005. 306 p.
Frantzis, A. 1998. Does acoustic testing strand whales? Nature 392(6671):29.
Frost, K.J., L.F. Lowry, and R.R. Nelson. 1984. Belukha whale studies in Bristol Bay, Alaska. p. 187-200 In: B.R.
Melteff and D.H. Rosenberg (eds.), Proceedings of the Workshop on Biological Interactions among Marine
Mammals and Commercial Fisheries in the Southeastern Bering Sea, Oct. 1983, Anchorage, AK. Univ.
Alaska Sea Grant Rep. 84-1. Univ. Alaska, Fairbanks, AK.
Gabriele, C.M. and B. Kipple. 2009. Measurements of near-surface, near-bow underwater sound from cruise ships.
p. 86 In: Abstr. 18th Bienn. Conf. Biol. Mar. Mamm., Québec, Oct. 2009. 306 p.
Gailey, G., B. Würsig, and T.L. McDonald. 2007. Abundance, behavior, and movement patterns of western gray
whales in relation to a 3-D seismic survey, northeast Sakhalin Island, Russia. Environ. Monit. Assessm.
134(1-3):75-91.
Gedamke, J., S. Frydman, and N. Gales. 2008. Risk of baleen whale hearing loss from seismic surveys: preliminary
results from simulations accounting for uncertainty and individual variation. Working Pap. SC/60/E9. Int.
Whal. Comm., Cambridge, U.K. 10 p.
Gentry, R. (ed.). 2002. Report of the workshop on acoustic resonance as a source of tissue trauma in cetaceans. 24-
25 April, Nat. Mar. Fish. Serv., Silver Spring, MD. 19 p. Available at http://www.nmfs.noaa.gov/pr/
acoustics/reports.htm
Gerstein, E.R., L.A. Gerstein, S.E. Forsythe, and J.E. Blue. 1999. The underwater audiogram of a West Indian
manatee (Trichechus manatus). J. Acoust. Soc. Am. 105(6):3575-3583.
Gerstein, E., L. Gerstein, S. Forsythe and J. Blue. 2004. Do manatees utilize infrasonic communication or
detection? J. Acoust. Soc. Am. 115(5, Pt. 2):2554-2555 (Abstract).
Ghoul, A., C. Reichmuth, and J. Mulsow. 2009. Source levels and spectral analysis of southern sea otter (Enhydra
lutris nereis) scream vocalizations. p. 90 In: Abstr. 18th Bienn. Conf. Biol. Mar. Mamm., Québec, Canada,
Oct. 2009. 306 p.
Goold, J.C. 1996a. Acoustic assessment of common dolphins off the West Wales coast, in conjunction with 16th
round seismic surveying. Rep. from School of Ocean Sciences, Univ. Wales, Bangor, Wales, for Chevron
UK Ltd., Repsol Exploration (UK) Ltd., and Aran Energy Exploration Ltd. 22 p.
Goold, J.C. 1996b. Acoustic assessment of populations of common dolphin Delphinus delphis in conjunction with
seismic surveying. J. Mar. Biol. Assoc. U.K. 76:811-820.
Goold, J.C. 1996c. Acoustic cetacean monitoring off the west Wales coast. Rep. from School of Ocean Sciences,
Univ. Wales, Bangor, Wales, for Chevron UK Ltd, Repsol Explor. (UK) Ltd, and Aran Energy Explor. Ltd.
20 p.
Goold, J.C. and R.F.W. Coates. 2006. Near source, high frequency air-gun signatures. Paper SC/58/E30 presented
to the IWC Scient. Commit., IWC Annu. Meet., 1-13 June, St. Kitts.
Goold, J.C. and P.J. Fish. 1998. Broadband spectra of seismic survey air-gun emissions, with reference to dolphin
auditory thresholds. J. Acoust. Soc. Am. 103(4):2177-2184.
Gordon, J., D. Gillespie, J. Potter, A. Frantzis, M.P. Simmonds, R. Swift, and D. Thompson. 2004. A review of the
effects of seismic surveys on marine mammals. Mar. Technol. Soc. J. 37(4):16-34.
Gordon, J., R. Antunes, N. Jaquet, and B. Würsig. 2006. An investigation of sperm whale headings and surface
behaviour before, during and after seismic line changes in the Gulf of Mexico. Working Pap. SC/58/E45.
Int. Whal. Comm., Cambridge, U.K. 10 p.
Gosselin, J.-F. and J. Lawson. 2004. Distribution and abundance indices of marine mammals in the Gully and two
adjacent canyons of the Scotian Shelf before and during nearby hydrocarbon seismic exploration program-
mes in April and July 2003. Res. Doc. 2004/133. Can. Sci. Advis. Secretariat, Fisheries & Oceans Canada.
24 p. Available at http://www.dfo-mpo.gc.ca/csas/Csas/DocREC/2004/RES2004_133_e.pdf

Appendix A: Impacts of Airgun Sounds on Marine Mammals
Environmental Assessment for SIO ETP Cruise, 2010 Page 146
Greene, C.R., Jr. 1997. Physical acoustics measurements. p. 3-1 to 3-63 In: W.J. Richardson (ed.), Northstar
marine mammal monitoring program, 1996: marine mammal and acoustical monitoring of a seismic
program in the Alaskan Beaufort Sea. LGL Rep. 2121-2. Rep. from LGL Ltd., King City, Ont., and
Greeneridge Sciences Inc., Santa Barbara, CA, for BP Explor. (Alaska) Inc., Anchorage, AK, and Nat.
Mar. Fish. Serv., Anchorage, AK, and Silver Spring, MD. 245 p.
Greene, C.R., Jr. and W.J. Richardson. 1988. Characteristics of marine seismic survey sounds in the Beaufort Sea.
J. Acoust. Soc. Am. 83(6):2246-2254.
Greene, G.D., F.R. Engelhardt, and R.J. Paterson (eds.). 1985. Proceedings of the Workshop on Effects of
Explosives Use in the Marine Environment, Jan. 1985, Halifax, NS. Tech. Rep. 5. Can. Oil & Gas Lands
Admin., Environ. Prot. Branch, Ottawa, Ont.
Greene, C.R., Jr., N.S. Altman, and W.J. Richardson. 1999a. Bowhead whale calls. p. 6-1 to 6-23 In: W.J. Rich-
ardson (ed.), Marine mammal and acoustical monitoring of Western Geophysical's open-water seismic
program in the Alaskan Beaufort Sea, 1998. LGL Rep. TA2230-3. Rep. from LGL Ltd., King City, Ont.,
and Greeneridge Sciences Inc., Santa Barbara, CA, for Western Geophysical, Houston, TX, and Nat. Mar.
Fish. Serv., Anchorage, AK, and Silver Spring, MD. 390 p.
Greene, C.R., Jr., N.S. Altman and W.J. Richardson. 1999b. The influence of seismic survey sounds on bowhead
whale calling rates. J. Acoust. Soc. Am. 106(4, Pt. 2):2280 (Abstract).
Guerra, M., A.M. Thode, S.B. Blackwell, C.R. Greene Jr. and M. Macrander. 2009. Quantifying masking effects of
seismic survey reverberation off the Alaskan North Slope. J. Acoust. Soc. Am. 126(4, Pt. 2):2230
(Abstract).
Gunn, L.M. 1988. A behavioral audiogram of the North American river otter (Lutra canadensis). M.S. thesis, San
Diego State Univ., San Diego, CA. 40 p.
Haley, B., and W.R. Koski. 2004. Marine mammal monitoring during Lamont-Doherty Earth Observatory‘s
seismic program in the Northwest Atlantic Ocean, July–August 2004. LGL Rep. TA2822-27. Rep. from
LGL Ltd., King City, Ont., for Lamont-Doherty Earth Observatory, Columbia Univ., Palisades, NY, and
Nat. Mar. Fish. Serv., Silver Spring, MD. November. 80 p.
Hanser, S.F., L.R. Doyle, A.R. Szabo, F.A. Sharpe and B. McCowan. 2009. Bubble-net feeding humpback whales
in Southeast Alaska change their vocalization patterns in the presence of moderate vessel noise. p. 105 In:
Abstr. 18th Bienn. Conf. Biol. Mar. Mamm., Québec, Canada, Oct. 2009. 306 p.
Harris, R.E., G.W. Miller, and W.J. Richardson. 2001. Seal responses to airgun sounds during summer seismic sur-
veys in the Alaskan Beaufort Sea. Mar. Mamm. Sci. 17:795-812.
Harris, R.E., [R.E.] T. Elliott, and R.A. Davis. 2007. Results of mitigation and monitoring program, Beaufort Span
2-D marine seismic program, open-water season 2006. LGL Rep. TA4319-1. Rep. from LGL Ltd., King
City, Ont., for GX Technol. Corp., Houston, TX. 48 p.
Hauser, D.D.W., M Holst, and V.D. Moulton. 2008. Marine mammal and sea turtle monitoring during Lamont-
Doherty Earth Observatory‘s marine seismic program in the Eastern Tropical Pacific, April–August 2008.
LGL Rep. TA4656/7-1. Rep. from LGL Ltd., King City., Ont., and St. John‘s, Nfld, for Lamont-Doherty
Earth Observatory of Columbia Univ., Palisades, NY, and Nat. Mar. Fish. Serv., Silver Spring, MD. 98 p.
HESS Team. 1999. High Energy Seismic Survey review process and interim operational guidelines for marine sur-
veys offshore Southern California. Rep. from High Energy Seismic Survey Team for Calif. State Lands
Commis. and Minerals Manage. Serv., Camarillo, CA. 39 p. + Appendices.
Available at www.mms.gov/omm/pacific/lease/fullhessrept.pdf
Hildebrand, J.A. 2005. Impacts of anthropogenic sound. p. 101-124 In: J.E. Reynolds, W.F. Perrin, R.R. Reeves,
S. Montgomery, and T. Ragen (eds.), Marine Mammal Research: Conservation Beyond Crisis. Johns
Hopkins Univ. Press, Baltimore, MD. 223 p.

Appendix A: Impacts of Airgun Sounds on Marine Mammals
Environmental Assessment for SIO ETP Cruise, 2010 Page 147
Hogarth, W.T. 2002. Declaration of William T. Hogarth in opposition to plaintiff‘s motion for temporary
restraining order, 23 Oct. Civ. No. 02-05065-JL. U.S. District Court, Northern District of Calif., San Fran-
cisco Div.
Holst, M. and M.A. Smultea. 2008. Marine mammal and sea turtle monitoring during Lamont-Doherty Earth
Observatory‘s marine seismic program off Central America, February – April 2008. LGL Rep. TA4342-3.
Rep. from LGL Ltd., King City, Ont., for Lamont-Doherty Earth Observatory of Columbia Univ., Palisades,
NY, and Nat. Mar. Fish. Serv., Silver Spring, MD. 133 p.
Holst, M., M.A. Smultea, W.R. Koski, and B. Haley. 2005a. Marine mammal and sea turtle monitoring during
Lamont-Doherty Earth Observatory‘s marine seismic program off the Northern Yucatán Peninsula in the
Southern Gulf of Mexico, January–February 2005. LGL Rep. TA2822-31. Rep. from LGL Ltd., King
City, Ont., for Lamont-Doherty Earth Observatory of Columbia Univ., Palisades, NY, and Nat. Mar. Fish
Serv., Silver Spring, MD.
Holst, M., M.A. Smultea, W.R. Koski, and B. Haley. 2005b. Marine mammal and sea turtle monitoring during
Lamont-Doherty Earth Observatory‘s marine seismic program in the Eastern Tropical Pacific Ocean off
Central America, November–December 2004. LGL Rep. TA2822-30. Rep. from LGL Ltd., King City,
Ont., for Lamont-Doherty Earth Observatory of Columbia Univ., Palisades, NY, and Nat. Mar. Fish. Serv.,
Silver Spring, MD.
Holst, M., W.J. Richardson, W.R. Koski, M.A. Smultea, B. Haley, M.W. Fitzgerald, and M. Rawson. 2006. Effects
of large- and small-source seismic surveys on marine mammals and sea turtles. Eos, Trans. Am. Geophys.
Union 87(36), Joint Assembly Suppl., Abstract OS42A-01. 23-26 May, Baltimore, MD.
Hooker, S.K., R.W. Baird, S. Al-Omari, S. Gowans, and H. Whitehead. 2001. Behavioral reactions of northern
bottlenose whales (Hyperoodon ampullatus) to biopsy darting and tag attachment procedures. Fish. Bull.
99(2):303-308.
Hutchinson, D.R. and R.S. Detrick. 1984. Water gun vs. air gun: a comparison. Mar. Geophys. Res. 6(3):295-
310.
IAGC. 2004. Further analysis of 2002 Abrolhos Bank, Brazil humpback whale strandings coincident with seismic
surveys. Intern. Assoc. Geophys. Contractors, Houston, TX. 12 p.
Ireland, D., M. Holst, and W.R. Koski. 2005. Marine mammal monitoring during Lamont-Doherty Earth Obser-
vatory‘s seismic program off the Aleutian Islands, Alaska, July-August 2005. LGL Rep. TA4089-3. Rep.
from LGL Ltd., King City, Ont., for Lamont-Doherty Earth Observatory of Columbia Univ., Palisades, NY,
and Nat. Mar. Fish. Serv., Silver Spring, MD. 67 p.
IWC. 2007. Report of the standing working group on environmental concerns. Annex K to Report of the Scientific
Committee. J. Cetac. Res. Manage. 9(Suppl.):227-260.
Jefferson, T.A. and B.E. Curry. 1994. Review and evaluation of potential acoustic methods of reducing or elimin-
ating marine mammal-fishery interactions. Rep. from the Mar. Mamm. Res. Progr., Texas A & M Univ.,
College Station, TX, for U.S. Mar. Mamm. Commis., Washington, DC. 59 p. NTIS PB95-100384.
Jepson, P.D., M. Arbelo, R. Deaville, I.A.P. Patterson, P. Castro, J.R. Baker, E. Degollada, H.M. Ross, P. Herráez,
A.M. Pocknell, F. Rodríguez, F.E. Howie, A. Espinosa, R.J. Reid, J.R. Jaber, V. Martin, A.A. Cunningham,
and A. Fernández. 2003. Gas-bubble lesions in stranded cetaceans. Nature 425(6958):575-576.
Jochens, A., D. Biggs, K. Benoit-Bird, D. Engelhaupt, J. Gordon, C. Hu, N. Jaquet, M. Johnson, R. Leben, B. Mate,
P. Miller, J. Ortega-Ortiz, A. Thode, P. Tyack, and B. Würsig. 2008. Sperm whale seismic study in the
Gulf of Mexico/Synthesis report. OCS Study MMS 2008-006. Rep. from Dep. Oceanogr., Texas A & M
Univ., College Station, TX, for U.S. Minerals Manage. Serv., Gulf of Mexico OCS Reg., New Orleans,
LA. 323 p.
Johnson, M.P. and P.L. Tyack. 2003. A digital acoustic recording tag for measuring the response of wild marine
mammals to sound. IEEE J. Oceanic Eng. 28(1):3-12.
Johnson, S.R., W.J. Richardson, S.B. Yazvenko, S.A. Blokhin, G. Gailey, M.R. Jenkerson, S.K. Meier, H.R.
Melton, M.W. Newcomer, A.S. Perlov, S.A. Rutenko, B. Würsig, C.R. Martin, and D.E. Egging. 2007. A

Appendix A: Impacts of Airgun Sounds on Marine Mammals
Environmental Assessment for SIO ETP Cruise, 2010 Page 148
western gray whale mitigation and monitoring program for a 3-D seismic survey, Sakhalin Island, Russia.
Environ. Monit. Assessm. 134(1-3):1-19.
Kastak, D. and R.J. Schusterman. 1998. Low-frequency amphibious hearing in pinnipeds: methods, measurements,
noise, and ecology. J. Acoust. Soc. Am. 103(4):2216-2228.
Kastak, D. and R.J. Schusterman. 1999. In-air and underwater hearing sensitivity of a northern elephant seal (Mir-
ounga angustirostris). Can. J. Zool. 77(11):1751-1758.
Kastak, D., R.L. Schusterman, B.L. Southall, and C.J. Reichmuth. 1999. Underwater temporary threshold shift
induced by octave-band noise in three species of pinnipeds. J. Acoust. Soc. Am. 106(2):1142-1148.
Kastak, D., B.L. Southall, R.J. Schusterman, and C. Reichmuth Kastak. 2005. Underwater temporary threshold
shift in pinnipeds: effects of noise level and duration. J. Acoust. Soc. Am. 118(5):3154-3163.
Kastelein, R.A., P. Mosterd, B. van Santen, M. Hagedoorn, and D. de Haan. 2002. Underwater audiogram of a
Pacific walrus (Odobenus rosmarus divergens) measured with narrow-band frequency-modulated signals.
J. Acoust. Soc. Am. 112(5):2173-2182.
Kastelein, R.A., W.C. Verboom, N. Jennings, and D. de Haan. 2008. Behavioral avoidance threshold level of a
harbor porpoise (Phocoena phocoena) for a continuous 50 kHz pure tone (L). J. Acoust. Soc. Am. 123(4):
1858-1861.
Kastelein, R.A., P.J. Wensveen, L. Hoek, W.C. Verboom and J.M. Terhune. 2009. Underwater detection of tonal
signals between 0.125 and 100 kHz by harbor seals (Phoca vitulina). J. Acoust. Soc. Am. 125(2):1222-
1229.
Kasuya, T. 1986. Distribution and behavior of Baird's beaked whales off the Pacific coast of Japan. Sci. Rep.
Whales Res. Inst. 37:61-83.
Ketten, D.R. 1991. The marine mammal ear: specializations for aquatic audition and echolocation. p. 717-750 In:
D. Webster, R. Fay and A. Popper (eds.), The Biology of Hearing. Springer-Verlag, Berlin.
Ketten, D.R. 1992. The cetacean ear: form, frequency, and evolution. p. 53-75 In: J.A. Thomas, R.A. Kastelein,
and A. Ya Supin (eds.), Marine Mammal Sensory Systems. Plenum, New York, NY.
Ketten, D.R. 1994. Functional analysis of whale ears: adaptations for underwater hearing. IEEE Proc. Under-
water Acoust. 1:264-270.
Ketten, D.R. 1995. Estimates of blast injury and acoustic trauma zones for marine mammals from underwater
explosions. p. 391-407 In: R.A. Kastelein, J.A. Thomas, and P.E. Nachtigall (eds.), Sensory Systems of
Aquatic Mammals. De Spil Publishers, Woerden, Netherlands. 588 p.
Ketten, D.R. 1998. Marine mammal auditory systems: a summary of audiometric and anatomical data and its
implications for underwater acoustic impacts. NOAA Tech. Memo. NOAA-TM-NMFS-SWFSC-256.
Southwest Fisheries Sci. Cent., La Jolla, CA. 74 p.
Ketten, D.R. 2000. Cetacean ears. p. 43-108 In: W.W.L. Au, A.N. Popper, and R.R. Fay (eds.), Hearing by
Whales and Dolphins. Springer-Verlag, New York, NY. 485 p.
Ketten, D.R., J. Lien and S. Todd. 1993. Blast injury in humpback whale ears: evidence and implications.
J. Acoust. Soc. Am. 94(3, Pt. 2):1849-1850 (Abstract).
Ketten, D.R., J. O'Malley, P.W.B. Moore, S. Ridgway, and C. Merigo. 2001. Aging, injury, disease, and noise in
marine mammal ears. J. Acoust. Soc. Am. 110(5, Pt. 2):2721 (Abstract).
Klima, E.F., G.R. Gitschlag, and M.L. Renaud. 1988. Impacts of the explosive removal of offshore petroleum
platforms on sea turtles and dolphins. Mar. Fish. Rev. 50(3):33-42.
Koski, W.R., D.W. Funk, D.S. Ireland, C. Lyons, K. Christie, A.M. Macrander, and S.B. Blackwell. 2009. An
update on feeding by bowhead whales near an offshore seismic survey in the central Beaufort Sea.
Working Pap. SC/61/BRG3. Int. Whal. Comm., Cambridge, U.K. 15 p
Kraus, S., A. Read, A. Solov, K. Baldwin, T. Spradlin, E. Anderson, and J. Williamson. 1997. Acoustic alarms
reduce porpoise mortality. Nature 388(6642):525.

Appendix A: Impacts of Airgun Sounds on Marine Mammals
Environmental Assessment for SIO ETP Cruise, 2010 Page 149
Kryter, K.D. 1985. The Effects of Noise on Man. 2nd ed. Academic Press, Orlando, FL. 688 p.
Kryter, K.D. 1994. The Handbook of Hearing and the Effects of Noise. Academic Press, Orlando, FL. 673 p.
Laurinolli, M.H. and N.A. Cochrane. 2005. Hydroacoustic analysis of marine mammal vocalization data from
ocean bottom seismometer mounted hydrophones in the Gully. p. 89-95 In: K. Lee, H. Bain and G.V.
Hurley (eds.), Acoustic monitoring and marine mammal surveys in The Gully and Outer Scotian Shelf
before and during active seismic surveys. Environ. Stud. Res. Funds Rep. 151. 154 p. Published 2007.
Lesage, V., C. Barrette, M.C.S. Kingsley, and B. Sjare. 1999. The effect of vessel noise on the vocal behavior of
belugas in the St. Lawrence River estuary, Canada. Mar. Mamm. Sci. 15(1):65-84.
Ljungblad, D.K., B. Würsig, S.L. Swartz, and J.M. Keene. 1988. Observations on the behavioral responses of
bowhead whales (Balaena mysticetus) to active geophysical vessels in the Alaskan Beaufort Sea. Arctic
41(3):183-194.
Lucke, K., U. Siebert, P.A. Lepper and M.-A. Blanchet. 2009. Temporary shift in masked hearing thresholds in a
harbor porpoise (Phocoena phocoena) after exposure to seismic airgun stimuli. J. Acoust. Soc. Am.
125(6):4060-4070.
Lusseau, D. and L. Bejder. 2007. The long-term consequences of short-term responses to disturbance experience
from whalewatching impact assessment. Intern. J. Compar. Psychol. 20(2-3):228-236.
MacGillivray, A.O. and D. Hannay. 2007a. Summary of noise assessment. p. 3-1 to 3-21 In: Marine mammal
monitoring and mitigation during open water seismic exploration by ConocoPhillips Alaska, Inc., in the
Chukchi Sea, July-October 2006. LGL Rep. P903-2 (Jan. 2007). Rep. from LGL Alaska Res. Assoc. Inc.,
Anchorage, AK, and JASCO Res. Ltd., Victoria, B.C., for ConocoPhillips Alaska Inc., Anchorage, AK,
and Nat. Mar. Fish. Serv., Silver Spring, MD. 116 p.
MacGillivray, A. and D. Hannay. 2007b. Field measurements of airgun array sound levels. p. 4-1 to 4-19 In:
Marine mammal monitoring and mitigation during open water seismic exploration by GX Technology in
the Chukchi Sea, October-November 2006: 90-day report. LGL Rep. P891-1 (Feb. 2007). Rep. from LGL
Alaska Res. Assoc. Inc., Anchorage, AK, and JASCO Res. Ltd., Victoria, B.C., for GX Technology,
Houston, TX, and Nat. Mar. Fish. Serv., Silver Spring, MD. 118 p.
MacLean, S.A. and B. Haley. 2004. Marine mammal monitoring during Lamont-Doherty Earth Observatory's
seismic study in the Støregga Slide area of the Norwegian Sea, August - September 2003. LGL Rep.
TA2822-20. Rep. from LGL Ltd., King City, Ont., for Lamont-Doherty Earth Observatory, Palisades, NY,
and Nat. Mar. Fish. Serv., Silver Spring, MD. 59 p.
MacLean, S.A. and W.R. Koski. 2005. Marine mammal monitoring during Lamont-Doherty Earth Observatory‘s
seismic program in the Gulf of Alaska, August–September 2004. LGL Rep. TA2822-28. Rep. from LGL
Ltd., King City, Ont., for Lamont-Doherty Earth Observatory, Columbia Univ., Palisades, NY, and Nat.
Mar. Fish. Serv., Silver Spring, MD. 102 p.
Madsen, P.T. 2005. Marine mammals and noise: problems with root mean square sound pressure levels for transi-
ents. J. Acoust. Soc. Am. 117(6):3952-3957.
Madsen, P.T., B. Mohl, B.K. Nielsen, and M. Wahlberg. 2002. Male sperm whale behavior during exposures to
distant seismic survey pulses. Aquat. Mamm. 28(3):231-240.
Madsen, P.T., M. Johnson, P.J.O. Miller, N. Aguilar de Soto, J. Lynch, and P.L. Tyack. 2006. Quantitative mea-
sures of air gun pulses recorded on sperm whales (Physeter macrocephalus) using acoustic tags during
controlled exposure experiments. J. Acoust. Soc. Am. 120(4):2366–2379.
Malakoff, D. 2002. Suit ties whale deaths to research cruise. Science 298(5594):722-723.
Malme, C.I. and P.R. Miles. 1985. Behavioral responses of marine mammals (gray whales) to seismic discharges.
p. 253-280 In: G.D. Greene, F.R. Engelhard, and R.J. Paterson (eds.), Proc. Workshop on Effects of Explo-
sives Use in the Marine Environment, Jan. 1985, Halifax, NS. Tech. Rep. 5. Can. Oil & Gas Lands
Admin., Environ. Prot. Br., Ottawa, Ont. 398 p.
Malme, C.I., P.R. Miles, C.W. Clark, P. Tyack, and J.E. Bird. 1984. Investigations of the potential effects of
underwater noise from petroleum industry activities on migrating gray whale behavior/Phase II: January
Appendix A: Impacts of Airgun Sounds on Marine Mammals
Environmental Assessment for SIO ETP Cruise, 2010 Page 150
1984 migration. BBN Rep. 5586. Rep. from Bolt Beranek & Newman Inc., Cambridge, MA, for MMS,
Alaska OCS Region, Anchorage, AK. NTIS PB86-218377.
Malme, C.I., P.R. Miles, P. Tyack, C.W. Clark, and J.E. Bird. 1985. Investigation of the potential effects of
underwater noise from petroleum industry activities on feeding humpback whale behavior. BBN Rep.
5851; OCS Study MMS 85-0019. Rep. from BBN Labs Inc., Cambridge, MA, for MMS, Anchorage, AK.
NTIS PB86-218385.
Malme, C.I., B. Würsig, J.E. Bird, and P. Tyack. 1986. Behavioral responses of gray whales to industrial noise:
feeding observations and predictive modeling. BBN Rep. 6265. OCS Study MMS 88-0048. Outer Contin.
Shelf Environ. Assess. Progr., Final Rep. Princ. Invest., NOAA, Anchorage 56(1988): 393-600. NTIS
PB88-249008.
Malme, C.I., B. Würsig, B., J.E. Bird, and P. Tyack. 1988. Observations of feeding gray whale responses to
controlled industrial noise exposure. p. 55-73 In: W.M. Sackinger, M.O. Jeffries, J.L. Imm, and S.D.
Treacy (eds.), Port and Ocean Engineering Under Arctic Conditions. Vol. II. Symposium on Noise and
Marine Mammals. Univ. Alaska Fairbanks, Fairbanks, AK. 111 p.
Manly, B.F.J., V.D. Moulton, R.E. Elliott, G.W. Miller and W.J. Richardson. 2007. Analysis of covariance of fall
migrations of bowhead whales in relation to human activities and environmental factors, Alaskan Beaufort
Sea: Phase I, 1996-1998. LGL Rep. TA2799-2; OCS Study MMS 2005-033. Rep. from LGL Ltd., King
City, Ont., and WEST Inc., Cheyenne, WY, for U.S. Minerals Manage. Serv., Herndon, VA, and Anchorage,
AK. 128 p.
Mate, B.R. and J.T. Harvey. 1987. Acoustical deterrents in marine mammal conflicts with fisheries. ORESU-W-
86-001. Oregon State Univ., Sea Grant Coll. Prog., Corvallis, OR. 116 p.
Mate, B.R., K.M. Stafford, and D.K. Ljungblad. 1994. A change in sperm whale (Physeter macrocephalus)
distribution correlated to seismic surveys in the Gulf of Mexico. J. Acoust. Soc. Am. 96(5, Pt. 2):3268-
3269 (Abstract).
McAlpine, D.F. 2002. Pygmy and dwarf sperm whales. p. 1007-1009 In: W.F. Perrin, B. Würsig, and J.G.M.
Thewissen (eds.), Encyclopedia of Marine Mammals. Academic Press, San Diego, CA. 1414 p.
McCall Howard, M.P. 1999. Sperm whales Physeter macrocephalus in the Gully, Nova Scotia: Population, distri-
bution, and response to seismic surveying. B.Sc. (Honours) Thesis. Dalhousie Univ., Halifax, NS.
McCauley, R.D., M.-N. Jenner, C. Jenner, K.A. McCabe, and J. Murdoch. 1998. The response of humpback whales
(Megaptera novaeangliae) to offshore seismic survey noise: preliminary results of observations about a
working seismic vessel and experimental exposures. APPEA J. 38:692-707.
McCauley, R.D., J. Fewtrell, A.J. Duncan, C. Jenner, M.-N. Jenner, J.D. Penrose, R.I.T. Prince, A. Adhitya, J.
Murdoch, and K. McCabe. 2000a. Marine seismic surveys: Analysis of airgun signals; and effects of air
gun exposure on humpback whales, sea turtles, fishes and squid. Rep. from Centre for Marine Science and
Technology, Curtin Univ., Perth, Western Australia, for Australian Petrol. Produc. & Explor. Association,
Sydney, NSW. 188 p.
McCauley, R.D., J. Fewtrell, A.J. Duncan, M.-N. Jenner, M-N., C. Jenner, R.I.T. Prince, A. Adhitya, K. McCabe
and J. Murdoch. 2000b. Marine seismic surveys – a study of environmental implications. APPEA J. 40:
692-708.
McDonald, M.A., J.A. Hildebrand, and S.C. Webb. 1995. Blue and fin whales observed on a seafloor array in the
Northeast Pacific. J. Acoust. Soc. Am. 98(2, Pt. 1):712-721.
McShane, L.J., J.A. Estes, M.L. Riedman, and M.M. Staedler. 1995. Repertoire, structure, and individual variation
of vocalizations in the sea otter. J. Mammal. 76(2):414-427.
Meier, S.K., S.B. Yazvenko, S.A. Blokhin, P. Wainwright, M.K. Maminov, Y.M. Yakovlev, and M.W. Newcomer.
2007. Distribution and abundance of western gray whales off northeastern Sakhalin Island, Russia, 2001-
2003. Environ. Monit. Assessm. 134(1-3):107-136.
Miller, G.W., R.E. Elliott, W.R. Koski, V.D. Moulton, and W.J. Richardson. 1999. Whales. p. 5-1 to 5-109 In:
W.J. Richardson (ed.), Marine mammal and acoustical monitoring of Western Geophysical's open-water

Appendix A: Impacts of Airgun Sounds on Marine Mammals
Environmental Assessment for SIO ETP Cruise, 2010 Page 151
seismic program in the Alaskan Beaufort Sea, 1998. LGL Rep. TA2230-3. Rep. from LGL Ltd., King
City, Ont., and Greeneridge Sciences Inc., Santa Barbara, CA, for Western Geophysical, Houston, TX, and
Nat. Mar. Fish. Serv., Anchorage, AK, and Silver Spring, MD. 390 p.
Miller, G.W., V.D. Moulton, R.A. Davis, M. Holst, P. Millman, A. MacGillivray, and D. Hannay. 2005. Monitor-
ing seismic effects on marine mammals—southeastern Beaufort Sea, 2001-2002. p. 511-542 In: S.L.
Armsworthy, P.J. Cranford, and K. Lee (eds.), Offshore Oil and Gas Environmental Effects Monitor-
ing/Approaches and Technologies. Battelle Press, Columbus, OH.
Miller, P.J.O., M.P. Johnson, P.T. Madsen, N. Biassoni, M. Quero, and P.L. Tyack. 2009. Using at-sea experiments
to study the effects of airguns on the foraging behavior of sperm whales in the Gulf of Mexico. Deep-Sea
Res. I 56(7):1168-1181.
Mooney, T.A., P.E. Nachtigall, M. Breese, S. Vlachos, and W.W.L. Au, 2009a. Predicting temporary threshold
shifts in a bottlenose dolphin (Tursiops truncatus): the effects of noise level and duration. J. Acoust. Soc.
Am. 125(3):1816-1826.
Mooney, T.A., P.E. Nachtigall and S. Vlachos. 2009b. Sonar-induced temporary hearing loss in dolphins. Biol.
Lett. 4(4):565-567.
Moore, S.E. and Angliss, R.P. 2006. Overview of planned seismic surveys offshore northern Alaska, July-October
2006. Paper SC/58/E6 presented to IWC Scient. Commit., IWC Annu. Meet., 1-13 June, St Kitts.
Morton A.B. and H.K. Symonds. 2002. Displacement of Orcinus orca (L.) by high amplitude sound in British
Columbia, Canada. ICES J. Mar. Sci. 59(1):71-80
Moulton, V.D. and J.W. Lawson. 2002. Seals, 2001. p. 3-1 to 3-48 In: W.J. Richardson (ed.), Marine mammal and
acoustical monitoring of WesternGeco‘s open water seismic program in the Alaskan Beaufort Sea, 2001.
LGL Rep. TA2564-4. Rep. from LGL Ltd., King City, Ont., and Greeneridge Sciences Inc., Santa Barbara,
CA, for WesternGeco, Houston, TX, and Nat. Mar. Fish. Serv., Anchorage, AK, and Silver Spring, MD.
95 p.
Moulton, V.D. and G.W. Miller. 2005. Marine mammal monitoring of a seismic survey on the Scotian Slope, 2003.
p. 29-40 In: K. Lee, H. Bain, and G.V. Hurley (eds.), Acoustic monitoring and marine mammal surveys in
the Gully and outer Scotian Shelf before and during active seismic programs. Environ. Stud. Res. Funds
Rep. 151. 154 p (Published 2007).
Moulton, V.D., B.D. Mactavish, and R.A. Buchanan. 2005. Marine mammal and seabird monitoring of Chevron
Canada Resources' 3-D seismic program on the Orphan Basin, 2004. LGL Rep. SA817. Rep. by LGL
Ltd., St. John's, NL, for Chevron Canada Resources, Calgary, Alb., ExxonMobil Canada Ltd., St. John's,
Nfld., and Imperial Oil Resources Ventures Ltd., Calgary, Alb. 90 p. + appendices.
Moulton, V.D., B.D. Mactavish, R.E. Harris, and R.A. Buchanan. 2006a. Marine mammal and seabird monitoring
of Chevron Canada Limited's 3-D seismic program on the Orphan Basin, 2005. LGL Rep. SA843. Rep. by
LGL Ltd., St. John's, Nfld., for Chevron Canada Resources, Calgary, Alb., ExxonMobil Canada Ltd., St.
John's, Nfld., and Imperial Oil Resources Ventures Ltd., Calgary, Alb. 111 p. + appendices.
Moulton, V.D., B.D. Mactavish, and R.A. Buchanan. 2006b. Marine mammal and seabird monitoring of Conoco-
Phillips‘ 3-D seismic program in the Laurentian Sub-basin, 2005. LGL Rep. SA849. Rep. by LGL Ltd.,
St. John‘s, Nfld., for ConocoPhillips Canada Resources Corp., Calgary, Alb. 97 p. + appendices.
Nachtigall, P.E., J.L. Pawloski, and W.W.L. Au. 2003. Temporary threshold shifts and recovery following noise
exposure in the Atlantic bottlenose dolphin (Tursiops truncatus). J. Acoust. Soc. Am. 113(6):3425-3429.
Nachtigall, P.E., A.Y. Supin, J. Pawloski, and W.W.L. Au. 2004. Temporary threshold shifts after noise exposure
in the bottlenose dolphin (Tursiops truncatus) measured using evoked auditory potentials. Mar. Mamm.
Sci. 20(4):673-687
Nachtigall, P.E., A.Y. Supin, M. Amundin, B. Röken,,T. Møller, A. Mooney, K.A. Taylor, and M. Yuen. 2007.
Polar bear Ursus maritimus hearing measured with auditory evoked potentials. J. Exp. Biol. 210(7):1116-
1122.

Appendix A: Impacts of Airgun Sounds on Marine Mammals
Environmental Assessment for SIO ETP Cruise, 2010 Page 152
Nations, C.S., S.B. Blackwell, K.H. Kim, A.M. Thode, C.R. Greene Jr., A.M. Macrander, and T.L. McDonald.
2009. Effects of seismic exploration in the Beaufort Sea on bowhead whale call distributions. J. Acoust.
Soc. Am. 126(4, Pt. 2):2230 (Abstract).
Nieukirk, S.L., K.M. Stafford, D.K. Mellinger, R.P. Dziak, and C.G. Fox. 2004. Low-frequency whale and seismic
airgun sounds recorded in the mid-Atlantic Ocean. J. Acoust. Soc. Am. 115(4):1832-1843.
Nieukirk, S.L., D.K. Mellinger, J.A. Hildebrand, M.A. McDonald, and R.P. Dziak. 2005. Downward shift in the
frequency of blue whale vocalizations. p. 205 In: Abstr. 16th Bienn. Conf. Biol. Mar. Mamm., San Diego,
CA, 12-16 Dec. 2005.
Nieukirk, S.L., S.L. Heimlich, S.E. Moore, K.M. Stafford, R.P. Dziak, M. Fowler, J. Haxel, J. Goslin and D.K.
Mellinger. 2009. Whales and airguns: an eight-year acoustic study in the central North Atlantic. p. 181-182
In: Abstr. 18th Bienn. Conf. Biol. Mar. Mamm., Québec, Oct. 2009. 306 p.
NMFS. 1995. Small takes of marine mammals incidental to specified activities; offshore seismic activities in
southern California. Fed. Regist. 60(200):53753-53760.
NMFS. 2000. Small takes of marine mammals incidental to specified activities; marine seismic-reflection data
collection in southern California. Fed. Regist. 65(20):16374-16379.
NMFS. 2001. Small takes of marine mammals incidental to specified activities; oil and gas exploration drilling
activities in the Beaufort Sea/Notice of issuance of an incidental harassment authorization. Fed. Regist.
66(26):9291-9298.
NMFS. 2005. Endangered Fish and Wildlife; Notice of Intent to Prepare an Environmental Impact Statement. Fed.
Regist. 70(7):1871-1875.
NOAA and U.S. Navy. 2001. Joint interim report: Bahamas marine mammal stranding event of 15-16 March
2000. Nat. Mar. Fish. Serv., Silver Spring, MD, and Assistant Secretary of the Navy, Installations &
Environ., Washington, DC. 61 p. Available at http://www.nmfs.noaa.gov/pr/acoustics/reports.htm
Nowacek, D.P., L.H. Thorne, D.W. Johnston, and P.L. Tyack. 2007. Responses of cetaceans to anthropogenic
noise. Mammal Rev. 37(2):81-115.
NRC. 2005. Marine Mammal Populations and Ocean Noise: Determining When Noise Causes Biologically
Significant Effects. U. S. Nat. Res. Counc., Ocean Studies Board. (Authors D.W. Wartzok, J. Altmann, W.
Au, K. Ralls, A. Starfield, and P.L. Tyack). Nat. Acad. Press, Washington, DC. 126 p.
Parente, C.L., M.C.C. Marcondes, and M.H. Engel. 2006. Humpback whale strandings and seismic surveys in
Brazil from 1999 to 2004. Working Pap. SC/58/E41. Int. Whal. Comm., Cambridge, U.K. 16 p.
Parente, C.L., J.P. de Araújo and M.E. de Araújo. 2007. Diversity of cetaceans as tool in monitoring environmental
impacts of seismic surveys. Biota Neotrop. 7(1):1-7.
Parks, S.E., C.W. Clark, and P.L. Tyack. 2007a. Short- and long-term changes in right whale calling behavior: the
potential effects of noise on acoustic communication. J. Acoust. Soc. Am. 122(6):3725-3731.
Parks, S.E., D.R. Ketten, J.T. O'Malley and J. Arruda. 2007b. Anatomical predictions of hearing in the North
Atlantic right whale. Anat. Rec. 290(6):734-744.
Parks, S.E., I. Urazghildiiev and C.W. Clark. 2009. Variability in ambient noise levels and call parameters of North
Atlantic right whales in three habitat areas. J. Acoust. Soc. Am. 125(2):1230-1239.
Potter, J.R., M. Thillet, C. Douglas, M.A. Chitre, Z. Doborzynski, and P.J. Seekings. 2007. Visual and passive
acoustic marine mammal observations and high-frequency seismic source characteristics recorded during a
seismic survey. IEEE J. Oceanic Eng. 32(2):469-483.
Reeves, R.R. 1992. Whale responses to anthropogenic sounds: A literature review. Sci. & Res. Ser. 47. New
Zealand Dep. Conserv., Wellington. 47 p.
Reeves, R.R., E. Mitchell, and H. Whitehead. 1993. Status of the northern bottlenose whale, Hyperoodon
ampullatus. Can. Field-Nat. 107(4):490-508.

Appendix A: Impacts of Airgun Sounds on Marine Mammals
Environmental Assessment for SIO ETP Cruise, 2010 Page 153
Reeves, R.R., R.J. Hofman, G.K. Silber, and D. Wilkinson. 1996. Acoustic deterrence of harmful marine mammal-
fishery interactions: proceedings of a workshop held in Seattle, Washington, 20-22 March 1996. NOAA
Tech. Memo. NMFS-OPR-10. Nat. Mar. Fish. Serv., Northwest Fisheries Sci. Cent., Seattle, WA. 70 p.
Reiser, C.M., B. Haley, J. Beland, D.M. Savarese, D.S. Ireland, and D.W. Funk. 2009. Evidence of short-range
movements by phocid species in reaction to marine seismic surveys in the Alaskan Chukchi and Beaufort
seas. p. 211 In:Abstr. 18th Bienn. Conf. Biol. Mar. Mamm., Québec, Canada, Oct. 2009. 306 p.
Richardson, W.J. and C.I. Malme. 1993. Man-made noise and behavioral responses. p. 631-700 In: J.J. Burns, J.J.
Montague, and C.J. Cowles (eds.), The Bowhead Whale. Spec. Publ. 2, Soc. Mar. Mammal., Lawrence,
KS. 787 p.
Richardson, W.J. and B. Würsig. 1997. Influences of man-made noise and other human actions on cetacean
behaviour. Mar. Freshw. Behav. Physiol. 29(1-4):183-209.
Richardson, W.J., B. Würsig, and C.R. Greene. 1986. Reactions of bowhead whales, Balaena mysticetus, to seis-
mic exploration in the Canadian Beaufort Sea. J. Acoust. Soc. Am. 79(4):1117-1128.
Richardson, W.J., R.A. Davis, C.R. Evans, D.K. Ljungblad, and P. Norton. 1987. Summer distribution of bowhead
whales, Balaena mysticetus, relative to oil industry activities in the Canadian Beaufort Sea, 1980-84.
Arctic 40(2):93-104.
Richardson, W.J., C.R. Greene, Jr., C.I. Malme, and D.H. Thomson. 1995. Marine Mammals and Noise. Academic
Press, San Diego, CA. 576 p.
Richardson, W.J., G.W. Miller, and C.R. Greene, Jr. 1999. Displacement of migrating bowhead whales by sounds
from seismic surveys in shallow waters of the Beaufort Sea. J. Acoust. Soc. Am. 106(4, Pt. 2):2281
(Abstract).
Richardson, W.J., M. Holst, W.R. Koski and M. Cummings. 2009. Responses of cetaceans to large-source seismic
surveys by Lamont-Doherty Earth Observatory. p. 213 In: Abstr. 18th Bienn. Conf. Biol. Mar. Mamm.,
Québec, Oct. 2009. 306 p.
Riedman, M.L. 1983. Studies of the effects of experimentally produced noise associated with oil and gas explor-
ation and development on sea otters in California. Rep. from Center for Coastal Marine Studies, Univ.
Calif., Santa Cruz, CA, for MMS, Anchorage, AK. 92 p. NTIS PB86-218575.
Riedman, M.L. 1984. Effects of sounds associated with petroleum industry activities on the behavior of sea otters
in California. p. D-1 to D-12 In: C.I. Malme, P.R. Miles, C.W. Clark, P. Tyack, and J.E. Bird. Investiga-
tions of the potential effects of underwater noise form petroleum industry activities on migrating gray
whale behavior/Phase II: January 1984 migration. BBN Rep. 5586. Rep. from BBN Inc., Cambridge,
MA, for Minerals Manage. Serv. Anchorage, AK. NTIS PB86-218377.
Romano, T.A., M.J. Keogh, C.Kelly, P. Feng, L. Berk, C.E. Schlundt, D.A. Carder, and J.J. Finneran. 2004.
Anthropogenic sound and marine mammal health: measures of the nervous and immune systems before
and after intense sound exposure. Can. J. Fish. Aquat. Sci. 61(7):1124-1134.
SACLANT. 1998. Estimation of cetacean hearing criteria levels. Section II, Chapter 7 In: SACLANTCEN
Bioacoustics Panel Summary Record and Report. Rep. from NATO Undersea Res. Center. Available at
http://enterprise.spawar.navy.mil/nepa/whales/pdf/doc2-7.pdf
Scheifele, P.M., S. Andrew, R.A. Cooper, M. Darre, F.E. Musiek, and L. Max. 2005. Indication of a Lombard
vocal response in the St. Lawrence River beluga. J. Acoust. Soc. Am. 117(3, Pt. 1):1486-1492.
Schlundt, C.E., J.J. Finneran, D.A. Carder, and S.H. Ridgway. 2000. Temporary shift in masking hearing thresh-
olds of bottlenose dolphins, Tursiops truncatus, and white whales, Delphinapterus leucas, after exposure to
intense tones. J. Acoust. Soc. Am. 107(6):3496-3508.
Simard, Y., F. Samaran and N. Roy. 2005. Measurement of whale and seismic sounds in the Scotian Gully and
adjacent canyons in July 2003. p. 97-115 In: K. Lee, H. Bain and C.V. Hurley (eds.), Acoustic monitoring
and marine mammal surveys in The Gully and Outer Scotian Shelf before and during active seismic
surveys. Environ. Stud. Res. Funds Rep. 151. 154 p (Published 2007).
Simmonds, M. P. and L.F. Lopez-Jurado. 1991. Whales and the military. Nature 351(6326):448.

Appendix A: Impacts of Airgun Sounds on Marine Mammals
Environmental Assessment for SIO ETP Cruise, 2010 Page 154
Smultea, M.A. and M. Holst. 2008. Marine mammal monitoring during a University of Texas Institute for
Geophysics seismic survey in the Northeast Pacific Ocean, July 2008. LGL Rep. TA4584-2. Rep. from
LGL Ltd., King City, Ont., for Lamont-Doherty Earth Observatory of Columbia Univ., Palisades, NY, and
Nat. Mar. Fish. Serv., Silver Spring, MD. 80 p.
Smultea, M.A., M. Holst, W.R. Koski, and S. Stoltz. 2004. Marine mammal monitoring during Lamont-Doherty
Earth Observatory's seismic program in the Southeast Caribbean Sea and adjacent Atlantic Ocean, April-
June 2004. LGL Rep. TA2822-26. Rep. from LGL Ltd., King City, Ont., for Lamont-Doherty Earth
Observatory of Columbia Univ., Palisades, NY, and Nat. Mar. Fish. Serv., Silver Spring, MD. 106 p.
Sodal, A. 1999. Measured underwater acoustic wave propagation from a seismic source. Proc. Airgun Environ-
mental Workshop, 6 July, London, UK.
Southall, B.L., A.E. Bowles, W.T. Ellison, J.J. Finneran, R.L. Gentry, C.R. Greene Jr., D. Kastak, D.R. Ketten, J.H.
Miller, P.E. Nachtigall, W.J. Richardson, J.A. Thomas, and P.L. Tyack. 2007. Marine mammal noise
exposure criteria: initial scientific recommendations. Aquat. Mamm. 33(4):411-522.
Stone, C.J. 2003. The effects of seismic activity on marine mammals in UK waters 1998-2000. JNCC Rep. 323.
Joint Nature Conserv. Commit., Aberdeen, Scotland. 43 p.
Stone, C.J. and M.L. Tasker. 2006. The effects of seismic airguns on cetaceans in UK waters. J. Cetac. Res.
Manage. 8(3):255-263.
Terhune, J.M. 1999. Pitch separation as a possible jamming-avoidance mechanism in underwater calls of bearded
seals (Erignathus barbatus). Can. J. Zool. 77(7):1025-1034.
Thomas, J.A., R.A. Kastelein and F.T. Awbrey. 1990. Behavior and blood catecholamines of captive belugas
during playbacks of noise from an oil drilling platform. Zoo Biol. 9(5):393-402.
Thompson, D., M. Sjöberg, E.B. Bryant, P. Lovell, and A. Bjørge. 1998. Behavioural and physiological responses
of harbour (Phoca vitulina) and grey (Halichoerus grypus) seals to seismic surveys. p. 134 In: Abstr. 12th
Bienn . Conf. and World Mar. Mamm. Sci. Conf., 20-25 Jan., Monte Carlo, Monaco. 160 p.
Thomson, D.H. and W.J. Richardson. 1995. Marine mammal sounds. p. 159-204 In: W.J. Richardson, C.R.
Greene, Jr., C.I. Malme, and D.H. Thomson. Marine Mammals and Noise. Academic Press, San Diego,
CA. 576 p.
Tolstoy, M., J. Diebold, S. Webb, D. Bohnenstiehl, and E. Chapp. 2004a. Acoustic calibration measurements.
Chapter 3 In: W.J. Richardson (ed.), Marine mammal and acoustic monitoring during Lamont-Doherty
Earth Observatory's acoustic calibration study in the northern Gulf of Mexico, 2003. Revised Rep. from
LGL Ltd., King City, Ont., for Lamont-Doherty Earth Observatory, Palisades, NY, and Nat. Mar. Fish.
Serv., Silver Spring, MD.
Tolstoy, M., J.B. Diebold, S.C. Webb, D.R. Bohenstiehl, E. Chapp, R.C. Holmes, and M. Rawson. 2004b. Broad-
band calibration of R/V Ewing seismic sources. Geophys. Res. Let. 31:L14310. doi: 10.1029/
2004GL020234
Tolstoy, M., J. Diebold, L. Doermann, S. Nooner, S.C. Webb, D.R. Bohnenstiehl, T.J. Crone and R.C. Holmes.
2009. Broadband calibration of the R/V Marcus G. Langseth four-string seismic sources. Geochem.
Geophys. Geosyst. 10(8):1-15. Q08011.
Tyack, P.L. 2008. Implications for marine mammals of large-scale changes in the marine acoustic environment.
J. Mammal. 89(3):549-558.
Tyack, P.L. 2009. Human-generated sound and marine mammals. Phys. Today 62(11, Nov.):39-44.
Tyack, P., M. Johnson, and P. Miller. 2003. Tracking responses of sperm whales to experimental exposures of
airguns. p. 115-120 In: A.E. Jochens and D.C. Biggs (eds.), Sperm whale seismic study in the Gulf of
Mexico/Annual Report: Year 1. OCS Study MMS 2003-069. Rep. from Texas A&M Univ., College Sta-
tion, TX, for U.S. Minerals Manage. Serv., Gulf of Mexico OCS Region, New Orleans, LA.
Tyack, P.L., M.P. Johnson, P.T. Madsen, P.J. Miller, and J. Lynch. 2006a. Biological significance of acoustic
impacts on marine mammals: examples using an acoustic recording tag to define acoustic exposure of

Appendix A: Impacts of Airgun Sounds on Marine Mammals
Environmental Assessment for SIO ETP Cruise, 2010 Page 155
sperm whales, Physeter catodon, exposed to airgun sounds in controlled exposure experiments. Eos,
Trans. Am. Geophys. Union 87(36), Joint Assembly Suppl., Abstract OS42A-02. 23-26 May, Baltimore,
MD.
Tyack, P.L., M. Johnson, N. Aguilar Soto, A. Sturlese, and P.T. Madsen. 2006b. Extreme diving of beaked whales.
J. Exp. Biol. 209(21):4238-4253.
Urick, R.J. 1983. Principles of Underwater Sound. 3rd ed. Peninsula Publ., Los Altos, CA. 423 p.
van der Woude, S. 2007. Assessing effects of an acoustic marine geophysical survey on the behaviour of bottlenose
dolphins Tursiops truncatis. In: Abstr. 17th Bienn. Conf. Biol. Mar. Mamm., 29 Nov.–3 Dec., Cape Town,
South Africa.
Wartzok, D., A.N. Popper, J. Gordon, and J. Merrill. 2004. Factors affecting the responses of marine mammals to
acoustic disturbance. Mar. Technol. Soc. J. 37(4):6-15.
Watkins, W.A. 1977. Acoustic behavior of sperm whales. Oceanus 20(2):50-58.
Watkins, W.A. 1986. Whale reactions to human activities in Cape Cod waters. Mar. Mamm. Sci. 2(4):251-262.
Watkins, W.A. and W.E. Schevill. 1975. Sperm whales (Physeter catodon) react to pingers. Deep-Sea Res.
22(3):123-129.
Watkins, W.A., K.E. Moore, and P. Tyack. 1985. Sperm whale acoustic behaviors in the southeast Caribbean.
Cetology 49:1-15.
Weilgart, L.S. 2007. A brief review of known effects of noise on marine mammals. Intern. J. Comp. Psychol.
20:159-168.
Weir, C.R. 2008a. Overt responses of humpback whales (Megaptera novaeangliae), sperm whales (Physeter
macrocephalus), and Atlantic spotted dolphins (Stenella frontalis) to seismic exploration off Angola.
Aquat. Mamm. 34(1):71-83.
Weir, C.R. 2008b. Short-finned pilot whales (Globicephala macrorhynchus) respond to an airgun ramp-up
procedure off Gabon. Aquat. Mamm. 34(3):349-354.
Weller, D.W., Y.V. Ivashchenko, G.A. Tsidulko, A.M. Burdin, and R.L. Brownell, Jr. 2002. Influence of seismic
surveys on western gray whales off Sakhalin Island, Russia in 2001. Paper SC/54/BRG14, IWC, Western
Gray Whale Working Group Meet., 22-25 Oct., Ulsan, South Korea. 12 p.
Weller, D.W., S.H. Rickards, A.L. Bradford, A.M. Burdin, and R.L. Brownell, Jr. 2006a. The influence of 1997
seismic surveys on the behavior of western gray whales off Sakhalin Island, Russia. Paper SC/58/E4
presented to the IWC Scient. Commit., IWC Annu. Meet., 1-13 June, St. Kitts.
Weller, D.W., G.A. Tsidulko, Y.V. Ivashchenko, A.M. Burdin and R.L. Brownell Jr. 2006b. A re-evaluation of the
influence of 2001 seismic surveys on western gray whales off Sakhalin Island, Russia. Paper SC/58/E5
presented to the IWC Scient. Commit., IWC Annu. Meet., 1-13 June, St. Kitts.
Wieting, D. 2004. Background on development and intended use of criteria. p. 20 In: S. Orenstein, L. Langstaff, L.
Manning, and R. Maund (eds.), Advisory Committee on Acoustic Impacts on Marine Mammals, Final
Meet. Summary. Second Meet., April 28-30, 2004, Arlington, VA. Sponsored by the Mar. Mamm.
Commis., 10 Aug.
Winsor, M.H. and B.R. Mate. 2006. Seismic survey activity and the proximity of satellite tagged sperm whales.
Working Pap. SC/58/E16. Int. Whal. Comm., Cambridge, U.K. 8 p.
Wright, A.J. and S. Kuczaj. 2007. Noise-related stress and marine mammals: An Introduction. Intern. J. Comp.
Psychol. 20(2-3):iii-viii.
Wright, A.J., N. Aguilar Soto, A.L. Baldwin, M. Bateson, C.M. Beale, C. Clark, T. Deak, E.F. Edwards,
A. Fernández, A. Godinho, L.T. Hatch, A. Kakuschke, D. Lusseau, D. Martineau, L.M. Romero, L.S.
Weilgart, B.A. Wintle, G. Notarbartolo-di-Sciara, and V. Martin. 2007a. Do marine mammals experience
stress related to anthropogenic noise? Intern. J. Comp. Psychol. 20(2-3):274-316.

Appendix A: Impacts of Airgun Sounds on Marine Mammals
Environmental Assessment for SIO ETP Cruise, 2010 Page 156
Wright, A.J., N. Aguilar Soto, A.L. Baldwin, M. Bateson, C.M. Beale, C. Clark, T. Deak, E.F. Edwards,
A. Fernández, A. Godinho, L.T. Hatch, A. Kakuschke, D. Lusseau, D. Martineau, L.M. Romero, L.S.
Weilgart, B.A. Wintle, G. Notarbartolo-di-Sciara and V. Martin. 2007b. Anthropogenic noise as a stressor
in animals: A multidisciplinary perspective. Intern. J. Comp. Psychol. 20(2-3): 250-273.
Wright, A.J., T. Deak and E.C.M. Parsons. 2009. Concerns related to chronic stress in marine mammals. Working
Pap. SC/61/E16. Int. Whal. Comm., Cambridge, U.K. 7 p.
Würsig, B., S.K. Lynn, T.A. Jefferson, and K.D. Mullin. 1998. Behaviour of cetaceans in the northern Gulf of
Mexico relative to survey ships and aircraft. Aquat. Mamm. 24(1):41-50.
Würsig, B.G., D.W. Weller, A.M. Burdin, S.H. Reeve, A.L Bradford, S.A. Blokhin, and R.L Brownell, Jr. 1999.
Gray whales summering off Sakhalin Island, Far East Russia: July-October 1997. A joint U.S.-Russian
scientific investigation. Final Report. Rep. from Texas A&M Univ., College Station, TX, and Kamchatka
Inst. Ecol. & Nature Manage., Russian Acad. Sci., Kamchatka, Russia, for Sakhalin Energy Investment Co.
Ltd and Exxon Neftegaz Ltd, Yuzhno-Sakhalinsk, Russia. 101 p.
Yazvenko, S.B., T.L. McDonald, S.A. Blokhin, S.R. Johnson, S.K. Meier, H.R. Melton, M.W. Newcomer, R.M.
Nielson, V.L. Vladimirov, and P.W. Wainwright. 2007a. Distribution and abundance of western gray
whales during a seismic survey near Sakhalin Island, Russia. Environ. Monit. Assessm. 134(1-3):45-73.
Yazvenko, S. B., T.L. McDonald, S.A. Blokhin, S.R. Johnson, H.R. Melton, and M.W. Newcomer. 2007b. Feeding
activity of western gray whales during a seismic survey near Sakhalin Island, Russia. Environ. Monit.
Assessm. 134(1-3):93-106.
Yoder, J.A. 2002. Declaration James A. Yoder in opposition to plaintiff‘s motion for temporary restraining order,
28 October 2002. Civ. No. 02-05065-JL. U.S. District Court, Northern District of Calif., San Francisco Div.

Appendix B: Effects of Airgun Sounds on Sea Turtles
Environmental Assessment for SIO ETP Cruise, 2010 Page 157
APPENDIX B:
REVIEW OF THE EFFECTS OF AIRGUN SOUNDS ON SEA TURTLES10
The following subsections review relevant information concerning the potential effects of airgun
sounds on sea turtles. This information is included here as background. Much of this information has
also been included in varying formats in other reviews, assessments, and regulatory applications prepared
by LGL Ltd.
1. Sea Turtle Hearing
Although there have been a limited number of studies on sea turtle hearing (see review by
Southwood et al. 2008), the available data are not very comprehensive. However, these data demonstrate
that sea turtles appear to be low-frequency specialists (see Table B-1).
Sea turtle auditory perception occurs through a combination of both bone and water conduction
rather than air conduction (Lenhardt 1982; Lenhardt and Harkins 1983). Detailed descriptions of sea
turtle ear anatomy are found in Ridgway et al. (1969), Lenhardt et al. (1985), and Bartol and Musick
(2003). Sea turtles do not have external ears, but the middle ear is well adapted as a peripheral
component of a bone conduction system. The thick tympanum is disadvantageous as an aerial receptor,
but enhances low-frequency bone conduction hearing (Lenhardt et al. 1985; Bartol et al. 1999; Bartol and
Musick 2003). A layer of subtympanal fat emerging from the middle ear is fused to the tympanum
(Ketten et al. 2006; Bartol 2004, 2008). A cartilaginous disk, the extracolumella, is found under the
tympanic membrane and is attached to the columella (Bartol 2004, 2008). The columella is a long rod
that expands to form the stapes, and fibrous strands connect the stapes to the saccule (Bartol 2004, 2008).
When the tympanum is depressed, the vibrations are conveyed via the fibrous stapedo-sacular strands to
the sacule (Lenhardt et al. 1985). This arrangement of fat deposits and bone enables sea turtles to hear
low-frequency sounds while underwater and makes them relatively insensitive to sound above water.
Vibrations, however, can be conducted through the bones of the carapace to reach the middle ear.
A variety of audiometric methods are available to assess hearing abilities. Electrophysiological
measures of hearing (e.g., auditory brainstem response or ABR) provide good information about relative
sensitivity to different frequencies. However, this approach may underestimate the frequency range to
which the animal is sensitive and may be imprecise at determining absolute hearing thresholds (e.g.,
Wolski et al. 2003). Nevertheless, when time is critical and only untrained animals are available, this
method can provide useful information on sea turtle hearing (e.g., Wolski et al. 2003).
Ridgway et al. (1969) obtained the first direct measurements of sea turtle hearing sensitivity (Table
B-1). They used an electrophysiological technique (cochlear potentials) to determine the response of
green sea turtles (Chelonia mydas) to aerial- and vibrational-stimuli consisting of tones with frequencies
30 to 700 Hz. They found that green turtles exhibit maximum hearing sensitivity between 300 and 500
Hz Hz, and speculated that the turtles had a useful hearing range of 60–1000 Hz. (However, there was
some response to strong vibrational signals at frequencies down to the lowest one tested — 30 Hz.)
____________________________________
10
By Valerie D. Moulton and W. John Richardson, with subsequent updates (to Feb. 2010) by Mari A.
Smultea and Meike Holst, all of LGL Ltd., environmental research associates.

Appendix B: Effects of Airgun Sounds on Sea Turtles
Environmental Assessment for SIO ETP Cruise, 2010 Page 158
TABLE B-1. Hearing capabilities of sea turtles as measured using behavioral and electro-physiological
techniques. ABR: auditory brainstem response; NA: no empirical data available.
Hearing
Sea Turtle Species
Range (Hz)
Highest Sensitivity (Hz)
Technique
Source
Green 60-1000
300-500 Cochlear Potentials
a
Ridgway et al. 1969
100-800 600-700 (juveniles) 200-400 (subadults)
ABR w Bartol & Ketten 2006;
Ketten & Bartol 2006
50-1600 50-400 ABR a,w
Dow et al. 2008 Hawksbill NA NA NA NA Loggerhead 250-1000 250 ABR
a Bartol et al. 1999
Olive ridley NA NA NA NA
Kemp’s ridley 100-500 100-200 ABR w Bartol & Ketten 2006;
Ketten & Bartol 2006 Leatherback NA NA NA NA Flatback NA NA NA NA
a measured in air;
w measured underwater
Bartol et al. (1999) tested the in-air hearing of juvenile loggerhead turtles Caretta caretta (Table B-
1). The authors used ABR to determine the response of the sea turtle ear to two types of vibrational
stimuli: (1) brief, low-frequency broadband clicks, and (2) brief tone bursts at four frequencies from 250
to 1000 Hz. They demonstrated that loggerhead sea turtles hear well between 250 and 1000 Hz; within
that frequency range the turtles were most sensitive at 250 Hz. The authors did not measure hearing sen-
sitivity below 250 Hz or above 1000 Hz. There was an extreme decrease in response to stimuli above
1000 Hz, and the vibrational intensities required to elicit a response may have damaged the turtle‘s ear.
The signals used in this study were very brief — 0.6 ms for the clicks and 0.8–5.5 ms for the tone bursts.
In other animals, auditory thresholds decrease with increasing signal duration up to ~100–200 ms. Thus,
sea turtles probably could hear weaker signals than demonstrated in the study if the signal duration were
longer.
Lenhardt (2002) exposed loggerhead turtles while they were near the bottom of holding tanks at a
depth of 1 m to tones from 35 to 1000 Hz. The turtles exhibited startle responses (neck contractions) to
these tones. The lowest thresholds were in the 400–500 Hz range (106 dB SPL re 1 Pa), and thresholds
in the 100–200 Hz range were ~124 dB (Lenhardt 2002). Thresholds at 735 and 100 Hz were 117 and
156 dB, respectively (Lenhardt 2002). Diving behaviour occurred at 30 Hz and 164 dB.
More recently, ABR techniques have been used to determine the underwater hearing capabilities of
six subadult green turtles, two juvenile green turtles, and two juvenile Kemp‘s ridley (Lepidochelys
kempii) turtles (Ketten and Bartol 2006; Bartol and Ketten 2006; Table B-1). The turtles were physically
restrained in a small box tank with their ears below the water surface and the top of the head exposed
above the surface. Pure-tone acoustic stimuli were presented to the animals, though the exact frequencies
of these tones were not indicated. The six subadult green turtles detected sound at frequencies 100–500
Hz, with the most sensitive hearing at 200–400 Hz. In contrast, the two juvenile green turtles exhibited a
slightly expanded overall hearing range of 100–800 Hz, with their most sensitive hearing occurring at

Appendix B: Effects of Airgun Sounds on Sea Turtles
Environmental Assessment for SIO ETP Cruise, 2010 Page 159
600–700 Hz. The most restricted range of sensitive hearing (100–200 Hz) was found in the two juvenile
Kemp‘s ridleys turtles, whose overall frequency range was 100–500 Hz.
Preliminary data from a similar study of a trained, captive green turtle indicate that the animal
heard and responded behaviorally to underwater tones ranging in frequency from 100 to 500 Hz. At 200
Hz, the threshold was between 107 and 119 dB, and at 400 Hz the threshold was between 121 and 131 dB
[reference units not provided] (Streeter 2003; ONR N.D.).
In summary, the limited available data indicate that the frequency range of best hearing sensitivity
of sea turtles extends from ~200 to 700 Hz. Sensitivity deteriorates as one moves away from this range to
either lower or higher frequencies. However, there is some sensitivity to frequencies as low as 60 Hz, and
probably as low as 30 Hz (Ridgway et al. 1969). Thus, there is substantial overlap in the frequencies that
sea turtles detect vs. the dominant frequencies in airgun pulses. Given that, plus the high energy levels of
airgun pulses, sea turtles undoubtedly hear airgun sounds. We are not aware of measurements of the
absolute hearing thresholds of any sea turtle to waterborne sounds similar to airgun pulses. Given the
high source levels of airgun pulses and the substantial received levels even at distances many km away
from the source, sea turtles probably can also hear distant seismic vessels. However, in the absence of
relevant absolute threshold data, we cannot estimate how far away an airgun array might be audible to a
sea turtle.
2. Effects of Airgun Pulses on Behavior and Movement
The effects of exposure to airgun pulses on the behavior and distribution of various marine animals
have been studied over the past three decades. Most such studies have concerned marine mammals (e.g.,
see reviews by Richardson et al. 1995; Gordon et al. 2004; Nowacek et al. 2007; Southall et al. 2007), but
also fish (e.g., reviewed by Thomson et al. 2001; Herata 2007; Payne et al. 2008). There have been far
fewer studies on the effects of airgun noise (or indeed any type of noise) on sea turtles, and little is known
about the sound levels that will or will not elicit various types of behavioral reactions. There have been
four directed studies that focused on short-term behavioral responses of sea turtles in enclosures to single
airguns. However, comparisons of results among studies are difficult because experimental designs and
reporting procedures have varied greatly, and few studies provided specific information about the levels
of the airgun pulses received by the turtles. Although monitoring studies are now providing some
information on responses (or lack of responses) of free-ranging sea turtles to seismic surveys, we are not
aware of any directed studies on responses of free-ranging sea turtles to seismic sounds or on the long-
term effects of seismic or other sounds on sea turtles.
Directed Studies.―The most recent of the studies of caged sea turtles exposed to airgun pulses was
a study by McCauley et al. (2000a,b) off Western Australia. The authors exposed caged green and
loggerhead sea turtles (one of each) to pulses from an approaching and then receding 20 in3 airgun
operating at 1500 psi and a 5-m airgun depth. The single airgun fired every 10 s. There were two trials
separated by two days; the first trial involved ~2 h of airgun exposure and the second ~1 h. The results
from the two trials showed that, above a received level of 166 dB re 1 Pa (rms) 11
, the turtles noticeably
____________________________________
11
rms = root mean square. This measure represents the average received sound pressure over the duration of the
pulse, with duration being defined in a specific way (from the time when 5% of the pulse energy has been received
to the time when 95% of the energy has been received). The rms received level of a seismic pulse is typically
about 10 dB less than its peak level, and about 16 dB less than its peak-to-peak level (Greene et al. 1997, 2000;
McCauley et al. 1998, 2000a,b).

Appendix B: Effects of Airgun Sounds on Sea Turtles
Environmental Assessment for SIO ETP Cruise, 2010 Page 160
increased their swim speed relative to periods when no airguns were operating. The behavior of the sea
turtles became more erratic when received levels exceeded 175 dB re 1 Pa rms. The authors suggested
that the erratic behavior exhibited by the caged sea turtles would likely, in unrestrained turtles, be
expressed as an avoidance response (McCauley et al. 2000a,b).
O‘Hara and Wilcox (1990) tested the reactions to airguns by loggerhead sea turtles held in a 300 ×
45 m area of a canal in Florida with a bottom depth of 10 m. Nine turtles were tested at different times.
The sound source consisted of one 10 in3
airgun plus two 0.8 in3 ―poppers‖ operating at 2000 psi
12 and an
airgun-depth of 2 m for prolonged periods of 20–36 h. The turtles maintained a standoff range of about
30 m when exposed to airgun pulses every 15 or 7.5 s. Some turtles may have remained on the bottom of
the enclosure when exposed to airgun pulses. O‘Hara and Wilcox (1990) did not measure the received
airgun sound levels. McCauley et al. (2000a,b) estimated that ―the level at which O‘Hara saw avoidance
was around 175–176 dB re 1 Pa rms.‖ The levels received by the turtles in the Florida study probably
were actually a few dB less than 175–176 dB because the calculations by McCauley et al. apparently did
not allow for the shallow 2-m airgun depth in the Florida study. The effective source level of airguns is
less when they are at a depth of 2 m vs. 5 m (Greene et al. 2000).
Moein et al. (1994) investigated the avoidance behavior and physiological responses of loggerhead
turtles exposed to an operating airgun, as well as the effects on their hearing. The turtles were held in a
netted enclosure ~18 m by 61 m by 3.6 m deep, with an airgun of unspecified size at each end. Only one
airgun was operated at any one time; the firing rate was one shot every 5–6 s. Ten turtles were tested
individually, and seven of these were retested several days later. The airgun was initially discharged
when the turtles were near the center of the enclosure and the subsequent movements of the turtles were
documented. The turtles exhibited avoidance during the first presentation of airgun sounds at a mean
range of 24 m, but the avoidance response waned quickly. Additional trials conducted on the same turtles
several days later did not show statistically significant avoidance reactions. However, there was an indi-
cation of slight initial avoidance followed by rapid waning of the avoidance response which the authors
described as ―habituation‖. Their auditory study indicated that exposure to the airgun pulses may have
resulted in temporary threshold shift (TTS; see later section). Reduced hearing sensitivity may also have
contributed to the waning response upon continued exposure. Based on physiological measurements,
there was some evidence of increased stress in the sea turtles, but this stress could also have resulted from
handling of the turtles.
Inconsistencies in reporting procedures and experimental design prevent direct comparison of this
study with either McCauley et al. (2000a,b) or O‘Hara and Wilcox (1990). Moein et al. (1994) stated,
without further details, that ―three different decibel levels (175, 177, 179) were utilized‖ during each test.
These figures probably are received levels in dB re 1 Pa, and probably relate to the initial exposure
distance (mean 24 m), but these details were not specified. Also, it was not specified whether these
values were measured or estimated, or whether they are expressed in peak-peak, peak, rms, SEL, or some
other units. Given the shallow water in the enclosure (3.6 m), any estimates based on simple assumptions
about propagation would be suspect.
____________________________________
12
There was no significant reaction by five turtles during an initial series of tests with the airguns operating at the
unusually low pressure of 1000 psi. The source and received levels of airgun sounds would have been
substantially lower when the air pressure was only 1000 psi than when it was at the more typical operating
pressure of 2000 psi.

Appendix B: Effects of Airgun Sounds on Sea Turtles
Environmental Assessment for SIO ETP Cruise, 2010 Page 161
Lenhardt (2002) exposed captive loggerhead sea turtles while underwater to seismic airgun (Bolt
600) sounds in a large net enclosure. At received levels of 151–161 dB, turtles were found to increase
swimming speeds. Similar to the McCauley et al. studies (2000a,b--see above), near a received level of
~175 dB, an avoidance reaction was common in initial trials, but habituation then appeared to occur.
Based on ABRs measured pre- and post-airgun exposures, a TTS of over 15 dB was found in one animal,
with recovery two weeks later. Lenhardt (2002) suggested that exposure of sea turtles to airguns at water
depths >10 m may result in exposure to more energy in the low frequencies with unknown biological
effects.
Despite the problems in comparing these studies, they are consistent in showing that, at some
received level, sea turtles show avoidance of an operating airgun. McCauley et al. (2000a,b) found
evidence of behavioral responses when the received level from a single small airgun was 166 dB re 1 Pa
rms and avoidance responses at 175 dB re 1 Pa rms. Based on these data, McCauley et al. estimated
that, for a typical airgun array (2678 in3, 12-elements) operating in 100–120 m water depth, sea turtles
may exhibit behavioral changes at ~2 km and avoidance around 1 km. These estimates are subject to
great variation, depending on the seismic source and local propagation conditions.
A further potential complication is that sea turtles on or near the bottom may receive sediment-
borne ―headwave‖ signals from the airguns (McCauley et al. 2000a,b). As previously discussed, it is
believed that sea turtles use bone conduction to hear. It is unknown how sea turtles might respond to the
headwave component of an airgun impulse or to bottom vibrations.
Related studies involving stimuli other than airguns may also be relevant. (1) Two loggerhead
turtles resting on the bottom of shallow tanks responded repeatedly to low-frequency (20–80 Hz) tones by
becoming active and swimming to the surface. They remained at the surface or only slightly submerged
for the remainder of the 1-min trial (Lenhardt 1994). Although no detailed data on sound levels at the
bottom vs. surface were reported, the surfacing response probably reduced the levels of underwater sound
to which the turtles were exposed. (2) In a separate study, a loggerhead and a Kemp‘s ridley sea turtle
responded similarly when vibratory stimuli at 250 or 500 Hz were applied to the head for 1 s (Lenhardt et
al. 1983). There appeared to be rapid habituation to these vibratory stimuli. (3) Turtles in tanks showed
agitated behaviour when exposed to simulated boat noise and recordings from the U.S. Navy‘s Low
Frequency Active (LFA) sonar (Samuel et al. 2005, 2006). The tones and vibratory stimuli used in these
two studies were quite different from airgun pulses. However, it is possible that resting sea turtles may
exhibit a similar ―alarm‖ response, possibly including surfacing or alternatively diving, when exposed to
any audible noise, regardless of whether it is a pulsed sound or tone.
Monitoring Results.―Data on sea turtle behavior near airgun operations have also been collected
during marine mammal and sea turtle monitoring and mitigation programs associated with various
seismic operations around the world. Although the primary objectives concerned marine mammals, sea
turtle sightings have also been documented in some of monitoring projects. Results suggest that some sea
turtles exhibit behavioral changes and/or avoidance within an area of unknown size near a seismic vessel.
However, avoidance of approaching seismic vessels is sufficiently limited and small-scale such that sea
turtles are often seen from operating seismic vessels. Also, average distances from the airguns to these
sea turtles are usually not greatly increased when the airguns are operating as compared with times when
airguns are silent.
For example, during six large-source (10–20 airguns; 3050–8760 in3) and small-source (up to six
airguns or three GI guns; 75–1350 in3) surveys conducted by L-DEO during 2003–2005, the mean closest
point of approach (CPA) for turtles was closer during non-seismic than seismic periods: 139 m vs. 228 m

Appendix B: Effects of Airgun Sounds on Sea Turtles
Environmental Assessment for SIO ETP Cruise, 2010 Page 162
and 120 m vs. 285 m, respectively (Holst et al. 2006). During a large-source L-DEO seismic survey off
the Pacific coast of Central America in 2008, the turtle sighting rate during non-seismic periods was
seven times greater than that during seismic periods (Holst and Smultea 2008). In addition, distances of
turtles seen from the seismic vessel were significantly farther from the airgun array when it was operating
(mean 159 m, n = 77) than when the airguns were off (mean 118 m, n = 69; Mann-Whitney U test,
P<0.001) (Holst and Smultea 2008). During another L-DEO survey in the Eastern Tropical Pacific in
2008, the turtle sighting rate during non-seismic periods was 1.5 times greater than that during seismic
periods; however, turtles tended to be seen closer to the airgun array when it was operating, but this
difference was not statistically significant (Hauser et al. 2008).
Weir (2007) reported on the behavior of sea turtles near seismic exploration operations off Angola,
West Africa. A total of 240 sea turtles were seen during 676 h of vessel-based monitoring, mainly for
associated marine mammals mitigation and monitoring observations. Airgun arrays with total volumes of
5085 and 3147 in3 were used at different times during the seismic program. Sea turtles tended to be seen
slightly closer to the seismic source, and at sighting rates twice as high, during non-seismic vs. seismic
periods (Weir 2007). However, there was no significant difference in the median distance of turtle
sightings from the array during non-seismic vs. seismic periods, with means of 743 m (n = 112) and 779
m (n = 57).
Off northeastern Brazil, 46 sea turtles were seen during 2028 h of vessel-based monitoring of
seismic exploration using 4–8 GI airguns (Parente et al. 2006). There were no apparent differences in
turtle sighting rates during seismic and non-seismic periods, but detailed behavioral data during seismic
operations were lacking (Parente et al. 2006).
Behavioral responses of marine mammals and fish to seismic surveys sometimes vary depending
on species, time of year, activity of the animal, and other unknown factors. The same species may show
different responses at different times of year or even on different days (e.g., Richardson et al. 1995;
Thomson et al. 2001). Sea turtles of different ages vary in size, behavior, feeding habits, and preferred
water depths. Nothing specific is known about the ways in which these factors may be related to airgun
sound effects in sea turtles. However, it is reasonable to expect lesser effects in young turtles concentrat-
ed near the surface (where levels of airgun sounds are attenuated) as compared with older turtles that
spend more time at depth where airgun sounds are generally stronger.
3. Possible Effects of Airgun Sounds on Distribution
In captive enclosures, sea turtles generally respond to seismic noise by startling, increasing
swimming speed, and/or swimming away from the noise source. Animals resting on the bottom often
become active and move toward the surface where received sound levels normally will be reduced,
although some turtles dive upon exposure. Unfortunately, quantitative data for free-ranging sea turtles
exposed to seismic pulses are very limited, and potential long-term behavioral effects of seismic exposure
have not been investigated. The paucity of data precludes clear predictions of sea turtle responses to
seismic noise. Available evidence suggests that localized behavioral and distributional effects on sea
turtles are likely during seismic operations, including responses to the seismic vessel, airguns, and other
gear (e.g., McCauley 1994; Pendoley 1997; Weir 2007). Pendoley (1997) summarized potential effects of
seismic operations on the behavior and distribution of sea turtles and identified biological periods and
habitats considered most sensitive to potential disturbance. The possible responses of free-ranging sea
turtles to seismic pulses could include
avoiding the entire seismic survey area to the extent that turtles move to less preferred habitat;

Appendix B: Effects of Airgun Sounds on Sea Turtles
Environmental Assessment for SIO ETP Cruise, 2010 Page 163
avoiding only the immediate area around the active seismic vessel (i.e., local avoidance of the
source vessel but remain in the general area); and
exhibiting no appreciable avoidance, although short-term behavioral reactions are likely.
Complete avoidance of an area, if it occurred, could exclude sea turtles from their preferred
foraging area and could displace them to areas where foraging is sub-optimal. Avoidance of a preferred
foraging area may prevent sea turtles from obtaining preferred prey species and hence could impact their
nutritional status. The potential alteration of a migration route might also have negative impacts.
However, it is not known whether avoidance by sea turtles would ever be on a sufficient geographic scale,
or be sufficiently prolonged, to prevent turtles from reaching an important destination.
Available evidence suggests that the zone of avoidance around seismic sources is not likely to exceed
a few kilometers (McCauley et al. 2000a,b). Avoidance reactions on that scale could prevent sea turtles
from using an important coastal area or bay if there was a prolonged seismic operation in the area,
particularly in shallow waters (e.g., Pendoley 1997). Sea turtles might be excluded from the area for the
duration of the seismic operation, or they might remain but exhibit abnormal behavioral patterns (e.g.,
lingering longer than normal at the surface where received sound levels are lower). Whether those that were
displaced would return quickly after the seismic operation ended is unknown.
It is unclear whether exclusion from a particular nesting beach by seismic operations, if it occurred,
would prevent or decrease reproductive success. It is believed that females migrate to the region of their
birth and select a nesting beach (Miller 1997). However, the degree of site fidelity varies between species
and also intra-seasonally by individuals. If a sea turtle is excluded from a particular beach, it may select a
more distant, undisturbed nesting site in the general area (Miller 1997). For instance, Bjorndal et al.
(1983) reported a maximal intra-seasonal distance between nesting sites of 290 km, indicating that turtles
use multiple nesting sites spaced up to a few hundred kilometers apart. Also, it is uncertain whether a
turtle that failed to go ashore because of seismic survey activity would abandon the area for that full
breeding cycle, or would simply delay going ashore until the seismic vessel moved to a different area.
Shallow coastal waters can contain relatively high densities of sea turtles during nesting, hatching,
and foraging periods. Thus, seismic operations in these areas could correspondingly impact a relatively
higher number of individual turtles during sensitive biological periods. Samuel et al. (2005) noted that
anthropogenic noise in vital sea turtle habitats, such as a major coastal foraging area off Long Island, NY,
could affect sea turtle behaviour and ecology. There are no specific data that demonstrate the conse-
quences to sea turtles if seismic operations with large or small arrays of airguns occur in important areas
at biologically important times of year. However, a number of mitigation measures can, on a case-by-
case basis, be considered for application in areas important to sea turtles (e.g., Pendoley 1997).
4. Possible Impacts of Airgun Sounds on Hearing
Noise-induced hearing damage can be either temporary or permanent. In general, the received
sound must be strong for either to occur, and must be especially strong and/or prolonged for permanent
impairment to occur.
Few studies have directly investigated hearing or noise-induced hearing loss in sea turtles. Moein
et al. (1994) used an evoked potential method to test the hearing of loggerhead sea turtles exposed to a
few hundred pulses from a single airgun. Turtle hearing was tested before, within 24 h after, and two
weeks after exposure to pulses of airgun sound. Levels of airgun sound to which the turtles were exposed
were not specifically reported. The authors concluded that five turtles exhibited some change in their
hearing when tested within 24 h after exposure relative to pre-exposure hearing, and that hearing had

Appendix B: Effects of Airgun Sounds on Sea Turtles
Environmental Assessment for SIO ETP Cruise, 2010 Page 164
reverted to normal when tested two weeks after exposure. The results are consistent with the occurrence
of TTS upon exposure of the turtles to airgun pulses. Unfortunately, the report did not state the size of the
airgun used, or the received sound levels at various distances. The distances of the turtles from the airgun
were also variable during the tests; the turtle was about 30 m from the airgun at the start of each trial, but
it could then either approach the airgun or move away to a maximum of about 65 m during subsequent
airgun pulses. Thus, the levels of airgun sounds that apparently elicited TTS are not known. Nonethe-
less, it is noteworthy that there was evidence of TTS from exposure to pulses from a single airgun.
However, the turtles were confined and unable to move more than about 65 m away. Similarly, Lenhardt
(2002) exposed loggerhead turtles in a large net enclosure to airgun pulses. A TTS of >15 dB was
evident for one loggerhead turtle, with recovery occurring in two weeks. Turtles in the open sea might
have moved away from an airgun operating at a fixed location, and in the more typical case of a towed
airgun or airgun array, very few shots would occur at or around one location. Thus, exposure to
underwater sound during net-enclosure experiments was not typical of that expected during an operational
seismic survey.
Studies with terrestrial reptiles have demonstrated that exposure to airborne impulse noise can
cause hearing loss. For example, desert tortoises (Gopherus agassizii) exhibited TTS after exposure to
repeated high-intensity sonic booms (Bowles et al. 1999). Recovery from these temporary hearing losses
was usually rapid (<1 h), which suggested that tortoises can tolerate these exposures without permanent
injury (Bowles et al. 1999).
The results from captive, restrained sea turtles exposed repeatedly to seismic sounds in enclosed
areas indicate that TTS is possible under these artificial conditions. However, there are no data to
indicate whether there are any plausible field situations in which exposure to repeated airgun pulses at
close range could cause permanent threshold shift (PTS) or hearing impairment in sea turtles. Hearing
impairment (whether temporary or permanent) from seismic sounds is considered unlikely to occur at sea;
turtles are unlikely to be exposed to more than a few strong pulses close to the sound source, as individ-
uals are mobile and the vessel travels relatively quickly compared to the swimming speed of a sea turtle.
However, in the absence of specific information on received levels of impulse sound necessary to elicit
TTS and PTS in sea turtles, it is uncertain whether there are circumstances where these effects could
occur in the field. If sea turtles exhibit little or no behavioral avoidance, or if they acclimate to seismic
noise to the extent that avoidance reactions cease, sea turtles might sustain hearing loss if they are close
enough to seismic sources. Similarly, in the absence of quantitative data on behavioral responses, it is
unclear whether turtles in the area of seismic operations prior to start-up move out of the area when
standard ramp-up (=soft-start) procedures are in effect. It has been proposed that sea turtles require a
longer ramp-up period because of their relatively slow swimming speeds (Eckert 2000). However, it is
unclear at what distance (if any) from a seismic source sea turtles could sustain hearing impairment, and
whether there would ever be a possibility of exposure to sufficiently high levels for a sufficiently long
period to cause permanent hearing damage.
In theory, a reduction in hearing sensitivity, either temporary or permanent, may be harmful for sea
turtles. However, very little is known about the role of sound perception in the sea turtle‘s normal activ-
ities. While it is not possible to estimate how much of a problem it would be for a turtle to have either
temporary or permanent hearing impairment, there is some evidence indicating that hearing plays an
important role in sea turtle survival. (1) It has been suggested (Eckert et al. 1998; Eckert 2000) that sea
turtles may use passive reception of acoustic signals to detect the hunting sonar of killer whales (Orcinus
orca), a known predator of leatherback sea turtles Dermochelys coriacea (Fertl and Fulling 2007).
Further investigation is needed before this hypothesis can be accepted. Some communication calls of

Appendix B: Effects of Airgun Sounds on Sea Turtles
Environmental Assessment for SIO ETP Cruise, 2010 Page 165
killer whales include components at frequencies low enough to overlap the frequency range where sea
turtles hear. However, the echolocation signals of killer whales are at considerably higher frequencies
and may be inaudible to sea turtles (e.g., Simon et al. 2007). (2) Hearing impairment, either temporary or
permanent, might inhibit a turtle‘s ability to avoid injury from vessels. A recent study found that green
sea turtles often responded behaviorally to close, oncoming small vessels and that the nature of the
response was related to vessel speed, with fewer turtles displaying a flee response as vessel speed
increased (Hazel et al. 2007). However, Hazel et al. (2007) suggested that a turtles‘ ability to detect an
approaching vessel was vision-dependent. (3) Hearing may play a role in navigation. For example, it has
been proposed that sea turtles may identify their breeding beaches by their acoustic signature (Lenhardt et
al. 1983). However, available evidence suggests that visual, wave, and magnetic cues are the main
navigational cues used by sea turtles, at least in the case of hatchlings and juveniles (Lohmann et al. 1997,
2001; Lohmann and Lohmann 1998).
5. Other Physical Effects
Other potential direct physical effects to sea turtles during seismic operations include entanglement
with seismic gear (e.g., cables, buoys, streamers, etc.) and ship strikes (Pendoley 1997; Ketos Ecology
2007; Weir 2007; Hazel et al. 2007). Entanglement of sea turtles with marine debris, fishing gear, and
other equipment has been documented; turtles can become entangled in cables, lines, nets, or other objects
suspended in the water column and can become injured or fatally wounded, drowned, or suffocated (e.g.,
Lutcavage et al. 1997). Seismic-survey personnel have reported that sea turtles (number unspecified)
became fatally entrapped between gaps in tail-buoys associated with industrial seismic vessel gear
deployed off West Africa in 2003 (Weir 2007). However, no incidents of entanglement of sea turtles
have been documented during NSF-funded seismic surveys, which since 2003 have included dedicated
ship-based monitoring by trained biological observers, in some cases in areas with many sea turtles
(e.g.,Holst et al. 2005a,b; Holst and Smultea 2008; Hauser et al. 2008).
6. Conclusions
Based on available data concerning sea turtles and other marine animals, it is likely that some sea
turtles exhibit behavioral changes and/or avoidance within an area of unknown size near an operating
seismic survey vessel. There is also the possibility of temporary hearing impairment or perhaps even
permanent hearing damage to turtles close to the airguns. However, there are very few data on temporary
hearing loss and no data on permanent hearing loss in sea turtles exposed to airgun pulses. Although
some information is available about effects of exposure to sounds from a single airgun on captive sea
turtles, the long term acoustic effects (if any) of a full-scale marine seismic operation on free-ranging sea
turtles are unknown. Entanglement of turtles in seismic gear and vessel strikes during seismic survey
operations are also possible but do not seem to be common. The greatest impact is likely to occur if
seismic operations occur in or near areas where turtles concentrate, and at seasons when turtles are con-
centrated there. However, there are no specific data that demonstrate the consequences of such seismic
operations to sea turtles. Until more data become available, it would be prudent to avoid seismic opera-
tions near important nesting beaches or in areas of known concentrated feeding during times of year when
those areas are in use by many sea turtles.
7. Literature Cited
Bartol, S.M. 2004. Sea turtle hearing and sensitivity to acoustic impact. Appendix H In: Geophysical and
geophysical exploration for mineral resources on the Gulf of Mexico outer continental shelf. OCS EIS/EA
MMS 2004-054. U.S. Minerals Manage. Serv. Gulf of Mexio OCS Region, New Orleans, LA.

Appendix B: Effects of Airgun Sounds on Sea Turtles
Environmental Assessment for SIO ETP Cruise, 2010 Page 166
Bartol, S.M. 2008. A review of auditory function of sea turtles. Bioacoustics 17(1-3):57-59.
Bartol, S.M. and D.R. Ketten. 2006. Turtle and tuna hearing. p. 98-103 In: Y. Swimmer and R. Brill (eds.), Sea
Turtle and Pelagic Fish Sensory Biology: Developing Techniques to Reduce Sea Turtle Bycatch in Longline
Fisheries. NOAA Tech. Memo. NMFS-PIFSC-7.
Bartol, S.M. and J. A. Musick. 2003. Sensory biology of sea turtles. p. 79-102 In: P.L. Lutz, J.A. Musick and J.
Wyneken (eds.), The Biology of Sea Turtles, Volume 2. CRC Press, Boca Raton, FL. 455 p.
Bartol, S.M., J.A. Musick, and M.L. Lenhardt. 1999. Auditory evoked potentials of the loggerhead sea turtle
(Caretta caretta). Copeia 1999(3):836-840.
Bjorndal K.A., A.B. Meylan, and B.J. Turner. 1983. Sea turtles nesting at Melbourne Beach, Florida, I. Size,
growth and reproduction. Biol. Conserv. 26(1):65-77.
Bowles, A.E., S. Eckert, L. Starke, E. Berg, L. Wolski, and J. Matesic, Jr. 1999. Effects of flight noise from jet
aircraft and sonic booms on hearing, behavior, heart rate, and oxygen consumption of desert tortoises
(Gopherus agassizii). U.S. Air Force Res. Lab., Wright-Patterson AFB, OH. 131 p.
Dow, W.E., D.A. Mann, T.T. Jones, S.A. Eckert, and C.A. Harms. 2008. In-water and in-air hearing sensitivity of
the green sea turtle (Chelonia mydas). Abstract, Acoustic Communication by Animals, 2nd
Intern. Conf., 12-
15 August 2008, Corvallis, OR.
Eckert, S.A. 2000. Letter to M. James, Nova Scotia Leatherback Turtle Working Group, re: possible impacts of
seismic exploration off Nova Scotia on sea turtles. Hubbs-Sea World Res. Inst., San Diego, CA. 4 p.
Eckert, S.A., A. Bowles, and E. Berg. 1998. The effect of seismic airgun surveys on leatherback sea turtles
(Dermochelys coriacea) during the nesting season. Rep. from Hubbs-Sea World Res. Inst., San Diego, CA,
for BHP Petroleum (Trinidad) Ltd. 67 p.
Fertl, D. and G.L. Fulling. 2007. Interactions between marine mammals and sea turtles. Mar. Turtle Newsl.
115:4-8.
Gordon, J., D. Gillespie, J. Potter, A. Frantzis, M.P. Simmonds, R. Swift, and D. Thompson. 2004. A review of the
effects of seismic surveys on marine mammals. Mar. Technol. Soc. J. 37(4):16-34.
Greene, C.R., Jr., with J.S. Hanna and R.W. Blaylock. 1997. Physical acoustics measurements. p. 3-1 to 3-63 In:
W.J. Richardson (ed.), Northstar marine mammal monitoring program, 1996: marine mammal and acoustical
monitoring of a seismic program in the Alaskan Beaufort Sea. LGL Rep. 2121-2. Rep. from LGL Ltd., King
City, Ont., and Greeneridge Sciences Inc., Santa Barbara, CA, for BP Explor. (Alaska) Inc., Anchorage, AK,
and Nat. Mar. Fish. Serv., Anchorage, AK, and Silver Spring, MD. 245 p.
Greene, C.R., Jr. and W.C. Burgess, with R. Norman and R.W. Blaylock. 2000. Physical acoustics measurements,
1999. p. 3-1 to 3-45 In: W.J. Richardson (ed.), Marine mammal and acoustical monitoring of Western Geo-
physical's open-water seismic program in the Alaskan Beaufort Sea, 1999. LGL Rep. TA2313-4. Rep. from
LGL Ltd., King City, Ont., and Greeneridge Sciences Inc., Santa Barbara, CA, for Western Geophysical,
Houston, TX, and U.S. Nat. Mar. Fish. Serv., Anchorage, AK, and Silver Spring, MD. 155 p.
Hauser, D.D.W., M Holst, and V.M. Moulton. 2008. Marine mammal and sea turtle monitoring during Lamont-
Doherty Earth Observatory‘s marine seismic program in the Eastern Tropical Pacific, April – August 2008.
LGL Rep. TA4656/7-1. Rep. from LGL Ltd., St. John‘s, Nfld, for Lamont-Doherty Earth Observatory of
Columbia Univ., Palisades, NY, and Nat. Mar. Fish. Serv., Silver Spring, MD. 98 p.
Hazel, J., I.R. Lawler, H. Marsh, and S. Robson. 2007. Vessel speed increases collision risk for the green turtle
Chelonia mydas. Endang. Species Res. 3:105-113.
Herata, H. (ed.). 2007. International workshop, Impacts of Seismic Survey Activities on Whales and Other Marine
Biota. Dessau, Germany, Sept. 2006.

Appendix B: Effects of Airgun Sounds on Sea Turtles
Environmental Assessment for SIO ETP Cruise, 2010 Page 167
Holst, M. and M.A. Smultea. 2008. Marine mammal and sea turtle monitoring during Lamont-Doherty Earth
Observatory‘s marine seismic program off Central America, February – April 2008. LGL Rep. TA4342-3.
Rep. from LGL Ltd., King City, Ont., for Lamont-Doherty Earth Observatory of Columbia Univ., Palisades,
NY, and Nat. Mar. Fish. Serv., Silver Spring, MD. 133 p.
Holst, M., M.A. Smultea, W.R. Koski, and B. Haley. 2005a. Marine mammal and sea turtle monitoring during
Lamont-Doherty Earth Observatory‘s marine seismic program in the Eastern Tropical Pacific Ocean off
Central America, November–December 2004. LGL Rep. TA2822-30. Rep. from LGL Ltd., King City, Ont.,
for Lamont-Doherty Earth Observatory, Columbia Univ., Palisades, NY, and NMFS, Silver Spring, MD.
Holst, M., M.A. Smultea, W.R. Koski, and B. Haley. 2005b. Marine mammal and sea turtle monitoring during
Lamont-Doherty Earth Observatory‘s marine seismic program off the Northern Yucatán Peninsula in the
Southern Gulf of Mexico, January–February 2005. LGL Rep. TA2822-31. Rep. from LGL Ltd., King City,
Ont., for Lamont-Doherty Earth Observatory, Columbia Univ., Palisades, NY, and NMFS, Silver Spring,
MD. 110 p.
Holst, M., W.J. Richardson, W.R. Koski, M.A. Smultea, B. Haley, M.W. Fitzgerald, and M. Rawson. 2006. Effects
of large and small-source seismic surveys on marine mammals and sea turtles. Abstract. Presented at Am.
Geophys. Union - Soc. Explor. Geophys. Joint Assembly on Environ. Impacts from Marine Geophys. &
Geological Studies - Recent Advances from Academic & Industry Res. Progr., Baltimore, MD, May 2006.
Ketos Ecology. 2007. Reducing the fatal entrapment of marine turtles in towed seismic survey equipment. Ketos
Ecology report. Available at www.ketosecology.co.uk/KE2007.pdf. 11 p.
Ketten, D.R. and S.M. Bartol. 2006. Functional measures of sea turtle hearing, ONR Award No: N00014-02-1-
0510. Rep. from Woods Hole Oceanogr. Inst., Woods Hole, MA, and Virginia Inst. Mar. Sci., Gloucester,
VA, for Office of Naval Res., Arlington, VA. 5 p.
Ketten, D.R., I. Fischer, S. Cramer, S.M. Bartol, and J. O‘Malley. 2006. Water, fats, and acoustic impedance: soft
tissue adaptations for underwater hearing in turtles, seabirds and marine mammals. p. 162 In: N.J. Pilcher
(ed.), Proc. 23rd
Symp. on Sea Turtle Biology and Conservation. NOAA Tech. Memo. NMFS-SEFSC-536.
283 p.
Lenhardt, M.L. 1982. Bone conduction hearing in turtles. J. Aud. Res. 22(3):153-160.
Lenhardt, M.L. 1994. Seismic and very low frequency sound induced behaviors in captive loggerhead marine
turtles (Caretta caretta). p. 238-241 In: K.A. Bjorndal, A.B. Bolten, D.A. Johnson and P.J. Eliazar (eds.),
Proc. 14th Symp. on Sea Turtle Biology and Conservation. NOAA Tech. Memo. NMFS-SEFSC-351. 323 p.
Lenhardt, M. 2002. Sea turtle auditory behavior. J. Acoust. Soc. Amer. 112(5, Pt. 2):2314 (Abstract).
Lenhardt, M.L. and S.W. Harkins. 1983. Turtle shell as an auditory receptor. J. Aud. Res. 23(4):251-260.
Lenhardt, M.L., S. Bellmund, R.A. Byles, S.W. Harkins, and J.A. Musick. 1983. Marine turtle reception of bone-
conducted sound. J. Aud. Res. 23(2):119-125.
Lenhardt, M.L., R.C. Klinger, and J.A. Musick. 1985. Marine turtle middle-ear anatomy. J. Aud. Res. 25(1):66-
72.
Lohmann, K.J. and C.M.F. Lohmann. 1998. Migratory guidance mechanisms in marine turtles. J. Avian Biol.
29(4):585-596.
Lohmann, K.J., B.E. Witherington, C.M.F. Lohmann, and M. Salmon. 1997. Orientation, navigation, and natal
beach homing in sea turtles. p. 107-135 In: P.L. Lutz and J.A. Musick (eds.), The biology of sea turtles.
CRC Press, Boca Raton, FL. 432 p.
Lohmann, K.J., S.D. Cain, S.A. Dodge, and C.M.F. Lohmann. 2001. Regional magnetic fields as navigational
markers for sea turtles. Science 294(5541):364-366.

Appendix B: Effects of Airgun Sounds on Sea Turtles
Environmental Assessment for SIO ETP Cruise, 2010 Page 168
Lutcavage, M.E., P. Plotkin, B. Witherington, and P.L. Lutz. 1997. Human impacts on sea turtle survival. p. 387-
409 In: P.L. Lutz and J.A. Musick (eds.), The biology of sea turtles. CRC Press, Boca Raton, FL. 432 p.
McCauley, R.D. 1994. The environmental implications of offshore oil and gas development in Australia – seismic
surveys. p. 19-122 In: M. Swan, J.M. Neff and P.C. Young (eds.), Environmental Implications of Offshore
Oil and Gas Development in Australia - The Findings of an Independent Scientific Review. Australian
Petroleum Explor. Assoc. and Energy Research and Developm. Corp., Sydney, N.S.W.
McCauley, R.D., M.-N. Jenner, C. Jenner, K.A. McCabe, and J. Murdoch. 1998. The response of humpback whales
(Megaptera novaeangliae) to offshore seismic survey noise: preliminary results of observations about a
working seismic vessel and experimental exposures. APPEA J. 38:692-707.
McCauley, R.D., J. Fewtrell, A.J. Duncan, C. Jenner, M-N. Jenner, J.D. Penrose, R.I.T. Prince, A. Adhitya, J.
Murdoch, and K. McCabe. 2000a. Marine seismic surveys – a study of environmental implications.
APPEA J. 40:692-708.
McCauley, R. D., J. Fewtrell, A.J. Duncan, C. Jenner, M.-N. Jenner, J.D. Penrose, R.I.T. Prince, A. Adhitya, J.
Murdoch, and K. McCabe. 2000b. Marine seismic surveys: Analysis and propagation of air-gun signals; and
effects of air-gun exposure on humpback whales, sea turtles, fishes and squid. Curtin Univ. Technol., Centre
for Mar. Sci. and Technol., Bentley, Australia.
Miller, J.D. 1997. Reproduction in sea turtles. p. 51-81 In: P.L. Lutz and J.A. Musick (eds.), The Biology of Sea
Turtles. CRC Press, Boca Raton, FL. 432 p.
Moein, S.E., J.A. Musick, J.A. Keinath, D.E. Barnard, M. Lenhardt, and R. George. 1994. Evaluation of seismic
sources for repelling sea turtles from hopper dredges. Rep. from Virginia Inst. Mar. Sci. [Gloucester Point],
VA, for U.S. Army Corps of Engineers. 33 p.
National Marine Fisheries Service (NMFS). 2007. Endangered Species Act, Section 7 Consultation, Biological
Opinion: Issuance of License to Neptune LNG by MARAD to Construct, Own, and Operate an LNG
Deepwater Port, FINE W2006104000. National Marine Fisheries Service, Northeast Region, Gloucester,
MA.
Nowacek, D.P., L.H. Thorne, D.W. Johnston, and P.L. Tyack. 2007. Responses of cetaceans to anthropogenic
noise. Mammal Rev. 37(2):81-115.
O‘Hara, J. and J.R. Wilcox. 1990. Avoidance responses of loggerhead turtles, Caretta caretta, to low frequency
sound. Copeia 1990(2):564-567.
ONR (Office of Naval Research). N.D. Science and Technology Focus, Oceanography, Ocean Life: Green sea
turtle – Current research. http://www.onr.navy.mil/focus/ocean/life/turtle4.htm. Last update not indicated.
Accessed 3 March 2009.
Parente, C.L., J.D. Lontra, and M.E. de Araújo. 2006. Occurrence of sea turtles during seismic surveys in
Northeastern Brazil. Biota Neotropica 6(1). Available at http://www.biotaneotropica.org.br/
Payne, J.F., C. Andrews, L. Fancey, D. White, and J. Christian. 2008. Potential effects of seismic energy on fish
and shellfish: An update since 2003. Canadian Science Advisory Secretariat Research Document 2008/060.
Department of Fisheries and Oceans Canada. www.dfo-mpo.gc.ca/CSAS/Csas/Publications/ResDocs-
DocRech/2008/2008_060_e.htm. Lasted updated 26 November 2008. Accessed 3 March 2009.
Pendoley, K. 1997. Sea turtles and management of marine seismic programs in Western Australia. Petrol. Expl.
Soc. Austral. J. 25:8-16.
Richardson, W.J., C.R. Greene, Jr., C.I. Malme, and D.H. Thomson. 1995. Marine mammals and noise. Academic
Press, San Diego, CA. 576 p.
Ridgway, S.H., E.G. Wever, J.G. McCormick, J. Palin, and J.H. Anderson. 1969. Hearing in the giant sea turtle,
Chelonia mydas. Proc. Nat. Acad. Sci. U.S. 64(2):884-890.

Appendix B: Effects of Airgun Sounds on Sea Turtles
Environmental Assessment for SIO ETP Cruise, 2010 Page 169
Samuel, Y., S.J. Morreale, C.W. Clark, C.H. Greene, and M.E. Richmond. 2005. Underwater, low-frequency noise
in a coastal sea turtle habitat. J. Acoust. Soc. Am. 117(3):1465-1472.
Samuel, Y., S.J. Morreale, C.W. Clark, M.E. Richmond, and C.H. Greene. 2006. Underwater noise and
anthropogenic disturbance in critical sea turtle habitats. p. 93 In: N.J. Pilcher (ed.), Proc. 23rd
Symp. on Sea
Turtle Biology and Conservation. NOAA Tech. Memo. NMFS-SEFSC-536. 283 p.
Simon, M., M. Wahlberg, and L.E. Miller. 2007. Echolocation clicks from killer whales (Orcinus orca) feeding on
herring (Clupea harengus) (L). J. Acoust. Soc. Amer. 121(2):749-752.
Southall, B.L., A.E. Bowles, W.T. Ellison, J.J. Finneran, R.L. Gentry, C.R. Greene Jr., D. Kastak, D.R. Ketten, J.H.
Miller, P.E. Nachtigall, W.J. Richardson, J.A. Thomas, and P.L. Tyack. 2007. Marine mammal noise
exposure criteria: initial scientific recommendations. Aquat. Mamm. 33(4):411-522.
Southwood, A., K. Fritsches, R. Brill, and Y. Swimmer. 2008. Sound, chemical, and light detection in sea turtles
and pelagic fishes: sensory-based approaches to bycatch reduction in longling fisheries. Endang. Species
Res. 5:225-238.
Streeter, K. 2003. Studying the hearing capabilities of a green sea turtle. Abstract. Presented at Environmental
Consequences of Underwater Sound (ECOUS) Symposium. San Antonio, TX, May 2003.
Thomson, D.H., J.W. Lawson, and A. Muecke. 2001. Proceedings of a workshop to develop methodologies for
conducting research on the effects of seismic exploration on the Canadian east coast fishery, Halifax, Nova
Scotia, 7-8 September 2000. ESRF Rep. 139. Environ. Stud. Res. Funds, Calgary, AB. 75 p.
Weir, C.R. 2007. Observations of marine turtles in relation to seismic airgun sound off Angola. Mar. Turtle
Newsl. 116:17-20.
Wolski, L.F., R.C. Anderson, A.E. Bowles, and P.K. Yochem. 2003. Measuring hearing in the harbor seal (Phoca
vitulina): Comparison of behavioral and auditory brainstem response techniques. J. Acoust. Soc. Am.
113(1):629-637.

Appendix C: Effects of Airgun Sounds and Fishes
Environmental Assessment for SIO ETP Cruise, 2010 Page 170
APPENDIX C:
REVIEW OF THE EFFECTS OF AIRGUN SOUNDS ON FISHES13
Here we review literature about the effects of airgun sounds on fishes during seismic surveys. The
potential effect of seismic sounds on fish has been studied with a variety of taxa, including marine,
freshwater, and anadromous species (reviewed by Fay and Popper 2000; Ladich and Popper 2004;
Hastings and Popper 2005; Popper and Hastings 2009a,b).
It is sometimes difficult to interpret studies on the effects of underwater sound on marine animals
because authors often do not provide enough information, including received sound levels, source sound
levels, and specific characteristics of the sound. Specific characteristics of the sound include units and
references, whether the sound is continuous or impulsive, and its frequency range. Underwater sound
pressure levels are typically reported as a number of decibels referenced to a reference level, usually
1 micro-Pascal (µPa). However, the sound pressure dB number can represent multiple types of measure-
ments, including ―zero to peak‖, ―peak to peak‖, or averaged (―rms‖). Sound exposure levels (SEL) may
also be reported as dB. The SEL is the integration of all the acoustic energy contained within a single
sound event. Unless precise measurement types are reported, it can be impossible to directly compare
results from two or more independent studies.
1. Acoustic Capabilities
Sensory systems – like those that allow for hearing – provide information about an animal‘s
physical, biological, and social environments, in both air and water. Extensive work has been done to
understand the structures, mechanisms, and functions of animal sensory systems in aquatic environments
(Atema et al. 1988; Kapoor and Hara 2001; Collin and Marshall 2003). All fish species have hearing and
skin-based mechanosensory systems (inner ear and lateral line systems, respectively) that provide
information about their surroundings (Fay and Popper 2000). Fay (2009) and some others refer to the
ambient sounds to which fishes are exposed as ‗underwater soundscapes‘. Anthropogenic sounds can
have important negative consequences for fish survival and reproduction if they disrupt an individual‘s
ability to sense its soundscape, which often tells of predation risk, prey items, or mating opportunities.
Potential negative effects include masking of key environmental sounds or social signals, displacement of
fish from their habitat, or interference with sensory orientation and navigation.
Fish hearing via the inner ear is typically restricted to low frequencies. As with other vertebrates,
fish hearing involves a mechanism whereby the beds of hair cells (Howard et al. 1988; Hudspeth and
Markin 1994) located in the inner ear are mechanically affected and cause a neural discharge (Popper and
Fay 1999). At least two major pathways for sound transmittance between sound source and the inner ear
have been identified for fishes. The most primitive pathway involves direct transmission to the inner
ear‘s otolith, a calcium carbonate mass enveloped by sensory hairs. The inertial difference between the
dense otolith and the less-dense inner ear causes the otolith to stimulate the surrounding sensory hair
cells. This motion differential is interpreted by the central nervous system as sound.
The second transmission pathway between sound source and the inner ear of fishes is via the swim
bladder, a gas-filled structure that is much less dense than the rest of the fish‘s body. The swim bladder,
being more compressible and expandable than either water or fish tissue, will differentially contract and
____________________________________
13
By John R. Christian and R.C. Bocking, LGL Ltd., environmental research associates (rev. Feb. 2010)

Appendix C: Effects of Airgun Sounds and Fishes
Environmental Assessment for SIO ETP Cruise, 2010 Page 171
expand relative to the rest of the fish in a sound field. The pulsating swim bladder transmits this
mechanical disturbance directly to the inner ear (discussed below). Such a secondary source of sound
detection may be more or less effective at stimulating the inner ear depending on the amplitude and
frequency of the pulsation, and the distance and mechanical coupling between the swim bladder and the
inner ear (Popper and Fay 1993).
A recent paper by Popper and Fay (2010) discusses the designation of fishes based on sound
detection capabilities. They suggest that the designations ‗hearing specialist‘ and ‗hearing generalist‘ no
longer be used for fishes because of their vague and sometimes contradictory definitions, and that there is
instead a range of hearing capabilities across species that is more like a continuum, presumably based on
the relative contributions of pressure to the overall hearing capabilities of a species.
According to Popper and Fay (2010), one end of this continuum is represented by fishes that only
detect particle motion because they lack pressure-sensitive gas bubbles (e.g., swim bladder). These
species include elasmobranchs (e.g., sharks) and jawless fishes, and some teleosts including flatfishes.
Fishes at this end of the continuum are typically capable of detecting sound frequencies below 1500 Hz.
The other end of the fish hearing continuum is represented by fishes with highly specialized
otophysic connections between pressure receptive organs, such as the swim bladder, and the inner ear.
These fishes include some squirrelfish, mormyrids, herrings, and otophysan fishes (freshwater fishes with
Weberian apparatus, an articulated series of small bones that extend from the swim bladder to the inner
ear). Rather than being limited to 1.5 kHz or less in hearing, these fishes can typically hear up to several
kHz. One group of fish in the anadromous herring sub-family Alosinae (shads and menhaden) can detect
sounds to well over 180 kHz (Mann et al. 1997, 1998, 2001). This may be the widest hearing range of
any vertebrate that has been studied to date. While the specific reason for this very high frequency
hearing is not totally clear, there is strong evidence that this capability evolved for the detection of the
ultrasonic sounds produced by echolocating dolphins to enable the fish to detect, and avoid, predation
(Mann et al. 1997; Plachta and Popper 2003).
All other fishes have hearing capabilities that fall somewhere between these two extremes of the
continuum. Some have unconnected swim bladders located relatively far from the inner ear (e.g.,
salmonids, tuna) while others have unconnected swim bladders located relatively close to the inner ear
(e.g., Atlantic cod, Gadus morhua). There has also been the suggestion that Atlantic cod can detect 38
kHz (Astrup and Møhl 1993). However, the general consensus was that this was not hearing with the ear;
probably the fish were responding to exceedingly high pressure signals from the 38-kHz source through
some other receptor in the skin, such as touch receptors (Astrup and Møhl 1998).
It is important to recognize that the swim bladder itself is not a sensory end organ, but rather an
intermediate part of the sound pathway between sound source and the inner ear of some fishes. The inner
ear of fishes is ultimately the organ that translates the particle displacement component into neural signals
for the brain to interpret as sound.
A third mechanosensory pathway found in most bony fishes and elasmobranchs (i.e., cartilaginous
fishes) involves the lateral line system. It too relies on sensitivity to water particle motion. The basic
sensory unit of the lateral line system is the neuromast, a bundle of sensory and supporting cells whose
projecting cilia, similar to those in the ears, are encased in a gelatinous cap. Neuromasts detect distorted
sound waves in the immediate vicinity of fishes. Generally, fishes use the lateral line system to detect the
particle displacement component of low frequency acoustic signals (up to 160 to 200 Hz) over a distance
of one to two body lengths. The lateral line is used in conjunction with other sensory systems, including
hearing (Sand 1981; Coombs and Montgomery 1999).

Appendix C: Effects of Airgun Sounds and Fishes
Environmental Assessment for SIO ETP Cruise, 2010 Page 172
2. Potential Effects on Fishes
Review papers on the effects of anthropogenic sources of underwater sound on fishes have been
published recently (Popper 2009; Popper and Hastings 2009a,b). These papers consider various sources
of anthropogenic sound, including seismic airguns. For the purposes of this review, only the effects of
seismic airgun sound are considered.
2.1 Marine Fishes
Evidence for airgun-induced damage to fish ears has come from studies using pink snapper Pagrus
auratus (McCauley et al. 2000a,b, 2003). In these experiments, fish were caged and exposed to the sound
of a single moving seismic airgun every 10 s over a period of 1 h and 41 min. The source SPL at 1 m was
about 223 dB re 1 µPa · mp-p, and the received SPLs ranged from 165 to 209 dB re 1 µPap-p. The sound
energy was highest over the 20–70 Hz frequency range. The pink snapper were exposed to more than 600
airgun discharges during the study. In some individual fish, the sensory epithelium of the inner ear
sustained extensive damage as indicated by ablated hair cells. Damage was more extensive in fish
examined 58 days post-exposure compared to those examined 18 h post-exposure. There was no
evidence of repair or replacement of damaged sensory cells up to 58 days post-exposure. McCauley et al.
(2000a,b, 2003) included the following caveats in the study reports: (1) fish were caged and unable to
swim away from the seismic source, (2) only one species of fish was examined, (3) the impact on the
ultimate survival of the fish is unclear, and (4) airgun exposure specifics required to cause the observed
damage were not obtained (i.e., a few high SPL signals or the cumulative effect of many low to moderate
SPL signals).
The fish exposed to sound from a single airgun in this study also exhibited startle responses to short
range start up and high-level airgun signals (i.e., with received SPLs of 182 to 195 dB re 1 µParms
(McCauley et al. 2000a,b). Smaller fish were more likely to display a startle response. Responses were
observed above received SPLs of 156 to 161 dB re 1 µParms. The occurrence of both startle response
(classic C-turn response) and alarm responses (e.g., darting movements, flash school expansion, fast
swimming) decreased over time. Other observations included downward distributional shift that was
restricted by the 10 m x 6 m x 3 m cages, increase in swimming speed, and the formation of denser
aggregations. Fish behavior appeared to return to pre-exposure state 15–30 min after cessation of seismic
firing.
Pearson et al. (1992) investigated the effects of seismic airgun sound on the behavior of captive
rockfishes (Sebastes sp.) exposed to the sound of a single stationary airgun at a variety of distances. The
airgun used in the study had a source SPL at 1 m of 223 dB re 1 µPa · m0-p, and measured received SPLs
ranged from 137 to 206 dB re 1 µPa0-p. The authors reported that rockfishes reacted to the airgun sounds
by exhibiting varying degrees of startle and alarm responses, depending on the species of rockfish and the
received SPL. Startle responses were observed at a minimum received SPL of 200 dB re 1 µPa0-p, and
alarm responses occurred at a minimum received SPL of 177 dB re 1 µPa0-p. Other observed behavioral
changes included the tightening of schools, downward distributional shift, and random movement and
orientation. Some fishes ascended in the water column and commenced to mill (i.e., ―eddy‖) at increased
speed, while others descended to the bottom of the enclosure and remained motionless. Pre-exposure
behavior was reestablished from 20 to 60 min after cessation of seismic airgun discharge. Pearson et al.
(1992) concluded that received SPL thresholds for overt rockfish behavioral response and more subtle
rockfish behavioral response are 180 dB re 1 µPa0-p and 161 dB re 1 µPa0-p, respectively.

Appendix C: Effects of Airgun Sounds and Fishes
Environmental Assessment for SIO ETP Cruise, 2010 Page 173
Using an experimental hook and line fishery approach, Skalski et al. (1992) studied the potential
effects of seismic airgun sound on the distribution and catchability of rockfishes. The source SPL of the
single airgun used in the study was 223 dB re 1 µPa · m 0-p, and the received SPLs at the bases of the
rockfish aggregations ranged from 186 to 191 dB re 1 µPa0-p. Characteristics of the fish aggregations
were assessed using echosounders. During long-term stationary seismic airgun discharge, there was an
overall downward shift in fish distribution. The authors also observed a significant decline in total catch
of rockfishes during seismic discharge. It should be noted that this experimental approach was quite
different from an actual seismic survey, in that duration of exposure was much longer.
In another study, caged European sea bass (Dicentrarchus labrax) were exposed to multiple dis-
charges from a moving seismic airgun array with a source SPL of about 256 dB re 1 µPa · m 0-p (unspec-
ified measure type) (Santulli et al. 1999). The airguns were discharged every 25 s during a 2-h period.
The minimum distance between fish and seismic source was 180 m. The authors did not indicate any
observed pathological injury to the sea bass. Blood was collected from both exposed fish (6 h post-
exposure) and control fish (6 h pre-exposure) and subsequently analyzed for cortisol, glucose, and lactate
levels. Levels of cortisol, glucose, and lactate were significantly higher in the sera of exposed fish
compared to sera of control fish. The elevated levels of all three chemicals returned to pre-exposure
levels within 72 h of exposure (Santulli et al. 1999).
Santulli et al. (1999) also used underwater video cameras to monitor fish response to seismic
airgun discharge. Resultant video indicated slight startle responses by some of the sea bass when the
seismic airgun array discharged as far as 2.5 km from the cage. The proportion of sea bass that exhibited
startle response increased as the airgun sound source approached the cage. Once the seismic array was
within 180 m of the cage, the sea bass were densely packed at the middle of the enclosure, exhibiting
random orientation, and appearing more active than they had been under pre-exposure conditions.
Normal behavior resumed about 2 h after airgun discharge nearest the fish (Santulli et al. 1999).
Boeger et al. (2006) reported observations of coral reef fishes in field enclosures before, during and
after exposure to seismic airgun sound. This Brazilian study used an array of eight airguns that was
presented to the fishes as both a mobile sound source and a static sound source. Minimum distances
between the sound source and the fish cage ranged from 0 to 7 m. Received sound levels were not
reported by Boeger et al. (2006). Neither mortality nor external damage to the fishes was observed in any
of the experimental scenarios. Most of the airgun array discharges resulted in startle responses although
these behavioral changes lessened with repeated exposures, suggesting habituation.
Chapman and Hawkins (1969) investigated the reactions of free ranging whiting (silver hake),
Merluccius bilinearis, to an intermittently discharging stationary airgun with a source SPL of 220 dB re 1
µPa · m0-p. Received SPLs were estimated to be 178 dB re 1 µPa0-p. The whiting were monitored with an
echosounder. Prior to any airgun discharge, the fish were located at a depth range of 25 to 55 m. In
apparent response to the airgun sound, the fish descended, forming a compact layer at depths greater than
55 m. After an hour of exposure to the airgun sound, the fish appeared to have habituated as indicated by
their return to the pre-exposure depth range, despite the continuing airgun discharge. Airgun discharge
ceased for a time and upon its resumption, the fish again descended to greater depths, indicating only
temporary habituation.
Hassel et al. (2003, 2004) studied the potential effects of exposure to airgun sound on the behavior
of captive lesser sandeel, Ammodytes marinus. Depth of the study enclosure used to hold the sandeel was
about 55 m. The moving airgun array had an estimated source SPL of 256 dB re 1 µPa · m (unspecified
measure type). Received SPLs were not measured. Exposures were conducted over a 3-day period in a

Appendix C: Effects of Airgun Sounds and Fishes
Environmental Assessment for SIO ETP Cruise, 2010 Page 174
10 km × 10 km area with the cage at its center. The distance between airgun array and fish cage ranged
from 55 m when the array was overhead to 7.5 km. No mortality attributable to exposure to the airgun
sound was noted. Behavior of the fish was monitored using underwater video cameras, echosounders,
and commercial fishery data collected close to the study area. The approach of the seismic vessel
appeared to cause an increase in tail-beat frequency although the sandeels still appeared to swim calmly.
During seismic airgun discharge, many fish exhibited startle responses, followed by flight from the
immediate area. The frequency of occurrence of startle response seemed to increase as the operating
seismic array moved closer to the fish. The sandeels stopped exhibiting the startle response once the
airgun discharge ceased. The sandeel tended to remain higher in the water column during the airgun
discharge, and none of them were observed burying themselves in the soft substrate. The commercial
fishery catch data were inconclusive with respect to behavioral effects.
Various species of demersal fishes, blue whiting, and some small pelagic fishes were exposed to a
moving seismic airgun array with a source SPL of about 250 dB re 1 µPa · m (unspecified measure type)
(Dalen and Knutsen 1986). Received SPLs estimated using the assumption of spherical spreading ranged
from 200 to 210 dB re 1 µPa (unspecified measure type). Seismic sound exposures were conducted every
10 s during a one week period. The authors used echosounders and sonars to assess the pre- and post-
exposure fish distributions. The acoustic mapping results indicated a significant decrease in abundance of
demersal fish (36%) after airgun discharge but comparative trawl catches did not support this. Non-
significant reductions in the abundances of blue whiting and small pelagic fish were also indicated by
post-exposure acoustic mapping.
La Bella et al. (1996) studied the effects of exposure to seismic airgun sound on fish distribution
using echosounder monitoring and changes in catch rate of hake by trawl, and clupeoids by gill netting.
The seismic array used was composed of 16 airguns and had a source SPL of 256 dB re 1 µPa · m 0-p The
shot interval was 25 s, and exposure durations ranged from 4.6 to 12 h. Horizontal distributions did not
appear to change as a result of exposure to seismic discharge, but there was some indication of a
downward shift in the vertical distribution. The catch rates during experimental fishing did not differ
significantly between pre- and post-seismic fishing periods.
Wardle et al. (2001) used video and telemetry to make behavioral observations of marine fishes
(primarily juvenile saithe, adult pollock, juvenile cod, and adult mackerel) inhabiting an inshore reef off
Scotland before, during, and after exposure to discharges of a stationary airgun. The received SPLs
ranged from about 195 to 218 dB re 1 µPa0-p. Pollock did not move away from the reef in response to the
seismic airgun sound, and their diurnal rhythm did not appear to be affected. However, there was an
indication of a slight effect on the long-term day-to-night movements of the pollock. Video camera
observations indicated that fish exhibited startle responses (―C-starts‖) to all received levels. There were
also indications of behavioral responses to visual stimuli. If the seismic source was visible to the fish,
they fled from it. However, if the source was not visible to the fish, they often continued to move toward
it.
The potential effects of exposure to seismic sound on fish abundance and distribution were also
investigated by Slotte et al. (2004). Twelve days of seismic survey operations spread over a period of 1
month used a seismic airgun array with a source SPL of 222.6 dB re 1 µPa · mp-p. The SPLs received by
the fish were not measured. Acoustic surveys of the local distributions of various kinds of pelagic fish,
including herring, blue whiting, and mesopelagic species, were conducted during the seismic surveys.
There was no strong evidence of short-term horizontal distributional effects. With respect to vertical
distribution, blue whiting and mesopelagics were distributed deeper (20 to 50 m) during the seismic

Appendix C: Effects of Airgun Sounds and Fishes
Environmental Assessment for SIO ETP Cruise, 2010 Page 175
survey compared to pre-exposure. The average densities of fish aggregations were lower within the
seismic survey area, and fish abundances appeared to increase in accordance with increasing distance
from the seismic survey area.
Fertilized capelin (Mallotus villosus) eggs and monkfish (Lophius americanus) larvae were
exposed to seismic airgun sound and subsequently examined and monitored for possible effects of the
exposure (Payne et al. 2009). The laboratory exposure studies involved a single airgun. Approximate
received SPLs measured in the capelin egg and monkfish larvae exposures were 199 to 205 dB re 1 µPap-p
and 205 dB re 1 µPap-p, respectively. The capelin eggs were exposed to either 10 or 20 airgun discharges,
and the monkfish larvae were exposed to either 10 or 30 discharges. No statistical differences in
mortality/morbidity between control and exposed subjects were found at 1 to 4 days post-exposure in any
of the exposure trials for either the capelin eggs or the monkfish larvae.
In uncontrolled experiments, Kostyvchenko (1973) exposed the eggs of numerous fish species
(anchovy, red mullet, crucian carp, blue runner) to various sound sources, including seismic airguns.
With the seismic airgun discharge as close as 0.5 m from the eggs, over 75% of them survived the
exposure. Egg survival rate increased to over 90% when placed 10 m from the airgun sound source. The
range of received SPLs was about 215 to 233 dB re 1 µPa0-p.
Eggs, yolk sac larvae, post-yolk sac larvae, post-larvae, and fry of various commercially important
fish species (cod, saithe, herring, turbot, and plaice) were exposed to received SPLs ranging from 220 to
242 dB re 1 µPa (unspecified measure type) (Booman et al. 1996). These received levels corresponded to
exposure distances ranging from 0.75 to 6 m. The authors reported some cases of injury and mortality but
most of these occurred as a result of exposures at very close range (i.e., <15 m). The rigor of anatomical
and pathological assessments was questionable.
Saetre and Ona (1996) applied a ―worst-case scenario‖ mathematical model to investigate the
effects of seismic sound on fish eggs and larvae. They concluded that mortality rates caused by exposure
to seismic airgun sound are so low compared to the natural mortality that the impact of seismic surveying
on recruitment to a fish stock must be regarded as insignificant.
2.2 Freshwater Fishes
Popper et al. (2005) tested the hearing sensitivity of three Mackenzie River fish species after
exposure to five discharges from a seismic airgun. The mean received peak SPL was 205 to 209 dB re
1 µPa per discharge, and the approximate mean received SEL was 176 to 180 dB re 1 µPa2 · s per dis-
charge. While the broad whitefish showed no Temporary Threshold Shift (TTS) as a result of the
exposure, adult northern pike and lake chub exhibited TTSs of 10 to 15 dB, followed by complete
recovery within 24 h of exposure. The same animals were also examined to determine whether there
were observable effects on the sensory cells of the inner ear as a result of exposure to seismic sound
(Song et al. 2008). No damage to the ears of the fishes was found, including those that exhibited TTS.
In another part of the same Mackenzie River project, Jorgenson and Gyselman (2009) investigated
the behavioral responses of arctic riverine fishes to seismic airgun sound. They used hydroacoustic
survey techniques to determine whether fish behavior upon exposure to airgun sound can either mitigate
or enhance the potential impact of the sound. The study indicated that fish behavioral characteristics were
generally unchanged by the exposure to airgun sound. The tracked fish did not exhibit herding behavior
in front of the mobile airgun array and, therefore, were not exposed to sustained high sound levels.

Appendix C: Effects of Airgun Sounds and Fishes
Environmental Assessment for SIO ETP Cruise, 2010 Page 176
2.3 Anadromous Fishes
In uncontrolled experiments using a very small sample of different groups of young salmonids, in-
cluding Arctic cisco, fish were caged and exposed to various types of sound. One sound type was either a
single firing or a series of four firings 10 to 15 s apart of a 300-in3 seismic airgun at 2000 to 2200 psi
(Falk and Lawrence 1973). Swim bladder damage was reported but no mortality was observed when fish
were exposed within 1 to 2 m of an airgun source with source level, as estimated by Turnpenny and Ned-
well (1994), of ~230 dB re 1 µPa · m (unspecified measure).
Thomsen (2002) exposed rainbow trout and Atlantic salmon held in aquaculture enclosures to the
sounds from a small airgun array. Received SPLs were 142 to 186 dB re 1 µPap-p. The fish were exposed
to 124 pulses over a 3-day period. In addition to monitoring fish behavior with underwater video
cameras, the authors also analyzed cod and haddock catch data from a longline fishing vessel operating in
the immediate area. Only eight of the 124 shots appeared to evoke behavioral reactions by the salmonids,
but overall impacts were minimal. No fish mortality was observed during or immediately after exposure.
The author reported no significant effects on cod and haddock catch rates, and the behavioral effects were
hard to differentiate from normal behavior.
Weinhold and Weaver (1972, cited in Turnpenny et al. 1994) exposed caged coho salmon smolts to
impulses from 330 and 660-in3 airguns at distances ranging from 1 to 10 m, resulting in received levels
estimated at ~214 to 216 dB (units not given). No lethal effects were observed.
It should be noted that, in a recent and comprehensive review, Hastings and Popper (2005) take
issue with many of the authors cited above for problems with experimental design and execution, mea-
surements, and interpretation. Hastings and Popper (2005) deal primarily with possible effects of pile-
driving sounds (which, like airgun sounds, are impulsive and repetitive). However, that review provides
an excellent and critical review of the impacts to fish from other underwater anthropogenic sounds.
3. Indirect Effects on Fisheries
The most comprehensive experimentation on the effects of seismic airgun sound on catchability of
fishes was conducted in the Barents Sea by Engås et al. (1993, 1996). They investigated the effects of
seismic airgun sound on distributions, abundances, and catch rates of cod and haddock using acoustic
mapping and experimental fishing with trawls and longlines. The maximum source SPL was about 248
dB re 1 µPa · m 0-p based on back-calculations from measurements collected via a hydrophone at depth
80 m. Nomeasurements of the received SPLs were made. Davis et al. (1998) estimated the received SPL
at the sea bottom immediately below the array and at 18 km from the array to be 205 dB re 1 µPa0-p and
178 dB re 1 µPa0-p, respectively. Engås et al. (1993, 1996) concluded that there were indications of
distributional change during and immediately following the seismic airgun discharge (45 to 64% decrease
in acoustic density according to sonar data). The lowest densities were observed within 9.3 km of the
seismic discharge area. The authors indicated that trawl catches of both cod and haddock declined after
the seismic operations. While longline catches of haddock also showed decline after seismic airgun
discharge, those for cod increased.
Løkkeborg (1991), Løkkeborg and Soldal (1993), and Dalen and Knutsen (1986) also examined the
effects of seismic airgun sound on demersal fish catches. Løkkeborg (1991) examined the effects on cod
catches. The source SPL of the airgun array used in his study was 239 dB re 1 µPa · m (unspecified
measure type), but received SPLs were not measured. Approximately 43 h of seismic airgun discharge
occurred during an 11-day period, with a five-second interval between pulses. Catch rate decreases
Appendix C: Effects of Airgun Sounds and Fishes
Environmental Assessment for SIO ETP Cruise, 2010 Page 177
ranging from 55 to 80% within the seismic survey area were observed. This apparent effect persisted for
at least 24 h within about 10 km of the survey area.
Turnpenny et al. (1994) examined results of these studies as well as the results of other studies on
rockfish. They used rough estimations of received SPLs at catch locations and concluded that catchability
is reduced when received SPLs exceed 160 to 180 dB re 1 µPa0-p. They also concluded that reaction
thresholds of fishes lacking a swim bladder (e.g., flatfish) would likely be about 20 dB higher. Given the
considerable variability in sound transmission loss between different geographic locations, the SPLs that
were assumed in these studies were likely quite inaccurate.
Turnpenny and Nedwell (1994) also reported on the effects of seismic airgun discharge on inshore
bass fisheries in shallow U.K. waters (5 to 30 m deep). The airgun array used had a source level of 250
dB re 1 µPa · m0-p. Received levels in the fishing areas were estimated to be 163–191 dB re 1 µPa0-p.
Using fish tagging and catch record methodologies, they concluded that there was not any distinguishable
migration from the ensonified area, nor was there any reduction in bass catches on days when seismic
airguns were discharged. The authors concluded that effects on fisheries would be smaller in shallow
nearshore waters than in deep water because attenuation of sound is more rapid in shallow water.
Skalski et al. (1992) used a 100-in3 airgun with a source level of 223 dB re 1 µPa
· m0-p to examine
the potential effects of airgun sound on the catchability of rockfishes. The moving airgun was discharged
along transects in the study fishing area, after which a fishing vessel deployed a set line, ran three echo-
sounder transects, and then deployed two more set lines. Each fishing experiment lasted 1 h 25 min.
Received SPLs at the base of the rockfish aggregations ranged from 186 to 191 dB re 1 µPa0-p. The
catch-per-unit-effort (CPUE) for rockfish declined on average by 52.4% when the airguns were operating.
Skalski et al. (1992) believed that the reduction in catch resulted from a change in behavior of the fishes.
The fish schools descended towards the bottom and their swimming behavior changed during airgun
discharge. Although fish dispersal was not observed, the authors hypothesized that it could have occurred
at a different location with a different bottom type. Skalski et al. (1992) did not continue fishing after
cessation of airgun discharge. They speculated that CPUE would quickly return to normal in the experi-
mental area, because fish behavior appeared to normalize within minutes of cessation of airgun discharge.
However, in an area where exposure to airgun sound might have caused the fish to disperse, the authors
suggested that a lower CPUE might persist for a longer period.
European sea bass were exposed to sound from seismic airgun arrays with a source SPL of 262 dB
re 1 µPa · m0-p
(Pickett et al. 1994). The seismic survey was conducted over a period of 4 to 5 months.
The study was intended to investigate the effects of seismic airgun discharge on inshore bass fisheries.
Information was collected through a tag and release program, and from the logbooks of commercial
fishermen. Most of the 152 recovered fish from the tagging program were caught within 10 km of the
release site, and it was suggested that most of these bass did not leave the area for a prolonged period.
With respect to the commercial fishery, no significant changes in catch rate were observed (Pickett et al.
1994).
4. Literature Cited
Atema, J., R.R. Fay, A.N. Popper, and W.N. Tavolga. 1988. The sensory biology of aquatic animals. Springer-
Boeger, W.A., M.R. Pie, A. Ostrensky, and M.F. Cardoso. 2006. The effect of exposure to seismic prospecting on
coral reef fishes. Braz. J. Oceanog. 54(4):235-239.

Appendix C: Effects of Airgun Sounds and Fishes
Environmental Assessment for SIO ETP Cruise, 2010 Page 178
Booman, C., J. Dalen, H. Leivestad, A. Levsen, T. van der Meeren, and K. Toklum. 1996. Effecter av luftkanon-
skyting på egg, larver og yngel. Fisken Og Havet 1996(3):1-83 (Norwegian with English summary).
Chapman, C.J. and A.D. Hawkins. 1969. The importance of sound in fish behaviour in relation to capture by
trawls. FAO Fish. Rep. 62:717-729.
Collin, S.P. and N.J. Marshall (eds.). 2003. Sensory processing in aquatic environments. Springer-Verlag, New
York, NY. 446 p.
Coombs, S. and J.C. Montgomery. 1999. The enigmatic lateral line system. p. 319-362 In: R.R. Fay and A.N.
Popper (eds.), Comparative hearing: fish and amphibians. Springer Handbook of Auditory Research 11.
Springer-Verlag, New York, NY. 438 p.
Dalen, J. and G.M. Knutsen. 1986. Scaring effects in fish and harmful effects on eggs, larvae and fry by offshore
seismic explorations. Symposium on Underwater Acoustics, Halifax.
Davis, R.A., D. Thomson, and C.I. Malme. 1998. Environmental assessment of seismic exploration of the Scotian
Shelf. Rep. by LGL Ltd., King City, Ont., and Charles I. Malme, Engineering and Scientific Services,
Hingham, MA, for Mobil Oil Canada Properties Ltd., Shell Canada Ltd., and Imperial Oil Ltd.
Engås, A., S. Løkkeborg, A.V. Soldal, and E. Ona. 1993. Comparative trials for cod and haddock using commer-
cial trawl and longline at two different stock levels. J. Northw. Atl. Fish. Sci. 19:83-90.
Engås, A, S. Løkkeborg, E. Ona, and A.V. Soldal. 1996. Effects of seismic shooting on local abundance and catch
rates of cod (G. morhua) and haddock (M. aeglefinus). Can. J. Fish. Aquat. Sci. 53(10):2238-2249.
Falk, M.R. and M.J. Lawrence. 1973. Seismic exploration: its nature and effects on fish. Tech. Rep. Ser. CEN/T-
73-9. Can. Dep. Environ., Fisheries & Marine Serv., Resource Manage. Br., Fisheries Operations Direct-
orate, Central Region (Environment), Winnipeg, Man.
Fay, R. 2009. Soundscapes and the sense of hearing of fishes. Integr. Zool. 4(1):26-32.
Fay, R.R. and A.N. Popper. 2000. Evolution of hearing in vertebrates: The inner ears and processing. Hearing
Res. 149(1):1-10.
Hassel, A., T. Knutsen, J. Dalen, S. Løkkeborg, K. Skaar, Ø. Østensen, E.K. Haugland, M. Fonn, Å. Høines, and
O.A. Misund. 2003. Reaction of sandeel to seismic shooting: a field experiment and fishery statistics
study. Institute of Marine Research, Bergen, Norway.
Hassel, A., T. Knutsen, J. Dalen, K. Skaar, S. Løkkeborg, O.A. Misund, O. Ostensen, M. Fonn, and E.K. Haugland.
2004. Influence of seismic shooting on the lesser sandeel (Ammodytes marinus). ICES J. Mar. Sci.
61(7):1165-1173.
Hastings, M.C. and A.N. Popper. 2005. Effects of sound on fish. Rep. from Jones & Stokes, Sacramento, CA, for
California Department of Transportation, Sacramento, CA. 28 January.
Howard J, W.M. Roberts, and A.J. Hudspeth. 1988. Mechanoelectrical transduction by hair cells. Annu. Rev.
Biophys. Chem. 17:99-124.
Hudspeth, A.J. and V.S. Markin. 1994. The ear‘s gears: mechanical transduction by hair cells. Physics Today
47(2):22-28.
Jorgenson, J.K. and E.C. Gyselman. 2009. Hydroacoustic measurements of the behavioral response of arctic river-
ine fishes to seismic airguns. J. Acoust. Soc. Am. 126(3):1598-1606.
Kapoor, B.G. and T.J. Hara (eds.). 2001. Sensory biology of jawed fishes: new insights. Science Publishers, Inc.,
Enfield, NH. 404 p.
Kostyvchenko, L.P. 1973. Effects of elastic waves generated in marine seismic prospecting on fish eggs in the
Black Sea. Hydrobiol. J. 9:45-48.

Appendix C: Effects of Airgun Sounds and Fishes
Environmental Assessment for SIO ETP Cruise, 2010 Page 179
La Bella, G., S. Cannata, C. Froglia, A. Modica, S. Ratti, and G. Rivas. 1996. First assessment of effects of air-gun
seismic shooting on marine resources in the Central Adriatic Sea. p. 227-238 In: Society of Petroleum
Engineers, Intern. Conf. on Health, Safety and Environ., New Orleans, LA, 9-12 June.
Ladich, F. and A.N. Popper. 2004. Parallel evolution in fish hearing organs. p. 95-127 In: G.A. Manley, A.N.
Popper, and R.R. Fay (eds.), Evolution of the vertebrate auditory system. Springer-Verlag, New York, NY.
415 p.
Løkkeborg, S. 1991. Effects of geophysical survey on catching success in longline fishing. Paper presented at
Intern. Council for the Exploration of the Sea (ICES) Annual Science Conf. ICES CM B 40:1-9.
Løkkeborg, S. and A.V. Soldal. 1993. The influence of seismic explorations on cod (Gadus morhua) behaviour and
catch rates. ICES Mar. Sci. Symp. 196:62-67.
Mann, D.A., Z. Lu, and A.N. Popper. 1997. A clupeid fish can detect ultrasound. Nature 389(6649):341.
Mann, D.A., Z. Lu, M.C. Hastings, and A.N. Popper. 1998. Detection of ultrasonic tones and simulated dolphin
echolocation clicks by a teleost fish, the American shad (Alosa sapidissima). J. Acoust. Soc. Am.
104(1):562-568.
Mann, D.A., D.M. Higgs, W.N. Tavolga, M.J. Souza, and A.N. Popper. 2001. Ultrasound detection by clupeiform
fishes. J. Acoust. Soc. Am. 109(6):3048-3054.
McCauley, R.D., J. Fewtrell, A.J. Duncan, C. Jenner, M.-N. Jenner, J.D. Penrose, R.I.T. Prince, A. Adhitya,
J. Murdoch, and K. McCabe. 2000a. Marine seismic surveys: analysis of airgun signals; and effects of air
gun exposure on humpback whales, sea turtles, fishes and squid. Rep. from Centre for Marine Science and
Technology, Curtin University, Perth, WA, for Australian Petroleum Production Association, Sydney, NSW.
McCauley, R.D., J. Fewtrell, A.J. Duncan, C. Jenner, M.-N. Jenner, J.D. Penrose, R.I.T. Prince, A. Adhitya, J.
Murdoch, and K. McCabe. 2000b. Marine seismic surveys – a study of environmental implications.
APPEA J. 40:692-706.
McCauley, R.D., J. Fewtrell, and A.N. Popper. 2003. High intensity anthropogenic sound damages fish ears. J.
Acoust. Soc. Am. 113(1):638-642.
Payne, J.F., J. Coady, and D. White. 2009. Potential effects of seismic airgun discharges on monkfish eggs
(Lophius americanus) and larvae. Environ. Stud. Res. Funds Rep. 170. St. John‘s, NL. 35 p.
Pearson, W.H., J.R. Skalski, and C.I. Malme. 1992. Effects of sounds from a geophysical survey device on
behavior of captive rockfish (Sebastes spp.). Can. J. Fish. Aquat. Sci. 49(7):1343-1356.
Pickett, G.D., D.R. Eaton, R.M.H. Seaby, and G.P. Arnold. 1994. Results of bass tagging in Poole Bay during
1992. Laboratory Leaflet Number 74. Ministry of Agriculture, Fisheries and Food, Directorate of Fisheries
Research, Lowestoft, UK.
Popper, A.N. 2009. Are we drowning out fish in a sea of noise? Marine Scientist 27:18-20.
Popper, A.N. and R.R. Fay. 1993. Sound detection and processing by fish: critical review and major research
questions. Brain Behav. Evol. 41(1):14-38.
Popper, A.N. and R.R. Fay. 1999. The auditory periphery in fishes. p. 43-100 In: R.R. Fay and A.N. Popper (eds.),
Comparative hearing: fish and amphibians. Springer-Verlag, New York, NY. 438 p.
Popper, A.N. and R.R. Fay. 2010. Rethinking sound detection by fishes. Hear. Res. (in press)
doi: 10.1016/j.heares.2009.12.023.
Popper, A.N. and M.C. Hastings. 2009a. The effects of human-generated sound on fish. Integr. Zool. 4(1):43-52.
Popper, A.N. and M.C. Hastings. 2009b. The effects of anthropogenic sources of sound on fishes. J. Fish Biol.
75(3):455-489.

Appendix C: Effects of Airgun Sounds and Fishes
Environmental Assessment for SIO ETP Cruise, 2010 Page 180
Popper, A.N., M.E. Smith, P.A. Cott, B.W. Hanna, A.O. MacGillivray, M.E. Austin, and D.A. Mann. 2005. Effects
of exposure to seismic airgun use on hearing of three fish species. J. Acoust. Soc. Am. 117(6):3958-3971.
Saetre, R. and E. Ona. 1996. Seismiske undersøkelser og skader på fiskeegg og -larver en vurdering av mulige
effekter pa bestandsniv. [Seismic investigations and damages on fish eggs and larvae; an evaluation of
possible effects on stock level] Fisken og Havet 1996:1-17, 1-8. (in Norwegian with English summary).
Sand, O. 1981. The lateral line and sound reception. p. 459-478 In: W.N. Tavolga, A.N. Popper, and R.R. Fay
(eds.), Hearing and sound communication in fishes. Springer-Verlag, New York, NY.
Santulli, A., C. Messina, L. Ceffa, A. Curatolo, G. Rivas, G. Fabi, and V. Damelio. 1999. Biochemical responses of
European sea bass (Dicentrachus labrax) to the stress induced by offshore experimental seismic prospecting.
Mar. Poll. Bull. 38(12):1105-1114.
Skalski, J.R., W.H. Pearson, and C.I. Malme. 1992. Effects of sounds from a geophysical survey device on catch-
per-unit-effort in a hook-and-line fishery for rockfish (Sebastes spp.). Can. J. Fish. Aquat. Sci. 49(7):1357-
1365.
Slotte, A., K. Hansen, J. Dalen, and E. Ona. 2004. Acoustic mapping of pelagic fish distribution and abundance in
relation to a seismic shooting area off the Norwegian west coast. Fish. Res. 67(2):143-150.
Song, J., D.A. Mann, P.A. Cott, B.W. Hanna, and A.N. Popper. 2008. The inner ears of Northern Canadian
freshwater fishes following exposure to seismic air gun sounds. J. Acoust. Soc. Am. 124(2):1360-1366.
Thomsen, B. 2002. An experiment on how seismic shooting affects caged fish. Thesis, Faroese Fisheries Labor-
atory, University of Aberdeen, Aberdeen, Scotland. 16 August.
Turnpenny, A.W.H. and J.R. Nedwell. 1994. Consultancy Report: The effects on marine fish, diving mammals and
birds of underwater sound generated by seismic surveys. FCR 089/94. Rep. from Fawley Aquatic Research
Laboratories Ltd. for U.K. Offshore Operators Association (UKOOA).
Turnpenny, A.W.H., K.P. Thatcher, and J.R. Nedwell. 1994. Research report: the effects on fish and other marine
animals of high-level underwater sound. FRR 127/94. Rep. from Fawley Aquatic Research Laboratories,
Ltd. for the Defence Research Agency.
Wardle, C.S., T.J. Carter, G.G. Urquhart, A.D.F. Johnstone, A.M. Ziolkowski, G. Hampson, and D. Mackie. 2001.
Effects of seismic airguns on marine fish. Cont. Shelf Res. 21(8-10):1005-1027.
Appendix D: Airgun Sounds on Marine Invertebrates
Environmental Assessment for L-DEO’s Marianas Seismic Survey, 2010 Page 181
APPENDIX D:
REVIEW OF THE EFFECTS OF AIRGUN SOUNDS ON MARINE INVERTEBRATES14
This review provides a detailed summary of the limited data and available literature on the
observed effects (or lack of effects) of exposure to airgun sound on marine invertebrates. Specific
conditions and results of the studies, including sound exposure levels and sound thresholds of responses,
are discussed when available.
Sound caused by underwater seismic survey equipment results in energy pulses with very high
peak pressures (Richardson et al. 1995). This was especially true when chemical explosives were used
for underwater surveys. Virtually all underwater seismic surveying conducted today uses airguns which
typically have lower peak pressures and longer rise times than chemical explosives. However, sound
levels from underwater airgun discharges might still be high enough to potentially injure or kill animals
located close to the source. Also, there is a potential for disturbance to normal behavior upon exposure to
airgun sound. The following sections provide an overview of sound production and detection in marine
invertebrates, and information on the effects of exposure to sound on marine invertebrates, with an
emphasis on seismic survey sound. In addition, Fisheries and Oceans Canada has published two internal
documents that provide a literature review of the effects of seismic and other underwater sound on
invertebrates (Moriyasu et al. 2004; Payne et al. 2008). The available information as reviewed in those
documents and here includes results of studies of varying degrees of scientific rigor as well as anecdotal
information.
1. Sound Production
Much of the available information on acoustic abilities of marine invertebrates pertains to
crustaceans, specifically lobsters, crabs and shrimps. Other acoustic-related studies have been conducted
on cephalopods. Many invertebrates are capable of producing sound, including barnacles, amphipods,
shrimp, crabs, and lobsters (Au and Banks 1998; Tolstoganova 2002). Invertebrates typically produce
sound by scraping or rubbing various parts of their bodies, although they also produce sound in other
ways. Sounds made by marine invertebrates may be associated with territorial behavior, mating,
courtship, and aggression. On the other hand, some of these sounds may be incidental and not have any
biological relevance. Sounds known to be produced by marine invertebrates have frequencies ranging
from 87 Hz to 200 kHz, depending on the species.
Both male and female American lobsters Homarus americanus produce a buzzing vibration with
the carapace when grasped (Pye and Watson III 2004; Henninger and Watson III 2005). Larger lobsters
vibrate more consistently than smaller lobsters, suggesting that sound production may be involved with
mating behavior. Sound production by other species of lobsters has also been studied. Among deep-sea
lobsters, sound level was more variable at night than during the day, with the highest levels occurring at
the lowest frequencies.
While feeding, king crab Paralithodes camtschaticus produce impulsive sounds that appear to
stimulate movement by other crabs, including approach behavior (Tolstoganova 2002). King crab also
appeared to produce ‗discomfort‘ sounds when environmental conditions were manipulated. These
discomfort sounds differ from the feeding sounds in terms of frequency range and pulse duration.
____________________________________
14
By John Christian, LGL Ltd., environmental research associates (revised Nov. 2009).

Appendix E: Airgun Sounds and Invertebrates
Environmental Assessment for L-DEO’s GOA Seismic Survey, 2010 Page 182
Snapping shrimp Synalpheus parneomeris are among the major sources of biological sound in
temperate and tropical shallow-water areas (Au and Banks 1998). By rapidly closing one of its frontal
chelae (claws), a snapping shrimp generates a forward jet of water and the cavitation of fast moving water
produces a sound. Both the sound and the jet of water may function in feeding and territorial behaviors of
alpheidae shrimp. Measured source sound pressure levels (SPLs) for snapping ship were 183–189 dB re
1 µPa · mp-p and extended over a frequency range of 2–200 kHz.
2. Sound Detection
There is considerable debate about the hearing capabilities of aquatic invertebrates. Whether they
are able to hear or not depends on how underwater sound and underwater hearing are defined. In contrast
to the situation in fish and marine mammals, no physical structures have been discovered in aquatic
invertebrates that are stimulated by the pressure component of sound. However, vibrations (i.e., mechan-
ical disturbances of the water) are also characteristic of sound waves. Rather than being pressure-
sensitive, aquatic invertebrates appear to be most sensitive to the vibrational component of sound
(Breithaupt 2002). Statocyst organs may provide one means of vibration detection for aquatic invert-
ebrates.
More is known about the acoustic detection capabilities in decapod crustaceans than in any other
marine invertebrate group, although cephalopod acoustic capabilities are now becoming a focus of study.
Crustaceans appear to be most sensitive to sounds of low frequencies, i.e., <1000 Hz (Budelmann 1992;
Popper et al. 2001). A study by Lovell et al. (2005) suggests greater sensitivity of the prawn Palaemon
serratus to low-frequency sound than previously thought. Lovell et al. (2006) showed that P. serratus is
capable of detecting a 500 Hz tone regardless of the prawn‘s body size and the related number and size of
statocyst hair cells. Studies of American lobsters suggest that these crustaceans are more sensitive to
higher frequency sounds than previously realized (Pye and Watson III 2004).
It is possible that statocyst hair cells of cephalopods are directionally sensitive in a way that is
similar to the responses of hair cells of the vertebrate vestibular and lateral line systems (Budelmann and
Williamson 1994; Budelmann 1996). Kaifu et al. (2008) provided evidence that the cephalopod Octopus
ocellatus detects particle motion with its statocyst. Studies by Packard et al. (1990), Rawizza (1995) and
Komak et al. (2005) have tested the sensitivities of various cephalopods to water-borne vibrations, some
of which were generated by low-frequency sound. Using the auditory brainstem response (ABR)
approach, Hu et al. (2009) showed that auditory evoked potentials can be obtained in the frequency ranges
400 to 1500 Hz for the squid Sepiotheutis lessoniana and 400 to 1000 Hz for the octopus Octopus
vulgaris, higher than frequencies previously observed to be detectable by cephalopods.
In summary, only a few studies have been conducted on the sensitivity of certain invertebrate
species to underwater sound. Available data suggest that they are capable of detecting vibrations but they
do not appear to be capable of detecting pressure fluctuations.
3. Potential Seismic Effects
In marine invertebrates, potential effects of exposure to sound can be categorized as pathological,
physiological, and behavioral. Pathological effects include lethal and sub-lethal injury to the animals,
physiological effects include temporary primary and secondary stress responses, and behavioral effects
refer to changes in exhibited behaviors (i.e., disturbance). The three categories should not be considered
as independent of one another and are likely interrelated in complex ways.

Appendix E: Airgun Sounds and Invertebrates
Environmental Assessment for L-DEO’s GOA Seismic Survey, 2010 Page 183
Pathological Effects.―In water, acute injury or death of organisms as a result of exposure to
sound appears to depend on two features of the sound source: (1) the received peak pressure, and (2) the
time required for the pressure to rise and decay. Generally, the higher the received pressure and the less
time it takes for the pressure to rise and decay, the greater the chance of acute pathological effects.
Considering the peak pressure and rise/decay time characteristics of seismic airgun arrays used today, the
associated pathological zone for invertebrates would be expected to be small (i.e., within a few meters of
the seismic source, at most). Few studies have assessed the potential for pathological effects on invert-
ebrates from exposure to seismic sound.
The pathological impacts of seismic survey sound on marine invertebrates were investigated in a
pilot study on snow crabs Chionoecetes opilio (Christian et al. 2003, 2004). Under controlled field
experimental conditions, captive adult male snow crabs, egg-carrying female snow crabs, and fertilized
snow crab eggs were exposed to variable SPLs (191–221 dB re 1 µPa0-p) and sound energy levels (SELs)
(<130–187 dB re 1 µPa2 · s). Neither acute nor chronic (12 weeks post-exposure) mortality was observed
for the adult crabs. However, a significant difference in development rate was noted between the exposed
and unexposed fertilized eggs/embryos. The egg mass exposed to seismic energy had a higher proportion
of less-developed eggs than did the unexposed mass. It should be noted that both egg masses came from
a single female and any measure of natural variability was unattainable (Christian et al. 2003, 2004).
In 2003, a collaborative study was conducted in the southern Gulf of St. Lawrence, Canada, to
investigate the effects of exposure to sound from a commercial seismic survey on egg-bearing female
snow crabs (DFO 2004). This study had design problems that impacted interpretation of some of the
results (Chadwick 2004). Caged animals were placed on the ocean bottom at a location within the survey
area and at a location outside of the survey area. The maximum received SPL was ~195 dB re 1 µPa0-p.
The crabs were exposed for 132 hr of the survey, equivalent to thousands of seismic shots of varying
received SPLs. The animals were retrieved and transferred to laboratories for analyses. Neither acute nor
chronic lethal or sub-lethal injury to the female crabs or crab embryos was indicated. DFO (2004)
reported that some exposed individuals had short-term soiling of gills, antennules and statocysts, bruising
of the hepatopancreas and ovary, and detached outer membranes of oocytes. However, these differences
could not be linked conclusively to exposure to seismic survey sound. Boudreau et al. (2009) presented
the proceedings of a workshop held to evaluate the results of additional studies conducted to answer some
questions arising from the original study discussed in DFO (2004). Proceedings of the workshop did not
include any more definitive conclusions regarding the original results.
Payne et al. (2007) recently conducted a pilot study of the effects of exposure to airgun sound on
various health endpoints of the American lobster. Adult lobsters were exposed either 20 to 200 times to
202 dB re 1μPap-p or 50 times to 227 dB re 1μPap-p, and then monitored for changes in survival, food
consumption, turnover rate, serum protein level, serum enzyme levels, and serum calcium level. Obser-
vations extended over a period of a few days to several months. Results showed no delayed mortality or
damage to the mechanosensory systems associated with animal equilibrium and posture (as assessed by
turnover rate).
In a field study, Pearson et al. (1994) exposed Stage II larvae of the Dungeness crab Cancer
magister to single discharges from a seven-airgun array and compared their mortality and development
rates with those of unexposed larvae. No statistically significant differences were found in immediate
survival, long-term survival, or time to molt between the exposed and unexposed larvae, even those
exposed within 1 m of the seismic source.

Appendix E: Airgun Sounds and Invertebrates
Environmental Assessment for L-DEO’s GOA Seismic Survey, 2010 Page 184
In 2001 and 2003, there were two incidents of multiple strandings of the giant squid Architeuthis
dux on the north coast of Spain, and there was speculation that the strandings were caused by exposure to
geophysical seismic survey sounds occurring at about the same time in the Bay of Biscay (Guerra et al.
2004). A total of nine giant squid, either stranded or moribund and floating at the surface, were collected
at these times. However, Guerra et al. (2004) did not present any evidence that conclusively links the
giant squid strandings and floaters to seismic activity in the area. Based on necropsies of seven (six
females and one male) specimens, there was evidence of acute tissue damage. The authors speculated
that one female with extensive tissue damage was affected by the impact of acoustic waves. However,
little is known about the impact of strong airgun signals on cephalopods and the authors did not describe
the seismic sources, locations, and durations of the Bay of Biscay surveys. In addition, there were no
controls, the observations were circumstantial, and the examined animals had been dead long enough for
commencement of tissue degradation.
McCauley et al. (2000a,b) exposed caged cephalopods to noise from a single 20-in3 airgun with
maximum SPLs of >200 dB re 1 µPa0-p. Statocysts were removed and preserved, but at the time of
publication, results of the statocyst analyses were not available. No squid or cuttlefish mortalities were
reported as a result of these exposures.
Physiological Effects.―Biochemical responses by marine invertebrates to acoustic exposure have
also been studied to a limited degree. Such studies of stress responses could possibly provide some indi-
cation of the physiological consequences of acoustic exposure and perhaps any subsequent chronic
detrimental effects. Stress responses could potentially affect animal populations by reducing reproductive
capacity and adult abundance.
Stress indicators in the haemolymph of adult male snow crabs were monitored immediately after
exposure of the animals to seismic survey sound (Christian et al. 2003, 2004) and at various intervals after
exposure. No significant acute or chronic differences were found between exposed and unexposed
animals in which various stress indicators (e.g., proteins, enzymes, cell type count) were measured.
Payne et al. (2007), in their study of the effects of exposure of adult American lobsters to airgun
sound, noted decreases in the levels of serum protein, particular serum enzymes and serum calcium, in the
haemolymph of animals exposed to the sound pulses. Statistically significant differences (P=0.05) were
noted in serum protein at 12 days post-exposure, serum enzymes at 5 days post-exposure, and serum
calcium at 12 days post-exposure. During the histological analysis conducted 4 months post-exposure,
Payne et al. (2007) noted more deposits of PAS-stained material, likely glycogen, in the hepatopancreas
of some of the exposed lobsters. Accumulation of glycogen could be due to stress or disturbance of
cellular processes.
Price (2007) found that blue mussels Mytilus edulis responded to a 10 kHz pure tone continuous
signal by decreasing respiration. Smaller mussels did not appear to react until exposed for 30 min where-
as larger mussels responded after 10 min of exposure. The oxygen uptake rate tended to be reduced to a
greater degree in the larger mussels than in the smaller animals.
In general, the limited studies done to date on the effects of acoustic exposure on marine inverte-
brates have not demonstrated any serious pathological and physiological effects.
Behavioral Effects.―Some recent studies have focused on potential behavioral effects on marine
invertebrates.

Appendix E: Airgun Sounds and Invertebrates
Environmental Assessment for L-DEO’s GOA Seismic Survey, 2010 Page 185
Christian et al. (2003) investigated the behavioral effects of exposure to airgun sound on snow
crabs. Eight animals were equipped with ultrasonic tags, released, and monitored for multiple days prior
to exposure and after exposure. Received SPL and SEL were ~191 dB re 1 µPa0-p and <130 dB re
1 µPa2 · s, respectively. The crabs were exposed to 200 discharges over a 33-min period. None of the
tagged animals left the immediate area after exposure to the seismic survey sound. Five animals were
captured in the snow crab commercial fishery the following year, one at the release location, one 35 km
from the release location, and three at intermediate distances from the release location.
Another study approach used by Christian et al. (2003) involved monitoring snow crabs with a
remote video camera during their exposure to airgun sound. The caged animals were placed on the ocean
bottom at a depth of 50 m. Received SPL and SEL were ~202 dB re 1 µPa0-p and 150 dB re 1 µPa2 · s,
respectively. The crabs were exposed to 200 discharges over a 33-min period. They did not exhibit any
overt startle response during the exposure period.
Christian et al. (2003) also investigated the pre- and post-exposure catchability of snow crabs
during a commercial fishery. Received SPLs and SELs were not measured directly and likely ranged
widely considering the area fished. Maximum SPL and SEL were likely similar to those measured during
the telemetry study. There were seven pre-exposure and six post-exposure trap sets. Unfortunately, there
was considerable variability in set duration because of poor weather. Results indicated that the catch-per-
unit-effort did not decrease after the crabs were exposed to seismic survey sound.
Parry and Gason (2006) statistically analyzed data related to rock lobster Jasus edwardsii commer-
cial catches and seismic surveying in Australian waters from 1978 to 2004. They did not find any evi-
dence that lobster catch rates were affected by seismic surveys.
Caged female snow crabs exposed to airgun sound associated with a recent commercial seismic
survey conducted in the southern Gulf of St. Lawrence, Canada, exhibited a higher rate of ‗righting‘ than
those crabs not exposed to seismic survey sound (J. Payne, Research Scientist, DFO, St. John‘s, Nfld.,
pers. comm.). ‗Righting‘ refers to a crab‘s ability to return itself to an upright position after being placed
on its back. Christian et al. (2003) made the same observation in their study.
Payne et al. (2007), in their study of the effects of exposure to airgun sound on adult American
lobsters, noted a trend for increased food consumption by the animals exposed to seismic sound.
Andriguetto-Filho et al. (2005) attempted to evaluate the impact of seismic survey sound on
artisanal shrimp fisheries off Brazil. Bottom trawl yields were measured before and after multiple-day
shooting of an airgun array. Water depth in the experimental area ranged between 2 and 15 m. Results of
the study did not indicate any significant deleterious impact on shrimp catches. Anecdotal information
from Newfoundland, Canada, indicated that catch rates of snow crabs showed a significant reduction
immediately following a pass by a seismic survey vessel (G. Chidley, Newfoundland fisherman, pers.
comm.). Additional anecdotal information from Newfoundland indicated that a school of shrimp observ-
ed via a fishing vessel sounder shifted downwards and away from a nearby seismic airgun sound source
(H. Thorne, Newfoundland fisherman, pers. comm.). This observed effect was temporary.
Caged brown shrimp Crangon crangon reared under different acoustical conditions exhibited
differences in aggressive behavior and feeding rate (Lagardère 1982). Those exposed to a continuous
sound source showed more aggression and less feeding behavior. It should be noted that behavioral
responses by caged animals may differ from behavioral responses of animals in the wild.
McCauley et al. (2000a,b) provided the first evidence of the behavioral response of southern
calamari squid Sepioteuthis australis exposed to seismic survey sound. McCauley et al. reported on the

Appendix E: Airgun Sounds and Invertebrates
Environmental Assessment for L-DEO’s GOA Seismic Survey, 2010 Page 186
exposure of caged cephalopods (50 squid and two cuttlefish) to noise from a single 20-in3 airgun. The
cephalopods were exposed to both stationary and mobile sound sources. The two-run total exposure
times during the three trials ranged from 69 to 119 min. at a firing rate of once every 10–15 s. The
maximum SPL was >200 dB re 1 µPa0-p. Some of the squid fired their ink sacs apparently in response to
the first shot of one of the trials and then moved quickly away from the airgun. In addition to the above-
described startle responses, some squid also moved towards the water surface as the airgun approached.
McCauley et al. (2000a,b) reported that the startle and avoidance responses occurred at a received SPL of
174 dB re 1 µParms. They also exposed squid to a ramped approach-depart airgun signal whereby the
received SPL was gradually increased over time. No strong startle response (i.e., ink discharge) was
observed, but alarm responses, including increased swimming speed and movement to the surface, were
observed once the received SPL reached a level in the 156–161 dB re 1 µParms range.
Komak et al. (2005) also reported the results of a study of cephalopod behavioral responses to local
water movements. In this case, juvenile cuttlefish Sepia officinalis exhibited various behavioral responses
to local sinusoidal water movements of different frequencies between 0.01 and 1000 Hz. These responses
included body pattern changing, movement, burrowing, reorientation, and swimming. Similarly, the
behavioral responses of the octopus Octopus ocellatus to non-impulse sound have been investigated by
Kaifu et al. (2007). The sound stimuli, reported as having levels 120 dB re 1 μPa rms, were at various
frequencies: 50, 100, 150, 200 and 1000 Hz. The respiratory activity of the octopus changed when
exposed to sound in the 50–150 Hz range but not for sound at 200–1,000 Hz. Respiratory suppression by
the octopus might have represented a means of escaping detection by a predator.
Low-frequency sound (<200 Hz) has also been used as a means of preventing settling/fouling by
aquatic invertebrates such as zebra mussels Dreissena polymorpha (Donskoy and Ludyanskiy 1995) and
balanoid barnacles Balanus sp. (Branscomb and Rittschof 1984). Price (2007) observed that blue mussels
Mytilus edulis closed their valves upon exposure to 10 kHz pure tone continuous sound.
Although not demonstrated in the invertebrate literature, masking can be considered a potential
effect of anthropogenic underwater sound on marine invertebrates. Some invertebrates are known to
produce sounds (Au and Banks 1998; Tolstoganova 2002; Latha et al. 2005). The functionality and
biological relevance of these sounds are not understood (Jeffs et al. 2003, 2005; Lovell et al. 2005;
Radford et al. 2007). If some of the sounds are of biological significance to some invertebrates, then
masking of those sounds or of sounds produced by predators, at least the particle displacement compon-
ent, could potentially have adverse effects on marine invertebrates. However, even if masking does occur
in some invertebrates, the intermittent nature of airgun sound is expected to result in less masking effect
than would occur with continuous sound.
4. Literature Cited
Andriguetto-Filho, J.M., A. Ostrensky, M.R. Pie, U.A. Silva, and W.A. Boeger. 2005. Evaluating the impact of
seismic prospecting on artisanal shrimp fisheries. Cont. Shelf Res. 25:1720-1727.
Au, W.W.L. and K. Banks. 1998. The acoustics of snapping shrimp Synalpheus parneomeris in Kaneohe Bay.
J. Acoust. Soc. Am. 103:41-47.
Boudreau, M., S.C. Courtenay, and K. Lee (eds.). 2009. Proceedings of a workshop held 23 January 2007 at the
Gulf Fisheries Center, Potential impacts of seismic energy on snow crab: An update to the September 2004
review. Can. Tech. Rep. Fish. Aquat. Sci. 2836.
Branscomb, E.S. and D. Rittschof. 1984. An investigation of low frequency sound waves as a means of inhibiting
barnacle settlement. J. Exp. Mar. Biol. Ecol. 79:149-154.

Appendix E: Airgun Sounds and Invertebrates
Environmental Assessment for L-DEO’s GOA Seismic Survey, 2010 Page 187
Breithaupt, T. 2002. Sound perception in aquatic crustaceans. p. 548-558 In: K. Wiese (ed.), The crustacean
nervous system. Springer-Verlag, Berlin-Heidelberg, Germany. 623 p.
Budelmann, B.U. 1992. Hearing in crustacea. p. 131-139 In: D.B. Webster, R.R. Fay, and A.N. Popper (eds.),
Evolutionary biology of hearing. Springer-Verlag, New York, NY.
Budelmann, B.U. 1996. Active marine predators: the sensory world of cephalopods. Mar. Freshw. Behav. Phys-
iol. 27:59-75.
Budelmann, B.U. and R. Williamson. 1994. Directional sensitivity of hair cell afferents in the octopus statocyst.
J. Exp. Biol. 187:245-259.
Chadwick, M. 2004. Proceedings of the peer review on potential impacts of seismic energy on snow crab. Gulf
Region, Department of Fisheries and Oceans Canada, Science Advisory Secretariat Proceedings Series
2004/045.
Christian, J.R., A. Mathieu, D.H. Thomson, D. White, and R.A. Buchanan. 2003. Effect of seismic energy on snow
crab (Chionoecetes opilio). Environ. Stud. Res. Funds Rep. 144. Calgary, Alberta.
Christian, J.R., A. Mathieu, and R.A. Buchanan. 2004. Chronic effects of seismic energy on snow crab
(Chionoecetes opilio). Environ. Stud. Res. Funds Rep. 158, Calgary, Alberta.
DFO. 2004. Potential impacts of seismic energy on snow crab. Canadian Science Advisory Secretariat Habitat
Status Report 2004/003.
Donskoy, D.M. and M.L. Ludyanskiy. 1995. Low frequency sound as a control measure for zebra mussel fouling.
Proc. 5th Int. Zebra Mussel and Other Aquatic Nuisance Organisms Conference, February 1995, Toronto, Ont.
Guerra, A., A.F. González, and F. Rocha. 2004. A review of the records of giant squid in the north-eastern Atlantic
and severe injuries in Architeuthis dux stranded after acoustic explorations. Paper presented at the
International Council for the Exploration of the Sea (ICES) Annual Science Conference, 22–25 Sept. 2004,
Vigo, Spain. ICES CM 2004/CC:29.
Henninger, H.P. and W.H. Watson, III. 2005. Mechanisms underlying the production of carapace vibrations and
associated waterborne sounds in the American lobster, Homarus americanus. J. Exp. Biol. 208:3421-3429.
Hu, M.Y., H.Y. Yan, W-S Chung, J-C Shiao, and P-P Hwang. 2009. Acoustically evoked potentials in two
cephalopods inferred using the auditory brainstem response (ABR) approach. Comp. Biochem. Physiol. A
153:278-283.
Jeffs, A., N. Tolimieri, and J.C. Montgomery. 2003. Crabs on cue for the coast: the use of underwater sound for
orientation by pelagic crab stages. Mar. Freshw. Res. 54:841-845.
Jeffs, A.G., J.C. Montgomery, and C.T. Tindle. 2005. How do spiny lobster post-larvae find the coast? N.Z. J.
Mar. Fresh. Res. 39:605-617.
Kaifu, K., S. Segawa, and K. Tsuchiya. 2007. Behavioral responses to underwater sound in the small benthic
octopus Octopus ocellatus. J. Mar. Acoust. Soc. Japan 34:46-53.
Kaifu, K., T. Akamatsu, and S. Segawa. 2008. Underwater sound detection by cephalopod statocyst. Fish. Sci.
74:781-786.
Komak, S., J.G. Boal, L. Dickel, and B.U. Budelmann. 2005. Behavioural responses of juvenile cuttlefish (Sepia
officinalis) to local water movements. Mar. Freshw. Behav. Physiol. 38:117-125.
Lagardère, J.P. 1982. Effects of noise on growth and reproduction of Crangon crangon in rearing tanks. Mar.
Biol. 71:177-186.
Latha, G., S. Senthilvadivu, R. Venkatesan, and V. Rajendran. 2005. Sound of shallow and deep water lobsters:
measurements, analysis, and characterization (L). J. Acoust. Soc. Am. 117: 2720-2723.

Appendix E: Airgun Sounds and Invertebrates
Environmental Assessment for L-DEO’s GOA Seismic Survey, 2010 Page 188
Lovell, J.M., M.M. Findley, R.M. Moate, and H.Y. Yan. 2005. The hearing abilities of the prawn Palaemon
serratus. Comp. Biochem. Physiol. A 140:89-100.
Lovell, J.M., R.M. Moate, L. Christiansen, and M.M. Findlay. 2006. The relationship between body size and
evoked potentials from the statocysts of the prawn Palaemon serratus. J. Exp. Biol. 209:2480-2485.
McCauley, R.D., J. Fewtrell, A.J. Duncan, C. Jenner, M.-N. Jenner, J.D. Penrose, R.I.T. Prince, A. Adhitya, J.
Murdoch, and K. McCabe. 2000a. Marine seismic surveys: analysis of airgun signals; and effects of air gun
exposure on humpback whales, sea turtles, fishes and squid. Rep. from Centre for Marine Science and
Technology, Curtin University, Perth, Western Australia, for Australian Petroleum Production Association,
Sydney, NSW.
McCauley, R.D., J. Fewtrell, A.J. Duncan, C. Jenner, M.-N. Jenner, J.D. Penrose, R.I.T. Prince, A. Adhitya,
J. Murdoch, and K. McCabe. 2000b. Marine seismic surveys – a study of environmental implications.
APPEA J. 40:692-706.
Moriyasu, M., R. Allain, K. Benhalima, and R. Claytor. 2004. Effects of seismic and marine noise on invertebrates:
A literature review. Fisheries and Oceans Canada, Science. Canadian Science Advisory Secretariat
Research Document 2004/126.
Packard, A., H.E. Karlsen, and O. Sand. 1990. Low frequency hearing in cephalopods. J. Comp. Physiol. A 166:
501-505.
Parry, G.D. and A. Gason. 2006. The effect of seismic surveys on catch rates of rock lobsters in western Victoria,
Australia. Fish. Res. 79:272-284.
Payne, J.F., C.A. Andrews, L.L. Fancey, A.L. Cook, and J.R. Christian. 2007. Pilot study on the effects of seismic
air gun noise on lobster (Homarus americanus). Can. Tech. Rep. Fish. Aquatic Sci. 2712.
Payne, J.F., C. Andrews, L. Fancey, D. White, and J. Christian. 2008. Potential effects of seismic energy on fish
and shellfish: An update since 2003. Fisheries and Oceans Canada Science, Canadian Science Advisory
Secretariat Research Document 2008/060.
Pearson, W., J. Skalski, S. Sulkin, and C. Malme. 1994. Effects of seismic energy releases on the survival and
development of zoeal larvae of Dungeness crab (Cancer magister). Mar. Environ. Res. 38:93-113.
Popper, A.N., M. Salmon, and K.W. Horch. 2001. Acoustic detection and communication by decapod crustaceans.
J. Comp. Physiol. A 187:83-89.
Price, A. 2007. The effects of high frequency, high intensity underwater sound on the oxygen uptakes of Mytilus
edulis (L.). B.Sc.(Hons.) Thesis, Heriot-Watt Univ., Scotland.
Pye, H.J., and W.H. Watson, III. 2004. Sound detection and production in the American lobster, Homarus amer-
icanus: sensitivity range and behavioral implications. J. Acoust. Soc. Am. 115 (Part 2):2486.
Radford, C.A., A.G. Jeffs, and J.C. Montgomery. 2007. Orientated swimming behavior of crab postlarvae in
response to reef sound. Poster at First Intern. Conf. on Effects of Noise on Aquatic Life, Nyborg, Denmark,
Aug. 2007.
Rawizza, H.E. 1995. Hearing and associative learning in cuttlefish, Sepia officinalis. Hopkins Marine Station
Student Paper. Stanford Univ., Palo Alto, CA.
Richardson, W.J., C.R. Greene, Jr., C.I. Malme, and D.H. Thomson. 1995. Marine mammals and noise. Academic
Press, San Diego, CA. 576 p.
Tolstoganova, L.K. 2002. Acoustical behavior in king crab (Paralithodes camtschaticus). p. 247-254 In: A.J. Paul,
E.G. Dawe, R. Elner, G.S. Jamieson, G.H. Kruse, R.S. Otto, B. Sainte-Marie, T.C. Shirley, and D. Woodby
(eds.), Crabs in cold water regions: biology, management, and economics. University of Alaska Sea Grant,
AK-SG-02-01, Fairbanks, AK.
Top Related
Copyright © 2022 FDOKUMEN

