


Bahasa
Halaman
Hukum


Residential Energy Efficiency Loan
Assistance Pilot Draft Impact Evaluation Report
November 2019

opiniondynamics.com
This study is covered under CPUC Contract 17PS5017 between Opinion Dynamics and the California Public
Utilities Commission (CPUC or the Commission). Dunsky Energy Consulting and Ridge & Associates are
subcontractors to Opinion Dynamics for this work.
Acknowledgments
This project was a collaborative effort under contract to the CPUC. The evaluation team would like to thank
the CPUC Staff, Investor-Owned Utilities, and the California Alternative Energy and Advanced Transportation
Financing Authority (CAEATFA) for guidance and input throughout the project planning and execution. Finally,
the evaluation team would like to thank the residential homeowners, contractors, financial institutions, and
program administrators who took the time to support this study by responding to survey efforts.
Legal Notice
This report was prepared as an account of work sponsored by the CPUC. It does not necessarily represent
the views of the Commission or any of its employees except to the extent, if any, that it has formally been
approved by the Commission at a public meeting. For information regarding any such action, communicate
directly with the Commission at 505 Van Ness Avenue, San Francisco, California 94102. Neither the
Commission nor the State of California, nor any officer, employee, or any of its contractors or subcontractors
makes any warrant, express or implied, or assumes any legal liability whatsoever for the contents of this
document.

opiniondynamics.com Page i
Table of Contents
1. Executive Summary ...................................................................................................................................... 1
2. Pilot Overview and Study Purpose .............................................................................................................. 22
2.1 Pilot Description .......................................................................................................................................... 22
2.2 Pilot Theory and Logic ................................................................................................................................ 24
2.3 Purpose of the Study .................................................................................................................................. 27
2.4 Study Timeframe ......................................................................................................................................... 28
3. Methodology ............................................................................................................................................... 29
4. Study Results Summary ............................................................................................................................. 30
4.1 Participation Characteristics and Pilot Accomplishments ................................................................... 30
4.2 Energy Savings ............................................................................................................................................ 40
4.3 Pilot Influence on Customer Decision Making ....................................................................................... 42
4.4 Pilot Benefits and Costs ............................................................................................................................. 46
4.5 Pilot Design and Implementation Model ................................................................................................ 51
4.6 Alternative Implementation Models ........................................................................................................ 59
4.7 Evolving Regulatory and Industry Environment ...................................................................................... 63
4.8 Scalability Potential .................................................................................................................................... 70
5. Detailed Gross Impact Results ................................................................................................................... 79
5.1 Data Sources and Data Cleaning ............................................................................................................. 79
5.2 Model Specification .................................................................................................................................... 80
5.3 Results .......................................................................................................................................................... 81
6. Detailed Net Impact Results and Pilot Influence ....................................................................................... 82
6.1 Net Impacts .................................................................................................................................................. 82
6.2 Pilot Influence Analysis .............................................................................................................................. 88
6.3 Future Considerations for Net-to-Gross Ratio Analysis ......................................................................... 94
7. Detailed Cost-Effectiveness Results .......................................................................................................... 98
7.1 Cost-Benefit Ratio ....................................................................................................................................... 99
7.1 Cost-Effectiveness Test Results ................................................................................................................ 99
8. Participant Survey Topline Results ........................................................................................................... 110
8.1 Survey Approach ....................................................................................................................................... 110
8.2 Survey Structure ........................................................................................................................................ 110
8.3 Results ........................................................................................................................................................ 111
9. Contractor Survey Topline Results ........................................................................................................... 128
9.1 Introduction and Approach ...................................................................................................................... 128
9.2 Results ........................................................................................................................................................ 129
10. Detailed Stakeholder Interview Results ................................................................................................... 145
10.1 CAEATFA and Program Administrators ................................................................................................. 145
10.2 Lenders ....................................................................................................................................................... 149

opiniondynamics.com Page ii
11. Secondary Research Findings .................................................................................................................. 153
11.1 LLR Management and Underwriting Practices ..................................................................................... 156
11.2 Managing Lenders: Multiple or Single-Model Approach ..................................................................... 158
11.3 Marketing and Integration with Resource Programs .......................................................................... 161
Appendix A. Early Participant Characterization Memo ................................................................................... 164
Introduction ......................................................................................................................................................... 164
Key Findings ........................................................................................................................................................ 167
Appendix B. Detailed Cost-Effectiveness Analysis Methods and Inputs ........................................................ 181
Financing Program Model ................................................................................................................................. 181
Appendix C. Acronyms, Abbreviations, and Finance Terms ........................................................................... 188

opiniondynamics.com Page iii
Table of Tables
Table 1. Self-Supporting REEL Program: Estimated Leverage Ratios and Interest Rate Riders ......................... 6
Table 2. Opportunities to Increase REEL Benefits and Reduce REEL Costs ...................................................... 13
Table 3. REEL Pilot Metrics .................................................................................................................................... 22
Table 4. Summary of Pilot Evaluation Tasks ........................................................................................................ 29
Table 5. Participation Characteristics (Two-Year Pilot Period) ............................................................................. 30
Table 6. Participation Characteristics (Two-and-a-Half-Year Pilot Period) .......................................................... 31
Table 7. REEL Loan Product Summary – Inception through July 2018 (N=212) ............................................... 34
Table 8. CalEnviro Scores among Participants ..................................................................................................... 36
Table 9. Credit Enhancements to Underserved .................................................................................................... 37
Table 10. Debt-to-Income Ratios among Participants ......................................................................................... 37
Table 11. Market Size of LMI Census Tracts in California ................................................................................... 38
Table 12. REEL Contractors’ Gross Annual Business Revenue in California ..................................................... 39
Table 13. REEL Contractors’ Business Size .......................................................................................................... 39
Table 14. Summary of Contractor Survey Respondent Specialties .................................................................... 39
Table 15. REEL Pilot Gross and Net Savings (First Two Years of Pilot) ............................................................... 40
Table 16. REEL Pilot Average Savings as a Percentage of Annual Consumption (First Two Years of Pilot) ..... 41
Table 17. Measure Types Financed by REEL Projects (First Two Years of Pilot) ................................................ 41
Table 18. Motivations for Home Upgrade ............................................................................................................. 43
Table 19. Need Financing in General for Energy Upgrades ................................................................................. 43
Table 20. Alternatives Participants Sought before Choosing REEL .................................................................... 44
Table 21. Reasons for Choosing REEL (Multiple Response) ............................................................................... 44
Table 22. REEL Influence on Pilot Projects ........................................................................................................... 45
Table 23. Benefit and Cost Components .............................................................................................................. 47
Table 24. Cost-Benefit Comparison across Three REEL Models ......................................................................... 48
Table 25. Cost-Effectiveness Results for the REEL Pilot and Two Future Programs (REEL BAU and REEL+) .. 48
Table 26. Comparison of Program Cost-Effectiveness Ratios ............................................................................. 50
Table 27. Contractor Satisfaction with REEL ........................................................................................................ 58
Table 28. Other Statewide Financing Programs ................................................................................................... 60
Table 29. Summary of Trends and Possible Strategies ....................................................................................... 70
Table 30. Opportunities to Increase REEL Benefits and Reduce REEL Costs .................................................... 75

opiniondynamics.com Page iv
Table 31. Interest Rate Rider Needed to Allow REEL to Be Self-Supporting ...................................................... 76
Table 32. Data-Cleaning Results ........................................................................................................................... 79
Table 33. Average Daily and Annual Gross Impacts Per Participant ................................................................... 81
Table 34. REEL Pilot Total Gross Impacts ............................................................................................................. 81
Table 35. Size of Initial Comparison Pool ............................................................................................................. 82
Table 36. Average Hourly Mahalanobis Distance, Covariate Balance for Matched Pre-Participation Period
Months by NEM Status, Electric ............................................................................................................................ 84
Table 37. Average Monthly Gas Consumption Data: Covariate Balance for Pre-Participation Period
Months .................................................................................................................................................................... 86
Table 38. Average Daily and Annual Net Impacts Per Participant ...................................................................... 88
Table 39. REEL Pilot Net Impacts .......................................................................................................................... 88
Table 40. Motivations for Home Upgrade ............................................................................................................. 89
Table 41. Likelihood to Do Projects without Financing ........................................................................................ 89
Table 42. Likelihood to Do Project of the Same EE Level without Financing ..................................................... 90
Table 43. Timing of Project without Financing ..................................................................................................... 90
Table 44. Relative Influence of Loans and Rebates (n=6) .................................................................................. 91
Table 45. Actual Alternatives Sought before Choosing REEL .............................................................................. 92
Table 46. Shopping Behavior (Hypothetical and Actual) ..................................................................................... 92
Table 47. Self-Reported Influence of REEL on Project Size If Qualified and If Loan Cost Was Higher ............. 93
Table 48. Reasons for Choosing REEL (Multiple Response) ............................................................................... 93
Table 49. Cost-Effectiveness Results for the REEL Pilot and Two Future Programs (REEL BAU and REEL+) 100
Table 50. Comparison of Annual Program Costs................................................................................................102
Table 51. Comparison of Program Benefits and Outcomes ..............................................................................103
Table 52. Comparison of Program Cost-Effectiveness Ratios ...........................................................................104
Table 53. NTGR Required for REEL to Be Cost-Effective ...................................................................................106
Table 54. Impacts of Volume on Cost-Effectiveness Results ............................................................................106
Table 55. Variables Influencing Cost-Effectiveness Results ..............................................................................107
Table 56. REEL Participant Survey Sample Frame ............................................................................................110
Table 57. Participant Survey Structure ...............................................................................................................110
Table 58. Contractor Survey Structure ................................................................................................................128
Table 59. Geographic Distribution of Contractors ..............................................................................................142
Table 60. Region-Level Summary (Mutually Exclusive Categories) ...................................................................143

opiniondynamics.com Page v
Table 61. Region-Level Summary (Multiple Regions Per Contractor) ...............................................................144
Table 62. Comparison of Residential Financing Programs Studied ..................................................................155
Table 63. Summary of Insights for Pilot Design and Implementation ..............................................................156
Table 64. Loan Servicing Cost Comparison: NYSERDA vs REEL .......................................................................160
Table 65. EE Financing Pilot Metrics ...................................................................................................................166
Table 66. REEL Loan Product Summary Inception through December 2018 (N=339) ..................................167
Table 67. REEL Loan Product Summary Inception through July 2018 (N=212) ..............................................167
Table 68. REEL Participant Characteristics Related to Resolution E-4900 Metrics ........................................168
Table 69. REEL Loan Summary by Lender (Inception through December 2018) ............................................173
Table 70. REEL Loan Summary by Lender (Inception through July 2018) .......................................................174
Table 71. REEL Loans by Underserved Designation (Inception through December 2018) ............................175
Table 72. REEL Loans by Underserved Designation (Inception though July 2018) .........................................175
Table 73. REEL Loans by LMI Tract and Credit Enhancement Level (Inception through December 2018)...176
Table 74. REEL Loans by LMI Tract and Credit Enhancement Level (Inception through July 2018) ..............176
Table 75. REEL Loans by FICO Score and Credit Enhancement Level (Inception through December 2018) 176
Table 76. REEL Loans by FICO Score and Credit Enhancement Level (Inception through July 2018) ...........177
Table 77. REEL Loans by DTI Ratio and Credit Enhancement Level (Inception through December 2018) ...177
Table 78. REEL Loans DTI Ratio and Credit Enhancement Level (Inception through July 2018) ...................177
Table 79. REEL Loan Summary by CalEnviro Score (Inception through December 2018) .............................177
Table 80. REEL Loan Summary by CalEnviro Score (Inception through July 2018) ........................................178
Table 81. Measure Types Financed by REEL Projects .......................................................................................178
Table 82. Percentage of Participants by Project Type, F2Y vs. Post-F2Y ..........................................................179
Table 83. Percentage of Participants by Project Type Detail, F2Y vs. Post-F2Y ...............................................180
Table 84. REEL Loans by Participation in Rebate Programs (Inception through December 2018) ...............180
Table 85. Financing Program Model and Key Inputs .........................................................................................181
Table 86. TRC/SCT High-Level Algorithm ............................................................................................................183
Table 87. PAC High-Level Algorithm ....................................................................................................................186
Table 88. Discount Rates .....................................................................................................................................186
Table 89. Summary of Cost-Effectiveness Model Inputs ...................................................................................187
Table 90. Acronyms and Abbreviations ...............................................................................................................188
Table 91. Finance Terms .....................................................................................................................................190

opiniondynamics.com Page vi
Table of Figures
Figure 1. REEL Loan Growth .................................................................................................................................. 10
Figure 2. Map of REEL Participation, Lender Activity, and Contractor Territories (2.5 Years into the Pilot) .... 11
Figure 3. REEL Pilot Program Theory Logic Model ............................................................................................... 26
Figure 4. Month-by-Month REEL Loan Growth ...................................................................................................... 32
Figure 5. Geographic Distribution of Loans by Statewide and Regional Lenders .............................................. 33
Figure 6. Proportion of Pilot Participants that are Underserved (Inception through July 2018) ....................... 35
Figure 7. REEL Pilot Expenditures from FY14-15 to FY17-18 ............................................................................. 47
Figure 8. Comparison of REEL Pilot and REEL+ Scenario Benefits and Costs ................................................... 49
Figure 9. Contractor Feedback on REEL Components ......................................................................................... 59
Figure 10. Home Upgrade and Advanced Home Upgrade Programs Claimed Total Expenditures ................... 65
Figure 11. 2016 Energy Use in California Buildings (MMBtu) ............................................................................. 66
Figure 12. New PACE Financing Reported to CAEATFA (until December 31, 2018) .......................................... 68
Figure 13. REEL Loan Growth ................................................................................................................................ 71
Figure 14. Cumulative REEL Financing ................................................................................................................. 72
Figure 15. Map of REEL Participation, Lender Activity, and Contractor Territories (2.5 Years into the Pilot) .. 73
Figure 16. Average Hourly Mahalanobis Distance Matching by NEM Status, Electric ....................................... 83
Figure 17. Average Monthly Mahalanobis Distance Matching, Gas ................................................................... 86
Figure 18. Proposed Framework for Self-Report-Based Finance Program NTGR .............................................. 95
Figure 19. Comparison of Costs and Benefits of the REEL Pilot and REEL+ Program ....................................100
Figure 20. Impacts of Key Variables ...................................................................................................................107
Figure 21. Month-to-Month REEL Loan Growth over Program Design Changes ..............................................169
Figure 22. Month-to-Month REEL Loan Growth over Lender 1st Loan Date ....................................................170
Figure 23. REEL Loan Distribution Over Time (by County) .................................................................................171
Figure 24. REEL Loans per Capita .......................................................................................................................172
Figure 25. Distribution of REEL Loans by Lender ...............................................................................................173
opiniondynamics.com Page vii
Table of Equations
Equation 1. Model Specification for Electric and Demand Fixed Effects Model without Comparison Group .. 80
Equation 2. Model Specification for Gas Fixed Effects Model without Comparison Group ............................... 80
Equation 3. Model Specification for Electric and Demand Fixed-Effects Model with Comparison Group ........ 87
Equation 4. Model Specification for Gas Fixed-Effects Model with Comparison Group .................................... 87

Executive Summary
opiniondynamics.com Page 1
1. Executive Summary
Introduction to the Residential Energy Efficiency Loan Assistance Pilot
In 2012, the California Public Utilities Commission (CPUC) allocated ratepayer funds to test financing as a
mechanism to make energy efficiency (EE) improvements1 more affordable2 to residential homeowners. The
CPUC wanted to leverage ratepayer funds to test the capability of a specific financing product — the
Residential Energy Efficiency Loan (REEL) Assistance Pilot — to stimulate deeper energy savings than the
state has historically achieved through other market incentives, such as rebates.3 The pilot’s primary goals
were to attract private capital to increase the volume of EE financing, increase the number of EE upgrades,
and attempt to reach residents in low- and moderate-income (LMI) markets. The California Alternative Energy
and Advanced Transportation Financing Authority (CAEATFA) was responsible for implementing the pilot.
The pilot provides lower-cost financing by establishing a loan loss reserve (LLR) as a risk mitigation strategy
for lenders who enroll and offer a REEL product to their customers. Lenders can offer loans up to $50,000
and the LLR can cover up to 90% of potential losses. By mitigating lender risk, the LLR leads to reduced
capital costs for borrowers via lower interest rates compared to products otherwise available in the market4;
lower monthly payments; and broader market coverage in underserved market segments, such as LMI or
credit-challenged borrowers. Borrowers living in single-family residences in any of the investor-owned
utilities’5 (IOUs) territories are required to use at least 70% of their REEL loan to fund eligible energy
efficiency measures (EEEMs), which are similar to the measures that qualify for IOU rebate programs. Loans
are intended for EE purposes and cannot be used for renewable measures, such as solar generation. The
pilot can work in concert with rebate programs, but this is not a requirement; borrowers can receive IOU
rebates or opt to only receive financing.
CAEATFA started approving and enrolling lenders in 2015. As an “open-market” program, these lenders are
responsible for developing their own origination processes; however, Currently, approved lenders are credit
unions (CUs) and none of them relies on contractor-based origination.6 In July 2016, the pilot issued its first
REEL loan. In November 2018, the CPUC contracted with Opinion Dynamics, Dunsky Energy Consulting, and
Ridge & Associates (the evaluation team) to evaluate the first two years of implementation.7
Research Objectives and Methods
This evaluation sought to answer the following eight research objectives:
1. Describe participation in the pilot as of the end of its two-year implementation period to measure the
degree to which it was successful in reaching its goals based on metrics adopted in Resolution
1 The CPUC provided guidance for, allocated budget to, and ordered implementation of the energy efficiency financing pilots via Ds.
12-05-015, 12-11-015, and 13-09-044. 2 This study does not objectively define “affordability” for customers; instead, it is considered a subjective concept of cost-band
beyond which customers feel they cannot venture. 3 D. 13-09-044, pg. 3. 4 The REEL regulations state that interest rates on enrolled loans must not exceed 750 basis points over the U.S. Government’s
10-year treasury rate. 5 Pacific Gas & Electric (PG&E), San Diego Gas & Electric (SDG&E), Southern California Gas Company (SCG), and Southern California
Edison (SCE). 6 Notably, the pilots have enrolled one financial institution (FI) that wants to employ a contractor-based model. 7 Defined here as the two years after the issuance of the first REEL loan, namely, July 2016–July 2018.

Executive Summary
opiniondynamics.com Page 2
E-4900. Notably, Resolution E-4900 metrics were established in December 2017, after the pilot was
designed and implemented.
2. Determine how much energy savings the pilot produced, including gas and electric savings.
3. Explore the influence of the pilot on customer decision making.
4. Explore the costs versus benefits of the REEL product during the pilot period and compare them to
other residential demand-side management (DSM) investments.
5. Gain feedback on the pilot design and implementation model from key stakeholders, including
Program Administrators8 (PAs), such as IOUs and Regional Energy Networks (RENs); CAEATFA;
participating contractors; and lenders.
6. Compare and contrast the pilot implementation model with other models.
7. Explore how the marketplace has changed since the 2012 decision9 to fund the pilots. Identify
trends, if any, that will help the CPUC reorient strategic EE financing goals.
8. Assess the scalability potential of the pilot.
To achieve these objectives, the evaluation team conducted the following research activities:
◼ A consumption analysis to estimate average electric and gas savings after completing REEL-funded
projects
◼ A telephone survey with 49 pilot participants to assess the influence of REEL on their home upgrade,
to understand property and household characteristics like square footage and income, and to
identify any changes to households or properties that might affect savings results
◼ A web survey with 57 contractors, including 34 who completed a REEL-funded project and 23
contractors who were REEL-certified but had not completed a REEL-funded project, the goal of which
was to gain feedback on REEL design and implementation and the impact of the pilot on contractors’
businesses
◼ An analysis of pilot tracking data, participant survey responses, and census data to understand the
characteristics of pilot participants
◼ An analysis of participant survey responses on pilot influence to understand how participants’
projects would have changed, or if they would have occurred at all, without the pilot
◼ In-depth interviews with CAEATFA, EE PAs, and enrolled lenders to gather feedback on the current
pilot and how the EE financing market has transformed since the pilot was approved
◼ A review of five similar financing programs for comparison purposes
◼ A cost-effectiveness analysis of the pilot under the current pilot scenario and two potential future
scenarios as a ratepayer program and an exploration of the necessary design changes to transition
to a self-supporting program without ratepayer funds
8 Program administrators in the context of this study include PG&E, SCE, SCG, the Bay Area Regional Energy Network (BayREN), the
Southern California Regional Energy Network (SoCalREN), and SDG&E. 9 D. 12-11-015.

Executive Summary
opiniondynamics.com Page 3
More information on the objectives and methods for this evaluation is available in Section 2.3 and Chapter 3,
respectively.
Pilot Participation Characteristics
The pilot created a financing tool that is leveraged by private capital and support. It enrolled four CUs in the
first two years that together distributed loans to 212 residents (or participants) across the state, amounting
to $3.7M in private capital lending. REEL contributed $475K of ratepayer dollars in LLR to mitigate lender
risk for these loans.
Participation was largely concentrated within one lender, California Coast CU, which represented 71% of the
private capital attracted, followed by Matadors Community CU with 23%. Both lenders operate throughout
the entire state, while the two smaller volume lenders are focused in one specific region. Notably, after six
more months, the pilot made further progress by enrolling three more regionally focused CUs, accumulating
339 participants and attracting $5.8M in private capital. Participation was also largely concentrated in
Southern California. Although California Coast CU and Matadors Community CU operate statewide, their
branch locations are found only in Southern California.
The lenders already had “signature” loan products for residential customers that were unsecured, and, as a
result of the LLR, they increased maximum allowable loan amounts and loan terms for the REEL product. For
lenders who participated during the first two years, maximum allowable loan amounts saw increases ranging
from $30,000 to $47,500, depending on the lender.10 All lenders increased the maximum allowable loan
term from 5.0–5.5 years for their signature product up to 15 years for the REEL product. The pilot design
specified that lenders could lend up to $50K with LLR support and REEL loan amounts ranged from $3,366
to $50,000. The average REEL borrower received a $17K loan and will be paying $200 per month for 10
years at 7% interest. While REEL distributed its first loan in July 2016, most of the loans began a year later,
which gave little time for customers to make payments and for the evaluation team to assess loan
performance and risk in the pilot period. However, during the two-and-a-half-year period being evaluated,11
only one borrower defaulted and 6% of the loans had already been paid in full.
The pilot attempted to reach underserved markets by offering a 20% credit enhancement to lenders who
qualified loans to LMI borrowers. Approximately one-third of the 212 REEL participants are LMI, based on
household income or census track. Further, many participants are “underserved” as defined by CalEnviro
Scores (34%). Notably, based on Fair, Isaac and Company (FICO) credit scores of the participants, only 8%
might be considered credit-challenged, with FICO scores of 640 or below.
In its first two and a half years, REEL certified 282 contractors who serve most counties in the state, and, as
of June 2019, this number had increased to 340 contractors.12 Surveys with contractors indicate that the
pilot recruited experienced, versatile, and highly qualified contractors who could assist with multiple types of
10 According to the “REEL Benefits aggregated by Lender” document provided by CAEATFA, Matadors Community CU increased its
maximum loan amount by $35,000 (from $15,000 to $50,000), California Coast CU and Valley Oak CU increased their maximum
loan amounts by $30,000 (from $20,000 to $50,000), and Desert Valleys Federal CU increased its maximum loan amount by
$47,500 (from $2,500 to $50,000). 11 The CPUC initially requested an evaluation of the first two years after the issuance of the first REEL loan (July 2016–July 2018)
similar to how Pilots are traditionally evaluated. Given the delay in the evaluation timing, the evaluation also includes further data
from the first two and a half years after the issuance of the first REEL loan (July 2016–December 2018) if the data helped to assess
the Pilot’s performance. 12 https://gogreenfinancing.com/residential. Last viewed on June 15, 2019.

Executive Summary
opiniondynamics.com Page 4
EE upgrades. These contractors are experienced (75% have offered residential services for more than 10
years), and their most common specializations are heating and cooling (89% offer one or both), water
heating (73%), weatherization and insulation (68%), and window (55%) services. In just the first two years,
82 certified contractors sold at least one project that was financed with REEL. Of the contractors who
completed a REEL project, the majority (68% or 56 contractors) completed one or two projects, while the
most projects completed by any one contractor was 28.
Energy Savings and Pilot Influence
After analyzing energy consumption before and after projects that were implemented in the pilot period,
participants, on average, saved 12.8% of their gross annual electric usage and 2.6% of their gross annual
gas usage, which amounts to 741 kWh and 11 therms, respectively, in annual savings per participant. The
electric savings in REEL is similar to the statewide Residential HVAC and Advanced Home Upgrade programs
(AHUPs); however, gas savings are remarkably lower. The types of projects and geographic distribution
across the state may be driving the difference in savings between gas and electric fuels. HVAC equipment
was by far the most common measure in REEL-funded projects, followed by building shell upgrades, such as
insulation; three-quarters of the projects involved replacing central air conditioning, which typically uses
electricity as the primary fuel. Participation was also concentrated in parts of Southern California that have
heavy cooling loads in summer months.
While there are clearly gross energy savings associated with REEL projects, it is important to explore whether
these savings would have naturally occurred in the marketplace without REEL, that is, would customers have
paid for the exact same project with other means? If not the same project, would they have done a different
project or a later project? The counterfactual for this pilot is challenging to measure. One way to measure the
net impacts is to analyze the difference in savings between the participating customers and a matched
comparison group of similar homes. Based on this approach, if the total net savings is divided by the gross
savings, it can be surmised that 41% of the electric and demand savings and 54% of the gas savings occurred,
at least in part, because of the REEL pilot.
The consumption analysis approach is one way to quantify the counterfactual for the pilot. This evaluation also
explored the influence of REEL through a survey of 49 participants. Financing in general is a tool for making
home upgrade projects more affordable for a customer by overcoming barriers related to paying with cash up
front and translating the total project cost into affordable monthly payments. However, the availability of
financing is not usually the impetus for deciding that there is a need to do a home upgrade. The most common
motivators among respondents were the desire to reduce energy bills and to increase comfort (more than half
of respondents cited one of these). The next most common motivation was to replace broken or failing
equipment (20%).
Almost half (49%) of participants said that they used financing because they did not have enough cash on
hand to do the project right away. Using a decision tree that provides a framework for measuring attribution
for financing (see Section 6.3), the evaluation team estimates that at least 27% of the projects would not have
occurred at all if REEL was unavailable. At the other extreme, one-quarter of the projects would likely have
occurred without the pilot. The remaining projects were at least partially influenced by REEL. These data from
just the first cohort of participants indicate that this pilot has the potential to garner more energy savings for
the state than would occur naturally in the marketplace through alternative financing options available to
customers.

Executive Summary
opiniondynamics.com Page 5
In the first two years, about one quarter (27%, or 57 of 212) of participants also used a rebate in addition to
financing. The evaluation team determined this by cross-referencing REEL and statewide rebate program
tracking databases (for example, California Energy and Data Reporting System [CEDARS] data); if this trend
continues in the future, impact evaluations that intend to claim savings will need to avoid double-counting
savings from both REEL and rebate programs.
More detail on REEL pilot influence is available in Section 6.2.
Costs and Benefits
In its simplest form, a cost-benefit (C/B) ratio is used to define the value of a program intervention versus
the cost of that intervention, considered from a variety of perspectives. The C/B ratio is derived by
converting the entire stream of current and future costs and benefits into present values. If the benefit is
higher than the cost (that is, the C/B ratio is greater than 1.0), the project is considered a good investment.
The analysis used data on pilot expenditures from 2014 through 2018. Pilot expenditures in fiscal year (FY)
14–15 and FY15–16 were mainly start-up costs needed to build the infrastructure, administration, and
lender and contractor networks. Most recently, in FY17–18, the pilot spent close to $1M to cover costs
associated with managing the LLR (bank trustee fees, master servicer), administration (operating expenses
and equipment, employee benefits, and salaries), and funding the contractor management and consultants.
The evaluation team expects the future costs of the program (bank trustee fees) to be an additional
$270K.13 The pilot spends the most on LLR-related costs, particularly the master servicer costs to enroll
loans and the bank trustee to maintain the LLR for the life of loans. To explore the pilot’s current and
potential costs and benefits, the evaluation team applied cost-effectiveness tests for three scenarios:
1. REEL Pilot: Based on actual pilot operating expenditures, participation, and savings.
2. REEL Business as Usual (BAU): A future scenario with modest savings in expenditures and a modest
increase in participation (240 participants per year) over a five-year period.
3. REEL+: A future scenario that assumes increased expenditures (additional staff and investments in
IT and an on-bill repayment [OBR] option) and a significant increase in participation rates (883
participants per year) over a five-year period.
The evaluation team ran multiple cost-effectiveness tests — Participant Cost Test (PCT), Total Resource Cost
Test (TRC), Societal Cost Test (SCT), and Program Administrator Cost Test (PAC) — for each scenario and found
that:
◼ The REEL model as it is currently structured carries a heavy administrative weight that affects the
ability to operate cost-effectively. Administration and LLR management costs make up a significant
portion of the costs (30%–40% and 25%–35% of total annual costs, respectively).
◼ Except for the REEL+ program under the SCT, neither the pilot nor the two future scenarios pass the
cost-effectiveness threshold (> 1.0) for any of the TRC, SCT, or PAC.
◼ The loans are cost-effective for participants using the PCT.
◼ While the contractor management costs are also high, interviews with CAEATFA, PAs, lenders, and
other jurisdictions revealed that this investment is critical to financing program success.
13 The bank trustee costs are incurred for the life of the loans. This cost is discounted to 2017 dollars.

Executive Summary
opiniondynamics.com Page 6
To achieve a TRC threshold of > 1.0 across all tests requires a combination of factors: reducing costs
(administration and LLR management fees) and increasing benefits (energy savings, accounting for other
non-energy benefits (NEBs), and further reductions in the annual percentage rate [APR]). However, the
estimated savings per REEL participant are based on the gross savings found in this evaluation; applying net
savings would further reduce savings and REEL’s ability to achieve cost-effectiveness. Further, REEL offers a
variety of social, economic, and environmental benefits that are not fully accounted for in the tests that the
evaluation team applied: helping underserved Californians make improvements that increase their comfort,
reduce energy poverty, and improve people’s health; boosting the value of housing stock; increasing
economic opportunities for partners; and accounting for the social cost of carbon. Finding opportunities to
reduce costs, applying a longer-term lens to measure market impacts, and reevaluating if and how ratepayer
funds can be used to support California’s climate-related goals should be considered.
Self-Supporting Program Scenarios
As an alternative, the team assessed the potential for REEL to become a self-supporting program without the
need for regular injections of ratepayer funds. This represents a self-supported REEL model that would not be
required to track loans and funds for each IOU and would have an LLR that is managed by CAEATFA itself.
The first step was to determine REEL’s private/public capital leverage ratio, which gives an indication of the
amount of funds that would need to be raised to support the REEL program relative to the overall program
loan volume. The team then determined what interest rate rider would be needed to cover the program costs.
The interest rate rider would be applied to each loan over its entire repayment term, collected from the lender
and remitted to the REEL PA to support the program costs. A high-level estimate was performed for each REEL
scenario assuming that the rate rider would cover all program administration costs and LLR-covered losses.
The calculation assumed that all loans are paid out over their full term and did not account for early
repayments. The results of this analysis are presented in Table 1.
Table 1. Self-Supporting REEL Program: Estimated Leverage Ratios and Interest Rate Riders
REEL Pilot REEL BAU REEL+
REEL+
(no master servicer)
Total Portfolio Value ($M) $3.75 $21.25 $78.18 $78.18
Leverage Ratio 1.86 3.08 7.19 8.40
Interest Rate Rider Required 6.20% 3.75% 1.44% 1.14%
From the results in Table 1 above, a few conclusions about REEL’s potential as a self-supported program
emerge.
◼ As program volume increases the potential for a self-supported program becomes more evident. The
leverage ratios rise and the required interest rate riders drop significantly under the REEL+ models,
suggesting that if REEL could generate significant volume, it would have a higher potential to be self-
supporting.
◼ The REEL+ and REEL BAU interest rate riders are significantly lower than the current average APR
reduction of 4.6%. Under the REEL+ model (with or without the master servicer), the interest rate
rider would be less than half the current average APR benefit, suggesting that, even with the rate
rider, the program would still pass along significant APR benefits to its customers.

Executive Summary
opiniondynamics.com Page 7
◼ While there is the potential to cover REEL’s costs via a rate rider, the LLR itself would require further
support. The interest rate riders do cover LLR losses but were not designed to provide the funds
needed to establish the initial LLR pool itself. Under the REEL+ model, with steady annual volumes,
the evaluation team estimates that the LLR would ramp up to nearly $15M within 10 years, as the
loan pool expands year by year, and then grow more slowly thereafter as the LLR revolves. This initial
pool of LLR funds would need to be supplied to CAEATFA in the initial years, like the Property
Assessed Clean Energy (PACE) LLR that it currently operates.
How REEL Compares to Other Statewide Financing Programs
The evaluation team compared REEL to five similar financing programs in other jurisdictions (New York,
Michigan, Oregon, Connecticut, and Colorado) to extract insights on best practices. These other programs all
offer financing to residential customers, aim to support EE upgrades, have statewide coverage, incorporate
credit enhancement features, and have varying lender partnership models (single- or multiple-lender
models). The following key themes emerged when comparing REEL to other statewide financing programs:
◼ All other programs analyzed include both EE and renewable energy (RE) measures, typically solar
panels and/or battery storage systems.
◼ REEL incurs significantly higher costs for LLR and lender management than other programs, likely
because of complex setup and reporting requirements.
◼ REEL can seize opportunities to continue to iterate and adapt LLR and underwriting practices to
improve program accessibility to underserved markets, for example, to further reduce the APR.
◼ Most programs find success with multiple local community lenders that include both statewide and
local lenders. This ensures that statewide coverage and local lenders provide added benefits (more
in tune with community needs and offering face-to-face interactions versus online services).
◼ Investments in training contractors are critical as they are a driving force behind marketing and
quality.
Stakeholder Perspective on REEL
Below is a summary of key stakeholders’ (lenders, CAEATFA, and PAs) perspectives on REEL design and
implementation.
Lender Perspective on REEL
The evaluation team interviewed seven participating lenders14 that produced the following key themes:
◼ Lenders would not be able to offer the same interest rates, terms, and loan amounts without the
LLR.
◼ Lenders agreed that REEL was supporting those who would otherwise not have access.
◼ REEL is a business opportunity for lenders; several lenders reported that most REEL loans are with
new CU members and REEL allows them to build relationships and sell more products.
◼ Lenders did not view PACE favorably, and this presents an opportunity for REEL.
14 Four were participating during the pilot evaluation period; three enrolled after.

Executive Summary
opiniondynamics.com Page 8
◼ More lenders can be leveraged to participate. Most participating lenders welcome more lenders into
the fold and suggest promoting REEL through trade associations like the California Credit Union
League.
◼ CAEATFA has built strong partnerships with lenders. Lenders reported high satisfaction with REEL
and CAEATFA. Lenders reported that CAEATFA is great to work with, very hands-on, and accessible.
All lenders hoped REEL would continue and planned to participate.
◼ REEL is labor intensive. Lenders reported that the time to book REEL loans is much greater than
other loan products and that a dedicated staff with knowledge of REEL guidelines and requirements
is necessary.
◼ There are opportunities to improve marketing. Utility bill inserts tend to drive most applications. After
the pilot period, one lender mentioned that it got 10–15 applications within a week of utility bill
inserts. Lenders expressed frustration with the manpower required for loan eligibility inspections and
manual reporting. Lenders suggested more automation and a reduction in reporting frequency, from
monthly to quarterly.
◼ Lenders can easily find REEL-certified contractors, but the contractors need a lot of hand-holding
when they do a REEL loan for the first time.
◼ One lender felt that there may be a need to conduct more quality assurance, particularly for non-
EEEM do-it-yourself (DIY) portions of projects. Currently, participants self-certify that 30% of the non-
EEEMs is DIY work, and it was felt that state funds could be open to misappropriation. The pilot’s
contractor management team performs site inspections on approximately 20% of projects.
Contractor Perspective on REEL
◼ Surveys with REEL-certified contractors revealed that a majority of them (61%) are satisfied with the
REEL pilot overall. Contractor satisfaction with the REEL pilot appears to be dependent on whether
the contractor completed REEL projects. Contractors who have completed a REEL project had a
slightly higher average satisfaction score than those REEL-certified contractors who had yet to
complete a REEL project. Notably, few contractors (6 of 57) reported that they were dissatisfied.
◼ Contractor feedback on various specific pilot components was overall positive, with contractors
describing the promptness of payment post-completion, increased loan duration, and maximum
amount as key benefits. Most respondents indicated that the key program design elements
(customer eligibility, REEL loan terms, and the application process) do not need improvement.
◼ Among the 57 contractors surveyed, 72% are out there promoting REEL to their customers in
addition to other financing options. REEL was the most commonly promoted, followed by PACE (63%
of contractors are promoting PACE). Survey results indicate that the most common reasons that
some contractors are not promoting REEL now to their customers are perceptions that REEL requires
too much of the contractors’ administration and sales time, few of their customers would be
interested in REEL, they prefer other types financing, and the project requirements for REEL are too
restrictive.
◼ Among contractors who are actively promoting REEL, approximately four in five of them (87%) say
REEL is helpful in selling EE projects.

Executive Summary
opiniondynamics.com Page 9
◼ Reasons that some contractors have not sold any REEL loans to date mainly speak to perceptions
that REEL is too complicated for the customer and the contractor, there is a lack of customer
awareness of REEL, customers have selected cash instead for projects, contractors have not had the
opportunity yet, or they attempted to connect customers with REEL but customers did not qualify.
CAEATFA and PA Perspective on REEL
Interviews with staff from CAEATFA, IOUs, and RENs produced the following key themes:
◼ Most PAs suggest that REEL’s multi-lender implementation model provides the benefit of offering
borrowers choice and the ability to work directly with lenders statewide.
◼ REEL’s status as a pilot is hindering growth. CAEATFA reported that it was challenging to recruit
larger lenders to a pilot program because they do not want to invest the time and money to set up a
new lending product (which can be costly to train staff and implement) that may exist over a short
timeframe.
◼ CAEATFA believes REEL getting to scale will require an IT investment and enrolling a large lender,
retail installment contracts (RICs), or a single originator that could standardize application
processing and approval and sell to the secondary market.
◼ There is demand for EE financing and, as PACE declines, there are opportunities for REEL to fill the
market gap. However, REEL needs to expand the eligible measures list and reduce barriers to make
inroads. Although new state PACE regulations have resulted in declining PACE volumes, REEL is not
growing at the same rate to fill the gap. PACE allowed for RE, EE, and other measures. Allowing REEL
to become a more comprehensive solution may increase participation.
◼ Investing in IT infrastructure may improve the contractor and customer experience and reduce
administrative costs associated with verifying customer eligibility.
◼ Offering EE loans (even with low interest rates) was not viewed as a solution for truly low-income
borrowers. There is hesitancy to offer financing to low-income customers that could potentially add
financial stress to this population, and many PAs favor other no-cost options available to low-income
homeowners (for example, Direct Install programs, Energy Savings Assistance Program [ESAP], and
California Alternate Rates for Energy [CARE]).
Scalability Potential
Below are the key insights from this evaluation that speak to the scalability of REEL.
Building on the REEL Pilot Infrastructure and Momentum
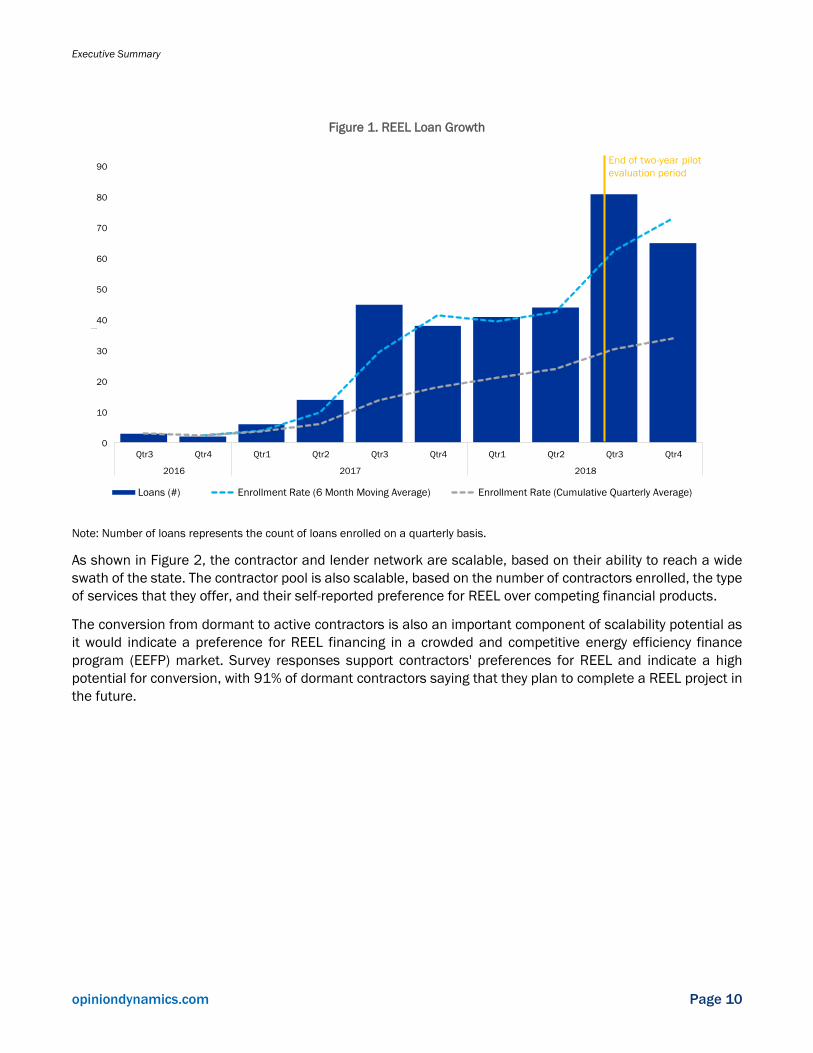
As shown in Figure 1, participation in the pilot grew steadily over the first years and then rapidly picked up
pace following the six months after the end of the two-year evaluation period. Specifically, in the first two
years, 212 participants participated in the pilot accounting for nine loans per month across the two-year
period; the monthly enrollment rate almost tripled in the five months after the pilot period to 25 loans per
month.
Executive Summary
opiniondynamics.com Page 10
Figure 1. REEL Loan Growth
Note: Number of loans represents the count of loans enrolled on a quarterly basis.
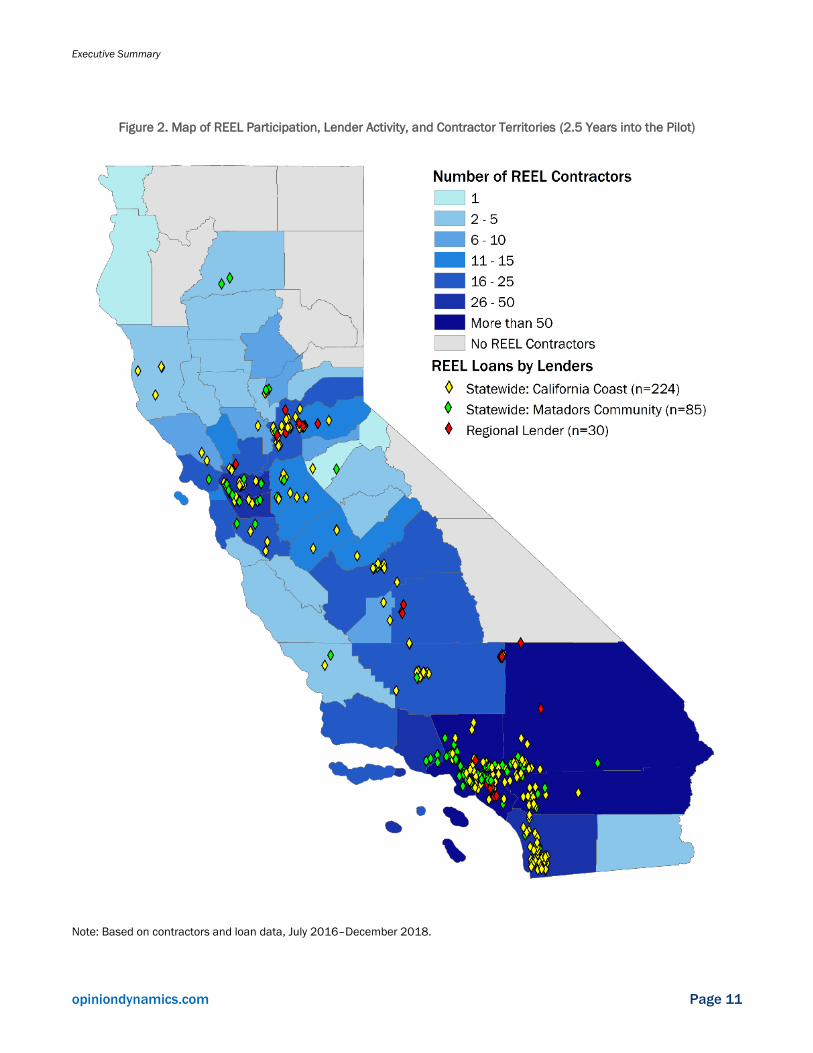
As shown in Figure 2, the contractor and lender network are scalable, based on their ability to reach a wide
swath of the state. The contractor pool is also scalable, based on the number of contractors enrolled, the type
of services that they offer, and their self-reported preference for REEL over competing financial products.
The conversion from dormant to active contractors is also an important component of scalability potential as
it would indicate a preference for REEL financing in a crowded and competitive energy efficiency finance
program (EEFP) market. Survey responses support contractors' preferences for REEL and indicate a high
potential for conversion, with 91% of dormant contractors saying that they plan to complete a REEL project in
the future.
0
10
20
30
40
50
60
70
80
90
Qtr3 Qtr4 Qtr1 Qtr2 Qtr3 Qtr4 Qtr1 Qtr2 Qtr3 Qtr4
2016 2017 2018
# of Loans
Loans (#) Enrollment Rate (6 Month Moving Average) Enrollment Rate (Cumulative Quarterly Average)
End of two - year pilot evaluation period
Executive Summary
opiniondynamics.com Page 11
Figure 2. Map of REEL Participation, Lender Activity, and Contractor Territories (2.5 Years into the Pilot)
Note: Based on contractors and loan data, July 2016–December 2018.

Executive Summary
opiniondynamics.com Page 12
Summary of Key Conclusions
In summary, this evaluation produced the following key conclusions.
Pilot Performance To Date
◼ Energy savings: The pilot generated statistically significant gas and electric savings, on average
12.8% of gross annual electric savings and 2.6% gross annual gas savings, which amounts to 741
kWh and 11 therms in annual savings per participant. Gas savings is significantly lower than electric
savings. The types of projects and geographic distribution across the state may be driving the
difference in savings between gas and electric fuels.
◼ Pilot influence: Three-quarters of surveyed borrowers noted that they were influenced in some way by
the availability of the pilot. More than a quarter would not have done a project at all (27%) and nearly
half (48%) would have done one much later or at a smaller scale.
◼ Reaching the underserved: The pilot achieved its goals of reaching underserved customers. It
provided 30% of loans and 51% of loan volume to LMI households, and a third of households are
“underserved” as defined by CalEnviro Scores. However, based on FICO scores of the participants,
only 8% might be considered credit-challenged.
◼ Lender and PA perspective: Lenders and PAs were generally supportive of the pilot and of CAEATFA
as the pilot administrator. All of these stakeholders suggested that a state-backed program adds
credibility, trust, and security. Stakeholders also commended CAEATFA for its ability to launch REEL;
identify and address constraints; and establish the infrastructure and team to deliver and build
strong relationships with lenders, contractors, and IOU staff. CAEATFA has gained valuable
experience that will benefit REEL if it continues and other future initiatives like the Small Business
Financing and Affordable Multifamily pilots.
◼ REEL-certified contractor perspective: Contractor feedback on the pilot was positive overall. Nearly
three-quarters (72%) of the REEL-certified contractors surveyed are promoting REEL, and REEL has
surpassed PACE as the top financing option among these contractors. Four in five contractors (87%)
who promote REEL say REEL is helpful in selling EE projects.
◼ Comparison to other program models: REEL has adopted several best practices found in similar
financing programs, including that it has recruited multiple local community lenders and invested
heavily in training contractors. However, REEL stands out among the six programs reviewed as the
only one that does not include RE measures. REEL also incurs higher LLR-related costs than these
other programs due to complex reporting requirements.
Scalability
◼ Participation: The pilot has built momentum for EE financing. Since issuing its first loans in Q3 2016,
the REEL pilot has steadily increased its loan volume, as is expected for a new financing product that
is being introduced to the market. This momentum in loan volume continued up to the end of the
two-year evaluation period and continued to grow further beyond the evaluation period, suggesting
the participation rate is increasing for the REEL product.
◼ Partners network: CAEATFA has built the infrastructure needed to support an expanded loan volume,
including the networks of lenders and contractors needed to generate projects and originate loans.
These financing tools can reach a significant and growing number of Californians as the current

Executive Summary
opiniondynamics.com Page 13
partner network of lenders and contractors covers most of the state. However, to further scale up,
the pilot would require enrollment of a larger volume lender with physical branches covering more of
the state. Further investments in IT systems to streamline loan applications could also help grow
volume and attract more lenders.
◼ Cost-effectiveness: The REEL model struggles to meet the required threshold in California’s cost-
effectiveness framework for EE programs, as it was not cost-effective under the TRC, SCT, and PAC.
However, a significant increase in loan volume would make it cost-effective. While the future
program would likely be more cost-effective than the pilot, simply scaling the program volume does
not appear to be sufficient for the REEL program to achieve cost-effectiveness. Notably, REEL offers
a variety of social, economic, and environmental benefits that are not fully accounted for in the tests
that the evaluation team applied.
Cost-Effectiveness
Overall, the cost-effectiveness analysis suggests that REEL would need to evolve in several notable ways if it
is to establish itself as a cost-effective (or near cost-effective) ratepayer-supported program. The current
administrative weight poses a significant barrier to REEL’s cost-effectiveness, particularly if REEL continues to
generate only modest loan volumes. Table 2 highlights a range of modifications that can help expand REEL’s
benefits and reduce its operating costs.
Table 2. Opportunities to Increase REEL Benefits and Reduce REEL Costs
Opportunities to Increase Benefits Opportunities to Reduce Costs
Expand the EEEMs list to include solar, electrification,
battery storage, and electric vehicles (EVs).
Account for the contribution REEL is making toward
California’s climate-related goals and include the social
cost of carbon.
Continue efforts to develop a public database on REEL
loan performance to demonstrate strong loan
performance to attract more lenders, and potentially
larger lenders, and inspire those participating to further
reduce their APR.
Require lenders to reduce APR on loans, in response to
very low default rates, to increase customer benefits and
attract more volume.
Enhance marketing to increase awareness of REEL and
drive participation.
Continue to invest in contractor support, training, and
streamlining of processes to improve contractor
experience and increase participation.
Reduce LLR ratios if the loan pool performance
warrants lower coverage.
Administer the LLR internally rather than contract
out to a master servicer and bank trustee. (This
would require reducing the constraints on the REEL
program and/or transferring to a nongovernmental
delivery agent.)
Address high loan enrollment costs and reduce
complexity in determining REEL eligibility (IOU
territory or not).
Aggregate LLR funds by IOU and lender up front,
and annually review and match the amount
allocated to each lender with its issued loan
volumes. (This would require simpler requirements
on the REEL program, such as a statewide measure
list.)
Explore efficiencies in administration and
contractor management operations. This is
currently under way.
The team assessed the potential for REEL to become a self-supporting program without the need for regular
injections of ratepayer funds. There are two key considerations for this scenario: the private/public capital
leverage ratio, which measures the amount of private investment required relative to program loan volume,
and an interest rate rider to cover the program costs. The rate rider would be applied to each loan, collected

Executive Summary
opiniondynamics.com Page 14
by participating lenders, and remitted to the REEL PA. Finally, the initial pool of LLR funds would need to be
supplied to CAEATFA in the early years, similar to the PACE LLR that it currently operates.
To become a standalone program, REEL as currently designed (the REEL BAU scenario in Table 1) would
require nearly three times the private investment compared to the pilot to date, and the rate rider (3.75%)
would negate a significant portion of the APR reduction (4.6% on average) for most customers. This yields a
potentially unattractive program for borrowers and lenders. However, the analysis suggests that if REEL could
generate significant volume (REEL+ scenario in Table 1), it would have a higher self-supporting potential.
Under the REEL+ model, the interest rate rider would equal less than half of the current average APR benefit;
even with the rate rider, the program would still pass along significant APR benefits to the customers. However,
it should be noted that 22% of REEL pilot participants had APR benefits of 3% or less, so the rate rider may
erode the interest rate benefit for some customers to the point that the program becomes unattractive to
them.
A self-supported program would have many fewer restrictions than the current pilot, as it would not be subject
to the rules that govern the use of ratepayer money. This could facilitate the following changes to the program.
◼ Expanded and consistent qualifying measures list: Without the ratepayer efficiency funds
restrictions, REEL could expand to include solar photovoltaic (PV). Under this model, REEL would
offer many of the same measures as PACE and may generate increased volume as a result, which
would further help maintain the self-supported model.
◼ Reduction of LLR complexity: With the removal of ratepayer money, it may be possible to significantly
reduce the LLR management complexity. Under this model, there would be no need to track the LLR
contributions to IOUs or to maintain the bank trustee. Examination of programs in other jurisdictions
that operate simple LLRs (tracking only the aggregate loan amount per lender) indeed showed much
lower LLR management costs, especially when the LLR can be managed internally by the PA.
◼ Enhanced flexibility: CAEATFA noted that making the needed adaptations to the REEL pilot model
was often slow due to the navigation through both standard state procedures and CPUC
administrative and governance processes. With the removal of ratepayer money, it is assumed that
the CPUC would no longer have responsibility for the program. This would remove the requirement
for the program to pass cost-effectiveness tests and may also give CAEATFA (or an alternative
administrator) the flexibility to adapt the program to market conditions and intelligence as it arises.
The interviews with programs in other jurisdictions underlined the importance of flexibility and
adaptation to delivering successful financing programs.
While removing ratepayer funds may offer options to expand the program and make it more flexible and
comprehensive, it would also pose some challenges.
◼ Reduced attractiveness for lenders: A self-supported program may be less attractive to lenders for
several reasons beyond simply the requirement that they would have to charge an interest rate rider
on behalf of CAEATFA (or an alternative PA). The self-supporting program would likely not be as
closely tied to the IOUs via the ratepayer funds, which could reduce marketing and leveraging options
through utility bill inserts and utility program contractors. Maintaining these linkages would likely be
important even for a self-supporting program. Also, having CAEATFA deliver the program would
maintain government support for the program, which attracted some of the enrolled lenders. Finally,
the rate rider itself may turn away lenders either because they feel that the attractiveness of the

Executive Summary
opiniondynamics.com Page 15
program for their customers is reduced or because they see the rider as a diversion of their own
potential returns from the loans.
◼ Reduced attractiveness for participants: Under a self-supported program, the interest rider would
reduce the APR benefits participants receive, thereby raising the cost of participation. The cost-
effectiveness analysis revealed that the current PCT is just slightly higher than 1.0, and this would
likely drop further with the rate rider. This could be offset by expanding the program to more
measures that either are more economically advantageous to participants or carry high NEBs.
◼ Capital sourcing challenges: The most daunting challenge for a self-supporting program would be
raising the initial LLR funds and managing program cash flow. As outlined earlier, the interest rate
rider assessed here does not cover the initial LLR establishment, it just covers the LLR losses.
Covering the LLR itself through lenders would require them to transfer a further 10%–20% of the
loan value to CAEATFA for each loan in the initial years, and less as the LLR pool grows. The
evaluation team does not believe that this is a viable model, and instead proposes that even a self-
supported program would require an initial injection of money, likely from the government. For
example, Connecticut (CT) Green Bank used remaining American Recovery and Reinvestment Act
(ARRA) funds to establish its Smart-E loan LLR.
◼ Cash flow management challenges: Finally, while the rate rider does provide enough returns to cover
REEL program costs, it does so over 10–15 years, while most of the costs are incurred in the year
that the loan is issued. This challenge would be most pronounced in the initial years as CAEATFA
builds its pool of covered loans and ramps up its revenues from the rate rider. CAEATFA would likely
require an injection of cash or bridge funding to cover its administrative costs in the initial years,
which could be paid back later once the rate rider revenues are sufficient.
Overall, this analysis suggests that, with some significant setup assistance, a self-supporting model may be
possible. However, it would likely take years to fully stand on its own. While it may be a challenge to pursue
this model, it does offer several benefits, such as increased flexibility, that could reduce the REEL
administrative burden and allow the program to continuously adapt to market demands and drive higher
volume.
Another avenue to consider is that, after the pilot has jump-started EE lending, the private market would
offer REEL financing without ratepayer-funded support. This evaluation revealed that, at this time,
participating lenders would not continue to offer REEL interest rates and terms without the LLR, though they
recognize that REEL is important in helping the community and serving those who would otherwise not have
access. It is too early to expect this type of market transformation to occur, as REEL accounts for a small
portion of these lenders’ total loan portfolio, and lenders need more time to assess the risk.
Additional Considerations
Contractors may require further marketing support from REEL. Although CAEATFA brought on a contractor
manager in late 2017, most contractors (51%) identified the marketing support available to contractors as
the program component needing the most improvement, citing a lack of homeowner awareness of REEL and
the need for simple and customizable marketing materials to educate customers (for example, the need for
term sheets that show monthly payments based on various project scenarios, cobranded materials, and user-
friendly website content). Although updates to the website would be a substantial investment, offering term
examples, cobranded marketing materials, and simplified application instructions and boosting REEL

Executive Summary
opiniondynamics.com Page 16
advertising are relatively simple fixes to overcome contractors’ barriers to successfully selling REEL to
homeowners.

Executive Summary
opiniondynamics.com Page 17
Snapshot of Conclusions & Recommendations
Evaluation
Metrics Metric Data15 Assessment Conclusion Recommendations
The financing
tool reaches
underserved
Californians
who would not
otherwise have
participated in
EE upgrades
• Allowable loan pay back loans max of 15 years. On
average, REEL customers borrowed $17K; paying
$200/month for 10 years at 7% interest.
• A third of borrowers are low- to moderate-income (LMI);
representing half (51%) of loan volume.
• A third could be considered “underserved” based on
CalEnviroScreen data.
• Three-quarters have good credit or better (FICO>700)
while 8% had fair or worse (FICO<641).
• Participating lenders did not have an energy-efficiency
specific loan product prior to REEL; they did have other,
less attractive, unsecured personal loan options
• Lenders changed existing loan products by specifying
energy efficiency, extending terms and increasing
amounts that translated into smaller monthly payments
for customers.
• Lenders say they would not be able to offer the same
interest rates, terms and loan amounts without REEL.
• According to borrowers, at least 27% of the projects
would not have occurred if REEL were unavailable. At
the other extreme, one-quarter of the projects would
likely have occurred without REEL. The remaining
projects were, at least, partially influenced by REEL.
• About a quarter of participants used IOU rebates in
addition to financing.
• The Pilot reached its goal of providing
at least one third of loan volume to
LMI customers.16
• The Pilot also successfully reached
“underserved” customers based on
CalEnviroScore data on vulnerable
communities.
• Lending does not appear to be going
to customers with poor credit scores.
• Loan terms are more affordable and
accessible than other options.
• Many borrowers would likely not have
qualified for other loans they could
afford or would accept.
• Many of these energy efficiency
projects would not have occurred at
all without REEL or customers would
have piecemealed the upgrades over
a longer period of time.
Green Light
The financing
tool produces
energy savings
• Based on consumption analysis of pre/post usage,
participants saved an average of 12.8% of their gross
annual electric usage and 2.6% of their gross annual
gas usage, which amounts to 741 kWh and 11 therms
in annual savings per participant.
• Comparison of energy savings from other programs:
electric savings is similar to the state-wide Residential
• The Pilot has measurable gross and
net energy savings at the meter level.
Comparing the savings to other loan
programs is challenging given most
others include both energy efficiency
and renewables. Green Light
• Should the Pilot become a
full program and start to
produce claimable savings,
the gross and net savings
methods will need to
account for the appropriate
baseline and avoid double-
15 Black font = Resolution E-4900 metric, Blue font = additional metrics for consideration 16 D. 13-09-044, pg. 33

Executive Summary
opiniondynamics.com Page 18
Evaluation
Metrics Metric Data15 Assessment Conclusion Recommendations
HVAC and Advanced Home Upgrade Programs,
however, gas savings are remarkably lower.
• Net savings, based on difference between participants
and a matched comparison group, show that 41% of
the electric savings and 54% of the gas savings,
occurred, at least in part, because of the Pilot.
• The Pilot has the potential to garner
more energy savings for the state
than would occur naturally in the
marketplace.
counting with rebate
programs.
The financing
tool is scalable
• 212 total loans in Pilot evaluation period
• Monthly loan growth rate: first Pilot year, averaged 9
loans/month, then spiked to ~25/month after Pilot
period
• Geographic distribution/ability to reach new regions of
the state, esp. those with large underserved
populations: Pilot loans spread across state but largely
concentrated in Southern California. Four participating
lenders in Pilot period have limited ability to reach new
regions of the state given physical branches only in
Southern California.
• Recruited network of 282 contractors who serve most
counties in state, after Pilot period grew to 340
contractors; the number of contractors and type of
contractors are a good fit for energy efficiency projects.
Most contractors prefer the REEL loan product over
other options; 72% of them are promoting REEL to their
customers but many need more marketing support.
• Lenders can easily find REEL-certified contractors.
• Loan growth rate is increasing and
can scale further.
• CAEATFA has built the infrastructure
needed to support expanded loan
volume, but REEL scalability is limited
without enrolling a large lender
and/or further investments to
streamline loan applications.
• The contractor pool can meet
expanded loan volume but needs
more marketing and information
support.
Yellow Light
• If Pilot becomes a full
program, make all efforts
needed to enroll a large
volume lender with physical
branches covering more of
the state.
• If Pilot becomes a full
program, make all efforts
needed to support Retail
Installment Contracts (RICs),
or a single originator clearing
house for all loans
regardless of lender.
• Continue to support
contractor information
needs as main marketing
tool for loans.
The financing
tool is leveraged
by private
capital and
support
• The Pilot enrolled four lenders; two localized credit
unions and two that operate statewide, but their branch
locations are limited to Southern California. Two more
credit unions enrolled after the Pilot evaluation period.
• REEL attracted $3.8M in private capital, supported by
$476K of ratepayer dollars in a loan loss reserve (LLR).
• None of the borrowers defaulted on loans in the Pilot
evaluation period.
• Pilot only attracted credit union
lenders, none of which are considered
large volume in the State nor do they
have the capability for contractor-
based origination.
• It is too early to assess loan
performance in terms of defaults and
“bridge loans”.
Yellow Light
Same recommendations as
above and:
If defaults rates continue to be
low, REEL could consider
reducing the amount of funds

Executive Summary
opiniondynamics.com Page 19
Evaluation
Metrics Metric Data15 Assessment Conclusion Recommendations
set aside in LLR, thereby
increasing leverage ratios.
We recommend further
evaluation of loan performance
after 5½ years of
implementation, starting in
2022. This should give
sufficient time to assess default
rates over a longer economic
cycle. It would also allow time
to further explore if and how
customers are using REEL for
“bridge funding” and what the
implications of this are on
REEL’s savings and APR
benefits impacts, and whether
customer early repayments
alter the attractiveness of REEL
for lenders.
Design and
implementation
are scalable
• REEL is labor intensive for lenders. Lenders report that
REEL loan processing time is much longer than other
loan products. Lenders need dedicated staff with
knowledge of REEL guidelines and contractors need a
lot of hand-holding when they are new to REEL
• Lenders expressed frustration with the manpower
required for loan eligibility inspections and manual
reporting; suggesting more automation, and reducing
to quarterly reporting from monthly.
• Lenders want more marketing support to get more
customers, such as bill inserts
• Among inactive contractors, reasons for not selling any
loans to date mainly pertain to perceptions that REEL is
too complicated, there is a lack of customer awareness
• The current program model is
challenging to scale further for
lenders due to loan processing,
eligibility inspections, monthly
reporting requirements and
contractors’ lack of knowledge when
they process their first loan. Despite
these challenges, lenders are
committed to the REEL product and
want more marketing support to
attract even more participants.
• The current program model can be
further scaled with the current
contractor pool. However, actions
Green Light
• If the pilot continues, we
recommend investments in
IT infrastructure to help
automate some of the loan
processing and reporting
requirements, which may
improve the lender,
contractor, and customer
experience and reduce the
administrative costs
associated with verifying
customer eligibility.
• If the pilot continues, we
recommend continuing

Executive Summary
opiniondynamics.com Page 20
Evaluation
Metrics Metric Data15 Assessment Conclusion Recommendations
of REEL, customers preferred to pay cash, contractors
have not had the opportunity yet, or they attempted to
connect customers with REEL but customers did not
qualify.
should be taken to reduce the
perceived complexity of REEL
amongst contractors and increase
market awareness.
efforts to simplify how REEL
is presented to both
contractors and customers.
Pilot contractors and
customers could provide
compelling testimonials for
marketing purposes.
Program Design
Scalability
• The CA energy policy landscape has evolved since the
Decision was first released to fund the Pilot in 2012,
with new assembly and senate bills such as AB 32, AB
811, SB 350, SB 100, and Executive Order B-55-18.
There is increased focus on reducing greenhouse gas
emissions, encouraging electrification, use of
renewables and battery storage. The price of avoiding
carbon is increasing. PACE financing is declining in the
marketplace.
• Since 2012 when the CPUC first
decided to fund this Pilot, several
factors have emerged that could
impact, either directly or indirectly, the
demand for and supply of the type of
financing that REEL provides as well
as its goals, design, and cost-
effectiveness. These factors should
be considered when determining the
future path for REEL.
Yellow Light
• We recommend the CPUC
take into consideration how
much has changed in the
California marketplace since
the CPUC first decided to
test this Pilot in 2012 and
what new goals or elements
should be added to REEL in
terms of how cost-
effectiveness is treated, how
the program is defined
(market transformation,
resource/non-resource), and
what projects qualify.
Program Model
is Scalable as a
Cost-Effective
Program
• The current implementation model carries significant
administrative and loan servicing costs. Specifically,
the administration costs (including the master loan
servicer) and LLR management account for over half of
the TRC and SCT costs.
• The contractor manager costs are high, but the Pilot
administrator, other energy efficiency Program
Administrators, lenders, and other jurisdictions
revealed this investment is critical to financing program
success.
• The loans are cost-effective for participants using the
Participant Cost Test (PCT).
• REEL future projected cost-effectiveness improves as
loan volume increases, approaching a TRC of 1.0 when
loan volume exceeds 2,000 per year, which would
• Increasing the loan volume appears
to improve the program cost-
effectiveness, but because the
variable costs are significant,
increased loan volume alone would
not likely make the program cost
effective. While increasing REEL to
2,000 participants per year could
eventually improve the TRC to over
0.9, it does not appear to reach a
TRC of 1.0 under any reasonable
loan volume.
• REEL carries notable administrative
weight, which impacts its ability to
operate cost-effectively while also
delivering to LMI borrowers. Finding
solutions to reduce the administrative
Red Light
While it does not appear that
REEL currently operates as a
cost-effective program, we
recommend extending REEL
out by an additional 5½ years in
order to pursue adjustments
that could lead either to it
becoming a cost- effective
resource or a market
transformation program.
During this time CAEATFA can
pursue efforts to increase the
program cost-effectiveness
such as offering an expanded
set of eligible measures,

Executive Summary
opiniondynamics.com Page 21
Evaluation
Metrics Metric Data15 Assessment Conclusion Recommendations
represent a significantly larger increase in annual
volume than CAEATFA has projected.
• Neither the Pilot nor two future scenarios pass the cost-
effectiveness threshold (> 1.0) for any of the Total
Resource Cost (TRC), Societal Cost (SCT), or Program
Administrator Cost (PAC) tests.
cost associated with the contractor
management, trustee bank fees and
maintaining the master servicer could
collectively improve the program cost-
effectiveness.
• Increased annual loan volume could
minimize administrative and
management costs.
• REEL offers a variety of social,
economic and environmental benefits
that are not fully accounted for in the
tests the Evaluation Team applied.
increase lending to low-FICO
participant and/or lower
interest rates (thereby
increasing APR benefits), grow
participation, and improve
administrative efficiency (i.e.
lower the cost per loan). In
parallel, the CPUC can further
evaluate the program benefit
streams to arrive at more
accurate values for the non-
energy benefits and carbon
reduction impacts. Finally, the
additional running time may
offer a long enough track record
to better assess the potential to
spin REEL off as a self-
supporting initiative, possibly
accessing an endowment for
the LLR capital, but generating
all administrative costs via a
rate rider or participant
charges.

Pilot Overview and Study Purpose
opiniondynamics.com Page 22
2. Pilot Overview and Study Purpose
This chapter provides an overview of the pilot design and theory and introduces the study research
objectives.
2.1 Pilot Description
The CPUC allocated ratepayer funds to support several EE financing pilots17 that were designed to test
“scalable” products, “leverage” ratepayer funds, and “stimulate deeper EE projects than previously achieved
through traditional program approaches (for example, audits, rebates, and information).”18 The CAEATFA
began implementing these pilots in the third quarter of 2014 through a central platform for information on
all EE financing pilots called the California Hub for Energy Efficiency Financing (CHEEF).
The first pilot CAEATFA launched was focused on the single-family residential market, known as the REEL
Loan Assistance Pilot. Starting in 2015, CAEATFA recruited lenders to provide lower-cost loans for EE
projects and contractors to support the pilot. The pilot issued its first loan in July 2016 and completed its
two-year pilot period in July 2018. In December 2018, the CPUC identified specific metrics that would help in
evaluating the pilot’s performance (see Table 3).19 Data on these metrics, and more, are included in this
report.
Table 3. REEL Pilot Metrics
Goal Metric CPUC Guidance
The financing tool is
scalable
Number of loans made by the pilot, with
breakdown by:
▪ Growth in the number of loans on a month-
by-month basis over the lifetime of the pilot
▪ Total amount of financing generated by the
pilot
▪ Geographic distribution of loans, including
ability to reach new regions of the state,
especially those with large, underserved
populations
Data should be presented to show whether
these financing tools can reach a
significant and growing number of
Californians.
The financing tool is
leveraged by private
capital and support
Private capital participation in the pilot, as
measured by:
▪ Number of financial institutions (FIs)
participating in the pilot and types of FIs
participating (such as CUs)
▪ Amount of private capital attracted
Data should be presented to indicate
whether these financing tools can become
partially or entirely self-supporting, that is,
whether they can reach a point where they
depend less or do not depend at all on the
use of ratepayer funds.
17 The CPUC provided guidance for, allocated budget to, and ordered implementation of the EE financing pilots via Ds. 12-05-015,
12-11-015, 13-09-044. 18 D. 13-09-044, pg. 3. 19 CPUC Resolution E-4900. December 18, 2018.

Pilot Overview and Study Purpose
opiniondynamics.com Page 23
Goal Metric CPUC Guidance
The financing tool
reaches underserved
Californians who would
not otherwise have
participated in EE
upgrades
Analysis of participants in the pilot, according
to:
▪ Credit scores of loan participants
▪ Length of time allowed for applicants to pay
back the loans
▪ Percentage of participants deemed
“underserved” as measured through
CalEnviro data, area median income (AMI),
or other poverty statistics
▪ Whether participants would have qualified
for existing private EE loan programs at
interest rates and terms that they can afford
or would accept
The “counterfactual” of whether
participants would have taken loans from
elsewhere for the same upgrades is
difficult to demonstrate, but best efforts
should be made to provide data showing
that hard-to-reach communities were
reached and analysis done by evaluation,
measurement, and verification (EM&V)
studies contractors can also be consulted.
Lower-income participants may prefer
longer loan payback periods, so the length
of time allowed for repayment may offer a
proxy for ability to reach low-income
communities.
The financing tool
produces energy savings
Energy savings that resulted, as measured:
▪ Through customer meter data provided by
the utilities via Energy Division data request
(customer privacy must be maintained)
▪ Through normalized metered energy
consumption (NMEC) analysis, as an option
▪ Comparison of energy savings from other
loan programs to that of the pilot, if
possible, to assess through EM&V
NMEC analysis has not previously been
applied to the analysis of financing pilots,
and is considered an option here to be
used if it can add to the understanding of
the results of the pilots.
Source: CPUC Resolution E-4900. December 18, 2018.
Notably, CAEATFA has adapted the pilot’s design multiple times over the first two and a half years in an
attempt to improve implementation processes and grow participation. According to CAEATFA, some of the
most impactful changes to the pilot, in terms of driving contractor interest, were changes to EEEMs lists.
From inception, REEL had four different EEEMs lists, one for each IOU, that included inconsistent measures.
Then, in March 2017, CPUC D. 17-03-026 gave CAEATFA more control over the program design, including
the list of EEEMs. After that decision, CAEATFA worked with the IOUs to gradually decouple REEL from the
IOU programs and create a single statewide EEEMs list by March 2018.
March 2018 was the last round of design changes to the pilot before the evaluation began. Aside from the
EEEMs update, other key changes included two adjustments to the qualification requirements for the 20%
“underserved” credit enhancement rate for lenders.
◼ CAEATFA added a “Credit-Challenged Program,” which was a voluntary “opt-in” program to allow
lenders to receive the underserved credit enhancement rate for loans to borrowers with credit scores
under 640, if they could prove that this allowed them to offer a better product to a broader set of
borrowers. Three lenders opted into the offering.
◼ CAEATFA added the option of using area median income (AMI) by census tract to qualify for the
underserved credit enhancement rate. Loans to borrowers in census tracts with AMI of less than
120% of county or metropolitan statistical area (MSA) median income would receive the underserved
credit enhancement rate.

Pilot Overview and Study Purpose
opiniondynamics.com Page 24
2.2 Pilot Theory and Logic
The pilot provides customers with access to lower-cost financing for eligible EE projects. It is available to
single-family residences that are customers of the California IOUs (PG&E, SCE, SCG, and SDG&E). The pilot is
administered by CAEATFA through the CHEEF. The CHEEF or “Hub” represents a public-private partnership
among California state agencies and the IOUs to help bring together lenders, contractors, and borrowers to
facilitate lower-cost financing for EE projects.
CPUC D. 13-09-044 called on CAEATFA and the IOUs to implement a residential financing pilot for the single-
family residential market funded with ratepayer dollars.20 The decision outlined several pilot goals. The
evaluation team interprets the decision language as establishing the following primary goals of the pilot:
1. To increase the volume of EE financing to attract capital providers and attract new market
participants
2. To increase the number and comprehensiveness of EE projects
3. To reach LMI customers
Secondarily, the pilot also hopes to increase the rate at which contractors can close a sale of EE equipment.
As such, the pilot established an LLR for enrolled lenders who offer loans of up to $50,000 to single-family
residential customers (including residential buildings with four or fewer units, with a $50,000 loan per unit)
to carry out EE upgrades. The LLR can cover 90% of capital losses resulting from charge-offs on enrolled
loans, which is intended to help mitigate lender risk and ideally lead to reduced capital costs for borrowers,21
improved terms, and broader market coverage in the LMI and low-FICO-score segments. At least 70% of the
total loan for a given project must be used to pay for EEEMs, which are similar to the measures that qualify
for IOU incentive/rebate programs.
REEL has a target of disbursing approximately one-third of the total credit enhancements to serve LMI single-
family residents. This is supported through two design features22:
◼ The LLR contribution for LMI borrowers is set at 20% of the loan principal amount, while it is set at
just 11% for other borrowers (to provide a stronger risk mitigation tool for the LMI market).
◼ Borrowers with FICO scores as low as 580 will be considered for loans under the pilot. However, for
applicants with FICO scores between 580 and 640, the lender must verify the borrower’s income as
part of the underwriting process. Enrolled lenders are responsible for developing their own
origination processes.
The pilot also includes an important investment in contractor training and marketing outreach. While enrolled
lenders are responsible for developing their own origination processes, none currently has the capability for
20 The pilots define single-family residential buildings as those that contain no more than four units. The pilots also include a
multifamily unit building financing program, but from a financing perspective this program is better considered in light of the
nonresidential market baseline.
21 The REEL regulations state that interest rates on enrolled loans must not exceed 750 basis points over the U.S. Government’s
10-year treasury rate. 22 California Code of Regulations Title 4 Business Regulations, Division 13. CAEATFA. Regulations Implementing the Residential
Energy Efficiency Loan Assistance Program. Effective September 8, 2015. Accessed at :
https://www.treasurer.ca.gov/caeatfa/cheef/reel/regulations/2018/proposed-regulation-text.pdf. Notably, these regulations are
currently under review and program design features may change based on the review.

Pilot Overview and Study Purpose
opiniondynamics.com Page 25
contractor-based origination.23 At least one participating vendor is in the process of setting up an automated
process for one contractor, but this had not been implemented at the time of this evaluation.
The REEL program theory and logic is shown in Figure 3. The pilot is designed to ultimately help make EE
more accessible to IOU customers in California who do not have the up-front cash to pay for projects. It is
important to note that financing is not necessarily the product that the state is encouraging customers to
buy; instead, EE is the desired product and financing, like rebates, is the vehicle that helps people pay for
the cost of making EE upgrades. As such, the pilot is theoretically designed to address the first cost barrier
to EE by offering more-attractive lending terms and rates than other lending products that ultimately
translate into an affordable monthly payment for customers. The pilot’s lending can make EE more
affordable through loans alone or through a combination of REEL loans and rebates. The pilot can work in
concert with rebate programs where customers can receive both incentive types for EE upgrades if they
meet the eligibility requirements. Alternatively, customers can opt to receive only the financing incentive.
23 Notably, the pilots have enrolled one lender that will employ a contractor-based model.

Pilot Overview and Study Purpose
opiniondynamics.com Page 26
Figure 3. REEL Pilot Program Theory Logic Model
Recruit & educate FIs
Train different types of contractors to integrate direct and indirect loan options
into their sales process. Integrate REEL training with other EE program trainings
1
• FIs are educated
• Fis participate as direct and indirect lenders
Provide credit enhancement
(CE) through LLR
Market availability of direct loans to
customers
2
• Amount of CE provided to low/mod income households & overall
• LLR protocols developed
• LLR account funded
4
Customer awareness of loan options increases
5
A diverse group of contractors are trained
3
Engage community orgs/ESAP to
promote pilot to low & moderate Income
homeowners
Community organizations and ESAP staff engaged with REEL
Review contractor payment
process and resolve issues
FIs offer EE loan products with better terms and/or less stringent underwriting than otherwise
Contractors offer customers direct and indirect loans as payment options for EE
projects.
Customers, including low & moderate income homeowners, are able to pay for more EE projects
(or make them more comprehensive) using indirect or direct loans than they otherwise would have
9
Existing financing instruments are not well-suited for energy efficiency (EE)
Low/Moderate Income Homeowners Have Limited Options to Pay for
EE Projects
Customers Face High Up-Front Costs for Major EE Projects
Contractors Have Difficulty Using Program
Offerings
Contractors Have Difficulty Floating EE Project Costs
Energy and non-energy benefits occur from REEL participation
and spillover projects
FIs understand EE Financing risk profile
Loan volume and FI participation increase
Contractor participation increases (to maintain competitive advantage)
Achieve California energy efficiency strategic plan goals
Standardized and attractive loan products become available without CEs, maximizing leverage of ratepayer funds
Overall energy savings in the single family market segment increases
10
11 12
1615
13
Ba
rrie
rsP
rog
ram
Acti
vit
ies
Ou
tpu
tsD
ire
ct
Ou
tco
me
sS
eco
nd
ary
O
utc
om
es
Lon
g
Te
rm
Ou
tco
me
s
Name: Residential Energy Efficiency Loan Pilot Offering IOUs: PG&E, SDG&E, SCE, SoCalGas Who is borrower: Ratepayers in Single Family Residences
Who is Lending: Financial Institutions
REEL = Residential Energy Efficiency Pilot ESAP = Energy Savings Assistance Program FI = Financial Institution CE = Credit Enhancement LLR = Loan Loss Reserve EE = Energy Efficiency
Direct loans are made by the FI to the customer. Inidrect loans are offered by contractors.
87
14
Payment process improves
6
After about two years of planning, recruiting, and development, the first REEL loan was issued in July 2016.
Between July 2016 and July 2018, the pilot provided loans to 212 customers. To evaluate the pilot’s first
two years, the evaluation team measured the pilot’s direct and secondary outcomes, highlighted in yellow
boxes in the Logic Model (Figure 3), and explored if and how the pilot influenced those outcomes. These
influential points include:
◼ Through the LLR, the pilot is expected to encourage lenders to offer loans with better terms and
rates than other lending products offered, allowing more customers to pay for EE than they could
afford otherwise. The pilot intended to educate lenders, such that they would acquire more
knowledge of the EE financing risk profile and start new EE products that would ultimately affect
their lending products, loan volume, and viewpoint on the risk profile associated with EE lending.

Pilot Overview and Study Purpose
opiniondynamics.com Page 27
◼ The pilot is expected to make EE more affordable to more customers and ultimately garner energy
savings that would not have occurred with traditional financing or with a combination of traditional
financing and rebates otherwise available in the market. REEL financing should increase the
accessibility of EE projects to customers, particularly LMI customers by allowing them to do an EE
project at all or by increasing the size of their EE project and/or allowing them to invest in a larger EE
project earlier instead of piecemeal over a longer period of time.
◼ The program theory suggests that contractors have a hard time covering the cost of EE projects
before being paid by the customer or helping customers finance EE projects such that they lose EE
project opportunities. As such, REEL financing is designed to equip contractors with REEL lending
information that they can market to their customers alongside their services. Contractors are
expected to market REEL to prospective customers and, if it works as intended, customers will enroll
in REEL to afford the projects, and contractors could then view REEL as a way to grow their EE
project sales and increase their competitive advantage in the marketplace.
2.3 Purpose of the Study
The overarching goal of this evaluation is to determine how well the pilot achieved or addressed the goals
originally set by the CPUC in D. 12-05-015 and reiterated in subsequent proceedings. It is not the goal of this
pilot evaluation to determine claimable gross or net savings for the pilot period or to produce ex ante
estimates of savings for the pilot. More importantly, this evaluation is geared toward determining how well
the pilot performed across several metrics and to provide data to help the CPUC determine if and how a
ratepayer-funded financing mechanism for residential customers should continue. As such, this evaluation
focuses on the following research objectives:
1. Describe participation in the pilot as of the end of its two-year implementation period to measure the
degree to which the program was successful in reaching its goals based on metrics adopted in
Resolution E-4900, including:
a. The number of loans made by the pilot, average loan size, total amount of financing generated,
and geographic distribution
b. The number of participating financial institutions (FIs) and REEL-certified contractors (pilot
“partners”), including an analysis of the distribution of participation across these partners
c. An analysis of participants, including credit scores, loan terms, percent underserved, and percent
who may qualify for other private loan options (for example, based on FICO score and income)
2. Determine how much energy savings the pilot produced, including gas and electric savings.
3. Explore the influence of the pilot on customer decision making.
4. Explore the costs versus benefits of the REEL product during the pilot period and compare them to
other residential DSM investments.
5. Gain feedback on the pilot design and implementation model from key stakeholders, including PAs,
CAEATFA, participating contractors, and lenders.
6. Compare and contrast the pilot implementation model with other models, both nationally and
internationally.

Pilot Overview and Study Purpose
opiniondynamics.com Page 28
7. Explore how the marketplace has changed since the 2012 decision24 to fund the pilots. Identify
trends, if any, that will help the CPUC reorient strategic EE financing goals.
8. Assess the scalability potential of this pilot.
2.4 Study Timeframe
This evaluation focuses on pilot operations and performance in its first two years, from July 2016 to July
2018. However, since this evaluation was conducted in the 12 months after this period, the evaluation
notes if there are any changes in pilot design or participation after July 2018 that should be taken into
consideration.
24 D. 12-11-015.

Methodology
opiniondynamics.com Page 29
3. Methodology
This report includes results from a range of data collection and analytical methods, including a consumption
analysis, a cost-effectiveness analysis, a secondary data review, and semi-structured interviews and surveys.
Table 4 summarizes the specific tasks undertaken to conduct this evaluation. Detailed descriptions of results
and methods are available in Chapters 1–10.
Table 4. Summary of Pilot Evaluation Tasks
Evaluation Task Summary
Consumption Analysis
Applied two different linear fixed effects regression (LFER) approaches: one without a
comparison group to estimate the gross savings from the pilot and one with a comparison
group to estimate the net savings.
Participant Survey
Telephone survey with 49 REEL pilot participants. The primary goals were to understand
the influence of the REEL loan on participants’ decisions to complete home upgrades,
collect information about their households, and understand any nonroutine adjustments
participants made to their homes or behaviors after the home upgrade. The survey was
conducted as a census, as the evaluation team attempted to complete a survey with all
212 participants in the pilot.
Contractor Survey
Web survey with 57 REEL-certified contractors (23 of which had yet to complete a REEL
project and 34 of which had completed a REEL project). The goals were to gain feedback
on REEL design and implementation, determine satisfaction with the pilot, and determine
whether the pilot has helped contractors overcome barriers associated with EE projects.
This survey was also conducted as a census; the evaluation team invited all contractors
who were certified in REEL as of December 2018 to respond to the survey.
Pilot Data Analysis
Combined primary and secondary data to characterize participants in terms of customer
characteristics (for example, credit score, income, debt-to-income [DTI] ratio), geographic
distribution (for example, climate zone, region), and home upgrade project characteristics
(for example, measure type, REEL loan size).
Participant Influence
Analysis
Use self-reported assessment of pilot influence from the participant survey to qualitatively
understand REEL financing influence versus other financing options available, establish a
net-to-gross ratio (NTGR) for the pilot, and understand the relative influence between
financing and rebates when customers take advantage of both.
Stakeholder In-Depth
Interviews
In-depth semi-qualitative interviews with CAEATFA, PAs (such as IOUs and RENs), and
enrolled lenders to assess whether REEL can effectively move from pilot to program
sustainably and to gain further insights into how the EE financing market has transformed
since the pilot was approved.
Secondary Research
Studied five similar programs to collect insights on three topic areas: LLR management
and underwriting practices, management of multiple lenders, and marketing and
integration with resource programs.
Cost-Effectiveness
Analysis
A C/B analysis of the REEL pilot, assessing a range of relevant quantitative and qualitative
C/B metrics, and a comparative analysis of the REEL pilot, two future REEL program rollout
scenarios, and other residential DSM initiatives in California.

Study Results Summary
opiniondynamics.com Page 30
4. Study Results Summary
This chapter provides a summary response for each of the research objectives. More detailed results by
evaluation task are available in Chapters 1 through 10.
4.1 Participation Characteristics and Pilot Accomplishments
Below is overview of pilot accomplishments and
participation characteristics that explores two key
metrics of the pilot: whether and how the pilot created a
financing tool that is leveraged by private capital and
support and whether and how it reached underserved
Californians.25
Financing Tool Leveraged by Private Capital and
Support
The pilot created a financing tool that is leveraged by
private capital and support. It enrolled four CUs in the
first two years that together distributed REEL loans to 212 participants across the state, amounting to
$3.7M in private capital lending.
Number of Lenders, Participants, and Financing Generated
Participation was largely concentrated within one lender, California Coast CU, which represents 71% of the
private capital attracted, followed by Matadors Community CU with 23%. Both CUs operate throughout the
entire state, while the two smaller volume lenders are focused in one specific region. Table 5 shows the
number of loans, the amount of private financing, and the ratepayer LLR contribution among the four
lenders in the pilot’s first two years.
Table 5. Participation Characteristics (Two-Year Pilot Period)
Lender Type
Date of First
Loan
# of
Loans
Original Loan
Amount
(Private Capital)
LLR
Contribution
Proportion of Loan
Volume Private
Capital by Lender (%)
California Coast CU Statewide 1/13/2017 150 $2,608,491 $331,106 71%
Matadors Community CU Statewide 7/19/2016 50 $829,341 $116,711 23%
Desert Valleys Federal CU Regional 9/11/2017 9 $167,935 $22,711 5%
Valley Oak CU Regional 11/28/2016 3 $50,368 $5,293 1%
Total 212 $3,656,135 $475,821 100%
Source: CAEATFA tracking data.
25 Two metrics specified in Resolution E-4900.
Objective 1
Describe participation in the REEL pilot as of
the end of its two-year implementation period
to measure the degree to which the program
was successful in creating a financing tool
that is leveraged by private capital, reaching
underserved Californians and building a
contractor network to introduce financing at
the point-of-sale.

Study Results Summary
opiniondynamics.com Page 31
Notably, after six more months, the pilot made further progress, enrolling three more regionally focused CUs,
accumulating 339 participants and attracting $5.8M in private capital. Table 6 below shows the
accumulated participation after two and a half years.
Table 6. Participation Characteristics (Two-and-a-Half-Year Pilot Period)
Lender Type
Date of First
Loan
# of
Loans
Original Loan
Amount
(Private Capital)
LLR
Contribution
Proportion of Loan
Volume Private
Capital by Lender (%)
California Coast CU Statewide 1/13/2017 224 $3,756,058 $496,250 65%
Matadors Community CU Statewide 7/19/2016 85 $1,560,791 $227,760 27%
Desert Valleys Federal
CU Regional 9/11/2017 12 $189,553 $25,701 3%
First US Community CU* Regional 9/28/2018 8 $116,526 $15,925 2%
Eagle Community CU* Regional 8/10/2018 5 $79,337 $12,615 1%
Valley Oak CU Regional 11/28/2016 4 $62,645 $7,581 1%
Pasadena Service
Federal CU* Regional 9/20/2018 1 $19,319 $1,905 0%
Total 339 $5,784,229 $787,737 100%
Source: CAEATFA tracking data. * indicates that the lender enrolled and began loans between July and December 2018.
Loan Volume Growth
Lenders joined the pilot at various times, starting with Matadors Community CU, followed by the other large
volume lender, California Coast CU, six months later. However, REEL loans really began to ramp up about
one year into the pilot and have continued to build momentum (see more on scalability in Section 4.8).
Figure 4 shows the growth in loan volume month by month based on data available at the time of this
evaluation. Notably, loan volume has grown steadily while experiencing some seasonal fluctuations.

Study Results Summary
opiniondynamics.com Page 32
Figure 4. Month-by-Month REEL Loan Growth
Source: CAEATFA tracking data.
Geographic Distribution
Figure 5 shows the distribution of REEL loans throughout California, distinguishing between the two statewide
lenders (California Coast CU and Matadors Community CU) and the regional lenders. While California Coast
CU and Matadors Community CU operate statewide, their branch locations are limited to Southern California.
The maps show that the majority of the participation in the first two years was in Southern California; however,
after two and a half years, there is a larger spread of participation throughout the state.
$0
$100,000
$200,000
$300,000
$400,000
$500,000
$600,000
0
5
10
15
20
25
30
35
Jul Aug Sep Oct Nov Dec Jan Feb Mar Apr May Jun Jul Aug Sep Oct Nov Dec Jan Feb Mar Apr May Jun Jul Aug Sep Oct Nov Dec
2016 2017 2018
# of Loans Loan Volume Linear (# of Loans)
Pasadena Svc CU
and First US
CU 1st Loans
Matadors CU
1st Loan*
*indicates state-wide Lender
California Coast
CU 1st Loan*
Valley Oak CU
1st Loan
Desert Valleys
CU 1st Loan
Eagle CU 1st Loan
End of 2 year Pilot
evaluation period
Loan
s (#
)L
oa
n V
olu
me
($)

Study Results Summary
opiniondynamics.com Page 33
Figure 5. Geographic Distribution of Loans by Statewide and Regional Lenders
Source: CAEATFA tracking data.
Reaching Underserved Californians
One of the intentions of this pilot was to create a financing product for customers who would not be able to
obtain loans elsewhere for EE upgrades. As such, the pilot attempted to target underserved residents by
designing a loan product that expanded eligibility to affordable terms. Below is a description of how this pilot
enrolled underserved residents in REEL lending in a myriad of ways.
REEL Changed the Lenders’ Existing Loan Products
The lenders already had “signature” loan products for residential customers who were unsecured, but most
were not focused on EE. REEL allowed lenders to increase loan amounts and terms and reduce their APR.
For lenders who participated during the first two years, maximum allowable loan amounts saw increases
ranging from $30,000 to $47,500, depending on the lender. All lenders increased the maximum allowable
loan term from 5–5.5 years for their signature product up to 15 years for the REEL product. The REEL APR
charged for borrowing was also reduced by 4.6% on average compared to their signature products. During
the pilot period, two-thirds of the loans had longer terms than the lenders’ comparable signature products,
which created lower monthly payment options. While all lenders indicated REEL made up a very small
portion of their total loan portfolio, given its introduction in the market and narrow industry focus, they
believed it enhanced their product offering. Most borrowers selected REEL over lender’s other similar

Study Results Summary
opiniondynamics.com Page 34
products, but one lender reported that, when given the option, 90% of borrowers chose their secured EE/RE
loan over REEL because it included solar.
Looking at the loan amounts and terms offered, as shown Table 7, the average loan amount was $17K, the
average loan term was about 10 years, and, on average, customers paid about $200 per month. While the
average interest rate of 7% was attractive, the average term length of 10 years was the driving force behind
the lenders’ ability to offer customers a more affordable monthly payment than they would have with their
signature products.
Table 7. REEL Loan Product Summary – Inception through July 2018 (N=212)
Characteristic Average Median Range
Loan Amount $17,246 $14,174 $3,366–$35,000
Interest Rate 6.95% 6.88% 4.50%–8.95%
Loan Term 117 months 120 months 24–180 months
Monthly Payment $219 $181 $50–$801
Source: CAEATFA tracking data.
The pilot’s design was intended to benefit underserved borrowers by offering more favorable loan terms (for
example, longer payback periods or lower interest rates) compared to alternative financing options, such as
traditional unsecured term loans. REEL has notable success in this area, while also offering no prepayment
penalties or closing costs.
Loan Performance in Pilot Period
Given that most of the 212 loans had only a few months to make payments within the evaluation period and
that most loan terms are as long as 10 years, it is too early to assess the loan performance of REEL at this
time. However, this evaluation reports on the performance statistics available below to document what is
currently known.
◼ Default rate was 0% in pilot period: No participants defaulted in the pilot period and only one
participant defaulted after the first two years (resulting in a direct loss of $2,250).
◼ Bridge funding is minimal so far; 6% are paid off: Thirteen participants paid the loan in full during the
pilot period (with the credit enhancement returned in full to the REEL LLR for future loans). These
participants suggest the possibility that the lack of a prepayment penalty and the low monthly
payment may encourage some customers who did not truly need the financing to use REEL as
“bridge funding” (that is, with the intention to pay the loan back very quickly).
◼ Other indicators of loan performance: In the last month of the pilot period, a few customers started
to make late payments, ranging from 1–5 customers per month, mostly in the 30-day late period.
Underserved Status of Pilot Participants
The pilot has also demonstrated clear success in reaching underserved Californians when looking at
participant data across numerous indicators. Approximately one-third of pilot loans reached underserved
communities according to household income or census tract median income, and these loans represented
51% of total financing in the first two years (approximately $1.9 million), which surpasses the requirement

Study Results Summary
opiniondynamics.com Page 35
set forth in D. 13-09-044.26 Resolution E-4900 also required the pilot to be evaluated according to other
“underserved” metrics, such as CalEnviro Score. As shown in Figure 6, among the first 212 participants,
approximately one-third could be considered underserved in terms of CalEnviro Scores or the proportion that
received a 20% credit enhancement due to LMI status. Going by FICO score alone, only 8% might be
considered underserved or credit-challenged. Further details for each of these three indicators of
underserved status are discussed below.
Figure 6. Proportion of Pilot Participants that are Underserved (Inception through July 2018)
CalEnviro Score
CalEnviro Scores offer additional insight into how REEL is reaching underserved communities. Table 8 shows
that 13% of the participants in the first two years live in the most vulnerable census tracts, with CalEnviro
Scores above the 75th percentile (that is, those with the highest 25% of scores for pollution burden and
socioeconomic vulnerability), while another 21% live in the second most vulnerable tract, above the 50th
percentile.
26 D. 13-09-044, pg. 33.
34%30%
8%
0%
20%
40%
60%
80%
100%
CALEnviro Score 50-100 Received 20% Credit
Enhancement Based on
LMI
FICO Score 640 or lower
N=212

Study Results Summary
opiniondynamics.com Page 36
Table 8. CalEnviro Scores among Participants
Tract
CalEnviro Score
(Percentile)
Inception through
July 2018 (N=212)
Inception through
Dec 2018 (N=339)
Least Vulnerable 1–25 33% 33%
26–50 33% 29%
51–75 21% 24%
Most Vulnerable 76–100 13% 14%
Source: CAEATFA data.
Credit Enhancements for Underserved Customers
To mitigate the lender risk to underserved borrowers, the REEL LLR for underserved borrowers is set at 20%
of the loan value and 11% for others.27 The pilot dispersed this 20% credit enhancement to borrowers based
on whether they met LMI standards or were credit-challenged. These were defined in the following ways.
◼ LMI is defined in two ways in the pilot period:
◼ Lender-reported household income falls below the LMI threshold for the area in which the
borrower resides. However, lenders calculated household income inconsistently, always
assumed a household of four, and typically excluded spousal income.
◼ LMI census tract: The property upgraded with the REEL loan is in a census tract in which the
median family income does not exceed 120% of area median family income.
◼ Credit-Challenged: The borrower has a credit score below 640 and the lender participates in the
Credit-Challenged Program, which entails additional agreement between CAEATFA and the lender to
provide lower rates and longer terms.
The pilot had a target of disbursing approximately one-third of the total credit enhancements to LMI single-
family residents.28 As shown in Table 9, it exceeded this target in the first two years by disbursing 41% of the
total credit enhancements to underserved residents. Further, one-third of the loans received a 20% credit
enhancement due to LMI status in the first two years. Both trends have increased slightly after two and a
half years. The CAEATFA’s definition of LMI was further validated through a participant survey where the
evaluation team found that the self-reported income and household size definition of LMI status for the
sample of 49 participants aligned with the LMI status in CAEATFA’s tracking records.
Further, none of the 212 participants in the first two years received a credit enhancement because they
were credit-challenged; instead, participants received it based on LMI status. However, 8% of participants
did have FICO scores below 640. Only one loan in the two-and-a-half-year period qualified for the 20% credit
assessment based on FICO score (notably, this customer’s property is also in an LMI census tract).
27 California Code of Regulations Title 4 Business Regulations, Division 13. 2015. 28 D. 13-09-044, pg. 33.

Study Results Summary
opiniondynamics.com Page 37
Table 9. Credit Enhancements to Underserved
Credit Enhancement Level
% of Loans through July 2018
(N=212)
% of Loans through Dec 2018
(N=339)
Not Underserved: 11% enhancement 70% 62%
Underserved: 20% enhancement 30% 38%
Received because deemed credit-challenged 0% <1%
Received because LMI based on household income 17% 11%
Received because LMI based on census tract 14% 27%
Total Credit Enhancements $475,821 $787,737
Total Credit Enhancements to Underserved $195,766 $389,091
% of Total Credit Enhancements to Underserved 41% 49%
Source: CAEATFA data.
FICO
Very few of the participants to date can be considered underserved as defined by their FICO score alone.
Borrowers with FICO scores as low as 580 are considered for loans under REEL. However, for applicants with
FICO scores between 580 and 640, the lender must verify the borrower’s income as part of the underwriting
process. Based on pilot records, 76% of participants have “good” or “excellent” credit (FICO score above
700), while only 8% had “very poor” or “fair” credit (FICO score below 641).
Debt-to-Income Ratios
Debt-to-income (DTI) ratios are often used to determine creditworthiness or ability to pay. This is not
necessarily an indicator of underserved status but is helpful in characterizing who has participated so far.
DTI ratios above 36% are often considered riskier borrowers, while DTI ratios above 55% are commonly
considered far too risky for any lending, even with REEL support. As shown in the table below, 54% of the
participants in the first two years had risker DTI ratios, between 36% and 55%, and this proportion fell only
slightly to 52% after two and a half years. These data suggest that the pilot design is reaching a large
proportion of customers with riskier financials who would have likely not received a loan at all or certainly
one with less attractive terms than REEL.
Table 10. Debt-to-Income Ratios among Participants
DTI Ratio
Inception through July 2018
(N=212)
Inception through Dec 2018
(N=339)
46%–55% 21% 19%
36%–45% 33% 33%
25%–35% 32% 32%
Under 25% 14% 17%
Source: CAEATFA data.

Study Results Summary
opiniondynamics.com Page 38
Product Changes That Could Reach More Underserved Customers
As mentioned above, CAEATFA designates a borrower as potentially LMI based on whether his/her address is
located in an LMI census tract as classified by the Federal Financial Institutions Examination Council (FFIEC).
FFIEC classifies a census tract as LMI if its median household income is 120% or less than the AMI of the
closest MSA or county if no MSA is available. According to this definition, of the 8,068 census tracts in
California, approximately 66% of them would be considered LMI (see Table 11 below).
Table 11. Market Size of LMI Census Tracts in California
LMI Status
Census Tracts
(Count) Percent
LMI (120% or less than AMI) 5,325 66%
Not LMI 2,618 32%
Unknown 125 2%
Total 8,068 100%
Some other loan programs in other states have taken further steps to direct financing toward customers most
in need that REEL should consider. For example, the New York State Energy Research and Development
Authority (NYSERDA), as a direct lender, introduced tiered interest rates, charging higher rates to households
with higher income and high credit ratings, while continuing to offer subsidized lending to lower-income/lower
FICO applicants. CT Green Bank introduced a “Credit-Challenged Program,” expanding underwriting
requirements and loan access to participants with lower scores (FICO < 580). For further improvements, CT is
considering the possibility of covering only loans that are not super-prime with the LLR.
REEL-Certified Contractors
The pilot successfully recruited and certified a pool of contractors who serve most counties in the state, and
the number of contractors has grown significantly over time. Based on survey responses from 52 of these
contractors (n=52), REEL contractors represent a large mix of business sizes. Table 12 and Table 13
summarize the business size (in terms of revenue and number of employees) of the REEL contractors who
responded to the survey. Interestingly, one lender interviewed mentioned that larger contractors that have
more staff and administrative support are driving applications. It reported that REEL is much more onerous
for smaller contractors. Although business size did not vary between active and dormant contractors who
responded to the survey, the evaluation team researched the most active REEL contractors to better
understand the business make-up of the largest sellers. There are seven contractors (6% of the 11929 who
completed REEL loans) who together completed roughly one-third (n=99) of the 339 projects completed in the
first two and a half years. All seven of these contractors are larger businesses; they have an established
internet presence, dedicated sales and administrative staff (the smallest of these companies appears to have
a staff of 11 and the largest a staff of 75), operate in multiple states (two of the seven), and have been in
business for at least 15 years.
29 The count of unique contractors is based on unique Contractors State License Board (CSLB) ID and does not include self-
installers.

Study Results Summary
opiniondynamics.com Page 39
Table 12. REEL Contractors’ Gross Annual Business Revenue in California
Response (among valid responses) Count Percent
Less than $100,000 4 8%
$100,000 to less than $500,000 12 23%
$500,000 to less than $1 million 9 17%
$1 million or more 27 52%
Total 52 100%
Table 13. REEL Contractors’ Business Size
Number of Employees
Total
Count Percent
5 or less 23 40%
6–10 13 23%
11–50 15 26%
51–99 4 7%
100 or more 2 4%
Total 57 100%
Survey data also indicate that the pilot recruited experienced, versatile, and highly qualified residential retrofit
contractors into its pool who can assist with multimeasure retrofits. These contractors are typically very
experienced with the California residential market (75% have offered residential services for more than 10
years). As shown in Table 14, almost all the contractors offer multiple services.
Table 14. Summary of Contractor Survey Respondent Specialties
Service Offered by Company
(n=57)
Total
Count Percent
Do renovations or building additions 27 47%
Weatherize and insulate homes 39 68%
Install windows 31 55%
Install water heating systems 41 73%
Install space heating systems 44 77%
Install space cooling systems, such as air conditioners 50 88%
Install lighting 24 43%
Install solar panels 25 44%
Install swimming pool equipment, such as pool pumps 18 32%
While the lack of an enrollment date prevents the evaluation team’s ability to determine the percentage of
certified contractors who completed a REEL project during the two-year study period, of the 282 certified
contractors listed on the CAEATFA’s website in December 2018, fewer than half (a total of 119) completed
projects with REEL financing during the first two and a half years. In the first two years, 82 contractors
completed at least one project and, among this group, the majority (68%) completed one or two projects. The
most projects completed by any one contractor was 28.

Study Results Summary
opiniondynamics.com Page 40
4.2 Energy Savings
The evaluation team estimated gross and net electric,
demand, and gas impacts through a linear fixed effects
regression (LFER) analysis of consumption data. The team
used two types of LFER: one with participants only and the
other with participants and a matched comparison group. The
former produces gross impacts and the latter produces
impacts that are close to net.30 Chapter 5 provides more detail
on the consumption analysis methods and results. Notably,
the cost-effectiveness analysis in this report relied on the gross savings estimates.
The pilot achieved measurable gross and net energy (kWh), demand (kW), and gas (therms) savings in its
first two years. As shown in Table 15, the pilot achieved approximately 64 MWh, 7 kW, and 1,262 therms in
net savings. Energy savings across fuel types and models are all statistically significant at the 90%
confidence level. Participants, on average, experienced gross electric savings of 12.8% and net electric
savings of 5.4%.
Table 15. REEL Pilot Gross and Net Savings (First Two Years of Pilot)
Total Participants Savings Units Total Pilot Savings
212
Gross
kWh 157,081
kW 17
Therms 2,321
Net
kWh 63,749
kW 7
Therms 1,262
The pilot achieved much higher average per-home electric savings than it did for gas savings. For comparison
purposes, REEL average net electric savings per participant derived from the consumption analysis (301 kWh)
is very close to what was recently found for the 2017 AHUP (average savings per participant was 371 kWh
based on a similar consumption analysis with a comparison group approach).31 Conversely, REEL achieved
fairly low average per-home gas savings (6 therms), lower than what was found in the recent Home Upgrade
Program (HUP) and Residential HVAC impact evaluations. Home Upgrade achieved 35 evaluated net therms
per participant32 and Residential HVAC (specifically furnace replacements) achieved 12 evaluated net therms
per participant.33
30 The evaluation team’s ability to control for self-selection was limited due to a lack of data on customer characteristics. 31 DNV-GL. Impact Evaluation Report Draft - Home Upgrade Program. March 2019. Prepared for the CPUC. 32 Ibid. 33 DNV-GL. Impact Evaluation Report Draft – Residential HVAC. March 2019. Prepared for the CPUC.
Objective 2
Determine how much energy savings
REEL produced in the pilot period,
including gas and electric savings, per
participant and overall.

Study Results Summary
opiniondynamics.com Page 41
Table 16. REEL Pilot Average Savings as a Percentage of Annual Consumption (First Two Years of Pilot)
Impacts Units
Participants in
Model
Per-Participant
Average Daily
Savings
Per-Participant
Average Annual
Savings
Percent of Average
Annual Baseline
Consumption
Gross
kWh 157 2.03 741 12.8%
kW 157 0.08 N/A 6.9%
Therms 150 0.03 11 2.6%
Net
kWh 157 0.82 301 5.4%
kW 157 0.03 N/A 2.9%
Therms 150 0.02 6 1.5%
The pilot’s measure mix and geographic spread provide some potential explanations for the savings results.
Table 17 summarizes the measure mix of REEL-financed projects in the first two years. Notably, HVAC
equipment was by far the most common measure, followed by building shell upgrades. More specifically, 76%
of projects replaced central air conditioning or, in very few cases, heat pumps, which typically use electricity
as the primary fuel. Replacing a split system (that is, furnace and air conditioner) was very common and as a
result about two-thirds (67%) replaced their furnace. However, as previously discussed, REEL projects have
typically been in Southern California and the Central Valley, where cooling loads (typically electric) are much
greater than heating loads (typically gas). This may explain the difference between gas and electric savings
despite the prevalence of furnace replacements.
Table 17. Measure Types Financed by REEL Projects (First Two Years of Pilot)
Measure
Percent of Participants
(N=212)
Average number of measures 2
HVAC
HVAC equipment 69%
Ductwork 27%
Building Envelope
Windows 33%
Insulation 31%
Air sealing 11%
Cool roof 10%
Radiant barrier 2%
Water Heater
Water heater 10%
Low-flow shower head or
faucet 1.0%

Study Results Summary
opiniondynamics.com Page 42
Measure
Percent of Participants
(N=212)
Other
Smart thermostat 5.7%
Lighting 2.4%
Pool products 1.9%
Refrigerator/freezer 1.0%
Dishwasher 1.0%
Clothes washer/dryer 0.5%
Air purifier 0.5%
Other – unspecified 1.0%
Source: CAEATFA tracking data.
Finally, the measure mix provides some insights into the longevity of annual savings. According to the
Database for Energy Efficiency Resources34 (DEER), air conditioner and heat pumps (75% of projects) have an
effective useful life (EUL) of 15 years, furnaces (67% of projects) have an EUL of 20 years, and the various
building shell measures above (up to 33% of projects, depending on the measure) have EULs between 18 and
20 years.
4.3 Pilot Influence on Customer Decision Making
While the evaluation team finds measurable energy savings
from this pilot, it is important to explore whether these savings
would have naturally occurred in the marketplace with other
financial mechanisms available to customers, that is, would
customers have taken a different loan instead for the same
project? Or would they have paid for the exact same project with
other means? Or is there some more nuanced influence of
REEL, such that it did, at least partially, have some level of influence on the size of the project, nature of the
project, or timing? Exploring if and how the REEL pilot influenced the energy savings to occur helps determine
if this pilot is needed in the marketplace to generate energy savings for the state.
In Chapter 6, the team provides an estimate of the net savings based on the difference in energy usage
between pilot participants and a matched comparison group. Based on this approach to exploring pilot
influence on savings, if the total net savings is divided by the gross savings, it can be surmised that 41% of
the electric and demand savings and 54% of the gas savings occurred, at least in part, because of the REEL
pilot.
The consumption analysis approach is one way to quantify the counterfactual for the pilot. This evaluation
also explored the influence of REEL through a survey of 49 of the first 212 participants in the pilot.
Quantifying the influence of a financing program on customer decision making is very challenging, but the
evaluation team attempted an approach in the participant survey to better understand whether participants
34 DEER website. http://www.deeresources.com/index.php/component/users/?view=login. 2014 Updated DEER effective useful life
table: http://www.deeresources.com/files/DEER2013codeUpdate/download/DEER2014-EUL-table-update_2014-02-05.xlsx.
Objective 3
Explore the influence of the pilot on
customer decision making to install
energy upgrades.

Study Results Summary
opiniondynamics.com Page 43
thought that they would have qualified for other loans at rates and terms they could afford or accept, and
whether they would have taken loans from elsewhere for the same upgrades.
Below is a summary of key takeaways from the participant survey regarding participants’ need for financing in
general and the specific influence of REEL versus other financing options. A topline of all participant survey
results can be found in Chapter 8 and more detail on pilot influence is available in Section 6.2.
4.3.1 Motivations for Doing a Home Upgrade Project
While financing is a tool for making home upgrade projects more affordable, it is not usually the impetus for
deciding that there is a need to do a home upgrade. As shown in Table 18, the most common motivators
among respondents were the desire to reduce energy bills and increase comfort (more than half of
respondents cited one of these). The next most common motivation (20%) was to repair existing equipment.
Table 18. Motivations for Home Upgrade
Motivation Frequency Percent
Reduce energy bills 14 29%
Comfort (home too hot or cold) 12 25%
Equipment repairs 10 20%
Improved environmental friendliness 6 12%
Home structure repairs 4 8%
Prepare for sale 2 4%
Something else 1 2%
Total 49 100%
4.3.2 Need for Financing in General
Participant survey responses make it clear that the kind of projects respondents completed typically required
financing. Almost half (49%) said that they used financing because they did not have enough cash on hand
to do the project right away, and another 6% did not want to deplete the cash they had. Many participants
reported needing a loan to do any project at all (49%), to do it with the same level of EE (30%), to do the
same size project (49%), or to do it sooner than they otherwise would have (39%); 65% needed a loan for at
least one of these reasons (see Table 19).
Table 19. Need Financing in General for Energy Upgrades
Need for Financing in General % of Participants (n=49)
Needed financing for any reason below 65%
Needed financing to do a project at all 49%
Needed financing to do the full size of the project 49%
Needed financing to do the full project at one time 39%
Needed financing to get energy-efficient level 30%

Study Results Summary
opiniondynamics.com Page 44
4.3.3 Influence of REEL
The pilot is only one of many possible options for financing a home upgrade project. While some participants
may have alternatives, others who have poor credit ratings or substantial DTI ratios may not, or they may
have less attractive options.
Survey data showed that most participants did not shop around for loans, which supports the benefit of
offering the loan through contractors; the loan is likely to be very attractive to customers because it is
convenient. Of the 16 participants in the survey sample who did seek other loans, only 5 (one-third) felt they
that could qualify for those other options. Of the 16 who did shop for alternatives, about a third found at least
one that they qualified for, but most found that other loans were less affordable than REEL (Table 20). Further,
only 16% of survey respondents thought that they could have qualified for a loan with better terms if they had
sought it out. This supports the argument that the key difference between REEL lending and alternatives is
that it extends loan terms for energy upgrades that translate into affordable monthly payments for customers
and therefore can encourage more customers to do EE projects than they could otherwise afford.
Table 20. Alternatives Participants Sought before Choosing REEL
Categories
% of Participants
(n=49)
Did NOT seek other financing options other than REEL 67%
Did seek other financing options other than REEL 33%
Among Those Who Sought Alternative (n=16)
Sought and would NOT qualify for alternative financing 11%
Sought and would qualify for alternative financing 5%
While some participants in the survey did shop for alternative loans, they did think that REEL offered the best
loan terms that they could find, especially in terms of interest rate and loan duration, both of which affect the
monthly payment. The most common reason participants gave for choosing REEL financing related to the
favorable terms of the loan (Table 21).
Table 21. Reasons for Choosing REEL (Multiple Response)
Response Count Percent (n=49)
Loan Terms
Low interest rate 26 53%
No lien on house 5 10%
Attractive loan terms (general) 6 12%
Monthly payment 3 6%
Loan duration 3 6%
No prepayment penalty 1 2%
Loan amount 1 2%
No down payment 1 2%
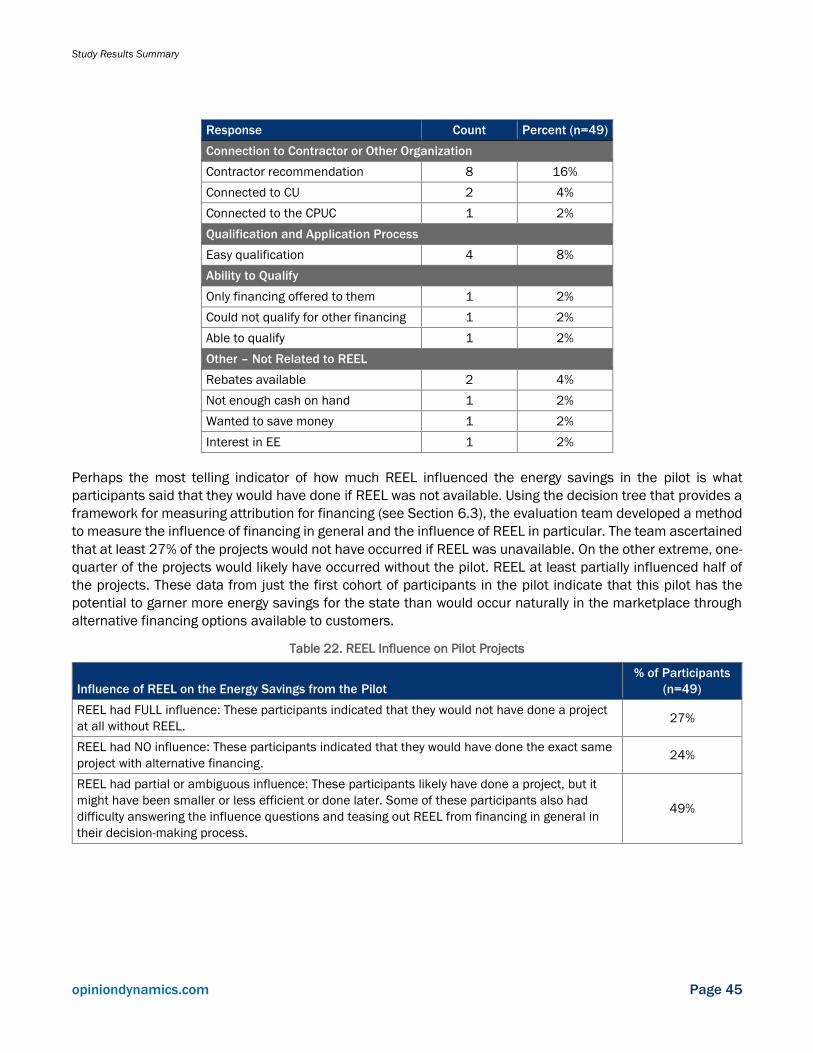
Study Results Summary
opiniondynamics.com Page 45
Response Count Percent (n=49)
Connection to Contractor or Other Organization
Contractor recommendation 8 16%
Connected to CU 2 4%
Connected to the CPUC 1 2%
Qualification and Application Process
Easy qualification 4 8%
Ability to Qualify
Only financing offered to them 1 2%
Could not qualify for other financing 1 2%
Able to qualify 1 2%
Other – Not Related to REEL
Rebates available 2 4%
Not enough cash on hand 1 2%
Wanted to save money 1 2%
Interest in EE 1 2%
Perhaps the most telling indicator of how much REEL influenced the energy savings in the pilot is what
participants said that they would have done if REEL was not available. Using the decision tree that provides a
framework for measuring attribution for financing (see Section 6.3), the evaluation team developed a method
to measure the influence of financing in general and the influence of REEL in particular. The team ascertained
that at least 27% of the projects would not have occurred if REEL was unavailable. On the other extreme, one-
quarter of the projects would likely have occurred without the pilot. REEL at least partially influenced half of
the projects. These data from just the first cohort of participants in the pilot indicate that this pilot has the
potential to garner more energy savings for the state than would occur naturally in the marketplace through
alternative financing options available to customers.
Table 22. REEL Influence on Pilot Projects
Influence of REEL on the Energy Savings from the Pilot
% of Participants
(n=49)
REEL had FULL influence: These participants indicated that they would not have done a project
at all without REEL. 27%
REEL had NO influence: These participants indicated that they would have done the exact same
project with alternative financing. 24%
REEL had partial or ambiguous influence: These participants likely have done a project, but it
might have been smaller or less efficient or done later. Some of these participants also had
difficulty answering the influence questions and teasing out REEL from financing in general in
their decision-making process.
49%

Study Results Summary
opiniondynamics.com Page 46
4.4 Pilot Benefits and Costs
The evaluation team conducted a comparative C/B analysis
of the REEL pilot, assessing a range of relevant quantitative
and qualitative metrics. The team then compared the REEL
pilot C/B result to those from other program models,
including two future REEL program rollout scenarios and
other residential DSM financing and rebate-based
initiatives in California. These metrics are presented
alongside the Resolution E-4900 metrics results to
evaluate the pilot impacts and determine the overall
program scalability as a longer-term program or financial product.
The C/B assessment presented here applies a set of standard efficiency resource program cost-
effectiveness tests. While cost-effectiveness testing was not initially included in the Resolution E-4900
metrics, these tests are included alongside a range of other metrics to provide an apples-to-apples C/B
comparison of the REEL pilot to other DSM program models. This analysis did not aim to determine if the
REEL pilot itself was cost-effective, but instead sought to assess whether the REEL model would over time
eventually prove to be cost-effective as a resource program supported by ratepayer funds.
To make this assessment, cost-effectiveness tests were applied to the following REEL models:
1. REEL Pilot: Based on actual pilot operating expenditures (excluding start-up costs), participation, and
estimated average savings per participant for the two-year evaluation period (FY16–17 and FY17–
18).
2. REEL BAU: A future REEL program scenario that assumes modest savings in expenditures and a
modest increase in participation (240 participants per year) over a five-year period.
3. REEL+: A future REEL program scenario that assumes increased expenditures (additional staff and
investments in IT and an OBR option) and a significant increase in participation rates (865
participants per year) over a five-year period.
Expenditures in the first two years of the pilot (FY14–15 and FY15–16) were designated as start-up costs to
build the infrastructure and team needed to design and manage the program and to recruit lenders and
contractors. The evaluation period (FY16–17 and FY17–18) includes remaining start-up costs and operating
costs associated with the LLR (bank trustee fees, master servicer fees), contractor management, consultants,
and administrative costs (operating expenses and equipment, employee benefits and salaries). LLR-related
costs (bank trustee fees) occur over the life of the loans and are thus included, discounted to FY17–18 dollars.
Figure 7 breaks down how funds were spent since the pilot’s inception through the end of the evaluation
period.
Objective 4
Explore the costs versus benefits of the
REEL product during the pilot period and
compare them to other residential DSM
investments.

Study Results Summary
opiniondynamics.com Page 47
Figure 7. REEL Pilot Expenditures from FY14-15 to FY17-18
To assess the cost-effectiveness of each REEL model, the evaluation team applied an interpretation of the
California Standard Practice Manual35 (SPM) cost-effectiveness tests that are adapted to include the specific
costs and benefits that are relevant to financing programs. The specific financing-related benefits and costs
are shown in Table 23.
Table 23. Benefit and Cost Components
Benefits Costs
Component Description Component Description
Energy NEBs from EEEMs Admin Program administrative and marketing
costs,* including contractor
management
Market Trans Net benefits from market
transformation
Part. Cost Net participant cost
APR Benefits Reduced APR benefits LLR Losses LLR default losses
Other Non-
Energy
Other net NEBs (for example,
comfort, utility, and environmental
externalities) derived from EEEMs,
and from the non-EEEM portion of
the REEL loans (under the mid and
high scenario only).
LLR OppCost LLR lost opportunity costs (costs for
encumbered capital)
Contractor Costs Costs principally for contractor training
Master Servicer +
Bank Trustee
Costs from Master Services and Bank
Trustee
* Marketing costs do not include expenditures by the marketing service provider, Center for Sustainable Energy.
35 CPUC. 2001. California Standard Practice Manual Economic Analysis of Demand-Side Programs and Projects.

Study Results Summary
opiniondynamics.com Page 48
A comparison of where benefits and costs differ among the three models on an annual basis is shown in Table
24. Specifically, costs differ based on the expected number of participants, wherein an increase in the
administration, LLR management, training, and outreach costs would increase incrementally with program
participation, based on cost projections provided from CAEATFA. Similarly, the benefits are prorated to program
participation, for example, the expected energy savings are directly proportional to the number of participants
(that is, no changes in average savings per participant would be expected under increased program volume
scenarios).
Table 24. Cost-Benefit Comparison across Three REEL Models
Variables
REEL Pilot
(FY 2017-18)
REEL BAU
(Program Projection)
Annualized
REEL+
(Program Projection)
Annualized
Costs ($M)
Administration and marketing 0.4 0.5 0.4
LLR Losses + Master Servicer + Bank Trustee 0.2 0.2 0.5
Contractor Management 0.4 0.4 0.4
Benefits
First year gross savings (kWh) 138,600 177,800 654,300
First year gross savings (Therms) 2,057 2,640 9,713
Number of loans 187 240 883
For each scenario, the evaluation team assessed the program cost-effectiveness, applying a range of benefits
values to represent the uncertainty around the potential values and assumptions. The cost-effectiveness test
results (Table 25) are then presented as a range, with the “Low” values representing the results obtained
when the most conservative benefits assumptions are applied, the “High” values representing the most
optimistic benefits assumptions, and the “Mid” values representing the most realistic benefits assumptions
(see Appendix B for each scenario assumptions).
Table 25. Cost-Effectiveness Results for the REEL Pilot and Two Future Programs (REEL BAU and REEL+)
REEL Scenario
Cost-Effectiveness Results (Financing Program Model)*
PCT PAC TRC SCT
REEL Pilot
excluding start-up costs
1.09
(0.93, 1.29)
0.14
(0.10, 0.18)
0.50
(0.40, 0.59)
0.57
(0.51, 1.66)
REEL BAU
excluding start-up costs
0.23
(0.16, 0.31)
0.63
(0.52, 0.78)
0.73
(0.65, 0.88)
REEL+
excluding start-up costs
0.52
(0.33, 0.80)
0.84
(0.68, 1.06)
0.97
(0.86, 1.20)
* The “Mid” scenario results are in bold. The “Low” and “High” scenario results are in parentheses below.
Figure 8 shows that program administration, contractor management, and LLR management costs make up
a significant portion of REEL costs. As volume increases under the REEL+ scenario, administration and LLR
management costs make up a smaller portion of the overall costs, as these costs are largely fixed. However,
they remain sizable and continue to affect REEL’s ability to achieve cost-effectiveness thresholds. Benefits are

Study Results Summary
opiniondynamics.com Page 49
largely driven by NEBs, namely, APR reductions accrued by participants, which lead to lower monthly payments
and expand access to capital for some borrowers.
Figure 8. Comparison of REEL Pilot and REEL+ Scenario Benefits and Costs
REEL Pilot
REEL+ Scenario
These results provide the following key takeaways.
1. The current administrative costs associated with REEL lead to reduced cost-effectiveness when the
program volume is low. If an eventual REEL program could achieve annual volumes on the order of
2,000 loans per year or more, it could approach cost-effective delivery.
2. While contractor management costs are somewhat high, interviews with CAEATFA, PAs, lenders, and
other jurisdictions revealed that contractor support is critical to program success.
◼ Neither the REEL pilot nor the two future hypothetical program projections pass the cost-
effectiveness threshold (> 1.0) for the PAC, TRC, and SCT under the Low and Mid scenarios. The
REEL+ program is cost-effective under the TRC and the SCT High scenarios, where the inputs
assume a decline in covered losses, increased market effects, a lower discount rate, and a
higher value placed on NEBs. However, the evaluation team cautions that the High scenario
applies the most optimistic assumptions for all program benefits (such as 100% NEBs adders for
EEEMs). The High scenario assumptions were intended only to provide an upper limit to the cost-
effectiveness results rather than an expected outcome of a future program. As noted above, the
Mid scenario is likely the most reasonable forecast.
Contractor
Management
Contractor
Management

Study Results Summary
opiniondynamics.com Page 50
◼ The programs are cost-effective from the participant perspective at 1.09. The PCT benefits do
not change among scenarios because costs and benefits from the participant perspective are
not affected by program volume or administration costs under the current model.
3. The PAC is particularly low. This runs counter to conventional cost-effectiveness expectations, where
PAC ratios are typically higher than the TRC and SCT. PAC results are lower in this case as energy
savings make up a small portion of the overall benefits and the PAC does not account for the APR
reduction, which is by far the largest program benefit, but is only counted in the TRC and SCT
because it accrues to the participants only.
To provide context for these results, the evaluation team benchmarked the pilot and two future REEL program
projections with other residential DSM investments, including Energy Upgrade California (EUC), the Residential
HVAC program, and the Residential Regional Finance Pilots (RFPs) that were funded with the ARRA. While
these are not apples-to-apples comparison, given differences in program designs, measure mix, and inputs
used in the C/B tests, for example, RFP C/B tests were based on ex ante savings and indicated that ex post
savings were on average only 25% of the ex ante savings values.36 However, these comparisons provide some
context for comparison, especially in terms of the costs side of the C/B equation. Table 26 presents the cost-
effectiveness results.
Table 26. Comparison of Program Cost-Effectiveness Ratios
Cost-
Effectiveness
Ratios
REEL (Pilot)
FY17–18
REEL BAU
(Program
Projection)
REEL+
(Program
Projections)
Regional
Finance Pilots
2013–2015
Residential HVAC
Program Year
2017
EUC
(HUP and AHUP)
Program Year 2017
TRC Ratio 0.50 0.63 0.84 0.97–1.40
(0.76–1.16)a 0.03–1.26 0.27
SCT Ratio 0.57 0.73 0.97 1.03–1.46
(0.73–1.13)a N/A N/A
PAC Ratio 0.14 0.23 0.52 0.36–0.59
(0.09–0.15)a 0.14–1.49 0.63
a The cost-effectiveness results for the RFPs were adjusted to account for the impact of applying the HUP ex post savings, which were
25% of the ex ante saving on average. All RFP participants were also participants of the HUP, but the ex ante / ex post savings ratio
may differ between the RFP participants and the HUP participants as a whole.
From the evaluation team’s cost-effectiveness analysis, the REEL model does not appear to pass the cost-
effectiveness test as a pilot or in any future models. The following takeaways should be considered from these
results.
◼ The mature incentive-based EE programs struggle to achieve cost-effectiveness, apart from some
IOU Residential HVAC programs. California has adopted very aggressive EE and RE goals; achieving
these goals has become more difficult due to the state’s stringent codes and standards that have
increasingly raised the minimum EE performance baseline.37 While California’s market
transformation efforts are having a positive transformative impact, resource programs are
challenged to deliver energy savings cost-effectively.
36 DNV GL. 2019. Impact Evaluation Report Home Upgrade Program – Residential Program Year 2017 California Public Utilities
Commission CALMAC ID: CPU0191.01. 37 The California Title 24 Building Energy Efficiency Standards ensure new and existing buildings achieve EE. The standards are
updated regularly by the California Energy Commission.

Study Results Summary
opiniondynamics.com Page 51
◼ Increasing REEL loan volumes may improve REEL program cost-effectiveness. As participation
increases from the REEL BAU to the REEL+ models, administration and LLR costs have less
effect on cost-effectiveness results as they are largely fixed. Focusing efforts on increasing the
loan volume of the REEL+ projections of more than 2,000 loans per year could play a key role in
improving the program’s cost-effectiveness.
◼ REEL’s ability to deliver low-cost loans causes non-energy savings (APR benefits primarily) to far
outweigh energy savings benefits. The APR reduction makes up the largest proportion of program
benefits by far. While participating lenders currently offer competitive interest rates, with some
as low as 4.50%, maintaining REEL in market and continuing to demonstrate that REEL loans are
performing well, particularly in risky market segments, could provide lenders with confidence to
pass on greater savings to borrowers. The Michigan (MI) Saves Home Energy Loan Program
demonstrated strong LLR performance, resulting in lenders reducing interest rates, which led to
increased loan volumes. Increasing these benefits could offer the best path forward toward a
cost-effective REEL program.
◼ The REEL model as it is currently structured carries notable administrative weight, which affects
the ability of the program to operate cost-effectively while delivering low or moderate loan
volumes. Finding solutions to reduce the administrative costs associated with contractor
management, bank trustee fees, and the master servicer could collectively improve the
program’s cost-effectiveness.
Finding a REEL program model that can achieve a TRC threshold > 1.0 will likely require leveraging several
of the factors outlined above. A cost-effective REEL model would need to reduce program costs
(administration and LLR management fees) and increase program volume and benefits (energy savings,
accounting for other NEBs, and further APR reductions). However, the estimated savings per REEL
participant are based on the gross savings found in this evaluation; applying net savings would further
reduce savings and REEL’s ability to achieve cost-effectiveness. REEL offers a variety of social, economic,
and environmental benefits that are not fully accounted for in the model: helping underserved Californian’s
make improvements that improve their comfort, reducing energy poverty, improving people’s health;
boosting the value of housing stock; increasing economic opportunities for partners; and accounting for the
social cost of carbon. Finding opportunities to reduce costs, applying a longer-term lens to measure market
impacts, and reevaluating how ratepayer funds are used to support California’s climate-related goals should
be considered.
4.5 Pilot Design and Implementation Model
The REEL organizational structure is made up of multiple actors; each plays a unique role and function to
support REEL in achieving its goals, including:
◼ The CPUC is responsible for governance and broad decision making.
◼ CAEATFA is responsible for developing and implementing CHEEF functions and various pilots to
increase the flow of private capital to EE projects; managing all program aspects, including enrolling
lenders; establishing project design and requirements; -and managing the flow of funds and data
◼ IOUs support initial program design and develop OBR and on-bill financing (OBF) infrastructure and
marketing coordination.

Study Results Summary
opiniondynamics.com Page 52
◼ The master servicer developed and manages the centralized platform to collect financing
enrollments and utility bill data and will facilitate future OBR infrastructure and transactions if
incorporated into REEL.
◼ The bank trustee holds utility funds and the LLR accounts.
◼ Private lenders originate, enroll, and service loans under the program, providing them to the master
servicer.
◼ The contractor manager recruits and trains REEL contractors and performs quality assurance, site
inspections, and contractor support. This functionality was initially conducted by CAEATFA until it
brought on an industry expert to serve this role in October 2017.
◼ REEL contractors install eligible EE measures and submit required project information to lenders.
◼ The marketing implementer (the Center for Sustainable Energy or DDB, depending on the time
period) designs and implements marketing, education, and outreach strategies.
Stakeholder feedback provides important perspective to
assess the effectiveness of the REEL implementation
model and the potential for a REEL program to be scaled
up in the future and to further understand how the
efficiency financing market has transformed since the
CPUC approved funding for the pilots in 2012. To meet this
objective, the evaluation team conducted semi-structured
in-depth interviews with CAEATFA; all seven enrolled
lenders38; and six efficiency PAs, including the four IOUs (Pacific Gas & Electric [PG&E], Southern California
Gas Company [SCG], San Diego Gas & Electric [SDG&E], and Southern California Edison [SCE]) and two
RENs (Bay Area Regional Energy Network [BayREN] and Southern California Regional Energy Network
[SoCalREN]).
Overall, these interviews played a central role in evaluating REEL’s processes and identifying opportunities to
fine tune the program to attract greater participation and support deeper savings.
CAEATFA and Program Administrator Perspectives
Pilot Design
The sentiment overall is that the REEL multilender model, with CAEATFA as PA, is supported by CAEATFA and
the PAs. While all parties interviewed agreed that a state-backed program adds credibility, trust, and
security, there are opportunities to enhance the REEL model and better define the target market. The
following key findings about pilot design were uncovered.
◼ There are several challenges with the current program structure. CAEATFA and the PAs reported
several pilot design challenges related to the customer and contractor experience and complications
to verify participant eligibility. Interviewees felt that investing in IT infrastructure may improve
contractor and customer experience; extending REEL to publicly owned utility (POU) territories would
streamline eligibility for participants who are not served by an IOU (for gas or electricity) and reduce
38 Only four lenders were participating during the evaluation period, but all seven lenders currently participating were interviewed.
Objective 5
Gain feedback on the pilot design and
implementation model from key
stakeholders, including PAs, CAEATFA,
participating contractors, and lenders.

Study Results Summary
opiniondynamics.com Page 53
administrative burdens and, although several changes have helped streamline the process,
administrative requirements like loan-by-loan eligibility checks take time and create complexity.
◼ REEL’s status as a pilot is hindering growth. CAEATFA reported that it was challenging to recruit
larger lenders to a pilot program because they do not want to invest the time and money to set up a
new lending product that may exist over a short timeframe. This sentiment was echoed by other
stakeholders, who indicated that they struggled to see the long-term benefits from joining a pilot.
◼ There is a lack of evidence on loan volume and performance. The pilot’s short timeframe does not
allow for a proven track record of loan volumes and loan performance.
◼ PAs felt that there is demand for EE financing and, as PACE financing declines, there are
opportunities for REEL to fill the market gap. However, REEL needs to expand the eligible measures
list and reduce barriers to make inroads. Although new state PACE regulations have resulted in
declining PACE volumes, REEL is not growing at the same rate to fill the gap. PACE allowed for RE,
EE, and other measures. Allowing REEL to become a more comprehensive solution may increase
participation.
◼ State policy goals for greenhouse gas (GHG) and electrification are changing, and there is a need to
reevaluate what customers and the market really need, how REEL can best serve the market, and
whether ratepayer funds can be used. There is a great deal of interest in electrification and
renewables, and many customers in California are looking to go “green” to help the environment and
mitigate climate change. REEL should include other energy solutions to align with state policies, for
example, solar. However, if these measures are not be eligible under a ratepayer-supported
efficiency program, it could limit REEL’s ability to adapt to consumer demand and state goals under
its current model.
◼ CAEATFA and PAs suggest that the multilender model offers borrower’s choice and the ability to work
directly with lenders. They also viewed the model as creating healthy competition among lenders and
avoiding participants being locked into one option or term. However, one PA suggested that using a
single lending partner may encourage that lender to make greater investments in technology and
marketing needed to scale up REEL. Another PA suggested that one lender adds simplicity for
borrowers (“Borrowers don’t have to evaluate multiple rates and terms”). CAEATFA believes REEL
could get to scale with an IT investment and enrolling large FIs, RICs, or a single originator that could
standardize application processing and sell to the secondary market.
◼ Offering EE loans (even with low interest rates) was not viewed as a solution for truly low-income
borrowers. There is hesitancy to offer financing to low-income customers that could potentially add
financial stress to this population, and many PAs favor other options available to low-income
homeowners (for example, Direct Install, ESAP, CARE). REEL could be a better option for moderate-
income borrowers, but the definition of moderate-income must be carefully considered. While REEL
offers attractive interest rates and longer payback periods to lower monthly payments, moderate-
income households may be vulnerable to falling into low-income status. Several PAs suggested that
REEL may be most appropriate for upper-moderate- and high-income borrowers or that if lower-
income homeowners are participating that the savings to investment ratio be greater than 1.0, so
the monthly energy savings exceed the monthly loan payments for the EE upgrades.

Study Results Summary
opiniondynamics.com Page 54
Pilot Implementation
REEL experienced several hurdles that affected implementation, including the regulatory process and the
complexity of financing and coordinating multiple players. Over time, program implementers recognized that
CAEATFA needed freedom and flexibility to make decisions and implement REEL. The CPUC granted CAEATFA
more latitude39 and CAEATFA made modifications to the program that it believes will improve REEL’s impact.
Moreover, CAEATFA’s experience implementing REEL is benefiting it as it launches additional initiatives like
the new Small Business Financing and Affordable Multifamily pilots. There are opportunities to better
integrate REEL with other efficiency programs and to educate and incent contractors.
◼ The CPUC regulatory process is important to minimize risk to ratepayer funds but can slow the ability
of the program to adapt. Having to make regulatory requests for each change prevents REEL from
being nimble and adjusting quickly to learnings as they emerge. Experience in other jurisdictions
show that the most successful EE lenders are constantly adjusting and updating their programs as
they generate new market intelligence and a deeper understanding of their customers’ needs.
◼ CAEATFA’s experience with REEL is benefiting other pilots. CAEATFA’s familiarity with the CPUC and
its experience with REEL has helped CAEATFA know where to go for information among the multiple
parties involved, how IOUs are organized, and how to ask the right questions. The small business
pilot is estimated to take three months to launch versus one year for REEL.
◼ OBR should continue to be explored to increase participation. The infrastructure for the Energy
Financing Line-Item Charge (EFLIC) was built with PG&E but was challenged when the lender that
had been interested in this model had a change of management and policy priorities and determined
not to move forward. One PA noted that, on the commercial side, utility OBR/OBF has steadily
become customers’ first choice because it avoids the complexity of going though lenders, has
different underwriting requirements, and allows repayment on a customer’s utility bill.
◼ Make it easy for contractors to participate. PAs perceived that
the process for enrolling in REEL was too long for contractors.
PAs suggested improving the contractor experience with
technology, minimizing paperwork, developing a support
network, staggering payments for larger projects, and offering
incentives to reduce administrative costs.
39 In the spring of 2017, bundling was removed (that is, single measure projects were allowed), modeling requirements were
removed, and EEEMs became consistent across all IOU lists. In the fall of 2017, a single EEEM list was developed, the Customer
Information Standardized Request (CISR) form was eliminated, lender certification for each loan was no longer required, IOU LLR
accounts allocation per lender was combined, non-EEEM eligible for IOU rebate was allowed, loans could be refinanced (within three
months), and mobile/manufactured homes became eligible. In the spring of 2018, the EEEMs list was incorporated into regulations
and separated from IOU control, the credit-challenged program was initiated, and the LMI census tract method was introduced to
measure underserved.
“Contractors do not shop for
the best offer for customers;
they promote the one that is
easiest to work with.”
— Program Administrator

Study Results Summary
opiniondynamics.com Page 55
◼ Not all EUC/HVAC contractors are REEL contractors,40 but once
onboard, some view REEL financing as an alternative to
rebates. Several PAs believe that contractors may be pushing
one or the other: “Whatever helps them close the project
quickly is going to win.” One PA noted that once a contractor
signs up with REEL, the contractor no longer promotes the HUP.
Another PA felt that if all contractors present financing, this
could formally align the single-family home upgrade, REEL, and other programs.
◼ Balancing safety and a desire to reduce complexity is challenging. Early on, CAEATFA chose to align
REEL with IOU processes. For quality assurance, health, and safety for HUPs, a Combustion
Appliance Safety (CAS) test was triggered for rebates whenever three building envelope measures
were involved. CAEATFA believes contractors may not be suggesting larger projects because they do
not want to trigger a CAS test (even though this is not a requirement for REEL).
Lender Perspectives
Key insights segmented into the two topics (pilot design and implementation) are presented below.
Pilot Design
Lenders reported that REEL is having a positive impact by offering customers better interest rates, helping
those who would otherwise not have access to financing, and creating business opportunities for lenders.
Lenders did identify several lost opportunities, notably, excluding publicly operated utilities, excluding solar,
and gaining traction with other lenders.41
◼ Lenders would not be able to offer the same interest rates, terms, and loan amounts without the
LLR. Without the LLR, all lenders stated that they would have to adjust their offer. Unsecured
personal loans are quicker, but no one (even high FICO score borrowers) would have access to the
same rates offered by REEL. Borrowers also like the fact that REEL is unsecured compared to
lender’s other home improvement/EE loan products that are secured. Several lenders reported
gaining comfort with REEL over time. One lender’s recent assessment of the risk profile of all their
existing borrowers revealed that all their REEL loans are performing well. No lenders raised any
concern.
◼ Lenders agreed that REEL was supporting those who would
otherwise not have access. Although most REEL borrowers
are in the moderate-to-high FICO tiers, lenders pointed out
that those with good credit may not have a lot of income and
REEL is a better option. Moreover, the LLR has increased
lenders’ comfort to offer better rates and be more lenient on
DTI ratios. One lender reported that one contractor that it
works with regularly prefers REEL because its current
financing arm is turning down its customers.
40 Only 26% were both during the two-year pilot evaluation period. 41 The evaluation team notes that CAEATFA made the strategic resource decision to not enroll new lenders until after the evaluation
so that it could target resources to the other pilots (Small Business Financing and Affordable Multifamily).
“People are familiar with
rebates; they are a natural
lead-in. Someone needs to
come up with the perfect pitch
to combine the two.”
— Program Administrator
“We started with minimum FICOs
of 640 and decreased it to 580
to align with other lenders. We
were losing two deals per month
because of the FICO difference
with other lenders.”
— Lender
Study Results Summary
opiniondynamics.com Page 56
◼ REEL is a business opportunity. Several lenders reported that
most REEL loans are with new members and REEL allows
them to build relationships and sell more products. While
other loan options are presented to members, REEL is often
more favorable. Auto loans make up a large percentage of
CUs’ loan portfolios and REEL offers an opportunity to
diversify and spread risk.
◼ Excluding POUs may be hindering REEL’s ability to scale. To participate in REEL, homeowners must
be receiving electric and/or gas from the IOUs.42 One lender reported that its field of membership is
in a dozen counties, but borrowers in regions served by POUs cannot participate.
◼ Lenders did not look favorably at PACE, and this presents an opportunity for REEL. All lenders
reported negative experiences with PACE. Lenders were often not aware of PACE liens until
borrowers refinanced their mortgages and details were unclear to consumers. But most lenders do
not think REEL is an alternative to PACE unless it includes other measures like solar. One lender with
a similar loan product (but secured) reported that 90% of potential REEL participants chose their
secured loan over REEL because it included solar. Another lender reported that one of five applicants
wanted solar.
◼ Leverage participating CUs to gain traction with other FIs. Most participating lenders welcome more
lenders into the fold. Multiple lenders provide options; promote better service, rates, and terms; and
broaden the target market. Several lenders suggested promoting REEL through trade associations
like the California Credit Union League. The Credit Union League hosts a statewide conference once
a year that brings together 40–50 executives. This is an opportune time to promote REEL and have
participating lenders share their experiences.
Pilot Implementation
Lenders are very satisfied with REEL and CAEATFA’s support, but there are areas to improve pilot
implementation, notably in marketing, supporting contractors and borrowers, relaxing lender guidelines and
conducting quality assurance.
◼ CAEATFA has built strong partnerships with lenders. Lenders
reported high satisfaction with REEL and CAEATFA. Lenders
reported that CAEATFA is great to work with, very hands-on,
and accessible. All lenders hoped REEL would continue and
planned to participate.
◼ REEL is labor intensive. Lenders reported that the time to
book REEL loans is much greater than other loan products and that a dedicated staff with knowledge
of REEL guidelines and requirements is necessary. Additional time is also spent with borrowers and
contractors. One lender reported that several emails are required for every single loan. Lenders
suggested that an online interface would help. Some lenders recognized that this is the cost of
participating in a pilot; the time to get up and running is all for the greater good.
42 “Eligible Property” is defined as receiving service from one or more IOU. California Code of Regulations Title 4 Business
Regulations, Division 13. CAEATFA. §10091.1.(u). Accessed at:
https://www.treasurer.ca.gov/caeatfa/cheef/reel/regulations/2018/reel-e-regs-9-17-18.pdf.
“We’re happy. The program took
us a while to get rolling but has
potential to move now. We’re all in
favor of the program continuing.”
— Lender
“One borrower had such a good
experience with REEL, they
wanted to do more business with
us."
— Lender

Study Results Summary
opiniondynamics.com Page 57
◼ There are opportunities to improve marketing. Lenders noted that co-marketing with IOUs (for
example, utility bill inserts) tend to drive most applications (the evaluation team notes that this
activity occurred outside the pilot evaluation period). One lender mentioned that it received 10–15
applications within a week of utility bill inserts. Some lenders reported a notable increase in
applications with co- marketing.
◼ Relax guidelines and let lenders do what they do best. Lenders expressed frustration with the state
getting caught up in details, inspecting each loan eligibility, and manual reporting. Lenders
suggested more automation and reducing monthly reporting to quarterly. One lender stated, “A
permanent program should consider how to reduce manpower.”
◼ Finding REEL-certified contractors is no longer an issue, but there is greater need to educate.
Lenders reported that getting contractors took a while and the ones that eventually came on board
were not necessarily interested in supporting REEL nor comfortable with how REEL works. While
streamlining of processes has helped, lenders are still hand-holding new contractors.
◼ One lender suggested a need to conduct more quality assurance particularly for non-EEEM DIYers.
One lender flagged the potential for self-certification to be manipulated, that is, people self-certify
that 30% non-EEEMs are DIY work, but may use funds for something else. There was concern that
state-backed funding is open to misappropriation without proper checks and balances. The REEL
contractor management team performs site inspections of approximately 20% of the projects.
REEL-Certified Contractor Feedback
The contractor web survey asked 57 REEL-certified contractors to provide their feedback on the REEL pilot
overall, as well as on specific components. As mentioned earlier, fewer than half of REEL-certified
contractors have completed REEL projects.
Contractor satisfaction with REEL pilot appears to be dependent on whether the contractor has completed a
REEL project. Almost two-thirds (61%) of contractors (35 of 57) indicated that they were either somewhat or
very satisfied with the REEL program overall. Notably, few contractors (6 of 57) reported that they were
dissatisfied, and contractors who had not yet completed a REEL project had “neutral” opinions of the pilot
(an average of 3 out of 5). As shown in Table 27, contractors who have completed a REEL project (“active”
contractors) had a slightly higher average satisfaction score (statistically significant) than those REEL-
certified contractors who had yet to complete a REEL project (“dormant” contractors).

Study Results Summary
opiniondynamics.com Page 58
Table 27. Contractor Satisfaction with REEL
Response
Total (n=57)
Dormant Contractors
(n=23)
Active Contractors
(n=34)
Count Percent Count Percent Count Percent
1 - Very dissatisfied 3 5% 2 9% 1 3%
2 - Somewhat dissatisfied 3 5% 1 4% 2 6%
3 - Neutral (neither satisfied nor dissatisfied) 16 28% 12 52% 4 12%a
4 - Somewhat satisfied 10 18% 3 13% 7 21%
5 - Very satisfied 25 44% 5 22% 20 59%a
Total 57 100% 23 100% 34 100%
Mean 3.9 3.4 4.3
Standard Deviation 1.2 1.2 1.1
a Indicates statistical significance at the 95% confidence level.
As shown in Figure 9, respondent feedback on various pilot components was overall positive, with
contractors describing the promptness of payment post-completion, increased loan duration, and maximum
amount as key benefits. Most respondents indicated that the key program design elements (customer
eligibility, REEL loan terms, application process) do not need improvement. Notably, Figure 9 reinforces the
finding that dormant contractors had slightly lower, more neutral perceptions of the pilot than active
contractors.
This is interesting, as PA interviews revealed that there is a perception that contractors find REEL complex
and will not participate without better support, streamlined processes, progressive payments, and
incentives. Lenders also noted that of those participating, additional training is needed to help them better
understand REEL and how to participate. The lender and PA perceptions may speak to why the other half of
enrolled contractors are currently not participating.

Study Results Summary
opiniondynamics.com Page 59
Figure 9. Contractor Feedback on REEL Components
Note: Original question was “Which components of the REEL program currently work as-is (and therefore do not need improvement)
and which, in your opinion, need improvement?” Percentages refer to those who indicated a component did not need improvement.
* Indicates statistically significant difference between proportion of active and dormant respondents answering at the 95%
confidence level.
4.6 Alternative Implementation Models
The REEL pilot model was compared to five similar
financing programs in other jurisdictions to extract insights
on best practices and suggest possible improvements that
could be considered if REEL is to be scaled as a long-term
program. The evaluation team explored three key topic
areas:
1. LLR management and underwriting practices
2. Management of lenders
3. Marketing and integration with resource programs
The programs analyzed were:
◼ NYSERDA Smart Energy Loans and OBR
◼ MI Saves Home Energy Loan
◼ Enhabit, Oregon (OR)
◼ CT Green Bank Smart-E Loans
◼ Colorado (CO) Energy Office Residential Energy Upgrade (RENU) Loan
Objective 6
Compare and contrast the pilot
implementation model with other models.

Study Results Summary
opiniondynamics.com Page 60
These were selected based on the following criteria: they offer financing to residential customers; they aim to
support EE upgrades; they have statewide coverage; they incorporate credit enhancement features, such as
LLRs; and they showcase different lender partnership models (single- or multilender models). The programs
are summarized in Table 28.
Table 28. Other Statewide Financing Programs
Program and PA
Start
Date
Number (and
type) of Lenders
Loan Volume
(total to date)
Average
Loan Size
($)
Loan Volume
as % of Single-
Family Homes
in the Statea
Amount Set
Aside for LLR
Smart-E loans,
CT Green Bank
(CT)
2011
12 local lendersb
(CUs, community
banks, community
development
financial
institution [CDFI])
As of May 2018,
2,700 loans closed
($48M)
$17,778 0.28%
7.5% for Class A
loan (≥680
FICO); 15% for
Class B (<680
FICO)
Enhabit
(OR) 2009
4 local
participating
lenders
(local banks)
As of June 2015, 1
lender issued more
than 3,000 loans
(exceeding $40M)
$13,333 0.25% N/P
Smart Energy
Loans and OBR,
NYSERDA
(NY)
2010 &
2012
1 lender
(NYSERDA)
+ 1 loan originator
+ servicer
As of June 30,
2018, 14,000
Smart Energy
Loans and 9,000
OBR loans issued
(over $263M
combined)
$11,435 0.59% N/A
Home Energy
Loan Program,
Michigan Savesc
(MI)
2009 5 local lenders
(CUs)
As of July 2016,
6,200 loans have
been issued (over
$57M)
$9,194 0.18% 5%
RENU, Colorado
Energy Office
(CO)
2018 1 local lender (CU)
As of 2018, 38
loans closed
($0.5M)d
$13,158 0.002% N/P
REEL,
CAEATFA
(CA)
2017 7 lenders (CUs),
1 master servicer
As of December
2018, 339 loans
closed ($5M)
$17,165 0.004%
11% (regular),
20% (LMI
borrowers)
N/A = Not applicable, N/P = Information not publicly available.
a Data for number of occupied single-family homes (1-unit attached and detached homes) per state sourced from American
FactFinder (https://factfinder.census.gov/faces/nav/jsf/pages/community_facts.xhtml).
b As of May 2018, https://aceee.org/sites/default/files/pdf/conferences/eeff/2018/3A-Elliott-Hill-O%27Neill.pdf.
c As of July 2016. Based on Dunsky Energy Consulting. 2018. Green Ontario Fund, Report 2: Single-Family Residential Financing,
pg. 29.
d CO Energy Office. 2018. Annual Report 2017–18, pg. 7. Accessed at: https://www.colorado.gov/pacific/energyoffice/reports.

Study Results Summary
opiniondynamics.com Page 61
Based on the evaluation team’s comparative analysis, the following insights emerged.
◼ REEL incurs significantly higher costs for LLR and lender management than other programs, likely
because of complex setup and reporting requirements.
◼ Challenge: REEL’s lack of LLR funds that it can administer independently creates a complex and
costly management process. Currently, REEL’s LLR setup, which uses utility ratepayer funds from
different IOUs, obligates REEL to use a master servicer to track loans individually to provide LLR
funds from the correct utility, based on borrower territory. This adds complexity to LLR and lender
management, as loans and LLR funds must be reconciled between utilities, PA, and the lenders.
◼ LLR Management: In comparison, other programs such as those offered by Michigan Saves (MI)
and the CT Green Bank, have access to LLR funds that they can administer internally. This has
several benefits: funds are aggregated at the lender (not borrower) level, leading to simpler and
less costly periodic reconciliation, and the program is able to reinvest and earn a return on LLR
funds (instead of paying a master servicer to track the flow of ratepayer funds and a bank
trustee to hold the funds, as REEL does).
◼ Lenders and Master Servicer: The open-market approach and OBR functionality options have led
CAEATFA to establish a master servicer, to create a centralized secure flow for data and funds
between lenders and utilities and to facilitate loan enrollment to scale. In comparison, the CT
Green Bank and MI Saves programs do not use a master servicer. NYSERDA uses a direct single-
lender model and has a master servicer that originates and services loans and manages data
and OBR. While the roles of the master servicer are different between NYSERDA and REEL, REEL
incurs a significantly higher cost per loan (2.5x).
◼ REEL can seize opportunities to iterate and adapt LLR and underwriting practices to improve
program accessibility and/or lower participant borrowing costs further.
◼ Three of the five programs the evaluation team reviewed had LLRs as part of credit
enhancement measures. Two programs, those offered by MI Saves and CT Green Bank,
experienced better-than-expected LLR performance (low default and delinquency rates). When
confronted with LLR coverage that exceeds the lender risk coverage needs, these lenders saw
three ways to update their programs to get more value out of the LLR:
◼ Reduce the capital held in the LLR, thereby freeing up capital for other needs (while
maintaining the original LLR obligation to lenders)
◼ Require lenders to expand underwriting criteria to take on more risk, lengthen terms, and/or
lower interest rates
◼ Jettison low-risk customers who do not need the LLR coverage, that is, cap the program’s
maximum FICO score.
◼ The CT Green Bank and MI Saves programs both considered this range of options, applying and
iterating to further improve the effectiveness of their LLR programs.
◼ Another successful practice is tiered underwriting, to expand program access to borrowers who
would not qualify for loans with traditional underwriting criteria. For example, NYSERDA’s Tier 2
Loans expands access to the number of people who can qualify using alternative underwriting,
considering mortgage payment history in place of FICO score. NYSERDA was able to adjust the
Study Results Summary
opiniondynamics.com Page 62
program such that it focused subsidized lending on low creditworthy applicants, while directing
high-FICO-score applicants to conventional loans.
◼ Most programs find success with multiple local community lenders.
◼ Three of the five programs analyzed leverage the value-alignment, customer familiarity, and
approachability of mission-driven lenders, such as CUs and local banks. With their strong links in
the community, these private lenders are more likely to share and support the values that drive
the financing program.
◼ Programs also found local lenders easier to approach, as larger lenders were not interested in
joining a program or offering a product that had not demonstrated significant market demand.
Similarly, REEL faced difficulties attracting large FIs, as the modest size of loans and the pilot
status of the program failed to garner their interest. Thus, REEL has embraced partnerships with
community lenders (all seven lenders are CUs). If REEL decides to pursue larger conventional
lenders in a program expansion, it could use the following arguments: its status as a
conventional program (no longer a pilot, reassuring lenders that it is “here to stay”), its ability to
leverage its track record (showcase statewide coverage, number of past customers, and strong
loan performance), and its capability to point to market demand (for EE improvements and to fill
the market gap left by the PACE financing decline).
◼ Although managing multiple lenders adds some complexity (for example, multiple terms and
rates, different service territories) and CUs specifically have other challenges (for example, field-
of-membership expansion restrictions), local lenders can add value for rural customers. In the
REEL pilot, most loans were issued by two statewide CUs whose branch locations were limited to
Southern California. Although the program could maintain statewide coverage with these two
lenders, it may prefer to offer more convenience to rural customers by continuing to work with
local lenders in parallel (more in tune with community needs, offering opportunities for face-to-
face rather than internet interaction). The MI Saves program, for example, has overlapping
lender coverage: One lender offers statewide coverage, while others focus exclusively on certain
counties.
◼ The NYSERDA single-lender model, which issues loans from state funds, offers a plausible
alternative to the multiple-lender model.
◼ Invest in training contractors, the driving force behind the marketing and quality of the program.
◼ Marketing: Contractors remain the main marketing mechanism behind the programs analyzed.
Other programs invest significant efforts to recruit and train contractors, through targeted
outreach, regular training and events, and supplying support materials (for example, marketing
or training tools). REEL also has a contractor enrollment and training process, which CAEATFA
began internally and then hired a dedicated contractor manager to oversee. However, all lenders
interviewed said that contractors still need further training, and surveys with contractors also
showed a desire for better marketing support.
◼ Quality: Training contractors is also essential for quality purposes and supports process
streamlining. The MI Saves program no longer requires project preapproval by the PA, after
investing heavily in contractor training and relying on contractors to determine project eligibility.
The program still conducts spot checking on the back end (taking remediation action with the

Study Results Summary
opiniondynamics.com Page 63
contractor, if necessary), but this is rare. REEL could consider this back-end approach as a way
to streamline the application process.
◼ Consider expanding to RE and Beneficial Electrification
◼ All other programs analyzed include both EE and RE measures, with RE typically including solar
panel installation and/or battery storage systems. Beyond this being a common practice in other
programs, RE was also mentioned as a key gap during lender interviews. Interviewees mentioned
that expansion to renewables would position REEL as a “one-stop shop” to fill the market gap left
by the decline of PACE in California, thus increasing its attractiveness. Interviewees also
suggested that REEL consider including beneficial electrification43 and electric vehicle (EV)
charging to align with state goals.
4.7 Evolving Regulatory and Industry Environment
Since early 2012, several factors have emerged that
could affect, either directly or indirectly, the demand for
and supply of the type of financing that REEL provides,
as well as its goals, design, and cost-effectiveness. This
section discusses important trends within three key
areas — regulatory policy, climate change, and the
financial industry — and then concludes with a number
of suggested strategies for responding to the impacts
these trends may have on REEL financing.
4.7.1 Regulatory Policy
The regulatory policies regarding EE, renewables, and carbon reduction have evolved rapidly and have
become more aggressive since the decision to launch the financing pilots in 2012. This section describes
these evolving policies and discusses how they have created both opportunities and challenges for REEL.
Two California Assembly Bills (ABs) paved the way for EE financing to emerge as a program design in
California. In 2006, AB 32 established a comprehensive program to reduce GHG emissions from all sources
throughout the state to 1990 levels by the year 2020, representing approximately a 30% reduction
statewide. In 2008, AB 811 was signed into law and helped California municipalities accomplish the goals
outlined by AB 32 by authorizing financing of renewable generation and EE improvements through low-
interest loans that would be repaid as an item on the property owner's property tax bill. Since this time, PACE
financing has become the leading form of EE financing in California, though other financing models have
emerged through ratepayer funding, including the RFPs and REEL.
In 2015, California State Bill (SB) 350 increased California's renewable electricity procurement goal from
33% by 2020 to 50% by 2030. In addition, SB 350 requires the state to double statewide EE in electricity
and natural gas end-uses by 2030. Then, in 2018, SB 100 set a planning target of 100% zero-carbon
electricity resources by 2045 and increased the 2030 renewables target from 50% to 60%. On the same day
43 Beneficial electrification is allowed if the IOU provides electric service. CAEATFA is currently working with the Decarbonization Task
Force to advance this.
Objective 7
Explore how the marketplace has changed
since the 2012 decision to fund the pilots.
Identify trends, if any, that will help the CPUC
reorient strategic EE financing goals.

Study Results Summary
opiniondynamics.com Page 64
that SB 100 was signed, Executive Order B-55-18 set a new statewide goal to achieve carbon neutrality
(zero-net GHG emissions) by 2045 and to maintain net negative emissions thereafter.
This aggressive GHG emission reduction and renewable electricity procurement strategy will increase the
use of Renewable Portfolio Standard (RPS)-eligible resources, including solar, wind, biomass, geothermal,
and others. This strategy also places enormous pressure on the California PAs to seek innovative
technologies and approaches to improve the design and cost-effectiveness of their EE, demand response,
and RE portfolios. These aggressive goals were made more difficult over the years as the number of savings
opportunities have been reduced. For example, increasing EE codes and standards have made certain
measures, such as CFLs, no longer worth incenting. REEL and the other planned statewide financing pilots
represent one such attempt at implementing an innovative approach to EE.
Finally, CPUC D. 18-01-004, in 2018, increased the required minimum percentage of third-party programs
from 20% of total budgeted portfolio by 2020 to at least 25% by the end of 2018, 40% by the end of 2020,
and 60% by the end of 2022. These solicitations may ultimately bring down overall costs of EE programs and
portfolios. The rationale for third-party requirements is based on supporting innovation in program design, as
well as the potential for cost savings through the competitive solicitation of programs. However, customers
might be confused by the increased number of PAs. Third-party programs may offer financing as part of their
proposed incentive structure. If REEL wants to continue to cross-promote financing alongside the PA and
third-party rebate programs, the number of parties that REEL needs to coordinate with for marketing would
multiply. As a result, the increase in third-party programs might make the marketing of the REEL program
(should it become a full-fledged third-party program) more challenging.
Increasing Price of Carbon
The increased focus on reducing carbon set forth in SB 350 and SB 100 will increase the value of each ton
of carbon avoided. This in turn will improve the cost-effectiveness of REEL, as well as all other EE, demand
response, and renewable programs. The current price of carbon in the California Cap and Trade Program is
approximately $15 per metric ton of CO2. However, in D. 16-02-007, the CPUC recommended a starting price
of $66.37 per metric ton of CO2 emissions, because they considered the current price to undervalue the
price due to the immaturity of the carbon market. Further, the CPUC recommended that this avoided-cost
adder be used for demand-side cost-effectiveness analyses. Importantly, this decision also increased the
price to $150 per metric ton by 2030.
4.7.2 Changes in the California Energy Efficiency Landscape
Energy Efficiency Program Expenditures Have Fallen Over Time
All demand-side resource programs in California must undergo cost-effectiveness analysis. During the last
evaluation cycle (2013–2015), the EE portfolio was not shown as cost-effective,44 which in turn has caused
changes to program funding levels. For example, HUP expenditures have declined for all IOUs in the past few
years (see Figure 10). In addition, the IOUs’ HUPs have experienced low realization rates (that is, the ratio of
claimed savings to evaluated savings). In program year 2017, evaluated savings ranged from 13% to 63% of
claimed savings for the program statewide.45 This may also be leading to reductions in program expenditures.
44 CPUC. 2018. Energy Efficiency Portfolio Report, pg. 12. 45 DNV GL. 2019. Impact Evaluation Report: Home Upgrade Program – Residential Program Year 2017. CPU0191.01.

Study Results Summary
opiniondynamics.com Page 65
Figure 10. Home Upgrade and Advanced Home Upgrade Programs Claimed Total Expenditures
Source: CEDARS.
A similar trend has been experienced across all residential Market Transformation programming in the state,
with expenditures falling from $80M in 2016 to $62M in 2017 to $30M in 2018. This points to potential
opportunities for REEL to continue to support EE upgrades as rebate programs scale back.
Expanding Eligible Energy Efficiency and Renewable Energy Measures
The REEL program is focused on financing EE measures. However, there are opportunities to expand the list
of measures to include solar, electrification, and battery storage.
Solar Photovoltaic
Since the design and launch of REEL, the cost for solar PV systems has fallen, while adoption of solar in the
building industry has increased. With the Energy Commission adopting the 2019 Building Energy Efficiency
Standards, which requires the installation of solar PV systems on the majority of new homes, starting
January 1, 2020, the adoption of solar will continue to grow in California. This could spur additional demand
in the retrofit market, which could benefit from financing.
Electrification
Electrification of space and water heating using highly efficient technologies is a key strategy to reduce or
eliminate GHG emissions from buildings. The 2018 Integrated Energy Policy Report Update discussed
shifting away from a reliance on natural gas at the end-use through electrification. Electrification allows for
the integration of RE while also reducing carbon emissions.
The opportunity for reducing natural gas usage is greatest in the residential sector, with most usage in water
and space heating (see Figure 11). Electrification efforts could also benefit from financing.

Study Results Summary
opiniondynamics.com Page 66
Figure 11. 2016 Energy Use in California Buildings (MMBtu)
Source: California Energy Commission. Accessed at: https://www.energy.ca.gov/sites/default/files/2019-
05/energy_efficiency.pdf.
Battery Storage
California’s rapidly evolving energy landscape and aggressive carbon reduction goals are increasing the
need for energy storage technologies. With a growing amount of renewable generation needed to meet the
state’s GHG emission reduction goals, energy storage can help address the issue of intermittent electricity
supply.
In compliance with AB 2514 (2010), the CPUC set targets for California’s electric IOUs, requiring them to
procure more than 1.3 GW of energy storage by 2020, with specific targets for transmission-connected,
distribution-connected, and customer-side energy storage systems. Customer-side energy storage systems
make up approximately 15% of the total target. While the focus has been on commercial scale storage,
residential storage opportunities are becoming more prominent as battery costs fall.
4.7.3 Financing Market
Increasing debt among Californians combined with a slowing California economy could affect the ability or
willingness of California households to take on additional debt to fund EE and RE projects. The LMI
population, a specific target segment of REEL, has been left behind in particular. These trends represent a
potential challenge for REEL’s scalability.
A 2016 American Council for an Energy-Efficient Economy (ACEEE) study found that, while the financing
market has grown overall, “significant gaps” remain for LMI customers. Further, the LMI population has not
been helped as much as other groups by the strong recovery from the great recession of 2008 and will
continue to need substantial help in adopting EE and RE measures. The recent June 2019 UCLA/Anderson

Study Results Summary
opiniondynamics.com Page 67
Forecast46 reported that the California economy is slowing down, with an unemployment rate of 4.3% and
inflation holding steady. However, new data from the U.S. Census Bureau’s supplemental poverty measure47
shows that roughly 7.5 million Californians — about 19% of the state’s population — live in poverty. California
is one of the three states tied for highest poverty rate, along with Florida and Louisiana. The national poverty
rate is 14%. This underscores the continuing need for affordable financing (offered by REEL) and other low-
income programs for the foreseeable future.
Finally, customer willingness and ability to participate in pilots like REEL is affected by their current debt
load. According to a recent New York Federal Bank study,48 among the 11 states reviewed, California had
the highest average debt per household, at $71,470. Yet while Californians are carrying the most debt, they
do not seem to be having much trouble keeping up with their payments. Of those 11 states, California had
the lowest level of seriously delinquent loans at 1.85%. The national average was 3.1%.
A 2016 ACEEE study suggested cementing stronger relationships to lenders that are already assisting LMI
customers, such as community development financial institutions (CDFIs).49 The REEL pilot is similar to this
proposed model, as it is implemented by a state agency and it leverages the established reputations of
seven locally based CUs as partner lenders. However, the pilot (or future program) might consider adding
CDFIs to the mix of lenders.
State Legislation Has Slowed the Growth of PACE Financing
Between July 2014 and June 2018, more than $4 billion of EE and RE upgrades were financed through
PACE in California.50 For most of these funds, applications were approved within minutes through contractor-
led point-of-sale financing. Approvals were largely based on home value, with income not an approval factor.
In addition, the industry has been riddled with consumer protection issues, contractor fraud, and high costs.
Stricter financing laws passed in 2017 and 2018, designed to enhance consumer protection and
underwriting, have led to lower PACE financing uptake. Figure 12 shows that California’s PACE financing
experienced a one-third drop for the first six months of 2018 (relative to the prior year).
46 UCLA/Anderson Forecast: June 2019 Economic Forecast (2018–2021). 47 See https://www.census.gov/content/dam/Census/library/publications/2018/demo/p60-265.pdf. 48 See https://www.americanbanker.com/list/household-debt-hit-another-all-time-high-is-it-poised-to-level-off. 49 CDFIs are institutions that seek to expand “economic opportunity in low-income communities by providing access to financial
products and services.” For more information, see https://www.cdfifund.gov/Documents/CDFI_infographic_v08A.pdf. 50 CAEATFA. 2018. PACE Loss Reserve Program Enrollment Activity. Accessed at: https://www.treasurer.ca.gov/caeatfa/pace/
activity.pdf.

Study Results Summary
opiniondynamics.com Page 68
Figure 12. New PACE Financing Reported to CAEATFA (until December 31, 2018)
Source: CAEATFA. 2018. PACE Loss Reserve Program Enrollment Activity. Accessed at: https://www.treasurer.ca.gov/caeatfa/pace/
activity.pdf.
While a lack of up-to-date PACE financing data has made it difficult to outline the extent of the impact of these
changes, there does appear to have been a reduction in market size. PACE administrators have publicly
claimed two key impacts from these laws.
1. The increased application burden has led contractors to be less likely to suggest PACE financing for
their clients, unless the homeowner is unable to qualify for any other kind of financing (for example,
home equity loan or unsecured loan). Approval time has increased from hours to days.
2. There has been a shift in homeowners submitting applications, with a decline of applications from
those with FICOs ≥ 661 and a resulting increase in the share of those with FICOs ≤ 660.51
It is possible that these recent changes will allow for other financing tools, such as REEL, to gain a broader
share of the market. By limiting PACE’s advantages related to a simple application process and not requiring
a credit check, the disadvantages of PACE (typically higher lender fees, a property lien, and higher interest
rates) may lead to fewer contractors suggesting the product.
4.7.4 Climate Change
The latest reports on climate change have become increasingly dire for California in particular52 and have
driven CPUC policies over the last 15 years.53 The expected impacts of climate change — wildfires, strategic
outages, and health effects — argue for increased efforts to measure a variety of NEBs and increased CPUC
51 Asset Securitization Report. 2019. Why PACE has become a ‘second-look’ product in California. Accessed at:
https://asreport.americanbanker.com/news/why-pace-has-become-a-second-look-product-in-california. 52 California’s Fourth Climate Change Assessment: California’s Changing Climate 2018. 53 Executive Order S-3-05.
$257
$767 $637
$430
$149
$554
$824
$678
$296
0
200
400
600
800
1000
1200
1400
1600
1800
2014 2015 2016 2017 2018
$ M
illio
ns
Jan - Jun Jul - Dec

Study Results Summary
opiniondynamics.com Page 69
willingness to include these benefits in its assessment of cost-effectiveness of programs like REEL and other
EE, demand response, and RE programs.
Wildfire Risk
The fourth Climate Change Assessment (CCA) notes that if GHG emissions continue to be reduced at current
rates, California will experience average daily high temperatures that are significantly warmer than the
historical average, and the number of extreme heat days will increase exponentially in many areas. These
changes bring with them increased risk of wildfire, and California is ranked as the most wildfire-prone
state.54 According to Verisk’s 2017 Wildfire Risk Analysis,55 losses from wildfires added up to $5.1 billion
over the past 10 years and 10 of the costliest wildland fires in the United States have been in California. The
CCA56 also reported that, if GHG emissions continue to rise and are not reduced, large wildfires (greater than
25,000 acres) could become 50% more frequent by the end of century.
These wildfires place not only homes and businesses at risk, but also the electric grid. Wildfires have already
affected the financial health of two of the state’s largest IOUs via bankruptcy and settlements, and some of
these costs may eventually be passed down to the consumer through rate increases. To minimize wildfire
risk, PG&E and SCE have decided that they will shut off power to wildfire-prone areas when the temperatures
and wind speed become dangerously high. This will further affect ratepayers through outages.
Wildfire risk ultimately creates a greater need for EE and RE programs. Reducing energy obtained from the
IOUs through the installation of EE technologies and solar panels will minimize the impact of the rate
increases on customers. REEL financing is designed to assisting households in overcoming the up-front cost
of such upgrades and may be especially helpful for LMI households. As a result, the increasing prices
expected to be seen by consumers will increase REEL’s cost-effectiveness using the PCT. Further, one
implication for marketing REEL and other EE programs to customers in wildfire-prone areas is to be clear
about the likely increase in service disruptions and the importance of minimizing their energy use and
discomfort through the installation of EE measures and on-site renewable generation and storage.57
Air Conditioning Saturation
The expected increase in temperatures is also expected to increase the saturation of air conditioning, which
in turn will exacerbate carbon emissions. As discussed earlier in Section 4.2, REEL projects to date have
primarily focused on air conditioning replacement (75% of projects). As such, REEL presents an opportunity
to increase the adoption of energy-efficient air conditioning, especially when paired with Residential HVAC or
Home Upgrade program rebates.
54 See https://www.verisk.com/insurance/visualize/key-findings-from-the-2017-verisk-wildfire-risk-analysis/?utm_source=
Social&utm_medium=Twitter&utm_campaign=VeriskSM&utm_content=842017. 55 Ibid. 56 Governor’s Office of Planning and Research, California Energy Commission, and the California Natural Resources Agency. 2018.
Climate Change Assessment: California’s Changing Climate 2018: A Summary of Key Findings from California’s Climate Change
Assessment. Accessed at: http://www.climateassessment.ca.gov/. 57 Customers with solar panels with current generation battery storage, when fully charged, can serve their energy demands during
such shutoffs.

Study Results Summary
opiniondynamics.com Page 70
Health and Safety
Finally, the CCA also shows that all Californians will likely endure more illness and be at greater risk of early
death because of climate change, with the vulnerable populations disproportionately affected. Heat waves
are an example of the current and future risk climate change poses to people. Studies show that while air
conditioning can reduce mortality and illness from heat, increased electrical demand for cooling due to
hotter conditions could also drive up emissions. While the state is rapidly moving to cleaner electricity
generation, increased support for energy-efficient air conditioners can make substantial contributions, and
REEL has an opportunity to contribute by making them more affordable up front.
4.7.5 Summary
Table 29 presents some of the trends that were discussed above and possible strategies to consider in
response.
Table 29. Summary of Trends and Possible Strategies
Trend Possible REEL Strategies
IOU rate increases to cover the cost of wildfires Alert customers to the possibility of rate increases and stress bill
reductions in marketing REEL.
Increasing outages due to IOU power shutoffs to
guard against wildfires
Alert customers to the increased probability of strategic outages
due to wildfire prevention efforts and stress the need for solar
panels and battery storage.
Increasing temperatures leading to increased
air conditioner saturation Stress the need for energy-efficient air conditioning.
Increasing health risks associated with
increasing temperatures
Develop defensible methods for estimating the health benefits due
to reductions in energy use and carbon.
Increasing importance and value of reducing
carbon emissions
Stress the importance of reducing carbon emissions to mitigate
climate change.
CPUC increases in carbon policies Include carbon scenarios in C/B analyses.
4.8 Scalability Potential
This evaluation sought to determine the scalability potential
of the REEL model to the extent possible after its two years
of implementation. To assess this, the evaluation team
focused on five key questions:
1. What infrastructure and momentum can REEL
leverage to generate further volume?
2. Can REEL be a scaled up as cost-effective resource
program?
3. Can REEL be self-supporting, thereby not requiring ratepayer money?
4. What is the appropriate administrative structure for a future REEL program?
5. What is the recommended path forward?
Objective 8
Assess the scalability potential of this pilot
and recommend if and how the pilot
should continue.

Study Results Summary
opiniondynamics.com Page 71
Building on the REEL Pilot Infrastructure and Momentum
Since issuing its first loans in Q3 2016, the REEL pilot has steadily increased its loan volume, as is to be
expected for a new financing product that is being introduced to the market. This momentum in loan volume
continued up to the end of the two-year evaluation period and continued to grow beyond the evaluation
period suggesting that the REEL model’s loan volume has more room to grow. Moreover, CAEATFA has built
the infrastructure needed to support an expanded loan volume, including the networks of lenders and
contractors needed to generate projects and originate loans. Overall, the evaluation results indicate that the
REEL pilot successfully created the infrastructure to support a scaled-up REEL program.
The pilot is already showing steadily increasing participation since the first two years. Analysis of the growth
in loan enrollment over the lifetime of the pilot shows that the number of loans closed per month has grown
steadily over time and that the enrollment rate has increased dramatically since the first two-year pilot period.
Figure 13 depicts both the cumulative loan growth and the six-month moving average, the latter of which
provides a better picture of month-to-month increases. The spike in growth at the end of the two-year period
demonstrates the recent momentum experienced by the pilot. Specifically, in the first two years, 212
participants participated in the pilot amounting to 9 loans per month across the two-year period; the monthly
enrollment rate almost tripled in the five months after the pilot period to 25 loans per month. Lastly, comparing
2017 and 2018 (that is, the first two full calendar years’ worth of operation), loan volume is significantly larger
quarter-by-quarter in 2018 compared to 2017.
Figure 13. REEL Loan Growth
Note: Number of loans represent the count of loans enrolled on a quarterly basis.
The amount of financing generated by the pilot ($5.78 million overall) follows the trend of growth in the number
of loans, showing a strong cumulative growth over the life of the pilot with a spike in financing at the end of
the two-year period and continuing five months later (see Figure 14). Approximately $2.13 million of the $5.78
0
10
20
30
40
50
60
70
80
90
Qtr3 Qtr4 Qtr1 Qtr2 Qtr3 Qtr4 Qtr1 Qtr2 Qtr3 Qtr4
2016 2017 2018
# o
f Lo
an
s
Loans (#) Enrollment Rate (6 Month Moving Average) Enrollment Rate (Cumulative Quarterly Average)
End of two-year Pilot
evaluation period

Study Results Summary
opiniondynamics.com Page 72
million total financing generated by the pilot over the 30-month period happened in this 5-month period, which
amounts to 37% of the pilot’s total financing happening within only 16% of its lifetime.
Figure 14. Cumulative REEL Financing
These financing tools can reach a significant and growing number of Californians as the current partner
network of CUs and contractors covers most of the state. However, to take this to further scale the pilot would
need to enroll a larger volume lender with physical branches covering more of the state.
◼ At least one REEL-certified contractor and lender operates in every single county that falls within the
IOUs’ service territories, with the exception of no contractors serving Mono and Inyo in the eastern
central part of the state. While participation to date is concentrated within the high population areas
of the state (Southern California and the Bay Area), there has been a gradual expansion into the
northeast and Central Valley, and, when population density is controlled for, the spread of loans per
capita shows penetration of REEL loans in the lower-population Central Valley counties that is
commensurate with that of the south and north.
◼ The statewide lenders have been notably successful in reaching parts of the state where they do not
have physical branches, but there remain opportunities for more lenders to increase access to the
pilot. Figure 15 shows the distribution of REEL loans throughout California, distinguishing between
the two statewide lenders and the regional lenders. It is worth noting that there are several areas of
the state that have REEL-certified contractors but no statewide or regional lender branches near
their community. These potential participants may face barriers to loan approval and paperwork
submission. For instance, interested residents in Madera county may need to travel up to an hour to
reach the nearest lender branch (Valley Oak CU in Tulare, Visalia, or Three Rivers) if it were
necessary to submit paperwork or sign documents in person. However, such barriers could be
eliminated if large lenders (with a national operating presence, fully equipped online services, and
RIC capabilities) joined.
$0
$1,000,000
$2,000,000
$3,000,000
$4,000,000
$5,000,000
$6,000,000
2016 2017 2018
Fin
an
cin
g G
en
era
ted
End of 2 year Pilot
evaluation period

Study Results Summary
opiniondynamics.com Page 73
Figure 15. Map of REEL Participation, Lender Activity, and Contractor Territories (2.5 Years into the Pilot)
Note: Based on contractors and loan data July 2016–December 2018.
The current contractor network is scalable based on the number of contractors enrolled, the type of services
that they offer, and their self-reported preference for REEL over competing financial products.
◼ Data provided in the PY2014 CA Finance Residential Market Baseline study,58 conducted in
anticipation of this pilot, estimated that approximately 56,000 contractors in California perform
residential retrofit work that might qualify for REEL financing. While this provides a sense of the
upper limit of contractor involvement, the REEL contractor pool was at 340 contractors as of June
2019 and is widely distributed across many parts of the state. This should not be viewed negatively
as REEL's contractor pool is comparable to similar programs and has shown growth over the pilot
period. For example, just over 500 contractors performed EUC-related upgrades in FY14–15 and two
successful LLR programs (CT Green Bank’s Smart-E loans and MI Saves Home Energy Loan Program)
have just over 300 participating contractors. This suggests that the current contractor pool is
sufficient to support a full-scale program. This is further supported by lender interviews, which
revealed that more contractors are not needed, rather existing contractors need more training.
58 See http://www.calmac.org/publications/PY2014_Residential_Finance_Market_Baseline_Volume_1_FINAL.pdf.

Study Results Summary
opiniondynamics.com Page 74
◼ Survey respondents indicated that most contractors specialized in services that align to the EEEM
requirements of the program (for example, space heating and cooling equipment, water heating), but
a significantly higher proportion of dormant contractors (65% versus 35% of active) offer services
typical of a general contractor, such as renovations and building additions. Since the 70–30 funding
rules make it less likely for a general contractor to have larger renovation projects that cover this
scope, focusing efforts around training and equipping the contractors that offer services that
complement REEL measure-specific activities is the best opportunity for scaling.
◼ The conversion from dormant to active contractors is also an important component of scalability
potential as it would indicate a preference for REEL financing in a crowded and competitive EEFP
market. Survey responses support contractors' preferences for REEL and indicate a high potential for
conversion, with 91% of dormant contractors saying that they plan to complete a REEL project in the
future. Additionally, although 81% (n=46) of survey respondents would offer some other type of
financing if REEL was not available (most saying PACE [n=21]), 20% said that they would not offer
any type of financing if REEL was not available. Compared to the alternative financing option, 40%
(n=18) said that REEL was superior and only 11 of the total answering said that REEL was inferior.
◼ Most survey respondents (51%, n=29) identified the marketing support available to contractors as
the program component needing the most improvement, citing a lack of homeowner awareness of
REEL and the need for simple and customizable marketing materials to educate customers (for
example, the need for term sheets that show monthly payments based on various project scenarios,
cobranded materials, and user-friendly website content). Although updates to the website would be a
substantial investment, offering term examples, cobranded marketing materials, and simplified
application instructions and boosting REEL advertising are relatively simple fixes to overcome
contractors’ barriers to successfully selling REEL to homeowners.
Cost-Effectiveness
The C/B analysis results indicate that the REEL model struggles to meet the cost-effectiveness thresholds
under the TRC, SCT, and PAC, even with a significant increase in loan volume. While the future program
would likely be more cost-effective than the pilot, simply scaling the program volume does not appear to be
sufficient for a REEL program to achieve cost-effectiveness. This is largely because many of the program
costs increase linearly with the increased program volume, most notably the LLR lost opportunity cost and
covered losses and, to some degree, the LLR-related costs.
To scale REEL as a cost-effective (or near cost-effective) resource program that is supported by ratepayer
funds, further modifications to the program may be needed to expand the benefits and reduce the
administrative costs. Table 30 highlights a range of modifications that could help expand the REEL benefits
and reduce its operating costs.

Study Results Summary
opiniondynamics.com Page 75
Table 30. Opportunities to Increase REEL Benefits and Reduce REEL Costs
Opportunities to Increase Benefits Opportunities to Reduce Costs
Expand the EEEMs list to include solar, electrification,
battery storage, and EVs.
Account for the contribution REEL is making toward
California’s climate-related goals and include the social
cost of carbon.
Continue efforts to develop a public database on REEL
loan performance to demonstrate loan performance
strength to attract more lenders, potentially larger lenders,
and to inspire those participating to further reduce their
APR.
Enhance marketing to increase awareness of REEL and
drive participation.
Continue to invest in contractor support, training, and
streamlining of processes to improve contractor
experience and increase participation.
Require lenders to reduce APR on loans, in response to
very low default rates, to increase customer benefits, and
to attract more volume.
Reduce LLR ratios if the loan pool performance
warrants lower coverage.
Administer the LLR internally rather than contract it
out to a master servicer and bank trustee. (This
would require reducing the constraints on the REEL
program and/or transferring to a nongovernmental
delivery agent.)
Address high loan enrollment costs to reduce
complexity in determining REEL eligibility (that is,
IOU territory or not).
Aggregate LLR funds by IOU and lender up front and
annually review and match the amount allocated to
each lender with its issued loan volumes. (This
would require simpler requirements on the REEL
program, such as a statewide measure list.)
Explore efficiencies in administration and contractor
management operations; this is currently under
way.
Based on the options open to modify REEL, the following strategies emerge as offering the highest potential
to improve its cost-effectiveness.
◼ Expand eligibility and applicable measures and lower the required interest rates to drive further loan
volume: Expanding eligibility to POU territories and expanding lender underwriting as the loan pool
performs well can help increase volume. The evaluation team recognizes, however, that POUs are
not under CPUC jurisdiction and may require a different approach. Expanding the eligible measures
to include solar PV, the CPUC can support REEL evolving into a cost-effective, ratepayer-supported
program. Finally, if the LLR performance continues to show extremely low default rates, work with
lenders to bring down the program interest rates and lower the minimum FICO scores, thereby
driving more participation and increasing the APR reduction benefits.
◼ Track loan pool performance and build new program efficiencies: The REEL pilot established a pool
of EE loans that can better describe the risk profile of REEL customers and projects. This provides an
opportunity to retune the LLR ratios and the loan terms to further improve the program cost-
effectiveness. Reducing the LLR ratio would likely have significant impact on program cost-
effectiveness by reducing the LLR lost opportunity costs of capital costs and, to some degree, the
LLR management costs. Finally, building and maintaining a public database of REEL loans and their
performance may attract more lenders into the EE space (either by joining REEL or independent of
REEL), which could further increase REEL volume and/or demonstrate market transformation
benefits.
◼ Account for the full range of REEL benefits: Finally, it has been recognized throughout the cost-
effectiveness analysis that many REEL benefits are not fully accounted for or are unknown. By

Study Results Summary
opiniondynamics.com Page 76
determining the correct values for NEBs from the EEEMs investments and, perhaps more
importantly, the non-EEEMs investments through REEL loans may support using the higher range
values for these benefits. Moreover, capturing the societal cost of carbon in the analysis would
further improve the REEL program cost-effectiveness, particularly if it is coupled with adding fuel
switching measures to the program.
Overall, the evaluation team’s analysis suggests that REEL would need to evolve in several notable ways if it
were to establish itself as a cost-effective, ratepayer-supported program. The current LLR management and
capital costs pose a barrier to program cost-effectiveness that may require significant modifications to
overcome.
Self-Supporting Program Over Time
As an alternative, the evaluation team assessed the potential for REEL to become a self-supporting program
without the need for regular injections of ratepayer funds. The first step was to determine REEL’s
private/public capital leverage ratio, which gives an indication of the amount of funds that would need to be
raised to support the REEL program, relative to the overall program loan volume.
The evaluation team then determined what interest rate rider would be needed to cover the program costs.
The interest rate rider would be applied to each loan over its entire repayment term, collected from the lender
and remitted to the REEL PA to support the program costs. A high-level estimate was performed for each REEL
model assuming that the rate rider would cover all program administration costs and LLR covered losses. The
calculation assumed that all loans are paid out over their full term and did not account for early repayments.
The results of this analysis and the leverage ratios are presented in Table 31. For this analysis, the evaluation
team added an additional scenario considering the REEL+ program and estimated volume, but without the
master servicer costs. This represents a self-supported REEL model that would not be required to track loans
and funds for each IOU and would have an LLR that is managed by CAEATFA itself.
Table 31. Interest Rate Rider Needed to Allow REEL to Be Self-Supporting
REEL Pilot REEL BAU REEL+
REEL+
(no master servicer)
Total Portfolio Value ($M) $3.75 $21.25 $78.18 $78.18
Leverage Ratio 1.86 3.08 7.19 8.40
Interest Rate Rider Required 6.20% 3.75% 1.44% 1.14%
From the results in Table 31, a few conclusions about REEL’s potential as a self-supported program emerge.
◼ As program volume increases the potential for a self-supported becomes more evident: The leverage
ratios rise, and the required interest rate rider drops significantly under the REEL+ models,
suggesting that if REEL could generate significant volume, it would have a higher potential to be self-
supporting.
◼ The REEL+ and REEL BAU interest rate rider is significantly lower than the current average APR
reduction of 4.6%: Under the REEL+ model (with or without the master servicer), the interest rate
rider would be less than half the current average APR benefit, suggesting that even with the rate
rider, the program would still pass along significant APR benefits to the customers. However, it
should be noted that 22% of REEL pilot participants had APR benefits of 3% or less, so the rate rider

Study Results Summary
opiniondynamics.com Page 77
may erode the interest rate benefit for some customers to the point that the program becomes less
attractive to them.
◼ While there is the potential to cover REEL’s costs via a rate rider, the LLR itself would require further
support: The interest rate riders do cover LLR losses but were not set sufficiently high to provide the
funds needed to establish the initial LLR pool itself, largely because this is a significant up-front cost
that cannot effectively be collected via a rate rider. Under the REEL+ model with steady annual
volumes, the evaluation team estimates that the LLR would ramp up to nearly $15M within 10 years
as the loan pool expands year by year. After 10 years (the average loan term), the required LLR
would grow slowly, mostly due to annual inflation in prices and loan values. This initial pool of LLR
funds would need to be supplied to CAEATFA in the initial years, like the PACE LLR that it currently
operates.
A self-supported program would have fewer restrictions than the current program as it would not be subject
to the rules that govern the use of ratepayer money. This could facilitate the following changes to the
program.
◼ Expanded and consistent EEEMs list: Without the ratepayer efficiency funds restrictions, REEL could
expand to include solar PV. Under this model, REEL would offer many of the same options as PACE
currently does and may generate increased volume as a result, which would further help maintain
the self-supported model.
◼ Reduction of LLR complexity: With the removal of ratepayer money, it may be possible to significantly
reduce the LLR management complexity. Under this model, there would be no need to track the LLR
contributions to IOUs or to maintain the bank trustee. Examination of programs in other jurisdictions
that operate simple LLRs (tracking only the aggregate loan amount per lender) indeed showed much
lower LLR management costs, especially when the LLR can be managed internally by the PA.
◼ Enhanced flexibility: CAEATFA noted that making the needed adaptations to the REEL pilot model
was often slow due to the navigation through both standard state procedures and CPUC
administrative and governance processes. With the removal of ratepayer money, it is assumed that
the CPUC would no longer have responsibility for the program. This would remove the requirement
for the program to pass cost-effectiveness tests and may also give CAEATFA (or an alternative
administrator) the flexibility to adapt the program to market conditions and intelligence as it arises.
The interviews with programs in other jurisdictions underlined the importance of flexibility and
adaptation to delivering successful financing programs.
While removing ratepayer funds may offer options to expand the program and make it more flexible and
comprehensive, it would also pose some challenges.
◼ Reduced attractiveness for lenders: A self-supported program may be less attractive to lenders for
several reasons beyond simply the requirement that they would have to charge an interest rate rider
on behalf of CAEATFA (or an alternative PA). The self-supporting program would likely not be as
closely tied to the IOUs via the ratepayer funds, which could reduce marketing and leveraging options
through utility bill inserts and utility program contractors. Maintaining these linkages would likely be
important even for a self-supporting program. Also, having CAEATFA deliver the program would
maintain government support for the program, which attracted some of the enrolled lenders. Finally,
the rate rider itself may turn away lenders either because they feel that the attractiveness of the

Study Results Summary
opiniondynamics.com Page 78
program for their customers is reduced or because they see the rider as a diversion of their own
potential returns from the loans.
◼ Reduced attractiveness for participants: Under a self-supported program, the interest rider would
raise costs for participants and reduce the APR benefits that they receive. The cost-effectiveness
analysis revealed that the current PCT is just slightly higher than 1.0, and this would likely drop
further with the rate rider. This could be offset by expanding the program to more measures that are
either more economically advantageous to participants or carry high NEBs.
◼ Capital sourcing challenges: The most daunting challenge for a self-supporting program would be
raising the initial LLR funds and managing program cash flow. As outlined earlier, the interest rate
rider assessed here does not cover the initial LLR establishment, it just covers the LLR losses.
Covering the LLR itself through lenders would require them to transfer a further 10%-20% of the loan
value to CAEATFA for each loan in the initial years, and less as the LLR pool grows. The evaluation
team does not believe that this is a viable model, and instead proposes that even a self-supported
program would require an initial injection of money, likely from the government. For example, CT
Green Bank used remaining ARRA funds to establish its Smart-E loan LLR.
◼ Cash flow management challenges: Finally, while the rate rider does provide enough returns to cover
REEL program costs, it does so over 10–15 years, while most of the costs are incurred in the year
that the loan is issued. This challenge would be most pronounced in the initial years as CAEATFA
builds its pool of covered loans and ramps up its revenues from the rate rider. CAEATFA would likely
require an injection of cash or bridge funding to cover its administrative costs in the initial years,
which could be paid back later once the rate rider revenues are sufficient.
Overall, this analysis suggests that, with some significant setup assistance, a self-supporting model may be
possible. Even then, it would likely take years to fully stand on its own. While it may be a challenge to pursue
this model, it does offer several benefits, such as increased flexibility, that could reduce the REEL
administrative burden and allow the program to continuously adapt to the market demands and drive higher
volume.
Another avenue that has been suggested is that, after the pilot has jump-started EE lending, the private
market would offer REEL financing without ratepayer-funded support. This evaluation indicates that it is too
early to expect this to occur, as REEL accounts for a small portion of these lenders’ total loan portfolio, and
the lenders will need more time to assess the risk. Given that most loans average about 10 years, it is too
early to assess how these loans will perform based on the first one to two years of this lending. Notably,
however, all lenders interviewed said that they would not offer the same rates and terms without the LLR,
but that they recognize that REEL is important in helping the community and serving those who would
otherwise not have access.
Administrative Structure
Those interviewed suggested that a state-backed program adds credibility, trust, and security. Stakeholders
also commended CAEATFA for its ability to launch REEL, identify and address constraints, and establish the
infrastructure and team to deliver and build strong relationships with partners. CAEATFA has gained valuable
experience that will benefit REEL if it continues, as well as other initiatives like the Small Business and
Affordable Multifamily pilots.

Detailed Gross Impact Results
opiniondynamics.com Page 79
5. Detailed Gross Impact Results
This chapter provides detail on the data sources, methods, and results for the LFER analysis to estimate
overall gross savings for the pilot. Notably, this LFER approach did not include a comparison group (that is,
the analysis included only participants). As such, the results estimate gross impacts only and do not reflect
the savings specifically attributable to the pilot (net savings). The evaluation team added a comparison
group to estimate net savings and those results are available in Chapter 6.
5.1 Data Sources and Data Cleaning
Four California IOUs (PG&E, SCE, SCG, and SDG&E) provided the evaluation team with hourly electric and
daily gas interval data for all participants who had enrolled in the pilot from inception through January 2018.
The evaluation team performed several data cleaning and quality control checks on the data. First, because
this evaluation focused on participants who enrolled within the first two years of the pilot, the data cleaning
process removed participants who had their loan approved after July 31, 2018. The evaluation team also
dropped participants who had insufficient pre-participation period data (that is, insufficient data to calculate
monthly energy usage for all the pre-participation period months). Table 32 shows that these data-cleaning
steps removed between 36% and 62% of REEL participants from the analysis, depending on IOU and fuel
type, primarily because many participants received loans after the evaluation period.
Table 32. Data-Cleaning Results
Fuel Type IOU
Number of
Participants
Enrolled after
July 31, 2018
Incomplete Pre-Participation
Period AMI Data
Included in
Model % Remaining
Electric
PG&E 121 –56 –18 47 39%
SCE 128 –36 –10 82 64%
SDG&E 45 –10 –7 28 62%
Gas
PG&E 125 –53 –25 47 38%
SCG 137 –51 –9 77 56%
SDG&E 43 –10 –7 26 60%
Note: The number of participants pre-cleaning (third column) does not sum to 339. Reasons include not having interval data
available, being customers of more than one utility, and receiving electric or gas service from a municipal utility.
In addition, the evaluation team:
◼ Averaged electric values with the same date and hour for a given customer
◼ Adjusted for electricity sent back to the grid through Net Energy Metering (NEM)
◼ Summed hourly electric usage to the daily level for kWh impacts
◼ Averaged hourly electric usage during the Commission Peak Period (4 pm–9 pm)59 for kW impacts
59 https://www.cpuc.ca.gov/WorkArea/DownloadAsset.aspx?id=6442459140.

Detailed Gross Impact Results
opiniondynamics.com Page 80
5.2 Model Specification
The evaluation team split the models by fuel type. The kWh impacts model included all hours of the day,
while the kW impacts model included only the Commission Peak Period hours (4 pm–9 pm). The evaluation
team tested a variety of model specifications for each fuel type and ultimately selected specifications that
yielded the best fit on standard econometric metrics. Notably, the various model specifications estimated
consistent results. Equation 1 and Equation 2 show the selected model specifications for each fuel type.
Again, it is important to note that the kWh and kW impacts used the same model specification, and differed
only in the electric usage hours included in the models (that is, the electric models included all 24 hours of
the day, while the demand models included only the Commission Peak Period hours).
Equation 1. Model Specification for Electric and Demand Fixed Effects Model without Comparison Group
𝑘𝑊ℎ𝑖𝑡 = 𝛼 + 𝛿𝑖 + 𝛽𝑝𝑜𝑠𝑡 𝑝𝑜𝑠𝑡𝑖𝑡 + 𝛽𝐻𝐷𝐷𝐻𝐷𝐷𝑖𝑡 + 𝛽𝐶𝐷𝐷𝐶𝐷𝐷𝑖𝑡 + ∑ 𝛽𝑚𝑜𝑛𝑡ℎ𝑚𝑜𝑛𝑡ℎ𝑚𝑡
12
𝑚=1+ 𝛽𝑝𝑜𝑠𝑡 𝐻𝐷𝐷𝑝𝑜𝑠𝑡𝑖𝑡
∗ 𝐻𝐷𝐷𝑖𝑡 + 𝛽𝑝𝑜𝑠𝑡 𝐶𝐷𝐷𝑝𝑜𝑠𝑡𝑖𝑡 ∗ 𝐶𝐷𝐷𝑖𝑡 + ∑ 𝛽𝑝𝑜𝑠𝑡 𝑚𝑜𝑛𝑡ℎ𝑝𝑜𝑠𝑡𝑖𝑡 ∗ 𝑚𝑜𝑛𝑡ℎ𝑚𝑡
12
𝑚=1+ 𝛽𝑁𝐸𝑀 𝐶𝐷𝐷𝑁𝐸𝑀𝑖
∗ 𝐶𝐷𝐷𝑖𝑡 + 𝛽𝑁𝐸𝑀 𝐻𝐷𝐷𝑁𝐸𝑀𝑖 ∗ 𝐻𝐷𝐷𝑖𝑡 + ∑ 𝛽𝑁𝐸𝑀 𝑚𝑜𝑛𝑡ℎ𝑁𝐸𝑀𝑖 ∗ 𝑚𝑜𝑛𝑡ℎ𝑚𝑡
12
𝑚=1+ 휀𝑖𝑡
Where:
𝑘𝑊ℎ𝑖𝑡 = Consumption (kWh) for household i at time t (all 24 hours for electric model and 4 pm–9 pm for
demand model)
𝛼 = Overall intercept
𝛿𝑖 = Household-specific intercept (absorbed)
𝑝𝑜𝑠𝑡𝑖𝑡 = Indicator variable for post-participation period (where a proxy-period is assigned to comparison
group customers based on the project completion data of their respective matched
participants)
𝐶𝐷𝐷𝑖𝑡 = Cooling degree days for household i at time t
𝐻𝐷𝐷𝑖𝑡 = Heating degree days for household i at time t
𝑚𝑜𝑛𝑡ℎ𝑚𝑡 = Set of 12 indicator variables for month of the year
𝑁𝐸𝑀𝑖 = Indicator variable for NEM rate status
𝛽𝑥 = Model coefficients
휀𝑖𝑡 = Error term
Equation 2. Model Specification for Gas Fixed Effects Model without Comparison Group
𝑡ℎ𝑒𝑟𝑚𝑠𝑖𝑡 = 𝛼 + 𝛿𝑖 + 𝛽𝑝𝑜𝑠𝑡𝑝𝑜𝑠𝑡𝑖𝑡 + 𝛽𝐶𝐷𝐷𝐶𝐷𝐷𝑖𝑡 + 𝛽𝐻𝐷𝐷𝐻𝐷𝐷𝑖𝑡 + 𝛽𝑝𝑜𝑠𝑡 𝐶𝐷𝐷𝑝𝑜𝑠𝑡𝑖𝑡 ∗ 𝐶𝐷𝐷𝑖𝑡 + 𝛽𝑝𝑜𝑠𝑡 𝐻𝐷𝐷𝑝𝑜𝑠𝑡𝑖𝑡
∗ 𝐻𝐷𝐷𝑖𝑡 + 휀𝑖𝑡
Where:
𝑡ℎ𝑒𝑟𝑚𝑠𝑖𝑡 = Consumption (therms) for household i at time t
𝛼 = Overall intercept
𝛿𝑖 = Household-specific intercept (absorbed)
𝑝𝑜𝑠𝑡𝑖𝑡 = Indicator variable for post-participation period (where a proxy-period is assigned to comparison
group customers based on the project completion data of their respective matched
participants)
𝐶𝐷𝐷𝑖𝑡 = Cooling degree days for household i at time t
𝐻𝐷𝐷𝑖𝑡 = Heating degree days for household i at time t

Detailed Gross Impact Results
opiniondynamics.com Page 81
𝛽𝑥 = Model coefficients
휀𝑖𝑡 = Error term
5.3 Results
Table 33 provides the average daily and annual gross impacts among the pilot participants in the model,
based on the LFER models without the comparison group. These estimates show that the pilot participants
saved, on average, 12.8% of their annual electricity consumption and 2.6% of their annual gas consumption.
Participants in the model also, on average, reduced their peak period electricity usage by about 7%.
Table 33. Average Daily and Annual Gross Impacts Per Participant
Fuel Type
Participants in
Model
Per-Participant Impacts
%
Impacts
Daily Baseline
Usage
Daily
Impacts
Standard
Error
Annual
Impacts
kWh 157 15.84 2.03 0.313 741 12.8%
kW 157 1.16 0.08 0.020 NA 6.9%
Therms 150 1.12 0.03 0.010 11 2.6%
Table values do not calculate appropriately due to rounding.
Applying the average savings above to the 212 REEL participants in the evaluation period yields total gross
electric and gas impacts for the pilot. As shown in Table 34, in its first two years, the pilot achieved
approximately 157 MWh in energy savings, 17 kW in peak demand savings, and 2,321 therms in gas savings.
Table 34. REEL Pilot Total Gross Impacts
Units
Total
Participants
Per-Participant
Daily Impacts Total Pilot Impacts
kWh
212
2.03 157,081
kW 0.08 17
Therms 0.03 2,321
Note: Total kWh and therm impacts are calculated as daily per-participant impact * 365 *
212. Total kW impacts are calculated as daily per-participant impact * 212. Table values
do not calculate appropriately due to rounding.

Detailed Net Impact Results and Pilot Influence
opiniondynamics.com Page 82
6. Detailed Net Impact Results and Pilot Influence
The evaluation team explored two approaches to understanding net impacts attributable to the pilot. The
first, presented in Section 6.1, shows the results of the LFER model using a matched comparison group. The
second, presented in Section 6.2, uses self-reported responses from the participant survey to further
understand pilot influence qualitatively.
6.1 Net Impacts
The evaluation team used an LFER model with matched comparison group approach to estimate net pilot
impacts. The comparison group is composed of nonparticipating residential customers who had similar
energy usage to REEL participants in the period before participants completed a REEL project. The use of
comparison groups is a standard approach for estimating net impacts for many types of residential
ratepayer programs in California, as it allows the model to account for a wide variety of exogenous factors
(that is, not related to the pilot) that might affect changes in energy use post-participation.
The next subsections detail the data sources and cleaning methods, model specifications, and results of the
LFER model with the matched comparison group.
6.1.1 Data Sources and Data Cleaning
The evaluation team used the same hourly electric and daily gas interval data provided by the IOUs for the
gross impact model described in Chapter 5. In addition, for use in the net impact model, the team requested
that the utilities provide interval data for a random sample of nonparticipants for a comparison pool. The
team requested that the comparison pool be 20 times the size of the participant sample to obtain a
sufficient range of potential comparison group customers and allow for proper matching. Table 35 provides
the total number of electric and gas comparison pool customers from each IOU.
Table 35. Size of Initial Comparison Pool
IOU Number of Electric Customers Number of Gas Customers
PG&E 2,420 2,500
SCE 2,560 N/A
SCG N/A 2,760
SDG&E 920 880
The evaluation team leveraged the cleaned participant dataset described in Section 5.1 and applied the same
steps to the matched comparison group pool prior to matching.
6.1.2 Comparison Group Matching
The evaluation team built the matched comparison groups based on energy consumption prior to the
completion of the project (that is, pre-participation period), specifically average daily use during each pre-
participation period month. The matching process included replacement, that is, one participant matched to
one or multiple comparison group customers. Each energy fuel type (electric and gas) had a separate
matched comparison group.

Detailed Net Impact Results and Pilot Influence
opiniondynamics.com Page 83
The team explored the use of several matching methods and ultimately selected the Mahalanobis distance
method for comparison group matching. The Mahalanobis method is a standard industry approach that
matches participants and comparison customers by choosing pairs with the smallest overall distance between
customers’ pre-participation period average monthly usage by normalizing the distances based on the
standard errors of each pre-participation period month and accounting for the covariance among all pre-
participation period months.
The evaluation team verified the equivalency of the participant and matched comparison groups by
conducting equivalency checks based on their pre-participation period energy usage. The sections below
provide greater details for these equivalency checks
Electric Usage Comparison Group Matching Results
For electric usage, participants matched to comparison group customers based on their pre-participation
period average monthly electric usage and NEM status. A customer with a NEM status of 1 indicates that the
customer was on, or switched to, a NEM rate at during the analysis period. The evaluation team matched
NEM participants to NEM comparison group customers and non-NEM participants to non-NEM comparison
group customers. In addition, the evaluation team verified matching based on the hourly and monthly usage.
Both NEM and non-NEM participants have similar pre-participation period electric usage compared to the
matched comparison group, as shown in Figure 16 and Table 36. Figure 16 compares the average hourly
pre-participation period energy usage graphically, while Table 36 quantifies the differences. The differences
between treatment and comparison groups, in both NEM and non-NEM cases, were close to 0 for all hours
during a typical pre-participation period day.
Figure 16. Average Hourly Mahalanobis Distance Matching by NEM Status, Electric

Detailed Net Impact Results and Pilot Influence
opiniondynamics.com Page 84
Table 36. Average Hourly Mahalanobis Distance, Covariate Balance for Matched Pre-Participation Period Months by
NEM Status, Electric
Customer Type Hour
Participant
Count
Comparison
Count
Average Hourly Electric Consumption
Participants
Comparison
Group Difference
Non-NEM
1
118 549
0.75 0.75 0.00
2 0.69 0.68 0.01
3 0.64 0.64 0.00
4 0.62 0.63 0.00
5 0.60 0.63 –0.04
6 0.63 0.68 –0.05
7 0.72 0.74 –0.02
8 0.77 0.80 –0.03
9 0.79 0.85 –0.05
10 0.83 0.89 –0.07
11 0.88 0.94 –0.06
12 0.93 0.98 –0.06
13 0.97 1.02 –0.05
14 1.02 1.06 –0.04
15 1.09 1.11 –0.02
16 1.16 1.16 0.00
17 1.24 1.22 0.03
18 1.33 1.30 0.04
19 1.35 1.33 0.02
20 1.32 1.32 0.00
21 1.25 1.27 –0.02
22 1.14 1.17 –0.02
23 0.98 1.00 –0.02
24 0.84 0.85 –0.01

Detailed Net Impact Results and Pilot Influence
opiniondynamics.com Page 85
Customer Type Hour
Participant
Count
Comparison
Count
Average Hourly Electric Consumption
Participants
Comparison
Group Difference
NEM
1
43 196
0.84 0.93 –0.09
2 0.73 0.83 –0.10
3 0.69 0.77 –0.08
4 0.67 0.73 –0.06
5 0.68 0.72 –0.04
6 0.77 0.77 0.01
7 0.78 0.76 0.02
8 0.58 0.61 –0.03
9 0.15 0.23 –0.07
10 –0.25 –0.19 –0.06
11 –0.53 –0.50 –0.03
12 –0.69 –0.63 –0.06
13 –0.61 –0.63 0.02
14 –0.41 –0.47 0.06
15 –0.06 –0.19 0.13
16 0.44 0.22 0.23
17 0.96 0.73 0.23
18 1.31 1.20 0.11
19 1.47 1.43 0.03
20 1.47 1.49 –0.02
21 1.47 1.46 0.01
22 1.37 1.35 0.02
23 1.21 1.18 0.03
24 1.01 1.03 –0.03
In addition, the evaluation team checked the balance after matching on the average monthly level. The non-
NEM participants have similar energy usage after Mahalanobis distance matching compared to the matched
comparison group. NEM participants, on the other hand, have higher average pre-participation period monthly
usage during the summer months compared to the matched comparison group. This was accounted for within
the regression model by adding monthly terms and interacting them with other coefficients within the model.
Gas Usage Comparison Group Matching Results
For gas usage, participants matched to comparison group customers based on their pre-participation period
average monthly gas usage and NEM status. Participants had very similar pre-participation period gas usage
compared to the matched comparison group after matching, as shown in Figure 17 and Table 37. Figure 17
compares the average monthly pre-participation period gas usage graphically, while Table 37 quantifies the
differences and shows them to be close to 0 for all pre-participation period months.

Detailed Net Impact Results and Pilot Influence
opiniondynamics.com Page 86
Figure 17. Average Monthly Mahalanobis Distance Matching, Gas
Table 37. Average Monthly Gas Consumption Data: Covariate Balance for Pre-Participation Period Months
Pre-
Participation
Period Month
Participant
Count
Comparison
Count
Participant
Average Monthly
Gas Consumption
Comparison Group
Average Monthly Gas
Consumption Difference
1
157 451
2.35 2.26 0.09
2 1.94 1.85 0.09
3 1.37 1.33 0.04
4 0.91 0.88 0.02
5 0.77 0.72 0.05
6 0.63 0.59 0.03
7 0.55 0.51 0.04
8 0.54 0.51 0.03
9 0.57 0.56 0.01
10 0.67 0.66 0.01
11 1.13 1.14 –0.01
12 2.28 2.20 0.08
6.1.3 Model Specifications
The evaluation team split the models by impact type (that is, kWh, kW, and therms). The kWh impacts model
included all hours of the day, while the kW impacts model included only the Commission Peak Period hours
(4 pm–9 pm). The evaluation team tested a variety of model specifications for each fuel type and ultimately
selected specifications that yielded the best fit on standard econometric metrics. Notably, the various model
specifications and matched comparison groups estimated consistent results. Equation 3 and Equation 4
show the selected model specifications of the LFER models with the comparison group for each fuel type. It
is important to note that the kWh and kW impacts used the same model specification and differed only in

Detailed Net Impact Results and Pilot Influence
opiniondynamics.com Page 87
the electric usage hours included in the models (that is, the electric models included all 24 hours of the day,
while the demand models included only the Commission Peak Period).
Equation 3. Model Specification for Electric and Demand Fixed-Effects Model with Comparison Group
𝑘𝑊ℎ𝑖𝑡 = 𝛼 + 𝛿𝑖 + 𝛽𝑝𝑜𝑠𝑡𝑝𝑜𝑠𝑡𝑖𝑡 + 𝛽𝐻𝐷𝐷𝐻𝐷𝐷𝑖𝑡 + 𝛽𝐶𝐷𝐷𝐶𝐷𝐷𝑖𝑡 + ∑ 12
𝑚=1𝛽𝑚𝑜𝑛𝑡ℎ𝑚𝑜𝑛𝑡ℎ𝑚𝑡 + 𝛽𝑝𝑜𝑠𝑡 𝐻𝐷𝐷𝑝𝑜𝑠𝑡𝑖𝑡 ∗ 𝐻𝐷𝐷𝑖𝑡 + 𝛽𝑝𝑜𝑠𝑡 𝐶𝐷𝐷𝑝𝑜𝑠𝑡𝑖𝑡
∗ 𝐶𝐷𝐷𝑖𝑡 + ∑ 12
𝑚=1𝛽𝑝𝑜𝑠𝑡 𝑚𝑜𝑛𝑡ℎ𝑝𝑜𝑠𝑡𝑖𝑡 ∗ 𝑚𝑜𝑛𝑡ℎ𝑚𝑡 + 𝛽𝑁𝐸𝑀 𝐶𝐷𝐷𝑁𝐸𝑀𝑖 ∗ 𝐶𝐷𝐷𝑖𝑡 + 𝛽𝑁𝐸𝑀 𝐻𝐷𝐷𝑁𝐸𝑀𝑖 ∗ 𝐻𝐷𝐷𝑖𝑡
+ ∑ 12
𝑚=1𝛽𝑁𝐸𝑀 𝑚𝑜𝑛𝑡ℎ𝑁𝐸𝑀𝑖 ∗ 𝑚𝑜𝑛𝑡ℎ𝑚𝑡 + 𝛽𝑝𝑜𝑠𝑡 𝑝𝑎𝑟𝑡𝑖𝑐𝑖𝑝𝑎𝑛𝑡𝑝𝑜𝑠𝑡𝑖𝑡 ∗ 𝑝𝑎𝑟𝑡𝑖𝑐𝑖𝑝𝑎𝑛𝑡𝑖 + 𝛽𝑝𝑎𝑟𝑡𝑖𝑐𝑖𝑝𝑎𝑛𝑡 𝐶𝐷𝐷𝑝𝑎𝑟𝑡𝑖𝑐𝑖𝑝𝑎𝑛𝑡𝑖
∗ 𝐶𝐷𝐷𝑖𝑡 + 𝛽 𝐻𝐷𝐷𝑝𝑎𝑟𝑡𝑖𝑐𝑖𝑝𝑎𝑛𝑡𝑖 ∗ 𝐻𝐷𝐷𝑖𝑡 + ∑ 12
𝑚=1𝛽𝑝𝑎𝑟𝑡𝑖𝑐𝑖𝑝𝑎𝑛𝑡 𝑚𝑜𝑛𝑡ℎ𝑝𝑎𝑟𝑡𝑖𝑐𝑖𝑝𝑎𝑛𝑡𝑖 ∗ 𝑚𝑜𝑛𝑡ℎ𝑚𝑡
+ ∑ 12
𝑚=1𝛽𝑝𝑜𝑠𝑡 𝑝𝑎𝑟𝑡𝑖𝑐𝑖𝑝𝑎𝑛𝑡 𝑚𝑜𝑛𝑡ℎ𝑝𝑜𝑠𝑡𝑖𝑡 ∗ 𝑝𝑎𝑟𝑡𝑖𝑐𝑖𝑝𝑎𝑛𝑡𝑖 ∗ 𝑚𝑜𝑛𝑡ℎ𝑚𝑡 + 휀𝑖𝑡
Where:
𝑘𝑊ℎ𝑖𝑡 = Consumption (kWh) for household i at time t (all 24 hours for electric model and 3 – 7 pm for
demand model)
𝛼 = Overall intercept
𝛿𝑖 = Household-specific intercept (absorbed)
𝑝𝑎𝑟𝑡𝑖𝑐𝑖𝑝𝑎𝑛𝑡𝑖𝑡 = Indicator variable for inclusion in participant group
𝑝𝑜𝑠𝑡𝑖𝑡 = Indicator variable for post-participation period (where a proxy-period is assigned to comparison
group customers based on the project completion data of their respective matched
participants)
𝐻𝐷𝐷𝑖𝑡 = Heating degree days for household i at time t
𝐶𝐷𝐷𝑖𝑡 = Cooling degree days for household i at time t
𝑚𝑜𝑛𝑡ℎ𝑚𝑡 = Set of 12 indicator variables for month of the year
𝑁𝐸𝑀𝑖 = Indicator variable for NEM rate status
𝛽𝑥 = Model coefficients
휀𝑖𝑡 = Error term
Equation 4. Model Specification for Gas Fixed-Effects Model with Comparison Group
𝑡ℎ𝑒𝑟𝑚𝑠𝑖𝑡 = 𝛼 + 𝛿𝑖 + 𝑝𝑜𝑠𝑡𝑖𝑡 + 𝑝𝑜𝑠𝑡𝑖𝑡 ∗ 𝑝𝑎𝑟𝑡𝑖𝑐𝑖𝑝𝑎𝑛𝑡𝑖 + 𝑝𝑜𝑠𝑡𝑖𝑡 ∗ 𝑝𝑎𝑟𝑡𝑖𝑐𝑖𝑝𝑎𝑛𝑡𝑖 ∗ 𝐶𝐷𝐷𝑖𝑡 + 𝑝𝑜𝑠𝑡𝑖𝑡
∗ 𝑝𝑎𝑟𝑡𝑖𝑐𝑖𝑝𝑎𝑛𝑡𝑖 ∗ 𝐻𝐷𝐷𝑖𝑡 + 휀𝑖𝑡
Where:
𝑡ℎ𝑒𝑟𝑚𝑠𝑖𝑡 = Consumption (therms) for household i at time t
𝛼 = Overall intercept
𝛿𝑖 = Household-specific intercept (absorbed)
𝑝𝑜𝑠𝑡𝑖𝑡 = Indicator variable for post-participation period (where a proxy-period is assigned to comparison
group customers based on the project completion data of their respective matched
participants)
𝑝𝑎𝑟𝑡𝑖𝑐𝑖𝑝𝑎𝑛𝑡𝑖 = Indicator variable for inclusion in participant group
𝐶𝐷𝐷𝑖𝑡 = Cooling degree days for household i at time t
𝐻𝐷𝐷𝑖𝑡 = Heating degree days for household i at time t
𝛽𝑥 = Model coefficients
휀𝑖𝑡 = Error term

Detailed Net Impact Results and Pilot Influence
opiniondynamics.com Page 88
6.1.4 Results
Table 38 provides the average daily and annual net impacts among REEL participants in the model, based
on the LFER models with the comparison group. These estimate show that REEL participants, on average,
achieved net impacts of 5% of their annual electricity consumption and 1.5% of their annual gas
consumption. Participants in the model also, on average, reduced their peak period electricity usage by
about 3%.
Table 38. Average Daily and Annual Net Impacts Per Participant
Fuel Type
Per-Participant Impacts
% Impacts
Participants
in Model
Daily Baseline
Usage
Daily
Impacts
Standard
Error
Annual
Impacts
kWh 157 15.39 0.82 0.291 301 5.4%
kW 157 1.17 0.03 0.020 NA 2.9%
Therms 150 1.11 0.02 0.009 6 1.5%
Table values do not calculate appropriately due to rounding.
Applying the average savings above to the 212 REEL participants in the evaluation period yields total net
electric and gas impacts for the pilot. As shown in Table 39, in its first two years, the pilot achieved
approximately 64 MWh in energy savings, 7 kW in peak demand savings, and 1,262 therms in gas savings.
Table 39. REEL Pilot Net Impacts
Units
Total
Participants
Per-Participant Daily
Impacts Total Pilot Impacts
kWh
212
0.82 63,749
kW 0.03 7
Therms 0.02 1,262
Note: Total kWh and therm impacts are calculated as daily per-participant impact * 365 *
212. Total kW impacts are calculated as daily per-participant impact * 212. Table values do
not calculate appropriately due to rounding.
6.2 Pilot Influence Analysis
This section explores the kinds and levels of influence the REEL pilot had on participants’ projects. The data
source for this analysis is the participant survey results (n=49), in which the evaluation team asked several
batteries of questions aimed at understanding the influence of financing in general and the specific
influence of REEL compared to other potential financing alternatives.
6.2.1 Motivations for Doing a Home Upgrade Project
While financing is a tool for making home upgrade projects more affordable, it is not usually the impetus for
deciding that there is a need to do a home upgrade. As shown in Table 40, the most common motivators
among respondents were the desire to reduce energy bills and increase comfort reasons (more than half of
respondents cited one of these). The next most common motivations (combined 28%) were to fix problems
with the equipment or structure of the home.

Detailed Net Impact Results and Pilot Influence
opiniondynamics.com Page 89
Table 40. Motivations for Home Upgrade
Motivation Frequency Percent
Reduce energy bills 14 29%
Comfort (home too hot or cold) 12 25%
Equipment repairs 10 20%
Improved environmental friendliness 6 12%
Home structure repairs 4 8%
Prepare for sale 2 4%
None of the above 1 2%
Total 49 100%
6.2.2 The Influence of Financing in General
Participant survey responses make it clear that the kind of projects respondents completed typically required
financing. Before asking specific questions about the effect of financing on various aspects of the project
(cost, timing, and efficiency), the survey asked a general question about reasons for seeking financing.
Almost half (49%) said that they used financing because they did not have enough cash on hand to do the
project right away, and another 6% did not want to deplete the cash they had. More than 16% cited the good
terms offered as a reason. This last response may indicate that some respondents were thinking of the REEL
pilot specifically in answering this question, but the responses are another reflection of how important
financing is to customers undertaking a home upgrade project.
A large majority of respondents (32, or 65%) indicated that the loan was necessary to do the exact same
project that they did or at the time that they did it.60 Looking at some of the influence factors individually, as
shown in Table 41, almost half (49%) said that they would have been somewhat or very unlikely to have
undertaken the project at all without financing, and 49% said that the size of their project (in terms of cost)
would have been somewhat or very unlikely to have been the same without the availability of financing.
Table 41. Likelihood to Do Projects without Financing
Likelihood of Doing the
Project without Financing
At All At the Same Cost
Count Percent Count Percent
Very Likely 17 35% 18 37%
Somewhat Likely 8 16% 7 14%
Somewhat Unlikely 8 16% 9 18%
Very Unlikely 16 33% 15 31%
Total 49 100% 49 100%
60 Source: Combination of survey questions asking about the likelihood to do the project at all (F2), at the same time (F3), at the
same efficiency level (F4), and at the same cost (F5). See Section 8.3.4.

Detailed Net Impact Results and Pilot Influence
opiniondynamics.com Page 90
For others, financing affected the level of efficiency that they incorporated into their project. As shown in Table
42, about 30% said that, to some extent, not having financing would have reduced the level of EE they chose.
Specifically, they said that the efficiency would have been at the code minimum or a little higher, but not as
high as the completed project.
Table 42. Likelihood to Do Project of the Same EE Level without Financing
Response Count Percent
The same or higher efficiency as what you installed 29 59%
Above the minimum but lower efficiency than what you installed 6 12%
The minimum efficiency standards or building code 9 18%
Don’t know 3 6%
Refused 2 4%
Total 49 100%
Financing also significantly accelerated the timing of the project for many participants. As shown in Table 43,
39% said that they would have done the project one and a half or more years in the future and another 8%
said that they never would have done it without financing.
Table 43. Timing of Project without Financing
Without Financing, Respondent
Would Have Done Project: Count Percent
At the same time or sooner 10 20%
Within six months 12 25%
Within a year 4 8%
Within a year and a half 5 10%
Within two years 1 2%
Two years or longer 13 27%
Never 4 8%
Total 49 100%
Financing Versus Rebates
Only six respondents (or 12%, n=49) received rebates in addition to the REEL loan. Among them, four said
that the loan was significantly more important than the rebate and two said that the loan was somewhat or
significantly less important than the rebate. There was a notable connection between the size of the
respondents’ rebate and their response on relative importance, as shown below.
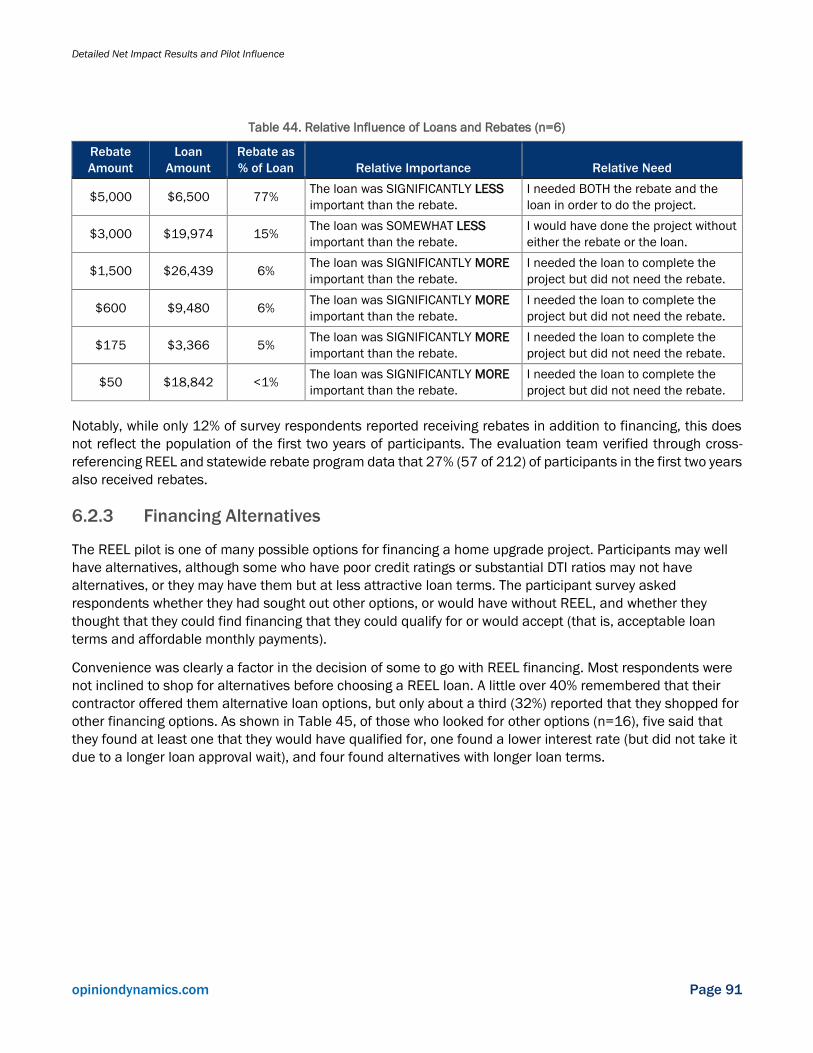
Detailed Net Impact Results and Pilot Influence
opiniondynamics.com Page 91
Table 44. Relative Influence of Loans and Rebates (n=6)
Rebate
Amount
Loan
Amount
Rebate as
% of Loan Relative Importance Relative Need
$5,000 $6,500 77% The loan was SIGNIFICANTLY LESS
important than the rebate.
I needed BOTH the rebate and the
loan in order to do the project.
$3,000 $19,974 15% The loan was SOMEWHAT LESS
important than the rebate.
I would have done the project without
either the rebate or the loan.
$1,500 $26,439 6% The loan was SIGNIFICANTLY MORE
important than the rebate.
I needed the loan to complete the
project but did not need the rebate.
$600 $9,480 6% The loan was SIGNIFICANTLY MORE
important than the rebate.
I needed the loan to complete the
project but did not need the rebate.
$175 $3,366 5% The loan was SIGNIFICANTLY MORE
important than the rebate.
I needed the loan to complete the
project but did not need the rebate.
$50 $18,842 <1% The loan was SIGNIFICANTLY MORE
important than the rebate.
I needed the loan to complete the
project but did not need the rebate.
Notably, while only 12% of survey respondents reported receiving rebates in addition to financing, this does
not reflect the population of the first two years of participants. The evaluation team verified through cross-
referencing REEL and statewide rebate program data that 27% (57 of 212) of participants in the first two years
also received rebates.
6.2.3 Financing Alternatives
The REEL pilot is one of many possible options for financing a home upgrade project. Participants may well
have alternatives, although some who have poor credit ratings or substantial DTI ratios may not have
alternatives, or they may have them but at less attractive loan terms. The participant survey asked
respondents whether they had sought out other options, or would have without REEL, and whether they
thought that they could find financing that they could qualify for or would accept (that is, acceptable loan
terms and affordable monthly payments).
Convenience was clearly a factor in the decision of some to go with REEL financing. Most respondents were
not inclined to shop for alternatives before choosing a REEL loan. A little over 40% remembered that their
contractor offered them alternative loan options, but only about a third (32%) reported that they shopped for
other financing options. As shown in Table 45, of those who looked for other options (n=16), five said that
they found at least one that they would have qualified for, one found a lower interest rate (but did not take it
due to a longer loan approval wait), and four found alternatives with longer loan terms.

Detailed Net Impact Results and Pilot Influence
opiniondynamics.com Page 92
Table 45. Actual Alternatives Sought before Choosing REEL
Question about Alternative Financing Yes (Count)
Did you seek out or research other financing
options? 16
Would/did you qualify? 5
Did they have lower interest? 1
Did they have a longer term? 4
However, respondents likely would have sought alternative financing had REEL not been available. The survey
asked respondents who did not seek financing alternatives what they hypothetically would have done absent
REEL. As shown in Table 46, combining the respondents who said that they did look at alternatives with those
who would have looked for something else absent REEL shows that 86% would have shopped for other
financing if REEL had not been available. In other words, only 14% would not have looked for financing absent
REEL. This reinforces the earlier finding (in Section 6.2.2) that respondents typically required financing to do
their project.
Table 46. Shopping Behavior (Hypothetical and Actual)
If There Were No REELa Count Percent (n=49)
Would have sought
alternatives 26 53%
Did seek alternatives 16 33%
Total 42 86%
a Categories based on responses to survey questions R1, R3, and R5a. See
Section 8.3.5.
6.2.4 Specific Influence of REEL Affordability
Respondents generally believed that the REEL loan offered a more attractive option than they otherwise
would have found, in terms of an affordable monthly payment. A large majority (78%, or 38 respondents)
thought it very likely that they would have qualified for another loan and six (12%) thought that it was
somewhat likely. However, only eight thought that they would be able to find a loan that was just as or more
affordable than REEL.
Given the inferior affordability of alternatives anticipated by most, about 38% said that they would have done
a somewhat or much smaller project if the REEL loan had not been available at the terms offered (Table 47).
An additional 18% said that they would not have used financing at all, which, as discussed in Section 6.2.2,
likely would have affected the size, efficiency, and/or timing of the projects. On the other hand, about 22%
said that they would have done exactly the same project, which indicates that they would have paid in cash
or used an alternative financing option even if it was less affordable.

Detailed Net Impact Results and Pilot Influence
opiniondynamics.com Page 93
Table 47. Self-Reported Influence of REEL on Project Size If Qualified and If Loan Cost Was Higher
Without REEL, Respondent Would Have: Count Percent
Done a much smaller project 10 20%
Done a somewhat smaller project 9 18%
Done the exact same project 11 22%
Not used financing at all 9a 18%
Don’t know 2 4%
Could have found a similarly or more affordable loanb 8 16%
Total 49 100%
a Original frequency was 8. Includes one extra person who said that he was “very unlikely” to qualify
for other financing and, thus, was not originally asked this question.
b Survey question excluded these eight respondents.
Notably, there were reasons beyond affordability that convinced customers to choose a REEL loan. As shown
in Table 48, contractor recommendations, avoiding a property lien (a direct comparison to PACE financing),
and an easy qualification process were also important factors for several respondents.
Table 48. Reasons for Choosing REEL (Multiple Response)
Response Count Percent (n=49)
Loan Terms
Low interest rate 26 53%
No lien on house 5 10%
Monthly payment 3 6%
Loan duration 3 6%
No prepayment penalty 1 2%
Loan amount 1 2%
No down payment 1 2%
Other attractive loan terms (not specific) 6 12%
Connection to Contractor or Other Organization
Contractor recommendation 8 16%
Connected to CU 2 4%
Connected to the CPUC 1 2%
Qualification and Application Process
Easy qualification 4 8%
Ability to Qualify
Only financing offered to them 1 2%
Could not qualify for other financing 1 2%
Able to qualify 1 2%
Other – Not REEL-Related
Rebates available 2 4%
Not enough cash on hand 1 2%
Wanted to save money 1 2%
Interest in EE 1 2%

Detailed Net Impact Results and Pilot Influence
opiniondynamics.com Page 94
6.3 Future Considerations for Net-to-Gross Ratio Analysis
The evaluation team spent a substantial amount of time thinking about how to measure and calculate
finance program influence or attribution, including net-to-gross ratios (NTGRs). In a prior study evaluating
some regional financing efforts throughout the state,61 the evaluation team used a latent class discrete
choice approach to estimate the impact of a finance program on residential customers’ decisions about their
home upgrades. This method can produce a NTGR along with other information. The approach was valuable
in that it allowed for the measurement of the impact of each loan and project attribute net of all others, and
what their joint effects were. However, that effort likely set the lower limit of what the real program NTGR
was because it considers only the stripped-down objective program components. It does not take into
account the human influence of contractors and their ability to sell the project and the financing, for
example. Part of the contractor influence could also be convenience and speed of processing. The
evaluation team on that study made an effort to include the convenience factor in the choice exercise, but
may not have successfully captured its entire effect, and the method may not allow for measuring contractor
salesmanship at all.
The evaluation team on the current study also completed a consumption analysis as part of this project and
that analysis has produced gross and net, or close to net, impacts of the pilot. As always, with a quasi-
experimental design, the net impact estimate probably does not estimate the pure net impact on
consumption, but something between net and gross. In this case, it is almost certainly closer to net than
gross because of the source of the comparison group. Still, it affords another estimate of a NTGR.
The team also included a NTGR battery of questions on the REEL participant survey. While it is a bit early in
the pilot’s implementation to calculate a NTGR, as early adopters in pilots do not often reflect what might be
experienced in a fully operational program, the team considered this project an opportunity to explore
methods of generating one by using a pretesting self-reported approach. The issues surrounding measuring
a self-report-based NTGR are much more complex than they are for assessing rebate or incentive programs.
For the latter, one needs to think and ask about only the impact of the rebate on the customer’s decision to
install. Even for behavior programs, one needs to think about and measure only the influence of the
intervention on changing customer behaviors. For finance programs, much more must be considered.
Calculating a NTGR for a finance program involves more than asking what participants would have done
absent the program, because a finance program is just one part of a very large finance market. There are
alternatives for many home upgraders, and these alternatives should be taken into account when thinking
about free-ridership (FR) on the pilot (or any other program). The evaluation team’s approach, starting with
the questionnaire, takes into account:
◼ Whether participants needed a loan to do their projects
◼ Whether they sought loan alternatives
◼ Whether they did or would qualify for the alternatives
◼ Whether the alternatives were more or less affordable than REEL
◼ What they would have done if facing a finance market that gave them less-affordable options than
REEL offered
61 http://www.calmac.org/publications/Regional_Finance_Program_Study_Final_Report_12.22.2017.pdf.

Detailed Net Impact Results and Pilot Influence
opiniondynamics.com Page 95
Addressing all issues is essential to generating a method that is realistic.
Given the complexity of the task, the team used a branching tree as a visual aid to think about and explain
the method (Figure 18).
Figure 18. Proposed Framework for Self-Report-Based Finance Program NTGR
The tree nodes include question numbers that readers can use to find the actual questions in Chapter 8.
Each branch in the tree represents possible responses to questions on the evaluation team’s participant
survey questionnaire. The recommended approach begins by asking a set of questions oriented to the
necessity (or lack) of getting some kind of loan for doing a home upgrade project. Participants who did not
need a loan at all would very probably be free-riders on the pilot. Questions pertaining to that are represented
by the first four nodes in the tree. These questions follow the current industry guidelines for the self-report
approach to NTGRs. Specifically, the team asked questions to measure the effect (in probability terms) of the
availability of loans on the project overall, its timing, its EE, and its size (quantity in the lingo of self-report
methods). The guidelines call for taking a mean of these four probabilities. This mean represents what would

Detailed Net Impact Results and Pilot Influence
opiniondynamics.com Page 96
be the average level of FR. The evaluation team recognizes that FR does not make sense when considering
the impact of the wider finance market on customer projects. There is no program on which customers could
ride free. However, the team retains that terminology because this probability is carried throughout the tree,
though it is modified along the way to take account of the influence of REEL per se. The overarching logic of
the approach and the tree that represents it is that the beginning of the REEL FR probability is the Loan FR
probability. The Loan FR is then either reduced or not depending on the participants’ answers to questions
relevant to the specific REEL program and its alternatives in the market.
It is important to repeat here that the tree approach to showing the logic is only a heuristic tool to help visualize
the logic. In reality, the team does not recommend assigning participants to categories of responses as may
be implied by the branches of the tree and the resulting nodes. In practice, probabilities associated with the
answers to each question rather than nodes or categories would be used. In fact, part of the overall approach
is to be able to multiply the probabilities at each level of the tree to produce the final REEL FR probability.
Starting with the Loan FR probability, represented as Node 1, go to the first branch, ending in Nodes 2 and
3. This branch represents whether respondents searched for loans (either before or after learning about the
REEL program). If participants did not do any searching for other loans, then their REEL FR probability would
be equal to the Loan FR probability and none of the subsequent questions pertain to them.
For those who searched for other loans, a critical question is whether they probably would have qualified for
the loans that they found in their searches. If they would not have qualified for alternatives, then they should
be assigned the Loan FR probability, modified (multiplied) by their probability of qualifying. The probabilities
associated with those calculations are represented in Nodes 4 and 5.
Nodes 6 and 7 reflect the values associated with the likely affordability of alternative loans that they
qualified for per their self-reports. If the loans that loan seekers were qualified for were equally or more
affordable than REEL’s, then that fact (or a probability associated with it) should reflect a high likelihood that
those participants would be free-riders on REEL.
However, if the alternative sources of financing were less affordable than REEL, the final question is what
those participants would have done under those conditions. The tree shows three nodes (8, 9, and 10) that
reflect the answers to that question. Those participants who say the alternatives that they qualified for were
less affordable than REEL would get different calculations for their final REEL FR probability, depending on
their answers.
◼ If they say that they would have completed the exact same project without the REEL loan terms and
the alternatives were more expensive,62 the final REEL FR probability should be set to 1, regardless
of prior answers because if they could have obtained a loan with equal or better terms, they did not
need REEL.
◼ If they say that they would have done smaller projects, then the probabilities associated with that
would be multiplied by the probability from Node 7 to produce a final REEL FR probability.
62 The evaluation team focused questions on affordability, but there are other loan terms that can also have an impact on customer
decisions (the length of the loan and whether or not it places a lien on the home are also important factors that were not
incorporated into this approach).

Detailed Net Impact Results and Pilot Influence
opiniondynamics.com Page 97
◼ If they give ambiguous answers, such as saying that they do not know what they would have done or
that they would not use financing at all, the prior probability represented in Nodes 6 and 7 would be
carried forward as their final REEL FR probability.
The team assigned probabilities to all of the FR questions so as to test the viability of the approach. Based
on that test, the team recommends it for estimating NTGRs for finance programs, but slight revisions to
some of the questions are needed, and, in many cases, the team assigned probabilities to response
categories, while the team would recommend asking the respondent to assign probabilities with the usual
0–10 scoring method.
Should REEL become a full resource acquisition program, several decisions would need to be made in terms
of the accepted evaluation method for calculating net savings claims and how to avoid double-counting in
gross and net savings between REEL and other ratepayer resource programs that overlap with REEL
including residential rebate programs and the codes and standards advocacy programs.63 Avoiding double-
counting needs to consider the best method to operationalize the evaluation results given that different
evaluation contractors are evaluating these various programs independently of each other. These concepts
were not fully explored in this evaluation, given that the pilot is not claiming savings and other research
questions were more pertinent to helping the CPUC assess the pilot’s potential to continue and scale. Should
REEL become a full program, the team recommends workshopping the methods and administration to
address these important factors among key stakeholders in California. The workshops would be designed to
produce a recommendation to the CPUC on the most optimal methods to calculate net savings and mitigate
double-counting across programs.
63 Given that most REEL projects have not received IOU rebates as well, there is the potential for these projects to show up in the
population that is examined as part of the Codes and Standards Advocacy Program, as these are residential retrofit projects that
meet or exceed code but did not receive utility rebates. There is no current potential for double-counting energy savings between the
REEL pilot and the Codes and Standard Advocacy Program as the 2016–2018 C&S Impact Evaluation removed all REEL projects
from its potential population pool.
Detailed Cost-Effectiveness Results
opiniondynamics.com Page 98
7. Detailed Cost-Effectiveness Results
The evaluation team performed a cost-effectiveness analysis on the REEL pilot, as well as on projected REEL
program models. As part of this effort, the evaluation team:
◼ Explored how pilot funding was spent (marketing, LLR, administration, start-up costs, etc.),
◼ Assessed the pilot costs and benefits achieved (including energy savings supported, contractors
trained, and lenders enrolled)
◼ Compared the results to other DSM investments (for example, the Residential HVAC program and
EUC)
The evaluation team conducted a C/B analysis of the pilot, assessing a range of relevant quantitative and
qualitative metrics. The team then performed a comparative analysis on the REEL pilot and two projected
future REEL program rollout scenarios. This analysis, combined with an assessment of the Resolution E-
4900 metrics, is valuable in determining the potential scalability and likely cost-effectiveness of a future
REEL program.
Central to the analysis is the application of two cost-effectiveness tests from the California SPM: the TRC and
the PAC.64 While cost-effectiveness was not identified as a Resolution E-4900 metric to measure pilot
success, cost-effectiveness testing provides a valuable comparative tool to address the CPUC’s request for
“exploring the costs and benefits” of the pilot and, more importantly, to determine if the REEL model could
be operated as a cost-effective resource program in the future.65 In other words, conducting the cost-
effectiveness analysis will provide an apples-to-apples C/B comparison to other residential DSM investments
in California.
The objectives of the cost-effectiveness analysis, in the context of this study, include:
◼ Assessing the cost-effectiveness of the REEL pilot, as well as two future program scenarios using an
interpretation of California’s SPM tests that specifically addresses the unique cost and benefits
associated with financing programs66
◼ Comparing the costs and benefits of the REEL pilot and future REEL program models to other DSM
investments in California
◼ Assessing whether the REEL model can be delivered in the future as a resource program that
achieves a TRC ratio greater than 1.0
◼ Providing recommendations on future statewide EE financing programs
64 CPUC. 2001. 65 Mandated by the legislature (Public Utility Code Section 454.5), the CPUC must ensure all available EE and demand reduction
resources be cost-effective. 66 The financing program model (FPM) interpretation applies an adapted version of the SPM tests to capture the full range of
financing-related costs and benefits, and thereby provide a fulsome assessment of the program’s cost-effectiveness.

Detailed Cost-Effectiveness Results
opiniondynamics.com Page 99
7.1 Cost-Benefit Ratio
In its simplest form, a C/B ratio is used to determine the value of a program intervention versus the cost of
that intervention, considered from a variety of perspectives. This ratio provides a value of benefits and costs
that are represented by actual dollars spent and gained. The basic algorithm is shown below.
𝐵𝐶𝑅 = 𝐵𝑒𝑛𝑒𝑓𝑖𝑡𝑠 ÷ 𝐶𝑜𝑠𝑡𝑠
The C/B ratio is derived by converting the entire stream of current and future costs and benefits into present
values. Detailed descriptions of the financing program model (FPM), inputs, assumptions, and algorithms
for each cost-effectiveness test and model is provided in Appendix B. Below is an overview of the cost-
effectiveness methodology, key inputs and assumptions, and sensitivity analysis performed by Dunsky.
7.1 Cost-Effectiveness Test Results
The pilot and two future REEL program scenarios assessed for cost-effectiveness are described below.
1. REEL Pilot: Based on actual pilot operating expenditures (excluding start-up costs), participation, and
estimated average savings per participant for the two-year evaluation period (FY16–17 and FY17–
18).
2. REEL BAU: A future REEL program based on modest operating expenditure reductions and modest
increases in participation (240 participants per year) over a five-year period, excluding start-up costs
realized during the pilot phase.
3. REEL+: A future REEL program that assumes increased expenditures (additional staff and
investments in IT and EFLIC) and a significant increase in participation rates (883 participants per
year), excluding start-up costs realized during the pilot phase.
To assess the REEL pilot and future REEL programs, the evaluation team made appropriate adjustments to
account for how the program could scale up and account for the reduced investment needed for setup and
operating costs. This approach seeks to answer whether the pilot points to a successful model to help achieve
California’s overarching DSM financing objectives.67
Some of the input assumptions cannot be measured directly and carry a significant degree of uncertainty. To
account for this, the evaluation team presents cost-effectiveness results as “Low,” “Mid,” and “High” values,
representing the range of possible results, with the “Mid” being judged as the most realistic outcome. The
cost-effectiveness results are shown in Table 49.
67 Ds. 12-05-015, 12-11-015, 13-09-044, and 17-03-026 directed support for EEFPs to test “scalable” products, “leverage”
ratepayer funds, and “stimulate deeper EE projects than previously achieved through traditional program approaches (e.g., audits,
rebates, and information).”

Detailed Cost-Effectiveness Results
opiniondynamics.com Page 100
Table 49. Cost-Effectiveness Results for the REEL Pilot and Two Future Programs (REEL BAU and REEL+)
REEL Scenario
Cost-Effectiveness Results (Financing Program Model)*
PCT PAC TRC SCT
REEL Pilot
excluding start-up costs
1.09
(0.93, 1.29)
0.14
(0.10, 0.18)
0.50
(0.40, 0.59)
0.57
(0.51, 1.66)
REEL BAU
excluding start-up costs
0.23
(0.16, 0.31)
0.63
(0.52, 0.78)
0.73
(0.65, 0.88)
REEL+
excluding start-up costs
0.52
(0.33, 0.80)
0.84
(0.68, 1.06)
0.97
(0.86, 1.20)
* The “Mid” scenario results are in bold. The “Low” and “High” scenario results are in parentheses below.
Figure 19. Comparison of Costs and Benefits of the REEL Pilot and REEL+ Program
REEL Pilot
REEL+
Program administration and loan servicing costs make up a significant portion of REEL pilot costs. However,
because the administration and loan servicing are mostly fixed costs, under an increased loan volume as
modeled in the REEL+ program, they would drop to a much smaller portion of the overall costs. Participant
costs are a significant portion of costs in both the TRC and SCT in all scenarios, as they scale with program
participant size. Similarly, NEBs in the form of APR reductions represent the majority of benefits in the SCT
and TRC under all scenarios, as they also scale with program participation.
Based on these results the following conclusions are drawn:
◼ The current implementation model for REEL carries significant administration and loan servicing
costs. Specifically, the administration costs (including the master servicer) and LLR management
Contractor
Management
Contractor
Management

Detailed Cost-Effectiveness Results
opiniondynamics.com Page 101
(including the bank trustee costs that extend for the life of the LLR) account for more than half of the
REEL pilot TRC and SCT costs. This becomes less of a concern under the REEL+ program, which
scales to incorporate more participants and in which the fixed administration costs remain relatively
stable.
◼ While the contractor management costs (embedded in the administration and loan servicing costs)
are also significant, interviews with CAEATFA, PAs, lenders, and other jurisdictions revealed that
contractor support is critical to program success.
◼ Overall, the REEL pilot and REEL program projections do not pass the cost-effectiveness tests
(> 1.0) under the “Mid” inputs scenario. The one exception is that the REEL+ Program passes
the SCT marginally (SCT = 1.02). The “Mid” inputs scenario represents the midpoint in the
projected program costs, estimated benefits, and program uptake ranges, and is considered to
be the most probable assessment of the three program models C/B results.
◼ Under the “High” inputs scenario, the REEL+ program passes the TRC and SCT, and the REEL BAU
program passes the SCT. However, it should be noted that the “High” inputs scenario represents the
most optimistic interpretation of each program’s cost and benefit stream, and it would be unlikely
that the program could deliver on all of them simultaneously. They include a decline in covered
losses, high-end APR reductions, increased market effects, deeper and more persistent energy
savings, a lower discount rate, and the high-end value placed on NEBs. The “High” scenario
assumptions were intended only to provide an upper limit to the cost-effectiveness results rather
than an expected outcome of a future program, while the “Mid” scenario represents the most
realistic expected results.
◼ The programs are cost-effective from the participant perspective under the “Mid” scenario. The PCT
benefits do not change among programs because all costs and benefits from the participant
perspective scale directly with the number of participants.
◼ The PAC results are particularly low compared to the TRC and SCT results. This runs counter to
conventional cost-effectiveness expectations where PAC ratios are typically higher than the TRC and
SCT. PAC results are lower in this case as energy savings make up only a small portion of the overall
benefits and the PAC does not account for the APR reduction, which is a benefit to the participant
only.
7.1.1 How Does REEL Compare to Other DSM Initiatives?
To better understand the results, the evaluation team benchmarked the REEL pilot and two future program
projections with other residential DSM investments, including:
◼ EUC: EUC is a rebate program that allows homeowners to choose one of two tracks. The AHUP is
most comparable to the types of projects in the REEL pilot.
◼ HUP is a customer entry point into whole-house efficiency upgrades. Customers must install at
least three measures, including one base measure, such as duct sealing, air sealing, or attic
insulation. Incentives are based on the measures installed, capped at 50% of the total project
cost or $1,300–$3,000, depending on the PA.
◼ The AHUP helps customers accomplish more-complex efficiency upgrades than HUP and involves
a comprehensive energy assessment. Incentives are based on the modeled percent energy

Detailed Cost-Effectiveness Results
opiniondynamics.com Page 102
savings rather than on the measures installed, up to $5,500, with higher incentives awarded
through “bonus kickers” based on total modeled savings. The IOUs offer the AHUP to customers
in their territories.
◼ Residential HVAC program: The Residential HVAC program offers prescriptive rebates for high-
efficiency HVAC equipment.
◼ RFPs: The Golden State Finance Authority (GSFA) Residential Energy Retrofit Program and the
SoCalREN Home Energy Loans Program provided loans to support EUC Home Upgrade and Advanced
Home Upgrade projects from 2013 to 2015.
For each program, the evaluation team compared how funding was allocated, the multiple benefits and
outcomes achieved, and the C/B ratios to better understand whether REEL points to a successful model to
achieve California’s goals.
Costs
Table 50. Comparison of Annual Program Costs
Component
Costs ($M) Annual
REEL (Pilot)
FY17–FY18a
REEL BAU
(Program
Projection)
Annualizedb
REEL+
(Program
Projection)
Annualizedc
Regional
Finance Pilots
2013–2015
Annualizedd
Residential
HVAC
Program
Year 2017e
EUC (HUP
and AHUP)
Program
Year 2017f
Administration 0.4 0.5 0.4 0.1 0.1 2.4
Investments/Incentives N/A N/A N/A 0.3 4.7 36.4
LLR Losses 0.005 0.03 0.1 .02 N/A N/A
Bank Trustee and
Master Servicer 0.2 0.2 0.4 N/A N/A N/A
Contractor Management
(training and outreach) 0.4 0.4 0.4 N/A 0.2 1.3
TOTAL Cost (M) $1.0 $1.1 $1.3 $0.4 $4.9 $40.0
Administrative Costs
($,000 spent per loan) 2.2 2.1 0.5 1.1 N/A N/A
Administrative Costs
($ per $ loan value) 0.11 0.12 0.03 0.05 N/A N/A
Administrative costs
(including bank trustee/
master servicer) as a %
of Total Cost
59% 65% 63% 28% 5% 9%
a Source: CAEATFA estimate of historic REEL expenses provided on June 3, 2019 and REEL participant data.
b Source: CAEATFA estimated annual REEL maintenance costs
c Source: CAEATFA estimated costs for REEL through FY22–FY23. Note, however, that this is not to be interpreted as a proposal by
CAEATFA.
d Source: Opinion Dynamics and Dunsky. 2017. Regional Finance Program Attribution and Cost-Effectiveness Study. Final Report.
Energy savings are ex ante (not evaluated) and may therefore be overestimated.

Detailed Cost-Effectiveness Results
opiniondynamics.com Page 103
e Source: CEDARS claimed program data for PGE2100 Residential HVAC, SCE Residential HVAC, SDG&E Residential HVAC Upstream,
SCG Residential HVAC Upstream 2017. Accessed at: https://cedars.sound-data.com/. Note that reported budgets may include
multifamily programs.
f Sources: CEDARS claimed program data for BayREN01 Single Family, PGE21004 EUC, SCE-13-SW-001D EUC, SCG Residential
Home Upgrade, SCE Flex Path Incentives, SDG&E SW-CALS-EUC WHRP 2017. https://cedars.sound-data.com/; DNV-GL. 2019.
Impact Evaluation Report Home Upgrade Program – Residential Program Year 2017. Note that reported budgets may include
multifamily.
REEL has significantly lower total costs compared to EUC and Residential HVAC but has significantly higher
administrative costs than either other program when considered as a portion of the overall running costs.
When the REEL pilot and REEL BAU program models are compared to the RFPs, it can be observed that the
REEL models carry significantly more administrative weight than the RFPs, both in terms of the administrative
cost per loan and in the cost per dollar of loan value delivered. However, under the REEL+ program projection,
the cost per loan drops to less than half of that for the RFPs due to the significant rise in the REEL+ program
volume. Beyond looking at these costs, it is also important to note that the pilot attracted more than seven
times the total ratepayer funds contributed during the pilot in private capital (see Section 4.1).
Benefits/Outcomes
Assessing the multiple pilot benefits and outcomes provides insights into the value for dollars spent. Table
51 compares the various benefits and outcomes of each program.
Table 51. Comparison of Program Benefits and Outcomes
Benefits /
Outcomes
REEL (Pilot)
Fiscal Year
2017-2018
REEL BAU
(Program
Projection)
REEL +
(Program
Projection)
Annualized
Regional
Finance Pilots
2013-2015
Annualized
Residential
HVAC
2017
Program Year
EUC (HUP and
AHUP)
2017
Program Year
First year gross
kWh savings 138,567 177,840 654,303
96,366
(Ex-Ante) 4,911,544 825,388
First year gross
therm savings 2,057 2,640 9,713
22,924
(Ex-Ante) -7,212 397,219
First year total
gross MMBtu
savings - all fuels
- per participant
3.6 3.6 3.6 26.1
(Ex-Ante) Not available 4.6
First year total
net MMBtu
savings all fuels -
per participant
1.6 1.6 1.6
8.9 (Ex-Ante cut
by at least 50%
in Ex-Post)
Not available 2.9
Share gross
electric savings 70% 70% 70% 13% 100% 7%
Share gross gas
savings 30% 30% 30% 87% Not applicable 93%
# of participating
contractors 340
435
(estimated)
435
(estimated) 35 Not available 539 a
# of participating
lenders 4 Not available Not available 3 N/A N/A

Detailed Cost-Effectiveness Results
opiniondynamics.com Page 104
Benefits /
Outcomes
REEL (Pilot)
Fiscal Year
2017-2018
REEL BAU
(Program
Projection)
REEL +
(Program
Projection)
Annualized
Regional
Finance Pilots
2013-2015
Annualized
Residential
HVAC
2017
Program Year
EUC (HUP and
AHUP)
2017
Program Year
# of Participants
(per year) 187 240 883 100 Not available 9,349
Average size of
project ($) 17,165 17,712 17,712 21,850 Not available 25,000
APR Benefits
(Interest rate
reduction)
4.6% 4.6% 4.6% 3.8% N/A N/A
a Source: EMI Consulting. 2016. Energy Upgrade California – Home Upgrade Program Process Evaluation 2014–2015.
Notable observations are summarized below.
◼ The share of electric savings in the REEL pilot is closer to that of the Residential HVAC program and
the savings per participant is like that of the HUP. This is not surprising as, on average, REEL
participants completed two measures per project; HVAC was the most common measure type
financed (69%), followed by building shell improvements (see Section 4.2 for details on measures
supported by REEL). Note that the RFPs appear to have much larger savings per participant.
However, only ex ante savings number were available at the time of that study. A more recent ex post
evaluation of the HUP program (which includes all the RFP participants) indicated that ex post
savings were on average only 25% of the ex ante savings values.68
◼ REEL offers low-cost financing (reduced APR). While both financing pilots (REEL and Regional
Finance) successfully delivered low-interest-rate financing, REEL offers somewhat better interest rate
reduction benefits (4.5% APR reduction, which results in an average interest rate of 7.3% for REEL
participants) compared to the RFPs (3.8% APR reduction). APR benefits make up a significant portion
of the overall benefits and any further reductions could benefit the program. It is uncertain how
much further REEL could reduce interest rates, but other jurisdictions offer loans with rates as low as
2.75%, (for example, Colorado’s RENU program).
Cost-Effectiveness Ratios
Cost-effectiveness ratios allow for a C/B comparison to other residential DSM investments in California.
Table 52 compares the results.
Table 52. Comparison of Program Cost-Effectiveness Ratios
Cost-
effectiveness
Ratios
REEL (Pilot)
Fiscal Year
2016-2018
REEL BAU
(Program
Projection)
REEL + (Program
Projection)
Regional
Finance
Pilots
2013-2015
Residential
HVAC
Program Year
2017
EUC (HUP and
AHUP)
Program Year
2017
TRC Ratio 0.50 0.63 0.84 0.97 - 1.40
(0.76 – 1.16) a 0.03 – 1.26 0.27
SCT Ratio 0.57 0.73 0.97 1.03 - 1.46 N/A N/A
68 DNV GL. 2019.

Detailed Cost-Effectiveness Results
opiniondynamics.com Page 105
Cost-
effectiveness
Ratios
REEL (Pilot)
Fiscal Year
2016-2018
REEL BAU
(Program
Projection)
REEL + (Program
Projection)
Regional
Finance
Pilots
2013-2015
Residential
HVAC
Program Year
2017
EUC (HUP and
AHUP)
Program Year
2017
(0.73 - 1.13) a
PAC Ratio 0.14 0.23 0.52 0.36 - 0.59
(0.09 – 0.15) a 0.14 – 1.49 0.63
a The cost-effectiveness results for the RFPs were adjusted to account for the impact of applying the HUP program ex post savings,
which were 25% of the ex ante savings on average. All RFP participants were also participants of the HUP, but the ex ante/ex post
savings ratio may differ between the RFP participants and the HUP participants as a whole.
Key insights emerge when comparing the cost-effectiveness of REEL to other programs.
◼ The mature incentive-based EE programs struggle to achieve cost-effectiveness apart from some IOU
Residential HVAC programs. California has adopted very aggressive EE and RE goals; achieving these
goals has become more difficult due to the state’s stringent codes and standards that have
increasingly raised the minimum EE performance baseline. While California’s market transformation
efforts are having a positive transformative impact, resource programs are challenged to deliver
energy savings cost-effectively.
◼ The REEL pilot and projected programs do not appear to be as cost-effective as the RFPs, primarily
due to the higher administrative costs relative to the size of the loan portfolios.69 Comparing the cost-
effectiveness results of the REEL pilot and REEL BAU programs to that of the RFPs demonstrates the
impact of lower administrative costs and no LLR management costs.
◼ Project size and depth of energy savings affects results. There is a significant difference between
REEL and the RFPs, in terms of both the share of electric and natural gas savings and the total
energy savings achieved per participant. However, note that the RFPs’ results were measured at a
time when only ex ante savings were available. As noted above, based on the HUP ex post evaluated
savings, on average, the RFP savings could be expected to drop to 25% of the ex ante savings.
Energy savings make up a limited portion of the overall benefits compared to others like APR
reduction, and therefore the RFP cost-effectiveness results are reduced somewhat (see Table 52). A
larger driver of the difference in cost-effectiveness between REEL and the RFPs is the expenditures,
as the RFPs had far fewer costs than REEL. Further, the estimated savings per REEL participant are
based on the gross savings found in this evaluation; applying net savings would further reduce
savings and REEL’s ability to achieve cost-effectiveness.
◼ Increased loan volume can help improve program cost-effectiveness. The REEL+ program assumes a
significant increase in participation without a significant change in costs or per-project energy
savings, compared to the REEL BAU or pilot results. This leads to the REEL+ achieving a higher PAC,
TRC, and SCT ratio, greater than the REEL pilot or the REEL BAU models.
69 This result is also influenced by the use of ex ante savings in the RFP cost-effectiveness assessment, while ex post savings are
used in the REEL cost-effectiveness assessment. A comparison of the PAC, TRC, and SCT values from the RFPs when estimated ex
post savings are applied shows that the cost-effectiveness of the REEL pilot and BAU is closer to that of the RFPs, but still somewhat
inferior.

Detailed Cost-Effectiveness Results
opiniondynamics.com Page 106
7.1.2 Can the Current REEL Model Deliver Savings Cost-Effectively?
The evaluation team explored key variables that have the greatest impact on the cost-effectiveness results,
such as NTGR, increased participation (loan volume), administration and LLR management costs, and
energy savings, to determine whether the REEL model could be cost-effective going forward.
Net-to-Gross Ratio
Given that this evaluation was not tasked with doing a formal net savings analysis or cost-effectiveness test
of the pilot, the evaluation team used gross savings in the C/B analysis. NTGRs affect energy benefits, NEBs,
market transformation benefits, and net attributed investment costs (to the participant). To highlight the
effect that NTGRs have on cost-effectiveness, for each “Mid” scenario, the team calculated what NTGR
would be necessary for the REEL pilot and future programs to be cost-effective. Results are presented in
Table 53, which shows that significant market effects and spillover would be required to achieve a NTGR of
this magnitude, which is unlikely.
Table 53. NTGR Required for REEL to Be Cost-Effective
Program Evaluated
Required NTGR
PAC TRC SCT
REEL Pilot 7.1 6.3 4.9
REEL BAU 4.4 4.1 2.9
REEL+ 2.0 2.0 1.1
Volume
The evaluation team tested what volume would be needed to achieve a TRC > 1.0 under the “Mid” scenario
for REEL+ scaling the current volume by order of magnitude. The results, presented in Table 54, indicate
that increasing the annual loan volume over and above the projected REEL+ volume could help bring the
program closer to cost-effectiveness. However, as the volume rises, the ratio of the variable costs to fixed
costs becomes higher, and therefore the incremental increase in cost-effectiveness diminishes with
increasing program volume.
Table 54. Impacts of Volume on Cost-Effectiveness Results
REEL Evaluation
Required Volume (loans/year)
883 2,000 20,000
REEL+, TRC 0.84 0.92 0.99
Benefits and Costs
To determine how key program performance or configuration settings may influence the program, the
evaluation team assessed the sensitivity of the REEL+ program cost-effectiveness in four key inputs
variables, as outlined in Table 55.

Detailed Cost-Effectiveness Results
opiniondynamics.com Page 107
Table 55. Variables Influencing Cost-Effectiveness Results
Variable Description
Administration and Contractor
Management Costs
The administration and contractor management costs (±50%) were varied to assess
the impact of these costs rising or falling as the program matures.
Master Servicer and Bank
Trustee Costs
The evaluation team tested the sensitivity of the results to a lower-end case, where
the master servicer and bank trustee are not needed (that is, the REEL program no
longer links to specific IOU ratepayer funds, as is the case with the RFPs) and a
higher-end case where the REEL program would cover all of CAEATFA bank trustee
fees (that is, it is the only program running) and that master servicer is required for
the full loan duration (that is, the OBR feature is engaged).
Value of EEEMs The evaluation team assessed the impact of varying the energy savings per project by
±50% to determine the sensitivity of the program cost-effectiveness.
APR Reduction
As the lenders gain experience with the program, they may be influenced to lower or
raise interest rates to account for lower- or high-than-expected default losses,
respectively. The evaluation team assessed the sensitivity of the results to a 2.3%
increase or decrease of the APR reduction benefits.
Figure 20 summarizes the sensitivity analysis results. This reflects the impacts of each variable on overall
REEL+ program cost-effectiveness. The blue bars reflect the impact of the “High” scenario of each variable
alone on cost-effectiveness results, with all other things being equal. The grey bars reflect the impact of the
“Low” scenario.
Figure 20. Impacts of Key Variables
Based on this sensitivity analysis, the evaluation team determined that:
◼ The PAC is most influenced by the administration and contractor management costs, LLR fees, and
value of EEEMs, while the TRC and SCT are most influenced cost of capital savings (APR reductions)
and LLR fees.

Detailed Cost-Effectiveness Results
opiniondynamics.com Page 108
◼ Increasing the APR reduction benefits have the largest impact on the TRC and SCT values.
Increasing the APR benefits to 6.9% would result in the REEL+ program achieving cost-
effectiveness under both tests. This would equate to an average interest rate of 4.8% (assuming
an average baseline interest rate of 11.7%, as determined from the pilot loan database). Given
that the LLR covers such a significant portion of the lender risk, and based on experience in
other jurisdictions where the initial credit enhancements were often found to exceed the
amounts needed to cover lender risk, requiring the lenders to focus on high-risk borrowers
and/or to lower their APRs within the REEL program may be the best path toward establishing a
cost-effective REEL program.
◼ The administration, contractor management, master servicer, and bank trustee costs each have a
notable impact on the program cost-effectiveness. However, even under the cases where there
would be reduced administration costs or the master servicer and bank trustee become unnecessary
(that is, if the requirement to link LLR funds to specific IOU service territories was removed), the
savings are not sufficient to render the program cost-effective under the TRC. If these impacts could
be combined, and the average savings per project also increased, it is possible that the program
could exceed a TRC of 1.0.
7.1.3 Cost-Effectiveness Assessment Results Summary
From the evaluation team’s cost-effectiveness analysis, the current REEL model does not appear to be cost-
effective as a pilot or in any future models. The following takeaways should be considered from these
results.
◼ The mature incentive-based EE programs struggle to achieve cost-effectiveness, apart from some
IOU Residential HVAC programs. California has adopted very aggressive EE and RE goals; achieving
these goals has become more difficult due to the state’s stringent codes and standards that have
increasingly raised the minimum EE performance baseline.70 While California’s market
transformation efforts are having a positive transformative impact, resource programs are
challenged to deliver energy savings cost-effectively.
◼ Increasing REEL loan volumes may improve REEL program cost-effectiveness. As participation
increases from the REEL BAU to the REEL+ models, administration and LLR costs have less effect on
cost-effectiveness results as they are largely fixed costs. Focusing efforts on increasing the loan
volume to approach the REEL+ projections of more than 883 loans per year could play a key role in
improving the program’s cost-effectiveness.
◼ REEL’s ability to deliver low-cost loans causes non-energy savings (APR benefits primarily) to far
outweigh energy savings benefits. The APR reduction makes up the largest proportion of program
benefits by far. While participating lenders currently offer competitive interest rates, with some as
low as 4.50%, maintaining REEL in market and continuing to demonstrate that REEL loans are
performing well, particularly in risky market segments, could provide lenders with confidence to pass
on greater savings to borrowers. The MI Saves Home Energy Loan Program demonstrated strong LLR
performance, resulting in lenders reducing interest rates, which led to increased loan volumes.
Increasing these benefits could offer the best path forward toward a cost-effective REEL program.
70 The California Title 24 Building Energy Efficiency Standards ensure new and existing buildings achieve EE. The standards are
updated regularly by the California Energy Commission.

Detailed Cost-Effectiveness Results
opiniondynamics.com Page 109
◼ The REEL model as it is currently structured carries notable administrative weight, which affects the
ability of the program to operate cost-effectively while delivering low or moderate loan volumes.
Finding solutions to reduce the administrative costs associated with the contractor management,
bank trustee fees, and the master servicer could collectively improve the program cost-effectiveness.
Finding a REEL program model that can achieve a TRC threshold > 1.0 will likely require leveraging a number
of the factors outlined above. A cost-effective REEL model would need to reduce program costs
(administration and LLR management fees) and increase program volume and benefits (energy savings,
accounting for other NEBs, and further APR reductions). REEL offers a variety of social, economic, and
environmental benefits that are not fully accounted for in the model: helping underserved Californian’s make
improvements that improve their comfort, reducing energy poverty, improving people’s health; boosting the
value of housing stock; increasing economic opportunities for partners; and accounting for the social cost of
carbon. Finding opportunities to reduce costs, applying a longer-term lens to measure market impacts, and
reevaluating how ratepayer funds are used to support California’s climate-related goals should be
considered.

Participant Survey Topline Results
opiniondynamics.com Page 110
8. Participant Survey Topline Results
In May 2019, the evaluation team fielded a survey to REEL pilot participants. The primary goals of the survey
were to understand the influence of the REEL loan on participants’ decisions to complete home upgrades,
collect information about their households, and understand any nonroutine adjustments participants made to
their homes or behaviors after the home upgrade.
8.1 Survey Approach
The survey was administered via telephone to all 339 households who received REEL loans from July 2016
through December 2018. To maximize responses, the evaluation team offered a $50 incentive. A total of 49
participants completed the survey, as shown in Table 56 below, and the response rate was 15.6%.
Table 56. REEL Participant Survey Sample Frame
Number of
Participants
Participants with Telephone
Contact Information
Total
Respondents
339 337 49
8.2 Survey Structure
Table 57 summarizes the purpose of each survey section.
Table 57. Participant Survey Structure
Section Purpose
Payment Methods ▪ Determine if other sources of payment or financing were used in addition to the REEL loan
▪ Determine if the respondent used utility rebates in addition to the REEL loan
Home Upgrade
Motivations
▪ Determine if the respondent lives/lived at the property, or if it is rented
▪ Understand the respondent’s motivations for getting an upgrade
Relative Influence of
Rebates and Financing
▪ Understand the relative influence of financing and utility rebates on the respondent’s
decision to do a home upgrade
General Financing
Influence
▪ Understand, qualitatively, why the respondent sought financing
▪ Collect data on how, absent financing, the home upgrade project would have been
affected (that is, overall, on timing, on EE, on size)
REEL Financing
Influence
▪ Understand how the respondent learned about REEL and if his/her contractor
recommended REEL
▪ Determine if the respondent shopped for/researched other financing options and how
these options compared to REEL
▪ Qualitatively understand why the respondent chose REEL over other options
▪ Understand, absent REEL, the overall likelihood to use a financing option other than REEL
▪ Understand how, absent REEL, the respondent’s decision to seek and/or ability to access
financing would have been affected
Demographics and
Property Changes
▪ Collect data on relevant household characteristics, physical changes to the property,
occupancy changes, etc. that may affect energy savings
▪ Identify respondents who are LMI or using government assistance
▪ Collect self-reported creditworthiness
▪ Collect self-reported intentions to pay the loan off earlier or make additional payments

Participant Survey Topline Results
opiniondynamics.com Page 111
8.3 Results
Below are the detailed survey responses from which the evaluation team drew out key findings. Please note
that some questions are “multiple response” and do not sum to 100% (totals are excluded from these
tables). In some cases, the percentages do not sum to 100% due to rounding. Unless italicized with
quotations, open-ended responses are coded. Tables are broken out by participants in the first two years
(the evaluation period) and after the first two years for comparison purposes.
8.3.1 Payment Method
P1. In addition to the Residential Energy Efficiency Loan, did you use any of the following ways to pay for your
project? [MULTIPLE RESPONSE]
Response
All First Two Years of Pilot After First Two Years
Count Percent Count Percent Count Percent
Nothing else 34 69% 20 63% 14 82%
Cash 10 20% 8 25% 2 12%
A credit card (intent to pay off with interest) 2 4% 1 3% 1 6%
Utility rebates 6 12% 6 19%a 0 0%
a Indicates statistical significance at the 90% confidence level between first-two-year and non-first-two-year participants.
P4. You mentioned that you received utility rebates. Approximately, what was the total rebate amount in dollars
that you received? Your best guess is fine.
Response All First Two Years of Pilot After First Two Years
$5,000 1 1 0
$3,000 1 1 0
$1,500 1 1 0
$600 1 1 0
$175 1 1 0
$50 1 1 0
Note: Only asked if P1 = “Utility rebates”.
8.3.2 Home Upgrade Motivations
M1. Did you live at the property at the time of the upgrade, or did you rent it to someone else?
Response
All First Two Years of Pilot After First Two Years
Count Percent Count Percent Count Percent
Lived there 48 98% 31 97% 17 100%
Rented to someone else 1 2% 1 3% 0 0%
Total 49 100% 32 100% 17 100%

Participant Survey Topline Results
opiniondynamics.com Page 112
M2. Do you still own the property?
Response
All First Two Years of Pilot After First Two Years
Count Percent Count Percent Count Percent
Yes 46 94% 30 94% 16 94%
No 3 6% 2 6% 1 6%
Total 49 100% 32 100% 17 100%
M2a. Do you CURRENTLY live at the property or rent it to someone else?
Response
All First Two Years of Pilot After First Two Years
Count Percent Count Percent Count Percent
Lives at the property 44 90% 29 91% 15 88%
Rents to someone else 1 2% 1 3% 0 0%
Moved (Recode based on M2) 3 6% 2 6% 1 6%
Refused 1 2% 0 0% 1 6%
Total 49 100% 32 100% 17 100%
M3. I am going to read a list of reasons why you may have chosen to do a home upgrade. When I finish reading
the list, please tell me which reason was the MOST IMPORTANT. If none of these was the most important
reason, just say “none of these.”
Response
All First Two Years of Pilot After First Two Years
Count Percent Count Percent Count Percent
I wanted to reduce my energy bills 14 29% 10 31% 4 24%
My property was uncomfortable, too cold,
or too hot 12 24% 9 28% 3 18%
I wanted to improve the property in
preparation for selling it 2 4% 0 0% 2 12%a
I wanted to improve the property in
preparation for renting it 0 0% 0 0% 0 0%
I had broken equipment in my home that
needed to be fixed 10 20% 5 16% 5 29%
I needed to make repairs to my home's
structure, such as the roof, flooring, or
foundation
4 8% 3 9% 1 6%
I wanted the property to be more
environmentally friendly 6 12% 4 13% 2 12%
“Replaced it for preventive maintenance” 1 2% 1 3% 0 0%
Total 49 100% 32 100% 17 100%
a Indicates statistical significance at the 90% confidence level between first-two-year and non-first-two-year participants.

Participant Survey Topline Results
opiniondynamics.com Page 113
8.3.3 Relative Influence of Rebates and Financing
A1. Earlier you mentioned that you received a utility rebate to help pay for the home upgrade project.
Thinking about both the rebates and the Residential Energy Efficiency Loan, please complete the following
statement. “In terms of my decision to complete a home upgrade project…”
Response Count Percent
The loan was SIGNIFICANTLY MORE important than the rebate. 4 67%
The loan was SOMEWHAT LESS important than the rebate. 1 17%
The loan was SIGNIFICANTLY LESS important than the rebate. 1 17%
Total 6 100%
Note: Only asked if P1 = “Utility rebates”. No non-first-two-year participants indicated that they received
rebates.
A2. Which of the following statements best describes the influence of the rebate and the Residential Energy
Efficiency Loan on your decision to complete a home upgrade project?
Response Count Percent
I would have done the project without either the rebate or the loan. 1 2%
I needed the loan to complete the project but did not need the rebate. 4 8%
I needed BOTH the rebate and the loan in order to do the project. 1 2%
Total 6 100%
Note: Only asked if P1 = “Utility rebates”. No non-first-two-year participants indicated that they received
rebates.
8.3.4 General Financing Influence
F0. To start, please briefly describe why you chose to use financing to pay for your home upgrade project.
[OPEN END]
Response
All First Two Years of Pilot After First Two Years
Count
Percent
(n=49) Count
Percent
(n=32) Count
Percent
(n=17)
Comment on Financing in General
Not enough cash on hand 24 49% 15 47% 9 53%
Did not want to pay out of pocket 4 8% 3 9% 1 6%
Enabled to do the project sooner 2 4% 2 6% 0 0%
Contractor recommended financing 1 2% 0 0% 1 6%
Did not want to use a credit card 1 2% 1 3% 0 0%
Received discount if used financing 1 2% 1 3% 0 0%
Comment Specific to REEL1
Low interest rate 7 14% 3 9% 4 24%
Easy/quick approval 4 8% 1 3% 3 18%a
No property lien 1 2% 1 3% 0 0%

Participant Survey Topline Results
opiniondynamics.com Page 114
Response
All First Two Years of Pilot After First Two Years
Count
Percent
(n=49) Count
Percent
(n=32) Count
Percent
(n=17)
Longer term available 1 2% 1 3% 0 0%
Low monthly payment 1 2% 1 3% 0 0%
Other/Invalid
“I didn't want to go into debt to finance
this project.” 1 2% 1 3% 0 0%
“Energy savings” 1 2% 1 3% 0 0%
“Did not use financing” 1 2% 1 3% 0 0%
Don’t know 1 2% 1 3% 0 0%
1 Several respondents did not appropriately answer the question, which was intended to be about financing in general; rather, they
commented on REEL’s benefits specifically.
a Indicates statistical significance at the 90% confidence level between first-two-year and non-first-two-year participants.
F1. Did you decide to do a home upgrade before you knew about financing options or afterwards?
Response
All First Two Years of Pilot After First Two Years
Count Percent Count Percent Count Percent
Before 28 57% 22 69%a 6 35%
After 21 43% 10 31% 11 65%a
Total 49 100% 32 100% 17 100%
a Indicates statistical significance at the 90% confidence level.
For the next four questions, I would like you to think about a hypothetical situation where you did not have any
financing to pay for your home upgrade project. In other words, all you could use was a credit card, cash, or
any utility rebates available.
F2. Without financing, how likely would you have been to undertake this project?
Response
All First Two Years of Pilot After First Two Years
Count Percent Count Percent Count Percent
Very likely 17 35% 13 41% 4 24%
Somewhat likely 8 16% 7 22% 1 6%
Somewhat unlikely 8 16% 5 16% 3 18%
Very unlikely 16 33% 7 22% 9 53%a
Total 49 100% 32 100% 17 100%
a Indicates statistical significance at the 90% confidence level.
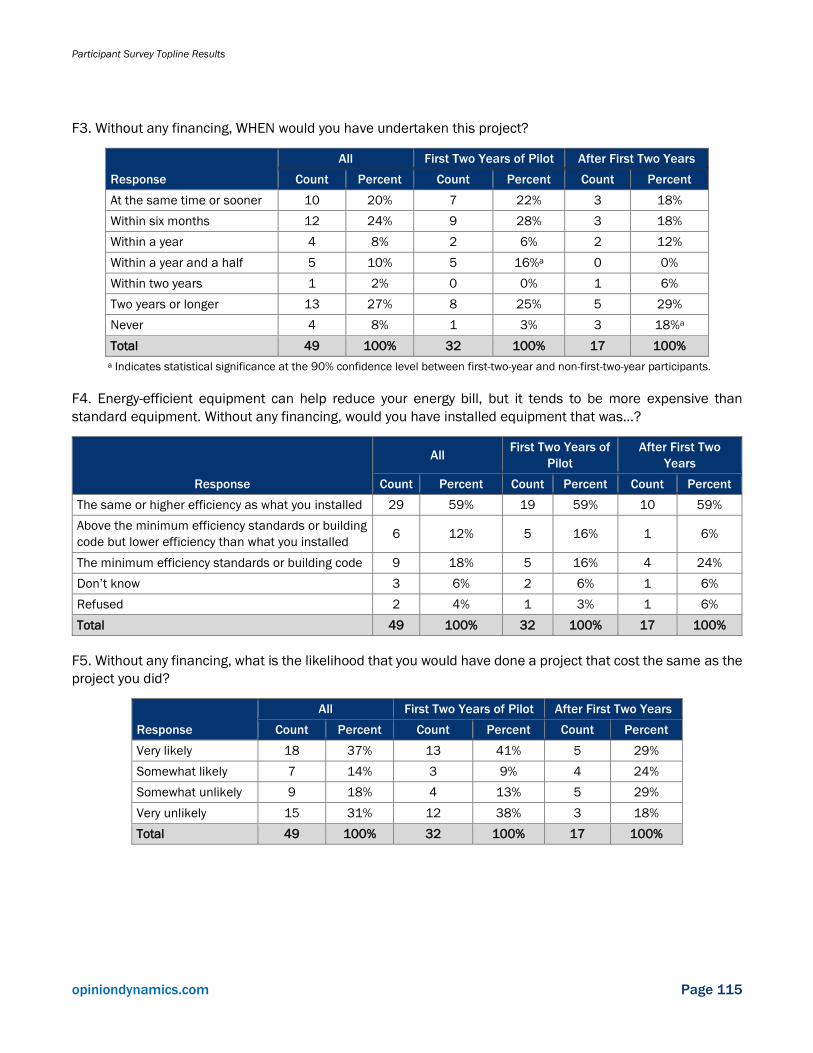
Participant Survey Topline Results
opiniondynamics.com Page 115
F3. Without any financing, WHEN would you have undertaken this project?
Response
All First Two Years of Pilot After First Two Years
Count Percent Count Percent Count Percent
At the same time or sooner 10 20% 7 22% 3 18%
Within six months 12 24% 9 28% 3 18%
Within a year 4 8% 2 6% 2 12%
Within a year and a half 5 10% 5 16%a 0 0%
Within two years 1 2% 0 0% 1 6%
Two years or longer 13 27% 8 25% 5 29%
Never 4 8% 1 3% 3 18%a
Total 49 100% 32 100% 17 100%
a Indicates statistical significance at the 90% confidence level between first-two-year and non-first-two-year participants.
F4. Energy-efficient equipment can help reduce your energy bill, but it tends to be more expensive than
standard equipment. Without any financing, would you have installed equipment that was…?
Response
All First Two Years of
Pilot
After First Two
Years
Count Percent Count Percent Count Percent
The same or higher efficiency as what you installed 29 59% 19 59% 10 59%
Above the minimum efficiency standards or building
code but lower efficiency than what you installed 6 12% 5 16% 1 6%
The minimum efficiency standards or building code 9 18% 5 16% 4 24%
Don’t know 3 6% 2 6% 1 6%
Refused 2 4% 1 3% 1 6%
Total 49 100% 32 100% 17 100%
F5. Without any financing, what is the likelihood that you would have done a project that cost the same as the
project you did?
Response
All First Two Years of Pilot After First Two Years
Count Percent Count Percent Count Percent
Very likely 18 37% 13 41% 5 29%
Somewhat likely 7 14% 3 9% 4 24%
Somewhat unlikely 9 18% 4 13% 5 29%
Very unlikely 15 31% 12 38% 3 18%
Total 49 100% 32 100% 17 100%
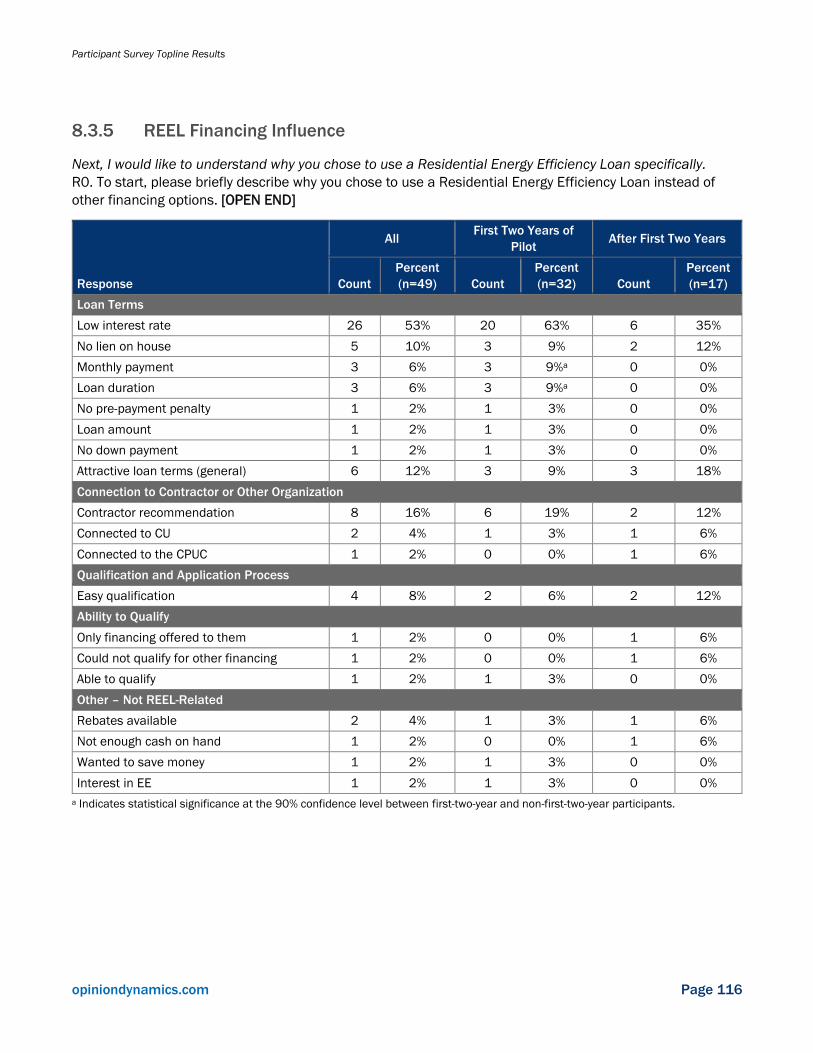
Participant Survey Topline Results
opiniondynamics.com Page 116
8.3.5 REEL Financing Influence
Next, I would like to understand why you chose to use a Residential Energy Efficiency Loan specifically.
R0. To start, please briefly describe why you chose to use a Residential Energy Efficiency Loan instead of
other financing options. [OPEN END]
Response
All First Two Years of
Pilot After First Two Years
Count
Percent
(n=49) Count
Percent
(n=32) Count
Percent
(n=17)
Loan Terms
Low interest rate 26 53% 20 63% 6 35%
No lien on house 5 10% 3 9% 2 12%
Monthly payment 3 6% 3 9%a 0 0%
Loan duration 3 6% 3 9%a 0 0%
No pre-payment penalty 1 2% 1 3% 0 0%
Loan amount 1 2% 1 3% 0 0%
No down payment 1 2% 1 3% 0 0%
Attractive loan terms (general) 6 12% 3 9% 3 18%
Connection to Contractor or Other Organization
Contractor recommendation 8 16% 6 19% 2 12%
Connected to CU 2 4% 1 3% 1 6%
Connected to the CPUC 1 2% 0 0% 1 6%
Qualification and Application Process
Easy qualification 4 8% 2 6% 2 12%
Ability to Qualify
Only financing offered to them 1 2% 0 0% 1 6%
Could not qualify for other financing 1 2% 0 0% 1 6%
Able to qualify 1 2% 1 3% 0 0%
Other – Not REEL-Related
Rebates available 2 4% 1 3% 1 6%
Not enough cash on hand 1 2% 0 0% 1 6%
Wanted to save money 1 2% 1 3% 0 0%
Interest in EE 1 2% 1 3% 0 0%
a Indicates statistical significance at the 90% confidence level between first-two-year and non-first-two-year participants.

Participant Survey Topline Results
opiniondynamics.com Page 117
R1. How did you FIRST learn about the Residential Energy Efficiency Loan?
Response
All First Two Years of Pilot After First Two Years
Count Percent Count Percent Count Percent
Contractor 15 31% 9 28% 6 35%
A website 11 22% 9 28% 2 12%
Utility website 5
3
2
City website 1 1 0
Contractor website 1 1 0
Don’t recall 1 1 0
Energy Upgrade California website 1 1 0
Google 1 1 0
Home repair website 1 1 0
REEL Lender or another lender 8 16% 4 13% 4 24%
Did their own research 8 16% 6 19% 2 12%
Other advertisement 5 10% 3 9% 2 12%
E-mail 2
0
2
Radio advertisement 2 2 0
State Fair 1 1 0
Friend, family member, or acquaintance 2 4% 1 3% 1 6%
Total 49 100% 32 100% 17 100%
R2. Did your contractor tell you about any other financing options?
Response
All First Two Years of Pilot After First Two Years
Count Percent Count Percent Count Percent
No 27 55% 18 56% 9 53%
Yes 20 41% 12 38% 8 47%
Don’t know 2 4% 2 6% 0 0%
Total 49 100% 32 100% 17 100%
R3. Did you seek out any other financing options?
Response
All First Two Years of Pilot After First Two Years
Count Percent Count Percent Count Percent
No 39 80% 24 75% 15 88%
Yes 10 20% 8 25% 2 12%
Total 49 100% 32 100% 17 100%

Participant Survey Topline Results
opiniondynamics.com Page 118
R3a. Did you find any other financing options you would have qualified for?
Response
All First Two Years of Pilot After First Two Years
Count Percent Count Percent Count Percent
No 10 63% 7 58% 3 75%
Yes 5 31% 4 33% 1 25%
Refused 1 6% 1 8% 0 0%
Total 16 100% 12 100% 4 100%
Note: Only asked if the respondent researched other financing options according to R1 (“Did their own
research”) or R3 (“Yes”).
R3b. Did the any of the other financing options you qualified for have a lower interest rate?
Response All First Two Years of Pilot After First Two Years
No 4 4 0
Yes 1 0 1
Total 5 4 1
Note: Only asked if R3a= “Yes”.
R3c. Did any of the other financing options you qualified have a longer loan term, which is the number of
months you have for paying the loan back?
Response All First Two Years of Pilot After First Two Years
Yes 4 3 1
No 1 1 0
Total 5 4 1
R3d. Why did you choose the Residential Energy Efficiency Loan over an option with a lower interest rate
and/or a longer loan term? [OPEN END]
Response All First Two Years of Pilot After First Two Years
“Because we wanted to pay it off sooner” 1 1 0
“Better rate” 1 1 0
“Timeframe for approval” 1 0 1
“Want to pay off as soon as possible” 1 1 0
Total 4 3 1
Note: Only asked if R3b and/or R3c= “Yes”.
For the next set of questions, please imagine a hypothetical scenario where the Residential Energy Efficiency
Loan was NOT available. In other words, you could choose to just use cash or credit card, or you could try to
apply for some other type of financing instead.

Participant Survey Topline Results
opiniondynamics.com Page 119
R5a. If the Residential Energy Efficiency Loan was not available, would you have taken the time to research
other options?
Response
All First Two Years of Pilot After First Two Years
Count Percent Count Percent Count Percent
Yes, would have shopped 24 49% 14 44% 10 59%
Yes, did shop other options
(Recode based on R1/R3) 16 33% 12 38% 4 24%
No 7 14% 4 13% 3 18%
Maybe 2 4% 2 6% 0 0%
Total 49 100% 32 100% 17 100%
R5b. If the Residential Energy Efficiency Loan was not available, do you think you would have considered
something OTHER THAN what the contractor offered?
Response
All First Two Years of Pilot After First Two Years
Count Percent Count Percent Count Percent
Yes 9 45% 4 33% 5 63%
No 8 40% 6 50% 2 25%
Maybe 3 15% 2 17% 1 13%
Total 20 100% 12 100% 8 100%
Note: Only asked if R2 = contractor told them about other financing options.
R6. What do you think is the likelihood you would have qualified for any another type of financing based on
your credit score and income? Your best guess is fine.
Response
All First Two Years of Pilot After First Two Years
Count Percent Count Percent Count Percent
Very likely 38 78% 25 78% 13 76%
Somewhat likely 6 12% 5 16% 1 6%
Somewhat unlikely 4 8% 1 3% 3 18%a
Very unlikely 1 2% 1 3% 0 0%
Total 49 100% 32 100% 17 100%
a Indicates statistical significance at the 90% confidence level between first-two-year and non-first-two-year
participants.

Participant Survey Topline Results
opiniondynamics.com Page 120
R7. If you had been able to qualify for another type of financing, do you think the monthly payment would have
been about the same as, higher than, or lower than the monthly payment for your Residential Energy Efficiency
Loan?
Response
All First Two Years of Pilot After First Two Years
Count Percent Count Percent Count Percent
Less affordable/higher payment 35 71% 24 75% 11 65%
As affordable/similar payment 5 10% 2 6% 3 18%
More affordable/lower payment 3 6% 1 3% 2 12%
Very unlikely to qualify for any other
financing (Recode based on R6) 1 2% 1 3% 0 0%
Don’t know 5 10% 4 13% 1 6%
Total 49 100% 32 100% 17 100%
R8. If all the other financing options you could find would have required a higher monthly payment, would you
have…?
Response
All First Two Years of Pilot After First Two Years
Count Percent Count Percent Count Percent
Done a much smaller project to
significantly reduce the monthly payment 10 25% 6 21% 4 33%
Done the exact same project with a
higher monthly payment 11 28% 8 29% 3 25%
Done a somewhat smaller project to
slightly reduce the monthly payment 9 23% 7 25% 2 17%
Not used financing at all 8 20% 6 21% 2 17%
Don’t know 2 5% 1 4% 1 8%
Total 40 100% 28 100% 12 100%
Note: Only asked if R7 = “More affordable/lower payment” or “Don’t know”. Skipped if “Very unlikely” to qualify for other financing
(R6) or other financing would have been “As affordable/similar payment” or “Less affordable/higher payment” (R7).
8.3.6 Demographics and Property Changes
D1a. Including yourself, how many people live at the property that was upgraded?
Response
All First Two Years of Pilot After First Two Years
Count Percent Count Percent Count Percent
1 4 9% 3 10% 1 6%
2 9 20% 5 17% 4 25%
3 9 20% 7 23% 2 13%
4 13 28% 7 23% 6 38%
5 6 13% 5 17% 1 6%
6 3 7% 2 7% 1 6%
8 2 4% 1 3% 1 6%
Total 46 100% 30 100% 16 100%
Note: Skipped if M2 = no longer owns the property.
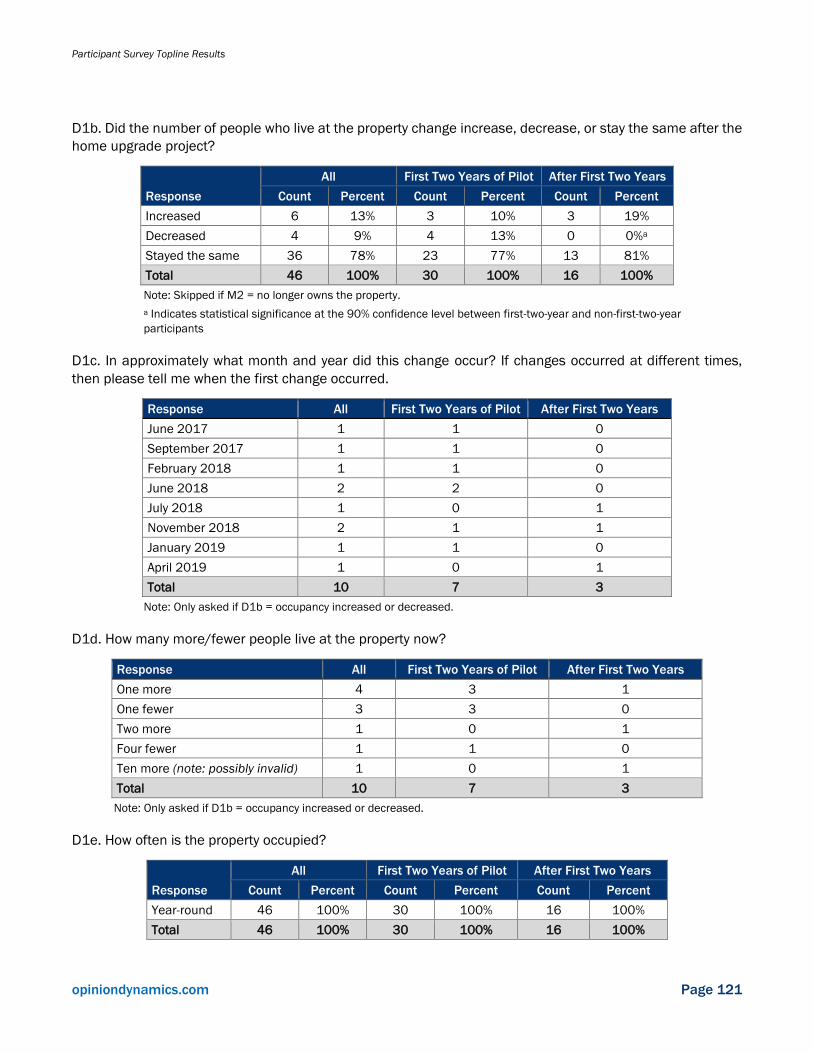
Participant Survey Topline Results
opiniondynamics.com Page 121
D1b. Did the number of people who live at the property change increase, decrease, or stay the same after the
home upgrade project?
Response
All First Two Years of Pilot After First Two Years
Count Percent Count Percent Count Percent
Increased 6 13% 3 10% 3 19%
Decreased 4 9% 4 13% 0 0%a
Stayed the same 36 78% 23 77% 13 81%
Total 46 100% 30 100% 16 100%
Note: Skipped if M2 = no longer owns the property.
a Indicates statistical significance at the 90% confidence level between first-two-year and non-first-two-year
participants
D1c. In approximately what month and year did this change occur? If changes occurred at different times,
then please tell me when the first change occurred.
Response All First Two Years of Pilot After First Two Years
June 2017 1 1 0
September 2017 1 1 0
February 2018 1 1 0
June 2018 2 2 0
July 2018 1 0 1
November 2018 2 1 1
January 2019 1 1 0
April 2019 1 0 1
Total 10 7 3
Note: Only asked if D1b = occupancy increased or decreased.
D1d. How many more/fewer people live at the property now?
Response All First Two Years of Pilot After First Two Years
One more 4 3 1
One fewer 3 3 0
Two more 1 0 1
Four fewer 1 1 0
Ten more (note: possibly invalid) 1 0 1
Total 10 7 3
Note: Only asked if D1b = occupancy increased or decreased.
D1e. How often is the property occupied?
Response
All First Two Years of Pilot After First Two Years
Count Percent Count Percent Count Percent
Year-round 46 100% 30 100% 16 100%
Total 46 100% 30 100% 16 100%

Participant Survey Topline Results
opiniondynamics.com Page 122
Note: Skipped if M2 = no longer owns the property.
D2. In what year was your home built?
Response
All First Two Years of Pilot After First Two Years
Count Percent Count Percent Count Percent
Before the 1970s 20 41% 15 47% 5 29%
1970s 14 29% 8 25% 6 35%
1980s 4 8% 2 6% 2 12%
1990-1994 4 8% 3 9% 1 6%
1994-1999 2 4% 1 3% 1 6%
2000s 3 6% 2 6% 1 6%
2010 to present 2 4% 1 3% 1 6%
Total 49 100% 32 100% 17 100%
D3a. Did you add square footage to your property during or after the home upgrade project?
Response
All First Two Years of Pilot After First Two Years
Count Percent Count Percent Count Percent
No 46 94% 30 94% 16 94%
Yes 2 4% 1 3% 1 6%
Refused 1 2% 1 3% 0 0%
Total 49 100% 32 100% 17 100%
D3b. Approximately how many square feet were added to the property?
Response All First Two Years of Pilot After First Two Years
4,000 square feet 1 1 0
2,100 square feet 1 0 1
Total 2 1 1
Note: Only asked if D3a = “Yes”.
D3c. Approximately what month and year did you make these changes in square footage? If you made changes
at different times, then please tell me when you made the first change.
Response All First Two Years of Pilot After First Two Years
Don’t know (4,000 square foot change) 1 1 0
May 2019 (2,100 square foot change) 1 0 1
Total 2 1 1
Note: Only asked if D3a = “Yes”.

Participant Survey Topline Results
opiniondynamics.com Page 123
D3d. Roughly how many square feet was the property when you last owned it/is the property currently?
Response
All First Two Years of Pilot After First Two Years
Count Percent Count Percent Count Percent
1,000 to 1,500 19 39% 9 28% 10 59%
1,501 to 2,000 9 18% 7 22% 2 12%
2,001 to 2,500 12 24% 8 25% 4 24%
2,501 to 3,000 3 6% 2 6% 1 6%
Less than 1,000 3 6% 3 9% 0 0%
More than 3,000 2 4% 2 6% 0 0%
Refused 1 2% 1 3% 0 0%
Total 49 100% 32 100% 17 100%
D4a. Did you make any other additions or changes to this property since completing the home upgrade
project? This could include additional home repairs or retrofits.
Response
All First Two Years of Pilot After First Two Years
Count Percent Count Percent Count Percent
No 30 61% 21 66% 9 53%
Yes 19 39% 11 34% 8 47%
Total 49 100% 32 100% 17 100%
D4b. Please briefly describe what changes you made. [OPEN END]
Response
All First Two Years of Pilot After First Two Years
Count
Percent
(n=49) Count
Percent
(n=32) Count
Percent
(n=17)
No changes 30 61% 21 66% 9 53%
Added solar 4 8% 3 9% 1 6%
Building Shell and HVAC
New HVAC 2 4% 0 0% 2 12%*
Windows 1 2% 1 3% 0 0%
New roof 1 2% 1 3% 0 0%
Lighting and Appliances
Energy-efficient lighting 3 6% 2 6% 1 6%
New appliances 2 4% 2 6% 0 0%
Removed hot tub 1 2% 1 3% 0 0%
Remodeling
Floor refurnishing/carpeting 3 6% 2 6% 1 6%
Doors (general) 2 4% 2 6% 0 0%
Kitchen remodel 2 4% 0 0% 2 12%a
Bathroom remodel 1 2% 1 3% 0 0%

Participant Survey Topline Results
opiniondynamics.com Page 124
Response
All First Two Years of Pilot After First Two Years
Count
Percent
(n=49) Count
Percent
(n=32) Count
Percent
(n=17)
Remodel (general) 1 2% 0 0% 1 6%
Exterior Changes
New porch 1 2% 0 0% 1 6%
Outdoor changes (general) 1 2% 0 0% 1 6%
New deck 1 2% 1 3% 0 0%
Swimming pool 1 2% 1 3% 0 0%
Upgraded backyard 1 2% 1 3% 0 0%
Added cement and flagpole 1 2% 0 0% 1 6%
Work on driveway 1 2% 1 3% 1 0%
a Indicates statistical significance at the 90% confidence level between first-two-year and non-first-two-year participants
D4c. Approximately what month and year did you make these changes? If you made changes at different
times, then please tell me when you made the first change.
Response
All First Two Years of Pilot After First Two Years
Count
Percent
(n=49) Count
Percent
(n=32) Count
Percent
(n=17)
July 2016 2 11% 1 9% 1 13%
September 2016 1 5% 1 9% 0 0%
March 2017 1 5% 0 0% 1 13%
June 2017 1 5% 1 9% 0 0%
August 2017 2 11% 2 18% 0 0%
September 2017 1 5% 1 9% 0 0%
July 2018 1 5% 0% 1 13%
August 2018 1 5% 0 0% 1 13%
September 2018 1 5% 1 9% 0 0%
November 2018 2 11% 1 9% 1 13%
January 2019 2 11% 1 9% 1 13%
February 2019 1 5% 1 9% 0 0%
April 2019 1 5% 1 9% 0 0%
May 2019 2 11% 0 0% 2 25%
Total 19 100% 11 100% 8 100%

Participant Survey Topline Results
opiniondynamics.com Page 125
D5a. Since the home upgrade, have you or members of your household changed the way you think about or
use energy in your home? This could include changes in how you use lights and/or appliances in your home.
Response
All First Two Years of Pilot After First Two Years
Count Percent Count Percent Count Percent
No 23 52% 15 52% 8 53%
Yes 20 45% 13 45% 7 47%
Don’t know 1 2% 1 3% 0 0%
Total 44 100% 29 100% 15 100%
Note: Only asked if M2a = lives at property.
D5b. Please briefly describe how your household’s thoughts or behaviors about energy use have changed
since the home upgrade.
Response
All First Two Years of Pilot After First Two Years
Count
Percent
(n=49) Count
Percent
(n=32) Count
Percent
(n=17)
No changes 28 57% 19 59% 9 53%
Skipped - no longer lives there 5 10% 3 9% 2 12%
No other changes (action recoded to D4b) 3 6% 2 6% 1 6%
More aware/thoughtful about energy Use 3 6% 3 9%a 0 0%
Behavioral Changes
Reduced AC use 3 6% 1 3% 2 12%
Turns off lights when not in use 3 6% 2 6% 1 6%
Turns appliances off when not in use 2 4% 2 6% 0 0%
Changed thermostat settings 3 6% 3 9%a 0 0%
Avoids using appliances at peak times 1 2% 0 0% 1 6%
Preference to purchase energy-efficient
equipment 2 4% 0 0% 2 12%a
a Indicates statistical significance at the 90% confidence level between first-two-year and non-first-two-year participants.
D6a. Have you noticed any change in your utility bill for the property since completing the home upgrade?
Response
All First Two Years of Pilot After First Two Years
Count Percent Count Percent Count Percent
Yes 37 76% 28 88%a 9 53%
No 10 20% 3 9% 7 41%
Don’t know 2 4% 1 3% 1 6%
Total 49 100% 32 100% 17 100%
a Indicates statistical significance at the 90% confidence level between first-two-year and non-first-
two-year participants.

Participant Survey Topline Results
opiniondynamics.com Page 126
D6b. Have you noticed an increase or decrease in your utility bill?
Response
All First Two Years of Pilot After First Two Years
Count Percent Count Percent Count Percent
Decrease in bill 33 67% 26 81% 7 41%
No noticeable change in bill
(Recoded based on D6a) 12 24% 4 13% 8 47%
Increase in bill 4 8% 2 6% 2 12%
Total 49 100% 32 100% 17 100%
D6c. Please describe what you think caused this change. [MULTIPLE RESPONSE]
Response
All First Two Years of Pilot After First Two Years
Count
Percent
(n=37) Count
Percent
(n=28) Count
Percent
(n=9)
The home upgrade project 31 84% 23 82% 8 89%
The weather 2 5% 2 7% 0 0%
A change in utility rates 1 3% 1 4% 0 0%
Other changes made to the property 2 5% 2 7% 0 0%
“Never had a bill due to not having a system”
(increased bill) 1 3% 1 4% 0 0%
“Central heating and A/C” (increased bill) 1 3% 1 4% 0 0%
Refused 1 3% 0 0% 1 11%
D7. What was your annual household income from all sources in 2018, before taxes? Your best estimate is
fine.
Response
All First Two Years of Pilot After First Two Years
Count Percent Count Percent Count Percent
Less than $25,000 0 0% 0 0% 0 0%
$25,000 to less than $35,000 1 2% 1 3% 0 0%
$35,000 to less than 50,000 1 2% 1 3% 0 0%
$50,000 to less than $75,000 6 12% 2 6% 4 24%
$75,000 to less than $100,000 6 12% 4 13% 2 12%
$100,000 to less than $150,000 9 18% 5 16% 4 24%
$150,000 to less than $200,000 5 10% 3 9% 2 12%
$200,000 or more 8 16% 8 25% 0 0%
Refused 13 27% 8 25% 5 29%
Total 49 100% 32 100% 17 100%
Note: Originally this was a battery of two questions. If respondents did not provide a specific number, the survey asked them for an
income range. The table above is a combination of the open-ended responses from D7a and ranges from D7b.

Participant Survey Topline Results
opiniondynamics.com Page 127
D7c. Does your household qualify for any state or government assistance, such as MediCal, the
CalFresh/SNAP/Foodstamp program, CalWorks, or some other type of welfare program?
Response
All First Two Years of Pilot After First Two Years
Count Percent Count Percent Count Percent
No 44 90% 29 91% 15 88%
Yes 3 6% 2 6% 1 6%
Don’t know 2 4% 1 3% 1 6%
Total 49 100% 32 100% 17 100%
D8. How would you describe your credit score? Would you say…?
Response
All First Two Years of Pilot After First Two Years
Count Percent Count Percent Count Percent
Excellent 22 45% 15 47% 7 41%
Good 14 29% 8 25% 6 35%
Average 6 12% 3 9% 3 18%
Total 49 100% 32 100% 17 100%
D9. Are you still paying back your Residential Energy Efficiency Loan?
Response
All First Two Years of Pilot After First Two Years
Count Percent Count Percent Count Percent
Yes 39 80% 22 69% 17 100%
No 9 18% 9 28% 0 0%
Refused 1 2% 1 3% 0 0%
Total 49 100% 32 100% 17 100%
D10. Do any of the following situations apply to you in terms of how you are paying back the Residential Energy
Efficiency Loan?
Response
All First Two Years of Pilot After First Two Years
Count Percent Count Percent Count Percent
Attempting to pay the loan off early 34 69% 20 63% 14 82%
I intend to pay the loan off early 18
10
8
I regularly pay more than the minimum
payment on the loan 13 7 6
I am ahead of schedule on paying off the loan 5 3 2
Already paid off early (recoded based on D9) 9 18% 9 28% 0 0%
I intend to just pay the minimum payment 6 12% 3 9% 3 18%
Total 49 100% 32 100% 17 100%

Contractor Survey Topline Results
opiniondynamics.com Page 128
9. Contractor Survey Topline Results
9.1 Introduction and Approach
The evaluation team conducted online surveys with contractors who participated in CAEATFA’s online REEL
compliance and enrollment training and enrolled as contractors for the REEL program. The survey relates to
Task 6 of the Year 1 Finance Sector Area Work Plan and the objectives are as follows:
◼ Gain feedback on REEL’s design and implementation model from the contractors’ perspective, as
well as their overall satisfaction with the program
◼ Assess the scalability potential of the pilot in terms of the impact contractors see it having on their
business and customers, and whether or not such an impact could be similarly produced with
existing EE financing mechanisms on the market
◼ Determine whether/how REEL has helped contractors overcome barriers associated with EE projects
(in terms of number of EE projects, breadth of EE projects, new types of customers served with EE
projects, etc.)
9.1.1 Survey Approach
This survey was administered via the internet and the sample included the 269 REEL-certified contractors
listed on the CHEEF website.71 All contractors were contacted via e-mail up to four times. To maximize
responses, the evaluation team offered a $100 incentive. A total of 57 contractors completed the survey.
9.1.2 Survey Structure
Table 58 summarizes the purpose of each survey section.
Table 58. Contractor Survey Structure
Survey Section Section Objectives
Introduction/Screener ▪ Introduces the survey to respondents and confirms that they are familiar with the
REEL program and qualify for the survey
Promotion of Finance Options ▪ Promotion of general financing options and REEL; why contractors are not
promoting REEL
▪ Promotion of rebates
▪ Perceived impact of financing versus rebates on helping close sales
Program Design and
Implementation Feedback
▪ Explore contractor knowledge, impressions, and satisfaction with the REEL
program
▪ Identify, from the contractor’s perspective, what components of program design
and implementation are effective and what components need improvement
▪ For contractors who verify completion of REEL projects, collect feedback on the
loan application process
71 http://www.sto.ca.gov/caeatfa/cheef/reel/index.asp.

Contractor Survey Topline Results
opiniondynamics.com Page 129
Survey Section Section Objectives
REEL’s Influence on the
Market, and Interest in and
Barriers to Future
Participation
▪ Explore the impact that contractors see REEL having on their business and
customers
▪ Identify if, and how, REEL has influenced contractor’s sales (in terms of the
number of projects, the breadth of projects, and the customers reached through
REEL loans)
▪ Understand the role contractors see REEL playing in the future of their business
Contractor Characteristics ▪ Collects firmographic information about contractors
9.2 Results
Below are the detailed survey responses from which the evaluation team drew out key findings. Please note
that some questions are “multiple response” and do not sum to 100% (totals are excluded from these
tables). In some cases, the percentages do not sum to 100% due to rounding. Unless italicized with
quotations, open-ended responses are coded. Where a statistically significant difference exists, tables are
broken out to show the difference between those who have completed a REEL project and those who have
not.
9.2.1 Promotion of Finance Options and Rebates
A1. Which of the following financing options are you promoting to your customers? This could include
verbally explaining the option to them, providing informational materials, or including information on your
website.
Response (Multiple Response)
Total No REEL Projects Completed REEL Projects
Count
Percent
(n=57) Count
Percent
(n=23) Count
Percent
(n=34)
REEL loans 41 72% 14 61% 27 79%
PACE loans 36 63% 16 70% 20 59%
EE fixed-term loans from banks or CUs
besides REEL 22 39% 12 52% 10 29%
Traditional fixed-term loans from bank
or CUs (no energy-related
requirements)
16 28% 8 35% 8 24%
Home equity lines of credit 14 25% 7 30% 7 21%a
Financing options through my company 11 19% 6 26% 5 15%
Other [OPEN END]:
▪ Synchrony Bank Financing Retail
Credit Cards (n=3)
▪ Sacramento Municipal Utility District
Financing (n=1)
4 7% 1 4% 3 9%
I do not promote any financing options 1 2% 1 4% 0 0%
a Indicates statistical significance at the 95% confidence level.

Contractor Survey Topline Results
opiniondynamics.com Page 130
A2. Please select the statements below, if any, that describe why you are not promoting REEL.
Responses (Multiple Response)
Total No REEL Projects
Completed REEL
Projects
Count
Percent
(n=15) Count
Percent
(n=8) Count
Percent
(n=7)
It takes too much time or effort on my part
to facilitate REEL loans. 4 31% 3 38% 1 14%
I prefer to promote other finance offerings. 3 23% 2 25% 1 14%
I don’t have enough marketing support for
promoting REEL. 3 23% 3 38%a 0 0%
Only a few of my customers would be
interested in REEL. 3 23% 1 13% 2 29%
I prefer to work with lenders I or my
customers are more familiar with. 3 23% 2 25% 1 14%
The measures required by REEL are too
restrictive. 2 15% 2 25% 0 0%
Only a few of my customers would be able
to qualify for a REEL loan. 1 8% 1 13% 0 0%
a Indicates statistical significance at the 90% confidence level.
Note: This question was given only to respondents if they did not select REEL in A1 or if they said that they did not promote any type
of financing in A1.
A3. When selling jobs to your customers, how often do you mention REEL financing?
Response Count Percent
Always 19 46%
Sometimes 21 51%
Never 1 2%
Total 41 100%
Note: Only asked if respondent indicated their promotion of REEL
in A1.
A4. How helpful is REEL financing to your ability to sell projects?
Response Count Percent
Very helpful 17 41%
Somewhat helpful 19 46%
Not helpful at all 5 12%
Total 41 100%
Note: Only asked if respondent indicated their promotion of REEL
in A1.

Contractor Survey Topline Results
opiniondynamics.com Page 131
A5. And how often do you mention utility rebates or incentives available to customers?
Response Count Percent
Always 37 65%
Sometimes 17 30%
Never 3 5%
Total 57 100%
A6. When selling jobs to your customers, how helpful is energy efficiency financing compared to utility rebates
and incentives? Would you say:
Response Count Percent
Energy efficiency financing is more helpful than rebates 12 21%
Rebates are more helpful than energy efficiency financing 17 30%
Energy efficiency financing and rebates are equally helpful 28 49%
Total 57 100%
9.2.2 Impact on Sales
R1. Since becoming REEL-certified, how many projects have you completed that used REEL loans? If you’re
unsure, your best estimate is fine.
Number of Projects Count Percent
Have Yet to Complete a
REEL-financed Project 23 40%
1 10 18%
2 8 14%
4 5 9%
5 1 2%
7 1 2%
8 1 2%
9 1 2%
10 4 7%
12 1 2%
24 1 2%
50 1 2%
Total 57 100%

Contractor Survey Topline Results
opiniondynamics.com Page 132
R1a. Why have you not completed any REEL loans so far? [OPEN END]
Reason for Not Completing
Total (n=23)
Count Percent
Too Complicated (for Homeowner and/or Contractor) 9 39%
Lack of homeowner interest/awareness of REEL 4 17%
Haven’t had the opportunity 4 17%
Customers chose to pay cash 3 13%
Homeowner did not qualify 2 9%
Invalid 1 4%
Note: Only asked this question if respondent indicated that they did not complete any REEL loans in
R1.
R2. Of all the jobs your company completed last year in California, how many would you say were residential
retrofit projects?
Number of Residential
Retrofit Projects
Total No REEL Projects Completed REEL Projects
Count Percent Count
Percent
(n=23) Count
Percent
(n=34)
Between 1 and 10 Projects 18 32% 6 26% 12 35%
Between 10 and 100 Projects 23 40% 8 35% 15 44%
More than 100 Projects 10 18% 3 13% 7 21%
No Residential Retrofit Projects 6 11% 6 26%a 0 0%
Total 57 100% 23 100% 34 100%
a Indicates statistical significance at the 95% confidence level.
R2a. And of these residential retrofit projects, how many would you say likely led to energy bill savings for your
customers?
Projects Leading to Energy Savings
(as a Percentage of all Residential Retrofits)
Total No REEL Projects Completed REEL Projects
Count Percent Count Percent Count Percent
25% or less 1 2% 0 0% 1 3%
25% to 50% 1 2% 1 6% 0 0%
50% to 75% 6 12% 2 12% 4 12%
75% up to 100% 7 14% 4 24% 3 9%
100% 36 71% 10 59% 26 76%
Total 51 100% 17 100% 34 100%
Note: Calculated percentages based on numerical open-ends provided in R2 and R2a. The six respondents who indicated that they
completed no residential retrofits last year were not asked R2a and as a result are not shown in the calculations above.

Contractor Survey Topline Results
opiniondynamics.com Page 133
R3. What percent of project(s) you sold last year were funded by each of the following payment mechanisms?
Funding Mechanism
Number of Residential
Energy-Related Projects % of Total Projects
REEL 155 4%
Other EE Financing (including PACE, Green Mortgages,
PowerSaver, and EE term loans) 844 19%
Financing with No EE Requirements (Home Equity Line of Credit,
Credit Card, Bank Loan) 1,331 30%
Financing Offered through Contractor’s Company 173 4%
Paid Up-Front and in Full 1,863 43%
Total EE Projects Completed by REEL-Certified Contractors 4,365 100%
Note: Project counts calculated based on R3-reported percentages applied to the total number of energy-related retrofits a
respondent reported to have completed in R2a. Calculations will not exactly equal R1 due to discrepancies between reported
number of projects and percentage of funding. Six participants said that they did not perform any retrofit projects that resulted in
energy savings and were therefore not included in this count.
9.2.3 Contractor Feedback on REEL Program Design and Implementation
R4. How often do customers ask you about REEL?
Response Count Percent
Never 21 37%
Rarely 23 40%
Sometimes 11 19%
Often 1 2%
Always 1 2%
Total 57 100%
R5. Below are some reasons why contractors might decide to enroll in the REEL program. Please select the
statements, if any, that describe why you decided to enroll. [MULTIPLE RESPONSE]
Response
Total (n=57) No REEL Projects
(n=23
Completed REEL
Projects (n=34)
Count Percent Count Percent Count Percent
Some of my prospective customers require financing to
do their projects. 34 60% 13 57% 21 62%
I wanted to learn about all energy efficiency financing
options available for my customers. 33 58% 14 61% 19 56%
I thought the REEL program would allow my customers to
complete larger projects than they could otherwise. 32 56% 15 65% 17 50%
I thought the REEL program would provide an opportunity
to get new customers. 31 54% 13 57% 18 53%

Contractor Survey Topline Results
opiniondynamics.com Page 134
Response
Total (n=57) No REEL Projects
(n=23
Completed REEL
Projects (n=34)
Count Percent Count Percent Count Percent
I thought being associated with a loan program that is
supported by the State of California would lend credibility
to my company.
30 53% 14 61% 16 47%
I wanted to be able to offer a complete retrofit package
to my customers, including financing. 30 53% 12 52% 18 53%
I thought being associated with a loan program that is
supported by the California energy companies would lend
credibility to my company.
27 47% 12 52% 15 44%
Something else, please describe what motivated you to
enroll [OPEN END]:
▪ Customers did not qualify for other types of financing
(n=2)
▪ Customers requested (n=3)
▪ Low Fees/Rates (n=3)
8 14% 0 0% 8 24%a
a Indicates statistical significance at the 95% confidence level.
R6. How satisfied are you with the REEL program overall?
Response
Total No REEL Projects Completed REEL
Projects
Count Percent Count Percent Count Percent
1 - Very dissatisfied 3 5% 2 9% 1 3%
2 - Somewhat dissatisfied 3 5% 1 4% 2 6%
3 - Neutral (neither satisfied nor dissatisfied) 16 28% 12 52% 4 12%a
4 - Somewhat satisfied 10 18% 3 13% 7 21%
5 - Very satisfied 25 44% 5 22% 20 59%a
Total 57 100% 23 100% 34 100%
Mean 3.9 3.4 4.3**
Standard Deviation 1.2 1.2 1.1
a Indicates statistical significance at the 95% confidence level.
R7. Using the chart below, please indicate which components of the REEL program currently work as-is (and
therefore do not need improvement) and which, in your opinion, need improvement.
Component
Respondents Indicating Program Component Does NOT Need
Improvement
Total (n=57)
No REEL Projects
(n=23)
Completed REEL
Projects (n=34)
Count Percent Count Percent Count Percent
The customer eligibility requirements
(that is, income, credit score) for REEL
loans
47 82% 16 70%a 31 91%a

Contractor Survey Topline Results
opiniondynamics.com Page 135
Component
Respondents Indicating Program Component Does NOT Need
Improvement
Total (n=57)
No REEL Projects
(n=23)
Completed REEL
Projects (n=34)
Count Percent Count Percent Count Percent
The loan application process for REEL 44 77% 16 70% 28 82%
The details of REEL loan terms (that is,
interest rates, durations, max/min
amounts)
43 75% 15 65% 28 82%
The lenders who offer REEL loans 42 74% 15 65% 27 79%
The key benefits of REEL loans
compared to other financing options 40 70% 15 65% 25 74%
The project eligibility requirements for
REEL loans 40 70% 12 52%a 28 82%a
The websites available for contractors
and customers 36 63% 12 52% 24 71%
The marketing support available to
contractors 28 49% 11 48% 17 50%
a Indicates statistical significance at the 95% confidence level.
Component
Respondents Indicating Program Component Needs Improvement
Total (n=57)
No REEL Projects
(n=23)
Completed REEL
Projects (n=34)
Count Percent Count Percent Count Percent
The marketing support available to
contractors 29 51% 12 52% 17 50%
The websites available for contractors
and customers 21 37% 11 48% 10 29%
The key benefits of REEL loans
compared to other financing options 17 30% 8 35% 9 26%
The project eligibility requirements for
REEL loans 17 30% 11 48%a 6 18%a
The lenders who offer REEL loans 15 26% 8 35% 7 21%
The details of REEL loan terms (that is,
interest rates, durations, max/min
amounts)
14 25% 8 35% 6 18%
The loan application process for REEL 13 23% 7 30% 6 18%
The customer eligibility requirements
(that is, income, credit score) for REEL
loans
10 18% 7 30%a 3 9%a
a Indicates statistical significance at the 95% confidence level.

Contractor Survey Topline Results
opiniondynamics.com Page 136
R8a-h. Please elaborate on why you think <INSERT R7a-h> needs improvement. [OPEN END]
Reason for Needs Improvement Count
Not user-friendly:
▪ “It’s hard to find easy answers and guidelines”
▪ Application process is overly complex and confuses homeowners (n=7)
▪ Website difficult to navigate and hard to use (n=12)
27
Need to enhance marketing, education, and outreach to increase awareness of REEL program and educate
potential REEL borrowers on the details of REEL:
▪ Better advertisement and promotion of the program (n=7)
▪ Comparison sheet of benefits of REEL versus competing financial products (n=4)
▪ Options to allow contractors to customize marketing materials (cobranded templates, REEL logo etc.)
(n=3)
▪ Need term examples based on different mixes of duration, credit etc. (n=3)
“The marketing sheets have way too much fluffy language and no term examples leaving me to create
my own side sheet to show loan examples. People don’t read and they want to see the bottom line
impact. Period.”
25
Little to no marketing assistance given to contractors:
▪ “For example, my E3 rep is in the office right now. My Ygrene and PACE Lending reps stop by once a
week.”
▪ “We have not received any marketing assistance from the program.”
▪ “What marketing?”
9
Web-based features such as contractor CRM, online application, and/or payment calculator needed
“An actual payment calculator based on the rate would be nice on the website so the customer could
estimate the payments. Some of the loan officers/managers do not know the specifics and misinform the
client…”
8
Expand eligible measures 8
Increase the number of participating Lenders 6
Increase the speed of loan approval or offer instant approval 6
Flexibility and transparency with customer eligibility requirements:
“Soften eligibility requirements and documentation needed. Had a customer declined because after her
raise she didn’t have enough paystubs to show the increased income to qualify.”
6
Lack of information available on the details of REEL loan terms and/or lack limited
understanding/awareness of the various terms 5
Lenders need better training and knowledge of the REEL product 5
The application process and REEL loan terms need to be standardized across the different Lenders 4
Higher rates than PACE or other financing options 4
Increase loan duration from up to 15 to up to 20 years 1
Option to receive portion of the loan up front to pay for project start-up costs 1
Option to allow contractor to “buy down” some of the interest rate so they could offer a special rate as an
incentive during slower periods 1
“In San Diego, there are no regional lenders. The 2 statewide lenders don’t have the best rate/term
combinations. Clients are payment driven.” 1
Note: Responses enclosed in quotation marks are verbatim responses from the respondent(s). Count of comment type will not sum
to counts by component (see R7) as responses covered multiple back-coded categories and 28 of the 136 open-end responses from
R8a-h were not applicable.

Contractor Survey Topline Results
opiniondynamics.com Page 137
R9-R9a. You mentioned in earlier that you have yet to complete a REEL loan project to date. Do you plan to
use REEL in the future [YES/NO]? Why not? [OPEN END]
Response Count Percent
Reason for Not Planning to Use REEL
in the Future (n=2)
Yes 21 91% ▪ Lack of information (n=1)
▪ “It would complicate my sales process and I don’t see a lot of
value.” (n=1)
No 2 9%
Total 23 100%
Note: Respondents were asked this question if they reported to have completed a REEL-financed project.
Source: Combined responses from R9–R9a.
R10a-h. We would like to get a bit more detail on your opinion about REEL’s details and processes. Please
select which elements of the REEL loan application process currently work as-is, and which, in your opinion
need improvement.
Component
Respondents Indicating
Component Does NOT Need
Improvement (n=34)
Respondents Indicating
Component Needs
Improvement (n=34)
Count Percent Count Percent
Maximum loan amount 31 91% 3 9%
Loan duration 30 88% 4 12%
Financing fees paid by customers 30 88% 4 12%
The ability to finance non-energy-related
improvements 30 88% 4 12%
Speed of loan approval 29 85% 5 15%
The responsiveness or turnaround time from
lenders 29 85% 5 15%
Finance process support provided to contractors
by lender 29 85% 5 15%
Interest rate 28 82% 6 18%
The effort required to fill out required paperwork 28 82% 6 18%
The time it takes to see if a customer will qualify
for the loan 27 79% 7 21%
Incentives/rewards provided by the lender to
contractors 14 41% 20 59%
Note: Respondents were only asked this question if they reported to have completed a REEL-financed project.

Contractor Survey Topline Results
opiniondynamics.com Page 138
R11. What do you think should be changed in the REEL loan product to help you sell more retrofit projects that
lead to energy savings? [OPEN END]
Responses Count Percent (n=34)
More promotion and marketing of REEL
“The REEL loan programs need to put up a few large billboards, not the electronic
boards but the old school boards that one can actually read throughout
neighborhoods that normally run high electrical bills due to non-energy efficiency AC
(HVAC), a few commercials wouldn’t hurt either.”
5 15%
Improve interest rates 4 12%
Simplify loan application process 3 9%
Option to receive portion of the loan up front to fund project start-up costs
“As a small business my only issue is with the no money down part. It can become
difficult to pay out over $5000 for a few weeks in order use this program.”
3 9%
Speed up approval turn-around time or offer instant approval 3 9%
Add incentives and/or rebates 2 6%
Flexibility in eligibility requirements for lower-income and elderly 1 3%
Increase 30% limit on loan amount towards non-energy improvements 1 3%
Increase loan amount 1 3%
Training for employees of REEL-certified contractors 1 3%
Web Portal 1 3%
Note: Respondents were asked this question if they reported to have completed a REEL-financed project. Total does not sum to total
answering due to respondents mentioning multiple components in their open-end responses. Eleven of the 34 respondents had no
additional feedback or non-applicable comments.
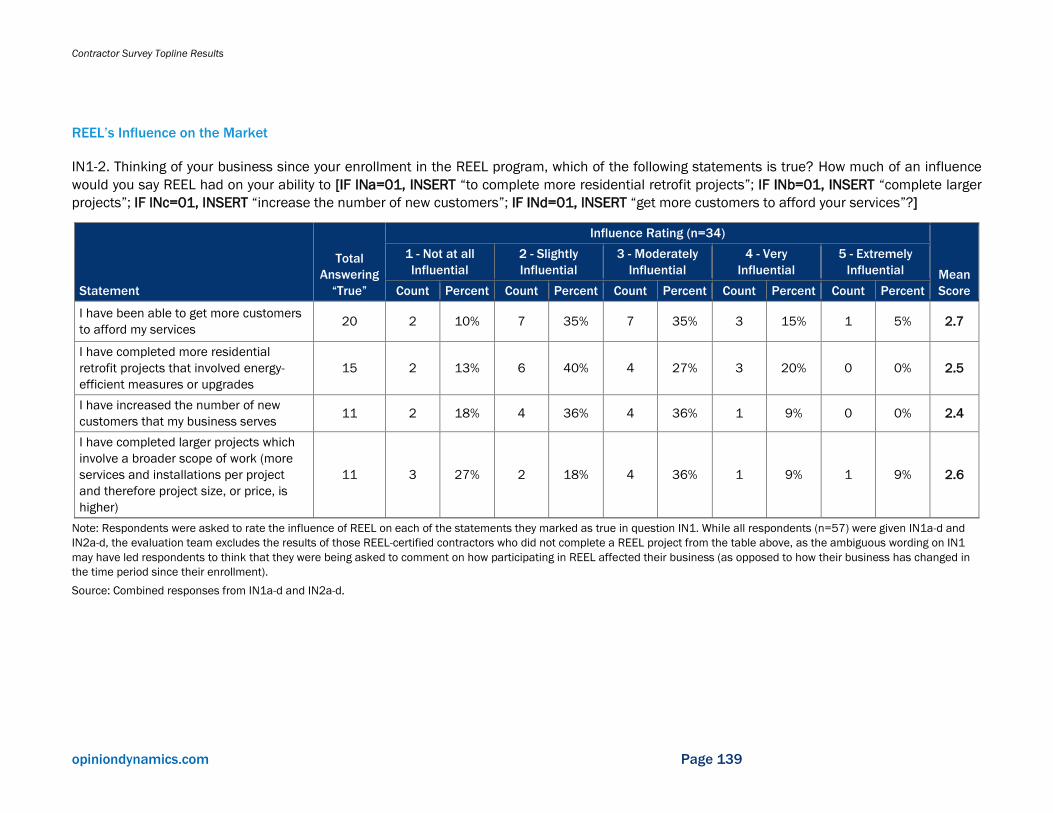
Contractor Survey Topline Results
opiniondynamics.com Page 139
REEL’s Influence on the Market
IN1-2. Thinking of your business since your enrollment in the REEL program, which of the following statements is true? How much of an influence
would you say REEL had on your ability to [IF INa=01, INSERT “to complete more residential retrofit projects”; IF INb=01, INSERT “complete larger
projects”; IF INc=01, INSERT “increase the number of new customers”; IF INd=01, INSERT “get more customers to afford your services”?]
Statement
Total
Answering
“True”
Influence Rating (n=34)
Mean
Score
1 - Not at all
Influential
2 - Slightly
Influential
3 - Moderately
Influential
4 - Very
Influential
5 - Extremely
Influential
Count Percent Count Percent Count Percent Count Percent Count Percent
I have been able to get more customers
to afford my services 20 2 10% 7 35% 7 35% 3 15% 1 5% 2.7
I have completed more residential
retrofit projects that involved energy-
efficient measures or upgrades
15 2 13% 6 40% 4 27% 3 20% 0 0% 2.5
I have increased the number of new
customers that my business serves 11 2 18% 4 36% 4 36% 1 9% 0 0% 2.4
I have completed larger projects which
involve a broader scope of work (more
services and installations per project
and therefore project size, or price, is
higher)
11 3 27% 2 18% 4 36% 1 9% 1 9% 2.6
Note: Respondents were asked to rate the influence of REEL on each of the statements they marked as true in question IN1. While all respondents (n=57) were given IN1a-d and
IN2a-d, the evaluation team excludes the results of those REEL-certified contractors who did not complete a REEL project from the table above, as the ambiguous wording on IN1
may have led respondents to think that they were being asked to comment on how participating in REEL affected their business (as opposed to how their business has changed in
the time period since their enrollment).
Source: Combined responses from IN1a-d and IN2a-d.

Contractor Survey Topline Results
opiniondynamics.com Page 140
IN3b. What role do you see REEL playing in the future of your business? [OPEN END]
Responses (Coded Open-Ends) Count Percent
An expanded and/or increased role (complete more projects, generate more customers, help
grow the business) 13 50%
Continued role 7 27%
Work on behalf of contractors in marketing efforts, help with customer targeting and
relationship building 4 15%
Be the alternative to PACE 2 8%
Total 26 100%
Note: This question was asked to 29 respondents who said REEL would play a moderately influential, very influential, or extremely
influential role in the future of their business (see IN3). Three responses were not applicable and therefore removed from the total
counts presented above.
IN4. What kind of financing would you offer to customers if REEL was not available?
Response
Total (n=57)
Count Percent
None 11 19%
Something else. Please Describe: [OPEN END]: 46 81%
▪ PACE (including HERO) 21 37%
▪ Traditional Secured Loans (through banks or CUs) 9 16%
▪ Financing through a Financial Technology Company (institution that partners with banks to
originate loans and with home improvement contractors to provide point-of-sale financing);
includes Greensky, Energy Loan Network, and Synchrony Financing
8 14%
▪ Unsecured Loans (for example, credit cards) 5 9%
▪ Traditional Loans with EE requirements (for example, EnerBank USA) 4 7%
▪ In-House Financing 4 7%
▪ Non-Specific Answer 3 5%
▪ Home Equity Line of Credit 3 5%
▪ Construction Loan 2 4%
▪ Manufacturer Financing 1 2%
Note: Open-ended responses included multiple financing alternatives. Italicized percentages are not intended to sum to the total who
chose an alternative financing option (n=46), but rather the proportion of total answering that identified a given financing type.
IN4b. How would you compare the REEL product to the alternative financing option you just described? Would
you say…
Response
Total No REEL Projects Completed REEL Projects
Count Percent Count Percent Count Percent
REEL is better than the alternative financing
option 18 39% 3 17% 15 54%a
REEL is equal to the alternative financing option 17 37% 7 39% 10 36%
REEL is inferior to the alternative financing option 11 24% 8 44% 3 11%a
Total 46 100% 18 100% 28 100%
a Indicates statistical significance at the 95% confidence level.

Contractor Survey Topline Results
opiniondynamics.com Page 141
Note: Respondents were only asked this question if they provided an alternative financing option in IN4 (n=46).
9.2.4 Contractor Characteristics
D1. What is your gross annual business revenue in California?
Response
Total No REEL Projects Completed REEL Projects
Count Percent Count Percent Count Percent
Less than $100,000 4 8% 3 15% 1 3%
$100,000 to less than $500,000 12 23% 2 10% 10 31%a
$500,000 to less than $1 million 9 17% 4 20% 5 16%
$1 million or more 27 52% 11 55% 16 50%
Total 52 100% 20 100% 32 100%
Note: Excludes five respondents who preferred not to answer.
a Indicates statistical significance at the 90% confidence level.
D2. Including yourself, how many employees does your company have in California?
Number of Employees
Total No REEL Projects Completed REEL Projects
Count Percent Count Percent Count Percent
5 or less 23 40% 10 43% 13 38%
6 to 10 13 23% 5 22% 8 24%
11 to 50 15 26% 5 22% 10 29%
51 to 99 4 7% 2 9% 2 6%
100 or more 2 4% 1 4% 1 3%
Total 57 100% 23 100% 34 100%
D3. For how many years has your company been offering services to the residential market in California?
Years
Total No REEL Projects Completed REEL Projects
Count Percent Count Percent Count Percent
1 to 3 8 15% 5 24% 3 9%
4 to 10 6 11% 2 10% 4 12%
11 to 20 14 26% 8 38% 6 18%
21 to 30 11 20% 3 14% 8 24%
31 to 40 9 17% 2 10% 7 21%
41 to 50 3 6% 0 0% 3 9%
More than 50 3 6% 1 5% 2 6%
Total 54 100% 21 100% 33 100%
Note: Excludes three respondents who preferred not to answer

Contractor Survey Topline Results
opiniondynamics.com Page 142
D4. Using the table below, please select the services your company offers to the residential market. [ROTATE]
Service Offered by Company
Total
(n=57)
No REEL Projects
(n=23)
Completed REEL Projects
(n=34)
Count Percent Count Percent Count Percent
Do renovations or building additions 27 47% 15 65%** 12 35%
Weatherize and insulate homes 39 68% 15 65% 24 71%
Install windowsa 31 55% 14 64% 17 50%
Install water heating systemsa 41 73% 17 77% 24 71%
Install space heating systems 44 77% 17 74% 27 79%
Install space cooling systems such as air
conditioners 50 88% 19 83% 31 91%
Install lightinga 24 43% 12 55% 12 35%
Install solar panels 25 44% 13 57% 12 35%
Install swimming pool equipment such
as pool pumpsa 18 32% 10 45%* 8 24%
Other [OPEN END]: Landscaping and/or
paving 3 5% 2 9% 1 3%
a One respondent who indicated “I’m not sure if we offer this service” was excluded from the percentage calculations for total
answering (n=56) and “No REEL Projects” (n=22). In all other instances, percentage calculations are out of 57 for “Total,” 23 for “No
REEL Projects,” and 34 for “Completed REEL Projects.”
* Indicates statistical significance at the 90% confidence level.
**Indicates statistical significance at the 95% confidence level.
Table 59. Geographic Distribution of Contractors
Region County
Total (n=57) No REEL Projects (n=23) Completed REEL Projects (n=34)
Count Percent Count Percent Count Percent
Central Amador 5 9% 2 9% 3 9%
Central Calaveras 1 2% 0 0% 1 3%
Central El Dorado 4 7% 0 0% 3 9%
Central Fresno 4 7% 1 4% 3 9%
Central Kings 4 7% 2 9% 2 6%
Central Madera 3 5% 2 9% 1 3%
Central Mariposa 1 2% 1 4% 0 0%
Central Merced 2 4% 2 9% 0 0%
Central Placer 5 9% 3 13% 2 6%
Central San Joaquin 4 7% 3 13% 1 3%
Central Stanislaus 3 5% 3 13% 0 0%
Central Tulare 7 12% 3 13% 3 9%
Central Tuolumne 3 5% 2 9% 1 3%
North Alameda 8 14% 4 17% 4 12%
North Contra Costa 5 9% 1 4% 4 12%

Contractor Survey Topline Results
opiniondynamics.com Page 143
Region County
Total (n=57) No REEL Projects (n=23) Completed REEL Projects (n=34)
Count Percent Count Percent Count Percent
North Humboldt 1 2% 1 4% 0 0%
North Lake 1 2% 1 4% 0 0%
North Marin 2 4% 2 9% 0 0%
North Mendocino 1 2% 1 4% 0 0%
North Napa 1 2% 0 0% 1 3%
North Sacramento 7 12% 4 17% 3 9%
North San Francisco 2 4% 1 4% 1 3%
North San Mateo 4 7% 2 9% 2 6%
North Santa Clara 6 11% 3 13% 3 9%
North Solano 2 4% 0 0% 2 6%
North Sonoma 2 4% 2 9% 0 0%
North Tehama 1 2% 0 0% 1 3%
North Yolo 2 4% 0 0% 2 6%
North Yuba 1 2% 0 0% 1 3%
North Shasta 1 2% 0 0% 1 3%
South Kern 8 14% 4 17% 4 12%
South Los Angeles 20 35% 5 22% 15 44%
South Orange 12 21% 1 4% 11 32%
South Riverside 11 19% 1 4% 10 29%
South San Bernardino 11 19% 1 4% 10 29%
South San Diego 6 11% 2 9% 4 12%
South San Luis Obispo 1 2% 0 0% 1 3%
South Santa Barbara 3 5% 1 4% 2 6%
South Ventura 6 11% 2 9% 4 12%
Note: Counties served determined using Geographic Area Served variable from “Residential Energy Efficiency Loan (REEL) Program
Enrolled Contractors as of 10/26/18” report downloaded from CHEEF website.
Table 60. Region-Level Summary (Mutually Exclusive Categories)
Region Served
Total No REEL Projects Completed REEL Projects
Count Percent Count Percent Count Percent
South 27 24% 9 39% 18 53%
North 12 11% 6 26% 6 18%
North and Central 7 6% 4 17% 3 9%
Central 5 4% 3 13% 2 6%
South and Central 4 4% 1 4% 3 9%
North and South 2 2% 0 0% 2 6%
Total 57 100% 23 100% 34 100%

Contractor Survey Topline Results
opiniondynamics.com Page 144
Table 61. Region-Level Summary (Multiple Regions Per Contractor)
Region Served
Total (n=57)
No REEL Projects
(n=23)
Completed REEL Projects
(n=34)
Count Percent Count Percent Count Percent
South 33 58% 10 43% 23 68%
North 21 37% 10 43% 11 32%
Central 16 28% 8 35% 8 24%

Detailed Stakeholder Interview Results
opiniondynamics.com Page 145
10. Detailed Stakeholder Interview Results
Semi-structured in-depth interviews were conducted with the following groups.
◼ CAEATFA: Staff were interviewed to understand the pilot processes and implementation model. The
evaluation team also captured their experience with the REEL model over the two-year pilot period
and determined which elements of the pilot design they felt had been most successful and where
improvements could be made. Finally, the evaluation team gathered perspectives on REEL
scalability, considering how a program could enroll more lenders, generate larger volume, and be
administrated most effectively.
◼ Enrolled Lenders: All seven enrolled lenders were interviewed to find out how REEL compares to
other financing products offered, the impact REEL has on their business and members, and their
level of satisfaction with REEL and coordination with CAEATFA. Interviews also explored lenders’
intentions to continue offering specialized EE loans and to what degree their experiences with REEL
influenced that decision. This is beyond the initial four lenders that were enrolled as of July 30,
2018.
◼ Efficiency PAs: The evaluation team interviewed representatives from six PAs, including financing
subject matter experts and/or EUC Home Upgrade and Residential HVAC program managers (that is,
staff involved in programs who were most likely to have overlap with REEL participants, based on the
observed mix of measures financed). The PAs included the four IOUs (PG&E, SCG, SDG&E, and SCE)
and two RENs (BayREN and SoCalREN). The in-depth interviews focused on collecting market
insights, PAs’ assessment of pilot scalability, and coordination with CAEATFA.
Overall, these interviews play a central role in evaluating REEL’s processes and identifying opportunities to
fine tune the program to attract greater participation and support deeper savings.
10.1 CAEATFA and Program Administrators
To simplify reporting, CAEATFA and the PAs’ findings are combined and summarized below.
A state-backed program is beneficial, but REEL’s pilot status, the regulatory process, and several
structural challenges are hindering REEL from scaling up.
◼ A state-backed program adds credibility, trust, and security, but the regulatory process slows the
ability to adapt. Having to make regulatory requests for each change prevents REEL from being as
nimble as it could be and adjusting more quickly to learnings as they emerge. Experience in other
jurisdictions shows that the most successful EE lenders are constantly adjusting and updating their
programs.
◼ REEL’s status as a pilot is hindering growth. CAEATFA reported that it was challenging to recruit
larger lenders to a pilot program because they do not want to invest the time and money to set up a
new lending product that may exist over a short timeframe. This sentiment was echoed by other
stakeholders, who indicated that they struggled to see the long-term benefits from joining a pilot.
◼ Several challenges with the current program structure. CAEATFA and the PAs reported several pilot
design challenges related to the customer and contractor experience, and complications to verify

Detailed Stakeholder Interview Results
opiniondynamics.com Page 146
participant eligibility. It was felt that investing in IT
infrastructure may improve contractor and customer
experience; extending REEL to POU territories would
streamline eligibility for participants who are not served by an
IOU (for gas or electricity); and, although several changes have
helped streamline the process, administrative requirements like loan-by-loan eligibility checks take
time and create complexity.
◼ All PAs recognized the challenge REEL faced as a pilot and that CAEATFA needs latitude to
implement. PAs recognized that their programs and the REEL pilot are heavily regulated and complex
and CAEATFA is balancing REEL and other pilots with limited resources.
Financing is not viewed as the best solution for low-income homeowners.
◼ Offering EE loans (even with low interest rates) was not viewed as a solution for truly low-income
borrowers. All those interviewed were weary of programs that put customers under additional
financial stress and pointed to other options available to low-income homeowners (for example,
Direct Install, ESAP, and CARE) where homeowners do not pay anything.
◼ REEL could be a better option for moderate-income borrowers, but how moderate-income borrowers
are defined must be carefully considered. While REEL offers attractive interest rates and longer
payback periods to lower monthly payments, moderate-income households may be vulnerable to
falling into low-income status. It was suggested that REEL may be most appropriate for moderate-,
upper-moderate- and high-income borrowers or that, if lower-income homeowners are participating,
that the savings-to-investment ratio be greater than 1.0, so that the energy savings exceed the costs
to pay for the EE upgrades.
There is demand for EE financing and, as PACE declines, there are opportunities for REEL to fill
the market gap. However, REEL needs to expand the eligible measures list and reduce barriers to
make inroads.
◼ New state PACE regulations have resulted in
declining PACE volumes, but REEL is not growing at
the same rate. State legislation has changed
underwriting guidelines, making PACE more like a
traditional finance program. Borrowers must show
they income qualify, not just based on property
equity, to verify the ability to repay. One PA noted that
conversations with PACE lenders indicated PACE
volumes are down 80% from a year ago. Indeed,
legislative changes in 2017 and 2018 have led to
lower PACE financing uptake. California’s PACE
financing experienced a one-third drop in the first six
months of 2018 (relative to the prior year).
◼ Demand for HVAC and windows are never going to go away, and PACE’s decline is not indicative of
declining demand. All PAs felt there was a need and desire to upgrade building envelopes, HVAC, and
windows, even if it is not the primary motivator. Many reported that financing inquiries are frequent,
“For the most part, PACE worked for
people who used it voluntarily. PACE got a
lot of dollars invested in energy efficiency
and renewable energy that hasn’t been
achieved in the past, but was driven by
wrong motivations (for example, projects
didn’t always achieve large savings, not
necessarily best for customer, people
didn’t understand the nature of PACE).”
— Program Administrator
“CAEATFA needs freedom and
flexibility to make decisions.”
— Program Administrator

Detailed Stakeholder Interview Results
opiniondynamics.com Page 147
and one PA’s recent market characterization study showed 38%–44% of customers would be
interested in financing options.
◼ Allowing REEL to become a more comprehensive solution may increase participation and loan
volume. PACE veered to general home improvements allowing RE, EE, windows, etc. REEL currently
credit enhances only IOU EE projects, excluding municipal and others. Several PAs mentioned
opportunities to include solar, electrification, storage, demand response, EV charging, and water-
saving measures.
◼ State policy goals for GHG and electrification are changing, and there is a need to reevaluate what
customers and the market really need, how REEL can best serve the market, and whether ratepayer
funds can be used. There is a lot of interest in electrification and renewables, and many customers
in California are looking to go "green" to help the environment and mitigate climate change. REEL
should include other energy solutions to align with state policies, for example, solar.
◼ OBR should continue to be explored to increase participation. The infrastructure for the EFLIC was
built with PG&E but was challenged when the lending partner changed senior management and
priorities and decided not to proceed. One PA noted that, on the commercial side, utility OBR/OBF
has steadily become customers’ first choice because it avoids the complexity of going though
lenders, has different underwriting requirements, and allows repayment on a homeowner’s utility bill.
◼ The HUP is complex with a lot of steps in the process that people do not understand, creating
mistrust and uncertainty — and financing adds to that uncertainty. Broadly, it was felt that there are
a lot of options in the market (for example, EE financing, personal loans, and contractor loans). It
confuses the market to have to weigh the benefits of each. Financing raises the bar on uncertainty:
"Am I borrowing money for the right reasons?"
The multilender model, with CAEATFA as PA is a strength, but there is interest in exploring other
options.
◼ The multilender model offers borrower’s choice and the ability to work directly with lenders. It was
also viewed as creating healthy competition among lenders and avoids being locked into one option
and terms. However, one PA suggested that using a single lending partner may encourage that
lender to make greater investments in technology and marketing needed to scale up REEL.
◼ CAEATFA’s experience with REEL has supported the integration
and coordination of other pilots. The experience with REEL has
helped CAEATFA know where to be referred, how IOUs are
organized, and what questions to ask. The small business pilot
is estimated to take three months to launch versus one year
with REEL. PAs agreed, mentioning that CAEATFA had a good
understanding of what is needed to be successful, are
inclusive, and communicate well. Moreover, having built the infrastructure and team over the last
three years comes with advantages.
◼ CAEATFA believes REEL will get to scale with large FIs, RICs, or a single originator that could
standardize and sell to the secondary market – and a substantial IT investment. “We think there is
room for both if REEL becomes permanent.” One PA suggested that there are benefits to going
“We would need to carefully
consider what we would gain
with someone else.”
— Program Administrator

Detailed Stakeholder Interview Results
opiniondynamics.com Page 148
through one lender rather than having to evaluate two, three, or four rates and terms: “Anything in
the process that adds time limits the ability to close.”
Contractors drive the market, therefore focus on educating contractors, streamlining processes,
and offering incentives to entice contractors.
◼ Make it easy for contractors to participate. There is a
perception among PAs that REEL is too long a process. PAs
suggested improving the contractor experience with
technology, minimizing paperwork, developing a support
network, staggering payments for larger projects, and
considering incentives to reduce administrative costs.
◼ Whole-home contractors versus single-trade contractors creates tension between achieving volume
and depth of savings. Customers want a contractor who presents their approach well, does quality
work, has whole-home experience, and is Building Performance Institute certified, but there are not
many of them. There is certainly value in training whole-home contractors who have more training
and certification, but the program also needs single-trade contractors who can get volume, even if
savings are shallower.
REEL could complement other resource programs, but better integration and streamlining of
processes is needed.
◼ Not all EUC/HVAC contractors are REEL contractors, but once
onboard, some view REEL financing as an alternative. Several
PAs believe that contractors may be pushing one or the other.
“Whatever helps them close the project quickly is going to
win.” One PA noted that once a contractor signs up with REEL,
the contractor no longer promotes its HUP anymore. Another
PA felt that if all contractors present financing, this could
formally align the single-family home upgrade, REEL, and other
programs.
◼ Resource programs are declining in general, but the number of REEL participants getting rebates
may be higher than what is reported. California’s resource programs are required to deliver net cost-
effective savings and HUPs’ TRC ratios are extremely low.72 This has resulted in programs ending
altogether — or incentives and EEEMs being scaled back — and the number of home upgrade
participants dropping. For example, the HUP expenditures have declined for all IOUs in the past few
years and a similar trend has been experienced across all residential market transformation
programming in the state, with expenditures falling from $80M in 2016, to $62M in 2017, and
$30M in 2018. CAEATFA simply asks participants whether they anticipate getting, or have gotten,
rebates but acknowledged that the accuracy of the self-report surveys is questionable. Similarly, PAs
reported that participants report whether they intend to go through a rebate program, but it is not
72 As California’s standards become more stringent and baselines increase, it is increasingly harder for resource programs to achieve
TRC ratios > 1.
“People are familiar with
rebates; they are a natural lead
in. Someone needs to come up
with the perfect pitch to
combine the two.”
— Program Administrator
“Contractors do not shop for the
best offer for customers; they
promote the one that is easiest
to work with.”
— Program Administrator

Detailed Stakeholder Interview Results
opiniondynamics.com Page 149
always correct. Finance has a quicker closeout than rebates and some PAs reported going back to
earlier REEL reports to match with rebates due to the lag time.
◼ Balancing safety and a desire to reduce complexity is challenging. Early on, CAEATFA chose to align
REEL with IOU processes. For quality assurance, health, and safety for HUPs, a CAS test is triggered
whenever gas lines are involved. CAEATFA believes that contractors may not be suggesting larger
projects because they do not want to trigger a CAS test. Alternatively, the CAS may be influencing
homeowner’s decision to apply for rebates. One PA shared his experience: When upgrading his
building envelope, he also replaced his gas furnace to a heat pump. He was eligible for $2,000 in
rebates. The CAS test found that the domestic water heater was not venting properly and, although
the water heater was out of scope, he had to fix it to receive the rebates. He is still undecided: “The
full [heat pump water heater] solves the venting issue, but that requires an additional $6,000
expense to get a $2,000 rebate.”
10.2 Lenders
The lender interviews revealed five overarching findings.
There is strong demand for EE financing. While there are comparable loan products, REEL offers
many advantages, particularly for underserved Californians.
◼ Lenders are offering other EE home improvement products but, in most cases, REEL is preferred.
Efficiency is a popular topic with lenders’ members. All lenders offer an EE or home improvement
loan, but they are secured by the home. Lenders have experienced difficulties with secured loans
and the priority lien in court: “People were confused and didn’t understand it even though the UCC-
173 financing statement was fully disclosed.” Borrowers like that REEL is unsecured.
◼ Lenders would not be able to offer the same interest rates, terms, and loan amounts without the
LLR. Without the LLR, all lenders stated that they would have to adjust their offer. Unsecured
personal loans are quicker, but no one (even high-FICO borrowers) would have access to the same
rates offered by REEL. People also like the fact that REEL is unsecured.
◼ Lenders did not look favorably at PACE and this presents an
opportunity for REEL. All lenders reported negative experiences with
PACE. Lenders were often not aware of the PACE lien until borrowers
refinanced their mortgages and details were unclear to consumers.
“PACE is not good for the borrower or the institution.” But most lenders
did not think REEL was an alternative to PACE unless it included solar
and EV charging.
◼ Lenders agreed that REEL was supporting those who would otherwise not have access. Although
majority of REEL borrowers are in moderate-to-high FICO tiers, lenders pointed out that those with
good credit may not have a lot of income and REEL is a better option. Moreover, the LLR has
73 A UCC-1 (Unified Commercial Code-1) financing statement is a legal form that a lender files to give notice that it has or may have
an interest in the personal property of a borrower. This form is filed to “perfect” a creditor’s security interest with the right to take
possession of and sell assets (for example, car or home) for repayment of debt. Once the form has been filed, the lender establishes
a relative priority with other creditors of the borrower.
“CAEATFA should be
promoting the fact that
REEL is not PACE.”
— Lender

Detailed Stakeholder Interview Results
opiniondynamics.com Page 150
increased lenders’ comfort to offer better rates and be more lenient on DTI ratios. One lender
reported that one contractor it works with regularly prefers REEL because its current financing arm is
turning its customers down.
REEL has positively affected participating lenders by helping them grow their membership and
sell more products, but lenders would like to see volume increase.
◼ REEL is a business opportunity. Several lenders reported that
the majority of REEL loans are with new members and that
REEL allows them to build relationships and sell more
products. While other loan options are presented to members,
REEL is often more favorable with lower rates, longer terms,
and reduced monthly payments. One lender is considering a
business development position to build relationships with
reputable contractors, while another is automating processes to improve contractor experience and
build membership.
◼ REEL helps CUs spread risk. Auto loans make up a large percentage of CUs’ loan portfolio and REEL
offers an opportunity to diversify and spread risk.
◼ While some lenders were not happy with the level of activity, others were not concerned. Several
lenders were disappointed in the volume, but one lender in rural California was thrilled with the
number of loans in its area. REEL makes up small portion of all lenders’ total loan portfolio, but REEL
is considered important in helping the community and serving those who would otherwise not have
access.
REEL’s multilender model is creating healthy competition, but there are lost opportunities,
notably, excluding POUs, solar, and limited traction with other CUs.
◼ Most participating lenders welcome more lenders into the fold.
Multiple lenders are viewed as increasing REEL’s ability to
provide more options; promote better service, rates, and
terms; and broaden the target market.
◼ Lenders are comfortable with loosening guidelines and
expanding loan amounts based on loan performance and
competing with other lenders offering better rates. Several
lenders reported gaining comfort with REEL over time. One
lender’s recent assessment of the risk profile of all its existing
borrowers revealed their REEL loans are performing well.
◼ Excluding POUs may be hindering REEL’s ability to scale. To
participate in REEL, homeowners must be receiving electric
and/or gas from the IOUs. One lender reported that its field of
membership is in a dozen counties, but borrowers in regions
served by POUs may not be eligible to participate, or may be
eligible for only some measures (electric or gas).
“One borrower had such a good
experience with REEL, they
wanted to do more business
with us."
— Lender
“We started with minimum
FICOs of 640 and decreased it
to 580 to align with other
lenders. We were losing two
deals per month because of the
FICO difference with other
lenders.”
— Lender
“Of course, everyone wants to
be the one, but I’m not sure that
would help the program. If you
have one lender, you are stuck
with their terms.”
— Lender

Detailed Stakeholder Interview Results
opiniondynamics.com Page 151
◼ Increasing the eligible measures list is viewed as an opportunity to increase interest and
participation. All lenders felt solar should be included. One lender with a similar loan product (but
secured) reported that 90% of potential REEL participants choose their secured loan over REEL
because it includes solar. Another lender reported that one out of five applicants want solar. As of
June 2019, the average cost of solar panels per watt in California is $4.06. A typical 6000 watt (6
kW) solar system is $24,390 before the federal solar credit and $17,073 after claiming the federal
solar tax credit.74 While 30% of the REEL loans can be used for non-eligible measures, with an
average REEL loan being almost $18,000, solar would push borrowers over the 30% non-EEEM
threshold.
◼ Leverage participating CUs to gain traction with other FIs. Several lenders suggest promoting REEL
through trade associations like the California Credit Union League. The Credit Union League hosts a
statewide conference once a year that brings together 40–50 executives. This is an opportune time
to promote REEL and have participating lenders share their experiences.
◼ CUs are hindered by their field of membership and operating hours. Rates are competitive in some
rural and underserved areas, but they are limited by their field of membership. One lender reported
that “80%–90% of inquiries are turned away because they are outside our field of membership.”
While two participating lenders operate statewide, their branch locations are concentrated in one
area, limiting their ability to build direct relationships, and there is a sense that they may not
understand specific community needs. Moreover, many contractors work on weekends when CUs are
closed. One lender is in the process of making changes to accommodate a large contractor that does
a lot of Saturday appointments by automating its underwriting.
There are enough REEL-certified contractors across California, but more education, support, and
quality assurance checks (for both contractors and DIYers) is needed.
◼ Finding REEL-certified contractors is no longer an issue, but there is greater need to educate them
about REEL. Lenders reported that getting contractors took a while and the ones that eventually
came onboard were not always interested, not comfortable with the process, or not knowledgeable
on how REEL works. While streamlining of processes has helped, lenders are still hand-holding new
contractors. “This is not our role, but we do it because they want the business.”
◼ Larger contractors are driving applications. One lender recently stumbled on a new contractor that is
driving most of its volume; its loan volume increased 150% in 2019 as a result. This contractor is
bigger, employs sales staff, and has administrative support to manage paperwork. REEL is much
more onerous for smaller contractors.
◼ There is a need to conduct more quality assurance, particularly for non-EEEM DIYers. Lenders agreed
that REEL-certified contractors provided a level of quality assurance, but there is a downside: There
is a perception that REEL contractors automatically increase rates. This may very well be because
REEL contractors have higher levels of training and certification; those who do not operate a
legitimate business can charge lower rates, but quality is reduced. One lender flagged the potential
for self-certification to be manipulated, that is, people self-certify that 30% of non-EEEMs are DIY
work, but may use funds for something else. However, CAEATFA’s contractor manager conducts site
inspections on approximately 20% of participants.
74 https://www.solarreviews.com/solar-panels/solar-panel-cost/cost-of-solar-panels-in-california.

Detailed Stakeholder Interview Results
opiniondynamics.com Page 152
Lenders are very satisfied with REEL and the support that they receive from CAEATFA, but there
are areas to improve, notably in marketing, supporting contractors and borrowers, and relaxing
guidelines.
◼ CAEATFA has built strong partnerships with lenders. Lenders
reported high satisfaction with REEL and CAEATFA. “Great to
work with.” REEL is very hands-on, accessible, and
communicates well. All lenders hoped REEL would continue.
◼ REEL is labor intensive. Lenders reported that the time to
enroll and book REEL loans is much greater than their other
loan products. One lender stated, “Each loan is unique, but
some can take a couple of hours or more — one took weeks.” Additional time is also spent with
borrowers and contractors. One lender reported that several emails are required for every single
loan. An online interface between lenders and contractors would help. Others recognized that this is
the cost of participating in a pilot; the time to get up and running is all for the greater good.
◼ There are opportunities to improve marketing. Lenders reported that utility bill inserts tend to drive
most applications.75 One lender mentioned that they get 10–15 applications within a week of utility
bill inserts. Others suggested co-promoting REEL may help increase applications. Some reported a
notable increase in applications with co-marketing.
◼ Relax guidelines and let lenders do what they do best: lend.
Lenders expressed frustration with the state getting caught up
in details, inspecting each loan, and manual reporting. Lenders
suggested more automation and reducing monthly reporting to
quarterly.
75 Note that utility bill inserts occurred after the pilot evaluation period.
“We’re happy. The program took
us a while to get rolling but has
potential to move now. We’re all
in favor of the program
continuing.”
-— Lender
“It is a hassle to go through
government. A permanent
program should consider how to
reduce manpower.”
-— Lender

Secondary Research Findings
opiniondynamics.com Page 153
11. Secondary Research Findings
The pilot implementation model was compared to other similar programs to extract insights on best
practices and suggest program improvements in three topic areas:
1. LLR management and underwriting practices
2. Management of lenders
3. Marketing and integration with resource programs
Five programs were selected as the focus for the secondary research based on the following criteria. They:
◼ Offer financing to residential customers
◼ Aim to support EE upgrades
◼ Have lender statewide coverage76
◼ Incorporate credit enhancement features, such as LLRs77
◼ Showcase different lending model options (both single- and multiple lenders)
The evaluation team’s research approach involved a review of relevant program documentation and studies,
complementary online research, and interviews with two PAs (Michigan Saves and CT Green Bank).
The programs analyzed are briefly described below.
NYSERDA, SMART
ENERGY LOANS
and OBR
NYSERDA has established a revolving loan fund to support EE financing for owners of
one- to four-unit residential buildings. Acting as single lender, using its own funds,
NYSERDA offers two types of loans: an unsecured consumer loan (Smart Energy Loan)
and OBR loans. The loans are managed by two external contractors. Energy Finance
Solutions (EFS) originates and approves loans based on NYSERDA’s underwriting
criteria; closes and disburses funds to contractors; and submits loans to NYSERDA’s
loan servicer, Concord Servicing Corporation. Concord is responsible for billing and loan
collection and monitoring the origination process for quality assurance. NYSERDA
reimburses EFS for the loan disbursement from the revolving loan fund. The fund is
replenished through loan repayments and bond proceeds.78 Interest rates range from
3.49% to 7.99% based on income level and payment mechanism.79
76 Not all programs are statewide from an IOU perspective. Enhabit does not appear to cover all IOU territories (PGE, NW Natural,
Pacific Power are included, but not Idaho Power). Similarly, NYSERDA states in its 2019 Green Jobs – Green New York report that its
OBR loan is available only to certain electric and gas utilities (Central Hudson, Con Edison, Long Island Power Authority, National Grid
- Upstate, New York State Electric and Gas Corporation, Rochester Gas and Electric Corporation, or Orange and Rockland Utilities).
Based on the evidence available, other programs do not appear restricted by IOU territory. 77 All programs except NY’s NYSERDA contain an LLR feature. Although NYSERDA’s program does not yet offer an LLR (this feature is
under consideration), it does offer other credit enhancement mechanisms. 78 Dunsky Energy Consulting, Opinion Dynamics. 2016. California Public Utilities Commission, Energy Division: Finance Partner
Outreach Strategy Study Report. Retrieved from:
https://pda.energydataweb.com/api/view/1761/CPUC%20-%20Partner%20Study%20-%20Report%20-%20FINAL.pdf. 79 NYSERDA. 2018. Green Jobs – Green New York: 2018 Annual Report. Retrieved from:
https://www.nyserda.ny.gov/About/Publications/GJGNY-Advisory-Council-Reports, pg. 29.
Secondary Research Findings
opiniondynamics.com Page 154
MICHIGAN SAVES,
HOME ENERGY
LOAN
The MI Saves Home Energy Loan Program offers available financing of up to $40,000
over 12–15 years for EE projects.80 Loans are provided through lender partners based
on standard underwriting criteria with interest rates of 4.25%–7.00% APR, which vary by
lender and loan term.81 MI Saves sets aside 5% of total outstanding loan value for the
program’s LLR. After 90 days of nonpayment, MI Saves covers 75%–80% of the loan; the
exact amount is dependent on FICO scores.
ENHABIT (OR) Enhabit helps homeowners conduct home improvements through an initial home
assessment, matching with certified local contractors, no-money-down secure financing
products through local lenders, and third-party oversight. Loans are provided through
partner lenders based on the lender’s standard underwriting criteria. Enhabit serves as
an intermediary, standardizing and aggregating financial products and services. Cash
incentives through the Energy Trust of Oregon to Enhabit subsidize the cost of
financing,82 and select utility customers have an OBR option.83
CONNECTICUT
GREEN BANK,
SMART-E LOANS
Smart-E Loans offer no-money-down, low-interest financing with terms of 5–20 years to
help homeowners upgrade their home’s energy performance. Applicants are
preapproved by a participating lender and must complete work using certified Smart-E
contractors. CT Green Bank approves the financing based on guidelines, such as DTI
ratio, credit score, eligible measures, and minimum/maximum loan amounts. Lenders
have the final say on underwriting, providing them with the ability to approve or decline
loans even if they meet minimum CT Green Bank criteria. Smart-E loans are supported
by credit enhancements (LLR and interest rate buydowns),84, 85 and interest rates range
between 4.49% and 6.99%.
COLORADO
ENERGY OFFICE,
RENU
The RENU Loan is a statewide program offering financing for home EE and RE projects,
backstopped by an LLR. The program currently works with a single lending partner
(Elevations CU) and is looking to recruit more. Loans ranging from $500 to $50,000 are
available for FICO scores as low as 580 for terms up to 15 years. Interest rates as low as
2.75% are available, depending on the applicant FICO score and the term length (2.75%
APR available for FICO >740 and three-year term).86
The REEL implementation model was compared with these financing programs. Table 62 summarizes these
programs, followed by a detailed assessment of their LLR management and underwriting practices,
management of lenders, and marketing and integration with resource programs.
80 https://michigansaves.org/residential-financing/. 81 Dunsky Energy Consulting, Opinion Dynamics. 2016. 82 Ibid. 83 As of July 2018, the day-to-day delivery of Enhabit’s residential program has been transitioned to Community Energy Project,
another nonprofit. See https://enhabit.org/news/enhabit-joins-forces-with-community-energy-project-to-advance-home-energy-score-
and-residential-improvement-services/. 84 Dunsky Energy Consulting, Opinion Dynamics. 2016. 85 https://aceee.org/sites/default/files/pdf/conferences/eeff/2018/3A-Elliott-Hill-O%27Neill.pdf. 86 Colorado Energy Office. 2018. Annual Report 2017–18. Retrieved from: https://www.colorado.gov/pacific/energyoffice/reports.

Secondary Research Findings
opiniondynamics.com Page 155
Table 62. Comparison of Residential Financing Programs Studied
Program and
PA (state)
Start
Date
Number
(and type) of
Lenders
Loan Volume
(total to date)
Average
Loan
Size ($)
Loan Volume as % of
Single-Family Homes
in the Statea
Amount Set
Aside for LLR
Smart-E Loans,
CT Green Bank
(CT)
2011
12 local
lendersb
(CUs,
Community
Banks, CDFI)
As of May 2018,
2,700 loans
closed ($48M)
17,778 0.28%
7.5% for
Class A loan
(680+ FICO);
15% for Class
B (<680 FICO)
Enhabit (OR) 2009
4 local
participating
lenders
(Local Banks)
As of June 2015,
1 lender issued
more than 3,000
loans (exceeding
$40M)
13,333 0.25% N/P
Smart Energy
Loans and
OBR, NYSERDA
(NY)
2010
and
2012
1 lender
(NYSERDA)
+ 1 loan
originator + 1
loan master
servicer
As of June 30,
2018, 14,000
Smart Energy
Loans and 9,000
OBR loans issued
(over $263M
combined)
11,435 0.59% N/A
Home Energy
Loan Program,
Michigan
Savesc (MI)
2009 5 local lenders
(CUs)
As of July 2016,
6,200 loans have
been issued (over
$57M)
9,194 0.18% 5%
RENU,
Colorado
Energy Office
(CO)
2018 1 local lender
(CU)
As of 2018, 38
loans closed
($0.5M)d
13,158 0.002% N/P
REEL, CPUC
(CA) 2017
7 lenders
(CUs)
1 master
servicer
As of Dec. 2018,
339 loans closed
($5M)
17,165 0.004%
11% (regular),
20% (LMI
borrowers)
N/A = Not applicable, N/P = Information not publicly available.
a Data for number of occupied single-family homes (one-unit attached and detached homes) per state sourced from American
FactFinder (https://factfinder.census.gov/faces/nav/jsf/pages/community_facts.xhtml).
b As of May 2018. See https://aceee.org/sites/default/files/pdf/conferences/eeff/2018/3A-Elliott-Hill-O%27Neill.pdf.
c As of July 2016. Based on Dunsky Energy Consulting. 2018. Green Ontario Fund, Report 2: Single Family Residential Financing,
pg. 29.
d Colorado Energy Office. 2018. Annual Report 2017–18. Retrieved from: https://www.colorado.gov/pacific/energyoffice/reports,
pg. 7.

Secondary Research Findings
opiniondynamics.com Page 156
Table 63 provides a summary of the insights that emerged from the comparative analysis, which were
presented in the summary section. These insights are elaborated on in the subsections below.
Table 63. Summary of Insights for Pilot Design and Implementation
Comparative Analysis Insights
▪ REEL incurs significantly higher costs for LLR and lender management than other programs, likely because of
complex setup and reporting requirements.
▪ REEL can seize opportunities to iterate and adapt LLR and underwriting practices to improve program accessibility.
▪ Most programs find success with multiple local community lenders.
▪ Invest in training contractors – driving force behind marketing and quality of the program.
▪ Consider expanding to RE and beneficial electrification.
11.1 LLR Management and Underwriting Practices
Four of the five programs analyzed include an LLR as part of their credit enhancement measures. This
section presents findings on how other programs keep LLR management costs down by administering the
LLR internally; aggregating funds by lender, rather than tracking each borrower individually; and iterating and
leveraging LLR and underwriting practices.
Minimize program costs by managing LLR internally at a higher level of aggregation and seeking
leveraging opportunities.
◼ Administer the LLR internally. Two PAs, MI Saves and CT Green Bank, incur minimal costs to
administer their LLR.87 Both hold LLR funds directly on their books and disburse funds to lenders
only if a default occurs. Both programs aggregate LLR funds by lender and periodically review and
match the amount allocated to each lender with its issued loan volumes (monthly for MI Saves,
quarterly for CT Green Bank). This reconciliation takes minimal effort (1–2 hours per month for MI
Saves and half a day per quarter for CT Green Bank, where a centralized platform collects lender
reports). Furthermore, holding the LLR funds on their books allows them to invest and earn returns.
In comparison, REEL is incurring significant costs to administer the LLR. LLR funds are held by a
bank trustee, which not only prevents the funds from being reinvested for a profit, but also charges
REEL for this service.
◼ Aggregate reporting level to reduce costs A major barrier for REEL is its inability to administer LLR
funds independently. As REEL uses utility ratepayer funds in its LLR, funds must be matched to each
borrower through the master servicer and reconciled monthly with the borrower’s utility. This is a
much more tedious and onerous process then MI Save and CT Green Bank, where LLR funds are
aggregated by lender and do not require utility reconciliation. Both those programs can
independently administer their LLR thanks to their funding sources (MI Saves received funds from
ARRA and the state; CT Green Bank initially received funds from ARRA and is now using CT Green
Bank funds).88, 89 REEL is not the only program to face challenges. The Colorado RENU Loan program
87 Note that CT Green Bank acts as a second, not first, LLR. 88 Dunsky Energy Consulting. 2019. Phone interview with Kerry O’Neill (CT Green Bank). 89 Dunsky Energy Consulting. 2019. Phone interview with Mary Templeton (MI Saves).

Secondary Research Findings
opiniondynamics.com Page 157
has also run into issues while using the State Housing Finance Authority to administer its LLR on its
behalf (including difficulties adding a new lender to the program and managing information).
◼ Ensure that the program is privately leveraged. Several programs monitor leverage as a success
metric (that is, ratio of private funds attracted to the program to the initial state or ratepayer
investment). In MI Saves, one of the pilot program objectives was to achieve a 5:1 ratio of leveraging
of grant funds.90 This objective was met by the end of its pilot in 2013; it has now increased to 20:1
in 2019.91 The leveraged funds include private capital backed by the LLR and funds from
homeowners and business owners,92 as well as supplementary sources, such as commercial, utility,
or low-income housing sources. In comparison, REEL, in the first two and a half years, had a 7:1
leverage ratio, attracting $5.8M in private capital, compared to the $0.8M of ratepayer funds
invested in the LLR in its first two years.
Iterate and adapt LLR and underwriting practices to improve accessibility.
◼ “Spend” good LLR performance on improving programs. Several programs, such as the MI Saves and
CT Green Bank programs, experienced better-than-expected LLR performance, and were able to “re-
invest” this performance to improve programs. In CT, for example, by 2016, the program had
experienced only a single loan default and under 1% delinquencies.93 In contrast, the applicant
decline rate was high (28%) and so was the average FICO score (753). CT Green Bank leveraged the
LLR’s strong performance to expand underwriting and reduce the decline rate (by introducing a
“Credit-Challenged Smart-E” to customers with lower minimum FICO scores) and to offer longer
terms (up from 12 to 15–20 years).94 Furthermore, CT Green Bank also seized this opportunity to
review its LLR agreement with lenders to free up liquidity. The bank negotiated to keep its financial
obligations to lenders in case of defaults, but no longer set aside the money in an idle account. The
program is now free to reinvest designated LLR funds, giving extra flexibility. In the MI program,
which also experienced better-than-expected LLR performance thanks to low default rates, lenders
were incented to reduce interest rates, which in turn resulted in increased loan volumes.95 In
comparison, REEL sets aside 11%–20% of loans and does not currently promote reports on LLR
performance that is easily accessible to lenders and others.
◼ Create tiered underwriting to improve program-access. Several programs, such as the NYSERDA
program, have introduced tiered underwriting to expand program access to borrowers who would
not qualify for loans with traditional criteria. This program introduced Tier 2 loans, which consider
mortgage payment history as a trade-off for lower FICO scores and have flexible options for
maximum DTI ratio. As of June 2017, Tier 2 loans constituted 20%–25% of monthly loan
volumes in NYSERDA.96
90 Better Buildings for Michigan. 2013. Final Report. Retrieved from: https://2wajqs10j6572p9ni53oi7r4-wpengine.netdna-
ssl.com/wp-content/uploads/2016/06/BetterBuildings-for-Michigan-Final-Report.pdf, p. iii. 91 Dunsky Energy Consulting. 2019. Phone interview with Mary Templeton (MI Saves). 92 The pilot program, Better Buildings for Michigan, included both residential and commercial components. 93 CT Green Bank defines “delinquency” according to its lender’s definition, that is, CT Green Bank considers a borrower delinquent if
it is reported as such by the concerned lender. 94 https://aceee.org/sites/default/files/pdf/conferences/eeff/2018/3A-Elliott-Hill-O%27Neill.pdf. 95 Dunsky Energy Consulting. 2018. Pg. 56. 96 NYSERDA. 2017. Green Jobs – Green New York: 2017 Annual Report. Retrieved from:
https://www.nyserda.ny.gov/About/Publications/GJGNY-Advisory-Council-Reports, pg. 42.

Secondary Research Findings
opiniondynamics.com Page 158
◼ Use differentiated rates to target customers most in need and recover costs. In 2016, NYSERDA,
as a direct lender, adjusted its program interest rates to provide “different rates based on
household income and credit considerations.”97 The change seeks to offset administration costs
linked to serving households with higher income and high credit ratings and who have other
financing options in the market by charging them higher interest rates, while continuing to offer
subsidized lending to low-credit applicants. This has redirected many higher-income households
away from NYSERDA loans and toward other options, such as home equity loans offered by
banks, or third-party options offered by contractors. While a viable option, care should be taken
that this does not create a barrier to higher-income households undertaking energy
improvements, especially as they typically live in bigger houses that consume more energy.
11.2 Managing Lenders: Multiple or Single-Model Approach
Most programs whose operations were deemed successful use a multiple-lender model, working with
several local mission-driven private lending partners. Only NYSERDA, which uses its own funds for lending,
has adopted a single-lender model; it uses a master servicer to externalize loan management activities. In
comparison, REEL uses a hybrid model, working both with multiple private lenders and with a master
servicer who acts as an intermediary between private lending partners, borrowers, and IOUs. REEL’s complex
financing setup (where loans must be tracked individually to enable matching to the appropriate utility funds
based on borrower territory) creates administrative hurdles. As a result, REEL is experiencing significantly
higher program administration costs than its counterparts. Indeed, most programs with multiple lenders
incur minimal loan LLR-related costs; compared to NYSERDA’s single-lender model, REEL’s costs are close to
2.5x higher.
This section provides an overview of the benefits and challenges of both, to help REEL navigate how
elements of its own management of lenders could be improved. Additionally, suggestions on best practices
for lender-communication are presented.
Most residential programs find success with local community lenders, although these bear
challenges.
◼ Leverage the value-alignment, customer familiarity, and approachability of mission-driven lenders.
The 2016 Partner Study identified that most residential programs find success with local community
lenders. This finding still stands true, as three out of the five programs analyzed use multiple
lenders. Of those, MI Saves and CT Green Bank work almost entirely with local CUs and community
banks, and found them to be best-fit lending partners.98 These private lenders are generally mission-
driven and have strong links with the community, making them more likely to share and support the
values that drive the financing program. Other lenders could be brought in over time for specific
purposes, such as CT Green Bank, which introduced a CDFI to address high decline rates.99 In terms
of approachability, MI Saves and CT Green Bank also found local lenders easier to approach, as they
“valued smaller loan volumes as sizable.”100 Both had tried to approach larger FIs, but generally
found that larger lenders were not interested in joining a program or offering a product that had not
97 Ibid., pg. 40. 98 Dunsky Energy Consulting. 2018. Pg. 56. 99 Ibid. 100 Dunsky Energy Consulting, Opinion Dynamics. 2016. Pg. 10.

Secondary Research Findings
opiniondynamics.com Page 159
demonstrated significant market demand. Similarly, REEL faced difficulties attracting large FIs due to
its modest size of loans and pilot status.
◼ Ensure coverage and consider customer convenience. Both the MI Saves and CT Green Bank
programs work with lenders who can cumulatively ensure statewide coverage. In the MI program,
for example, one lender offers statewide coverage, while others focus on certain counties only.101
Similarly, in the REEL pilot, lender coverage overlaps. Most loans are issued by two statewide
CUs with branch locations limited to Southern California; the other lenders enrolled in the pilot
are very rural with a limited field of membership. Although statewide coverage could be achieved
with the two leading lenders alone, smaller regional lenders add value by having direct
knowledge of their communities and their challenges. Rural lenders can also offer face-to-face
service that is not always available from a large statewide lender (not everyone wants to deal
with a bank online).
◼ Private lending partners undertake loan servicing activities, lowering costs. Another advantage of
working with private lending partners is the simplification and cost reduction of loan servicing.
Interviews with CT Green Bank and MI Saves Pas revealed that the loan servicing activities of
both programs (underwriting, loan collection, billing) are entirely borne by the lending partners,
as part of their regular activities. One administrator commented: “It is part of [lenders’] business:
providing capital, charging interests. They then give us the data on all the loans.” PAs still have a
role in shaping and monitoring the program through key steps — providing guidelines for lender
underwriting criteria, capping interest rates, coordinating the project approval process between
contractors and lenders — but are freed from day-to-day handling of loan servicing, paying a
master servicer to manage the flow of funds between lenders, IOUs, and the bank trustee, and
having a separate entity managing the LLR (bank trustee). REEL, however, has had to bring in a
master servicer and a bank trustee.
Mitigate challenges of working with multiple lenders by being prepared for multiple rates,
coverage, and increased management complexity.
◼ Multiple rates: Allowing multiple lenders to operate under the program might lead to different
interest rates being offered, which could create some confusion in the market. In California, for
example, REEL lenders with the most aggressive rates reported that customers typically see them
listed on the statewide website and apply, but are declined because they reside outside their service
area. However, this issue has since been addressed through a front-end evaluation on
gogreenfinancing.com, which helps participants identify lenders in their county. Furthermore,
multiple rates could also be considered an advantage. Indeed, allowing multiple lenders with
statewide or overlapping coverage to operate gives customers a choice, creating market competition
and possibly reducing rates for customers.
◼ Coverage: Programs using multiple lenders (as in MI, CT, and OR) often partner with local lenders.
This could pose a challenge for ensuring statewide coverage. MI addressed this by working with the
Michigan Credit Union League, to easily enlist the initial nine CUs in the program. For REEL, this
raises the possibility of simplifying its model, and removing the need for a master servicer, by dealing
101 Based on lenders enrolled in August 2019.

Secondary Research Findings
opiniondynamics.com Page 160
with a single lender operating per IOU territory (similar to the RFPs). Different from the MI Saves and
CT Green Bank route, this option would raise its own set of challenges.
◼ Managing complexity: Managing multiple lenders may increase complexity. Some programs, such as
Enhabit, have chosen to “minimize the number of lenders (if all desired financing products are
offered),” and instead focus on maintaining “a closer and more flexible relationship with
partners.”102 Other programs, such as MI Saves, have set restrictions, such as requiring lenders to
have a minimum loan volume (100 loans per month) to participate in the program.103
NYSERDA’s single-lender model incurs significantly lower costs per loan than REEL’s.
◼ A single-lender model can simplify management and lower costs. Unlike the other programs
analyzed, NYSERDA uses a single-lender model. The program uses its own funds for financing;
however, it outsources financing activities (loan origination and servicing and OBR) to two external
providers, EFS and Concord. EFS originates all loans based on NYSERDA’s underwriting criteria,
disburses funds to the contractor (from a cash advance pool provided by NYSERDA), and submits the
loan to its master servicer (Concord). Concord is then responsible for loan payment collection (either
directly from the borrower or via remittances from utilities), borrower billing, and monitoring of the
origination process.104 For NYSERDA’s OBR program, the participating utilities (seven in 2019) remit
repayments to Concord, which coordinates data communications with each utility. In comparison,
REEL uses the master servicer (also Concord) to enroll loans into the program to manage and match
the flow of ratepayer funds and data between the IOUs, lenders and bank trustee, and OBR
(although it is important to note that OBR has yet to be established for REEL). All loans are enrolled
with Concord by the private lenders. Private lenders also verify project eligibility and originate and
service the loans. However, Table 64 shows that REEL incurs a cost per loan close 2.5x higher than
NYSERDA.
Table 64. Loan Servicing Cost Comparison: NYSERDA vs REEL
NYSERDA (Program Start–2018) REEL (July 2016–July 2018)
Cost per loan $520 $1,328
Cost per loan dollar $0.04 $0.08
a NYSERDA costs include origination and servicing fees, while REEL costs include master servicer and
bank trustee costs.
Maintain good communications with lenders; tackle pain points together.
◼ Although most lenders are independent, programs maintain open communications. The 2016
Partner Study found that most lenders are independent and need “relatively little support beyond the
occasional training.” Although this insight still applies, a 2018 study finds successful programs, such
as MI Saves, maintain good communication with lenders by setting up a dedicated liaison and
through biannual meetings to allow for feedback and sharing of program updates and news
regarding contractors and/or marketing.105 Comparing this to REEL, all lenders interviewed said
communications have been very good, and described CAEATFA as open and accessible. It will be
102 Dunsky Energy Consulting, Opinion Dynamics. 2016. Pg. 20. 103 Dunsky Energy Consulting. 2018. 104 NYSERDA. 2017. Pg. 12. 105 Dunsky Energy Consulting. 2018.

Secondary Research Findings
opiniondynamics.com Page 161
important for REEL to leverage this great onboarding experience and establish clear future
communication paths with lenders.
◼ Reporting no longer seen as a pain point. Previous studies and evaluations of REEL showed that
information systems and reporting emerged as pain points. The 2016 Partner Study found that
reporting was a pain point for lenders in programs such as MI Saves, often due to reporting
requirements not always integrating perfectly with lender systems. In the case of REEL, initial
insufficient funding in IT infrastructure created challenges for data exchange. However, this concern
did not emerge in the most recent set of interviews, as lenders felt reporting was not too heavy or a
big issue. Instead, lenders point to the application verification and project approval as a pain point.
11.3 Marketing and Integration with Resource Programs
This last subsection presents best practices surrounding successful marketing, as well as recommendations
to ensure that the credit enhancement program is well integrated with existing resource programs.
Expand eligible measures list to include RE and beneficial electrification, to increase program
attractiveness.
◼ All other programs analyzed include both EE and RE measures. RE typically includes solar panel
installation and/or battery storage systems. REEL currently does not include RE. Beyond this being a
common practice in other programs, RE was also mentioned as a key program gap during lender
interviews. Interviewees mentioned that expansion to renewables would position REEL as a “one-
stop shop” to fill the market gap left by the decline of PACE in California, thereby increasing its
attractiveness. Expanding eligible measures under REEL would likely require changing its scope from
an “energy efficiency” to an “energy efficacy” scheme at the Commission level and/or perhaps at the
state level.
Program promotion is driven by contractors and REEL would be more successful if all program
actors acted in coordination toward a high close rate.
◼ Contractors drive programs: Contractors are identified as the main marketing mechanism behind the
EE programs analyzed. According to CT Green Bank, the Smart-E program is viewed by contractors as
a “tool to close the sale.” To leverage this value proposition further, CT Green Bank pays contractors
a portion of the work (one-third) at loan close, and the rest at project completion.106 All PAs invest
efforts to recruit and train contractors, for example, through targeted outreach to trade organizations
(CT Green Bank); regularly attending utility trade ally meetings or email blasts to its authorized
contractors (MI Saves)107; or providing regular training, including “Techie Brekkies” (Enhabit).108 The
MI Saves program goes as far as requesting authorized contractors to pay a fee (1.9% of the total
amount financed) for contractors to receive operations and sales training, marketing materials, etc.
This has not hindered contractor engagement (MI Saves has a network of more than 300 authorized
contractors).109 Similarly, REEL also recognized the importance of contractors. In 2017, the program
106 Dunsky Energy Consulting. 2018. Pg. 56. 107 Dunsky Energy Consulting, Opinion Dynamics. 2016. 108 https://enhabit.org/programs/clean-energy-works/. 109 Dunsky Energy Consulting. 2018. Pg. 59.

Secondary Research Findings
opiniondynamics.com Page 162
set up a contractor manager, responsible for recruiting, training, and managing the then 160 (now
340) enrolled REEL contractors.110, 111 However, all lenders interviewed said contractors still need
further training.
◼ Streamline the application process while maintaining adequate safeguards: Not surprisingly, a more
streamlined application process helps increase the loan volume and program success. Previous
studies, confirmed by lenders during the most recent interviews, have found that the initial financing
application and paperwork is a bottleneck. Several programs have attempted to minimize this. MI
Saves has set up a centralized call center to take customer calls and provides conditional approval
before transferring customer to lenders. NYSERDA revised the audit application approval process to
facilitate automation. In 2017, approximatively 83% of audit applications were approved upon
submission; the remainder were reviewed in one business day.112 In general, PAs suggested
“checklists, guides, and one-on-one support” as possible ways to address this issue.113 Similarly,
REEL encountered this issue and identified opportunities to streamline the application process, while
respecting the safeguards necessary with the use of ratepayer funds. For example, the Customer
Information Standardized Request (CISR) form was eliminated.114
◼ Special promotions and marketing campaigns can have a big impact on the market: Programs such
as CT Green Bank’s have effectively used limited-time promotions to achieve lasting impact. For
example, the Smart-E Loan program launched a seven-month, 0.99% interest rate buydown
campaign, which had several benefits, including increasing the loan volume sixfold during the
campaign and creating customer “pull” for contractors, which recruited 54 new contractors to the
program. This short but impactful marketing strategy could be useful to draw customers to REEL and
could help the program fill the gap left by the declining PACE market.
◼ Conduct quality control: Conducting sporadic project quality control is important to ensure program
success, specifically with new contractors.115 In interviews, MI Saves insisted that investing in
contractor training, and spot checking in the back end, has seen great results. The program no
longer requires project preapproval (streamlining the application process) and instead relies on
contractors to know which projects to undertake, taking remediation action if necessary. MI Saves
performs post-installation site inspections on around 20% of upgrade projects,116 CO RENU inspects
10% of projects and requires all improvements be installed by an approved contractor,117 and
NYSERDA performs quality assurance inspections on 10%–15% of contractor projects and follows up
with contractors to “ensure remediation takes place” if projects failed to meet standards. In all
programs, repeated contractor failure to meet program standards may lead to removal from their
certified contractor list.118 Quality control is especially important to REEL, as one lender interviewed
underlined that the self-certified DIY option (for the 30% non-EE measures) risks funds being
misused. In terms of contractor quality assurance, REEL established a contractor manager
110 Evergreen Economics. 2017. California Statewide Finance Pilots Early EM&V: Draft Report, pg. 20. 111 https://gogreenfinancing.com/residential. 112 NYSERDA. 2017. Pg. 35. 113 Dunsky Energy Consulting, Opinion Dynamics. 2016. Pg. 24. 114 Evergreen Economics. 2017. Pg. 20. 115 Dunsky Energy Consulting, Opinion Dynamics. 2016. Pg. 34. 116 Better Buildings for Michigan. 2013. Pg. 28. 117 https://www.colorado.gov/pacific/sites/default/files/atoms/files/CO%20RENU%20Loan%20contractor%20training_v11.pdf. 118 NYSERDA. 2017. Pg. 33.
Secondary Research Findings
opiniondynamics.com Page 163
responsible for, among other things, contractor training and conducting quality assurance and
quality control for contractors.119
Ensure program is integrated with resource programs.
◼ Many eligible financing participants do not access rebates: An interesting finding from early REEL
data shows that fewer than a third of borrowers applied for a rebate, despite several participants
likely being eligible to do so. One possible explanation emerging from the interviews is that
contractors may be presenting financing and resource programs as “either-or” solutions in order to
leverage the most appropriate program to close the sale and avoid having to complete paperwork for
both. However, credit enhancement programs benefit from being integrated with resource programs.
In the MI Saves pilot, available rebates were described and included in estimates to homeowners,
and presented as program “perks,” along with low interest rates. Furthermore, the program
benefited from utility marketing; several utilities provided information on their website and on letters
and e-mails to customers.120 This is echoed in the Smart-E loan program, where PAs have monthly
meetings with utilities to align and strategically collaborate,121 and in Enhabit, where the program
markets itself as a “financing solution” integrated with “utility rebates and instant rebates.”122
NYSERDA created guidelines to help contractors determine “how best to coordinate services
between two programs” for households who qualified for two different financing programs.123
119 Evergreen Economics. 2017. Pg. 20. 120 Better Buildings for Michigan. 2013.Pg. 28. 121 Dunsky Energy Consulting. 2019. Phone interview with Kerry O’Neill (CT Green Bank). 122 https://enhabit.org/programs/clean-energy-works/. 123 NYSERDA. 2017. Pg. 36.

Early Participant Characterization Memo
opiniondynamics.com Page 164
Appendix A. Early Participant Characterization Memo
Below is a memo that the evaluation team submitted to the CPUC in April 2019, prior to the completion of
several evaluation tasks, including the impact analysis, cost-effectiveness analyses, and several surveys and
interviews. As such, it summarizes only what was ascertainable through CAEATFA tracking data at the time of
the memo and should not be considered as the final conclusions of the evaluation team.
Memorandum To: Kevin Feizi, California Public Utilities Commission
From: Opinion Dynamics Evaluation Team
Date: April 2019
Re: REEL Pilot Early Participant Characterization Memo
Introduction
As the first step in the Residential Energy Efficiency Loan Assistance Pilot evaluation, this memorandum
characterizes the pilot participants based on the data that California Alternative Energy and Advanced
Transportation Financing Authority (CAEATFA) collects from participants. The purpose of this first evaluation
step is to characterize what is known about participants and pilot performance based on CAEATFA’s tracking
records.
Limitations and Future Research
Notably, this memo summarizes data for two time periods; inception through July 2018 and progress
through December 2018. Per CPUC directive, the pilot was expected to be evaluated for the first time based
on its first two years of implementation. However, given the timing of the evaluation, the pilot provided all of
its data through December 2018. As such, the primary time period for analysis in this evaluation is through
July 2018, however additional data on pilot performance after July 2018 is included if it helps to further
assess the pilot performance and scalability potential moving forward.
The findings in this memo represent the first step in assessing the accomplishments of the REEL pilot and
are intended to provide early characteristics of pilot participants based on CAEATFA’s tracking data. A
significant amount of additional data collection and analysis are required to fully evaluate the pilot. The
evaluation team will deliver a full evaluation report to the CPUC in June 2019. Please refer to the full
evaluation plan for comprehensive view of all of the research objectives and planned tasks for this
evaluation.
Data Sources

Early Participant Characterization Memo
opiniondynamics.com Page 165
The evaluation team received tracking data from CAEATFA covering pilot participation from July 19, 2016
(the first loan) to December 26, 2018. This included the following data files:
◼ REEL loan tracking data with approximately 75 data points related to the loan terms and rates,
project measures and costs, and underserved determinants;
◼ Participant contact information for all REEL borrowers included in the REEL loan tracking data;
◼ A list of all EEEMs
◼ A lender product comparison file which provides a detailed breakdown by FICO credit score of the
interest rates REEL Lenders offer customers in comparison with their “signature” (that is, regular)
products
◼ Supplemental materials including an accounting of requested data points, answers to LLR questions
posed by the evaluation team, and a list of significant program design and implementation
modifications to REEL and their associated impact.

Early Participant Characterization Memo
opiniondynamics.com Page 166
Energy Efficiency Financing Pilot Metrics
CPUC Resolution E-4900 established metrics for evaluating the success of REEL and the other EEFPs* (see Table 65).
Table 65. EE Financing Pilot Metrics
Goal Metric CPUC Comments
The financing tool is
scalable
Number of loans made by the pilot, with breakdown by:
▪ Growth in the number of loans on a month-by-month basis over the lifetime
of the pilot
▪ Total amount of financing generated by the pilot
▪ Geographic distribution of loans, including ability to reach new regions of
the state especially those with large underserved populations
Data should be presented to show whether these financing tools
can reach a significant and growing number of Californians
The financing tool is
leveraged by private
capital and support
Private capital participation in the pilot, as measured by:
▪ Number of FIs (Lenders) participating in the pilot, and types of FIs
participating
▪ Amount of private capital attracted
Data should be presented to indicate whether these financing
tools can become partially or entirely self-supporting, that is can
they reach a point where they depend less or do not depend on
the use of ratepayer funds
The financing tool
reaches underserved
Californians who would
not otherwise have
participated in EE
upgrades
Analysis of participants in the pilot, according to:
▪ Credit scores of loan participants reported on an aggregate basis
▪ Length of time allowed for applicants to pay back the loans
▪ Percentage of participants deemed “underserved” as measured through
CalEnviro data, AMI, or other poverty statistics
▪ Whether participants would have qualified for existing private EE loan
programs at interest rates and terms that they can afford or would accept
The “counterfactual” of whether participants would have taken
loans from elsewhere for the same upgrades is difficult to
demonstrate, but best efforts should be made to provide data
showing that hard-to-reach communities were reached – and
analysis done by Evaluation, Measurement & Verification
contractors can also be consulted.
Lower-income participants may prefer longer loan pay back
periods, so the length of time allowed for repayment may offer a
proxy for ability to reach low-income communities
The financing tool
produces energy
savings
Energy savings that resulted, as measured:
▪ Through customer meter data provided by the utilities via Energy Division
data request (customer privacy must be maintained)
▪ Through NMEC analysis, as an option
▪ Comparison of energy savings from other loan programs to that of the pilot,
if possible, to assess through EM&V studies
NMEC analysis has not previously been applied to the analysis
of financing pilots, and is considered an option here to be used
if it can add to the understanding of the results of the pilots
* D. 17-03-026.

Early Participant Characterization Memo
opiniondynamics.com Page 167
Key Findings
Loan Characteristics
The REEL pilot distributed 339 loans over two and a half years (July 2016–December 2018) and generated
a total of $5,784,229 in financing through seven participating Lenders. Notably, the bulk of REEL financing
(92% of the loans to date) has been through the two statewide CUs, California Coast CU and Matadors
Community CU. As shown in Table 66, the average loan size was $17K, the average loan term is about 10
years and on average, customers are paying about $200 per month to repay the loan and pay an average of
7% in interest.
Table 66. REEL Loan Product Summary Inception through December 2018 (N=339)
Characteristic Average Median Range
Loan Amount $17,063 $14,350 $2,500 – $50,000
Interest Rate 7.04% 6.88% 4.50% – 8.95%
Loan Term 117 months 120 months 24 – 180 months
Monthly Payment $216 $189 $50 – $801
Source: CAEATFA tracking data.
Table 67. REEL Loan Product Summary Inception through July 2018 (N=212)
Characteristic Average Median Range
Loan Amount $17,246 $14,174 $3,366 – $50,000
Interest Rate 6.95% 6.88% 4.50% - 8.95%
Loan Term 117 months 120 months 24 – 180 months
Monthly Payment $219 $181 $50 – $801
Source: CAEATFA tracking data.
The REEL program requires participants to hire contractors through a network of REEL-certified contractors.
In the two-and-a-half-year period, REEL certified 282 contractors but less than half (42% or 119) of them
completed projects with REEL financing. Of those that completed REEL-financed projects, most (79 of 119, or
66%) completed one to two projects. The most projects completed by any one contractor company (based on
Contractor State License Board number) was 28.
Summary of Achievements
Table 68 below summarizes what the REEL pilot has accomplished according to CAEATFA’s tracking data,
organized by Resolution E-4900 metrics. Notably, many of the data points in the table below will require
further investigation by the evaluation team to confirm the pilot’s achievements.

Early Participant Characterization Memo
opiniondynamics.com Page 168
Table 68. REEL Participant Characteristics Related to Resolution E-4900 Metrics
Goal
Summary of CAEATFA Data for Evaluation Period
(Inception through July 2018)
Summary of CAEATFA Data for All Data Received (Inception
through Dec 2018)
The financing tool is
scalable
▪ 212 loans issued; generally positive growth in loan volume month-to-
month, despite some seasonal fluctuations
▪ $3.7M in financing generated
▪ Concentration of participation in Southern California, and gradual
expansion into Northern California and the Central Valley
▪ 339 loans issued; generally positive growth in loan volume
month-to-month, despite some seasonal fluctuations
▪ $5.8M in financing generated
▪ Concentration of participation in Southern California, and
gradual expansion into Northern California and the Central
Valley
The financing tool is
leveraged by private
capital and support
▪ Four Lenders, all of which are CUs
▪ Participation was concentrated within one lender; California Coast CU
represents 71% of private capital
▪ $3.7M in private capital attracted
▪ Seven Lenders, all of which are CUs
▪ Participation was concentrated within one lender; California
Coast CU represents 65% of private capital
▪ $5.8M in private capital attracted
The financing tool
reaches underserved
Californians who would
not otherwise have
participated in EE
upgrades
▪ 76% of participants have “good” or “excellent” credit (FICO above 700);
8% had “very poor” or “fair” credit (FICO below 641); the remaining
16% had moderate credit scores
▪ Average loan term was 117 months; 142 loans (67%) had longer terms
than the Lenders’ comparable signature products
▪ 30% of loans received the “underserved” credit enhancement based
on census tract (29) or household income (35) (none on FICO score);
however, it is necessary to conduct further research to confirm the
number of “underserved” borrowers
▪ 13% of loans were issued to borrowers in the most vulnerable
communities as defined by CalEnviro Score (above the 75th percentile)
▪ 75% of participants have “good” or “excellent” credit (FICO
above 700); 6% had “very poor” or “fair” credit (FICO below
641); the remaining 19% had moderate credit scores
▪ Average loan term was 117 months; 236 loans (70%) had
longer terms than the Lenders’ comparable signature
products
▪ 38% of loans received the “underserved” credit
enhancement based on census tract (92), household income
(37), or FICO score (1); however, it is necessary to conduct
further research to confirm the number of “underserved”
borrowers
▪ 14% of loans were issued to borrowers in the most vulnerable
communities as defined by CalEnviro Score (above the 75th
percentile)
The financing tool
produces energy
savings
▪ Participants, on average, saved 12.8% of their gross annual electric
usage and 2.6% of their gross annual gas usage, which amounts to
741 kWh and 11 therms in annual savings per participant.
▪ On average, participants completed two measures. HVAC (151
measures) and building shell (123 measures) were the most common
types of measures.
▪ On average, participants completed two measures. HVAC
(241 measures) and building shell (199 measures) were the
most common types of measures.
Source: CAEATFA tracking data.

Early Participant Characterization Memo
opiniondynamics.com Page 169
The next sections provide further detail on characteristics to-date by metric category.
Scalability
The number of loans closed per month has grown steadily over time. Specifically, half of the months during
this period saw a positive increase in number of loans, thirteen saw a decrease, and two were neutral.
According to CAEATFA, the summer peaks in activity may be because many projects were in areas where the
cooling season is more of a concern for homeowners than the heating season (for example, Southern
California). The upward trend could be due in part to several program design changes related to the EEEMs
list, LLR account organization, decoupling from IOU programs, and loan application requirements and
processes – all of which potentially made REEL loans more attractive for lenders, contractors, and
borrowers. Figure 21 and Figure 22 show the growth in the number of loans and the loan volume on a
month-by-month basis. Although there can be a lag between the initiation of pilot changes and their effects
on the enrollment of REEL loans, the red lines in Figure 1 mark the date of key design changes and the red
lines in Figure 22 mark the dates that each Lender enrolled their first REEL loan. While more research is
needed to assess the extent to which such changes contributed to increased participation, these dates
provide useful context for understanding progress-to-date. For instance, the largest uptick in loan volume
occurred after California Coast CU enrolled their first loan in January 2017, and another notable uptick
occurred after CAEATFA made design changes in March 2018.
Figure 21. Month-to-Month REEL Loan Growth over Program Design Changes
Source: CAEATFA tracking data

Early Participant Characterization Memo
opiniondynamics.com Page 170
Figure 22. Month-to-Month REEL Loan Growth over Lender 1st Loan Date
Source: CAEATFA tracking data
REEL loans were used to finance home upgrades in 30 counties, which is just over half of the 54 counties in
California served by the IOUs. Notably, 18 of these counties saw five loans or less, with the bulk of participation
coming from Southern California. Four counties in particular– Los Angeles, Kern, San Diego and Orange
County– accounted for over half of the loans enrolled in REEL (163 of 339, or 48%) and 47% of the total
financing generated by the pilot ($2.7M). Given the total number of REEL Lenders (four as of July 2017 and
seven as of January 2019) and the pilot phase of REEL at this time, it is natural to see a geographic
concentration of the loans in the areas where both statewide and local Lenders operate (as is the case for
Kern, Orange and Los Angeles counties) and then a gradual expansion to other areas after establishing a
foothold. Over time, participation has continued to grow in the San Francisco Bay Area and Greater Northern
California (especially Sacramento County), and there has been a notable expansion into the Central California
(for example, Fresno County).
Figure 23 depicts the distribution of REEL loans at the county-level at four distinct points in time: 1.25 years
into the pilot (November 2017), 1.75 years into the pilot (May 2018), 2 years into the pilot (July 2018) and
two and a half years into the pilot (December 2018). The first two dates were chosen to assess the impact, if
any, that program design changes occurring in the preceding months had on the geographic distribution of
loans. The fourth map provides the most current spread of REEL loan products.

Early Participant Characterization Memo
opiniondynamics.com Page 171
Figure 23. REEL Loan Distribution Over Time (by County)
Source: CAEATFA tracking data

Early Participant Characterization Memo
opiniondynamics.com Page 172
Figure 24 provides a slightly different view of the current spread of participation by examining REEL loans
per capita, thereby controlling for Southern California’s high population density. While the general spread of
participation still holds, Figure 24 shows that the program has gained significant penetration in lower
population areas such as the north coast and the Sierra Nevada.
Figure 24. REEL Loans per Capita
Source: CAEATFA tracking data for Loan Volume and Demographic Research Unit of the California Department of Finance for 2017
population estimates by county. (Available here: http://www.dof.ca.gov/Forecasting/Demographics/)
Privately Leveraged
The pilot contributed $787,737 in ratepayer funds to the LLR for the 339 REEL loans during this period. In
response, the pilot attracted more than seven times that amount in private capital ($5,784,229 in loans).
REEL currently partners with seven FIs (Lenders), all of which are CUs. Of the seven lenders, five are local
CUs (that is, serving a specific region) and two are statewide CUs. Figure 25 shows the distribution of REEL
loans throughout California, distinguishing between the two statewide Lenders (California Coast CU and
Matadors Community CU) and the regional Lenders, and shows that the statewide Lenders represent most
of the loan activity (see Table 69 for detailed statistics). Further, while California Coast CU and Matadors
Community CU branch locations are limited to Southern California, they have successfully closed loans
throughout the state.

Early Participant Characterization Memo
opiniondynamics.com Page 173
Figure 25. Distribution of REEL Loans by Lender
Source: CAEATFA tracking data
Table 69 shows the breakout of loans, private financing and ratepayer LLR contribution by Lender. Again, the
bulk of REEL financing has been through the two statewide CUs, California Coast and Matadors Community
CU.
Table 69. REEL Loan Summary by Lender (Inception through December 2018)
Lender Date of First Loan
# of
Loans
Original Loan
Amount (Private
Capital) LLR Contribution
Private
Capital by
Lender (%)
California Coast CU 1/13/2017 224 $3,756,058 $496,250 65%
Matadors Community CU 7/19/2016 85 $1,560,791 $227,760 27%
Desert Valleys Federal CU 9/11/2017 12 $189,553 $25,701 3%
First US Community CU 9/28/2018 8 $116,526 $15,925 2%
Eagle Community CU 8/10/2018 5 $79,337 $12,615 1%
Valley Oak CU 11/28/2016 4 $62,645 $7,581 1%
Pasadena Service Federal CU 9/20/2018 1 $19,319 $1,905 0%
Total 339 $5,784,229 $787,737 100%
Source: CAEATFA tracking data.
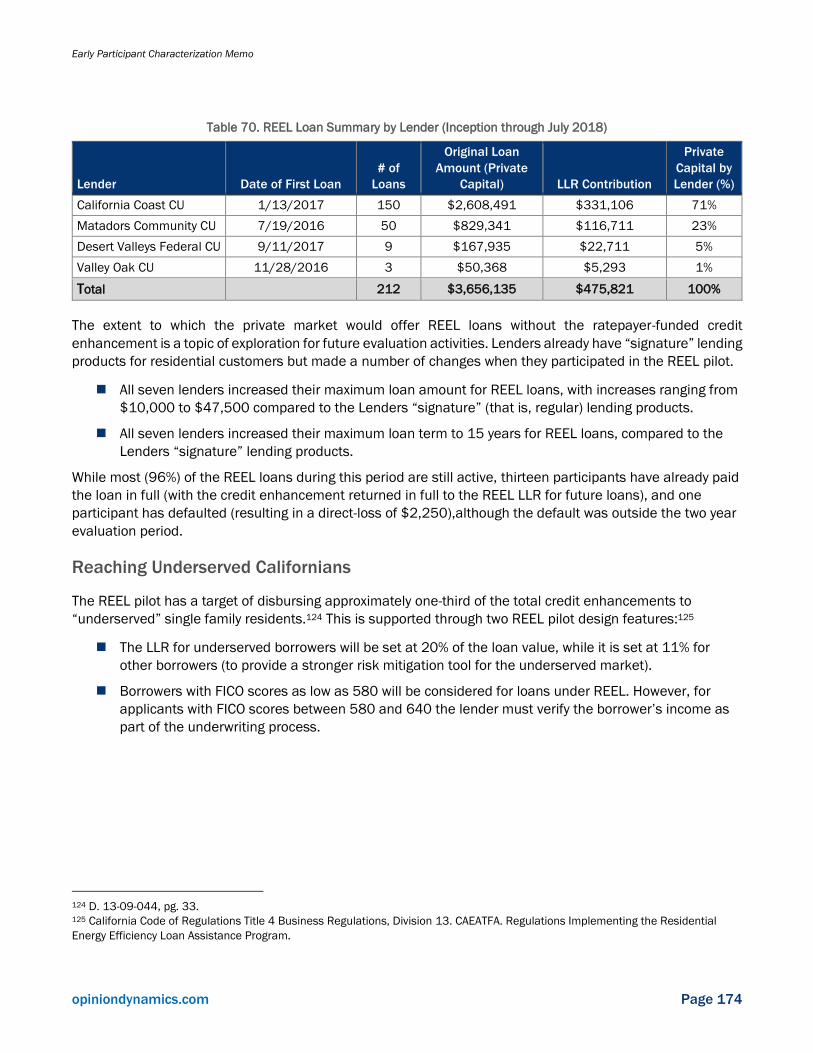
Early Participant Characterization Memo
opiniondynamics.com Page 174
Table 70. REEL Loan Summary by Lender (Inception through July 2018)
Lender Date of First Loan
# of
Loans
Original Loan
Amount (Private
Capital) LLR Contribution
Private
Capital by
Lender (%)
California Coast CU 1/13/2017 150 $2,608,491 $331,106 71%
Matadors Community CU 7/19/2016 50 $829,341 $116,711 23%
Desert Valleys Federal CU 9/11/2017 9 $167,935 $22,711 5%
Valley Oak CU 11/28/2016 3 $50,368 $5,293 1%
Total 212 $3,656,135 $475,821 100%
The extent to which the private market would offer REEL loans without the ratepayer-funded credit
enhancement is a topic of exploration for future evaluation activities. Lenders already have “signature” lending
products for residential customers but made a number of changes when they participated in the REEL pilot.
◼ All seven lenders increased their maximum loan amount for REEL loans, with increases ranging from
$10,000 to $47,500 compared to the Lenders “signature” (that is, regular) lending products.
◼ All seven lenders increased their maximum loan term to 15 years for REEL loans, compared to the
Lenders “signature” lending products.
While most (96%) of the REEL loans during this period are still active, thirteen participants have already paid
the loan in full (with the credit enhancement returned in full to the REEL LLR for future loans), and one
participant has defaulted (resulting in a direct-loss of $2,250),although the default was outside the two year
evaluation period.
Reaching Underserved Californians
The REEL pilot has a target of disbursing approximately one-third of the total credit enhancements to
“underserved” single family residents.124 This is supported through two REEL pilot design features:125
◼ The LLR for underserved borrowers will be set at 20% of the loan value, while it is set at 11% for
other borrowers (to provide a stronger risk mitigation tool for the underserved market).
◼ Borrowers with FICO scores as low as 580 will be considered for loans under REEL. However, for
applicants with FICO scores between 580 and 640 the lender must verify the borrower’s income as
part of the underwriting process.
124 D. 13-09-044, pg. 33. 125 California Code of Regulations Title 4 Business Regulations, Division 13. CAEATFA. Regulations Implementing the Residential
Energy Efficiency Loan Assistance Program.

Early Participant Characterization Memo
opiniondynamics.com Page 175
CAEATFA’s implementation of these design features includes a 20% credit enhancement to borrowers who
meet any of the following criteria:
1. LMI: Household Income: CAEATFA initially provided the 20% enhancement to borrows whose Lender-
reported household income falls below the LMI threshold for the area in which the borrower resides.
However, CAEATFA has noted several issues with this approach, including that Lenders calculated
household income inconsistently, assumed a household of four, and typically excluded spousal income.
As a result, CAEATFA discontinued this approach in March 2018 in favor of the Census Tract approach
below
2. LMI: Census Tract: The property upgraded with the REEL loan resides in a census tract in which the
median income does not exceed 120% of AMI.
3. Credit-Challenged: The borrower has a credit score below 640 and the Lender participates in the Credit-
Challenged Program. This program entails an additional agreement between CAEATFA and the Lender to
provide lower rates and longer terms to credit-challenged individuals.
Over the two-and-a-half-year period, CAEATFA has provided the 20% credit enhancement to 130 of the 339
borrowers (38%) according to these criteria listed above, with the reason for their classification summarized
in Table 71. This totals to $389,091 in credit enhancements, or 49% of total enhancements.
Table 71. REEL Loans by Underserved Designation (Inception through December 2018)
Credit Enhancement Level # of Loans
% of Loans
(n=339)
Not Underserved - 11% enhancement 209 62%
Underserved – 20% enhancement 130 38%
Credit-Challenged 1 0%
LMI: Household Income (Lender-Reported) 37 11%
LMI: Census Tract 92 27%
Source: CAEATFA data/
Table 72. REEL Loans by Underserved Designation (Inception though July 2018)
Credit Enhancement Level # of Loans
% of Loans
(n=212)
Not Underserved - 11% enhancement 148 70%
Underserved – 20% enhancement 64 30%
Credit-Challenged 0 0%
LMI: Household Income (Lender-Reported) 35 17%
LMI: Census Tract 29 14%
Source: CAEATFA data
Through review of the data and discussions with CAEATFA, the evaluation team noted several cases related to
LMI qualification that suggest the true percentage of credit enhancements going to underserved borrowers
may be understated. Specifically, as shown in Table 73, 102 borrowers who live in LMI census tracts did not
receive the underserved credit enhancement and 56 who do not live in LMI census tracts did receive it. In the
latter case, the Lender had reported the household as LMI based on household income. To address this issue,
CAEATFA’s quarterly reports provide the percentage of borrowers whose properties are in LMI census tracks,

Early Participant Characterization Memo
opiniondynamics.com Page 176
regardless of the initial credit enhancement level. The evaluation team will investigate this topic further by
collecting data on the characteristics of REEL borrowers who respond to the participant survey.
Table 73. REEL Loans by LMI Tract and Credit Enhancement Level (Inception through December 2018)
Credit Enhancement Level
LMI Census Tract
Yes No Total
Underserved – 20% enhancement 74 56 130
Not Underserved - 11% enhancement 102 107 209
Total 176 163 339
Source: CAEATFA data.
Note: Green areas denote areas of potential misalignment between credit enhancement
level and borrower characteristics.
Table 74. REEL Loans by LMI Tract and Credit Enhancement Level (Inception through July 2018)
Credit Enhancement Level
LMI Census Tract
Yes No Total
Underserved – 20% enhancement 35 29 64
Not Underserved - 11% enhancement 69 79 148
Total 104 108 212
Source: CAEATFA data.
Note: Green areas denote areas of potential misalignment between credit enhancement
level and borrower characteristics.
Only one loan in the two-and-a-half-year period has qualified for the 20% credit assessment based on FICO
score (notably, this customer’s property is also in an LMI census tract). As mentioned earlier, Lenders must
participate in the Credit-Challenged Program to receive the higher credit enhancement for credit-challenged
individuals. As such, Table 75 and Table 77 show a number of borrowers who did not qualify for the higher
credit enhancement yet have credit scores under 641 or have DTI ratios exceeding 36%. These are both
generally-accepted indicators of low creditworthiness and likely make it difficult for borrowers to qualify for
traditional loans in the market. This provides further evidence to suggest that the pilot has provided more
benefit to underserved segments than CAEATFA’s initial credit enhancement classification depicts.
Table 75. REEL Loans by FICO Score and Credit Enhancement Level (Inception through December 2018)
Credit Enhancement Level
FICO Score
580-640 641-700 701-760 761-820 821+ Total
Underserved – 20% enhancement 10 22 55 32 11 130
Not Underserved - 11% enhancement 12 42 81 61 13 209
Total 22 64 136 93 24 339
Source: CAEATFA data.
Note: Green areas denote areas of potential misalignment between credit enhancement level and borrower characteristics.

Early Participant Characterization Memo
opiniondynamics.com Page 177
Table 76. REEL Loans by FICO Score and Credit Enhancement Level (Inception through July 2018)
Credit Enhancement Level
FICO Score
580-640 641-700 701-760 761-820 821+ Total
Underserved – 20% enhancement 5 5 33 14 7 64
Not Underserved - 11% enhancement 11 29 57 42 9 148
Total 16 34 90 56 16 212
Source: CAEATFA data.
Note: Green areas denote areas of potential misalignment between credit enhancement level and borrower characteristics.
Table 77. REEL Loans by DTI Ratio and Credit Enhancement Level (Inception through December 2018)
Credit Enhancement Level
DTI Ratio
Under 25% 25-35% 36-45% 46-55% Total
Underserved – 20% enhancement 28 29 50 23 130
Not Underserved - 11% enhancement 28 78 63 40 209
Total 56 107 113 63 339
Source: CAEATFA data.
Note: Green areas denote areas of potential misalignment between credit enhancement level and borrower characteristics.
Table 78. REEL Loans DTI Ratio and Credit Enhancement Level (Inception through July 2018)
Credit Enhancement Level
DTI Ratio
Under 25% 25-35% 36-45% 46-55% Total
Underserved – 20% enhancement 14 10 23 17 64
Not Underserved - 11% enhancement 15 57 48 28 148
Total 29 67 71 45 212
Source: CAEATFA data.
Note: Green areas denote areas of potential misalignment between credit enhancement level and borrower characteristics
Aside from the LMI and creditworthiness characteristics, CalEnviro Scores for REEL borrowers’ census tracts
offer additional insight into how the REEL loan product is penetrating vulnerable or harder-to-reach
communities. Table 79 indicates that more than a third of REEL loans (in terms of products and volume of
financing) are going to the least vulnerable census tracts (with scores between the 1st and 25th percentile).
The most vulnerable census tracts, with CalEnviro Scores above the 75th percentile (that is, those with the
highest 25% of scores for pollution burden and socioeconomic vulnerability) received just over 12% of the total
loan volume and only 14% of all REEL loans.
Table 79. REEL Loan Summary by CalEnviro Score (Inception through December 2018)
CalEnviro Score (Percentile) # of Loans
# of Loans
(%)
Total Loan
Volume
Total Loan
Volume (%)
Average Loan
Size
Less Vulnerable 1-25 112 33% $2,057,450 36% $18,370
26-50 100 29% $1,678,806 29% $16,788
51-75 81 24% $1,341,605 23% $16,563
More Vulnerable 76-100 46 14% $702,345 12% $15,268
Grand Total 339 100% $5,780,206 100% $17,051
Source: CAEATFA tracking data.

Early Participant Characterization Memo
opiniondynamics.com Page 178
Table 80. REEL Loan Summary by CalEnviro Score (Inception through July 2018)
CalEnviro Score (Percentile) # of Loans
# of Loans
(%)
Total Loan
Volume
Total Loan
Volume (%)
Average Loan
Size
Less Vulnerable 1-25 71 33% $1,299,764 36% $18,307
26-50 69 33% $1,085,289 30% $15,729
51-75 45 21% $825,671 23% $18,348
More Vulnerable 76-100 27 13% $445,325 12% $16,494
Grand Total 212 100% $3,656,049 100% $17,246
Source: CAEATFA tracking data.
The pilot’s design is intended to attract underserved borrowers by offering more favorable loan terms (for
example, longer pay-back periods or lowered interest rates) compared to alternative financing options. REEL
has notable success in this area, with expanding financing to lower FICO-score borrowers at three of the seven
Lenders, as well as increasing the loan term periods, and offering no pre-payment penalties or closing costs.
On the other hand, the 12 loans that have already been paid back in full suggest the possibility that the lack
of a pre-payment penalty and the low monthly payment may encourage some customers who did not truly
need the financing to use REEL financing as “bridge funding” (that is, with the intention to pay the loan back
very quickly).
Energy Savings
CAEATFA data does not calculate ex-ante energy savings associated with REEL projects. A review of the
measures received to date provides a glimpse into the potential sources and end-uses of REEL energy
savings. Out of 34 unique measure categories, on average, borrowers installed two measures at a time and
the most common measure type was HVAC equipment and/or ductwork. This trend has remained consistent
between the first-two-year evaluation period (F2Y) and the post-evaluation period (post-F2Y). Table 81
summarizes the measure mix of REEL-financed projects by electric and gas service provider.
Table 81. Measure Types Financed by REEL Projects
Measure F2Y (N=212) Post F2Y (N=127) All (N=339)
Average Number of Measures 2 2 2
HVAC
HVAC Equipment 69% 64% 67%
Ductwork 27% 37% 31%
Building Envelope
Windows 33% 23% 29%
Insulation 31% 24% 28%
Air Seal 11% 8% 10%
Cool Roof 10% 16% 12%
Radiant Barrier 2% - 1%
Water Heating
Water heater 10% 3% 9%
Low-flow shower head or faucet 1% 6% 1%

Early Participant Characterization Memo
opiniondynamics.com Page 179
Measure F2Y (N=212) Post F2Y (N=127) All (N=339)
Other
Smart Thermostat 5.7% 9% 7%
Lighting 2.4% 6% 2%
Pool products 1.9% 0% 2%
Refrigerator/Freezer 1% 2% 1%
Dishwasher 1% 2% 1%
Clothes Washer/Dryer 0.5% 1% 1%
Air purifier 0.5% - 0.3%
Other - unspecified 1% 1% 1%
Source: CAEATFA tracking data.
The evaluation team plans to conduct a consumption analysis to estimate energy savings from the REEL pilot.
Notably, this analysis will not be able to include all REEL projects during this period, as some projects
completed in late 2018 or 2019 do not have sufficient post-participation period data at this time. Based on
loan enrollment date,126 the evaluation team estimates that the consumption analysis will include 179
projects (approximately 52% of all REEL loans). For the remaining 160 loans, the evaluation team will explore
the feasibility of summarizing the potential savings based on prescriptive values for EEEMs measures.
In general, there is no strong evidence that average savings per project will be significantly different between
the F2Y and post-F2Y periods. Half of customers in the pilot (50%, N=339) did either HVAC Equipment only
or Building Envelope only, which are likely the measures with the most energy savings. The proportion of
Building Envelope projects has slightly increased in the post-F2Y period, but not significantly. The remaining
half of participants did a wide range of bundles with no dominant type of bundle, with the most common
being HVAC Equipment + Ductwork (10%), followed by HVAC Equipment + Building Envelope (9%). Notably,
while still small, the number of “Other” measures has generally increased post-F2Y. However, these
measures tend to be relatively low savers compared to Building Envelope and HVAC Equipment.
Table 82 compares the types of projects completed in the F2Y and post-F2Y periods. The table is ordered by
the potential for energy savings, assuming HVAC Equipment and Building Envelope generally have the most
potential for savings. Table 83 provides additional detail on how many projects contain “Other” measures
versus just HVAC Equipment, Building Shell, and/or Ductwork. The final report will include a similar
comparison of project included and not included in the consumption analysis to identify any potential
sources of bias.
Table 82. Percentage of Participants by Project Type, F2Y vs. Post-F2Y
Period
HVAC
Equipment +
Building
Envelope +
Ductwork
HVAC
Equipment +
Building
Envelope
HVAC
Equipment +
Ductwork
HVAC
Equipment
Building
Envelope
Everyone
Else
(No HVAC
or Building
Envelope) Total
F2Y (N=212) 12% 16% 13% 28% 28% 3% 100%
Post F2Y (N=127) 16% 10% 14% 24% 29% 7% 100%
All (N=339) 13% 14% 13% 27% 28% 5% 100%
126 Per CAEATFA, this is the date that the loan is considered enrolled in the pilot.
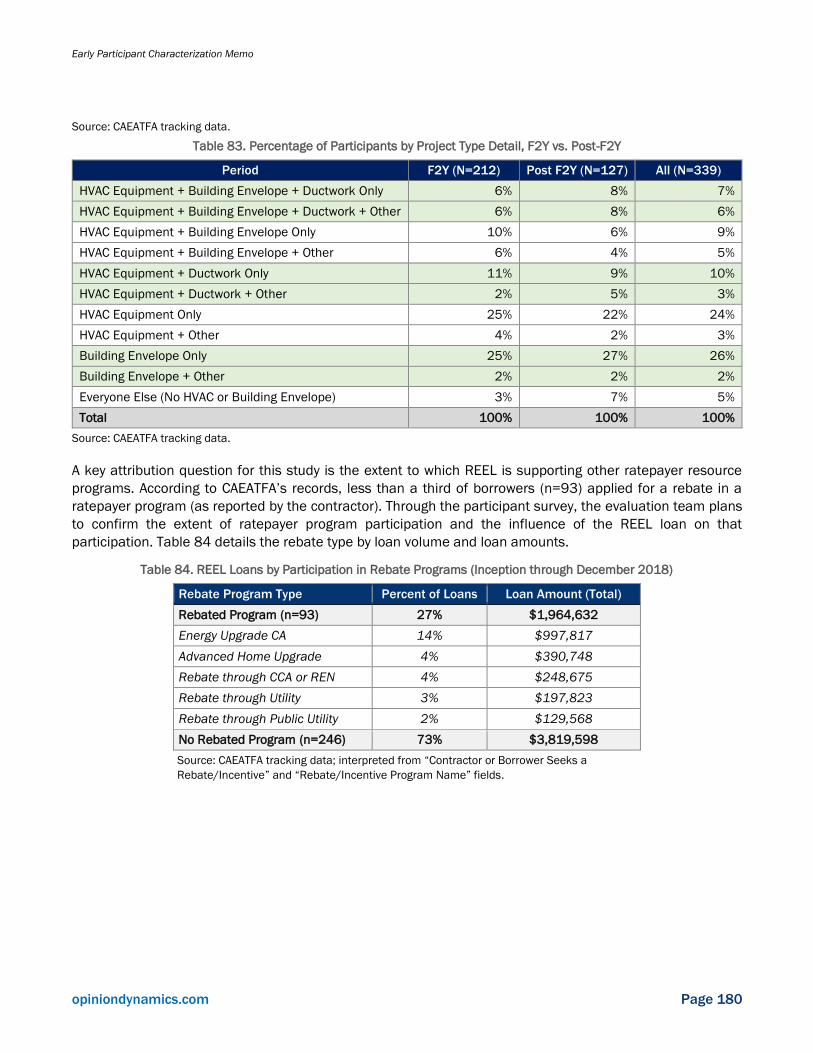
Early Participant Characterization Memo
opiniondynamics.com Page 180
Source: CAEATFA tracking data.
Table 83. Percentage of Participants by Project Type Detail, F2Y vs. Post-F2Y
Period F2Y (N=212) Post F2Y (N=127) All (N=339)
HVAC Equipment + Building Envelope + Ductwork Only 6% 8% 7%
HVAC Equipment + Building Envelope + Ductwork + Other 6% 8% 6%
HVAC Equipment + Building Envelope Only 10% 6% 9%
HVAC Equipment + Building Envelope + Other 6% 4% 5%
HVAC Equipment + Ductwork Only 11% 9% 10%
HVAC Equipment + Ductwork + Other 2% 5% 3%
HVAC Equipment Only 25% 22% 24%
HVAC Equipment + Other 4% 2% 3%
Building Envelope Only 25% 27% 26%
Building Envelope + Other 2% 2% 2%
Everyone Else (No HVAC or Building Envelope) 3% 7% 5%
Total 100% 100% 100%
Source: CAEATFA tracking data.
A key attribution question for this study is the extent to which REEL is supporting other ratepayer resource
programs. According to CAEATFA’s records, less than a third of borrowers (n=93) applied for a rebate in a
ratepayer program (as reported by the contractor). Through the participant survey, the evaluation team plans
to confirm the extent of ratepayer program participation and the influence of the REEL loan on that
participation. Table 84 details the rebate type by loan volume and loan amounts.
Table 84. REEL Loans by Participation in Rebate Programs (Inception through December 2018)
Rebate Program Type Percent of Loans Loan Amount (Total)
Rebated Program (n=93) 27% $1,964,632
Energy Upgrade CA 14% $997,817
Advanced Home Upgrade 4% $390,748
Rebate through CCA or REN 4% $248,675
Rebate through Utility 3% $197,823
Rebate through Public Utility 2% $129,568
No Rebated Program (n=246) 73% $3,819,598
Source: CAEATFA tracking data; interpreted from “Contractor or Borrower Seeks a
Rebate/Incentive” and “Rebate/Incentive Program Name” fields.

Detailed Cost-Effectiveness Analysis Methods and Inputs
opiniondynamics.com Page 181
Appendix B. Detailed Cost-Effectiveness Analysis Methods and
Inputs
Cost-effectiveness was conducted using a FPM that is an interpretation of the California SPM. The FPM
accounts for the C/B ratio associated with financing programs that are not incurred in traditional rebate
programs.
Financing Program Model
The evaluation team applied the costs and assessed the benefits achieved by the REEL pilot to address the
CPUC’s evaluation objectives and also took a future-oriented approach to assess specific performance levels
(that is, attributable savings) that would be needed for a theoretical REEL program to prove cost-effective
under the TRC, SCT, or PAC using a finance-specific interpretation of California’s SPM.
Prior to the launch of REEL, Dunsky presented the “Cost-Effectiveness of Energy Efficiency Financing
Programs” whitepaper127 to the CPUC during the Financing and Non-Resource Program Evaluation work
conducted by Opinion Dynamics and Dunsky from 2013 to 2018. The whitepaper provides an interpretation
of the California SPM based on a comprehensive view of finance-related costs and benefits relevant to each
of the cost-effectiveness tests therein.
Table 85 provides a list of key inputs used for the TRC and PAC.
Table 85. Financing Program Model and Key Inputs
Input Description TRC PAC
Administration
Non-financing expenditures, including overhead, program management, program
support, evaluation, enabling strategies (communications, marketing and outreach,
done by IOUs), costs and fees for service (data management, contractor management).
These exclude setup costs.
✓ ✓
LLR
Costs associated with the LLR, including fees for service (bank trustee and master
servicer), direct losses, lost opportunity cost of capital (spread between LLR fund’s
anticipated rate of return and that capital’s assumed value if not used for an LLR)
(assumed equal to the IOU weighted average cost of capital).
✓ ✓
Participant
Cost The incremental cost of RFP- driven measures. ✓
Avoided Costs
Utility- avoided costs related to generation and distribution of energy from
conventional power plants and natural gas lines. Values are based on the 2017
Avoided Cost Model produced by Energy + Environmental Economics, Inc. (E3) for use
in demand- side cost-effectiveness proceedings at the CPUC.
✓ ✓
Leveraging
Effect of LLR
For an LLR that is maintained at 10% of the overall loan pool for the RFPs, thus a 10:1
leveraging ratio is applied for private loan capital to program capital. Similar leverage
ratios can be calculated for other LLR coverage rates.
✓ ✓
NEBs The environmental, economic, and health-related externalities. ✓
Reduced
Borrowing Cost Consumers benefit from lower interest rates and/or longer loan terms. ✓
127 Dunsky. 2016. Cost-Effectiveness of Energy Efficiency Financing Programs - Methodology & Strategic Issues.

Detailed Cost-Effectiveness Analysis Methods and Inputs
opiniondynamics.com Page 182
Input Description TRC PAC
Market
Transformation
Assumes that the program/pilots will generate some degree of market effects as a
percent of EEEM benefits, leading to continued incremental activity after its initial two-
year life.
✓
Note: Prior to launching the RFPs, the IOUs will have incurred material setup costs, including costs relating to administration,
overhead, and marketing and outreach to lenders and others. The evaluation team treated these as sunk costs for the purposes of
this analysis.
As shown in the table above, the FPM includes the following considerations.
◼ The LLR: A fundamental difference between innovative financing programs/pilots and conventional
rebate programs relates to time. Specifically, while rebate costs are incurred as measures are
adopted, costs associated with the LLR are primarily incurred after loans are made, typically over a
period of many years, and at unknown amounts at the outset. For example, a rebate is issued
following the purchase and installation of an eligible measure, whereas the LLR may have to cover a
portion of a participating lender’s losses if, when, and to the extent such losses occur over the life of
the loan.
Furthermore, the LLR is expected to be used as leverage to increase the total loan book volume for
both LMI borrowers and all other borrowers. Holding the funds in an LLR creates leveraging
opportunity across the project lifetime (benefit), but also results in lost opportunity cost of capital —
the spread between the LLR fund’s anticipated rate of return and that capital’s assumed value if not
used for an LLR (cost).
◼ Reduced Borrowing Costs: Mitigating eligible loans for lenders (through an LLR that backstops 90%
of the total outstanding value of loans). These consumers gain benefits from lower interest rates
and/or longer loan terms.
◼ NEBs: The CPUC does not historically account for NEBs. Since 2011, the avoided-cost model
includes an avoided GHG cost, so while not strictly financial, other than this one non-energy impact,
the EE cost-effectiveness tests do not contain any non-energy impacts.128 The REEL program differs
from rebate programs in two significant ways:
◼ REEL allows up to 30% of the financed project to include non-EEEMs to support comprehensive
projects.
◼ REEL offers an LLR that covers the entire value of the projects financed regardless of the portion
invested in EEEMs versus non-EEEM investments.
Neglecting NEBs would effectively allow the TRC129 to make an arguably weak assumption: that
consumers would voluntarily assume debt for zero benefit. Indeed, past studies show that NEBs
comprise a significant portion of the benefits in residential programs, outweighing the energy
benefits and costs. For example, in the evaluation of three RFPs,130 it was observed that the APR
reduction made up the largest portion of benefits to participants, and without considering these
benefits, the programs would not have passed cost-effectiveness tests. Moreover, studies commonly
find NEB values exceed avoided-energy costs for residential weatherization and HVAC programs. A
128 Societal Cost Test Workshop, Societal Cost Test Introduction (SCT): Background and Staff Research. September 22, 2016. 129 NEBs apply only to the TRC, since they provide no value to the PA. 130 ODC and Dunsky. 2017. Regional Finance Program Attribution and Cost-Effectiveness Study: Final Report.

Detailed Cost-Effectiveness Analysis Methods and Inputs
opiniondynamics.com Page 183
2014 PG&E study131 of EUC found NEBs far outweigh bill savings (the evaluation team interpreted it
at 129% of avoided-energy costs).
Even the REEL participant survey conducted for this analysis showed that, while the primary interest
in EE programs is for the bill savings (29%), others were motivated by improving comfort (24%) and
environmental benefits (12%). See Chapter 8.
◼ Market Transformation: The REEL pilot is partly driven by a desire to transform the EE market by
demonstrating to lenders that specialized efficiency loans provide a preferential risk/return profile.
The evaluation team’s analysis attempts to capture the value that the REEL pilot/future program will
generate through market effects, leading to continued incremental efficiency lending after the initial
program/pilot period. An early process evaluation of REEL132 recommended development of a public
database to help transform the market by making loan and project performance available. This
would benefit participating REEL lenders and inform other lenders interested in joining the pilot or a
future program. While several lenders interviewed said that REEL loans are performing well,
information is not shared widely; therefore, market effects are estimated to be modest.
Algorithms for Financing Program Model
While the California SPM provides a framework for evaluating cost-effectiveness, it was designed specifically
to evaluate rebate or incentive programs; it does not consider the unique distinctions of EE financing. The
FPM is an interpretation of the TRC and PAC SPM framework that reconsiders existing inputs and includes
new inputs.
Below are the high-level algorithms for each model and details of the adapted benefits and costs by
component for the TRC and PAC.
Table 86. TRC/SCT High-Level Algorithm
Standard Practice Manual Financing Program Model
𝐵𝑇𝑅𝐶 = ∑𝑈𝐴𝐶𝑡 + 𝑇𝐶𝑡
(1 + 𝑑)𝑡−1
𝑁
𝑡=1
+ ∑𝑈𝐴𝐶𝑎𝑡 + 𝑃𝐴𝐶𝑎𝑡
(1 + 𝑑)𝑡−1
𝑁
𝑡=1
𝐶𝑇𝑅𝐶 = ∑𝑃𝑅𝐶𝑡 + 𝑃𝐶𝑁𝑡 + 𝑈𝐼𝐶𝑡
(1 + 𝑑)𝑡−1
𝑁
𝑡=1
𝐵𝑇𝑅𝐶 = 𝐸𝐵𝐸𝐸𝐸𝑀 + 𝑁𝐸𝐵𝐸𝐸𝐸𝑀 + 𝐶𝐶𝑆 + 𝑀𝑇𝐵
𝐶𝑇𝑅𝐶 = 𝐶𝑃𝐴𝐶 + 𝐿𝐿𝑅𝐶 + 𝑃𝐶𝑁 + 𝑈𝐼𝐶
Where:
BTRC = Benefits of the program
CTRC = Costs of the program
UACt = Utility-avoided supply costs in year t
TCt = Tax credits in year t
UACat = Utility-avoided supply costs for the alternate fuel in year t
PACat = PA program costs for alternate fuel in year t
PRCt = PA program costs in year t
PCNt = Net participant costs in year t
UICt = Utility increased supply costs in year t
d = discount rate
Where:
BTRC = Benefits of the program
CTRC = Costs of the program
EBEEEM = Energy benefits from EEEMs
NEBEEEM = NEBs from EEEMs
CCS = Capital cost savings
MTB = Benefits from market transformation
CPAC = PA program costs
LLRC = LLR costs
PCN = Net participant costs
UIC = Utility increased supply costs
131 Opinion Dynamics and Research Into Action. 2014. PG&E Whole House Program: Marketing and Targeting Analysis. 132 Evergreen Economics. 2017.

Detailed Cost-Effectiveness Analysis Methods and Inputs
opiniondynamics.com Page 184
Adapted TRC/SCT Benefits (By Component)
1) EBEEEM: Energy Benefits from Eligible Energy Efficiency Measures
𝐸𝐵𝐸𝐸𝐸𝑀 = ∑𝐶𝐴𝐸𝑆𝑡 × 𝐴𝐶𝑡
(1 + 𝑑)𝑡−1
𝑁
𝑡=1
Where:
CAESt Cumulative Annual Gross Energy savings in year t
ACt Avoided costs in year t
d Discount rate
2) NEBEEEM: Non-Energy Benefits from Eligible Energy Efficiency Measures
𝑁𝐸𝐵𝐸𝐸𝐸𝑀 = 𝑉𝑁𝐸𝐵𝐸𝐸𝐸𝑀 × 𝐸𝐵𝐸𝐸𝐸𝑀
Where:
VNEBEEEM Value of NEBs for EEEMs as a percent of avoided costs
3) CCS: Capital Cost Savings
𝐶𝐶𝑆 = 𝐴𝑃𝑅𝐵𝐸𝑁𝐸𝐹𝐼𝑇 × [𝑟
1 − (1 + 𝑟)−𝑛−
𝑟′
1 − (1 + 𝑟′)−𝑛] × ∑ ∑
𝐼𝑡
(1 + 𝑑)𝑡+𝑖−2
𝐿𝐷
𝑖=1
𝑁
𝑡=1
Where:
𝑟 = 𝐴𝑃𝑅𝐵𝐴𝑆𝐸𝐿𝐼𝑁𝐸
𝑟′ = 𝐴𝑃𝑅𝐵𝐴𝑆𝐿𝐼𝑁𝐸 − 𝐴𝑃𝑅𝑇𝑅𝐼𝐶𝐾𝐿𝐸
APRBASELINE APR Baseline: Assumed weighted average APR for benefiting participants
APRTRICKLE APR Trickle is the reduction in participant APR attributable to LLR security
n Number of periods
It Investment in year t
APRBENEFIT Percent of participants who benefit from reduced APR
4) MTB: Market Transformation Benefits
𝑀𝑇𝐵 = 𝑀𝐸 × 𝐼𝐴𝐸𝑆𝐿𝑌 × ∑𝑀𝑇𝐵𝐶𝑡 × 𝐴𝐶𝑡
(1 + 𝑑)𝑡−1
𝑁
𝑡=1
Where:
IAESLY Incremental annual energy savings form the last year of the program
ME Market effects: the continued activity beyond pilots as a percent of IAESLY
MTBCt Market transformation benefits curve value in year t

Detailed Cost-Effectiveness Analysis Methods and Inputs
opiniondynamics.com Page 185
Adapted TRC/SCT Costs (By Component)
1) LLRC: Loan Loss Reserve Costs
𝐿𝐿𝑅𝐶 = 𝐿𝐿𝑅𝐿 + 𝐿𝑂𝐶𝐶 + 𝐿𝐿𝑅𝑀𝐶
Where:
LLRL Loan loss reserve losses
LOCC Lost opportunity cost of capital
LLRMC Lost opportunity reserve management costs
2) Loan Loss Reserve Losses
𝐿𝐿𝑅𝐿 = ∑ ∑ 𝐶𝐿𝑖 ×𝐿𝐿𝑅𝑡
(1 + 𝑑)𝑡+𝑖−2
𝐿𝐷
𝑖=1
𝑃𝐷
𝑡=1
Where:
LLRt Loan loss reserve fund in year t
CLi Covered losses expressed as a percentage of LLR in year i of the loan
LD Loan duration
3) Lost Opportunity Cost of Capital
𝐿𝑂𝐶𝐶 = (𝑑 − 𝑟𝐿𝐿𝑅) × ∑ ∑𝐿𝐿𝑅𝑡
(1 + 𝑑)𝑡+𝑖−2
𝐿𝐷
𝑖=1
𝑃𝐷
𝑡=1
Where:
rLLR Annual interest rate on LLR funds
LD Average duration of loans
4) Loan Loss Reserve Management Costs
𝐿𝐿𝑅𝑀𝐶 = ∑𝐿𝐿𝑅𝐹𝑡 + 𝐿𝐿𝑅𝑂𝑡
(1 + 𝑑)𝑡−1
𝑁
𝑡=1
Where:
LLRFt Loan loss reserve fund fees in year t
LLROt Loan loss reserve fund other costs in year t

Detailed Cost-Effectiveness Analysis Methods and Inputs
opiniondynamics.com Page 186
5) PCN: Net Participant Costs
𝑃𝐶𝑁 = ∑(𝐿𝐿𝑅𝑡 × 𝐿𝐴𝐿𝐿) + 𝑃𝐶𝑁𝐵,𝑡
(1 + 𝑑)𝑡−1× 𝑆𝐴 × 𝑃𝐶𝐸𝐸𝐸𝑀
𝑁
𝑡=1
Where:
PCNB,t Amount of non-borrowed participant contributions in year t
PCEEEM Incremental cost as a percent of total EEEM cost
Table 87. PAC High-Level Algorithm
Standard Practice Manual Financing Program Model
𝐵𝑃𝐴𝐶 = ∑𝑈𝐴𝐶𝑡
(1 + 𝑑)𝑡−1
𝑁
𝑡=1
+ ∑𝑈𝐴𝐶𝑎𝑡
(1 + 𝑑)𝑡−1
𝑁
𝑡=1
𝐶𝑃𝐴𝐶 = ∑𝑃𝑅𝐶𝑡 + 𝐼𝑁𝐶𝑡 + 𝑈𝐼𝐶𝑡
(1 + 𝑑)𝑡−1
𝑁
𝑡=1
𝐵𝑃𝐴𝐶 = 𝐸𝐵𝐸𝐸𝐸𝑀 + 𝑀𝑇𝐵
𝐶𝑃𝐴𝐶 = 𝑃𝑅𝐶 + 𝐿𝐿𝑅𝐶 + 𝑈𝐼𝐶
Where:
BPAC = Benefits of the program
CPAC = Costs of the program
UACt = Utility-avoided supply costs in year t
UACat = Utility-avoided supply costs for the alternate fuel in year t
PRCt = PA program costs in year t
INCt = Incentives paid to the participant by the sponsoring utility in year t
UICt = Utility increased supply costs in year t
Where:
BPAC = Benefits of the program
CPAC = Costs of the program
Note: All individual cost and benefit components described previously under TRC/SCT algorithm.
Discount Rates
Table 88 details the discount rates used in the model for each test and scenario with a brief description and
reference behind the input.
Table 88. Discount Rates
Low Medium High
PAC/TRC 7.5% – Weighted Average Cost of
Capital After Taxes for Utilitiesa
5.3% - Average of Low and High
Scenarios
3.0% – Suggested rate from
CPUC hearingb
SCT 3.9% – 2019 20-Year California
General Obligation Bond Yieldc
3.3% – 2019 5-Year California
General Obligation Bond Yield
1.4% – Stern Review: The
Economics of Climate Changed
a “The Basics of Cost-Effectiveness Analysis.” 2015. http://www.cpuc.ca.gov/WorkArea/DownloadAsset.aspx?id=5189.
b http://docs.cpuc.ca.gov/PublishedDocs/Efile/G000/M184/K627/184627134.PDF.
c https://neighborly-issuance-documents.s3.amazonaws.com/production/4d0c3ff3-a570-4ee3-a3b1-
f22e313a249c_os_1507132635.pdf.
d http://mudancasclimaticas.cptec.inpe.br/~rmclima/pdfs/destaques/sternreview_report_complete.pdf.
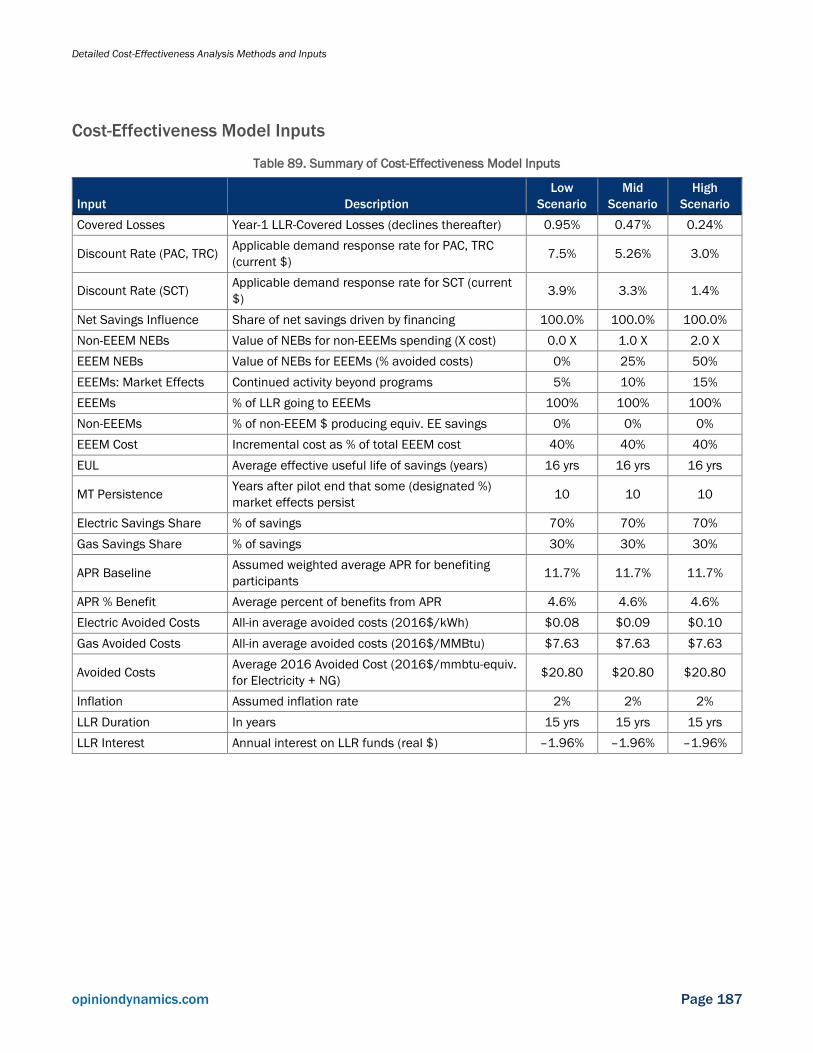
Detailed Cost-Effectiveness Analysis Methods and Inputs
opiniondynamics.com Page 187
Cost-Effectiveness Model Inputs
Table 89. Summary of Cost-Effectiveness Model Inputs
Input Description
Low
Scenario
Mid
Scenario
High
Scenario
Covered Losses Year-1 LLR-Covered Losses (declines thereafter) 0.95% 0.47% 0.24%
Discount Rate (PAC, TRC) Applicable demand response rate for PAC, TRC
(current $) 7.5% 5.26% 3.0%
Discount Rate (SCT) Applicable demand response rate for SCT (current
$) 3.9% 3.3% 1.4%
Net Savings Influence Share of net savings driven by financing 100.0% 100.0% 100.0%
Non-EEEM NEBs Value of NEBs for non-EEEMs spending (X cost) 0.0 X 1.0 X 2.0 X
EEEM NEBs Value of NEBs for EEEMs (% avoided costs) 0% 25% 50%
EEEMs: Market Effects Continued activity beyond programs 5% 10% 15%
EEEMs % of LLR going to EEEMs 100% 100% 100%
Non-EEEMs % of non-EEEM $ producing equiv. EE savings 0% 0% 0%
EEEM Cost Incremental cost as % of total EEEM cost 40% 40% 40%
EUL Average effective useful life of savings (years) 16 yrs 16 yrs 16 yrs
MT Persistence Years after pilot end that some (designated %)
market effects persist 10 10 10
Electric Savings Share % of savings 70% 70% 70%
Gas Savings Share % of savings 30% 30% 30%
APR Baseline Assumed weighted average APR for benefiting
participants 11.7% 11.7% 11.7%
APR % Benefit Average percent of benefits from APR 4.6% 4.6% 4.6%
Electric Avoided Costs All-in average avoided costs (2016$/kWh) $0.08 $0.09 $0.10
Gas Avoided Costs All-in average avoided costs (2016$/MMBtu) $7.63 $7.63 $7.63
Avoided Costs Average 2016 Avoided Cost (2016$/mmbtu-equiv.
for Electricity + NG) $20.80 $20.80 $20.80
Inflation Assumed inflation rate 2% 2% 2%
LLR Duration In years 15 yrs 15 yrs 15 yrs
LLR Interest Annual interest on LLR funds (real $) –1.96% –1.96% –1.96%

Acronyms, Abbreviations, and Finance Terms
opiniondynamics.com Page 188
Appendix C. Acronyms, Abbreviations, and Finance Terms
Table 90. Acronyms and Abbreviations
Acronym/
Abbreviation Definition
AB Assembly Bill
ACEEE American Council for an Energy-Efficient Economy
AHUP Advanced Home Upgrade Program
AMI Area Median Income
APR Annual Percentage Rate
ARRA American Recovery and Reinvestment Act
BAU Business as Usual
BayREN Bay Area Regional Energy Network
C/B Cost-Benefit
CA California
CAEATFA California Alternative Energy and Advanced Transportation Financing Authority
CARE California Alternate Rates for Energy
CAS Combustion Appliance Safety
CCA Climate Change Assessment
CDFI Community Development Financial Institution
CEDARS California Energy and Data Reporting System
CHEEF California Hub for Energy Efficiency Financing
CISR Customer Information Standardized Request
CO Colorado
CPUC California Public Utilities Commission
CT Connecticut
CU Credit Union
DEER Database for Energy Efficiency Resources
DIY Do-It-Yourself
DSM Demand-Side Management
DTI Debt-to-Income
E3 Energy + Environmental Economics, Inc.
EE Energy Efficiency
EEEM Eligible Energy Efficiency Measure
EEFP Energy Efficiency Finance Program
EFLIC Energy Financing Line-Item Charge
EFS Energy Finance Solutions
EM&V Evaluation, Measurement, and Verification
ESAP Energy Savings Assistance Program
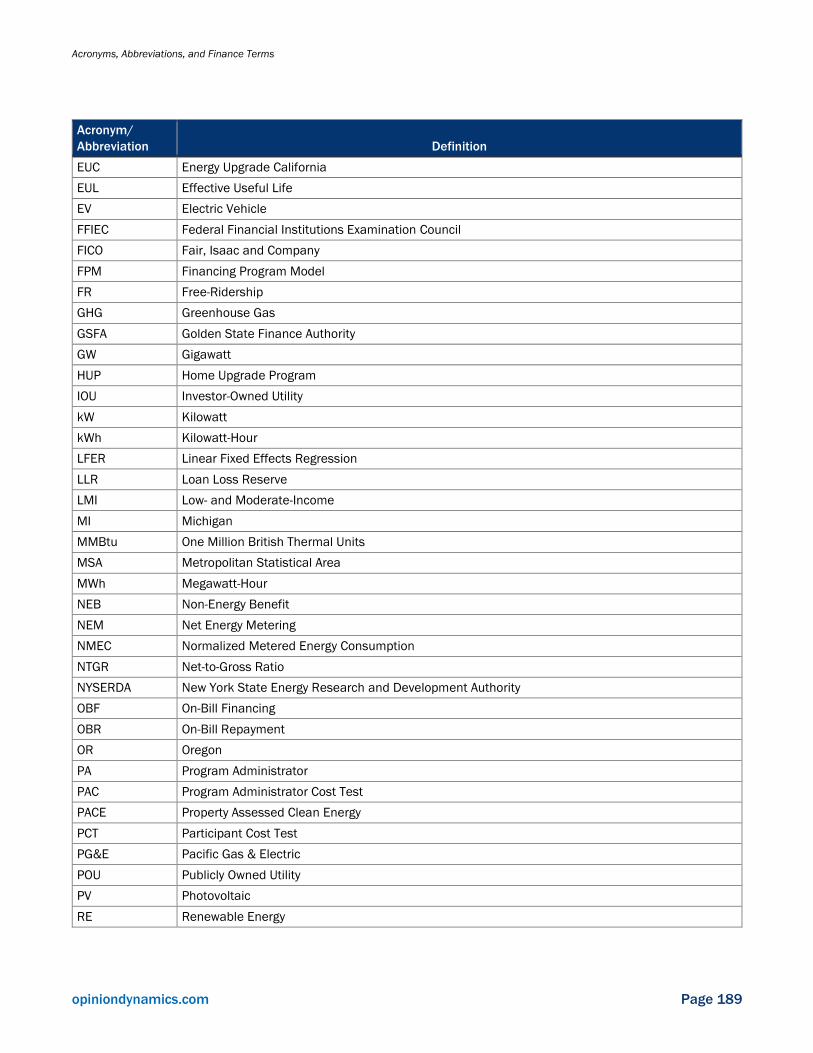
Acronyms, Abbreviations, and Finance Terms
opiniondynamics.com Page 189
Acronym/
Abbreviation Definition
EUC Energy Upgrade California
EUL Effective Useful Life
EV Electric Vehicle
FFIEC Federal Financial Institutions Examination Council
FICO Fair, Isaac and Company
FPM Financing Program Model
FR Free-Ridership
GHG Greenhouse Gas
GSFA Golden State Finance Authority
GW Gigawatt
HUP Home Upgrade Program
IOU Investor-Owned Utility
kW Kilowatt
kWh Kilowatt-Hour
LFER Linear Fixed Effects Regression
LLR Loan Loss Reserve
LMI Low- and Moderate-Income
MI Michigan
MMBtu One Million British Thermal Units
MSA Metropolitan Statistical Area
MWh Megawatt-Hour
NEB Non-Energy Benefit
NEM Net Energy Metering
NMEC Normalized Metered Energy Consumption
NTGR Net-to-Gross Ratio
NYSERDA New York State Energy Research and Development Authority
OBF On-Bill Financing
OBR On-Bill Repayment
OR Oregon
PA Program Administrator
PAC Program Administrator Cost Test
PACE Property Assessed Clean Energy
PCT Participant Cost Test
PG&E Pacific Gas & Electric
POU Publicly Owned Utility
PV Photovoltaic
RE Renewable Energy
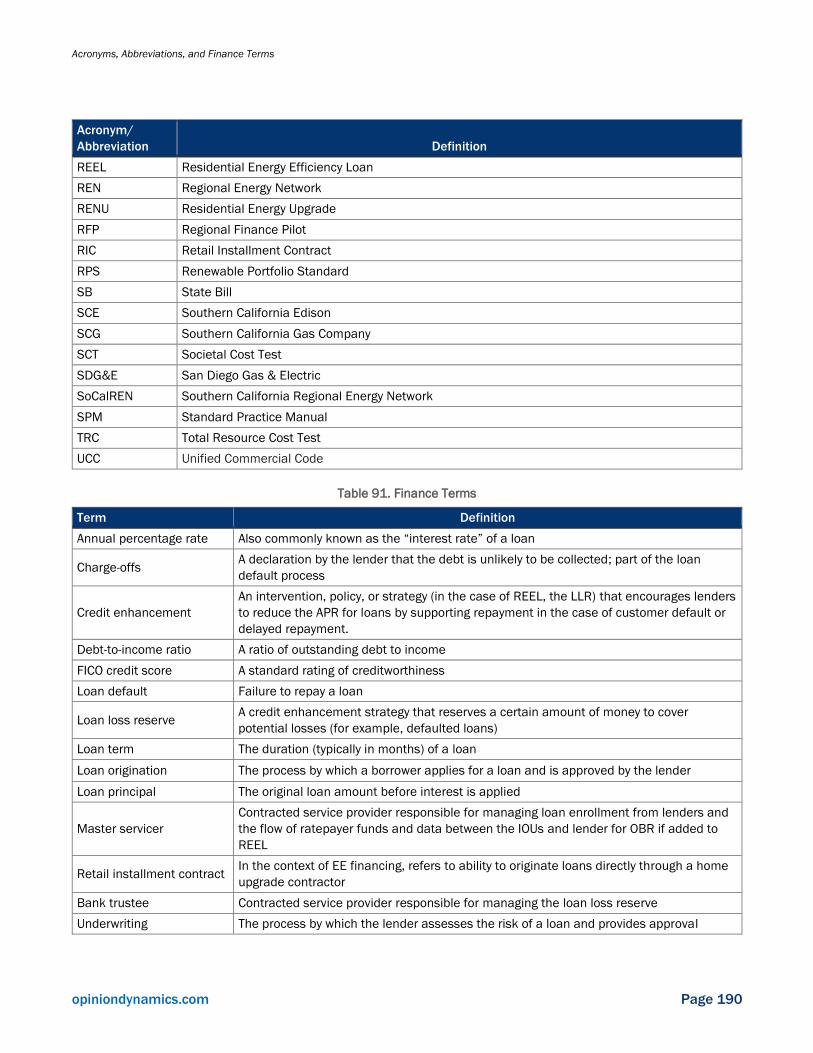
Acronyms, Abbreviations, and Finance Terms
opiniondynamics.com Page 190
Acronym/
Abbreviation Definition
REEL Residential Energy Efficiency Loan
REN Regional Energy Network
RENU Residential Energy Upgrade
RFP Regional Finance Pilot
RIC Retail Installment Contract
RPS Renewable Portfolio Standard
SB State Bill
SCE Southern California Edison
SCG Southern California Gas Company
SCT Societal Cost Test
SDG&E San Diego Gas & Electric
SoCalREN Southern California Regional Energy Network
SPM Standard Practice Manual
TRC Total Resource Cost Test
UCC Unified Commercial Code
Table 91. Finance Terms
Term Definition
Annual percentage rate Also commonly known as the “interest rate” of a loan
Charge-offs A declaration by the lender that the debt is unlikely to be collected; part of the loan
default process
Credit enhancement
An intervention, policy, or strategy (in the case of REEL, the LLR) that encourages lenders
to reduce the APR for loans by supporting repayment in the case of customer default or
delayed repayment.
Debt-to-income ratio A ratio of outstanding debt to income
FICO credit score A standard rating of creditworthiness
Loan default Failure to repay a loan
Loan loss reserve A credit enhancement strategy that reserves a certain amount of money to cover
potential losses (for example, defaulted loans)
Loan term The duration (typically in months) of a loan
Loan origination The process by which a borrower applies for a loan and is approved by the lender
Loan principal The original loan amount before interest is applied
Master servicer
Contracted service provider responsible for managing loan enrollment from lenders and
the flow of ratepayer funds and data between the IOUs and lender for OBR if added to
REEL
Retail installment contract In the context of EE financing, refers to ability to originate loans directly through a home
upgrade contractor
Bank trustee Contracted service provider responsible for managing the loan loss reserve
Underwriting The process by which the lender assesses the risk of a loan and provides approval

Acronyms, Abbreviations, and Finance Terms
opiniondynamics.com Page 191
For more information, please contact:
Megan Campbell
Vice President
858-270-5010 tel
Top Related
Copyright © 2022 FDOKUMEN

