IMPACT EVALUATION OF THE 1ST PHASE OF 'SWAPNO'
55
Final Draft IMPACT EVALUATION OF THE 1 ST PHASE OF ‘SWAPNO’ Kazi Iqbal (Study Director) Minhaj Mahmud Tahreen Tahrima Chowdhury Paritosh K. Roy Amin Bin Hasib BANGLADESH INSTITUTE OF DEVELOPMENT STUDIES 10.09.2017
-
Upload
khangminh22 -
Category
Documents
-
view
0 -
download
0
Transcript of IMPACT EVALUATION OF THE 1ST PHASE OF 'SWAPNO'

Final Draft
IMPACT EVALUATION OF
THE 1ST PHASE OF ‘SWAPNO’
Kazi Iqbal (Study Director)
Minhaj Mahmud
Tahreen Tahrima Chowdhury
Paritosh K. Roy
Amin Bin Hasib
BANGLADESH INSTITUTE OF DEVELOPMENT STUDIES
10.09.2017
1
Table of Contents Chapter 1 ....................................................................................................................................................... 6
Introduction ............................................................................................................................................... 6
Scope of Work ....................................................................................................................................... 7
Deliverables ........................................................................................................................................... 7
Chapter 2 ....................................................................................................................................................... 8
Literature Review: How SWAPNO Fares with Other Graduation Models? ................................................ 8
Targeting beneficiary and wage setting ................................................................................................. 11
Project monitoring ............................................................................................................................... 13
Chapter 3 ..................................................................................................................................................... 15
Sampling and Methodology ...................................................................................................................... 15
Chapter 4 ..................................................................................................................................................... 18
Demographic and Socioeconomic Profile ................................................................................................. 18
4.1 Household size and age distribution ............................................................................................... 18
4.2 Marital Status of Female Household Head ...................................................................................... 19
4.3 Education of Household Heads (Female) ....................................................................................... 19
4.4 Occupation of female head ............................................................................................................. 19
Chapter 5 ..................................................................................................................................................... 21
Income, Asset and Expenditure ............................................................................................................... 21
5.1 Household income and poverty ...................................................................................................... 21
5.2 Household Expenditure .................................................................................................................. 26
5.3 Asset and Land Holdings ................................................................................................................ 27
Chapter 6 ..................................................................................................................................................... 30
Food Security and Coping with Disasters ................................................................................................. 30
6.1 Food Security ................................................................................................................................. 30
6.2 Coping with Natural Disasters ........................................................................................................ 31
Chapter 7 ..................................................................................................................................................... 33
Education, Health and Nutrition .............................................................................................................. 33
7.1. Education of children .................................................................................................................... 33
7.2 Health of beneficiary women .......................................................................................................... 33
7.3 Water and sanitation ....................................................................................................................... 35
7.4 Child health .................................................................................................................................... 36
Chapter 8 ..................................................................................................................................................... 37
2
Women Empowerment and Aspiration .................................................................................................... 37
Chapter 9 ..................................................................................................................................................... 41
Training: What Did the Beneficiaries Learn? ............................................................................................ 41
9.1 Participation in training................................................................................................................... 41
9.2 Perception of the beneficiaries about the courses ............................................................................ 41
9.3 Module specific test of knowledge .................................................................................................. 42
9.4 Knowledge about violence and places to lodge complaints ............................................................. 43
9.5 Knowledge about rights and entitlements ....................................................................................... 43
9.6 Knowledge about laws .................................................................................................................... 44
Chapter 10 ................................................................................................................................................... 47
Through the lens of SDGF Evaluation Criteria ........................................................................................ 47
Relevance ............................................................................................................................................. 47
Effectiveness ........................................................................................................................................ 47
Efficiency ............................................................................................................................................. 48
Impact.................................................................................................................................................. 49
Sustainability ........................................................................................................................................ 51
Chapter 11 ................................................................................................................................................... 52
Conclusion: Some Insights on Project Design .......................................................................................... 52
List of Tables
Table A3.1: Distribution of sample by district, sub-districts and union .................................................................. 16
Table 4.1: Average HH size, Female Headed HH and Average Age of Female .................................................... 18
Table 4.2: Age distribution and Dependency Ratio .................................................................................................... 18
Table 4.3: Marital status of female head ........................................................................................................................ 19
Table 4.4: Education of Household Head (Female) - End-line ................................................................................ 19
Table 4.5: Percentage of households with primary occupation of female household heads- End-line .............. 20
Table 5.1: HH size and number of income earners .................................................................................................... 21
Table 5.2: Household and per capita income ............................................................................................................... 22
Table 5.3: Income of the beneficiary households from MIS data............................................................................. 22
Table 5.3: Use of SWAPNO bonus ............................................................................................................................... 24
Table 5.4: Land under lease and share contracts (decimal) ........................................................................................ 24
Table 5.5A: Lower Poverty Line (% of HH below lower poverty line) ................................................................... 25

3
Table 5.5B: Upper Poverty Line (% of HH below upper poverty line) ................................................................... 25
Table 5.6A: Percentage of HH below lower poverty line (with disposable income) ............................................. 26
Table 5.6B: Percentage of HH below upper poverty line (with disposable income) ............................................. 26
Table 5.7: Average expenditure (BDT) of households before and after intervention ........................................... 27
Table 5.8: Mean value (BDT) of asset (non-land, non-financial) .............................................................................. 27
Table 5.9: Average size of own land holdings .............................................................................................................. 28
Table 5.10: Housing and fuel .......................................................................................................................................... 28
TableA5.1: Income percentiles and other measures of poverty based on gross income ...................................... 29
Table A5.2: Income percentiles and other measures of poverty based on ‘net’ income ....................................... 29
Table 6.1: Food deficit by seasonality ............................................................................................................................ 31
Table 6.2: HH (%) with Different Coping Strategies .................................................................................................. 32
Table 7.1: Child education ............................................................................................................................................... 33
Table 7.2: General health of women.............................................................................................................................. 33
Table 7.3: BMI of the women (kg/meter-sq) ............................................................................................................... 34
Table 7.4: How do you describe your health in general? ............................................................................................ 35
Table 7.5: Water and sanitation ...................................................................................................................................... 35
Table 7.6: Child’s height and weight .............................................................................................................................. 36
Table 8.1: Women Empowerment Indicators: Control over income and assets and intra-household decision
making................................................................................................................................................................................. 37
Table 8.2: Women Empowerment Indicators: Mobility as freedom ........................................................................ 38
Table 8.3: Women empowerment through enhancing self-confidence and self esteem ....................................... 40
Table 9.1: Participation in each Training Module ........................................................................................................ 41
Table 9.2: Self-evaluated usefulness of the training modules .................................................................................... 42
Table 9.3: Simple accounting and IGA related knowledge responses...................................................................... 42
Table 9.4: Reporting on violence related knowledge .................................................................................................. 43
Table 9.5: Rights and Entitlements ................................................................................................................................ 43
Table 9.6: Knowledge about laws ................................................................................................................................... 44
Table A9.1: Self-reported ordering of the training modules based on usefulness ................................................. 46
List of Figures
Figure 5.1: Distribution of sources of additional income for the beneficiaries ...................................................... 23
Figure 6.1: Number of times meal taken a day in last one year ................................................................................. 30
Figure 6.1: HH (%) with coping strategies for all phases ........................................................................................... 32

4
Executive Summary
Strengthening Women’s Ability for Productive New Opportunities, also known as SWAPNO is a typical public
works based ‘graduation model’ targeting only the distressed and vulnerable rural women. Since it is a so called
‘graduation model’, it not only aims at lifting the poor out of poverty during the project period, but also helps
them sustain with the higher income level in the absence of the project. While the first part is relatively easy
due to high wage income, the second part of sustainability of project outcome after the project requires
additional interventions. SWAPNO, following the global best practices, complements public works with
mandatory savings, participation in ROSCA, trainings on life skill and livelihood and linkages with local markets
and potential employers. The idea is that the set of skills learnt from training will help beneficiaries invest their
savings in productive purposes which will yield a stream of income in the absence of project. We found that
guaranteed wage employment has increased their household income substantially, lifting a large share of
beneficiaries from abject poverty during the project life. This has also led to an improvement of their social
status, self-esteem and confidence as well as their aspiration for a better life in future. These non-income
outcomes are also believed to help beneficiaries sustain their high income and living standard beyond project.
The beneficiary women were employed from 16 August 2015 to 15 February 2017 for a tenure of 18 months and each beneficiary received a total of BDT 66,450 as cash wage payments along with the amount of BDT 22,150 as a ‘graduation bonus’, which was built up from the mandatory savings scheme of the project. Along with employment, the SWAPNO women also received seven basic life skill and livelihood trainings. The purpose of this study is, thus, to assess the impact of these interventions on the well-being of the beneficiaries. To this end, we conduct an end-line survey on the same treatment and control groups that were in baseline sample. The baseline survey was conducted in August 2015 on a total of 1200 households (HHs) which included 800 intervention HHs and 400 control HHs in Kurigram and Satkhira districts. The baseline HH survey utilized the Randomized Control Trial (RCT) design which allows us to evaluate the impact of the interventions with proper counterfactual.
We found substantial increase in income and assets of the beneficiaries. The project contributes about 40 thousand Taka increase in income which has led to a drastic reduction of poverty, both moderate and extreme. They are now more food secured as the share of households skipping one or two meals has dropped. The increase in income has resulted in increase in both food and non-food expenditure, particularly, education expenditure. In the project period, the source of income did not rely on project income only; the beneficiaries had income from other sources such as IGAs and non-SWAPNO labor income. At the time of interview, most of the beneficiaries have invested their graduation bonus and they invested in livestock, poultry and other productive purposes. Livestock is now the main asset of the beneficiaries. Not only the amount, but the composition of asset has changed - livestock constitutes about 43% of total asset which was only 13% before SWAPNO. The graduation bonus has also helped the beneficiaries access agricultural land market as they are leasing in land. This shift of occupation from a wage labor to a mix of farmer and wage labor has tremendous impact on their self-esteem and social status.
Beneficiaries now perceive to have better health despite little change in scientific measures of heath condition such as BMI. However, we did not find any significant impact on child’s education or health. Their coping strategies in the face of disaster has also changed; now they rely more on their savings than borrowing from others such as Mohajaon at high interest rate.
The participation rate was high in all courses of the training program and the beneficiaries found the courses useful; they learnt new things and applied in their lives. We found that the beneficiaries have better knowledge on IGA and accounting than the control group. They also learnt a few things on laws – they are now more aware of the punishments in laws for polygamy, child marriage, dowry and divorce than the control groups.
Public works based ‘graduation model’ is argued to be different from direct asset transfer based model on the ground that the former enhances women empowerment and boosts self-confidence and aspiration which are

5
the key ingredients of the sustainability of the project outcomes. While asset is a transfer in latter case, beneficiaries build asset from their hard-earned income form guaranteed employment in the public work based model. The fact that destitute women earn, save and build asset on their own gives them self-confidence and self-esteem. SWAPNO is expected to help develop group solidarity, self-confidence, aspiration and access to institutions. We found that the beneficiary women have higher control over personal and household assets than their non-participant counterpart and are more able to make decisions about IGAs on their own, thanks to SWAPNO. The beneficiaries are more mobile than before outside their community which is an important indicator of women empowerment. They are found to be more optimistic about their future and have higher self-esteem, self-confidence and the aspiration to live a better life in the years to come.
Since the survey was conducted right after the project ended, this study can only capture the short run impact, that is, it assesses only what has happened during the project period. However, there are indications that the short term impact of the project is likely to sustain, though the extent of sustainability can be debated. As we discussed, the first major indication is the amount and type of productive investment they made out of their wage income and mandatory saving. Second, the beneficiaries have learnt some basics of running a business and basic arithmetic. It has boosted up their confidence in themselves which is manifested in their discourse, body language and attitude. Third, their control over their assets as well as their mobility has increased along with self-confidence, self-efficacy and aspiration. All these indicators indicate that the beneficiaries now aspire to live a better life and they will continue to do so in the absence of the project.

6
Chapter 1
Introduction
Strengthening Women’s Ability for Productive New Opportunities, also known as SWAPNO is a project undertaken by the Local Government Division, MoLGRD&C and supported by United Nations Development Programme (UNDP), Bangladesh. The project is basically a public works based program of social safety net for the destitute and vulnerable women of the country which also has a built-in ‘poverty graduation’ mechanism embedded in it.
The SWAPNO project is not just a simple safety net program with short term transfers which aims to keep the poor from slipping further into poverty. Rather, it focuses on the long term objective of lifting the poor out of poverty and into resilient and dependable livelihoods so that they may become self-sufficient and no longer dependent on government aid. At the same time, the project also focuses on the empowerment and human capital base development of the beneficiary women through general awareness creation and specific training courses. These interventions are intended to help the women choose and develop sustainable means of livelihood while leading an improved and dignified life.
In the pilot phase of the SWAPNO project, the beneficiary women were employed from 16 August 2015 to 15 February 2017 for a tenure of 18 months. During this period, the women were employed by the Union Parishad (UP) in public works involving public asset maintenance. The work-fare typically includes maintenance of local roads and other public assets. The selection of the public works was done by the local elected leaders with the consultation of the community. As a result, the villagers and the users of the public assets associate the quality of public works with the commitment and initiatives of the local elected leader. Hence, quality maintenance of the public asset is very much aligned with the leaders’ political goal and career. This is an important aspect of the SWAPNO project.
Each beneficiary received a total of BDT 66,450 as cash wage payments along with the amount of BDT 22,150 as a ‘graduation bonus’, which was built up from the mandatory savings scheme of the project. The idea here is that the women will be able to use this amount of savings for the purpose of asset accumulation or investments in income generating activities (IGAs). The wage payments were made fortnightly and the team leader of each group is responsible to collect the wage payment for all group members.
SWAPNO also encourages personal savings habits by promoting group savings mechanisms like Rotating Savings and Credit Associations (ROSCA). The group members meet once in every two weeks when the wage payment is made. They all chip in 200 Taka per person and conduct the lottery among themselves. The winner gets the whole pot. Once a beneficiary gets the loan, she becomes ineligible for the current cycle and has to wait for the next cycle. If it is a 12 member group, it takes about 6 months to complete a cycle.
Along with employment, the SWAPNO women also received seven basic life skill and livelihood trainings. The livelihood trainings include trainings on preparation of business and simple accounting while life skill trainings were on health and nutrition, gender and development, women rights and entitlement, leadership development and coping with climate change. Trainings on livelihood are customized according to the local need. For example, in Satkhira there was a training module on fish culture and crab fattening. Other specialized courses include training on cow fattening, cow, goad, sheep and poultry rearing, vegetable cultivation, etc.
According to the project document, the project also aims at creating different types of linkages between the beneficiary women and various service delivery institutions and organizations including service delivery departments at the UP level as well as local SMEs and other businesses. The purpose is to enhance the post-SWAPNO business and employment opportunities of the women. However, this intervention did not get much momentum during the piloting phase of the project.
In short, there are three major interventions of the project that we will investigate – i) fixed wage contract for 18 months, ii) compulsory savings along with ROSCA, and iii) several life skill and livelihood trainings.

7
Therefore, the purpose of this study is to assess the impact of these interventions on the well-being of the beneficiaries. To this end, we conduct an end-line survey on the same treatment and control groups that were in baseline sample. The baseline survey was conducted in August 2015 on a total of 1200 households (HHs) which included 800 intervention HHs and 400 control HHs in Kurigram and Satkhira districts. The baseline HH survey utilized the Randomized Control Trial (RCT) design which allows us to evaluate the impact of the interventions with proper counterfactual.
Scope of Work
UNDP Bangladesh and LGD has contracted BIDS through direct procurement for the purpose of conducting the end line survey and study of the pilot phase of SWAPNO project. The main objective of this assignment is to conduct a repeat or end line survey on the 1200 HHs surveyed in the base line study including 800 beneficiary HHs and 400 control HHs in order to evaluate the impact of the SWAPNO project. Towards this end, several outputs have been outlined by UNDP & LDG as requirements from this study. They are as follows:
1. A literature review of the poverty graduation models that have already been implemented in the country and how SWAPNO compares and contrasts with them, including the lessons that can be learnt from the project. It will also shed light on how SWAPNO is in line with best and most effective practices as validated by global evidences.
2. Participate in meetings with relevant staffs of SWAPNO, LGD and UNDP and review relevant project documents (e.g. the Pro Doc) to understand the project design, particularly the interventions (employment and training), delivery mechanism, and incentive structure.
3. Submission of a detailed work plan to SWAPNO which will include the timeframe of the study along with the mention of the responsible parties.
4. Visit and consultation of the core research team with project stakeholders including women beneficiaries, community members, Union Parishads’ Representatives, Deputy Director Local Government, project Staff members in field operation area to evaluate project progress and identify lessons learnt.
5. Finalize the survey methodology including data collection methods and analysis framework. Finalize data collection tools (questionnaire, checklist) and guidelines for the end-line survey as well as the methods of analysis.
6. Organize training session for the enumerators and supervisors followed by field practice. 7. Collect data from the respondents as per sampling list, using prescribed tools and techniques. 8. Prepare and finalize data analysis and tabulation plan and generate required output tables. 9. Provide soft copy of cleaned data set with summary output tables. 10. Submit draft report of the study to SWAPNO prior to submission of the final report (which will
incorporate the feedback from SWAPNO on the draft report).
Deliverables The list of deliverables required from this study is as follows:
1. A literature review of different poverty graduation models, how SWAPNO differs from them and what are the lessons that can be learnt from SWAPNO
2. Report of the SWAPNO project impact evaluation study (draft and final reports) 3. Data set of the end line HH survey

8
Chapter 2
Literature Review: How SWAPNO Fares with Other Graduation Models?
Currently, almost all developing countries run a variety of social safety net programs to provide support to the
poor in order to prevent them from slipping or falling into further poverty below a certain level. These usually
include transfers of cash or food to the poor and these programs are found to have significant positive impact
on the level of income and their ability to cope shocks (Hagen-Zanker et al., 2011). But the scope of such
interventions is very limited and does not take into account the long term impact, ensuring a permanent solution
to the low level equilibrium of poverty trap. The evidence that temporary support to the poor is not enough to
lift them out of poverty in the long run has spawned a host of models, popularly known as ‘graduation model’
which includes a package of interventions aiming to upgrade the ability of the beneficiaries so that can maintain
high income in the absence of the project. There are differences in views among the practitioners and policy
makers on the types and their optimal mix of ingredients in the package, its delivery mechanism and also length
of interventions, giving rise to a myriad of ‘graduation models’.
While the literature on graduation model is very thick, we will concentrate on two sets of models only – direct
asset transfer program (ATP) and public works (PW) based model. The purpose of this literature review is not
to provide the readers with a full gamut of issues pertaining to the debate of graduation models, rather to offer
a brief account of these two models so that the reader can place SWAPNO in proper context. In doing so, we
will discuss some aspects of project design and implementation mechanism of SWAPNO in detail, in
comparison with other models.
This model of poverty graduation was first conceived in 1985 when BRAC partnered with the Government of
Bangladesh and the World Food Programme (WFP) using an existing safety net program of the government
titled ‘Vulnerable Group Feeding (VGF)’ to incorporate a graduation mechanism in it. The resulting pilot
program of the initiative became the ‘Income Generation for Vulnerable Group Development (IGVGD)’
program and further improvements in the program design lead to the creation of BRAC’s hallmark initiative
‘Challenging the Frontiers of Poverty Reduction/Targeting the Ultra Poor (CFPR/TUP)’ program in 2002. It
was initially implemented in 3 relatively poor districts in Northwest Bangladesh - Rangpur, Kurigram, and
Nilphamari and later was scaled up in 15 districts. In addition to assets, the package includes assistance for
using asset effectively as microenterprise, training on livelihoods and general education, microfinance, health
services and family planning, installing sanitary latrine and helping build social capital through village support
networks. This set of complementary inputs is more comprehensive than what a typical public works based
model offers. A number of rigorous studies has been conducted to assess the impact of TUP and all of them
have found significant impact of program participation on net income, food security, ownership of livestock
and household durables such as tube wells and blankets/quilts of the ultra-poor households (See Emran, et al.
(2009); Bandiera, et al (2017)).
Following the spirit and design of TUP, experiments with the types and mix of inputs which complement the
asset transfer continues in Bangladesh. In this vein, the Char Livelihood Program (CLP) was introduced in 2004
and was implemented in 4 phases till 2010. In this case, the beneficiaries were the extremely poor households
living on low-lying temporary sand islands (called chars) on the Jamuna River in Northern Bangladesh. in
addition to an asset, which is typically a livestock, beneficiary receive a monthly stipend for the first six months
(Tk. 400-600 per month) followed by a lower stipend (Tk. 300-350 per month) for the subsequent 12 months.
Supplementary inputs for graduation included training on social development, village savings and loans
associations, community health care, and enterprise development. The beneficiaries of CLP are also found to
have improved their living condition through higher income and asset base (OECD, 2011), though the study
is not a robust one.

9
Another notable asset transfer program is EEP-Shiree which was implemented from 2008 to 2016 in 3 Districts
- Sunamgonj, Habiganj and Kishoregon. Unlike other ATPs, it introduced the transfer of a wide range of assets
such as livestock, poultry, rickshaw, van, other productive inputs, and Khas land distribution. Routine project
evaluation reveals that 95% of beneficiaries have graduated from extreme poverty due to EEP-Shiree (DFID,
2015).
In a nutshell, initial consumption support followed by an asset transfer with a package of complementary inputs
and training has become the workhorse model of all Asset Transfer Progams (ATP) in Bangladesh. Though
this program involves the government, it is primarily driven by NGOs and donors and this marks a significant
departure from public works based model such as SWAPNO. In the context of a developing country like
Bangladesh, if any development effort has to be scaled up in coverage, the involvement of the government at
some level of project implementation is essential. It is important to provide the ‘ownership’ of the project to
the government so that it can integrate this effort into its overall development initiative and achieve the level
of scale and efficiency that is required for such programs. The government does not want to get involved
directly in asset transfer because its implantation is complex, cumbersome and costly for the government. On
the other hand, public works based model involves different tiers of government in different phases of the
project such as project and beneficiary selection, monitoring of the public works, payment mechanism, etc. In
fact, a beneficiary works as an employee of Union Parishad, giving government the right to monitor the works
as well as the ownership of the work. Therefore, it can be argued that scaling up of public work based (PW)
safety net programs is more feasible than the ATPs because of greater involvement of the government.
However, it is also worth noting that BRAC’s TUP has reached about 4 lacs households in 2011 and it was
possible due to its country-wide branch network and its experiences in delivering complementary inputs, unlike
other NGOs.
Direct asset transfer program (ATP) also differs from public works (PW) based approach to the extent social
protection can contribute to economic growth. Dual objectives of poverty reduction and public asset building
can be argued to contribute to economic growth (Alderman and Yemtsov, 2014) more than the objective of
poverty reduction through private asset building. If in both cases, households end up accumulating similar
assets such livestock, a natural question one can ask: why not transferring the asset directly to the beneficiary
instead? If operational costs are same, the PW involves building both public and private asset while ATP builds
only private assets. The combined effect of both private and public assets of PW approach can contribute more
to economic growth than that of ATP.
Setting wage under the market rate in public works approach helps target the poor efficiently. The targeting
instrument relying on the differential opportunity costs of the poor and non-poor (Besley and Coate, 1992) also
makes this approach different from ATPs.
Now we will briefly discuss one PW program in Bangladesh and some notable ones from other countries.
Important global examples include the Productive Safety Net Programme (PSNP) in Ethiopia, the Mahatma
Gandhi National Rural Employment Guarantee Act (MGNREGA) in India, the Vision 2020 Umurenge
Programme (VUP) in Rwanda and the Expanded Public Works Programme (EPWP) in South Africa, and
Programa de Jefes y Jefas de Hogar in Argentina. In local context, we will draw some lessons from REOPA,
the predecessor of SWAPNO.
In Bangladesh, REOPA (Rural Employment Opportunities for Public Assets) was the pioneer in public works
based graduation model which started in 2010 and was implemented in 41 Upazila of 6 districts. The SWAPNO
project is built on REOPA with little modification - the length of the work-fare of REOPA was 24 months as
opposed to 18 months in SWAPNO; size of Women Crew Groups per union was 30 while it varies from 12 to
36 in SWAPNO; Union Worker is also an innovation in SWAPNO. All other supplementary interventions are

10
similar including their implementing agencies. The project evaluation report suggests significant improvement
in their socioeconomic conditions, food security, nutrition and women empowerment. (European Union, 2013)
Public works programs have a long history of implementation. A public works relief program was used to
construct a section of a road between Islamabad and Peshawar in the 12th century in what is now Pakistan. In
the 18th century, the Poor Employment Act in England was used to hire surplus labor for work in public assets
while at the turn of the 20th century, public works programs were launched in many parts of Africa and South
Asia. But it was the Indian experience of the 1970s that geared much of the current momentum for
implementing and scaling up public works programs that we now observe today. The Indian state of
Maharashtra was struck by a huge drought that forced 70% of its rural population into poverty. In response to
this disaster, an innovative public works program was introduced which offered a guarantee of employment for the
very first time in India, the Maharashtra Employment Guarantee Scheme (MEGS). The MEGS program was
very much successful in not only reducing the level of rural poverty, but it also led to the development of rural
infrastructure and improved resilience against shocks.
Inspired by the success of MEGS, India introduced the Mahatma Gandhi National Rural Employment
Guarantee Scheme (MGNREGS) in February 2006, which was later scaled up to become the largest public
works program in the world, providing unskilled manual work to 57.8 million adults from 38.9 million rural
households during the fiscal year of 2014-15. Strong role of local government (gram panchayat), efficient
monitoring mechanism and use of ICT makes it distinguishable from other PW models practiced in Bangladesh
and elsewhere. For eligibility, one has to first apply and register for job card to the gram panchayat and then he
or she can apply for work. Any adult member (above 18 years) household can apply for work and if work is
not provided within 15 days of a worker’s application, state governments are liable to provide an unemployment
cash benefit. The program also has a target for the inclusion of women (one-third) in the program design (ILO,
2016).
What makes MGNREGS innovative is its use of ICT in implementing and monitoring the program.
NREGASoft is a specialized management information system used for management and monitoring of
MGNREGS. Its MIS system is very extensive covering job cards, work estimates, pay orders, and pay slips; it’s
web portal contains real time data in public domain.
Ethiopia’s Productive Safety Net Program (PSNP), launched in 2005 with the aim to transform the food aid-
based system into a productive one, differs SWAPNO in three broad ways. First, it is a mix of cash and food
transfers to households that are unable to fulfill the work requirement (20 percent) and guaranteed works for
households with able-bodied members (80 percent). Second, in PSNP the length varies with clients - clients
will remain in the PSNP project for multiple years until they reach the graduation threshold (Ministry of
Agriculture, Ethiopia, 2014). Third, the wage rate is determined based on food security considerations and on
the number of people in the household unlike REOPA or SWAPNO which offers below the market rate to
promote self-selection into the program.
The current daily wage rate in the program is about US$0.80. The estimated annual transfers per beneficiary
household are equivalent to about 40 percent of their annual food needs. The program reaches more than 7
million people, or about 10 percent of the national population of Ethiopia, and implements about 34,000 small-
scale labor-intensive public works projects per year, with labor costs accounting for about 80 percent of the
total cost of each sub-project. Rigorous evaluations of this program have confirmed that it has made significant
changes in the lives of the poor in Ethiopia.
PSNP-type of program has become very popular in other parts of Africa. Similar to PSNP, Rwanda’s Vision
2020 Umurenge Program (VUP) combines public works (50 percent of resources), cash transfers (20 percent),
and microfinance loans (30 percent) to targeted poor beneficiary households in the poorest sub-districts. The
program is managed by the Ministry of Local Government and the different public works encompass land

11
productivity and irrigation, mainly terracing, ditches, small dams and forestry, as well as the construction of
roads, school classrooms, and health centers. However, wage-rate setting follows the objective of efficient
targeting, like SWAPNO. Wages are set at the district level and vary by project type but with a guideline that
they should be less than or equal to the market rate for similar work. As of 2009, wages averaged about US$
1.50 per day. As of FY 2010/2011, the government spent Rwf 8.9 billion on VUP public works, equal to about
0.7 percent of the national budget, and employed 522,856 people, half of whom were women. This is equivalent
to about 5 percent of the national population. VUP public works were found to have reduced extreme poverty
in the areas covered by the program (Government of Rwanda, 2007.).
Over time, public works have been used both for the purpose of poverty reduction as well as for temporary
employment creation in countries facing adverse shocks which lead to rising unemployment. While SWAPNO
and Rwanda’s Vision 2020 Umurenge Program are public works programs which focus on poverty reduction,
Argentina’s Jefes de Hogar (Head of Household) and Latvia’s Workplaces with Stipend Emergency Public
Works Program are examples of programs to address temporary unemployment. Public works can also be
undertaken with the goal of infrastructure development, as in Sri Lanka’s Cash for Work Component of the
Emergency Northern Recovery Project.
In recent times, public works programs have been modified to include several important design and operational
innovations that have led to improved programs with higher efficiency and more holistic approaches. One such
significant innovation, and one which is definitely important for us, is the addition of a scheme to create a
pathway out of poverty for the poor (graduation). Such modified models are termed as ‘public works plus’.
SWAPNO therefore is an example of a public works plus model. The use of information technology for a host
of services like beneficiary selection, payment processing, monitoring program and tracking activities to
improve efficiency, accountability and governance is also an important innovation. Other innovations include
the use of community networks in social audits and an increased emphasis on engaging women by making the
programs female-friendly.
Public works programs across the world are implemented by a variety of institutions. For example, in South
Asia, they are mostly run by the government as part of a larger poverty reduction strategy, while in Africa other
implementing actors like bilateral donors, NGOs, social funds, and private contractors are more prominent. In
Latin America, such programs are primarily run by governments alone or in collaboration with donors
(Subbharo et. al., 2012). The SWAPNO model makes use of a combination of implementing agencies. The
project is primarily implemented by the Union Parishads (UP), which is the local government entity, with
support from UNDP (development agency) and partner NGOs. The UPs determine the type of work to be
undertaken by the public works scheme and also monitor the progress and quality of work. While UNDP
designed the various features of the program and helps in their implementation, the bulk of the delivery of
program interventions is carried out by the partner NGOs.
Targeting beneficiary and wage setting When public works focus on poverty reduction, the program usually employs specific targeting methods like
geographic targeting or households with below a certain threshold poverty line income in conjunction with or
instead of other selection methods. But one of the most effective methods of beneficiary identification is that
through the use of wages as a self-selecting mechanism. The main idea behind this method is that if the wages
from the program are set low enough, then it will only attract those people who are in most need of employment
i.e. those who have no other employment opportunities. Therefore, this method helps to address the adverse
selection problem to some extent by encouraging those who are genuinely in need of assistance to receive the
program benefits while at the same discouraging participation of the non-poor.
SWAPNO employs a combination of geographic targeting, self-selection using the wage rate and finally administrative and
categorical targeting.

12
Geographic targeting is most commonly used when the poor and vulnerable of the country are
disproportionately located in specific regions. This is the case of Bangladesh where the poor and vulnerable are
mostly located in the Southern coastal and Northen monga (seasonal food shortages) affected divisions of
Dhaka, Barisal, Khulna, Rajshahi and Rangpur. The initial phase of the SWAPNO program was conducted in
two districts, the coastal Satkhira and the monga prone Kurigram district. SWAPNO employed updated
geographic targeting procedures to identify the Upazilas and Unions with the most poor and vulnerable
population taking into account vulnerability brought on by climate change, geographic remoteness, incidence
of poverty, riverbank erosion and natural disasters (SWAPNO Pro Doc).
After selection of the regions where the program would be implemented, the next step was the identification
and selection of beneficiaries. The full procedure of beneficiary selection is outlined as follows. Extensive
promotional campaigns through canvassing, distribution of leaflets and posters were undertaken by the
SWAPNO Union Workers and other project officials to inform the locals about the upcoming program for the
poor. The campaigns also provided information on the type of work to be carried out by the beneficiaries, wage
rate for the work and the eligibility criteria for applicants. The criteria for eligibility included the following:
women who are poor and have limited economic opportunities, are widowed, divorced or deserted, are not
currently involved in any income earning activities, do not have access to sufficient amount of land or other
productive assets and are the primary income earners of their households.
Interested applicants were asked to come to the Union Parishad office on a given date and time along with
their National ID cards. The UP prepared a viva board comprising of the UP Chairman, Ward Members and
members of the Standing Committee for the purpose of beneficiary selection. This was the first round of
screening of the applicants where their eligibility, age and fitness for work was checked. Next, after approval
from the viva board, the short-listed candidates were given a token with their name and were brought to the
front of the UP office for conducting the lottery. The UP Chairman himself was present during the lottery so
that the process could be fairly conducted and any issues that may arise could be addressed quickly with the
help of the local public representative. The lottery was conducted with the help of small children to illustrate
the fairness of the process to the women. A total of 36 women were selected through lottery from each of the
Union with 4 women from each Ward and those whose name did not come up in the lottery were put in a
waiting list. The use of lottery for beneficiary selection has 2 major advantages. First, it made the process
transparent and so those who were not selected would have weaker grounds for complaining. Second, it meant
that the women could not pay bribes or coax the authorities in any other way to secure their participation in
the program.
After the first round of women were selected though lottery, the SWAPNO Union Workers visited the
households of each of the 36 women from the Union to verify their eligibility. If any woman was found to be
ineligible (e.g. if they had provided wrong or false information), then they would be dismissed and replaced by
another woman from the waiting list picked through a second lottery. Prior to the conducting of the second
lottery, the Union Workers also visited the households of the women in the waiting list to verify their eligibility
beforehand.
The SWAPNO program set the wage rate for the public works at Tk. 200 per day. In Kurigram, while the wage
rate is subjected to seasonal fluctuations, a woman agricultural labour can earn on an average of around Tk.
300 per day in the peak season. By setting the wage rate of the program slightly below the market wage rate,
the SWPANO program employed the mechanism of self-selection using the wage rate so that the non-poor
women would be discouraged from participation while the targeted poor women would have higher scope of
participation. At the same time, the program also used a set of eligibility criteria for participation in the program
and this method of selection falls under administrative and categorical targeting (which is the targeting of
characteristics beyond poverty like gender based selection of participants).
13
Another popular method of targeting beneficiaries used by many poverty graduation programs, both in the
country and internationally, is the method of Participatory Wealth Ranking developed by BRAC for the
implementation of the CFPR/TUP program. In this method, groups of 40 to 50 villagers are asked to discuss
and rank the wealth of every household in the village. In ranking the wealth of households, the participants are
asked to consider several aspects like does the household have a steady source of income, ownership of
productive assets, material use for housing and children school attendance among others. After identification
of the poorest households, the program staffs visit each of the households and uses questionnaires to determine
who qualifies. The information collected is then reviewed by senior managers to determine the final selection
of beneficiaries.
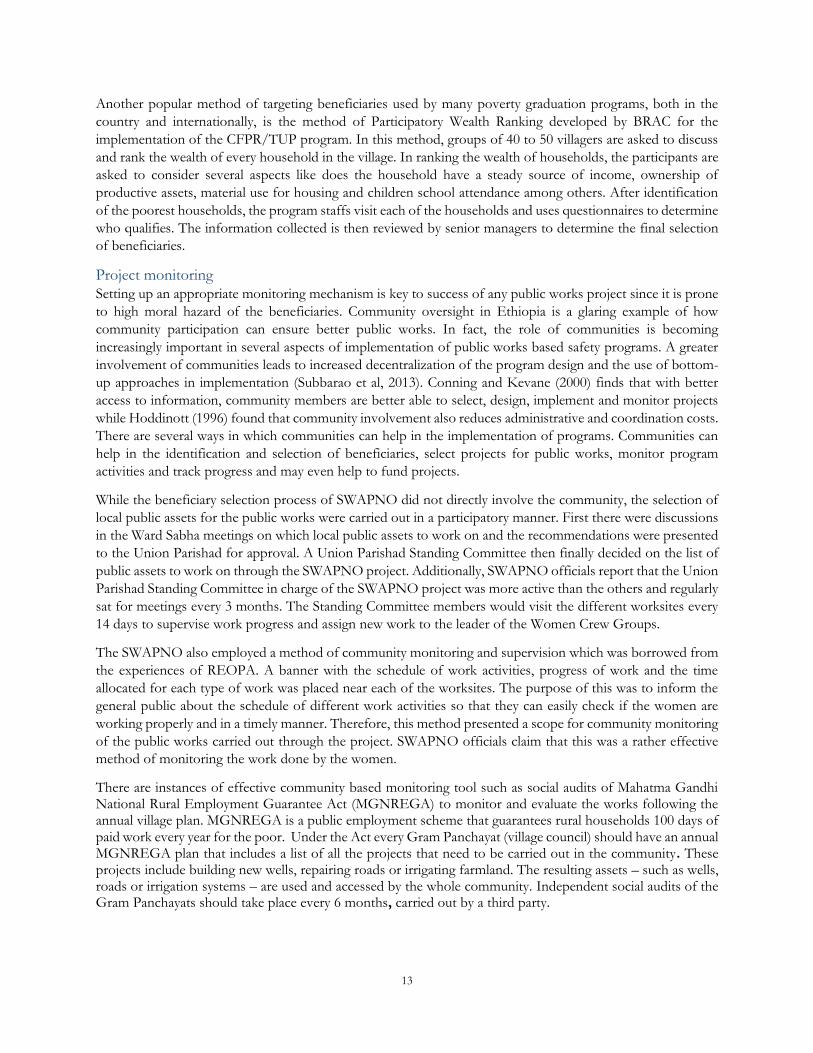
Project monitoring
Setting up an appropriate monitoring mechanism is key to success of any public works project since it is prone
to high moral hazard of the beneficiaries. Community oversight in Ethiopia is a glaring example of how
community participation can ensure better public works. In fact, the role of communities is becoming
increasingly important in several aspects of implementation of public works based safety programs. A greater
involvement of communities leads to increased decentralization of the program design and the use of bottom-
up approaches in implementation (Subbarao et al, 2013). Conning and Kevane (2000) finds that with better
access to information, community members are better able to select, design, implement and monitor projects
while Hoddinott (1996) found that community involvement also reduces administrative and coordination costs.
There are several ways in which communities can help in the implementation of programs. Communities can
help in the identification and selection of beneficiaries, select projects for public works, monitor program
activities and track progress and may even help to fund projects.
While the beneficiary selection process of SWAPNO did not directly involve the community, the selection of
local public assets for the public works were carried out in a participatory manner. First there were discussions
in the Ward Sabha meetings on which local public assets to work on and the recommendations were presented
to the Union Parishad for approval. A Union Parishad Standing Committee then finally decided on the list of
public assets to work on through the SWAPNO project. Additionally, SWAPNO officials report that the Union
Parishad Standing Committee in charge of the SWAPNO project was more active than the others and regularly
sat for meetings every 3 months. The Standing Committee members would visit the different worksites every
14 days to supervise work progress and assign new work to the leader of the Women Crew Groups.
The SWAPNO also employed a method of community monitoring and supervision which was borrowed from
the experiences of REOPA. A banner with the schedule of work activities, progress of work and the time
allocated for each type of work was placed near each of the worksites. The purpose of this was to inform the
general public about the schedule of different work activities so that they can easily check if the women are
working properly and in a timely manner. Therefore, this method presented a scope for community monitoring
of the public works carried out through the project. SWAPNO officials claim that this was a rather effective
method of monitoring the work done by the women.
There are instances of effective community based monitoring tool such as social audits of Mahatma Gandhi National Rural Employment Guarantee Act (MGNREGA) to monitor and evaluate the works following the annual village plan. MGNREGA is a public employment scheme that guarantees rural households 100 days of paid work every year for the poor. Under the Act every Gram Panchayat (village council) should have an annual MGNREGA plan that includes a list of all the projects that need to be carried out in the community. These projects include building new wells, repairing roads or irrigating farmland. The resulting assets – such as wells, roads or irrigation systems – are used and accessed by the whole community. Independent social audits of the Gram Panchayats should take place every 6 months, carried out by a third party.

14
References
Alderman, H., & Yemtsov, R., 2014. How can safety nets contribute to economic growth? The World Bank
Economic Review, 28(1), 1–20.
Bandiera, Oriana, Robin Burgess, Narayan Das, Selim Gulesci, Imran Rasul, Munshi Sulaiman, 2017, Labor
Market and Poverty in Village Economies, Vol. 132(2): 811-870, Quarterly Journal of Economics
Besley, T., & Coate, S. (1992). Workfare versus welfare: Incentive arguments for work requirements in poverty-
alleviation programs. The American Economic Review, 82(1), 249–261.
Conning, Jonathan and Michael Kevane. 2000. Community Based Targeting for Social Safety Nets. Department
of Economics Working Papers 2000–09, Williams College, Williamstown, MA.
DFID, 2015, EEP/Shiree Annual Report, Dhaka
Emran, Shahe, M. and Robano, Virginia and Smith, Stephen C, 2009, “Assessing the Frontiers of Ultra Poverty
Reduction: Evidence from CFPR/TUP, an Innovative Program in Bangladesh: Institute for International
Economic Policy Working Paper Series
European Union, 2013, Ex-post Evaluation of the Rural Employment Opportunities for Public Assets (REOPA), Dhaka Government of Rwanda, 2007, “Vision 2020 Umurenge An Integrated Local Development Program to
Accelerate Poverty Eradication, Rural Growth, and Social Protection”. EDPRS Flagship Program Document.
Government of Rwanda.
Hagen-Zanker, Jessica, Anna McCord and Rebecca Holmes, Francesca Booker and Elizabeth Molinari, (2011)
“Systematic Review of the Impact of Employment Guarantee Schemes and Cash Transfers on the Poor”,
Overseas Development Institute, UK
ILO, 2016, “Building Social Protection Floors, Country Note Series. India: National Rural Employment
Guarantee Scheme”, Mahatma Gandhi National Rural Employment Guarantee Scheme. India.
Ministry of Agriculture, Ethiopia, 2014, “Productive Safety Net Programme, Phase IV, Programme
Implementation Manual”. Addis Ababa.
OECD (2011) Independent Impact Assessment of the Chars Livelihoods Programme – Phase 1, Final Report,
Department of International Development
Subbarao, Kalanidhi, Carlo del Ninno, Colin Andrews, and Claudia Rodríguez-Alas. 2013. Public Works as a
Safety Net: Design, Evidence, and Implementation. Washington, DC: World Bank.

15
Chapter 3
Sampling and Methodology
The present study captures the socioeconomic impacts on the beneficiary women from participating in the SWAPNO project. A baseline survey was conducted prior to the administration of the program interventions in order to evaluate the ex-ante socio-economic conditions of the poor women. The method of Randomized Control Trail (RCT) was employed in which some randomly selected individuals are chosen to receive the intended treatments while a group of individuals (also randomly selected) are assigned as the Control group (who do not receive any treatment). The idea is that, if the treatments are randomly assigned, the post intervention changes in the treatment group (compared to the control group) can be attributable to the program interventions alone.
In order to ensure transparency, lottery in each union was conducted in front of the Union Parishad Chairman, other elected members of the Union Parishad, local elites and the local people. The selection procedure of the beneficiaries is discussed in details in chapter 2.
Thus, the purpose of the end line survey is to gather information on the ex-post socio-economic conditions of the women and evaluate the effectiveness of the program by comparing it to the baseline data. Therefore, the sample of 1200 HHs interviewed is the same sample that was included in the baseline study with some exceptions. In the baseline, a total of 14 Upazilas were chosen from the two districts of Kurigram and Satkhira, with 9 Upazilas from Kurigram and 5 Upazilas from Satkhira. From each of the districts, 20 Unions were selected where the SWANPO project interventions were administered and data on households from both the treatment and control groups were collected. From each of the Union, 20 Treatment and 10 Control households (for a total of 30 households) were surveyed for the end line with the only exception being Jaimonirhat Union, from which 11 Control households were taken (to maintain consistency with the Base Line survey).
The size of the attrition is below 5% of the baseline sample – 20 in Kurigram and 35 in Satkhira. The attrition occurred because some of the respondent women were not available in the area during the survey period. Most of our questions are beneficiary specific and we ask a good number of questions about the perceptions of the respondent. Therefore, we did not allow others to answer on the behalf of the respondents. Some of the respondents had moved away to other places in search of job; some got married and are now living with their husband in another area. Some respondents migrated elsewhere with their entire families. The attrition is found to be more prevalent in the control group than in the treatment group. The treatment group had been under close monitoring of the project staff and therefore was easier to locate.
In case of attrition in treatment group, the replacement is simple – finding another household in the neighborhood enrolled in the SWAPNO project. However, finding a control household was troublesome – we had to painstakingly scrutinize the list of names who did not win the lottery. The final list of the sample by districts and sub-districts is at the end of the chapter in the appendix (Table A3.1).
A structured questionnaire was used for the HH survey. The questionnaire used in the base line survey was largely retained for the purpose of the end line survey while some changes were made to it to better reflect the requirements of the end line study. In this regard, the end line questionnaire included a new section (section 13) specific to the interventions of the SWAPNO project to identify the impact. Additionally, the questionnaire was modified in several places to ensure that the relevant questions are asked and the impact of the interventions fully captured. For example, non-income outcomes such as women empowerment, self-confidence and aspiration were made salient in the questionnaire. In order to understand the delivery mechanism of the project better, we also collected administrative data of the project on the qualification of the Union Workers and the instructors of the training program.
We also conducted two Focus Group Discussions (FGDs) one in each district and also Key Informant Interviews (KIIs) with the relevant stakeholders such as the beneficiary women, UP officials, relevant personals

16
of the SWAPNO project Dhaka office, UNDP Bangladesh head office and Local Government Division, MoLGRD&C.
We use state-of-the-art techniques to present our results. Note that we have four groups to analyze– treatment and control in the baseline and the same two groups in the end-line. We use difference-in-difference method for the major variables so that we can attribute the changes in the variables from the baseline to the end-line to the SWAPNO project. That is, for each major variable, we run the following regression
𝑂𝑢𝑡𝑐𝑜𝑚𝑒 𝑖,𝑡 = 𝛽0 + 𝛽1𝐴𝑓𝑡𝑒𝑟 + 𝛽2𝑆𝑤𝑎𝑝𝑛𝑜 + 𝛽3 (𝑆𝑤𝑎𝑝𝑛𝑜 𝑥 𝐴𝑓𝑡𝑒𝑟) + 𝜀𝑖,𝑡
Where the dependent variable 𝑂𝑢𝑡𝑐𝑜𝑚𝑒 𝑖,𝑡 is income, asset, health, education, etc. of household i at time t
which could be either baseline or end-line. ‘After’ is a dummy variable which takes on 1 if the data comes from end-line and zero otherwise. ‘Swapno’ is also a dummy variable which assumes 1 if the household is a participant
of Swapno and zero otherwise. The interaction term 𝑆𝑤𝑎𝑝𝑛𝑜 𝑥 𝐴𝑓𝑡𝑒𝑟 captures the treatment effect or the
difference-in-difference estimates. Therefore, 𝛽3 is our parameter of interest and it is reported in the right most column of all tables with their level of significances. Single, double and triple asterisks signify the level of significance at 10, 5 and 1 percent respectively. However, it is also important to note that there are some questions for which the baseline data are not available. In such cases, we did not run difference-in-differences.
Appendix
Table A3.1: Distribution of sample by district, sub-districts and union
District Upazila Union Treatment Control Total
Kurigram Bhurungmari Baladia 20 10 30
Bhurungmari Jaimonirhat 20 11 31
Bhurungmari Shilkhari 20 10 30
Chilmari Astomirchar 20 10 30
Chilmari Raniganj 20 10 30
Fulbari Borovita 20 10 30
Fulbari Naodanga 20 10 30
Kurigram Sadar Belgacha 20 10 30
Kurigram Sadar Pachgachi 20 10 30
Nageswari Ballaverkhas 20 10 30
Nageswari Bamandanga 20 10 30
Nageswari Narayanpur 20 10 30
Nageswari Nun Khawa 20 10 30
Rajarhat Chinai 20 10 30
Rajarhat Ghorialdanga 20 10 30
Rajibpur Mohonganj 20 10 30
Rowmari Jadurchar 20 10 30
Ulipur Bazra 20 10 30
Ulipur Begumganj 20 10 30
Ulipur Hatia 20 10 30
Satkhira Assasuni Anulia 20 10 30
Assasuni Assasuni Sadar 20 10 30

17
Assasuni Protapnagar 20 10 30
Assasuni Sovenali 20 10 30
Debhata Debhata Sadar 20 10 30
Debhata Nowpara 20 10 30
Kaliganj Barasimla 20 10 30
Kaliganj Krishnanagor 20 10 30
Kaliganj Kusulia 20 10 30
Kaliganj Nalta 20 10 30
Kaliganj Tarile 20 10 30
Shyamnagar Gaburia 20 10 30
Shyamnagar Munshiganj 20 10 30
Shyamnagar Ramzannagar 20 10 30
Shyamnagar Paddapukur 20 10 30
Tala Khesra 20 10 30
Tala Kumuria 20 10 30
Tala Nagarghata 20 10 30
Tala Tala Sadar 20 10 30
Tala Tetulia 20 10 30

18
Chapter 4
Demographic and Socioeconomic Profile The purpose of providing an account on demographic and socio-economic conditions of the beneficiary households as well as the households in control group is two-folds: i) to learn who these people are behind the numbers, and ii) to establish that the demographic and socioeconomic conditions of the treatment and control groups were more or less similar before the SWAPNO project was rolled out.
4.1 Household size and age distribution
Average size of household remains same in baseline and end-line for both control and intervention groups (Table 4.1) which is about 3 persons per household. Even though percentage of female headed households were more or less same for both treatment and control groups at baseline, the proportion declines for control group in the end-line survey. However, the percentage remains same for treatment group at end-line which indicates no significant changes in demography between the two surveys. About 94% of the households are headed by females in treatment group. Average age of female is about 35 years in both control and treatment groups. It implies that these households are headed by relatively younger women who are capable of doing physical labor.
Table 4.1: Average HH size, Female Headed HH and Average Age of Female
Variables Baseline End-line
Control Treatment Diff Control Treatment Diff
Average HH size 3.145 3.006 -0.138 3.027 2.929 -0.0987
% of Female-headed HH 92.3 93.6 1.36 86.8 93.5 6.72
Average age of female 34.99 35.23 0.242
Age distribution of household members does not differ across treatment and control groups in the end-line survey (Table 4.2). Note that we don’t have this information for the baseline. More than 66% of household members are of working age category (15-59 years) for both groups. Young people (0-14 years) comprises around 25% and old people (above 59 years) are of around 7% of total population for both treatment and control group.
Table 4.2: Age distribution and Dependency Ratio
Variables End-line
Control Treatment
HH member aged 0-14 years (%) 24.85 26.13
HH member aged 15-59 years (%) 67.98 66.41
HH member aged 59+ years (%) 7.171 7.408
Dependency Ratio
Overall dependency ratio 0.667 0.746
Young aged dependency ratio 0.524 0.586
Old aged dependency ratio 0.143 0.160
Overall dependency ratio for control group is around 67% whereas this ratio is around 75% for treatment group in the end-line survey (Table 4.2), implying that the young age dependency ratio is more profound than the old age dependency ratio. Female headed households with household size of 3 and higher young age dependency ratio implies that a typical household of both treatment and control groups comprise of an adult female and two children.

19
4.2 Marital Status of Female Household Head About 45% of female household heads in treatment and 43% in control groups are widow and about 24-26% of female household heads are abandoned by husband in both groups at end-line (Table 4.3). The proportions of divorced female household head are 17% and 23% for control and intervention group respectively. The proportion of married female household heads in both groups is very low (14% in control and 8% in treatment). The distribution of marital status shows the targeting efficiency of the program.
Table 4.3: Marital status of female head
Marital Status End-line
Control Treatment
Divorced 16.95 23.26
Abandonment 26.15 23.93
Married 13.79 8.021
Unmarried 0.575 0.134
Widow 42.53 44.65
4.3 Education of Household Heads (Female) In terms of literacy, about 80% of female household head can sign while this proportion is 72% for control group (Table 4.4). Treatment group found to be more literate than the control – ability to read and write letter, and ability to sign is higher for the treatment group.
Table 4.4: Education of Household Head (Female) - End-line
Control Treatment Difference
Literacy of Female Household Head (%)
Can read and write letter 11.49 15.64 4.147
Can only read letter 1.149 0.936 -0.214
Can only sign 72.41 79.55 7.132
Cannot sign 14.94 3.877 -11.07
Education of Female Household Head (%)
No Schooling 0.575 0.401 -0.174
Incomplete Primary 76.72 75 -1.724
Class 5 Passed 12.93 12.7 -0.23
Class 8 Passed 7.471 8.957 1.486
SSC/Equivalent Passed 1.724 2.273 0.549
HSC/Equivalent Passed 0.287 0.668 0.381
HSC above 0.287 0 -0.287
In terms of educational attainment, the difference between treatment and control group in post-treatment survey is not substantial. There is hardly any difference in completion of different grades. The fact that the female heads in both control and treatment are similar in schooling but the females in treatment have higher ability to sign, read and write demonstrates SWAPNO’s contribution in improving literacy.
4.4 Occupation of female head Self-employment of female household head in both agriculture (around 25%) and non-agriculture (around 26.5%) have been found significantly higher compared to control households (Table 4.5). On the contrary, wage labor is much more prevalent among female household head in both agriculture (39%) and non-agriculture (around 48%) of control households. The treatment group women are found to be more self-
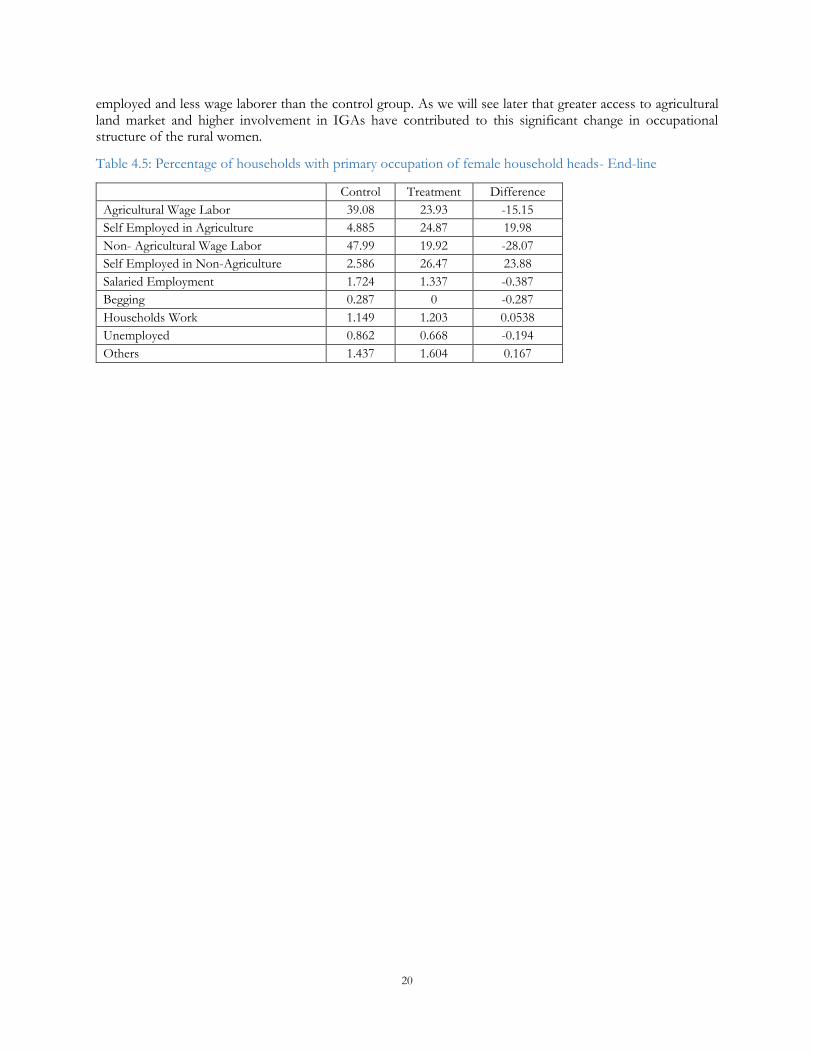
20
employed and less wage laborer than the control group. As we will see later that greater access to agricultural land market and higher involvement in IGAs have contributed to this significant change in occupational structure of the rural women.
Table 4.5: Percentage of households with primary occupation of female household heads- End-line
Control Treatment Difference
Agricultural Wage Labor 39.08 23.93 -15.15
Self Employed in Agriculture 4.885 24.87 19.98
Non- Agricultural Wage Labor 47.99 19.92 -28.07
Self Employed in Non-Agriculture 2.586 26.47 23.88
Salaried Employment 1.724 1.337 -0.387
Begging 0.287 0 -0.287
Households Work 1.149 1.203 0.0538
Unemployed 0.862 0.668 -0.194
Others 1.437 1.604 0.167

21
Chapter 5
Income, Asset and Expenditure
SWAPNO provided guaranteed job for 18 months to the distressed women of rural households. Each beneficiary received a total of BDT 66,450 as cash wage payments which was about Taka 3700 per month. The remaining BDT 22,150 was mandatory saving which was paid back to the beneficiaries as a ‘graduation bonus’ when the project ended. These wage income and the income from the investment of the ‘graduation bonus’ constitute the major source of income of the beneficiaries. The beneficiary households were also involved in ROSCA, the rotating saving scheme and each beneficiary won the lottery more than once during the project life. To the extent a beneficiary was able to invest the ‘graduation bonus’ as well as the sum from ROSCA in IGAs determines the success in improving their living condition in the absence of SWAPNO.
It is tricky to assess the impact of an intervention which is yet to benefit the beneficiaries. The forced saving or the graduation bonus of SWAPNO is an interesting example of such intervention. While assessing the income and poverty status of the beneficiaries, it is therefore essential to distinguish between their gross income and the ‘disposable’ income. This distinction is important because the beneficiaries did not receive about 25% of their income until the end of the project. Therefore, during the project life, the beneficiaries had to sacrifice their current consumption for higher future stream of income. Hence, in accounting sense, their gross income from SWAPNO was Taka 88,600 and since they were able to spend only 75% of it, the net amount of taka 66,450 can be referred as ‘disposable income’. Therefore, the delicate question is: while assessing the incidence of poverty, which income to consider? – ‘gross’ or ‘disposable’? If we use ‘gross’ income it shows what would have happened if all income was spent. That is, it will yield an ‘upper limit’ of the number of households moving out of poverty line in the project period. However, if we use the ‘disposable’ income net of graduation bonus it will give us the ‘actual’ number of households escaping poverty during the project period. Poverty analysis during the project period does not mean much when the full benefits of the interventions are yet to materialize.
What would happen after SWAPNO is beyond the scope of our study. Since the survey was conducted right after the project ends, we can only assess the short term impact of SWAPNO. That is, we ask the simple question: what has happened to the beneficiaries during the project period compared to the similar controls and baseline situations? However, we also assess their investment and make some educated guesses about their future stream of income in the absence of SWAPNO.
5.1 Household income and poverty First, we will discuss household income and incidence of poverty. To do so, we need to know some demographic characteristics of the households such as size of households, number of income earners and the percentage of households with female as the main income earners. This is essential since these households are characterized largely by female-headed ones where male earning members are absent.
i. The beneficiary - the adult female – is the main bread earner
Table 5.1: HH size and number of income earners
Variables Baseline End-line Diff-in-
diff Control Treatment Diff Control Treatment Diff
Average HH size 3.145 3.006 -0.14 3.027 2.929 -0.099 0.0397
Average Number of Income Earners 1.41 1.52 0.11 1.696 1.561 -0.135 -0.245
% of HH with Female as Main Income Earner
79.30 86.13 6.823 86.03 92.88 6.840 0.0168
22
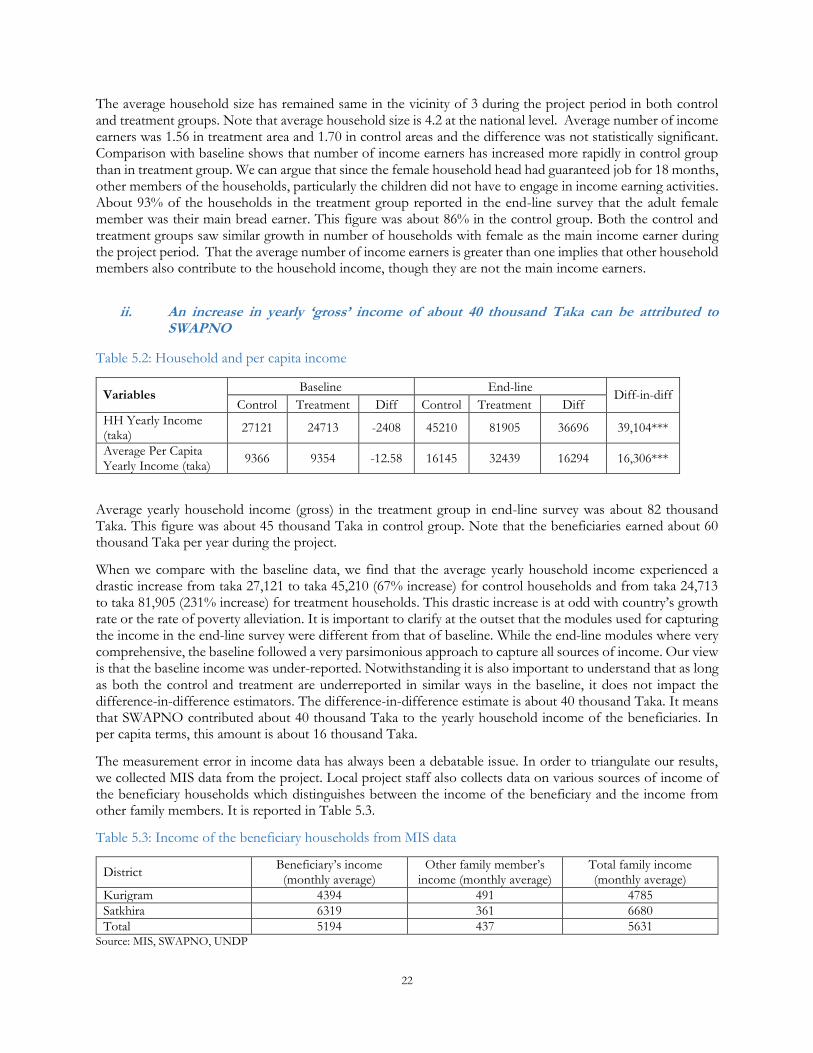
The average household size has remained same in the vicinity of 3 during the project period in both control and treatment groups. Note that average household size is 4.2 at the national level. Average number of income earners was 1.56 in treatment area and 1.70 in control areas and the difference was not statistically significant. Comparison with baseline shows that number of income earners has increased more rapidly in control group than in treatment group. We can argue that since the female household head had guaranteed job for 18 months, other members of the households, particularly the children did not have to engage in income earning activities. About 93% of the households in the treatment group reported in the end-line survey that the adult female member was their main bread earner. This figure was about 86% in the control group. Both the control and treatment groups saw similar growth in number of households with female as the main income earner during the project period. That the average number of income earners is greater than one implies that other household members also contribute to the household income, though they are not the main income earners.
ii. An increase in yearly ‘gross’ income of about 40 thousand Taka can be attributed to
SWAPNO
Table 5.2: Household and per capita income
Variables Baseline End-line
Diff-in-diff Control Treatment Diff Control Treatment Diff
HH Yearly Income (taka)
27121 24713 -2408 45210 81905 36696 39,104***
Average Per Capita Yearly Income (taka)
9366 9354 -12.58 16145 32439 16294 16,306***
Average yearly household income (gross) in the treatment group in end-line survey was about 82 thousand Taka. This figure was about 45 thousand Taka in control group. Note that the beneficiaries earned about 60 thousand Taka per year during the project.
When we compare with the baseline data, we find that the average yearly household income experienced a drastic increase from taka 27,121 to taka 45,210 (67% increase) for control households and from taka 24,713 to taka 81,905 (231% increase) for treatment households. This drastic increase is at odd with country’s growth rate or the rate of poverty alleviation. It is important to clarify at the outset that the modules used for capturing the income in the end-line survey were different from that of baseline. While the end-line modules where very comprehensive, the baseline followed a very parsimonious approach to capture all sources of income. Our view is that the baseline income was under-reported. Notwithstanding it is also important to understand that as long as both the control and treatment are underreported in similar ways in the baseline, it does not impact the difference-in-difference estimators. The difference-in-difference estimate is about 40 thousand Taka. It means that SWAPNO contributed about 40 thousand Taka to the yearly household income of the beneficiaries. In per capita terms, this amount is about 16 thousand Taka.
The measurement error in income data has always been a debatable issue. In order to triangulate our results, we collected MIS data from the project. Local project staff also collects data on various sources of income of the beneficiary households which distinguishes between the income of the beneficiary and the income from other family members. It is reported in Table 5.3.
Table 5.3: Income of the beneficiary households from MIS data
District Beneficiary’s income
(monthly average) Other family member’s
income (monthly average) Total family income (monthly average)
Kurigram 4394 491 4785
Satkhira 6319 361 6680
Total 5194 437 5631 Source: MIS, SWAPNO, UNDP

23
The above table shows that average yearly income of a beneficiary household is about 67,572 Taka and this excludes the mandatory savings. Note that our estimate of household income net of mandatory savings stands at 67,145 Taka which is very close to the MIS data. It offers greater confidence on our estimates.
iii. Beneficiaries were able to generate additional income beyond the project’s
Earlier we noted that households’ yearly gross income exceeds wage income from SWAPNO by about 22 thousand Taka. That the household income is higher than the project income is also confirmed by MIS data. Now the question is: where does the additional amount come from? It is interesting to note that their household income has other sources than the SWAPNO. We learnt from Table 5.1 that average number of income earners was about 1.6 in the treatment group. Moreover, it has been found that some beneficiaries had started their IGAs during the project period. FGDs also reveal that as their working hour ends by 2 pm, the beneficiaries had time to work for their own IGAs as well as for wage payment (e.g. in chatals).
Figure 5.1 plots the distribution of the source of additional income. It shows that the major sources are non-SWAPNO wage income and income from business and they constitute about three-fourth of additional income. The shares of crop and non-crop agriculture are still very low. One argument is that their investment in land market and also in IGAs such as poultry and livestock are yet to yield return.
Figure 5.1: Distribution of sources of additional income for the beneficiaries
iv. Most of the beneficiaries have invested their graduation bonus
At the time of interview, about 93% of beneficiaries (746 out of 800 beneficiaries) were found to have received the graduation bonus while 380 beneficiaries out of 746 (51%) were found to have spent their graduation bonus. Most of the spending was found to be in productive investment. Table 5.4 reports the number of beneficiaries who have spent their bonus, partially or fully, and the average spending amount. It shows that 159 beneficiaries have already invested in livestock and the mean size of investment is about 19,500 Taka. 39 beneficiaries have invested about 16 thousand Taka on average in businesses. Apart from typical IGAs, 59 beneficiaries have either bought or rented land with the bonus. The mean amount is about 19 thousand Taka. About 11 thousand Taka was spent on house construction and repair as well.
Among the beneficiaries who spent on household expenditure, daily household expenditure and medical expenditure stood out. We found one beneficiary who spent all her bonus in marrying off her daughter.
Business
Non-SWAPNO wage Income
Assistance/safety nets
Non-crop agriculture
Crop agriculture

24
Table 5.3: Use of SWAPNO bonus
No of
Beneficiaries Mean of spending
amount (BDT)
Poultry 7 3485.71
Livestock 159 19487.74
Wood Work 2 10200.00
Other business 39 16482.05
HH expenditure 80 2832.50
HH medical expenses 20 6147.50
Education expenditure 1 2000.00
Marriage of children 1 22000.00
House repair/Construction cost 31 10695.16
Buying/Leasing of land 59 18848.31
Repay the loan 26 12165.38
Others 67 12180.60
Note: The number of beneficiaries do not add up to 380 as there are overlaps.
v. The beneficiaries have greater access to agricultural land market (rental)
We will see in Table 5.9 that average size of own landholding has not changed. Further, table 5.3 indicates that the beneficiaries have either rented in or bought farm land from the graduation bonus. Taken together, we can conclude that the farm land has been rented not bought out of graduation bonus. This is a remarkable shift of occupation from only wage labor to a mix of wage laborer and farming. This matches the national trend which shows that the wage employment for rural women has decreased.
Table 5.4 shows how the amount of land under leasing and sharecropping contracts of the beneficiaries and also control groups has changed from the baseline. Amount of land under fixed rent contract (i.e. lease) has increased from about 0.56 decimal from baseline to about 4.7 decimal in the end-line for the beneficiaries. For the control group, this change is from 0.19 decimal to 0.85 decimal. The diff-in-diff coefficient is about 3.5 decimal which is statistically significant at 1% level. It implies that SWAPNO contributed to the increase in access to the land under fixed rent contract by about 3.5 decimal. There is only a small change in land under sharecropping contract and the difference is not statistically significant. It also corroborates with the national trend of shifting the contract for land from sharecropping to fixed rent.
Table 5.4: Land under lease and share contracts (decimal)
Type of land contract Baseline End-line
Diff-in-diff Control Treatment Diff Control Treatment Diff
Lease In (fixed rent contract) 0.193 0.560 0.367 0.852 4.700 3.848 3.482***
Share In (sharecropping) 0.0798 0.287 0.208 0.703 0.816 0.112 -0.0953
vi. Increase in gross income indicates significant reduction of incidence, extent and severity of poverty
First, we estimate the number of poor based on ‘gross’ income of the households. Though the full income has not been at the disposal of the households, it is still a part of their income.

25
Before SWAPNO, about 96% households in the control groups and 95% households in the treatment groups were extreme poor – that is below the lower poverty line. Hence, the treatment and control groups were very similar in terms of poverty status when the baseline survey was conducted. After 18 months of tenure in SWAPNO project, the income of the beneficiaries increased by more than three times and this has reduced the incidence of poverty. End-line survey shows that only 28% of the treatment households were below the lower poverty line. This figure is still very high in the control group- about 81%. The difference-in-differences estimates show that about 52% reduction of extreme poverty can be attributed to SWAPNO.
We don’t observe significant differences between Kurigram and Satkhira in terms of reduction of poverty due to SWAPNO. About 26% of the households in Kurigram and 30% in Satkhira are below the upper poverty line in the beneficiary groups after SWAPNO. The contribution of SWAPNO in reducing extreme poverty in these two districts are 54% and 50% respectively.
Table 5.5A: Lower Poverty Line (% of HH below lower poverty line)
Baseline End-line
Diff-in-Diff Control Treatment Diff Control Treatment Diff
Overall 95.761 94.625 -1.13 80.798 27.875 -52.925 -51.787***
Kurigram 96.02 93.5 -2.52 82.09 26 -56.09 -53.57***
Satkhira 95.5 95.75 0.25 79.5 29.75 -49.75 -50***
Table 5.5B: Upper Poverty Line (% of HH below upper poverty line)
Baseline End-line
Diff-in-Diff Control Treatment Diff Control Treatment Diff
Overall 97.257 95 -2.257 84.04 34.5 -49.54 -47.283***
Kurigram 97.512 93.5 -4.012 84.577 31.75 -52.827 -48.815***
Satkhira 97 96.5 -0.5 83.5 37.25 -46.75 -45.75***
Now consider the upper poverty line. About 97% of the households control groups and 95% households in treatment groups were moderately poor before the interventions of SWAPNO started. After 18 months with SWAPNO, the increased income of the beneficiaries has helped reduced moderate poverty to 35%. However, in the control group, the incidence of moderate poverty reduced to about 84%. That is, we can attribute about 47% reduction of moderate poverty to SWAPNO. The reduction of poverty is found slightly higher for Kurigram than Satkhira, similar to extreme poverty.
Table A5.1 in appendix shows that there has been significant change in the lower part of income distributions (20th, 30th, and 40th percentiles) of the treatment group and this is also reflected in lower poverty gap and squared poverty gap measures. Poverty gap index which captures the extent of poverty has reduced from 0.59 in baseline to 0.27 in end-line for the treatment group. Similarly, poverty gap squared, measuring the severity of poverty has gone down to 0.10 from 0.39.
vii. Mandatory saving has lowered the poverty status of many households during project
period
We have considered the ‘gross’ income which includes the mandatory saving of SWANPO and this was paid back at the end of the project in Tables 5.5. They show what would happen if all of income was spent on consumption. But, in reality, a part of the current consumption during the project period was postponed for higher future income. This may have lowered their standard of living as well as their poverty status. To probe

26
this, we calculate the number of poor households below the poverty lines using ‘disposable’ income net of mandatory savings.
Table 5.6A and 5.6B show that 40% households are below lower poverty lines and 53% households are below upper poverty line when we use ‘disposable’ income net of graduation bonus. The contribution of SWAPNO in reducing poverty has now been reduced to only 40% and 30% for extreme and moderate poverty respectively. With the reduction of 25% of the gross income, 12% additional households slipped below the lower poverty line which indicates the welfare loss of the households’ due to mandatory saving. This also highlights the importance of investing the saving in productive purposes so that future stream of income can offset the welfare loss during the project period.
Table 5.6A: Percentage of HH below lower poverty line (with disposable income)
Baseline End-line Diff-in-Diff
Control Treatment Diff Control Treatment Diff
Overall 95.76 94.63 -1.136 80.80 40 -40.80 -39.66***
Kurigram 96.02 93.50 -2.520 82.09 40.25 -41.84 -39.32***
Satkhira 95.50 95.75 0.250 79.50 39.75 -39.75 -40***
Table 5.6B: Percentage of HH below upper poverty line (with disposable income)
Baseline End-line Diff-in-Diff
Control Treatment Diff Control Treatment Diff
Overall 97.26 95 -2.257 84.04 52.50 -31.54 -29.28***
Kurigram 97.51 93.50 -4.012 84.58 42.75 -41.83 -37.81***
Satkhira 97 96.50 -0.500 83.50 62.25 -21.25 -20.75***
From methodological point of view, it is important to note that money-metric poverty lines - both upper and lower – are estimated from HIES 2010. These are reported in terms of per capita monthly income. However, during the baseline (in 2015) and end-line (in 2017) the poverty-line income (per capita monthly income of 2010) cannot buy the same basket of goods and services as it could in 2010. Therefore, we adjusted the poverty-line income upward using CPI. Further, we did not convert all members of the household into adult-equivalent in order to get per capita income. Therefore, our poverty measures have some upward-biases. That is, we are overestimating the number of poor; the actual number could be lower.
Table A5.2 reports percentiles, poverty gap and poverty gap squared for ‘net income’, net of graduation bonus. It shows that SWAPNO did not contribute to reducing poverty gap but it helped reduce severity of poverty.
5.2 Household Expenditure
viii. In addition to food, non-food expenditure has also increased both in absolute and relative terms for the beneficiaries
Annual household expenditure has increased by about 20 thousand Taka, from about 36 thousand Taka in pre-intervention period to about 56 thousand Taka in post-intervention for the treatment group. Households in control group experienced about 10 thousand Taka increase in household expenditure. Beneficiary households have spent substantially higher than the control groups in food, clothing, and education. All these increases in

27
expenditure are attributable to SWAPNO as the difference-in-difference estimators are highly statistically significant.
Food expenditure has increased by about 1 thousand Taka for the treatment group. Of this increase, about 450 Taka can be attributed to SWAPNO.
Table 5.7: Average expenditure (BDT) of households before and after intervention
Baseline End-line Difference in Difference Control Treatment Diff Control Treatment Diff
Food (monthly) 2439 2292 -146.9 3013 3320 306.9 453.8***
Clothing (yearly) 1327 1053 -274.3 3167 3623 455.2 729.5***
Medical (yearly) 1774 1965 190.7 2607 2866 258.9 68.25
Education (yearly) 1027 1014 -12.64 1803 2372 568.7 581.4***
Others (yearly) 6972 4756 -2216 6647 7363 716.6 2,933***
Total (yearly) 40362 36287 -4075 50378 56060 5682 9,758***
Non-food expenditure has increased not in absolute terms only, but in relative share also for the beneficiaries. In the treatment group, food expenditure is still about 72% in the end-line, down from 79% in the baseline. Share of expenditure on clothing is about 7% of total household expenditure, up from only 3% in baseline. The share of education expenditure has also increased. The difference-in-difference estimates are also statistically significant for clothing and education.
5.3 Asset and Land Holdings
ix. Livestock is now the main asset of the beneficiaries
We have already observed in above tables that the beneficiaries have invested their savings, both voluntary and non-voluntary, in productive investment such as livestock, poultry, fisheries, trees, etc. On average, mean value of livestock for the treatment group increased from about 2 thousand Taka in baseline to about 21 thousand Taka in end-line. About 16 thousand Taka increase in value of livestock can be attributed to SWAPNO project. In case of poultry, the value of asset has increased from about 4 hundred Taka to about 18 hundred taka and project’s contribution is about 13 hundred Taka. Similar results are found for fisheries and trees. Households also built asset in forms of household durables, capital machineries and precious metals.
Among all types of assets, livestock constitutes about 43% of total asset which was only 13% before SWAPNO. There has been a drastic change in the composition of household assets from baseline to end-line. Household durables make up about 54% of total assets in both treatment and control group in baseline. This composition has eventually changed with SWAPNO for the treatment group. The share of household durables declined to 19% for treatment households. This shift in composition of assets from unproductive (which does not yield income) to productive ones is a life-changing event for the beneficiaries which has significant implications for the sustainability of the outcome of the project.
Table 5.8: Mean value (BDT) of asset (non-land, non-financial)
Baseline End-line Difference in Difference Control Treatment Diff Control Treatment Diff
Livestock 2279 1927 -351.9 5136 20757 15621 15,973***
Poultry 452 369.2 -82.79 552.9 1777 1225 1,307***
Fisheries 0 0 0 147.1 1757 1610 1,610***
Tree 768.8 554.3 -214.5 1954 4144 2190 2,405***

28
Household Durables 2568 2381 -187.6 3436 4862 1427 1,614***
Capital Machinery 121.8 151.2 29.42 779.3 888.5 109.2 79.74
Precious Metals 698.8 629.7 -69.12 1140 2347 1207 1,276***
Others 179.2 118.4 -60.85 1838 2406 568.5 629.3***
Total 7068 6131 -937.3 14982 38940 23957 24,895***
x. The beneficiaries did not invest in agricultural land
Table 5.9: Average size of own land holdings
Types of Land Baseline End-line
Diff-in-diff Control Treatment Diff Control Treatment Diff
Homestead land 1.276 0.801 -0.475 2.040 2.189 0.149 0.624
Cultivable land 0.254 0.907 0.653 20.50 18.88 -1.624 -2.277
Table 5.9 indicates that the size of homestead land farm land has not changed in the end-line from the baseline both for control and treatment groups. The savings of the beneficiaries were not enough to purchase farm land, FGD reveals.
xi. The housing condition also remained same, though the access to electricity has increased
Table 5.10: Housing and fuel
Variable Baseline End line Diff-in-
Diff Control Treatment Diff Control Treatment Diff
% of HH with different types of houses (1st room)
Pukka 0.0176 0.00633 -0.0113 0.00748 0.00375 -0.00373 0.00753
Semi Pukka 0.0603 0.0468 -0.0135 0.0150 0.0175 0.00254 0.0160
Tin shed house 0.580 0.566 -0.0146 0.758 0.759 0.000645 0.0152
Kancha/bamboo/straw 0.342 0.381 0.0393 0.219 0.220 0.000549 -0.0388
% of HH with mostly used fuel for cooking
Wood 19.20 21 1.798 37.41 39.38 1.969 0.171
Coal 0.249 0.375 0.126 0.748 0.500 -0.248 -0.374
Straw 73.57 70.25 -3.316 58.85 58 -0.853 2.463
Gas 0.998 0 -0.998 0.499 0.125 -0.374 0.624
Jute stick/chalk 0 0 0 39.40 41.88 2.474 2.474
Cow Dung 2.993 4.875 1.882 12.97 18.75 5.782 3.900
Electricity 0.249 0.375 0.126 0 0 0 -0.126
% of HH with Access to Electricity
17.21 14.88 -2.332 40.90 47.13 6.227 8.559**
Table 5.3 shows that only 31 households have spent about 11 thousand Taka on average from their graduation bonus on repairing and construction of their houses. However, Table 5.10 indicates that the changes in housing condition of the beneficiaries have not been noteworthy when we consider all households. Share of households with pukka, semi pukka or tin shed houses have not increased significantly for the beneficiary households. In case of fuel, types of fuel have not changed much but the share of households with access to electricity has increased substantially for the beneficiary households.

29
Appendix
TableA5.1: Income percentiles and other measures of poverty based on gross income
Variable Baseline End-line
Diff-in-Diff Control Treatment Diff Control Treatment Diff
Income of 10th percentile 322.9 317.7 -5.208 485.7 1105 619.7 624.9
Income of 20th percentile 427.5 422.2 -5.313 664.6 1286 621.4 626.8*
Income of 30th percentile 550 494.3 -55.69 849.5 1413 563.7 619.4**
Income of 40th percentile 633.3 587.5 -45.83 989.7 1795 805.7 851.6***
Poverty Gap 0.575 0.594 0.0189 0.468 0.271 -0.198 -0.217***
Squared poverty gap 0.371 0.391 0.0210 0.268 0.102 -0.166 -0.187***
Table A5.2: Income percentiles and other measures of poverty based on ‘net’ income
Variable Baseline End-line
Diff-in-Diff Control Treatment Diff Control Treatment Diff
Income of 10th percentile 322.9 317.7 -5.208 485.7 820.5 334.8 340.0
Income of 20th percentile 427.5 422.2 -5.313 664.6 917 252.4 257.7
Income of 30th percentile 550 494.3 -55.69 849.5 1079 229.1 284.8*
Income of 40th percentile 633.3 587.5 -45.83 989.7 1265 275.1 321.0**
Poverty Gap 0.575 0.594 0.019 0.468 0.471 0.0032 -0.0158
Squared poverty gap 0.371 0.391 0.021 0.268 0.239 -0.0286 -0.049***

30
Chapter 6
Food Security and Coping with Disasters
6.1 Food Security Expenditure on food reported in Table 5.7 shows that beneficiaries now spent about 3320 Taka on food per year and this amount is about 1 thousand taka more from baseline. This increase in food expenditure for the treatment group offsets the increase for the control group in the same period by about 450 Taka. This is the contribution of SWAPNO. This highlights the fact that the SWAPNO participants were more food secured during the project period.
i. Share of households taking meal only once or twice a day is lower for the treatment group
Figure 6.1: Number of times meal taken a day in last one year
We asked respondents to report their frequency of taking meals. About 55% of the beneficiaries and 42% of the control group women reported that they took meal three times a day but could not eat to heart’s content. Share of households who skipped one meal is reported to be lower for the treatment group - about 38% beneficiaries and 48% control women reported that they had meal only twice a day. The share of households with acute food crisis is also much lower for the treatment group – 7% treatment vs. 11% control.
ii. While both the control and treatment groups reported the similar months as the months
of acute food crisis, average number of days with acute food crisis is much lower for the treatment group.
Food insecurity has seasonal pattern – certain months of the year are characterized by lesser opportunities of works for the wage laborers. Table 6.1 records share of households reporting a particular month as the month of maximum food deficit and the average number of days with acute food deficit. Most of the households in both treatment and control groups reported that they experienced highest food deficit from Ashar to Kartik. For example, 14% households in both treatment and control groups reported Ashar as the month of maximum food deficit. Interestingly, still 21% households in the treatment reported Ashin as the worst month while 14% of the control households reported the same. Average number of days with acute food crisis per month is about 5.2 days whereas this number is 11.5 for the control groups.
0
10
20
30
40
50
60
Took meal three timesa day
Took meal twice a day Took meal once a day
control treatment

31
Table 6.1: Food deficit by seasonality
Month
% of HH reporting this month with
maximum food deficit
Average no of days with acute food
deficit
% of HH reporting this month with
maximum food deficit
Average no of days with acute food
deficit
Treatment Control
Boishakh 4.4 7 5.8 10.1
Joishtha 1.1 10 3 10.9
Ashar 14.3 7.7 14.2 10.9
Shrabon 19.8 7.5 14.4 10.6
Bhadra 17.6 6.2 7.9 10.4
Ashshin 20.9 5.5 13.7 11.6
Kartrik 15.4 7.9 19.7 12.1
Ogrohayon 0 4.4 10
Poush 0 10.8 15.8
Magh 1.1 5 0.4 11.7
Falgun 0 1.3 11.6
Choitra 5.5 5.4 14.3 11.7
6.2 Coping with Natural Disasters One of the objectives of the interventions of SWAPNO is that the beneficiaries will be more climate-change resilient and better equipped with the coping strategies for climate change induced natural disasters such as flood, cyclone, river erosion, draught, etc. We consider five types of coping strategies in three phases of disaster – before, during and after. The coping strategies include i) borrowing, ii) asset sale or mortgage, iii) sale of labor, iv) relief or assistance, and v) temporary migration. These coping strategies are new addition to the end-line survey and therefore we cannot compare them with the baseline.
i. In the pre-disaster phase, coping strategies are similar for both treatment and control groups.
In the pre-disaster phase, the major coping strategy is the sale of labor which includes advance sale. About 85% of control households and 84% of treatment households coped by selling labor before the disaster strikes (Table 6.2). The beneficiaries also sold or mortgaged assets in this phase.
ii. Beneficiaries rely more on own asset for coping than borrowing from others during shock
The sale or mortgage of assets become the dominant strategy during shocks and it is used more by the beneficiaries than the control group. 81% of the households in the treatment group and 66% of the households in the control group sold or mortgaged assets during disasters. In the post shock period, the sale of asset is also wide spread. Note that assets include household savings, durables, business capital, trees, and ornaments. It indicates that beneficiaries are now more able to cope disaster with their own asset, particularly their own savings. During shocks, share of households who borrowed from relatives, NGOs and Mohajon is less for the treatment groups. As we know from the anecdotal evidence that ‘Dadon’ (loan form Mohajan) becomes very widespread after any natural disaster and this credit charges very high interest rate - sometimes as high as 200%. We found such evidence after the cyclone Roanu in Chittagong and Moheshkhali in 2016.

32
iii. Incidence of displacement or migration is lower for the beneficiary group
In both phases – during and after – incidence of temporary displacement and migration has been found lower for the beneficiaries. During disasters, about 10% of the households in the control group and 6% of the households in the treatment group have experienced temporary displacement or migration. This difference is also statistically significant. In the post disaster period, the rate of temporary displacement is much lower for the treatment group than the control group.
Table 6.2: HH (%) with Different Coping Strategies
End-line
Control Treatment Difference
Strategies before shocks
Loan 0 0.529 0.529
Asset sale/mortgage 4 4.233 0.233
Sale of labor 85.33 83.60 -1.735
Relief & assistance 8 6.878 -1.122
Temporary displacement 0 0.529 0.529
Others 2.667 4.233 1.566
Strategies during shocks
Loan 9.756 3.509 -6.247**
Asset sale/mortgage 65.85 80.70 14.85***
Sale of labor 4.878 5.263 0.385
Relief & assistance 9.756 4.386 -5.370**
Temporary displacement 9.756 6.140 -3.616*
Strategies after shocks
Loan 34.44 24.88 -9.562***
Asset sale/mortgage 25.56 39.44 13.88***
Sale of labor 8.889 4.695 -4.194**
Relief & assistance 24.44 27.70 3.255
Temporary displacement 6.667 1.878 -4.789*
Others 0 1.408 1.408
Figure 6.1: HH (%) with coping strategies for all phases
0
20
40
60
80
100
Control Treated
Loan Asset Sale/Mortgage Sale of Labor
Relief & Assistance Displacement Others

33
Chapter 7
Education, Health and Nutrition
7.1. Education of children
i. Education outcome of the children has not changed much
From Table 5.7 we observe that expenditure on education has increased from about 1 thousand Taka in baseline to 2400 taka in the end-line for the beneficiaries and an increase in 6 hundred Taka can be attributed to SWAPNO. While we observe an increase in education expenditure, education outcome has not changed much. Share of school going children has remained unchanged statistically. The reason is that this share was very high to begin with in the baseline survey. About 97% of the school going children were going to school before the intervention. Interestingly, among those who are enrolled in schools, share of children not attending school is lower for the treatment group. Note that choice of outcome variables is constrained by the baseline survey, which primarily focuses on school attendance.
Table 7.1: Child education
Baseline End-line Difference in Difference Control Treatment Diff Control Treatment Diff
Percentage of school going children going school
96.70 97.26 0.554 92.78 95.07 2.282 1.728
If yes: go to school
Regularly 89.39 90.67 1.279 85.93 92.04 6.116 4.837
Irregularly 10.61 9.328 -1.279 2.222 1.384 -0.838 0.440
Not Entirely 0 0 0 11.85 6.574 -5.277 -5.277**
7.2 Health of beneficiary women
ii. Beneficiaries now perceive to have better health despite little change in scientific measures
Though medical expenditure of the beneficiary group has increased from about 2 thousand Taka to 2.9 thousand Taka, this change is not statistically significant when we compare it with the change in the control group. Table 7.2 reports frequency of being sick and treatment seeking pattern of both the control and treatment groups. The SWAPNO beneficiaries reported to be sick less frequently than the control group. About half of the beneficiaries reported that they hardly fell sick in the last one year compared to 42% of the control women. There is not much difference between treatment and control group in terms of types of medical services they availed. However, there is evidence of lower incidence of visit to quacks by the beneficiaries.
Table 7.2: General health of women
Baseline End-line Difference in
Difference Control Treatment Diff Control Treatment Diff
How many times have you been sick in the last 12 months?
Frequently 4.271 4.010 -0.261 6.733 4.875 -1.858 -1.597
Occasionally 50 54.26 4.261 55.61 46.38 -9.236 -13.50***
Hardly 45.73 41.73 -3.999 37.66 48.75 11.09 15.09***
How have your family members been sick in the last 12 months?
Frequently 14.96 12.53 -2.427 7.731 7 -0.731 1.696
Occasionally 48.82 50.13 1.316 60.10 57.50 -2.600 -3.916
Hardly 36.22 37.33 1.111 32.17 35.50 3.330 2.219

34
In the last 12 months, where did you take treatment (last meeting)?
I did not receive treatment 3.535 4.841 1.305 0.998 0.125 -0.873 -2.178*
We have treated ourselves 1.010 0.892 -0.118 0.249 0.125 -0.124 -0.00600
MBBS Doctor 20.71 19.11 -1.599 3.242 3.625 0.383 1.982
Rural Doctor 59.85 56.43 -3.415 35.66 30.25 -5.411 -1.995
Kabiraj 1.010 1.146 0.136 0.499 0.125 -0.374 -0.510
Maulvi/Sadhu/Ojha 0 0 0 0.499 0.250 -0.249 -0.249
Quack 1.515 2.548 1.033 1.995 0.625 -1.370 -2.403**
Pharmacy 6.818 9.554 2.736 9.227 9.250 0.0231 -2.713
Community Clinic 0.505 1.019 0.514 33.17 38.63 5.458 4.944
Private Hospitals 0.253 0.255 0.00225 1.496 2.375 0.879 0.876
Government Hospitals 3.030 2.293 -0.737 12.47 14.50 2.031 2.768
Others 1.768 1.911 0.143 0.499 0.125 -0.374 -0.517
Note that the cut-off point of BMI is 18.5 kg/meter-sq., according to WHO. Women with BMI below this
point are considered to be deprived of basic nutrition. Table 7.3 shows that on average the BMI indices of the
respondent women are higher than the cut-off point in both control and treatment groups in baseline and end-
line. It is likely that the healthier women self-selected into the program knowing the type of works they had to
perform.
There has been no change in the Body Mass Index (BMI) of beneficiaries’ due to SWAPNO. BMI of the
beneficiary and the control group women were almost same in the baseline and changed little after the project
(Table 7.3). It has to be borne in mind that the beneficiary women were engaged in physically strenuous job for
18 months. In our questionnaire, we asked the beneficiary to comment on the extent the public work was
physically strenuous. About 90% reported that it was physically demanding. This physically demanding job for
a prolonged period may have implications for their BMI of the beneficiaries.
Table 7.3: BMI of the women (kg/meter-sq)
Baseline End-line Difference in
Difference Control Treatment Diff Control Treatment Diff
BMI of respondent 20.42 20.54 0.114 21.21 21.15 -0.0544 -0.168
We also asked about the perception of their current health condition compared to the situation two years ago in absence of SWAPNO. In the absence of baseline information, we rely on recall observations only. The proportion of women reporting better health increases over the period, while proportion reporting worse health decreases, when we compare differences in responses between control and treatment group. It implies while the scientific measure of BMI indicates no improvement in health of the beneficiaries in certain dimensions due to SWAPNO, their perception about their health condition has improved. It indicates that they now feel better about their health than they used to do two years ago despite their engagement in physically demanding works.

35
Table 7.4: How do you describe your health in general?
Two years ago Currently Difference in
Difference Control Treated Diff Control Treated Diff
Very poor 0.249 1.875 1.626 0.998 0.250 -0.748 -2.373***
Poor 15.21 21.50 6.288 11.22 2.750 -8.472 -14.76***
Satisfactory 48.88 49.75 0.872 40.15 12.88 -27.27 -28.15***
Good 33.42 25.38 -8.041 41.90 66.75 24.85 32.90***
Very good 2.244 1.500 -0.744 5.736 17.38 11.64 12.38***
7.3 Water and sanitation Table 7.5: Water and sanitation
Baseline End-line Difference
in Difference
Control Treatment Diff Control Treatment Diff
What is the source of water for your food?
Tube Well 87.72 88.35 0.627 91.27 92.63 1.353 0.727
Well 0.501 0.376 -0.125 0.249 0.500 0.251 0.376
Pond 6.266 6.391 0.125 3.242 2.125 -1.117 -1.242
River 0.251 0 -0.251 0 0.125 0.125 0.376
Reserve rain water 2.757 0.877 -1.880 0.249 0.500 0.251 2.130**
Tap/supply water 0.752 0.627 -0.125 3.242 3 -0.242 -0.117
Others 1.754 3.383 1.629 1.746 1.125 -0.621 -2.250*
Do you have toilet in your premise?
Yes 78.04 75.52 -2.521 84.54 91.13 6.586 9.107***
What kind of toilet/toilet type is?
Hole closet 25.66 27.46 1.799 14.16 8.230 -5.929 -7.728**
Slab latrine 66.96 65.07 -1.887 81.71 84.22 2.514 4.401
Water seal slab 0 0.896 0.896 2.655 6.722 4.067 3.171**
Hanging closet 5.900 5.522 -0.377 1.475 0.823 -0.652 -0.275
Others 1.475 1.045 -0.430 0 0 0 0.430
Where do you toilet?
Hole closet 22.19 25.06 2.870 12.22 7.375 -4.844 -7.715**
Slab latrine 66.58 63.36 -3.221 68.83 76.88 8.047 11.27***
Open space field 5.222 4.326 -0.896 10.72 6.500 -4.223 -3.327
Water seal slab 4.439 4.580 0.142 2.494 6.500 4.006 3.865**
Hanging closet 0.261 1.399 1.138 0.998 0.375 -0.623 -1.761**
Others 1.305 1.272 -0.0332 4.738 2.375 -2.363 -2.330*
iii. SWAPNO has been found to have impact on use of hygiene latrine but not safer water
The beneficiaries are not found to use safer source of water than the control group. However, it is reported
that the beneficiary uses more reserve water than the control group. The beneficiaries are more likely to have
toilets in their premises. About 91% of the beneficiaries have reported to have toilets in their premises
compared to 76% of the control women. Most of the respondents have slab latrine – about 84% of the
beneficiaries and 82% of the control group. Moreover, the beneficiaries are more likely to use water seal slab

36
toilets and less likely to use hole closet than the non-participants. There is, therefore, some indication that the
beneficiaries are using more hygiene latrine than the control group and SWAPNO has a role to play. Note that,
the training program of SWAPNO includes a module on health and nutrition which taught sanitation and
hygiene practices. However, better hygiene can be the outcome of both income effect and training.
7.4 Child health
iv. Average height and weight of children have not changed significantly due to SWAPNO
Table 7.6: Child’s height and weight
Baseline End-line Difference in
Difference Control Treatment Diff Control Treatment Diff
Average Child Age 34.20 29.82 -4.371
Average Height of Children (cm)
86.36 82.79 -3.573 83.15 78.74 -4.416 -0.843
Average Weight of Children (kg)
10.75 10.36 -0.393 10.76 10.63 -0.129 0.264

37
Chapter 8
Women Empowerment and Aspiration
Public works based ‘graduation model’ is argued to be different from direct asset transfer based model on the ground that the former enhances women empowerment and boosts self-confidence and aspiration which are the key ingredients of the sustainability of the project outcomes. While asset is a transfer in latter case, beneficiaries build asset from their hard-earned income form guaranteed employment in the public work based model. The fact that destitute women earn, save and build asset on their own gives them self-confidence and self-esteem. Since these issues are central to the justification of choosing public works based model over direct transfer, we discuss these issues in details in this chapter.
In literature, the issue of women empowerment has been approached and measured in many different ways including female educational attainment, labor force participation, women’s decision-making ability, and intra-household resource allocation by gender, and women’s self-esteem and other psychosocial measures. As the project aims at enhancing women’s productivity by improving their ability and opportunities, this should result in more efficient labor market outcome for women and systematically enhance women’s empowerment. We therefore study how women’s ability to make decisions within their households has improved over the project period. The guaranteed employment could empower women since the lack of women’s influence in intra-household decision-making can be partly explained by the traditional gender norm that restricts women’s link to market-based activities. Participating in public works program under a guaranteed employment scheme could work as a catalyzing factor towards her inclusion in social networks. This facilitates formation of new friendship, enabling them to join social groups and public meetings, exposure to formal work life and interactions at work place. ROSCA participation could enhance a sense of unity and support among these women, in addition to facilitating access to income-generating activities. Hence, SWAPNO is expected to help develop group solidarity, self-confidence, aspiration and access to institutions. Early field evidence suggests that beneficiary women are invited to community mediations, social gatherings and functions and as a result their social status seem to have been upgraded. This can affect their own sense of self-esteem and aspiration – their personal feeling about themselves; worthiness in family and society as well as self-efficacy – their belief about themselves to succeed towards goals despite challenges. The project is expected to have significant impact on these empowerment indicators. Table 8.1: Women Empowerment Indicators: Control over income and assets and intra-household decision making
Baseline End line Difference
in Difference
Control Treated Diff Control Treated Diff
Control over personal income and asset
I myself can decide to use my personal income
89.78 95.38 5.599**
I myself can decide to use my own savings
89.28 95.25 5.973**
I have full control over my immoveable/movable property
80.05 90.63 10.58***
Control over household asset
I have influence over the use of family income and savings
81.80 90.75 8.954**
I have influence over family land 75.31 86.75 11.44**
I have influence over family immovable/movable assets
75.31 87.25 11.94***
Decision making new income earning activities

38
Women involved with any income generating activities
72.82 68.50 -4.318 47.38 95.63 48.24 52.56***
Decision of income generating activity was taken by women
0.797 0.840 0.0427 0.708 0.830 0.122 0.0789**
Decision of income generating activity was taken Jointly with a male
0.0551 0.0331 -0.0221 0.279 0.168 -0.112 -0.0895***
Decision of income generating activity was taken after consulting woman
0.0301 0.0153 -0.0148 0 0.00125 0.00125 0.0161*
No involvement in decision making 0.118 0.112 -0.00584 0.0125 0.00125 -0.0112 -0.00538
i. The beneficiary women have higher control over personal and household assets than their non-participant counterpart
ii. The beneficiaries are now more able to make decisions about IGAs on their own, thanks to SWAPNO
In Table 8.1, we report certain outcome variables denoting women’s empowerment. These include women’s control over personal and family income and assets as well the extent they can make their own decisions. In the absence of baseline information about control over income and asset, we only provide end line comparison, which is only indicative of the impact of SWAPNO. For other outcome indicators, we provide estimates of double difference meaning that differences in outcome between baseline and end line comparing treatment and control groups. We report significant increase in the proportion of women reporting their greater control over own income and asset. About 91% women in treatment group as opposed to about 80% women in control group reported to have full control over their immoveable or movable property. We found similar magnitude of difference for family assets too. Beneficiary women are also found to report higher decision making ability in income generating activities. SWAPNO contributes about 53% increase in the share of women involved in making decision about IGAs. While this is somewhat obvious that the treatment group women had access to income and training to engage in further income generating activities, this also indicates that their ability to make decision on their own will help them sustain their income in the absence of the program.
iii. The beneficiaries are more mobile than before outside their community due to SWAPNO
Another dimension of women empowerment is their mobility as opposed to traditional gender norm internalized by men. Often women are restricted in terms of their mobility outside home limiting their access to economic and social intuitions. As reported in Table 8.2, our treatment group women reportedly have shown improvement in terms of this specific indicator. While we do not find any significant improvement in terms of their mobility within closer community, we observe significant improvement over their mobility outside home (sub-district and district level mobility), facilitating their access to various market and social institute as a result of program participation.
Table 8.2: Women Empowerment Indicators: Mobility as freedom
Baseline End line Difference in
Difference Control Treated Diff Control Treated Diff
Mobility outside community (para/village)
Herself 99.25 99.75 0.498 99 99.13 0.123 -0.375
Accompanied by Male 0.750 0.252 -0.498 0.499 0.375 -0.124 0.374
Accompanied by others in a group 0 0 0 0.499 0.500 0.00125 0.00125
No outside mobility

39
Mobility within the union territory
Herself 93.77 94.47 0.707 96.01 98.13 2.115 1.408
Accompanied by Male 1.496 1.508 0.0113 1.247 0.750 -0.497 -0.508
Accompanied by others in a group 4.489 3.894 -0.594 2.743 1.125 -1.618 -1.024
No outside mobility 0.249 0.126 -0.124 0 0 0 0.124
Mobility within the Upazila territory
Herself 62 63.44 1.442 76.56 85.13 8.566 7.124*
Accompanied by Male 12.25 11.18 -1.069 8.978 6 -2.978 -1.908
Accompanied by others in a group 23.25 21.48 -1.768 13.72 8.375 -5.341 -3.573
No outside mobility 2.500 3.894 1.394 0.748 0.500 -0.248 -1.643
Mobility within district or divisional city
Herself 28.50 30.23 1.727 45.89 64.75 18.86 17.14***
Accompanied by Male 29 23.55 -5.448 22.94 14.13 -8.818 -3.369
Accompanied by others in a group 31.25 33.63 2.377 28.68 19.63 -9.053 -11.43***
No outside mobility 11.25 12.59 1.344 2.494 1.500 -0.994 -2.338
i. Beneficiaries are found to be more optimistic about their future
ii. The self-esteem of the beneficiaries is also found to be significantly higher
In order to assess women’s improvement over life skill management through self- confidence, self -efficacy and self-esteem, we include several questions related to these and rely on recall information in the absence of baseline data for both control and treatment group women. It is expected that individuals with high self -efficacy would view difficult goals as a challenge while individuals with low self-efficacy would view the same goal as beyond achievable. As reported below, treatment group women appear to be highly optimistic about future, show substantially and significantly higher optimism about achieving their future goals and show positive assessment of goal realization. These results are consistent with the high self-efficacy as well we higher self-esteem as discussed below. In order to capture a measure of individuals self-esteem, we ask several questions consistent with Rosenberg self-esteem scale( Rosenberg 1965; Society and the adolescent self-image , Princeton University Press) and record level of agreement (strongly disagree, disagree, agree and strongly agree) to the statements such as 1) generally speaking I am satisfied with my-self, 2) Often I think I am a powerless person, 3) often I think I have certain quality, 4) I think I do not have anything to be proud of, 5) sometime I think I am worth less, 6) sometime I think I have importance in society. Then we calculate sum of each responses to define the self- esteem score. In the absence of baseline data, we ask individuals to recall and record what would be their responses (level of agreement) considering their position two years ago. So, for both treatment and control group of respondents we use recall data for baseline. We compute z-score with equal weight on each response and then aggregate the scores. The z-score is computed by subtracting sample mean from the raw score and diving the difference by respective standard deviation. As we observe there has been significant increase in self –esteem among treatment women compared to control women in terms of standard deviation (over 1 S.D). The proportion of women reporting to be willing to make new friends compared to two years ago were 10.6 percentage points higher in treatment group compared to control group respondents.

40
Table 8.3: Women empowerment through enhancing self-confidence and self esteem
Two years ago Currently Diff-in
Diff Control Treated Diff Control Treated Diff
Have future plan for life? 46.88 34.75 -12.13 64.84 87.13 22.29 34.42***
How optimistic are you in implementing your future plan?
Not quite optimistic 9.574 13.31 3.735 1.247 0 -1.247 -4.982**
Somewhat optimistic 25 29.14 4.137 25.44 12.88 -12.56 -16.70***
Fairly optimistic 45.21 39.93 -5.285 69.83 70.13 0.300 5.584
Very optimistic 20.21 17.63 -2.587 3.491 17 13.51 16.10***
In retrospect, do you think the goal you set two years ago are accomplished?
Accomplished 5.319 8.273 2.954
Somewhat accomplished 45.21 79.14 33.92
Nothing accomplished 49.47 12.59 -36.88
Self-esteem indicator (Z Score) 0.153 -0.0769 -0.230 -0.650 0.326 0.976 1.206***
Are you willing to make new friends?
12.97 12.25 -0.718 21.20 31.13 9.928 10.65***

41
Chapter 9
Training: What Did the Beneficiaries Learn?
The training program is an integral part of the graduation model followed by SWAPNO project with two major objectives: i) improving the basic life skill through awareness building regarding their rights and entitlements, and ii) improving basic knowledge and skill for running an IGA such as arithmetic skill, technical knowledge on cow-fattening, poultry, etc. SWAPNO offered 7 different courses on life skill and livelihood for its beneficiaries. Union workers and other trade specific personnel were hired to teach these courses. A typical livelihood training is a five-day course while a life skill training runs for a day. Average size of the class is 25. Participation in the training was regarded as an on-job training and the participants were paid their regular wages for taking part in the courses.
First, we will investigate the overall perception of the participants about the training and later we will study the impact of training on their knowledge. Note that in our questionnaire we asked some specific questions which are taken from the course modules taught in the training program.
9.1 Participation in training
i. The participation rate was high in all courses
Each of the training modules had participation rates higher than 70% while 4 of the training modules saw above 80% participation of the beneficiaries ‘Women Rights’ and Entitlements’ module had the largest participation (about 89%) while ‘Gender & Development’ module had the least (about 71%). While 10 (1.25%) of the SWAPNO beneficiaries reported receiving no training at all, 356 (about 45%) of them received training from all 7 modules. It indicates that there is a scope to increase the participation rate through greater monitoring by the project staff. About 88% of the beneficiaries received training of 4 or more modules.
Table 9.1: Participation in each Training Module
SN Name of the Training Participation
Number %
1 Preparation of Business 582 72.75
2 Simple Accounting 640 80.00
3 Climate Change 625 78.13
4 Health & Nutrition 705 88.13
5 Gender & Development 565 70.63
6 Women Rights & Entitlements 711 88.88
7 Leadership Development 669 83.63
9.2 Perception of the beneficiaries about the courses
ii. Beneficiaries found the courses useful; they learnt new things and applied in their lives
Almost all the beneficiaries were aware of each of the 7 different training modules and reported that the knowledge learnt from the modules were relevant to real life. Almost 98% of the Beneficiaries report applying knowledge learnt from the module ‘Simple Accounting’ in real life while about 58% used the knowledge gained from the module ‘Leadership Development’. A large proportion of the respondents’ report sharing the knowledge from the training modules with their own HH members as well as their neighbors.
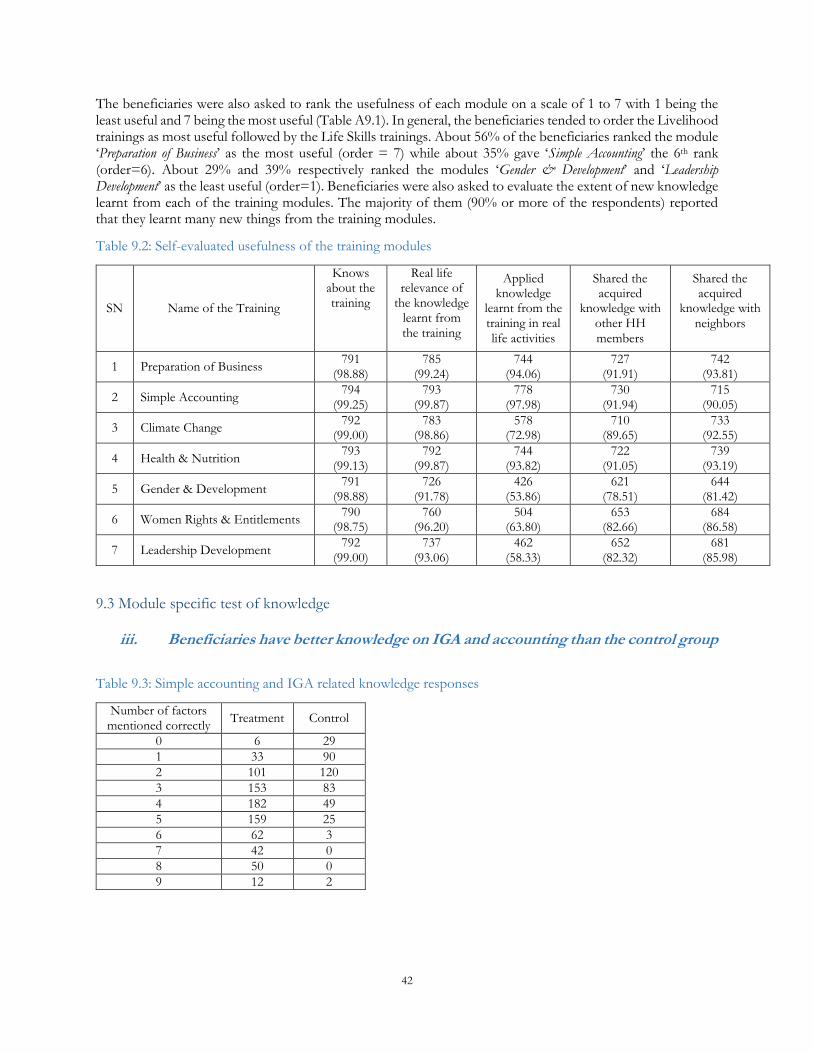
42
The beneficiaries were also asked to rank the usefulness of each module on a scale of 1 to 7 with 1 being the least useful and 7 being the most useful (Table A9.1). In general, the beneficiaries tended to order the Livelihood trainings as most useful followed by the Life Skills trainings. About 56% of the beneficiaries ranked the module ‘Preparation of Business’ as the most useful (order = 7) while about 35% gave ‘Simple Accounting’ the 6th rank (order=6). About 29% and 39% respectively ranked the modules ‘Gender & Development’ and ‘Leadership Development’ as the least useful (order=1). Beneficiaries were also asked to evaluate the extent of new knowledge learnt from each of the training modules. The majority of them (90% or more of the respondents) reported that they learnt many new things from the training modules.
Table 9.2: Self-evaluated usefulness of the training modules
SN Name of the Training
Knows about the training
Real life relevance of
the knowledge learnt from the training
Applied knowledge
learnt from the training in real
life activities
Shared the acquired
knowledge with other HH
members
Shared the acquired
knowledge with neighbors
1 Preparation of Business 791
(98.88) 785
(99.24) 744
(94.06) 727
(91.91) 742
(93.81)
2 Simple Accounting 794
(99.25) 793
(99.87) 778
(97.98) 730
(91.94) 715
(90.05)
3 Climate Change 792
(99.00) 783
(98.86) 578
(72.98) 710
(89.65) 733
(92.55)
4 Health & Nutrition 793
(99.13) 792
(99.87) 744
(93.82) 722
(91.05) 739
(93.19)
5 Gender & Development 791
(98.88) 726
(91.78) 426
(53.86) 621
(78.51) 644
(81.42)
6 Women Rights & Entitlements 790
(98.75) 760
(96.20) 504
(63.80) 653
(82.66) 684
(86.58)
7 Leadership Development 792
(99.00) 737
(93.06) 462
(58.33) 652
(82.32) 681
(85.98)
9.3 Module specific test of knowledge
iii. Beneficiaries have better knowledge on IGA and accounting than the control group
Table 9.3: Simple accounting and IGA related knowledge responses
Number of factors mentioned correctly
Treatment Control
0 6 29
1 33 90
2 101 120
3 153 83
4 182 49
5 159 25
6 62 3
7 42 0
8 50 0
9 12 2

43
The respondents were asked to mention some factors to consider before undertaking any IGA. These factors are taken from training material of the ‘Preparation of Business’ module. There were 9 options in total for naming such factor. 6 (0.8%) respondents of the treatment group were unable to mention a single consideration correctly while the same number for the control group is 29 (7.2%). Only 12 Beneficiaries could mention all of the 9 considerations correctly while 2 of the respondents from the Control group also managed to achieve the same feat. About 21% of the Beneficiaries could mention 6 or more considerations correctly while the same figure for the Control group is a meager 1.2%.
The respondents were also asked to solve a simple Profit and Loss problem based on the content of the ‘Simple Accounting’ training module. 652 (81.5%) of the Beneficiaries reported the correct answer while 298 (74.3%) of the Control respondents could do the same. The share of correct answer was higher for the treatment group and it is statistically significant.
9.4 Knowledge about violence and places to lodge complaints Table 9.4: Reporting on violence related knowledge
Response/Frequency Treatment Control
Aware about where to make complaints if subjected to violence/harassment
756 (94.97)
370 (91.36)
Places of lodging complaints
Shalish (Mediation) 188 (24.87)
91 (24.59)
Village Court/Court of law 78 (10.32)
30 (8.11)
Police/Law enforcing agency 57 (7.54)
32 (8.65)
Victim Support Center 6 (0.79)
2 (0.54)
Union Parishad (UP) 312 (41.27)
132 (35.68)
Village elders/Morol/Matbor/others 115 (15.21)
83 (22.43)
iv. There is hardly any difference in knowledge on violence between treatment and control group
The beneficiaries were asked about their knowledge on the places of lodging formal complaints if they face any violence. It is based on the ‘Gender & Development’ training module. The majority of the respondents are aware of where to complain if subjected to violence with the treatment respondents slightly favoring the Union Parishad (UP) to make complaints compared to the control respondents. There is hardly any difference in knowledge between these two groups in where to go if they are subjected to violence.
9.5 Knowledge about rights and entitlements
v. Beneficiaries are more aware of their rights than the control group
Table 9.5: Rights and Entitlements
Variable Name Treatment Control
Aware of Inheritance rights 773
(96.63) 377
(94.01)

44
Aware of Citizens’ Rights 622
(77.75) 195
(48.63)
Frequency of mentioning each aspect of citizens’ rights:
Food 411
(51.38) 97
(24.19)
Clothing 293
(36.63) 37
(9.23)
Place to live 306
(38.25) 64
(15.96)
Healthcare services 296
(37.00) 61
(15.21)
Education 239
(29.88) 31
(7.73)
Right to vote 487
(60.88) 164
(40.90)
Right to receive services from UP and Upazila 284
(35.50) 97
(24.19)
The knowledge of the respondents is tested on issues of rights and entitlements (based on the content of the ‘Women Rights & Entitlements’ training module). More than 90% of the respondents from each group are aware of inheritance rights. A much larger proportion of treatment respondents (about 78%) are aware of citizens’ rights compared to control respondents (about 49%). About half of the beneficiaries are aware of their right to getting food while this share is about one-fourth for the control group. The component of citizens’ rights that respondents are most aware of is ‘the right to vote’ while the component least aware of is ‘the right to education’, in case of both groups. About 61% of the treatment women and 41% of the control women are aware of their right to vote. In case of education, about 30% and 8% women in treatment and control groups are aware that it is their right.
9.6 Knowledge about laws
Table 9.6: Knowledge about laws
SN Variable Name Response Treatment Control
A Multiple Marriage/Polygamy Law
1 Steps a wife can take if her husband takes part in polygyny without her prior consent
a. File a lawsuit Yes
710 (88.75)
315 (78.55)
b. Apply for a divorce Yes
128 (16.00)
25 (6.23)
c. Claim ‘Mahr’ payments from husband Yes
197 (24.63)
74 (18.45)
d. Try mediation through ‘Shalish (arbitration)’ Yes
507 (63.38)
230 (57.36)
e. No steps can be taken, continue to be with husband Yes
21 (2.63)
17 (4.24)
B Child Marriage Law
2 Reported minimum age for marriage of girl child (in years) 18
783 (97.88)
386 (96.26)
20 17
(2.13) 15
(3.74)

45
3 Reported minimum age for marrying off unmarried female household member (in years)
18 783
(97.88) 386
(96.26)
20 17
(2.13) 15
(3.74)
4 Aware that arranging Child Marriage (of children aged below 18 years) is a punishable offence
Yes 791
(98.88) 379
(94.51)
5 Mentions of possible punishments for arranging child marriage:
a. Punishment for the Groom (imprisonment/fine) Yes
425 (53.13)
177 (44.14)
b. Punishment for the Bride (imprisonment/fine) Yes
255 (31.88)
100 (24.94)
c. Punishment for the Groom’s Guardians (imprisonment/fine)
Yes 621
(77.63) 251
(62.59)
d. Punishment for the Bride’s Guardians (imprisonment/fine) Yes
619 (77.38)
253 (63.09)
e. If adult groom and child bride, groom may face imprisonment/fine
Yes 133
(16.63) 34
(8.48)
f. If guardians arrange marriage for child bride and child groom, guardians may face imprisonment/fine
Yes 212
(26.50) 79
(19.70)
C Dowry Prohibition Law
6 Have paid or will pay dowry in daughters’ marriage Yes
125 (22.89)
90 (33.71)
Nos. of responses
546 267
7 Have taken or will take dowry in sons’ marriage Yes
59 (10.35)
41 (13.53)
Nos. of responses
570 303
8 Aware that receiving or paying dowry is a punishable offence Yes
794 (99.25)
387 (96.51)
9 Mentions of possible punishments for receiving or paying dowry:
a. Dowry provider may face imprisonment/fines Yes 501 (62.63)
208 (51.87)
b. Dowry receiver may face imprisonment/fines Yes 573 (71.63)
282 (70.32)
c. Both may face imprisonment/fines Yes 427 (53.38)
129 (32.17)
10 Mentions of possible punishments if husband/in-laws torture wife for dowry payments
a. May face legal fines Yes 458 (57.25)
192 (47.88)
b. May face imprisonment Yes 720 (90.00)
320 (79.80)
c. No punishment applicable Yes 23 (2.88)
9 (2.24)
D Divorce Law
11 Mentions of legally recognized methods of divorce in the country
a. Spoken Talaq (Triple Talaq) Yes 273 (34.13)
171 (42.64)
b. Divorce through legal procedures Yes 680 (85.00)
272 (67.83)
c. Both methods lead to divorce Yes 134 (16.75)
43 (10.72)

46
vi. The beneficiaries are more aware of the punishments in laws for polygamy, child marriage, dowry and divorce than the control groups
Respondents of both groups are more or less similarly familiar with the steps a wife can take if her husband practices polygyny without her prior consent, with the most reported courses of action being filing a lawsuit and trying mediation through ‘shalish’. The treatment group is more found to be more aware of divorce and claim ‘Mahr’ payments from husband.
Almost all the respondents, both treatment and control, reported that the minimum age for marriage of girl child is 18 years and were aware that Child Marriage is a punishable offence. While both groups are aware of the different punishments for arranging child marriage, a greater proportion of the treatment group respondents are aware of the punishments with the most mentioned types of punishment being imprisonment/fine for the bride’ and groom’s guardians.
While almost all respondents are aware that receiving or paying dowry is a punishable offence, some of them still received/paid or expect to receive/pay dowry in the marriage of son/daughter. Respondents of both groups are more or less similarly aware of the punishments for practicing dowry and for torturing wife for dowry payments. While the majority of the respondents reported that divorce through legal method is formally accepted in the country, a significant number of them also reported that Spoken Talaq (triple talaq) also leads to divorce and this is more prevalent among the non-beneficiaries.
Appendix
Table A9.1: Self-reported ordering of the training modules based on usefulness
SN Rank of
Usefulness
Name of the Training
Preparation of Business
Simple Accounting
Climate Change
Health & Nutrition
Gender & Development
Women Rights & Entitlements
Leadership Development
1 1 44 (5.56)
24 (3.02)
110 (13.89)
31 (3.91)
228 (28.82)
62 (7.85)
308 (38.89)
2 2 28 (3.54)
29 (3.65)
106 (13.38)
39 (4.92)
159 (20.10)
217 (27.47)
200 (25.25)
3 3 28 (3.54)
45 (5.67)
114 (14.39)
56 (7.06)
185 (23.39)
220 (27.85)
139 (17.55)
4 4 52 (6.57)
100 (12.59)
217 (27.40)
134 (16.90)
113 (14.29)
119 (15.06)
59 (7.45)
5 5 70 (8.85)
178 (22.42)
127 (16.04)
237 (29.89)
61 (7.71)
76 (9.62)
43 (5.43)
6 6 129 (16.31)
281 (35.39)
93 (11.74)
182 (22.95)
24 (3.03)
57 (7.22)
24 (3.03)
7 7 440 (55.63)
137 (17.25)
25 (3.16)
114 (14.38)
21 (2.65)
39 (4.94)
19 (2.40)

47
Chapter 10
Through the lens of SDGF Evaluation Criteria
The Sustainable Development Goals (SDGs) succeeds the Millennium Development Goals (MDGs), building
on the experiences, lessons learnt and best practices of the latter. The SDG Fund is a development cooperation
mechanism that provides assistance to sustainable development activities through integrated and
multidimensional Joint Programmes and in the process, acts to facilitate the transition from the MDGs to the
SDGs. Strengthening Women’s Ability for Productive New Opportunities (SWAPNO) is a development
programme undertaken by the Local Government Division (LGD) of Bangladesh and UNDP as a SDGF Joint
Programme. As per the requirement of the SDG Fund, all Joint Programmes have to commission an
independent final evaluation. The current report presents the final evaluation of the SWAPNO project in line
with the SDG Fund requirement.
Relevance The beginning of the 7th Five Year Plan (FYP) of Bangladesh coincided with the launch of the United Nations
SDGs and as such, the plan has made accommodations to achieve several of the SDG targets within the
stipulated time. In line with the SDGs, the 7th FYP aims to reduce poverty through a broad-based strategy of
inclusiveness and attain sustainable economic growth that is resilient to climate changes. In particular, the plan
has specific strategies in place to deal with poverty and inequality, gender issues, social protection, climate
change and disasters and sustainable development pathways.
SWAPNO is a public works based social safety net programme which is part of the current social protection
strategy (SPPS programme) of the government of Bangladesh. At the same time, it also falls under the United
Nations Development Assistance Framework (UNDAF) Outcome 2.1: Economic growth is achieved in an inclusive
manner, extending opportunities to the rural and urban poor and protecting the vulnerable from shocks. The expected program
outputs correspond to Output 2.1.2: Poor families are less vulnerable to external shocks through greater access to financial
and insurance services, Social Safety Nets with clear graduation strategies.
The main objective of the SWAPNO project is to address the needs and vulnerabilities of the ultra-poor and
the marginalized, and in the process, provide them a pathway out of poverty. Hence, SWAPNO targets ultra-
poor female headed households (who are usually the most vulnerable and lacking in economic opportunities)
to receive the set of program interventions. SWAPNO utilizes both protection and promotion strategies and
works to provide a long-term solution to poverty and inequality reduction. This not only corresponds to the
7th FYP but with the long term Perspective Plan of the country, to achieve sustainable growth in an inclusive
manner.
SWAPNO is a joint programme between the UNDP and LGD, MLGRD&C of the Government of Bangladesh
with local Partner NGOs (PNGOs) acting as implementing partners. While development programs
implemented by NGOs (e.g. BRAC’s TUP-CFPR) and private sector consulting companies (such as the Chars
Livelihoods Program) have been successful in reducing poverty in the country, they are limited in their scope
in achieving government ownership and the potential for national level delivery. Government ownership of
development programs can enable such efforts to continue for longer periods of time and has the potential for
national level replicability. Hence building on the experiences of another successful UNDP program REOPA,
SWAPNO involves the local government as the implementing agency.
Effectiveness An initial baseline survey for the project was conducted in August 2015 on a sample of 1200 households from
Kurigram and Satkhira districts. The survey employed the RCT design and 800 households receiving project
benefits (i.e. the beneficiaries) were taken as the Treatment group while 400 others served as the Control. The

48
baseline survey supplemented by an end line one on the same sample of households, conducted between May-
June of 2017. This section presents the key findings from the comparisons between the baseline and end line
observations.
A substantial increase in income and assets of the beneficiaries can be observed between the two periods as
well a drastic reduction in poverty, both moderate and extreme. The households are now more food secure and
expenditure on non-food items, particularly, education has increased. The households also had diversified
sources of income as they earn from IGAs (Income Generating Activities) and non-SWAPNO labor income.
Most of the beneficiaries have invested their ‘graduation bonus’ money in livestock, poultry or other productive
assets. Livestock were found to be the main assets of the beneficiaries at the end line, accounting for 43% of
total assets (up from 13% at baseline). The graduation bonus has also helped the beneficiaries with greater
access to agricultural land market as they are now leasing in land. At the same time, a shift in occupation from
wage labor to a mix of farmer and wage labor can be observed.
While there is little change in scientific measures of health conditions like BMI, beneficiaries’ perception of
their own health has improved at the end line but no significant impact on child’s education or health is
observed. In coping with disasters, the beneficiaries’ strategies now rely more on personal savings than high
interest rate loans. SWAPNO beneficiaries have better knowledge on IGA and accounting than the control
group while they are also found to be better informed on laws and punishments for polygamy, child marriage,
dowry and divorce. Additionally, the beneficiaries have greater control over personal and household assets, are
more mobile outside their community and are more optimistic about their lives in the future compared to the
control respondents.
Good practices and replicable experiences
This section highlights some of the good practices and experiences learnt from the implementation of the
SWAPNO project.
The role of Union Workers - While the UPs are the implementing agency of the project, they are
limited in their capacity in terms of the required manpower. Therefore, SWAPNO Union Workers
(UWs) were hired by the PNGOs to fill in this gap. The role of the UWs was that of a catalyst that
expedited the overall operations of the project. The UWs played crucial roles in almost all the steps of
program implementation ranging from helping in beneficiary selection, supervising ROSCA and
fortnightly meetings, monitoring work, providing life skills and livelihood trainings, counselling the
women, help in receiving wage payments, maintaining different records and updating the MIS database
among others. In short, the UWs were the backbone of the entire project delivery mechanism.
Community monitoring of public works – while this mechanism was originally introduced in the
REOPA project, the success led to its replication in the SWAPNO program as well. A banner with the
schedule of work activities, progress of work and the time allocated for each type of work was placed
near each of the worksites. It served to inform the general people about the schedule of different work
activities so that they can easily verify if the women are working properly and timely. Therefore, it
offered some form of community monitoring of the public works in the program.
Efficiency The parameters pertaining to the efficiency of the program was not studied as part of the end line evaluation
of the SWAPNO project. To fully assess the efficiency of the joint programme management model as well as
meaningfully compare it to single-agency interventions would be the scope of another study with different
objectives in mind. Similarly, the study also did not explore the cost structure and expenditure patterns of the
programme.

49
But we do have some estimates of the unit cost comparison between SWAPNO and the Chars Livelihoods
Programme (CLP) which used similar beneficiary identification approaches to SWAPNO (SWAPNO Pro Doc).
The unit cost per core beneficiary household (excluding direct costs not targeting the core beneficiaries) in CLP
Phase 2 is estimated at USD 1740. SWAPNO, which aims to reach 65,000 core beneficiary households, has an
estimated unit cost of USD 1460 of which USD 1060 is the value of monetary benefits received by core
beneficiaries. Additionally, it is also estimated that of this unit cost, USD 1170 will be equal to the communities’
benefits of having well maintained or repaired public assets. Therefore, the per beneficiary cost shows that
SWAPNO compares favorably with other similar programs and the public works nature of the program
generates additional benefits for the communities.
An interesting point to note is that the Government has a greater ownership stake in the SWAPNO project,
committing to share 25% of the total project cost, a large jump from just 1.7% in the case of the previous
REOPA project. Hence it shows that this joint programme has contributed to the progress of fostering national
ownership processes and outcomes.
The project employed several methods to enhance the overall efficiency of operations. For example, it
introduced community monitoring of public works to ensure quality of work and engage the local community
at the same time. It also introduced the practice of revision of the training materials so that the beneficiaries
can better retain the new knowledge and thus improve the effectiveness of the trainings. The project used bank
accounts to deliver the fortnightly wages and the graduation bonus to the beneficiaries thereby avoiding the
possible leakage of funds if the payments were made in cash instead.
While the SWAPNO program aims to expand the holding of productive assets by the poor households, it does
not follow the model of Asset Transfer Programs (where assets are transferred to the poor unconditionally).
But rather it takes the route of public works based employment where the beneficiaries have to work to receive
the different project benefits including income. Therefore, when beneficiaries invest in the assets of their
choice, they have a greater sense of ownership of the assets instilled in them and are less likely to use them in
unproductive ways. This helps to improve the efficiency of the model as when the beneficiaries use their assets
to generate further income, the process of graduation gets set into motion, which is the ultimate goal of the
program.
The program also placed a large emphasis on the practice of group savings (or ROSCA) to promote the savings
habit of the beneficiaries and encouraged them to invest the savings in productive assets. This not only helped
the beneficiary households to expand their asset base during the project period, but at the same time also
provided a scope for the beneficiaries to experiment with different IGAs before moving on to larger
investments with their graduation bonus. The counselling and monitoring by the Union Workers on the
different IGAs undertaken by the women after receiving the graduation bonus also played an important role.
All such activities helped to improve the efficiency of the program and boost the confidence of the beneficiaries
in conducting different IGAs, thereby improving their likelihood of graduation out of poverty.
While this section does shed some light on the methods and practices adopted by the project to improve
efficiency in operation, a full assessment of the efficiency context of the SWAPNO program is beyond the
scope of the end line study and would require follow up studies with additional objectives in focus.
Impact SWAPNO focuses on the graduation out of poverty of ultra-poor female headed households. It strives to
achieve so by employing a public works plus social safety net program. While one of the goals of the program is
to support and guide the beneficiary households to expand their productive asset base, a complementary but
equally important objective is to develop the human capital of the poor and vulnerable women. Improving
human capital will allow the beneficiaries to be more productive, better equipped to take advantage of

50
opportunities, more aware of different entitlements, rights and laws and as a result, lead a better-quality life
than before. Therefore, this joint programme not only aims for gender mainstreaming but also focuses on the
empowerment of women. At the same time, as the program engages the local government by using the Union
Parishads (UPs) as the implementing agency and local NGOs (PNGOs) as the implementing partner, it also
works towards establishing public private partnerships (PPPs) in development initiatives.
The program is built around the model of poverty graduation and evidence from such models employed across
different countries and across various settings show that its effect on poverty reduction in the long term is very
promising. Therefore, while the scope of the end line study does not permit analysis of sustainability of the
project impacts, prior experience of similar interventions suggests that they are likely to sustain in the long run.
Contribution to the SDGs
Since SWAPNO aims to provide a pathway out of poverty to poor and vulnerable female headed households,
it objectives coincide with many of that of the Sustainable Development Goals (SDGs). The list below presents
the SDGs which are closest to the objectives of SWAPNO.
SDG 1 - End poverty in all its forms everywhere
SDG 2 - End hunger, achieve food security and improved nutrition, and promote sustainable agriculture
SDG 3 - Ensure healthy lives and promote well-being for all at all ages
SDG 4 - Ensure inclusive and equitable quality education and promote life-long learning opportunities for all
SDG 5 - Achieve gender equality and empower all women and girls
SDG 9 - Build resilient infrastructure, promote inclusive and sustainable industrialization and foster innovation
SDG 16 - Promote peaceful and inclusive societies for sustainable development, provide access to justice for all and build
effective, accountable and inclusive institutions at all levels
The primary objectives of SWAPNO clearly coincides with SDG 1 (reducing poverty), SDG 5 (gender
mainstreaming and women empowerment) and SDG 9 (build and repair climate resilient public assets and
infrastructure). At the same time, SWAPNO also works to reduce food insecurity and improve the nutritional
status of beneficiaries (SDG 2), promote practices for good health and well-being (SDG 3), provide basic
knowledge, arithmetic skills and small business-related knowledge to the beneficiaries (SDG 4) and improve
the capacity of local institutions for pro-poor service delivery (SDG 16).
End line evaluation of the SWAPNO project shows that it had a significant positive impact on the beneficiaries.
Income and asset holding of the project participants have increased substantially while there has been a drastic
reduction in poverty. Food security has improved, expenditure on education has increased and the households
now have diversified sources of income thanks to the IGAs undertaken. A shift in occupation of the
beneficiaries from wage labor to a mix of farmer and wage labor can also be observed, indicating greater self-
sufficiency. At the same time, the beneficiaries are more knowledge on issues of IGA, accounting, rights,
entitlements and laws, are more mobile outside their community and more optimistic about their lives in the
future than the control group members. These suggests that the women are now more empowered than before.
While SWAPNO aims to reach and lift 65,000 ultra-poor women out of poverty, the pilot phase of the project
had an outreach to around 4500 core beneficiary households. SWAPO employed a robust mechanism for
identifying and targeting the poor households which minimized the inclusion errors associated with beneficiary
selection. It might be noted here that there were usually a large number of potential applicants, suggesting the
necessity for more development projects in the future to address the needs of the poor.

51
Sustainability Given the fact that the end line survey was conducted right after the end of the project, the end line study can
only capture the short run impacts, that is, it only evaluates what happened during the project period. However,
there are indications that the short-term impact of the project is likely to sustain, though the extent of
sustainability can be debated. The first major indication is the amount and type of productive investment the
beneficiaries made out of their wage income and mandatory saving. Second, the beneficiaries have learnt some
basics of running a business as well as basic arithmetic. This has boosted their self-confidence which is reflected
in their discourse, body language and attitude. Third, the beneficiaries now have greater control over their assets
while at the same time, their mobility has increased along with self-confidence, self-efficacy and aspiration. All
these indicators strongly suggest that the beneficiaries now aspire to live a better life and they will continue to
do so in the absence of the project. But to fully assess and document the sustainability of the project impacts,
a follow up survey needs to be conducted at least one year after the project end. Similarly, the extent of longer
term impacts can be explored through subsequent surveys.
While the SWAPNO pilot phase was only carried out in two districts, the model is scalable and the plan is that
from the third year, it will begin a cascading expansion at the national level to another 20 districts of the country
(SWAPNO Pro Doc).

52
Chapter 11
Conclusion: Some Insights on Project Design
i. Addressing dual objectives of wellbeing of the beneficiaries and public works
It is important to note that the success of the project doesn’t depend on how effectively public works have been done. The beneficiaries may just sit idle and draw their salary and all the outcomes of the project pertaining to the wellbeing of the beneficiaries can be achieved. That is, if wellbeing of the beneficiaries becomes the sole focus of the project, it will beat the purpose achieving dual objective of public works and poverty alleviation.
The success of the SWAPNO approach – public works built in safety net program with complementary inputs - depends on two ingredients- i) effective public works, and ii) boosting women’s confidence and aspiration. Note that the provision of SWAPO type safety net program is very costly which involves high delivery and monitoring cost. The government and the development partners are willing to incur such high costs because they believe that the benefits of these two ingredients will outweigh the high operational cost. If it does not, direct transfer of asset such as livestock would be a preferred option. If the moral hazard problem in public works is high, it neither builds public asset nor does it help women build their self-confidence and esteem. The feeling that they are in a regular job which earns bread and butter for their families may get attenuated and replaced by the feeling of getting freebees.
ii. Is 18-month work-fare long enough?
There is hardly any experimental evidence on the effect of length of work-fare on the welfare of the beneficiaries. It is obvious that the longer the length of tenure, better the impact of the project. But the trade-off between the length of the tenure and the coverage pose daunting challenge for the resource constrained government. Stretching the length of guaranteed work means less women will be covered. Note that the length of work-fare in REOPA was 24 months.
We asked the beneficiaries about the length of the program in FGDs. Almost everybody thinks that it should be stretched up to 2 years. Their argument was that it took about a year to ‘get on their feet’ and they needed one more year to improve their situations. The first year was all about repaying debt and making some essential spending on food, clothing, housing, health, etc. Therefore, the length of the tenure can be reconsidered for the scaled-up project. It was also pointed out by the beneficiaries that the work-fare can be phased out gradually, for example, full-time work for the first 18 months and part-time works for the following 6 months when the beneficiaries will work for 2-3 days a week.
iii. Is the impact sustainable after SWAPNO?
The end-line survey was conducted right after the project closure. In previous sections we discussed the types of investment the beneficiaries made out of the compulsory savings they received at the end of the project. It is encouraging that most of them invested in productive income generating activities such as livestock, poultry, small businesses, etc. However, the returns of these IGAs are yet to materialize in most of the cases. Therefore, it is too premature to comment on the sustainability of the level of income which they used to earn during the project life. We need another follow-up survey at least after one year to assess the sustainability of the interventions beyond the project. The sustainability of the outcomes of the project after the project life should be a part of the monitoring tool of SWAPNO. Knowledge on what works and what does not remain incomplete if the long term impact of the intervention is not assessed.
However, there are indications that the short term impact of the project is likely to sustain, though the extent of sustainability can be debated. As we discussed, the first major indication is the amount and type of investment they made out of their wage income and mandatory saving. Second, the beneficiaries have learnt some basics of running a business and basic arithmetic. It has boosted up their confidence in themselves which is manifested in their discourse, body language and attitude. Third, their control over their assets as well as their mobility has

53
increased along with self-confidence, self-efficacy and aspiration. They now have a plan how to live their lives in the years to come. All these indicators indicate that the beneficiaries now aspire to live a better life and they will continue to do so in the absence of the project.
iv. Asset monitoring and early payment of bonus
Since the graduation bonus is paid at the end of the project, the project staffs, particularly the Union Workers hardly have any time left to guide, coach and oversee the investment made by the beneficiaries. The bonus is given at the end of the 18-month tenure and most of the IGA activities start with this capital. Though the sustainability of the project outcome after the project critically depends on the success of the investment, the beneficiaries are left on their own to run their IGAs with little technical help and monitoring from the project.
For example, in case of cow-fattening, the beneficiaries need to be monitored very closely till the asset is sold. Cow-fattening requires technical knowledge which the five-day livelihood training may not be good enough to offer. It requires one-to-one monitoring. This type of investment is subject to various types of shocks such as diseases, price shock, etc. and the beneficiaries should know how to cope with these shocks under the supervision of project staffs.
One way to solve this asset monitoring problem is to disburse graduation bonus in the middle of the project life, for example, after six months. All livelihood trainings can be completed by the time the bonus is disbursed. In this case, their graduation bonus will be greater than the amount saved in first six months. That is, the beneficiaries will borrow from their own future income. If the investment is made right after six months of the start of the project, the project staff will have ample time to monitor the asset. The incubation period of the business will get long enough time to experiment with and to redesign the investment options if required. The beneficiaries will also earn their labor income and investment income at the same time. It has the potential to generate greater momentum in their income earning opportunities through higher savings and investment.
v. Business Models: Beneficiaries should know in advance what would happen after the project
What the project design lacks is the projection of the situation of the beneficiaries in the absence of the project. These projections must include several scenarios of investment with possible stream of income for the following one or two years. That is, carefully crafted business models should be the part of the project design – if a beneficiary earns Taka 100 from the project, saves Taka 40 during the project period and invest in option X, it will bring Taka Y in the next one year. These types of exercise will give beneficiaries the confidence that they can maintain the similar standard of living after the project what they used to maintain during the project life. These business models should be the part of the training program. If a woman earns Taka 2000 per month before enrolling SWAPNO and Taka 5000 per month during the project, business model should specify how she would earn at least Taka 3000 in the post-SWAPNO period.
vi. Union Worker: The catalyst of change
Union worker is a great innovation of this project which was not a part of the initial project design. Each program union has a Union Worker employed by the partner NGOs. The FGDs reveal that the follow-up visit by the union workers was very helpful in learning the materials taught in the training program. Though it is not in the original ToR of the Union Worker, the local project officials felt its usefulness and included in the project. This initiative can be scaled up and formalized in the project design. The one-to-one meeting of the union workers with the beneficiaries on investment decisions and running an IGA was found to be very effective, though it was practiced for a very short period of time before the project ends. Union workers were also involved in monitoring the public works. FGDs with the union workers reveal that this type of monitoring requires full-time workers. Since they are multi-tasking, it compromises with the quality of monitoring and other works. Better monitoring mechanism should be in place to oversee the public works, as FGDs suggested. In this light, it was recommended to increase the number of union workers per union. Monetary incentives of a union worker were also argued to be low and does not commensurate with the work load it demands.

54
vii. Life-skill and livelihood trainings: Require revisiting
We have discussed the training program and its effectiveness in previous chapter. It highlights that while all the trainings were reportedly useful to the beneficiaries, its sole dependency on class room teaching is debatable. That is, the participants acknowledge and understand the usefulness of the training but may not know how to use them effectively in their real lives. Class-room training can thus be complemented by the hands-on training on various business options such as cow-fattening, poultry, wood-work, etc. Teaching materials on social issues such as gender, human rights, etc. can be made more interesting and communicable with help of internet and multimedia. These types of contents are readily available in the internet and can be used with very low cost. Union Digital Center (UDC) can play an important role in delivering such materials.
While conducting KII with the trainers of courses, shortage of the skilled manpower in the union to conduct the specialized courses such as on cattle, goat and poultry rearing were identified as the major obstacles for effective learning. In some cases, union workers also teach a course of two. While they may be good at teaching some courses on social issues, technical issues should be taught by technical personnel. Sub-district level public and NGO officials with specialization can be identified and invited to teach these courses.
The content of the courses can be re-assessed by an education expert before scaling up the project in order to better serve the beneficiaries. We believe there are scopes to merge and squeeze some of the overlapping issues on gender, human rights and leadership development.
viii. Involvement of Union Digital Center (UDC)
All Union Parishad offices of Bangladesh house a UDC which is a public-private partnership enterprise offering a host of public services such issuing birth certificates, delivering social security benefits, etc. We discussed with a couple of UDCs regarding its scope of involvement in SWAPNO. It is found that these UDCs are under-utilized and can be involved in several stages of the project implementation from beneficiary selection to project monitoring.