
Residential Retrofit High Impact Measure Evaluation Report
220
Jai J. Mitchell Analytics Residential Retrofit High Impact Measure Evaluation Report Prepared For The California Public Utilities Commission Energy Division February 8, 2010 Work Performed Under Contract By: The Cadmus Group, Inc (Prime Contractor) Itron, Inc. Jai J. Mitchell Analytics KEMA PA Consulting Group Summit Blue Consulting, LLC
-
Upload
khangminh22 -
Category
Documents
-
view
2 -
download
0
Transcript of Residential Retrofit High Impact Measure Evaluation Report

Jai J. Mitchell Analytics
Residential Retrofit
High Impact Measure Evaluation Report
Prepared For The California Public Utilities Commission
Energy Division
February 8, 2010
Work Performed Under Contract By:
The Cadmus Group, Inc (Prime Contractor)
Itron, Inc. Jai J. Mitchell Analytics
KEMA PA Consulting Group
Summit Blue Consulting, LLC

HIM Evaluation Report
1. ABSTRACT
This document was prepared by the Residential Retrofit Evaluation Team, led by The Cadmus Group for the California Public Utilities Commission (CPUC). It describes the evaluation efforts that were conducted by the Evaluation Team in reviewing the 2006-2008 residential energy efficiency programs run by the Investor-Owned Utilities (IOUs) in California.
The purpose of this evaluation effort is to provide a high-quality, reliable and objective estimate of energy and demand impacts from residential retrofit energy efficiency programs operated in California. This estimate of impacts contributes to decisions on the cost-effectiveness of the programs and is an element in the decision-making process regarding the verifiability and accuracy of the earnings claims by the IOUs in California.
The methodologies for this evaluation effort were framed by the California Energy Efficiency
Evaluation Protocols, the International Performance Measurement and Verification Protocol (IPMVP), and the Request for Proposals issued for this project (RFP No. 06 PS 5683). The research included 24,475 evaluation data collection points, including telephone surveys, onsite verifications, field metering sites, and equipment lab testing. The final results include recommendations for gross and net energy savings recommendations for 12 High Impact Measure (HIM) groups that each represent at least 1% of an IOU’s portfolio claimed energy savings during the 2006-2008 program cycle.

HIM Evaluation Report
2. Contents
1. ABSTRACT ........................................................................................................................................ I
2. CONTENTS ....................................................................................................................................... II
3. EXECUTIVE SUMMARY ................................................................................................................ I
4. INTRODUCTION AND PURPOSE OF STUDY ............................................................................ 1
High Impact Measure Approach ................................................................................................ 1 4.1 RESIDENTIAL RETROFIT PROGRAMS ........................................................................................... 4 4.2 CALCULATION OF NET-TO-GROSS RATIOS ................................................................................. 6 4.3 VALIDITY AND RELIABILITY ....................................................................................................... 7
5. FURNACES (PGE2000, SCG3517, SCG3510) ................................................................................. 9
5.1 EVALUATION OBJECTIVES FOR FURNACES ................................................................................. 9 Program Overviews ................................................................................................................... 9 Qualifying Furnaces and Claimed Savings .............................................................................. 10
5.2 METHODOLOGY AND SPECIFIC METHODS USED FOR FURNACES .............................................. 11 Measure Verification Methods ................................................................................................. 12 Net-to-Gross Methods .............................................................................................................. 13 Energy Savings Methods .......................................................................................................... 13
5.3 CONFIDENCE AND PRECISION OF KEY FINDINGS FOR FURNACES .............................................. 13 5.4 VALIDITY AND RELIABILITY OF FURNACE EVALUATION MEASUREMENTS ............................... 14 5.5 DETAILED FINDINGS FOR PGE2000 FURNACES ........................................................................ 14
Measure Verification Findings ................................................................................................ 14 Net-to-Gross Findings .............................................................................................................. 15 Spillover Findings .................................................................................................................... 16 Additional Furnace Findings ................................................................................................... 16 Energy Savings Findings ......................................................................................................... 18
5.6 DISCUSSION OF FINDINGS AND RECOMMENDATIONS FOR FURNACES ....................................... 22 Discussion of Net Savings Findings ......................................................................................... 22 Discussion of Gross Savings Findings ..................................................................................... 22 Summary of Key Evaluation Parameters ................................................................................. 23
6. CLOTHES WASHERS (SDGE3023, PGE2000, SCG3517).......................................................... 24
6.1 EVALUATION OBJECTIVES FOR CLOTHES WASHERS ................................................................. 24 Program Overviews ................................................................................................................. 24 Qualifying Clothes Washers and Claimed Savings .................................................................. 25
6.2 METHODOLOGY AND SPECIFIC METHODS USED FOR CLOTHES WASHER EVALUATION ............ 29 Measure Verification Methods ................................................................................................. 30 Net-to-Gross Methods .............................................................................................................. 31 Energy Savings Methods .......................................................................................................... 31
6.3 CONFIDENCE AND PRECISION OF KEY FINDINGS FOR CLOTHES WASHERS ............................... 33 6.4 VALIDITY AND RELIABILITY OF CLOTHES WASHER EVALUATION MEASUREMENTS ................ 36 6.5 DETAILED FINDINGS FOR CLOTHES WASHERS .......................................................................... 38
Measure Verification Findings for Clothes Washers ............................................................... 38 Net-to-gross Findings .............................................................................................................. 39 Spillover Findings .................................................................................................................... 40 Additional Clothes Washer Survey Findings ........................................................................... 40 Energy and Demand Savings Findings .................................................................................... 41
6.6 DISCUSSION OF FINDINGS AND RECOMMENDATIONS FOR CLOTHES WASHERS ......................... 48 Summary of Key Evaluation Parameters ................................................................................. 49

HIM Evaluation Report
7. DISHWASHERS (SDGE3024, PGE2000, SCG3517) .................................................................... 51
7.1 EVALUATION OBJECTIVES FOR DISHWASHERS ......................................................................... 51 Program Overviews ................................................................................................................. 51 Qualifying Dishwashers and Claimed Savings ........................................................................ 52
7.2 METHODOLOGY AND SPECIFIC METHODS USED FOR THE DISHWASHER EVALUATION ............. 54 Measure Verification Methods ................................................................................................. 55 Net-to-Gross Methods .............................................................................................................. 55 Usage Determination Methods ................................................................................................ 55
7.3 CONFIDENCE AND PRECISION OF KEY FINDINGS FOR DISHWASHERS ........................................ 56 7.4 VALIDITY AND RELIABILITY OF DISHWASHER EVALUATION MEASUREMENTS......................... 56 7.5 DETAILED FINDINGS FOR SDGE3024 DISHWASHERS ............................................................... 57
Measure Verification Findings ................................................................................................ 57 Net-to-Gross Findings .............................................................................................................. 58 Spillover Findings .................................................................................................................... 58 Dishwasher Usage Findings .................................................................................................... 58 Energy Savings Findings ......................................................................................................... 59
7.6 DISCUSSION OF FINDINGS AND RECOMMENDATIONS FOR DISHWASHERS ................................. 60 Discussion Of Net Savings Findings ........................................................................................ 60 Discussion of Dishwasher Usage Findings .............................................................................. 61 Discussion of Gross Savings Findings ..................................................................................... 62 Summary of Key Evaluation Parameters ................................................................................. 62
8. HIGH EFFICIENCY GAS WATER HEATERS (SDGE3024 & PGE2000) ............................... 65
8.1 EVALUATION OBJECTIVES FOR HIGH EFFICIENCY GAS WATER HEATERS ................................ 65 Program Overviews ................................................................................................................. 65 Qualifying Hot Water Heaters and Claimed Savings .............................................................. 66
8.2 METHODOLOGY AND SPECIFIC METHODS USED FOR HIGH EFFICIENCY GAS WATER HEATERS................................................................................................................................... 67 Measure Verification Methods ................................................................................................. 68 Net-to-Gross Methods .............................................................................................................. 68 Energy and Demand Savings Methods..................................................................................... 68
8.3 CONFIDENCE AND PRECISION OF KEY FINDINGS FOR HIGH EFFICIENCY GAS WATER HEATERS................................................................................................................................... 69
8.4 VALIDITY AND RELIABILITY OF HIGH EFFICIENCY GAS WATER HEATER EVALUATION MEASUREMENTS ....................................................................................................................... 69
8.5 DETAILED FINDINGS FOR HIGH EFFICIENCY GAS WATER HEATERS ......................................... 69 Measure Verification Findings ................................................................................................ 69 Net-to-gross Findings .............................................................................................................. 70 Spillover Findings .................................................................................................................... 71 Water Heater Replacement, Capacity and Usage Pattern Findings ........................................ 71 Energy Savings Findings ......................................................................................................... 73
8.6 DISCUSSION OF FINDINGS AND RECOMMENDATIONS FOR HIGH EFFICIENCY GAS WATER HEATERS ...................................................................................................................... 74 Discussion of Net Savings Findings ......................................................................................... 74 Summary of Key Evaluation Parameters ................................................................................. 75
9. LOW-FLOW SHOWERHEAD AND FAUCET AERATORS (SDGE3035, SDGE3017, AND SCG3517) ................................................................................................................................. 77
9.1 EVALUATION OBJECTIVES FOR LOW-FLOW SHOWERHEADS AND FAUCET AERATORS .............. 77 Program Overviews ................................................................................................................. 77 Qualifying Showerhead and Faucet Aerators and Claimed Savings ....................................... 78
9.2 METHODOLOGY AND SPECIFIC METHODS USED FOR LOW-FLOW SHOWERHEADS AND FAUCET AERATORS .................................................................................................................. 79 Measure Verification Methods ................................................................................................. 79 Net-to-Gross Methods .............................................................................................................. 80

HIM Evaluation Report
Usage Determination Methods ................................................................................................ 80 Energy and Demand Savings Methods..................................................................................... 80
9.3 CONFIDENCE AND PRECISION OF KEY FINDINGS FOR LOW-FLOW SHOWERHEADS AND FAUCET AERATORS .................................................................................................................. 80
9.4 VALIDITY AND RELIABILITY OF LOW-FLOW SHOWERHEAD AND FAUCET AERATOR EVALUATION MEASUREMENTS ................................................................................................. 81
9.5 DETAILED FINDINGS FOR LOW-FLOW SHOWERHEADS AND FAUCET AERATORS ....................... 81 Measure Verification Findings for Low-Flow Showerheads and Faucet Aerators.................. 81 Measure Verification Findings for SCG3517 .......................................................................... 82 Net-to-gross Findings .............................................................................................................. 82 Spillover Findings .................................................................................................................... 84 Single-Family Low-flow Showerhead Usage Pattern Findings ............................................... 85 Energy Savings Findings ......................................................................................................... 87
9.6 DISCUSSION OF FINDINGS AND RECOMMENDATIONS FOR LOW-FLOW SHOWERHEADS AND FAUCET AERATORS ........................................................................................................... 88 Investigating Water Utility Measure Offering.......................................................................... 88 Possible Future Evaluation Activities ...................................................................................... 89 Summary of Key Evaluation Parameters ................................................................................. 89
10. INSULATION (PGE2000, SCG3517, SDGE3024) ........................................................................ 91
10.1 EVALUATION OBJECTIVES FOR INSULATION ............................................................................. 91 Program Overviews ................................................................................................................. 91 Discussion of Qualifying Insulation and Claimed Savings Findings ....................................... 92
10.2 METHODOLOGY AND SPECIFIC METHODS USED FOR INSULATION HIM EVALUATION ............... 95 Telephone Survey Methods ...................................................................................................... 96 Measure Verification Methods ................................................................................................. 96 Net-to-Gross Methods .............................................................................................................. 97 Unit Energy Savings Methods .................................................................................................. 97
10.3 CONFIDENCE AND PRECISION OF KEY FINDINGS FOR INSULATION ........................................... 99 10.4 VALIDITY AND RELIABILITY OF INSULATION EVALUATION MEASUREMENTS .......................... 99 10.5 DETAILED FINDINGS FOR INSULATION .................................................................................... 100
Measure Verification Findings .............................................................................................. 100 Net-to-Gross Findings ............................................................................................................ 101 Spillover Findings .................................................................................................................. 102 Thermal Imaging Equipment.................................................................................................. 102 Billing Analysis ...................................................................................................................... 106
10.6 DISCUSSION OF FINDINGS AND RECOMMENDATIONS FOR INSULATION ................................... 110 Discussion of Verification Findings ....................................................................................... 110 Thermal Imaging Equipment.................................................................................................. 110 Discussion of Energy Savings Findings ................................................................................. 110 Summary of Key Evaluation Parameters ............................................................................... 111
11. APPLIANCE RECYCLING: REFRIGERATORS (PGE2000, SCE2500, SDGE3028) ........... 113
11.1 EVALUATION OBJECTIVES FOR RECYCLED REFRIGERATORS .................................................. 113 Program Overview ................................................................................................................. 114
11.2 METHODOLOGY AND SPECIFIC METHODS USED TO EVALUATE RECYCLED REFRIGERATORS ..................................................................................................................... 115 Measure Verification Methods ............................................................................................... 116 Energy and Demand Impacts Methods .................................................................................. 117 Net-to-Gross Methods ............................................................................................................ 125
11.3 CONFIDENCE AND PRECISION OF KEY FINDINGS FOR RECYCLED REFRIGERATORS................. 128 11.4 VALIDITY AND RELIABILITY FOR EVALUATION ESTIMATES FOR RECYCLED
REFRIGERATORS ..................................................................................................................... 129 11.5 DETAILED FINDINGS FOR RECYCLED REFRIGERATORS ........................................................... 131
Measure Verification Findings .............................................................................................. 131 Energy and Demand Impacts Findings .................................................................................. 131

HIM Evaluation Report
11.6 DISCUSSION OF FINDINGS AND RECOMMENDATIONS FOR RECYCLED REFRIGERATORS .......... 150 Comparison of Per-Unit Gross Savings ................................................................................. 150 Utilization of In situ Metering ................................................................................................ 151 Emphasize Data Collection and Consistency ......................................................................... 152 Summary of Key Evaluation Parameters ............................................................................... 153
12. ROOM AIR CONDITIONERS (PGE2000, SDGE3024, & SCE2501) ....................................... 155
12.1 EVALUATION OBJECTIVES FOR ROOM AIR CONDITIONERS ..................................................... 155 Program Overviews ............................................................................................................... 155 Qualifying Room Air Conditioners and Claimed Savings ...................................................... 156
12.2 METHODOLOGY AND SPECIFIC METHODS USED FOR THE ROOM AIR CONDITIONER EVALUATION .......................................................................................................................... 157 Measure Verification Methods ............................................................................................... 158 Net-to-Gross Methods ............................................................................................................ 158 Energy and Demand Savings Methods................................................................................... 158
12.3 CONFIDENCE AND PRECISION OF KEY FINDINGS FOR ROOM AIR CONDITIONERS ................... 162 12.4 VALIDITY AND RELIABILITY OF ROOM AIR CONDITIONER EVALUATION
MEASUREMENTS ..................................................................................................................... 162 12.5 DETAILED FINDINGS FOR ROOM AIR CONDITIONERS .............................................................. 163
Measure Verification Findings for Room Air Conditioners ................................................... 163 Net-to-gross Findings ............................................................................................................ 164 Spillover Findings .................................................................................................................. 165 Additional Room Air Conditioner Survey Findings ............................................................... 165 Room Air Conditioner Retailer Survey Findings ................................................................... 166 Room AC Laboratory Testing Results .................................................................................... 167 Energy and Demand Savings for Room Air Conditioners...................................................... 169
12.6 DISCUSSION OF FINDINGS AND RECOMMENDATIONS FOR ROOM AIR CONDITIONERS ............ 173
13. POOL PUMPS & MOTORS (SDGE3024) ................................................................................... 177
13.1 EVALUATION OBJECTIVES FOR POOL PUMPS AND MOTORS .................................................... 177 Program Overview ................................................................................................................. 177 Qualifying Pool Pumps/Motors and Claimed Savings ........................................................... 178
13.2 EVALUATION METHODOLOGY AND SPECIFIC METHODS USED FOR THE POOL PUMPS AND MOTORS EVALUATION .................................................................................................... 178 Measure Verification Methods ............................................................................................... 179 Net-to-Gross Methods ............................................................................................................ 179 Energy and Demand Savings Methods................................................................................... 179
13.3 CONFIDENCE AND PRECISION OF KEY FINDINGS FOR POOL PUMP AND MOTORS MEASURES .............................................................................................................................. 180
13.4 VALIDITY AND RELIABILITY OF POOL PUMP AND MOTOR EVALUATION MEASUREMENTS ..................................................................................................................... 180
13.5 DETAILED FINDINGS FOR POOL PUMPS AND MOTORS ............................................................. 181 Measure Verification Findings for the Pool Pump Reset Agreement .................................... 182 Net-to-gross Findings ............................................................................................................ 183 Spillover Findings .................................................................................................................. 184 Additional Pool Pump and Motor Findings ........................................................................... 184 Energy and Demand Savings Findings .................................................................................. 184
13.6 DISCUSSION OF FINDINGS AND RECOMMENDATIONS FOR SDGE3024 POOL PUMPS ............... 186 Efficient Pool Pumps and Motors Findings and Recommendations ...................................... 186 Pool Pump Reset Agreement Findings and Recommendations .............................................. 187
14. DOWNSTREAM LIGHTING PROGRAMS (PGE2000, PGE2078, SCE2502, SCE2501, SDGE3017, SDGE3006) ................................................................................................ 189
14.1 EVALUATION OBJECTIVES FOR DOWNSTREAM LIGHTING ....................................................... 189 Program Overviews ............................................................................................................... 189 Qualifying Measures and Claimed Savings ........................................................................... 190

HIM Evaluation Report
14.2 METHODOLOGY AND SPECIFIC METHODS USED FOR DOWNSTREAM LIGHTING SAVINGS EVALUATION ........................................................................................................... 191 Measure Verification Methods ............................................................................................... 192 Net-to-Gross Methods ............................................................................................................ 192 Energy and Demand Savings Methods................................................................................... 193
14.3 CONFIDENCE AND PRECISION OF KEY FINDINGS FOR DOWNSTREAM LIGHTING ..................... 194 14.4 VALIDITY AND RELIABILITY OF DOWNSTREAM LIGHTING EVALUATION
MEASUREMENTS ..................................................................................................................... 195 14.5 DETAILED FINDINGS FOR DOWNSTREAM LIGHTING................................................................ 196
Measure Verification Findings or Multi-family Lighting Programs ...................................... 196 Measure Verification Findings for Lighting Exchange Programs ......................................... 197 Net-to-Gross Findings ............................................................................................................ 197 Spillover Findings .................................................................................................................. 198 Additional Downstream Lighting Findings ............................................................................ 198 Multi-family Energy and Demand Savings Findings ............................................................. 199 Lighting Exchange Energy Savings Findings ........................................................................ 202
14.6 DISCUSSION OF FINDINGS AND RECOMMENDATIONS DOWNSTREAM LIGHTING ..................... 204 Multi-family Lighting Findings and Recommendations ......................................................... 204 Discussion of Lighting Exchange Findings and Recommendations ....................................... 205
APPENDICES
APPENDIX A - FURNACE SURVEY AND ONSITE DATA COLLECTION INSTRUMENTS
APPENDIX B - CLOTHES WASHER SURVEY AND ONSITE DATA COLLECTION INSTRUMENTS
APPENDIX C - DISHWASHER SURVEY AND ONSITE DATA COLLECTION INSTRUMENTS
APPENDIX D - WATER HEATER SURVEY AND SITE VERIFICATION PROCEDURE FORMS
APPENDIX E - SHOWERHEAD AND AERATOR SURVEY INSTRUMENTS
APPENDIX F - INSULATION SURVEY AND ONSITE DATA COLLECTION INSTRUMENTS
APPENDIX G - APPLIANCE RECYCLING SURVEY AND ONSITE DATA COLLECTION INSTRUMENTS
APPENDIX H - ROOM ACS SURVEY AND ONSITE DATA COLLECTION INSTURMENTS
APPENDIX I - POOL PUMP SURVEY AND ONSITE DATA COLLECTION INSTRUMENTS
APPENDIX J - DOWNSTREAM LIGHTING SURVEY AND ONSITE DATA COLLECTION INSTRUMENTS
APPENDIX K - NTG DISCUSSION, STABILITY ANALYSIS, NTG 90% CONFIDENCE INTERVALS, AND RESPONSE TO OVERARCHING COMMENTS REGARDING THE USE OF SR NTG
APPENDIX L - COMPARISON OF PROPOSED VS. EVALUATED SAMPLE SIZES
APPENDIX M - DISPOSITION OF RESIDENTIAL RETROFIT COMMENTS
UPSTREAM LIGHTING APPENDICES LISTED SEPARATELY

HIM Evaluation Report
i
3. Executive Summary
This report documents the impacts of the California Investor-Owned Utilities’ (IOU) 2006-2008 residential retrofit programs, and excludes the results of residential Upstream Lighting and residential Heating Ventilation and Air Conditioning (HVAC) programs which are presented in separate reports. The Cadmus Group, Inc. served as the prime contractor, and was assisted by a group of subcontractors including Itron, Jai J. Mitchell, KEMA, PA Consulting, and Nexus Market Research. This evaluation was managed and directed by the CPUC Energy Division. Assistance was provided to the Energy Division and Cadmus on study design and quality control by the CPUC’s technical support contractors for this evaluation cycle (the Data Management and Quality Control (DMQC) Contractor, the Master Evaluation Contract Team (MECT), and the Database for Energy Efficiency Resources (DEER) contractor).
Evaluation Approach Although the evaluation planning process initially took utility programs as a key organizational element, it was also emphasized by many evaluation teams that the portfolio should be examined from the perspective of key measures. In this report, this prioritization is referred to as the high impact measure (HIM) approach. The philosophy behind the HIM approach organizes energy and demand impacts by measure groups and energy metrics (electric energy, electric demand, and gas energy) across programs at the utility level. In order to increase consistency and accuracy, the HIM approach sought to standardize the analytical and data collection methods used for key measures across both programs and contract groups.1
A list of HIMs was developed from the E32 calculators delivered by the IOUs covering program savings claims through the end of the second quarter of 2008 (Q2-2008).
The 13 Residential Retrofit HIMs included in this report were selected by identifying all measures that represented more than 1% of the energy savings claimed by any IOU. In total, these measures represent 45.1% of utility-claimed kWh savings, 6.3% of demand savings, and 11.7% of gas savings.
Methodology Depending on a measure’s representative percentage of utility portfolio savings, each measure had a unique set of verification and evaluation activities. A summary of these
1 The transition to the HIM-based approach shifted priorities slightly for the Residential Retrofit
Evaluation. As a result, some measures and programs included in the 2007 Verification Report did not qualify as HIMs and subsequent evaluation efforts were discontinued. This report, however, presents a complete summary of all research conducted during the course of this evaluation and includes some measures for the first two years (2006 and 2007) of the three-year program cycle only.
2 For information on the E3 calculators, please refer to http://californiaenergyefficiency.com/calenergy_old/2006_08_programs.html

HIM Evaluation Report
ii
activities, and each associated parameter, is presented in Table ES1. These activities included:
Participant telephone surveys to verify program measures were installed and operating and to assess net-to-gross (NTG) ratios.
Retailer and dealer telephone surveys to provide insight into net program impacts.
Onsite audits – typically a subset of the telephone surveys – to verify measures were installed and operating, and to install data loggers for those sites selected for this type of evaluation input.
Field measurement/metering- to collect in situ energy use of energy efficiency measures that were included in the programs to assess the gross unit energy savings (UES).
Lab testing to measure the unit energy consumption (UEC) of various program energy efficiency measures.
Billing analysis to assess gross program UES values.
Estimating the NTGR One objective of the California energy efficiency program evaluations is to identify the portion of savings directly attributable to the program effort and to properly account for the effects that would have occurred in the absence of the program. California reporting protocols for the 2006-2008 program cycle require the discounting of savings by a ―free-ridership factor‖ in the estimation of net program savings by applying this net-to-gross ratio (NTGR3). The 2006 evaluation protocols allow for the use of a participant self-report approach (SRA) to estimate the NTGR for the basic level of rigor, and additional participant-specific documentation for the standard level of rigor.
The Energy Division convened a committee of evaluators to develop a standard framework for the systematic and consistent measurement of net-to-gross ratios4 for residential and small commercial programs using the SRA. The approach was designed to fully comply with the evaluator protocols. With the assistance of the Master Evaluation Contractor Team (MECT), the Energy Division (ED) developed the Guidelines for Estimating Net-To-Gross Ratios Using the Self-Report Approaches in October 2007, providing more detailed guidance than was available in the California Evaluator Protocols.
Participants who were involved in the decision-making process at each respondent household were interviewed to measure each program’s influence on that person's decision-making. The survey obtained highly structured responses concerning the
3 For information on the evaluator protocols, please refer to
http://www.calmac.org/events/EvaluatorsProtocols_Final_AdoptedviaRuling_06-19-2006.pdf 4 Currently, California net impacts are specified as net of free-riders and do not include participant or non-
participant spillover.

HIM Evaluation Report
iii
probability that the household would have installed the same measure(s) at the same time in the absence of the program. The survey also included open- and closed-ended questions that focused on the participant's motivation for installing the efficiency measure. These questions covered all the requirements provided in the Guidelines, such as multiple questions, efficiency level, likelihood of adoption, timing and quantity, and consistency checks.
The NTGR algorithm derived four separate measurements of free-ridership from different inquiry routes. These four measurements were averaged to derive the final free-ridership estimate at the measure level.
For many of the evaluation efforts discussed below, there were multiple surveys fielded to different market actors. In each case, the results of the free-ridership analysis from all efforts are presented. However; the final presented NTGR number is based on the SRA.
Table ES1. Summary of Evaluation Approaches and Parameter Estimates
Parameters Verification Gross Savings Net Savings
Surveys, Onsite Audits
Billing Analysis
Field Measurement
Lab Testing
Participant Self-report
Upstream Survey
Other Approach
Installation rate
Usage settings
Run times
NTG Ratio
NTG insight
Unit Energy Savings
Summary of Findings Table ES2 provides a summary of the key evaluated parameters researched as part of the study, including the verification rate, the NTGR, and UES values. The Residential Retrofit Evaluation Team recommends these values be used when calculating final net program savings for the Energy Division’s final report.

HIM Evaluation Report
iv
Table ES2. Summary of Key Evaluated Parameters5
Measure Utility Program High Impact
Measure
% of IOU Claimed Savings
% installed and operating
Evaluated NTG
(1-FR)
Evaluated UES
(Therm/Yr)
Evaluated UES (kWh/Yr)
Furnace (Chapter 5)
PGE2000 Yes 1.84% Thm 100% 0.18* 28.4-40.3 NA
SCG3517 No 0.29% Thm NA NA 23.5-28.2 NA
SCG3510 No 0.00%Thm NA NA 23.5-28.2 NA
Clothes Washer (Chapter 6)6
SDGE3023 Yes 6.61% Thm 99.4% 0.31* 13.4-21.9 114.2-185.9
PGE2000 Yes 3.97% Thm 99.5% 0.31* 6.4-12.4 300.5-435.3
SCG3517 No 1.00% Thm 98% 0.29 14.9-23.9 74.2-132.3
Dishwasher (Chapter 7)
SDGE3024 Yes 1.03% Thm 99.7% 0.24 0-6.6 4.2-30.2
PGE2000 No 0.23% Thm 99.5% NA NA NA
SCG3517 No 0.17% Thm 99.1% NA NA NA
High Efficiency Gas Water Heaters (Chapter 8)
SDGE3024 Yes 0.33% Thm 97.4% 0.22 8.8-10.8 NA
PGE2000 Yes 1.06% Thm 99.4% 0.17* 10.0-12.5 NA
SCG3517 No NA NA NA NA NA
SCE2501 No NA NA NA NA NA
Low Flow Showerhead/ Aerator7
(Chapter 9)
SDGE3035 (Showerhead) Yes 0.58% Thm 80% 0.72 7.4 NA
SDGE3035 (Aerator) Yes 0.75% Thm 77% 0.75 5.6 NA
SDGE3017 (Showerhead) Yes 0.00% Thm 59% 0.68 6.7 NA
SDGE3017 (Aerator) Yes 0.01% Thm 59% 0.59 5.0 NA
SCG3517 (Showerhead) Yes 0.19%Thm 76% 0.70 NA NA
Insulation8
(Chapter 10)
PGE2000 Yes 1.49% Thm 72.7% 0.26 NA NA
SCG3517 Yes 1.24% Thm 88.7% 0.30* 0.04 -0.05 NA
SDGE3024 Yes 1.79% Thm 78.9% 0.25 0.04 NA
Refrigerator Recycling (Chapter 11)
PGE2000 Yes 3.0% kWh 100% 0.51 NA 1,130
SCE2500 Yes 6.1% kWh 100% 0.56 NA 1,087
SDGE3028 Yes 5.3% kWh 100% 0.58 NA 960
Room Air Conditioner (Chapter 12)
PGE2000 No 0.1% kW 93.0% 0.41 NA NA
SDGE3024 Yes 1.4% kW 93.0% 0.31 NA 47
SCE2501 Yes 3.2% kW 96.0% 0.36* NA 20-60
Pool Pumps (Chapter 13)
SDGE3024 Yes 4.3% kW
Single Speed 96.7%
Multispeed 99.5%
Single/Multi 0.32
Reset 0.73 NA
Single Speed 578.6
Multispeed 810.1
Reset 217.2
Upstream Lighting (Reported separately)
Downstream Lighting9
PGE2000 Yes 1.5% kWh 77-89% 0.59-0.81* NA 24.6-184.0
PGE2078 No 0.0% kWh NA NA NA NA
5 During the course of responding to comments on the December 10, 2009 Draft Residential Retrofit
Evaluation Report and completing data quality review, the Residential Retrofit Evaluation Team updated a number of NTG values. Those that have been updated are notated with an asterisk. These updated NTG values are based on changes related to the weighting.
6 As part of the quality control process, the Residential Retrofit Evaluation Team caught and corrected an erroneous outlier for the metering data for a non-ENERGY STAR clothes washer. Clothes Washer UES values for all three utilities have therefore been updated from the Draft Evaluation Report.
7 UES based on 2004-2005 DEER Saving values since no 2008 DEER were available. 8 Percent installed represents data from site visits only

HIM Evaluation Report
v
Measure Utility Program High Impact
Measure
% of IOU Claimed Savings
% installed and operating
Evaluated NTG
(1-FR)
Evaluated UES
(Therm/Yr)
Evaluated UES (kWh/Yr)
(Chapter 14) SCE2502 Yes 3.9% kWh 71-87% 0.75-0.78* NA 38.1-166.2
SCE2501 Yes 0.2% kWh 93.0% 0.66* NA 37.7
SDGE3017 Yes 0.8% kWh 71-92% 0.72-0.75* NA 25.6-36.3
SDGE3006 Yes 0.3% kWh 100% 0.44 NA 31.6
Recommendations and Discussion of Findings The evaluation of the Residential Retrofit Programs revealed a number of high-level findings and recommendations, including:
The assumed UES values should either correctly apply the most recent DEER values or clearly document, through work papers, how the values were derived. There were a number of examples, including furnaces and dishwashers, where IOUs had incorrectly applied DEER values (e.g., one utility apparently mistakenly claimed the dishwasher annual kWh savings as the annual therm savings). In addition, in a number of cases (e.g., clothes washers, showerheads/aerators, insulation, and room ACs), the utilities were unable to provide the full set of work papers that were used to determine the claimed savings values. The source of the claimed savings values should be fully transparent to any reviewer.
The self-report approach identified a number of programs with high free-ridership. Programs should continue to monitor for evidence of high free-ridership and adjust program offerings accordingly. For example, the National ENERGY STAR retailer partner data has demonstrated consistently high market share for ENERGY STAR dishwashers, even after standard changes in 2007, providing some evidence of high baseline sales of efficient equipment (i.e., high free-rider/free-ridership). The programs should monitor any market data for similar evidence, and consider adjusting program offerings to focus on higher-efficiency products (e.g., more efficient CEE10 tier levels).
IOUs should provide detailed guides/maps between E3 calculators and tracking database. There were numerous examples of missing and/or incorrect measures and erroneous assignments. This can be facilitated by providing a consistent unique ID associated with each transaction/record within their tracking database that does not change by reporting year/quarter, and by providing a consistent unique ID associated with each E3 line item to ensure there are not duplicative records in the E3.
There were also a number of important measure- and program-specific findings and recommendations, including:
9 Range of values represent type of impact measure (interior CF fixture, exterior CF fixture, linear
fluorescent fixture, interior CFL) 10 Information on the Consortium for Energy Efficiency (CEE) can be found at http://www.cee1.org

HIM Evaluation Report
vi
Furnaces: The findings relating to the temperature set points indicate that additional study is needed to determine the actual gas consumption of furnaces at the different efficiency levels across climate zones and to measure the sensitivity of these set-points to actual weather conditions, fuel prices and economic conditions. At a minimum, it would appear that the assumptions in DEER should be updated to reflect the actual settings that occupants are using.
Clothes Washers: As both electric and gas savings were documented during our evaluation activities, dual-fuel utilities like SDG&E may wish to consider claiming savings on both fuels for efficient clothes washers. Further investigation regarding the amount of dryer usage and alternative drying methods may also be warranted as part of future evaluation efforts.
Showerheads and Aerators: Future evaluations should consider modeling the change in actual hot water usage based on the installed measure definition. The change in hot water use (measured in gallons per day) is a critical parameter and modeling impacts would benefit from current pre- and post-measurement data. Additionally, IOUs should coordinate closely with water utilities to avoid duplication of efforts.
Insulation: Utilities should conduct more frequent and rigorous site inspections to check that installations are meeting program eligibility requirements. This evaluation found that a substantial number of insulation participants did not meet the program eligibility requirements, typically because pre-existing attic insulation exceeded the program limit of R-11 or wall insulation was already present or installed between two similarly conditioned/unconditioned spaces.
Refrigerator Recycling: The evaluation recommends that future evaluations utilize in situ metering (as opposed to the United States Department of Energy (DOE) lab testing, or a combination of approaches) to evaluate the savings generated by refrigerator recycling. In situ better accounts for usage and household characteristics in the participating population compared to DOE testing, plus standalone in situ metering would reduce evaluation costs while still achieving robust results. The evaluation further recommends that greater emphasis be placed on quality control related to data collection, including the accurate collection of all relevant appliance characteristics such as configuration, age, and size. These are critically important to the estimation of gross savings.
Pool Pumps and Motors: Utilities should consider conducting enhanced verification to ensure that program participants are eligible for incentives. For example, the evaluation found that approximately 20% of SDGE3024 participants had installed pumps that were not eligible for the program. In addition, 30% of SDGE3024 Pool Pump Reset Agreement participants reported on their applications that they were not running during peak hours prior to participation (and thus ineligible), yet these customers were still sent incentives and included as program participants.
Downstream Lighting Program: The Downstream Lighting Programs should provide more accurate and verifiable data in the IOU tracking database so the

HIM Evaluation Report
vii
measures can be more easily verified by third party evaluators. The tracking data was of limited value, in many cases not identifying the location of the installed measure. The programs should also improve the quality of the program fixtures to mitigate early failures and make sure that property managers have spare bulbs and access to low-cost replacement bulbs.

Residential Retrofit Contract Group HIM Evaluation Report
1
4. INTRODUCTION AND PURPOSE OF STUDY
The purpose of this evaluation effort is to provide a high-quality, reliable and objective estimate of energy and demand impacts from residential retrofit energy efficiency programs operated in California.
Impact evaluations serve many purposes, including improving programs, supporting cost-effectiveness analyses, providing data for future programs and strategic planning, and helping to determine shareholder incentives and penalties in California. With finite resources, the evaluations have been targeted to reflect the highest priorities, including providing adjustments to the gross savings claimed by the utilities, the net savings after accounting for free-ridership, and information essential to valuing the savings, such as the annual load shapes of the savings.
HIGH IMPACT MEASURE APPROACH
Because many of these priorities are best met by producing data at the measure or end-use level, the Residential Retrofit Evaluation Team focused on the most important high-impact measures (HIMs) in the current portfolio.11 A list of HIMs was developed from the E312 calculators delivered by the IOUs covering program savings claims through the end of the second quarter of 2008 (Q2-2008). The list of HIMs was developed by identifying all measures that contributed more than 1% to any of the energy savings metrics by IOU.
A single Microsoft Access™ database containing the E3 measure line items from the Input tab of the E3 calculator was created. Each of the measures was assigned to a measure name using a consistent measure-naming scheme. The savings claims for each IOU were tabulated for each named measure, and the contribution of each measure to the total IOU portfolio savings claim for kWh, kW and Therms was calculated. Depending on the percentage of utility portfolio savings, each measure had a unique set of verification and evaluation activities. These activities included: telephone surveys and onsite audits to verify measures were installed and operating; billing analysis, field measurement/metering, lab testing to estimate gross savings; and participant self-report and retailer surveys to assess net savings impacts. A summary of the evaluation activities for each of the Residential Retrofit HIMs is presented in Table 1. A summary of the data
11 Note that prior to this evaluation report the Residential Retrofit Evaluation Team aggregated research
efforts and findings by program, not by HIM (as was done for the Residential Retrofit Verification Report in March 2009). The transition to the HIM-based approach occurred in fall 2008, with the approval of the final Residential Retrofit HIM Evaluation Plan in February 2009. The transition to the HIM-based approach required a reallocation of resources; additionally, some program measures that had been included in the evaluation research conducted in 2008 did not qualify as HIMs and thus were not included in the subsequent evaluation efforts. This report, however, presents a complete summary of all research conducted through both the verification and evaluation efforts; some measures, therefore, may only include verification and NTG findings for the first two years (2006 and 2007) of the three-year program cycle.
12 For information on the E3 calculators, please refer to http://californiaenergyefficiency.com/calenergy_old/2006_08_programs.html

Residential Retrofit Contract Group HIM Evaluation Report
2
collection activities, including the number of surveys, site visits, and metered sites for the Residential Retrofit HIMs, including ULP, is presented in Table 2 and Table 3. Note the results of residential Upstream Lighting and residential Heating Ventilation and Air Conditioning (HVAC) programs are presented in separate reports.
Table 1. Summary of Evaluation Activities for High Impact Measure Parameters
HIM Installation rate
UES NTG Hours of Use Unique Parameters
Furnaces Surveys, site visits
Savings claims Participant self-report, Dealer survey
NA NA
Clothes washers Surveys, site visits
Field measurement
Participant self-report surveys
Field measurement
Water consumption (measurement through onsite metering)
Dishwashers Surveys Savings claims Participant self-report surveys
Surveys NA
Water Heaters Surveys, site visits
Savings claims Participant self-report surveys
NA Model number (collected from onsite verification visits)
Faucet Aerators/ Showerheads
Surveys Savings claims Participant self-report surveys
NA NA
Insulation Surveys, site visits
Billing analysis, Thermal imaging pilot
Participant self-report surveys
NA NA
Appliance Recycling Program (ARP)
NA End-use metering, Lab Testing
Participant self-report surveys, Upstream Survey
NA Removal rate (measured through surveys and onsite metering)
Room Air Conditioners (RACs)
Surveys, site visits
End-use metering, Lab Testing
Participant self-report surveys
Field measurement, peak demand
NA
Pool pumps Surveys, site visits
Savings claims Participant self-report surveys
Surveys, site visits
NA
Upstream Lighting Program (ULP)
Surveys, site visits
End-use metering
Participant self-report surveys, Econometric modeling
Field measurement
Delta watts (site visits)
Downstream Lighting Program (DLP)
Surveys, site visits placement
NA Participant self-report surveys
Field measurement, baseline
NA
Residential Refrigerant Charge and Airflow (Res RCA)
Surveys, site visits
End-use metering, modeling
Participant self-report surveys
Field measurement, peak demand
NA
Commercial and Industrial Refrigerant Charge and Airflow (C&I RCA)
Surveys, site visits
End-use metering, modeling
Participant self-report surveys
Field measurement, peak demand
NA

Residential Retrofit Contract Group HIM Evaluation Report
3
Table 2. Data Collection Efforts for Upstream Lighting
High-Impact Measures
Evaluation Activity Sample Size Details
Site Visits Metered Sites
Surveys
Upstream Interior screw lighting, Upstream C&I Interior screw lighting, Upstream Exterior CFL fixture, Upstream CFL fixture
Onsites 1,233 1,129 0
Manufacturer/Retailer interviews NA NA
364 total (32 in depth interviews with
manuf/retail buyers in 2008, and 28 in 2009;
plus 155 participating and 149 non-participating
retail store managers in 2009).
Consumer In-store Intercept Surveys NA NA 1,200 (400 per wave)
Consumer Intercept Telephone Survey Follow-up
NA NA 74
Focus Groups NA NA 18 Groups (123 total
participants)
CFL User Telephone Surveys NA NA
3,979 total and 491 recent purchasers
(approx 800 and 100 per wave, respectively)
CFL User Nested Follow-up Site Visit
222 (approx 50 per
wave, no 5th wave)
NA NA
Table 3. Data Collection Sample Sizes for Residential Retrofit HIMs (Excluding Upstream Lighting)
Cluster High-Impact Measures Site Visits
Metered Sites
Surveys
Downstream Lighting CFL fixture, Outdoor CFL fixture, Linear fluorescent, Interior screw lighting
614 41 2,072
HVAC
Res RCA 228 121 538
C& I RCA 46 42 35
Duct sealing 248 33 539
Furnace 70 70 301
High Efficiency A/C 76 76 204
Water Heating
Clothes washer 164 136 990
Dishwasher 43 0 604
Water heater 150 0 600
Water Heater Controls 0 0 0
Aerators and Showerheads 394 0 1742
Miscellaneous
Insulation 327 0 1797
Recycle Refrigerator 210 210 1,380
Res Room AC 103 103 1,097
Pool pumps 100 0 647
Total 2,773 832 12,546

Residential Retrofit Contract Group HIM Evaluation Report
4
4.1 Residential Retrofit Programs The HIMs researched as part of this report are offered through 15 IOU residential programs. These programs are summarized in Table 4.
Table 4. Summary of Evaluated Residential Retrofit Programs and Key Measures
Program ID Program Description Key Measures
PGE2000 Mass Market Program - Includes numerous programs such as: HVAC Incentive Program, Multi-family Rebate Program, Upstream Lighting Program, and Appliance Recycling Program in order to promote usage and installation of energy efficiency product. This program also advocates improving current appliances to ENERGY STAR. This is accomplished through offering rebates and incentives to manufacturers, retailers, contractors, and customers.
Clothes washer
Dishwasher
Furnace replacement
Insulation
Cool roof
Pool pump/Motor
Room AC
Water heater replacement
Boiler replacement
Tenant unit lighting
Common area lighting
Coin-op Measures
Water heater controllers
Window replacement
Non-participant survey
Non-participant property manager survey
Interior Lighting
Exterior Lighting
HEES
PGE2078 This is the Comprehensive Manufactured-Mobile Home Program (CMMHP). This program was developed to accomplish outreach, provide installations, provide scheduling and customer service, quality control of energy efficiency products, and provide education on these products/appliances for customers to gain interest. The program was directed at both mobile homes and customers manufacturing their first homes.
Comprehensive Manufactured-Mobile Home
Duct Test and Sealing
AC Diagnostic and Tune Up
Aerators and Low Flow Showerheads
CFLs
PGE2080 This program is titled the Upstream Lighting Program and had two major components. One was to have utilities offer large incentives to retailers to lower the pricing for the customers. The second was to offer incentives to manufacturers in order to sell them to the customers cheaper. The goal was to push customers toward ENERGY STAR bulbs. 15% of the incentives were going toward hard-to-reach rural areas, while 35% were going to both drug & grocery stores. The retailers and manufacturers that performed well received additional allotment.
Upstream CFL lighting
Upstream CFL fixtures
SCG3510 This is the Multi-family Energy Efficiency Retrofit. Very similar to SCE2502 and SDGE3017, which are both titled Multi-family Rebate Program. These three programs engage landlords or land managers to install all energy efficient measures through offering incentives.
Energy efficient lighting components
HVAC measures
Water heater controls
Appliances
Multi-family Rebate Program

Residential Retrofit Contract Group HIM Evaluation Report
5
Program ID Program Description Key Measures
SCE2502 Comprehensive Manufactured-Mobile Home Program (CMMHP) Multi-family Rebate Program (MFR) *Please see SCG3510
Multi-family Energy Efficiency Program
Interior Lighting
Exterior Lighting
SCG3517 Single-Family Energy Efficiency Retrofit Program. This is the Point-of-Purchase Program. This program is unchanged for the customer; however, it was simplified for retailers. SCG3517 focuses on HVAC components and rebates for retailers on these. This outreach was responsible for more interest in energy efficient products.
Single-Family Rebate Program
Clothes washers
Dishwashers
Insulation wall
Insulation attic
Starter kits (showerheads, aerators)
Water heaters
Furnaces
Tank-less water heaters
Natural gas water heaters
SCE2500 This is the Appliance Recycling Program (ARP). This program is identical to a program in the PGE2000 and also to SDGE3028. This program removes operable, inefficient, primary & secondary refrigerators and freezers, and room air conditioners. It offers eligible small commercial businesses up to $35.00 depending on the appliance.
Appliance Recycling Program
Refrigerators
Freezers
Room AC
SCE2501 Residential Energy Efficiency Incentive Program (REEIP) Upstream Lighting Program. *Please see PGE2080
Residential Energy Efficiency Incentive Program
Upstream Lighting
Room AC
Evap Coolers
Lighting Fixtures
Whole House Fan
Refrigerators
Insulation
Cool Roofs
Water Heaters
Pool Pumps
SCE2503 This is the Home Energy Efficiency Survey (HEES) Program. This program is primarily about providing education to single-family homes about energy efficiency programs. The data analyzes usage by non-participants and participants, with either a pre/post participation consumption measure.
Home Energy Efficiency Survey
SDGE3006 This is the Hard-to-Reach Lighting Exchange Program. This program offers CFL bulbs and torchiers to customers for free in exchange for any incandescent or halogen bulbs & fixtures they are willing to give up. It targets customers in designated geographic areas with a moderate to low income.
Exchange of used, inefficient lighting for efficient CFLs and torchiers
SDGE3016 Upstream Lighting Program *Please see PGE2080
Upstream Lighting Program
CFL
Exterior Fixture
Interior HW Fixture
Specialty
SDGE3017 Multi-family Rebate Program (MFR) Multi-family Rebate Program

Residential Retrofit Contract Group HIM Evaluation Report
6
Program ID Program Description Key Measures
*Please see SCG3510 Clothes Washers
Dishwashers
Attic Insulation
Wall Insulation
Central Gas Furnaces
Water Heaters
Starter Kit: Aerators, Low Flow Showerhead
Interior Lighting
Water heater controls
SDGE3024 Residential Incentive Program (RIP) This is the Single-Family Rebate program. This program is to do an audit on a home and provide education and upgrades on newer ENERGY STAR appliances and energy efficient products. Rebates are offered to the single-family homeowners in order to encourage them to become more energy- efficient.
Single-Family Rebate Program
Room AC
Insulation
Electric Water Heater
Whole House Fan
Dishwashers
Refrigerator
Pool Pump Agreement
Gas Water Heater
Pool Pumps
Gas Furnace
SDGE3028 Appliance Recycling Programs (ARP) *Please see SCE2500
Appliance Recycling Program
Refrigerators
Freezers
Room AC
SDGE3035 Comprehensive Manufactured-Mobile Home Program (CMMHP) *Please see PGE2078
Comprehensive Manufactured-Mobile Home
Duct Test and Sealing
AC Diagnostic and Tune Up
Aerators and Low Flow Showerheads
CFLs
4.2 Calculation of Net-To-Gross Ratios One objective of the California energy efficiency program evaluations is to identify the portion of savings directly attributable to the program effort and properly account for the effects that would have occurred in the absence of the program. California reporting protocols for the 2006-2008 program cycle require the discounting of savings by a ―free-ridership factor‖ in the estimation of net program savings by applying this net-to-gross ratio (NTGR). The 2006 evaluation protocols allow for the use of a participant self-report approach (SRA) to estimate the NTGR for the basic level of rigor, and additional participant-specific documentation for the standard level of rigor.
The Energy Division convened a committee of evaluators to develop a standard framework for the systematic and consistent measurement of net-to-gross ratios13 for residential and small commercial programs using the SRA approach. The approach was designed to fully comply with the evaluator protocols. The Energy Division developed
13 Currently, California net impacts are specified as net of free-riders and do not include participant or non-
participant spillover.

Residential Retrofit Contract Group HIM Evaluation Report
7
the Guidelines for Estimating Net-To-Gross Ratios Using the Self-Report Approaches in October 2007, providing more detailed guidance than was available in the California Evaluation Protocols. 14
Participants who were involved in the decision-making process at each respondent household were interviewed to measure each program’s influence on that person's decision-making. The survey obtained highly structured responses concerning the probability that the household would have installed the same measure(s) at the same time in the absence of the program. The survey also included open- and closed-ended questions that focused on the participant's motivation for installing the efficiency measure. These questions covered all the requirements provided in the Guidelines, such as multiple questions, efficiency level, likelihood of adoption, timing and quantity, and consistency checks.
The NTGR algorithm derived four separate measurements of free-ridership from different inquiry routes. The first measurement consisted of responses to a series of yes/no questions that measured the impact of the program on the quantity, efficiency, and timing of the purchase. The second measurement consisted of a 0-10 scale that asked the likelihood that the respondent would have purchased the same exact high-efficiency measure in the absence of the program. The third measurement combined responses to the quantity and timing questions with responses to a 0-10 scale that asked the respondent’s agreement with the statement that, in the absence of the program, they would have paid the additional rebate amount to buy the high-efficiency equipment on their own. The final measurement combined responses to the quantity and timing questions with responses to a 0-10 scale that asked respondent’s agreement with the statement that the program was a critical factor in their decision to purchase the high-efficiency equipment. When responses were inconsistent among the four measurements, an analyst reviewed responses to open-ended questions that asked for clarification of the inconsistency and recorded the four measurements as needed.
These four measurements were averaged to derive the final free-ridership estimate at the measure level. Prior to finalizing the NTGR algorithm, the committee conducted iterative testing with a partial data set. This testing contributed to the reliability of the algorithm and its computer coding.
4.3 Validity and Reliability This evaluation effort seeks to meet the CPUC’s stated objective of obtaining reliable estimates of net energy savings realized for each of the high-impact measures. Reasonably accurate and precise estimates can be considered reliable because they minimize the potential for each of these types of error:
Measured: This type of error may be caused by inaccurate equipment or human error. This potential source of error has been minimized by ordering the best metering equipment within the allowable budget, conducting rigorous training
14 See Appendix K for the standardized free-ridership battery and algorithm used for this assessment.

Residential Retrofit Contract Group HIM Evaluation Report
8
manuals and activities for field staff, and developing a Quality Control (QC) procedure for all data collection.
Collected: Non-response error occurs when some portion(s) of the population proves less likely than other portions to provide data. Investments that increase the response rate, such as incentives and multiple contact attempts, are typically used to minimize non-response bias errors. For example, every telephone survey included up to five attempts to reach survey respondents at different times of day and days of the week. Survey participants who agreed to participate in field work were offered incentives and provided site visit times throughout the day, evening, and on weekends. An important potential for non-response error occurs when customer contact information is unavailable, as in the case of a number of program measures that offer point-of-sale (POS) rebates. For example, SCG3517, SDGE3024, and SCE2501 all offer POS rebates, with varying rates of success collecting customer contact information by offering small incentives (e.g., a Starbucks gift card for customers that provide their name and contact information). The Evaluation Team relied on available participant contact information; conducting a random population survey to identify POS participants would have been cost-prohibitive, plus the potential for misreporting participation (e.g., respondents might not recall if the utility was the actual source of the rebate) would have more than offset any benefits from potentially reducing non-response error. More detail regarding the incidence of missing POS contact information is presented in each of the relevant HIM sections.
Described (modeled): When statistical models create estimates, errors may occur due to the use of inappropriate functional forms, inclusion of irrelevant explanatory variables, and so on. The Evaluation Team ran a number of diagnostics to ensure that all regression assumptions were met, investigating for heteroskedasticity, auto correction, and anomalous observations.
Random Error: Using sampling rather than census modeling can create random errors; any sample can be drawn from a population with a large number of possible samples of the same size and design. The sample for most evaluations, however, exceeded the minimum requirement of 90% confidence and 10% precision15 and thus has attempted to minimize any potential random error associated with sampling.
15 A 90% confidence and 10% percent precision indicates that 90% of the time, the true answer is within
10% ( 10%) of the presented answer

Residential Retrofit Contract Group HIM Evaluation Report
9
5. Furnaces (PGE2000, SCG3517, SCG3510)
5.1 Evaluation Objectives for Furnaces Efficient furnaces were rebated through the 2006-2008 PGE2000, SCG3517, and SCG3510 programs. However, furnaces exceeded the CPUC-assigned HIM threshold of 1% of utility gas savings only for PG&E (Table 5). Because furnaces did not meet the HIM threshold in the SCG territory, the evaluation results presented below are limited to research conducted in the PG&E service territory.
Three primary objectives were determined for the furnace evaluation:
Determine the percentage of rebated furnaces that were installed and operating properly.
Derive NTG ratios to evaluate net savings for furnaces.
Determine energy savings through a metering study.
PROGRAM OVERVIEWS
PGE2000 Mass Markets The PGE2000 program targets single-family and multi-family residential retrofit and commercial customers. The Mass Markets program uses PG&E staff, third-party specialists, and local government partnerships to deliver a portfolio of energy efficiency, demand response, and distributed generation services. It includes statewide elements as well as those specially targeted to mass market customers in PG&E’s service area.
SCG3517 Single-Family Energy Efficient Retrofit Program (SFEER) The SCG3517 SFEER program seeks to help residential customers reduce their natural gas usage with rebates for replacing less efficient gas-fired equipment with new energy efficient equipment. The program also offers weatherization services. The program uses an array of tactics to influence key market actors, including incentive rebates, education, and outreach. The program targets customers, retailers, manufacturers, distributors, and contractors.
SCG has chosen to implement SFEER itself, using a single program approach, rather than separate local programs, to ensure consistency with other statewide offerings and to leverage overall portfolio dollars. The SCG SFEER hopes to reach single-family homeowners who had not previously installed energy efficient measures.
SCG3510 Multi-family Energy Efficiency Retrofit Program (MFEER) SCG’s MFEER program (SCG3510) targets property owners and managers of multi-family residential dwellings, homeowners associations, and mobile home park associations in its service territory. The program encourages property owners and managers to install qualifying energy efficiency products in common areas as well as in tenant units.
Residential Retrofit Contract Group HIM Evaluation Report
10
QUALIFYING FURNACES AND CLAIMED SAVINGS
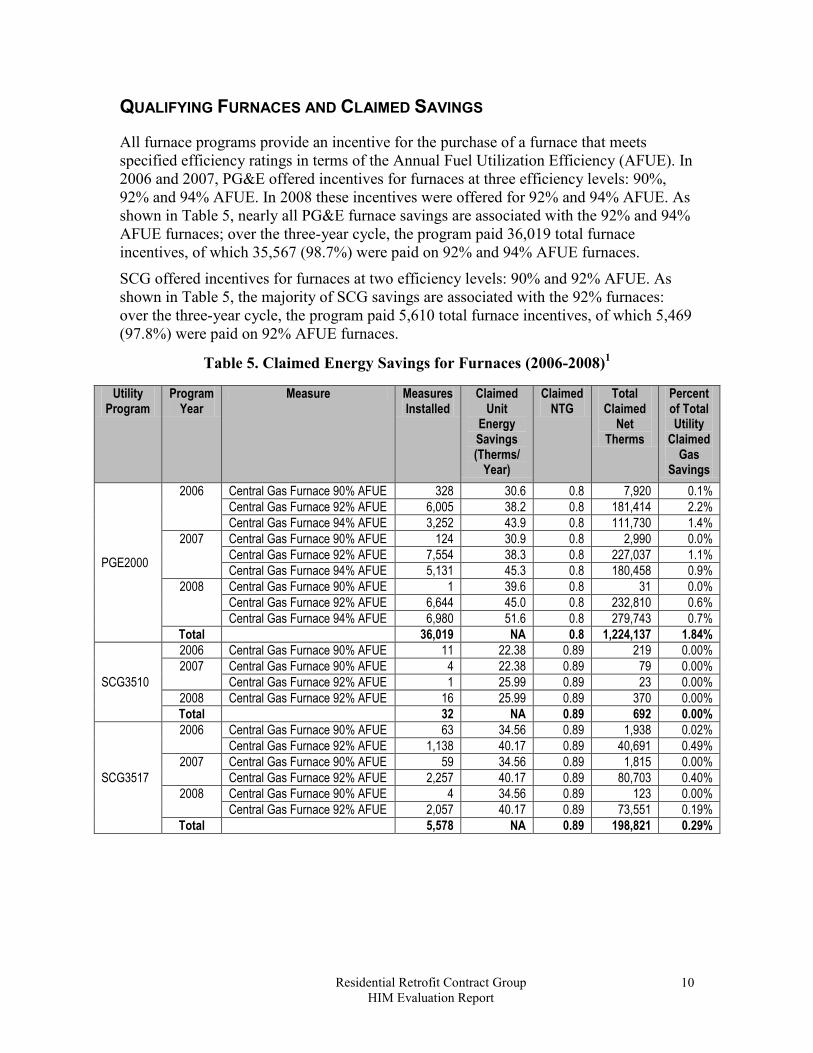
All furnace programs provide an incentive for the purchase of a furnace that meets specified efficiency ratings in terms of the Annual Fuel Utilization Efficiency (AFUE). In 2006 and 2007, PG&E offered incentives for furnaces at three efficiency levels: 90%, 92% and 94% AFUE. In 2008 these incentives were offered for 92% and 94% AFUE. As shown in Table 5, nearly all PG&E furnace savings are associated with the 92% and 94% AFUE furnaces; over the three-year cycle, the program paid 36,019 total furnace incentives, of which 35,567 (98.7%) were paid on 92% and 94% AFUE furnaces.
SCG offered incentives for furnaces at two efficiency levels: 90% and 92% AFUE. As shown in Table 5, the majority of SCG savings are associated with the 92% furnaces: over the three-year cycle, the program paid 5,610 total furnace incentives, of which 5,469 (97.8%) were paid on 92% AFUE furnaces.
Table 5. Claimed Energy Savings for Furnaces (2006-2008)1
Utility Program
Program Year
Measure Measures Installed
Claimed Unit
Energy Savings (Therms/
Year)
Claimed NTG
Total Claimed
Net Therms
Percent of Total Utility
Claimed Gas
Savings
PGE2000
2006 Central Gas Furnace 90% AFUE 328 30.6 0.8 7,920 0.1%
Central Gas Furnace 92% AFUE 6,005 38.2 0.8 181,414 2.2%
Central Gas Furnace 94% AFUE 3,252 43.9 0.8 111,730 1.4%
2007 Central Gas Furnace 90% AFUE 124 30.9 0.8 2,990 0.0%
Central Gas Furnace 92% AFUE 7,554 38.3 0.8 227,037 1.1%
Central Gas Furnace 94% AFUE 5,131 45.3 0.8 180,458 0.9%
2008 Central Gas Furnace 90% AFUE 1 39.6 0.8 31 0.0%
Central Gas Furnace 92% AFUE 6,644 45.0 0.8 232,810 0.6%
Central Gas Furnace 94% AFUE 6,980 51.6 0.8 279,743 0.7%
Total 36,019 NA 0.8 1,224,137 1.84%
SCG3510
2006 Central Gas Furnace 90% AFUE 11 22.38 0.89 219 0.00%
2007 Central Gas Furnace 90% AFUE 4 22.38 0.89 79 0.00%
Central Gas Furnace 92% AFUE 1 25.99 0.89 23 0.00%
2008 Central Gas Furnace 92% AFUE 16 25.99 0.89 370 0.00%
Total 32 NA 0.89 692 0.00%
SCG3517
2006 Central Gas Furnace 90% AFUE 63 34.56 0.89 1,938 0.02%
Central Gas Furnace 92% AFUE 1,138 40.17 0.89 40,691 0.49%
2007 Central Gas Furnace 90% AFUE 59 34.56 0.89 1,815 0.00%
Central Gas Furnace 92% AFUE 2,257 40.17 0.89 80,703 0.40%
2008 Central Gas Furnace 90% AFUE 4 34.56 0.89 123 0.00%
Central Gas Furnace 92% AFUE 2,057 40.17 0.89 73,551 0.19%
Total 5,578 NA 0.89 198,821 0.29%

Residential Retrofit Contract Group HIM Evaluation Report
11
Utility Program
Program Year
Measure Measures Installed
Claimed Unit
Energy Savings (Therms/
Year)
Claimed NTG
Total Claimed
Net Therms
Percent of Total Utility
Claimed Gas
Savings
SCG3510 AND SCG3517 Combined Claimed Energy Savings
2006 Central Gas Furnace 90% AFUE 74 32.75 0.89 2,157 0.02%
Central Gas Furnace 92% AFUE 1,138 40.17 0.89 40,691 0.49%
2007 Central Gas Furnace 90% AFUE 63 33.79 0.89 1,894 0.00%
Central Gas Furnace 92% AFUE 2,258 40.16 0.89 80,726 0.40%
2008 Central Gas Furnace 90% AFUE 4 34.56 0.89 123 0.00%
Central Gas Furnace 92% AFUE 2,073 40.06 0.89 73,921 0.19%
Total 5,610 NA 0.89 199,513 0.3%
5.2 Methodology and Specific Methods Used for Furnaces
As noted above, furnaces represented a small fraction of the savings for PG&E and SCG. However, these savings were greater than the 1% of total claimed savings for PG&E. Consequently, the evaluation efforts were focused in the PG&E territory.
As shown in Table 6 and Table 7, a total of 301 telephone surveys and a subsample of 70 site visits of PG&E 2006 and 200716 program participants were conducted during the fall of 200817. Phone surveys were completed with a stratified random sample of participants, with stratification being assigned to obtain a 90/10 confidence and precision level based on participation levels in each climate zone of the PG&E service territory, excluding climate zones 1 and 13 which had minimal participation. Similarly, the 70 site visits were stratified proportionally based on the same participation levels.
Note also that while the original evaluation plan presented a target of 900 survey completes, 300 each with PG&E, SCG and SDG&E customers who received furnace rebates, this number was revised with the CPUC prior to the beginning of the evaluation activities. In the end, the final number of surveys that were conducted was 300. These 300 surveys were conducted only with PG&E customers as the bulk of the savings from furnaces were achieved by the PG&E program in the cooler northern regions of California served by PG&E.
16 2008 participants were not available at the time that survey and metering efforts needed to commence. 17 See Appendix A for all data collection instruments for furnaces.

Residential Retrofit Contract Group HIM Evaluation Report
12
Table 6: Overview of Evaluation Activities for Furnaces Activity Programs Sample size Parameters
Participant phone survey PGE2000 301 NTG, Installation Rate, Site Visit Recruitment
Non-participant phone survey
PGE2000 181 UES18
Participant site visits/ Metered sites
PGE2000 70 Baseline Efficiencies, NTG, Identification of Non-participants
Dealer survey PGE2000 70
Verification of Installation, Verification of Nameplate Details, Measurement of Efficiency, Gathering of Site Specific Contextual Information, Recording Thermostat Set Points
Table 7: Detailed Evaluation Activities for Furnaces Evaluation Activity (Year Completed)
Participant Type
Year Participants/ Respondents
Phone survey (2008) Participant
2006 122
2007 179
2008 NA
Total 301
Phone survey (2009) Non-
participant Total 181
Phone survey (2009) Dealer Total 70
Site visits (2008) Participant
2006 27
2007 43
2008 NA
Total 70
MEASURE VERIFICATION METHODS
For the measure verification aspect of the study, phone survey respondents were asked whether they had purchased a new furnace and received a program rebate, if the furnace was installed in their home or if it had been installed in another location (e.g. a second home or rental property), and if it was installed in a location other than the primary home, and whether that location was within the PG&E service territory.19 Standard survey protocols were used and included probing to find the proper respondent in the household, multiple attempts with each participant, and determining whether the unit was operating properly. A subsample of 70 of these respondents received follow-up site visits to verify the presence and details of the furnaces.
18 181 PG&E customers who had purchased furnaces without receiving a rebate were identified through a
non-participant phone survey that was conducted as part of the clothes washer evaluation. This sample was insufficient to support a billing analysis which was the primary purpose of attempting to identify these individuals.
19 Ibid.

Residential Retrofit Contract Group HIM Evaluation Report
13
The phone survey was intended to verify installation rates, obtain self-report NTG estimates, and recruit for site visits. The site visit confirmed information from the phone survey, verified the presence, operation, nameplate size and efficiency ratings, as well as thermostat settings and other household characteristics/contextual information (i.e. presence of other major gas-using appliances).
NET-TO-GROSS METHODS
The CPUC assigned the Basic rigor level to the determination of a value for net program impact (or NTG). This evaluation determined NTG through the Joint Sample self-report NTG method, administered during the telephone survey.20 Additional attribution information was collected as part of a survey conducted with 70 furnace dealers21 in the PG&E service territory during the fall of 2009.
ENERGY SAVINGS METHODS
The Evaluation Team conducted site visits with participants who received rebates for furnaces through the PGE2000 program during the winter of 2008. The purpose of the survey calls was to gather information for the participant self-report Net-to-Gross analysis, and to identify homes for the site visits. The purpose of the site visits, in turn, was to install metering equipment to validate the IOU reported gas savings claims for the program.
The metering approach monitors the control signals for the furnaces, and documents the start and end times of each call for heat. After installing the meters, several interim site visits were conducted to validate the data that was being collected.
When the interim data was analyzed, it became apparent that the correlation between call signals and gas flow (times when gas is ―on‖) was not sufficient for a reliable analysis of gas consumption. The reasons for the lack of correlation include installer selectable cycle programming (the installer can select from among several types of cycles through the use of toggle switches, DIP switches or jumpers on the control boards of many makes of furnaces), and variable timing between the start of a call for heat and the beginning of the flow of gas. This variability existed between cycles even for a single unit; consequently, no algorithm could be developed to calculate gas consumption from this meter data even at the individual furnace level.
5.3 Confidence and Precision of Key Findings for Furnaces
The telephone sample size of 301 respondents for PGE2000 furnace participants provides estimates of verification and NTG at 90% confidence and 4.8% precision, exceeding the minimum requirements of 90% confidence and 10% precision (as recommended by the California Evaluation Protocols) for the verification and NTG estimates. In addition, the
20 See Appendix K for the standardized free-ridership battery and algorithm used for this assessment. 21 See Appendix A for the final telephone survey instruments.

Residential Retrofit Contract Group HIM Evaluation Report
14
sample size of 70 participants for the onsite portion of the study provides results in 90% confidence and 10% precision.
5.4 Validity and Reliability of Furnace Evaluation Measurements
This evaluation effort seeks to meet the CPUC’s stated objective of obtaining reliable estimates of net energy savings realized for the furnace high-impact measure. Section 4 of this report provides an overview of how the Evaluation Team minimized the potential for error. The following section describes how the potential for error was minimized for furnaces in particular. Reasonably accurate and precise estimates can be considered reliable because they minimize the potential for each of these types of error:
Measured: The Evaluation Team used meters to measure the frequency, duration and time of call signals. However, measurement error occurred because the correlation between the length of call signals and the actual gas flow of each individual furnace was insufficient to permit an accurate analysis of gas consumption. The Evaluation Team had attempted to mitigate this source of error by using a previously tested and vetted approach that was successful in other evaluations.22 Due to the nature of the furnaces that were eligible for this program, however, the previously used approach did not translate effectively to this evaluation.
Collected: Non-response error occurs when some portion(s) of the population proves less likely than other portions to provide data. Investments that increase the response rate, such as incentives and multiple contact attempts, are typically used to minimize non-response bias errors. The furnace evaluation included up to five attempts to reach survey respondents at different times of day and days of the week. Incentives to encourage participation in the metering study/site-visit portion of the study were set to minimize non-response bias.
Random Error: Using sampling rather than census modeling can create random errors; any sample can be drawn from a population with a large number of possible samples of the same size and design. The sample for the furnace evaluation, however, exceeded the minimum requirement of 90% confidence and 10% precision and thus has attempted to minimize any potential random error associated with sampling.
5.5 Detailed Findings for PGE2000 Furnaces
MEASURE VERIFICATION FINDINGS
Table 8 presents the verification results from the telephone surveys and site visits for the PG&E furnace measures. Telephone survey and site visit results both revealed that all
22 See the Residential New Construction section of the Codes and Standards Evaluation Report

Residential Retrofit Contract Group HIM Evaluation Report
15
(100%) of the program furnaces were installed and operating in the PG&E service territory.
Table 8. PGE2000 Furnace Verification Findings
Phone Survey (n=301)
Onsite Survey (n=71)
Total Survey Adjustment
Furnaces
% Units currently installed/operable23 100% (301) 100% (71) 100%
% Units not installed/operable 0.0% (0) 0.0% (0) NA
NET-TO-GROSS FINDINGS
While estimates for free-ridership were obtained from surveys of both furnace dealers and participating customers, the Evaluation Team relied on the Joint Sample Self-Report NTG method, administered during the telephone surveys with participating customers for the final free-ridership value. The results from both survey efforts are discussed below; however, as discussed in the Executive Summary, the final results rely on the SRA.
Results from this analysis indicate a very high level of free-ridership (81.3%) as compared to the ex ante savings estimate24 of 20% for PG&E (Table 9). A free-ridership value of 81.3% equates to a net-to-gross value of 0.187. For comparison purposes, the current (2009) recommended assumed net-to-gross value for furnaces from DEER is 0.60.25
The free-ridership value, as reported by end-use customers, is significantly greater than was reported by furnace dealers. When asked about the differences in efficiency levels of furnaces sold to participants in the PG&E program versus those sold to customers in the same regions who did not participate in the program, 42% of dealers reported that the efficiency levels were the same (42% free-riders). The remaining 58% of dealers reported that they sold units that were significantly more efficient to participants, increasing the average AFUE from 80% for non-participants to over 92% for participants. The influence of the program on this second set of dealers would indicate that free-ridership among the customers of these dealers would be minimal. The overall estimate of free-ridership that would be obtained by analyzing the responses of furnace dealers is about 0.58 which is in line with the current DEER recommended NTG value of 0.60.
Program participants that were surveyed reported that a significant share of the units they purchased would have been purchased at the same efficiency level even in the absence of the program. In 10 instances – representing 10 of the 301 units or 3.3% of units –, customers reported that the furnace for which they received a rebate had been installed prior to their having learned about the rebate program. In analyzing the self-reported free-
23 Includes two units that were installed at a location other than the incentive address, but within the PG&E
service territory, and one home with two units. 24 Administrator-forecasted savings used for program and portfolio planning purposes as filed with the
CPUC, from the Latin for “beforehand.” 25 Source: DEER 2008.2

Residential Retrofit Contract Group HIM Evaluation Report
16
ridership questions, consideration was made for the fact that the program claimed savings assume that the furnaces are replacements for units that have burned out. In other words, most purchases are made when the previous unit has failed or is near failure, and the purchase of a new furnace would be made with or without the furnace. Savings, therefore, are based on the ability of the program to influence customers to purchase higher-efficiency units than would have been purchased in the absence of a program. Consequently, the analysis of the free-ridership questions for this HIM diverges from the standard methodology by discounting the influence of questions that asked consumers if they would have purchased a furnace in the absence of a program. Because the programs do not claim savings for early replacement units, it is therefore worthy to note that 10 (3.3% of units) customers reported that because of the program, they purchased a furnace earlier than they would have in absence of a program. These 10 respondents are unique from the 10 that reported their furnaces had been installed prior to learning of the rebate. Since dealers report that on average (weighted) the old furnaces which were replaced by the program had an AFUE of 73%, these units would have likely resulted in greater savings than were claimed by the utility.
Table 9. PGE2000 Furnace NTG/Free-rider Findings
Participation Year % Free-riders (FR)
NTG (1-FR)
2006 79.1% 0.20
2007 82.9% 0.17
2008 NA NA
Total Weighted by Year 81.4% 0.19
Total Weighted by Therm Savings 80.0% 0.18
SPILLOVER FINDINGS
Of the 301 furnace participants surveyed over the telephone, none reported purchasing additional energy efficient measures without any utility assistance. Consequently, the Evaluation Team finds that there appears to be no meaningful spillover impact resulting from participation in furnace programs.
ADDITIONAL FURNACE FINDINGS
During the onsite verification visits, information on the thermostat set-points was collected. An analysis of these set points, across the 70 single-family homes for which site visits were conducted and by climate zone, is presented in Table 10 below. Due to the significant number of variations in programming options available from the numerous makes and models of thermostats, the data was retrieved and is presented in a common form that addresses the most common uses of the thermostats. The number of hours at which a thermostat was programmed to remain at a high, medium or low temperature for each day of the week, and the temperature settings for each of these levels on each day, was recorded. The high temperature typically equates to a ―Day‖ or ―Home‖ setting for a thermostat, the medium to a ―Night‖ or ―Sleep‖ setting, and the low to an ―Away‖

Residential Retrofit Contract Group HIM Evaluation Report
17
setting.26 Thermostat data was collected in winter by reading the actual thermostat settings. These data were supplemented by self-reported data on usage in order to capture details such as periods when the thermostat or furnace may have been turned off, and whether the programming is bypassed on a regular basis.
Table 10. PG&E Furnace Thermostat Set-points for Single-Family Homes27
Climate Zone
Heating Level
Temperature/ Time
Monday Tuesday Wednesday Thursday Friday Saturday Sunday
Ove
rall
High (Day)
WA28 Temp 68.06 68.07 68.06 68.07 68.06 68.14 68.09
Hours 10.53 10.53 10.51 10.53 10.51 11.19 11.06
Medium (Night)
WA Temp 63.30 63.30 63.30 63.30 63.30 62.94 63.28
Hours 2.10 2.10 2.10 2.10 2.10 1.84 2.07
Low (Away)
WA Temp 59.80 59.77 59.77 59.77 59.77 59.83 59.80
Hours 8.43 8.44 8.44 8.44 8.44 7.99 7.87
Off WA Temp - - - - - - -
Hours 2.94 2.93 2.94 2.93 2.94 2.99 3.00
2 (n
=8)
High (Day)
WA Temp 68.82 68.82 68.82 68.82 68.82 68.92 68.92
Hours 9.63 9.63 9.63 9.63 9.63 12.38 12.38
Medium (Night)
WA Temp 63.18 63.18 63.18 63.18 63.18 62.14 62.14
Hours 2.75 2.75 2.75 2.75 2.75 1.75 1.75
Low (Away)
WA Temp 59.80 59.80 59.80 59.80 59.80 59.46 59.46
Hours 8.00 8.00 8.00 8.00 8.00 6.25 6.25
Off WA Temp - - - - - - -
Hours 3.63 3.63 3.63 3.63 3.63 3.63 3.63
3 (n
=22
)
High (Day)
WA Temp 67.56 67.57 67.57 67.57 67.57 67.46 67.46
Hours 9.68 9.64 9.64 9.64 9.64 9.59 9.59
Medium (Night)
WA Temp 63.26 63.26 63.26 63.26 63.26 63.02 63.02
Hours 2.95 2.95 2.95 2.95 2.95 3.00 3.00
Low (Away)
WA Temp 58.46 58.39 58.39 58.39 58.39 58.32 58.32
Hours 8.41 8.45 8.45 8.45 8.45 8.27 8.27
Off WA Temp - - - - - - -
Hours 2.95 2.95 2.95 2.95 2.95 3.14 3.14
26 Different makes and models have different settings and this correlation between some of the common
names for the program modes and the high, medium, low and off temperatures and durations that were recorded is provided only as a contextual reference for readability. No actual correlation between the use of the “Day” mode and the “High” temperature setting is being claimed. This same caveat applies to the “Night” and “Medium” as well as the “Away” and “Low” correlations.
27 When analyzing the thermostat setting detail, the temperature set points were initially recorded as temperature set point 1, 2 or 3. During the analysis, these set points were sorted into the high, medium and low categories, along with the corresponding hours. When only two temperatures were present, these were treated as a high and low setting. When only one setting was present, this was treated as a high temperature.
28 Weighted Average (WA)

Residential Retrofit Contract Group HIM Evaluation Report
18
Climate Zone
Heating Level
Temperature/ Time
Monday Tuesday Wednesday Thursday Friday Saturday Sunday 4
(n=
7)
High (Day)
WA Temp 67.96 67.98 67.96 67.98 67.96 68.07 68.05
Hours 12.71 12.86 12.71 12.86 12.71 12.14 12.00
Medium (Night)
WA Temp 66.70 66.70 66.70 66.70 66.70 66.59 66.59
Hours 2.86 2.86 2.86 2.86 2.86 2.43 2.43
Low (Away)
WA Temp 65.03 65.03 65.03 65.03 65.03 64.71 64.71
Hours 4.71 4.71 4.71 4.71 4.71 5.86 5.86
Off WA Temp - - - - - - -
Hours 3.71 3.57 3.71 3.57 3.71 3.57 3.71
11 (
n=
4)
High (Day)
WA Temp 68.69 68.69 68.69 68.69 68.69 68.58 68.58
Hours 9.75 9.75 9.75 9.75 9.75 10.00 10.00
Medium (Night)
WA Temp 60.89 60.89 60.89 60.89 60.89 60.00 60.00
Hours 2.25 2.25 2.25 2.25 2.25 1.25 1.25
Low (Away)
WA Temp 63.20 63.20 63.20 63.20 63.20 63.14 63.14
Hours 10.00 10.00 10.00 10.00 10.00 10.75 10.75
Off WA Temp - - - - - - -
Hours 2.00 2.00 2.00 2.00 2.00 2.00 2.00
12 (
n=
29)
High (Day)
WA Temp 68.16 68.16 68.16 68.16 68.16 68.30 68.19
Hours 11.00 11.00 11.00 11.00 11.00 12.00 11.72
Medium (Night)
WA Temp 61.97 61.97 61.97 61.97 61.97 61.41 63.12
Hours 1.07 1.07 1.07 1.07 1.07 0.93 1.48
Low (Away)
WA Temp 59.57 59.57 59.57 59.57 59.57 59.63 59.55
Hours 9.24 9.24 9.24 9.24 9.24 8.38 8.10
Off WA Temp - - - - - - -
Hours 2.69 2.69 2.69 2.69 2.69 2.69 2.69
As noted above, the Evaluation Team recorded information about thermostat set-points during the site visits that were conducted for this evaluation effort. The findings of that effort – presented by climate zone, day of the week, and program cycle in Table 10 – indicate that the weighted average set-point across the PG&E service territory is 64.34 degrees for 21.05 hours per day. The findings also show that on average, homeowners in the PG&E territory have their heat turned off for 2.95 hours per day.
ENERGY SAVINGS FINDINGS
As shown in Table 11 and Table 12, the values used for Unit Energy Savings (UES) in the utility claims were different for each program. This is due to variation in both the efficiency of the installed unit and the age of the homes where the furnace was installed. UES is dependent on the vintage of the home and the rated efficiency (AFUE) of the unit; therefore, the numbers presented below represent a utility average.
The weighted average UES claimed by PG&E from 2006-2008 is roughly 15% higher than the recommended UES provided in DEER. The UES claimed by SCG is also greater than the UES that is recommended for that territory, but to a significantly greater extent,

Residential Retrofit Contract Group HIM Evaluation Report
19
54%. The detail of units and savings claims by efficiency level and climate zone for PG&E is presented in Table 12.
Table 11. Furnace Unit Energy Savings for Single-Family Homes
Utility/ Program
Measure Number of Incented
Units
Program Claimed UES (Annual),
weighted average
DEER 200829
UES (Annual)
Therms/Year Therms/Year
PGE2000
(n=36,019)
Residential Gas-Fired Furnace
AFUE 90% 453 30.70 28.38
Residential Gas-Fired Furnace
AFUE 92% 20,203 40.47 34.46
Residential Gas-Fired Furnace
AFUE 94% 15,363 47.87 40.26
SCG3510 and SCG3517
(n=5,610)
Residential Gas-Fired Furnace
AFUE 90% 141 29.61 23.51
Residential Gas-Fired Furnace
AFUE 92% 5,469 35.72 28.22
29 Source: DEER 2008.2

Residential Retrofit Contract Group HIM Evaluation Report
20
Table 12. Furnace Unit Energy Savings for Single-Family Homes Detailed by Climate Zone
Utility Year Efficiency Climate Zone
Qty Therms per Unit
NTG Net Therms Units
PGE2000 2006 90% AFUE 1 22 50.81 0.80 784.18 21
2 82 29.40 0.80 1,928.39 82
3B 75 29.75 0.80 1,785.04 75
4 29 29.04 0.80 673.65 29
11 16 33.72 0.80 431.61 16
12 98 27.31 0.80 2,140.96 98
13 4 22.51 0.80 72.04 4
14 1 27.19 0.80 21.75 1
16 1 103.11 0.80 82.49 1
92% AFUE
1 72 56.26 0.80 3,240.45 72
2 856 44.29 0.80 30,167.56 851
3B 1,040 38.90 0.80 31,968.28 1,031
4 543 35.76 0.80 15,323.41 536
11 368 35.08 0.80 10,075.69 363
12 3,031 36.87 0.80 88,234.87 3,004
13 83 32.33 0.80 2,019.22 80
14 4 29.49 0.80 94.36 4
16 6 60.63 0.80 291.02 6
System 2 - 0.80 - 2
94% AFUE
1 17 70.03 0.80 952.46 17
2 176 52.19 0.80 7,325.80 175
3B 575 45.37 0.80 20,411.04 569
4 459 43.90 0.80 15,393.05 449
11 172 44.38 0.80 5,987.25 170
12 1,797 42.74 0.80 60,276.11 1,777
13 45 27.65 0.80 972.50 44
14 9 39.43 0.80 283.90 9
16 2 80.32 0.80 128.51 2

Residential Retrofit Contract Group HIM Evaluation Report
21
Utility Year Efficiency Climate Zone
Qty Therms per Unit
NTG Net Therms Units
2007
90% AFUE
1 14 20.42 0.80 228.70 14
2 19 33.69 0.80 512.13 19
3B 23 29.95 0.80 551.16 23
4 12 27.26 0.80 261.67 12
11 5 40.43 0.80 161.72 5
12 49 34.16 0.80 1,267.40 48
16 1 10.12 0.80 8.10 1
System 1 - 0.80 - 1
92% AFUE
1 86 49.78 0.80 3,424.83 86
2 1,152 43.13 0.80 39,547.91 1,149
3B 1,488 39.63 0.80 46,186.69 1,472
4 842 36.34 0.80 23,860.91 827
11 425 32.65 0.80 10,696.02 414
12 3,435 37.01 0.80 100,117.30 3,403
13 114 34.43 0.80 2,723.13 106
14 3 42.13 0.80 101.11 3
16 9 52.71 0.80 379.48 9
94% AFUE
1 37 60.18 0.80 1,781.26 37
2 416 50.74 0.80 16,564.44 412
3B 1,053 47.65 0.80 39,459.27 1,043
4 612 44.63 0.80 21,330.95 602
11 315 42.15 0.80 10,191.37 309
12 2,653 43.95 0.80 89,958.23 2,593
13 38 33.33 0.80 950.70 36
14 7 39.68 0.80 222.18 7
2008
90% AFUE 4 1 39.59 0.80 31.68 1
92% AFUE
1 84 70.95 0.80 4,634.39 83
2 1,183 50.25 0.80 46,539.56 1,171
3B 1,409 45.60 0.80 49,697.71 1,385
4 689 42.23 0.80 22,874.66 682
11 314 39.65 0.80 9,766.57 311
12 2,848 43.49 0.80 96,335.57 2,803
13 100 36.66 0.80 2,609.00 94
14 2 46.69 0.80 74.70 2
16 3 107.78 0.80 258.67 3
System 12 2.05 0.80 19.66 12
94% AFUE
1 80 71.02 0.80 4,545.26 80
2 776 60.12 0.80 37,021.30 773
3B 1,628 52.84 0.80 67,151.80 1,605
4 568 50.00 0.80 22,160.83 559
5 1 59.77 0.80 47.82 1
11 548 46.61 0.80 19,342.79 530
12 3,314 49.76 0.80 127,382.90 3,246
13 52 36.89 0.80 1,455.27 50
14 5 41.66 0.80 166.64 5
16 5 108.51 0.80 434.04 5
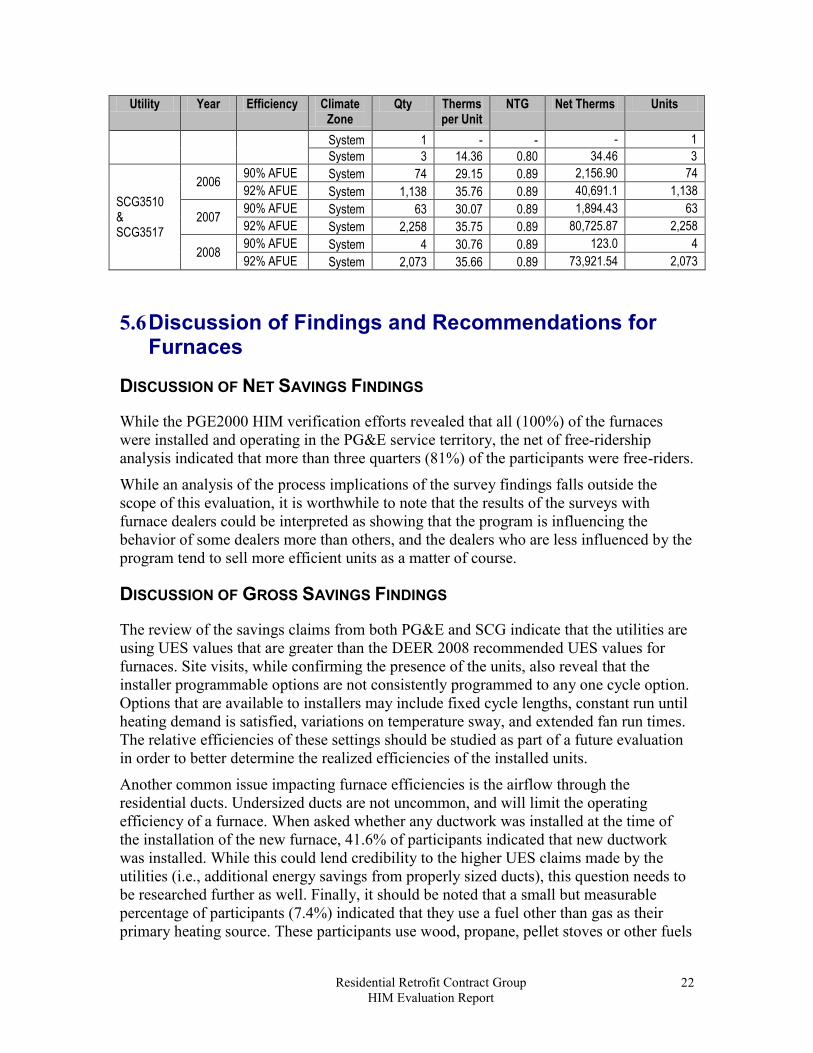
Residential Retrofit Contract Group HIM Evaluation Report
22
Utility Year Efficiency Climate Zone
Qty Therms per Unit
NTG Net Therms Units
System 1 - - - 1
System 3 14.36 0.80 34.46 3
SCG3510 & SCG3517
2006 90% AFUE System 74 29.15 0.89 2,156.90 74
92% AFUE System 1,138 35.76 0.89 40,691.1 1,138
2007 90% AFUE System 63 30.07 0.89 1,894.43 63
92% AFUE System 2,258 35.75 0.89 80,725.87 2,258
2008 90% AFUE System 4 30.76 0.89 123.0 4
92% AFUE System 2,073 35.66 0.89 73,921.54 2,073
5.6 Discussion of Findings and Recommendations for Furnaces
DISCUSSION OF NET SAVINGS FINDINGS
While the PGE2000 HIM verification efforts revealed that all (100%) of the furnaces were installed and operating in the PG&E service territory, the net of free-ridership analysis indicated that more than three quarters (81%) of the participants were free-riders.
While an analysis of the process implications of the survey findings falls outside the scope of this evaluation, it is worthwhile to note that the results of the surveys with furnace dealers could be interpreted as showing that the program is influencing the behavior of some dealers more than others, and the dealers who are less influenced by the program tend to sell more efficient units as a matter of course.
DISCUSSION OF GROSS SAVINGS FINDINGS
The review of the savings claims from both PG&E and SCG indicate that the utilities are using UES values that are greater than the DEER 2008 recommended UES values for furnaces. Site visits, while confirming the presence of the units, also reveal that the installer programmable options are not consistently programmed to any one cycle option. Options that are available to installers may include fixed cycle lengths, constant run until heating demand is satisfied, variations on temperature sway, and extended fan run times. The relative efficiencies of these settings should be studied as part of a future evaluation in order to better determine the realized efficiencies of the installed units.
Another common issue impacting furnace efficiencies is the airflow through the residential ducts. Undersized ducts are not uncommon, and will limit the operating efficiency of a furnace. When asked whether any ductwork was installed at the time of the installation of the new furnace, 41.6% of participants indicated that new ductwork was installed. While this could lend credibility to the higher UES claims made by the utilities (i.e., additional energy savings from properly sized ducts), this question needs to be researched further as well. Finally, it should be noted that a small but measurable percentage of participants (7.4%) indicated that they use a fuel other than gas as their primary heating source. These participants use wood, propane, pellet stoves or other fuels

Residential Retrofit Contract Group HIM Evaluation Report
23
to provide the majority of their heat. As a result, gas savings from these participants is much lower than for those who use the rebated furnace as their primary heat source. Finally, the findings relating to the temperature set-points indicate that additional study is needed to determine the actual gas consumption of furnaces at the different efficiency levels across climate zones and to measure the sensitivity of these set-points to actual weather conditions, fuel prices and economic conditions. At a minimum, it would appear that the assumptions in DEER should be updated to reflect the actual settings that occupants are using.
SUMMARY OF KEY EVALUATION PARAMETERS
Table 13 summarizes the key evaluated parameters for PGE2000 furnaces.
Table 13. Summary of Key Evaluation Parameters for PGE2000 Furnaces
Parameter IOU Claimed
(A)
Evaluated
(B)
Difference
(A-B)
NTG 0.80 0.18 0.62
% Installed 100.0% 100.0% 0.0%

Residential Retrofit Contract Group HIM Evaluation Report
24
6. Clothes Washers (SDGE3023, PGE2000, SCG3517)
6.1 Evaluation Objectives for Clothes Washers This chapter includes the findings from the verification and evaluation efforts for residential clothes washers, which were incented in the following three utility programs:
SDGE3023 High-Efficiency Clothes Washer Voucher Incentive Program
PGE2000 Mass Markets Residential Program
SCG3517 Single-Family Energy Efficient Retrofit Program (SFEER) The HIMs are defined as those efficiency measures common across IOU programs that contribute greater than 1% to the entire IOU savings portfolio for reductions in electrical consumption, electrical demand, or natural gas consumption. Clothes washers met or exceeded the CPUC-assigned threshold of 1% of utility gas savings in all three of these utility programs. Because clothes washers represented a relatively large percentage of energy savings during the 2006–2008 programs, the clothes washer evaluation included a substantial metering component.
There were four primary objectives of the clothes washer evaluation effort:
Determine the percentage of clothes washers that are installed and operating properly.
Derive NTG ratios to evaluate net savings for clothes washers.
Determine Unit Energy Savings (kW, kWh and Therms) based on logged field data.
Determine clothes washer usage (loads per week), and the accuracy of participant self-report vs. metering data for this parameter.
The evaluation changed between the time the Residential Retrofit HIM Evaluation Plan was completed (March 10, 2009) and the publication of the Residential Retrofit HIM Evaluation Report (December 7, 2009). The HIM Plan identified PGE2000 and SCG3517 as the programs that were to be the focus of the evaluation. Later, the decision was made to focus the study on PGE2000 and SDGE3023 since the clothes washer measure represented 4% of total utility gas savings for PG&E and nearly 7% for SDG&E, both substantially higher than SCG3517 (which represented approximately 1% of total claimed savings).
PROGRAM OVERVIEWS
SDGE3023 High-Efficiency Clothes Washer Voucher Incentive Program The high-efficiency clothes washer component of the Voucher Incentive Program offers point-of-purchase vouchers to encourage consumers to purchase high-efficiency clothes washers. Water customers of participating water agencies are eligible as long as vouchers are available for those agencies. Vouchers are provided to single-family and multi-family residences.

Residential Retrofit Contract Group HIM Evaluation Report
25
The program is marketed through a variety of tactics including:
Partnering with other SDG&E programs (i.e. SDGE3024, Single-Family Rebate Program) to reach customers.
Using SDG&E marketing/account execs to assist with outreach.
Providing voucher program information on SDG&E residential web site and San Diego County Water Authority web site (and flyer in water agency bill inserts).
Contacting retailers with program information (fax, direct contact, site visits) to pass on to customers through their marketing channels.
Focusing on Sears as 70% of program vouchers were redeemed at Sears.
PGE2000 Mass Markets The PGE2000 program targets single-family and multi-family residential retrofit and commercial customers, who often lack information, time, and resources to engage in energy efficiency projects. The Mass Markets program uses PG&E staff, third-party specialists, and local government partnerships to deliver a portfolio of energy efficiency, demand response, and distributed generation services. It includes statewide elements as well as elements specially targeted to mass market customers in PG&E’s service area.
SCG3517 Single-Family Energy Efficient Retrofit (SFEER) The SCG3517 SFEER program seeks to help residential customers reduce their natural gas usage with rebates for replacing less efficient gas-fired equipment with new energy efficient equipment. The program also offers weatherization services. The program uses an array of tactics to influence key market actors, including incentive rebates, education, and outreach. The program targets customers, retailers, manufacturers, distributors, and contractors.
SCG has chosen to implement SFEER itself, using a single program approach, rather than separate local programs, to ensure consistency with other statewide offerings and to leverage overall portfolio dollars. The SCG SFEER hopes to reach single-family homeowners who had not previously installed energy efficient measures.
In addition to traditional mail-in rebates, SFEER utilizes a point-of-sale (POS) rebate delivery method for some measures. The utility reimburses the retailer for the rebate, eliminating the need for customers to fill out a rebate application. Those not purchasing qualifying products from a participating retailer continue to have the option of a mail-in or online rebate application.
QUALIFYING CLOTHES WASHERS AND CLAIMED SAVINGS
All programs provide an incentive for the purchase of clothes washers that meet specified efficiency ratings in terms of the Modified Energy Factor (MEF), Water Factor (WF), and Energy Factor (EF).
Throughout the 2006-2008 program cycle, SDGE3023 offered an incentive on ENERGY STAR clothes washers. SDG&E only claimed gas savings for this measure. As shown in

Residential Retrofit Contract Group HIM Evaluation Report
26
Table 14, the program paid incentives on more than 30,000 clothes washers over the three year program period.
Throughout the 2006-2008 program cycle, the PGE2000 program offered incentives on ENERGY STAR clothes washers, though those incentives varied based on CEE30 Tier levels. In 2006, a $35 incentive was offered for CEE Tier 1 machines and a $75 incentive for CEE Tier 2 and Tier 3 machines. Later in the program cycle, the $35 incentive offer was withdrawn and an incentive was offered only on the higher-efficiency washers. As shown in Table 14, the program paid incentives on more than 170,000 clothes washers over the three year program period.
Throughout the 2006-2008 program cycle, the SCG3517 program offered incentives on ENERGY STAR clothes washers. Similar to PGE2000, SCG3517 paid incentives on CEE Tier 1 and CEE Tier 2 machines in 2006 and 2007 but only on CEE Tier 2 in 2008. As shown in Table 14, the program paid incentives on more than 73,000 clothes washers over the three year program period.
Table 14. Claimed Energy Savings for Clothes Washers (2006-2008)31
Program Year
Measure Measures Installed
Per Unit Therm
Savings
Assumed NTG
Total
Claimed Net Therms
Percent of
Claimed Gas
Savings
Claimed Net kWh Savings
Claimed Net kW Savings
SDGE3023
2006
242001-ENERGY STAR Clothes Washer - 3.5 cf (Res) 1,893 21.9 0.80 33,100 0.42% NA NA
2007
242001-ENERGY STAR Clothes Washer - 3.5 cf (Res) 15,303 21.9 0.80 267,581 3.36% NA NA
2008
242001-ENERGY STAR Clothes Washer - 3.5 cf (Res) 12,907 21.9 0.80 225,686 2.84% NA NA
Total 30,103 21.9 0.80 526,367 6.61% NA NA
PGE2000
2006
ENERGY STAR CEE Tier 1
MEF 1.60 /1.80
7,411 15.0 0.80 88,932 0.13% 515,806 21
ENERGY STAR CEE Tier 1
MEF 1.80
39,320 20.0 0.80 629,120 0.95% 3,114,144 129
2007
ENERGY STAR CEE Tier 1
MEF 1.60 /1.80
1,542 15.0 0.80 18,504 0.03% 107,323 4
ENERGY STAR CEE Tier 2
12,064 17.7 0.80 171,116 0.26% 3,291,059 1,998
30 Information on the Consortium for Energy Efficiency (CEE) can be found at http://www.cee1.org 31 Total claimed savings per the IOU Q4 2008 Participant Tracking database

Residential Retrofit Contract Group HIM Evaluation Report
27
Program Year
Measure Measures Installed
Per Unit Therm
Savings
Assumed NTG
Total
Claimed Net Therms
Percent of
Claimed Gas
Savings
Claimed Net kWh Savings
Claimed Net kW Savings
MEF >= 2.0 WF 4.6 - 6.0
ENERGY STAR CEE Tier 2
MEF >= 2.0 WF 4.6 - 6.0
25,971 19.7 0.80 409,303 0.62% 8,165,282 4,571
ENERGY STAR CEE Tier 3
MEF >= 2.0 WF 4.6 - 6.0
7,892 20.0 0.80 126,272 0.19% 846,654 265
2008
ENERGY STAR CEE Tier 1
MEF 1.60 /1.80
1 15.0 0.80 12 0.00% 70 0
ENERGY STAR CEE Tier 2
MEF >= 2.0 WF 4.6 - 6.0
9,474 17.7 0.80 134,379 0.20% 2,584,507 1,569
ENERGY STAR CEE Tier 2
MEF >= 2.0 WF 4.6 - 6.0
75 19.7 0.80 1,182 0.00% 23,580 13
ENERGY STAR CEE Tier 3
MEF >= 2.0 WF 4.6 - 6.0
3 3.0 0.80 7 0.00% 322 0
ENERGY STAR CEE Tier 3
MEF >= 2.0 WF 4.6 - 6.0
235 17.7 0.80 3,333 0.01% 64,108 39
ENERGY STAR CEE Tier 3
MEF >= 2.0 WF 4.6 - 6.0
66,403 19.7 0.80 1,046,511 1.58% 20,877,103 11,687
ENERGY STAR CEE Tier 3
MEF >= 2.0 WF 4.6 - 6.0
4 20.0 0.80 64 0.00% 317 0
ENERGY STAR CEE Tier 1
MEF 1.80
4 20.0 0.80 64 0.00% 317 0
Total 170,399 19.3 0.80 2,628,799 3.97% 39,590,592 20,296
SCG3517
2006
315008-Clothes Washer Tier I 15,254 19.7 0.80 239,793 0.36% NA NA
315010-Clothes Washer Tier I 1 19.7 0.80 16 0.00% NA NA
2007
315008-Clothes Washer Tier I 9,046 19.7 0.80 142,203 0.21% NA NA
315010-Clothes 117 19.7 0.80 1,839 0.00% NA NA

Residential Retrofit Contract Group HIM Evaluation Report
28
Program Year
Measure Measures Installed
Per Unit Therm
Savings
Assumed NTG
Total
Claimed Net Therms
Percent of
Claimed Gas
Savings
Claimed Net kWh Savings
Claimed Net kW Savings
Washer Tier I
315034-ENERGY STAR Clothes Washer - MEF=1.72 WF=8.0 20,404 7.3 0.80 118,343 0.18% NA NA
2008
315034-ENERGY STAR Clothes Washer - MEF=1.72 WF=8.0 28,264 7.3 0.80 163,931 0.25% NA NA
Total 73,086 11.4 0.80 666,125 1.00% NA NA

Residential Retrofit Contract Group HIM Evaluation Report
29
6.2 Methodology and Specific Methods Used for Clothes Washer Evaluation
As shown in the tables above, clothes washers represented a significant percentage of energy savings—from 1% for SCG3517 to nearly 7% for SDGE3023—during the 2006–2008 program cycle.
For PGE2000 and SDGE3023 the evaluation used a combination of telephone surveys and onsite metering to determine key parameters. Telephone surveys were conducted to determine installation rates, free-ridership, and participant spillover. Onsite metering was performed at a large number of sites to determine actual usage of energy (kW, kWh, and therms) and water.
The evaluation examined usage and associated energy and water consumption for both clothes washers and clothes dryers. This is necessary since the energy ratings for clothes washers and the associated savings take into account an expected decrease in dryer usage with ENERGY STAR clothes washers. The decrease in dryer usage comes about because the ENERGY STAR washers use higher spin speeds that result in the removal of more water from the clothing than occurs with non-ENERGY STAR washers that have lower spin speeds.
Considerable detail on the data to be collected, analyses to be performed, and energy-calculation algorithms were provided in the Residential Retrofit High Impact Measure Evaluation Plan which can be found at www.energydataweb.com/cpuc32.
Table 15 provides an overview of the evaluation activities for clothes washers. As part of the Energy Division’s high impact measure approach, the focus of this effort changed from the evaluation of the clothes washer programs of all three utilities to those of SDG&E and PG&E only.
In 2008, surveys and site visits were conducted for PGE2000 and SCG3517 to support required verification of the clothes washer measure.
In 2009, surveys were conducted for SDGE3023 and also for PGE2000 to support the evaluation of the HIM clothes washer measure.
Also in 2009, onsite metering was performed for participants and non-participants in the SDG&E and PG&E service territories.
32 The clothes washer section of the Residential Retrofit High Impact Measure Evaluation Plan is section
4, which begins on page 60. The document, ResHIMPlans_1.pdf , was posted on April 20, 2009 and can be found under the “Residential Retro & CFL Market Effects” Topic of http://www.energydataweb.com/cpuc/ A direct link to the file follows: http://www.energydataweb.com/cpucFiles/18/ResHIMPlans_1.pdf

Residential Retrofit Contract Group HIM Evaluation Report
30
Table 15: Overview of Evaluation Activities for Clothes Washers
Activity Programs Sample size Parameters
Participant Phone Survey SDGE3023, PGE2000, SCG3517 990 NTG, Installation rate End Use Metering SDGE3023, PGE2000 74 Usage, UES
Non-Participant End Use Metering SDGE3023, PGE2000 41 Baseline Usage
As shown in Table 16, a total of 551 PGE2000 telephone surveys were conducted with program participants; 219 of these in the 2008 survey and the rest in the 2009 survey. The 2009 survey was focused on two objectives: data collection for the NTG analysis and recruiting for the onsite metering. By design, the overall survey distribution closely matched the program participation distribution as shown here using installation data.
As shown in Table 16, a total of 323 SDGE3023 telephone surveys were conducted with program participants. Since this program was not part of the evaluation prior to the summer of 2009, all surveys were conducted in 2009.
Table 16 provides similar data on SCG3517 for completeness. This survey data was used to support required verification efforts in 2008. The survey distribution was heavily skewed toward the 2006 participants, which reflects the availability of data at the time of the survey. No additional surveys were conducted in 2009 consistent with the decision not to evaluate SCG3517 further.
Table 16. Detailed Evaluation Activities for Clothes Washers
IOU Year of Participation
Survey 2008
Survey 2009
Survey Total
Percent of Total
Survey Sample by
Utility
Total Claimed
Measures by Year
Percent of Measures
Claimed by Year
PGE2000
2006 109 46 155 28.1% 46,731 27.4%
2007 110 40 150 27.2% 47,469 27.9%
2008 NA 246 246 44.7% 76,199 44.7%
Subtotal 219 332 551 100% 170,339 100%
SDGE3023
2006 NA 0 0 0.0% 1,893 6.3%
2007 NA 21 21 6.5% 15,303 50.8%
2008 NA 302 302 93.5% 12,907 42.9%
Subtotal 0 323 323 100% 30,103 100%
SCG3517
2006 102 NA 102 87.9% 15,255 20.9%
2007 14 NA 14 12.1% 29,567 40.5%
2008 0 NA 0 0.0% 28,264 38.7%
Subtotal 116 NA 116 100% 73,086 100%
Total 355 655 990 NA 273,588 100%
MEASURE VERIFICATION METHODS
For the measure verification aspect of the study, respondents were asked whether they had purchased a new clothes washer and received a program rebate, and if the clothes

Residential Retrofit Contract Group HIM Evaluation Report
31
washer was installed within the utility service territory and operating properly. The interviewer probed to find the proper respondent in the household and explored—where applicable— the reasons why the unit was not installed and operating properly.33
NET-TO-GROSS METHODS
The CPUC assigned the Basic rigor level to the determination of a value for net program impact (or NTG). This evaluation, therefore, determined NTG through the Joint Sample self-report NTG method, administered during the telephone survey.34 A total of 551 NTG surveys were conducted for PGE2000 and 323 for SDGE3023 exceeding the precision levels recommended in the California Evaluation Protocols.
ENERGY SAVINGS METHODS
Use of an efficient clothes washer reduces direct energy usage by the clothes washer and dryer in up to three ways:
Reduced consumption of heated water per wash load. Less heated water translates to therm savings where water is heated with gas, and energy (kWh) and demand (kW) savings for households that have electric water heaters.
Reduced energy for clothes drying. Based on higher spin cycle speeds in the washing machine, the amount of water remaining in a load of wash is lower than in less efficient machines. This difference is captured in the Modified Energy Factor (MEF). Based on this reduction in residual moisture, users of more efficient clothes washers may possibly use less energy for clothes drying.
Reduced electricity usage by the washing machine. Efficient clothes washers use slightly less electricity than standard units. The magnitude of this energy savings, however, was anticipated to be relatively small compared with water heating and dryer energy estimated savings.
Based on these potential savings, the following aspects of laundry systems were metered in the field to characterize their use and to directly measure the energy their operation consumed:
Volumetric flow through hot water hose serving the clothes washer
The temperature of the hot water entering the clothes washer
The electricity consumed by the clothes washer
The electricity consumed by the electric dryer In addition, to understand how the laundry system was operated and in particular to understand the use of cold water in various wash cycles, the following was also logged:
Volumetric flow through cold water hose serving the clothes washer
33 See Appendix B for all data collection instruments for clothes washers. 34 See Appendix K for the standardized free-ridership battery and algorithm used for this assessment.

Residential Retrofit Contract Group HIM Evaluation Report
32
The temperature of the cold water entering the clothes washer The sample of clothes washers metered is shown below in Table 17. Further information on the total metered sample is in Table 19 and descriptions of the CEE tiers are in Table 18.
Table 17. Metering Efforts by Tier for Clothes Washers
Participant/ non-participant
Tier Label Total
Non-participant
CEE Tier 1 (2007-2008) 5
CEE Tier 2 (2007-2008) 4
CEE Tier 3A (2006) 1
CEE Tier 3B (2006) 2
CEE Tier3 (2007-2008) 5
Non-Energy Star 24
Non-participant Total 41
Participant
CEE Tier 1 (2007-2008) 3
CEE Tier 2 (2007-2008) 10
CEE Tier 3A (2006) 1
CEE Tier 3B (2006) 9
CEE Tier3 (2007-2008) 51
Participant Total 74
Grand Total 115
In order to align our metering study to the utility claims, each clothes washer was assigned to CEE tiers according to the modified energy factor (MEF) and water factor (WF) associated with each. The MEF and WF were recorded from a web search of each washer make and model. Both ENERGY STAR and CEE tiers changed during the 2006-2008 program cycle (on January 1, 2007), so each washing machine has both an ENERGY STAR/CEE tier efficiency and an associated vintage (Table 18).35
Table 18. Clothes Washer Efficiency Tiers
Standard Before January 1, 2007 On or after January 1, 2007
Minimum MEF
Maximum Water Factor
Minimum MEF
Maximum Water Factor
Federal Standard 1.04 NA 1.26 NA
EPA ENERGY STAR 1.42 NA 1.72 8.00
CEE Tier 1 1.42 9.50 1.80 7.50
CEE Tier 2 1.60 8.50 2.00 6.00
CEE Tier 3 NA NA 2.20 4.50
CEE Tier 3A 1.80 7.50 NA NA
CEE Tier 3B 1.80 5.50 NA NA
35 Note that the ENERGY STAR requirement changed again on January 1, 2009, requiring an MEF of
1.80 and a maximum WF of 7.5.

Residential Retrofit Contract Group HIM Evaluation Report
33
While Tiers 3A and 3B have ratings of 1.8, these are minimums and many of these machines are well above 2. Conversely, Tier 2 machines after 2007 are rated at 2 and generally have ratings in the range of 2.0 because more efficient machines meet the higher rating of Tier 3. As a result, the Tier 3B machines metered have an average MEF higher than the Tier 2 machines.
Calculating Water Heater Energy Use There are several aspects of calculating heat energy that were considered in the analysis. The water flowing through the hot water hose will initially be near ambient temperature, because of a ―dead leg‖ of water that has equilibrated with its surroundings between washer uses. The volume of this water will vary based on the length of piping from the hot water heater to the clothes washer, but can be one gallon or more. As discussed below, this aspect was accounted for during data analysis.
During design of the M&V plan, plumbing in a temperature well was also considered, but rejected because of the cost, the risk of damage to homes, and the anticipated decrease in recruits. A surface-mounted probe was considered and also rejected because during testing against submerged probes, the reaction was poor and even moderate accuracy would be wholly dependent on installation skill. In addition, this method would not work on non-metallic pipe such as PEX. The added benefit of the method chosen is that the effect of the ―dead leg‖ can be directly observed allowing calculation of the heat energy that never reaches the clothes washer.
Calculating Number of Cycles Because standby use is relatively minor, the energy analyses are normalized to energy use per wash cycle and per drying cycle. The number of cycles is based upon observing clothes washer electricity use, water flows, and dryer electricity use. ―Mound shaped‖ relative maximums indicate a wash cycle and are recorded, and to ensure correctness the Evaluation Team visually inspected the energy and flow logs for each of the metered units. The number of wash cycles was checked against the total water used for plausibility, and the number of washer and dryer cycles are compared, realizing that in some cases washer and dryer cycles will differ for a number of reasons (e.g., less dryer cycles due to line drying, more dryer cycles due to ―fluff‖ cycles to remove wrinkles, etc.). Note the washer savings are normalized to measured washer cycles, while the dryer savings are normalized to the minimum of the site-specific washer or dryer cycles (i.e., so no energy savings is claimed for line drying or ―fluff‖ cycles).
6.3 Confidence and Precision of Key Findings for Clothes Washers
For survey-based results, the sample size of over 300 respondents for PGE2000 and SDGE3023 provides verification results at 90% confidence and 5% precision, thus exceeding the minimum requirements of 90% confidence and 10% precision recommended by the California Evaluation Protocols. The sample size of over 300 NTG surveys meets the recommended sample size for NTG in the California Evaluation Protocols.

Residential Retrofit Contract Group HIM Evaluation Report
34
For the metered data, the initial design of the study included 75 sites each for participants and non-participants for each HIM. These numbers were designed for the study to obtain results with 90% confidence and 10% precision for each of these populations, based on a coefficient of variance of 0.50. As noted during the M&V review, the plan to use a difference of means between these groups results in somewhat larger error (since the difference is a much smaller number), but it was agreed that this type of error was unavoidable given the design of the study.
The actual number of metered sites fell considerably below the target despite a tremendous effort to meter additional sites. Reasons for the shortfall are provided in detail below (Table 19), and are dominated by space and electrical safety considerations. Of the 136 sites metered, 44% had some level of data fault, primarily because of failures of the Watts Up? PRO 120Volt logging power meters. Since most of the energy in a laundry system is consumed by the dryer, the associated savings are similarly linked to dryers. Consequently, the electricity used by the clothes washer itself is a relatively minor factor and the data from sites with a failed Watts Up? PRO could be recovered, as could the data from several other sites. The final number of 115 sites yielded data suitable for analysis of clothes drying energy usage.
Table 19. Number of Metered Sites by HIM: Target and Actual
PGE SDGE TOTAL
Total recruits for metering from PA, PRS 239 106 345
Total sites scheduled 121 89 210
Not enough space 25 7 32
Gas Dryer NA 6 6
Equipment inconvenience NA 2 2
Recruit No Show 5 6 11
Range cord (three straight prongs) 2 2 4
W/D in separate rooms NA 1 1
Language barrier NA 1 1
Electrical test did not pass 4 2 6
No dryer NA 2 2
Unknown 2 7 9
Scheduled sites that were not metered 38 36 74
Total installed sites 83 53 136
Dryer data not gathered/sensor failed 4 0 4
Gas dryer data logged 0 4 4
Failed HOBO logger/sensor failed 5 2 8
120 volt dryer logged 2 4 6
Total installed sites with incomplete data 11 10 21
Total sites with complete data 72 43 115
The lower sampling rate will decrease confidence and precision accordingly. If the samples are combined across the utilities and across the non-participant and participant categories, then the confidence and precision levels of the average energy used by the sites remain at 90% and 10%, respectively. The rationale of combining these populations for assessing energy use is that homeowner behavior is likely similar in term of wash cycles among participants and non-participants and among utility territories. The main

Residential Retrofit Contract Group HIM Evaluation Report
35
determinant of energy use outside of behavior variability in this larger group is the technology of their washer and dryer.
This assertion of similar behavior among non-participants and participants was examined and found to be well supported by the data. Table 20 shows that the number of wash loads per week for these two groups was similar at 5.38 and 4.80, respectively.
Table 21 shows that the temperature rise from cold water supply to hot water is essentially identical. Similarly, Table 22 shows that the percentage of wash water volume that is delivered by the hot water hose is also nearly identical at 17% and 16%, respectively. Table 23 shows that the average participant dryer loads per week are about 85% of the loads done by non-participants. While this factor was not included in savings calculations, it is a significant difference and may warrant further investigation.
Table 20. Wash Loads by Participant Category and Machine Type
Wash Loads
Participant Category Efficiency Average 90% C.I.
41 Non-participants 24 Non-ENERGY STAR 4.77 23%
17 ENERGY STAR, Tiers 1-3 6.23 21%
All non-participants 5.38 16%
74 Participants ENERGY STAR, Tiers 1-3 4.80 11%
Table 21. Temperature Delta by Participant Category and Machine Type
Temperature Change
Participant Category Efficiency Average 90% C.I.
41 Non-participants 24 Non-ENERGY STAR 48.67 16%
17 ENERGY STAR, Tiers 1-3 56.10 8%
All non-participants 52.25 9%
74 Participants ENERGY STAR, Tiers 1-3 54.40 5%
Table 22. Usage of Hot Water by Participant Category and Machine Type
% of Loads Using HW
Participant Category Efficiency Average 90% C.I.
41 Non-participants
24 Non-ENERGY STAR 14% 7% 21%
17 ENERGY STAR, Tiers 1-3 23% 14% 27%
All non-participants 17% 12% 22%
74 Participants ENERGY STAR, Tiers 1-3 16% 13% 18%

Residential Retrofit Contract Group HIM Evaluation Report
36
Table 23. Dryer Cycles by Participant Category and Machine Type
Dryer Loads
Participant Category Efficiency Average 90% C.I.
41 Non-participants
24 Non-ENERGY STAR 4.71 28%
17 ENERGY STAR, Tiers 1-3 5.94 19%
All non-participants 5.22 17%
74 Participants ENERGY STAR, Tiers 1-3 4.30 12%
The variation in hot water usage between owners of non-ENERGY STAR and ENERGY STAR machines among non-participants appears significant. Owners of non-ENERGY STAR machines maintained relatively low hot water usage, just 14% of recorded cycles used hot water. Non-participant owners of ENERGY STAR machines used hot water in 23% of the recorded loads. While these variations are interesting and probably point to high variability in the temperature choices of users, the impact on savings is relatively small compared with dryer energy. The lower number of dryer loads is not quite significant at the 90% confidence level but likely warrants further investigation.
6.4 Validity and Reliability of Clothes Washer Evaluation Measurements
This evaluation effort seeks to meet the CPUC’s stated objective of obtaining reliable estimates of net energy savings realized for the Clothes Washer HIMs. Section 4 of this report provides an overview of how the Evaluation Team minimized the potential for error. The following section describes how the potential for error was minimized for clothes washers in particular. Reasonably accurate and precise estimates can be considered reliable because they minimize the potential for each of these types of error:
Measured: The clothes washer evaluation included a number of direct measurements. The measurements and the accuracy (or potential error) for each are described in Table 24.
Collected: Of the 73,000 units evaluated for SDG3517, approximately 16% were offered through direct POS discounts, making individual contact information unavailable. To the extent that the POS participants differed from participants who received an incentive through the U.S. mail or the Internet, there is potential non-response error. Since the incentive participants are about 84% of the program participants, we assume this error is minimal.

Residential Retrofit Contract Group HIM Evaluation Report
37
Table 24. Clothes Washer Metering Equipment and Potential Error
Function/ Data to
Measure
Brand / Model Per Set-Up
For All Set Ups
Full Scale Accuracy
Expected Measurement
Metering Interval
Water Flow / Water Temp
Omega FTB-8007B-PT (20 pulses / gallon) 2 200 1.5% reading pulse 30s log
Onset Pulse Input Adapter S-UCD-M006 2 200 NA NA
Copper Mounting Setup 2 200 NA NA
Onset Water Temp Sensor S-TMB-M006 2 200 ±0.2°C, ±0.36°F
50F; 130F 2s measure/ 30s log
Dryer Power WattNode T-WNB-3D-240 1 100 0.3% reading pulse 30s log
Onset Pulse Input Adapter S-UCC-M006 1 100 1% of reading
Pulse; 5,000
W-hour per load
30s log
MAGNELAB 50A CT T-MAG-SCT-050 2 200 NA NA
Dryer Cord / Line Splitting Apparatus 1 100 NA pulse 30s log
Washer Power
Watts up? PRO ES 1 100 ±1.5% 100Wh per load 5 min
Power Strip 1 100 NA NA NA
Data Logger Onset HOBO H22-001 Energy Logger Pro 1 70 NA NA NA
HOBO U30-GSM-VIA-10-S100-105 1 30 NA NA NA
Power Supply
Onset AC-U30 1 70 NA NA NA
Onset P-AC-1 1 30 NA NA NA
Calculated: Estimates for this type of error were included in the M&V Plan and are provided here in Table 25 as well.
Table 25. Clothes Washer Calculation Error
Accuracy of Equations Units Accuracy
Electricity consumed by clothes washer per load (sum of products of time intervals and instantaneous power readings)
kWh Less than +/- 1.5%
Electric demand for clothes washer per load kW +/- 1.5%
Electricity consumed by clothes dryer per load (sum of products of time intervals and instantaneous power readings)
kWh Less than +/- 1%
Electric demand for clothes dryer per load kW +/- 1%
Volume of water measurement by flow meter Gallons 1.5% of reading
Temperature of water measurement by temp sensor Degrees F ±0.2°C, ±0.36°F
Delta T difference between measured temperatures Degrees F ±0.51°F typical, 0.73%
Degree Gallons incremental water energy Degree-Gallons 1.67% for typical quantities
Heat Content in BTUs, kWh BTUs or kWh 1.18% for sum of two
Extrapolating from short-term metering to annual hourly loads ± 5%
Propagation of Error (POE). We considered errors incurred at each level of the analysis and have reached the following conclusions:
For each site, measurement error (from the instruments) will propagate from the initial power, water volume, and water temperature to the total energy quantities for that site. Our analysis using the standard equations (below) and shown in the

Residential Retrofit Contract Group HIM Evaluation Report
38
table above shows that the error in the energy estimates for each site will be relatively small.
d(x-y) = d(x +y) = [(dx)2 + (dy)2]1/2)
and
d(xy)/xy = d(x/y)/(x/y) = [(dx/x)2 + (dy/y)2]1/2
For the mean of the two groups (participants and non-participants) the error will include the systematic (measurement) error above and sampling error (which will be consistent with the 90% / 10% basis used to determine the sample size). At this point, this sampling error is not known but it is expected to be fairly small (less than +/- 10%).
For the difference between the means of the two groups, we expect that the combined error will be somewhat larger.
6.5 Detailed Findings for Clothes Washers These findings are based on analysis of the metering data from participant and non-participant sites. The reasons for this are explained in some detail in Section 6.3 above. To briefly summarize, all non-ENERGY STAR clothes washers came from the non- participant sample. This group is the baseline against which ENERGY STAR machines were evaluated. All ENERGY STAR / CEE Tier 1-3 machines were grouped together in the analysis. Most of the ENERGY STAR / CEE Tier 1-3 machines came from the participant sample and the rest came from the non-participant sample. The Evaluation Team checked survey and metered data to be sure that usage of these machines in the two groups is similar and so could be reasonably grouped together in the analysis.
MEASURE VERIFICATION FINDINGS FOR CLOTHES WASHERS
Table 26 presents the verification results from the telephone survey for the SDG&E, SCG, and PG&E clothes washer measures. Over 98% of the rebated units were reported to be installed and operating within the service territory for every program.

Residential Retrofit Contract Group HIM Evaluation Report
39
Table 26. Self-reported Installation Verification for Clothes Washers
IOU Phone Survey
Onsite Survey
Total Survey Adjustment
PGE2000
(Phone survey n=357)
% of units currently installed/operable 99.5% NA 99.5%
% of units not installed/operable 0.5% NA NA
SCG3517
(Phone survey n=80)
% of units currently installed/operable 98.0% NA 98.0%
% of units not installed/operable 2.0% NA NA
SDGE3023
(Phone survey n=270)
% of units currently installed/operable 99.4% NA 99.4%
% of units not installed/operable 0.6% NA NA
NET-TO-GROSS FINDINGS
The Evaluation Team used the Joint Sample Self-Report NTG method, administered during the telephone survey, to determine free-ridership. Results from this analysis indicate a very high level of free-ridership across all three programs as compared to ex ante assumptions, shown below in Table 27. For example, the average free-ridership for SDGE3023 (69.0%), PGE2000 (68.6%), and SCG3517 (70.5%) far exceed the ex ante assumption of only 20% free-ridership.36
Table 27. Clothes Washer NTG/Free-rider Findings IOU Participation Year % Free-riders
(FR) NTG Ratio
(1-FR)
SDGE3023
2006 NA NA
2007 NA NA
2008 68.6% 0.31
Total Weighted by Year 68.6% 0.31
Total Weighted by Therms 69.0% 0.31
PGE2000
2006 67.7% 0.32
2007 69.3% 0.30
2008 69.1% 0.30
Total Weighted by Year 68.8% 0.31
Total Weighted by Therms 68.6% 0.31
SCG3517
2006 70.1% 0.29
2007 74.1% 0.25
2008 NA NA
Total Weighted by Year 72.7% 0.27
Total Weighted by Therms 70.5% 0.29
36 Note that SDGE3023 does not include free-ridership estimates prior to the 2008 program year, and
SCG3517 does not include free-ridership estimates for the 2008 program year. In addition, SDGE3023 and SCG3517 did not claim any electric savings, so kWh and kW weighted NTG estimates are not relevant.

Residential Retrofit Contract Group HIM Evaluation Report
40
SPILLOVER FINDINGS
Table 28 shows the spillover findings for SDGE3023, PGE2000 and SCG3517 programs. In SDGE3023, a total of 91 respondents (33.7%) indicated that they purchased additional efficiency measures because of their participation in the SDGE3023 program. The spillover participants indicated an average rating of 4.6 for the program’s influence on their decision to purchase other measures (based on a scale of 1 to 10, with 10 being most influential). Similarly, a total of 94 PGE2000 respondents (26.33%) and 14 SCG3517 respondents (17.5%) indicated that they purchased additional efficiency measures because of their participation in the clothes washer program. PG&E participants indicated an average rating of 4.7 for the program’s influence on their decision to purchase other measures while SCG participants indicated an average rating of 4.1 for the program’s influence on their decision to purchase other measures (based on a scale of 1 to 10, with 10 being most influential.)
Table 28. Clothes Washer Participant Spillover Findings
IOU Category SDGE3023 Clothes Washer
SDGE3023
(n=270)
# of respondents reporting purchase of additional energy efficiency measures
91
Percent of sample 33.7%
Average rating for program influence (based on a scale of 1 to 10, with 10 being most influential)
4.6
PGE2000
(n=357)
# of respondents reporting purchase of additional energy efficiency measures
94
Percent of sample 26.3%
Average rating for program influence (based on a scale of 1 to 10, with 10 being most influential)
4.7
SCG3517
(n=80)
# of respondents reporting purchase of additional energy efficiency measures
14
Percent of sample 17.5%
Average rating for program influence (based on a scale of 1 to 10, with 10 being most influential)
4.1
ADDITIONAL CLOTHES WASHER SURVEY FINDINGS
The 2009 evaluation telephone survey contained a number of additional questions used to assess the results of the metering analysis, and the results of these questions are presented here.37
In order to estimate the energy used to heat water for washing clothes, the telephone survey asked the type of fuel the water heater consumes. The majority of participating homes (89%) in both PG&E and SDG&E service territories used gas water heaters (Table 29).
37 Note that most of these questions were not asked as part of the 2008 verification research, so
responses are not available for SCG.

Residential Retrofit Contract Group HIM Evaluation Report
41
Table 29. Self-reported Water Heater Fuel Type
Fuel Type PGE SDGE Average
(n=422) (n=301)
Gas 89% 89% 89%
Electric 7% 9% 8%
Other 4% 2% 3%
Total 100% 100% 100%
On average, respondents reported that they perform approximately 5.82 wash loads each week (Table 30) and most of the loads were washed with either warm or cold water settings. Additionally, 63% of households did not change the number of wash loads when they purchased the new rebated clothes washer (Table 31).
Table 30. Self-reported Wash Loads per Week and Cycle Water Heat
PGE SDGE Average
Average Loads/week 5.84 5.80 5.82
% of Wash Loads on Hot 14% 12% 13%
% of Wash Loads on Warm 42% 37% 39%
% of Wash Loads on Cold 45% 51% 47%
Table 31. Self-reported Change in Weekly Wash Loads with New Washer
PGE SDGE Average
No – Loads Stayed the Same 64% 63% 63%
Yes - We do more loads now 7% 9% 8%
Yes - We do less loads now 29% 28% 28%
However, the clothes dryer fuel type did vary significantly between the utilities. SCG and SDG&E had significantly higher proportions of gas dryers, while PG&E respondents had more electric (58%) (Table 32). Very few respondents reported not to have a clothes dryer.
Table 32. Self-reported Dryer Fuel Type
PGE SDGE SCG
Electric Dryer 58% 23% 16%
Gas Dryer 41% 76% 84%
No Dryer 1% 1% 0%
ENERGY AND DEMAND SAVINGS FINDINGS
Hot and cold water use of the clothes washer was measured, and hot water use was converted to input energy accounting for the inefficiency of water heating. The use of hot water was measured by logging the flow of hot water through the hot water hose. The meters used had a resolution of 20 pulses per gallon, with continuous flow metering. The pulses were totaled, logged every 30 seconds and converted to gallons of hot water. The temperature of the hot water passing through the flow meter was continuously monitored and recorded every 30 seconds. Table 33 shows machines in order of decreasing WF. The

Residential Retrofit Contract Group HIM Evaluation Report
42
overall water use drops from non-ENERGY STAR through Tier 2 (2007-2008) but rises for Tier 3A. This is because Tier 3A is similar to Tier 1 and because there was a single Tier 3A machine in the sample. Curiously, the water use of Tier 3 machines is somewhat higher than the other efficient Tiers. This may in part be due to recent Tier 3 machines being larger. Tier 3 machines were found to be, on average, 6% larger than the other ENERGY STAR machines. However, the effect of size on washer usage and savings was not studied as part of this evaluation.
The hot water usage varies and does not appear to follow the efficiency of the machines. This is because the choice of wash cycles is variable and user driven. In addition, the sample sizes for Tier 1, 3A, and 3B are small.
Table 33. Average Gallons of Water per Cycle
Average Hot Water
Gallons/cycle
Average Cold Water
Gallons/cycle
Average Total
Gallons/cycle
Non-ENERGY STAR 3.8 37.4 41.2
CEE Tier 1 (2007-2008) 4.2 18.7 22.9
CEE Tier 2 (2007-2008) 2.5 13.6 16.1
CEE Tier 3B (2006) 3.2 11.6 14.9
CEE Tier3 (2007-2008) 2.2 14.5 16.8
Average 2.9 19.3 22.2
One aspect of a typical laundry system complicated direct measurement of heat energy. Typically, there is a run of piping from the hot water heater to the clothes washer valve that is usually at least 12 feet for pipes run across the ceiling, and can be as much as 20 feet long. Table 34 shows that this can create a ―dead leg‖ of 1 gallon or more.
Table 34. Pipe Volume in Gallons/Minute
Pipe Diameter
Run length 1/2" 3/4"
10’ 0.4 gallons 0.9 gallons
15’ 0.6 gallons 1.4 gallons
20’ 0.8 gallons 1.8 gallons
For hot water flows the temperature of the first few data points would be ambient temperature in the range of 70 to 75 F, then would rise to near the hot water set point (minus the small steady state loss between the hot water heater and the clothes washer). In order to determine the change in temperature, we took a measurement of the hot and cold water at the faucet closest to the washing machine and subtracted the cold from the hot to get the difference. A single hot and cold mean temperature was created by averaging the 25 hottest and 25 coldest readings from all sites (after removing the most extreme five hot and cold outliers). Table 35 shows that while the hot water temperature difference is as great as 20 F between the tiers (primarily due to small sample sizes per bin), the temperatures varied less than 3°F between non-participants and participants. Variation in temperature difference (delta T) arises primarily from user behavior and piping layout. Clothes washers with bins of larger sample sizes varied only a few degrees from 54 F.

Residential Retrofit Contract Group HIM Evaluation Report
43
Table 35. Average Change in Water Temperature
Participant/Non-participant
Tier Label Total (in degrees F)
Non-participant CEE Tier 1 (2007-2008) 57.34
CEE Tier 2 (2007-2008) 41.71
CEE Tier 3B (2006) 69.22
CEE Tier3 (2007-2008) 52.49
Non-ENERGY STAR 48.67
Non-participant Average 52.25
Participant CEE Tier 1 (2007-2008) 53.58
CEE Tier 2 (2007-2008) 53.46
CEE Tier 3B (2006) 66.02
CEE Tier3 (2007-2008) 52.92
Participant Average 54.40
Grand Average 53.63
Similarly, the cold water drawn into the hot water tank would vary somewhat depending on its dwell time in the cold water pipe leading to the heater and the length of that pipe. In designing the analysis plan, several computational options were tested and the heat energy in wash water accounted for 11% of the total energy used by the laundry systems. The hot water energy savings constitute a relatively low percentage of the energy saved through this program because of the high proportion of cold water loads, the fact that even hot loads typically use significant amounts of cold water during rinse cycles, and the very high energy use of clothes dryers.
The electricity use of the clothes washer and dryer was metered directly. However, the heat energy of hot water used was calculated based on the following equation:
Heat energy (BTU) = Flow (gallons) * (hot temperature – entering cold temperature) * 8.3 (lb/gallon) * 1 BTU/temperature) * 8.3 (lb/gallon) * 1 BTU/ F*lb
Table 36 is arranged to reflect decreasing WF rather than increasing MEF to better reflect water use. The water heating energy use for non-ENERGY STAR machines is low because of the small amount of hot water used in our sample of non-ENERGY STAR machines. However, non-ENERGY STAR units use more total water (hot + cold) than their ENERGY STAR counterparts (as seen in Table 33). In addition, the average temperature rise of the hot water was 10% lower for these non-ENERGY STAR machines. Similarly, Tier 1 machines had higher than average hot water use (higher than standard machines). The unexpected values in the table arise from small sample sizes for standard and Tier 1 machines and highly variable user behavior. Tier 2 and 3 machines have results that would be expected. The anomalous results have only a small impact on savings because of the relatively small role that water heating energy plays in the overall energy use of laundry systems.

Residential Retrofit Contract Group HIM Evaluation Report
44
Table 36. Average Water heating BTU’s per Cycle
Average BTU's per Cycle
Non-ENERGY STAR 1,975
CEE Tier 1 (2007-2008), 3A 2,171
CEE Tier 2 (2007-2008) 1,084
CEE Tier 3B (2006) 1,787
CEE Tier3 (2007-2008) 1,050
Average 1,410
Dryer Electricity Use Dryer electricity use was directly metered using a custom assembled 240V meter that plugged into the dryer. The meter consisted of a 240V Watt Node, 2 50A CTs with 2-wrap wires, and a pulse converter. The electricity use was continuously measured and logged or recorded every 30 seconds. Similar to the other energy inputs, dryer energy was normalized to the average energy used per load for each site.38 Table 37 is arranged in order of increasing MEF. The average electricity use per drying cycle dropped sharply from a dryer associated with a base machine to a Tier 1 machine, and dropped again for Tier 3B and Tier 2 machines. Curiously, the average use rose for Tier 3 machines, by roughly 20 % over Tier 2, this may be because the clothes washers are larger but this is not confirmed.
Table 37. Average Dryer Energy Use per Cycle
Clothes Washer Efficiency Average Dryer
kWh/Cycle
Average Peak Dryer Usage (kW)
Average Dryer
Therms/Cycle @ 90% eff.
Non-ENERGY STAR 3.66 0.0009 0.139
CEE Tier 1, 3A (2007-2008) 2.63 0.0009 0.100
CEE Tier 2 (2007-2008) 2.17 0.0033 0.082
CEE Tier 3B (2006) 2.31 0.0009 0.088
CEE Tier3 (2007-2008) 2.38 0.0033 0.090
Total Average 2.64 0.0023 0.100
Peak usage was calculated by taking the average kW draw during 2pm-5pm on summer weekdays. Although there are reasons to think that usage could be higher or lower on the peak days (e.g., people are inside more so may do more laundry, or people are more likely to line draw and do less dryer loads), the limited data made running a temperature dependent usage model impractical. Instead, we chose to assume any weather related impacts are neutral and took the average of all summer weekday-staggered because of the staggered metering schedule-in estimating peak usage and savings. Note that non-ENERGY STAR machines used only slightly more peak kW.
38 As noted above, the number of dryer cycles could differ from washer cycles.

Residential Retrofit Contract Group HIM Evaluation Report
45
Calculating Dryer Gas Usage The basic difference between gas and electric dryers is whether the air is heated by a gas flame or electrical resistance coils. Most electric dryers top out at about 6kW, while gas dryers can have higher capacities. In general most dryers are about 5kW or about 22,000 BTU/hour, where the ratio of capacities is about 84% with the gas dryer higher.
Little data comparing drying efficiency between the two types of dryers is available. The reported minimum efficiency for gas and electric models is 2.67 pounds of clothing per kilowatt-hour of electricity, and 3.01 respectively39,40,41. This equates to a ratio of about 89%, with the electric dryer higher. The gas input is converted into kWh for purpose of the standard.
Given the lack of comparative efficiency data and the similarity of the minimum efficiencies, for purposes of this report we have conservatively converted electric dryer savings into equivalent gas dryer savings using simple unit conversion with an efficiency of 90% to account for the gas heat exchanger. The following equation converts the electric usage into BTUs, and then into therms:
Therms per dryer cycle = (kWh per dryer cycle * 3,412) /.9/ 1,000
Clothes Washer Electricity Use Electricity use of the clothes washers was sampled every 15 seconds. This spot reading was assigned to the previous 15 seconds and the electricity use summed for the cycle. This is mathematically equivalent to taking the average wattage of the cycle and multiplying for the duration. For most installations electricity use by the clothes washer was overshadowed by hot water heating and clothes dryer electricity use. For example, the average program clothes washer uses 0.20 kWh/cycle, approximately 7% of the average total dryer usage per cycle. The metered non-ENERGY STAR machines actually used less peak kW than the ENERGY STAR units (Table 38). This is most likely due to random occurrences as we do not believe that purchasing decisions alter usage patterns. In general, clothes washer electricity is not an area of savings and the range in the data is very small, on the order of 0.04 kWh variation from the average.
Similar to dryer peak usage, peak washer usage was calculated as the average weekday kW demand, based on the metered data, between the hours of 2pm and 5pm. The metered non-ENERGY STAR machines actually used less peak kW than the ENERGY STAR units. This is most likely due to random occurrences as we do not believe that purchasing decisions alter usage patterns.
39 http://www.gcec.com/knowledge.aspx?id=105#jump1; California Energy Commission. (2008) Consumer
Energy Center - Clothes Dryers. 40 Final Rule published May 14, 1991 set performance standards effective May 14, 1994. (56 FR 22250) 41 Kao, James Y., Energy Test Results of a Conventional Clothes Dryer and a Condenser Clothes Dryer,
International Appliance Technical Conference, 1998.

Residential Retrofit Contract Group HIM Evaluation Report
46
Table 38. Average Washer Electricity Usage per Cycle
Average Washer
kWh/Cycle
Average Peak Washer Usage (kW)
Non-ENERGY-STAR 0.2129 0.0040
CEE Tier 1 (2007-2008) 0.2336 0.0105
CEE Tier 2 (2007-2008) 0.1636 0.0076
CEE Tier 3B (2006) 0.1544 0.0087
CEE Tier3 (2007-2008) 0.2056 0.0056
Total Average 0.2007 0.0063
As noted previously, there are three ways an efficient clothes washer contributes to energy savings:
Reduced consumption of heated water per wash load
Reduced energy for clothes drying
Reduced electricity usage by the washing machine The Evaluation Team therefore determined average per cycle water heater, clothes dryer, and washer usage. These parameters were calculated both for homes with efficient (ENERGY STAR or better) and standard (non-ENERGY STAR) clothes washers (Table 39). To begin the calculations, we took the energy usage per device, which can be seen in Table 36 and Table 37, and converted the water heater BTUs and the dryer kWh into therms and kWh to account for different fuel types of these units. For example, an average Tier 1 gas water heater uses 0.03 therms/cycle, as opposed to an electric water heater which uses 0.64 kWh.
Table 39. Average Per Cycle Energy Usage by Fuel
Efficiency Water Heating Fuel Use
per Cycle
Dryer Usage
per Cycle
Clothes Washer Usage
per cycle
Total Electricity
Therm kWh Therm kWh kWh kWh
Non-ENERGY STAR 0.03 0.58 0.14 3.66 0.21 4.45
CEE Tier 1 (2007-2008) 0.03 0.64 0.10 2.63 0.23 3.50
CEE Tier 2 (2007-2008) 0.01 0.32 0.08 2.17 0.16 2.66
CEE Tier 3A (2006) NA NA NA NA NA NA
CEE Tier 3B (2006) 0.02 0.52 0.09 2.31 0.15 2.99
CEE Tier3 (2007-2008) 0.01 0.31 0.09 2.38 0.21 2.89
Average 0.02 0.41 0.10 2.64 0.20 3.26
The total electricity used drops from the base machine through Tier 2, but curiously rises for Tier 3 machines, because of the rise in dryer energy previously discussed. Tier 3B is a relatively small sample size.
Table 40 shows the relative precision of the savings and usage calculations in this section. Note that because therm estimates are an extrapolation of kWh, the relative precision is the same for both fuel types.

Residential Retrofit Contract Group HIM Evaluation Report
47
Table 40. Relative Precision of Use and Savings Estimates
Average kWh/Cycle
Standard Error
Relative Precision
Non-ENERGY STAR 3.72 0.32 14%
ENERGY STAR (Tiers 1-3) 2.92 0.11 6%
Savings (kWh/cycle) 0.80 0.34 69%
To calculate per cycle savings (Table 41) we took the difference of the various tiers of efficient units and subtracted out the non-ENERGY STAR washer usage as a baseline estimate for each of the three devices and fuel options.
Table 41. Average per Cycle Energy Savings by Fuel
Efficiency Water Heating Savings per Cycle
Dryer Savings per Cycle
Clothes Washer Savings per cycle
Total Electricity
Saved
Therm kWh Therm kWh kWh kWh
CEE Tier 1 (2007-2008) -0.003 -0.057 0.039 1.025 -0.021 0.947
CEE Tier 2 (2007-2008) 0.012 0.261 0.056 1.484 0.049 1.795
CEE Tier 3A (2006) NA NA NA NA NA NA
CEE Tier 3B (2006) 0.002 0.055 0.051 1.348 0.058 1.462
CEE Tier3 (2007-2008) 0.012 0.271 0.049 1.279 0.007 1.558
Because homeowners only have one fuel type for their water heater and one for their dryer, we utilized the saturation of fuel types reported on the phone survey (Table 29 and Table 32) to weight the savings to the average household characteristics in each service territory and then combine the savings from each device. As shown in Table 42 the different fuel shares – primarily of dryers – lead to different savings estimates. For example, 58% of the PG&E participants reported having an electric dryer compared to only 23% of SDG&E participants (Table 32), and thus PG&E’s expected kWh savings are at least double those of SDG&E across every efficiency tier.
Table 42. Average Per Cycle Energy Savings by Utility (Savings Weighted Based on Distribution of Water Heater and Dryer Fuel Types per IOU)
SCG Savings/Cycle for the Average Household
SDGE Savings/Cycle for the Average Household
PG&E Savings/Cycle for the Average Household
Therm kWh Therm kWh Therm kWh
CEE Tier 1 (2007-2008) 0.030 NA 0.027 0.219 0.013 0.584
CEE Tier 2 (2007-2008) 0.058 NA 0.054 0.423 0.034 0.951
CEE Tier 3B (2006) 0.045 NA 0.041 0.384 0.023 0.864
CEE Tier3 (2007-2008) 0.052 NA 0.048 0.333 0.031 0.789
To convert the per cycle savings into annual savings, we multiplied per cycle savings (above) by the average self-reported weekly wash loads (from the telephone survey) and by weeks in a year. Results are below in Table 43.

Residential Retrofit Contract Group HIM Evaluation Report
48
Table 43. Average Annual Unit Energy Savings by Utility
Efficiency SCG per Unit Annual Savings
SDGE per Unit Annual Savings PG&E per Unit Annual Savings
Therm kWh Therm kWh Therm kWh
CEE Tier 1 (2007-2008) 9.2 NA 8.2 66.1 4.1 177.2
CEE Tier 2 (2007-2008) 17.5 NA 16.2 127.7 10.2 288.8
CEE Tier 3B (2006) 13.7 NA 12.4 115.9 7.0 262.2
CEE Tier3 (2007-2008) 15.7 NA 14.5 100.6 9.3 239.4
In Table 44 we can see that the peak change is on the order of 0.1 to 0.3% of the peak draw of a 5kW dryer. Because we do not believe that a purchase of a clothes washer would result in behavioral changes, we are not advocating any peak savings (positive or negative) from efficient clothes washers.
Table 44. Average per Unit Peak Demand (kW) Savings
Efficiency Washer kW Savings
Dryer kW savings
CEE Tier 1 (2007-2008) -0.0065 -0.0001
CEE Tier 3B (2006) -0.0047 0.0000
CEE Tier 2 (2007-2008) -0.0036 -0.0024
CEE Tier3 (2007-2008) -0.0016 -0.0024
6.6 Discussion of Findings and Recommendations for Clothes Washers
A summary of the claimed vs. evaluated key parameters is presented in Table 45. Note that SDG&E did not stratify the clothes washer savings claims by efficiency tier, so the savings provided are an average of the metered efficiency tiers. In addition, while SDG&E did not claim electricity savings for clothes washers, the Evaluation Team has included electricity savings in the results for this measure. The tiers PG&E used to claim savings do not compare exactly to the CEE tiers, so the team used the MEF and WF provided in the measure description to assign the appropriate savings.
In general, although the vast majority of the incentivized clothes washers are installed and operating, the savings are lower than expected due to two factors:
Free-ridership is far higher than predicted. While the IOUs had only assumed 20% free-ridership, the self-report NTGR estimated free-ridership of 68%-73%. The self-report NTGR is also substantially higher than the market share data reported by the Department of Energy (DOE). The National ENERGY STAR Retailer Partners are required to annually provide sales data to the DOE for dishwashers, clothes washers, room air conditioners, and refrigerators. In 2006-2008 the National ENERGY STAR retailer partners reported the market share data for ENERGY STAR clothes washers (which is also inclusive of all the more efficient CEER tiers) was 38% in 2006, 42%, and 24%, respectively. Additionally, the 2007 Itron Market Share Report42 found that 45% of California
42 California Residential Efficiency Market Share Tracking -Appliances 2007. Itron. May 1, 2009.

Residential Retrofit Contract Group HIM Evaluation Report
49
clothes washer sales were ENERGY STAR rated or higher. While this is not an estimate of free-ridership, it is an indication that sales of ENERGY STAR clothes washers were in the 24%-42% range throughout the U.S., substantially lower than the self-reported estimate of free-ridership in this study.
Unit Energy Savings (UES) are generally lower than claimed. The metered data reveal that, in general, expected gas energy savings are substantially lower than the claimed savings values. Because work papers were unavailable it is difficult to determine what assumptions went into the utility values.
SUMMARY OF KEY EVALUATION PARAMETERS
Table 45. Summary of Key Evaluation Parameters for Clothes Washers
Parameter IOU Claimed
(A)
Evaluated (B)
Difference (A-B)
SDGE3023
NTG 0.80 0.31 0.49
% Installed 100% 99.4% 0.6%
ENERGY STAR Clothes Washer (2006-2008)
UES: Therms/year 21.9 12.82 9.08
UES: kWh/year - 102.49 -102.49
PGE2000
NTG 0.80 0.31 0.49
% Installed 100% 99.5% 0.5%
ENERGY STAR CEE Tier 1 MEF 1.60 /1.80
UES: Therms/year 15.00 4.07 10.93
UES kWh/year 69.60 177.17 -107.57
UES: kW/year 0.00 -43 0.00
ENERGY STAR CEE Tier 1 MEF 1.80
UES: Therms/year 20.00 4.07 15.93
UES kWh/year 79.20 177.17 -97.97
UES: kW/year 0.00 - 0.00
ENERGY STAR CEE Tier 2 MEF >= 2.0 WF 4.6 - 6.0
UES: Therms/year 17.73 10.17 7.56
UES kWh/year 272.80 288.76 -15.96
UES: kW/year 0.17 - 0.17
ENERGY STAR CEE Tier 2 MEF >= 2.0 WF 4.6 - 6.0
UES: Therms/year 19.70 10.17 9.53
UES kWh/year 314.40 288.76 25.64
UES: kW/year 0.18 - 0.18
ENERGY STAR CEE Tier 3 MEF >= 2.0 WF 4.6 - 6.0
UES: Therms/year 20.00 10.17 9.83
UES kWh/year 107.28 288.76 -181.48
UES: kW/year 0.03 - 0.03
SCG3517
NTG 0.80 0.29 0.51
% Installed 100% 98% 2%
Tier 1 UES: therms/year 19.65 9.15 10.50
ENERGY STAR Clothes Washer - Tier 1
UES: therms/year 7.25 9.15 -1.90
43 Evaluated peak savings is set to zero due to statistically insignificant results.


Residential Retrofit Contract Group HIM Evaluation Report
51
7. Dishwashers (SDGE3024, PGE2000, SCG3517)
7.1 Evaluation Objectives for Dishwashers This chapter includes the findings from the verification and evaluation efforts for dishwashers, which were incented through the SDGE3024 Residential Incentive Program (RIP), the PGE2000 Mass Markets Single-Family Program, and the SCG3517 Single-Family Energy Efficient Retrofit Program (SFEER).
The HIMs are defined as those efficiency measures common across IOU programs that contribute greater than 1% to the entire IOU savings portfolio for reductions in electrical consumption, electrical demand, or natural gas consumption. Dishwashers slightly exceeded the CPUC-assigned HIM threshold of 1% of utility savings only for SDG&E, representing 1.03% of SDG&E claimed 2006–2008 gas savings (Table 46). The findings presented in this chapter for PGE2000 and SCG3517, therefore, only represent the evaluation research conducted in 2008.
There were four primary objectives of the dishwasher evaluation effort:
Determine the percentage of incented dishwashers that were installed and are operating properly.
Derive NTG ratios to evaluate net savings for dishwashers.
Review the ex-post gross savings assumptions compared to earlier and current DEER estimates.
Analyze self-reported household usage data collected to support future evaluation work and research.
Because dishwashers represented a relatively small percentage of energy savings during the 2006–2008 programs, the dishwasher evaluation did not include any metering, billing analysis, or other primary data collection to estimate unit energy or demand savings.
PROGRAM OVERVIEWS
SDGE3024 Residential Incentive Program (RIP) SDGE3024 RIP provides the residential market with incentives to purchase high-efficiency appliances and home equipment. The program offers incentives for other appliances such as pool pumps and motors, whole-house fans, storage water heaters, attic and wall insulation, ENERGY STAR refrigerators, central natural gas furnaces, and room air conditioners.
In addition to the traditional mail-in incentives, RIP uses a point-of-sale (POS) incentive delivery method for some measures. The program establishes relationships with retailers who agree to stock qualifying products and provide an instant incentive for the customer at check out. The retailer is then reimbursed for the incentive by the utility, and the customer does not have to fill out an incentive application. This method simplifies participation in order to maximize it. Customers who purchase qualifying products from a

Residential Retrofit Contract Group HIM Evaluation Report
52
non-participating retailer still have the option of completing a mail-in or online incentive application.
This program coordinates efforts with SDG&E’s education and outreach programs to inform customers about energy efficient practices for the home. The program theory posits that this increased education and financial incentives for the customer will induce retailers to stock energy efficient products.
PGE2000 Mass Markets The PGE2000 program targets single-family and multi-family residential retrofit and commercial customers, who often lack information, time, and resources to engage in energy efficiency projects. The Mass Markets program uses PG&E staffers, third-party specialists, and local government partnerships to deliver a portfolio of energy efficiency, demand response, and distributed generation services. It includes statewide elements as well as elements targeted to mass market customers in PG&E’s service area.
SCG3517 Single-Family Energy Efficient Retrofit (SFEER) The SCG3517 SFEER program seeks to help residential customers reduce their natural gas usage by providing incentives to replace less efficient gas-fired equipment with new energy efficient equipment. The program also offers weatherization services. It uses an array of tactics to influence key market actors, including incentives, education, and outreach. The program targets customers, retailers, manufacturers, distributors, and contractors.
SCG has chosen to implement SFEER itself, using a single-program approach, rather than separate local programs, to ensure consistency with other statewide offerings and to leverage portfolio dollars. The SCG SFEER hopes to reach single-family homeowners who have not installed energy efficient measures.
QUALIFYING DISHWASHERS AND CLAIMED SAVINGS
All programs provide an incentive for the purchase of a dishwasher that meets specified efficiency ratings in terms of the Energy Factor (EF). In 2006, the SDGE3024 program offered two incentive levels for dishwashers: Tier I (EF 0.62 – 0.67) and Tier II (EF 0.68 or greater). In 2007 a new ENERGY STAR standard took effect, and RIP changed the incentive structure to offer incentives on any ENERGY STAR qualified dishwasher (EF 0.65 or greater). As shown in Table 46 for SDG&E, the larger portion of savings is associated with the .65+ EF category because a larger proportion of participation was observed in 2007 and 2008. Over the three-year cycle, the program paid incentives on more than 20,000 dishwashers (Table 46).

Residential Retrofit Contract Group HIM Evaluation Report
53
Table 46.Claimed Energy Savings for Dishwashers (2006 – 2008)44
Utility Program
Program Year
Measure Measures Installed
Claimed Unit
Energy Savings (Therms/ Year)45
Claimed NTG
Total Claimed Net
Therm Savings
Percent of Total Utility
Claimed Gas
Savings
SD
GE
3024
2006 Dishwasher - ENERGY
STAR Tier I EF=0.62-0.67 4,488 4.2 0.80 15,223 0.21%
2007 Dishwasher - ENERGY STAR Tier II EF=0.68+ 1,141 5.3 0.80 4,849 0.07%
2007 Dishwasher ENERGY STAR (EF+0.65+) 14,489 4.7 0.80 54,479 0.75% 2008
Total 20,118 4.6 0.80 74,551 1.03%
PG
E20
00
2006
HI EFF DISHWASHER LEVEL 1 - EF = 0.62 TO
0.67 8,539 3.0 0.80 20,494 0.03%
HI EFF DISHWASHER LEVEL 2 - EF >= 0.68 2,522 3.0 0.80 6,053 0.01%
2007
HI EFF DISHWASHER LEVEL 1 - EF = 0.62 TO
0.67 2,615 3.0 0.80 6,276 0.01%
HI EFF DISHWASHER LEVEL 1 - EF = 0.65 TO
0.67 8,535 3.0 0.80 20,484 0.03%
HI EFF DISHWASHER LEVEL 2 - EF >= 0.68 10,874 3.0 0.80 26,098 0.04%
2008
HI EFF DISHWASHER LEVEL 1 - EF = 0.62 TO
0.67 3 3.0 0.80 7 0.00%
HI EFF DISHWASHER LEVEL 1 - EF = 0.65 TO
0.67 11,867 3.0 0.80 28,481 0.04%
HI EFF DISHWASHER LEVEL 2 - EF >= 0.68 18,067 3.0 0.80 43,358 0.07%
Total 63,022 3.0 0.80 151,251 0.23%
SC
G35
17
2006 ENERGY STAR Labeled
Dishwasher Tier I EF=0.62 5,358 5.3 0.80 22,718 0.03%
2007
ENERGY STAR Labeled Dishwasher Tier I EF=0.62 4,036 5.3 0.80 17,113 0.03%
ENERGY STAR Dish Washer EF=0.65 9,504 4.4 0.80 33,150 0.05%
2008
ENERGY STAR Labeled Dishwasher Tier I EF=0.62 4 5.3 0.80 17 <0.001%
ENERGY STAR Dish Washer EF=0.65 12,443 4.4 0.80 43,401 0.07%
Total 31,345 4.7 0.80 116,399 0.17%
44 Source: Total claimed savings from IOU Q4 2008 Participant Tracking database 45 Claimed per unit therm savings are documented in SDG&E’s work paper issued February 1, 2007

Residential Retrofit Contract Group HIM Evaluation Report
54
In 2006, the PGE2000 program offered two incentive levels for dishwashers: Level I (EF 0.62 – 0.67) and Level 2 (EF 0.68 or greater). A new ENERGY STAR standard took effect in 2007, and Mass Markets changed the incentive structure to offer incentives on any ENERGY STAR qualified dishwasher (EF 0.65 or greater). As shown in Table 46 for PG&E, the larger portion of savings is associated with the 0.68+ EF category because a larger proportion of participation was observed in 2007 and 2008. Over the three-year cycle, the program paid incentives on more than 63,000 dishwashers (Table 46).
In 2006, the SCG3517 program offered only one incentive level for dishwashers: Tier I (EF 0.62 or greater). In 2007 a new ENERGY STAR standard took effect, and SFEER changed the incentive structure to also offer incentives on any ENERGY STAR qualified dishwasher (EF 0.65 or greater). As shown in Table 46 for SCG, the larger portion of savings is associated with the 0.65+ EF category because a larger proportion of participation was observed in 2007 and 2008. Over the three-year cycle, the program paid incentives on more than 31,000 dishwashers (Table 46).
7.2 Methodology and Specific Methods Used for the Dishwasher Evaluation
As noted above, dishwashers represented a relatively small percentage of energy savings during the 2006 – 2008 program cycle. The evaluation, therefore, relied on telephone surveys46 to determine installation rates, free-ridership, participant spillover, and usage patterns.
Table 47 provides an overview of the evaluation activities for dishwashers. The evaluation approach to the dishwasher measure changed over the course of this evaluation:
In 2008, surveys and site visits were conducted for PGE2000 and SCG3517 to support required verification of the dishwasher measure. The research was conducted with participants in the 2006-2007 programs.
In 2008, surveys were conducted for SDGE3024, which was consistent with the plan to conduct research in two waves although verification was not required for dishwashers in this program. These results have not been reported previously.
In 2009, dishwashers in SDGE3024 were identified as a HIM. For this reason, participant surveys were conducted to support the HIM evaluation.
Table 47: Overview of Evaluation Activities for Dishwashers Activity Programs Sample size Parameters
Participant Phone Survey SDGE3024, PGE2000, SCG3517 603 NTG, Installation rate, Usage
Verification Site Visits SDGE3024, PGE2000 76 Installation rate
As shown in Table 48 below, 300 SDGE3024 telephone surveys of program participants were conducted. Roughly half were surveyed as part of the previous 2007 – 2008 evaluation research (n = 160) and the remainder were conducted for the 2009 evaluation
46 See Appendix C for all data collection instruments for dishwashers.

Residential Retrofit Contract Group HIM Evaluation Report
55
effort.47 The percentage of survey respondents by year closely reflects the percentage of SDGE3024 dishwasher incentives by year.
As shown in Table 48, a total of 193 PGE2000 telephone surveys were conducted with program participants as part of the 2006 – 2007 evaluation research.48 Table 48 shows a total of 110 SCG3517 telephone surveys conducted with program participants as part of the 2006 – 2007 evaluation research.
MEASURE VERIFICATION METHODS
For the measure verification aspect of the study, respondents were asked whether they had purchased a new dishwasher and received a program incentive, and whether the dishwasher was installed in the utility service territory and operating properly. The interviewer probed to find the proper respondent in the household and explored—where applicable— the reasons a unit was not installed and operating properly.
NET-TO-GROSS METHODS
The CPUC assigned the Basic rigor level to the determination of a value for net program impact (or NTG). This evaluation, therefore, determined NTG through the Joint Sample self-report NTG method, administered during the telephone survey.49 More than 300 NTG surveys were conducted as recommended in the California Evaluation Protocols.
USAGE DETERMINATION METHODS
The 2009 telephone survey included questions to assess dishwasher usage, including a question about the number of cycles per week that a respondent’s dishwasher typically runs. The responses to this question can be compared to the DEER assumptions, and to other industry databases, to gain insights into energy savings assumptions and whether future research about dishwasher usage is needed. The survey also included a question about typical cycle settings (e.g., normal vs. power wash).
47 For the purpose of the HIM evaluation, “participants” were defined as utility customers receiving
financial incentives for installing ENERGY STAR qualified dishwashers. 48 Dishwashers did not exceed the CPUC-assigned HIM threshold of 1% of utility savings for PG&E and
SCG, and thus no additional research was conducted in 2009 as part of the evaluation effort for the 2008 participants. The results for PGE2000 and SCG3517 Dishwasher participants, therefore, represent only the research conducted for the evaluation research conducted in 2008.
49 See Appendix K for the standardized free-ridership battery and algorithm used for this assessment.

Residential Retrofit Contract Group HIM Evaluation Report
56
Table 48. Detailed Evaluation Activities for Dishwashers
Utility Programs
Survey Effort (Year
Conducted)
Year of Participation
Total Program Participation Response Distribution for Survey Respondents
Number of Participants
Percentage of
Participants*
Total Survey Respondents
Percentage of Total Survey
Sample**
SD
GE
3024
Verification (2008)
2006 4,024 20.0% 65 21.5%
2007 8,248 41.0% 97 32.3%
Evaluation (2009) 2008 7,846 39.0% 139 46.2%
Total 2006-2008 20,118 100% 301 100%
Parameters NA NA NA NTG, Installation rate
PG
E20
00 Verification
(2008)
2006 11,061 17.6% 68 35.2%
2007 22,024 34.9% 125 64.8%
Total 2006-2007 33,085 52.5% 193 100%
Parameters NA NA NA NTG, Installation rate
SC
G35
17 Verification
(2008) 2006 5,358 17.1% 102 92.7%
2007 13,540 43.2% 8 7.3%
Total 2006-2007 18,898 60.3% 110 100%
Parameters NA NA NA NTG, Installation rate
*n for SDG&E=20,118; PG&E=63,022; SCG=31,345
**n for SDG&E=300; PG&E=193; SCG=110
7.3 Confidence and Precision of Key Findings for Dishwashers
The sample of 300 respondents for SDGE3024 provides verification results at 90% confidence and 5% precision, thus exceeding the minimum requirements of 90% confidence and 10% precision recommended by the California Evaluation Protocols. The sample of 300 SDGE3024 NTG surveys also meets the sample size recommendation of the California Evaluation Protocols.
The verification sample sizes for PGE2000 and SCG3517 also had confidence and precision levels that exceeded 90%/10%, but, because they were not selected as HIMs, the research efforts did not include all three years of the program cycle.
7.4 Validity and Reliability of Dishwasher Evaluation Measurements
This evaluation effort seeks to meet the CPUC’s stated objective of obtaining reliable estimates of net energy savings realized for the dishwasher high-impact measure. Section 4 of this report provides an overview of how the Evaluation Team minimized the potential for error. This section describes how the potential for error was minimized for dishwashers in particular. Reasonably accurate and precise estimates can be considered reliable because they minimize the potential for each of these types of error:
Measured: The dishwasher evaluation did not include any direct measurements, eliminating them as a potential source of error.

Residential Retrofit Contract Group HIM Evaluation Report
57
Collected: The SDGE3024 dishwasher evaluation included up to five attempts to reach survey respondents at different times of day and days of the week. Incentives were not used since field work was not required. Note that of the 20,118 incentives paid, there was contact information for 15,842 participants (79%); the other incentives were offered through direct POS discounts, and individual contact information for these respondents was not available. To the extent that the POS participants differed from participants who received an incentive through the U.S. mail or the Internet, there is potential non-response error. Since the incentive participants are almost 80% of the program participants, we assume this error is minimal.
Described (modeled): The SDGE3024 dishwasher evaluation did not include any modeling, and thus modeling is not a potential source of error.
Random Error: The sample for the dishwasher evaluation exceeded the minimum requirement of 90% confidence and 10% precision and thus has attempted to minimize any potential random error associated with sampling.
7.5 Detailed Findings for SDGE3024 Dishwashers
MEASURE VERIFICATION FINDINGS
Table 49 presents the verification results from the telephone surveys for the SDGE3024 dishwasher measures. The telephone surveys revealed that nearly all (99.7%) of the program dishwashers were installed and operating in the SDG&E service territory. No onsite inspections were conducted to verify these responses; however, the 2008 evaluation research did include onsite verifications for the PGE2000 and SCG3517 dishwashers and found the results to be almost identical to the telephone surveys, as can be seen in Table 49.
Table 49. Dishwasher Verification Findings
Utility Program
Measured Parameter Phone Survey* (n=300)
Onsite Survey**
Total Survey Adjustment
SDGE3024 % Units currently installed/operable50 99.7% (299) NA 99.7%
% Units not installed/operable 0.3% (1) NA NA
PGE2000 % Units currently installed/operable 99.5% (196) 100% (33) 99.5%
% Units not installed/operable 0.5% (1) 0% (0) NA
SCG3517 % Units currently installed/operable 99.1% (109) 100% (43) 99.1%
% Units not installed/operable 0.9% (1) 0% (0) NA *n for SDG&E=300; PG&E=197; SCG=110 **n for SDG&E=NA; PG&E=33; SCG=43
50 Includes five units that were installed at a location other than the incentive address, but within the
SDG&E service territory

Residential Retrofit Contract Group HIM Evaluation Report
58
NET-TO-GROSS FINDINGS
The Evaluation Team used the Joint Sample Self-Report NTG method, administered during the telephone survey, to determine free-ridership. The results indicate a very high level of free-ridership across all three programs compared to ex ante assumptions, shown below in Table 50. The average free-ridership for SDGE3024 dishwasher participants is 75.5% compared to an ex ante assumption of 20%.
Table 50. Dishwasher NTG/Free-rider Findings
Utility Program Participation Year % Free-
riders (FR) NTG
(1-FR)
SD
GE
3024
2006 70.4% 0.30
2007 73.8% 0.26
2008 79.8% 0.20
Total Weighted by Year 75.6% 0.25
Therm Weighted by Therm Savings 76.1% 0.24
PG
E20
00 2006 71.3% 0.29
2007 79.9% 0.20
2008 NA NA
Total Weighted by Year NA NA
SC
G35
17 2006 83.2% 0.17
2007 78.5% 0.22
2008 NA NA
Total Weighted by Year NA NA
SPILLOVER FINDINGS
Table 51 shows participants in SDGE3024 who reported the purchase of additional energy efficient measures without any utility assistance. Only 14 respondents (4.7%) said that they had purchased additional efficiency measures because of their participation in the SDGE3024 program. The spillover participants gave an average rating of 8.9 for the program’s influence on their decision to purchase other measures (based on a scale of 1 to 10, with 10 being most influential).
Table 51. SDGE3024 Dishwasher Participant Spillover Findings
Category SDGE3024 Dishwashers (n=300)
# of respondents reporting purchasing additional energy efficiency measures 14
Percent of sample 4.7%
Average rating for program influence 8.9
DISHWASHER USAGE FINDINGS
Respondents to the 2009 SDGE3024 telephone survey reported operating their dishwasher approximately four times a week (4.06), or about 212 cycles per year (based on 52.1 weeks/year). This finding is discussed further in Section 7.6 below.

Residential Retrofit Contract Group HIM Evaluation Report
59
In addition, the 2009 telephone survey asked participants about the percentage of time their dishwasher ran in each of the cycles or settings listed in Table 52. A majority of participants (67.1%) indicated that the normal cycle is the cycle used most often, followed by the ―conserve‖ wash cycle (14.0%), the power wash cycle (5.5%), and other cycle categories (13.4%).
Table 52. SDGE3024 Dishwasher Cycle Types
Dishwasher Cycle SDGE3024
(2009 Survey, n=140)
Normal wash cycle 67.1%
Conserve wash cycle 14.0%
Power wash cycle 5.5%
Rinse wash cycle 0.0%
Other cycle 13.4%
Total 100%
ENERGY SAVINGS FINDINGS
As shown in Table 46 above and summarized in Table 53 below, the values used for unit energy savings (UES) in the utility claims were different for each program. One reason for this may be that the ENERGY STAR standard was updated to include more efficient machines with correspondingly higher energy factors (EFs) over time. DEER 2005, however, provided values only for machines with an EF of 0.58.
In the utility work papers, PGE2000 stated that its claim was based on DEER 2005 and an assumption of 215 cycles/year. As shown in Table 53, the value then should have been 4.0 therms/year, rather than the 3.0 that was used in the PGE2000 claim.
The utility work papers for SCG3517 and SDGE3024 refer to a spreadsheet (―Clothes and dishwasher standards update conversion.xls‖) that documents in some detail the energy consumption and savings values based on three EF values (0.58, 0.62, 0.68), water heat fuel (gas or electric), and housing type (single-family or multi-family). The spreadsheet and the work papers support a UES of 5.30 therms/year for dishwashers with an EF of 0.62. SCG3517 used this value. The SCG work paper cites the 4.36 therms/year value when EF equals 0.65, but states that this is a ―Temporary Change - Awaiting Management Approval and Policy Review‖.
For SDGE3024, however, where the work papers and spreadsheet provide the UES values shown in the far right column in Table 53, the SDGE3024 claim uses the values shown in the next column (second from the right). A close inspection of the supporting spreadsheet shows that the values used in the claim are actually the expected electrical energy savings (kWh/year), which apparently were used by mistake. Additional inconsistencies were found in the kWh claims for SDGE3024.

Residential Retrofit Contract Group HIM Evaluation Report
60
Table 53. Dishwasher Unit Energy Savings Values for homes with Gas Water Heating (Therms/Year)
Energy Factor Cycles / Year
DEER 2005
PGE2000 Claimed
SCG3517 Claimed
SDGE3024 Claimed
SDGE3024 &SCG3517
Work papers
0.58 Multi-family 160 3.00 NA NA NA NA
0.58 Single-Family 215 4.00 NA NA NA NA
0.62-0.67 215 NA 3.00 5.30 4.24 5.30
0.68+ 215 NA 3.00 NA 5.31 6.64
0.65+ 215 NA 3.00 4.36 4.70 NA
Since it appears that a number of mistakes were made in the SDGE3024 claim, Table 54 is provided to document the claims and the recommended UES values for gas and electrical savings. The approved and published DEER 2008 (2006 – 2007 version) does not include updated UES values for efficient dishwashers; therefore, it is recommended that the values documented in the SDGE3024 and SCG3517 spreadsheet be used as the best available information.
There are still some gaps for dishwashers with EFs of 0.65 since this efficiency level is not included in the utility spreadsheet. Although a value for gas UES is given in the SCG3517 work papers, assumptions are not documented. These values are provided in the table below based on engineering assumptions using the midpoint of the 0.62 and 0.68 EF savings.
Table 54. SDGE3024 Dishwasher Unit Energy Savings for Single-Family Homes51
Measure Number of Incented
Units
Program Claimed UES (Annual)
n=20,118
Evaluation UES (Annual) for Gas Water Heat
Evaluation UES (Annual) for
Electric Water Heat
Therms kWh Therms kWh Therms kWh
Dishwasher - ENERGY STAR Tier I EF=0.62-0.67 4,488 4.24 24.2 5.30 4.24 NA 24.2
Dishwasher - ENERGY STAR Tier II EF=0.68+ 1,141 5.31 30.2 6.64 5.31 NA 30.2
Dishwasher ENERGY STAR (EF+0.65+) 14,489 4.70 27.0 5.97 4.78 NA 27.0
7.6 Discussion of Findings and Recommendations for Dishwashers
DISCUSSION OF NET SAVINGS FINDINGS
While the SDGE3024 HIM verification efforts revealed that nearly all (99.7%) of the dishwashers were installed and operating in the SDG&E service territory, the net of free-
51 Source: SDGE3024 Q4 2008 Participant Tracking Database

Residential Retrofit Contract Group HIM Evaluation Report
61
ridership analysis indicated that approximately three-quarters of the participants (75.5%) were free-riders.
This high free-ridership rate, however, is consistent with the market share data reported by the Department of Energy (DOE). The National ENERGY STAR retailer partners are required to provide the DOE with annual sales data for dishwashers, clothes washers, room air conditioners, and refrigerators. In 2006, the National ENERGY STAR retailer partners reported that the market share data for ENERGY STAR dishwashers was 94%.52 In 2007 and 2008, more rigorous standards for ENERGY STAR dishwashers took effect, and market share decreased to approximately 80% and 67%, respectively. While this is not an estimate of free-ridership, it is an indication that sales of ENERGY STAR
dishwashers were extremely high throughout the U.S., including in states where utilities did not provide incentives.
DISCUSSION OF DISHWASHER USAGE FINDINGS
Table 55, below, provides dishwasher cycle/week data from a number of sources. Results of the 2009 SDGE3024 telephone survey—about 4.1 cycles/week—were nearly identical to the value used by the DOE, which is also the basis for ENERGY STAR estimates of single-family energy consumption. DEER 2005 used the same model of 215 cycles/year (4.1 cycles/week) for single-family homes and 160 cycles/year (3.1 cycles/week) for multi-family homes.
A somewhat lower level (2.67 cycles/week) was found by the 2005 California Lighting and Appliance Saturation Survey. This finding is nearly identical to the findings from the statewide 2004 Residential Appliance Saturation Survey (RASS) of 2.69 cycles per week and the same findings for RASS filtering for SDG&E customers only (2.61 cycles per week).
All the studies cited here are based on self-reported data from samples of varying size. While there is some discrepancy between usage estimates for single-family homes (over 4 cycles/week) and the earlier California saturation studies (about 2.7 cycles/week), it may be due in part to the mix of single- and multi-family homes in each study. In any case, dishwashers represent a small percentage of portfolio savings. Even if the higher usage estimates were adopted, dishwashers would remain a small contributor to overall portfolio savings, especially after accounting for free-ridership. Thus, additional research into cycles per week is not warranted.
52 Sales data from 1998 to 2008 can be found at
https://www.energystar.gov/index.cfm?c=manuf_res.pt_appliances

Residential Retrofit Contract Group HIM Evaluation Report
62
Table 55. Assumptions for SDGE3024 Dishwasher Cycles per Week
Source Cycles/week
SDGE3024 Participant Dishwasher Survey (2009) 4.06
ENERGY STAR53 (for a Single-family Home) 4.13
ENERGY STAR54 (for a Multi-family Home) 3.07
2005 California Lighting and Appliance Saturation Survey (CLASS)55 2.67
California 2004 Residential Appliance Saturation Survey (RASS) - Statewide56 2.69
California 2004 Residential Appliance Saturation Survey (RASS) - SDGE Only57 2.61
DISCUSSION OF GROSS SAVINGS FINDINGS
The review of UES values in Section 7.5 concluded with a recommendation to use the utility-documented savings values for the major EF levels identified in SDGE3024. At present, every unit claimed by SDGE3024 (and PGE2000 and SCG3517) includes gas savings. However, these savings can be realized only for homes that heat water with natural gas. The program database does not have data on water heat fuel for each participant on which to base a revised savings claim. However, it is noteworthy that the 2005 Residential Saturation Survey indicates that 70% of SDG&E customers have gas water heat, 9% have electric water heat, and 21% have solar/other as the identified fuel. Table 54 above, provides recommended savings values for homes with either gas or electric water heat.
The revised UES values for dishwashers in homes that heat water with gas are higher than previously claimed. Therefore, adoption of the recommended values will increase gas savings achieved by the installation of the efficient dishwasher HIM. For SDGE3024 (and PGE2000), where there are also claims of electric (kWh) savings, the revised values would reduce the total electric savings.
SUMMARY OF KEY EVALUATION PARAMETERS
Table 56 summarizes the key evaluated parameters for SDGE3024 dishwashers.
53 ENERGY STAR Program Requirements for Dishwashers cites the average cycles per year to be 215;
https://www.energystar.gov/ia/partners/prod_development/revisions/downloads/dishwashers/DW_ProgramRequirements_111408.pdf based on the Department of Energy’s testing procedures;
54 ENERGY STAR Program Requirements for Dishwashers cites the average cycles per year to be 215; https://www.energystar.gov/ia/partners/prod_development/revisions/downloads/dishwashers/DW_ProgramRequirements_111408.pdf based on the Department of Energy’s testing procedures.
55 RLW Analytics, Inc. “2005 California Statewide Residential Lighting and Appliance Efficiency Saturation Study”, Final Report, prepared for California’s Investor Owned Utilities, June 2, 2005.
56 http://websafe.kemainc.com/RASSWEB/DesktopDefault.aspx 57 http://websafe.kemainc.com/RASSWEB/DesktopDefault.aspx

Residential Retrofit Contract Group HIM Evaluation Report
63
Table 56. Summary of Key Evaluation Parameters for SDGE3024 Dishwashers
Parameter IOU Claimed
(A)
Evaluated
(B)
Difference
(A-B)
NTG 0.80 0.24 0.56
% Installed 100.0% 99.7% 0.3%


Residential Retrofit Contract Group HIM Evaluation Report
65
8. High Efficiency Gas Water Heaters (SDGE3024 & PGE2000)
8.1 Evaluation Objectives for High Efficiency Gas Water Heaters
The HIMs are defined as those efficiency measures common across IOU programs that contribute greater than 1% to the entire IOU savings portfolio for reductions in electrical consumption, electrical demand, or natural gas consumption. Using this definition high-efficiency gas water heaters were selected as a high-impact measure for SDGE3024 and PGE2000. Total units and energy savings claimed by these utilities for these measures are shown in Table 57. Therefore, the findings presented in this chapter for SCG3517 and SCE2501 represent only the research conducted for the evaluation research.
The high-efficiency gas water heater evaluation effort had four primary objectives:
Determine the percentage of rebated hot water heaters that were installed and operating properly
Derive net-to-gross ratios to evaluate net savings for hot water heaters
Review the ex-post gross savings assumptions compared to the 2008 DEER database
Gather water heater data including average energy factor, average temperature setting, and average gallons to support future evaluation work and research
PROGRAM OVERVIEWS
SDGE3024 – Residential Incentive Program (RIP) RIP targets owners and renters of single-family homes, condominiums, mobile homes, and attached homes up to a four-plex. The program has four core components: (1) traditional customer incentives, (2) POS rebates, (3) customer information and education, and (4) marketing and outreach to trade allies, including manufacturers, retailers, and distributors. The 2006 – 2008 program offered financial incentives for ENERGY STAR appliances, home improvement measures, and pools. RIP offered a $30 incentive for high-efficiency natural gas water heaters. To qualify, natural gas water storage heaters must have an EF of 0.62 or greater with a capacity of 30 gallons or more.
PGE2000– Mass Markets Program (Residential) The PG&E Mass Markets Residential Program targets the combined segments of single-family and multi-family residential retrofit, commercial and residential renters, and commercial customers who often lack information, time, and resources for energy efficiency projects. The program has four core components: (1) traditional customer incentives, (2) POS rebates, (3) customer information and education, and (4) marketing and outreach to trade allies, including manufacturers, retailers, and distributors.

Residential Retrofit Contract Group HIM Evaluation Report
66
The Mass Markets Program offered a $30 incentive for high-efficiency natural gas water heaters. To qualify, natural gas storage water heaters must have an EF of 0.62 or greater with capacity of 40 gallons or more.
In addition to the traditional mail-in incentives, RIP leverages all market actors within the water heating industry. This includes working with manufacturers, wholesaler/ distributors, water heater dealers and plumbing contractors throughout PG&E’s service territory. The program encourages participation of these market actors by offering incentives to stock and sell the most efficient models. The market actor is then required to pass on part of the incentive to their customers.
SCG3517 – Single-Family Energy Efficiency Retrofit Program (SFEER) and SCE2501 - Residential Energy Efficiency Incentive Program (REEIP) SFEER seeks to help residential customers reduce their natural gas usage with financial incentives for replacing less efficient gas-fired equipment with new energy efficient equipment. REEIP seeks to provide the residential and specific non-residential markets with incentives to purchase high-efficiency products including high-efficiency water heaters. These two programs were included in the 2008 evaluation research but, because their total savings accounted for less than 1% of overall portfolio savings, they were not selected as HIM to be evaluated. The data gathered for the 2008 evaluation research are included where available.
QUALIFYING HOT WATER HEATERS AND CLAIMED SAVINGS
All programs provide an incentive for the purchase of a gas hot water with an EF of 0.62 or greater. The number of rebated units, savings per unit, and total percentage of portfolio savings for SDGE3024 and PGE2000 are presented below in Table 57.

Residential Retrofit Contract Group HIM Evaluation Report
67
Table 57. Program Claimed Gas Savings for Hot Water Heaters (2006-2008)
Utility Program Measure
Measures Installed
Climate Zone
Claimed Unit Energy
Savings (Therms/
Year) Claimed
NTG Total Claimed Net Therms58
% Portfolio Savings
SDGE3024
Water Heating -High Energy Factor Unit –Gas Storage
2,952 Average DEER Msrs
9.8591 0.89 25,903 0.33%
PGE2000
HIGH EFF WTR HTR (GAS) >=.62
4,017 11,12,13,14 11.222 0.80 36,063 0.05%
HIGH EFF WTR HTR (GAS) >=.62
4,243 1,2,3B,4, 5,16
9.378 0.80 31,833 0.05%
Natural Gas Storage Water Heater59
56,852 System 14 0.80 636,742 0.96%
Total Gas 65,112 NA NA NA 704,638 1.06%
8.2 Methodology and Specific Methods Used for High Efficiency Gas Water Heaters
Table 58 provides a summary of the evaluation activities for hot water heaters. As shown in Table 59, the Evaluation Team conducted telephone surveys60 and site visits during 2008 and 2009 (for 2006 – 2008 participants) to verify installation and collect data on specific parameters such as average energy use, size of water heater, and current temperature setting. Because high-efficiency gas water heaters represented a relatively small percentage of energy savings during the 2006 – 2008 program cycle, this evaluation relied on a review of the DEER values, rather than metering, billing analysis, or other method, to estimate unit energy savings.
58 Total claimed savings per the SDG&E 2006 – 2008 tracking database. These values are different from
the savings in the Residential Retrofit High Impact Measure Evaluation Plan prepared by The Cadmus Group, Inc., on March 10, 2009. In the HIM Plan, Cadmus reported that the second quarter 2008 utility reports showed what appeared to be an irregularity: a few duplicate lines gave the quantities, savings, and other summary information for each measure. The duplicate lines appear to have been removed from SDG&E’s official 2006 – 2008 tracking database, so net therm savings are different than the original plan.
59 This measure represents a midstream incented water heater that was included in the HIM planning. End-use customer information was not available, so participants in this program are not included in the telephone surveys or site visits. The Evaluation Team was unable to verify the 14 therms per unit because this was not a value in the DEER database. PG&E was unable to provide a source or work paper for this measure.
60 See Appendix D for all data collection instruments for hot water heaters.

Residential Retrofit Contract Group HIM Evaluation Report
68
Table 58: Overview of Evaluation Activities for Hot Water Heaters Activity Programs Sample size Parameters
Participant Phone Survey SDGE3024, PGE2000, SCG3517, SCE2501
995 NTG, Installation rate
Verification Site Visits SDGE3024, PGE2000 160 Installation rate, Size of unit, Temperature setting, , Energy Factor,
Table 59. Detailed Evaluation Activities for Hot Water Heaters
Utility Program 2008 Phone
Survey 2009 Phone
Surveys 2008 Onsite
Visits 2009 Onsite
Visits
PGE2000R 82 310 10 75
SDGE3024 154 302 0 75
SCG3517 110 0 0 0
MEASURE VERIFICATION METHODS
The evaluation relied on telephone surveys and site visits to verify installation. Telephone survey respondents were asked whether they had received an incentive from their utility around the date of claimed installation. Respondents who said yes were asked whether the equipment was installed in the service territory. If the equipment had not been installed, the interviewer probed for the reasons why.
During the SDGE3024 and PGE2000 site visits, inspectors verified that each unit was operational and collected data on manufacturer, brand, and model number. Specific unit characteristics such as capacity, efficiency, energy source, temperature set-point, and BTU input were also captured. Data were then entered into the evaluation tracking database.
NET-TO-GROSS METHODS
The CPUC assigned the Basic rigor level to the determination of a value for net program impact (or NTG). This evaluation, therefore, determined NTG through the Joint Sample Self-Report NTG method, administered during the telephone survey.61 Over 300 NTG surveys were conducted for both SDGE3024 and PGE2000, thus exceeding the recommendations in the California Evaluation Protocols.
ENERGY AND DEMAND SAVINGS METHODS
The Evaluation Team reviewed the claimed UES values and compared them to the corresponding savings from the 2004 – 2005 DEER database and the 2008 DEER Update. As noted above, specific water heater characteristics were collected during the site visits, including capacity, EF, and temperature setting. This additional information was gathered to compare to the DEER assumptions and provide possible insights into future DEER saving estimates or program design.
61 See Appendix K for the standardized free-ridership battery and algorithm used for this assessment.

Residential Retrofit Contract Group HIM Evaluation Report
69
8.3 Confidence and Precision of Key Findings for High Efficiency Gas Water Heaters
The sample size of 300 respondents for SDGE3024 provides verification results at 90% confidence and 5% precision, thus exceeding the minimum requirements of 90% confidence and 10% precision recommended by the California Evaluation Protocols. The sample size of 300 SDGE3024 NTG surveys meets the recommended sample size of the California Evaluation Protocols.
The targeted confidence and precision levels for the high-efficiency gas water heaters HIM was set at 90% confidence and 10% precision, as recommended by the California Evaluation Protocols. The Evaluation Team completed more than 300 participant telephone surveys and 75 site visits for both SDGE3024 and PGE2000, thus exceeding the specified 90% confidence and 10% precision levels.
The sample sizes for SCG3517 and SCE2501 were substantially smaller, but, because gas water heaters offered through these programs were not selected as HIMs, the research efforts did not include all three years of the program cycle.
8.4 Validity and Reliability of High Efficiency Gas Water Heater Evaluation Measurements
This evaluation seeks to meet the CPUC’s stated objective of obtaining reliable estimates of annual energy savings generated by the designed HIM groups. Section 4 of this report provides an overview of how the Evaluation Team minimized the potential for error. The following section describes how the potential for error was minimized for high-efficiency gas water heaters in particular. Reasonably accurate and precise estimates can be considered reliable because they minimize the potential for each of these types of error:
Measured: The high-efficiency gas water heater evaluation did not include any direct metering measurements, although the Evaluation Team did gather data on equipment characteristics during the site visits. To minimize data recording error, the water heater nameplates were photographed. Any impact from measurement error, therefore, would be minimal for this evaluation.
Random Error. The sample for the high-efficiency gas water heaters met the minimum requirements of 90% confidence and 10% precision, thus minimizing any potential random error associated with sampling.
8.5 Detailed Findings for High Efficiency Gas Water Heaters
MEASURE VERIFICATION FINDINGS
Table 60 presents the verification results from the telephone and onsite inspections for the SDGE3024 and PGE2000 high efficiency gas water heater measures. Site visits verified that nearly all of the water heaters (97.4%) were installed and operating in the SDG&E service territory. One unit was found to have and EF of 0.59, which is below the

Residential Retrofit Contract Group HIM Evaluation Report
70
program requirement of 0.62. In the PG&E territory, two units were unaccounted for out of the 392 surveys completed. Nearly all of the units (99.4%) were installed and operating in PG&E’s service territory.
Table 60. Self-report and Site Visit Verification for Hot Water Heaters
Utility Program Response
Phone Survey 2009*
Onsite Survey 2009**
Total Survey Adjustment***
SDGE3024 % Currently installed 98.7% 98.7% 97.4%
% Not Eligible NA 1.3%
% Not installed 1.3% 0% NA
PGE2000 % Currently installed 99.4% 100% 99.4%
% Not installed 0.6% NA NA
* n for SDG&E=302; PG&E=392
** Most site visit participants were recruited during phone survey efforts and thus are a subset of the telephone survey participants. n for SDG&E=75; PG&E=85
*** Realization rate is the product of the % of units currently installed/operable/operable from the phone survey and the onsite surveys
NET-TO-GROSS FINDINGS
The Evaluation Team used the Joint Sample Self-Report NTG method, administered during the telephone survey, to determine free-ridership. Results from the NTG analysis indicate slight variations in levels of free-ridership by program and year, as shown in Table 61. This analysis indicates a very high level of free-ridership (78.2%) compared to ex ante assumptions of 20% free-ridership (0.80 NTG).
Table 61. Gas Hot Water Heater NTG/Free-ridership Findings
Utility Program Participation Year
% Free- riders (FR) NTG (1-FR)
SDGE3024
2006 75.9% 0.24
2007 76.3% 0.24
2008 80.5% 0.20
Total Weighted by Year 76.9% 0.23
Total Weighted by Therm Savings 78.2% 0.22
PGE2000
2006 82.5% 0.18
2007 83.5% 0.17
2008 80.6% 0.19
Total Weighted by Year 82.4% 0.18
Total Weighted by Therm Savings 83.3% 0.17
SCG3517
2006 75.5% 0.25
2007 70.4% 0.30
2008 NA NA
Total Weighed by Year NA NA

Residential Retrofit Contract Group HIM Evaluation Report
71
SPILLOVER FINDINGS
Table 62 shows participants in SDGE3024 and PGE2000 who reported the purchase of additional energy efficient measures without any utility assistance. While 27% of the SDGE3024 and 15% of the PGE2000 participants reported that they purchased additional efficiency measures because of their participation in the program, the average rating for the program’s influence on their decision to purchase other measures was relatively low (4.9 for SDGE3024 and 5.3 for PGE2000 based on a scale of 1 to 10, with 10 being most influential).
Table 62. Hot Water Heater Participant Spillover Findings
Utility Program
Category Hot Water Heaters
SDGE3024 (n=302)
# of respondents reporting purchasing additional energy efficiency measures 82
Percent of sample 27%
Average rating for program influence 4.9
PGE2000 (n=392)
# of respondents reporting purchasing additional energy efficiency measures 59
Percent of sample 15%
Average rating for program influence 5.3
WATER HEATER REPLACEMENT, CAPACITY AND USAGE PATTERN FINDINGS
Figure 1 and Figure 2 provide self-reported data on age and working status of replaced water heaters from the SDGE3024 and PGE2000 2009 telephone surveys.
Figure 1. Age of Replaced Water Heater

Residential Retrofit Contract Group HIM Evaluation Report
72
Figure 2. Working Status of Replaced Water Heater
Table 63, Table 64, and Table 65 provide further details on usage, storage size, and temperature settings gathered during the site visits. Storage size was captured from the nameplate or energy guide. In some instances, site verification technicians were unable to locate a unit’s energy factor. Where this occurred the Evaluation Team looked up the energy factor using make and model information. The actual temperature setting of the unit was determined by capturing the exact dial setting and referring to the owner’s manual at a later time to correlate the setting (i.e., ―warm‖) to degrees Fahrenheit.
Table 63. Energy Factor for Rebated Hot Water Heaters
Energy Factor (EF)62 Utility Program
PGE2000 (n=75) SDGE3024 (n=75)
Gas EF of 0.59 0 1
Gas EF of 0.62 43 46
Gas EF of 0.63 18 23
Gas EF of 0.64 2 0
NA 12 5
Gas EF – Average 0.623 0.622
62 When the EF was not available from site visits, the Evaluation Team conducted a make/model look-up
(e.g., the Website: http://www.nipsco.com/energyprograms/eh/waterheaters_prod_list.html)

Residential Retrofit Contract Group HIM Evaluation Report
73
Table 64. Average Storage Size for Rebated Hot Water Heaters
Storage Size (Gallons) Utility Program
PGE2000 (n=75) SDGE3024 (n=75)
30 Gallon Tank 3 7
40 Gallon Tank 43 37
50 Gallon Tank 25 31
NA 4 0
Average Size 43.1 43.2
Table 65. Average Temperature Setting for Hot Water Heaters
Utility Average Temperature Setting
PGE2000 (n=75) 128
SDGE3024 (n=75) 125
Average temperature setting is lower than federal testing procedure, which is set at 135 degrees Fahrenheit.
ENERGY SAVINGS FINDINGS
The Evaluation Team compared the 2004 – 2005 DEER saving estimates to the revised 2008 DEER estimates, as shown in Table 66. The 2005 DEER used simplified engineering calculations to estimate savings from high-efficiency water heaters. The 2008 DEER estimates water heater savings by incorporating the domestic hot water system into the residential simulation prototypes.63
63 2008 DEER Update – Version 2008.2.05 for 2009-2011 Planning/Reporting

Residential Retrofit Contract Group HIM Evaluation Report
74
Table 66. Per Unit Energy Saving Comparison by Utility and HIM
Utility Measure Climate Zone
Claimed Unit
Energy Savings (Therms/
Year)
2004-2005 DEER Saving
Estimates
(Therm/ Year)
2008 DEER Saving Estimates
(Therms/Year) S
DG
E30
24
Water Heating -High Energy Factor Unit –Gas Storage
Average DEER
Msrs 9.8591 9.275
9.1 (CZ 6)
10.1 (CZ 7)
9.8 (CZ 8)
9.3 (CZ 10)
10.8 (CZ 14)
8.8 (CZ 15)
PG
E20
00R
HIGH EFF WTR HTR (GAS) >=.62
11,12, 13,14
11.222 11.222
10.2(CZ 11)
10.7(CZ 12)
10.0(CZ 13)
10.7(CZ 14)
PG
E20
00R
HIGH EFF WTR HTR (GAS) >=.62
1,2,3B, 4,5,16
9.378 9.378
12.5(CZ 1)
11.2(CZ 2)
12.2(CZ 3B)
11.2(CZ 4)
10.6(CZ 5)
12.3 (CZ 16)
PG
E20
00R
Natural Gas Storage Water Heater
1,2,3B,4, 5, 11,12, 13,14,16
14.0
CZ1,2,3B,4,5,16 =9.378
CZ11,12,13,14=11.222
10.0 – 12.5
8.6 Discussion of Findings and Recommendations for High Efficiency Gas Water Heaters
DISCUSSION OF NET SAVINGS FINDINGS
This evaluation found a high percentage of free-riders for high-efficiency gas water heaters and conducted a search for market share data to provide additional context for the current findings. The Evaluation Team contacted the Gas Appliance Manufacturers Association (GAMA) and various plumbing trade associations, but was unable to acquire secondary market share data for high-efficiency hot water heaters.
The Consortium for Energy Efficiency (CEE), however, recognizes higher sales of gas hot waters heaters at or above 0.62 EF and has established a tiered structure to rate water heater efficiency levels (Table 67). The 2008 DEER has adopted these CEE tiers.

Residential Retrofit Contract Group HIM Evaluation Report
75
Table 67. Energy Efficient Water Heater Performance
Storage ≤ 75,000 Btuh
Tier 0 ≥0.62 EF
Tier 1 ≥0.67 EF
Tier 2 ≥0.80 EF
Tankless
50,000 and < 200,000 Btuh
Tier 1 ≥0.82 EF (w/electronic ignition)
SUMMARY OF KEY EVALUATION PARAMETERS
Table 68 provides key parameters for SDGE3024 and PGE2000R evaluations. The 2008 DEER energy saving values for water heaters are based on modeling simulations, rather than engineering algorithms; therefore, there is no evaluation update to the 2008 DEER energy saving values (i.e., no update applying any adjustment from the average EF, size, or temperature settings of the program units). Note also that the PG&E midstream gas water measure (labeled Natural Gas Storage Water Heater) was offered throughout the service territory. A weighted average of the expected savings values by climate zone, however, could be calculated based on the zip codes of the incentive recipients (e.g., the plumbers or retailers).
Table 68. Summary of Key Evaluation Parameters for Hot Water Heaters
Utility Program
Parameter IOU Claimed
(A)
Evaluated
(B)
Difference
(A-B)
SDGE3024 NTG 0.89 0.22 0.67
% Installed/Eligible 100.0% 97.4% 2.6%
PGE2000 NTG 0.80 0.17 0.63
% Installed 100% 99.4% 0.6


Residential Retrofit Contract Group HIM Evaluation Report
77
9. Low-flow Showerhead and Faucet Aerators (SDGE3035, SDGE3017, and SCG3517)
9.1 Evaluation Objectives for Low-flow Showerheads and Faucet Aerators
The HIMs are defined as those efficiency measures common across IOU programs that contribute greater than 1% to the entire IOU savings portfolio for reductions in electrical consumption, electrical demand, or natural gas consumption. Using this definition, faucet aerators and low-flow showerheads qualified as HIMs for SDGE3035, SDGE3017, and SCG3517. Total units and energy savings claimed by the utilities for these measures are shown in Table 69.
The low-flow showerhead and faucet aerator evaluation effort had three primary objectives:
Verify the percentage of program showerheads and aerators that are installed
Derive net-to-gross ratios to evaluate net savings for low-flow showerheads and faucet aerators
Analyze self-reported household usage data collected to support future evaluation work and research
PROGRAM OVERVIEWS
SDGE3035 Comprehensive Manufactured/Mobile Home Program (CMMHP) CMMHP seeks to produce cost-effective, long-term peak demand reductions and annual energy savings in the residential market sector. To stimulate participation, CMMHP measures are installed free of charge. The program provides residents of manufactured homes with general information about energy efficiency—and specific information about the energy efficiency measures installed in their homes. Each customer receives a brochure of energy efficiency tips and information about other energy efficiency programs, including contact information.
CMMHP installs or performs as many of the following measures and activities as possible in existing manufactured homes: duct testing and sealing; air conditioning diagnostics and tune-ups; installation of compact fluorescent lamps (CFLs), faucet aerators, low-flow showerheads, and CFL hardwire fixtures; and efficiency upgrades (CFL bulbs and fixtures) for lighting in common areas in manufactured-home parks.
SDGE3017 Multi-family Rebate Program (MFRP) MFRP offers rebates to encourage owners and managers of multi-family properties to install energy efficient products in individual apartments and common areas. The program offers rebates for high-efficiency, residential interior screw-in CFL lamps, reflectors, interior and exterior residential fluorescent lighting fixtures (such as T-8 lamps and exit signs), lighting controls (such as photocells), attic insulation, room air

Residential Retrofit Contract Group HIM Evaluation Report
78
conditioners, gas water heaters, water heater controllers, and low-flow faucet aerators, showerheads, and dishwashers.
SDG&E’s program was promoted through marketing strategies such as direct mail, presentations at community housing workshops, and local multi-family association meetings and online at www.sdge.com.
SCG3517 Single-Family Energy Efficiency Retrofit Program (SFEER) SCG’s 2006 – 2008 SFEER program sought to help residential customers use less natural gas by providing rebates for replacing less efficient gas-fired equipment with new energy efficient equipment. The program used an array of tactics besides incentive rebates, including education and outreach, to influence key market actors. The program targeted customers, retailers, manufacturers, distributors, and contractors. By offering substantial rebates that were easy for customers to claim, SFEER reached owners of single-family homes who had not already installed energy-efficiency measures. To encourage water conservation, the SFEER program gave away kits that included low-flow showerheads and faucet aerators at community events.
QUALIFYING SHOWERHEAD AND FAUCET AERATORS AND CLAIMED SAVINGS
With the exception of SDGE3035, which installed the measures for free, all programs provide an incentive for the purchase of low-flow showerhead and faucet aerators. The number of rebated units, savings per unit, and total percentage of portfolio savings for SDGE3035, SDGE3017 and SCG3517 are shown in Table 69 below.
Table 69. Program Claimed Savings for Low-flow Showerheads and Faucet Aerators
Program Measure Measures Installed
Climate Zone
Claimed Unit Energy Savings
(Therms/ year)
Claimed NTG
Total Claimed Net Therms
(Annual Therms)64
% Portfolio Savings
SDGE3035 (Manufactured Homes)
Showerhead 7,018 System 7.42 0.89 46,345 0.58%
Faucet Aerator 12,007 System 5.565 0.89 59,469 0.75%
SDGE3017 (Multi-family)
Showerhead 6,684 System 7.0837 0.89 42,139 0.005%
Faucet Aerator 17,490 System 5.3127 0.89 82,698 0.010%
SCG3517 (Single-family)
Showerhead 27,191 System 5.92 0.80 128,777 0.19%
Showerhead 13 System 8.978 0.89 104 0%
64 Total claimed savings per utility quarter 4, 2008 E3 calculator. These values are different from the
savings in the Residential Retrofit High Impact Measure Evaluation Plan prepared by The Cadmus Group, Inc. on March 10, 2009. In the HIM Plan Cadmus reported that the quarter 2, 2008 utility reports showed what appeared to be an irregularity where there were a few duplicate lines that gave the quantities, savings, and other summary information for each measure. The duplicate lines appear to have been removed from the quarter 4, 2008 E3 calculator and therefore net therm savings are different than the original plan.

Residential Retrofit Contract Group HIM Evaluation Report
79
9.2 Methodology and Specific Methods Used for Low-flow Showerheads and Faucet Aerators
Table 70 provides an overview of the evaluation activities for low-flow showerheads and faucet aerators. As shown in Table 71, the Evaluation Team conducted telephone surveys65 and conducted site visits during 2008 and 2009 to verify installations and collect data on specific parameters such as usage. Because low-flow showerheads and faucet aerators represented a relatively small percentage of energy savings during the 2006 – 2008 programs, and the savings for each measure were relatively low, this evaluation did not use any metering, billing analysis, or more costly method to estimate energy or demand savings.
Table 70: Overview of Evaluation Activities for Low-flow Showerheads and Faucet Aerators
Activity Programs Sample size Parameters Participant Phone Survey SDGE3035, SDGE3017, SCG3517 747 NTG, Installation rate
Verification Site Visits SDGE3024, PGE2000 117 Installation rate
Table 71. Detailed Evaluation Activities for Low-Flow Showerhead and Faucet Aerators
Utility Program Measure
Telephone Survey (2008)
Telephone Survey (2009)
Site Visits (2008)66
SDGE3035
(Manufactured Homes)
Showerhead NA 160 65
Faucet Aerator NA 150 65
SDGE3017
(Multi-family)67
Showerhead NA 15 52
Faucet Aerator NA 43 52
SCG3517 (Single-Family)68 Showerhead 73 306 NA
MEASURE VERIFICATION METHODS
The evaluation relied on site visits and telephone surveys to determine whether low-flow showerheads and faucet aerators were installed. All site inspections were part of a larger
65 See Appendix E for all data collection instruments for low-flow showerheads and faucet aerators. 66 A multi-family site visit occurs at the multi-family complex level, not all tenants. In general, the onsite
verification team attempted to gain access to 10 treated dwellings at larger sites. If the number of treated sites was less than or equal to 4 dwellings, the team attempted to enter all treated dwellings. The number of dwellings actually verified at each site depended largely on the cooperation of tenants and the site management.
67 After aggregating the multi-family participation data, the sample population consisted of 204 properties representing 156 owners/managers. The Evaluation Team completed interviews with 49 properties representing 39 different owners/managers. This provided a total of 58 surveys conducted between the two HIMs. Surveys were only conducted with building owners when individual tenant contact and phone information was not available.
68 In the 2008 telephone survey, showerheads and faucet aerators were treated as one measure. In the 2009 HIM evaluation, these measures were broken out as two separate measures in the survey. . . .

Residential Retrofit Contract Group HIM Evaluation Report
80
whole building or house audit. During the SDGE3035 site visits, inspectors visually identified low-flow showerheads and faucet aerators and checked whether they were operating. The inspectors were equipped with the same make and model showerhead and faucet aerator used by the installing contractor. The SDGE3017 multi-family site inspections included a gallons-per-minute test to verify the equipment was low-flow and met program requirements.
Telephone surveys were also conducted. Interviewers sought to find the proper respondents in the household or the building owner or manager familiar with the program.
For SDGE3035 and SCG3517, respondents were asked whether they had received a free showerhead and faucet aerator from their utility around the date of the claimed installation or mailing. Respondents who said yes were asked whether the equipment was installed at their property. If the equipment had not been installed, the interviewer probed for the reasons why.
Similarly, building owners or managers were asked whether they had purchased a low-flow showerhead or faucet aerator and whether the measure had been installed. If a respondent mentioned that a device was not installed or was removed at a later time, the interviewer asked the respondent additional questions for clarification.
NET-TO-GROSS METHODS
This evaluation determined NTG from participant self-report responses to a telephone survey. The instrument and algorithm used was the Joint Sample Self-Report NTG method as described in Section 4. See Appendices D and E for details on the self-report approach guidelines, the algorithm, and the free-ridership stability indicators.
USAGE DETERMINATION METHODS
Although the Residential Sector Non-Weather-Sensitive Energy DEER reports that low-flow showerheads and aerators saving estimates are calculated using a percentage savings from a base water heat end-use, shower usage pattern information was gathered to provide possible insight into future DEER saving estimates or program design. (Usage questions were part of the 2009 telephone survey only).
ENERGY AND DEMAND SAVINGS METHODS
The Evaluation Team verified that the estimated energy savings were consistent with the corresponding savings from the 2004 – 2005 DEER database. At the time the report was being written, there were no 2008 DEER values for low-flow showerheads or faucet aerators.
9.3 Confidence and Precision of Key Findings for Low-flow Showerheads and Faucet Aerators
The targeted confidence and precision levels for the low-flow showerhead and faucet aerator HIMs were 90% confidence and 10% precision, as specified by the California
Residential Retrofit Contract Group HIM Evaluation Report
81
Protocols. To satisfy the requirements of the Impact Evaluation Protocol, the sample of 300 participants was also used to develop a net-to-gross value for SDGE3035 and SCG3517. SDGE3017 had a total population of only 204 properties consisting of 156 contacts who had installed either low-flow showerheads or faucet aerators. The Evaluation Team completed interviews with 49 properties representing 39 different owners/managers. This effort provided a total of 58 surveys conducted between the two HIMs, which were enough to achieve the specified 90% confidence and 10% precision levels.
9.4 Validity and Reliability of Low-flow Showerhead and Faucet Aerator Evaluation Measurements
This evaluation seeks to meet the CPUC’s stated objective of obtaining reliable estimates of annual energy savings generated by the designated HIM groups. Section 4 of this report provides an overview of how the Evaluation Team minimized the potential for error. The following section describes how the potential for error was minimized for low-flow showerheads and faucet aerators in particular. Reasonably accurate and precise estimates can be considered reliable because they minimize the potential for each of these types of error:
Measured: The Evaluation Team performed flow-rate tests for a sample of the sites where low-flow showerheads and faucet aerators were installed for SDGE3017. For both SDGE3017 and SCG3517, measures were physically examined and make and model recorded if possible; the water was turned on to determine whether the HIMs had been installed correctly and were operational.
Random Error: The sample for the low-flow showerhead and faucet aerator evaluation met the minimum requirements of 90% confidence and 10% precision, thus minimizing any potential random error associated with sampling.
9.5 Detailed Findings for Low-flow Showerheads and Faucet Aerators
MEASURE VERIFICATION FINDINGS FOR LOW-FLOW SHOWERHEADS AND FAUCET AERATORS
Table 72 presents the verification results from the telephone and onsite inspections for the SDGE3035 and SDGE3017 low-flow showerhead and faucet aerator measures. There was a difference in the results between the two forms of verification: the telephone survey resulted in a higher level of self-reported installation, 9% for showerheads and 16% for faucet aerators. The Evaluation Team used the 2008 onsite survey as the total measure adjustment because that survey relied on a more rigorous verification approach, visual inspections by a third-party verifier rather than self-reported results.
Table 72 also presents the verification results from the telephone and onsite inspections for the SDGE3017 low-flow showerhead and faucet aerator measures. The results from these two verification methodologies differ by as much as 37%. This difference is not unexpected because the population for telephone surveys was small and the survey was
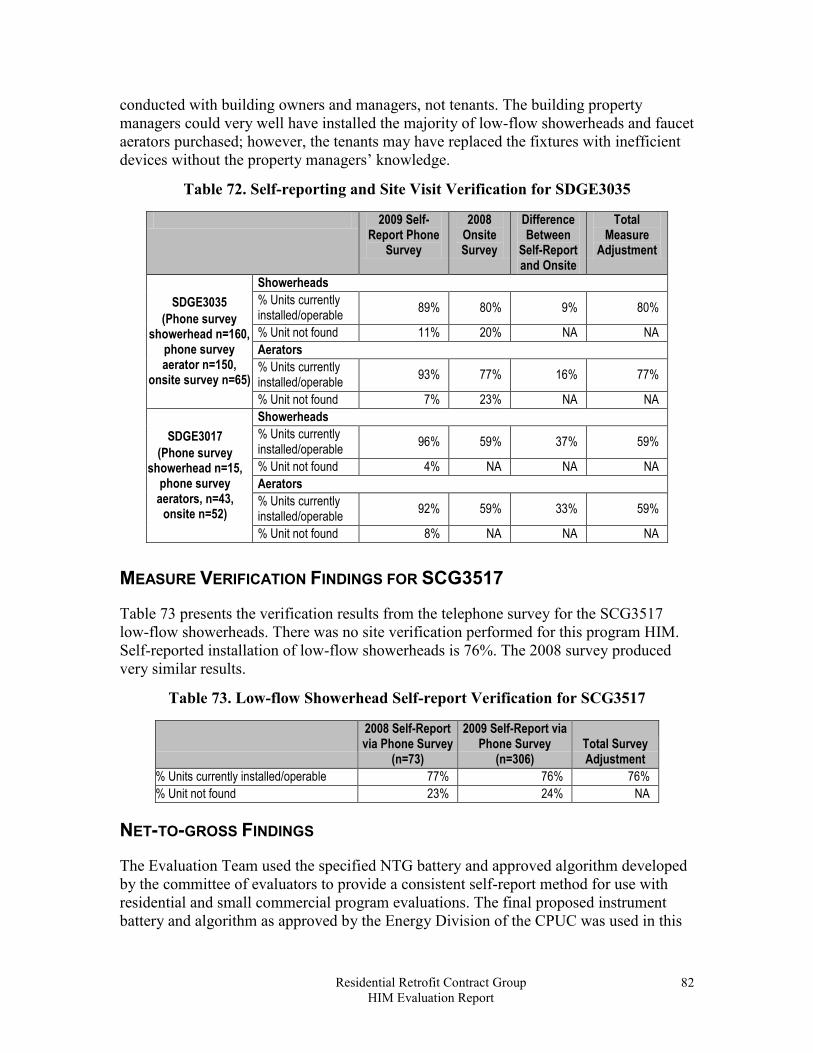
Residential Retrofit Contract Group HIM Evaluation Report
82
conducted with building owners and managers, not tenants. The building property managers could very well have installed the majority of low-flow showerheads and faucet aerators purchased; however, the tenants may have replaced the fixtures with inefficient devices without the property managers’ knowledge.
Table 72. Self-reporting and Site Visit Verification for SDGE3035
2009 Self-Report Phone
Survey
2008 Onsite Survey
Difference Between
Self-Report and Onsite
Total Measure
Adjustment
SDGE3035
(Phone survey showerhead n=160,
phone survey aerator n=150,
onsite survey n=65)
Showerheads
% Units currently installed/operable
89% 80% 9% 80%
% Unit not found 11% 20% NA NA
Aerators
% Units currently installed/operable
93% 77% 16% 77%
% Unit not found 7% 23% NA NA
SDGE3017
(Phone survey showerhead n=15,
phone survey aerators, n=43,
onsite n=52)
Showerheads
% Units currently installed/operable
96% 59% 37% 59%
% Unit not found 4% NA NA NA
Aerators
% Units currently installed/operable
92% 59% 33% 59%
% Unit not found 8% NA NA NA
MEASURE VERIFICATION FINDINGS FOR SCG3517
Table 73 presents the verification results from the telephone survey for the SCG3517 low-flow showerheads. There was no site verification performed for this program HIM. Self-reported installation of low-flow showerheads is 76%. The 2008 survey produced very similar results.
Table 73. Low-flow Showerhead Self-report Verification for SCG3517
2008 Self-Report via Phone Survey
(n=73)
2009 Self-Report via Phone Survey
(n=306) Total Survey Adjustment
% Units currently installed/operable 77% 76% 76%
% Unit not found 23% 24% NA
NET-TO-GROSS FINDINGS
The Evaluation Team used the specified NTG battery and approved algorithm developed by the committee of evaluators to provide a consistent self-report method for use with residential and small commercial program evaluations. The final proposed instrument battery and algorithm as approved by the Energy Division of the CPUC was used in this

Residential Retrofit Contract Group HIM Evaluation Report
83
evaluation. See Section 4 for a summary of the method and Appendices D and E for additional related information.
Results from the NTG analysis indicate varied levels of free-ridership by HIM and program, as shown in Table 74.
Table 74. Low-Flow Showerhead and Faucet Aerators NTG/ Free-ridership Findings69
Utility Program Measure % Free- riders
NTG (1-FR)
SDGE3035
(Manufactured Homes)
Showerhead
Total Weighted by Year 29.8% 0.72
Total Weighted by Therms
29.8% 0.72
Faucet Aerator
Total Weighted by Year 24.7% 0.75
Total Weighted by Therms
24.7% 0.75
SDGE3017
(Multi-family)
Showerhead
Total Weighted by Year 32.1% 0.68
Total Weighted by Therms
32.1% 0.68
Faucet Aerator
Total Weighted by Year 40.9% 0.59
Total Weighted by Therms
40.9% 0.59
SCG3517
(Single-Family)
Showerhead
Total Weighted by Year 30.3% 0.70
Total Weighted by Therms
30.3% 0.70
The NTG battery included questions for respondents who gave inconsistent responses regarding free-ridership. The Evaluation Team examined these consistency checks and found that many respondents either answered exactly the same (i.e., gave a rating of 10 for each battery of questions, regardless of the question) or dramatically altered their answers (i.e., answering 10 and then providing a rating of 1 for all answers) from the original set of free-ridership questions.
To deal with what appeared to be survey fatigue or respondents not paying attention to the question, the Evaluation Team removed these responses from the free-ridership sample. Only 6% to 11% of the responses were removed in order to provide a more reliable evaluation estimate. In general, the free-ridership estimate was slightly higher before removing these cases. (The effect of this action reduced the free-ridership rate from no effect to less than a three percentage point decrease). The final estimates
69 Note that the therm claimed savings values are consistent among all participants for each measure
(e.g., SCG3517 showerhead participant received the same claimed savings values, regardless of climate zone) thus the free-ridership and NTG estimates do not vary between the weighting approaches.

Residential Retrofit Contract Group HIM Evaluation Report
84
reported here are based on more reliable responses because these respondents were more consistent across their answers.70
SPILLOVER FINDINGS
The telephone surveys included a set of spillover questions that focused on whether the respondent purchased more water saving devices, the approximate quantity purchased, and the extent to which the program influenced the respondent’s decision to add these efficiency measures. Table 75, Table 76, and Table 77 provide the spillover results for each of the programs examined in this chapter.
Table 75. SDGE3035 Low-Flow Showerhead and Faucet Aerators Participant Spillover Findings
Category Totals
# of respondents reporting purchasing more water conservation measures 63
Percent of sample 23%
For those who purchased more, total increase 93
Average rating for program influence 6.9
Indicator of participant spillover savings rate (sample % (0.23) * # increase per those obtaining additional (93/63) * influence rate/10)
23% increase in savings
Table 76. SDGE3017 Low-Flow Showerhead and Faucet Aerators Participant Spillover Findings
Category Totals
# of respondents reporting purchasing more water conservation measures 22
Percent of sample 56%
For those who purchased more, total increase - Total 584
For those who purchased more,–increase in Showerheads 316
For those who purchased more, –increase in Aerators 268
Average rating for program influence 6.2
Indicator of participant spillover savings rate (sample % (0.56) * # increase per those obtaining additional (584/22) * influence rate/10)
921.7% increase in savings71
70 Further detail can be found in Appendix K. 71 The high level of this indicator would suggest that future program designs test how best to capture
these types of savings most cost-effectively. Future evaluations should then also be better aimed to increase the rigor within those evaluations.

Residential Retrofit Contract Group HIM Evaluation Report
85
Table 77. SCG3517 Low-Flow Showerhead and Faucet Aerators Participant Spillover Findings
Category Totals
# of respondents reporting purchasing more water conservation measures 80
Percent of sample 25%
For those who purchased more, how many more 108
Average rating for program influence 6.8
Indicator of participant spillover savings rate (sample % (0.25) * # increase per those obtaining additional (108/80) * influence rate/10)
23% increase in savings
SINGLE-FAMILY LOW-FLOW SHOWERHEAD USAGE PATTERN FINDINGS
Figure 3 through Figure 7 provide low-flow showerhead and faucet aerator usage patterns and installation locations as reported by SDGE3035, SDGE3017, and SCG3517 survey respondents.
Figure 3. Self-Reported Typical Low-Flow Showerhead Locations

Residential Retrofit Contract Group HIM Evaluation Report
86
Figure 4.Self-Reported Number of People Typically Using the Shower with the Low-Flow Showerhead
Figure 5.Self-Reported Number of Times the Shower with the Showerhead is Used Per Day

Residential Retrofit Contract Group HIM Evaluation Report
87
Figure 6. Self-Reported Typical Shower Length, in Minutes, Using Low-flow Showerhead
Figure 7. Self-Reported Installation Location of Low-flow Faucet Aerator
ENERGY SAVINGS FINDINGS
The Evaluation Team compared the E3 calculator unit saving estimates to the 2004–2005 DEER database unit savings, as shown in Table 78. At the time of writing the report, there were no 2008 DEER values for low-flow showerheads or faucet aerators.

Residential Retrofit Contract Group HIM Evaluation Report
88
Table 78. Per Unit Energy Saving Comparison by Utility and HIM
Utility Program Measure Climate Zone
E3 Calculator Saving Estimate
(Therm/ Unit)
2004-2005 DEER Saving
Estimates
(Therm/ Unit)
2008 DEER
SDGE3035
(Manufactured Homes)
Showerhead System 7.42 7.4 NA
Faucet Aerator System 5.65 5.6 NA
SDGE3017
(Multi-family)
Showerhead System 7.08 6.7 NA
Faucet Aerator System 5.31 5.0 NA
SCG3517
(Single-Family)1 Showerhead System 5.92 and 8.978 NA NA
There were slight differences between the energy savings per unit values being used and the values in the DEER database. These very small differences are likely due to rounding issues that occurred during the creation of each E3 calculator. The Evaluation Team could not verify the SCG3517 program unit savings value. SCG work papers cite a DEER Run ID: RSFM10AVWHShw. The Evaluation Team was not able to identify this Measure ID in the DEER database.72 Also, the SCG3517 E3 calculator contains two low-flow showerhead rows, each with a different gross unit annual gas savings value. The majority (27,191) of claimed low-flow showerhead units is calculated at 5.92 annual therms/unit value and only 13 are calculated at 8.978 therms/unit. It is unclear to the Evaluation Team why the SCG3517 program would report two different saving values for the same HIM.
9.6 Discussion of Findings and Recommendations for Low-flow Showerheads and Faucet Aerators
INVESTIGATING WATER UTILITY MEASURE OFFERING
Southern California water utilities were active in promoting low-flow showerheads and faucet aerators to their customers during the 2006 – 2008 period. Since water, electric, and gas utilities were promoting and installing the same equipment measure simultaneously, a question arises as to how to verify if the low-flow showerhead and faucet aerator installed is a device from either the SDG&E or SCG programs or the local water utility’s incentivized measure.
To answer this question the Evaluation Team identified 20 water utilities in the SCG and SDG&E service areas. The utilities were contacted to determine (1) whether they promoted low-flow showerheads and faucet aerators, (2) their target audience (i.e., multi-family, single-family, etc), (3) and the make and model of the devices they promoted.
72 The 2004–2005 Database for Energy Efficiency Resources (DEER) Update Study was used to compare
E3 calculator savings.

Residential Retrofit Contract Group HIM Evaluation Report
89
The results of this survey were then compared to the site inspections conducted for SDGE3035 and SDGE3017. There were no site visits conducted for single-family participants in the SCG3517 program, and program reports did not identify the make and model of the showerhead being promoted. Therefore, at this time no comparison was performed for the SCG3517 program.
Based on discussion with water utilities surveyed there does not appear to be an overlap in product. However, it is difficult to be certain since many water utilities were not able or willing to provide the specific make and model of the low-flow device. Many utilities only provided the manufacturer (i.e. Niagara Corporation) and not the model. One water utility did mention that SDG&E provided them with low-flow showerheads, which were apparently from a surplus from one of their programs, but this seemed to have occurred after the 2008 time period. Most water utilities actively promoted these devices and distributed them to their single and multi-family customers, indicating that there could have been possible overlap.
POSSIBLE FUTURE EVALUATION ACTIVITIES
Low-flow showerheads and faucet aerators qualified for the list of HIMs to evaluate, but represented a much lower percentage of program savings compared to other measures. Therefore, during the evaluation planning stage the Evaluation Team and CPUC staff decided to evaluate low-flow showerheads and faucet aerators, but to limit the focus to measure verification and NTG measurement. Pre-or post-usage measurement was not part of the evaluation plan for these HIMs.
Future savings estimates for the low-flow showerhead and faucet aerator measures should consider modeling the change in actual hot water usage. The change in hot water use (measured in gallons per day) is a critical parameter and modeling impacts would benefit from current pre- and post-measurement data.73 Future evaluation plans may include investigating the possibility of obtaining such data to further enhance specific measures’ energy savings; however, the logistics and cost may be prohibitive and may not be justified.
SUMMARY OF KEY EVALUATION PARAMETERS
Table 79 provides key parameters for SDGE3035, SDGE3017 and SCE3517 low-flow showerheads, while Table 80 provides key parameters for SDGE3035, SDGE3017 low-flow faucet aerators.
73 E-mail correspondence from Paul Reeves of the Partnership for Resource Conservation. September 16,
2009. A related issue often discussed in regard to these measures is the issue of snapback or takeback. The
evaluation researchable question is: Do customers take longer showers or longer faucet use given the lower flows? How much longer and what is the total net impacts including these factors?

Residential Retrofit Contract Group HIM Evaluation Report
90
Table 79. Summary of Key Evaluation Parameters for Low-flow Showerheads
Utility Program
Parameter IOU Claimed
Evaluated Difference
(A) (B) (A-B)
SDGE3035 NTG 0.89 0.72 0.17
% Installed/Eligible 100% 80% 20%
SDGE3017 NTG 0.89 0.68 0.21
% Installed/Eligible 100% 59% 41%
SCG3517 NTG 0.80 0.70 0.10
% Installed/Eligible 100% 76% 0.24
Table 80. Summary of Key Evaluation Parameters for Low-flow Faucet Aerators
Utility Program
Parameter IOU Claimed
Evaluated Difference
(A) (B) (A-B)
SDGE3035 NTG 0.89 0.75 0.14
% Installed/Eligible 100% 77% 0.23%
SDGE3017 NTG 0.89 0.59 0.30
% Installed/Eligible 100% 59% 41%

Residential Retrofit Contract Group HIM Evaluation Report
91
10. Insulation (PGE2000, SCG3517, SDGE3024)
10.1 Evaluation Objectives for Insulation This chapter includes the findings from the verification and evaluation efforts for insulation that was rebated through PGE2000, SCG3517 and SDGE3024. The HIMs are defined as those efficiency measures common across IOU programs that contribute greater than 1% to the entire IOU savings portfolio for reductions in electrical consumption, electrical demand, or natural gas consumption. Insulation exceeded the CPUC-assigned HIM threshold of 1% of utility savings in all three of these utility programs.
There were four primary objectives of the insulation evaluation effort:
Verification of installation rate for attic and wall insulation
Determination of measure impact on gas consumption
Determination of net-to-gross value
Pilot use of thermal imaging equipment for verifying presence of wall insulation
PROGRAM OVERVIEWS
SCG3517 Single-Family Energy Efficient Retrofit The SCG3517 Single-Family Energy Efficient Retrofit (SFEER) Program seeks to help residential customers reduce their natural gas usage by providing rebates to off-set the initial cost of replacing less-efficient gas-fired equipment with new energy efficient equipment. In addition, the program offers incentives for retrofit insulation and other weatherization measures. The program uses an array of tactics to influence key market actors, including rebates, energy education, and outreach. The program targets customers, retailers, manufacturers, distributors, and contractors.
SCG implements SFEER using internal staff and a single program approach, rather than separate local programs, to ensure consistency with other statewide offerings and to leverage portfolio dollars. A primary goal of the SCG SFEER is to reach single-family homeowners who had not previously installed energy efficient measures.
SDGE3024 Residential Incentive Program SDGE3024 Residential Incentive Program (RIP) provides the residential market with incentives to purchase high-efficiency appliances and home equipment. The program offers rebates for appliances such as pool pumps and motors, whole-house fans, storage water heaters, attic and wall insulation, and ENERGY STAR refrigerators, central natural gas furnaces, and Room ACs.
In addition to the traditional mail-in rebates, RIP uses a point-of-sale (POS) rebate for some measures. The retailer is reimbursed from the utility for the rebate, and the customer does not have to fill out a rebate application. Customers who purchase

Residential Retrofit Contract Group HIM Evaluation Report
92
qualifying products from a non-participating retailer still have the option of a mail-in or online rebate application.
This program coordinates efforts with SDG&E’s education and outreach programs to inform customers of energy efficient practices for the home. The program theory posits that increased education and financial incentives for the customer induces retailers to be more inclined to stock energy efficient products.
PGE2000 Mass Markets The PGE2000 Mass Markets Program targets single-family and multi-family residential retrofit and commercial customers, who often lack information, time, and resources to engage in energy efficiency projects. The program uses PG&E staff, third-party specialists, and local government partnerships to deliver a portfolio of energy efficiency, demand-response, and distributed-generation services. It includes statewide and specially targeted mass marketing efforts in PG&E’s service area.
DISCUSSION OF QUALIFYING INSULATION AND CLAIMED SAVINGS FINDINGS
All three of the utility programs provide an incentive of $0.15 per square foot for the installation of insulation. To qualify, attic insulation must meet these criteria:
The pre-retrofit insulation level was R-11 or less
All materials must be new
Insulation must be installed between conditioned living areas and unconditioned areas; garages or non-living areas do not count
Insulation must achieve a minimum of R-30 if there is 24 inches of space between the ceiling joists and the highest peak of the roof rafters. If this space is less than 24 inches, a minimum insulation level of R-19 must be installed.
To qualify, wall insulation must meet these criteria:
Only un-insulated walls may receive rebated insulation
All materials must be new
Insulation must be installed in walls that separate conditioned living areas from unconditioned areas; garages or non-living areas do not count
Insulation must achieve a minimum of R-13 The savings claims for insulation in each of the three utility programs are summarized in Table 81 below. All of the claims are based on DEER 2004–2005, although each IOU used the DEER database in a slightly different way. DEER 2004–2005 uses the 16 climate zones defined by the California Energy Commission74 (CEC) and building type (single-family, multi-family, etc.) to determine the expected Unit Energy Savings (UES) that will result from installation of insulation. Since the Insulation HIM comprises two
74 The CEC Climate zones can be found at www.energy.ca.gov/maps/CLIMATE_ZONES.PDF

Residential Retrofit Contract Group HIM Evaluation Report
93
types of insulation (attic and wall) and because program participants are located in nearly each of the 16 climate zones, the utility claims can include many line items based on the possible combinations.
The upper section of Table 81 shows the savings claim for PGE2000. Shown are the aggregated claims for attic and wall insulation in each year of the program. The data summarizes the 39 line items that make up the actual claim in the PGE2000 participant database and E3 calculator. From the totals calculated for each year, the effective UES claim for each line item has been calculated. Since the proportion of square footage claimed in each climate zone changed each year, these calculated values are slightly different each year.
The middle section of Table 81 shows the savings claim for SCG3517. This claim is also based on DEER 2004–2005, but it is considerably simpler than the PGE2000 claim. All of the SCG claims are based on the UES values for Climate Zone 10. There is only a single value in the database for wall insulation in this climate zone. The range of values for attic insulation is based on the age (vintage) of the building. The SCG claim assumes that 50% of buildings were constructed between 1978 and 1992 and 50% were built before 1978. With these assumptions, the UES values for SCG claims remained constant throughout the program period.
The lower section of Table 81 shows the savings claim for SDGE3024. This claim is also based on DEER 2004–2005, but uses a blend of DEER values that reflect the SDG&E service territory. Wall insulation uses a weighted UES based 70% on the coastal Climate Zone 7 and 30% on the inland Climate Zone 10. Attic insulation uses a blend of six distinct climate zone/vintage values, which is explained in the utility work paper as follows:
Based on Census 2000. Vintage weights are 60% pre 1978, 30% 1978–1992, 10% 1993–2000. Climate zone weights are: 70% zone 7 (San Diego – weather station) 30% zone 10 (Riverside – weather station)
The use of consistent assumptions is reflected in the UES values, which remained constant throughout the program period.

Residential Retrofit Contract Group HIM Evaluation Report
94
Table 81. Claimed Energy Savings for Insulation (2006-2008)75
Utility Program
Program Year
Measure Measures Installed (Sq. Feet)
Assumed NTG
Claimed Per Unit Therm
Savings (Therms/Square
Foot)
Total Claimed
Net Therm Savings
Total Claimed Net kWh Savings
Total Claimed Net kW Savings
Percent of
Claimed Gas
Savings
PGE2000
2006 Attic Insulation 4,891,551 0.80 0.02 85,052 176,584 515 0.13%
Wall Insulation 1,395,342 0.80 0.146 162,645 238,484 340 0.25%
2007 Attic Insulation 6,403,844 0.80 0.023 118,205 253,298 708 0.18%
Wall Insulation 1,727,563 0.80 0.148 204,866 301,910 444 0.31%
2008 Attic Insulation 7,045,058 0.80 0.030 168,451 383,511 1,030 0.25%
Wall Insulation 2,084,799 0.80 0.149 249,147 364,998 548 0.38%
Total Attic Insulation 18,340,453 0.80 0.025 371,708 813,393 2,252 0.56%
Wall Insulation 5,207,704 0.80 0.148 616,658 905,392 1,332 0.93%
Total PGE2000 23,548,157 0.80 0.052 988,366 1,718,785 3,585 1.49%
SCG3517
2006 Attic Insulation 2,909,184 0.89 0.031 81,124 422,167 258 0.12%
Wall Insulation 1,179,252 0.89 0.099 104,193 434,399 194 0.16%
2007 Attic Insulation 4,991,812 0.89 0.031 139,200 724,388 443 0.21%
Wall Insulation 2,062,323 0.89 0.099 182,217 759,694 340 0.27%
2008 Attic Insulation 5,022,757 0.89 0.031 140,063 728,879 446 0.21%
Wall Insulation 2,040,074 0.89 0.099 180,251 751,499 336 0.27%
Total Attic Insulation 12,923,753 0.89 0.031 360,387 1,875,434 1,148 0.54%
Wall Insulation 5,281,649 0.89 0.099 466,662 1,945,592 871 0.70%
Total SCG3517 18,205,402 0.89 0.051 827,048 3,821,027 2,019 1.24%
SDGE3024
2006 Attic Insulation 684,692 0.89 0.023 13,813 48,292 59 0.17%
Wall Insulation 238,848 0.89 0.084 17,814 41,368 33 0.22%
2007 Attic Insulation 1,193,577 0.89 0.023 24,079 84,184 102 0.30%
Wall Insulation 441,275 0.89 0.084 32,912 76,428 62 0.41%
2008 Attic Insulation 1,342,155 0.89 0.023 27,076 94,664 115 0.34%
Wall Insulation 361,202 0.89 0.084 26,940 62,560 51 0.34%
Total Attic Insulation 3,220,424 0.89 0.023 64,968 227,140 276 0.82%
Wall Insulation 1,041,325 0.89 0.084 77,667 180,357 146 0.98%
Total SDGE3024 4,261,749 0.89 0.038 142,635 407,497 422 1.79%
75 Total claimed savings per the IOU Q4 2008 Participant Tracking database. Note that the claimed kWh
and kW savings for each IOU are less than 1% and thus are not displayed here and are not investigated as part of this evaluation.

Residential Retrofit Contract Group HIM Evaluation Report
95
10.2 Methodology and specific methods used for Insulation HIM Evaluation
As noted above, insulation was identified as a HIM with therm savings of 1.2%–1.8% of total utility gas energy savings during the 2006–2008 program cycle. The following methods were used to accomplish the objectives for the evaluation, a summary of which appears in Table 82.
Verification of installation rate for attic and wall insulation. Telephone surveys of 1,797 randomly selected participants were conducted. During the surveys participating homeowners were recruited for onsite verification. Through these site inspections, the evaluation was able to determine installation rates and to confirm eligibility for insulation in each program.
Determination of measure impact on gas consumption. A billing analysis was performed using a basic statistical regression approach to model the differences in customers’ energy usage between pre- and post-installation periods using actual customer billing data. The models were specified using billing data, tracking data, and weather data. Each model included non-participants and participants. The use of non-participants in the billing analysis is meant to control for other background changes such as economic change. This statistical controlling for these other changes allowed this effort to meet the Enhanced rigor level.
Determination of net-to-gross value. The evaluation used the Joint Simple SR NTG Method. Use of this industry-accepted method helped to ensure uniformity in evaluation techniques across programs and contractors and provided for greater transparency and reliability.
Pilot use of thermal imaging equipment for verifying presence of wall insulation. The verification of closed wall insulation is largely based on interviews with the homeowner because most closed walled insulation is blown in and cannot be directly verified. To meet the challenge of verifying closed-wall insulation, the Team used thermal imaging cameras to provide additional insight into the quality and thoroughness of the wall insulation. These cameras allowed the Team to visibly identify a number of voids and gaps in the wall insulation of participants’ homes.
Table 82 provides an overview of the evaluation activities for insulation. The following bullets highlight how the evaluation approach to the insulation measure changed over the course of this evaluation.
In 2008, surveys and site visits were conducted for PGE2000 and SCG3517 to support required verification of the insulation measure.
In 2008, surveys were conducted for SDGE3024, which was consistent with the plan to conduct research in two waves although verification was not required for insulation in this program. These results have not been previously reported.
As noted above, in 2009 insulation was identified as a HIM in PGE2000, SCG3517, and SDGE3024. For this reason, participant surveys were conducted to support the HIM evaluation.

Residential Retrofit Contract Group HIM Evaluation Report
96
Table 82: Overview of Evaluation Activities for Insulation Activity Programs Sample
size Parameters
Participant Phone Survey SDGE3024, PGE2000, SCG3517 1,797 NTG, Installation rate Verification Site Visits SDGE3024, PGE2000 409 Installation rate
Thermal Imaging Camera Analysis SDGE3024, SCG3517, PGE2000 213 Installation rate
Billing Analysis SDGE3024, SCG3517 7,707 UES
TELEPHONE SURVEY METHODS
Table 83 below summarizes the telephone survey efforts that have been conducted as part of the verification and evaluation efforts.76 Telephone surveys were used to recruit participants for site visits and to conduct the self-report net-to-gross interviews.
An effort was made to match the number of survey respondents to the program participation by year. In these tables, measure installation (in square feet) has been used as a proxy for participation. The respondent mix most closely matches participation for PGE2000, but the number of surveys provides a solid basis for analysis in all cases. Even the smallest sample, 88 ―2008‖ respondents for SDGE3024, provides 90/10 confidence and precision for that set of survey results.
Table 83. Detailed Evaluation Activities for Insulation
Utility Program
Year of Participation
Survey 2008
Survey 2009
Survey Total
Survey Distribution
Total Measure Installation
(All Participants)
Percent of Measure
Installation
PGE2000
2006 86 18 104 21.3% 6,286,893 26.7%
2007 99 99 198 40.6% 8,131,407 34.5%
2008 186 186 38.1% 9,129,857 38.8%
Total 185 303 488 100.0% 23,548,157 100.0%
SCG3517
2006 138 47 185 23.7% 4,088,436 22.5%
2007 215 181 396 50.8% 7,054,135 38.7%
2008 198 198 25.4% 7,062,831 38.8%
Total 353 426 779 100.0% 18,205,402 100.0%
SDGE3024
2006 62 93 155 29.2% 923,540 21.7%
2007 107 180 287 54.2% 1,634,852 38.4%
2008 88 88 16.6% 1,703,357 40.0%
Total 169 361 530 100.0% 4,261,749 100.0%
MEASURE VERIFICATION METHODS
Verification was achieved through the site visits, which included direct physical inspection of the measure installation. Participants were asked to have documentation of the work available for the field technician to review. Paperwork, including contractor
76 See Appendix F for all data collection instruments for insulation.

Residential Retrofit Contract Group HIM Evaluation Report
97
work orders and receipts, was provided by the participants in a majority of site visits. The visual inspection was supplemented by the use of thermal imaging equipment.
It is important to note that verifying the installation of insulation differs from verifying the installation of other HIMs in a number of ways. First, the verification checks not only that the measure was installed, but that the eligibility criteria were met. Second, verification is far more challenging for insulation, particularly wall insulation which is in an enclosed cavity.
Finally, and most importantly, any deficiencies identified through the verification effort should be fully quantified by the billing analysis. For example, if the insulation was installed in a home that already had insulation exceeding the pre-program maximum or was installed between unconditioned spaces—two common reasons for participants to fail the program eligibility requirements—the billing analysis would quantify these impacts on the energy savings. In other words, for these two examples the billing analysis will identify lower than anticipated program savings, and will quantify these impacts in the realization rate and recommended UES value. Penalizing the program based on both the verification adjustment and the billing analysis adjustment would be adjusting program savings twice for the same deficiencies. The verification effort for insulation, therefore, is an important indicator of how well the program requirements are being met, but it is not used as a direct input to any savings adjustments.
NET-TO-GROSS METHODS
The CPUC assigned the Basic rigor level to the determination of a value for net program impact (or NTG). This evaluation, therefore, determined NTG through the Joint Simple Self-report NTG method that was administered during the telephone surveys.77
UNIT ENERGY SAVINGS METHODS
The Unit Energy Savings (UES) was estimated through the use of a billing analysis. For the attic and wall insulation measures in each utility program, the primary method for evaluating unit energy savings (therms) was a billing analysis using two ANCOVA (fixed-effects) models: Conditional Savings (CSA) and Statistically Adjusted Engineering (SAE). The general specification for each of these models is given below. The use of two models provided increased confidence as the results were compared to confirm that they were reasonably consistent.
The participant group consisted of a census of the utility customers who received the measure according to each utility’s participant database. Our approach was to separate the program participants into four quartiles based on their level of consumption. In our experience, this approach delivers a stronger analytical result.
77 See Appendix K for the standardized free-ridership battery and algorithm used for this assessment.

Residential Retrofit Contract Group HIM Evaluation Report
98
CSA Model This model has the following specification:
ADC it = i + β1AVGHDDit+β2 POSTt+ it
Where, for each customer i and calendar month t,
i is a unique intercept for each participant, derived by estimating the relationship using the ANCOVA (fixed-effects) procedure.
ADCit is the average daily therm consumption during the pre- and post-program periods.
AVGHDDit, is the average daily heating degree days (base 65) based on home location.
POSTt is a dummy variable that is 1 in the post-period and 0 otherwise.
β1 is the average daily therm consumption per heating degree day.
β2 is the average daily therm participant savings for the installed measures.
SAE Model This model has the following specification:
ADC it = i + β1AVGHDDit+ β2 EE t+ it
Where, for each customer i and calendar month t,
i is a unique intercept for each participant, derived by estimating the relationship using the ANCOVA procedure.
ADCit is the average daily therm or kWh consumption during the pre- and post-program periods.
AVGHDDit, is the average daily heating degree days (base 65) based on home location.
EEt is the average daily engineering estimate of savings in the post-period, and 0 otherwise.
β1 is the average daily therm or kWh consumption per heating degree day.
β2 is the average daily therm or kWh net participant realization rate. For example, a coefficient of -0.9 indicates a 90% realization rate.
The SAE model yields the realization rate directly from the coefficient of β2.

Residential Retrofit Contract Group HIM Evaluation Report
99
10.3 Confidence and Precision of Key Findings for Insulation
The insulation surveys exceeded the NTG sample size of 300 recommended in the California Evaluation Protocols. The sample size of 488 telephone surveys for PGE2000 insulation provided estimates of NTG at 90% confidence and 3.7% precision. For SCG3517 insulation, the telephone sample size of 779 provided estimates of NTG at 90% confidence and 3% precision, and for SDGE3024 insulation the telephone sample size of 530 provided estimates of NTG at 90% confidence and 3.6% precision.
As noted above, the verification estimates were used as an indicator of how well the program requirements were being met and were not used as a direct input for savings adjustments. Still, the onsite sample sizes of over 70 sites per utility (combined attic and wall) exceeded the minimum requirements of 90% confidence and 10% precision for the verification, as recommended by the California Evaluation Protocols.
Finally, the billing analyses were run on a full census of program participants, and thus were designed to achieve the highest level of confidence and precision possible for the UES estimate.78
10.4 Validity and Reliability of Insulation Evaluation Measurements
This evaluation effort seeks to meet the CPUC’s stated objective of obtaining reliable estimates of net energy savings realized for the insulation high-impact measure. Section 4 of this report provides an overview of how the Evaluation Team minimized the potential for error. The following section describes how the potential for error was minimized for insulation in particular. The reasonably accurate and precise estimates can be considered reliable because they minimize the potential for each of these types of error:
Verification of Insulation: The physical spaces—attics and closed walls into which these measures are installed—create the potential for error due to problems of access and visibility. For example, field staff could not open walls to inspect for wall insulation. This evaluation took the following steps to minimize these inspection errors:
Used attic access hatches/doors to a larger extent than in 2008 Used thermal imaging equipment to get some visibility into closed walls Increased measurement of pre-existing attic insulation In the team’s experience most trained surveyors can estimate these values based
on onsite inspections and customer interviews, but these estimates, of course, are not actual measured values.
78 An additional analysis was conducted to see if the savings differed between eligible sites and ineligible
sites (where pre-existing insulation exceeded program limits). The set of homes was limited to those for which complete data was available. This limited the analysis to 46 homes in the SDGE program and 43 homes in the SDGE program. The analysis was run for the group that included all homes--eligible and ineligible--and then for the eligible homes alone. Due to the very small sample sizes, however, the precision levels were in the 25%-35% range, and thus the results are not presented here.

Residential Retrofit Contract Group HIM Evaluation Report
100
Measured: The insulation evaluation included only direct measurement in the verification procedure. These measurements do not have a large impact on the overall evaluation, but are noted here for completeness.
o Technicians conducting insulation verification on site measured the depth of attic insulation using low-technology physical scales.
o Technicians using thermal imaging equipment estimated the area of any voids or exceptions. There is potential for error in this estimate.
Collected: An effort was made to minimize non-response bias for the site visit component by offering an incentive of $25 per inspected site.
Described (modeled): The insulation evaluation used a regression-based billing approach to estimate program savings. The Evaluation Team ran a number of diagnostics to ensure that all regression assumptions were met, investigating for heteroskedasticity, auto correction, and anomalous observations.
10.5 Detailed Findings for Insulation
MEASURE VERIFICATION FINDINGS
The results of site visits conducted to verify the installation and eligibility of the insulation HIM are presented in Table 84 below. The inspections covered over 400 installations of attic and wall insulation (although teams did not go to quite that many sites since both measures had been installed at some sites). These site inspections examined over 571,000 square feet of insulation claims. The total number of sites and area of installations is larger for SCG3517 and PGE2000 since site visits were conducted for these programs as part of both the verification effort in 2008 and the evaluation effort in 2009.
The site inspections found that insulation had been installed at every site and the area installed closely matched the area claimed. However, the field staff found a significant amount of insulation was installed in situations that were not eligible for the program rebate. The two most significant reasons wall insulation was found ineligible are that 1) walls had been previously insulated, and 2) walls were insulated between conditioned and conditioned living spaces or between non-conditioned and non-conditioned spaces. The most common reasons ceiling insulation was found to be ineligible are that 1) existing, pre-retrofit insulation levels were too high (greater than R-11) and 2) ceilings (or parts of ceilings) were insulated between non-conditioned and non-conditioned spaces such as in garages or entry-way overhangs.

Residential Retrofit Contract Group HIM Evaluation Report
101
Table 84. Insulation Site Visit Findings
Utility Program
Attic Wall Total
PGE2000
Number of sites 78 sites 48 sites 126 sites
N (square feet) 122,609 sq ft 48,195 sq ft 170,804 sq ft
Units currently installed / eligible 79,911 65.2% 44,186 91.7% 124,097 72.7%
Units not installed / ineligible 42,698 34.8% 4,009 8.3% 46,707 27.3%
SCG3517
Number of sites 125 sites 88 sites 213 sites
N (square feet) 187,235 sq ft 122,652 sq ft 309,887 sq ft
Units currently installed / eligible 155,782 83.2% 118,935 97.0% 274,717 88.7%
Units not installed / ineligible 31,453 16.8% 3,717 3.0% 35,170 11.3%
SDGE3024
Number of sites 52 sites 18 sites 70 sites
N (square feet) 75,363 sq ft 15,908 sq ft 91,271 sq ft
Units currently installed / eligible 58,915 78.2% 13,084 82.2% 71,999 78.9%
Units not installed / ineligible 16,448 21.8% 2,824 17.8% 19,272 21.1%
NET-TO-GROSS FINDINGS
The Evaluation Team used the Joint Simple Self-Report NTG method, administered during the telephone survey, to determine free-ridership. Results from this analysis, shown below in Table 85, indicate a very high level of free-ridership across all three programs, significantly greater than the ex ante assumptions for free-ridership of 20% for PGE2000 and 11% for both SCG3517 and SDGE3024.
Table 85. Insulation NTG/Free-rider Findings
Utility Program Participation Year % Free-riders (FR) NTG (1-FR)
PGE2000 2006 71.8% 0.28
2007 68.5% 0.32
2008 73.6% 0.26
Total Unweighted 71.2% 0.29
Total Weighted (kWh) 75.4% 0.25
Total Weighted (kW) 72.3% 0.28
Total Weighted (Therms) 74.3% 0.26
SCG3517 2006 65.0% 0.35
2007 68.7% 0.31
2008 64.5% 0.36
Total Unweighted 66.8% 0.33
Total Weighted (kWh) 70.4% 0.30
Total Weighted (kW) 70.5% 0.30
Total Weighted (Therms) 70.4% 0.30
SDGE3024 2006 68.6% 0.31
2007 75.0% 0.25
2008 75.0% 0.25
Total Unweighted 73.2% 0.27
Total Weighted (kWh) 74.2% 0.25
Total Weighted (kW) 73.7% 0.26
Total Weighted (Therms) 74.8% 0.25

Residential Retrofit Contract Group HIM Evaluation Report
102
SPILLOVER FINDINGS
The telephone surveys included a set of spillover questions that focused on whether the respondent purchased additional energy saving measures and the extent to which the program influenced the respondent’s decision.79 Table 86 provides the results of those questions.
Table 86. Insulation Spillover Findings
Utility Program
Category Respondents Reporting Spillover
PGE2000
# of respondents reporting purchase of additional energy-efficiency measures 53
Percent of sample 11%
Average rating for program influence (On a scale of 1-10 where 1 is no influence and 10 is complete influence)
3.9
SCG3517
# of respondents reporting purchase of additional energy-efficiency measures 85
Percent of sample 11%
Average rating for program influence
(On a scale of 1-10 where 1 is no influence and 10 is complete influence) 4.6
SDGE3024
# of respondents reporting purchase of additional energy-efficiency measures 87
Percent of sample 16%
Average rating for program influence
(On a scale of 1-10 where 1 is no influence and 10 is complete influence) 3.3
THERMAL IMAGING EQUIPMENT
As noted above, the verification effort was intended to indicate how well the program requirements were being met, not to quantify program savings. To aid in this effort, the Evaluation Team used thermal imaging equipment (Fluke Thermal Imager TiR1) to explore the potential for this technology to detect voids and gaps in insulation, as well as thickness and other details.
For the 2009 site visits, all field technicians were provided with thermal imaging cameras and trained on the use of this equipment. Field procedures and training included the following instructions:
Take a photo of the address to identify subsequent photos as corresponding to that site
Take a photo of the exterior of the house and note features (style, stories, brick/siding, etc.)
Measure the exterior dimensions of the house
Take photos of exterior walls
Identify exterior walls with fewest windows
79 See Appendix K for the standardized spillover battery.

Residential Retrofit Contract Group HIM Evaluation Report
103
Take photos to identify insulation voids, if present
Measure attic insulation depth with tool; take multiple photos of attic insulation
If attic insulation cannot be inspected, take photos of the ceiling on the lower level/floor
Determine whether the wall separating the garage and living space is insulated
Insulation technicians took 2,340 photos of attic and wall insulation at 210 participating households. The technicians uploaded their photos to Cadmus servers using an internal data tool. Five photo analysts reviewed the photos determine voids in attic and wall insulation. The photo analysts used Fluke Smart View software to analyze photos, adjust infrared levels, and generate reports for each site. The photo analysts also estimated total square footage of attic and wall insulation voids for each site. Upon completion, total estimated square feet of voids were calculated as a percentage of total verified square feet of insulation.
Wall Insulation Retrofitting insulation in walls can sometimes be hampered by plumbing or by electrical or other building systems in the walls, which can obstruct blown insulation from fully filling a previously un-insulated wall. To mitigate interference from outside light, technicians attempted to photograph walls with the fewest windows. The thermal imaging cameras can detect very subtle changes in temperature, therefore it was necessary to avoid direct sunlight, reflections, or heat generated by electrical appliances. The thermal imaging camera provided the best indication of voids in exterior walls in rooms with low levels of natural and artificial light. Insulation voids were typically identified by heat coming through the wall from outside (since the work was done in the generally warm months of August and September). Insulation voids ranged from small areas around windows to large areas covering the entire space between wall studs. Some walls were found to have thin insulation rather than definite voids. In these cases, care was taken to estimate the size of the actual void, rather than the size of thin insulation.
Attic Insulation Technicians performed visual inspections of attic insulation and photographed it. The photos indicated that, in general, attic insulation tends to be free of voids and evenly distributed. In some cases, photos of attic insulation could not be used due to lack of detail, poor lighting, or visual obstructions such as air ducts, joists, or beams. Thermal imaging showed a distinct difference in temperature between attic ceiling (roof) and attic floor insulation. In general, attic ceilings registered as warmer than attic insulation; indicating that outside heat was coming in through the roof. Clearly, the time of day and outside temperature had a significant impact on this observation. Attic insulation generally appeared cooler than the attic ceiling if the photo was taken during the day. Warmer insulation readings were typically obtained when photos were taken during cooler parts of the day such as late afternoon and evening.

Residential Retrofit Contract Group HIM Evaluation Report
104
When adequate attic insulation photos could not be obtained, some technicians took photos of the ceiling in the level below the attic. The results generally showed some thin areas in attic insulation; however, a few thermal images showed very large voids that might not have been identified using visual light photos. Attic entrances and crawl spaces were also photographed to determine whether insulation was present.
Image Analysis Total square footage of verified attic and wall insulation was 312,823. Technicians identified approximately 53 attic voids, which totaled approximately 155 square feet (Table 87). Thermal images of exterior walls revealed a greater number of voids and gaps in the insulation; the insulation technicians found 149 wall voids, totaling about 416 square feet.
These voids, however, represent less than 1% of the square footage for both attic (0.07%) and wall (0.46%) insulation. In general, there were very few voids in the insulation installed in participating homes.
Table 87. Summary of Thermal Imaging Findings
Type
Total Area Inspected (sq feet)
Number of Voids Identified
Area of voids (sq feet)
Void % of
Total Area
Attic Insulation 223,195 53 154.8 0.07%
Wall Insulation 89,628 149 415.9 0.46%
The following images from site visits demonstrate the capabilities of the Fluke thermal imaging cameras. The images have been adjusted to show both the actual image and the infrared areas. A brief synopsis follows each image.
Attic Insulation – Image 1
Image 1 shows attic insulation that is free of voids and evenly distributed. The light blue infrared area indicates that the temperature is less than the red/orange area on the attic wall. The red/orange area indicates that the outside temperature is most likely very warm and heat is coming through the roof.

Residential Retrofit Contract Group HIM Evaluation Report
105
Attic Insulation – Image 2
Image 2 also shows attic insulation that appears to be free of voids. The color contrast indicates there are temperature differences along the surface of the insulation. As in Image 1, the red/orange area is the attic roof, which is warmer than the insulation surface. In this image, the insulation appears to be functioning as intended.
Wall Insulation Void – Image 3
Image 3 shows a very clear void in wall insulation indicated by the red/orange/light green area. The faint vertical light green lines are wall studs and provide general guidance80 for estimating the size of wall voids. Since this image is of an exterior wall, the non-blue areas indicate that heat is entering the house from the outside.
80 Stud walls are usually spaced 16 inches on center. When wall studs were visible, it was relatively easy
to see whether entire or partial wall panels were missing insulation.

Residential Retrofit Contract Group HIM Evaluation Report
106
Wall Insulation Void – Image 4
Image 4 also shows a clear insulation void indicated by the heat coming through the wall (red/orange areas). In general, insulation voids in exterior walls were not definite; the insulation seemed to gradually thin out until it was no longer present. Image 4 indicates that insulation is thinner in the middle green area than in the dark blue areas.
Wall Insulation Void – Image 5
Image 5 shows a more stark contrast in color, which indicates there is no thinning of insulation as it approaches the void. Note that the wall studs are clearly visible here.
BILLING ANALYSIS
Billing records were analyzed as described in Section 10.2. Although the analysis plan included all three utility programs, the analysis for PGE2000 encountered two significant issues: the measure-tracking database was incomplete and the post-installation PG&E

Residential Retrofit Contract Group HIM Evaluation Report
107
billing data had significant gaps. We were able to work around the first problem, but the second prevented us from completing the analysis.
Detailed findings for the completed billing analyses are shown in Table 88 and Table 89.81 A summary of the projected realization rates, based on the regression findings, are presented in Table 90 below. For the measures in each program, a number of different results were obtained. The results of the analysis with no quartile separation are shown on the line labeled ―Overall Model,‖ and the results with distinct energy quartiles are also included on the lines labeled ―AVG Q‖ (for Average Quartile).
The CSA and SAE models were used, as planned. The CSA model was run at the measure level (―CSA Measure‖) and at a higher level with attic and wall insulation combined (―CSA Overall‖). The results were generally consistent, which gives us greater confidence in the accuracy of the results. From the various results, we selected the CSA Measure model and the average of the quartile-derived results to use as the realization rates for energy-savings calculations. The closer agreement between the overall model results for attic insulation and the average quartile was the primary factor that went into this decision.
The final recommended realization rates for SCG3517 from the CSA Measure model, with quartile separation, are 36% for wall insulation and 156% for attic insulation (Table 90). The 95% confidence intervals for the SCG calculated realization rates are 33% to 39% for wall insulation and 150% to 162% for attic insulation. The final recommended realization rates for SDGE3024 insulation are 43% for wall insulation and 166% for attic insulation. The 95% confidence intervals for the SDGE calculated realization rates are 34% to 52% for wall insulation and 150% to 182% for attic insulation.
The Evaluation Team also attempted to run a regression model based only on the homes that participated in the site visits. The purpose of this model was to examine the impact of the verification findings on the UES values; in other words, to determine the typical per home savings for participants that met the eligibility criteria and had the insulation installed. Due to the small sample sizes, however, the, measure level sample sizes could not be developed, only overall CSA results. The results are somewhat close to the results with all the participants, however the precision levels are in the 25-35% range, and thus the results are not presented here.
81 Full regression SAS output is presented in Appendix F. Appendix F also includes the regression output
from the 24 (12 per utility) quarterly regression model results, which provided nearly identical results to the overall (annual) models presented here.

Residential Retrofit Contract Group HIM Evaluation Report
108
Table 88. Regression Results for SCG3517 Insulation
Variable* Parameter Estimate
Std. Error t Value
Overall SAE Model (Adj. R-Squared=0.38)
Intercept 0.69 0.003 207.7
Avg HDD 0.16 0.001 310.9
exp_wall -0.27 0.015 -18.4
exp_attic -0.61 0.030 -20.1
Overall CSA Measure Model (Adj. R-Squared=0.39)
Intercept 0.75 0.003 220.5
Avg HDD 0.16 0.001 313.6
wall2 -0.11 0.005 -20.9
attic2 -0.20 0.004 -44.3
Overall CSA (pre/post) Model (Adj R-Squared=0.40)
Intercept 0.77 0.003 221.9
Avg HDD 0.16 0.001 314.9
post -0.27 0.004 -65.0
* All models are based on predicted daily energy use for 156,182 monthly observations. Variables represent the coefficients used in the regression analysis:
Avg HDD = Average heating degree days
exp_wall = Expected therm savings for wall insulation
exp_attic = Expected therm savings for attic insulation
wall2 = “Dummy” variable for post-program wall insulation
attic2 = “Dummy” variable for post-program attic installation
Post = “Dummy” variable for post-program insulation

Residential Retrofit Contract Group HIM Evaluation Report
109
Table 89. Regression Results for SDGE3024 Insulation
Variable* Parameter Estimate
Std. Error t Value
Overall SAE Model (Adj. R-Squared=0.38)
Intercept 0.46 0.006 74.3
Avg HDD 0.13 0.001 122.0
exp_wall -0.21 0.039 -5.4
exp_attic -0.55 0.083 -6.7
Overall CSA Measure Model (Adj. R-Squared=0.39)
Intercept 0.51 0.006 79.6
Avg HDD 0.13 0.001 122.5
wall2 -0.07 0.009 -8.0
attic2 -0.13 0.008 -17.0
Overall CSA (pre/post) Model (Adj R-Squared=0.39)
Intercept 0.52 0.007 79.6
Avg HDD 0.13 0.001 122.6
post -0.17 0.007 -22.8
*All models are based on predicted daily energy use for 24,927 monthly observations. Variables represent the coefficients used in the regression analysis:
Avg HDD = Average heating degree days
exp_wall = Expected therm savings for wall insulation
exp_attic = Expected therm savings for attic insulation
wall2 = “Dummy” variable for post-program wall insulation
attic2 = “Dummy” variable for post-program attic installation
Post = “Dummy” variable for post-program insulation
Table 90. Results of Billing Analysis for SCG3517 and SDGE3024
Model SCG3517 SDGE 3024
Realization Rate Realization Rate
SAE Wall Attic Wall Attic
Overall Model 27% 61% 21% 55%
AVG Q 29% 107% 30% 110%
CSA Measure Wall Attic Wall Attic
Overall Model 35% 151% 38% 161%
AVG Q 36% 156% 43% 166%
CSA OVERALL Overall Overall
Overall Model 103% 109%
AVG Q 103% 112%

Residential Retrofit Contract Group HIM Evaluation Report
110
10.6 Discussion of Findings and Recommendations for Insulation
DISCUSSION OF VERIFICATION FINDINGS
Site inspections found significant issues with participant claims. The primary issues were installation of attic insulation where pre-existing insulation exceeded the program limit of R-11 and the installation of wall insulation when insulation was already present or between two similarly conditioned or unconditioned spaces. We recommend that site inspections be conducted in the future to continue to check that installations are meeting program eligibility requirements.
THERMAL IMAGING EQUIPMENT
Thermal imaging equipment significantly improved an inspector’s ability to determine the presence of wall insulation. The equipment proved useful for allowing inspectors to see voids in the installed insulation. The fact that the voids found represented only a small portion of the total area inspected lets the Evaluation Team conclude with confidence that wall insulation reported to have been installed actually was present.
DISCUSSION OF ENERGY SAVINGS FINDINGS
UES values for each utility are shown in Table 91 below. As noted in the table, SCG3517 and SDGE3024 claimed savings values directly from DEER 2005 or combined DEER 2005 values as documented in the utility work papers. It is not clear what the source is for these values. The work papers from the utilities did not explain, or identify the sources of, the UES values. In the aggregate, the attic insulation for PGE2000 UES is similar to SCG3517 and SDGE3024, but the wall insulation UES is significantly higher.
Using realization rates from the billing analysis for SCG3517 and SDGE3024, the UES values for those programs are updated in the table below.

Residential Retrofit Contract Group HIM Evaluation Report
111
Table 91. Insulation Per Unit Energy Savings Claimed and Evaluated
Utility Program
Measure Climate Zone
Vintage82 Code
Utility Claim
Per Unit Therm
Savings
(A)
DEER 2005
Per Unit Therm
Savings
Evaluated Realization Rate from
CSA Model
Evaluated Per Unit Therm
Savings
(B)
Difference
(A-B)
SCG3517 Attic Insulation 10 3, 4 0.0313 0.0313 156.40% 0.0490 0.0177
Wall Insulation 10 3 0.0993 0.0993 36.28% 0.0360 (0.0633)
SDGE3024 Attic Insulation 7, 10 3, 4, 5 0.0227 0.0227 166.22% 0.0377 0.0150
Wall Insulation 7, 10 3 0.0838 0.0838 42.93% 0.0360 (0.0478)
SUMMARY OF KEY EVALUATION PARAMETERS
The key areas evaluated with regard to measure impact are the energy savings and NTG ratio. Energy savings have been presented and discussed above. NTG ratios are summarized in Table 92 below.
Table 92. Summary of Key Evaluation Parameters for Insulation
Program Parameter IOU Claimed
(A)
Evaluated
(B)
Difference
(A-B)
PGE2000 NTG Weighted (Therms) 0.80 0.26 0.54
SCG3517 NTG Weighted (Therms) 0.89 0.30 0.59
SDGE3024 NTG Weighted (Therms) 0.89 0.25 0.64
82 Vintage Code When Built 3 75 Built before 1978 4 85 Built between 1978 and 1992 5 96 Built between 1993 and 2001


Residential Retrofit Contract Group HIM Evaluation Report
113
11. Appliance Recycling: Refrigerators (PGE2000, SCE2500, SDGE3028)
11.1 Evaluation Objectives for Recycled Refrigerators The Appliance Recycling Program (ARP) is implemented by PG&E, SCE, and SDG&E. The program is designed to remove and recycle operable but inefficient refrigerators, freezers, and room air conditioners in order to prevent their continued use within the participant’s home or elsewhere within the utilities’ service territory, potentially under different environmental or usage conditions.
The HIMs are defined as those efficiency measures common across IOU programs that contribute greater than 1% to the entire IOU savings portfolio for reductions in electrical consumption, electrical demand, or natural gas consumption. Of the three appliances, only the recycling of refrigerators was identified as a high impact measure (HIM) by the California Public Utilities Commission (CPUC). As a result, the evaluation results below are limited to only the refrigerators recycled through each utility’s ARP.
The following tables detail ARP participation by utility and year, as well as the claimed ex ante energy savings and demand reductions associated with recycled appliances. In addition, the tables provide the percent of each utility’s overall residential portfolio gross energy savings generated by ARP.
Table 93: Recycled Refrigerator Claimed Savings
Program Year
Measures Recycled
Claimed Demand
Reduction (kW)
Claimed Energy Savings (kWh)
Claimed NTG
Total Claimed Net Demand Reduction
(kW)
Total Claimed Net Energy
Savings (kWh)
% of Total Gross
Portfolio Demand
Reduction
% of Total Gross
Portfolio Energy Savings
PGE200083 2006 19,210 5,763 37,382,660 0.35 2,017 13,083,931 4.0% 4.4%
2007 38,539 11,562 74,996,894 0.35 4,047 26,248,913 3.5% 3.5%
2008 38,785 11,636 75,475,610 0.35 4,072 26,416,464 2.3% 2.3%
Total 96,534 28,960 187,855,164 10,136 65,749,307 2.9% 3.0%
SCE250084 2006 57,786 17,336 95,693,616 0.614 10,644 58,755,880 12.1% 10.1%
2007 52,100 15,630 86,277,600 0.614 9,597 52,974,446 4.8% 4.2%
2008 77,283 23,185 127,980,648 0.614 14,236 78,580,118 5.7% 6.0%
Total 187,169 56,151 309,951,864 34,477 190,310,444 6.3% 6.1%
83 Measures Recycled Source: PGE2000 Q4 2008 Participant Tracking database Claimed Demand
Reduction (kW), Energy Savings (kWh), and NTG Source: PGE2000 2008 Q4 E3 Calculator 84 Measures Recycled Source: SCE2500 Q4 2008 Participant Tracking database
Claimed Demand Reduction (kW), Energy Savings (kWh), and NTG Source: SCE2500 2008 Q4 E3 Calculator

Residential Retrofit Contract Group HIM Evaluation Report
114
Program Year
Measures Recycled
Claimed Demand
Reduction (kW)
Claimed Energy Savings (kWh)
Claimed NTG
Total Claimed Net Demand Reduction
(kW)
Total Claimed Net Energy
Savings (kWh)
% of Total Gross
Portfolio Demand
Reduction
% of Total Gross
Portfolio Energy Savings
SDGE302885 2006 6,305 1,892 12,269,530 0.35 662 4,294,336 4.8% 6.1%
2007 13,857 4,157 26,965,722 0.35 1,455 9,438,003 5.3% 5.8%
2008 9,902 2,971 19,269,292 0.35 1,040 6,744,252 4.0% 4.5%
Total 30,064 9,019 58,504,544 3,157 20,476,590 4.7% 5.3%
The three primary objectives of the ARP evaluation were:
Determine the average annual gross energy savings generated when a participating refrigerator is recycled through each utility’s program.
Calculate the net-to-gross (NTG) ratio associated with each utility’s program.
Continue the investigation into the disparity in estimated energy savings determined using Department of Energy (DOE) testing and those determined through in situ metering.
PROGRAM OVERVIEW
The overarching goal of ARP is to prevent the continued operation of older, inefficient appliances by offering customers an incentive and free pick-up service for the old unit. In addition, ARP used mass media, bill inserts and earned media to disseminate information about the cost of operating older appliances and to encourage participation. ARP has been implemented statewide since 2002, prior to which it had been implemented exclusively by SCE beginning in 1994.
JACO Environmental (JACO) implemented ARP on behalf of PG&E, while The Appliance Recycling Centers of America, Inc. (ARCA) implemented the program within SDG&E’s service territory. The two firms shared implementation responsibilities for SCE.
In order to be eligible to participate in ARP, a refrigerator must be operable, larger than 10 cubic feet in volume, and operated by a residential utility customer. Though programs in the past have stipulated a minimum age requirement, no such requirement was in place for 2006 - 2008.
To stimulate participation, ARP offered incentives for all eligible measures. Incentives varied slightly by utility as presented in Table 94.
85 Measures Recycled Source: SDGE3028 Q4 2008 Participant Tracking database
Claimed Demand Reduction (kW), Energy Savings (kWh), and NTG Source: SDGE3028 2008 Q4 E3 Calculator

Residential Retrofit Contract Group HIM Evaluation Report
115
Table 94. Incentive Levels by Measure and Utility
Utility Refrigerator Freezer* Room Air Conditioner*
PGE $35 $35 $25
SCE $35** $50 $25
SDGE $35** $35** $25
*Not identified as a HIM. **Increased to $50 in 2008
In addition, ARP collaborates with other utility programs such as the Residential Energy Efficiency Incentive program and Multi-family Energy Efficiency Rebate program. These programs help encourage ARP participants to replace retired units with ENERGY STAR-qualified refrigerators, freezers, and room air conditioners.
The 2006–08 programs included two significant changes from prior programs:
Adding room air conditioners
Expanding eligibility to include small commercial businesses At the suggestion of the Program Advisory Group (PAG) and based on market saturation and potential for additional cost-effective, long-term, coincident peak demand reduction, and long-term, annual energy savings, ARP added room air conditioners to the existing set of appliances. The addition of room air conditioners complements the existing ARP portfolio and supplements the ENERGY STAR-qualified room air conditioner rebate offered through other utility programs. Implementation of room air conditioners follows the best practice model established through the Keep Cool Bounty program of New York State Energy Research and Development Authority (NYSERDA).
Also, as a number of office complexes and industrial buildings have standard, residential-size refrigerators and freezers, the PAG recommended expanding the 2006-2008 ARP. In response, the program now offers incentives to select nonresidential customers, including office complexes, industrial customers, schools, and municipalities.
Finally, it should be noted that appliance recycling programs are fundamentally different from most utility implemented demand-side management programs since savings are generated by providing incentives for the removal of an operable though inefficient measure, rather than rebating the installation of an efficient measure.
11.2 Methodology and Specific Methods Used to Evaluate Recycled Refrigerators
The ARP evaluation employed a dual metering study to determine the energy savings associated with appliances recycled during the 2006-2008 implementation cycle. Dual metering, in which a sample of eligible appliances was metered in situ (in its original place, i.e., within the participant’s home) and in a lab following the relevant United States Department of Energy (DOE) appliance testing procedure,86 exceeded the required level
86 10 CFR 430.23(A1), 2008 (a copy of which is available at: http://law.justia.com/us/cfr/title10/10-
3.0.1.4.16.2.9.3.html)

Residential Retrofit Contract Group HIM Evaluation Report
116
of evaluation rigor and aligned this evaluation with the metering approach undertaken in the previous statewide evaluation.87
By employing and subsequently comparing DOE testing and in situ metering methodologies, the evaluation sought to determine the most accurate and cost-effective approach for evaluating program savings. While an amalgamated approach in which in situ metering findings are used to calibrate DOE testing results to reflect participant environmental conditions is possible, it is expensive, greatly exceeds the evaluation methodologies deemed suitable for evaluating other HIMs, and unnecessary to reliably estimate program savings. As a result, this evaluation sought to independently assess energy savings using both DOE testing and in situ metering, analyze the differences between the two methods for the purpose of identifying the most appropriate evaluation approach for this and future evaluations. It should also be noted that ARP was one of the few evaluations to employ both field and laboratory testing; the majority of HIMs evaluated through the Residential Retrofit Evaluation relied either on field metering, billing analysis, or engineering estimates to determine energy savings.88
In addition to the dual metering effort, surveys89 were also conducted with ARP participants and non-participants (customers who discarded a refrigerator independent of ARP in 2006-2008) as well as interviews with new appliance retailers, used appliance retailers and appliance haulers across the state.
Table 95 provides an overview of the data collection efforts undertaken to support the evaluation, while Table 96 shows a more detailed account.
Table 95. Overview of Evaluation Activities for Recycled Refrigerators
Activity Programs Sample size Parameters Participant Phone Survey PGE2000, SCE2500, SDGE3028 1,857 UES, NTG, Installation rate
Non-participant Phone Survey PGE2000, SCE2500, SDGE3028 1,173 Net-to-Gross Ratio
In situ End Use Metering PGE2000, SCE2500, SDGE3028 166 UES, Relationship between DOE and In situ Metering
DOE Testing PGE2000, SCE2500, SDGE3028 137 UES, Relationship between DOE and In situ Metering
Retailer and Appliance Hauler Interviews
PGE2000, SCE2500, SDGE3028 81 Net-to-Gross Ratio, Program Impact on Availability of Used Appliances
MEASURE VERIFICATION METHODS 87 ADM Associates, Inc., Athens Research, Hiner & Partners, Innovologie LLC, “Evaluation Study of the
2004-05 Statewide Residential Appliance Recycling Program” April 2008. http://www.calmac.org/publications/EM&V_Study_for_2004-2005_Statewide_RARP_-_Final_Report.pdf
88 The Room AC evaluation plan originally called for lab metering to determine the difference in energy use between ENERGY STAR vs. standard efficiency units. This methodology was selected only after field metering – synomous with in situ metering - of new, standard efficiency room AC units was considered cost-prohibitive due to issues identifying and recruiting homes. Ultimately, energy savings were based on an engineering algorithm, not the limited number of lab tests conducted.
89 See Appendix G for all data collection instruments for appliance recycling.

Residential Retrofit Contract Group HIM Evaluation Report
117
To verify the accuracy of each utility’s participation claims, surveyed ARP participants were asked to validate program records regarding their recycled refrigerator. Using an identical instrument, two waves of participant surveys were conducted (April 2008 and May 2009). The surveys were conducted in waves in order to gather information throughout the program’s implementation cycle, as well as to support the study’s separate verification and evaluation reports. A copy of the ARP participant survey instrument can be found in Appendix G.
Table 96. Detailed Evaluation Activities for Refrigerator Recycling
Effort (Yr Conducted)
Year PGE SCE SDGE
Program Participation
Surveys Program Participation
Surveys Program Participation
Surveys
Verification (2008) 2006 37,480 113 57,786 110 6,821 76
2007 36,720 134 52,104 122 14,779 159
Evaluation (2009) 2008 43,155 465 77,283 341 18,910 337
Overall 2006-2008
117,355 712 187,173 573 40,510 572
ENERGY AND DEMAND IMPACTS METHODS
To determine the energy savings generated by ARP, a sample of participating refrigerators were metered both in situ and following the DOE testing procedure. The methodology for both approaches is provided below, as well as the historical context for conducting dual metering.
DOE Testing Methods As stated previously, the time-of-retirement DOE testing undertaken to support this evaluation was similar to that utilized by the 2002-2003 and 2004-2005 ARP evaluations. DOE testing was used in both evaluations to estimate program savings. For this evaluation, 137 refrigerators recycled through ARP were tested using DOE procedures at BR Laboratories Inc. in Huntington Beach, California. BR Laboratories also conducted DOE testing for the previous two evaluations, further ensuring consistency across evaluations.
Once testing was complete, a multiple regression model was used to determine the impact of individual appliance characteristics (e.g., age, size, configuration, etc.) on observed DOE-estimated annual unit energy consumption (UEC).
Once the model was developed, the resulting regression coefficients (e.g., 43 kWh per cubic foot in size) were used to estimate the UEC for the ―average‖ refrigerator recycled by each utility. Data for the calculation of the ―average‖ refrigerator recycled came from each utility’s program database.
To convert the UEC determined for each utility’s average participating refrigerator into an estimate of gross savings, an adjustment was made to account for participating refrigerators not operational year-round. Based on the participant survey, a part-use factor—which reflected the percent of the year the average participating refrigerator was operational—was calculated. The part-use factor was first used in the 2002-2003

Residential Retrofit Contract Group HIM Evaluation Report
118
evaluation, but as part of the net-to-gross adjustment. For this evaluation, the part-use factor was used to adjust gross, not net, savings.
In situ Metering Methods Before undergoing DOE testing, each of the 137 refrigerators was metered for 10 to 14 days within the participant’s home in situ. In fact, an additional twenty nine appliances that did not complete DOE testing for a variety of reasons were also metered in situ thereby increasing the total in situ metering sample to 166.90
As noted above, in situ metering built upon similar metering undertaken by the previous evaluation. In situ metering was introduced in the previous evaluations to explore the apparent disparity between estimating appliance consumption using the two methods. In situ metering – an approach regularly taken to evaluate non-ARP programs – was introduced as an alternative to DOE testing since it accounted for variation in environmental factors not permitted under the controlled DOE testing conditions (90° F test chamber, empty refrigerator and freezer cabinets, and no door openings).
The dual metering data collected for the 137 refrigerators built upon the data collected for 184 dual metered refrigerators during the 2004-2005 evaluation. Aggregation of the two datasets increased the evaluation’s ability to test the statistical significance of exogenous factors (i.e., climate zone, household size, etc.) on observed deviations in estimated annual consumption using DOE testing and in situ metering.
To facilitate metering, the evaluation enlisted utility customers enrolled in ARP whose appliances had not yet been picked up. To identify such customers, the Evaluation Team worked closely with each utility and its implementers, receiving daily lists of scheduled participants. Once an eligible participant was solicited, ARCA/JACO canceled the participant’s pick-up and scheduled an appointment to install the metering equipment instead.
Specifically, five meters were installed to measure energy consumption, as well as other usage and environmental factors that impact energy consumption. All meters were set to gather data in five minute intervals, consistent with previous studies and frequent enough to capture data on compressor cycling. In addition to collecting average AC current, meters also recorded internal refrigerator and freezer cabinet temperature, ambient temperature, and the frequency and duration of door openings.
While not all meters were used to directly assess energy consumption, many were used to diagnose potential problems encountered in the metering process thereby increasing the quality of data used in analysis. For example, freezer temperature was used to verify the accuracy of installation and removal times recorded on data collection forms. Also, observed ambient temperature was compared against observed refrigerator cabinet temperature to ensure that the refrigerator was operational throughout the metering period. Finally, the frequency of door openings were used to check the accuracy of the primary/secondary designation provided by the participant (i.e., if there were only five
90 Reasons refrigerators underwent in situ metering but not DOE testing include being inadvertently
recycled prematurely, damaged during transport to the testing facility, failure to adequate cool during DOE testing and participants opting to keep their appliance.

Residential Retrofit Contract Group HIM Evaluation Report
119
door opening within a two week period, the appliance was clearly not being used as the primary refrigerator).
A summary of the metering equipment used is provided in Table 97.
Table 97. Metering Equipment Overview
Metering Equipment Data Location
HOBO UA-002 Temperature Gauge Refrigerator Temperature Wall of Refrigerator Cabinet (Interior)
HOBO UA-002 Temperature Gauge Freezer Temperature Wall of Freezer Cabinet (Interior)
HOBO U9-002 Light Sensor Frequency/Duration Door Openings Roof of Refrigerator Cabinet (Interior)
HOBO U12-012 External Data Logger Ambient Temperature/Humidity Side of Appliance (Exterior)
HOBO TMC6-HD Temperature Meter Cord External Refrigerator Temperature Lower Backside of Appliance* (Exterior)
Watts up? Pro ES Power Meter Energy Consumption Top of Appliance (Exterior)
*Connects to the U12-012 External Data Logger located on side of appliance
For cost-effectiveness reasons, ARCA/JACO performed the physical installation and removal of metering equipment. However, while ARCA/JACO installed and removed the meters, all sampling design and selection, recruitment, metering equipment programming, data extraction, and data analysis was conducted by the Evaluation Team. To ensure the installations and removals were performed properly, evaluation engineers provided multiple onsite trainings with all ARCA/JACO staff supporting the evaluation. The trainings, as well as all subsequent installations and removals, were guided by metering protocol developed by the Evaluation Team and approved by the CPUC.
To further ensure high quality, unbiased data were collected, evaluation engineering staff accompanied each ARCA/JACO staff member installing and removing meters during their first five appointments. During these appointments, the evaluation staff verified meters were being installed and removed correctly and the metering protocol was being followed. CPUC representatives and contractors also accompanied evaluation and ARCA/JACO staff on several of the visits to ensure adherence to quality-control procedures.
The following information was collected using the data collection instrument referenced in Appendix G for each metered refrigerator:
Participant characteristics (name, address, phone, ATO91, utility, etc.)
Meter installation date and time
Meter removal date and time
Appliance configuration
Estimated appliance age
Estimated internal capacity (cubic feet)
Frost-free/manual defrost
Through door features
91 Appliance Turn-In Order: Used by implementers to track eligible appliances

Residential Retrofit Contract Group HIM Evaluation Report
120
Use status: primary/secondary
Location: conditioned/unconditioned space
Manufacturer
Full load AMP After 10 to 14 days of data collection, the meters were removed and the appliance transported to BR Laboratories Inc. for DOE testing. In return for delaying their participation in ARP and allowing meters to be installed, metering study participant were given a $50 incentive.92 Figure 8 provides a process flow diagram detailing the metering process described above.
92 The incentive was increased to $100 near the end of the metering study to encourage greater participation.

Residential Retrofit Contract Group HIM Evaluation Report
121
Figure 8. In situ Metering Process Flow

Residential Retrofit Contract Group HIM Evaluation Report
122
Sample Design Methods The metering sample was designed to represent the distribution of refrigerators participating in the 2006-2008 ARP, as well as complement the sample metered as part of the previous evaluation. Specifically, the following strata – also employed as part of the 2004-2005 evaluation – were used:
1. Configuration/Defrost Group: Information about the distribution of participating configurations (Top Freezer, Side-by-Side, etc.) and defrost type (Manual or Automatic/Frost-Free) was obtained from each utility’s program database. Since many combinations of configuration and defrost types exist, refrigerators were placed into one of three groups to enable stratification and sampling. As evident in Table 98, the majority of the eligible appliances were either Top Freezer, Frost-Free (Group A) or Side-by-Side, Frost-Free (Group B). The less common configurations and defrost types were bundled into Group C in order to ensure the full range of appliances were included in the sampling frame.
Table 98. Percent of 2006-2008 Program Participation by Metering Strata93
Configuration/Defrost Group
Configuration/Defrost
Detail
PGE* SCE SDGE
A Top Freezer, Frost-Free 61.8% 61.7% 62.0%
A Single Door, Frost-Free 1.4% 1.4% 1.5%
B Side-by-Side, Frost-Free 30.6% 30.7% 30.1%
B Bottom Freezer, Frost-Free 2.5% 2.5% 2.4%
C Top Freezer, Partial Frost-Free 0.3% 0.3% 0.3%
C Top Freezer, Manual Defrost 1.6% 1.6% 1.4%
C Side-by-Side, Partial Frost-Free 0.0% 0.0% 0.0%
C Side-by-Side, Manual Defrost 0.3% 0.3% 0.2%
C Bottom Freezer, Partial Frost-Free 0.0% 0.0% 0.0%
C Bottom Freezer, Manual Defrost 0.1% 0.1% 0.1%
C Single Door, Partial Frost-Free 0.0% 0.0% 0.0%
C Single Door, Manual Defrost 1.5% 1.3% 1.9%
*Due to lack of data, PG&E proportions calculated as a weighted average of the other two utilities. Again, see Table 66 for more details regarding missing utility data.
2. Use Scenario: Due to previous research indicating that energy consumption is impacted by usage (primary v. secondary) and location (conditioned v. unconditioned space); use scenario was also used as a stratum. It should be noted that these two characteristics are extremely correlated and used interchangeably throughout the report. These characteristics dictate how often an appliance may be used (less frequently for secondary units), to what extent it might be filled, and the range of ambient temperatures it may be subjected to. The distributions of appliance usage were determined through the participant surveys as this information is not currently tracked by program implementers.
93 Percentages are for those appliances for which configuration and defrost were recorded. . . . It is
assumed data attrition is random and thus these proportions should be reflective of the population. See Table 113 for more details regarding missing utility data.

Residential Retrofit Contract Group HIM Evaluation Report
123
Table 99. Primary/Secondary Distributions by Utility Utility Primary Secondary
PGE 62% 38%
SCE 69% 31%
SDGE 62% 38%
3. Utility/Climate Region: To account for the range of weather conditions throughout the state, the stratification also included utility/climate zone. The specific climate zones represented by the ZIP codes sampled are listed in Table 100.
Table 100. Weather in Sampled Zip Codes
Utility ZipCode3 Climate Zone(s)
SCE-1 902 6, 8, 9
SCE-1 906 8, 9
SCE-1 907 6, 8
SCE-1 908 6
SCE-2 917 9, 10, 16
SCE-3 926 6, 8
SCE-3 927 6, 8
SCE-3 928 8, 10
SCE-3 930 6, 9
PGE 945 2, 3, 10, 12
PGE 946 3
PGE 947 3
PGE 948 3
SDGE 920 7, 10
SDGE 921 7
The metering sample developed at the outset of the study is presented in Table 101. As noted previously, the sampling plan employed was based primarily on the distribution of eligible appliances in the 2006-2008 ARP but also adjusted to account for its eventual aggregation with similar 2004-2005 metering data. Specifically, the plan oversampled less common refrigerators’ configurations (Group C) and refrigerators in more extreme climate zones. By collecting more data for these strata, the evaluation was able to complement data collected as part of the 2004-2005 study and better assess the impact these factors have on the observed disparity between DOE testing and in situ metering.
Table 101. Proposed Dual Metering (DOE and In situ) Sample
Stratum PGE SCE-1 SCE-2 SCE-3 SDGE Adjusted Statewide
Unadjusted Statewide*
A-P 14 14 11 19 12 70 82
A-S 6 5 5 9 5 30 45
B-P 10 11 8 14 9 51 43
B-S 5 4 3 5 3 19 24
C-P 2 4 3 4 2 15 5
C-S 2 2 2 4 4 15 3
Total 39 40 32 55 35 201 201
*Sample points allocated exclusively based on 2006-2008 participation.

Residential Retrofit Contract Group HIM Evaluation Report
124
However, due to difficulty recruiting sufficient participants for the metering study, the final metering sample fell short of its goal. In particular, the evaluation was unable to solicit as many primary appliances as targeted. This was due to participants’ unwillingness to postpone delivery of their replacement appliances in order to allow sufficient time for metering. There were also issues related to the timeliness of participation data provided by the utilities or its implementers. In addition, a significant number of metering study participants canceled after initially agreeing to participate. As noted above, this problem was particularly prevalent for primary appliances.
To overcome these difficulties, the evaluation requested the utilities ask their implementers to mention the metering study to the customers when they enrolled in ARP. Only one of the utilities, SDG&E, eventually did so and as a result, metering study participation within SDG&E’s territory greatly exceeded its goals. In addition, the evaluation publicized the in situ metering study using fliers at appliance retailers. These efforts were generally ineffective and did not influence program participation as planned.
The final DOE metering sample is provided in Table 102, while the final in situ metering sample is presented in Table 103. Although the samples are based on the same set of appliances (i.e., the same participating refrigerator was metered in situ and then tested under DOE protocols), the final samples sizes for each approach differ because, as noted above, twenty nine refrigerators metered in situ did not also undergo DOE testing. In other words, the final DOE sample of 137 refrigerators is a subset of the 166 refrigerators metered in situ. As evident in the tables, the evaluation oversampled within PG&E and SDG&E’s service territory to offset participant shortfalls within SCE. While the utility/climate zone was one of three stratifications, subsequent analyses showed weather had the lowest impact of the three stratifications on energy consumption. As a result, the oversampling of PG&E and SDG&E and under sampling of SCE did not significantly impact the overall analysis.
Table 102. Final DOE Testing Sample – 2006-2008
Stratum PGE SCE-1 SCE-2 SCE-3 SDGE Statewide
A-P 11 6 1 2 20 40
A-S 16 3 4 7 8 38
B-P 3 2 5 1 14 25
B-S 9 7 2 1 4 23
C-P 0 1 0 2 0 3
C-S 1 1 3 2 1 8
Total 40 20 15 15 47 137

Residential Retrofit Contract Group HIM Evaluation Report
125
Table 103. Final In situ Metering Sample – 2006-2008
Stratum PGE SCE-1 SCE-2 SCE-3 SDGE Statewide
A-P 13 8 2 3 23 49
A-S 17 4 4 9 11 45
B-P 5 5 5 2 15 32
B-S 10 8 2 1 6 27
C-P 0 1 0 3 0 4
C-S 1 1 3 2 2 9
Total 46 27 16 20 57 166
As noted previously, the dual metering sample developed for this evaluation was intended to complement the 2004-2005 evaluation and facilitate aggregation with data collected for the 184 refrigerators dually metered as part of that effort. By combining datasets, this evaluation was able to based its findings on a significantly larger sample and generate more reliable and statistically significant results.
All results presented in this report rely on the aggregated 2004-2008 evaluation sample presented in Table 104. It should be noted that the dual metering sample is identical to the DOE testing sample because all DOE tested refrigerators were also metered in situ, but not all in situ metered refrigerators underwent DOE testing.
Table 104. Final Aggregated Metering Samples – 2004-2008
Stratum 2004-2005 Evaluation Sample
2006-2008 Evaluation Sample
2004-2008 Aggregated Evaluation Sample
DOE testing 184 137 321
In situ Metering 184 166 350
Dual Metering (DOE and In situ ) 184 137 321
Demand Calculation Methods Peak impact is a measure of average demand reduction from 2pm to 5pm during three consecutive weekday periods containing the weekday with the hottest temperature of the year for each climate zone.94 This evaluation applies the DEER 2008 definition for the warmest weekday stretch. Since no refrigerator metering took place during the defined peak demand period, this evaluation quantifies the relationship between outdoor temperature and refrigerator demand such that the peak demand reduction can be extrapolated for the range of temperatures established in the DEER 2008 definition.
NET-TO-GROSS METHODS
To determine the net-to-gross ratio for each utility, a methodology similar to that employed in the 2004-2005 statewide ARP evaluation was undertaken. The methodology utilizes surveys with participants, non-participants and market actors to calculate program savings ―net of free-riders‖ (i.e., no program savings are accrued if refrigerator would
94 Per R.06-06-063 ALJ/MEG which can be found at
http://docs.cpuc.ca.gov/published/FINAL_DECISION/77638.htm

Residential Retrofit Contract Group HIM Evaluation Report
126
have been destroyed in the absence of program or remained unused in participating home).
Independent of program intervention, participating refrigerators would have been subject to four potential scenarios:
The refrigerator would have been kept by the participating household and still used
The refrigerator would have been kept by the participating household but stored unused
The refrigerator would have been discarded by the participating household in a manner leading to its continued operation elsewhere
The refrigerator would have been discarded by the participating household in a manner leading to its eventual destruction.
Of these scenarios, two – refrigerators kept but stored unused and those discarded in a manner leading to destruction – are indicative of free-ridership since the refrigerators would not have continued to consume energy independent of program participation. An example, using responses provided by SDG&E program participants recycling primary refrigerators, is illustrated in Figure 9.
Figure 9. Net-to-Gross Methodology
As noted above, the percent of eligible appliances in each of these two scenarios was estimated primarily by using the results of the participant survey (see Table 96) and a survey with non-participants. Non-participants, defined as utility customers who discarded a refrigerator in 2006, 2007 or 2008 independent of ARP, were identified and

Residential Retrofit Contract Group HIM Evaluation Report
127
surveyed as part of a separate statewide non-participant survey designed to inform multiple HIM evaluations (appliance recycling, clothes washers, and furnaces).
To inform the net-to-gross calculation, respondents were asked what would have happened to the participating refrigerator had it not been removed by the program. Each response, such as ―sold it to a used appliance dealer‖ or ―hauled to a recycling center myself‖ was associated with one of the four scenario categories after a series of follow-up questions (i.e., ―Why did you not follow through with this transaction?‖ and ―Do you have the ability to physically move and transport the appliance yourself?‖, respectively) validated the response. Once validated and associated with one of the four potential scenarios, the individual response was determined as either indicative or not indicative of free-ridership. Using this information, a participant-based net-to-gross value was calculated.
The stated intentions of participants regarding their hypothetical action in absence of ARP accounts for half of the net-to-gross calculation, with information obtained from non-participants regarding how they actually discarded a refrigerator independent of ARP comprising the other half. Non-participant responses, when asked how they discarded the refrigerator, were categorized in a similar manner to participants and identified as indicative or not indicative of free-ridership based on whether the appliance remained operational or destroyed. Again similar to participants, a non-participant-based net-to-gross ratio was calculated.
Details regarding the sample of non-participants surveyed to inform this evaluation are provided in Table 105.
Table 105. Non-participant Survey Sample Sizes
Year Conducted PGE SCE SDGE Statewide
2008 505 248 420 1,173
Following the methodology established in the previous statewide ARP evaluation, the programs overall net-to-gross ratio was calculated as a weighted average of the determined participant and non-participant net-to-gross ratios. Since the true population of non-participants is unknown, values were weighted using the inverse of the variance of each ratio. This method of weighting gives greater weight to those values which are less variable or more precise.
It should be noted that some of the hypothetical or actual methods for discarding a refrigerator cited by participants and non-participants required additional research in order to determine if the method was indicative of free-ridership. For example, one response provided by both responding participants and non-participants alike was ―Would have had/Had it removed by the dealer I got my new or replacement appliance from.‖ In order to determine whether refrigerators discarded in this manner remained operational (therefore not free-riders) or were destroyed (free-riders), interviews were conducted with three groups of market actors: new appliance retailers, used appliance retailers and appliance haulers.
To ensure information gathered from the interviewed market actors aligned geographically with ARP activity, the sample of responding retailers and haulers was

Residential Retrofit Contract Group HIM Evaluation Report
128
based on the initial ARP participation IOU stratification estimate for 2006-2008. Details are provided in Table 106.
Table 106. Market Actor Interviews for Refrigerator Recycling
Respondent PG&E (34% of Statewide ARP
Participation)
SCE (54% of Statewide ARP
Participation)
SDG&E (12% of Statewide ARP
Participation)
Large Appliance Retailers 17 4 1
Used Appliance Retailers 18 7 5
Appliance Haulers 18 9 3
Overall 53 20 9
In addition to informing the net-to-gross ratio, interviews with retailers and haulers also provided insight into the impact of ARP on the market for used appliances within the state. Specifically, the interviews sought to determine whether ARP decreased the total number of used appliances available within California or if used appliances were imported from other regions in order to meet the demand for less expensive, used appliances.
11.3 Confidence and Precision of Key Findings for Recycled Refrigerators
Since refrigerators recycled through ARP were identified by the CPUC as a high-impact program/measure combination, all telephone survey samples for verification and evaluation were developed to exceed the required 10% precision at 90% confidence levels (Table 96) statewide. Assuming a 90% confidence level, relative precision varies for each key calculation (i.e., part-use and net-to-gross) and utility based on its final achieved sample size. The achieved relative precision and confidence levels for survey results at the utility, as well as statewide, level are provided in Table 107.
Table 107. Precision and Confidence – Survey Findings
Utility Part-Use Net-to-Gross Other Participant Survey Results
PGE 90% ± 2% 90% ± 5% 90% ± 4%
SCE 90% ± 2% 90% ± 7% 90% ± 4%
SDGE 90% ± 3% 90% ± 6% 90% ± 4%
The relative precision and confidence associated with the UECs determined using both DOE testing and in situ metering are shown in Table 108. Relative precision estimates were generated based on standard errors specific to each utility and year as modeled in Table 112 and Table 118. For all modeled UECs, estimates were found to be within 10% relative precision at the 90% confidence interval.

Residential Retrofit Contract Group HIM Evaluation Report
129
Table 108. Confidence and Precision – UEC’s
2006 DOE In situ
PGE 90% ± 7% 90% ± 7%
SCE 90% ± 6% 90% ± 8%
SDGE 90% ± 7% 90% ± 8%
2007
PGE 90% ± 7% 90% ±7%
SCE 90% ± 7% 90% ± 8%
SDGE 90% ± 7% 90% ± 9%
2008
PGE 90% ± 7% 90% ± 7%
SCE 90% ± 7% 90% ± 8%
SDGE 90% ± 6% 90% ± 8%
The relative precision and confidence for the annual gross and net energy savings of sampled refrigerators are shown in Table 109. These estimates encapsulate both the ratios calculated from survey results, but also modeled UEC’s. As can be seen in the table, the combined precision is within at most 11% of the estimates shown.
Table 109. Confidence and Precision – Energy Savings95
2006 Gross Net
PGE 90% ± 8% 90% ± 9%
SCE 90% ± 8% 90% ± 10%
SDGE 90% ± 9% 90% ± 10%
2007
PGE 90% ± 8% 90% ± 9%
SCE 90% ± 8% 90% ± 11%
SDGE 90% ± 9% 90% ± 11%
2008
PGE 90% ± 8% 90% ± 9%
SCE 90% ± 8% 90% ± 11%
SDGE 90% ± 8% 90% ± 10%
11.4 Validity and Reliability for Evaluation Estimates for Recycled Refrigerators
Accounting for threats to validity, reliability assessment and bias testing were part of our standard approach to ARP participant and non-participant survey administration. For example, one distinct group of evaluators was responsible for implementing all surveys, drawing all survey samples, pre-testing all instruments, and training survey staff. This
95 Being the product of estimated proportions (part-use, NTG) and modeled UECS, the standard errors
used to find relative precision for savings estimates are the square root of the sum of squared standard errors divided by their respective means.

Residential Retrofit Contract Group HIM Evaluation Report
130
ensured consistency, minimal interviewer bias, and equivalence of questions across programs. To ensure consistency with previous ARP evaluations, a participant and non-participant survey instrument similar to that used in the 2004-2005 evaluation was implemented.
This evaluation effort seeks to meet the CPUC’s stated objective of obtaining reliable estimates of net coincident peak demand reduction and annual energy savings generated by the designed high-impact program measure groups. Section 4 of this report provides an overview of how the Evaluation Team minimized the potential for error. The following section describes how the potential for error was minimized for recycled refrigerators in particular. Reasonably accurate and precise estimates can be considered reliable because they minimize the potential for error:
Measured: Several procedures were put in place to ensure accurate energy consumption data was collected during the in situ metering period. Installers were trained and accompanied on site visits during the onset of the study by evaluation staff. Installers that had not undergone training and supervised installations were not allowed to install or remove equipment. To assure the data collected were accurate, any instrumentation that presented unusual results was removed from circulation immediately so as to minimize equipment-related data loss. There is no indication that any instrument failure not caught by safeguards would bias estimates in a particular dimension and can therefore be considered random. Repeated consistency checks were made at each step of the data collection process to ensure reliability of recruitment, implementation, and instrumentation.
Collected: Investments that increase the response rate, such as incentives and multiple contact attempts, were used to minimize non-response and selectivity bias errors. To mitigate self-selection bias the study developed and implemented a sample design that stratified by appliance usage (primary v. secondary), appliance configuration (e.g., Top Freezer) and utility service territory. Another potential source of bias when collecting data in situ is the Hawthorne Effect. The Hawthorne Effect refers to study participants altering their typical behavior – in this case the use of their refrigerator – because they are being observed. However, since refrigerators are baseload measures (i.e., plugged in and operational through the observation period) and not manually regulated by participants in the same manner as a room air conditioner or CFL, the potential impact of the Hawthorne Effect is significantly diminished. To ensure all metered appliances were operational throughout the metering period, the evaluation analyzed the observed ratio of internal to ambient temperature. Any appliances exhibiting large fluctuations or with periods of time when the internal temperature approached ambient temperature were removed from the analysis sample.
Random Error: The sample for the refrigerator evaluation exceeded the minimum requirement of 90% confidence and 10% precision and thus has attempted to minimize any potential random error associated with sampling.

Residential Retrofit Contract Group HIM Evaluation Report
131
11.5 Detailed Findings for Recycled Refrigerators
MEASURE VERIFICATION FINDINGS
To verify the removal of specific refrigerators detailed in each utility’s program database, the evaluation surveyed participants and asked each respondent to verify their participation. As evident in Table 110, the evaluation verified that 100% of the refrigerators recycled by utility customers responding to the participant surveys were indeed removed and recycled by ARP.
Table 110. Measure Verification, by Utility
Survey Effort (Year Conducted)
Year of Participation
Pct. Of Participants Verified
PGE (n=712)
SCE (n=573)
SDGE (n=572)
Verification (2008) 2006 100% 100% 100%
2007 100% 100% 100%
Evaluation (2009) 2008 100% 100% 100%
Overall 2006-2008 100% 100% 100%
ENERGY AND DEMAND IMPACTS FINDINGS
DOE Testing Findings The first assessment of the gross energy savings relied on the results of DOE testing. Using these results, the evaluation developed a regression model employing DOE-based UEC as the dependent variable and the various characteristics (configuration, age, size, etc.) of the tested refrigerators as the independent variables. After quantifying the relationship between sampled appliances’ characteristics and their DOE-based UEC, the evaluation used observed relationships to extrapolate the results to each utility’s program population. This approach, understanding the impact of various appliance characteristics on energy consumption and using information contained in each utility’s program database to determine average gross savings, is consistent with the previous evaluations.
The above model utilized DOE test results collected for both this evaluation (n=137) and the previous evaluation (n=184). The DOE analysis was limited to the 2004-2005 and 2006-2008 evaluation samples for two primary reasons. First, to accurately compare DOE and in situ-based UECs the analysis was limited to the only existing dual metering datasets.96Second, as shown in Table 111, the age distribution of the appliances from 2004-2005 and 2006-2008 dual metering samples more closely resembles the actual 2006-2008 program participation than previous DOE testing samples. As presented in the table, 91.4% of the appliances contained in previous DOE testing samples were manufactured prior to 1985, while only 13.6% of the appliances participating in the 2006-2008 ARP were of similar age.
96 No in situ metering was conducted as part of ARP evaluations prior to 2004-2005.

Residential Retrofit Contract Group HIM Evaluation Report
132
Table 111: Year of Manufacture by Metering Sample Year of Manufacture Previous
DOE Samples97
2004-2005 and 2006-2008
Dual Metering Samples
2006-2008 ARP
Program (Statewide)
Pre-1960 10.6% 0.7% 0.1%
1960-1969 24.0% 2.0% 0.6%
1970-1979 41.1% 9.9% 4.9%
1980-1984 15.7% 19.2% 8.0%
1985-1989 5.8% 35.8% 27.4%
1990-1992 2.7% 6.6% 12.0%
1993-1996 0.0% 15.2% 31.5%
1997-2000 0.0% 5.3% 8.2%
2000-Current 0.0% 5.3% 7.2%
Metering Sample Size 1,242 302
Table 112 contains the final set of terms included in the model with their coefficients and associated t-values.
Table 112. Regression Details – Determinants of Energy Consumption (Dependent Variable – DOE Estimated UEC) (R2 = 0.41)
Independent Variables Coefficient t-Value
Intercept 491.83 1.9
Dummy: Side-by-Side Configuration 98.96 0.5
Size (Cubic Feet) 35.30 2.9
Age (Years) 25.25 4.7
Interaction: Side-by-Side x Age 19.98 2.2
Dummy: 2006-2008 Metering Sample -413.99 -6.3
There are a number of noteworthy issues in model selection:
The initial model, prior to the considerations and refinement detailed below, included terms similar to that used in previous ARP evaluations (age, configuration, size, frost-free/manual defrost).
Interaction terms were included only if statistically at the .05 level after controlling for the effects of their base additive terms.
Weighting was not used in model development.
To control for observed differences in energy consumption between the 2004-2005 sample (average annual DOE energy consumption of 1,833 kWh) and the current metering sample (1,370 kWh annually), a dummy variable indicating for which evaluation the refrigerator was metered was considered. The evaluation
97 ARCA Metering Sample (1,143 appliances, 1993-1994), Southern California Edison Sample
(136 appliances, 1998), 2002-2003 Statewide ARP Evaluation (100 appliances, 2003).

Residential Retrofit Contract Group HIM Evaluation Report
133
sample dummy variable, which was determined to be significant, implicitly controls for differences in appliance vintage between the two metering samples.98
A dummy variable indicating whether sampled refrigerators were manufactured before or after 1993 – the year a significant national refrigerator efficiency standard became effective – was considered to control for differences in energy consumption.99 However, the statistical significance of the Pre-1993 dummy variable was negligible in the presence of the Age term. While removing the Age term from the model made the Pre-1993 dummy significant, but came at the expense of model fit.
To account for non-linear appliance degradation over time, an age-squared term was considered for the model, but was not significant in the presence of the other model terms. The frost-free dummy was not statistically significant due to the small sample size (n=21) of manual defrost refrigerators in the aggregated modeling sample. No special concessions were made for including this variable in the final model, given the small proportion of manual defrost refrigerators that participated in 2006-2008 (5.6%).
Like the frost-free dummy, the bottom freezer (n=12) and single door (n=11) indicators were not significant due to lack of sample size. Similarly, no special concessions were made for including these variables in the final model, given their limited incidence in the overall program (2.6% and 2.9%, respectively).
To determine the UEC for refrigerators participating in ARP, the results of the model above were applied to the average appliance recycled by each utility. The average value for each independent variable was calculated using each utility’s 2006-2008 program database and are presented in Table 113.
With the notable exception of appliance age, the average characteristics vary only slightly across the three utilities. As seen in the table, the average PG&E refrigerator was found to be approximately 25% older than the average SDG&E and SCE refrigerators. This deviation is likely a function of record-keeping and not a fundamental difference in the vintage of appliance recycled in PG&E versus the other two utilities.100 The difference,
98 A model was also considered that specified appliance vintage explicitly. In this model, both age at the
time of metering and years since manufacture (vintage) were both specified. However, inclusion of years since manufacture is functionally equivalent to including the 2006-08 Metering Sample dummy shown above.
99 On November 17, 1989, DOE published a final rule in the Federal Register (FR) updating the performance standards; the new standards became effective on January 1, 1993. The 1993 standard was estimated to be 30% more effective than the previous 1990 standard. See http://ees.ead.lbl.gov/projects/past_projects/refrigerators and http://www.energystar.gov/ia/products/recycle/documents/StartAFridgeFreezerRecyclingProgram_FINAL.pdf
100 Unlike SCE and SDG&E, PG&E’s program database tracked year of manufacture (e.g., 1987) instead of appliance age at the time of retirement (e.g., 22 years old). Although this difference does not explain the disparity in average ages (the evaluation converted PG&E’s data to an age by subtracting the year of manufacture from the year of retirement), the difference in approach highlights data collection inconsistencies across utilities.

Residential Retrofit Contract Group HIM Evaluation Report
134
and its potential origins, is important to note as average age is a key input into the DOE model detailed above.
Table 113. Average Participant Characteristics for DOE Model Independent Variables by Utility
Independent Variables PGE SCE SDGE
Dummy: Side-by-Side Configuration * 0.3085 0.3102 0.3009
Size (Cubic Feet) 19.1896 19.2636 19.9006
Age (Years) 19.6933 14.7589 15.0780
Interaction: Side-by-Side x Age * 4.6029 4.6190 4.5285
Dummy: 2006-2008 Metering Sample 1 1 1
*Due to missing data the average of SCE and SDG&E was used as a proxy for PG&E.
Using SDG&E as an example, the averages in the previous table indicate:
30.1% of the refrigerators recycled were Side-by-Side models.
Average refrigerator size was 19.90 cubic feet.
Average refrigerator age was 15.08 years.
Interaction term (.301 x 15.08 = 4.53). The average participant characteristics for each utility were input into the model to estimate the DOE-based UEC for the average participating appliance and a corresponding standard error. Again, using SDG&E as an example, summing the product of the model coefficients with their respective averages gives an estimated annual consumption of 1,281 kWh. An example of this calculation, which was similarly done for SCE and PG&E, is provided below:
(491.83) + (98.96)(0.3009 percent Side-by-Side Configuration) + (35.30)(19.9006 cubic feet) + (25.25)( 15.0780 years old) + (19.98)(4.5285) -
(413.99)(1) = 1,281 kWh Table 114 contains the modeled DOE-based UEC value for each utility. It should be noted that these values are not the same as per-unit gross savings since part-use has not yet been accounted for. The greater savings determined for PG&E are the result of the difference in average participant age discussed above.
Table 114. DOE-Based Full-Year UEC Estimate by Utility
Utility Full-Year UEC (kWh/Year) Relative Precision
PGE 1,374 6.59%
SCE 1,254 6.80%
SDGE 1,281 6.63%
This methodology makes two implicit assumptions in calculating the above UECs:
1. The refrigerators sampled to support the evaluation were tested in 2009 and technically part of the next implementation cycle. The assumption is made that refrigerators participating early in the subsequent implementation cycle are representative of those that participated in the 2006-2008 cycle.

Residential Retrofit Contract Group HIM Evaluation Report
135
2. Using characteristics of the average appliance for each utility in the calculation assumes that missing data in the utility tracking database are randomly distributed. That is, the distributions of the independent variables in the regression model are the same for refrigerators with and without missing data, and thus substituting the mean for a missing value does not bias the estimation. As previously noted, PG&E was not able to supply configuration information, so the weighted average of SCE and SDG&E was used in its place.101 Otherwise, very little data were missing for any of the primary model variables and concerns about missing data introducing bias are low (Table 115).
Table 115. Proportion of Missing Data by Utility
Refrigerators Configuration Age Size
PGE 99,976 99.2% 0.7% <0.1%
SCE 187,173 -- <0.1% --
SDGE 40,510 0.1% -- --
In situ Findings The second assessment of the gross energy savings relied on the results of the in situ metering.
As stated previously, the evaluation continued the dual metering methodology initiated in the previous ARP evaluation to further explore apparent disparities in energy use estimates using the two approaches and to determine the most appropriate method for evaluating and reporting gross energy savings.
The evaluation began by extrapolating the short-term metering results (10-14 days) into an accurate UEC. To do so, a regression model was developed to explore the seasonality of refrigerator energy consumption again using the aggregated 2004-2005 and 2006-2008 in situ dataset. The following modeling considerations were made:
The dependent variable was average metered hourly kW.
The independent variables were average hourly outdoor air temperature102 from a National Oceanic and Atmospheric Administration (NOAA) weather station in the same climate zone and the refrigerator-specific mean observed hourly energy consumption over the metering period.
Each metered refrigerator’s mean hourly kWh was included in the model in order to control for the variety of factors (configuration, age, size, household size, location, etc.) that impact energy consumption beyond weather. The interpretation
101 Utilizing SCE and SDG&E average values as a proxy for PG&E’s missing configuration was deemed
the most appropriate method for addressing the missing information for two reasons. First, not all appliances had complete information on manufacturer, model and/or serial number. Second, since model numbers are often used by manufactures to identify a line of appliances for multiple years, merging information regarding participating appliances with other data sources is problematic and can lead to errors.
102 Outdoor temperature, as opposed to indoor temperature, was used to facilitate extrapolation due to its availability for all climate zones. In situ metering was limited to a subset of climate zones.

Residential Retrofit Contract Group HIM Evaluation Report
136
of temperature coefficient in the model then becomes an adjustment to mean hourly kW per unit temperature.
A dummy variable for location in conditioned/unconditioned space was considered in the model, but was not significant after controlling for temperature and mean hourly kWh.
Table 116 contains the final set of terms included in the model with their coefficients and statistical significance.
Table 116. Regression Details – Impact of Outdoor Air Temperature on In situ Energy Consumption
(Dependent Variable – Average Hourly In situ kW (R2 = 0.74))
Independent Variables Coefficient t-Value
Intercept -0.0319 -12.8
Mean Hourly kWh 1.0002 235.1
Outdoor Air Temperature (F˚) 0.0005 13.4
A chart illustrating the modeled relationship between energy consumption and outdoor air temperature for an ―average‖ appliance is provided in Figure 10.
Figure 10. Impact of Outdoor Air Temperature on In situ Energy Consumption
Once the relationship between average hourly demand and outdoor air temperature was quantified, the evaluation used hourly typical meteorological year (TMY) weather data for each sampled participant’s respective climate zone. An estimate of hourly energy consumption was computed for each of the 8,760 hours in a year for each participant. Summing the weather-driven hourly energy values for the entire year provided an in situ UEC estimate for a TMY for each metered refrigerator. This conversion from kW to kWh is possible because average hourly demand encapsulates the entire range of demand values observed during any given hour.

Residential Retrofit Contract Group HIM Evaluation Report
137
After using this procedure to extrapolate the observed short-term in situ results to a full-year UEC for the sample of metered appliances, the evaluation undertook a second extrapolation – similar to that used in the DOE analysis described above – to model in situ UEC and extrapolate to the program population.
Specifically, the following modeling considerations, not previously noted with respect to the comparable DOE model, were made:
In situ modeling was done independently from DOE modeling – all terms determined insignificant in the DOE model were still considered in the in situ model.
Interaction terms were included only if statistically significant at the .05 level after controlling for the effects of their base additive terms.
Weighting was not used in model development.
In addition to terms pertaining to appliance characteristics, three environmental factors were considered in the in situ model: climate zone, primary or secondary appliance, and household size. Variation in observed energy consumption under in situ conditions are subject to these factors, while the DOE tested energy consumption is not due to the DOE protocol’s controlled environmental condition. Appliances in warmer climate zones are hypothesized to consume more energy, as are primary appliances and appliances in larger households. For example, Table 117 illustrates the relationship with household size and appliance designation (primary or secondary) with door openings.
Table 117: Average Number of Door Openings per Day by Household Size and Appliance Designation103
Household Size Primary Appliance Secondary Appliance
1 10.4 NA
2 18.8 2.4
3 20.8 2.5
4 or More 23.0 4.1
Interactions with these environmental factors were considered in modeling, but as in the comparable DOE model, were only considered net of their additive base term effects.
Table 118 contains the final set of terms included in the model with their coefficients and statistical significance.
103 Similar to the rest of the DOE and in situ analysis, these data are from the aggregated 2004-2005 and
2006-2008 dual metering samples.

Residential Retrofit Contract Group HIM Evaluation Report
138
Table 118. Regression Details – Determinants of Energy Consumption104 (Dependent Variable – In situ Estimated UEC) (R2 = 0.32)
Independent Variables Coefficient t-Value
Intercept 506.05 3.2
Dummy: Single Door -629.71 -3.2
Dummy: Side-by-Side 435.71 6.0
Age (Years) 25.88 5.4
Dummy: 2009 Metering Sample -340.35 -4.8
Dummy: Primary Appliance 256.47 3.4
Household Size 71.15 2.8
Dummy: Warmer Climate Zone 225.77 3.2
Similar to the DOE analyses, the results of the in situ model were applied the average appliance recycled by each utility to determine the average UEC for participating refrigerators. The average for each independent variable was calculated using each utility’s program database for 2006-2008 and is presented in Table 119.
Table 119. Average Participant Characteristics for In situ Model Independent Variables by Utility
Independent Variables PGE SCE SDGE
Dummy: Single Door * 0.0287 0.0275 0.0341
Dummy: Side-by-Side * 0.3085 0.3102 0.3009
Age (Years) 19.6933 14.7589 15.0780
Dummy: 2009 Metering Sample 1 1 1
Dummy: Primary Appliance ** 0.6182 0.6947 0.6205
Household Size ** 2.5535 3.0023 2.6466
Dummy: Warmer Climate Zone 0.3914 0.5491 0.2680
*Due to missing data the average of SCE and SDG&E was used as a proxy for PG&E.
**Determined using participant surveys.
The average participant characteristics for each utility were entered into the regression model to estimate the in situ -based UEC for the average participating appliance and a corresponding standard error. Again, using SDG&E as an example, summing the product of the model coefficients with their respective averages gives an estimated annual consumption of 1,074 kWh. An example of this calculation, which was similarly done for SCE and PG&E, is provided below:
(506.05) - (629.71)(.034 percent Single Door Configuration) + (435.71)(.301 percent Side-by-Side Configuration) + (25.88)(15.1 years old)+ … + (225.77)(.27 percent in
Warmer Climate Zone) =1,074 kWh Table 120 contains the modeled in situ-based UEC value for each utility. It should be noted that these values are not the same as per-unit gross savings since part-use has not yet been accounted for.
104 The Evaluation Team initially specified the in situ model using the same parameters as those for the
DOE. However the inclusion of additional environmental parameters produced a more robust model with largely similar results (average difference of 5.7% across utilities) and greater explanatory power. . . . As a result, the evaluation relied on the more robust model to estimate in situ -based derived UECs.

Residential Retrofit Contract Group HIM Evaluation Report
139
Table 120. In situ-Based Full-Year UEC Estimate by Utility
Utility Full-Year UEC (kWh/Year) Precision
PGE 1,220 7.27%
SCE 1,181 7.96%
SDGE 1,074 8.32%
DOE vs. In situ Findings The results from the DOE and in situ UEC models are combined and presented in Table 121, illustrating the consumption differences between the two methodologies. Although the model specifications differ slightly, the findings are comparable because the additional explanatory variables included in the in situ model and not the DOE model (with the exception the single door dummy105) do not explain deviations in energy consumption. Since the DOE test chamber temperature is consistent across tests and the door is not opened, including independent variables for climate zone, unconditioned/conditioned space and household size, would have no impact on the results.
As evident in Table 121, a comparison of the utility-level DOE and in situ-based UEC estimates presented earlier in the section reveals a disparity in estimated savings between the two metering approaches. A discussion of environmental factors that drive the magnitude of the apparent disparities is provided below.
Table 121. Comparison of Full-Year UEC Estimate by Metering Approach
Utility DOE-Based Full-Year UEC
(kWh/Year)
In situ -Based Full-Year UEC
(kWh/Year)
% Difference (In situ - DOE)
PGE 1,374 1,220 -11.2%
SCE 1,254 1,181 -5.8%
SDGE 1,281 1,074 -16.2%
Based on the independent variables determined to be significant in the in situ UEC model (Table 118), three environmental factors that influence in situ consumption can be inferred:
Primary appliances use less energy than secondary appliances. The primary appliance dummy variable is extremely correlated with the considered condition/unconditioned space dummy variable; capturing largely the same information while providing a more intuitive model interpretation.
Appliances in households with more people use more energy than those with fewer.
Appliances in warmer climate zones (climate zones 9 through 15) use more energy than those in cooler climate zones (climate zones 1 through 8 and 16).
105 The single door dummy was determined to be statistically significant in the in situ model, but not in the
DOE model.

Residential Retrofit Contract Group HIM Evaluation Report
140
While climate zone-specific estimates would be an optimal result, sampling does not span the 16 climate zones.
As seen in Table 121, this difference is not consistent across the three utilities due to the differences in drivers illustrated in Table 119. For example, 54% of the appliances recycled in SCE service territory were from warmer climate zones, versus 39% and 28% in PG&E and SDG&E, respectively. This difference in climate zone distribution explains the in situ to DOE consumption delta being positive for SCE. Likewise, participant surveys revealed that household sizes in the SCE service territory were, on average, larger than those in the PG&E and SDG&E service territories. This difference again explains the difference between the in situ and DOE UEC estimates.
To better understand the apparent disparities, the evaluation built a regression model with the purpose of quantifying the difference between the determined DOE and in situ -based UECs as a function of environmental drivers. Several considerations were made in model selection:
Unlike the prior in situ model presented, this model uses extrapolated in situ UEC as the dependent variable and the DOE estimated UEC for all sampled refrigerators along with the three identified environmental factors (primary/secondary appliance, household size, and warm climate zone dummy) as the independent variables.
Interactions between the three environmental factors were considered, but none were significant at the .05 level.
Model coefficients and significance are shown in Table 122.
Table 122. Regression Details – Determinants of Energy Consumption (Dependent Variable – In situ Estimated UEC) (R2 = 0.53)
Independent Variables Coefficient t-Value
Intercept 51.5 0.6
DOE UEC 0.7 17.3
Dummy: Primary Appliance 154.2 2.7
Dummy: Household Size 3+ 223.6 4.1
Dummy: Warmer Climate Zone 146.0 2.6
DOE testing was not done for every participating appliance, thus this model cannot be generalized to the statewide population and is specific to the 321 refrigerators in the aggregated 2004-2005 and 2006-2008 dual metering samples. However the results shown in Table 123 are useful for illustrating the range of in situ to DOE consumption differences for various combinations of the three environmental factors.

Residential Retrofit Contract Group HIM Evaluation Report
141
Table 123: In situ Adjustments to DOE Estimated UEC
Primary Appliance*
Household Size*
Climate Zone n % In situ Delta106
90% CI
Yes
1-2 Cool 29 -30.8% (-36.4%, -25.1%)
Warm 18 -19.2% (-27.2%, -11.1%)
3+ Cool 50 -16.0% (-21.8%, -10.2%)
Warm 32 -6.4% (-12.8%, -0.1%)
No
1-2 Cool 86 -21.3% (-25.7%, -16.8%)
Warm 42 -15.8% (-20.4%, -11.2%)
3+ Cool 59 -6.8% (-12.1%, -1.6%)
Warm 31 1.3% (-4.6%, 7.2%)
*Determined using participant surveys.
At one extreme, the adjustment matrix shown above indicates that a secondary appliance in a home with 3 or more people located in warm climate zones uses 1.3 % more energy modeled in situ than following the DOE testing procedure (90% confidence interval 4.6% less to 7.2% more). At the opposite extreme, a primary appliance from a 1-2 person household in a cooler climate zone, is modeled to use 30.8% less energy based on in situ metering (90% confidence interval 36.4% less to 25.1% less) than DOE testing.
The evaluation determined using in situ metering results to report gross energy savings – rather than DOE-based estimates – more accurately reflected the actual energy consumption of participating refrigerators given the methodology’s ability to account for additional environmental factors. As evident in Table 124, an in situ-based approach incorporates critical information about appliance environmental factors that are held constant under DOE testing protocols.
Table 124. Factors Considered in UEC Estimations
Factor DOE UEC Analysis In situ UEC Analysis
Configuration
Age / Vintage
Size
Primary/Secondary
Household Size
Climate Zone
While possible to adjust DOE-based estimates using a variety of adjustment factors based on participant’s environmental context (climate zone, unconditioned/conditioned space, household size, etc.), such an approach would require continuing dual metering or assuming the relationship between in situ and DOE-based estimates determined through this evaluation will remain unchanged.
There are two other potential arguments for DOE over in situ. First, it is undeniable that DOE testing provides a more controlled and precise environment for assessing energy consumption of a participating appliance. However, the test environment (constant 90o F test chamber, empty food compartments, no door openings, etc.) does not reflect the true
106 A negative in situ delta represents an in situ UEC that is lower that the DOE UEC

Residential Retrofit Contract Group HIM Evaluation Report
142
refrigerator operating environment. The analysis began during the previous evaluation and continued here reveals that while DOE testing provides an accurate assessment of the relative consumption or efficiency of refrigerators, it does not provide an equally accurate assessment of the annual energy consumption of refrigerators.
Second, limiting the analysis to in situ metering samples prevents this evaluation from drawing upon the wealth of DOE results gathered to support previous evaluations and appliance recycled related efforts.107 While true, as shown in Table 111, those datasets consist largely of refrigerators manufactured prior to those appliances recycled in the 2006-2008 ARP. In other words, the refrigerators included in the cumulative DOE testing dataset prior to the two most recent evaluations represent antiquated models (manufactured prior to 1985) that are not representative of the models that are currently being recycled through the program.
As a result of these issues, all of the results presented in the remainder of the report are based on the in situ findings presented above.
Part-Use Findings To adjust the annualized in situ energy consumption determined for each utility to reflect the percent of the year participating refrigerators were actually used, utility-specific part-use factors were calculated. To do so, surveys were used to categorize sampled participants into the following three usage categories:
Not used for at least one full year prior to participation have a part-use factor of 0.0.
Used only a portion of the previous year. For example, for PG&E, 4.3% of participating refrigerators fell into this usage category. Of these participants, the refrigerators were operated an average of 3.52 months per year. Dividing this value by 12 months yields a part-use factor of 0.29.
Operated the entire year prior to participation have a part-use factor of 1.0. Once the proportion of participating refrigerators in each usage category was determined, the in situ UEC was multiplied against each category’s part-use factor. The weighted average of these products yielded the part-use adjusted in situ -based energy savings estimate for each utility.
As evident in Table 125, the application of the part-use factor adjusted the determined UEC downward between 7% and 11% depending on the utility.
107 ARCA Metering Sample (1,143 appliances, 1993-1994), Southern California Edison Sample (136
appliances, 1998), 2002-2003 Statewide ARP Evaluation (100 appliances, 2003).

Residential Retrofit Contract Group HIM Evaluation Report
143
Table 125. Application of Part-Use Factors to Determine Gross Savings
PGE SCE SDGE
Pct of Units
Use Factor
Annual Per-Unit Unit Savings (kWh)
Pct of Units
Use Factor
Annual Per-Unit Unit Savings (kWh)
Pct of Units
Use Factor
Annual Per-Unit Unit Savings (kWh)
Not Running
4.3% - - 5.3% - - 6.2% - -
Running Part Time
4.3% 0.29 356 5.0% 0.46 552 6.2% 0.31 331
Running All Time
91.4% 1.00 1,220 89.7% 1.00 1,181 87.5% 1.00 1,074
Total 100% NA 1,130 100% NA 1,087 100% NA 960
In summary, the application of the participant-informed part-use factor to the in situ UEC for each utility’s average refrigerator yielded the following per-unit gross energy savings (Table 126). It should be noted that the gross savings methodology employed to evaluate the 2006-2008 ARP does not consider the potential interactive effects associated with appliance recycling or the impact of avoided transfers on the purchasing decisions of other utility customers. Estimation of interactive effects would have required a more comprehensive metering effort. Interactive effect terms, if developed in the future, can be applied to the savings impacts presented in this report. Lastly, investigating potential avoided transfers is difficult to ascertain from survey responses alone.
Table 126. Annual Per-Unit Gross Energy Savings (Part-Use Adjusted) – By Utility
Utility Gross Savings (kWh/Year) Using In situ Metering
Confidence and Relative
Precision
PGE 1,130 90%±8%
SCE 1,087 90%±8%
SDGE 960 90%±9%
A comparison of the evaluated per-unit gross energy savings for each utility with that determined through the previous two statewide ARP evaluations is provided in Table 127. As evident, the savings for 2006-2008 are significantly lower than those determined through the previous evaluation. There are a number of reasons for the observed decrease in savings including:
Impact of Efficiency Standards. The first national efficiency standard for refrigerators became effective in 1993. Unlike the previous evaluation’s metering sample, which was entirely comprised of pre-1993 units, the current evaluation’s metering sample was approximately half post-1993 refrigerators.
Switch from DOE to In situ -based Reporting. As discussed in detail above, this report utilized in situ metering instead of DOE-test results to report gross savings. As a result, the gross savings were reduced by approximately 5%.

Residential Retrofit Contract Group HIM Evaluation Report
144
Table 127. Comparison of Evaluated Annual Per-Unit Gross Energy Savings (kWh/Year)
Evaluation PGE SCE SDGE
2002-2003 1,712 1,712 1,712
2004-2005 1,647 1,656 1,663
2006-2008 1,130 1,087 960
Replacement Rates Findings As part of the participant survey, respondents also reported whether the participating refrigerator was replaced. If the refrigerator was replaced, the respondent was asked what type of refrigerator (new ENERGY STAR, new standard efficiency or used model) it was replaced with.
The replacement rates contained in Table 128 were not used to adjust the reported gross energy savings. These values are provided for information and program design purposes only. They have no impact on either the gross or net impacts presented in this report.
Table 128. Participant Self-Reported Replacement Scenarios
Utility Appliance Type
Not Replaced Replaced with Used Unit
Replaced with a New ENERGY
STAR Unit
Replaced with New Standard Efficiency Unit
PGE Primary 18% 7% 33% 43%
Secondary 54% 7% 7% 32%
Overall 33% 7% 22% 38%
SCE Primary 11% 11% 45% 33%
Secondary 48% 9% 10% 33%
Overall 33% 7% 22% 38%
SDGE Primary 17% 8% 40% 36%
Secondary 50% 8% 10% 33%
Overall 29% 8% 28% 35%
Demand Findings Peak demand for each climate zone and utility was developed based on the observed relationship between outdoor temperature and hourly energy consumption modeled previously in Table 116. For each utility, the estimated full year in situ UEC divided by 8,760 was used as the mean hourly energy consumption, while outdoor temperatures were chosen according to the DEER 2008 guidelines. An example follows for SDG&E, Climate Zone 6:
Avg. Hourly kW/Peak Demand = -.0319 + (1.0002)(1,074 kWh/8760 hrs.) + (.00047)(85˚) = 0.131
This value was then adjusted, as shown below, using the self-reported part-use factor for SDG&E, as was done to estimate gross energy savings.
Part-use Adjusted Gross Avg. Hourly kW/Peak Demand = 0.131*.895=0.117

Residential Retrofit Contract Group HIM Evaluation Report
145
Table 129 shows per-appliance and total demand reduction for each utility and climate zone. Empty cells are shown for climate zones not covered by utility service areas.
Table 129. Per-Unit Gross Demand Reduction by Utility and Climate Zone
Climate Zone
Peak Temp108
PGE SCE SDGE
Per-Unit Average Demand Reduction
(kW)
Per-Unit Average Demand Reduction
(kW)
Per-Unit Average Demand Reduction
(kW)
1 80 0.134 NA NA
2 99 0.143 NA NA
3 89 0.138 NA NA
4 97 0.142 NA NA
5 93 0.140 NA NA
6 85 NA 0.132 0.117
7 92 NA NA 0.120
8 98 NA 0.137 0.122
9 101 NA 0.139 NA
10 104 0.145 0.140 0.125
11 104 0.145 NA NA
12 103 0.145 NA NA
13 106 0.146 0.141 NA
14 106 0.146 0.141 0.126
15 114 NA 0.144 NA
16 96 0.141 0.136 NA
Market Actor Findings Based on the information gathered from interviewed market actors, it was not possible to conclusively determine whether ARP has had a significant impact on the local or state market for secondary refrigerators. The majority of the large appliance dealers and almost all haulers were unfamiliar with the program and therefore unable to provide direct insight regarding the impact of the program on their businesses or the larger market for used appliances. Most of the used appliance dealers had heard of ARP. However, few indicated it had any significant sway over their ability to acquire and sell used refrigerators.
To inform the net-to-gross ratio, all market actors were asked what becomes of older refrigerators picked up from customer’s homes when a new appliance is delivered. Both large appliance dealers and haulers reported that all replaced refrigerators picked up in conjunction with a delivery are recycled. However, used appliance dealers noted an increase in the number of refrigerators acquired through customer pick-ups since the previous evaluation. Similar to the previous evaluation – which contained a robust market analysis of the used appliance market in California - the used dealers provided information that newer, less than 5 to 10 years old, well maintained (or easily fixable)
108 As defined for DEER 2008

Residential Retrofit Contract Group HIM Evaluation Report
146
refrigerators had market value. All older appliances, especially those lacking more recent features (e.g., through the door water/ice) had little to no value.
Net-to-Gross Findings As discussed previously the net-to-gross ratio (NTG) was calculated by estimating the number of participating refrigerator units that would have been kept but not used by the participant or that would have been discarded in a manner leading to its destruction independently of the program. Combining these scenarios provides an indication of free-ridership.
It should be noted that the NTG methodology employed for this evaluation differs from the Self-Report Approach employed for other HIMs due to the unique nature of appliance recycling programs. Unlike most programs, the savings from an appliance recycling program stem from removing an operable but inefficient appliance rather than installing an efficient one. Also, these programs do not derive their savings primarily from encouraging participants to remove the units but to do so in a way that avoids the units from being used in other locations.109 Quantifying the net impact of these programs therefore necessitates a unique methodology.
Determining the percent of refrigerators that would have been kept and not used was achieved using information obtained through the participant survey. Each surveyed participant was asked whether they would have kept their refrigerator had they not participated in ARP. Those participants stating they would have retained the appliance were then asked if they would have used the refrigerator or stored it unplugged indefinitely. The product of these responses (offered in Table 130) yields the proportion of participating refrigerators that would have been kept and not used independent of ARP. As noted previously, these appliances which would have been inactive without ARP’s intervention were identified as indicative of free-ridership.
Table 130. Free-ridership Scenario 1—Kept but Not Used
Utility Primary Secondary
Pct. That Would Have Been Kept
Pct. That Would Have
Not Been Used
Pct. That Would Have Been Kept
and Not Used
Pct. That Would Have Been Kept
Pct. That Would Have
Not Been Used
Pct. That Would Have Been Kept
and Not Used
PGE 14.5% 7.0% 1.0% 15.9% 3.6% 0.6%
SCE 16.0% 9.0% 1.4% 17.3% 7.5% 1.3%
SDGE 11.3% 5.9% 0.7% 11.0% 3.9% 0.4%
Calculating the second instance of free-ridership—refrigerators that would have been discarded by the participating household in a manner that leads to its eventual destruction —relies on the results of the participant survey, non-participant survey and the market actor interviews.
109 For example, 89.7% of SDG&E participants recycling primary refrigerators indicated that they would
have gotten ridden of their appliance independent of program intervention. This does not necessarily mean that the NTG ratio for SDG&E primary appliances is 11.3%.

Residential Retrofit Contract Group HIM Evaluation Report
147
Known as socially desirable response bias, participants of utility demand-side management programs often exaggerate the frequency with which they would have done ―the right thing‖—in this case defined as recycling their refrigerator independent of ARP. Further complicating the issue, participants may not be aware of which potential alternative is feasible and which is not. To mitigate these issues, the stated intentions offered by participants regarding ―what they would have done‖ is balanced by information gathered from non-participants about ―what they actually did‖ when discarding a refrigerator outside of ARP in 2006, 2007 or 2008.
Table 131 and Table 132 provided by participants and non-participants relate to the discarding of refrigerators – both hypothetical (participants) and actual (non-participants). Since the methods of discard often differ between primary and secondary units, these responses are provided separately.
Table 131. Free-ridership Scenario 2—Discarded and Destroyed (Participant Responses)
Self-Reported Action in Absence of Program
Indicative of Free-ridership
Percent of Survey Respondents
PGE SCE SDGE
Primary Refrigerators
Sell it to private party No 3.0% 2.0% 3.0%
Sell it to used appliance dealer Possibly 5.7% 5.0% 7.0%
Give away to private party No 2.7% 2.0% 2.0%
Give away to charity Possibly 9.8% 15.0% 12.0%
Had it removed by dealer Yes 13.6% 23.0% 20.0%
Hauled it to dump yourself Yes 6.8% 10.0% 8.0%
Hauled it to recycling center yourself Yes 17.8% 8.0% 12.0%
Hire someone to haul away Yes 16.7% 11.0% 14.0%
Secondary Refrigerators
Don't know No 3.0% 2.0% 2.0%
Sell it to private party No 5.0% 7.0% 11.0%
Sell it to used appliance dealer Possibly 1.0% 1.0% 0.0%
Give away to private party No 14.0% 19.0% 12.0%
Give away to charity Possibly 20.0% 28.0% 25.0%
Had it removed by dealer Yes 4.0% 3.0% 8.0%
Hauled it to dump yourself Yes 14.0% 8.0% 10.0%
Hauled it to recycling center yourself Yes 13.0% 7.0% 15.0%
Hire someone to haul away Yes 9.0% 7.0% 5.0%
Don't know No 12.0% 10.0% 5.0%

Residential Retrofit Contract Group HIM Evaluation Report
148
Table 132. Free-ridership Scenario 2 – Discarded and Destroyed (Non-participant Responses)
Self-Reported Action Indicative of Free-ridership
Percent of Survey Respondents
PGE SCE SDGE
Primary Refrigerators
Took it to a recycler or scrap dealer Yes 4.0% 2.9% 3.0%
Took it to the landfill or threw it away Yes 4.0% 2.4% 3.0%
Sold it to a friend, acquaintance or relative No 2.0% 0.0% 2.0%
Sold it on Craigslist or other Internet site (e.g. eBay) No 3.0% 3.4% 3.0%
Sold it to a used refrigerator or freezer dealer No 2.0% 1.0% 2.0%
Sold it via garage sale, estate sale, or newspaper ad No 0.0% 0.0% 0.0%
Sold it when you moved to new occupant No 1.0% 1.0% 1.0%
Hired someone to pick it up (for junking or dumping) Possibly 0.0% 0.0% 0.0%
Utility program hauled it away NA 2.0% 1.9% 3.0%
Traded it for a replacement unit Possibly 14.0% 22.7% 19.0%
Dealer I bought a new one from took it away Possibly 3.0% 2.9% 2.0%
Gave it away No 41.0% 36.7% 39.0%
Left it behind when moved (for new occupant) No 14.0% 18.8% 16.0%
Other (specify) NA 0.0% 0.0% 1.0%
Don't know NA 10.0% 6.3% 6.0%
Secondary Refrigerators
Took it to a recycler or scrap dealer Yes 2.4% 0.0% 6.5%
Took it to the landfill or threw it away Yes 4.7% 0.0% 1.6%
Sold it to a friend, acquaintance or relative No 1.2% 0.0% 0.0%
Sold it on Craigslist or other Internet site (e.g. eBay) No 3.5% 2.4% 0.0%
Sold it via garage sale, estate sale, or newspaper ad No 3.5% 0.0% 3.2%
Hired someone to pick it up (for junking or dumping) Yes 2.4% 4.8% 1.6%
Utility program hauled it away NA 5.9% 0.0% 1.6%
Traded it for a replacement unit Possibly 32.9% 45.2% 43.5%
Dealer I bought a new one from took it away Possibly 3.5% 2.4% 1.6%
Gave it away No 22.4% 19.0% 14.5%
Other (specify) NA 12.9% 16.7% 17.7%
Don't know No 4.7% 9.5% 8.1%
Of potential actions for both participants and non-participants, most clearly indicate destruction of the participating unit, and therefore imply free-ridership (e.g., Haul it to the dump yourself), while others are denoted as ―possibly‖ being indicative of free-ridership.
To investigate the ―possibly‖ responses further, market research undertaken for this evaluation confirmed the findings of the previous evaluation that most new and used appliance dealers do not sell used refrigerators unless they are full-featured units less than 5 to 10 years old. Consequently, it can be assumed that all units greater than 10 years of age, discarded through a new or used appliance dealer, would have been destroyed independently of the program. This same assumption was applied to those participants indicating they would have donated their appliance to charity. Units less than 10 years of age discarded through these channels likely would have remained active, and therefore were not indicative of free-ridership.

Residential Retrofit Contract Group HIM Evaluation Report
149
Table 133 summarizes the responses presented in the previous tables for both participants and non-participants.
Table 133. Summary of Free-ridership Scenario 2—Discarded and Destroyed
Utility Participant Non-participant
Pct. That Would Have
Been Discarded
Pct. That Would Have
Been Destroyed
Pct. That Would Have Been
Discarded and Destroyed
Pct. That Were
Discarded
Pct. That Were
Destroyed
Pct. That Were Discarded and
Destroyed
Primary Refrigerators
PGE 85.5% 67.5% 57.8% 85.5% 51.3% 43.9%
SCE 84.0% 58.5% 49.2% 84.0% 53.8% 45.2%
SDGE 88.7% 55.5% 49.2% 88.7% 45.4% 40.2%
Secondary Refrigerators
PGE 84.1% 61.0% 51.3% 84.1% 32.2% 27.1%
SCE 82.7% 50.0% 41.4% 82.7% 15.4% 12.7%
SDGE 89.0% 52.5% 46.7% 89.0% 13.3% 11.9%
As shown in the tables above, a significant disparity occurred between the stated intentions of participants and actual disposal methods reported by surveyed non-participants. This finding is not surprising and validates the inclusion of non-participants in the NTG methodology.
To determine each utility’s NTG, a weighted average of participant and non-participant responses, as well as respondents discarding primary and secondary refrigerators was calculated.110 This average NTG serves as the evaluation’s final determination of program NTG for each utility.
110 Inverse variance weighting was used to generate averages of participants and non-participants, thereby
lending greater weight to more precise findings. Despite weighting, results did not differ from a simple average within two decimal places. This approach is identical to that employed by the previous evaluation and was undertaken by the current evaluation to ensure the comparability of the findings.

Residential Retrofit Contract Group HIM Evaluation Report
150
Table 134. Net-to-Gross Ratios by Utility
Overall Net-To-Gross Ratio (Weighted Average of Primary/Secondary)
Utility Participant Non-participant
Weighted Average
PGE 0.44 0.59 0.51
SCE 0.52 0.60 0.56
SDGE 0.51 0.64 0.58
Primary Net-To-Gross Ratio
Utility Participant Non-participant
Weighted Average
PGE 0.41 0.56 0.45
SCE 0.49 0.55 0.48
SDGE 0.50 0.60 0.52
Secondary Net-To-Gross Ratio
Utility Participant Non-participant
Weighted Average
PGE 0.48 0.73 0.62
SCE 0.57 0.87 0.78
SDGE 0.53 0.88 0.78
11.6 Discussion of Findings and Recommendations for Recycled Refrigerators
COMPARISON OF PER-UNIT GROSS SAVINGS
Table 135 provides a comparison of the ex ante, DOE-based and in situ -based estimates of per-unit gross and net energy savings for each utility’s 2006-2008 ARP. As evident in the table, the in situ -based savings estimates – which were used to report evaluated gross savings – are considerably lower than the ex ante estimates.
Table 135. Per-Unit Gross and Net Energy Savings (kWh/Year) – 2006-2008 Refrigerator Recycling
Utility Ex ante DOE In situ
Gross Net Gross Net Gross Net
PGE 1,946 681 1,265 651 1,130 582
SCE 1,656 1,017 1,147 644 1,087 559
SDGE 1,946 681 1,136 657 960 494
While a downward trend in energy savings is typical of appliance recycling programs (each subsequent implementation cycle recycles increasingly efficient models), the magnitude of the difference between the 2006-2008 ex ante and evaluated savings is substantial and noteworthy for several specific reasons.
First, as discussed in detail in the report, this evaluation departed from the historical precedent of using DOE testing to report energy savings in favor of in situ metering. The

Residential Retrofit Contract Group HIM Evaluation Report
151
decision to report in situ -based gross savings was based on the methodology’s inherent ability to account for variations in important environmental factors (household size, climate zone, conditioned vs. unconditioned space) that impact energy consumption. Since DOE testing is done in an environmentally controlled testing chamber, the method essentially assumes that a refrigerator uses the same amount of energy regardless of where it is located or how it is used. The analysis conducted for this, as well as the previous evaluation, has shown that this is not the case. Since in situ -based gross savings estimates are typically lower than their DOE counterparts, the decision to use in situ metering rather than DOE testing contributes to the observed difference between the ex ante and evaluated savings.
Second, for the first time a significant percentage (56%) of eligible appliances in the program were manufactured after the DOE’s first appliance efficiency standard became effective (1993). The adoption of the standard prompted a sharp increase in average efficiency, accelerating what had previously been a relative constant, though slow, annual gain in efficiency.
Third, for two of the utilities (PG&E and SDG&E) the ex ante values were based on the findings of the 2002-2003 statewide evaluation, not the more recent 2004-2005 evaluation. This is likely because the final 2004-2005 report was not completed until April 2008 – well after the start of the 2006-2008 implementation cycle. While SCE adjusted its ex ante values when the more recent evaluation was completed and available, PG&E and SDG&E did not.
UTILIZATION OF IN SITU METERING
The evaluation recommends that in situ metering, not DOE testing, be used to evaluate the energy savings generated by the 2006-2008 ARP. This recommendation is grounded in the ability of in situ metering to capture the energy consumption of appliances as typically used with participating homes. Unlike DOE testing, in which all environmental conditions are controlled and held constant (90° F test chamber, empty refrigerator and freezer cabinets, and no door openings), in situ metering accounts for the impact of these critical factors (e.g., household size and climate zone) on energy consumption. As a result, in situ metering provides a more accurate representation of the actual energy savings achieved by removing appliances from participating homes.
In addition, standalone in situ metering would greatly reduce evaluation costs relative to dual metering while still achieving robust and reliable results. Also, in situ metering – or field metering or simply metering as it is typically called – is recognized as a reliable methodology for evaluating the gross energy savings of all the other HIMs. Using in situ metering to evaluate appliance recycling is therefore consistent with the other HIM methodologies and evaluation protocols. There is no evidence to suggest that assessing appliance recycling savings is substantially different and requires additional laboratory testing at significant cost.

Residential Retrofit Contract Group HIM Evaluation Report
152
EMPHASIZE DATA COLLECTION AND CONSISTENCY
Given the recommendation to continue in situ metering, the evaluation further recommends that greater emphasis be placed on quality control related to data collection. The accuracy of analytic methods such as those undertaken for this evaluation is predicated on the availability and quality of data contained in program implementation databases. Appliance characteristics such as configuration, age, and size are critically important in the estimation of gross savings estimates. The difference between the UECs for PG&E and the other two utilities illustrates the impact data collected for age – or any other of the key explanatory characteristics – has on gross savings estimates.
As shown in Table 115, these data are also not reliably present in utility databases (for 2006-2008 this was particularly true for PG&E). For this reason the evaluation recommends each utility work closely with its implementer(s) to ensure the accurate collection of all relevant appliance characteristics.

Residential Retrofit Contract Group HIM Evaluation Report
153
SUMMARY OF KEY EVALUATION PARAMETERS
Table 136. Summary of Key Evaluation Parameters for Appliance Recycling111 Utility Parameter IOU Claimed
(A)
Evaluated
(B)
Difference
(A-B)
PGE2000
UES: kWh/year 1,946 1,130 816
NTG Ratio 0.35 0.51 -0.16
% Installed 100% 100% 0
Climate Zone 1 UES kW/year 0.300 0.134 0.166
Climate Zone 2 UES kW/year 0.300 0.143 0.157
Climate Zone 3 UES kW/year 0.300 0.138 0.162
Climate Zone 4 UES kW/year 0.300 0.142 0.158
Climate Zone 5 UES kW/year 0.300 0.140 0.160
Climate Zone 10 UES kW/year 0.300 0.145 0.155
Climate Zone 11 UES kW/year 0.300 0.145 0.155
Climate Zone 12 UES kW/year 0.300 0.145 0.155
Climate Zone 13 UES kW/year 0.300 0.146 0.154
Climate Zone 14 UES kW/year 0.300 0.146 0.154
Climate Zone 16 UES kW/year 0.300 0.141 0.159
SCE2500
UES: kWh/year 1,656 1,087 569
NTG Ratio 0.614 0.56 0.05
% Installed 100% 100% 0
Climate Zone 6 UES kW/year 0.300 0.132 0.168
Climate Zone 8 UES kW/year 0.300 0.137 0.163
Climate Zone 9 UES kW/year 0.300 0.139 0.161
Climate Zone 10 UES kW/year 0.300 0.140 0.160
Climate Zone 13 UES kW/year 0.300 0.141 0.159
Climate Zone 14 UES kW/year 0.300 0.141 0.159
Climate Zone 15 UES kW/year 0.300 0.144 0.156
Climate Zone 16 UES kW/year 0.300 0.136 0.164
SDGE3028
UES: kWh/year 1,946 960 986
NTG Ratio 0.35 0.58 -0.23
% Installed 100% 100% 0
Climate Zone 6 UES kW/year 0.300 0.117 0.183
Climate Zone 7 UES kW/year 0.300 0.120 0.180
Climate Zone 8 UES kW/year 0.300 0.122 0.178
Climate Zone 10 UES kW/year 0.300 0.125 0.175
Climate Zone 14 UES kW/year 0.300 0.126 0.174
111 Though demand savings are provided at both the utility and climate zone level, consumption savings
are only available at the utility level. This is due to the lack of sufficiently robust survey data to estimate model parameters at the granularity of climate zone.


Residential Retrofit Contract Group HIM Evaluation Report
155
12. Room Air Conditioners (PGE2000, SDGE3024, & SCE2501)
12.1 Evaluation Objectives for Room Air Conditioners The HIMs are defined as those efficiency measures common across IOU programs that contribute greater than 1% to the entire IOU savings portfolio for reductions in electrical consumption, electrical demand, or natural gas consumption. Room air conditioners (RACs) slightly exceeded the CPUC-assigned HIM threshold of 1% of utility savings for SDG&E (kW savings) and SCE (kW and kWh savings) (Table 137). RACs did not meet the HIM threshold in Pacific Gas and Electric (PG&E) territory and therefore data represented in this report are from research conducted in 2008 as part of the first verification effort.
Three primary objectives were determined for the RAC evaluation:
Determine the percentage of rebated RACs that were installed and operating properly.
Derive NTG ratios to evaluate net savings for RACs.
Determine energy and demand savings through metering study and lab tests.
PROGRAM OVERVIEWS
SDGE3024 Residential Incentive Program SDGE3024 Residential Incentive Program (RIP) provides the residential market with incentives to purchase high-efficiency appliances and home equipment. The program offers rebates for appliances such as pool pumps and motors, whole-house fans, storage water heaters, attic and wall insulation, and ENERGY STAR refrigerators, central natural gas furnaces, and room air conditioners.
In addition to the traditional mail-in rebates, RIP uses a point-of-sale (POS) rebate delivery method for some measures. The retailer is then reimbursed by the utility for the rebate, and the customer does not have to fill out a rebate application. Customers who purchase qualifying products from a non-participating retailer still have the option of a mail-in or online rebate application.
This program coordinates efforts with SDG&E’s education and outreach programs to inform customers of the energy efficient practices for the home. The program theory posits that the increased education and financial incentives for the customer induces retailers to be more inclined to stock energy efficient products.
SCE2501 Residential Energy Efficiency Incentive Program The SCE2501 Residential Energy Efficiency Incentive Program (REEIP) seeks to provide the residential and specific non-residential markets (such as small commercial customers) with incentives to purchase high-efficiency products. REEIP offers upstream lighting incentives and rebates on lighting measures including: compact fluorescent

Residential Retrofit Contract Group HIM Evaluation Report
156
lighting (CFL), high-efficiency fixtures, lighting controls, address signs, and cold cathode lighting. Additionally, the program contains a light fixture exchange component. Non-lighting incentives offered by the program include: pool pumps and motors, ENERGY STAR refrigerators and room air conditioners, whole house fans, electric storage water heaters, attic and wall insulation, cool roofs, and evaporative coolers. This chapter will only address the room air conditioner component.
In addition to traditional mail-in rebates, REEIP utilizes a POS rebate delivery method for some measures. The utility reimburses the retailer for the rebate, eliminating the need for customers to fill out a rebate application. Those not purchasing qualifying products from a participating retailer continue to have the option of a mail-in or online rebate application.
PGE2000 Mass Markets The PGE2000 program targets single-family and multi-family residential retrofit and commercial customers. The Mass Markets program uses PG&E staff, third-party specialists, and local government partnerships to deliver a portfolio of energy-efficiency, demand response, and distributed generation services. It includes statewide elements as well as those specially targeted to mass market customers in PG&E’s service area. This program was included in the 2008 evaluation research, but because its total RAC savings accounted for less than 1% of the overall portfolio savings, it was not selected as a HIM to be evaluated. The data gathered for the 2008 evaluation research is included where available.
QUALIFYING ROOM AIR CONDITIONERS AND CLAIMED SAVINGS
All programs provide an incentive for the purchase of a room air conditioner that meets ENERGY STAR specifications. Table 137 and Table 138 show the number of incented units and claimed savings for each utility.
Table 137. Summary of Claimed Energy Savings for Room Air Conditioners (2006-2008)112
Number of Participants
Net Energy Savings (kWh)
Net Demand Savings (kW)
% IOU Portfolio Savings
kWh kW
SDGE3024 25,365 2,577,084 2,003 0.3% 1.4%
SCE2501 181,482 33,013,615 19,165 1.0% 3.2%
PGE2000 7,595 613,311 950 0.0% 0.1%
112 Source: Total claimed savings per the IOU Q4 2008 Participant Tracking database

Residential Retrofit Contract Group HIM Evaluation Report
157
Table 138. Detailed Claimed Energy Savings for Room Air Conditioners (2006-2008)113
Program Climate Zone
Measures Installed
Claimed Unit
Energy Savings
(kWh/Year)
Claimed Unit
Energy Savings
(kW/Year)
Claimed NTG
Total Claimed Net kWh Savings
Total Claimed Net kW Savings
SDGE3024 NA 25,365 127 0.099 0.80 2,577,084 2,003
SCE2501
6 29,629 198 0.132 0.80 4,686,123 3,129
8 50,064 247 0.132 0.80 9,892,646 5,287
9 49,031 232 0.132 0.80 9,111,921 5,178
10 38,391 220 0.132 0.80 6,750,673 4,054
13 3,133 218 0.132 0.80 546,145 331
14 8,213 201 0.132 0.80 1,322,622 867
15 2,967 294 0.132 0.80 696,652 313
16 54 158 0.132 0.80 6,834 6
PGE2000
1 7 30 0.047 0.80 168 0
2 903 76 0.118 0.80 54,902 85
3B 1061 30 0.047 0.80 25,464 39
4 1548 76 0.118 0.80 94,118 146
5 8 76 0.118 0.80 486 1
11 1039 136 0.211 0.80 113,043 175
12 1597 136 0.211 0.80 173,754 269
13 1086 136 0.211 0.80 118,157 183
14 6 166 0.257 0.80 797 1
16 94 106 0.164 0.80 7,971 12
2 16 76 0.118 0.89 1,082 2
3B 14 30 0.047 0.89 374 1
4 59 76 0.118 0.89 3,991 6
11 10 136 0.211 0.89 1,210 2
12 138 136 0.211 0.89 16,704 26
13 9 136 0.211 0.89 1,089 2
12.2 Methodology and Specific Methods Used for the Room Air Conditioner Evaluation
Table 139 and Table 140 provide an overview of the evaluation activities for room air conditioners. As shown below, the Evaluation Team conducted telephone surveys114 and onsite metering with program participants. Note that the meter installations were nested samples, recruited as part of the telephone survey effort. End use participants were determined
113 Ibid. 114 See Appendix H for all data collection instruments for room air conditioners.

Residential Retrofit Contract Group HIM Evaluation Report
158
from utility tracking databases of direct (mail-in or online) rebates and POS participants that provided contact information (SCE only).
Table 139. Overview of Evaluation Activities for Room Air Conditioners
Table 140: Detailed Evaluation Activities for Room Air Conditioners
Program 2008 Phone Survey
2009 Phone Survey
Retailer Telephone
Surveys (2009)
Site Visits (2008)
Onsite Meters (2009)
SDGE3024 0 377 10 0 36
SCE2501 426 203 37 0 66
PGE2000 91 0 24 10 0
MEASURE VERIFICATION METHODS
For the measure verification aspect of the study, telephone survey respondents were asked whether they had received a program rebate for the purchase of a new RAC, if it was installed within the utility service territory, and operating properly. Measure verification was performed for all programs. The interviewer probed to find the proper respondent in the household and explored – where applicable – the reasons why the unit was not installed and operating properly.
NET-TO-GROSS METHODS
This evaluation determined NTG through the joint sample self-report NTG method, administered during the telephone survey.116 Additional attribution information was collected as part of a survey conducted with 70 room air conditioner retailers in the SCE and SDG&E service territories.
ENERGY AND DEMAND SAVINGS METHODS
Energy (kWh) savings and demand (kW) reduction were determined through a combination of onsite metering and lab tests. Metering was conducted on a total of 102 participant RAC units for 90 days during June through September 2009. Two meters were used for each unit, the Watts up? PRO.Net (recording demand values) and the
115 Hours of use (HOU) 116 See Appendix K for the standardized free-ridership battery and algorithm used for this assessment.
Activity Programs Sample size Parameters Participant phone Survey SDGE3024, PGE 2000, SCE 2501 1,097 NTG, Installation rate End Use Metering SDGE3024, SCE 2501 102 HOU115, UES
Retailer Survey SDGE3024, PGE 2000, SCE 2501 70 Market Share, NTG
DOE Lab Testing SDGE3024, PGE 2000, SCE 2501 4 UES

Residential Retrofit Contract Group HIM Evaluation Report
159
HOBO U12-12 (recording indoor temperature and humidity). Hourly regression models were developed to estimate hourly energy use as a function of outdoor temperature.117 Lab tests were conducted for four RACs. This testing was performed to provide the difference in demand between qualifying ENERGY STAR units and standard (non-ENERGY STAR) units. Details regarding the findings from the metering and lab testing are provided in section 13.5.
Data Cleaning and Model Development for Metered Usage Data The Evaluation Team collected metered data on energy usage, indoor dry bulb temperature, and relative humidity at 102 residences. All data went through a rigorous review process before they were included in any modeling or calculations. First, the raw data were examined site by site in order to determine if there were meter failures. Monthly load shapes and time of RAC use were reviewed, and any unconventional behavior was further scrutinized. The energy usage data were compared to the indoor temperature and relative humidity data to determine if irregularities were accurate or due to meter failures. After this review, 19 datasets were excluded from the analysis.
The remaining datasets were combined for the modeling process and examined hour-by-hour (e.g. all observations that occurred during the 1:00 P.M. hour were reviewed together). Several metrics including: studentized residuals, cooks distance, fitted values, and leverage, were used in order to identify outliers that were unduly impacting the model. One site and 2 specific observations were removed as a result of this process. The final model was developed based on data from 82 of the 102 metered sites.
The Evaluation Team tested multiple models that included various independent variables in order to estimate energy usage. The address of each site was mapped to the closest National Oceanic and Atmospheric Administration (NOAA) weather station with hourly data in the same climate zone to determine outdoor temperature.118 The Evaluation Team also evaluated the models with alternative measures of outdoor temperature. The models and variables that were considered and tested are listed below:
Models
Hourly ordinary least squares (OLS) Random effects model 2-part model 4-part model
Variables
Outdoor dry bulb temperature Outdoor dry bulb temperature the previous hour Average daily temperature Average daily temperature between 12 P.M. and 6 P.M.
117 See Appendix H for the hourly regression models. 118 “Quality Controlled Local Climatological Data.” NOAA Satellites and Information: National
Environmental Satellite, Data, and Information Service, https://ols.nndc.noaa.gov/sub-login.html, downloaded 10/22/2009.

Residential Retrofit Contract Group HIM Evaluation Report
160
Maximum daily temperature Indoor wet bulb temperature Weekday indicator
After reviewing the options with industry experts and examining statistical metrics, such as t-statistics and root mean squared error, it was determined that a four-part model119 gave the best estimate of energy use. The four parts of the model are:
1. A probit model is used to estimate the probability that the RAC unit is running (This prediction is also used to determine hours of use.) The probability that the RAC is running is given by:
P(O=1) = Φ(β10 + β11A + β12W)
where:
O = Indicator that machine is running (0=off, 1=running) A = Average outdoor dry bulb temperature between 12 P.M. and 6 P.M., in Fahrenheit W =Dummy variable indicating a weekend (0=weekday, 1=weekday) Φ = Standard normal cumulative distribution
2. If the RAC is running a second probit model is used to estimate whether the compressor is running. The model assumed the compressor was running when energy use exceeded 250 watts.
P(C=1|O=1) = Φ(β20 + β21T)
where:
C = Indicator that compressor is running (0=off, 1= running) T = Outdoor dry bulb temperature, in Fahrenheit
3. Ordinary least squares (OLS) is used to predict energy use when the compressor is not running.
(Y1|O=1, C=0) = β30 + β31T + e1
where:
Y1 = energy use of machines that are on fan only, in watts e1 ~ N(0,σ)
4. A second OLS model is used to predict energy use for cases when the compressor is running. This stage distinguishes between large RACs (a BTUH of 10,000 or greater) and small RACs.
(Y2| O=1, C=1) = β30 + β31T + β32L + β33L*T + e2
where:
119 Naihua Duan, Willard G. Manning, Jr., Carl N. Morris, Joseph P. Newhouse. “A Comparison of
Alternative Models for the Demand for Medical Care.” Journal of Business & Economic Statistics, Vol. 1, No. 2 (Apr., 1983), pp. 115-126.

Residential Retrofit Contract Group HIM Evaluation Report
161
Y2 = Energy use of machines with compressor running, in watts L = Dummy variable indicating large RAC (BTUH >= 10,000) e2 ~ N(0,σ)
Separate models are run for each hour of the day, allowing the impact of outdoor temperature on energy use to vary by hour. The expected value of energy use, including machines that are off and machines that are only running their fan, is given by:
E(Y) = P1[(1-P2)Y1 + P2(Y2)]
The model provides separate estimates for large and small RACs. Energy use of a typical machine is the weighted average of the two estimates, where the weight is the proportion of large machines in sample:
E(Y) = P(L=1)*Y|large + P(L=0)*Y|small
Room Air Conditioning Laboratory Testing Methods In order to better understand how RAC performance and efficiency varies under different environmental conditions, four room air conditioners were tested in a laboratory. The specific objectives for the laboratory testing were to:
Develop EER for varying conditions
Provide data for EER curves future simulation modeling
Compare the relative performance of ENERGY STAR and non-ENERGY STAR units over a variety of environmental conditions
The Evaluation Team used BR Laboratories to conduct the testing. Table 141 shows the four units for testing which were selected based on the retailer survey responses of the most popular units sold in the region.120
Table 141. Room AC Units Selected for Lab Testing
Manufacturer Model ENERGY STAR
Rated?
Nameplate EER
(BTU/h/W)
Nameplate Cooling Capacity (BTU/hr)
Kenmore 580.75080900 No 9.8 8,000
Kenmore 580.75080500 No 9.8 8,000
Frigidaire FAC104P1A No 9.8 10,000
Frigidaire FAC106P1A Yes 10.8 10,000
All testing was performed following American National Standards Institute (ANSI)/ Association of Home Appliance Manufacturers (AHAM) RAC-1-2003 – Room Air Conditioners. Testing was performed by BR Laboratories, Inc in Huntington Beach, CA. EER was measured at four different temperature conditions as specified below. All other conditions and tolerances not mentioned followed those specified in ANSI/AHAM RAC-1-2003. The following trials were conducted on all four units.
120 Retailers reported that the most common selling units were in the 7,800-10,000 BTU range, and the
most popular brand was LG.

Residential Retrofit Contract Group HIM Evaluation Report
162
A. Trial 1: Perform 6.1. Cooling Capacity Test as specified in ANSI/AHAM RAC-1-2003 for Standard Test Conditions (5.2.1.1 ):
a. Room Air Temp = 80 deg F dry bulb, 67 deg F wet bulb
b. Outside Air Temp = 95 deg F dry bulb, 75 deg wet bulb
c. Measure electrical power input (5.3.2. Electrical Power Input) and report EER following 3.9 Energy Efficiency Ratio.
d. All other conditions, tolerances, etc. following those specified in ANSI/AHAM RAC-1-2003.
B. Trial 2: Maximum Operating Conditions (6.6)
a. Room Air Temp = 90 deg F dry bulb, 73 deg F wet bulb
b. Outside Air Temp = 110 deg F dry bulb, 78 deg wet bulb
C. Trial 3: Freeze-Up Test (6.7)
a. Room Air Temp = 70 deg F dry bulb, 60 deg F wet bulb
b. Outside Air Temp = 70 deg F dry bulb, 60 deg wet bulb
D. Trail 4: Sweat Test (6.8)
a. Room Air Temp = 80 deg F dry bulb, 75 deg=2 degF wet bulb
b. Outside Air Temp = 80 deg F dry bulb, 75 deg wet bulb
12.3 Confidence and Precision of Key Findings for Room Air Conditioners
The telephone sample size of 377 respondents for SDGE3024 RACs provides estimates of verification and NTG at 90% confidence and 4% precision, while the sample size of 629 telephone respondents for SCE2501 RACs provides estimates at 90% confidence and 3% precision. Both programs, therefore, exceed the minimum requirements of 90% confidence and 10% precision, as recommended by the California Evaluation Protocols, for the verification and NTG estimates. The metering sample size of 100 RAC participants was selected based on the Coefficient of Variation (CV) from a metering study conducted in New England, and was expected to provide energy and demand savings at 90% confidence and 5% precision.121
12.4 Validity and Reliability of Room Air Conditioner Evaluation Measurements
This evaluation effort seeks to meet the CPUC’s stated objective of obtaining reliable estimates of net energy savings realized for the RAC high-impact measure. Section 4 of this report provides an overview of how the Evaluation Team minimized the potential for
121 Evaluation of National Grid’s 2003 Appliance Management Program: Room Air Conditioning Metering
and Non-Energy Benefits Study, National Grid Service Company, March 23, 2005.

Residential Retrofit Contract Group HIM Evaluation Report
163
error. The following section describes how the potential for error was minimized for RACs in particular.
Measured: The Evaluation Team minimized this type of error by using both temperature and energy meters. Using two meters allows comparisons between the power draw and the temperature change, thereby ensuring that the energy meter is properly recording usage when the room temperature drops dramatically. Data that did not line up correctly was discarded.
Collected: Survey participants who agreed to participate in the metering study were offered incentives. Note that, of the SCE and SDG&E rebates paid, there was contact information for less than 10% of participants; the other rebates were offered through POS discounts, and individual contact information for those respondents was not available. To the extent that the POS participants use RACs differently from participants who received a rebate through the mail or the Internet, there is potential non-response error. We assume that there is no difference in RAC usage for the different rebate participants, and identifying participants who received POS incentives was cost prohibitive and likely to lead to other sources of error (e.g., respondents incorrectly reporting program participation).
12.5 Detailed Findings for Room Air Conditioners
MEASURE VERIFICATION FINDINGS FOR ROOM AIR CONDITIONERS
Table 142 presents the verification results from the telephone survey for the SDG&E, SCE, and PG&E efficient room air conditioners measures. Over 93% of the rebated units were reported to be installed within the IOU service territory of each respective program. The total survey adjustment includes the measures reported to be currently installed, installed within the service territory, and in seasonal storage (i.e., units that were not currently installed because they were in storage until needed in hotter weather were not counted against the savings verifications values).
Table 142. Self-reported Installation Verification for Room Air Conditioners
IOU Phone Survey
Onsite Survey*
Total Survey Adjustment**
SDGE3024
(Phone survey n=377, Onsite survey n=36)
% of units currently installed/operable 93.0% 100.0% 93.0%
% of units not installed/operable 7.0% NA NA
SCE2501
(Phone survey n=1,044, Onsite survey n=67)
% of units currently installed/operable 96.0% 100.0% 96.0%
% of units not installed/operable 4.0% NA NA
PGE2000
(Phone survey n=105,
Onsite survey n=0)
% of units currently installed/operable 93.0% 100.0% 93.0%
% of units not installed/operable 7.0% NA NA
* Most site visit participants were recruited during phone survey efforts and thus are a subset of the telephone survey participants.
**Realization rate is the product of the % of units currently installed/operable/operable from the phone survey and the onsite survey

Residential Retrofit Contract Group HIM Evaluation Report
164
RACs are a unique efficiency measure in that they may only be installed for part of the year (e.g., during the summer months), and then stored for the rest of the year. For those participants that reported that their RAC was not currently installed but was in storage, we probed for when the unit would most likely be installed for use. The installation timing varied substantially by utility, but the majority was expected to be installed within one year (Table 143).
Table 143. Self-reported Installation Timeframe for Room AC Units in Storage
SDGE3024 (n=34)
SCE2501 (n=31)
PGE2000 (n=16)
Within 3 months 20% 64% 44%
3 to 6 months 0% 18% 14%
6 to 12 months 40% 0% 14%
More than a year 10% 0% 0%
Never 20% 9% 14%
Don't Know 10% 9% 14%
NET-TO-GROSS FINDINGS
The Evaluation Team used the specified NTG battery and approved algorithm developed by the CPUC to determine free-ridership. Results from the NTG analysis indicate varied levels of free-ridership for RACs, as shown in Table 144. The PG&E program showed the lowest free-ridership level (59%) while SCE and SDG&E programs were similar at 64% and 69%, respectively. These free-ridership estimates are significantly higher than the ex ante assumptions of 20% (i.e., a claimed NTG ratio of .80).122
Table 144. Room AC Free-ridership/NTG by Program
% Free-riders (FR) NTG Ratio (1-FR)
SDGE3024 (n=377)
SCE2501 (n=615)
PGE2000 (n=105)
SDGE3024 (n=377)
SCE2501 (n=615)
PGE2000 (n=105)
2006 Participants 74% 60% 67% 0.26 0.40 0.33
2007 Participants 74% 60% 52% 0.26 0.40 0.48
2008 Participants 67% 78% 61% 0.33 0.22 0.39
Total Weighted by Year 69% 63% 58% 0.31 0.37 0.42
Total Weighted by kWh 69% 64% 59% 0.31 0.36 0.41
Total Weighted by kW 69% 64% 59% 0.31 0.36 0.41
122 PG&E also used a NTG ratio value of 0.89 for Multi-family RACs. Multi-family RACs represented only
3% of the total PG&E rebated units. . . .

Residential Retrofit Contract Group HIM Evaluation Report
165
SPILLOVER FINDINGS
The telephone surveys included a set of spillover questions that focused on whether the respondent purchased additional energy saving measures and to what extent the program influenced the respondent’s decision.123 Table 145 provides the results of those questions.
Table 145. Spillover for Room Air Conditioners by Program
Category SDGE3024 (n=377)
SCE2501 (n=615)
PGE2000 (n=105)
# of respondents reporting purchase of additional energy efficiency measures
97 111 23
Percent of sample 26% 18% 22%
Average rating for program influence (On a scale of 1-10 where 1 is no influence and 10 is complete influence)
6.0 5.2 7.0
ADDITIONAL ROOM AIR CONDITIONER SURVEY FINDINGS
Additionally, field staff documented the unit’s location, size (BTU), and energy efficiency ratio (EER) during the onsite metering.124
The majority of the room AC units were in bedrooms and living spaces, approximately 10,000 BTU, and between 10 and 10.9 EER (Table 146, Table 147, Table 148).
Table 146. Room Air Conditioner Installation Location
SDGE3024 (n=36)
SCE2501 (n=67)
Bathroom 0% 2%
Bedroom 42% 26%
Dining Room 0% 8%
Kitchen 3% 3%
Primary/secondary living space/rooms 44% 53%
Office 11% 9%
Table 147. Room Air Conditioner Size (BTU)
SDGE3024 SCE2501
5,000 - 6,999 BTUs 24% 15%
7,000 - 8,999 BTUs 18% 32%
9,000 - 10,999 BTUs 15% 10%
11,000 - 12,999 BTUs 30% 27%
13,000 - 14,999 BTUs 3% 3%
15,000 + BTUs 9% 13%
Average BTU 9,729 10,091
123 See Appendix K for the standardized spillover battery. 124 Note that no onsite visits were conducted as part of the PGE2000 RAC verification effort.

Residential Retrofit Contract Group HIM Evaluation Report
166
Table 148. Room Air Conditioner Efficiency (EER)
SDGE3024 SCE2501
<9 EER 3% 0%
9 - 9.9 EER 6% 10%
10 - 10.9 EER 84% 83%
11 + EER 6% 7%
Average EER 10.7 10.7
ROOM AIR CONDITIONER RETAILER SURVEY FINDINGS
To gain an understanding of what types of air conditioning units are being supplied and sold, 71 interviews125 were conducted with participating and non-participating retailers throughout the SCE and SDG&E service territories. The sample included a mix of distribution channels and included hardware (such as ACE), large home improvement (such as Home Depot), mass merchandise (such as Wal-Mart), and membership stores (such as Costco). Almost half (47%) of the retailers that were interviewed were large home improvement stores (Table 149). Interviewed stores carried an average of seven AC models throughout the year and sold an average of 460 units.
Table 149. Number of Interviews Conducted by Store Type
Store Type Interviews
Hardware 2
Large Home Improvement 34
Mass Merchandise 10
Membership 25
Total 71
The majority of room air conditioners sold and stocked were ENERGY STAR labeled. Specifically, 66% of the units stocked were ENERGY STAR and 71% of sold units were ENERGY STAR (Table 150). Retailers interviewed also said that 50.7% of customers ask often or somewhat often for ENERGY STAR rated room air conditioners.
Table 150. Room AC ENERGY STAR Market Share
Average % of Total Units (n=71)
Percent of RAC Units Carried that are ENERGY STAR rated 66%
Percent of RAC units sold that are ENERGY STAR rated 71%
As shown in Figure 11, most of the those interviewed (80.3%) were familiar with the fact that some California utilities offer rebates to customers for purchasing ENERGY STAR rated RACs. Over two-thirds (67.6%) advertise or display a utility rebate if it is available for RACs and well over three quarters (80%) reported that, based on their own experience, such incentives influence a customer’s room AC purchasing decisions.
125 See Appendix H for the RAC retailer survey instrument.

Residential Retrofit Contract Group HIM Evaluation Report
167
Additionally, less than half of customers reportedly ask specifically for utility rebated room AC units (42.8%, includes ―very often‖ and ―somewhat often‖).
Figure 11. Summary of RAC Retailer Survey Responses (n=71)
80.3%
67.6%
80.0%
42.8%
0.0%
10.0%
20.0%
30.0%
40.0%
50.0%
60.0%
70.0%
80.0%
90.0%
% interviewed that arefamiliar with utility
rebates
% that advertise ifrebate available
% interviewed thatbelieve incentive
influences purchasingdecisions
% of customers whooften ask for rebated
unit
ROOM AC LABORATORY TESTING RESULTS
As shown in Table 151, the claimed EER values from the manufacturer closely matched EER values measured at AHAM standard conditions (within +/- 0.2 EER). Results for the three standard efficiency units were within +/- 0.1 of the nameplate EER of 9.8. On the ® qualified unit the nameplate EER is 10.8 while the result from this test was 10.6.
Table 151 also demonstrates that the EER for the units tested were higher under the no temperature difference conditions of the Freeze Up and Sweat tests, but dropped under the higher load of the Maximum Operating Conditions test. The relative efficiency of the ENERGY STAR qualified unit (Frigidaire FAC106P1A ), when compared to the standard efficiency equivalent (Frigidaire FAC104P1A), was higher during the Freeze Up and Sweat tests but lower during the Maximum Operating tests. This trend can be seen in Figure 12, Figure 13, and Figure 14, which compare measured EER to the difference between indoor and outdoor temperature and outside air temperature. In each case there is a clear trend toward lower relative efficiency between the ENERGY STAR unit and standard efficiency unit with increasing temperatures.
As these results are based on very limited samples of air conditioners, care should be taken when making any broad conclusions. However, the results do suggest that for cases with outdoor temperatures that approach the temperatures used in the Freeze Up and Sweat tests, use of the nameplate EER may be conservative. At higher loads however, as

Residential Retrofit Contract Group HIM Evaluation Report
168
demonstrated by the Maximum Operating conditions results, energy savings based on the nameplate EER could be overstated.
Table 151. EER Results from Room AC Laboratory Tests
Manufacturer Model Manufacturer
Rated EER
AHAM Standard
Test 1
AHAM MAX Operation
Test 2
AHAM Freeze Up
Test 3
AHAM Sweat Test 4
Kenmore 580.75080900 9.8 9.7 8.4 10.4 10.1
Kenmore 580.75080500 9.8 9.7 8.9 10.7 10.1
Frigidaire FAC104P1A 9.8 9.8 8.3 10.5 10.0
Frigidaire FAC106P1A 10.8 10.6 8.6 11.7 11.1
Figure 12. EER and Energy Savings (%) vs. ∆ T for Frigidaire Units Tested
Figure 13. EER and Energy Savings (%) vs. Outdoor Air Temperature (dry bulb) for Frigidaire Units Tested

Residential Retrofit Contract Group HIM Evaluation Report
169
Figure 14. Power Measured
ENERGY AND DEMAND SAVINGS FOR ROOM AIR CONDITIONERS
Modeling Results The Evaluation Team used the model described in section 12.2 to predict energy usage annually and during peak days and peak hours. Hourly temperature data as well as peak definitions by climate zone are consistent with the DEER 2008 Measure Analysis Revisions126 definitions. As such, peak days vary by climate zone, but peak hours are always 2:00 PM to 5:00 PM. A floor was applied to the model so that no energy usage is reported for months with an average temperature between 12:00 PM and 6:00 PM of less than 65o Fahrenheit. This floor was applied by climate zone. An example load shape created from the model (climate zone 6) is given in Figure 15. The energy usage presented is the mean usage for each hour of the day over the DEER defined three day peak period. As expected, the metered maximum energy usage corresponded with the 2:00 PM to 5:00 PM peak hours of the day.
126 Summary of 2008 DEER Measure Energy Analysis Revisions Version 2008.2.05; 09-11
Planning/Reporting Version

Residential Retrofit Contract Group HIM Evaluation Report
170
Figure 15. ENERGY STAR Room AC Mean Energy Usage During Peak Period (Climate Zone 3 – PG&E)
0
20
40
60
80
100
120
140
160
0 1 2 3 4 5 6 7 8 9 10 11 12 13 14 15 16 17 18 19 20 21 22 23
Hour of the Day
Ener
gy U
sage
(Wat
ts)
Peak Hours
Similar load shapes can be generated for each of the 5 California climate zones that were metered in the evaluation. Table 152 summarizes the results.

Residential Retrofit Contract Group HIM Evaluation Report
171
Table 152. ENERGY STAR Room Air Conditioner Mean Energy Usage during Peak Period by Climate Zone (Watts)
CZ 6 CZ 7 CZ 8 CZ 9 CZ 10
Hour 7/9 to 7/11
9/9 to 9/11
9/23 to 9/25 8/6 to 8/8
7/8 to 7/10
0:00 35.07 38.06 62.71 60.63 75.03
1:00 29.94 32.21 55.85 52.99 62.04
2:00 27.98 32.26 52.15 48.32 53.72
3:00 27.49 31.51 43.50 42.25 45.36
4:00 30.37 32.63 41.25 41.36 43.11
5:00 30.59 31.03 37.68 38.80 41.34
6:00 29.14 29.31 35.42 37.83 42.17
7:00 29.10 29.54 38.27 41.52 49.13
8:00 31.95 30.84 50.42 54.74 73.42
9:00 34.77 34.89 82.46 90.21 147.32
10:00 46.10 50.54 116.93 135.97 214.60
11:00 63.39 74.19 178.17 224.14 337.92
12:00 85.25 99.59 237.32 297.98 434.32
13:00 104.71 122.53 287.09 348.94 523.48
14:00 126.32 140.22 317.24 389.49 578.92
15:00 137.99 142.91 340.85 411.92 632.58
16:00 138.71 146.46 341.44 406.49 634.99
17:00 136.06 139.77 312.76 422.51 619.59
18:00 106.52 120.15 270.17 381.08 571.52
19:00 82.32 100.11 199.79 285.90 425.12
20:00 60.01 78.01 143.06 188.85 279.21
21:00 49.34 64.83 111.27 144.62 215.34
22:00 42.25 55.50 81.35 102.94 147.38
23:00 40.53 48.56 65.49 78.87 108.32
The models can also be used to predict annual energy usage and hours of use by using data for temperature at every hour of the year (8760 hours). This is done by using the hourly regression model and predicting use at each hour of the year (e.g., January 1 at midnight, 1:00 AM, 2:00 AM, etc. all the way through December 31 at 11:00 PM). The results of the demand at each hour are then summed up to estimate the modeled annual kWh savings. As with the previous results, the hourly outdoor temperature inputs which are used to predict the usage at each hour are consistent with the DEER 2008 information. Two hours of use measurements are given. The first is the total hours the RAC was on annually, including the time only the RAC fan was running. The second measurement is the total hours the RAC compressor was on annually. (Note: The models are based on metered data from June through September. Behavioral changes that occur outside that time period and that are not directly captured by changes in outdoor temperature are not represented in these results.) Table 153 summarizes the results for each climate zone.

Residential Retrofit Contract Group HIM Evaluation Report
172
Table 153. ENERGY STAR Room AC Modeled Annual Energy Usage (kWh) and Annual Hours of Use
Climate Zone
Modeled Energy Usage (kWh)
Modeled Annual
Hours of Use (Fan or
Compressor)
Modeled Annual
Hours of Use (Compressor
Only)
6 201 469 225
7 240 521 273
8 333 674 370
9 485 925 522
10 592 1007 631
Table 154 is an example of the calculated regression coefficients and the associated t-statistics for hour 16. The full set of regression models for all 24 hours is included in Appendix H.
Table 154. ENERGY STAR Room AC Model Parameters Hour 16
Parameter Probability RAC is On
Probability the Compressor is On
if RAC is On
Fan Energy Usage if Only the Fan is
On
Compressor Energy Usage if
Compressor is On
Temperature NA 0.05 -0.11 12.41
NA [2.87]B [0.11] [3.82]B
Daily Average Temp 12pm to 6pm
0.05 NA NA NA
[4.99]B NA NA NA
Weekend 0.09 NA NA NA
[1.45] NA NA NA
High*Temperature NA NA NA 578.36
NA NA NA [1.73]A
High*Weekend NA NA NA -1.92
NA NA NA [0.44]
Constant -4.73 -2.43 129.90 -341.11
[5.90]B [1.86]A [1.57] [1.38]
Observations 88612 18772 2666 16106
R-squared 0.072 0.057 0.000 0.723
Note: T Statistics are in brackets.
A. Significant at the 10% level.
B significant at the 5% level.
Temperature is outdoor dry bulb oF.
Weekend is a flag for weekends (0= weekdays, 1=weekend).
High is a flag for units greater than or equal to 10,000 BTUH.
Energy and Demand Savings for Room Air Conditioners In order to calculate unit energy savings, an EER of 10.8 was assumed for ENERGY STAR units and an EER of 9.8 was assumed for non ENERGY STAR units. The difference in efficiency was applied to the model results to estimate savings.

Residential Retrofit Contract Group HIM Evaluation Report
173
Table 155 presents the total savings (kWh) annually and the mean peak demand reduction (kW) of going from a standard efficiency room AC to a program qualified ENERGY STAR unit.
Table 155. Room AC Estimated Annual Energy and Peak Demand Savings by Climate Zone
Climate Zone Total Unit Energy Savings During Cooling Season
(kWh)
Mean Unit Energy Peak
Demand Savings (kW)
90% Confidence Intervals (+/-)
(kWh)
90% Confidence Intervals (+/-) (kW)
6 20 0.014 6 0.002
7 24 0.015 6 0.002
8 34 0.034 9 0.007
9 49 0.041 12 0.009
10 60 0.063 15 0.019
12.6 Discussion of Findings and Recommendations for Room Air Conditioners
A summary of the claimed vs. evaluated key parameters is presented in Table 156. Note that SDG&E did not stratify the room AC savings claims by climate zone, so the savings provided is a weighted average of the incentivized units in each climate zone provided in the SDG&E tracking database. The difference column represents the difference between the claimed and evaluated savings parameters.
In general, although the vast majority of the incentivized RACs are installed and operating, the savings are lower than expected due to two factors:
Free-ridership is far higher than predicted. While the IOUs had only assumed 20% free-ridership, the self-report NTG estimated free-ridership of 58%-74%. This high rate, however, is somewhat inconsistent with the market share data reported by the Department of Energy (DOE). The National ENERGY STAR Retailer Partners are required to annually provide sales data to the DOE for dishwashers, clothes washers, room air conditioners, and refrigerators. In 2006-2008 the National ENERGY STAR retailer partners reported the national market share data for ENERGY STAR room air conditioners was 36%, 50%, and 43%, respectively.127 While this is not an estimate of free-ridership, it is an indication that sales of ENERGY STAR room air conditioners were in the 36%-50% range throughout the U.S., substantially lower than the self-reported estimate of free-ridership in this study.
Unit Energy Savings are generally lower than claimed. Unfortunately, utility work papers were not available for this measure, so we are unable to expand on the reason for the disparity. Room AC measures are also not included in DEER 2004-2005 or DEER 2008.
127 Sales data from 1998 to 2008 can be found at
https://www.energystar.gov/index.cfm?c=manuf_res.pt_appliances

Residential Retrofit Contract Group HIM Evaluation Report
174
Table 156. Key Evaluated Parameters for SDGE3024, SCE2501, and PGE2000 Room Air Conditioners128
Utility Parameter IOU Claimed
(A)
Evaluated
(B)
Difference
(A-B)
SDGE3024
NTG Ratio 0.80 0.31 0.49
% Installed 100% 93.0% 7.0%
UES: kWh/year 127 47 80
UES kW/year 0.099 0.045 0.053
SCE2501
NTG 0.80 0.36 0.44
% Installed 100% 96.0% 4.0%
Climate Zone 6 UES: kWh/year 198 20 178
Climate Zone 6 UES kW/year 0.132 0.014 0.12
Climate Zone 8 UES: kWh/year 247 34 213
Climate Zone 8 UES kW/year 0.132 0.034 0.10
Climate Zone 9 UES: kWh/year 232 49 183
Climate Zone 9 UES kW/year 0.132 0.041 0.09
Climate Zone 10 UES: kWh/year 220 60 160
Climate Zone 10 UES kW/year 0.132 0.063 0.07
Climate Zone 13 UES: kWh/year 218 NA NA
Climate Zone 13 UES kW/year 0.132 NA NA
Climate Zone 14 UES: kWh/year 201 NA NA
Climate Zone 14 UES kW/year 0.132 NA NA
Climate Zone 15 UES: kWh/year 294 NA NA
Climate Zone 15 UES kW/year 0.132 NA NA
Climate Zone 16 UES: kWh/year 158 NA NA
Climate Zone 16 UES kW/year 0.132 NA NA
PGE2000
NTG 0.80/0.89 0.41 0.39/0.48
% Installed 100% 93.0% 7.0%
Climate Zone 1 UES: kWh/year 30 NA NA
Climate Zone 1 UES kW/year 0.047 NA NA
Climate Zone 2 UES: kWh/year 76 NA NA
Climate Zone 2 UES kW/year 0.118 NA NA
Climate Zone 3B UES: kWh/year 30 NA NA
Climate Zone 3B UES kW/year 0.047 NA NA
Climate Zone 4 UES: kWh/year 76 NA NA
Climate Zone 4 UES kW/year 0.118 NA NA
Climate Zone 5 UES: kWh/year 76 NA NA
Climate Zone 5 UES kW/year 0.118 NA NA
Climate Zone 11 UES: kWh/year 136 NA NA
Climate Zone 11 UES kW/year 0.211 NA NA
Climate Zone 12 UES: kWh/year 136 NA NA
Climate Zone 12 UES kW/year 0.211 NA NA
Climate Zone 13 UES: kWh/year 136 NA NA
128 No evaluated UES values were calculated for climate zones that were not metered.

Residential Retrofit Contract Group HIM Evaluation Report
175
Utility Parameter IOU Claimed
(A)
Evaluated
(B)
Difference
(A-B)
Climate Zone 13 UES kW/year 0.211 NA NA
Climate Zone 1 UES: kWh/year 30 NA NA
Climate Zone 1 UES kW/year 0.047 NA NA
Climate Zone 2 UES: kWh/year 76 NA NA


Residential Retrofit Contract Group HIM Evaluation Report
177
13. Pool Pumps & Motors (SDGE3024)
13.1 Evaluation Objectives for Pool Pumps and Motors The HIMs are defined as those efficiency measures common across IOU programs that contribute greater than 1% to the entire IOU savings portfolio for reductions in electrical consumption, electrical demand, or natural gas consumption. Using this definition pool pumps and motors qualified as high-impact measures for SDGE3024. Total units and energy/demand savings claimed by SDG&E are shown in Table 157 and Table 158.
The Pool Pump & Motor evaluation effort had four primary objectives:
Determine the percentage of program eligible Pool Pumps that were installed and operating
Determine the percentage of Pool Pump Reset Agreement participants that were in compliance with the program pre- and post-participation requirements
Derive net-to-gross ratios to determine net savings
Evaluate savings algorithms used and, where applicable, determine new unit energy savings estimates
PROGRAM OVERVIEW
SDGE3024 – Residential Incentive Program The SDGE3024 Residential Incentive program (RIP) is designed to provide the residential market, including owners and renters of single-family homes, condominiums, mobile homes, and attached homes up to four-plex, with incentives to purchase high efficiency appliances and home equipment. The program offered rebates for pool pumps and motors, whole house fans, storage water heaters, attic and wall insulation, ENERGY STAR refrigerators, dishwashers, central natural gas furnaces, and room air conditioners.
To be eligible for the single- or multi-speed pump rebate, SDG&E customers had to purchase an efficient pool pump that was included on the qualifying model list. In order to qualify for the Pool Pump Reset Agreement rebate, SDG&E customers had to meet four conditions:
Swimming pool must be in-ground (spas and above-ground pools do not qualify)
Did not participate in the single-speed pool pump rebate program in 2005
Currently filter during peak times between noon and 6:00 p.m.
During the off-season (October-April), able to reduce daily filtering time by at least one hour
If the above four conditions were met, then the applicant was asked to agree to reduce daily filtering time by at least one hour during the off-season (October 1-April 30) and to reset the pool filtering time clock to run before noon or after 6:00 p.m. (year-round).

Residential Retrofit Contract Group HIM Evaluation Report
178
QUALIFYING POOL PUMPS/MOTORS AND CLAIMED SAVINGS
Table 157 and Table 158 show the claimed savings by each of the measures examined as part of the Pool Pump and Motor evaluation effort. The vast majority of the participants, energy, and demand savings come from the Pool Pump Reset Agreement.
Table 157. SDGE3024 Claimed Gross UES Values for Pool Pumps and Motors (2006-2008)129
Measure Name Gross Unit Annual Electricity Savings
(kWh/unit)
Gross Unit Demand Savings
(kW/unit)
High Efficiency Pool Pump and Motor Single Speed 650 0.104
High Efficiency Pool Pump (two-speed) 1400 0.54
Pool Pump Time Clock Reset Agreement 900 1
Pool Pump Time Clock Seasonal Reset Agreement (off peak) 271.8 0
Pool Pump Time Clock Seasonal Reset Agreement (peak) 271.8 1
Table 158. SDGE3024 Claimed Savings for Pool Pumps and Motors (2006-2008)130
Measure Name Number of Participants
Claimed NTG
Claimed Net Energy Savings (kWh)
Claimed Net
Demand Savings
(kW)
% IOU Claimed Savings
kWh kW
Single Speed Pool Pump 718 0.80 373,360 60 0.0% 0.0%
Multi-Speed Pool Pump 333 0.89 414,918 160 0.0% 0.1%
Pool Pump Reset Agreement 7,107 0.89 4,540,698 6,169 0.5% 4.2%
13.2 Evaluation Methodology and Specific Methods Used for the Pool Pumps and Motors Evaluation
As shown in Table 159 and Table 160, the Evaluation Team conducted telephone surveys131 and made site visits during 2008 and 2009 to verify installations and collect data on specific parameters such as hours of use. End use participants were determined from utility tracking databases of direct (mail-in or online) rebates.
Table 159: Overview of Evaluation Activities for Pool Pumps and Motors
Activity Programs Sample size Parameters Participant Phone Survey SDGE3024 647 NTG, Installation rate, HOU, Eligibility Verification Site Visits SDGE3024 100 Installation rate, HOU
129 Source: SDGE3024 Q4 Participant Tracking database 130 Source: SDGE3024 Q4 Participant Tracking database 131 See Appendix I for all data collection instruments for pool pumps and motors.

Residential Retrofit Contract Group HIM Evaluation Report
179
MEASURE VERIFICATION METHODS
The evaluation relied on site visits and telephone surveys to verify installation, program eligibility & compliance, and hours of use. During the SDGE3024 site visits, inspectors visually identified the incentivized pool pump and documented the programmed hours of use.
For the efficient pool pump measures, respondents were asked whether they had received a rebate for their pool pump from their utility around the date of claimed installation. Respondents who said yes were then asked whether the equipment was installed at their property. If the equipment had not been installed, the interviewer probed for the reasons why.
For the Pool Pump Reset Agreement measure, respondents were asked additional questions regarding their filtering hours before and after participation. In addition, the Evaluation Team reviewed the filtering times reported by program participants on the program applications.
Table 160. Detailed Evaluation Activities for Pool Pumps and Motors
Number of Phone Surveys Number of Site Visits
Wave 1 Wave 2 Total Wave 1 Wave 2 Total
Single Speed Pool Pump 131 79 210 18 15 33
Multi-Speed Pool Pump 30 78 108 14 16 30
Pool Pump Reset Agreement 179 150 329 15 22 37
NET-TO-GROSS METHODS
The CPUC assigned the Basic rigor level to the determination of a value for net program impact (or NTG). This evaluation, therefore, determined NTG through the Joint Sample Self-Report NTG method, administered during the telephone survey.132 This evaluation determined two NTG values, one for the efficient pool pump measures and one for the Pool Pump Reset Agreement measure. Over 300 NTG surveys for each of these measures were conducted, as recommended in the California Evaluation Protocols. Note, however, the NTG values are based only on the responses from eligible and compliant participants (i.e., reset agreement participants that did not actually shift their schedules were not included in the NTG estimate).
ENERGY AND DEMAND SAVINGS METHODS
The Evaluation Team reviewed the SDG&E provided savings algorithms and work papers and adjusted as appropriate. New unit energy savings estimates were determined based on the findings of the phone and onsite efforts.
132 See Appendix K for the standardized free-ridership battery and algorithm used for this assessment.

Residential Retrofit Contract Group HIM Evaluation Report
180
13.3 Confidence and Precision of Key Findings for Pool Pump and Motors Measures
The targeted confidence and precision levels for the pool pump and HIMs were set at 90% confidence and 10% precision. To satisfy the requirements of the Impact Evaluation Protocol, the sample of 300 phone survey participants was also used develop net-to-gross values for the efficient pool pump measures and the Pool Pump Reset Agreement measures.
13.4 Validity and Reliability of Pool Pump and Motor Evaluation Measurements
This evaluation seeks to meet the CPUC’s stated objective of obtaining reliable estimates of annual energy savings generated by the designed HIM groups. Section 4 of this report provides an overview of how the Evaluation Team minimized the potential for error. The following section describes how the potential for error was minimized for pool pumps in particular. Reasonably accurate and precise estimates can be considered reliable because they minimize the potential for each of these types of error:
Measured: The Evaluation Team did not conduct any onsite metering or equipment measurement as part of the pool pump evaluation. Pool pump filtering times were recorded, and pictures were taken to help verify the findings. Measurement is, at most, an extremely small potential source of error for the pool pump and motor evaluation.
Collected: The pool pump and motor evaluation included up to five attempts to reach survey respondents at different times of the day and different days of the week. Telephone survey respondents were also offered an incentive to participate in the onsite portion of the study, and the interviewer provided site visit times throughout the day, evenings and on weekends.
Described (modeled): The pool pump evaluation did not use any modeling, so modeling is not a potential source of error.
Random Error. The sample for the pool pump evaluation met the minimum requirements of 90% confidence and 10% precision, and thus minimizing any potential random error associated with sampling.

Residential Retrofit Contract Group HIM Evaluation Report
181
13.5 Detailed findings for Pool Pumps and Motors Table 161Table 162 present the verification results from the telephone and onsite inspections for the SDGE30324 efficient pool pump measures. The majority of the single speed (96.7%) and multispeed (99.5%) were installed and operating at participant homes within the SDG&E service territory.
Table 161. Self-reporting and Site Visit Verification for SDGE3024 Single Speed Pool Pumps
Single Speed Pool Pump
Total Survey Adjustment
Phone Survey (n=210)
Onsite Survey (n=33)
% currently installed 96.7% 100.0% 96.7%
% installed then removed 1.3% NA NA
% not installed for other reason 2.0% NA NA
Table 162. Self-reporting and Site Visit Verification for SDGE3024 Multispeed Pool Pumps
Multi-Speed Pool Pump
Total Survey Adjustment
Phone Survey (n=108)
Onsite Survey (n=30)
% currently installed 99.5% 100.0% 99.5%
% installed outside service territory 0.5% NA NA
The Evaluation Team also compared the make and model of the pool pumps identified onsite to the list of SDGE3024 program qualifying pool pumps, and found a number of rebated pool pumps that did not qualify for the program; in total, 79% of the single speed and 82% of the multispeed were found on the list of eligible pumps (Table 163).
Table 163. Site Visit Verification for SDGE3024 Eligible Pumps
Single Speed Onsite Survey
(n=33)
Multi-Speed Onsite Survey
(n=30)
% eligible pumps installed 79% 82%
During the phone surveys, respondents were asked questions on the type of pool where the rebated pool pump was installed, or in the case of the reset agreement, the type of pool the reset agreement was applied to. Table 164 illustrates that over 91% of all pool pumps rebated were attached to in-ground pools. The in-ground spa/hot tub (without pool) and the above ground pools were not eligible for the rebate.

Residential Retrofit Contract Group HIM Evaluation Report
182
Table 164. SDGE3204 Rebated Pool Types
Type of Pool Reset
Agreement Single Speed
Pump Multi-Speed
Pump
In-ground pool 94.0% 91.1% 91.0%
Above ground pool 0.0% 1.3% 0.0%
In-ground spa/hot tub 0.7% 1.3% 1.3%
Above ground spa/hot tub 0.0% 1.3% 0.0%
In-ground pool and spa/hot tub 5.3% 5.1% 7.7%
MEASURE VERIFICATION FINDINGS FOR THE POOL PUMP RESET AGREEMENT
As noted previously, there are several requirements to be eligible for the SDGE3024 Pool Pump Reset Agreement:
Swimming pool must be in-ground (spas and above-ground pools do not qualify).
Did not participate in the single-speed pool pump rebate program in 2005.
Currently (pre-program) filter during peak times between noon and 6:00 p.m.
During the off-season (October-April), able to reduce daily filtering time by at least one hour.
Once eligibility is established, the following guidelines must be met in order to be in compliance with the program:
Reduce daily filtering time by at least one hour during the off-season (October 1-April 30).
Reset the pool filtering time clock to run before noon or after 6:00 p.m. (year-round).
Because the evaluation could not perform onsite inspections prior to participation, phone survey results were used to estimate pre-participation hours of use. The main criteria examined was whether or not participants were filtering their pool during peak hours (defined as noon to 6:00pm for this program) prior to participating in the program. As shown in Table 165, 51.2% of program participants reported that they were running during peak hours prior to participating; nearly half (48.8%) of program participants, therefore, did not qualify for the program because they were not running during peak hours prior to participation.133
Table 165. Eligibility Results for SDGE3024 Pool Pump Reset Agreement
Eligibility Criteria Phone Survey Results (n=329)
Participants Running Pool Pump During Peak (Pre-Program) 51.2%
133 Note that a review of 312 program applications also revealed a high degree of ineligible customers
receiving program incentives: in total, 30% of customers reported, on their applications, that they were not running during peak hours prior to participation.

Residential Retrofit Contract Group HIM Evaluation Report
183
The second criterion examined was whether or not participants were in compliance with the program by not running the pool pump filter during peak hours. This metric was determined onsite, through a visual inspection of the programmed pool pump filtering times. As seen in Table 166, 87.2% of those visited onsite had pool pump operating hours that fell outside the peak hours (i.e., 12.8% were still operating their pool pumps during peak hours and thus were not compliant with the program requirements).
Table 166. Peak Compliance Results for SDGE3024 Pool Pump Reset Agreement
Compliance Criteria Onsite Results (n=37)
Participants Not Running Pool Pump During Peak (Post Participation) 87.2%
The third criterion examined was compliance with the one hour reduction in winter filtering requirement. Again, since the team could not perform site visits prior to participation, phone surveys were used to evaluate this metric. The average decrease in both summer and winter filtering times was 0.5 hour (Table 167).
Table 167. Winter Filtering Time Reduction Compliance Results for SDGE3024 Pool Pump Reset Agreement
Telephone Survey Results (n=329)
Pre-Participation
Post-Participation
Change in Hours per Day
Average HOU per day Summer 3.8 3.3 0.5
Average HOU per day Winter 3.1 2.6 0.5
NET-TO-GROSS FINDINGS
The Evaluation Team used the specified NTG battery and approved algorithm developed by the CPUC to determine free-ridership. Results from the NTG analysis indicate varied levels of free-ridership by measure, as shown in Table 168.
Table 168. Free-ridership by HIM and by Program134
% Free-riders (FR) NTG (1-FR)
Reset Agreement
Single Speed Pump
Multi-Speed Pump
Reset Agreement
Single Speed Pump
Multi-Speed Pump
2006 Participants 28% 64% 41% 0.72 0.36 0.59
2007 Participants 27% 71% 69% 0.73 0.29 0.31
2008 Participants 21% 74% 72% 0.79 0.26 0.28
Total Weighted by Year 27% 68% 68% 0.73 0.32 0.32
Total Weighted by kWh 27% 68% 68% 0.73 0.32 0.32
Total Weighted by kW 27% 68% 68% 0.73 0.32 0.32
134 Note that the kWh and kW claimed savings values are consistent among all participants for each
measure (e.g., every reset agreement participant received the same claimed savings values, regardless of climate zone) thus the free-ridership and NTG estimates do not vary between the weighting approaches.

Residential Retrofit Contract Group HIM Evaluation Report
184
SPILLOVER FINDINGS
The telephone surveys included a set of spillover questions that focused on whether the respondent purchased additional energy saving measures and the extent to which the program influenced the respondent’s decision. Table 169 provides the results of those questions.
Table 169. Spillover for Pool Pumps
Category Reset Agreement (n=329)
Single Speed Pump (n=210)
Multi-Speed Pump (n=108)
# of respondents reporting purchasing additional energy efficiency measures 102 53 26
Percent of sample 31% 26% 24%
Average rating for program influence 3.9 4.5 4.2
ADDITIONAL POOL PUMP AND MOTOR FINDINGS
Additionally, the onsite field staff documented the amperage and horsepower for the pool pumps visited. Results are shown in Table 170.
Table 170. Average Pool Pump Amperage and Horsepower
Reset Agreement
Single Speed Pump
Multi-Speed Pump
Average Pool Pump Amperage 9.3 9.6 21.5
Average Pool Pump Horsepower 1.6 1.2 2.4
ENERGY AND DEMAND SAVINGS FINDINGS
The Evaluation Team analyzed the SDG&E work paper used to estimate savings for the efficient pool pump and the Pool Pump Reset Agreement measures. Several adjustments have been made to both the inputs and the algorithms used, resulting in the changes in Table 171.
Table 171. Recommended Savings Changes
Measure Name Electricity Savings (kWh/unit)
Demand Savings (kW/unit)
SDGE Value
Evaluated Value
SDGE Value
Evaluated Value
High Efficiency Pool Pump and Motor Single Speed 650 578.6 0.104 0.373
High Efficiency Pool Pump and Motor Multispeed 1400 810.1 0.54 0.153
Pool Pump Timeclock Reset Agreement 900 217.2 1 1.190
A discussion of recommended adjustments is below.

Residential Retrofit Contract Group HIM Evaluation Report
185
High Efficiency Pool Pump Engineering Review SDG&E assumes that the average baseline per unit draw for the efficient pool pump measures was 1.531938 kW and the post-retrofit kW draw was 1.255701 kW. According to SDG&E’s self-report data there was an average of a 1.87-hour decrease in the filtering time. The average pre-filtering period was 5.7105 hours a day and the post-filtering period was 3.8421 hours a day. Note that a 0.5 HP reduction is equivalent to 0.373 kW.
The algorithm used by SDG&E for efficient pool pumps is:
(0.28*hours of use*days)+(baseline kW draw*hours of filter time reduction*days)135 Or, (.28*3.8*365)+(1.531938*1.87*365)=1,438kWh per Pump/Motor component
However, several of the inputs used can be updated based on the findings from this evaluation. Specifically, hours of use, filtering time decrease, and average motor horsepower can all be updated (Table 172).
Table 172. SDGE3024 Assumed Values and Evaluation Findings
SDGE
Assumption Evaluation Findings
Average hours of use 3.8421 4.25
Decrease in filtering time 1.87 0.5
Average HP 1 1.5
By updating the above inputs, the new engineering algorithm for single speed pool pumps would be:
(0.373kw*4.25hours/day*365days/year)= 578.6 kWh energy reduction per year per Pump/Motor assembly.
According to a 2007 Design and Engineering Services pool pump evaluation for SCE, dual speed pumps and motors use on average 40% less energy than single speed pumps.136 Therefore, an updated algorithm for multi-speed pumps would be:
(40%* 578.62 kWh)+ (578.62 kWh)= 810.1 kWh energy reduction per year per Multi Speed Pump/Motor assembly.
The demand reduction equation from the above report was calculated for multispeed pumps, and is explained below. The coincident peak demand savings takes into account the degree to which the demand savings coincides with the DEER peak demand, defined as average demand between 2:00 pm and 5:00 pm during a three-day summer heat wave. According to the ADM report, Peak Coincidence Factor is 0.52 for single and two speed pumps and the single speed pump average peak demand is 735 Watts. Using this information, the existing coincident peak demand reduction (kW) per two-speed pool pump is calculated as follows:
135 The source of the first figure (0.28) was clearly identified by SDG&E. 136 Performance and Energy Efficiency Evaluation of Residential Variable-Speed Pool Pumps, Prepared by
Design & Engineering Services, Southern California Edison, March 2007, pages 2-4, 6-8, 10-11, 13, 18-27, and 33-54

Residential Retrofit Contract Group HIM Evaluation Report
186
(Two speed kWh Savings*Single speed peak demand*Single speed peak coincidence factor) /(Single speed kWh usage) =(1040 kWh/yr*735Watts *52%)/(2600 kWh/year)=152.88 Watts demand reduction per Multi speed pump/motor.
Pool Pump Reset Agreement Engineering Review For the Pool Pump Reset Agreement, SDG&E assumed the actual average baseline kW draw was 1.531938, this is using the self-reported usage data provided by ADM to SDG&E137. According to SDG&E’s self-report data there was an average of a 1.87-hour decrease in the filtering time.
The algorithm used by SDG&E for the Pool Pump Reset Agreement is:
1.531938*1.87*365=1,045.62 kWh, or (baseline kW draw*hours of filter time reduction*days) =kWh reduction per pump/motor component.
The above SDG&E calculations take into account observed kW reductions from a 2001 analysis conducted by ADM, the same data that was used in the Pool Pump/Motor calculations. Updated data on average pumping time per day and average horsepower was gathered from administered phone surveys and site visits during this evaluation (Table 172). Average HP for reset agreement pumps was 1.6, which equals 1.19kW. Average pumping time was reduced by 0.5 hours in each season. By updating the above inputs, new engineering algorithms for the Pool Pump Reset Agreement would be:
(1.19kW/pump*0.5hour reduction in Summer months * (365/2)days) + (1.19kw/pump*0.5hour reduction in Winter months*(365/2)days)=217.2kWh reduction per year per Reset Agreement, and 1.19kW shifted from Peak Demand times.
13.6 Discussion of Findings and Recommendations for SDGE3024 Pool Pumps
EFFICIENT POOL PUMPS AND MOTORS FINDINGS AND RECOMMENDATIONS
Although the efficient pool pump measures contributed a relatively small amount to the overall SDG&E savings portfolio as seen in Table 161 & Table 162, over 96% of single speed and 99% of multi-speed pumps reported to be installed and operating. The main area for improvement would be in verifying that the rebated unit was on the list of eligible pool pumps. Specifically, only 79% of single speed and 82% of multispeed pool pumps visited onsite were verified to be on the list of eligible pumps (Table 163). Additionally, the inputs and algorithms used to calculate savings were updated in this evaluation resulting in a decrease in the claimed per unit demand savings and a decrease
137 Evaluation of Year 2001 Summer Initiatives Pool Pump Program, Performed by ADM associates for
Pacific Gas and Electric Company, April 2002, p. 1-2; 3-1; 3-2; 4-1; 4-4; 4-6; 5-1; 5-4

Residential Retrofit Contract Group HIM Evaluation Report
187
in the per unit energy savings (Table 171). A summary of the claimed vs. evaluated key parameters is presented in Table 173 and Table 174.
Table 173. Key Evaluation Parameters for SDGE3024 Single Speed Efficient Pool Pumps and Motors
Parameter IOU Claimed
(A)
Evaluated
(B)
Difference
(A-B)
NTG 0.80 0.32 0.48
% Installed 100% 96.7% 3.3%
% Qualified Model 100% 79% 21%
UES: kWh/year 650 578.6 11%
UES kW/year 0.104 0.373 259%
Table 174. Key Evaluation Parameters for SDGE3024 Multispeed Efficient Pool Pumps and Motors
Parameter IOU Claimed
(A)
Evaluated
(B)
Difference
(A-B)
NTG 0.89 0.32 0.57
% Installed 100% 99.5% 0.5%
% Qualified Model 100% 82% 18%
UES: kWh/year 1400 810.1 42%
UES kW/year 0.54 0.153 72%
POOL PUMP RESET AGREEMENT FINDINGS AND RECOMMENDATIONS
The Pool Pump Reset Agreement is a fundamentally difficult measure to enforce and evaluate. Firstly, the utility has to depend on the participant to accurately report their pre-participation filtering times. According to the phone survey, only 51% of incentivized participants were eligible for the incentive (i.e., ran their filtering types during eligible times, Table 165). Secondly, participants have to change their filtering times, and 13% did not meet the peak demand requirements (Table 166) while on average participants only reduced filtering times by 0.5 hours (Table 167). Additionally, the inputs and algorithms used to calculate savings were updated in this evaluation resulting in an increase in the claimed per unit demand savings (from 1 to 1.19kW) and a decrease in the per unit energy savings (from 900 to 217kWh) (Table 171). A summary of the claimed vs. evaluated key parameters is presented in Table 175.
Because such a large percentage of participants in the Pool Pump Reset Agreement are considered ineligible, the IOUs should consider screening the program applications to verify eligibility before incentives are paid to participants. As noted above, 30% of SDG&E Pool Pump Reset Agreement participants reported, on their applications, that they were not running during peak hours prior to participation, yet these customers were still sent incentives and included as program participants.

Residential Retrofit Contract Group HIM Evaluation Report
188
Table 175. Key Evaluation Parameters for SDGE3024 Pool Pump Reset Agreement
Parameter IOU Claimed
(A)
Evaluated
(B)
Difference
(A-B)
NTG 0.89 0.73 0.16
% Eligible and compliant
% Eligible 100% 51% 49%
% Compliant 100% 87% 13%
Total % Elig. And Compliant 100% 38% 62%
UES: kWh/year 900 217.2 76%
UES kW/year 1 1.19 19%

Residential Retrofit Contract Group HIM Evaluation Report
189
14. Downstream Lighting Programs (PGE2000, PGE2078, SCE2502, SCE2501, SDGE3017, SDGE3006)
14.1 Evaluation Objectives for Downstream Lighting The HIMs are defined as those efficiency measures common across IOU programs that contribute greater than 1% to the entire IOU savings portfolio for reductions in electrical consumption, electrical demand, or natural gas consumption. The four high impact measure categories included in the downstream lighting program (DLP) evaluation are interior compact fluorescent fixtures, exterior compact fluorescent fixtures, linear fluorescent fixtures, and interior CFLs. These measures were offered through downstream lighting programs as part of a total of six programs from PG&E (PGE2000 and PGE2078), SCE (SCE2502 and SCE2501), and SDG&E (SDGE3017 and SDGE3006).
There were four primary objectives of the DLP evaluation:
Determine the percentage of program lighting that was installed and operating properly
Derive net-to-gross ratios to evaluate net savings
Determine hours of use for common area lighting fixtures that were not covered as part of the upstream lighting evaluation
Determine end use savings estimates
PROGRAM OVERVIEWS
The downstream lighting programs utilized three distinct implementation strategies with different savings claims. For this reason, the DLP evaluation employed different methods to evaluate the multi-family, lighting exchange, and Comprehensive Manufactured and Mobile Home Program (CMMHP) segments.
PGE2000, SCE2502 and SDGE3017 Multi-family Rebate Programs The multi-family rebate programs motivate owners and managers of multi-family properties to install energy efficient products in individual apartments and common areas. The programs offer rebates for high-efficiency, residential interior screw-in CFL lamps, reflectors, interior and exterior residential fluorescent lighting fixtures, lighting controls (such as photocells), attic insulation, room air conditioners, gas water heaters, water heater controllers, and low-flow faucet aerators, showerheads, and dishwashers.
SCE2501 and SDGE3006 Lighting Exchange Programs SCE and SDGE target low income and hard to reach constituents through lighting fixture and bulb exchange events. These events are held at various places and times throughout the territory and allow customers to trade in inefficient lighting fixtures or bulbs for new, efficient options. The lighting exchange programs offer holiday lights, nightlights, torchiers, CFLs, desk and floor lamps for exchange.

Residential Retrofit Contract Group HIM Evaluation Report
190
PGE2078 Comprehensive Manufactured/Mobile Home Program (CMMHP) CMMHP seeks to produce cost-effective, long-term peak demand reductions and annual energy savings in the residential market sector. To stimulate participation, CMMHP measures are installed free of charge. The program provides residents of manufactured homes with general information about energy efficiency—and specific information about the energy efficiency measures installed in their homes. Each customer receives a brochure of energy efficiency tips that also has information about other energy efficiency programs, including phone numbers and contact information. CMMHP installs or performs as many of the following measures and activities as possible in existing manufactured homes: duct testing and sealing; air conditioning diagnostics and tune-ups; installation of compact fluorescent lamps (CFLs), faucet aerators, low-flow showerheads, and CFL hardwire fixtures.
QUALIFYING MEASURES AND CLAIMED SAVINGS
The multi-family programs account for by far the most savings from the downstream lighting programs, exceeding the HIM threshold of 1% energy or demand savings for all three electric IOUs (Table 176). Multi-family programs contributed most to the utility savings claims, while the exchange and CMMHP programs contribute <1% of utility savings. Savings by fixture type varied by utility, and included a mix of interior fixtures, exterior fixtures, linear fluorescents, and interior CFLs (Table 177).
Table 176. Claimed Energy Savings for Downstream Lighting Programs138
Segment Utility Program Claimed Savings % of IOU Claimed Savings
Units kWh kW kWh kW
Multi-family
PGE 658,186 81,078,107 7,282 1.5% 0.9%
SCE 1,669,714 126,357,156 5,864 3.9% 1.0%
SDGE 202,005 6,744,064 3,950 0.8% 2.7%
Exchange SCE 73,723 4,990,683 394 0.2% 0.1%
SDGE 60,297 2,855,142 271 0.3% 0.2%
CMMHP PGE 49,630 1,900,117 187 0.0% 0.0%
138 Source: Total claimed savings from IOU Q4 2008 Participant Tracking database

Residential Retrofit Contract Group HIM Evaluation Report
191
Table 177. Claimed Energy Savings for Downstream Lighting Multi-family Measures139
Utility Measure Program Claimed Savings % of IOU Claimed Savings
kWh kW kWh kW
PGE
Interior CF Fixtures 39,896,245 4,876 0.8% 0.6%
Exterior CF Fixtures 21,781,417 - 0.4% 0.0%
Linear Fluorescent 18,807,308 2,332 0.4% 0.3%
Interior CFLs 2,493,254 260 0.0% 0.0%
SCE
Interior CF Fixtures 47,368,807 4,443 1.5% 0.7%
Exterior CF Fixtures 63,310,266 - 1.9% 0.0%
Linear Fluorescent 2,845,442 250 0.1% 0.0%
Interior CFLs 17,823,323 1,565 0.5% 0.3%
SDGE Linear Fluorescent 1,375,772 3,262 0.2% 2.2%
Interior CFLs 8,223,434 958 1.0% 0.7%
14.2 Methodology and Specific Methods Used for Downstream Lighting Savings Evaluation
Table 179 below provides an overview of the evaluation activities for downstream lighting. As shown in Table 179 the Evaluation Team conducted telephone surveys, site visits, and installed light meters with hundreds of program participants. Note that the site visits and meter installations were nested samples of participants who also took part in the telephone survey effort. End use participants were determined from utility and implementer tracking databases of direct (mail-in or online) rebates and exchanges.
Table 178. Overview of Evaluation Activities for Downstream Lighting
Activity Programs Sample size Parameters Participant Phone Survey PGE2000, PGE2078, SCE2502,
SCE2501, SDGE3017, SDGE3006 2,071
NTG, Installation rate, Installation location
Verification Site Visits PGE2000, SCE2502, SDGE3017 614 Installation rate, Installation location
End Use Metering PGE2000, SCE2502 122 HOU, UES
139 Source: Total claimed savings from IOU Q4 2008 Participant Tracking database

Residential Retrofit Contract Group HIM Evaluation Report
192
Table 179. Detailed Evaluation Activities for Downstream Lighting
Measure Program % of IOU Claimed kWh
Savings
% of IOU Claimed kW
Savings
Number of Phone
Surveys
Number of Site Visits
Number of Sites
Metered
Multi-family Interior CF Fixtures PGE2000 0.8% 0.6% 291 93 17
SCE2502 1.3% 0.7% 311 104 24
Outdoor Fixtures PGE2000 0.4% 0.0% 202 72 20
SCE2502 1.9% 0.0% 309 97 23
Linear Fluorescent PGE2000 0.4% 0.3% 116 42 4
SCE2502 0.1% 0.0% 196 69 34
SDGE3017 0.2% 2.2% 55 55 0
Interior CFL PGE2000 0.0% 0.0% 23 2 0
SCE2502 0.5% 0.3% 173 53 0
SDGE3017 0.6% 0.5% 43 27 0
Exchange Interior Fixtures SCE2501 0.2% 0.1% 251 0 0
Interior CFL SDGE3006 0.3% 0.2% 102 0 0
CMMHP Interior CFL PGE2078 <0.1% <0.1% 0 0 0
Total* 6.71% 4.91% 2,072 614 122
*The totals reflect the number of sites with each measure. Because some sites had multiple measures the actual total of phone surveys, site visits, and metered sites is lower.
MEASURE VERIFICATION METHODS
The evaluation relied on telephone surveys and site visits to determine whether claimed downstream lighting measures were installed and operating. For each program, the interviewer sought to find the proper respondent in the household or the building owner/manager familiar with the program. Respondents were asked whether they had received rebated lighting or exchanged a fixture through their utility around the date of claimed installation or exchange event. Respondents who recalled receiving a measure were then asked whether the equipment was installed at their property, and where the measure was installed. If the equipment had not been installed, the interviewer probed for the reasons why.140
Site visits were conducted for participants in the multi-family component of the DLP, which represents the largest percentage of program savings. During the multi-family site visits, inspectors visually identified program rebated bulbs and fixtures and checked whether they were operating. The inspectors recorded the make, model, location, and wattage of the program installed bulbs when onsite.
NET-TO-GROSS METHODS
This evaluation determined NTG through the Joint Sample Self-report NTG method, administered during the telephone survey.141 Additional spillover questions were asked
140 See Appendix J for all data collection instruments for downstream lighting. 141 See Appendix K for the standardized free-ridership battery and algorithm used for this assessment.

Residential Retrofit Contract Group HIM Evaluation Report
193
during the multi-family onsite visits as well. The SDG&E multi-family program could not meet the recommended 300 participant threshold due to the low number of participating facilities. In this case, a census was attempted.
ENERGY AND DEMAND SAVINGS METHODS
First-year gross electricity savings is estimated using a simple engineering model of savings, as shown in the following equation.
First-Year Gross Electricity Savings Calculation
Average Change in Wattage X
Average Hours of Use per Day X
Days per Year / 1000
= kWh savings per year per bulb
Due to the relatively small budget and savings claims attributed to the downstream lighting programs, the intent of this evaluation was to rely heavily on the findings from ULP and to supplement that data when necessary. This evaluation did not attempt to replicate the ULP methodology.
Delta Watts Methods Because the Team was not able to confirm the actual wattage of the bulb replaced by the rebated lighting, the Team relied on the comprehensive data being collected via the lighting inventory as part of the upstream lighting metering study to further assess delta watts assumptions. Therefore, the delta watts ratios found during the ULP study were applied to the DLP program bulb onsite findings. DLP estimates were also informed by onsite inspections of the wattage of similar lighting fixtures that were not retrofitted as part of the program.
Hours of Use Methods Hours of use was gathered from two sources, the Residential Retrofit ULP Evaluation, and meter data collected as part of this effort.142 The upstream lighting evaluation metered lights from interior and exterior multi-family units, while the downstream lighting evaluation metered common area fixtures. For this evaluation, apartment and common area lighting was delineated by who controlled the light switch. For example, if an exterior fixture was controlled by an individual apartment, it was considered an apartment light. In contrast, if that same fixture was controlled centrally by the property manager or office, it was considered a common area lighting and metered as part of the DLP evaluation.
HOBO U1212 light loggers were utilized to record the on/off status of program rebated fixtures. The meters were installed for an average of 80 days during the 2009 summer months (July through September). As noted in Table 71, the downstream lighting evaluation focused metering efforts on program rebated common area linear fluorescent, interior compact fluorescent fixtures, and exterior compact fluorescent fixtures in the PG&E and SCE territories.
142 See the ULP Report for a thorough description on the calculation of delta watts for the ULP.

Residential Retrofit Contract Group HIM Evaluation Report
194
Effective Useful Life (EUL) Utilization Methods The Evaluation Team utilized 2008 DEER values as estimates for the Effective Useful Life (EUL) for program measures.
Gross Peak Demand (kW) Assessment Methods The gross demand savings calculation is shown in the equation below.
Gross Demand Savings Calculation
Average Change in Wattage
X Average
Coincidence Factor
÷ 1000 = demand savings (kW)
Average coincidence factors were determined by analyzing data from the upstream and downstream metering studies by room type/location. Specifically, the metered data were analyzed to determine the percent of time in which the efficient lighting was typically on between 2pm and 5pm during summer (defined as July through September) weekdays (i.e., the peak coincidence factor).143
Note this approach assumes that the percent of time lighting is used does not vary with temperature (i.e., the lighting peak coincidence factor is not temperature dependent). Residential lighting usage may be lower or higher than assumed on the hottest days of the year due to resident behavior such as shutting off lights to keep the space cooler or keeping more lights on as people remain inside the conditioned space rather than outside in the heat. However, limiting the metered data analysis to the 2009 peak (or approximate peak days) would provide less rigorous data, as it would only be based on three consecutive weekdays. For this reason, the Evaluation Team chose to use the average summer weekday usage between 2pm and 5pm rather than limiting the metered data analysis to the 2009 peak (based on three consecutive weekdays) since this would provide a less rigorous data set.
14.3 Confidence and Precision of Key Findings for Downstream Lighting
The targeted verification confidence and precision levels for the downstream lighting HIMs were set at 90% confidence and 10% precision, as recommended by the California Evaluation Protocols. For all programs except for PGE2078, the completed phone surveys and site visits exceeded the 90/10 level. The CMMHP (PGE2078) site visits were set by the HVAC Evaluation Team and do not meet the 90/10 confidence and precision levels, but make up a small portion of utility portfolio savings (Table 180).
143 As described in Chapter 15, ULP used the weekday model from the HOU analysis to calculate the
average daily use for the three peak days of the logger’s climate zone. DLP, with a significantly smaller sample and only a three month metering time frame, did not develop predictive models for HOU, and could not stratify by climate zone.

Residential Retrofit Contract Group HIM Evaluation Report
195
Table 180. Confidence and Precision Estimates for the DLP Evaluation
Segment Program Site Visits Phone Surveys
Number of Completes
Confidence/Precision
Number of Completes
Confidence/Precision
Multi-family
PGE2000 209 90%±6% 632 90% ±3%
SCE2502 323 90%±5% 989 90% ±3%
SDGE3017 82 90%±9% 98 90% ±8%
Exchange SCE2501 0 NA 251 90% ±5%
SDGE3006 0 NA 102 90% ±8%
14.4 Validity and Reliability of Downstream Lighting Evaluation Measurements
This evaluation seeks to meet the CPUC’s stated objective of obtaining reliable estimates of annual energy savings generated by the designed HIM groups. Section 4 of this report provides an overview of how the Evaluation team minimized the potential for error. The following section describes how the potential for error was minimized for DLP in particular. Reasonably accurate and precise estimates can be considered reliable because they minimize the potential for each of these types of error:
Measured: The Evaluation Team visually inspected the lighting, and turned the fixtures on to verify they were operational. The inspectors were equipped with the make, model, picture and location of the program installed bulbs when onsite. However, certain program measures cannot be determined definitively, as there are not program markers on the bulbs. In these instances, field staff assumed that a measure found that matched the location and description provided in the tracking database was in fact the rebated measure. There were also instances where the wattage of the bulb could not be identified. For these, field staff assumed that the program tracking database was accurate. The IOU tracking database was also hugely inaccurate. Because of this, field staff often could not find the program rebated fixture based on the description and location provided by the utility. The bulb or fixture may have been installed at a different location or apartment, but the field staff could not verify measures that did not match the tracking description. Field staff attempted to minimize this error by querying the building manager or owner to identify the program measures. A very small sample (less than 1% of the meters used for this evaluation) were found to have time ―drift,‖ where the date and the data tracking time starts to either slow or increase. To mitigate this, a sample of the lighting loggers for this evaluation were tested for the presence of any time ―drift‖ prior to installation. Additionally, quality control checks to ensure that the meter was logging data correctly were performed on all meters before launching.

Residential Retrofit Contract Group HIM Evaluation Report
196
14.5 Detailed Findings for Downstream Lighting
MEASURE VERIFICATION FINDINGS OR MULTI-FAMILY LIGHTING PROGRAMS
This section presents the verification results from the onsite inspections for the SCE, PG&E, and SDG&E multi-family lighting programs. Because property owners and managers cannot not know the status of lighting installed in all of their facilities and units, onsite verification was relied upon to determine the number of program bulbs and fixtures that are installed and operational. The verification rates varied dramatically by program and measure, most likely due to the differences in implementation strategies and program fixture quality. The highest verification rate found was for SDG&E linear fluorescent (92%), the lowest were SCE interior fixtures and SDGE interior CFLs (71%) (Table 181).
There were two primary reasons the verification rates were relatively low:
1. The inaccuracy of the tracking database. As noted earlier, there were many instances where field staff could not locate program fixtures based on the location and model information provided by the utility. This could mean that the measure was installed elsewhere, but we were unable to locate it, or that a different model was installed.
2. Broken/Removed fixtures. When onsite, many property managers and renters were quite forthcoming with why the fixture was no longer installed. Reasons cited included
a. Unreliable/easily broken fixtures
b. Expensive or hard to find replacement bulbs
c. Quality of light
Table 181. Onsite Verification Rates for Multi-family Lighting Programs
Multi-family Program Onsite Verification Rate (% Installed and Operating)
Interior CF Fixtures PGE2000 87%
SCE2502 71%
Outdoor Fixtures PGE2000 89%
SCE2502 87%
Linear Fluorescent
PGE2000 77%
SCE2502 77%
SDGE3017 92%
Interior CFL
PGE2000 89%
SCE2502 72%
SDGE3017 71%

Residential Retrofit Contract Group HIM Evaluation Report
197
MEASURE VERIFICATION FINDINGS FOR LIGHTING EXCHANGE PROGRAMS
Table 182 presents the verification results from the telephone surveys with SDGE3006 and SCE2501 lighting exchange participants. Both SCE and SDGE exchange had high installation rates, with 93% of SCE fixtures and 100% of SDGE bulbs reported installed within the service territory.
Table 182. Verification for Lighting Exchange Programs
Utility Program
Parameter Phone Survey
Onsite Survey
Installation Rate
SCE2501
(N=251)
% of units currently installed/operable
93.0% NA 93.0%
% of units not installed/operable
7.0% NA NA
SDGE3006 (N=102)
% of units currently installed/operable
100.0% NA 100.0%
% of units not installed/operable
0.0% NA NA
NET-TO-GROSS FINDINGS
The Evaluation Team used the specified NTG battery and algorithm developed by the CPUC to determine free-ridership. Results from the NTG analysis indicate relatively low levels of free-ridership for the multi-family programs, as shown in Table 183. These free-ridership values are only slightly higher than the ex ante assumptions (presented in Table 199 through Table 202.) of 11% to 22%, depending on the utility and HIM.
Table 183. Multi-family Free-ridership by HIM and Utility HIM % Free-riders (FR) NTG (1-FR)
PGE SCE SDGE PGE SCE SDGE
Interior CF fixtures 20% 23% NA 0.80 0.77 NA
Exterior CF fixtures 20% 25% NA 0.80 0.75 NA
Linear fluorescents 19% 23% 28% 0.81 0.77 0.72
Interior CFLs 41% 22% 25% 0.59 0.78 0.75
The two fixture exchange programs had very different free-ridership levels. The interior CFL bulb exchange had a higher percent of free-riders (56%) than did the fixture exchange (34%), as shown in Table 184. These values, however, were both higher than the ex ante assumptions of 20% free-ridership.
Table 184. Lighting Exchange Free-ridership by HIM and Utility HIM Program % Free-riders (FR) NTG (1-FR)
Interior Fixtures SCE2501 34% 0.66
Interior CFL SDGE3006 56% 0.44

Residential Retrofit Contract Group HIM Evaluation Report
198
SPILLOVER FINDINGS
The telephone surveys included a set of spillover questions that focused on whether the respondent purchased additional energy saving measures and the extent to which the program influenced the respondent’s decision. Table 185 and Table 186 provide the results of those questions from the downstream lighting programs.
Table 185. Spillover for Lighting Exchange Category SCE2501 SDGE3006
# of respondents reporting purchasing additional energy efficiency measures 63 61
Percent of sample 25% 60%
Average rating for program influence 7.3 7.3
Table 186. Spillover for Multi-family Programs
Category PGE SCE SDGE
# of respondents reporting purchasing additional energy efficiency measures 13 20 5
Percent of sample 8% 11% 17%
Average rating for program influence 9.6 8.5 9.4
ADDITIONAL DOWNSTREAM LIGHTING FINDINGS
During the phone surveys, lighting exchange participants were asked questions on where the new light bulb or fixture was installed. Table 187 illustrates that the two most common installation locations for both SCE and SDG&E were the living/family room and bedrooms. As shown in the hours of use analysis in Chapter 15, living rooms had somewhat high hours of use (average of 2.3 hours/day), but bedrooms had lower than average hours of use per day (1.5 hours/day).
Table 187. Lighting Exchange Installation Locations Program Living/
Family Room
Dining Room
Kitchen Bedroom Bathroom Closet Hallway Garage Outside Other
SCE2501 42% 4% 0% 42% 4% 0% 0% 0% 0% 8%
SDGE3006 33% 3% 7% 27% 11% 1% 5% 3% 4% 7%
Additionally, the onsite field staff documented the control type of the multi-family lighting verified (Table 188). Lights that were left continuously on were mostly linear fluorescents, which are often located in the common areas such as parking garages and hallways. Motion and photo sensors were most common for outdoor fixtures. Note the metering study included a random sample of participant program measures, and thus accounts for a mix of the control types.

Residential Retrofit Contract Group HIM Evaluation Report
199
Table 188. Multi-family DLP Control Type Multi-family Program Continuous
On Motion/ Photo
Sensor
Switch Timer
Interior CF Fixtures PGE2000 6% 1% 80% 13%
SCE2502 <1% 1% 99% 0%
Exterior CF Fixtures PGE2000 0% 47% 11% 41%
SCE2502 0% 53% 32% 16%
Linear Fluorescent
PGE2000 26% 15% 49% 10%
SCE2502 17% 6% 53% 24%
SDGE3017 22% 6% 68% 3%
Interior CFL
PGE2000 0% 0% 100% 0%
SCE2502 0% 8% 77% 15%
SDGE3017 3% 0% 96% 1%
Common area and apartment lighting distribution for the DLP multi-family component is provided in Table 189, and demonstrates the percentage of bulbs located in individual apartments vs. those in common area varies significantly based on the type of bulbs. The program exterior CF fixtures were largely in common areas, interior CF fixtures were predominately in apartments, while interior CFLs and linear fluorescents varied by utility.
Table 189. Multi-family DLP Location
Measure Location PGE SCE SDGE
Exterior CF fixtures Apartment 5.99% 19.98% NA
Common Area 94.01% 80.02% NA
Interior CF fixtures Apartment 76.56% 95.45% NA
Common Area 23.44% 4.55% NA
Interior CFLs Apartment 63.57% 45.39% 85.45%
Common Area 36.43% 54.61% 14.55%
Linear fluorescents Apartment 50.58% 37.29% 52.63%
Common Area 49.42% 62.71% 47.37%
MULTI-FAMILY ENERGY AND DEMAND SAVINGS FINDINGS
As noted above, calculating unit energy and demand savings required developing estimates of a number of parameters, including hours of use, delta watts, and peak coincidence factors. Each of these is discussed below.
Hours of Use Findings Average multi-family metered daily hours of use, by measure, is shown in Table 190. . The values for the apartments are based on the analysis conducted for the ULP, as described in Chapter 15. Because DLP only metered in the summer months, when daylight is the longest and light usage is expected to be the least, the Evaluation Team applied seasonality adjustments to determine annual hours of use. The DLP team utilized the seasonality factors found during the multi-family component of the ULP metering

Residential Retrofit Contract Group HIM Evaluation Report
200
study since the upstream lighting evaluation metered year round. With seasonality adjustments applied, annual hours of use by fixture can be determined.
Table 190. Multi-family Summer Hours of Use
Measure Location Avg Daily Summer
HOU*
Ratio of Annual/Summer Hours of Use**
Average Annual
Hours of Use***
Exterior CF fixtures Apartment 3.69 1.087 1,462.7
Common Area 8.55 1.087 3,390.3
Interior CF fixtures Apartment 1.59 1.164 674.1
Common Area 5.56 1.087 2,207.3
Interior CFLs Apartment 1.59 1.164 674.1
Common Area 5.56 1.087 2,207.3
Linear fluorescents144 Apartment 3.76 1.164 1,595.7
Common Area 10.94 1.087 4,339.6
*Based on DLP metering effort for common areas and ULP metering effort for apartments
**Ratios derived from ULP for multi-family apartments and applied to common areas
***Calculated as the average daily summer HOU * ratio of annual/summer * 365 days.
Delta Watts Findings The DLP evaluation also needed to determine the average difference between a program rebated bulb and an incandescent or baseline linear fluorescent bulb. To do that, we utilized the average program bulb wattage by IOU service territory found during the DLP verification efforts, and the average ratio of CFL-to-non-CFL wattage from the upstream lighting efforts. The average change in wattage is summarized in Table 191.
Table 191. Multi-family Average Delta Watts (Per Bulb) Measure PGE SDGE SCE
Avg. Install Watts
Ratio of Baseline to
Install
Delta Watts
Avg. Install Watts
Ratio of Baseline to Install
Delta Watts
Avg. Install Watts
Ratio of Baseline to Install
Delta Watts
Interior CFLs 31.8 3.50 79.45 16.3 3.48 40.44 17.4 3.85 49.58
Exterior CF fixtures 18 4.12 56.18 NA NA NA 20.7 3.67 55.29
Interior CF fixtures 28.3 3.50 70.71 NA NA NA 27.3 3.85 77.8
Linear fluorescents145 33.3 1.25 8.33 35.3 1.25 8.83 46 1.25 11.5
Sources:
Avg. Install watts represents average installed program bulb wattage collected during the onsite verification.
Ratio of baseline to install represents the calculated ratio, from the ULP lighting inventory (for MF), of non-program (baseline) to program bulbs.
Delta watts represents the difference between calculated baseline watts and the program installed bulb wattage, calculated as: Delta watts = (Avg. Install Watts * Ratio of Baseline to Install) – Avg. Install Watts
144 At the time of this report draft, the ULP apartment linear fluorescent meter data had not been analyzed.
Therefore, the team took the average apartment to common area HOU ratio and applied it to the linear fluorescent hours of use.
145 The linear fluorescent wattage is based off the assumption that the average T-8 uses 25% less energy than a T-12

Residential Retrofit Contract Group HIM Evaluation Report
201
Peak Coincidence Factor Findings As part of the analysis for both upstream and downstream metered data, the team determined peak coincidence factors for the different HIMs. Common area lighting, which is also likely to be on for more hours a day, generally has substantially higher peak coincidence factors than individual units (Table 192).
Table 192. Multi-family Average Peak Coincident Factors Measure Location Peak
Coincidence Factor
Exterior CF fixtures Apartment 14.2%
Common Area 9.0%
Interior CF fixtures Apartment 5.3%
Common Area 15.3%
Interior CFLs Apartment 5.3%
Common Area 15.3%
Linear fluorescents146 Apartment 14.6%
Common Area 42.3%
Source: ULP lighting inventory and metering study (for MF)
Calculation of Energy and Peak Demand Savings Findings To calculate annual energy savings per bulb, the team multiplied the change in watts (Table 191) by the annual hours of use (Table 190) and converted to kWh (dividing by 1,000). Results are below in Table 193.
Table 193. DLP Multi-family Estimated Gross Unit Energy Savings by Measure and Location147
Measure Location Estimated Annual Energy Savings (kWh/Year)
PGE SCE SDGE
Exterior CF fixtures Apartment 82.17 80.88 NA
Common Area 190.47 187.46 NA
Interior CF fixtures Apartment 47.66 52.44 NA
Common Area 156.08 171.72 NA
Interior CFLs Apartment 53.56 33.42 27.26
Common Area 175.38 109.45 89.26
Linear fluorescents Apartment 13.28 18.35 14.08
Common Area 36.13 49.91 38.30
To calculate the peak savings per bulb, the team multiplied the change in watts (Table 191) by the peak coincidence factors (Table 192) and converted to kW Results are below in Table 194.
146 At the time of this report draft, the apartment linear fluorescent meter data had not been analyzed.
Therefore, the team took the average apartment to common area peak ratio and applied it to the linear fluorescent peak coincidence factor.
147 These are estimated gross savings per bulb, not accounting for the verification or NTG adjustments.

Residential Retrofit Contract Group HIM Evaluation Report
202
Table 194. DLP Multi-family Gross Peak Savings by Measure and Location148
Measure Location Peak Savings (kW)
PGE SCE SDGE
Exterior CF fixtures Apartment 0.008 0.008 NA
Common Area 0.005 0.005 NA
Interior CF fixtures Apartment 0.004 0.004 NA
Common Area 0.011 0.012 NA
Interior CFLs Apartment 0.004 0.003 0.002
Common Area 0.012 0.008 0.006
Linear fluorescents Apartment 0.001 0.002 0.001
Common Area 0.004 0.005 0.004
Since many of the utilities do not differentiate between common area and apartment lighting savings, we applied the ratio of apartment and common area program fixtures found during the onsite verification (Table 189) to determine savings by HIM and utility (Table 196).
Table 195. DLP Multi-family Gross Energy Savings by HIM149
HIM Peak Savings (kW) Energy Savings (kWh)
PGE SCE SDGE PGE SCE SDGE
Exterior CF fixtures 0.005 0.006 NA 183.98 166.16 NA
Interior CF fixtures 0.005 0.004 NA 73.08 57.87 NA
Interior CFLs 0.007 0.005 0.003 97.94 74.94 36.28
Linear fluorescents 0.002 0.004 0.002 24.57 38.14 25.55
Table 196 details the relative precision of savings estimates for multi-family lighting by HIM and utility.
Table 196. DLP Multi-family Relative Precision of Savings
HIM Peak Savings (kW) Relative Precision
Energy Savings (kWh) Relative Precision
PGE SCE SDGE PGE SCE SDGE
Exterior CF fixtures 58.7% 47.4% NA 25.9% 14.9% NA
Interior CF fixtures 45.9% 52.7% NA 17.4% 16.0% NA
Interior CFLs 44.8% 48.5% 48.7% 20.7% 27.4% 16.9%
Linear fluorescents 17.1% 19.1% 16.9% 11.9% 14.6% 11.5%
LIGHTING EXCHANGE ENERGY SAVINGS FINDINGS
Because the lighting exchange programs are tailored to individuals rather than multi-family landlords or facility managers, the upstream lighting metering study provided more relevant hours of use, change in watts, and peak coincidence factors (i.e., the parameter estimates for single-family and apartments, rather than common areas, are 148 These are estimated gross savings per bulb, not accounting for the verification or NTG adjustments. 149 These are estimated gross savings per bulb, not accounting for the verification or NTG adjustments.

Residential Retrofit Contract Group HIM Evaluation Report
203
more appropriate). The phone survey asked participants about the location of the incentivized bulbs and fixtures (Table 187), so we stratified the savings parameters by the same location types (Table 197).
Table 197. DLP Lighting Exchange Gross Savings Parameters150
Location Type Daily Hours of Use Delta Watts Peak Coincidence Factor
SCE SDGE SCE SDGE SCE SDGE
Living/Family Room 2.50 2.00 52.77 55.21 6% 3%
Dining Room 1.90 1.50 32.95 65.13 6% 4%
Kitchen 2.60 1.90 77.18 17.43 8% 4%
Bedroom 1.70 1.20 49.54 69.68 5% 2%
Bathroom 1.50 1.00 42.99 51.00 8% 5%
Closet 1.70 1.10 50.31 52.62 6% 3%
Hallway 1.50 0.90 46.86 24.45 5% 2%
Garage 1.90 1.50 50.31 52.62 12% 9%
Outside 4.00 3.40 52.59 65.13 15% 12%
Other 1.70 1.10 50.31 52.62 6% 3%
Just as with the multi-family data, peak savings were calculated by multiplying the change in watts by the peak coincidence factors (Table 197) and converting to kW. Energy savings were calculated by multiplying the change in watts by the annual hours of use (Table 199) and converting to kWh. Results are shown below in Table 200. Because the utilities do not stratify their savings by room, we utilized the phone survey results to determine the installation locations (Table 187) and create weighted average gross savings estimates.
Table 198. DLP Lighting Exchange Annual Gross Savings by Room Type151
Location Type Energy Savings (kWh/Year)
Peak Savings (kW)
SCE SDGE SCE SDGE
Living/Family Room 48.16 40.30 0.003 0.002
Dining Room 22.85 35.66 0.002 0.002
Kitchen 73.24 12.09 0.006 0.001
Bedroom 30.74 30.52 0.003 0.002
Bathroom 23.54 18.61 0.003 0.002
Closet 31.22 21.13 0.003 0.002
Hallway 25.66 8.03 0.002 0.001
Garage 34.89 28.81 0.006 0.005
Outside 76.78 80.83 0.008 0.008
Other 31.22 21.13 0.003 0.002
Weighted average (based on bulbs per room type) 37.69 31.60 0.003 0.002
150 The key ULP parameters utilized for the Lighting Exchange Program, including hours of use, delta
watts, and peak coincidence factor, are based on single-family households. 151 These are estimated gross savings per bulb, not accounting for the verification or NTG adjustments.

Residential Retrofit Contract Group HIM Evaluation Report
204
14.6 Discussion of Findings and Recommendations Downstream Lighting
MULTI-FAMILY LIGHTING FINDINGS AND RECOMMENDATIONS
Because the multi-family lighting programs varied so dramatically, so did the claimed savings and verification rates, as shown below in Table 201 through Table 202. While the NTG was typically not substantially different from the claimed values, the verification rate of the installed measures tended to be low. The IOUs could improve the DLP, and increase the future verification rate, in two ways:
Provide more accurate and verifiable data in the IOU tracking database so that the measures could be more easily verified by third party evaluators. The tracking data was of limited value, in many cases not identifying the location of the installed measure. In some cases the property manager could not even identify the program bulbs for the onsite inspectors.
Improve the quality of the program fixtures to mitigate early failures. Residents and property managers expressed frustration regarding the early failure of program bulbs, as well as the difficulty of finding replacement bulbs and the high cost of the replacement bulbs. In some cases, property managers replaced pin-based CFL program fixtures with traditional screw-based sockets as this was less expensive than purchasing a hard-to-find replacement bulb. Higher quality fixtures would minimize early failures, and making sure property managers have spare bulbs and access to low-cost replacement bulbs would prevent many cases of early fixture removal.
Table 199. Key Savings Parameters SDGE3017
Measure Parameter IOU Claimed (A)
Evaluated (B)
Difference (A-B)
Interior CFLs NTG 0.89 0.75 0.14
% Installed 100% 71% 29%
UES: kWh/year 43.46 36.28 7.19
UES kW/year 0.006 0.003 0.003
Linear Fluorescents
NTG 0.89 0.72 0.17
% Installed 100% 92% 8%
UES: kWh/year 17.52 25.55 (8.03)
UES kW/year 0.042 0.002 0.039

Residential Retrofit Contract Group HIM Evaluation Report
205
Table 200. Key Savings Parameters SCE2502
Measure Parameter IOU Claimed (A)
Evaluated (B)
Difference (A-B)
Exterior CF Fixtures
NTG 0.78 0.75 0.03
% Installed 100% 87% 13%
UES: kWh/year 207.76129 166.16 41.60
UES kW/year 0 0.006 (0.006)
Interior CF Fixtures
NTG 0.78 0.77 0.01
% Installed 100% 71% 29%
UES: kWh/year 54.68 57.87 (3.17)
UES kW/year 0.005 0.004 0.001
Interior CFLs NTG 0.78 0.78 0.00
% Installed 100% 72% 28%
UES: kWh/year 41.42 74.94 (33.52)
UES kW/year 0.004 0.005 (0.002)
Linear Fluorescents
NTG 0.89 0.77 0.12
% Installed 100% 77% 23%
UES: kWh/year 17.80 38.14 (20.34)
UES kW/year 0.002 0.004 (0.002)
Table 201. Key Savings Parameters PGE2000
Measure Parameter IOU Claimed (A)
Evaluated (B)
Difference (A-B)
MF Interior CF Fixtures
NTG 0.89 0.80 0.09%
% Installed 100% 87% 13%
UES: kWh/year 94 73.08 21.05
UES kW/year 0.012 0.005 0.006
MF Exterior CF Fixtures
NTG 0.89 0.80 0.09
% Installed 100% 89% 11%
UES: kWh/year 194.46 183.98 10.47
UES kW/year 0 0.005 (0.005)
MF Interior CFLs NTG 0.89 0.59 0.30
% Installed 100% 89% 11%
UES: kWh/year 145.81 97.94 47.87
UES kW/year 0.018 0.007 0.011
MF Linear Fluorescents
NTG 0.89 0.81 0.08
% Installed 100% 77% 23%
UES: kWh/year 159.05 24.57 134.48
UES kW/year 0.020 0.002 0.017
DISCUSSION OF LIGHTING EXCHANGE FINDINGS AND RECOMMENDATIONS
The two lighting exchange programs, SDGE3006 and SCE2501, have substantially lower evaluated savings than claimed savings. The free-ridership numbers were quite high (30% to 55%), and the claimed UES savings appeared to be excessively high: in some cases, the per-fixture claimed savings was upwards of 440 kWh.

Residential Retrofit Contract Group HIM Evaluation Report
206
Table 202. Key Evaluation Savings Estimates for Lighting Exchange
Measure Parameter IOU Claimed (A)
Evaluated (B)
Difference (A-B)
SDGE3006
(Interior CFL)
NTG 0.80 0.44 0.36
% Installed 100% 100% 0%
UES: kWh/year 47.4 31.60 15.75
UES kW/year 0.00 0.00 0.00
SCE2501
(Interior CF Fixtures)
NTG 0.80 0.66 0.14
% Installed 100% 93% 7%
UES: kWh/year 67.69 37.69 30.00
UES kW/year 0.00 0.00 0.00