


Bahasa
Halaman
Hukum

Schizophrenia Research, 6 (1992) 15-24 0 1992 Elsevier Science Publishers B.V. All rights reserved 0920-9964/92/$05.00
15
SCHIZO 00191
CEEG mapping in drug-free schizophrenics
Differences from healthy subjects and changes induced by haloperidol
treatment
Silvana Galderisi, Armida Mucci, Maria Laura M&none, Mario Maj and Dargut Kemali
Department qf Psychiatry, First Medical School, Universit.y qf Naple.7. Large Madonna delle Grazie, I-80138 Naples, Itall
(Received 10 January 1991, accepted 14 April 1991)
A topographic CEEG investigation was carried out in 20 drug-free, DSM-IIIR diagnosed schizophrenics and in a group of matched healthy controls. The effects of acute and chronic haloperidol treatment were then assessed in the patient group. On the baseline recording, schizophrenics showed a widespread increase in delta, theta, and beta, amplitude. Acute haloperidol administration produced a decrease in delta and an increase in slow beta amplitude. After 28 days of treatment, delta and fast beta were reduced while theta, and alpha, were increased. CEEG abnormalities in schizophrenic subjects appear, therefore, to be reduced by chronic neuroleptic treatment.
Key words: CEEG mapping; DSM-IIIR schizophrenia; Haloperidol
INTRODUCTION
CEEG abnormalities in schizophrenia have been the subject of a large body of literature (Itil, 1977; Morihisa, 1986; Buchsbaum and Haier, 1987).
An augmented activity in the slow EEG fre- quencies in schizophrenic patients compared to healthy subjects has been consistently reported (Itil et al., 1972; Lifshitz and Gradijan, 1974; Etevenon et al., 1979; Stevens and Livermore, 1982; Morihisa et al., 1983; Karson et al., 1987; Guenther et al., 1988; Miyauchi et al., 1990). However, the possible influence of eye movement artifacts or neuroleptic treatment on these results is still debated.
The first issue of the possible influence of eye movement artifacts was raised by some investiga- tors reporting the largest percentage of delta activ- ity in schizophrenic patients over the frontal leads (Morihisa et al., 1983; Morstyn et al., 1983;
Correspondence to: S. Galderisi, Department of Psychiatry,
First Medical School, University of Naples, Largo Madonna delle Grazie, I-80138 Naples. Italy.
Guenther et al., 1986, 1988). Such an antero- posterior gradient has been interpreted as either a contamination of EEG activity with eye movement artifacts (Karson et al., 1987) or as an EEG correlate of the decreased frontal blood flow/ glucose metabolism documented by rCBF and PET studies (Ingvar and Franzen, 1974; Buchs-
baum and Haier, 1987). However, the study by
Karson et al. (1987), addressing more specifically the problem of eye movement contribution to
frontal slowing, did not confirm the antero-poste- rior gradient and reported a widespread increase
of delta. On the other hand, rCBF and PET results concerning frontal regions have been called into
question by more recent studies (Berman and Weinberger, 1986).
Whether neuroleptic medication increases the observed EEG findings is controversial. Although pharmaco-EEG studies show an increase of delta activity in healthy subjects after neuroleptic admin-
istration (Fink, 1974) most of the studies support- ing a delta increase in schizophrenia involved unmedicated patients (Itil et al., 1972; Etevenon
et al.. 1979; Stevens and Livermore, 1982; Morihisa et al.. 1983; Karson et al., 1987). Moreover, when both
Subjects
Patients were recruited from the inpatient and outpatient facilities of a mental health service and a psychiatric department. Selection criteria for patients were: (1) a DSM-ITTR diagnosis of schizo- phrenia; (2) an age between 18 and 45 years; (3) an educational level of at least 5 years; (4) a negative neurological examination; (5) no history of mental retardation, alcoholism, drug abuse. neurological disorders, head injury; (6) no history of electroconvulsive therapy.
Healthy controls were unpaid volunteers re- cruited from medical students and department personnel. They all met the following selection criteria: (1) the absence of personal or family history of psychiatric disorders; (2) the comparabil- ity to patients with respect to age. sex, educational level and handedness; (3) a negative neurological examination; (4) no history of mental retardation,
alcoholism, drug abuse, neurological disorders, head injury.
The patient sample was represented by 20 schizo- phrenics, seven females and 13 males, with an age range between 19 and 37 years (mean? SD 25.65 +4.84), a duration of illness ranging from 6 months to 17 years (mean k SD 6.1 k4.8 years) and an age at onset from 16 to 26 (mean f SD 20.9 + 2.8). 18 of them had previously been treated with neuroleptics (with a dosage range of 200- 800 CPZ equivalents); long-acting neuroleptics were reported only for five patients (haloperidol decanoate, 50- 100 mg/month; fluphenazine dec- anoate, 2550 mg,/month); concomitant medic- ations were benzodiazepine and anticholinergic drugs.
Patients were subtyped according to both DSM- IIIR criteria and Andreasen’s criteria for positive. negative, and mixed schizophrenia.
18 patients completed a wash-out period of at least 15 days (1 month for long-acting neuroleptics) before entering the study. Two patients were drug- naive.
The control group included 21 healthy subjects, eight females and 13 males, with an age range of 19-38 years (mean _t SD 27.05 i4.83).
For both patients and controls 10 min of resting, eyes closed EEG were recorded at about 8.30 a.m. For patients this baseline EEG was recorded at the end of the wash-out period; in the same day, further recordings were obtained. I, 3, 6 and 8 h after the administration of a single oral dose of 3 mg of haloperidol. This dose was selected accord- ing to the department clinical protocol and previ- ous studies on CEEG changes induced by haloperidol in schizophrenic patients, using dos- ages between 2 and 5 mg (Saito, 1978; Itil et al., 1981; Saletu et al., 1986). Drug administration was continued for 28 days, and EEG recordings were obtained on the 7th and 28th day of treatment. 14 h from the last drug administration. The daily dosage of haloperidol was 3 mg during the first week; it was increased to 5 mg during the 2nd week and, when tolerated (in 14 out of 20 patients), to 7 mg during the 3rd and 4th week. No other CNS effective drugs were allowed during this period. Only three patients required an anticholin- ergic medication (biperiden. 4 mgjday) for extra-
delta
(1.3-3.5 Hz)
theta,_
(3.75-5.5 Hz)
Schizophrenics 17
Controls
(26.
be %a3
25- .35.0 Hz)
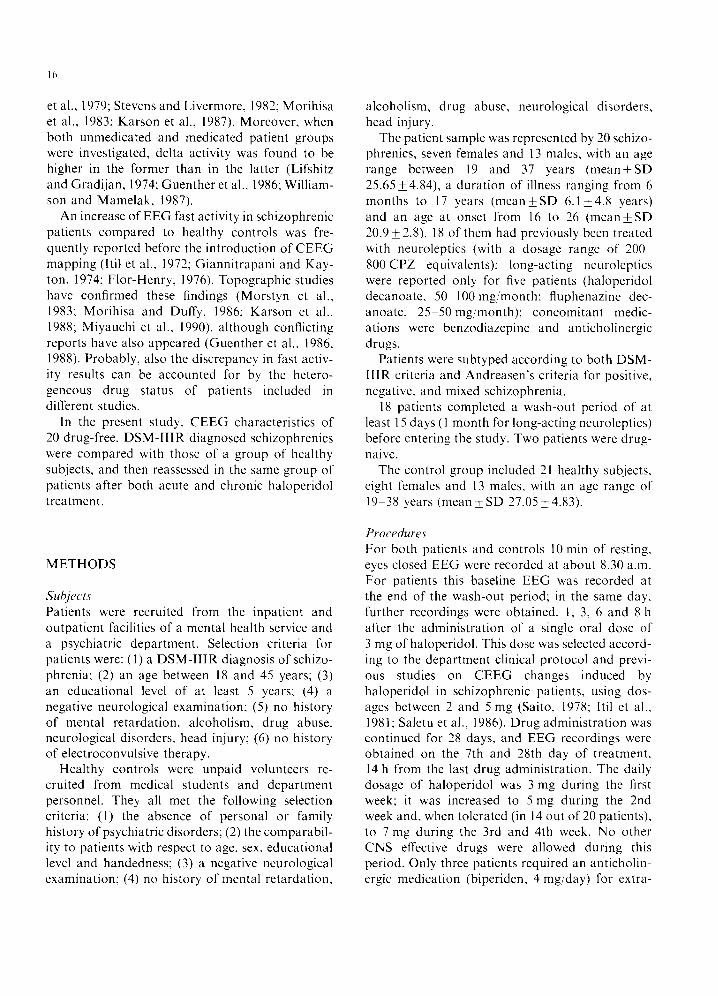
Fig. 1. Mean amplitude maps for schizophrenics and healthy controls. Color key is shown on the right. Numbers are amplitude values in pV.
pyramidal side effects. This was always discontin- ued 2 days before EEG recordings.
Ag-AgCl electrodes were attached according to the International lo-20 System procedures; 16 unipolar leads were used (Fpl, Fp2, F3, F4, F7, F8, T3, T4, T5, T6, C3, C4. P3. P4, 01, 02, each referred to the ipsilateral earlobe). Fp2 and an additional electrode placed below the center of the right eye, both referred to the right ear, were used to control for vertical eye movements: in fact, referring both electrodes to the ear will demon- strate in-phase waves between the two channels if the activity is coming from the frontal lobe and phase-reversal between the two electrodes if there is eye movement in the vertical plane. Horizontal eye movements were monitored from Fpl referred to an electrode placed at the outer canthus of the left eye. To reduce blink artifacts, light gauze pads were placed over the closed eye lids of the subject.
EEGs were recorded in an electrically shielded, sound and light attenuated room. A 21 channel Nihon Kohden electroencephalograph was used, with a bandpass between 1.3 and 35 Hz and with a 50 Hz notch filter. Electrode impedance was kept below 5 kQ throughout the EEG recording.
For analog-to-digital conversion and fast Fourier transformation of the EEG signal, the HZ1 BFM System for Compaq 386 was used. Eight frequency bands were calculated: delta, from 1.3 to 3.5 Hz; theta,, from 3.75 to 5.5 Hz; theta,, from 5.75 to 7.5 Hz; alpha,, from 7.75 to 9.5 Hz; alpha,. from 9.75 to 12.5 Hz; beta,, from 12.75 to 15.0 Hz; beta,, from 15.25 to 26 Hz; beta,, from 26.25 to 35 Hz.
The paper record was visually inspected to select artifact-free epochs for subsequent analysis. In order to include a subject in the study a minimum number of 16 5 s epochs for each EEG was re- quired.
Since, even after removal of epochs contami- nated by artifacts, small blinks or muscle activity could be detected in 11 out of the 41 subjects at Fpl, Fp2, F7 and F8 these leads were not included in the statistical analysis.
Explorative statistical analysis was performed following Abt’s recommendation for EEG topo- graphic results (Abt, 1988). The Mann-Whitney I/ test was applied for group comparisons, and the Wilcoxon-Wilcox test was used for the analysis of CEEG changes induced by haloperidol in band amplitude (square root of absolute power) and mean frequency.
EEG maps were constructed by a nearest four point linear interpolation (Buchsbaum et al., 1982).
Clinical evaluation was done at time 0 and then weekly. The Scale for the Assessment of Positive Symptoms (SAPS, Andreasen, 1984) the Scale for the Assessment of Negative Symptoms (SANS, Andreasen, 198 I). and the Comprehensive Psycho- pathological Rating Scale (CPRS. Asberg et al., 1978) were used for symptom ratings.
RESULTS
Using DSM-IIIR criteria, 12 patients were classi- fied as paranoid, three as undifferentiated. four as disorganized and one as catatonic. Six patients met the criteria for positive, two for negative. and 12 for mixed schizophrenia (using Andreasen’s scales (1981, 1984)).
Mean scores on psychopathological rating scales (total and subscale scores on SAPS and SANS and total score on CPRS) at the end of the wash- out period (time 0) and after 28 days of haloperidol treatment are reported in Table 1. A significant reduction of the total scores on SAPS, SANS and CPRS was observed after treatment. As to the
Scores on SAPS
Hallucinations
Delusions
Bizarre behaviour
Positive formal
thought disorder
Total
Scores on SANS
Affective flattening Alogia Avolition
Anhcdonia
Attention
Total
Total score
on CPRS
4.6 f 5.3 11.2+7.7 2.313.6
5.x * 7.4 24.1 * 19
x.2*7.3 4.4k4.5
5.6k3.7
9.9 i 3.9 3.1k2.9
31.3+19.2
34.1* 17.1
1.3+2.3***
4.7 2 4.9****
1.3*3.5**
3.x i6.F 11.2+ 14****
6+6.3**
3.4*3.6* 4.4*3.4**
x.9*4.1 2.4*2.7**
2S.?t 16.9**
18.5+ 14.4****
*,‘<().05; **/,<o.ol: ***p<o.o05; ****P~0.0005
subscales, only scores on anhedonia were not significantly reduced after treatment.
Differences in band amplitude between schizo- phrenics and healthy controls are shown in Fig. 1.
An increase of delta, theta, and beta, amplitude, and a decrease of alpha, amplitude, were observed in the patient group compared with controls. In Table 2 p values below 0.05, obtained from this comparison, are reported. showing that in schizo- phrenics the increase of delta amplitude was sig- nificant over all the explored leads and the increase of theta, and beta, in most of the leads.
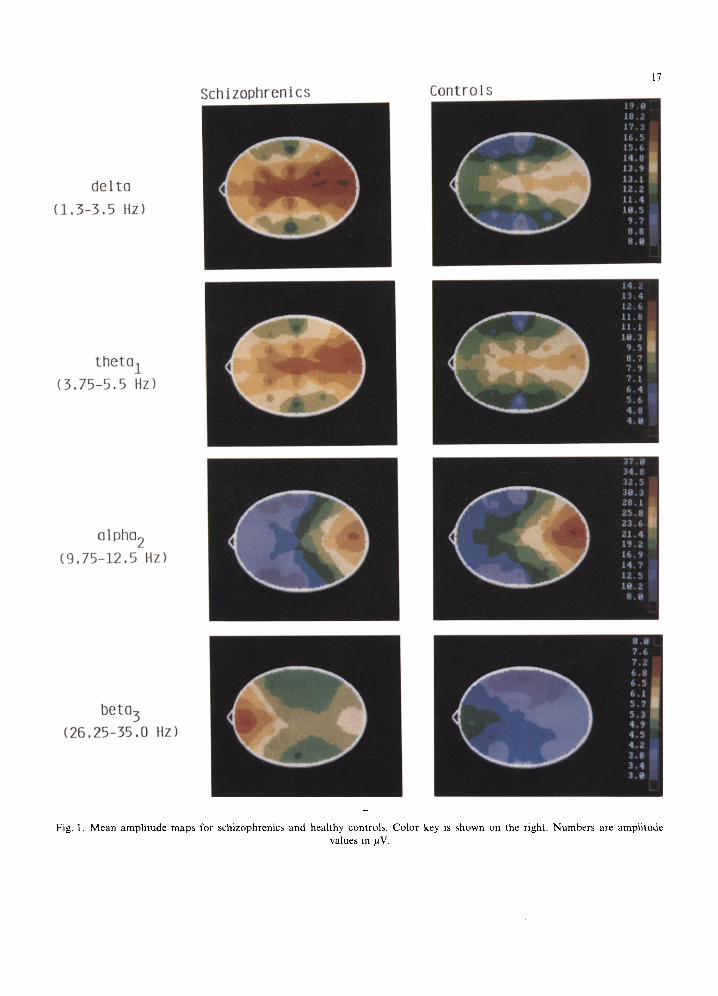
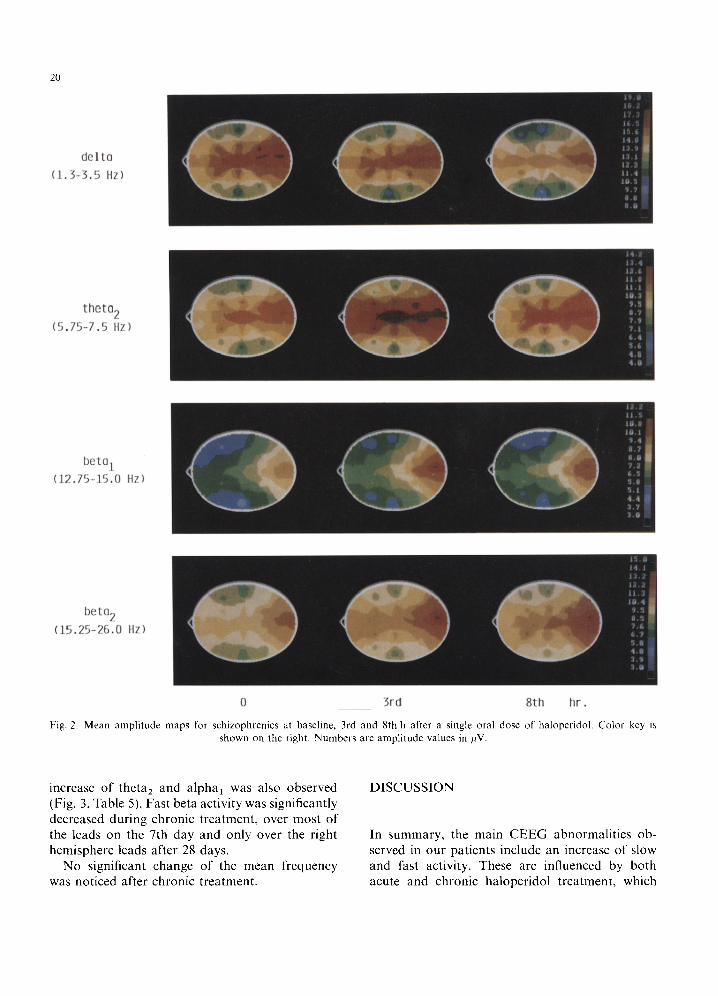
Fig. 2 describes amplitude changes induced by acute haloperidol treatment in the patient group.
Only results from the 3rd and the 8th h after
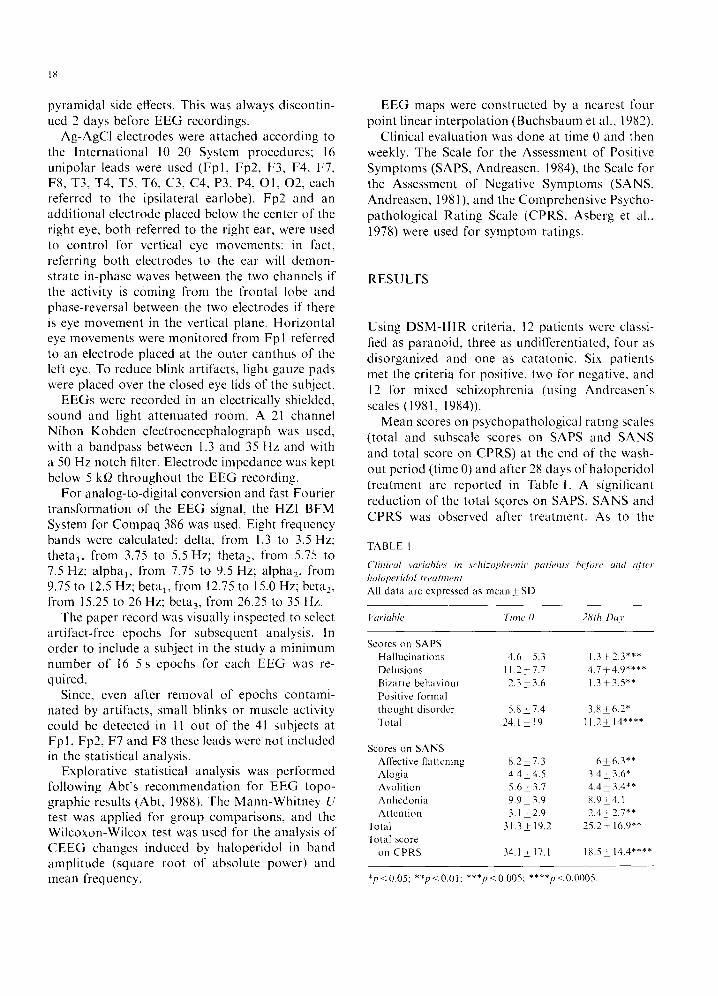
TABLE 2
I 0
drug administration are discussed. since in the 1st h there was no significant change and in the 6th and 8th h CEEG modifications were very similar. but generally more marked in the 8th h.
After 3 and 8 h delta amplitude was reduced with respect to the baseline EEG. Such a decrease was significant only over two leads (T3 and C3) in the 3rd h and over most of the leads in the 8th h (Table 3). A rather widespread increase in beta, and beta2 was also observed (Fig. 2. Table 3). Theta, was augmented over F3. C3 and C4 in the 3rd h. As a result of these changes, an increase of the mean frequency was observed (Table 4).
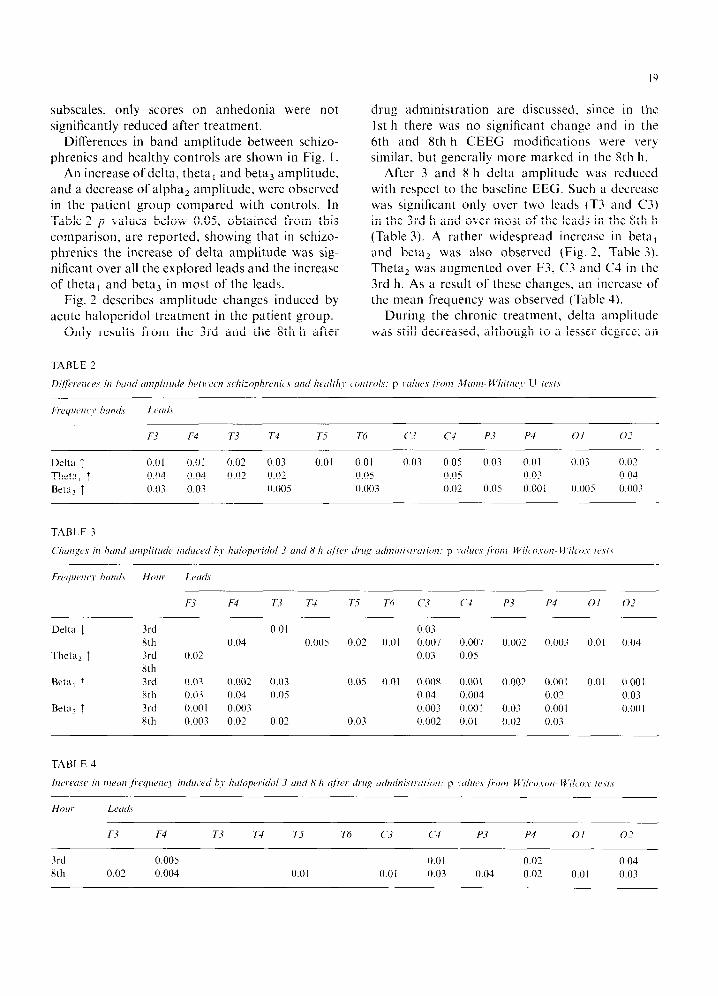
During the chronic treatment, delta amplitude was still decreased, although to a lesser degree; an
Dilfarcrlc~c~s ill htrt7tl tl/li/~lilLt& he/ll~lY~n .cc,lli-_oph,erfic., tnld lfc~tll~ll~’ c~0tltrf~l.S: p I’tlllrcJ.v /1.01?1 ~2~flWl- M’hiftK~~~ U I(‘\/.\
Ft~y~cv~c~~~ hundv LCdY
F3 F4 T3 T4 T-7 Th c‘3 c4 P3 P4 0 I 0.J
Delta 1 0.01 0.01 0.02 0.03 0.01 0.01 0.03 0.05 0.03 0.01 0.03 0.0’ Theta, t 0.04 0.04 0.02 0.0’ 0.05 0.05 0.03 0.04
Beta, T 0.03 0.03 0.005 0.003 0.02 0.05 0.00 I 0.00s 0.003
Frer/ucnc~~~ hrmtl.\ Hou, Lrd,
F3 F4 T3 T4 T-7 Th c-3 (‘4 P3 P4 0 I 0_7
Delta 1 3rd 0.01 0.03
8th 0.04 0.005 0.02 0.01 0.007 0.007 0.002 0.003 0.01 0.04
Theta, T 3rd 0.02 0.03 0.05
Xth
Beta, 7 3rd 0.03 0.002 0.03 0.05 0.01 0.008 0.001 0.002 0.001 0.01 0.00 I 8th 0.03 0.04 0.05 0.04 0.004 0.02 0.03
Beta, t 3rd 0.00 I 0.003 0.003 0.001 0.03 0.001 0.00 I 8th O.OU3 0.02 0.02 0.03 0.002 0.01 0.02 0.03
20
delta
(1.3-3.5 Hz)
theta2
(5.75-7.5 Hz)
beta1
(12.75-15.0 Hz)
beta2
(15.25-26.0 Hz)
0 3rd 8th hr .
Fig. 2. Mean amplitude maps for schizophrenics at baseline, 3rd and 8th h after a single oral dose of haloperidol. Color key is
shown on the right. Numbers are amplitude values in pV.
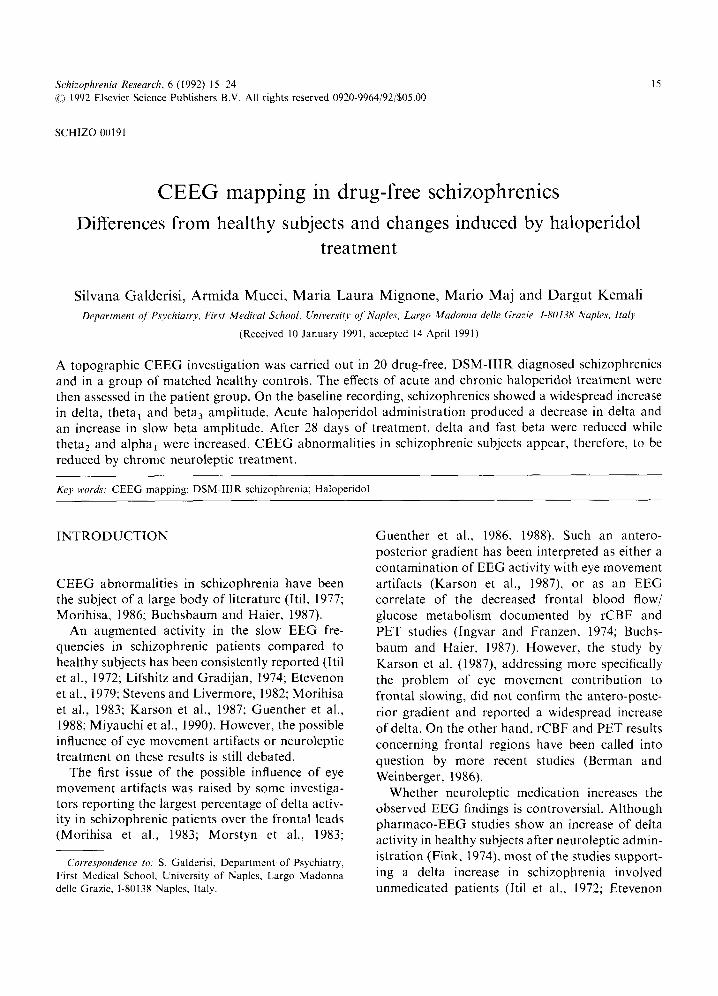
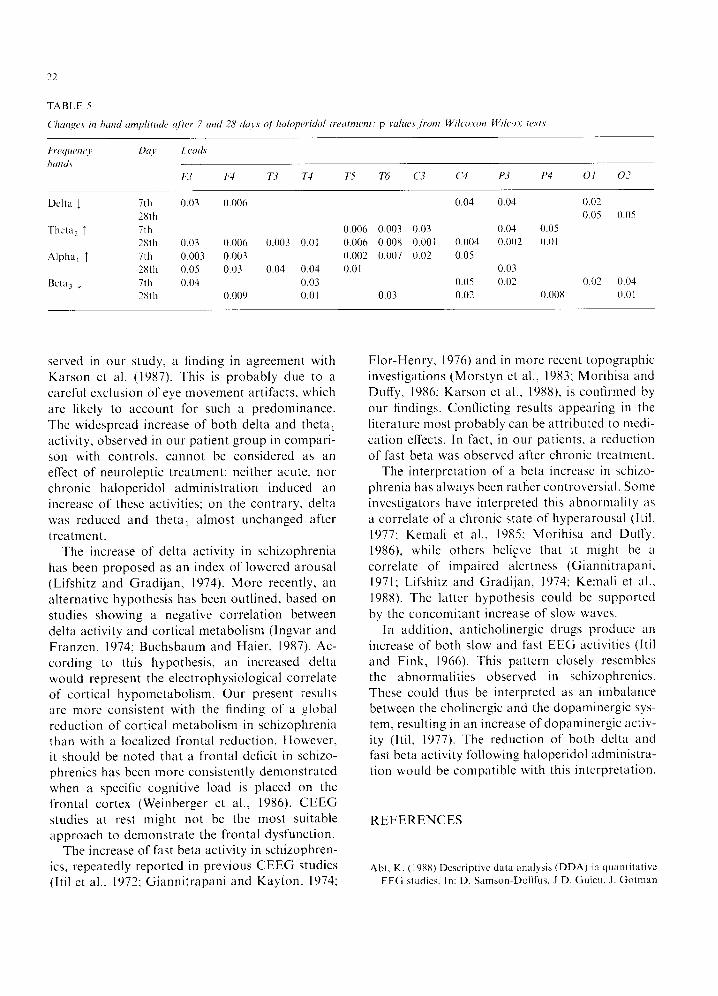
increase of theta, and alpha, was also observed (Fig. 3, Table 5). Fast beta activity was significantly decreased during chronic treatment, over most of the leads on the 7th day and only over the right hemisphere leads after 28 days.
No significant change of the mean frequency was noticed after chronic treatment.
DISCUSSION
In summary, the main CEEG abnormalities ob- served in our patients include an increase of slow and fast activity. These are influenced by both acute and chronic haloperidol treatment, which
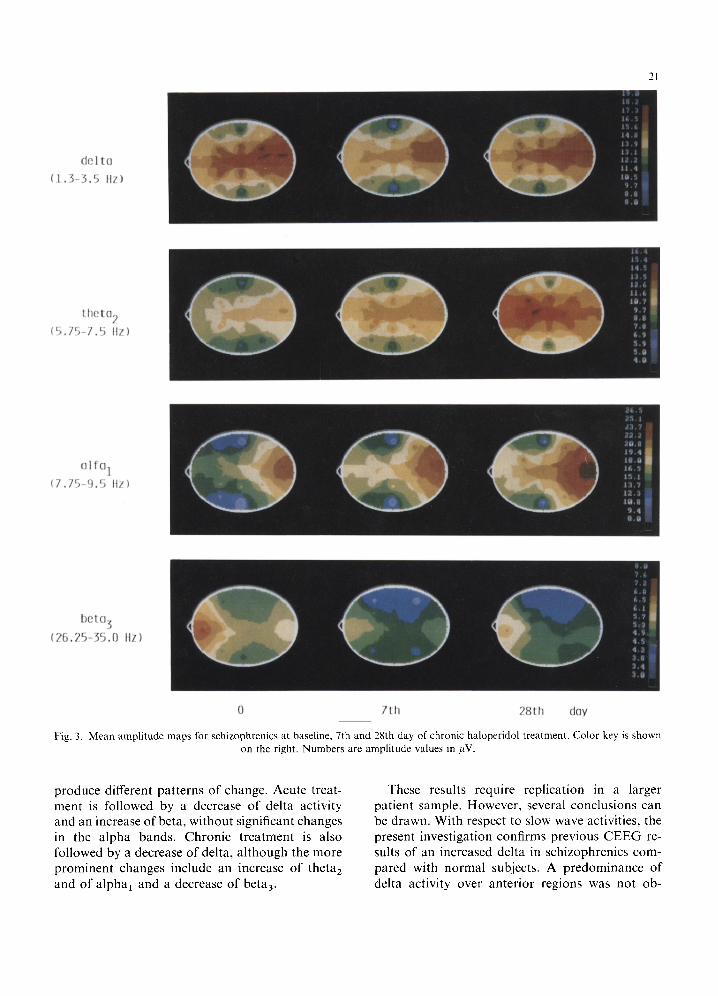
0 7th 28th day
Fig. 3. Mean amplitude maps for schizophrenics at baseline. 7th and 28th day of chronic haloperidol treatment. Color key is shown on the right. Numbers are amplitude values in pV.
produce different patterns of change. Acute treat- ment is followed by a decrease of delta activity and an increase of beta, without significant changes in the alpha bands. Chronic treatment is also followed by a decrease of delta, although the more prominent changes include an increase of theta, and of alpha, and a decrease of beta,.
These results require replication in a larger patient sample. However, several conclusions can be drawn. With respect to slow wave activities, the present investigation confirms previous CEEG re- suits of an increased delta in schizophrenics com- pared with normal subjects. A predominance of delta activity over anterior regions was not ob-
22
/lUJ
7th 2Xth
7th
28111
7111
28th 7th
28th
I.cudc
F3 F4 T3 T4 75 Tc, c’3 c4 P3 P4 01 o-7
0.03 0.006 0.04 0.04 0.02
0.05 0.05
0.006 0.003 0.03 0.04 0.05 0.03 0.006 0.003 0.01 0.006 0.008 0.001 0.004 0.001 0.0 I 0.003 0.003 0.002 0.007 0.02 0.05 0.05 0.03 0.04 0.04 0.01 0.03 0.04 0.03 0.05 0.02 0.03 0.03
0.009 0.01 0.03 0.02 0.00x 0.01
served in our study, a finding in agreement with Karson et al. (1987). This is probably due to a careful exclusion of eye movement artifacts, which are likely to account for such a predominance. The widespread increase of both delta and theta, activity, observed in our patient group in compari- son with controls, cannot be considered as an effect of neuroleptic treatment: neither acute, nor chronic haloperidol administration induced an increase of these activities; on the contrary, delta was reduced and theta, almost unchanged after treatment.
The increase of delta activity in schizophrenia has been proposed as an index of lowered arousal (Lifshitz and Gradijan. 1974). More recently, an alternative hypothesis has been outlined, based on studies showing a negative correlation between delta activity and cortical metabolism (Ingvar and Franzen, 1974; Buchsbaum and Haier, 1987). Ac- cording to this hypothesis, an increased delta would represent the electrophysiological correlate of cortical hypometabolism. Our present results are more consistent with the finding of a global reduction of cortical metabolism in schizophrenia than with a localized frontal reduction. However, it should be noted that a frontal deficit in schizo- phrenics has been more consistently demonstrated when a specific cognitive load is placed on the frontal cortex (Weinberger et al., 1986). CEEG studies at rest might not be the most suitable approach to demonstrate the frontal dysfunction.
The increase of fast beta activity in schizophren- ics, repeatedly reported in previous CEEG studies (Itil ct al., 1972; Giannitrapani and Kayton. 1974;
Flor-Henry, 1976) and in more recent topographic investigations (Morstyn et al., 1983; Morihisa and Duffy. 1986; Karson et al., 1988). is confirmed by our findings. Conflicting results appearing in the literature most probably can be attributed to medi- cation effects. In fact, in our patients. a reduction of fast beta was observed after chronic treatment.
The interpretation of a beta increase in schizo- phrenia has always been rather controversial. Some investigators have interpreted this abnormality as a correlate of a chronic state of hyperarousal (Itil. 1977: Kemali et al., 1985; Morihisa and DufTy. 19X6), while others bel@e that it might be a correlate of impaired alertness (Giannitrapani. 1971; Lifshitz and Gradijan, 1974; Kemali et al., 1988). The latter hypothesis could be supported by the concomitant increase of slow waves.
In addition, anticholinergic drugs produce an increase of both slow and fast EEG activities (Itil and Fink, 1966). This pattern closely resembles the abnormalities observed in schizophrenics. These could thus be interpreted as an imbalance between the cholinergic and the dopaminergic sys- tem, resulting in an increase of dopaminergic activ- ity (Itil, 1977). The reduction of both delta and fast beta activity following haloperidol administra- tion would be compatible with this interpretation.
REFERENCES
Abt. K. (1988) Descriptive data analysis (DDA) in quanlitativc EEC studies. In: D. Samson-Dollfus, J.D. Guieu. J. Golman
and P. Etevenon (Eds.), Statistics and Topography in Quanti-
tative EEG. Elsevier. Amsterdam, pp. 150~160.
Andreasen. N.C. (19X1) Scale for the Assessment of Negative
Symptoms (SANS). The University of Iowa. Iowa City, IA.
Andreasen, N.C. (1984) Scale for the Assessment of Posi-
tive Symptoms (SAPS). The University of Iowa, Iowa
City. IA.
Asbcrg. M.. Montgomery. S.A.. Perris. C., Schalling, D. and
Sedvall, G. (197X) The Comprehenstve Psychopathological
Rating Scale. Acta Psychiatr. Stand. 271 (suppl.). 5527.
Berman. F.K. and Weinbcrger. D.R. (1986) Cerebral blood
flow studies in schizophrenia. In: H.A. Nasrallah (Series
Ed.). Handbook of Schizophrenia, Vol. I: H.A. Nasrallah
and D.K. Weinbcrger (Eds.). The Neurology of Schirophre-
nia. Elsevier. Amsterdam, pp. 277-307.
Buchsbaum. M.S. and Haier. R.J. (1987) Functional and
anatomical brain imaging: impact on schizophrenia research.
Schirophr. Bull. 13. I I5 132.
Buchsbaum. M.S.. Rigal, F., Coppola. R.. Cappelletti. J., King.
A.C. and Johnson, .I. (19X2) A new system for gray-level
surface distribution maps of electrical activity.
Electroenccphalogr. Clin. Neurophysiol. 53. 2377242.
Etevenon. P.. Pidoux, P.. Rioux. P.. Peron-Magnan, P.. Ver-
deaux. G. and Demker, P. (1979) Intra- and interhemispheric
EEG differences quantified by spectral analysis. Acta Psychi-
atr. Stand. 60. 57-68.
Fink. M. (1974) EEG profiles and bioavailability measures of
psychoactive drugs. In: T.M. Itil (Ed.). Psychotropic Drugs
and the Human EEG. Modern Problems of Pharmacopsychi-
atry. Vol. 8. Karger. Basel. pp. 76-9X.
Flor-Henry. P. (1976) Lateralired temporal-limbic dysfunction
and psychopathology. Ann. N.Y. Acad. Sci. 280. 777-797.
Giannitrapani, D. (1971) Scanning mechanisms and the EEG.
Electroencephalogr. Clin. Neurophysiol. 30. 1399145.
Giannitrapani, D. and Kayton. L. (1974) Schizophrenia and
EEG spectral analysis. Electroencephalogr. Clin. Neurophys-
iol. 36, 377-386.
Guenther. W.. Breitling, D.. Banquet, J.P., Marcie, P. and
Rondot. P. (1986) EEG mapping of left hemisphere dysfunc-
tion during motor performance in schizophrenia. Biol. Psy-
chiatry 21. 2499262.
Guenther. W., Davous. P.. Godet, J.L., Guillibert, E.. Breitling,
D. and Rondot, P. (198X) Bilateral brain dysfunction during
motor activation in type II schizophrenia measured by EEG
mapping.‘Biol. Psychiatry 23. 295-3 11.
Ingvar, D.H. and Franzen. G. (1974) Abnormalities of cerebral
blood flow distribution in patients with chronic schizophre-
nia. Acta Psychiatr. Stand. 50, 425-462.
Itil, T.M. (1977)‘Qualitative and quantitative EEG findings in
schizophrenia. Schizophr. Bull. 3. 61-79.
Itil, T.M. and Fink, M. (1966) Anticholinergic drug induced
delirium (experimental modification, quantitative EEG and behavioral correlations). J. New. Ment. Dis. 143. 4922507.
Itil, T.M.. Saletu, B. and Davis, S. (1972) EEG findings in chronic schizophrenics based on digital period analysis and
analog power spectra. Biol. Psychiatry 5, l-13.
Itil. T.M., Shapiro. D.. Schneider. J. and Francis, I.B. (1981)
Computerized EEG as a predictor of drug response in
treatment resistant schizophrenics. J. Ncrv. Ment. Dis. 169.
6299637.
Karson. C.N.. Coppola. R.. Daniel. D.G. and Wcinbergcr.
D.R. (1988) Computerized EEG in schizophrenta. Schizopht-.
Bull. 14. 1833197.
Karson. C.N.. Coppola. R.. Morihisa. J.M. and Wcinberger,
D.R. (1987) Computed electroencephalographic activity
mapping in schizophrenia: the resting state rcconsidrrcd.
Arch. Gen. Psychiatry 44, 514-517.
Kemali. D., Maj, M.. Iorio. G.. Marciano. t . . Nolfc. G..
Galderisi, S. and Salvati. A. (1985) Relationship hetuccn
CSF noradrenaline levels, C-EEG indicators of activation
and psychosis ratings in drug-free schirophrcnic patients.
Acta Psychiatr. Stand. 71. 19-24.
Kemali, D.. Galderisi, S. and M21.j. M. (198X) EEG correlates
of clinical heterogeneity of schizophrenia. In: D. Giannitra-
pani and L. Murri (Eds.). The EEG of Mental Activities.
Karger. Basel. pp. 169- I8 I. Lifshitz, K. and Gradijan. J. (1974) Spectral evaluation of the
electroencephalogram: power and variability in chronic schiz-
ophrenics and control subjects. Psychophysiology I I, 4799490.
Miyauchi, T.. Tanaka, K.. Hagimoto. H., Miura. T.. Kishi-
moto, H. and Matsushita, M. (1990) Computerized EEG in
schizophrenic patients. Biol. Psychiatry 7X. 488 494.
Morihisa. J.M. (19X6) Computerized mapping of clectrophys-
iologic data in schizophrenia research: two possible organiz-
ing strategies. In: H.A. Nasrallah (Series Ed.). Handbook 01
Schizophrenia, Vol. I: H.A. Nasrallah and D.K. Wcinberger
(Eds.). The Neurology of Schizophrenia. Elscvier. Amster-
dam. pp. 2677276.
Morihisa. J.M. and Duffy. F.H. (1986) Focal cortical arousal
in the schizophrenias. In: F.H. DutTy (Ed.), Topographic
Mapping of Brain Electrical Activity. Butterworth. Stone-
ham. pp. 37 I-379.
Morihisa. J.M.. D&y. F.H. and McCarley, R.W. (1983) Brain
electrical activity mapping (BEAM) in schizophrenic patients.
Arch. Gen. Psychiatry 4. 719 72X.
Moratyn. R., Duffy. F.H. and McCarley. R.W. (1983) Altered
topography of EEG spectral content in schizophrenia.
Electroencephalogr. Clin. Neurophysiol. 56, 263-27 I, Saito, M. (197X) CEEG study on patients under the psychiatric
drug treatment; the correlation between EEG alteration and
clinical evolution. In: J. Obiols. C. Ballus. E. Gon7alcs
Moncltis and J. Pujol (Eds.). Biological Psychiatry Today.
Elsevier, Amsterdam, pp. 1307713 I?.
Saletu. B.. Kiifferle. B.. Grunenberg. J. and Anderer, P. (1986)
Quantitative EEG, SPEM. and psychometrtc studies tn schiz-
ophrenics before and during differential neuroleptic therapy.
Pharmacopsychiatry 19. 434 -437.
Stevens. J.R. and Livermore. A. (19X2) Telemetered EEG in
schizophrenia: spectral analysis during abnormal behaviour
episodes. J. Neural. Neurosurg. Psychiatry 45. 3X5-395. Williamson, P. and Mamelak, M. (1987) Frontal spectral EEG
fndings in acutely ill schizophrenics. Biol. Psychiatry 22. 102lllO24.
Top Related
Copyright © 2022 FDOKUMEN

