


Bahasa
Halaman
Hukum


University of Southern Queensland
Faculty of Health, Engineering & Sciences
Cathodic protection of reinforced concrete bridges in the marine environment as an asset management tool
A dissertation submitted by
Steven Brailsford
In fulfilment of the requirements of
Course ENG4112 - Research Project
Towards the degree of
Bachelor of Engineering (Civil)
Submitted: October, 2013

i
ABSTRACT
Recent investigations into the RMS bridges stock has revealed a number of bridges
are showing premature signs of corrosive deterioration. This poses problems for
future use and longevity due to problems such as reduced structural capacity as the
reinforcement steel is being compromised.
Cathodic protection (CP) of bridges is seen as an important asset management tool
for RMS and a number of bridges have been retrofitted with the technology. This
project investigates a number of recent implementations by way of case studies. This
will aid in the assessment of cathodic protection to determine if it is an effective and
efficient tool and if it warrants the resources required for its implementation.
The project consists of a literature review of current cathodic protection theory and
systems. It then considers a number of recent implementations as case studies. The
case studies consider factors such as bridge background, assessment methods, costs
and issues of implementation and perceived benefits/problems to date. The level of
cathodic protection each system provides is considered.
The assessment of results from trials on three separate bridges suggests that the
Galvanode DAS system is the best performing sacrificial cathodic protection
alternative. Some trial sacrificial CP systems have produced less than satisfactory
results which reinforces the need for such trials before roll out of larger scale
implementations of the systems.
Future work will involve monitoring sites so that perceived benefits of systems can
be assessed over longer periods. Other research can possibly be undertaken to
monitor such phenomena such as hydrogen embrittlement of reinforcement steel due
to CP. This is particularly true for any possible implementations on pre or post-
tensioned reinforcement tendons.

ii
University of Southern Queensland
Faculty of Health, Engineering & Sciences
ENG4111/ENG4112 Research Project
LIMITATIONS OF USE
The Council of the University of Southern Queensland, its Faculty of Health,
Engineering & Sciences, and the staff of the University of Southern Queensland, do
not accept any responsibility for the truth, accuracy or completeness of material
contained within or associated with this dissertation.
Persons using all or any part of this material do so at their own risk, and not at the
risk of the Council of the University of Southern Queensland, its Faculty of Health,
Engineering & Sciences of the staff of the University of Southern Queensland.
This dissertation reports an educational exercise and has no purpose or validity
beyond this exercise. The sole purpose of the course pair entitled “Research Project”
is to contribute to the overall education within the student’s chosen degree program.
This document, the associated hardware, software, drawings, and other material set
out in the associated appendices should not be used for any other purpose: if they are
so used, it is entirely at the risk of the user.
Dean
Faculty of Health, Engineering & Sciences

iii
CERTIFICATION OF DISSERTATION
I certify that the ideas, designs and experimental work, results, analyses and
conclusions set out in this dissertation are entirely my own effort, except where
otherwise indicated and acknowledged.
I further certify that the work is original and has not been previously submitted for
assessment in any other course or institution, except where specifically stated.
Full name : Steven Brailsford
Student Number : 0019422004
Signature
22/10/2003
Date

iv
ACKNOWLEDGMENTS
This research was carried out under the supervision of Dr Sourish Banerjee.
Appreciation is also due to many RMS colleagues, past and present, including David
Pattison, Farhana Jesmin, and Michael Moore. I would also like to thank the
members of Road and Fleet Services (RFS) who delivered the implementation of the
cathodic protection systems on the bridges where the case studies were undertaken.
Finally, I would like to acknowledge my wife Sally and children, Bailey, Paris and
Samuel for their ongoing support and belief.
Steven Brailsford
University of Southern Queensland
22 October 2013

v
TABLE OF CONTENTS
ABSTRACT ................................................................................................................. i
LIMITATIONS OF USE ........................................................................................... ii
CERTIFICATION OF DISSERTATION .............................................................. iii
ACKNOWLEDGMENTS ........................................................................................ iv
TABLE OF CONTENTS ........................................................................................... v
LIST OF FIGURES ................................................................................................ viii
LIST OF TABLES .................................................................................................... xi
1 INTRODUCTION ............................................................................................ 1
1.1 PROJECT AIM ......................................................................................... 1
1.2 PROJECT OBJECTIVES ......................................................................... 1
1.3 STRUCTURE OF THIS DOCUMENT .................................................... 2
2 LITERATURE REVIEW (CATHODIC PROTECTION) ........... ................ 4
2.1 REINFORCED CONCRETE .................................................................... 4
2.2 DURABILITY OF REINFORCED CONCRETE STRUCTURES.......... 4
2.3 DETERIORATION OF REINFORCED CONCRETE ............................ 7
2.3.1 DETERIORATION OF CONCRETE ............................................. 7
2.3.1.1 STRUCTURAL DETERIORATION ................................ 7
2.3.1.2 CHEMICAL DETERIORATION ..................................... 8
2.4 DETERIORATION OF REINFORCEMENT .......................................... 9
2.4.1 CORROSION DUE TO CARBONATION ................................... 11
2.4.2 CORROSION DUE TO CHLORIDES ......................................... 13
2.5 CATHODIC PROTECTION .................................................................. 14
2.5.1 WHAT IS CATHODIC PROTECTION? ..................................... 15
2.6 TYPES OF CATHODIC PROTECTION ............................................... 15
2.6.1 GALVANIC ANODE CATHODIC PROTECTION (GACP) ...... 15
2.6.2 IMPRESSED CURRENT CATHODIC PROTECTION (ICCP) .. 19
2.6.2.1 ADVANTAGES OF ICCP SYSTEMS ........................... 21
2.6.2.2 DISADVANTAGES OF ICCP SYSTEMS .................... 21
2.7 DETERMINATION OF GACP SYSTEM LIFE .................................... 21
3 BRIDGE ASSESSMENT METHODS .......................................................... 25
3.1 RMS BRIDGE INSPECTIONS .............................................................. 25
3.2 BRIDGE DURABILITY INSPECTION/TESTING .............................. 34
3.2.1 SCOPE OF WORK ........................................................................ 35
3.2.2 VISUAL INSPECTION ................................................................ 36
3.2.3 DELAMINATION SURVEY ....................................................... 36
3.2.4 DIAGNOSTIC TESTS .................................................................. 37
3.2.5 REINFORCEMENT COVER SURVEY ...................................... 37

vi
3.2.6 POTENTIAL MAPPING SURVEY ............................................. 38
3.2.7 CHLORIDE ANALYSIS .............................................................. 38
3.2.8 CARBONATION TESTING ......................................................... 38
3.2.9 CONCRETE ELECTRICAL RESISTIVITY TESTING .............. 38
3.2.10 REINFORCEMENT CONTINUITY TESTING ......................... 39
3.2.11 REPORTING ............................................................................... 39
4 CATHODIC PROTECTION PRODUCT DESCRIPTIONS ..................... 42
4.1 GALVASHIELD XP............................................................................... 42
4.2 GALVASHIELD CC .............................................................................. 43
4.3 GALVACORR ........................................................................................ 44
4.4 GALVANODE DAS ............................................................................... 45
5 CATHODIC PROTECTION CASE STUDIES ........................................... 48
5.1 BOYD’S BAY BRIDGE (B7628) .......................................................... 48
5.1.1 BRIDGE BACKGROUND ........................................................... 48
5.1.2 BRIDGE ASSESSMENT .............................................................. 51
5.1.3 GACP IMPLEMENTATION ........................................................ 54
5.1.3.1 TRIAL OF CC ANODE - OVERVIEW ......................... 54
5.1.3.2 TRIAL OF CC ANODE - DESIGN ................................ 54
5.1.3.3 TRIAL OF CC ANODE - CONSTRUCTION ................ 55
5.1.3.4 INSTALL OF XP AND CC ANODES - OVERVIEW .. 56
5.1.3.5 INSTALL OF XP AND CC ANODES - DESIGN ......... 57
5.1.3.6 INSTALL OF XP AND CC ANODES - CONSTRUCTION ...................................................... 57
5.1.4 COSTS OF IMPLEMENTATION ................................................ 62
5.1.5 ISSUES/PROBLEMS WITH IMPLEMENTATION .................... 63
5.1.6 MONITORING RESULTS ........................................................... 64
5.1.6.1 CC ANODE TRIAL 1 ..................................................... 64
5.1.6.2 CC ANODE TRIAL 2 ..................................................... 68
5.1.6.3 CC anode trial 3 ............................................................... 71
5.1.6.4 XP ANODE TRIAL 1 ..................................................... 74
5.1.7 ESTIMATION OF SYSTEM LIFE ............................................... 76
5.1.8 ASSESSMENT OF IMPLEMENTATION ................................... 77
5.2 MORORO BRIDGE (B2154) ................................................................. 79
5.2.1 BRIDGE BACKGROUND ........................................................... 79
5.2.2 BRIDGE ASSESSMENT .............................................................. 84
5.2.3 GACP IMPLEMENTATION ........................................................ 84
5.2.3.1 TRIAL OF GALVANODE DAS - OVERVIEW............ 84
5.2.3.2 TRIAL OF GAVANODE DAS - DESIGN ..................... 84
5.2.3.3 FULL INSTALL OF GAVANODE DAS - OVERVIEW86
5.2.3.4 MORORO FULL INSTALL OF GAVANODE DAS DESIGN ...................................................................... 87

vii
5.2.3.5 MORORO FULL INSTALL OF GAVANODE DAS - CONSTRUCTION ...................................................... 92
5.2.4 COSTS OF IMPLEMENTATION ................................................ 94
5.2.5 ISSUES/PROBLEMS WITH IMPLEMENTATION .................... 94
5.2.6 MONITORING RESULTS ........................................................... 95
5.2.6.1 GALVANODE DAS ANODE TRIAL 1 (Pile A) ........... 96
5.2.6.2 GALVANODE DAS ANODE TRIAL 2 (Pile B) ......... 100
5.2.7 ESTIMATION OF SYSTEM LIFE ............................................. 103
5.2.8 ASSESSMENT OF IMPLEMENTATION ................................. 104
5.3 TERRANORA BRIDGE (B8002) ........................................................ 107
5.3.1 BRIDGE BACKGROUND ......................................................... 107
5.3.2 BRIDGE ASSESSMENT ............................................................ 110
5.3.3 GACP IMPLEMENTATION ...................................................... 110
5.3.3.1 TRIAL 1 OF GALVACORR - OVERVIEW ................ 110
5.3.3.2 TRIAL 1 OF GALVACORR - DESIGN ...................... 111
5.3.3.3 TRIAL 1 OF GALVACORR - CONSTRUCTION ...... 112
5.3.3.4 TRIAL 2 OF GAVANODE DAS - OVERVIEW ......... 116
5.3.3.5 TRIAL 2 OF GALVANODE DAS ANODE - DESIGN .................................................................... 117
5.3.3.6 FULL INSTALLATION OF GALVANODE DAS - OVERVIEW ............................................................. 118
5.3.3.7 FULL INSTALLATION OF GALVANODE DAS - DESIGN .................................................................... 120
5.3.3.8 FULL INSTALLATION OF GALVANODE DAS - CONSTRUCTION .................................................... 123
5.3.4 COSTS OF IMPLEMENTATION .............................................. 127
5.3.5 ISSUES/PROBLEMS WITH IMPLEMENTATION .................. 128
5.3.6 MONITORING RESULTS ......................................................... 129
5.3.6.1 GALVANODE DAS ANODE TRIAL 2 (1.2 lb/ft) ...... 130
5.3.6.2 GALVANODE DAS ANODE TRIAL 2 (0.6 lb/ft) ...... 133
5.3.7 ESTIMATION OF SYSTEM LIFE ............................................. 135
5.3.8 ASSESSMENT OF IMPLEMENTATION ................................. 136
6 CONCLUSIONS AND FURTHER WORK ............................................... 138
6.1 Achievement of Project Objectives ....................................................... 138
6.2 Further Work ......................................................................................... 139
BIBLIOGRAPHY .................................................................................................. 141
APPENDIX A - PROJECT SPECIFICATIONS
APPENDIX B - TRIAL OBSERVATION DATA
APPENDIX C - GACP PRODUCT INFORMATION

viii
LIST OF FIGURES Figure 1 - RMS Northern Region ................................................................................ 1 Figure 2 - Cracking as a result of AAR........................................................................ 9 Figure 3 - The anode-cathode reaction....................................................................... 10 Figure 4 - Cracking and spalling of concrete ............................................................. 11 Figure 5 - Carbonation of reinforced concrete ........................................................... 12
Figure 6 - Water level zones on coastal concrete bridges .......................................... 12
Figure 7 - Example chloride content for various bridge elements ............................. 14
Figure 8 - The Galvanic Series................................................................................... 16 Figure 9 - The Galvanic cell....................................................................................... 17 Figure 10 - Installation of Galvashield XP within a beam ......................................... 18
Figure 11 - Installation of multiple XP units within column ..................................... 18
Figure 12 - Typical ICCP system ............................................................................... 20 Figure 13 - Tranformer/Rectifier unit installed under a bridge.................................. 20
Figure 14 - Reinforced Concrete Piers - Condition State 1 ....................................... 33
Figure 15 - Reinforced Concrete Piers - Condition State 4 ....................................... 34
Figure 16 - Typical report outputs - Test Area .......................................................... 41
Figure 17 - Section of Galvashield XP ...................................................................... 42 Figure 18 - Section of Galvashield CC anode ............................................................ 43
Figure 19 - GalvaCorr brochure diagram showing product methodology ................. 44
Figure 20 - The Galvanode DAS system ................................................................... 46
Figure 21 - Galvanode DAS installed ........................................................................ 46 Figure 22 - Location of Boyd's Bay Bridge ............................................................... 48
Figure 23 - Eastern Elevation of Boyd's Bay bridge .................................................. 49
Figure 24 - Boyd's Bay bridge in 2007 prior to CP installation ................................. 49
Figure 25 - Boyd’s Bay bridge design - Piers ............................................................ 50
Figure 26 - Boyd's Bay - Delaminated condition of concrete piers in 2003 .............. 52
Figure 27 - Boyd's Bay - Fire damage to concrete piers in 2003. .............................. 53
Figure 28 - Boyd's Bay - Severe corrosion and spalling ............................................ 53
Figure 29 - Boyd’s Bay - CC anode trial design ........................................................ 55
Figure 30 - Boyd's Bay - CC anode concrete coring - CC Trial 2 shown .................. 56
Figure 31 - Boyd's Bay - CC anode installation ......................................................... 56
Figure 32 - Boyd’s Bay - XP/CC anode design ......................................................... 57
Figure 33 - Boyd’s Bay - Water blasting of deteriorated concrete in pier columns. . 58
Figure 34 - Boyd’s Bay - XP unit tied to reinforcement steel ................................... 59
Figure 35 - Boyd’s Bay - XP (square type) units tied to reinforcement steel ............ 59
Figure 36 - Boyd’s Bay - XP (square type) units and reference electrodes ............... 60
Figure 37 - Boyd’s Bay - CC anodes showing backfilled patch repair ...................... 61
Figure 38 - Boyd's Bay - Monitoring box installed ................................................... 61
Figure 39 - Boyd's Bay - Completed XP/CC install and protective coating .............. 62
Figure 40 - Boyd's Bay - CC Trial 1 - Current measurements ................................... 65
Figure 41 - Boyd's Bay - CC Trial 1 - Potential Decay ............................................. 66
Figure 42 - Boyd’s Bay - CC Trial 1 - Anode and RE layout ................................... 67
Figure 43 - Boyd's Bay - CC Trial 2 - Anode layout ................................................. 68
Figure 44 - Boyd's Bay - CC Trial 2 - Current measurements ................................... 68
Figure 45 - Boyd's Bay - CC Trial 2 - Potential Decay ............................................. 69
Figure 46 - Boyd’s Bay - CC Trial 2 - Anode and RE layout .................................... 70
Figure 47 - Boyd's Bay - CC Trial 3 - Anode layout ................................................. 71

ix
Figure 48 - Boyd's Bay - CC Trial 3 - Current measurements ................................... 71
Figure 49 - Boyd's Bay - CC Trial 3 - Potential Decay ............................................. 72
Figure 50 - Boyd’s Bay - CC Trial 3 - Anode and RE layout .................................... 73
Figure 51 - Boyd's Bay - XP Trial 1 - Anode layout. ................................................ 74
Figure 52 - Boyd's Bay - CC Trial 1 - Current measurements ................................... 74
Figure 53 - Boyd's Bay - XP Trial 1 - Potential Decay .............................................. 75
Figure 54 - Location of Mororo Bridge in relation to the North Coast...................... 79
Figure 55 - Location of Mororo in relation to the Lower Clarence River ................. 79
Figure 56 - Mororo Bridges - North and Southbound ............................................... 80
Figure 57 - Mororo - Western elevation .................................................................... 81 Figure 58 - Mororo - View of Southern end showing piles 1 & 2 ............................. 81
Figure 59 - Mororo bridge design - Elevation ........................................................... 82
Figure 60 - Mororo bridge design - Piles ................................................................... 83 Figure 61 - Mororo Trial - DAS Pile anode trial design ............................................ 85
Figure 62 - Mororo - Galvanode DAS anode design - General layout ...................... 88
Figure 63 - Mororo - Galvanode DAS anode design - Pier 1 layout ......................... 89
Figure 64 - Mororo - Galvanode DAS anode design - Pier 7 layout ......................... 90
Figure 65 - Mororo - Galvanode DAS anode design - Section and wiring details .... 91
Figure 66 - Mororo - Saw cuts for DAS installation .................................................. 92
Figure 67 - Mororo - Installation of Galvanode DAS unit......................................... 92
Figure 68 - Mororo - Installation, backfilling and connection of anodes .................. 93
Figure 69 - Mororo - Connections to monitoring box ............................................... 93
Figure 70 - Mororo Bridge - Location of CP Trials on pier 5.................................... 96
Figure 71 - Mororo - DAS Trial 1 (Pile A) - Anode and wiring layout ..................... 97
Figure 72 - Mororo - DAS Trial 1 (Pile A)- Current measurements ......................... 98
Figure 73 - Mororo - DAS Trial 1 (Pile A)- Potential Decay .................................... 99
Figure 74 - Mororo - DAS Trial 2 (Pile B) - Anode and wiring layout ................... 101
Figure 75 - Mororo - DAS Trial 2 (Pile B)- Current measurements ........................ 102
Figure 76 - Mororo - DAS Trial 1 (Pile B)- Potential Decay .................................. 103
Figure 77 - Terranora Creek Bridge location ........................................................... 107
Figure 78 -Terranora bridge - Western elevation ..................................................... 108
Figure 79 - Terranora Bridge design - General Arrangement .................................. 109
Figure 80 - Terranora Trial 1 - GalvaCorr design .................................................... 111
Figure 81 - Terranora Trial 1 - Chase out on pier face ............................................ 112
Figure 82 - Terranora Trial 1 - Reference electrode positioning ............................. 113
Figure 83 - Terranora Trial 1 - Connection to rebar ................................................ 113
Figure 84 - Terranora Trial 1 - Backfilled RE and connection points ..................... 114
Figure 85 - Terranora Trial 1 - Installation of the GalvaCorr system ...................... 114
Figure 86 - Terranora Trial 1 - Installation of the GalvaCorr system ...................... 115
Figure 87 - Terranora Trial 1 - Wiring of monitoring box ....................................... 115
Figure 88 - Terranora Trial 1 - Finished install of GalvaCorr Product on Pier 4 .... 116
Figure 89 - Terranora Trial 2 - Galvanode DAS trial design ................................... 117
Figure 90 - Terranora full CP install - Pier DAS anode design ............................... 120
Figure 91 - Terranora full CP install - Pile cap DAS anode design ......................... 121
Figure 92 - Terranora - DAS connection detail to reinforcement bar ...................... 122
Figure 93 - Terranora - Preparation of piers for DAS installation ........................... 124
Figure 94 - Terranora - Working platform. .............................................................. 125 Figure 95 - Terranora - DAS installation in process ................................................ 125
Figure 96 - Terranora - Installation of DAS anodes and connections...................... 126
Figure 97 - Terranora - Pile cap DAS anode installation ......................................... 126

x
Figure 98 - Terranora - Installation of DAS............................................................. 127 Figure 99 - Terranora - Trial 2 (1.2 lb/ft Galvanode DAS) anode layout ................ 130
Figure 100 - Terranora - Trial 2 (1.2 lb/ft Galvanode DAS) Current ...................... 131
Figure 101 - Terranora - Trial 2 (1.2 lb/ft Galvanode DAS) - Potential Decay ....... 132
Figure 102 - Terranora - Trial 2 (1.2 lb/ft Galvanode DAS) anode layout .............. 133
Figure 103 - Terranora - Trial 2 (0.6 lb/ft Galvanode DAS) Current ...................... 134

xi
LIST OF TABLES
Table 1- Effective zinc mass of various CP products ................................................ 23 Table 2- Level 1 Bridge inspection frequency/description ........................................ 26 Table 3 - Level 2 Bridge inspection frequency/description ....................................... 27 Table 4 - Level 3 Bridge inspection frequency/description ....................................... 29 Table 5 - Level 4 Bridge inspection frequency/description ....................................... 31 Table 6 - Level 5 Bridge inspection frequency/description ....................................... 31 Table 7 - Bridge inpsection - Condition state descriptions ........................................ 32 Table 8 - Example Bridge assessment summary table ............................................... 40 Table 9 - Galvanode DAS products in metric units ................................................... 47 Table 10 - Boyd's Bay CC trial 1 - Current output summary for last readings .......... 66 Table 11 - Boyd's Bay CC trial 2 - Current output summary for last readings .......... 69 Table 12 - Boyd's Bay CC trial 3 - Current output summary for last readings .......... 72 Table 13 - Boyd's Bay XP trial 1 - Current output summary for last readings .......... 75 Table 14 - Boyd's Bay - Anode life calculations ....................................................... 76 Table 15 - Mororo Galvanode DAS schedule ............................................................ 86 Table 16 - Mororo - DAS Trial 1 (Pile A) - Current output summary....................... 99 Table 17 - Mororo - DAS Trial 2 (Pile B) - Current output summary ..................... 102 Table 18 - Mororo - Anode life calculations ............................................................ 104 Table 19 - Terranora - Trial 2 (1.2 lb/ft) - Current output summary ....................... 132 Table 20 - Terranora - Trial 2 (0.6 lb/ft) - Current output summary ....................... 134 Table 21 - Terranora - Anode life calculations ........................................................ 135

1
1 INTRODUCTION
1.1 PROJECT AIM
The project seeks to evaluate the use of cathodic protection of reinforced concrete
bridges in the marine environment. In particular, the emphasis will be how cathodic
protection has been implemented by Road and Maritime Services (RMS - Previously
the RTA), the major roads authority in NSW. This will include and assessment of
recent implementations by way of case studies.
1.2 PROJECT OBJECTIVES
The RMS Northern Region extends from Port Macquarie in the south to the
Queensland border in the north and westward to Gunnedah. In this section alone,
there are 1200 bridge sized structures of an average age of 34 years. (Mitchelhill
2012)
This poses a major maintenance effort in terms of resources. Premature corrosive
activity is a major risk to the existing asset management function and particularly so
in marine environments where corrosive elements are typically at their worst.
Cathodic protection is a vital tool in the management of these bridges.
Figure 1 -RMS Northern Region
(Mitchelhill 2012, p1)

2
The broad objectives of this project are:
1) Research literature and background material relating to:
a) Cathodic Protection (CP)
b) Various types of CP installation and products
c) CP for protection of bridges in the marine environment
2) Determine the mechanisms and tools for evaluation of existing assets
3) Use a number of existing bridges within (RMS) Northern Region to carry out case studies and discuss/evaluate the following:
a) Bridge background b) Bridge assessment methods
c) Discuss/examine costs in implementing CP
d) Issues/problems with implementation
e) Perceived benefits and actual results to date
4) Investigate methods for determining life of CP protection and describe asset
maintenance implications
5) Report findings in the required written and oral formats
1.3 STRUCTURE OF THIS DOCUMENT
This document is structured as follows:
1) Chapter 1 - Introduction to the project, objectives and structure of document
2) Chapter 2 - Literature review. This introduces the reader to the background
theory about cathodic protection (CP). It defines what CP is, the various
types of installation and products. It outlines how CP is being used for the
purpose of protection specifically to reinforced concrete bridges in the marine
environment. The methods used for the determination of GACP system life is
also defined

3
3) Chapter 3 - Bridge assessment Methods. This chapter describes the different
methods for bridge assessment currently being used by RMS
4) Chapter 4 - Cathodic Protection product descriptions. This chapter describes
the CP products used in the bridge implementations outlined in the case
studies
5) Chapter 5 - CP in bridges (Case studies). This chapter represents the major
component of this project. It describes three CP installations on bridges by
RMS within the Northern Region. Each bridge has an “Assessment of
implementation” section which discusses the implementation and possible
future outcomes and improvements
6) Chapter 6 - Conclusions/Further Work. This chapter summarises the findings
from the project and defines further work that could be undertaken
7) Appendices - Various appendices are included to include specific information
such as project scope, observation data and product information

4
2 LITERATURE REVIEW (CATHODIC PROTECTION)
2.1 REINFORCED CONCRETE
Reinforced concrete is a major component of many structures including bridges. The
high compressive strength of concrete is complimented by the use of reinforcement,
typically carbon steel, to provide strength primarily in tension. (Foster, Kilpatrick &
Warner 2010)
Correctly designed, constructed and maintained reinforced concrete structures can be
very durable and the expected design life can typically be 100 years or more. Many
larger structures including bridges represent a major investment to the community. If
major problems occur before the end of the expected life of the structure, these
problems pose a real dilemma in replacement costs and increased repair and
maintenance. (Austroads 2002)
As described in the Austroads Guide to Bridge Technology 2009 - Part 1: Introduction
and Bridge Performance (Austroads 2009a):
“The requirement for durability, reliability and robustness of bridges
over a full 100 year life must be at the forefront of considerations by
bridge owners/authorities for all aspects of bridge procurement and use,
from planning and design, through the construction phase, to
maintenance and operations.”
In addition the design life required by AS 5100 (Standards Australia 2004), the
Australian Standard for new bridge design is 100 years.
2.2 DURABILITY OF REINFORCED CONCRETE
STRUCTURES
Durability of reinforced concrete structures is directly related to the expected life.
Australian Standard AS3600-2009 - Concrete structures, outlines the design for
durability in section four of that document. For the case of bridges built in the marine
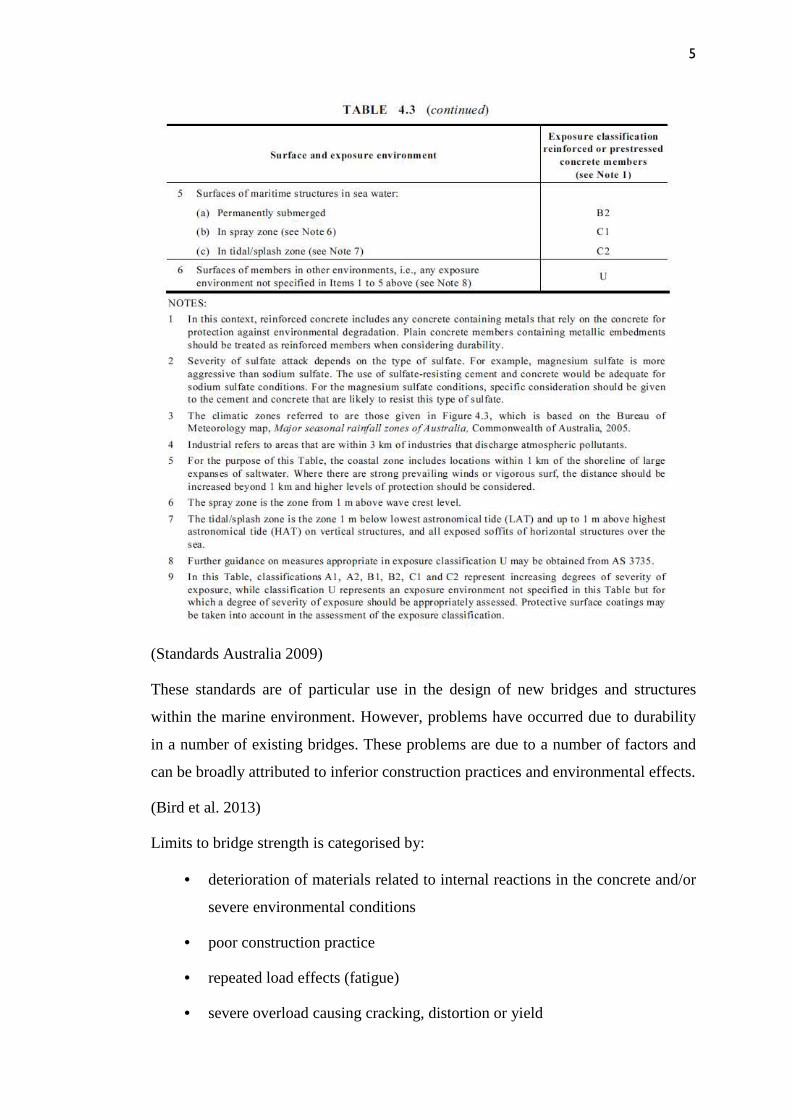
environment, the exposure classifications B2 to C2 are shown below:
5
(Standards Australia 2009)
These standards are of particular use in the design of new bridges and structures
within the marine environment. However, problems have occurred due to durability
in a number of existing bridges. These problems are due to a number of factors and
can be broadly attributed to inferior construction practices and environmental effects.
(Bird et al. 2013)
Limits to bridge strength is categorised by:
• deterioration of materials related to internal reactions in the concrete and/or
severe environmental conditions
• poor construction practice
• repeated load effects (fatigue)
• severe overload causing cracking, distortion or yield

6
• flooding, scour and debris loads
• ground movements.
(Austroads 2009a)
Concrete durability in bridges was questioned in the late 1970’s when it was
observed that relatively new bridges were showing signs of premature deterioration.
It was thought that the cement content used within the concrete was being decreased
because cement technology was making cements finer and more reactive. The
strength requirements were still being met but problems arose due to the fact that
chlorine ingress through the concrete and to the reinforcement steel was happening
at a much faster rate. The research at the time showed that the alkalinity of the
concrete surrounding the reinforcement had been reduced which led to an increased
rate of corrosion.
The studies within the 1970’s showed that bridges built in the 1960’s were
performing to a satisfactory level. The improved durability of the earlier constructed
bridges was directly linked to the concrete mix designs which used more cement.
Whilst advances in cement properties were thought to deliver more efficient
concrete, the fact was that the durability component and ultimate life expectancy of
some bridges were compromised. (Austroads 2009b)
In 2006 the RMS undertook a study to review its coastal bridge stock. This study
looked at the durability performance of these structures (a sample size of 42 bridges).
The sample included a wide range of bridges with varying age, construction type and
environmental exposure. This study was commenced as the RMS was concerned
with the amount of structures suffering from reinforcement corrosion that appeared
to be caused by the ingress of chlorine from the coastal environment. This study
concluded that the deterioration due to corrosion posed the most significant risk to
the integrity of RMS bridges. (Moore 2009)
Durability problems in reinforced concrete bridges are not limited to Australia alone.
In the United States, similar problems have occurred. As of 2002 it was estimated
that a total of 587,964 bridges were maintained in the United States. The estimated

7
cost to maintain the bridges from 1999 to 2019 was estimated to be some $5.8 billion
dollars (USD) annually. The annual cost of corrosion defects was given as $10.6
billion dollars over the period, not including those costs that could be indirectly
linked to the general public as a result of bridge closures. (ASCE 2001, Koch et al
2002, TRIP 2002)
2.3 DETERIORATION OF REINFORCED CONCRETE
Deterioration of reinforced concrete structures can occur through problems with the
concrete and steel reinforcement. Corrosion of steel reinforcement is responsible for
greater than 90% of these and less than 10% being due to concrete deficiencies and
processes such as AAR (Alkali Aggregate Reaction), ASR (Alkali-silica reaction),
DEF (Delayed Ettringite Formation) and Acid attack. (Dantanarayana 2010)
2.3.1 DETERIORATION OF CONCRETE
The causes for concrete deterioration can be broadly grouped into 3 main sub
groups:
1) Structural
2) Chemical
3) Physical
2.3.1.1 STRUCTURAL DETERIORATION
Structural deterioration of concrete can be due to the impact of construction,
movement and overload. The major influence being construction practices. These
include:
• Incorrect concrete specification
• Design detailing
• Low values of specified cover
• Poor construction and curing
• Cracking due to shrinkage, thermal and AAR effects
(ACI 2001)

8
Concrete mix specification directly influences the durability of the concrete. As
stated previously, past practices and designs have decreased amounts of cement
which has led to inferior properties which leave the concrete open for corrosive
attack.
Poor detailing of structures has also led to cracking of elements which leaves a direct
path for corrosive influences to reinforcement steel. Consequent loss of section in the
reinforcement has caused less capacity for tensile forces and some structures have
become unstable, or failed.
A direct correlation with concrete cover and corrosive effects has meant that some
structures are showing signs of corrosion long before expected. Construction
tolerances and tight coverage design means that the effective cover to reinforcement
is low and the ingress of chlorination and carbonation effects have reached the
reinforcement steel faster than anticipated.
Some construction techniques and curing regimes have produced structures that have
sub optimum finishes. High early strength properties of some concrete mixes require
careful curing procedures to combat high temperature produced by hydration effects.
Premature cracking of concrete due to incorrect curing and finishing allow further
attack by environmental effects as well as inducing stress in some design elements.
(ACI 2001)
2.3.1.2 CHEMICAL DETERIORATION
Chemical deterioration of concrete can be due to AAR, Sulphates and Hostile
elements.
AAR (Alkali Aggregate Reaction) occurs when the alkalis in cement react with
aggregate particles. Alkali-silica (ASR) or alkali carbonate gel is formed around the
aggregate which may lead to expansion on contact with moisture. The change of
volume can cause major cracks to appear in the concrete. (ACI 2013)

9
Sulphate attack can be problematic to concrete. Various forms of sulphates such as
calcium sulphate, sodium sulphate and magnesium sulphate can attack concrete by
reacting with hydrated compounds. These compounds are within the hardened
cement paste. Pressure from the reactions can cause the concrete to disintegrate. (The
Constructor 2013)
Hostile elements include the presence of environmental factors such as chlorine rich
waters (salt water), Atmospheric conditions such as the presence of elevated rates of
carbon dioxide and relative humidity.
Figure 2 - Cracking as a result of AAR
(ACI 2013)
2.4 DETERIORATION OF REINFORCEMENT
Deterioration of reinforcement poses a major problem for the durability of reinforced
concrete structures, particularly in the marine or saltwater environment. The majority
of the degrading of the steel is caused by electrochemical corrosion. The effects of
electrochemical corrosion can be categorised due to carbonation, chloride ingress
and stray current.
In the construction process, a protective oxide film forms on the surface of the
reinforcement bar. This film protects the steel and is created when the cement
hydration takes place. It is also present due to the high alkalinity of the cement with
a pH in the range of 12.6-15.5. This protection remains in place until the film is
compromised such as attack by chloride ions. (Bird et al 2013)

10
The corrosion process can be represented by the anode-cathode reaction where the
steel consisting of iron (The Anode) loses positive charged ions which react with
oxygen and moisture (oxidation) to form rust. The process is shown in the diagram
below:
Figure 3 - The anode-cathode reaction
(Dantanarayana 2010)
The formation of rust on the reinforcement bar is problematic because rust or iron
oxide takes up to 8 times the volume of the parent metal. This volume increase can
lead to spalling and cracking of the concrete. (ACI 2001)

11
Figure 4 - Cracking and spalling of concrete
Source : <http://pmsiofflorida.wordpress.com/2013/03/06/concrete-spalling>
2.4.1 CORROSION DUE TO CARBONATION
Carbonation occurs when the concrete is neutralised by the action of carbon dioxide
CO2 on the alkaline components of the cement paste. The carbon dioxide is present
in the atmosphere and the reaction produces a weak acid that compromises the
concrete and ultimately the protective film around the reinforcement. The most
aggressive environment for carbonation coincides with alternate wet and dry
conditions in a hot environment. (ACI 2001)

12
Figure 5 - Carbonation of reinforced concrete
(Dantanarayana 2010)
Therefore in the tidal or splash zones in the marine environment and relative warm
temperatures on the East Coast of NSW, carbonation is a concern for the RMS.
These zones have alternate wet and dry periods, chloride rich water and humidity
conditions which are prime conditions for carbonation. The identification of various
levels of bridge structures and corrosive effects are shown on the diagram below:
Figure 6 - Water level zones on coastal concrete bridges
(Dantanarayana 2010)
CO2
Passivated layer
Carbonation zone
13
2.4.2 CORROSION DUE TO CHLORIDES
A major problem with reinforced concrete bridges in the marine environment is
corrosion due to chlorides. (Austroads 2002)
The marine environment provides salty water (chlorides), moisture and typically wet
and dry conditions due to tidal effects or splash and wave action. In North America
and other colder climates, the use of de-icing agents such as salt, also introduce
chlorination problems. (ACI 2001)
Chlorides can also enter as accelerators within aggregates of the concrete mix.
Typical marine environments also carry sea spray and mist which have high levels of
chlorides. Sufficient quantities of the chlorides initiate steel corrosion by again
breaking down the passive protective film. (Moore 2009)
The level of chlorination can be measured at different depths into the reinforced
concrete. The level of chlorination where corrosion will commence depends on a
number of factors, but in most cases a value of 0.06% chloride by weight volume of
concrete, is an established threshold. (Moore 2009)
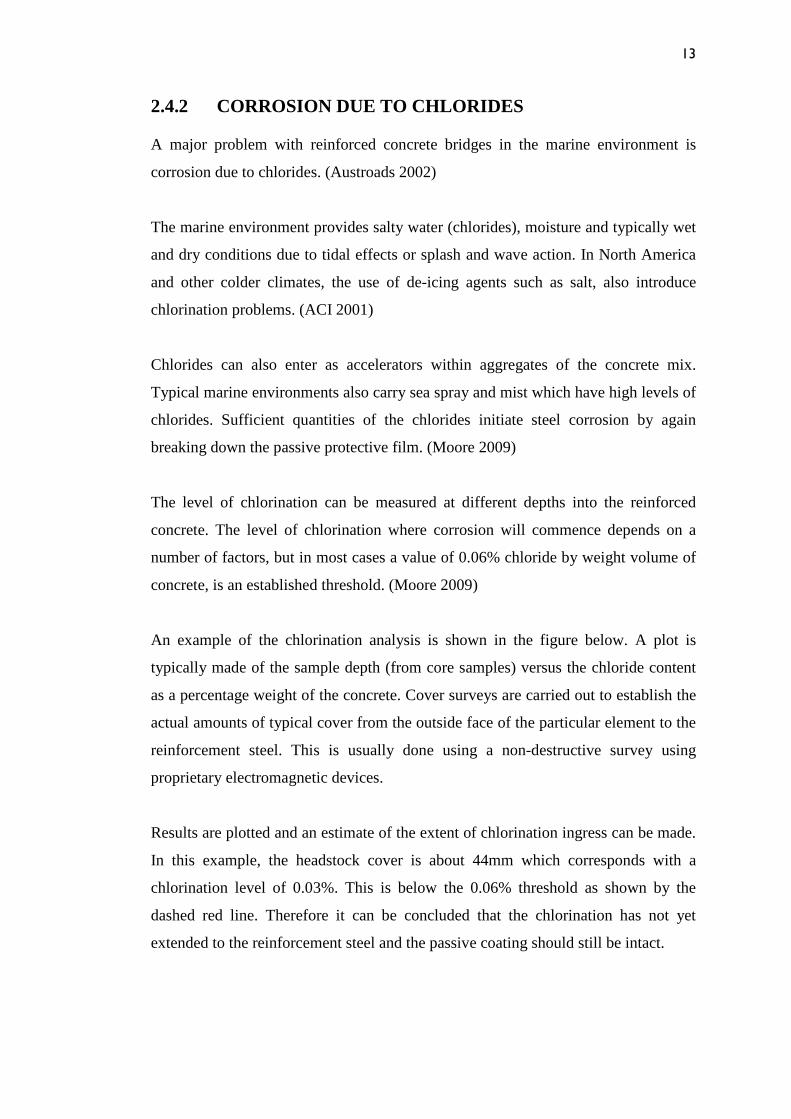
An example of the chlorination analysis is shown in the figure below. A plot is
typically made of the sample depth (from core samples) versus the chloride content
as a percentage weight of the concrete. Cover surveys are carried out to establish the
actual amounts of typical cover from the outside face of the particular element to the
reinforcement steel. This is usually done using a non-destructive survey using
proprietary electromagnetic devices.
Results are plotted and an estimate of the extent of chlorination ingress can be made.
In this example, the headstock cover is about 44mm which corresponds with a
chlorination level of 0.03%. This is below the 0.06% threshold as shown by the
dashed red line. Therefore it can be concluded that the chlorination has not yet
extended to the reinforcement steel and the passive coating should still be intact.

14
Conversely, at the pile covers (F1 & F2) the chloride content is much greater than
the threshold (approximately 0.2% content at 55mm cover). For the pile covers it can
be concluded that chlorination has reached the reinforcement steel, the passive
coating has been compromised and corrosion has most probably started.
Figure 7 - Example chloride content for various bridge elements
(Dantanarayana 2010)
2.5 CATHODIC PROTECTION
Once concrete structures have been compromised due to corrosive influences there
are a number of alternatives available for treatment and maintenance. These may
include:
1) Patching of concrete
2) Use of electrochemical chloride extraction
3) Repairing of cracks
4) Use of sealers, membranes and waterproofing materials
5) Application of corrosion inhibitors
6) Application of cathodic protection systems
Amongst all the stated alternatives, cathodic protection is considered to be the only
technology that can stop corrosion. The remaining methods are useful in the short
term but they do not provide long term solutions for the treatment of the cause of the
corrosive influences. (Transportation Research Board 2009)

15
2.5.1 WHAT IS CATHODIC PROTECTION?
Cathodic protection involves reversal of the flow of existing electrical currents that
create the corrosion. This is done by introducing an external current into the system
which acts as an external anode. This external anode provides the source for
positively charged ions rather than the reinforcement steel. The cathodic protection
system favours the cathodic element and discourages the anode. In this way the
anodic reaction that once took place on the reinforcement steel is stopped.
(Transportation Research Board 2009)
2.6 TYPES OF CATHODIC PROTECTION
There are two basic types of Cathodic Protection:
1) Galvanic Anode Cathodic Protection (GACP)
2) Impressed Current Cathodic Protection (ICCP)
Both forms of cathodic protection seek to alter the electrical flow that causes the
corrosion of the reinforcement steel.
2.6.1 GALVANIC ANODE CATHODIC PROTECTION
(GACP)
This type of treatment uses sacrificial metals that are more reactive than steel to act
as the anode. In this way, the sacrificial metal corrodes in favour of the steel. Zinc is
commonly used as a sacrificial metal. Its position on the galvanic series is shown on
the diagram below:

16
Figure 8 - The Galvanic Series
Source : <http://www.amacgroup.com.au/index.php?ID=12>
The major advantage of GACP systems is that they do not require external power
supplies. The electrical flow (DC - direct current) is produced due to different metals
(the reinforcement steel and sacrificial metal) having a different electrochemical
potential. This requires an electrical connection between the metals and the presence
of an electrolyte. (Dantanarayana 2010)
The basic galvanic cell is shown below. This shows the electrical connection
between the two different metals and presence of the electrolyte. The electrolyte in
the reinforced concrete is the water within the pores of the concrete mix. The
electrical connection is provided by direct fixing to the reinforcement steel.

17
Figure 9 - The Galvanic cell
Source : <http://www.meritnation.com/ask-answer/question/draw-an-electrolytic-
cell-and-label-the-following-a-anod/chemical-effects-of-electric-current/3467267>
In GACP installations in steel reinforced concrete elements, the sacrificial metal is
usually cast within the member by the following method:
1) First exposing the reinforcement bar by breaking back the concrete
2) Cleaning of the reinforcement bar to remove excess corrosive build up (rust)
3) Treating the exposed reinforcement bar by painting with inhibitors such as
zinc based paints
4) The sacrificial devices are placed or tied
5) A connection from the sacrificial devices are connected to the reinforcement
steel (e.g. riveted or direct tying)
6) The structure is repacked or finished with or without protective coating (e.g.
Silanes or siloxanes)
(Dantanarayana 2010)
Various types of GACP product are available for cathodic protection. Shown below
is an example of a product called Galvashield XP. This product contains a zinc
anode core.

18
Figure 10 - Installation of Galvashield XP within a beam - Exposed beam
showing connection to reinforcement steel
(Moore 2009)
Figure 11 - Installation of multiple XP units within column
Source : <http://www.maxfrank.se/se/products/reinforcement-
technologies/Galvashield.php>
The use of GACP is thought to be an effective tool for management of the RMS
bridge stock. It is currently considered within the RMS as a short to mid-term

19
solution for corrosion protection. It is thought that the GACP systems offer around
10-15 years protection, but this may me more or less depending on the specific
product used, structure condition, design and the environmental circumstances. The
ability to adjust current is not available with current GACP systems, so changes in
resistivity may render the treatments ineffective in some circumstances.
GACP systems also provide further advantages over other types of preventions such
as ICCP, as the risk of vandalism to the systems is avoided as it is incorporated into
the structure itself. Installations can usually be implemented by semi-skilled workers
and once the surfaces have been repacked and painted etc. the final finish is
representative of the original design. Visual aspects to bridges are becoming
increasing important to the general public. (Moore 2009)
2.6.2 IMPRESSED CURRENT CATHODIC PROTECTION
(ICCP)
ICCP cathodic protection systems provide the electrical current through an external
low voltage source. An anodic material is most often present but the material is
usually inert. It is usual to connect the main power supply though a rectifier that
converts the alternating current (AC) to a direct current (DC). However, some
systems have been designed to work off solar and battery arrangements.
(Sohanghpurwala et al. 2007)
The direct current pushed through the anodic material effectively shuts down the
anodic reaction so that the reinforcement steel becomes the cathode. In this regard, it
is much the same manner as GACP systems. Some examples of the anodic material
used are platinum niobium wire, which consists of a copper core, niobium substrate
and platinum cladding. (Transportation Research Board 2009)

20
Figure 12 - Typical ICCP system
(Transportation Research Board 2009, p 7)
Figure 13 - Tranformer/Rectifier unit installed under a bridge
(Moore 2009)
ICCP systems are generally regarded as the best cathodic protection available but the
costs of installation (approximately $1-2 Million AUD) per bridge makes it
prohibitive in most circumstances. However for large structures and bridges it is
thought to provide the longest anode life, with more than 50 years expected from a
single but maintained system. There are a number of advantages and disadvantages
with ICCP systems.
21
2.6.2.1 ADVANTAGES OF ICCP SYSTEMS
ICCP systems have the following perceived advantages:
• Current can be adjusted to suit. Some concrete resistivity can change over
time so being able to adjust current can compensate for this.
• More than 50 years of anode life can be expected
• Systems may include back to base technology where the system can be
monitored and controlled by an expert in a head office or remotely.
(Moore 2009)
2.6.2.2 DISADVANTAGES OF ICCP SYSTEMS
• Power source required
• Higher maintenance requirements
• Costly to implement
• Usually requires specialised staff/electricians for installation
• Can be subject to vandalism
• Can be subject to lighting, flooding etc
• May lead to hydrogen embrittlement. This occurs in high strength steel and is
caused by additional hydrogen being released due to the ICCP process.
Embrittlement can lead to sudden failure of the steel.
(Moore 2009)
2.7 DETERMINATION OF GACP SYSTEM LIFE
An estimate of GACP system life can be made with the application of Faraday’s
laws of electrolysis.
Faraday's 1st Law of Electrolysis : The amount of chemical change produced by
current at an electrode-electrolyte boundary is proportional to the quantity
of electricity used.

22
Faraday's 2nd Law of Electrolysis : the amounts of chemical changes produced by
the same quantity of electricity in different substances are proportional to their
equivalent weights.
(Britannica 2013)
From Faraday's Law of Electrolysis, m = M i t z F
Where :
m = mass of zinc in grams (g)
M = molecular weight of zinc (mass of 1 mole of zinc atoms) = 65.4 g
i = current in Amps (A)
t = time in seconds (s)
z = valency of zinc = 2
F = Faraday’s constant = 96500
Rearrangement of the formula gives, t = m z F M i (Dantanarayana 2010)
An efficiency factor of 70% is applied to the initial mass of zinc to allow for the
possibility that it might not all be consumed. This is a common corrosion protection
industry practice when calculating the life of a zinc galvanic anode. This will have
an effect of underestimation of anode life.
(Dantanarayana 2010).
It is noted that all GACP systems used in the case studies use zinc as the sacrificial
metal. From the time of installation, the zinc anode will produce current and lose
mass according to Faraday’s laws of electrolysis.
To estimate the amount of mass lost for the installation period (i.e. from time of
installation to the last reading), an average of all measurements for that time is used.
This average is used as a constant current value within the equation shown above to
estimate total zinc required. This mass of required zinc is then taken away from the

23
original effective mass of the anode to estimate the remaining amount as of the last
reading.
The last value of measured current and the remaining mass of zinc is used for
determination of future anode life. As the current is generally decreasing with time,
the corresponding anode life calculated is most probably underestimated.
The mass of zinc for various CP products are summarised in the table below:
Table 1- Effective zinc mass of various CP products
Product Actual
mass
Effective mass
(70% of Actual mass)
Galvashield XP 62 g 43.4 g
Galvashield CC100 145 g 101.5 g
Galvanode DAS 0.6 lb/ft 893 g/m 625 g/m
Galvanode DAS 1.2 lb/ft 1786 g/m 1250 g/m
Galvanode DAS 2.4 lb/ft 3572 g/m 2500 g/m
EXAMPLE CALCULATION
For Galvashield CC100, effective mass, m = 101.5g.
For an installation period of 54.8 months the average current is 0.526 mA.
Calculation of the installation time period t1 in seconds
t1 = 54.8 months = (54.8/12)x60x60x24x365 = 144.0144 x 10⁶ seconds.
Amount of zinc lost for installation period m1 :
m1 = M i t1 = 65.4 x 0.526 x 10-3 x 144.0144 x106 = 25.7 g z.F 2 x 96500
Remaining zinc mass
Remaining zinc mass, m = Effective mass of anode - mass of zinc lost
= 101.5 - 25.7
= 75.8 g
Determination of future anode life

24
Last current measurement i = 0.17 mA, m = 75.8 g
t = m z F = 75.8 x 2 x 96500 = 1315.830 x 106 seconds M i 65.4 x 0.17 x 10-3
1315.830 x 106 seconds = 41.73 years 60 x 60 x 24 x 365
Calculation of total anode life
Total anode life = Time installed + future anode life (t)
= 54.8/12 + 41.73
= 46.29 years
Therefore the total anode life is estimated at 46.29 years
The estimation outlined is based on current measurement and does not take into
account the potential decay. Whilst current may still be produced by the anode into
the future it may be that the amount of cathodic protection provided by the system is
sub-optimal. Some systems can still produce current but the potential decay may be
much less than a 100mV value. This value is considered the lower limit of protection
as defined in Australian Standard AS2832.5-2008. (Standards Australia 2008)

25
3 BRIDGE ASSESSMENT METHODS
3.1 RMS BRIDGE INSPECTIONS
Most road and bridge authorities are committed to preserving assets and use ongoing
inspections as a tool for monitoring the asset condition. Various bridge details
including condition reports are usually stored in administrated databases and
information systems. In the case of the RMS, the Bridge Information System (BIS) is
used to hold all bridge related information such as :
1) Consistent, reliable and up to date bridge inventory data, and
2) Consistent, reliable and up to date bridge inspection and condition
data
(RMS 2011a)
Within RMS, The Bridge Inspection Procedure Manual 2007 (RMS 2007a) and the
policy for Bridge inventory, inspection and condition rating - PN158 (RMS 2011a)
outline the bridge inspection process. PN158 outlines five different levels of
inspections with responsible persons as follows:
1) Level 1 inspection - Routine (Works Supervisor/Bridge Inspector/Network
Inspector/Contract Manager).
Note: Regional Bridge Maintenance planner = RBMP
RTA = RMS

26
Table 2- Level 1 Bridge inspection frequency/description
Frequency Description
All bridges
In accordance with the
inspection regime required by
the RTA’s road maintenance
contracts.
A basic drive-by inspection performed as part
of the general network asset assessment. The
inspection would be performed by a works
supervisor/inspector (not necessarily a RTA
TRAINED BRIDGE INSPECTOR), and would be
expected to collect information on visible
accident damage or other deformations in
superstructure like trusses and information
regarding the status and performance of
ancillary elements such as barriers, deck
scuppers, and waterways. While these
inspections are not recorded in the BIS, any
significant defect identified should be
reported to the RBMP (Regional Bridge
Maintenance planner) for further action.
The inspection may also be generated by
reports arising from an incident or
community input. Regional Asset Managers
shall ensure that these inspections are carried
out in accordance with the RTA’s QA
Specifications for road network management.
2) Level 2 inspection - Condition assessment (RTA Trained Bridge
Inspector).
Unless determined otherwise in accordance with this policy, the Level 2
inspection shall cover the full bridge, and include condition rating for all
applicable elements and all the required maintenance actions (RMAs) found
necessary on the day of the inspection (even if some RMAs had been
identified in previous inspections).

27
Table 3 - Level 2 Bridge inspection frequency/description
Frequency Description
Other than complex bridges:
Concrete and steel bridges:
i. Normally 2 yearly interval
ii. If all structural elements are
in condition 1, interval for
inspection can be extended
to 4 years, as determined by
the RBMP.
iii. Bridges in marine or
aggressive environment
should be inspected at a 2
year interval even if all
elements are in condition 1.
Timber bridges:
i. Annually
ii. Test bore large timbers
likely to contain heart wood,
in accordance with the
Timber Manual, every 4
years or shorter intervals as
nominated by RBMP.
A detailed visual assessment of element
condition reported in accordance with
parameters defined within inspection
manual guidelines. The inspection would
be undertaken by a RTA TRAINED BRIDGE
INSPECTOR who is suitably trained to
assess the particular material of the
bridge.
The RBMP shall assess the condition
rating of all members to determine if a
Level 3 inspection is warranted.
Where a bridge inspection reveals distress
or deterioration that may be structurally
significant the inspector shall rate the
element or member in the worst condition
state until the matter is further assessed by
an experienced structural engineer. The
inspector shall immediately inform the
RBMP of the location and extent of the
distress or deterioration observed.
The RBMP shall carry out an inspection
immediately and take the necessary action
to address the problem. This action may
include closure of the bridge, the
imposition of a load limit or arranging for
a Level 3 Inspection. The RBMP shall
mobilise the Bridge Assessment
Committee (BAC) if required.

28
Complex bridges
As set out in the inspection plan
for the bridge
All bridges designated as “complex” in
the BIS shall be inspected by a RTA
TRAINED BRIDGE INSPECTOR, trained to
assess the particular material type of the
bridge, and in accordance with the
inspection plan for the bridge, prepared by
the SENIOR BRIDGE ENGINEER (A&E).
The plan may require additional personnel
with specified competencies to
accompany the RTA TRAINED BRIDGE
INSPECTOR.
The inspection plan will set out the
frequency and detail the inspection
required, including access needs,,
especially for critical areas, such as joints,
areas adjacent to joints, bearings, stringer
- girder connections, cable anchorages,
potential corrosion traps, etc
Under water/scour
Inspections:
Every 4 years or shorter
intervals, as nominated by the
RBMP.
The inspection would be undertaken by an
experienced diving contractors directed by
RTA staff in accordance with the RTA
QA specifications on Underwater
Inspections.
A report of the defects in the chosen
sample parts of the underwater elements
with necessary photographs and videos by
the diving contractor shall be uploaded
into the BIS.
The inspection may also be initiated in
response to a flood event, an incident or a
community report.

29
3) Level 3 inspection - Structural safety assessment (Experienced structural
engineer).
The scope of the inspection shall be defined by the RBMP and/or the
SENIOR BRIDGE ENGINEER (A&E). The scope of the inspection can cover the
full bridge or only specific elements as required.
Table 4 - Level 3 Bridge inspection frequency/description
Frequency Description
Concrete, steel and timber
Bridges:
The need for a Level 3
inspection is identified by:
i. A level 2 inspection,
ii. A Level 4 assessment
indicating strength issues,
or
iii. Performance of similar
class of bridges/ bridge
elements.
iv. Incident on the bridge
impacting structural
capacity
v. Post natural disaster such
as heavy floods , earth
quake etc.
RBMP in consultation with the Manager
Bridge Assets shall decide to program a
level 3 inspection. Requirements for Level
3 inspections are:
i. A Level 3 inspection of a bridge must be
a structural inspection of the complete
bridge except where the RBMP deems a
partial inspection is adequate. Partial
structural inspections are allowed for
inspections relating to bridge
emergencies, or monitoring or follow-up
inspections within two years subsequent
to a complete Level 3 inspection, or
where the RBMP deems a partial
inspection is adequate.
ii. The Regional RTA TRAINED BRIDGE
INSPECTOR shall accompany and support
the experienced structural engineer
during the inspection.
iii. The structural engineer who conducts
the Level 3 inspection shall write a full
structural inspection report without any
constraint.
iv. As part of the Level 3 inspection, the
condition of the bridge elements must

30
also be rated by the structural engineer
and RTA TRAINED BRIDGE INSPECTOR
in accordance with the 'RTA Bridge
Inspection Procedure' for a Level 2
inspection
v. Where deemed necessary by the RBMP
or structural engineer, an assessment in
consultation with a durability engineer
or any other specialists required shall be
carried out. It is essential that electronic
versions of the full reports be uploaded
to the BIS as “Specialist” inspections, as
part of entering the Level 3 inspection
into the BIS In addition to any other
reporting requirements, the full
inspection report should be supplied in
electronic format (.pdf and .doc) and
should include any supplementary
reports (e.g. material testing) from other
specialists if engaged.
vi. The recording of ‘Required Maintenance
Actions’ from the list of maintenance
activities in the BIS as part of Level 3
inspections where relevant is
recommended but NOT mandatory.
If a Level 3 inspection of a complete bridge
is done (and recorded in BIS), then the
subsequent Level 2 inspection of the bridge
shall be carried out at the normal required
time interval (1 year or 2 years or as
determined previously) from the date of the
Level 3 inspection unless an earlier Level 2
inspection is recommended by the structural
engineer who conducted Level 3 inspection.
However, if the Level 3 inspection is issue
based and covers only selected elements,
then a Level 2 inspection shall be carried out
on the other elements and at the same time
as the Level 3 inspection.

31
4) Level 4 inspection - Load capacity assessment (Experienced structural
engineer).
Table 5 - Level 4 Bridge inspection frequency/description
Frequency Description
All bridges:
As requested for changes
in legal loads or new
vehicles.
As per Level 3 inspection for determining
load capacity of a bridge.
5) Level 5 inspection - Inspection carried out by Specialists.
Table 6 - Level 5 Bridge inspection frequency/description
Frequency Description
Specialist Inspections:
These inspections are for
other specialists such as
specialist surveyors,
material specialists or
innovative technical
solution providers.
Eg. Assessment of
‘Lead’ contamination of
bridge site, durability
assessment, etc.
The frequency of
specialist inspections is
determined on an as
needs basis
Carried out by a RTA accepted specialist
on a specific bridge management issue.
Full electronic version of the inspection by
the specialist shall be uploaded to the BIS.

32
Level 1 inspections, as defined in PN158, can be undertaken by persons that are not
necessarily trained bridge inspectors. The information is not recorded with the BIS
and the method of inspections is typically a drive-by visual assessment.
Level 2 inspections are normally undertaken at two yearly intervals and may identify
corrosion and concrete deterioration such as spalling. Inspections and reports should
be carried out by suitably trained internal staff or contracted out to specialists. These
inspections are used by the regional bridge maintenance planners to schedule
maintenance works and rehabilitation works such as the installing of cathodic
protection systems.
The level 2 inspections include a detailed inspection of bridge elements in order to
rate their relative condition. This information is then recorded within a bridge
inspection report and entered into the BIS.
The condition state of each element is described according to standard definitions as
given in the Bridge Inspection Procedure Manual (BIPM) (RMS 2007a). For
Reinforced Concrete - Condition state descriptions these are:
Table 7 - Bridge inpsection - Condition state descriptions
Condition state Description
1 The element shows no deterioration. There may be
discolouration, efflorescence, and/or superficial cracking.
2 Minor cracks and spalls may be present but there is no
exposed reinforcement or surface evidence of corrosion of
reinforcement.
3 Some delaminations, significant cracks or spalls may be
present or some reinforcement may be exposed. Corrosion
of reinforcement may be present but loss of section is minor
and is not sufficient to warrant analysis to ascertain the
impact on the strength and/or serviceability of either the
element or the bridge.
4 Advanced deterioration. Corrosion of reinforcement and/or

33
loss of concrete section is sufficient to warrant analysis to
ascertain the impact on the strength and/or serviceability of
either the element or the bridge.
Various visual examples are included in the BIPM for defining the condition state.
The following are defined for reinforced concrete piers:
Condition State 1
The element shows no deterioration. There may be discolouration, efflorescence,
and/or superficial cracking.
Figure 14 - Reinforced Concrete Piers - Condition State 1
(RMS 2007a)
Condition State 4
Advanced deterioration. Corrosion of reinforcement and/or loss of concrete section
is sufficient to warrant analysis to ascertain the impact on the strength and/or
serviceability of either the element or the bridge.

34
Figure 15 - Reinforced Concrete Piers - Condition State 4
(RMS 2007a)
3.2 BRIDGE DURABILITY INSPECTION/TESTING
Level 3 to 5 inspections are typically carried out by specialist teams or consultants
with relevant experience. Depending on the condition of the particular bridge or its
intended use, the level of inspection is determined by the regional bridge
maintenance planners.
RMS has undertaken a program of bridge durability inspection/testing for a number
of coastal bridges within the Northern Region. This program was initiated due to the
findings of an assessment of the current bridge stock which identified a high level of
corrosion in existing coastal bridges. The delivery of such inspections/testing is
typically outsourced to external consultants with relevant experience and testing
facilities.
Bridge identification and assessment includes inspection and testing of bridge pile
caps, pier columns and tie beams subject to concrete deterioration and abrasion, and
prediction of the remaining service life of the elements. The brief or scope usually
directs the consultant to undertake a detailed investigation to evaluate the condition

35
of the structures and determine appropriate rehabilitation or repair methodologies for
the bridges, if required.
Normal reporting items include the analysis of concrete deterioration in the form of
concrete cracking, spalling and delamination. Previous repairs and maintenance and
their perceived success are required to be assessed as part of the reporting.
Contractors undertaking work on behalf of RMS are also required to work under a
Quality System (ISO 9001 2008 or AS3901) and accordingly, a Quality Plan is
required to be submitted to cover all activities covered by the brief. These measures
are put in place so that the contractor conforms to the works as specified.
(RMS 2013a)
3.2.1 SCOPE OF WORK
A typical scope of work for a bridge durability assessment would include:
1) Physical Inspection of the Structure
a) Visual inspection and defect mapping
b) Delamination survey
2) Diagnostic Testing:
a) Reinforcement cover survey
b) Electrode potential survey
c) Chloride analysis
d) Carbonation testing
e) Concrete electrical resistivity testing
f) Reinforcement continuity testing
3) Reporting:
a) Analysis of the inspection and test results
b) Repair options assessment
(RMS 2013a)

36
The physical inspection of the bridge consists of a visual inspection and a
delamination survey. Sketches indicating all defects and previous patching are
included as part of this work.
3.2.2 VISUAL INSPECTION
Visual inspection of the concrete elements of the bridge (excluding piles below the
Mean Low Water Springs - MLWS) are typically undertaken to identify existing
defects and previous repairs. The defects to be mapped may include:
• Cracking
• Spalling
• Scaling
• Rust staining
• Physical damage including scour
Digital colour photographs are taken of all typical defects and specific areas of
interest. The defect mappings also include crack width measurements of
representative cracks. (RMS 2013a)
3.2.3 DELAMINATION SURVEY
A delamination survey is conducted by hammer-tapping (usually a geological
hammer) of a representative percentage of the concrete surface area.
The visual and delamination survey provides sufficient information to:
• Identify Test Areas for diagnostic testing
• Estimate the extent of physical concrete deterioration
• Estimate the extent of previous repairs, including failed repairs
The above estimates of concrete deterioration and previous repairs are separately
recorded for each element-type (columns, tie-beams etc). The estimates are
presented in terms of surface area (m2) as well as expressed as a percentage of the
total surface area of the element-type. (RMS 2013a)

37
3.2.4 DIAGNOSTIC TESTS
Diagnostic testing allows existing bridge condition information to be gathered and is
a very important tool in the bridge assessment. The consultant may recommend
additional testing, as considered necessary. The additional testing may include
testing for AAR.
Test area locations are nominated by the consultant following the visual inspection
and delamination survey. The locations should be representative of the various
condition states of the element with emphasis on more aggressive environments (i.e.
tidal and splash zone). Test area locations are required to be approved by RMS prior
to the commencement of diagnostic testing.
The Consultant should repair or make good cored or exposed concrete using an
appropriate high build proprietary repair mortar.
Other information to be recorded includes the water level at the time of the survey in
relation to the top of the pile cap, or in bridges without pile caps to the soffit of
girders or headstock. The date and time of the measurements should also be included
in the report. (RMS 2013a)
3.2.5 REINFORCEMENT COVER SURVEY
A reinforcement cover survey should be undertaken using an electro-magnetic
covermeter with proven accuracy up to 5mm. The extent of the covermeter surveys
will be dictated by the location of diagnostic testing.
Location and depth of all reinforcement within each covermeter survey area should
be recorded an a minimum of one (1) concrete breakout shall be performed per
survey area to confirm the location, depth, size and condition of the reinforcement
and to calibrate the covermeter results. (RMS 2013a)

38
3.2.6 POTENTIAL MAPPING SURVEY
A potential survey should be undertaken using a portable Cu/CuSO4 reference
electrode. Potential survey areas are usually specified to be a minimum of 3m2 in
size, with readings taken on a 250 mm grid. A minimum of one (1) concrete
breakout should be performed per potential survey areas to calibrate the potential
readings. Portable reference electrodes are checked against a known laboratory
standard reference electrode, or similar, at the beginning and end of each application.
The electrical continuity of the reinforcement should be checked before potential
mapping by testing concrete resistance across area boundaries. Potential surveys
should not be performed within locations of delaminated concrete as results would
be erroneous. (RMS 2013a)
3.2.7 CHLORIDE ANALYSIS
Concrete samples, for the analysis of chloride content are retrieved within each test
area. The samples comprise cores which are usually a minimum of 80mm in length
and approximately 50 mm diameter. The core is split into four (4) depth increments
for testing, at 0-10mm, 10mm-30mm, 30mm-50mm and 50mm-70mm.
The chloride samples should be analysed in a NATA accredited laboratory for acid
soluble chloride content by weight of concrete sample, in accordance with AS
1012.20. (RMS 2013a)
3.2.8 CARBONATION TESTING
The depth of carbonation should be measured for each test area. The depth of
carbonation is determined by spraying freshly exposed concrete with
phenolphthalein pH indicator and measuring the distance of penetration.
(RMS 2013a)
3.2.9 CONCRETE ELECTRICAL RESISTIVITY TESTING
The electrical resistivity of the concrete should be measured within each test area.
Electrical resistivity is measured using a soil resistance meter, utilising the Wenner

39
4-probe method. Measurements are made by inserting the probes into the concrete
surface.
3.2.10 REINFORCEMENT CONTINUITY TESTING
Reinforcement continuity is assessed by resistance testing between two sections of
exposed reinforcement. The resistance is measured using a high impedance
voltmeter. Continuity testing usually involves measurements between a minimum of
six test points. One test point is located within each adjacent element, to assess
continuity between elements. (RMS 2013a)
3.2.11 REPORTING
The consultant is required to provide a detailed report on the bridge, outlining all
aspects of the condition assessment including an analysis of the results. The report
should contain a detailed analysis of the physical inspection and diagnostic test
results which are to be displayed in a summary table format. (See Table 8 for an
example of the assessment summary table). (RMS 2013a)
Conclusions should be based on sound engineering judgement. Computer prediction
models should be used, where appropriate, for prognosis of deterioration.
Based on the results of the visual and delamination survey, the following estimates
should be provided:
• The extent of physical concrete deterioration;
• The extent of previous repairs, including failed repairs.
Concrete deterioration and previous repairs shall be separately recorded for each
element-type (piles, tie-beams etc). The estimates are to be presented in terms of
surface area (m2) as well as expressed as a percentage of the total surface area of the
element-type.
Based on the results of the diagnostic testing, the following information should be
provided:

40
• An estimate of the extent of corrosion activity;
• The corrosion mechanism that is responsible for corrosion activity or that
presents the greatest risk of future corrosion activity for the various
elements;
• An indication of the extent of any future corrosion risk (i.e. estimate ‘time
to corrosion initiation’ for areas that are not presently corroding, using
acceptable corrosion models).
The above estimates of corrosion activity should be separately recorded for each
element-type (piles, tie-beams etc). The estimates should be presented in terms of
surface area (m2) as well as expressed as a percentage of the total surface area of the
element-type. An example of the output required for a given test area is shown in
Figure 16 - Typical report outputs - Test Area. (RMS 2013a)
Table 8 - Example Bridge assessment summary table
Element Dominant
Corrosion
Mechanism
Physical Concrete Damage Corrosion Activity
Area
(m2)
% (of
total
surface
area)
Comments Area
(m2)
% (of
total
surface
area)
Comments
Piles Chloride
attack
23 15 Damage
generally
confined to
within ~ 1
m of HWL
65 43 Corrosion
activity
confined to ~
1.5 m above
HWL
Headstocks Carbonation 7 5 Damage
confined to
headstock
soffit
15 10 Corrosion activity
generally confined to headstock
soffit

41
Figure 16 - Typical report outputs - Test Area (RMS 2013a)
C1 C2
C3
0 0.25 0.5 0.75 1 1.25 1.5 1.75 20
0.25
0.5
0.75
1
1.25
1.5
1.75
2
Horizonal Distance (m)
Ver
tica
l Dis
tance
(m
)
Half Cell Potenial MappingPier 4 Downstream Column South Face
-450--400 -400--350 -350--300 -300--250 -250--200
-200--150 -150--100 -100--50 -50-0 0-50
Test Area
HWL
HWL
C1
C2
C3
Min
Min
Min Mean
Mean
Mean
100
500
750
Continuity Checks Cover Calibration
Reinforcement Cover

42
4 CATHODIC PROTECTION PRODUCT
DESCRIPTIONS
This section outlines the products used in the following case studies and
installations. It gives and overview of the products used by RMS for Galvanic Anode
Cathodic Protection (GACP) systems to date in the Northern Region.
4.1 GALVASHIELD XP
Galvashield XP or XP anodes are sacrificial type anode systems. The anode consists
of a zinc core (up to 60g) surrounded by an active cementitious matrix. The system is
designed so that the zinc core corrodes preferentially to the surrounding
reinforcement bar.
Figure 17 - Section of Galvashield XP
(Moore 2009)
The product is aimed at patch repair installations and requires removal of the entire
damaged concrete section, preparing reinforcement steel (usually a corrosive
preventing primer paint) and then tying the units directly to the steel. The product
has also been designed to focus protection directly adjacent to the repair.

43
The size (68mm diameter, 28mm thick) and discrete nature of the anode makes it
suitable in circumstances where space is a premium, such as in tightly confined areas
or structures with low cover values as the units can generally be placed between gaps
in the reinforcement.
The Galvashield XP embedded anode has been in use in North America since 1998
in a wide variety of applications and the manufacturer claims that it can also reduce
the effect of ring-anode corrosion commonly associated with concrete patch repairs
in reinforced concrete. This damage occurs when the patch repair does not have a
large enough margin of removal and corrosive influences of the old area remain.
(CIF 2013)
Further details on the Galvashield XP product can be found in Appendix C.
4.2 GALVASHIELD CC
Galvashield CC or CC anodes are discrete sacrificial type anode systems. The anode
consists of a zinc core surrounded by an active cementitious matrix but the unit is
cylindrical in shape and can hold up to 100g of zinc.
Figure 18 - Section of Galvashield CC anode
(RESAPOL 2013)
Connection wire
Sacrificial zinc anode core
Active cementitous matrix

44
The Galvashield CC anode is similar to the XP product but is typically implemented
by core drilling and inserting the units. External wiring connects the unit in series
and a separate connection made to the rebar.
These types of sacrificial anodes are usually used where the concrete is sound but
where corrosive activity is present.
Further details on the Galvashield CC product can be found in Appendix C.
4.3 GALVACORR
GalvaCorr is a three component, moisture cured, metal rich urethane coating. This
material is a high build, galvanic coating for concrete that uses sacrificial metals to
provide cathodic protection to embedded steel rebar. The GalvaCorr coating is
electrically connected to the rebar and galvanically stops the corrosion. The
effectiveness of the GalvaCorr system can be monitored by electrical current
measurements and polarisation tests. The manufacturer claims that GalvaCorr gives
CP protection for a life of up to 10 years before the coating may need to be re-
applied.
Figure 19 - GalvaCorr brochure diagram showing product methodology
(CORTEC 2013)
Further details on the GalvaCorr product can be found in Appendix C.

45
4.4 GALVANODE DAS
The Galvanode DAS Technical Data Sheet (TDS) produced by Parchem
Construction supplies states:
“Galvanode DAS is a distributed anode system designed to provide
corrosion control or cathodic protection to concrete decks, columns,
beams and walls. Galvanode DAS galvanic anode system is distributed
over concrete and masonry structures to provide global corrosion
protection. The system can be encased in new concrete, embedded in
concrete overlays, encapsulated inside reinforced concrete jackets or
used in conjunction with stay-in-place FRP or steel jackets for column
and pile protection.”
(Parchem 2013a)
Within the TDS for the Galvanode DAS anode system the manufacturer also claims:
1) The system includes distributed galvanic anode units which are alkali-
activated with a pH greater than 14
2) They contain zinc evenly distributed along the length of the unit
3) The system is in compliance with ASTM B418 Type II (Z13000) and ASTM
B6 Special High Grade (Z13001) with iron content less than 15 ppm
4) The anode unit is contained within FRP reinforcing to resist expansion
(Parchem 2013a)

46
Figure 20 - The Galvanode DAS system - Encased "sausage" with rebar connection
shown (Parchem 2013b)
Figure 21 - Galvanode DAS installed. (RMS 2012) - Showing perforated chain
connections. Further details on the Galvanode DAS product can be found in
Appendix C.

47
The Galvanode DAS product is manufactured in the USA and comes in pre-
determined lengths and weight categories. Weight/length measurements are given in
imperial units. Metric units of standard products are given in the table below:
Table 9 - Galvanode DAS products in metric units
Galvanode DAS
product (lb of zinc/ft)
Equivalent metric units
(kg of zinc/m)
0.6 0.9
1.2 1.8
2.4 3.6

48
5 CATHODIC PROTECTION CASE STUDIES
This section represents the major component of this project. It describes three CP
installations on bridges by RMS within the Northern Region. These bridges include:
1) Boyd’s Bay Bridge (B7628)
2) Mororo (B2154)
3) Terranora (B8002)
5.1 BOYD’S BAY BRIDGE (B7628)
5.1.1 BRIDGE BACKGROUND
Boyd’s Bay Bridge is built across the Tweed River (Terranora inlet) and was
constructed in 1985. The bridge is constructed on Minjungbal Drive at Tweed Heads
in Northern NSW.
Figure 22 - Location of Boyd's Bay Bridge. (Google Earth 2013a)
Boyd’s Bay Bridge

49
Boyd’s Bay Bridge consists of 8 spans of simply supported 24m PSC trough girders
supported by cantilevered headstocks with a single column for each carriageway.
There are 3 lanes of traffic northbound and 2 lanes southbound with a mountable
median. Both superstructures share common abutments. A walkway is provided on
the downstream side of the southbound deck.
Figure 23 - Eastern Elevation of Boyd's Bay bridge. (RMS 2007b)
Figure 24 - Boyd's Bay bridge in 2007 prior to CP installation. (RMS 2007b)

50
Figure 25 - Boyd’s Bay bridge design - Piers. (RMS 1985)

51
5.1.2 BRIDGE ASSESSMENT
Various inspections of the bridge from as early as 1995 revealed signs of premature
structural deficiencies including fine cracking in pier columns as well as the deck.
Major influences on the deterioration of the structure included fire damage to the
face of piers caused by fisherman lighting fires on the pile caps to keep warm. Also
early signs of corrosion and delamination within the splash zone were observed.
(ARRB 2004)
An internal report carried out by RMS in 2003 identified deterioration of the column
and pilecaps within the structure. The report made the following observations:
“Most of the column concrete in the tidal and splash has some degree
of degradation that can be attributed to one or all of the following
factors” ;
• Fishermen have used the very large, flat pile caps as a fishing
platform for many years and some have lit fires up against the
columns that have damaged the concrete
• The mix design was not appropriate for this very hostile
environment and much of the surface has eroded and cracked, some
evidence of inadequate mixing is visible
• The column concrete was placed using a tremmie pipe and kipple,
which resulted in uneven placement combined with minimal
compaction. This was not evident when the concrete was new but
after time the surface has eroded to expose the problems
• Contamination with seawater before, during and directly after
placement
• Minimal curing as this site was subject to vandalism and theft of the
curing hoses and covers
• Corrosion of the column reinforcement that has caused heavy
cracking allowing direct entry of seawater

52
• Some repair work has been carried out without removing all of the
surrounding damaged concrete, which has allowed water to enter
and collect behind the patch
Figure 26 - Boyd's Bay - Delaminated condition of concrete piers in 2003
(RMS 2003, p4)

53
Figure 27 - Boyd's Bay - Fire damage to concrete piers in 2003.
(RMS 2003, p4)
Figure 28 - Boyd's Bay - Severe corrosion and spalling - Lower part of pier
column as at 2007.
(RMS 2007b)

54
In June 2007 an Impressed Current Cathodic Protection (ICCP) system
implementation was adopted as the preferred treatment method within RMS to halt
the corrosive impacts on the bridge. However, budget restraints precluded the
installation going ahead as the costing for the system was in the order of $2 Million
dollars. Alternatives were sought including the assessment of sacrificial CP products
(GACP) as a stop gap measure.
(RMS 2008a)
5.1.3 GACP IMPLEMENTATION
Boyd’s Bay bridge was the first large scale trial and implementation of GACP in the
RMS Northern Region. There have been a number of trials and implementations on
the bridge including:
1) A trial installation of a CC anodes in December 2007
2) Full installation of XP and CC anodes in August 2008 in pier columns
5.1.3.1 TRIAL OF CC ANODE - OVERVIEW
A trial was initiated in December 2007 using embedded CC anodes on pier 4 of the
structure. Observations were recorded for a six month period to ascertain if a full
scale implementation was warranted. Initial results showed potential decays of
greater than 100mV indicating that the system was providing a good level of
cathodic protection to the reinforcement steel. Success of the trial gave confidence in
developing a roll out of CC anodes the remaining bridge structure.
5.1.3.2 TRIAL OF CC ANODE - DESIGN
Design for the install was carried out by internal RMS staff in conjunction with the
supplier of the CC anode products :

55
Figure 29 - Boyd’s Bay - CC anode trial design
(RMS 2007b)
5.1.3.3 TRIAL OF CC ANODE - CONSTRUCTION
Implementation of the trial was carried out by Road and Fleet Services (RFS) which
is a construction arm of the RMS in December 2007. Steel reinforcement positions
were verified by a covermeter device and the position chalked up on the face of the
pier. The core positions were marked out on the face with adjustments made where
necessary to avoid contact with the existing reinforcement steel. Specialist sub-
contractors were required for the concrete drilling.
(RMS 2007b)

56
Figure 30 - Boyd's Bay - CC anode concrete coring - CC Trial 2 shown
(RMS 2007b)
Figure 31 - Boyd's Bay - CC anode installation. (RMS 2007b)
5.1.3.4 INSTALL OF XP AND CC ANODES - OVERVIEW
After encouraging initial trial of the CC anode system, a full roll out of the GACP
systems was planned and implemented in August 2008. XP anodes were installed in
areas where the concrete was not sound and where extensive patch repairs were

57
required. CC anodes were designed for upper parts of pier columns where the
concrete was structurally adequate and could be core drilled.
5.1.3.5 INSTALL OF XP AND CC ANODES - DESIGN
Design for the install was carried out by internal RMS staff in conjunction with the
supplier of the XP and CC anode products. A typical installation design shows area
to be patch repaired (with associated XP anodes) and upper parts showing CC anode
installation location.
Figure 32 - Boyd’s Bay - XP/CC anode design. (RMS 2008b)
5.1.3.6 INSTALL OF XP AND CC ANODES - CONSTRUCTION
Given the poor state of the delaminated and spalled areas around the base of the pier
columns, the deteriorated concrete was removed back to where it was considered
sound. This is shown on the design drawing as the breakout area.
Very high pressure water blasting equipment was used by a specialist contractor to
remove the concrete in the breakout areas.

58
Figure 33 - Boyd’s Bay - Water blasting of deteriorated concrete in pier
columns.
(RMS 2008b)
The exposed reinforcement steel was then primed with a corrosive resistant paint
before the XP units were tied onto the steel. Due to product changes and supply the
XP units used were both round disks and square type.

59
Figure 34 - Boyd’s Bay - XP unit tied to reinforcement steel
(RMS 2008b)
Figure 35 - Boyd’s Bay - XP (square type) units tied to reinforcement steel
(RMS 2008b)

60
Installation of reference electrodes were also carried out to enable base potential
measurements to be made as part of ongoing monitoring. Connection to the
reinforcement steel was made with wiring (Red) provided to future monitoring box.
The blue wiring is the connection from the reference electrodes to the same
monitoring box.
Figure 36 - Boyd’s Bay - XP (square type) units and reference electrodes
(RMS 2008b)
Once the XP units, reference electrodes and connections were made, the patch was
repacked with a high strength mortar.
Core drilling was then undertaken and the installation of CC anodes was performed
as per the construction sequence for the previously described CC anode trial.

61
Figure 37 - Boyd’s Bay - CC anodes showing backfilled patch repair
(RMS 2008b)
Figure 38 - Boyd's Bay - Monitoring box installed
(RMS 2008b)
Extent of patch
repair
CC Anodes
Chase containing connected wires to monitoring box

62
Once all the voids were packed out with the high strength grout and finished, a
protective siloxane coating was provided. This coating is used to prevent chloride
ingress through the concrete to the reinforcement steel.
Figure 39 - Boyd's Bay - Completed XP/CC install and protective coating -
Siloxane
(RMS 2008b)
5.1.4 COSTS OF IMPLEMENTATION
The cost of the initial trial CC installation of 2007 was approximately $15,000. A
major component of this was the concrete coring which had to be completed by a
specialist contractor. Installation of the anode systems, wiring and backfilling of
anodes were carried out by Road and Fleet Services (RFS) which are the
construction arm of RMS.
CC Trial 1 coverage area is defined by the outer anode string and the anode spacing
of 400mm. Therefore the area of coverage is 2 x 2 = 4m2. This equates to $15,000/4
= $3,750/m2.

63
The XP trial cost $10,000. The difference with the XP trial is that is consisted of a
major area of concrete patching. This area was in the order of 2m2. The concrete
patching component was estimated at $3500/m2. This equates to $7000 for the
patching alone. The installation of the XP anodes was therefore $3000. Cost for XP
installation was $3000/2 = $1500/m2
The full roll out of the XP and CC systems was approximately $400,000. Again, the
implementation of concrete patching was a major component with 40m2 of sub-
standard concrete removed and/or patched. This amount included full construction
costs including planning, site establishment, environmental controls, plan hire,
labour, training, quality assurance and other construction tasks.
It is noted that an ICCP system was considered for this bridge. Early estimates put
the cost for such a system at $1.5 - 2 million.
5.1.5 ISSUES/PROBLEMS WITH IMPLEMENTATION
Given the poor state of the lower parts of pier columns, the blasting back to remove
spalled areas of concrete was a major undertaking. Whilst not directly related to CP,
this task added a level of complexity in arranging separate contracts for private
companies to do the work.
Supply of the XP product also introduced some problems for the project. Early
application of the round disk type had to be supplemented with the rectangular shape
anodes. This did not have a major impact for the implementation but did require
additional management and negotiation with suppliers.
Like a number of bridge maintenance projects over water bodies, the major problem
with the implementation was the environment. The environmental concerns were not
only to safeguard the marine organisms, water quality etc. but also to manage the
construction teams to gain access to the work areas in safe manner with the right
equipment and resources. Power supply, potable water and other site facilities were
required for the duration of the project which required careful planning.

64
5.1.6 MONITORING RESULTS
Monitoring of trial installations included three CC and XP trials. CC anode trial 1
was installed in December 2007. CC trials 2, CC trial 3 and all XP trials were
installed in August 2008. Results are summarised as follows:
5.1.6.1 CC ANODE TRIAL 1
ANODE LAYOUT
The layout of the anode strings are shown in the figure below. Note that the
observation box is wired to the central anode strings (Strings 1-4) and does not
include separate areas shown by #1, #2, #4 and #5.
Figure 1 - Boyd's Bay - CC Trial 1 - Anode layout
(RMS 2008b)

65
CURRENT
Bodys Bay - CC Trial 1 - Current Output
0
5
10
15
20
0.0 10.0 20.0 30.0 40.0 50.0 60.0
Time (months)
Cur
rent
(m
A)
1 2 3 4
Figure 40 - Boyd's Bay - CC Trial 1 - Current measurements
Measurements show a general decline in value with anode strings 1 to 3 producing
about 0.5 to 0.8mA after 55 months of monitoring. Anode string 4 is producing
2.8mA after the same period.
The zig-zag nature of the output corresponds to humidity and temperature variations.
Observations of current are generally higher in summer months when humidity and
temperatures are generally higher. This phenomenon can be seen in the various
installations and demonstrates that measurements should be taken over various times
of the year to ensure representative values are obtained.
As the discrete anodes are wired in series, an estimate is made of the per anode
current by dividing the relevant string current by the number of anodes in that string.
For example, the single anode current for string 1 = 0.52/3 = 0.17mA. Anode string 4
contains 16 separate discrete anodes therefore the single anode current = 2.8/16 =
0.17mA. Single anode current is summarised in the following table.

66
Table 10 - Boyd's Bay CC trial 1 - Current output summary for last readings
Anode string Current for string
(mA)
Number of Anodes
in string
Single anode
current (mA)
1 0.52 3 0.17
2 0.49 3 0.16
3 0.8 3 0.27
4 2.86 16 0.18
POTENTIAL DECAY
Values for potential decay give an indication to the level of cathodic protection.
Values above 100mV are defined in AS2832.5 as providing cathodic protection for
steel reinforced concrete structures. It can be seen in the figure below that for almost
5 years this system has been providing good levels of cathodic protection with
Reference electrode 1 just falling below this requirement. (Standards Australia 2008)
Boyds Bay - CC Trial 1 - Potential Decay
0
50
100
150
200
250
0.0 10.0 20.0 30.0 40.0 50.0 60.0
Time (months)
Po
ten
tial (
mV
)
Reference Electrode 1 Reference Electrode 2
Figure 41 - Boyd's Bay - CC Trial 1 - Potential Decay

67
Figure 42 - Boyd’s Bay - CC Trial 1 - Anode and RE layout
(RMS 2007b)
The positioning of the reference electrode is important in interpreting results. The
reference electrodes (RE) for trial 1 are positioned 1.555m and 0.755m above HWL
(High Water Level) for RE1 and RE2 respectively as shown in the figure above. This
means that cathodic protection is satisfactory for that region. Cathodic protection for
the region just above the HWL may not be adequate.

68
5.1.6.2 CC ANODE TRIAL 2
ANODE LAYOUT
Figure 43 - Boyd's Bay - CC Trial 2 - Anode layout
(RMS 2008b)
CURRENT
Boyds Bay - CC Trial 2 - Current Output
02
468
1012
1416
0.0 5.0 10.0 15.0 20.0 25.0 30.0 35.0 40.0 45.0 50.0
Time (months)
Cur
ren
t (m
A)
1 2 3 4
Figure 44 - Boyd's Bay - CC Trial 2 - Current measurements

69
Measurements show a general decline in value with anode strings 1 to 3 producing
about 0.5 to 0.8mA after 46 months of monitoring. Anode string 4 is producing
4.2mA after the same period.
Measurements follow changes in humidity and temperature variations. Observations
of current are generally higher in summer months when humidity and temperatures
are generally higher.
Table 11 - Boyd's Bay CC trial 2 - Current output summary for last readings
Anode string Current for string
(mA)
Number of Anodes
in string
Single anode
current (mA)
1 0.44 3 0.15
2 0.51 3 0.17
3 0.81 3 0.27
4 4.19 16 0.26
POTENTIAL DECAY
The potential decay for CC trial 2 can be seen on the following figure:
Boyds Bay - CC Trial 2 - Potential Decay
0
50
100
150
200
250
0.0 5.0 10.0 15.0 20.0 25.0 30.0 35.0 40.0 45.0 50.0
Time (months)
Po
tent
ial (
mV
)
RE 1 RE 2
Figure 45 - Boyd's Bay - CC Trial 2 - Potential Decay
The potential decay figure for the CC trial 2 shows that RE1 is performing
satisfactorily whilst RE2 is showing sub-optimum values for cathodic protection
(<100mV) .

70
Figure 46 - Boyd’s Bay - CC Trial 2 - Anode and RE layout
(RMS 2008b)
The reference electrodes (RE) for trial 2 are positioned 0.57m and 0.14m above the
HWL for RE1 and RE2 respectively. The results are as anticipated, as compared to
CC trial 1 since the cathodic protection system will be working harder in the lower
parts of the pile due to more aggressive corrosive activity and conditions. As RE2 is
positioned lower in the pile as compared to trial 1, the corrosion activity and required
CP for that area is substantially more.

71
5.1.6.3 CC anode trial 3
ANODE LAYOUT
Figure 47 - Boyd's Bay - CC Trial 3 - Anode layout
(RMS 2008b)
CURRENT
Boyds bay - CC trial 3 - Current output
0
2
4
6
8
10
12
14
16
0.0 5.0 10.0 15.0 20.0 25.0 30.0 35.0 40.0 45.0 50.0Time (months)
Cur
rent
(m
A)
Series1 Series2 Series3 Series4
Figure 48 - Boyd's Bay - CC Trial 3 - Current measurements

72
Measurements again show a general decline in value with anode strings 1 to 3
producing about 0.16 to 0.27mA after 46 months of monitoring. Anode string 4 is
producing 2.21mA after the same period.
Measurements generally follow changes in humidity and temperature variations.
Observations of current are generally higher in summer months when humidity and
temperatures are generally higher. Measurements taken at 30 months appear to be
erroneous and near 0 for all anode strings.
Table 12 - Boyd's Bay CC trial 3 - Current output summary for last readings
Anode string Current for string
(mA)
Number of Anodes
in string
Single anode
current (mA)
1 0.23 3 0.08
2 0.16 3 0.05
3 0.27 3 0.09
4 2.21 16 0.14
POTENTIAL DECAY
The potential decay for CC trial 3 can be seen on the following figure:
Boyds Bay - CC Trial 3 - Potential Decay
0
20
40
60
80
100
120
140
160
180
200
0.0 5.0 10.0 15.0 20.0 25.0 30.0 35.0 40.0
Time (months)
Pot
entia
l (m
V)
Reference Electrode 1 Reference Electrode 2
Figure 49 - Boyd's Bay - CC Trial 3 - Potential Decay
The potential decay figure for the CC trial 3 shows that RE1 is performing
satisfactorily whilst RE2 is showing sub optimum values for cathodic protection
(<100mV) .

73
Figure 50 - Boyd’s Bay - CC Trial 3 - Anode and RE layout
(RMS 2008b)
The reference electrodes (RE) for trial 2 are positioned 0.65m and 0.3m above the
HWL for RE1 and RE2 respectively.
The results are anticipated as compared to CC trial 1 as the cathodic protection
system will be working harder in the lower parts of the pile due to more aggressive
corrosive activity and conditions. As RE2 is positioned lower in the pile as compared
to trial 1, the corrosion activity and required CP for that area is substantially more.
The results of CC Trial 3 compared to CC trial 2 show slightly better CP for zone
around RE2. Again this is anticipated as the position of RE2 in Trial 3 is slightly
higher than Trial 2. The corrosion activity in the zone associated with RE2 in Trial 3
is not as severe as in Trial 2 and therefore the required CP for that area is less.

74
5.1.6.4 XP ANODE TRIAL 1
ANODE LAYOUT
The layout of the XP anode strings are shown in the figure below. Note that the
observation box is wired individually to each XP unit (Strings 1-4) only.
Figure 51 - Boyd's Bay - XP Trial 1 - Anode layout. (RMS 2008b)
CURRENT
Boyds Bay - XP trial 1 - Current Output
0
0.1
0.2
0.3
0.4
0.5
0.6
0.7
0.0 5.0 10.0 15.0 20.0 25.0 30.0 35.0Time (months)
Cu
rren
t (m
A)
Series1 Series2 Series3 Series4
Figure 52 - Boyd's Bay - CC Trial 1 - Current measurements

75
Measurements show a general decline in value with anode strings 1 to 4 producing
about 0.2 to 0.3mA after 29 months of monitoring.
As the XP anodes are wired individually, the current measured is for a single anode.
Single anode current is summarised in the following table.
Table 13 - Boyd's Bay XP trial 1 - Current output summary for last readings
Anode string Single anode
current (mA)
1 0.20
2 0.29
3 0.22
4 0.24
POTENTIAL DECAY
Boyds Bay - XP trial 1 - Potential Decay
0
10
20
30
40
50
60
0.0 5.0 10.0 15.0 20.0 25.0 30.0 35.0 40.0 45.0 50.0
Time (months)
Pot
entia
l (m
A)
RE 1 RE 2
Figure 53 - Boyd's Bay - XP Trial 1 - Potential Decay
The potential decay figure for the XP trial 1 shows that both zones near RE1 and
RE2 are performing poorly and achieving values of about 10mA. (Full CP requires
decay >100mV).
The reference electrodes (RE) for XP trial 1are positioned 0.85m and 0.7m above the
HWL for RE1 and RE2 respectively. The positioning of the electrodes was

76
constrained by the area of breakout. Low values of CP in these zones would be
expected to be even worse in lower regions of the pile.
5.1.7 ESTIMATION OF SYSTEM LIFE
An estimation of system life can be made using basic assumptions and the use of
Faraday’s Laws of Electrolysis (See section 2.7). The results are summarised in the
following table:
Table 14 - Boyd's Bay - Anode life calculations
Trial Anode
string
Time from
Installation
to last
reading
(years)
Average
single anode
current since
installation
(mA)
Predicted
additional
life
(years)
Total
estimated
anode life
(years)
CC 1
1 4.57 0.53 41.19 45.75
2 4.57 0.45 45.48 50.04
3 4.57 0.62 25.00 29.57
4 4.57 0.43 42.25 46.81
CC 2
1 3.83 0.33 56.57 60.40
2 3.83 0.34 48.08 51.91
3 3.83 0.73 24.78 28.62
4 3.83 0.47 29.35 33.19
CC 3
1 3.83 0.37 103.76 107.59
2 3.83 0.32 150.98 154.81
3 3.83 0.44 87.05 90.89
4 3.83 0.43 56.86 60.69
XP 1*
1 2.38 0.33 26.84 29.23
2 2.38 0.40 21.51 23.89
3 2.38 0.36 24.37 26.76
4 2.38 0.36 24.00 26.38

77
* - Although CC2, CC3 and XP 1 were installed at the same time, no current
measurements were available for XP 1 at the last observation date. Therefore
installation life is different and based on the last readings.
These values do not represent the number of years that the system will provide
adequate Cathodic Protection. Rather, it is an estimate of the number of years that
the zinc material can be consumed at the last current value.
5.1.8 ASSESSMENT OF IMPLEMENTATION
The installation of GACP in Boyd’s Bay Bridge represented the first trials of the
technology in the Northern RMS Region. As such, there were no past practices,
development guides or lessons learnt to base the all important planning before
undertaking the work. The installation showed that the technology could be
implemented mostly by RMS staff. This is important for an asset management tool
as there are a number of bridges requiring early intervention and there is only limited
funding available. Important lessons were learnt from the trials and installations
including training of construction crews which will benefit future GACP
implementations.
From the costing of implementations it was shown that XP was the cheapest at
$1500/m2 with the CC anodes costing approximately $3750/m2. The XP installation
was also done in conjunction with a major concrete patching task. The cost for
concrete patching was estimated at $3500/m2.
The case study on this bridge showed that the CP systems were producing varying
levels of current and offering certain levels of protection. The Galvashield CC
anodes were the best performing in terms of current generation and potential decay.
CC trial 1 showed very good results for potential decay with values near or greater
than 100mV for the almost 5 year period. However, the high position of the
reference electrodes for this trial may have indicated better results than what exist.
CC trials 2 and 3, with reference electrodes placed lower in the pile (where corrosion
was most active) indicated that partial CP was available. Given that the
reinforcement in the piles was so actively corroding, this was still encouraging.

78
To gain better results from the CC installations it may have required the spacing of
anodes to be less than 400mm as specified in the majority of cases. This could have
introduced more zinc per unit area to produce more current and possibly better
potential decay results. This would have had obvious adverse cost implications
however, due to more concrete coring, anodes and wiring. Structural integrity of the
pier may also be brought into question as the number of cores would influence
strength properties.
The XP trials were disappointing in terms of showing adequate cathodic protection.
Current values produced were low and potential decay values of 10mV were
recorded from the last observations. AS 2832.5 stipulates that the minimum decay
value should be 100mV for full CP. Whilst the XP units are the easiest of all CP
products used in the case studies to install (simple ties to exposed reinforcement), the
effectiveness of the system for providing protection has not been shown in the trial.
Some protection may be offered by the system in patching work where the units
slow or prevent ring-anode corrosion which is commonly associated with concrete
patch repairs in reinforced concrete. (Standards Australia 2008)
Future considerations such as anode life were considered. Life of anode calculations,
were carried out with reference to current measurements. This showed that the
amount of zinc in the anodes would not be consumed by the relative low current
values for a number of years. However, the life of the anode does not have a direct
relationship with full cathodic protection. This is shown in the case of the XP anodes
which have up to 29 years life due to the low current but do not offer good levels of
CP. It appears that the more current a system can produce, the better the CP.
Other considerations for future systems and maintenance, is the possible requirement
to recover the anodes once the system is no longer offering CP. In the case of the CC
anodes, this may require major coring and cost. Recovery of the XP anodes would
require very accurate coring or wholesale repatching. Either option would be
problematic and may influence selection of the systems for future projects.

79
5.2 MORORO BRIDGE (B2154)
5.2.1 BRIDGE BACKGROUND
Mororo Bridge (northbound) is located on the Pacific Highway over the north arm of
the Clarence River North of Maclean, NSW.
Figure 54 - Location of Mororo Bridge in relation to the North Coast
(Ainsworth Heritage 2009)
Figure 55 - Location of Mororo in relation to the Lower Clarence River
(Ainsworth Heritage 2009)

80
Figure 56 - Mororo Bridges - North and Southbound
(Google Earth 2013b)
Mororo Bridge was built in 1935 and carried two lanes of the Pacific Highway until
1993 when a new concrete structure was completed to the East to carry all
southbound traffic. The old bridge was reduced to one lane of traffic only and had
additional barriers installed to prevent collision damage.
B2154 is a 13 span bridge consisting of 10 simply supported steel girder approach
spans of 10.66m each with a reinforced concrete deck either side of the truss spans.
This bridge has two steel riveted through trusses of 36.88M each with a reinforced
concrete deck. Between these through trusses is a disabled vertical lift span of
16.45m with two main fabricated, riveted steel girders and a reinforced concrete
deck, the lift span support system is still in place but all lift machinery has been
removed.
This bridge is supported by a combination of driven, reinforced concrete piles with
integrated reinforced concrete headstocks on the approach spans and steel caissons,
concrete filled and wall type piers under the truss spans. (RMS minor works REF)

81
Figure 57 - Mororo - Western elevation
(RMS 2010)
Figure 58 - Mororo - View of Southern end showing piles 1 & 2
(RMS 2010)

82
Figure 59 - Mororo bridge design - Elevation. (RMS 2010)

83
Figure 60 - Mororo bridge design - Piles. (RMS 2010)

84
5.2.2 BRIDGE ASSESSMENT The level 2 inspection of the bridge in 2008 revealed obvious signs of corrosion.
Technical bridge section of RMS undertook core sampling on a number of the piles
which showed chloride ingress had substantially passed to the reinforcement level.
The sampling suggested that corrosion was confined to the bottom 0.75 m above the
High Water Line (HWL). Chlorine content at reinforcement depth was in the order
of 0.1% (~ 0.5m above HWL). It is noted that a chlorine value of 0.06% is
considered the level at which reinforcement steel will start to corrode. (RMS 2010)
5.2.3 GACP IMPLEMENTATION
There have been 2 different types of installation on Mororo bridge including:
1) A trial installation of a Galvanode DAS anodes in early 2010
2) A full scale implementation of Galvanode DAS anodes in late 2010
5.2.3.1 TRIAL OF GALVANODE DAS - OVERVIEW
A trial was initiated in early 2010 using embedded DAS zinc anodes on two piles-
Piles A & B. Results recorded showed polarisation exceeding 100mV and indicating
that the system was providing a good level of cathodic protection to the
reinforcement steel. Success of the trial gave confidence in developing a full
installation to the remaining bridge structure. (RMS 2010)
5.2.3.2 TRIAL OF GAVANODE DAS - DESIGN
Design for the install was carried out by internal RMS staff in conjunction with the
supplier of the DAS product :

85
Figure 61 - Mororo Trial - DAS Pile anode trial design
(RMS 2010)

86
5.2.3.3 FULL INSTALL OF GAVANODE DAS - OVERVIEW
After a successful trial of the Galvanode DAS system, a decision was made to install
the anodes to the selected bridge piles and some diaphragm walls.
A specification was written for the installation. (RMS 2010) Within the
specification, the following anode schedule is shown:
Table 15 - Mororo Galvanode DAS schedule
Anode
type
Product Pier Location Length
(mm)
Qty Comment End
type
A1
Galvanode DAS anode 1.2lb/ft 1,2,3,4,5,6,11,12 1500 120
Common installation in 415x415 pile single anode installation (vertical cut) Strap
B1
Galvanode DAS anode 1.2lb/ft 7,8,9,10 2000 32
Linked to either anode B2 or B3 (bolted connection) Strap
B2
Galvanode DAS anode 1.2lb/ft 7,10 1500 8
Linked to anode B1 (bolted connection) Strap
B3
Galvanode DAS anode 1.2lb/ft 8,9 1000 8
Linked to anode B1 (bolted connection) Strap
C1
Galvanode DAS anode 1.2lb/ft 2,3,4, 500 36
Monitoring pile (3 locations)
Insulated Copper wire

87
5.2.3.4 MORORO FULL INSTALL OF GAVANODE DAS
DESIGN
Design for the install was carried out by internal RMS staff in conjunction with the
supplier of the DAS product. This differed in design to the trial as some of the
diaphragm walls between piles were also specified.
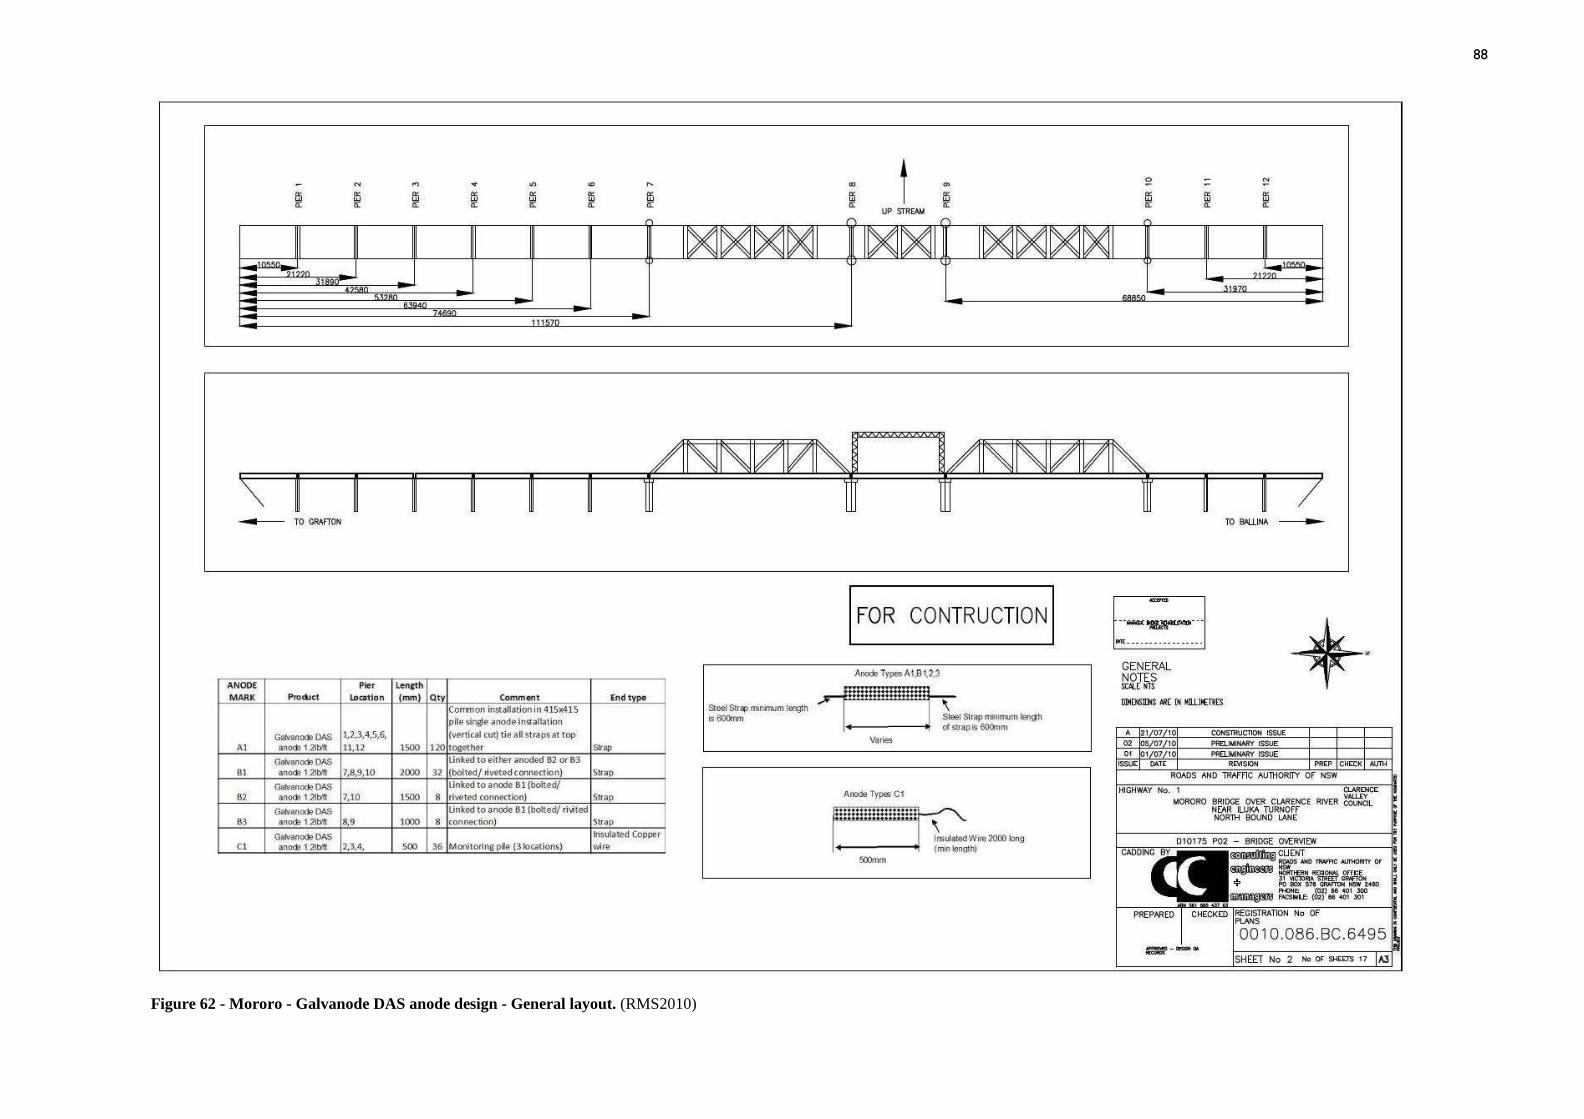
88
Figure 62 - Mororo - Galvanode DAS anode design - General layout. (RMS2010)

89
Figure 63- Mororo - Galvanode DAS anode design - Pier 1 layout. (RMS 2010)

90
Figure 64 - Mororo - Galvanode DAS anode design - Pier 7 layout. (RMS 2010)

91
Figure 65 - Mororo - Galvanode DAS anode design - Section and wiring details. (RMS 2010)

92
5.2.3.5 MORORO FULL INSTALL OF GAVANODE DAS -
CONSTRUCTION
Figure 66 - Mororo - Saw cuts for DAS installation. (RMS 2010)
Figure 67 - Mororo - Installation of Galvanode DAS unit. (RMS 2010)

93
Figure 68 - Mororo - Installation, backfilling and connection of anodes
(RMS 2010)
Figure 69 - Mororo - Connections to monitoring box
(RMS 2010)

94
5.2.4 COSTS OF IMPLEMENTATION
The cost of the initial Galvanode DAS trials was approximately $15,000. Installation
of the anode systems, wiring and backfilling of anodes were carried out by Road and
Fleet Services (RFS). (RMS 2010)
The trial coverage area is defined by the Piles A and B which have 2 x 0.5m per face
coverage or for 2 piles with 4 faces, 8 x 2 x 0.5 = 8m2. This equates to $15,000/8 =
$1,875/m2. This compares to $3,750/ m2 for the CC trial and $1,500/ m2 for the XP
trials on Boyd’s Bay bridge.
The full installation cost was approximately $626,000. This amount included full
construction costs including planning, site establishment, environmental controls,
plan hire, labour, training, quality assurance and other construction tasks. (RMS
2010)
The split of the costing was as follows:
• Labour 56% of the expenditure was for labour
• Materials 23% for materials.
• Plant hire 14%
• Contractual costs (including management) 7%
Site access was a major cost for the installation as a working platform had to be
constructed. This differed from the cases of Boyd’s Bay and Terranora Bridges
where an extensive pilecap was used. An access ramp and pontoon was also
constructed due to locality constraints.
5.2.5 ISSUES/PROBLEMS WITH IMPLEMENTATION
As was the case with the Boyd’s Bay and Terranora Bridges, Mororo Bridge is built
over tidal waters. Access for CP implementation required construction of a
temporary platform that wrapped around the piles. Movement due to the tide again
required careful planning and ingenuity in design.

95
Due to the location of the Mororo Bridge, a number of other access problems were
encountered. No boat launching facilities (i.e. ramps of jetties) were in close
proximity to the site which meant that a pontoon had to be constructed. This also
added to overall project costs. The absence of critical services such as power and
potable water had to be overcome by installing connection points near the bridge.
Environmental constraints also had to be managed including the monitoring of bat
habitat (nesting sites) under the bridge. Also an osprey’s nest on the lifting gantry
above the bridge had to be taken into consideration. Management of waste materials
was also important.
Existing cover to reinforcement was also problematic for installation of the
Galvanode DAS anodes in some areas. The concrete saw cutting in a few cases
actually came into contact with the reinforcement steel. Structural assessment of the
steel and some strengthening was required to rectify these problems.
5.2.6 MONITORING RESULTS
Monitoring of trial installations included two Galvanode DAS trials on two piles-
Piles A & B which were both positioned on pier 5.

96
Figure 70 - Mororo Bridge - Location of CP Trials on pier 5
(RMS 2010)
The trials were installed in early 2010. Results are summarised as follows:
5.2.6.1 GALVANODE DAS ANODE TRIAL 1 (Pile A)
ANODE LAYOUT
The layout of the anode strings and wiring configuration for Pile A are shown in the
figure below. This trial made use of a 2.4lb/ft Galvanode DAS product (3.6kg/m).
Each anode strings consists of 4 x 500mm lengths.
Two reference electrodes were placed in the tidal region between the High Water
Level (HWL) and the Low Water Level (LWL). An additional two reference
electrodes were placed above the HWL which is considered to be in the splash zone.
Pile A Pile B
Pier 5

97
Figure 71 - Mororo - DAS Trial 1 (Pile A) - Anode and wiring layout
(RMS 2010)

98
CURRENT
Mororo - DAS Trial 1 - Current Output
0
2
4
6
8
10
12
14
16
0.0 1.0 2.0 3.0 4.0 5.0 6.0Time (months)
Cu
rren
t (m
A)
1 2 3 4
Figure 72 - Mororo - DAS Trial 1 (Pile A)- Current measurements
Measurements show a general decline in value with anode strings 1 to 3 producing
about 3.6 to 8.8mA after 5 months of monitoring. Anode string 4 is producing almost
14mA after the same period. The amount of current produced by these systems is
approximately double that for the same period for the CC anodes of Boyd’s Bay
Bridge.
As the anodes are wired in series consisting of 4 x 500mm (Total 2m) individual
anodes, an estimate is made of the per/m anode current by dividing the relevant
string current by two (2) . For example, the anode current per metre for string 1 =
3.6/2 = 1.8mA / m length of anode.
Per metre anode current is summarised in the following table.

99
Table 16 - Mororo - DAS Trial 1 (Pile A) - Current output summary for last
readings
Anode string Current for string
(mA)
Anode
current/
metre length
(mA)
1 3.60 1.80
2 3.80 1.90
3 8.80 4.40
4 13.80 6.90
POTENTIAL DECAY
It can be seen in the figure below that the system is proving very good levels of
cathodic protection with all reference electrodes above 100mV.
Mororo - DAS Trial 1 - Potential Decay
0
100
200
300
400
500
600
700
800
900
0.0 2.0 4.0 6.0 8.0 10.0 12.0 14.0
Time (months)
Pot
entia
l (m
V)
Reference Electrode 1 Reference Electrode 2 Reference Electrode 3 Reference Electrode 4
Figure 73 - Mororo - DAS Trial 1 (Pile A)- Potential Decay
From the durability assessment of the bridge, the high corrosive areas were identified
as being 0.75m above the HWL which correspond to the splash zone. These areas are
monitored by reference electrodes 1 and 2 positioned in that zone. Both electrodes
are showing a level of protection above 300mV for the 12 month period.

100
The performance in the levels in the splash zone are very encouraging and the
system is outperforming the CC and XP systems employed in Boyd’s Bay Bridge for
the same time period by a considerable amount. Potential decay values for the same
period
5.2.6.2 GALVANODE DAS ANODE TRIAL 2 (Pile B)
ANODE LAYOUT
The layout of the anode strings and wiring configuration for Pile B are shown in the
figure below. This trial made use of a 1.2lb/ft Galvanode DAS product (1.8kg/m).
Each anode strings consists of 4 x 500mm lengths.
Again as per the Pile A, two reference electrodes were placed in the tidal region
between the High Water Level (HWL) and the Low Water Level (LWL). An
additional two reference electrodes were placed above the HWL which is considered
to be in the splash zone.

101
Figure 74 - Mororo - DAS Trial 2 (Pile B) - Anode and wiring layout
(RMS 2010)

102
CURRENT
Mororo - DAS Trial 2 - Current Output
0
5
10
15
20
25
0.0 1.0 2.0 3.0 4.0 5.0 6.0Time (months)
Cur
rent
(m
A)
1 2 3 4
Figure 75 - Mororo - DAS Trial 2 (Pile B)- Current measurements
Measurements show a slight increase for strings 1 and 2 and a general decline in
value with anode strings 3 and 4. Last readings of current ranged between 7.2 to
9.25mA after 5 months of monitoring. As in Trial 1, the amount of current produced
by these systems is substantially more than the CC anodes of Boyd’s Bay Bridge.
The anodes were wired similarly to Trial 1 and the length of anodes were the same in
Trial 2. Per metre anode current is summarised in the following table.
Table 17 - Mororo - DAS Trial 2 (Pile B)- Current output summary for last
readings
Anode string Current for string
(mA)
Anode
current/
metre length
(mA)
1 7.20 3.60
2 6.25 3.13
3 8.09 4.05
4 9.25 4.63

103
POTENTIAL DECAY
It can be seen in the figure below that the system is providing very good levels of
cathodic protection with all reference electrodes above 100mV.
Mororo - DAS Trial 2 - Potential Decay
0
200
400
600
800
1000
1200
0.0 2.0 4.0 6.0 8.0 10.0 12.0 14.0Time (months)
Pot
ent
ial (
mV
)
Reference Electrode 1 Reference Electrode 2 Reference Electrode 3 Reference Electrode 4
Figure 76 - Mororo - DAS Trial 1 (Pile B)- Potential Decay
As in Trial 1, the splash zone areas are monitored by reference electrodes 1 and 2
positioned in that zone. Both electrodes are showing a level of protection above
300mV for the 12 month period.
5.2.7 ESTIMATION OF SYSTEM LIFE
An estimation of system life can be made using basic assumptions and the use of
Faraday’s Laws of Electrolysis (See section 2.7). The results are summarised in the
following table:

104
Table 18 - Mororo - Anode life calculations
Trial Anode
string
Time from
Installation
to last
reading
(years)
Average
anode/m
current
since
installation
(mA/m)
Predicted
additional
life
(years)
Total
estimated
anode life
(years)
1
Galvanode
DAS
2.4lb/ft
1 0.41 3.44 129.18 129.59
2 0.41 2.93 122.49 122.91
3 0.41 4.68 52.73 53.14
4 0.41 5.39 33.58 34.00
2
Galvanode
DAS
1.2lb/ft
1 0.41 2.17 32.24 32.66
2 0.41 2.67 37.08 37.49
3 0.41 7.32 28.17 28.58
4 0.41 7.97 24.58 24.99
These values do not represent the number of years that the system will provide
adequate Cathodic Protection. Rather, it is an estimate of the number of years that
the zinc material can be consumed at the last current value.
It can be seen that Trial 1 system has a larger life expectancy. This was expected as
the Trial 1 system (2.4lb/ft) has twice as much zinc per anode as compared to Trial 2
(1.2lb/ft). i.e. More zinc mass is available in the Trial 1 system.
5.2.8 ASSESSMENT OF IMPLEMENTATION
The installation of Galvanode DAS systems in the Mororo Bridge has proven to be
very successful. Very good current and potential decay values have been recorded
and this has given RMS confidence to develop projects for major rollouts of this type
of GACP system. This bridge did have access issues and new techniques and

105
methodologies were required to be used for installation on piles without a building
platform provided by a pilecap as in Boyd’s bay and Terranora bridges.
From the costing of the Galvanode DAS trial it was shown that the application was
in the order of $1875/m2. This compares with the CC anodes trial of Boyd’s bay
costing approximately $3750/m2. The application rate calculated for the Galvanode
DAS anode system for this bridge was based on the pile layout with anodes installed
vertically on each face of the trial piles. This meant that the coverage area was quite
high and may explain why the application rate was relatively low. It is noted that the
other case studies involved bridges where trials were implemented on a large face of
pier columns.
The Galvanode DAS trials (Piles A and B) showed very good current production
with all anodes strings producing more than 4mA and over a 5 month period. Results
for potential decay with excellent with values greater than 100mV for all anodes
(most cases are well above) over a 12 month observation period. Whilst the
observation period was short, for the same time period the CC anode trials on Boyd’s
Bay Bridge were producing far less current and potential decay values. For example
CC trial 2 on Boy’s bay was producing 2mA current and from 50mV for potential
decay for the same period.
The observation period for the Mororo trials has been hampered due to the fact that
scheduled observations were not able to be carried out. This has been due to flooding
and other concerns including safety and the environment. More observation data for
the trials is required and planned for the near future.
The larger anode mass trial, trial 1 (Pile A) consisting of 3.6kg/m anodes is generally
performing better than the trial 2 (Pile B) system which has anodes of half the size of
1.8kg/m. This was expected as the larger mass of zinc was thought to produce more
current and therefore potential decay and CP. However, the amount of benefit from
doubling the mass of the anode did not produce a twofold increase in current or
potential decay. The results section shows the observations for both systems.

106
Life of anode calculations, were carried out with reference to current measurements.
Most anode life predictions were excellent. Even for Trial 2, the minimum total
estimated life was 25 years. As mentioned previously, the life of the anode does not
have a direct relationship with full cathodic protection. However, given that the CP
has been demonstrated by the high potential decay values, the systems are
performing well and can be expected to be useful for more than the expected 10 year
design life.
Recovery of the systems once depleted will require major construction. However, it
is thought that the concrete saw cutting and excavation process can be successfully
undertaken by RMS staff and may not involve external contractors. This has costing
advantages other methods where specialist contractors are required e.g. concrete
coring or water blasting. High accuracy setout of the existing anodes may also not be
required as in other discrete systems.
Lessons learnt from the initial trials led to a full implementation of the Galvanode
DAS system for the bridge. The design utilised the 1.8kg/m (1.2lb/ft) anode system
as this was chosen as the most efficient system based on the trials. Provision of
current monitoring devices will ensure that the systems can be monitored into the
future.
The success of this project has led to the development of system implementation to
other bridges in the Northern Region and throughout the state. More observation is
clearly needed, but initial results have far outperformed other GACP
implementations such as those described for the Boyd’s Bay Bridge.

107
5.3 TERRANORA BRIDGE (B8002)
5.3.1 BRIDGE BACKGROUND
Terranora Creek bridge is located on the Pacific Highway at Tweed Heads over
Terranora Creek.
Figure 77 - Terranora Creek Bridge location
(RMS 2009b)
The bridge is in positioned over Dry Dock Road which passes under the Southern
approach spans. The bridge was built in 1990 and consists of 5 spans, simply
supported of 35m length and 2 spans of 28.5m (ILBG) box girders supported by a
single pier column for each carriageway. The carriageway facilitates 2 lane dual
carriage way and a suspended underbridge walkway is provided on the downstream
side of the southbound deck.

108
Terranora Bridge is an important link on the Pacific Highway between Sydney and
Brisbane with an approximate Annual Average Daily Traffic (AADT) of 50,000
vehicles.
(RMS 2009b)
Figure 78 -Terranora bridge - Western elevation
(RMS 2009b)

109
Figure 79 - Terranora Bridge design - General Arrangement
(RMS 2009b)

110
5.3.2 BRIDGE ASSESSMENT The level 2 inspection of the bridge in 2008 revealed some drummy concrete in the
bottom of the pier columns and further investigations revealed that there is extensive
corrosion activity within the lower sections of the columns. Based on core sampling
and analysis on two columns, corrosion activity was reported as being confined to
the bottom metre (1m) of the piers (i.e. up to 1m above the pile cap). In order to
prevent further corrosion-induced concrete damage RMS Bridge Engineering
recommended installation of Sacrificial Cathodic Protection (SCP) system for the
bottom parts of piers up to a height of ~1500 mm from top of the pile cap. (RMS
2009b)
5.3.3 GACP IMPLEMENTATION
There have been 3 different types of installation on Terranora bridge including:
1) A trial installation of a GalvaCorr zinc coating in 2009
2) A trial installation of DAS anodes in 2010
3) A full scale implementation of DAS anodes in 2011
(RMS 2009b)
5.3.3.1 TRIAL 1 OF GALVACORR - OVERVIEW
In the latter part of 2009, the 1st trial was undertaken on a single pier using Galvacor
zinc coating, a spray on compound of aluminium, magnesium and zinc. This trial did
not provide satisfactory results and was discontinued. The major problems with the
trial were:
1) The installation was carried out by specialist installers from the United
States. Training of RMS staff would require a major investment in terms of
resources and may not represent value for money depending on the results

111
2) The coating system requires a special sequence of mixing and is a hazardous
substance. Given the sensitive marine environments where the applications
are required, stringent controls are required
3) The wire components of the system involve intricate connections. Faulty
connections can lead to problems with conductivity and electrical
connectivity
The GalvaCorr system is described in the design and implementation sections but
results and life of anode sections are not described since monitoring was
discontinued.
5.3.3.2 TRIAL 1 OF GALVACORR - DESIGN
Design for the install was carried out by internal RMS staff in conjunction with the
manufacturer of the GalvaCorr product :
Figure 80 - Terranora Trial 1 - GalvaCorr design. (RMS 2009b)

112
5.3.3.3 TRIAL 1 OF GALVACORR - CONSTRUCTION
The trial was limited to applying 8 litres of GalvaCorr material over 12 to 13 m2 area
of a single pier (Pier 4). Installation was carried on both faces of the pier.
Installation of reference electrodes and reinforcement bar connection
The first task was to install the reference electrodes (Ag/AgCl) and a connection
made to the rebar. The reference electrodes enable current measurements to be
compared following installation of the GalvaCorr product.
Figure 81 - Terranora Trial 1 - Chase out on pier face - (Downstream - south
face) for reference electrode and rebar connection.
(RMS 2009b)

113
Figure 82 - Terranora Trial 1 - Reference electrode positioning
(RMS 2009b)
Figure 83 - Terranora Trial 1 - Connection to rebar
(RMS 2009b)

114
Figure 84 - Terranora Trial 1 - Backfilled RE and connection points - Wiring
loop to future monitoring box position. (RMS2009b)
Installation of GalvaCorr Product
The installation of the GalvaCorr product was undertaken by a specialist installer.
Connections were made to the existing cabling installed as part of the reference
electrode and reinforcement bar connection process.
Figure 85 - Terranora Trial 1 - Installation of the GalvaCorr system
(RMS 2009b)

115
Figure 86 - Terranora Trial 1 - Installation of the GalvaCorr system - Final - Application of metal rich urethane coating. (RMS 2009b)
Finalisation of GalvaCorr install
The wiring from both the electrode and rebar connections and the GalvaCorr system
were wired to a central observation box. This can be can be manually monitored
using a simple multimeter.
Figure 87 - Terranora Trial 1 - Wiring of monitorin g box
(RMS 2009b)

116
Figure 88 - Terranora Trial 1 - Finished install of GalvaCorr Product on Pier 4
Downstream - South face. (RMS 2009b)
5.3.3.4 TRIAL 2 OF GAVANODE DAS - OVERVIEW
The second trial was initiated in mid 2010 using embedded DAS zinc anodes. Initial
results were promising, showing decay values exceeding 100mV and indicating that
the system was providing a good level of cathodic protection to the reinforcement
steel. This trial showed the DAS system was relatively simple to install, and
importantly, did not require specialist contractors for implementing the product. The
success of this trial led to the development of the large scale implementation on this
bridge.

117
5.3.3.5 TRIAL 2 OF GALVANODE DAS ANODE - DESIGN
Design
Design for the install was carried out by internal RMS staff in conjunction with the
supplier of the DAS product :
Figure 89 - Terranora Trial 2 - Galvanode DAS trial design
(RMS 2009b)

118
5.3.3.6 FULL INSTALLATION OF GALVANODE DAS -
OVERVIEW
After a successful trial of the Galvanode DAS system, a decision was made to install
the anodes to the remainder of the bridge piers. The success of this installation also
led to a further treatment of pile caps immediately after the completion of the pier
implementation.
The process involved in the installation of the Galvanode DAS anodes was described
in the Report on Environmental Factors (REF). The REF was prepared to address
environmental concerns and meet legislative requirements. A description of the
process was as follows:
Repair Drummy Concrete on Piers
• Identify locations of damaged (drummy/cracked) concrete on splash zone of
piers, which is currently estimated to be less than 5 m2 in total area.
• Repair areas of damaged concrete with a proprietary, cementitious repair
system as per manufacturer’s recommendations. Suitable systems include
Renderoc HB40 (hand applied) and LA55 (form and pour).
Supply and Install Vector Galvanode DAS zinc anodes
• Saw cut four horizontal channels in piers around full pier perimeter, ~ 50 mm
wide x ~70 mm deep, starting ~200mm above the pile cap and at a spacing of
400mm.
• Remove concrete within channels according to the design using jack hammer
or similar.
• Place a bedding layer of fresh mortar (Renderoc HB40), ~15 mm thick.

119
• Immediately after placement of bedding mortar, position Vector Galvanode
DAS sacrificial zinc anodes (1.2 lb/ft) in channels and secure in place with
cable ties. Anodes within the same horizontal row to be connected as per the
drawings
• Backfill channels with Parchem Renderoc HB40 following manufacturer’s
recommendations in application process.
• Provide four negative (reinforcement) connections per pier.
• Install junction boxes and run cables back to junction boxes as per the
drawings.
Repeat above process on all piers standing in water way area of the bridge to
complete Sacrificial Current Cathodic Protection System.
Reference installations with observation boxes (3 off)
On each of three piers, install three silver/ silver chloride reference electrodes. The
monitoring system is to be installed under the full-time supervision of Bridge
Engineering.
(RMS 2011)

120
5.3.3.7 FULL INSTALLATION OF GALVANODE DAS - DESIGN
Design for the install was carried out by internal RMS staff in conjunction with the
supplier of the DAS product. This differed in design to the trial as the anodes were
specified for each face of the pier.
Figure 90 - Terranora full CP install - Pier DAS anode design - Note narrow face
(Side B) specified. (RMS 2011)

121
Figure 91 - Terranora full CP install - Pile cap DAS anode design
(RMS 2011)

122
Figure 92 - Terranora - DAS connection detail to reinforcement bar - Notice use
of rivet.
(RMS 2011)

123
5.3.3.8 FULL INSTALLATION OF GALVANODE DAS -
CONSTRUCTION
The proposed construction works were described in the Terranora Bridge
Stakeholder Letter of 2 March 2011:
The rehabilitation works will generally involve the following principal tasks:
• Utilising the existing RTA Depot which is located on the Southern Side of
Kennedy Drive between the Pacific Highway and Shearwater Parade.
• Setting up environmental controls.
• Launching of boats and barges from the boat ramp at Ray Pascoe Park,
approximately 1 km downstream of the bridge. Workers and materials will
be loaded and unloaded from the boat ramp or public Jetty located at Ray
Pascoe Park. Interim access may also be made to the small park on the south
west side of the bridge, off Dry Dock Road for minor tasks. There will be no
other access to the river banks at any stage during the works.
• The daily set up of barges at each side of respective pier to be worked on
and the placement of channel markers. Securing the barges and planking out
working areas around the piers.
• Placing geotextile fabric around base of the pier columns for
catching/collecting concrete debris.
• Cutting slots into the faces and sides of the pier columns with concrete saw.
A total of eleven pier columns will be affected.
• Jack hammering the waste material from between the slots, creating three
rows of channels on the four sides of the pier columns, approximately 50mm
Wide x 60mm Deep x 1000 to 2000mm Long.
• Placement of anode in the channel.
• Placement of a wiring junction box on the faces of the pier columns, 2.0m
above the pier caps.
• Filling the channels with grout.

124
• Removal and patch repair of small sections of ‘drummy’ concrete located at
the base of some pier columns. Concrete saw cutting and jack hammering
will be involved in the ‘drummy’ concrete removal process. These minor
concrete repairs are limited in total area to approximately 5 sq. m.
Other relevant details include:
• The cutting process will be undertaken for a period of 4-5 hours per day, and
it is anticipated that each pier column will take one day to complete the
cutting.
• Construction activities would occur during normal working hours in
accordance with the Interim Construction Noise Guidelines.
• All the pier columns along the full length of the bridge will be protected,
except for Pier 4 (Downstream) which has been used as a ‘trial’ installation,
and the works is expected to take 3 to 4 months in total.
(RMS 2011)
Figure 93 - Terranora - Preparation of piers for DAS installation - Saw cuts
shown - Note secondary containment lip installed to prevent contaminants enetering
the waterway. (RMS 2011)

125
Figure 94 - Terranora - Working platform - Note Navigation lights for waterway,
geofabric protection for contaminants and temporary scaffold arrangement.
(RMS 2011)
Figure 95 - Terranora - DAS installation in process - Note Spalled concrete,
corroded reinforcement bar at lower level and use of the covermeter. (RMS 2011)

126
Figure 96 - Terranora - Installation of DAS anodes and connections
(RMS 2011)
Figure 97 - Terranora - Pile cap DAS anode installation. (RMS 2011)

127
Figure 98 - Terranora - Installation of DAS - Showing wiring connection to future
monitoring box and backfilled channels. (RMS 2011)
5.3.4 COSTS OF IMPLEMENTATION
The cost of the initial Galvanode DAS trials (1.2lb/ft and 0.6lb/ft) was approximately
$11,000. Installation of the anode systems, wiring and backfilling of anodes were
carried out by Road and Fleet Services (RFS). (RMS 2011)
The trial coverage area is defined by the Pier column 3 (upstream) from a height of
1.3m above the pile cap. The average with of the column is 2.8m therefore the
coverage area is 1.3 x 3 = 3.9 m2. This equates to $11,000/3.9 = $2820/m2. This
compares to $3,750/ m2 for the CC trial and $1,500/ m2 for the XP trials on Boyd’s

128
Bay bridge. The Galvanode DAS trial system installed on Mororo Bridge was
$1,875/m2.
The difference in relative costing per m2 between the Galvanode DAS trial at
Terranora and Mororo Bridges is due to the perceived coverage area. Although the
length of anode placed is similar (8m vs 7.2m for Terranora and Mororo
respectively) the anode spacing and the fact it is on one face only of the column
make the coverage area smaller on Terranora.
The full installation cost on the pier columns and pilecaps was approximately
$822,000. This amount included two separate packages of work for the columns and
then the pilecaps. The costing includes planning, site establishment, environmental
controls, plan hire, labour, training, quality assurance and other construction tasks.
The split of the costing was as follows:
• Labour 53% of the expenditure was for labour
• Materials 32% for materials.
• Plant hire 13%
• Contractual costs (including management) 4%
(RMS 2011)
The installation is a major expenditure within the RMS asset budget. However, ICCP
systems for the bridge were estimated to be approximately $2 Million. It was also
seen as an investment in terms of doing precautionary work now before paying
larger rehabilitation works in the future. Concrete damage and repair costs are
known to increase exponentially as the deterioration in reinforced concrete structures
(including corrosion) continues over time.
5.3.5 ISSUES/PROBLEMS WITH IMPLEMENTATION
Terranora Bridge, like all other bridges considered in the case studies is built over
tidal waters. Launching of boats was able to be done from a close-by boat ramp and
use of extensive pilecap platforms. Other services such as power and potable water

129
had to be connected to site facilities and extended under the bridge in the case of
water. Electrical devices at the bridge piers were driven with the use of portable
generators.
Environmental constraints within the implementation included sensitive marine
environment including nearby oyster leases. Excavation of concrete material and
management of other waste had to be carefully considered during construction.
Temporary barrier systems were placed around work areas so that all contaminants
could be captured to prevent entry into the water.
The site also had challenges in that it was a busy navigation area with private vessels
using the inlet for recreation purposes. This provided a number of challenges
including keeping navigation channels open, providing appropriate signage and
lighting. Also the site was a popular fishing area so the community was informed of
the upcoming works. Security issues were also implemented to safeguard the public
and minimise vandalism and theft.
Problems with the GalvaCorr installation were discussed in the trial 1 of Galvacorr -
overview section.
5.3.6 MONITORING RESULTS
An initial trial installation of Galvacorr (Trial 1) was implemented on Terranora
Bridge. However, monitoring was discontinued early after the installation as results
were poor. Therefore Trial 1 will not be presented in these results.
Monitoring of trial installations included Galvanode DAS trials on a single pile (Pile
3 Upstream) and using two different products. Trial 2 (1.2 lb/ft) used a 1.2lb/ft
(1.8kg/m) Galvanode DAS anode. Trial 2 (0.6 lb/ft) used a 0.6lb/ft (0.9kg/m)
Galvanode DAS anode.
The trials were installed in early 2010. Results are summarised as follows:

130
5.3.6.1 GALVANODE DAS ANODE TRIAL 2 (1.2 lb/ft)
ANODE LAYOUT
This trial made use of a 1.2lb/ft Galvanode DAS product (1.8kg/m). Each anode is
1200mm in length. Two reference electrodes were placed in the splash zone as
indicated on the figure below.
Figure 99 - Terranora - Trial 2 (1.2 lb/ft Galvanode DAS) anode layout
(RMS 2009b)
Trial 2 1.2 lb/ft

131
CURRENT
0
5
10
15
20
25
0 5 10 15 20 25Time (months)
Cu
rren
t (m
A)
1 2 3
Terranora - Galvanode DAS Trial (1.2lb/ft or 1.8kg/m) - Current Output
Figure 100 - Terranora - Trial 2 (1.2 lb/ft Galvanode DAS) Current
MEASUREMENTS
Measurements show a general decline in value with anode strings 1 to 2 producing
about 2.35 mA after 20 months of monitoring. Anode string 3 is producing 9.2 mA
after the same period. The amount of current produced by these systems is
approximately three (3) times that for the same period for the CC anodes of Boyd’s
Bay Bridge.
Each anode string consists of a 1200mm individual anode. Current for each string
represents the value for the 1.2m length. Values for a per metre length of anode is
calculated by dividing the current by 1.2

132
Table 19 - Terranora - Trial 2 (1.2 lb/ft Galvanode DAS) - Current output
summary for last readings
Anode string Current for string
(mA)
Anode
current
/metre length
(mA)
1 2.35 1.96
2 2.34 1.95
3 9.19 7.66
POTENTIAL DECAY
It can be seen in the figure below that the system is providing very good levels of
cathodic protection in the zone around Reference Electrode 1 (RE1) with values
greater than 100mV. However, the area defined by Reference Electrode 2 (i.e. the
lower part of the pier column) is only showing values of decay around 50mV. The
positioning of Reference Electrode 2 is very low on the pier column (0.15m from top
of pilecap). This confirms that the lower part of the pier is most corrosive. RE1
which is positioned slightly higher is showing that full CP is available to the
majority of the pile with the exception of the lower parts.
Terranora - Galvanode DAS Trial (1.2lb/ft or 1.8kg/m) - Potential Decay
0
50
100
150
200
250
0.0 2.0 4.0 6.0 8.0 10.0 12.0 14.0
Time (months)
Po
ten
tial (
mV
)
Reference Electrode 1 Reference Electrode 2
Figure 101 - Terranora - Trial 2 (1.2 lb/ft Galvanode DAS) - Potential Decay

133
5.3.6.2 GALVANODE DAS ANODE TRIAL 2 (0.6 lb/ft)
ANODE LAYOUT
This trial made use of a 0.6lb/ft Galvanode DAS product (0.9kg/m). Each anode is
1200mm in length.
Two reference electrodes were placed in the splash zone as indicated on the figure
below.
Figure 102 - Terranora - Trial 2 (1.2 lb/ft Galvanode DAS) anode layout
(RMS 2009b)
Trial 2 0.6 lb/ft

134
CURRENT
Terranora - DAS Trial (0.6lb/ft or 0.9kg/m) - Curre nt Output
0
5
10
15
0 5 10 15 20 25
Time (months)
Cur
rent
(m
A)
1 2 3
Figure 103 - Terranora - Trial 2 (0.6 lb/ft Galvanode DAS) Current
measurements
Measurements show a general decline in value with anode strings 1 to 3 producing
about 0.25 to 2.75 mA after 20 months of monitoring. Whilst the amount of current
produced by these systems is greater for the same period for the CC anodes of
Boyd’s Bay Bridge, the current is less than the trial using the 1.2lb/ft anodes on this
pier. This is expected as this trial is using an anode half the mass.
Each anode string consists of a 1200mm individual anode. Current for each string
represents the value for the 1.2m length. Values for a per metre length of anode is
calculated by dividing the current by 1.2
Table 20 - Terranora - Trial 2 (0.6 lb/ft Galvanode DAS) - Current output
summary for last readings
Anode string Current for string
(mA)
Anode
current
/metre length
(mA)
1 2.75 2.29
2 1.10 0.92
3 0.25 0.21

135
POTENTIAL DECAY
Values for potential decay were not available for Reference Electrodes 3 and 4.
Given that the current values are generally lower than the other trial on the pier, it is
expected that this system would not provide full CP.
5.3.7 ESTIMATION OF SYSTEM LIFE
An estimation of system life can be made using basic assumptions and the use of
Faraday’s Laws of Electrolysis (See section 2.7). Anode life calculations were not
performed for the Galvacorr trial due to initial poor results. The results for the
Galvanode DAS trials are summarised in the following table:
Table 21 - Terranora - Anode life calculations
Trial Anode
string
Time from
Installation
to last
reading
(years)
Average
anode
current since
installation
(mA)
Predicted
additional
life
(years)
Total
estimated
anode life
(years)
2 Galvanode DAS 1.2 lb/ft
1 1.64 2.73 47.81 49.45
2 1.64 4.35 46.89 48.54
3 1.64 9.98 10.94 12.58
2 Galvanode DAS 0.6 lb/ft
1 1.64 2.89 19.54 21.19
2 1.64 3.12 48.33 49.98
3 1.64 3.10 213.62 215.26
These values do not represent the number of years that the system will provide
adequate Cathodic Protection. Rather, it is an estimate of the number of years that
the zinc material can be consumed at the last current value.
It can be seen that the trials have varying life expectancy. The 12.58 years estimated
life of anode 3 of the Trial 2 (1.2lb/ft) is due to the relative high current reading for
the last observation. This demonstrates that although there may be adequate zinc
mass to provide a number of years current, that the amount of current may not be
adequate to provide cathodic protection as was shown by poor decay values.

136
5.3.8 ASSESSMENT OF IMPLEMENTATION
An early trial of the GalvaCorr product indicated that the product would not be
satisfactory. Further use of the product was not considered for a number of reasons.
The current readings and potential decay values were poor for the initial trial. The
system also required specialist installation and would be difficult and expensive to
implement on the remainder of the bridge and other sites.
The trial Galvanode DAS systems implemented were moderately successful. Good
current and potential decay values were observed for the upper level anode strings
and reference electrodes. For trial 2 (1.2 lb /ft), current for lower level anode strings
was approximately 2.5mA for a 20 month period. For trial 2 (0.6 lb/ft) the
corresponding current was 0.25 mA. The lesser mass of zinc in the 0.6 lb/ft anode
(0.9kg/m) appears not to be able to provide enough current for the conditions. From
the potential decay observations, the value for the 1.2lb/ft trial is also as low as
50mV which is not above the minimum of 100mV to be classified as full CP. The
upper anode string of this trial did produce full CP however, with a value of 136mV.
From the costing of the Galvanode DAS trial it was shown that the application was
in the order of $2820/m2. This compares to $3,750/ m2 for the CC trial and $1,500/
m2 for the XP trials on Boyd’s Bay bridge. The Galvanode DAS trial system installed
on Mororo Bridge was $1,875/m2. The rates for the Galvanode DAS trials on this
bridge were based on installation on one face. The coverage area was not as much as
for the Mororo installation which accounts for the differing application rates.
Given the early results of the trials, the design for the full implementation of the
Galvanode DAS systems was changed. All anodes used were the 1.2lb/ft type and
the anode strings were increased by adding 3 anodes in series. This new design
consisted of two anodes in the face and one in the side of the pier column for each
anode string. This increased amount of the product was anticipated to produce larger
currents and protection. It also demonstrated the importance of carrying out trials
before full installation. Corrosive influences are complex systems and basic
assumptions are often found to be inaccurate.

137
Recovery of the systems once depleted will require major construction. However, it
is thought that the concrete saw cutting and excavation process can be successfully
undertaken by RMS staff and may not involve external contractors as was the case
with installations on the Mororo Bridge. Again, this has costing advantages other
methods where specialist contractors are required. High accuracy setout of the
existing anodes is not required as in discrete systems.
More observations will evaluate the GACP implementations and particularly the new
design layouts with addition anodes. Early indications of current output from the
new systems put current output of some anode strings at over 30mA. This is very
significant and should provide a good level of CP into the future.
138
6 CONCLUSIONS AND FURTHER WORK
This project has investigated the use of cathodic protection on reinforced concrete
bridges in the marine environment. It has described how the RMS have used CP as a
tool to manage corrosion problems in the existing bridge stock and compared various
installations of the technology in the Northern Region.
It has described through three separate case studies the implementation of a number
of different types of GACP systems. It has compared the relevant systems by
considering bridge background, assessment methods, cost, results from observations
and other matters such as implementation issues. Life of anode systems has been
described and calculations for future life undertaken based on current output.
Given the assessment of the case studies and other additional research, the
Galvanode DAS GACP anode system appears to be the best product used to date.
Successful implementations of the system on the Mororo and Terranora Bridges as
shown in the case studies has indicated that good levels of CP is being provided and
that the life of the systems may be up to 25 years based on current observations.
Given that the GACP systems were considered as only a stop gap measure until full
ICCP systems could be implemented, the sacrificial systems may be out performing
expectations which was typically 10 years.
6.1 Achievement of Project Objectives
The following objectives have been addressed:
1) Research literature and background material relating to:
d) Cathodic Protection (CP)
e) Various types of CP installation and products
f) CP for protection of bridges in the marine environment
This has been covered in Chapter 2 where background information was gathered
from a number of sources. Basic concepts were defined and CP systems were
described.

139
2) Determine the mechanisms and tools for evaluation of existing assets
This objective has been achieved by the description of bridge assessment methods in
Chapter 3. This chapter outlines the process within RMS for bridge inspections and
required information for bridge assessments which are used to evaluate the existing
bridge stock.
3) Use a number of existing bridges within (RMS) Northern Region to carry out case studies and discuss/evaluate the following:
a) Bridge background
b) Bridge assessment methods
c) Discuss/examine costs in implementing CP
d) Issues/problems with implementation
e) Perceived benefits and actual results to date
The case studies have been detailed in chapter 5. All items have been addressed for
each bridge.
4) Investigate methods for determining life of CP protection and describe asset
maintenance implications
The method to determine life of CP has been defined in section 2.7. Anode system
life has been shown for each trial system in the relevant case study under the section
heading “Estimation of system life”.
5) Report findings in the required written and oral formats
The final dissertation formally represents the written requirement or ENG4111/4112.
A presentation regarding the project was also made at the final year project Seminar
at USQ on 26 September 2013.
6.2 Further Work
Further observations of systems will be required to assess the life of CP. This is
particularly true for the Mororo Bridge which has only had limited observations due

140
to flooding and safety concerns. More information is also required to model how
quickly potential decay values decrease to help predict real life of CP systems.
Additional research or trials may also consider an irregular spacing of anodes. For
example, for the full implementation of the Galvanode DAS anodes on Terranora
Bridge, a regular spacing was specified. Investigation may involve having a high
density of anode in the lower parts of columns (i.e. in the splash zone) where most
corrosion activity is. This would involve having a smaller spacing from the bottom
of the pile and larger spacing at the top of the installation where activity isn’t as
severe.
Further study in general for CP is required in the area of implementation to other
structural elements such as pre and post tensioned members which are common in
bridge structures. Hydrogen embrittlement is a concern for high tension tendons in
these.

141
BIBLIOGRAPHY
ACI 2013, Alkali-aggregate reaction in mass concrete, ACI concrete knowledge
centre, viewed 22 May 2013
<http://www.concrete.org/FAQ/afmviewfaq.asp?faqid=46>
ACI 2001, Protection of Metals in Concrete Against Corrosion, ACI manual of
Concrete practice, vol. 2001, no. 222R-01, pp. 2-7
Ainsworth Heritage 2009, Mororo Bridge Maintenance Works -
Statement of Heritage Impact, Ainsworth Heritage, In possession of RMS,
unpublished, Grafton
ARRB 2004, Inspection Report – Report on the inspection and testing of Boyd’s Bay
bridge columns with respect to corrosion and delamination, ARRB Transport
Research LTD, In possession of RMS, unpublished, Grafton
ASCE (American Society of Civil Engineers) 2001, Report card for America’s
infrastructure, ASCE, Virginia, viewed 22 May 2013
<http://www.asce.org/uploadedFiles/Infrastructure/Report_Card/Full_Report_Card_
2001.pdf>
Austroads 2002, Management of Concrete Bridge Structures to Extend Their
Service Life, Sydney, A4, 126pp, AP-T11/02
Austroads 2009a, Guide To Bridge Technology - Part 1: Introduction and Bridge
Performance, Sydney, A4, 61pp, T01-09
Austroads 2009b, Guide To Bridge Technology - Part 2: Materials, Sydney, A4,
132pp, AGBT02-09

142
Bird, A, Cope, M, Rix A n.d. Repair and maintenance of marine structures by
cathodic protection, Marine and Civil Maintenance, Sydney, viewed 22 May 2013,
<http://www.marineandcivil.com.au/cathodic_protection.html#marine_structure
2009>
Britannica 2013, Faraday’s laws of electrolysis, Encyclopaedia Britannica Online,
viewed 19 October 2013,
<http://www.britannica.com/EBchecked/topic/201755/Faradays-laws-of-
electrolysis>
CIF 2013, Galvashield® XP Embedded Galvanic Anode, Construction Innovation
Forum, viewed 22 October 2013,
<http://www.cif.org/noms/2003/12_-_Imbedded_Galvanic_Anode.pdf>
CORTEC 2013, GalvaCorr, CORTEC Corporation, viewed 22 October 2013,
< http://www.cortecvci.com/Publications/Brochures/GalvaCorr%20Brochure.pdf>
Dantanarayana, T 2010, Cathodic Protection systems for Concrete Bridges, 2010
RMS Bridge conference, RMS, Sydney.
Foster, S, Kilpatrick, A & Warner, RF 2010, Reinforced concrete basics 2E :
analysis and design of reinforced concrete structures, 2nd edn, Pearson Education
Australia, Frenchs Forest, NSW.
Google Earth 7.1. 2013a. Boyd’s Bay Bridge 28.185777°S, 153.537688°E, elevation
9M. <http://www.google.com/earth/index.html> [Viewed 22 October 2013].
Google Earth 7.1. 2013b. Mororo Bridge 29.367043°S, 153.250239°E, elevation 1M.
<http://www.google.com/earth/index.html> [Viewed 22 October 2013].
Koch , G.H, Brongers, M.P.H, Thompson, N.G, Virmani, Y.P, and Payer J.H. 2002,
Corrosion costs and Preventitive Strategies in the United States, Virginia, viewed 22
May 2013,
< http://www.nace.org/uploadedFiles/Publications/ccsupp.pdf>

143
Mitchelhill, S 2012, Northern Region’s forward bridge program 2012-2013, RMS,
unpublished, p1
Moore, M 2009, A global study of Chloride induced Corrosion Within the RTA's
Reinforced Concrete Bridge Stock, RMS, unpublished, pp 9
Parchem 2013a, Galvanode DAS - Technical Data Sheet, Parchem Construction
Supplies, viewed 22 October 2013,
< http://www.parchem.com.au/public/pdfs/data-sheets/Galvanode-DAS-TDS.pdf>
Parchem 2013b, Galvanode DAS, Parchem Construction Supplies, viewed 22
October 2013,
<http://www.parchem.com.au/construction/product/corrosion-control-
systems/galvanode-das/i/29/>
RESAPOL 2013, Vector Galvashield CC, Resapol Ltd – Distributors of
Construction Chemicals, viewed 22 October 2013,
< http://www.resapol.com/datasheets/data1471.pdf>
RMS 1985, B7628 – WAE records, In possession of RMS, unpublished, Grafton
RMS 2003, Preliminary Inspection report - Deterioration of Column and Pilecap
Concrete within splash zone, Internal RMS report, In possession of RMS,
unpublished, Grafton
RMS 2007a, Roads and Maritime Services Bridge Inspection Procedure Manual,
RMS, viewed 22 October 2013,
< http://www.rms.nsw.gov.au/doingbusinesswithus/downloads/lgr/bridge-inspection-
procedure-manual.html>
RMS 2007b, B7628 – Boyd’s Bay CP project data, In possession of RMS,
unpublished, Grafton

144
RMS 2008a, The Boyd’s Bay Bridge rehabilitation project, Powerpoint presentation,
RMS – Project Management Services, RMS, Grafton.
RMS 2008b, B7628 – Boyd’s Bay CP project data, In possession of RMS,
unpublished, Grafton
RMS 2009a, Bridge inventory, inspection and condition rating -
Policy, RMS, viewed 22 October 2013,
<http://www.rms.nsw.gov.au/gipa/downloads/trbf/pn158.pdf>
RMS 2009b, B8002 – Terranorra Bridge CP project data, In possession of RMS,
unpublished, Grafton
RMS 2010, B2154 – Mororo Bridge CP project data, In possession of RMS,
unpublished, Grafton
RMS 2011, B8002 – Terranorra Bridge CP project data, In possession of RMS,
unpublished, Grafton
RMS 2012, B8002 - Terranora CP project photos, In possession of RMS,
unpublished, Grafton
RMS 2013a, Brief for Kempsey Bridge durability assessment 2013, RMS,
unpublished
Sohanghpuwala, A and Jamieson, R 2007, Evaulation of Alternative Power Sources
for Impressed Current Cathodic Protection of Reinforced Concrete Slabs, Maine
Department of Transportation, Augusta
Standards Australia 2004, AS5100-2004 - Bridge Design, Sydney, Standards
Australia
Standards Australia 2008, AS2832.5-2008 – Cathodic protection of metals, Part 5:
Steel in concrete structures, Sydney, Standards Australia

145
Standards Australia 2009, AS3600-2009 - Concrete structures, Sydney, Standards
Australia
Stratfull R.F 1973, Preliminary Investigation of Cathodic Protection of a Bridge
Deck, Caltrans, Sacramento, viewed 20 May,
< http://www.dot.ca.gov/hq/research/researchreports/1973/bridge_deck.pdf>
The Constructor 2013, Factors Affecting Durability of Concrete, viewed 20 May
2013,
<http://theconstructor.org/concrete/durability-of-concrete/1115/>
Transportation Research Board 2009, NCHRP Synthesis 398: Cathodic Protection
for Life Extension of Existing Reinforced Concrete Bridge Elements, Transportation
research board, Washington, pp 49
TRIP 2002, Showing their age: The Nations Bridges at 40 (TRIP), The road
information program, Washington


APPENDIX A - PROJECT SPECIFICATIONS

University of Southern Queensland Faculty of Engineering and Surveying ENG 4111/2 Research Project
Project Specification Student: Steven Brailsford Topic: Cathodic protection of concrete reinforced bridges in the marine
environment as an asset management tool Supervisor: Dr Sourish Banerjee Aim: To evaluate the use of Cathodic protection as an asset management tool for reinforced concrete bridges. To evaluate this technology and practical issues by comparing typical installations in a number of cases as part of the asset management process by NSW Roads and Maritime Services (RMS) Northern Region. Program: Version A, 11 March 2013
6) Research literature and background material relating to: • Cathodic Protection (CP);
• Various types of CP installation and products;
• CP for protection of bridges in the marine environment
7) Determine the mechanisms and tools for evaluation of existing assets.
8) Use a number of existing bridges within (RMS) Northern Region carry out case studies discuss/evaluate the following: f) Bridge background; g) Bridge assessment methods; h) Discuss/examine costs in implementing CP; i) Issues/problems with implementation;
• Perceived benefits and actual results to date;
9) Evaluate methods for determining life of CP protection and asset maintenance implications.
10) Report findings in the required written and oral formats.
If time permits: Develop methods for prioritising CP projects within the RMS Northern Region, or Develop methods to select appropriate CP products/systems
Student: S.Brailsford 11/3/2013 Supervisor S.Banerjee 11/3/2013

APPENDIX B - TRIAL OBSERVATION DATA

Note : All data sourced from internal RMS observation logs and records 2013.
CURRENT MEASUREMENTS Boyds Bay Bridge - Pier 4 US - CC trial 1 Current Monitoring (mA)
Test Date Time (months)
Currents
1 2 3 4
24/01/2008 0.0 6/03/08 1.4 3.5 3.3 3.9 15.6 11/09/2008 7.5 2 1.9 2.2 8 21/01/2009 11.7 3.2 3 3.6 11.3 9/04/2009 14.2 2.3 2.1 2.5 8.6 3/06/2009 16.0 1.6 1.4 1.7 5.9 23/07/2009 17.6 1.45 0.97 1.68 6.62
20/10/2009 20.5 1.57 1.22 1.91 7.54 3/02/2010 23.9 2.18 1.56 2.52 9.12
23/06/2010 28.4 0.9 0.7 1.1 4.3
15/02/2011 36.1 1.41 1.12 1.78 6.45
1/06/2011 39.5 0.65 0.53 0.85 3.57
5/10/2011 43.5 0.66 0.47 0.75 3.77
2/02/2012 47.4 1.188 1.013 1.641 6.218 2/06/2012 51.3 0.524 0.475 0.8 2.87 18/09/2012 54.8 0.517 0.491 0.802 2.857
Boyds Bay Bridge - Pier 1 DS - CC trial 2 Current Monitoring (mA)
Test Date Time (months)
Currents
1 2 3 4
23/10/2008 0.0 21/01/09 2.9 2.2 1.7 4.7 14.6 26/04/2009 6.0 1.5 1.4 3.7 11 15/05/2009 6.6 1.2 1.2 3.1 8.9 3/06/2009 7.2 1 1 2.1 7.7 23/07/2009 8.8 1.06 1.01 2.07 8.19 20/10/2009 11.7 1.15 1.22 2.47 8.06 3/02/2010 15.1 1.37 1.52 3.31 9.8 23/06/2010 19.6 0.7 0.8 1.5 5.2 15/02/2011 27.3 0.9 1.13 2.4 7.49 1/06/2011 30.7 0.47 0.57 1.02 4.29
5/10/2011 34.7 0.51 0.6 0.92 4.8 2/02/2012 38.6 0.867 0.994 1.568 7.184 2/06/2012 42.5 0.421 0.504 0.809 4.116 18/09/2012 46.0 0.437 0.512 0.813 4.193

Boyds Bay Bridge - Pier 6 US - CC trial 3
Current Monitoring (mA)
Test Date Time (months)
Currents
1 2 3 4
23/10/2008 0.0 21/01/09 2.9 2.7 2.5 3 13 26/04/2009 6.0 1.9 1.7 2.3 10.4 15/05/2009 6.6 1.5 1.2 1.8 7.3 3/06/2009 7.2 1.2 1 1.4 6.5 23/07/2009 8.8 1.06 0.79 1.2 6.8 20/10/2009 11.7 1.12 1.06 1.53 7.9 3/02/2010 15.1 1.14 1.05 1.49 7.67 23/06/2010 19.6 0.54 0.5 0.7 3.4 15/02/2011 27.3 1.68 1.74 2.15 15.07 5/10/2011 34.7 0.37 0.27 0.41 2.6 2/02/2012 38.6 0.592 0.494 0.669 3.821 2/06/2012 42.5 0.258 0.194 0.299 2.365 18/09/2012 46.0 0.234 0.164 0.269 2.211
Boyds Bay Bridge - Pier 4 DS - XP trial 1
Current Monitoring (mA)
Test Date Time (months)
Currents
1 2 3 4
11/09/2008 0.0 26/04/09 7.3 0.5 0.6 0.6 0.6 23/07/2009 10.2 0.4 0.5 0.4 0.4 23/06/2010 21.0 0.2 0.2 0.2 0.2 15/02/2011 28.6 0.2 0.29 0.22 0.24
Mororo Bridge - Pier 5 DS - DAS trial 1 (2.4lb/ft)
Current Monitoring (mA)
Test Date Time (months)
Currents
1 2 3 4
20/05/2010 0.0 9.1 8.22 11.64 9.1 16/06/2010 0.9 7.7 6.27 9.34 13 15/07/2010 1.8 7 6 9 9 18/08/2010 2.9 7 5 8 9 20/10/2010 4.9 3.6 3.8 8.8 13.8

Mororo Bridge - Pier 5 Centre - DAS trial 2 (1.2lb/ft)
Current Monitoring (mA)
Test Date Time (months)
Currents
1 2 3 4
20/05/2010 0.0 5.84 6.44 18.34 23.4 16/06/2010 0.9 3.61 5.02 17.78 20 15/07/2010 1.8 3 4 16 14 18/08/2010 2.9 2 5 13 13 20/10/2010 4.9 7.2 6.25 8.09 9.25
Terranora Bridge - Pier 3 US NF - DAS trial 2 (1.2lb/ft = 1.8kg/m))
Current Monitoring (mA)
Test Date Time (months)
Currents
1 2 3
5/06/2010 0 4.6 11.2 15.4 23/06/2010 0.6 2.1 2.6 2.9 19/08/2010 2.5 2.67 3.25 2.96 15/02/2011 8.4 2.84 4.38 19.34 21/10/2011 16.5 1.812 2.343 10.115 24/01/2012 19.7 2.353 2.342 9.193
Terranora Bridge - Pier 3 US NF - DAS trial 2 (0.6lb/ft = 0.9kg/m)
Current Monitoring (mA)
Test Date Time (months)
Currents 1 2 3
5 /06/2010 0 7.9 9.1 12.9 23/06/2010 0.6 1.7 3 2.5 18/08/2010 2.5 1.05 3.85 1.69 20/09/2010 8.4 1 1 1 21/10/2011 16.5 2.93 0.676 0.233 24/01/2012 19.7 2.75 1.104 0.25
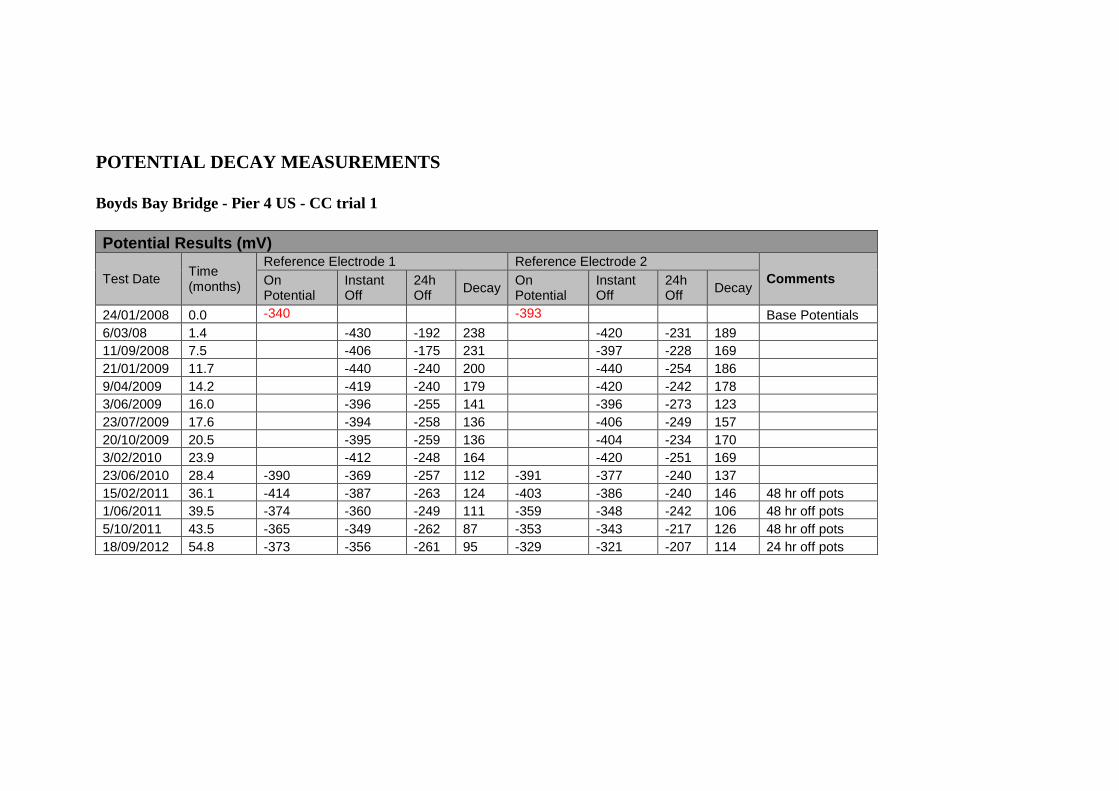
POTENTIAL DECAY MEASUREMENTS Boyds Bay Bridge - Pier 4 US - CC trial 1 Potential Results (mV)
Test Date Time (months)
Reference Electrode 1 Reference Electrode 2 Comments On
Potential Instant Off
24h Off Decay
On Potential
Instant Off
24h Off Decay
24/01/2008 0.0 -340 -393 Base Potentials 6/03/08 1.4 -430 -192 238 -420 -231 189 11/09/2008 7.5 -406 -175 231 -397 -228 169 21/01/2009 11.7 -440 -240 200 -440 -254 186 9/04/2009 14.2 -419 -240 179 -420 -242 178 3/06/2009 16.0 -396 -255 141 -396 -273 123 23/07/2009 17.6 -394 -258 136 -406 -249 157 20/10/2009 20.5 -395 -259 136 -404 -234 170 3/02/2010 23.9 -412 -248 164 -420 -251 169 23/06/2010 28.4 -390 -369 -257 112 -391 -377 -240 137 15/02/2011 36.1 -414 -387 -263 124 -403 -386 -240 146 48 hr off pots 1/06/2011 39.5 -374 -360 -249 111 -359 -348 -242 106 48 hr off pots 5/10/2011 43.5 -365 -349 -262 87 -353 -343 -217 126 48 hr off pots 18/09/2012 54.8 -373 -356 -261 95 -329 -321 -207 114 24 hr off pots

Boyds Bay Bridge - Pier 1 DS - CC trial 2 Potential Results (mV)
Test Date Time (months)
Reference Electrode 1 Reference Electrode 2 Comments On
Potential Instant Off
24h Off
Decay On Potential
Instant Off
24h Off
Decay
23/10/2008 0.0 -126 -272 Base Potentials 21/01/09 2.9 -329 -106 223 -261 -211 50 48 Hr off 26/04/2009 6.0 -309 -98 211 -233 -177 56 15/05/2009 6.6 -327 -153 174 -227 -182 45 3/06/2009 7.2 -272 -151 121 -231 -194 37 23/07/2009 8.8 -263 -143 120 -234 -195 39 20/10/2009 11.7 -309 -103 206 -244 -198 46 42 hr off 3/02/2010 15.1 -279 -106 173 -235 -202 33 23/06/2010 19.6 -285 -242 -136 106 -225 -215 -192 23 15/02/2011 27.3 -295 -227 -115 112 -227 -212 -185 27 48 Hr off 1/06/2011 30.7 -261 -219 -120 99 -208 -199 -176 23 48 Hr off 5/10/2011 34.7 -251 -215 -114 101 -200 -191 -164 27 48 Hr off 18/09/2012 46.0 -233 -198 -111 87 -185 -176 -152 24 24 Hr off

Boyds Bay Bridge - Pier 6 US - CC trial 3 Potential Results (mV)
Test Date Time (months)
Reference Electrode 1 Reference Electrode 2 Comments On
Potential Instant Off
24h Off
Decay On Potential
Instant Off
24h Off
Decay
23/10/2008 0.0 -213 -218 Base Potentials 21/01/09 2.9 -304 -209 95 -404 -235 169 48 Hr off 26/04/2009 6.0 -296 -214 82 -381 -211 170 15/05/2009 6.6 -296 -210 86 -360 -220 140 3/06/2009 7.2 -282 -209 73 -382 -251 131 23/07/2009 8.8 -280 -212 68 -386 -234 152 20/10/2009 11.7 -279 -207 72 -384 -202 182 42 hr off 3/02/2010 15.1 -270 -207 63 -367 -207 160 23/06/2010 19.6 -254 -251 -199 52 -357 -331 -207 124 15/02/2011 27.3 -201 -198 -190 8 -381 -310 -232 78 48 Hr off 1/06/2011 30.7 -236 -234 -181 53 -341 -321 -220 101 48 Hr off 5/10/2011 34.7 -231 -229 -177 52 -331 -311 -210 101 48 Hr off 18/09/2012 46.0 -25 -21 -173 -152 -43 -39 -203 -164 24 Hr off

Boyds Bay Bridge - Pier 4 DS - XP trial 1
Potential Results (mV)
Test Date Time (months)
Reference Electrode 1 Reference Electrode 2 Comments On
Potential Instant Off
24h Off
Decay On Potential
Instant Off
24h Off
Decay
11/09/2008 0.0 -213 -213 Base Potentials 26/04/09 7.3 -329 -328 -319 9 -362 -361 -347 14 23/07/2009 10.2 -309 -309 -298 11 -343 -343 -328 15 23/06/2010 21.0 -257 -257 -229 28 -273 -273 -221 52 15/02/2011 28.6 -241 -241 -231 10 -264 -263 -253 10 18/09/2012 47.4 -200 -200 -190 10 -198 -196 -184 12 24 Hr off

Mororo Bridge - Pier 5 DS - DAS trial 1 (2.4lb/ft)
Potential Results (mV)
Test Date Time (months)
Reference Electrode 1 Reference Electrode 2 Reference Electrode 3 On Potential Instant Off 24h Off Decay
On Potential Instant Off 24h Off Decay
On Potential Instant Off 24h Off Decay
20/05/2010 0.0 16/06/2010 0.9 -420 -413 70 483 -494 -471 -160 311 -839 -819 -338 481 15/07/2010 1.8 -426 -414 114 528 -488 -469 -112 357 -827 -802 -280 522 18/08/2010 2.9 -418 -409 234 643 -468 -449 -19 430 -815 -789 -263 526 20/10/2010 4.9 -796 -451 372 823 -537 -487 26 513 -792 -695 -465 230 30/05/2011 12.1 -533 -422 140 562 -558 -488 -167 321 -688 -625 -372 253
Potential Results (mV)
Test Date Time (months) Reference Electrode 4
Comments On Potential Instant Off 24h Off Decay
20/05/2010 0.0 SS 16/06/2010 0.9 -683 -653 -430 223 15/07/2010 1.8 -688 -644 -477 167 18/08/2010 2.9 -668 -621 -428 193 20/10/2010 4.9 -875 -809 -684 125 30/05/2011 12.1 -833 -792 -674 118

Mororo Bridge - Pier 5 Centre - DAS trial 2 (1.2lb/ft)
Potential Results (mV)
Test Date Time (months)
Reference Electrode 1 Reference Electrode 2 Reference Electrode 3 On Potential
Instant Off 24h Off Decay On Potential
Instant Off 24h Off Decay On Potential
Instant Off 24h Off Decay
20/05/2010 0.0 16/06/2010 0.9 -878 -675 380 1055 -627 -560 30 590 -728 -671 -440 231 15/07/2010 1.8 -855 -663 393 1056 -612 -551 34 585 -698 -644 -428 216 18/08/2010 2.9 -848 -701 338 1039 -595 -536 63 599 -680 -635 -435 200 20/10/2010 4.9 -416 -398 -2 396 -463 -436 0 436 -802 -765 -20 745 30/05/2011 12.1 -435 -431 8 439 -671 -588 -237 351 -882 -557 -290 267
Potential Results (mV)
Test Date Time (months) Reference Electrode 4
Comments On Potential Instant Off 24h Off Decay
20/05/2010 0.0 16/06/2010 0.9 -837 -811 -681 130 15/07/2010 1.8 -853 -819 -646 173 18/08/2010 2.9 -842 -811 -649 162 20/10/2010 4.9 -760 -690 -519 171 30/05/2011 12.1 -689 -667 -500 167

Terranora Bridge - Pier 3 US NF - DAS trial 2 (1.2lb/ft = 1.8kg/m))
Potential Results (mV)
Test Date Time (months)
Reference Electrode 1 Reference Electrode 2 Comments On
Potential Instant Off
24h Off Decay On Potential
Instant Off
24h Off Decay
23/06/2010 0.0 -237 -234 -98 136 -197 -195 -146 49 27/07/2010 1.7 -209 -206 -98 108 -194 -192 -152 40 19/08/2010 2.4 -222 -224 -98 126 -203 -201 -152 49 15/02/2011 8.2 -391 -378 -155 223 -238 -234 -138 96 1 /06/2011 11.6 -284 -283 -147 136 -200 -199 -152 47


APPENDIX C - GACP PRODUCT INFORMATION


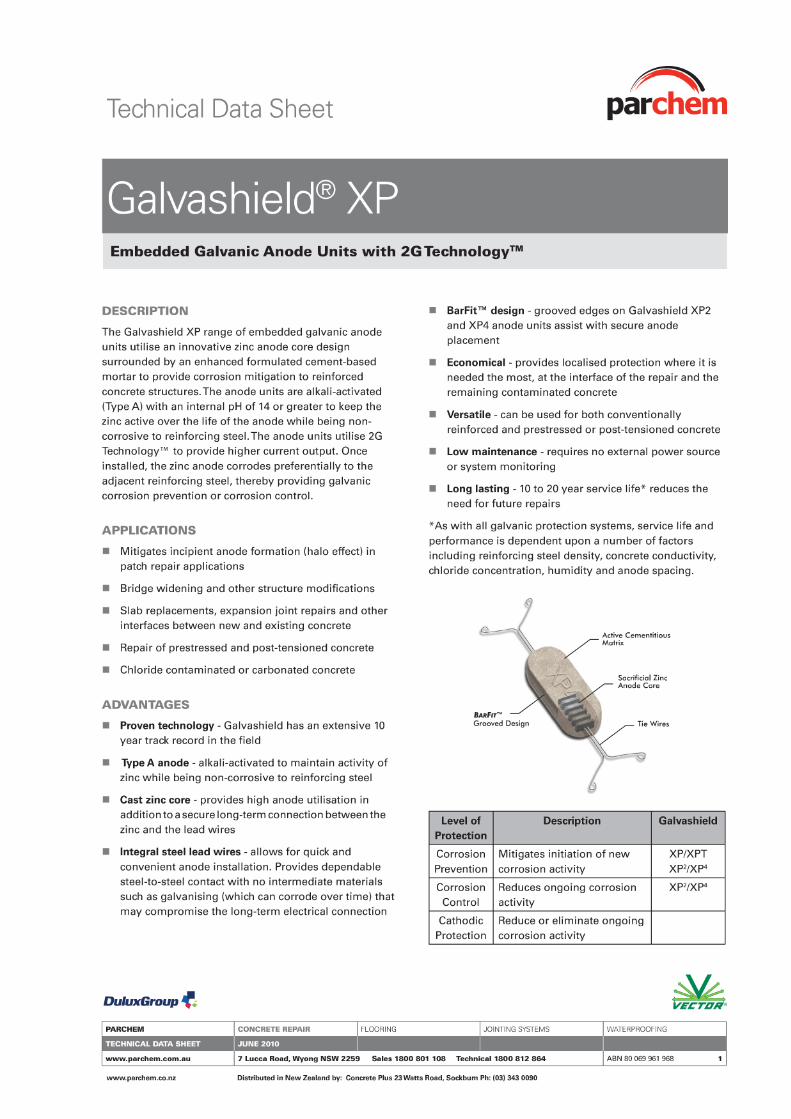


Top Related
Copyright © 2022 FDOKUMEN

