Zuckerman, MK., EM Garofalo, B Frohlich, and DJ Ortner. 2014. Anemia or scurvy: A pilot study on...
7
International Journal of Paleopathology 5 (2014) 27–33 Contents lists available at ScienceDirect International Journal of Paleopathology j ourna l ho mepage: www.elsevier.com/locate/ijpp Technical Note Anemia or scurvy: A pilot study on differential diagnosis of porous and hyperostotic lesions using differential cranial vault thickness in subadult humans Molly K. Zuckerman a,∗ , Evan M. Garofalo b , Bruno Frohlich c , Donald J. Ortner c a Department of Anthropology and Middle Eastern Cultures, Cobb Institute of Archaeology, Mississippi State University, P.O. Box AR, Mississippi State, MS 39762-5542, USA b Department of Anatomy and Neurobiology, University of Maryland School of Medicine, Baltimore, MD 21201, USA c Department of Physical Anthropology, Smithsonian Institution: National Museum of Natural History, Washington, DC 20560, USA a r t i c l e i n f o Article history: Received 17 February 2013 Received in revised form 10 February 2014 Accepted 16 February 2014 Keywords: Scurvy Anemia Cribra orbitalia Porotic hyperostosis Cranial vault thickness Fuzzy landmarks a b s t r a c t Metabolic disorders, such as scurvy, manifested in human skeletal remains provide insight into health, nutrition, and environmental quality in past populations. Porous cranial vault lesions are often used to diagnose metabolic conditions in subadult remains, but overlapping gross lesion expressions have led to over-diagnosis of anemia and under-diagnosis of scurvy. Studies by Ortner and colleagues have suggested that specific porous cranial lesions are pathognomonic of scurvy, but additional diagnostic tools are nec- essary. In this technical report, we offer a preliminary assessment of cranial vault thickness (CVT) at the site of porous lesions (sensu lato porotic hyperostosis, cribra orbitalia) as a method for distinguishing between scurvy and anemia in subadult crania. Computed Tomography (CT) was used to measure CVT at various landmarks associated with porotic hyperostosis and cribra orbitalia, complemented by lesion scores, from scorbutic (N = 11), anemic (N = 3), and non-pathological (N = 28) subadult crania used as a control group. Results indicate that CVT consistently distinguishes scorbutic from non-pathological indi- viduals, while anemic individuals overlap with both – likely a function of small sample size in this study. Despite current limitations, CVT has the potential to be an objective diagnostic tool for distinguishing scurvy and expanding reconstructions of nutritional adequacy over the life course in past populations. © 2014 Elsevier Inc. All rights reserved. 1. Introduction Porous lesions on the cranial vault are among the most com- monly reported skeletal lesions in the paleopathological record. These include porotic hyperostosis, which is characterized by areas of circumscribed porosity and pitting on the ectocranial vault, and cribra orbitalia, a morphologically similar lesion that occurs on the orbital roofs. Since the 1960s, these lesions have frequently been attributed to iron deficiency anemia. However, more recent scholarship and advancements in differential diagnosis within paleopathology suggests that iron-deficiency anemia has been over-diagnosed; porous lesions, including porotic hyperostosis and ∗ Corresponding author. Tel.: +1 662 325 7519; fax: +1 662 325 8690. E-mail addresses: [email protected], [email protected] (M.K. Zuckerman), [email protected] (E.M. Garofalo), [email protected] (B. Frohlich). cribra orbitalia, may instead: (1) be related to other conditions, especially megaloblastic and hemolytic anemias, scurvy, and rick- ets, and; (2) that underlying and subtle differences in lesion etiology may be distinguished based on the morphology and distribution of lesions on the crania (Ortner and Ericksen, 1997; Ortner et al., 1999, 2001; Walker et al., 2009). In an influential series of works, Ortner and colleagues (1997, 1999, 2001, 2003) proposed that scurvy, which at the time was infrequently diagnosed in archaeological skeletal samples, could be identified in subadults based on the presence of two spe- cific lesions. These include porous and occasionally hypertrophic bilateral lesions on the greater wing of the sphenoid bone, often accompanied by cribra orbitalia, and porous and hyperostotic, non- hypertrophic vault lesions. While such specific diagnosis is not possible in all instances, this criterion has since been used to iden- tify many cases of scurvy in the archaeological record (sensu lato Geber and Murphy, 2012; Mays, 2008). Zuckerman and colleagues (2007) further proposed that differential cranial vault thickness http://dx.doi.org/10.1016/j.ijpp.2014.02.001 1879-9817/© 2014 Elsevier Inc. All rights reserved.
Transcript of Zuckerman, MK., EM Garofalo, B Frohlich, and DJ Ortner. 2014. Anemia or scurvy: A pilot study on...

T
Aas
Ma
3b
c
a
ARRA
KSACPCF
1
mToctbspo
((
h1
International Journal of Paleopathology 5 (2014) 27–33
Contents lists available at ScienceDirect
International Journal of Paleopathology
j ourna l ho mepage: www.elsev ier .com/ locate / i jpp
echnical Note
nemia or scurvy: A pilot study on differential diagnosis of porousnd hyperostotic lesions using differential cranial vault thickness inubadult humans
olly K. Zuckermana,∗, Evan M. Garofalob, Bruno Frohlichc, Donald J. Ortnerc
Department of Anthropology and Middle Eastern Cultures, Cobb Institute of Archaeology, Mississippi State University, P.O. Box AR, Mississippi State, MS9762-5542, USADepartment of Anatomy and Neurobiology, University of Maryland School of Medicine, Baltimore, MD 21201, USADepartment of Physical Anthropology, Smithsonian Institution: National Museum of Natural History, Washington, DC 20560, USA
r t i c l e i n f o
rticle history:eceived 17 February 2013eceived in revised form 10 February 2014ccepted 16 February 2014
eywords:curvynemiaribra orbitaliaorotic hyperostosis
a b s t r a c t
Metabolic disorders, such as scurvy, manifested in human skeletal remains provide insight into health,nutrition, and environmental quality in past populations. Porous cranial vault lesions are often used todiagnose metabolic conditions in subadult remains, but overlapping gross lesion expressions have led toover-diagnosis of anemia and under-diagnosis of scurvy. Studies by Ortner and colleagues have suggestedthat specific porous cranial lesions are pathognomonic of scurvy, but additional diagnostic tools are nec-essary. In this technical report, we offer a preliminary assessment of cranial vault thickness (CVT) at thesite of porous lesions (sensu lato porotic hyperostosis, cribra orbitalia) as a method for distinguishingbetween scurvy and anemia in subadult crania. Computed Tomography (CT) was used to measure CVTat various landmarks associated with porotic hyperostosis and cribra orbitalia, complemented by lesion
ranial vault thicknessuzzy landmarks
scores, from scorbutic (N = 11), anemic (N = 3), and non-pathological (N = 28) subadult crania used as acontrol group. Results indicate that CVT consistently distinguishes scorbutic from non-pathological indi-viduals, while anemic individuals overlap with both – likely a function of small sample size in this study.Despite current limitations, CVT has the potential to be an objective diagnostic tool for distinguishingscurvy and expanding reconstructions of nutritional adequacy over the life course in past populations.
© 2014 Elsevier Inc. All rights reserved.
. Introduction
Porous lesions on the cranial vault are among the most com-only reported skeletal lesions in the paleopathological record.
hese include porotic hyperostosis, which is characterized by areasf circumscribed porosity and pitting on the ectocranial vault, andribra orbitalia, a morphologically similar lesion that occurs onhe orbital roofs. Since the 1960s, these lesions have frequentlyeen attributed to iron deficiency anemia. However, more recent
cholarship and advancements in differential diagnosis withinaleopathology suggests that iron-deficiency anemia has beenver-diagnosed; porous lesions, including porotic hyperostosis and∗ Corresponding author. Tel.: +1 662 325 7519; fax: +1 662 325 8690.E-mail addresses: [email protected], [email protected]
M.K. Zuckerman), [email protected] (E.M. Garofalo), [email protected]. Frohlich).
ttp://dx.doi.org/10.1016/j.ijpp.2014.02.001879-9817/© 2014 Elsevier Inc. All rights reserved.
cribra orbitalia, may instead: (1) be related to other conditions,especially megaloblastic and hemolytic anemias, scurvy, and rick-ets, and; (2) that underlying and subtle differences in lesion etiologymay be distinguished based on the morphology and distribution oflesions on the crania (Ortner and Ericksen, 1997; Ortner et al., 1999,2001; Walker et al., 2009).
In an influential series of works, Ortner and colleagues (1997,1999, 2001, 2003) proposed that scurvy, which at the time wasinfrequently diagnosed in archaeological skeletal samples, couldbe identified in subadults based on the presence of two spe-cific lesions. These include porous and occasionally hypertrophicbilateral lesions on the greater wing of the sphenoid bone, oftenaccompanied by cribra orbitalia, and porous and hyperostotic, non-hypertrophic vault lesions. While such specific diagnosis is not
possible in all instances, this criterion has since been used to iden-tify many cases of scurvy in the archaeological record (sensu latoGeber and Murphy, 2012; Mays, 2008). Zuckerman and colleagues(2007) further proposed that differential cranial vault thickness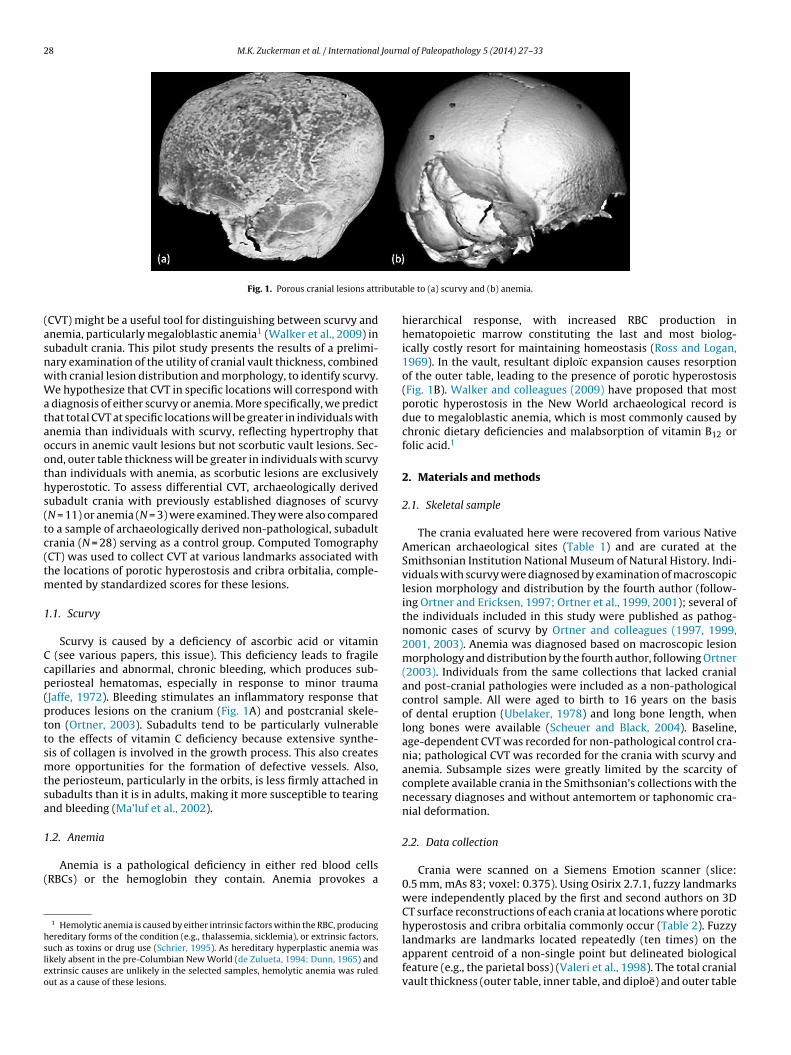
28 M.K. Zuckerman et al. / International Journal of Paleopathology 5 (2014) 27–33
ributa
(asnwWataooths(tc(tm
1
Ccp(pttsmtsa
1
(
hsleo
Fig. 1. Porous cranial lesions att
CVT) might be a useful tool for distinguishing between scurvy andnemia, particularly megaloblastic anemia1 (Walker et al., 2009) inubadult crania. This pilot study presents the results of a prelimi-ary examination of the utility of cranial vault thickness, combinedith cranial lesion distribution and morphology, to identify scurvy.e hypothesize that CVT in specific locations will correspond with
diagnosis of either scurvy or anemia. More specifically, we predicthat total CVT at specific locations will be greater in individuals withnemia than individuals with scurvy, reflecting hypertrophy thatccurs in anemic vault lesions but not scorbutic vault lesions. Sec-nd, outer table thickness will be greater in individuals with scurvyhan individuals with anemia, as scorbutic lesions are exclusivelyyperostotic. To assess differential CVT, archaeologically derivedubadult crania with previously established diagnoses of scurvyN = 11) or anemia (N = 3) were examined. They were also comparedo a sample of archaeologically derived non-pathological, subadultrania (N = 28) serving as a control group. Computed TomographyCT) was used to collect CVT at various landmarks associated withhe locations of porotic hyperostosis and cribra orbitalia, comple-
ented by standardized scores for these lesions.
.1. Scurvy
Scurvy is caused by a deficiency of ascorbic acid or vitamin (see various papers, this issue). This deficiency leads to fragileapillaries and abnormal, chronic bleeding, which produces sub-eriosteal hematomas, especially in response to minor traumaJaffe, 1972). Bleeding stimulates an inflammatory response thatroduces lesions on the cranium (Fig. 1A) and postcranial skele-on (Ortner, 2003). Subadults tend to be particularly vulnerableo the effects of vitamin C deficiency because extensive synthe-is of collagen is involved in the growth process. This also createsore opportunities for the formation of defective vessels. Also,
he periosteum, particularly in the orbits, is less firmly attached inubadults than it is in adults, making it more susceptible to tearingnd bleeding (Ma’luf et al., 2002).
.2. Anemia
Anemia is a pathological deficiency in either red blood cellsRBCs) or the hemoglobin they contain. Anemia provokes a
1 Hemolytic anemia is caused by either intrinsic factors within the RBC, producingereditary forms of the condition (e.g., thalassemia, sicklemia), or extrinsic factors,uch as toxins or drug use (Schrier, 1995). As hereditary hyperplastic anemia wasikely absent in the pre-Columbian New World (de Zulueta, 1994; Dunn, 1965) andxtrinsic causes are unlikely in the selected samples, hemolytic anemia was ruledut as a cause of these lesions.
ble to (a) scurvy and (b) anemia.
hierarchical response, with increased RBC production inhematopoietic marrow constituting the last and most biolog-ically costly resort for maintaining homeostasis (Ross and Logan,1969). In the vault, resultant diploïc expansion causes resorptionof the outer table, leading to the presence of porotic hyperostosis(Fig. 1B). Walker and colleagues (2009) have proposed that mostporotic hyperostosis in the New World archaeological record isdue to megaloblastic anemia, which is most commonly caused bychronic dietary deficiencies and malabsorption of vitamin B12 orfolic acid.1
2. Materials and methods
2.1. Skeletal sample
The crania evaluated here were recovered from various NativeAmerican archaeological sites (Table 1) and are curated at theSmithsonian Institution National Museum of Natural History. Indi-viduals with scurvy were diagnosed by examination of macroscopiclesion morphology and distribution by the fourth author (follow-ing Ortner and Ericksen, 1997; Ortner et al., 1999, 2001); several ofthe individuals included in this study were published as pathog-nomonic cases of scurvy by Ortner and colleagues (1997, 1999,2001, 2003). Anemia was diagnosed based on macroscopic lesionmorphology and distribution by the fourth author, following Ortner(2003). Individuals from the same collections that lacked cranialand post-cranial pathologies were included as a non-pathologicalcontrol sample. All were aged to birth to 16 years on the basisof dental eruption (Ubelaker, 1978) and long bone length, whenlong bones were available (Scheuer and Black, 2004). Baseline,age-dependent CVT was recorded for non-pathological control cra-nia; pathological CVT was recorded for the crania with scurvy andanemia. Subsample sizes were greatly limited by the scarcity ofcomplete available crania in the Smithsonian’s collections with thenecessary diagnoses and without antemortem or taphonomic cra-nial deformation.
2.2. Data collection
Crania were scanned on a Siemens Emotion scanner (slice:0.5 mm, mAs 83; voxel: 0.375). Using Osirix 2.7.1, fuzzy landmarkswere independently placed by the first and second authors on 3DCT surface reconstructions of each crania at locations where porotichyperostosis and cribra orbitalia commonly occur (Table 2). Fuzzy
landmarks are landmarks located repeatedly (ten times) on theapparent centroid of a non-single point but delineated biologicalfeature (e.g., the parietal boss) (Valeri et al., 1998). The total cranialvault thickness (outer table, inner table, and diploë) and outer table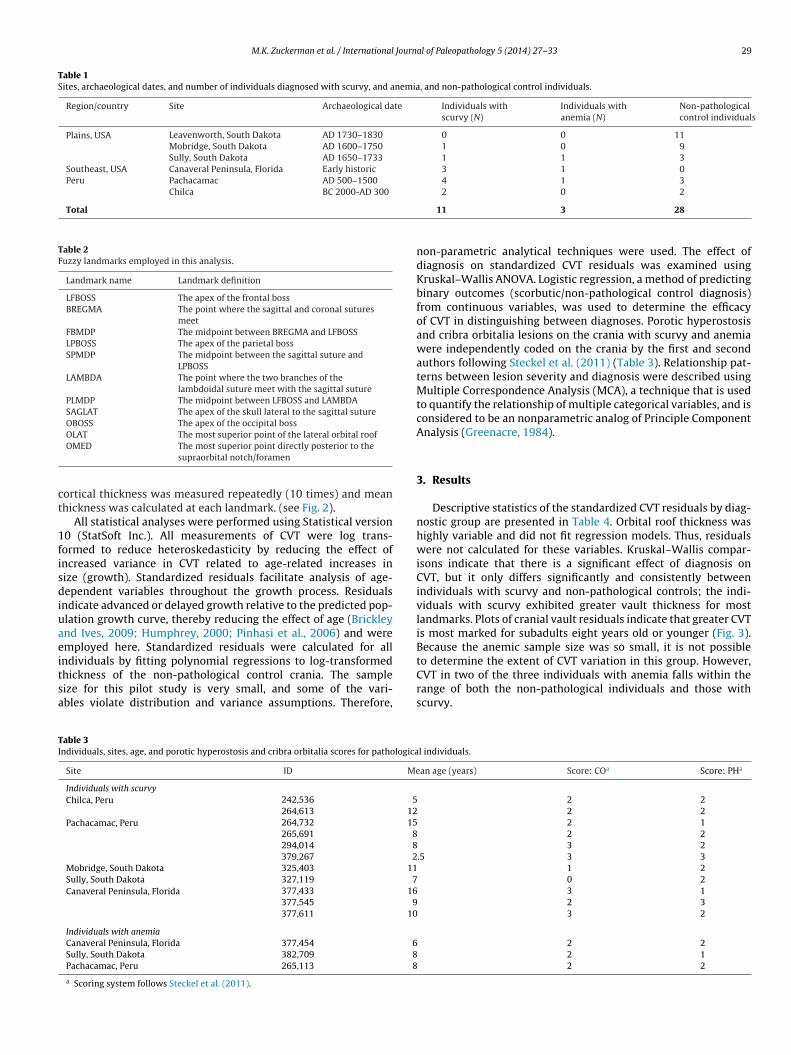
M.K. Zuckerman et al. / International Journal of Paleopathology 5 (2014) 27–33 29
Table 1Sites, archaeological dates, and number of individuals diagnosed with scurvy, and anemia, and non-pathological control individuals.
Region/country Site Archaeological date Individuals withscurvy (N)
Individuals withanemia (N)
Non-pathologicalcontrol individuals
Plains, USA Leavenworth, South Dakota AD 1730–1830 0 0 11Mobridge, South Dakota AD 1600–1750 1 0 9Sully, South Dakota AD 1650–1733 1 1 3
Southeast, USA Canaveral Peninsula, Florida Early historic 3 1 0Peru Pachacamac AD 500–1500 4 1 3
Chilca BC 2000-AD 300
Total
Table 2Fuzzy landmarks employed in this analysis.
Landmark name Landmark definition
LFBOSS The apex of the frontal bossBREGMA The point where the sagittal and coronal sutures
meetFBMDP The midpoint between BREGMA and LFBOSSLPBOSS The apex of the parietal bossSPMDP The midpoint between the sagittal suture and
LPBOSSLAMBDA The point where the two branches of the
lambdoidal suture meet with the sagittal suturePLMDP The midpoint between LFBOSS and LAMBDASAGLAT The apex of the skull lateral to the sagittal sutureOBOSS The apex of the occipital bossOLAT The most superior point of the lateral orbital roof
ct
1fisdiuaeitsa
TI
OMED The most superior point directly posterior to thesupraorbital notch/foramen
ortical thickness was measured repeatedly (10 times) and meanhickness was calculated at each landmark. (see Fig. 2).
All statistical analyses were performed using Statistical version0 (StatSoft Inc.). All measurements of CVT were log trans-ormed to reduce heteroskedasticity by reducing the effect ofncreased variance in CVT related to age-related increases inize (growth). Standardized residuals facilitate analysis of age-ependent variables throughout the growth process. Residuals
ndicate advanced or delayed growth relative to the predicted pop-lation growth curve, thereby reducing the effect of age (Brickleynd Ives, 2009; Humphrey, 2000; Pinhasi et al., 2006) and weremployed here. Standardized residuals were calculated for all
ndividuals by fitting polynomial regressions to log-transformedhickness of the non-pathological control crania. The sampleize for this pilot study is very small, and some of the vari-bles violate distribution and variance assumptions. Therefore,able 3ndividuals, sites, age, and porotic hyperostosis and cribra orbitalia scores for pathologica
Site ID Me
Individuals with scurvyChilca, Peru 242,536 5
264,613 12Pachacamac, Peru 264,732 15
265,691 8294,014 8379,267 2
Mobridge, South Dakota 325,403 11Sully, South Dakota 327,119 7Canaveral Peninsula, Florida 377,433 16
377,545 9377,611 10
Individuals with anemiaCanaveral Peninsula, Florida 377,454 6Sully, South Dakota 382,709 8Pachacamac, Peru 265,113 8
a Scoring system follows Steckel et al. (2011).
2 0 2
11 3 28
non-parametric analytical techniques were used. The effect ofdiagnosis on standardized CVT residuals was examined usingKruskal–Wallis ANOVA. Logistic regression, a method of predictingbinary outcomes (scorbutic/non-pathological control diagnosis)from continuous variables, was used to determine the efficacyof CVT in distinguishing between diagnoses. Porotic hyperostosisand cribra orbitalia lesions on the crania with scurvy and anemiawere independently coded on the crania by the first and secondauthors following Steckel et al. (2011) (Table 3). Relationship pat-terns between lesion severity and diagnosis were described usingMultiple Correspondence Analysis (MCA), a technique that is usedto quantify the relationship of multiple categorical variables, and isconsidered to be an nonparametric analog of Principle ComponentAnalysis (Greenacre, 1984).
3. Results
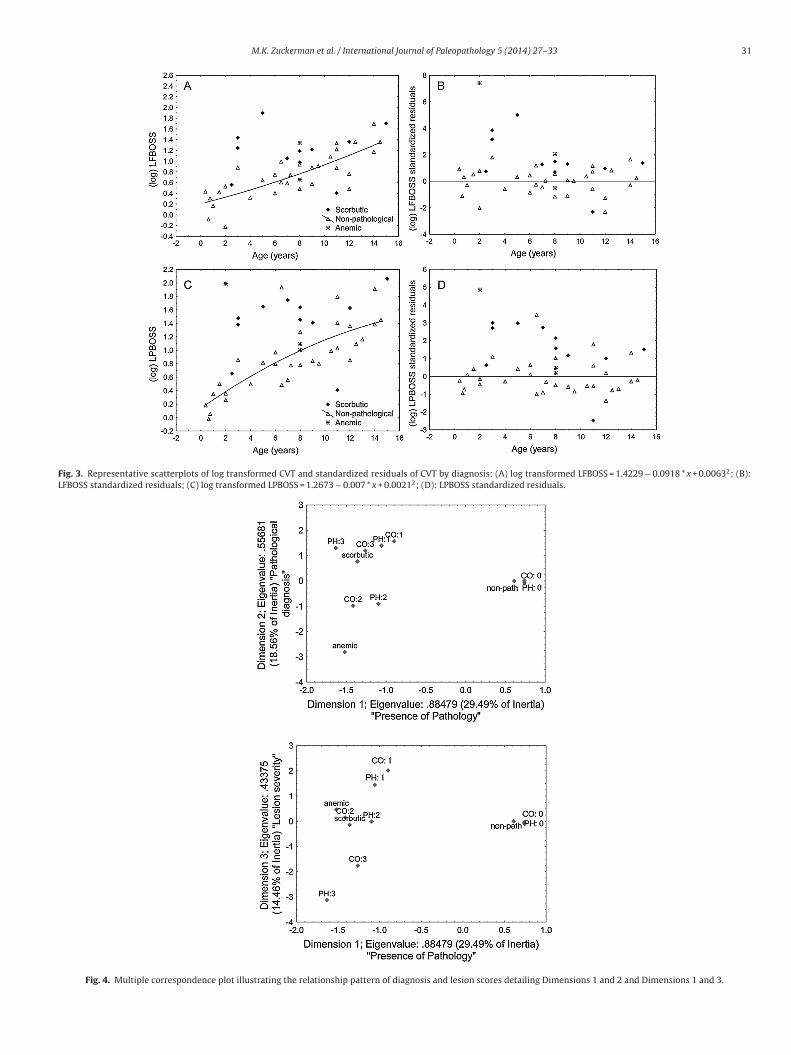
Descriptive statistics of the standardized CVT residuals by diag-nostic group are presented in Table 4. Orbital roof thickness washighly variable and did not fit regression models. Thus, residualswere not calculated for these variables. Kruskal–Wallis compar-isons indicate that there is a significant effect of diagnosis onCVT, but it only differs significantly and consistently betweenindividuals with scurvy and non-pathological controls; the indi-viduals with scurvy exhibited greater vault thickness for mostlandmarks. Plots of cranial vault residuals indicate that greater CVTis most marked for subadults eight years old or younger (Fig. 3).Because the anemic sample size was so small, it is not possible
to determine the extent of CVT variation in this group. However,CVT in two of the three individuals with anemia falls within therange of both the non-pathological individuals and those withscurvy.l individuals.
an age (years) Score: COa Score: PHa
2 2 2 2 2 1
2 2 3 2.5 3 3
1 2 0 2
3 1 2 3
3 2
2 2 2 1 2 2

30 M.K. Zuckerman et al. / International Journal of Paleopathology 5 (2014) 27–33
Fig. 2. Cross-sectional lesion morphology of (a) an individual with scurvy demonstrating total CVT and (b) an individual with anemia demonstrating diploïc thickness atFBMDP.
Table 4Descriptive residuals and results of Kruskal–Wallis comparisons of CVT residuals by diagnosis.
Total thickness Outer table thickness
Landmark Diagnosis Valid N Meana SEb Landmark Diagnosis Valid N Meana SEb
LFBOSS* Non-path 31 0.00 0.18 LFBOSS Non-path 31 0.00 0.18Anemia 3 2.99 2.33 Anemia 3 −0.83 1.44Scurvy 11 1.60 0.58 Scurvy 11 0.71 0.25
FBMDP* Non-path 31 0.00 0.18 FBMDP† Non-path 31 0.00 0.18Anemia 3 3.35 2.25 Anemia 3 −0.09 1.53Scurvy 11 2.57 0.72 Scurvy 11 1.67 0.65
LPBOSS* Non-path 31 0.00 0.18 LPBOSS* Non-path 31 0.00 0.18Anemia 3 1.83 1.51 Anemia 3 0.45 0.52Scurvy 11 1.55 0.47 Scurvy 11 0.76 0.23
PLMDP† Non-path 30 0.00 0.18 PLMDP Non-path 30 0.00 0.18Anemia 3 0.92 1.16 Anemia 3 0.52 0.21Scurvy 11 1.17 0.59 Scurvy 11 0.59 0.30
SAGLAT Non-path 31 0.00 0.18 SAGLAT* Non-path 31 0.00 0.18Anemia 3 1.66 1.69 Anemia 3 −0.14 0.88Scurvy 11 1.00 0.45 Scurvy 11 0.98 0.23
SPBMDP* Non-path 31 0.00 0.18 SPBMDP† Non-path 31 0.00 0.18Anemia 3 2.58 1.90 Anemia 3 −0.04 1.38Scurvy 11 1.44 0.66 Scurvy 11 1.04 0.41
OBOSS Non-path 29 0.00 0.18 OBOSS Non-path 30 0.00 0.18Anemia 3 0.45 0.39 Anemia 3 0.28 0.86Scurvy 11 0.06 0.42 Scurvy 11 0.22 0.26
a NB CVT growth models are based on the non-pathological control individuals, therefore residual means for this group are similar to zero.b Standard error of the estimate. Variable: Kruskal–Wallis comparison of diagnoses df = 2; p < 0.05; Variable: df = 2; p < 0.01.* Significant post hoc Mann–Whitney multiple comparisons between individuals with scurvy and non-pathological controls marked as df = 2; p < 0.01.† Significant post hoc Mann–Whitney multiple comparisons between individuals with scurvy and non-pathological controls marked as df = 2; p < 0.05.
Table 5Logistic regression statistics (N = 39: scurvy, N = 11; non-pathological, N = 28; df = 37). Independent variable is the log CVT residual, dependent/response variable is the diagnosisof scurvy or non-pathological. Regression modeled as the probability that diagnosis = scurvy. Values in bold are statistically significant (p < 0.05).
Independent/predictor variable Model Test
B SE Wald statistic p Chi2 p Nagelkerke R2 Odds
LFBOSS Total 1.06 0.43 5.99 0.014 11.11 0.001 0.34 0.01LFBOSS Cortical 0.93 0.47 3.87 0.049 4.88 0.027 0.16 0.05FBMDP Total 1.10 0.40 7.57 0.006 17.07 0.000 0.49 0.01FBMDP Cortical 0.87 0.37 5.61 0.018 9.85 0.002 0.31 0.02LPBOSS Total 1.01 0.35 8.42 0.004 11.56 0.001 0.35 0.00LPBOSS Cortical 1.12 0.56 4.01 0.045 5.87 0.015 0.19 0.05SPMDP Total 0.78 0.31 6.40 0.011 8.29 0.004 0.26 0.01SPMDP Cortical 1.02 0.43 5.55 0.019 7.58 0.006 0.24 0.02SAGLAT Total 0.80 0.37 4.70 0.030 6.02 0.014 0.20 0.03SAGLAT Cortical 1.32 0.52 6.53 0.011 9.14 0.003 0.29 0.01OBOSS Total 0.05 0.33 0.02 0.877 0.02 0.877 0.00 7.15OBOSS Cortical 0.26 0.39 0.44 0.507 0.46 0.499 0.02 1.03PLMDP Total 0.74 0.34 4.80 0.028 6.36 0.012 0.21 0.03PLMDP Cortical 0.69 0.42 2.66 0.103 3.10 0.078 0.11 0.11
M.K. Zuckerman et al. / International Journal of Paleopathology 5 (2014) 27–33 31
Fig. 3. Representative scatterplots of log transformed CVT and standardized residuals of CVT by diagnosis: (A) log transformed LFBOSS = 1.4229 − 0.0918 * x + 0.00632; (B):LFBOSS standardized residuals; (C) log transformed LPBOSS = 1.2673 − 0.007 * x + 0.00212; (D): LPBOSS standardized residuals.
Fig. 4. Multiple correspondence plot illustrating the relationship pattern of diagnosis and lesion scores detailing Dimensions 1 and 2 and Dimensions 1 and 3.

3 Journal of Paleopathology 5 (2014) 27–33
oowtdtndiDvldst(toRns
(svas
4
toAHiwwn
tannTengtttdhat
ahttLams
e
grou
p
in
rela
tion
to
dia
gnos
is
–
scor
buti
c,
anem
ic
or
non
-pat
hol
ogic
al.
n
LFB
OSS
LFB
OSS
C
FBM
DP
FBM
DP
C
LPB
OSS
LPB
OSS
C
SPM
DP
SPM
DP
C
SAG
LAT
SAG
LAT
C
PLM
DP
PLM
DP
C
OB
OSS
OB
OSS
C
cal c
ontr
ol8
1.43
1.46
1.49
1.43
1.43
1.40
1.54
1.37
1.52
1.41
1.57
1.57
2.52
1.83
0.51
0.52
0.32
0.29
0.43
0.38
0.88
0.46
0.66
0.49
0.57
0.57
1.19
0.57
8
1.92
1.92
2.81
2.23
2.65
2.18
2.93
2.01
2.48
1.92
2.70
2.24
3.86
2.28
0.41
0.41
0.74
0.51
1.76
1.46
0.78
0.55
0.74
0.55
0.45
0.37
1.29
0.59
9
2.60
2.15
3.10
2.16
3.24
2.33
3.72
2.08
3.38
2.24
3.54
2.30
4.56
2.43
0.70
0.76
0.99
0.65
1.31
0.34
1.23
0.67
0.53
0.51
1.04
0.45
0.85
0.43
7
3.38
2.38
4.21
2.77
3.92
2.58
4.55
2.48
4.16
2.44
4.66
2.82
4.90
2.69
1.38
0.53
1.37
0.54
1.42
0.66
1.60
0.66
1.37
0.54
0.88
0.79
1.33
0.87
2
2.61
2.09
6.98
3.61
3.15
2.16
3.95
2.58
3.30
2.12
2.46
2.46
2.90
1.85
1.22
0.48
2.86
2.06
1.73
0.48
1.77
0.60
1.10
0.16
1.04
1.04
1.48
0.00
2
4.76
1.98
5.54
2.15
5.45
2.59
6.78
2.39
4.46
2.13
5.45
2.04
6.54
2.51
2.68
0.01
2.74
0.33
0.38
0.49
1.73
0.75
3.60
0.83
1.60
0.37
2.94
0.92
4
2.70
2.22
3.83
2.62
3.76
2.41
4.04
2.44
3.21
2.61
3.51
2.55
2.79
2.45
0.86
0.52
1.00
0.83
1.57
0.63
2.05
0.90
0.23
0.51
1.14
0.52
0.95
0.68
2
4.70
3.23
5.48
3.53
6.48
3.59
5.43
3.41
4.41
3.34
5.74
3.63
5.35
3.20
1.13
0.39
2.09
0.39
1.94
0.30
0.32
0.41
2.46
0.94
2.14
0.32
1.13
0.28
1
10.0
70.
52
11.9
5
0.78
7.32
1.18
11.9
5
0.66
8.23
0.90
3.34
1.66
3.18
1.26
–
–
–
– –
–
–
–
–
–
–
–
–
–2
2.88
2.28
3.64
2.82
2.85
2.81
3.63
2.75
2.69
2.35
2.80
2.59
4.38
3.03
1.34
0.39
0.55
0.12
0.18
0.06
0.18
0.25
0.51
0.45
0.38
0.08
1.48
0.39
2 M.K. Zuckerman et al. / International
Results of the Logistic Regression suggest that most measuresf CVT distinguish between non-pathological diagnoses and thatf scurvy (Table 5). Due to sample size, individuals with anemiaere not included in this analysis. In an examination of the rela-
ionship between lesion severity and diagnosis (Table 3), MCAemonstrates that three dimensions explain approximately 63% ofhe relationship (Fig. 4). Dimension 1 describes pathological versuson-pathological diagnoses, and explains 30% of the variation. Theifference between individuals with anemia and those with scurvy
s described by Dimension 2, which explains 18.6% of the variation.imension 3, or the scale of lesion severity, explains 14.5% of theariation, wherein severe lesion (3) scores load low on the axis, theess severe (1) load high, and moderate lesion (2) scores for bothiagnoses and non-pathological scores exhibit overlap in neutralpace. Although the reported percentage of variation here is lowerhan expected, MCA tends to return low percentages of variationGreenacre, 1994; Lebart, 2006). However, the eigenvalues suggesthat a higher proportion of variance is explained by the relationshipf the variables (0.884, 0.557, and 0.433 for DIM 1–3, respectively).aw data, in the form of mean CVT by age group in relation to diag-osis (scurvy, anemia, and non-pathological) can be found in onlineupplemental files (Table 6).
Taken together, scurvy is associated with thicker cranial vaultsparticularly during early periods of growth) and individuals withcurvy generally exhibit more severe lesion scores. The few indi-iduals with anemia provide comparative context to the analysis asnemic CVT collected herein overlaps in the non-pathological andcorbutic ranges, likely due to sample size issues.
. Discussion
Overall, the results of these pilot data do not yet suggesthat CVT is unequivocally useful for establishing a diagnosisf either scurvy or anemia for subadult porous cranial lesions.t this time, the sample of anemic individuals is too limited.owever, they do suggest that CVT may be a robust diagnostic
ndicator and therefore warrants further evaluation, specificallyith an enlarged sample of those with anemia, to determinehether this relationship can be extended to differential diag-oses.
At the very least, comparisons of CVT residuals suggesthat analysis of multiple landmarks promotes CVT as a usefuldditional tool for differentiating individuals with scurvy fromon-pathological individuals, particularly those manifesting cra-ial porosity associated with normal growth and development.he results demonstrate that CVT is markedly thicker during thearly years of growth in pathological individuals in comparison toon-pathological individuals. This pattern might be related to thereater susceptibility of young infants and juveniles (<8 years) tohe effects of metabolic disorders (Ortner, 2003). Further work onhis topic should expand the sample of anemic individuals in ordero clarify the discrepancy between the virtually pathognomoniciagnostic criterion of scurvy (cranial porosity with no marrowypertrophy), the observed increased CVT in most young infantsnd juveniles with scurvy, and the lack of marked hypertrophy inhe anemic individuals.
The relationship between relative CVT at multiple landmarksnd lesion severity scores for both cribra orbitalia and poroticyperostosis provide preliminary support for this interpreta-ion. Further, these analyses also suggest that translating CVT
o dry bone measurements at several landmarks (i.e. FBMDP,FBOSS, LPBOSS) may be useful for differentiating scurvy fromnemia, as well as from cranial porosity associated with nor-al growth and development, particularly in mild cases ofcurvy. Tab
le
6M
ean
CV
T
by
ag
Age
grou
p
Non
-pat
holo
gi0–
3
year
s
St. d
ev.
4–7
year
sSt
. dev
.
8–11
year
sSt
. dev
.
12–1
5
year
sSt
. dev
.
Scor
buti
c0–
3
year
s
St. d
ev.
4–7
year
s
St. d
ev.
8–11
year
sSt
. dev
.
12–1
5
year
sSt
. dev
Ane
mic
0–3
year
sSt
. dev
.
8–11
year
s
St. d
ev

Journ
5
climgtrpt
A
Crtat
R
B
d
D
G
G
G
of porotic hyperostosis and cribra orbitalia: a reappraisal of the iron-deficiency-
M.K. Zuckerman et al. / International
. Conclusion
The results suggest that when used in concert with diagnosticriteria based on the morphology and distribution of porous cranialesions, CVT at several landmarks may be a useful tool for assist-ng in the identification of scurvy in subadult crania, particularly in
ild cases and in crania exhibiting porosity associated with normalrowth and development. Further improvement of the differen-ial diagnosis of scurvy in the archaeological record is critical foreconstructing environmental quality and dietary adequacy in theast, particularly that experienced by infants and children, who arehe most vulnerable to biological stress in any population.
cknowledgments
Sincere thanks are extended to Drs. Dave Hunt, Valerie DeLeon,hris Ruff, and George Armelagos for their assistance with theesearch design, and to Miranda Taubert for her research assis-ance. We thank John Crandall, Haagen Klaus, Jane Buikstra, andnonymous reviewers for their editorial comments. We dedicatehis paper to the memory of Don Ortner.
eferences
rickley, M., Ives, R., 2009. The effects of socioeconomic status on endochondral andappositional bone growth, and acquisition of cortical bone in children from 19thcentury Birmingham, England. Am. J. Phys. Anthropol. 140, 410–416.
e Zulueta, J., 1994. Malaria and ecosystems: from prehistory to posteradication.Parassitologia 36, 7–15.
unn, F., 1965. On the antiquity of malaria in the western hemisphere. Hum. Biol.37, 385–393.
reenacre, M., 1984. Theory and Applications of Correspondence Analysis. AcademicPress, London.
reenacre, M., 1994. Correspondence analysis and its interpretation. In: Greenacre,
M., Blasius, J. (Eds.), Correspondence Analysis in the Social Sciences. AcademicPress, San Diego, CA, pp. 3–22.eber, J., Murphy, E.L., 2012. Scurvy in the Great Irish Famine: evidence of vitamin Cdeficiency from a mid-19th century skeletal population. Am. J. Phys. Anthropol.148, 512–524.
al of Paleopathology 5 (2014) 27–33 33
Humphrey, L., 2000. Growth studies of past populations: an overview and an exam-ple. In: Cox, M., Mays, S. (Eds.), Human Osteology in Archaeology and ForensicScience. Cambridge University Press, Cambridge, pp. 23–38.
Jaffe, H., 1972. Metabolic, Degenerative, and Inflammatory Diseases of Bones andJoints. Lea and Febiger, Philadelphia.
Lebart, L., 2006. Validation techniques in multiple correspondence analysis. In:Greenacre, M., Blasius, J. (Eds.), Multiple Correspondence Analysis and RelatedMethods. Chapman & Hall/CRC, London, pp. 179–195.
Ma’luf, R., Zein, W., El Deiri, M., Bashshur, Z., 2002. Bilateral subperiostealhematomas and Henoch–Schonlein purpura. Arch. Ophthalmol. 120,1398–1399.
Mays, S., 2008. A likely case of scurvy from early Bronze Age Britain. Int. J. Osteoar-chaeol. 18, 178–187.
Ortner, D., 2003. Identification of Pathological Conditions in Human SkeletalRemains, second ed. Academic Press, Amsterdam.
Ortner, D., Ericksen, M., 1997. Bone changes in the human skull probably resultingfrom scurvy in infancy and childhood. Int. J. Osteoarchaeol. 7, 212–220.
Ortner, D., Kimmerle, E.H., Diez, M., 1999. Probable evidence of scurvy in subadultsfrom archaeological sites in Peru. Am. J. Phys. Anthropol. 108, 321–331.
Ortner, D.J., Butler, W., Cafarella, J., Milligan, L., 2001. Evidence of probable scurvyin subadults from archaeological sites in North America. Am. J. Phys. Anthropol.114, 343–351.
Pinhasi, R., Shaw, P., White, B., Ogden, A., 2006. Morbidity, rickets and long-bonegrowth in post-medieval Britain: a cross-population analysis. Ann. Hum. Biol.33, 372–389.
Ross, P., Logan, W., 1969. Roentgen findings in extramedullary hematopoiesis. Am.J. Roentgenol. 106, 604–613.
Scheuer, L., Black, S., 2004. The Juvenile Skeleton. Elsevier, Amsterdam.Schrier, S., 1995. Extrinsic nonimmune hemolytic anemias. In: Hoffman, R., Benz Jr.,
E., Shattil, S., Furie, B., Cohen, H. (Eds.), Hematology: Basic Principles and Practice,second ed. Churchill Livingstone, New York, pp. 514–520.
Steckel, R., Larsen, C., Sciulli, P., Walker, P., 2011. The Global Historyof Health Project: Data Collection Codebook. http://global.sbs.ohio-state.edu/new docs/Codebook-01-24-11-em.pdf
Ubelaker, D.H., 1978. Human Skeletal Remains: Excavation, Analysis, and Interpre-tation. Smithsonian Institution Press, Washington, DC.
Valeri, C.J., Cole, T.M.I., Lele, S., Richtsmeier, J.T., 1998. Capturing data from three-dimensional surfaces using fuzzy landmarks. Am. J. Phys. Anthropol. 107,113–124.
Walker, P., Bathurst, R., Richman, R., Gjerdrum, T., Andrushko, V., 2009. The causes
anemia hypothesis. Am. J. Phys. Anthropol. 139, 109–125.Zuckerman, M., Garofalo, E., Ortner, D., 2007. Anemia or scurvy: distinguishing the
etiology of porotic hyperostosis via differential cranial vault thickness in juvenilehumans. Am. J. Phys. Anthropol. 132, 196.