
Two models of structural epistemology: Russell and Zhang Dongsun
Upload
khangminh22Category
view
1download
0
3
Department of Human and Engineered Environmental Studies Graduate School of Frontier Sciences
The University of Tokyo
2019
Master’s Thesis
高倍率集光型太陽電池冷却用相変化冷却器に関
する研究 (Study on two phase cooling unit applied for high concentration solar cell)
Submitted February 6th, 2020
Adviser: Professor Dang Chaobin (seal)
Student ID Number 47123456
Zhang Bohan
1
Contents Chapter 1 Introduction ....................................................................................................................... 2
1.1. Research background .................................................................................................... 2 1.1.1 Photovoltaic system .......................................................................................... 2 1.1.2 Solar thermal energy ......................................................................................... 2 1.1.3 High-concentration-photovoltaic-thermal system ............................................. 3 1.1.4 Solar radiation ................................................................................................... 6 1.1.5 Concentration ratio ............................................................................................ 7
1.2. Cooling methods for concentration cell ........................................................................ 8 1.2.1 Single-phase convective heat transfer ............................................................... 8 1.2.2 Two-phase flow boiling heat transfer in micro-channel .................................... 8
1.3. Flow regime ................................................................................................................. 10 1.4. Two-phase flow pressure drop .................................................................................... 12 1.5. Two-phase flow instability........................................................................................... 14 1.6. Calculation of heat transfer coefficient of micro-channel ........................................... 16 1.7. Conventional research in our laboratory .................................................................... 17 1.8. Objective of study ....................................................................................................... 18
Chapter 2 Experiment on thermal characteristics of radial expanding micro-channel heat exchanger . 19 2.1 Previous work .............................................................................................................. 19 2.2 A design of new-type micro-channel exchanger ......................................................... 22 2.3 Experimental setup ..................................................................................................... 25 2.4 Suppression of two-phase flow instabilities ................................................................ 30 2.5 Test procedure and data processing............................................................................ 32 2.6 Theoretical analysis on thermal characteristics .......................................................... 33 2.7 Experiment of heat transfer ........................................................................................ 34 2.8 Conclusion ................................................................................................................... 41
Chapter 3 Experiment of effect of gravity on radial expansion microchannel HE ................................ 43 3.1 The effect of gravity .................................................................................................... 43 3.2 Experiment of thermal characteristic with improved HE in different orientation ...... 48
3.2.1 Experimental setup .......................................................................................... 48 3.2.2 Test procedure and data processing ................................................................. 52 3.2.3 Result .............................................................................................................. 52
3.3 Visualization ................................................................................................................ 54 3.4 Experiment of the thermal characteristic with improved radial expansion microchannel heat exchanger ................................................................................................. 56
Chapter 4 Experiment of thermal performance on HCPVT system with improved microchannel heat exchanger ......................................................................................................................................... 59
4.1. Experiment setup ........................................................................................................ 60 4.2. Thermal characteristics ............................................................................................... 62
Chapter 5 Conclusion ........................................................................................................................ 65 Reference ......................................................................................................................................... 66 Acknowledgment .............................................................................................................................. 69
2
Chapter 1 Introduction
1.1. Research background
1.1.1 Photovoltaic system
Energy is one of the vital factors for any country development. Till date the coal as one of
the major sources of electricity production has the share of electricity by 42% and it will still
be the main source of electricity in many countries in the next few decades [1]. But the problems
of worldwide energy shortage and environment pollution are becoming more serious, so
renewable energy has been encouraged by many countries due to the advantages of being
sustainable and not contributing to the world's CO2 greenhouse gas emissions [2]. Solar energy
as an abundant and large potential renewable energy source in the world has no pollution [3],
so it has been widely used. Such a system generates electricity by converting the Sun’s energy
directly into electricity. According to 2015's data, solar photovoltaics (PV) contribute about 227
GW, and concentrating solar power (CSP) technologies contribute about 4.8 GW in electricity
generation capacity [4].
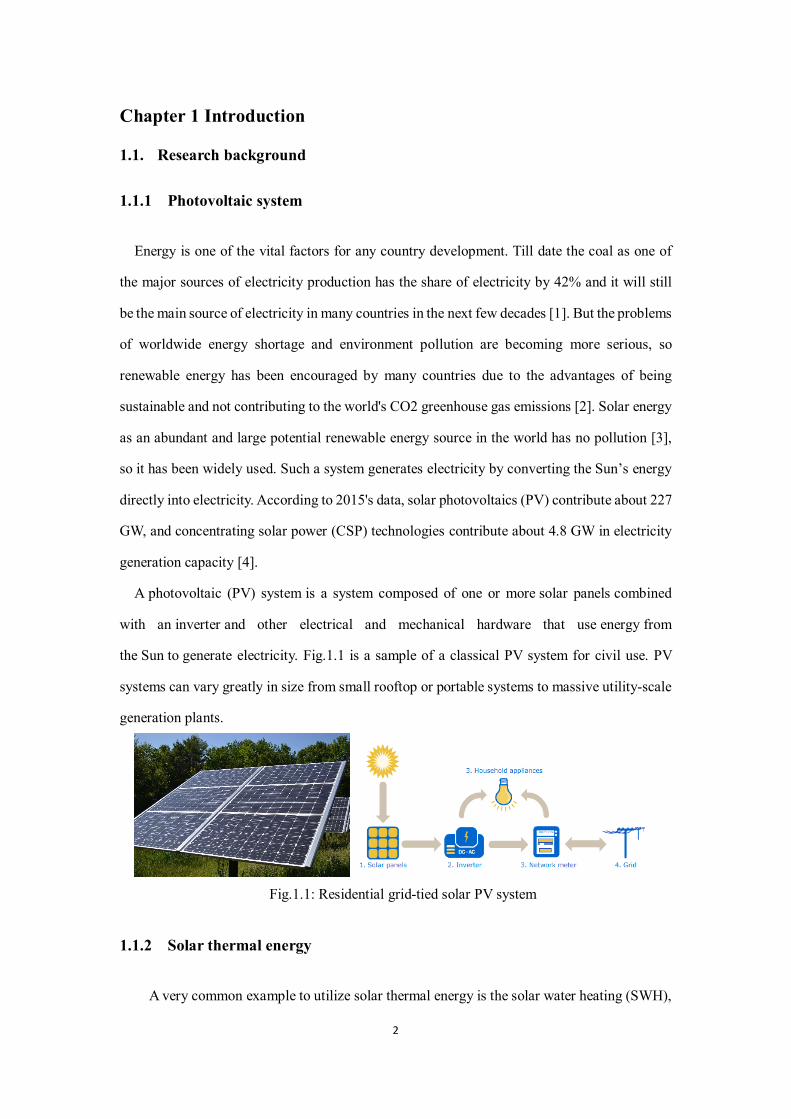
A photovoltaic (PV) system is a system composed of one or more solar panels combined
with an inverter and other electrical and mechanical hardware that use energy from
the Sun to generate electricity. Fig.1.1 is a sample of a classical PV system for civil use. PV
systems can vary greatly in size from small rooftop or portable systems to massive utility-scale
generation plants.
Fig.1.1: Residential grid-tied solar PV system
1.1.2 Solar thermal energy
A very common example to utilize solar thermal energy is the solar water heating (SWH),
3
which is widely used for residential and some industrial applications. Solar water heating is the
conversion of sunlight into heat for water heating using a solar thermal collector. A sun-facing
collector heats a working fluid that passes into a storage system for later use. SWH is an active
and reliable way to converse solar energy to thermal energy. They are heated directly or via
light-concentrating mirrors. They operate independently or as hybrids with electric or gas
heaters.[5] In large-scale installations, mirrors may concentrate sunlight into a smaller collector.
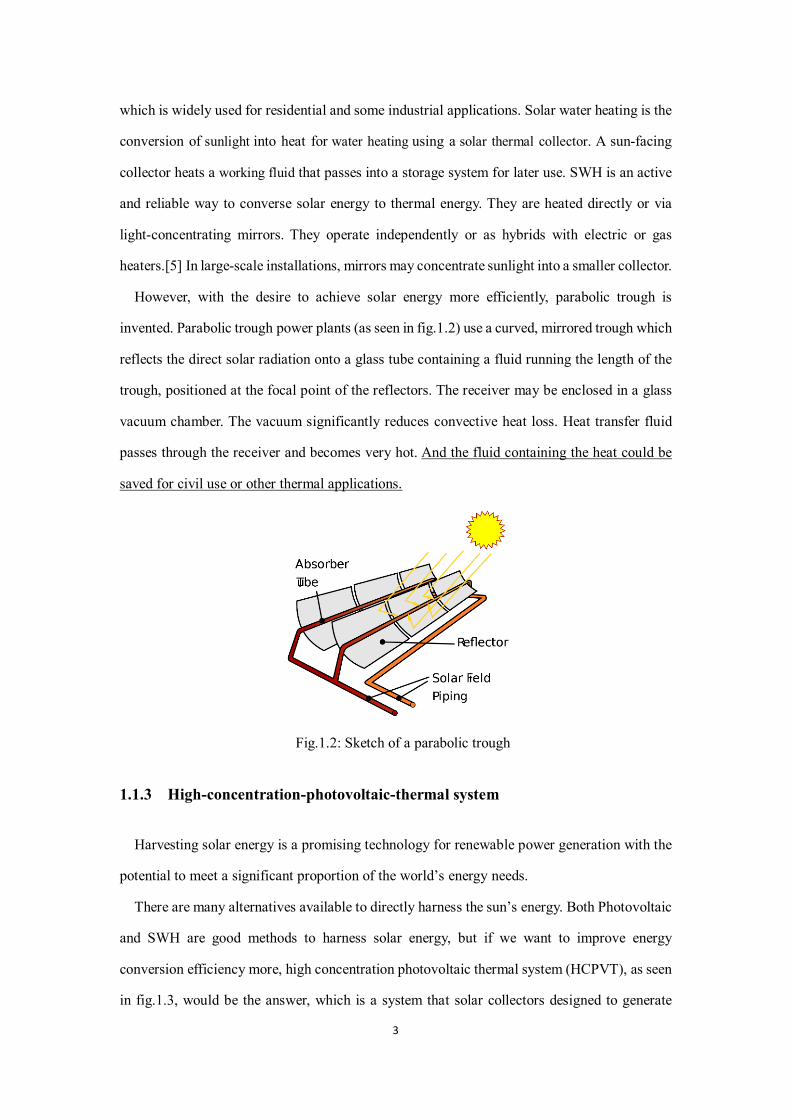
However, with the desire to achieve solar energy more efficiently, parabolic trough is
invented. Parabolic trough power plants (as seen in fig.1.2) use a curved, mirrored trough which
reflects the direct solar radiation onto a glass tube containing a fluid running the length of the
trough, positioned at the focal point of the reflectors. The receiver may be enclosed in a glass
vacuum chamber. The vacuum significantly reduces convective heat loss. Heat transfer fluid
passes through the receiver and becomes very hot. And the fluid containing the heat could be
saved for civil use or other thermal applications.
Fig.1.2: Sketch of a parabolic trough
1.1.3 High-concentration-photovoltaic-thermal system
Harvesting solar energy is a promising technology for renewable power generation with the
potential to meet a significant proportion of the world’s energy needs.
There are many alternatives available to directly harness the sun’s energy. Both Photovoltaic
and SWH are good methods to harness solar energy, but if we want to improve energy
conversion efficiency more, high concentration photovoltaic thermal system (HCPVT), as seen
in fig.1.3, would be the answer, which is a system that solar collectors designed to generate
4
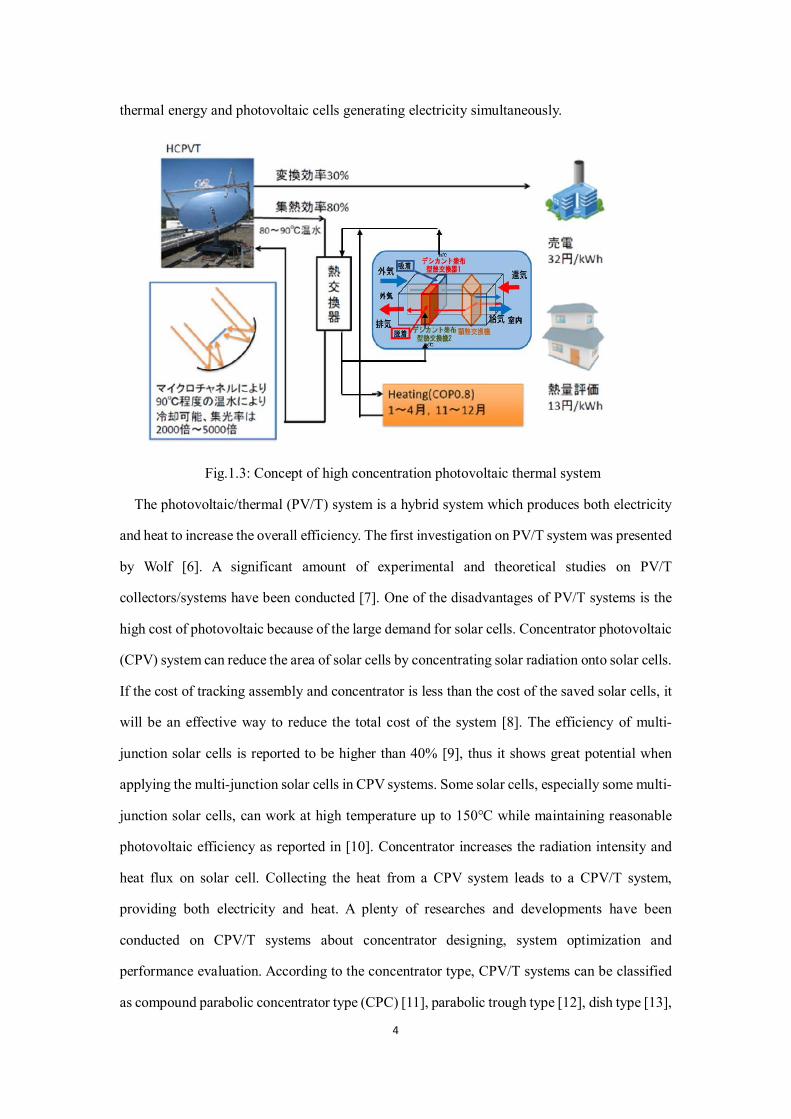
thermal energy and photovoltaic cells generating electricity simultaneously.
Fig.1.3: Concept of high concentration photovoltaic thermal system
The photovoltaic/thermal (PV/T) system is a hybrid system which produces both electricity
and heat to increase the overall efficiency. The first investigation on PV/T system was presented
by Wolf [6]. A significant amount of experimental and theoretical studies on PV/T
collectors/systems have been conducted [7]. One of the disadvantages of PV/T systems is the
high cost of photovoltaic because of the large demand for solar cells. Concentrator photovoltaic
(CPV) system can reduce the area of solar cells by concentrating solar radiation onto solar cells.
If the cost of tracking assembly and concentrator is less than the cost of the saved solar cells, it
will be an effective way to reduce the total cost of the system [8]. The efficiency of multi-
junction solar cells is reported to be higher than 40% [9], thus it shows great potential when
applying the multi-junction solar cells in CPV systems. Some solar cells, especially some multi-
junction solar cells, can work at high temperature up to 150℃ while maintaining reasonable
photovoltaic efficiency as reported in [10]. Concentrator increases the radiation intensity and
heat flux on solar cell. Collecting the heat from a CPV system leads to a CPV/T system,
providing both electricity and heat. A plenty of researches and developments have been
conducted on CPV/T systems about concentrator designing, system optimization and
performance evaluation. According to the concentrator type, CPV/T systems can be classified
as compound parabolic concentrator type (CPC) [11], parabolic trough type [12], dish type [13],
5
linear Fresnel type [14] and point-focus Fresnel type [15].
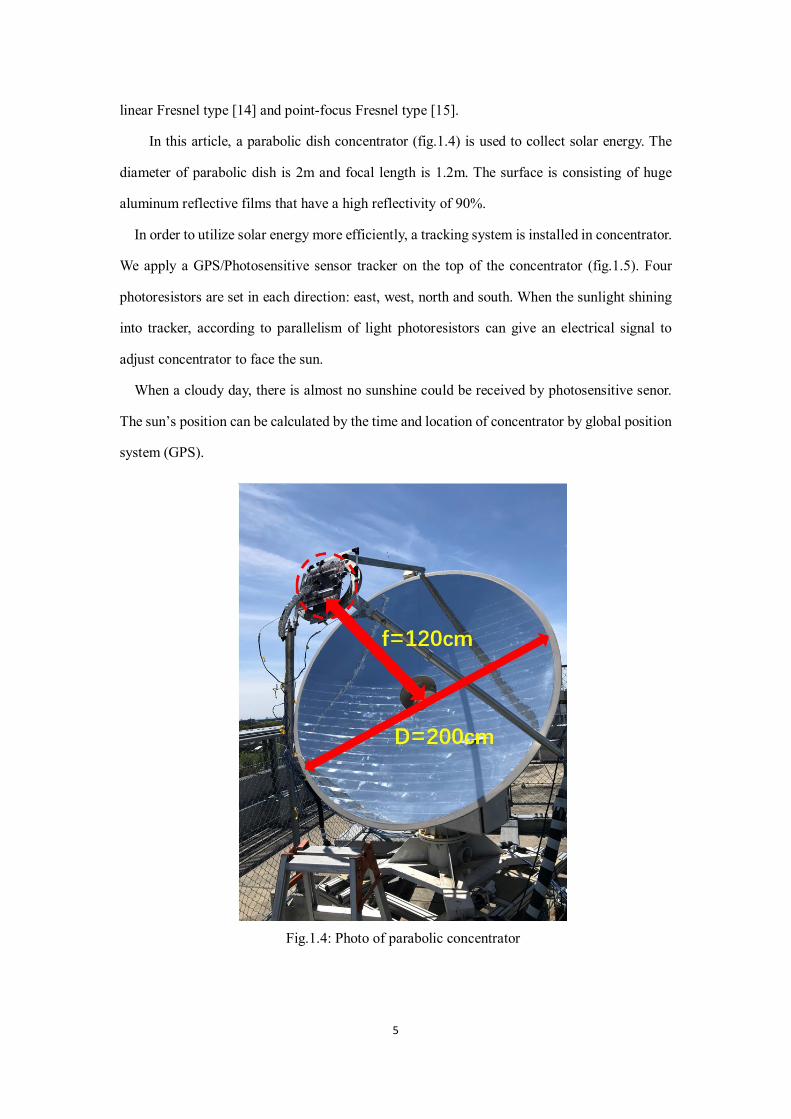
In this article, a parabolic dish concentrator (fig.1.4) is used to collect solar energy. The
diameter of parabolic dish is 2m and focal length is 1.2m. The surface is consisting of huge
aluminum reflective films that have a high reflectivity of 90%.
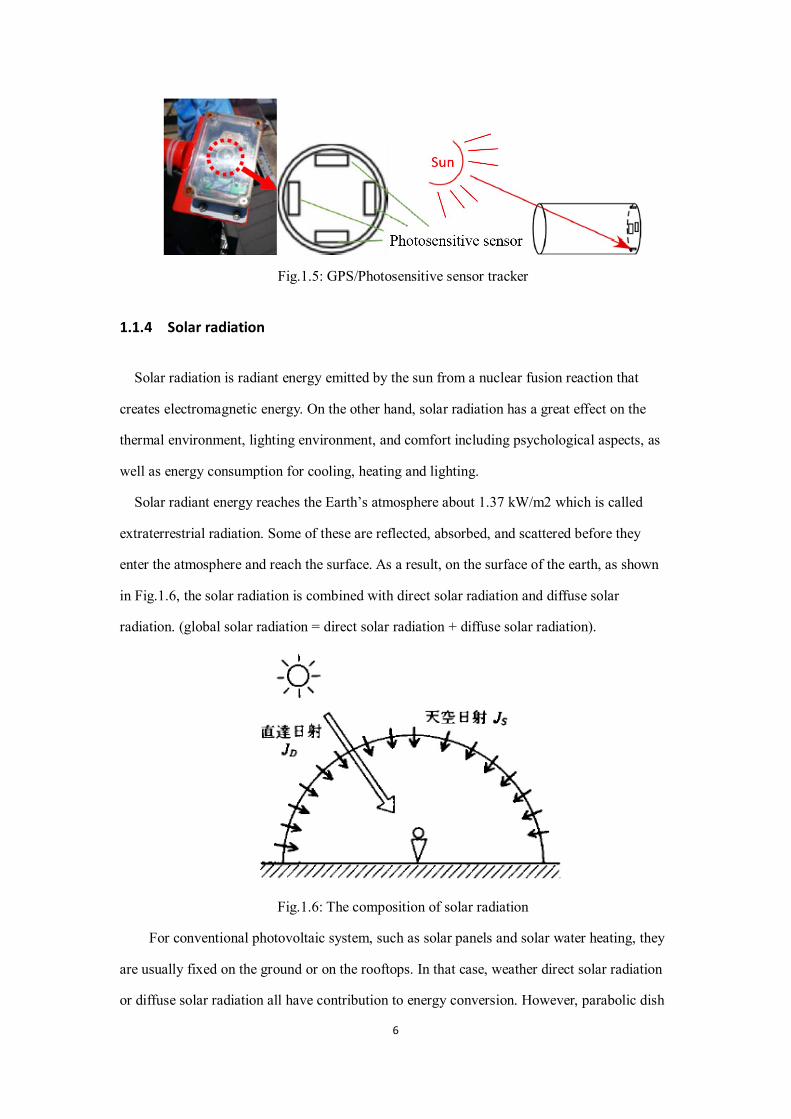
In order to utilize solar energy more efficiently, a tracking system is installed in concentrator.
We apply a GPS/Photosensitive sensor tracker on the top of the concentrator (fig.1.5). Four
photoresistors are set in each direction: east, west, north and south. When the sunlight shining
into tracker, according to parallelism of light photoresistors can give an electrical signal to
adjust concentrator to face the sun.
When a cloudy day, there is almost no sunshine could be received by photosensitive senor.
The sun’s position can be calculated by the time and location of concentrator by global position
system (GPS).
Fig.1.4: Photo of parabolic concentrator
6
Fig.1.5: GPS/Photosensitive sensor tracker
1.1.4 Solar radiation
Solar radiation is radiant energy emitted by the sun from a nuclear fusion reaction that
creates electromagnetic energy. On the other hand, solar radiation has a great effect on the
thermal environment, lighting environment, and comfort including psychological aspects, as
well as energy consumption for cooling, heating and lighting.
Solar radiant energy reaches the Earth’s atmosphere about 1.37 kW/m2 which is called
extraterrestrial radiation. Some of these are reflected, absorbed, and scattered before they
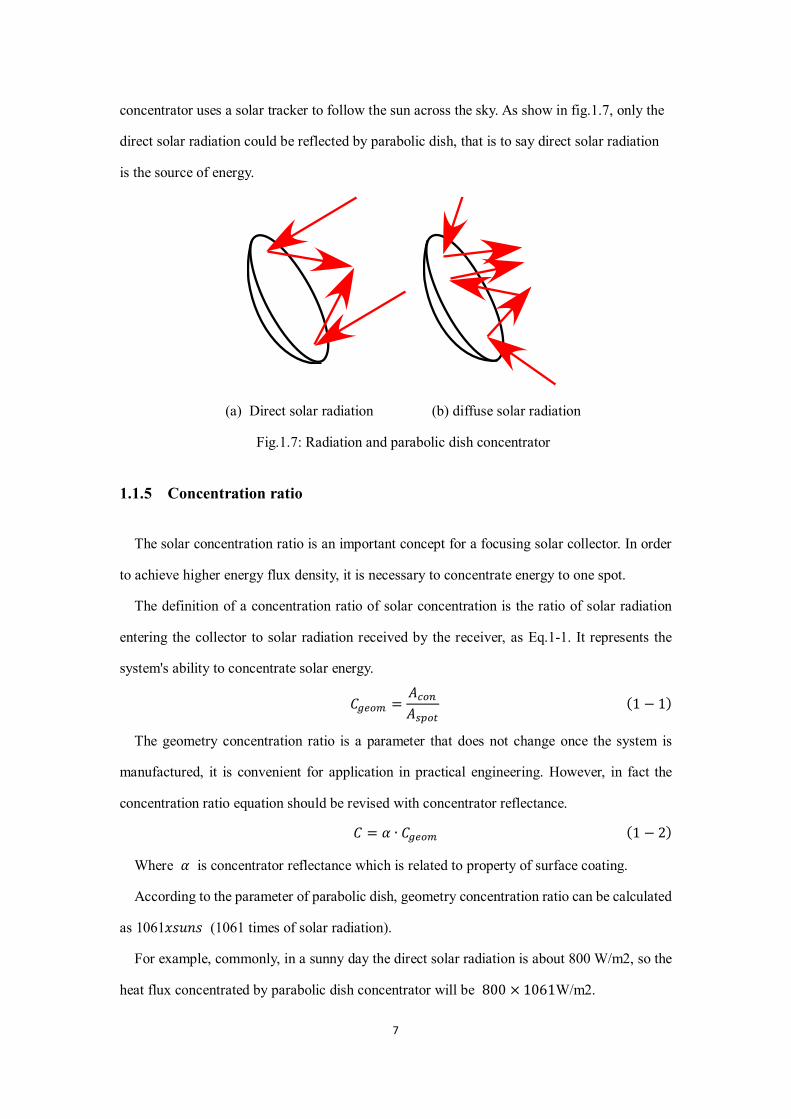
enter the atmosphere and reach the surface. As a result, on the surface of the earth, as shown
in Fig.1.6, the solar radiation is combined with direct solar radiation and diffuse solar
radiation. (global solar radiation = direct solar radiation + diffuse solar radiation).
Fig.1.6: The composition of solar radiation
For conventional photovoltaic system, such as solar panels and solar water heating, they
are usually fixed on the ground or on the rooftops. In that case, weather direct solar radiation
or diffuse solar radiation all have contribution to energy conversion. However, parabolic dish
7
concentrator uses a solar tracker to follow the sun across the sky. As show in fig.1.7, only the
direct solar radiation could be reflected by parabolic dish, that is to say direct solar radiation
is the source of energy.
(a) Direct solar radiation (b) diffuse solar radiation
Fig.1.7: Radiation and parabolic dish concentrator
1.1.5 Concentration ratio
The solar concentration ratio is an important concept for a focusing solar collector. In order
to achieve higher energy flux density, it is necessary to concentrate energy to one spot.
The definition of a concentration ratio of solar concentration is the ratio of solar radiation
entering the collector to solar radiation received by the receiver, as Eq.1-1. It represents the
system's ability to concentrate solar energy.
𝐶𝐶𝑔𝑔𝑔𝑔𝑔𝑔𝑔𝑔 =𝐴𝐴𝑐𝑐𝑔𝑔𝑐𝑐𝐴𝐴𝑠𝑠𝑠𝑠𝑔𝑔𝑠𝑠
(1 − 1)
The geometry concentration ratio is a parameter that does not change once the system is
manufactured, it is convenient for application in practical engineering. However, in fact the
concentration ratio equation should be revised with concentrator reflectance.
𝐶𝐶 = 𝛼𝛼 ∙ 𝐶𝐶𝑔𝑔𝑔𝑔𝑔𝑔𝑔𝑔 (1 − 2)
Where 𝛼𝛼 is concentrator reflectance which is related to property of surface coating.
According to the parameter of parabolic dish, geometry concentration ratio can be calculated
as 1061𝑥𝑥𝑥𝑥𝑥𝑥𝑥𝑥𝑥𝑥 (1061 times of solar radiation).
For example, commonly, in a sunny day the direct solar radiation is about 800 W/m2, so the
heat flux concentrated by parabolic dish concentrator will be 800 × 1061W/m2.
8
1.2. Cooling methods for concentration cell
1.2.1 Single-phase convective heat transfer
Single-phase cooling is a cooling method that uses a liquid refrigerant to exchange heat
without phase change. Compared to air cooling, it has the advantage of higher heat transfer
coefficient and silent. Since no phase change occurs, stable cooling is possible. However, since
the single-phase flow is cooled by sensible heat, the temperature of the fluid rises along the
flow direction, and a great temperature difference is generated on the cooling surface. In
addition, the single-phase cooling requires the pump to drive the refrigerant, and has a
disadvantage that the driving power is larger than the two-phase cooling.
1.2.2 Two-phase flow boiling heat transfer in micro-channel
Microchannel heat exchangers have the potential of achieving very high heat transfer rates
compared to conventional heat exchangers due to the very high surface area to volume ratio.
For example, Kang et al. [16] tested the performance of a cross flow microchannel heat
exchanger using de-ionized water. The core volume of this heat exchanger was 0.918 𝑐𝑐𝑐𝑐3 and
consisted of 26 stacked layers of silicon substrate with 125 channels etched on top of each layer
resulting in a total surface area to volume ratio of 15,294 𝑐𝑐2/𝑐𝑐3. They reported that the heat
transfer rate between the hot and cold fluid streams reached 5 kW at 4.5 l/min liquid flow rate,
2.47 bar pressure drop and 30 K mean temperature difference. In other words, this micro heat
exchanger achieved a volumetric heat transfer rate of 5.44 𝐺𝐺𝐺𝐺/𝑐𝑐3 at about 24W pumping
power. This value is huge compared to existing compact heat exchangers. For instance, using
the specifications published by a typical heat exchanger manufacturer, one can see that a
compact heat exchanger of 12 kW has overall dimensions of 1630 𝑐𝑐𝑐𝑐3, weights approximately
3 kg, has a surface area to volume ratio of 650 𝑐𝑐2/𝑐𝑐3 and a volumetric heat transfer rate of
approximately only 14 𝑀𝑀𝐺𝐺/𝑐𝑐3. This example demonstrates that the surface area to volume
ratio and the heat transfer rate per unit volume of microchannel heat exchangers are
significantly higher than that of typical compact heat exchangers.
Moreover, microchannel heat exchanger has another advantage in HCPVT system. When
9
using water as a working fluid, the outlet temperature of microchannel heat exchanger is over
100℃. This high exergy energy could be applied on other thermal applications such as,
adsorption chiller, desalination and etc. By two-phase flow cooling the usefulness of the thermal
energy extracted from the heat exchanger is much higher than space cooling or single-phase
flow cooling, so two-phase flow cooling can greatly improve overall system performance.
Based on that, more research was conducted in the last two decades towards investigating
flow boiling in microchannel heat exchangers with the objective of cooling high heat flux
systems, the parabolic dish concentrator is a great example of them. To cool down the solar cell
and recovery of low exergy energy, flow boiling heat transfer is the best answer.
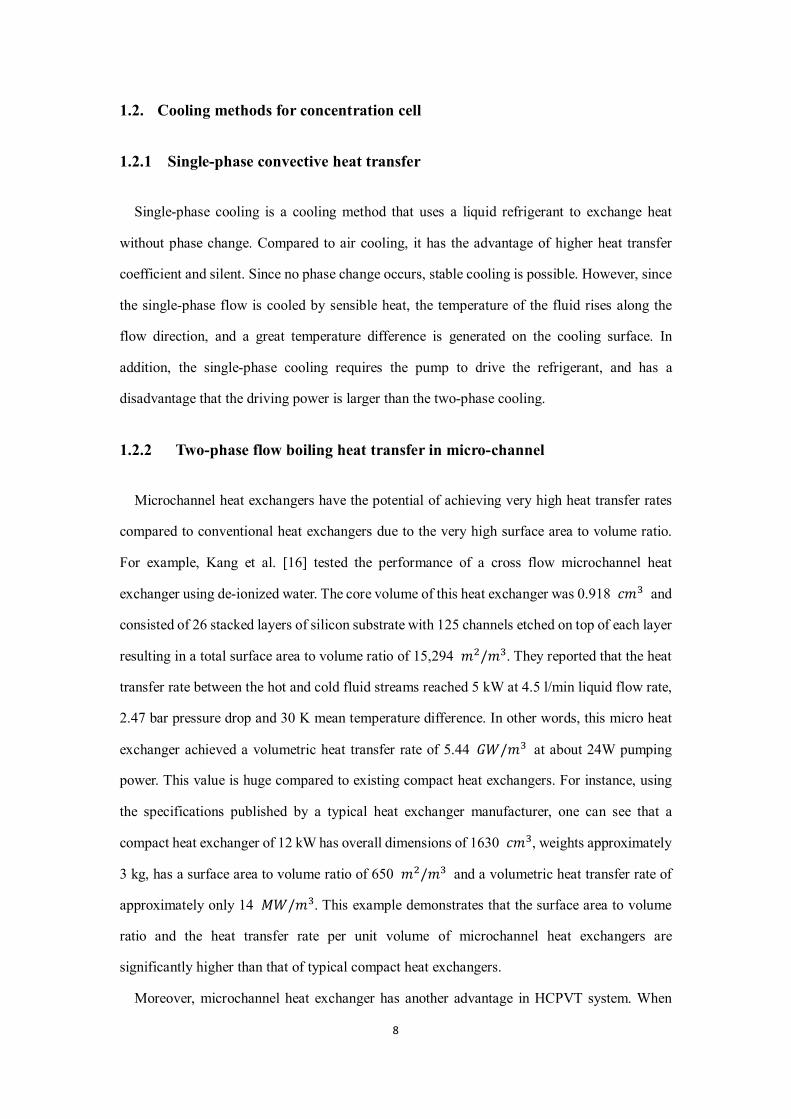
Fig.1.8: Comparison of effective heat transfer coefficient for different cooling technologies
The significant advantages of using flow boiling in these systems can be summarized as
follows:
(1) Flow boiling can achieve small variations in the surface temperature (almost uniform at
values slightly above the saturation temperature). This can improve the durability of the
electronic equipment significantly due to the reduction of the thermo-mechanical stresses
inside the chip. In this article, temperature of solar cell needs to be strictly controlled
below 150 degrees or the cell would be burned. So, it is very approbative to utilize flow
boiling heat transfer in the HCPVT system.
10
(2) The capability of achieving very high heat transfer rates at small liquid flowrates
compared to single phase cooling. This means that a small liquid pump is required
resulting in a very compact cooling system.
(3) Two-phase flow cooling has a great capability of heat transfer performance, which means
the temperature difference of flow and wall will be very small and it is possible to create
a safe working condition for triple-junction solar cell.
(4) Because of the high exergy flow generated by micro-channel heat exchanger. Two-phase
flow heat transfer can elevate the overall system energy conversion efficient.
When the nucleate boiling becomes the dominant heat transfer mechanism in micro-channels,
another two advantages may be added.
The first one is the increase of the heat transfer coefficient with increasing heat flux in
nucleate boiling. This will result in very small variations in the chip temperature when the heat
dissipation rate varies (increase/decrease). For example, for flow boiling of R-134a in a 1 mm
diameter tube when the heat flux was increased from 13 𝑘𝑘𝐺𝐺/𝑐𝑐2 to 25 𝑘𝑘𝐺𝐺/𝑐𝑐2, the heat
transfer coefficient increased from 6000 𝐺𝐺/𝑐𝑐 2𝐾𝐾 to 8000 𝐺𝐺/𝑐𝑐 2𝐾𝐾, see Mahmoud et al.
[17]. Based on these values at 8 bar system pressure (𝑇𝑇𝑥𝑥𝑇𝑇𝑇𝑇 = 31.3℃), the surface temperature
increases only by 3% for this 12 𝑘𝑘𝐺𝐺/𝑐𝑐2 increase in heat flux. In contrast, if single phase
liquid cooling was used, the surface temperature increases by about 60%. The significant
variations in chip temperature in single phase flow when the heat dissipation rate varies may
affect the lifetime of the electronic equipment. The second advantage of nucleate boiling is the
independence of the heat transfer coefficient on mass flux. This makes it possible to use a fixed
speed pump, i.e. no need for a speed controller, which will result in a simpler and more reliable
cooling system at a reduced cost.
The design of such two-phase flow micro-channel heat sink involves an understanding of
flow regimes, pressure drop, flow instabilities and heat transfer coefficient.
1.3. Flow regime
Single-phase flow is classified into laminar flow and turbulent flow, and their heat transfer
characteristics are different. The flow regime of two-phase flow is complicated, and shows
different flow characteristics and heat transfer coefficient on each flow regime. In that way, the

11
research of the flow regime is necessary.
Although there are still arguments on the classification of the flow patterns, most researchers
agreed to categorize their observations into four main flow patterns: stratified flow, intermittent
flow, annular flow and bubble flow. Each main class could be subdivided into subclasses.
Taitel [18] and Barnea [19] defined five typical flow patterns in their vertical upward flow
pattern map, i.e. dispersed bubble, bubbly, slug, churn and annular.
These are as follows (Fig.1.9):
Dispersed bubble: numerous small bubbles float in a continuous liquid phase.
Bubbly: bubble size is comparable to but not as large as the tube diameter.
Slug: bubbles develop into bullet shape due to the tube wall restriction. Sometimes the bullet
bubbles are followed by a stream of small bubbles creating a trail.
Churn: bullet bubbles start to distort and small bubbles in liquid slug coalesce into gas clump
with increase of gas velocity. It is a highly oscillatory flow with chaotic interface.
Annular: gas phase becomes a continuous flow in the core of the tube.
Mist: liquid film is blown away from tube wall and numerous liquid droplets float in high-
speed
vapor flow.
Fig.1.9: Flow patterns observed in 4.26 mm internal diameter tube at 10 bar
Actually, flow pattern is closely related to local heat transfer coefficient because vapor
quality in each flow pattern is different from others and vapor quality has influence on the
formation of boundary layer. So, it is essential to figure out the relationship between flow
12
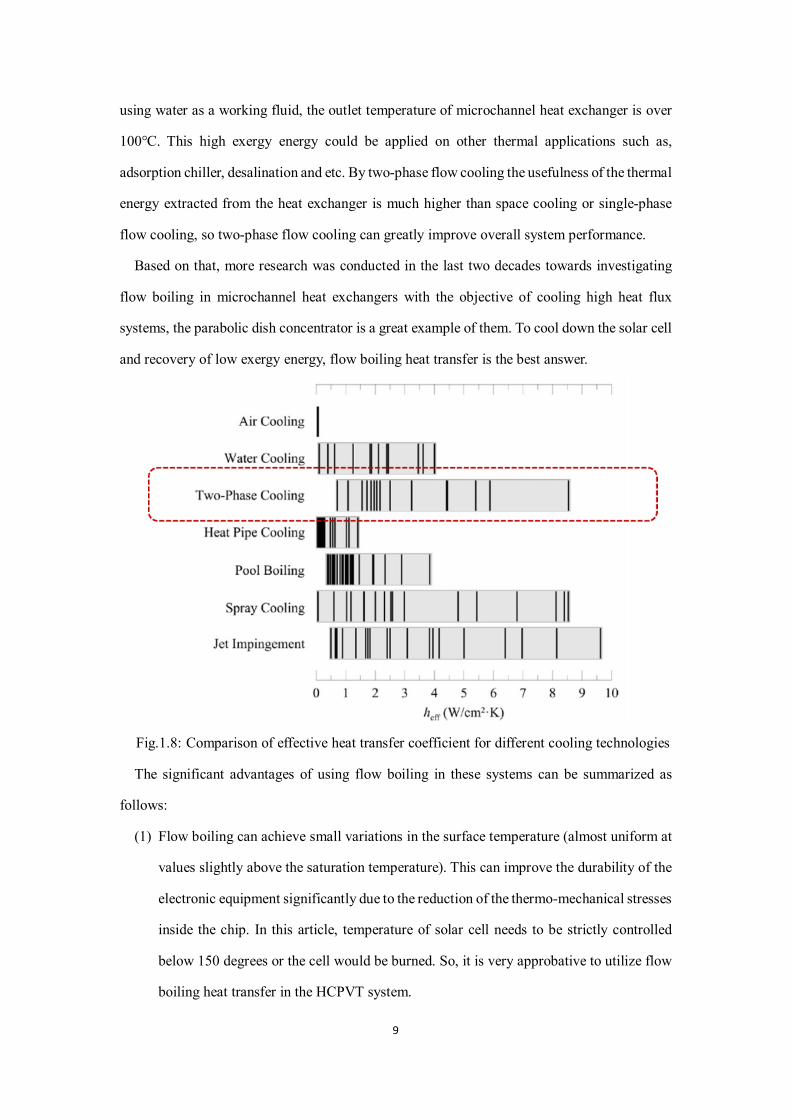
pattern (vapor quality) and heat transfer coefficient.
Fig. 1.10. Schematic drawing for the different mechanisms in flow boiling in small to
micro diameter channels.
Thome [20] compared the experimental data of recent microchannels with the heat transfer
model and summarized the mechanism of flow boiling heat transfer in the microchannel in
terms of the two-phase flow pattern and the flow boiling heat transfer mechanism. In the low
vapor quality region of the microchannel, nucleate boiling is the main heat transfer mechanism,
and in the high vapor quality region, the nucleate boiling is suppressed and the liquid film
evaporation is the main heat transfer mechanism. Saturation pressure, heat flux, mass velocity
and quality have a great influence on heat transfer. In particular, in the low mass velocity region
of less than 100 𝑘𝑘𝑘𝑘/𝑐𝑐2𝑥𝑥, inertia force, surface tension, and shear force in the pipe is different
from that in the high mass velocity region, so the flow pattern also differs. In a word, flow
regime has a close relationship with local heat transfer coefficient in micro-channels, and from
the flow regime, it is possible to judge whether there is a stable boiling heat transfer occurred
in micro-channel or not.
1.4. Two-phase flow pressure drop
Two-phase flow pressure drop has been one of the most formidable issues since the 1940's.
To predict two-phase flow pressure drop is very necessary. In a two-phase flow system, the
pressure drop determines required pump drive power, so if the pressure drop can be predicted
correctly, it will lead to an improvement of effective use of energy and a simplified design. The
pressure loss of a two-phase flow consists of the gravity term, friction pressure drop and
acceleration pressure drop. Usually in a microchannel, the static pressure drop is extremely
small. Friction is affected by the shear force at the gas-liquid interface and by the turbulence
13
caused by the motion of the gas phase or bubbles. When the mass flow is low, these effects
become significant. Acceleration drop is based on the momentum difference between the inlet
and the outlet of the pipe, the proportion of acceleration pressure drop in the pipe is generally
small. However, when under a high heat flux working condition, it is on the same order as
friction pressure drop. [21]
Lockhart and Martinelli separated flow model [22] is able to calculate pressure drop when
under a high heat flux and it is the most common way to calculate two-phase flow pressure drop
based on a two-phase multiplier for the liquid-phase, or the vapor-phase, respectively.
The two-phase pressure drops for flows inside tubes are the sum of three contributions: the
static pressure drop 𝛥𝛥𝑃𝑃𝑠𝑠𝑠𝑠𝑠𝑠𝑠𝑠𝑠𝑠𝑐𝑐, the acceleration pressure drop 𝛥𝛥𝑃𝑃𝑠𝑠𝑐𝑐𝑐𝑐 and the frictional pressure
drop 𝛥𝛥𝑃𝑃𝑓𝑓 as:
𝛥𝛥𝑃𝑃𝑠𝑠𝑔𝑔𝑠𝑠𝑠𝑠𝑡𝑡 = 𝛥𝛥𝑃𝑃𝑠𝑠𝑠𝑠𝑠𝑠𝑠𝑠𝑠𝑠𝑐𝑐 + 𝛥𝛥𝑃𝑃𝑠𝑠𝑐𝑐𝑐𝑐 + 𝛥𝛥𝑃𝑃𝑓𝑓 (1 − 3)
The static pressure drop is given by:
𝛥𝛥𝑃𝑃𝑠𝑠𝑠𝑠𝑠𝑠𝑠𝑠𝑠𝑠𝑐𝑐 = 𝜌𝜌𝑠𝑠𝑠𝑠𝑘𝑘𝑔𝑔 sin𝜃𝜃 (1 − 4)
Where 𝜃𝜃 is the angle of inclination, average density of two-phase flow 𝜌𝜌𝑠𝑠𝑠𝑠 is obtained
from:
𝜌𝜌𝑠𝑠𝑠𝑠 = 𝜌𝜌𝑡𝑡(1− 𝛼𝛼) + 𝜌𝜌𝑔𝑔𝛼𝛼 (1 − 5)
The void fraction α is given by:
𝛼𝛼 = �1 + �1− 𝑥𝑥𝑥𝑥
��𝜌𝜌𝑣𝑣𝜌𝜌𝐿𝐿�23�
−1
(1 − 6)
Where 𝑥𝑥 is vapor quality.
The acceleration pressure drop reflects the change in kinetic energy of the flow and is given
by:
∆𝑃𝑃acc =𝐺𝐺2
𝜌𝜌𝐿𝐿�𝑥𝑥out2
𝛼𝛼out�𝜌𝜌L𝜌𝜌v�+
(1− 𝑥𝑥out)2
1− 𝛼𝛼out− 1� (1 − 7)
The friction pressure drop is given by:
∆𝑃𝑃f =2𝐺𝐺2𝐿𝐿tp𝑑𝑑h𝑥𝑥out
�𝑓𝑓r(1 − 𝑥𝑥)𝜙𝜙L2
𝜌𝜌𝑡𝑡d𝑥𝑥
𝑥𝑥out
𝑥𝑥in(1 − 8)
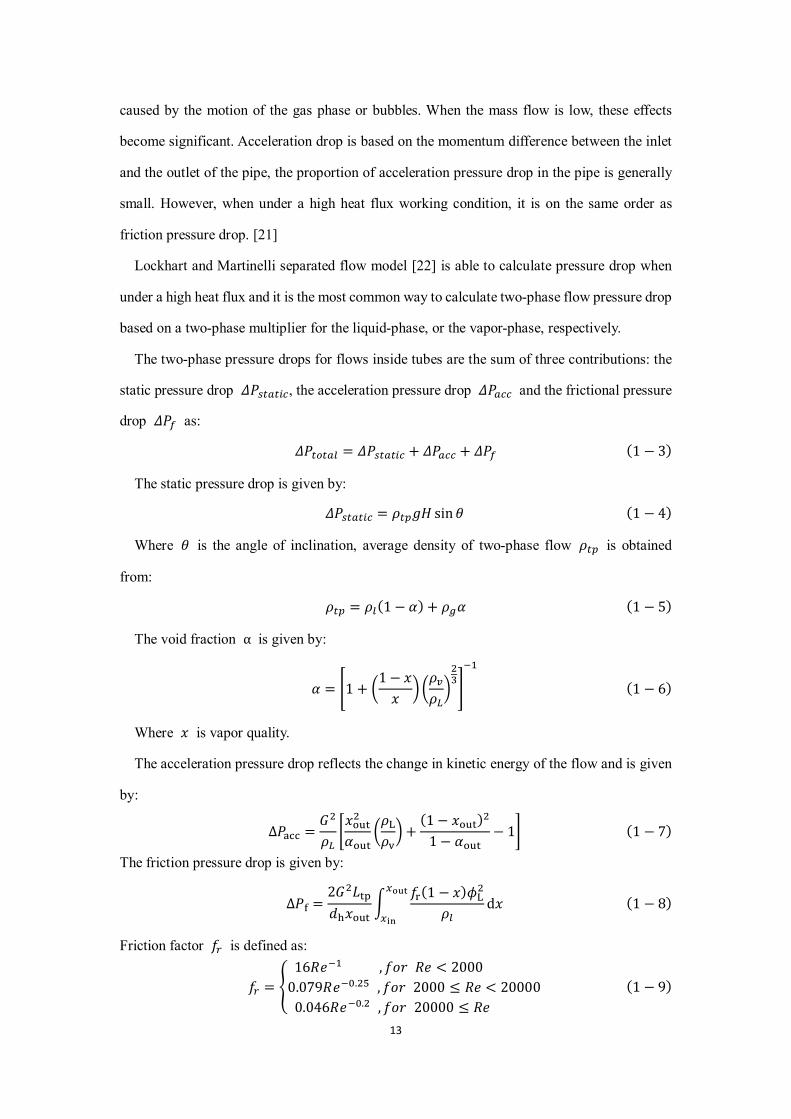
Friction factor 𝑓𝑓𝑟𝑟 is defined as:
𝑓𝑓𝑟𝑟 = �16𝑅𝑅𝑒𝑒−1 ,𝑓𝑓𝑓𝑓𝑓𝑓 𝑅𝑅𝑒𝑒 < 2000
0.079𝑅𝑅𝑒𝑒−0.25 ,𝑓𝑓𝑓𝑓𝑓𝑓 2000 ≤ 𝑅𝑅𝑒𝑒 < 200000.046𝑅𝑅𝑒𝑒−0.2 ,𝑓𝑓𝑓𝑓𝑓𝑓 20000 ≤ 𝑅𝑅𝑒𝑒
(1 − 9)
14
Φ𝐿𝐿2 is defined as:
Φ𝐿𝐿2 = 1 +
𝐶𝐶𝑋𝑋
+1𝑋𝑋2
(1− 10)
where 𝑋𝑋 is the Martinelli parameter defined as:
𝑋𝑋2 = ��𝑑𝑑𝑃𝑃𝑑𝑑𝑑𝑑�𝐿𝐿�𝑑𝑑𝑃𝑃𝑑𝑑𝑑𝑑�𝑣𝑣
� (1− 11)
Where 𝑑𝑑h is hydraulic diameter, 𝐺𝐺 is mass velocity.
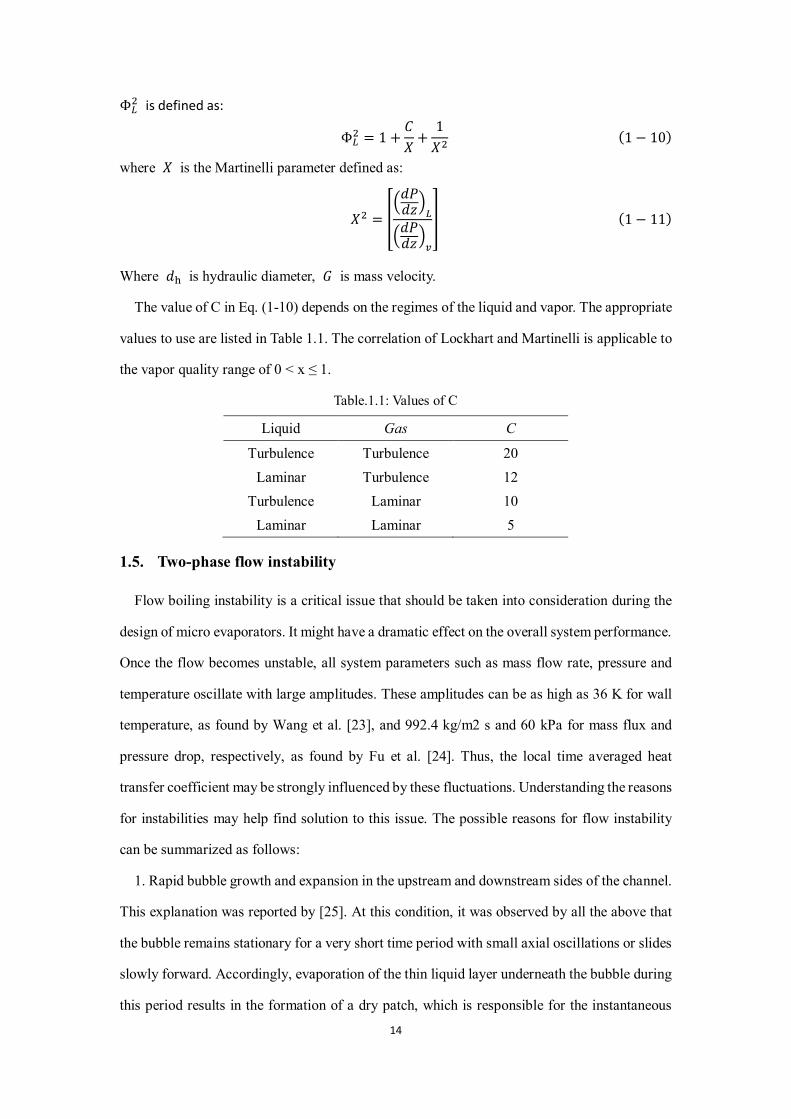
The value of C in Eq. (1-10) depends on the regimes of the liquid and vapor. The appropriate
values to use are listed in Table 1.1. The correlation of Lockhart and Martinelli is applicable to
the vapor quality range of 0 < x ≤ 1.
Table.1.1: Values of C
Liquid Gas C
Turbulence Turbulence 20 Laminar Turbulence 12
Turbulence Laminar 10 Laminar Laminar 5
1.5. Two-phase flow instability
Flow boiling instability is a critical issue that should be taken into consideration during the
design of micro evaporators. It might have a dramatic effect on the overall system performance.
Once the flow becomes unstable, all system parameters such as mass flow rate, pressure and
temperature oscillate with large amplitudes. These amplitudes can be as high as 36 K for wall
temperature, as found by Wang et al. [23], and 992.4 kg/m2 s and 60 kPa for mass flux and
pressure drop, respectively, as found by Fu et al. [24]. Thus, the local time averaged heat
transfer coefficient may be strongly influenced by these fluctuations. Understanding the reasons
for instabilities may help find solution to this issue. The possible reasons for flow instability
can be summarized as follows:
1. Rapid bubble growth and expansion in the upstream and downstream sides of the channel.
This explanation was reported by [25]. At this condition, it was observed by all the above that
the bubble remains stationary for a very short time period with small axial oscillations or slides
slowly forward. Accordingly, evaporation of the thin liquid layer underneath the bubble during
this period results in the formation of a dry patch, which is responsible for the instantaneous
15
jump in the wall temperature. When the bubble departs and moves away from the nucleation
site, fresh liquid wets the surface and the wall temperature drops again.
2. Size of outlet section – single channel. This reason was proposed by Qi et al. [26] who
investigated flow boiling of liquid nitrogen in four cold drawn stainless-steel tubes having
diameters of 0.531, 0.834, 1.042 and 1.931 mm. The test sections were connected between two
plenums with diameters larger than the test section diameter, i.e. inlet and outlet restrictions.
They attributed the instability observed in their experiment to the effect of the outlet restriction
(outlet plenum) and they explained it as follows: after boiling incipience, small bubbles move
downstream and enter the outlet plenum, where their velocity decreases due to the sudden area
enlargement. As a result, more bubbles accumulate inside the plenum, resulting in the formation
of a large vapor patch, which can cause a temporary blockage. This blockage leads to a sharp
decrease in mass flux, which in turn results in an increase in the wall temperature and vapor
quality. The sudden increase in vapor quality, due to the reduction in mass flow rate, results in
a sudden peak in pressure drop. Once the vapor patch passes through the outlet restriction, fresh
liquid enters the tube and the mass flux increases again, improving the heat transfer process and
reducing wall temperature.
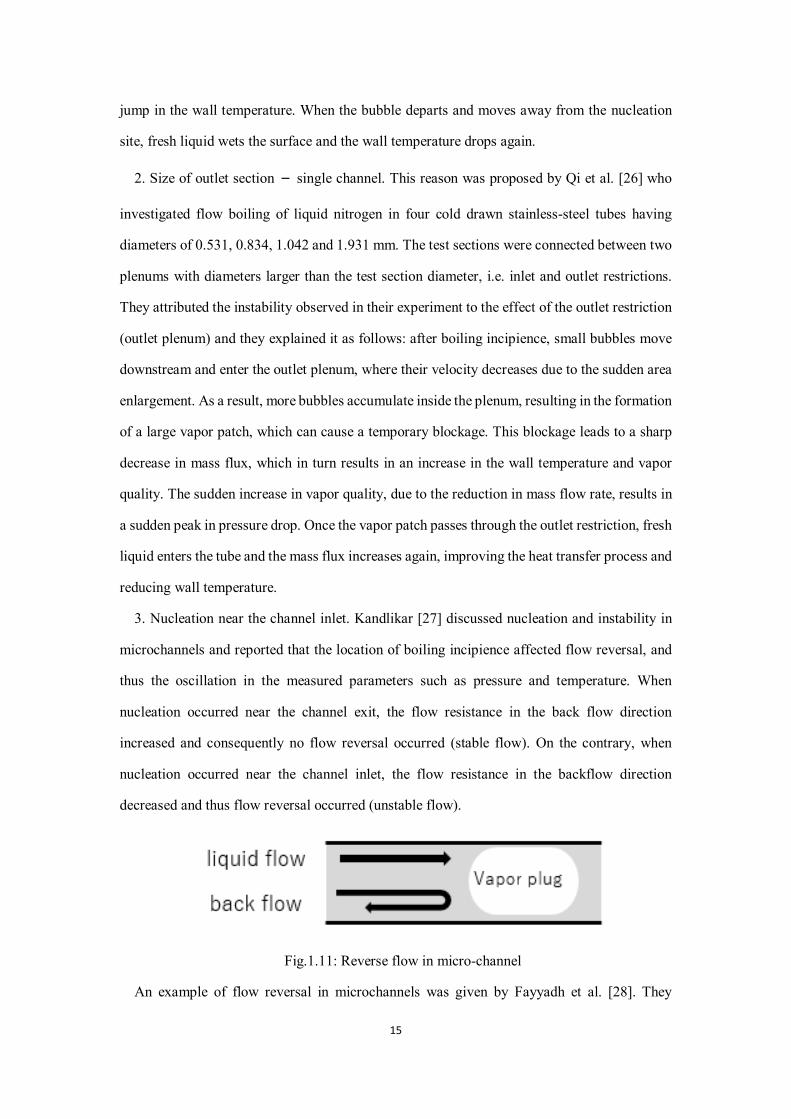
3. Nucleation near the channel inlet. Kandlikar [27] discussed nucleation and instability in
microchannels and reported that the location of boiling incipience affected flow reversal, and
thus the oscillation in the measured parameters such as pressure and temperature. When
nucleation occurred near the channel exit, the flow resistance in the back flow direction
increased and consequently no flow reversal occurred (stable flow). On the contrary, when
nucleation occurred near the channel inlet, the flow resistance in the backflow direction
decreased and thus flow reversal occurred (unstable flow).
Fig.1.11: Reverse flow in micro-channel
An example of flow reversal in microchannels was given by Fayyadh et al. [28]. They
16
investigated flow boiling of R134a in a copper, multi-microchannel evaporator having a 0.3
mm channel width, a 0.7 mm channel height, a 0.2 mm fin thickness and a 20 mm channel
length. The channels were cut on the top of a copper block, while the manifold and plenum
were cut in the polycarbonate housing block. The fluid entered the channels through a deep
plenum and a manifold with a convergent cross-sectional area and the same depth as the channel.
It left the channel through a manifold with a divergent cross section area into a deep outlet
plenum. The mass flux ranged from 50 to 300 kg/m2 s. It was found that, for G = 50 kg/m2 s,
flow reversal occurred at boiling incipience and continued for all heat fluxes. Fig. 11 shows the
sequence of pictures for flow reversal occurring at boiling incipience for P = 6.5 bar and G =
50 kg/m2 s. It is obvious from the pictures that the vapor patch stays for about 210 ms in the
inlet manifold, with back and forth motion, before its rupture into segmented bubbles that
moved downstream. As the mass flux increased, the heat flux at which flow reversal occurred
increased. Very mild flow reversal was observed in the inlet manifold at a base heat flux of 149
kW/m2 for G = 300 kg/m2 s, where the vapor patch stayed only for about 10 ms in the inlet
manifold.
1.6. Calculation of heat transfer coefficient of micro-channel
With advance of state-of-the-art micro-scale technologies and demands for more high
cooling efficiency in such practical applications as the cooling of diverters of fusion reactors,
high performance electronic chips, compact heat exchangers and other heat transfer devices,
research work on heat transfer coefficient of micro-channels has never stopped.
Some common correlations for predicting saturated flow boiling heat transfer coefficients in
conventional channels will be reviewed briefly. As well known, flow boiling heat transfer is
governed mainly by two important mechanisms: nucleate boiling and forced convection. So far
it is not well understood yet how these two mechanisms are superimposed in the flow boiling
field. Three kinds of models exist in the literature, one by Chen [29], using addition of two
components corresponding to the two mechanisms with a suppression factor and a Reynolds
number factor, one by Shah [30], selecting the greater one of the two components with the use
of the boiling number Bo and the convective number Co, and another one by Kutateladze [31],
combining two components by a power-type asymptotic model. A number of flow boiling
17
correlations published in the last three decades are only variations of these models.
To make a simple prediction before the experiment, here we choose Chen’s model for
calculation.
By using the additive concept in principle, Chen [29] formulated the first general correlation
for flow boiling heat transfer as
ℎ𝑠𝑠𝑠𝑠 = 𝑆𝑆 ∙ ℎ𝑐𝑐𝑛𝑛 + 𝐹𝐹 ∙ ℎ𝑠𝑠𝑠𝑠 (1− 12)
Where,
for 1/𝑋𝑋𝑠𝑠𝑠𝑠 > 0.1, 𝐹𝐹 = 2.35( 1𝑋𝑋𝑡𝑡𝑡𝑡
+ 0.213)0.736,
for 1/𝑋𝑋𝑠𝑠𝑠𝑠 ≤ 0.1, 𝐹𝐹 = 1,
𝑋𝑋𝑠𝑠𝑠𝑠 = �1−𝑥𝑥𝑥𝑥�0.9
(𝜌𝜌𝑔𝑔𝜌𝜌𝑓𝑓
)0.5(𝜇𝜇𝑓𝑓𝜇𝜇𝑔𝑔
)0.1,
ℎ𝑠𝑠𝑠𝑠 = 0.023𝑅𝑅𝑒𝑒𝑓𝑓0.8𝑃𝑃𝑓𝑓0.4(𝑘𝑘𝑓𝑓𝐷𝐷ℎ
),
𝑆𝑆 = 1/(1 + 2.53 × 10⁻⁶𝑅𝑅𝑒𝑒𝑓𝑓1.17),
ℎ𝑐𝑐𝑛𝑛 = 0.00122(𝑘𝑘𝑓𝑓0.79𝑐𝑐𝑝𝑝𝑓𝑓
0.45𝜌𝜌𝑓𝑓0.49
𝜎𝜎0.5𝜇𝜇𝑓𝑓0.29ℎ𝑓𝑓𝑔𝑔
0.24𝜌𝜌𝑔𝑔0.24)∆𝑇𝑇𝑠𝑠𝑠𝑠𝑠𝑠0.24∆𝑃𝑃𝑠𝑠𝑠𝑠𝑠𝑠0.75,
Here Chen introduced two dimensionless factors, the suppression factor S and the Reynolds
number factor F, to account for the smaller effective superheat due to forced convection as
compared to that in a pool boiling case, and for the increase in convective turbulence due to the
presence of vapor phase, respectively.
1.7. Conventional research in our laboratory
Nakamura et al. [32] (2014) reported that when compared to conventional solar systems
HCPVT system is a system with superior economics in terms of energy collection power,
energy conversion efficiency and introduction cost. In addition, a concentrator was designed
that could collect sunlight sufficiently at wind speeds of up to 20 𝑐𝑐/𝑥𝑥 and could withstand
wind speeds up to 40 𝑐𝑐/𝑥𝑥. Hara et al. [22] (2016) reported that a three-junction solar cell is
very suitable for concentrating photovoltaic system. When concentration ratio up to 200 𝑥𝑥𝑥𝑥𝑥𝑥𝑥𝑥𝑥𝑥,
the photovoltaic energy conversion is an average of 25.6%. Besides, a micro-channel cooler
was attached to the concentrator, and its heat recovery performance was evaluated. Heat
recovery efficiency of 53.2% at maximum and 34.7% on average was obtained, and the
possibility of simultaneous use of sunlight and heat was shown in experiments, and it was stated
18
that some contrivance was needed to improve system performance. Zheng et al. [24] (2017)
conducted a boiling heat transfer experiment at a heat flux of 11.9 to 46.8 𝐺𝐺/𝑐𝑐𝑐𝑐2 using a flat
tube heat exchanger with a hydraulic diameter of 0.847 mm. It was reported that flow instability
appeared when heat flux exceeded 46.8 𝐺𝐺/𝑐𝑐𝑐𝑐2,that is to say heat sink could not work under
that situation. Hamada et al. [25] (2018) reported that there were some flaws in the parabolic
dish concentrator composed of mirror. Some of the parts had low reflectivity or even could not
reflect the sunlight.
1.8. Objective of study
High concentration photovoltaic system is complicated that mixed a lot of disciplines
including electronics, heat transfer, solar energy technology, geography and etc.
In order to realize the co-generation of HCPVT system, from the perspective of heat transfer,
this study is dedicated to figure out an appropriate way to cool the solar cell while concentrating.
Thus, the parameters concerned with thermal characteristics are discussed in this article. The
detailed objectives are as follows.
1. Experiment on the heat transfer coefficient with a high heat flux.
2. Suppress the flow boiling instability in two-phase flow.
3. Figure out the effect of gravity/orientation on the micro-channel exchanger.
4. Apply the solar cell on the heat exchanger and realize co-generation of HCPVT system.
19
Chapter 2 Experiment on thermal characteristics of radial expanding
micro-channel heat exchanger
2.1 Previous work
HCPVT system is a hybrid system which extends the functionality of concentrating
photovoltaics (CPV) from simply generating electricity, to providing simultaneously electricity
and heat. The utilization of otherwise wasted heat significantly enhances the overall system
efficiency and boosts the economic value of the generated power output. An ideal system should
consist of a scalable hybrid photovoltaic–thermal receiver package, cooled with an integrated
high performance microchannel heat sink.
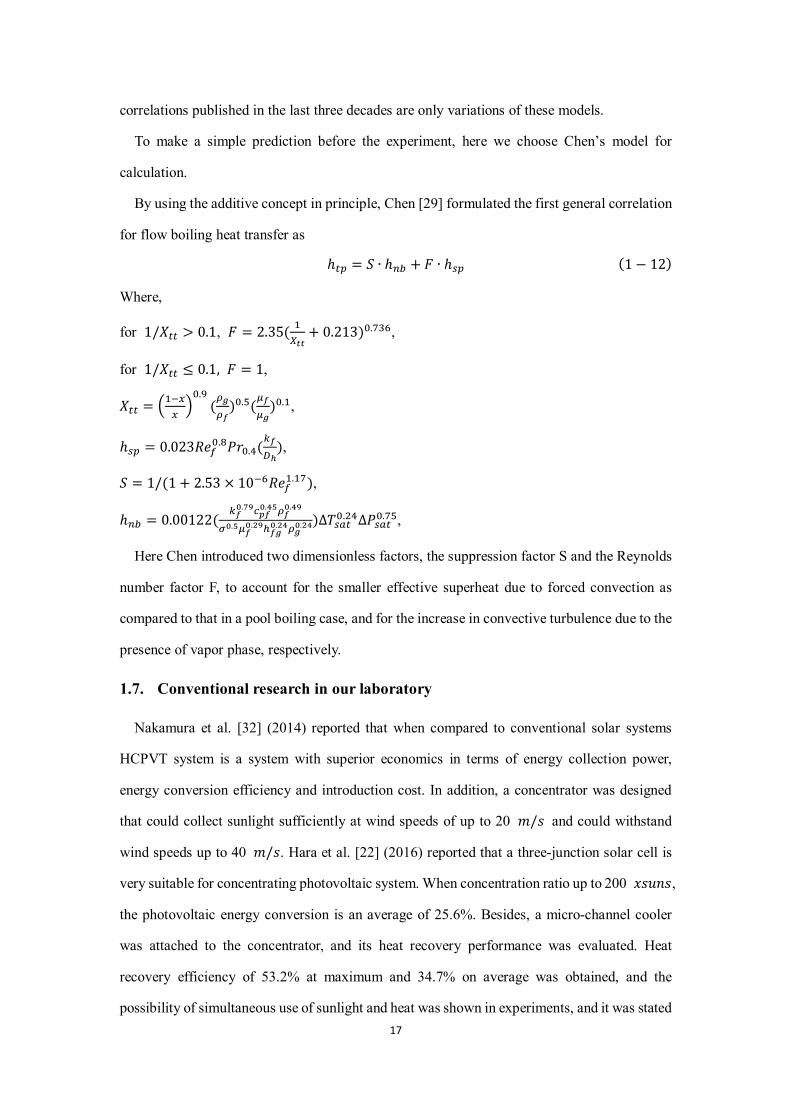
Actually, the experiment of HCPVT system has been operated for several months, an
experimental loop, as shown in fig.2.1, has been established. The receiver package was
mounted on an outdoor (on the rooftop of the environment building) active-tracking system.
The sunlight was concentrated on the receiver with a diameter of 2 m, focal length of 1.2m
parabolic dish concentrator having a concentration ratio of approximately 1000. The parabolic
dish was located on a two-stage tracker to pursuit the movement of the sun enabling consistent
measurements for an extended time period. As seen in fig2.2, The direct solar radiation was
recorded by a pyranometer fixed on the concentrator and global radiation was measured by a
pyranometer on the top of building.
Fig.2.1: Scheme of the parabolic dish concentrator and the experimental outdoor test facility
20
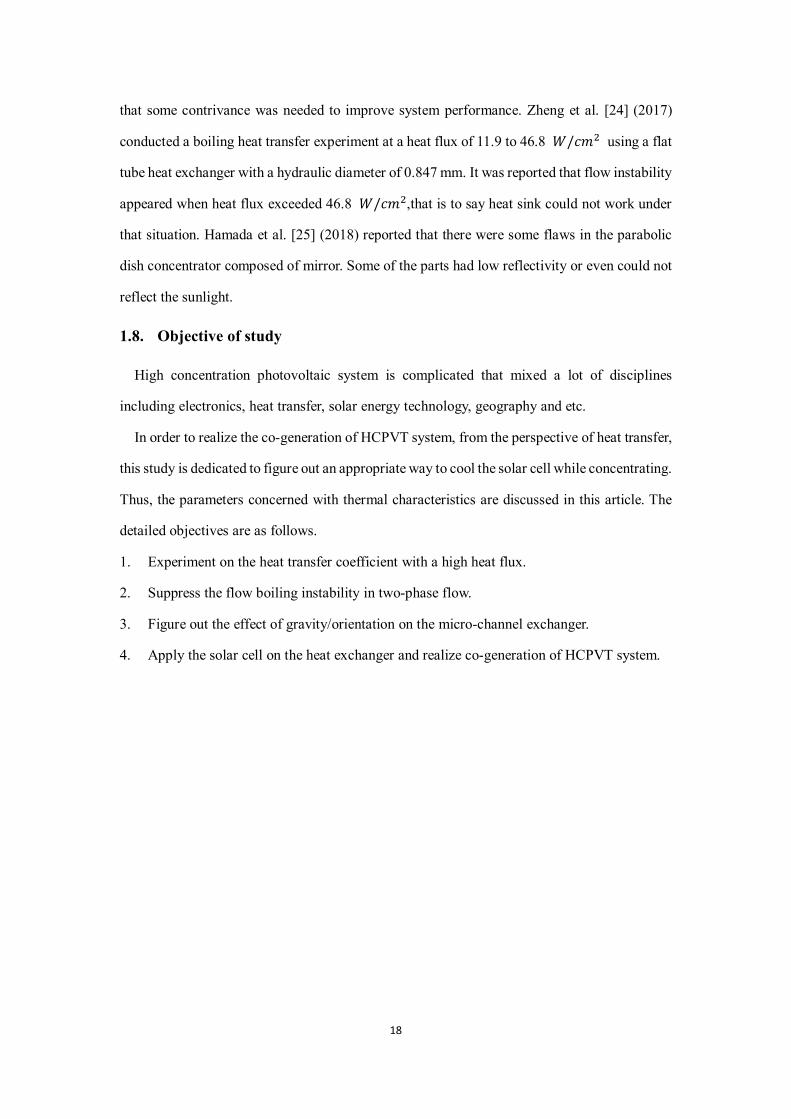
Fig.2.2: Pyranometer for recording solar radiation
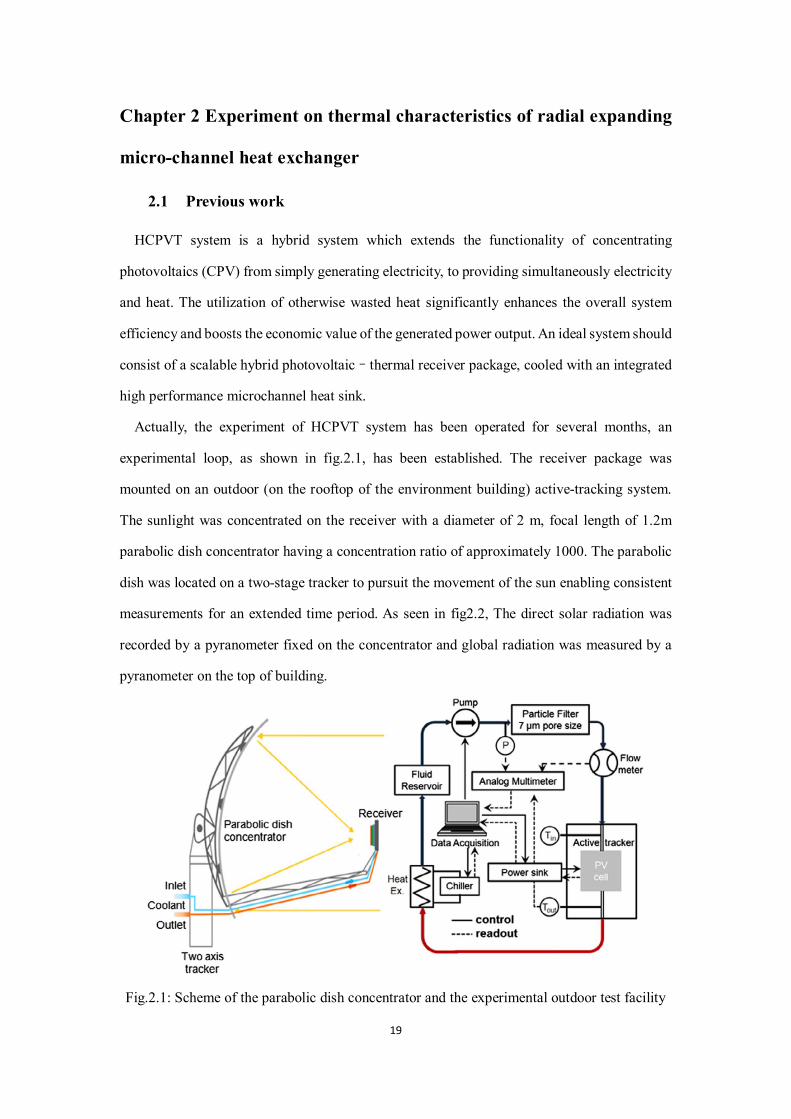
A micro-channel heat sink was used in the HCPVT system and single-phase flow convection
heat transfer was utilized to cool the solar cell. Fig.2.3 is the solar radiation and inlet/outlet
temperature as a function of time. The testing was from 12:00 at noon and last 4 hours till the
16:00, the solar radiation is linear to the time, that is to say the testing condition is stable and
reliable. Keeping the inlet temperature in about 36℃ is to realize a stable flow convection
condition.
Fig.2.3: Fluid temperature and solar radiation
0.00
100.00
200.00
300.00
400.00
500.00
600.00
700.00
800.00
900.00
1000.00
0.00
10.00
20.00
30.00
40.00
50.00
60.00
70.00
80.00
155
010
9916
4821
9727
4632
9538
4443
9349
4254
9160
4065
8971
3876
8782
3687
8593
3498
8310
432
1098
111
530
1207
912
628
1317
713
726
1427
514
824
1537
315
922
入口温度、出口温度と直達日射
直達日射 入口温度 出口温度
21
To predict the thermal characteristics, the conventional convection flow heat transfer
coefficient is calculated by,
t𝑓𝑓 =𝑇𝑇𝑠𝑠𝑐𝑐 + 𝑇𝑇𝑔𝑔𝑜𝑜𝑠𝑠
2(2 − 1)
𝑥𝑥 =𝑄𝑄𝐴𝐴
(2 − 2)
Re =𝑥𝑥𝑑𝑑𝑉𝑉𝑓𝑓
(2 − 3)
𝑁𝑁𝑥𝑥 = 1.86 �𝑅𝑅𝑒𝑒𝑃𝑃𝑓𝑓𝑑𝑑𝑙𝑙�
13
(2 − 4)
Nu =ℎ𝑑𝑑λ
(2 − 5)
𝑔𝑔 = 𝑁𝑁𝑥𝑥 ×𝜆𝜆𝑑𝑑
(2 − 6)
∆𝑇𝑇 =𝑞𝑞𝑔𝑔𝑓𝑓𝑓𝑓𝑔𝑔
(2 − 7)
𝑇𝑇ℎ𝑔𝑔 = 𝑇𝑇𝑠𝑠𝑐𝑐 + ∆𝑇𝑇 (2 − 8)
Where 𝑉𝑉𝑓𝑓 is Viscosity coefficient, 𝑃𝑃𝑟𝑟 is Prandtl number, 𝜌𝜌𝑓𝑓 is water density and d is
Channel Hydraulic diameter.
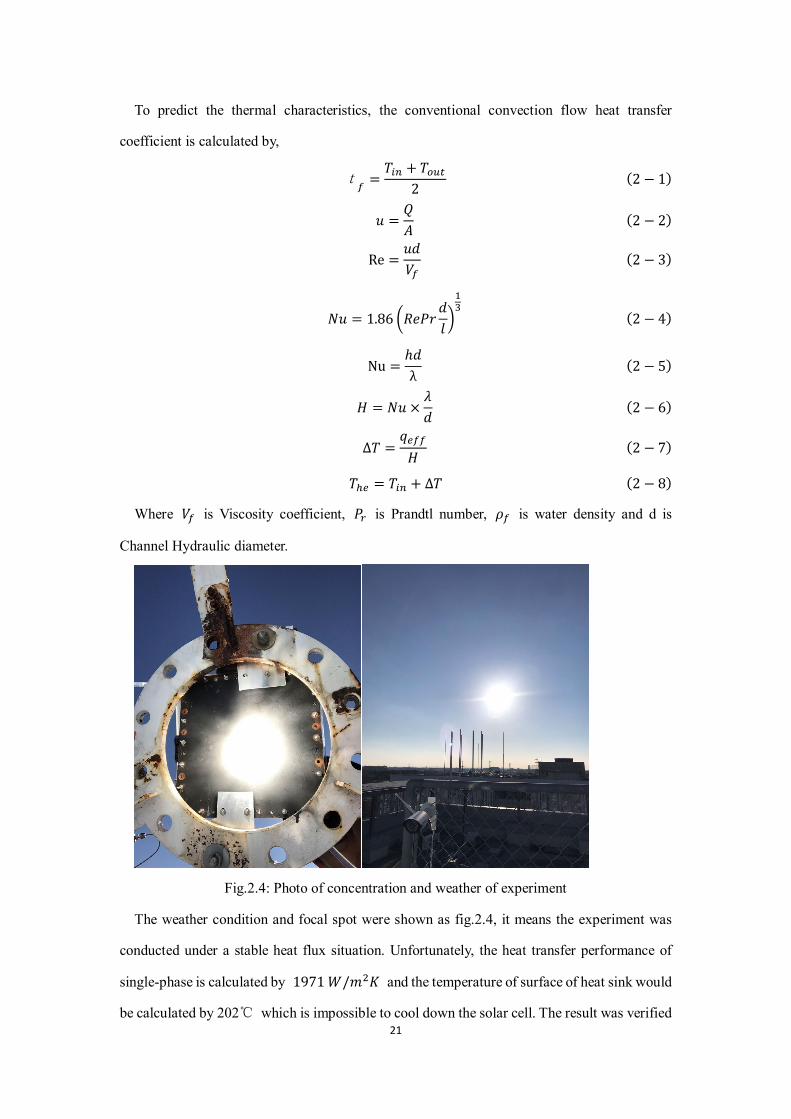
Fig.2.4: Photo of concentration and weather of experiment
The weather condition and focal spot were shown as fig.2.4, it means the experiment was
conducted under a stable heat flux situation. Unfortunately, the heat transfer performance of
single-phase is calculated by 1971 𝐺𝐺/𝑐𝑐2𝐾𝐾 and the temperature of surface of heat sink would
be calculated by 202℃ which is impossible to cool down the solar cell. The result was verified
22
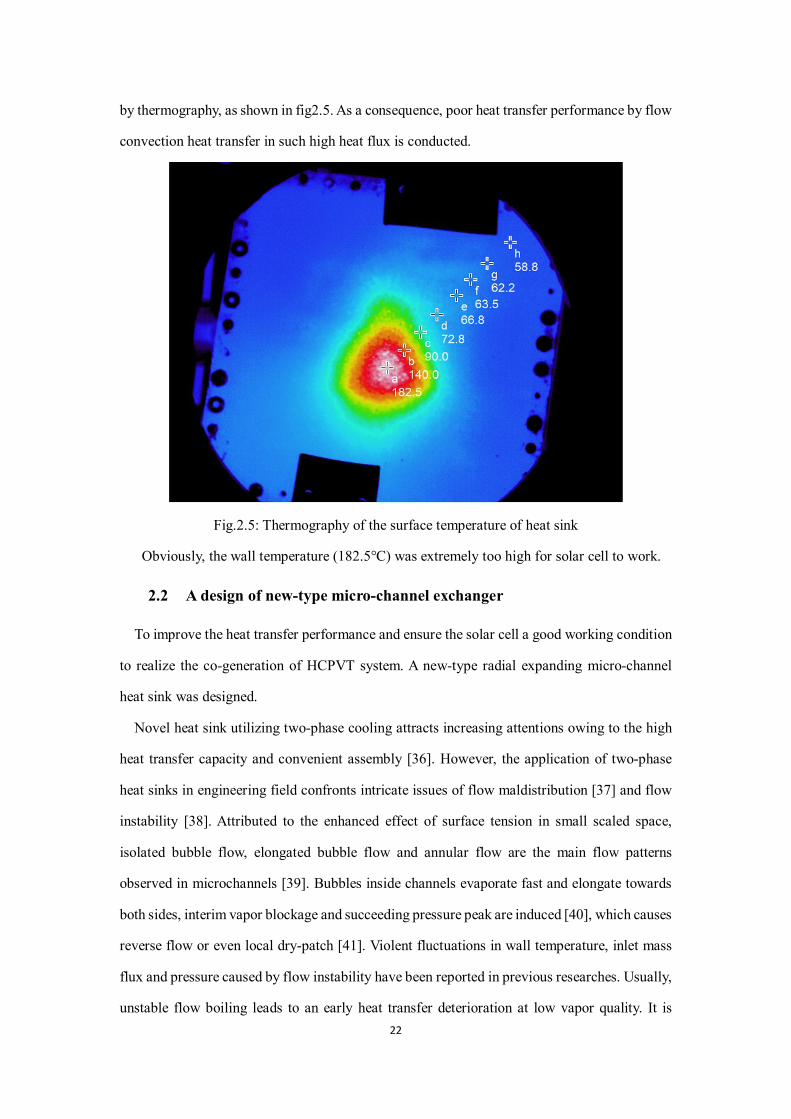
by thermography, as shown in fig2.5. As a consequence, poor heat transfer performance by flow
convection heat transfer in such high heat flux is conducted.
Fig.2.5: Thermography of the surface temperature of heat sink
Obviously, the wall temperature (182.5℃) was extremely too high for solar cell to work.
2.2 A design of new-type micro-channel exchanger
To improve the heat transfer performance and ensure the solar cell a good working condition
to realize the co-generation of HCPVT system. A new-type radial expanding micro-channel
heat sink was designed.
Novel heat sink utilizing two-phase cooling attracts increasing attentions owing to the high
heat transfer capacity and convenient assembly [36]. However, the application of two-phase
heat sinks in engineering field confronts intricate issues of flow maldistribution [37] and flow
instability [38]. Attributed to the enhanced effect of surface tension in small scaled space,
isolated bubble flow, elongated bubble flow and annular flow are the main flow patterns
observed in microchannels [39]. Bubbles inside channels evaporate fast and elongate towards
both sides, interim vapor blockage and succeeding pressure peak are induced [40], which causes
reverse flow or even local dry-patch [41]. Violent fluctuations in wall temperature, inlet mass
flux and pressure caused by flow instability have been reported in previous researches. Usually,
unstable flow boiling leads to an early heat transfer deterioration at low vapor quality. It is

23
concerned that the flow instability often occurs in parallel array micro-channels.
To relieve the instability of two-phase flow, a brand-new design of micro-channel is
introduced. An expanding channel heat sink is designed for two-phase flow heat exchanger, as
seen in fig.2.6.
Fig.2.6: Expanding channel
It displays the schematic sketch of a single bubble’s elongation in an expanding channel, W1
and W2 is the diameter of channel cross-section area. Compared to straight channel, the
expanding channel cross-section produces a net surface tension on an elongated bubble, which
assists the removal of vapor and eases the vapor blockage in channels. For one channel, the net
surface tension force can be illustrated by Eq.2-9.
∆𝑃𝑃𝑠𝑠 = 𝜎𝜎 �1𝐺𝐺1
−1𝐺𝐺2
� (2 − 9)
Where 𝜎𝜎 is the surface tension of liquid. Eq.2-9 shows a force pushing the vapor
out of the channel.
To suppress the flow reversal, we proposed to add cut-off structures to interrupt the
backward expansion of vapor in the channel. Fig.2.7 shows the structure of cross-
cutting grooves perpendicular to the flow direction, with the help of cut-off structures,
long bubbles would be broken into several pieces which leads to a lower pressure drop
and also could redistribute the flow rate among the micro-channels. Thus, the flow
instability can be hugely suppressed.
24
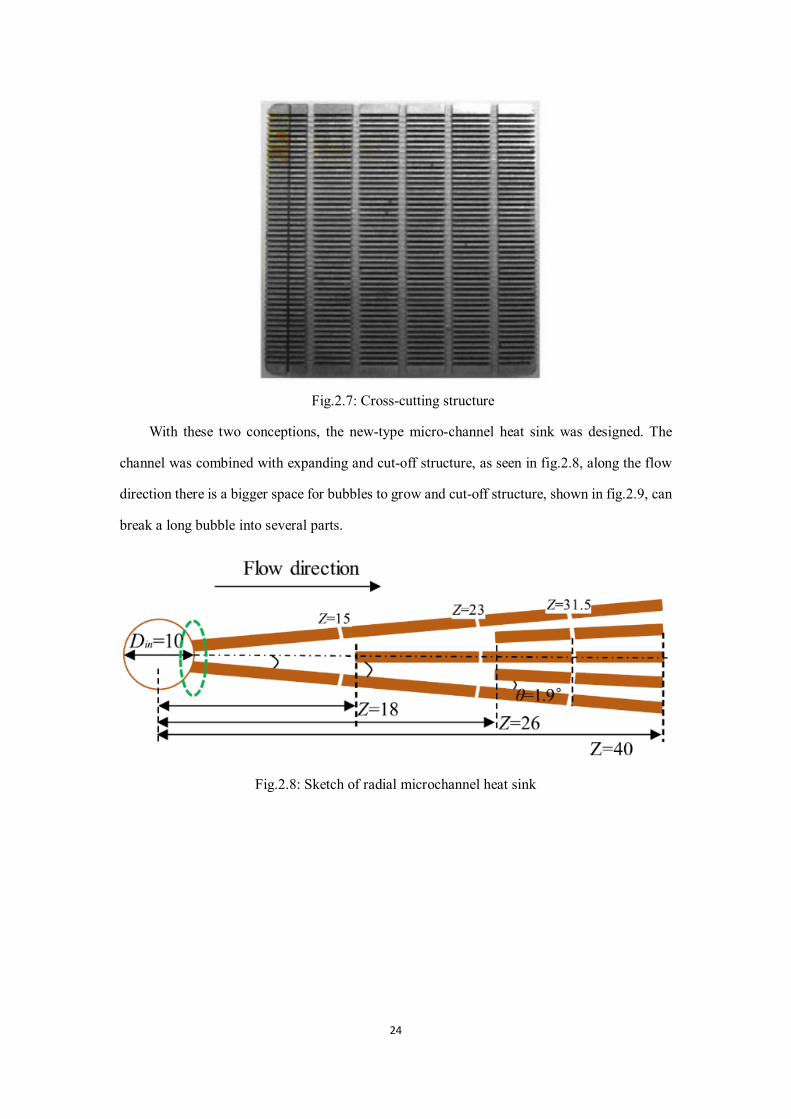
Fig.2.7: Cross-cutting structure
With these two conceptions, the new-type micro-channel heat sink was designed. The
channel was combined with expanding and cut-off structure, as seen in fig.2.8, along the flow
direction there is a bigger space for bubbles to grow and cut-off structure, shown in fig.2.9, can
break a long bubble into several parts.
Fig.2.8: Sketch of radial microchannel heat sink
25
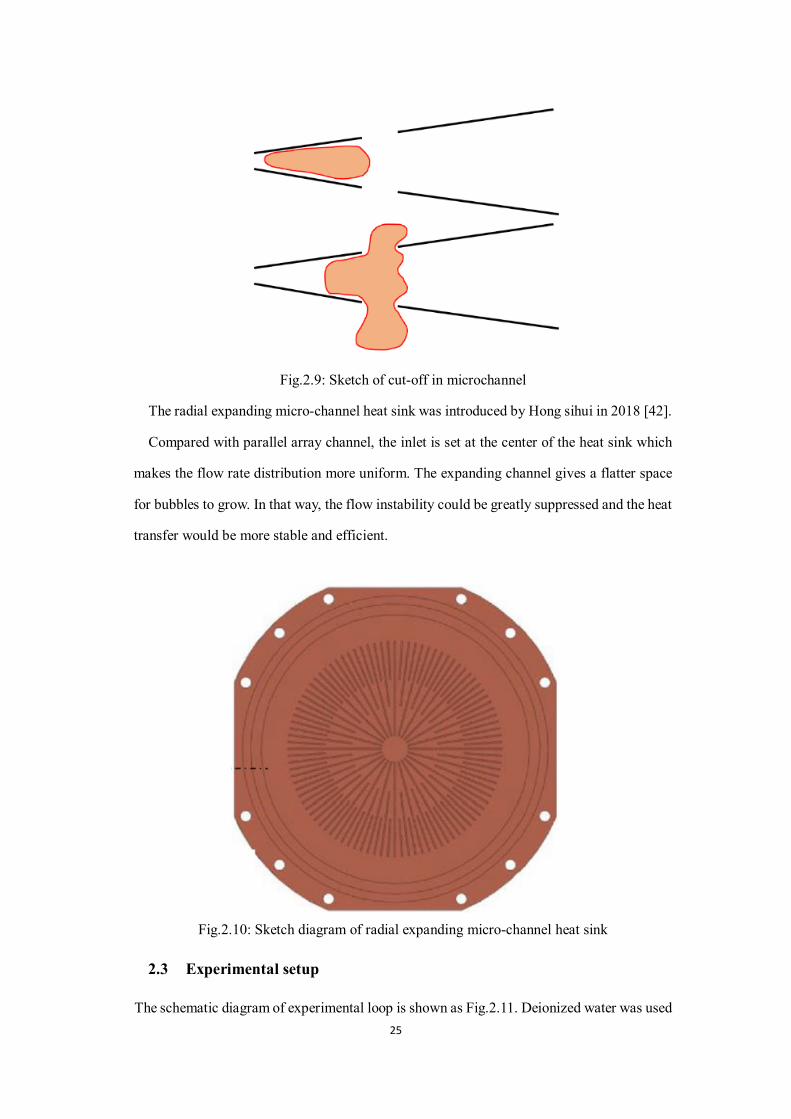
Fig.2.9: Sketch of cut-off in microchannel
The radial expanding micro-channel heat sink was introduced by Hong sihui in 2018 [42].
Compared with parallel array channel, the inlet is set at the center of the heat sink which
makes the flow rate distribution more uniform. The expanding channel gives a flatter space
for bubbles to grow. In that way, the flow instability could be greatly suppressed and the heat
transfer would be more stable and efficient.
Fig.2.10: Sketch diagram of radial expanding micro-channel heat sink
2.3 Experimental setup
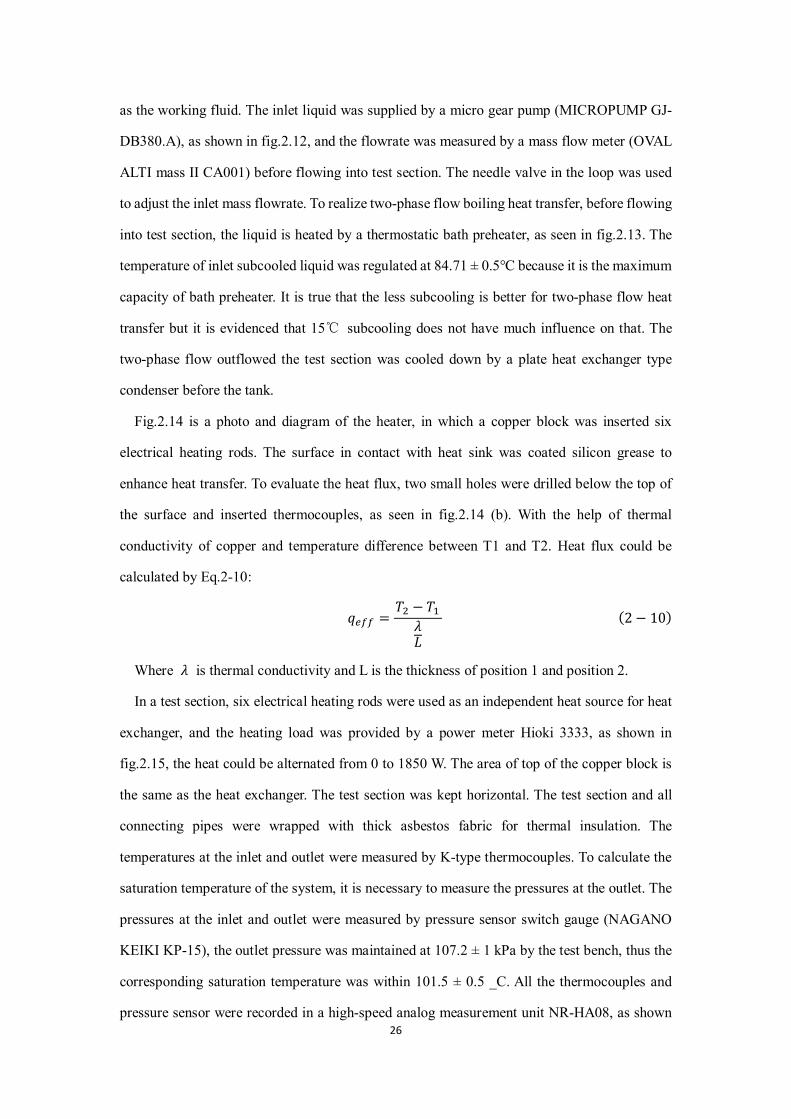
The schematic diagram of experimental loop is shown as Fig.2.11. Deionized water was used
26
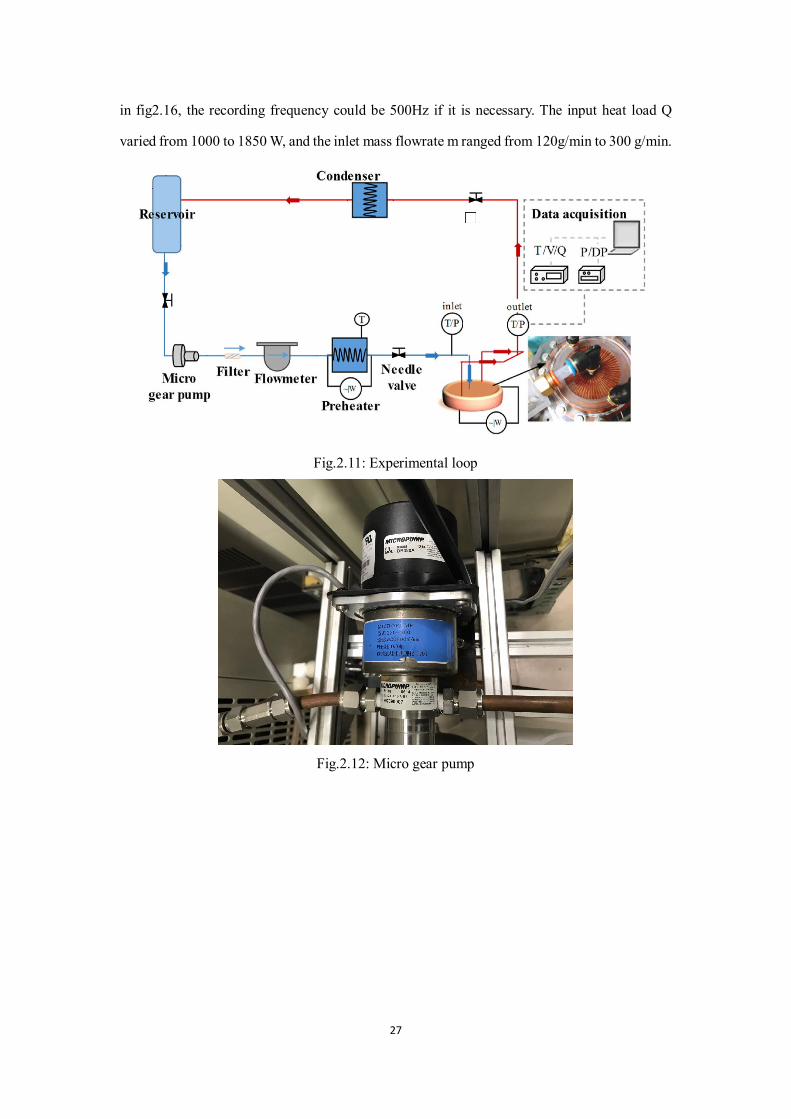
as the working fluid. The inlet liquid was supplied by a micro gear pump (MICROPUMP GJ-
DB380.A), as shown in fig.2.12, and the flowrate was measured by a mass flow meter (OVAL
ALTI mass II CA001) before flowing into test section. The needle valve in the loop was used
to adjust the inlet mass flowrate. To realize two-phase flow boiling heat transfer, before flowing
into test section, the liquid is heated by a thermostatic bath preheater, as seen in fig.2.13. The
temperature of inlet subcooled liquid was regulated at 84.71 ± 0.5℃ because it is the maximum
capacity of bath preheater. It is true that the less subcooling is better for two-phase flow heat
transfer but it is evidenced that 15℃ subcooling does not have much influence on that. The
two-phase flow outflowed the test section was cooled down by a plate heat exchanger type
condenser before the tank.
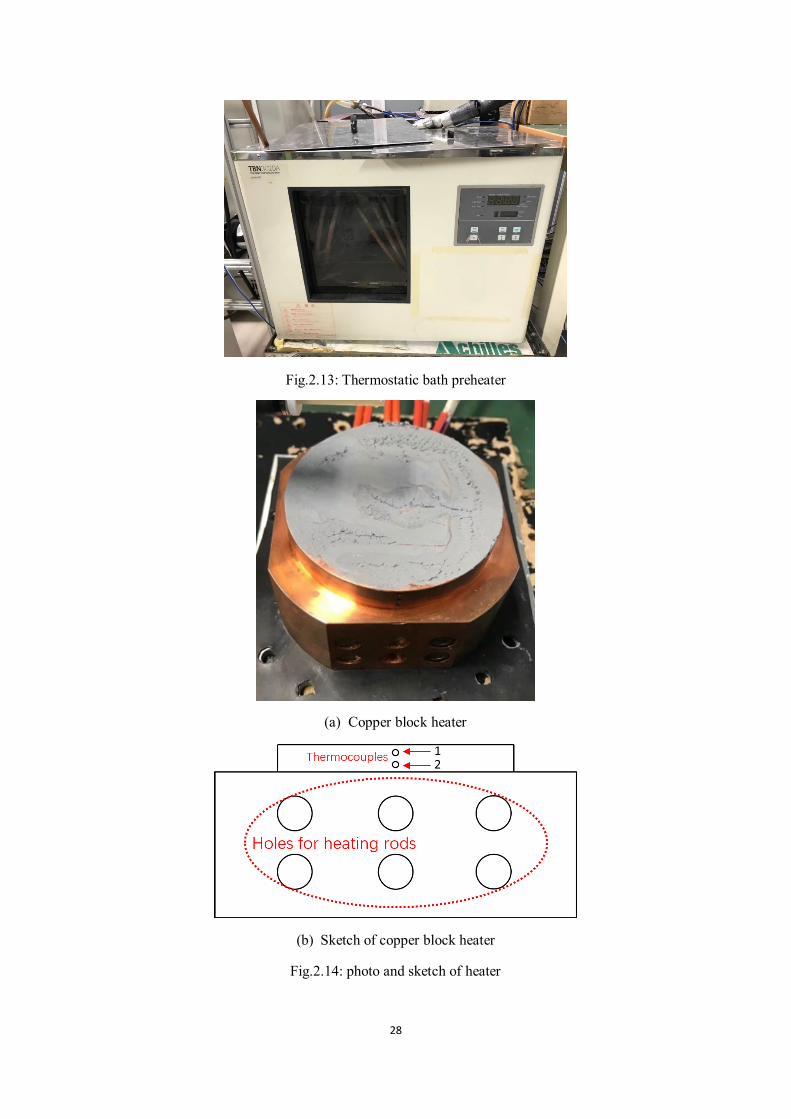
Fig.2.14 is a photo and diagram of the heater, in which a copper block was inserted six
electrical heating rods. The surface in contact with heat sink was coated silicon grease to
enhance heat transfer. To evaluate the heat flux, two small holes were drilled below the top of
the surface and inserted thermocouples, as seen in fig.2.14 (b). With the help of thermal
conductivity of copper and temperature difference between T1 and T2. Heat flux could be
calculated by Eq.2-10:
𝑞𝑞𝑔𝑔𝑓𝑓𝑓𝑓 =𝑇𝑇2 − 𝑇𝑇1
𝜆𝜆𝐿𝐿
(2− 10)
Where 𝜆𝜆 is thermal conductivity and L is the thickness of position 1 and position 2.
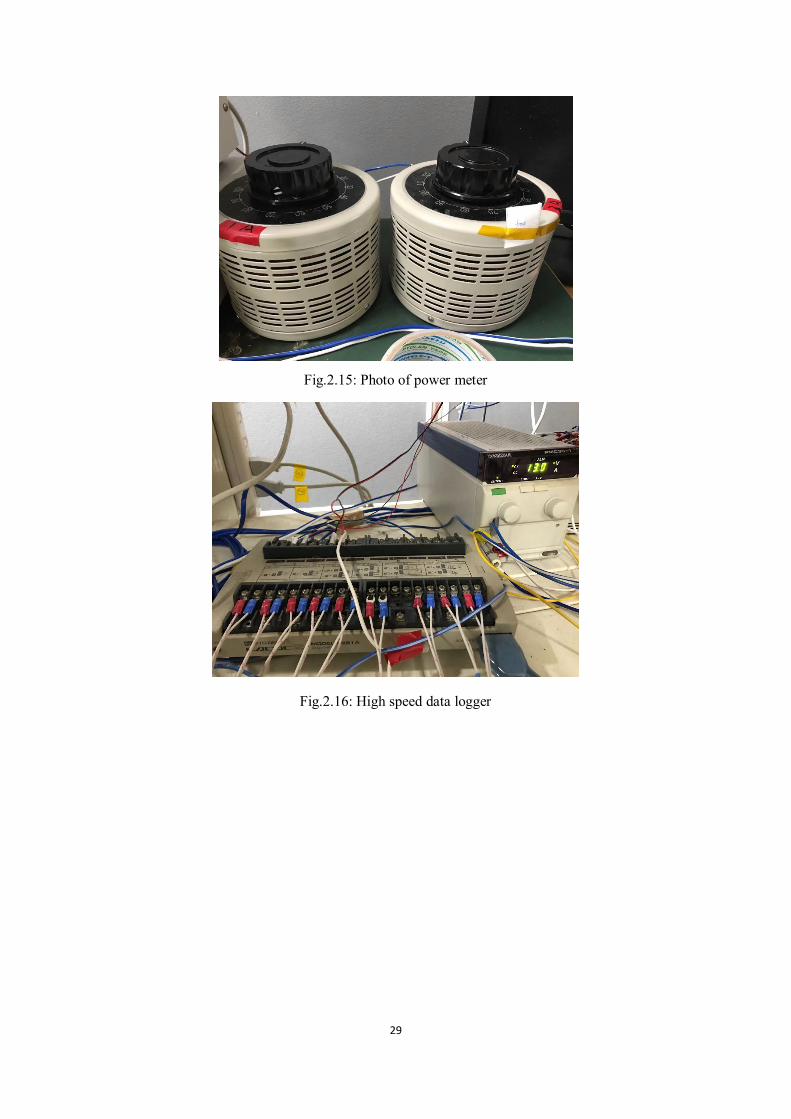
In a test section, six electrical heating rods were used as an independent heat source for heat
exchanger, and the heating load was provided by a power meter Hioki 3333, as shown in
fig.2.15, the heat could be alternated from 0 to 1850 W. The area of top of the copper block is
the same as the heat exchanger. The test section was kept horizontal. The test section and all
connecting pipes were wrapped with thick asbestos fabric for thermal insulation. The
temperatures at the inlet and outlet were measured by K-type thermocouples. To calculate the
saturation temperature of the system, it is necessary to measure the pressures at the outlet. The
pressures at the inlet and outlet were measured by pressure sensor switch gauge (NAGANO
KEIKI KP-15), the outlet pressure was maintained at 107.2 ± 1 kPa by the test bench, thus the
corresponding saturation temperature was within 101.5 ± 0.5 _C. All the thermocouples and
pressure sensor were recorded in a high-speed analog measurement unit NR-HA08, as shown
27
in fig2.16, the recording frequency could be 500Hz if it is necessary. The input heat load Q
varied from 1000 to 1850 W, and the inlet mass flowrate m ranged from 120g/min to 300 g/min.
Fig.2.11: Experimental loop
Fig.2.12: Micro gear pump
28
Fig.2.13: Thermostatic bath preheater
(a) Copper block heater
(b) Sketch of copper block heater
Fig.2.14: photo and sketch of heater
29
Fig.2.15: Photo of power meter
Fig.2.16: High speed data logger
30
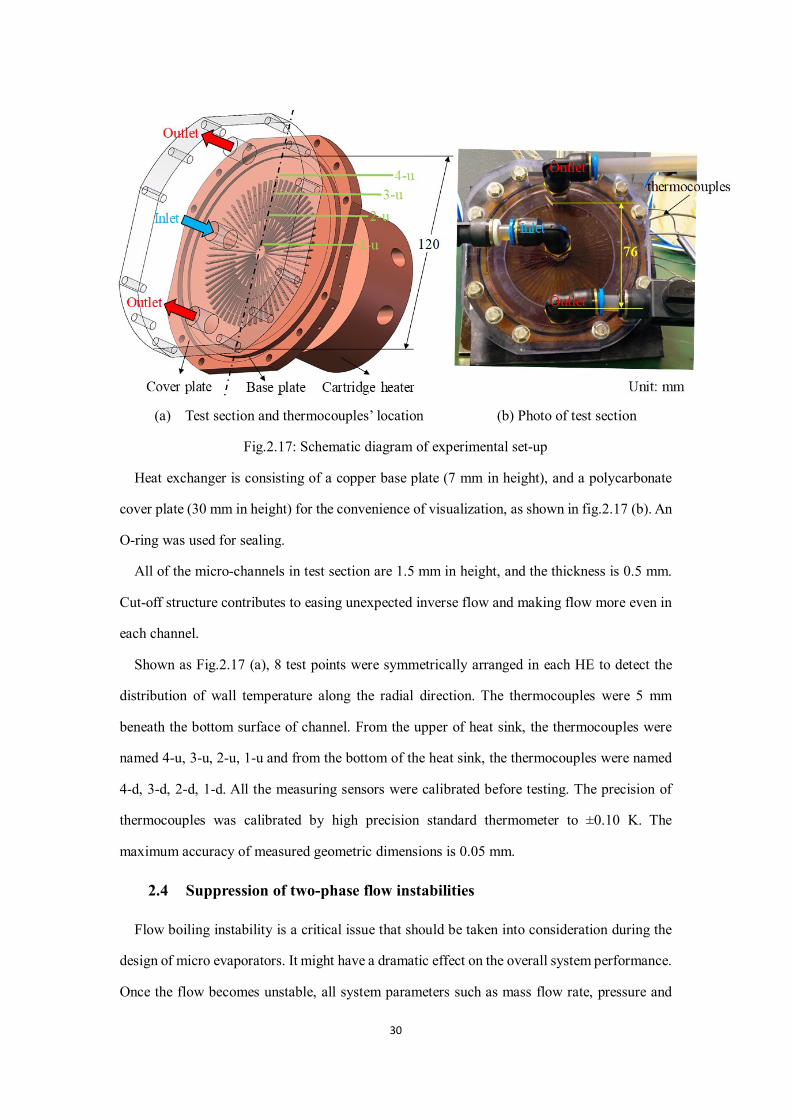
(a) Test section and thermocouples’ location (b) Photo of test section
Fig.2.17: Schematic diagram of experimental set-up
Heat exchanger is consisting of a copper base plate (7 mm in height), and a polycarbonate
cover plate (30 mm in height) for the convenience of visualization, as shown in fig.2.17 (b). An
O-ring was used for sealing.
All of the micro-channels in test section are 1.5 mm in height, and the thickness is 0.5 mm.
Cut-off structure contributes to easing unexpected inverse flow and making flow more even in
each channel.
Shown as Fig.2.17 (a), 8 test points were symmetrically arranged in each HE to detect the
distribution of wall temperature along the radial direction. The thermocouples were 5 mm
beneath the bottom surface of channel. From the upper of heat sink, the thermocouples were
named 4-u, 3-u, 2-u, 1-u and from the bottom of the heat sink, the thermocouples were named
4-d, 3-d, 2-d, 1-d. All the measuring sensors were calibrated before testing. The precision of
thermocouples was calibrated by high precision standard thermometer to ±0.10 K. The
maximum accuracy of measured geometric dimensions is 0.05 mm.
2.4 Suppression of two-phase flow instabilities
Flow boiling instability is a critical issue that should be taken into consideration during the
design of micro evaporators. It might have a dramatic effect on the overall system performance.
Once the flow becomes unstable, all system parameters such as mass flow rate, pressure and
31
temperature oscillate with large amplitudes. These amplitudes can be as high as 36 K for wall
temperature, as found by Wang et al. [73], and 992.4 kg/m2 s and 60 kPa for mass flux and
pressure drop, respectively, as found by Fu et al. [74]. Thus, the local time averaged heat
transfer coefficient may be strongly influenced by these fluctuations.
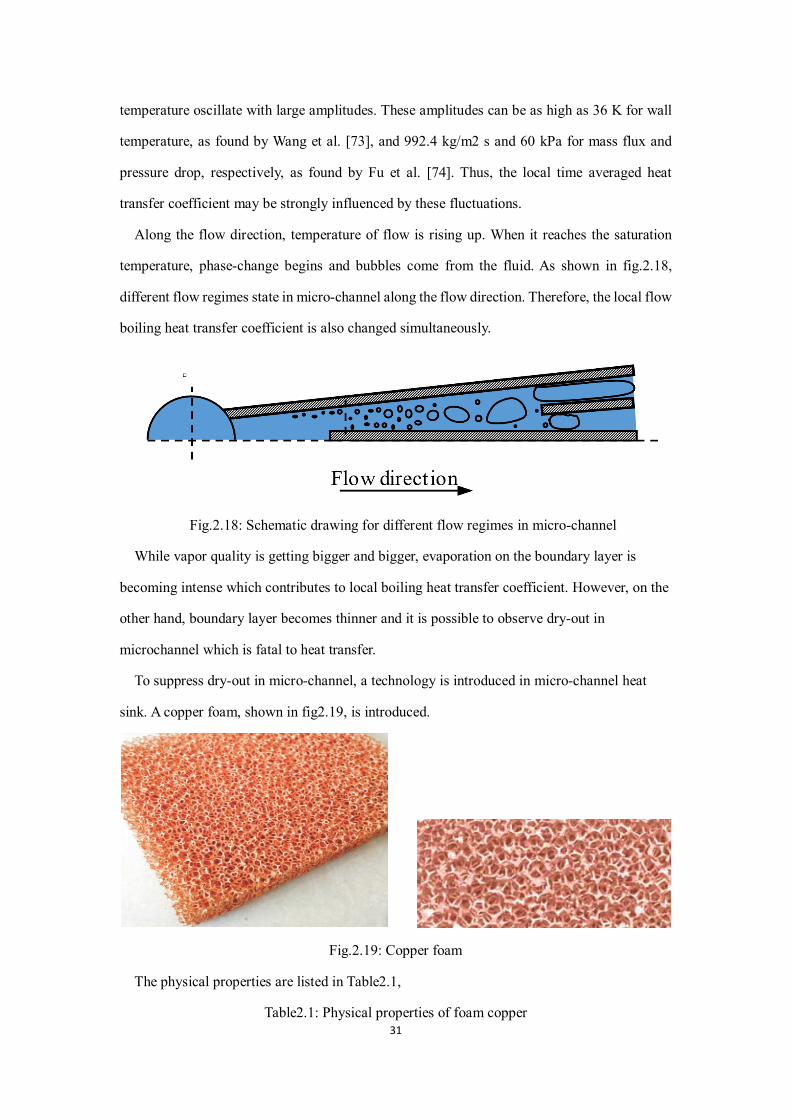
Along the flow direction, temperature of flow is rising up. When it reaches the saturation
temperature, phase-change begins and bubbles come from the fluid. As shown in fig.2.18,
different flow regimes state in micro-channel along the flow direction. Therefore, the local flow
boiling heat transfer coefficient is also changed simultaneously.
Fig.2.18: Schematic drawing for different flow regimes in micro-channel
While vapor quality is getting bigger and bigger, evaporation on the boundary layer is
becoming intense which contributes to local boiling heat transfer coefficient. However, on the
other hand, boundary layer becomes thinner and it is possible to observe dry-out in
microchannel which is fatal to heat transfer.
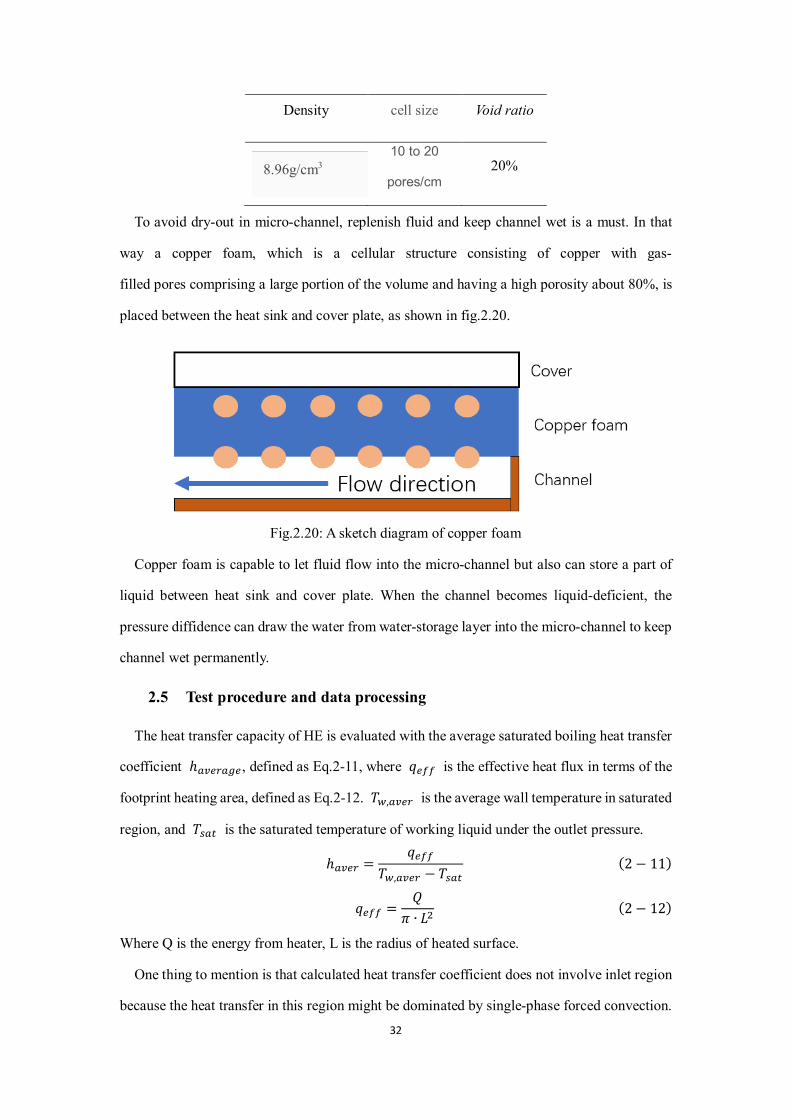
To suppress dry-out in micro-channel, a technology is introduced in micro-channel heat
sink. A copper foam, shown in fig2.19, is introduced.
Fig.2.19: Copper foam
The physical properties are listed in Table2.1,
Table2.1: Physical properties of foam copper
32
Density cell size Void ratio
8.96g/cm3
10 to 20
pores/cm 20%
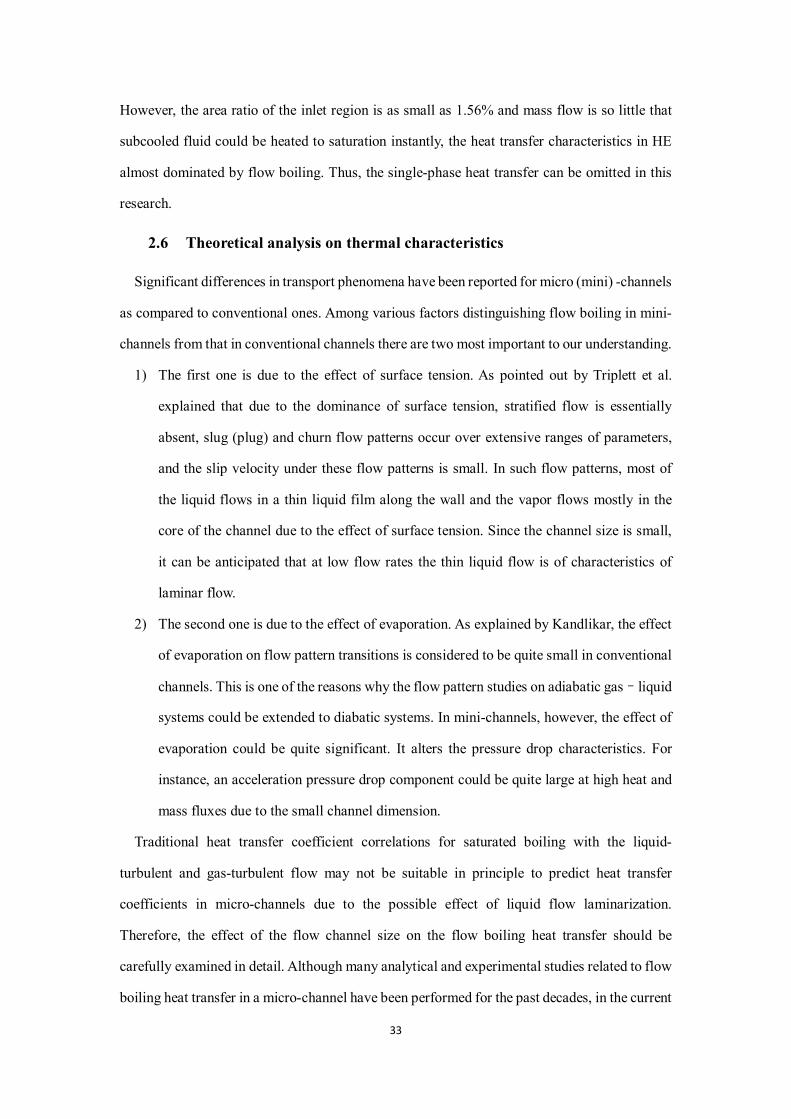
To avoid dry-out in micro-channel, replenish fluid and keep channel wet is a must. In that
way a copper foam, which is a cellular structure consisting of copper with gas-
filled pores comprising a large portion of the volume and having a high porosity about 80%, is
placed between the heat sink and cover plate, as shown in fig.2.20.
Fig.2.20: A sketch diagram of copper foam
Copper foam is capable to let fluid flow into the micro-channel but also can store a part of
liquid between heat sink and cover plate. When the channel becomes liquid-deficient, the
pressure diffidence can draw the water from water-storage layer into the micro-channel to keep
channel wet permanently.
2.5 Test procedure and data processing
The heat transfer capacity of HE is evaluated with the average saturated boiling heat transfer
coefficient ℎ𝑠𝑠𝑣𝑣𝑔𝑔𝑟𝑟𝑠𝑠𝑔𝑔𝑔𝑔, defined as Eq.2-11, where 𝑞𝑞𝑔𝑔𝑓𝑓𝑓𝑓 is the effective heat flux in terms of the
footprint heating area, defined as Eq.2-12. 𝑇𝑇𝑤𝑤,𝑠𝑠𝑣𝑣𝑔𝑔𝑟𝑟 is the average wall temperature in saturated
region, and 𝑇𝑇𝑠𝑠𝑠𝑠𝑠𝑠 is the saturated temperature of working liquid under the outlet pressure.
ℎ𝑠𝑠𝑣𝑣𝑔𝑔𝑟𝑟 =𝑞𝑞𝑔𝑔𝑓𝑓𝑓𝑓
𝑇𝑇𝑤𝑤,𝑠𝑠𝑣𝑣𝑔𝑔𝑟𝑟 − 𝑇𝑇𝑠𝑠𝑠𝑠𝑠𝑠(2− 11)
𝑞𝑞𝑔𝑔𝑓𝑓𝑓𝑓 =𝑄𝑄
𝜋𝜋 ∙ 𝐿𝐿2(2− 12)
Where Q is the energy from heater, L is the radius of heated surface.
One thing to mention is that calculated heat transfer coefficient does not involve inlet region
because the heat transfer in this region might be dominated by single-phase forced convection.
33
However, the area ratio of the inlet region is as small as 1.56% and mass flow is so little that
subcooled fluid could be heated to saturation instantly, the heat transfer characteristics in HE
almost dominated by flow boiling. Thus, the single-phase heat transfer can be omitted in this
research.
2.6 Theoretical analysis on thermal characteristics
Significant differences in transport phenomena have been reported for micro (mini) -channels
as compared to conventional ones. Among various factors distinguishing flow boiling in mini-
channels from that in conventional channels there are two most important to our understanding.
1) The first one is due to the effect of surface tension. As pointed out by Triplett et al.
explained that due to the dominance of surface tension, stratified flow is essentially
absent, slug (plug) and churn flow patterns occur over extensive ranges of parameters,
and the slip velocity under these flow patterns is small. In such flow patterns, most of
the liquid flows in a thin liquid film along the wall and the vapor flows mostly in the
core of the channel due to the effect of surface tension. Since the channel size is small,
it can be anticipated that at low flow rates the thin liquid flow is of characteristics of
laminar flow.
2) The second one is due to the effect of evaporation. As explained by Kandlikar, the effect
of evaporation on flow pattern transitions is considered to be quite small in conventional
channels. This is one of the reasons why the flow pattern studies on adiabatic gas–liquid
systems could be extended to diabatic systems. In mini-channels, however, the effect of
evaporation could be quite significant. It alters the pressure drop characteristics. For
instance, an acceleration pressure drop component could be quite large at high heat and
mass fluxes due to the small channel dimension.
Traditional heat transfer coefficient correlations for saturated boiling with the liquid-
turbulent and gas-turbulent flow may not be suitable in principle to predict heat transfer
coefficients in micro-channels due to the possible effect of liquid flow laminarization.
Therefore, the effect of the flow channel size on the flow boiling heat transfer should be
carefully examined in detail. Although many analytical and experimental studies related to flow
boiling heat transfer in a micro-channel have been performed for the past decades, in the current
34
status of this subject, sufficient systematic and accurate data bases are still unavailable to
understand flow boiling characteristics in a micro-channel, and a reliable heat transfer
coefficient correlation applicable to a wide range of conditions in micro-channels has not been
developed yet.
The heat transfer coefficient in micro-channel is a complicated issue which has been
researching yet. That is to say, the experiment is an important way to evaluate the thermal
performance of heat exchanger.
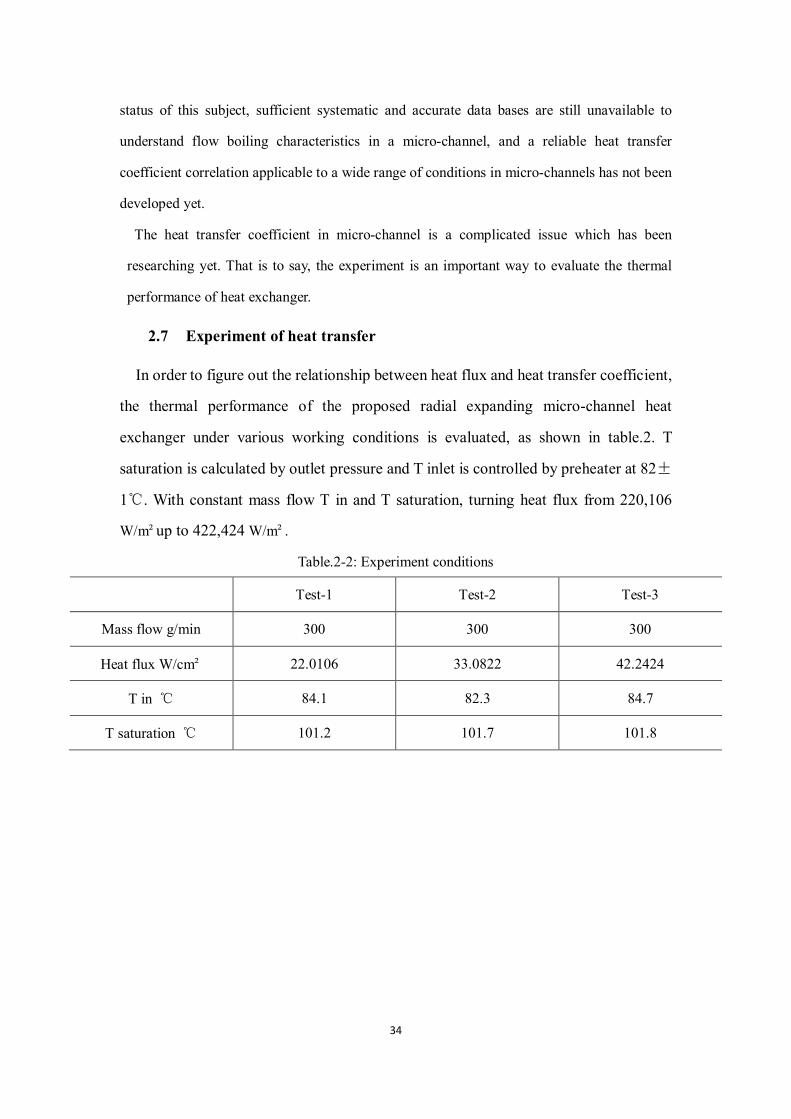
2.7 Experiment of heat transfer
In order to figure out the relationship between heat flux and heat transfer coefficient,
the thermal performance of the proposed radial expanding micro-channel heat
exchanger under various working conditions is evaluated, as shown in table.2. T
saturation is calculated by outlet pressure and T inlet is controlled by preheater at 82±
1℃. With constant mass flow T in and T saturation, turning heat flux from 220,106
W/m²up to 422,424 W/m².
Table.2-2: Experiment conditions
Test-1 Test-2 Test-3
Mass flow g/min 300 300 300
Heat flux W/cm² 22.0106 33.0822 42.2424
T in ℃ 84.1 82.3 84.7
T saturation ℃ 101.2 101.7 101.8
35
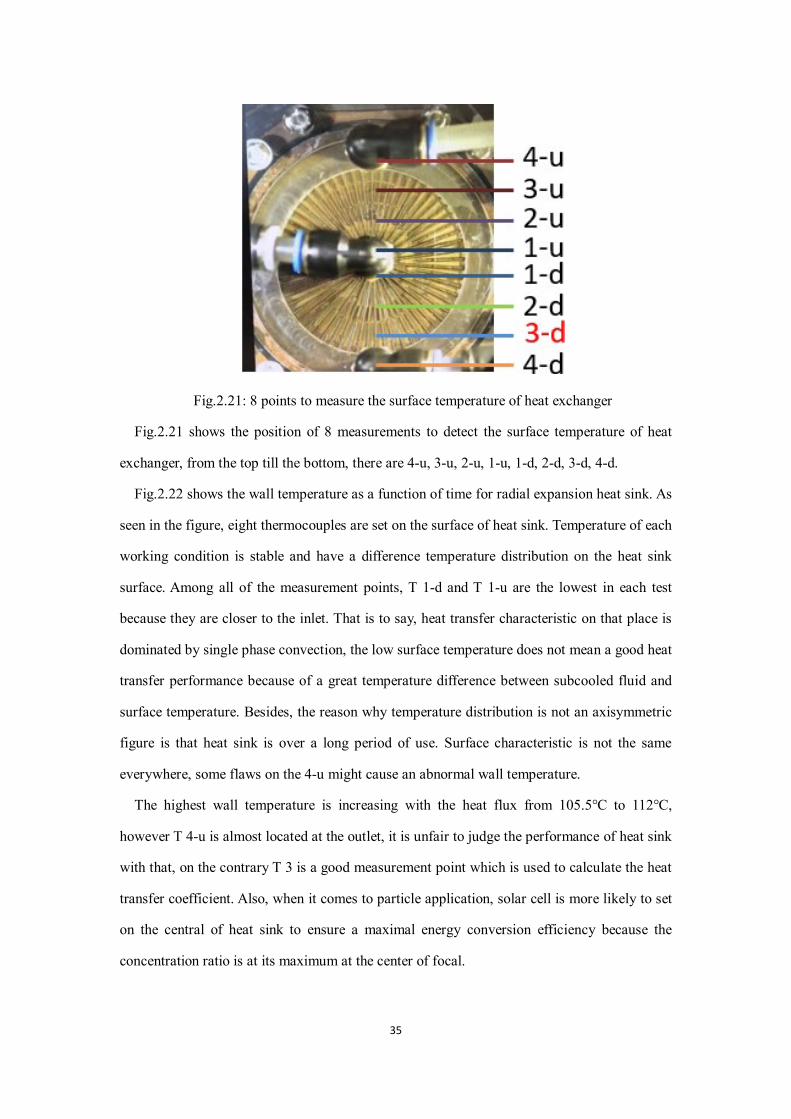
Fig.2.21: 8 points to measure the surface temperature of heat exchanger
Fig.2.21 shows the position of 8 measurements to detect the surface temperature of heat
exchanger, from the top till the bottom, there are 4-u, 3-u, 2-u, 1-u, 1-d, 2-d, 3-d, 4-d.
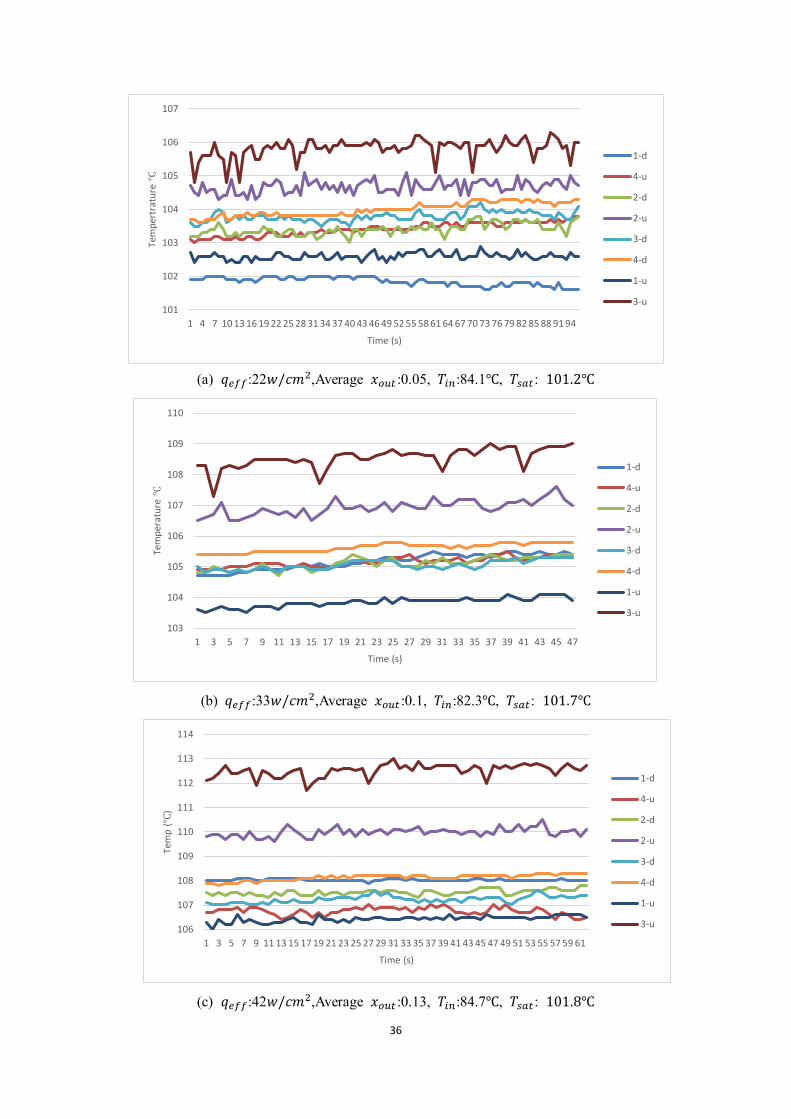
Fig.2.22 shows the wall temperature as a function of time for radial expansion heat sink. As
seen in the figure, eight thermocouples are set on the surface of heat sink. Temperature of each
working condition is stable and have a difference temperature distribution on the heat sink
surface. Among all of the measurement points, T 1-d and T 1-u are the lowest in each test
because they are closer to the inlet. That is to say, heat transfer characteristic on that place is
dominated by single phase convection, the low surface temperature does not mean a good heat
transfer performance because of a great temperature difference between subcooled fluid and
surface temperature. Besides, the reason why temperature distribution is not an axisymmetric
figure is that heat sink is over a long period of use. Surface characteristic is not the same
everywhere, some flaws on the 4-u might cause an abnormal wall temperature.
The highest wall temperature is increasing with the heat flux from 105.5℃ to 112℃,
however T 4-u is almost located at the outlet, it is unfair to judge the performance of heat sink
with that, on the contrary T 3 is a good measurement point which is used to calculate the heat
transfer coefficient. Also, when it comes to particle application, solar cell is more likely to set
on the central of heat sink to ensure a maximal energy conversion efficiency because the
concentration ratio is at its maximum at the center of focal.
36
(a) 𝑞𝑞𝑔𝑔𝑓𝑓𝑓𝑓:22𝑤𝑤/𝑐𝑐𝑐𝑐2,Average 𝑥𝑥𝑔𝑔𝑜𝑜𝑠𝑠 :0.05, 𝑇𝑇𝑠𝑠𝑐𝑐:84.1℃, 𝑇𝑇𝑠𝑠𝑠𝑠𝑠𝑠: 101.2℃
(b) 𝑞𝑞𝑔𝑔𝑓𝑓𝑓𝑓:33𝑤𝑤/𝑐𝑐𝑐𝑐2,Average 𝑥𝑥𝑔𝑔𝑜𝑜𝑠𝑠 :0.1, 𝑇𝑇𝑠𝑠𝑐𝑐:82.3℃, 𝑇𝑇𝑠𝑠𝑠𝑠𝑠𝑠: 101.7℃
(c) 𝑞𝑞𝑔𝑔𝑓𝑓𝑓𝑓:42𝑤𝑤/𝑐𝑐𝑐𝑐2,Average 𝑥𝑥𝑔𝑔𝑜𝑜𝑠𝑠 :0.13, 𝑇𝑇𝑠𝑠𝑐𝑐:84.7℃, 𝑇𝑇𝑠𝑠𝑠𝑠𝑠𝑠: 101.8℃
101
102
103
104
105
106
107
1 4 7 10 13 16 19 22 25 28 31 34 37 40 43 46 49 52 55 58 61 64 67 70 73 76 79 82 85 88 91 94
Tem
pert
ratu
re ℃
Time (s)
1-d
4-u
2-d
2-u
3-d
4-d
1-u
3-u
103
104
105
106
107
108
109
110
1 3 5 7 9 11 13 15 17 19 21 23 25 27 29 31 33 35 37 39 41 43 45 47
Tem
pera
ture
℃
Time (s)
1-d
4-u
2-d
2-u
3-d
4-d
1-u
3-u
106
107
108
109
110
111
112
113
114
1 3 5 7 9 11 13 15 17 19 21 23 25 27 29 31 33 35 37 39 41 43 45 47 49 51 53 55 57 59 61
Tem
p (℃
)
Time (s)
1-d
4-u
2-d
2-u
3-d
4-d
1-u
3-u
37
Fig.2.22: Temperature distribution of 8 measurement points of HE at mass flow: 300g/min,
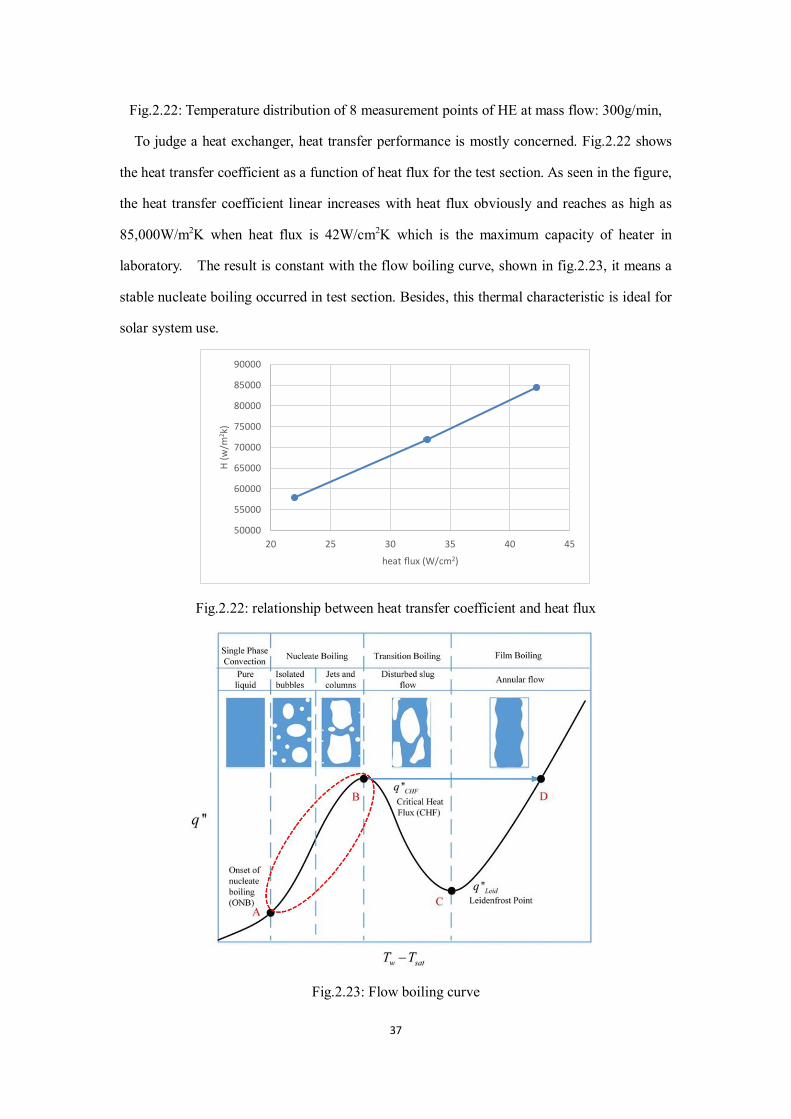
To judge a heat exchanger, heat transfer performance is mostly concerned. Fig.2.22 shows
the heat transfer coefficient as a function of heat flux for the test section. As seen in the figure,
the heat transfer coefficient linear increases with heat flux obviously and reaches as high as
85,000W/m2K when heat flux is 42W/cm2K which is the maximum capacity of heater in
laboratory. The result is constant with the flow boiling curve, shown in fig.2.23, it means a
stable nucleate boiling occurred in test section. Besides, this thermal characteristic is ideal for
solar system use.
Fig.2.22: relationship between heat transfer coefficient and heat flux
Fig.2.23: Flow boiling curve
50000
55000
60000
65000
70000
75000
80000
85000
90000
20 25 30 35 40 45
H (w
/m2 k
)
heat flux (W/cm2)
38
When it comes to practice application, installed in photovoltaic system, the working
condition of 42W/cm2K heat flux tested in laboratory is equivalent to 761 𝑥𝑥𝑥𝑥𝑥𝑥𝑥𝑥𝑥𝑥
concentration ratio with a direct normal radiation of 600W/m2. When radiation increases to
1000W/m2, the heat flux concentrated on the surface of heat sink will rise which also leads to
a higher thermal performance.
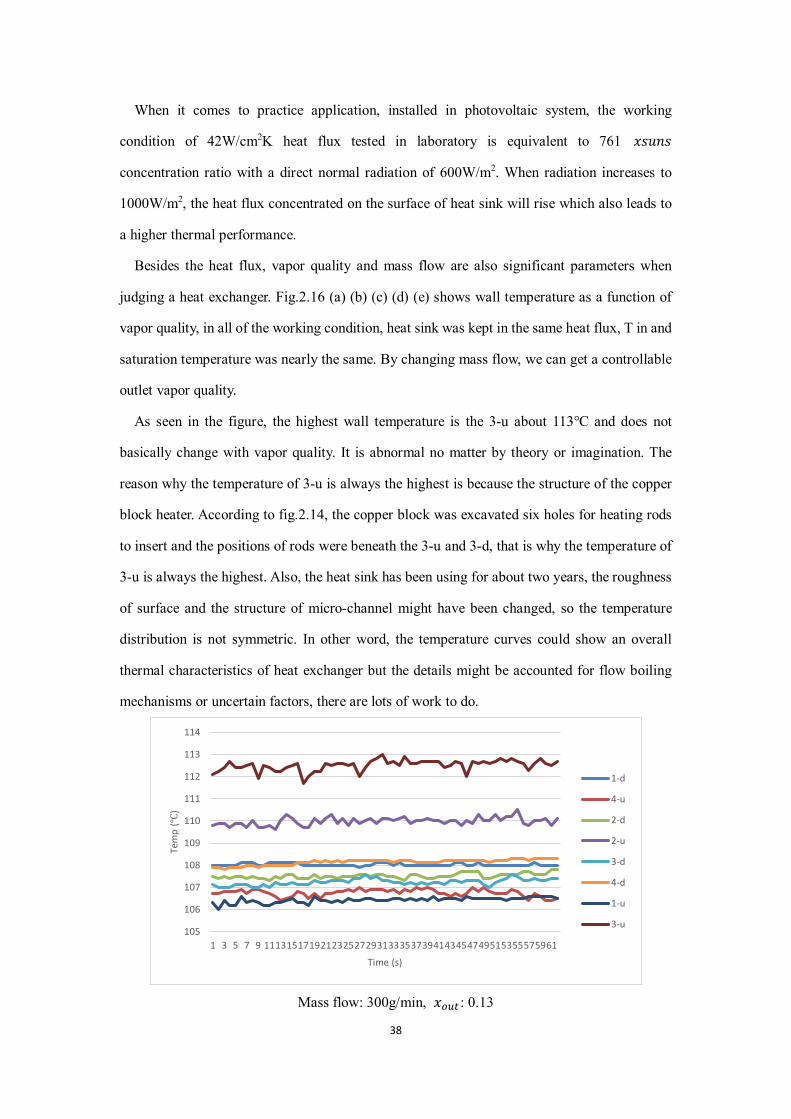
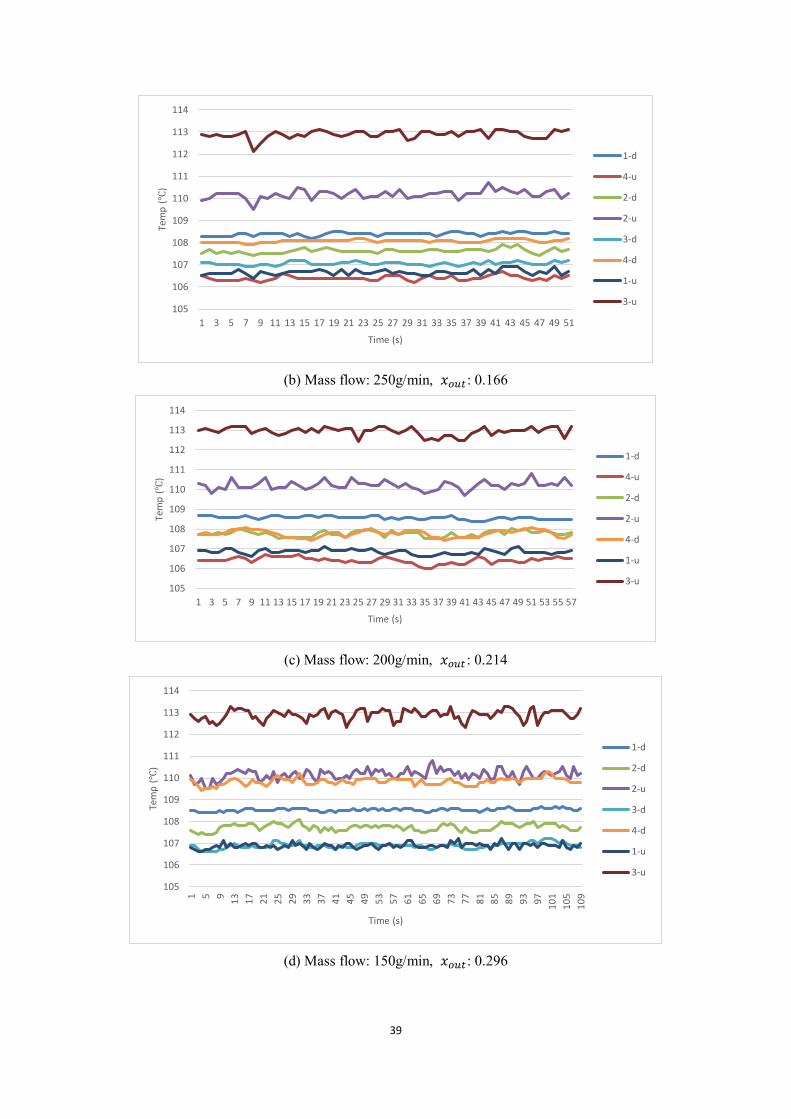
Besides the heat flux, vapor quality and mass flow are also significant parameters when
judging a heat exchanger. Fig.2.16 (a) (b) (c) (d) (e) shows wall temperature as a function of
vapor quality, in all of the working condition, heat sink was kept in the same heat flux, T in and
saturation temperature was nearly the same. By changing mass flow, we can get a controllable
outlet vapor quality.
As seen in the figure, the highest wall temperature is the 3-u about 113℃ and does not
basically change with vapor quality. It is abnormal no matter by theory or imagination. The
reason why the temperature of 3-u is always the highest is because the structure of the copper
block heater. According to fig.2.14, the copper block was excavated six holes for heating rods
to insert and the positions of rods were beneath the 3-u and 3-d, that is why the temperature of
3-u is always the highest. Also, the heat sink has been using for about two years, the roughness
of surface and the structure of micro-channel might have been changed, so the temperature
distribution is not symmetric. In other word, the temperature curves could show an overall
thermal characteristics of heat exchanger but the details might be accounted for flow boiling
mechanisms or uncertain factors, there are lots of work to do.
Mass flow: 300g/min, 𝑥𝑥𝑔𝑔𝑜𝑜𝑠𝑠 : 0.13
105
106
107
108
109
110
111
112
113
114
1 3 5 7 9 1113151719212325272931333537394143454749515355575961
Tem
p (℃
)
Time (s)
1-d
4-u
2-d
2-u
3-d
4-d
1-u
3-u
39
(b) Mass flow: 250g/min, 𝑥𝑥𝑔𝑔𝑜𝑜𝑠𝑠: 0.166
(c) Mass flow: 200g/min, 𝑥𝑥𝑔𝑔𝑜𝑜𝑠𝑠 : 0.214
(d) Mass flow: 150g/min, 𝑥𝑥𝑔𝑔𝑜𝑜𝑠𝑠: 0.296
105
106
107
108
109
110
111
112
113
114
1 3 5 7 9 11 13 15 17 19 21 23 25 27 29 31 33 35 37 39 41 43 45 47 49 51
Tem
p (℃
)
Time (s)
1-d
4-u
2-d
2-u
3-d
4-d
1-u
3-u
105
106
107
108
109
110
111
112
113
114
1 3 5 7 9 11 13 15 17 19 21 23 25 27 29 31 33 35 37 39 41 43 45 47 49 51 53 55 57
Tem
p (℃
)
Time (s)
1-d
4-u
2-d
2-u
4-d
1-u
3-u
105
106
107
108
109
110
111
112
113
114
1 5 9 13 17 21 25 29 33 37 41 45 49 53 57 61 65 69 73 77 81 85 89 93 97 101
105
109
Tem
p (℃
)
Time (s)
1-d
2-d
2-u
3-d
4-d
1-u
3-u
40
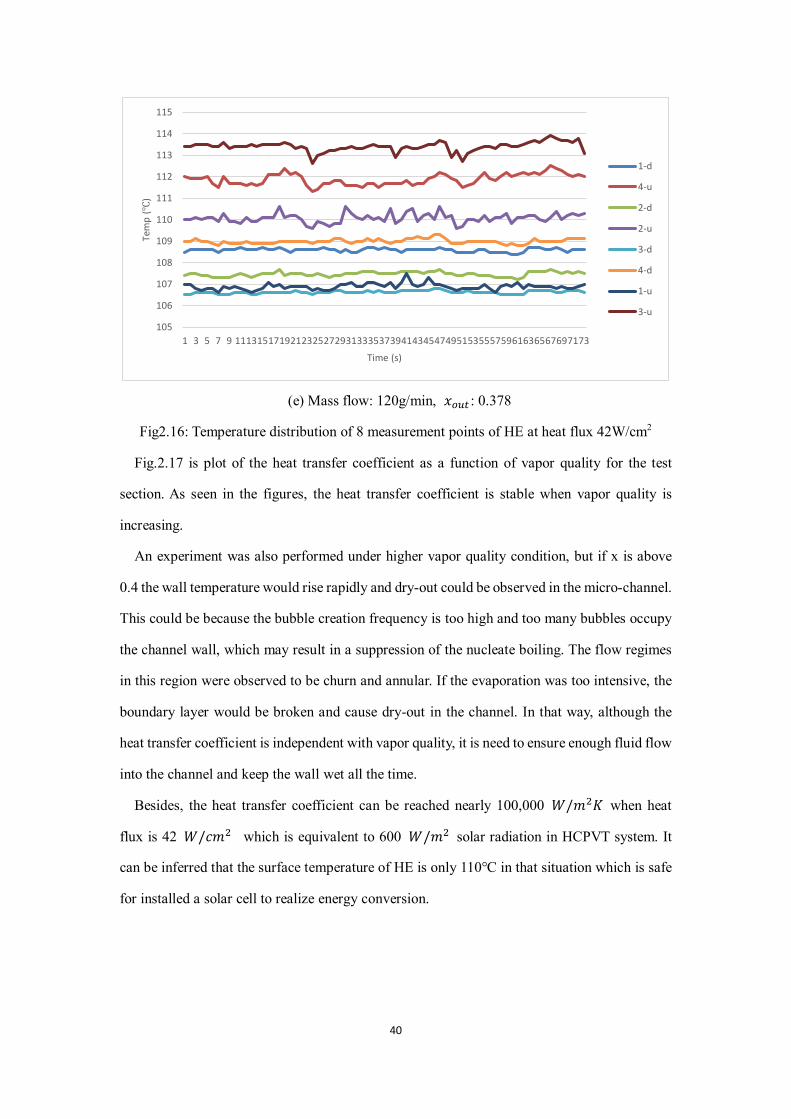
(e) Mass flow: 120g/min, 𝑥𝑥𝑔𝑔𝑜𝑜𝑠𝑠 : 0.378
Fig2.16: Temperature distribution of 8 measurement points of HE at heat flux 42W/cm2
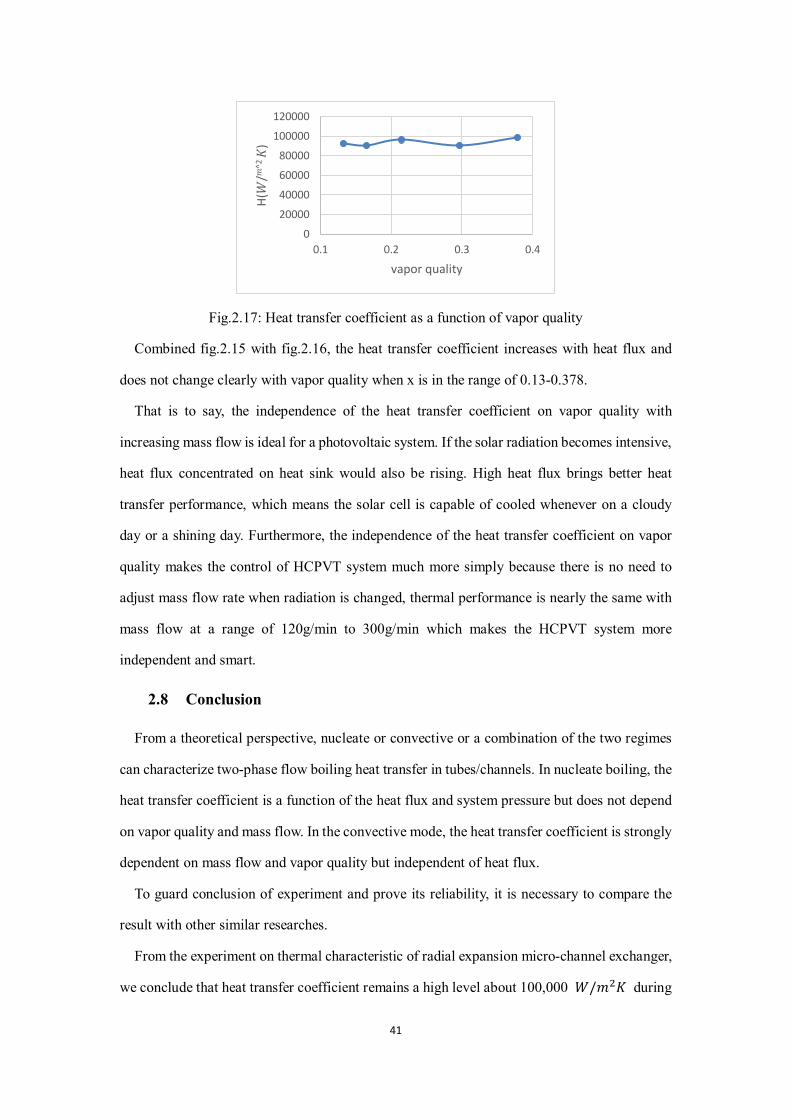
Fig.2.17 is plot of the heat transfer coefficient as a function of vapor quality for the test
section. As seen in the figures, the heat transfer coefficient is stable when vapor quality is
increasing.
An experiment was also performed under higher vapor quality condition, but if x is above
0.4 the wall temperature would rise rapidly and dry-out could be observed in the micro-channel.
This could be because the bubble creation frequency is too high and too many bubbles occupy
the channel wall, which may result in a suppression of the nucleate boiling. The flow regimes
in this region were observed to be churn and annular. If the evaporation was too intensive, the
boundary layer would be broken and cause dry-out in the channel. In that way, although the
heat transfer coefficient is independent with vapor quality, it is need to ensure enough fluid flow
into the channel and keep the wall wet all the time.
Besides, the heat transfer coefficient can be reached nearly 100,000 𝐺𝐺/𝑐𝑐2𝐾𝐾 when heat
flux is 42 𝐺𝐺/𝑐𝑐𝑐𝑐2 which is equivalent to 600 𝐺𝐺/𝑐𝑐2 solar radiation in HCPVT system. It
can be inferred that the surface temperature of HE is only 110℃ in that situation which is safe
for installed a solar cell to realize energy conversion.
105
106
107
108
109
110
111
112
113
114
115
1 3 5 7 9 1113151719212325272931333537394143454749515355575961636567697173
Tem
p (℃
)
Time (s)
1-d
4-u
2-d
2-u
3-d
4-d
1-u
3-u
41
Fig.2.17: Heat transfer coefficient as a function of vapor quality
Combined fig.2.15 with fig.2.16, the heat transfer coefficient increases with heat flux and
does not change clearly with vapor quality when x is in the range of 0.13-0.378.
That is to say, the independence of the heat transfer coefficient on vapor quality with
increasing mass flow is ideal for a photovoltaic system. If the solar radiation becomes intensive,
heat flux concentrated on heat sink would also be rising. High heat flux brings better heat
transfer performance, which means the solar cell is capable of cooled whenever on a cloudy
day or a shining day. Furthermore, the independence of the heat transfer coefficient on vapor
quality makes the control of HCPVT system much more simply because there is no need to
adjust mass flow rate when radiation is changed, thermal performance is nearly the same with
mass flow at a range of 120g/min to 300g/min which makes the HCPVT system more
independent and smart.
2.8 Conclusion
From a theoretical perspective, nucleate or convective or a combination of the two regimes
can characterize two-phase flow boiling heat transfer in tubes/channels. In nucleate boiling, the
heat transfer coefficient is a function of the heat flux and system pressure but does not depend
on vapor quality and mass flow. In the convective mode, the heat transfer coefficient is strongly
dependent on mass flow and vapor quality but independent of heat flux.
To guard conclusion of experiment and prove its reliability, it is necessary to compare the
result with other similar researches.
From the experiment on thermal characteristic of radial expansion micro-channel exchanger,
we conclude that heat transfer coefficient remains a high level about 100,000 𝐺𝐺/𝑐𝑐2𝐾𝐾 during
0
20000
40000
60000
80000
100000
120000
0.1 0.2 0.3 0.4H(𝐺𝐺
/𝑐𝑐^2
𝐾𝐾)
vapor quality
42
the test and is independent on vapor quality at a range of 0.13-0.37. The surface temperature
can be cooled at nearly 110℃ while saturation temperature is 101.2℃, that is to say the
temperature difference between wall and fluid is only 8.8℃ under a heat flux of 42 𝐺𝐺/𝑐𝑐𝑐𝑐2.
That means radial expansion micro channel HE has a great capability of heat transfer and proves
that it is feasible to cool solar cell with that HE.
43
Chapter 3 Experiment of effect of gravity on radial expansion
microchannel HE
3.1 The effect of gravity
Miniaturization of electronic devices has led to an increase in power density which poses
severe challenges to maintain the operating temperatures within the safe limit [59–61].
Conventional single-phase cooling systems with air/liquid coolants are insufficient to meet this
demand [11,62]. Accordingly, there is a need to develop advanced thermal management
solutions capable of dissipating high heat flux within minimal temperature budgets. In this
regard, flow boiling in microchannels is envisioned as a viable solution to dissipate high heat
flux in excess of 10 MW/m2. However, practical implementation of flow boiling in
microchannels is limited due to two-phase flow instabilities encountered at high heat fluxes.
As a kind of instability, rapid bubble growth and expansion in the upstream and downstream
sides of the channel. This explanation was reported by [75–79]. At this condition, it was
observed by all the above that the bubble remains stationary for a very short time period with
small axial oscillations or slides slowly forward. Accordingly, evaporation of the thin liquid
layer underneath the bubble during this period results in the formation of a dry patch, which is
responsible for the instantaneous jump in the wall temperature. When the bubble departs and
moves away from the nucleation site, fresh liquid wets the surface and the wall temperature
drops again. This is a classical flow instability and has a deadly influence on micro-channel
heat exchanger.
When it comes to application on HCPVT system, the instability becomes more difficult to
solve. The fundamental principle behind concentrating photovoltaics (CPV) is the substitution
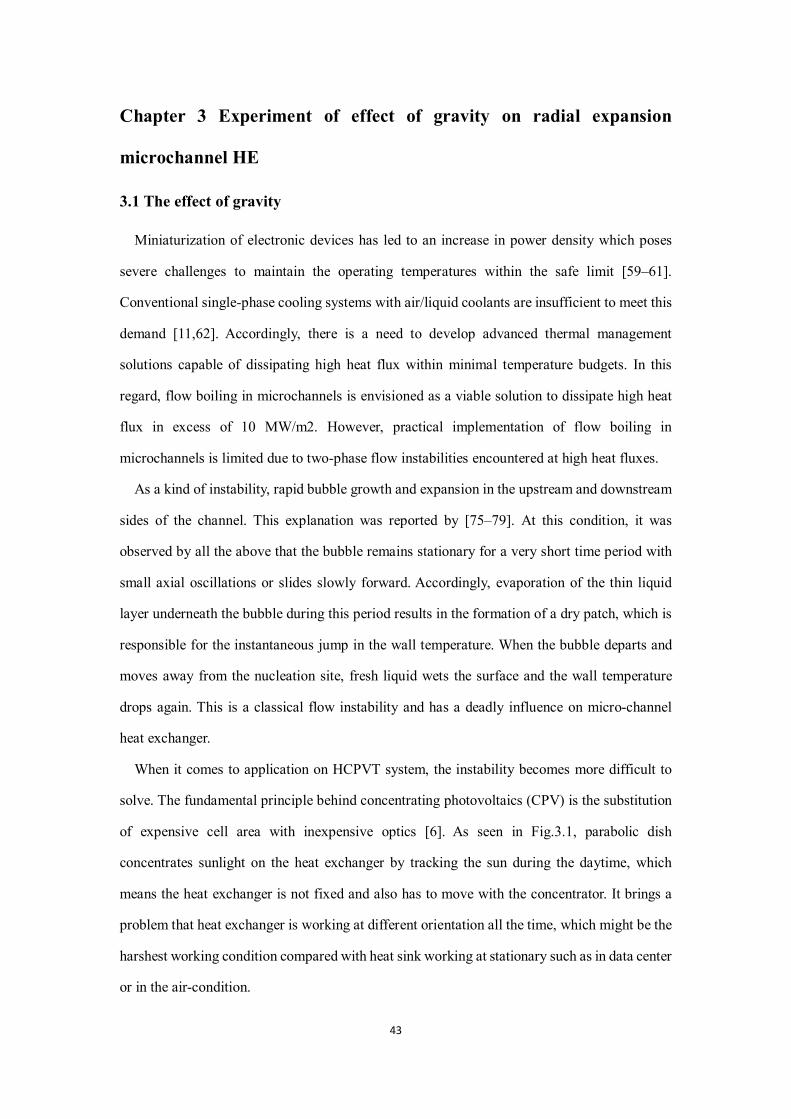
of expensive cell area with inexpensive optics [6]. As seen in Fig.3.1, parabolic dish
concentrates sunlight on the heat exchanger by tracking the sun during the daytime, which
means the heat exchanger is not fixed and also has to move with the concentrator. It brings a
problem that heat exchanger is working at different orientation all the time, which might be the
harshest working condition compared with heat sink working at stationary such as in data center
or in the air-condition.
44
Fig.3.1: Scheme of the parabolic dish concentrator of HCPTV system
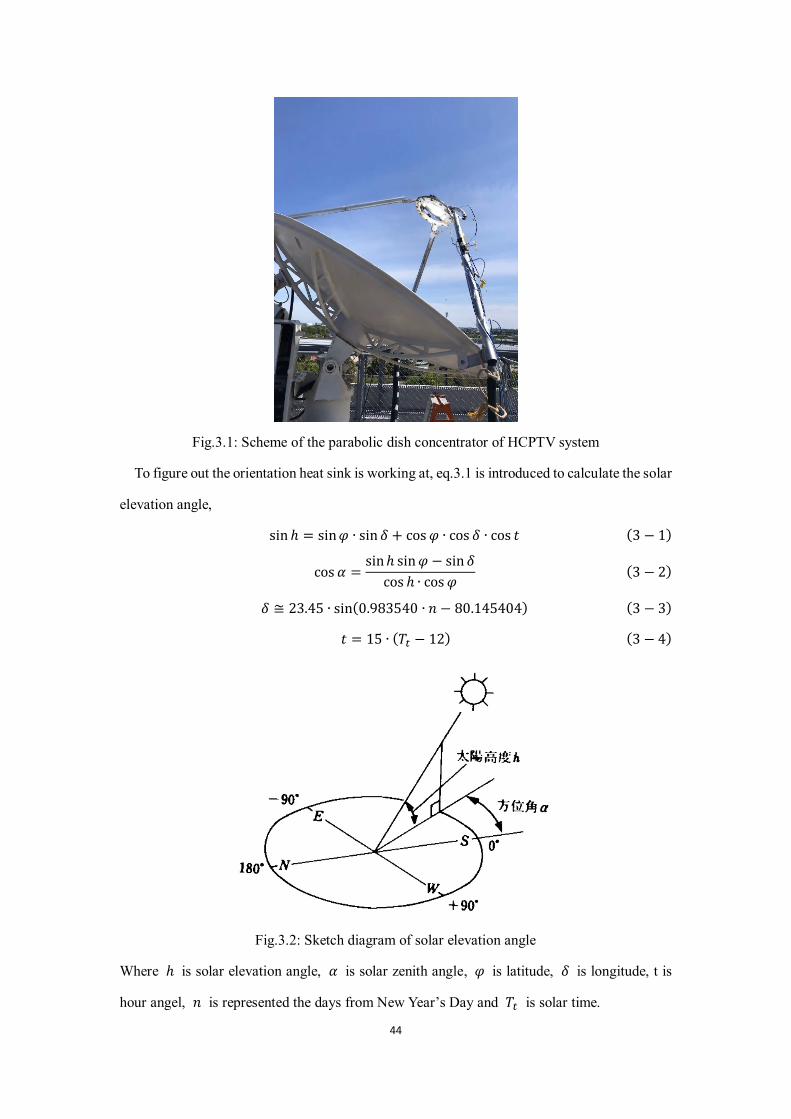
To figure out the orientation heat sink is working at, eq.3.1 is introduced to calculate the solar
elevation angle,
sinℎ = sin𝜑𝜑 ∙ sin𝛿𝛿 + cos𝜑𝜑 ∙ cos 𝛿𝛿 ∙ cos 𝑇𝑇 (3 − 1)
cos𝛼𝛼 =sinℎ sin𝜑𝜑 − sin𝛿𝛿
cos ℎ ∙ cos𝜑𝜑(3 − 2)
𝛿𝛿 ≅ 23.45 ∙ sin(0.983540 ∙ 𝑥𝑥 − 80.145404) (3 − 3)
𝑇𝑇 = 15 ∙ (𝑇𝑇𝑠𝑠 − 12) (3 − 4)
Fig.3.2: Sketch diagram of solar elevation angle
Where ℎ is solar elevation angle, 𝛼𝛼 is solar zenith angle, 𝜑𝜑 is latitude, 𝛿𝛿 is longitude, t is
hour angel, 𝑥𝑥 is represented the days from New Year’s Day and 𝑇𝑇𝑠𝑠 is solar time.
45
Thus, we found the heat exchanger working orientation in University of Tokyo, Kashiwa,
Chiba, Japan (35.9N,139.94E) is at a range of 31.74 degrees to 78.26 degrees. In other words,
the heat exchanger installed in HCPVT system is working almost vertically most of the time in
winter. It makes flow boiling instability much more severe.
Bubble growth in the microchannel is the main cause of reverse flow instability of the two-
phase flow. The fluid in the microchannel is governed by the surface tension, and when the
fluid is continuously heated it evaporates and becomes bubbles. If the saturation liquid
continues to be heated, the bubble expands rapidly. The pressure inside the bubbles increases
and may become larger than the pressure of the inlet fluid, pushing the fluid back to the inlet
and causing a reverse flow.
If reverse occurs in the channel, it would be fatal to the heat transfer performance because
the downstream is being a lack of fluid and liquid film would evaporate quickly and never be
replenished as long as the large pressure of vapor prohibits fluid coming into the channel. If
downstream of microchannel could not be cooled, wall temperature would rise dramatically
which is called dry-out flaw.
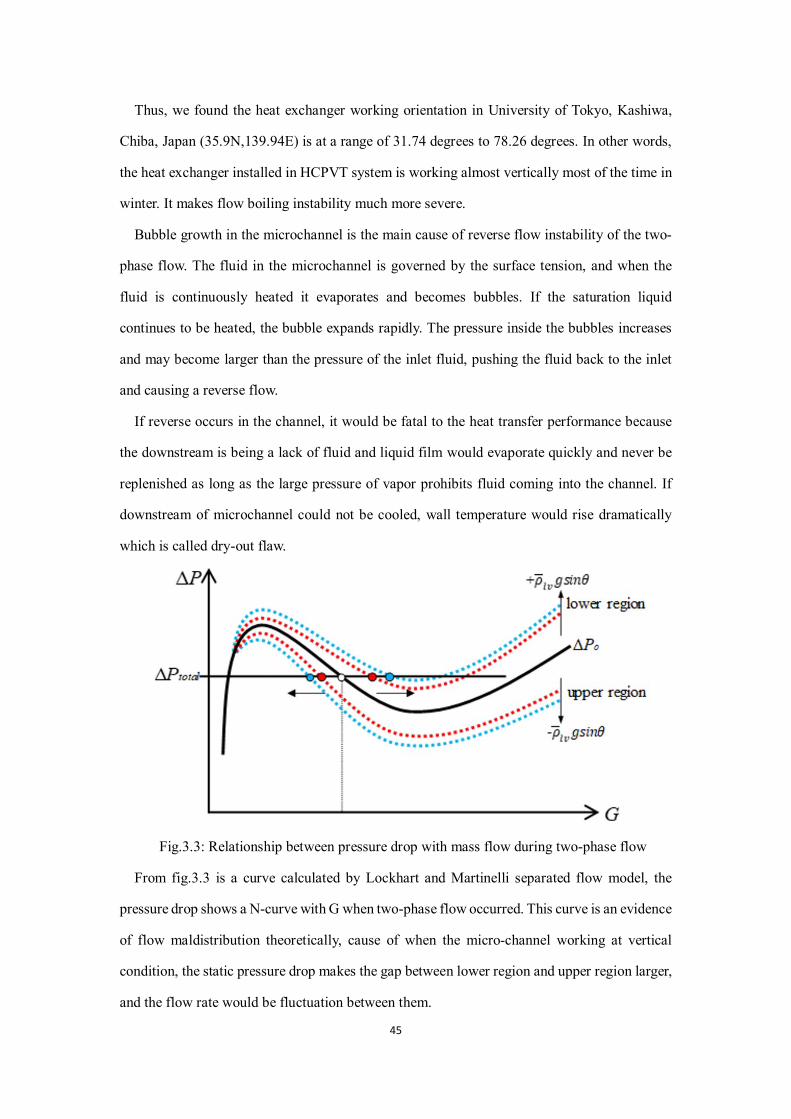
Fig.3.3: Relationship between pressure drop with mass flow during two-phase flow
From fig.3.3 is a curve calculated by Lockhart and Martinelli separated flow model, the
pressure drop shows a N-curve with G when two-phase flow occurred. This curve is an evidence
of flow maldistribution theoretically, cause of when the micro-channel working at vertical
condition, the static pressure drop makes the gap between lower region and upper region larger,
and the flow rate would be fluctuation between them.

46
What makes matters worse is, parabolic dish concentrator tracks the sun at a lower orientation
about 11.74 degrees in winter as above, which means heat exchanger is working more like a
perpendicular condition at that time. Fig.3.4 and fig.3.5 is a force analysis of a single channel,
trying to account for how flow boiling instability occur and exploring the solution.
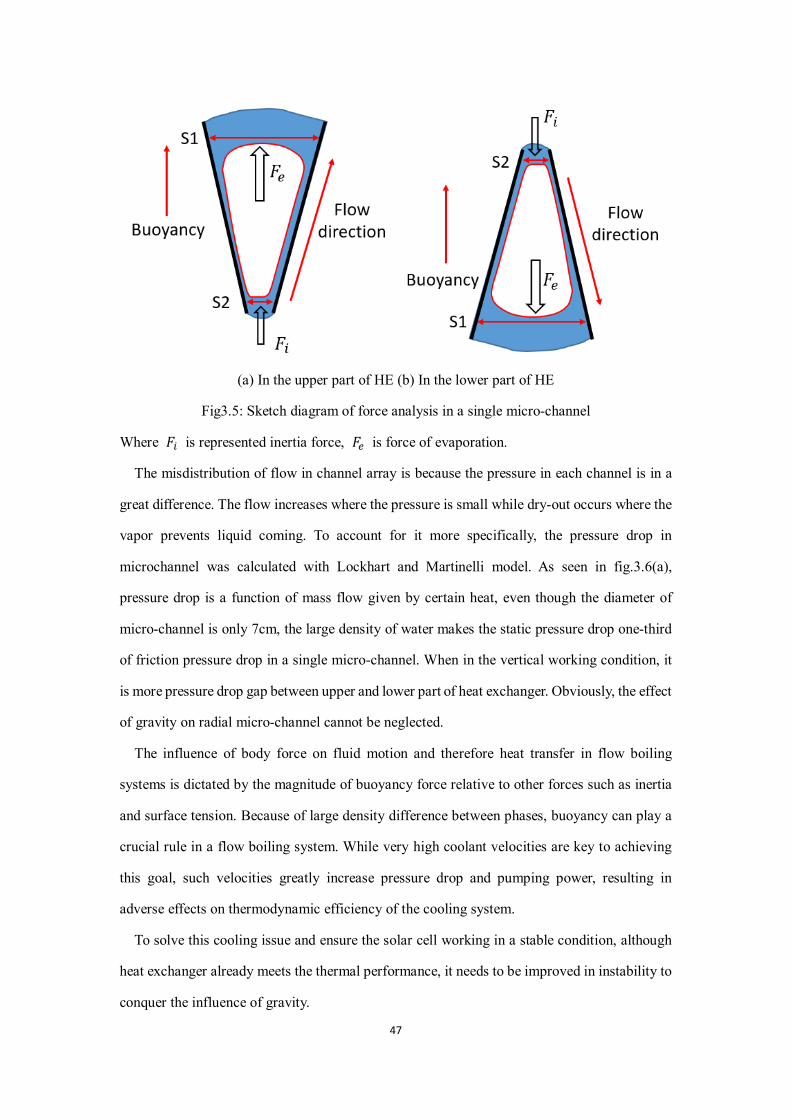
Compared two position of microchannel heat sink, as seen (a) and (b) in fig.3.3, when bubble
is heated and inflates, in the upper part of HE buoyancy contributes to accelerate the vapor
escape the channel, however, in the lower part of HE the buoyancy prevents bubble inflate and
make vapor float upward to the inlet.
These two opposite phenomena in microchannel lead to significant discrepancy in the flow
distribution among channel arrays. When placed non-horizontally, liquid starve may occur in
the upper region, while the lower channels could be flooded with liquid but in lower vapor
quality, which causes large temperature difference. When solar cell is installed on the surface
of heat exchanger great gap of temperature would occur hot spots flaw or even burn-out of
target solar cells. This flow maldistribution becomes more pronounced with the increase of
orientation angle, hindering the application of two-phase flow heat sink.
Fig.3.4: Choose two area to analysis
47
(a) In the upper part of HE (b) In the lower part of HE
Fig3.5: Sketch diagram of force analysis in a single micro-channel
Where 𝐹𝐹𝑠𝑠 is represented inertia force, 𝐹𝐹𝑔𝑔 is force of evaporation.
The misdistribution of flow in channel array is because the pressure in each channel is in a
great difference. The flow increases where the pressure is small while dry-out occurs where the
vapor prevents liquid coming. To account for it more specifically, the pressure drop in
microchannel was calculated with Lockhart and Martinelli model. As seen in fig.3.6(a),
pressure drop is a function of mass flow given by certain heat, even though the diameter of
micro-channel is only 7cm, the large density of water makes the static pressure drop one-third
of friction pressure drop in a single micro-channel. When in the vertical working condition, it
is more pressure drop gap between upper and lower part of heat exchanger. Obviously, the effect
of gravity on radial micro-channel cannot be neglected.
The influence of body force on fluid motion and therefore heat transfer in flow boiling
systems is dictated by the magnitude of buoyancy force relative to other forces such as inertia
and surface tension. Because of large density difference between phases, buoyancy can play a
crucial rule in a flow boiling system. While very high coolant velocities are key to achieving
this goal, such velocities greatly increase pressure drop and pumping power, resulting in
adverse effects on thermodynamic efficiency of the cooling system.
To solve this cooling issue and ensure the solar cell working in a stable condition, although
heat exchanger already meets the thermal performance, it needs to be improved in instability to
conquer the influence of gravity.
48
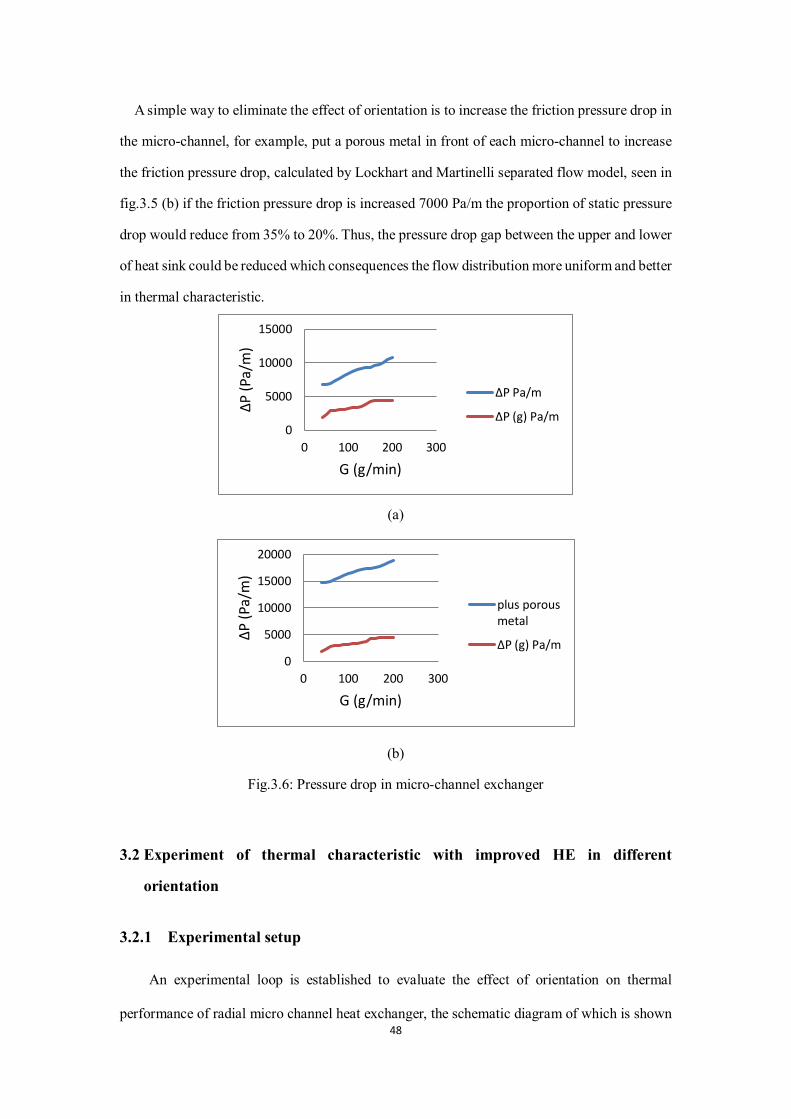
A simple way to eliminate the effect of orientation is to increase the friction pressure drop in
the micro-channel, for example, put a porous metal in front of each micro-channel to increase
the friction pressure drop, calculated by Lockhart and Martinelli separated flow model, seen in
fig.3.5 (b) if the friction pressure drop is increased 7000 Pa/m the proportion of static pressure
drop would reduce from 35% to 20%. Thus, the pressure drop gap between the upper and lower
of heat sink could be reduced which consequences the flow distribution more uniform and better
in thermal characteristic.
(a)
(b)
Fig.3.6: Pressure drop in micro-channel exchanger
3.2 Experiment of thermal characteristic with improved HE in different
orientation
3.2.1 Experimental setup
An experimental loop is established to evaluate the effect of orientation on thermal
performance of radial micro channel heat exchanger, the schematic diagram of which is shown
0
5000
10000
15000
0 100 200 300
ΔP (P
a/m
)
G (g/min)
ΔP Pa/m
ΔP (g) Pa/m
0
5000
10000
15000
20000
0 100 200 300
ΔP (P
a/m
)
G (g/min)
plus porousmetal
ΔP (g) Pa/m

49
as Fig.3.7(a).
The main parts of setup are similar with the one in chapter 2. A micro gear pump
(MICROPUMP GJ-DB380.A), a needle valve, a bypass loop and a flow meter (OVAL ALTI
mass II CA001) were used to monitor and regulate the inlet mass flux. A thermostatic bath
preheater was used to adjust the inlet subcooled degree of working fluid. A condenser was used
to chill the outlet two-phase flow and stabilize the system outlet pressure. The different
orientation angle was achieved by adjusting the upright height of test section, as shown in
Fig.3.7 (b). The test section was as the same as previously introduced, which was made up of a
polycarbonate cover plate, a copper base plate and a copper cartridge heater. An O-ring was
used for sealing between cover plate and base plate. To detect the temperature distribution and
temperature difference on HE, 4 thermocouples were symmetrically arranged from inlet to each
outlet. All thermocouples were placed 5 mm below the surface of microchannel and inserted to
the center cross-section of HE.
To calculate the saturation temperature of the system, it is necessary to measure the pressures
at the outlet. Temperature and pressure at the inlet and outlet were both monitored, where K-
type thermocouples and pressure sensor switch gauge (NAGANO KEIKI KP-15) were used. In
the present work, the outlet pressure was controlled at 107.2±1 kPa, and the corresponding
saturation temperature was maintained within 101.6±0.3 oC.
MEMRECAM high-speed digital camera (NAC Image Technology, HX-6), as shown in
fig3.9, and two laser light sources were used to conduct visualization, where 500 frame/s (fps)
and 1280 × 1280 dpi was set as the frame rate and spatial resolution, respectively. The
placement of lens was confirmed for the visualization tests under different orientations.
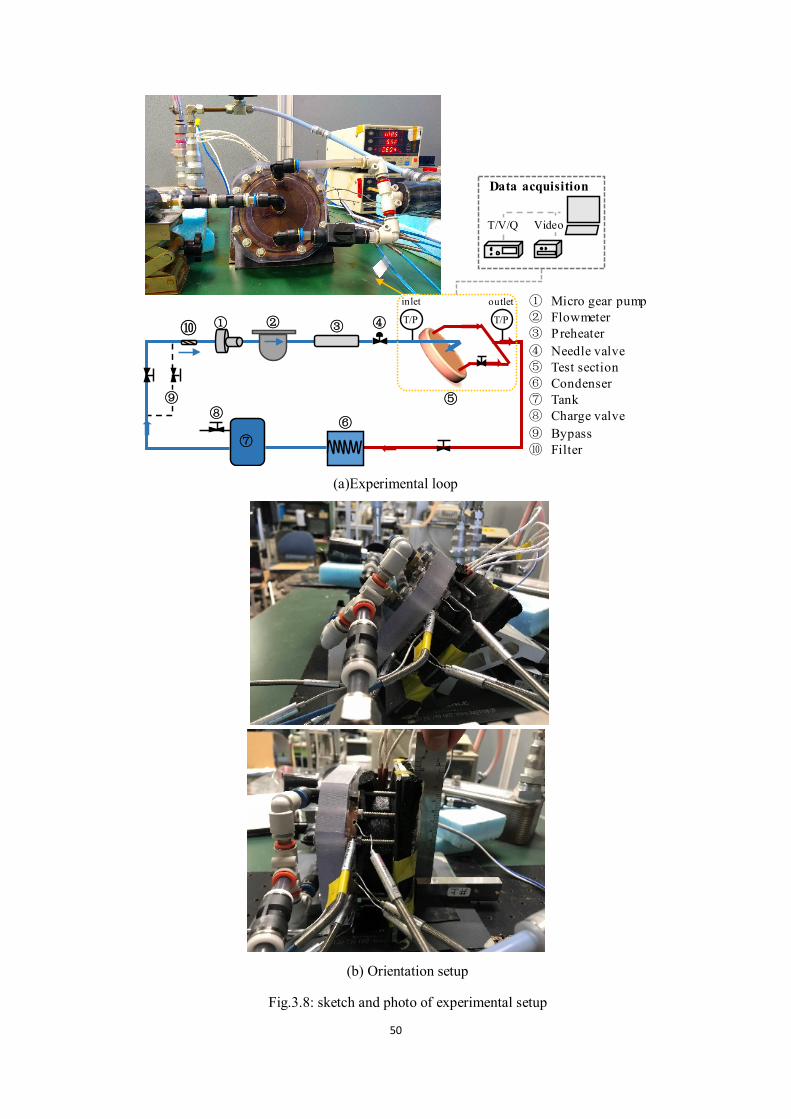
50
(a)Experimental loop
(b) Orientation setup
Fig.3.8: sketch and photo of experimental setup
②⑩ ③T/P T/P
⑧⑨
inlet outlet
Data acquisition
Video
④
T/V/Q
① Micro gear pump ② Flowmeter ③ Preheater ④ Needle valve⑤ Test section ⑥ Condenser ⑦ Tank ⑧ Charge valve ⑨ Bypass⑩ Filter
①
⑤
⑦
⑥
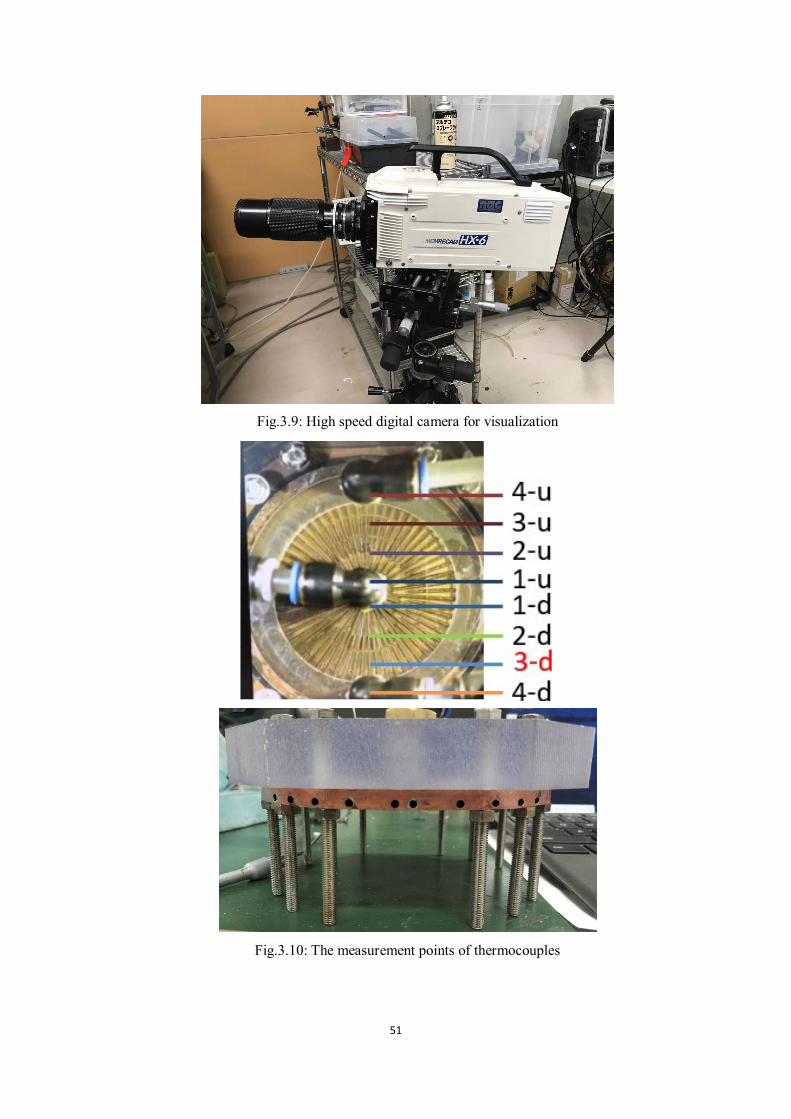
51
Fig.3.9: High speed digital camera for visualization
Fig.3.10: The measurement points of thermocouples
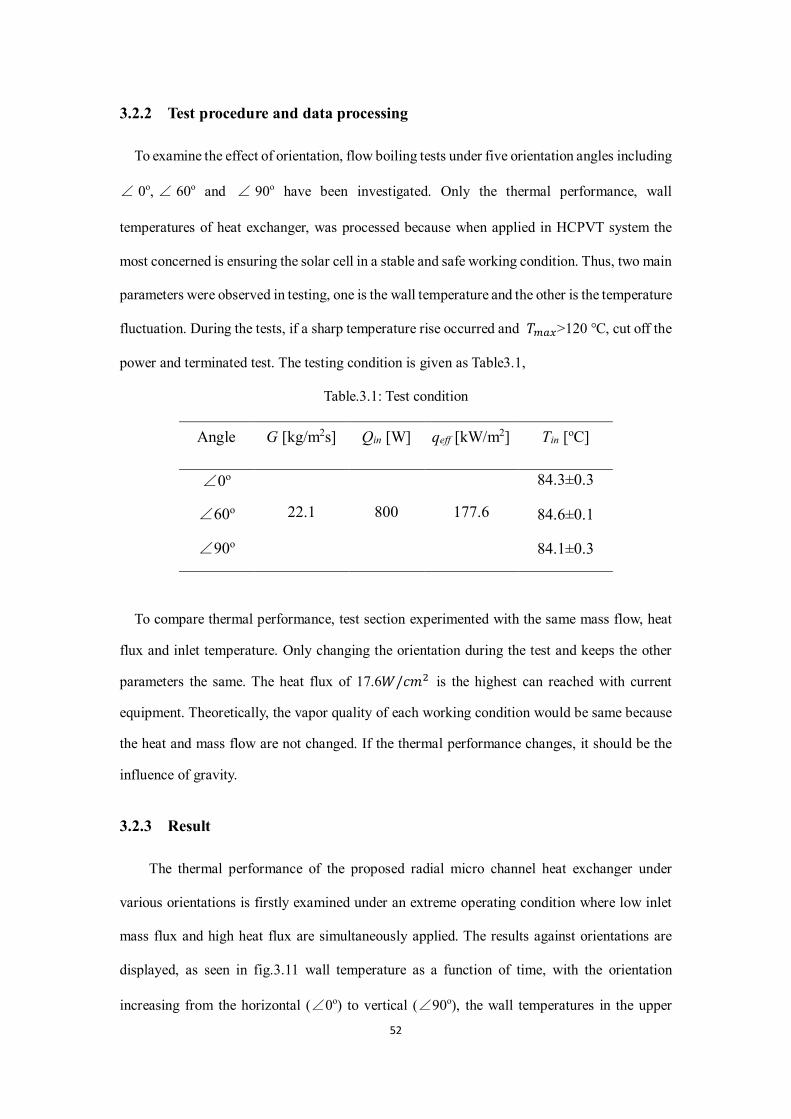
52
3.2.2 Test procedure and data processing
To examine the effect of orientation, flow boiling tests under five orientation angles including
∠ 0o, ∠ 60o and ∠ 90o have been investigated. Only the thermal performance, wall
temperatures of heat exchanger, was processed because when applied in HCPVT system the
most concerned is ensuring the solar cell in a stable and safe working condition. Thus, two main
parameters were observed in testing, one is the wall temperature and the other is the temperature
fluctuation. During the tests, if a sharp temperature rise occurred and 𝑇𝑇𝑔𝑔𝑠𝑠𝑥𝑥>120 ℃, cut off the
power and terminated test. The testing condition is given as Table3.1,
Table.3.1: Test condition
Angle G [kg/m2s] Qin [W] qeff [kW/m2] Tin [oC]
∠0o
22.1 800 177.6
84.3±0.3
∠60o 84.6±0.1
∠90o 84.1±0.3
To compare thermal performance, test section experimented with the same mass flow, heat
flux and inlet temperature. Only changing the orientation during the test and keeps the other
parameters the same. The heat flux of 17.6𝐺𝐺/𝑐𝑐𝑐𝑐2 is the highest can reached with current
equipment. Theoretically, the vapor quality of each working condition would be same because
the heat and mass flow are not changed. If the thermal performance changes, it should be the
influence of gravity.
3.2.3 Result
The thermal performance of the proposed radial micro channel heat exchanger under
various orientations is firstly examined under an extreme operating condition where low inlet
mass flux and high heat flux are simultaneously applied. The results against orientations are
displayed, as seen in fig.3.11 wall temperature as a function of time, with the orientation
increasing from the horizontal (∠0o) to vertical (∠90o), the wall temperatures in the upper
53
region of HE oscillate more violently owing to the reduced mass flow and increased vapor
quality, whereas the wall temperatures in the lower region barely oscillate but decrease slightly
with the aid of the gravity.
That is to say, agree on the previous theoretical analysis on a single channel, in the upper
region, the buoyancy contributes to being a positive factor to accelerate vapor escaping the
channel, elevates the velocity of two phases of fluid. Thus, the convective heat transfer becomes
better and wall temperature is lower than which placed in horizon. On the contrary, in the lower
region of HE, after the bubble is getting bigger along the flow direction, the vapor stays
stationary in the channel and even floats upper to the inlet of HE. As the same with theoretical
derivation, the buoyancy presents a negative effect on thermal performance because the
direction of buoyancy is against the inertia force of flow and makes the block of vapor be an
obstacle in the channel, reducing the mass flow. As a kind of flow instability, the reverse flow
occurs. The detail and comparison would be showed in visualization.
From the comparison of each orientation working conditions, even though violent
temperature fluctuations are recorded with the increasing of orientation angle, 𝑇𝑇𝑔𝑔𝑠𝑠𝑥𝑥 of wall
temperature is maintained below 110℃ and ∆𝑇𝑇𝑔𝑔𝑠𝑠𝑥𝑥 is kept below 5 K, which meets the
thermal management demand for PV-CSP system. Namely, the increasing of orientation angle
brings about a certain temperature oscillation during the operation but an insignificant effect on
the static thermal performance, proving that REMHS can operate satisfactorily for all
orientations under the extreme condition. Besides, it is noted that the most violent temperature
oscillation occurs at ∠60o instead of ∠90o, which illustrates that the variation of thermal
performance against orientation is non-linear, which is also consist with the recorded high-
speed visualization results.

54
Fig.3.11: Dynamic variations of wall temperature
3.3 Visualization
Fig. 12 compares the visualization results of dynamic two-phase flow in radial micro-channel
heat exchanger under ∠0o, and ∠90o in a same time interval. It is confirmed that the
temperature oscillation in the upper region of HE is resulted from intermittent vapor choke and
relief in the upper channels under reduced mass flow and increased vapor quality. As expected,
the expand cross-section area of microchannel facilitates the elongated vapor plugs to move
spontaneously towards the outlet instead of complete blocking the channel.
When heat sink working at horizon, as seen in visualization of ∠0°, the flow distribution
was almost uniform in each micro-channel, both upper and lower region of heat sink were filled
with fluid. Bubbles were growing up along with the flow direction and escaping successfully.
No reverse flow was observed during the test. When it comes to thermal performance, the
results of visualization are in accord with fig.3.11 which the wall temperature is stable.
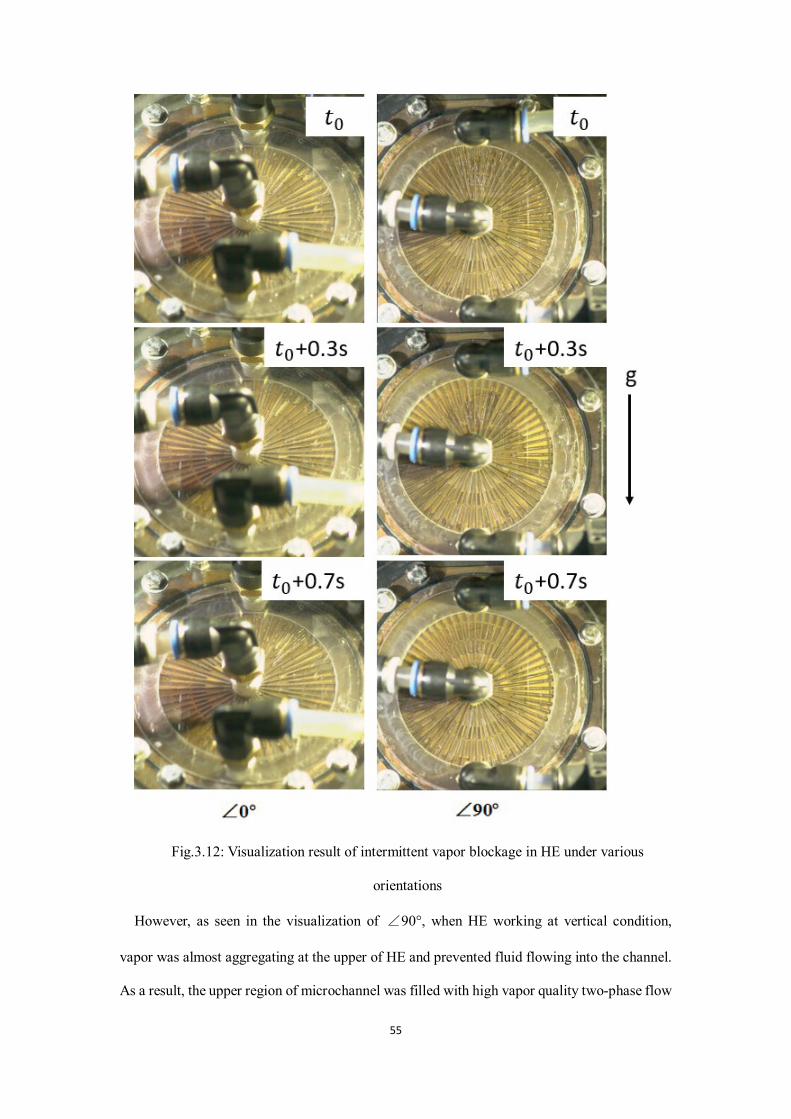
55
Fig.3.12: Visualization result of intermittent vapor blockage in HE under various
orientations
However, as seen in the visualization of ∠90°, when HE working at vertical condition,
vapor was almost aggregating at the upper of HE and prevented fluid flowing into the channel.
As a result, the upper region of microchannel was filled with high vapor quality two-phase flow
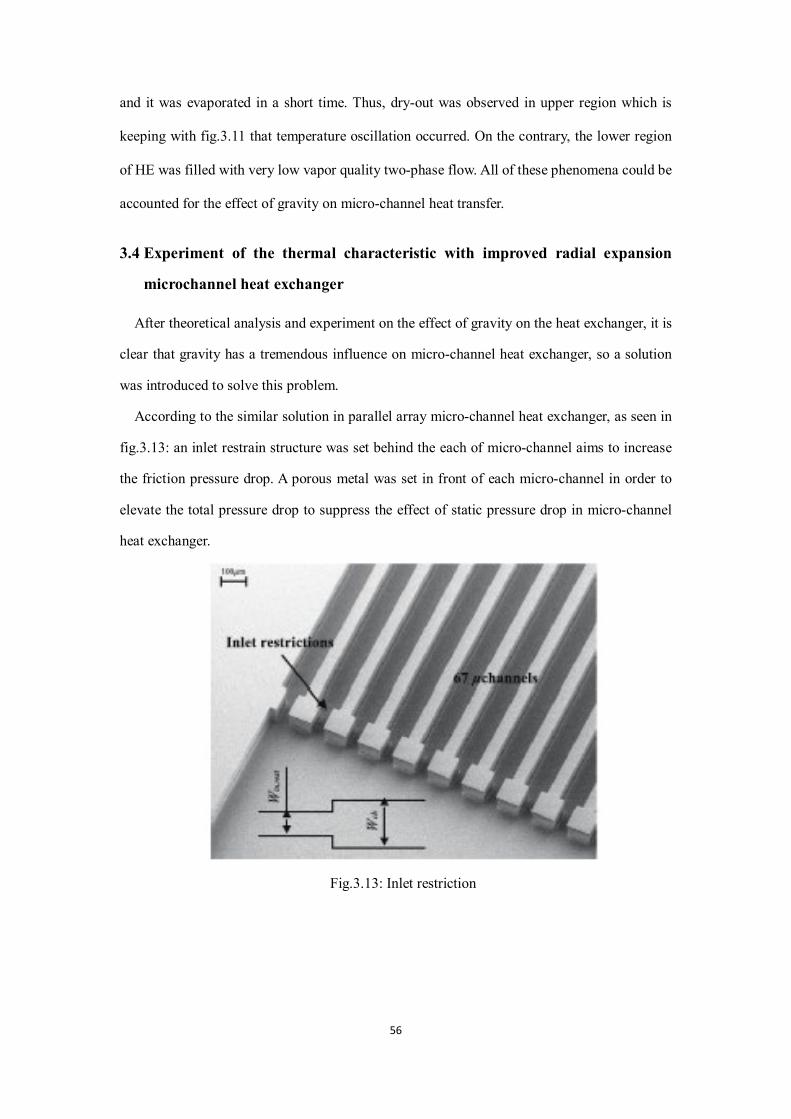
56
and it was evaporated in a short time. Thus, dry-out was observed in upper region which is
keeping with fig.3.11 that temperature oscillation occurred. On the contrary, the lower region
of HE was filled with very low vapor quality two-phase flow. All of these phenomena could be
accounted for the effect of gravity on micro-channel heat transfer.
3.4 Experiment of the thermal characteristic with improved radial expansion
microchannel heat exchanger
After theoretical analysis and experiment on the effect of gravity on the heat exchanger, it is
clear that gravity has a tremendous influence on micro-channel heat exchanger, so a solution
was introduced to solve this problem.
According to the similar solution in parallel array micro-channel heat exchanger, as seen in
fig.3.13: an inlet restrain structure was set behind the each of micro-channel aims to increase
the friction pressure drop. A porous metal was set in front of each micro-channel in order to
elevate the total pressure drop to suppress the effect of static pressure drop in micro-channel
heat exchanger.
Fig.3.13: Inlet restriction
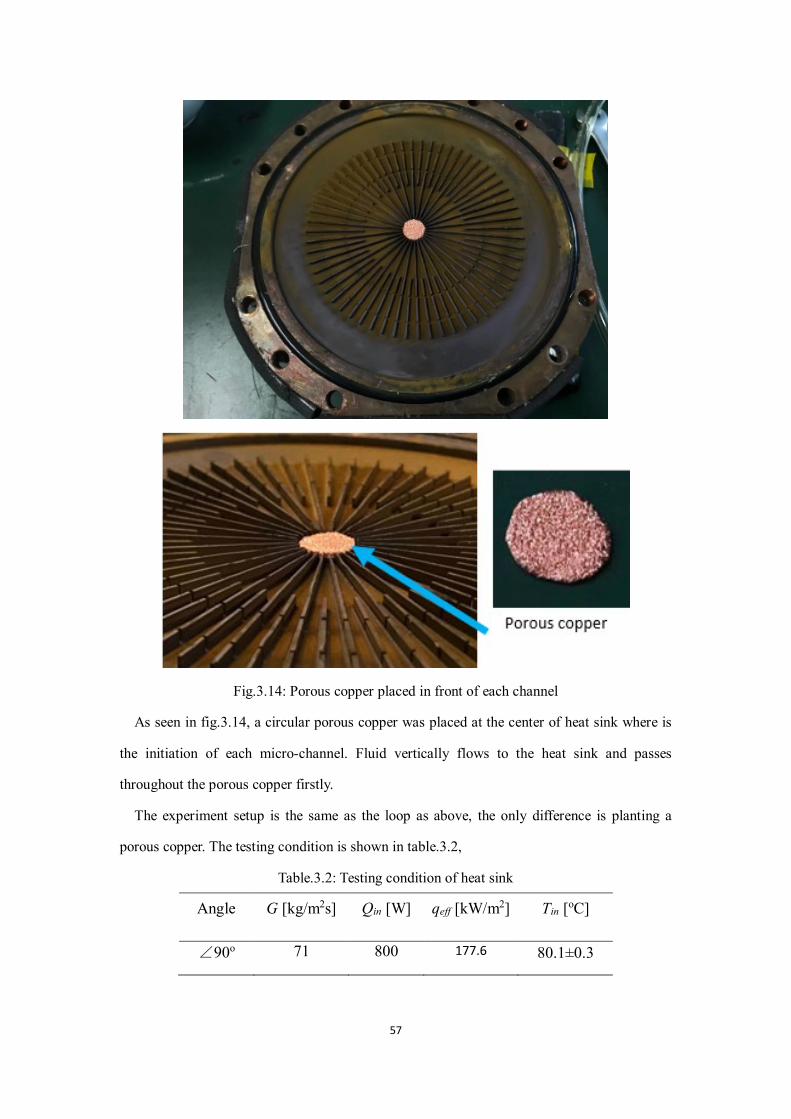
57
Fig.3.14: Porous copper placed in front of each channel
As seen in fig.3.14, a circular porous copper was placed at the center of heat sink where is
the initiation of each micro-channel. Fluid vertically flows to the heat sink and passes
throughout the porous copper firstly.
The experiment setup is the same as the loop as above, the only difference is planting a
porous copper. The testing condition is shown in table.3.2,
Table.3.2: Testing condition of heat sink
Angle G [kg/m2s] Qin [W] qeff [kW/m2] Tin [oC]
∠90o 71 800 177.6 80.1±0.3
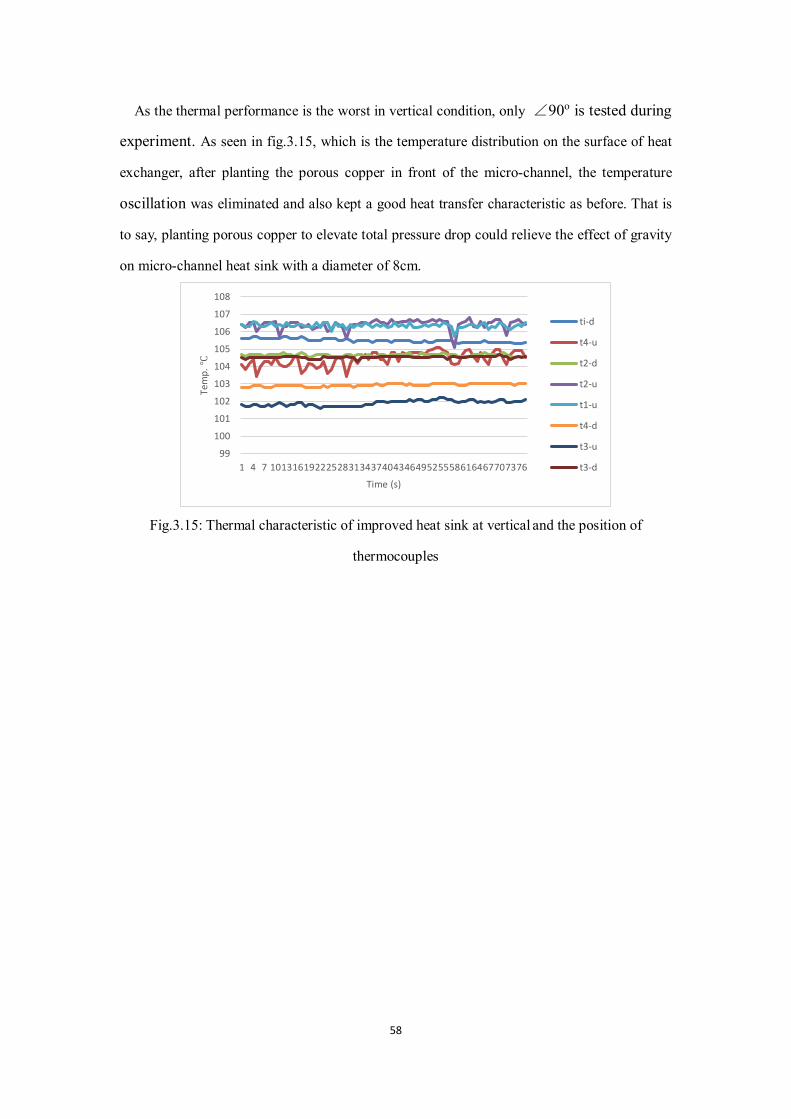
58
As the thermal performance is the worst in vertical condition, only ∠90o is tested during
experiment. As seen in fig.3.15, which is the temperature distribution on the surface of heat
exchanger, after planting the porous copper in front of the micro-channel, the temperature
oscillation was eliminated and also kept a good heat transfer characteristic as before. That is
to say, planting porous copper to elevate total pressure drop could relieve the effect of gravity
on micro-channel heat sink with a diameter of 8cm.
Fig.3.15: Thermal characteristic of improved heat sink at vertical and the position of
thermocouples
99
100
101
102
103
104
105
106
107
108
1 4 7 1013161922252831343740434649525558616467707376
Tem
p. ℃
Time (s)
ti-d
t4-u
t2-d
t2-u
t1-u
t4-d
t3-u
t3-d
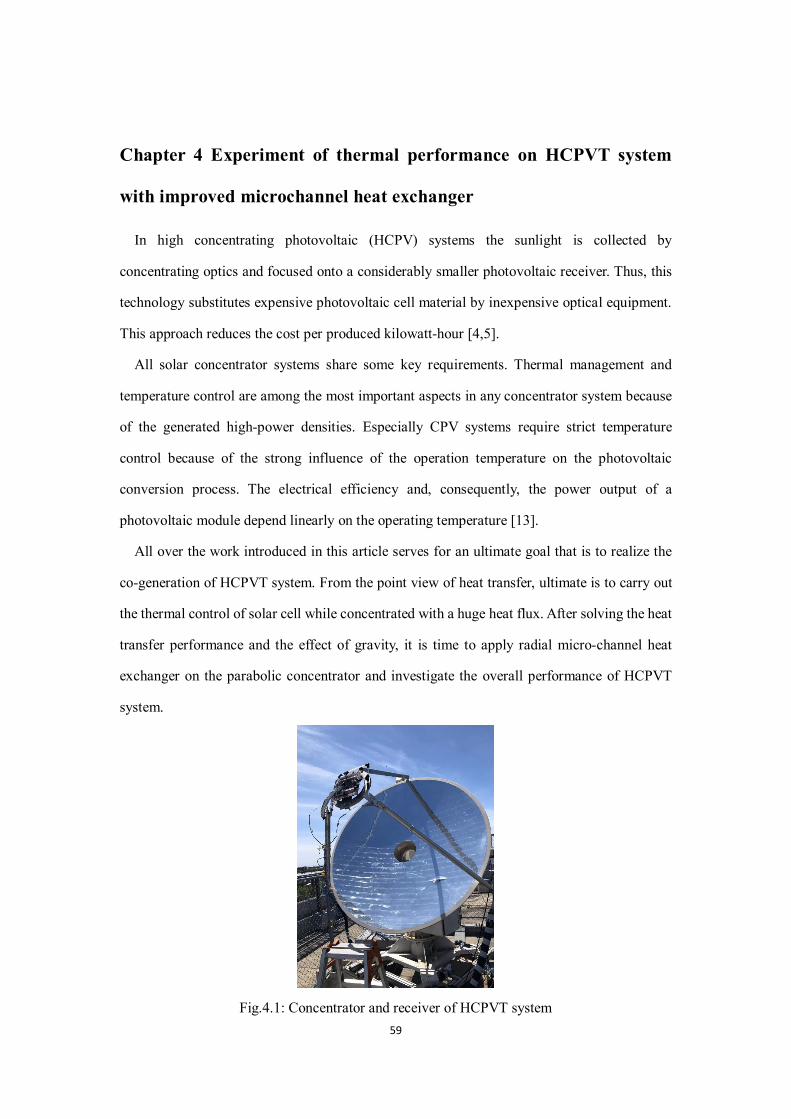
59
Chapter 4 Experiment of thermal performance on HCPVT system
with improved microchannel heat exchanger
In high concentrating photovoltaic (HCPV) systems the sunlight is collected by
concentrating optics and focused onto a considerably smaller photovoltaic receiver. Thus, this
technology substitutes expensive photovoltaic cell material by inexpensive optical equipment.
This approach reduces the cost per produced kilowatt-hour [4,5].
All solar concentrator systems share some key requirements. Thermal management and
temperature control are among the most important aspects in any concentrator system because
of the generated high-power densities. Especially CPV systems require strict temperature
control because of the strong influence of the operation temperature on the photovoltaic
conversion process. The electrical efficiency and, consequently, the power output of a
photovoltaic module depend linearly on the operating temperature [13].
All over the work introduced in this article serves for an ultimate goal that is to realize the
co-generation of HCPVT system. From the point view of heat transfer, ultimate is to carry out
the thermal control of solar cell while concentrated with a huge heat flux. After solving the heat
transfer performance and the effect of gravity, it is time to apply radial micro-channel heat
exchanger on the parabolic concentrator and investigate the overall performance of HCPVT
system.
Fig.4.1: Concentrator and receiver of HCPVT system
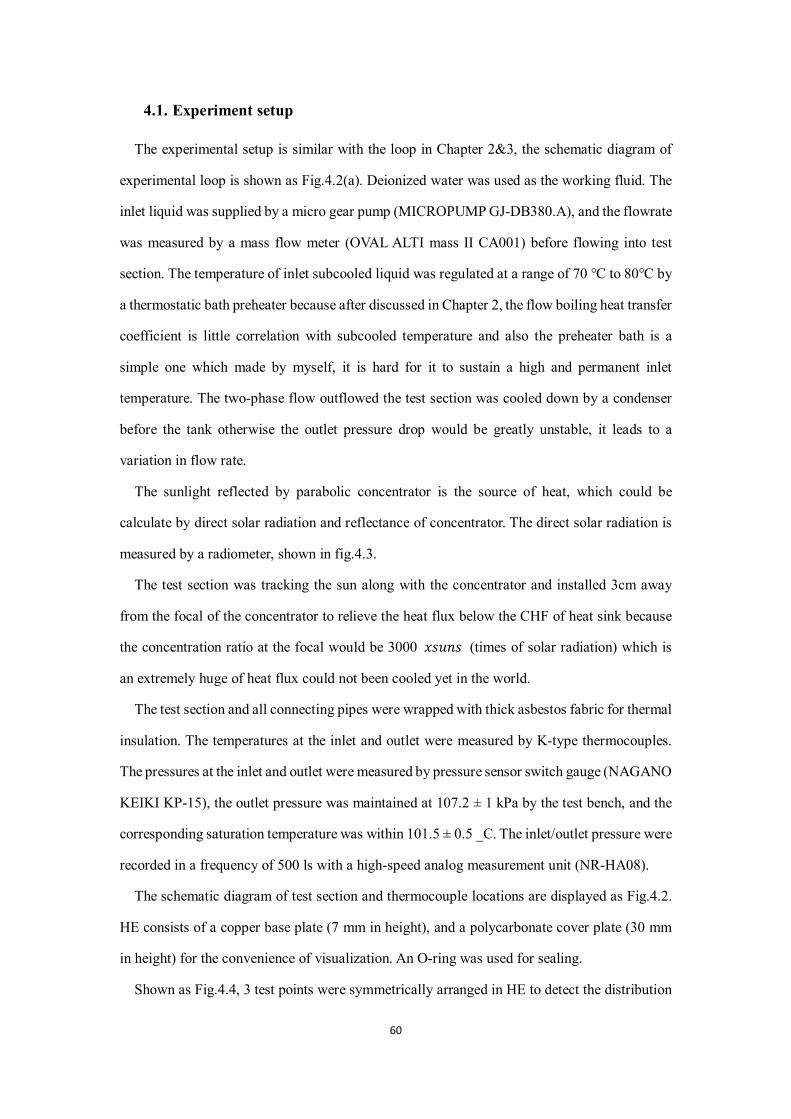
60
4.1. Experiment setup
The experimental setup is similar with the loop in Chapter 2&3, the schematic diagram of
experimental loop is shown as Fig.4.2(a). Deionized water was used as the working fluid. The
inlet liquid was supplied by a micro gear pump (MICROPUMP GJ-DB380.A), and the flowrate
was measured by a mass flow meter (OVAL ALTI mass II CA001) before flowing into test
section. The temperature of inlet subcooled liquid was regulated at a range of 70 ℃ to 80℃ by
a thermostatic bath preheater because after discussed in Chapter 2, the flow boiling heat transfer
coefficient is little correlation with subcooled temperature and also the preheater bath is a
simple one which made by myself, it is hard for it to sustain a high and permanent inlet
temperature. The two-phase flow outflowed the test section was cooled down by a condenser
before the tank otherwise the outlet pressure drop would be greatly unstable, it leads to a
variation in flow rate.
The sunlight reflected by parabolic concentrator is the source of heat, which could be
calculate by direct solar radiation and reflectance of concentrator. The direct solar radiation is
measured by a radiometer, shown in fig.4.3.
The test section was tracking the sun along with the concentrator and installed 3cm away
from the focal of the concentrator to relieve the heat flux below the CHF of heat sink because
the concentration ratio at the focal would be 3000 𝑥𝑥𝑥𝑥𝑥𝑥𝑥𝑥𝑥𝑥 (times of solar radiation) which is
an extremely huge of heat flux could not been cooled yet in the world.
The test section and all connecting pipes were wrapped with thick asbestos fabric for thermal
insulation. The temperatures at the inlet and outlet were measured by K-type thermocouples.
The pressures at the inlet and outlet were measured by pressure sensor switch gauge (NAGANO
KEIKI KP-15), the outlet pressure was maintained at 107.2 ± 1 kPa by the test bench, and the
corresponding saturation temperature was within 101.5 ± 0.5 _C. The inlet/outlet pressure were
recorded in a frequency of 500 ls with a high-speed analog measurement unit (NR-HA08).
The schematic diagram of test section and thermocouple locations are displayed as Fig.4.2.
HE consists of a copper base plate (7 mm in height), and a polycarbonate cover plate (30 mm
in height) for the convenience of visualization. An O-ring was used for sealing.
Shown as Fig.4.4, 3 test points were symmetrically arranged in HE to detect the distribution

61
of wall temperature along the radial direction. The thermocouples were 5 mm beneath the
bottom surface of channel.
(a) Sketch diagram of experiment loop
Fig.4.2: Sketch of HCPVT system and receiver
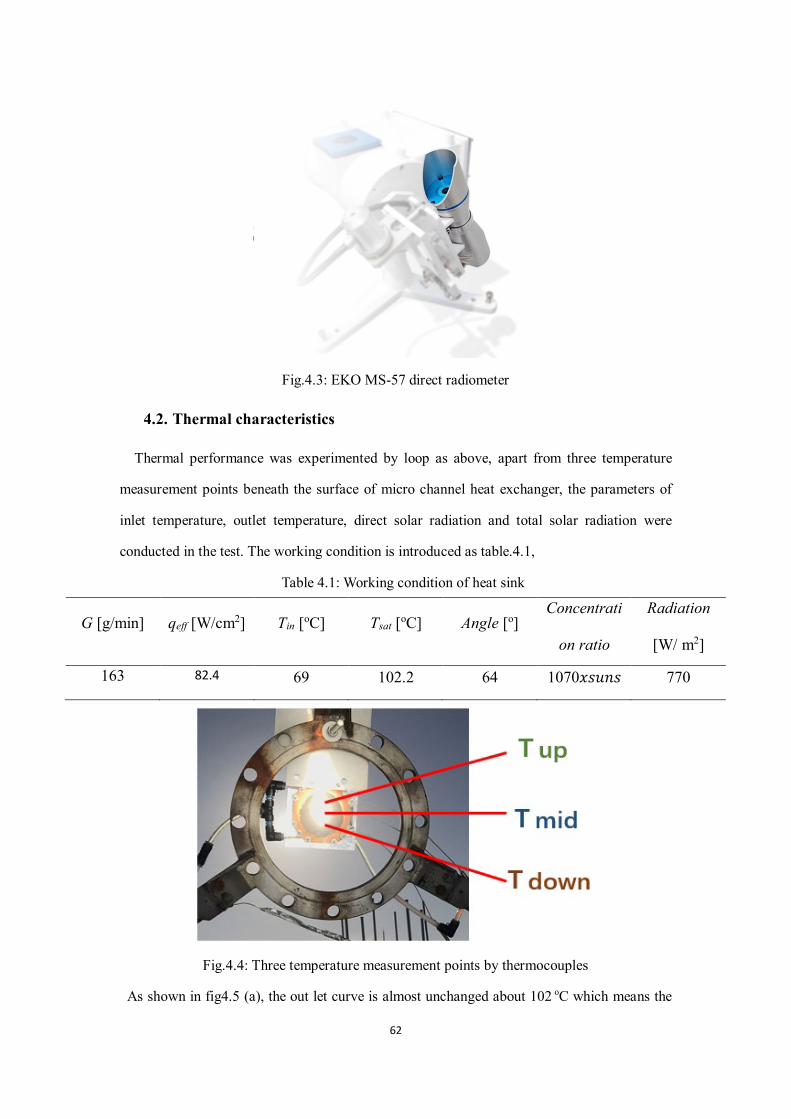
62
Fig.4.3: EKO MS-57 direct radiometer
4.2. Thermal characteristics
Thermal performance was experimented by loop as above, apart from three temperature
measurement points beneath the surface of micro channel heat exchanger, the parameters of
inlet temperature, outlet temperature, direct solar radiation and total solar radiation were
conducted in the test. The working condition is introduced as table.4.1,
Table 4.1: Working condition of heat sink
G [g/min] qeff [W/cm2] Tin [oC] Tsat [oC] Angle [o] Concentrati
on ratio
Radiation
[W/ m2]
163 82.4 69 102.2 64 1070𝑥𝑥𝑥𝑥𝑥𝑥𝑥𝑥𝑥𝑥 770
Fig.4.4: Three temperature measurement points by thermocouples
As shown in fig4.5 (a), the out let curve is almost unchanged about 102 oC which means the
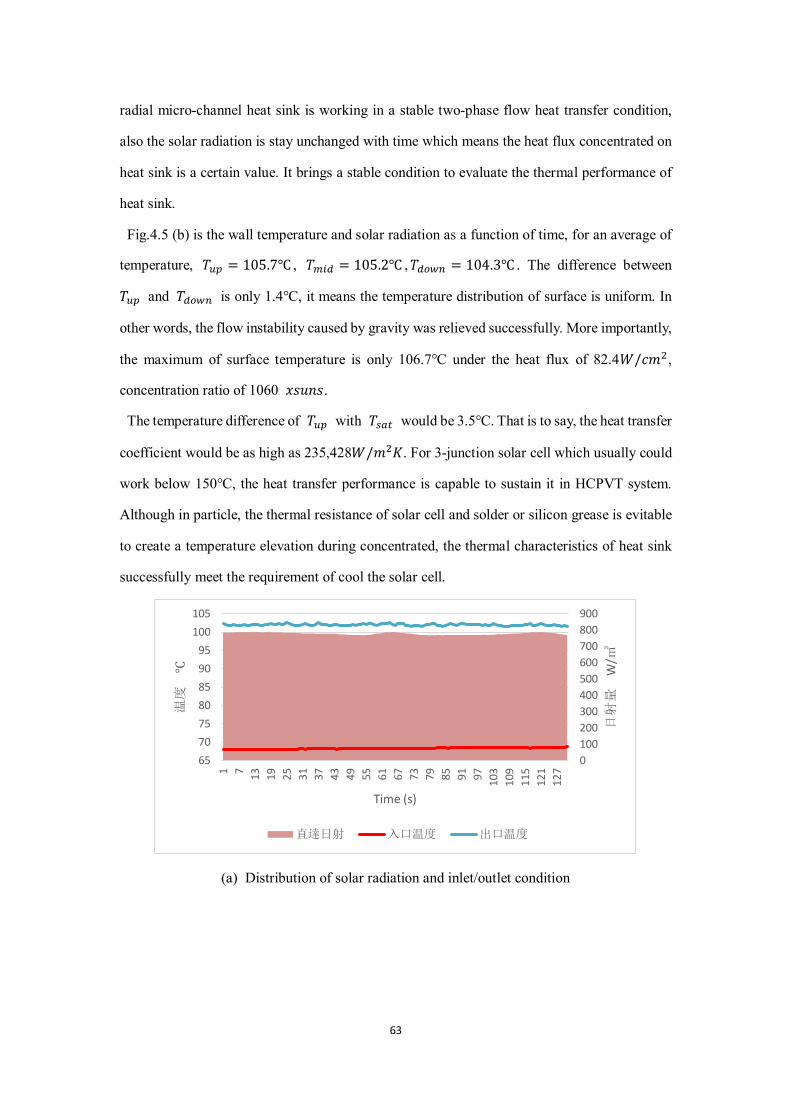
63
radial micro-channel heat sink is working in a stable two-phase flow heat transfer condition,
also the solar radiation is stay unchanged with time which means the heat flux concentrated on
heat sink is a certain value. It brings a stable condition to evaluate the thermal performance of
heat sink.
Fig.4.5 (b) is the wall temperature and solar radiation as a function of time, for an average of
temperature, 𝑇𝑇𝑜𝑜𝑠𝑠 = 105.7℃ , 𝑇𝑇𝑔𝑔𝑠𝑠𝑚𝑚 = 105.2℃ ,𝑇𝑇𝑚𝑚𝑔𝑔𝑤𝑤𝑐𝑐 = 104.3℃ . The difference between
𝑇𝑇𝑜𝑜𝑠𝑠 and 𝑇𝑇𝑚𝑚𝑔𝑔𝑤𝑤𝑐𝑐 is only 1.4℃, it means the temperature distribution of surface is uniform. In
other words, the flow instability caused by gravity was relieved successfully. More importantly,
the maximum of surface temperature is only 106.7℃ under the heat flux of 82.4𝐺𝐺/𝑐𝑐𝑐𝑐2 ,
concentration ratio of 1060 𝑥𝑥𝑥𝑥𝑥𝑥𝑥𝑥𝑥𝑥.
The temperature difference of 𝑇𝑇𝑜𝑜𝑠𝑠 with 𝑇𝑇𝑠𝑠𝑠𝑠𝑠𝑠 would be 3.5℃. That is to say, the heat transfer
coefficient would be as high as 235,428𝐺𝐺/𝑐𝑐2𝐾𝐾. For 3-junction solar cell which usually could
work below 150℃, the heat transfer performance is capable to sustain it in HCPVT system.
Although in particle, the thermal resistance of solar cell and solder or silicon grease is evitable
to create a temperature elevation during concentrated, the thermal characteristics of heat sink
successfully meet the requirement of cool the solar cell.
(a) Distribution of solar radiation and inlet/outlet condition
0100200300400500600700800900
65707580859095
100105
1 7 13 19 25 31 37 43 49 55 61 67 73 79 85 91 97 103
109
115
121
127
日射量
W/㎡
温度
℃
Time (s)
直達日射 入口温度 出口温度

64
(b) Distribution of Surface temperature and direct solar radiaiton
Fig.4.5: Thermal characteristics of radial micro-channel heat sink in HCPVT sytem
755
760
765
770
775
780
785
790
795
100
101
102
103
104
105
106
107
108
1 8 15 22 29 36 43 50 57 64 71 78 85 92 99 106
113
120
127
日射
量W
/㎡
温度
℃
Time (s)
直達日射 出口温度 T-up T-mid T-down
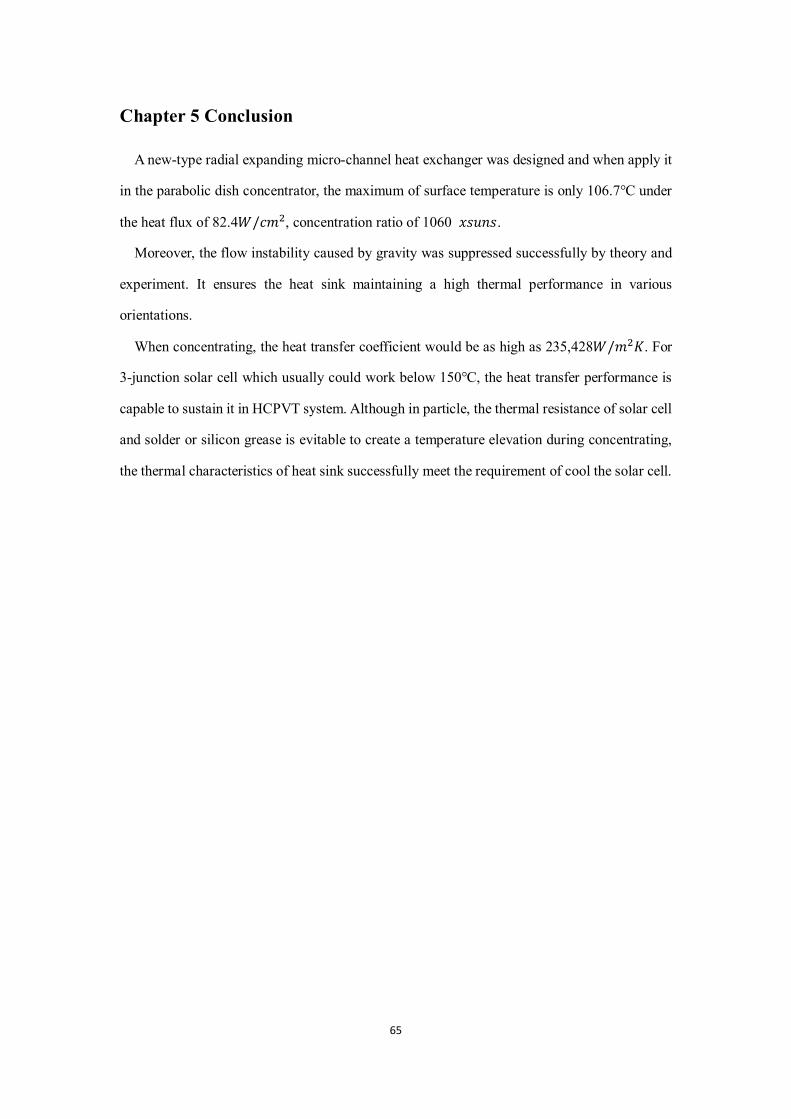
65
Chapter 5 Conclusion
A new-type radial expanding micro-channel heat exchanger was designed and when apply it
in the parabolic dish concentrator, the maximum of surface temperature is only 106.7℃ under
the heat flux of 82.4𝐺𝐺/𝑐𝑐𝑐𝑐2, concentration ratio of 1060 𝑥𝑥𝑥𝑥𝑥𝑥𝑥𝑥𝑥𝑥.
Moreover, the flow instability caused by gravity was suppressed successfully by theory and
experiment. It ensures the heat sink maintaining a high thermal performance in various
orientations.
When concentrating, the heat transfer coefficient would be as high as 235,428𝐺𝐺/𝑐𝑐2𝐾𝐾. For
3-junction solar cell which usually could work below 150℃, the heat transfer performance is
capable to sustain it in HCPVT system. Although in particle, the thermal resistance of solar cell
and solder or silicon grease is evitable to create a temperature elevation during concentrating,
the thermal characteristics of heat sink successfully meet the requirement of cool the solar cell.
66
References
1) C. Wolfram, O. Shelef, P. Gertler, How will energy demand develop in the developing
world, J Econ. Persp. 26 (1) (2012) 119–138.
2) Primary energy, Statistical Review of World Energy 2012, 2012.
3) M.A. Green, K. Emery, Y. Hishikawa, W. Warta, E.D. Dunlop, Solar cell efficiency tables
(version 42), Progr. Photovoltaics 21 (5) (2013) 827–837.
4) D. Faiman, S. Biryukov, K.K. Pearlmutter, PETAL: a research pathway to
fossilcompetitive solar electricity, I. IEEE, 2002.
5) Xudong Zhao, Xiaoli Ma,” Advanced Energy Efficiency Technologies for Solar Heating,
Cooling and Power Generation”, pp. 32-35, 2019
6) Wolf M. Performance analyses of combined heating and photovoltaic power systems for
residences. Energy Convers 1976;16(1):79–90.
7) Gang P et al. Annual analysis of heat pipe PV/T systems for domestic hot water and
electricity production. Energy Convers Manage 2012;56:8–21.
8) Rabl A. Comparison of solar concentrators. Sol Energy 1976;18(2):93–111.
9) Kurtz S, Geisz J. Multijunction solar cells for conversion of concentrated sunlight to
electricity. Opt Express 2010;18(101):A73–8.
10) Meneses-Rodrı´ guez D et al. Photovoltaic solar cells performance at elevated
temperatures. Sol Energy 2005;78(2):243–50.
11) Brogren M, Nostell P, Karlsson B. Optical efficiency of a PV-thermal hybrid CPC module
for high latitudes. Sol Energy 2001;69:173–85.
12) Luque A et al. Some results of the EUCLIDES photovoltaic concentrator prototype. Prog
Photovoltaics: Res Appl 1997;5(3):195–212.
13) Chen H et al. Thermal analysis of a high concentration photovoltaic/thermal system. Sol
Energy 2014;107:372–9.
14) Rosell J et al. Design and simulation of a low concentrating photovoltaic/ thermal system.
Energy Convers Manage 2005;46(18):3034–46.
15) Chengdong K, Zilin X, Qiang Y. Outdoor performance of a low-concentrated photovoltaic-
thermal hybrid system with crystalline silicon solar cells. Appl Energy 2013;112:618–25.
67
16) S.-W. Kang, Y.T. Chen, G.-S. Chang, The manufacturing and test of (1 1 0) orientated
silicon based micro heat exchanger, Tamkang J. Sci. Eng. 5 (3) (2002) 129–136.
17) M.M. Mahmoud, T.G. Karayiannis, D.B.R. Kenning, in: Emerging Topics in Heat Transfer
Enhancement and Heat Exchangers, WIT Press, 2014, pp. 321–396 (Chapter 10).
18) Y. Taitel, Flow pattern transition in two phase flow, Keynote lecture, in: 9th International
Heat Transfer Conference, Jerusalem, Israel, 19–24 August 1990, pp. 237–254.
19) D. Barnea, An unified model for predicting flow-pattern transitions for the whole range of
pipe inclinations, Int. J. Multiphase Flow 13 (1) (1987) 1–12.
20) J. R. Thome, “Boiling in microchannels: A review of experiment and theory,” Int. J. Heat
Fluid Flow, vol. 25, no. 2, pp. 128–139, 2004.
21) 辰洋植田, 気液二相流-流れと熱伝達-. 養賢堂, 1981.
22) L. R.W. and M. R.C., “Proposed correlation of data for isothermal two-phase, two-
component flow in pipes.” Chem. Eng. Prog. 45, pp. 39–48, 1949.
23) G. Wang, P. Cheng, H. Wu, Unstable and stable flow boiling in parallel microchannels and
in a single microchannel, Int. J. Heat Mass Transfer 50 (21–22) (2007) 4297–4310.
24) X. Fu, S.L. Qi, P. Zhang, R.Z. Wang, Visualization of flow boiling of liquid nitrogen in a
vertical mini-tube, Int. J. Multiphase Flow 34 (4) (2008) 333– 351.
25) M.R. Aligoodarz, Y. Yan, D.B.R. Kenning, Wall temperature and pressure variations
during flow boiling in narrow channels, Proc.11th Int. Heat Transfer Conference (IHTC),
August 23–28, vol. 2, 1998, pp. 225–230.
26) S.L. Qi, P. Zhang, R.Z. Wang, L.X. Xu, Flow boiling of liquid nitrogen in microtubes: Part
I – the onset of nucleate boiling, two-phase flow instability and two-phase flow pressure
drop, Int. J. Heat Mass Transfer 50 (25–26) (2007) 4999–5016.
27) S.G. Kandlikar, Nucleation characteristics and stability considerations during flow boiling
in microchannels, Exp. Therm. Fluid Sci. 30 (2006) 441–447.
28) E.M. Fayyadh, M.M. Mahmoud, T.G. Karayiannis, Flow boiling heat transfer of R134a in
multi microchannels, Int. J. Heat Mass Transfer (2016) (Submitted for publication).
29) J.C. Chen, A correlation for boiling heat transfer to saturated fluid in convective flow,
ASME Paper, 63-HT-34 (1963) 1–11.
30) M.M. Shah, A new correlation for heat transfer during flow boiling through pipes,
68
ASHRAE Trans. 82 (2) (1976) 66–86.
31) S.S. Kutateladze, Fundamentals of Heat Transfer, Edward Arnold, London, 1963.
32) 中村亘 and 飛原英治, “2014 年度卒業論文 太陽光・太陽熱の同時活用システム
の研究,” 2014.
33) 飛原英治, 原上青, and 党超鋲, “三接合太陽電池を用いる集光型ソーラーコジェ
ネレションシステムに関する研究,” 太陽/風力エネルギー講演論文集, 2016.
34) 鄭晨 and 飛原英治, “修士論文 高熱流束マイクロチャンネル冷却器の研究,” 2017.
35) 濵田未勇 and 飛原英治, “修士論文 高倍率集光型太陽エネルギーの利用 に関す
る研究,” 2018.
36) S.G. Kandlikar, Review and projections of integrated cooling systems for
threedimensional integrated circuits, Trans. ASME, J. Electronic Packag. 136 (024001)
(2014) 1–11.
37) T.V. Oevelen, J.A. Weibel, S.V. Garimella, The effect of lateral thermal coupling between
parallel microchannels on two-phase flow distribution, Int. J. Heat Mass Transf. 124
(2018) 769–781.
38) Y.W. Kuang, W. Wang, J.Y. Miao, X.G. Yu, H.X. Zhang, R. Zhuan, Flow boiling of
ammonia and flow instabilities in mini-channels, Appl. Therm. Eng. 113 (2017) 831–842.
39) T.G. Karayiannis, M.M. Mahmoud, Flow boiling in microchannels: Fundamentals and
applications, Appl. Therm. Eng. 115 (2017) 1372–1397.
40) S.G. Kandlikar, Nucleation characteristics and stability considerations during flow boiling
in microchannels, Exp. Therm. Fluid Sci. 30 (5) (2006) 441–447.
41) S.H. Kim, I.C. Chu, M.H. Choi, D.J. Euh, Mechanism study of departure of nucleate
boiling on forced convective channel flow boiling, Int. J. Heat Mass Transf. 126 (2018)
1049–1058.
42) S. Hong et al, Experimental investigation on flow boiling in radial expanding minichannel
heat sinks applied for low flow inertia condition, International Journal of Heat and Mass
Transfer 143 (2019) 118588
69
Acknowledgment
When I consulted senior students’ thesis for reference, the part that I most interested in is the
acknowledgment. From this part, I can see people writing something from his own heart, never
need to disguise anymore because nobody is concerned with the acknowledgment in a thesis.
Unfortunately, I did.
So, I found the senior students were not only a distinguished researcher but also an affectionate
people, they were all truly appreciate to advisor and the University of Tokyo. Of course, me too.
Actually, I have nothing but appreciation to my advisor professor Dang. He gave me a chance
to have access to the top research laboratory in the world. And during my master’s studying,
professor Dang was always teaching me how to solve technical problem with knowledge, more
important is he taught me how to be a better people. Thanks professor Dang picked me up and
gave me such a great chance to do research and study in such fantastic environment, whenever
I get frustrated in doing research, the motivation to support me was to repay the advisor’s trust.
Obviously, I am not a talented person in doing research, but I am willing to spend time and
no fear to face failure. Professor Hihara is the chief of our group, he is full of wisdom and
kindness all the time and always encourages me in doing experiment. What impresses me most
is such an outstanding scholar like Hihara always did cleaning for our laboratory. I felt ashamed
of myself, professor Hihara taught me that to be a people with good manner is as important as
study. Undoubtedly, it is a great honor for me to study in such an excellent laboratory and learn
from professor Hihara and professor Dang.
During my study time in University of Tokyo, all members of our group gave me power and
much help in doing research. Hong sihui, Cao xufa, Xu jingren, Cheng zhizhong, Song mengjie,
Zhang zhihua, Hirai shyo and so many members I would like to appreciate. Distinctly, without
the help of them, it is no way for me to graduate. Thanks for the accompanying in the study and
daily life.
Last but not least, I would like to write something for my parents and my girlfriend. There is
a little space for acknowledgment but the length could not show my love. They all the treasure
for me, it is true I made you mad and had countless quarrels during daily life, but you stood up
when I overwhelmed with fear and terror, that is enough.
Copyright © 2022 FDOKUMEN