Wartość ciała we współczesnej kulturze w świetle postaw przejawianych przez młode kobiety
Upload
khangminh22Category
view
3download
0
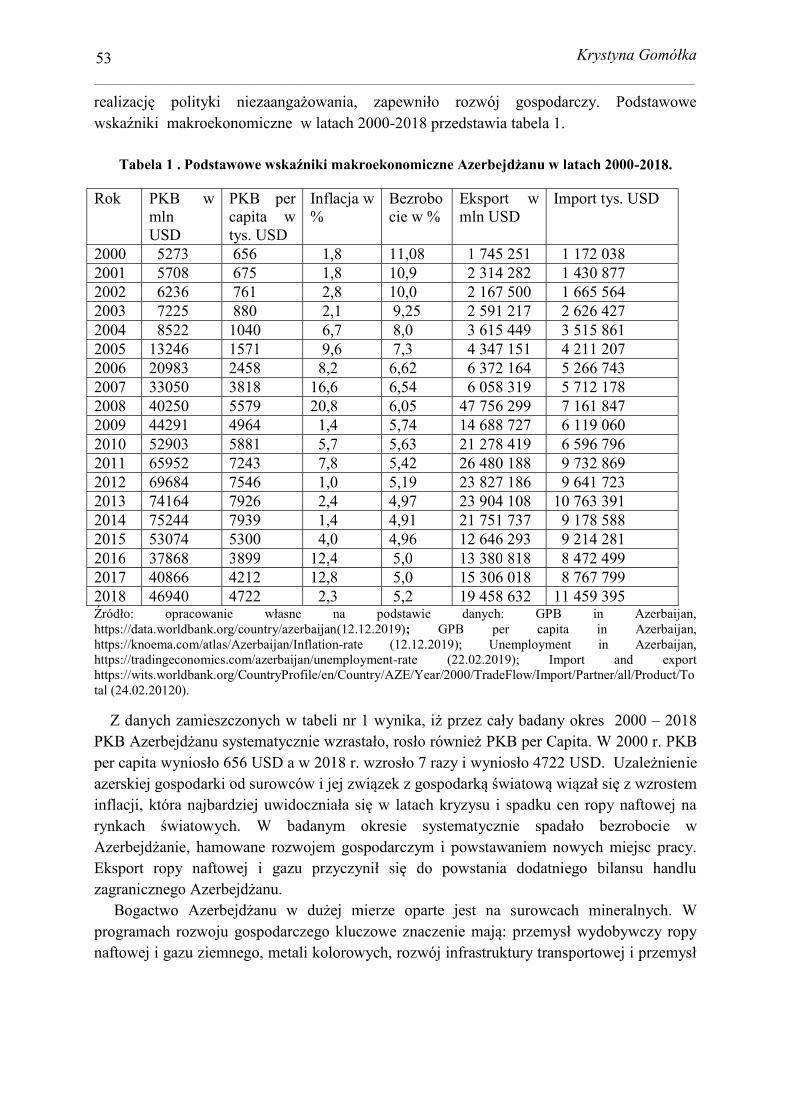
zamieszkiwanej przez 9981,5 tys. obywateli85
mineralne
86. - ropy i gazu dla
Celem prac
Celem weryfikacji hipotezy autor
latach 2000-2018?. sektorze wydobycia ropy i gazu ?
-2018?
ropy i gazu w latach 2005-2018.
rosyjskim.
85 Azebaijan in figures 2019 r. https://www.stat.gov.az/source/demoqraphy/?lang=en ( 22.02.2020). 86 Mineral Resources in Azerbaijan , International Geology Review, 2009, s. 82-85, https://www.tandfonline.com/doi/abs/10.1080/00206815909473472?journalCode=tigr20 (22.02.2020).
A
_________________________________________________________________________________________________________________
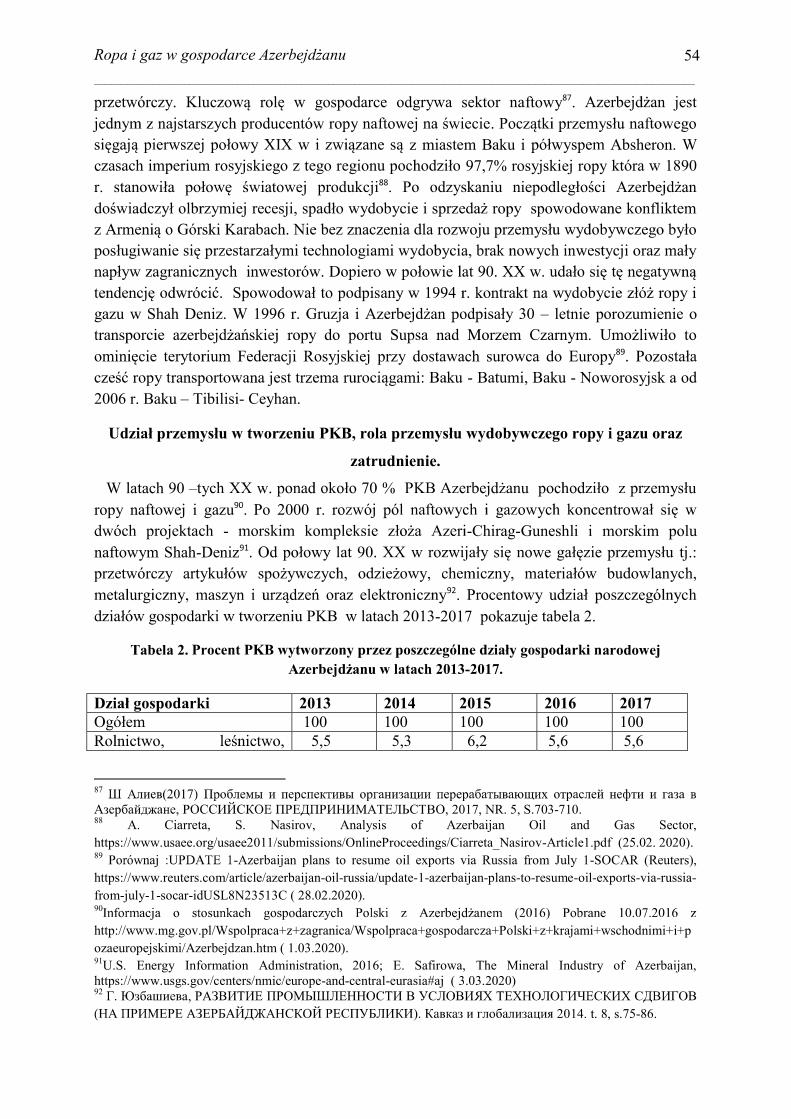
53
-2018 przedstawia tabela 1.
-2018.
Rok PKB w mln USD
PKB per capita w tys. USD
Inflacja w %
Bezrobocie w %
Eksport w mln USD
Import tys. USD
2000 5273 656 1,8 11,08 1 745 251 1 172 038 2001 5708 675 1,8 10,9 2 314 282 1 430 877 2002 6236 761 2,8 10,0 2 167 500 1 665 564 2003 7225 880 2,1 9,25 2 591 217 2 626 427 2004 8522 1040 6,7 8,0 3 615 449 3 515 861 2005 13246 1571 9,6 7,3 4 347 151 4 211 207 2006 20983 2458 8,2 6,62 6 372 164 5 266 743 2007 33050 3818 16,6 6,54 6 058 319 5 712 178 2008 40250 5579 20,8 6,05 47 756 299 7 161 847 2009 44291 4964 1,4 5,74 14 688 727 6 119 060 2010 52903 5881 5,7 5,63 21 278 419 6 596 796 2011 65952 7243 7,8 5,42 26 480 188 9 732 869 2012 69684 7546 1,0 5,19 23 827 186 9 641 723 2013 74164 7926 2,4 4,97 23 904 108 10 763 391 2014 75244 7939 1,4 4,91 21 751 737 9 178 588 2015 53074 5300 4,0 4,96 12 646 293 9 214 281 2016 37868 3899 12,4 5,0 13 380 818 8 472 499 2017 40866 4212 12,8 5,0 15 306 018 8 767 799 2018 46940 4722 2,3 5,2 19 458 632 11 459 395
https://data.worldbank.org/country/azerbaijan(12.12.2019); GPB per capita in Azerbaijan, https://knoema.com/atlas/Azerbaijan/Inflation-rate (12.12.2019); Unemployment in Azerbaijan, https://tradingeconomics.com/azerbaijan/unemployment-rate (22.02.2019); Import and export https://wits.worldbank.org/CountryProfile/en/Country/AZE/Year/2000/TradeFlow/Import/Partner/all/Product/Total (24.02.20120).
Z danych zamieszczonych w tabeli nr 1 wynika 2018 PKB per Capita. W 2000 r. PKB
ie
e w
urowcach mineralnych. W programach rozwoju gospoda
_________________________________________________________________________________________________________________
54
ftowy .
z miastem Baku i Absheron. W c 97,7% rosyjskiej ropy
gazu w Shah Deniz. letnie porozumienie o
iej przy dostawach surowca do Europy- Batumi, Baku - Noworosyjsk a od
2006 r. Baku Tibilisi- Ceyhan.
zatrudnienie.
W latach 90 ropy naftowej i gazu . Po 2000 r. r
- -Chirag-Guneshli i morskim polu naftowym Shah-Deniz tj.:
-2017 pokazuje tabela 2.
Tabela 2. arodowej -2017.
2013 2014 2015 2016 2017 100 100 100 100 100
5,5 5,3 6,2 5,6 5,6
87 2017, NR. 5, S.703-710.
88 A. Ciarreta, S. Nasirov, Analysis of Azerbaijan Oil and Gas Sector, https://www.usaee.org/usaee2011/submissions/OnlineProceedings/Ciarreta_Nasirov-Article1.pdf (25.02. 2020). 89 -Azerbaijan plans to resume oil exports via Russia from July 1-SOCAR (Reuters), https://www.reuters.com/article/azerbaijan-oil-russia/update-1-azerbaijan-plans-to-resume-oil-exports-via-russia-from-july-1-socar-idUSL8N23513C ( 28.02.2020). 90
http://www.mg.gov.pl/Wspolpraca+z+zagranica/Wspolpraca+gospodarcza+Polski+z+krajami+wschodnimi+i+pozaeuropejskimi/Azerbejdzan.htm ( 1.03.2020). 91U.S. Energy Information Administration, 2016; E. Safirowa, The Mineral Industry of Azerbaijan, https://www.usgs.gov/centers/nmic/europe-and-central-eurasia#aj ( 3.03.2020) 92 ,
2014. t. 8, s.75-86.
_________________________________________________________________________________________________________________
55
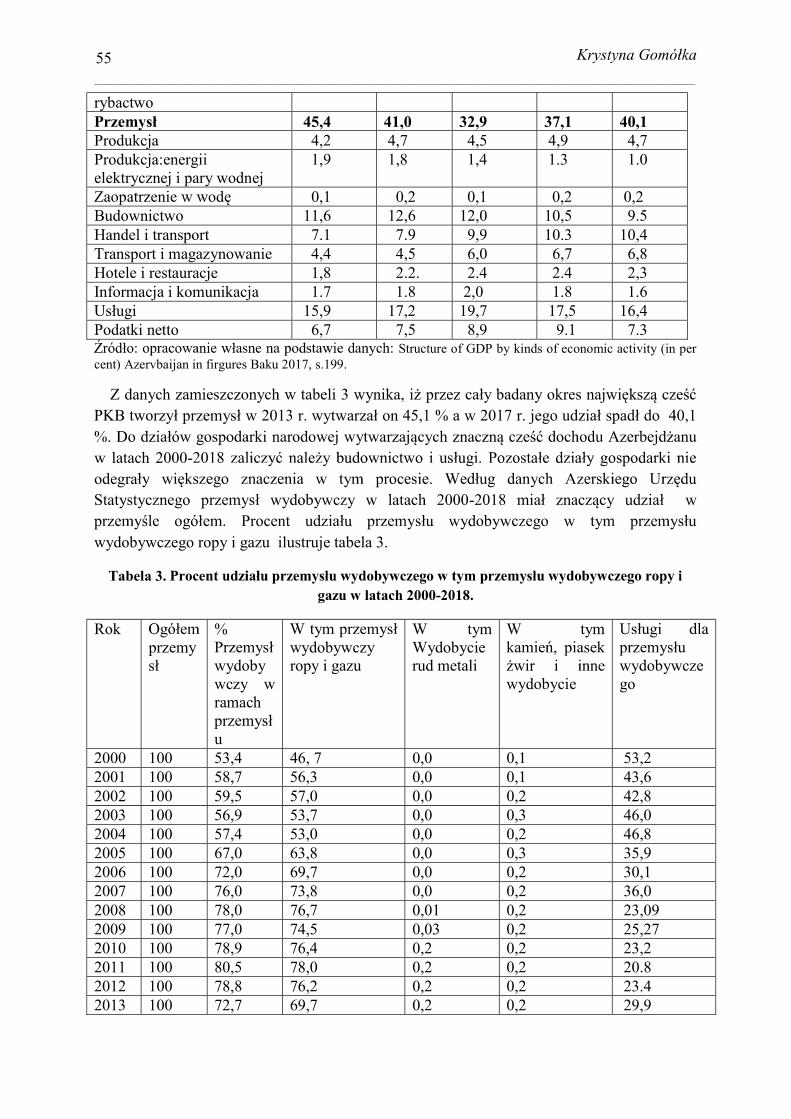
rybactwo 45,4 41,0 32,9 37,1 40,1
Produkcja 4,2 4,7 4,5 4,9 4,7 Produkcja:energii elektrycznej i pary wodnej
1,9 1,8 1,4 1.3 1.0
0,1 0,2 0,1 0,2 0,2 Budownictwo 11,6 12,6 12,0 10,5 9.5 Handel i transport 7.1 7.9 9,9 10.3 10,4 Transport i magazynowanie 4,4 4,5 6,0 6,7 6,8 Hotele i restauracje 1,8 2.2. 2.4 2.4 2,3 Informacja i komunikacja 1.7 1.8 2,0 1.8 1.6
15,9 17,2 19,7 17,5 16,4 Podatki netto 6,7 7,5 8,9 9.1 7.3
Structure of GDP by kinds of economic activity (in per cent) Azervbaijan in firgures Baku 2017, s.199.
Z danych
w latach 2000-odegra
-
wydobywczego ropy i gazu ilustruje tabela 3.
Tabela 3. gazu w latach 2000-2018.
Rok przemy
%
wydobywczy w ramach
u
wydobywczy ropy i gazu
W tym Wydobycie rud metali
W tym
wydobycie wydobywczego
2000 100 53,4 46, 7 0,0 0,1 53,2 2001 100 58,7 56,3 0,0 0,1 43,6 2002 100 59,5 57,0 0,0 0,2 42,8 2003 100 56,9 53,7 0,0 0,3 46,0 2004 100 57,4 53,0 0,0 0,2 46,8 2005 100 67,0 63,8 0,0 0,3 35,9 2006 100 72,0 69,7 0,0 0,2 30,1 2007 100 76,0 73,8 0,0 0,2 36,0 2008 100 78,0 76,7 0,01 0,2 23,09 2009 100 77,0 74,5 0,03 0,2 25,27 2010 100 78,9 76,4 0,2 0,2 23,2 2011 100 80,5 78,0 0,2 0,2 20.8 2012 100 78,8 76,2 0,2 0,2 23.4 2013 100 72,7 69,7 0,2 0,2 29,9
_________________________________________________________________________________________________________________
56
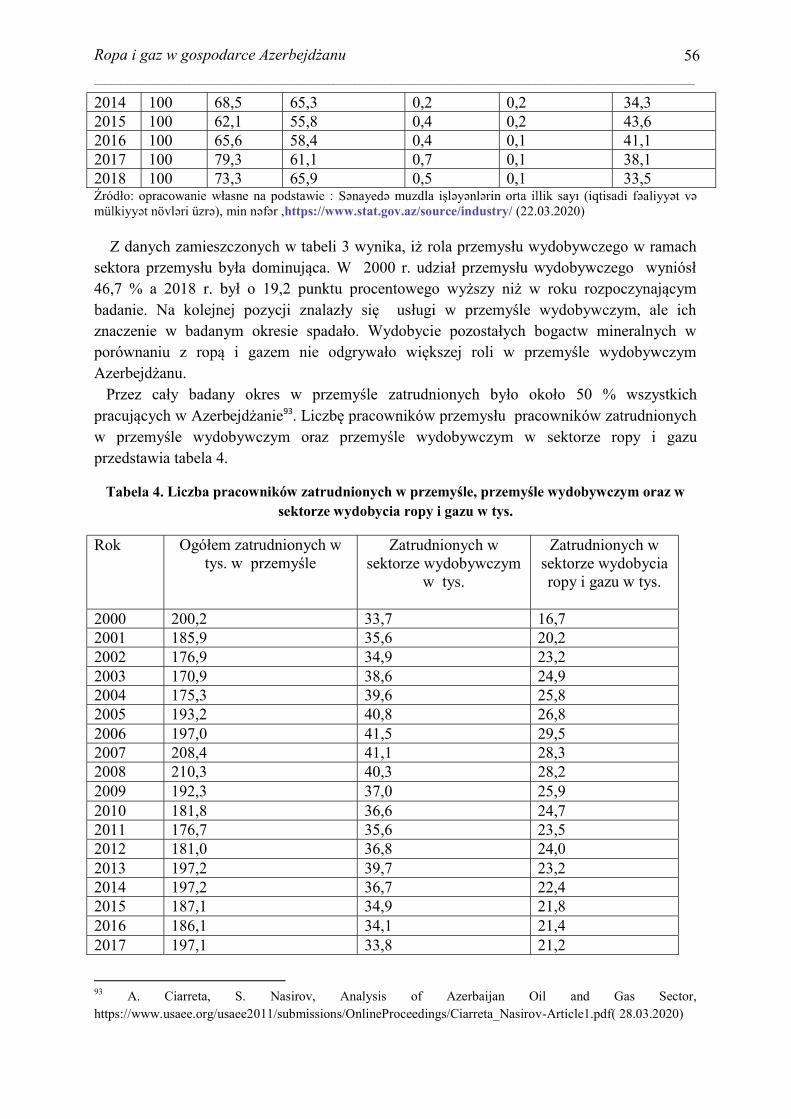
2014 100 68,5 65,3 0,2 0,2 34,3 2015 100 62,1 55,8 0,4 0,2 43,6 2016 100 65,6 58,4 0,4 0,1 41,1 2017 100 79,3 61,1 0,7 0,1 38,1 2018 100 73,3 65,9 0,5 0,1 33,5
S nayed y nl aliyy t v ), min n f r ,https://www.stat.gov.az/source/industry/ (22.03.2020)
badan
P 50 % wszystkich
Azerb sektorze ropy i gazu
przedstawia tabela 4.
Tabela 4. sektorze wydobycia ropy i gazu w tys.
Rok
Zatrudnionych w sektorze wydobywczym
w tys.
Zatrudnionych w sektorze wydobycia ropy i gazu w tys.
2000 200,2 33,7 16,7 2001 185,9 35,6 20,2 2002 176,9 34,9 23,2 2003 170,9 38,6 24,9 2004 175,3 39,6 25,8 2005 193,2 40,8 26,8 2006 197,0 41,5 29,5 2007 208,4 41,1 28,3 2008 210,3 40,3 28,2 2009 192,3 37,0 25,9 2010 181,8 36,6 24,7 2011 176,7 35,6 23,5 2012 181,0 36,8 24,0 2013 197,2 39,7 23,2 2014 197,2 36,7 22,4 2015 187,1 34,9 21,8 2016 186,1 34,1 21,4 2017 197,1 33,8 21,2
93 A. Ciarreta, S. Nasirov, Analysis of Azerbaijan Oil and Gas Sector, https://www.usaee.org/usaee2011/submissions/OnlineProceedings/Ciarreta_Nasirov-Article1.pdf( 28.03.2020)
_________________________________________________________________________________________________________________
57
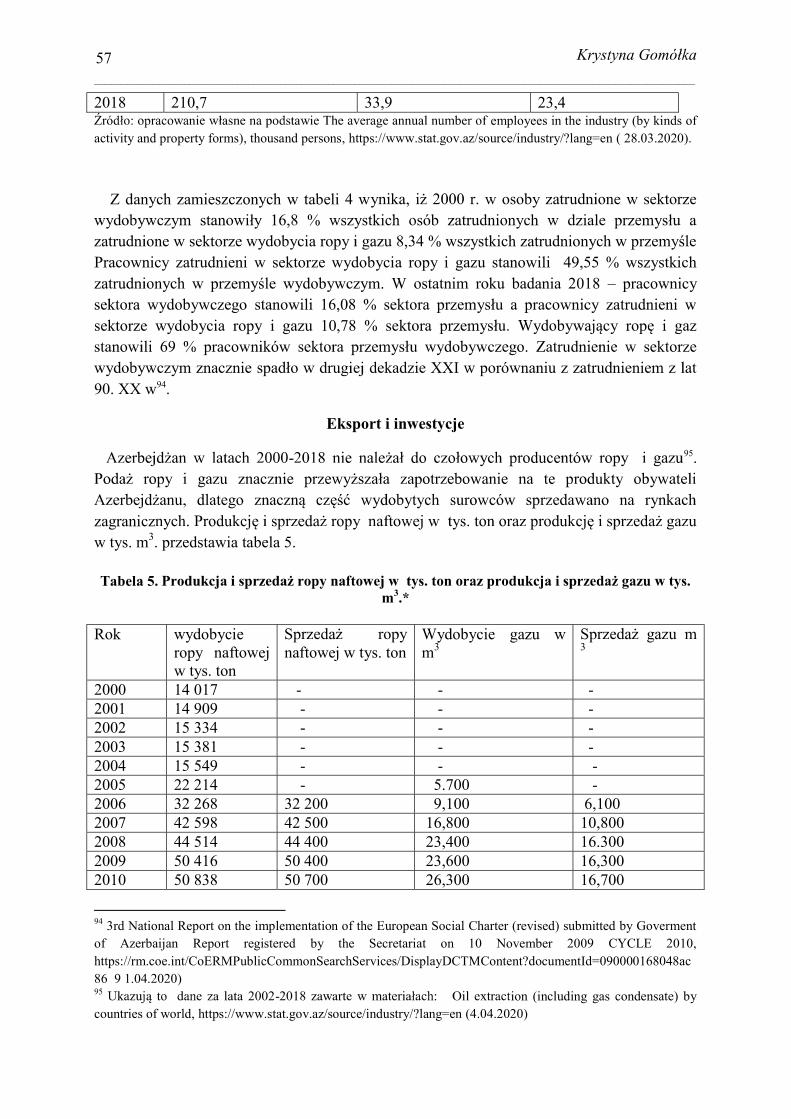
2018 210,7 33,9 23,4 employees in the industry (by kinds of
activity and property forms), thousand persons, https://www.stat.gov.az/source/industry/?lang=en ( 28.03.2020).
Z danych zamieszczonych w tabeli 4 w
Pracownicy zatrudnieni w sektorze wydobycia ropy i gazu stanowili 49,55 % wszystkich pracownicy
sektorze wydobycia ropy i gazu 10,78 % sekt
90. XX w94.
Eksport i inwestycje
- 95.
zagraniczw tys. m3. przedstawia tabela 5. Tabela 5.
m3.* Rok wydobycie
ropy naftowej w tys. ton
naftowej w tys. ton Wydobycie gazu w m3 3
2000 14 017 - - - 2001 14 909 - - - 2002 15 334 - - - 2003 15 381 - - - 2004 15 549 - - - 2005 22 214 - 5.700 - 2006 32 268 32 200 9,100 6,100 2007 42 598 42 500 16,800 10,800 2008 44 514 44 400 23,400 16.300 2009 50 416 50 400 23,600 16,300 2010 50 838 50 700 26,300 16,700
94 3rd National Report on the implementation of the European Social Charter (revised) submitted by Goverment of Azerbaijan Report registered by the Secretariat on 10 November 2009 CYCLE 2010, https://rm.coe.int/CoERMPublicCommonSearchServices/DisplayDCTMContent?documentId=090000168048ac86 9 1.04.2020) 95 - ion (including gas condensate) by countries of world, https://www.stat.gov.az/source/industry/?lang=en (4.04.2020)
_________________________________________________________________________________________________________________
58
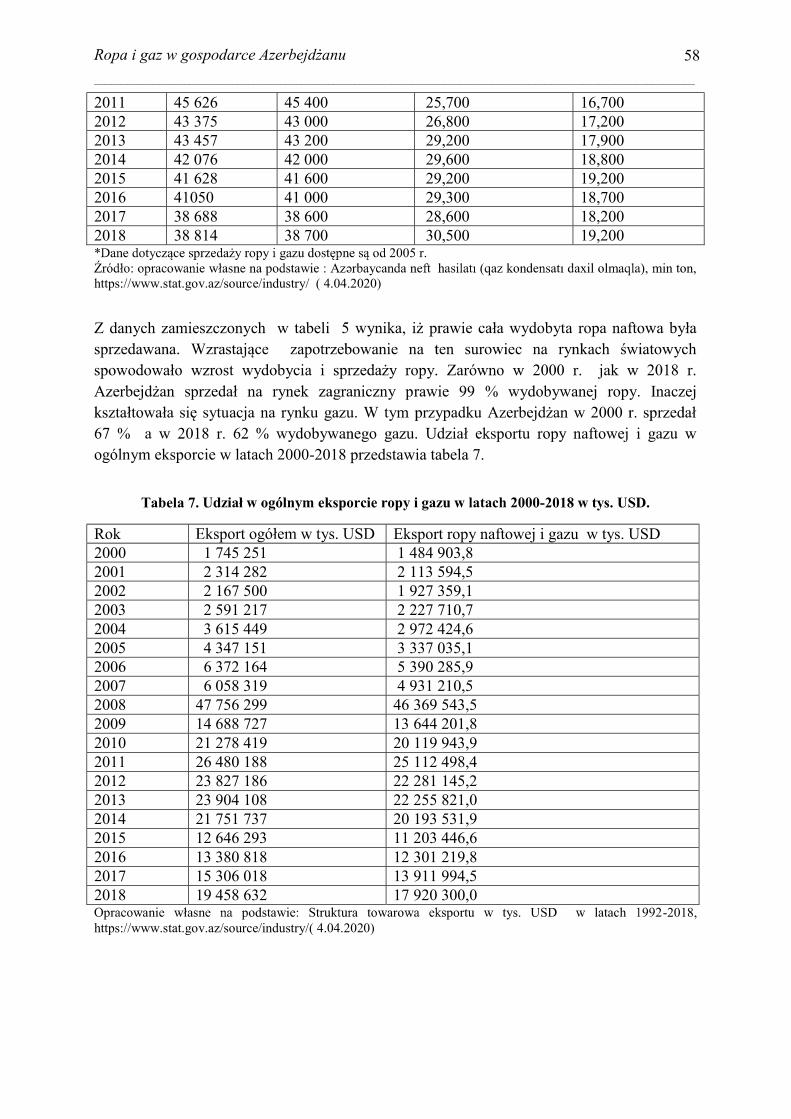
2011 45 626 45 400 25,700 16,700 2012 43 375 43 000 26,800 17,200 2013 43 457 43 200 29,200 17,900 2014 42 076 42 000 29,600 18,800 2015 41 628 41 600 29,200 19,200 2016 41050 41 000 29,300 18,700 2017 38 688 38 600 28,600 18,200 2018 38 814 38 700 30,500 19,200 *
https://www.stat.gov.az/source/industry/ ( 4.04.2020)
Z danych zamieszczonych w tabeli
rawie 99 % wydobywanej ropy. Inaczej
-2018 przedstawia tabela 7.
Tabela 7. -2018 w tys. USD.
Rok Eksport ropy naftowej i gazu w tys. USD 2000 1 745 251 1 484 903,8 2001 2 314 282 2 113 594,5 2002 2 167 500 1 927 359,1 2003 2 591 217 2 227 710,7 2004 3 615 449 2 972 424,6 2005 4 347 151 3 337 035,1 2006 6 372 164 5 390 285,9 2007 6 058 319 4 931 210,5 2008 47 756 299 46 369 543,5 2009 14 688 727 13 644 201,8 2010 21 278 419 20 119 943,9 2011 26 480 188 25 112 498,4 2012 23 827 186 22 281 145,2 2013 23 904 108 22 255 821,0 2014 21 751 737 20 193 531,9 2015 12 646 293 11 203 446,6 2016 13 380 818 12 301 219,8 2017 15 306 018 13 911 994,5 2018 19 458 632 17 920 300,0
-2018, https://www.stat.gov.az/source/industry/( 4.04.2020)
_________________________________________________________________________________________________________________
59
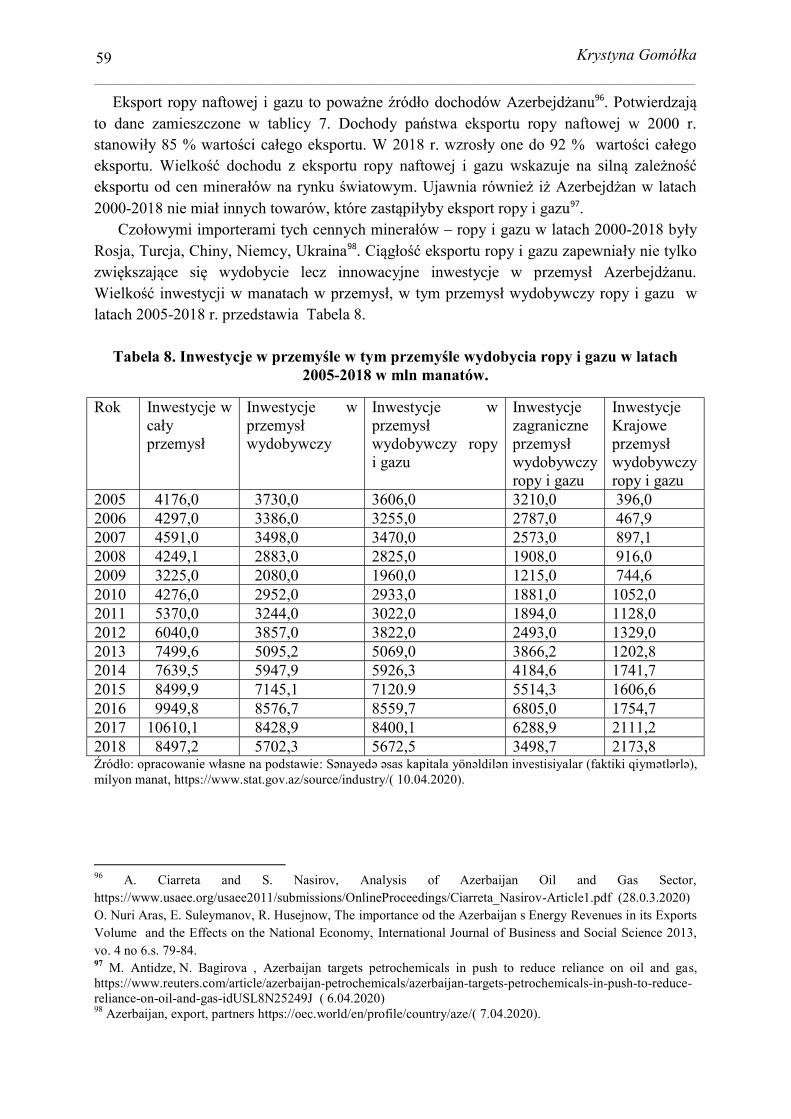
2000- . ropy i gazu w latach 2000-Rosja, Turcja, Chiny, Niemcy, Ukraina nie tylko
w manatach w w latach 2005-2018 r. przedstawia Tabela 8.
Tabela 8. 2005-
Rok Inwestycje w
Inwestycje w
wydobywczy
Inwestycje w
wydobywczy ropy i gazu
Inwestycje zagraniczne
wydobywczy ropy i gazu
Inwestycje Krajowe
wydobywczy ropy i gazu
2005 4176,0 3730,0 3606,0 3210,0 396,0 2006 4297,0 3386,0 3255,0 2787,0 467,9 2007 4591,0 3498,0 3470,0 2573,0 897,1 2008 4249,1 2883,0 2825,0 1908,0 916,0 2009 3225,0 2080,0 1960,0 1215,0 744,6 2010 4276,0 2952,0 2933,0 1881,0 1052,0 2011 5370,0 3244,0 3022,0 1894,0 1128,0 2012 6040,0 3857,0 3822,0 2493,0 1329,0 2013 7499,6 5095,2 5069,0 3866,2 1202,8 2014 7639,5 5947,9 5926,3 4184,6 1741,7 2015 8499,9 7145,1 7120.9 5514,3 1606,6 2016 9949,8 8576,7 8559,7 6805,0 1754,7 2017 10610,1 8428,9 8400,1 6288,9 2111,2 2018 8497,2 5702,3 5672,5 3498,7 2173,8
: S nayed ldil n investisiyalar (faktiki qiym tl rl ), milyon manat, https://www.stat.gov.az/source/industry/( 10.04.2020).
96 A. Ciarreta and S. Nasirov, Analysis of Azerbaijan Oil and Gas Sector, https://www.usaee.org/usaee2011/submissions/OnlineProceedings/Ciarreta_Nasirov-Article1.pdf (28.0.3.2020) O. Nuri Aras, E. Suleymanov, R. Husejnow, The importance od the Azerbaijan s Energy Revenues in its Exports Volume and the Effects on the National Economy, International Journal of Business and Social Science 2013, vo. 4 no 6.s. 79-84. 97 M. Antidze, N. Bagirova , Azerbaijan targets petrochemicals in push to reduce reliance on oil and gas, https://www.reuters.com/article/azerbaijan-petrochemicals/azerbaijan-targets-petrochemicals-in-push-to-reduce-reliance-on-oil-and-gas-idUSL8N25249J ( 6.04.2020) 98 Azerbaijan, export, partners https://oec.world/en/profile/country/aze/( 7.04.2020).
_________________________________________________________________________________________________________________
60
89,3 % a w
dekadach XXI w99
inwestycji krajowych100
4 %. Inwestycje krajowe wzro101
sektora
65,7 %
zatrudnienia w tym sektorze z 167 c -2018 sprzedano
za
99 A. Mehlijew, Foreign direct Investment in Azerbaijan Economy : Current Status , development trends and challenges, https://bakuresearchinstitute.org/foreign-direct-investment-in-azerbaijans-economy-current-status-development-trends-and-challenges/( 12.04.2020). 100 Azerbaijan Linking Domestic Suppliers with Foreign Investors, https://www.oecd.org/eurasia/competitiveness-programme/eastern-partners/Azerbaijan-Linking-Domestic-Suppliers-with-Foreign-Investors.pdf ( 13.04.2020) 101 2019 Investment Climate Statements: Azerbaijan, https://www.state.gov/reports/2019-investment-climate-
statements/azerbaijan/( 2.22.03.2020)
_________________________________________________________________________________________________________________
61
102. Nie byli oni w tym okresie czasu zainteresowani mniej
zysko
Streszczenie
eralnych ropy i gazu w gospodarce
okresach
65,7 %
2020
zowe:
Ropa naftowa, gaz, gospodarka, PKB, eksport, import
Key words:
oil, gas, economy, GPB, export, import
Bibliografia:
1.
2017, NR. 5, S.703-710. 2. Azerbaijan, export, partners https://oec.world/en/profile/country/aze/( 7.04.2020). 3. Azerbaijan Linking Domestic Suppliers with Foreign Investors,
https://www.oecd.org/eurasia/competitiveness-programme/eastern-partners/Azerbaijan-Linking-Domestic-Suppliers-with-Foreign-Investors.pdf (13.04.2020).
4. Antidze M., Bagirova N., Azerbaijan targets petrochemicals in push to reduce reliance on oil and gas, https://www.reuters.com/article/azerbaijan-petrochemicals/azerbaijan-targets-petrochemicals-in-push-to-reduce-reliance-on-oil-and-gas-idUSL8N25249J ( 6.04.2020).
102Foreign direct in Azerbaijan , https://www.ceicdata.com/en/azerbaijan/foreign-investment ( 15.04.2020).
_________________________________________________________________________________________________________________
62
5. https://www.stat.gov.az/source/industry/ ( 4.04.2020).
6. Aras O. N, Suleymanov E., Husejnow R., The importance od the Azerbaijan s Energy Revenues in its Exports Volume and the Effects on the National Economy, International Journal of Business and Social Science 2013, vol. 4 no 6.s. 79-84.
7. Azebaijan in figures 2019 r. https://www.stat.gov.az/source/demoqraphy/?lang=en ( 22.02.2020).
8. Ciarreta A. Nasirov S., Analysis of Azerbaijan Oil and Gas Sector, https://www.usaee.org/usaee2011/submissions/OnlineProceedings/Ciarreta_Nasirov-Article1.pdf (25.02. 2020).
9. Foreign direct in Azerbaijan , https://www.ceicdata.com/en/azerbaijan/foreign-investment ( 15.04.2020).
10. GPB in Azerbaijan, https://data.worldbank.org/country/azerbaijan (12.12.2019) 11. 2019 Investment Climate Statements: Azerbaijan, https://www.state.gov/reports/2019-
investment-climate-statements/azerbaijan/( 2.22.03.2020). 12. Import and export
https://wits.worldbank.org/CountryProfile/en/Country/AZE/Year/2000/TradeFlow/Import/Partner/all/Product/Total( 24.02.2020).
13. Informacja 10.07.2016 z http://www.mg.gov.pl/Wspolpraca+z+zagranica/Wspolpraca+gospodarcza+Polski+z+krajami+wschodnimi+i+pozaeuropejskimi/Azerbejdzan.htm ( 1.03.2020).
14.
2014. t. 8, s.75-86. 15. Mineral Resources in Azerbaijan , International Geology Review, 2009, s. 82-85,
https://www.tandfonline.com/doi/abs/10.1080/00206815909473472?journalCode=tigr20 (22.02.2020).
16. Mehlijew A., Foreign direct Investment in Azerbaijan Economy : Current Status , development trends and challenges, https://bakuresearchinstitute.org/foreign-direct-investment-in-azerbaijans-economy-current-status-development-trends-and-challenges/( 12.04.2020).
17. Oil extraction (including gas condensate) by countries of world, https://www.stat.gov.az/source/industry/?lang=en (4.04.2020).
18. https://www.stat.gov.az/source/industry/ (22.03.2020).
19. manathttps://www.stat.gov.az/source/industry/( 10.04.2020)
20. 3rd National Report on the implementation of the European Social Charter (revised) submitted by Goverment of Azerbaijan Report registered by the Secretariat on 10 November 2009 CYCLE 2010, https://rm.coe.int/CoERMPublicCommonSearchServices/DisplayDCTMContent?documentId=090000168048ac86 9 1.04.2020).
_________________________________________________________________________________________________________________
63
21. Struktura towarowa eksportu w tys. USD w latach 1992-2018, https://www.stat.gov.az/source/industry/( 4.04.2020).
22. The average annual number of employees in the industry (by kinds of activity and property forms), thousand persons, https://www.stat.gov.az/source/industry/?lang=en ( 28.03.2020).
23. Unemployment in Azerbaijan, https://tradingeconomics.com/azerbaijan/unemployment-rate (22.02.2019)
24. UPDATE 1-Azerbaijan plans to resume oil exports via Russia from July 1-SOCAR (Reuters), https://www.reuters.com/article/azerbaijan-oil-russia/update-1-azerbaijan-plans-to-resume-oil-exports-via-russia-from-july-1-socar-idUSL8N23513C (28.02.2020).
25. U.S. Energy Information Administration, 2016; E. Safirowa, The Mineral Industry of Azerbaijan, https://www.usgs.gov/centers/nmic/europe-and-central-eurasia#aj (3.03.2020)
Copyright © 2022 FDOKUMEN