Z-scan fluorescence profile deconvolution of cytosolic and membrane-associated protein populations.
10
Z-scan fluorescence profile deconvolution of cytosolic and membrane-associated protein populations Elizabeth M. Smith a , Jared Hennen a , Yan Chen a,b , Joachim D. Mueller a,b,c,⇑ a School of Physics and Astronomy, University of Minnesota, Minneapolis, MN 55455, USA b Institute for Molecular Virology, University of Minnesota, Minneapolis, MN 55455, USA c Department of Biomedical Engineering, University of Minnesota, Minneapolis, MN 55455, USA article info Article history: Received 16 December 2014 Received in revised form 22 March 2015 Accepted 23 March 2015 Available online 7 April 2015 Keywords: Peripheral membrane protein Point spread function Brightness Translocation Phospholipase C Pleckstrin homology domain abstract This study introduces a technique that characterizes the spatial distribution of peripheral membrane pro- teins that associate reversibly with the plasma membrane. An axial scan through the cell generates a z- scan intensity profile of a fluorescently labeled peripheral membrane protein. This profile is analytically separated into membrane and cytoplasmic components by accounting for both the cell geometry and the point spread function. We experimentally validated the technique and characterized both the resolvabil- ity and stability of z-scan measurements. Furthermore, using the cellular brightness of green fluorescent protein, we were able to convert the fluorescence intensities into concentrations at the membrane and in the cytoplasm. We applied the technique to study the translocation of the pleckstrin homology domain of phospholipase C delta 1 labeled with green fluorescent protein on ionomycin treatment. Analysis of the z- scan fluorescence profiles revealed protein-specific cell height changes and allowed for comparison between the observed fluorescence changes and predictions based on the cellular surface area-to-volume ratio. The quantitative capability of z-scan fluorescence profile deconvolution offers opportunities for investigating peripheral membrane proteins in the living cell that were previously not accessible. Ó 2015 Elsevier Inc. All rights reserved. Peripheral membrane proteins associate reversibly with cellular membranes through noncovalent interactions with lipids and inte- gral membrane proteins. They constitute a broad and diverse class of proteins involved in various membrane-mediated cellular pro- cesses, including but not limited to cell signaling, cytoskeletal structure, lipid homeostasis, and electron transport [1–3]. The ability to transition between soluble and membrane-bound forms has been recognized as an important regulation and control mechanism of cells. The interaction with the membrane allows a mechanism to induce conformational changes in the protein that modulate its activity. On the other hand, the interactions with the membrane-associated protein can also change the composi- tion, dynamics, and shape of cellular membranes [4–7]. This com- plex bidirectional interplay between peripheral membrane proteins and cellular membranes is only beginning to be unraveled through the use of model membrane systems and cellular studies. The energetics and dynamics of the interaction process have been primarily studied with model membranes [8,9]. These exper- iments provide quantitative information about protein interactions with lipids, but like all in vitro studies they cannot reproduce the environment and complex interaction network found in cells. Live-cell studies monitor peripheral membrane proteins in their natural habitat and are an essential complement to ex situ meth- ods. Cellular translocation studies of fluorescent protein-tagged proteins provide a powerful and convenient approach to visualize the subcellular distribution of peripheral membrane proteins and their dynamic relocation in real time by fluorescence imaging methods such as confocal or total internal reflection fluorescence microscopy [10–13]. Translocation studies typically report qualitative differences in the subcellular distribution of proteins, which reflects the difficulty of identifying the concentration of the membrane-bound and sol- uble proteins from fluorescence intensity data [10,11]. Attempts at quantifying the fluorescence signal to gain information about the relative strength of the interaction between protein and mem- brane have been restricted to heuristic approaches that are unable to analytically separate the fluorescence signal. The current study addresses this problem and introduces a fluorescence-based approach for measuring the time-resolved distribution of proteins at the plasma membrane and in the cytosol of a living cell. We specifically focus on characterizing the interaction of a fluorescently labeled cytoplasmic protein with the plasma http://dx.doi.org/10.1016/j.ab.2015.03.030 0003-2697/Ó 2015 Elsevier Inc. All rights reserved. ⇑ Corresponding author. Fax: +1 612 624 4578. E-mail address: [email protected] (J.D. Mueller). Analytical Biochemistry 480 (2015) 11–20 Contents lists available at ScienceDirect Analytical Biochemistry journal homepage: www.elsevier.com/locate/yabio
Transcript of Z-scan fluorescence profile deconvolution of cytosolic and membrane-associated protein populations.

Analytical Biochemistry 480 (2015) 11–20
Contents lists available at ScienceDirect
Analytical Biochemistry
journal homepage: www.elsevier .com/locate /yabio
Z-scan fluorescence profile deconvolution of cytosolic andmembrane-associated protein populations
http://dx.doi.org/10.1016/j.ab.2015.03.0300003-2697/� 2015 Elsevier Inc. All rights reserved.
⇑ Corresponding author. Fax: +1 612 624 4578.E-mail address: [email protected] (J.D. Mueller).
Elizabeth M. Smith a, Jared Hennen a, Yan Chen a,b, Joachim D. Mueller a,b,c,⇑a School of Physics and Astronomy, University of Minnesota, Minneapolis, MN 55455, USAb Institute for Molecular Virology, University of Minnesota, Minneapolis, MN 55455, USAc Department of Biomedical Engineering, University of Minnesota, Minneapolis, MN 55455, USA
a r t i c l e i n f o a b s t r a c t
Article history:Received 16 December 2014Received in revised form 22 March 2015Accepted 23 March 2015Available online 7 April 2015
Keywords:Peripheral membrane proteinPoint spread functionBrightnessTranslocationPhospholipase CPleckstrin homology domain
This study introduces a technique that characterizes the spatial distribution of peripheral membrane pro-teins that associate reversibly with the plasma membrane. An axial scan through the cell generates a z-scan intensity profile of a fluorescently labeled peripheral membrane protein. This profile is analyticallyseparated into membrane and cytoplasmic components by accounting for both the cell geometry and thepoint spread function. We experimentally validated the technique and characterized both the resolvabil-ity and stability of z-scan measurements. Furthermore, using the cellular brightness of green fluorescentprotein, we were able to convert the fluorescence intensities into concentrations at the membrane and inthe cytoplasm. We applied the technique to study the translocation of the pleckstrin homology domain ofphospholipase C delta 1 labeled with green fluorescent protein on ionomycin treatment. Analysis of the z-scan fluorescence profiles revealed protein-specific cell height changes and allowed for comparisonbetween the observed fluorescence changes and predictions based on the cellular surface area-to-volumeratio. The quantitative capability of z-scan fluorescence profile deconvolution offers opportunities forinvestigating peripheral membrane proteins in the living cell that were previously not accessible.
� 2015 Elsevier Inc. All rights reserved.
Peripheral membrane proteins associate reversibly with cellularmembranes through noncovalent interactions with lipids and inte-gral membrane proteins. They constitute a broad and diverse classof proteins involved in various membrane-mediated cellular pro-cesses, including but not limited to cell signaling, cytoskeletalstructure, lipid homeostasis, and electron transport [1–3]. Theability to transition between soluble and membrane-bound formshas been recognized as an important regulation and controlmechanism of cells. The interaction with the membrane allows amechanism to induce conformational changes in the protein thatmodulate its activity. On the other hand, the interactions withthe membrane-associated protein can also change the composi-tion, dynamics, and shape of cellular membranes [4–7]. This com-plex bidirectional interplay between peripheral membraneproteins and cellular membranes is only beginning to be unraveledthrough the use of model membrane systems and cellular studies.
The energetics and dynamics of the interaction process havebeen primarily studied with model membranes [8,9]. These exper-iments provide quantitative information about protein interactions
with lipids, but like all in vitro studies they cannot reproduce theenvironment and complex interaction network found in cells.Live-cell studies monitor peripheral membrane proteins in theirnatural habitat and are an essential complement to ex situ meth-ods. Cellular translocation studies of fluorescent protein-taggedproteins provide a powerful and convenient approach to visualizethe subcellular distribution of peripheral membrane proteins andtheir dynamic relocation in real time by fluorescence imagingmethods such as confocal or total internal reflection fluorescencemicroscopy [10–13].
Translocation studies typically report qualitative differences inthe subcellular distribution of proteins, which reflects the difficultyof identifying the concentration of the membrane-bound and sol-uble proteins from fluorescence intensity data [10,11]. Attemptsat quantifying the fluorescence signal to gain information aboutthe relative strength of the interaction between protein and mem-brane have been restricted to heuristic approaches that are unableto analytically separate the fluorescence signal. The current studyaddresses this problem and introduces a fluorescence-basedapproach for measuring the time-resolved distribution of proteinsat the plasma membrane and in the cytosol of a living cell.
We specifically focus on characterizing the interaction of afluorescently labeled cytoplasmic protein with the plasma

Fig.1. Concept of z-scanning. The two-photon excitation spot is scanned along thez-axis of a cell expressing a fluorescently labeled peripheral membrane protein,which results in a z-dependent fluorescence intensity profile.
12 Partitioning of peripheral membrane proteins / E.M. Smith et al. / Anal. Biochem. 480 (2015) 11–20
membrane. An axial scan of the two-photon point spread function(PSF)1 through the cell generates a z-scan intensity profile as illus-trated in Fig. 1. By accounting for the cell geometry and the PSF,we recover the distinct cytoplasmic and membrane-bound proteinfluorescence contributions from the intensity profile, a process werefer to as z-scan fluorescence profile deconvolution (FPD). Theintensity profile was first introduced in z-scan fluorescence fluctua-tion spectroscopy (FFS) studies [14,15], where it served as a by-pro-duct for determining the proper weighing factors that connected theFFS data to the oligomeric state of proteins at the plasma membraneand in the cytoplasm. Here we focus exclusively on the z-scan inten-sity profile to demonstrate that it offers a powerful approach forstudying protein binding at the plasma membrane without the needfor time-consuming FFS measurements.
We first examined the resolvability limits of FPD analysis of thefluorescence intensity profile by systematically varying the cyto-plasmic intensity relative to the membrane fluorescence intensityand studied the stability of z-scan measurements over a prolongedsampling time. We applied the technique to investigate the translo-cation of the green fluorescent protein-labeled pleckstrin homology(PH) domain of phospholipase C delta 1 (PH–PLCd–EGFP) in U2OScells from the plasma membrane to the cytoplasm on treatmentwith ionomycin. Quantitative analysis of the z-scan intensity pro-files taken before and after treatment identified movement of themembrane position and allowed direct comparison between the flu-orescence change at the membrane and in the cytoplasm.
Materials and methods
Experimental setup
All data were taken with a Zeiss 63� C-Apochromat waterimmersion objective (NA = 1.2) on a homebuilt two-photon micro-scope as described previously [14,16]. The sample was excited at awavelength of 1000 nm and an average power ranging from 0.30 to0.38 mW after the objective. The dual-channel measurementswere carried out with a dichroic mirror centered at 580 nm to splitthe fluorescence emission into two detection channels. An addi-tional 84-nm-wide bandpass filter centered at 510 nm was addedto the green detection channel (Semrock, Rochester, NY, USA) toeliminate the reflected fluorescence of mCherry. Photon countswere detected by an avalanche photodiode (APD; SPCM-AQ-141,PerkinElmer, Dumberry, Quebec, Canada) and recorded by aFlex02-01D card (Correlator.com, Bridgewater, NJ, USA). Data anal-ysis was performed in IDL 8.3 (Research Systems, Boulder, CO,USA).
An arbitrary waveform generator (model 33250A, AgilentTechnologies, Santa Clara, CA, USA) provided the voltage signal todrive a PZ2000 piezo stage (ASI, Eugene, OR, USA) along its z-axis.A triangular function with a peak-to-peak amplitude of 2.4 V and aperiod of 10 s was used for the z-scan experiments. This waveformcorresponded to 24.1 lm of axial travel in 5 s, with the cells occu-pying roughly 3 to 4 lm in the center of each pass. The data sam-pling frequency of the z-scan experiments was 20 kHz. In addition,we performed independent measurements on cells expressing thefluorescent label EGFP to determine its brightness kEGFP asdescribed previously [17,18]. This brightness serves as a calibrationfactor for the conversion of fluorescence intensities intoconcentrations.
1 Abbreviations used: PSF, point spread function; FPD, fluorescence profile decon-volution; FFS, fluorescence fluctuation spectroscopy; PH–PLCd–EGFP, green fluores-cent protein-labeled pleckstrin homology domain of phospholipase C delta 1; mGL,modified squared Gaussian–Lorentzian; RIPSF, radially integrated point spreadfunction; SA/V, surface area-to-volume.
Plasmid construction, sample preparation, and cell measurements
The pEGFP–C1 and pEGFP–N1 plasmids were purchased fromClontech (Mountain View, CA, USA), and the mCherry–C1 plasmidwas described previously [19]. The EGFP–H-Ras plasmid was a giftfrom Mark Phillips (New York University School of Medicine). ThePH–PLCd–EGFP plasmid was a gift from Joseph Abanesi(University of Texas Southwestern). All sequences were verifiedby automatic sequencing. The cellular studies were performedusing transiently transfected U2OS cells (HTB-96) that wereobtained from American Type Culture Collection (ATCC;Manassas, VA, USA) and maintained in 10% fetal bovine serum(Hyclone Laboratories, Logan, UT, USA) and Dulbecco’s modifiedEagle’s medium. Cells were subcultured in eight-well coverglasschamber slides (Nalge Nunc International, Rochester, NY, USA) 12h before transfection. Transient transfections were carried outusing GeneJet (Thermo Scientific, Pittsburgh, PA, USA) accordingto the manufacturer’s instructions 24 h prior to measurement.Immediately before measurement, the growth medium wasreplaced with 200 ll of Leibovitz’s L-15 medium, no phenol red(Gibco, Life Technologies, Grand Island, NY, USA).
For kinetic studies, repeated z-scans were performed on indi-vidual cells. An objective heater with a thermal controller(MATS–ULH, Tokai Hit, Japan) was used to maintain a mediumtemperature of 32 �C. Prior to scanning, 100 ll of medium wasremoved from the well. Pre-warmed L-15 medium (100 ll) con-taining Texas Red and ionomycin calcium salt (Life Technologies,Carlsbad, CA, USA) was later added to the well for final concentra-tions of 1.26 mM for Ca2+ and 5 or 10 lM for ionomycin. Texas Redserved as a tracer to identify the time of delivery of ionomycin atthe cell and was monitored in the red detection channel.
The delta layer model was created by using a layer of rhodaminefibronectin (Cytoskeleton, Denver, CO, USA). The fibronectin layerwas created by pipetting a solution of 200 ll buffer (0.5 M NaCland 0.5 M Tris, pH 7.5) mixed with 13 lg of fibronectin into a cham-ber of an eight-well coverglass slide. The eight-well slide was thenplaced in an incubator for 24 h before the remaining liquid waspipetted out and replaced with 200 ll of Dulbecco’s phosphate-buf-fered saline with calcium and magnesium (BioWhittaker,Walkerville, MD, USA). For the semi-infinite model, a dilute fluores-cein solution was added to a well of the chamber slide.
Z-scan calibration of PSF
A modified squared Gaussian–Lorentzian (mGL) point spreadfunction,
PSFðq; fÞ ¼ z20
z20 þ f2
!ð1þyÞ
exp �4z20
w20
q2
z20 þ f2
!; ð1Þ

Partitioning of peripheral membrane proteins / E.M. Smith et al. / Anal. Biochem. 480 (2015) 11–20 13
first introduced by Macdonald and coworkers [14], provides a goodapproximation of the PSF of our two-photon microscope and servesas the model for this study. A z-scan calibration procedure was per-formed as described previously [14] to determine the free parame-ters of our model. The calibration resulted in z0 = 1.02 ± 0.1 lm,y = 2.50 ± 0.3 lm, and w0 = 0.47 ± 0.05 lm, where w0 and z0
describe the radial and axial beam waist, whereas y changes theaxial decay shape of the PSF. Z-scan analysis relies on the radiallyintegrated point spread function (RIPSF), which for the mGL PSF isgiven by [14]
RIPSFðzÞ ¼Z 1
0PSFðq; fÞ2pqdq ¼ pw2
0
41þ ðz=zRÞ2� ��y
: ð2Þ
The mGL PSF volume is given by V1 ¼Rþ1�1 RIPSF
ðfÞdf=1=4ðpw20zRÞ
ffiffiffiffipp
Cðy� 12Þ=CðyÞ, and the cross-sectional area at
the center of the mGL PSF is determined by A0 ¼pw2
04 [14].
Z-scan data analysis
Photon counts were rebinned by software to a z-scan samplingtime of Tz = 4 ms, which with a z-scan speed of vz = 4.82 lm/s pro-vides a step size Dz = vzTz = 19.3 nm between adjacent binnedphoton counts kz. The experimental fluorescence intensity profileis given by F(z) = kz/Tz and fit to a model intensity profile using aLevenberg–Marquardt algorithm with the PSF parameters zR andy fixed to the calibrated values. The standard error r of kz wasdetermined from the standard deviation of the unbinned countsby r ¼ runbinned
ffiffiffiffiffiffiNBp
with the number of samples NB in a singlebin being equal to 80.
Simulations were performed as follows. A z-scan intensity pro-file Fmodel (z) for a membrane–cytoplasmic membrane geometrywas calculated from Eq. (6) (see Results) using the calibrated PSFparameters and experimental step size Dz. The calculated intensityprofile was converted into simulated data Fsim(z) using aPoissonian random number generator PPoisson (k) to account forshot noise, FsimðzÞ ¼ PPoissonðFmodelðzÞ�TzÞ
Tz.
Results
Z-scan intensity profile of single layers
A scan of the two-photon excitation spot along the z-axis of acell generates a fluorescence intensity profile F(z). This intensityprofile results from the convolution of the PSF of the instrumentwith the concentration profile cM(z) of the fluorescently labeledprotein along the scan axis. We assume in this study that the con-centration only varies along the z-direction, which reflects a geom-etry based on stratified layers. For a single layer, a scan along the z-direction results in a fluorescence intensity function [14]
FðzÞ ¼ kcZ 1
�1Sð1þ zÞRIPSFð1Þdf; ð3Þ
where k is the monomeric brightness of the labeled protein, c rep-resents the concentration of the labeled protein expressed as mono-mers, and RIPSF is the radially integrated point spread function [14].The function s(z) describes the geometric shape of the single layer[14] and is discussed in more detail later. We define the concentra-tion profile as the product of the protein concentration and the geo-metric shape function, cMðzÞ ¼ c SðzÞ.
We consider three basic geometries and their associated inten-sity profiles: the delta layer, the slab, and the semi-infinite layer.The concentration profile of the slab layer cMðzÞ ¼ cPðz; zB; zTÞ isconstant between zB and zT (Fig. 2A), which corresponds to a
geometric shape function Pðz; zB; zTÞ that equals 1 for zB 6 z 6 zT
and 0 everywhere else. The fluorescence intensity profile for theslab layer is obtained from Eq. (3),
FðzÞ ¼ F1aV ðz; zB; zTÞ; ð4Þ
which introduces the fractional PSF volume aV ðz; a; bÞ=R b�z
a�z
RIPSFð1Þdf=V1 to describe the incomplete overlap of the PSF withthe sample [15]. This description differs from conventional FFS,where we assume a PSF that is completely embedded within thesample. In essence, conventional FFS corresponds to a shape func-tion S(z) = 1 and a constant concentration profile cM(z) = c. In thiscase, Eq. (3) reduces to a z-independent fluorescence intensity,F1 ¼ kcV1. Conversely, for a thinner cell section, the PSF achievesonly partial overlap with the sample, which is accounted for by afractional PSF volume VðzÞ ¼ V1aV ðzÞ. The z-scan intensity profilethrough a cell expressing a fluorescently labeled cytoplasmic pro-tein is well approximated by a fit to the slab model (Fig. 2B). Themaximum intensity Fmax of the z-scan occurred at the midsectionbetween the bottom and top layers, zmid ¼ 1
2 ðzB þ zTÞ, and is lessthan the limiting value of F1, because the cell thickness at the scanlocation is not sufficiently thick to completely embed the PSF(aV ðzmid; zB; zTÞ < 1).
The concentration profile of the semi-infinite layer (Fig. 2C) issimilar to the slab layer but with zT !1, which leads to an inten-sity profile FðzÞ ¼ F1 aV ðz; zB;1Þ. A good example of such an inten-sity profile is given by a z-scan through the microscope coverslipinto a fluorescent solution, as shown in Fig. 2D together with afit to the model. The intensity increases as the PSF moves deeperinto the solution and reaches a maximum of F1 once it is com-pletely embedded in the solution.
The delta layer describes a very thin section, such as the plasmamembrane, with a thickness that is much less than the axial size ofthe PSF. Its concentration profile is given by cMðzÞ ¼ rdðz� zMÞ,where d(z) is the delta function, r represents the surface concen-tration of the layer, and zM is the axial position of the thin layer(Fig. 2E). The intensity profile for a delta layer located at zM isobtained from Eq. (3):
FðzÞ ¼ krRIPSFðzM � zÞ ¼ Fmax aAðzM � zÞ: ð5Þ
The RIPSF value at a specific location z may be interpreted as anarea determined by the cross section of the PSF with the deltalayer, AðzÞ ¼ RIPSFðzÞ. The maximum of the intensity Fmax isreached when the PSF is centered on the membrane (z ¼ zM),which corresponds to Fmax ¼ kr0A0 with A0 ¼ Að0Þ. We define afractional PSF area by aAðzM � zÞ ¼ AðzM � zÞ=A0 to describe theintensity profile of Eq. (5) in compact form. A coverslip coveredwith a thin layer of fluorescently labeled fibronectin served as amodel system for a delta layer. A fluorescence intensity z-scanthrough the sample and its fit to Eq. (5) is shown in Fig. 2F.
Z-scan intensity profile of multiple layers
A peripheral membrane protein found at the plasma membraneand in the cytoplasm is described by a delta–slab–delta concentra-tion profile cdsd(z) consisting of a delta layer for the bottom mem-brane located at zB, followed by a slab layer and another delta layerrepresenting the top plasma membrane located at zT. Thisconcentration profile (Fig. 3A) can be written as cdsdðzÞ ¼rBdðz� zBÞ þ ccytoPðz; zB; zTÞ þ rTdðz� zTÞ, where rB and rT denotethe surface concentrations of the fluorescently labeled protein atthe bottom and top membranes, whereas ccyto is the cytoplasmicprotein concentration. The corresponding fluorescence intensityprofile is the sum of the intensity profiles from each layer [15],
FdsdðzÞ ¼ FB aAðz� zBÞ þ Fcyto;1aV ðz; zB; zTÞ þ FT aAðz� zTÞ; ð6Þ

Fig.2. Z-dependent concentration function for a slab (A), semi-infinite (C), and delta (E) layer. The lower panels show an experimental intensity profile Fexp(z) (solid line) andfit to a model intensity profile FmodðzÞ (shaded line) for each concentration function. (B) The intensity profile Fexp(z) of a fluorescent cell is described by the slab model(v2
r = 1.2). The maximum intensity Fmax is less than the intensity F1 for the infinite sample. (D) The intensity profile of a fluorescent solution matches the semi-infinite model(v2
r ¼ 1:1). (F) The intensity profile of thin fibronectin layer is in good agreement with FmodðzÞ for a delta layer (v2r = 1.0).
Fig.3. The delta–slab–delta model. (A) Concentration profile. (B) Z-scan intensity profile for EGFP–H-Ras (solid line) and fit (shaded line) to Eq. (6) (fB = 0.92, fT = 0.95, v2r = 1.2)
with normalized residuals in lower panel. Dotted–dashed line: contribution from the cytoplasmic layer; dotted lines: contribution from the membrane layers. (C and D)Intensity profile of cells expressing EGFP–H-Ras and mCherry fit to delta–slab–delta model (v2
r = 1.3 and 1.1).
14 Partitioning of peripheral membrane proteins / E.M. Smith et al. / Anal. Biochem. 480 (2015) 11–20
where FB and FT are the maximum fluorescence intensity at themembrane layers and Fcyto;1 represents the limiting cytoplasmicintensity of a thick layer.
We introduce the membrane intensity fraction fM as a measurefor the relative amount of fluorescence intensity coming from themembrane,
f M ¼FM
FM þ Fcyto;1; ð7Þ
where FM and Fcyto;1 are the maximum fluorescence intensities atthe membrane and in a thick cytoplasmic sample as defined byEq. (6). Because the z-scan intensity profile distinguishes betweenthe bottom and top membranes, we further introduce the intensityfraction fB of the bottom membrane and the intensity fraction fT ofthe top membrane, which are defined by replacing FM with FB and
FT, respectively, in Eq. (7). High membrane intensity fractions areeasy to resolve because the z-scan intensity profile displays twoprominent peaks, as illustrated by the EGFP–H-Ras data (Fig. 3B;fB = 0.96 and fT = 0.97). Conversely, we expect a larger uncertaintyin determining fM from data with lower membrane intensityfractions.
We transfected cells with EGFP–H-Ras and mCherry to experi-mentally determine the limits of resolvability of fM. H-Ras is pre-dominantly membrane bound, whereas mCherry is entirelycytoplasmic. The presence of two differently colored fluorescentproteins provided a straightforward method to select cells express-ing each protein at the desired intensity ratio. This approachallowed us to systematically vary the membrane intensity fractionover a wide range. Because the fluorescence was split into greenand red detection channels, we combined the photon counts of

Fig.4. Resolvability of membrane intensity fractions fM from z-scan intensityprofiles. (A) Relative errors (asterisks) versus the membrane intensity fraction fM.Each data point was determined from fits of 10 consecutive scans. All intensityprofiles were taken from cells with cytoplasmic intensities Fcyto,1 between 100 and1000 kcps. The relative errors in fM from simulated intensity profiles (n = 1000) areshown for Fcyto,1 = 10 kcps (squares), 100 kcps (triangles), and 1000 kcps (dia-monds). Inset: Relative errors versus membrane intensity fractions fM means fromcells with Fcyto,1 between 11 and 16 kcps. Relative errors from individual scans(open circles) are reduced by summing groups of 10 scan profiles (solid circles). (B)Relative error in fM as a function of the number of summed intensity profiles for onecell (squares) from the inset.
Partitioning of peripheral membrane proteins / E.M. Smith et al. / Anal. Biochem. 480 (2015) 11–20 15
both channels in software to mimic the fluorescence signal of a sin-gle-colored fluorescent protein found in the cytoplasm and at themembrane.
We selected two cells that illustrate z-scan intensity traces withlow membrane intensity fractions. The intensity profile of Fig. 3Cretains a slight double peak, and the fit to the three-layer modelreturns membrane intensity fractions of fB = 0.32 and fT = 0.36.The next intensity profile (Fig. 3D) lacks the double peak, whichis consistent with a fit returning lower membrane intensityfractions than in the previous case (fB = 0.19 and fT = 0.12). We per-formed a systematic study by selecting cells based on the relativemembrane intensity fraction and performed 10 consecutivez-scans at a thick section of each cell. After fitting the intensity pro-file of each scan, the averages and standard deviations of the 10membrane intensity fractions were calculated and are plotted asasterisks in Fig. 4A. The experiments were performed on cells withcytoplasmic intensities Fcyto;1 ranging from 100 to 1000 kcps, andscans were taken at cell heights ranging from 2.2 to 4.1 lm (meanof 3.1 lm).
We further performed simulations to compare the experimentaluncertainties with predictions based on our model. Intensity traceswere calculated according to Eq. (6) with shot noise added toaccount for the photon detection noise. Parameters were chosenthat mimic the experimental conditions as explained in Materialsand Methods. The cell height was 3 lm for all simulations. Themembrane intensity fraction was varied between 0.05 and 0.9 forcytoplasmic intensities Fcyto;1 of 10, 100, and 1000 kcps. Multipletraces (n = 1000) were simulated for each choice of parametersand analyzed analogous to the experimental data described aboveto determine the standard deviation of the membrane intensityfraction. The result of the simulations, plotted as lines with filledsymbols in Fig. 4A, demonstrate that higher intensities and highermembrane intensity fraction reduce the uncertainty. Ourexperimental results closely match the simulation results in thatthe experimental data are scattered between the simulation resultsfor cytoplasmic intensities Fcyto;1 of 100 kcps and Fcyto of1000 kcps. This suggests that shot noise is the dominant factorshaping the experimental uncertainty. At lower membrane inten-sity fractions (fM 6 0.1), the uncertainty increases rapidly, whichimposes a practical limit for resolving very small signal contribu-tions from the membrane. Because the experimental and simu-lated results demonstrate the feasibility of resolving membraneintensity fractions greater than 0.1 from z-scan intensity profiles,we limited our study to cells with fM P 0.1.
Stability of cellular z-scan intensity profiles
The study of time-dependent changes in the membrane-boundpopulation of cellular proteins requires a series of z-scans over aprolonged period of time. Any process that alters the binding con-ditions of the peripheral membrane protein will be reflected in atime-dependent evolution of the membrane intensity profile. Thechanges in the cytoplasmic and membrane-bound populations ofthe protein can be identified from analysis of the z-scan profilesprovided that the instrument is stable and introduces no artifacts.We investigate the stability of our setup by performing a series ofrepeated z-scans through the same x–y position in a cell. By fittingthe intensity profiles from the repeated scans to Eq. (6), membranemovement, cell height changes, and instrument z-drift can be stud-ied over time. Fig. 5A shows the top and bottom membrane posi-tions of a U2OS cell expressing EGFP–H-Ras over a 750-s period.An offset was added to the data to place the midpoint of the cellinitially at zero. The position of the top membrane drifts byapproximately 0.5 lm (standard deviation of 0.12 lm) in parallelwith the position of the bottom membrane during the repeated
scans. This parallel motion of the two cellular surfaces is indicativeof focal drift in the instrument, whereas the cell height (Fig. 5B),h ¼ zT � zB, stays approximately fixed (standard deviation of0.02 lm). The fastest drift rate estimated from Fig. 5A is 10 nm/s,which is small enough to have a negligible influence on the shapeof the intensity profile because the PSF has significant overlap withthe cell for only approximately 1 s during the scan.
Despite drift and occasional changes in cell height, the fluores-cence intensities determined from fits to Eq. (6) remain remarkablyconstant, as demonstrated by Fig. 5C and D. The average mem-brane intensity fractions for the top and bottom membranes arefT = 0.87 and fB = 0.85 with a standard error of 1%. The experimentaluncertainty agrees well with the simulations from Fig. 4A, whichpredict an uncertainty of 1% for Fcyto;1 = 10 kcps for a membranefraction of 0.9. Because we also collected intensity fluctuations,our experiments were capable of converting fluorescence intensi-ties to concentrations. The relation Fcyto;1 ¼ kccytoV1 connects thecytoplasmic concentration and intensity. The PSF volume was cal-culated as explained in Materials and Methods, and the brightnessof the monomeric protein was determined as described previously[15]. Similarly, the surface concentration of the protein at the topand bottom membranes are given by FT ¼ krT A0 and FB ¼ krBA0.Applying these relations, we obtained rB = 1260 lm–2 andrT = 1530 lm–2 for Fig. 5C and ccyto = 340 lm–3 for Fig. 5D. The

Fig.5. Repeated z-scans performed at the same x–y position in a U2OS cellexpressing EGFP–H-Ras are fit by Eq. (6). (A) Top (black circles) and bottom (shadedcircles) membrane positions as a function of time show parallel movement withapproximately 0.5 lm z-drift over a period of 12 min. (B) The cell thickness (solidline) stays approximately constant. (C) Top (dashed line) and bottom (solid line)membrane intensities as a function of time are constant (FBM = 88.8 ± 3.1 kcps andFTM = 108.4 ± 3.1 kcps). (D) The cytoplasmic intensity (dotted–dashed line) remainsstable (Fcyto = 16.2 ± 0.9 kcps).
16 Partitioning of peripheral membrane proteins / E.M. Smith et al. / Anal. Biochem. 480 (2015) 11–20
intensity variations over the measurement period of 750 s led to arelative uncertainty of less than 5% for all concentrations.
The data and simulations illustrate that the uncertainty ofdetermining membrane intensity fraction strongly depend on thefluorescence intensity (Fig. 4A). Thus, quantifying small intensityfractions when the cellular protein concentration is low will behampered by large uncertainties. Because shot noise appears tobe the dominant noise limiting the resolvability of membraneintensity fractions, collecting more photons in the z-scan profileshould reduce the uncertainty. Because cell height stays fixed overprolonged periods of time, this suggests the possibility of takingconsecutive z-scans and aligning the individual z-scan intensityprofiles by software to correct for offsets introduced by focal drift.The photon count signal of the aligned intensity profiles are thenadded up to create a summed profile with a larger signal, whichis expected to result in a reduction in the uncertainty of the fitparameters. To test this procedure and facilitate the early detectionof small membrane intensity fractions in cells with low cytoplas-mic protein concentrations, we selected cells with cytoplasmicintensities ranging from 11 to 16 kcps. We collected 100 z-scanintensity profiles from each cell and divided the scans into groupsof N, which were aligned and summed. Each of the summed pro-files was fit to Eq. (6), and the averages and standard deviationsof the fitted membrane intensity fraction fM were determined.The inset in Fig. 4A shows the relative uncertainty in fM of individ-ual scans (open circles, N = 1) together with the uncertainty of the
summed intensity profiles (filled circles, N = 10). Summing 10intensity profiles led to an average reduction in the relative uncer-tainty of 2.8 with a standard deviation of 0.6. The decrease of therelative error with N is illustrated in Fig. 4B for one of the data sets.The results are consistent with the expected 1=
ffiffiffiffiNp
behavior anddemonstrate the feasibility to improve the signal-to-noise ratioof dim samples by combining the signal from several fast z-scanintensity profiles.
Kinetic studies of peripheral membrane protein partitioning
Time-dependent changes in the distribution of a membrane-bound protein can be quantitatively characterized through a seriesof repeated z-scans. Here we study the PH domain of PLCd, whichbinds with high affinity to PtdIns(4,5)P2 lipids at the plasma mem-brane [20]. When fluorescently labeled, PH–PLCd–EGFP maps thedistribution of PtdIns(4,5)P2 within a cell and exhibits az-dependent intensity profile with a prominent double peak.Ionomycin induces depletion of internal Ca2+ stores and stimulatesstore-operated Ca2+ entry, which raises the Ca2+ concentration inthe cytoplasm [21]. The increased Ca2+ concentration in turn acti-vates PLC-mediated hydrolysis of PtdIns(4,5)P2 into diacylglyceroland inositol triphosphate [22]. This process leads to the displace-ment of PH–PLCd–EGFP from the plasma membrane to the cytosolbecause the hydrolysis depletes the membrane binding site of theprotein [23].
We investigate the time-resolved distribution of PH–PLCd–EGFPby performing a series of repeated z-scans through the same x–yposition in a cell and fitting the intensity profiles from the repeatedscans to Eq. (6). Fig. 6A shows the fluorescent intensities from thetop membrane, bottom membrane, and cytoplasm over a period of210 s within the cell. Ionomycin-containing solution was added atthe 60-s time point, and a dramatic redistribution of fluorescentintensities from the membrane to the cytosol was observedapproximately 60 s after ionomycin treatment. In the cytoplasmthe pre-treatment signal was approximately 100 kcps, and post-treatment the signal was approximately 700 kcps. At the mem-brane both signals decreased; for the top membrane the signaldropped from approximately 200 to 0 kcps, whereas the bottommembrane signal dropped from approximately 200 to 100 kcps.The fit of the z-scan profile to Eq. (6) also recovered the cell’sheight, which destabilized on treatment with ionomycin. Thiswas particularly evident in cells expressing PH–PLCd–EGFP, wherethe time trace (Fig. 6B) identified a reduction in cell height of0.34 lm after ionomycin treatment. The change in height was cal-culated by comparing the average height from the intervalbetween 0 and 60 s with the average height in the interval fromapproximately 140 to 200 s. This loss of height was typical forPH–PLCd–EGFP cells following the addition of ionomycin and isdiscussed in more detail later. The data further show that the delaybetween adding ionomycin and fluorescence response cannot beexplained by slow mixing of the ionomycin solution with cell med-ium, as demonstrated by the fluorescence intensity trace (Fig. 6C)of Texas Red that was included with the ionomycin solution.
As a control, ionomycin solution was also added to cellsexpressing EGFP and cells expressing EGFP–H-Ras. The z-scanswere fit to a slab model for EGFP and a delta–slab–delta modelfor EGFP–H-Ras. The fluorescence intensities of EGFP in the cyto-plasm as well as the cell height remained approximately constantbefore and after the addition of ionomycin at t = 60 s (Fig. 7A).Similarly for EGFP–H-Ras, we observed no significant change in cellheight, the fluorescence at the membrane, or the fluorescence inthe cytoplasm on adding ionomycin (Fig. 7B).
We used box-and-whisker plots to characterize the changes incell height, cytoplasmic intensity, and membrane intensity before
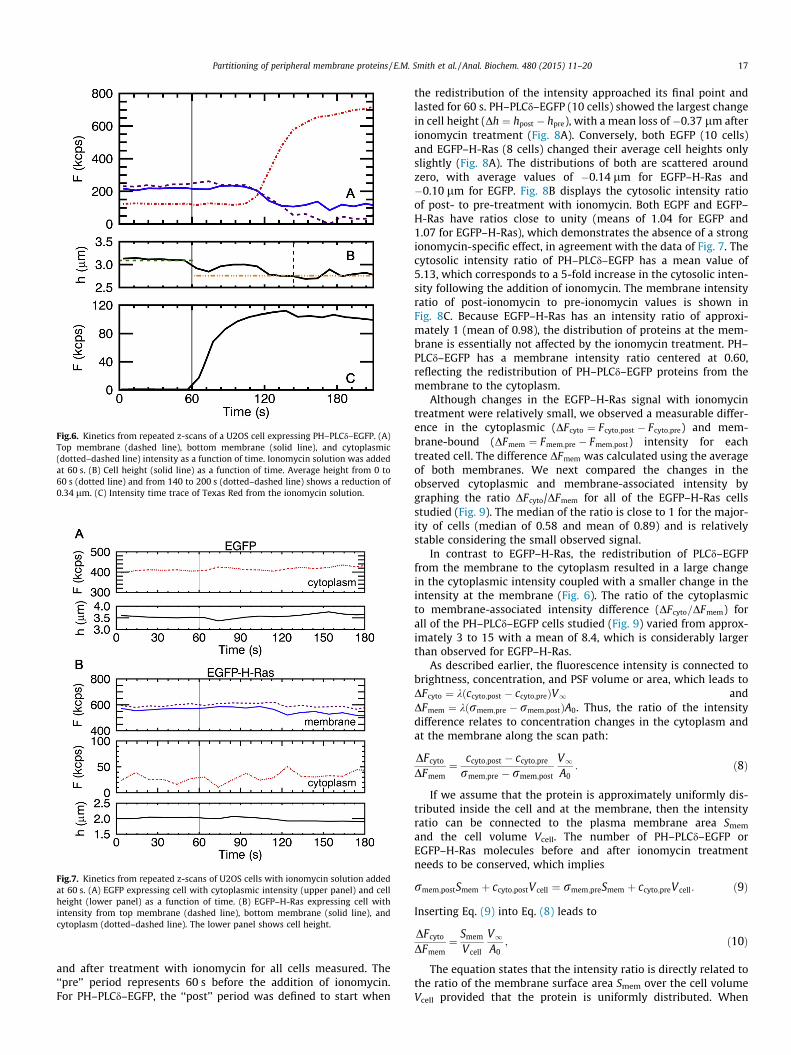
Fig.6. Kinetics from repeated z-scans of a U2OS cell expressing PH–PLCd–EGFP. (A)Top membrane (dashed line), bottom membrane (solid line), and cytoplasmic(dotted–dashed line) intensity as a function of time. Ionomycin solution was addedat 60 s. (B) Cell height (solid line) as a function of time. Average height from 0 to60 s (dotted line) and from 140 to 200 s (dotted–dashed line) shows a reduction of0.34 lm. (C) Intensity time trace of Texas Red from the ionomycin solution.
Fig.7. Kinetics from repeated z-scans of U2OS cells with ionomycin solution addedat 60 s. (A) EGFP expressing cell with cytoplasmic intensity (upper panel) and cellheight (lower panel) as a function of time. (B) EGFP–H-Ras expressing cell withintensity from top membrane (dashed line), bottom membrane (solid line), andcytoplasm (dotted–dashed line). The lower panel shows cell height.
Partitioning of peripheral membrane proteins / E.M. Smith et al. / Anal. Biochem. 480 (2015) 11–20 17
and after treatment with ionomycin for all cells measured. The‘‘pre’’ period represents 60 s before the addition of ionomycin.For PH–PLCd–EGFP, the ‘‘post’’ period was defined to start when
the redistribution of the intensity approached its final point andlasted for 60 s. PH–PLCd–EGFP (10 cells) showed the largest changein cell height (Dh ¼ hpost � hpre), with a mean loss of �0.37 lm afterionomycin treatment (Fig. 8A). Conversely, both EGFP (10 cells)and EGFP–H-Ras (8 cells) changed their average cell heights onlyslightly (Fig. 8A). The distributions of both are scattered aroundzero, with average values of �0.14 lm for EGFP–H-Ras and�0.10 lm for EGFP. Fig. 8B displays the cytosolic intensity ratioof post- to pre-treatment with ionomycin. Both EGPF and EGFP–H-Ras have ratios close to unity (means of 1.04 for EGFP and1.07 for EGFP–H-Ras), which demonstrates the absence of a strongionomycin-specific effect, in agreement with the data of Fig. 7. Thecytosolic intensity ratio of PH–PLCd–EGFP has a mean value of5.13, which corresponds to a 5-fold increase in the cytosolic inten-sity following the addition of ionomycin. The membrane intensityratio of post-ionomycin to pre-ionomycin values is shown inFig. 8C. Because EGFP–H-Ras has an intensity ratio of approxi-mately 1 (mean of 0.98), the distribution of proteins at the mem-brane is essentially not affected by the ionomycin treatment. PH–PLCd–EGFP has a membrane intensity ratio centered at 0.60,reflecting the redistribution of PH–PLCd–EGFP proteins from themembrane to the cytoplasm.
Although changes in the EGFP–H-Ras signal with ionomycintreatment were relatively small, we observed a measurable differ-ence in the cytoplasmic (DFcyto ¼ Fcyto;post � Fcyto;pre) and mem-brane-bound (DFmem ¼ Fmem;pre � Fmem;post) intensity for eachtreated cell. The difference DFmem was calculated using the averageof both membranes. We next compared the changes in theobserved cytoplasmic and membrane-associated intensity bygraphing the ratio DFcyto/DFmem for all of the EGFP–H-Ras cellsstudied (Fig. 9). The median of the ratio is close to 1 for the major-ity of cells (median of 0.58 and mean of 0.89) and is relativelystable considering the small observed signal.
In contrast to EGFP–H-Ras, the redistribution of PLCd–EGFPfrom the membrane to the cytoplasm resulted in a large changein the cytoplasmic intensity coupled with a smaller change in theintensity at the membrane (Fig. 6). The ratio of the cytoplasmicto membrane-associated intensity difference (DFcyto=DFmem) forall of the PH–PLCd–EGFP cells studied (Fig. 9) varied from approx-imately 3 to 15 with a mean of 8.4, which is considerably largerthan observed for EGFP–H-Ras.
As described earlier, the fluorescence intensity is connected tobrightness, concentration, and PSF volume or area, which leads toDFcyto ¼ kðccyto;post � ccyto;preÞV1 andDFmem ¼ kðrmem;pre � rmem;postÞA0. Thus, the ratio of the intensitydifference relates to concentration changes in the cytoplasm andat the membrane along the scan path:
DFcyto
DFmem¼ ccyto;post � ccyto;pre
rmem;pre � rmem;post
V1A0
: ð8Þ
If we assume that the protein is approximately uniformly dis-tributed inside the cell and at the membrane, then the intensityratio can be connected to the plasma membrane area Smem
and the cell volume Vcell. The number of PH–PLCd–EGFP orEGFP–H-Ras molecules before and after ionomycin treatmentneeds to be conserved, which implies
rmem;postSmem þ ccyto;postVcell ¼ rmem;preSmem þ ccyto;preV cell: ð9Þ
Inserting Eq. (9) into Eq. (8) leads to
DFcyto
DFmem¼ Smem
Vcell
V1A0
; ð10Þ
The equation states that the intensity ratio is directly related tothe ratio of the membrane surface area Smem over the cell volumeVcell provided that the protein is uniformly distributed. When

Fig.8. Box plots of changes in cell height and intensity between pre- and post-ionomycin treatment of U2OS cells expressing PH–PLCd–EGFP (n = 10), EGFP(n = 10), and EGFP–H-Ras (n = 8). (A) Differences in cell height (Dh ¼ hpre � hpost)with means of �0.37 lm for PH–PLCd–EGFP, �0.10 lm for EGFP, and �0.14 lm forEGFP–H-Ras. (B) Cytoplasmic intensity ratios (Fpost=Fpre) with mean values of 5.13for PH–PLCd–EGFP, 1.04 for EGFP, and 1.07 for EGFP–H-Ras. (C) Membrane intensityratios (Fpost=Fpre) with mean values of 0.60 for PH–PLCd–EGFP and 0.98 forEGFP–H-Ras.
Fig.9. Box plots of the ratios of Fcyto;post � Fcyto;pre and Fmem;pre � Fmem;post forionomycin-treated U2OS cells expressing PH–PLCd–EGFP (n = 10) and EGFP–H-Ras(n = 8).
18 Partitioning of peripheral membrane proteins / E.M. Smith et al. / Anal. Biochem. 480 (2015) 11–20
accounting for the PSF volume and area of the experimental setup(A0 = 0.18 lm2 and V1 ¼ = 0.24 lm3), the average of DFcyto=DFmem
predicts surface-to-volume ratios (Smem/Vcell) of 6.7 lm–1 for PH–PLCd–EGFP and 0.7 lm–1 for EGFP–H-Ras. These two predictionsdiffer widely, which is discussed later in more detail.
Discussion
Distinguishing cytoplasmic and membrane-bound protein pop-ulations relies on the accurate breakdown of the z-scan intensityprofile into its individual components. A prerequisite for thisdeconvolution is an accurate PSF model and parameterization. Itis crucial to test the selected PSF model on experimental z-scantraces with well-defined geometries. The delta layer is optimal totest the PSF model because it directly probes the RIPSF profile(Fig. 2F). A second important test model is the semi-infinite layer(Fig. 2D). The same PSF parameters that describe the delta layeralso need to model the z-scan intensity profile of the semi-infinitelayer. Because the semi-infinite layer probes the PSF deeper intothe solution than the delta layer, depth changes in the PSF, suchas those caused by spherical aberrations, are easily noticed.There should be no deviation between the model and the experi-mental intensity profile, at least to a depth that covers the size ofthe object to be scanned, which in the case of adherent cells is afew micrometers. A PSF model that passes the above tests is viablefor z-scan FPD analysis. We previously demonstrated that themodified Gaussian–Lorentzian PSF model [14,15] is suitable forour two-photon instruments and identified the PSF parameters.
Identifying the cytoplasmic and membrane-bound intensities isbased on fitting of the z-scan intensity profile. Reliable extractionof the fit parameters requires the correct assignment of measure-ment uncertainties in addition to selecting an accurate PSF model.We calculated the uncertainty based on shot noise, which resultedin fits with reduced chi-square values of approximately 1 for theexperimental intensity traces. This result implies that shot noisedue to the photon detection process is the dominant source ofnoise of experimental z-scan intensity traces, which is further cor-roborated by the simulated z-scan intensity profiles that give riseto uncertainties in the fractional membrane intensity that closelymatch the experimental data (Fig. 4A).
Extracting the intensities from the membrane and cytoplasmrelies on the shape of the intensity profile. Thus, the cell at the scanlocation needs to be sufficiently thick to generate a profile with thetwo membrane intensity peaks readily distinguishable. As a rule ofthumb, the thickness should be at least twice the axial beam waistz0 of the PSF, which implies a minimum thickness of approximately2 lm for our setup. This condition was satisfied for all cell mea-surements presented in this study. Furthermore, the amplitude ofthe membrane intensity peaks needs to be strong enough to mea-surably influence the shape of the intensity profile. Although peaksare no longer visible when the membrane intensity fraction fallsbelow 25%, quantitative analysis of the z-scan intensity profileextends to lower membrane intensity fractions. The experimentsand simulation identify a practical lower limit for the membraneintensity fractions of approximately 0.1 (Fig. 4A).
The uncertainty in the fit parameters increases rapidly at lowmembrane intensity fractions. Collecting more photons during thescan reduces the fit uncertainty, but increasing laser power is lim-ited by the onset of photobleaching of the sample, which distortsthe intensity profile. Slowing down the z-scan speed would collectmore photons, but this approach requires a very stable instrumentand might not be an option in many cases. Our instrument requiresrelatively fast scans to counteract the distorting influence of focaldrift. Measurements over several months identified a maximumdrift rate of approximately 10 nm/s. In this study, we collected acomplete intensity profile in 5 s (half a scan period), which is suffi-ciently fast to render the influence of drift negligible. Although weobserved slow changes in cell height in some cases, the cell thick-ness at the scan location is usually remarkably constant for pro-longed periods of time. A stable cell thickness provides analternative to improve the signal-to-noise ratio of the measurement

Partitioning of peripheral membrane proteins / E.M. Smith et al. / Anal. Biochem. 480 (2015) 11–20 19
that does not rely on a slow scan speed. We demonstrated thatsumming the signal from repeated fast z-scans is feasible andresults in a lower uncertainty in the fit parameters. Together, theseresults establish that quantitative z-scan analysis can be performedon a regular microscope without the need for specialized hardwarethat corrects focus drift.
FPD analysis of the z-scan intensity determines the intensityfrom each fluorescent layer and the separation between layers.The scanning rate used to collect fluorescence intensity profiles isfast enough that the layer intensity and separation can be appliedto time-resolved studies of protein binding to the membrane, asdemonstrated by the data in Fig. 6. Furthermore, it is possible torelate intensities to concentration through the use of a conversionfactor from an independent control experiment. In our case, wedetermined the brightness kEGFP of monomeric EGFP in an indepen-dent cell experiment. The protein concentration in the cytoplasmand at the membrane is calculated from the intensities and thebrightness, as explained in Results. Because kEGFP corresponds tothe brightness of monomeric EGFP, the calculated concentrationis expressed in terms of monomer. In contrast to the z-scan inten-sity profile, z-scan FFS is a slow technique that is not suited fortime-resolved studies because the additional FFS measurementslead to data acquisition times approaching 100 s. Thus, z-scanFFS measurements have an advantage over z-scan FPD only if theoligomeric state of proteins at the plasma membrane and in thecytoplasm needs to be identified.
This study applied z-scan FPD with a time resolution of 5 s toquantify the redistribution of PH–PLCd–EGFP from the plasmamembrane to the cytoplasm on ionomycin treatment. Becausethe time scale of the cellular response to signaling events typicallyis longer than 1 min [24], a resolution of 5 s should be sufficient inmost cases. We monitored the appearance of Texas Red fluores-cence to account for the variability in the mixing time on addingionomycin solution (Fig. 6), which served to identify the exact timepoint of ionomycin delivery to the cell. The experiment recorded atime delay between ionomycin delivery and the onset of the fluo-rescence intensity redistribution (Fig. 6). The delay of approxi-mately 30 s is consistent with studies of Ca2+ cell signalingshowing that Ca2+ reached maximum levels 30 to 60 s after iono-mycin treatment [21,25,26].
The membrane translocation kinetics of peripheral membraneproteins such as PH–PLCd–EGFP have been studied by fluorescenceimaging methods. Initial studies used confocal imaging to show theredistribution of PH–PLCd–EGFP from the membrane to the cyto-plasm after ionomycin treatment or PFA receptor stimulation[10,11]. Both studies used the intensity profile from a line segmentof the image to quantify the relative change in fluorescence aroundthe membrane region over time. Although this captured the kinet-ics of the process, the profile itself provides no direct measure forseparating cytoplasmic and membrane-bound components. Loewand coworkers noted another problem with intensity profileslinked to membrane movement. They imaged PH–PLCd–EGFP andobserved bradykinin stimulation-induced cell shape changes andmembrane movement [12]. To address this issue, a region of inter-est including membrane and cytoplasm was selected, followed by athresholding step to segment the membrane region. The averageintensity above the threshold was used to estimate the intensityat the membrane [12]. Although this approach was judged to avoidissues associated with membrane movement, the local cellgeometry within the region of interest and a precise PSF modelwere not taken into account, which prevented a truly quantitativeseparation of membrane-associated and cytoplasmic fluorescence.Z-scan FPD overcomes these shortcomings and achieves quantita-tive separation of the intensity profile by analytically accountingfor cell geometry and PSF shape.
The inherent quantitative nature of z-scan FPD analysis allowedus to measure membrane movement that had been mentioned as aconcern but not quantified [12]. PH–PLCd–EGFP showed a signifi-cant reduction in cell height on ionomycin treatment (Fig. 8A).Control experiments on cells expressing EGFP and EGFP–H-Rasrevealed a negligible effect of ionomycin on cell height. BecausePH–PLCd–EGFP lacks enzymatic activity of its own, the resultsimply that the observed change in cell height was specific to thedissociation of PH–PLCd–EGFP from the plasma membrane andthat the interaction of the peripheral membrane protein with thelipid had an influence on the plasma membrane and the cell shape.This observation agrees with other studies that have pointed outthat protein–membrane interactions can change properties of themembrane itself [4–7] as well as modulate the adhesion strengthbetween the cytoskeleton and membrane lipids [27]. For example,PH–PLCd–EGFP has been shown to induce positive membrane cur-vature in model membranes when it binds to PtdIns(4,5)P2 lipids[28]. Although the previous study was performed ex situ, ourresults demonstrate that PH–PLCd–EGFP binding also affects themembrane inside a living cell. In addition, we observed a slightasymmetry in the response of the top and bottom membranes onionomycin treatment. Although the fluorescence intensity fromPH–PLCd–EGFP associated with either membrane was approxi-mately identical before treatment, the top membrane consistentlyshowed a more pronounced decrease in fluorescent intensity thanthe bottom membrane following ionomycin treatment (Fig. 6A).The cause for this difference is currently not known and willrequire further study. However, because the rigidity of the glasssubstrate can alter the bottom membrane’s properties [29,30],the membrane–glass attachment might contribute to the observedeffect. Z-scan FPD provides the means to quantitatively study dif-ferences at the top and bottom membranes, which is not readilyaccessible by other fluorescence techniques. The influence of sub-strate rigidity can be explored in future experiments by coatingthe glass coverslips in order to change the substrate stiffness.
An estimate of the surface area-to-volume (SA/V) ratio of U2OScells based on a simple model of the cell as a cylinder with a cross-sectional area of approximately 400 lm2 and a volume of approx-imately 1 pl [31] leads to a value on the order of 1 lm–1. This esti-mate predicts that changes in fluorescence at the plasmamembrane and in the cytoplasm due to translocation results in aratio DFcyto/DFmem of approximately 1 (Eq. (10)) provided that theconcentrations at the membrane and in the cytoplasm are uniform.As mentioned above, the SA/V ratio for EGFP–H-Ras is 0.7 lm–1,which is in good agreement with the above estimate, but for PH–PLCd–EGFP we arrived at a ratio (SA/V = 6.7 lm–1) that is inconsis-tent with the model. The ratio is significantly larger than theexpected value, which indicates the appearance of more proteinin the cytoplasm than is expected from the loss at the plasmamembrane. This outcome could be achieved by the additionalrelease of PH–PLCd–EGFP from internal membranes such as theGolgi, but studies have found very little association of PH–PLCd–EGFP with internal membranes [32,33]. Another source that couldaccount for the large ratio is the presence of plasma membraneareas outside the z-scan location that carry a higher protein con-centration. It has been shown that PtdIns(4,5)P2 and PH–PLCd–EGFP are more highly concentrated in membrane ruffles [32,34–37] compared with other regions of the membrane. The ruffles ofU2OS cells are located closer to the periphery of the cell, a regionthat was not sampled in our study because it is too thin for z-scanFPD analysis. Thus, a likely explanation for the high ratio is therelease of additional PH–PLCd–EGFP located at membrane ruffles.
In summary, z-scan FPD analysis introduces a method todecompose the fluorescence contributions from the cytoplasmand membrane of a peripheral membrane protein in the living cell.

20 Partitioning of peripheral membrane proteins / E.M. Smith et al. / Anal. Biochem. 480 (2015) 11–20
Only three elements are required: the fluorescent intensity profilealong the axial dimension of the cell, a well-characterized pointspread function, and a model of the cell geometry. Intensities bothat the membrane and in the cytoplasm are readily converted intoconcentrations by including a brightness calibration measurementtaken in EGFP expressing cells. The quantitative nature of z-scanFPD, as demonstrated by our results, opens new opportunities forinvestigating peripheral membrane proteins in cells. It will beinteresting to explore combining this method with lateral scanningin future development work. Such an extension of the techniquewould allow probing lateral heterogeneity of protein density atthe membrane, such as the presence of punctate structures, whilestill retaining the ability to quantitatively distinguish fluorescentintensity contributions from cytoplasmic and membrane layers.
Acknowledgments
This research was supported by the National Institutes ofHealth (NIH; R01 GM064589 and GM098550) and the NationalScience Foundation (PHY-0957728). Melissa Gardner kindly loanedthe objective collar heater used in this work. E.M.S. acknowledgessupport from the National Institute of Allergy and InfectionDiseases, of NIH grant 5T32A1083196 (Minnesota TrainingProgram in Virology), and a University of Minnesota GraduateSchool Doctoral Dissertation Fellowship.
References
[1] F.M. Goñi, Non-permanent proteins in membranes: when proteins come asvisitors [review], Mol. Membr. Biol. 19 (2002) 237–245.
[2] W. Cho, R.V. Stahelin, Membrane–protein interactions in cell signaling andmembrane trafficking, Annu. Rev. Biophys. Biomol. Struct. 34 (2005) 119–151.
[3] C.G. Sudhahar, R.M. Haney, Y. Xue, R.V. Stahelin, Cellular membranes and lipid-binding domains as attractive targets for drug development, Curr. Drug Targets9 (2008) 603–613.
[4] H.T. McMahon, J.L. Gallop, Membrane curvature and mechanisms of dynamiccell membrane remodelling, Nature 438 (2005) 590–596.
[5] J. Zimmerberg, M.M. Kozlov, How proteins produce cellular membranecurvature, Nat. Rev. Mol. Cell Biol. 7 (2006) 9–19.
[6] M.A. Lemmon, Membrane recognition by phospholipid-binding domains, Nat.Rev. Mol. Cell Biol. 9 (2008) 99–111.
[7] T.R. Graham, M.M. Kozlov, Interplay of proteins and lipids in generatingmembrane curvature, Curr. Opin. Cell Biol. 22 (2010) 430–436.
[8] W. Cho, L. Bittova, R.V. Stahelin, Membrane binding assays for peripheralproteins, Anal. Biochem. 296 (2001) 153–161.
[9] H. Zhao, P. Lappalainen, A simple guide to biochemical approaches foranalyzing protein–lipid interactions, Mol. Biol. Cell 23 (2012) 2823–2830.
[10] P. Várnai, T. Balla, Visualization of phosphoinositides that bind pleckstrinhomology domains: Calcium- and agonist-induced dynamic changes andrelationship to myo-[3H]inositol-labeled phosphoinositide pools, J. Cell Biol.143 (1998) 501–510.
[11] T.P. Stauffer, S. Ahn, T. Meyer, Receptor-induced transient reduction in plasmamembrane PtdIns(4,5)P2 concentration monitored in living cells, Curr. Biol. 8(1998) 343–346.
[12] C. Xu, J. Watras, L.M. Loew, Kinetic analysis of receptor-activatedphosphoinositide turnover, J. Cell Biol. 161 (2003) 779–791.
[13] A. Wuttke, J. Sågetorp, A. Tengholm, Distinct plasma membrane PtdIns(4)P andPtdIns(4,5)P2 dynamics in secretagogue-stimulated beta-cells, J. Cell Sci. 123(2010) 1492–1502.
[14] P.J. Macdonald, Y. Chen, X. Wang, Y. Chen, J.D. Mueller, Brightness analysis byz-scan fluorescence fluctuation spectroscopy for the study of proteininteractions within living cells, Biophys. J. 99 (2010) 979–988.
[15] E.M. Smith, P.J. Macdonald, Y. Chen, J.D. Mueller, Quantifying protein–proteininteractions of peripheral membrane proteins by fluorescence brightnessanalysis, Biophys. J. 107 (2014) 66–75.
[16] Y. Chen, L.-N. Wei, J.D. Mueller, Probing protein oligomerization in living cellswith fluorescence fluctuation spectroscopy, Proc. Natl. Acad. Sci. U.S.A. 100(2003) 15492–15497.
[17] Y. Chen, J.D. Müller, S.Y. Tetin, J.D. Tyner, E. Gratton, Probing ligand proteinbinding equilibria with fluorescence fluctuation spectroscopy, Biophys. J. 79(2000) 1074–1084.
[18] A. Sanchez-Andres, Y. Chen, J.D. Müller, Molecular brightness determined froma generalized form of Mandel’s Q-parameter, Biophys. J. 89 (2005) 3531–3547.
[19] B. Wu, Y. Chen, J.D. Müller, Fluorescence fluctuation spectroscopy of mCherryin living cells, Biophys. J. 96 (2009) 2391–2404.
[20] M.A. Lemmon, K.M. Ferguson, R. O’Brien, P.B. Sigler, J. Schlessinger, Specificand high-affinity binding of inositol phosphates to an isolated pleckstrinhomology domain, Proc. Natl. Acad. Sci. U.S.A. 92 (1995) 10472–10476.
[21] A.J. Morgan, R. Jacob, Ionomycin enhances Ca2+ influx by stimulating store-regulated cation entry and not by a direct action at the plasma membrane,Biochem. J. 300 (1994) 665–672.
[22] S.G. Rhee, Y.S. Bae, Regulation of phosphoinositide-specific phospholipase Cisozymes, J. Biol. Chem. 272 (1997) 15045–15048.
[23] P. Várnai, T. Balla, Live cell imaging of phosphoinositide dynamics withfluorescent protein domains, Biochim. Biophys. Acta 1761 (2006) 957–967.
[24] R. Brent, Cell signaling: what is the signal and what information does it carry?,FEBS Lett 583 (2009) 4019–4024.
[25] R.E. Dolmetsch, R.S. Lewis, Signaling between intracellular Ca2+ stores anddepletion-activated Ca2+ channels generates [Ca2+]i oscillations in Tlymphocytes, J. Gen. Physiol. 103 (1994) 365–388.
[26] R.M. Tombes, C. Simerly, G.G. Borisy, G. Schatten, Meiosis, egg activation, andnuclear envelope breakdown are differentially reliant on Ca2+, whereasgerminal vesicle breakdown is Ca2+ independent in the mouse oocyte, J. CellBiol. 117 (1992) 799–811.
[27] D. Raucher, T. Stauffer, W. Chen, K. Shen, S. Guo, J.D. York, M.P. Sheetz, T.Meyer, Phosphatidylinositol 4,5-bisphosphate functions as a secondmessenger that regulates cytoskeleton–plasma membrane adhesion, Cell 100(2000) 221–228.
[28] K. Temmerman, W. Nickel, A novel flow cytometric assay to quantifyinteractions between proteins and membrane lipids, J. Lipid Res. 50 (2009)1245–1254.
[29] R.J. Pelham, Y.I. Wang, Cell locomotion and focal adhesions are regulated bysubstrate flexibility, Proc. Natl. Acad. Sci. U.S.A. 94 (1997) 13661–13665.
[30] H.B. Wang, M. Dembo, S.K. Hanks, Y. Wang, Focal adhesion kinase is involvedin mechanosensing during fibroblast migration, Proc. Natl. Acad. Sci. U.S.A. 98(2001) 11295–11300.
[31] A. Tzur, R. Kafri, V.S. LeBleu, G. Lahav, M.W. Kirschner, Cell growth and sizehomeostasis in proliferating animal cells, Science 325 (2009) 167–171.
[32] S.A. Watt, G. Kular, I.N. Fleming, C.P. Downes, J.M. Lucocq, Subcellularlocalization of phosphatidylinositol 4,5-bisphosphate using the pleckstrinhomology domain of phospholipase C delta 1, Biochem. J. 363 (2002) 657–666.
[33] G.R.V. Hammond, S.K. Dove, A. Nicol, J.A. Pinxteren, D. Zicha, G. Schiavo,Elimination of plasma membrane phosphatidylinositol (4,5)-bisphosphate isrequired for exocytosis from mast cells, J. Cell Sci. 119 (2006) 2084–2094.
[34] A. Honda, M. Nogami, T. Yokozeki, M. Yamazaki, H. Nakamura, H. Watanabe, K.Kawamoto, Phosphatidylinositol 4-phosphate 5-kinase alpha is a downstreameffector of the small G protein ARF6 in membrane ruffle formation, Cell 99(1999) 521–532.
[35] S. McLaughlin, J. Wang, A. Gambhir, D. Murray, PIP(2) and proteins:Interactions, organization, and information flow, Annu. Rev. Biophys PIP2and proteins: Interactions, organization, and information flow, Biomol. Struct.31 (2002) 151–175.
[36] S. McLaughlin, D. Murray, Plasma membrane phosphoinositide organizationby protein electrostatics, Nature 438 (2005) 605–611.
[37] N. Araki, Y. Egami, Y. Watanabe, T. Hatae, Phosphoinositide metabolism duringmembrane ruffling and macropinosome formation in EGF-stimulated A431cells, Exp. Cell Res. 313 (2007) 1496–1507.