Yuma County June 30, 2012 Comprehensive Annual ...
284
-
Upload
khangminh22 -
Category
Documents
-
view
0 -
download
0
Transcript of Yuma County June 30, 2012 Comprehensive Annual ...


In 1905, John Gandolfo built the Gandolfo Annex at 46 W. 2nd St. He originally used it as an office and hotel annex.
Prior to the Ocean to Ocean bridge, the ferry was means to cross the Colorado River from Yuma, Arizona to California
In 1883, John Gandolfo built the Gandolfo Building, which housed the Gandolfo Hotel and Gandolfo Café, on Main Street. With more than 50 hotel rooms, it was the largest and ‘most elegant’ building in Yuma.
With its distinct arches the County Administration building was a favorable shopping stop in 1937, on the corner of 2nd & Main Street.
Yuma County Courthouse Built in 1928 the structure was designed by the team of Ralph Swearingen and G. A. Hanssen with Frank M. Connor and C. J. Brown as contractors.
John Gandolfo built the Gandolfo Theatre at 202 S. 1st Ave. in 1917 with a seating capacity of 635. During World War II, the theater served as a USO canteen.
Yuma Territorial opened for business in 1876. In its heyday, the prison was often called “Devil’s Island” or “Hell Hole” giving one the impression of its menacing notoriety
Southern Pacific handcar on the Colorado River Bridge in Yuma, Arizona. SP built these handcars in their shops and they can be identified by their unique spoked wheels. Spokes gave way to pressed steel wheels for durability. This image from 1880 is about the time the pump car design became the standard.
Cover Illustration Details
Provided by Brenda Mendez

YYYUUUMMMAAA CCCOOOUUUNNNTTTYYY
"Yuma County Government is dedicated to providing customer-focused services to enhance the health, safety, well-being, and future of our entire community."
CCCooommmppprrreeehhheeennnsssiiivvveee AAAnnnnnnuuuaaalll FFFiiinnnaaannnccciiiaaalll RRReeepppooorrrttt
For the Fiscal Year
Ended June 30, 2012
BOARD OF SUPERVISORS Gregory S. Ferguson, Chair
5th District
Lenore Loroña Stuart, 1st District Russell McCloud, 2nd District
Casey Prochaska, 3rd District Marco A. (Tony) Reyes, 4th District
COUNTY ADMINISTRATOR Robert Pickels
Prepared by Yuma County Department of Financial Services
Director Scott G. Holt
Deputy Director
Gilberto Villegas, Jr.
Accountants Toni Lindsay Debra Beyer
LeeAnne Rachels Tammy Vasquez
Engracia Lopez Mary Jo McIntyre
Denise Perez Elizabeth Canela Elsa Garcia Maritza Retiz Denise Butler

{This page is intentionally left blank}

YUMA COUNTYComprehensive Annual Financial Report
For the Fiscal Year Ended June 30, 2012
TABLE OF CONTENTS
INTRODUCTORY SECTION Exhibit Page
Letter of Transmittal................................................................................................................ 3Organizational Chart............................................................................................................... 8Certificate of Achievement for Excellence in Financial Reporting .......................................... 9
FINANCIAL SECTION
Independent Auditors' Report................................................................................................. 13
Management's Discussion and Analysis ................................................................................ 17
Basic Financial StatementsGovernment-Wide Financial Statements
Statement of Net Assets ............................................................................... A-1 30Statement of Activities .................................................................................. A-2 31
Fund Financial Statements
Balance Sheet - Governmental Funds .......................................................... B-1 34Reconciliation of the Balance Sheet of Governmental Funds to the
Statement of Net Assets ............................................................................ B-2 37Statement of Revenues, Expenditures, and Changes in
Fund Balances - Governmental Funds ...................................................... B-3 38Reconciliation of the Statement of Revenues, Expenditures, and
Changes in Fund Balances of Governmental Funds to theStatement of Activities................................................................................ B-4 41
Statement of Net Assets - Proprietary Funds ............................................... C-1 42Statement of Revenues, Expenses, and Changes in
Fund Net Assets - Proprietary Funds ........................................................ C-2 43Statement of Cash Flows - Proprietary Funds .............................................. C-3 44
Statement of Fiduciary Net Assets - Fiduciary Funds ................................... D-1 45Statement of Changes in Fiduciary Net Assets - Fiduciary Funds ................ D-2 46
Notes to Financial Statements .......................................................................................... 47
Required Supplementary InformationBudgetary Comparison Schedules
General Fund ............................................................................................. E-1 76Jail District - General Operations Fund ..................................................... E-2 78Library District - General Operations Fund ................................................ E-3 79Flood Control District Fund ........................................................................ E-4 80Health Services District Fund ………………………………………………… E-5 81Development Services HURF Fund …………………………………………… E-6 82
Notes to Budgetary Comparison Schedules .................................................................. 83Schedule of Agent Retirement Plans' Funding Progress……………………… F-1 86Notes to Schedule of Agent Retirement Plans' Funding Progress ……………………… 87Infrastructure Assets ..................................................................................... F-2 90

YUMA COUNTYComprehensive Annual Financial Report
For the Fiscal Year Ended June 30, 2012
TABLE OF CONTENTS
FINANCIAL SECTION (Continued) Exhibit PageOther Supplementary Information
Supplementary Schedules - Major Governmental Funds:Schedule of Revenues by Category - Budget and Actual
General Fund ............................................................................................. G-1 96Schedule of Expenditures by Category - Budget and Actual
General Fund ............................................................................................. G-2 98Budgetary Comparison Schedule: Capital Improvements Fund ........................................................................ G-3 100Budgetary Comparison Schedule: Debt Service Fund ...................................................................................... G-4 101
Nonmajor Governmental Funds:Combining Balance Sheet - Nonmajor Governmental Funds
Special Revenue Funds ............................................................................ H-1 106Debt Service Funds ................................................................................... H-2 122Capital Projects Funds .............................................................................. H-3 124All Nonmajor Governmental Funds ........................................................... H-4 126
Combining Statement of Revenues, Expenditures, and Changes inFund Balances - Nonmajor Governmental Funds
Special Revenue Funds .......................................................................... I-1 128Debt Service Funds ................................................................................ I-2 144Capital Projects Funds ............................................................................ I-3 146All Nonmajor Governmental Funds ......................................................... I-4 148
Budgetary Comparison Schedules - Nonmajor Governmental FundsSpecial Revenue Funds ............................................................................ J-1 150Debt Service Funds ................................................................................... J-2 192Capital Projects Funds .............................................................................. J-3 196All Nonmajor Governmental Funds............................................................ J-4 199
Internal Service Funds:Combining Statement of Net Assets ............................................................. K-1 202Combining Statement of Revenues, Expenses, and
Changes in Fund Net Assets ..................................................................... K-2 203Combining Statement of Cash Flows ............................................................ K-3 204

YUMA COUNTYComprehensive Annual Financial Report
For the Fiscal Year Ended June 30, 2012
TABLE OF CONTENTS
FINANCIAL SECTION (Concluded) Exhibit PageTrust and Agency Funds:
Combining Statement of Net Assets ............................................................. L-1 206Combining Statement of Changes in Net Assets .......................................... L-2 207Statement of Changes in Assets and Liabilities ……………………………… L-3 208
Capital Assets Used in the Operations of Governmental FundsComparative Schedules by Source ............................................................... M-1 210Schedule by Function and Activity ................................................................ M-2 211Schedule of Changes by Function and Activity ............................................. M-3 212
STATISTICAL SECTION Table Page
Financial TrendsGovernment-wide Revenues by Source .......................................................... A-1 216Government-wide Expenses by Function ........................................................ A-2 218General Government Expenditures by Function .............................................. A-3 220Fund Balances of Governmental Funds............................................................ A-4 222Change in Fund Balances - All Funds Including Ratio of Total Debt Service
to Total Non-Capital Expenditures ................................................................ A-5 224General Government Revenues by Source ..................................................... A-6 226Tax Revenues by Source ................................................................................ A-7 228Licenses and Permits by Source ...................................................................... A-8 230Intergovernmental Revenues by Source ......................................................... A-9 232Charges for Services by Source ..................................................................... A-10 234Fines and Forfeits by Source .......................................................................... A-11 236Miscellaneous Revenues by Source ............................................................... A-12 238Other Financing Sources (Uses) ...................................................................... A-13 240Net Assets by Category .................................................................................. A-14 242General Fund Changes in Fund Balance ......................................................... A-15 244
Revenue Capacity
Assessed and Estimated Actual Value of Taxable Property............................. B-1 246General Fund - Property Tax Levied and Collections (by Year Collected)....... B-2 247General Fund - Property Tax Levied and Collections (by Year Levied)............ B-3 247Principal Taxpayers........................................................................................... B-4 248County General Sales Tax by Category............................................................ B-5 249Sales Tax Rates in Yuma County..................................................................... B-6 249

YUMA COUNTYComprehensive Annual Financial Report
For the Fiscal Year Ended June 30, 2012
TABLE OF CONTENTS
STATISTICAL SECTION (Concluded)Debt Capacity
Property Tax Rates - Direct and Overlapping Governments(General Taxing Authorities) ...................................................................... C-1 252
Property Tax Rates - Direct and Overlapping Governments(Special District Taxing Authorities) ........................................................... C-2 253
Debt by Type..................................................................................................... C-3 254Legal Debt Margin............................................................................................. C-4 256Ratio of Net General Bonded Debt to Assessed
Value and Net Bonded Debt per Capita..................................................... C-5 257Ratio of Annual Debt Service Expenditures for General Bonded
Debt to Total General Expenditures........................................................... C-6 258Computation of Direct and Overlapping Debt................................................... C-7 259Pledged Revenues............................................................................................ C-8 260
Economic and Demographic Information
Demographic Statistics:Population and Employment - by Sector.................................................... D-1 264Population and Employment - by City........................................................ D-2 265County Employees - by Activity.................................................................. D-3 266Top Employers........................................................................................... D-4 268
County-Wide Other Demographic Statistics...................................................... D-5 269County-Wide Building Permits, Bank Deposits, and Retail Sales..................... D-6 270
Operational InformationCapital Asset and Infrastructure Statistics by Function/Program...................... E-1 273Operating Indicators by Function/Program....................................................... E-2 274Schedule of Insurance in Force........................................................................ E-3 276

INTRODUCTORY SECTION
The Introductory Section is intended to familiarize the reader with Yuma County’s organization structure, nature and scope of provided services, and specifics of its operating environment. The information in this section should provide adequate background and sufficient context to assist the reader with the financial section of this CAFR. The following is contained in the Introductory Section:
Letter of Transmittal 3 – 7 Organizational Chart 8
Certificate of Achievement for Excellence in Financial Reporting 9
1

{This page is intentionally left blank}
2

FINANCIAL SERVICES DEPARTMENT
Scott G. Holt
Director
198 South Main Street Yuma, Arizona. 85364 Voice (928) 373-1012 FAX (928) 373-1152
Gil Villegas Jr.
Deputy Director
November 9, 2012 The Honorable Board of Supervisors and Citizens of Yuma County To the Board of Supervisors and the Citizens of Yuma County, the Financial Services Department respectfully submits Yuma County’s Comprehensive Annual Financial Report (CAFR) for the fiscal year ending June 30, 2012. CAFR COMPOSITION This report consists of management’s representations concerning the finances of Yuma County (County) in the form of financial statements. The responsibility for the accuracy, completeness, and fairness of the presented data, including all disclosures and notes, rests with the management of Yuma County. To the best of our knowledge and belief, the data presented is accurate in all material respects. It is presented in a manner designed to fairly set forth the financial position and results of operations of the County as measured by the financial activity of its various funds. All disclosures necessary to enable the reader to gain an understanding of the County’s financial affairs have been included. U.S. GAAP requires management provide a narrative introduction, overview, and analysis to accompany the basic financial statements in the form of Management’s Discussion and Analysis (MD&A). This letter of transmittal is designed to complement the MD&A and should be read in conjunction with it.
OTHER REPORTING REQUIRMENTS
Yuma County is required to undergo an annual single audit in conformity with the provisions of the Single Audit Act of 1984, the Single Audit Act Amendment of 1996, and U.S. Office of Management and Budget (OMB) Circular A-133, Audits of States, Local Governments, and Non-Profit Organizations. Information related to this single audit, including a schedule of expenditures of federal awards, findings and questionable costs, and an independent auditors’ report on compliance with applicable laws, regulations, contracts, and grants to each major program and on internal control over compliance are under a separate cover. The State of Arizona requires additional supplemental information in the form of a report entitled “Expenditure Limitation Report” to be completed. This report is also under a separate cover. THE REPORTING ENTITY County Profile: Yuma County, bordered by California to the West and Mexico to the South, was founded in 1864 as one of the four original counties established by the first Territorial Legislature. It maintained its designated boundaries until 1983 when voters resolved to split Yuma County into LaPaz County in the north and a “new” Yuma County in the south encompassing 5,522 square miles. In 1540, just 48 years after Columbus stumbled upon the New World and 67 years before the settlement of Jamestown, Hernando de Alarcon visited the site of what is now the city of Yuma. He was the first European to set foot in the area and to recognize the best natural crossing of the Colorado River. From the 1850s through the 1870s, steamboats on the Colorado River transported passengers and goods to mines, ranches, and military outposts in the area, serving the ports of Yuma, Laguna, Castle Dome, Norton’s Landing, Ehrenberg, Aubry, Ft. Mohave, and Hardyville. For many years, Yuma served as the gateway to the new western territory of California. In 1870, the Southern Pacific Railroad bridged the river, and Yuma became a hub for the railroad and was selected as the county seat.
3

THE REPORTING ENTITY (Concluded)
Much of Yuma County is desert land accented by rugged mountains. The valley regions contain an abundance of arable land, which is irrigated by the Colorado River. Local Economy: Agriculture, tourism, military and government are the county’s principal industries. During the winter months, the population nearly doubles with part-time residents, commonly known as “snow birds”. Although, the State of Arizona is now starting to recover from recession, the recovery effects are not expected to be seeing in Yuma County for a couple more years. It is expected that revenue will remain at the same level for the next couple of years, as the economy continues to correct itself. The County is also monitoring expenditures and working with all levels of staff to continue to provide the services desired or mandated with the available resources. Organization: A five-member Board of Supervisors (the Board) carries out the governmental and administrative affairs of the County. Each member is elected from a designated district to serve a four-year concurrent term. The Board members collectively select the chair. The Board is responsible for establishing the policies of the County to provide guidance to the various County departments, and appointing a County Administrator who is responsible for the general administrative and overall operations of the various departments of the County. Additionally, the Board furnishes budget authority to all other County Elected Officials and the Court System. Entity defined: Yuma County includes in its financial statements all funds, agencies, trusts, boards, commissions, and authorities for which the Yuma County Board of Supervisors is financially accountable. In accordance to Governmental Accounting Standards Board (GASB) No. 14, The Financial Reporting Entity: financially accountable includes, but is not limited to: selection of governing authority, designation of management, ability to significantly influence operations, financial interdependence, and accountability for fiscal matters. Various school districts and certain special districts within Yuma County are governed independently. The financial statements of these districts are not included in this report except to reflect amounts held in an agency / trust capacity by the County Treasurer. Services provided: Yuma County provides an ample range of governmental and community services. These services can be divided into two categorizations: mandated and optional. Mandated services are services that the County is required to provide by either Federal or State legislative bodies. Optional services are services that the County is not required to provide, but chooses to do so for the overall benefit of its citizens, as guided by the citizens. Mandated: Superior and Justice Courts, Adult and Juvenile Probation / Detention, Law Enforcement, Public and Legal Defenders, Recording of Deeds, Indigent health and mental health care, Immunization and disease control, Sanitation inspections, Rabies and vector control, Treasure functions, Land use planning and zoning, Building code enforcement, Elections and Voter registration, School Superintendent, and Road maintenance. Optional: Libraries, Parks, Solid waste collection, Improvement districts, New road construction, Cable TV franchise, AIDS / cardiovascular injury prevention programs, Flood control, Emergency management (other than for hazardous materials), Public housing, Economic development, and Job training. FINANCIAL INFORMATION Accounting Policy: Yuma County maintains accounts in accordance with the principles of fund accounting to ensure that limitations and restrictions on the County’s available resources are observed and adhered to. Fund accounting classifies resources into funds with respect to the intended activities or objectives specified by those resources for accounting controls and financial reporting purposes. Each fund is an independent fiscal and accounting entity, and its operations are accounted for in a separate set of self-balancing accounts that are comprised of assets, liabilities, fund equity, revenues, and expenditures or expenses. There is no limit to the number of funds a government may establish and maintain for accounting and financial reporting. A generally practiced governmental accounting guideline is that a government should use the smallest number of individual funds as possible, consistent with its particular circumstances, and individual funds are closed when its intended purpose is no longer operating. A description of the fund categories used by the County follows:
Governmental Funds: These funds are used to account for all of Yuma County’s expendable financial resources, except for those reported in the Internal Service funds. The measurement focus is on determination of financial position rather than determination of income. The modified accrual basis of accounting is used for these funds. The County’s General, Special Revenue, Debt Service, and Capital Projects funds are included in this fund category.
4

FINANCIAL INFORMATION (Concluded)
General Fund: The General Fund is the primary operating fund. It accounts for all financial resources of Yuma County, except for those required, either by rule of statute or U.S. GAAP, to be accounted for elsewhere, or chosen to do so for internal tracking purposes. Special Revenue Funds: Special Revenue Funds account for unique revenue sources legally restricted by statute, ordinance, or other specific requirements to finance specific functions or activities. Debt Service Funds: These funds are used to account for the resources accumulated for the payment of interest, principal, and related costs on long-term debt, special assessments, and capital leases. This fund type is not used to account for the outstanding debt itself. Capital Projects Funds: Yuma County uses Capital Projects Funds to account for the acquisition and construction of major capital activities, and establishes a separate fund for each individual construction project or revenue source. The majority of these funds compositions have imposed restrictions similar to the Special Revenue Funds, but due to their capital nature they are accounted for as Capital Projects Funds.
Proprietary Funds: These funds are used to account for the County’s ongoing activities that can be viewed as similar to the private sector. Measurement focus is on determination of income, financial position, and changes in financial position. The full accrual basis of accounting is used for these funds.
Internal Service Funds: Yuma County uses Internal Service Funds to account for: IT Life Cycle Management Fund to ensure the County maintains a three year cycle on computer systems; a Revolving Fund used to cover costs, expenses, and salaries associated with improvements made to Improvement Districts; a Workers Compensation Fund established to operate on a self-funded basis, a Health Self – Insurance Fund established to account for the financing of a self-funded benefit plan, and a Liability Self-Insurance Fund established to account for the departmental funded insurance liability plan.
Fiduciary Funds: These funds are used to account for assets held by the County in a trustee or agency capacity. Fiduciary funds account for assets held by the County Treasurer on behalf of others and are either Investment Trust Funds or Agency Funds which are custodial in nature and do not involve measurement of results of operations. The accrual basis of accounting is used for these funds.
Internal Control: In regard to accounting, internal controls are designed to provide reasonable (not absolute) assurance that: (1) Assets are safeguarded against loss from unauthorized use, theft, or disposition; and (2) The reliability of financial records for preparing financial statements and maintaining accountability for assets. Implemented internal control mechanisms should recognize the cost of maintaining control procedures and should not exceed the benefit derived as a result of their adherence. The evaluation of costs and benefits requires estimates and judgments by the County’s management. It should also be recognized that all internal control policies and procedures are inherently vulnerable to conspiracy, collusion, and deliberate management override. BUDGETARY CONTROLS
Yuma County complies with Arizona Revised Statutes (A.R.S.) by operating under a balanced budget and appropriating all available resources. The County stays within State regulated levy and expenditure limitations. With this principle, the measure of financial performance is monitored by the realization of estimated revenues and abiding by the appropriations during the budget year. Budgetary Basis: Yuma County prepares its budget using accounting principles consistent with its financial reporting methods. Revenues are recognized when they are both available and measurable. For this purpose the County considers revenues to be available if they are collected within 60 days after the fiscal year end. Open encumbrances lapse at fiscal year end.
5

BUDGETARY CONTROLS (Concluded)
Budget Administration: Yuma County administration monitors the County’s budget at the fund level for Special Revenue, Debt Service, and Internal Service Funds. The General Fund and Capital Project Funds are monitored at the department and project level, respectively. The budget is modified throughout the year as additional resources become available or anticipated resources dissipate, if permitted under A.R.S. 42-17105 and 42-17106. This methodology ensures all available resources are accounted for with appropriate budgetary controls, and only available resources are disbursed or encumbered. MAJOR INITIATIVES The management of Yuma County is committed to continuing to find ways to reduce taxpayers’ cost for providing the services desired by its constituents, meeting increasing operating costs for those services and statutorily required activities, and accomplishing this within the constraints placed upon the County through statutory limitations and declining revenues from outside sources. The management staff within Yuma County has exhibited an unprecedented spirit of cooperation over the past years in devising ways to limit their own departmental spending. This commitment toward providing more cost effective services shows the strong character of Yuma County’s leadership and will enable Yuma County to serve its constituents in a manner which is economically responsible in the current economic situation. Management is striving to maintain Yuma County’s cash reserve at an appropriate level to provide financial stability for the County and its constituents. Another major goal is to maintain a structural balance between recurring revenues and expenditures. It is the County’s desire to use one- time revenues to provide for special projects. Finally, on March 2012 the Board of Supervisors approved construction of a new building to be located in the east side of the County and will serve as satellite office to provide services to east county constituents. Funding for the new building was secured by issuing revenue bonds.
LONG-TERM FINANCIAL PLANNING Total fund balance in the General Fund (26.0% of total General Fund revenues) currently exceeds the policy guidelines of 15 percent of total General Fund revenues set by the Yuma County Board of Supervisors for budgetary and planning purposes. This level of fund balance has to do with a conservative expending philosophy implemented by management for the last three fiscal years, to continue maintaining healthy reserves. Yuma County attempts to use existing resources and available funds to reduce its outstanding liabilities, proof of that are additional principal payments to improvement districts loans ($25,000 to El Prado; $50,000 to El Prado WIFA; and $100,000 to Gadsden USDA loans). The County continues to reduce debt and plans to continue being conservative in its spending for the next few years, until the economic conditions improve. County’s management has also reduced the number of capital projects in an effort the redirect funds to cover more pressing and mandated services. The few existing projects are expected to be completed with funds other than local sources while any new projects will be critically reviewed prior to any decisions being made. RELEVANT FINANCIAL POLICIES Yuma County has the policy of keeping recurring expenditures at or below recurring revenues and using one-time revenues for one-time projects. Additionally the County tries to maintain reserves at a minimum of 15 percent of General Fund revenues. This allows the County to fund one time projects on a cash basis and keep debt to a minimum. The County has traditionally had a conservative viewpoint toward taxation of its constituents and has strived to reduce tax levies even during periods of reduced assessed values. It has maintained a level of taxation below the maximum level allowed when all other counties within the State were taxing to the maximum level. With the imposition of the 2% increase limit in the taxes levied on existing property plus new construction approved by voters on November 7, 2006 in a statewide referendum, this has required the County to levy taxes on property at its maximum level. The County has asked for and received total cooperation from all of its departments concerning a voluntary restriction on expenditures and replacement of employees, except where absolutely necessary. This resulted in a 26.14% reversion on all governmental funds including a 6.46% reversion in the General Fund from actual to budgeted expenditures. While many other agencies throughout the State have had layoffs and mandatory cuts in expenditures, Yuma County has been able to work with all levels in the County to achieve its cuts by voluntary actions.
6

CASH MANAGEMENT
The Yuma County Treasurer is responsible for cash management and investments for the County. Most cash assets of the County, other than impress accounts, are on deposit through this office. Cash that is temporarily idle during the year is invested on a short-term basis.
INDEPENDENT AUDIT
Pursuant to Arizona Revised Statutes, the Auditor General has contracted with the accounting firm of Fester & Chapman P.C. to perform an audit of Yuma County’s financial statements for fiscal year ended June 30, 2012. The results of this audit are outlined in the Independent Auditors’ Report that is included in the Financial Section.
AWARDS
The Government Finance Officers Association (GFOA) awarded a Certificate of Achievement for Excellence in Financial Reporting to Yuma County for its comprehensive annual financial report (CAFR) for the fiscal year ended June 30, 2011. This was the eleventh consecutive year that Yuma County has received this prestigious award. In order to be awarded a Certificate of Achievement, Yuma County published an easily readable and efficiently organized CAFR. This report satisfied both GAAP and applicable legal requirements.
A Certificate of Achievement is valid for a period of one year only. We believe our current CAFR continues to meet the Certificate of Achievement Program’s requirements and we are submitting it to the GFOA to determine its eligibility for another certificate.
GFOA has also given an Award for Outstanding Achievement in Popular Annual Financial Reporting to Yuma County for its Popular Annual Financial Report for fiscal year ended June 30, 2011. The Award for Outstanding Achievement in Popular Annual Financial Reporting is a prestigious national award recognizing conformance with the highest standards for preparation of state and local government popular reports. In order to receive this award, a government unit must publish a Popular Annual Financial Report, whose contents conform to program standards of creativity, presentation, understandability, and reader appeal.
In addition, Yuma County received the GFOA’s Distinguished Budget Presentation Award for its annual budget document for fiscal year 2011-2012. In order to qualify for the Distinguished Budget Presentation Award, Yuma County’s budget document was judged to be proficient in several categories, including as a policy document, a financial plan, an operations guide, and a communications device.
ACKNOWLEDGMENTS
The presentation of this report would not have been possible without the efficient, effective, dedicated, and supportive services of the entire staff of the Financial Services Department. Their bestowed efforts to enhance procedures, ensure accuracy, improve systems, and conduct extensive research have allowed for the completion of the annual audit and this report.
We would like to express our appreciation to all members of all other agencies assisting and contributing to the preparation of this report. Credit also must be given to the Board of Supervisors and the Administration for their unsurpassable support for maintaining and strengthening the utmost standards of professionalism in the management of Yuma County.
Respectfully submitted,
Scott G. Holt Gilberto Villegas Jr. Director – Financial Services. Deputy Director- Financial Services
7

Yuma County Government
Court Commissioners
Court Administrator
Adult Probation
Superior Court , Div. 1Presiding Judge
Superior CourtDivisions 2,3, & 4
Juvenile Court Services
Superior CourtDivision 5
Clerk of theSuperior Court
Justice Court Administrator
Justice of the PeacePrecinct 1
Justices of the PeacePrecincts 2 & 3
ConstablesPrecincts 1,2 & 3 Flood Control District
Operations
Development Services Health
Elections Information Technology
Facilities Management Legal Defender
Financial Services Library District
Housing Public Defender
Human Resources Public Works
Public Fiduciary
County Administrator
Board of Supervisors Assessor County Attorney
Recorder SchoolSuperintendent
Jail DistrictOperations
Sheriff Treasurer
People of Yuma County
LEGEND = Elected officials Note A: The Superior Court Presiding Judge also exercises administrative supervision over all Superior Court personnel. Note B: The Board of Supervisors has budget authority over all organizational units, including those of elected officials. Note C: The Board of Supervisors is also the governing board of the Library District, Flood Control District, Health Services District & the Jail District.
8

9

{This page is intentionally left blank}
10

FINANCIAL SECTION
The Financial Section contains all basic financial statements and supplementary information required to be disclosed by GAAP (Generally Accepted Accounting Principles) and Arizona State Law, as well as information on all individual funds not reported separately in the basic financial statements. Also in this section is other useful supplementary information that is not required by GAAP or Arizona State Law to represent a financial overview of Yuma County. The following is contained in the Financial Section:
Independent Auditors’ Report 13 - 15 Management’s Discussion and Analysis 17 - 25
Basic Financial Statements:
Government-Wide Financial Statements 29 - 31 Fund Financial Statements 33 - 46 Notes to Financial Statements 47 - 72
Required Supplementary Information 73 - 91
Other Supplementary Information 93 - 212
11

{This page is intentionally left blank}
12

Independent Auditors’ Report
13

4001 North 3rd Street Suite 275 Phoenix, AZ 85012-2060 Tel: (602) 264-3077 Fax: (602) 265-6241
14
Independent Auditors’ Report
The Auditor General of the State of Arizona The Board of Supervisors of Yuma County, Arizona We have audited the accompanying financial statements of the governmental activities, each major fund, and aggregate remaining fund information of Yuma County, Arizona (the County) as of and for the year ended June 30, 2012, which collectively comprise the County’s basic financial statements as listed in the table of contents. These financial statements are the responsibility of the County’s management. Our responsibility is to express opinions on these financial statements based on our audit. We conducted our audit in accordance with U.S. generally accepted auditing standards and the standards applicable to financial audits contained in Government Auditing Standards, issued by the Comptroller General of the United States. Those standards require that we plan and perform the audit to obtain reasonable assurance about whether the financial statements are free of material misstatement. An audit includes examining, on a test basis, evidence supporting the amounts and disclosures in the financial statements. An audit also includes assessing the accounting principles used and significant estimates made by management, as well as evaluating the overall financial statement presentation. We believe that our audit provides a reasonable basis for our opinions. In our opinion, the financial statements referred to above present fairly, in all material respects, the respective financial position of the governmental activities, each major fund, and aggregate remaining fund information of Yuma County as of June 30, 2012, and the respective changes in financial position and, where applicable, cash flows thereof for the year then ended in conformity with U.S. generally accepted accounting principles. U.S. generally accepted accounting principles require that the Management’s Discussion and Analysis on pages 17 through 25, the Budgetary Comparison Schedules on pages 76 through 84, the Schedule of Agent Retirement Plans’ Funding Progress on pages 86 through 88, and the Infrastructure Assets information on pages 90 and 91 be presented to supplement the basic

15
financial statements. Such information, although not a part of the basic financial statements, is required by the Governmental Accounting Standards Board who considers it to be an essential part of financial reporting for placing the basic financial statements in an appropriate operational, economic, or historical context. We have applied certain limited procedures to the required supplementary information in accordance with U.S. generally accepted auditing standards, which consisted of inquiries of management about the methods of preparing the information and comparing the information for consistency with management’s responses to our inquiries, the basic financial statements, and other knowledge we obtained during our audit of the basic financial statements. We do not express an opinion or provide any assurance on the information because the limited procedures do not provide us with sufficient evidence to express an opinion or provide any assurance. Our audit was conducted for the purpose of forming opinions on the financial statements that collectively comprise the County’s basic financial statements. The combining and individual fund statements and schedules and the introductory and statistical sections listed in the table of contents are presented for purpose of additional analysis and are not required parts of the basic financial statements. Such information is the responsibility of the County’s management and was derived from and relates directly to the underlying accounting and other records used to prepare the basic financial statements. The combining and individual fund statements and schedules have been subjected to the auditing procedures applied in the audit of the basic financial statements and certain additional procedures, including comparing and reconciling such information directly to the underlying accounting and other records used to prepare the basic financial statements or to the basic financial statements themselves, and other additional procedures in accordance with U.S. generally accepted auditing standards. In our opinion, the combining and individual fund statements and schedules are fairly stated in all material respects in relation to the basic financial statements as a whole. The introductory and statistical sections have not been subjected to the auditing procedures applied in the audit of the basic financial statements, and accordingly, we do not express an opinion or provide any assurance on them. In connection with our audit, nothing came to our attention that caused us to believe that the County failed to use highway user revenue fund monies received by the County pursuant to Arizona Revised Statutes Title 28, Chapter 19, Article 2, and any other dedicated state transportation revenues received by the County solely for the authorized transportation purpose. However, our audit was not directed primarily toward obtaining knowledge of such noncompliance. In accordance with Government Auditing Standards, we will also issue our report on our consideration of the County’s internal control over financial reporting and on our tests of its compliance with certain provisions of laws, regulations, contracts, and grant agreements and other matters at a future date. The purpose of that report is to describe the scope of our testing of internal control over financial reporting and compliance and the results of that testing, and not to provide an opinion on internal control over financial reporting or on compliance. That report is an integral part of an audit performed in accordance with Government Auditing Standards and should be considered in assessing the results of our audit.

16
This report is intended solely for the information and use of the members of the Arizona State Legislature, the Auditor General of the State of Arizona, the Board of Supervisors, management, and others within the County and is not intended to be and should not be used by anyone other than these specified parties. However, this report is a matter of public record, and its distribution is not limited. January 4, 2013

FINANCIAL SERVICES DEPARTMENT
Scott G. Holt
Director
198 South Main Street Yuma, Arizona. 85364 Voice (928) 373-1012 FAX (928) 373-1152
Gil Villegas Jr.
Deputy Director
Management’s Discussion and Analysis
As management of Yuma County, we offer readers of Yuma County’s financial statements this narrative overview and analysis of the financial activities of Yuma County for the fiscal year ended June 30, 2012. We encourage readers to consider the information presented here in conjunction with additional information we have furnished in our letter of transmittal, which can be found on pages 3 to 7 of this report.
FINANCIAL HIGHLIGHTS
The total assets of Yuma County exceeded its liabilities at the close of the most recent fiscal year by $379,217,671 (net assets). Of this amount, $28,128,486 (unrestricted net assets) may be used to meet the government’s ongoing obligations to citizens and creditors.
Yuma County’s total net assets increased by $12,791,492. The increase was primarily due to an increase in
assets held by trustee upon the deposit of funds from a bond issuance to finance the construction of an East County facility ($2.4 million); an increase in net capital assets ($8.4 millions); and a $1.2 million reduction in operating expenses.
Within the revenues category; The County’s Sales Taxes are divided among three restricted categories:
general, jail, and health services; 0.5 percent on each dollar for each category except for the health services which receives 0.1 of a cent on each dollar. The total of these categories increased from the prior year by $1,228,874 or 5.2%, a reflection of a possible recovery of the local economy after years of decreases. The State Shared Sales tax had also a modest increase of $670,563 (4.0%) from the prior year. Also, an unusual reduction in claims and judgments increased miscellaneous revenues by $820,195.
The County property taxes levied for all purposes (General Fund, Library and Flood districts) increased only $864,330 or 2.3%, as a result of current economic conditions and assessed values paired with the rest of the State. Again property tax for the General Fund experienced the most significant increase of $1,088,364 or 4.7% from the prior year.
At the end of the fiscal year, Yuma County’s governmental funds reported combined ending fund balances of
$87,599,221, an increase of 3.3% or $2,834,513 in comparison with the prior year. Fiscal year end 2012 fund balances are categorized as follows: 0.3% or $296,905 is Nonspendable; 74.4% or $65,147,313 is Restricted; 11.6% or $10,189,457 is Committed; 1.3% or $1,149,959 is Assigned; and 12.4% or $10,815,587 is Unassigned, which means funds are available for spending at the government’s discretion within the boundaries set forth in the governmental fund’s purposes.
Of the Major funds reported; The Health Services District Fund experienced the largest decrease in fund
balance ($305,933). The main reason that drove the decrease was because the minimal increase in revenues of 5.28% was not sufficient to cover the expenditures increase for the required services. During the current fiscal year, it was decided to separate operations from grant activities within the district. On the other hand; the Flood control district fund experienced the largest increase in fund balance of $2,173,492 or 14.1%. The increase resulted from savings related to construction projects placed on hold due to stagnant and uncertain economic activity. The Capital Projects funds also experienced a significant increase in fund balance this fiscal year $2,105,979 or 85.6% as compared with last year. The main reason for the increase in capital projects was due to the proceeds received for the construction of a facility in East County.
At the end of the fiscal year, total fund balance for the General Fund was $17,928,734 (2.5% decrease) or
25.7% of total General Fund expenditures and transfers out. The decrease of $467,710 was mainly due to the yearly minimal revenues increase of $536,135 or 0.78%; combined with the increase in operational expenditures of $2,016,910 or 3.4%. Increase in expenditures was driven by Medical Eligibility (Welfare) services’ increase of $2,146,332 or 24.5%.
17

OVERVIEW OF THE FINANCIAL STATEMENTS
This discussion and analysis is intended to serve as an introduction to Yuma County’s basic financial statements. Yuma County’s basic financial statements consist of three components:
1) Government-wide financial statements, 2) Fund financial statements, and 3) Notes to financial statements.
This report also contains required and other supplementary information in addition to the basic financial statements. Government-wide financial statements The government-wide financial statements are designed to provide readers with a broad overview of Yuma County’s finances, in a manner similar to a private-sector business. This includes the government-wide statement of net assets and the statement of activities listed below.
The statement of net assets presents information on all of Yuma County’s assets and liabilities, with the difference between the two reported as net assets. Over time, increases or decreases in net assets may serve as a useful indicator of whether the financial position of Yuma County is improving or deteriorating.
The statement of activities presents information showing how Yuma County’s net assets changed during the most recent fiscal year. All changes in net assets are reported as soon as the underlying event giving rise to the change occurs, regardless of the timing of related cash flows. Thus, revenues and expenses are reported in this statement for some items which will only result in cash flows in future fiscal periods (such examples are uncollected taxes and earned but unused vacation leave). The government-wide financial statements distinguish functions of Yuma County principally supported by taxes and intergovernmental revenue (governmental activities) from other functions which are intended to recover all or a significant portion of their costs through user fees and charges (business-type activities). The governmental activities of Yuma County include general government, public safety, highway and streets, sanitation, health, welfare, culture and recreation, education, and interest on long-term debt. The government-wide financial statements can be found on pages 29 to 31 of this report. Fund financial statements A fund is a grouping of related accounts used to maintain control over resources segregated for specific activities or objectives. Yuma County, like other state and local governments, uses fund accounting to ensure and demonstrate compliance with finance-related legal requirements.
Governmental funds are used to account for essentially the same functions reported as governmental activities in the government-wide financial statements. However, unlike the government-wide financial statements, governmental fund financial statements focus on near-term inflows and outflows of spendable resources, as well as on balances of spendable resources available at the end of the fiscal year. Such information may be useful in evaluating a government’s near-term financing requirements. Because the focus of governmental funds is narrower than the government-wide financial statements, it is useful to compare the information presented for governmental funds with similar information presented for governmental activities in the government-wide financial statements. By doing so, readers may better understand the long-term impact of the government’s near-term financing decisions. Both the governmental fund balance sheet and the governmental fund statement of revenues, expenditures, and changes in fund balances provide a reconciliation to facilitate this comparison between governmental funds and governmental activities. Yuma County maintains one hundred twenty one (121) governmental funds. Information is presented separately in the governmental fund balance sheet and in the governmental fund statement of revenues, expenditures, and changes in fund balances for the general fund; capital improvements fund; jail district’s general operations fund; the library district’s general operations fund; flood control district general operations fund; the health services district general operations fund; the development services highway users revenue fund (HURF), and the improvement district B & C Colonia debt service fund, all of which are considered to be major funds. These financial statements can be found on pages 33 to 41 of this report. Data from the other one hundred and thirteen (113) governmental funds are combined into a single, aggregated presentation. Individual fund data for each of these nonmajor governmental funds is provided in the form of combining statements and schedules on pages 105 to 200. Yuma County adopts an annual appropriated budget for all of its governmental funds. Budgetary comparison schedules have been provided to demonstrate compliance with these budgets.
18

Fund financial statements (Concluded)
Proprietary funds are used to account for Yuma County’s internal service funds, which is a device to accumulate and allocate costs internally among Yuma County’s various functions. Yuma County uses internal service funds to account for the Information and Technology (IT) life cycle management, revolving fund for improvement districts, workers compensation insurance, health self-insurance and liability self-insurance fund.
Because these services predominantly benefit governmental rather than business-type functions, they have been included within governmental activities in the government-wide financial statements. Proprietary funds provide the same type of information as the government-wide financial statements. Internal service funds are combined into a single, aggregated presentation in the proprietary fund financial statements. Individual fund data for the internal service funds is provided in the form of combining statements elsewhere in this report. The basic proprietary fund financial statements can be found on pages 42 to 44 of this report.
Fiduciary funds are used to account for resources held for the benefit of parties outside the primary government (Yuma County). Fiduciary funds are not reflected in the government-wide financial statements because their resources are not available to support Yuma County’s own programs. The accounting used for fiduciary funds is similar to that used for proprietary funds. The basic fiduciary fund financial statements can be found on pages 45 to 46 of this report. Notes to financial statements The notes provide additional information essential to a full understanding of the data provided in the government-wide and fund financial statements. The notes to financial statements can be found on pages 47 to 72 of this report. Other information In addition to the basic financial statements and accompanying notes, this report also presents certain required supplementary information concerning Yuma County’s progress in funding its obligations to provide pension benefits to its employees, as well as schedules illustrating the County’s compliance with legally adopted budgets and an explanation of the County’s application of the modified approach to the reporting of infrastructure assets. Required supplementary information can be found on pages 73 to 91 of this report. The combining statements referred to earlier in connection with non-major governmental funds and internal service funds as well as budgetary comparison schedules for other major funds are presented immediately following the required supplementary information. Combining and individual fund statements and schedules can be found on pages 95 to 208 of this report.
GOVERNMENT-WIDE FINANCIAL ANALYSIS
As noted earlier, net assets may serve over time as a useful indicator of a government’s financial position. In the case of Yuma County, assets exceeded liabilities by $379,217,671 at the close of this fiscal year.
By far the largest portion of Yuma County’s total net assets, $286,593,510 (75.6%), is invested in capital assets (land, buildings, improvements other than buildings, machinery and equipment, infrastructure, and construction in progress), net of the related debt used to acquire those assets that is still outstanding, and accumulated depreciation. The County uses these capital assets to provide services on behalf of Yuma County’s citizens; consequently, these assets are not available for future spending. Although the County’s investment in its capital assets is reported net of related debt, it should be noted the resources needed to repay this debt must be provided from other sources, since the capital assets themselves cannot be used to liquidate these liabilities. The County’s net assets increased $12,791,492 during the current fiscal year. Total assets increased $8,728,383 or 2.0% from last fiscal year. The assets increase is largely due to the increase of $8,402,924 in capital assets, mostly from donated roads to the County. Investment held by trustee increased $3,081,610 due to proceeds of bonds issued for a capital project and to defease the 2007 Jail district revenue bonds issue. An additional portion of Yuma County’s net assets, restricted net assets of $64,495,675 or 17.0%, represents resources subject to external restrictions on how they may be used. The unrestricted net assets balance ($28,128,486) may be used to meet the government’s ongoing obligations to citizens and creditors. At the end of the current fiscal year, Yuma County reported positive balances in all three categories of net assets.
19

Government-wide financial analysis (Concluded):
Below is a brief summary of County’s statement of net assets:
Below is a brief summary of Yuma County’s change in net assets:
2012 2011Cash, cash equivalents and investments 88,272,595$ 93,361,521$ Investments held by trustee – restricted 3,899,185 817,575 All other current and other assets 15,773,449 13,440,444 Capital assets 346,201,764 337,799,070
Total assets 454,146,993$ 445,418,610$
Long-term liabilities outstanding 68,172,610$ 67,440,739$ Other liabilities 6,756,712 11,551,692
Total liabilities 74,929,322$ 78,992,431$
Invested in capital assets, net of related debt 286,593,510$ 277,357,668$ Restricted 64,495,675 51,932,168 Unrestricted 28,128,486 37,136,343
Total net assets 379,217,671$ 366,426,179$
YUMA COUNTY Condensed Statements of Net Assets
As of June 30, 2012 and 2011
Governmental Activities
2012 2011
Charges for services 11,018,049$ 11,626,293$ Operating grants and contributions 36,579,844 38,885,744 Capital grants and contributions 11,519,306 17,969,458
Property taxes 38,788,697 37,924,367 Other county taxes: County sales tax 24,965,329 23,736,455 Franchise tax 180,411 186,550 Auto in lieu tax 6,358,376 6,727,463 State shared sales taxes 17,349,424 16,678,861 Grants and contributions not restricted to 3,954,280 3,932,483 Investment earnings 646,064 1,103,459 Miscellaneous 2,510,793 1,690,598
153,870,573 160,461,731
44,961,830 45,977,581 40,778,911 41,268,389 11,148,656 11,610,502
892,460 911,775 9,121,693 9,043,830
15,570,314 13,728,818 8,995,200 8,453,590 6,983,411 8,641,568 2,626,606 2,608,233
141,079,081 142,244,286 12,791,492 18,217,355
366,426,179 348,208,824 379,217,671$ 366,426,179$ Net assets - ending June 30
EducationInterest on long-term debt
Total expensesIncrease in net assetsNet assets - beginning July 1
Highway and streetsSanitationHealthWelfareCulture and recreation
Total revenuesExpenses:
General governmentPublic safety
As of June 30, 2012 and 2011Governmental Activities
Revenues:Program revenues:
General revenues:
YUMA COUNTY Condensed Statements of Activities
20
Governmental activities (concluded)
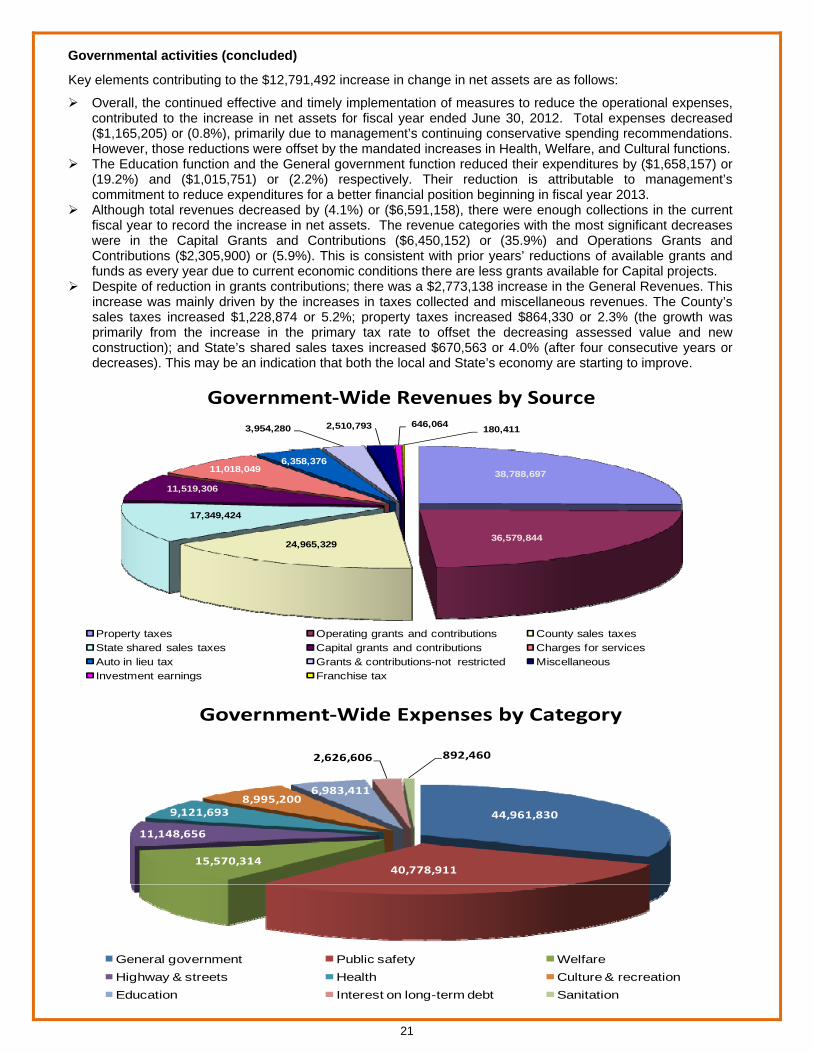
Key elements contributing to the $12,791,492 increase in change in net assets are as follows:
Overall, the continued effective and timely implementation of measures to reduce the operational expenses, contributed to the increase in net assets for fiscal year ended June 30, 2012. Total expenses decreased ($1,165,205) or (0.8%), primarily due to management’s continuing conservative spending recommendations. However, those reductions were offset by the mandated increases in Health, Welfare, and Cultural functions.
The Education function and the General government function reduced their expenditures by ($1,658,157) or (19.2%) and ($1,015,751) or (2.2%) respectively. Their reduction is attributable to management’s commitment to reduce expenditures for a better financial position beginning in fiscal year 2013.
Although total revenues decreased by (4.1%) or ($6,591,158), there were enough collections in the current fiscal year to record the increase in net assets. The revenue categories with the most significant decreases were in the Capital Grants and Contributions ($6,450,152) or (35.9%) and Operations Grants and Contributions ($2,305,900) or (5.9%). This is consistent with prior years’ reductions of available grants and funds as every year due to current economic conditions there are less grants available for Capital projects.
Despite of reduction in grants contributions; there was a $2,773,138 increase in the General Revenues. This increase was mainly driven by the increases in taxes collected and miscellaneous revenues. The County’s sales taxes increased $1,228,874 or 5.2%; property taxes increased $864,330 or 2.3% (the growth was primarily from the increase in the primary tax rate to offset the decreasing assessed value and new construction); and State’s shared sales taxes increased $670,563 or 4.0% (after four consecutive years or decreases). This may be an indication that both the local and State’s economy are starting to improve.
38,788,697
36,579,844 24,965,329
17,349,424
11,519,306
11,018,0496,358,376
3,954,280 2,510,793 646,064 180,411
Government‐Wide Revenues by Source
Property taxes Operating grants and contributions County sales taxesState shared sales taxes Capital grants and contributions Charges for services
Auto in lieu tax Grants & contributions-not restricted MiscellaneousInvestment earnings Franchise tax
44,961,830
40,778,911 15,570,314
11,148,656
9,121,693 8,995,200
6,983,411
2,626,606 892,460
Government‐Wide Expenses by Category
General government Public safety Welfare
Highway & streets Health Culture & recreation
Education Interest on long-term debt Sanitation
21

FINANCIAL ANALYSIS OF YUMA COUNTY’S FUNDS
Yuma County uses fund accounting to ensure and demonstrate compliance with finance-related legal requirements. The County implemented the provisions of GASB Statement No. 54, Fund Balance Reporting and Governmental Fund Type Definitions (see Note 1, summary of significant Accounting Policies). Since this is the second year of implementation, the comparative analysis and discussion of the fund balance classifications between the years might not be meaningful.
Governmental funds The focus of Yuma County’s governmental funds is to provide information on near-term inflows, outflows, and balances of spendable resources. Such information is useful in assessing Yuma County’s financing requirements. In particular, fund balance may serve as a useful measure of a government’s net resources restricted, committed, assigned, and available for spending at the end of the fiscal year. All governmental funds: At the end of the current fiscal year, the County’s governmental funds reported combined ending fund balances of $87,599,221, an increase of $2,834,513 (3.3%) in comparison with the prior year. Fiscal year end 2012 fund balances are categorized as follows: 0.3% or $296,905 Nonspendable; 74.6% or $65,347,046 is Restricted, meaning that amounts are subject to external enforceable legal restrictions; 11.6% or $10,189,457 are Committed to self-imposed constraints by the Board of Supervisors; 1.3% or $1,149,959 Assigned or “ear marked” by management for specific purposes and 12.1% or $10,615,854 Unassigned, which means funds are available for spending at the government’s discretion.
Below is a year-to-year comparison of Yuma County’s governmental funds revenues from all sources
Following are explanations of the key elements that contributed to the revenues decrease of (1.1%) or ($1,688,929) compared to the prior year:
Intergovernmental revenues decreased (4.1%) from the prior the year. This is due to fewer grants received through the federal recovery program for the completion of the B & C Colonial sewer project. As the project draws near completion, fewer funds are drawn or needed from grantors.
Investment income again decreased (41.0%) due to the reduction of invested funds. As revenues fail to be generated, departments need the cash flow to support operational activities. Also, the continuing very poor returns on investments contributed to the decrease.
Taxes, primarily local taxes, increased 2.5% from prior year. Property and local sales taxes experienced a combined increase of $1,717,978, an indication the local economy continues to reflect the upward movement in the economy. The State’s shared sales tax also increased, reflecting a possible overall economic movement.
The increase in special assessments is mainly due to the completion of the sewer lines project for B&C Colonia improvement district. As the project was completed, special assessments are now needed to begin paying for the portion of borrowed funds.
Amount Percent Amount Percent Amount Percent
Taxes 70,292,813$ 47.0% 68,574,835$ 45.3% 1,717,978$ 2.5%
Special assessments 572,462 0.4% 112,319 0.1% 460,143 409.7%
Licenses and permits 970,355 0.6% 1,057,715 0.7% (87,360) -8.3%
Intergovernmental 65,712,740 44.0% 68,532,952 45.3% (2,820,212) -4.1%
Charges for services 6,743,112 4.5% 7,086,558 4.7% (343,446) -4.8%
Fines and forfeits 3,003,379 2.0% 3,151,654 2.1% (148,275) -4.7%
Investment income 581,131 0.4% 984,739 0.7% (403,608) -41.0%
Rents 301,201 0.2% 330,365 0.2% (29,164) -8.8%
Miscellaneous 1,310,408 0.9% 1,345,393 0.9% (34,985) -2.6%Total Revenues 149,487,601$ 100.0% 151,176,530$ 100.0% (1,688,929)$ -1.1%
2012 2011 Variance
Yuma County
Governmental Funds Revenues by SourceYears Ended June 30, 2012 and 2011
22

Governmental funds (Concluded)
Below is a year by year comparison of Yuma County’s governmental funds expenditures by function:
Below are explanations of the expenditures that changed significantly compared to prior year:
Overall expenditures decreased, ($4,312,944) or (2.8%), as compared to prior year. The decrease in expenditures was mainly due to management’s efforts to implement a conservative spending strategy primarily among the general fund funded departments. It is management’s intention to continue with this strategy until the economy fully recovers.
Welfare expenses increased 14.1% due state mandated costs for medical eligibility services. Education expenses decreased, ($1,651,990) or (19.1%), as a result of reductions in funding from the
Recovery Act education (97%) and Workforce Investment Act (11.8% Reduction).
The Capital outlay decrease, (24.9%) or ($4,875,302), was mainly due to fewer payments on the B & C Colonial sewer project as previously discussed.
The General Fund is the chief operating fund of Yuma County. At the end of the current fiscal year, total fund balance was $17,928,734. The net change in fund balance was a decrease of ($467,710) during the current fiscal year. Revenues increased $1,536,135 or 2.28% which was primarily from the increase in property taxes, of $1,049,742, resulting from the higher property taxes rate adopted. Expenditures increased $2,016,910 or 3.4% primarily due to a 23.4% or $2,173,710 increase in welfare, as result of Title 36 payments (Mental Health Services). This increase in expenditures was offset by decreases in other categories to achieve the net reduction stated above. All debt service funds had a combined fund balance at the end of the current fiscal year in the amount of $4,740,574. This amount is dedicated to pay for future debt obligations of the outstanding Library General Obligation bonds, the Jail District Revenue bonds, and various Special Assessment bonds. The County refunded the 2007 Jail District Bonds by issuing new bonds extending the term of maturity and reducing the annual payments required. The 2007 Bonds were set to mature in 2015 and the new bonds were issued for 10 years. Only $167,298 is restricted as they represent the creditors required reserve for future payments in all Improvement districts and the Jail district. The remainder funds are either committed for future debt service payments or unassigned. The capital projects funds have a combined fund balance of $5,223,620. The (25.4%) or ($941,559) decrease in fund balance is primarily due to the transfer of funds ($2,879,570) to the Library Debt Service Fund from the Library Capital Fund to fund future debt service payments as a result of earnings from interest on the bond proceeds obtained for the construction of the new library facilities
Amount Percent Amount Percent Amount Percent General government 42,582,154$ 28.5% 42,399,498$ 27.6% 182,656$ 0.4%Public safety 38,624,854 25.8% 38,814,882 25.2% (190,028) -0.5%Highway and streets 9,466,126 6.3% 9,855,973 6.4% (389,847) -4.0%Sanitation 842,870 0.6% 854,966 0.6% (12,096) -1.4%Health 8,781,513 5.9% 8,628,172 5.6% 153,341 1.8%Welfare 15,184,030 10.1% 13,308,587 8.6% 1,875,443 14.1%Culture and recreation 7,514,881 5.0% 7,404,440 4.8% 110,441 1.5%Education 6,975,040 4.7% 8,627,030 5.6% (1,651,990) -19.1%Capital outlay 14,713,004 9.8% 19,588,306 12.7% (4,875,302) -24.9%Debt service: Principal retirement 2,296,887 1.5% 1,830,822 1.2% 466,065 25.5% Interest and fiscal charges 2,626,606 1.8% 2,608,233 1.7% 18,373 0.7%
Total Expenditures 149,607,965$ 100.0% 153,920,909$ 100.0% (4,312,944)$ -2.8%
Years Ended June 30, 2012 and 2011
2012 2011 Variance
Yuma County
Governmental Funds Expenditures by Function
23

GENERAL FUND BUDGETARY HIGHLIGHTS
During fiscal year, 2012 there were no significant variances between the adopted and final budget amounts. General government reduced its budget authority by $239,141 to transfer authority to welfare ($167,103) in order to account for increments on AHCCCS’ costs; the remainder $72,038 and additional budget authority from public safety in an amount of $62,516, were transferred to other financial uses- transfer out for additional funds needed for capital improvements projects.
At the close of the current fiscal year, Yuma County General Fund received a total of $1,980,268 more revenues than budgeted. This was due to an unexpected increase in tax revenues ($891,242 property taxes and $499,017 Sales Taxes). Also, State shared revenues had a positive increase of $642,638. This may be an indication that the economy is starting to turn around.
Yuma County General Fund had $4,292,279 less expenditures than budgeted. For the second year, the General Government function had the most significant positive variance between budgeted and actual, it amounting to $3,683,646. This is a reflection of management’s strategies to limit expenditures in all General Fund departments including a mandatory 2% expenditure reduction.
CAPITAL ASSET AND DEBT ADMINISTRATION
Capital assets
Yuma County’s investment in capital assets for its governmental activities at June 30, 2012 amounts to $346,201,764 (net of accumulated depreciation). This investment in capital assets includes land, buildings, improvements other than buildings, machinery and equipment, infrastructure, and construction in progress.
The total increase in Yuma County’s net capital assets for this fiscal year was 2.5% or $8,402,694. This is mainly for the donations of roads and rights-of-way from local developments (as developed sub-divisions are turned over to County for maintenance), and additional funding received from pledged revenues bond issuance for the construction of a new facility to be located East of Yuma County. Additional information on Yuma County’s capital assets can be found in note 7 on pages 58-59 of this report.
As provided by GASB Statement No. 34, Yuma County has elected to record its Asphalt Pavement Roads, Infrastructure Subsystem, using the “Modified Approach”. Assets accounted for under the modified approach include approximately 581.69 center lane miles of paved roads the County is responsible for maintaining. The County manages its roads using the Pavement Management System, which measures the condition of the pavement and its ability to serve the traveling public. The Pavement Management System is composed of various factors evaluating distress and quality, which when combined provides a unit of measurement called “Overall Condition Index” (OCI). OCI uses a one hundred-point scale (100 Excellent, 0 Needs immediate work) to characterize the condition of the paved roadway. Yuma County has committed to an average OCI level of 65 for the overall subsystem. The most recent assessment indicates that an overall average rating of 74.71 was achieved for fiscal year 2012. There are no significant changes contemplated for adjusting either the committed OCI level, or the application of the Pavement Management System. Refer to pages 90 through 91 for a complete disclosure of the Modified Approach.
Long-term debt
At the end of current fiscal year, Yuma County had total bonded debt outstanding of $58,078,967, of which $56,107,127 is considered long-term and $1,971,840 payable within one year. This amount is comprised of $10,435,000 of revenue bonds; $46,755,000 of general obligation bonds backed by property tax collections of the Yuma County Library District; $43,400 in special assessment bonds for which the government is liable in the event of default by the property owners subject to the assessment; and $845,567 unamortized premiums resulting from the defeasement of the 2007 Jail district revenue bond. The County also has $3,616,115 in Rural Development loans, of which $3,455,657 are considered long-term. Additional information on the County’s long-term debt can be found in notes 9-14 on pages 60-65 of this report.
Governmental Activities Long-term debt 2012 2011
Revenue bonds $ 10,435,000 $ 8,525,000 General obligation bonds 46,755,000 47,875,000 Special assessment bonds with governmental commitment 43,400 75,240 Rural development loan 3,616,115 3,924,887 Capital leases payable - 41,275 Premiums 845,567 - Total $61,695,082 $60,441,402
24

ECONOMIC FACTORS AND NEXT YEAR’S BUDGETS
Yuma County expects the collection of its major revenue sources (local sales tax, state shared sales tax, and auto in lieu tax) to continue in a normal very moderate growth mode based on observed economic activity in the national, local and state economies. After several years of retrenching in revenue sources at both the local and state levels, the County continues to experience a moderate but important increase in tax revenues which constitute 58.6% of the counties total revenues. Property tax levy amounts are capped by statute at a maximum 2% increase annually from the prior year’s levy amount plus the additional value contributed by new construction as a result of a statewide voter action in November, 2006. These increases should be sufficient to continue funding of the core operations of the County with astute financial management, if the Board of Supervisors elects to take advantage of this available revenue source. Given the current observed economic trends management anticipates this moderate growth rate to continue unless outside sources and factors intercede.
The most recent estimates reflect the population of Yuma County continuing to grow; 2.4% for fiscal year
2012, while the unemployment rate is reported to be 25.4% for the calendar year 2011. Traditionally Yuma County has a very high rate of unemployment, typically in the range of 14% to 16%, due to seasonal field workers. However, due to the national recession, over the last three years the County continues in averaging a 24.4% unemployment rate. We do not anticipate seeing a significant drop in this rate in the foreseeable future. Our observations indicate a very moderate but sustained growth in the economic factors for the local Yuma County economy barring any unforeseen actions by outside forces.
The County continues its efforts to position itself in a minimum long term debt status. Administration believes the continued reduction of long term debt not only saves the County on interest payments, but also improves the County’s credit ratings and borrowing capacity for emergencies by keeping a low ratio of debt to expenditures and revenues. In line with this policy the Jail District board of directors approved during the fiscal year the refunding of the 2007 Series Bonds by refinancing the outstanding debt at a lower rate and extending the maturity date to 2021 to facilitate a more manageable lower level of expenditures for debt service payments by the jail district given the current economic conditions and its level of revenues.
The County has for the last four years and continuing into fiscal year 2013 working with management at all
levels to responsibly minimize the operating costs within all levels of government given the continuing trends of very moderate growth patterns within the economy nationally, statewide and locally. This year the County saw a reversion of 26.96% of actual expenditures as compared to budget from all its operational governmental units. The Yuma County Administration is continuing its efforts to control the level of expenditures in an effort to maintain its position within the revenues being received without significant impact to the service demands. The County saw a reduction of expenditures from Fiscal Year 2011 by 2.8% compared to a reduction in revenues of 1.2%.
The nation, State and County appear to be in a recovery mode as a result of the recent recession. Yuma
County continues to take a very conservative but active attitude towards its activities as it responds to the existing economic conditions along with the requirements and policies established by its governing body. We are expecting this moderate growth trend to continue throughout the current fiscal year into the following year.
REQUESTS FOR INFORMATION This financial report is designed to provide a general overview of Yuma County’s finances for all those with an interest in the government’s finances. Questions concerning any of the information provided in this report or requests for additional financial information should be addressed to either: Scott G. Holt, Director, or Gilberto Villegas, Jr., Deputy Director-Financial Services, 198 South Main Street, Yuma, AZ. 85364 (928) 373-1012.
25

{This page is intentionally left blank}
26

Basic Financial Statements
27

{This page is intentionally left blank}
28

Government-Wide Financial Statements
29

YUMA COUNTY Exhibit A- 1Statement of Net Assets
GovernmentalActivities
Cash, cash equivalents and investments 88,272,595$ Receivables (net of allowances for uncollectibles):
Property taxes 1,896,317 Accounts 1,157,728 Special assessments 2,613,274 Accrued interest 90,203 Due from other governments 9,719,022
Inventory 10,028 Prepaid items 286,877 Investment held by trustee - restricted 3,899,185 Capital assets (net of accumulated depreciation):
Land 48,520,591
Buildings 139,900,951 Improvements other than buildings 9,601,037 Machinery and equipment 11,539,166 Infrastructure 110,024,091 Construction in progress 26,615,928
Total Assets 454,146,993$
Accounts payable 3,387,387$ Accrued payroll and employee benefits 1,379,319 Insurance claims payable 968,000 Due to other governments 90 Deposits held for others 409,604 Retainage payable 130,110 Unearned revenue 293,655
Interest and fiscal charges payable 188,547 Long-term liabilities:
Due within one year 5,964,009 Due in more than one year 62,208,601
Total Liabilities 74,929,322$
Invested in capital assets, net of related debt 286,593,510$ Restricted for:
Public safety 5,344,418 Highways and streets 38,279,501 Sanitation 423,787 Health 855,403 Culture and recreation 9,628,372 Capital projects 5,223,620 Debt service 4,740,574
Unrestricted 28,128,486
Total Net Assets 379,217,671$
The notes to the financial statements are an integral part of this statement.
June 30, 2012
ASSETS
LIABILITIES
NET ASSETS
30

YUMA COUNTY Exhibit A- 2Statement of ActivitiesYear Ended June 30, 2012
Net Revenues
(Expenses) and
Changes in
Net Assets
Operating Capital Total
Charges for Grants and Grants and GovernmentalExpenses Services Contributions Contributions Activities
Governmental activities:
General government 44,961,830$ 7,161,588$ 2,156,453$ - (35,643,789)$
Public safety 40,778,911 2,462,699 9,166,014 - (29,150,198)
Highway and streets 11,148,656 44,381 10,133,167 3,733,839$ 2,762,731
Sanitation 892,460 35,809 276,990 7,785,467 7,205,806
Health 9,121,693 865,286 4,210,745 - (4,045,662)
Welfare 15,570,314 351,361 3,282,915 - (11,936,038)
Culture and recreation 8,995,200 96,925 126,674 - (8,771,601)
Education 6,983,411 - 7,226,886 - 243,475 Interest on long-term debt 2,626,606 - - - (2,626,606)
Total governmental activities 141,079,081$ 11,018,049$ 36,579,844$ 11,519,306$ (81,961,882)
General revenues:
Taxes:
Property taxes, levied for general purposes 25,146,806
Property taxes, levied for the Library District 10,439,203
Property taxes, levied for the Flood Control District 3,202,688
Other County taxes:
County sales taxes for General Purposes 11,344,479
County sales taxes for Jail District 11,344,489
County sales taxes for Health Services District 2,258,309
County sales taxes for Capital Projects 18,052
Franchise tax 180,411
Unrestricted State Shared taxes :
Auto in lieu of tax 6,358,376
Sales taxes 17,349,424
Grants and contributions not restricted to specific programs 3,954,280
Investment earnings 646,064
Miscellaneous 2,510,793
Total general revenues 94,753,374
Change in net assets 12,791,492
Net assets, July 1, 2011 366,426,179
Net Assets, June 30, 2012 379,217,671$
The notes to the financial statements are an integral part of this statement.
Functions / Programs
Program Revenues
31

{This page is intentionally left blank}
32

Fund Financial Statements
33

YUMA COUNTYBalance SheetGovernmental Funds
Jail Library
Capital District District
General Improvements General Operations General Operations
Cash, cash equivalents and investments 13,922,666$ 1,592,881$ 657,876$ 9,758,471$
Receivables (net of allowances for uncollectibles):
Property taxes 1,077,077 - - 541,336
Accounts 117,627 - 52,969 875
Special assessments - - - -
Accrued interest 16,972 1,722 1,483 9,952
Due from:
Other funds 2,026,537 711,002 - -
Other governments 3,433,499 1,281 1,737,619 - Inventory - - - -
Prepaid items 266,480 - - 4,511
Investment held by trustee - restricted - 2,402,702 - 83,935
Total Assets 20,860,858$ 4,709,588$ 2,449,947$ 10,399,080$
Liabilities:
Accounts payable 792,677$ 117,878$ 208,911$ 273,398$ Accrued payroll and employee benefits 693,994 - 212,931 71,327
Due to:
Other funds 129,540 - 220,164 68,003 Other governments - - - -
Deposits held for others 143,175 - - 100
Retainage payable - 25,366 - -
Interest and fiscal charges payable - - - -
Revenue bonds payable - - - -
Deferred revenue 1,172,738 - - 452,849
Total Liabilities 2,932,124$ 143,244$ 642,006$ 865,677$
Fund balances:
Nonspendable 266,480$ - - 4,511$
Restricted 7,201,997 - 1,807,941$ 9,528,892
Committed - 4,566,344$ - -
Assigned - - - -
Unassigned 10,460,257 - - -
Total fund balances 17,928,734 4,566,344 1,807,941 9,533,403
Total liabilities and fund balances 20,860,858$ 4,709,588$ 2,449,947$ 10,399,080$
The notes to the financial statements are an integral part of this statement.
June 30, 2012
Assets
Liabilities and Fund Balances
34

Exhibit B- 1
Flood Control Health Services Development Improvement Other Total
District District Services District B & C Governmental Governmental
General Operations General Operations HURF Colonia, Debt Srv Funds Funds
17,920,660$ - 16,349,253$ 402,954$ 18,332,292$ 78,937,053$
231,532 - - - 46,372 1,896,317
- - - 30,748 943,261 1,145,480
- - - 2,496,198 117,076 2,613,274
17,249 - 16,068 405 17,711 81,562
- 784,951$ - - 411,773 3,934,263
- 346,203 556,526 - 3,643,894 9,719,022 - - - - 10,028 10,028
2,526 - 12,601 - 759 286,877
- - - - 1,412,548 3,899,185
18,171,967$ 1,131,154$ 16,934,448$ 2,930,305$ 24,935,714$ 102,523,061$
98,696$ 25,221$ 507,794$ - 1,288,951$ 3,313,526$ 6,318 41,671 24,091 - 320,544 1,370,876
254,631 585,244 419,587 38,755$ 2,417,196 4,133,120 - - - - 90 90
- - 6,995 - 259,334 409,604
10,450 - 94,294 - - 130,110
- - - - 188,547 188,547
- - - - 795,000 795,000
201,368 - - 2,496,198 259,814 4,582,967
571,463$ 652,136$ 1,052,761$ 2,534,953$ 5,529,476$ 14,923,840$
2,526$ - 12,601$ - 10,787$ 296,905$
17,597,978 479,018$ 15,869,086 127,466$ 12,734,668 65,347,046
- - - 267,886 5,355,227 10,189,457
- - - - 1,149,959 1,149,959
- - - - 155,597 10,615,854
17,600,504 479,018 15,881,687 395,352 19,406,238 87,599,221
18,171,967$ 1,131,154$ 16,934,448$ 2,930,305$ 24,935,714$ 102,523,061$
35

{This page is intentionally left blank}
36

YUMA COUNTY Exhibit B- 2Reconciliation of the Balance Sheet of Governmental Funds to the Statement of Net Assets
Fund balance - total governmental funds 87,599,221$
Amounts reported for governmental activities in the Statement of Net Assets are different
because:
Capital assets used in governmental activities are not financial resources and,
therefore, are not reported in the funds. 346,201,764
Some receivables are not available to pay for current-period expenditures and, therefore,
are deferred in the funds. 4,289,312
Internal service funds are used by management to charge the costs of certain activities
such as insurance and maintenance and technology, to individual funds. The assets and
liabilities of the internal service funds are included in governmental activities
in the Statement of Net Assets:
IT Life Cycle Management 52,778$
Revolving Fund 110,246
Workers Compensation 654,562
Health Self-Insurance 7,512,654
Liability Self-Insurance 174,744
Total 8,504,984
Long-term liabilities are not due and payable in the current period and therefore, are
not reported in the funds:
Revenue bonds payable (9,640,000)$
Unamortized premiums (845,567)
General obligation bonds payable (46,755,000)
Special assessment bonds payable (43,400)
Rural development loans payable (3,616,115)
Compensated absences payable (5,654,936)
Claims and judgments payable (822,592)
Total (67,377,610)
Net assets of governmental activities 379,217,671$
The notes to the financial statements are an integral part of this statement.
June 30, 2012
37

YUMA COUNTYStatement of Revenues, Expenditures, and Changes in Fund Balances Governmental FundsYear Ended June 30, 2012
Jail Library
Capital District District
General Improvements General Operations General Operations
Revenues:
Taxes 40,246,924$ 18,052$ 11,344,489$ 10,439,203$
Special assessments - - - -
Licenses and permits 543,592 - - -
Intergovernmental 21,495,464 - 135,030 70,348
Charges for services 4,473,558 - 463,708 21,359
Fines and forfeits 1,658,743 - - 74,005
Investment income 105,192 19,545 3,802 70,495
Rents 17,675 - - 1,561
Miscellaneous 374,865 12,166 11,644 145,749
Total Revenues 68,916,013 49,763 11,958,673 10,822,720
Expenditures:
Current:
General government 37,632,254 223,552 - -
Public safety 11,275,279 - 16,536,724 -
Highways and streets - - - -
Sanitation 560,891 - - -
Health 278,420 - - -
Welfare 11,468,976 - - -
Culture and recreation 5,855 - - 7,390,235
Education 362,028 - - -
Capital outlay 533,039 914,232 117,802 47,814
Debt service:
Principal retirement 41,275 - - -
Interest and fiscal charges 1,824 - - -
Total Expenditures 62,159,841 1,137,784 16,654,526 7,438,049
Excess (deficiency) of revenues overexpenditures 6,756,172 (1,088,021) (4,695,853) 3,384,671
Other financing sources (uses):Bonds proceeds - 2,435,000 - -
Payment to bond refunding escrow agent - - - -
Premiums - - - -
Transfers in 413,870 1,588,000 6,215,366 - Transfers out (7,637,752) (829,000) (1,407,925) (3,324,825)
Total other financing sources (uses) (7,223,882) 3,194,000 4,807,441 (3,324,825)
Net change in fund balance (467,710) 2,105,979 111,588 59,846
Fund balances - beginning (July 1, 2011) 18,396,444 2,460,365 1,696,353 9,473,557
Fund balances - ending (June 30, 2012) 17,928,734$ 4,566,344$ 1,807,941$ 9,533,403$
The notes to the financial statements are an integral part of this statement.
38

Exhibit B- 3
Flood Control Health Services Development Improvement Other Total
District District Services District B & C Governmental Governmental
General Operations General Operations HURF Colonia, Debt Srv Funds Funds
3,202,688$ 2,258,309$ 912,500$ - 1,870,648$ 70,292,813$
- - - 532,495$ 39,967 572,462
2,610 355,830 34,192 - 34,131 970,355
- - 4,400,660 - 39,611,238 65,712,740
7,579 378,074 - - 1,398,834 6,743,112
- 30 - - 1,270,601 3,003,379
121,556 1,734 119,142 2,011 137,654 581,131
- - - - 281,965 301,201
334 70,704 1,633 - 693,313 1,310,408
3,334,767 3,064,681 5,468,127 534,506 45,338,351 149,487,601
- - - - 4,726,348 42,582,154
- - - - 10,812,851 38,624,854
937,204 - 1,888,145 - 6,640,777 9,466,126
- - - - 281,979 842,870
- 3,836,372 - - 4,666,721 8,781,513
- - - - 3,715,054 15,184,030
- - - - 118,791 7,514,881
- - - - 6,613,012 6,975,040
224,071 - 3,689,254 - 9,186,792 14,713,004
- - - 126,274 2,129,338 2,296,887
- - - 110,921 2,513,861 2,626,606
1,161,275 3,836,372 5,577,399 237,195 51,405,524 149,607,965
2,173,492 (771,691) (109,272) 297,311 (6,067,173) (120,364)
- - - - 8,000,000 10,435,000
- - - - (8,692,607) (8,692,607)
- - - - 845,567 845,567
- 786,898 - - 9,977,066 18,981,200 - (321,140) - - (5,093,641) (18,614,283)
- 465,758 - - 5,036,385 2,954,877
2,173,492 (305,933) (109,272) 297,311 (1,030,788) 2,834,513
15,427,012 784,951 15,990,959 98,041 20,437,026 84,764,708
17,600,504$ 479,018$ 15,881,687$ 395,352$ 19,406,238$ 87,599,221$
39

{This page is intentionally left blank}
40

YUMA COUNTY Exhibit B- 4Reconciliation of the Statement of Revenues, Expenditures, and Changes in Fund Balances of Governmental Funds to the Statement of Activities
Net change in fund balances - total governmental funds 2,834,513$
Amounts reported for governmental activities in the Statement of Activities are different
because:
Governmental funds report capital outlays as expenditures. However, in the Statement
of Activities the cost of those assets is allocated over their estimated useful lives and
reported as depreciation expense.
Capital expenditures 14,713,003
Depreciation expense (8,079,094)
Certain capital assets donated to the County are reported as revenue on the Statementof Activities. However, revenue is not reported in the governmental funds as these
donations do not provide for current financial resources. 3,733,839
Revenues in the Statement of Net Assets that do not provide current financial
resources are not reported as revenue in the governmental funds. 20,274
Debt proceeds provide current financial resources to governmental funds, but issuing
debt increases long-term liabilities in the Statement of Net Assets. Repayment of
debt principal is an expenditure in the governmental funds, but the repaymentreduces long-term liabilities in the Statement of Net Assets.
Principal paid 10,989,494
Bonds proceeds (10,435,000)
Premiums (845,567)
Some expenses reported in the Statement of Activities do not require the use of
current financial resources and therefore, are not reported as expenditures in the
governmental funds.
Increase in compensated absences payable (42,117)
Decrease in claims and judgments payable 563,926
Internal service funds are used by management to charge the costs of certain activities
such as technology, maintenance and insurance to individual funds. The net
revenue (expense) of the internal service funds is reported with governmental activities
in the Statement of Net Assets.
IT Life Cycle Management 1,534
Revolving Fund 35,146
Workers Compensation (278,562)
Health Self-Insurance (387,043)
Liability Self-Insurance (32,854)
Change in net assets of governmental activities 12,791,492$
The notes to the financial statements are an integral part of this statement.
Year Ended June 30, 2012
41

YUMA COUNTY Exhibit C- 1Statement of Net AssetsProprietary Funds
Governmental Activities -
Internal ServiceFunds
Current Assets:Cash and cash equivalents 9,335,542$ Receivables (net of allowances for uncollectibles):
Accounts 12,248 Accrued interest 8,641
Due from:Other funds 205,456
Total Assets 9,561,887$
Current Liabilities:Accounts payable 73,861$ Accrued payroll and employee benefits 8,443 Insurance claims payable 968,000 Due to:
Other funds 6,599
Total Liabilities 1,056,903$
Unrestricted 8,504,984$
Total Net Assets 8,504,984$
The notes to the financial statements are an integral part of this statement.
Net Assets
June 30, 2012
Assets
Liabilities
42

YUMA COUNTY Exhibit C- 2
Statement of Revenues, Expenses, and Changes in Fund Net Assets
Proprietary Funds
Governmental
Activities -
Internal ServiceFunds
Charges for services 12,812,587$
Miscellaneous 98,450
Total operating revenues 12,911,037
Personal services 416,754
Supplies and services 424,293
Tools and minor equipment 124,428
Professional services 175,160
Health services claims 8,943,002
Health services other 2,003,107
Insurance 1,094,653
Other 89,435
Total operating expenses 13,270,832
Operating loss (359,795)
Investment income 64,933
Total nonoperating revenues 64,933
Loss before transfers (294,862)
Transfers In 8,911 Transfers out (375,828)
Total transfers (366,917)
Decrease in net assets (661,779)
Total net assets, July 1, 2011 9,166,763
Total net assets, June 30, 2012 8,504,984$
The notes to the financial statements are an integral part of this statement.
Operating expenses
Nonoperating revenues
Year Ended June 30, 2012
Operating revenues
43

YUMA COUNTY Exhibit C- 3Statement of Cash Flows Proprietary Funds
Governmental Activities -
Internal ServiceFunds
Receipts from customers 12,692,628$ Receipts from other funds for goods and services provided 797,472 Other receipts 12,717 Payments for supplies and to providers of goods and services (13,428,955) Payments for employee wages and benefits (367,665) Other payments (2,524)
Net cash used for operating activities (296,327)
Cash transfers out to other funds (375,828) Cash transfers in from other funds 8,911
Net cash used for noncapital financing activities (366,917)
Interest received on investments 73,331
Net cash provided by investing activities 73,331
Net decrease in cash and cash equivalents (589,913)
Cash and cash equivalents, July 1, 2011 9,925,455
Cash and cash equivalents, June 30, 2012 9,335,542$
Reconciliation of operating loss to net cash used for operating activities:
Operating loss (359,795)$
Adjustments to reconcile operating loss to net cash used for operating activites:
Changes in assets and liabilities: (Increase) / decrease in assets: Accounts receivable 370,677 Due from other funds 55,512 Increase / (decrease) in liabilities: Accounts payable (68,662) Accrued payroll and employee benefits (20,075) Insurance claims payable (237,000) Due to other funds (36,984)
Net cash used for operating activities (296,327)$
The notes to the financial statements are an integral part of this statement.
Cash flows from noncapital financing activities:
Cash flows from investing activities:
Year Ended June 30, 2012
Cash flows from operating activities:
44

YUMA COUNTY Exhibit D- 1Statement of Fiduciary Net AssetsFiduciary Funds
InvestmentTrust Agency Funds Funds
Cash and cash equivalents 21,628,425$ 4,143,800$ Receivables (net of allowances for uncollectibles):
Accrued interest 141,250 -
Total Assets 21,769,675$ 4,143,800$
Deposits held for others - 4,143,800$
Total Liabilities - 4,143,800$
Reserved for:Held in trust for investment trust participants 21,769,675$
Total Net Assets 21,769,675$
The notes to the financial statements are an integral part of this statement.
Net Assets
June 30, 2012
Assets
Liabilities
45

YUMA COUNTY Exhibit D- 2Statement of Changes in Fiduciary Net Assets Fiduciary Funds
InvestmentTrustFunds
Contributions from participants 374,872,591$ Investment income 1,248,640
Total additions 376,121,231
Distributions to participants 372,864,234
Total deductions 372,864,234
Change in net assets 3,256,997
Net assets held in trust, July 1, 2011 18,512,678
Net assets held in trust, June 30, 2012 21,769,675$
The notes to the financial statements are an integral part of this statement.
Year Ended June 30, 2012
Additions:
Deductions:
46

Notes to Financial Statements
47

Yuma County Notes to Financial Statements June 30, 2012
Note 1 - Summary of Significant Accounting Policies Yuma County (The County)’s accounting policies conform to generally accepted accounting principles applicable to governmental units adopted by the Governmental Accounting Standards Board (GASB). A. Reporting Entity The County is a general-purpose local government that is governed by a separately elected board of five county supervisors (The Board). The accompanying financial statements present the activities of the County (the primary government) and its legally separate component units, entities for which the County is considered to be financially accountable. Blended component units, although legally separate entities, are so intertwined with the County that they are in substance part of the County's operations; therefore, data from these units is combined with data of the primary government. Discretely presented component units, on the other hand, are reported in a separate column in the government-wide financial statements to emphasize they are legally separate from the County. Each blended component unit discussed below has a June 30 year-end. The County has no discretely presented component units. The following table describes the County’s component units:
For Separate Description; Criteria Reporting Financial
Component Unit for Inclusion Method Statements
Yuma County A tax-levying district that provides flood Blended Not Available Flood Control District control systems; County’s board of
supervisors serves as board of directors
Yuma County A tax-levying district that provides and Blended Not Available Library District maintains library services for the County's
residents; County board of supervisors serves as board of directors
Yuma County Constructs or improves sidewalks, curbs Blended Not Available Special Assessment and gutters, irrigation systems, and street
(Improvement) lighting within the County; County’s board Districts of supervisors serves as board of directors
Yuma County A tax-levying district that acquires, Blended Yuma County
Jail District constructs, operates, maintains, and Financial Services finances county jails and jail systems; the 198 South Main County’s board of supervisors serves as Street board of directors Yuma, AZ 85364
Yuma County A tax-levying district that provides health Blended Not Available Health Services services which promote healthy lifestyles
District and prevent disease and disability; the County’s board of supervisors serves as board of directors
Yuma County is required by law to maintain its support of corrections facilities and services operated, maintained and performed by the Yuma County Jail District. The amount of this maintenance of effort for the year ended June 30, 2012 is $6,215,366. Yuma County is also required to maintain support of the Health Services District. The amount for health services support for the year ended June 30, 2012 is $786,898. The health services district also includes the Rabies Control Fund.
48

Yuma County Notes to Financial Statements June 30, 2012
Note 1 - Summary of Significant Accounting Policies (Continued)
B. Basis of Presentation
The basic financial statements include both government-wide statements and fund financial statements. The government-wide statements focus on the County as a whole, while the fund financial statements focus on major funds. Each presentation provides valuable information that can be analyzed and compared between years and between governments to enhance the usefulness of the information. 1. Government-wide statements – provide information about the primary government (the County) and its component units. The statements include a statement of net assets and a statement of activities. These statements report the overall government’s financial activities, except for fiduciary activities. They also distinguish between the governmental and business-type activities. Governmental activities generally are financed through taxes and intergovernmental revenues. The County has no business-type activities or discretely presented component units. A statement of activities presents a comparison between direct expenses and program revenues for each function of the County’s governmental activities. Direct expenses are those that are specifically associated with a program or function and, therefore, are clearly identifiable to a particular function. The County does not allocate indirect expenses to programs or functions. Program revenues include:
charges to customers or applicants for goods, services, or privileges provided; operating grants and contributions; and capital grants and contributions, including special assessments
Revenues that are not classified as program revenues, including internally dedicated resources and all taxes levied or imposed by the County, are reported as general revenues. Generally, the effect of interfund activity has been eliminated from the government-wide financial statements to minimize the double counting of internal activities. However, charges for interfund services provided and used are not eliminated if the prices approximate their external exchange values. 2. Fund financial statements – provide information about the County’s funds, including fiduciary funds and blended component units. Separate statements are presented for the governmental, proprietary, and fiduciary fund categories. The emphasis of fund financial statements is on major governmental funds, each displayed in a separate column. All remaining governmental funds are aggregated and reported as nonmajor funds. Fiduciary funds are aggregated and reported by fund type. Proprietary fund revenues and expenses are classified as either operating or non-operating. Operating revenues and expenses generally result from transactions associated with the fund’s principal activity. Accordingly, revenues, such as user charges, in which each party receives and gives up essentially equal values, are operating revenues. Other revenues, such as investment income, result from transactions in which the parties do not exchange equal values and are reported as non-operating revenues. Operating expenses include the cost of services and administrative expenses. The County has no non-operating expenses. The County reports the following major governmental funds:
The General Fund is the County’s primary operating fund. It accounts for all financial resources of the general government, except those required to be accounted for in another fund.
The Capital Improvements Fund accounts for the majority of the County’s Capital Projects. These projects are on their majority general fund funded.
The Jail District General Operations Fund is the primary operating fund of the Jail District. It accounts for all financial resources of the Jail District, except those required to be accounted for in another fund. The Jail District constructs, operates, maintains, and finances the County jails and jail systems. The primary sources of income comes from a voter approved .05 cent transaction privilege (sales) tax and the maintenance of effort, which is formula driven, from the general fund as determined by State statute.
49

Yuma County Notes to Financial Statements June 30, 2012
Note 1 - Summary of Significant Accounting Policies (Continued)
The Library District General Operations Fund is the primary operating fund of the Library District. It accounts for all financial resources of the Library District, except those required to be accounted for in another fund. The Library District provides and maintains library services for the County’s residents. The library district’s primary support is the levy of property taxes; the District has the authority to levy its own property taxes based on assessed values.
The Flood Control District General Operations Fund is the primary operating fund of the Flood Control District. It accounts for all financial resources of the Flood Control District, except those required to be accounted for in another fund. The Flood Control District constructs and maintains flood control systems throughout the County. The district is primarily supported from the levy of property taxes as approved by the board of supervisors.
The Health Services District General Operations Fund is the primary operating fund of the Health Services District. It accounts for all financial resources of the Health Services District, except those required to be accounted for in another fund. The Health Services District provides health programs and services for the County’s residents. The Health Services District as a whole is supported by a predetermined required contribution from the general fund, a .01 cent transaction privilege (sales) tax, and a number of federal and state grants aimed to aid in the implementation of the required health programs and services.
The Development Services Highway Users Revenue Fund (HURF) is a special revenue fund restricted to construct, acquire, and maintain the County’s highway system. It is funded through federal and state sources including the auto in lieu tax and road fund permits. HURF revenue, the fund’s primary source of revenue, is collected by the State of Arizona Department of Transportation then allocated to the County based on a population formula.
The Improvement District B & C Colonia, Debt Service Fund accounts for the resources that are accumulated for the payment of interest, principal, and related costs on the Improvement District’s sewer project long –term debt. The Improvement District installed a sewer system funded from federal grants and borrowed funds. Additionally, the County reports the following fund types:
The Internal Service Funds account for health insurance for county employees; property and personal liability insurance; and the maintenance and purchase of technology equipment and software provided to County departments or to other governments on a cost-reimbursement basis.
The Investment Trust Funds account for pooled assets and individual investment accounts the County Treasurer holds and invests on behalf of other governmental entities.
The Agency Funds account for assets the County holds as an agent for the State, school districts, individuals, and various local governments, mainly for property taxes collected and distributed to the State, local school districts, community college districts, and special districts. One agency fund is reported to account for all custodial activities. C. Basis of Accounting
The government-wide, proprietary fund and fiduciary fund financial statements are presented using the economic resources measurement focus, with the exception of the agency funds, and the accrual basis of accounting. The agency funds are custodial in nature and do not have a measurement focus. Revenues are recorded when earned, and expenses are recorded at the time liabilities are incurred, regardless of when the related cash flows take place. Property taxes are recognized as revenue in the year for which they are levied. Grants and donations are recognized as revenue as soon as all eligibility requirements the provider imposed have been met.
Under the terms of grant agreements, the County funds certain programs by a combination of grants and general revenues. Therefore, when program expenses are incurred, there are both restricted and unrestricted net assets available to finance the program. The County applies grant resources to such programs before using general revenues.
50

Yuma County Notes to Financial Statements June 30, 2012
Note 1 - Summary of Significant Accounting Policies (Continued)
Governmental funds in the fund financial statements are reported using the current financial resources measurement focus and the modified accrual basis of accounting. Under this method, revenues are recognized when they are both measurable and available. The County considers all revenues reported in the governmental funds to be available if the revenues are collected within 60 days after fiscal year-end. The County’s major revenue sources that are susceptible to accrual are property taxes, special assessments, intergovernmental, charges for services, and investment earnings. Expenditures are recorded when the related fund liability is incurred, except for principal and interest on long-term debt, claims and judgments, and compensated absences, which are recognized as expenditures to the extent they are due and payable. General capital asset acquisitions are reported as expenditures in governmental funds. Issuances of long-term debt and acquisitions under capital lease agreements are reported as other financing sources. D. Cash and Investments
For purposes of its statement of cash flows, the County considers cash on hand, demand deposits, cash on deposit with the County Treasurer, and only those highly liquid investments with a maturity of 3 months or less when purchased to be cash equivalents.
Nonparticipating interest-earning investment contracts are stated at cost. Money market investments and participating interest-earning investment contracts with a remaining maturity of 1 year or less at the time of purchase are stated at amortized cost. All other investments are stated at fair value. E. Inventories and Prepaid Items
Inventories, of the governmental funds consist of expendable supplies held for consumption and are recorded as assets when purchased and expended when consumed. These inventories are stated at cost using the first-in, first-out method. Certain payments to vendors reflect costs applicable to future accounting periods and are recorded as prepaid items in both the government-wide and fund financial statements. The County has adopted the consumption method of accounting for prepaid items. That is, the asset is recorded when the payments to vendors are made, and the expenditures are recorded in the appropriate accounting period.
In the governmental funds, inventories and prepaid items are classified as nonspendable in the fund balance section as they do not constitute spendable resources. F. Property Tax Calendar
The County levies real and personal property taxes on or before the third Monday in August that become due and payable in two equal installments. The first installment is due on the first day of October and becomes delinquent after the first business day of November. The second installment is due on the first day of March of the next year and becomes delinquent after the first business day in May.
A lien assessed against real and personal property attaches on the first day of January preceding assessment and levy. G. Capital Assets
Capital assets are reported at actual cost, (or estimated historical cost if historical records are not available). Donated assets are reported at estimated fair value at the time received.
51

Yuma County Notes to Financial Statements June 30, 2012
Note 1 - Summary of Significant Accounting Policies (Continued)
Capitalization thresholds (the dollar values above which asset acquisitions are added to the capital asset accounts), depreciation methods, and estimated useful lives of capital assets reported in the government-wide statements are as follows:
Capitalization
Threshold
Land All
Construction in Progress All Depreciation Estimated
Infrastructure (paved roads) All Method Useful Life
Buildings $ 10,000 Straight line 15-50 Improvements Other than Buildings 10,000 Straight line 5-40 Machinery and Equipment 5,000 Straight line 5-25 Infrastructure (except paved roads) 10,000 Straight line 10-50
The County uses the modified approach for reporting its paved roads subsystem and, therefore, no depreciation is recorded for these assets. Under the modified approach, the County has determined that the condition level for eligible infrastructure assets to be maintained is an average Overall Condition Index (OIC) of 65. The Yuma County Public Works Department is responsible for determining the appropriate condition level of the eligible infrastructure. No amounts are capitalized in connection with improvements that lengthen the lives of such assets, unless the improvements also increase their efficiency and/or capacity. The Public Works Department maintains an inventory of these eligible infrastructure assets and performs periodic condition assessments to establish that the predetermined condition level is being maintained. Complete condition assessments are determined in a consistent manner on a triennial basis. Annual estimates of the amounts that must be expended to preserve and maintain these infrastructure assets at the predetermined condition levels are computed by the Public Works Department. H. Fund Balance Classifications
Fund balances of the governmental fund are reported separately within classifications based on a hierarchy of the constraints placed on the use of those resources. The classifications are based on the relative strength of the constraints that control how the specific amounts can be spent. The classifications are nonspendable, restricted and unrestricted, which includes committed, assigned and unassigned fund balance classifications.
The nonspendable fund balance classification includes amounts that cannot be spent because they are either not in spendable form, such as inventories and prepaid items, or are legally or contractually required to be maintained intact. Restricted fund balances are those that have externally imposed restrictions on their usage by creditors, such as through debt covenants, grantors, contributors, or laws and regulations
The unrestricted fund balance category is composed of committed, assigned, and unassigned resources. Committed fund balances are self-imposed limitations approved by the County’s Board of Supervisors, which is the highest level of decision-making authority within the County. The committed fund balance constraints can only be removed or changed by Board action when adopting a resolution to establish, modify, or rescind the commitment. During the fiscal Year 2012 budget adoption process, the Board committed to funds to complete various capital projects including the completion of an East County facility. Assigned fund balances are resources constrained by the County’s intent to be used for specific purposes, but are neither restricted nor committed. The Board has authorized the County Administrator, who in turn has authorized department heads to make assignments of resources for specific purposes for the fund assigned under their custody. Elected officials are also authorized to make assignments as seen fit.
The unassigned fund balance is the residual classification for the General Fund and includes all spendable amounts not reported in the other classifications. Also, deficits in fund balances of the other governmental funds are reported as unassigned.
When an expenditure is incurred that can be paid from either restricted or unrestricted fund balances, it’s the County’s policy to use restricted fund balances first.
52

Yuma County Notes to Financial Statements June 30, 2012
Note 1 - Summary of Significant Accounting Policies (Concluded)
The County has not formally adopted a policy specifying the hierarchy in use of unrestricted fund balances; however, the County considers that the committed amounts will be used first, followed by assigned amounts, and then unassigned amounts.
I. Investment Income
Investment income is composed of interest, dividends, and net changes in the fair value of applicable investments. J. Sales Tax Revenue
Sales tax revenues are collected by the State of Arizona and are generally remitted to the County Treasurer on a monthly basis. Sales tax revenue is recognized as revenues for the month reported and collected by the State of Arizona. K. Intergovernmental Grants and Aid
Grants and assistance awards made on the basis of entitlement periods are recorded as intergovernmental receivables and revenues when entitlement occurs. Reimbursement grants are recorded as intergovernmental receivables and revenues when the related expenditures are incurred. Reimbursements not received within 60 days subsequent to fiscal year-end are reported as deferred revenues in the governmental funds’ financial statements.
L. Compensated Absences
Compensated absences payable consist of vacation leave and a calculated amount of sick leave earned by employees based on services already rendered.
Employees may accumulate up to 240 hours of vacation depending on years of service, but any vacation hours in excess of the maximum amount that are unused at calendar year-end are forfeited, unless otherwise approved by the Board to temporarily carry excess vacation hours. Upon terminating employment, all unused and unforfeited vacation benefits are paid to employees. Accordingly, vacation benefits are accrued as a liability in the government-wide financial statements. A liability for these amounts is reported in the governmental funds’ financial statements only if they have matured, for example, as a result of employee resignations and retirements by fiscal year-end.
Employees may accumulate an unlimited number of sick leave hours. Generally, sick leave benefits provide for ordinary sick pay and are cumulative, but are forfeited upon terminating employment. However, for employees who terminate with a minimum of five years continuous service, sick leave benefits do vest, and, therefore, are accrued. Upon termination, eligible employees are compensated for actual sick leave up to 1,000 hours at $3 per hour. Vested accumulated sick hours are recorded and accrued as a liability in the government-wide financial statements similar to the vacation benefits. A liability for sick hours is reported in the governmental funds’ financial statements only when vested employees depart from the County. M. Long-term Obligations
In the government-wide financial statements, long-term debt and other long-term obligations are reported as liabilities in governmental activities. Bond premiums are deferred and amortized over the life of the bonds using the straight-line method. In the fund financial statements, governmental fund types recognized bond premiums during the current period. The face amount of debt issued is reported as other financing sources. Premiums received on debt issuances are reported as other financing sources.
53

Yuma County Notes to Financial Statements June 30, 2012
Note 2 – Fund Balance Classifications of the Governmental Funds
The fund balances classifications of the governmental funds as of June 30, 2012, were as follows:
Note 3 - Stewardship, Compliance, and Accountability
Deficit fund balances – At June 30, 2012, the following funds reported deficits in fund balances. These fund deficits resulted from either operations during the year or a carryover deficit from prior years but are expected to be corrected through normal operations in the next fiscal year. The debt service fund deficit was the result of additional monies needed to defease debt.
Jail Library Flood Control Health Serv Imp District
District District District District Development B & C OtherCapital General General General General Services Colonia Governmental
Fund balance General Improvements Operations Operations Operations Operations HURF Debt Serv Funds Total
Nonspendable:Inventory - - - - - - - - 10,028$ 10,028$ Prepaid expenses items 266,480$ - - 4,511$ 2,526$ - 12,601$ - 759 286,877
Total nonspendable 266,480 - - 4,511 2,526 - 12,601 - 10,787 296,905
Restricted for:Capital Projects
Improvement districts - - - - - - - - 75,070 75,070 Bridges and drains - - - - 1,194,330 - - - - 1,194,330 Roads - - - - - - 1,394,116 - 24,519 1,418,635
Operations and maintenanceLibrary district - - - 9,528,892 - - - - 94,969 9,623,861 Health district 786,898 - - - - 479,018$ - - 350,785 1,616,701 Flood control district - - - - 16,403,648 - - - - 16,403,648 Highways and streets - - - - - - 14,474,970 - 4,797,310 19,272,280
Debt service reserve - - - - - - - 127,466$ 39,832 167,298 Judicial activities - - - - - - - - 3,180,764 3,180,764 Housing activities - - - - - - - - 1,095,450 1,095,450 Law enforcement 6,415,099 - 1,807,941$ - - - - - 746,343 8,969,383 Other - - - - - - - - 2,329,626 2,329,626
Total restricted 7,201,997 - 1,807,941 9,528,892 17,597,978 479,018 15,869,086 127,466 12,734,668 65,347,046
Committed to:Capital projects
Library district - - - - - - - - 189,702 189,702 Jail district - - - - - - - - 807 807 Improvement districts - - - - - - - - 36,897 36,897 New buildings - 1,704,817$ - - - - - - - 1,704,817 Miscellaneous - 2,861,527 - - - - - - - 2,861,527
Operations and maintenanceSuperior court - - - - - - - - 137,335 137,335 Local courts - - - - - - - - 408,752 408,752
Health- Rabies - - - - - - - - 25,600 25,600 Debt service payments - - - - - - - 267,886 4,556,134 4,824,020
Total Committed - 4,566,344 - - - - - 267,886 5,355,227 10,189,457
Assigned to:Attorney- Enhancements - - - - - - - - 180,570 180,570 Housing activities - - - - - - - - 466,587 466,587 Imp Dist maintenance - - - - - - - - 309,808 309,808 Juvenile judicial activities - - - - - - - - 150,575 150,575 Other - - - - - - - - 42,419 42,419
Total Assigned - - - - - - - - 1,149,959 1,149,959
Unassigned 10,460,257 - - - - - - - 155,597 10,615,854
Total fund balances 17,928,734$ 4,566,344$ 1,807,941$ 9,533,403$ 17,600,504$ 479,018$ 15,881,687$ 395,352$ 19,406,238$ 87,599,221$
Fund Agency Number Amount Governmental Funds:
Crime Victim Compensation Grant County Attorney 2209 $ 1 Court Appointed Specialist Juvenile Court 2248 4 Improving AM Schools Juvenile Court 2257 12,361
Debt Service Jail District 3500 250,744 El Prado Estates Improvement Districts 4717 9,750 B & C Colonia ARRA Improvement Districts 4722 28,132
54

Yuma County Notes to Financial Statements June 30, 2012
Note 3 - Stewardship, Compliance, and Accountability (Concluded)
For the fiscal year ended June 30, 2012, expenditures exceeded final budget amounts at the department level within each fund are as follows:
Fund Agency Number Excess Governmental Funds: General Fund: Medical Examiner – Sheriff General Fund 0100 $ 7,570 School Superintendant General Fund 8000 105
Juvenile Probation Juvenile Court 2259 16
Local Assistance- Clerk of Superior Court Superior Court 2221 14
The majority of these departments exceeded budgets because of unusual and unplanned events. The Sheriff’s Medical Examiner department in the General fund exceeded its expenditures budget for fiscal year 2012 due to an increase in related cases.
The most common offense is the departments failing to request budget adjustments to match actual grant award amounts and offsetting expenditures. All of these funds had enough contingency reserves. The County is working on creating additional reporting mechanisms to enable a more frequent and more comprehensive analysis of budget to actual expenditures throughout the year.
Note 4 - Deposits and Investments
Arizona Revised Statutes (A.R.S.) authorize the County to invest public monies in the State Treasurer’s investment pool; obligations issued or guaranteed by the United States or any of the senior debt of its agencies, sponsored agencies, corporations, sponsored corporations, or instrumentalities; specified state and local government bonds and notes; interest earning investments such as savings accounts, certificates of deposit, and repurchase agreements in eligible depositories, specified commercial paper, bonds, debentures, and notes issued by corporations organized and doing business in the United States; and certain open-end and closed-end mutual funds, including exchange trade funds. In addition, the County Treasurer may invest trust funds in certain fixed income securities of corporations doing business in the United States or District of Columbia. Credit risk- Statutes have the following requirements for credit risk:
1. Commercial paper must be of prime quality and be rated within the top two ratings by a nationally recognized rating agency.
2. Corporate bonds, debentures, and notes must be rated within the top three ratings by a nationally recognized rating agency.
3. Fixed income securities must carry one of the two highest ratings by Moody’s investors service and Standard and Poor’s rating service. If only one of the above-mentioned services rates the security, it must carry the highest rating of that service.
Custodial credit risk- Statutes require collateral for deposits and certificates of deposit at 101 percent of all deposits not covered by federal depository insurance. Concentration of credit risk- Statutes do not include any requirements for concentration of credit risk. Interest rate risk- Statutes require that public monies invested in securities and deposits have a maximum maturity of 5 years. Investments in repurchase agreements must have a maximum maturity of 180 days. Foreign currency risk- Statutes do not allow foreign investments. Deposits – At June 30, 2012, the carrying amount of the County’s deposits was $10,255,029 and the bank balance was $14,924,282. The County does not have a policy related to custodial credit risk.
55

Yuma County Notes to Financial Statements June 30, 2012
Note 4 - Deposits and Investments (Continued)
Investments – The County’s investments at June 30, 2012, were as follows:
Investment Type Fair Value State Treasurer’s investment pool 7 $ 41,401,328 State Treasurer’s investment pool 5 84,831 U.S. agency securities 64,456,685 Total $ 105,942,844
The State Board of Investment provides oversight for the State Treasurer’s pools. The fair value of a participant’s position in the pool approximates the value of that participant’s pool shares, and the participant’s shares are not identified with specific investments. Credit Risk – The County does not have a formal investment policy with respect to credit risk. As of June 30, 2012, credit risk for the County’s investments was as follows: Investment Type Rating Rating Agency Amount State Treasurer’s investment pool 7 Unrated Not applicable $ 41,401,328State Treasurer’s investment pool 5 AAAf/S1+ Standard and Poor’s 84,831U.S. agency securities Aaa Moody’s 64,456,685 $ 105,942,844
Custodial credit risk – For an investment, custodial credit risk is the risk that, in the event of the counterparty’s failure, the County will not be able to recover the value of its investments or collateral securities that are in an outside party’s possession. The County does not have a formal investment policy with respect to custodial credit risk. The following investments are held by a trustee. These funds have a higher exposure to custodial credit risk than the County as a whole, since these amounts with trustee are held by the counterparty and are not in the County’s name.
FUND Debt Service Construction Other Total Jail District $ 721,363 $ 429,000 - $ 1,150,363 Library District - - $ 83,935 83,935 Yuma County 262,185 2,402,702 - 2,664,887
Totals $ 983,548 $2,831,702 $ 83,935 $ 3,899,185 Concentration of credit risk – The County does not have a formal investment policy with respect to concentration of credit risk. The County had investments at June 30, 2012, of 5 percent or more of the County’s total investments in the Federal National Mortgage Association of 52.94%. Interest rate risk – The County does not have a formal investment policy with respect to interest rate risk. As of June 30, 2012, the County had the following investments in debt securities:
Weighted Average Investment Amount Maturity (In Years) State Treasurer’s investment pool 7 $ 41,401,328 .08 State Treasurer’s investment pool 5 84,831 .07 U.S. agency securities 64,456,685 .52 Total $ 105,942,844
A reconciliation of cash, deposits, and investments to amounts shown on the Statements of Net Assets follows: Cash, deposits, and investments:
Cash on hand $ 1,746,132 Amount of deposits 10,255,029 Amount of investments 105,942,844 Total $ 117,944,005
56

Yuma County Notes to Financial Statements June 30, 2012
Note 4 - Deposits and Investments (Concluded)
Statement of Net Assets: Governmental Investment Agency Activities Trust Funds Funds Total Cash, cash equivalents and investments $ 88,272,595 $21,628,425 $4,143,800 $114,044,820Investments held by trustee-restricted 3,899,185 - - 3,899,185 Total $ 92,171,780 $ 21,628,425 $4,143,800 $ 117,944,005
Note 5 - Condensed Financial Statements of County Treasurer’s Investment Pool
Arizona Revised Statutes require community colleges, school districts, and other local governments to deposit certain public monies with the County Treasurer. The Treasurer has a fiduciary responsibility to administer those and the County’s monies under his stewardship. The Treasurer invests, on a pool basis, all idle monies not specifically invested for a fund or program. In addition, the Treasurer determines the fair value of those pooled investments annually at June 30. The County Treasurer’s investment pool is not registered with the Securities and Exchange Commission as an investment company and there is no regulatory oversight of its operations. The pool’s structure does not provide for shares and the County has not provided or obtained any legally binding guarantees to support the value of the participants’ investments. The Treasurer allocates interest earnings to each of the pool’s participants. At June 30, 2012 the bank balance of the County Treasurer’s investment pool deposits was $5,290,397. The deposit and investment risks of the Treasurer’s investment pool are substantially the same as the County’s deposit and investment risks. A condensed statement of the investment pool’s net assets and changes in net assets follows:
Statement of Net Assets Assets $ 104,296,583 Liabilities - Net assets $ 104,296,583
Net assets held in trust for: Internal participants $ 86,757,783 External participants 17,538,800 Total net assets held in trust $ 104,296,583
Statement of Changes in Net Assets Total additions $ 632,118,090 Total deductions 624,532,338 Net increase 7,585,752 Net assets held in trust: July 1, 2011 96,710,831 June 30, 2012 $ 104,296,583
Details of each major investment classification follow: Interest Investment Type Principal Rate Maturities Fair Value U.S. agency securities $ 64,456,685 0.50-4.00% 06/12-02/17 $64,456,685 State Treasurer’s investment pool 34,688,407 Not stated N/A 34,688,407
57

Yuma County Notes to Financial Statements June 30, 2012
Note 6 - Property Taxes Receivable
Property taxes receivable consist of uncollected property taxes as determined from the records of the County Treasurer's Office, and at June 30, 2012, the uncollected property taxes and related allowances for uncollectibles were as follows: Major Governmental Funds
Library District Flood Control Nonmajor General General Ops General Ops Governmental
Fiscal Year Fund Fund District Fund Funds
Current 2011-12 $ 1,177,935 $ 534,699 $ 165,272 $ 40,844
Prior years 448,716 205,262 66,260 5,528
Total receivable 1,626,651 739,961 231.532 46,372
Less allowances for uncollectibles (549,574) (198,625) - - Property Taxes Receivable (Net of Uncollectibles) $1,077,077 $ 541,336 $ 231,532 $ 46,372
Note 7 - Capital Assets
Capital asset activity for the year ended June 30, 2012, was as follows:
Governmental activities: Balance Balance July 1, 2011 Additions Deletions June 30, 2012
Capital assets, not being depreciated :Land 47,663,225$ 1,044,765$ (187,399)$ 48,520,591$ Infrastructure: Paved roads 80,972,224 2,920,784 (124,082) 83,768,926 Construction in progress 17,398,942 12,165,128 (2,948,142) 26,615,928
Total capital assets not being depreciated 146,034,391 16,130,677 (3,259,623) 158,905,445
Capital assets, being depreciated :Buildings 176,964,093 514,501 (201,923) 177,276,671 Improvements other than buildings 12,589,150 387,946 12,977,096 Machinery and equipment 33,187,405 2,166,154 (743,017) 34,610,542 Infrastructure (except paved roads) 59,127,903 692,577 59,820,480
Total capital assets being depreciated 281,868,551 3,761,178 (944,940) 284,684,789
Less accumulated depreciation for:Buildings (33,521,065) (3,915,679) 61,024 (37,375,720) Improvements other than buildings (2,827,831) (548,228) (3,376,059) Machinery and equipment (21,328,509) (2,476,339) 733,472 (23,071,376) Infrastructure (except paved roads) (32,426,467) (1,138,848) (33,565,315)
Total accumulated depreciation (90,103,872) (8,079,094) 794,496 (97,388,470)
Total capital assets, being depreciated, net 191,764,679 (4,317,916) (150,444) 187,296,319
Governmental activities capital assets, net 337,799,070$ 11,812,761$ (3,410,067)$ 346,201,764$
58

Yuma County Notes to Financial Statements June 30, 2012
Note 7 - Capital Assets (Concluded)
Depreciation expense was charged to functions as follows: Governmental activities: General government $ 2,201,771 Public safety 2,022,787 Highway and streets 1,662,335 Sanitation 45,604 Health 310,419 Welfare 379,375 Culture and recreation 1,451,886 Education 4,917
Total depreciation expense- governmental activities $ 8,079,094 Yuma County is engaged in various construction projects as of June 30, 2012. The projects include widening existing streets, constructing streets, installing sewer lines, new storm drainages systems, new basins, bridge rehabilitation, construction of new Justice Center East County, and remodeling existing buildings. At year end the County’s commitments with projects are as follows:
Constructions projects are funded from various sources. The East County Satellite facility is being funded mainly from revenue bonds issued in March 2012 and transfers from the General Fund. The Housing building renovations are from HUD programs funds. Projects classified as Infrastructure are funded from the State’s shared Highway Users Revenue Fund with the exceptions of: a) Ave B & C Colonia project which is funded with funds from the American Recovery and Reinvestment Act, federal loans, and special assessments; and b) Drainage Projects which are funded with flood control funds.
Project Expenditures Total Project Remaining Project Description Class to date Cost Commitments East County Satellite facility Buildings 412,628$ 2,594,667$ 2,182,039$ Housing @ 8450 West HWY 95 Somerton Buildings 1,040,956 1,843,613 802,657 GIS Assessor Software Upgrade Mach & Equip 28,787 653,000 624,213 Sewer- Ave B & C Colonia ID Infrastructure 20,756,705 22,985,146 2,228,441 Rd- @ Co 14 & Somerton Ave to Ave G Infrastructure 178,845 1,789,627 1,610,782 Rd- @ City 8 St & Ave C thru D Infrastructure 186,971 3,465,943 3,278,972 Rd- @ Frontage Road from Ave 8E to Ave 13E Infrastructure 288,593 4,375,070 4,086,477 Rd- @ Ave C, 8 St to 1 St Infrastructure 2,547,315 4,181,482 1,634,167 Rd- @ Ave B: Co 15 to Co 18 Infrastructure 403,612 4,757,249 4,353,637 Rd- @ Co 12 St, Ave 11E to 12E Infrastructure 157,895 3,400,177 3,242,282 Rd- @ Ave C and Co 15 St curve realignment Infrastructure 47,215 1,100,000 1,052,785 Rd- @ Corridor- Ave E from I95 to Co 18 St Infrastructure 28,500 530,000 501,500 Bridge- Replace #9271 ( Ave F 1/2 & 19 St) Infrastructure 92,187 973,832 881,645 Bridge- Hwy 80 & Union Pacific Rehab Infrastructure 20,234 520,000 499,766 Bridge- Avenue 64E Rehab Infrastructure 104,500 2,312,650 2,208,150
Infrastructure 146,769 1,212,109 1,065,340 Infrastructure 106,620 830,536 723,916 Infrastructure 2,806 504,391 501,585
Somerton Area Drain Improvements Infrastructure 63,520 1,474,449 1,410,929 San Luis Drainage Improvements Infrastructure 1,270 5,285,270 5,284,000
26,615,928$ 64,789,211$ 38,173,283$
Foothills Master Drainage PlanWest Yuma Mesa Storm Drainage System Engler and Pacific Basin Improvements
59

Yuma County Notes to Financial Statements June 30, 2012
Note 8 - Due from Other Governments Amounts due from other governments reported in the Governmental Funds totaling $9,719,022 at June 30, 2012 includes County sales taxes revenues of $3,822,719 (Allocated $1,737,617 to General Fund, $1,737,619 to Jail District, $346,203 to Health District, and $1,280 to capital projects); State shared sales taxes revenues of $1,494,033 and Payment in Lieu of Tax of $230,295 ($161,309 for the General Fund and $68,986 for HURF). The remaining $4,171,975 of the total receivables consists of grants and reimbursements from local, state, and federal governments, and all other miscellaneous receivables.
Note 9 - Changes in Long-Term Liabilities
The following schedule details the County’s long-term liability and obligation activity for year ended June 30, 2012.
Note 10 - Bonds Payable
The County's bonded debt consists of two revenue bond issues, two general obligation bond issues and a special assessment bond issue with governmental commitment. Bond proceeds primarily pay for acquiring or constructing capital facilities. Bonds have also been issued to advance-refund previously issued bonds. Revenue Bonds — The Yuma County Jail District Revenue Bonds of 2007 ($10,000,000) were issued to finance the expansion of Yuma County’s correctional facilities. The bonds are non-callable with interest payable semiannually and maturing July 2015. On September 2011, the District refunded the remaining outstanding principal. New Debt Issue – The Yuma County Jail district board authorized the issuance of $8,000,000 non-callable bank qualified pledged revenue bonds with an interest of 2.00 - 5.00 percent for an advance and current refunding of $7,885,000 of outstanding 2007 Series bonds with an interest rate of 3.75 – 4.75 percent. The net proceeds of $8,845,567 paid the closing costs and underwriters’ fees of $159,000 and the remaining of $8,686,567 was deposited in an irrevocable trust with an escrow agent to provide for the principal and interest payments on the 2007 bond issuance. Accordingly, the trust account assets and the liability for the defeased bonds are not included in the County’s financial statements. The District completed the advance refunding to restructure the required debt service payments due within the following 5 years and to provide for the appropriate cash flow desired to continue with the district’s operations. The advance refunded resulted in an economic loss (difference between the present values of the old and new debt service payments) of $ 591,321. Details of the refunding transactions are as follows:
Amount of refunding bonds issued $ 8,000,000 Amount of bonds refunded $ 7,885,000 Increase in debt service payments $ 1,384,501
Economic (loss) $ (591,321)
Balance Balance Due withinGovernmental activities: July 1, 2011 Additions Reductions June 30, 2012 1 year
Bonds Payable:Revenue bonds $8,525,000 10,435,000$ $8,525,000 10,435,000$ 795,000$ Premiums - 845,567 - 845,567 - General obligation bonds 47,875,000 - 1,120,000 46,755,000 1,170,000 Special assessments bonds
with governmental commitment 75,240 - 31,840 43,400 6,840 Total bonds payable 56,475,240 11,280,567 9,676,840 58,078,967 1,971,840
Rural development loans 3,924,887 - 308,772 3,616,115 160,458 Capital leases payable 41,275 - 41,275 - - Compensated absences payable 5,612,819 3,028,825 2,986,708 5,654,936 3,009,119 Claims and judgements payable 1,386,518 472,592 1,036,518 822,592 822,592
Governmental activities long-term liabilities 67,440,739$ 14,781,984$ 14,050,113$ 68,172,610$ 5,964,009$
60

Yuma County Notes to Financial Statements June 30, 2012
Note 10 - Bonds Payable (Continued)
On March 01, 2012 the Yuma County Board of supervisors issued $2,435,000 in Revenue Bonds with an interest rate of 1.22 – 3.86 percent to fund the construction of an East County facility. The Revenue Bonds are generally callable at any time before maturity, without any penalties. Interest for the pledged revenue bonds is payable semiannually on July 1 and January 1 commencing July 1, 2012; principal payments are due yearly on July 1, with first principal payment due July 1, 2012.
Revenue bonds outstanding at June 30, 2012 were as follows:
Outstanding Outstanding Original Interest Maturity Principal Issues / Principal
Description Amount Rates Ranges July 1, 2011 (Retirements) June 30, 2012
Series- 2007 Defeased $10,000,000 3.75 -4.75%
7/08-7/15
$8,525,000
$(8,525,000) -
Series- 2011 Refunding 8,000,000 2.00 – 5.00%
7/12-7/21 - 8,000,000 $ 8,000,000
Series- 2012 2,435,000 1.22 – 3.86%
7/12-7/21 - 2,435,000 2,435,000
Total $ 8,525,000 $ 1,910,000 $ 10,435,000
Principal and interest requirements at June 30, 2012, were as follows:
General Obligation Bonds — During the year ended June 30, 2006, the County issued $10,050,000 general obligation bonds with an interest rate of 4.37–4.5 percent to fund various Library branches and remodels. Interest on the obligation is payable semiannually. During the year ended June 30, 2008, the County issued the remaining $43,715,000 authorized bonds. The bonds are payable from a voter-approved property tax, not to exceed $.3400 per $100,000 assessed valuation.
Outstanding Outstanding Original Interest Maturity Principal Issues / Principal
Description Amount Rates Ranges July 1, 2011 (Retirements) June 30,2012 Library General Obligation Bonds, 2006
$10,050,000
4.37-4.5%
7/07-7/35 $ 7,950,000 $ (100,000) $ 7,850,000
Library General Obligation Bonds, 2007 $43,715,000
4.0-5.0%
7/08-6/35
39,925,000 (1,020,000) 38,905,000
Total $47,875,000 $ (1,120,000) $ 46,755,000
Fiscal Annual Debt Fiscal Annual DebtYear Principal Interest Service Year Principal Interest Service2013 550,000$ 337,225$ 887,225$ 2013 245,000$ 48,598$ 293,598$ 2014 705,000 321,150 1,026,150 2014 220,000 61,110 281,110 2015 725,000 296,075 1,021,075 2015 225,000 57,257 282,257 2016 755,000 266,475 1,021,475 2016 230,000 52,313 282,313 2017 780,000 235,775 1,015,775 2017 235,000 46,358 281,358
2018-22 4,485,000 580,088 5,065,088 2018-22 1,280,000 117,499 1,397,499 Totals 8,000,000$ 2,036,788$ 10,036,788$ Totals 2,435,000$ 383,135$ 2,818,135$
June 30, 2012Refunding Revenue Bonds- Series 2011
Yuma County Jail DistrictDEBT SERVICE REQUIREMENTS TO MATURITY DEBT SERVICE REQUIREMENTS TO MATURITY
Yuma CountyRevenue Bonds- Series 2012
June 30, 2012
61

Yuma County Notes to Financial Statements June 30, 2012
Note 10 - Bonds Payable (Concluded)
Debt service requirements for the General Obligation bonds outstanding at June 30, 2012 were as follows:
Special Assessment Bonds with Governmental Commitment—Special assessment bonds are secured by pledges of revenues from special assessments levied against the benefiting property owners. The proceeds of the bond issues were used to finance construction in these districts. These bonds are generally callable with interest payable semiannually. The El Prado District’s board opted to retire an additional $25,000 in current fiscal year. Funds were from advance payments collected.
The following special assessment districts had bonds outstanding at June 30, 2012: Outstanding Outstanding
Original Interest Maturity Principal Issues / Principal Description Amount Rates Ranges July 1, 2011 (Retirements) June 30, 2012
El Prado Estates Improvement District USDA Bond $ 136,730 4.375%
1/03-1/19 $ 75,240 $ (31,840) $ 43,400
Total $ 75,240 $ (31,840) $ 43,400
The following schedule details debt service requirements to maturity for the County’s special assessment bonds with governmental commitment payable at June 30, 2012:
Fiscal Annual Debt Fiscal Annual DebtYear Principal Interest Service Year Principal Interest Service2013 225,000$ 344,750$ 569,750$ 2013 945,000$ 1,814,275$ 2,759,275$ 2014 225,000 333,500 558,500 2014 1,005,000 1,776,475 2,781,475 2015 200,000 322,250 522,250 2015 1,085,000 1,736,275 2,821,275 2016 225,000 312,250 537,250 2016 1,125,000 1,692,875 2,817,875 2017 225,000 301,000 526,000 2017 1,190,000 1,647,875 2,837,875
2018-22 1,750,000 1,308,750 3,058,750 2018-22 6,365,000 7,401,125 13,766,125 2023-27 1,750,000 949,563 2,699,563 2023-27 8,425,000 5,675,050 14,100,050 2028-32 1,750,000 571,126 2,321,126 2028-32 11,050,000 3,390,875 14,440,875 2033-36 1,500,000 155,250 1,655,250 2033-35 7,715,000 686,925 8,401,925
Totals 7,850,000$ 4,598,439$ 12,448,439$ Totals 38,905,000$ 25,821,750$ 64,726,750$
DEBT SERVICE REQUIREMENTS TO MATURITY DEBT SERVICE REQUIREMENTS TO MATURITY Yuma County Free Library District Yuma County Free Library District
General Obligations Bonds- Series 2006 General Obligations Bonds- Series 2007June 30, 2012 June 30, 2012
Fiscal Annual DebtYear Principal Interest Service2013 6,840$ 1,899$ 8,739$ 2014 6,840 1,600 8,440 2015 6,840 1,300 8,140 2016 6,840 1,001 7,841 2017 6,840 702 7,542
2018-19 9,200 506 9,706 Totals 43,400$ 7,007$ 50,407$
DEBT SERVICE REQUIREMENTS TO MATURITY El Prado Estates Improvement District No. 97-10
Special Assessments Bonds June 30, 2012
62

Yuma County Notes to Financial Statements June 30, 2012
Note 11 - Rural Development Loans
During the year ended June 30, 2001, the County entered into a loan agreement with the United States Department of Agriculture through its Water Infrastructure Financing Authority (WIFA) for water system improvements. The WIFA loan authorized amounts of $261,555 and the money is borrowed as construction payments are made. At June 30, 2005, the final draw was made for the WIFA loan.
During the fiscal year ended June 30, 2005, the County acquired another loan to fund the completion of a sewer project taking place in the town of Gadsden. The loan is with the United States Department of Agriculture through its Rural Utility Services office and has a principal amount of $479,610. Payments are due semiannually on January 1 and July 1, commencing July 1, 2005.
On May 20, 2010 the Yuma County Board of Supervisor approved two loans to assist with the construction and completion of the B & C Colonial sewer project. The funds are borrowed as construction payments are made. The first loan was acquired from the Water Infrastructure Financing Authority (WIFA) in the amount of $1,437,915. Interest payments for this WIFA loan are due semiannually on January 1 and July 1 commencing January 1, 2011; principal payments are due yearly on July 1, with the first principal payment due July 1, 2012.
The Second loan was with the United States Department of Agriculture (USDA) through its Rural Utility Services office. The USDA loan has a principal amount of $ 2,000,000. Interest payments are also due semiannually on January 1 and July 1, commencing July 1, 2011 and the first principal payment is due January 1, 2012 and annually thereafter.
The following Rural Development Loans were outstanding at June 30, 2012: Outstanding Outstanding Original Interest Maturity Principal Issues / Principal
Description Amount Rates Ranges July 1, 2011 (Retirements) June 30, 2012 El Prado Estates Improvement District WIFA Loan $ 261,555 3.900%
1/03-1/17 $ 127,267 $ (62,515) $ 64,752
Gadsden Estates Improvement District USDA Loan 479,610 4.500%
1/06-1/24
359,705
(119,985) 239,720
B & C Colonia Improvement District WIFA Loan 1,437,915 2.775%
7/11- 7/35 1,437,915 (42,972) 1,394,943
B & C Colonia Improvement District USDA-RD Loan 2,000,000 2.500%
7/11-1/35 2,000,000 (83,300) 1,916,700
Total $ 3,924,887 $308,772 $3,616,115
During the current fiscal year, additional principal payments were made to El Prado WIFA Loan and the Gadsden USDA loan. Additional funds were mainly from advance collections from new tenants. Additional payments in the amounts of $50,000 and $100,000 for the El Prado WIFA loan and the Gadsden USDA Loan were issued.
The amortization schedules for Rural Development Loans debt service requirements to maturity are as follows:
Fiscal Annual Debt Fiscal Annual DebtYear Principal Interest Service Year Principal Interest Service2013 13,008$ 2,525$ 15,533$ 2013 19,984$ 10,787$ 30,771$ 2014 13,520 2,018 15,538 2014 19,984 9,888 29,872 2015 14,053 1,491 15,544 2015 19,984 8,989 28,973 2016 14,606 943 15,549 2016 19,984 8,090 28,074 2017 9,566 373 9,939 2017 19,984 7,190 27,174 Totals 64,752$ 7,350$ 72,102$ 2018-22 99,920 22,463 122,383
2023-24 39,880 2,690 42,570 Totals 239,720$ 70,097$ 309,817$
DEBT SERVICE REQUIREMENTS TO MATURITY DEBT SERVICE REQUIREMENTS TO MATURITY El Prado, Sewer Improvement Project Gadsden Sewer Connection Project
No. 97-10 (WIFA) No 96-07 (USDA)June 30, 2012 June 30, 2012
63

Yuma County Notes to Financial Statements June 30, 2012
Note 11 - Rural Development Loans (Concluded)
Note 12 - Pledged Revenues
Pledged Revenues— The County has pledged certain future revenues to repay specific bonded and loan debt as follows:
Amount Type Pledged revenue Purpose Remaining Term
Revenue bonds Sales tax and maintenance of effort Construction $12,854,923 7-21
General Obligation bonds
Library district property tax Construction 77,175,189 7-35
Special Assessment bonds Property owner assessments Construction 50,407 1-19
Water Infrastructure Financing Authority Rural loans
Property owner assessments
Water system improvements and sewer construction 1,977,272 7-35
United States Department of Agriculture Rural utility loan
Property owner assessments
Sewer construction 2,777,788 1-35
The following chart shows the net revenues available and the relationship between the debt service payments and the pledged revenue for fiscal year 2012:
Revenue
Net Revenue Available
Principal and Interest
Paid
Percentage of available net
pledged revenue
Total Revenue Available
Percentage Pledged of
Total
Jail district sales tax and maintenance of effort $ 1,122,747 $ 822,276 73.24%
$17,559,855 6.39%
Library district property tax 7,207,503 3,324,826 46.13% 10,439,257 69.04%Property owner assessments 1,008,653 471,118 46.71% 1,008,653 100.00%East County Facility 833,942 262,185 31.44% 23,161,816 3.60%
Fiscal Annual Debt Fiscal Annual DebtYear Principal Interest Service Year Principal Interest Service2013 44,166$ 38,667$ 82,833$ 2013 83,300$ 46,876$ 130,176$ 2014 45,390 37,443 82,833 2014 83,300 44,794 128,094 2015 46,648 36,185 82,833 2015 83,300 42,711 126,011 2016 47,941 34,892 82,833 2016 83,300 40,629 123,929 2017 49,270 33,563 82,833 2017 83,300 38,546 121,846
2018-22 267,611 146,554 414,165 2018-22 416,500 161,494 577,994 2023-27 306,815 107,351 414,166 2023-27 416,500 109,431 525,931 2028-32 351,764 62,402 414,166 2028-32 416,500 57,369 473,869 2033-36 235,338 13,171 248,509 2033-35 250,700 9,421 260,121
Totals 1,394,943$ 510,228$ 1,905,171$ Totals 1,916,700$ 551,271$ 2,467,971$
No. 07-09 (WIFA) No. 07-09 (USDA-RD)June 30, 2012 June 30, 2012
DEBT SERVICE REQUIREMENTS TO MATURITY DEBT SERVICE REQUIREMENTS TO MATURITY B & C Colonia Sewer Improvement Project B & C Colonia Sewer Improvement Project
64

Yuma County Notes to Financial Statements June 30, 2012
Note 12 - Pledged Revenues (Concluded)
Net available revenues are funds transferred from operation funds to meet yearly obligations; included are investment income earned in the debt service fund; and reserves held at the trustee for the purpose of satisfying the yearly debt requirements. Property owners have the option of repaying the assessment on their property in installments or they may pay in full. For those property owners who pay in full, that revenue is retained in the fund to satisfy the future debt payments. Therefore, the collection of assessment revenue in any given year may be less than the debt payment obligation for that year. For further information on long-term debt, refer to Note 9. For additional information on pledged revenues refer to Table C-8 (pages 260-261).
Note 13 – Obligations Under Leases Capital Leases—The County has acquired machinery and equipment under the provisions of various long-term lease agreements classified as capital leases for accounting purposes because they provide for a bargain purchase option or a transfer of ownership by the end of the lease term. The final payment to satisfy the capital lease was submitted on February 2012. The assets acquired through capital leases are as follows:
Governmental
Activities
Machinery and equipment $ 417,228 Less: accumulated depreciation 111,691 Carrying value $ 305,537
Note 14 - Compensated Absences and Claims and Judgments Payable
Compensated absences are to be paid from various funds in the same proportion that those funds pay payroll costs. Claims and judgments are generally paid from the fund that accounts for the activity that gave rise to the claim. The County’s projected liability for compensated absences at June 30, 2012 is $5,654,936, of which 48% is assignable to the General Fund, 27% to other major funds, and 25% to other nonmajor funds. The County is a defendant in various legal proceedings incidental to the County’s normal operations. In the opinion of the County Attorney, Risk Director, and County management, reasonable possible and probable losses not covered by insurance from these proceedings total $822,592 at June 30, 2012. This total amount is probable to be incurred within one year and is all assignable to the General Fund
Note 15 - Risk Management
The County is exposed to various risks of loss related to torts; theft of, damage to, and destruction of assets; errors and omissions; injuries to employees; and natural disasters. These risks of loss are accounted for and financed by the following described insurance coverage and internal risk management program. For the below mentioned liabilities, settled claims have not exceeded insurance coverage for any of the past three fiscal years. Workers’ Compensation – Effective January 1, 2008, the County became self-insured for its workers’ compensation insurance program. Initial contributions to the Workers’ Compensation fund were based upon loss history, previous premium amounts paid to the County’s prior insurer, State Compensation Fund Arizona (“SCF Arizona”), and requirements of the Industrial Commission of Arizona. Future contributions to the fund, as well as overall funding levels, will be based upon actuarial analysis. Adjustment and payment of all claims arising from losses prior to January 1, 2008 remain the sole responsibility of SCF Arizona and all claims arising from losses after January 1, 2008 are the sole responsibility of the County.
65

Yuma County Notes to Financial Statements June 30, 2012
Note 15 - Risk Management (concluded)
Excess Workers’ Compensation – In order to limit the County’s exposure to loss in its workers’ compensation self-insurance program, the County purchases excess insurance coverage through a commercial insurer. The insurance currently in place limits the loss exposure of the County to $600,000 per injury. Property Insurance – To insure its real and personal property against loss, the County purchases insurance through a commercial insurer. Premiums are based, in part, upon the appraised value of the County’s properties. Losses are covered by the insurer after the exhaustion of various deductibles. General Liability – The County maintains an insured retention of $400,000 for its general liability exposures. Losses that exceed this amount are covered by a primary commercial insurance policy to a limit of $10,000,000 per occurrence/aggregate. All losses that exceed this limit are covered by an excess commercial insurance policy to a limit of $10,000,000 per occurrence/aggregate. Employment Practices Liability – The County maintains an insured retention of $500,000 for its employment practices liability exposures. Losses that exceed this amount are covered by a primary commercial insurance policy to a limit of $10,000,000 per occurrence/aggregate. All losses that exceed this limit are covered by an excess commercial insurance policy to a limit of $10,000,000 per occurrence/aggregate. Crime – The County’s employee crime and faithful performance exposures are covered by a commercial crime insurance policy to a limit of $1,000,000 per claim for employee dishonesty/faithful performance/funds transfer fraud (with a $10,000 deductible) and $50,000 per claim for money orders and counterfeit currency (with no deductible).
Fiduciary Liability – The fiduciary liability exposure of the Yuma County Employee Benefit Trust is covered by a commercial insurance policy with a limit of $2,000,000 per claim.
Underground Storage Tank Liability – The County’s underground storage tank liability (tanks operated and maintained by the Yuma County Sheriff) is covered by a commercial insurance policy to a limit of $1,000,000 per occurrence/aggregate after the application of a $5,000 deductible.
Pollution Legal Liability – The Yuma County Housing Department operates a water treatment and water production plant that provides water service for the County’s Valle Vista Apartments at 8450 Highway 95, Somerton, Arizona. To cover the risk of any pollution caused by the plant, an insurance policy was purchased. Limits on the insurance are $5,000,000 per loss/aggregate with a $25,000 deductible.
Tourist Auto Liability – The County purchases a tourist auto liability policy to cover County vehicles that are driven into Mexico. Policy limits are $100,000 for property damage/liability, $2,000 medical, and $100,000 legal assistance.
Effective January 1, 2000, the Employee Benefit Fund (an Internal Service Fund) accounts for the financing of the Yuma County Employee Benefit Trust (YCEBT) which is a self-funded benefit plan established to provide certain health benefits (comprehensive major medical) to eligible employees and their dependents. Under this program, the Trust provides coverage up to a lifetime maximum of $2,000,000 per individual. The uninsured risk of loss per individual is $125,000 per plan year (January 1 through December 31) not to exceed an annual aggregate of 120% of projected claims paid per plan year countywide.
The Fund purchases commercial insurance (reinsurance) for claims in excess of this coverage. Claims have not exceeded insurance coverage for any of the past three fiscal years.
The insurance claims payable liability of the Trust totaling $968,000 at June 30, 2012, is the estimated ultimate cost of settling claims that have been reported but not settled and claims that have been incurred but not reported. This estimate is based on actuarial estimates. Changes in the Trust’s claims payables for the years ended June 30, 2011 and 2012 were as follows: 2011 2012 Claims payable, beginning of fiscal year $ 1,116,000 $ 1,205,000 Current-fiscal year claims and changes in estimates 10,714,970 8,943,002 Claim payments (10,625,970) (9,180,002) Claims payable, end of fiscal year $ 1,205,000 $ 968,000
66

Yuma County Notes to Financial Statements June 30, 2012
Note 16 - Pensions and other Postemployment Benefits Plan Descriptions—The County contributes to the four plans described below. Benefits are established by state statute, and generally provide retirement, long-term disability, and health insurance premium benefits, including death and survivor benefits. The retirement benefits are generally paid at a percentage, based on years of service, of the retirees’ average compensation. Long-term disability benefits vary by circumstance, but generally pay a percentage of the employee’s monthly compensation. Health insurance premium benefits are generally paid as a fixed dollar amount per month towards the retiree’s healthcare insurance premiums, in amounts based on whether the benefit is for the retiree or for the retiree and his or her dependents. The Arizona State Retirement System (ASRS) administers a cost-sharing multiple-employer defined benefit pension plan; a cost-sharing multiple-employer defined benefit health insurance premium plan; and a cost-sharing, multiple-employer defined benefit long-term disability plan that covers employees of the State of Arizona and employees of participating political subdivisions and school districts. The ASRS is governed by the Arizona State Retirement System Board according to the provisions of A.R.S. Title 38, Chapter 5, Article 2. The Public Safety Personnel Retirement System (PSPRS) administers an agent multiple-employer defined benefit pension plan and an agent multiple-employer defined benefit health insurance premium plan that covers public safety personnel who are regularly assigned hazardous duty as employees of the State of Arizona and participating political subdivisions. The PSPRS, acting as a common investment and administrative agent, is governed by a seven-member board, known as The Board of Trustees, and the participating local boards according to the provisions of A.R.S. Title 38, Chapter 5, Article 4. The Corrections Officer Retirement Plan (CORP) administers an agent multiple-employer defined benefit pension plan and an agent multiple-employer defined benefit health insurance premium plan that covers state, county, and local correction officers; dispatchers; and probation, surveillance, and juvenile detention officers. The CORP is governed by The Board of Trustees, of PSPRS and the participating local boards according to the provisions of A.R.S. Title 38, Chapter 5, Article 6. The Elected Officials Retirement Plan (EORP) administers a cost-sharing, multiple-employer defined benefit pension plan and a cost-sharing, multiple-employer defined benefit health insurance premium plan that covers State of Arizona and county elected officials and judges, and elected officials of participating cities. The EORP is governed by The Board of Trustees, of PSPRS according to the provisions of A.R.S. Title 38, Chapter 5, Article 3. Because the health insurance premium plan benefit of the EORP is not established as a formal trust, the EORP is reported in accordance with GASB Statement No. 45 as an agent multiple-employer defined benefit plan. Accordingly, the disclosures that follow reflect the EORP as if it were an agent multiple-employer defined benefit plan.
Each plan issues a publicly available financial report that includes its financial statements and required supplementary information. A report may be obtained by writing or calling the applicable plan.
Funding Policy—The Arizona State Legislature establishes and may amend active plan members’ and the County’s contribution rates for the ASRS, PSPRS, CORP and EORP.
Cost-sharing plans—For the year ended June 30, 2012, active ASRS members were required by statute to contribute at the actuarially determined rate of 10.74 percent (10.5 percent retirement and 0.24 percent long-term disability) of the members’ annual covered payroll and the County was required by statute to contribute at the actuarially determined rate of 10.74 percent (9.87 percent for retirement, 0.63 percent for health insurance premium and 0.24 percent for long-term disability) of the members’ annual covered payroll.
ASRS PSPRS, CORP, and EORP
3300 N. Central Ave. P.O. Box 33910 Phoenix, AZ 85067-3910
3010 E. Camelback Road Suite 200 Phoenix, AZ 85016-4416
(602) 240-2000 or (800) 621-3778 (602) 255-5575
67

Yuma County Notes to Financial Statements June 30, 2012
Note 16 - Pensions and other Postemployment Benefits (Continued)
The County’s contributions for the current and 2 preceding years, all of which were equal to the required contributions, were as follows:
Year ended June 30
Retirement Fund
Health Benefit Supplement Fund
Long-term Disability Fund
2012 $ 3,645,177 $ 245,959 $ 100,300 2011 3,505,148 233,677 97,365 2010 3,230,983 255,696 154,970
Agent plans—For the year ended June 30, 2012, active PSPRS members were required by statute to contribute 8.65 percent of the members’ annual covered payroll, and the County was required to contribute 19.99 percent, the aggregate of which is the actuarially required amount. The health insurance premium portion of the contribution rate was actuarially set at 1.05 percent of covered payroll. Active CORP members were required by statute to contribute 8.41 percent of the members’ annual covered payroll, and the County was required to contribute 5.00 percent. The aggregate of members’ and the County’s contributions is the actuarially required amount. The health insurance premium portion of the contribution rate was actuarially set at 0.66 percent of covered payroll. Active Administrative Office of the Courts (AOC) CORP members (non-dispatcher members) were required by statute to contribute 8.41 percent of the members’ annual covered payroll, and the County was required to contribute 13.13 percent. The health insurance premium portion of the contribution rate was actuarially set at 1.43 percent of covered payroll. Active EORP members were required by statute to contribute 10.00 percent of the members’ annual covered payroll, and the County was required to remit a designated portion of certain court fees plus additional contributions at the actuarially determined rate of 17.96 percent of the members’ annual covered. The health insurance premium portion of the contribution rate for normal costs was actuarially set at 1.79 percent of covered payroll. Actuarial methods and assumptions—The contribution requirements for the year ended June 30, 2012, were established by the June 30, 2010, actuarial valuations, and those actuarial valuations were based on the following actuarial methods and assumptions: Actuarial valuations involve estimates of the value of reported amounts and assumptions about the probability of events in the future. Amounts determined regarding the funded status of the plans and the annual required contributions are subject to continual revision as actual results are compared to past expectations and new estimates are made. The required schedule of funding progress presented as required supplementary information provides multiyear trend information that shows whether the actuarial value of the plans’ assets are increasing or decreasing over time relative to the actuarial accrued liability for benefits. Projections of benefits are based on (1) the plans as understood by the County and plans’ members, and include the types of benefits in force at the valuation date, and (2) the pattern of sharing benefit costs between the County and plans’ members to that point. Actuarial calculations reflect a long-term perspective and employ methods and assumptions that are designed to reduce short-term volatility in actuarial accrued liabilities and the actuarial value of assets.
68

Yuma County Notes to Financial Statements June 30, 2012
Note 16 - Pensions and other Postemployment Benefits (Continued)
The significant actuarial methods and assumptions used are the same for all plans and related benefits (unless noted), and the actuarial methods and assumptions used to establish the fiscal year 2012 contribution requirements, are as follows:
Actuarial valuation date : June 30, 2010
Actuarial cost method: Projected unit credit
Amortization method: Level percent closed for unfunded actuarial accrued liability, open for excess.
Remaining amortization period: 26 years for unfunded actuarial accrued liability, 20 years for excess.
Asset valuation method: 7-year smoothed market value.
Actuarial assumptions:
Investment rate of return 8.50%
Projected salary increases 5.50% - 8.50% for CORP and PSPRS; 5.00% for EORP
Includes inflation at 5.50% for PSPRS and CORP; 5.00% for EORP
Annual Pension/OPEB Cost— The Yuma County pension/OPEB cost for the agent plans for the year ended June 30, 2012, and related information follows:
PSPRS CORP CORP-AOC EORP Contribution rates: County 19.99% 5.00% 13.13% 17.96% Plan members 8.65% 8.41% 8.41% 10.00%Required contributions: Annual pension $ 926,217 $ 236,330 $ 720,457 $ 321,797 Health insurance premium 51,348 35,943 88,058 35,622
Contributions made: Pension $ 926,217 $ 236,330 $ 720,457 $ 321,797 Health insurance premium 51,348 35,943 88,058 35,622
Trend Information—Annual pension and OPEB cost information for the current and two preceding years follows for each of the agent plans.
Plan
Year Ended
June 30
Annual Pension/ OPEB
Cost
Percentage of Annual
Cost Contributed
Net Pension/OPEB
Obligation
PSPRS
Pension 2012 $ 926,217 100% -
Health insurance 2012 51,348 100% -
Pension 2011 965,424 100% $ 23
Health insurance 2011 58,000 100% (23)
Pension 2010 948,056 104% 39,393
Health insurance 2010 56,003 30% (39,393)
69

Yuma County Notes to Financial Statements June 30, 2012
Note 16 - Pensions and other Postemployment Benefits (Continued)
Plan
Year Ended
June 30
Annual Pension/ OPEB
Cost
Percentage of Annual
Cost Contributed
Net Pension/OPEB
Obligation
CORP
Pension 2012 $ 236,330 100% -
Health insurance 2012 35,943 100% -
Pension 2011 231,715 102% $ 5,278
Health insurance 2011 43,219 88% (5,278)
Pension 2010 300,060 112% 34,601
Health insurance 2010 35,168 2% (34,601)
CORP-AOC
Pension 2012 $ 720,457 100% -
Health insurance 2012 88,058 110% -
Pension 2011 628,711 102% $ 9,905
Health insurance 2011 81,104 88% (9,905)
Pension 2010 353,702 104% 14,500
Health insurance 2010 14,738 2% (14,500)
EORP
Pension 2012 $ 321,797 100% -
Health insurance 2012 35,622 100% -
Pension 2011 297,285 148 % $ 49,892
Health insurance 2011 33,623 83 % (49,892)
Pension 2010 225,642 110% 21,860
Health insurance 2010 34,503 37% (21,860) Funded Status—The funded status of the plans as of the most recent valuation date, June 30, 2011, along with actuarial assumptions and methods used in those valuations follow. The EORP, by statute, is a cost-sharing plan. However, because of its statutory construction, in accordance with GASB Statement No. 43, paragraphs 5 and 41, the EORP is reported for such purposes as an agent multiple-employer plan. The Board of Trustees obtains an actuarial valuation for the EORP on its statutory basis as a cost-sharing plan, and therefore, actuarial information for the County, as a participating government, is not available.
70

Yuma County Notes to Financial Statements June 30, 2012
Note 16- Pensions and other Postemployment Benefits (Concluded)
The funded status information for CORP-AOC is only reported for the plan as a whole and, therefore, actuarial information for the County, as a participating government, is not available and not presented.
The actuarial methods and assumptions used are the same for all plans and related benefits, and for the most recent valuation date, are as follows:
Actuarial valuation date June 30, 2011
Actuarial cost method Entry age normal
Amortization method Level percent closed for unfunded actuarial accrued liability, open for excess
Remaining amortization period 25 years for unfunded actuarial accrued liability, 20 years for excess
Asset valuation method 7-Year smoothed market value
Actuarial assumptions:
Investment rate of return 8.25%
Projected salary increases 5.00% - 8.00% for PSPRS and CORP; 4.50% for EORP
Inflation rate 5.00% for PSPRS and CORP; 4.50% for EORP
Note 17 - Interfund Balances and Activity Interfund transfers – Interfund transfers for the year ended June 30, 2012, were as follows:
Capital Jail District Library Distirct Health Internal Nonmajor General Improvements General General Services Service Governmental
Transfer To: Fund Fund Operations Operations District Funds Funds Totals General Fund - - 384,000$ - - - 29,870$ 413,870$
Capital Improvements Fund 268,000$ - - - - 368,000$ 952,000 1,588,000
Jail District, Operations 6,215,366 - - - - - - 6,215,366
Health Services District 786,898 - - - - - - 786,898
Internal Service Funds 1,865 - - - - 7,017 29 8,911
Nonmajor Governmental Funds 365,623 829,000$ 1,023,925 3,324,825$ 321,140$ 811 4,111,742 9,977,066
Totals 7,637,752$ 829,000$ 1,407,925$ 3,324,825$ 321,140$ 375,828$ 5,093,641$ 18,990,111$
Transfers From:
PSPRS CORP
Pension Health
Insurance
Pension Health
Insurance Actuarial accrued liability (a) $ 22,972,839 $ 597,529 $ 12,475,019 $ 411,608 Actuarial value of assets (b) 14,927,778 - 11,465,215 - Unfunded actuarial accrued liability (funding excess) (a) – (b) 8,045,061 597,529
1,009,804 411,608
Funded ratio (b)/(a) 65.00% 0.00% 91.90% 0.00% Annual covered payroll (c) $ 4,999,438 $ 4,999,438 $ 5,450,325 $ 5,450,325 Unfunded actuarial accrued liability (funding excess) as a percentage of covered payroll (a) - (b) / (c) 160.90% 11.95%
18.50% 7.55%
71

Yuma County Notes to Financial Statements June 30, 2012
Note 17 - Interfund Balances and Activity (Concluded)
The majority of the larger transfers listed above resulted from the funding of capital projects ($1,588,000), required debt service payments and reserves ($8,057,320), and from the statutory subsidies to the Jail and Health districts’ operations from the General Fund ($6,215,366 and $786,898 respectively). Also, this year, County administration requested additional funds from the Workers Compensation Internal Service Fund to assist funding needed capital projects ($368,000); this was a onetime transaction. Jail District transferred $384,000 to the General Fund as part of a previously agreed transaction resulting from previous years’ General Fund’s support to the Jail District. All transfers are consistent with the funds’ purposes, the County’s policy, and as permitted by State law. Interfund receivables and payables – Interfund balances at June 30, 2012, were as follows:
The outstanding balances between funds mainly result from the time lag between the dates that (1) interfund goods and services are provided or reimbursable expenditures occur, (2) transactions are recorded in the accounting system, and (3) payments between funds are made. These balances are all consistent with the various funds’ purpose and the County’s policy. All interfund balances are expected to be repaid within one year.
Jail District Library District Flood Health Development Imp District Internal Nonmajor General General General Control Services Services B & C Service Governmental
Payables To: Fund Operations Operations District District HURF Debt Service Funds Funds Totals General Fund - 220,151$ - 254,631$ 585,244$ 419,587$ - - 546,924$ 2,026,537$
Capital Improvements 152$ - - - - - - - 710,850 711,002
Health Services District - - - - - - - - 784,951 784,951
Internal Service Funds 19,668 13 995$ - - - - 1,930$ 182,850 205,456
Nonmajor Governmental Funds 109,720 - 67,008 - - - 38,755$ 4,669 191,621 411,773
Totals 129,540$ 220,164$ 68,003$ 254,631$ 585,244$ 419,587$ 38,755$ 6,599$ 2,417,196$ 4,139,719$
Payables From:
72

Required Supplementary Information
73

{This page is intentionally left blank}
74

Budgetary Comparison Schedules
75

YUMA COUNTY Exhibit E- 1Required Supplementary InformationBudgetary Comparison Schedule - General FundYear Ended June 30, 2012
Actual Variance with
Original Final Amounts Final Budget *
Revenues:Taxes 38,852,460$ 38,852,460$ 40,246,924$ 1,394,464$ Licenses and permits 521,544 521,544 543,592 22,048 Intergovernmental 20,644,707 20,644,707 21,495,464 850,757 Charges for services 4,573,430 4,573,430 4,473,558 (99,872) Fines and forfeits 1,818,000 1,818,000 1,658,743 (159,257) Investment income 200,000 200,000 105,192 (94,808) Rents 17,675 17,675 17,675 - Miscellaneours 307,929 307,929 374,865 66,936
Total Revenue 66,935,745 66,935,745 68,916,013 1,980,268
Expenditures:Current:
General government:County Administrator 2,495,795 2,559,289 2,377,547 181,742 Board of Supervisors 479,462 479,462 469,506 9,956 Treasurer 717,624 717,624 694,972 22,652 Assessor 1,827,377 1,827,377 1,807,488 19,889 Recorder 611,250 611,250 551,975 59,275 Election Services 422,180 422,180 351,456 70,724 Attorney - Civil Division 804,985 802,985 705,182 97,803 Attorney - Criminal Division 2,764,735 2,790,364 2,747,149 43,215 Attorney - Administration Division 597,051 597,051 559,089 37,962 Clerk of Superior Court 1,918,293 1,918,293 1,898,145 20,148 Superior Court 2,801,260 2,857,446 2,827,582 29,864 Superior Court - Security 518,034 518,034 490,761 27,273 Superior Court - Collections 323,521 323,521 305,124 18,397 Court Trial Services 754,732 791,238 593,836 197,402 Superior Court - Information And Tech 400,893 405,993 390,866 15,127 Justice Court #1 1,132,558 1,132,558 1,067,465 65,093 Justice Court #2 296,162 296,162 289,550 6,612 Justice Court #3 316,535 316,535 297,778 18,757 Constable Precinct #1 271,025 271,025 253,841 17,184 Constable Precinct #2 78,421 79,921 79,419 502 Constable Precinct #3 7,218 7,218 1,341 5,877 Attorney - Victim Services 245,506 245,506 239,046 6,460 Public Defender 2,015,171 2,130,171 2,093,711 36,460 General Government 2,912,564 2,280,778 1,106,249 1,174,529 County Administrator - Channel 77 201,072 201,072 107,293 93,779 Juvenile Justice Center - Administration 1,569,063 1,569,063 1,500,284 68,779 Juvenile Justice Center - Detention 3,237,081 3,237,081 3,076,200 160,881 Financial Services 1,402,950 1,402,950 1,299,484 103,466 Legal Defender 1,221,670 1,231,670 1,157,397 74,273 Human Resources 740,794 820,794 762,263 58,531 General Services 2,099,934 2,099,934 1,967,160 132,774 Information Technology Services 2,973,112 2,973,112 2,560,712 412,400 Development Services 790,018 790,018 705,987 84,031 Geographical Information Systems 460,972 460,972 398,305 62,667 Planning and Zoning 1,157,179 1,157,179 958,239 198,940 DDS- Customer Service 695,013 695,013 579,894 115,119 Superior Court - Adult Probation - Pretr 358,728 359,958 359,958 -
General Fund
Budgeted Amounts
76

YUMA COUNTY Exhibit E- 1Required Supplementary Information (Concluded)Budgetary Comparison Schedule - General FundYear Ended June 30, 2012
Actual Variance with
Original Final Amounts Final Budget *
Public safety:Building Safety 622,281 622,281 553,338 68,943 Superior Court - Adult Probation 1,975,912 1,913,347 1,861,543 51,804 Adult Prob-Graffiti Abate 64,612 64,661 64,455 206 Sheriff - Administration 8,329,442 8,329,442 8,270,173 59,269 Sheriff - Medical Examiner 432,272 432,272 439,842 (7,570) Emergency Services 174,415 174,415 85,928 88,487
Sanitation:Public Works - Solid Waste Operations 666,863 666,863 560,891 105,972
Health:Environmental Programs 291,464 291,464 278,363 13,101 Medical Eligibility Prog - - 57 (57)
Welfare:Medical Eligibility Prog 10,939,121 11,106,224 10,922,887 183,337 Public Fiduciary 597,242 597,242 546,089 51,153
Culture and recreation:Public Works - Parks 6,627 6,627 5,855 772
Education:School Superintendent 361,923 361,923 362,028 (105)
Capital outlay 461,462 461,462 533,039 (71,577) Debt service:
Principal retirement 41,276 41,276 41,275 1 Interest and fiscal charges 1,824 1,824 1,824 -
Total Expenditures 66,586,674 66,452,120 62,159,841 4,292,279
Excess (deficiency) of revenues overexpenditures 349,071 483,625 6,756,172 6,272,547
Other financing sources (uses):Transfers in 384,000 384,000 413,870 29,870 Transfers out (7,975,018) (8,159,572) (7,637,752) 521,820
Total other financing sources (uses) (7,591,018) (7,775,572) (7,223,882) 551,690
Net change in fund balance (7,241,947) (7,291,947) (467,710) 6,824,237
Fund balances - beginning (July 1, 2011) 7,241,947 7,291,947 18,396,444 11,104,497
Fund balances - ending (June 30, 2012) -$ -$ 17,928,734$ 17,928,734$
* Variance = Positive or (Negative)
See accompanying notes to budgetary comparison schedules.
General Fund
Budgeted Amounts
77

YUMA COUNTY Exhibit E - 2Required Supplementary InformationBudgetary Comparison Schedule - Jail District - General Operations FundYear Ended June 30, 2012
02300
Actual Variance with
Original Final Amounts Final Budget *
Revenues:Taxes 10,845,462$ 10,845,462$ 11,344,489$ 499,027$ Intergovernmental 223,244 223,244 135,030 (88,214) Charges for services 495,500 495,500 463,708 (31,792) Investment income 21,865 21,865 3,802 (18,063) Miscellaneous 25,532 25,532 11,644 (13,888)
Total Revenue 11,611,603 11,611,603 11,958,673 347,070
Expenditures:Current:
Public SafetySheriff - Detention 17,394,181 17,394,181 16,536,724 857,457
Capital outlay 64,000 64,000 117,802 (53,802)
Total Expenditures 17,458,181 17,458,181 16,654,526 803,655
Excess (deficiency) of revenues over expenditures (5,846,578) (5,846,578) (4,695,853) 1,150,725
Other financing sources (uses):Transfers in 6,215,366 6,215,366 6,215,366 - Transfers out (1,881,925) (1,881,925) (1,407,925) 474,000
Total other financing sources (uses) 4,333,441 4,333,441 4,807,441 474,000
Net change in fund balance (1,513,137) (1,513,137) 111,588 1,624,725
Fund balances - beginning (July 1, 2011) 1,513,137 1,513,137 1,696,353 183,216
Fund balances - ending (June 30, 2012) -$ -$ 1,807,941$ 1,807,941$
* Variance = Positive or (Negative)
See accompanying notes to budgetary comparison schedules.
Jail District - General Operations Fund
Budgeted Amounts
78

YUMA COUNTY Exhibit E - 3Required Supplementary InformationBudgetary Comparison Schedule - Library District General Operations FundYear Ended June 30, 2012
02276
Actual Variance with
Original Final Amounts Final Budget *
Revenues:Taxes 10,225,013$ 10,225,013$ 10,439,203$ 214,190$ Intergovernmental 16,276 16,276 70,348 54,072 Charges for services 16,016 16,016 21,359 5,343 Fines and forfeits 46,723 46,723 74,005 27,282 Investment income 155,070 155,070 70,495 (84,575) Rents 4,880 4,880 1,561 (3,319) Miscellaneous 62,615 62,615 145,749 83,134
Total Revenue 10,526,593 10,526,593 10,822,720 296,127
Expenditures:Current:
Culture and recreation:Library 8,116,076 8,116,076 7,390,235 725,841
Capital outlay 30,000 30,000 47,814 (17,814)
Total Expenditures 8,146,076 8,146,076 7,438,049 708,027
Excess of revenues over expendituresExcess of revenues over expenditures 2,380,517 2,380,517 3,384,671 1,004,154
Other financing sources (uses):Transfers out (3,324,825) (3,324,825) (3,324,825) -
Total other financing sources (uses) (3,324,825) (3,324,825) (3,324,825) -
Net change in fund balance (944,308) (944,308) 59,846 1,004,154
Fund balances - beginning (July 1, 2011) 944,308 944,308 9,473,557 8,529,249
Fund balances - ending (June 30, 2012) -$ -$ 9,533,403$ 9,533,403$
* Variance = Positive or (Negative)
See accompanying notes to budgetary comparison schedules.
Library District - General Operations Fund
Budgeted Amounts
79

YUMA COUNTY Exhibit E - 4Required Supplementary InformationBudgetary Comparison Schedule - Flood Control District General Operations FundYear Ended June 30, 2012
02295
Actual Variance with
Original Final Amounts Final Budget *
Revenues:Taxes 3,118,174$ 3,118,174$ 3,202,688$ 84,514$ Licenses and permits - - 2,610 2,610 Charges for services 6,000 6,000 7,579 1,579 Fines and forfeits - - - - Investment income 46,863 46,863 121,556 74,693 Miscellaneous - - 334 334
Total Revenue 3,171,037 3,171,037 3,334,767 163,730
Expenditures:Current:
Highway and streets:Flood Control 3,063,585 3,063,585 937,204 2,126,381
Capital outlay 14,420,000 14,420,000 224,071 14,195,929
Total Expenditures 17,483,585 17,483,585 1,161,275 16,322,310
Excess (deficiency) of revenues overexpenditures (14,312,548) (14,312,548) 2,173,492 16,486,040
Net change in fund balance (14,312,548) (14,312,548) 2,173,492 16,486,040
Fund balances - beginning (July 1, 2011) 14,312,548 14,312,548 15,427,012 1,114,464
Fund balances - ending (June 30, 2012) -$ -$ 17,600,504$ 17,600,504$
* Variance = Positive or (Negative)
See accompanying notes to budgetary comparison schedules.
Budgeted Amounts
Flood Control District- General Operations Fund
80

YUMA COUNTY Exhibit E - 5Required Supplementary InformationBudgetary Comparison Schedule - Health Services District General Opertions FundYear Ended June 30, 2012
02360
Actual Variance with
Original Final Amounts Final Budget *
Revenues:Taxes 2,169,093$ 2,169,093$ 2,258,309$ 89,216$ Licenses and permits 398,000 398,000 355,830 (42,170) Charges for services 576,961 630,961 378,074 (252,887) Fines and forfeits - - 30 30 Investment income 6,500 6,500 1,734 (4,766) Miscellaneous 18,200 18,200 70,704 52,504
Total Revenue 3,168,754 3,222,754 3,064,681 (158,073)
Expenditures:Current:
Health:Health 1,690,470 1,690,470 1,616,112 74,358 Child Health 403,350 403,350 221,756 181,594 Communicable Disease 471,711 471,711 389,813 81,898 Environmental Health 476,831 476,831 471,804 5,027 Vector Control 140,665 140,665 142,179 (1,514) Vital Records 185,595 239,595 194,447 45,148 Nursing 998,596 998,596 736,443 262,153 Injury Prevention 65,739 65,739 63,818 1,921
Total Expenditures 4,432,957 4,486,957 3,836,372 650,585
Excess (deficiency) of revenues overexpenditures (1,264,203) (1,264,203) (771,691) 492,512
Other financing sources (uses):Transfers in 786,898 786,898 786,898 - Transfers out (321,140) (321,140) (321,140) -
Total other financing sources (uses) 465,758 465,758 465,758 -
Net change in fund balance (798,445) (798,445) (305,933) 492,512
Fund balances - beginning (July 1, 2011) 798,445 798,445 784,951 (13,494)
Fund balances - ending (June 30, 2012) -$ -$ 479,018$ 479,018$
* Variance = Positive or (Negative)
See accompanying notes to budgetary comparison schedules.
Budgeted Amounts
Health Services District- General Operations Fund
81

YUMA COUNTY Exhibit E - 6Required Supplementary InformationBudgetary Comparison Schedule - Development Services HURF FundYear Ended June 30, 2012
02252
Actual Variance with
Original Final Amounts Final Budget *
Revenues:Taxes 1,100,000$ 1,100,000$ 912,500$ (187,500)$ Licenses and permits 25,000 25,000 34,192 9,192 Intergovernmental 4,630,006 4,630,006 4,400,660 (229,346) Charges for services 12,000 12,000 - (12,000) Investment income 150,000 150,000 119,142 (30,858) Miscellaneous - - 1,633 1,633
Total Revenue 5,917,006 5,917,006 5,468,127 (448,879)
Expenditures:Current:
Highway and Streets:Development Services 2,978,262 2,978,262 1,888,145 1,090,117
Capital outlay 16,894,622 16,894,622 3,689,254 13,205,368
Total Expenditures 19,872,884 19,872,884 5,577,399 14,295,485
Excess (deficiency) of revenues overexpenditures (13,955,878) (13,955,878) (109,272) 13,846,606
Net change in fund balance (13,955,878) (13,955,878) (109,272) 13,846,606
Fund balances - beginning (July 1, 2011) 13,955,878 13,955,878 15,990,959 2,035,081
Fund balances - ending (June 30, 2012) -$ -$ 15,881,687$ 15,881,687$
* Variance = Positive or (Negative)
See accompanying notes to budgetary comparison schedules.
Development Services HURF Fund
Budgeted Amounts
82

Notes to Budgetary Comparison Schedules
83

Yuma County Required Supplementary Information Notes to Budgetary Comparison Schedules June 30, 2012
Note 1 - Budgeting and Budgetary Control
Arizona Revised Statutes (A.R.S.) requires the County to prepare and adopt a balanced budget annually for each governmental fund. The Board of Supervisors must approve such operating budgets on or before the third Monday in July to allow sufficient time for the legal announcements and hearings required for the adoption of the property tax levy on the third Monday in August. A.R.S. prohibit expenditures or liabilities in excess of the amounts budgeted.
Expenditures may not legally exceed appropriations at the department level. In certain instances, transfers of appropriations between departments or from the contingency account to a department may be made upon the Board of Supervisors’ approval. With the exception of the General Fund and Health Services District General Operations fund, each fund includes only one department.
Note 2 - Budgetary Basis of Accounting The County’s budget is prepared on a basis consistent with generally accepted accounting principles.
84

Schedule of Agent Retirement Plans’
Funding Progress
85

YUMA COUNTY Exhibit F- 1Required Supplementary InformationSchedule of Agent Retirement Plans' Funding Progress
Actuarial Actuarial Funding Annual Unfunded Liability
Actuarial Value of Accrued (Liability) Funded Covered as Percentage of
Valuation Plan Assets Liability Excess Ratio Payroll Covered Payroll
Date (a) (b) (a-b) (a/b) ( c ) ([a-b] / c)
6/30/2011
Pension 14,927,778$ 22,972,839$ (8,045,061)$ 65.00% 4,999,438$ -160.94%
Health Insurance - 597,529 (597,529) 0.00% 4,999,438 -11.95%
6/30/2010
Pension 13,867,657 21,560,771 (7,693,114) 64.32% 5,302,661 145.08%
Health Insurance - 485,986 (485,986) 0.00% 5,302,661 9.16%
6/30/2009
Pension 12,863,210 19,729,227 (6,866,017) 65.20% 4,531,312 151.53%
Health Insurance - 460,920 (460,920) 0.00% 4,531,312 10.17%
Actuarial Actuarial Funding Annual Unfunded Liability
Actuarial Value of Accrued (Liability) Funded Covered as Percentage of
Valuation Plan Assets Liability Excess Ratio Payroll Covered Payroll
Date (a) (b) (a-b) (a/b) ( c ) ([a-b] / c)
6/30/2011
Pension 11,465,215$ 12,475,019$ (1,009,804)$ 91.90% 5,450,325$ -18.56%
Health Insurance - 411,608 (411,608) 0.00% 5,450,325 -7.55%
6/30/2010
Pension 11,068,507 10,663,857 404,650 103.79% 5,702,635 0.00%
Health Insurance - 220,916 (220,916) 0.00% 5,702,635 3.87%
6/30/2009
Pension 10,554,739 9,417,154 1,137,585 112.08% 5,627,614 0.00%
Health Insurance - 240,990 (240,990) 0.00% 5,627,614 4.28%
See accompanying notes to schedule of agent retirement plans' funding progress
June 30, 2012
Public Safety Personnel Retirement System (PSPRS)
Corrections Officer Retirement Plan (CORP)
86

Notes to Schedule of Agent Retirement Plans’
Funding Progress
87

Yuma County Required Supplementary Information Notes to Schedule of Agent Retirement Plans’ Funding Progress June 30, 2012
Note 1 – Actuarial Information Available
The EORP, by statute, is a cost-sharing plan. However, because of its statutory construction, in accordance with GASB Statement No. 43, paragraphs 5 and 41, the EORP is reported for such purposes as an agent multiple-employer plan. The Board of Trustees obtains an actuarial valuation for the EORP on its statutory basis as a cost-sharing plan and, therefore, actuarial information for the County, as a participating government, is not available. The funding progress information for CORP-AOC is only reported for the plan as a whole and, therefore, actuarial information for the County, as a participating government, is not available. As provided by the PSPRS and CORP plans, actuarial reports are provided individualized to Yuma County. The actuarial reports describe the methodology and assumptions made to satisfy the funding objectives.
88

Infrastructure Assets
89

Yuma County Required Supplementary Information Infrastructure Assets June 30, 2012
Modified Approach for County’s Paved Roads In accordance with GASB Statement No. 34, Yuma County is required to account for and report infrastructure capital assets. The County defines infrastructure as long-lived capital assets that normally are stationary in nature and can be preserved for a significant greater number of years than most capital assets. Yuma County’s major infrastructure network systems include the roads system, bridges and large culverts systems, storm drains and sewer systems, and traffic signals systems. Each major infrastructure network system can be divided into subsystems. For example, the roads system can be divided into county highway, subdivision, and public access asphalt pavements roads; and gravel roads. Network subsystem detail is not presented in these basic financial statements; however, the County maintains detailed information on these subsystems. Yuma County has elected to use the “Modified Approach” as defined by GASB Statement No. 34 for infrastructure reporting for its Asphalt Pavements Road Subsystem only. Assets accounted for under the modified approach include approximately 581.69 center lane miles (addition of 1.71 miles from last fiscal year) of paved roads that the County is responsible to maintain and preserve. Under GASB Statement No. 34, eligible infrastructure capital assets are not required to be depreciated under the following requirements: Eligible infrastructure must be part of a network or network subsystem. The County manages the eligible infrastructure capital assets using an asset management system with the
following characteristics: (1) it has an up-to-date inventory; (2) it performs condition assessments and summarizes the results using a measurement scale; and (3) it estimates the annual amount to maintain and preserve the subsystem at the established condition assessment level.
The County must commit to a predetermined condition level, and the County’s board of supervisors must
have made that commitment in an open forum and documented the decision. The County documents that the eligible infrastructure capital assets are being preserved approximately at
or above the established and disclosed condition assessment level. In May 2003, the Yuma County Board of Supervisors adopted a resolution to maintain eligible asphalt pavements roads at an average overall condition index (OCI) level of 65. County-owned roads are classified based on land use, access and traffic utilization into the following three classifications: County highways, subdivisions, and public access roads.
To manage and preserve eligible roads, Yuma County utilizes a Pavement Management System. The County’s Pavement Management System’s purpose is to develop a cost effective rehabilitation program that preserves the County’s roads investment and enhances public transportation and safety. Each road segment is evaluated using 8 different road distress factors: cracking, potholes, rutting, bleeding, adhesive failure, loss of fine aggregate, shoulder drop off, and polished aggregate. All of these factors are averaged to obtain a distress rating. Additionally, 6 pavement quality factors are rated: geometrics, ride, safety, service level, surface friction, and structure. These evaluations (distress and pavement quality) are combined to obtain an “Overall Condition Index” (OCI); this index is then assigned to each road and expressed in a continuous scale from 0 to 100, for which 0 is assigned to the least acceptable road condition and 100 is assigned the physical characteristics of a new road. The following conditions were defined:
Condition OCI RangeExcellent – Very good 100 – 80Above average – Good 80 – 65Average 65 – 40Below average – Poor 40 – 20Very poor – Needs immediate work 20 – 0
90

Exhibit F-2
Modified Approach for County’s Paved Roads (Concluded)
The current assessment of eligible roads was completed in May 2012. Yuma County Department of Public Works, in preparation for compliance with GASB Statement No. 34, accomplished this task. The prior assessment studies were completed on July 2009, May 2006, May 2003, and July 2000. The County’s adopted policy is to maintain and preserve eligible infrastructure roads at an average OCI rating of 65. As of June 30 2012, the County’s eligible roads were rated at an OCI of 74.71 on average with the following detailed conditions:
Condition % of Street OCI Range
Excellent – Very good 20.86 % 100 – 80 Above average – Good 63.16 % 80 – 65 Average 14.30 % 65 – 40 Below average – Poor 1.6383 % 40 – 20 Very poor – Needs immediate work 0.0447 % 20 – 0
The County is continuously taking action to stop road deterioration through short-term maintenance activities such as pothole patching, sweeping, and sidewalk repairs. The County expended $1,318,980 on maintenance for the fiscal year ended June 30, 2012. These expenditures delayed deterioration and preserved the condition to an acceptable level, however the overall condition of the roads was not improved through these maintenance expenditures. The County has estimated that the amount of annual expenditures required to maintain paved roads at the average OCI of 65 is a minimum of $ 856,254 for the fiscal year ending June 30, 2013. The decrease of $765,678 in actual expenditures in fiscal year 2011 over fiscal year 2010 was due to the State of Arizona budget cuts for the second year in a row. As less revenue was anticipated fewer repair contracts were entered into, and therefore, less costs were incurred. The 2012 estimated budget has increased in the amount of $897,137 due to a carryover in funds from 2011.The 2013 estimated budget has decreased $816,437 due to continual State of Arizona budget cuts. A schedule of estimated annual amounts calculated to maintain and preserve its streets at the current level compared to actual expenditures for road maintenance for the last 10 (ten) years is presented below:
Fiscal Year Maintenance Estimate Actual Expenditures OCI Rating
2003 – 2004 980,182 1,161,080 78.04 2004 – 2005 1,161,000 1,798,833 79.30 2005 – 2006 988,412 808,199 79.29 2006 – 2007 1,971,293 1,858,342 76.31 2007 – 2008 2,563,000 1,633,484 76.40 2008 – 2009 2,035,000 2,048,509 77.35 2009 – 2010 2,687,000 1,688,034 74.99 2010 – 2011 775,554 922,356 74.67 2011 – 2012 1,672,691 1,318,980 74.71 2012 – 2013 856,254 N/A N/A
91

{This page is intentionally left blank}
92

Other Supplementary Information
93

{This page is intentionally left blank}
94

Supplementary Schedules
Major Governmental Funds
General Fund 96 Capital Improvements Fund 100 Debt Service Fund 101
95

YUMA COUNTY Exhibit G- 1
Schedule of Revenues by Category
Budget and Actual- General Fund
0100
Actual
Description by Category Original Final Amount Variance *_______________ _______________ _______________ _______________
Property Taxes 22,270,574$ 22,270,574$ 23,161,816$ 891,242$ Interest On Delinquent Taxes 956,562 956,562 1,026,842 70,280 Auto Lieu Tax 4,593,862 4,593,862 4,533,376 (60,486) County Sales Tax 10,845,462 10,845,462 11,344,479 499,017 Franchise Tax 186,000 186,000 180,411 (5,589)
Total Taxes 38,852,460 38,852,460 40,246,924 1,394,464
Business Licenses 2,000 2,000 2,925 925 Building Permits 240,169 240,169 297,773 57,604 Plumbing Permits 32,500 32,500 27,545 (4,955) Electrical Permits 71,200 71,200 63,696 (7,504) Mechanical Permits 17,993 17,993 16,984 (1,009) Sign Permits 3,000 3,000 7,247 4,247 Environmental Health Permits 120,000 120,000 77,695 (42,305) Mobile Home Permits 22,705 22,705 17,220 (5,485) Planning Variance Permits 3,000 3,000 7,358 4,358 Special Use Permits 8,977 8,977 25,149 16,172
Total Licenses and permits 521,544 521,544 543,592 22,048
Budgeted Amounts
Year Ended June 30, 2012
General Fund
Federal Grants 75,000 75,000 83,211 8,211 Federal Payments In Lieu Of Taxes 3,224,801 3,224,801 3,325,344 100,543 Southwest Border Grant Initiative 400,000 400,000 628,936 228,936 Agency Reimbursements 209,120 150,183 5,000 (145,183) State Grants - 58,937 59,826 889 State Shared Sales Tax 16,706,786 16,706,786 17,349,424 642,638 State Shared Liquor Licenses 29,000 29,000 24,216 (4,784) State Shared Revenue - - 19,507 19,507
Total Intergovernmental 20,644,707 20,644,707 21,495,464 850,757
Septic Reassignment Fee 6,000 6,000 17,650 11,650 Plan Check Fees 145,000 145,000 159,948 14,948 Legal Services/Attorney's Fees 405,000 405,000 436,385 31,385 Modifications (P&Z) - - 1,140 1,140 Zoning Application Fees 17,500 17,500 16,125 (1,375) Subdivision Fees 13,000 13,000 11,100 (1,900) Recording Fees 375,000 375,000 305,647 (69,353) Reinspection Fees 6,500 6,500 4,324 (2,176) Temporary Use Permit 5,000 5,000 3,855 (1,145) Planning & Zoning Books & Maps 50 50 92 42 Treasurer's Office Fees 8,500 8,500 140,943 132,443 Public Fiduciary Fees & Charges 67,000 67,000 67,455 455 Assessor's Office Fees 2,000 2,000 4,215 2,215 Payroll Garnishment Fees 2,000 2,000 2,881 881 Special District Charges 386,979 386,979 248,447 (138,532) Indirect Cost Revenue 2,906,051 2,906,051 2,909,067 3,016 Sheriff Fees 26,000 26,000 18,936 (7,064) Sheriff Fingerprint/Copy Fees 76,000 76,000 58,909 (17,091) Correctional Housing - Juvenile 102,500 102,500 39,964 (62,536) Medical Services Fees 23,350 23,350 26,475 3,125
Total Charges for services 4,573,430 4,573,430 4,473,558 (99,872)
96

YUMA COUNTY Exhibit G- 1
Schedule of Revenues by Category
Budget and Actual- General Fund
0100
Actual
Description by Category Original Final Amount Variance *_______________ _______________ _______________ _______________
Budgeted Amounts
Year Ended June 30, 2012
General Fund
Superior Court Fines 385,000 385,000 291,433 (93,567) Constable Fines 25,000 25,000 23,050 (1,950) Justice Court #1 Fines 850,000 850,000 805,580 (44,420) Justice Court #2 Fines 150,000 150,000 215,234 65,234 Justice Court #3 Fines 265,000 265,000 216,018 (48,982) House Arrest Fees 10,000 10,000 11,841 1,841 Juvenile Court Fines & Fees 60,000 60,000 48,413 (11,587) Work Furlough Fees 53,000 53,000 29,064 (23,936) Zoning Violation Fines 7,500 7,500 1,415 (6,085) Other Fines 12,500 12,500 16,695 4,195 Anti-Racketeering Forfeits - - - - Fill The Gap Earned Revenue - - - -
Total Fines and forfeits 1,818,000 1,818,000 1,658,743 (159,257)
Interest On Investments 200,000 200,000 105,192 (94,808)
Total Investment income 200,000 200,000 105,192 (94,808)
Rent General 6,001 6,001 6,001 - Rent Housing Property 11,674 11,674 11,674 -
Total Rents 17,675 17,675 17,675 -
Vending Machine Proceeds 6,650 6,650 686 (5,964) Telephone Revenue 655 655 213 (442) Bad Check Fees 2,792 2,792 2,250 (542) Elections Deposits 141,332 141,332 174,266 32,934 Void/Stale Dated Revenue 10,000 10,000 20,487 10,487 Restitution & Other Payments 6,500 6,500 7,907 1,407 Sale Of Auction Items 40,000 40,000 37,268 (2,732) Cash Over/Short 500 500 70 (430) Miscellaneous Revenues 99,500 99,500 131,718 32,218
Total Miscellaneous 307,929 307,929 374,865 66,936
Total General Fund Revenue 66,935,745$ 66,935,745$ 68,916,013$ 1,980,268$
* Variance = Positive / (Negative)
97

YUMA COUNTY Exhibit G- 2
Schedule of Expenditures by Category
Budget and Actual- General Fund
0100 Total
Agency
Department / Agency Original Final Current Capital Outlay Expenditure Variance *_______________ _______________ _______________ _______________ _______________ _______________
County Administrator 2,495,795$ 2,559,289$ 2,377,547$ - 2,377,547$ 181,742$ Board of Supervisors 479,462 479,462 469,506 - 469,506 9,956 Treasurer 717,624 717,624 694,972 - 694,972 22,652 Assessor 1,827,377 1,827,377 1,807,488 - 1,807,488 19,889 Recorder 611,250 611,250 551,975 - 551,975 59,275 Election Services 422,180 422,180 351,456 - 351,456 70,724 Attorney - Civil Division 804,985 802,985 705,182 - 705,182 97,803 Attorney - Criminal Division 2,764,735 2,790,364 2,747,149 - 2,747,149 43,215 Attorney - Administration Division 597,051 597,051 559,089 - 559,089 37,962 Clerk of Superior Court 1,918,293 1,918,293 1,898,145 - 1,898,145 20,148 Superior Court 2,801,260 2,857,446 2,827,582 - 2,827,582 29,864 Superior Court - Security 518,034 518,034 490,761 - 490,761 27,273 Superior Court - Collections 323,521 323,521 305,124 - 305,124 18,397 Court Trial Services 754,732 791,238 593,836 - 593,836 197,402 Superior Court - Information And Tech 400,893 405,993 390,866 9,469$ 400,335 5,658 Justice Court #1 1,132,558 1,132,558 1,067,465 - 1,067,465 65,093 Justice Court #2 296,162 296,162 289,550 - 289,550 6,612 Justice Court #3 316,535 316,535 297,778 - 297,778 18,757 Constable Precinct #1 271,025 271,025 253,841 - 253,841 17,184 Constable Precinct #2 78,421 79,921 79,419 - 79,419 502 Constable Precinct #3 7,218 7,218 1,341 - 1,341 5,877 Attorney - Victim Services 245,506 245,506 239,046 - 239,046 6,460 Public Defender 2,020,171 2,135,171 2,093,711 - 2,093,711 41,460 General Government 2,912,564 2,280,778 1,106,249 - 1,106,249 1,174,529 County Administrator - Channel 77 227,571 227,571 107,293 - 107,293 120,278 Juvenile Justice Center - Administration 1,569,063 1,569,063 1,500,284 31,902 1,532,186 36,877 Juvenile Justice Center - Detention 3,237,081 3,237,081 3,076,200 26,840 3,103,040 134,041 Fi i l S i 1 402 950 1 402 950 1 299 484 1 299 484 103 466
Budgeted Amounts
Year Ended June 30, 2012
Actual Amounts
General Fund
Financial Services 1,402,950 1,402,950 1,299,484 - 1,299,484 103,466 Legal Defender 1,221,670 1,231,670 1,157,397 - 1,157,397 74,273 Human Resources 740,794 820,794 762,263 - 762,263 58,531 General Services 2,109,934 2,109,934 1,967,160 - 1,967,160 142,774 Information Technology Services 2,973,112 2,973,112 2,560,712 36,287 2,596,999 376,113 Development Services 790,018 790,018 705,987 1,898 707,885 82,133 Geographical Information Systems 460,972 460,972 398,305 - 398,305 62,667 Planning and Zoning 1,157,179 1,157,179 958,239 - 958,239 198,940 DDS- Customer Service 695,013 695,013 579,894 - 579,894 115,119 Superior Court - Adult Probation - Pretr 358,728 359,958 359,958 - 359,958 -
Total General government 41,661,437 41,422,296 37,632,254 106,396 37,738,650 3,683,646
Building Safety 622,281 622,281 553,338 - 553,338 68,943 Superior Court - Adult Probation 1,975,912 1,913,347 1,861,543 9,675 1,871,218 42,129 Adult Prob-Graffiti Abate 64,612 64,661 64,455 - 64,455 206 Sheriff - Administration 8,749,405 8,749,405 8,270,173 401,755 8,671,928 77,477 Sheriff - Medical Examiner 432,272 432,272 439,842 - 439,842 (7,570) Emergency Services 174,415 174,415 85,928 12,713 98,641 75,774
Total Public safety 12,018,897 11,956,381 11,275,279 424,143 11,699,422 256,959
Public Works - Solid Waste Operations 709,963 709,963 603,990 - 603,990 105,973
Total Sanitation 709,963 709,963 603,990 - 603,990 105,973
Environmental Programs 291,464 291,464 278,363 2,500 280,863 10,601 Medical Eligibility Prog - - 57 - 57 (57)
Total Health 291,464 291,464 278,420 2,500 280,920 10,544
98

YUMA COUNTY Exhibit G- 2
Schedule of Expenditures by Category
Budget and Actual- General Fund
0100 Total
Agency
Department / Agency Original Final Current Capital Outlay Expenditure Variance *_______________ _______________ _______________ _______________ _______________ _______________
Budgeted Amounts
Year Ended June 30, 2012
Actual Amounts
General Fund
Medical Eligibility Prog 10,939,121 11,106,224 10,922,887 - 10,922,887 183,337 Public Fiduciary 597,242 597,242 546,089 - 546,089 51,153
Total Welfare 11,536,363 11,703,466 11,468,976 - 11,468,976 234,490
Public Works - Parks 6,627 6,627 5,855 - 5,855 772
Total Culture and recreation 6,627 6,627 5,855 - 5,855 772
School Superintendent 361,923 361,923 362,028 - 362,028 (105)
Total Education 361,923 361,923 362,028 - 362,028 (105)
Total General Fund 66,586,674$ 66,452,120$ 61,626,802$ 533,039$ 62,159,841$ 4,292,279$
* Variance = Positive / (Negative)
99

YUMA COUNTY Exhibit G - 3Budgetary Comparison Schedule - Capital Improvements FundYear Ended June 30, 2012
04407
Actual Variance with
Original Final Amounts Final Budget *
Revenues:Taxes - - 18,052$ 18,052$ Investment income 32,000$ 32,000$ 19,545 (12,455) Miscellaneous - - 12,166 12,166
Total Revenue 32,000 32,000 49,763 17,763
Expenditures:Current:
General government:General Services 125,000 125,000 181,827 (56,827) Information Technology Services - - 7,921 (7,921) Development Services 1,243,500 1,243,500 32,981 1,210,519 Public Fiduciary - 50,000 823 49,177
Capital outlay:Election Services - 142,000 - 142,000 General Services 318,259 346,346 181,086 165,260 Information Technology Services 751,452 751,452 384,574 366,878 Development Services 19,006,952 19,006,952 348,572 18,658,380
Total Expenditures 21,445,163 21,665,250 1,137,784 20,527,466
Excess (deficiency) of revenues overexpenditures (21,413,163) (21,633,250) (1,088,021) 20,545,229
Other financing sources (uses):Bonds proceeds - - 2,435,000 2,435,000 Transfers in 1,496,000 1,588,000 1,588,000 - Transfers out (1,500,000) (1,500,000) (829,000) 671,000
Total other financing sources (uses) (4,000) 88,000 3,194,000 3,106,000
Net change in fund balance (21,417,163) (21,545,250) 2,105,979 23,651,229
Fund balance - beginning (July 1, 2011) 21,417,163 21,545,250 2,460,365 (19,084,885)
Fund balance - ending (June 30, 2012) -$ -$ 4,566,344$ 4,566,344$
* Variance = Positive or (Negative)
Capital Improvements Fund
Budgeted Amounts
100

YUMA COUNTY Exhibit G - 4Budgetary Comparison Schedule - B and C Colonia - Debt Service FundYear Ended June 30, 2012
03548
Actual Variance with
Original Final Amounts Final Budget *
Revenues:Special assessments 214,497$ 214,497$ 532,495$ 317,998$ Investment income - - 2,011 2,011
Total Revenue 214,497 214,497 534,506 320,009
Expenditures:Debt service:
Principal retirement 126,275 126,275 126,274 1 Interest and fiscal charges 88,222 88,222 110,921 (22,699)
Total Expenditures 214,497 214,497 237,195 (22,698)
Excess (deficiency) of revenues overexpenditures - - 297,311 297,311
Net change in fund balance - - 297,311 297,311
Fund balance - beginning (July 1, 2011) - - 98,041 98,041
Fund balance - ending (June 30, 2012) -$ -$ 395,352$ 395,352$
* Variance = Positive or (Negative)
B & C Colonia - Debt Service Fund
Budgeted Amounts
101

{This page is intentionally left blank}
102

Nonmajor Governmental Funds
103

{This page is intentionally left blank}
104

Combining Balance Sheet
Nonmajor Governmental Funds
Special Revenue Funds 106 Debt Service Funds 122 Capital Projects Funds 124
105

YUMA COUNTY
Combining Balance Sheet
Nonmajor Governmental Funds- Special Revenue Funds
Adult Probation Community Intensive Probation State Aid Drug Treatment
Drug Grant Punishment Probation Subsidy Enhancement & Education
2228 2229 2230 2231 2288 2309______________ ______________ ______________ ______________ ______________ ______________
Cash and cash equivalents 23,158$ 53,192$ - 683,339$ 45,491$ 40,294$
Receivables (net of allowances for uncollectibles):
Property taxes - - - - - -
Accounts - - - 52,408 - 25
Accrued interest 32 81 85$ 669 156$ 50
Due from:
Other funds - - 65,934 - - -
Other governments - - - - - -
Inventory - - - - - -
Prepaid items - - - - - -
Total Assets 23,190$ 53,273$ 66,019$ 736,416$ 45,647$ 40,369$
Liabilities
Accounts payable 19,662$ 52,507$ - 845$ 10,843$ 21,674$
Accrued payroll and employee benefits 492 168 27,336$ 9,711 17,710 1,841
Due to:
Other funds 1,118 492 2,000 1,151 1 -
Other governments - - - - - -
Deposits held for others - - - - - -
Deferred revenue - - - - - -
Total Liabilities 21,272$ 53,167$ 29,336$ 11,707$ 28,554$ 23,515$
Fund balances:
Nonspendable - - - - - -
Restricted 1,918$ 106$ 36,683$ 724,709$ 17,093$ 16,854$
Committed - - - - - -
Assigned - - - - - -
Unassigned - - - - - -
Total fund balances 1,918$ 106$ 36,683$ 724,709$ 17,093$ 16,854$
Total liabilities and fund balances 23,190$ 53,273$ 66,019$ 736,416$ 45,647$ 40,369$
Liabilities and Fund Balances
June 30, 2012
Assets
Adult Probation
106

Exhibit H-1
(Continued)
Assessor Attorney
Drug Court Intensive Prob Extra Interstate Global Positioning AZ Wanted Property Atty Drug
Planning SupCrt / JCE Probation Comp System Task Force Information Enforcement
2310 2321 2322 2323 2333 2345 2202 2207______________ ______________ ______________ ______________ ______________ ______________ ______________ ______________
26,175$ 208,984$ 33,831$ 42,996$ 40$ - 100,872$ -
- - - - - - - -
1,735 - - - - - - -
38 243 32 41 - - 98 -
- - 232 - - - 7 -
- - - - - 908$ - 33,839$
- - - - - - - -
320 - - - - - - -
28,268$ 209,227$ 34,095$ 43,037$ 40$ 908$ 100,977$ 33,839$
559$ 33,355$ 125$ - - 58$ 156$ -
1,624 6,602 - - - - - 3,668$
- 147,135 - - - 844 - 30,171
- - - - - - - -
- - - - - - - -
- - - - - - - -
2,183$ 187,092$ 125$ -$ -$ 902$ 156$ 33,839$
320$ - - - - - - -
25,765 22,135$ 33,970$ 43,037$ 40$ 6$ 100,821$ -
- - - - - - - -
- - - - - - - -
- - - - - - - -
26,085$ 22,135$ 33,970$ 43,037$ 40$ 6$ 100,821$ -$
28,268$ 209,227$ 34,095$ 43,037$ 40$ 908$ 100,977$ 33,839$
Adult Probation
107

YUMA COUNTY
Combining Balance Sheet
Nonmajor Governmental Funds- Special Revenue Funds
Crime Victim Witness Federal Victim Bad Check HIDTA Anti-
Comp Grant Program Comp Grant Fund Grant (SBA) Racketeering
2209 2210 2223 2225 2227 2235______________ ______________ ______________ ______________ ______________ ______________
Cash and cash equivalents 837$ - 3$ 8,975$ - 355,502$
Receivables (net of allowances for uncollectibles):
Property taxes - - - - - -
Accounts - - - - - -
Accrued interest - - - 16 - 346
Due from:
Other funds - - - - 10,365$ 6,637
Other governments 18,874 22,807$ - - - -
Inventory - - - - - -
Prepaid items - - - - - -
Total Assets 19,711$ 22,807$ 3$ 8,991$ 10,365$ 362,485$
Liabilities
Accounts payable 5,512$ - - 5,888$ - 1,608$
Accrued payroll and employee benefits - 4,187$ - 918 4,353$ 763
Due to:
Other funds 14,200 18,620 3$ 1,380 - -
Other governments - - - - - -
Deposits held for others - - - - - -
Deferred revenue - - - - - -
Total Liabilities 19,712$ 22,807$ 3$ 8,186$ 4,353$ 2,371$
Fund balances:
Nonspendable - - - - - -
Restricted - - - 805$ 6,012$ 360,114$
Committed - - - - -
Assigned - - - - - -
Unassigned (1)$ - - - - -
Total fund balances (1)$ -$ -$ 805$ 6,012$ 360,114$
Total liabilities and fund balances 19,711$ 22,807$ 3$ 8,991$ 10,365$ 362,485$
June 30, 2012
Assets
Liabilities and Fund Balances
Attorney
108

Exhibit H-1
(Continued)
Fed Revenue Federal Federal Justice ACJC Domestic Crime Prosecution Victim Serv Victim Serv Victims
Asset Sharing Justice Asset Sharing Violence Enhancement Restitution ST Restitution FED Compensation
2277 2278 2280 2284 2290 2330 2331 2335____________ ____________ ____________ ____________ ____________ ____________ ____________ ____________
5,025$ 12,041$ 827$ 1,942$ 147,868$ 240,664$ 20,536$ 8,461$
- - - - - - - -
- - - - - - - -
5 12 1 2 156 - 281 -
- - - - - - 8 -
- - - - 35,735 - - -
- - - - - - - -
- - - - - - - -
5,030$ 12,053$ 828$ 1,944$ 183,759$ 240,664$ 20,825$ 8,461$
126$ - - - - - - -
- - - - 2,301$ - - -
- - - - 888 4,479$ 15$ -
- - - - - - - -
- - - - - - - -
- - - - - - - -
126$ -$ -$ -$ 3,189$ 4,479$ 15$ -$
- - - - - - - -
4,904$ 12,053$ 828$ 1,944$ - 236,185$ 20,810$ 8,461$
- - - - - - - -
- - - - 180,570$ - - -
- - - - - - - -
4,904$ 12,053$ 828$ 1,944$ 180,570$ 236,185$ 20,810$ 8,461$
5,030$ 12,053$ 828$ 1,944$ 183,759$ 240,664$ 20,825$ 8,461$
Attorney
109

YUMA COUNTY
Combining Balance Sheet
Nonmajor Governmental Funds- Special Revenue Funds
Victim Assist Victim Assist Victim Rights Expedited Child Support Clerk's
Program Subrogation Program Child Support Automation Fund
2343 2344 2346 2213 2214 2216____________ ____________ ____________ ______________ ______________ ______________
Cash and cash equivalents 912$ 12,235$ 5,732$ 47,083$ 1,636$ 77,589$
Receivables (net of allowances for uncollectibles):
Property taxes - - - - - -
Accounts - - - - - -
Accrued interest - - - 45 2 75
Due from:
Other funds 352 - - - - -
Other governments - - - - - -
Inventory - - - - - -
Prepaid items - - - - - -
Total Assets 1,264$ 12,235$ 5,732$ 47,128$ 1,638$ 77,664$
Liabilities
Accounts payable - - - - - -
Accrued payroll and employee benefits 1,264$ - 1,248$ 417$ - 922$
Due to:
Other funds - - 4,484 - - 139
Other governments - - - - - -
Deposits held for others - - - - - -
Deferred revenue - - - - - -
Total Liabilities 1,264$ -$ 5,732$ 417$ -$ 1,061$
Fund balances:
Nonspendable - - - - - -
Restricted - 12,235$ - 46,711$ 1,638$ 76,603$
Committed - - - - - -
Assigned - - - - - -
Unassigned - - - - - -
Total fund balances -$ 12,235$ -$ 46,711$ 1,638$ 76,603$
Total liabilities and fund balances 1,264$ 12,235$ 5,732$ 47,128$ 1,638$ 77,664$
June 30, 2012
Assets
Liabilities and Fund Balances
Clerk of Superior CourtAttorney
110

Exhibit H-1
(Continued)
Emergency Mgnt
Spousal Maint IV-D Case Victims Road Help Health and Other
Enforcement Processing Location Fund CDBG America Vote Human Services Grants
2218 2318 2336 2251 2296 2203 2347 2334______________ ______________ ______________ ______________ ______________ ______________ ______________ ______________
58,829$ 7,867$ 2,976$ 826,161$ - 11,903$ 30,000$ -
- - - - - - - -
- - - - - - - -
56 - 3 797 41$ 4 11 -
- - - - 17,920 - - -
- - - - 78,293 - - 25,650$
- - - - - - - -
- - - - - - - -
58,885$ 7,867$ 2,979$ 826,958$ 96,254$ 11,907$ 30,011$ 25,650$
- - - - 71,735$ - - 3,113$
- - - - - - - 1,675
- 7,867$ - 24,250$ - - - 1,902
- - - - - - - -
- - - - - - - -
- - - - - - - -
-$ 7,867$ -$ 24,250$ 71,735$ -$ -$ 6,690$
- - - - - - - -
58,885$ - 2,979$ 802,708$ 24,519$ 11,907$ 30,011$ 18,960$
- - - - - - - -
- - - - - - -
- - - - - - - -
58,885$ -$ 2,979$ 802,708$ 24,519$ 11,907$ 30,011$ 18,960$
58,885$ 7,867$ 2,979$ 826,958$ 96,254$ 11,907$ 30,011$ 25,650$
Development Services Election ServicesClerk of Superior Court
111

YUMA COUNTY
Combining Balance Sheet
Nonmajor Governmental Funds- Special Revenue Funds
Juvenile Court
HOME Public Conventional Section 8 Water Co. Family
Grant Housing 13-6-PHA Voucher Prog 13-6 Counseling
2269 2271 2273 2274 2275 2212_________ __________ ____________ ___________ ______________ ____________
Cash and cash equivalents 2,639$ 65,433$ 524,198$ 836,721$ 454,470$ 6,389$
Receivables (net of allowances for uncollectibles):
Property taxes - - - - - -
Accounts - 7,825 38,107 49 13,381 -
Accrued interest 2 1 - - - 12
Due from:
Other funds - - - 874 - 456
Other governments 3,300 - - - - -
Inventory - - 10,028 - - -
Prepaid items - - 256 183 - -
Total Assets 5,941$ 73,259$ 572,589$ 837,827$ 467,851$ 6,857$
Liabilities
Accounts payable 250$ 1,678$ 27,661$ 46,557$ 1,264$ 28$
Accrued payroll and employee benefits - 14,750 - - - -
Due to:
Other funds 356 26,729 6,384 - - -
Other governments - - - - - -
Deposits held for others - - 169,647 89,687 - -
Deferred revenue - - - - - -
Total Liabilities 606$ 43,157$ 203,692$ 136,244$ 1,264$ 28$
Fund balances:
Nonspendable - - 10,284$ 183$ - -
Restricted 5,335$ 30,102$ 358,613 701,400 - 6,829$
Committed - - - - - -
Assigned - - - - 466,587$ -
Unassigned - - - - - -
Total fund balances 5,335$ 30,102$ 368,897$ 701,583$ 466,587$ 6,829$
Total liabilities and fund balances 5,941$ 73,259$ 572,589$ 837,827$ 467,851$ 6,857$
Assets
Liabilities and Fund Balances
June 30, 2012
Housing
112

Exhibit H-1
(Continued)
Juvenile Juvenile Crime Juvenile Detention Charter Juvenile State Aid Court Appointed
Probation Fees Reduction Restitution Education School Victim Rights Supreme Court Specialist
2232 2233 2240 2242 2245 2246 2247 2248______________ ______________ ______________ ______________ ______________ ______________ ______________ ______________
211,644$ 15,654$ 13,097$ 456,411$ 536,699$ 498$ 40,580$ 1,458$
- - - - - - - -
21,304 - - - 5,709 - - -
176 19 - 464 536 2 123 12
- 1 - 2 - - 622 48
- - - - 64,929 - - -
- - - - - - - -
- - - - - - - -
233,124$ 15,674$ 13,097$ 456,877$ 607,873$ 500$ 41,325$ 1,518$
- 15,673$ - 3,640$ 5,865$ - 551$ 4$
2,542$ - - 3,522 7,902 249$ 12,838 1,465
19,202 - 5,522$ - 59,242 249 - -
- - - - - - - 53
- - - - - - - -
- - - - - - - -
21,744$ 15,673$ 5,522$ 7,162$ 73,009$ 498$ 13,389$ 1,522$
- - - - - - - -
211,380$ 1$ - 449,715$ 391,864$ 2$ 27,936$ -
- - - - - - - -
- - 7,575$ - 143,000 - - -
- - - - - - - (4)$
211,380$ 1$ 7,575$ 449,715$ 534,864$ 2$ 27,936$ (4)$
233,124$ 15,674$ 13,097$ 456,877$ 607,873$ 500$ 41,325$ 1,518$
Juvenile Court
113

YUMA COUNTY
Combining Balance Sheet
Nonmajor Governmental Funds- Special Revenue Funds
Court Improving AM Juvenile Drug Court Intensive Juvenile
Improvement Schools Probation Education Probation Diversion Intake
2249 2257 2259 2262 2265 2266______________ ______________ ______________ ______________ ______________ ______________
Cash and cash equivalents 1,567$ 586$ 16,682$ 1,662$ 50,354$ 81,303$
Receivables (net of allowances for uncollectibles):
Property taxes - - - - - -
Accounts - - - - - -
Accrued interest 5 2 17 8 169 150
Due from:
Other funds - - - 86 - -
Other governments - - - - - -
Inventory - - - - - -
Prepaid items - - - - - -
Total Assets 1,572$ 588$ 16,699$ 1,756$ 50,523$ 81,453$
Liabilities
Accounts payable 1,216$ 1,757$ - 310$ 5,151$ 20,036$
Accrued payroll and employee benefits 355 163 - 511 15,666 9,854
Due to:
Other funds - 11,029 16,668$ - - -
Other governments - - - - - -
Deposits held for others - - - - - -
Deferred revenue - - - - - -
Total Liabilities 1,571$ 12,949$ 16,668$ 821$ 20,817$ 29,890$
Fund balances:
Nonspendable - - - - - -
Restricted 1$ - 31$ 935$ 29,706$ 51,563$
Committed - - - - - -
Assigned - - - - - -
Unassigned - (12,361)$ - - - -
Total fund balances 1$ (12,361)$ 31$ 935$ 29,706$ 51,563$
Total liabilities and fund balances 1,572$ 588$ 16,699$ 1,756$ 50,523$ 81,453$
June 30, 2012
Assets
Liabilities and Fund Balances
Juvenile Court
114

Exhibit H-1
(Continued)
Justice Courts
Juvenile Juvenile Account Justice Court Indigent Defender LSTA Other
Diversion Prog Treatment Incentive Enhancement Dependency Training Grants Grants
2267 2268 2327 2317 2241 2326 2312 2313______________ ______________ ______________ ______________ ____________ ____________ ____________ ____________
10,666$ 32,606$ 4,283$ 418,715$ 1,893$ 9,110$ 9,798$ 95,354$
- - - - - - - -
- - - 1,191 - 29 - -
20 80 6 402 2 15 11 106
- 137 552 - - - - 4,518
- - 4,645 - - 3,485 - -
- - - - - - - -
- - - - - - - -
10,686$ 32,823$ 9,486$ 420,308$ 1,895$ 12,639$ 9,809$ 99,978$
438$ 6,198$ 195$ 615$ - 952$ 171$ 14,647$
1,507 6,283 399 4,173 - - - -
- - - 6,768 - 1,660 - -
- - - - - - - -
- - - - - - - -
- - - - - - - -
1,945$ 12,481$ 594$ 11,556$ -$ 2,612$ 171$ 14,647$
- - - - - - - -
8,741$ 20,342$ 8,892$ - - 10,027$ 9,638$ 85,331$
- - - 408,752$ - - - -
- - - - 1,895$ - - -
- - - - - - - -
8,741$ 20,342$ 8,892$ 408,752$ 1,895$ 10,027$ 9,638$ 85,331$
10,686$ 32,823$ 9,486$ 420,308$ 1,895$ 12,639$ 9,809$ 99,978$
Library DistrictLegal & Public Defenders Juvenile Court
115

YUMA COUNTY
Combining Balance Sheet
Nonmajor Governmental Funds- Special Revenue Funds
Recorder Superintendent
Health Rabies Waste Pub Wrk Recorder's School
Grants Control Tire HURF Fund Grants
2260 2264 2204 2253 2205 2281______________ ______________ ______________ ______________ _________________ ______________
Cash and cash equivalents 21,707$ 105,808$ 381,576$ 2,977,312$ 271,703$ -
Receivables (net of allowances for uncollectibles):
Property taxes - - - - - -
Accounts - 770 279 2,332 - 695,968$
Accrued interest 344 6 387 3,040 273 -
Due from:
Other funds 169,599 - - - - -
Other governments 1,079,810 - 68,301 1,003,984 - -
Inventory - - - - - -
Prepaid items - - - - - -
Total Assets 1,271,460$ 106,584$ 450,543$ 3,986,668$ 271,976$ 695,968$
Liabilities
Accounts payable 76,186$ 75,503$ 18,814$ 148,021$ 1,301$ -
Accrued payroll and employee benefits 59,538 2,610 1,127 58,128 1,115 -
Due to:
Other funds 784,951 2,871 6,815 209,704 1,686 98$
Other governments - - - - - -
Deposits held for others - - - - - -
Deferred revenue - - - - - -
Total Liabilities 920,675$ 80,984$ 26,756$ 415,853$ 4,102$ 98$
Fund balances:
Nonspendable - - - - - -
Restricted 350,785 - 423,787$ 3,570,815$ 267,874$ 695,870$
Committed - 25,600$ - - - -
Assigned - - - - - -
Unassigned - - - - - -
Total fund balances 350,785$ 25,600$ 423,787$ 3,570,815$ 267,874$ 695,870$
Total liabilities and fund balances 1,271,460$ 106,584$ 450,543$ 3,986,668$ 271,976$ 695,968$
Public Works
June 30, 2012
Public Health
Assets
Liabilities and Fund Balances
116

Exhibit H-1
(Continued)
Narcotic Drug Task Local Law Other Jail Inmate Facility LEBSF Boat Other
Enforcement Force Enforcement Grants Enhancement Health Commissary Patrol Jail Grants
2299 2302 2303 2306 2237 2238 2286 2301 2308______________ ______________ ______________ ______________ ______________ ______________ ______________ ______________ ______________
- - 30$ - 279,022$ 11,020$ 197,326$ 13,026$ 32,698$
- - - - - - - - -
61$ - - - - 600 38,301 - -
2 - - 42$ 278 10 216 36 41
- - - - - - - - -
113,166 70,628$ - 285,266 24,695 - - - 6,634
- - - - - - - - -
- - - - - - - - -
113,229$ 70,628$ 30$ 285,308$ 303,995$ 11,630$ 235,843$ 13,062$ 39,373$
32,200$ 6,173$ - - - - 28,268$ - 3,345$
1,611 3,616 - - 2,402$ - 3,052 4,337$ 1,056
76,662 5,996 - 59,614$ 3,057 - 52,623 4,337 26,776
- - - - - - - - -
- - - - - - - - -
- - - - - - - - -
110,473$ 15,785$ -$ 59,614$ 5,459$ -$ 83,943$ 8,674$ 31,177$
- - - - - - - - -
2,756$ 54,843$ 30$ 225,694$ 298,536$ - 151,900$ 4,388$ 8,196$
- - - - - - - - -
- - - - - 11,630$ - - -
- - - - - - - - -
2,756$ 54,843$ 30$ 225,694$ 298,536$ 11,630$ 151,900$ 4,388$ 8,196$
113,229$ 70,628$ 30$ 285,308$ 303,995$ 11,630$ 235,843$ 13,062$ 39,373$
Sheriff- Jail District Sheriff- Admin
117

YUMA COUNTY
Combining Balance Sheet
Nonmajor Governmental Funds- Special Revenue Funds
Conciliation Domestic Local Court JCEF Law Aztec Field
Court Relations Assistance Time Payment Library Training
2211 2217 2221 2222 2224 2234______________ ______________ ______________ ______________ ______________ ______________
Cash and cash equivalents 81,901$ 25,204$ 145,626$ 56,150$ 49,619$ 3,640$
Receivables (net of allowances for uncollectibles):
Property taxes - - - - - -
Accounts - - - 315 218 -
Accrued interest 68 25 144 44 56 6
Due from:
Other funds - - - 1,981 345 -
Other governments - - - - - -
Inventory - - - - - -
Prepaid items - - - - - -
Total Assets 81,969$ 25,229$ 145,770$ 58,490$ 50,238$ 3,646$
Liabilities
Accounts payable 22$ 2,200$ - 13,375$ 8,583$ -
Accrued payroll and employee benefits 664 - 698$ - 208 487$
Due to:
Other funds - - 116,178 - - 1
Other governments - - - - - 37
Deposits held for others - - - - - -
Deferred revenue - - - - - -
Total Liabilities 686$ 2,200$ 116,876$ 13,375$ 8,791$ 525$
Fund balances:
Nonspendable - - - - - -
Restricted 81,283$ 23,029$ - 45,115$ 41,447$ 3,121$
Committed - - - - - -
Assigned - - 28,894$ - - -
Unassigned - - - - - -
Total fund balances 81,283$ 23,029$ 28,894$ 45,115$ 41,447$ 3,121$
Total liabilities and fund balances 81,969$ 25,229$ 145,770$ 58,490$ 50,238$ 3,646$
June 30, 2012
Assets
Liabilities and Fund Balances
Superior Court
118

Exhibit H-1
(Continued)
Treasurer
Supreme Court Fee- Case Children's Child Support Treasurer's Fill Southwest ARRA
Enhancement Management Issues Educate Enforcement Information The Gap Border Grants
2324 2325 2339 2215 2201 2319 2320 2342______________ ______________ ______________ ______________ ______________ ______________ ______________ ____________
39,009$ 151,158$ 77,676$ 29,244$ 150,433$ - - 3,434$
- - - - - - - -
- - - - - - - 6,632
29 142 72 39 145 - - 8
- 7,877 - 54,815 - 15,684$ - -
- 1,000 - 32,574 - - - 439
- - - - - - - -
- - - - - - - -
39,038$ 160,177$ 77,748$ 116,672$ 150,578$ 15,684$ -$ 10,513$
- 60,402$ 1,495$ 452$ - - - -
- 1,478 - 309 - 8,729$ - -
- - - - - - - 7,626$
- - - - - - - -
- - - - - - - -
- - - - - - - -
-$ 61,880$ 1,495$ 761$ -$ 8,729$ -$ 7,626$
- - - - - - - -
- - 76,253$ 115,911$ 150,578$ 6,955$ - 2,887$
39,038$ 98,297$ - - - - - -
- - - - - - - -
- - - - - - - -
39,038$ 98,297$ 76,253$ 115,911$ 150,578$ 6,955$ -$ 2,887$
39,038$ 160,177$ 77,748$ 116,672$ 150,578$ 15,684$ -$ 10,513$
Superior Court Other- Multiple Departments
119

YUMA COUNTY Exhibit H-1
Combining Balance Sheet
Nonmajor Governmental Funds- Special Revenue Funds (Concluded)
Total
Workforce Improvement Other Special
Investment Act Districts Nonmajor Funds Revenue
2291 ALL Misc Funds______________ ______________ ___________ ______________
Cash and cash equivalents 32,796$ 1,219,102$ 17$ 13,400,683$
Receivables (net of allowances for uncollectibles):
Property taxes - 43,835 - 43,835
Accounts 55,833 - - 943,072
Accrued interest 49 1,191 - 12,411
Due from:
Other funds - - 11,240 370,292
Other governments 664,932 - - 3,643,894
Inventory - - - 10,028
Prepaid items - - - 759
Total Assets 753,610$ 1,264,128$ 11,257$ 18,424,974$
Liabilities
Accounts payable 399,954$ 19,886$ - 1,278,803$
Accrued payroll and employee benefits - - - 320,544
Due to:
Other funds 264,978 85,865 17$ 2,124,803
Other governments - - - 90
Deposits held for others - - - 259,334
Deferred revenue - 37,660 - 37,660
Total Liabilities 664,932$ 143,411$ 17$ 4,021,234$
Fund balances:
Nonspendable - - - 10,787$
Restricted 35,255$ 810,909$ 756$ 12,619,766
Committed - - - 571,687
Assigned - 309,808 - 1,149,959
Unassigned 53,423 - 10,484 51,541
Total fund balances 88,678$ 1,120,717$ 11,240$ 14,403,740$
Total liabilities and fund balances 753,610$ 1,264,128$ 11,257$ 18,424,974$
Assets
Liabilities and Fund Balances
Other - Miscellaneous
June 30, 2012
120

{This page is intentionally left blank}
121

YUMA COUNTY
Combining Balance Sheet
Nonmajor Governmental Funds- All Debt Service Funds
Jail
East Co District El Prado
Facility Debt Estates Gadsden
3503 3500 3545 3546____________ ____________ ____________ ____________
Cash and cash equivalents 571,193$ - 77,196$ 62,087$
Receivables (net of allowances for uncollectibles):
Property taxes - 2,537$ - -
Accounts - - 122 67
Special assessments - - 29,970 87,106
Accrued interest 698 9 - -
Due from:
Other funds - - 570 2,156
Investment held by trustee - restricted 262,185 721,363 - -
Total Assets 834,076$ 723,909$ 107,858$ 151,416$
Liabilities
Due to:
Other funds - 251,415$ - -
Interest and fiscal charges payable 17,185$ 171,362 - -
Revenue bonds payable 245,000 550,000 - -
Deferred revenue - 1,876 29,970$ 87,106$
Total Liabilities 262,185$ 974,653$ 29,970$ 87,106$
Fund balances:
Restricted - - 19,848$ 19,984$
Committed 571,891$ - 58,040 44,326
Unassigned - (250,744)$ - -
Total fund balances 571,891$ (250,744)$ 77,888$ 64,310$
Total liabilities and fund balances 834,076$ 723,909$ 107,858$ 151,416$
Liabilities and Fund Balances
June 30, 2012
Assets
Improvement Districts
122

Exhibit H- 2
Library Total
District Debt
Debt Service
3547 Funds______________ ______________
3,877,713$ 4,588,189$
- 2,537
- 189
- 117,076
4,164 4,871
- 2,726
- 983,548
3,881,877$ 5,699,136$
- 251,415$
- 188,547
- 795,000
- 118,952
-$ 1,353,914$
- 39,832$
3,881,877$ 4,556,134
- (250,744)
3,881,877$ 4,345,222$
3,881,877$ 5,699,136$
123

YUMA COUNTY
Combining Balance Sheet
Nonmajor Governmental Funds- Capital Projects Funds
Jail
District El Prado B & C B & C
Capital Estates Gadsden Colonial ARRA
04403 04717 04719 04721 04722______________ ______________ ______________ ______________ ______________
Cash and cash equivalents 806$ 7,272$ 1,075$ 52,636$ 92,357$
Accrued interest 1 - - - -
Due from:
Other funds - - - 38,755 -
Investment held by trustee - restricted 429,000 - - - -
Total Assets 429,807$ 7,272$ 1,075$ 91,391$ 92,357$
Liabilities
Accounts payable - - - 3,981$ 6,167$
Due to:
Other funds - 17,025$ 1,075$ 11,758 11,120
Deferred revenue - - - - 103,202
Total Liabilities -$ 17,025$ 1,075$ 15,739$ 120,489$
Fund balances:
Restricted - - - - 75,070$
Committed 807$ - - 36,897$ -
Unassigned 429,000 (9,753)$ - 38,755 (103,202)
Total fund balances 429,807$ (9,753)$ -$ 75,652$ (28,132)$
Total liabilities and fund balances 429,807$ 7,272$ 1,075$ 91,391$ 92,357$
Liabilities and Fund Balances
June 30, 2012
Assets
Improvement Districts
124

Exhibit H- 3
Library Total
District Capital
Capital Projects
04720 Funds______________ ______________
189,274$ 343,420$
428 429
- 38,755
- 429,000
189,702$ 811,604$
- 10,148$
- 40,978
- 103,202
-$ 154,328$
- 75,070$
189,702$ 227,406
- 354,800
189,702$ 657,276$
189,702$ 811,604$
125

YUMA COUNTY Exhibit H- 4
Combining Balance Sheet
All Nonmajor Governmental Funds
Total
Special Debt Capital Nonmajor
Revenue Service Projects Governmental
Funds Funds Funds Funds______________ ______________ ______________ ______________
Cash and cash equivalents 13,400,683$ 4,588,189$ 343,420$ 18,332,292$
Receivables (net of allowances for uncollectibles):
Property taxes 43,835 2,537 - 46,372
Accounts 943,072 189 - 943,261
Special assessments - 117,076 - 117,076
Accrued interest 12,411 4,871 429 17,711
Due from:
Other funds 370,292 2,726 38,755 411,773
Other governments 3,643,894 - - 3,643,894
Inventory 10,028 - - 10,028
Prepaid items 759 - - 759
Investment held by trustee - restricted - 983,548 429,000 1,412,548
Total Assets 18,424,974$ 5,699,136$ 811,604$ 24,935,714$
Liabilities
Accounts payable 1,278,803$ - 10,148$ 1,288,951$
Accrued payroll and employee benefits 320,544 - - 320,544
Due to:
Other funds 2,124,803 251,415$ 40,978 2,417,196
Other governments 90 - - 90
Deposits held for others 259,334 - - 259,334
Interest and fiscal charges payable - 188,547 - 188,547
Revenue bonds payable - 795,000 - 795,000 Deferred revenue 37,660 118,952 103,202 259,814
Total Liabilities 4,021,234$ 1,353,914$ 154,328$ 5,529,476$
Fund balances:
Nonspendable 10,787$ - - 10,787$
Restricted 12,619,766 39,832$ 75,070$ 12,734,668
Committed 571,687 4,556,134 227,406 5,355,227
Assigned 1,149,959 - - 1,149,959 Unassigned 51,541 (250,744) 354,800 155,597
Total fund balances 14,403,740$ 4,345,222$ 657,276$ 19,406,238$
Total liabilities and fund balances 18,424,974$ 5,699,136$ 811,604$ 24,935,714$
Liabilities and Fund Balances
Total All Nonmajor Governmental Funds
June 30, 2012
Assets
126

Combining Statement of Revenues, Expenditures, and Changes in Fund Balances
Nonmajor Governmental Funds
Special Revenue Funds 128 Debt Service Funds 144 Capital Projects Funds 146
127
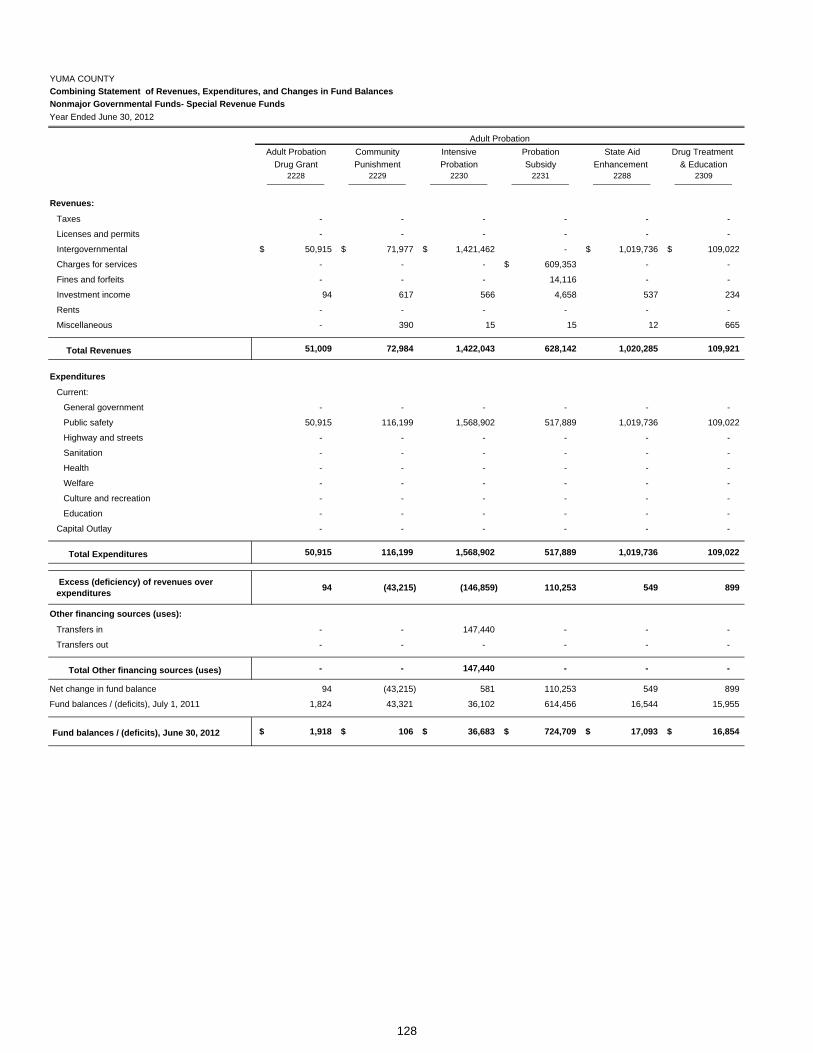
YUMA COUNTY
Combining Statement of Revenues, Expenditures, and Changes in Fund Balances
Nonmajor Governmental Funds- Special Revenue Funds
Adult Probation Community Intensive Probation State Aid Drug Treatment
Drug Grant Punishment Probation Subsidy Enhancement & Education2228 2229 2230 2231 2288 2309
______________ ______________ ______________ ______________ ______________ ______________
Revenues:
Taxes - - - - - -
Licenses and permits - - - - - -
Intergovernmental 50,915$ 71,977$ 1,421,462$ - 1,019,736$ 109,022$
Charges for services - - - 609,353$ - -
Fines and forfeits - - - 14,116 - -
Investment income 94 617 566 4,658 537 234
Rents - - - - - -
Miscellaneous - 390 15 15 12 665
Total Revenues 51,009 72,984 1,422,043 628,142 1,020,285 109,921
Expenditures
Current:
General government - - - - - -
Public safety 50,915 116,199 1,568,902 517,889 1,019,736 109,022
Highway and streets - - - - - -
Sanitation - - - - - -
Health - - - - - -
Welfare - - - - - -
Culture and recreation - - - - - -
Education - - - - - -
Capital Outlay - - - - - -
Total Expenditures 50,915 116,199 1,568,902 517,889 1,019,736 109,022
94 (43,215) (146,859) 110,253 549 899
Other financing sources (uses):
Transfers in - - 147,440 - - -
Transfers out - - - - - -
Total Other financing sources (uses) - - 147,440 - - -
Net change in fund balance 94 (43,215) 581 110,253 549 899
Fund balances / (deficits), July 1, 2011 1,824 43,321 36,102 614,456 16,544 15,955
Fund balances / (deficits), June 30, 2012 1,918$ 106$ 36,683$ 724,709$ 17,093$ 16,854$
Excess (deficiency) of revenues over expenditures
Year Ended June 30, 2012
Adult Probation
128

Exhibit I-1
(Continued)
Assessor Attorney
Drug Court Intensive Prob Extra Interstate Global Positioning AZ Wanted Property Atty Drug
Planning SupCrt / JCE Probation Comp Systems Task Force Information Enforcement2310 2321 2322 2323 2333 2345 2202 2207
______________ ______________ ______________ ______________ ______________ ______________ ______________ ______________
- - - - - - - -
- - - - - - - -
152,599$ 539,378$ - - 2,840$ 8,941$ - 273,267$
- - 720$ 6,236$ - - 52,751$ -
8,718 - - - - - - -
264 1,236 343 288 1 - 708 -
- - - - - - - -
7 - 5,807 - - - 10 -
161,588 540,614 6,870 6,524 2,841 8,941 53,469 273,267
- - - - - - 11,191 273,268
184,559 391,939 37,105 391 2,840 8,941 - -
- - - - - - - -
- - - - - - - -
- - - - - - - -
- - - - - - - -
- - - - - - - -
- - - - - - - -
- - - - - - - -
184,559 391,939 37,105 391 2,840 8,941 11,191 273,268
(22,971) 148,675 (30,235) 6,133 1 - 42,278 (1)
- - - - - - - -
- (147,440) - - - - - -
- (147,440) - - - - - -
(22,971) 1,235 (30,235) 6,133 1 - 42,278 (1)
49,056 20,900 64,205 36,904 39 6 58,543 1
26,085$ 22,135$ 33,970$ 43,037$ 40$ 6$ 100,821$ -$
Adult Probation
129

YUMA COUNTY
Combining Statement of Revenues, Expenditures, and Changes in Fund Balances
Nonmajor Governmental Funds- Special Revenue Funds
Crime Victim Witness Federal Victim Bad Check HIDTA Anti-
Comp Grant Program Comp Grant Fund Grant (SBA) Racketeering2209 2210 2223 2225 2227 2235
______________ ______________ ______________ ______________ ______________ ______________
Revenues:
Taxes - - - - - -
Licenses and permits - - - - - -
Intergovernmental 139,859$ 171,183$ 1,195$ - 251,677$ -
Charges for services - - - - - -
Fines and forfeits - - - - - 75,442$
Investment income - - - 195$ - 2,514
Rents - - - - - -
Miscellaneous - - - 25,884 - 41,305
Total Revenues 139,859 171,183 1,195 26,079 251,677 119,261
Expenditures
Current:
General government 139,860 253,994 - 57,030 - -
Public safety - - - - 251,775 86,679
Highway and streets - - - - - -
Sanitation - - - - - -
Health - - - - - -
Welfare - - - - - -
Culture and recreation - - - - - -
Education - - - - - -
Capital Outlay - - - - - -
Total Expenditures 139,860 253,994 - 57,030 251,775 86,679
(1) (82,811) 1,195 (30,951) (98) 32,582
Other financing sources (uses):
Transfers in 1,195 82,810 - 26,652 - -
Transfers out - - (1,195) - - -
Total Other financing sources (uses) 1,195 82,810 (1,195) 26,652 - -
Net change in fund balance 1,194 (1) - (4,299) (98) 32,582
Fund balances / (deficits), July 1, 2011 (1,195) 1 - 5,104 6,110 327,532
Fund balances / (deficits), June 30, 2012 (1)$ -$ -$ 805$ 6,012$ 360,114$
Excess (deficiency) of revenues over expenditures
Year Ended June 30, 2012
Attorney
130

Exhibit I-1
(Continued)
Fed Revenue Federal Federal Justice ACJC Domestic Crime Prosecution Victim Serv Victim Serv Victims
Asset Sharing Justice Asset Sharing Violence Enhancement Restitution ST Restitution FED Compensation2277 2278 2280 2284 2290 2330 2331 2335
______________ ______________ ______________ ______________ ______________ ______________ ______________ ______________
- - - - - - - -
- - - - - - - -
- - - - 167,096$ - - -
- - - - - - - -
- - - - - - - -
67$ 118$ 27$ 14$ 1,082 - 2,195$ -
- - - - - - - -
1 - - - 3 21,235$ 48 -
68 118 27 14 168,181 21,235 2,243 -
- - - - 126,697 - 1,159 -
6,723 5,045 10,494 - - - - -
- - - - - - - -
- - - - - - - -
- - - - - - - -
- - - - - - - -
- - - - - - - -
- - - - - - - -
- 5,863 - - - - - -
6,723 10,908 10,494 - 126,697 - 1,159 -
(6,655) (10,790) (10,467) 14 41,484 21,235 1,084 -
- - 8 - - - 355 -
- - - - (21,013) - - -
- - 8 - (21,013) - 355 -
(6,655) (10,790) (10,459) 14 20,471 21,235 1,439 -
11,559 22,843 11,287 1,930 160,099 214,950 19,371 8,461
4,904$ 12,053$ 828$ 1,944$ 180,570$ 236,185$ 20,810$ 8,461$
Attorney
131

YUMA COUNTY
Combining Statement of Revenues, Expenditures, and Changes in Fund Balances
Nonmajor Governmental Funds- Special Revenue Funds
Victim Assist Victim Assist Victim Rights Expedited Child Support Clerk's
Program Subrogation Program Child Support Automation Fund2343 2344 2346 2213 2214 2216
______________ ______________ ______________ ______________ ______________ ______________
Revenues:
Taxes - - - - - -
Licenses and permits - - - - - -
Intergovernmental 25,600$ - 73,298$ - - -
Charges for services - - - - - 47,903$
Fines and forfeits - - - 31,259$ - -
Investment income - - - 313 12$ 520
Rents - - - - - -
Miscellaneous - - - 2 - 6
Total Revenues 25,600 - 73,298 31,574 12 48,429
Expenditures
Current:
General government 75,549 - 86,255 24,385 - 54,881
Public safety - - - - - -
Highway and streets - - - - - -
Sanitation - - - - - -
Health - - - - - -
Welfare - - - - - -
Culture and recreation - - - - - -
Education - - - - - -
Capital Outlay - - - - - -
Total Expenditures 75,549 - 86,255 24,385 - 54,881
(49,949) - (12,957) 7,189 12 (6,452)
Other financing sources (uses):
Transfers in 49,949 - 12,956 - - -
Transfers out - - - - - -
Total Other financing sources (uses) 49,949 - 12,956 - - -
Net change in fund balance - - (1) 7,189 12 (6,452)
Fund balances / (deficits), July 1, 2011 - 12,235 1 39,522 1,626 83,055
Fund balances / (deficits), June 30, 2012 -$ 12,235$ -$ 46,711$ 1,638$ 76,603$
Excess (deficiency) of revenues over expenditures
Attorney Clerk of Superior Court
Year Ended June 30, 2012
132

Exhibit I-1
(Continued)
Emergency Mgnt
Spousal Maint IV-D Case Victims Road Help Health and Other
Enforcement Processing Location Fund CDBG America Vote Human Services Grants2218 2318 2336 2251 2296 2203 2347 2334
______________ ______________ ______________ ______________ ______________ ______________ ______________ ______________
- - - - - - - -
- - - - - - - -
- - - - 406,207$ 11,404$ 30,000$ 135,145$
- - - - - - - -
5,688$ - - - - - - -
404 - 23$ 6,770$ 83 575 11 61
- - - - - - - -
- - - 39 - - - -
6,092 - 23 6,809 406,290 11,979 30,011 135,206
- 7,867$ - - 404,062 92,555 - -
- - - - - - - 126,670
- - - - - - - -
- - - - - - - -
- - - - - - - -
- - - - - - - -
- - - - - - - -
- - - - - - - -
- - - - - 24,295 - 12,713
- 7,867 - - 404,062 116,850 - 139,383
6,092 (7,867) 23 6,809 2,228 (104,871) 30,011 (4,177)
- - - - - - - -
- - - - (152) - - -
- - - - (152) - - -
6,092 (7,867) 23 6,809 2,076 (104,871) 30,011 (4,177)
52,793 7,867 2,956 795,899 22,443 116,778 - 23,137
58,885$ -$ 2,979$ 802,708$ 24,519$ 11,907$ 30,011$ 18,960$
Clerk of Superior Court Development Services Election Services
133

YUMA COUNTY
Combining Statement of Revenues, Expenditures, and Changes in Fund Balances
Nonmajor Governmental Funds- Special Revenue Funds
Juvenile Court
HOME Public Conventional Section 8 Water Co. Family
Grant Housing 13-6-PHA Voucher Prog 13-6 Counseling2269 2271 2273 2274 2275 2212
______________ ______________ ______________ ______________ ______________ ______________
Revenues:
Taxes - - - - - -
Licenses and permits - - - - - -
Intergovernmental 144,532$ - 1,122,431$ 2,160,484$ - 24,350$
Charges for services - - - - - -
Fines and forfeits - - - - - -
Investment income 17 114$ 13 1,619 720$ 101
Rents - - 281,965 - - -
Miscellaneous - - 8,956 35,798 141,577 -
Total Revenues 144,549 114 1,413,365 2,197,901 142,297 24,451
Expenditures
Current:
General government 146,059 - - - - -
Public safety - - - - - 24,350
Highway and streets - - - - - -
Sanitation - - - - - -
Health - - - - - -
Welfare - 64 1,104,467 2,490,455 120,068 -
Culture and recreation - - - - - -
Education - - - - - -
Capital Outlay - - 278,284 - - -
Total Expenditures 146,059 64 1,382,751 2,490,455 120,068 24,350
(1,510) 50 30,614 (292,554) 22,229 101
Other financing sources (uses):
Transfers in - - - - - -
Transfers out - - - - - -
Total Other financing sources (uses) - - - - - -
Net change in fund balance (1,510) 50 30,614 (292,554) 22,229 101
Fund balances / (deficits), July 1, 2011 6,845 30,052 338,283 994,137 444,358 6,728
Fund balances / (deficits), June 30, 2012 5,335$ 30,102$ 368,897$ 701,583$ 466,587$ 6,829$
Excess (deficiency) of revenues over expenditures
Year Ended June 30, 2012
Housing
134

Exhibit I-1
(Continued)
Juvenile Juvenile Crime Juvenile Detention Charter Juvenile State Aid Court Appointed
Probation Fees Reduction Restitution Education School Victim Rights Supreme Court Specialist2232 2233 2240 2242 2245 2246 2247 2248
______________ ______________ ______________ ______________ ______________ ______________ ______________ ______________
- - - - - - - -
- - - - - - - -
- 39,945$ - 15,321$ 823,889$ 17,050$ 739,476$ 97,084$
236,302$ - - - - - - -
- - - - - - - -
1,035 - - 2,347 3,616 42 577 -
- - - - - - - -
17 - 3,283$ 23,360 4,922 1 - -
237,354 39,945 3,283 41,028 832,427 17,093 740,053 97,084
- - - - - - - -
169,682 39,945 5,128 330,697 - 17,092 739,476 97,088
- - - - - - - -
- - - - - - - -
- - - - - - - -
- - - - - - - -
- - - - - - - -
- - - - 701,394 - - -
- - - - 10,850 - - -
169,682 39,945 5,128 330,697 712,244 17,092 739,476 97,088
67,672 - (1,845) (289,669) 120,183 1 577 (4)
- - - 394,569 - - - -
- - - - (2,803) - - -
- - - 394,569 (2,803) - - -
67,672 - (1,845) 104,900 117,380 1 577 (4)
143,708 1 9,420 344,815 417,484 1 27,359 -
211,380$ 1$ 7,575$ 449,715$ 534,864$ 2$ 27,936$ (4)$
Juvenile Court
135

YUMA COUNTY
Combining Statement of Revenues, Expenditures, and Changes in Fund Balances
Nonmajor Governmental Funds- Special Revenue Funds
Court Improving AM Juvenile Drug Court Intensive Juvenile
Improvement Schools Probation Education Probation Diversion Intake2249 2257 2259 2262 2265 2266
______________ ______________ ______________ ______________ ______________ ______________
Revenues:
Taxes - - - - - -
Licenses and permits - - - - - -
Intergovernmental 26,594$ 3,613$ 81,204$ 41,940$ 1,035,140$ 633,619$
Charges for services - - - - - -
Fines and forfeits - - - - - -
Investment income - 8 145 37 725 794
Rents - - - - - -
Miscellaneous - 5 2 - - -
Total Revenues 26,594 3,626 81,351 41,977 1,035,865 634,413
Expenditures
Current:
General government 25,770 - - 41,940 - -
Public safety 823 15,994 92,709 - 1,035,140 618,524
Highway and streets - - - - - -
Sanitation - - - - - -
Health - - - - - -
Welfare - - - - - -
Culture and recreation - - - - - -
Education - - - - - -
Capital Outlay - - - - - 15,094
Total Expenditures 26,593 15,994 92,709 41,940 1,035,140 633,618
1 (12,368) (11,358) 37 725 795
Other financing sources (uses):
Transfers in - 2,803 - - - -
Transfers out - - - - - -
Total Other financing sources (uses) - 2,803 - - - -
Net change in fund balance 1 (9,565) (11,358) 37 725 795
Fund balances / (deficits), July 1, 2011 - (2,796) 11,389 898 28,981 50,768
Fund balances / (deficits), June 30, 2012 1$ (12,361)$ 31$ 935$ 29,706$ 51,563$
Excess (deficiency) of revenues over expenditures
Juvenile Court
Year Ended June 30, 2012
136

Exhibit I-1
(Continued)
Justice Courts
Juvenile Juvenile Account Justice Court Indigent Defender LSTA Other
Diversion Prog Treatment Incentive Enhancement Dependency Training Grants Grants2267 2268 2327 2317 2241 2326 2312 2313
______________ ______________ ______________ ______________ ______________ ______________ ______________ ______________
- - - - - - - -
- - - - - - - -
93,460$ 360,039$ 37,657$ 8,504$ - 13,433$ 49,675$ -
- - - - - - - -
- - - 301,614 - - - -
88 440 28 3,266 14$ 103 165 752$
- - - - - - - -
- - - 4,572 - 182 3 69,193
93,548 360,479 37,685 317,956 14 13,718 49,843 69,945
- - 36,869 327,164 - 14,147 - -
93,460 360,039 - - - - - -
- - - - - - - -
- - - - - - - -
- - - - - - - -
- - - - - - - -
- - - - - - 49,675 61,129
- - - - - - - -
- - - - - - - -
93,460 360,039 36,869 327,164 - 14,147 49,675 61,129
88 440 816 (9,208) 14 (429) 168 8,816
- - 7,320 2,056 - - - -
- - - (312,113) - - - -
- - 7,320 (310,057) - - - -
88 440 8,136 (319,265) 14 (429) 168 8,816
8,653 19,902 756 728,017 1,881 10,456 9,470 76,515
8,741$ 20,342$ 8,892$ 408,752$ 1,895$ 10,027$ 9,638$ 85,331$
Legal & Public Defenders Library DistrictJuvenile Court
137

YUMA COUNTY
Combining Statement of Revenues, Expenditures, and Changes in Fund Balances
Nonmajor Governmental Funds- Special Revenue Funds
Recorder Superintendent
Health Rabies Waste Pub Wrk Recorder's School
Grants Control Tire HURF Fund Grants 2260 2264 2204 2253 2205 2281
______________ ______________ ______________ ______________ ______________ ______________
Revenues:
Taxes - - - 912,500$ - -
Licenses and permits - 34,131$ - - - -
Intergovernmental 4,210,745$ - 276,990$ 5,732,507 - 846,310$
Charges for services - - 35,809 - 116,200$ -
Fines and forfeits - 1,877 - - - -
Investment income 1,744 300 3,005 23,769 2,764 -
Rents - - - - - -
Miscellaneous 306 1 5 155,453 36 -
Total Revenues 4,212,795 36,309 315,809 6,824,229 119,000 846,310
Expenditures
Current:
General government - - - - 100,671 -
Public safety - - - - - -
Highway and streets - - - 6,640,777 - -
Sanitation - - 281,979 - - -
Health 4,206,482 439,735 - - - -
Welfare - - - - - -
Culture and recreation - - - - - -
Education - - - - - 408,354
Capital Outlay - 102,596 15,477 441,449 - -
Total Expenditures 4,206,482 542,331 297,456 7,082,226 100,671 408,354
6,313 (506,022) 18,353 (257,997) 18,329 437,956
Other financing sources (uses):
Transfers in - 453,694 - - - -
Transfers out - - - - (492,000) (431,313)
Total Other financing sources (uses) - 453,694 - - (492,000) (431,313)
Net change in fund balance 6,313 (52,328) 18,353 (257,997) (473,671) 6,643
Fund balances / (deficits), July 1, 2011 344,472 77,928 405,434 3,828,812 741,545 689,227
Fund balances / (deficits), June 30, 2012 350,785$ 25,600$ 423,787$ 3,570,815$ 267,874$ 695,870$
Excess (deficiency) of revenues over expenditures
Public Works Public Health District
Year Ended June 30, 2012
138
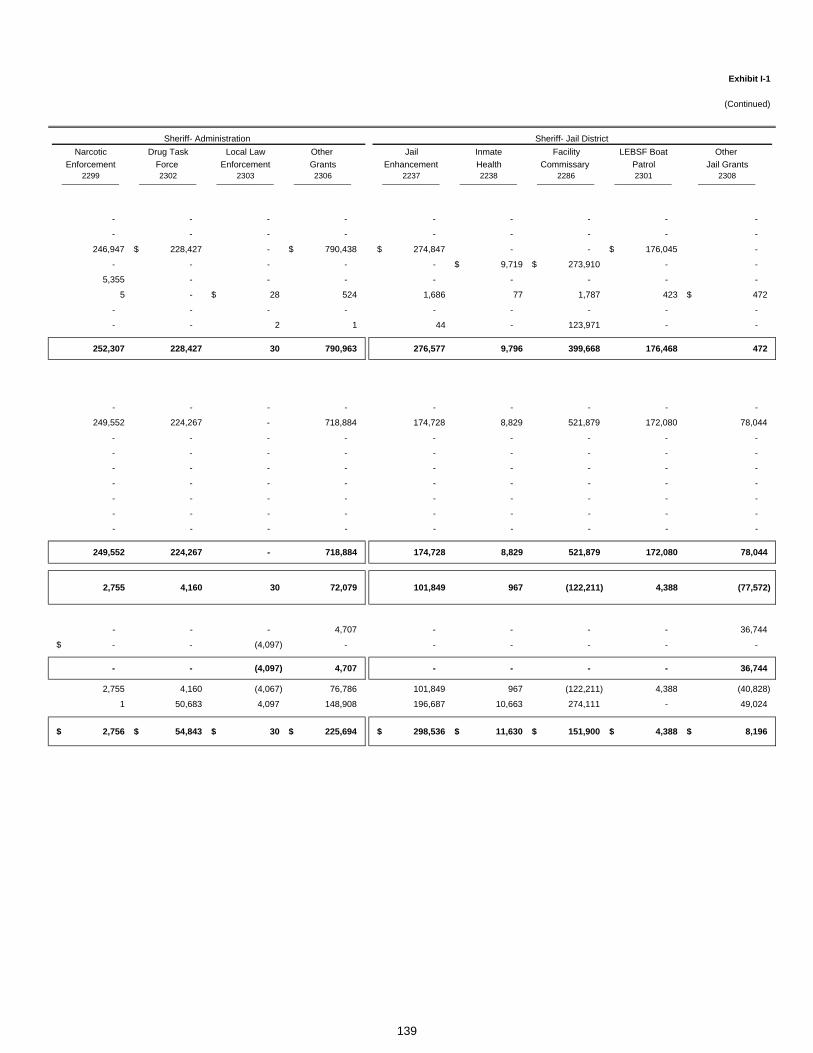
Exhibit I-1
(Continued)
Narcotic Drug Task Local Law Other Jail Inmate Facility LEBSF Boat Other
Enforcement Force Enforcement Grants Enhancement Health Commissary Patrol Jail Grants2299 2302 2303 2306 2237 2238 2286 2301 2308
______________ ______________ ______________ ______________ ______________ ______________ ______________ ______________ ______________
- - - - - - - - -
- - - - - - - - -
246,947 228,427$ - 790,438$ 274,847$ - - 176,045$ -
- - - - - 9,719$ 273,910$ - -
5,355 - - - - - - - -
5 - 28$ 524 1,686 77 1,787 423 472$
- - - - - - - - -
- - 2 1 44 - 123,971 - -
252,307 228,427 30 790,963 276,577 9,796 399,668 176,468 472
- - - - - - - - -
249,552 224,267 - 718,884 174,728 8,829 521,879 172,080 78,044
- - - - - - - - -
- - - - - - - - -
- - - - - - - - -
- - - - - - - - -
- - - - - - - - -
- - - - - - - - -
- - - - - - - - -
249,552 224,267 - 718,884 174,728 8,829 521,879 172,080 78,044
2,755 4,160 30 72,079 101,849 967 (122,211) 4,388 (77,572)
- - - 4,707 - - - - 36,744
-$ - (4,097) - - - - - -
- - (4,097) 4,707 - - - - 36,744
2,755 4,160 (4,067) 76,786 101,849 967 (122,211) 4,388 (40,828)
1 50,683 4,097 148,908 196,687 10,663 274,111 - 49,024
2,756$ 54,843$ 30$ 225,694$ 298,536$ 11,630$ 151,900$ 4,388$ 8,196$
Sheriff- Administration Sheriff- Jail District
139

YUMA COUNTY
Combining Statement of Revenues, Expenditures, and Changes in Fund Balances
Nonmajor Governmental Funds- Special Revenue Funds
Conciliation Domestic Local Court JCEF Law Aztec Field
Court Relations Assistance Time Payment Library Training2211 2217 2221 2222 2224 2234
______________ ______________ ______________ ______________ ______________ ______________
Revenues:
Taxes - - - - - -
Licenses and permits - - - - - -
Intergovernmental - - - - - 25,003$
Charges for services - - - - - -
Fines and forfeits 76,097$ 9,502$ 180,101$ 102,782$ 97,749$ -
Investment income 420 180 876 266 524 -
Rents - - - - - -
Miscellaneous 4,589 4 18 2 5,777 -
Total Revenues 81,106 9,686 180,995 103,050 104,050 25,003
Expenditures
Current:
General government 44,247 15,520 36,228 116,401 115,869 -
Public safety - - - - - 25,262
Highway and streets - - - - - -
Sanitation - - - - - -
Health - - - - - -
Welfare - - - - - -
Culture and recreation - - - - - -
Education - - - - - -
Capital Outlay - - - - 14,022 -
Total Expenditures 44,247 15,520 36,228 116,401 129,891 25,262
36,859 (5,834) 144,767 (13,351) (25,841) (259)
Other financing sources (uses):
Transfers in - - - - - -
Transfers out - - (116,178) - (85,000) -
Total Other financing sources (uses) - - (116,178) - (85,000) -
Net change in fund balance 36,859 (5,834) 28,589 (13,351) (110,841) (259)
Fund balances / (deficits), July 1, 2011 44,424 28,863 305 58,466 152,288 3,380
Fund balances / (deficits), June 30, 2012 81,283$ 23,029$ 28,894$ 45,115$ 41,447$ 3,121$
Excess (deficiency) of revenues over expenditures
Year Ended June 30, 2012
Superior Court
140

Exhibit I- 1
(Continued)
Treasurer
Supreme Court Fee- Case Children's Child Support Treasurer's Fill the Southwest ARRA
Enhancement Management Issues Educate Enforcement Information Gap Border Grants 2324 2325 2339 2215 2201 2319 2320 2342
______________ ______________ ______________ ______________ ______________ ______________ ______________ ______________
- - - - - - - -
- - - - - - - -
- 3,200$ - 162,881$ - 110,053$ - 730,982$
- - - - 9,931$ - - -
71,048$ 112,435 34,045$ - - 132,289 - -
327 1,028 491 250 1,020 272 107$ 25
- - - - - - - -
2 - - 2,113 10,065 15 478 -
71,377 116,663 34,536 165,244 21,016 242,629 585 731,007
87,118 160,533 18,314 160,705 - 504,661 - 149,737
- - - - - - - 228,170
- - - - - - - -
- - - - - - - -
- - - - - - - 20,504
- - - - - - - -
- - - - - - - 7,187
- - - - - - - 29,001
- 6,144 - - - - - 188,782
87,118 166,677 18,314 160,705 - 504,661 - 623,381
(15,741) (50,014) 16,222 4,539 21,016 (262,032) 585 107,626
- 12,113 - - - 136,303 686 168
- (25,000) - - - - (27,351) (429)
- (12,887) - - - 136,303 (26,665) (261)
(15,741) (62,901) 16,222 4,539 21,016 (125,729) (26,080) 107,365
54,779 161,198 60,031 111,372 129,562 132,684 26,080 (104,478)
39,038$ 98,297$ 76,253$ 115,911$ 150,578$ 6,955$ -$ 2,887$
Superior Court Other- Multiple Departments
141

YUMA COUNTY Exhibit I- 1
Combining Statement of Revenues, Expenditures, and Changes in Fund Balances
Nonmajor Governmental Funds- Special Revenue Funds (Concluded)
Total
Workforce Improvement Other Special
Investment Act Districts Nonmajor Funds Revenue2291 ALL Misc Funds
______________ ______________ ______________ ______________
Revenues:
Taxes - 958,139$ - 1,870,639$
Licenses and permits - - - 34,131
Intergovernmental 5,527,686$ - - 31,975,302
Charges for services - - - 1,398,834
Fines and forfeits - - 10,484$ 1,270,601
Investment income 429 8,436 8 92,539
Rents - - - 281,965
Miscellaneous 11 2,851 - 693,059
Total Revenues 5,528,126 969,426 10,492 37,617,070
Expenditures
Current:
General government - 840,339 - 4,551,045
Public safety - - - 10,537,666
Highway and streets - - - 6,640,777
Sanitation - - - 281,979
Health - - - 4,666,721
Welfare - - - 3,715,054
Culture and recreation - - - 117,991
Education 5,474,263 - - 6,613,012
Capital Outlay - - - 1,115,569
Total Expenditures 5,474,263 840,339 - 38,239,814
53,863 129,087 10,492 (622,744)
Other financing sources (uses):
Transfers in - 860 547 1,373,935
Transfers out - (889) (2,098) (1,669,071)
Total Other financing sources (uses) - (29) (1,551) (295,136)
Net change in fund balance 53,863 129,058 8,941 (917,880)
Fund balances / (deficits), July 1, 2011 34,815 991,659 2,299 15,321,620
Fund balances / (deficits), June 30, 2012 88,678$ 1,120,717$ 11,240$ 14,403,740$
Excess (deficiency) of revenues over expenditures
Other - Miscellaneous
Year Ended June 30, 2012
142

{This page is intentionally left blank}
143

YUMA COUNTY
Combining Statement of Revenues, Expenditures, and Changes in Fund Balances
Nonmajor Governmental Funds- All Debt Service Funds
Jail
East Co District El Prado
Facility Debt Estates Gadsden
3503 3500 3545 3546______________ ______________ ______________ ______________
Revenues:
Taxes - 9$ - -
Special assessments - - 18,347$ 21,620$
Investment income 1,290$ 6,104 - -
Miscellaneous 134 1 4 -
Total Revenues 1,424 6,114 18,351 21,620
Expenditures
Current:
Public safety - 159,185 - -
Culture and recreation - - - -
Debt service:
Principal retirement 245,000 550,000 94,354 119,984
Interest and fiscal charges 17,185 272,276 6,112 13,462
Total Expenditures 262,185 981,461 100,466 133,446
(260,761) (975,347) (82,115) (111,826)
Other financing sources (uses):
Proceeds from sale of bonds - 8,000,000 - -
Payment to refunded debt - (8,692,607) - -
Premiums - 845,567 - -
Transfers in 829,000 1,023,925 811 -
Transfers out - (545,000) - -
Total Other financing sources (uses) 829,000 631,885 811 -
Net change in fund balance 568,239 (343,462) (81,304) (111,826)
Fund balances / (deficits), July 1, 2011 3,652 92,718 159,192 176,136
Fund balances / (deficits), June 30, 2012 571,891$ (250,744)$ 77,888$ 64,310$
Year Ended June 30, 2012
Excess (deficiency) of revenues over expenditures
Improvement Districts
144

Exhibit I- 2
Library Total
District Debt
Debt Service
3547 Funds______________ ______________
- 9$
- 39,967
24,214$ 31,608
- 139
24,214 71,723
- 159,185
800 800
1,120,000 2,129,338
2,204,826 2,513,861
3,325,626 4,803,184
(3,301,412) (4,731,461)
- 8,000,000
- (8,692,607)
- 845,567
6,204,395 8,058,131
- (545,000)
6,204,395 7,666,091
2,902,983 2,934,630
978,894 1,410,592
3,881,877$ 4,345,222$
145

YUMA COUNTY
Combining Statement of Revenues, Expenditures, and Changes in Fund Balances
Nonmajor Governmental Funds- Capital Projects Funds
Jail
District El Prado B & C B & C
Capital Estates Gadsden Colonial ARRA
04403 04717 04719 04721 04722______________ ______________ ______________ ______________ ______________
Revenues:
Intergovernmental - - - 1,057,758$ 6,562,191$
Investment income 15$ - - - -
Miscellaneous 112 3$ - - -
Total Revenues 127 3 - 1,057,758 6,562,191
Expenditures
Current:
General government - - - 7,487 82,060
Public safety 116,000 - - - -
Capital Outlay - - - 1,081,901 6,495,160
Total Expenditures 116,000 - - 1,089,388 6,577,220
(115,873) 3 - (31,630) (15,029)
Other financing sources (uses):
Excess (deficiency) of revenues over expenditures
Year Ended June 30, 2012
Improvement Districts
Other financing sources (uses):
Transfers in 545,000 - - - -
Transfers out - - - - -
Total Other financing sources (uses) 545,000 - - - -
Net change in fund balance 429,127 3 - (31,630) (15,029)
Fund balances / (deficits), July 1, 2011 680 (9,756) - 107,282 (13,103)
Fund balances / (deficits), June 30, 2012 429,807$ (9,753)$ -$ 75,652$ (28,132)$
146

Exhibit I- 3
Library Total
District Capital
Capital Projects
04720 Funds______________ ______________
15,987$ 7,635,936$
13,492 13,507
- 115
29,479 7,649,558
85,756 175,303
- 116,000
494,162 8,071,223
579,918 8,362,526
(550,439) (712,968)
- 545,000
(2,879,570) (2,879,570)
(2,879,570) (2,334,570)
(3,430,009) (3,047,538)
3,619,711 3,704,814
189,702$ 657,276$
147

YUMA COUNTY Exhibit I- 4
Combining Statement of Revenues, Expenditures, and Changes in Fund Balances
All Nonmajor Governmental Funds
Total
Special Debt Capital Nonmajor
Revenue Service Projects Governmental
Funds Funds Funds Funds______________ ______________ ______________ ______________
Revenues:
Taxes 1,870,639$ 9$ - 1,870,648$
Special assessments - 39,967 - 39,967
Licenses and permits 34,131 - - 34,131
Intergovernmental 31,975,302 - 7,635,936$ 39,611,238
Charges for services 1,398,834 - - 1,398,834
Fines and forfeits 1,270,601 - - 1,270,601
Investment income 92,539 31,608 13,507 137,654
Rents 281,965 - - 281,965
Miscellaneous 693,059 139 115 693,313
Total Revenues 37,617,070 71,723 7,649,558 45,338,351$
Expenditures
Current:
General government 4,551,045 - 175,303 4,726,348
Public safety 10,537,666 159,185 116,000 10,812,851
Highway and streets 6,640,777 - - 6,640,777
Sanitation 281,979 - - 281,979
Health 4,666,721 - - 4,666,721
Welfare 3,715,054 - - 3,715,054
Culture and recreation 117,991 800 - 118,791
Education 6,613,012 - - 6,613,012
Capital outlay 1,115,569 - 8,071,223 9,186,792
Debt service:
Principal retirement - 2,129,338 - 2,129,338
Interest and fiscal charges - 2,513,861 - 2,513,861
Total Expenditures 38,239,814 4,803,184 8,362,526 51,405,524
(622,744) (4,731,461) (712,968) (6,067,173)
Other financing sources (uses):
Sale of bonds - 8,000,000 - 8,000,000
Payment to refunded debt - (8,692,607) - (8,692,607)
Premiums - 845,567 - 845,567
Transfers in 1,373,935 8,058,131 545,000 9,977,066
Transfers out (1,669,071) (545,000) (2,879,570) (5,093,641)
Total other financing sources (uses) (295,136) 7,666,091 (2,334,570) 5,036,385
Net change in fund balance (917,880) 2,934,630 (3,047,538) (1,030,788)
Fund balances / (deficits), July 1, 2011 15,321,620 1,410,592 3,704,814 20,437,026
Fund balances / (deficits), June 30, 2012 14,403,740$ 4,345,222$ 657,276$ 19,406,238$
Year Ended June 30, 2012
Total All Nonmajor Governmental Funds
Excess (deficiency) of revenues over expenditures
148

Budgetary Comparison Schedules Nonmajor Governmental Funds
Special Revenue Funds 150 Debt Service Funds 192 Capital Projects Funds 196
149

YUMA COUNTY
Budgetary Comparison Schedule- Nonmajor Governmental Funds- Special Revenue Funds
2228 2229
Budget Actual Variance * Budget Actual Variance *
Revenues:
Taxes - - - - - -
Licenses and permits - - - - - -
Intergovernmental 62,495$ 50,915$ (11,580)$ 120,555$ 71,977$ (48,578)$
Charges for services - - - - - -
Fines and forfeits - - - - - -
Investment income 124 94 (30) 3,305 617 (2,688)
Rents - - - - - -
Miscellaneous - - - - 390 390
Total Revenues 62,619 51,009 (11,610) 123,860 72,984 (50,876)
Expenditures
Current:
General government - - - - - -
Public safety 62,495 50,915 11,580 171,369 116,199 55,170
Highway and streets - - - - - -
Sanitation - - - - - -
Health - - - - - -
Welfare - - - - - -
Culture and recreation - - - - - -
Education - - - - - -
Capital Outlay - - - - - -
Total Expenditures 62,495 50,915 11,580 171,369 116,199 55,170
124 94 (30) (47,509) (43,215) 4,294
Other financing sources (uses):
Transfers in - - - - - -
Transfers out - - - - - -
Total Other financing sources (uses) - - - - - -
Net change in fund balance 124 94 (30) (47,509) (43,215) 4,294
Fund balances / (deficits), July 1, 2011 (124) 1,824 1,948 47,509 43,321 (4,188)
Fund balances / (deficits), June 30, 2012 -$ 1,918$ 1,918$ -$ 106$ 106$
* Variance = Positive / (Negative)
Adult Probation Drug Grant Community Punishment
Year Ended June 30, 2012
Adult Probation
Excess (deficiency) of revenues over expenditures
150

Exhibit J- 1
(Continued)
2230 2231 2288
Budget Actual Variance * Budget Actual Variance * Budget Actual Variance *
- - - - - - - - -
- - - - - - - - -
1,421,462$ 1,421,462$ - - - - 1,019,736$ 1,019,736$ -
- - - 566,786$ 609,353$ 42,567$ - - -
- - - 12,409 14,116 1,707 - - -
1,048 566 (482)$ 6,813 4,658 (2,155) 987 537 (450)$
- - - - - - - - -
- 15 15 - 15 15 - 12 12
1,422,510 1,422,043 (467) 586,008 628,142 42,134 1,020,723 1,020,285 (438)
- - - - - - - - -
1,593,258 1,568,902 24,356 577,415 517,889 59,526 1,024,736 1,019,736 5,000
- - - - - - - - -
- - - - - - - - -
- - - - - - - - -
- - - - - - - - -
- - - - - - - - -
- - - - - - - - -
- - - - - - - - -
1,593,258 1,568,902 24,356 577,415 517,889 59,526 1,024,736 1,019,736 5,000
(170,748) (146,859) 23,889 8,593 110,253 101,660 (4,013) 549 4,562
169,963 147,440 (22,523) - - - 5,000 - (5,000)
- - - - - - - - -
169,963 147,440 (22,523) - - - 5,000 - (5,000)
(785) 581 1,366 8,593 110,253 101,660 987 549 (438)
785 36,102 35,317 (8,593) 614,456 623,049 (987) 16,544 17,531
-$ 36,683$ 36,683$ -$ 724,709$ 724,709$ -$ 17,093$ 17,093$
State Aid EnhancementIntensive Probation Probation Subsidy
151

YUMA COUNTY
Budgetary Comparison Schedule- Nonmajor Governmental Funds- Special Revenue Funds
2309 2310
Budget Actual Variance * Budget Actual Variance *
Revenues:
Taxes - - - - - -
Licenses and permits - - - - - -
Intergovernmental 120,571$ 109,022$ (11,549)$ 152,608$ 152,599$ (9)$
Charges for services - - - - - -
Fines and forfeits - - - 9,164 8,718 (446)
Investment income 396 234 (162) 778 264 (514)
Rents - - - - - -
Miscellaneous 5,601 665 (4,936) - 7 7
Total Revenues 126,568 109,921 (16,647) 162,550 161,588 (962)
Expenditures
Current:
General government - - - - - -
Public safety 126,172 109,022 17,150 184,559 184,559 -
Highway and streets - - - - - -
Sanitation - - - - - -
Health - - - - - -
Welfare - - - - - -
Culture and recreation - - - - - -
Education - - - - - -
Capital Outlay - - - - - -
Total Expenditures 126,172 109,022 17,150 184,559 184,559 -
396 899 503 (22,009) (22,971) (962)
Other financing sources (uses):
Transfers in - - - - - -
Transfers out - - - - - -
Total Other financing sources (uses) - - - - - -
Net change in fund balance 396 899 503 (22,009) (22,971) (962)
Fund balances / (deficits), July 1, 2011 (396) 15,955 16,351 22,009 49,056 27,047
Fund balances / (deficits), June 30, 2012 -$ 16,854$ 16,854$ -$ 26,085$ 26,085$
* Variance = Positive / (Negative)
Drug Treatment & Education Drug Court Planning
Year Ended June 30, 2012
Adult Probation
Excess (deficiency) of revenues over expenditures
152

Exhibit J- 1
(Continued)
2321 2322 2323
Budget Actual Variance * Budget Actual Variance * Budget Actual Variance *
- - - - - - - - -
- - - - - - - - -
562,360$ 539,378$ (22,982)$ - - - - - -
- - - 3,245$ 720$ (2,525)$ 7,090$ 6,236$ (854)$
- - - - - - - - -
2,109 1,236 (873) 1,018 343 (675) 389 288 (101)
- - - - - - - - -
- - - - 5,807 5,807 - - -
564,469 540,614 (23,855) 4,263 6,870 2,607 7,479 6,524 (955)
-
- - - - - - - - -
391,939 391,939 - 68,468 37,105 31,363 700 391 309
- - - - - - - - -
- - - - - - - - -
- - - - - - - - -
- - - - - - - - -
- - - - - - - - -
- - - - - - - - -
- - - - - - - - -
391,939 391,939 - 68,468 37,105 31,363 700 391 309
172,530 148,675 (23,855) (64,205) (30,235) 33,970 6,779 6,133 (646)
- - - - - - - - -
(174,963) (147,440) 27,523 - - - - - -
(174,963) (147,440) 27,523 - - - - - -
(2,433) 1,235 3,668 (64,205) (30,235) 33,970 6,779 6,133 (646)
2,433 20,900 18,467 64,205 64,205 - (6,779) 36,904 43,683
-$ 22,135$ 22,135$ -$ 33,970$ 33,970$ -$ 43,037$ 43,037$
Extra Probation Interstate Comp Intensive Probation SupCrt / JCEF
Adult Probation
153

YUMA COUNTY
Budgetary Comparison Schedule- Nonmajor Governmental Funds- Special Revenue Funds
2333 2345
Budget Actual Variance * Budget Actual Variance *
Revenues:
Taxes - - - - - -
Licenses and permits - - - - - -
Intergovernmental 2,840$ 2,840$ - 14,000$ 8,941$ (5,059)$
Charges for services - - - - - -
Fines and forfeits - - - - - -
Investment income 5 1 (4)$ - - -
Rents - - - - - -
Miscellaneous - - - - - -
Total Revenues 2,845 2,841 (4) 14,000 8,941 (5,059)
Expenditures
Current:
General government - - - - - -
Public safety 2,840 2,840 - 14,000 8,941 5,059
Highway and streets - - - - - -
Sanitation - - - - - -
Health - - - - - -
Welfare - - - - - -
Culture and recreation - - - - - -
Education - - - - - -
Capital Outlay - - - - - -
Total Expenditures 2,840 2,840 - 14,000 8,941 5,059
5 1 (4) - - -
Other financing sources (uses):
Transfers in - - - - - -
Transfers out - - - - - -
Total Other financing sources (uses) - - - - - -
Net change in fund balance 5 1 (4) - - -
Fund balances / (deficits), July 1, 2011 (5) 39 44 - 6 6
Fund balances / (deficits), June 30, 2012 -$ 40$ 40$ -$ 6$ 6$
* Variance = Positive / (Negative)
AZ Wanted Task ForceGlobal Positiioning Syst
Adult ProbationAdult Probation
Year Ended June 30, 2012
Excess (deficiency) of revenues over expenditures
154

Exhibit J- 1
(Continued)
2202 2207 2209
Budget Actual Variance * Budget Actual Variance * Budget Actual Variance *
- - - - - - - - -
- - - - - - - - -
- - - 288,167$ 273,267$ (14,900)$ 145,208$ 139,859$ (5,349)$
50,000$ 52,751$ 2,751$ - - - - - -
- - - - - - - - -
- 708 708 - - - - - -
- - - - - - - - -
- 10 10 - - - - - -
50,000 53,469 3,469 288,167 273,267 (14,900) 145,208 139,859 (5,349)
- -
16,888 11,191 5,697 288,167 273,268 14,899 145,208 139,860 5,348
- - - - - - - - -
- - - - - - - - -
- - - - - - - - -
- - - - - - - - -
- - - - - - - - -
- - - - - - - - -
- - - - - - - - -
- - - - - - - - -
16,888 11,191 5,697 288,167 273,268 14,899 145,208 139,860 5,348
33,112 42,278 9,166 - (1) (1) - (1) (1)
- - - - - - - 1,195 1,195
- - - - - - - - -
- - - - - - - 1,195 1,195
33,112 42,278 9,166 - (1) (1) - 1,194 1,194
(33,112) 58,543 91,655 - 1 1 - (1,195) (1,195)
-$ 100,821$ 100,821$ -$ -$ -$ -$ (1)$ (1)$
Property Information Atty Drug Enforcement Crime Victim Comp Grant
AttorneyAssessor
155

YUMA COUNTY
Budgetary Comparison Schedule- Nonmajor Governmental Funds- Special Revenue Funds
2210 2223
Budget Actual Variance * Budget Actual Variance *
Revenues:
Taxes - - - - - -
Licenses and permits - - - - - -
Intergovernmental 171,183$ 171,183$ - 37,155$ 1,195$ (35,960)$
Charges for services - - - - - -
Fines and forfeits - - - - - -
Investment income - - - - - -
Rents - - - - - -
Miscellaneous - - - - - -
Total Revenues 171,183 171,183 - 37,155 1,195 (35,960)
Expenditures
Current:
General government 259,206 253,994 5,212$ 37,155 - 37,155
Public safety - - - - - -
Highway and streets - - - - - -
Sanitation - - - - - -
Health - - - - - -
Welfare - - - - - -
Culture and recreation - - - - - -
Education - - - - - -
Capital Outlay - - - - - -
Total Expenditures 259,206 253,994 5,212 37,155 - 37,155
(88,023) (82,811) 5,212 - 1,195 1,195
Other financing sources (uses):
Transfers in 88,023 82,810 (5,213) - - -
Transfers out - - - - (1,195) (1,195)
Total Other financing sources (uses) 88,023 82,810 (5,213) - (1,195) (1,195)
Net change in fund balance - (1) (1) - - -
Fund balances / (deficits), July 1, 2011 - 1 1 - - -
Fund balances / (deficits), June 30, 2012 -$ -$ -$ -$ -$ -$
* Variance = Positive / (Negative)
Year Ended June 30, 2012
Witness Program Federal Victim Comp Grant
Attorney
Excess (deficiency) of revenues over expenditures
156

Exhibit J- 1
(Continued)
2225 2227 2235
Budget Actual Variance * Budget Actual Variance * Budget Actual Variance *
- - - - - - - - -
- - - - - - - - -
- - - 243,051$ 251,677$ 8,626$ - - -
- - - - - - - - -
- - - - - - 100,000$ 75,442$ (24,558)$
300$ 195$ (105)$ - - - 2,000 2,514 514
- - - - - - - - -
27,173 25,884 (1,289) - - - 40,000 41,305 1,305
27,473 26,079 (1,394) 243,051 251,677 8,626 142,000 119,261 (22,739)
57,426 57,030 396 - - - - - -
- - - 251,775 251,775 - 354,980 86,679 268,301
- - - - - - - - -
- - - - - - - - -
- - - - - - - - -
- - - - - - - - -
- - - - - - - - -
- - - - - - - - -
- - - - - - - - -
57,426 57,030 396 251,775 251,775 - 354,980 86,679 268,301
(29,953) (30,951) (998) (8,724) (98) 8,626 (212,980) 32,582 245,562
26,652 26,652 - - - - - - -
- - - - - - - - -
26,652 26,652 - - - - - - -
(3,301) (4,299) (998) (8,724) (98) 8,626 (212,980) 32,582 245,562
3,301 5,104 1,803 8,724 6,110 (2,614) 212,980 327,532 114,552
-$ 805$ 805$ -$ 6,012$ 6,012$ -$ 360,114$ 360,114$
HIDTA Grant (SBA)Bad Check Fund
Attorney
Anti- Racketeering
157

YUMA COUNTY
Budgetary Comparison Schedule- Nonmajor Governmental Funds- Special Revenue Funds
2277 2278
Budget Actual Variance * Budget Actual Variance *
Revenues:
Taxes - - - - - -
Licenses and permits - - - - - -
Intergovernmental - - - - - -
Charges for services - - - - - -
Fines and forfeits - - - - - -
Investment income 150$ 67$ (83)$ 250$ 118$ (132)$
Rents - - - - - -
Miscellaneous - 1 1 - - -
Total Revenues 150 68 (82) 250 118 (132)
Expenditures
Current:
General government - - - - - -
Public safety 11,673 6,723 4,950 22,726 5,045 17,681
Highway and streets - - - - - -
Sanitation - - - - - -
Health - - - - - -
Welfare - - - - - -
Culture and recreation - - - - - -
Education - - - - - -
Capital Outlay - - - - 5,863 (5,863)
Total Expenditures 11,673 6,723 4,950 22,726 10,908 11,818
(11,523) (6,655) 4,868 (22,476) (10,790) 11,686
Other financing sources (uses):
Transfers in - - - - - -
Transfers out - - - - - -
Total Other financing sources (uses) - - - - - -
Net change in fund balance (11,523) (6,655) 4,868 (22,476) (10,790) 11,686
Fund balances / (deficits), July 1, 2011 11,523 11,559 36 22,476 22,843 367
Fund balances / (deficits), June 30, 2012 -$ 4,904$ 4,904$ -$ 12,053$ 12,053$
* Variance = Positive / (Negative)
Year Ended June 30, 2012
Excess (deficiency) of revenues over expenditures
Attorney
Fed Revenue Asset Sharing Federal Justice
158

Exhibit J- 1
(Continued)
2280 2284 2290
Budget Actual Variance * Budget Actual Variance * Budget Actual Variance *
- - - - - - - - -
- - - - - - - - -
- - - - - - 120,000$ 167,096$ 47,096$
- - - - - - - - -
- - - - - - - - -
150$ 27$ (123)$ - 14$ 14$ 1,500 1,082 (418)
- - - - - - - - -
- - - - - - - 3 3
150 27 (123) - 14 14 121,500 168,181 46,681
- - - - - - 126,697 126,697 -
11,404 10,494 910 - - - - - -
- - - - - - - - -
- - - - - - - - -
- - - - - - - - -
- - - - - - - - -
- - - - - - - - -
- - - - - - - - -
- - - - - - - - -
11,404 10,494 910 - - - 126,697 126,697 -
(11,254) (10,467) 787 - 14 14 (5,197) 41,484 46,681
- 8 8 - - - - - -
- - - - - - (21,013) (21,013) -
- 8 8 - - - (21,013) (21,013) -
(11,254) (10,459) 795 - 14 14 (26,210) 20,471 46,681
11,254 11,287 33 - 1,930 1,930 26,210 160,099 133,889
-$ 828$ 828$ -$ 1,944$ 1,944$ -$ 180,570$ 180,570$
ACJC Domestic Violence
Attorney
Crime Prosecution EnhancementFederal Justice Asset Sharing
159

YUMA COUNTY
Budgetary Comparison Schedule- Nonmajor Governmental Funds- Special Revenue Funds
2330 2331
Budget Actual Variance * Budget Actual Variance *
Revenues:
Taxes - - - - - -
Licenses and permits - - - - - -
Intergovernmental - - - - - -
Charges for services - - - - - -
Fines and forfeits - - - - - -
Investment income - - - 9,307$ 2,195$ (7,112)$
Rents - - - - - -
Miscellaneous 25,000$ 21,235$ (3,765)$ 2,700 48 (2,652)
Total Revenues 25,000 21,235 (3,765) 12,007 2,243 (9,764)
Expenditures
Current:
General government 50,000 - 50,000 6,000 1,159 4,841
Public safety - - - - - -
Highway and streets - - - - - -
Sanitation - - - - - -
Health - - - - - -
Welfare - - - - - -
Culture and recreation - - - - - -
Education - - - - - -
Capital Outlay - - - - - -
Total Expenditures 50,000 - 50,000 6,000 1,159 4,841
(25,000) 21,235 46,235 6,007 1,084 (4,923)
Other financing sources (uses):
Transfers in - - - - 355 355
Transfers out - - - - - -
Total Other financing sources (uses) - - - - 355 355
Net change in fund balance (25,000) 21,235 46,235 6,007 1,439 (4,568)
Fund balances / (deficits), July 1, 2011 25,000 214,950 189,950 (6,007) 19,371 25,378
Fund balances / (deficits), June 30, 2012 -$ 236,185$ 236,185$ -$ 20,810$ 20,810$
* Variance = Positive / (Negative)
Year Ended June 30, 2012
Victim Serv Restitution FED
Attorney
Excess (deficiency) of revenues over expenditures
Victim Serv Restitution ST
160

Exhibit J- 1
(Continued)
2335 2343 2344
Budget Actual Variance * Budget Actual Variance * Budget Actual Variance *
- - - - - - - - -
- - - - - - - - -
- - - 25,600$ 25,600$ - - - -
- - - - - - - - -
- - - - - - - - -
- - - - - - - - -
- - - - - - - - -
- - - - - - 6,500$ - (6,500)$
- - - 25,600 25,600 - 6,500 - (6,500)
2,559 - 2,559 76,057 75,549 508$ 6,500 - 6,500
- - - - - - - - -
- - - - - - - - -
- - - - - - - - -
- - - - - - - - -
- - - - - - - - -
- - - - - - - - -
- - - - - - - - -
- - - - - - - - -
2,559 - 2,559 76,057 75,549 508 6,500 - 6,500
(2,559) - 2,559 (50,457) (49,949) 508 - - -
- - - 50,457 49,949 (508) - - -
- -$ - - - - - - -
- - - 50,457 49,949 (508) - - -
(2,559) - 2,559 - - - - - -
2,559 8,461$ 5,902 - - - - 12,235$ 12,235
-$ 8,461$ 8,461$ -$ -$ -$ -$ 12,235$ 12,235$
Victims Compensation Victim Assist SubrogationVictim Assist Program
Attorney
161

YUMA COUNTY
Budgetary Comparison Schedule- Nonmajor Governmental Funds- Special Revenue Funds
2346 2213
Budget Actual Variance * Budget Actual Variance *
Revenues:
Taxes - - - - - -
Licenses and permits - - - - - -
Intergovernmental 73,300$ 73,298$ (2)$ - - -
Charges for services - - - - - -
Fines and forfeits - - - 29,219$ 31,259$ 2,040$
Investment income - - - 461 313 (148)
Rents - - - - - -
Miscellaneous - - - - 2 2
Total Revenues 73,300 73,298 (2) 29,680 31,574 1,894
Expenditures
Current:
General government 2,000 86,255 (84,255)$ 24,385 24,385 -
Public safety 84,312 - 84,312 - - -
Highway and streets - - - - - -
Sanitation - - - - - -
Health - - - - - -
Welfare - - - - - -
Culture and recreation - - - - - -
Education - - - - - -
Capital Outlay - - - - - -
Total Expenditures 86,312 86,255 57 24,385 24,385 -
(13,012) (12,957) 55 5,295 7,189 1,894
Other financing sources (uses):
Transfers in 13,012 12,956 (56) - - -
Transfers out - - - - - -
Total Other financing sources (uses) 13,012 12,956 (56) - - -
Net change in fund balance - (1) (1) 5,295 7,189 1,894
Fund balances / (deficits), July 1, 2011 - 1 1 (5,295) 39,522 44,817
Fund balances / (deficits), June 30, 2012 -$ -$ -$ -$ 46,711$ 46,711$
* Variance = Positive / (Negative)
Year Ended June 30, 2012
Victim Rights Program Expedited Child Support
Attorney Clerk of Superior Court
Excess (deficiency) of revenues over expenditures
162

Exhibit J- 1
(Continued)
2214 2216 2218
Budget Actual Variance * Budget Actual Variance * Budget Actual Variance *
- - - - - - - - -
- - - - - - - - -
- - - - - - - - -
- - - 50,262$ 47,903$ (2,359)$ - - -
- - - - - - 6,080$ 5,688$ (392)$
27$ 12$ (15)$ 860 520 (340) 680 404 (276)
- - - - - - - - -
- - - - 6 6 - - -
27 12 (15) 51,122 48,429 (2,693) 6,760 6,092 (668)
- - - 63,591 54,881 8,710 - - -
- - - - - - - - -
- - - - - - - - -
- - - - - - - - -
- - - - - - - - -
- - - - - - - - -
- - - - - - - - -
- - - - - - - - -
- - - - - - - - -
- - - 63,591 54,881 8,710 - - -
27 12 (15) (12,469) (6,452) 6,017 6,760 6,092 (668)
- - - - - - - - -
- - - - - - - - -
- - - - - - - - -
27 12 (15) (12,469) (6,452) 6,017 6,760 6,092 (668)
(27) 1,626 1,653 12,469 83,055 70,586 (6,760) 52,793 59,553
-$ 1,638$ 1,638$ -$ 76,603$ 76,603$ -$ 58,885$ 58,885$
Child Support Automation Clerk's Fund Spousal Maint Enforcement
Clerk of Superior Court
163

YUMA COUNTY
Budgetary Comparison Schedule- Nonmajor Governmental Funds- Special Revenue Funds
2318 2336
Budget Actual Variance * Budget Actual Variance *
Revenues:
Taxes - - - - - -
Licenses and permits - - - - - -
Intergovernmental - - - - - -
Charges for services - - - - - -
Fines and forfeits - - - - - -
Investment income - - - 253$ 23$ (230)$
Rents - - - - - -
Miscellaneous - - - - - -
Total Revenues - - - 253 23 (230)
Expenditures
Current:
General government 7,867$ 7,867$ - - - -
Public safety - - - - - -
Highway and streets - - - - - -
Sanitation - - - - - -
Health - - - - - -
Welfare - - - - - -
Culture and recreation - - - - - -
Education - - - - - -
Capital Outlay - - - - - -
Total Expenditures 7,867 7,867 - - - -
(7,867) (7,867) - 253 23 (230)
Other financing sources (uses):
Transfers in - - - - - -
Transfers out - - - - - -
Total Other financing sources (uses) - - - - - -
Net change in fund balance (7,867) (7,867) - 253 23 (230)
Fund balances / (deficits), July 1, 2011 7,867 7,867 - (253) 2,956 3,209
Fund balances / (deficits), June 30, 2012 -$ -$ -$ -$ 2,979$ 2,979$
* Variance = Positive / (Negative)
Year Ended June 30, 2012
Excess (deficiency) of revenues over expenditures
Victims LocationIV-D Case Processing
Clerk of Superior Court
164

Exhibit J- 1
(Continued)
2251 2296 2203
Budget Actual Variance * Budget Actual Variance * Budget Actual Variance *
- - - - - - - - -
- - - - - - - - -
- - - 549,376$ 406,207$ (143,169)$ 17,675$ 11,404$ (6,271)$
- - - - - - - - -
- - - - - - - - -
- 6,770$ 6,770$ - 83 83 500 575$ 75
- - - - - - - - -
- 39 39 - - - - - -
- 6,809 6,809 549,376 406,290 (143,086) 18,175 11,979 (6,196)
- - - 549,376 404,062 145,314 21,675 92,555 (70,880)
- - - - - - - - -
- - - - - - - - -
- - - - - - - - -
- - - - - - - - -
- - - - - - - - -
- - - - - - - - -
- - - - - - - - -
- - - - - - 113,288 24,295 88,993
- - - 549,376 404,062 145,314 134,963 116,850 18,113
- 6,809 6,809 - 2,228 2,228 (116,788) (104,871) 11,917
- - - - - - - - -
- - - - (152) (152) - - -
- - - - (152) (152) - - -
- 6,809 6,809 - 2,076 2,076 (116,788) (104,871) 11,917
- 795,899 795,899 - 22,443 22,443 116,788 116,778 (10)
-$ 802,708$ 802,708$ -$ 24,519$ 24,519$ -$ 11,907$ 11,907$
Help America Vote Community Dev Block Grant
Development Services
Road Fund
Election Services
165

YUMA COUNTY
Budgetary Comparison Schedule- Nonmajor Governmental Funds- Special Revenue Funds
2347 2334
Budget Actual Variance * Budget Actual Variance *
Revenues:
Taxes - - - - - -
Licenses and permits - - - - - -
Intergovernmental 30,000$ 30,000$ - 204,181$ 135,145$ (69,036)$
Charges for services - - - - - -
Fines and forfeits - - - - - -
Investment income - 11 11$ 45 61 16
Rents - - - - - -
Miscellaneous - - - - - -
Total Revenues 30,000 30,011 11 204,226 135,206 (69,020)
Expenditures
Current:
General government 30,000 - 30,000 - - -
Public safety - - - 202,258 126,670 75,588
Highway and streets - - - - - -
Sanitation - - - - - -
Health - - - - - -
Welfare - - - - - -
Culture and recreation - - - - - -
Education - - - - - -
Capital Outlay - - - - 12,713 (12,713)
Total Expenditures 30,000 - 30,000 202,258 139,383 62,875
- 30,011 30,011 1,968 (4,177) (6,145)
Other financing sources (uses):
Transfers in - - - - - -
Transfers out - - - - - -
Total Other financing sources (uses) - - - - - -
Net change in fund balance - 30,011 30,011 1,968 (4,177) (6,145)
Fund balances / (deficits), July 1, 2011 - - - (1,968) 23,137 25,105
Fund balances / (deficits), June 30, 2012 -$ 30,011$ 30,011$ -$ 18,960$ 18,960$
* Variance = Positive / (Negative)
Election Services
Year Ended June 30, 2012
Excess (deficiency) of revenues over expenditures
Other GrantsHealth and Human Services
Emergency Management
166

Exhibit J- 1
(Continued)
2269 2271 2273
Budget Actual Variance * Budget Actual Variance * Budget Actual Variance *
- - - - - - - - -
- - - - - - - - -
330,000$ 144,532$ (185,468)$ - - - 1,071,536$ 1,122,431$ 50,895$
- - - - - - - - -
- - - - - - - - -
- 17 17 - 114$ 114$ 1,000 13 (987)
- - - - - - 332,131 281,965 (50,166)
- - - - - - 89,221 8,956 (80,265)
330,000 144,549 (185,451) - 114 114 1,493,888 1,413,365 (80,523)
330,000 146,059 183,941 - - - - - -
- - - - - - - - -
- - - - - - - - -
- - - - - - - - -
- - - - - - - - -
- - - 79,339 64 79,275 1,102,277 1,104,467 (2,190)
- - - - - - - - -
- - - - - - - - -
- - - - - - 343,348 278,284 65,064
330,000 146,059 183,941 79,339 64 79,275 1,445,625 1,382,751 62,874
- (1,510) (1,510) (79,339) 50 79,389 48,263 30,614 (17,649)
- - - - - - - - -
- - - - - - - - -
- - - - - - - -
- (1,510) (1,510) (79,339) 50 79,389 48,263 30,614 (17,649)
- 6,845 6,845 79,339 30,052 (49,287) (48,263) 338,283 386,546
-$ 5,335$ 5,335$ -$ 30,102$ 30,102$ -$ 368,897$ 368,897$
Conventional 13-6-PHA
Housing Services
Public HousingHOME Grant
167

YUMA COUNTY
Budgetary Comparison Schedule- Nonmajor Governmental Funds- Special Revenue Funds
2274 2275
Budget Actual Variance * Budget Actual Variance *
Revenues:
Taxes - - - - - -
Licenses and permits - - - - - -
Intergovernmental 2,478,188$ 2,160,484$ (317,704)$ - - -
Charges for services - - - - - -
Fines and forfeits - - - - - -
Investment income 1,000 1,619 619 1,146$ 720$ (426)$
Rents - - - - - -
Miscellaneous 31,985 35,798 3,813 126,656 141,577 14,921
Total Revenues 2,511,173 2,197,901 (313,272) 127,802 142,297 14,495
Expenditures
Current:
General government - - - - - -
Public safety - - - - - -
Highway and streets - - - - - -
Sanitation - - - - - -
Health - - - - - -
Welfare 2,521,843 2,490,455 31,388 138,733 120,068 18,665
Culture and recreation - - - - - -
Education - - - - - -
Capital Outlay - - - - - -
Total Expenditures 2,521,843 2,490,455 31,388 138,733 120,068 18,665
(10,670) (292,554) (281,884) (10,931) 22,229 33,160
Other financing sources (uses):
Transfers in - - - - - -
Transfers out - - - - - -
Total Other financing sources (uses) - - - - - -
Net change in fund balance (10,670) (292,554) (281,884) (10,931) 22,229 33,160
Fund balances / (deficits), July 1, 2011 10,670 994,137 983,467 10,931 444,358 433,427
Fund balances / (deficits), June 30, 2012 -$ 701,583$ 701,583$ -$ 466,587$ 466,587$
* Variance = Positive / (Negative)
Excess (deficiency) of revenues over expenditures
Housing
Water Company 13-6Section 8 Voucher Program
Year Ended June 30, 2012
168

Exhibit J- 1
(Continued)
2212 2232 2233
Budget Actual Variance * Budget Actual Variance * Budget Actual Variance *
- - - - - - - - -
- - - - - - - - -
24,378$ 24,350$ (28)$ - - - 51,245$ 39,945$ (11,300)$
- - - 240,000$ 236,302$ (3,698)$ - - -
- - - - - - - - -
130 101 (29) 1,500 1,035 (465) 15 - (15)
- - - - - - - - -
- - - - 17 17 - - -
24,508 24,451 (57) 241,500 237,354 (4,146) 51,260 39,945 (11,315)
- - - - - - - - -
24,378 24,350 28 250,534 169,682 80,852 51,260 39,945 11,315
- - - - - - - - -
- - - - - - - - -
- - - - - - - - -
- - - - - - - - -
- - - - - - - - -
- - - - - - - - -
- - - - - - - - -
24,378 24,350 28 250,534 169,682 80,852 51,260 39,945 11,315
130 101 (29) (9,034) 67,672 76,706 - - -
- - - - - - - - -
- - - - - - - - -
- - - - - - - - -
130 101 (29) (9,034) 67,672 76,706 - - -
(130) 6,728 6,858 9,034 143,708 134,674 - 1 1
-$ 6,829$ 6,829$ -$ 211,380$ 211,380$ -$ 1$ 1$
Juvenile Crime Reduction
Juvenile Court
Family Counseling Juvenile Probation Fees
169

YUMA COUNTY
Budgetary Comparison Schedule- Nonmajor Governmental Funds- Special Revenue Funds
2240 2242
Budget Actual Variance * Budget Actual Variance *
Revenues:
Taxes - - - - - -
Licenses and permits - - - - - -
Intergovernmental - - - 394,570$ 15,321$ (379,249)$
Charges for services - - - - - -
Fines and forfeits - - - - - -
Investment income 40$ - (40)$ 3,000 2,347 (653)
Rents - - - - - -
Miscellaneous 2,800 3,283$ 483 15,000 23,360 8,360
Total Revenues 2,840 3,283 443 412,570 41,028 (371,542)
Expenditures
Current:
General government - - - - - -
Public safety 6,900 5,128 1,772 381,817 330,697 51,120
Highway and streets - - - - - -
Sanitation - - - - - -
Health - - - - - -
Welfare - - - - - -
Culture and recreation - - - - - -
Education - - - - - -
Capital Outlay - - - - - -
Total Expenditures 6,900 5,128 1,772 381,817 330,697 51,120
(4,060) (1,845) 2,215 30,753 (289,669) (320,422)
Other financing sources (uses):
Transfers in - - - - 394,569 394,569
Transfers out - - - - - -
Total Other financing sources (uses) - - - - 394,569 394,569
Net change in fund balance (4,060) (1,845) 2,215 30,753 104,900 74,147
Fund balances / (deficits), July 1, 2011 4,060 9,420 5,360 (30,753) 344,815 375,568
Fund balances / (deficits), June 30, 2012 -$ 7,575$ 7,575$ -$ 449,715$ 449,715$
* Variance = Positive / (Negative)
Excess (deficiency) of revenues over expenditures
Year Ended June 30, 2012
Juvenile Restitution
Juvenile Court
Detention Education
170

Exhibit J- 1
(Continued)
2245 2246 2247
Budget Actual Variance * Budget Actual Variance * Budget Actual Variance *
- - - - - - - - -
- - - - - - - - -
827,024$ 823,889$ (3,135)$ 17,050$ 17,050$ - 740,027$ 739,476$ (551)$
- - - - - - - - -
- - - - - - - - -
3,816 3,616 (200) 20 42 22$ 1,000 577 (423)
- - - - - - - - -
4,900 4,922 22 - 1 1 - - -
835,740 832,427 (3,313) 17,070 17,093 23 741,027 740,053 (974)
- - - - - - - - -
- - - 17,100 17,092 8 740,027 739,476 551
- - - - - - - - -
- - - - - - - - -
- - - - - - - - -
- - - - - - - - -
- - - - - - - - -
726,904 701,394 25,510 - - - - - -
- 10,850 (10,850) - - - - - -
726,904 712,244 14,660 17,100 17,092 8 740,027 739,476 551
108,836 120,183 11,347 (30) 1 31 1,000 577 (423)
- - - - - - - - -
(2,803) (2,803) - - - - - - -
(2,803) (2,803) - - - - - - -
106,033 117,380 11,347 (30) 1 31 1,000 577 (423)
(106,033) 417,484 523,517 30 1 (29) (1,000) 27,359 28,359
-$ 534,864$ 534,864$ -$ 2$ 2$ -$ 27,936$ 27,936$
Juvenile Victim Rights
Juvenile Court
Charter School State Aid Supreme Court
171

YUMA COUNTY
Budgetary Comparison Schedule- Nonmajor Governmental Funds- Special Revenue Funds
2248 2249
Budget Actual Variance * Budget Actual Variance *
Revenues:
Taxes - - - - - -
Licenses and permits - - - - - -
Intergovernmental 97,092$ 97,084$ (8)$ 26,733$ 26,594$ (139)$
Charges for services - - - - - -
Fines and forfeits - - - - - -
Investment income 32 - (32) 7 - (7)
Rents - - - - - -
Miscellaneous - - - - - -
Total Revenues 97,124 97,084 (40) 26,740 26,594 (146)
Expenditures
Current:
General government - - - 26,740 25,770 970
Public safety 97,124 97,088 36 - 823 (823)
Highway and streets - - - - - -
Sanitation - - - - - -
Health - - - - - -
Welfare - - - - - -
Culture and recreation - - - - - -
Education - - - - - -
Capital Outlay - - - - - -
Total Expenditures 97,124 97,088 36 26,740 26,593 147
- (4) (4) - 1 1
Other financing sources (uses):
Transfers in - - - - - -
Transfers out - - - - - -
Total Other financing sources (uses) - - - - - -
Net change in fund balance - (4) (4) - 1 1
Fund balances / (deficits), July 1, 2011 - - - - - -
Fund balances / (deficits), June 30, 2012 -$ (4)$ (4)$ -$ 1$ 1$
* Variance = Positive / (Negative)
Year Ended June 30, 2012
Juvenile Court
Excess (deficiency) of revenues over expenditures
Court Appointed Specialist Court Improvement
172

Exhibit J- 1
(Continued)
2257 2259 2262
Budget Actual Variance * Budget Actual Variance * Budget Actual Variance *
- - - - - - - - -
- - - - - - - - -
18,312$ 3,613$ (14,699)$ 81,203$ 81,204$ 1$ 42,164$ 41,940$ (224)$
- - - - - - - - -
- - - - - - - - -
- 8 8 100 145 45 100 37 (63)
- - - - - - - - -
- 5 5 - 2 2 - - -
18,312 3,626 (14,686) 81,303 81,351 48 42,264 41,977 (287)
- - - - - - 42,164 41,940 224
18,312 15,994 2,318 92,693 92,709 (16) - - -
- - - - - - - - -
- - - - - - - - -
- - - - - - - - -
- - - - - - - - -
- - - - - - - - -
- - - - - - - - -
- - - - - - - - -
18,312 15,994 2,318 92,693 92,709 (16) 42,164 41,940 224
- (12,368) (12,368) (11,390) (11,358) 32 100 37 (63)
2,803 2,803 - - - - - - -
- - - - - - - - -
2,803 2,803 - - - - - - -
2,803 (9,565) (12,368) (11,390) (11,358) 32 100 37 (63)
(2,803) (2,796) 7 11,390 11,389 (1) (100) 898 998
-$ (12,361)$ (12,361)$ -$ 31$ 31$ -$ 935$ 935$
Juvenile Probation
Juvenile Court
Drug Court EducationImproving AM Schools
173

YUMA COUNTY
Budgetary Comparison Schedule- Nonmajor Governmental Funds- Special Revenue Funds
2265 2266
Budget Actual Variance * Budget Actual Variance *
Revenues:
Taxes - - - - - -
Licenses and permits - - - - - -
Intergovernmental 1,039,905$ 1,035,140$ (4,765)$ 635,406$ 633,619$ (1,787)$
Charges for services - - - - - -
Fines and forfeits - - - - - -
Investment income 1,300 725 (575) 1,200 794 (406)
Rents - - - - - -
Miscellaneous - - - - - -
Total Revenues 1,041,205 1,035,865 (5,340) 636,606 634,413 (2,193)
Expenditures
Current:
General government - - - - - -
Public safety 1,039,905 1,035,140 4,765 635,406 618,524 16,882
Highway and streets - - - - - -
Sanitation - - - - - -
Health - - - - - -
Welfare - - - - - -
Culture and recreation - - - - - -
Education - - - - - -
Capital Outlay - - - - 15,094 (15,094)
Total Expenditures 1,039,905 1,035,140 4,765 635,406 633,618 1,788
1,300 725 (575) 1,200 795 (405)
Other financing sources (uses):
Transfers in - - - - - -
Transfers out - - - - - -
Total Other financing sources (uses) - - - - - -
Net change in fund balance 1,300 725 (575) 1,200 795 (405)
Fund balances / (deficits), July 1, 2011 (1,300) 28,981 30,281 (1,200) 50,768 51,968
Fund balances / (deficits), June 30, 2012 -$ 29,706$ 29,706$ -$ 51,563$ 51,563$
* Variance = Positive / (Negative)
Juvenile Diversion Intake
Juvenile Court
Year Ended June 30, 2012
Intensive Probation
Excess (deficiency) of revenues over expenditures
174

Exhibit J- 1
(Continued)
2267 2268 2327
Budget Actual Variance * Budget Actual Variance * Budget Actual Variance *
- - - - - - - - -
- - - - - - - - -
93,898$ 93,460$ (438)$ 360,551$ 360,039$ (512)$ 43,163$ 37,657$ (5,506)$
- - - - - - - - -
- - - - - - - - -
100 88 (12) 1,000 440 (560) - 28 28
- - - - - - - - -
- - - - - - - - -
93,998 93,548 (450) 361,551 360,479 (1,072) 43,163 37,685 (5,478)
- - - - - - 53,238 36,869 16,369
93,898 93,460 438 360,551 360,039 512 - - -
- - - - - - - - -
- - - - - - - - -
- - - - - - - - -
- - - - - - - - -
- - - - - - - - -
- - - - - - - - -
- - - - - - - - -
93,898 93,460 438 360,551 360,039 512 53,238 36,869 16,369
100 88 (12) 1,000 440 (560) (10,075) 816 10,891
- - - - - - 9,757 7,320 (2,437)
- - - - - - - - -
- - - - - - 9,757 7,320 (2,437)
100 88 (12) 1,000 440 (560) (318) 8,136 8,454
(100) 8,653 8,753 (1,000) 19,902 20,902 318 756 438
-$ 8,741$ 8,741$ -$ 20,342$ 20,342$ -$ 8,892$ 8,892$
Juvenile Treatment Account Incentive
Juvenile Court
Juvenile Diversion Program
175

YUMA COUNTY
Budgetary Comparison Schedule- Nonmajor Governmental Funds- Special Revenue Funds
2317 2241
Budget Actual Variance * Budget Actual Variance *
Revenues:
Taxes - - - - - -
Licenses and permits - - - - - -
Intergovernmental 9,646$ 8,504$ (1,142)$ - - -
Charges for services - - - - - -
Fines and forfeits 333,520 301,614 (31,906) - - -
Investment income 11,640 3,266 (8,374) 11$ 14$ 3$
Rents - - - - - -
Miscellaneous 15,135 4,572 (10,563) - - -
Total Revenues 369,941 317,956 (51,985) 11 14 3
Expenditures
Current:
General government 397,110 327,164 69,946 - - -
Public safety - - - - - -
Highway and streets - - - - - -
Sanitation - - - - - -
Health - - - - - -
Welfare - - - - - -
Culture and recreation - - - - - -
Education - - - - - -
Capital Outlay - - - - - -
Total Expenditures 397,110 327,164 69,946 - - -
(27,169) (9,208) 17,961 11 14 3
Other financing sources (uses):
Transfers in 2,056 2,056 - - - -
Transfers out (312,113) (312,113) - - - -
Total Other financing sources (uses) (310,057) (310,057) - - - -
Net change in fund balance (337,226) (319,265) 17,961 11 14 3
Fund balances / (deficits), July 1, 2011 337,226 728,017 390,791 (11) 1,881 1,892
Fund balances / (deficits), June 30, 2012 -$ 408,752$ 408,752$ -$ 1,895$ 1,895$
* Variance = Positive / (Negative)
Excess (deficiency) of revenues over expenditures
Indigent DependencyJustice Court Enhancement
Legal & Public Defenders Justice Court
Year Ended June 30, 2012
176

Exhibit J- 1
(Continued)
2326 2312 2313
Budget Actual Variance * Budget Actual Variance * Budget Actual Variance *
- - - - - - - - -
- - - - - - - - -
14,800$ 13,433$ (1,367)$ 73,000$ 49,675$ (23,325)$ - - -
- - - - - - - - -
- - - - - - - - -
- 103 103 - 165 165 - 752$ 752$
- - - - - - - - -
- 182 182 - 3 3 60,856$ 69,193 8,337
14,800 13,718 (1,082) 73,000 49,843 (23,157) 60,856 69,945 9,089
14,421 14,147 274 - - - - - -
- - - - - - - - -
- - - - - - - - -
- - - - - - - - -
- - - - - - - - -
- - - - - - - - -
- - - 73,000 49,675 23,325 111,536 61,129 50,407
- - - - - - - - -
- - - - - - - - -
14,421 14,147 274 73,000 49,675 23,325 111,536 61,129 50,407
379 (429) (808) - 168 168 (50,680) 8,816 59,496
- - - - - - - - -
- - - - - - - - -
- - - - - - - - -
379 (429) (808) - 168 168 (50,680) 8,816 59,496
(379) 10,456 10,835 - 9,470 9,470 50,680 76,515 25,835
-$ 10,027$ 10,027$ -$ 9,638$ 9,638$ -$ 85,331$ 85,331$
Defender Training
Library District
LSTA Grants Other Grants
Legal & Public Defenders
177

YUMA COUNTY
Budgetary Comparison Schedule- Nonmajor Governmental Funds- Special Revenue Funds
2260 2264
Budget Actual Variance * Budget Actual Variance *
Revenues:
Taxes - - - - - -
Licenses and permits - - - 41,250$ 34,131$ (7,119)$
Intergovernmental 4,951,307$ 4,210,745$ (740,562)$ - - -
Charges for services 30,000 - (30,000) - - -
Fines and forfeits - - - 6,000 1,877 (4,123)
Investment income - 1,744 1,744 200 300 100
Rents - - - - - -
Miscellaneous 500 306 (194) - 1 1
Total Revenues 4,981,807 4,212,795 (769,012) 47,450 36,309 (11,141)
Expenditures
Current:
General government - - - - - -
Public safety - - - - - -
Highway and streets - - - - - -
Sanitation - - - - - -
Health 4,965,189 4,206,482 758,707 498,604 439,735 58,869
Welfare - - - - - -
Culture and recreation - - - - - -
Education - - - - - -
Capital Outlay - - - 57,000 102,596 (45,596)
Total Expenditures 4,965,189 4,206,482 758,707 555,604 542,331 13,273
16,618 6,313 (10,305) (508,154) (506,022) 2,132
Other financing sources (uses):
Transfers in - - - 453,694 453,694 -
Transfers out - - - - - -
Total Other financing sources (uses) - - - 453,694 453,694 -
Net change in fund balance 16,618 6,313 (10,305) (54,460) (52,328) 2,132
Fund balances / (deficits), July 1, 2010 (16,618) 344,472 361,090 54,460 77,928 23,468
Fund balances / (deficits), June 30, 2011 -$ 350,785$ 350,785$ -$ 25,600$ 25,600$
* Variance = Positive / (Negative)
Excess (deficiency) of revenues over expenditures
Public Health District
Year Ended June 30, 2012
Other Grants Rabies Control
178

Exhibit J- 1
(Continued)
2204 2253 2205
Budget Actual Variance * Budget Actual Variance * Budget Actual Variance *
- - - 1,100,000$ 912,500$ (187,500)$ - - -
- - - - - - - - -
260,000$ 276,990$ 16,990$ 6,313,393 5,732,507 (580,886) - - -
27,500 35,809 8,309 - - - 124,939$ 116,200$ (8,739)$
- - - - - - - - -
4,000 3,005 (995) 50,000 23,769 (26,231) 8,130 2,764 (5,366)
- - - - - - - - -
- 5 5 10,000 155,453 145,453 - 36 36
291,500 315,809 24,309 7,473,393 6,824,229 (649,164) 133,069 119,000 (14,069)
- - - - - - 133,274 100,671 32,603
- - - - - - - - -
- - - 8,671,181 6,640,777 2,030,404 - - -
393,751 281,979 111,772 - - - - - -
- - - - - - - - -
- - - - - - - - -
- - - - - - - - -
- - - - - - - - -
35,000 15,477 19,523 600,000 441,449 158,551 - - -
428,751 297,456 131,295 9,271,181 7,082,226 2,188,955 133,274 100,671 32,603
(137,251) 18,353 155,604 (1,797,788) (257,997) 1,539,791 (205) 18,329 18,534
- - - - - - - - -
- - - - - - (492,000) (492,000) -
- - - - - - (492,000) (492,000) -
(137,251) 18,353 155,604 (1,797,788) (257,997) 1,539,791 (492,205) (473,671) 18,534
137,251 405,434 268,183 1,797,788 3,828,812 2,031,024 492,205 741,545 249,340
-$ 423,787$ 423,787$ -$ 3,570,815$ 3,570,815$ -$ 267,874$ 267,874$
Recorder's Fund
Public Works Recorder
Waste Tire Public Works HURF
179

YUMA COUNTY
Budgetary Comparison Schedule- Nonmajor Governmental Funds- Special Revenue Funds
2281 2299
Budget Actual Variance * Budget Actual Variance *
Revenues:
Taxes - - - - - -
Licenses and permits - - - - - -
Intergovernmental 803,492$ 846,310$ 42,818$ 251,849$ 246,947$ (4,902)$
Charges for services - - - - - -
Fines and forfeits - - - - 5,355 5,355
Investment income - - - - 5 5
Rents - - - - - -
Miscellaneous - - - - - -
Total Revenues 803,492 846,310 42,818 251,849 252,307 458
Expenditures
Current:
General government - - - - - -
Public safety - - - 251,849 249,552 2,297
Highway and streets - - - - - -
Sanitation - - - - - -
Health - - - - - -
Welfare - - - - - -
Culture and recreation - - - - - -
Education 803,492 408,354 395,138 - - -
Capital Outlay - - - - - -
Total Expenditures 803,492 408,354 395,138 251,849 249,552 2,297
- 437,956 437,956 - 2,755 2,755
Other financing sources (uses):
Transfers in - - - - - -
Transfers out - (431,313) (431,313) - -$ -
Total Other financing sources (uses) - (431,313) (431,313) - - -
Net change in fund balance - 6,643 6,643 - 2,755 2,755
Fund balances / (deficits), July 1, 2011 - 689,227 689,227 - 1 1
Fund balances / (deficits), June 30, 2012 -$ 695,870$ 695,870$ -$ 2,756$ 2,756$
* Variance = Positive / (Negative)
Excess (deficiency) of revenues over expenditures
School Grants Narcotic Enforcement
School Superintendent Sheriff- Administration
Year Ended June 30, 2012
180

Exhibit J- 1
(Continued)
2302 2303 2306
Budget Actual Variance * Budget Actual Variance * Budget Actual Variance *
- - - - - - - - -
- - - - - - - - -
272,276$ 228,427$ (43,849)$ - - - 2,619,966$ 790,438$ (1,829,528)$
- - - - - - - - -
- - - - - - - - -
- - - - 28$ 28$ - 524 524
- - - - - - - - -
- - - - 2 2 - 1 1
272,276 228,427 (43,849) - 30 30 2,619,966 790,963 (1,829,003)
- - - - - - - - -
224,267 224,267 - - - - 2,005,517 718,884 1,286,633
- - - - - - - - -
- - - - - - - - -
- - - - - - - - -
- - - - - - - - -
- - - - - - - - -
- - - - - - - - -
- - - - - - 613,180 - 613,180
224,267 224,267 - - - - 2,618,697 718,884 1,899,813
48,009 4,160 (43,849) - 30 30 1,269 72,079 70,810
- - - - - - - 4,707 4,707
- - - - (4,097) (4,097) - - -
- - - - (4,097) (4,097) - 4,707 4,707
48,009 4,160 (43,849) - (4,067) (4,067) 1,269 76,786 75,517
(48,009) 50,683 98,692 - 4,097 4,097 (1,269) 148,908 150,177
-$ 54,843$ 54,843$ -$ 30$ 30$ -$ 225,694$ 225,694$
Drug Task Force Local Law Enforcement Other Grants
Sheriff- Administration
181

YUMA COUNTY
Budgetary Comparison Schedule- Nonmajor Governmental Funds- Special Revenue Funds
2237 2238
Budget Actual Variance * Budget Actual Variance *
Revenues:
Taxes - - - - - -
Licenses and permits - - - - - -
Intergovernmental 280,000$ 274,847$ (5,153)$ - - -
Charges for services - - - 7,649$ 9,719$ 2,070$
Fines and forfeits - - - - - -
Investment income 255 1,686 1,431 90 77 (13)
Rents - - - - - -
Miscellaneous 6,746 44 (6,702) - - -
Total Revenues 287,001 276,577 (10,424) 7,739 9,796 2,057
Expenditures
Current:
General government - - - - - -
Public safety 263,980 174,728 89,252 8,829 8,829 -
Highway and streets - - - - - -
Sanitation - - - - - -
Health - - - - - -
Welfare - - - - - -
Culture and recreation - - - - - -
Education - - - - - -
Capital Outlay - - - - - -
Total Expenditures 263,980 174,728 89,252 8,829 8,829 -
23,021 101,849 78,828 (1,090) 967 2,057
Other financing sources (uses):
Transfers in - - - - - -
Transfers out - - - - - -
Total Other financing sources (uses) - - - - - -
Net change in fund balance 23,021 101,849 78,828 (1,090) 967 2,057
Fund balances / (deficits), July 1, 2011 (23,021) 196,687 219,708 1,090 10,663 9,573
Fund balances / (deficits), June 30, 2012 -$ 298,536$ 298,536$ -$ 11,630$ 11,630$
* Variance = Positive / (Negative)
Excess (deficiency) of revenues over expenditures
Jail Enhancement Inmate Health
Year Ended June 30, 2012
Sheriff- Jail District
182

Exhibit J- 1
(Continued)
2286 2301 2308 2211
Budget Actual Variance * Budget Actual Variance * Budget Actual Variance * Budget Actual Variance *
- - - - - - - - - - - -
- - - - - - - - - - - -
- - - 238,874$ 176,045$ (62,829)$ 30,141$ - (30,141)$ - - -
232,670$ 273,910$ 41,240$ - - - - - - - - -
- - - - - - - - - 69,388$ 76,097$ 6,709$
7,000 1,787 (5,213) - 423 423 950 472$ (478) 102 420 318
- - - - - - - - - - - -
156,310 123,971 (32,339) - - - - - - 3,061 4,589 1,528
395,980 399,668 3,688 238,874 176,468 (62,406) 31,091 472 (30,619) 72,551 81,106 8,555
- - - - - - - - - 72,964 44,247 28,717
602,159 521,879 80,280 233,177 172,080 61,097 87,478 78,044 9,434 - - -
- - - - - - - - - - - -
- - - - - - - - - - - -
- - - - - - - - - - - -
- - - - - - - - - - - -
- - - - - - - - - - - -
- - - - - - - - - - - -
- - - - - - - - - - - -
602,159 521,879 80,280 233,177 172,080 61,097 87,478 78,044 9,434 72,964 44,247 28,717
(206,179) (122,211) 83,968 5,697 4,388 (1,309) (56,387) (77,572) (21,185) (413) 36,859 37,272
- - - - - - - 36,744 36,744 - - -
- - - - - - - - - - - -
- - - - - - - 36,744 36,744 - - -
(206,179) (122,211) 83,968 5,697 4,388 (1,309) (56,387) (40,828) 15,559 (413) 36,859 37,272
206,179 274,111 67,932 (5,697) - 5,697 56,387 49,024 (7,363) 413 44,424 44,011
-$ 151,900$ 151,900$ -$ 4,388$ 4,388$ -$ 8,196$ 8,196$ -$ 81,283$ 81,283$
Facility Commissary Other Jail Grants Conciliation CourtLEBSF Boat Patrol
Superior CourtSheriff- Jail District
183

YUMA COUNTY
Budgetary Comparison Schedule- Nonmajor Governmental Funds- Special Revenue Funds
2217 2221
Budget Actual Variance * Budget Actual Variance *
Revenues:
Taxes - - - - - -
Licenses and permits - - - - - -
Intergovernmental - - - - - -
Charges for services - - - - - -
Fines and forfeits 7,054$ 9,502$ 2,448$ 180,101$ 180,101$ -
Investment income 2,592 180 (2,412) 513 876 363$
Rents - - - - - -
Miscellaneous - 4 4 - 18 18
Total Revenues 9,646 9,686 40 180,614 180,995 381
Expenditures
Current:
General government 31,006 15,520 15,486 36,214 36,228 (14)
Public safety - - - - - -
Highway and streets - - - - - -
Sanitation - - - - - -
Health - - - - - -
Welfare - - - - - -
Culture and recreation - - - - - -
Education - - - - - -
Capital Outlay - - - - - -
Total Expenditures 31,006 15,520 15,486 36,214 36,228 (14)
(21,360) (5,834) 15,526 144,400 144,767 367
Other financing sources (uses):
Transfers in - - - - - -
Transfers out - - - (132,391) (116,178) 16,213
Total Other financing sources (uses) - - - (132,391) (116,178) 16,213
Net change in fund balance (21,360) (5,834) 15,526 12,009 28,589 16,580
Fund balances / (deficits), July 1, 2011 21,360 28,863 7,503 (12,009) 305 12,314
Fund balances / (deficits), June 30, 2012 -$ 23,029$ 23,029$ -$ 28,894$ 28,894$
* Variance = Positive / (Negative)
Excess (deficiency) of revenues over expenditures
Domestic Relations Local Court Assistance
Year Ended June 30, 2012
Superior Court
184

Exhibit J- 1
(Continued)
2222 2224 2234
Budget Actual Variance * Budget Actual Variance * Budget Actual Variance *
- - - - - - - - -
- - - - - - - - -
- - - - - - 25,000$ 25,003$ 3$
- - - - - - - - -
109,160$ 102,782$ (6,378)$ 104,580$ 97,749$ (6,831)$ - - -
728 266 (462) 2,308 524 (1,784) 118 - (118)
- - - - - - - - -
- 2 2 3,000 5,777 2,777 - - -
109,888 103,050 (6,838) 109,888 104,050 (5,838) 25,118 25,003 (115)
110,115 116,401 (6,286) 135,346 115,869 19,477 - - -
- - - - - - 25,307 25,262 45
- - - - - - - - -
- - - - - - - - -
- - - - - - - - -
- - - - - - - - -
- - - - - - - - -
- - - - - - - - -
18,000 - 18,000 14,806 14,022 784 - - -
128,115 116,401 11,714 150,152 129,891 20,261 25,307 25,262 45
(18,227) (13,351) 4,876 (40,264) (25,841) 14,423 (189) (259) (70)
- - - - - - - - -
- - - (85,000) (85,000) - - - -
- - - (85,000) (85,000) - - - -
(18,227) (13,351) 4,876 (125,264) (110,841) 14,423 (189) (259) (70)
18,227 58,466 40,239 125,264 152,288 27,024 189 3,380 3,191
-$ 45,115$ 45,115$ -$ 41,447$ 41,447$ -$ 3,121$ 3,121$
Aztec Field TrainingJCEF Time Payment Law Library
Superior Court
185

YUMA COUNTY
Budgetary Comparison Schedule- Nonmajor Governmental Funds- Special Revenue Funds
2324 2325
Budget Actual Variance * Budget Actual Variance *
Revenues:
Taxes - - - - - -
Licenses and permits - - - - - -
Intergovernmental - - - 8,200$ 3,200$ (5,000)$
Charges for services - - - - - -
Fines and forfeits 72,221$ 71,048$ (1,173)$ 128,587 112,435 (16,152)
Investment income 1,021 327 (694) 1,133 1,028 (105)
Rents - - - - - -
Miscellaneous - 2 2 - - -
Total Revenues 73,242 71,377 (1,865) 137,920 116,663 (21,257)
Expenditures
Current:
General government 87,118 87,118 - 135,375 160,533 (25,158)
Public safety - - - - - -
Highway and streets - - - - - -
Sanitation - - - - - -
Health - - - - - -
Welfare - - - - - -
Culture and recreation - - - - - -
Education - - - - - -
Capital Outlay - - - 71,000 6,144 64,856
Total Expenditures 87,118 87,118 - 206,375 166,677 39,698
(13,876) (15,741) (1,865) (68,455) (50,014) 18,441
Other financing sources (uses):
Transfers in - - - 12,113 12,113 -
Transfers out - - - (25,000) (25,000) -
Total Other financing sources (uses) - - - (12,887) (12,887) -
Net change in fund balance (13,876) (15,741) (1,865) (81,342) (62,901) 18,441
Fund balances / (deficits), July 1, 2011 13,876 54,779 40,903 81,342 161,198 79,856
Fund balances / (deficits), June 30, 2012 -$ 39,038$ 39,038$ -$ 98,297$ 98,297$
* Variance = Positive / (Negative)
Excess (deficiency) of revenues over expenditures
Supreme Court Enhancement Fee- Case Management
Year Ended June 30, 2012
Superior Court
186

Exhibit J- 1
(Continued)
2339 2215 2201
Budget Actual Variance * Budget Actual Variance * Budget Actual Variance *
- - - - - - - - -
- - - - - - - - -
- - - 175,917$ 162,881$ (13,036)$ - - -
- - - - - - - 9,931$ 9,931$
28,277$ 34,045$ 5,768$ - - - - - -
318 491 173 584 250 (334) 2,500$ 1,020 (1,480)
- - - - - - - - -
- - - 2,391 2,113 (278) - 10,065 10,065
28,595 34,536 5,941 178,892 165,244 (13,648) 2,500 21,016 18,516
18,314 18,314 - 175,495 160,705 14,790 35,216 - 35,216
- - - - - - - - -
- - - - - - - - -
- - - - - - - - -
- - - - - - - - -
- - - - - - - - -
- - - - - - - - -
- - - - - - - - -
- - - - - - - - -
18,314 18,314 - 175,495 160,705 14,790 35,216 - 35,216
10,281 16,222 5,941 3,397 4,539 1,142 (32,716) 21,016 53,732
- - - - - - - - -
- - - - - - - - -
- - - - - - - - -
10,281 16,222 5,941 3,397 4,539 1,142 (32,716) 21,016 53,732
(10,281) 60,031 70,312 (3,397) 111,372 114,769 32,716 129,562 96,846
-$ 76,253$ 76,253$ -$ 115,911$ 115,911$ -$ 150,578$ 150,578$
Treasurer's InformationChildren's Issues and Educate Child Support Enforcement
Superior Court Treasurer
187

YUMA COUNTY
Budgetary Comparison Schedule- Nonmajor Governmental Funds- Special Revenue Funds
2319 2291
Budget Actual Variance * Budget Actual Variance *
Revenues:
Taxes - - - - - -
Licenses and permits - - - - - -
Intergovernmental 80,967$ 110,053$ 29,086$ 6,972,435$ 5,527,686$ (1,444,749)$
Charges for services - - - - - -
Fines and forfeits 122,248 132,289 10,041 - - -
Investment income - 272 272 - 429 429
Rents - - - - - -
Miscellaneous - 15 15 - 11 11
Total Revenues 203,215 242,629 39,414 6,972,435 5,528,126 (1,444,309)
Expenditures
Current:
General government 527,683 504,661 23,022 - - -
Public safety - - - - - -
Highway and streets - - - - - -
Sanitation - - - - - -
Health - - - - - -
Welfare - - - - - -
Culture and recreation - - - - - -
Education - - - 6,972,435 5,474,263 1,498,172
Capital Outlay - - - - - -
Total Expenditures 527,683 504,661 23,022 6,972,435 5,474,263 1,498,172
(324,468) (262,032) 62,436 - 53,863 53,863
Other financing sources (uses):
Transfers in 204,880 136,303 (68,577) - - -
Transfers out - - - - - -
Total Other financing sources (uses) 204,880 136,303 (68,577) - - -
Net change in fund balance (119,588) (125,729) (6,141) - 53,863 53,863
Fund balances / (deficits), July 1, 2011 119,588 132,684 13,096 - 34,815 34,815
Fund balances / (deficits), June 30, 2012 -$ 6,955$ 6,955$ -$ 88,678$ 88,678$
* Variance = Positive / (Negative)
Excess (deficiency) of revenues over expenditures
Fill the Gap Workforce Investment Act
Other - Multiple Departments
Year Ended June 30, 2012
188

Exhibit J- 1
(Continued)
2320 2342 ALL
Budget Actual Variance * Budget Actual Variance * Budget Actual Variance *
- - - - - - 1,171,138$ 958,139$ (212,999)$
- - - - - - - - -
- - - 1,052,350$ 730,982$ (321,368)$ - - -
- - - - - - - - -
- - - - - - - - -
- 107$ 107$ 180 25 (155) - 8,436 8,436
- - - - - - - - -
- 478 478 - - - - 2,851 2,851
- 585 585 1,052,530 731,007 (321,523) 1,171,138 969,426 (201,712)
- - - 181,353 149,737 31,616 1,095,945 840,339 255,606
- - - 230,196 228,170 2,026 - - -
- - - - - - - - -
- - - - - - - - -
- - - 27,377 20,504 6,873 - - -
- - - - - - - - -
- - - 11,650 7,187 4,463 - - -
- - - 579,001 29,001 550,000 - - -
- - - 192,458 188,782 3,676 - - -
- - - 1,222,035 623,381 598,654 1,095,945 840,339 255,606
- 585 585 (169,505) 107,626 277,131 75,193 129,087 53,894
- 686 686 - 168 168 - 860 860
- (27,351) (27,351) - (429) (429) - (889) (889)
- (26,665) (26,665) - (261) (261) - (29) (29)
- (26,080) (26,080) (169,505) 107,365 276,870 75,193 129,058 53,865
- 26,080 26,080 169,505 (104,478) (273,983) (75,193) 991,659 1,066,852
-$ -$ -$ -$ 2,887$ 2,887$ -$ 1,120,717$ 1,120,717$
Improvement Districts
Other - MiscellaneousOther - Multiple Departments
SW Border Prosecution ARRA Grants
189

YUMA COUNTY Exhibit J- 1
Budgetary Comparison Schedule- Nonmajor Governmental Funds- Special Revenue Funds (Concluded)
Misc
Budget Actual Variance * Budget Actual Variance *
Revenues:
Taxes - - - 2,271,138$ 1,870,639$ (400,499)$
Licenses and permits - - - 41,250 34,131 (7,119)
Intergovernmental - - - 38,187,581 31,975,302 (6,212,279)
Charges for services - - - 1,340,141 1,398,834 58,693
Fines and forfeits - 10,484$ 10,484$ 1,318,008 1,270,601 (47,407)
Investment income - 8 8 144,334 92,539 (51,795)
Rents - - - 332,131 281,965 (50,166)
Miscellaneous - - - 635,535 693,059 57,524
Total Revenues - 10,492 10,492 44,270,118 37,617,070 (6,653,048)
Expenditures
Current:
General government - - - 5,409,848 4,551,045 858,803
Public safety - - - 12,899,743 10,537,666 2,362,077
Highway and streets - - - 8,671,181 6,640,777 2,030,404
Sanitation - - - 393,751 281,979 111,772
Health - - - 5,491,170 4,666,721 824,449
Welfare - - - 3,842,192 3,715,054 127,138
Culture and recreation - - - 196,186 117,991 78,195
Education - - - 9,081,832 6,613,012 2,468,820
Capital Outlay - - - 2,058,080 1,115,569 942,511
Total Expenditures - - - 48,043,983 38,239,814 9,804,169
- 10,492 10,492 (3,773,865) (622,744) 3,151,121
Other financing sources (uses):
Transfers in - 547 547 1,038,410 1,373,935 335,525
Transfers out - (2,098) (2,098) (1,245,283) (1,669,071) (423,788)
Total Other financing sources (uses) - (1,551) (1,551) (206,873) (295,136) (88,263)
Net change in fund balance - 8,941 8,941 (3,980,738) (917,880) 3,062,858
Fund balances / (deficits), July 1, 2011 - 2,299 2,299 3,980,738 15,321,620 11,340,882
Fund balances / (deficits), June 30, 2012 -$ 11,240$ 11,240$ -$ 14,403,740$ 14,403,740$
* Variance = Positive / (Negative)
Excess (deficiency) of revenues over expenditures
Other Nonmajor Funds Total Special Revenue Funds
Year Ended June 30, 2012
Other - Miscellaneous
190

{This page is intentionally left blank}
191

YUMA COUNTY
Budgetary Comparison Schedule- Nonmajor Governmental Funds- All Debt Service Funds
3503 3500
Budget Actual Variance * Budget Actual Variance *
Revenues:
Taxes - - - - 9$ 9$
Special assessments - - - - - -
Intergovernmental 153,343$ - (153,343)$ - - -
Investment income - 1,290$ 1,290 6,104$ 6,104 -
Miscellaneous - 134 134 - 1 1
Total Revenues 153,343 1,424 (151,919) 6,104 6,114 10
Expenditures
Current:
Public safety - - - 3,000 159,185 (156,185)
Culture and recreation - - - - - -
Principal retirement 3,993,712 245,000 3,748,712 1,078,656 550,000 528,656
Interest and fiscal charges 676,332 17,185 659,147 288,907 272,276 16,631
Total Expenditures 4,670,044 262,185 4,407,859 1,370,563 981,461 389,102
(4,516,701) (260,761) 4,255,940 (1,364,459) (975,347) 389,112
Other financing sources (uses):
Proceeds from sale of bonds 4,155,000 - (4,155,000) - 8,000,000 8,000,000
Loan proceeds - - - - (8,692,607) (8,692,607)
Transfers in 1,935,114 - (1,935,114) 1,367,563 845,567 (521,996)
Transfers out - 829,000 829,000 - 1,023,925 1,023,925
Total Other financing sources (uses) 6,090,114 829,000 (5,261,114) 1,367,563 631,885 (735,678)
Net change in fund balance 1,573,413 568,239 (1,005,174) 3,104 (343,462) (346,566)
Fund balances / (deficits), July 1, 2011 (1,573,413) 568,239 2,141,652 (3,104) (343,462) (340,358)
Fund balances / (deficits), June 30, 2012 -$ 1,136,478$ 1,136,478$ -$ (686,924)$ (686,924)$
* Variance = Positive / (Negative)
Facility
East County Jail District
Excess (deficiency) of revenues over expenditures
Year Ended June 30, 2012
Debt Service
192

Exhibit J- 2
(Continued)
3545 3546
Budget Actual Variance * Budget Actual Variance *
- - - - - -
27,264$ 18,347$ (8,917)$ 35,721$ 21,620$ (14,101)$
- - - - - -
- - - - - -
- 4 4 - - -
27,264 18,351 (8,913) 35,721 21,620 (14,101)
- - - - - -
- - - - - -
130,139 94,354 35,785 129,984 119,984 10,000
7,910 6,112 1,798 15,737 13,462 2,275
138,049 100,466 37,583 145,721 133,446 12,275
(110,785) (82,115) 28,670 (110,000) (111,826) (1,826)
- - - - - -
- - - - - -
- - - - - -
- 811 811 - - -
- 811 811 - - -
(110,785) (81,304) 29,481 (110,000) (111,826) (1,826)
110,785 (81,304) (192,089) 110,000 (111,826) (221,826)
-$ (162,608)$ (162,608)$ -$ (223,652)$ (223,652)$
GadsdenEl Prado Estates
Improvement Districts
193

YUMA COUNTY Exhibit J- 2
Budgetary Comparison Schedule- Nonmajor Governmental Funds- All Debt Service Funds (Concluded)
3547
Budget Actual Variance * Budget Actual Variance *
Revenues:
Taxes - - - - 9$ 9$
Special assessments - - - 62,985$ 39,967 (23,018)
Intergovernmental - - - 153,343 - (153,343)
Investment income 15,000$ 24,214$ 9,214$ 21,104 31,608 10,504
Miscellaneous - - - - 139 139
Total Revenues 15,000 24,214 9,214 237,432 71,723 (165,709)
Expenditures
Current:
Public safety - - - 3,000 159,185 (156,185)
Culture and recreation 5,800 800 5,000 5,800 800 5,000
Principal retirement 1,120,000 1,120,000 - 6,452,491 2,129,338 4,323,153
Interest and fiscal charges 2,204,825 2,204,826 (1) 3,193,711 2,513,861 679,850
Total Expenditures 3,330,625 3,325,626 4,999 9,655,002 4,803,184 4,851,818
(3,315,625) (3,301,412) 14,213 (9,417,570) (4,731,461) 4,686,109
Other financing sources (uses):
Proceeds from sale of bonds - - - 4,155,000 8,000,000 3,845,000
Loan proceeds - - - - (8,692,607) (8,692,607)
Transfers in 6,204,395 - (6,204,395) 9,507,072 845,567 (8,661,505)
Transfers out - 6,204,395 6,204,395 - 8,058,131 8,058,131
Total Other financing sources (uses) 6,204,395 6,204,395 - 13,662,072 7,666,091 (5,995,981)
Net change in fund balance 2,888,770 2,902,983 14,213 4,244,502 2,934,630 (1,309,872)
Fund balances / (deficits), July 1, 2011 (2,888,770) 2,902,983 5,791,753 (4,244,502) 2,934,630 7,179,132
Fund balances / (deficits), June 30, 2012 -$ 5,805,966$ 5,805,966$ -$ 5,869,260$ 5,869,260$
* Variance = Positive / (Negative)
Total Debt Service Funds Debt Service
Library District
Year Ended June 30, 2012
Excess (deficiency) of revenues over expenditures
194

{This page is intentionally left blank}
195

YUMA COUNTY
Budgetary Comparison Schedule- Nonmajor Governmental Funds- Capital Projects Funds
4403 4717
Budget Actual Variance * Budget Actual Variance *
Revenues:
Intergovernmental - - - 100,000$ - (100,000)$
Investment income - 15$ 15$ - - -
Miscellaneous - 112 112 - 3$ 3
Total Revenues - 127 127 100,000 3 (99,997)
Expenditures
Current:
General government - - - - - -
Public safety 69,000$ 116,000 (47,000) - - -
Capital Outlay 61,362 - 61,362 100,000$ - 100,000
Total Expenditures 130,362 116,000 14,362 100,000 - 100,000
(130,362) (115,873) 14,489 - 3 3
Other financing sources (uses):
Transfers in 130,362 545,000 414,638 - - -
Transfers out - - - - - -
Total Other financing sources (uses) 130,362 545,000 414,638 - - -
Net change in fund balance - 429,127 429,127 - 3 3
Fund balances / (deficits), July 1, 2011 - 680 680 - (9,756) (9,756)
Fund balances / (deficits), June 30, 2012 -$ 429,807$ 429,807$ -$ (9,753)$ (9,753)$
* Variance = Positive / (Negative)
Excess (deficiency) of revenues over expenditures
Capital Projects El Prado
Year Ended June 30, 2012
Jail District Improvement Districts
196

Exhibit J- 3
(Continued)
4719 4721 4722
Budget Actual Variance * Budget Actual Variance * Budget Actual Variance *
- - - 1,360,053$ 1,057,758$ (302,295)$ 9,714,682$ 6,562,191$ (3,152,491)$
- - - 250 - (250) 100 - (100)
- - - - - - - - -
- - - 1,360,303 1,057,758 (302,545) 9,714,782 6,562,191 (3,152,591)
- - - - 7,487 (7,487) - 82,060 (82,060)
- - - - - - - - -
- - - 1,423,193 1,081,901 341,292 9,714,782 6,495,160 3,219,622
- - - 1,423,193 1,089,388 333,805 9,714,782 6,577,220 3,137,562
- - - (62,890) (31,630) 31,260 - (15,029) (15,029)
- - - - - - - - -
- - - - - - - - -
- - - - - - - - -
- - - (62,890) (31,630) 31,260 - (15,029) (15,029)
- - - 62,890 107,282 44,392 - (13,103) (13,103)
-$ -$ -$ -$ 75,652$ 75,652$ -$ (28,132)$ (28,132)$
Gadsden B & C Colonial ARRAB & C Colonial
Improvement Districts
197

YUMA COUNTY Exhibit J- 3
Budgetary Comparison Schedule- Nonmajor Governmental Funds- Capital Projects Funds (Concluded)
4720
Budget Actual Variance * Budget Actual Variance *
Revenues:
Intergovernmental - 15,987$ 15,987$ 11,174,735$ 7,635,936$ (3,538,799)$
Investment income 76,492$ 13,492 (63,000) 76,842 13,507 (63,335)
Miscellaneous - - - - 115 115
Total Revenues 76,492 29,479 (47,013) 11,251,577 7,649,558 (3,602,019)
Expenditures
Current:
General government 85,756 85,756 - 85,756 175,303 (89,547)
Public safety - - - 69,000 116,000 (47,000)
Capital Outlay 494,162 494,162 - 11,793,499 8,071,223 3,722,276
Total Expenditures 579,918 579,918 - 11,948,255 8,362,526 3,585,729
(503,426) (550,439) (47,013) (696,678) (712,968) (16,290)
Other financing sources (uses):
Transfers in - - - 130,362 545,000 414,638
Transfers out (2,879,570) (2,879,570) - (2,879,570) (2,879,570) -
Total Other financing sources (uses) (2,879,570) (2,879,570) - (2,749,208) (2,334,570) 414,638
Net change in fund balance (3,382,996) (3,430,009) (47,013) (3,445,886) (3,047,538) 398,348
Fund balances / (deficits), July 1, 2011 3,382,996 3,619,711 236,715 3,445,886 3,704,814 258,928
Fund balances / (deficits), June 30, 2012 -$ 189,702$ 189,702$ -$ 657,276$ 657,276$
* Variance = Positive / (Negative)
Excess (deficiency) of revenues over expenditures
Capital Projects Total Capital Projects Funds
Year Ended June 30, 2012
Library District
198

YUMA COUNTY Exhibit J- 4
Budgetary Comparison Schedule- All Nonmajor Governmental Funds
Budget Actual Variance *
Revenues:
Taxes 2,271,138$ 1,870,648$ (400,490)$
Special assessments 62,985 39,967 (23,018)
Licenses and permits 41,250 34,131 (7,119)
Intergovernmental 49,515,659 39,611,238 (9,904,421)
Charges for services 1,340,141 1,398,834 58,693
Fines and forfeits 1,318,008 1,270,601 (47,407)
Investment income 242,280 137,654 (104,626)
Rents 332,131 281,965 (50,166)
Miscellaneous 635,535 693,313 57,778
Total Revenues 55,759,127 45,338,351 (10,420,776)
Expenditures
Current:
General government 5,495,604 4,726,348 769,256
Public safety 12,971,743 10,812,851 2,158,892
Highway and streets 8,671,181 6,640,777 2,030,404
Sanitation 393,751 281,979 111,772
Health 5,491,170 4,666,721 824,449
Welfare 3,842,192 3,715,054 127,138
Culture and recreation 201,986 118,791 83,195
Education 9,081,832 6,613,012 2,468,820
Capital Outlay 13,851,579 9,186,792 4,664,787
Debt service:
Principal retirement 6,452,491 2,129,338 4,323,153
Interest and fiscal charges 3,193,711 2,513,861 679,850
Total Expenditures 69,647,240 51,405,524 18,241,716
(13,888,113) (6,067,173) 7,820,940
Other financing sources (uses):
Sale of bonds 4,155,000 8,000,000 3,845,000
Loan proceeds - (8,692,607) (8,692,607)
Proceeds form sale of capital assets 10,545,482 2,219,502 (8,325,980)
Transfers in (1,114,921) 6,934,060 8,048,981
Transfers out (2,879,570) (3,424,570) (545,000)
Total Other financing sources (uses) 10,705,991 5,036,385 (5,669,606)
Net change in fund balance (3,182,122) (1,030,788) 2,151,334
Fund balances / (deficits), July 1, 2011 3,182,122 21,961,064 18,778,942
Fund balances / (deficits), June 30, 2012 -$ 20,930,276$ 20,930,276$
* Variance = Positive / (Negative)
Year Ended June 30, 2012
Total All Nonmajor Governmental Funds
Excess (deficiency) of revenues over expenditures
199

{This page is intentionally left blank}
200

Internal Service Funds
201

YUMA COUNTY Exhibit K- 1
Combining Statement of Net Assets
All Internal Service Funds
TotalIT Life Cycle Revolving Workers Health Liability InternalManagement Fund Compensation Self-Insurance Self-Insurance Service
6601 6602 6605 6607 6608 Funds______________ ______________ ______________ ______________ ______________ ______________
Cash and cash equivalents 35,853$ 73,879$ 526,814$ 8,515,006$ 183,990$ 9,335,542$
Receivables (net of allowances for uncollectibles):
Accounts - 12,248 - - - 12,248
Accrued interest 35 79 318 8,001 208 8,641
Due from:
Due from other funds 16,890 36,680 144,869 7,017 - 205,456
Total Assets 52,778$ 122,886$ 672,001$ 8,530,024$ 184,198$ 9,561,887$
Liabilities
Accounts payable - 10,832$ 17,219$ 41,336$ 4,474$ 73,861$
Accrued payroll and employee benefits - 1,808 220 2,960 3,455 8,443
Claims payable - - - 968,000 - 968,000
Due to:
Due to other funds - - - 5,074 1,525 6,599
Total Liabilities -$ 12,640$ 17,439$ 1,017,370$ 9,454$ 1,056,903$
June 30, 2012
Assets
Liabilities
Net Assets
Unrestricted 52,778$ 110,246$ 654,562$ 7,512,654$ 174,744$ 8,504,984$
Total net assets 52,778$ 110,246$ 654,562$ 7,512,654$ 174,744$ 8,504,984$
202

YUMA COUNTY Exhibit K- 2
Combining Statement of Revenues, Expenses, and Changes in Fund Net Assets
All Internal Service Funds
Total
IT Life Cycle Revolving Workers Health Liability Internal
Management Fund Compensation Self-Insurance Self-Insurance Service
6601 6602 6605 6607 6608 Funds______________ ______________ ______________ ______________ ______________ ______________
Charges for services - insurance premiums 123,641$ - 550,264$ 11,165,137$ 900,724$ 12,739,766$
Charges for services - 72,821$ - - - 72,821
Miscellaneous - 57,389 603 43 40,415 98,450
Total operating revenues 123,641 130,210 550,867 11,165,180 941,139 12,911,037
Personal services - 30,657 13,507 182,157 190,433 416,754
Supplies and services - 2,724 946 403,300 17,323 424,293
Tools and minor equipment 121,496 - 35 1,795 1,102 124,428
Professional services - 40,308 28,046 66,041 40,765 175,160
Health services claims - - - 8,943,002 - 8,943,002
Health services other - - - 2,003,107 - 2,003,107
Insurance - 299 368,498 6,949 718,907 1,094,653
Other 845 20,779 53,052 4,448 10,311 89,435
Total operating expenses 122,341 94,767 464,084 11,610,799 978,841 13,270,832
Operating revenues
Operating expenses
Year Ended June 30, 2012
Operating income / (loss) 1,300 35,443 86,783 (445,619) (37,702) (359,795)
Investment income 234 485 2,655 58,576 2,983 64,933
Total nonoperating revenues 234 485 2,655 58,576 2,983 64,933
Income / (loss) before transfers 1,534 35,928 89,438 (387,043) (34,719) (294,862)
Transfers in - 29 - 7,017 1,865 8,911
Transfers out - (811) (368,000) (7,017) - (375,828)
Total operating transfers - (782) (368,000) - 1,865 (366,917)
Change in net assets 1,534 35,146 (278,562) (387,043) (32,854) (661,779)
Total net assets / (deficit), July 1, 2011 51,244 75,100 933,124 7,899,697 207,598 9,166,763
Total net assets / (deficit), June 30, 2012 52,778$ 110,246$ 654,562$ 7,512,654$ 174,744$ 8,504,984$
Nonoperating revenues
Transfers
203

YUMA COUNTY Exhibit K- 3
Combining Statement of Cash Flows
All Internal Service Funds
TotalIT Life Cycle Revolving Workers Health Liability InternalManagement Fund Compensation Self-Insurance Self-Insurance Service
6601 6602 6605 6607 6608 Funds______________ ______________ ______________ ______________ ______________ ______________
Receipts from customers - 18,935$ - 11,768,892$ 904,801$ 12,692,628$
Receipts from other funds for goods and services provided 186,767$ 64,578 546,127$ - - 797,472
Other receipts - 1,673 - 146 10,898 12,717
Payments for supplies and to providers of goods and services (150,952) (53,632) (473,972) (11,882,635) (867,764) (13,428,955)
Payments to employees - (24,120) (12,418) (152,688) (178,439) (367,665)
Other payments (844) (336) - (816) (528) (2,524)
Net cash provided (used) by operating activities 34,971 7,098 59,737 (267,101) (131,032) (296,327)
Transfers in - 29 - 7,017 1,865 8,911 Transfers out - (811) (368,000) (7,017) - (375,828)
Net cash provided (used) by noncapital financial activities - (782) (368,000) - 1,865 (366,917)
Interest received on investments 201 522 3,520 65,680 3,408 73,331
Net cash provided by investing activities 201 522 3,520 65,680 3,408 73,331
Year Ended June 30, 2012
Cash flows from operating activities:
Cash flows from investing activities:
Cash flows to noncapital financial activities:
Net increase / (decrease) in cash and cash equivalents 35,172 6,838 (304,743) (201,421) (125,759) (589,913)
Cash and cash equivalents, July 1, 2011 681 67,041 831,557 8,716,427 309,749 9,925,455
Cash and cash equivalents, June 30, 2012 35,853$ 73,879$ 526,814$ 8,515,006$ 183,990$ 9,335,542$
Reconciliation of operating income (loss) to net cashprovided (used) by operating activities:Operating income (loss) 1,300$ 35,443$ 86,783$ (445,619)$ (37,702)$ (359,795)$ Adjustments to reconcile operating income (loss) to net cash provided (used) by operating activities:
Changes in assets and liabilities: (Increase) / decreases in assets: Accounts receivable - (11,333) - 382,010 - 370,677 Due from other funds 75,310 (19,251) 2,535 (3,082) - 55,512 Increase / (decrease) in liabilities: Accounts payable - 8,804 (29,050) 39,392 (87,808) (68,662) Accrued payroll and employee benefits - (4,621) (531) (7,876) (7,047) (20,075) Insurance claims payable - - - (237,000) - (237,000) Due to other funds (41,639) (1,944) - 5,074 1,525 (36,984)
Total Adjustments 33,671 (28,345) (27,046) 178,518 (93,330) 63,468
Net cash provided (used) by operating activities 34,971$ 7,098$ 59,737$ (267,101)$ (131,032)$ (296,327)$
204

Trust and Agency Funds
205

YUMA COUNTY Exhibit L- 1Combining Statement of Net AssetsAll Trust and Agency Funds
TotalTreasurer's Individual Investment Agency
Pool Accounts Trust Funds Funds Total
Cash and cash equivalents 17,397,550$ 4,230,875$ 21,628,425$ 4,143,800$ 25,772,225$ Receivables (net of allowances for uncollectibles):
Accrued interest 141,250 - 141,250 - 141,250
Total Assets 17,538,800$ 4,230,875$ 21,769,675$ 4,143,800$ 25,913,475$
Deposits held for others - - - 4,143,800$ 4,143,800$
Total Liabilities -$ -$ -$ 4,143,800$ 4,143,800$
Held in trust for investment trust participants 17,538,800$ 4,230,875$ 21,769,675$ 21,769,675$
June 30, 2012
Assets
Investment Trust Funds
Net Assets
Liabilities
206

YUMA COUNTY Exhibit L- 2Combining Statement of Changes in Net AssetsAll Trust and Agency Funds
TotalTreasurer's Individual Investment Agency
Pool Accounts Trust Funds Funds Total
Contributions from participants 374,865,833$ 6,758$ 374,872,591$ 27,530,700$ 402,403,291$ Investment income 1,248,640 - 1,248,640 - 1,248,640
Total additions 376,114,473 6,758 376,121,231 27,530,700 403,651,931
Distributions to participants 365,852,008 7,012,226 372,864,234 27,530,700 400,394,934
Total deductions 365,852,008 7,012,226 372,864,234 27,530,700$ 400,394,934
Change in net assets 10,262,465 (7,005,468) 3,256,997 3,256,997
Net assets held in trust, July 1, 2011 7,276,335 11,236,343 18,512,678 18,512,678
Net assets held in trust, June 30, 2012 17,538,800$ 4,230,875$ 21,769,675$ 21,769,675$
Additions:
Deductions:
Investment Trust Funds
Year Ended June 30, 2012
207

YUMA COUNTY Exhibit L- 3Statement of Changes in Assets and LiabilitiesAgency Fund
Balance Balance July 1, 2011 Additions Deletions June 30, 2012
Cash and cash equivalents 3,926,773$ 217,027$ - 4,143,800$
Total Assets 3,926,773$ 217,027$ -$ 4,143,800$
Deposits held for others 3,926,773$ 217,027$ - 4,143,800$
Total Liabilities 3,926,773$ 217,027$ -$ 4,143,800$
For the Year Ended June 30, 2012
Assets
Liabilities
208

Capital Assets Used in the Operations of Governmental Funds
209

Yuma County, Arizona Exhibit M-1Capital Assets Used in the Operations of Governmental FundsComparative Schedules by Source *As of June 30,2011 and June 30,2012
2011 2012Governmental Funds capital assets:
Land 47,663,225$ 48,520,591$ Buildings 176,964,093 177,276,671 Improvements other than buildings 12,589,150 12,977,096 Machinery and equipment 33,187,405 34,610,542 Infrastructure 140,100,127 143,589,406 Construction in progress 17,398,942 26,615,928
Total governmental funds capital assets 427,902,942$ 443,590,234$
Investments in governmental funds capital assets by source:General Fund 19,457,247$ 19,697,907$ Major Capital Projects Funds 162,816,621 171,802,074 Flood Control District 25,385,080 25,609,114 Health Services District 1,134,319 1,221,233 DDS HURF 41,984,997 46,186,748 Other Funds 173,856,951 175,805,431 Donations 3,267,727 3,267,727
Total governmental funds capital assets 427,902,942$ 443,590,234$
* This schedule presents only the capital assets balances related to governmental funds.Accordingly, the capital assets reported in the internal service fund are excluded from the above amounts. Generally, the capital assets of the service fund are included as governmental activities in the statement of net assets.
210

Yuma County, ArizonaCapital Assets Used in the Operations of Governmental Funds Exhibit M-2Schedule by Function and Activity* Year Ended June 30, 2012
Improvements Machinery Construction Other than and in
Total Land Buildings Buildings Equipment Infrastructure ProgressFunction and Activity:General Government:
Administration 41,025,702$ 663,575$ 5,684,770$ 5,067,359$ 8,411,878$ - 21,198,120$ Adult Probation 4,008,530 - 3,882,012 6,010 120,508 - - Attorneys 196,894 - 39,271 - 157,623 - - Courts 31,646,427 649,851 27,189,874 2,506,043 1,300,659 - - Development Services 6,006,852 196,380 4,567,800 6,910 1,235,762 - - Juvenile Court 13,044,353 - 12,450,900 15,840 577,613 - - Public Defender 511,700 39,200 435,447 - 37,053 - -
Total General Government 96,440,458 1,549,006 54,250,074 7,602,162 11,841,096 - 21,198,120
Public Safety:Adult probation 198,773 - 72,186 - 126,587 - - Juvenile Court - Grants 251,545 - 84,705 38,618 128,222 - - Sheriff - Administration 62,896,058 1,773,939 50,675,747 1,435,885 9,010,487 - - Sheriff - Boat Patrol 896,887 112,750 618,776 - 165,361 - -
Total Public Safety 64,243,263 1,886,689 51,451,414 1,474,503 9,430,657 - -
Highways and Streets:Flood Control 25,491,033 2,950,119 - 26,652 88,620 22,000,158$ 425,484 Roads 178,305,964 38,484,248 5,010,882 33,486 9,236,733 121,589,247 3,951,368
Total Highways and Streets 203,796,997 41,434,367 5,010,882 60,138 9,325,353 143,589,405 4,376,852
Sanitation:Solid Waste 1,057,757 1,773 - 188,214 867,770 - -
Total Sanitation 1,057,757 1,773 - 188,214 867,770 - -
Health :Health 9,988,007 - 8,406,968 820,349 760,690 - -
Total Health 9,988,007 - 8,406,968 820,349 760,690 - -
Welfare:Cemetery 25,288 25,288 - - - - - Housing 14,594,263 202,766 11,822,671 1,670,840 292,389 - 605,597
Total Welfare 14,619,551 228,054 11,822,671 1,670,840 292,389 - 605,597
Culture and Recreation:Library 52,345,854 3,100,192 46,123,482 614,730 2,072,091 - 435,359 YMPO 7,789 - 7,789 - - - - Parks 863,066 303,010 - 546,160 13,896 - -
Total Culture and Recreation 53,216,709 3,403,202 46,131,271 1,160,890 2,085,987 - 435,359
Education:Juvenile Court 197,994 - 191,394 - 6,600 - - School Superintendent 29,497 17,500 11,997 - - - -
Total Education 227,491 17,500 203,391 - 6,600 - -
Total governmental funds capital assets 443,590,233$ 48,520,591$ 177,276,671$ 12,977,096$ 34,610,542$ 143,589,405$ 26,615,928$
* This schedule presents only the capital assets balances related to governmental funds.Accordingly, the capital assets reported in the internal service funds are excluded from the above amounts. Generally, the capital assets of the service fund are included as governmental activities in the statement of net assets.
211
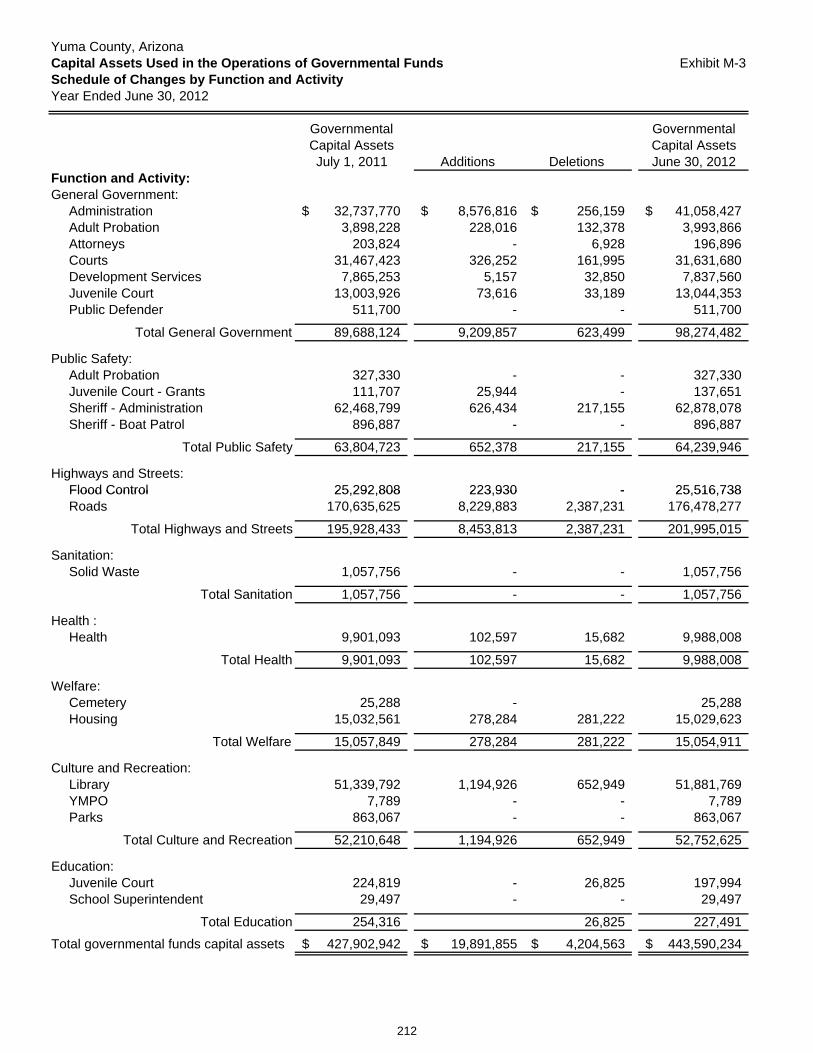
Yuma County, ArizonaCapital Assets Used in the Operations of Governmental Funds Exhibit M-3Schedule of Changes by Function and ActivityYear Ended June 30, 2012
Governmental GovernmentalCapital Assets Capital AssetsJuly 1, 2011 Additions Deletions June 30, 2012
Function and Activity:General Government:
Administration 32,737,770$ 8,576,816$ 256,159$ 41,058,427$ Adult Probation 3,898,228 228,016 132,378 3,993,866 Attorneys 203,824 - 6,928 196,896 Courts 31,467,423 326,252 161,995 31,631,680 Development Services 7,865,253 5,157 32,850 7,837,560 Juvenile Court 13,003,926 73,616 33,189 13,044,353 Public Defender 511,700 - - 511,700
Total General Government 89,688,124 9,209,857 623,499 98,274,482
Public Safety:Adult Probation 327,330 - - 327,330 Juvenile Court - Grants 111,707 25,944 - 137,651 Sheriff - Administration 62,468,799 626,434 217,155 62,878,078 Sheriff - Boat Patrol 896,887 - - 896,887
Total Public Safety 63,804,723 652,378 217,155 64,239,946
Highways and Streets:Flood Control 25,292,808 223,930 - 25,516,738Flood Control 25,292,808 223,930 - 25,516,738 Roads 170,635,625 8,229,883 2,387,231 176,478,277
Total Highways and Streets 195,928,433 8,453,813 2,387,231 201,995,015
Sanitation:Solid Waste 1,057,756 - - 1,057,756
Total Sanitation 1,057,756 - - 1,057,756
Health :Health 9,901,093 102,597 15,682 9,988,008
Total Health 9,901,093 102,597 15,682 9,988,008
Welfare:Cemetery 25,288 - 25,288 Housing 15,032,561 278,284 281,222 15,029,623
Total Welfare 15,057,849 278,284 281,222 15,054,911
Culture and Recreation:Library 51,339,792 1,194,926 652,949 51,881,769 YMPO 7,789 - - 7,789 Parks 863,067 - - 863,067
Total Culture and Recreation 52,210,648 1,194,926 652,949 52,752,625
Education:Juvenile Court 224,819 - 26,825 197,994 School Superintendent 29,497 - - 29,497
Total Education 254,316 26,825 227,491
Total governmental funds capital assets 427,902,942$ 19,891,855$ 4,204,563$ 443,590,234$
212

STATISTICAL SECTION
The Statistical Section should assist the user of the CAFR (Comprehensive Annual Financial Report) in understanding the environment in which Yuma County operates. This section discloses economic, financial, and demographic information that is interesting and relevant to assessing Yuma County’s financial condition. A listing of the statistical topics is provided on the following pages.
Financial Trends .............................................................................................................. 215-244 These schedules provide trend information to help the reader understand how the County’s financial performance and well-being have changed over time.
Revenue Capacity ........................................................................................................... 245-250
These schedules contain trend information to help the reader assess the County’s most significant revenue source, the property tax.
Debt Capacity .................................................................................................................. 251-261
These schedules contain trend information to help the reader assess the affordability of the County’s current levels of outstanding debt and the County’s ability to issue additional debt in the future.
Economic and Demographic Information ........................................................................ 263-270
These schedules offer economic and demographic indicators to help the reader understand how the information in the County’s financial report relates to the services the County provides and the activities it performs.
Operational Information ................................................................................................... 271-276
These schedules contain service and infrastructure data to help the reader understand how the information in the County’s financial report relates to the services the County provides and the activities it performs.
Sources: Unless otherwise noted, the information in these schedules is derived from the comprehensive financial reports for the relevant year
213

{This page is intentionally left blank}
214

Financial Trends
215

Yuma County, ArizonaGovernment-wide Revenues by SourceLast Ten Fiscal Years
Amount % Chg Amount % Chg Amount % Chg Amount % Chg
Program Revenues Charges for Services
General Government 6,200,706$ 16.8% 7,093,636$ 14.4% 8,300,405$ 17.0% 5,696,671$ (31.4%)
Public Safety 2,277,867 5.2% 2,402,007 5.4% 2,870,355 19.5% 5,065,274 76.5%
Highway & Streets 103,758 (21.7%) 105,975 2.1% 108,477 2.4% 87,631 (19.2%)
Sanitation 27,457 1.1% 50,555 84.1% 66,087 30.7% 69,131 4.6%
Health 727,192 12.7% 643,951 (11.4%) 689,350 7.1% 657,953 (4.6%)
Welfare 250,219 (36.6%) 295,885 18.3% 336,485 13.7% 338,791 0.7%
Culture & Recreation - 0.0% 59,964 0.0% 59,642 (0.5%) 62,542 4.9%
Education 90,640 207.6% - 0.0% - 0.0% - 0.0%
Operating Grants & Contributions 36,210,868 13.1% 37,597,648 3.8% 37,842,357 0.7% 35,522,157 (6.1%)
Capital Grants & Contributions 3,304,062 0.0% 3,672,046 11.1% 10,399,038 183.2% 5,306,408 (49.0%)
Total Program Revenues 49,192,769$ 20.7% 51,921,667$ 5.5% 60,672,196$ 16.9% 52,806,558$ (13.0%)
General Revenues
Taxes
Property Taxes 19,943,241$ 10.3% $20,582,593 3.2% 22,176,789$ 7.7% 23,511,137$ 6.0%
County Sales Taxes 24,384,798 5.7% 27,740,649 13.8% 32,226,336 16.2% 37,592,727 16.7%
Auto-in-Lieu of Tax 5,286,522 6.7% 5,855,576 10.8% 6,265,275 7.0% 7,030,262 12.2%
Franchise Taxes 123,972 10.5% 135,173 9.0% 120,253 (11.0%) 185,592 54.3%
Shared State Sales Taxes 13,752,283 8.7% 14,652,864 6.5% 16,212,307 10.6% 18,265,508 12.7%
Total Taxes 63,490,816 7.8% 68,966,855 8.6% 77,000,960 11.6% 86,585,226 12.4%
Grants and Contributions Not
Restricted to Specific Programs 3,408,688 65.5% 4,544,710 33.3% 1,909,810 (58.0%) 2,223,283 16.4%
Investment earnings (162,326) (107.1%) 1,466,106 (1003.2%) 2,280,631 55.6% 3,156,042 38.4%
Miscellaneous 1,020,656 20.7% 2,573,950 152.2% 1,707,991 (33.6%) 3,107,989 82.0%
Total General Revenues 67,757,834$ 5.8% 77,551,621$ 14.5% 82,899,392$ 6.9% 95,072,540$ 14.7%
Total Revenues 116,950,603$ 11.6% 129,473,288$ 10.7% 143,571,588$ 10.9% 147,879,098$ 3.0%
Fiscal Year
2005-062002-03 2003-04 2004-05
216

Table A-1
Amount % Chg Amount % Chg Amount % Chg Amount % Chg Amount % Chg Amount % Chg
5,548,210$ (2.6%) 5,831,240$ 5.1% 7,030,773$ 20.6% 6,924,335$ (1.5%) 7,757,721$ 12.0% 7,161,588$ (7.7%)
3,795,111 (25.1%) 2,797,166 (26.3%) 2,291,689 (18.1%) 2,093,447 (8.7%) 2,371,176 13.3% 2,462,699 3.9%
125,189 42.9% 93,919 (25.0%) 109,838 16.9% 77,197 (29.7%) 42,994 (44.3%) 44,381 3.2%
64,823 (6.2%) 75,462 16.4% 52,503 (30.4%) 21,468 (59.1%) 52,230 143.3% 35,809 (31.4%)
701,720 6.7% 1,176,177 67.6% 999,275 (15.0%) 893,349 (10.6%) 931,425 4.3% 865,286 (7.1%)
360,780 6.5% 367,184 1.8% 411,912 12.2% 370,074 (10.2%) 377,567 2.0% 351,361 (6.9%)
64,742 3.5% 22,536 (65.2%) 67,293 198.6% 95,059 41.3% 93,180 (2.0%) 96,925 4.0%
- 0.0% - 0.0% - 0.0% - 0.0% - 0.0% - 0.0%
36,731,225 3.4% 39,624,394 7.9% 36,786,741 (7.2%) 40,790,384 10.9% 38,885,744 (4.7%) 36,579,844 (5.9%)
50,253 (99.1%) 115,686 130.2% 104,924 (9.3%) 4,470,804 4161.0% 17,998,927 302.6% 11,519,306 (36.0%)
47,442,053$ (10.2%) 50,103,764$ 5.6% 47,854,948$ (4.5%) 55,736,117$ 16.5% 68,510,964$ 22.9% 59,117,199$ (13.7%)
29,610,778$ 25.9% 33,498,939$ 13.1% 35,695,623$ 6.6% 37,493,095$ 5.0% 37,924,367$ 1.2% 38,788,697$ 2.3%
34,612,349 (7.9%) 27,282,231 (21.2%) 26,064,311 (4.5%) 22,768,588 (12.6%) 23,736,455 4.3% 24,965,329 5.2%
7,541,525 7.3% 7,917,255 5.0% 7,557,201 (4.5%) 6,861,013 (9.2%) 6,727,463 (1.9%) 6,358,376 (5.5%)
171,633 (7.5%) 181,123 5.5% 148,778 (17.9%) 181,228 21.8% 186,550 2.9% 180,411 (3.3%)
19,283,910 5.6% 18,693,288 (3.1%) 17,157,731 (8.2%) 16,878,309 (1.6%) 16,678,861 (1.2%) 17,349,424 4.0%
91,220,195 5.4% 87,572,836 (4.0%) 86,623,644 (1.1%) 84,182,233 (2.8%) 85,253,696 1.3% 87,642,237 2.8%
2,148,468 (3.4%) 1,897,819 (11.7%) 5,900,085 210.9% 4,552,739 (22.8%) 3,932,483 (13.6%) 3,954,280 0.6%
5,106,758 61.8% 6,695,423 31.1% 3,531,219 (47.3%) 1,713,898 (51.5%) 1,103,459 (35.6%) 646,064 (41.5%)
1,894,298 (39.1%) 1,837,847 (3.0%) 1,837,234 (0.0%) 2,345,158 27.6% 1,601,598 (31.7%) 2,510,793 56.8%
100,369,719$ 5.6% 98,003,925$ (2.4%) 97,892,182$ (0.1%) 92,794,028$ (5.2%) 91,891,236$ (1.0%) 94,753,374$ 3.1%
147,811,772$ (0.0%) 148,107,689$ 0.2% 145,747,130$ (1.6%) 148,530,145$ 1.9% 160,402,200$ 8.0% 153,870,573$ (4.1%)
Fiscal Year
2011-122008-09 2010-112009-102007-082006-07
217

Yuma County, ArizonaGovernment-wide Expenses by FunctionLast Nine Fiscal Years
Amount % Chg Amount % Chg Amount % Chg Amount % Chg
General Government 31,102,182$ N/A 35,978,984$ 15.7% 38,160,597$ 6.1% 40,039,629$ 4.9%
Public Safety 31,039,222 N/A 31,748,603 2.3% 36,145,190 13.8% 38,574,625 6.7%
Highway & Streets 12,470,931 N/A 14,248,072 14.3% 11,462,736 (19.5%) 15,451,075 34.8%
Sanitation 715,578 N/A 871,424 21.8% 857,984 (1.5%) 862,621 0.5%
Health 5,614,325 N/A 6,351,269 13.1% 6,628,428 4.4% 7,488,353 13.0%
Welfare 11,648,231 N/A 11,820,871 1.5% 12,695,814 7.4% 13,146,757 3.6%
Culture & Recreation 3,522,959 N/A 3,450,050 (2.1%) 4,559,772 32.2% 4,348,632 (4.6%)
Education 9,258,092 N/A 9,662,024 4.4% 6,963,110 (27.9%) 6,176,103 (11.3%)
Interest on Long-term Debt 1,875,070 N/A 1,738,525 (7.3%) 1,576,642 (9.3%) 2,206,422 39.9%
Total - Expenses 107,246,590$ N/A 115,869,822$ 8.0% 119,050,273$ 2.7% 128,294,217$ 7.8%
Change in Net Assets (1) 22,226,698$ N/A 27,701,766$ 24.6% 28,828,825$ 4.1% 19,517,555$ (32.3%)
Beginning Net Assets (1) 218,914,033 N/A 241,140,731 10.2% 268,842,497 11.5% 297,671,322 10.7%
Ending Net Assets (1) 241,140,731$ N/A 268,842,497$ 11.5% 297,671,322$ 10.7% 317,188,877$ 6.6%
(1) Information not available prior to implementation of GASB 34 FY 2002-03.
Fiscal Year
2004-052003-04 2005-06 2006-07
218

Table A-2
Amount % Chg Amount % Chg Amount % Chg Amount % Chg Amount % Chg
42,799,239$ 6.9% 45,304,045$ 5.9% 50,150,134$ 10.7% 45,977,581$ (8.3%) 44,961,829$ (2.2%)
40,728,698 5.6% 40,217,770 (1.3%) 40,251,320 0.1% 41,268,389 2.5% 40,778,911 (1.2%)
7,280,293 (52.9%) 7,011,932 (3.7%) 14,316,356 104.2% 11,610,502 (18.9%) 11,148,656 (4.0%)
877,712 1.7% 878,146 0.0% 841,767 (4.1%) 911,775 8.3% 892,460 (2.1%)
8,623,313 15.2% 8,587,612 (0.4%) 8,633,914 0.5% 9,043,830 4.7% 9,121,693 0.9%
13,139,929 (0.1%) 14,140,558 7.6% 12,884,373 (8.9%) 13,728,818 6.6% 15,570,314 13.4%
4,824,207 10.9% 8,205,586 70.1% 8,152,455 (0.6%) 8,453,590 3.7% 8,995,200 6.4%
6,358,736 3.0% 6,933,698 9.0% 10,266,758 48.1% 8,641,658 (15.8%) 6,983,411 (19.2%)
3,806,777 72.5% 3,166,589 (16.8%) 2,983,100 (5.8%) 2,608,233 (12.6%) 2,626,606 0.7%
128,438,904$ 0.1% 134,445,936$ 4.7% 148,480,177$ 10.4% 142,244,376$ (4.2%) 141,079,081$ (0.8%)
19,668,785$ 0.8% 11,301,194$ (42.5%) 49,968$ (99.6%) 18,217,355$ 36358.0% 12,791,492$ (29.8%)
317,188,877 6.6% 336,857,662 6.2% 348,158,856 3.4% 348,208,824 0.0% 366,426,179 5.2%
336,857,662$ 6.2% 348,158,856$ 3.4% 348,208,824$ 0.0% 366,426,179$ 5.2% 379,217,671$ 3.5%
2011-122010-112009-102008-092007-08
219

Yuma County, ArizonaGeneral Government Expenditures by Function (1)
Last Ten Fiscal Years
Amount % Chg Amount % Chg Amount % Chg Amount % Chg
General Government 27,786,796$ 12.14% 31,787,613$ 14.40% 35,706,375$ 12.33% 36,195,797$ 1.37%
Public Safety 26,440,571 11.06% 29,729,919 12.44% 31,488,941 5.92% 35,111,387 11.50%
Highway & Streets 8,151,162 36.62% 10,673,332 30.94% 12,051,334 12.91% 9,783,495 (18.82%)
Sanitation 751,527 28.93% 697,616 (7.17%) 865,829 24.11% 830,489 (4.08%)
Health 4,708,643 11.16% 5,406,788 14.83% 6,351,269 17.47% 6,462,001 1.74%
Welfare 10,602,430 3.76% 11,252,257 6.13% 11,820,871 5.05% 12,284,357 3.92%
Culture & Recreation 3,265,640 9.76% 3,380,410 3.51% 3,495,949 3.42% 4,484,142 28.27%
Education 10,214,274 329.78% 9,250,498 (9.44%) 9,693,452 4.79% 6,967,139 (28.13%)
Capital Outlay 15,813,693 (17.24%) 19,007,393 20.20% 22,864,257 20.29% 15,856,061 (30.65%)
Debt Service - Principal 2,030,720 (13.18%) 2,525,260 24.35% 4,661,203 84.58% 2,338,059 (49.84%)
Debt Service - Interest 1,976,815 (4.45%) 1,875,070 (5.15%) 1,738,525 (7.28%) 1,576,642 (9.31%)
Total 111,742,271$ 13.49% 125,586,156$ 12.39% 140,738,005$ 12.06% 131,889,569$ (6.29%)
Change in Balance (2) 1,821,721$ (72.65%) (600,402)$ (132.96%) (4,412,270)$ 634.89% 20,912,712$ (573.97%)
Fund Balance -Beginning (1) 86,320,119 8.36% 88,141,840 2.11% 87,541,438 (0.68%) 83,129,168 (5.04%)
Fund Balance -Ending (1)(3) 88,141,840$ 2.11% 87,541,438$ (0.68%) 83,129,168$ (5.04%) 104,041,880$ 25.16%
(1) Includes General, Special Revenue, Debt Service, and Capital Project Funds
Fiscal Year
2002-03 2004-05 2005-062003-04
220

Table A-3
Amount % Chg Amount % Chg Amount % Chg Amount % Chg Amount % Chg Amount % Chg
38,134,493$ 5.36% 39,795,414$ 4.36% 42,397,350$ 6.54% 42,119,564$ (0.66%) 42,399,498$ 0.66% 42,582,154$ 0.43%
37,882,894 7.89% 37,821,622 (0.16%) 38,366,468 1.44% 38,202,107 (0.43%) 38,814,882 1.60% 38,624,854 (0.49%)
11,286,358 15.36% 11,008,356 (2.46%) 11,179,796 1.56% 12,541,134 12.18% 9,855,973 (21.41%) 9,466,126 (3.96%)
850,721 2.44% 819,880 (3.63%) 828,464 1.05% 794,215 (4.13%) 854,966 7.65% 842,870 (1.41%)
7,384,788 14.28% 8,039,525 8.87% 8,217,172 2.21% 8,288,126 0.86% 8,628,172 4.10% 8,781,513 1.78%
12,742,949 3.73% 12,989,098 1.93% 13,682,775 5.34% 12,477,589 (8.81%) 13,308,587 6.66% 15,184,030 14.09%
4,344,464 (3.11%) 4,488,158 3.31% 8,009,183 78.45% 7,794,138 (2.68%) 7,404,440 (5.00%) 7,514,881 1.49%
6,193,698 (11.10%) 6,266,518 1.18% 6,923,526 10.48% 10,260,122 48.19% 8,627,030 (15.92%) 6,975,040 (19.15%)
17,793,463 12.22% 40,107,795 125.41% 39,012,758 (2.73%) 11,297,777 (71.04%) 19,588,306 73.38% 14,713,004 (24.89%)
12,020,108 414.11% 13,570,649 12.90% 4,495,840 (66.87%) 7,314,848 62.70% 1,830,822 (74.97%) 2,296,887 25.46%
2,206,422 39.94% 3,806,777 72.53% 3,166,589 (16.82%) 2,983,100 (5.79%) 2,608,233 (12.57%) 2,626,606 0.70%
150,840,358$ 14.37% 178,713,792$ 18.48% 176,279,921$ (1.36%) 154,072,720$ (12.60%) 153,920,909$ (0.10%) 149,607,965$ (2.80%)
7,742,450$ (62.98%) 12,618,237$ 62.97% (30,557,824)$ (342.17%) (9,872,875)$ (67.69%) 792,840$ (108.03%) 2,834,513$ 257.51%
104,041,880 25.16% 111,784,330 7.44% 124,402,567 11.29% 93,844,743 (24.56%) 83,971,868 (10.52%) 84,764,708 0.94%
111,784,330$ 7.44% 124,402,567$ 11.29% 93,844,743$ (24.56%) 83,971,868$ (10.52%) 84,764,708$ 0.94% 87,599,221$ 3.34%
2006-07 2007-08 2008-09
Fiscal Year
2011-122010-112009-10
221

Yuma County, ArizonaFund Balances of Governmental FundsLast Ten Fiscal Years
2002-03 2003-04 2004-05 2005-06
General fundReserved 26,923$ 29,816$ 130,101$ 196,490$ Unreserved 16,886,569 15,494,871 17,903,235 16,902,397
Nonspendable Restricted Committed Assigned Unassigned
Total General Fund 16,913,492$ 15,524,687$ 18,033,336$ 17,098,887$
All other governmental fundsReserved 349,332$ 84,645$ 44,703$ 55,329$ Unreserved, reported in:
Debt service funds 5,054,358 5,284,990 5,461,660 5,974,171 Capital projects funds 31,599,030 32,044,405 24,576,613 44,506,282 Special revenue funds 34,225,628 34,602,711 35,012,856 36,407,211
Nonspendable Restricted Committed Assigned Unassigned
Total all other governmental funds 71,228,348$ 72,016,751$ 65,095,832$ 86,942,993$
Fiscal Year
222

Table A-4
2006-07 2007-08 2008-09 2009-10 2010-11 2011-12
68,868$ 14,717,551 14,467,797$ 17,999,370$ 18,236,669$
216,910$ 266,480$ 6,967,045 7,002,264
268,000 269,640
10,674,849 10,659,990
14,786,419$ 14,467,797$ 17,999,370$ 18,236,669$ 18,396,444$ 17,928,734$
931,027$
6,441,128 5,346,337$ 3,566,628$ 1,498,137$ 51,121,753 54,623,120 18,823,959 7,563,779 38,504,003 49,965,313 53,454,786 56,673,283
64,808$ 30,425$ 57,368,443 58,145,049
8,473,311 10,189,457 1,223,067 1,149,959 (761,365) 155,597
96,997,911$ 109,934,770$ 75,845,373$ 65,735,199$ 66,368,264$ 69,670,487$
Fiscal Year
223

Yuma County, ArizonaChange in Fund Balances- All Funds (1)
Including Ratio of Total Debt Service to Total Non-Capital ExpendituresLast Ten Fiscal Years
Ratio ofFiscal Debt ServiceYear to
Amount % Chg Amount % Chg Non- Capital
02-03 91,921,043 22.65% 4,007,535 (9.09%) 4.36%
03-04 106,578,763 15.95% 4,400,330 9.80% 4.13%
04-05 117,496,673 10.24% 6,399,728 45.44% 5.45%
05-06 116,033,508 (1.25%) 3,914,701 (38.83%) 3.37%
06-07 133,046,895 14.66% 14,226,530 263.41% 10.69%
07-08 108,605,997 (18.37%) 17,377,426 22.15% 16.00%
08-09 137,267,163 26.39% 7,662,429 (55.91%) 5.58%
09-10 142,774,943 4.01% 10,297,948 34.40% 7.77%
10-11 134,332,603 (5.91%) 4,439,055 (56.89%) 3.30%
11-12 129,971,468 (3.25%) 4,923,493 10.91% 3.79%
(1) Includes General, Special Revenue, Debt Services, and Capital Projects Funds(2) FY 04-11 Restated
Total
Expenditures (2)
Total
ExpendituresNon-Capital Debt Service
224

Table A-5
Amount % Chg Amount % Chg Amount % Chg
1,821,721 (72.65%) 86,320,119 8.36% 88,141,840 2.11%
(600,402) (132.96%) 88,141,840 2.11% 87,541,438 (0.68%)
(4,412,270) 634.89% 87,541,438 (0.68%) 83,129,168 (5.04%)
20,912,712 (573.97%) 83,129,168 (5.04%) 104,041,880 25.16%
7,742,450 (62.98%) 104,041,880 25.16% 111,784,330 7.44%
12,618,237 62.97% 111,784,330 7.44% 124,402,567 11.29%
(30,557,824) (342.17%) 124,402,567 11.29% 93,844,743 (24.56%)
(9,872,875) (67.69%) 93,844,743 (24.56%) 83,971,868 (10.52%)
792,840 (108.03%) 83,971,868 (10.52%) 84,764,708 94.00%
2,834,513 257.51% 84,764,708 0.94% 87,599,221 3.34%
Beginning (1) Ending(1)Change in Balance Fund Balance Fund Balance
225

General Government Revenues by Source
2003-04
Amount % Chg Amount % Chg Amount % Chg Amount % Chg
Taxes 49,645,570$ 7.74% 54,689,904$ 10.16% 60,762,963$ 11.10% 68,319,718$ 12.44%
Special Assessments 178,471 20.91% 167,573 (6.11%) 231,955 38.42% 301,455 29.96%
License & Permits 2,008,019 31.33% 2,534,078 26.20% 2,476,335 (2.28%) 2,050,209 (17.21%) Intergovernmental 54,086,358 15.78% 56,795,219 5.01% 58,058,184 2.22% 57,861,185 (0.34%) Charges for Services 5,260,293 3.42% 5,604,958 6.55% 6,962,411 24.22% 6,914,586 (0.69%) Fines & Forfeits 2,075,221 12.91% 2,270,569 9.41% 2,477,111 9.10% 2,416,846 (2.43%)
Investment Income (162,326) (107.09%) 1,466,106 (1003.19%) 2,177,538 48.53% 2,913,282 33.79%
Rents 334,306 10.08% 282,112 (15.61%) 281,994 (0.04%) 294,900 4.58%
Miscellaneous 1,020,656 20.73% 1,450,235 42.09% 1,940,938 33.84% 2,186,123 12.63%
Total Revenues 114,446,568$ 9.17% 125,260,754$ 9.45% 135,369,429$ 8.07% 143,258,304$ 5.83%
Yuma County
Last Ten Fiscal Years
Fiscal Year
2002-03 2004-05 2005-06
226

Table A-6
Amount % Chg Amount % Chg Amount % Chg Amount % Chg Amount % Chg Amount % Chg
71,936,285$ 5.29% 68,879,548$ (4.25%) 69,465,913$ 0.85% 67,303,924$ (3.11%) 68,574,835$ 1.89% 70,292,813$ 2.51%
182,960 (39.31%) 100,086 (45.30%) 93,232 (6.85%) 403,653 332.96% 112,319 (72.17%) 572,462 409.68%
1,474,468 (28.08%) 1,545,983 4.85% 1,254,161 (18.88%) 1,113,776 (11.19%) 1,057,715 (5.03%) 970,355 (8.26%)
58,792,620 1.61% 60,912,491 3.61% 60,566,427 (0.57%) 63,580,073 4.98% 68,532,952 7.79% 65,712,740 (4.12%)
5,972,773 (13.62%) 5,430,007 (9.09%) 5,737,349 5.66% 5,774,101 0.64% 7,086,558 22.73% 6,743,112 (4.85%)
2,714,438 12.31% 2,955,329 8.87% 3,518,565 19.06% 3,259,234 (7.37%) 3,151,654 (3.30%) 3,003,379 (4.70%)
4,701,157 61.37% 6,243,034 32.80% 3,264,827 (47.70%) 1,547,473 (52.60%) 984,739 (36.36%) 581,131 (40.99%)
319,659 8.40% 332,282 3.95% 360,728 8.56% 330,421 (8.40%) 330,365 (0.02%) 301,201 (8.83%)
2,512,697 14.94% 1,344,253 (46.50%) 1,260,888 (6.20%) 1,226,518 (2.73%) 1,345,393 9.69% 1,310,408 (2.60%)
148,607,057$ 3.73% 147,743,013$ (0.58%) 145,522,090$ (1.50%) 144,539,173$ (0.68%) 151,176,530$ 4.59% 149,487,601$ (1.12%)
2007-08 2008-09
Fiscal Year
2011-122006-07 2010-112009-10
227

Yuma County, ArizonaTax Revenues by SourceLast Ten Fiscal Years(All information from prior year financial reports unless otherwise specified)
Fiscal
Year Amount % Chg Amount % Chg Amount % Chg Amount % Chg Amount % Chg
02-03 14,417,100$ 9.53% - 0.00% 3,090,138$ 9.62% 1,680,811$ 9.06% 653,901$ 56.55%
03-04 15,269,302 5.91% - 0.00% 3,244,656 5.00% 1,779,172 5.85% 665,243 1.73%
04-05 15,770,808 3.28% - 0.00% 3,865,984 19.15% 1,901,775 6.89% 612,527 (7.92%)
05-06 16,721,819 6.03% - 0.00% 4,188,056 8.33% 2,068,590 8.77% 532,672 (13.04%)
06-07 18,018,569 7.75% - 0.00% 8,251,721 97.03% 2,682,331 29.67% 658,157 23.56%
07-08 19,330,702 7.28% - 0.00% 10,002,549 21.22% 3,314,578 23.57% 851,110 29.32%
08-09 20,763,199 7.41% - 0.00% 10,269,314 2.67% 3,757,681 13.37% 905,429 6.38%
09-10 22,104,685 6.46% - 0.00% 10,750,925 4.69% 3,717,939 (1.06%) 919,546 1.56%
10-11 23,106,954 4.53% - 0.00% 10,321,903 (3.99%) 3,536,926 (4.87%) 958,584 4.25%
11-12 24,188,658 4.68% 9$ 100.00% 10,439,203 1.14% 3,202,688 (9.45%) 958,139 (0.05%)
Fiscal
Year Amount % Chg Amount % Chg Amount % Chg Amount % Chg
02-03 3,319,014$ 7.61% 1,967,508$ 5.21% 123,972$ 10.53% 8,297$ 0.00%
03-04 3,706,770 11.68% 2,148,806 9.21% 135,173 9.04% - 0.00%
04-05 3,991,507 7.68% 2,273,768 5.82% 120,253 (11.04%) - 0.00%
05-06 4,449,474 11.47% 2,580,788 13.50% 185,592 54.33% - 0.00%
06-07 4,821,719 8.37% 2,719,806 5.39% 171,633 (7.52%) - 0.00%
07-08 5,114,403 6.07% 2,802,852 3.05% 181,123 5.53% - 0.00%
08-09 4,985,571 (2.52%) 2,571,630 (8.25%) 148,778 (17.86%) - 0.00%
09-10 4,583,767 (8.06%) 2,277,246 (11.45%) 181,228 21.81% - 0.00%
10-11 4,520,947 (1.37%) 2,206,516 (3.11%) 186,550 2.94% - 0.00%
11-12 4,533,376 0.27% 1,825,000 (17.29%) 180,411 (3.29%) - 0.00%
(1) Includes all property tax revenues
(2) Capital Sales Tax implemented in FY 00-01 by voter approval and terminated in FY 06-07 as maximum amount collected
(3) Health Services District Sales Tax implemented in fiscal year 2005-2006 by voter approval
Flood Control
District (1)
Improvement
Districts (1)
Property Taxes (1)LibraryJail
District (1) District (1)
General
Fund (1)
Fund Funds
Auto-in-LieuGeneral
Franchise Tax GeneralHURF
Other Taxes
FundFund
General
228

Table A-7
Amount % Chg Amount % Chg Amount % Chg Amount % Chg Amount % Chg
8,140,216$ 5.54% 8,158,678$ 5.82% 8,085,935$ 5.69% - 0.00% 24,384,829$ 216.17%
9,259,931 13.76% 9,258,301 13.48% 9,222,550 14.06% - 0.00% 27,740,782 13.76%
10,736,927 15.95% 10,756,744 16.18% 10,732,670 16.37% - 0.00% 32,226,341 16.17%
11,883,146 10.68% 11,883,461 10.47% 11,826,904 10.20% 1,999,216$ 0.00% 37,592,727 16.65%
12,427,290 4.58% 12,427,423 4.58% 7,292,550 (38.34%) 2,465,086 23.30% 34,612,349 (7.93%)
12,373,201 (0.44%) 12,372,890 (0.44%) 54,809 (99.25%) 2,481,331 0.66% 27,282,230 (21.18%)
11,826,051 (4.42%) 11,826,297 (4.42%) 60,702 10.75% 2,351,261 (5.24%) 26,064,311 (4.46%)
10,344,860 (12.52%) 10,344,969 (12.53%) 19,339 (68.14%) 2,059,420 (12.41%) 22,768,587 (12.64%)
10,778,810 4.19% 10,778,684 4.19% 37,088 91.78% 2,141,873 4.00% 23,736,456 4.25%
11,344,479 5.25% 11,344,489 5.25% 18,052 (51.33%) 2,258,309 5.44% 17,349,424 (26.91%)
Amount % Chg
49,645,570$ 7.74%
54,689,904 10.16%
60,762,963 11.10%
68,319,718 12.44%
71,936,285 5.29%
68,879,548 (4.25%)
69,465,913 0.85%
67,303,924 (3.11%)
68,574,835 1.89%
70,292,813 2.51%
Local SalesTotal
Local Sales TaxesFund
Taxes
Capital
Sales Tax (2)
Health
District (3)
General Jail
District (1)
Total All
229

Yuma County, ArizonaLicenses and Permits by Source Last Ten Fiscal Years(All information from prior year financial reports unless otherwise specified)
Fiscal Year Amount % Chg Amount % Chg Amount % Chg Amount % Chg
02-03 966,245$ 62.13% 113,834$ 38.38% 226,007$ 43.86% 50,208$ (15.18%)
03-04 1,295,329 34.06% 173,476 52.39% 321,561 42.28% 53,348 6.25%
04-05 1,394,431 7.65% 160,828 (7.29%) 301,374 (6.28%) 60,209 12.86%
05-06 1,153,857 (17.25%) 122,792 (23.65%) 253,181 (15.99%) 62,358 3.57%
06-07 614,421 (46.75%) 57,268 (53.36%) 137,902 (45.53%) 49,798 (20.14%)
07-08 486,257 (20.86%) 47,763 (16.60%) 117,467 (14.82%) 63,604 27.72%
08-09 340,100 (30.06%) 29,467 (38.31%) 89,303 (23.98%) 40,533 (36.27%)
09-10 316,054 (7.07%) 36,053 22.35% 94,861 6.22% 24,683 (39.10%)
10-11 276,243 (12.60%) 33,541 (6.97%) 90,409 (4.69%) 22,225 (9.96%)
11-12 297,773 7.79% 27,545 (17.88%) 80,680 (10.76%) 17,220 (22.52%)
Fiscal
Year Amount % Chg Amount % Chg Amount % Chg Amount % Chg
02-03 934$ 3.09% 369,198$ 4.64% 88,636$ (12.20%) 2,008,019$ 31.33%
03-04 1,071 14.67% 368,276 (0.25%) 69,878 (21.16%) 2,534,078 26.20%
04-05 1,595 48.93% 135,332 (63.25%) 82,409 17.93% 2,476,335 (2.28%)
05-06 815 (48.90%) 71,305 (47.31%) 69,599 (15.54%) 2,050,209 (17.21%)
06-07 3,284 302.94% 256,648 259.93% 98,566 41.62% 1,474,468 (28.08%)
07-08 2,885 (12.15%) 479,650 86.89% 74,619 (24.30%) 1,545,983 4.85%
08-09 1,595 (44.71%) 497,762 3.78% 96,499 29.32% 1,254,161 (18.88%)
09-10 2,215 38.87% 441,114 (11.38%) 68,336 (29.18%) 1,113,776 (11.19%)
10-11 2,330 5.19% 462,903 4.94% 34,836 (49.02%) 1,057,715 (5.03%)
11-12 2,610 12.02% 355,830 (23.13%) 68,323 96.13% 970,355 (8.26%)
Mechanical & Electrical Mobile Homes
GENERAL FUND
Building Permits Plumbing
Licenses & Permits
Total All
Permits Permits
ALL OTHER FUNDSFlood District Health District
All Other Funds
230

Table A-8
Amount % Chg Amount % Chg Amount % Chg
23,691$ 83.23% 160,507$ (0.43%) 8,759$ 55.55%
33,118 39.79% 206,885 28.89% 11,136 27.14%
15,891 (52.02%) 319,010 54.20% 5,256 (52.80%)
30,743 93.46% 281,352 (11.80%) 4,207 (19.96%)
20,919 (31.96%) 231,753 (17.63%) 3,909 (7.08%)
37,529 79.40% 228,410 (1.44%) 7,799 99.52%
27,420 (26.94%) 125,502 (45.05%) 5,980 (23.32%)
11,551 (57.87%) 112,338 (10.49%) 6,571 9.88%
26,541 129.77% 99,063 (11.82%) 9,624 46.46%
32,507 22.48% 77,695 (21.57%) 10,172 5.69%
Variance & Special Use
GENERAL FUND
Other Permits Permits
231

Yuma County, ArizonaIntergovernmental Revenues by Source Last Ten Fiscal Years(All information from prior year financial reports unless otherwise specified)
Fiscal
Year Amount % Chg Amount % Chg Amount % Chg Amount % Chg
02-03 13,186,424$ 4.24% 3,404,409$ 125.43% 550,035$ 0.00% 67,799$ (18.74%)
03-04 14,652,864 11.12% 1,870,691 (45.05%) 550,035 0.00% 46,044 (32.09%)
04-05 16,310,084 11.31% 1,909,810 2.09% 550,035 0.00% 279,779 507.63%
05-06 18,299,455 12.20% 1,944,685 1.83% 550,035 0.00% 419,558 49.96%
06-07 19,283,910 5.38% 1,936,291 (0.43%) 550,035 0.00% 524,398 24.99%
07-08 18,693,288 (3.06%) 1,910,901 (1.31%) 550,035 0.00% 747,780 42.60%
08-09 17,157,731 (8.21%) 4,308,880 125.49% 522,533 (5.00%) 697,438 (6.73%)
09-10 16,878,309 (1.63%) 3,229,109 (25.06%) 304,381 (41.75%) 543,585 (22.06%)
10-11 16,678,861 (1.18%) 3,261,388 1.00% - 0.00% 137,310 (74.74%)
11-12 17,349,424 4.02% 3,325,344 1.96% - 0.00% 5,000 (96.36%)
Fiscal
Year Amount % Chg Amount % Chg Amount % Chg Amount % Chg
02-03 2,406,614$ 2.55% 1,329,838$ 14.08% 4,338,594$ (52.41%) 3,254,052$ 15.02%
03-04 2,377,463 (1.21%) 1,095,250 (17.64%) 4,082,377 (5.91%) 3,379,751 3.86%
04-05 2,687,574 13.04% 859,166 (21.56%) 4,408,980 8.00% 3,236,681 (4.23%)
05-06 3,083,170 14.72% 1,047,650 21.94% 5,077,705 15.17% 2,911,207 (10.06%)
06-07 3,292,038 6.77% 940,215 (10.25%) 5,201,130 2.43% 2,935,079 0.82%
07-08 3,341,232 1.49% 1,235,129 31.37% 5,951,624 14.43% 3,434,266 17.01%
08-09 3,147,213 (5.81%) 1,138,867 (7.79%) 4,273,416 (28.20%) 3,574,328 4.08%
09-10 3,150,298 0.10% 778,161 (31.67%) 3,693,276 (13.58%) 4,115,679 15.15%
10-11 3,214,287 2.03% 804,849 3.43% 3,555,169 (3.74%) 3,542,481 (13.93%)
11-12 3,376,870 5.06% 1,103,175 37.07% 4,400,660 23.78% 3,427,447 (3.25%)
Fiscal
Year Amount % Chg Amount % Chg Amount % Chg Amount % Chg
02-03 488,980$ (70.82%) 8,798,221$ 0.01% 2,070,254$ (52.30%) 54,086,358$ (2.57%)
03-04 613,619 25.49% 8,029,723 (8.73%) 5,560,808 168.61% 56,795,219 5.01%
04-05 760,570 23.95% 7,742,629 (3.58%) 4,355,596 (21.67%) 58,058,184 2.22%
05-06 912,537 19.98% 5,168,782 (33.24%) 2,876,454 (33.96%) 57,861,085 (0.34%)
06-07 694,555 (23.89%) 4,434,415 (14.21%) 2,447,458 (14.91%) 58,792,620 1.61%
07-08 732,104 5.41% 4,438,414 0.09% 2,843,044 16.16% 60,912,491 3.61%-
08-09 1,205,013 64.60% 4,977,186 12.14% 4,167,169 46.57% 60,566,427 (0.57%)
09-10 790,076 (34.43%) 4,674,389 (6.08%) 10,274,534 261.39% 63,580,073 4.98%
10-11 906,430 14.73% 6,203,116 32.70% 13,985,587 235.61% 68,532,952 7.79%
11-12 846,310 (6.63%) 5,527,686 (10.89%) 11,244,505 9.44% 65,712,740 (4.12%)
All Other Funds
All Other Funds
Attorney HURF Housing
Adult
Probation
General Fund
Lottery
State Shared
Sales Tax
Federal
PILT
State
Reimbursements
Workforce Other Special Total
School Investment Act Revenue Funds Intergovernmental
232

Table A-9
Amount % Chg Amount % Chg Amount % Chg
20,103$ (57.51%) 852,684$ (14.12%) 17,443,518$ 15.12%
44,467 121.20% 882,102 3.45% 17,405,656 (0.22%)
32,437 (27.05%) 1,568,400 77.80% 19,788,299 13.69%
19,334 (40.40%) 1,544,430 (1.53%) 21,788,571 10.11%
32,457 67.88% 1,788,202 15.78% 23,008,403 5.60%
31,267 (3.67%) 1,749,647 (2.16%) 22,353,836 (2.84%)
29,874 (4.46%) 2,075,843 18.64% 24,792,299 10.91%
29,888 0.05% 1,730,313 (16.65%) 22,715,585 (8.38%)
31,621 5.80% 977,529 (43.51%) 21,086,709 (7.17%)
24,216 (23.42%) 791,480 (19.03%) 21,495,464 1.94%
Amount % Chg Amount % Chg Amount % Chg
2,800,224$ (7.63%) 4,341,732$ (36.82%) 6,814,332$ 3594.81%
3,488,422 24.58% 4,048,614 (6.75%) 6,713,535 (1.48%)
3,138,778 (10.02%) 4,095,042 1.15% 6,984,874 4.04%
3,275,644 4.36% 4,432,490 8.24% 7,286,876 4.32%
4,079,137 24.53% 4,864,310 9.74% 6,895,880 (5.37%)
3,673,727 (9.94%) 4,635,262 (4.71%) 8,273,853 19.98%
3,337,179 (9.16%) 4,507,479 (2.76%) 6,696,123 (19.07%)
4,016,879 20.37% 3,859,822 (14.37%) 6,389,228 (4.58%)
4,134,804 2.94% 3,806,305 (1.39%) 6,284,065 (1.65%)
4,210,745 1.84% 4,070,381 6.94% 6,009,497 (4.37%)
All Other FundsHealth
Works
General Fund
State Shared Liquor LicensesOther
Grants Revenues
Intergovernmental
Juvenile Public
District Court
233

Yuma County, ArizonaCharges for Services by SourceLast Ten Fiscal Years(All information from prior year financial reports unless otherwise specified)
Fiscal Year Amount % Chg Amount % Chg Amount % Chg Amount % Chg
02-03 36,231$ 1.94% 380,254$ 25.23% 427,581$ 27.76% 251,948$ 8.47%
03-04 38,955 7.52% 427,432 12.41% 543,144 27.03% 257,839 2.34%
04-05 114,668 194.36% 552,150 29.18% 549,860 1.24% 286,135 10.97%
05-06 68,765 (40.03%) 574,059 3.97% 669,481 21.75% 289,703 1.25%
06-07 38,173 (44.49%) 345,017 (39.90%) 526,811 (21.31%) 333,493 15.12%
07-08 75,575 97.98% 240,841 (30.19%) 458,767 (12.92%) 402,764 20.77%
08-09 31,807 (57.91%) 185,300 (23.06%) 340,384 (25.80%) 410,080 1.82%
09-10 17,485 (45.03%) 155,051 (16.32%) 370,006 8.70% 405,558 (1.10%)
10-11 7,732 (55.78%) 160,018 3.20% 360,064 (2.69%) 388,490 (4.21%)
11-12 16,125 108.55% 159,948 (0.04%) 305,647 (15.11%) 436,385 12.33%
Fiscal
Year Amount % Chg Amount % Chg Amount % Chg Amount % Chg
02-03 136,610$ 32.95% 1,533,923$ (6.61%) 410,691$ 3.86% 166,826$ 129.75%
03-04 147,508 7.98% 1,573,350 2.57% 439,873 7.11% 186,584 11.84%
04-05 194,138 31.61% 2,080,643 32.24% 461,813 4.99% 206,868 10.87%
05-06 176,881 (8.89%) 1,827,032 (12.19%) 485,405 5.11% 218,912 5.82%
06-07 165,766 (6.28%) 1,154,038 (36.84%) 506,546 4.36% 95,272 (56.48%)
07-08 139,835 (15.64%) 809,335 (29.87%) 531,097 4.85% - (100.00%)
08-09 158,679 13.48% 629,852 (22.18%) 488,622 (8.00%) - 0.00%
09-10 132,580 (16.45%) 403,380 (35.96%) 516,071 5.62% 127,742 0.00%
10-11 232,883 75.65% 685,079 69.83% 575,941 11.60% 120,478 (5.69%)
11-12 280,130 20.29% 747,337 9.09% 616,309 7.01% 52,751 (56.22%)
DistrictCharges Probation Assessor
Rezoning
Jail
Plan Check
GENERAL FUND
GENERAL FUND
Applications
OTHER FUNDSOther
Fees Fees
Adult
Recorder
Fees
GF Attorney
234

Table A-10
Amount % Chg Amount % Chg Amount % Chg Amount % Chg
167,716$ 3.79% 53,465$ 54.04% 47,958$ 7.38% 878,746$ 5.43%
171,236 2.10% 28,743 (46.24%) 68,566 42.97% 1,026,592 16.82%
181,940 6.25% 55,468 92.98% 82,976 21.02% 1,097,804 6.94%
96,350 (47.04%) 35,393 (36.19%) 87,291 5.20% 1,250,511 13.91%
197,730 105.22% 27,059 (23.55%) 116,351 33.29% 1,075,259 (14.01%)
316,684 60.16% 34,390 27.09% 203,659 75.04% 1,360,592 26.54%
341,132 7.72% 31,398 (8.70%) 89,482 (56.06%) 2,157,025 58.54%
386,979 13.44% 70,374 124.14% 102,349 14.38% 2,281,782 5.78%
384,825 (0.56%) 87,872 24.86% 68,652 (32.92%) 3,148,068 37.97%
248,447 (35.44%) 77,845 (11.41%) 39,964 (41.79%) 2,909,067 (7.59%)
Amount % Chg Amount % Chg Amount % Chg Amount % Chg
286,818$ 24.87% 167,782$ 19.64% 313,744$ (39.97%) 5,260,293$ 3.42%
270,590 (5.66%) 187,320 11.64% 237,226 (24.39%) 5,604,958 6.55%
553,824 104.67% 204,911 9.39% 339,213 42.99% 6,962,411 24.22%
583,647 5.38% 221,548 8.12% 329,608 (2.83%) 6,914,586 (0.69%)
444,902 (23.77%) 216,862 (2.12%) 729,484 121.32% 5,972,763 (13.62%)
339,944 (23.59%) 149,705 (30.97%) 366,819 (49.72%) 5,430,007 (9.09%)
369,348 8.65% 141,143 (5.72%) 363,097 (1.01%) 5,737,349 5.66%
325,500 (11.87%) 121,866 (13.66%) 357,378 (1.58%) 5,774,101 0.64%
353,028 8.46% 122,914 0.86% 390,513 9.27% 7,086,558 22.73%
378,074 7.09% 116,200 (5.46%) 358,883 (8.10%) 6,743,112 (4.85%)
Indirect
Recorder FundsHealth FundsOther
Fees
Prisoner Boarding
Public
GENERAL FUND
TotalOTHER FUNDS
Sheriff
CostFees
All
Special District
Fees
235

Yuma County, ArizonaFines and Forfeits by SourceLast Ten Fiscal Years(All information from prior year financial reports unless otherwise specified)
Fiscal
Year Amount % Chg Amount % Chg Amount % Chg Amount % Chg
02-03 223,753$ 9.02% 24,781$ 1.52% 1,024,170$ 14.09% 68,762$ 23.67%
03-04 207,414 (7.30%) 32,114 29.59% 911,724 (10.98%) 24,945 (63.72%)
04-05 498,863 140.52% 34,209 6.52% 954,692 4.71% 21,217 (14.94%)
05-06 225,739 (54.75%) 41,435 21.12% 1,017,999 6.63% 24,125 13.71%
06-07 275,162 21.89% 41,814 0.91% 1,071,715 5.28% 25,433 5.42%
07-08 293,417 6.63% 34,747 (16.90%) 1,346,854 25.67% 20,628 (18.89%)
08-09 508,885 73.43% 31,803 (8.47%) 1,492,818 10.84% 10,498 (49.11%)
09-10 419,276 (17.61%) 24,934 (21.60%) 1,243,087 (16.73%) 7,283 (30.62%)
10-11 330,137 (21.26%) 19,286 (22.65%) 1,296,573 4.30% 12,683 74.15%
11-12 291,433 (11.72%) 23,050 19.52% 1,236,832 (4.61%) 11,841 (6.64%)
Fiscal Year Amount % Chg Amount % Chg Amount % Chg Amount % Chg
02-03 82,839$ (8.33%) 477,272$ 37.09% 44,850$ 7.15% 6,382$ (40.89%)
03-04 172,267 107.95% 541,875 13.54% 46,505 3.69% 27,583 332.20%
04-05 176,460 2.43% 561,880 3.69% 44,642 (4.01%) 2,178 (92.10%)
05-06 306,620 73.76% 592,123 5.38% 46,464 4.08% 21,010 864.65%
06-07 388,006 26.54% 629,794 6.36% 45,731 (1.58%) 26,484 26.05%
07-08 327,848 (15.50%) 675,001 7.18% 46,349 1.35% 28,882 9.05%
08-09 378,311 15.39% 754,060 11.71% 50,432 8.81% 32,089 11.10%
09-10 337,162 (10.88%) 855,347 13.43% 73,019 44.79% 37,984 18.37%
10-11 318,945 (5.40%) 862,684 0.86% 70,809 (3.03%) 24,173 (36.36%)
11-12 301,614 (5.43%) 683,759 (20.74%) 74,005 4.51% 172,869 615.13%
Library District
OTHER FUNDS
Fines Fees Fines and Fees
Fines and Fees Fines and Fees Fines and FeesFines and Fees
Other FundsJustice Court Superior Court
Fees
Superior Court Constable
GENERAL FUNDJuvenile Probation House Arrest
236

Table A-11
Amount % Chg Amount % Chg Amount % Chg Amount % Chg Amount % Chg
64,054$ 23.70% 1,166$ 233.14% 13,618$ 42.70% 21,509$ (73.95%) 22,065$ 12.62%
72,291 12.86% 4,764 308.58% 44,159 224.27% 160,464 646.03% 24,464 10.87%
86,595 19.79% 5,457 14.55% 36,962 (16.30%) 31,853 (80.15%) 22,103 (9.65%)
77,985 (9.94%) 3,660 (32.93%) 29,578 (19.98%) 20,692 (35.04%) 15,054 (31.89%)
85,854 10.09% 3,600 (1.64%) 29,022 (1.88%) 75,655 265.62% 16,168 7.40%
76,439 (10.97%) 5,250 45.83% 40,243 38.66% 35,589 (52.96%) 24,082 48.95%
62,017 (18.87%) 9,160 74.48% 44,829 11.40% 115,641 224.93% 28,022 16.36%
59,997 (3.26%) 6,095 (33.46%) 65,634 46.41% 97,874 (15.36%) 31,542 12.56%
55,081 (8.19%) 3,120 (48.81%) 39,809 (39.35%) 82,065 (16.15%) 36,289 15.05%
48,413 (12.11%) 1,415 (54.65%) 45,759 14.95% 75,442 (8.07%) 36,947 1.81%
Amount % Chg
2,075,221$ 12.91%
2,270,569 9.41%
2,477,111 9.10%
2,422,484 (2.21%)
2,714,438 12.05%
2,955,329 8.87%
3,518,565 19.06%
3,259,234 (7.37%)
3,151,654 (3.30%)
3,003,379 (4.70%)
Fines and Fees
Fines and Fees
Total All
OTHER FUNDSClerk of Superior CourtAnti-Racketeering
Fines and FeesFines and FeesFines and FeesFines
GENERAL FUNDJuvenile Court Zoning Violation Other
237
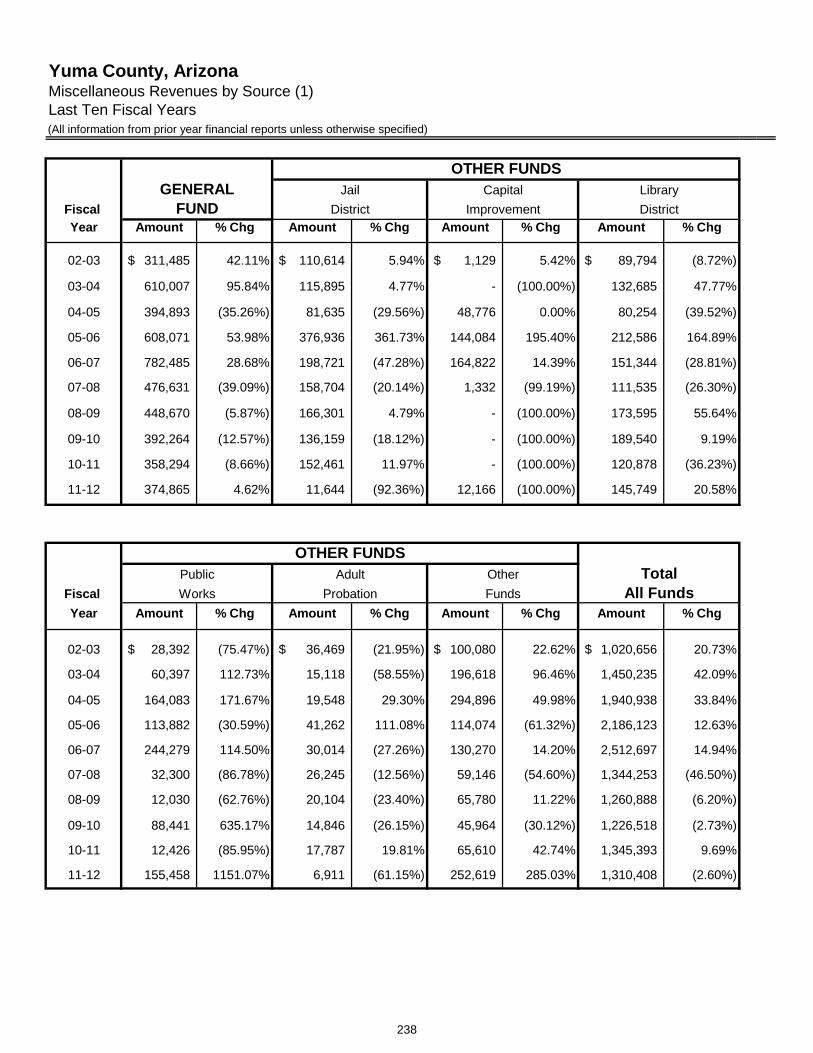
Yuma County, ArizonaMiscellaneous Revenues by Source (1)Last Ten Fiscal Years(All information from prior year financial reports unless otherwise specified)
Fiscal
Year Amount % Chg Amount % Chg Amount % Chg Amount % Chg
02-03 311,485$ 42.11% 110,614$ 5.94% 1,129$ 5.42% 89,794$ (8.72%)
03-04 610,007 95.84% 115,895 4.77% - (100.00%) 132,685 47.77%
04-05 394,893 (35.26%) 81,635 (29.56%) 48,776 0.00% 80,254 (39.52%)
05-06 608,071 53.98% 376,936 361.73% 144,084 195.40% 212,586 164.89%
06-07 782,485 28.68% 198,721 (47.28%) 164,822 14.39% 151,344 (28.81%)
07-08 476,631 (39.09%) 158,704 (20.14%) 1,332 (99.19%) 111,535 (26.30%)
08-09 448,670 (5.87%) 166,301 4.79% - (100.00%) 173,595 55.64%
09-10 392,264 (12.57%) 136,159 (18.12%) - (100.00%) 189,540 9.19%
10-11 358,294 (8.66%) 152,461 11.97% - (100.00%) 120,878 (36.23%)
11-12 374,865 4.62% 11,644 (92.36%) 12,166 (100.00%) 145,749 20.58%
Fiscal
Year Amount % Chg Amount % Chg Amount % Chg Amount % Chg
02-03 28,392$ (75.47%) 36,469$ (21.95%) 100,080$ 22.62% 1,020,656$ 20.73%
03-04 60,397 112.73% 15,118 (58.55%) 196,618 96.46% 1,450,235 42.09%
04-05 164,083 171.67% 19,548 29.30% 294,896 49.98% 1,940,938 33.84%
05-06 113,882 (30.59%) 41,262 111.08% 114,074 (61.32%) 2,186,123 12.63%
06-07 244,279 114.50% 30,014 (27.26%) 130,270 14.20% 2,512,697 14.94%
07-08 32,300 (86.78%) 26,245 (12.56%) 59,146 (54.60%) 1,344,253 (46.50%)
08-09 12,030 (62.76%) 20,104 (23.40%) 65,780 11.22% 1,260,888 (6.20%)
09-10 88,441 635.17% 14,846 (26.15%) 45,964 (30.12%) 1,226,518 (2.73%)
10-11 12,426 (85.95%) 17,787 19.81% 65,610 42.74% 1,345,393 9.69%
11-12 155,458 1151.07% 6,911 (61.15%) 252,619 285.03% 1,310,408 (2.60%)
Public Adult Other TotalWorks Probation Funds All Funds
OTHER FUNDS
OTHER FUNDS
Jail
District
Library
FUNDGENERAL Capital
Improvement District
238

Table A-12
Amount % Chg Amount % Chg Amount % Chg Amount % Chg
84,028$ 21.09% 165,904$ 545.42% 20,014$ 835.23% 72,747$ (10.21%)
83,435 (0.71%) 167,416 0.91% - (100.00%) 68,664 (5.61%)
228,566 173.94% 183,474 9.59% 395,835 0.00% 48,978 (28.67%)
115,740 (49.36%) 183,595 0.07% 91,958 (76.77%) 183,935 275.55%
155,876 34.68% 199,232 8.52% 281,588 206.21% 174,066 (5.37%)
61,622 (60.47%) 275,962 38.51% 12,973 (95.39%) 127,803 (26.58%)
29,282 (52.48%) 257,423 (6.72%) 10,438 (19.54%) 77,265 (39.54%)
46,394 58.44% 224,756 (12.69%) 6,228 (40.33%) 81,926 6.03%
22,804 (50.85%) 466,852 107.72% 35,730 473.70% 92,551 12.97%
70,704 210.05% 186,331 (60.09%) 1,672 (95.32%) 92,289 (0.28%)
OTHER FUNDS
Housing
Development
ServicesDistrict Attorney
Health
239
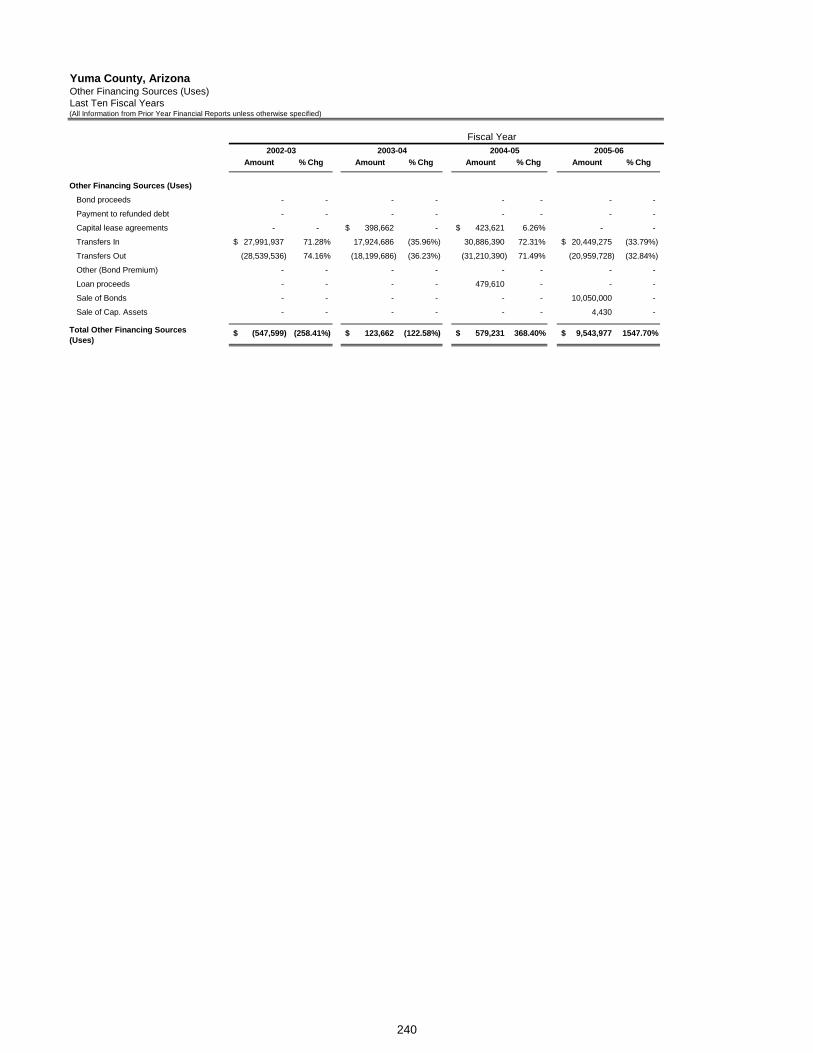
Yuma County, ArizonaOther Financing Sources (Uses)Last Ten Fiscal Years(All Information from Prior Year Financial Reports unless otherwise specified)
2003-04 2004-05
Amount % Chg Amount % Chg Amount % Chg Amount % Chg
Other Financing Sources (Uses)
Bond proceeds - - - - - - - -
Payment to refunded debt - - - - - - - -
Capital lease agreements - - 398,662$ - 423,621$ 6.26% - -
Transfers In 27,991,937$ 71.28% 17,924,686 (35.96%) 30,886,390 72.31% 20,449,275$ (33.79%)
Transfers Out (28,539,536) 74.16% (18,199,686) (36.23%) (31,210,390) 71.49% (20,959,728) (32.84%)
Other (Bond Premium) - - - - - - - -
Loan proceeds - - - - 479,610 - - -
Sale of Bonds - - - - - - 10,050,000 -
Sale of Cap. Assets - - - - - - 4,430 -
(547,599)$ (258.41%) 123,662$ (122.58%) 579,231$ 368.40% 9,543,977$ 1547.70%Total Other Financing Sources (Uses)
2002-03
Fiscal Year 2005-06
240

Table A-13
Amount % Chg Amount % Chg Amount % Chg Amount % Chg Amount % Chg Amount % Chg
- - - - - - - - - - 11,280,567$ 100.00%
- - - - - - - - - - (8,692,607) 100.00%
227,613$ - 189,625$ (16.69%) - - - - - - - -
28,042,195 37.13% 34,936,593 24.59% 36,814,313$ 5.37% 21,266,440$ (42.23%) 15,986,583$ (24.83%) 18,981,200 18.73%
(28,555,195) 36.24% (35,252,202) 23.45% (36,614,306) 3.86% (21,857,416) (40.30%) (15,887,279) (27.31%) (18,614,283) 17.16%
261,138 - - - - - - - - - - -
- - - - - - 251,648 - 3,437,915 - - -
10,000,000 (0.50%) 43,715,000 337.15% - - - - - - - -
- - - - - - - - - - -
9,975,751$ 4.52% 43,589,016$ 336.95% 200,007$ (99.54%) (339,328)$ (269.66%) 3,537,219$ (1142.42%) 2,954,877$ (16.46%)
2007-08 2008-09
Fiscal Year2011-122010-112009-102006-07
241

Yuma County, ArizonaNet Assets by Category (1)
Last Ten Fiscal Years(All Information from Prior Year Financial Reports unless otherwise specified)
Amount % Chg Amount % Chg Amount % Chg Amount % Chg
Governmental Activities
Invested in Capital Assets,
net of related debt 146,129,440$ N/A 155,410,656$ 6.35% 183,023,938$ 17.77% 195,616,407$ 6.88%
Restricted for:
Public Safety 7,412,064 N/A 5,631,100 (24.03%) 4,336,202 (23.00%) 2,661,676 (38.62%)
Highway & Streets 16,195,341 N/A 15,793,696 (2.48%) 17,535,433 11.03% 17,919,093 2.19%
Sanitation - N/A - N/A - N/A - N/A
Health - N/A - 0.00% - 0.00% 2,816,346 0.00%
Culture & Recreation 1,665,057 N/A 1,789,026 7.45% 2,480,971 38.68% 2,724,956 9.83%
Debt Service 3,038,858 N/A 3,749,490 23.38% 5,996,160 59.92% 8,129,538 35.58%
Capital Projects 15,931,361 N/A 23,702,381 48.78% 21,716,661 (8.38%) 31,521,351 45.15%
Other Purposes 246,038 N/A - (100.00%) - 0.00% - 0.00%
Unrestricted 28,295,874 N/A 35,064,382 23.92% 33,753,132 (3.74%) 36,281,955 7.49%
Total governmental net assets 218,914,033$ N/A 241,140,731$ 10.15% 268,842,497$ 11.49% 297,671,322$ 10.72%
2003-042002-03 2004-05 2005-06
242

Table A-14
Amount % Chg Amount % Chg Amount % Chg Amount % Chg Amount % Chg Amount % Chg
208,559,572$ 6.62% 233,880,537$ 12.14% 248,106,049$ 6.08% 254,210,170$ 2.46% 277,357,668$ 9.11% 286,593,510$ 3.33%
2,838,133 6.63% 3,108,067 9.51% 989,600 (68.16%) 790,279 -20.14% 11,415,461 1344.48% 5,344,418 -53.18%
8,447,696 (52.86%) 10,128,511 19.90% 12,694,335 25.33% 14,687,855 15.70% 21,021,104 43.12% 38,279,501 82.10%
- N/A - N/A - N/A - N/A - N/A 423,787 100.00%
3,233,852 14.82% 2,711,793 (16.14%) 1,983,782 (26.85%) 1,603,295 -19.18% 1,994,249 24.38% 855,403 -57.11%
3,974,791 45.87% 6,688,032 68.26% 8,464,426 26.56% 9,732,831 14.99% 9,559,542 -1.78% 9,628,372 0.72%
6,441,128 (20.77%) 5,346,337 (17.00%) 3,566,628 (33.29%) 7,563,779 112.07% 1,508,633 -80.05% 4,740,574 214.23%
41,121,753 30.46% 26,541,613 (35.46%) 18,711,838 (29.50%) 1,498,137 -91.99% 6,433,179 329.41% 5,223,620 -18.80%
- 0.00% - 0.00% - 0.00% - 0.00% - 0.00% - 0.00%
42,571,952 17.34% 48,452,772 13.81% 53,642,198 10.71% 58,122,478 8.35% 37,182,644 -36.03% 28,128,486 -24.35%
317,188,877$ 6.56% 336,857,662$ 6.20% 348,158,856$ 3.35% 348,208,824$ 0.01% 366,472,480$ 5.25% 379,217,671$ 3.48%
2011-122007-082006-07 2010-112009-102008-09
243

Yuma County, Arizona Table A-15General Fund Changes in Fund BalanceLast Ten Fiscal Years(All Information from Prior Year Financial Reports unless otherwise specified)
Operating Sources Operating Uses Net Change
Fiscal Transfers In Transfers Out in
Year Revenues & Other Total Expenditures & Other Total Fund Balance
2002-03 49,362,913$ 38,666$ 49,401,579$ 38,391,740$ 8,058,218$ 46,449,958$ 2,951,621$
2003-04 53,151,273 25,000 53,176,273 43,116,445 11,448,633 54,565,078 (1,388,805)
2004-05 58,189,093 305,774 58,494,867 47,004,323 8,981,895 55,986,218 2,508,649
2005-06 62,737,664 18,767 62,756,431 51,657,521 12,033,359 63,690,880 (934,449)
2006-07 65,273,762 417,408 65,691,170 55,962,510 12,041,128 68,003,638 (2,312,468)
2007-08 66,451,637 203,936 66,655,573 58,326,778 8,647,417 66,974,195 (318,622)
2008-09 70,057,911 4,347,002 74,404,913 60,015,890 10,857,450 70,873,340 3,531,573
2009-10 66,935,949 743,273 67,679,222 58,792,270 8,649,653 67,441,923 237,299
2010-11 67,379,878 1,467,970 68,847,848 60,142,931 8,545,142 68,688,073 159,775
2011-12 68,916,013 413,870 69,329,883 62,159,841 7,637,752 69,797,593 (467,710)
Fiscal Other Transfers & Adjustments General Fund - Fund Balance
Year Residual Prior Period Misc Beginning Change in Ending % Change
2002-03 - - (3)$ 13,961,874$ 2,951,618$ 16,913,492$ 21.14%
2003-04 - - - 16,913,492 (1,388,805) 15,524,687 (8.21%)
2004-05 - - - 15,524,687 2,508,649 18,033,336 16.16%
2005-06 - - - 18,033,336 (934,449) 17,098,887 (5.18%)
2006-07 - - - 17,098,887 (2,312,468) 14,786,419 (13.52%)
2007-08 - - - 14,786,419 (318,622) 14,467,797 (2.15%)
2008-09 - - - 14,467,797 3,531,573 17,999,370 24.41%
2009-10 - - - 17,999,370 237,299 18,236,669 1.32%
2010-11 - - - 18,236,669 159,775 18,396,444 0.88%
2011-12 - - - 18,396,444 (467,710) 17,928,734 (2.54%)
244

Revenue Capacity
245

Yuma County, ArizonaAssessed and Estimated Actual Value of Taxable PropertyLast Ten Fiscal Years ########
(All information obtained from County Assessor's abstract records)
Ratio of Ratio of
Secured Personal Property Assessed Total Net Assessed
Tax and Real Property Value to Total Direct Value to Total
(fiscal) Type Assessed Value Estimated Actual Value Estimated Exempt Assessed Value Tax Estimated
Year Amount % Chng Amount % Chng Value Amount % Chng Amount % Chng Rate Value
2002 Primary 694,983,151$ 6.84% 4,862,083,195$ 8.63% 14.29% 98,483,034$ -2.73% 596,500,117$ 8.60% 2.3180 12.27%
(2002) Secondary 716,632,240 7.36% 5,017,610,685 8.20% 14.28% 100,712,011 1.87% 615,920,229 8.31% 3.1720 12.28%
2003 Primary 734,852,978 5.74% 5,161,887,329 6.17% 14.24% 102,909,916 4.50% 631,943,062 5.94% 2.3180 12.24%
(2003) Secondary 771,600,322 7.67% 5,394,833,720 7.52% 14.30% 121,165,557 20.31% 650,434,765 5.60% 3.1720 12.06%
2004 Primary 775,088,708 4.07% 5,484,294,110 15.28% 12.85% 116,325,312 3.03% 658,763,396 4.24% 2.3180 11.07%
(2004) Secondary 795,421,099 1.28% 5,632,972,757 4.07% 13.92% 116,700,410 -15.19% 678,720,689 4.35% 3.2420 12.09%
2005 Primary 826,245,093 8.04% 5,937,434,635 0.25% 13.85% 115,989,457 9.40% 710,255,636 7.82% 2.2239 11.91%
(2005) Secondary 848,416,576 8.57% 6,122,618,368 9.31% 13.82% 119,147,184 15.95% 729,269,392 7.45% 3.1479 11.88%
2006 Primary 808,886,482 -2.10% 6,229,502,893 15.95% 13.80% 133,545,053 15.14% 820,782,919 15.56% 2.1429 11.87%
(2006) Secondary 1,067,728,387 25.85% 7,756,796,877 26.61% 13.81% 126,459,760 6.14% 941,268,627 25.79% 3.4069 11.81%
2007 Primary 1,074,488,725 32.84% 7,958,279,842 27.75% 13.50% 136,612,011 2.30% 937,876,714 14.27% 2.0192 11.78%
(2007) Secondary 1,265,353,376 18.51% 9,500,029,297 22.47% 13.32% 158,738,054 25.52% 1,106,615,322 17.57% 3.2832 11.65%
2008 Primary 1,250,863,952 16.41% 9,454,203,269 18.80% 13.23% 171,047,780 25.21% 1,079,816,172 15.13% 1.8825 11.42%
(2008) Secondary 1,627,707,823 28.64% 12,580,105,769 32.42% 12.94% 258,546,322 62.88% 1,369,161,501 23.73% 2.9674 10.88%
2009 Primary 1,397,513,008 11.72% 10,778,538,187 14.01% 12.97% 174,307,866 1.91% 1,223,205,142 13.28% 1.7548 11.35%
(2009) Secondary 1,712,123,701 5.19% 13,435,858,375 6.80% 12.74% 262,445,742 1.51% 1,449,677,959 5.88% 2.7747 10.79%
2010 Primary 1,496,641,880 7.09% 11,657,522,744 8.15% 12.84% 195,311,492 12.05% 1,301,330,388 6.39% 1.7397 11.16%(2010) Secondary 1,673,888,080 -2.23% 13,030,768,568 -3.01% 12.85% 237,953,039 -9.33% 1,435,935,041 -0.95% 2.7596 11.02%
2011 Primary 1,254,317,477 -16.19% 11,518,177,617 -1.20% 10.89% 224,238,502 14.81% 1,247,021,315 -4.17% 1.8798 10.83%(2011) Secondary 1,312,293,848 -21.60% 12,317,787,777 -5.47% 10.65% 265,883,481 11.74% 1,316,076,878 -8.35% 2.9608 10.68%
*Arizona has two tax divisions - primary and secondary assessed values. Operating property taxes are restricted to being applied to the primary value. Special Districts
are assessed based upon the secondary value. In the table both the primary rate and any rates applicable to special districts are in included in the secondary values.
Table B-1
Net Assessed Value
Secured Personal Property
and Real Property
246

Yuma County, Arizona Table B-2General Fund - Property Tax Levied and Collections (by Year Collected)Last Ten Fiscal Years
Total
Percent of Collection as
Fiscal Tax Current Tax Levy Total Tax Percent of
Year Levy Collections (1) Collected Collections Current Levy
2002-03 13,826,873$ 12,531,081$ 90.63% 12,531,081$ 90.63%
2003-04 14,648,440 13,734,084 93.76% 13,734,084 93.76%
2004-05 15,270,136 14,511,502 95.03% 14,511,502 95.03%
2005-06 15,795,395 15,543,999 98.41% 15,543,999 98.41%
2006-07 17,588,577 17,431,574 99.11% 17,431,574 99.11%
2007-08 18,936,854 18,731,286 98.91% 18,731,286 98.91%
2008-09 20,327,539 19,886,957 97.83% 19,886,957 97.83%
2009-10 21,509,071 21,118,123 98.18% 21,118,123 98.18%
2010-11 22,681,316 22,112,074 97.49% 22,112,074 97.49%
2011-12 23,478,870 23,161,816 98.65% 23,161,816 98.65%
Yuma County, Arizona Table B-3General Fund - Property Tax Levied and Collections (by Year Levied)Last Ten Fiscal Years
General Current Percent of Collected in Total Percent of Total Outstanding Percent ofFiscal Tax Tax Levy Subsequent Tax Tax Collected Delinquent Delinquent TaxesYear Levy Collection Collected Year (2) Collections to Tax Levy Taxes to Tax Levy
2002-03 13,826,873$ 12,196,378$ 88.21% 324,441$ 12,520,819$ 90.55% 1,306,054$ 9.45%
2003-04 14,648,440 13,409,643 91.54% - 13,409,643 95.03% 1,238,797 8.46%-
2004-05 15,270,136 14,004,035 91.71% 507,467 14,511,502 95.03% 758,634 4.97%- -
2005-06 15,795,395 15,410,537 97.56% 133,462 15,543,999 98.41% 251,396 1.59%
2006-07 17,588,577 17,144,126 97.47% 287,448 17,431,574 99.11% 157,003 0.89%
2007-08 18,936,854 18,453,958 97.45% 277,328 18,731,286 98.91% 205,568 1.09%
2008-09 20,327,539 19,508,404 95.97% 378,553 19,886,957 97.83% 440,582 2.17%
2009-10 21,509,071 20,551,870 95.55% 566,253 21,118,123 98.18% 390,948 1.82%
2010-11 22,681,316 21,506,754 94.82% 605,320 22,112,074 97.49% 569,242 2.51%
2011-12 23,478,870 22,519,140 95.91% 642,676 23,161,816 98.65% 317,054 1.35%
(1) Included in year collected / received.(2) Included in year levied / billed.
247

2012 2003Percent of Percent of
Actual County's Net Actual County's Net
Assessed Assessed Assessed Assessed
Taxpayer Valuation Rank Valuation Valuation Rank Valuation
Arizona Public Service Co 60,672,662$ 1 4.87% 35,156,866$ 1 6.24%Walmart Stores Inc DE Corp. 8,360,696 2 0.67% - - Qwest Corporation 7,745,483 3 0.62% 15,020,317 2 2.19%Union Pacific Railroad Co 7,613,797 4 0.61% 7,429,049 4 1.11%Yuma Palms 1030 Delaware LLC et al 7,473,024 5 0.60% - - Southwest Gas Corporation (T&D) 7,261,902 6 0.58% 5,677,262 6 0.94%Dole Fresh Vegetable Inc. CA Corp 3,705,628 7 0.30% 3,593,808 9 0.71%Far West Water and Sewer Inc. 3,467,000 8 0.28% - - North Baja Pipeline LLC 3,229,072 9 0.26% - - Underhill Transfer Co AZ Corp 3,001,781 10 0.24% - - Qwest Vomm Corporation 3,328,635 10 0.64%Level 3 Communications, LLC. 6,287,615 5 0.46%Yuma Cogeneration Associates 4,694,500 7 0.83%Kinder Morgan Energy Partners 10,167,086 3 2.97%Imperial Irrigation District 3,921,777 8 0.64%
Totals $112,531,045 9.02% 95,276,915$ 16.73%
Source: Yuma County Assessor's(1) Data not available prior to 2003
YUMA COUNTY, ARIZONA Table B-4Principal TaxpayersCurrent Year and Nine Year Comparison (1)
248

Yuma County, Arizona Table B-5County General Sales Tax by Category (1) (2) (3)
Current year and seven years ago
2004-05 2011-12 % Change
Utilities 917,371$ $1,248,665 36.11%
Communications 406,960 340,709 (16.28%)
Publishing 16,049 8,924 (44.40%)
Restaurants & Bars 800,445 1,104,456 37.98%
Amusements 49,130 68,783 40.00%
Rental of Real Prop - 0 0.00%
Rental of Personal Prop 308,258 413,450 34.12%
Contracting 2,043,827 1,518,631 (25.70%)
Retail 5,910,968 6,284,096 6.31%
Hotel/Motel 210,876 282,703 34.06%
All Other 93,637 74,062 (20.91%)
TOTAL 10,757,521$ 11,344,479$ 5.46%
(1) Information obtained from Arizona Department of Revenue and County records (2) Information prior to fiscal year 2004-05 unavailable (3) Only Sales Tax revenues of the General Fund are included
Yuma County, Arizona Table B-6Sales Tax Rates in Yuma County (Direct and Overlapping) (1)
Last Ten Years (Rates in cents per dollar)
Fiscal Jail Capital Health
Year State General District (3) Projects (4) District (5) San Luis Somerton Wellton Yuma
2002-03 5.60 0.50 0.50 0.50 - 2.50 2.50 2.50 1.70
2003-04 5.60 0.50 0.50 0.50 - 3.50 2.50 2.50 1.70
2004-05 5.60 0.50 0.50 0.50 - 3.50 2.50 2.50 1.70
2005-06 5.60 0.50 0.50 0.50 0.10 3.50 2.50 2.50 1.70
2006-07 5.60 0.50 0.50 0.50 0.10 3.50 2.50 2.50 1.70
2007-08 5.60 0.50 0.50 - 0.10 3.50 2.50 2.50 1.70
2008-09 5.60 0.50 0.50 - 0.10 3.50 2.50 2.50 1.70
2009-10 6.60 0.50 0.50 - 0.10 3.50 2.50 2.50 1.70
2010-11 6.60 0.50 0.50 - 0.10 3.50 2.50 2.50 1.70
2011-12 6.60 0.50 0.50 - 0.10 4.00 3.30 2.50 1.70
Source is Arizona Department of Revenue and County records.
(1) Rates established by action of governing body and voter approval.(2) Governing body is elected Board of Supervisors.(3) Rate established by action of governing body and voter approval in 1996; extended in 2011 Special Election through December 31, 2036.(4) Rate established by action of governing body and voter approval in 2000; ended Jan 31, 2007 by board action.(5) Rate established by action of governing body in 2005. (6) Governing body is elected City Council.
County (2) Cities (6)
June 30, 2012
June 30, 2012
Category
249

{This page is intentionally left blank}
250

Debt Capacity
251

Yuma County, Arizona Table C-1Property Tax Rates - Direct and Overlapping Governments (General Taxing Authorities)(Per $100 of Assessed Value)Last Ten Years
Somerton- Somerton- DowntownState Amistade Amistade Mall San Luis- San Luis-
Tax Year of Yuma City of City of Estates Estates Maintenance Ranchos Los(Fiscal Year) Type Arizona County Equalization Yuma Somerton Unit #3 Unit #4 District Los Oros Portales
Primary Tax Authority No. 00986 02000 02001 04154 04152 31001 31,004 28204 31,003 31,002
Secondary Tax Authority No. - 52000 - - 54152 - - - - -
2002 Primary - 2.3180 0.4889 1.8621 - 157.5663 287.5561 4.7747 492.2007 196.4004 2002-03 Secondary - - - - - - - - - -
2003 Primary - 2.3180 0.0472 1.8693 - 157.5663 287.5561 4.7747 492.2007 196.3651 2003-04 Secondary - - - - - - - - - -
2004 Primary - 2.3180 0.0456 1.8693 - 117.0047 162.9726 4.7747 448.1113 187.7277 2004-05 Secondary - - - - - - - - - -
2005 Primary - 2.2239 0.4358 1.8693 - 117.0047 162.9726 4.7747 490.3965 195.6453 2005-06 Secondary - - - - - - - - - -
2006 Primary - 2.1429 0.0000 1.7321 1.5094 117.0047 195.5671 4.7747 704.7547 281.1642 2006-07 Secondary - - - - - - - - - -
2007 Primary - 2.0192 0.0000 1.6744 1.3442 105.3042 195.5671 4.7747 1,311.2520 523.1283 2007-08 Secondary - - - - - - - - - -
2008 Primary - 1.8825 0.0000 1.5596 1.3514 347.1139 289.7291 4.7747 574.0274 229.02512008-09 Secondary - - - - - - - - - -
2009 Primary - 1.7548 0.3306 1.4706 1.1795 319.8128 296.9723 4.7747 574.0274 229.07012009-10 Secondary - - - - - - - - - -
2010 Primary - 1.7397 0.3564 1.4691 1.2238 319.8128 296.9723 4.7747 574.0650 229.07012010-11 Secondary - - - - - - - - - -
2011 Primary - 1.8798 0.4259 1.5787 1.2807 319.8128 296.9723 2.7927 635.7076 253.63262011-12 Secondary - - - - - - - - - -
Yuma Yuma ArizonaElementary Crane Antelope Union High Western
School Somerton School Hyder Mohawk Wellton Gadsden Union School CommunityTax Year District Elementary District Elementary Elementary Elementary Elementary High District College
(Fiscal Year) Type No. 01 No. 13 No. 70 District
Primary Tax Authority No. 05001 05011 05013 05016 05017 05024 05032 06101 06103 08150
Secondary Tax Authority No. 55001 55011 55013 55016 55017 55024 55032 56101 56103 58150
2002 Primary 2.5956 3.1446 2.7172 2.4703 2.9200 2.8881 2.7750 2.1123 2.7563 1.82672002-03 Secondary 1.4277 1.4519 1.2473 2.2844 1.0884 0.9098 1.9231 0.6347 0.7880 0.2550
2003 Primary 2.0527 3.1439 2.5066 2.1697 2.1605 2.9292 4.0216 2.2942 2.2323 1.82672003-04 Secondary 1.3679 2.2545 1.1845 2.5056 1.0295 0.8229 1.6510 0.6555 0.7868 0.2301
2004 Primary 1.7880 3.1189 2.4501 2.1278 2.5582 2.9292 3.9794 2.3254 2.3305 1.8605 2004-05 Secondary 1.2566 2.2783 0.7018 2.6591 1.0194 1.6807 0.6816 0.6816 0.7428 0.2178
2005 Primary 2.7753 3.4753 2.0844 1.7244 2.6492 2.8109 4.1645 2.1730 2.2739 1.88472005-06 Secondary 1.1599 1.1605 0.6475 1.5126 1.0391 0.8287 1.5085 0.6950 0.7426 0.4727
2006 Primary 1.9817 3.3935 1.4298 3.8278 3.3216 3.2284 4.1644 2.0057 2.2666 1.88522006-07 Secondary 0.7616 1.2555 0.9252 2.1344 1.4945 0.8817 1.2021 0.2351 0.7450 0.4993
2007 Primary 2.0418 2.2875 2.0173 2.5132 2.0828 2.3046 4.0609 2.0607 1.7345 1.88522007-08 Secondary 0.5626 0.8436 0.5752 1.9379 0.4429 0.3509 1.0518 0.0000 0.4419 0.4993
2008 Primary 1.8209 4.4348 1.7392 1.9744 2.0347 2.4573 4.3122 2.0480 1.9214 1.62742008-09 Secondary 0.3381 1.0407 0.7150 1.7010 0.3860 0.0831 0.0301 0.4342 0.7450 0.3652
2009 Primary 1.5759 3.9003 1.8459 2.7394 2.3724 1.9897 1.7464 1.6723 1.8218 1.51422009-10 Secondary 0.3237 0.6218 0.7011 1.6384 1.2565 0.6229 0.1538 0.4364 0.3322 0.3163
2010 Primary 1.2247 3.4050 1.7450 2.6449 2.5154 2.3847 1.7837 1.5999 1.4606 1.50002010-11 Secondary 0.3709 0.6795 0.7568 1.5491 0.9874 0.4107 0.2019 0.5605 0.6275 0.3079
2011 Primary 1.8588 2.5499 1.8995 3.2394 2.7444 2.1774 1.9274 2.1030 2.0755 1.61632011-12 Secondary 0.3448 0.6696 0.6394 1.6535 0.7813 0.3888 0.1676 0.3165 0.9263 0.3297
(All information obtained from County Financial records)
GENERAL TAXING AUTHORITIES
GENERAL TAXING AUTHORITIES
252

Yuma County, Arizona Table C-2Property Tax Rates - Direct and Overlapping Governments (Special District Taxing Authorities)(Per $100 of Assessed Value)Last Ten Years(All information obtained from County Financial records)
Yuma - North Gila Wellton -
Yuma Maricopa Flood Mesa Yuma Valley Mohawk Hillander C
Tax Year Hospital Electrical Library Control Irrigation Irrigation Irrigation Irrigation Irrigation
(Fiscal Year) Type District District #8 * District District District District District District District
Special District Authority No. 10699 12001 14900 15829 16701 16702 16703 16704 16705
2002 Primary - - - - - - - - -
2002-03 Secondary - 0.6646 0.5040 0.3500 50.0000 30.0000 26.0000 87.79 -
2003 Primary - - - - - - - - -
2003-04 Secondary - 3.5248 0.5040 0.3500 50.0000 30.0000 26.0000 159.70 8.6928
2004 Primary - - - - - - - - -
2004-05 Secondary - 4.2448 0.5740 0.3500 50.0000 30.0000 26.0000 159.70 5.2157159.7000
2005 Primary - - - - - - - - -
2005-06 Secondary - 0.7622 0.5740 0.3500 60.0000 30.0000 32.0000 159.70 5.2157
2006 Primary - - - - - - - - -
2006-07 Secondary - 0.6680 0.9140 0.3500 60.0000 30.0000 32.0000 159.70 5.2157
2007 Primary - - - - - - - - -
2007-08 Secondary - 0.5053 0.9140 0.3500 60.0000 35.0000 32.0000 159.70 5.2157
2008 Primary - - - - - - - - -
2008-09 Secondary - 0.5244 0.7671 0.3178 60.0000 35.0000 32.0000 159.70 5.2157
2009 Primary - - - - - - - - -
2009-10 Secondary - 0.6274 0.7341 0.2858 70.0000 40.0000 38.0000 159.70 5.2157
2010 Primary - - - - - - - - -
2010-11 Secondary - 0.3421 0.7341 0.2858 85.0000 40.0000 55.0000 151.20 5.2157
2011 Primary - - - - - - - - -
2011-12 Secondary - 0.3347 0.8016 0.2794 85.0000 45.0000 55.0000 165.60 5.2157
Unit B Unit B Unit B Unit B Hyder County County
Irrigation Irrigation Irrigation Irrigation Valley Citrus Pest Pest
Tax Year District District District District Irrigation Control Abatement
(Fiscal Year) Type O & M Contract Non Coop Special District District District
Special District Authority No. 16706 16707 16708 16709 17851 19709 19710
2002 Primary - - - - - - -
2002-03 Secondary 115.0000 8.6800 1.0000 1.0000 - 6.5000 0.3000
2003 Primary - - - - - - -
2003-04 Secondary 125.0000 8.6800 1.0000 1.0000 - 7.0000 0.2500
2004 Primary - - - - - - -
2004-05 Secondary 125.0000 8.6800 1.0000 1.0000 - 7.0000 0.2500
2005 Primary - - - - - - -
2005-06 Secondary 125.0000 8.6800 1.0000 - - 7.0000 0.2250
2006 Primary - - - - - - -
2006-07 Secondary 130.0000 8.6800 1.0000 1.0000 - 7.0000 0.2000
2007 Primary - - - - - - -
2007-08 Secondary 130.0000 8.6800 1.0000 1.0000 - 7.0000 0.1800
2008 Primary - - - - - - -
2008-09 Secondary 165.0000 8.6800 1.0000 1.0000 - 7.0000 0.1800
2009 Primary - - - - - - -
2009-10 Secondary 185.0000 8.6800 1.0000 1.0000 18.8097 8.0000 0.1800
2010 Primary - - - - - - -
2010-11 Secondary 185.0000 8.6800 1.0000 1.0000 20.9305 8.0000 0.1800
2011 Primary - - - - - - -
2011-12 Secondary 185.0000 8.6800 1.0000 1.0000 17.0775 8.0000 0.1800
* 2010-11 Restated Secondary Rate to match actual rate charged.
SPECIAL DISTRICT TAXING AUTHORITIES
SPECIAL DISTRICT TAXING AUTHORITIES
253

Yuma County, ArizonaDebt by TypeLast Ten Fiscal Years(All information obtained from County Financial records)
Gen Obligation
Fiscal Jail East Library Del Sur Donovan El Prado WIFA USDAYear District County District Estates Estates Loan Sewer
2001-02 15,535,000$ - - 101,000$ 439,200$ 136,730$ 220,570$ -
2002-03 14,460,000 - - 87,000 361,300 129,900 211,732 -
2003-04 13,335,000 - - 73,000 342,700 123,070 202,545 -
2004-05 12,140,000 - - 59,000 323,200 116,240 192,997 479,610$
2005-06 10,875,000 - 10,050,000$ 45,000 362,900 109,410 183,069 459,629
2006-07 19,545,000 - 8,150,000 - 341,700 102,580 172,757 439,641
2007-08 18,150,000 - 50,935,000 - 319,600 95,750 162,035 419,657
2008-09 16,210,000 - 49,960,000 - 296,500 88,920 150,891 399,673
2009-10 14,175,000 - 48,940,000 - - 82,080 139,307 379,689
2010-11 8,525,000 - 47,875,000 - - 75,240 1,565,182 2,359,705
2011-12 7,450,000 2,190,000$ 46,755,000 - - 43,400 1,459,695 2,156,421
Special AssessmentRural Development
LoansBonds
Revenue
254

Table C-3
Total Debt TotalTotal as a % of Debt
1998 Health 1999 Adult 2001 A Juv & 2001 A Juv & Capital Outstanding Personal PerBuilding Probation Justice Centers Justice Centers Leases Debt Income Capita
3,940,000$ 3,725,000$ 16,640,000$ 2,420,000$ 278,207$ 43,435,707$ 1.41% 255.87
3,590,000 3,385,000 16,440,000 2,390,000 110,055 41,164,987 1.18% 235.17
3,240,000 3,045,000 16,440,000 2,390,000 327,074 39,518,389 1.14% 217.77
2,880,000 2,705,000 16,090,000 2,340,000 504,370 37,830,417 0.99% 199.65
2,520,000 2,365,000 13,990,000 2,040,000 267,201 43,267,209 1.05% 221.32
1,800,000 1,685,000 7,320,000 1,080,000 202,696 40,839,374 0.97% 207.95
- 1,345,000 - - 291,308 71,718,350 1.56% 356.28
- - - - 211,526 67,317,510 1.38% 347.23
- - - - 128,233 63,844,309 1.22% 327.85
- - - - 41,275 60,441,402 1.20% 308.77
- - - - - 60,054,516 1.13% 299.63
Certificates of Participation
255

Yuma County, Arizona Table C-4Legal Debt Margin(Constitutional General Obligation Bond Capacity)
Assessed Valuation (Secondary) 1,312,293,848$
Gross Indebtedness 13,299,516$
Less Exempt Debt:
Revenue Bonds - Jail District 7,450,000$
Revenue Bonds - East County 2,190,000
Special Assessment Notes - El Prado Estates 43,400
Rural Development Loan - WIFA - El Prado 64,752
Rural Development Loan - WIFA - B & C Colonia 1,394,943
Rural Development Loan - USDA- B & C Colonia 1,916,700
Rural Development Loan - Gadsden Sewer Project 239,721
Total Exempt Debt (13,299,516)
Total Non-exempt Debt -
Six Percent (6%) unvoted Debt Limitation (6% of Assessed Valuation) 78,737,631
Total Limited - Non-exempt Bonds Outstanding -
Debt Margin within 6% Unvoted Debt Limitation 78,737,631$
Yuma County Library District (Voter Approved) 46,755,000$
Total Voter Approved Debt 46,755,000$
Fifteen Percent (15%) Voted and Unvoted Debt Limitation (15% of Assessed Valuation) 196,844,077$
Total Non-exempt Bonds Outstanding (46,755,000)
Debt Margin within 15% Debt Limitation 150,089,077$
Per the Arizona Constitution, Counties may issue general obligation bonds up to 6% of the jurisdiction's net secondary
assessed valuation without voter approval. Voter approval is required before issuing over the 6%. With voter approval
counties may issue general obligation bonds up to 15% of the jurisdiction's net secondary assessed valuation.
(Arizona Constitution, Article 9, Section 8)
June 30, 2012
256

Yuma County, Arizona Table C-5Ratio of Net General Bonded Debt to Assessed Value and Net Bonded Debt Per CapitaLast Ten Years
Ratio of NetAssessed Net Net Bonded Bonded
Fiscal Net Value Bonded Debt to Debt PerYear *Population (Secondary) Debt ** Assessed Value Capita
2002-03 167,608 615,920,229$ - 0.00% -
2003-04 172,033 650,434,765 - 0.00% -
2004-05 177,209 678,720,689 - 0.00% -
2005-06 183,659 729,269,392 10,050,000$ 1.38% 54.72$
2006-07 189,163 917,331,539 8,150,000 0.89% 43.08
2007-08 192,699 1,106,578,023 50,935,000 4.60% 264.32
2008-09 193,869 1,369,161,501 49,960,000 3.65% 257.70
2009-10 194,737 1,477,891,304 48,940,000 3.31% 251.31
2010-11 195,751 1,418,967,607 47,875,000 3.37% 244.57
2011-12 200,431 1,312,293,848 46,755,000 3.56% 233.27
*Information from azstats.gov from 2009 to current** Fiscal Years 03-11 restated.
Note: Excludes Pledged Revenue Bonds, Improvement Bonds, Improvement Loans & Capital Leases.
257

Table C-6Ratio of Annual Debt Service Expenditures for General Bonded Debt to Total General ExpendituresLast Ten Years
Fiscal Outstanding Debt Total Expenditures
Year Principal* Interest* (1) Debt Service* (2) General (3) Ratio (4)
2002-03 - - - 112,077,248$ 0.00%
2003-04 - - - 125,984,818 0.00%
2004-05 - - - 140,360,930 0.00%
2005-06 10,050,000$ 7,039,876$ - 131,889,570 0.00%
2006-07 8,150,000 6,382,188 2,557,688$ 150,840,358 1.70%
2007-08 50,935,000 39,492,968 3,296,426 178,713,792 1.84%
2008-09 49,960,000 37,163,663 3,304,226 176,279,921 1.87%
2009-10 48,940,000 34,873,518 3,310,226 154,072,720 2.15%
2010-11 47,875,000 32,625,013 3,313,425 153,920,909 2.15%
2011-12 46,755,000 30,420,189 3,324,825 149,607,965 2.22%
(1) Includes agent and other fees.
(2) Includes only debt service expenditures related to general bonded debt.
(3) Includes general, special revenue, capital projects, and debt service funds.
(4) Ratio of debt service related expenditures to total general expenditures
* Fiscal Years 03-11 restated.
YUMA COUNTY, ARIZONA
258

Table C-7
Net Net Percentage Amount
Assessed Debt Applicable Applicable to
Jurisdiction Value Outstanding to County County
Yuma County: Library District 1,312,293,848$ 46,755,000$ 100% 46,755,000$
Total Direct General Obligation Bonded Debt 46,755,000 46,755,000
Arizona Western Junior College (1) 1,312,293,848 64,760,000 100% 64,760,000
City of Yuma (2) 665,352,517 1,345,000 100% 1,345,000
Yuma Elementary School District No. 1 881,636,603 5,860,000 100% 5,860,000
Somerton Elementary School District No. 11 65,709,060 1,815,000 100% 1,815,000
Crane Elementary School District No. 13 233,516,238 12,505,000 100% 12,505,000
Hyder Elementary School District No.16 8,493,410 - 100% -
Mohawk Valley Elementary School District No.17 20,246,297 625,000 100% 625,000
Wellton Elementary School District No.24 31,667,187 - 100% -
Gadsden Elementary School District No. 32 71,025,052 325,000 100% 325,000
Antelope Union High School District No. 50 60,406,894 1,920,000 100% 1,920,000
Yuma Union High School District No. 70 1,251,886,983 29,920,000 100% 29,920,000
Total Overlapping General Obligation Bonded Debt 119,075,000 119,075,000
Total Direct and Overlapping General Obligation Bonded Debt $165,830,000
*County records and the State and County Abstract of the Assessment Roll, Arizona Department of Revenue.
(1) Total debt is shared with La Paz County. Estimated 50% allocation to each County Source: [email protected]
(Az. Western College)
(2) Source: City of Yuma website "CAFR" notes long-term liabilities GO Bonds
Computation of Direct and Overlapping Debt*June 30, 2012
Yuma County, Arizona
259

Yuma County, ArizonaPledged RevenuesLast Ten Fiscal Years
2002-03 2003-04 2004-05 2005-06 2006-07Pledged Revenues
Jail District Sales Tax (1) 8,158,678$ 9,258,301$ 10,756,744$ 11,883,461$ 12,427,423$ Capital Projects Sales Tax (2) 6,386,386 2,202,293 4,152,264 1,626,229 9,223,702 Library District Property Tax (3) - - - - 3,040,298 Special Assessment Districts (4)
Donovan Estates 80,182 66,082 56,061 53,133 60,388 Del Sur Estates 25,959 33,014 13,850 14,145 7,337 El Prado Estates 72,330 68,477 41,634 72,101 44,592
Gadsden - - - 162,076 70,643
Total Projected Revenues 14,723,535$ 11,628,167$ 15,020,553$ 13,811,145$ 24,874,383$
Debt Service RequirementsJail District - Bonds Principal 1,125,000$ 1,195,000$ 1,265,000$ 1,330,000$ 1,395,000$ Interest 781,822 708,582 637,122 566,256 590,638
Total Jail District Requirements 1,906,822 1,903,582 1,902,122 1,896,256 1,985,638
East County - BondsPrincipal - - - - - Interest - - - - -
Total East County Requirements - - - - -
Capital Sales Tax - Certificates of PaymentPrincipal 690,000 1,100,000 3,100,000 700,000 8,330,000 Interest 1,133,402 1,108,448 1,050,288 919,918 887,502
Total Jail District Requirements 1,823,402 2,208,448 4,150,288 1,619,918 9,217,502
Library District - Bonds Principal - - - - 1,900,000 Interest - - - - 657,688
Total Library District Requirements - - - - 2,557,688
Assessment Districts Donovan Estates - Bonds Principal 17,900 18,600 19,500 20,300 21,200 Interest 18,891 18,025 17,192 16,231 15,413
Total Donovan Estates 36,791 36,625 36,692 36,531 36,613
Del Sur Estates - Bonds Principal 14,000 14,000 14,000 14,000 45,000 Interest 4,465 3,800 3,135 2,470 1,555
Total Del Sur Estates 18,465 17,800 17,135 16,470 46,555
El Prado Estates - WIFA Loan Principal 15,668 16,017 16,378 16,755 17,146 Interest 14,349 13,695 13,027 12,345 11,647
Total El Prado Estates 30,017 29,712 29,405 29,100 28,793
Gadsden - RDA Loan Principal - - - 19,984 19,984 Interest - - - 21,133 20,234
Total Gadsden Estates - - - 41,117 40,218
B & C Colonia - WIFA Loan Principal - - - - - Interest - - - - -
Total B & C Colonia Estates - - - - -
B & C Colonia - RDA Loan Principal - - - - - Interest - - - - -
Total B & C Colonia Estates - - - - -
Total Assessment Districts Requirements 85,273 84,137 83,232 123,218 152,179
Total Annual Requirements 3,815,497$ 4,196,167$ 6,135,642$ 3,639,392$ 13,913,007$
3.86 2.77 2.45 3.79 1.79 Estimated Coverage
(1)
(2)
The Jail District receives revenues from a voter approved .05 cent privilege tax applied to all sales within the county. Monies to meet the debt requirements have been pledged to pay the bonds. All bonds are scheduled to be fully paid by Fiscal Year 2015 when the tax is set to terminate unless the tax is extended by voter action.
A Capital Sales Tax of .05 cents was approved by voters in 2000 for the purpose of construction of specific capital certificates of participation which had been previously issued. This tax was to continue until the total amount approved by the voters was collected. The tax was terminated in January, 2007 at which time the total amount approved was anticipated to be collected.
Fiscal Year
260

Table C-8
2007-08 2008-09 2009-2010 2010-2011 2011-12
Jail District Sales Tax (1) 12,372,890$ 11,826,297$ 6,447,521$ 10,778,684$ 11,344,489$ Capital Projects Sales Tax (2) 9,922,548 1,742,172 19,339 37,089 18,052 Library District Property Tax (3) 3,574,367 3,305,456 4,264,422 3,314,226 3,325,625 Special Assessment Districts (4)
Donovan Estates 29,577 29,154 336,590 - - Del Sur Estates - - - - - El Prado Estates 29,889 16,143 193,995 20,345 18,348
Gadsden 40,620 47,935 209,176 25,956 21,619 Ave B&C Colonial 31,267 66,017 532,495
Total Projected Revenues 25,969,891$ 16,967,157$ 11,502,310$ 14,242,317$ 15,260,629$
Jail District - Bonds Principal 1,940,000$ 2,035,000$ 5,650,000$ 640,000$ 550,000$ Interest 842,063 746,823 579,157 328,827 272,276
Total Jail District Requirements 2,782,063 2,781,823 6,229,157 968,827 822,276
East County - BondsPrincipal - - - - 245,000 Interest - - - - 17,185
Total East County Requirements - - - - 262,185
Capital Sales Tax - Certificates of PaymentPrincipal 10,540,000 1,345,000 - - - Interest 536,332 35,563 - - -
Total Jail District Requirements 11,076,332 1,380,563 - - -
Library District - Bonds Principal 930,000 975,000 1,020,000 1,065,000 1,120,000 Interest 2,366,426 2,329,226 2,290,226 2,248,425 2,204,825
Total Library District Requirements 3,296,426 3,304,226 3,310,226 3,313,425 3,324,825
Assessment Districts Donovan Estates - Bonds Principal 22,100 23,100 296,500 - - Interest 14,466 13,477 11,226 - -
Total Donovan Estates 36,566 36,577 307,726 - -
Del Sur Estates - Bonds Principal - - - - - Interest - - - - -
Total Del Sur Estates - - - - -
El Prado Estates - WIFA Loan Principal 17,552 17,974 18,423 18,880 62,514 Interest 10,934 10,205 9,458 8,693 3,523
Total El Prado Estates 28,486 28,179 27,881 27,573 66,037
Gadsden - RDA Loan Principal 19,984 19,984 19,984 19,984 119,984 Interest 19,334 18,435 17,536 16,636 13,462
Total Gadsden Estates 39,318 38,419 37,520 36,620 133,446
B & C Colonia - WIFA Loan Principal - - - - 42,974 Interest - - - 44,288 23,208
Total B & C Colonia Estates - - - 44,288 66,182
B & C Colonia - RDA Loan Principal - - - - 83,300 Interest - - - 50,000 48,959
Total B & C Colonia Estates - - - 50,000 132,259
Total Assessment Districts Requirements 104,370 103,175 373,126 158,481 397,925
Total Annual Requirements 17,259,191$ 7,569,788$ 9,912,509$ 4,440,734$ 4,807,211$
1.50 2.24 1.16 3.21 3.17 Estimated Coverage
(3)
(4)
Fiscal Year
The Library District, by voter action in 2005, approved issuance of $53,765,000 in bonds to cover the construction of new library facilities, and the levying of a property tax to repay the bonds. Upon repayment of these bonds the property tax will be discontinued.
Special Assessment Districts are formed under Arizona Revised Statutes to provide for infrastructure improvements construction and operation of these activities, irrigation, street lighting, sewer and water, roads, etc. These districts are established by the owners of the parcels for the specific benefit of on the members of the district to cover all costs for the operation of the district and the repayment of any debt incurred to provide for the improvements
261

{This page is intentionally left blank}
262

Economic and Demographic Information
263

Yuma County, Arizona Table D-1Demographic Statistics - Population and Employment - by SectorLast Ten Years
C i v i l i a n
Calendar Total Labor Unemp. Grand Total Trade, Trnp., Comm. Financial Actv. Service Misc.
Year Population Force Employed Rate Employed % Employed % Employed % Employed %
2002 167,608 72,800 55,450 23.8% 25,075 45.2% 9,775 17.6% 1,300 2.3% 14,000 25.2%
2003 172,033 71,650 54,275 24.2% 25,025 46.1% 9,450 17.4% 1,400 2.6% 14,175 26.1%
2004 177,209 72,800 61,400 15.7% 27,800 45.3% 9,700 15.8% 1,400 2.3% 16,700 27.2%
2005 183,659 75,470 63,370 16.0% 29,600 46.7% 10,200 16.1% 1,500 2.4% 17,900 28.2%
2006 189,163 76,237 64,878 14.9% 30,100 46.4% 10,500 16.2% 1,600 2.5% 18,000 27.7%
2007 192,699 79,100 70,200 11.3% 30,100 42.9% 10,700 15.2% 1,500 2.1% 17,900 25.5%
2008 193,869 82,525 69,300 16.0% 29,900 44.3% 10,500 15.2% 1,500 2.2% 17,900 25.8%
2009 194,737 85,600 67,500 21.1% 27,700 41.0% 9,500 14.1% 1,600 2.4% 16,600 24.6%
2010 195,751 92,372 67,789 26.6% 29,200 43.3% 9,100 13.4% 1,400 2.1% 18,700 27.7%
2011 200,431 87,566 65,316 25.4% 29,300 43.4% 8,900 13.6% 1,200 1.8% 19,200 28.4%
F a r m i n g / G o o d s P r o d u c i n g G o v e r n m e n t
Calendar Total Agriculture * Grand Total Construction Manufacturing Grand Total Federal State and Local
Year* Population * Employed % Employed % Employed % Employed % Employed % Employed % Employed %
2002 167,608 12,200 22.0% 5,425 9.8% 3,425 6.2% 2,000 3.6% 12,750 23.0% 2,725 4.9% 10,025 18.1%
2003 172,033 10,625 19.6% 5,650 10.4% 3,750 6.9% 1,900 3.5% 13,000 24.0% 2,700 5.0% 10,300 19.0%
2004 177,209 12,900 21.0% 7,300 11.9% 4,300 7.0% 3,000 4.9% 13,400 21.8% 2,900 4.7% 10,500 17.1%
2005 183,659 12,170 19.2% 7,800 12.3% 4,800 7.6% 3,000 4.7% 13,800 21.8% 3,000 4.7% 10,800 17.0%
2006 189,163 13,000 20.0% 8,100 12.5% 5,300 8.2% 2,800 4.3% 14,400 22.2% 3,200 4.9% 11,200 17.3%
2007 192,699 16,140 23.0% 7,700 11.0% 4,800 6.8% 2,900 4.1% 14,900 21.2% 3,400 4.8% 11,500 16.4%
2008 193,869 16,000 23.1% 7,000 10.1% 4,100 5.9% 2,900 4.2% 14,800 21.4% 3,500 5.1% 11,300 16.3%
2009 194,737 17,600 26.1% 5,200 7.7% 3,400 5.0% 1,800 2.7% 15,200 22.5% 3,600 5.3% 11,600 17.2%
2010 195,751 14,730 21.7% 4,100 6.0% 2,500 3.7% 1,600 2.4% 14,100 20.8% 3,900 5.8% 10,200 15.0%
2011 200,431 15,650 24.0% 3,900 6.0% 2,100 3.2% 1,800 2.8% 16,000 24.5% 3,800 5.8% 12,200 18.7%
Source: Arizona Department of Administration (azstats.gov)
* Source: United States Bureau of Labor Statistics (bls.gov)
S e r v i c e P r o d u c i n g
264

Yuma County, Arizona Table D-2Demographic Statistics - Population and Employment - by CityLast Ten Years
State of Arizona Yuma County Fortuna Foothills CDP City of San Luis
Calendar Labor Unemp. Pop. Labor Unemp. Pop. Labor Unemp. Pop. Labor Unemp.
Year Force Rate Force Rate Force Rate Force Rate
2002 2,671,705 6.2% 167,608 72,800 16.9% 22,149 5,544 9.1% 18,345 5,518 35.9%
2003 2,665,322 5.6% 172,033 71,650 17.0% 23,035 5,835 9.1% 19,745 5,816 36.0%
2004 2,837,052 4.6% 177,209 72,800 15.6% 23,591 5,963 8.4% 21,180 5,795 33.8%
2005 2,866,800 4.7% 183,659 75,470 16.0% 25,113 6,170 8.6% 21,799 6,040 34.5%
2006 3,025,464 3.8% 189,163 76,237 14.9% 25,984 6,272 7.9% 23,710 6,008 32.5%
2007 3,029,090 3.8% 192,699 79,100 13.9% 25,393 6,532 7.3% 25,658 6,133 30.8%
2008 3,136,231 7.0% 193,869 82,500 16.0% 28,268 6,748 8.6% 26,705 6,603 34.4%
2009 3,142,641 7.4% 194,737 85,600 26.3% 26,727 6,875 15.0% 27,629 7,196 49.7%
2010 3,181,532 10.1% 195,751 92,372 26.6% 27,325 7,110 15.1% 25,614 8,467 50.0%
2011 3,017,885 8.5% 200,431 87,566 25.4% 26,265 6,973 16.1% 30,607 17,249 67.5%
City of Somerton Town of Wellton City of Yuma
Calendar Pop. Labor Unemp. Pop. Labor Unemp. Pop. Labor Unemp.
Year Force Rate Force Rate Force Rate
2002 7,895 3,267 26.0% 1,870 654 18.7% 81,380 37,013 13.0%
2003 8,180 3,442 26.2% 1,880 702 18.8% 83,330 38,962 13.0%
2004 8,855 3,462 24.4% 1,900 696 17.2% 77,515 39,674 12.0%
2005 9,642 3,598 24.8% 2,031 723 17.7% 86,543 41,098 12.3%
2006 10,100 3,608 23.3% 2,145 729 16.5% 92,160 41,646 11.4%
2007 10,879 3,712 21.8% 2,303 754 15.4% 93,212 43,249 10.6%
2008 11,377 3,935 24.8% 2,318 791 17.7% 93,719 44,942 12.2%
2009 11,713 4,184 38.3% 2,363 825 28.7% 94,361 46,243 20.8%
2010 14,329 4,712 38.6% 2,884 897 29.0% 93,275 48,814 21.0%
2011 14,470 4,703 40.4% 2,926 888 30.5% 91,906 44,590 16.8%
* Source: Arizona Department of Administration (azstats.gov)
265

Yuma County, ArizonaDemographic Statistics - County Employees - by ActivityLast Ten Fiscal Years (1) (2)
Full Total Full Total Full Total Full Total Full TotalTime FTEs Paid Time FTEs Paid Time FTEs Paid Time FTEs Paid Time FTEs Paid
General GovernmentAssessor 28 28 28 28 28 28 29 29 29 28 28 28 29 30 30 Board of Supervisors / County Admin 17 17 17 17 17 17 17 17 17 21 21 21 22 22 22 Development Services 67 68 68 67 67 67 70 72 73 76 77 78 77 77 77 Election Services 2 2 2 2 3 3 2 2 2 2 3 3 2 3 3 Financial Services 16 16 16 16 16 16 17 17 17 19 20 20 20 21 21 General Services 29 30 30 29 30 31 34 34 34 40 40 40 39 39 39 Human Resources 9 9 9 8 8 8 8 8 8 8 8 8 9 10 10 Information Technology Services 20 20 20 20 20 20 20 22 23 22 23 24 24 24 24 Recorder 10 10 10 10 10 10 10 10 10 8 8 8 10 10 10 Treasurer 9 10 10 9 10 10 9 10 10 10 10 10 10 10 10 YMPO 2 6 10 2 6 10 2 6 10 4 6 8 4 3 10
Total General Government 209 216 220 208 215 220 218 227 233 238 244 248 246 249 256
Public SafetyAdult Probation 79 79 79 79 80 80 82 82 82 85 85 85 86 88 88 Sheriff 299 300 301 293 294 294 303 304 305 311 313 314 302 303 304
Total Public Safety 378 379 380 372 374 374 385 386 387 396 398 399 388 391 392
Highway & StreetsPublic Works 90 90 90 89 89 89 92 92 92 91 91 91 90 90 90
Total Highway & Streets 90 90 90 89 89 89 92 92 92 91 91 91 90 90 90
HealthHealth 83 88 92 86 90 93 90 93 95 88 91 94 87 94 98
Total Health 83 88 92 86 90 93 90 93 95 88 91 94 87 94 98
Cultural & RecreationLibrary 51 57 62 50 56 61 51 57 62 51 57 62 54 58 61
Total Cultural & Recreation 51 57 62 50 56 61 51 57 62 51 57 62 54 58 61
WelfareHousing 19 23 26 20 22 24 18 20 21 16 16 16 16 16 16 Public Fiduciary 4 4 4 4 4 4 7 8 8 8 8 8 8 8 8
Total Welfare 23 27 30 24 26 28 25 28 29 23 24 24 24 24 24
EducationSchool Superintendent 5 5 5 5 5 5 5 5 5 5 5 5 5 5 5
Total Education 5 5 5 5 5 5 5 5 5 5 5 5 5 5 5
Legal ActivitiesClerk of Superior Court 31 32 32 31 31 31 36 36 36 40 40 40 37 38 38 Constable Precinct #1 2 3 3 3 4 4 3 4 4 3 3 4 4 4 4 Constable Precinct #2 - - - 1 1 1 1 1 1 1 1 1 1 1 1 Constable Precinct #3 - - - 1 1 1 1 1 1 1 1 1 1 1 1 County Attorney 53 54 54 56 56 56 57 58 58 61 61 61 61 61 61 County Attorney: Victim Services 10 10 10 10 10 10 11 11 11 11 11 11 11 11 11 Justice Court #1 19 19 19 17 17 17 17 18 18 2 21 22 20 20 20 Justice Court #2 3 3 3 3 3 3 3 3 3 4 4 4 3 3 3 Justice Court #3 4 4 4 4 4 4 4 4 4 3 3 4 4 4 4 Juvenile Court 129 131 132 141 142 142 142 143 144 131 131 131 152 154 155 Legal Defender 9 9 9 9 9 9 7 7 7 11 11 12 10 10 10 Public Defender 18 18 18 17 17 17 16 16 16 23 23 24 15 16 16 Superior Court 43 45 47 46 48 50 46 49 60 61 54 56 57 59 61
Total Legal Activities 321 328 331 339 343 345 344 351 355 354 362 366 376 382 385
Total Employee Count: 1,160 1,190 1,210 1,173 1,198 1,215 1,210 1,239 1,258 1,246 1,272 1,289 1,270 1,293 1,311
(1) Numbers reported as of the end of the calendar year(2) Numbers from county payroll records
2002-2003 2003-2004 2004-2005EmployeesEmployees Employees Employees Employees2006-20072005-2006
266

Table D-3
Full Total Full Total Full Total Full Total Full TotalTime FTEs Paid Time FTEs Paid Time FTEs Paid Time FTEs Paid Time FTEs Paid
29 29 29 30 30 30 31 31 31 32 32 32 32 32 32 25 25 25 23 23 23 25 25 25 25 25 26 28 28 28 81 81 81 62 62 62 73 73 73 70 70 70 71 71 71 2 2 2 2 2 2 2 2 3 2 2 3 3 3 3
20 20 20 20 20 20 20 20 20 20 20 20 20 20 20 38 38 38 40 40 40 40 40 40 39 39 39 40 40 40 11 11 11 12 12 12 11 11 11 11 11 11 11 11 11 25 25 25 20 20 20 23 23 23 19 19 19 29 29 29 9 9 9 11 11 11 10 10 10 10 10 10 10 10 10
10 10 10 10 10 10 10 10 10 10 10 10 10 10 10 3 4 5 1 3 3 5 5 5 5 5 13 - - -
253 254 255 231 233 233 250 250 251 243 244 253 254 254 254
87 89 91 83 84 86 82 84 86 84 84 84 92 92 92 317 318 318 320 321 321 329 331 331 342 343 344 382 382 382 404 407 409 403 405 407 411 415 417 426 427 428 474 474 474
77 77 77 73 73 73 75 75 75 69 69 70 79 79 79 77 77 77 73 73 73 75 75 75 69 69 70 79 79 79
91 98 102 89 95 98 97 102 105 97 105 109 118 118 118 91 98 102 89 95 98 97 102 105 97 105 109 118 118 118
53 57 61 63 68 73 78 86 95 78 90 105 96 96 96 53 57 61 63 68 73 78 86 95 78 90 105 96 96 96
16 16 16 16 16 16 16 16 16 16 16 16 16 16 16 7 7 7 8 8 8 7 7 7 8 8 8 8 8 8
23 23 23 24 24 24 23 23 23 24 24 24 24 24 24
5 5 5 5 5 5 5 5 5 5 5 5 5 5 5 5 5 5 5 5 5 5 5 5 5 5 5 5 5 5
40 41 41 40 41 41 39 39 39 40 40 40 41 41 41 4 4 4 4 4 4 4 4 4 3 3 4 4 4 4 1 1 1 1 1 1 1 1 1 1 1 1 1 1 1 - - - 1 1 1 1 1 1 1 1 1 1 1 1
65 65 65 65 65 65 65 65 65 65 65 65 64 64 64 11 11 11 11 11 11 11 11 11 11 11 11 11 11 11 22 22 23 21 21 22 20 20 21 21 21 22 22 22 22 4 4 4 4 4 4 4 4 4 4 4 4 5 5 5 4 4 4 2 2 2 4 4 4 3 3 4 4 4 4
144 144 144 136 136 136 132 132 132 131 131 131 141 141 141 9 9 9 11 11 11 8 8 8 11 11 12 13 13 13
22 22 22 23 23 23 22 22 22 23 23 24 24 24 24 55 56 57 52 58 62 55 56 57 60 61 64 68 68 68
381 383 385 371 378 383 366 367 369 374 375 383 397 397 397
1,287 1,305 1,317 1,259 1,281 1,296 1,305 1,324 1,340 1,316 1,339 1,377 1,446 1,446 1,446
2008-2009Employees
2011-12Employees
2010-11Employees
2007-2008Employees
2009-2010Employees
267

Yuma County, Arizona Table D-4Demographic Statistics - Top EmployersCurrent Year and Six Years Ago (1)(2)
Total % of Total Total % of TotalEmployment Rank Employed Employment Rank Employed
U.S. Army 2,319 1 2.65% 1,176 6 1.56%
Yuma Regional Medical Center 2,080 2 2.38% 1,500 2 1.99%
Yuma Elementary School District 1,700 3 1.94% 1,200 5 1.59%
Wal-Mart Stores 1,394 4 1.59% - -
Yuma City Government 1,388 5 1.59% 864 10 1.14%
Yuma County 1,350 6 1.54% 1,289 4 1.71%
U.S. Marine Corps Air Station 1,350 7 1.54% 6,043 1 8.01%
Bose Corporation 1,300 8 1.48% - -
US Border Patrol 920 9 1.05% - -
ACT, Advanced Call Ctr Tech 814 10 0.93% - -
Yuma Union High School District - - 690 9 0.91%
Grower's Company - - 1,500 3 1.99%
Sayler American Fresh Foods - - 1,000 7 1.33%
Dole Corporation - - 1,000 8 1.33%
Total Top Employers 14,615 16.69% 16,262 21.55%
Total County Employment 87,566 75,470
(1) Source: Greater Yuma Economic Development Corporation/Yuma County Chamber of Commerce.(2) Information prior to fiscal year 2005-06 unavailable.(3) Based on last available full calendar year info as of 12/31/2011.(4) Based on last available full calendar year info as of 12/31/2006.
FY2012 (3) FY2006 (4)
268

YUMA COUNTY, ARIZONA Table D-5County - Wide Other Demographic StatisticsLast Ten Years
Total
Calendar County Personal
Year Population(1) Income (2)
Amount % Change (In 000's) Amount % Change Amount % Change
2002 167,608 19,861 9.12% 3,328,862$ 31,465 (0.58%) 6,166 2.34%
2003 172,033 19,171 (3.47%) 3,298,045 31,791 1.04% 6,284 1.91%
2004 177,209 20,265 5.71% 3,591,140 34,514 8.57% 6,450 2.64%
2005 183,659 21,005 3.65% 3,857,757 35,621 3.21% 7,468 15.78%
2006 189,163 21,336 1.58% 4,035,982 37,320 4.77% 7,707 3.20%
2007 192,699 22,772 6.73% 4,388,142 37,886 1.52% 7,600 (1.39%)
2008 193,869 23,988 5.34% 4,650,530 37,229 (1.73%) 7,898 3.92%
2009 194,737 25,496 6.29% 4,965,015 37,967 1.98% 8,655 9.58%
2010 195,751 34,999 37.27% 5,196,000 37,858 (0.29%) 8,834 2.07%
2011 200,431 39,937 14.11% 5,300,165 37,307 (1.46%) 9,058 2.54%
(1) Source: Arizona Department of Administration (azstats.gov)
(2) Source: Bureau of Economic Analysis (bea.gov)
(3) Source: Arizona Department of Education (azed.org)
Income (2) (through Grade 12) Enrollment
Average Daily School College and
Per Capita Membership (3) University
269

YUMA COUNTY, ARIZONA Table D-6County - Wide Building Permits, Bank Deposits, and Retail Sales Last Ten Years
Calendar
Year
Amount % Change Amount % Change Amount % Change Amount % Change
2002 149,800,941$ 34.88% 1,607 22.67% 922,000,000$ 16.38% 893,498,570$ 3.14%
2003 217,343,008 45.09% 1,805 12.32% 997,000,000 8.13% 966,672,745 8.19%
2004 327,483,949 50.68% 2,475 37.12% 1,111,000,000 11.43% 1,053,583,182 8.99%
2005 511,502,562 56.19% 2,586 4.48% 1,223,000,000 10.08% 1,225,866,861 16.35%
2006 182,228,696 (64.37%) 1,307 (49.46%) 1,347,000,000 10.14% 1,279,315,606 4.36%
2007 250,338,844 37.38% 2,362 80.72% 1,325,000,000 (1.63%) 1,341,139,317 4.83%
2008 93,181,843 (62.78%) 1,136 (51.91%) 1,339,000,000 1.06% 1,331,107,532 (0.75%)
2009 83,645,949 (10.23%) 881 (22.45%) 1,314,000,000 (1.87%) 1,197,319,952 (10.05%)
2010 57,114,289 (31.72%) 637 (27.70%) 1,362,000,000 3.65% 1,271,566,415 6.20%
2011 39,043,445 (31.64%) 319 (49.92%) 1,389,000,000 1.98% 1,230,944,602 (3.19%)
* Source: Prior to 2008 'Arizona Statistical Abstracts', Yuma Stats ® as provided by Yuma County Assessor (yumastats.com)
** Source: Federal Deposit Insurance Corp (fdic.gov/bank/analytical/state profile/San Francisco/Az/AZ.pdf)
*** Source: Prior to 2008 Arizona Department of Revenue, Yuma Stats ® as provided by Yuma County Assessor (yumastats.com)
Retail Sales ***Construction Cost*
New Housing
Units Authorized * Bank Deposits **
Value of Building
270

Operational Information
271

{This page is intentionally left blank}
272

YUMA COUNTY, ARIZONA Table E-1Capital Asset & Infrastructure Statistics by Function/Program
2002-03 2003-04 2004-05 2005-06 2006-07 2007-08 2008-09 2009-10 2010-11 2011-12
Function/ProgramPolicy & executive
buildings 1 1 1 1 1 1 1 1 1 1
Law & justiceCourt Buildings 3 3 4 4 4 4 4 4 5 5 Legal defense buildings 2 2 2 2 2 2 2 2 2 2 Juvenile Building 1 1 1 1 1 1 1 1 1 1 Adult Probation Building 1 1 1 1 1 1 1 1 1 1 Parking Garage - - 1 1 1 1 1 1 1 1
Public safetyAdministration buildings 1 1 1 1 1 1 1 1 1 1 Jail detention facility 1 1 1 1 1 1 2 2 2 2 Aircraft 3 2 1 - - - - - - - Patrol units 60 70 75 80 85 96 138 134 137 124 Sheriff sub-stations 4 4 4 4 4 4 4 4 4 4 Boats 3 3 3 3 4 5 5 5 5 5 Criminal investigation building 2 2 2 3 3 3 3 3 3 3 Boat Storage Unit 1 1 1 1 1 1 Emergency Communications Site 1 1 1 2
Health & public assistanceAdministration 1 1 1 1 1 1 1 1 1 1 Clinics 2 2 2 2 2 2 2 2 2 2 TB housing unit - - - 1 1 1 1 1 1 1 Rabies Control - - - - - - - - - 1 Public Fiduciary 1 1 1 1 1 1 1 1 1 1
HousingHousing units 3 3 3 3 3 3 3 3 3 3
Cultural & recreationLibraries 5 5 5 5 5 5 5 6 7 8 Parks 5 5 5 5 5 5 5 5 5 5
Community resources & public facilitiesRoad lane miles-asphalt 1,010 1,024 1,051 1,068 1,081 1,097 1,106 1,100 1,160 1,163 Road lane miles-gravel 3,000 3,000 3,000 3,000 3,000 3,000 3,000 3,000 3,000 3,000 Bridges 99 99 99 99 99 99 99 99 100 100 Traffic signals 9 9 9 9 9 9 9 8 13 14 Roads-heavy equipment 88 88 88 88 96 100 100 105 105 109 Retention basins 32 32 32 32 32 32 32 33 34 34 Sanitary sewers - miles 1.70 1.70 1.70 1.70 1.70 1.70 1.70 1.70 1.70 1.70
EducationAdministration Building 1 1 1 1 1 1 1 1 1 1
General government & support servicesBuildings 9 10 8 8 8 8 8 8 8 8
Solid wasteSolid waste transfer sites 4 4 4 4 4 4 4 4 4 4 Solid waste heavy equipment 2 3 5 5 5 8 8 8 8 8
All information developed from Yuma County Records
Last Ten Fiscal Years
Fiscal Year
273

YUMA COUNTY, ARIZONAOperating Indicators by Function/Program Last Ten Years (1)
2002 % Chg 2003 % Chg 2004 % Chg 2005 % Chg 2006 % ChgFunction/Program
Community resources & public facilitiesBuilding inspections 19,540 33.57% 27,788 42.21% 25,653 (7.68%) 19,047 (25.75%) 14,760 (22.51%)Enhanced lanes maintained (miles) 500 32.66% 505 0.94% 512 1.42% 525 2.62% 534 1.63%
General government & support servicesClerk-Recorder-Assessor
# recorded documents 47,468 23.15% 48,352 1.86% 57,388 18.69% 51,685 (9.94%) 48,168 (6.80%)
Health & Public assistance* ADMHS clients served 30 (3.23%) 17 (43.33%) 5 (70.59%) 99 1880.00% 63 (36.36%)
Processed child support payments 300,582 10.54% 289,403 (3.72%) 319,098 10.26% 305,689 (4.20%) - N/A* Patient treatments at clinics 31,339 38.60% 31,660 1.02% 32,720 3.35% 35,008 6.99% 25,378 (27.51%)
HousingNew Applications-public housing 445 1.14% 452 1.57% 460 1.77% 484 5.22% 445 (8.06%)New Applications-section 8 590 0.34% 594 0.68% 602 1.35% 613 1.83% 541 (11.75%)
Law & JusticeFiled felonies-County Attorney 1,634 0.00% 1,866 14.20% 1,773 (4.98%) 1,702 (4.00%) 1,827 7.34%Filed misdemeanors-County Attorney 1,186 0.00% 1,316 10.96% 1,474 12.01% 1,501 1.83% 2,606 73.62%Fel/Misd. Pet./Cit. (Juvenile) -Co. Atty 1,072 68.55% 1,166 8.77% 1,114 (4.46%) 900 (19.21%) 1,249 38.78%
* New caseload-Public Defenders 839 31.92% 2,509 199.05% 2,473 (1.43%) 2,213 (10.51%) 2,118 (4.29%)* New caseload-Legal Defenders 683 12.15% 768 12.45% 457 (40.49%) 393 (14.00%) 470 19.59%
Superior Court cases 4,529 0.56% 4,985 10.07% 4,876 (2.19%) 4,953 1.58% 5,428 9.59%Minute entries generated 17,801 3.37% 22,035 23.79% 21,186 (3.85%) 20,533 (3.08%) 20,699 0.81%Justice Court cases 22,635 0.44% 21,623 (4.47%) 22,876 5.79% 23,418 2.37% 26,141 11.63%
Public SafetyTotal miles patrolled - Sheriff 1,500,000 0.00% 1,500,000 0.00% 1,500,000 0.00% 1,500,000 0.00% 1,500,000 0.00%Processed offenders-Sheriff 9,220 9.35% 8,761 (4.98%) 9,456 7.93% 9,332 (1.31%) 9,146 (1.99%)
* Juvenile referrals -Probation 4,631 6.22% 4,983 7.60% 4,909 (1.49%) 4,788 (2.46%) 4,657 (2.74%)* Cases supervised-Probation 596 (8.31%) 660 10.74% 557 (15.61%) 586 5.21% 514 (12.29%)* Minor institutional care days-Probation 17,408 8.09% 17,327 (0.47%) 17,025 (1.74%) 16,672 (2.07%) 17,002 1.98%
Adult sentencing reports-Probation 1,056 (8.17%) 1,258 19.13% 1,331 5.80% 1,228 (7.74%) 1,321 7.57%
Solid Waste* Waste recycled 754 8277.78% 675 (10.48%) 1,238 83.41% 1,281 3.47% 1,128 (11.94%)* Landfill waste disposal 6,624 (15.25%) 5,928 (10.51%) 6,021 1.57% 5,588 (7.19%) 6,636 18.75%
All information obtained from various county departmental records* These items are Fiscal Year all others are calendar year as of 6/30/12N/A- Not available at time of printing
274

Table E-2
2007 % Chg 2008 % Chg 2009 % Chg 2010 % Chg 2011 % Chg
13,043 (11.63%) 11,257 (13.69%) 9,434 (16.19%) 7,998 (15.22%) 8,582 7.30%539 1.01% 548 1.68% 553 0.82% 550 (0.52%) 582 5.76%
43,253 (10.20%) 37,075 (14.28%) 35,090 (5.35%) 33,306 (5.08%) 29,468 (11.52%)
95 50.79% 104 9.47% 116 11.54% 232 100.00% 244 5.17%- N/A - N/A - N/A - N/A NA N/A
21,555 (15.06%) 19,490 (9.58%) 13,160 (32.48%) 16,183 22.97% 15,088 (6.77%)
539 21.12% 592 9.83% 610 3.04% 634 3.93% 533 (15.93%)575 6.28% 663 15.30% 680 2.56% 655 (3.68%) 627 (4.27%)
1,945 6.46% 1,714 (11.88%) 1,772 3.38% 1,685 (4.91%) 1,644 (2.43%)2,563 (1.65%) 3,087 20.44% 3,164 2.49% 3,295 4.14% 2,911 (11.65%)1,172 (6.16%) 1,082 (7.68%) 966 (10.72%) 924 (4.35%) 1,878 103.25%1,746 (17.56%) 1,955 11.97% 2,593 32.63% 2,494 (3.82%) 2,016 (19.17%)
373 (20.64%) - N/A 523 N/A 645 23.33% 329 (48.99%)5,449 0.39% 5,837 7.12% 5,858 0.36% 5,243 (10.50%) 4,110 (21.61%)
20,697 (0.01%) 22,465 8.54% 21,120 (5.99%) 19,893 (5.81%) 19,478 (2.09%)16,271 (37.76%) 29,316 80.17% 29,359 0.15% 21,950 (25.24%) 20,444 (6.86%)
1,500,000 0.00% 1,500,000 0.00% 1,500,000 0.00% 1,500,000 0.00% 1,500,000 0.00%10,823 18.34% 12,344 14.05% 14,319 16.00% 7,224 (49.55%) 7,066 (2.19%)4,843 3.99% 4,306 (11.09%) 4,017 (6.71%) 3,295 (17.97%) 2,854 (13.38%)
516 0.39% 702 36.05% 1,251 78.21% 1,222 (2.32%) 429 (64.89%)17,662 3.88% 19,870 12.50% 17,587 (11.49%) 16,344 (7.07%) 17,389 6.39%1,198 (9.31%) 1,140 (4.84%) 1,264 10.88% 1,246 (1.42%) 1,054 (15.41%)
1,165 3.28% 2,477 112.62% 1,370 (44.70%) 1,920 40.15% 1,114 (41.96%)8,361 25.99% 8,069 (3.49%) 5,901 (26.87%) 5,682 (3.71%) 5,603 (1.39%)
275

Table E-3
Type of Policy Details of Coverage Agency Expiration Date Annual Premium
Public Entity Liability $20,000,000 per Occurrence C.V. Starr & Company 08/01/2012 $300,000
$20,000,000 Errors & Omissions Annual Aggregate
$500,000 deductible for employment practices
$400,000 deductible for all others
Property $281,347,106 blanket limit ($25,000,000 Earthquake/Flood) The Travelers Indemnity Company 08/01/2012 $161,655
$ 25,000 deductible - Boiler & Machinery
$ 25,000 deductible - All other perils
$ 100,000 deductible - Earth Movement
$ 100,000 deductible - Flood
Commercial Crime $1,000,000 Limit Employee Theft and Fraud The Fidelity and Deposit 08/01/2012 $3,271
$50,000 Limit Money Orders/Counterfeit Currency Company of Maryland
$10,000 Deductible
Underground Storage $1,000,000 limit each claim ACE American 04/26/2013 $8,454
Tank $1,000,000 aggregate Insurance Company
$5,000 deductible each claim
Tourist Auto Liability $100,000 Property Damage and Liability AXA Seguros, S.A. de C.V. 11/01/2012 $1,735
$2,000 per person $10,000 per accident Medical
$100,000 Legal Assistance
Collision Deductible = 2% of insured value or $400 minimum
Theft Deductible = 5% of insured value or $800 minimum
Reinsurance for Medical Individual Claims exceeding $150,000 (Specific) HM Insurance Company July 2011 to Dec 2011 $453,850
Self Insurance Plan $150,000 - deductible (6 mo. Premium)
Individual Claims exceeding $150,000 (Specific) Blue Cross Blue Shield Jan 2012 - June 2012 $343,779
$150,000 - deductible (6 mo. Premium)
Medical Self Insurance Yuma County Perpetual $10,068,969
Plan 1 $250 deductible maximum per person Employee Benefit
Plan 2 $750 deductible maximum per person Trust
Fiduciary Liability Insurance $2,000,000 limit Chubb 7/1/2012 $6,500
for YCEBT & Trustees $0.00 Deductible
Workers' Compensation $500,000 Law Enforcement Self Insured Retention Yuma County Workers' Perpetual $550,264
Self Insurance $400,000 All Other Self Insured Retention Compensation Fund Fiscal 11/12 Premium
Excess Workers' Statutory Limit Injury/Disease Safety National 1/1/2013 $52,298
Compensation Insurance $2,000,000 Employers' Liability Casualty Corporation
Healthcare Professional $3,000,000 Aggregate Limit Arch Specialty Insurance Company 10/30/2012 $33,000
Liability Insurance $1,000,000 per incident limit
for Nursing staff at Jail $0 Deductible
Pollution Legal $5,000,000 Aggregate Limit XL Insurance Group/ 11/1/2012 $21,528
Liability Insurance $5,000,000 per incident limit Indian Harbor Insurance Company
for Wastewater/Water $25,000 Deductible
Treatment Plant at
Somerton Housing
YUMA COUNTY, ARIZONASchedule of Insurance in Force
June 30, 2012
276