Youth Sport - Fakulteta za šport
175
Youth Sport Proceedings of the 8 th Conference for youth sport Mojca Doupona Topič (ed.) Ljubljana, 2016
-
Upload
khangminh22 -
Category
Documents
-
view
1 -
download
0
Transcript of Youth Sport - Fakulteta za šport
Youth Sport
Proceedings of the 8th Conference for youth sport
Mojca Doupona Topič (ed.)
Ljubljana, 2016

2
Naslov / Title: Youth Sport: Proceedings of the 8th Conference for youth sport in
Ljubljana, 9-10 December 2016.
Izdala / Published by: University of Ljubljana, Faculty of Sport, Gortanova 22, SI-
1000
Ljubljana, Slovenia
Urednik / Editor: Mojca Doupona Topič
Oblikovanje in računalniški prelom / Manuscript designer: Samo Rauter
Oblikovanje naslovnice / Cover design: Snežana Madič Lešnik
Naklada: 400
© 2016 University of Ljubljana, Faculty of Sport. Vse pravice pridržane / All rights reserved.
Cofinancing: The Foundation for the financing of sports organizations in Slovenia
CIP - Kataložni zapis o publikaciji
Narodna in univerzitetna knjižnica, Ljubljana
796.034-053.4/.6(082)(0.034.2)
CONFERENCE for Youth Sport (8; 2016; Ljubljana)
Youth sport: proceedings of the 8th Conference for Youth Sport Ljubljana, 9-10 December 2016 /
Mojca Doupona Topič (ed.). - Ljubljana: Faculty of Sport, 2016
ISBN 978-961-6843-78-2
1. Gl. stv. nasl. 2. Doupona Topič, Mojca
289572608
3
YOUNG ATHLETES AS A NATIONAL IDOLS – WITH WHAT CHALLENGES DO
THEY HAVE TO FACE?
Bartoluci, S.1, Doupona Topič, M.2
1University of Zagreb, Faculty of Kinesiology, Zagreb, Croatia
2University of Ljubljana, Faculty of Sport, Ljubljana, Slovenia
ABSTRACT
Athletes’ top results are considered the most important factors of promotion and thus of every
nation’s or country’s identification; elite athletes are most often called “ambassadors of the country”.
Elite athletes enjoy a special status in society, one might even say they are different from regular
mortals, while some of them even become ‘immortal’. Young people need idols. If idols are looked at
from the cultural perspective, a star is somebody offering a personality construct by demonstrating
values that individual’s project onto themselves. A study of the media image of the biathlete Jakov Fak
is not only interesting from the aspect of youth’s identification with a sports idol who has been
competing for two countries, but also in terms of the globalisation and migration processes that are
changing our attitude to a person’s national identity and the society as such. This paper deals with the
case of Jakov Fak, a highly successful Croatian/Slovenian athlete in biathlon. He was forced to make his
choices of citizenship with the aim of better training conditions and finding ways to attain success. This
case allows us to observe how such choice brought questions of identification to the general public.
INTRODUCTION
Athletes’ top results are considered the most important factors of promotion and thus of every
nation’s or country’s identification; elite athletes are most often called “ambassadors of the country”
(Bednarik et al., 2002). From the microeconomic perspective, one could say that images of elite
athletes are an effective factor in the promotion of the brands and the companies which, in a business
relationship, sponsor athletes.
In a world saturated with fame, almost everyone seems to be in the process of creating or at least
enabling the existence of famous and admired people. Although celebrities are in fact complete
strangers who one will probably never meet, they can importantly affect the way a person copes with
their everyday life and their attitude to life (Andrews & Jackson, 2001).
Elite athletes enjoy a special status in society, one might even say they are different from regular
mortals, while some of them even become ‘immortal’. Elite athletes are worshipped by masses of
people, they feature in the newspapers, are much spoken about in public and represent an image that
many recreational athletes have in mind when practising sport. While elite athletes become celebrities
due to a number of characteristics and traits, it is most often what they do that turns them into
celebrities. Professional work and top results are undoubtedly what distinguishes elite athletes from
the general public. Particularly interesting are those athletes who have another point of distinction
4
apart from their high performance levels – this might be their looks, behaviour, physical or mental
characteristics or some other accomplishment that only a few people are good at. Such an elite athlete
can, with help of a team of experienced experts, polish their attributes up to the point that they
become the ‘one and only’ (Škorc, 2005).
In the case of stars, it is the difference between commonness and extraordinariness that underpins
their stardom system. According to Mills (2000), a celebrity is defined as follows: “These are the names
that need no further identification. Those who know them outnumber those who need a detailed
explanation. Wherever the celebrities go, they are recognised with some excitement and awe. More
or less continuously they are the material for the media of communication and entertainment. And
when that time ends, everybody remembers them with admiration”.
The power of a celebrity is not only a consequence of their individual identity and charisma but also of
their audiences’ admiration. The star system does not create stars by itself, but only offers an individual
who is then crowned by people as a star. An important role is played by the media which, using the
modern methods of the public relations industry, ensure that the celebrity comes as close as possible
to their audiences (Škorc, 2005).
Young people need idols. If idols are looked at from the cultural perspective, a star is somebody
offering a personality construct by demonstrating values that individual’s project onto themselves. An
idol is an embodiment of ideals. A prerequisite for a person to become a celebrity in cultural terms is
their popularity in a given space and time, which depends on the ideology of the time and its
manifestations.
A study of the media image of the biathlete Jakov Fak is not only interesting from the aspect of youth’s
identification with a sports idol who has been competing for two countries, but also in terms of the
globalisation and migration processes that are changing our attitude to a person’s national identity
and the society as such.
Sport can play a seemingly contradictory role in global processes and identity formation. In terms of
sociological processes, it is not surprising that sport extends emotional identification between
members of different societies and civilisations, and, at the same time, fuels decivilising counter-
thrusts (Maguire, 2005).
Global sport processes, therefore, can lead to the under- or dependent development of a nation’s
talent (Maguire & Pearton, 2000). When a young person in a country decides to pursue a sports career,
his choice is socially constructed as a legitimate path enabling a qualified young athlete to penetrate
foreign markets.
The case of Jakov Fak is of interest from a sociological perspective because it allows us to observe how
individual, sports-related choices brought questions of identification before the general public, and
laid a heavy burden on the shoulders of a young athlete. What should you do when your own country
calls you a traitor if you decide to join another country’s team? The issues of training and finding ways
to attain success in sports are also closely linked with questions of media attention and national/ethnic
discourse in this instance. This paper deals with the case of Jakov Fak, who made his choices despite
having to face challenges unusual for a young athlete.
5
MATERIALS AND METHODS
This paper deals with different media interpretations of the case of Jakov Fak in Croatia and Slovenia.
We used content and discourse analysis of print media. The analysis was performed on all texts
concerning this topic published in three high-circulation Croatian daily newspapers – Jutarnji list,
Večernji list and Sportske novosti – and three high-circulation Slovenian daily newspapers – Dnevnik,
Delo and Ekipa – three days before tournaments, during tournaments, and three days after
tournaments. We analysed two sporting events – the 2009 World Biathlon Championship and the 2010
Winter Olympics.
RESULTS
The issue of athletes migrating or transferring from one club to another or from one national team to
another in European sports is determined in relation to the globalisation process, which has also
affected the sports industry. Several studies have researched the mobility of athletes who move across
national borders, and these can contribute to a better understanding of athletes’ migrations, along
with the theories of migration in a general sense (Eliasson, 2009). There are many reasons for
migration. The first is usually the athlete’s financial gain. Nevertheless, the main reason appears to be
sport-related ambitions as the athlete wants to improve their chances of success and pursue a real
career (Elliot & Maguire, 2008).
The analysis of the discourse in media writings shows the complex situation in which this young athlete
found himself since he was competing for one state but training in another. Both the Croatians and
the Slovenians wanted to bring him under their flag.
When Jakov said: “With 99.9-percent certainty I claim that I will compete for Slovenia. Another solution
I can’t find. I know that the Croatian people will be disappointed and will see me as a traitor, but I have
clean hands when looking for a livelihood” (Delo, 22.7.2009), he was labeled in the Croatian media.
This was not the first case of labeling a Croatian athlete who had changed their citizenship to ensure
better sports training conditions. Although a few months before it had been completely unknown to
the Croatian media, biathlon was suddenly becoming an important political issue. Politicisation of this
case was only to intensify after Jakov won an Olympic Bronze medal in 2010.
Young athletes take on high risks when they leave their home country for a sports career. They must
settle in a new cultural environment as professional athletes so as to earn physical capital, not
academic capital that can secure their social status. In other words, a sports career is only temporary
and often very risky; it is based solely on an athlete’s physical abilities (Agergaard & Sorensen, 2009).
One athlete says, “He doesn’t have any training conditions in Croatia, no coach, no nothing, so he was
practically all on his own, nobody helped him and now that he has won a bronze medal they all say ’He
must be a Croat!’. I think he is a Croat (…) but it is a very delicate issue to present to the people in a
way that you are not perceived as a traitor” (Damir Buric). Being given the label of "traitor" is nothing
but being labeled according to the key ‘one of us’ or ‘against us’ which is a reflection of nationalism as
an ideology. It shows the system’s disregard for sport.

6
The Slovenian media cheered for Jakov and supported him even while competing for Croatia. When
Jakov won the bronze medal, leaving the Slovenian biathlete Bauer behind who ultimately came 4th,
Bauer said, “If Jakov competed for the Slovenian team, Slovenia would be a world power”.
After Jakov transferred to the Slovenian team, Delo called him “by far the best Slovenian biathlete”
and at the same time a “Croat on the Slovenian team”. Media discourse is marked by civic nationalism,
for example one headline declared “Croatian gold for Slovenia” or “He knows well where his homeland
is” (Dnevnik, 2012).
After winning two medals for Slovenia in the World Biathlon Championship 2012, the Croatian media
used sports discourse, and no longer the discourse of ethnic nationalism:
“It’s hard to forget the desire of the most famous guy from Mrkoplje to defend the colours of Slovenia,
where they have provided him with training conditions he could not have dreamt of in the Croatian
Biathlon Association”.
CONCLUSION
International sport success in the late 20th century entails competition between the systems taking
part in the world’s top sports competitions. The development of sport depends on several factors:
exploiting the focus and effectiveness of a sports organisation, access to and identification of human
resources, training methods and qualifications, use of sport medicine and sport sciences (Maguire &
Falcous, 2011). Moreover, the development of specific sports in certain societies depends on the
sport’s status at the international level. Less developed countries are unable to utilise the talent of
their strong performers and/or tend to lose them to more powerful nations in global sport (Maguire &
Pearton, 2000). Therefore, the biathlete Jakov Fak’s decision to join the Slovenian national team did
not take the professional community by surprise; it was only the opinions of the Slovenian and Croatian
general public that came into opposition.
REFERENCES
Andrews D., Jackson S. (2001). Sport Stars: The Cultural Politics of Sporting Celebrity. London:
Routledge.
Agergaard, S., Botelho, V., (2011) Female football migration: motivational factors for early migratory
processes. In Sport and Migration: borders, boundaries and crossings. New York: Routledge.
Eliasson, A. (2009). The European football market, globalization and mobility among players. Soccer &
Society, 10(3-4), 386–397.
Maguire, J. (2005). Power and Global Sport (p. 198). New York: Routledge.
Maguire, J., Falcous, M. (2011). Sport and Migration: borders, boundaries and crossings. New York:
Routledge.
7
Maguire, J., Pearton, R. (2000). The impact of elite labour migration on the identification, selection and
development of European soccer players. Journal of Sport Sciencies, 18, 759–769.
Mills C. W. (2000). The Power Elite. New York: Oxford University Press
Škorc, N. (2005). Vpliv podobe vrhunskega športnika na blagovno znamko. Magistrsko delo. Ljubljana:
Univerza v Ljubljani, Ekonomska fakulteta.
8
COPING WITH RETIREMENT FROM SPORT CAREER CAN BE EASIER - THE CASE OF SLOVENIAN HANDBALL PLAYERS
Bon, M., Novak T.
University of Ljubljana, Faculty of sport, Ljubljana, Slovenia
ABSTRACT
The present study deals with coping with retirement from professional or half-professional sport, which is one of the most stressful periods in athletes’ careers and is in many cases connected with different emotional, social and financial problems. Our study included 106 former athletes (41 women [38.7%] and 65 [63.3%] men) with an average age between 40 and 50. Most of the (37.7 % ) women are between 30 and 40 years old, while the men are mostly half of tehm (No – 33) aged between 40 and 50. Only 39.4 % of the men and 27.9% of the women are married and living together with partners and children. Others are either divorced (men 10.6%, women 4.8%) or single.
A special survey, specifically designed for former athletes was used. After the general and sports biographical data have been obtained, the respondents answered a set of multiple choice, yes/no, ranking and rating questions about the process of athletic retirement. During their active career nearly half (48.1%) of the players were playing at the first division level, among those 16 (15.1%) also at the international level of competition. Only 5 (4.7%) respondents evaluated their career as very successful, and 33 players (31.1%) as successful. Most of them described their adaptation to life after the career in sport as not extremlly problematic. The results of the study point to the conclusion that engaging in the sport on a recreational basis is a very effective way of keeping a balance in post-sports career life.
KEYWORDS: sport career, retairment, handball players
INTRODUCTION
A sports career can be defined as a long-term sports activity of an individual, directed towards achievements at the highest level in sport and towards improving one’s own sports abilities. A sports career can be viewed from two aspects: namely from the point of view of sports results and from the point of view of the influence of a sports career in shaping the development and lifestyle of an individual. According to Cecić Erpič (2002), a sports career consists of 6 levels, each of them defining a set of specific requirements to which an athlete has to adhere, with inherent transitional periods between separate levels of the chosen sports career.
At the time of entering the world of sport, nearly all athletes do so with high goals, expectations and dreams about success. After some years, they turn their thoughts to the possibility of retirement. According to many authors (f.e. Harrison, Lawrence, Bukstein, Carr, Lauren, 2016; Cokley, 1983; Alffermann, 2004)) the dynamics of the retirement process, for athletes in top-level interscholastic and amateur sports as well as in professional sports is under descavering. According to Stambulova N., Yannick S., Jäphag (2007) transition out of elite sports is a dynamic, multidimensional, multilevel, and multifactor process in which also nationality/culture plays an important role.
Several researches (Bon, 2014; Lavallee, Daid, Willeman, 2000, Cecić_ Erpič, 2006) ) suggest that retirement for athletes in each of these contexts is not an inevitable source of stress, identity crisis, or adjustment problems. It is argued that the dynamics of the sport retirement process are grounded in the social structural context in which retirement takes place. Factors such as gender, race, age, socio-economic status, and social and emotional support networks shape the manner in which one makes
9
the transition out of sport. Therefore, whilst retirement from sport may sometimes be the cause of stress and trauma by itself, it is often not the major cause of diferent problems in retairment process.
The difficulty lies in the fact that the reasons for deciding to end a sports career resemble the chaos theory model: numerous, varied and cumulative. However, some researchers have tried to shed light on this retairment process by classifying the reasons for retirement according to several factors, for example (a) voluntary versus involuntary (Alfermann, 2000, Crook and Robertson, 1991, Webb et al., 1998 and Werthner and Orlick, 1986), (b) planned versus unplanned (Alfermann et al., 2004), (c) athletic versus non-athletic (Erpič, Wylleman, & Zupančič, 2004).
In Slovenia, retirement from professional sport seams to be an important topic in Slovene sociatety, mostly under umbreall of Olympic Comite Slovenia. Even the most famous and most secsessful former top athletes in many cases expres social and emotional unstabililitzy by coping problems in their social life after ending their sports career. Is the similar with other athletes? This study has focused on a special group – former handball players who are attending special organized tournaments for former and non-regiatered players.
MATERIALS AND METHODS
Our study included 106 former athletes (40 [37.7%] women, 65 men) with the average age between 40 and 50, mostly coming from the Dolenjska region.
The female respondents are on average younger than their male counterparts. Most (37.7 %) of the women are between 30 and 40 years old, while the men (33) are mostly aged between 40 and 50. Among the male players are some 70 years old and over, while no woman player is over 60.
Only 39.4 % of the men and 27.9% of the women are married and living together as family. Others are either divorced (men 10.6% men, women 4.8%) or single.
Protocol
A special survey, specifically designed for former athletes/participants in handball veterans’ tournaments, was used. After the general and sports biographical data have been obtained, the respondents answered a set of multiple choice, yes/no, ranking and rating questions about the process of athletic retirement, including pre-conditions (athletic identity during the sports career, satisfaction with the career, reasons for termination, retirement planning, voluntary/involuntary retirement, timing of termination), coping and related factors during the transition (emotional reactions to retirement; perceived difficulties during the transition, including the difficulty in changing the identity; received financial and psychological support; coping strategies; duration of the transition), perceived quality and long-term consequences of the transition (satisfaction with professional choices??, perceived success in their professional career, general life satisfaction, current athletic identity and relation to sport nowadays).
The survey was conducted in Sevnica, in May 2015, among the handball veterans’ tournament participants.
RESULTS
During their active career nearly half (48.1 %) of the players were playing at the first division level, among those 16 (15. 1%) at the international level of competition. For them we can say that they were
10
part of professional or semi-professional handball. It is typical that top athletes rarely participate in handball veterans’ tournaments.
It is also interesting that only 5 (4.7%) participants evaluated their career as very successful, and 33 of players (31.1 %) as successful . Even 17 of respondents (16.0%) of them even thought that they had been unsuccessful during their career. Nearly half (44.3%) of them are of the opinion: “neither successful nor unsuccessful”.
Using a t-test and Levene’s?? Test (0,292; p= 0,59), it was found that it was not possible to set statistically significant differences (P= 0,31) betwen evaluating sucessnes between professional and amateur level players. By evaluating sports competitions goals in their careers nearly half players (48.1%) marked the answer: “neither many nor few”. 17.9% of the respondents were of the opinion that they had reached a lot of competitions goals in their careers. On the other hand, 28.3 % of the respondents indicated that they had accomplished few or indeed none of their competitions goals.
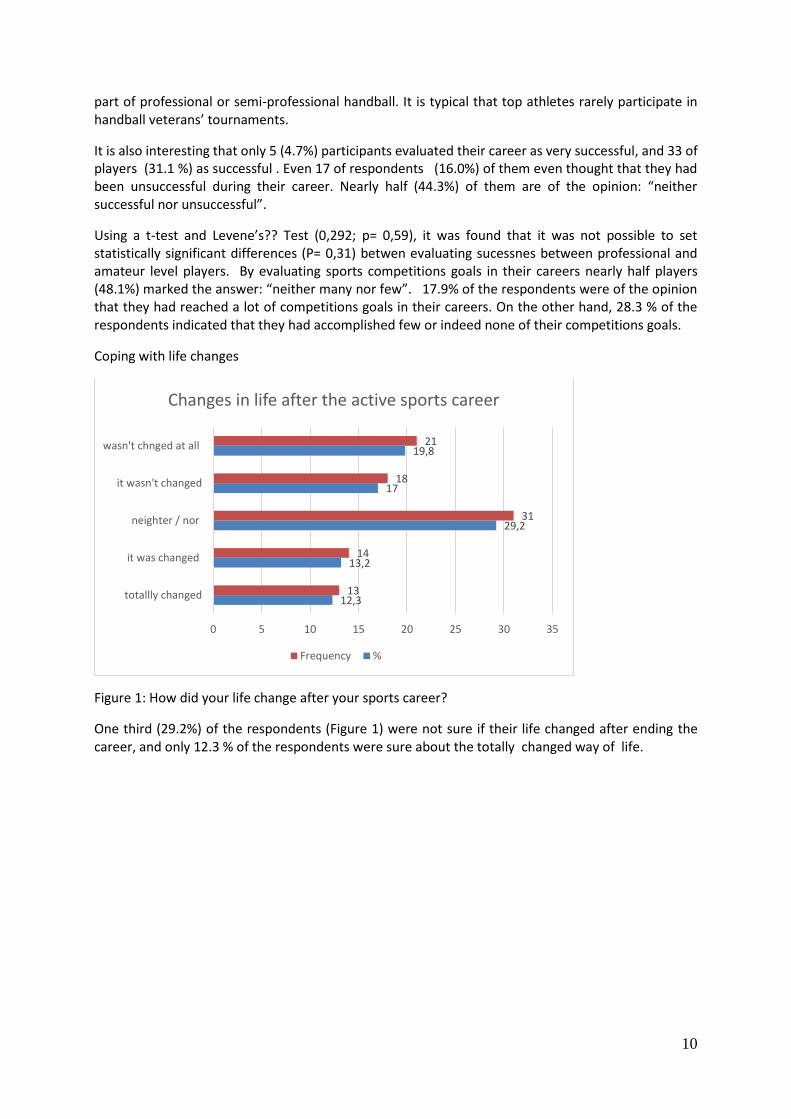
Coping with life changes
Figure 1: How did your life change after your sports career?
One third (29.2%) of the respondents (Figure 1) were not sure if their life changed after ending the career, and only 12.3 % of the respondents were sure about the totally changed way of life.
12,3
13,2
29,2
17
19,8
13
14
31
18
21
0 5 10 15 20 25 30 35
totallly changed
it was changed
neighter / nor
it wasn't changed
wasn't chnged at all
Changes in life after the active sports career
Frequency %
11
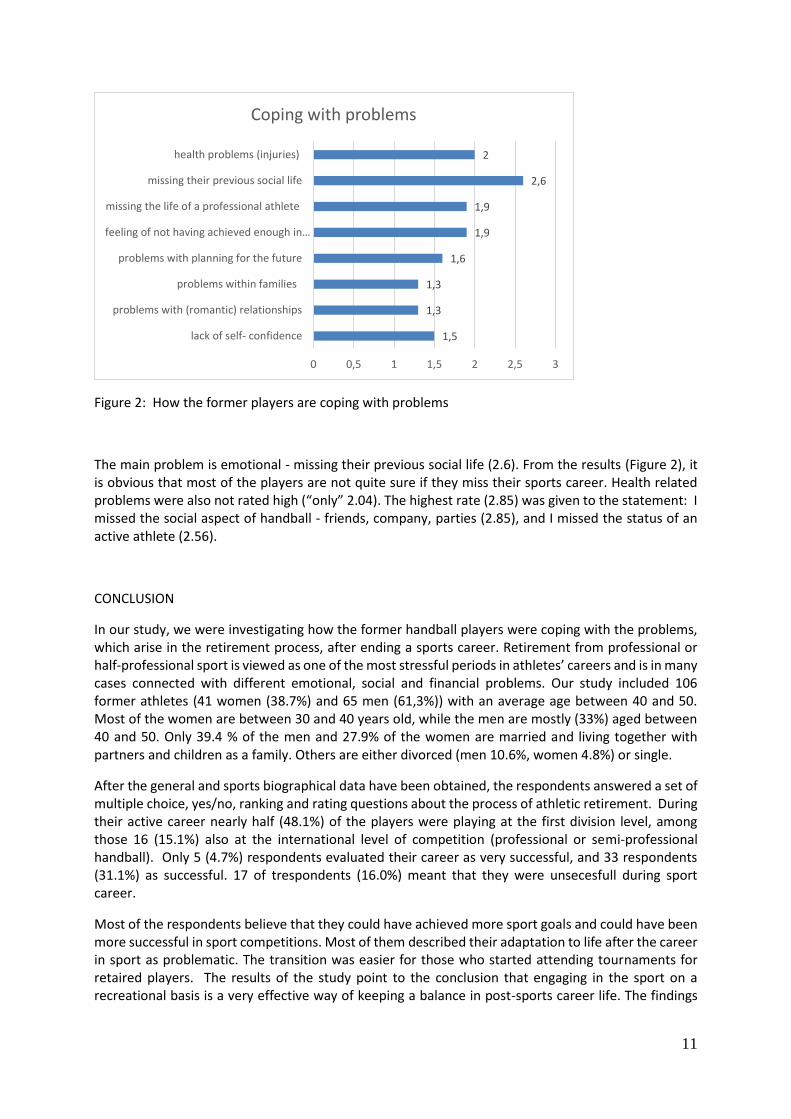
Figure 2: How the former players are coping with problems
The main problem is emotional - missing their previous social life (2.6). From the results (Figure 2), it is obvious that most of the players are not quite sure if they miss their sports career. Health related problems were also not rated high (“only” 2.04). The highest rate (2.85) was given to the statement: I missed the social aspect of handball - friends, company, parties (2.85), and I missed the status of an active athlete (2.56).
CONCLUSION
In our study, we were investigating how the former handball players were coping with the problems, which arise in the retirement process, after ending a sports career. Retirement from professional or half-professional sport is viewed as one of the most stressful periods in athletes’ careers and is in many cases connected with different emotional, social and financial problems. Our study included 106 former athletes (41 women (38.7%) and 65 men (61,3%)) with an average age between 40 and 50. Most of the women are between 30 and 40 years old, while the men are mostly (33%) aged between 40 and 50. Only 39.4 % of the men and 27.9% of the women are married and living together with partners and children as a family. Others are either divorced (men 10.6%, women 4.8%) or single.
After the general and sports biographical data have been obtained, the respondents answered a set of multiple choice, yes/no, ranking and rating questions about the process of athletic retirement. During their active career nearly half (48.1%) of the players were playing at the first division level, among those 16 (15.1%) also at the international level of competition (professional or semi-professional handball). Only 5 (4.7%) respondents evaluated their career as very successful, and 33 respondents (31.1%) as successful. 17 of trespondents (16.0%) meant that they were unsecesfull during sport career.
Most of the respondents believe that they could have achieved more sport goals and could have been more successful in sport competitions. Most of them described their adaptation to life after the career in sport as problematic. The transition was easier for those who started attending tournaments for retaired players. The results of the study point to the conclusion that engaging in the sport on a recreational basis is a very effective way of keeping a balance in post-sports career life. The findings
1,5
1,3
1,3
1,6
1,9
1,9
2,6
2
0 0,5 1 1,5 2 2,5 3
lack of self- confidence
problems with (romantic) relationships
problems within families
problems with planning for the future
feeling of not having achieved enough in…
missing the life of a professional athlete
missing their previous social life
health problems (injuries)
Coping with problems
12
also suggest that a systematic, from handball federation planed system, approach to post-sports career planning should be adopted.
Coping with retirement from professional sports takes many different pathways, which are connected with different factors, from diferent sports to sports culture, general mentality etc.. According to Shachar, Ben; Brewer, Britton W; Cornelius, Allen E; Petitpas, Britton J;2004) identity is considered a central contributor to the career development process in athletes and is thought to influence adjustment to sport career termination. Some studies (Harrison, Lawrence, Bukstein, Carr, Lauren, 2016) focus more on the emotional part (Retirement in My Heart¸ Internal Peaceful Decision; Tough Moments Create Beauty; Love and Respect for Fans and Players….). The dual career theory and framework were applied to the “real-time” retirement announcement and self-awareness letter written by the former American National Basketball Association (NBA) player, Kobe Bryant of the Los Angeles Lakers. Conducting the survey, and from knewing many condactors personaly it culd be said that Slovenian players would not be ready to answer such emotional questions at all.
On results of this study, and having some personal experience of coping with the retirement process, it could be concluded that the participants in the tournaments for retairement players are a special social group which copes with retirement in a specific way. They seem happy with their lifestyle, their expectations are not so high, they are on average satisfied with their life conditions, they are confident that they cope with different sort of problems (for them) well enough. Other studies (Quickly, 2012, Stambulova, Yannick, Japhag, 2007; Alfermann, 2004) have shown that an athlete's coping mechanisms regarding retirement are directly influenced by available choices. If an athlete has been pushed to retirement suddenly through deselection or injury, there is a good chance of exponentially experiencing symptoms of depression, anxiety and a loss of self-identity. There is also no guarantee that an athlete that is prepared for retirement will not struggle with the transition, but having the ability to adjust mentally and plan ahead may ease the burden.
In process of retairemnt changes occur in all areas of life, and most athletes are able to cope well if they have some plans, strategies and adequate support to ease the transition from one part of life to another.On the base of experoance and on findings of previous study it could be conclude, that it would be necessary to organize some sort of expert support for retired athletes, especially for former top level athletes. Our next study will focus on top level athletes to find needs and suggest possible solutions for official support for athletes in this transition.
REFERENCES
Stambulova N., Yannick S., Jäphag ( 2007): Athletic retirement: A cross-national comparison of elite French and Swedish athletes; Psychology of Sport and Exercise; Volume 8, Issue 1, January 2007, Pages 101–118
Cecić Erpič S (2002): Konec športne kariere: razvojno psihološki in športno psihološki vidiki. Ljubljana: Fakulteta za šport, 2002. 230 p,
BON, Marta (2011):. Igralec, ne potrebujemo te več. Polet, ISSN 1580-8041, 14. jul. 2011, letn. 10, št. 27, str. [31]. [COBISS.SI-ID 4076721]
Coakley Jay J. (2012): Leaving Competitive Sport: retirement of Rebirth, 2012; Quest , 1983 p.8-11
Shachar, Ben; Brewer, Britton W; Cornelius, Allen E; Petitpas, Britton J (2004); Career decision making, athltic identity, and adjustment difficulties among retired athletes: a comparision between coaches and noncoaches : Kinesiologia Slovenica Volume 10, No. 1
13
Alfermann, D. (2004). Career Transitions in Sport. V: Psychology of sport and exercise: Volume 5, Issue 1.
BON, M. (2011). A sports career and education: characteristics of participants in specialised handball classes. Kinesiologia Slovenica, ISSN 1318-2269 Diener, E. (2000): “Subjective well-being: The science of happiness and a proposal for a national index.” V: American Psychologist, str. 34-43.
Lavallee, David in Wylleman, Paul (2000). Career Transitions in Sport: International Perspectives. Morgantown: Fitness Information Technology Pavot, W. i n Diener, E . (2008). “The Satisfaction with Life Scale and the emerging construct of life satisfaction.” V: The Journal of Positive Psychology, 3 (2), str. 137-152.
Wylleman, P. (2004). Career termination and social integration among elite athletes. Psychology of Sport andexercise 5 (1) 45-59
14
RELATIONSHIP BETWEEN BODY SCHEME ACQUISITION AND DEVELOPMENT OF DRAWING IN EARLY CHILDHOOD EDUCATION: A CASE STUDY
Gomis-Gomis M.J., Pérez-Turpin. J.A.
University of Alicante, Spain
ABSTRACT:
The purpose of the study is to analyze the relationship between body scheme acquisition in children of Early Childhood Education (5 years) and the evolution of the drawing. The study involved a total of 44 boys and girls from a school, as well as 12 kindergarten teachers with experience, all in the province of Alicante. The instruments used, based on PREFIT battery, were an anthropometric assessment, measurement of handgrip strength test by TKK and the standing long jump test. In addition, the Human Figure Drawing Test and a variation using colors and other elements. To complement the research, semi-structured interviews were conducted by teachers, a questionnaire on eating habits and a sociodemographic questionnaire for parents. The data analysis techniques include descriptive statistics, t of Student for independent samples and the correlation coefficient Pearson. The results can induce the existence of positive relationship between body image development and evolution of the drawing.
Keywords: body scheme, Human Figure Drawing test, Early Childhood Education
INTRODUCTION Motor skills can be considered a very important part of people's development. Since it is sometimes so complex to analyse the physical activity, it is necessary to use other techniques. Motor performance analysis is a very well-established technique (Ayan, 2013), which is increasingly used both in education and in the scientist with the intention of collecting objective data (Hughes & Bartlett, 2002). By means of this objective analysis, it is possible to study different variables that affect the physical activity, which facilitates quantitative and qualitative feedback, an objective feedback necessary for some kind of change in the physical activity.
In the analysis and assessment of motor skills in Early Childhood Education, we can include biological variables of anthropometry and physiology (heart rate, respiratory rate and blood pressure) and behavioral variables, including measurement of strength, speed, balance, visual measurement, body scheme and scales of assessment of the physical activity. Sometimes, the motor skills in children of Early Childhood Education may have a relative relevance in its development, it is the reason why the motor skill and the motor success may need qualitative analysis to reinforce the information coming from the quantitative ones.
In this line, Knudson & Morrison (2002) differentiate two types of biomechanical analysis in physical activity, that is, quantitative and qualitative analysis. Notational analysis from a biomechanical point of view may indicate that qualitative aspects of motor biomechanical analysis, based on observation (notational analysis), can be seen, but without timely quantitative cutoff measurements.
The scientific models most used in motor assessment are those based on the quantitative analysis of the technique, and can be developed by applying the principles of mechanics to the human being. They usually combine mechanical relations, multi-segmental interactions and the biological characteristics of the human being (musculoskeletal system).
15
The construction of the body structure plays a crucial role in the development of the subject, the body allows to perceive the external world and to interact with it (Raich, 2000; Vayer, 1972, cit. in Barnet et al., 2015). From a psychoanalytic perspective, knowledge of the body is described as a mental representation of the body that each person constructs. The body knowledge of each person is related to the perception of the whole body and its parts (Barnet et al., 2015). In this way, Pérez-Turpin & Suárez (2007) identified a positive evolution in the body scheme development of two motor disabled girls, analysing their drawings as a result of applying a psychopedagogical and motor intervention program.
As the drawing is a natural communication system for the boy and the girl, the tests derived from drawing have had a rapid and extensive use (Maganto & Garaigordobil, 2011). The Human Figure Drawing test (HFD) can be used to quantify developmental and maturity factors, as well as body image (Koppitz, 2000, cit. in Barnet et al, 2015).
The objective of our research was to analyse the relationship between body scheme acquisition and development of drawing in Early Childhood Education (5 years).
MATERIALS AND METHODS
Participants
The study included 44 children (20 girls and 24 boys) from 5 to 6 years (M = 5.34). 12 Pre-school Education teachers collaborated in the study. All belonged to an educational center in the province of Alicante, Spain.
Instruments
We have relied on the PREFIT battery (Ortega et al., 2015) of field tests for the assessment of health-related physical condition in pre-school children. The PREFIT battery is in the analysis phase and publication of results, which is the continuation of the Assessing Levels of Physical Activity and Fitness (ALPHA) project (Ruiz et al., 2011). From the PREFIT battery, the handgrip strength test and the standing long jump test have been selected as tests to evaluate the musculoskeletal capacity, which have been used in this research given its relationship with body schema. The anthropometric assessment was determined by measuring the mass (kg) and the height (cm) in a classroom enabled for it. The body mass index (BMI) was calculated using the formula kg/cm2. The calculation of BMI appears in the PREFIT battery as a measure of body composition.
In addition, Ortega et al., (2015) indicate that reliability studies have been identified that suggest that both the handgrip strength test and the standing long jump test can be reliable measures in pre-school children, especially in children of 4 and 5 years old. In previous methodological studies it was observed that both tests are good indicators of total strength. Specifically, TKK is considered the most reliable of the studied dynamometers, showing better validity. In addition, the TKK allows the adjustment of the distance between the handles continuously (Ortega et al., 2015).
The weight measurement was carried out barefoot, with trousers and T-shirt and the subjects were placed standing on the electric scale model Taurus. For the size, participants were measured barefoot, standing and in contact with the wall, where the meter was.
In the handgrip strength test, children take the TKK dynamometer with one hand, they squeeze it forcefully while holding the dynamometer away from their body for at least 2 seconds. Do it twice (alternately with both hands) with the optimum grip adjustment at 4.0 cm9 for pre-school children and with a short rest between measures, the highest measurement is recorded in each hand. For the
16
standing long jump test, children stand behind the jump line, with a foot gap equal to the width of their shoulders. From this position, they will bend their knees with their arms in front of the body and parallel to the ground, swing their arms, push hard and jump as far as possible. They will contact the floor with both feet simultaneously in an upright position. The examiner recorded the distance jumped by each child, from the jump line to the back of the heel closest to that line, using a tape measure.
Baena, Granero & Ruiz (2010) propose the HFD as a body schematic test, in which children make a graphic representation of their body. Specifically, the Koppitz HFD test, used in this research, is one of the most experimentally supported and the one that is most appropriate to the objective of this research, with children of 5 and 6 years. Also, a second test of the drawing was made, with variations regarding the HFD, in which each student was given a blank sheet DIN-4, they could use colours and draw other persons or elements.
Semi-structured interviews were conducted by teachers, a questionnaire on eating habits and a sociodemographic questionnaire for parents, both surveys created specifically for this research.
Procedure
For the children included in the research we obtained permission from their parents and their educational center, who were also briefly informed about the purpose and the procedure of measuring timed performance.
The research was carried out over four sessions, the first two were devoted to the realization of the two types of drawings, the last two being those used for physical tests and anthropometric parameters. Previously the instructions were explained.
Statistical Analysis
A descriptive correlational design was adopted, in which several independent variables such as BMI and musculoskeletal capacity tests have been taken into account, which are considered to be related to the dependent variable that refers to the drawing of schoolchildren.
Statistical Package for Social Sciences (SPSS) was used to analyse the data. 23.0 for Windows, a test of normality and homogeneity of variance was initially performed. The descriptive statistics were then analysed and the Student t test for independent samples was finally applied. The Pearson correlation coefficient was used to estimate the relationship between the variables jump length, grip strength and elements drawn by the students. The level of significance was determined as p≤.05 for significant values and p≤.001 for very significant.
A notational analysis was done with the Kinovea v.0.8.25.exe program, to analyse the drawings made by the children. The data were analysed of each drawing, the synchronization of the software avoided adjustment errors, since an analysis with each digitalized drawing was realized. In addition, we performed intra-observer and inter-observer reliability. All data were calculated by two expert researchers, who observed twice each data collected by Kinovea software. We used the follow equation to determine the percentage differences when calculating the reliability (Choi, O´Donoghue & Hughes, 2007) of the systems using data from two observations A and B:
%error = 100 x |A-B| / ((A+B)/2) (1)
For the qualitative analysis of the interviews to the teachers and the two questionnaires, the AQUAD program has been used.
17
RESULTS
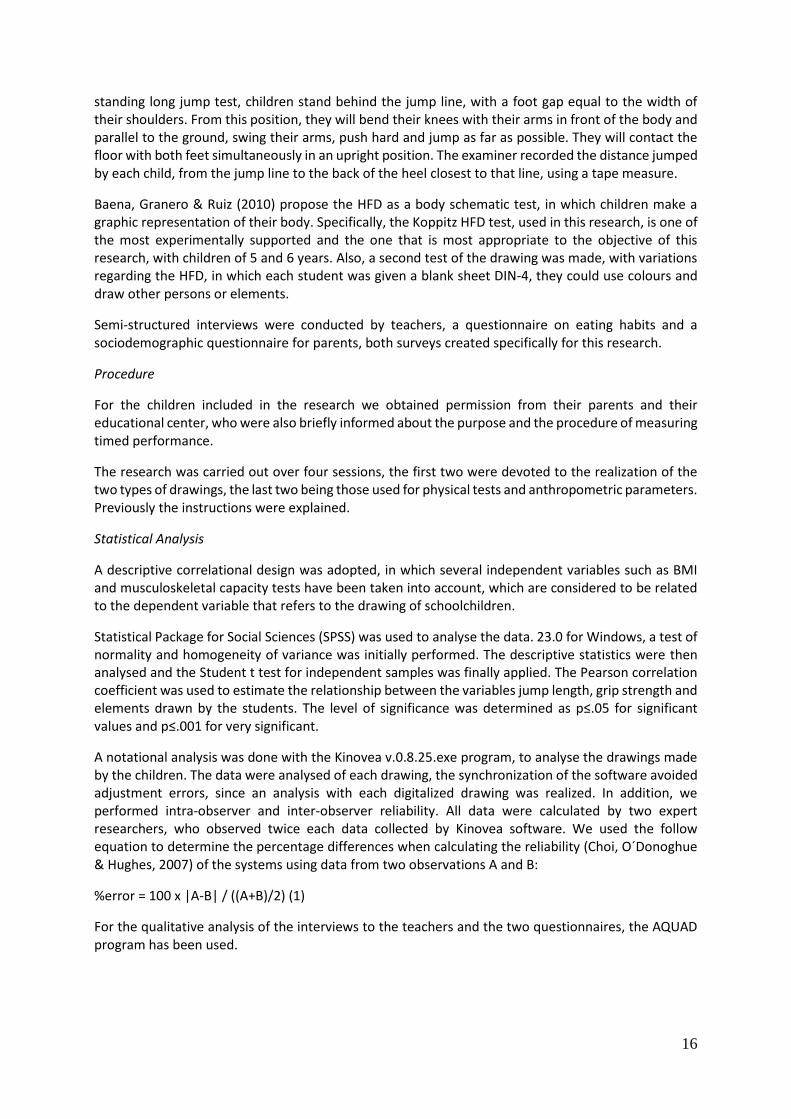
For the descriptive statistics of the anthropometric variables and the three variables related to the musculoskeletal capacity, differentiating by gender, the results show similar means for both boys and girls in these parameters, except in the case of jump centimetres. In which, the average of the boys is 81.44 cm and the average of the girls is less, 74.96 cm. In the analysed sample, 59.1% are children and 40.9% are girls.
Table 1. Basic statistical parameters of the antropometric variables
Weight Height BMI
Participants 44 44 44
Median 20.8 114.2 15.8
Mean 20.0 114.0 15.7
Standard deviation 3.2 6.1 1.2
Table 2. Basic statistical parameters of the musculoskeletal capacity
HR HL SLJ
Participants 44 44 44
Median 6.5 6.4 78.4
Mean 6.8 6.9 80.6
Standard deviation 2.6 2.8 23.9
Legend: HR - Handgrip strength test with right hand; HL - Handgrip strength test with left hand; SLJ - Standing long jump test
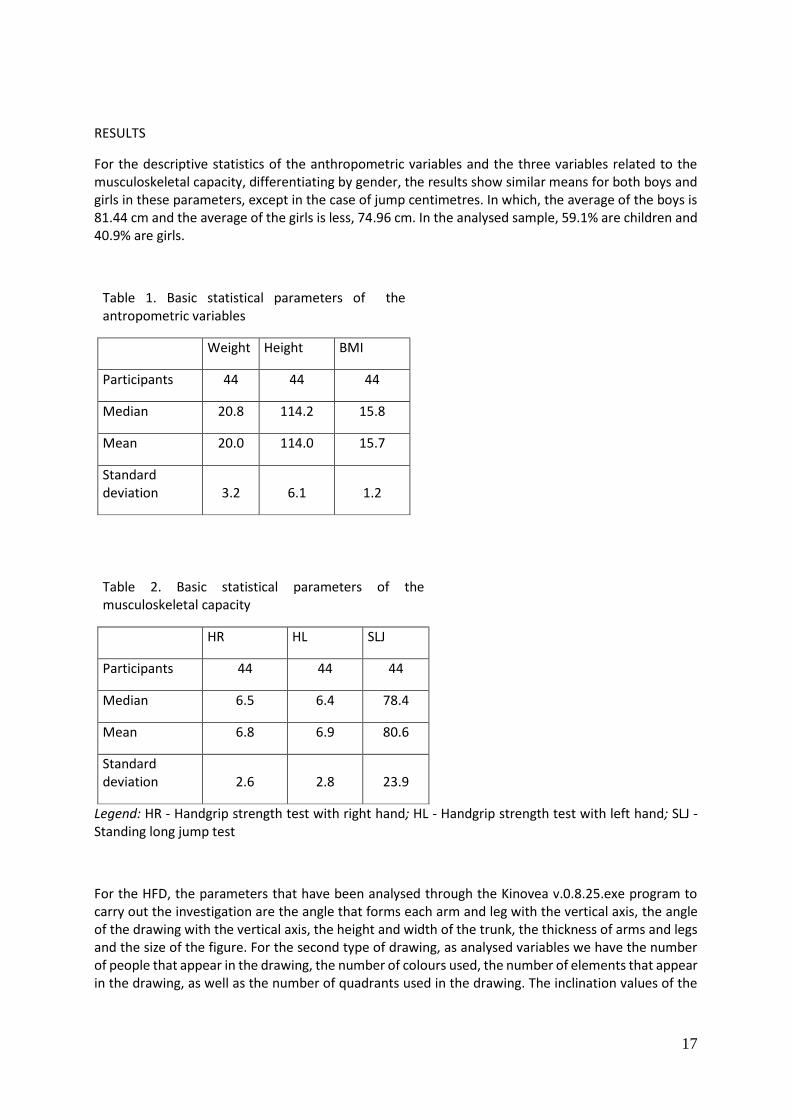
For the HFD, the parameters that have been analysed through the Kinovea v.0.8.25.exe program to carry out the investigation are the angle that forms each arm and leg with the vertical axis, the angle of the drawing with the vertical axis, the height and width of the trunk, the thickness of arms and legs and the size of the figure. For the second type of drawing, as analysed variables we have the number of people that appear in the drawing, the number of colours used, the number of elements that appear in the drawing, as well as the number of quadrants used in the drawing. The inclination values of the
18
axis from the vertical range from -37 degrees to 14 degrees, with the range from -1 to 1 being the most predominant.
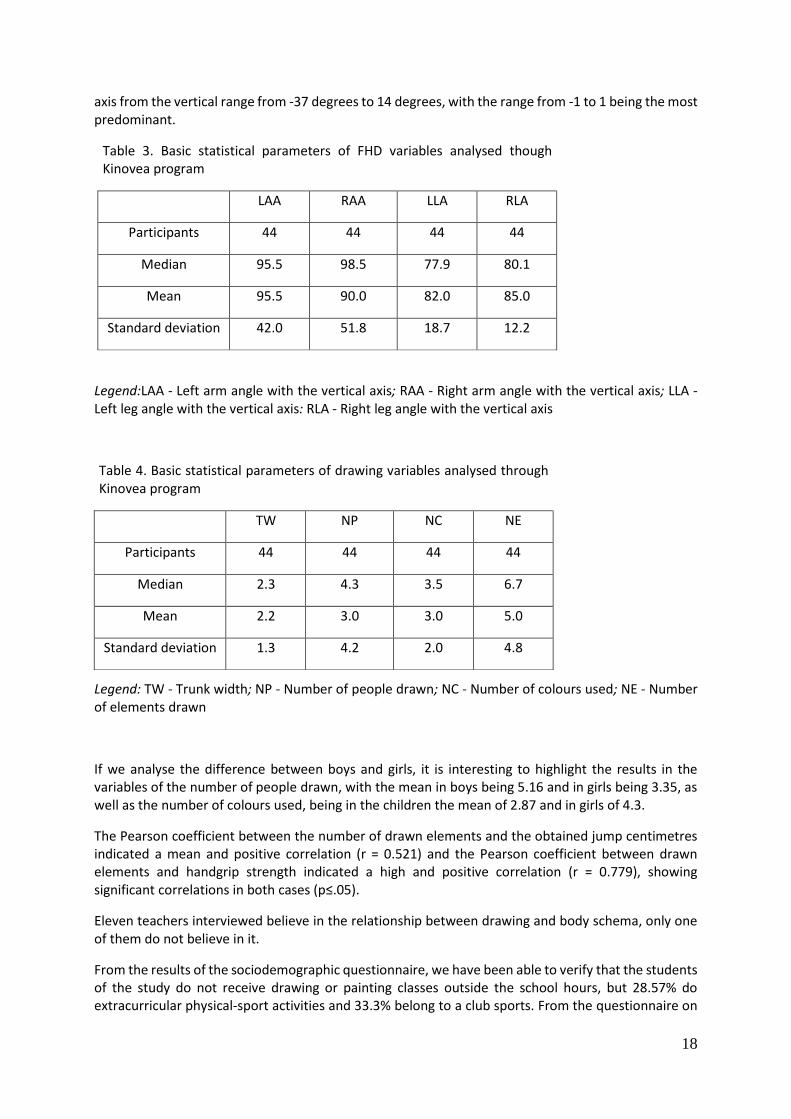
Table 3. Basic statistical parameters of FHD variables analysed though Kinovea program
LAA RAA LLA RLA
Participants 44 44 44 44
Median 95.5 98.5 77.9 80.1
Mean 95.5 90.0 82.0 85.0
Standard deviation 42.0 51.8 18.7 12.2
Legend:LAA - Left arm angle with the vertical axis; RAA - Right arm angle with the vertical axis; LLA - Left leg angle with the vertical axis: RLA - Right leg angle with the vertical axis
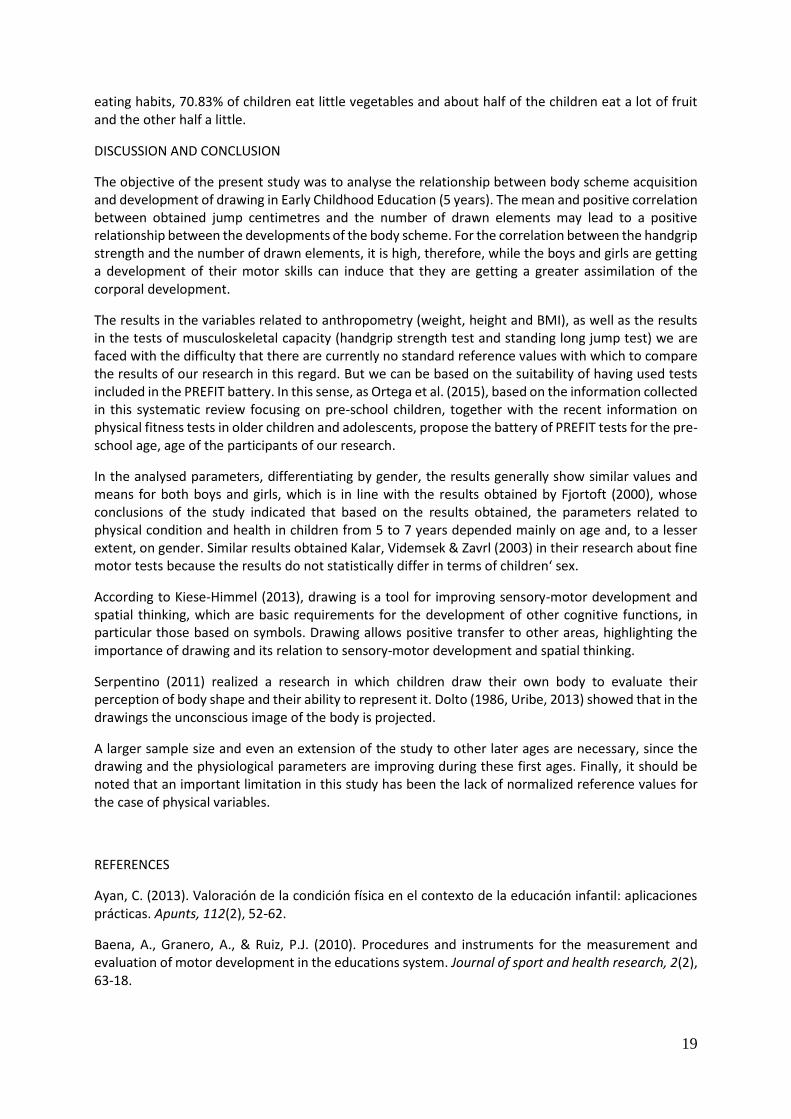
Legend: TW - Trunk width; NP - Number of people drawn; NC - Number of colours used; NE - Number of elements drawn
If we analyse the difference between boys and girls, it is interesting to highlight the results in the variables of the number of people drawn, with the mean in boys being 5.16 and in girls being 3.35, as well as the number of colours used, being in the children the mean of 2.87 and in girls of 4.3.
The Pearson coefficient between the number of drawn elements and the obtained jump centimetres indicated a mean and positive correlation (r = 0.521) and the Pearson coefficient between drawn elements and handgrip strength indicated a high and positive correlation (r = 0.779), showing significant correlations in both cases (p≤.05).
Eleven teachers interviewed believe in the relationship between drawing and body schema, only one of them do not believe in it.
From the results of the sociodemographic questionnaire, we have been able to verify that the students of the study do not receive drawing or painting classes outside the school hours, but 28.57% do extracurricular physical-sport activities and 33.3% belong to a club sports. From the questionnaire on
Table 4. Basic statistical parameters of drawing variables analysed through Kinovea program
TW NP NC NE
Participants 44 44 44 44
Median 2.3 4.3 3.5 6.7
Mean 2.2 3.0 3.0 5.0
Standard deviation 1.3 4.2 2.0 4.8
19
eating habits, 70.83% of children eat little vegetables and about half of the children eat a lot of fruit and the other half a little.
DISCUSSION AND CONCLUSION
The objective of the present study was to analyse the relationship between body scheme acquisition and development of drawing in Early Childhood Education (5 years). The mean and positive correlation between obtained jump centimetres and the number of drawn elements may lead to a positive relationship between the developments of the body scheme. For the correlation between the handgrip strength and the number of drawn elements, it is high, therefore, while the boys and girls are getting a development of their motor skills can induce that they are getting a greater assimilation of the corporal development.
The results in the variables related to anthropometry (weight, height and BMI), as well as the results in the tests of musculoskeletal capacity (handgrip strength test and standing long jump test) we are faced with the difficulty that there are currently no standard reference values with which to compare the results of our research in this regard. But we can be based on the suitability of having used tests included in the PREFIT battery. In this sense, as Ortega et al. (2015), based on the information collected in this systematic review focusing on pre-school children, together with the recent information on physical fitness tests in older children and adolescents, propose the battery of PREFIT tests for the pre-school age, age of the participants of our research.
In the analysed parameters, differentiating by gender, the results generally show similar values and means for both boys and girls, which is in line with the results obtained by Fjortoft (2000), whose conclusions of the study indicated that based on the results obtained, the parameters related to physical condition and health in children from 5 to 7 years depended mainly on age and, to a lesser extent, on gender. Similar results obtained Kalar, Videmsek & Zavrl (2003) in their research about fine motor tests because the results do not statistically differ in terms of children‘ sex.
According to Kiese-Himmel (2013), drawing is a tool for improving sensory-motor development and spatial thinking, which are basic requirements for the development of other cognitive functions, in particular those based on symbols. Drawing allows positive transfer to other areas, highlighting the importance of drawing and its relation to sensory-motor development and spatial thinking.
Serpentino (2011) realized a research in which children draw their own body to evaluate their perception of body shape and their ability to represent it. Dolto (1986, Uribe, 2013) showed that in the drawings the unconscious image of the body is projected.
A larger sample size and even an extension of the study to other later ages are necessary, since the drawing and the physiological parameters are improving during these first ages. Finally, it should be noted that an important limitation in this study has been the lack of normalized reference values for the case of physical variables.
REFERENCES
Ayan, C. (2013). Valoración de la condición física en el contexto de la educación infantil: aplicaciones prácticas. Apunts, 112(2), 52-62.
Baena, A., Granero, A., & Ruiz, P.J. (2010). Procedures and instruments for the measurement and evaluation of motor development in the educations system. Journal of sport and health research, 2(2), 63-18.
20
Barnet, S., Pérez, S., Cabedo, J., Gozzoli, C., Oviedo, G.R., & Miriam, G. (2015). Developmental Items of Human Figure Drawing: Dance/Movement Therapy for Adults with Intellectual Disabilities. American Journal of Dance Therapy, 37, 135-149.
Choi, H., O D́onoghue, P., & Hughes, M. (2007). An investigation of inter-operator reliability tests for real-time analysis system. International Journal of Performance Analysis in Sport, 7(1), 49-61.
Fjortoft, I. (2000). Motor Fitness in Pre-Primary School Children. The EUROFIT Motor Fitness Test Explored on 5-7 year old children. Pediatric Exercise Science, 12, 424-436.
Hughes M., & Bartlett, M. (2002). The use of performance indicators in performance analysis. Journal of Sports Science, 20, 739-754.
Kalar, Z., Videmsek, M., & Zavrl, N. (2003). Analysis of fine motor tests in five-to six-year-old. Kinesiologia Slovenica, 9(2), 28-36 (2003).
Kiese-Himmel, C. (2013). Enhancing drawing (pictorial) activities in kindergarten and preschool children. More questions than answers. Kindheit & Entwicklung, 22(3), 181-188.
Knudson D., & Morrison, G. (2002). Qualitative Analysis of Human Movement. Champaign, IL: Human Kinetics.
Maganto, C., & Garaigordobil, M. (2011). Indicadores emocionales complementarios para la evaluación emocional del Test del dibujo de dos figuras humanas (T2F). Revista Iberoamericana de Diagnóstico y Evaluación Psicológica, 1(31), 73-95.
Ortega, F., Cadenas, C., Sánchez, G., Mora, J., Martínez, B., Artero, E., … Ruiz, J.R. (2015). Systematic Review and Proposal of a Field-Based Physical Fitness-Test Battery in Preschool Children: The PREFIT Battery. Sports Medicine, 45, 533-555.
Pérez-Turpin, J.A., & Suárez, C. (2007). The motor disabled children: a study about infant drawing as an evaluation method within the physical education area. Journal Sport & Exercise, 11(1), 35-41.
Ruiz J.R. et al. (2011). Field-based fitness assessment in young people: the ALPHA health-related fitness test battery for children and adolescents. British journal of sports medicine, 45(6): 518-24.
Serpentino, C. (2011). The moving body: a sustainable project to improve children's physical activity at kindergarten. International Journal of Pediatric Obesity, 6(2), 60-62.
Uribe, N. (2013). Concepciones psicoanalíticas del dibujo en la clínica con niños. Revista Affectio Societatis, 10(19), 48-59.
21
EMG COMPARISON OF TIBAL MUSCLES DURING PLANTAR FLEXION AT EXTENDED AND FLEXED KNEE
Bavdek, R., Zdolšek, A., Dolenec, A.
University of Ljubljana, Faculty of sport, Ljubljana, Slovenia
ABSTRACT
EMG signal indicates muscle activity. One of the most common for normalization EMG signals to those associated with a maximal voluntary isometric contraction (MVIC) (Burden, 2010). Therefore, it is necessary to choose a limb position that allows the measured muscle to activate to its maximum. The purpose of this study was to compare the value of EGM signal during plantar flexion at extended and flexed knee. 14 people participated in this study (25,6 ± 3,6 age, 178,0 ± 8,8 cm, 72,9 ± 12,9 kg), on which we measured MVIC with ankle extension when the knee was extended or flexed (90° angle). We analysed the average value of EMG from those MVIC for muscles TA, PL, PB, GM, GL in SOL by SENIAM recommendation. To compare the results, we used Paired Samples t-test. During plantar flexion, muscles TA and GM were more activated when knee was extended (TAflex 0,003 ± 0,01 mV, TAext 0,032 ± 0,048 mV; GMflex 0,134 ± 0,165 mV, GMext 0,246 ± 0,199; p ≤ 0.05). There were no other statistical significant differences with other muscles.To normalize EGM signal for muscle GM, it is, by MVIC method, better to use the measurement with extended rather than flexed knee, which also reported by Hébert-Losier (2011) and Arampatzis (2006). Higher TA activity in plantar flexion with extended knee shows an increased co-activation of plantar and dorsal flexors with extended knee.
INTRODUCTION
EMG signal is the indicator of muscle activity. It helps us determine which muscles are fired in a specific activity, in dynamic as well as static conditions. In order to evaluate the amount of measured electrical activity in a movement task we need an orientational value – we normalise the measured electrical activity of the muscle. One of the most common methods used in science is to normalize EMG signals to those associated with a maximal voluntary isometric contraction - MVIC (Hébert-Losier at al., 2013). Burden (2010) states that such a normalizing method improves precision and comparison of an EMG signal among different subjects, and also the comparison between particular subjects (the comparison of the initial and final state).
The length of the muscle influences the amount of electrical activity. The research results have shown that the same muscle has a lower amount of electrical activity in its shortened position than at normal length (Crosswell in sod., 1995; Miaki in sod., 1999). This is also true for ankle extensors, more precisely the muscle gastrocnemuis medialis (GM), as its shortening represents also its lower EMG signal (Miaki et al., 1999).
The occurance at which the shortened muscle performs isometric NHK, while the EMG amount is lower due to its shortening, is called active insufficiency (Herzog, 2000). The GM muscle is a two-joint muscle, and its length is influenced by the ankle angle as well as the knee angle. Themore the knee is bent, the shorter the length of GM muscle is, and vice versa.
GM muscle is very important in movements such as walking and running, which makes it a frequently studied muscle. In order to correctly meassure the amount of electrical activity of theg gastroscnemius muscle, Hébert-Losier et al. (2011) monitored the amount of EMG signal of GM, soleus (SOL) and gastrocnemuis lateralis (GL) muscle, in ankle extension at different knee ankles (0° and 45°).
22
The results have shown a higher GL and GM activity at extended knee (0°) than at 45°, and higher SOL activity at knee angle of 45°. They have reached the same results in the Arampatzis et al., 2006 research. Monitoring of the GM muscle activity at increasing knee angle has shown lower amounts of EMG signal. Previously mentionec studies did not research the amount of electrical activity of gastrocnemius muscle at the knee angle of 90°.
The 90° angle in the knee is commonly usedin performing isometric plantar flexion, therefore the aim of this study is to compare the amount of EMG signal of six tibial muscles during MVIC of plantar flexion (PF), at extended and flexed (90°) knee.
MATERIALS AND METHODS
14 subjects participated in the study (25,6 ± 3,6 years, 178,0 ± 8,8 cm, 72,9 ± 12,9 kg). First the measuring equipment was placed on the subject: surface electrodes on all six tibial muscles. After the placement the subject warmed up by stepping on a 20 cm high box for six minutes at tempo 100 beats per minute, which was measured with a metronome. The subject switched the starting stepping leg every minute.the electrical muscle activity was measured with electromyogram and a digital signal converter (Biovision, Weherheim, Germany). Surface ECG Kendall electrodes, 24 mm diametre, were used (Germany). The preparation of the site and electrode placement was done in compliance with SENIAM recommendations. EMG signals were saved in a miniature laptop (Viliv, Yukyung Technologies Corp., South Korea) with DasyLab 10 programme (Ireland). We used Labchart 7 (AD Instruments, New Zealand) for EMG signal processing. When processing data of maximum desired isometric contractions we first filtered the signal (500Hz/20Hz) and changed the signal into absolute values. Then we smoothed the signal using Median filter - window width of samples – 1001 value. We took the highest value of EMG signal at each of the six muscles.
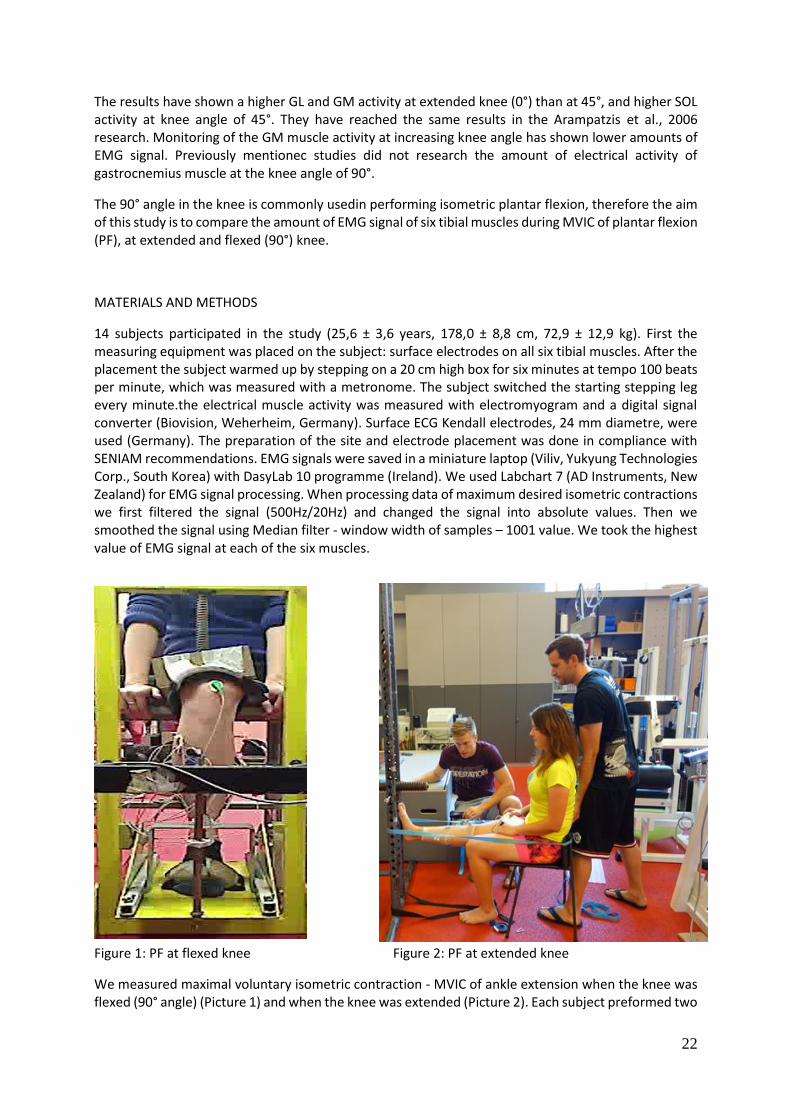
Figure 1: PF at flexed knee Figure 2: PF at extended knee
We measured maximal voluntary isometric contraction - MVIC of ankle extension when the knee was flexed (90° angle) (Picture 1) and when the knee was extended (Picture 2). Each subject preformed two
23
MVIC. While performing MVIC the subjects were stable at both movements, and the soles of their feet (also the heel) were entirely touching the ground. When performing PF at flexed knee, the knee was fixed (Picture 1). We analysed the highest value of smoothing signal during isometric PF at extended as well as flexed knee (90 degrees) for muscles tibialis anterior (TA), peroneus longus (PL), peroneus brevis (PB), GM, GL and SOL. To compare the results we used Paired Sample T-test.
RESULTS
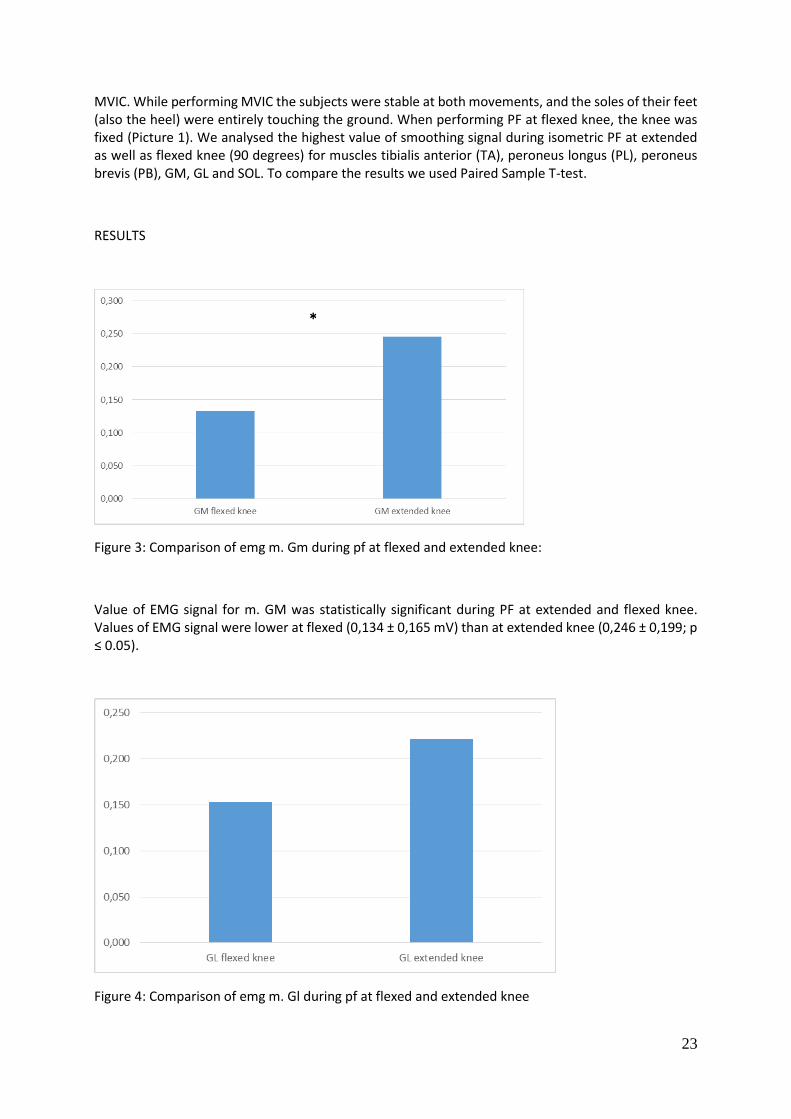
Figure 3: Comparison of emg m. Gm during pf at flexed and extended knee:
Value of EMG signal for m. GM was statistically significant during PF at extended and flexed knee. Values of EMG signal were lower at flexed (0,134 ± 0,165 mV) than at extended knee (0,246 ± 0,199; p ≤ 0.05).
Figure 4: Comparison of emg m. Gl during pf at flexed and extended knee
24
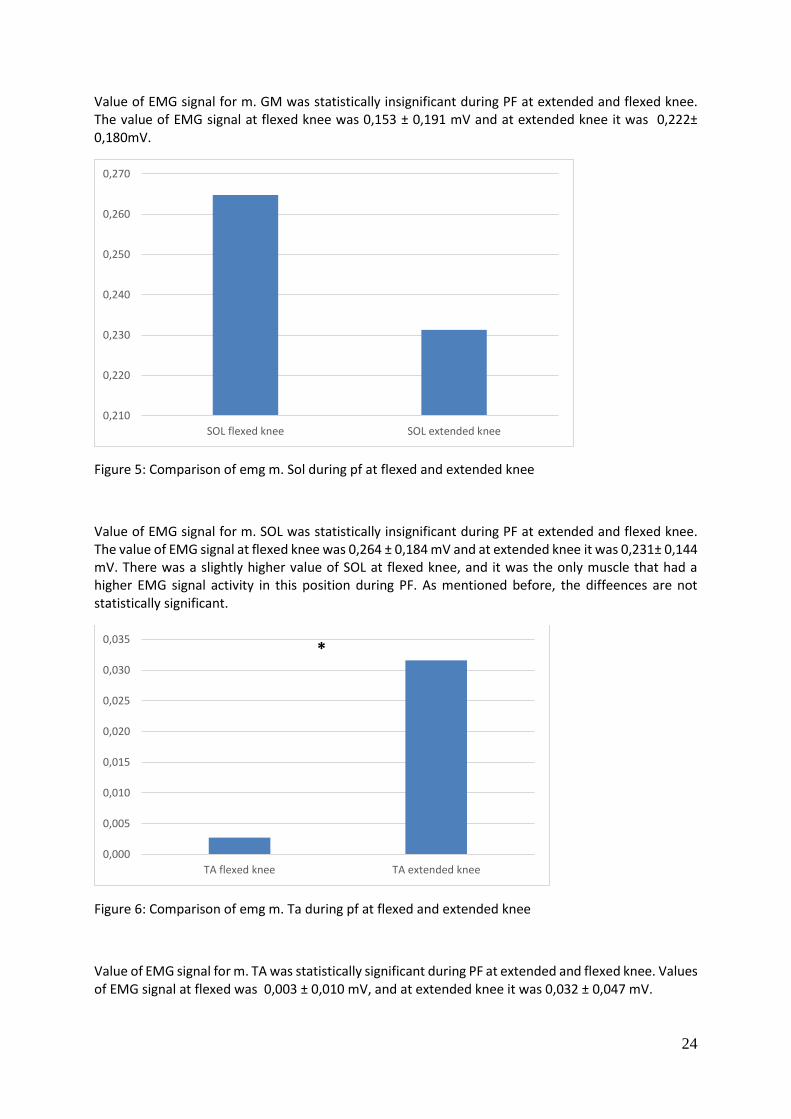
Value of EMG signal for m. GM was statistically insignificant during PF at extended and flexed knee. The value of EMG signal at flexed knee was 0,153 ± 0,191 mV and at extended knee it was 0,222± 0,180mV.
Figure 5: Comparison of emg m. Sol during pf at flexed and extended knee
Value of EMG signal for m. SOL was statistically insignificant during PF at extended and flexed knee. The value of EMG signal at flexed knee was 0,264 ± 0,184 mV and at extended knee it was 0,231± 0,144 mV. There was a slightly higher value of SOL at flexed knee, and it was the only muscle that had a higher EMG signal activity in this position during PF. As mentioned before, the diffeences are not statistically significant.
Figure 6: Comparison of emg m. Ta during pf at flexed and extended knee
Value of EMG signal for m. TA was statistically significant during PF at extended and flexed knee. Values of EMG signal at flexed was 0,003 ± 0,010 mV, and at extended knee it was 0,032 ± 0,047 mV.
0,210
0,220
0,230
0,240
0,250
0,260
0,270
SOL flexed knee SOL extended knee
0,000
0,005
0,010
0,015
0,020
0,025
0,030
0,035
TA flexed knee TA extended knee
*
25
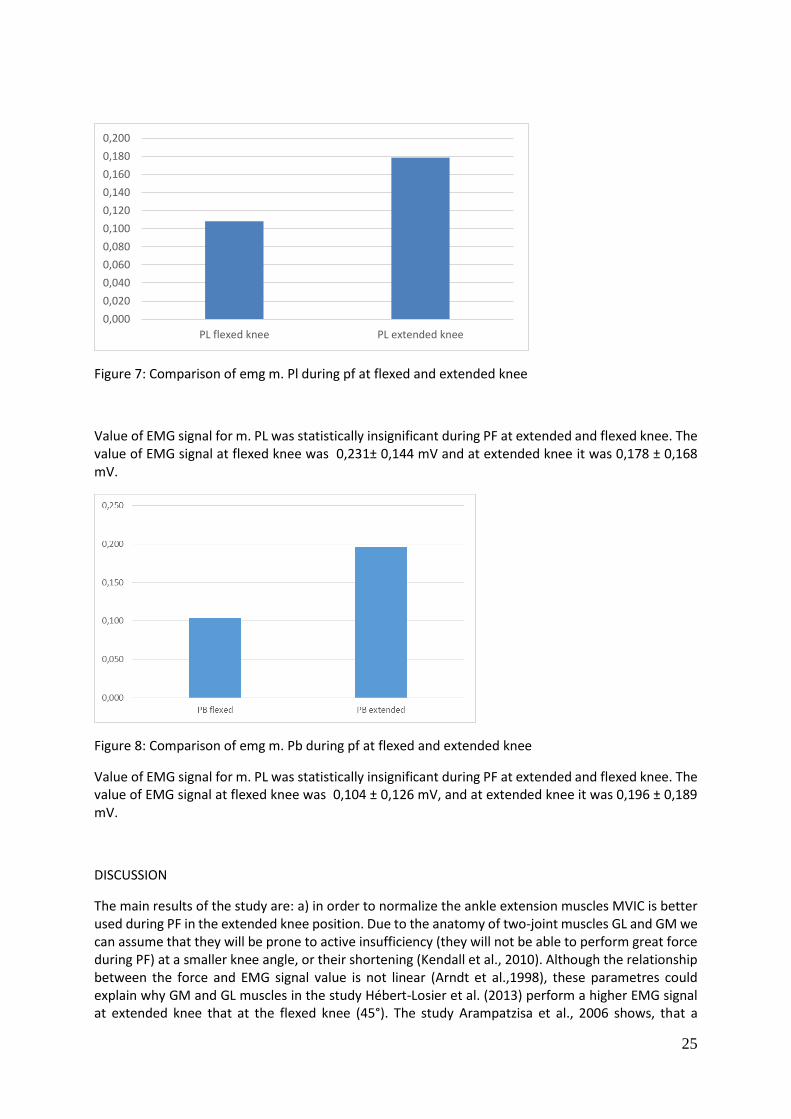
Figure 7: Comparison of emg m. Pl during pf at flexed and extended knee
Value of EMG signal for m. PL was statistically insignificant during PF at extended and flexed knee. The value of EMG signal at flexed knee was 0,231± 0,144 mV and at extended knee it was 0,178 ± 0,168 mV.
Figure 8: Comparison of emg m. Pb during pf at flexed and extended knee
Value of EMG signal for m. PL was statistically insignificant during PF at extended and flexed knee. The value of EMG signal at flexed knee was 0,104 ± 0,126 mV, and at extended knee it was 0,196 ± 0,189 mV.
DISCUSSION
The main results of the study are: a) in order to normalize the ankle extension muscles MVIC is better used during PF in the extended knee position. Due to the anatomy of two-joint muscles GL and GM we can assume that they will be prone to active insufficiency (they will not be able to perform great force during PF) at a smaller knee angle, or their shortening (Kendall et al., 2010). Although the relationship between the force and EMG signal value is not linear (Arndt et al.,1998), these parametres could explain why GM and GL muscles in the study Hébert-Losier et al. (2013) perform a higher EMG signal at extended knee that at the flexed knee (45°). The study Arampatzisa et al., 2006 shows, that a
0,000
0,020
0,040
0,060
0,080
0,100
0,120
0,140
0,160
0,180
0,200
PL flexed knee PL extended knee
26
significant difference EMg signal ofGM muscle occurs at gradual lowering of knee angle (but not for GL). This coul also be seen in our research.
A dilemma occurs as to how the process of normalization of extension muscles of the ankle could be performed, in the extended or in the flexed knee position. Due to the anatomy of the single joint ankle extension muscle it was believed that the normalization of SOL muscle should be performed in the flexed knee position during the isometric NHK at PF. The comparison of EMG SOL muscle values (picture 5) shows a slightly higher value of SOL at flexed knee, and it was the only muscle that had a higher EMG signal activity in this position during PF. However, the findings of our study show no statistically significant differences in PF in the extended and the flexed knee position. We can therefore conclude, that there is no need for separaten normalization in the flexed knee position of the SOL muscle, and we can perform this in the extended knee position, which is also in coordinance with the literature (Crosswell in sod., 1995; Arampatzis in sod., 2006).
The study shows statistically significant difference in the activation of tA muscle in the extended knee position, compared to the flexed knee position. The EMG values ofTA muscle and also the other antagonists (PL and PB muscle) in plantar flexion in the extended knee position show an increased coactivation of plantar and dorsal flexors. The increased coactivation of previously mentioned muscles can be a result of a relatively small standing ground and consequently a lower stability of the standing ground used for the performance of plantar flexion in the extended knee position. To confirm this, a new study would be needed.
CONCLUSIONS
The results of thestudy show, that tibial muscles are more activated during the performance in the extended knee position (except SOLmuscle), statistical differences can be found at Gm and TA muscles. For the normalisation of the EMG signal of the GM muscle, using the maximal voluntary isometric contraction method, it is better to make the measuements in the extended rather than in flexed knee position. The results match the results of other studies. (Hébert-Losier K, 2011; Arampatzis et al., 2006).
REFERENCES
Arampatzis A, in sod., Gastrocnemius medialis fascicle length and EMG activity during isometric plantar flexion. J Biomech 2006;39:1891–902.
Burden, A. (2010). How should we normalize electromyograms obtained from healthy participants? What we have learned from over 25 years of research. J Electromyogr Kinesiol. 2010 Dec;20(6):1023-35. doi: 10.1016/j.jelekin.2010.07.004. Epub 2010 Aug 10.
Cresswell, A.,G., Löscher, W.,N., Thorstensson, A. Influence of gastrocnemius muscle length on triceps surae torque development and electromyographic activity in man. Exp Brain Res. 1995;105(2):283-90.
Miaki, H., Someya, F., Tachino, K., A comparison of electrical activity in the triceps surae at maximum isometric contraction with the knee and ankle at various angles. Eur J Appl Physiol Occup Physiol. 1999 Aug;80(3):185-91.
Herzog, W., 2000. Muscle properties and coordination during voluntary movement. Journal of Sports Sciences 18, 141–152.
27
Hébert-Losier K., Holmberg H-C. Knee angle-specific MVIC for triceps surae EMG signal normalization in weight and non weight-bearing conditions. J Electromyogr Kinesiol (2013).
Hébert-Losier, K., Schneiders, A.,G., García, J.,A., Sullivan, S.,J., Simoneau, G.,G. Peak triceps surae muscle activity is not specific to knee flexion angles during MVIC. J Electromyogr Kinesiol 2011;21:819–26.
28
PSYCHOLOGICAL CONTEXTS OF TRAINING LOAD IN ADOLESCENCE – VERIFYING THE UTILITY OF THE PROFILE OF MOOD STATES AND TRAINING
DISTRESS SCALE IN CZECH SOCIOCULTURAL CONDITIONS
Burešová, I., Demlová, T.
Masaryk University, Faculty of Arts, Department of Psychology, Czech Republic
ABSTRACT
Background: Trends in rapid development of the majority of sport disciplines are reflected in the pressure on the performance of adolescent athletes, which leads to increased strain during training. Physical activity of adolescent athletes is thus associated with positive but also with negative impact on their physical and mental health.
Aims: The primary purpose of the study was to map the occurrence of possible overtraining in adolescent athletes in the Czech socio-cultural environment and the relationship between the level of perceived load and intensity of training preparation. The secondary aim was to verify the basic psychometric characteristic of the method used.
Method: Cross-sectional research design was used. Instruments: Czech shortened version of Profile of Mood States and Czech translation of Training Distress Scale. Sample: 230 adolescents aged 14 to 20 yrs. (M=16.4; 64 % M, 36 % F) participating in sports (team 58 %; individual 42%).
Results: Study brings interesting results concerning the impact of strain perceived not only immediately after performance (lack of energy, muscle pain, heaviness in extremities, inability to eat well) but also 24 hrs. after (lack of energy and appetite are followed by inability to concentrate and lack of interest in everyday activities). Signs of extreme overtraining were not found and neither was a statistically significant relationship between the intensity of training and the measure of perceived strain. Both methods used showed good internal consistency and results of mutual correlation confirm their suitability and utility in research.
Keywords: overtraining; adolescence; psychometric characteristic; method
Acknowledgements: MUNI/A/1042/2015 Psychological Aspects of Coping with Strain in Top Athletes
INTRODUCTION
Physically active lifestyle, associated with training of adolescent athletes, has a significant impact on their health (Stephan, Sutin, & Terracciano, 2014), and it influences their mental health as well (Jewett et al., 2014). For future successful development of adolescents, an active lifestyle has considerable positive consequences (Allen, Vella, & Laborde, 2015), because it is a significant protective factor in a great number of ailments having a biological or psychological base (Hills, King, & Armstrong, 2007; Janssen & LeBlanc, 2010; Biddle & Asare, 2011; Brown, Pearson, Braithwaite, Brown, & Biddle, 2013; Jewet et al., 2014; Kodama et al., 2013, and others). Physical activity of adolescents also decreases the level of perceived stress and increases one’s own evaluation of mental health in future developmental stage (Jewett et al., 2014). Moreover, a number of research studies have proven a positive correlation between active participation in sports and academic performance (Singh, Uijtdewilligen, Twisk, Van Mechelen, & Chinapaw, 2012).
29
However, the trend in a rapid development of the majority of sport disciplines is reflected in the pressure placed on adolescent athletes to perform during training as well as competition. In individual as well as team sports, we see increased level of professionalism and competitiveness, and the demands placed on athletes are very high (Norton & Olds, 2001). For that reason, there is growing tendency to increase the load during training in order to attain better athletic results. The physical activity of adolescent athletes has, thus, positive as well as negative impact on their physical and mental health (Bertelloni, Ruggeri, & Baroncelli, 2006; Merkel, 2013).
Optimizing the performance of adolescent athletes usually requires a more intense training program, which assumes an increased number of hours of sports activity per day (Kenttä & Hasmen, 1998). At the same time, in order to create specific conditions leading to the athlete’s increased performance, continuous training load is necessary. In practice, this is based on a simple principle: training load disturbs the equilibrium of the organism, which is followed by the necessary phase of regeneration. This leads to the required adaptation to repeated training load, resulting in an increase in the functional state and thus an increase in performance (Lambert & Borresen, 2010). In case of insufficient regeneration, this load leads to the organism’s maladaptive response in the form of overstrain and/or overtraining (Matos, Winsley, & Williams, 2011).
In professional literature, two basic load types are discussed: internal (the size of the internal load is determined by the size of the organism’s reaction to the exercise) and external (the size is given by the size of the training session). External load has two components: quantitative (volume) and qualitative (intensity) (Weaving, Marshall, Earle, Nevill, & Abt, 2014). Perič and Dovalil (2010) present basic functions of training load, which need to be taken into account when creating a training plan for the athlete: development (the goal is to reach the maximum level by progressive improvements in the training), stabilization (the goal is to maintain the level of training and performance), renewal (renew the athlete’s training and performance following possible decrease from the maximum level previously attained (e.g. following an illness or injury, etc.), and regeneration (the goal is active rest – thus, the load does not cause greater fatigue, on the contrary, it positively affects the course of the recovery process). The optimal size of the load, must therefore, reflect not just the level of development of the athlete but how well trained he/she is as well. However, considering the rapid changes going on in the physical and psychological development of adolescent athletes, it is sometimes quite difficult to determine, in the framework of their training, what level of a load is still healthy and beneficial to them and what level can become harmful and represent overtraining (Meeusen et al., 2006; Brenner, 2007).
Overtraining is associated primarily with long term unreceding fatigue and decreased performance, and this fatigue associated with training stress no longer brings the athlete higher performance after recovery but paralyzes him/her instead and prevents further training. Fatigue cannot be accurately defined nor can it be objectively measured because it involves a subjective feeling, where, along with the current physical and mental state, conditions during training and other environmental factors play a role as well – only some of the fatigue’s manifestations are measurable (Halson, 2014). Therefore, fatigue can have a general, local, physical and mental character and an acute or chronic form1. Our study is based on the classification of fatigue used in current research (see e.g. Matos, Winsley, & Williams, 2011; Kreher & Schwartz, 2012), agreed upon in a joint position by the European College of Sport Science (ECSS) and American College of Sports Medicine (ACSM): functional overreaching (FOR); nonfunctional overreaching (NFOR) a overtraining syndrome (OTS). Regarding the above, Meeusen et al. (2013) point out that the primary indicator of OR or OTS is the decrease in specific performance in sport, however, it is very important to exclude other potential causes of a temporary decrease in performance (e.g. anemia, acute infection, muscle injury, insufficient intake of carbohydrates, etc.). Nonetheless, the development of OR and OTS does not involve only biological correlates and physical
1 In terms of concrete metabolic changes in the muscles, we distinguish between aerobic and anaerobic fatigue,
where aerobic fatigue has a slow onset and anaerobic is a rapidly oncoming fatigue with increase in lactate and
development of metabolic acidosis (Jančík, Závodná, & Novotná, 2007).
30
demands of intense training (Lloyd & Oliver, 2014). A substantial role here is played by complex psychological factors (e.g. excessive expectations of coaches or parents, competition nerves, personal structure, social environment, family and friends relations, monotony of training sessions, personal or emotional problems, school demands and others). In terms of psychological phenomena, understanding the character and forms of fatigue and possible overtraining syndrome is important for the athletes themselves (recognizing symptoms and risk level) as well as individuals who are involved in the assessment, education and coaching of athletes (Kreher & Schwartz, 2012). Continuous assessment of the current level of fatigue can, along with the assessment of current level of physical and mental wellbeing, provide important information concerning the athlete’s readiness to train and compete, which can support the overall performance throughout the season (Gastin, Meyer, & Robinson, 2013).
PROBLEM STATEMENT
The primary aim of the study was to map key psychological aspects of training load in adolescence and the occurrence of possible overtraining, and to examine possible connections between perceived level of load and the intensity of training. An additional aim was to verify the basic psychometric properties of the Czech abridged version of the Profile of Mood States and the proposed Czech translation of the Training Distress Scale under Czech sociocultural conditions.
METHOD
The quantitative research design was done using a one-time questionnaire survey.
PROCEDURE
The data collection procedure was carried out during academic year 2016. The data were collected using paper/pencil questionnaire administered in schools with a sports focus and sports clubs. The test battery was always administered by a professional, and it took 15-20 minutes to administer. Data were collected following a consent from the school administration, a coach or a director of the sports club, who were subsequently provided with a feedback and the results of the survey. Some sports schools were not willing to allow the data collection at their schools, in other words, the school administration refused to allow studying the possible negative psychological effects of overtraining on the part of their students.
SAMPLE
Research sample consisted of 230 adolescents, aged 14 - 20 yrs. (M=16.4; 64 % M, 36 % F), involved in a sport at a top competitive level (team sports 58 %; of which: soccer 72.3 %, track 25.1 %, hokey 17.7 %). The average time of training load given by the subjects was 14.2 hours/week. The research sample included adolescents involved in a sports activity on a broad spectrum of various intensity, from recreational athletes (14 %), to club athletes/players with regular training sessions (77 %), up to internationally competitive athletes, who intend to continue (or are actually already doing it) on a professional level (9 %). Subjects were involved in their preferred sport for various lengths of time: less than 3 yrs. (8,7 %), 3 - 5 yrs. (10 %), 5 - 8 yrs. (13,9 %), and more than 8 yrs. (67 %). The hours of weekly training in our sample ranged from 3 hrs./week to a maximum of 44.5 hrs./week (M=14.2, m=14.0, sd= 6.6). The greatest number of subjects trained in the range of 6 - 21.5 hours per week.
INSTRUMENTS
The test battery mapped the subjects’ basic demographic data and determined select data relevant to the research aim – sports activity of the subjects, frequency of this activity, type of sport preferred, years devoted to this sport, and competition level (recreational activity, sports club or international level). In addition, the following questionnaire methods were used:
31
Training Distress Scale (TDS, according to Grove, Main, Partridge, Bishop, Russell, Shepherdson, & Ferguson, 2014). This one-dimensional questionnaire method consists of 19 items, focused on the assessment of physiological (muscle and/or joint pain, lack of energy, lack of appetite, etc.) and psychological (memory issues, irritability, lack of concentration, etc.) distress symptoms identified by Fry et al. (1994). For the purpose of this study, this method was translated into Czech and subsequently administered to the subjects. In the framework of the test battery, it was administered twice in order to record the perceived load; first time immediately after a demanding training session and the second time 24 hours later. The subjects always answered using a 5-point scale (not at all – very much).
Profile of Mood States (POMS; McNair, Lorr, & Doppleman, 1971, 1992, revised by Stuchlíková, Man, & Hagtvet, 2005). This method is based on an original 65-item version of POMS, designed for profiling emotional states and moods. POMS is often used in sports psychology and it is considered to be a quick and economic method to determine transient, short-term (minutes to a week) affective states (Terry, Lane, & Fogarty, 2003). The Czech abridged version of this questionnaire has been used in the Czech population only in research conducted with university students not adolescents (Stuchlíková, Man, & Hagtvet 2005). The method includes 37 items, where subjects assess the presented adjectives describing affective states on a 5-point scale (not at all – extremely). The current mental state is assessed using six dimensions determined always by several adjectives: Tension-Anxiety (T); Depression-Dejection (D); Anger-Hostility (A); Vigor-Activity (V); Fatigue-Inertia (F); Confusion-Bewilderment (C).
DATA ANALYSIS
In this study we used descriptive statistics in order to compare the means of two groups using independent sample t-tests, and Pearson correlation coefficient to determine the correlation between variables, its degree and direction. Concerning the methods used, we conducted a reliability assessment in terms of internal consistency – Cronbach’s Alfa.
RESULTS
The perceived training load in adolescents was determined using the two following questionnaire methods: Training Distress Scale and Profile of Mood States.
Training Distress Scale
In the test battery, the subjects filled out the questionnaire twice with two different instructions. With the first questionnaire administration (TDS_1) we determined the type of overload symptoms perceived by the subjects immediately following a demanding training session, and with the second administration (TDS_2) we focused on perceived symptoms 24 hours after a demanding training session. The overall value of the measure of the perceived load in TDS was calculated by averaging the sum of the test’s raw scores, separately for TDS_1 and for TDS_2.
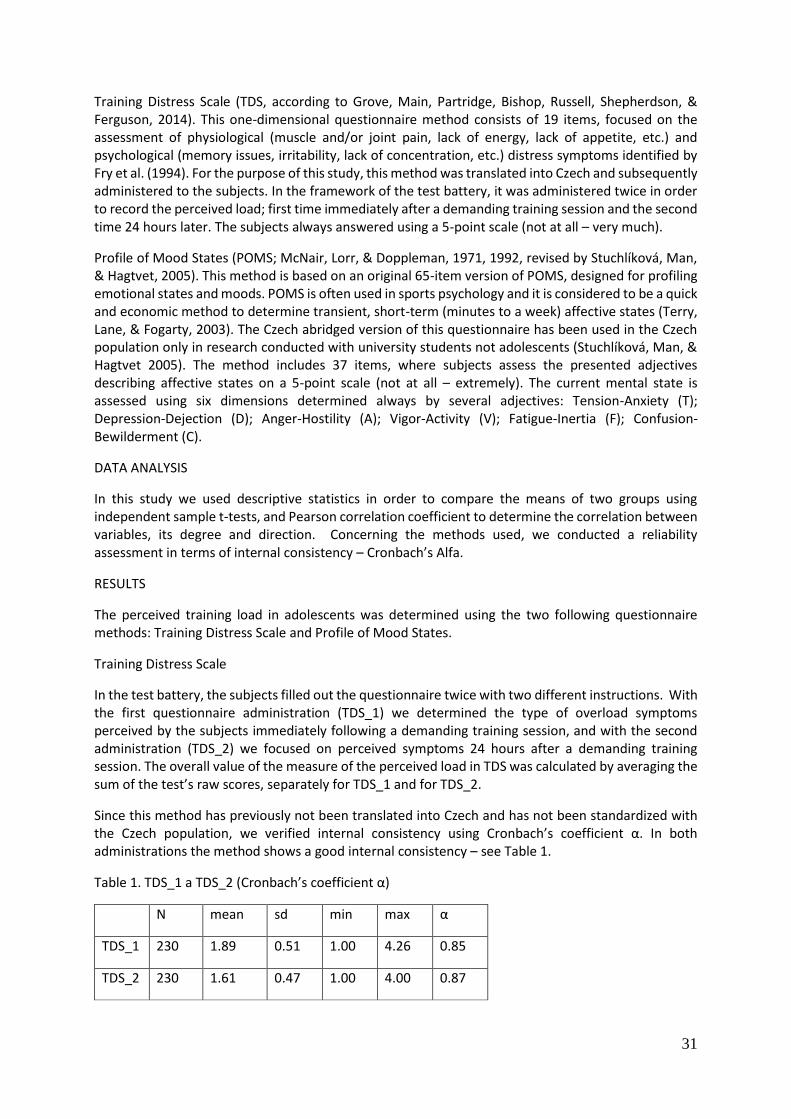
Since this method has previously not been translated into Czech and has not been standardized with the Czech population, we verified internal consistency using Cronbach’s coefficient α. In both administrations the method shows a good internal consistency – see Table 1.
Table 1. TDS_1 a TDS_2 (Cronbach’s coefficient α)
N mean sd min max α
TDS_1 230 1.89 0.51 1.00 4.26 0.85
TDS_2 230 1.61 0.47 1.00 4.00 0.87
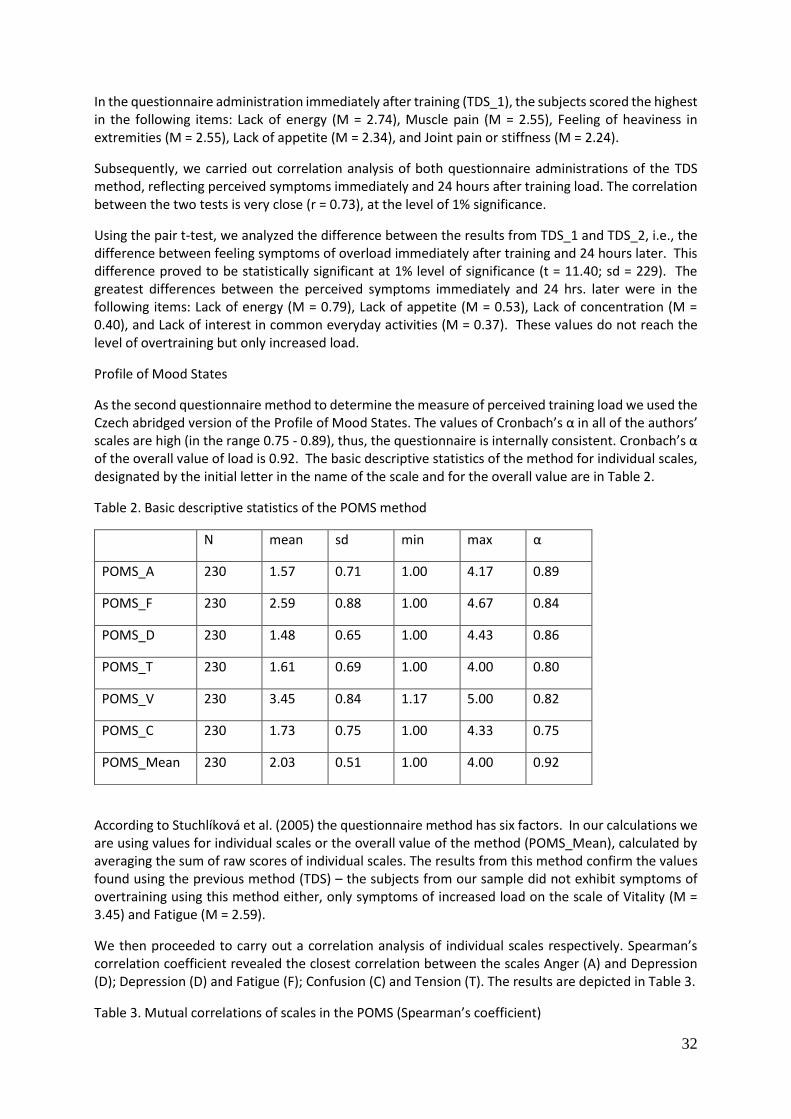
32
In the questionnaire administration immediately after training (TDS_1), the subjects scored the highest in the following items: Lack of energy (M = 2.74), Muscle pain (M = 2.55), Feeling of heaviness in extremities (M = 2.55), Lack of appetite (M = 2.34), and Joint pain or stiffness (M = 2.24).
Subsequently, we carried out correlation analysis of both questionnaire administrations of the TDS method, reflecting perceived symptoms immediately and 24 hours after training load. The correlation between the two tests is very close (r = 0.73), at the level of 1% significance.
Using the pair t-test, we analyzed the difference between the results from TDS_1 and TDS_2, i.e., the difference between feeling symptoms of overload immediately after training and 24 hours later. This difference proved to be statistically significant at 1% level of significance (t = 11.40; sd = 229). The greatest differences between the perceived symptoms immediately and 24 hrs. later were in the following items: Lack of energy (M = 0.79), Lack of appetite (M = 0.53), Lack of concentration (M = 0.40), and Lack of interest in common everyday activities (M = 0.37). These values do not reach the level of overtraining but only increased load.
Profile of Mood States
As the second questionnaire method to determine the measure of perceived training load we used the Czech abridged version of the Profile of Mood States. The values of Cronbach’s α in all of the authors’ scales are high (in the range 0.75 - 0.89), thus, the questionnaire is internally consistent. Cronbach’s α of the overall value of load is 0.92. The basic descriptive statistics of the method for individual scales, designated by the initial letter in the name of the scale and for the overall value are in Table 2.
Table 2. Basic descriptive statistics of the POMS method
N mean sd min max α
POMS_A 230 1.57 0.71 1.00 4.17 0.89
POMS_F 230 2.59 0.88 1.00 4.67 0.84
POMS_D 230 1.48 0.65 1.00 4.43 0.86
POMS_T 230 1.61 0.69 1.00 4.00 0.80
POMS_V 230 3.45 0.84 1.17 5.00 0.82
POMS_C 230 1.73 0.75 1.00 4.33 0.75
POMS_Mean 230 2.03 0.51 1.00 4.00 0.92
According to Stuchlíková et al. (2005) the questionnaire method has six factors. In our calculations we are using values for individual scales or the overall value of the method (POMS_Mean), calculated by averaging the sum of raw scores of individual scales. The results from this method confirm the values found using the previous method (TDS) – the subjects from our sample did not exhibit symptoms of overtraining using this method either, only symptoms of increased load on the scale of Vitality (M = 3.45) and Fatigue (M = 2.59).
We then proceeded to carry out a correlation analysis of individual scales respectively. Spearman’s correlation coefficient revealed the closest correlation between the scales Anger (A) and Depression (D); Depression (D) and Fatigue (F); Confusion (C) and Tension (T). The results are depicted in Table 3.
Table 3. Mutual correlations of scales in the POMS (Spearman’s coefficient)
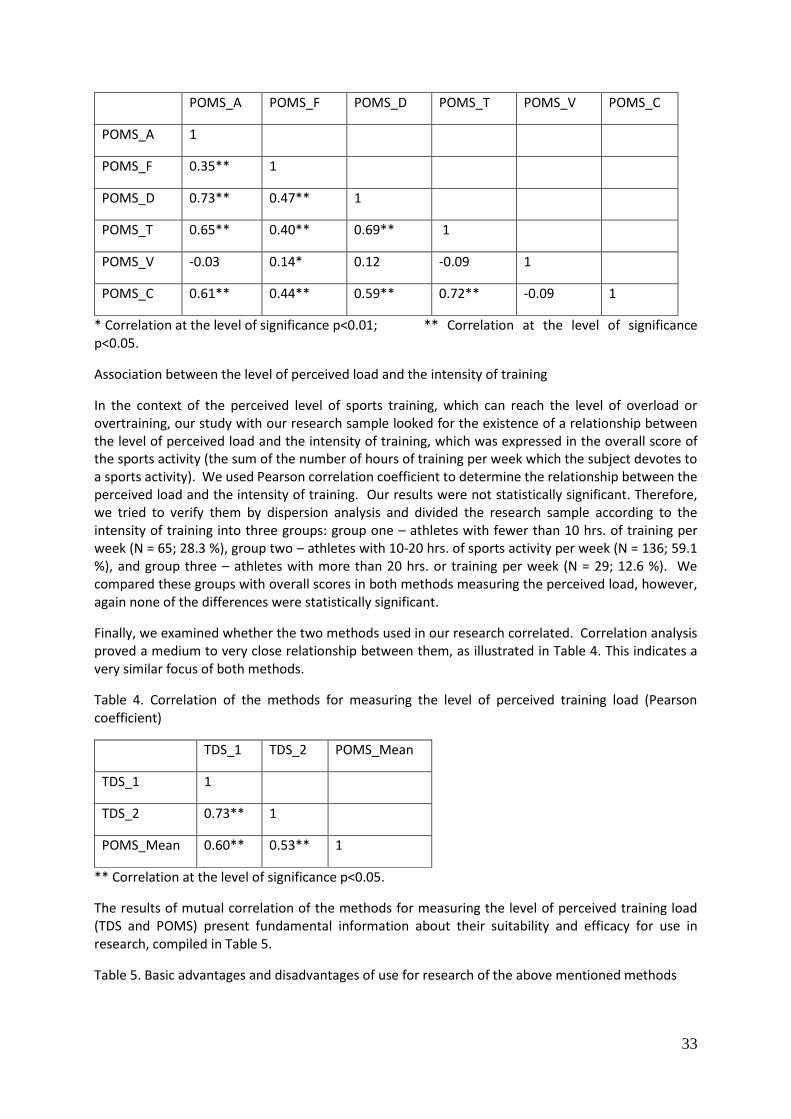
33
POMS_A POMS_F POMS_D POMS_T POMS_V POMS_C
POMS_A 1
POMS_F 0.35** 1
POMS_D 0.73** 0.47** 1
POMS_T 0.65** 0.40** 0.69** 1
POMS_V -0.03 0.14* 0.12 -0.09 1
POMS_C 0.61** 0.44** 0.59** 0.72** -0.09 1
* Correlation at the level of significance p<0.01; ** Correlation at the level of significance p<0.05.
Association between the level of perceived load and the intensity of training
In the context of the perceived level of sports training, which can reach the level of overload or overtraining, our study with our research sample looked for the existence of a relationship between the level of perceived load and the intensity of training, which was expressed in the overall score of the sports activity (the sum of the number of hours of training per week which the subject devotes to a sports activity). We used Pearson correlation coefficient to determine the relationship between the perceived load and the intensity of training. Our results were not statistically significant. Therefore, we tried to verify them by dispersion analysis and divided the research sample according to the intensity of training into three groups: group one – athletes with fewer than 10 hrs. of training per week (N = 65; 28.3 %), group two – athletes with 10-20 hrs. of sports activity per week (N = 136; 59.1 %), and group three – athletes with more than 20 hrs. or training per week (N = 29; 12.6 %). We compared these groups with overall scores in both methods measuring the perceived load, however, again none of the differences were statistically significant.
Finally, we examined whether the two methods used in our research correlated. Correlation analysis proved a medium to very close relationship between them, as illustrated in Table 4. This indicates a very similar focus of both methods.
Table 4. Correlation of the methods for measuring the level of perceived training load (Pearson coefficient)
TDS_1 TDS_2 POMS_Mean
TDS_1 1
TDS_2 0.73** 1
POMS_Mean 0.60** 0.53** 1
** Correlation at the level of significance p<0.05.
The results of mutual correlation of the methods for measuring the level of perceived training load (TDS and POMS) present fundamental information about their suitability and efficacy for use in research, compiled in Table 5.
Table 5. Basic advantages and disadvantages of use for research of the above mentioned methods
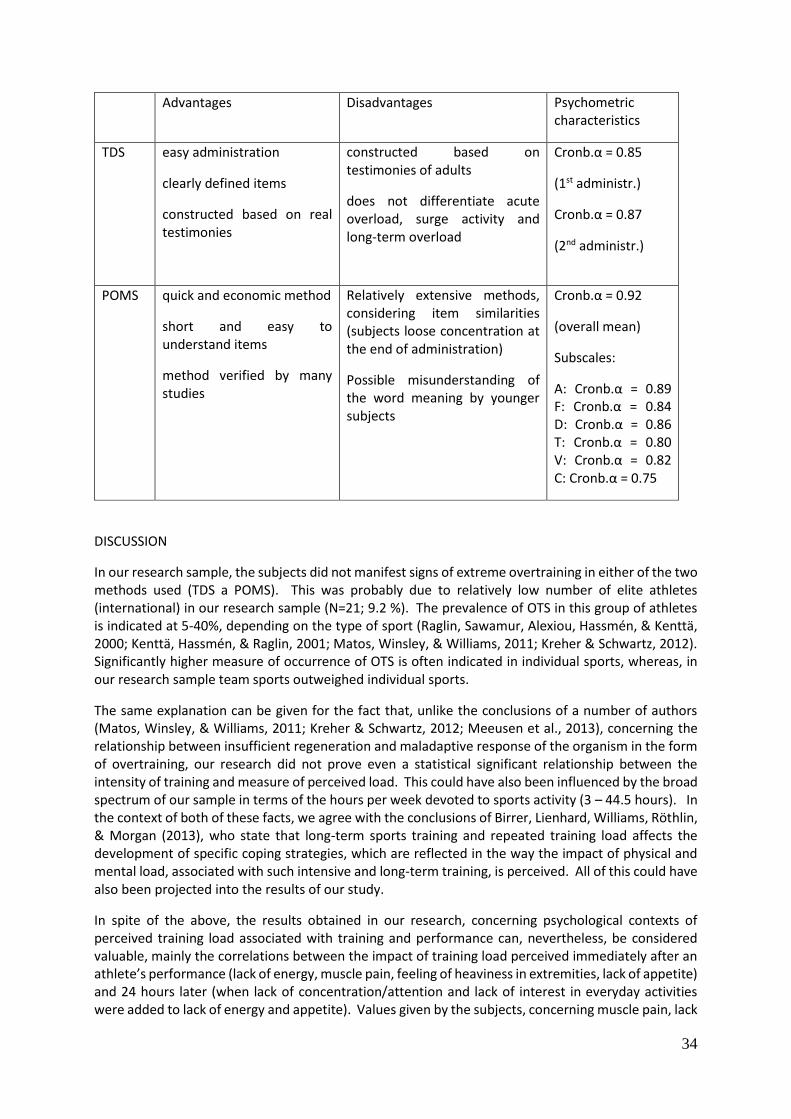
34
Advantages Disadvantages Psychometric characteristics
TDS easy administration
clearly defined items
constructed based on real testimonies
constructed based on testimonies of adults
does not differentiate acute overload, surge activity and long-term overload
Cronb.α = 0.85
(1st administr.)
Cronb.α = 0.87
(2nd administr.)
POMS quick and economic method
short and easy to understand items
method verified by many studies
Relatively extensive methods, considering item similarities (subjects loose concentration at the end of administration)
Possible misunderstanding of the word meaning by younger subjects
Cronb.α = 0.92
(overall mean)
Subscales:
A: Cronb.α = 0.89 F: Cronb.α = 0.84 D: Cronb.α = 0.86 T: Cronb.α = 0.80 V: Cronb.α = 0.82 C: Cronb.α = 0.75
DISCUSSION
In our research sample, the subjects did not manifest signs of extreme overtraining in either of the two methods used (TDS a POMS). This was probably due to relatively low number of elite athletes (international) in our research sample (N=21; 9.2 %). The prevalence of OTS in this group of athletes is indicated at 5-40%, depending on the type of sport (Raglin, Sawamur, Alexiou, Hassmén, & Kenttä, 2000; Kenttä, Hassmén, & Raglin, 2001; Matos, Winsley, & Williams, 2011; Kreher & Schwartz, 2012). Significantly higher measure of occurrence of OTS is often indicated in individual sports, whereas, in our research sample team sports outweighed individual sports.
The same explanation can be given for the fact that, unlike the conclusions of a number of authors (Matos, Winsley, & Williams, 2011; Kreher & Schwartz, 2012; Meeusen et al., 2013), concerning the relationship between insufficient regeneration and maladaptive response of the organism in the form of overtraining, our research did not prove even a statistical significant relationship between the intensity of training and measure of perceived load. This could have also been influenced by the broad spectrum of our sample in terms of the hours per week devoted to sports activity (3 – 44.5 hours). In the context of both of these facts, we agree with the conclusions of Birrer, Lienhard, Williams, Röthlin, & Morgan (2013), who state that long-term sports training and repeated training load affects the development of specific coping strategies, which are reflected in the way the impact of physical and mental load, associated with such intensive and long-term training, is perceived. All of this could have also been projected into the results of our study.
In spite of the above, the results obtained in our research, concerning psychological contexts of perceived training load associated with training and performance can, nevertheless, be considered valuable, mainly the correlations between the impact of training load perceived immediately after an athlete’s performance (lack of energy, muscle pain, feeling of heaviness in extremities, lack of appetite) and 24 hours later (when lack of concentration/attention and lack of interest in everyday activities were added to lack of energy and appetite). Values given by the subjects, concerning muscle pain, lack
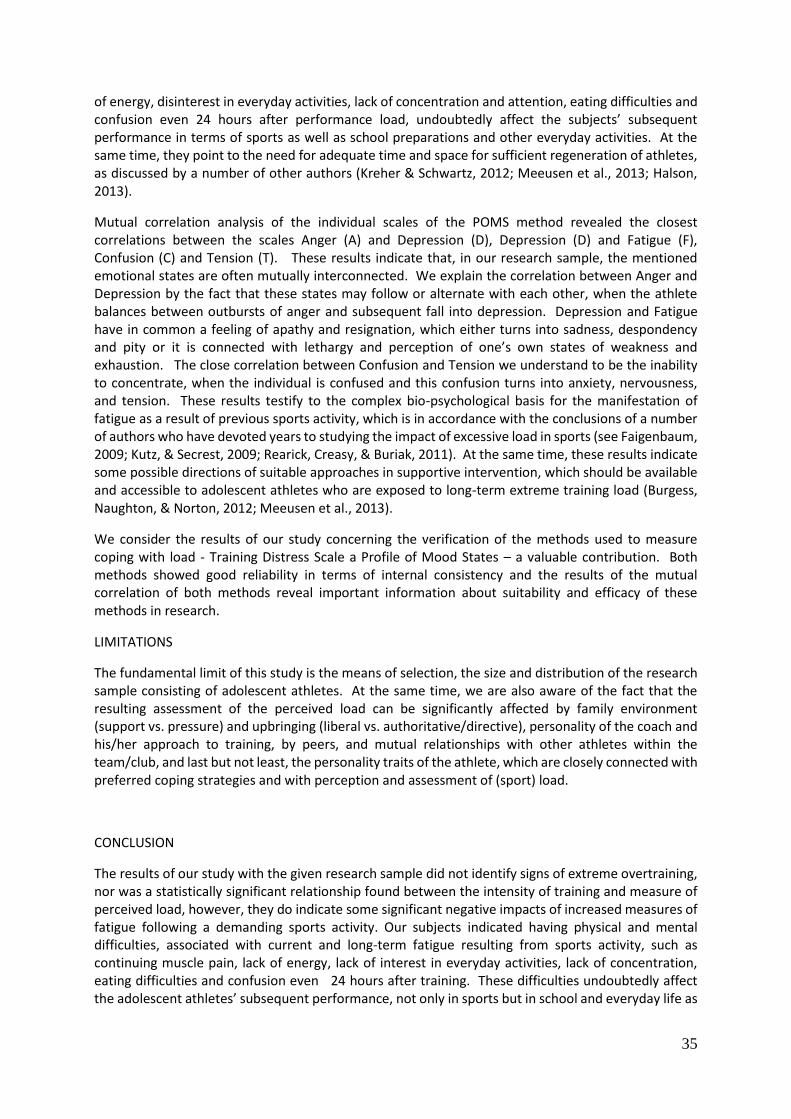
35
of energy, disinterest in everyday activities, lack of concentration and attention, eating difficulties and confusion even 24 hours after performance load, undoubtedly affect the subjects’ subsequent performance in terms of sports as well as school preparations and other everyday activities. At the same time, they point to the need for adequate time and space for sufficient regeneration of athletes, as discussed by a number of other authors (Kreher & Schwartz, 2012; Meeusen et al., 2013; Halson, 2013).
Mutual correlation analysis of the individual scales of the POMS method revealed the closest correlations between the scales Anger (A) and Depression (D), Depression (D) and Fatigue (F), Confusion (C) and Tension (T). These results indicate that, in our research sample, the mentioned emotional states are often mutually interconnected. We explain the correlation between Anger and Depression by the fact that these states may follow or alternate with each other, when the athlete balances between outbursts of anger and subsequent fall into depression. Depression and Fatigue have in common a feeling of apathy and resignation, which either turns into sadness, despondency and pity or it is connected with lethargy and perception of one’s own states of weakness and exhaustion. The close correlation between Confusion and Tension we understand to be the inability to concentrate, when the individual is confused and this confusion turns into anxiety, nervousness, and tension. These results testify to the complex bio-psychological basis for the manifestation of fatigue as a result of previous sports activity, which is in accordance with the conclusions of a number of authors who have devoted years to studying the impact of excessive load in sports (see Faigenbaum, 2009; Kutz, & Secrest, 2009; Rearick, Creasy, & Buriak, 2011). At the same time, these results indicate some possible directions of suitable approaches in supportive intervention, which should be available and accessible to adolescent athletes who are exposed to long-term extreme training load (Burgess, Naughton, & Norton, 2012; Meeusen et al., 2013).
We consider the results of our study concerning the verification of the methods used to measure coping with load - Training Distress Scale a Profile of Mood States – a valuable contribution. Both methods showed good reliability in terms of internal consistency and the results of the mutual correlation of both methods reveal important information about suitability and efficacy of these methods in research.
LIMITATIONS
The fundamental limit of this study is the means of selection, the size and distribution of the research sample consisting of adolescent athletes. At the same time, we are also aware of the fact that the resulting assessment of the perceived load can be significantly affected by family environment (support vs. pressure) and upbringing (liberal vs. authoritative/directive), personality of the coach and his/her approach to training, by peers, and mutual relationships with other athletes within the team/club, and last but not least, the personality traits of the athlete, which are closely connected with preferred coping strategies and with perception and assessment of (sport) load.
CONCLUSION
The results of our study with the given research sample did not identify signs of extreme overtraining, nor was a statistically significant relationship found between the intensity of training and measure of perceived load, however, they do indicate some significant negative impacts of increased measures of fatigue following a demanding sports activity. Our subjects indicated having physical and mental difficulties, associated with current and long-term fatigue resulting from sports activity, such as continuing muscle pain, lack of energy, lack of interest in everyday activities, lack of concentration, eating difficulties and confusion even 24 hours after training. These difficulties undoubtedly affect the adolescent athletes’ subsequent performance, not only in sports but in school and everyday life as
36
well. At the same time, these results draw attention to evidently insufficient time and space given to regeneration of the organism and to the lack of respect for the need to adequately adjust the concept of training to the developmental phase of the adolescent athlete, particularly with regards to maintaining his/her participation in the sport in the future.
REFERENCES
Allen, M. S., Vella, S. A., & Laborde, S. (2015). Sport participation, screen time, and personality trait development during childhood. British Journal of Developmental Psychology, 33, 375-390.
Bertelloni, S., Ruggeri, S., & Baroncelli, G. I. (2006). Effects of sports training in adolescence on growth, puberty and bone health. Gynecological Endocrinology, 22(11), 605-612.
Biddle, S. J. H., & Assare, M. (2011). Physical activity and mental health in children and adolescents: A review of reviews. British Journal of Sports Medicine, 45, 886-895.
Birrer, D., Lienhard, D., Williams, C. A., Röthlin, P., & Morgan, G. (2013). Prevalence of non-functional overreaching and the overtraining syndrome in Swiss elite athletes. Schweizerische Zeitschrift für Sportmedizin und Sporttraumatologie, 61(4), 23–29.
Brenner, J. S. (2007). Overuse injuries, overtraining, and burnout in child and adolescent athletes. Pediatrics, 119(6), 1242-1245.
Brown, H. E., Pearson, N., Braithwaite, R. E., Brown, W. J., & Biddle, S. J. (2013). Physical activity interventions and depression in children and adolescents: A systematic review and meta-analysis. Sports Medicine, 43, 195-206.
Burgess, D., Naughton, G. & Norton, K. (2012). Quantifying the gap between under 18 and senior AFL football: 2003 and 2009. International Journal of Sports Physiology and Performance, 7, 53-58.
Faigenbaum, A. (2009). Overtraining in young athletes: How much is too much? ACSM s Health & Fitness Journal, 13(4), 1-6.
Fry, R. W, Grove, J. R., Morton, A. R., Zeroni, P. M., Gaudieri, S., & Keast, D. (1994). Psychological and immunological correlates of acute overtraining. British Journal of Sports Medicine, 28(4). 241-246.
Gastin, P. B., Meyer, D., & Robinson, D. (2013). Perceptions of wellness to monitor adaptive responses to training and competition in elite Australian football. Journal of Strength and Conditioning Research, 27, 2518–2526.
37
THE IMPORTANCE OF MONITORING AND MAINTAINING DATA IN SPORTS
TRAINING PROCESS
Fister, I. Jr.1, Fister, K.2, Fister, D.1, Fister, I.1, Rauter, S.3
1University of Maribor, Faculty of Electrical Engineering and Computer Science, Maribor, Slovenia
2General Hospital Rakičan, Murska Sobota, Slovenia
3University of Ljubljana, Faculty of Sport, Ljubljana, Slovenia
ABSTRACT
The sports training process is an origin of huge amounts of data obtained using mobile devices equipped with various sensors. Heart rate monitors, GPS, step counters, velocity meters, cadence meters and power meters are just some of them. If interpreted carefully, collected data offer an outstanding insight into an athlete's current form. Thus, sports trainers can recognize an athlete’s abilities, fatigue or performance of implementing each sports training and, consequently, the optimal training can be predicted based on the existing sports activities. In the past few years, many computational methods were developed for analysing sports training data automatically. These methods incorporate recent knowledge from disciplines like data mining and computational intelligence. As a result, they offer an automatic sports training planning, athlete's habits discovery and food prediction regarding the sports training plans. On the other hand, storing data during the athlete's sports training sessions could provide many statistical comparisons among various generations of athletes or even sports teams. Actually, it would be interesting to know how the training plan of a marathon athlete looked over a hundred years ago. The purpose of this paper is to show the importance of monitoring, maintaining and storing data obtained during the sport training sessions. In line with this, we discuss the sports activity datasets creation process. Then, the simple and one of the more efficient ways of maintaining data is presented. Finally, the social effects of these data are exposed, where activity datasets could be distributed via the Internet for research and analysis purposes.
Keywords: Data mining, dataset, sports activity, sports training
INTRODUCTION "Information is power. But like all power, there are those who want to keep it for themselves." were the first two sentences in the Guerilla Open Access Manifesto that was written by Aaron Swartz back in 2008 (Swartz, 2008). He exposed the problem where much scientific literature is in the hands of big publishing corporations and, thus, locked by paywalls. Aaron Swartz has seen the potential of the open access to the scientific literature, books and data for the common good. He fought for the ideal that everyone in the world would have open access to the common data free of charge. During his life, he has organized many campaigns that promoted the access to open data and made people aware of the importance of this subject. His visions were very important for the whole world. In the past years, many organizations began releasing open data for research purposes. Eventually, open access publishers are also attracting more and more people as their venues for publishing their research.
Nowadays, sport represents the most important marginal thing in the world. For instance, if you turn the TV on, broadcasts of various sport competitions, interviews, news, and even talk shows about sport, are presented every day. Magazines, newspapers, health organizations, universities are promoting a healthy lifestyle and the benefits of practicing in sports. On the other hand, successful
38
professional sport athletes become heroes with whom mass peoples are identifying. For this role, however, these heroes are paid in amounts that were unimaginable earlier. Producers of sports equipment also want to exploit the benefits offered in modern sport. In line with this, bikes have never been as improved as they are nowadays. During the sports training sessions, a lot of data have been created by an athlete using mobile devices. Currently, every athlete trains with a smart watch or smartphone that is capable of producing an enormous amount of data. Data from heart rate monitors and GPS tracks are just a few of them. On the other hand, modern trainers monitor almost every state of the athlete, their performances, health status, characteristics, habits, and so on. As a result, both sources have collected a huge amount of data characterizing the behaviour of an athlete in sports training. Approximately 15 years ago, athletes and trainers were not aware about the opportunities of using their collected data, since computers were not as available as they are nowadays. The situation now is slightly different, although both trainers and athletes still do not give sufficient attention to the power of these data. Although data obtained during sports training sessions are produced by a multitude of athletes around the world daily, these data are typically hidden or kept secret by trainers or the athletes themselves. They are hiding data because they think that these could serve to improve the performance of their competitors and rivals. However, they are not aware that hiding data also has many weaknesses. Instead of sharing and allowing the other athletes open access to data and, thus, improving competitiveness in specific sports disciplines, these stay hidden and often untreated on their web profiles or hard disks.
After studying this situation, we have realized some facts that prevent athletes from enabling open access to their data. Indeed, there are two important facts that must be taken into account. The first fact is connected with fear, where athletes do not want to release data because of fear of their opponents. Especially, professional athletes think that they have advances over rivals, when they hide data about their sports training performance. For example, data from sport trackers may serve for revealing their training characteristics, habits, and heart rate statistics and so on. Fortunately, some professionals do not care about these problems and share their data with the others without any problems. The second fact is connected with collection and preparation of activity datasets and their later sharing. According to our interviews, it can be concluded that more athletes are not aware why their data are so important for the future progress in some sports disciplines. On the other hand, most of the athletes also do not have any experience about how to collect data, what is important, how to anonymize some parameters and, finally, how to share data. In order to break this wall, the intention of this short paper is to write a guide (a short methodology) that may help athletes and trainers to prepare and share an archive of the sports activity datasets easily. WHAT KIND OF DATA DO WE HAVE IN SPORT?
The process of sports training is the most important task of the coach. The process consists of four stages: (1) Planning, (2) Implementation, (3) Monitoring and (4) Evaluation. Although all four phases are equally important, the majority of coaches have been focused primarily on the first two phases in the past. With the rapid development of new technologies, which allows tracking of an athlete’s indicator load during the training process, the third and fourth stages in this process (i.e., monitoring and evaluation) became manageable. However, both stages cannot be considered without data that can arise from various sources. In this study, we focus on the four data sources, as follows:
- Sports tracker data,
- Laboratory measured performance data,
- Laboratory measured health data,
- Sport results data. In the remainder of this section, the mentioned data sources available for performance analysis in sports are presented in detail.
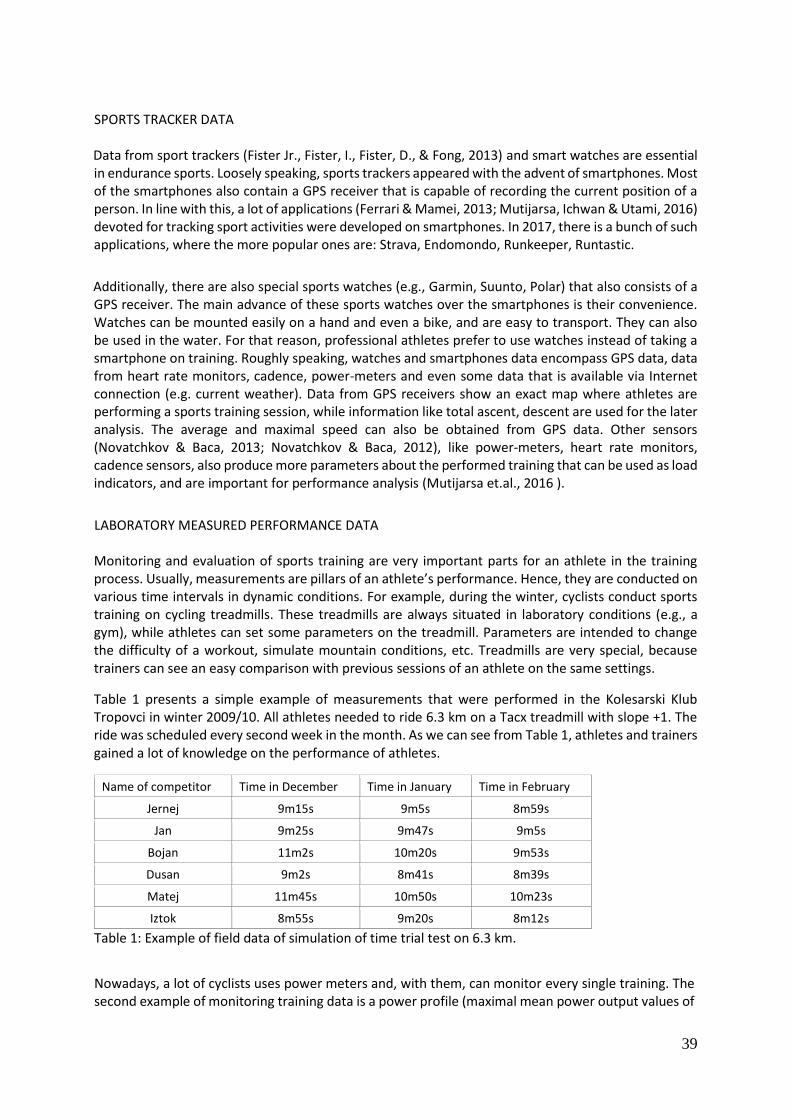
39
SPORTS TRACKER DATA Data from sport trackers (Fister Jr., Fister, I., Fister, D., & Fong, 2013) and smart watches are essential in endurance sports. Loosely speaking, sports trackers appeared with the advent of smartphones. Most of the smartphones also contain a GPS receiver that is capable of recording the current position of a person. In line with this, a lot of applications (Ferrari & Mamei, 2013; Mutijarsa, Ichwan & Utami, 2016) devoted for tracking sport activities were developed on smartphones. In 2017, there is a bunch of such applications, where the more popular ones are: Strava, Endomondo, Runkeeper, Runtastic.
Additionally, there are also special sports watches (e.g., Garmin, Suunto, Polar) that also consists of a GPS receiver. The main advance of these sports watches over the smartphones is their convenience. Watches can be mounted easily on a hand and even a bike, and are easy to transport. They can also be used in the water. For that reason, professional athletes prefer to use watches instead of taking a smartphone on training. Roughly speaking, watches and smartphones data encompass GPS data, data from heart rate monitors, cadence, power-meters and even some data that is available via Internet connection (e.g. current weather). Data from GPS receivers show an exact map where athletes are performing a sports training session, while information like total ascent, descent are used for the later analysis. The average and maximal speed can also be obtained from GPS data. Other sensors (Novatchkov & Baca, 2013; Novatchkov & Baca, 2012), like power-meters, heart rate monitors, cadence sensors, also produce more parameters about the performed training that can be used as load indicators, and are important for performance analysis (Mutijarsa et.al., 2016 ).
LABORATORY MEASURED PERFORMANCE DATA Monitoring and evaluation of sports training are very important parts for an athlete in the training process. Usually, measurements are pillars of an athlete’s performance. Hence, they are conducted on various time intervals in dynamic conditions. For example, during the winter, cyclists conduct sports training on cycling treadmills. These treadmills are always situated in laboratory conditions (e.g., a gym), while athletes can set some parameters on the treadmill. Parameters are intended to change the difficulty of a workout, simulate mountain conditions, etc. Treadmills are very special, because trainers can see an easy comparison with previous sessions of an athlete on the same settings.
Table 1 presents a simple example of measurements that were performed in the Kolesarski Klub Tropovci in winter 2009/10. All athletes needed to ride 6.3 km on a Tacx treadmill with slope +1. The ride was scheduled every second week in the month. As we can see from Table 1, athletes and trainers gained a lot of knowledge on the performance of athletes.
Name of competitor Time in December Time in January Time in February
Jernej 9m15s 9m5s 8m59s
Jan 9m25s 9m47s 9m5s
Bojan 11m2s 10m20s 9m53s
Dusan 9m2s 8m41s 8m39s
Matej 11m45s 10m50s 10m23s
Iztok 8m55s 9m20s 8m12s
Table 1: Example of field data of simulation of time trial test on 6.3 km.
Nowadays, a lot of cyclists uses power meters and, with them, can monitor every single training. The second example of monitoring training data is a power profile (maximal mean power output values of
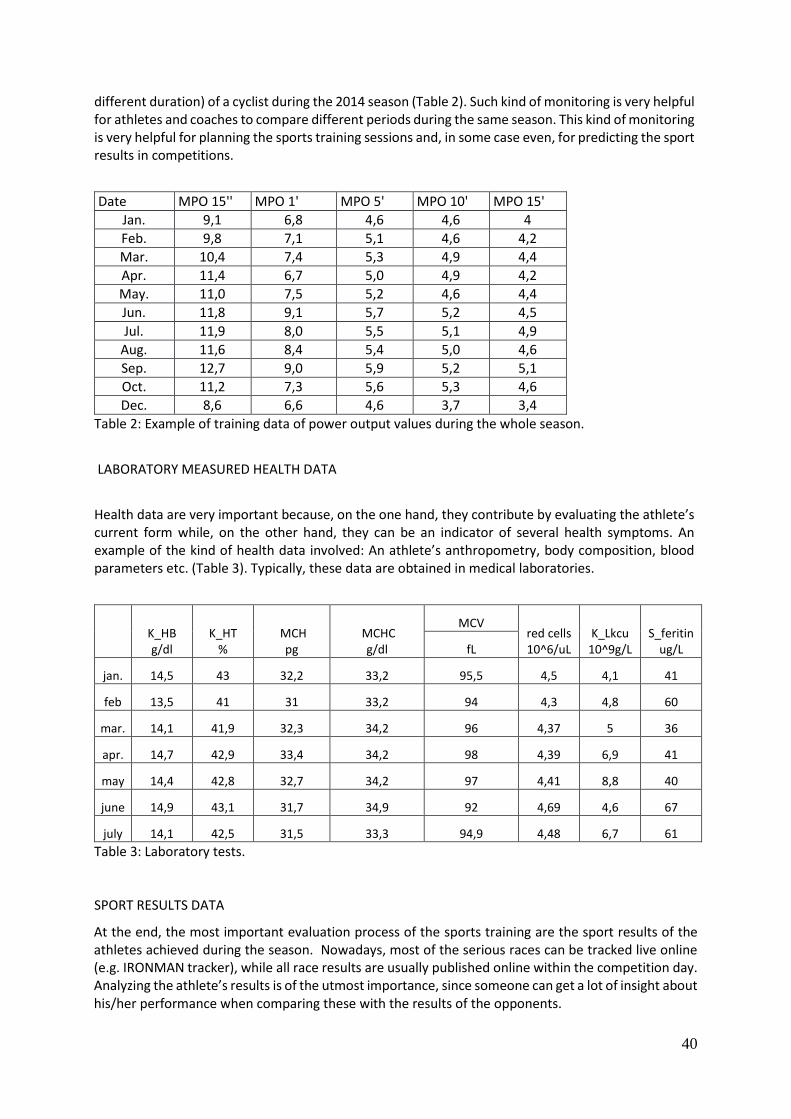
40
different duration) of a cyclist during the 2014 season (Table 2). Such kind of monitoring is very helpful for athletes and coaches to compare different periods during the same season. This kind of monitoring is very helpful for planning the sports training sessions and, in some case even, for predicting the sport results in competitions.
Date MPO 15'' MPO 1' MPO 5' MPO 10' MPO 15'
Jan. 9,1 6,8 4,6 4,6 4
Feb. 9,8 7,1 5,1 4,6 4,2
Mar. 10,4 7,4 5,3 4,9 4,4
Apr. 11,4 6,7 5,0 4,9 4,2
May. 11,0 7,5 5,2 4,6 4,4
Jun. 11,8 9,1 5,7 5,2 4,5
Jul. 11,9 8,0 5,5 5,1 4,9
Aug. 11,6 8,4 5,4 5,0 4,6
Sep. 12,7 9,0 5,9 5,2 5,1
Oct. 11,2 7,3 5,6 5,3 4,6
Dec. 8,6 6,6 4,6 3,7 3,4
Table 2: Example of training data of power output values during the whole season.
LABORATORY MEASURED HEALTH DATA
Health data are very important because, on the one hand, they contribute by evaluating the athlete’s current form while, on the other hand, they can be an indicator of several health symptoms. An example of the kind of health data involved: An athlete’s anthropometry, body composition, blood parameters etc. (Table 3). Typically, these data are obtained in medical laboratories.
K_HB g/dl
K_HT %
MCH pg
MCHC g/dl
MCV red cells 10^6/uL
K_Lkcu 10^9g/L
S_feritin ug/L fL
jan. 14,5 43 32,2 33,2 95,5 4,5 4,1 41
feb 13,5 41 31 33,2 94 4,3 4,8 60
mar. 14,1 41,9 32,3 34,2 96 4,37 5 36
apr. 14,7 42,9 33,4 34,2 98 4,39 6,9 41
may 14,4 42,8 32,7 34,2 97 4,41 8,8 40
june 14,9 43,1 31,7 34,9 92 4,69 4,6 67
july 14,1 42,5 31,5 33,3 94,9 4,48 6,7 61
Table 3: Laboratory tests.
SPORT RESULTS DATA
At the end, the most important evaluation process of the sports training are the sport results of the athletes achieved during the season. Nowadays, most of the serious races can be tracked live online (e.g. IRONMAN tracker), while all race results are usually published online within the competition day. Analyzing the athlete’s results is of the utmost importance, since someone can get a lot of insight about his/her performance when comparing these with the results of the opponents.
41
CREATING AN ARCHIVE OF SPORTS ACTIVITIES DATASETS Some years ago, we were trying to perform some sport related research involving data from sports trackers. However, we have quickly identified that there is a lack of these files for serious research. Hence, there was not any special possibility then to begin collecting the sports activity datasets produced by athletes in various sports disciplines (e.g., cycling, running). We began with extensive calling of various athletes (amateurs, as well as professionals, participating in various endurance sports) in order to give us some data for research. Mainly, the aim was to create our own archive of the sports activity datasets that can be used openly for the general public. After some weeks, we received some valuable data of athletes that were well-formed and suitable for research. We downloaded data from Garmin Connect and Strava profiles of those athletes who allowed us access to their data. At the beginning, we released the data in TCX and GPX format while, later, we delivered data only in GPX format. Guidelines of how to deal with these data are available here (Rauter, Fister I., & Fister Jr. I, 2016), while a deeper description of data for the reader can be found in the following technical reports (Rauter, Fister I & Fister Jr. I, 2015; Rauter, Fister I & Fister Jr. I 2016).
PRACTICAL GUIDANCE FOR COLLECTING, STORING AND DISTRIBUTING DATA IN SPORT Many athletes that we started to interview firstly raised the following questions: “Who will use my data?”, “I am not a superstar. Therefore, why is my data so important for you?” Unfortunately, these athletes were not aware that these data are part of a very complex system and, therefore, very important for developing new tools enabling deep performance analysis. Today's computer can process enormous amounts of data. Hence, there is no problem if someone can provide some more MB's of sports activity datasets. All these data serve a common purpose, i.e., to make a huge archive of the sports activity datasets dedicated to current or future performance analysis.
A lot of professional athletes, especially in team sports, have realized that, after their career, they do not have any data with which ups and downs during their careers could be analysed. For instance, the professional volleyball player Claudio Carletti mentioned in his talk (February 2017) in Maribor that, after more than 20 years of playing volleyball he, in fact, did not have any data for describing his career in detail. He realized that he has no information about his training plans, no health data, no match statistics and even no recorded matches. Thus, he mentions that, today, he is like nobody since, when he left the club in which he played the last seasons, it erased all its data. After realizing these problems, he began to make people aware of collecting their sports data for later use. Additionally, he also started a big project, Vanda (https://github.com/CarlSpobble/vanda), where he wishes to collect sport data together to the archive and use it. Claudio's story is just one of the many stories that show us how important the sports data are. This means that collecting the sports activity datasets should start already at young ages.
The next step for someone who wishes to collect sports activity datasets, is to transform these data into a universal format. Usually, athletes and trainers are collecting all data in Excel tables or Word documents. Although Excel files are a very good tool, because of portability and easy processing, dealing with sport tracker data can be performed using many web applications available today. In this case, only download of this data needs to be conducted.
When sports activity datasets are collected into an archive, the easiest way to make these data accessible publicly is to put them on the Internet or save them into other storage warehouses, e.g. Dropbox. However, the archive needs to be well documented in order to enable people to start work on this data.
42
CONCLUSION This paper describes briefly creating and exploring the archiving of valuable sports data that are generated during the process of sport training. Some years ago, nobody had given any special attention to these data. With the rise of data mining and artificial intelligence methods, data have also been becoming very attractive for research purposes (e.g., performance analysis of realized sports training sessions).
In line with this, we have exposed systematically various types of sports data arising during the sports training and present a practical guidance for collecting, storing and distributing data arising in sports. The guidance is devoted to potential athletes that should contribute their sports data into the archive for the future research purposes. REFERENCES
Fister Jr, I., Fister, I., Fister, D., & Fong, S. (2013). Data mining in sporting activities created by sports trackers. In Computational and Business Intelligence (ISCBI), 2013 International Symposium on, 88–91.
Swartz A (2008). Guerilla open access manifesto. Online-Ressource, URL http://www. openeverything. eu/guerilla-open-access-manifest.
Rauter, S., Fister, I., & Fister Jr, I. (2015). How to deal with sports activity datasets for data mining and analysis: Some tips and future challenges. International Journal of Advanced Pervasive and Ubiquitous Computing (IJAPUC), 7(2), 27-37.
Rauter, S., Fister Jr, I., & Fister, I. (2015). A collection of sport activity files for data analysis and data mining. Ver 12.05. Ljubljana: University of Ljubljana.
Rauter, S., Fister Jr, I., & Fister, I. (2016). A collection of sport activity datasets for data analysis and data mining 2016b. Technical report 2016b, University of Maribor, 2016. Novatchkov, H., & Baca, A. (2013). Artificial intelligence in sports on the example of weight training. Journal of sports science & medicine, 12(1), 27. Novatchkov, H., & Baca, A. (2012). Machine learning methods for the automatic evaluation of exercises on sensor-equipped weight training machines. Procedia Engineering, 34, 562-567. Ferrari, L., & Mamei M. (2013). "Identifying and understanding urban sport areas using nokia sports tracker." Pervasive and Mobile Computing 9(5), 616-628. Mutijarsa, K., Ichwan, M., & Utami, D. B. (2016). Heart rate prediction based on cycling cadence using feedforward neural network. In Computer, Control, Informatics and its Applications (IC3INA), 2016 International Conference on (pp. 72-76). IEEE.
43
ILLICIT DRUGS AND OTHERS SUBSTANCES USED BY YOUNG ATHLETES BETWEEN AGES OF 10 AND 25
Gabrovec, B.
National Institute of Public Health, Slovenia
ABSTRACT
The purpose of this study was to establish the abuse of illicit and other substances among young recreational athletes according to the type of sport, training frequency, etc. The study examined young and active athletes from Slovenia between the ages of 10 and 25 that are actively engaged in any sports activity at least twice per week. The survey was undertaken by 1,780 respondents, who provided 1,095 of appropriately filled out questionnaires (61.51%). The total number of respondents included 575 (52.5%) men and 520 (47.5%) women. Research shows that young athletes actively engaged in sports activities less frequently use different types of substances compared to the general population. Provided that athletes have already been exposed to various substances their average age of first encounter with drugs is higher compared to that of a general population.
Key words: Nicotine, Alcohol, Cannabis, Illicit drugs, Heroin, Sports.
INTRODUCTION Drug use and abuse represent risk for people of all age groups. However, adolescents are particularly vulnerable to substance abuse (Usher, Jackson & O’Brien, 2005). In 2011, a European School Survey Project on Alcohol and Other Drugs (European Monitoring Centre for Drugs and Drug Addiction, 2011) was conducted for the fifth year in a row. According to the research, 24.8% of surveyed high school students aged 15 to 16 has already tried one of the illicit drugs during their life. However, in comparison to the average recorded in other ESPAD countries Slovenia stands out in the field of inhalant and cannabis use throughout a person’s life. Therefore, 20% of high school students reported a life-long abuse of inhalants, and 23% reported a life-long abuse of cannabis (Drev, 2013).
According to the survey on tobacco, alcohol and other drugs 16.1% of the Slovenian population aged 15 to 64 tried one of the illicit drugs at least once in their life (at least 20% of men and 12.2% of women). Among respondents who consumed illicit drugs at least once in their life, most of them tried cannabis or hashish. Cocaine, as well as ecstasy, was found to be used by 2.1% people in Slovenia, 1.0% of people consumed LSD, 0.9% amphetamines, and 0.5% heroine (Drev, 2013).
Individuals reported about diverse health and social advantages of sports, and also observed that sports and exercise helped them to reduce their heroin abuse. Sports were the most commonly reported type of activity (Neale, Nettleton & Pickering, 2012).
Spanish Sport Sciences university students in general disagree with the use of performance enhancing drugs in competitive sport (Morente-Sanchez et al., 2015). Measures, such as interventions in improving the implementation of responsible alcohol management practices, which were adopted by some sports clubs, had already been proven as successful (Kingsland et al., 2015).
44
MATERIALS AND METHODS
Subjects and sample
The study examined young and active recreational athletes between the ages of 10 and 25 who are actively engaged in any sports activity at least twice per week. The purpose of this study was to establish the abuse of illicit and other substances among young recreational athletes according to the type of sport, training frequency, etc. The web survey was undertaken by 1,780 respondents, who provided 1,095 of appropriately filled out questionnaires (61.51%). The total number of respondents included 575 (52.5 %) of men and 520 (47.5 %) of women.
The age of respondents: 10 to 15 years (275 respondents – 25.1%), 16 to 20 years (513 respondents – 46.8%), 21 to 25 years (307 respondents – 28.1%). The survey included 279 (25.5%) primary school students, 382 (34.9%) high school students, 319 (29.1%) students, 5 (0.5%) unemployed and 110 (10.0%) employed individuals. Together, the respondents were engaged in 23 different sports activities, of which the following were most common: athletics (23.7%), swimming (19.6%), handball (18.6%), karate (12.2%), judo (9.8%). 25.8% of the respondents engages in sports activities on a daily basis, 22.4% five-times a week, 18.3% six-times a week, and 15.9% three-times a week.
Study procedures
The study involved a non-experimental quantitative research and a questionnaire, which was used for data collection. Research was carried out by means of a web survey with a non-standardized questionnaire. Questionnaire was designed by using literature on heroin and cocaine addiction, therapy, illicit drugs, testing for illicit drugs, MDMA, methamphetamine, and designer drugs, was used. Research took place in May and June 2015.
Statistical Analysis
Data were analysed using statistical software IBM SPSS Version 21 and IBM AMOS Version 21 (SPSS Inc., Chicago, IL, USA). Compiled data were processed by means of descriptive statistics, correlation analysis, Kolmogorov-Smirnov test, Shapiro-Wilkov test, Kruskal-Wallis, Mann-Whitney U test and linear regression. High reliability was established for Cronbach’s alpha (Cencič, 2009), coefficient of reliability was 0.959. The significance level was calculated using the statistical significance value of p<0.05.
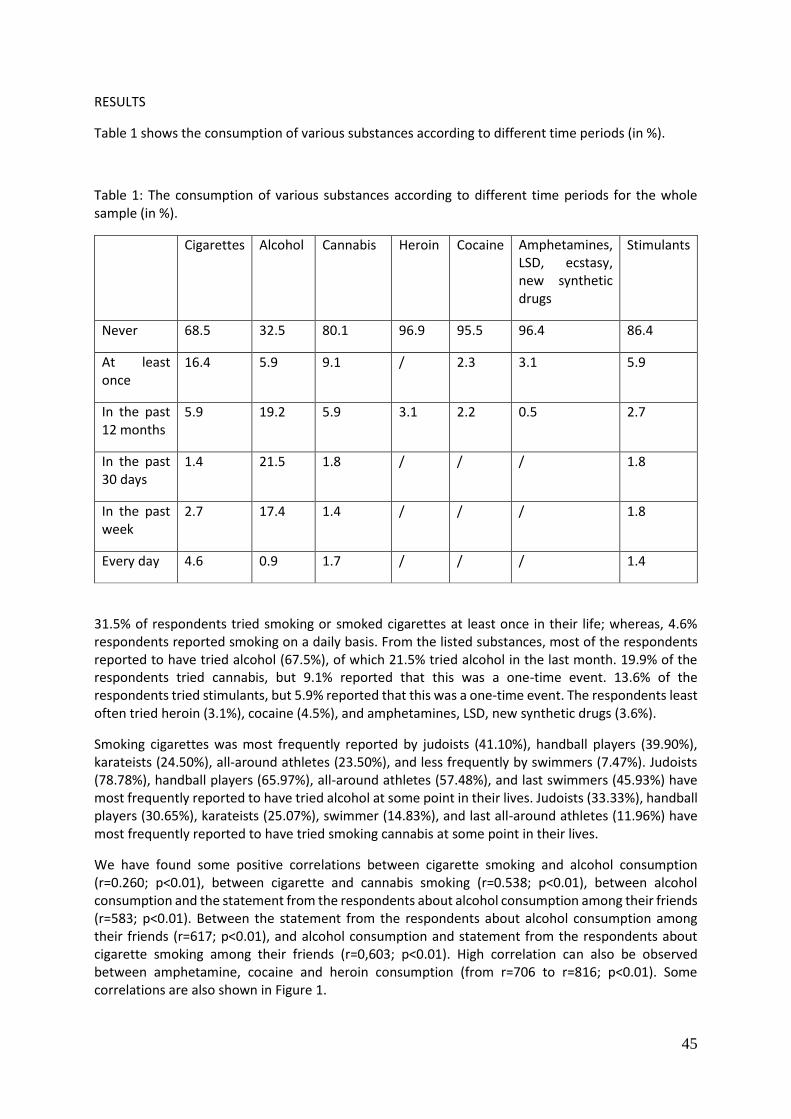
45
RESULTS
Table 1 shows the consumption of various substances according to different time periods (in %).
Table 1: The consumption of various substances according to different time periods for the whole sample (in %).
Cigarettes Alcohol Cannabis Heroin Cocaine Amphetamines, LSD, ecstasy, new synthetic drugs
Stimulants
Never 68.5 32.5 80.1 96.9 95.5 96.4 86.4
At least once
16.4 5.9 9.1 / 2.3 3.1 5.9
In the past 12 months
5.9 19.2 5.9 3.1 2.2 0.5 2.7
In the past 30 days
1.4 21.5 1.8 / / / 1.8
In the past week
2.7 17.4 1.4 / / / 1.8
Every day 4.6 0.9 1.7 / / / 1.4
31.5% of respondents tried smoking or smoked cigarettes at least once in their life; whereas, 4.6% respondents reported smoking on a daily basis. From the listed substances, most of the respondents reported to have tried alcohol (67.5%), of which 21.5% tried alcohol in the last month. 19.9% of the respondents tried cannabis, but 9.1% reported that this was a one-time event. 13.6% of the respondents tried stimulants, but 5.9% reported that this was a one-time event. The respondents least often tried heroin (3.1%), cocaine (4.5%), and amphetamines, LSD, new synthetic drugs (3.6%).
Smoking cigarettes was most frequently reported by judoists (41.10%), handball players (39.90%), karateists (24.50%), all-around athletes (23.50%), and less frequently by swimmers (7.47%). Judoists (78.78%), handball players (65.97%), all-around athletes (57.48%), and last swimmers (45.93%) have most frequently reported to have tried alcohol at some point in their lives. Judoists (33.33%), handball players (30.65%), karateists (25.07%), swimmer (14.83%), and last all-around athletes (11.96%) have most frequently reported to have tried smoking cannabis at some point in their lives.
We have found some positive correlations between cigarette smoking and alcohol consumption (r=0.260; p<0.01), between cigarette and cannabis smoking (r=0.538; p<0.01), between alcohol consumption and the statement from the respondents about alcohol consumption among their friends (r=583; p<0.01). Between the statement from the respondents about alcohol consumption among their friends (r=617; p<0.01), and alcohol consumption and statement from the respondents about cigarette smoking among their friends (r=0,603; p<0.01). High correlation can also be observed between amphetamine, cocaine and heroin consumption (from r=706 to r=816; p<0.01). Some correlations are also shown in Figure 1.
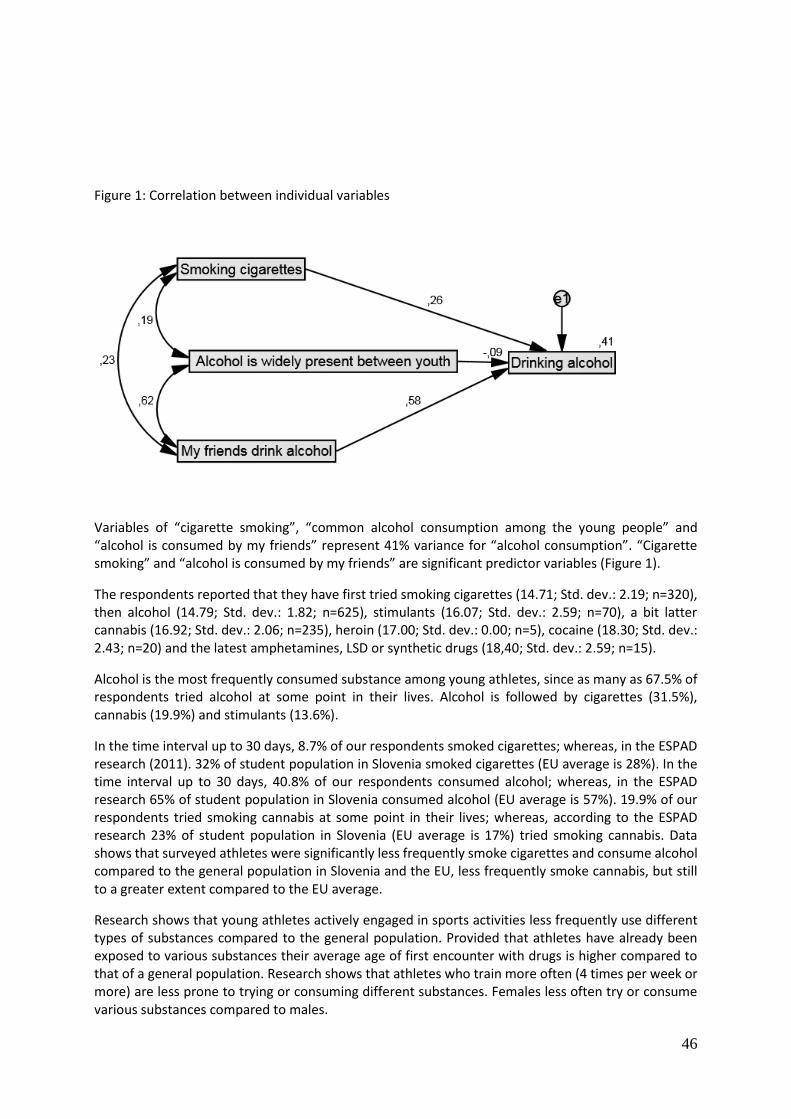
46
Figure 1: Correlation between individual variables
Variables of “cigarette smoking”, “common alcohol consumption among the young people” and “alcohol is consumed by my friends” represent 41% variance for “alcohol consumption”. “Cigarette smoking” and “alcohol is consumed by my friends” are significant predictor variables (Figure 1).
The respondents reported that they have first tried smoking cigarettes (14.71; Std. dev.: 2.19; n=320), then alcohol (14.79; Std. dev.: 1.82; n=625), stimulants (16.07; Std. dev.: 2.59; n=70), a bit latter cannabis (16.92; Std. dev.: 2.06; n=235), heroin (17.00; Std. dev.: 0.00; n=5), cocaine (18.30; Std. dev.: 2.43; n=20) and the latest amphetamines, LSD or synthetic drugs (18,40; Std. dev.: 2.59; n=15).
Alcohol is the most frequently consumed substance among young athletes, since as many as 67.5% of respondents tried alcohol at some point in their lives. Alcohol is followed by cigarettes (31.5%), cannabis (19.9%) and stimulants (13.6%).
In the time interval up to 30 days, 8.7% of our respondents smoked cigarettes; whereas, in the ESPAD research (2011). 32% of student population in Slovenia smoked cigarettes (EU average is 28%). In the time interval up to 30 days, 40.8% of our respondents consumed alcohol; whereas, in the ESPAD research 65% of student population in Slovenia consumed alcohol (EU average is 57%). 19.9% of our respondents tried smoking cannabis at some point in their lives; whereas, according to the ESPAD research 23% of student population in Slovenia (EU average is 17%) tried smoking cannabis. Data shows that surveyed athletes were significantly less frequently smoke cigarettes and consume alcohol compared to the general population in Slovenia and the EU, less frequently smoke cannabis, but still to a greater extent compared to the EU average.
Research shows that young athletes actively engaged in sports activities less frequently use different types of substances compared to the general population. Provided that athletes have already been exposed to various substances their average age of first encounter with drugs is higher compared to that of a general population. Research shows that athletes who train more often (4 times per week or more) are less prone to trying or consuming different substances. Females less often try or consume various substances compared to males.
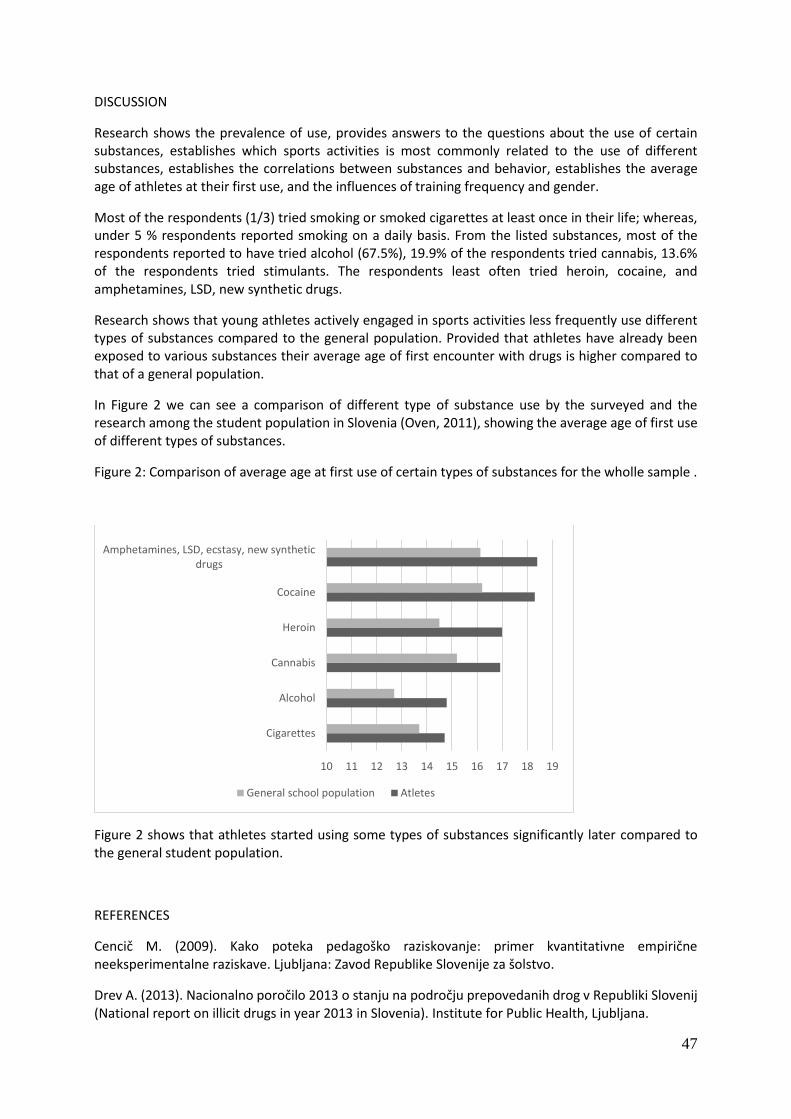
47
DISCUSSION
Research shows the prevalence of use, provides answers to the questions about the use of certain substances, establishes which sports activities is most commonly related to the use of different substances, establishes the correlations between substances and behavior, establishes the average age of athletes at their first use, and the influences of training frequency and gender.
Most of the respondents (1/3) tried smoking or smoked cigarettes at least once in their life; whereas, under 5 % respondents reported smoking on a daily basis. From the listed substances, most of the respondents reported to have tried alcohol (67.5%), 19.9% of the respondents tried cannabis, 13.6% of the respondents tried stimulants. The respondents least often tried heroin, cocaine, and amphetamines, LSD, new synthetic drugs.
Research shows that young athletes actively engaged in sports activities less frequently use different types of substances compared to the general population. Provided that athletes have already been exposed to various substances their average age of first encounter with drugs is higher compared to that of a general population.
In Figure 2 we can see a comparison of different type of substance use by the surveyed and the research among the student population in Slovenia (Oven, 2011), showing the average age of first use of different types of substances.
Figure 2: Comparison of average age at first use of certain types of substances for the wholle sample .
Figure 2 shows that athletes started using some types of substances significantly later compared to the general student population.
REFERENCES
Cencič M. (2009). Kako poteka pedagoško raziskovanje: primer kvantitativne empirične neeksperimentalne raziskave. Ljubljana: Zavod Republike Slovenije za šolstvo.
Drev A. (2013). Nacionalno poročilo 2013 o stanju na področju prepovedanih drog v Republiki Slovenij (National report on illicit drugs in year 2013 in Slovenia). Institute for Public Health, Ljubljana.
10 11 12 13 14 15 16 17 18 19
Cigarettes
Alcohol
Cannabis
Heroin
Cocaine
Amphetamines, LSD, ecstasy, new syntheticdrugs
General school population Atletes
48
European Monitoring Centre for Drugs and Drug Addiction. 2011 report – Slovenia. Available from: http://www.espad.org/slovenia# . Accessed: June 15.2015.
Kingsland M., Wolfenden L., Tindall J., Rowland B., Sidey M., McElduff P., Wiggers J.H. (2015). Improving the implementation of responsible alcohol management practices by community sporting clubs: A randomised controlled trial. Drug and Alcohol review. 34(4): 447-457.
Morente-Sanchez J., Friere-SantaCruz C., Mateo-March M., Zabala M. (2015). Attitude towards doping in Spanish Sport Sciences university students according to the type of sport practised: Individual versus team sports. Science/Sports. 30(2): 96-100.
Neale J., Nettleton S., Pickering L. (2012). Heroin usersꞌ views and experiences of physical activity, sport and exercise. Int j drug policy. 23:120-127.
Oven M. (2011). Uporaba drog med šolsko populacijo v Mestni občini Nova Gorica. (Drug use between school populations in Nova Gorica, Slovenia). Dissertation.
Usher K., Jackson D., O’Brien L. (2005). Adolescent drug abuse: Helping families survive. International journal of mental health nursing. 14(3): 209-214.
49
EFFECTS OF IN-SEASON STRENGTH TRAINING IN MALE AD FEMALE YOUTH VOLLEYBALL
Gubellini, L.1, Sfregola, A.2, Merni, F.1
1 University of Bologna, Department of Biomedical and Neuromotor Sciences, Italy
2 University of Bologna, Shool of Pharmacy, Biotechnology and Sport Sciences, Italy
ABSTRACT This study aimed to compare the effects of in-season strength training in male compared to female youth volleyball players. 10 male and 13 female volleyball players performed a physical testing battery (CMJ; throwing medicine balls (weight 1, 2, 3 kg); Sit and Reach; Agility T-test). Males showed increase of CMJ and medicine ball. Female showed improvement in agility test. The present findings demonstrate that youth male and female volleyball players show partially different responses. Key words: Volleyball; Explosive strength; countermovement jump; agility T-test INTRODUCTION Modern volleyball is a team game and very dynamic, requiring the body to a higher level both physically and mentally. (Benedek 2012). A strength training allows the anatomical adaptation of the musculoskeletal system, considered important for the prevention of accidents (Herodek and Simonovic 2013). Male and female teams with better jumping ability rank better than those with lower capacity, while the capacity of agility and speed are decisive for females since the 14-15 years (Katic et al. 2006). The power (the ability to apply force at full speed), responsiveness and agility (the ability to change direction while maintaining the balance) are crucial athletic abilities for the physical performance in volleyball (Lidor and Ziv 2010) This study aimed to compare the effects of in-season strength training in male compared to female youth volleyball players on the Power, Agility and Flexibility performances. METHODS: Ten male (15.3±0.4 yrs, 177.5±6.7 cm, 69.1±14 kg) and thirteen female (15.1±0.3 yrs, 168.7±7.3 cm, 63.5±9.6 kg) volleyball players have been evaluated with anthropometric measurements and testing during the course of the season. The test session started at the beginning of the season (September) and was repeated every four months throughout the season (January, April, June). Anthropometric measurements including height, weight, and skinfolds, which allowed the calculation of the fat and fat free mass with the of Jackson & Pollock method. The battery included the following tests: Countermovement jump (CMJ) and CMJ+A with arm swing, executed with Bosco’s methods. It is measured in cm. The CMJ was executed with hands at his hips, in the CMJ+A the arms are swung.
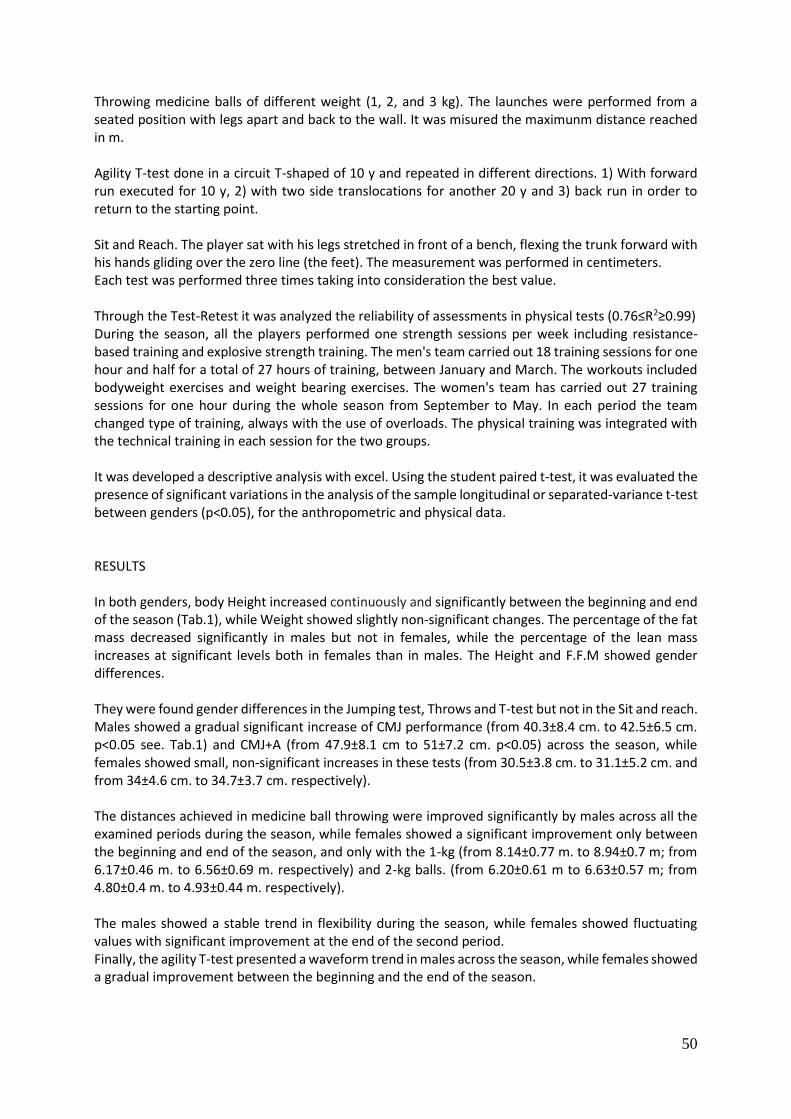
50
Throwing medicine balls of different weight (1, 2, and 3 kg). The launches were performed from a seated position with legs apart and back to the wall. It was misured the maximunm distance reached in m. Agility T-test done in a circuit T-shaped of 10 y and repeated in different directions. 1) With forward run executed for 10 y, 2) with two side translocations for another 20 y and 3) back run in order to return to the starting point. Sit and Reach. The player sat with his legs stretched in front of a bench, flexing the trunk forward with his hands gliding over the zero line (the feet). The measurement was performed in centimeters. Each test was performed three times taking into consideration the best value. Through the Test-Retest it was analyzed the reliability of assessments in physical tests (0.76≤R2≥0.99) During the season, all the players performed one strength sessions per week including resistance-based training and explosive strength training. The men's team carried out 18 training sessions for one hour and half for a total of 27 hours of training, between January and March. The workouts included bodyweight exercises and weight bearing exercises. The women's team has carried out 27 training sessions for one hour during the whole season from September to May. In each period the team changed type of training, always with the use of overloads. The physical training was integrated with the technical training in each session for the two groups. It was developed a descriptive analysis with excel. Using the student paired t-test, it was evaluated the presence of significant variations in the analysis of the sample longitudinal or separated-variance t-test between genders (p<0.05), for the anthropometric and physical data. RESULTS In both genders, body Height increased continuously and significantly between the beginning and end of the season (Tab.1), while Weight showed slightly non-significant changes. The percentage of the fat mass decreased significantly in males but not in females, while the percentage of the lean mass increases at significant levels both in females than in males. The Height and F.F.M showed gender differences. They were found gender differences in the Jumping test, Throws and T-test but not in the Sit and reach. Males showed a gradual significant increase of CMJ performance (from 40.3±8.4 cm. to 42.5±6.5 cm. p<0.05 see. Tab.1) and CMJ+A (from 47.9±8.1 cm to 51±7.2 cm. p<0.05) across the season, while females showed small, non-significant increases in these tests (from 30.5±3.8 cm. to 31.1±5.2 cm. and from 34±4.6 cm. to 34.7±3.7 cm. respectively). The distances achieved in medicine ball throwing were improved significantly by males across all the examined periods during the season, while females showed a significant improvement only between the beginning and end of the season, and only with the 1-kg (from 8.14±0.77 m. to 8.94±0.7 m; from 6.17±0.46 m. to 6.56±0.69 m. respectively) and 2-kg balls. (from 6.20±0.61 m to 6.63±0.57 m; from 4.80±0.4 m. to 4.93±0.44 m. respectively). The males showed a stable trend in flexibility during the season, while females showed fluctuating values with significant improvement at the end of the second period. Finally, the agility T-test presented a waveform trend in males across the season, while females showed a gradual improvement between the beginning and the end of the season.
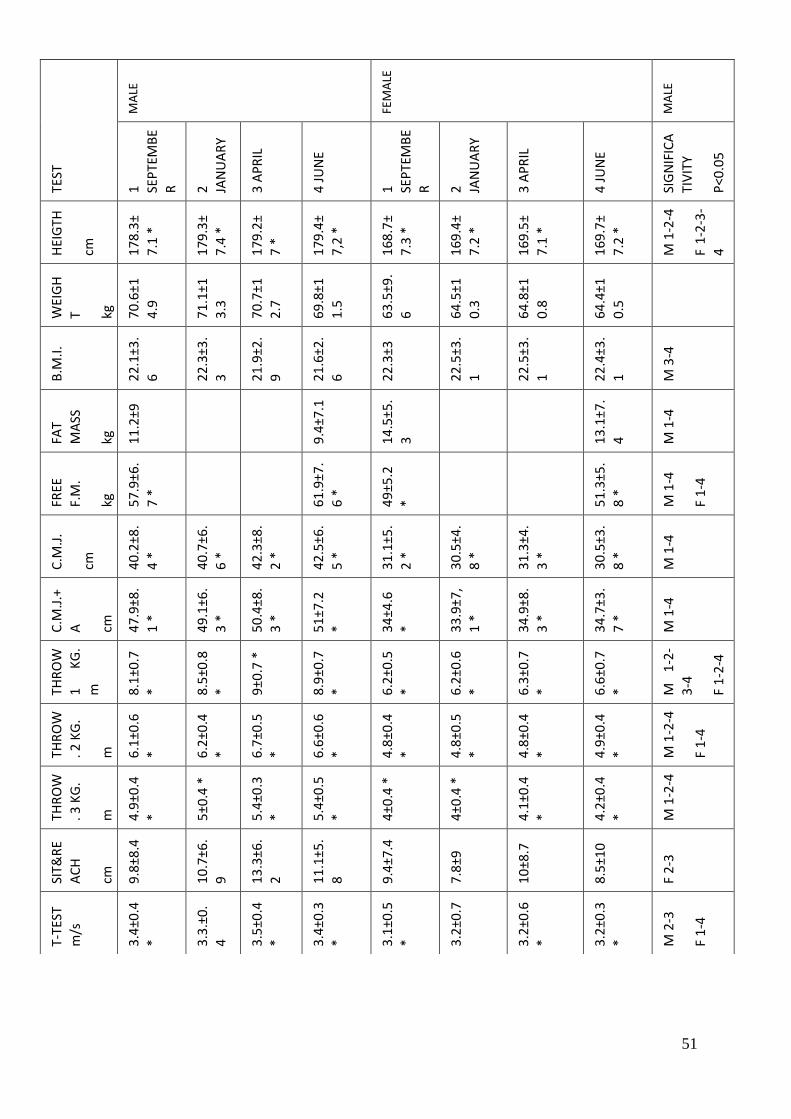
51
TEST
MA
LE
FEM
ALE
MA
LE
1
SEP
TEM
BE
R
2
JAN
UA
RY
3 A
PR
IL
4 J
UN
E
1
SEP
TEM
BE
R
2
JAN
UA
RY
3 A
PR
IL
4 J
UN
E
SIG
NIF
ICA
TIV
ITY
P<0
.05
HEI
GTH
cm
17
8.3
±
7.1
*
17
9.3
±
7.4
*
17
9.2
±
7 *
17
9.4
±
7,2
*
16
8.7
±
7.3
*
16
9.4
±
7.2
*
16
9.5
±
7.1
*
16
9.7
±
7.2
*
M 1
-2-4
F 1
-2-3
-
4
WEI
GH
T
kg
70
.6±1
4.9
71
.1±1
3.3
70
.7±1
2.7
69
.8±1
1.5
63
.5±9
.
6
64
.5±1
0.3
64
.8±1
0.8
64
.4±1
0.5
B.M
.I.
22
.1±3
.
6
22
.3±3
.
3
21
.9±2
.
9
21
.6±2
.
6
22
.3±3
22
.5±3
.
1
22
.5±3
.
1
22
.4±3
.
1
M 3
-4
FAT
MA
SS
kg
11
.2±9
9.4
±7.1
14
.5±5
.
3 13
.1±7
.
4 M 1
-4
FREE
F.M
.
kg
57
.9±6
.
7 *
61
.9±7
.
6 *
49
±5.2
* 51
.3±5
.
8 *
M 1
-4
F 1
-4
C.M
.J.
cm
40
.2±8
.
4 *
40
.7±6
.
6 *
42
.3±8
.
2 *
42
.5±6
.
5 *
31
.1±5
.
2 *
30
.5±4
.
8 *
31
.3±4
.
3 *
30
.5±3
.
8 *
M 1
-4
C.M
.J.+
A
cm
47
.9±8
.
1 *
49
.1±6
.
3 *
50
.4±8
.
3 *
51
±7.2
* 34
±4.6
* 33
.9±7
,
1 *
34
.9±8
.
3 *
34
.7±3
.
7 *
M 1
-4
THR
OW
1
KG
.
m
8.1
±0.7
* 8.5
±0.8
* 9±0
.7 *
8.9
±0.7
* 6.2
±0.5
* 6.2
±0.6
* 6.3
±0.7
*
6.6
±0.7
* M
1-2
-
3-4
F 1
-2-4
THR
OW
. 2 K
G.
m
6.1
±0.6
*
6.2
±0.4
*
6.7
±0.5
*
6.6
±0.6
*
4.8
±0.4
*
4.8
±0.5
*
4.8
±0.4
*
4.9
±0.4
*
M 1
-2-4
F 1
-4
THR
OW
. 3 K
G.
m
4.9
±0.4
* 5±0
.4 *
5.4
±0.3
* 5.4
±0.5
* 4±0
.4 *
4±0
.4 *
4.1
±0.4
* 4.2
±0.4
* M 1
-2-4
SIT&
RE
AC
H
cm
9.8
±8.4
10
.7±6
.
9 13
.3±6
.
2 11
.1±5
.
8 9.4
±7.4
7.8
±9
10
±8.7
8.5
±10
F 2
-3
T-TE
ST
m/s
3.4
±0.4
* 3.3
.±0
.
4
3.5
±0.4
* 3.4
±0.3
* 3.1
±0.5
* 3.2
±0.7
3.2
±0.6
* 3.2
±0.3
* M 2
-3
F 1
-4

52
CONCLUSION
In conclusion, the present findings demonstrate that youth male and female volleyball players show partially different responses to similar strength training programs during the season, probably due to a different responsiveness to training linked to hormonal processes. According to Lidor and Ziv (2010), it is very important to increase the vertical jumping ability, a factor that distinguishes the fundamental attachment and wall. Females despite the physical conditioning, did not show significant improvements in elevation, suggesting that the loads used were not sufficient, or that strength training has been diluted during the season. The males showed the greater improvement in CMJ+A test that most follows the execution of technical movements. The men's team showed good subsequent response to strength of the upper limbs, with obvious improvements with the three weights used in the test. Females are only improved with lighter weights confirming the diversified responses in the two kinds of strength training (Speed strength and Power). The speed strength of the upper limbs can be important in fundamental serving and attack. Even the improved figures for T-test according to Katic et al. (2006) have shown, however, diversified trend in the two genders. REFERENCES Benedek, F. (2012). Study Regarding Importance Of Plyometric Training In Developing The Jump For Volleyball Players – Juniors I. Gymnasium- Scientific Journal of Education, Sports, and Health, n. 2, volume XIII , 177-187 Herodek, K. & Simonović, C. (2013). Strength Development Of Children And Yung Athletes. APES- Activities in Physical Education and Sport, Federation of the Sports Pedagogues of the Republic of Macedonia, volume 3, n.1, 82- 84 Katić R., Grgantov Z. and Jurko D. (2006). Motor Structures in Female Volleyball Players Aged 14–17 According to Technique Quality and Performance. Collegium Antropologicum. volume 30, n.1, 103–112 Lidor, R. e Ziv, G. (2010). Physical Characteristics and Physiological Attributes of Adolescent Volleyball Players—A Review. Pediatric Exercise Science, Human Kinetics, volume 22, 114-134 Jackson A. e Pollock M. 1985, “Practical assessment of body composition”, The physician and sportsmedicine volume 13 issue 5
53
THE EFFECTS OF PHYSICAL ACTIVITY ON HEALTH AND LEARNING OUTCOMES AMONG SECONDARY SCHOOL PUPILS
Johansson, L., Ruud, E.
Norwegian Knowledge Center for Education, The Research Council of Norway, Oslo, Norway.
This paper reports from a systematic review on the effects of physical activity on health and learning variables in secondary schools. Following established literature search procedures and quality assessment of the research literature according to systematic review standards, 30 primary studies and nine review-articles were included in the systematic review. The included primary studies showed great heterogeneity, both in relation to how physical activity is defined and how the various outcome variables are measured. Based on these observations, and the great variability in study designs, it was concluded that a meta-analysis could not be conducted. Instead, a qualitative synthesis was conducted, where the studies were examined side-by-side to identify common features and themes across the studies. A number of outcome variables on physical health showed small but significant effects. On the other hand, the effects on and correlations between physical activity and outcome variables related to mental health, learning outcomes and learning environments were generally small, contradictory, or simply non-existing. Thus, it is impossible to pin out a specifically effective physical activity on other outcomes than physical health. However, the synthesis shed light on key aspects that seem to be of importance in relation to how the physical activity is designed and conducted. As long as the physical activity is designed to increase physical fitness, the actual nature of the activity seems to be of less importance. In general, activities that encourage social relations or include team-based activities are more likely to be successful. Often, there is an explicit or inherent pre-assumption in the literature that physical activity has positive effects on learning outcomes and other school related variables. The results from the systematic review are inconclusive on this point. This paper highlights this issue and raise questions why a positive effect on physical health seldom is acknowledged as an end-point in its own right.
Keywords: Physical activity, physical health, mental health, learning outcomes, learning environment, secondary school, systematic review.
INTRODUCTION This paper is based on a systematic review on the effects of physical activity (PA) on youth on four different overarching outcomes: physical health, mental health, learning environment and learning (Lillejord, Vågan, Johansson, Børte & Ruud 2016). The review finds convincing effects of PA on physical health, and variables concerning for example BMI, blood pressure and anthropometry. However, the review struggles to find effects on and correlations with the other outcomes, and especially on those related to learning. This despite the often intuitive belief and the explicit hypotheses in many studies (see for example Corder et al. 2015) that PA improves school performance. First, the method of the systematic review is described and with explanations how the specific articles were identified, with regards to relevance and quality. The method for the sub-review is then shortly presented. Further, the six studies identified in accordance with the question of the sub-review are described with special emphasis on the results. Finally, the so-called quest for elusive effects is discussed; highlighting reasons why it might be difficult to identify conclusive effects of PA on learning and thus, the need for more research on specific is issues are emphasized.
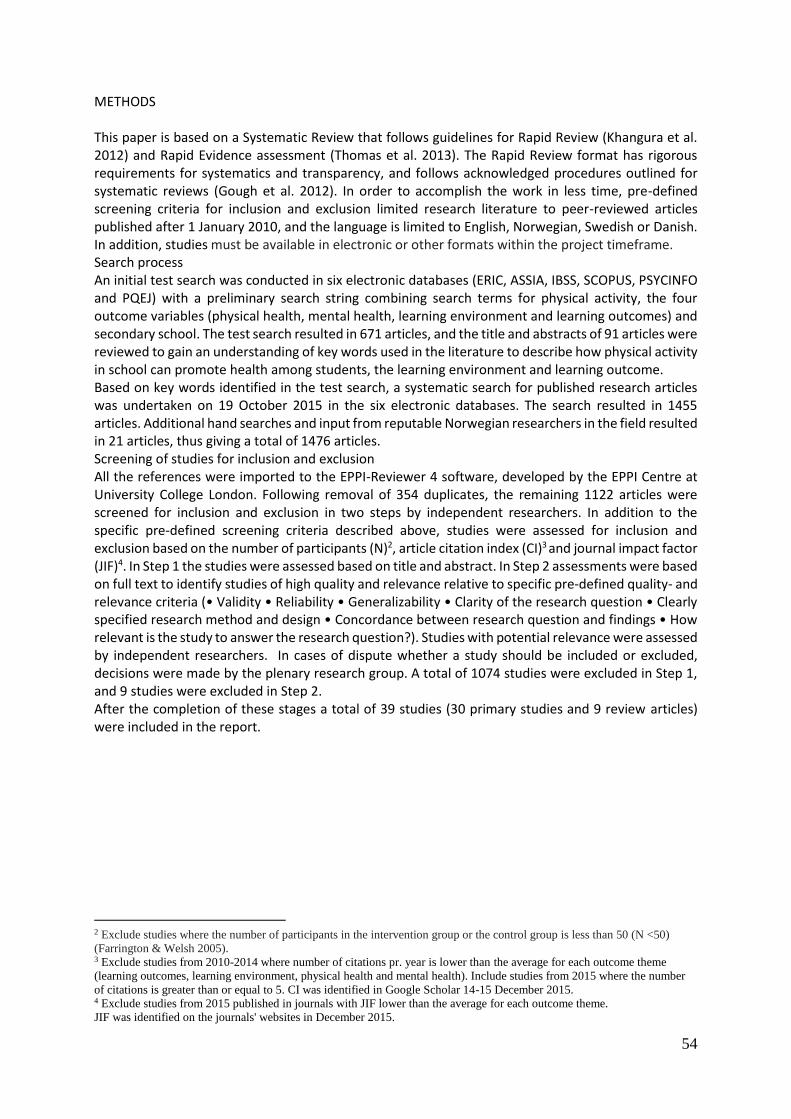
54
METHODS This paper is based on a Systematic Review that follows guidelines for Rapid Review (Khangura et al. 2012) and Rapid Evidence assessment (Thomas et al. 2013). The Rapid Review format has rigorous requirements for systematics and transparency, and follows acknowledged procedures outlined for systematic reviews (Gough et al. 2012). In order to accomplish the work in less time, pre-defined screening criteria for inclusion and exclusion limited research literature to peer-reviewed articles published after 1 January 2010, and the language is limited to English, Norwegian, Swedish or Danish. In addition, studies must be available in electronic or other formats within the project timeframe. Search process An initial test search was conducted in six electronic databases (ERIC, ASSIA, IBSS, SCOPUS, PSYCINFO and PQEJ) with a preliminary search string combining search terms for physical activity, the four outcome variables (physical health, mental health, learning environment and learning outcomes) and secondary school. The test search resulted in 671 articles, and the title and abstracts of 91 articles were reviewed to gain an understanding of key words used in the literature to describe how physical activity in school can promote health among students, the learning environment and learning outcome. Based on key words identified in the test search, a systematic search for published research articles was undertaken on 19 October 2015 in the six electronic databases. The search resulted in 1455 articles. Additional hand searches and input from reputable Norwegian researchers in the field resulted in 21 articles, thus giving a total of 1476 articles. Screening of studies for inclusion and exclusion All the references were imported to the EPPI-Reviewer 4 software, developed by the EPPI Centre at University College London. Following removal of 354 duplicates, the remaining 1122 articles were screened for inclusion and exclusion in two steps by independent researchers. In addition to the specific pre-defined screening criteria described above, studies were assessed for inclusion and exclusion based on the number of participants (N)2, article citation index (CI)3 and journal impact factor (JIF)4. In Step 1 the studies were assessed based on title and abstract. In Step 2 assessments were based on full text to identify studies of high quality and relevance relative to specific pre-defined quality- and relevance criteria (• Validity • Reliability • Generalizability • Clarity of the research question • Clearly specified research method and design • Concordance between research question and findings • How relevant is the study to answer the research question?). Studies with potential relevance were assessed by independent researchers. In cases of dispute whether a study should be included or excluded, decisions were made by the plenary research group. A total of 1074 studies were excluded in Step 1, and 9 studies were excluded in Step 2. After the completion of these stages a total of 39 studies (30 primary studies and 9 review articles) were included in the report.
2 Exclude studies where the number of participants in the intervention group or the control group is less than 50 (N <50)
(Farrington & Welsh 2005). 3 Exclude studies from 2010-2014 where number of citations pr. year is lower than the average for each outcome theme
(learning outcomes, learning environment, physical health and mental health). Include studies from 2015 where the number
of citations is greater than or equal to 5. CI was identified in Google Scholar 14-15 December 2015. 4 Exclude studies from 2015 published in journals with JIF lower than the average for each outcome theme.
JIF was identified on the journals' websites in December 2015.
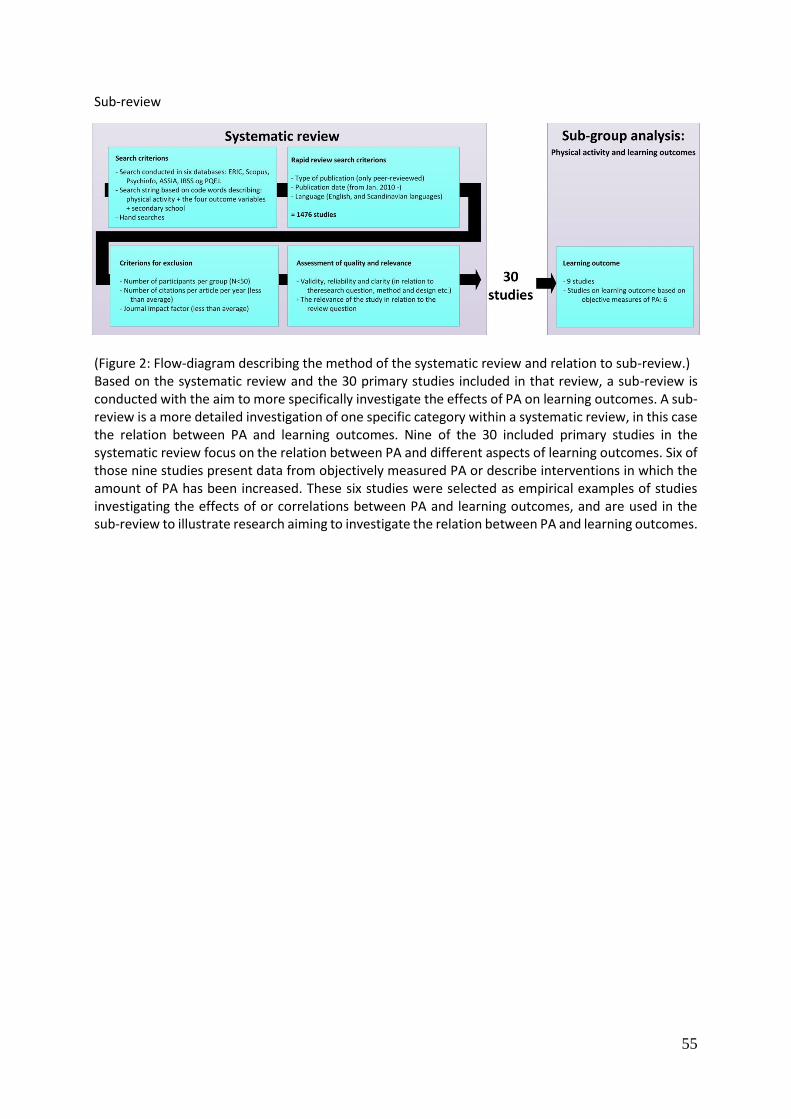
55
Sub-review
(Figure 2: Flow-diagram describing the method of the systematic review and relation to sub-review.) Based on the systematic review and the 30 primary studies included in that review, a sub-review is conducted with the aim to more specifically investigate the effects of PA on learning outcomes. A sub-review is a more detailed investigation of one specific category within a systematic review, in this case the relation between PA and learning outcomes. Nine of the 30 included primary studies in the systematic review focus on the relation between PA and different aspects of learning outcomes. Six of those nine studies present data from objectively measured PA or describe interventions in which the amount of PA has been increased. These six studies were selected as empirical examples of studies investigating the effects of or correlations between PA and learning outcomes, and are used in the sub-review to illustrate research aiming to investigate the relation between PA and learning outcomes.
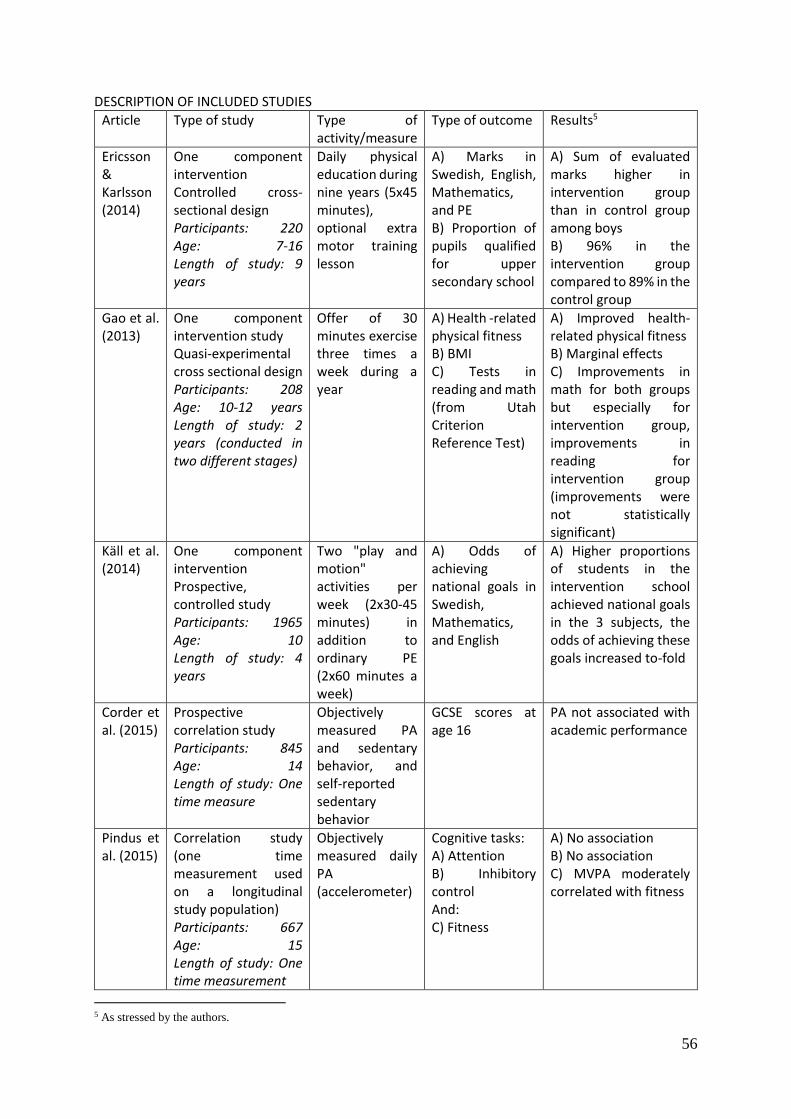
56
DESCRIPTION OF INCLUDED STUDIES
Article Type of study Type of activity/measure
Type of outcome Results5
Ericsson & Karlsson (2014)
One component intervention Controlled cross-sectional design Participants: 220 Age: 7-16 Length of study: 9 years
Daily physical education during nine years (5x45 minutes), optional extra motor training lesson
A) Marks in Swedish, English, Mathematics, and PE B) Proportion of pupils qualified for upper secondary school
A) Sum of evaluated marks higher in intervention group than in control group among boys B) 96% in the intervention group compared to 89% in the control group
Gao et al. (2013)
One component intervention study Quasi-experimental cross sectional design Participants: 208 Age: 10-12 years Length of study: 2 years (conducted in two different stages)
Offer of 30 minutes exercise three times a week during a year
A) Health -related physical fitness B) BMI C) Tests in reading and math (from Utah Criterion Reference Test)
A) Improved health-related physical fitness B) Marginal effects C) Improvements in math for both groups but especially for intervention group, improvements in reading for intervention group (improvements were not statistically significant)
Käll et al. (2014)
One component intervention Prospective, controlled study Participants: 1965 Age: 10 Length of study: 4 years
Two "play and motion" activities per week (2x30-45 minutes) in addition to ordinary PE (2x60 minutes a week)
A) Odds of achieving national goals in Swedish, Mathematics, and English
A) Higher proportions of students in the intervention school achieved national goals in the 3 subjects, the odds of achieving these goals increased to-fold
Corder et al. (2015)
Prospective correlation study Participants: 845 Age: 14 Length of study: One time measure
Objectively measured PA and sedentary behavior, and self-reported sedentary behavior
GCSE scores at age 16
PA not associated with academic performance
Pindus et al. (2015)
Correlation study (one time measurement used on a longitudinal study population) Participants: 667 Age: 15 Length of study: One time measurement
Objectively measured daily PA (accelerometer)
Cognitive tasks: A) Attention B) Inhibitory control And: C) Fitness
A) No association B) No association C) MVPA moderately correlated with fitness
5 As stressed by the authors.
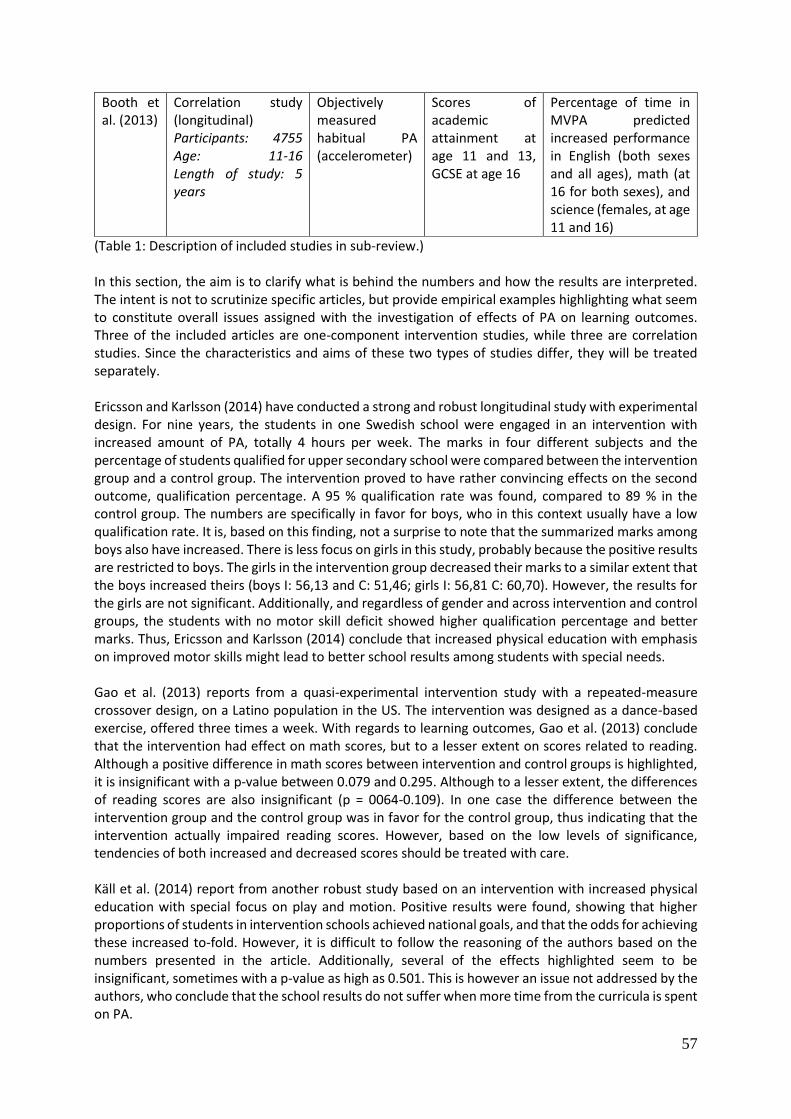
57
Booth et al. (2013)
Correlation study (longitudinal) Participants: 4755 Age: 11-16 Length of study: 5 years
Objectively measured habitual PA (accelerometer)
Scores of academic attainment at age 11 and 13, GCSE at age 16
Percentage of time in MVPA predicted increased performance in English (both sexes and all ages), math (at 16 for both sexes), and science (females, at age 11 and 16)
(Table 1: Description of included studies in sub-review.) In this section, the aim is to clarify what is behind the numbers and how the results are interpreted. The intent is not to scrutinize specific articles, but provide empirical examples highlighting what seem to constitute overall issues assigned with the investigation of effects of PA on learning outcomes. Three of the included articles are one-component intervention studies, while three are correlation studies. Since the characteristics and aims of these two types of studies differ, they will be treated separately. Ericsson and Karlsson (2014) have conducted a strong and robust longitudinal study with experimental design. For nine years, the students in one Swedish school were engaged in an intervention with increased amount of PA, totally 4 hours per week. The marks in four different subjects and the percentage of students qualified for upper secondary school were compared between the intervention group and a control group. The intervention proved to have rather convincing effects on the second outcome, qualification percentage. A 95 % qualification rate was found, compared to 89 % in the control group. The numbers are specifically in favor for boys, who in this context usually have a low qualification rate. It is, based on this finding, not a surprise to note that the summarized marks among boys also have increased. There is less focus on girls in this study, probably because the positive results are restricted to boys. The girls in the intervention group decreased their marks to a similar extent that the boys increased theirs (boys I: 56,13 and C: 51,46; girls I: 56,81 C: 60,70). However, the results for the girls are not significant. Additionally, and regardless of gender and across intervention and control groups, the students with no motor skill deficit showed higher qualification percentage and better marks. Thus, Ericsson and Karlsson (2014) conclude that increased physical education with emphasis on improved motor skills might lead to better school results among students with special needs. Gao et al. (2013) reports from a quasi-experimental intervention study with a repeated-measure crossover design, on a Latino population in the US. The intervention was designed as a dance-based exercise, offered three times a week. With regards to learning outcomes, Gao et al. (2013) conclude that the intervention had effect on math scores, but to a lesser extent on scores related to reading. Although a positive difference in math scores between intervention and control groups is highlighted, it is insignificant with a p-value between 0.079 and 0.295. Although to a lesser extent, the differences of reading scores are also insignificant (p = 0064-0.109). In one case the difference between the intervention group and the control group was in favor for the control group, thus indicating that the intervention actually impaired reading scores. However, based on the low levels of significance, tendencies of both increased and decreased scores should be treated with care. Käll et al. (2014) report from another robust study based on an intervention with increased physical education with special focus on play and motion. Positive results were found, showing that higher proportions of students in intervention schools achieved national goals, and that the odds for achieving these increased to-fold. However, it is difficult to follow the reasoning of the authors based on the numbers presented in the article. Additionally, several of the effects highlighted seem to be insignificant, sometimes with a p-value as high as 0.501. This is however an issue not addressed by the authors, who conclude that the school results do not suffer when more time from the curricula is spent on PA.
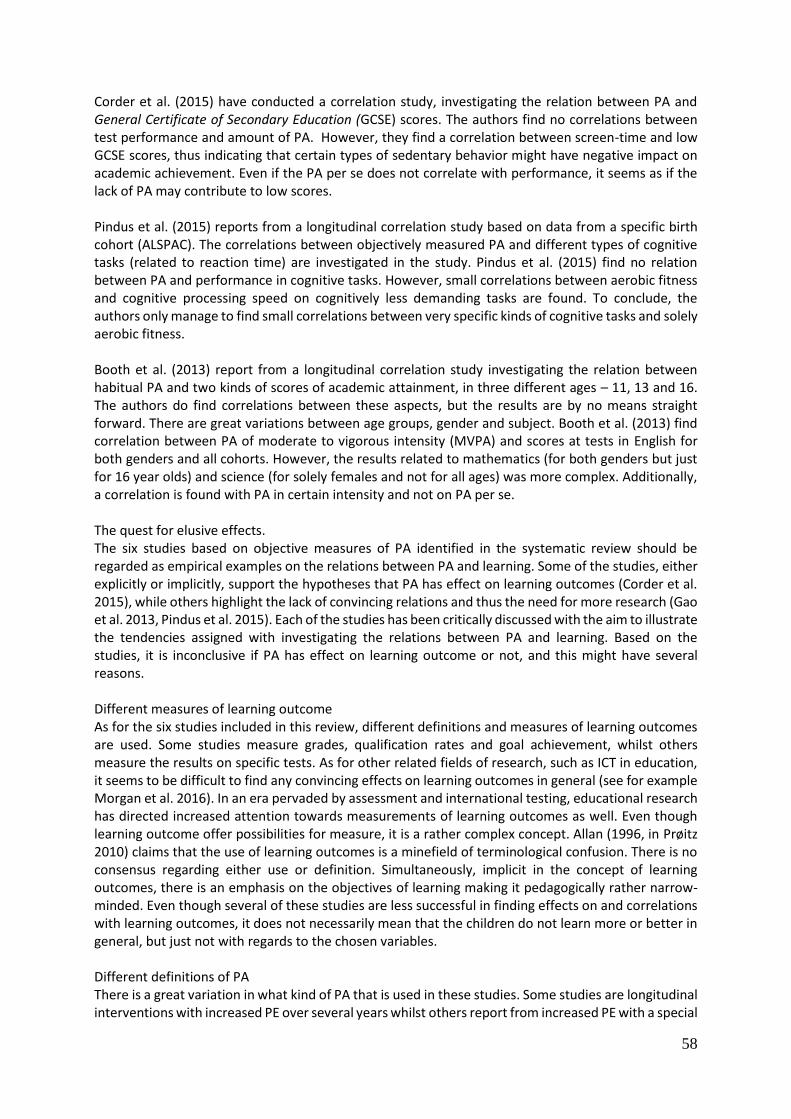
58
Corder et al. (2015) have conducted a correlation study, investigating the relation between PA and General Certificate of Secondary Education (GCSE) scores. The authors find no correlations between test performance and amount of PA. However, they find a correlation between screen-time and low GCSE scores, thus indicating that certain types of sedentary behavior might have negative impact on academic achievement. Even if the PA per se does not correlate with performance, it seems as if the lack of PA may contribute to low scores. Pindus et al. (2015) reports from a longitudinal correlation study based on data from a specific birth cohort (ALSPAC). The correlations between objectively measured PA and different types of cognitive tasks (related to reaction time) are investigated in the study. Pindus et al. (2015) find no relation between PA and performance in cognitive tasks. However, small correlations between aerobic fitness and cognitive processing speed on cognitively less demanding tasks are found. To conclude, the authors only manage to find small correlations between very specific kinds of cognitive tasks and solely aerobic fitness. Booth et al. (2013) report from a longitudinal correlation study investigating the relation between habitual PA and two kinds of scores of academic attainment, in three different ages – 11, 13 and 16. The authors do find correlations between these aspects, but the results are by no means straight forward. There are great variations between age groups, gender and subject. Booth et al. (2013) find correlation between PA of moderate to vigorous intensity (MVPA) and scores at tests in English for both genders and all cohorts. However, the results related to mathematics (for both genders but just for 16 year olds) and science (for solely females and not for all ages) was more complex. Additionally, a correlation is found with PA in certain intensity and not on PA per se. The quest for elusive effects. The six studies based on objective measures of PA identified in the systematic review should be regarded as empirical examples on the relations between PA and learning. Some of the studies, either explicitly or implicitly, support the hypotheses that PA has effect on learning outcomes (Corder et al. 2015), while others highlight the lack of convincing relations and thus the need for more research (Gao et al. 2013, Pindus et al. 2015). Each of the studies has been critically discussed with the aim to illustrate the tendencies assigned with investigating the relations between PA and learning. Based on the studies, it is inconclusive if PA has effect on learning outcome or not, and this might have several reasons. Different measures of learning outcome As for the six studies included in this review, different definitions and measures of learning outcomes are used. Some studies measure grades, qualification rates and goal achievement, whilst others measure the results on specific tests. As for other related fields of research, such as ICT in education, it seems to be difficult to find any convincing effects on learning outcomes in general (see for example Morgan et al. 2016). In an era pervaded by assessment and international testing, educational research has directed increased attention towards measurements of learning outcomes as well. Even though learning outcome offer possibilities for measure, it is a rather complex concept. Allan (1996, in Prøitz 2010) claims that the use of learning outcomes is a minefield of terminological confusion. There is no consensus regarding either use or definition. Simultaneously, implicit in the concept of learning outcomes, there is an emphasis on the objectives of learning making it pedagogically rather narrow-minded. Even though several of these studies are less successful in finding effects on and correlations with learning outcomes, it does not necessarily mean that the children do not learn more or better in general, but just not with regards to the chosen variables. Different definitions of PA There is a great variation in what kind of PA that is used in these studies. Some studies are longitudinal interventions with increased PE over several years whilst others report from increased PE with a special
59
emphasis on certain physical skills. The correlation studies measure amount of PA activity with an accelerometer, over different periods of time. Additionally, while some studies investigate certain skills others measure different intensity of PA. The variation makes it difficult to compare the results of the studies, and to conclude comprehensively. Group differences Booth et al. (2013) study highlights the difficulties with investigating the impact of PA and learning outcomes – even if some effects and correlations are found, they are often so specific with regards to either age or gender, or subject, or intensity and type of PA. When positive effects are found for the marks among boys, negative effects are found for girls. The scattered results make it difficult to decide whether there really are any effects of PA on learning outcomes in general, and thus how eventual effects can be interpreted. Wrong point of departure? Based on this sub-review of a systematic review, it is as bold to conclude that PA has effect on learning outcome as it would be to conclude the opposite. Although this contradicts the intuitive belief, the lack of conclusive effects seems to be in line with previous research (se for example Busch et al. 2014 and Raspberry et al. 2011). It might be that so few convincing effects are found either because there are no effects, or because the wrong point of departure is taken. Physical fitness, or specifically aerobe fitness, might be a more accurate indicator of school performance than mere PA (se for example London & Castrechini 2011, Wittberg et al.2012 and Bass et al. 2013). Additionally, it might not be the PA in itself that cause eventual effects, but rather what the PA may be assigned with, such as being in a social context (as especially for team-sports) or out in the fresh air (such as skateboarding etc.) (see for example Busch et al. 2014). This paper highlights the need for more research to address these issues. REFERENCES Bass, R. W., Brown, D. D., Laurson, K. R., & Coleman, M. M. (2013). Physical fitness and academic performance in middle school students. Acta paediatrica, 102(8), 832-837.
Booth, J. N., Leary, S. D., Joinson, C., Ness, A. R., Tomporowski, P. D., Boyle, J. M., & Reilly, J. J. (2013). Associations between objectively measured physical activity and academic attainment in adolescents from a UK cohort. British Journal of Sports Medicine, bjsports-2013. Busch, V., Loyen, A., Lodder, M., Schrijvers, A. J., van Yperen, T. A., & de Leeuw, J. R. (2014). The Effects of Adolescent Health-Related Behavior on Academic Performance A Systematic Review of the Longitudinal Evidence. Review of Educational Research, 0034654313518441.
Corder, K., Atkin, A. J., Bamber, D. J., Brage, S., Dunn, V. J., Ekelund, U., Owens, N., van Sluijs E. M. F., & Goodyer, I. M. (2015). Revising on the run or studying on the sofa: prospective associations between physical activity, sedentary behaviour, and exam results in British adolescents. International Journal of Behavioral Nutrition and Physical Activity, 12(1), 1-8.
Ericsson, I., & Karlsson, M. K. (2014). Motor skills and school performance in children with daily physical education in school–a 9‐year intervention study. Scandinavian journal of medicine & science in sports, 24(2), 273-278.
Farrington, D. P., & Welsh, B. C. (2005). Randomized experiments in criminology: What have we learned in the last two decades? Journal of Experimental Criminology, 1(1), 9-38.
60
Featherstone, R. M., Michelle, D. M., Guise, J-M., Mitchell, M.D., Paynter, R. A., Robinson, K. A., Umscheid, C. A., and Hartling, L. (2015): Advancing knowledge of rapid reviews: An analysis of results, conclusions and recommendations from published review articles examining rapid reviews. Systematic reviews 4:50.
Featherstone, R. M., Michelle, D. M., Guise, J-M., Mitchell, M.D., Paynter, R. A., Robinson, K. A., Umscheid, C. A., and Hartling, L. (2015): Advancing knowledge of rapid reviews: An analysis of results, conclusions and recommendations from published review articles examining rapid reviews. Systematic reviews 4:50.
Gao, Z., Hannan, P., Xiang, P., Stodden, D. F., & Valdez, V. E. (2013). Video game–based exercise, Latino Children’s physical health, and academic achievement. American journal of preventive medicine, 44(3), S240-S246. Gough, D., Olivier, S. and Thomas, J. (2012): An introduction to systematic reviews, p 156. London: Sage publications. Gough, D., Olivier, S. and Thomas, J. (2012): An introduction to systematic reviews, p 156. London: Sage publications.
Khangura, S., Konnuy, K. Cushman, R., Grimshaw, J. and Moher, D. (2012): Evidence summaries and the evolution of a rapid review approach, Systematic Reviews, 1-10.
Khangura, S., Konnuy, K. Cushman, R., Grimshaw, J. and Moher, D. (2012): Evidence summaries and the evolution of a rapid review approach, Systematic Reviews, 1-10. Käll, L. B., Nilsson, M., & Lindén, T. (2014). The impact of a physical activity intervention program on academic achievement in a Swedish elementary school setting. Journal of school health, 84(8), 473-480.
Lillejord, S., Vågan, A., Johansson, L., Børte, K. & Ruud, E. (2016). Hvordan fysisk aktivitet i skolen kan fremme elevers helse, læringsmiljø og læringsutbytte. En systematisk kunnskapsoversikt. [How physical activity in school can promote health among pupils, the learning environment and learning outcome. A systematic review.] Oslo. Kunnskapssenter for Utdanning. www.kunnsskapsenter.no (Report in Norwegian).
London, R. A., & Castrechini, S. (2011). A longitudinal examination of the link between youth physical fitness and academic achievement. Journal of School Health, 81(7), 400-408.
Morgan, K., Morgan, M., Johansson, L. & Ruud, E. (2016). A systematic mapping of the effects of ICT on learning outcomes. Oslo. Knowledge Center for Education. www.kunnskapssenter.no
Pindus, D. M., Davis, R. D. M., Hillman, C. H., Bandelow, S., Hogervorst, E., Biddle, S. J., & Sherar, L. B. (2015). The relationship of moderate-to-vigorous physical activity to cognitive processing in adolescents: findings from the ALSPAC birth cohort. Psychological research, 79(5), 715-728. Prøitz, T. S. (2010). Learning outcomes: What are they? Who defines them? When and where are they defined?. Educational assessment, evaluation and accountability, 22(2), 119-137.
Rasberry, C. N., Lee, S. M., Robin, L., Laris, B. A., Russell, L. A., Coyle, K. K., & Nihiser, A. J. (2011). The association between school-based physical activity, including physical education, and academic performance: a systematic review of the literature. Preventive medicine, 52, S10-S20.
61
Thomas, J., Newman, M. and Oliver, S. (2013): Rapid evidence assessment of research to inform social policy: taking stock and moving forward, Evidence & Policy 9(1), pp 5-27 http:// dx.doi.org/10.1332/174426413X662572
Thomas, J., Newman, M. and Oliver, S. (2013): Rapid evidence assessment of research to inform social policy: taking stock and moving forward, Evidence & Policy 9(1), pp 5-27 http:// dx.doi.org/10.1332/174426413X662572
Varker, T., Forbes, D., Dell, L., Weston, A., Merlin, T., Hodson, S. and O’Donnell, M. (2015): Rapid evidence assessment: Increasing the transparency of an emerging methodology. Journal of Evaluation in Clinical Practice, DOI: 10.1111/jep. 12405.
Varker, T., Forbes, D., Dell, L., Weston, A., Merlin, T., Hodson, S. and O’Donnell, M. (2015): Rapid evidence assessment: Increasing the transparency of an emerging methodology. Journal of Evaluation in Clinical Practice, DOI: 10.1111/jep. 12405. Wittberg, R. A., Northrup, K. L., & Cottrell, L. A. (2012). Children’s aerobic fitness and academic achievement: a longitudinal examination of students during their fifth and seventh grade years. American Journal of Public Health, 102(12), 2303-2307.
62
MOTIVATION TO PARTICIPATE IN RECREATIONAL ACTIVITIES IN RELATION TO HEALTH STATUS AND TIME COMMITMENT
Jovanović, S., Tešanović, G., Jakovljević, V.
University of Banja Luka, Faculty of Physical Education and Sport, Bosnia and Herzegovina
ABSTRACT
Youth participation in sports and recreational activities is often studied area and in the modern world it is given much attention to it. However, in this region, in youth age many factors influence to participate in recreational activities, so the aim of this study was to determine some of the motives for participation in recreational activities for this population. In a sample of 72 examinees aged 16 to 32 years, who have been engaged in some of the recreational activities, we wanted to analyze their motives and attitude towards participation in recreational activities in conjunction with their health status and the time they dedicated to engagement in these activities. For the assessment of motivation the survey was used which contained in addition to basic demographic information and motives for exercise, and whether the patients identified some of the deformities i.e. what their health status. From this analysis, it was concluded that in addition to the common motives for doing recreational activities such as team spirit and a sense of satisfaction and achievement, there are differences within the group of subjects on the basis of established deformities, as well as the time of practicing the activity. Whereby, women with established deformities were motivated in different segments of the forms, health and technical level of mastering activities. The analyzed results can help in better form and content of the formation class of recreation as well as the quality of psychological work with such people, in order to recreation experts can better motivate the members of this population.
Key words: motivation, leisure activities, health status, dissenting time
INTRODUCTION
Besides all the stress factors affecting human health in today's conditions of life it is difficult to find a motive for dealing with some recreational activities. It has been proven through many studies that regular physical exercise positively influences the preventive effect in some diseases for example: heart diseases, blood pressure disorders or deformities of the spinal column (8). Seen from the other side to act preventively control the level of stress (6) and overall satisfaction (9). It could be said that in general engage in recreational activities in their free time has a positive effect on many aspects that contribute to the general good state of health of the individual. When talking about the area of motivation is often to speak from the aspect of emotions that are related to the activity itself. Management motivation for this exercise represents the product of the relationship of psychological factors that occur as a result of physiological and emotional factors that accompany regular physical exercise. Factors that motivate individuals to engage in recreational activities and to persevere in this are largely different. The existence of specialized facilities and premises in which it is possible to carry out recreational activities regardless of weather conditions or seasons helps in the initial accession recreational activities but continues to engage through a longer period of time becomes more and more area of interest of different authors. Specifically, an intense beginner is in the development and the positive effects of exercise but as time goes by self-knowledge, learning the techniques involved, and communication with the coach as well as various internal motives come under a kind of test of perseverance and staying in the further course of recreational activities (4). In this paper, we tried to give some answers to the question of whether young people are aware of all these facts, and how their
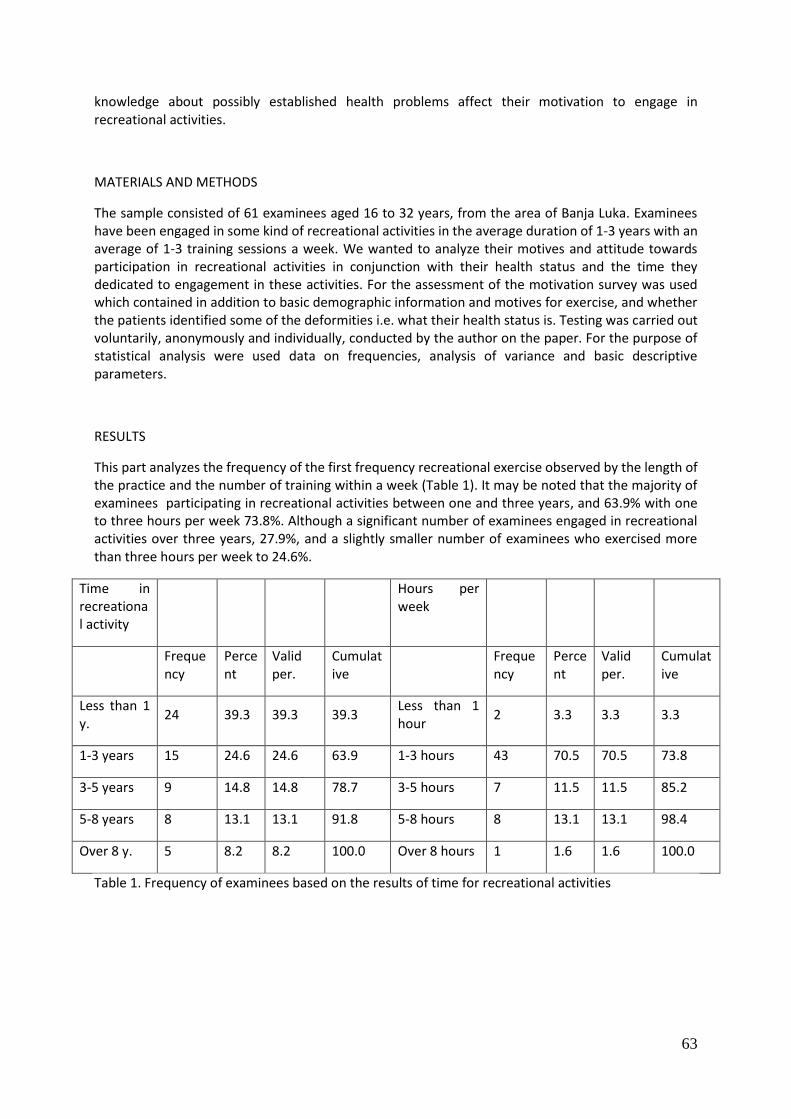
63
knowledge about possibly established health problems affect their motivation to engage in recreational activities.
MATERIALS AND METHODS
The sample consisted of 61 examinees aged 16 to 32 years, from the area of Banja Luka. Examinees have been engaged in some kind of recreational activities in the average duration of 1-3 years with an average of 1-3 training sessions a week. We wanted to analyze their motives and attitude towards participation in recreational activities in conjunction with their health status and the time they dedicated to engagement in these activities. For the assessment of the motivation survey was used which contained in addition to basic demographic information and motives for exercise, and whether the patients identified some of the deformities i.e. what their health status is. Testing was carried out voluntarily, anonymously and individually, conducted by the author on the paper. For the purpose of statistical analysis were used data on frequencies, analysis of variance and basic descriptive parameters.
RESULTS
This part analyzes the frequency of the first frequency recreational exercise observed by the length of the practice and the number of training within a week (Table 1). It may be noted that the majority of examinees participating in recreational activities between one and three years, and 63.9% with one to three hours per week 73.8%. Although a significant number of examinees engaged in recreational activities over three years, 27.9%, and a slightly smaller number of examinees who exercised more than three hours per week to 24.6%.
Time in recreational activity
Hours per week
Frequency
Percent
Valid per.
Cumulative
Frequency
Percent
Valid per.
Cumulative
Less than 1 y.
24 39.3 39.3 39.3 Less than 1 hour
2 3.3 3.3 3.3
1-3 years 15 24.6 24.6 63.9 1-3 hours 43 70.5 70.5 73.8
3-5 years 9 14.8 14.8 78.7 3-5 hours 7 11.5 11.5 85.2
5-8 years 8 13.1 13.1 91.8 5-8 hours 8 13.1 13.1 98.4
Over 8 y. 5 8.2 8.2 100.0 Over 8 hours 1 1.6 1.6 100.0
Table 1. Frequency of examinees based on the results of time for recreational activities
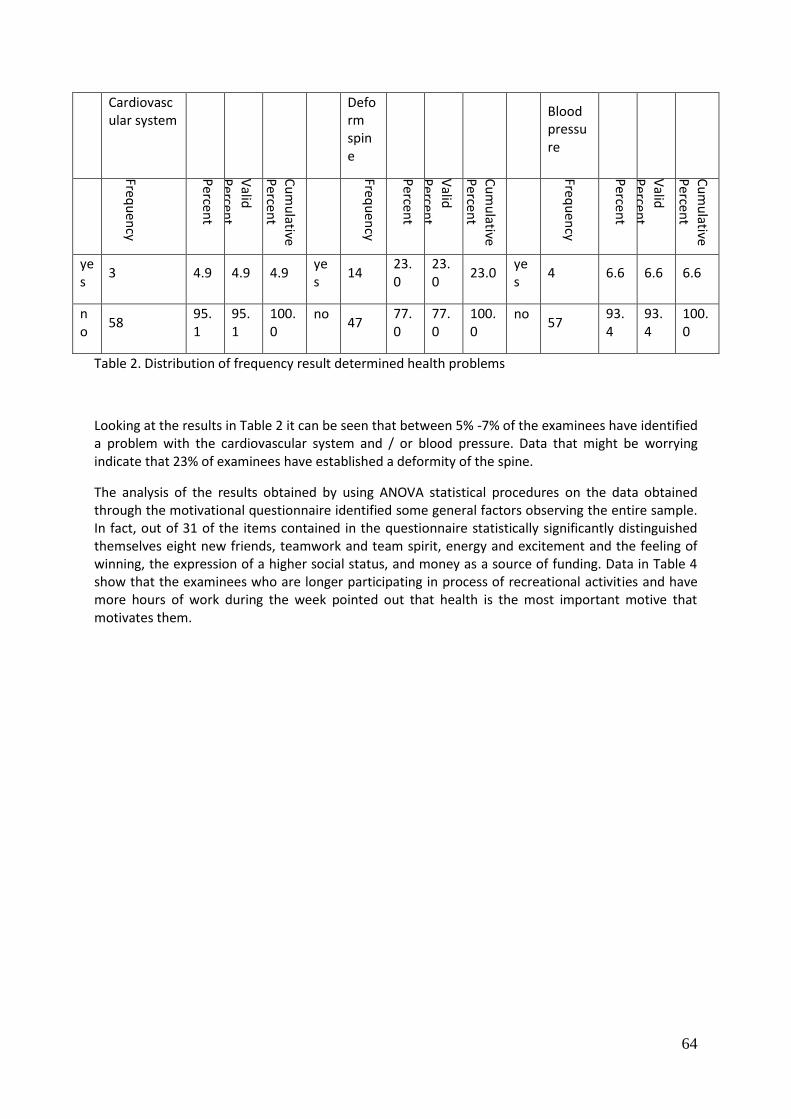
64
Cardiovascular system
Deform spine
Blood pressure
Frequ
ency
Percen
t
Valid
Percen
t
Cu
mu
lative P
ercent
Frequ
ency
Percen
t
Valid
Percen
t
Cu
mu
lative
Percen
t
Frequ
ency
Percen
t
Valid
Percen
t
Cu
mu
lative P
ercent
yes
3 4.9 4.9 4.9 yes
14 23.0
23.0
23.0 yes
4 6.6 6.6 6.6
no
58 95.1
95.1
100.0
no 47
77.0
77.0
100.0
no 57
93.4
93.4
100.0
Table 2. Distribution of frequency result determined health problems
Looking at the results in Table 2 it can be seen that between 5% -7% of the examinees have identified a problem with the cardiovascular system and / or blood pressure. Data that might be worrying indicate that 23% of examinees have established a deformity of the spine.
The analysis of the results obtained by using ANOVA statistical procedures on the data obtained through the motivational questionnaire identified some general factors observing the entire sample. In fact, out of 31 of the items contained in the questionnaire statistically significantly distinguished themselves eight new friends, teamwork and team spirit, energy and excitement and the feeling of winning, the expression of a higher social status, and money as a source of funding. Data in Table 4 show that the examinees who are longer participating in process of recreational activities and have more hours of work during the week pointed out that health is the most important motive that motivates them.
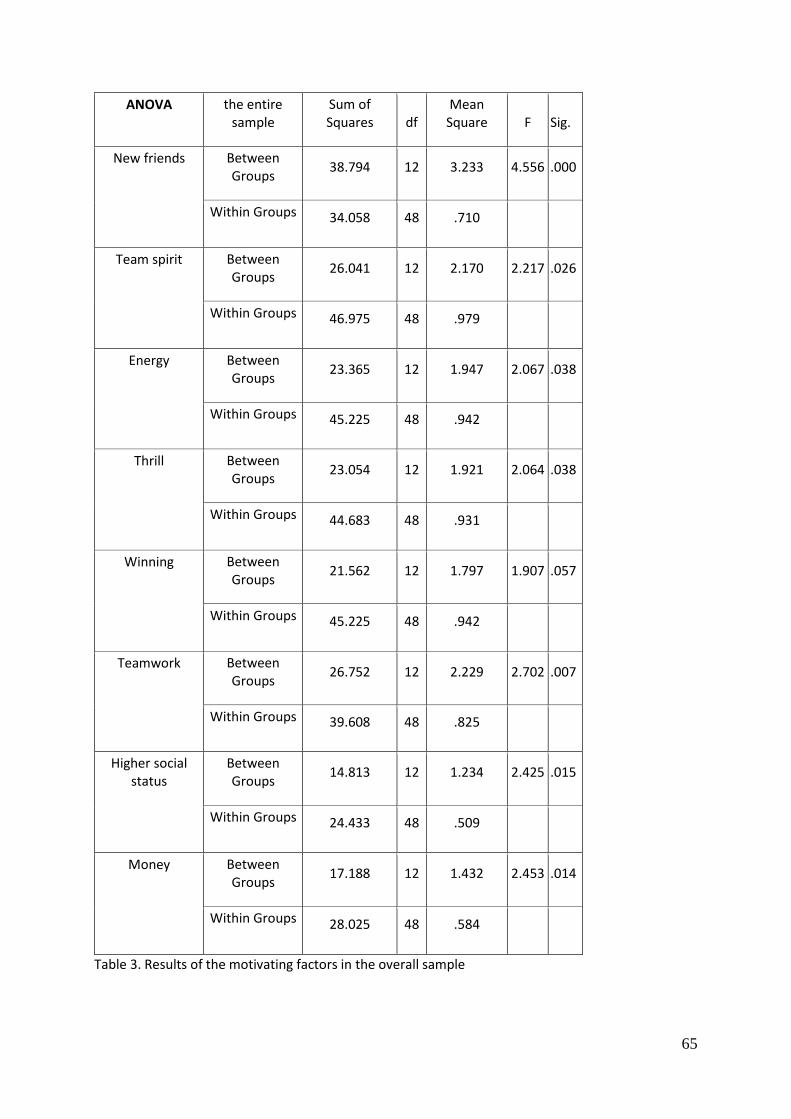
65
ANOVA the entire sample
Sum of Squares df
Mean Square F Sig.
New friends Between Groups
38.794 12 3.233 4.556 .000
Within Groups 34.058 48 .710
Team spirit Between Groups
26.041 12 2.170 2.217 .026
Within Groups 46.975 48 .979
Energy Between Groups
23.365 12 1.947 2.067 .038
Within Groups 45.225 48 .942
Thrill Between Groups
23.054 12 1.921 2.064 .038
Within Groups 44.683 48 .931
Winning Between Groups
21.562 12 1.797 1.907 .057
Within Groups 45.225 48 .942
Teamwork Between Groups
26.752 12 2.229 2.702 .007
Within Groups 39.608 48 .825
Higher social status
Between Groups
14.813 12 1.234 2.425 .015
Within Groups 24.433 48 .509
Money Between Groups
17.188 12 1.432 2.453 .014
Within Groups 28.025 48 .584
Table 3. Results of the motivating factors in the overall sample
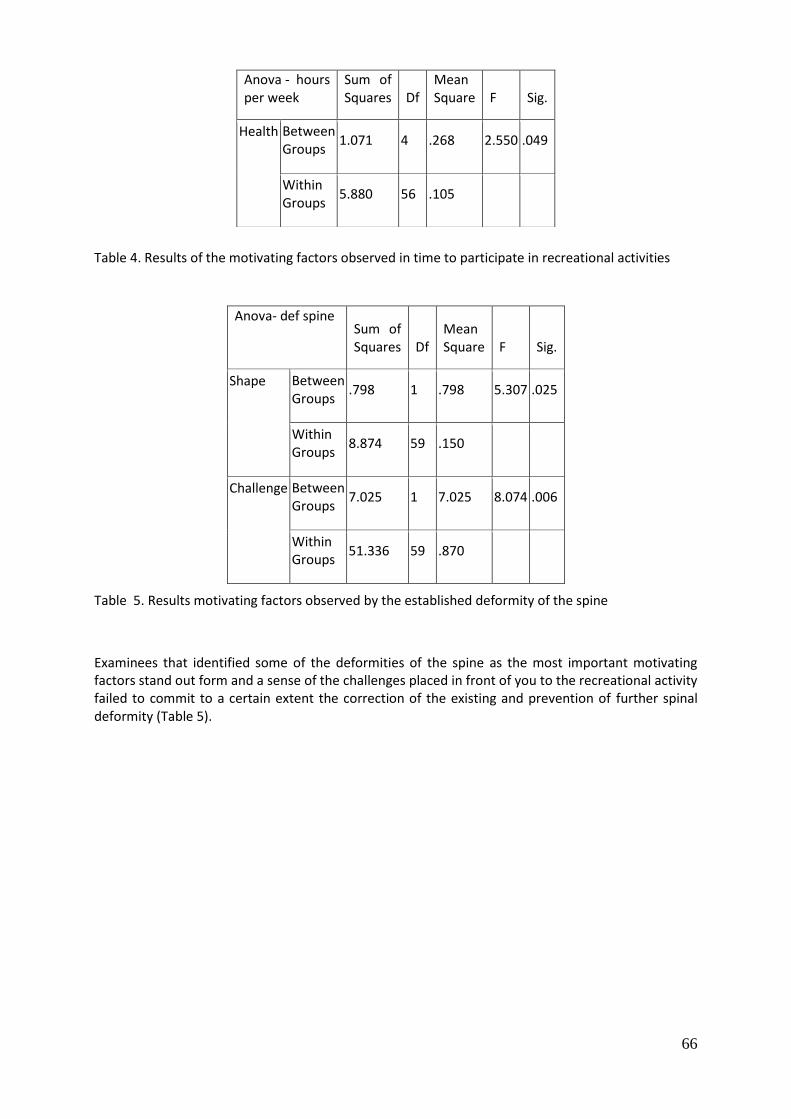
66
Table 4. Results of the motivating factors observed in time to participate in recreational activities
Table 5. Results motivating factors observed by the established deformity of the spine
Examinees that identified some of the deformities of the spine as the most important motivating factors stand out form and a sense of the challenges placed in front of you to the recreational activity failed to commit to a certain extent the correction of the existing and prevention of further spinal deformity (Table 5).
Anova - hours per week
Sum of Squares Df
Mean Square F Sig.
Health Between Groups
1.071 4 .268 2.550 .049
Within Groups
5.880 56 .105
Anova- def spine
Sum of Squares Df
Mean Square F Sig.
Shape Between Groups
.798 1 .798 5.307 .025
Within Groups
8.874 59 .150
Challenge Between Groups
7.025 1 7.025 8.074 .006
Within Groups
51.336 59 .870

67
Anova -blood pressure
Sum of Squares Df
Mean Square F Sig.
Health Between Groups
.582 1 .582 5.396 .024
Within Groups
6.368 59 .108
Technique Between Groups
4.861 1 4.861 7.776 .007
Within Groups
36.877 59 .625
Table 6. Results of motivating factors observed by the established problems with blood pressure
We should particularly look back on awareness of those examinees that identified health problems with blood pressure, which in addition to proper technical performance of exercises emphasized fitness and improve the general health status indicating a higher degree of awareness and the needs of recreational exercise (Table 6). Subjects with recognized health problem with cardio vascular system as the most important motivating factor emphasized mastering the proper technical performance of exercises (Table 7).
Anova cardiovascular
Sum of Squares Df
Mean Square F Sig.
Technique Between Groups
2.755 1 2.755 4.170 .046
Within Groups
38.983 59 .661
Table 7. Results of the motivating factors observed by the established problem of cardiovascular system
DISCUSSION AND CONCLUSIONS
Regarding the structure of the sample, which consisted mostly less experienced examinees that have a shorter period in the system of exercise and recreation with fewer hours per week, can be said that the general incentives to acquire new friendships and group affiliations expressed through teamwork and the spirit of the relative expected. They showed that positively motivation energy and excitement of the physiological motivate them and gives them a sense of satisfaction by participating in
68
recreational activities. Part of the examinees pointed out that through participation in recreational activities provide themselves a higher status position in society and to give them the perspective of quality participation in activities in the future period can serve as a sort of further education and a source of income. Looking at the results of the participation criteria expressed in hours per week can be a positive motivation to affirm women who exercised more than three hours a week and that have declared health as the most important motivational factor. Similar research is confirmed in Annecy and Whitaker (1) and Baker Brownell (2) and where he established positive correlation between the times of exercise of positive changes at the psychological level examinees. Whereby, women with established deformities were motivated in different segments of the forms, challenge, condition, health and technical level of mastering activities. The variety of motifs subjects with established some of the health problems it is certainly commendable and indicates a higher level of awareness of examinees about their current health status, desire and willingness to get quality approaches to positive changes and that participate in recreational activities, positive prevention sedentary lifestyle that is substantially exists. Their motivation as correctly as possible to adopt the technical performance of the program in which they participate suggest coaches and instructors to respect that this is a group program focuses its work should move to better quality of explaining the technique execution thus raising awareness of movement performance in women, creating them even greater sense satisfaction and a sense of progression achieved what they ultimately leads to the examinees remain a longer period in the system of exercise and recreation. Also, examinees indicate that their challenge is to participate in recreational activities and challenge placed before yourself to do a very important positive changes which, to some extent confirmed by the results of Deci and Ryan (3). The challenge before asking the examinees themselves come in a potentially stressful situation by failing to fulfill their expectations of what it can create a negative feeling of the exercise and lead to abandonment or withdrawal of the exercise. Therefore, instructors and coaches must in the preparation of the news in an interview with the examinees that a good assessment of their motives and in accordance with them during a workout following examinees and do not permit to come to that sense of disappointment and failure to achieve their motives. Generally speaking examinees demonstrated positive incentives to start exercising some first period of participation but are up to the professionals to great responsibility that during the process through communication insights into the extent to which the prime motivating factors are met and that you create new motifs. or whether it is the right time to assist examinees in the creation of new incentives with a view to a longer and better quality of participation in recreational activities that allow positive action regardless of the identified health problem or not. The analyzed results can help in better form and content of the class formation of recreation as well as the quality of psychological work with such people, in order to recreation experts can better motivate the members of this population.
REFERENCES
Annesi JJ, Whitaker AC. Weight loss and pychologic gain in obese women-participants in a supported exercise intervention. Permanente Jurnal, 2008; 12(3):36-45.
Baker CW, Brownell KD. Physical activity and maintenance of weight loss: physiological and psychological mechanisms. In: Bouchard C, ed.Physical activity and obesity. Champaign, Illinois: Human Kinetics, 2000; 311-328.
Deci EL, Ryan RM. Intristic motivation and self-determination in human behavior.New York. Plenum Press, 1985.
69
Deci EL, Ryan RM. Self-dermination Theory and Fascilitation of Intristic Motivation, social development and well-being.University of Rochester, 1995.
Edwards, S. Physical exercise and psychological well-being. South African Journal of Psychology. 2006; 36 (2): 357-373.
Heyward VH.Advanced fitness assessment and exercise prescription.Second edition.Human Kinetics, Champaign, Illinois; 1991.
Markland, D., Ingledew, D.K. Exercise participation motives: A self-determination theory perspective. In: Hagger M., Chatzisarantis N.L.D. [ur.] Self-determination theory in sport and exercise, Champaign, Illinois: Human Kinetics: 2007.
Plonezynski DJ.Measurement of motivaton for exercise.Health Educ research, 2000; 15:695-705.
Weinberg RS, Gould D. Foundation of Sport and Exercise Psychology.Fourth edition. Human Kinetics, Champaign, Illinois; 2007.
70
EFFECTIVENESS OF A MOBILE APPLICATION WITH RESPECT TO ITS PERSONALIZATION AND USE OF MOTIVATIONAL ELEMENTS
Kajtna, T.1, Cvetković, B.2, Janko, V.2, Štrumbelj, B.1, Štihec, J.1, Luštrek, M.2
1 Univerza v Ljubljani, Fakulteta za šport, Ljubljana, Slovenija
2 Institut »Jožef Stefan«, Odsek za inteligentne sisteme, Ljubljana, Slovenija
School physical education aims to teach essential movement patterns and sports, and to encourage children to be physically active in their leisure time throughout their lives. Unfortunately the physical fitness of Slovenian youth has decreased substantially in the last 20 years. Because of that, the e-Gibalec project developed a mobile application that – in cooperation with physical-education teachers and parents – encourages schoolchildren to be more active and adopt a healthier lifestyle. The application uses smartphone sensors and intelligent computer methods to monitor the children's movement in their leisure time. In addition, the application itself encourages physical activity: feedback about physical activity and friendly avatars will instill internal motivation, while competition with friends will complement this as external motivation. The application uses avatars as means of communication of the application with the user and these avatars send daily messages, inform the user of the progress, achieving of daily goals and so on. In our pilot research we tested the effectiveness of a “blank” application, with no avatars and no personalized messages and compared it to the effectiveness of an application, which uses these elements. Our results show that children, who used the “full” version, including the avatars and personalized messages, were more satisfied with the use of the application, used it more frequently and more frequently expressed the intention to keep using this application.
Keywords: physical education, mobile and web application, monitoring and encouraging physical activity, human energy expenditure
INTRODUCTION Regular physical activity is of utmost importance to a healthy lifestyle and personal well-being. At the same time, it acts as a major preventive factor in development of various chronic and other diseases by neutralising the effects of an increasingly sedentary lifestyle and other bad habits. The effects of sedentary lifestyle accumulate over the lifetime, so one should adopt an active lifestyle at an early age. Children are first systematically introduced to the connection between physical activities and healthy life in schools, through physical education (PE) classes. The aim of PE is not only to teach children essential movement patterns and sports, but also to encourage them to be physically active in their leisure time throughout their lives. However, it appears that PE is failing in its objectives. A study monitoring physical development and performance of elementary and high school students in Slovenia for over 20 years, using standardized tests (Strel, Starc & Kovač, 2010) revealed some worrisome trends. The average physical fitness has been decreasing over the last two decades, while the child obesity is increasing. Although the number of children with reduced or insufficient fitness has stabilized in recent years, the overall situation is nevertheless considered bad, as the number is still more than twice as high as it was 20 years ago. This problem is not specific to Slovenia and can be observed worldwide (Hills, Andersen & Byrne, 2011). The drop in fitness can be related to an increasing use of computers and other consumer electronics, with subsequent lifestyle changes. However, these same technologies can be used as a tool to stimulate children to increase their physical activity. Several studies (Lau, Lau, Wong & Ransdell, 2011)
71
have already demonstrated that mobile applications can motivate children to be more active. A review of studies (Kriemler et al., 2011) also demonstrated that the best interventions with the aim of increasing physical activity in children are carried out through schools. This all motivated us to develop the e-Gibalec system (Slovene for “e-mover“). The system uses a holistic approach that involves all actors involved in physical education of children, namely children themselves, their parents and their PE teachers. e-Gibalec consists of a smartphone application designed for elementary school children and a web application designed for PE teachers and parents. There are products that are specifically designed for children to motivate them to be more active, such as Leap Band, KidFit or belt- shoe-mounted pedometers Ibitz. The activity monitoring mechanism is very basic, it essentially counts child’s steps and use this information to stimulate children to be active by awarding them virtual currency or allowing them to unlock higher levels in the game. The activity monitoring should be enhanced with motivational modules, since we aim at changing the behaviour and the long-term lifestyle of the children. Current applications usually only display statistics about physical activity and/or energy expenditure, but have limited capabilities to motivate the user towards a healthier lifestyle. On the other hand, using gamification could have a great potential in this regard. One of the most prominent recent examples of an application that uses gamification is “Pokemon Go”. Study of Althoff, White and Horvitz (2016) showed that, for people using the application, the number of steps per day increased significantly - for more than 25 %. This indicates that such motivational approaches can be very effective. However, the application recognises only walking, and does so only through GPS - which is expensive in regard to battery life. Furthermore, the commercial nature of the application makes it potentially inappropriate to advertise in schools. Up to date, we found no wide-scale use of applications that promote active lifestyle in school population and, in addition, there are no PE-related applications available in Slovene. Here we present the e-Gibalec system which in addition to children engages the PE teachers and parents into the process. It performs the activity monitoring solely with in-built accelerometers in a smartphone and provides a playful environment which aims at motivating children to be more active. Internal motivation, also called the autotelic motivation (Hein & Hagger, 2007), causes people to engage in an activity for their own pleasure, to improve with respect to themselves (Deci & Ryan, 2000). Physical education is frequently the only or the most important physical activity of children (Jurak et al., 2015), and they frequently dislike this subject and its contents, which may also cause them to dislike physical activity itself. Through not engaging in physical activity and finding no pleasure in it, they are neglecting one of the basic prerequisites for a healthy lifestyle (Rutten, Savelberg, Biddle & Kremers, 2013). Our application automatically detects a child’s activity. This helps the child to see that he/she is improving in his activity, which is the essential part of internal motivation. As most physical activity takes places during the PE classes, the children’s motivation for participation will increase. Consequently, children will be more active in PE classes and physical activity will slowly start to become their habit. An important mechanism of internal motivation are the avatars which represent the users in the application. Feedback for children is more effective when it is provided in a personalized manner, which is also seen as developmentally appropriate (Hassandra, Goudas & Chroni, 2003). While adults can interpret and use raw numbers and graphs, the feedback for children should be more playful. Therefore, we decided to introduce the avatar figures that would offer the children information on their activity. Our aim was to make the avatars look friendly and, in addition, to introduce a variety of options so that children can choose the one that suits them best. Avatars convey emotions depending on how far towards the daily goal the child currently is, motivating them to try and reach it.
72
The purpose of this study was to evaluate the use of motivational elements (avatars, daily goals, equipment purchase and upgrades and avatar’s statements) in the E – gibalec application. METHODS Participants 16 boys and 26 girls aged 10, 56 years (SD = 0,39) participated in the study, 12 of them participated in the control group and 30 in the experimental group, 19 of them were from an urban area and 23 from the outskirts of the capital city. Instruments The e-Gibalec system consists of a smartphone application for children and a web application for PE teachers and parents. Both applications are connected to a cloud, hosted by The Academic and Research Network of Slovenia (ARNES), which is the internet provider for educational institutions in Slovenia. The mobile application was developed for all major mobile platforms: Android, iOS, and Windows Phone and is available on respective mobile markets. It utilizes the data from the smartphone inertial sensor to recognize the users’ activity and estimates its intensity. The web application was developed using the Django platform and other open-source technologies. The e-Gibalec system (smartphone applications and web application) has been made open-source and is available on Sourceforge. When children log into the application for the first time, they are assigned a default avatar in the shape of an animal, which they can then change. In total, there are six different avatars available to choose (dinosaur, fox, bear, wolf, rabbit, and dragon). Children also create their profiles, by choosing a username and password, and inputting their date of birth and weight, the latter being required for better energy-expenditure estimates. The “Avatar” button allows the user to change the avatar and to purchase and upgrade sport equipment with the in-game currency. There are two types of currency – virtual coins, obtained by daily activities (corresponding to the points collected by being active), and special currency, obtained by reaching the daily goals (which is by default set to 12 points). The special currency is avatar-specific, such as a bone for the dinosaur, feather for the fox, honey for the bear, etc. Virtual coins are used to purchase sport equipment which then allows challenges in additional activities. For example, a racket can be used for challenges in tennis, table tennis, and badminton; a ball can be used for challenges in football and basketball. The special currency is used for equipment upgrades, in the sequence regular-bronze-silver-gold, with each level increasing rewards for activity challenges. Activity challenges are an important social component of the application. They are accessible through the “Friends” button. On the friend screen, users can add one another as friends (searching by the username). Challenges can take place over one day, three days, or the whole week, and can be limited to activities registered by sensors, or can include all activities (this allows the users to take into account the perceived honesty of the friends they challenge). The progress can be monitored on a dedicated status bar and the winner of the challenge (the more active person) receives virtual coins as the reward. In addition to challenges from human friends, the application also contains a virtual challenger Veselko Gibalec (Slovene for “Merry Mover”) who occasionally invites to challenges of its own. When the daily goal is achieved, e-Gibalec uses a push notification to notify the user. Otherwise, unless opened, the application does not interact with the user and runs in the background. The web application complements the smartphone application and is intended for parents and PE teachers. Since e-Gibalec is somewhat a didactic application, including parents and teachers can
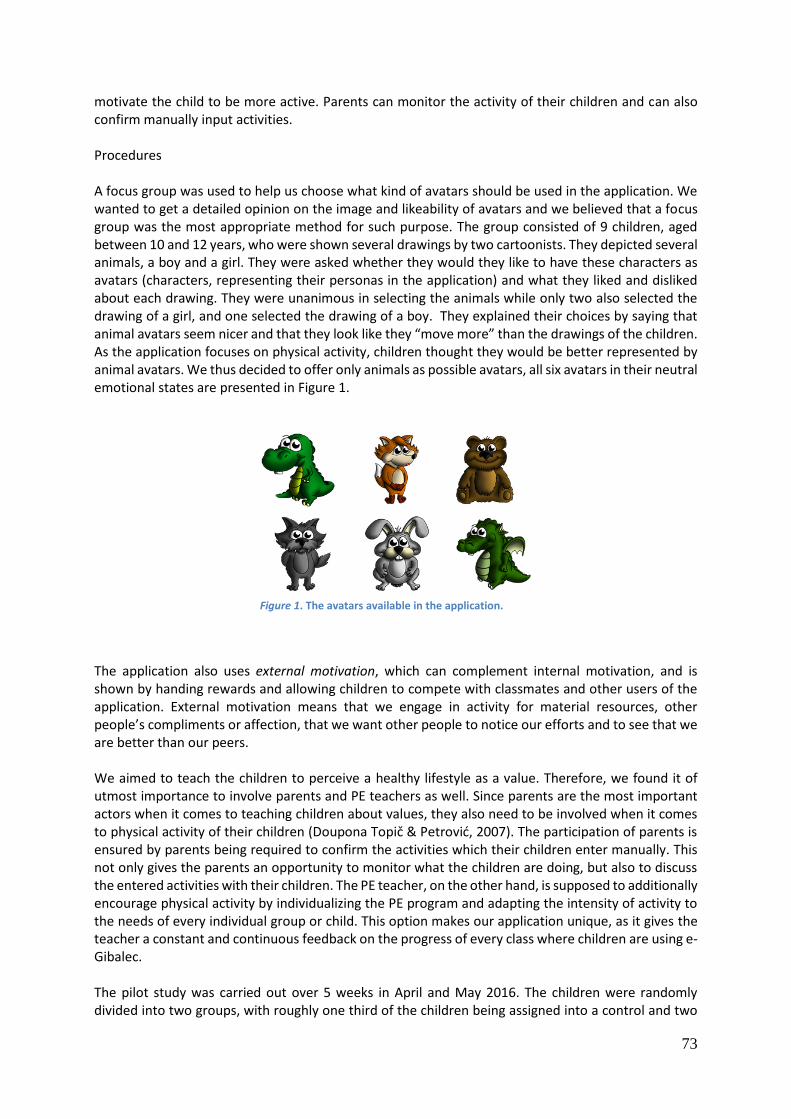
73
motivate the child to be more active. Parents can monitor the activity of their children and can also confirm manually input activities. Procedures A focus group was used to help us choose what kind of avatars should be used in the application. We wanted to get a detailed opinion on the image and likeability of avatars and we believed that a focus group was the most appropriate method for such purpose. The group consisted of 9 children, aged between 10 and 12 years, who were shown several drawings by two cartoonists. They depicted several animals, a boy and a girl. They were asked whether they would they like to have these characters as avatars (characters, representing their personas in the application) and what they liked and disliked about each drawing. They were unanimous in selecting the animals while only two also selected the drawing of a girl, and one selected the drawing of a boy. They explained their choices by saying that animal avatars seem nicer and that they look like they “move more” than the drawings of the children. As the application focuses on physical activity, children thought they would be better represented by animal avatars. We thus decided to offer only animals as possible avatars, all six avatars in their neutral emotional states are presented in Figure 1.
The application also uses external motivation, which can complement internal motivation, and is shown by handing rewards and allowing children to compete with classmates and other users of the application. External motivation means that we engage in activity for material resources, other people’s compliments or affection, that we want other people to notice our efforts and to see that we are better than our peers. We aimed to teach the children to perceive a healthy lifestyle as a value. Therefore, we found it of utmost importance to involve parents and PE teachers as well. Since parents are the most important actors when it comes to teaching children about values, they also need to be involved when it comes to physical activity of their children (Doupona Topič & Petrović, 2007). The participation of parents is ensured by parents being required to confirm the activities which their children enter manually. This not only gives the parents an opportunity to monitor what the children are doing, but also to discuss the entered activities with their children. The PE teacher, on the other hand, is supposed to additionally encourage physical activity by individualizing the PE program and adapting the intensity of activity to the needs of every individual group or child. This option makes our application unique, as it gives the teacher a constant and continuous feedback on the progress of every class where children are using e-Gibalec. The pilot study was carried out over 5 weeks in April and May 2016. The children were randomly divided into two groups, with roughly one third of the children being assigned into a control and two
Figure 1. The avatars available in the application.
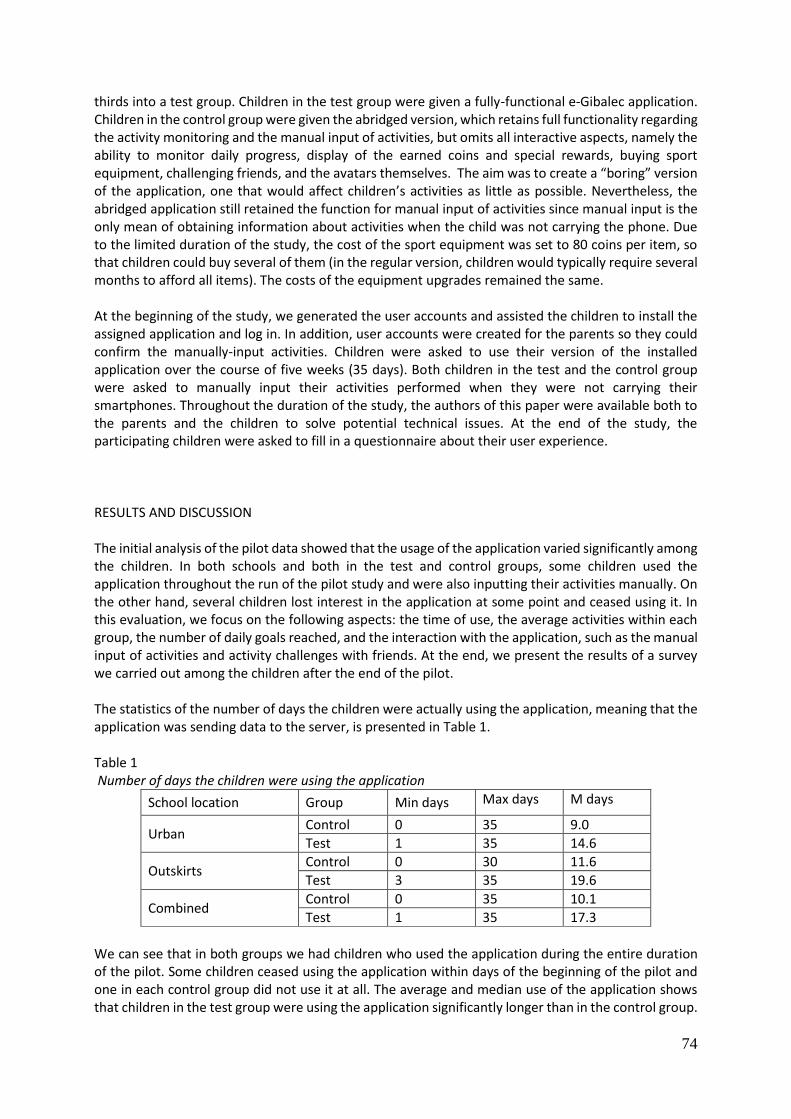
74
thirds into a test group. Children in the test group were given a fully-functional e-Gibalec application. Children in the control group were given the abridged version, which retains full functionality regarding the activity monitoring and the manual input of activities, but omits all interactive aspects, namely the ability to monitor daily progress, display of the earned coins and special rewards, buying sport equipment, challenging friends, and the avatars themselves. The aim was to create a “boring” version of the application, one that would affect children’s activities as little as possible. Nevertheless, the abridged application still retained the function for manual input of activities since manual input is the only mean of obtaining information about activities when the child was not carrying the phone. Due to the limited duration of the study, the cost of the sport equipment was set to 80 coins per item, so that children could buy several of them (in the regular version, children would typically require several months to afford all items). The costs of the equipment upgrades remained the same. At the beginning of the study, we generated the user accounts and assisted the children to install the assigned application and log in. In addition, user accounts were created for the parents so they could confirm the manually-input activities. Children were asked to use their version of the installed application over the course of five weeks (35 days). Both children in the test and the control group were asked to manually input their activities performed when they were not carrying their smartphones. Throughout the duration of the study, the authors of this paper were available both to the parents and the children to solve potential technical issues. At the end of the study, the participating children were asked to fill in a questionnaire about their user experience. RESULTS AND DISCUSSION The initial analysis of the pilot data showed that the usage of the application varied significantly among the children. In both schools and both in the test and control groups, some children used the application throughout the run of the pilot study and were also inputting their activities manually. On the other hand, several children lost interest in the application at some point and ceased using it. In this evaluation, we focus on the following aspects: the time of use, the average activities within each group, the number of daily goals reached, and the interaction with the application, such as the manual input of activities and activity challenges with friends. At the end, we present the results of a survey we carried out among the children after the end of the pilot. The statistics of the number of days the children were actually using the application, meaning that the application was sending data to the server, is presented in Table 1. Table 1 Number of days the children were using the application
School location Group Min days Max days M days
Urban Control 0 35 9.0
Test 1 35 14.6
Outskirts Control 0 30 11.6
Test 3 35 19.6
Combined Control 0 35 10.1
Test 1 35 17.3
We can see that in both groups we had children who used the application during the entire duration of the pilot. Some children ceased using the application within days of the beginning of the pilot and one in each control group did not use it at all. The average and median use of the application shows that children in the test group were using the application significantly longer than in the control group.
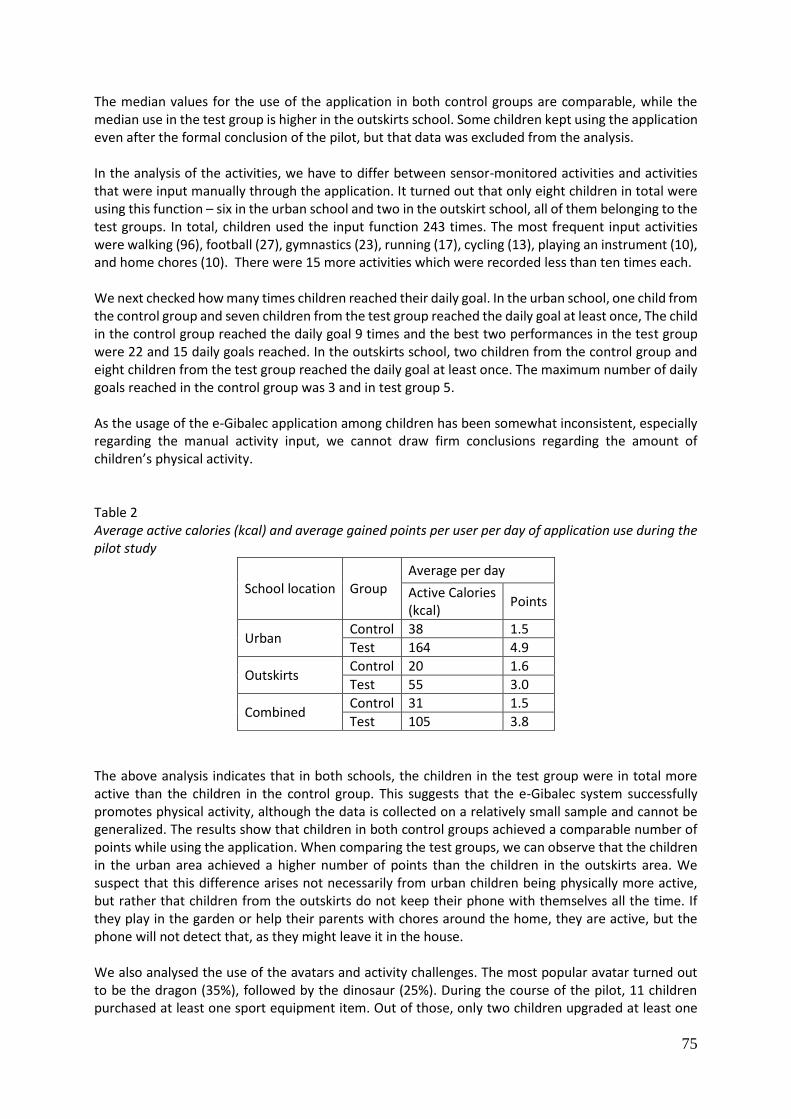
75
The median values for the use of the application in both control groups are comparable, while the median use in the test group is higher in the outskirts school. Some children kept using the application even after the formal conclusion of the pilot, but that data was excluded from the analysis. In the analysis of the activities, we have to differ between sensor-monitored activities and activities that were input manually through the application. It turned out that only eight children in total were using this function – six in the urban school and two in the outskirt school, all of them belonging to the test groups. In total, children used the input function 243 times. The most frequent input activities were walking (96), football (27), gymnastics (23), running (17), cycling (13), playing an instrument (10), and home chores (10). There were 15 more activities which were recorded less than ten times each. We next checked how many times children reached their daily goal. In the urban school, one child from the control group and seven children from the test group reached the daily goal at least once, The child in the control group reached the daily goal 9 times and the best two performances in the test group were 22 and 15 daily goals reached. In the outskirts school, two children from the control group and eight children from the test group reached the daily goal at least once. The maximum number of daily goals reached in the control group was 3 and in test group 5. As the usage of the e-Gibalec application among children has been somewhat inconsistent, especially regarding the manual activity input, we cannot draw firm conclusions regarding the amount of children’s physical activity. Table 2 Average active calories (kcal) and average gained points per user per day of application use during the pilot study
School location Group Average per day
Active Calories (kcal)
Points
Urban Control 38 1.5
Test 164 4.9
Outskirts Control 20 1.6
Test 55 3.0
Combined Control 31 1.5
Test 105 3.8
The above analysis indicates that in both schools, the children in the test group were in total more active than the children in the control group. This suggests that the e-Gibalec system successfully promotes physical activity, although the data is collected on a relatively small sample and cannot be generalized. The results show that children in both control groups achieved a comparable number of points while using the application. When comparing the test groups, we can observe that the children in the urban area achieved a higher number of points than the children in the outskirts area. We suspect that this difference arises not necessarily from urban children being physically more active, but rather that children from the outskirts do not keep their phone with themselves all the time. If they play in the garden or help their parents with chores around the home, they are active, but the phone will not detect that, as they might leave it in the house. We also analysed the use of the avatars and activity challenges. The most popular avatar turned out to be the dragon (35%), followed by the dinosaur (25%). During the course of the pilot, 11 children purchased at least one sport equipment item. Out of those, only two children upgraded at least one
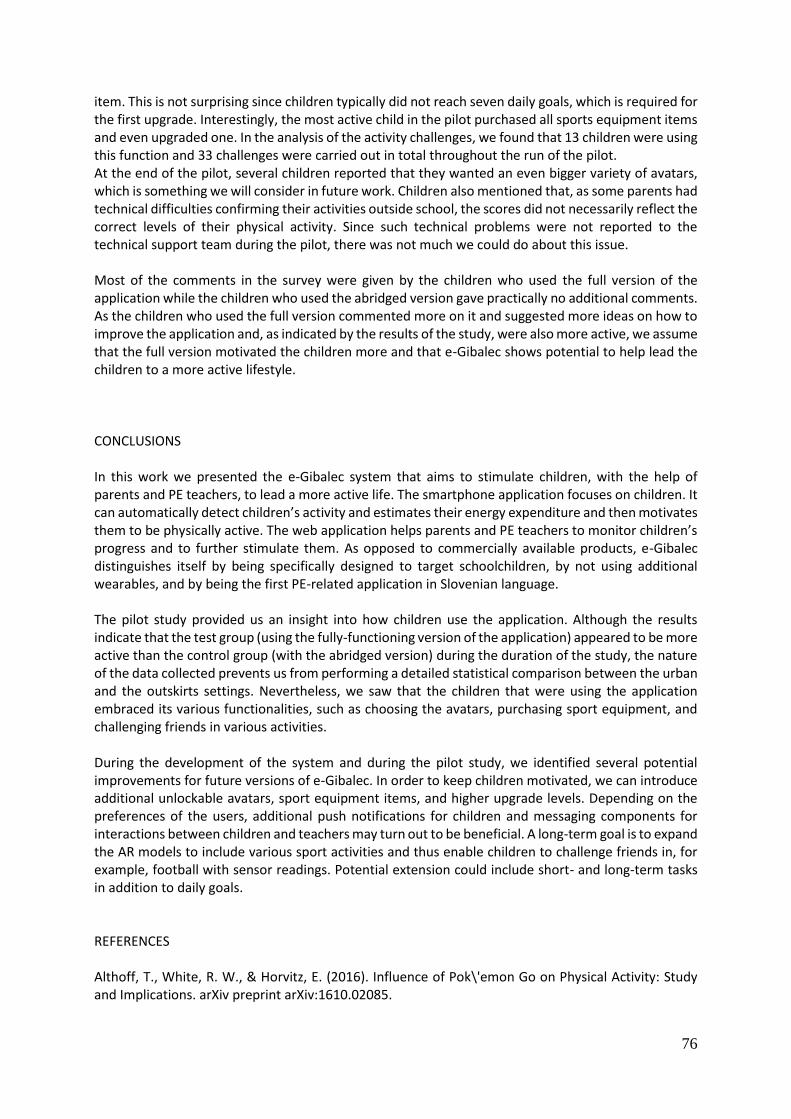
76
item. This is not surprising since children typically did not reach seven daily goals, which is required for the first upgrade. Interestingly, the most active child in the pilot purchased all sports equipment items and even upgraded one. In the analysis of the activity challenges, we found that 13 children were using this function and 33 challenges were carried out in total throughout the run of the pilot. At the end of the pilot, several children reported that they wanted an even bigger variety of avatars, which is something we will consider in future work. Children also mentioned that, as some parents had technical difficulties confirming their activities outside school, the scores did not necessarily reflect the correct levels of their physical activity. Since such technical problems were not reported to the technical support team during the pilot, there was not much we could do about this issue. Most of the comments in the survey were given by the children who used the full version of the application while the children who used the abridged version gave practically no additional comments. As the children who used the full version commented more on it and suggested more ideas on how to improve the application and, as indicated by the results of the study, were also more active, we assume that the full version motivated the children more and that e-Gibalec shows potential to help lead the children to a more active lifestyle. CONCLUSIONS In this work we presented the e-Gibalec system that aims to stimulate children, with the help of parents and PE teachers, to lead a more active life. The smartphone application focuses on children. It can automatically detect children’s activity and estimates their energy expenditure and then motivates them to be physically active. The web application helps parents and PE teachers to monitor children’s progress and to further stimulate them. As opposed to commercially available products, e-Gibalec distinguishes itself by being specifically designed to target schoolchildren, by not using additional wearables, and by being the first PE-related application in Slovenian language. The pilot study provided us an insight into how children use the application. Although the results indicate that the test group (using the fully-functioning version of the application) appeared to be more active than the control group (with the abridged version) during the duration of the study, the nature of the data collected prevents us from performing a detailed statistical comparison between the urban and the outskirts settings. Nevertheless, we saw that the children that were using the application embraced its various functionalities, such as choosing the avatars, purchasing sport equipment, and challenging friends in various activities. During the development of the system and during the pilot study, we identified several potential improvements for future versions of e-Gibalec. In order to keep children motivated, we can introduce additional unlockable avatars, sport equipment items, and higher upgrade levels. Depending on the preferences of the users, additional push notifications for children and messaging components for interactions between children and teachers may turn out to be beneficial. A long-term goal is to expand the AR models to include various sport activities and thus enable children to challenge friends in, for example, football with sensor readings. Potential extension could include short- and long-term tasks in addition to daily goals. REFERENCES Althoff, T., White, R. W., & Horvitz, E. (2016). Influence of Pok\'emon Go on Physical Activity: Study and Implications. arXiv preprint arXiv:1610.02085.
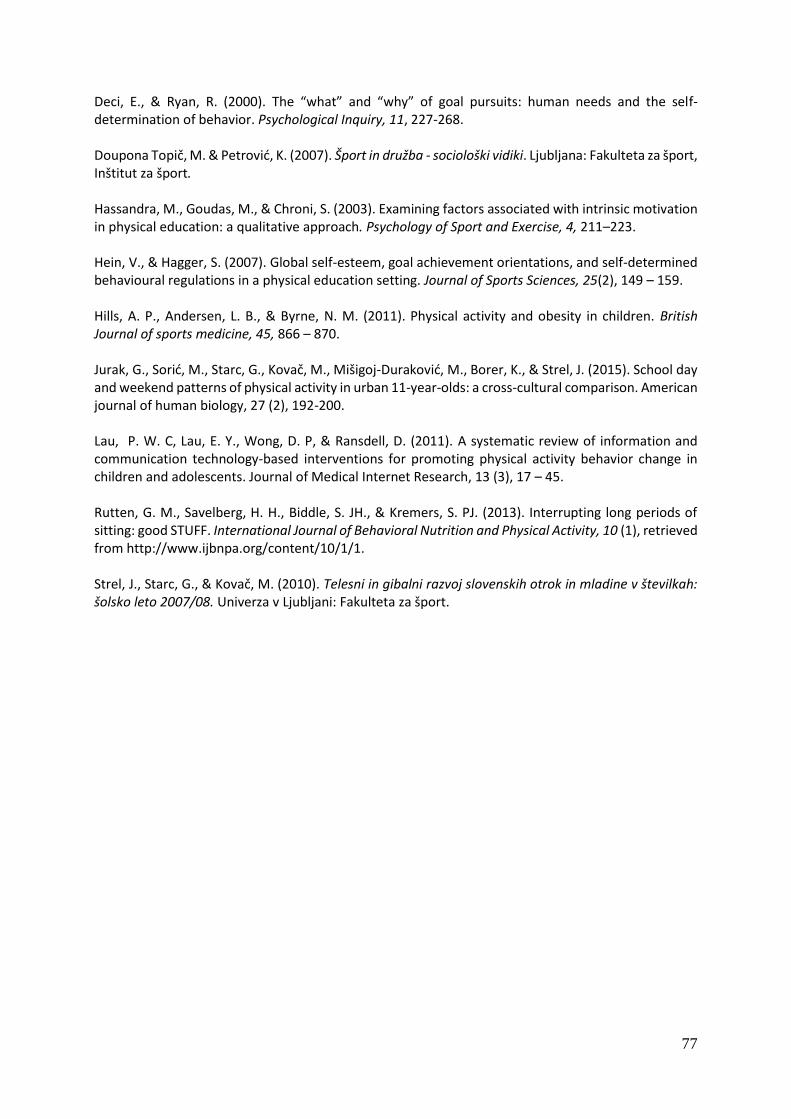
77
Deci, E., & Ryan, R. (2000). The “what” and “why” of goal pursuits: human needs and the self-determination of behavior. Psychological Inquiry, 11, 227-268. Doupona Topič, M. & Petrović, K. (2007). Šport in družba - sociološki vidiki. Ljubljana: Fakulteta za šport, Inštitut za šport. Hassandra, M., Goudas, M., & Chroni, S. (2003). Examining factors associated with intrinsic motivation in physical education: a qualitative approach. Psychology of Sport and Exercise, 4, 211–223. Hein, V., & Hagger, S. (2007). Global self-esteem, goal achievement orientations, and self-determined behavioural regulations in a physical education setting. Journal of Sports Sciences, 25(2), 149 – 159. Hills, A. P., Andersen, L. B., & Byrne, N. M. (2011). Physical activity and obesity in children. British Journal of sports medicine, 45, 866 – 870. Jurak, G., Sorić, M., Starc, G., Kovač, M., Mišigoj-Duraković, M., Borer, K., & Strel, J. (2015). School day and weekend patterns of physical activity in urban 11-year-olds: a cross-cultural comparison. American journal of human biology, 27 (2), 192-200. Lau, P. W. C, Lau, E. Y., Wong, D. P, & Ransdell, D. (2011). A systematic review of information and communication technology-based interventions for promoting physical activity behavior change in children and adolescents. Journal of Medical Internet Research, 13 (3), 17 – 45. Rutten, G. M., Savelberg, H. H., Biddle, S. JH., & Kremers, S. PJ. (2013). Interrupting long periods of sitting: good STUFF. International Journal of Behavioral Nutrition and Physical Activity, 10 (1), retrieved from http://www.ijbnpa.org/content/10/1/1. Strel, J., Starc, G., & Kovač, M. (2010). Telesni in gibalni razvoj slovenskih otrok in mladine v številkah: šolsko leto 2007/08. Univerza v Ljubljani: Fakulteta za šport.
78
PRESCHOOL NON-SWIMMERS CAN SWIM BREASTSTROKE LONGER WITH THE SUBMERGED FACE THAN WITH THE HEAD ABOVE THE WATER
Kapus, J., Moravec, T.
University of Ljubljana, Faculty of sport, Ljubljana, Slovenia
ABSTRACT Considering the breathing, the easiest way to swim breaststroke is with the head above the water. Indeed, this rudimentary stroke is often the first attempt of beginners' swimming. However, it could be questionable if it is an appropriate swimming form for non-swimmers in relation to the breaststroke with the face submerged. Indeed, different head positions during breaststroke have different biomechanical effect via body position and buoyancy on non-swimmers' swimming. Therefore, the purpose of the study was to quantify the differences in abilities of non-swimmers to swim the breaststroke with the head above the water or with the face submerged. The latter was enabled by wearing a mask and breathing through a snorkel. For presented purpose, the swimming of the 13 preschool non-swimmers (8 boys, 5 girls, ages 6 years ± 8 months, height 120 ± 6 cm, weight 24 ± 5 kg) was evaluated. The participants were asked to swim breaststroke as long as possible in two different conditions. Each swim trial was filmed for subsequent analyses of the stroke rate. The participants were able to swim the breaststroke significantly longer with the face submerged (73 ± 37 seconds) than with the head held above the water (42 ± 32 seconds) (p < 0.01). Additionally, there were significant differences in stroke rate between swim trials (p < 0.01). Considering the obtained results, it could be concluded, that the face being submerged enabled participants easier breaststroke swimming in comparison with holding the head above the water. Keywords: Swimming beginners; learning; head position; body position INTRODUCTION The breaststroke is the oldest known swimming stroke. Despite different arguments of swimming learning experts, it has been thought the best stroke to teach swimming novices for many European countries (Langendorfer, 2013; Stallman, 2014). Considering the breathing, the easiest way to swim breaststroke is with the head above the water. Indeed, this rudimentary stroke is often the first attempt of beginners' swimming. With this adaptation they can breathe continuously and can better look forward during the swim. Once they have mastered the leg kick, the arm action as well as the timing and coordination, they will be able to swim relatively long distances without needing to submerge the face or head into the water. However, it could be questionable if the breaststroke with the head above the water is an appropriate swimming form for non-swimmers in relation to the breaststroke with the face submerged. The latter is enabled by wearing a mask and breathing through a snorkel, i.e. swim aids frequently used in the swimming learning programmes. Therefore, the purpose of the study was to quantify the differences in abilities of non-swimmers to swim the breaststroke with the head above the water or with the face submerged.
79
MATERIALS AND METHODS Participants 13 children (8 boys, 5 girls) participated in the study (ages 6 years ± 8 months, height 120 ± 6 cm, weight 24 ± 5 kg). The general swimming performance of these children was assessed as “beginners” or “non-swimmers”. They had no previous formal swimming lessons. Prior to testing they attended a water familiarisation course (32 hours in two weeks) that has also enabled them to get familiar with wearing the mask and breathing through the snorkel. However, they were not enrolled in any other swimming programmes during the testing period. Prior the start of the study, all parents were informed about the purpose and testing procedure before giving their written consent for their children's participation. Procedures The ability to swim was measured by swimming to exhaustion. The participants were asked to swim breaststroke as long as possible in two different conditions i.e. with the head above the water and with the face submerged. If the participant was able to swim longer than 25 meters, the test was stopped. After each swim trial there was a recovery period of at least 10 minutes. All testing was performed in a 25 metre long swimming pool with deep water only (water and air temperature 32ºC and 28ºC, respectively). Measures The swimming test was filmed from the side using a video camera (DCR-TRV 410E, PAL standard recorder, Sony, Tokyo, Japan) operating at 25 Hz. The measurements of the swim time and the stroke parameters were taken from the videotapes. The swim time and the number of stroke cycles were used to calculate stroke rate according to the following equation: stroke rate (min-1) = stroke cycles × 60/swim time Statistical analyses The values were presented as means and standard deviations. Repeated measures ANOVA was used to determine the main effect of different head positions during breaststroke swimming. Tukey LSD post hoc tests were used to examine pairwise differences. Statistical significance was accepted at the p ≤ 0.05 level. All statistical parameters were calculated using the statistics package SPSS (version 15.0, SPSS Inc., Chicago, USA). RESULTS All participants were able to swim breaststroke with the head held above water and with the face submerged. For nine of them the swim trial with the face submerged was stopped before their ended it on their own because they were able to swim 25 meters or more. Table 1 shows that the swim distance was significantly longer when participants swum the breaststroke with the face being submerged in comparison with the head above the water (p < 0.01). Furthermore, there were significant differences in stroke rate between swim trials (p < 0.01).
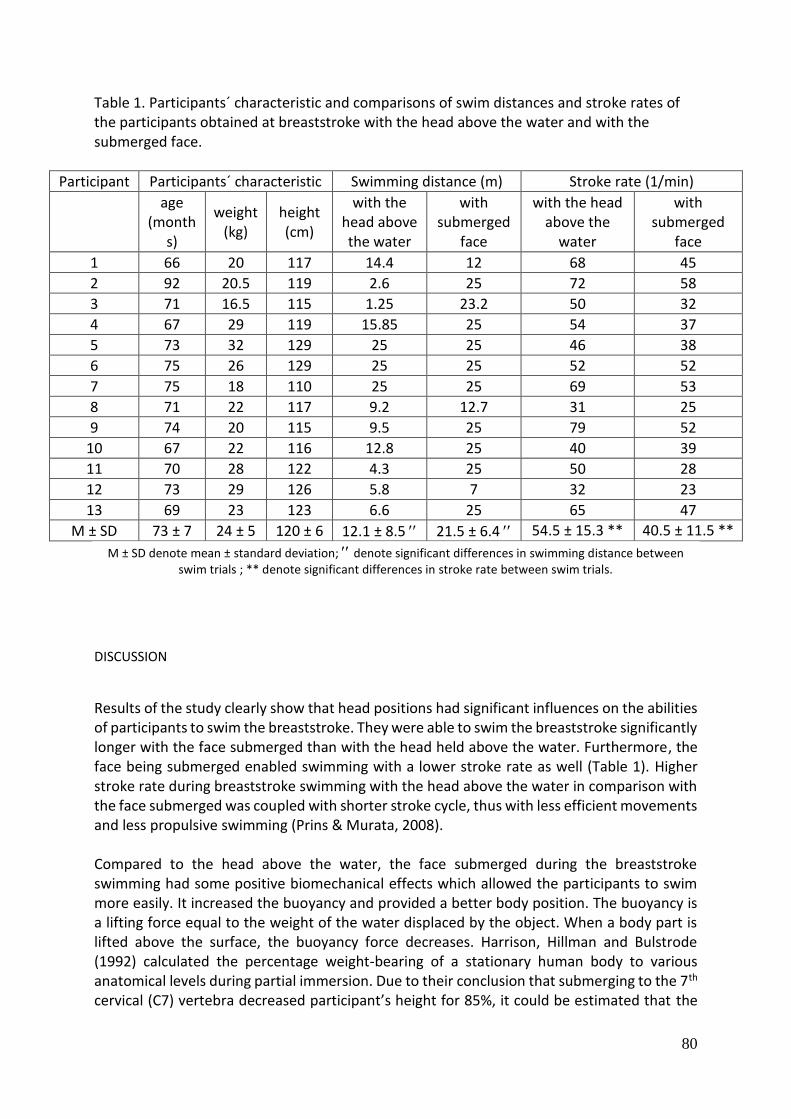
80
Table 1. Participants´ characteristic and comparisons of swim distances and stroke rates of the participants obtained at breaststroke with the head above the water and with the submerged face.
Participant Participants´ characteristic Swimming distance (m) Stroke rate (1/min)
age
(months)
weight (kg)
height (cm)
with the head above the water
with submerged
face
with the head above the
water
with submerged
face
1 66 20 117 14.4 12 68 45
2 92 20.5 119 2.6 25 72 58
3 71 16.5 115 1.25 23.2 50 32
4 67 29 119 15.85 25 54 37
5 73 32 129 25 25 46 38
6 75 26 129 25 25 52 52
7 75 18 110 25 25 69 53
8 71 22 117 9.2 12.7 31 25
9 74 20 115 9.5 25 79 52
10 67 22 116 12.8 25 40 39
11 70 28 122 4.3 25 50 28
12 73 29 126 5.8 7 32 23
13 69 23 123 6.6 25 65 47
M ± SD 73 ± 7 24 ± 5 120 ± 6 12.1 ± 8.5 21.5 ± 6.4 54.5 ± 15.3 ** 40.5 ± 11.5 **
M ± SD denote mean ± standard deviation; denote significant differences in swimming distance between swim trials ; ** denote significant differences in stroke rate between swim trials.
DISCUSSION
Results of the study clearly show that head positions had significant influences on the abilities of participants to swim the breaststroke. They were able to swim the breaststroke significantly longer with the face submerged than with the head held above the water. Furthermore, the face being submerged enabled swimming with a lower stroke rate as well (Table 1). Higher stroke rate during breaststroke swimming with the head above the water in comparison with the face submerged was coupled with shorter stroke cycle, thus with less efficient movements and less propulsive swimming (Prins & Murata, 2008). Compared to the head above the water, the face submerged during the breaststroke swimming had some positive biomechanical effects which allowed the participants to swim more easily. It increased the buoyancy and provided a better body position. The buoyancy is a lifting force equal to the weight of the water displaced by the object. When a body part is lifted above the surface, the buoyancy force decreases. Harrison, Hillman and Bulstrode (1992) calculated the percentage weight-bearing of a stationary human body to various anatomical levels during partial immersion. Due to their conclusion that submerging to the 7th cervical (C7) vertebra decreased participant’s height for 85%, it could be estimated that the
81
head above the water decreased the buoyancy force for 10% to 15% in comparison to full immersion. Therefore, the head above the water enabled swimming with less buoyancy in comparison with the submerged face. Furthermore, the different head positions may have an influence on the body position during swimming. A swimmer's ability to float statically in a horizontal position is determined largely by the rotating effect resulting from their body weight and buoyancy forces. This is termed the buoyant torque. The oriented downward gravitational force i.e. weight acts through the body's centre of mass, while the resultant upward buoyancy force acts through the centre of buoyancy. The distance between the centre of mass and the centre of buoyancy determines the static floating position of an individual. In static floating, the centre of buoyancy is generally closer to the head in comparison to the centre of mass. Consequently, the buoyant torque acts to sink the legs (Gagnon & Montpetit, 1981; McLean & Hinrichs, 2000). Beside the potential lower buoyancy, it could be suggested that head above the water induced more inclined body position during swimming in comparison with the face submerged. Indeed, during gliding under water, the head above water increased passive drag for 5.2% in comparison with the submerged head or head on the surface (Cortesi & Gatta, 2015). Considering this, we could assume that the head above the water during the breaststroke swimming induced higher drag than the submerged face (Chatard, Bourgaoi, & Lacour, 1990; Chatard, Lavoie, & Lacour, 1990). Higher resistance could be the reason for higher energy cost, heart rate and lactic production at swimming breaststroke with the head above the water than with proper head movements (Stallman et al., 2010). Additional reason for the results that the swim trial with the face submerged was longer than with the head above the water is the fact that the participants performed it by wearing a mask and breathing through the snorkel. These swim aids provided important advantages for them. It enabled unobstructed vision and normal breathing, thus an easier swim for non-swimmers who had a real aversion to putting the face in the water and had lower skill levels. Considering the results of our study, it seemed that the mask and the snorkel were also act like buoyancy aids. They assisted the participants by placing them in the proper horizontal body position and thereby simplify the complex coordination of arms, legs and breathing skills (Parker, Blanksby, & Quek, 1999). CONCLUSIONS We concluded, that the face being submerged enabled participant easier breaststroke swimming in comparison with holding the head above the water. Furthermore, it seemed that the mask and the snorkel were also act like buoyancy aids. REFERENCES Chatard, J.C., Bourgaoi, B., & Lacour, J.R. (1990). Passive drag is still a good evaluator of swimming aptitude. European Journal of Applied Physiology, 59 (6), 399-404. Chatard, J.C., Lavoie, J.M., & Lacour, J.R. (1990). Analysis of determinants of swimming economy in front crawl. European Journal of Applied Physiology, 61 (1-2), 88-92.
82
Cortesi, M, & Gatta, G. (2015). Effect of the swimmer’s head position on passive drag. Journal of Human Kinetics, 49 (1), 37-45. Gagnon, M., & Montpetit, R. (1981). Technological development for the measurement of the center of volume in the human body. Journal of Biomechanics, 14 (4), 235-241. Harrison, R.A., Hillman, M., & Bulstrode, S.J. (1992). Loading of the lower limb when walking partially immersed: Implications for clinical practice. Physiotherapy, 78 (3), 164-166. Langendorfer, S.J. (2013). Which Stroke First? International Journal of Aquatic Research and Education, 7 (4), 286-289. McLean, S.P., & Hinrichs, R.N. (2000). Influence of arm position and lung volume on the center of buoyancy of competitive swimmers. Research Quarterly for Exercise and Sport, 71 (2), 182-189. Parker, H.E., Blanksby, B.A., & Quek, K.L. (1999). Learning to swim using buoyancy aides. Pediatric Exercise Science, 11 (4), 377-392. Prins, J., & Murata, N. (2008). Kinematic analysis of swimmers with permanent physical disabilities. International Journal of Aquatic Research and Education, 2 (4), 330-345. Stallman, R.K., Major, J., Hemmer, S., & Haavaag, G. (2010). Movement economy in breaststroke swimming: A survival perspective. In: P.L. Kjendlie, R.K. Stallman, & J. Cabri (Eds.). Proceedings of the XIth International Symposium for Biomechanics and Medicine in Swimming (pp. 79-80). Oslo: Norwegian School of Sport Science. Stallman, R.K. (2014). Which Stroke First? No Stroke First! International Journal of Aquatic Research and Education, 8 (1), 5-8.
83
SPORTS CAREER AND EDUCATION SPORTS CAREER AND EDUCATION OF TOP NORDIC ATHLETES: COMPARISON BETWEEN THE SLOVENIAN, ITALIAN
AND NORWEGIAN ATHLETES
Kerštajn, R.1, Doupona Topič, M.2
1Primary school Prežihov Voranc Jesenice
2University of Ljubljana, Faculty of sport, Ljubljana, Slovenia
ABSTRACT
The phrase dual career (the term was first written down in 2007, European Commission) indicates the career of the athletes who coordinate their sport activities with education during their sports career. Top athletes are often faced with problems regarding coordination of sports career and education.The purpose of the study was to determine the course of a dual career, coordination of school and sporting obligations of Norwegian, Italian and Slovenian top Nordic athletes. We tried to find out whether there are differences among countries in terms of education, training and competitions in relation to athletes of different Nordic sports and what problems these athletes face while they coordinate a dual career.The study was conducted on a sample of 174 top Nordic athletes from Norway, Italy and Slovenia that compete at the highest level of competitions (Olympic Games, World Championships, World Cup) and come from the following sports disciplines: cross-country skiing, ski jumping and biathlon. Data were collected through an online questionnaire, which was used to determine the characteristics of athletes’ dual careers. The survey was carried out during the World Cup in the 2015–16 season. The results were analysed by the means of descriptive statistics with cross-tables, and non-parametric chi-square test was used to determine the statistical relationship between individual variables. The results show that Norwegian athletes have less difficulty in coordinating school and sporting obligations than Slovenian Nordic athletes. 85% of Norwegian athletes managed to complete their education at a certain level and then they completely devoted themselves to sports career, while the majority of Slovenian athletes (63.6%) dropped out of school due to sport already in middle school or at higher levels of education. 37% of Italian athletes terminated schooling, while 39.1% did not continue to a higher level of education due to their sports career.Based on results of the study, consideration may be given regarding the modification of competitive system in Slovenia, especially in relation to cross-country skiers and biathletes. The existing system is far too competitively oriented and requires premature specialization. Depending on the specific needs of Nordic skiers (snow, sports infrastructure), consideration may be given regarding special secondary schools in Slovenia, following the example of Norway, where all perspective Nordic skiers would educate and stay in one place, provided with teachers and sports coordinators, while Slovenian Ski Association would ensure trainers and other professionals.
Keywords: education, sport, dual career, competitive systems, education system, sports career, Nordic sports
INTRODUCTION
In this field, there is no literature that would present difficulties that Nordic athletes are facing when coordinating sports and schooling obligations.
84
They are absent from regular educational process for the most time of winter semester, even more than 120 days. Training and competitions, education – studies/schooling. Coordination of sports and schooling obligations; if not – a decision for sport or school.
Some secondary schools provide contracts with young elite athletes on the coordination of school work and sporting commitments. The responsibility of the state for education of Slovenian athletes, secondary schools (adjustments, sports departments), universities without adjustments (except Faculty of Sport).
In Slovenia, Italy and Norway there aren’t any structural measures (legal basis) regarding educational services for top athletes at higher level of education. On most universities in Slovenia and Norway, adjustments of school and sports obligations more or less depend on informal or individual negotiations of each student.
Some characteristics of sport and education systems in Norway, Italy and Slovenia
Norway
Huge database of athletes in the Nordic disciplines and the long tradition of Nordic sports. Theirs competitive orientation is late (from the age of 17 onwards).
In addition, they have excellent conditions and facilities for training, coaches and other experts provided and in five gymnasiums that are officially recognized by Norwegian Ski Federation and have been given a status of ski schools by the Norwegian government, adjustments. Universities, adjustments, for example: 50% attendance, extended time for conclusion of a year’s study.
Italy
Most of the best competitors from the Nordic disciplines come from the northern part of Italy, where the best conditions for training and competitions are. They have early orientation of children to competitive sport. Four the so-called special secondary schools with sports departments for winter athletes (northern Italy). In Italy, athletes do not have any special adjustments at universities, but they can conclude one year’s study in several years.
Slovenia
Olympic Committee of Slovenia measures effectiveness of sports results by means of the categorization of athletes that is divided into several classes (world, international, national, promising, youth). Categorization is a basic principle in the allocation of financial resources to the national inter-professional associations, municipalities, and societies.
In Slovenia the competition system is early-oriented (national championship since the age of 10 onwards), selections (even before the age of 14). There are no special schools for winter sport athletes, sports departments, adjustments in some secondary schools are quite well regulated. At the universities there are no adjustments for the athletes, except at Faculty of Sport. A large dropout of athletes during the transition between secondary school and university.
The purpose and aim of the study
We examined the characteristics of education and sport systems in Norway, Italy and Slovenia in terms of coordination of dual careers among athletes that compete in Nordic disciplines.
We identified difficulties and problems that top Nordic athletes are facing when coordinating a dual career, according to motivation for education and sports, country, gender, sports discipline, socio-demographic characteristics...
85
METHODS
Variables used
The survey included 93 variables, the SAMSAQ-EU questionnaire, sports identity, socio-demographic issues.
Socio-demographic background (sex, type of settlement, mother’s and father’s education).
Sports characteristics (sports discipline, years of training, hours of training per week, categorization, the level of competitions …).
The parent-athlete relationship (who suggested the selected sports to the elite athletes, mother’s and father’s activities).
The connection between schooling and sport (absence, problems with the coordination of school work and sporting obligations, decision on further education after finished secondary school …).
Sports identity (status among peers, adults, and focus on sport or education, sports or academic career …).
We have good response, even at World Cup competitions. Only Norway’s biathlon team refused to cooperate.
Methods of data processing
We used online survey, also the printed version of the questionnaire, which was activated in December 2015 and concluded in June 2016.
The data were analyzed by the means of the statistical package IBM SPSS Advanced Statistics 20.0. The data were properly classified and described by the methods of descriptive statistics and inferential statistics with the aim of proving the statistical relationship between individual variables.
Non-parametric chi-squared test and bivariant Spearman’s rank correlation coefficient were used for the determination of statistical relationship between individual variables.
For statistical interpretation, we used online tool 1ka, IBM SPSS Advanced statistics 20.0., descriptive statistics, and inferential statistics.
The sample
The study included 174 top Nordic athletes from Italy, Norway and Slovenia
The athletes are competing in Nordic disciplines such as Cross-country skiing, Ski Jumping and Biathlon.
They compete at the Olympic Games, World Championships, World Cups and other major international competitions.
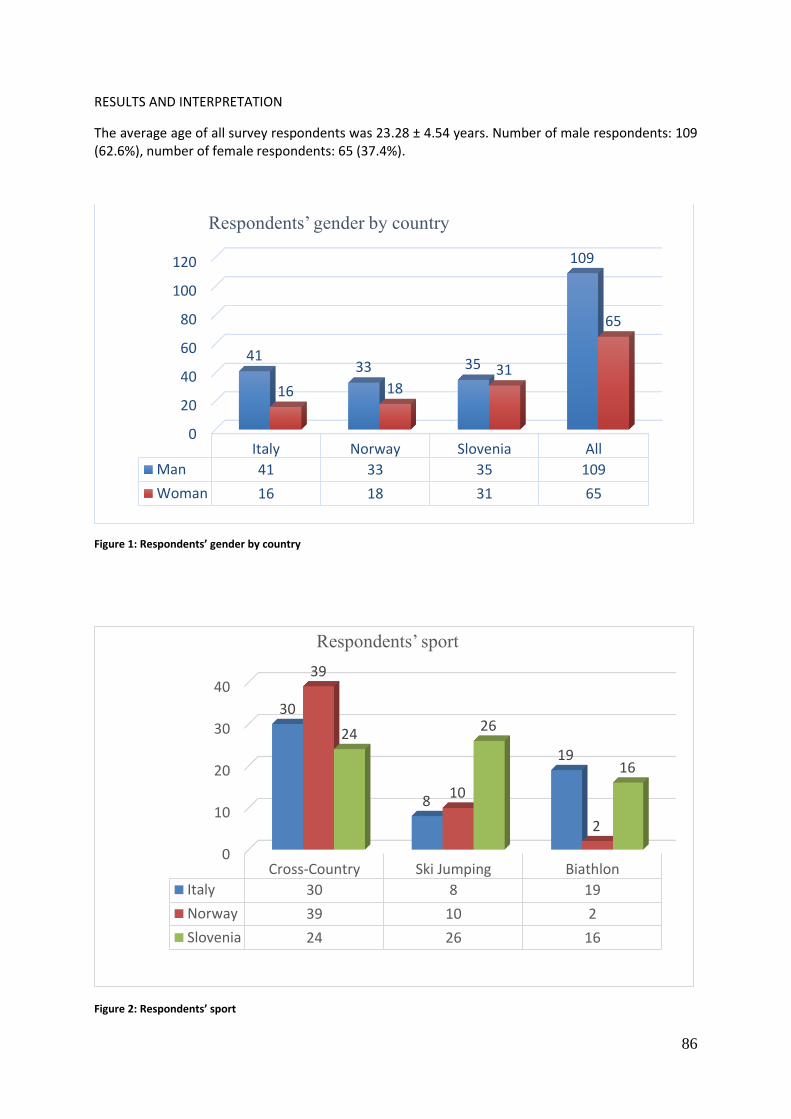
86
RESULTS AND INTERPRETATION
The average age of all survey respondents was 23.28 ± 4.54 years. Number of male respondents: 109 (62.6%), number of female respondents: 65 (37.4%).
Figure 1: Respondents’ gender by country
Figure 2: Respondents’ sport
0
20
40
60
80
100
120
Italy Norway Slovenia All
Man 41 33 35 109
Woman 16 18 31 65
4133 35
109
16 1831
65
Respondents’ gender by country
0
10
20
30
40
Cross-Country Ski Jumping Biathlon
Italy 30 8 19
Norway 39 10 2
Slovenia 24 26 16
30
8
19
39
10
2
2426
16
Respondents’ sport
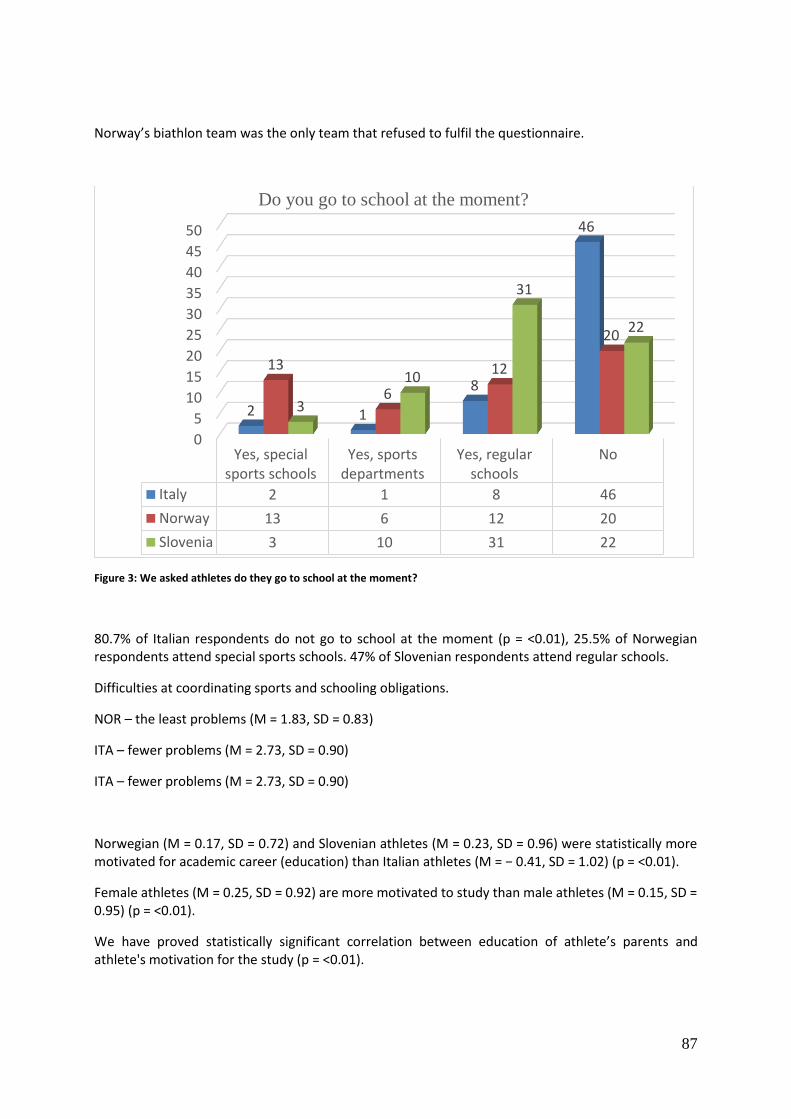
87
Norway’s biathlon team was the only team that refused to fulfil the questionnaire.
Figure 3: We asked athletes do they go to school at the moment?
80.7% of Italian respondents do not go to school at the moment (p = <0.01), 25.5% of Norwegian respondents attend special sports schools. 47% of Slovenian respondents attend regular schools.
Difficulties at coordinating sports and schooling obligations.
NOR – the least problems (M = 1.83, SD = 0.83)
ITA – fewer problems (M = 2.73, SD = 0.90)
ITA – fewer problems (M = 2.73, SD = 0.90)
Norwegian (M = 0.17, SD = 0.72) and Slovenian athletes (M = 0.23, SD = 0.96) were statistically more motivated for academic career (education) than Italian athletes (M = − 0.41, SD = 1.02) (p = <0.01).
Female athletes (M = 0.25, SD = 0.92) are more motivated to study than male athletes (M = 0.15, SD = 0.95) (p = <0.01).
We have proved statistically significant correlation between education of athlete’s parents and athlete's motivation for the study (p = <0.01).
0
5
10
15
20
25
30
35
40
45
50
Yes, specialsports schools
Yes, sportsdepartments
Yes, regularschools
No
Italy 2 1 8 46
Norway 13 6 12 20
Slovenia 3 10 31 22
2 1
8
46
13
6
12
20
3
10
31
22
Do you go to school at the moment?
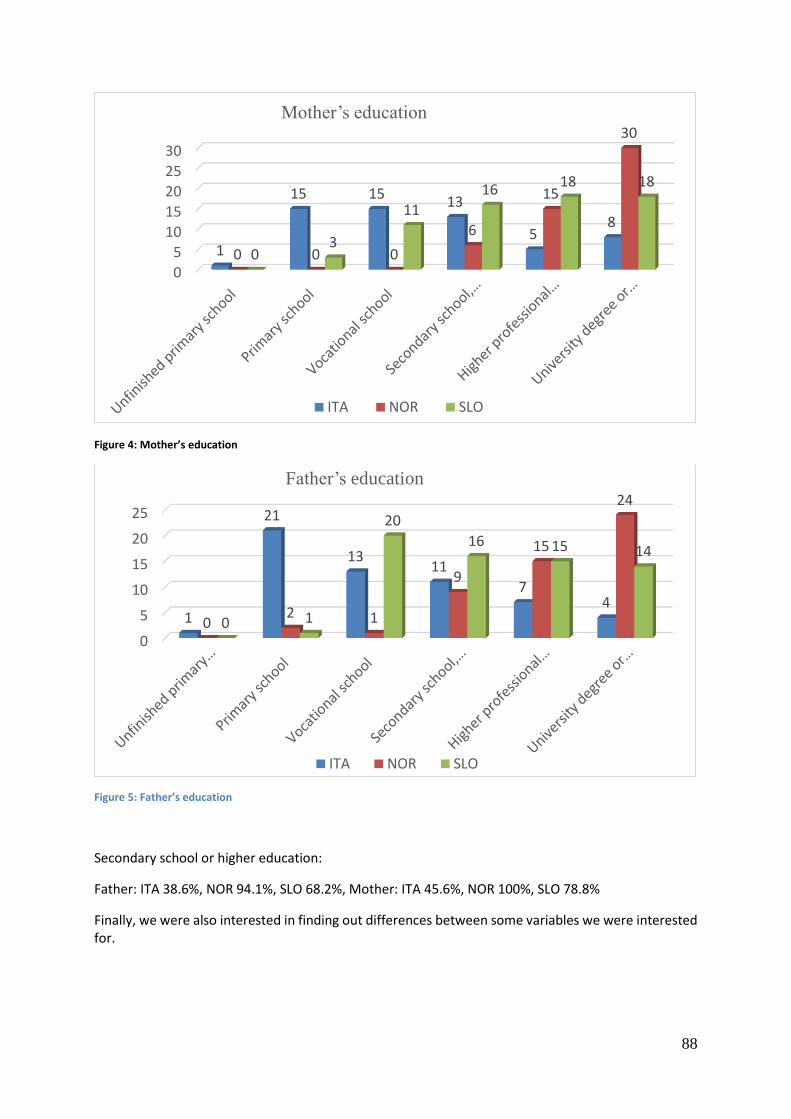
88
Figure 4: Mother’s education
Figure 5: Father’s education
Secondary school or higher education:
Father: ITA 38.6%, NOR 94.1%, SLO 68.2%, Mother: ITA 45.6%, NOR 100%, SLO 78.8%
Finally, we were also interested in finding out differences between some variables we were interested for.
0
5
10
15
20
25
30
1
15 1513
58
0 0 0
6
15
30
03
11
1618 18
Mother’s education
ITA NOR SLO
0
5
10
15
20
25
1
21
1311
74
02 1
9
15
24
0 1
20
16 15 14
Father’s education
ITA NOR SLO

89
Table 1: Bivariate analysis of individual variables’ correlation
**. Correlation is significant at the 0.01 level (2-tailed).
*. Correlation is significant at the 0.05 level (2-tailed).
CONCLUSION
In Norway the possibility of schooling in special secondary schools for Nordic athlete adjustments at universities, the possibility of part-time schooling with adjustments (universities in Lillehammer, Trondheim, and Oslo). They have different motivational approach to schooling of Norwegian athletes and their parents are more educated. In addition, they have few difficulties in coordinating sports and schooling obligations
In Italy are four specific secondary schools (in the north of Italy) with sports departments while at the universities there are no special adjustments but students have possibility of prolonged study Italian athletes are less motivated to study, better motivation for sport
In Slovenia, athletes have possibility to school in some regular secondary schools in sports departments. There is no formal adjustments for top athletes at the university (with the exception of Faculty of Sport and partly Faculty of Organizational Sciences Maribor) and although they are well motivated for schooling and sport, they have more difficulties with their studies (driving to and from trainings, conditions ...)
After finished secondary school, many athletes decide to put their education above sport and stop training (simultaneous transition to a higher level of education and the transition from youth to senior category).
We have proposal for a regulation of the legal basis regarding schooling adjustments for top athletes at the universities in Slovenia
90
REFERENCES
Aquilina, D., & Henry, I. (2010). Elite athletes and university education in Europe: A review of policy and practice in higher education in the European Union Member States. International Journal of Sport Policy, 2(1), 25-47.
Baldishol, B. Intervju, Skype, 15.11.2015.
Breslauer, N., Bujan, I., & Horvat, V. (2012). Career after sports career-the business career. Zbornik radova Međimurskog veleučilišta u Čakovcu, 3(1), 7-13.
Corrado, L., Tessitore, A., Capranica, L., Rauter, S., & Doupona Topič, M. (2012). Motivation for dual career: Italian and Slovenian student-athletes. Kinesiologia Slovenica, 18(3), 47-56
European Commission (2012). Guidelines on Dual Careers of Athletes Recommended Policy Actions in Support of Dual Careers in High-Performance Sport. Retrieved August 16 2015 from http://ec.europa.eu/sport/news/20130123-eu-guidelines-dualcareers_en.htm
Gimnazija Jesenice. Pravilnik o kategorizaciji v športnih oddelkih (2016). Retrieved 12.6.2016, from http://www.gimjes.si/files/2010/11/Kategorizacija%20v%20%C5%A1portnih%20oddelkih.pdf.
Paruzzi, G. Intervju. Kranjska Gora, 27.5.2016.
Program zaposlovanja športnikov. (2012). Adecco. Retrived 12.6.2016, from http://www.adecco.si/druzbenaodgovornost/sportniki.asp
Univerza v Ljubljani Fakulteta za šport. Pravila o organizaciji in delovanju Fakultete za šport (2012).
Univerza v Ljubljani. (2016). Pravila za dodelitev statusa kandidata s posebnim statusom v prijavno sprejemnem postopku za vpsi na Univerzo v Ljubljani. Retrieved 12.6.2016, from https://www.uni-lj.si/studij/prijavno_sprejemni_postopki/kandidati_s_posebnim_statusom/
Univerza v Ljubljani. Statut Univerze v Ljubljani (2015). Retrieved from https://www.uni-lj.si/o_univerzi_v_ljubljani/organizacija__pravilniki_in_porocila/predpisi_statut_ul_in_pravilniki/2013070915432663/
Zakon o športu (1998). Ljubljana. Ministrstvo za šolstvo in šport.
91
TABLE TENNIS AS THE THIRD LESSON IN THE SYSTEM OF PHYSICAL EDUCATION IN PRIMARY SCHOOL CHILDREN
Mokrousov, E.
State University of Physical Education and Sport of the Republic of Moldova, , Manager Department Theory and Methods of Games, Chisinau, Republic of Moldova
ABSTRACT
In this work presented for publication is reflected the experimental material for realivation of socially important task like the educational process in school of the Republic of Moldova, which consists of the application of new qualitative approaches and techniques. In the secondary schools (gymnasiums) where are planned still 2 lessons of physical education a week and which undoubtedly are not enough, there is a need to intensify the existing motor activities in the primary school pupils especially, in the regime of training process with the addition of new simple but developing kinds of motor activity of sports character. Such kind of sports activity can be table tennis. Key words: educational process, physical culture, lesson of physical education, primary school, table tennis, motor activity, children. INTRODUCTION Physical activity has a positive effect on all the psychological functions of the human being [3,5]. In the studies made by psychologists and teachers is shown a direct correlation of systematically organized motor activity with the physical development, as well as with the best manifestations of perception, memory, positive emotions and thinking. The movement also contributes for increasing the diversity of the vocabulary of speech, which improves the mental state of a person. In other words, motor activity not only creates an energy basis for normal growth and development, but also stimulates the formation of mental function, which is especially important for children in early school period. Exactly at this age in children lays the foundation of their normal development supported by a variety of complex interdependence, systematically organized physical education classes, as well as a stable motivation for self-employment by physical exercises in the future [1] Actuality In accordance with the Law on Physical Culture and Sports in the Republic of Moldova (number 330-XIV from 03.25.99), in secondary schools is provided 3 (three) lessons of physical education for students in the school week mode. At the same time, in practice social conditions, this requirement of the Law is not fulfilled almost by the entire territory of the Republic of Moldova. In all schools are still planned only two lessons in physical education in the weekly mode, which, by their efficiency (no necessary material and technical conditions, the lack of specialized personnel) do not meet the modern requirements. Moreover, twice a week, including the aimed nature of the motor activity of
92
children is no longer sufficient due to the progressive physical inactivity associated with the pleasures of the scientific and technical progress. A similar picture is in the primary school, where the issue of physical education of children is crucially important because of the characteristics age of their development. In the majority of primary school physical education classes are replaced by big changes due to the congestion in all of the educational process and the lack of specialized personnel. According to a variety of reasons, instead of physical education teachers there are working class teachers of general education subjects. Therefore, in the secondary schools, where at the moment are still being planned for children two lessons of physical education in the weekly mode, and which also are clearly insufficient, it is necessary, in our view, to intensify the existing motor activity especially in primary school pupils during the additional and uncomplicated school-time, to develop different kinds of motor sports activities character. That kind of sports activities can be table tennis. The purpose of study. To develop recommendations and methodology of physical education for younger pupils with the application of table tennis means in the conditions of the third lesson of physical education. The hypothesis of the study. It suggests that the inclusion of table tennis exercise in an additional lesson of physical education in 1st grade pupils will increase their level of physical preparation. The scientific novelty of the research consists in the development of a methodology and justification of the tennis exercise inclusion, as well as the including of a gaming activity in the additional physical education of younger pupils. The practical importance of the research is as follows:
there are offered adequate means as table tennis for the characteristic younger age of pupils in the content of an additional lesson of physical education in a higher volume of motor activity of students;
there are developed practical recommendations in table tennis for extra lessons in physical education that will help to intensify the development of basic and coordination abilities of elementary school children.
We also believe that in the present conditions it is required the experimental development of new, specific recommendations for additional physical education in children, which by their organizational and substantial aspects should be adequate to the current conditions of schools, causing among the involved children high positive emotion, forming their unobtrusive and stable motivation through gaming methods, implementing during the lessons of complex motor actions promoting as well the general physical development, and the successful use of specialized tools for 'thin' motor skills necessary for children at this age. Table tennis - one of the most popular and exciting types of motor activity, as well a sports one. Entertainment, availability and easiness of game rules and tools, expand the circle of this
93
sport fans and promote the inclusion of table tennis in the program of various sports and cultural events, carrying out of competitions, the using in the physical education system in the educational institutions. It is well known that the primary school age children and social conditions of directed influence motor activity cause the level of its morpho-functional development of the body, which in turn forms the motor state and the ability to move and skills.[5, 8]. Therefore the study of age-related features of the morphological and functional systems of primary school children, will allow being adequate only by planning implemented means and methods of physical training to develop the necessary motor abilities. Table tennis is available to all, it can be played both indoors and outdoors. Simple equipment and simple rules of this fascinating game conquer day by day many fans. Selection of sports games for motor development, table tennis, it is determined by its popularity in the children's environment, accessibility, widespread in the city, educational and material resources of the school and, of course, the very preparedness of the teacher of physical education [1,2,4,5,7]. It is very important that the child could relieve physical and emotional stress after the lessons. This can be achieved easily in the school medium, by the means of table tennis training [3,4,5]. Table tennis activities of those involved contribute to the development and improvement of basic physical qualities - endurance, coordination, speed-strength, the formation of a variety of motor skills, health promotion, as well as forming the personality of the child: communication skills, will, camaraderie, sense of responsibility for their actions in front of him and his comrades. The desire to surpass the opponent helps the speed of motor manifestations and lead to tactical plans.These features of table tennis create favorable conditions for the education of students' ability to control emotions; do not lose control over their actions, if they win, to do not weaken the struggle, and if the failure to do not lose hope. In today's primary school conditions, students in connection with the large volumes of training loads and homework develop physical inactivity. The recommendations offered by us are designed to solve the problem of the additional motor development through third table tennis lesson in the learning process (at the end of the school week) at the same time for all pupils’ classes of primary school. Additional motor activity through the table tennis will be aimed at meeting the needs of children in the movement process, rehabilitation and maintenance of the body's functionality, coordinating actions, ingenuity, hit innings, definition of impact and other activities aimed at achieving victory, and will contribute to the mobilization of their capabilities, to act with maximum effort to overcome the difficulties arising in the course of sports struggle. RESEARCH METHODS The study conducted by us on the mentioned topic was carried out by the following methods:
94
theoretical study and analysis of the scientific literature of leading scientists in the field of physiology, pedagogy, psychology and physical education of primary school children, followed by a generalization of the information received;
pedagogical observations were made according the health of children 7-8 years and their motor potential;
pedagogical experiments. It involves ascertains and basic experiments for the scientific foundation of the 3rd lesson effectiveness in table tennis;
control test method was supposed to test and evaluate the development of the basic motor skills in 7-8 years old children;
methods of mathematical and statistical processing of the experimental results were used for the study and processing of the resulting statistical data on main statistical characteristics, followed by correlation and comparative analysis on the t - Student criterion.
Pedagogical observations.
Conducting pedagogical observations allowed us to have a concrete idea of the content state of specialized issues and was implemented in the following areas:
the health condition, physical development, motor activity and physical readiness of children in primary schools from Dubossary;
the nature and specificity training sessions in physical education.
Thus, the specific details of pedagogical observations have updated and systematized our understanding of the physical training of 7-11 years old children, their level of physical activity and training. PEDAGOGICAL EXPERIMENT The whole period of scientific research included carrying out a pedagogical experiment and two ascertains. In ascertaining experiment was studied the level of physical readiness of primary school students, tests processing, and the impact of additional training in table tennis as the 3rd lesson. Methods of evaluation tests. For full and effective representation of the physical condition of children of primary school age, we studied and statistically proved necessary tests, the data which would be characterized by the following indicators of the motor development of children. Motor condition of 7-8 years old children, was determined from the experimental procedure of Elena Mokrousov. [7, 8]. To study the motor status of 1st class children, we have proved by statistical methods a certain range of the motor tests that conform to a sufficient degree of validity, reliability and informativeness and their results reliably, reflect the true organism motor state of the primary school pupils. At the same time, motor status of 7-11 years old children was studied using the following motor tests
3x10 m shuttle run
long jump with space
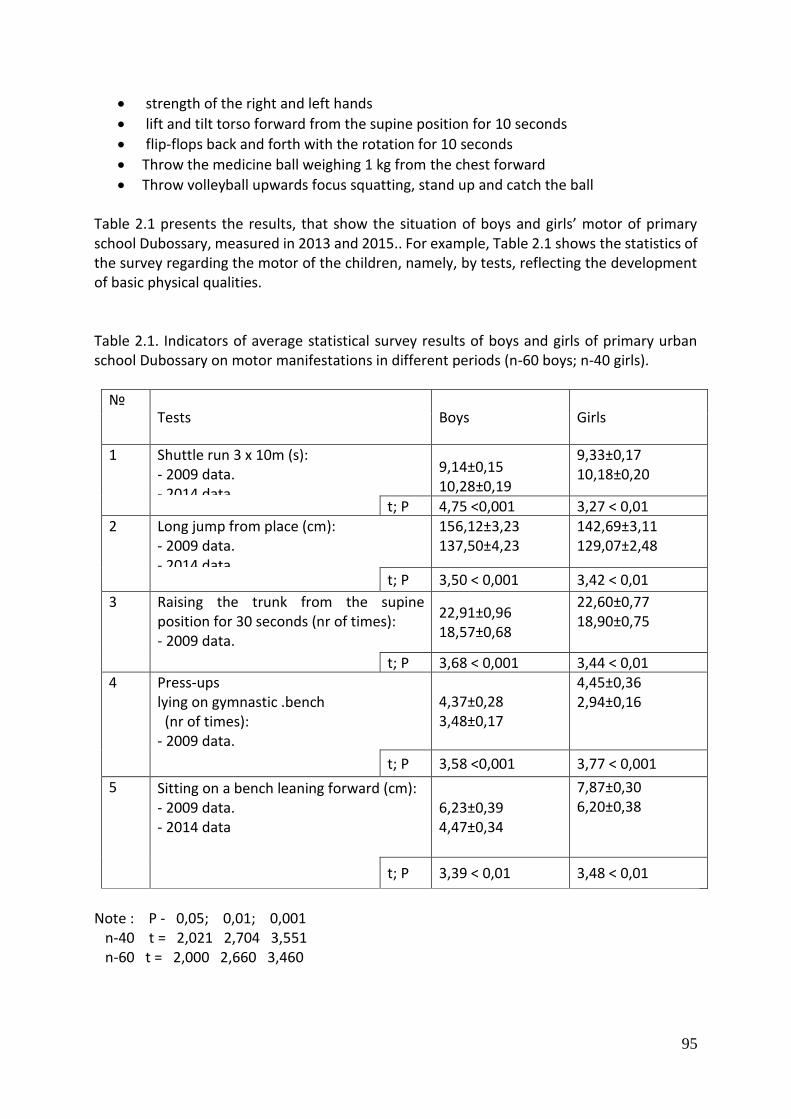
95
strength of the right and left hands
lift and tilt torso forward from the supine position for 10 seconds
flip-flops back and forth with the rotation for 10 seconds
Throw the medicine ball weighing 1 kg from the chest forward
Throw volleyball upwards focus squatting, stand up and catch the ball Table 2.1 presents the results, that show the situation of boys and girls’ motor of primary school Dubossary, measured in 2013 and 2015.. For example, Table 2.1 shows the statistics of the survey regarding the motor of the children, namely, by tests, reflecting the development of basic physical qualities. Table 2.1. Indicators of average statistical survey results of boys and girls of primary urban school Dubossary on motor manifestations in different periods (n-60 boys; n-40 girls).
№ Tests Boys Girls
1
Shuttle run 3 x 10m (s): - 2009 data. - 2014 data .
9,14±0,15 10,28±0,19
9,33±0,17 10,18±0,20
t; P 4,75 <0,001 3,27 < 0,01 2
Long jump from place (cm): - 2009 data. - 2014 data
156,12±3,23 137,50±4,23
142,69±3,11 129,07±2,48
t; P 3,50 < 0,001 3,42 < 0,01
3 Raising the trunk from the supine position for 30 seconds (nr of times): - 2009 data. - 2014 data .
22,91±0,96 18,57±0,68
22,60±0,77 18,90±0,75
t; P 3,68 < 0,001 3,44 < 0,01 4
Press-ups lying on gymnastic .bench (nr of times): - 2009 data. - 2014 data.
4,37±0,28 3,48±0,17
4,45±0,36 2,94±0,16
t; P 3,58 <0,001 3,77 < 0,001
5 Sitting on a bench leaning forward (cm): - 2009 data. - 2014 data
6,23±0,39 4,47±0,34
7,87±0,30 6,20±0,38
t; P 3,39 < 0,01 3,48 < 0,01
Note : Р - 0,05; 0,01; 0,001 n-40 t = 2,021 2,704 3,551 n-60 t = 2,000 2,660 3,460
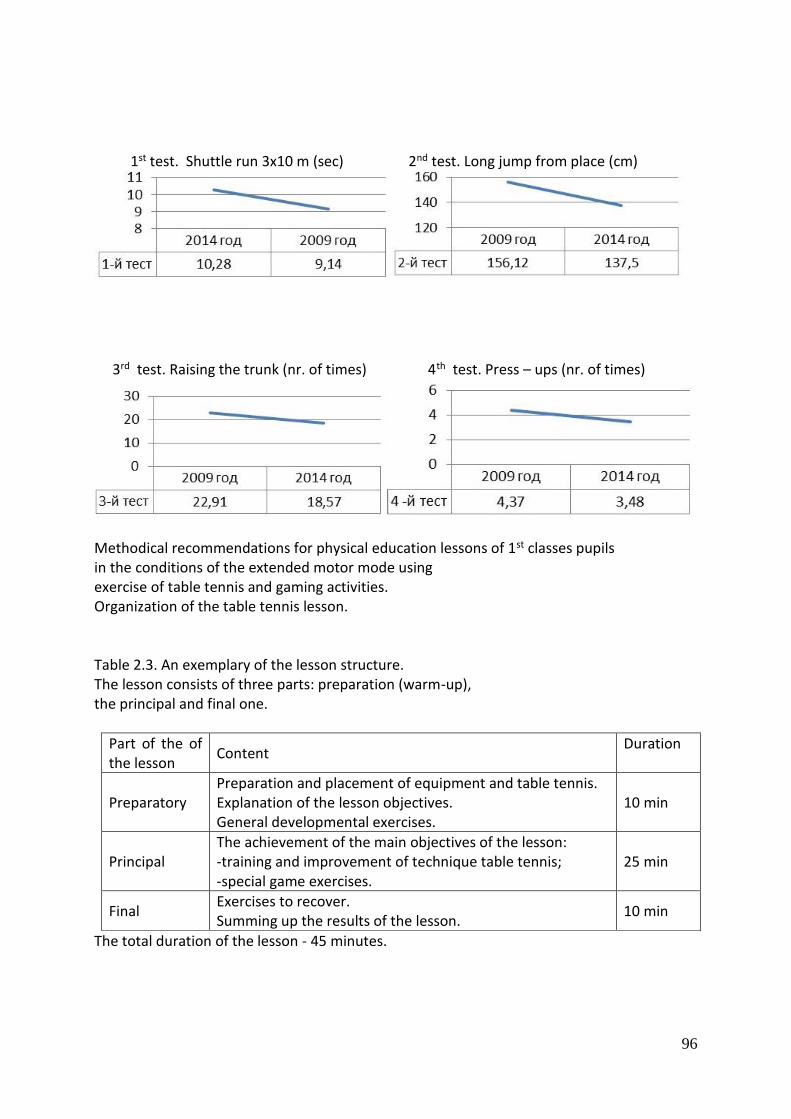
96
1st test. Shuttle run 3x10 m (sec) 2nd test. Long jump from place (cm)
3rd test. Raising the trunk (nr. of times) 4th test. Press – ups (nr. of times)
Methodical recommendations for physical education lessons of 1st classes pupils in the conditions of the extended motor mode using exercise of table tennis and gaming activities. Organization of the table tennis lesson. Table 2.3. An exemplary of the lesson structure. The lesson consists of three parts: preparation (warm-up), the principal and final one.
Part of the of the lesson
Content Duration
Preparatory Preparation and placement of equipment and table tennis. Explanation of the lesson objectives. General developmental exercises.
10 min
Principal The achievement of the main objectives of the lesson: -training and improvement of technique table tennis; -special game exercises.
25 min
Final Exercises to recover. Summing up the results of the lesson.
10 min
The total duration of the lesson - 45 minutes.
97
CONCLUSIONS
1. Targeted, selective and developing, the impact of motor means and techniques of table tennis on the body of children, should also be based on age characteristics of the functioning of the body, which in turn will help to intensify the process of physical education aimed to improve the children’s health, their functional and motor development and their involvement in sports activities, and identifying talent for table tennis.
2. Examination of the physical readiness of primary school children from .Dubossary school notes a tendency to a significant reduction in the studied parameters in the dynamics of five years. This is due to the continued decline of children physical activity, especially of primary school, lack of motor development in traditionally implemented school system of physical education.
3. The pedagogical experiment conducted by its results objectively showed that introduction into the educational process on physical training of additional 3rd of the lesson from a game orientation gives positive results regarding the increase of the physical preparation of elementary school children.
4. The proposed guidelines for the 3rd lesson in table tennis will significantly contribute to the development of basic motor abilities and the formation of the complex coordinated movements in 1st grade children of primary school.
REFERENCES:
1. Ameline A.N. For a successful training: the organization of self-training and table tennis. In: Sports Games, № 8, Moscow, 1982, 24-25 p.
2. Ameline A. Modern table tennis. Moscow: Physical Culture and Sports, 1982. 111 p. 3. Barchukova GV, Baksheev K.S. Problems evaluation and planning of loadings in sports
(on the tennis example). The Theory and Practice of Physical Culture. 2006. № 9, 32-36 p.
4. Barchukova G.V. Table Tennis: physical preparation of players: Method, techn. for students. GTSIOLFK. Moscow: GTSOLIFK, 1989. 22 p.
5. Grosul V.S. Formation of motor skills and conduct effective training process involved in learning table tennis. Dubossary, 2010, 5-9 p.
6. Demchenko P.P. Mathematical and analytical methods in the structure of educational research of physical culture. Chisinau: USEFS, 2009. 518 p.
7. Mokrousov E. Regarding the issue of training the technique of playing table tennis. In: Materials of International Scientific Conference of PhD Students' “Physical Culture: Scientific problems of Education and Sport ". 8th Edition . Chisinau SUPES 2012, 234-238 p.
8. Mokrousov E. Actual children's selection questions for the initial stage of sports training in table tennis. In: Current Issues on improving the system of education in the field of physical culture: Materials of international scientific conference. Chisinau, SUPES 2013, 400-408 p.
98
THE EFFECT OF THE USE OF MASK AND SNORKEL DURING SWIM LEARNING PROGRAMME FOR PRESCHOOL NON-SWIMMERS
Moravec, T., Kapus, J.
University of Ljubljana, Faculty of Sport, Department for swimming, Ljubljana, Slovenia
ABSTRACT A mask and a snorkel are frequently used swim aids in modern learn-to-swim programmes. They enable pupils an easier way to put their head under the water, to see and breathe easier during swimming. The aim of the study was to determine the effect of the use of the mask and the snorkel during the learn-to-swim programme on water adjustment of preschool non-swimmers. 39 children participated in the study (ages 6 years ± 6 months, height 119 ± 5 cm, weight 22 ± 4 kg). They were divided into matched pairs based on their swimming knowledge and skills shown at initial testing. Subsequently, they were assigned randomly to an experimental or a control group. Both groups completed similar learn-to-swim programmes for non-swimmers by using the mask and the snorkel (the experiential group) or without it (the control group). The programme was carried out in a 25-metre long swimming pool with deep water only (water and air temperature 30ºC and 30ºC, respectively) in 16 hours (2 hours per day in 8 days). Water adaptation tests were done before and after the programme. Both groups showed an improvement in water adjustment due to the learn-to-swim programme. However, there was only one significant difference in the tested skills between the experimental and the control group after the programme. There were more participants in the control group who were able to perform relaxed exhalation in water than in the experimental group. Considering the results, it could be concluded that the learn-to-swim programme was not more effective in the development of water adjustment skills when the mask and snorkel are used than without this swim aids. Furthermore, it could be suggested that the swim teacher should focus on teaching the non-swimmers to open their eyes under the water and teach them exhalation in the water after the use of the mask and the snorkel. This requires additional time and thus prolongs the program. Key words: adjustment to the water, breaststroke, mask, snorkel, preschool children, learning programme INTRODUCITON Nowadays various swim aids are known for adjustment to the water and for improving swimming techniques. On one hand they help children to float, decrease fear in the water, enable better position of the body, enable to swim with strokes or kicks only, breath in an easier way and enable them to swim also in the deep water. With them swim teachers can also instruct more children at the same time and create swim exercises more interesting (Kapus et al., 2002). Bitenc (2014) states that among different swim aids swim teachers in Slovenia know mainly swimming tuba, boards, glasses and floating toys. There are only few previous studies which consider the effect of the use of swim aids during learning programme on swimming knowledge. Parker et al. (1999) compared the final swimming knowledge between group A which was learning with swim aids (bubbles, kick board, flippers) and
99
group S which was learning only with kick board. They came to the conclusion that the swimming knowledge of front crawl was on the same level in both groups. They also noted that some teachers used swim aids for teaching swimming, because they enabled children to have better horizontal position of the body in the water. In that position children could learn stroking with arms and kicking with legs in an easier way. Another group of teachers did not use swim aids, because children did not float independently with them. Kjendlie and Mendritzki (2012) have observed differences in movement patterns of children during free play in a swimming school. One group was taught by using flotation vests and another without them. Flotation aid group (FLOAT) asked for flotation toys significantly more often than control group during free play. Their aquatic confidence, especially in flotation skills, was lower than the aquatic confidence of the children in the control group. With the help of floating toys children could swim with their heads above the water and did not need to do surface dives and jumps. No statistical differences were found between groups in breathing, diving, water entry skills, the distance moved on land and in water. Children, who were learning to swim using flotation aids had a tendency to move more horizontally during free play and not to choose vertically-oriented movements (jumping, surface diving) compared to children being taught without the flotation vest. The aim of this study was to determine the effect of the use of the mask and the snorkel during learn-to-swim programme on water adjustment of preschool non-swimmers. The mask and the snorkel enable pupils an easier way to put their head under the water to see and to breathe easier. MATERIALS AND METHODS Participants 39 children participated in this research (ages 6 years ± 6 months, height 119 ± 5 cm, weight 22 ± 4 kg). Before we started with the research, we had got the permission for measurement, taking photos, recording and using results for interpretation from their parents. Procedures The swimming course lasted for 8 days. Children had a two-hour course every day with a 15-minute break. Children were swimming in a 25-metre long swimming pool with only deep water. On one side of the swimming pool the water was 3.5 m deep and on the other side 1.35 m. Water and air temperature was 30ºC. The participants were divided in the experimental and control group. Both groups underwent similar learn-to-swim programme. The programme included the water adaptation exercises (water entry, putting the head under the water, watching under the water, exhalation into the water, floating on the back and gliding) and learning breaststroke. The course started by using the buoyancy aids, however, later in the course these aids were gradually removed from the exercises. The experimental group performed the learn-to-swim programme with the mask and the snorkel and the control group without it. Before and after the programme the water adaptation tests were done. We tested the abilities for putting the head under the water, opening eyes and seeing under the water, relaxed exhalation into the water, floating on the back and gliding. Statistical analyses Data analysis was done using the statistical functions in Microsoft Excel 2010 and IBM SPSS Statistics 21.0. We were comparing the experimental and the control group. We calculated frequency statistic by nominal variables (putting the head under the water, seeing under the water, relaxed exhalation into the water, floating on the back) and we were searching for differences between the groups with
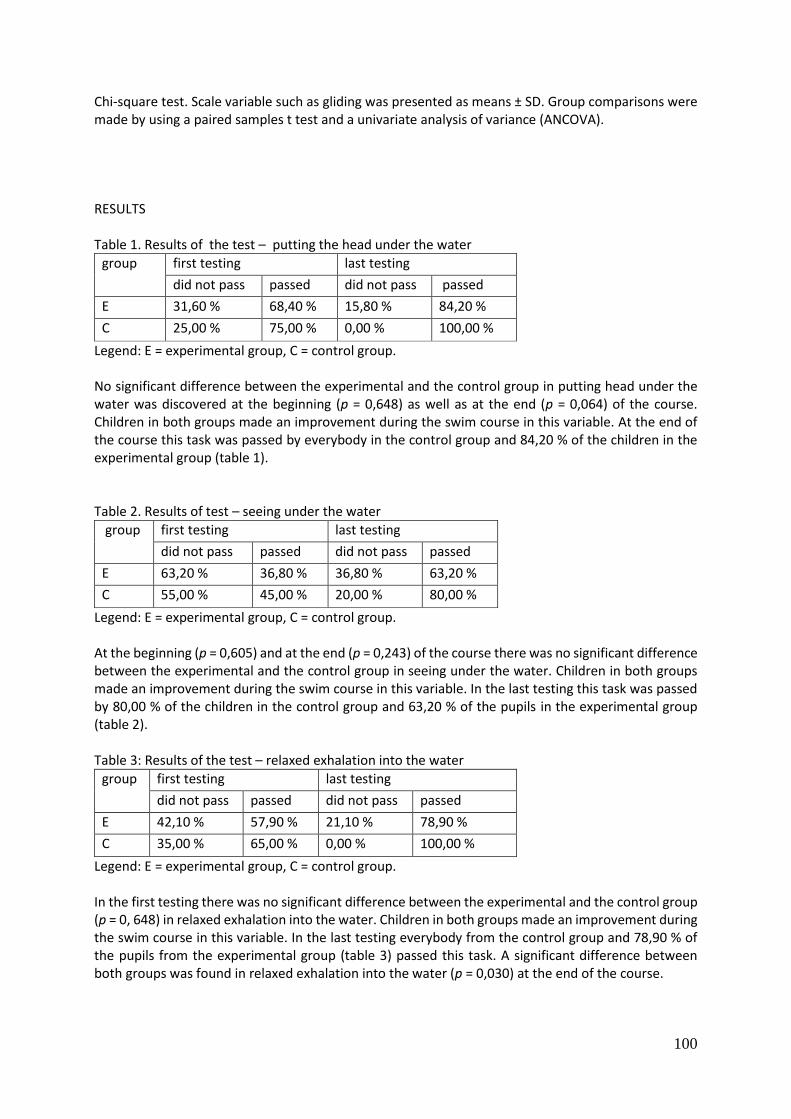
100
Chi-square test. Scale variable such as gliding was presented as means ± SD. Group comparisons were made by using a paired samples t test and a univariate analysis of variance (ANCOVA). RESULTS Table 1. Results of the test – putting the head under the water
group first testing last testing
did not pass passed did not pass passed
E 31,60 % 68,40 % 15,80 % 84,20 %
C 25,00 % 75,00 % 0,00 % 100,00 %
Legend: E = experimental group, C = control group. No significant difference between the experimental and the control group in putting head under the water was discovered at the beginning (p = 0,648) as well as at the end (p = 0,064) of the course. Children in both groups made an improvement during the swim course in this variable. At the end of the course this task was passed by everybody in the control group and 84,20 % of the children in the experimental group (table 1). Table 2. Results of test – seeing under the water
group first testing last testing
did not pass passed did not pass passed
E 63,20 % 36,80 % 36,80 % 63,20 %
C 55,00 % 45,00 % 20,00 % 80,00 %
Legend: E = experimental group, C = control group. At the beginning (p = 0,605) and at the end (p = 0,243) of the course there was no significant difference between the experimental and the control group in seeing under the water. Children in both groups made an improvement during the swim course in this variable. In the last testing this task was passed by 80,00 % of the children in the control group and 63,20 % of the pupils in the experimental group (table 2). Table 3: Results of the test – relaxed exhalation into the water
group first testing last testing
did not pass passed did not pass passed
E 42,10 % 57,90 % 21,10 % 78,90 %
C 35,00 % 65,00 % 0,00 % 100,00 %
Legend: E = experimental group, C = control group. In the first testing there was no significant difference between the experimental and the control group (p = 0, 648) in relaxed exhalation into the water. Children in both groups made an improvement during the swim course in this variable. In the last testing everybody from the control group and 78,90 % of the pupils from the experimental group (table 3) passed this task. A significant difference between both groups was found in relaxed exhalation into the water (p = 0,030) at the end of the course.
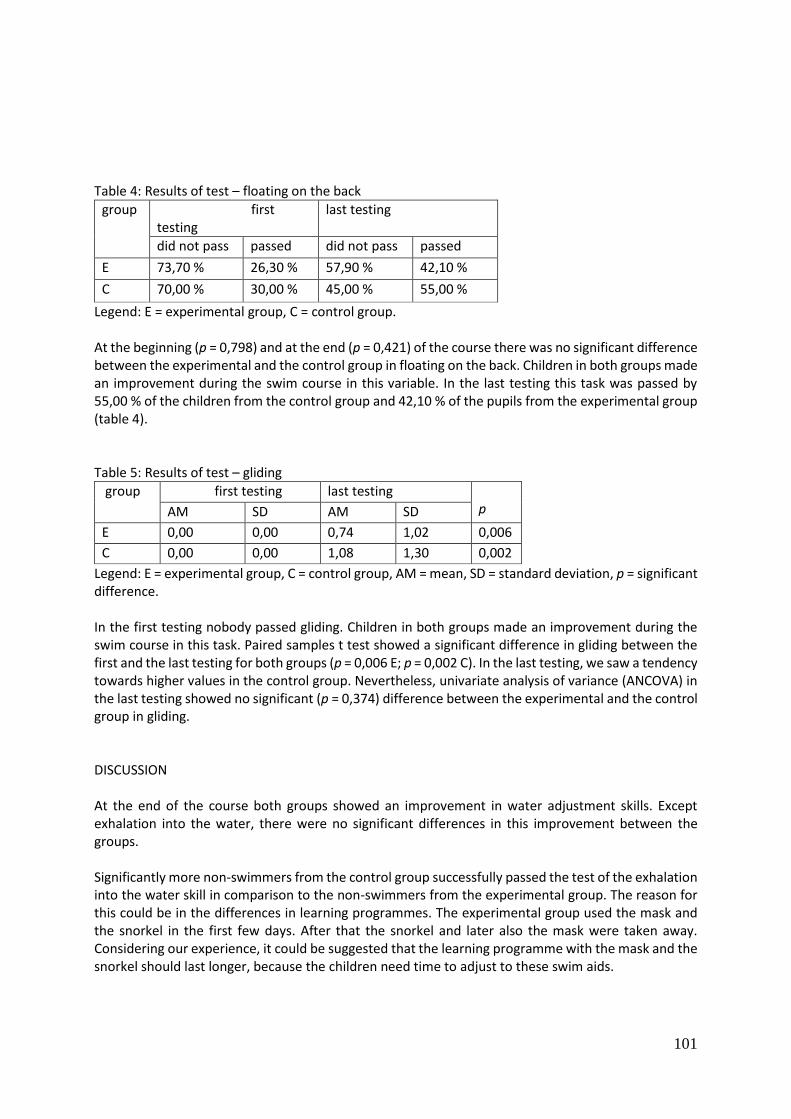
101
Table 4: Results of test – floating on the back
group first testing
last testing
did not pass passed did not pass passed
E 73,70 % 26,30 % 57,90 % 42,10 %
C 70,00 % 30,00 % 45,00 % 55,00 %
Legend: E = experimental group, C = control group. At the beginning (p = 0,798) and at the end (p = 0,421) of the course there was no significant difference between the experimental and the control group in floating on the back. Children in both groups made an improvement during the swim course in this variable. In the last testing this task was passed by 55,00 % of the children from the control group and 42,10 % of the pupils from the experimental group (table 4). Table 5: Results of test – gliding
group first testing last testing p AM SD AM SD
E 0,00 0,00 0,74 1,02 0,006
C 0,00 0,00 1,08 1,30 0,002
Legend: E = experimental group, C = control group, AM = mean, SD = standard deviation, p = significant difference. In the first testing nobody passed gliding. Children in both groups made an improvement during the swim course in this task. Paired samples t test showed a significant difference in gliding between the first and the last testing for both groups (p = 0,006 E; p = 0,002 C). In the last testing, we saw a tendency towards higher values in the control group. Nevertheless, univariate analysis of variance (ANCOVA) in the last testing showed no significant (p = 0,374) difference between the experimental and the control group in gliding. DISCUSSION At the end of the course both groups showed an improvement in water adjustment skills. Except exhalation into the water, there were no significant differences in this improvement between the groups. Significantly more non-swimmers from the control group successfully passed the test of the exhalation into the water skill in comparison to the non-swimmers from the experimental group. The reason for this could be in the differences in learning programmes. The experimental group used the mask and the snorkel in the first few days. After that the snorkel and later also the mask were taken away. Considering our experience, it could be suggested that the learning programme with the mask and the snorkel should last longer, because the children need time to adjust to these swim aids.
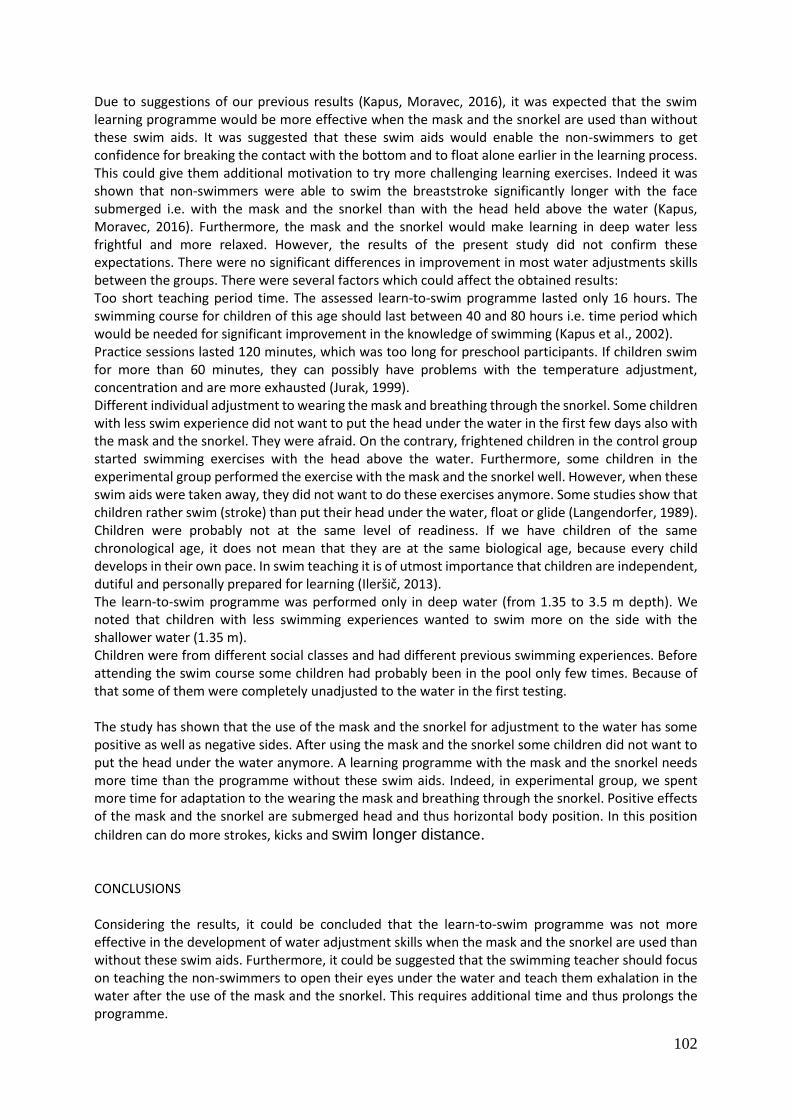
102
Due to suggestions of our previous results (Kapus, Moravec, 2016), it was expected that the swim learning programme would be more effective when the mask and the snorkel are used than without these swim aids. It was suggested that these swim aids would enable the non-swimmers to get confidence for breaking the contact with the bottom and to float alone earlier in the learning process. This could give them additional motivation to try more challenging learning exercises. Indeed it was shown that non-swimmers were able to swim the breaststroke significantly longer with the face submerged i.e. with the mask and the snorkel than with the head held above the water (Kapus, Moravec, 2016). Furthermore, the mask and the snorkel would make learning in deep water less frightful and more relaxed. However, the results of the present study did not confirm these expectations. There were no significant differences in improvement in most water adjustments skills between the groups. There were several factors which could affect the obtained results: Too short teaching period time. The assessed learn-to-swim programme lasted only 16 hours. The swimming course for children of this age should last between 40 and 80 hours i.e. time period which would be needed for significant improvement in the knowledge of swimming (Kapus et al., 2002). Practice sessions lasted 120 minutes, which was too long for preschool participants. If children swim for more than 60 minutes, they can possibly have problems with the temperature adjustment, concentration and are more exhausted (Jurak, 1999). Different individual adjustment to wearing the mask and breathing through the snorkel. Some children with less swim experience did not want to put the head under the water in the first few days also with the mask and the snorkel. They were afraid. On the contrary, frightened children in the control group started swimming exercises with the head above the water. Furthermore, some children in the experimental group performed the exercise with the mask and the snorkel well. However, when these swim aids were taken away, they did not want to do these exercises anymore. Some studies show that children rather swim (stroke) than put their head under the water, float or glide (Langendorfer, 1989). Children were probably not at the same level of readiness. If we have children of the same chronological age, it does not mean that they are at the same biological age, because every child develops in their own pace. In swim teaching it is of utmost importance that children are independent, dutiful and personally prepared for learning (Ileršič, 2013). The learn-to-swim programme was performed only in deep water (from 1.35 to 3.5 m depth). We noted that children with less swimming experiences wanted to swim more on the side with the shallower water (1.35 m). Children were from different social classes and had different previous swimming experiences. Before attending the swim course some children had probably been in the pool only few times. Because of that some of them were completely unadjusted to the water in the first testing. The study has shown that the use of the mask and the snorkel for adjustment to the water has some positive as well as negative sides. After using the mask and the snorkel some children did not want to put the head under the water anymore. A learning programme with the mask and the snorkel needs more time than the programme without these swim aids. Indeed, in experimental group, we spent more time for adaptation to the wearing the mask and breathing through the snorkel. Positive effects of the mask and the snorkel are submerged head and thus horizontal body position. In this position
children can do more strokes, kicks and swim longer distance. CONCLUSIONS Considering the results, it could be concluded that the learn-to-swim programme was not more effective in the development of water adjustment skills when the mask and the snorkel are used than without these swim aids. Furthermore, it could be suggested that the swimming teacher should focus on teaching the non-swimmers to open their eyes under the water and teach them exhalation in the water after the use of the mask and the snorkel. This requires additional time and thus prolongs the programme.
103
REFERENCES Bitenc, P. (2014). Uporaba didaktičnih pripomočkov pri učenju plavanja [Use of teaching aids in swimming lessons]. Bechelor's thesis, Univerza v Ljubljani, Fakulteta za šport Retrieved from http://www.fsp.uni-lj.si/COBISS/Diplome/Diploma22063290BitencPetra.pdf Ileršič, E. (2013). Povezanost med številom ponovitev sonožnega udarca in osvojenim znanjem plavanja prsno po 10-urnem plavalnem tečaju po Fredovem programu [Correlation between the number of repetition of breaststroke kicks and progress of breaststroke swimming knowledge after 10 hour lessons in Fred's swimming program]. Bechelor's thesis, Univerza v Ljubljani, Fakulteta za šport. Retrieved from http://www.fsp.uni-lj.si/COBISS/Diplome/Diploma22090215IlersicEva.pdf Jurak, G. (1999). Primerjava treh programov učenja plavanja 8- do 9- letnih otrok z vidika znanja plavanja tehnike prsno [Comparison of three swimming teaching programmes of youngsters between 8 and 9 years of age regarding the knowledge of swimming breaststroke] (Master's thesis). Univerza v Ljubljani, Fakulteta za šport. Kapus, V., Štrumbelj, B., Kapus, J., Jurak, G., Šajber Pincolič, D., Vute, R., … Čermak, V. (2002). Plavanje, učenje. Ljubljana: Fakulteta za šport, Inštitut za šport. Kapus, J., & Moravec, T. (2016). Preschool non-swimmers can swim breaststroke longer with the submerged face than with the head above the water. Youth Sport: Abstract book of the 8th Conference for youth sport in Ljubljana, 9-10 December 2016, 74. Univerza v Ljubljani, Fakulteta za šport. Kjendlie, P.-L., & Mendritzki, M. (2012). Movement Patterns in Free Water Play After Swimming Lessons With Flotation Aids. International Journal of Aquatic Research and Education, 6, 149-155. Langendorfer, S. (1989). Aquatic Experiences for Young Children: Evaluating Risks and Benefits. Pediatric Exercise Science, 1, 230-243. Parker, H. E., Blanksby, B. A., & Quek, K. L. (1999). Learning to Swim Using Buoyancy Aides. Pediatric Exercise Science, 11, 377-392.
104
VALIDITY OF DIFFERENT SYSTEMS FOR TIME MEASUREMENT IN 30M-SPRINT TEST
Nigro, F.1, Bartolomei, S.2, Merni, F.1
1Department of Biomedical and Neuromotor Sciences, University of Bologna, Bologna, Italy.
2 Sport and Exercise Science, University of Central Florida, Orlando, FL, USA. ABSTRACT Sprinting is a key factor in many sports and specific sprint tests are often performed to detect talent in youth. The main purpose of this study was to assess the validity and the reliability of two 30 m sprint tests using different starting conditions: rest (RST) and flying-start (FST). In addition the aim was to verify the differences in measurement between a high-frequency camera (250 Hz) and photocells (1000 Hz). 81 Bologna’s student, from 4 to 25 years old, were divided in four age groups: 4-6y (n=18); 7-9y (n=17); 10-12y (n=17); ≥13y (n=29). Reliability has been studied with Cronbach’s alfa. A study of the errors has been ran to compare the two methods of time measurement. The error series has been controlled by video analysis. The duration of the acceleration phase and the maintenance of the maximum speed has been measured in each group. The correlation between the output data of the two system of measurement was of 0.92. The reliability was between 0.94 and 0.98 for the RST and between 0.92 and 0.98 for FST using both methods of measurement. All the participants reached the maximum running speed over the first 15 m. A slight decrease in speed after 20m was observed in participants under the age of 13, while older participants were able to maintain the speed to the end of the 30m run. The sprint test showed a high validity and reliability in young participants. High speed camera and photocells can be used alternatively for this purpose.
Keywords: 30m running test, scholars, students INTRODUCTION Sprinting is a key factor in many sports (Green 2011). Some authors (Israel 1977) suggested the importance of detecting the sprint ability early in the development of young athletes. Specific sprint tests are often performed to detect talent or to check the running performance of athletes (Harrison 2005, Bradshow 2010, Lockie 2013). Speed tests in sport are usually performed via indirect measures of time using photocells or stopwatch (Earp 2012). Furthermore, the system could be synchronized with high frequency cameras to control the error of measurement (Larson 2014). The main purpose of this study was to assess the validity and the reliability of two 30 m sprint tests using different starting conditions: rest (RST) and flying start (FST). In addition, the purpose was to analyse the different sprint phases (acceleration phase and maximum speed reaching) in relation to the starting condition. Another aim was to verify the differences in measurement between a commercial high frequency video camera and photocells gates commonly used in sport assessments. MATERIALS AND METHODS 81 male scholars and university students of Bologna (Italy), between the age of 4 and 25 years old participated in the present study. Participants were divided into four age groups: from 4 to 6 years old (4 – 6 y; n = 18 ), from 7 to 9 years old (7 – 9 y; n = 17), from 10 to 12 years old (10 – 12 y; n = 17) and
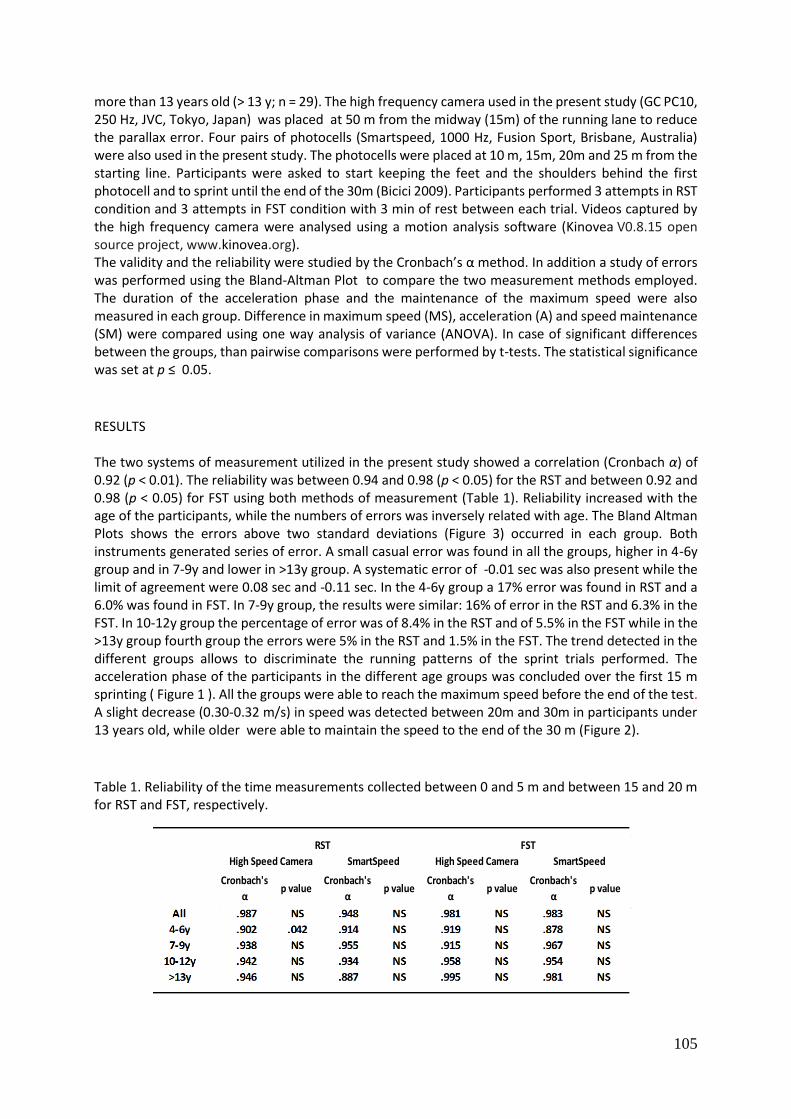
105
more than 13 years old (> 13 y; n = 29). The high frequency camera used in the present study (GC PC10, 250 Hz, JVC, Tokyo, Japan) was placed at 50 m from the midway (15m) of the running lane to reduce the parallax error. Four pairs of photocells (Smartspeed, 1000 Hz, Fusion Sport, Brisbane, Australia) were also used in the present study. The photocells were placed at 10 m, 15m, 20m and 25 m from the starting line. Participants were asked to start keeping the feet and the shoulders behind the first photocell and to sprint until the end of the 30m (Bicici 2009). Participants performed 3 attempts in RST condition and 3 attempts in FST condition with 3 min of rest between each trial. Videos captured by the high frequency camera were analysed using a motion analysis software (Kinovea V0.8.15 open source project, www.kinovea.org). The validity and the reliability were studied by the Cronbach’s α method. In addition a study of errors was performed using the Bland-Altman Plot to compare the two measurement methods employed. The duration of the acceleration phase and the maintenance of the maximum speed were also measured in each group. Difference in maximum speed (MS), acceleration (A) and speed maintenance (SM) were compared using one way analysis of variance (ANOVA). In case of significant differences between the groups, than pairwise comparisons were performed by t-tests. The statistical significance was set at p ≤ 0.05.
RESULTS The two systems of measurement utilized in the present study showed a correlation (Cronbach α) of 0.92 (p < 0.01). The reliability was between 0.94 and 0.98 (p < 0.05) for the RST and between 0.92 and 0.98 (p < 0.05) for FST using both methods of measurement (Table 1). Reliability increased with the age of the participants, while the numbers of errors was inversely related with age. The Bland Altman Plots shows the errors above two standard deviations (Figure 3) occurred in each group. Both instruments generated series of error. A small casual error was found in all the groups, higher in 4-6y group and in 7-9y and lower in >13y group. A systematic error of -0.01 sec was also present while the limit of agreement were 0.08 sec and -0.11 sec. In the 4-6y group a 17% error was found in RST and a 6.0% was found in FST. In 7-9y group, the results were similar: 16% of error in the RST and 6.3% in the FST. In 10-12y group the percentage of error was of 8.4% in the RST and of 5.5% in the FST while in the >13y group fourth group the errors were 5% in the RST and 1.5% in the FST. The trend detected in the different groups allows to discriminate the running patterns of the sprint trials performed. The acceleration phase of the participants in the different age groups was concluded over the first 15 m sprinting ( Figure 1 ). All the groups were able to reach the maximum speed before the end of the test. A slight decrease (0.30-0.32 m/s) in speed was detected between 20m and 30m in participants under 13 years old, while older were able to maintain the speed to the end of the 30 m (Figure 2). Table 1. Reliability of the time measurements collected between 0 and 5 m and between 15 and 20 m for RST and FST, respectively.
Cronbach's
αp value
Cronbach's
αp value
Cronbach's
αp value
Cronbach's
αp value
RST FST
High Speed Camera SmartSpeedHigh Speed Camera SmartSpeed
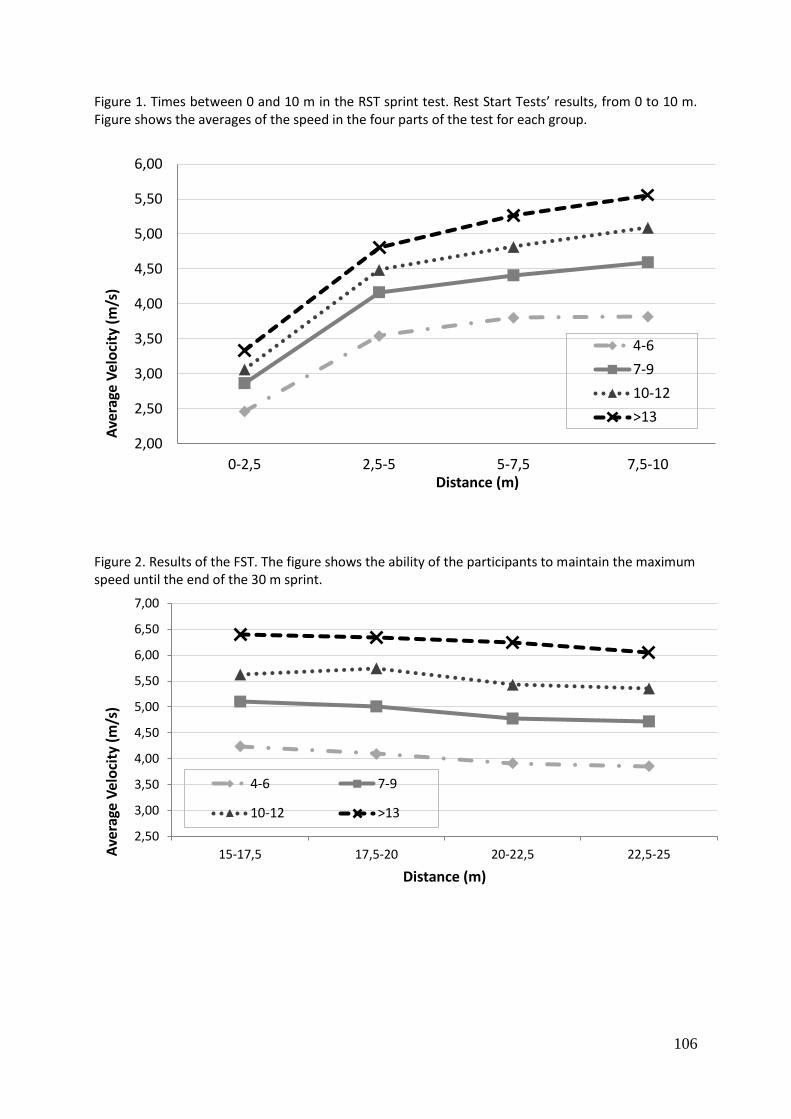
106
Figure 1. Times between 0 and 10 m in the RST sprint test. Rest Start Tests’ results, from 0 to 10 m. Figure shows the averages of the speed in the four parts of the test for each group.
Figure 2. Results of the FST. The figure shows the ability of the participants to maintain the maximum speed until the end of the 30 m sprint.
2,00
2,50
3,00
3,50
4,00
4,50
5,00
5,50
6,00
0-2,5 2,5-5 5-7,5 7,5-10
Ave
rage
Vel
oci
ty (
m/s
)
Distance (m)
4-6
7-9
10-12
>13
2,50
3,00
3,50
4,00
4,50
5,00
5,50
6,00
6,50
7,00
15-17,5 17,5-20 20-22,5 22,5-25Ave
rage
Vel
oci
ty (
m/s
)
Distance (m)
4-6 7-9
10-12 >13
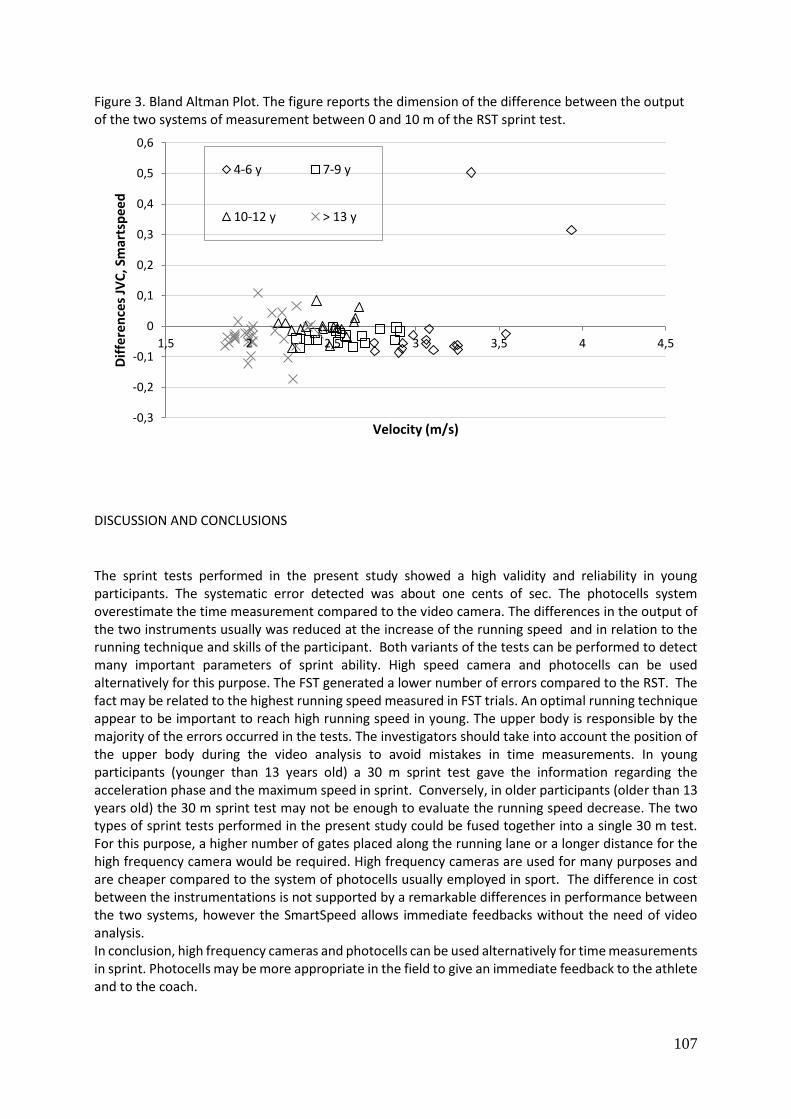
107
Figure 3. Bland Altman Plot. The figure reports the dimension of the difference between the output of the two systems of measurement between 0 and 10 m of the RST sprint test.
DISCUSSION AND CONCLUSIONS The sprint tests performed in the present study showed a high validity and reliability in young participants. The systematic error detected was about one cents of sec. The photocells system overestimate the time measurement compared to the video camera. The differences in the output of the two instruments usually was reduced at the increase of the running speed and in relation to the running technique and skills of the participant. Both variants of the tests can be performed to detect many important parameters of sprint ability. High speed camera and photocells can be used alternatively for this purpose. The FST generated a lower number of errors compared to the RST. The fact may be related to the highest running speed measured in FST trials. An optimal running technique appear to be important to reach high running speed in young. The upper body is responsible by the majority of the errors occurred in the tests. The investigators should take into account the position of the upper body during the video analysis to avoid mistakes in time measurements. In young participants (younger than 13 years old) a 30 m sprint test gave the information regarding the acceleration phase and the maximum speed in sprint. Conversely, in older participants (older than 13 years old) the 30 m sprint test may not be enough to evaluate the running speed decrease. The two types of sprint tests performed in the present study could be fused together into a single 30 m test. For this purpose, a higher number of gates placed along the running lane or a longer distance for the high frequency camera would be required. High frequency cameras are used for many purposes and are cheaper compared to the system of photocells usually employed in sport. The difference in cost between the instrumentations is not supported by a remarkable differences in performance between the two systems, however the SmartSpeed allows immediate feedbacks without the need of video analysis. In conclusion, high frequency cameras and photocells can be used alternatively for time measurements in sprint. Photocells may be more appropriate in the field to give an immediate feedback to the athlete and to the coach.
-0,3
-0,2
-0,1
0
0,1
0,2
0,3
0,4
0,5
0,6
1,5 2 2,5 3 3,5 4 4,5
Dif
fere
nce
s JV
C, S
mar
tsp
eed
Velocity (m/s)
4-6 y 7-9 y
10-12 y > 13 y
108
REFERENCES Bicici R., Ayhan S., Kavak V., The Motoric Properties Of Individual And Team Sportsman, Science, Movement & Health, 9 (2), 101-109, 2009 Bradshaw E., Hume P., Calton M., Aisbett B., Reliability and variability of day-to-day vault training measures in artistic gymnastics, Sports Biomechanics, 9 (2), 79-97, 2010 Green B.S., Blake C., Caulfield B. M., A valid field test protocol of linear speed and agility in rugby union, Journal of Strength and Conditioning Research, 25 (5), 1256-1262, 2011 Harrison J. A., Jensen R. L., Donoghue O., A Comparison of Laser and Video Techniques for Determining Displacement and Velocity During Running, Measurement in Physical Educational and Exercise Science, 9 (4), 219-231, 2005 Earp J. E., Newton R. U., Advances In Electronic Timing Systems: Considerations For Selecting An Appropriate Timing System, Journal of Strength and Conditioning Research, 26 (5), 1245-1248, 2012 Larson D. P., Noonan B. C., A Simple Video-Based Timing System For On-Ice Team Testing In Ice Hockey: A Technical Report, Journal of Strength and Conditioning Research, 28 (9), 2697-2703, 2014 Lockie R. G., Schultz A. B., Callaghan S. J., Jeffriess M. D., Berry S. P., Reliability and Validity of a New Test of Change-of-Direction Speed for Field-Based Sports: the Change-of-Direction and Acceleration Test (CODAT), Journal of Sports Science and Medicine, 12 (1), 88-96, 2013 Israel S., Bewegungskoordination frühzeitig ausbilden. Lehre der Leichtathletik, 30989, 1977
109
IMPROVING GRIP STRENGTH OF G-JUDOKAS
Pečnikar Oblak, V., Karpljuk, D., Šimenko, J.
University of Ljubljana, Faculty of sport, Ljubljana, Slovenia
ABSTRACT
Judo, as a defensive martial art and combat sport, is practiced on tatami (mats) and offers many safe training options for different levels of knowledge and motor skills. G-judo is adjusted judo for people with mental and physical disabilities. To improve their techniques and strength we decided to do some measurements of physical strength. For judo, as a grappling sport, the strength in hands is one of the key skills, therefore we performed measurements of hand grip strength. Measurements were performed on a chassis dynamometer Camry EH101 on a 17 (4 girls in 13 boys) athletes with special needs. Measurements showed average grip strength of 21.3 ± 9.3 kg in the dominant side and 19.27 ± 7.83 kg in non-dominant side. A statistically significant difference between dominant and none-dominant hand was found. After initial measurements we selected a few grip strength exercises which were practiced by G-judokas twice a week during their regular one-hour training for one month. New exercises brought enthusiasm in both G-judo groups. All exercise contained gripping and pulling. Results of the second measurement have shown improvement of grip strength. In the process of reviewing the data we detected that the hand grip dynamometer can also be used for detecting handedness for people who cannot or do not know how to write.
Keywords: G-judo, mental and physical disabilities, techniques, physical strength
INTRODUCTION Judo as a defensive martial art, practiced on tatami (mats), offers many safe training options for different levels of knowledge and motor skills. »Early on, the development of randori as a form of exercise offered a safe way to compare the technical skills, physical ability and fighting spirit of athletes. « (Sluga, 2014) G-judo is a form of specially adapted judo for people with mental and physical disabilities. G-judo or Gan-judo means judo training for people with special needs (gan – including, ju – soft, do – way). Dangerous techniques such as choking, leverage and throwing are left out. Special Olympics competition rules include other safety measures. The remaining elements are the same as in judo. “Special needs judo training varies from competition training, but nurtures the same aims and principles. Positive effects and experiences of those who take on judo are well known internationally and in relevant literature. It should be pointed out that in other countries training “a different kind of judo” is approached as team work (coach, sports doctor, physical therapist and volunteers), to meet the individual’s special needs as much as possible.” (Dadič, 2001)
The Meaning of Grip Strength in Judo The strength and technique of the kimono grip - judogi (Judo Gi) with the aim of toppling the opponent is an important element of the sport. A strong and adequate grip determines the outcome of the match by toppling, getting ready for the throw and the end grip. In judo, the opponents are in a constant physical contact, the kimono grip being the necessary element of the fight. “Many studies of judo fighting have proven a strong grip to be very effective. The fist making strength is extremely important for judo training. There are special exercises and challenges regarding the
110
kimono grip. The intensity and form of training, especially during preparations, influence the athlete’s level of achievement.” (Karakoc, 2016)
Ways of Training In the case of The Sokol Judo Club G-judo training, experience teaches us how important it is for a student to practice with his or her teacher for several times in a row, before starting to implement the technique in training with another student. “(A child with mental disability) … often needs a more explicit instruction and many repetitions, as well as adapting the training pace to his or her wishes at a certain time to better understand the new activity or gather new experience.” (Videmšek, Karpljuk, Zajec and Meško, 2012)
THE METHOD The Participants We took a measuring sample of 17 G-judokas (4 girls and 13 boys). Two boys proved unfit for the measurements. The average age of measured students was 20.82 (± 14.24), the average height 160 (± 16.13) cm, and the average weight 60.66 (± 18.14) kg. All participants were right-handed, i.e. the right arm was their dominant arm. The judo belt level averaged 7.65 (± 1.54) KYU. All trainees were interested in our study and mostly reacted positively to the encouragement and explanation that we shall need to repeat the measurements following a period of time to be able to see the difference before and after training. One junior judoka (age 11) failed to do the strength measurement. He did express his interest but hesitated, and both verbally and behaviourally refused to squeeze the digital manual muscle dynamometer. Another junior judoka (age 9) merely examined the appliance in his hands but wasn’t able to properly squeeze the grip for us to get a valid result. The Instruments The maximum fist squeezing force was measured by a dynamometer. Squeezing strength test (in kg) was carried out by a digital manual muscle dynamometer (Camry EH101), which measures the results of the maximum squeezing force with a 0.1 kg accuracy. The Camry Electronic Handgrip Dynamometer saves and stores results with up to 19 users. The handle is adjustable to five different positions, according to the user’s palm size, for the optimal grip (Chen, Lu and Zhang, 2014). Our measurements were done at positions 2 and 3. The subjects were in a neutral standing position with the untested shoulder adducted and neutrally rotated, the elbow and forearm in a neutral position, as recommended by the Fess and Morgan Protocol (1981). The subjects were given a clear sign when to start squeezing the grip as hard as they could, hold it for 3 seconds and then let go. They were allowed to rest for 20-30 seconds. Two sets of measurements were carried out with both hands, taking into account the highest value of both measurements for further data processing (Meng et al., 2015) The Procedure The testing took place in March 2016, during the training of two G-judo groups of The Sokol Ljubljana Judo Club. The subjects' parents were informed about the measurement in writing, giving their approvals orally. The data was analysed with the SPSS 21.0 program. A descriptive statistic method was used to describe the sample. The dominant versus non-dominant hand distinction was determined by a paired t-test. Statistical characteristics of the differences were determined at the 5 % risk level. Pictures 5 and 6 show grip measurements using a dynamomet
111
Pictures 1 and 2: Dynamometer grip measurements at The Sokol Judo Club (Photo: The Sokol Judo Club Archives)
THE RESULTS Table 6: Descriptive Statistics of the Test Subjects
VARIABLE No. of subjects
Mean Value
Standard Deviation
Minimum Maximum
AGE 17 20,82 14,24 8,00 63,00
WEIGHT 17 60,66 18,14 28,10 94,00
HEIGHT 17 160,00 16,13 122,00 188,00
BELT LEVEL -KYU 17 7,65 1,54 4,00 9,00
DIN-R hand 15 21,30 9,30 7,80 44,10
DIN-L hand 15 19,27 7,83 9,20 38,40
DIN-R hand – grip strength right hand, DIN-L hand – grip strength left hand Table 2 : Paired T-test of left and right hand strength
GROUP
THE RIGHT HAND
LEFT HAND 95% CI
VARIABLE The mean
SD The mean
SD Lower Upper DF t p
DYNAMOMETRY (kg) 21.3. 9.3. 19.27 7.83 0.54 3.53 14 2.92 0.011
p ≤ 0.05 Table 1 shows the average value of the right dominant hand grip strength of 21.3 ± 9.3 kg and the left non-dominant hand grip strength of 19.27 ± 7.83 kg. Table 2 shows a statistically relevant difference between the dominant and non-dominant hand grip strength in G-judokas (DIN-R hand, DIN-L hand) t (14) = 2.92, p = 0.011.
112
DISCUSSION The initial measurements of dominant and non-dominant hand grip in judoists with special needs by a digital dynamometer have shown a statistically relevant difference in left and right hand grip strength. Carefully planned training and some extra targeted exercises can improve certain training processes, increase motivation and endurance, as well as improve the technique and strength. By observing the development of strength after the introduction of simple additional grip exercises in each training session, we would like to examine further how fast and with what minimum targeted input we could see an improvement. “Studies have proven that training guaranties development. Muscle tonus is crucial for retaining balance. And balance, as well as motor skills can be maintained by means of judo training.” (Karakoc, 2016). To determine the dominant hand in moderately to severely mentally challenged people is somewhat more demanding, due to the fact that some of them cannot write or have difficulty writing. Three subjects' parents have told us that their judoists use both hands in their daily routine. The three mentioned subjects' results have shown equal strength levels of their right and left hands. Since the test group was small, this fact could be attributed to chance, but we recommend further research into how the use of the dynamometer could simplify the dominant and non-dominant hand determination. During the measurements, we have discovered that a different shape of the equipment might facilitate its use for some of the subjects. Because a grip only makes a handle move a little bit, many of the physically weaker judoists soon lost interest and became restless. To further our research, we gave them mainly fist flexion exercises to enhance the grip strength. We shall repeat the measurements in different time frames and study the data achieved before and after the introduction of those exercises. Our study will present the status of G-judoists’ grip strength and give an account of the general training process. By further researching the grip strength in different periods of time while adding exercises for a stronger fist grip could improve the effects of training. This has been confirmed by Masleša (2013), who used eight tests to measure motor skills of people with special needs. Furthermore, he performed nine expert tests for martial arts sports to measure the level of specific motor skills. Improvement was observed in seven of the eight tests for motor abilities, as well as in all nine motor skills tests for people with special needs. Data included in this study form only a small piece of a larger mosaic, aimed at an improved and more planned training process of judoist with special needs. For that reason, after the first set of measurements in March 2016, we decided on hand strengthening exercises, above all the fist grip, in order to repeat the test after one month of extra exercises and analyse the data before and after.
REFERENCES Banovic, I. (2001). Possible judo performance prediction based on certain motor abilities and technical knowledge (skills) assessment. Kinesiology, 33(2), 191–206. Chen, X.-P., Lu, Y.-M. in Zhang, J. (2014). Intervention study of finger-movement exercises and finger weight-lift training for improvement of handgrip strength among the very elderly. International Journal of Nursing Sciences. 1(2). 165–170. Čuš, V. (2004). Judo: Popusti, da zmagaš. Slovenska Bistrica: Judo zveza Slovenije.
113
Dadič, T. (2001). Šport kot sredstvo bogatitve in način življenja oseb s posebnimi potrebami. Socialno delo, 40 (5), 255-274 Fess, E. E. in Moran, C. (1981). Clinical assessment recommendations. Indianapolis: American Society of Hand Therapists. Gorše. L. (2014). Pomen in uporaba specialnega testiranja v borilnih športih. Šport: Revija Za Teoretična in Praktična Vprašanja Športa, 62 (1-2), 157-161. Karakoc, O. (2016). The Investigation of Physical Performance Status of Visually and Hearing Impaired Applying Judo Training Program. Journal of Education and Training Studies. 4(6). 10-17. Masleša, S. (2013). Učinek osemtedenskega eksperimentalnega programa vadbe na telesne značilnosti, gibalne sposobnosti ter znanje izbranih elementov borilnih športov pri osebah z motnjo v duševnem razvoju. Doktorska disertacija, Ljubljana: Fakulteta za Šport Meng, Y., Wu, H., Yang, Y., Du, H., Xia, Y., Guo, X., … Niu, K. (2015). Relationship of anabolic and catabolic biomarkers with muscle strength and physical performance in older adults: a population-based cross-sectional study. BMC Musculoskelet Disord. 16. 202. Pistotnik, B. (2004). Vedno z igro: elementarne in družabne igre za delo in prosti čas. Ljubljana: Fakulteta za šport, Inštitut za šport. Stavrev, V., Videmšek. M. in Karpljuk, D. (2014). Prvi koraki v judo vrtcu. Šport: Revija Za Teoretična in Praktična Vprašanja Športa, 62 (1-2), 109-114. Sluga, J. (2014). Geneza Juda. Šport: Revija Za Teoretična in Praktična Vprašanja Športa, 62 (1-2), 104-108. Šimenko, J. (2014a). Razvijanje gibalnih sposobnosti v predpubertetnem obdobju mladih judoistov. Šport: Revija Za Teoretična in Praktična Vprašanja Športa, 62 (1-2), 121-129. Šinkovec, V., Karpljuk, D., Filipčič, T., … Hadžič, V. (2012). Otroci in mladostniki z dispraksijo ter športna dejavnost. Šport: Revija Za Teoretična in Praktična Vprašanja Športa, 59 (1-2), 198-202. Šömen, D., (2015). Judo in duševno zdravje: Poročilo o delovanju programa. Slovenska Bistrica: Judo zveza Slovenije. Thomas, S.G., Cox, M. H., LeGal, Y. M., Verde, T. J., in Smith, H. K. (1989). Physiological profiles of the Canadian National Judo Team. Journal Canadien des Sciences du Sport, 14(3), 142-147 Videmšek, M., Karpljuk, D., Zajec, J., in Meško, M. (2012). Gibalna /športna dejavnost predšolskih otrok s posebnimi potrebami. Šport: Revija Za Teoretična in Praktična Vprašanja Športa, 59 (1-2), 183-191. Zubitashvili, G. (2011). Adjusting the Training Process in Judo According to Physical and Functional Parameters. Education Physical Training Sport, 3(83), 68–75.
114
ARISTOTLE UNIVERSITY OF THESSALONIKI SPORTS CENTRE: STUDENTS’ SATISFACTION ABOUT ENROLLMENT IN SPORTS AND RECREATIONAL
ACTIVITIES.
Papacharisis, V., Bouchouras, G., Dimou, K., Doganis, G.
Aristotle University of Thessaloniki –University Sports Centre, Greece
The purpose of this study was to examine the satisfaction of students about the quality of program services in the Aristotle University of Thessaloniki Sports Center (A.U.Th.S.C.). A total of 194 students (99male, 95 female) completed a questionnaire assessing quality of service and satisfaction about their decision to enroll in A.U.Th.S.C. Sports and recreational activities. Servqua, a questionnaire with 28- items assessing quality of service (Parasuraman et al 1985) adopted to the Greek language based on the Greek adaptation (Alexadris et.al., 2004) and was utilized to asses 5 underlying dimensions of service quality: (a) personnel (7-items), (b) reliability (5-items), (c) perceived outcomes (6-items), (d) facilities (5-items) and (e) responsiveness (5-items). The mean score of responses to 3 different items estimated total satisfaction. The answers were given in a seven-point Likert-type scale (1 = very bad, 7 = excellent). Students scored relatively high on the perceived outcomes (M=6.1), personnel (M=5.5), facilities (M=5.1), responsiveness (M=4.8), reliability (M=5.3), and the total satisfaction was found to be M=5.7. For the present study, internal consistency was confirmed using Cronbach’s alpha (.72) and factor analysis confirmed that in the proposed factor structure, for all the items’ loadings revealed above .65. A multiple linear regression model was performed to identify those variables of quality of service that could predict satisfaction. The stepwise method of variable selection was used. Results showed that a model including personnel, facilities, and responsiveness as predictor variables provides the best fit to the data explaining almost 21% of the total variance in satisfaction. This prediction was statistically significant as confirmed by the large F value (F=51.48, p<.001). These results are consistent with similar research findings on service quality of sports centers in Greece, and Europe, showing that the main factors of quality services were the facilities and the employees. In conclusion, we believe that University Sports and Recreational programs should invest in human resources training and lifelong education of the staff. Furthermore, they must have the appropriate facilities with the necessary equipment and programs adapted to the students’ participation needs and responses.
Keywords: university students, sports activities, recreational activities, program satisfaction and service quality.
INTRODUCTION
In now days the importance of participating in university recreational and sports programs is increasing because sports has been instrumental. University sports and recreational programs provide a lot of benefits. Students, participation in those programs enhances the quality of student life (Ellis, Compton, Tyson, & Bohlig, 2002), brings students together to understand each other better (Gallien, 2007), provides the opportunity for students to continue participating in sports during their studies, and further develops the concept of maintaining a lifetime of physical activity (Byl, 2002). It has also been suggested that participation results in personal and social diversity enhancement, competence and mastery of leadership skills, and increased retention rates and students learning (Barcelona & Ross, 2002; Haines, 2001). The former president of the International University Sports Federation, Dr Claude –Lois Gallien says that: “One fundamental task for University today is to open new prospects, to impulse new bounding’s, to teach young people to choose system of society, to mould it and not just put up with it, to let them know they have to create their own age, and not just send back a reflect of the actual era. University sport can serve as an effective tool for giving a broader and more concrete dimension to this task”. Therefore, it
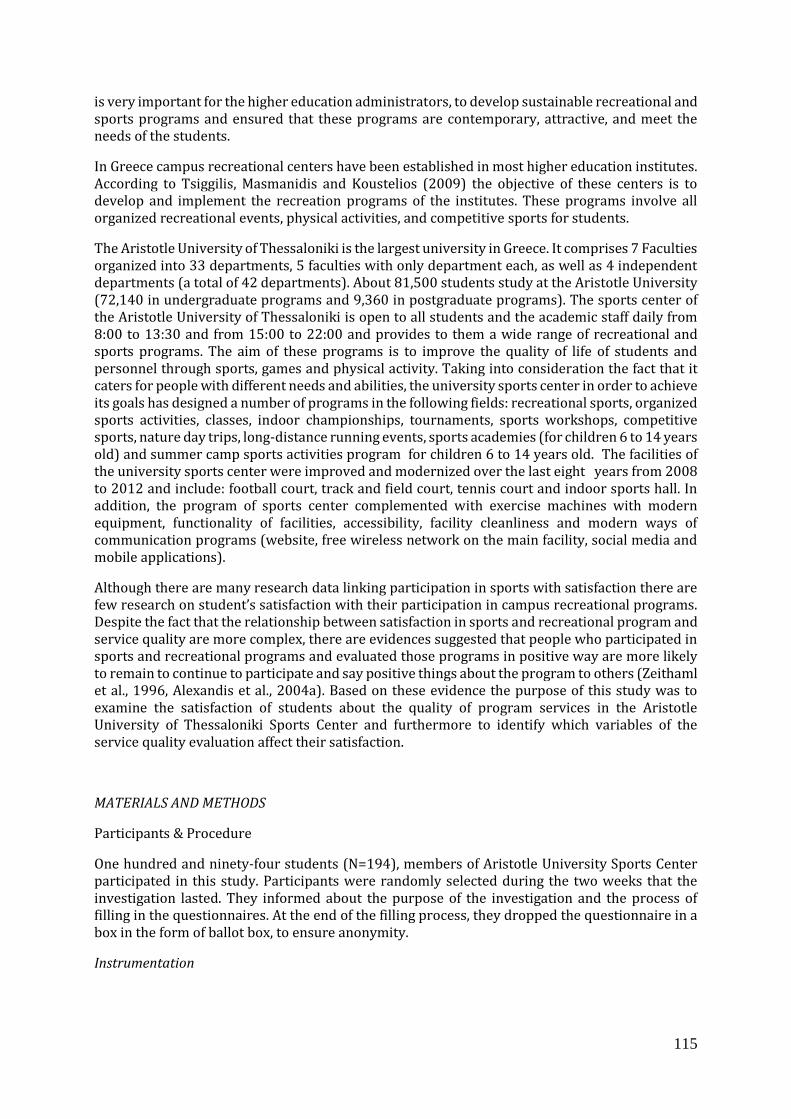
115
is very important for the higher education administrators, to develop sustainable recreational and sports programs and ensured that these programs are contemporary, attractive, and meet the needs of the students.
In Greece campus recreational centers have been established in most higher education institutes. According to Tsiggilis, Masmanidis and Koustelios (2009) the objective of these centers is to develop and implement the recreation programs of the institutes. These programs involve all organized recreational events, physical activities, and competitive sports for students.
The Aristotle University of Thessaloniki is the largest university in Greece. It comprises 7 Faculties organized into 33 departments, 5 faculties with only department each, as well as 4 independent departments (a total of 42 departments). About 81,500 students study at the Aristotle University (72,140 in undergraduate programs and 9,360 in postgraduate programs). The sports center of the Aristotle University of Thessaloniki is open to all students and the academic staff daily from 8:00 to 13:30 and from 15:00 to 22:00 and provides to them a wide range of recreational and sports programs. The aim of these programs is to improve the quality of life of students and personnel through sports, games and physical activity. Taking into consideration the fact that it caters for people with different needs and abilities, the university sports center in order to achieve its goals has designed a number of programs in the following fields: recreational sports, organized sports activities, classes, indoor championships, tournaments, sports workshops, competitive sports, nature day trips, long-distance running events, sports academies (for children 6 to 14 years old) and summer camp sports activities program for children 6 to 14 years old. The facilities of the university sports center were improved and modernized over the last eight years from 2008 to 2012 and include: football court, track and field court, tennis court and indoor sports hall. In addition, the program of sports center complemented with exercise machines with modern equipment, functionality of facilities, accessibility, facility cleanliness and modern ways of communication programs (website, free wireless network on the main facility, social media and mobile applications).
Although there are many research data linking participation in sports with satisfaction there are few research on student’s satisfaction with their participation in campus recreational programs. Despite the fact that the relationship between satisfaction in sports and recreational program and service quality are more complex, there are evidences suggested that people who participated in sports and recreational programs and evaluated those programs in positive way are more likely to remain to continue to participate and say positive things about the program to others (Zeithaml et al., 1996, Alexandis et al., 2004a). Based on these evidence the purpose of this study was to examine the satisfaction of students about the quality of program services in the Aristotle University of Thessaloniki Sports Center and furthermore to identify which variables of the service quality evaluation affect their satisfaction.
MATERIALS AND METHODS
Participants & Procedure
One hundred and ninety-four students (N=194), members of Aristotle University Sports Center participated in this study. Participants were randomly selected during the two weeks that the investigation lasted. They informed about the purpose of the investigation and the process of filling in the questionnaires. At the end of the filling process, they dropped the questionnaire in a box in the form of ballot box, to ensure anonymity.
Instrumentation
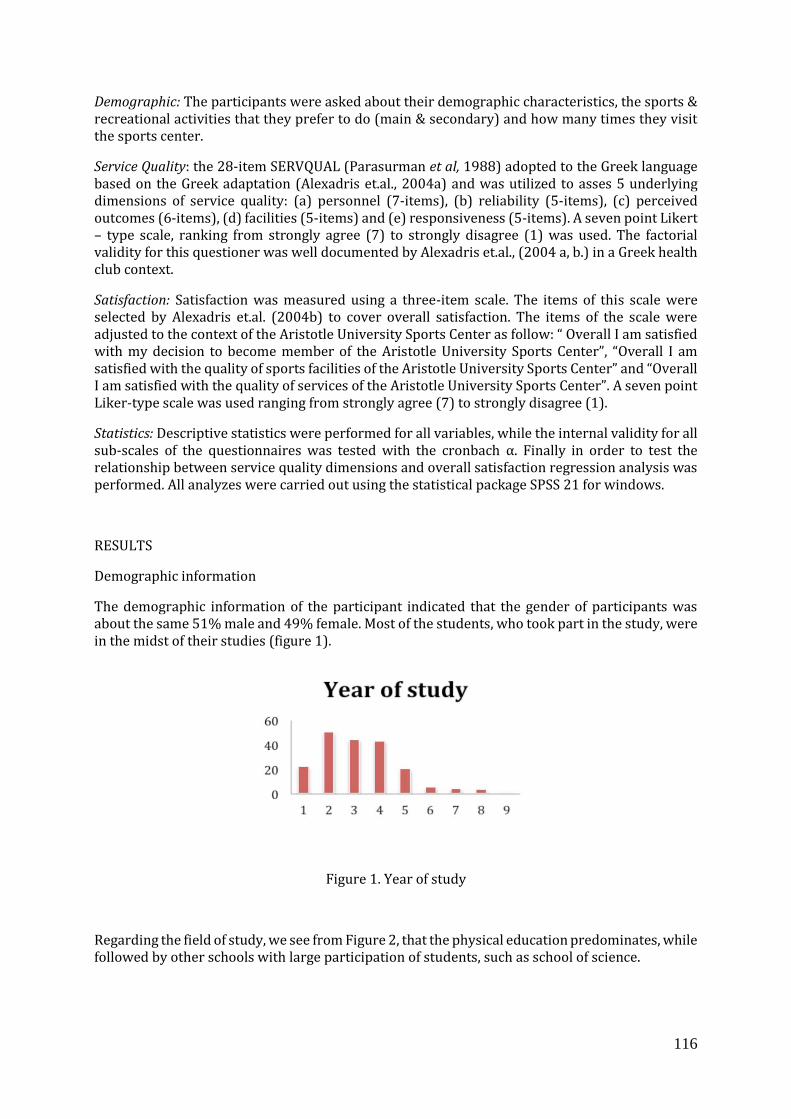
116
Demographic: The participants were asked about their demographic characteristics, the sports & recreational activities that they prefer to do (main & secondary) and how many times they visit the sports center.
Service Quality: the 28-item SERVQUAL (Parasurman et al, 1988) adopted to the Greek language based on the Greek adaptation (Alexadris et.al., 2004a) and was utilized to asses 5 underlying dimensions of service quality: (a) personnel (7-items), (b) reliability (5-items), (c) perceived outcomes (6-items), (d) facilities (5-items) and (e) responsiveness (5-items). A seven point Likert – type scale, ranking from strongly agree (7) to strongly disagree (1) was used. The factorial validity for this questioner was well documented by Alexadris et.al., (2004 a, b.) in a Greek health club context.
Satisfaction: Satisfaction was measured using a three-item scale. The items of this scale were selected by Alexadris et.al. (2004b) to cover overall satisfaction. The items of the scale were adjusted to the context of the Aristotle University Sports Center as follow: “ Overall I am satisfied with my decision to become member of the Aristotle University Sports Center”, “Overall I am satisfied with the quality of sports facilities of the Aristotle University Sports Center” and “Overall I am satisfied with the quality of services of the Aristotle University Sports Center”. A seven point Liker-type scale was used ranging from strongly agree (7) to strongly disagree (1).
Statistics: Descriptive statistics were performed for all variables, while the internal validity for all sub-scales of the questionnaires was tested with the cronbach α. Finally in order to test the relationship between service quality dimensions and overall satisfaction regression analysis was performed. All analyzes were carried out using the statistical package SPSS 21 for windows.
RESULTS
Demographic information
The demographic information of the participant indicated that the gender of participants was about the same 51% male and 49% female. Most of the students, who took part in the study, were in the midst of their studies (figure 1).
Figure 1. Year of study
Regarding the field of study, we see from Figure 2, that the physical education predominates, while followed by other schools with large participation of students, such as school of science.
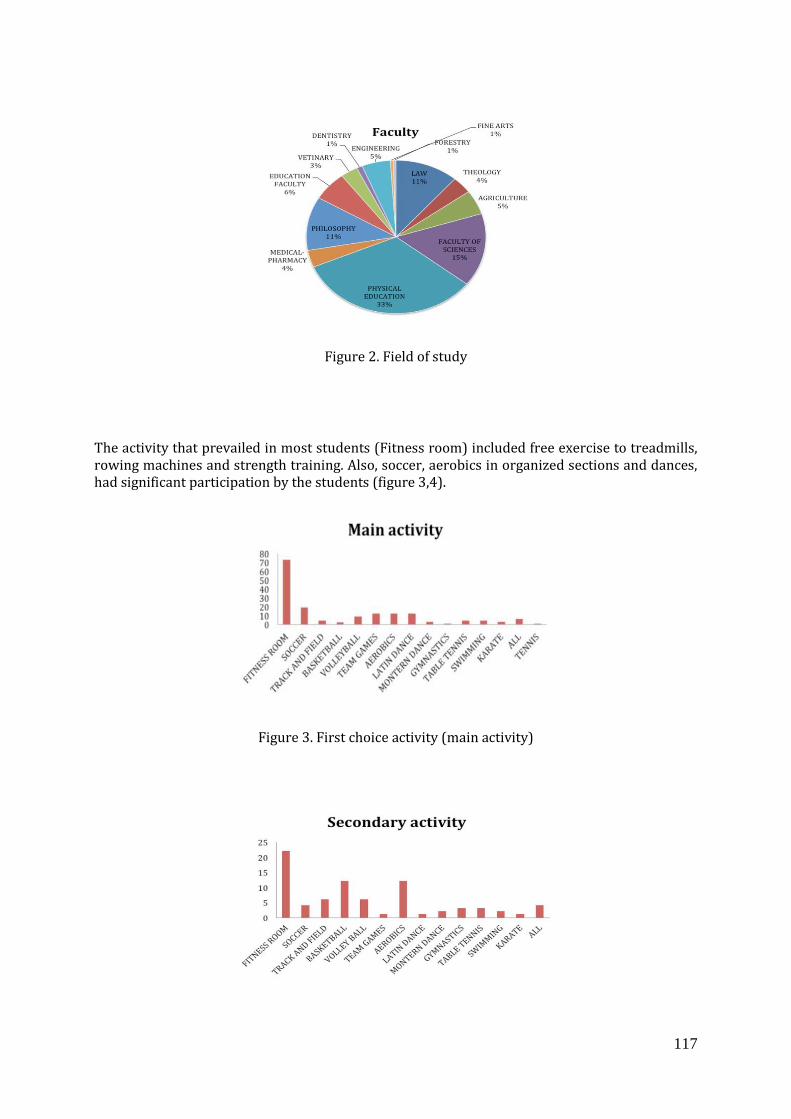
117
Figure 2. Field of study
The activity that prevailed in most students (Fitness room) included free exercise to treadmills, rowing machines and strength training. Also, soccer, aerobics in organized sections and dances, had significant participation by the students (figure 3,4).
Figure 3. First choice activity (main activity)
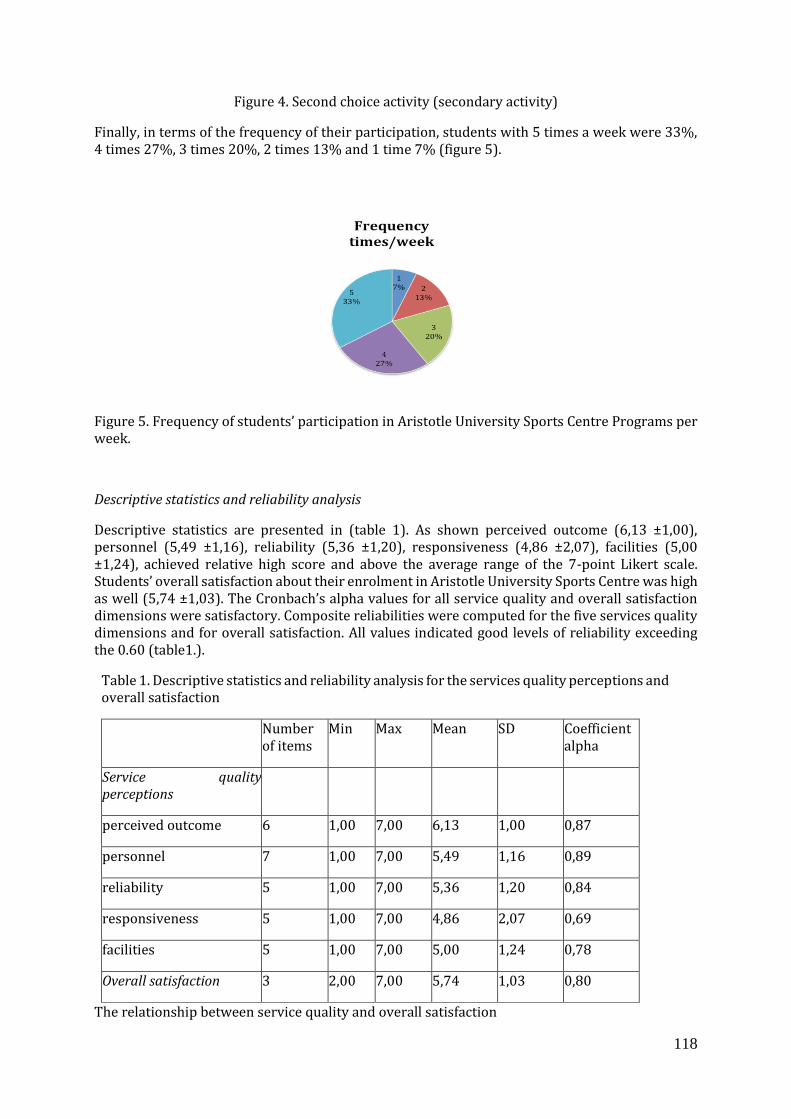
118
Figure 4. Second choice activity (secondary activity)
Finally, in terms of the frequency of their participation, students with 5 times a week were 33%, 4 times 27%, 3 times 20%, 2 times 13% and 1 time 7% (figure 5).
Figure 5. Frequency of students’ participation in Aristotle University Sports Centre Programs per week.
Descriptive statistics and reliability analysis
Descriptive statistics are presented in (table 1). As shown perceived outcome (6,13 ±1,00), personnel (5,49 ±1,16), reliability (5,36 ±1,20), responsiveness (4,86 ±2,07), facilities (5,00 ±1,24), achieved relative high score and above the average range of the 7-point Likert scale. Students’ overall satisfaction about their enrolment in Aristotle University Sports Centre was high as well (5,74 ±1,03). The Cronbach’s alpha values for all service quality and overall satisfaction dimensions were satisfactory. Composite reliabilities were computed for the five services quality dimensions and for overall satisfaction. All values indicated good levels of reliability exceeding the 0.60 (table1.).
Table 1. Descriptive statistics and reliability analysis for the services quality perceptions and overall satisfaction
Number of items
Min Max Mean SD Coefficient alpha
Service quality perceptions
perceived outcome 6 1,00 7,00 6,13 1,00 0,87
personnel 7 1,00 7,00 5,49 1,16 0,89
reliability 5 1,00 7,00 5,36 1,20 0,84
responsiveness 5 1,00 7,00 4,86 2,07 0,69
facilities 5 1,00 7,00 5,00 1,24 0,78
Overall satisfaction 3 2,00 7,00 5,74 1,03 0,80
The relationship between service quality and overall satisfaction
119
A multiple linear regression analysis was performed, with the five service quality dimensions as the independent variable and overall satisfaction as the depended one, to identify those variables of quality of service that could predict satisfaction. The stepwise method of variable selection was used. Results showed that a model including personnel, facilities, and responsiveness as predictor variables provides the best fit to the data explaining almost 21% of the total variance in satisfaction. This prediction was statistically significant as confirmed by the large F value (F=51.48, p<. 001). The regression equation can be presented as follows:
Overall Satisfaction =3,27+personnel*2,18+ facilities*2,12+responsiveness*0,53
DISCUSSION AND CONCLUSIONS
This study was conducted to assess the service quality of Aristotle University Sports Centre and their students’ satisfaction. According to the demographic results, it is kind of expected that students, studying physical education and sports, to be more athletic and active. That's why they dominate in relation to the participants. Also, the faculties of science, have traditionally more students in Greece, and so their proportion to the percentage of the Aristotle University Sports Center members is increased. In addition we observed that most students (80%), who participated in this study visited the sports center programs more than two times per week and they prefer to do as a main activity fitness exercise. Thus the results cannot be generalized to all students of the University and for all sports & recreational programs offered by the sports center.
Mean values of the service quality questioner were above the scale’s midpoint.
This shows that the exercise programs and the services are offered in such a way so as to meet the expectations of the participants arising from the benefits of exercise in general. Overall satisfaction from participating was well above average, indicating that students are satisfied and they “say” positive things about the University Sports Center. This is very important issue about the Aristotle University Sports Center and should be consider by the managers and administrators of the university.
The study also indicated that the personnel, facilities and responsiveness dimensions were the most powerful predictors of overall satisfaction. These results are consistent with similar research findings on service quality (Afthinos,Theodorakis, & Nassis, 2005; Chelladurai 1999) and show how important is for the students satisfaction the employees’ behavior, knowledge, and willingness to provide attention to them, the facilities and equipment of the sports center and the ability of the sport center to provide prompt services.
In conclusion we can say that sports campus managers who desire to improve the levels of organizational effectiveness of the campus recreational programs may focus on the human resource training and life long education of the staff. Further more the sport centers must have the appropriate facilities with the necessary equipment and programs adapted to the student’s participation needs and responses.
Acknowledgments
This project is partial supported by Hellenic Committee of University Sports. This Committee belongs to the Ministry of Education of Greece.
120
REFERENCES
N., & Nassis, P. (2005). Customers’ expectations of Service in Greek Fitness Centers: Gender, Age, Type of Sport Center, and Motivation Differences. Managing Service Quality. 15, (3), 245-258.
Alexadris, K. Zahariadis, P., Tzorbatzoudis, C., & Grouios, G. (2004a). An empirical investigation in to the role of the outcome dimension in measuring perceived service quality in a health club context. International Journal of Sport Management, 5, 281-294.
Alexadris, K. Zahariadis, P., Tzorbatzoudis, C., & Grouios, G. (2004b). An empirical investigation of the relationships among service quality, customer satisfaction and psychological commitment in a health club context. European Sport Management Quarterly, 4, 36-52.
Barcelona, R.J., & Ross, C.M. (2002). Participation patterns in campus recreational sports: An examination of quality of student effort from 1983–1998. Recreational Sports Journal, 26, 41-53.
Byl, J.(2002). Intramural recreation: A step-by-step-guide to creating an effective program. Champaign, IL: Human Kinetics Chelladurai, P. (1999). A mentoring model for management in sport and Physical education. Quest. 51. 24-38. Ellis, G. D., Compton, D. M., Tyson, B., & Bohlig, M. (2002). Campus recreation participation, health and quality of life. Recreational Sports Journal, 26 (2), 51-60. Gallien, C.L. (2007). Society, education and sport, university sport. In V. Papacharisis (Ed.), Proceedings book of the 3rd Forum for Physical Education (pp. 7-25). Thessaloniki: Hellenic Academy of Physical Education. Haines, D.J. (2001). Undergraduate student benefits from the university recreation. Recreational Sports Journal, 25, 25–33. Parasuraman, A., Zeithaml, V.A., & Berry, L.L. (1985). A conceptual model of service and its implication form future research. Journal of marketing, 49, 41-50 Tsigilis N., Masmanidis, T., & Koustelios, A. (2009). University Students’ Satisfaction and Effectiveness of Campus Recreation Programs. Recreational Sports Journal, 33, 51-60. Zeithaml, V, Berry, L., & Parasuraman, A. (1996). The behavioural consequences of service quality. Journal of Marketing, 60 (4), 31-46.
121
ANALYSIS OF EFFORT DURING EXERCISE WITH FREESTLYER™
ELASTIC TUBES OF DIFFERENT RESISTANCE
Pori, P., Jarc Šifrar, T., Dolenc, M., Pistotnik B.
University of Ljubljana, Faculty of sport, Ljubljana, Slovenia
ABSTRACT
Workouts on Freestyler™ board are performed with stretching elastic tubes which are attached to arms and legs. The aim of the study was to investigate the effects of exercises with Freestyler™ elastic tubes of different resistance on heart rate frequency. Eleven males (Age 23.4±1.1 years; Height 181.6±3.1 cm; Weight 81.4±4.9 kg) participated in the study. Effort was assessed with measuring heart rate (HR) frequency. To get data of maximum HR frequencies (HRmax) an intermittent Fitness test 30-15 (Buchheit, et.al, 2009) was used. Relative HR frequencies (% HRmax) were calculated using Karvonen formula (Karvonen, J. and Vuorimma, T., 1988). One-way analysis of variance - Repeated measures was used to analyse the effects of exercises with elastic tubes of different resistance. The results showed that in relative HR frequency (% HRmax) (F(4, 40) = 161, 906); p = .000) are statistically significant differences when performing exercises with elastic tubes of different resistance. It could be concluded that doing the same exercises with Freestyler™ elastic tubes of different resistance could increase the relative HR frequency from 19 % to 43 % compared to no additional resistance.
Keywords: Effort, HR frequency, Freestyler™ board
INTRODUCTION
Physiological benefits of Physical activity (PA) are well established (Seefeldt, Malina, and Clark, 2002; Penedo and Dahn, 2005; USDHHS, 2008; ACSM, 2010); beside all it has great effect on body weight control (Mišigoj-Duraković 2003). According to WHO (2009) in 2016 there will be over 2,3 billion overweight people in the world, in Slovenia 70% of adult Slovenes are overweight (IVZ DAL VEN). Latest recommendation for PA for health suggests that not only aerobic activities but also strength and flexibility exercises should be included in weekly workouts (Sharkey, 2011).
Freestyler™ board is a 120 cm long oval platform with two rollers on each ends. A 100 cm long elastic tube is placed through each roller. Workouts on Freestyler™ board are performed with stretching elastic tubes of five different resistance levels, which are attached to arms or/and legs (either by holding handles or using ankle cuffs). Unique elastic tube placement and the configuration of the Freestyler™ board itself enables full three dimensional body movements with a very high impact on the whole body strengthening by changing resistance pulls at each limb attachment (Petrović, 2007).
Several studies investigated elastic resistance exercise benefits stated that could represent one of The most effective tools in strength training (Hintermeister, Lange, Schultheis, Bey and Hawkins, 1998; Ebben and Jensen, 2002; Aboodarda, Page and Behm, 2016). Movements with elastic resistance could be performed slowly and under control, which activates muscles in concentric and also in eccentric phase of contraction. Workouts with elastic resistance represent kind of PCT (proprioceptive training) which has positive effects on strength and coordination development as well as on joints' stabilization (Šarabon, Zupanc, and Jakše, 2003).
Among different types of PA as strategies for improving physical health, workouts on Freestyler™ board could be suitable for participants of different age and levels of physical fitness. The aim of the
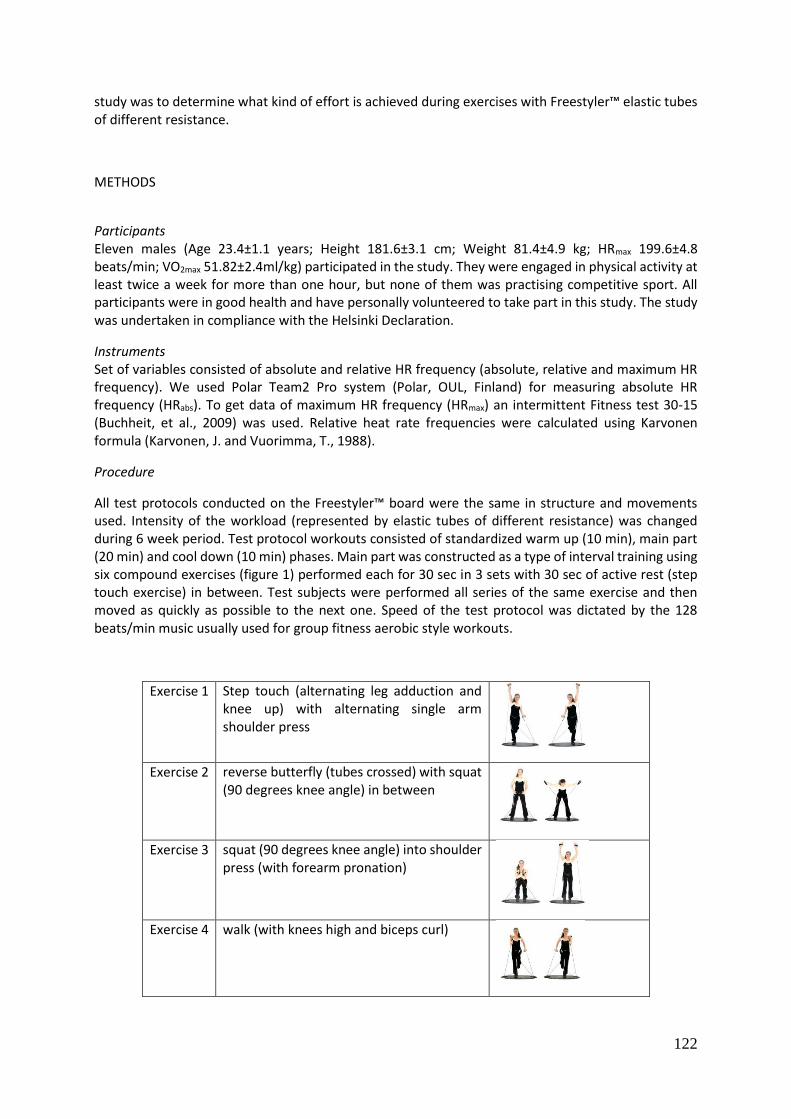
122
study was to determine what kind of effort is achieved during exercises with Freestyler™ elastic tubes of different resistance.
METHODS
Participants Eleven males (Age 23.4±1.1 years; Height 181.6±3.1 cm; Weight 81.4±4.9 kg; HRmax 199.6±4.8 beats/min; VO2max 51.82±2.4ml/kg) participated in the study. They were engaged in physical activity at least twice a week for more than one hour, but none of them was practising competitive sport. All participants were in good health and have personally volunteered to take part in this study. The study was undertaken in compliance with the Helsinki Declaration.
Instruments Set of variables consisted of absolute and relative HR frequency (absolute, relative and maximum HR frequency). We used Polar Team2 Pro system (Polar, OUL, Finland) for measuring absolute HR frequency (HRabs). To get data of maximum HR frequency (HRmax) an intermittent Fitness test 30-15 (Buchheit, et al., 2009) was used. Relative heat rate frequencies were calculated using Karvonen formula (Karvonen, J. and Vuorimma, T., 1988).
Procedure
All test protocols conducted on the Freestyler™ board were the same in structure and movements used. Intensity of the workload (represented by elastic tubes of different resistance) was changed during 6 week period. Test protocol workouts consisted of standardized warm up (10 min), main part (20 min) and cool down (10 min) phases. Main part was constructed as a type of interval training using six compound exercises (figure 1) performed each for 30 sec in 3 sets with 30 sec of active rest (step touch exercise) in between. Test subjects were performed all series of the same exercise and then moved as quickly as possible to the next one. Speed of the test protocol was dictated by the 128 beats/min music usually used for group fitness aerobic style workouts.
Exercise 1 Step touch (alternating leg adduction and knee up) with alternating single arm shoulder press
Exercise 2 reverse butterfly (tubes crossed) with squat (90 degrees knee angle) in between
Exercise 3 squat (90 degrees knee angle) into shoulder press (with forearm pronation)
Exercise 4 walk (with knees high and biceps curl)
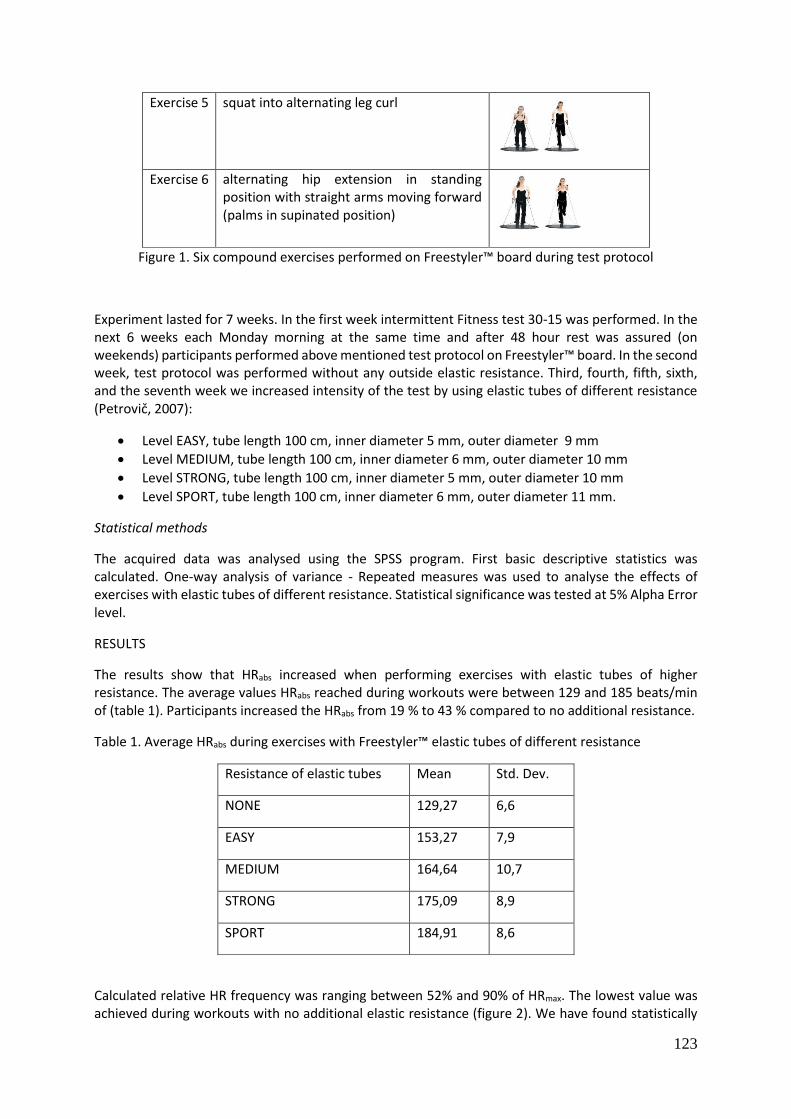
123
Exercise 5 squat into alternating leg curl
Exercise 6 alternating hip extension in standing position with straight arms moving forward (palms in supinated position)
Figure 1. Six compound exercises performed on Freestyler™ board during test protocol
Experiment lasted for 7 weeks. In the first week intermittent Fitness test 30-15 was performed. In the next 6 weeks each Monday morning at the same time and after 48 hour rest was assured (on weekends) participants performed above mentioned test protocol on Freestyler™ board. In the second week, test protocol was performed without any outside elastic resistance. Third, fourth, fifth, sixth, and the seventh week we increased intensity of the test by using elastic tubes of different resistance (Petrovič, 2007):
Level EASY, tube length 100 cm, inner diameter 5 mm, outer diameter 9 mm
Level MEDIUM, tube length 100 cm, inner diameter 6 mm, outer diameter 10 mm
Level STRONG, tube length 100 cm, inner diameter 5 mm, outer diameter 10 mm
Level SPORT, tube length 100 cm, inner diameter 6 mm, outer diameter 11 mm.
Statistical methods
The acquired data was analysed using the SPSS program. First basic descriptive statistics was calculated. One-way analysis of variance - Repeated measures was used to analyse the effects of exercises with elastic tubes of different resistance. Statistical significance was tested at 5% Alpha Error level.
RESULTS
The results show that HRabs increased when performing exercises with elastic tubes of higher resistance. The average values HRabs reached during workouts were between 129 and 185 beats/min of (table 1). Participants increased the HRabs from 19 % to 43 % compared to no additional resistance.
Table 1. Average HRabs during exercises with Freestyler™ elastic tubes of different resistance
Resistance of elastic tubes Mean Std. Dev.
NONE 129,27 6,6
EASY 153,27 7,9
MEDIUM 164,64 10,7
STRONG 175,09 8,9
SPORT 184,91 8,6
Calculated relative HR frequency was ranging between 52% and 90% of HRmax. The lowest value was achieved during workouts with no additional elastic resistance (figure 2). We have found statistically
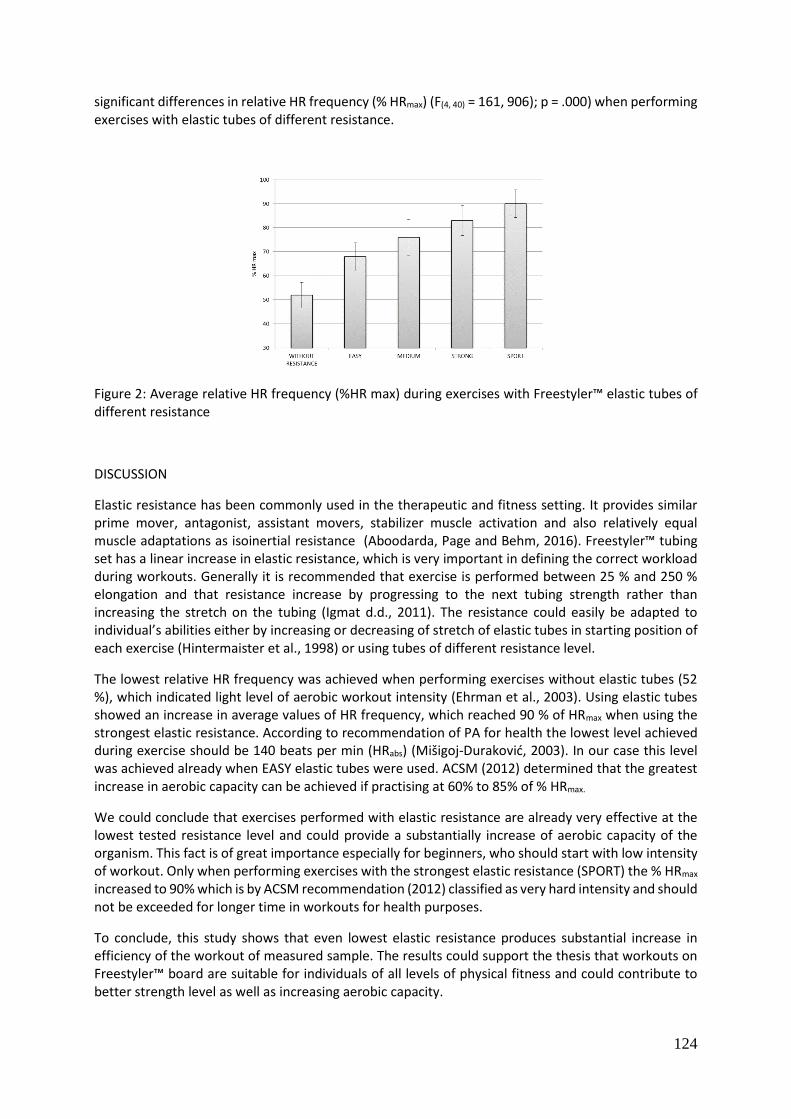
124
significant differences in relative HR frequency (% HRmax) (F(4, 40) = 161, 906); p = .000) when performing exercises with elastic tubes of different resistance.
Figure 2: Average relative HR frequency (%HR max) during exercises with Freestyler™ elastic tubes of different resistance
DISCUSSION
Elastic resistance has been commonly used in the therapeutic and fitness setting. It provides similar prime mover, antagonist, assistant movers, stabilizer muscle activation and also relatively equal muscle adaptations as isoinertial resistance (Aboodarda, Page and Behm, 2016). Freestyler™ tubing set has a linear increase in elastic resistance, which is very important in defining the correct workload during workouts. Generally it is recommended that exercise is performed between 25 % and 250 % elongation and that resistance increase by progressing to the next tubing strength rather than increasing the stretch on the tubing (Igmat d.d., 2011). The resistance could easily be adapted to individual’s abilities either by increasing or decreasing of stretch of elastic tubes in starting position of each exercise (Hintermaister et al., 1998) or using tubes of different resistance level.
The lowest relative HR frequency was achieved when performing exercises without elastic tubes (52 %), which indicated light level of aerobic workout intensity (Ehrman et al., 2003). Using elastic tubes showed an increase in average values of HR frequency, which reached 90 % of HRmax when using the strongest elastic resistance. According to recommendation of PA for health the lowest level achieved during exercise should be 140 beats per min (HRabs) (Mišigoj-Duraković, 2003). In our case this level was achieved already when EASY elastic tubes were used. ACSM (2012) determined that the greatest increase in aerobic capacity can be achieved if practising at 60% to 85% of % HRmax.
We could conclude that exercises performed with elastic resistance are already very effective at the lowest tested resistance level and could provide a substantially increase of aerobic capacity of the organism. This fact is of great importance especially for beginners, who should start with low intensity of workout. Only when performing exercises with the strongest elastic resistance (SPORT) the % HRmax
increased to 90% which is by ACSM recommendation (2012) classified as very hard intensity and should not be exceeded for longer time in workouts for health purposes.
To conclude, this study shows that even lowest elastic resistance produces substantial increase in efficiency of the workout of measured sample. The results could support the thesis that workouts on Freestyler™ board are suitable for individuals of all levels of physical fitness and could contribute to better strength level as well as increasing aerobic capacity.
125
REFERENCES
Aboodarda, S.J, Page, P.A, Behm, D.G. (2016). Muscle activation comparisons between elastic and isoinertial resistance: A meta-analysis. Clinical Biomechanics Journal 39, 52-61.
ACSM - American College of Sports Medicine (2010). ACSM's guidelines for exercise testing and prescription (8th edition). Philadelphia: Lippincott Williams& Wilkins.
ACSM - American College of Sports Medicine (2012). Foundation of Strength Training and Conditioning. Indianapolis: Lippincott Williams and Wilkins Customer.
Buchheit, M., Haddad, H., Millet, G.P., Lepretre, P.M., Newton, M., & Ahmaidi S. (2009). Cardiorespiratory and cardiac autonomic responses to 30-15 intermittent fitness test in team sport players. Journal of Strength and Conditioning Research 23 (1), 93-100.
Ebben, W., & Jensen, R. L. (2002). Electromyographic and kinetics analysis of traditional, chain, and elastic bands squats. Journal of Strength and Conditioning Research 16 (4), 547-550.
Ehrman, J.K., Gordon, P.M., Visich, P.S., & Keteyan, S.J. (2003). Clinical Exercise Physiology. Champaign, Il: Human Kinetics.
Hintermeister, R.A., Lange, G.W., Schultheis, J.M., Bey, M.J., & Hawkins, R. J. (1998). Electromyographic activity and applied load during shoulder rehabilitation exercises using elastic resistance. The American Journal of Sport Medicine 26 (2), 210-219.
Karvonen J, & Vuorimaa, T. (1988). Heart rate and exercise intensity during sports activities. Practical application. Journal of Sports Medicine 5 (5), 303–11.
Mišigoj Duraković, M. (2003). Telesna vadba in zdravje. Znanstveni dokazi, stališča in priporočila zveze društev športnih pedagogov Slovenije: Fakulteta za šport, Zavod za šport Slovenije: Zagreb: Kineziološka fakulteta.
Petrović, S. (2007). Manual of basic to multiaxis exercises on Freestyler. Pridobljeno 14.6.2013 s: http://www.ivz.si
Igmat d.d., 2012. Quality tests & Warranty. Pridobljeno 14.6.2013 s: http://www.igmat.si
Seefeldt, V., Malina, R.M., & Clark, M.A. (2002). Factors affecting levels of physical activity in adults. Sports Medicine 32 (3), 143-168.
Šarabon, N., Zupanc, O., & Jakše, B. (2003). Pomen proprioceptivnega treninga v košarki. [Proprioceptive training in basketball]. Šport 51 (3), 26-29.
WHO (2009). Obesity. Ženeva: World Health Organisation.
USDHHS - United States Department of Health and Human Services, 2008. Pridobljeno 5.8.2011 s: http://www.nhlbi.nih.gov/health/dci/Diseases/phys/phys_what.html

126
EFFECTS OF TRADITIONAL AND HIGHLY EMOTIONAL PHYSICAL EDUCATION PROGRAM IN HIGH-SCHOOL STUDENTS
Semprini, G1., Ceciliani, A.2, Di Michele, R.1, Toselli, S.1, Merni F.1
1Department of Biomedical and Neuromotor Sciences, University of Bologna, Italy 2Department for Life Quality Studies, University of Bologna, Italy
ABSTRACT
This study aimed to compare, in high-school students (mean age: 15 yrs), the effects of a traditional (TR) and a highly emotional (HE) physical education program. 96 boys (TR:46; HE:50) and 69 girls (TR:34; HE:35) were involved. The activity consisted of two hour/week throughout the school year. HE included pre-acrobatics, climbing, diving, skating, frisbee, beach tennis, and sailing. In TR, typical activities characterising the national PE programs were proposed.The following test battery was administered: standing broad jump (SBJ), hand-grip strength (HG), endurance (Leger), dynamic balance, sit&reach (SR). Furthermore, the students completed the following questionnaires: Self-Efficacy, Psychobiosocial states (PBS), Physical Activity Enjoyment Scale (PACES), Physical Self-Description Questionnaire (PSDQ).Boys of both groups significantly increased HG strength (2.6 kg), and girls of the TR group. Both groups and sexes showed slightly (1-5 cm) increased SBJ, slightly decreased endurance, and improved balance (0.5-0.7 m/s). SR showed a significant improvement (3 cm) in the TR group (both sexes). Self-Efficacy decreased in boys of the HE group, and increased in girls of the TR group. Boys showed increased scores in the PBS and PACES, whereas girls showed small improvements in the PBS. Boys of the TR group improved in the PSDQ (self-esteem factor), whereas girls of the TR group showed a worsened score. Finally, in the TR group, all students improved the score in the PSDQ activity scale. In summary, varied effects of PE were observed on physical fitness and psychosocial variables, according to the sex of students and the type of proposed activity.
Keywords: youth population, physical education programme, PSDQ questionnaire
INTRODUCTION
Scientific literature confirms that a healthy lifestyle results from a combination of physical and mental components. Sport and exercise are key instruments to involve the future generations in programs focusing on disease prevention (Saakslahti et al, 2004; Kimm et al. 2005; Strong et al. 2005; Flynn et al. 2006; Salmon et al. 2007; Dumuid D., Physio B., Olds T., et al. 2017; Nooijen, Galanti, ef al. 2017). In fact, physical activity is an essential tool to improve self-perception, self-consideration and to enhance the motivation of a healthy lifestyle (Corbin 2002; Cairney et al. 2008; Bortoli, Bertollo, & Robazza; 2009; Bortoli et al.2015). In Italy, a national survey (ISTAT, 2003) showed a decrease in the number of adolescents and young adults participating in sport and physical activities. The low levels of motivation is considered the main reason of this decreasing trend. Physical education school classes are social environments where motivational processes can be easily observed and assessed (Biddle, 2001). Therefore the knowledge of the enjoyment, psychobiosocial states, perceived physical self-esteem and self-efficacy in PE lessons at school is an interesting and challenging topic.
According to O’Reilly, Tompkins and Gallant (2001), fun is considered one of the most important reason for children and adolescents to be involved in physical activity, and lack of fun is likely to lead them to withdraw. Enjoyable experiences during PE lessons are expected to enhance intrinsic motivation,
127
develop positive attitudes, and promote long-lasting adherence to physical activity (Ryan, et al 1997; Wankel, 1993). Kendzeierski and De Carlo in 1991 conducted two validation studies about reliability and validity of the Physical Activity Enjoyment Scale (PACES), including 18 items. Carraro, Young and Robazza (2008) proposed and validated the Italian version of the PACES.
A psychobiosocial state is manifested through seven pleasant or unpleasant interactive components included within psychological (cognitive, emotional, motivational), biological (bodily, kinaesthetic), and social (performance, communicative) modalities. Bortoli and colleagues (Bortoli, Bertollo, & Robazza, 2009) were the first to examine the feasibility and usefulness of investigating a range of pleasant and unpleasant psychobiosocial states as related to achieving goals and a motivational climate in youth sport.
Psychobiosocial states have been recently studied in youth sport (Bortoli, Bertollo, & Robazza, 2009; Bortoli, Bertollo, Comani, & Robazza, 2011; Bortoli, Messina, Zorba, & Robazza, 2012) and physical education (Bortoli & Robazza, 2007; Bortoli, Bertollo, Filho & Robazza 2014). Self-generated, relevant individual adjectives are classified according to two psychobiosocial state categories: pleasant or unpleasant.
The perceived self-efficacy (Bandura, 1986) denotes an individual’s belief in his/her ability to make changes with regard to a specific behaviour. An individual must not only intend to perform a behaviour, he/she must also believe that he/she is capable of performing that behaviour before the action occurs. It was predicted that the greater is an individual’s sense of self-efficacy, the better would be her or his exercise behaviour. In self-concept research, Marsh et al., (1994) proposed the Physical self-description questionnaire (PSDQ), a multidimensional physical self-concept instrument for adolescents regarding physical ability, physical appearance and esteem, and physical fitness components. Meleddu et al., (2002) validated the Italian version of the PSDQ, for adolescents ranging from 13 to 18 years of age.
Relations between PE motivations and emotional aspects were found in literature (Robazza & Bortoli, 2005; Ceciliani et al., 2008), suggesting the opportunity of proposing interventions centered on highly emotional activities.
The main aim of this study was to verify the effectiveness of two educational programs, based on different typology of motor activities, oriented to enhance students’ motivations to be involved in physical activities. It is hypothesized that i) a traditional intervention determined physical performance improvements and ii) the practice of new sports and highly emotional motor activities determined relevant changes in psychological traits, as enjoyment, psychobiological states, physical self-perception and efficacy.
MATERIALS AND METHODS
175 high-school students, mean ± SD age 15.5 ± 0.6 years, height (M) 172.2 ± 7.1 cm; (F) 161.4 ± 5.4 cm and weight (M) 64.8 ± 10.6 kg; (F) 55.5 ± 8.6 kg were involved in the study. These anthropometric data are in agreement with the literature (Cacciari, E., Milani, S., Balsamo, A., & SIEDP, 2006). The sample was divided in two groups: the traditional group (TR), with 46 boys and 34 girls; and the Highly Emotional group (HE) with 50 boys and 35 girls. In both groups, the activity consisted of two hours per week throughout the school year (curricular physical education (PE) lessons) and the educational programs were planned, standardized and monitored in collaboration with PE teachers. In TR typical activities characterizing the national PE programs were proposed, including pre-athletics, exercises with small tools, pre-sport and sport games, while HE included innovative and highly
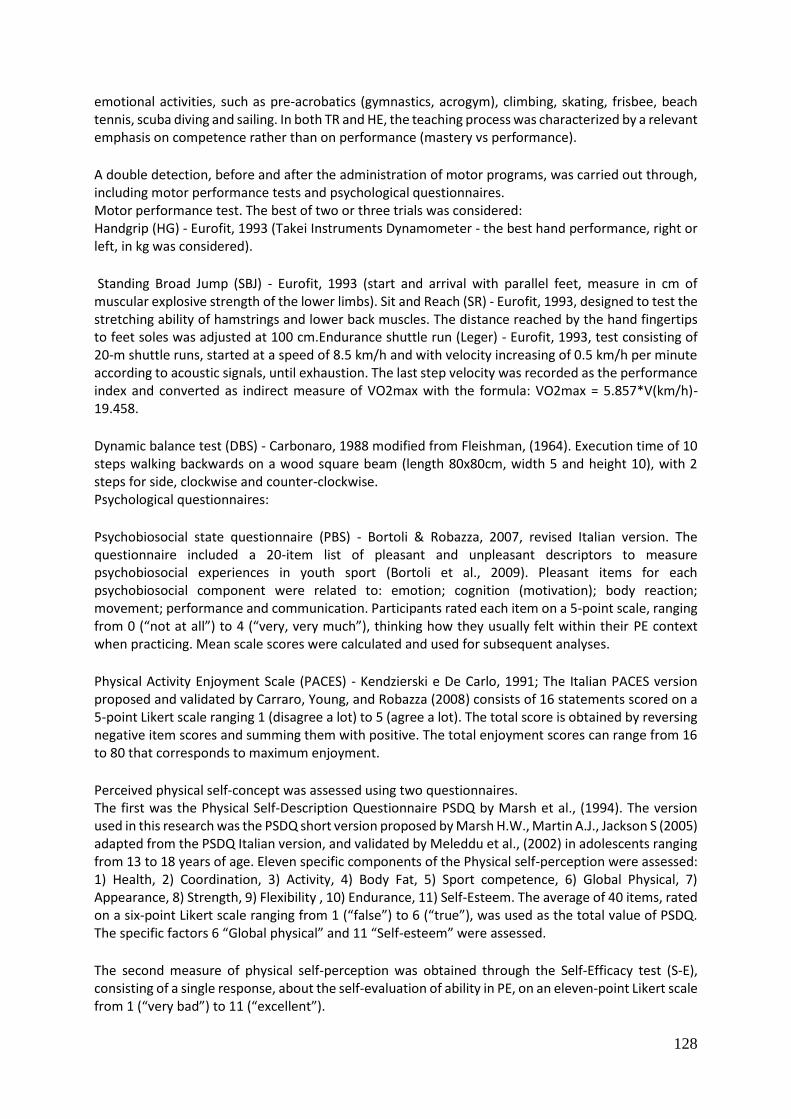
128
emotional activities, such as pre-acrobatics (gymnastics, acrogym), climbing, skating, frisbee, beach tennis, scuba diving and sailing. In both TR and HE, the teaching process was characterized by a relevant emphasis on competence rather than on performance (mastery vs performance).
A double detection, before and after the administration of motor programs, was carried out through, including motor performance tests and psychological questionnaires. Motor performance test. The best of two or three trials was considered: Handgrip (HG) - Eurofit, 1993 (Takei Instruments Dynamometer - the best hand performance, right or left, in kg was considered).
Standing Broad Jump (SBJ) - Eurofit, 1993 (start and arrival with parallel feet, measure in cm of muscular explosive strength of the lower limbs). Sit and Reach (SR) - Eurofit, 1993, designed to test the stretching ability of hamstrings and lower back muscles. The distance reached by the hand fingertips to feet soles was adjusted at 100 cm.Endurance shuttle run (Leger) - Eurofit, 1993, test consisting of 20-m shuttle runs, started at a speed of 8.5 km/h and with velocity increasing of 0.5 km/h per minute according to acoustic signals, until exhaustion. The last step velocity was recorded as the performance index and converted as indirect measure of VO2max with the formula: VO2max = 5.857*V(km/h)-19.458.
Dynamic balance test (DBS) - Carbonaro, 1988 modified from Fleishman, (1964). Execution time of 10 steps walking backwards on a wood square beam (length 80x80cm, width 5 and height 10), with 2 steps for side, clockwise and counter-clockwise. Psychological questionnaires:
Psychobiosocial state questionnaire (PBS) - Bortoli & Robazza, 2007, revised Italian version. The questionnaire included a 20-item list of pleasant and unpleasant descriptors to measure psychobiosocial experiences in youth sport (Bortoli et al., 2009). Pleasant items for each psychobiosocial component were related to: emotion; cognition (motivation); body reaction; movement; performance and communication. Participants rated each item on a 5-point scale, ranging from 0 (“not at all”) to 4 (“very, very much”), thinking how they usually felt within their PE context when practicing. Mean scale scores were calculated and used for subsequent analyses.
Physical Activity Enjoyment Scale (PACES) - Kendzierski e De Carlo, 1991; The Italian PACES version proposed and validated by Carraro, Young, and Robazza (2008) consists of 16 statements scored on a 5-point Likert scale ranging 1 (disagree a lot) to 5 (agree a lot). The total score is obtained by reversing negative item scores and summing them with positive. The total enjoyment scores can range from 16 to 80 that corresponds to maximum enjoyment.
Perceived physical self-concept was assessed using two questionnaires. The first was the Physical Self-Description Questionnaire PSDQ by Marsh et al., (1994). The version used in this research was the PSDQ short version proposed by Marsh H.W., Martin A.J., Jackson S (2005) adapted from the PSDQ Italian version, and validated by Meleddu et al., (2002) in adolescents ranging from 13 to 18 years of age. Eleven specific components of the Physical self-perception were assessed: 1) Health, 2) Coordination, 3) Activity, 4) Body Fat, 5) Sport competence, 6) Global Physical, 7) Appearance, 8) Strength, 9) Flexibility , 10) Endurance, 11) Self-Esteem. The average of 40 items, rated on a six-point Likert scale ranging from 1 (“false”) to 6 (“true”), was used as the total value of PSDQ. The specific factors 6 “Global physical” and 11 “Self-esteem” were assessed.
The second measure of physical self-perception was obtained through the Self-Efficacy test (S-E), consisting of a single response, about the self-evaluation of ability in PE, on an eleven-point Likert scale from 1 (“very bad”) to 11 (“excellent”).
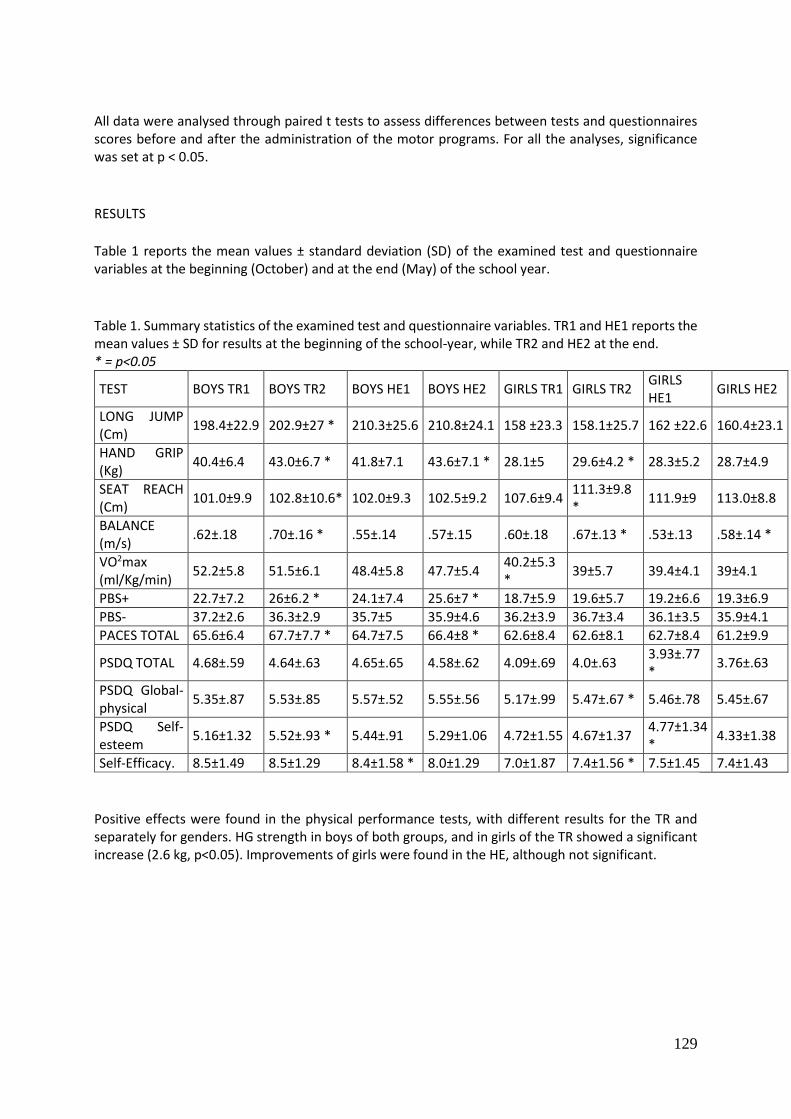
129
All data were analysed through paired t tests to assess differences between tests and questionnaires scores before and after the administration of the motor programs. For all the analyses, significance was set at p < 0.05.
RESULTS
Table 1 reports the mean values ± standard deviation (SD) of the examined test and questionnaire variables at the beginning (October) and at the end (May) of the school year. Table 1. Summary statistics of the examined test and questionnaire variables. TR1 and HE1 reports the mean values ± SD for results at the beginning of the school-year, while TR2 and HE2 at the end. * = p<0.05
TEST BOYS TR1 BOYS TR2 BOYS HE1 BOYS HE2 GIRLS TR1 GIRLS TR2 GIRLS HE1
GIRLS HE2
LONG JUMP (Cm)
198.4±22.9 202.9±27 * 210.3±25.6 210.8±24.1 158 ±23.3 158.1±25.7 162 ±22.6 160.4±23.1
HAND GRIP (Kg)
40.4±6.4 43.0±6.7 * 41.8±7.1 43.6±7.1 * 28.1±5 29.6±4.2 * 28.3±5.2 28.7±4.9
SEAT REACH (Cm)
101.0±9.9 102.8±10.6* 102.0±9.3 102.5±9.2 107.6±9.4 111.3±9.8 *
111.9±9 113.0±8.8
BALANCE (m/s)
.62±.18 .70±.16 * .55±.14 .57±.15 .60±.18 .67±.13 * .53±.13 .58±.14 *
VO2max (ml/Kg/min)
52.2±5.8 51.5±6.1 48.4±5.8 47.7±5.4 40.2±5.3 *
39±5.7 39.4±4.1 39±4.1
PBS+ 22.7±7.2 26±6.2 * 24.1±7.4 25.6±7 * 18.7±5.9 19.6±5.7 19.2±6.6 19.3±6.9
PBS- 37.2±2.6 36.3±2.9 35.7±5 35.9±4.6 36.2±3.9 36.7±3.4 36.1±3.5 35.9±4.1
PACES TOTAL 65.6±6.4 67.7±7.7 * 64.7±7.5 66.4±8 * 62.6±8.4 62.6±8.1 62.7±8.4 61.2±9.9
PSDQ TOTAL 4.68±.59 4.64±.63 4.65±.65 4.58±.62 4.09±.69 4.0±.63 3.93±.77 *
3.76±.63
PSDQ Global-physical
5.35±.87 5.53±.85 5.57±.52 5.55±.56 5.17±.99 5.47±.67 * 5.46±.78 5.45±.67
PSDQ Self-esteem
5.16±1.32 5.52±.93 * 5.44±.91 5.29±1.06 4.72±1.55 4.67±1.37 4.77±1.34 *
4.33±1.38
Self-Efficacy. 8.5±1.49 8.5±1.29 8.4±1.58 * 8.0±1.29 7.0±1.87 7.4±1.56 * 7.5±1.45 7.4±1.43
Positive effects were found in the physical performance tests, with different results for the TR and separately for genders. HG strength in boys of both groups, and in girls of the TR showed a significant increase (2.6 kg, p<0.05). Improvements of girls were found in the HE, although not significant.
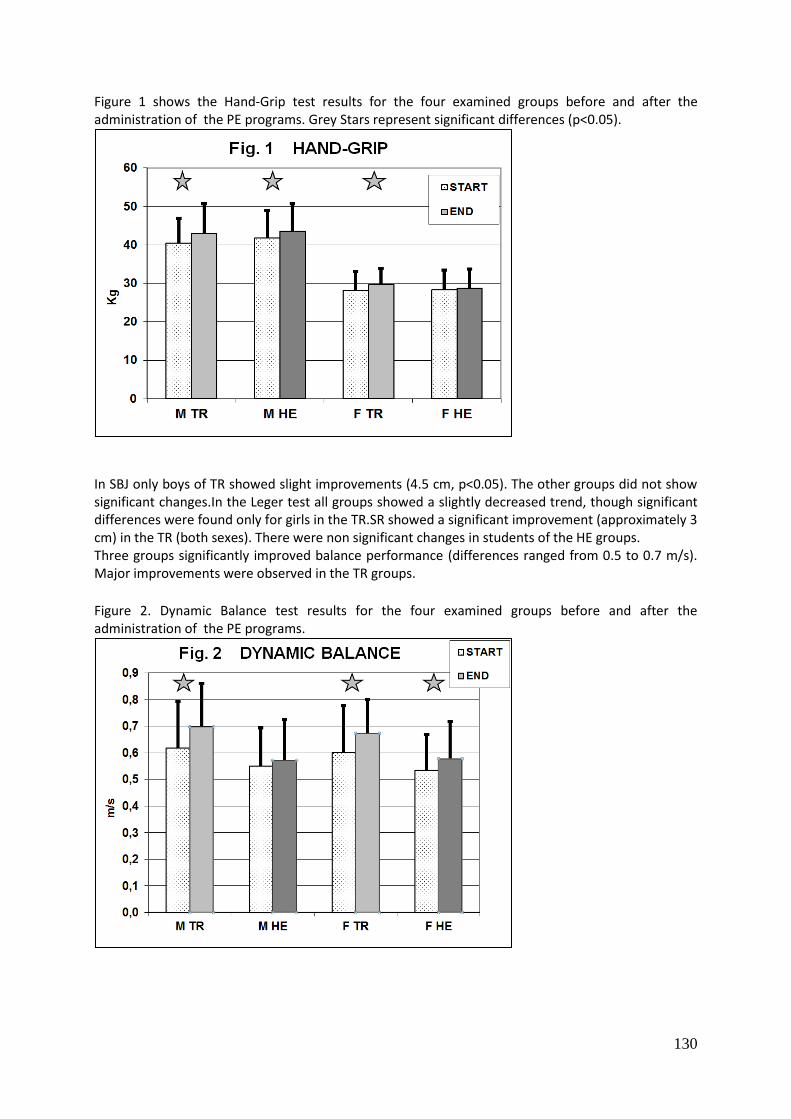
130
Figure 1 shows the Hand-Grip test results for the four examined groups before and after the administration of the PE programs. Grey Stars represent significant differences (p<0.05).
In SBJ only boys of TR showed slight improvements (4.5 cm, p<0.05). The other groups did not show significant changes.In the Leger test all groups showed a slightly decreased trend, though significant differences were found only for girls in the TR.SR showed a significant improvement (approximately 3 cm) in the TR (both sexes). There were non significant changes in students of the HE groups. Three groups significantly improved balance performance (differences ranged from 0.5 to 0.7 m/s). Major improvements were observed in the TR groups.
Figure 2. Dynamic Balance test results for the four examined groups before and after the administration of the PE programs.
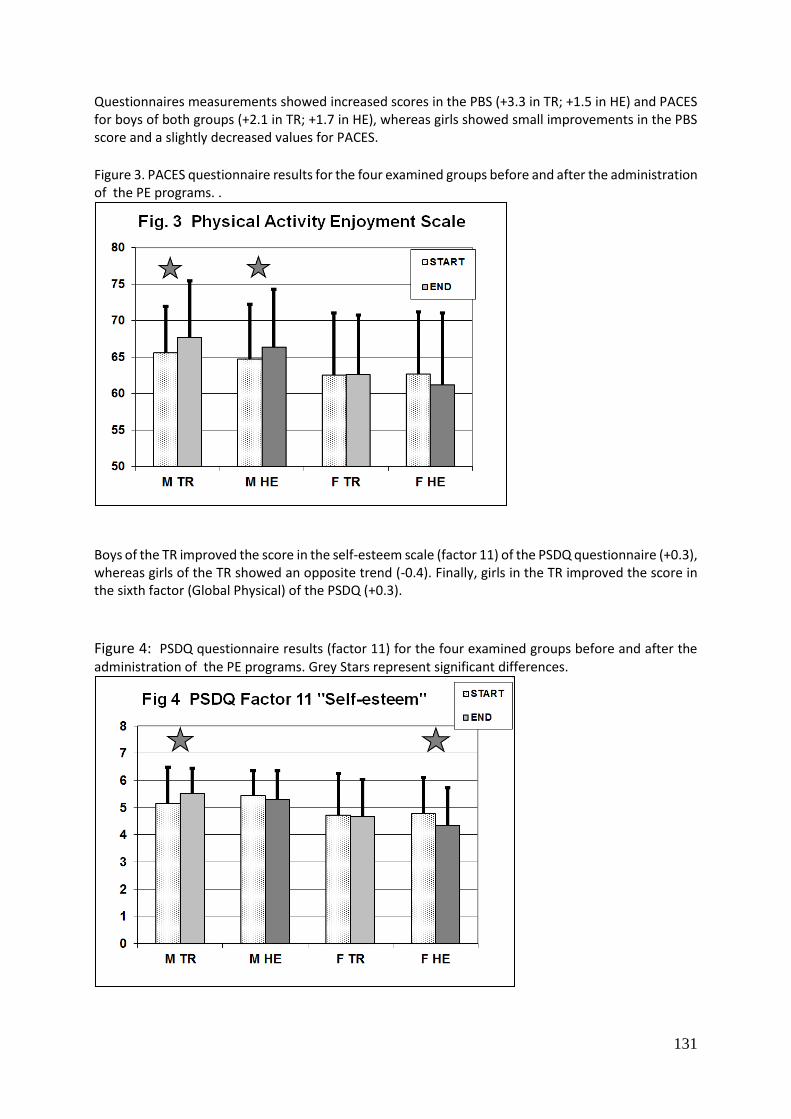
131
Questionnaires measurements showed increased scores in the PBS (+3.3 in TR; +1.5 in HE) and PACES for boys of both groups (+2.1 in TR; +1.7 in HE), whereas girls showed small improvements in the PBS score and a slightly decreased values for PACES. Figure 3. PACES questionnaire results for the four examined groups before and after the administration of the PE programs. .
Boys of the TR improved the score in the self-esteem scale (factor 11) of the PSDQ questionnaire (+0.3), whereas girls of the TR showed an opposite trend (-0.4). Finally, girls in the TR improved the score in the sixth factor (Global Physical) of the PSDQ (+0.3). Figure 4: PSDQ questionnaire results (factor 11) for the four examined groups before and after the administration of the PE programs. Grey Stars represent significant differences.
132
Therefore, boys showed positive effects in PBS and self-esteem, independently from the performed activities, while S-E decreased in boys of the HE group (from 8.0 ± 1.29 to 8.4 ± 1.58), and increased in girls of the TR group (from 7.4±1.56 to 7.0±1.87). DISCUSSION AND CONCLUSIONS Considering the different interventions, positive effects were found in four out of five of the examined physical performance tests. These findings would seem to confirm that traditional activities can improve strength, balance and flexibility, both in boys and girls. Innovative and highly emotional activities, on the contrary, seem to have a smaller effect on the physical performance. In the HE small improvements were found in the HG test only in boys, and in the balance test in girls. The endurance test showed an overall worsening trend, especially in girls of TR groups, according to the secular trend results reported by Tomkinson and colleagues (2003). The outcome of our study could be also explained by an insufficient endurance training during PE lessons, or a decline of motivation and effort dedicated to the final test.
In the PBS questionnaire the two interventions had a different effect on the two sexes, showing always positive responses in boys but not in girls. In TR, boys showed improvements also in the PACES and in the eleventh factor (self-esteem) of the PSDQ. Girls of the TR showed positive effects in the sixth factor (global physical) of PSDQ. Negative effects were found in the HE, in PSDQ global scores and particularly in factor 11 (self-esteem). The decreased scores in the S-E for males could be considered a positive outcome. Taking in account that boys usually tend to overestimate their physical self-concept, new experiences could lead them to a more realistic self-concept about their motor competences, and to reflect that there are always new competence to be developed.
Innovative and highly emotional programs seem therefore to have different effects in girls than in boys. The decreasing of self-esteem in HE girls suggest that highly emotionally activities could not be enjoyed by all the girls. Teachers should therefore be careful, organizing activities and sports groups based on the interest and satisfaction demonstrated by girls.
In conclusion, understanding the relationships between the psychological variables as physical education enjoyment, pshychobiological states, perceived physical self-efficacy and self-description can help researchers and teachers to plan more effective intervention strategies. In this study, different effects of PE were observed on physical fitness and psychosocial variables, according to the sex of students and the type of proposed activity. The results of this study suggest that teachers should strengthen positive feelings of self-esteem and self-confidence in students, promoting positive attitudes towards physical exercise and motor and sport learning. In addition, PE teachers should encourage the students’ active participation in new physical activities and sport experiences.
Acknowledgments
This research was funded by a grant from the Italian Ministry of Instruction, University and Research for Scientific Research Programs of Relevant National Interest (PRIN; Programmi di ricerca scientifica di interesse nazionale).
Conflicts of interest
The authors declare that they have no conflict of interest.
133
REFERENCES Bandura, A. (1986). Social foundations of thought and action: A social cognitive theory. Englewood Cliffs, NJ: Prentice-Hall.
Biddle, S. J. (2001). Enhancing motivation in physical education. In G. C. Roberts (Ed.), Advances in motivation in sport and exercise (pp. 101-127). Champaign, IL: Human Kinetics.
Bortoli, L., & Robazza, C. (2007). Dispositional goal orientations, motivational climate, and psychobiosocial states in physical education. In L. A. Chiang (Ed.), Motivation of exercise and physical activity (pp. 119–133). New York, NY: Nova Science.
Bortoli, L., Bertollo, M., & Robazza, C. (2009). Dispositional goal orientations, motivational climate, and psychobiosocial states in youth sport. Personality and Individual Differences, 47: 18-24.
Bortoli, L., Bertollo, M., Comani, S., & Robazza, C. (2011).Competence, achievement goals, motivational climate, and pleasant psychobiosocial states in youth sport. Journal of Sports Sciences , 29: 171–180.
Bortoli, L., Messina, G., Zorba, M., & Robazza, C. (2012). Contextual and individual influences on antisocial behaviour and psychobiosocial states of youth soccer players. Psychology of Sport and Exercise, 13: 397–406.
Bortoli L, Bertollo M, Filho E, Robazza C. (2014) Do psychobiosocial states mediate the relationship between perceived motivational climate and individual motivation in youngsters? Journal of Sports Sciences, 32: 572-82.
Bortoli L, Bertollo M, Vitali F, Filho E, Robazza C. (2015) The effects of motivational climate interventions on psychobiosocial states in high school physical education. Research Quarterly for Exercise and Sport, 86: 196- 204.
Cacciari, E., Milani, S., Balsamo, A., & SIEDP Directive Council 2002-03 (2006). Italian cross sectional growth charts for height, weight and BMI (2 to 20 yr). Journal of Endocrinological Investigation , 29: 581-93.
Cairney, J., Hay, J. A., Faught, B. E., Léger, L., & Mathers, B. (2008). Generalized self-efficacy and performance on the 20-metre shuttle run in children. American Journal of Human Biology, 20: 132 -138.
Carbonaro G., Madella A., Manno R., Merni F., Mussino A. (1988). La valutazione nello sport dei giovani, Società Stampa Sportiva, Roma.
Carraro, A., Young, M. C., & Robazza, C. (2008). A contribution to the validation of the physical activity enjoyment scale in an Italian sample. Social Behavior and Personality, 36: 911 – 918.
Ceciliani A., Bardella L., Grasso M. L., Zabonati A., Robazza C. (2008). Effects of a physical education program on children's attitudes and emotions associated with sport climbing. Perceptual and motor skills, 106: 775 - 784,
Corbin, C. B. (2002). Physical education as an agent of change. Quest, 54: 181–195.
134
Dumuid D., Physio B., Olds T., et al. (2017) Health-Related Quality of Life and Lifestyle Behavior Clusters in School-Aged Children from 12 Countries. Journal of Pediatrics,in press.
EUROFIT Handbook for the EUROFIT Tests of Physical Fitness, 2nd edn. (1993). Council of Europe – Committee for the development of sport, Committee of experts on sport research, Strasbourg. Fleisham E.A., The Structure and Measurement of Physical Fitness, Prentice-Hall, Inc. Enlewood Cliffs, N.J., 1964.
Flynn MA, McNeil DA, Maloff B, Mutasingwa D, Wu M, et al. (2006). Reducing obesity and related chronic disease risk in children and youth: a synthesis of evidence with ‘best practice’ recommendations. Obesity Reviews , 7 (1): 7–66.
ISTAT, Istituto Nazionale di Statistica. (2003). Indagine multiscopo sulla famiglie. “Aspetti della vita quotidiana”. Dicembre 2001-Marzo 2002. Available from http://www.istat.it
Kendzierski, D., & DeCarlo, K. J. (1991). Physical activity enjoyment scale: two validation studies. Journal of Sport and Exercise Psychology, 13: 60–64.
Kimm Y. S., Glynn N.W., Obarzanek E., Kriska A. M., Daniels S.R., MDe, Barton B.A., Liu K.. (2005). Relation between the changes in physical activity and body-mass index during adolescence: a multicentre longitudinal study. The Lancet, 366, 9482, 301–307
Léger L.A. (1988) The multistage 20 metre shuttle run test for aerobic fitness. Journal of Sports Sciences, 6 (2): 93-101 .
Marsh, H.W., Richards, G. E., Johnson, S., Roche, L., & Tremayne, P. (1994). Physical self-description questionnaire: psychometric properties and a multitrait multimethod analysis of relations to existing instruments. Journal of Sport and Exercise Psychology, 16: 270–305
Marsh, H. W., Ellis, L., Parada, L., Richards, G., & Heubeck, B. G. (2005). A short version of the Self-Description Questionnaire II: Operationalizing criteria for short-form evaluation with new applications of confirmatory factor analyses. Psychological Assessment, 17: 81–102.
Meleddu M, Scalas LF, Guicciardi M. (2002). Contributo alla validazione italiana del physical self-description questionnaire. Bollettino di Psicologia Applicata: 237: 36–52. Nooijen C. F. J., Galanti M. R., Engström K., Möller J. and Forsell1 Y. (2017) Effectiveness of interventions on physical activity in overweight or obese children: a systematic review and meta-analysis including studies with objectively measured outcomes. Obesity Reviews 18, 195–213.
O’Reilly, E., Tompkins, J., & Gallant, M. (2001). “They ought to enjoy physical activity, you know?”: Struggling with fun in physical education. Sport, Education, and Society, 6 : 211-221.
Robazza C, Bortoli L. (2005). Changing students' attitudes towards risky motor tasks: an application of the IZOF model. Journal of Sports Sciences, 23:1075-88.
Ryan, R. M., Frederick, C. M., Lepes, D., Rubio, N., & Sheldon, K. M. (1997). Intrinsic motivation and exercise adherence. International Journal of Sport Psychology, 28: 335-354.
135
Saakslahti, A., Numminen, P., Varstala, V., Helenius, H., Tammi, A., Viikari, J. And Valimaki, I. (2004). Physical Activity as a Preventive Measure for Coronary Heart Disease Risk Factors in Early Childhood. Scandinavian Journal of Medicine and Science in Sports, 14(3): 143–9.
Salmon J, Booth ML, Phongsavan P, et al. (2007). Promoting physical activity participation among children and adolescents. Epidemiologic Review, 29:144–59. Strong WB, Malina RM, Blimkie CJ, Daniels SR, Dishman RK, Gutin B, Hergenroeder AC, Must A, Nixon PA, Pivarnik JM, Rowland T, Trost S, Trudeau F (2005). Evidence based physical activity for school-age youth. Journal of Pediatrics, 146 (6):732-737.
Tomkinson, G., Leger, A., Olds, T., Cazorla, G., 2003. Secular trends in the performance of children and adolescents (1980-2000): an analysis of 55 studies of the 20m shuttle run test in11 countries. Sports Medicine, 33 (4): 285-300. Wankel, L. M. (1993). The importance of enjoyment to adherence and psychological benefits from physical activity. International Journal of Sport Psychology, 24: 151-169.
136
EVALUATION OF MISTAKES AT THE SWIMMING TECHIQUES
Stibilj, J.1, Kapus, J.2, Košmrlj, K.3
1Primary school Branik
2University of Ljubljana, Faculty of sport, Ljubljana, Slovenia
3University of Primorska, Faculty of management, Koper, Slovenia
ABSTRACT
Different methods are used to evaluate the swimmer's abilities, swimming skills and knowledge during swimming learning process. The tests are usually based on swim distances and/or achieved times for selected swim distance. However, in some cases this approach could not reflect the progress in swimmer's swimming technique. Therefore, the main purpose of this study was to evaluate mistakes that occur at the swimming techniques and to construct a scale for a testing of swimming knowledge. Sixty two Slovenian swimming coaches were in the group of experts. They evaluated 158 mistakes at breaststroke, front crawl and backstroke which usual occur at swimming beginners. The mistakes were grouped by the elements of the swimming technique i.e. position of the body, kicking, stroking, head movement and coordination. A questionnaire based on Thurstone models was constructed for each swimming technique. The experts evaluated each mistake on a seven–point continuum by its importance and on a three-point continuum by its the frequency. Considering the median value, interquartile range values and frequency of the each mistake, the scale of the mistakes were determined. The suggested scale could be used for classification of swimmers by their swimming knowledge. Therefore, it could be useful tool for swimming teachers and coaches.
Keywords: swimming, learning, qualitative analysis, evaluation
INTRODUCTION
Qualitative assessment is mostly used in sports with aesthetic component and sometimes in assessment of sport technique in school. For this purposes the qualitative scale for analysing body movements are made. They are based on criteria and descriptors, which should be simple and clear (Kovač, Jurak and Strel, 2003). They gather small, medium and large mistakes which can occur in single part of movement. The value of mistake presents the importance of mistake at evaluation of knowledge (Lees, 2002). This kind of assessment is difficult, because the assessment is slow and time – consuming. The positive aspect of it is immediate feedback information (Dežman, Majerič and Grabnar, 2010). The athlete or pupil can compare initial, intermediate and final level of knowledge. In addition, with this approach the mistakes are easier to recognise and to correct.
Different methods are used to evaluate the swimmer's abilities, swimming skills and knowledge during swimming learning process. The test are usually based on the swim distance and/ or achieved times for selected swim distance. However, in some cases this approach could not reflect the progress in the swimmer's swimming technique. Considering our knowledge, qualitative assessment of swimming have not been presented yet. Therefore, the main purpose of this study was to evaluate the mistakes that occur at the swimming techniques and to construct a scale for testing swimming knowledge. Latter would be composed by the sum of values of mistakes which would appeared at swimming of individual swimmer. In this way, the swimmer would be classified on qualitative level.
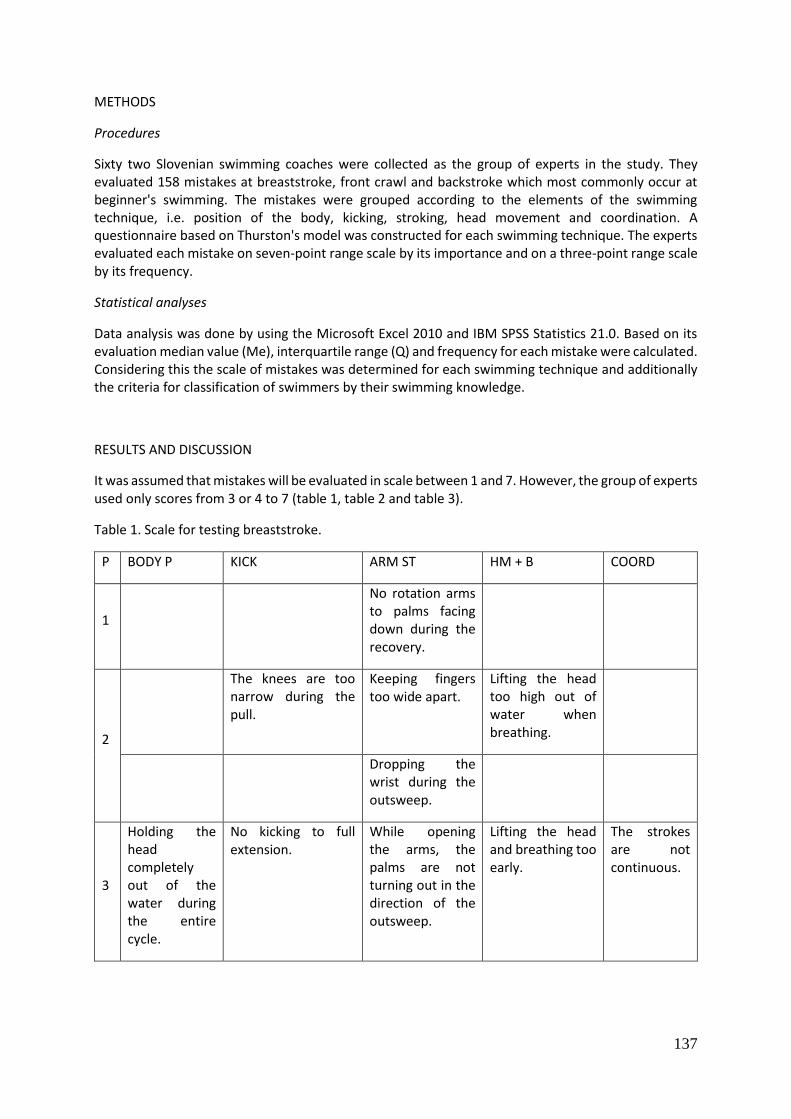
137
METHODS
Procedures
Sixty two Slovenian swimming coaches were collected as the group of experts in the study. They evaluated 158 mistakes at breaststroke, front crawl and backstroke which most commonly occur at beginner's swimming. The mistakes were grouped according to the elements of the swimming technique, i.e. position of the body, kicking, stroking, head movement and coordination. A questionnaire based on Thurston's model was constructed for each swimming technique. The experts evaluated each mistake on seven-point range scale by its importance and on a three-point range scale by its frequency.
Statistical analyses
Data analysis was done by using the Microsoft Excel 2010 and IBM SPSS Statistics 21.0. Based on its evaluation median value (Me), interquartile range (Q) and frequency for each mistake were calculated. Considering this the scale of mistakes was determined for each swimming technique and additionally the criteria for classification of swimmers by their swimming knowledge.
RESULTS AND DISCUSSION
It was assumed that mistakes will be evaluated in scale between 1 and 7. However, the group of experts used only scores from 3 or 4 to 7 (table 1, table 2 and table 3).
Table 1. Scale for testing breaststroke.
P BODY P KICK ARM ST HM + B COORD
1
No rotation arms to palms facing down during the recovery.
2
The knees are too narrow during the pull.
Keeping fingers too wide apart.
Lifting the head too high out of water when breathing.
Dropping the wrist during the outsweep.
3
Holding the head completely out of the water during the entire cycle.
No kicking to full extension.
While opening the arms, the palms are not turning out in the direction of the outsweep.
Lifting the head and breathing too early.
The strokes are not continuous.
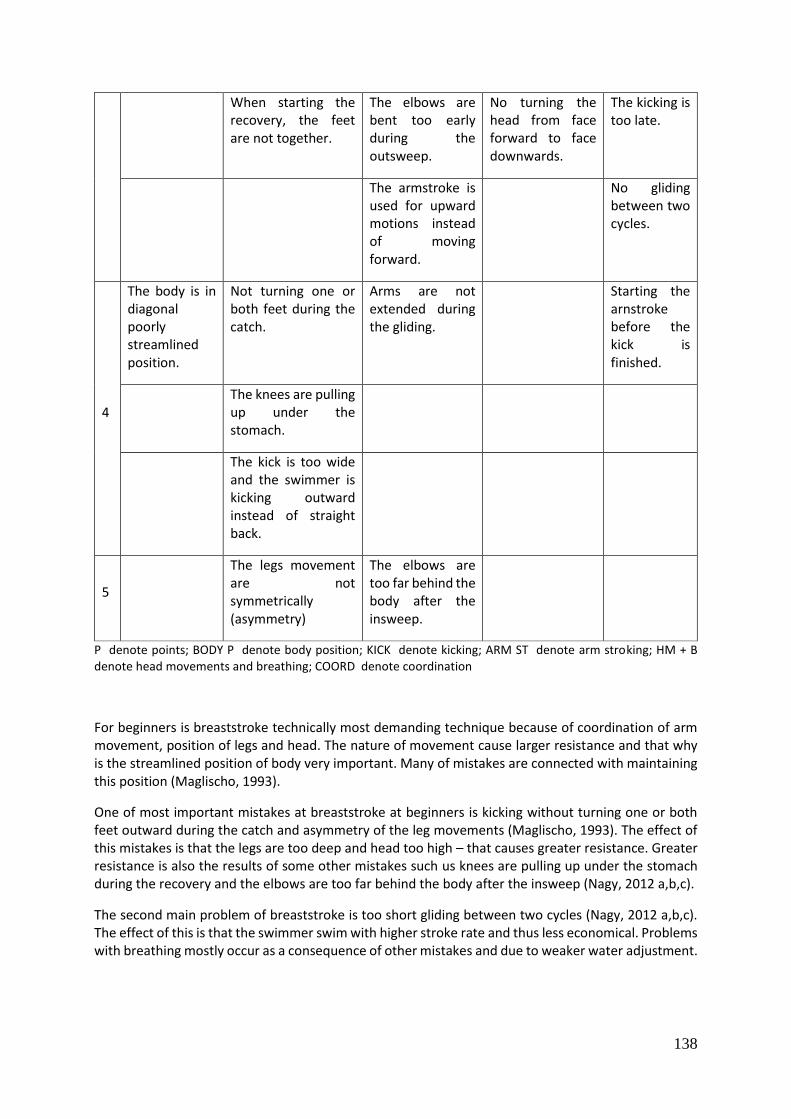
138
When starting the recovery, the feet are not together.
The elbows are bent too early during the outsweep.
No turning the head from face forward to face downwards.
The kicking is too late.
The armstroke is used for upward motions instead of moving forward.
No gliding between two cycles.
4
The body is in diagonal poorly streamlined position.
Not turning one or both feet during the catch.
Arms are not extended during the gliding.
Starting the arnstroke before the kick is finished.
The knees are pulling up under the stomach.
The kick is too wide and the swimmer is kicking outward instead of straight back.
5
The legs movement are not symmetrically (asymmetry)
The elbows are too far behind the body after the insweep.
P denote points; BODY P denote body position; KICK denote kicking; ARM ST denote arm stroking; HM + B denote head movements and breathing; COORD denote coordination
For beginners is breaststroke technically most demanding technique because of coordination of arm movement, position of legs and head. The nature of movement cause larger resistance and that why is the streamlined position of body very important. Many of mistakes are connected with maintaining this position (Maglischo, 1993).
One of most important mistakes at breaststroke at beginners is kicking without turning one or both feet outward during the catch and asymmetry of the leg movements (Maglischo, 1993). The effect of this mistakes is that the legs are too deep and head too high – that causes greater resistance. Greater resistance is also the results of some other mistakes such us knees are pulling up under the stomach during the recovery and the elbows are too far behind the body after the insweep (Nagy, 2012 a,b,c).
The second main problem of breaststroke is too short gliding between two cycles (Nagy, 2012 a,b,c). The effect of this is that the swimmer swim with higher stroke rate and thus less economical. Problems with breathing mostly occur as a consequence of other mistakes and due to weaker water adjustment.
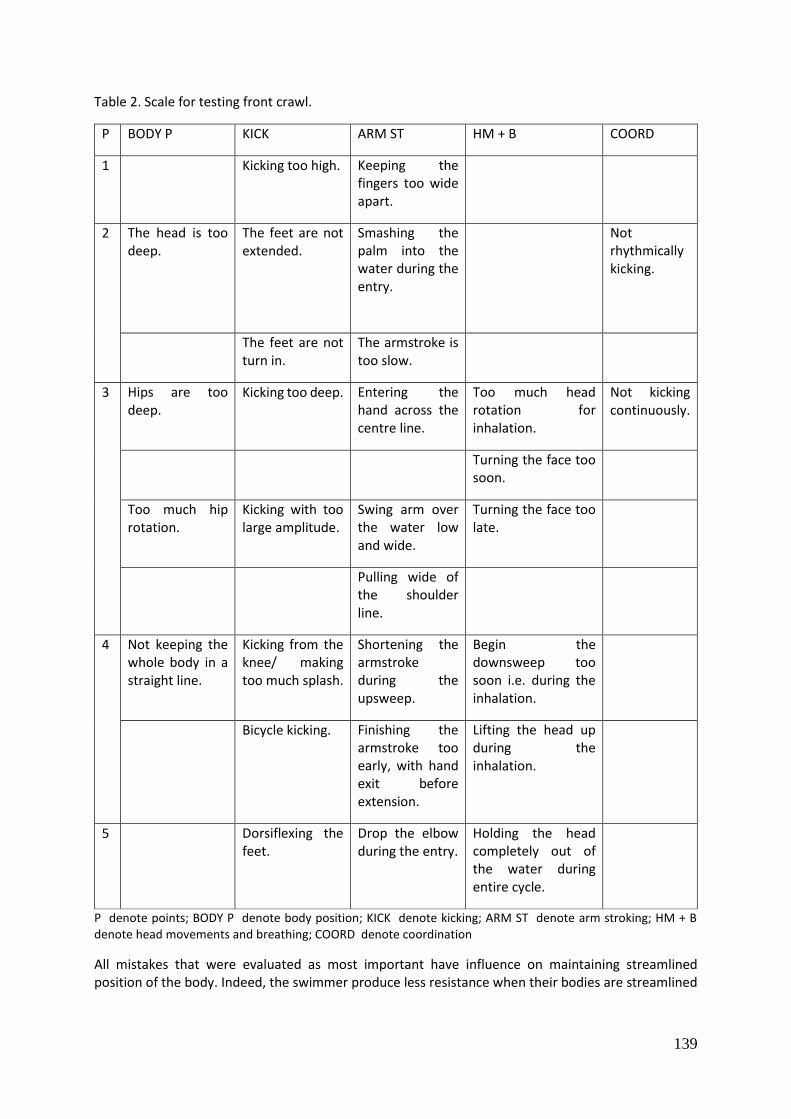
139
Table 2. Scale for testing front crawl.
P BODY P KICK ARM ST HM + B COORD
1
Kicking too high. Keeping the fingers too wide apart.
2 The head is too deep.
The feet are not extended.
Smashing the palm into the water during the entry.
Not rhythmically kicking.
The feet are not turn in.
The armstroke is too slow.
3 Hips are too deep.
Kicking too deep. Entering the hand across the centre line.
Too much head rotation for inhalation.
Not kicking continuously.
Turning the face too soon.
Too much hip rotation.
Kicking with too large amplitude.
Swing arm over the water low and wide.
Turning the face too late.
Pulling wide of the shoulder line.
4 Not keeping the whole body in a straight line.
Kicking from the knee/ making too much splash.
Shortening the armstroke during the upsweep.
Begin the downsweep too soon i.e. during the inhalation.
Bicycle kicking. Finishing the
armstroke too early, with hand exit before extension.
Lifting the head up during the inhalation.
5
Dorsiflexing the feet.
Drop the elbow during the entry.
Holding the head completely out of the water during entire cycle.
P denote points; BODY P denote body position; KICK denote kicking; ARM ST denote arm stroking; HM + B denote head movements and breathing; COORD denote coordination
All mistakes that were evaluated as most important have influence on maintaining streamlined position of the body. Indeed, the swimmer produce less resistance when their bodies are streamlined
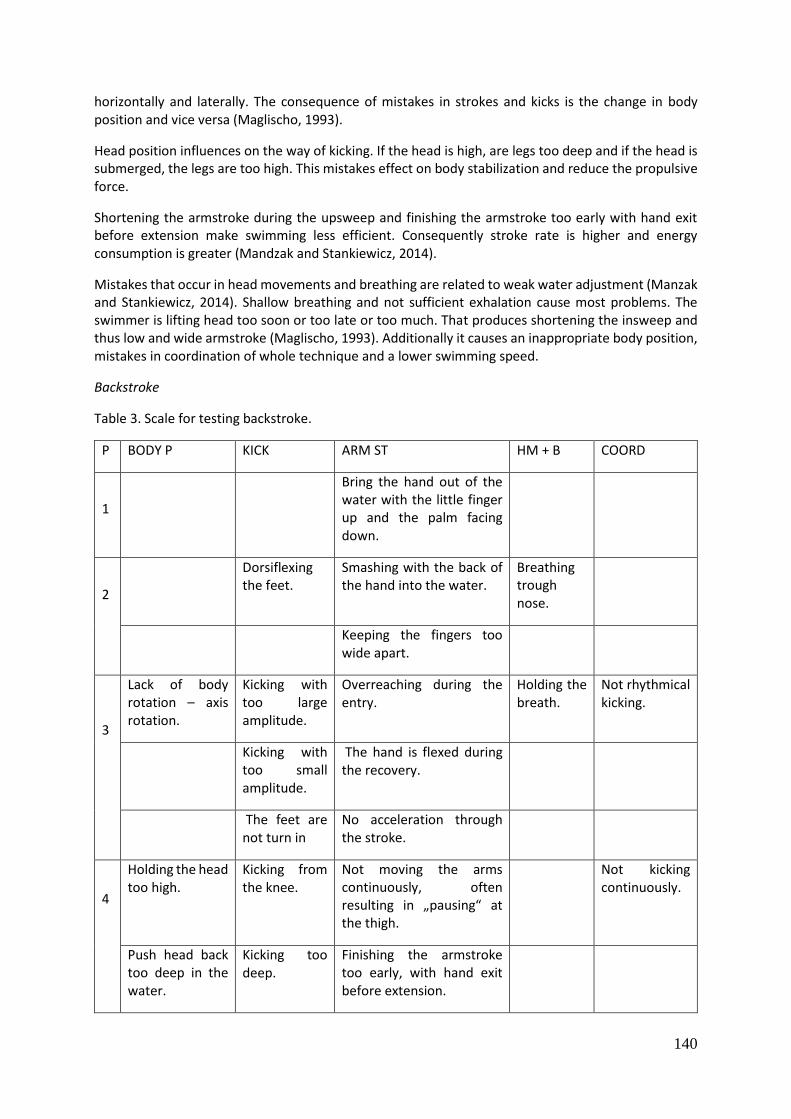
140
horizontally and laterally. The consequence of mistakes in strokes and kicks is the change in body position and vice versa (Maglischo, 1993).
Head position influences on the way of kicking. If the head is high, are legs too deep and if the head is submerged, the legs are too high. This mistakes effect on body stabilization and reduce the propulsive force.
Shortening the armstroke during the upsweep and finishing the armstroke too early with hand exit before extension make swimming less efficient. Consequently stroke rate is higher and energy consumption is greater (Mandzak and Stankiewicz, 2014).
Mistakes that occur in head movements and breathing are related to weak water adjustment (Manzak and Stankiewicz, 2014). Shallow breathing and not sufficient exhalation cause most problems. The swimmer is lifting head too soon or too late or too much. That produces shortening the insweep and thus low and wide armstroke (Maglischo, 1993). Additionally it causes an inappropriate body position, mistakes in coordination of whole technique and a lower swimming speed.
Backstroke
Table 3. Scale for testing backstroke.
P BODY P KICK ARM ST HM + B COORD
1
Bring the hand out of the water with the little finger up and the palm facing down.
2
Dorsiflexing the feet.
Smashing with the back of the hand into the water.
Breathing trough nose.
Keeping the fingers too wide apart.
3
Lack of body rotation – axis rotation.
Kicking with too large amplitude.
Overreaching during the entry.
Holding the breath.
Not rhythmical kicking.
Kicking with too small amplitude.
The hand is flexed during the recovery.
The feet are not turn in
No acceleration through the stroke.
4
Holding the head too high.
Kicking from the knee.
Not moving the arms continuously, often resulting in „pausing“ at the thigh.
Not kicking continuously.
Push head back too deep in the water.
Kicking too deep.
Finishing the armstroke too early, with hand exit before extension.
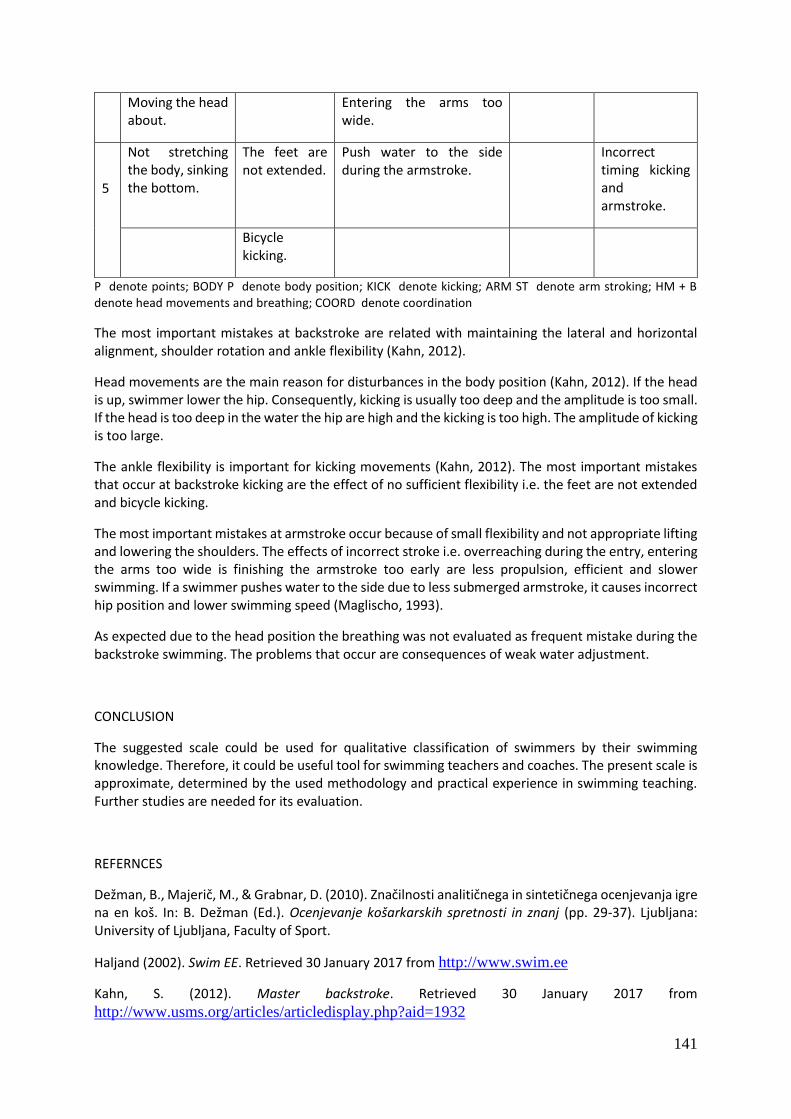
141
Moving the head about.
Entering the arms too wide.
5
Not stretching the body, sinking the bottom.
The feet are not extended.
Push water to the side during the armstroke.
Incorrect timing kicking and armstroke.
Bicycle kicking.
P denote points; BODY P denote body position; KICK denote kicking; ARM ST denote arm stroking; HM + B denote head movements and breathing; COORD denote coordination
The most important mistakes at backstroke are related with maintaining the lateral and horizontal alignment, shoulder rotation and ankle flexibility (Kahn, 2012).
Head movements are the main reason for disturbances in the body position (Kahn, 2012). If the head is up, swimmer lower the hip. Consequently, kicking is usually too deep and the amplitude is too small. If the head is too deep in the water the hip are high and the kicking is too high. The amplitude of kicking is too large.
The ankle flexibility is important for kicking movements (Kahn, 2012). The most important mistakes that occur at backstroke kicking are the effect of no sufficient flexibility i.e. the feet are not extended and bicycle kicking.
The most important mistakes at armstroke occur because of small flexibility and not appropriate lifting and lowering the shoulders. The effects of incorrect stroke i.e. overreaching during the entry, entering the arms too wide is finishing the armstroke too early are less propulsion, efficient and slower swimming. If a swimmer pushes water to the side due to less submerged armstroke, it causes incorrect hip position and lower swimming speed (Maglischo, 1993).
As expected due to the head position the breathing was not evaluated as frequent mistake during the backstroke swimming. The problems that occur are consequences of weak water adjustment.
CONCLUSION
The suggested scale could be used for qualitative classification of swimmers by their swimming knowledge. Therefore, it could be useful tool for swimming teachers and coaches. The present scale is approximate, determined by the used methodology and practical experience in swimming teaching. Further studies are needed for its evaluation.
REFERNCES
Dežman, B., Majerič, M., & Grabnar, D. (2010). Značilnosti analitičnega in sintetičnega ocenjevanja igre na en koš. In: B. Dežman (Ed.). Ocenjevanje košarkarskih spretnosti in znanj (pp. 29-37). Ljubljana: University of Ljubljana, Faculty of Sport.
Haljand (2002). Swim EE. Retrieved 30 January 2017 from http://www.swim.ee
Kahn, S. (2012). Master backstroke. Retrieved 30 January 2017 from
http://www.usms.org/articles/articledisplay.php?aid=1932
142
Kapus, V.,Štrumbelj, B., Kapus, J., Jurak, G., Šajber- Pincolič, D., Bednarik, J., Vute, R., Čermak, V., &
Kapus,. M. (2002). Plavanje, učenje. Slovenska šola plavanja za novo tisočletje. Ljubljana: University of Ljubljana, Faculty of Sport.
Kovač, M., Jurak, G. in Strel, J. (2003). Nekatera teoretična izhodišča preverjanja in ocenjevanja znanja iz športne vzgoje. Šport, 51 (2), 21-27.
Lees, A. (2002). Tecnique analysisi in sport: a critical review. Journal of Sports Science, 20, 813-828.
Maglischo, E. W. (1993). Swimming even faster. California: Mayfield Publishing company.
Mandzak, P., & Stankiewicz, B. (2014). Correction of errors front crawl swimming techique of students of physical education and sport. Journal of Health science. 4(14), 27-38.
Nagy, J. (2012a). Common swimming mistakes: part one. Swimming world. Retrieved 30 January 2017
from https://www.swimmingworldmagazine.com/news/common-breaststroke-mistakes-part-
one.
Nagy, J. (2012b). Common swimming mistakes: part two. Swimming world. Retrieved 30 January 2017
from https://www.swimmingworldmagazine.com/news/common-breaststroke-mistakes-part-
two.
Nagy, J. (2012c). Common swimming mistakes: part three. Swimming world. Retrieved 30 January 2017
from https://www.swimmingworldmagazine.com/news/common-breaststroke-mistakes-part-
three.
143
DIFFERENCES IN THE DUAL CAREER PATHS OF STUDENTS ATHLETES IN SLOVENIA, CROATIA AND SERBIA
Šetinc, A., Doupona Topič, M.
University of Ljubljana, Faculty of Sports, Ljubljana
The purpose of this study was to determine the characteristics of dual career of athletes and their motivation for a dual-career path. To this purpose we used SAMSAQ-EU questionnaire completed by student athletes, actively competing during their regular studies (on local, national or international level) and enrolled in the Faculty of sport in Slovenia (N = 117), Croatia (N = 123) and Serbia (N = 165). The study between these free countries is interested because all those countries have no determinant system or low how they help students’ athletes. More or less everything dependents on each athlete and how he or she can negotiate for students benefits during the study age. The established hypotheses relate to the motivation for the study and for the sports. We have tried to determine whether there exist differences in motivation among different countries. Using the appropriate statistical methods. We have found out that there exist statistically significant differences in motivation to study among the students in Slovenia, Croatia and Serbia. We will evaluate the results by trying to support which country has better support system for student athletes and why. In addition, we will try to suggest changes in system for higher motivation students athletes.
Keywords: dual career, student-athlete, sport, elite sport, academic, motivation
INTRODUCTION
Although sport participation is strongly encouraged, youth elite athletes encounter several difficulties in combining their sport and educational commitments (Capranica & Millard-Stafford, 2011; Conzelmann & Nagel, 2003). Professional level of sport as interpreted by Willeman model (2003 in Wylleman, 2004) begins with adulthood and individual development of an athlete and it coincides with the time when it is also necessary to enroll in a college and decide about their future life. It is also necessary to decide whether sport activity in the athlete's life should come in first or it should be combined with study and thus provide a career option after the completion of the sports channels. More and more attention is devoted to the research of a double career, as increasingly more athletes decide to follow this path.
Henry (2010) performed a more detailed overview of the flexibility of higher educational systems in the European countries whereby he found out found that countries vary considerably. Many countries within the European Union do not have precisely defined rules and laws to support athletes which would allow them a more simple life during their sporting career and after its completion.
In fact, to achieve athletic excellence 20–30 h per week for training and competitions are required, whereas students spend around 30 h per week to attain a satisfactory academic career (Aquilina, 2013). Furthermore, competition schedules spread over several months (i.e. team sports) or packed periods (i.e. individual sports) could affect the student athlete’s capability to successfully organize his / her athletic and educational commitments. (Lupo, C.; Guidotti, F.; Goncalves, Carlos E.; Moreira, L.; Doupona Topic, M.; Bellardini, H.; Tonkonogi, M.; Colin, A.; Capranica, 2015)
The institutional support which is responsible for athletes’ development, his educational rights and the possibilities of how an athlete is represented in the society plays a key role in the protection of young athletes (Capranica & Millard - Stafford, 2011).
144
Different studies have confirmed that only it is hardly ever possible to successfully combine higher education (Guidotti, 2014; Wylleman, 2004) and sport without the flexibility within the educational programs. In the European Union, some of the Universities have adjusted entries for the study programs and they also offer flexible support systems for students athletes (Caput - Jogunica, Ćurković & Bjelić, 2012).
The White paper book on sport (White paper book on sport, 2007) which covers sport career and education specifically states that in order to assure a dual career path for an elite athlete it is necessary already in the early stages to take into consideration their vocational training and provide high quality local training and vocational centres in order to protect athletes’ educational and vocational interests.
With a research of factors that influence the student athletes’ motivation for sport it is possible to recognize a level of motivation of a student athlete and encourage him in the field of his academic motivation before his motivation for sport significantly influences his educational results (Althouse, 2007).
In particular, the protection of youth athletes has been deemed crucial through the recognition of consistent institutional support to guarantee their athletic development, educational/vocational rights, and opportunities to emerge in the society (Capranica & Millard Stafford, 2011).
In USA students athletes are recognized as an important part of the University system (Guidotti & Cortis, 2014), whereas in Europe the attitude toward a student-athlete varies from one country to another since each European country has its own regulation.
Flexibility systems of the Universities in Slovenia, Croatia and in Serbia are defined by the statutes of each University and are supplemented by the rules of each Faculty. Therefore the faculties within the same country can have different rules and conditions for student athletes. Besides University and Faculty rules and regulations governing the education of elite student athletes, each of the countries also has its own regulations and recommendations issued by their ministries for education and sport.
The object of research is the study of dual career of student-athletes who are enrolled in various sports study programs in Slovenia, Croatia and Serbia. These countries have similar regulatory systems of providing the assistance and have very little or even no formal structures for providing the assistance to student athletes (Henry, 2010). The options of the adjustment to the athletes during their study are in the above mentioned countries primarily described by the Sports Act (Službeni glasnik RS, 2012), and more specifically by the university or faculty statutes, rules and other instructions.
Slovenia
In Slovenia the athletes have the right to apply for a scholarship from the Olympic committee, Ministry of education, science and sport and the Foundation for financing sport organizations in Slovenia. The condition for awarding the scholarship are the sports results (Pravilnik o štipendiranju športnikov in športnic v Sloveniji, 2011). In the field of the higher education there were in the past no particular models which would allow a student-athlete equal educational rights at all Faculties.
The Statute of the University of Ljubljana (Statut Univerze v Ljubljani, 2015) defines the rights of the student athlete. The student receives a student athlete status if at the beginning of each study year he / she submits the confirmation of the elite athlete status from the Slovenian Olympic committee (OKS). The award of the status of student athlete also brings additional points at the enrolment to the faculty. Otherwise, student athlete can have benefits during the study year. Because of his intense sport schedule, student athlete can attend his exams at extraordinary days or can take individual exams with the agreement of the professors. Student athlete can extend his status of a student athlete as an exception.
145
Faculty of sport has based on the statute of the University of Ljubljana created its own rules and regulations regarding student athletes and coaches of athletes. At the Faculty of sport in Ljubljana the student athlete with the categorisation of OKS receives special points at the enrolment to the study program at the faculty. Also based on the same categorisation, the student can request one of the three different statuses (international level, perspective, national) which allows different benefits for the athletes during the study year. As student athletes with the categorization the students are allowed to miss out a certain percent of the education process, they can have individual dates for the exams based on an agreement with the professors and they have the possibility to attain a lower number of total exam points during the study year in order to be able to enol to the next.
Croatia
In Croatia the recommendations for the adjustments on the education of the Faculty to the student athlete are based on the Rectors council (Rektorski zbor, 2008). In any case, however, each faculty has its own autonomy to decide which benefits elite athletes will have during the study year.
At the Faculty of Kinesiology in Zagreb, the elite athletes’ points for the enrolment to the faculty are based on the categorisation provided by the Croatian Olympic committee (HOOC). But elite athletes who are actual champions by the category of HOOC are awarded a direct enrolment to the first study year. They only have to pass a medical examination and a swimming test at Faculty of Kinesiology in Zagreb (Kineziološki fakultet Sveučilišta u Zagrebu, 2013). At the Faculty of Kinesiology in Split the elite athletes with HOOC categorisation of the first and the second level have at the enrolment to the faculty certain privileges, for example they are exempted from taking the motoric test in swimming (Sveučilište u Splitu Kineziološki Fakultet, 2011). All the benefits and obligations of the student athletes are stated in the rule book of the faculties where there are identified minimal standards for enrolment to the next year of study, the obligations regarding the athletes’ presence at the education process, the minimum of the study obligations during the study year (Sveučilište u Splitu Kineziološki Fakultet, 2011), and at the Faculty in Zagreb the athletes also have the possibility to prolong their study for seven years (Kineziološki fakultet Sveučilišta u Zagrebu, 2011,
The researcher in Croatia, Breslauer, (2012) indicates that in Croatia most of the higher education facilities do not provide enough support for student athletes, yet she agrees that certain progress in this field has been achieved. Some of the faculties do accept the recommendations and all the athletes with the categorisation are granted a direct enrolment to the study programs. At those faculties the athletes are guided by their mentors and there is a lot of cooperation between the athletes and the students. Some of the faculties have provided also e-learning for the students to help them to miss less of the study content.
Serbia
Serbia has in its law (Službeni glasnik RS br 52/96 i 101/05, 2012) stipulated that elite athlete has a right to study by special conditions which are in accordance with the statute of each individual faculty. At the faculty of sport and education the athletes with the categorisation of their Olympic committee receive extra points at enrolment to the study program. During the study year they can freeze their student status for reasons like preparation for important sports events, like Olympic games, world championship or European championship (Fakulteta sporta i fizičkog vaspitanja Univerzitet u Nišu, 2012). If the athlete in Serbia wins any of he medals at the Olympic games, European championship, world championship in the Olympic or non-Olympic disciplines or is the owner of the world record in the Olympic or non-Olympic sport disciplines or is the owner of Davis cup or FED cup from the world tennis federation he gets a state recognition in the form of a lifetime monthly rent which the athlete can start to use after he / she reaches forty years of age (Službeni glasnik, 2012).
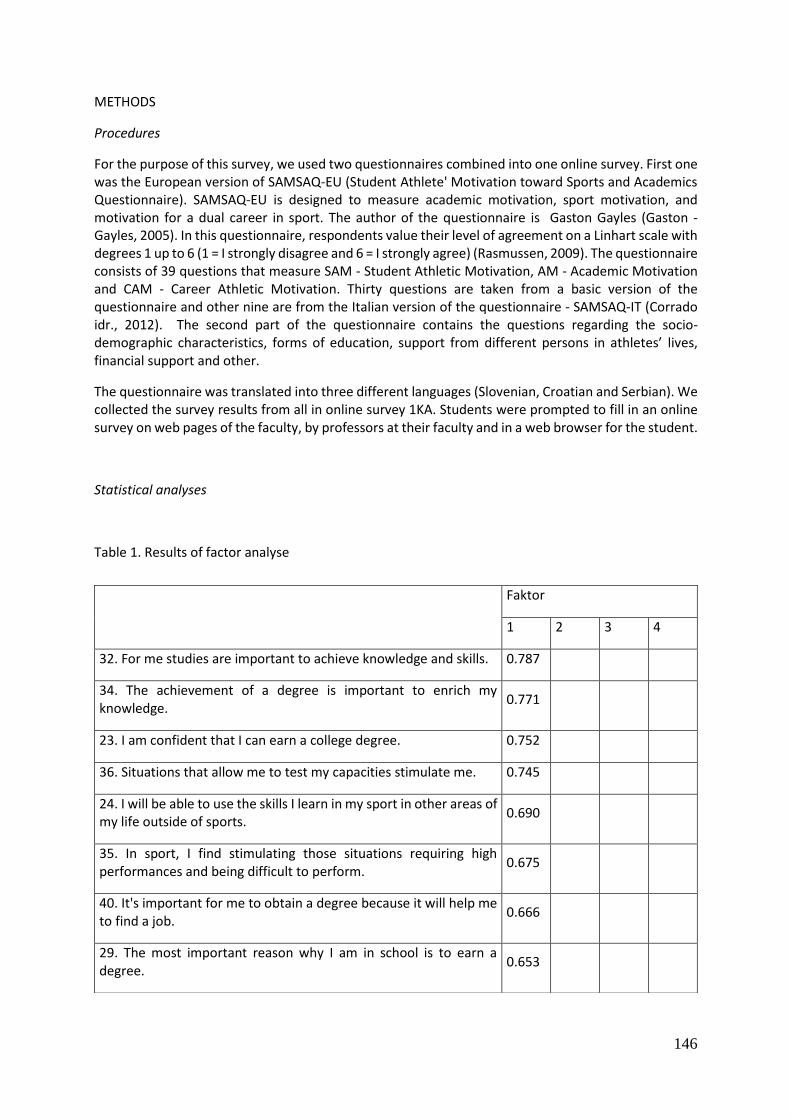
146
METHODS
Procedures
For the purpose of this survey, we used two questionnaires combined into one online survey. First one was the European version of SAMSAQ-EU (Student Athlete' Motivation toward Sports and Academics Questionnaire). SAMSAQ-EU is designed to measure academic motivation, sport motivation, and motivation for a dual career in sport. The author of the questionnaire is Gaston Gayles (Gaston - Gayles, 2005). In this questionnaire, respondents value their level of agreement on a Linhart scale with degrees 1 up to 6 (1 = I strongly disagree and 6 = I strongly agree) (Rasmussen, 2009). The questionnaire consists of 39 questions that measure SAM - Student Athletic Motivation, AM - Academic Motivation and CAM - Career Athletic Motivation. Thirty questions are taken from a basic version of the questionnaire and other nine are from the Italian version of the questionnaire - SAMSAQ-IT (Corrado idr., 2012). The second part of the questionnaire contains the questions regarding the socio-demographic characteristics, forms of education, support from different persons in athletes’ lives, financial support and other.
The questionnaire was translated into three different languages (Slovenian, Croatian and Serbian). We collected the survey results from all in online survey 1KA. Students were prompted to fill in an online survey on web pages of the faculty, by professors at their faculty and in a web browser for the student.
Statistical analyses
Table 1. Results of factor analyse
Faktor
1 2 3 4
32. For me studies are important to achieve knowledge and skills. 0.787
34. The achievement of a degree is important to enrich my knowledge.
0.771
23. I am confident that I can earn a college degree. 0.752
36. Situations that allow me to test my capacities stimulate me. 0.745
24. I will be able to use the skills I learn in my sport in other areas of my life outside of sports.
0.690
35. In sport, I find stimulating those situations requiring high performances and being difficult to perform.
0.675
40. It's important for me to obtain a degree because it will help me to find a job.
0.666
29. The most important reason why I am in school is to earn a degree.
0.653
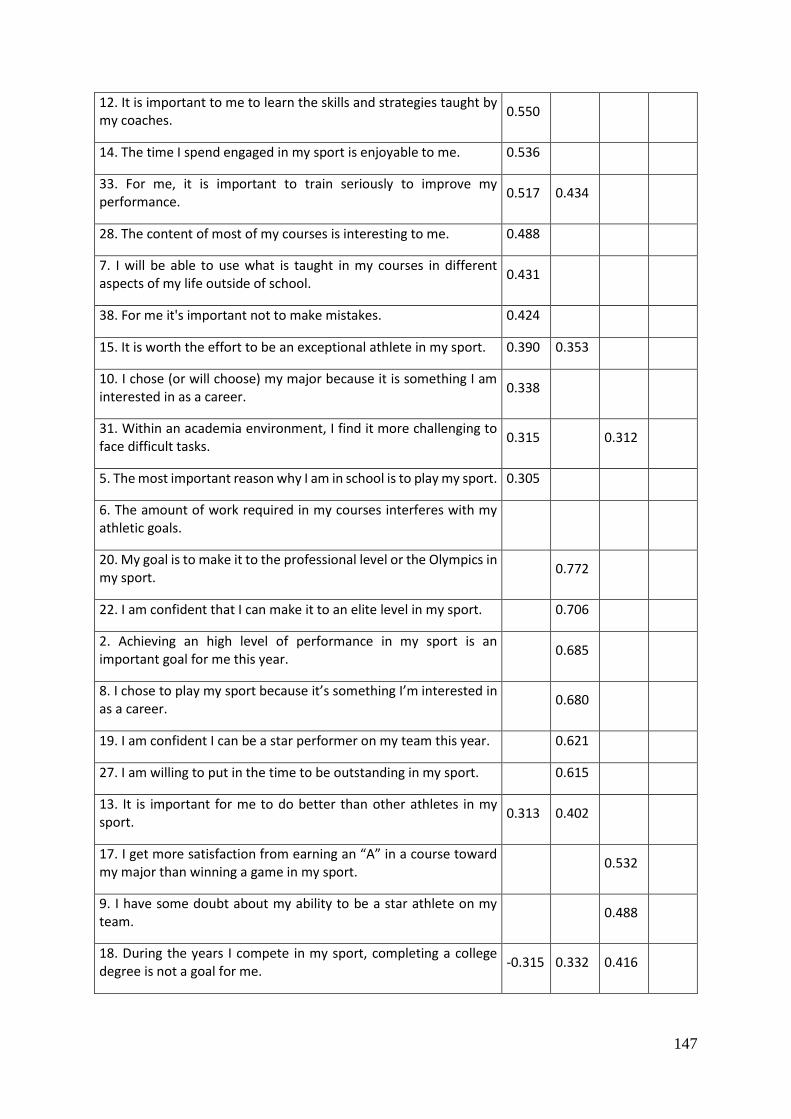
147
12. It is important to me to learn the skills and strategies taught by my coaches.
0.550
14. The time I spend engaged in my sport is enjoyable to me. 0.536
33. For me, it is important to train seriously to improve my performance.
0.517 0.434
28. The content of most of my courses is interesting to me. 0.488
7. I will be able to use what is taught in my courses in different aspects of my life outside of school.
0.431
38. For me it's important not to make mistakes. 0.424
15. It is worth the effort to be an exceptional athlete in my sport. 0.390 0.353
10. I chose (or will choose) my major because it is something I am interested in as a career.
0.338
31. Within an academia environment, I find it more challenging to face difficult tasks.
0.315 0.312
5. The most important reason why I am in school is to play my sport. 0.305
6. The amount of work required in my courses interferes with my athletic goals.
20. My goal is to make it to the professional level or the Olympics in my sport.
0.772
22. I am confident that I can make it to an elite level in my sport. 0.706
2. Achieving an high level of performance in my sport is an important goal for me this year.
0.685
8. I chose to play my sport because it’s something I’m interested in as a career.
0.680
19. I am confident I can be a star performer on my team this year. 0.621
27. I am willing to put in the time to be outstanding in my sport. 0.615
13. It is important for me to do better than other athletes in my sport.
0.313 0.402
17. I get more satisfaction from earning an “A” in a course toward my major than winning a game in my sport.
0.532
9. I have some doubt about my ability to be a star athlete on my team.
0.488
18. During the years I compete in my sport, completing a college degree is not a goal for me.
-0.315 0.332 0.416
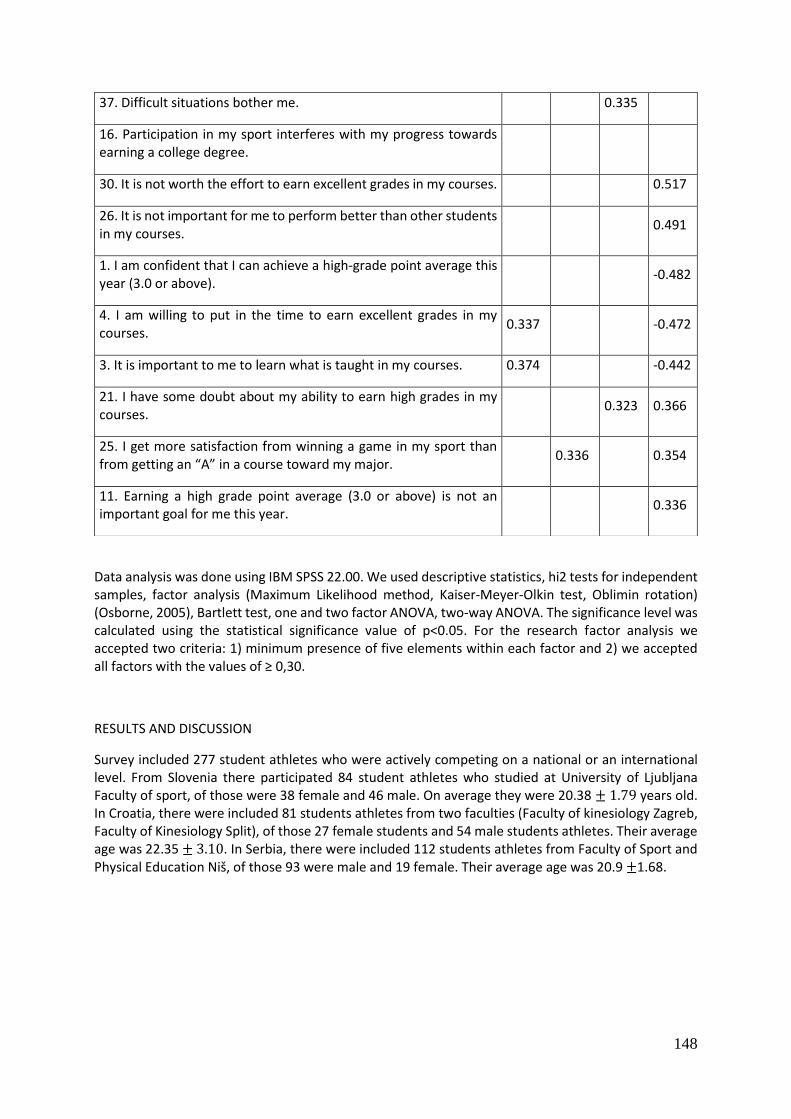
148
Data analysis was done using IBM SPSS 22.00. We used descriptive statistics, hi2 tests for independent samples, factor analysis (Maximum Likelihood method, Kaiser-Meyer-Olkin test, Oblimin rotation) (Osborne, 2005), Bartlett test, one and two factor ANOVA, two-way ANOVA. The significance level was calculated using the statistical significance value of p<0.05. For the research factor analysis we accepted two criteria: 1) minimum presence of five elements within each factor and 2) we accepted all factors with the values of ≥ 0,30.
RESULTS AND DISCUSSION
Survey included 277 student athletes who were actively competing on a national or an international level. From Slovenia there participated 84 student athletes who studied at University of Ljubljana Faculty of sport, of those were 38 female and 46 male. On average they were 20.38 ± 1.79 years old. In Croatia, there were included 81 students athletes from two faculties (Faculty of kinesiology Zagreb, Faculty of Kinesiology Split), of those 27 female students and 54 male students athletes. Their average age was 22.35 ± 3.10. In Serbia, there were included 112 students athletes from Faculty of Sport and Physical Education Niš, of those 93 were male and 19 female. Their average age was 20.9 ±1.68.
37. Difficult situations bother me. 0.335
16. Participation in my sport interferes with my progress towards earning a college degree.
30. It is not worth the effort to earn excellent grades in my courses. 0.517
26. It is not important for me to perform better than other students in my courses.
0.491
1. I am confident that I can achieve a high-grade point average this year (3.0 or above).
-0.482
4. I am willing to put in the time to earn excellent grades in my courses.
0.337 -0.472
3. It is important to me to learn what is taught in my courses. 0.374 -0.442
21. I have some doubt about my ability to earn high grades in my courses.
0.323 0.366
25. I get more satisfaction from winning a game in my sport than from getting an “A” in a course toward my major.
0.336 0.354
11. Earning a high grade point average (3.0 or above) is not an important goal for me this year.
0.336
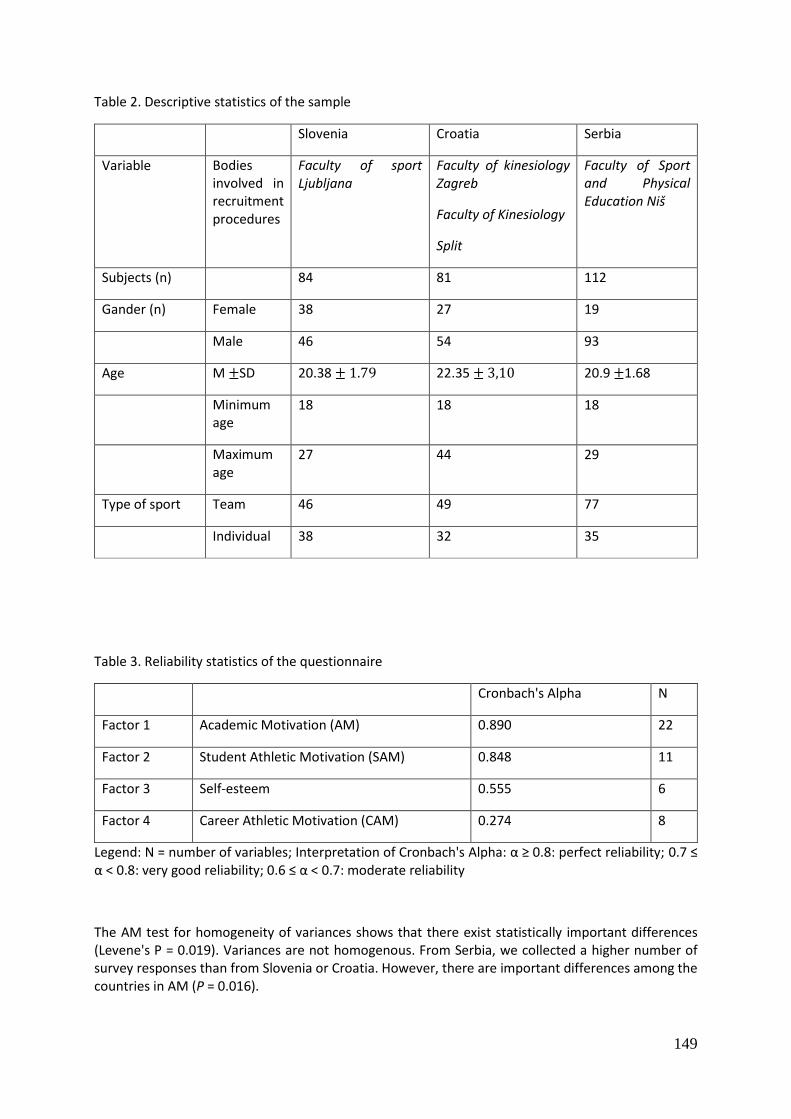
149
Table 2. Descriptive statistics of the sample
Slovenia Croatia Serbia
Variable Bodies involved in recruitment procedures
Faculty of sport Ljubljana
Faculty of kinesiology Zagreb
Faculty of Kinesiology
Split
Faculty of Sport and Physical Education Niš
Subjects (n) 84 81 112
Gander (n) Female 38 27 19
Male 46 54 93
Age M ±SD 20.38 ± 1.79 22.35 ± 3,10 20.9 ±1.68
Minimum age
18 18 18
Maximum age
27 44 29
Type of sport Team 46 49 77
Individual 38 32 35
Table 3. Reliability statistics of the questionnaire
Cronbach's Alpha N
Factor 1 Academic Motivation (AM) 0.890 22
Factor 2 Student Athletic Motivation (SAM) 0.848 11
Factor 3 Self-esteem 0.555 6
Factor 4 Career Athletic Motivation (CAM) 0.274 8
Legend: N = number of variables; Interpretation of Cronbach's Alpha: α ≥ 0.8: perfect reliability; 0.7 ≤ α < 0.8: very good reliability; 0.6 ≤ α < 0.7: moderate reliability
The AM test for homogeneity of variances shows that there exist statistically important differences (Levene's P = 0.019). Variances are not homogenous. From Serbia, we collected a higher number of survey responses than from Slovenia or Croatia. However, there are important differences among the countries in AM (P = 0.016).
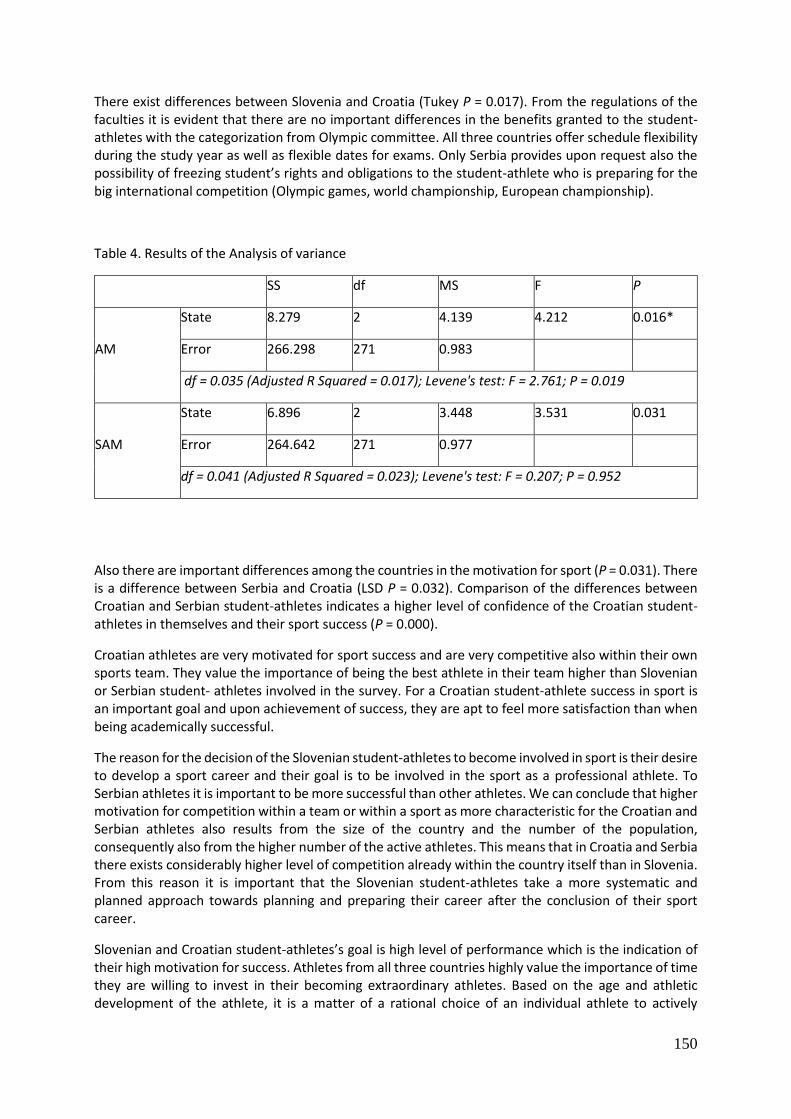
150
There exist differences between Slovenia and Croatia (Tukey P = 0.017). From the regulations of the faculties it is evident that there are no important differences in the benefits granted to the student-athletes with the categorization from Olympic committee. All three countries offer schedule flexibility during the study year as well as flexible dates for exams. Only Serbia provides upon request also the possibility of freezing student’s rights and obligations to the student-athlete who is preparing for the big international competition (Olympic games, world championship, European championship).
Table 4. Results of the Analysis of variance
SS df MS F P
AM
State 8.279 2 4.139 4.212 0.016*
Error 266.298 271 0.983
df = 0.035 (Adjusted R Squared = 0.017); Levene's test: F = 2.761; P = 0.019
SAM
State 6.896 2 3.448 3.531 0.031
Error 264.642 271 0.977
df = 0.041 (Adjusted R Squared = 0.023); Levene's test: F = 0.207; P = 0.952
Also there are important differences among the countries in the motivation for sport (P = 0.031). There is a difference between Serbia and Croatia (LSD P = 0.032). Comparison of the differences between Croatian and Serbian student-athletes indicates a higher level of confidence of the Croatian student-athletes in themselves and their sport success (P = 0.000).
Croatian athletes are very motivated for sport success and are very competitive also within their own sports team. They value the importance of being the best athlete in their team higher than Slovenian or Serbian student- athletes involved in the survey. For a Croatian student-athlete success in sport is an important goal and upon achievement of success, they are apt to feel more satisfaction than when being academically successful.
The reason for the decision of the Slovenian student-athletes to become involved in sport is their desire to develop a sport career and their goal is to be involved in the sport as a professional athlete. To Serbian athletes it is important to be more successful than other athletes. We can conclude that higher motivation for competition within a team or within a sport as more characteristic for the Croatian and Serbian athletes also results from the size of the country and the number of the population, consequently also from the higher number of the active athletes. This means that in Croatia and Serbia there exists considerably higher level of competition already within the country itself than in Slovenia. From this reason it is important that the Slovenian student-athletes take a more systematic and planned approach towards planning and preparing their career after the conclusion of their sport career.
Slovenian and Croatian student-athletes’s goal is high level of performance which is the indication of their high motivation for success. Athletes from all three countries highly value the importance of time they are willing to invest in their becoming extraordinary athletes. Based on the age and athletic development of the athlete, it is a matter of a rational choice of an individual athlete to actively
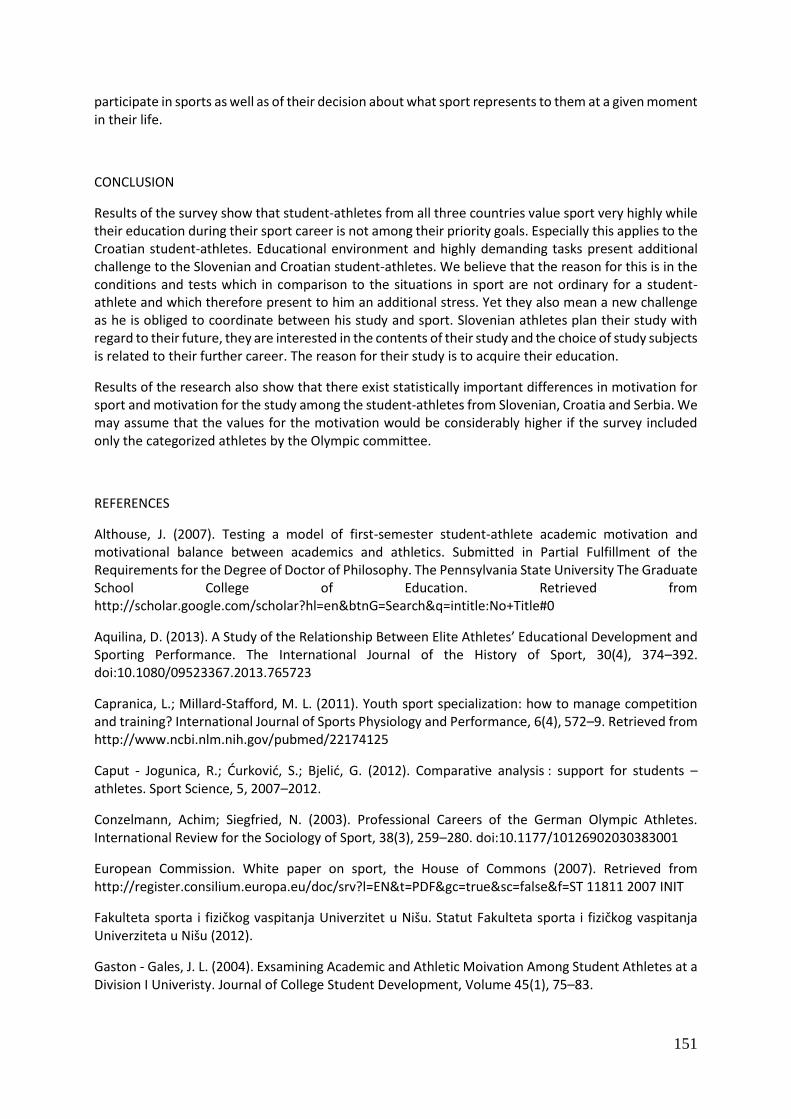
151
participate in sports as well as of their decision about what sport represents to them at a given moment in their life.
CONCLUSION
Results of the survey show that student-athletes from all three countries value sport very highly while their education during their sport career is not among their priority goals. Especially this applies to the Croatian student-athletes. Educational environment and highly demanding tasks present additional challenge to the Slovenian and Croatian student-athletes. We believe that the reason for this is in the conditions and tests which in comparison to the situations in sport are not ordinary for a student-athlete and which therefore present to him an additional stress. Yet they also mean a new challenge as he is obliged to coordinate between his study and sport. Slovenian athletes plan their study with regard to their future, they are interested in the contents of their study and the choice of study subjects is related to their further career. The reason for their study is to acquire their education.
Results of the research also show that there exist statistically important differences in motivation for sport and motivation for the study among the student-athletes from Slovenian, Croatia and Serbia. We may assume that the values for the motivation would be considerably higher if the survey included only the categorized athletes by the Olympic committee.
REFERENCES
Althouse, J. (2007). Testing a model of first-semester student-athlete academic motivation and motivational balance between academics and athletics. Submitted in Partial Fulfillment of the Requirements for the Degree of Doctor of Philosophy. The Pennsylvania State University The Graduate School College of Education. Retrieved from http://scholar.google.com/scholar?hl=en&btnG=Search&q=intitle:No+Title#0
Aquilina, D. (2013). A Study of the Relationship Between Elite Athletes’ Educational Development and Sporting Performance. The International Journal of the History of Sport, 30(4), 374–392. doi:10.1080/09523367.2013.765723
Capranica, L.; Millard-Stafford, M. L. (2011). Youth sport specialization: how to manage competition and training? International Journal of Sports Physiology and Performance, 6(4), 572–9. Retrieved from http://www.ncbi.nlm.nih.gov/pubmed/22174125
Caput - Jogunica, R.; Ćurković, S.; Bjelić, G. (2012). Comparative analysis : support for students – athletes. Sport Science, 5, 2007–2012.
Conzelmann, Achim; Siegfried, N. (2003). Professional Careers of the German Olympic Athletes. International Review for the Sociology of Sport, 38(3), 259–280. doi:10.1177/10126902030383001
European Commission. White paper on sport, the House of Commons (2007). Retrieved from http://register.consilium.europa.eu/doc/srv?l=EN&t=PDF&gc=true&sc=false&f=ST 11811 2007 INIT
Fakulteta sporta i fizičkog vaspitanja Univerzitet u Nišu. Statut Fakulteta sporta i fizičkog vaspitanja Univerziteta u Nišu (2012).
Gaston - Gales, J. L. (2004). Exsamining Academic and Athletic Moivation Among Student Athletes at a Division I Univeristy. Journal of College Student Development, Volume 45(1), 75–83.
152
Gaston - Gayles, J. L. (2005). The Factor Structure and Reliability of the Student Athletes’ Motivation toward Sports and Academics Questionnaire (SAMSAQ). Journal of College Student Development, 46(3), 317–327. doi:10.1353/csd.2005.0025
Guidotti, F.; Cortis, C. . C. L. (2014). Dual Career of European student-athletes: A systematic literature review. Paper awarded the Bengt Nybelius Scholarship, 11th EAS Conference.
Henry, I. (2010). Elite Athletes and Higher Education: Lifestyle, Balance and the Managment of Sporting and Educational Performance. International Olympic Committee Document, 1–18. Retrieved from http://scholar.google.com/scholar?hl=en&btnG=Search&q=intitle:Elite+Athletes+and+Higher+Education+:+Lifestyle+,+“+Balance+”+and+the+Management+of+Sporting+and+Educational+Performance#5
Kineziološki fakultet Sveučilišta u Zagrebu. Pravilnik o studiranju na integriranom preddiplomskom i diplomskom sveučilišnom studiju kineziologije (2011). Retrieved from https://www.kif.unizg.hr/_download/repository/Pravilnik_o_studiju[1].pdf
Kineziološki fakultet Zagreb. Statut Kinezioloskog fakulteta u Zagrebu (2013). Zagreb. Retrieved from https://www.kif.unizg.hr/_download/repository/Statut_Kinezioloskog_fakulteta_Sveucilista_u_Zagrebu,_sijecanj_2013..pdf
Komisija evropskih skupnosti. (2007). BELA KNJIGA O ŠPORTU. Bruselj. Retrieved from http://eur-lex.europa.eu/legal-content/SL/TXT/PDF/?uri=CELEX:52007DC0391&from=EN
Lupo, C.; Guidotti, F.; Goncalves, Carlos E.; Moreira, L.; Doupona Topic, M.; Bellardini, H.; Tonkonogi, M.; Colin, A.; Capranica, L. (2015). Motivation towards dual career of European student-athletes. European Journal of Sport Science, 15:2(December), 151–160. doi:10.1080/17461391.2014.940557
Ministrstvo za izobraževanje, znanost in šport. (2014). Nacionalni program športa v RS 2014-2023.
Olimpijski komite Slovenije Združenje športnih zvez. Pravilnik o štipendiranju športnikov in športnic v Republiki Sloveniji (2011). Retrieved from http://www.olympic.si/fileadmin/dokumenti/vrhunski-sport/SportnaKariera/sportne stipendije/Pravilnik o stipendiranju - NOV.pdf
Rasmussen, J. M. (2009). Investigation of scholar-baller and non scholar-baller Division I football student-athletes‟ academic, athletic, intrinsic motivation and athletic identity. Retrieved from http://medcontent.metapress.com/index/A65RM03P4874243N.pdf
Rektorski zbor. (2008). Preporuka o uvjetima studiranja kategoriziranih sportasa. Retrieved from http://www.vsmti.hr/images/stories/Dokumenti/preporuka_sport.pdf
Službeni glasnik RS br 52/96 i 101/05. Zakon o sportu Republike Srbije (2012). Retrieved from http://www.mzrkl.org/dokumenti/Zakon_o_sportu.pdf
Sveučilište u Splitu Kineziološki Fakultet. Pravilnik o studiju i sustavu studiranja na Kineziološkom fakultetu u Splitu (2011).
Univerza v Ljubljani. Statut Univerze v Ljubljani (2015). Retrieved from https://www.uni-lj.si/o_univerzi_v_ljubljani/organizacija__pravilniki_in_porocila/predpisi_statut_ul_in_pravilniki/2013070915432663/
Wylleman, P; Alfermann, D.; Lavallee, D. (2004). Career transitions in sport: European perspectives, Psychology of sport and exercise. Psychology of Sport and Exercise, 5(1), 7–20.
153
ATHLETIC IDENTITY OF DISABLED SKIERS
Šuc, N., Lešnik, B.
University of Ljubljana, Faculty of sport, Ljubljana, Slovenia
ABSTRACT
Athletic identity is the degree to which an individual identifies with the athlete's role and looks to others for acknowledgement of that role. It is a type of self-schema or how individuals perceive themselves. By participating in a sport, individuals are making a social statement about who they are and how they want others to regard them. Athletic identity is developed through the acquisition of skills, confidence, and social interaction during sport. It plays a part in both the cognitive and social roles. The aim of our research was to ascertain differences in athletic identity between two groups of disabled persons. There were thirty disabled persons involved in our study, all had an acquired disability, aged 37.4 ± 7.2. Half of the participants were actively engaged in alpine skiing, the other half were not active in any sport. We used a questionnaire that consisted of twenty-four statements about athletic identity. The respondents evaluated each of the statements with a scale of 1-5, where 1 means I completely disagree and 5 means I completely agree. In all twenty-four statements there was a statistically significant difference (t < 0.05) in favour of the active group.Engaging in disabled sport plays a major role in athletic identity which influences the social identity, subjective quality of life, self-concept, social interactions, process of rehabilitation and physical capacity, such as strength, skills, balance, etc.Due to all the positive aspects of high athletic identity, we suggest involvement in sports already in the last phase of rehabilitation.
Key words: Athletic identity, Alpine skiing, Disability
INTRODUCTION
Erikson (1963) defines identity as a subjective feeling of sameness and continuity, which is not merely the sum of roles, performed by the individual, but also includes his/her abilities and the way the person experiences him or herself, the world and other people’s reactions (Lamovec, 1994). Marcia (1989) defines identity as a state or as a dynamic structure of personality, which combines individual instincts, habits, beliefs and internal identification (Tušak, Tušak and Barborič, 2002). Slovenian authors say that the concept of identity comprises the perception and experience of self as separate and distinct from others, as self-consistent; the experience of integrity and continuity of self over time and the feeling of psycho-social reciprocity, consistency between individuals' perceptions about themselves and about what they perceive that others see in and expect of them (Tušak, Tušak and Barborič, 2002).
When dealing with identity, Južnič (1993) distinguishes identification with the body, personal and collective identity, cultural identity and ethnicity and national identity. The concept of identity involves identifying the individual (the relationship between private and public, self-recognition and recognition by the environment) and the concept of separation and exclusion (stigmatization, marginalization and movable identity). The concept of identity is semantically associated with a number of concepts, including the relationship of the individual with himself, such as self-esteem, self-concept, self, I, ego and ideal (Tušak, and Tušak Barborič, 2002).
The nature of identity is such that it is situational and changeable - it moves and changes in time, context and interaction with others. It is constantly in the process of creation (Musek, 2002). Identity
154
is such a weak mechanism, that keeping it in balance needs constant maintenance and support from the right environment and it can easily happen that something goes wrong with it (Faganel, 2003). The investigation of individual’s identity through different life periods reveals a mix of identities with varying degrees of emphasized characteristics and excellence - some are rigid and long-term, while others disappear fairly quickly (Brewer et al, 1993). Furthermore, within the sociology of sport there is a research tradition which takes into account the possible conflict between the student-athlete identities, respectively the complementarity of these two identities (Weiss, 2001).
Researches show how important relations with others are for the development of one's personality and self-image. We create our own identity on the basis of relationships with others (Masten, 2002). Responses from others help us develop as clear and accurate picture of ourselves as possible. If others perceive us as valuable, we will evaluate ourselves accordingly (Šuc, 2014). The qualities, which we admire in others, are those that we try to develop in ourselves. Interpersonal relations teach us how to assume different social roles, which we then incorporate into our perception of self. Interpersonal relations actually reveal who we are as a person (Kobal, 2000).
People are social and cultural beings who connect with others around them within the system of central relations. The process of expectating other people's reactions (primarily significant others and then others with whom we come into interaction) enhances the development of self and allows people to see themselves just as they are in the eyes of others. This self can be understood as a selection of different identities. Every person possesses identities, whether as a pupil in school, a member of a sports club, the youngest child in a family, or later as partner, parent, staff member, and colleague (Tušak et al, 2003). People assume an identity in every social relationship they enter or find themselves in. From this perspective, human behaviour can be understood as a basic quest for identity validation. Self-esteem is embedded in the strengthening of identity or social recognition. Self-awareness contains an ability to have confidence in this self-esteem, which is affected by the way in which an individual wins recognition from others in relation to self (Cecić Erpič, 1998). It must be assumed that, in order to obtain social recognition, therefore, to strengthen the identity, active effort is required (Weiss, 2001).
The roles we assume are best understood as products of our social interaction with others and not by connecting to a specific physiological and psychological element. Motives and needs appear in interactions as expressions which explain or justify the way our roles are played out. Sports activities are to a greater or lesser extent, managed by these basic sociopsychological first conditions or assumptions. Adopting roles allows participants to confirm their roles. An athlete experiences success through the attention of the society, through its approval or non-approval (Cecić Erpič, 1998)otwithstanding any physical evidence of success, self-evaluation is always evaluation in the eyes of others. Self-validation is not possible without the internal belief that recognition comes from others. People need other people not only to survive, but also to allow them to experience themselves. People cannot have confidence or any self if they are cut off from interaction with other humans (Weiss, 2001).
In his article Tušak (2003) explains that the concept of athletic identity is in many ways related to the concept of self-esteem i.e. self. Athletic identity is part of an individual's ego and self-esteem, which gives value and meaning to doing sport and exercise. To put it plainly, athletic identity is the feeling which makes someone think of himself more as an athlete than as another role in life (e.g. a disabled person). It depends on the commitment, involvement, self-worth and meaning, that people get from sports activities (Tušak, 2003)
Athletic identity can be defined as the degree to which an individual identifies with the role of an athlete. Athletic identity is part of the identity of the individual self and makes participating in sport and doing exercise meaningful and worthwhile (Tušak et al, 2005). The size of athletic identity as part of the self relies on the level of commitment, involvement, self-worth and meaning that people find in sport. In the broadest sense, athletic identity is a social role, regardless of whether the individual is a
155
professional or recreational sportsperson. In this case, the degree to which an individual identifies himself as a sportsperson, is significantly affected by family members, friends and the wider community (Tušak, 2003).
When compared to non-athletes, recreational athletes have a more positive outlook on their own bodies, their physical condition, physical appearance, ability and sexuality. Also, in comparison to non-athletes, recreational athletes achieve higher values in athletic identity, and express higher values in the following variables - physical self, family self, the social self and self-worth (Tušak, 2003).
METHODS
Participants
The sample of respondents who participated in the survey is represented by two groups of people after an injury. There were 15 respondents in each group. The first group of respondents (age 39.8 ± 2.3 years) was actively involved in alpine skiing after the injury, whereas the second group (age 36.7 ± 5.4 years) remained physically inactive.
Most of the 30 respondents reside in urban areas (75 %) between 50 and 100 km away from the nearest ski slope (73 %). In relation to the general population, they are relatively highly educated; 60% of the skiers and 40% of the non-skiers have a university education, the rest have completed a higher vocational education. Due to a high level of education, 73 % of skiers have a full-time employment with a monthly income of between 1,000 and 2,000 Euros. 50% of the respondents of the non-skiers are employed on a full-time basis with the same monthly income.
Paraplegia was cited as the most frequent type of injury in both groups, namely 86.7 % among skiers and 66.7 % in the non-skiers’ group. Quadriplegia and amputation of both lower extremities were also cited. The level of injury in paraplegia ranged from TH4 to L3. In both groups, the most common cause of injury was a traffic accident, 60 i.e. 66.7 %. When they suffered the injury, the average age of participants was 28.3 years in the skiers’ group and 27.9 years in the non-skiers group. 60 % of respondents of both groups were in rehabilitation for 3-6 months, while others were in rehabilitation for less than 3 months. None of them were introduced to adaptive sport during rehabilitation.
Instruments
We used a 24 statements' questionnaire about athletic identity. Respondents evaluated statements on the Likert scale from 1 to 5, 1 meaning I completely disagree, 5 meaning I completely agree. Consistency of the test is alpha = 0.81. We divided statements into four life aspects: society (and important others), physical condition, everyday life and psycho-social condition.
Procedure
For research purposes, a survey method of specially prepared questionnaire was used. The questionnaire was divided into several sections: general data, data on disability, information on sports activities, equipment and ski slopes availability and the athletic identity scale.
The questionnaire also examined the participants’ stratification characteristics (gender, age, education, income, marital status, place of residence), the frequency of their participation in sports activities before and after the injury, and the degree of disability.
The data was analysed using the SPSS; the t-test was used for comparisons between the groups, and the non-parametric Mann-Whitney test was used where the distribution was not normal.
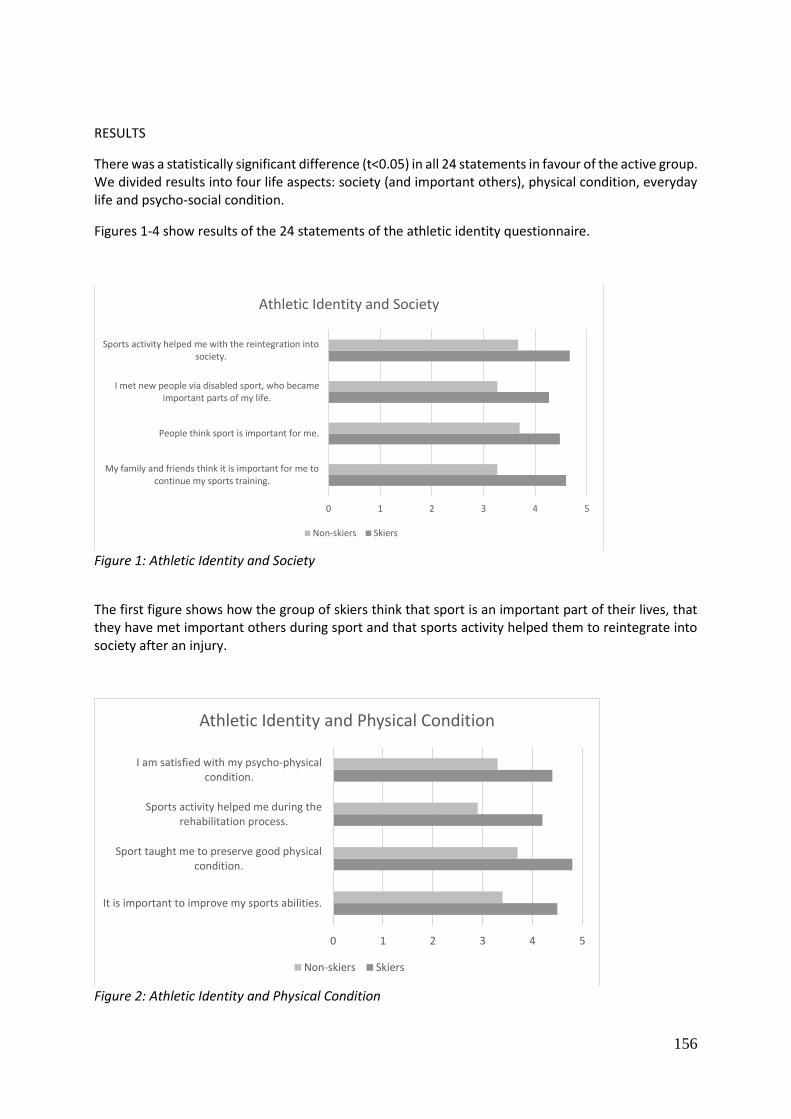
156
RESULTS
There was a statistically significant difference (t<0.05) in all 24 statements in favour of the active group. We divided results into four life aspects: society (and important others), physical condition, everyday life and psycho-social condition.
Figures 1-4 show results of the 24 statements of the athletic identity questionnaire.
Figure 1: Athletic Identity and Society
The first figure shows how the group of skiers think that sport is an important part of their lives, that they have met important others during sport and that sports activity helped them to reintegrate into society after an injury.
Figure 2: Athletic Identity and Physical Condition
0 1 2 3 4 5
My family and friends think it is important for me tocontinue my sports training.
People think sport is important for me.
I met new people via disabled sport, who becameimportant parts of my life.
Sports activity helped me with the reintegration intosociety.
Athletic Identity and Society
Non-skiers Skiers
0 1 2 3 4 5
It is important to improve my sports abilities.
Sport taught me to preserve good physicalcondition.
Sports activity helped me during therehabilitation process.
I am satisfied with my psycho-physicalcondition.
Athletic Identity and Physical Condition
Non-skiers Skiers
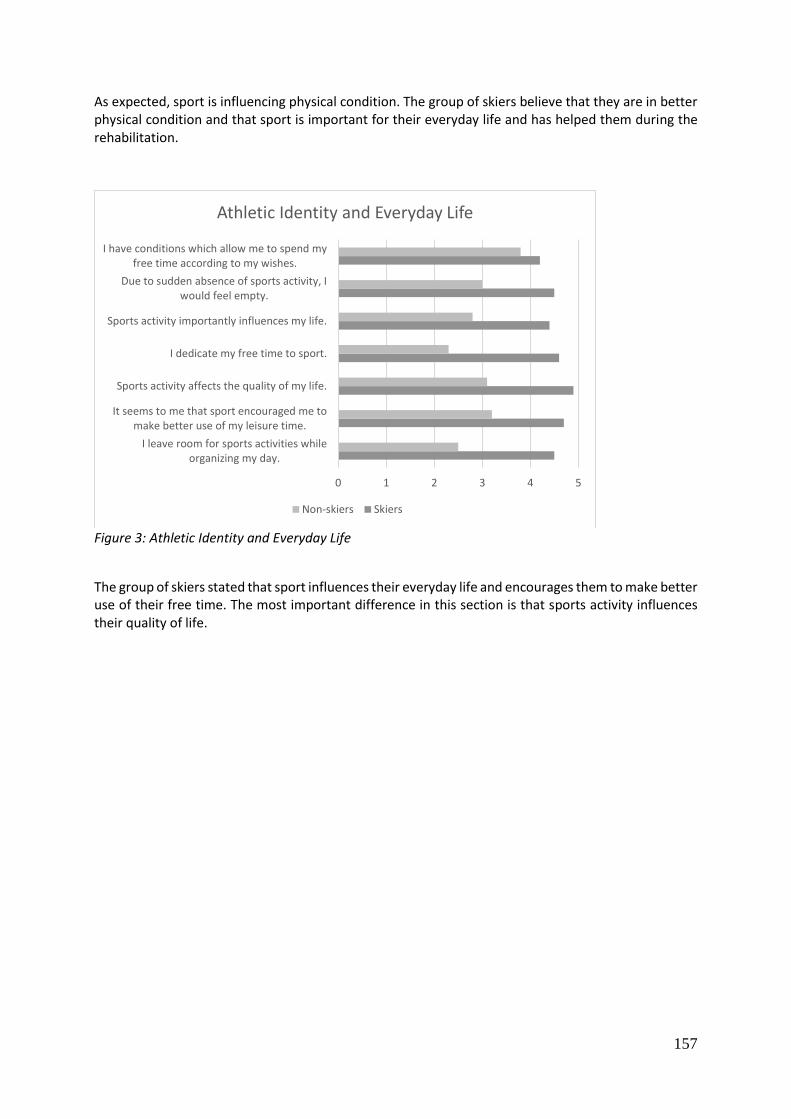
157
As expected, sport is influencing physical condition. The group of skiers believe that they are in better physical condition and that sport is important for their everyday life and has helped them during the rehabilitation.
Figure 3: Athletic Identity and Everyday Life
The group of skiers stated that sport influences their everyday life and encourages them to make better use of their free time. The most important difference in this section is that sports activity influences their quality of life.
0 1 2 3 4 5
I leave room for sports activities whileorganizing my day.
It seems to me that sport encouraged me tomake better use of my leisure time.
Sports activity affects the quality of my life.
I dedicate my free time to sport.
Sports activity importantly influences my life.
Due to sudden absence of sports activity, Iwould feel empty.
I have conditions which allow me to spend myfree time according to my wishes.
Athletic Identity and Everyday Life
Non-skiers Skiers
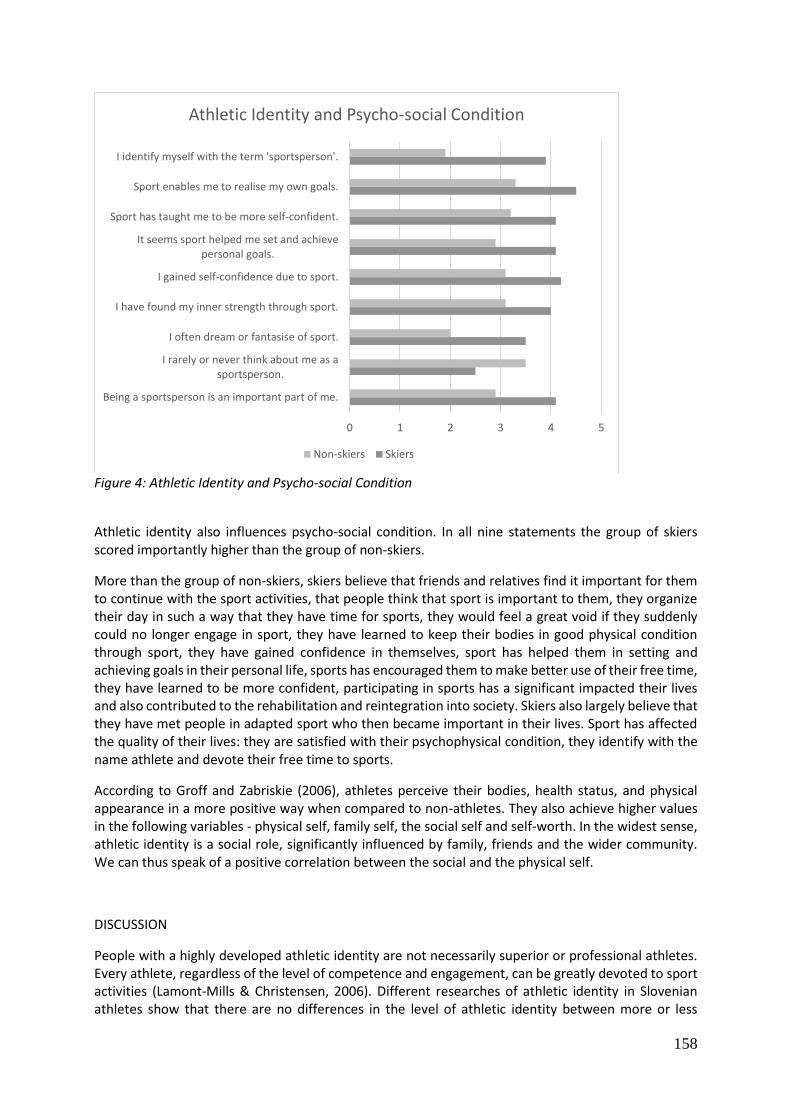
158
Figure 4: Athletic Identity and Psycho-social Condition
Athletic identity also influences psycho-social condition. In all nine statements the group of skiers scored importantly higher than the group of non-skiers.
More than the group of non-skiers, skiers believe that friends and relatives find it important for them to continue with the sport activities, that people think that sport is important to them, they organize their day in such a way that they have time for sports, they would feel a great void if they suddenly could no longer engage in sport, they have learned to keep their bodies in good physical condition through sport, they have gained confidence in themselves, sport has helped them in setting and achieving goals in their personal life, sports has encouraged them to make better use of their free time, they have learned to be more confident, participating in sports has a significant impacted their lives and also contributed to the rehabilitation and reintegration into society. Skiers also largely believe that they have met people in adapted sport who then became important in their lives. Sport has affected the quality of their lives: they are satisfied with their psychophysical condition, they identify with the name athlete and devote their free time to sports.
According to Groff and Zabriskie (2006), athletes perceive their bodies, health status, and physical appearance in a more positive way when compared to non-athletes. They also achieve higher values in the following variables - physical self, family self, the social self and self-worth. In the widest sense, athletic identity is a social role, significantly influenced by family, friends and the wider community. We can thus speak of a positive correlation between the social and the physical self.
DISCUSSION
People with a highly developed athletic identity are not necessarily superior or professional athletes. Every athlete, regardless of the level of competence and engagement, can be greatly devoted to sport activities (Lamont-Mills & Christensen, 2006). Different researches of athletic identity in Slovenian athletes show that there are no differences in the level of athletic identity between more or less
0 1 2 3 4 5
Being a sportsperson is an important part of me.
I rarely or never think about me as asportsperson.
I often dream or fantasise of sport.
I have found my inner strength through sport.
I gained self-confidence due to sport.
It seems sport helped me set and achievepersonal goals.
Sport has taught me to be more self-confident.
Sport enables me to realise my own goals.
I identify myself with the term 'sportsperson'.
Athletic Identity and Psycho-social Condition
Non-skiers Skiers
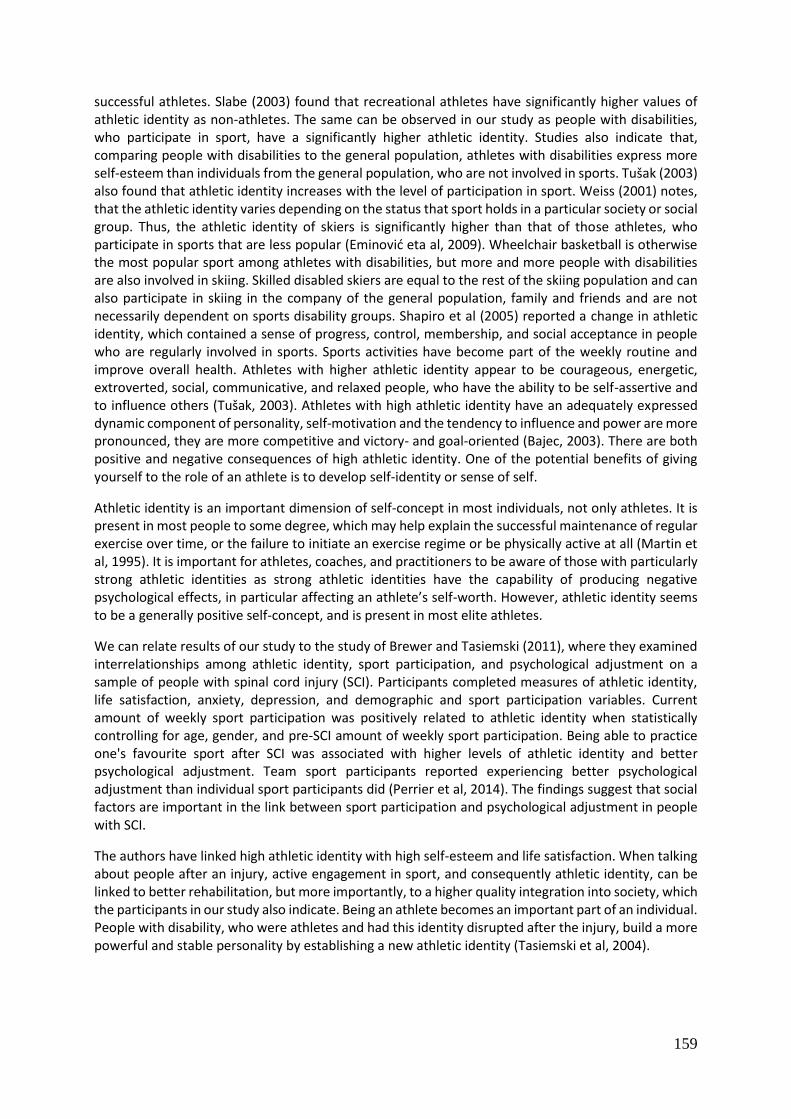
159
successful athletes. Slabe (2003) found that recreational athletes have significantly higher values of athletic identity as non-athletes. The same can be observed in our study as people with disabilities, who participate in sport, have a significantly higher athletic identity. Studies also indicate that, comparing people with disabilities to the general population, athletes with disabilities express more self-esteem than individuals from the general population, who are not involved in sports. Tušak (2003) also found that athletic identity increases with the level of participation in sport. Weiss (2001) notes, that the athletic identity varies depending on the status that sport holds in a particular society or social group. Thus, the athletic identity of skiers is significantly higher than that of those athletes, who participate in sports that are less popular (Eminović eta al, 2009). Wheelchair basketball is otherwise the most popular sport among athletes with disabilities, but more and more people with disabilities are also involved in skiing. Skilled disabled skiers are equal to the rest of the skiing population and can also participate in skiing in the company of the general population, family and friends and are not necessarily dependent on sports disability groups. Shapiro et al (2005) reported a change in athletic identity, which contained a sense of progress, control, membership, and social acceptance in people who are regularly involved in sports. Sports activities have become part of the weekly routine and improve overall health. Athletes with higher athletic identity appear to be courageous, energetic, extroverted, social, communicative, and relaxed people, who have the ability to be self-assertive and to influence others (Tušak, 2003). Athletes with high athletic identity have an adequately expressed dynamic component of personality, self-motivation and the tendency to influence and power are more pronounced, they are more competitive and victory- and goal-oriented (Bajec, 2003). There are both positive and negative consequences of high athletic identity. One of the potential benefits of giving yourself to the role of an athlete is to develop self-identity or sense of self.
Athletic identity is an important dimension of self-concept in most individuals, not only athletes. It is present in most people to some degree, which may help explain the successful maintenance of regular exercise over time, or the failure to initiate an exercise regime or be physically active at all (Martin et al, 1995). It is important for athletes, coaches, and practitioners to be aware of those with particularly strong athletic identities as strong athletic identities have the capability of producing negative psychological effects, in particular affecting an athlete’s self-worth. However, athletic identity seems to be a generally positive self-concept, and is present in most elite athletes.
We can relate results of our study to the study of Brewer and Tasiemski (2011), where they examined interrelationships among athletic identity, sport participation, and psychological adjustment on a sample of people with spinal cord injury (SCI). Participants completed measures of athletic identity, life satisfaction, anxiety, depression, and demographic and sport participation variables. Current amount of weekly sport participation was positively related to athletic identity when statistically controlling for age, gender, and pre-SCI amount of weekly sport participation. Being able to practice one's favourite sport after SCI was associated with higher levels of athletic identity and better psychological adjustment. Team sport participants reported experiencing better psychological adjustment than individual sport participants did (Perrier et al, 2014). The findings suggest that social factors are important in the link between sport participation and psychological adjustment in people with SCI.
The authors have linked high athletic identity with high self-esteem and life satisfaction. When talking about people after an injury, active engagement in sport, and consequently athletic identity, can be linked to better rehabilitation, but more importantly, to a higher quality integration into society, which the participants in our study also indicate. Being an athlete becomes an important part of an individual. People with disability, who were athletes and had this identity disrupted after the injury, build a more powerful and stable personality by establishing a new athletic identity (Tasiemski et al, 2004).
160
CONCLUSION
Persons after an injury often experience a feeling of inferiority, because of what they cannot handle due to their acquired disability. The physical self-image suffers, which in turn affects the social self-esteem and inclusion into society, and thus the subjective life satisfaction drops. It is important that the individual continues experiencing pleasant emotions. A person should engage in activities that he or she is able to engage in despite the handicap, which enables him or her the experience of positive emotions. Sports activities contribute a great deal to the physical well-being, the ability to perform physically demanding tasks and above all to the successful social inclusion. All these components are experienced as positive emotions. Athletic identity influences self-concept, satisfaction with life, and coping with life after a spinal cord injury.
Furthermore, we can suggest new research possibilities. A larger sample of respondents could be included in the current study, which is in our case impossible, for there aren’t more disabled Slovenian recreational alpine skiers. A more complex and longer lasting study could include sustainability or the change in athletic identity from the initial stage immediately after the injury to integration into society and participation in sports.
Disabled sports are on the rise, both in the number of recreational athletes as in the development of professionalism. This study deals with the current topic of engaging in disability sports contributes to a better subjective life satisfaction and social integration after an injury. We wish the findings would encourage as many disabled people as possible to engage in recreational sports and thus maintain and gain not only physical abilities but also new social interactions and subsequently spend quality leisure time with significant others. In addition, we would like to encourage rehabilitation organizations to introduce adaptive sports in the final phase of rehabilitation.
REFERENCES
Bajec, B. (2003). Povezanost športne identitete z osebnostjo športnikov. Diplomsko delo. Univerza v Ljubljani, Fakulteta za šport.
Brewer, B.W., Van Raalte, J.I. & Linder, D.E. (1993) Athletic identity: Hercules’ muscles or achilles heel? International Journal of Sport Psychology 24: 237-254.
Cecić Erpič, S. (1998). Spremljanje razvoja življenjskih struktur in življenjskega zadovoljstva v zgodnji odraslosti: Primerjava med bivšmi vrhunskimi športniki in nešportniki. Magistrsko delo, Univerza v Ljubljani, Filozofska fakulteta.
Eminović, F. et al. (2009). Attitudes toward inclusion of persons with disabilities in sport activities. Sport science, 2 (1): 72–77.
Erikson, E.H. (1963). Childhood and Society. (2nd ed.). New York: Norton.
Faganel, M. (2003). Nekateripsihološki dejavniki športne identitete. Šport, 51 (3): 22-28.
Groff, D.G. & Zabriskie, R.B. (2006) An exploratory study of athletic identity among elite alpine skiers with physical disabilities: Issues of measurement and design. Journal of Sport Behavior, 29 (2):126-141.
Južnič, S. (1993). Identiteta. Ljubljana: Fakulteta za družbene vede.
Kobal, D. (2000). Temeljni vidiki samopodobe. Ljubljana, Pedagoški inštitut.
161
Lamont-Mills, A., Christensen, S.A. (2006). Athletic identity and its relationship to sport participation levels. Journal in Science and Medicine in Sport, 9 (6): 472-478.
Lamovec, T. (1994). Psihodiagnostika osebnosti 2. Ljubljana. Filozofska fakulteta, Znanstveni inštitut FF.
Marcia, J. E. (1989). Identity and intervention. Journal of Adolescence, 12: 401-410.
Martin, J.J., Adams-Mushett, C., Smith, K.L. (1995). Athletic identity and Sport Orientation of Adolescent Swimmers with Disabilities. Adapted Physical Avtivity Quarterly, 12 (2): 113-123.
Masten, R. (2002). Identiteta in šport. V M. Tušak in J. Bednarik (Ur.), Nekateri psihološki, socialni in ekonomski vidiki športa v Slovenije (241–248). Univerza v Ljubljani, Fakulteta za šport.
Musek, J. (2010). Psihologija življenja. Inštitut za psihologijo osebnosti.
Perrier, M.J., Smith, B., Strachan, S.M., Latimer, A.E. (2014). Narrattives of at
hletic identitiy after acquiring a permanent physical disability. Adapted Physical Activity Quarterly 31 (2): 106-124.
Shapiro, D. R., Martin, J.J. (2010). Athletic identity, affect and peer relations in youth athletes with physical disabilities. Disability and Health Journal, 3 (2): 79-85.
Slabe, P. (2004). Samopodoba in športna identiteta rekreativnih športnikov. Diplomsko delo. Univerza v Ljubljani, Fakulteta za šport.
Šuc, N. (2014). Vpliv prilagojenega alpskega smučanja na vključevanje v družbo. Diplomsko delo. Univerza v Ljubljani, Pedagoška fakulteta.
Tasiemski, T., Kennedy, P., Gardner, B.P. & Blaikley, R.A. (2004) Athletic identity and sports participation in people with spinal cord injury. Adapted Physical Activity Quarterly 21: 364-378.
Tasiemski, T., Brewer, B.W. (2011). Athletic identity, sport participation and psychological adjustment in people with spinal cord injury. Adapted Physical Activity Quarterly; 28 (3): 233-250.
Tušak, M., Tušak, M. in Barborič, K. (2002). Razvoj in dejavniki športne identitete in uspešnost v športu. V M. Tušak in J. Bednarik (Ur.), Nekateri psihološki, socialni in ekonomski vidiki športa v Slovenije (249–256). Ljubljana, Fakulteta za šport.
Tušak, M., Marinšek, M., Tušak, M. (2003). Vloga družine in staršev v športu. Ljubljana, Klub M. T.
Tušak, M. (2003). Samopodoba in športna identiteta. Šport mladih, 11 (92): 48–49.
Tušak, M., Faganel, M., Bednarik, J. (2005). Is athletic identity an important motivator? International Journal of Sport Psychology, 36: 39-49.
Weiss, O. (2001). Identity Reinforcement in Sport. Revisiting the Symbolic Interactionist Legacy. International Review for the Sociology of sport, 4: 393–405.
162
EXERCISES PROGRAM OF KID’S ATHLETICS AS A MEANS OF IMPROVEMENT OF MOTOR ABILITIES
Tešanović, G.1, Jakovljević, V., 1Stanković, V.2, Bošnjak, G.1
1Faculty of Physical Education and Sport, University of Banja Luka
2Faculty of Sport and Physical Education, University of Priština
ABSTRACT
The training for alpine skiers is difficult to perform in summer months when conditions for skiing has exclusively on glaciers, so coaches and their professional teams look for alternative sports activities, which will similarly burden competitors as well as during the training on skis. A further problem arises in a selection of appropriate alternative sports in the training process of children. From all motor skills, explosive power, coordination, balance, agility and mobility are proven in positive correlation with competition results in alpine skiing. Since the model of LTAD program and Kids' Athletics for children age 9-12 years, is recommended application of multilateral and basic physical training, which would affect on motor skills that are most effectively developed at this age and that are directly related to alpine skiing, a survey was conducted in order to find efficacy of application program’s kids athletics in training process of children skiers. Program Kids Athletics is conducted during three months (September, October and November) training process - 12 weeks during which was held three training on a day, in minimum duration of 60 minutes. The sample consisted of 33 male respondents who were divided into two groups - the experimental group comprised 17 boys and a control group which consisted of 16 boys aged 10 to 11 years (± 6 months), members of the ski club. After statistical analysis of data, comparative statistics (ANOVA) showed that there is a statistically significant difference in the final measurement between experimental and control groups, in all tests for assessment of motor abilities. On this basis, it can be concluded that the applied program had a positive impact, and that led to improved of balance, agility, and mobility at respondents in the experimental group.
Keywords: Kids Athletics, skiing, motoric abillities
INTRODUCTION
Growth and development of child takes place according to scheme of growing up during which change is occurring and there is no training, but participation in sport can highlight and lead to maximization. One of the most important period for the development of motor skills of agility, balance, coordination and speed is the age of 9 to 12 (Balyi & Way, 1995; Viru et al., 1998), because at this age children are entering in phase suitable for acquisition of basic motor skills which include most natural forms of movement: running, jumping, throwing, catching, jumping, climbing. According to model of long-term athlete development, which implies a late specialization, Long Term Athlete Development - LTAD (Balyi & Hamilton, 2004), there are phases during which effects of training process can be implemented in maximum of athlete development. In ages 9-12 years, is phase of learning training, during which the goal is training and acquisition of sports skills. Balyi & Hamilton (2004) recommend strength training exercises with your own body, medicine balls and pilates balls, and the gradual introduction of the viper and jumps as a means to develop strength. Also, according to work on increasing suppleness and speed on basis of agility, and endurance development should be implemented through the game and relay games. Coordination skills, as primary in basis development of children's abilities can be developed by repeating of various trends and changes in conditions in which movement takes place, and repeating tasks that include variations of movement performance, changes in external conditions,
163
combination of readiness for movement, maximum tempo, variation of receipt of information and variations of movement after previous load. At the end of phase children have to be physically "written" in the field of basic motor and sport skills (Balyi, 2001). 2005, the International Association of Athletics Federations IAAF has launched a development program in sport called Kids' Athletics whose purpose was to introduce children to athletics at a basic level and to ensure a steady and sustainable policy of development of sport of athletics. The program is intended not only for Member Federations and clubs, but also for schools and all institutions who are interested in the well-being of children through three event groups: Sprinting / Running Event Group, Jumping Event Group and a Throwing Event Group. There are three age categories targeted by the program: 7-8 years, 9-10 years and 11-12 years. Kids' Athletics is a concept that is designed to bring entertainment to engage in athletics through innovative organization and discipline of the new age-appropriate and sensitive periods of development of motor skills (which combine running, skipping, rolling, throwing, catching, infiltration and relay games) that can be run on all possible areas (sports stadium, playground, gymnasium, any place suitable for sport, etc.).
In line with growth and development of basic motor skills is considered that as long as the exercise of power with its own body give results in terms of progress, it is not necessary to introduce exercises with external load, except in case of need the engagement of specific, isolated muscle groups (Jevtić, Radojević, Juhas, Ropret, 2011), and that with strength training, working with children aged 10 to 11 years recommended that the load does not exceed 30% of body weight (Kukolj, 2006). On the subject of alpine skiing, conducted numerous studies, which emphasize that with exceptional technique, alpine skiing requires a highly developed aerobic and anaerobic capacity of athletes, and motor skills which primarily include power, explosiveness, agility, balance, flexibility and coordination (Andersen & Montgomery, 1988; Brown, Wilkinson, 1983; Matković, Matković, Ivanek, 1994). From motor skills explosive strength, balance and agility with proven positive results associated with competition in Alpine skiing (Bosco, 1997; Fetz, 1997; Neumayr et al., 2003). This is confirmed by works of many authors (Ellis i Šparovec, 2009; White & Johnson 1991; White & Johnson, 1993; Mujanović, 2007) which emphasize that in skiing vast and proven role played coordination, explosive strength (as a mode of power), agility (a specific kind of speed) and mobility. For a successful fitness training in Alpine skiing is extremely important to be adapted to chronological or biological age and the athletes themselves and be viable in all parts of annual cycle due to non-standard and specific circumstances in which it is carried out (Cigrovski & Matković, 2003). How is training alpine skiers on snow hampered carried out in the summer, when conditions for skiing exclusively to glaciers, both trainers and their professional teams looking for alternative sports (skating, soccer or sports gymnastics), which will similarly loaded and competitors during training on skis. The frequency and quantity of their application depends on period in which alpine skier, and now is era of competition (Herrero et al., 2003; Miller, 2003). Following the example of hockey players using rolls, alpine skiers also use them during trainings in preparation period (Kroll et al., 2005). An additional problem arises in selection of adequate alternative sports in training process of children, which is intended to enrich application of training process and period of a few months a year during which there is no snow, and that would affect improvement of motor skills of young skiers. Since the model of LTAD program and Kids' Athletics for children ages 9-12 years recommended application of multilateral and basic physical training, which would motor skills that are most effectively developed at this age that are directly related to alpine skiing, a survey was conducted in order to determine the efficacy of program Kids' Athletics in training process of children skiers on motor abilities.
METHODOLOGY
Program Kids' Athletics was conducted during three months (September, October and November), of training process - 12 weeks during which it held three training, minimum duration of 60 minutes. Before implementing program was initially established state of respondents, and after it was
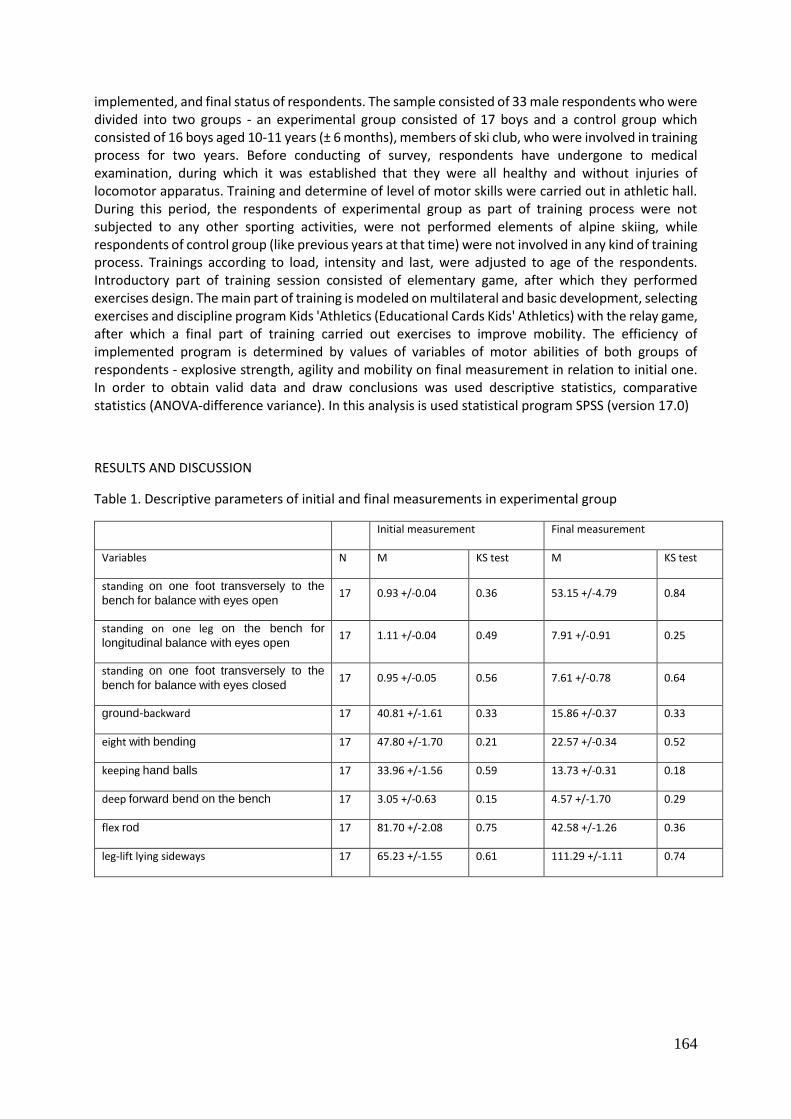
164
implemented, and final status of respondents. The sample consisted of 33 male respondents who were divided into two groups - an experimental group consisted of 17 boys and a control group which consisted of 16 boys aged 10-11 years (± 6 months), members of ski club, who were involved in training process for two years. Before conducting of survey, respondents have undergone to medical examination, during which it was established that they were all healthy and without injuries of locomotor apparatus. Training and determine of level of motor skills were carried out in athletic hall. During this period, the respondents of experimental group as part of training process were not subjected to any other sporting activities, were not performed elements of alpine skiing, while respondents of control group (like previous years at that time) were not involved in any kind of training process. Trainings according to load, intensity and last, were adjusted to age of the respondents. Introductory part of training session consisted of elementary game, after which they performed exercises design. The main part of training is modeled on multilateral and basic development, selecting exercises and discipline program Kids 'Athletics (Educational Cards Kids' Athletics) with the relay game, after which a final part of training carried out exercises to improve mobility. The efficiency of implemented program is determined by values of variables of motor abilities of both groups of respondents - explosive strength, agility and mobility on final measurement in relation to initial one. In order to obtain valid data and draw conclusions was used descriptive statistics, comparative statistics (ANOVA-difference variance). In this analysis is used statistical program SPSS (version 17.0)
RESULTS AND DISCUSSION
Table 1. Descriptive parameters of initial and final measurements in experimental group
Initial measurement Final measurement
Variables N M KS test M KS test
standing on one foot transversely to the bench for balance with eyes open
17 0.93 +/-0.04 0.36 53.15 +/-4.79 0.84
standing on one leg on the bench for longitudinal balance with eyes open
17 1.11 +/-0.04 0.49 7.91 +/-0.91 0.25
standing on one foot transversely to the bench for balance with eyes closed
17 0.95 +/-0.05 0.56 7.61 +/-0.78 0.64
ground-backward 17 40.81 +/-1.61 0.33 15.86 +/-0.37 0.33
eight with bending 17 47.80 +/-1.70 0.21 22.57 +/-0.34 0.52
keeping hand balls 17 33.96 +/-1.56 0.59 13.73 +/-0.31 0.18
deep forward bend on the bench 17 3.05 +/-0.63 0.15 4.57 +/-1.70 0.29
flex rod 17 81.70 +/-2.08 0.75 42.58 +/-1.26 0.36
leg-lift lying sideways 17 65.23 +/-1.55 0.61 111.29 +/-1.11 0.74
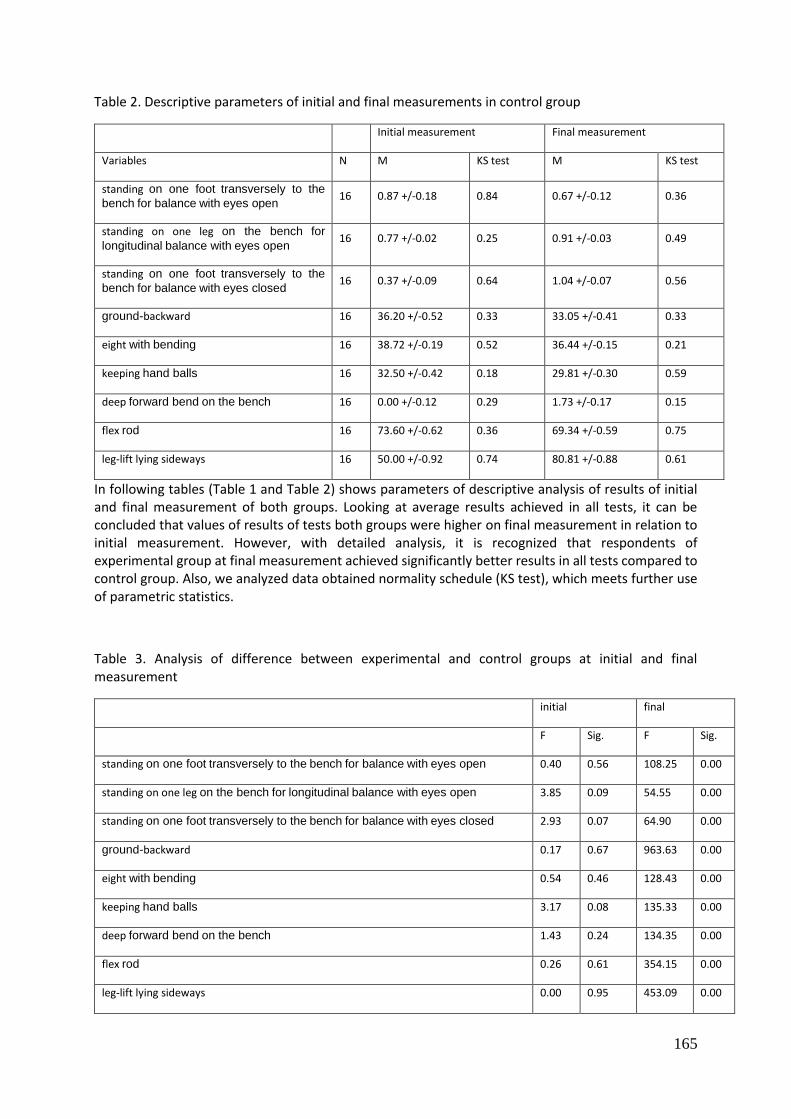
165
Table 2. Descriptive parameters of initial and final measurements in control group
Initial measurement Final measurement
Variables N M KS test M KS test
standing on one foot transversely to the bench for balance with eyes open
16 0.87 +/-0.18 0.84 0.67 +/-0.12 0.36
standing on one leg on the bench for longitudinal balance with eyes open
16 0.77 +/-0.02 0.25 0.91 +/-0.03 0.49
standing on one foot transversely to the bench for balance with eyes closed
16 0.37 +/-0.09 0.64 1.04 +/-0.07 0.56
ground-backward 16 36.20 +/-0.52 0.33 33.05 +/-0.41 0.33
eight with bending 16 38.72 +/-0.19 0.52 36.44 +/-0.15 0.21
keeping hand balls 16 32.50 +/-0.42 0.18 29.81 +/-0.30 0.59
deep forward bend on the bench 16 0.00 +/-0.12 0.29 1.73 +/-0.17 0.15
flex rod 16 73.60 +/-0.62 0.36 69.34 +/-0.59 0.75
leg-lift lying sideways 16 50.00 +/-0.92 0.74 80.81 +/-0.88 0.61
In following tables (Table 1 and Table 2) shows parameters of descriptive analysis of results of initial and final measurement of both groups. Looking at average results achieved in all tests, it can be concluded that values of results of tests both groups were higher on final measurement in relation to initial measurement. However, with detailed analysis, it is recognized that respondents of experimental group at final measurement achieved significantly better results in all tests compared to control group. Also, we analyzed data obtained normality schedule (KS test), which meets further use of parametric statistics.
Table 3. Analysis of difference between experimental and control groups at initial and final measurement
initial final
F Sig. F Sig.
standing on one foot transversely to the bench for balance with eyes open 0.40 0.56 108.25 0.00
standing on one leg on the bench for longitudinal balance with eyes open 3.85 0.09 54.55 0.00
standing on one foot transversely to the bench for balance with eyes closed 2.93 0.07 64.90 0.00
ground-backward 0.17 0.67 963.63 0.00
eight with bending 0.54 0.46 128.43 0.00
keeping hand balls 3.17 0.08 135.33 0.00
deep forward bend on the bench 1.43 0.24 134.35 0.00
flex rod 0.26 0.61 354.15 0.00
leg-lift lying sideways 0.00 0.95 453.09 0.00
166
In Table 3 distinction between initial and final state of studied groups in all applied tests is showed analysis of variance at 0.05 level. The resulting value of significance on initial measurement, shows that between the control and experimental groups there was no statistically significant difference in results in all tests. These obtained data indicate that sample of respondents selected good, because it excludes side effects before applying exercise program Kids' Athletics. However, looking at value of significance of final measurement, it can be noted that between the experimental and control groups, and between all test results on final measuring, there is a statistically significant difference. On this basis, it can be concluded that program Kids' Athletics had a positive effect on improving balance, agility and mobility in experimental group.Krističević, Živčić, Cigrovski, Simović & Rački (2010), a sample of 46 young alpine skiers (24 boys and 22 girls) aged 8-10 years have shown that application of acrobatic elements significantly associated with success in alpine skiing. This research showed that treated sample application exercises (containing elements of running, skipping, rolling, throwing, catching, broaching, rolling, balancing and acrobatics) mached program Kids' Athletics and embedded in training process of young skiers, had a positive effect on development of motor skills of balance, agility and mobility of respondents. Accordingly, it can be assumed that motor skills there are improved not only because of organized and programmed implementation of training process, but also because application of new and interesting content with use of equipment which materials and colors look like toys but not like equipment that applied in training process of athletes, which is sure lead to greater engagement of cognitive and conative characteristics of respondents and resulting in greater focus of respondents to complete all tasks. In accordance to this, many authors from different ski nations, apply specific divisions and models of teaching individual ski techniques that exist in modern school of skiing (Feinberg - Densmore, L., 2000; Jurković & Jurković, 2003; John, 2006; Murovec, 2006; Matković et al. 2004; Anderson, 2007; Božidar et al; 2010; Lešnik & Žvan 2010).
On development of all motor skills, the most possible influence is in children's age (Kostelić, 2005; Bompa, 2005), as confirmed by this survey. This survey showed that in a relatively short period, with selection and adaptation of appropriate exercises to children age which meet model LTAD, can contribute to improving of balance, agility and mobility of children.
CONCLUSION
Kids' Athletics is concept that is designed to bring entertainment to engage in athletics, through innovative organization of new disciplines tailored to age and sensitive periods of development of motor abilities. In this study was shown, that this program is successfully implemented and resulted in a positive effect on treated sample of young skiers, on basis of which it can be assumed that they can expect a positive effect of its implementation in training process of young skiers and young athletes of other sports, if training process is based and implemented on model LTAD. This research give focus and points to need of including exercises and activities to help improvement of motor skills of children, regardless of which sport are characteristic, because training process of children should be conceived and directed by multilateral and basic development.
REFERENCES
Andersen, R. E., & Montgomery, D. L. (1988). Physiology of Alpine skiing. Sports Med, 6(4), 210-221.
Anderson David (2007). Ski school. United Kingdom. Published by New Holland Publishers Ltd.

167
Balyi I, and Hamilton, A. (2004). “The Concept of Long-term Athlete Development” Strength and Conditioning Coach, The Official Magazine of the Australian Strength and Conditioning Association. Volume 3, No. 2. pp.5 - 6.
Balyi I. (2001) Sport System Building and Long-term Athlete Development in British Columbia. Canada: SportsMed BC
Balyi, I., & Hamilton, A. (2004). Long-Term Athlete Development: Trainability in children and adolescents. Windows of opportunity. Optimal trainability. Victoria, BC: National Coaching Institute British Columbia & Advanced Training and Performance Ltd.
Balyi, I., & Way, R. (1995). Long-term planning for athlete development: The training to train phase. BC Coach (Canada), Fall, pp. 2–10.
Bompa, T. (2005). Cjelokupni trening za mlade pobjednike. Zagreb: Gopal.
Bosco, C. (1997). Evoluation and planning condition training for alpine skiers. U E. Muller i sar. (ur.), Science and skiing, (str. 229 – 250). London: E&FN Spoon.
Božidar,I, Robert,R. i Milan,I. (2010). Virtuelno alpsko skijanje. Beograd: Fakultet sporta i fizičkog vaspitanja.
Brown SL, Wilkinson JG. (1983). Characteristics of national, divisional, and club male alpine ski racers. MedSci Sports Exerc.;15(6):491-5.
Cigrovski, V. i B. Matković (2003). Specifična kondicijska priprema skijaša. U Kondicijska priprema sportaša, Zbornik radova, Zagreb, 518- 520.
Ellis, D., & Sparovec, J. (2009). Canadian alpine ski team testing protocol. Preuzeto 10.04.2016. sa Web sajta: http://www.fitness.bcalpine.com/.
Feinberg, Densmore, L. (2000). Ski faster. Camden, ME: Ragged Mountain Press.
Fetz, F. (1997). A profile of sensorimotor balance of alpine skiers. U Muller i sur. (ur.), Science and skiing, (str. 356 – 371). London: E&FN Spoon.
Gozzoli, C., Simohamed,J. & Malek El-Hebil,A. (2006). Educational Cards Kids’ Athletics. Working Group: IAAF, Nestle.
Herrero, J.A., Garcia, D., Martinez, F.J. (2003). Analisis y propuesta de los factores de rendimiento en le entrenamiento en seco del esqui alpino. www. Rendimientodeportivo.com, n°5, articulo 23.
Jevtić, B., Radojević, J., Juhas, I., Ropret, R. (2011). Dečiji sport od prakse do akademske oblasti. Beograd: Fakultet sporta i fizičkog vaspitanja.
John Fry (2006). The story of modern skiing. United States of America. Published by University Press of New England one Court Street Lebanon.
Jurković,N. i Jurković,D.(2003). Skijanje, tehnika, metodika i osnove treninga. Zagreb: Graphis.
Kostelić, A. (2005). Prikaz i analiza kondicijske pripreme Ivice i Janice Kostelić tijekom sportske karijere (razvoj i rezultati). (Diplomski rad). Zagreb: Kineziološki fakultet Sveučilišta u Zagrebu.
Krističević, T., Živčić, K., Cigrovski, V., Simović, S., & Rački, G. (2010). Correlation between Knowledge of Acrobatic Elements and Success in Slalom and Giant Slalom in Young Alpine Skiers. Croatian Sports Medicine Journal, 25, 9-15.
168
Kroll, J., Schiefermuller, C., Birklbauer, J., & Muller, E. (2005). In-line skating as dry land modality for slalom racers-elektromyographic and dynamic similarities and differences. In: E. Muller, D. Bacharch, R. Klika, S. Lindinger, & H. Schwameder (Eds.), Proceedings from: The thirth international Congress on Skiing and Science (pp. 76–86). Oxford, UK: Mayer & Mayer Sport.
Kukolj, M. (2006). Antropomotorika. FSFV, Beograd.
Lešnik,B. & Žvan,M. (2010). A turn to move on – Alpine skiing – Slovenian way, Theory and methodology of alpine skiing; SZS – Združenje učiteljev in trenerjev smučanja.
Matković B, Matković B, Ivanek M. (1994). Morphological characteristics of prospective alpine skiers. CollegiumAntropologicum.; 18: 47-50.
Miller, L. (2003). Get Rolling. The beginner’s guide to in-line skating. 3rd edition. Get rolling books, California (EE.UU).
Mujanović, E. (2007). Uticaj antropoloških dimenzija na uspjeh u alpskom smučanju, Doktorska disertacija, Fakultet fizičke kulture Univerziteta u Istočnom Sarajevu.
Murovec, S. (2006). Na kanto!:UPS-učenje s podaljševanjem smuči. Kranj: Format Kranj.
Neumayr, G., H. Hoertnagl, R. Pfister, A. Koller, G. Eibl, E. Raas (2003). Physical and Physiological Factors Associated with Success in Professional Alpine Skiing. International Journal of Sports Medicine. 24(8), str. 571 – 575.
Viru, A, Loko, J., Volver, A., Laaneots, L., Karlesom, K and Viru, M. (1998). Age periods of accelerated improvements of muscle strength, power, speed and endurance in age interval 6-18 years. In “Biology of Sport” , Warsaw, V., 15 (4) 1998, 211-227 pp.
White A. T., & Johnson, S. C. (1991). Physiological comparison of international, national and regional alpine skiers. Internacional Journal of Sports Medicine, 12(4), 374 – 376.
White A. T., & Johnson, S. C. (1993). Physiological – aspects and injury in elite alpine skiers. Internacional Journal of Sports Medicine, 15(3), 170-178.
169
COMPARISON OF EVERTOR MUSCLE ACTIVITY BETWEEN FOOT EVERSION AND EXTERNAL ROTATION
Zdolšek, A., Bavdek, A., Dolenec, A.
Universitiy of Ljubljana, Faculty of Sport, Ljubljana, Slovenija
ABSTRACT
EMG signal is an indicator of muscle electric activity during contraction. For comparison of EMG signal between individuals and different tasks is necessary to normalize EMG signal. Maximum EMG signal obtained with maximal voluntary isometric contraction can be used for normalisaton. In our study we compared foot eversion and external rotation, because it is hard for a participant to perform correct isometric contraction, as there is no visual feedback. The aim of this study was to determine during which isometric contraction (foot eversion or external rotation) there is higher muscle electric activity of PB and PL and so to choose the better ankle move for EMG signal normalisation. Sixteen subjects participated in this study (8 women and 10 men) with average age of 26.8±5.6 years, height 177.2±8.2 cm and weight 73±13.1 kg. EMG electrodes were placed on muscles according to SENIAM recommendations (Hermens idr., 2000). We measured two maximum voluntary contractions in isometric strength-testing device, which is designed for external rotation and two maximum volnuteric contractions in isometric strength-testing device, which is designed for foot eversion. Data was analyzed with Labchart 7 (AD Instruments, New Zeland). EMG signals were filtered (500Hz/20Hz), absolute value of signal was used and smoothed. EMG signal was measured in the range of one second during contraction and taken average value. Statistic data processing was made in SPSS with paired-samples T-test. There were no statistically significant differences between contractions in any muscle (average value for PB in eversion was 0.304±0.193 and in external rotation was 0.337±0.196; average value for PL in eversion was 0.174±0.189 and in external rotation was 0.159±0.234). Some of the subjects had higher EMG muscle signal (PB or PL) during external rotation and some during foot eversion. It makes no difference which contraction we use for EMG normalisation, but perhaps it is wise to use both.
Keywords: emg, eversion, external rotation, evertors
INTRODUCTION The anatomy of the foot is very complex, because the ankle can be either static or mobile. When the body is standing still, the ankle is statically active, because it has to carry the whole body weight and transfer it to the surface. When the body is walking, running or performing other locomotion, the ankle is mobile, because it lifts the body away from the surface, actively adjusts to the surface, and acts as a shock absorber when the foot hits the surface. The talocrural joint is located between the fibula and the tibia. Movments in the talocrural joint are dorsal flexion and plantar flexion. The subtalar joint is located between the talus and the calcaneus. The subtalar joint performs more movements in different directions. Amplitudes of those movements are are small. If we observe the subtalar joint from the frontal axis, possible movements include internal and external rotation of the foot. If we observe it from the sagittal axis, possible movements include are plantar and dorsal flexion. If we combine all the three axes together, possible movements include foot pronation and supination (Brockett & Chapman, 2016). Possible ankle movements therefore include plantar/dorsal flexion, supination/pronation and
170
external/internal rotation (Brockett and Chapman, 2016). In our study we observed only foot eversion and external rotation of the foot. Muscles which are the most active during those two ankle movements are peroneus brevis and peroneus longus. Peroneal muscles are the main muscles performing eversion and external rotation. They are also abductors and pronators of the foot and only the peroneus longus muscle additionally performs plantar flexion of the foot (Calais-Germain, 2007). Peroneal muscles are also important during walking, because they are responsible for active foot stabilization in the stance phase and prevent foot inversion which can cause mild to severe ankle sprains. Strong evertors are important in preventing the most severe ankle injuries (Louwerens, Van Linge,De Klerk, Mulderand Snijders,1995). The best indicator of electric muscle activity during different movements is the EMG signal. EMG signal is a biomedical signal that measures electrical currents in muscles during different muscle activities. EMG signal is controlled by the nervous system and it depends on the anatomical and physiological properties of muscles. EMG is also reffered to as myoelectric activity. Muscles conduct electric signals similar to the way nerves do. The method of recording muscle information is referred to as the surface EMG (Reaz, Hussain and Mohd-Yasin, 2006). Normalization of EMG signal is important if we want to compare muscle activity during different tasks and the best way to normalize muscles is from maximum EMG signal obtained with maximal voluntary isometric contraction (Bruden, Trew and Baltzopoulos, 2003). The purpose of this study was to determine during which isometric contraction (foot eversion or external rotation of the foot) there is higher muscle electric activity of PB or PL, which would help us choose the best foot movement for EMG signal normalization.
MATERIALS AND METHODS
In this study participated 16 subjects (age: 26.8±5.6 years, height 177.2±8.2 cm and weight 73±13.1 kg). The ubjects that took part in this study did not have any ankle injury prior to the study for at least 6 months. At first, subjects received a measuring kit: bipolar surface electrodes for the peroneus brevis and peroneus longus muscles. After the electrode placement, each subject performed a 6-minute warm up routine with stepping up on a box that was 20 cm high (the subjects switched the starting foot every 1 minute) with a predetermined pace of 100 steps per minute. Electric muscle activity was measured with electromyograph and an analog-to-digital signal converter (Biovision, Weherheim, Germany). Electrodes that were used were bipolar ECG electrodes Kendall with the diameter of 24 mm (Germany). The electrodes were placed on the muscles according to SENIAM recommendations. EMG signals were saved in a miniature computer (Viliv, Yukyung Technologies Corp., South Korea) and recorded with the program DasyLab 10 (Ireland). Labchart 7 (AD Instruments, New Zealand) was used for the EMG signal data processing. The EMG signal was filtered (500Hz/20Hz), smoothed and the absolute value was taken. Each subject performed two maximun voluntary isometric contractions and the best of the two was used for further analysis.
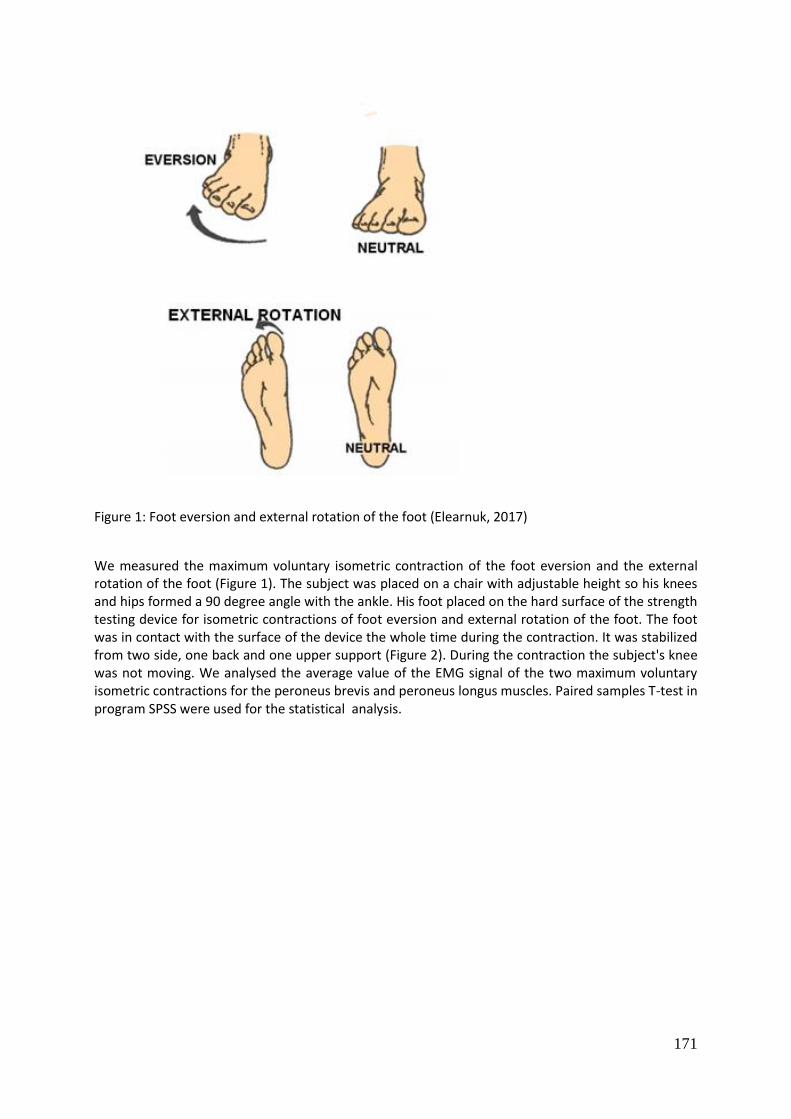
171
Figure 1: Foot eversion and external rotation of the foot (Elearnuk, 2017)
We measured the maximum voluntary isometric contraction of the foot eversion and the external rotation of the foot (Figure 1). The subject was placed on a chair with adjustable height so his knees and hips formed a 90 degree angle with the ankle. His foot placed on the hard surface of the strength testing device for isometric contractions of foot eversion and external rotation of the foot. The foot was in contact with the surface of the device the whole time during the contraction. It was stabilized from two side, one back and one upper support (Figure 2). During the contraction the subject's knee was not moving. We analysed the average value of the EMG signal of the two maximum voluntary isometric contractions for the peroneus brevis and peroneus longus muscles. Paired samples T-test in program SPSS were used for the statistical analysis.
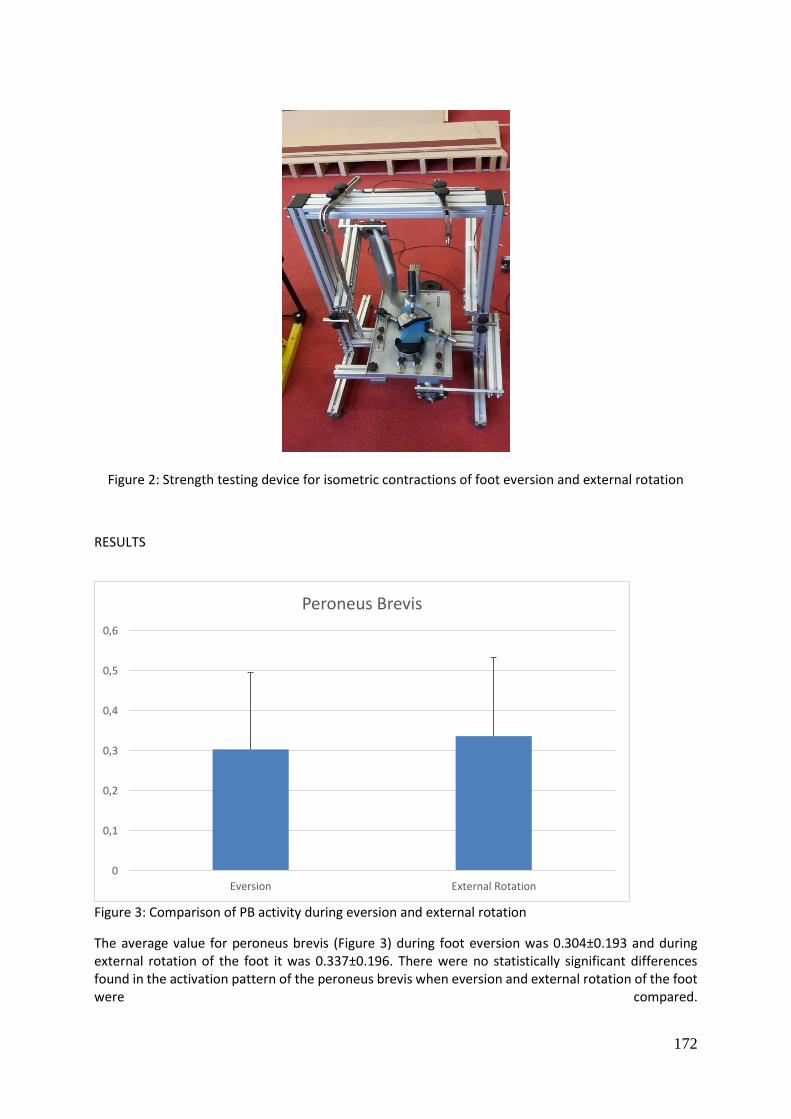
172
Figure 2: Strength testing device for isometric contractions of foot eversion and external rotation
RESULTS
Figure 3: Comparison of PB activity during eversion and external rotation
The average value for peroneus brevis (Figure 3) during foot eversion was 0.304±0.193 and during external rotation of the foot it was 0.337±0.196. There were no statistically significant differences found in the activation pattern of the peroneus brevis when eversion and external rotation of the foot were compared.
0
0,1
0,2
0,3
0,4
0,5
0,6
Eversion External Rotation
Peroneus Brevis
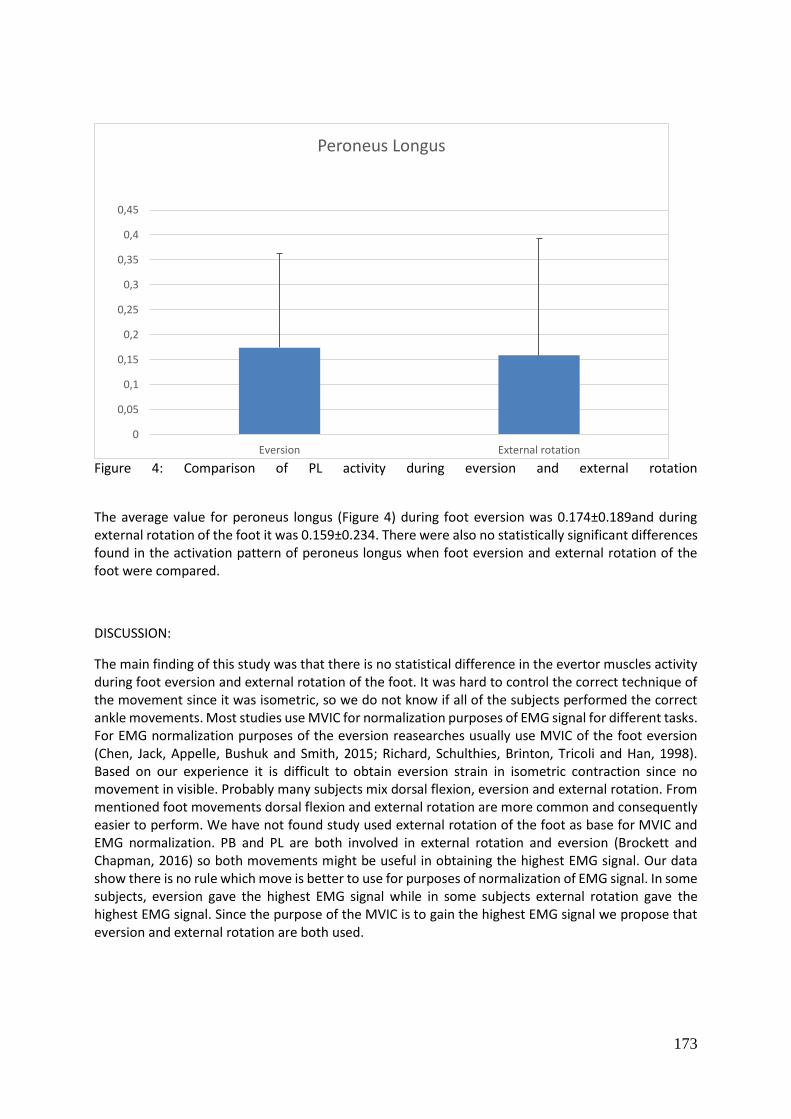
173
Figure 4: Comparison of PL activity during eversion and external rotation
The average value for peroneus longus (Figure 4) during foot eversion was 0.174±0.189and during external rotation of the foot it was 0.159±0.234. There were also no statistically significant differences found in the activation pattern of peroneus longus when foot eversion and external rotation of the foot were compared.
DISCUSSION:
The main finding of this study was that there is no statistical difference in the evertor muscles activity during foot eversion and external rotation of the foot. It was hard to control the correct technique of the movement since it was isometric, so we do not know if all of the subjects performed the correct ankle movements. Most studies use MVIC for normalization purposes of EMG signal for different tasks. For EMG normalization purposes of the eversion reasearches usually use MVIC of the foot eversion (Chen, Jack, Appelle, Bushuk and Smith, 2015; Richard, Schulthies, Brinton, Tricoli and Han, 1998). Based on our experience it is difficult to obtain eversion strain in isometric contraction since no movement in visible. Probably many subjects mix dorsal flexion, eversion and external rotation. From mentioned foot movements dorsal flexion and external rotation are more common and consequently easier to perform. We have not found study used external rotation of the foot as base for MVIC and EMG normalization. PB and PL are both involved in external rotation and eversion (Brockett and Chapman, 2016) so both movements might be useful in obtaining the highest EMG signal. Our data show there is no rule which move is better to use for purposes of normalization of EMG signal. In some subjects, eversion gave the highest EMG signal while in some subjects external rotation gave the highest EMG signal. Since the purpose of the MVIC is to gain the highest EMG signal we propose that eversion and external rotation are both used.
0
0,05
0,1
0,15
0,2
0,25
0,3
0,35
0,4
0,45
Eversion External rotation
Peroneus Longus
174
CONCLUSIONS:
The results of our study show, that some subjects have a higher electric activity during foot eversion while others have a higher signal during external rotation of the foot. There is no rule as to which movement is better to use for the purposes of normalizaton of the EMG signal, so it is best to use both. For the strengthening of evertor muscles both movements have potential, but we cannot apply our study to strength training programs since our study was isometric, while strengthening of the muscles is usually dynamic. Further studies in dynamic conditions need to confirm the potential of both movements for the strengthening of evertor muscles.
REFERENCES:
Brockett, L. C. and Chapman, J. G. (2016). Biomechanics of the ankle. Orthop Trauma, 30(3), 232-238.
Burden, A. M., Trew, M. and Baltzopoulos, V. (2003). Normalisation of gait EMGs: a re-examination. Journal of Electromyography and Kinesiology, 13(6), 519-532.
Calais-Germain, B. (2007). Anatomija gibanja: uvod v analizo telesnih tehnik. Ljubljana: Zavod EMANAT.
Chen, J., Jack, R., Appelle, J., Bushuk, M. and Smith, C. (2015). Surface Electromyographic Study of Peroneus Longus Activation during Ankle Eversion and Heel Lift. Journal of Therapy and Rehabilitation, 3, 101-108.
Louwerens, K. J. W., Van Linge B., De Klerk, W. L. L., Mulder, G. H. P. and Snijders, J. C. (1995). Peroneus longus and tibialis anterior muscle activity in the stance phase. Acta orthop scand, 66 (6), 517-523.
Movements of the foot. (13.1.2017). Elearn UK. Retrieved from http://www.elearnuk.co.uk/uploads/courses/168.pdf
Reaz, M. B. I., Hussain, M. S and Mohd-Yasin, F. (2006). Techniques of EMG signal analysis: detection, processing, classification and applications. Biological Procedures Online, 8.
Ricard, M. D., Schulthies, S. S., Brinton, M., Tricoli, V. A. and Han, M. (1998). The Role of the Evertors in Sudden Inversion and Gait. Proceedings of the Twelfth Congress of the International Society of Electrophysiology and Kinesiology, 248-249.
175
Index of authors
Bartolomei, 104 Bartoluci, 3 Bavdek, 21, 169 Bon, 8 Bošnjak, 162 Bouchouras, 114 Burešová, 28 Ceciliani, 126 Cvetković, 70 Demlová, 28 Di Michele, 126 Dimou, 114 Doganis, 114 Dolenc, M, 121 Dolenec, A, 21, 169 Doupona Topič, 3, 83, 143 Fister, D, 37 Fister, I, 37 Fister, I. Jr, 37 Fister, K, 37 Gabrovec, 43 Gomis-Gomis, 14 Gubellini, 49 Jakovljević, 62, 162 Janko, 70 Jarc Šifrar, 121 Johansson, 53 Jovanović, 62 Kajtna, 70
Kapus, 78, 98, 136 Karpljuk, 109 Kerštajn, 83 Košmrlj, 136 Lešnik, 153 Luštrek, 70 Merni, 49, 104, 126 Mokrousov, 91 Moravec, 78, 98 Nigro, 104 Papacharisis, 114 Pečnikar Oblak, 109 Pérez-Turpin, 14 Pistotnik, 121 Pori, 121 Rauter, 37 Ruud, 53 Semprini, 126 Šetinc, 143 Sfregola, 49 Šimenko, 109 Stanković, 162 Stibilj, 136 Štihec, 70 Štrumbelj, 70 Šuc, 153 Tešanović, 62, 162 Toselli, 126 Zdolšek, 21, 169