DIPLOMSKA NALOGA - Fakulteta za farmacijo
76
UNIVERZA V LJUBLJANI FAKULTETA ZA FARMACIJO BLAŽ FERJANC DIPLOMSKA NALOGA UNIVERZITETNI ŠTUDIJ FARMACIJE Ljubljana, 2012
-
Upload
khangminh22 -
Category
Documents
-
view
3 -
download
0
Transcript of DIPLOMSKA NALOGA - Fakulteta za farmacijo
UNIVERZA V LJUBLJANI
FAKULTETA ZA FARMACIJO
BLAŽ FERJANC
DIPLOMSKA NALOGA
UNIVERZITETNI ŠTUDIJ FARMACIJE
Ljubljana, 2012
UNIVERZA V LJUBLJANI
FAKULTETA ZA FARMACIJO
BLAŽ FERJANC
DOLOČITEV CELOTNEGA NUKLEOTIDNEGA ZAPOREDJA
GENA DOMNEVNE GLIKOZILTRANSFERAZE IZ JABLANE
(MALUS X DOMESTICA) IN POSKUS IZRAŽANJA
KODIRANEGA PROTEINA V EKSPRESIJSKEM SISTEMU
E._COLI
GENE SEQUENCING OF PUTATIVE
GLYCOSYLTRANSFERASE FROM APPLE (MALUS X
DOMESTICA) AND AN ATTEMPT OF HETEROLOGOUS
EXPRESSION IN E. COLI
Ljubljana, 2012
I
The research work was carried out at Department of Pharmaceutical Biology, Faculty
of Pharmacy, Technische Universität Braunschweig, Germany under the supervision
of my co-mentor dr. Leif Barleben and home mentorship of assist. prof. Tomaž
Bratkovič. The sequential analyses were performed by Eurofins Operon MWG,
Ebersberg, Germany.
Acknowledgments
I would like to thank dr. Leif Barleben for the opportunity to make my research work
in Germany, while I would also like to thank for the help with my research to Malte
Büttner, Frauke Gumz, Mariam Gaid and in fact the whole Deparment of
Pharmaceutical Biology for their friendliness, helpfulness and good spirit, which
made my months of work very pleasant and enjoyable. I am also extremely grateful to
my mentor doc. dr. Tomaž Bratkovič for the help with the writing of my thesis and
completion in the desired timeframe. Last, I would like to thank my family, Mateja
Lumpert, my friends and collegues for their support in my studies.
Statement
I declare that I have carried out my diploma work independently under the mentorship
of assist. prof. Tomaž Bratkovič and co-mentorship of dr. Leif Barleben.
Ljubljana, 2012
Graduation commission president: assoc. prof. dr. Marija Bogataj
Graduation commission member: assist. dr. Stane Pajk
II
Table of contents STATEMENT ............................................................................................................................ I TABLE OF CONTENTS ............................................................................................................. II LIST OF ABBREVIATIONS ..................................................................................................... IV LIST OF FIGURES .................................................................................................................. VI LIST OF TABLES .................................................................................................................. VII POVZETEK ......................................................................................................................... VIII ABSTRACT ........................................................................................................................... IX
I. INTRODUCTION ................................................................................................................. 1 1.1 FUNCTION OF GLYCOSYLTRANSFERASES ......................................................................... 1 1.2 CLASSIFICATION OF GLYCOSYLTRANSFERASES ............................................................... 1 1.3 GLYCOSYLTRANSFERASES IN PLANTS .............................................................................. 2
1.3.1 APPLICATION POSSIBILITIES OF PLANT GLYCOSYLTRANSFERASES ........... 3 1.4 PLANT DEFENSE ................................................................................................................ 3 1.5 APPLE AND FIRE BLIGHT ................................................................................................... 4 1.6 CHARACTERIZATION OF GLYCOSYLTRANSFERASES ........................................................ 4 1.7 POLYMERASE CHAIN REACTION ....................................................................................... 5
1.7.1 THERMOSTABLE DNA POLYMERASE ................................................................. 6 1.8 MOLECULAR CLONING ..................................................................................................... 7
II. RESEARCH OBJECTIVE ................................................................................................. 8 III. MATERIALS AND METHODS ...................................................................................... 9
3.1 MATERIALS ....................................................................................................................... 9 3.1.1 BIOLOGICAL MATERIAL ....................................................................................... 9
3.1.1.1 Plant material ................................................................................................................................... 9 3.1.1.2 Bacterial strains: ............................................................................................................................... 9
3.1.1.2.1 XL1 Blue ................................................................................................................................. 9 3.1.1.2.2 Rosetta (DE3) .......................................................................................................................... 9 3.1.1.2.3 Origami (DE3) ....................................................................................................................... 10 3.1.1.2.4 Arctic Express (DE3) ............................................................................................................. 10 3.1.1.2.5 Tuner (DE3) ........................................................................................................................... 10
3.1.1.3 Plasmid vectors .............................................................................................................................. 11 3.1.1.4 Enzymes ......................................................................................................................................... 11
3.1.2 PRIMERS ................................................................................................................ 11 3.1.2.1 Forward gene-specific primers ...................................................................................................... 11 3.1.2.2 3’end RACE primers (reverse) ...................................................................................................... 11 3.1.2.3 Profilin primer ................................................................................................................................ 11 3.1.2.4 Expression primers with restriction sites ....................................................................................... 11 3.1.2.5 Sequencing primers ........................................................................................................................ 12
3.1.3 CULTURE MEDIA ................................................................................................. 12 3.1.3.1 LB medium .................................................................................................................................... 12 3.1.3.2 SOC Medium ................................................................................................................................. 12 3.1.3.3 Medium for plant cultures .............................................................................................................. 13
3.1.4 BIOCHEMICAL KITS ............................................................................................ 13 3.1.5 BUFFERS AND SOLUTIONS ................................................................................ 13
3.1.5.1 TBE Buffer for agarose electrophoresis ........................................................................................ 13 3.1.5.2 Buffers for plasmid isolation ......................................................................................................... 14 3.1.5.3 Buffers and solutions for immobilized metal affinity chromatography (IMAC) .......................... 14
3.1.5.3.1 0.1 M potassium phosphate buffer pH 8 (KPi buffer) ........................................................... 14 3.1.5.3.2 Basic buffer ............................................................................................................................ 14 3.1.5.3.3 Imidazole buffers ................................................................................................................... 14
3.1.5.4 Buffer and solutions for SDS PAGE ............................................................................................. 14 3.1.5.4.1 3x SDS loading dye ............................................................................................................... 14 3.1.5.4.2 Polyacrylamide gel ................................................................................................................ 15 3.1.5.4.3 SDS PAGE Running buffer ................................................................................................... 15 3.1.5.4.4 Coomassie staining ................................................................................................................ 15
3.1.5.5 Markers used in gel electrophoresis ............................................................................................... 16 3.1.6 OTHER SOLUTIONS AND REAGENTS ................................................................ 16 3.1.7 EQUIPMENT .......................................................................................................... 16
III
3.2 METHODS ....................................................................................................................... 17 3.2.1 INDUCTION AND HARVESTING OF PLANT SUSPENSION CULTURE ........... 17 3.2.2 RAPID AMPLIFICATION OF cDNA ENDS (RACE) ............................................ 17
3.2.2.1 RNA extraction .............................................................................................................................. 18 3.2.2.2 Reverse Transcription .................................................................................................................... 19
3.2.2.2.1 SuperScript III First-Strand Synthesis System ...................................................................... 19 3.2.2.2.2 RevertAid H Minus First Strand cDNA Synthesis Kit .......................................................... 20
3.2.2.3 PCR amplification .......................................................................................................................... 20 3.2.2.3.1 Phusion polimerase ................................................................................................................ 21 3.2.2.3.2 Dream Taq ............................................................................................................................. 21
3.2.3 AGAROSE ELECTROPHORESIS .......................................................................... 22 3.2.4 DNA FRAGMENT EXTRACTION .......................................................................... 23 3.2.5 LIGATION OF INSERT INTO A PLASMID VECTOR ........................................... 23
3.2.5.1 Plasmid vector pGEM-T Easy ....................................................................................................... 23 3.2.5.2 Plasmid vector pET-52(+) .............................................................................................................. 24
3.2.6 TRANSFORMATION OF E. COLI WITH PLASMID DNA .................................... 25 3.2.6.1 Standard transformation protocol .................................................................................................. 25 3.2.6.2 Blue-white screening ..................................................................................................................... 25
3.2.7 PLASMID ISOLATION ........................................................................................... 25 3.2.7.1 Plasmid Miniprep Kit for plasmid DNA isolation ......................................................................... 25 3.2.7.2 Manual Alkaline Plasmid Isolation (a protocol from Susanne Kühle, AG Beerhues) .................. 26
3.2.8 RESTRICTION DIGESTION OF DNA ................................................................... 27 3.2.8.1 EcoRI digestion procedure ............................................................................................................. 27 3.2.8.2 DoubleDigest procedure with KpnI and SalI ................................................................................. 27
3.2.8.2.1 Insert sequence digestion ....................................................................................................... 28 3.2.8.2.2 Plasmid pET-52(+) Digestion ................................................................................................ 28 3.2.8.2.3 Test digestion of isolated plasmid DNA ................................................................................ 29
3.2.9 HETEROLOGOUS EXPRESSION OF TARGET GENE IN E. COLI .................... 29 3.2.9.1 Expression of the target enzyme .................................................................................................... 29 3.2.9.2 Protein isolation and purification of 6xHis-tagged target protein with immobilized metal affinity chromatography ......................................................................................................................................... 30
3.2.9.2.1 Preparation of a cell extract ................................................................................................... 30 3.2.9.2.2 IMAC ..................................................................................................................................... 31
3.2.10 SDS PAGE ............................................................................................................ 32 3.2.10.1 Sample preparation ...................................................................................................................... 32 3.2.10.2 SDS PAGE ................................................................................................................................... 32 3.2.10.3 Coomassie staining ...................................................................................................................... 32
3.3 RESEARCH WORK SCHEMES ............................................................................................ 33 3.3.1 RACE OF GOLDEN DELICIOUS ......................................................................... 33 3.3.2 RACE OF COX’S ORANGE PIPPIN ..................................................................... 34 3.3.3 CONSTRUCTION OF THE EXPRESSION VECTOR ............................................ 35 3.3.4 HETEROLOGOUS EXPRESSION IN E. COLI ...................................................... 36
IV. RESULTS ......................................................................................................................... 37 4.1 RACE OF GOLDEN DELICIOUS TEMPLATE ..................................................................... 37 4.2 RACE OF COX’S ORANGE PIPPIN TEMPLATE ................................................................. 41 4.3 CONSTRUCTION OF EXPRESSION VECTOR ....................................................................... 46 4.4 HETEROLOGOUS EXPRESSION OF PUTATIVE GLYCOSYL TRANSFERASE ......................... 50
4.4.1 SDS PAGE of Rosetta (DE3) and Origami (DE3) .................................................. 50 4.4.2 SDS PAGE OF Arctic Express (DE3) and Tuner (DE3) ........................................ 52
V. DISCUSSION ..................................................................................................................... 54 5.1 RACE GOLDEN DELICIOUS ............................................................................................ 54 5.2 RACE COX’S ORANGE PIPPIN ........................................................................................ 55 5.3 CONSTRUCTION OF A VECTOR WITH THE COMPLETE TARGET GENE SEQUENCE ............ 57 5.4 UNIPROT BLAST ........................................................................................................... 60 5.5 PROTEIN EXPRESSION AND ISOLATION ........................................................................... 61
VI. CONCLUSION ................................................................................................................. 62 VII. REFERENCES: .............................................................................................................. 63
IV
List of abbreviations AEG agarose electrophoresis gel
APS ammonium persulphate
BLAST Basic Local Alignment Search Tool
BME beta-mercapto ethanol
cDNA complementary DNA
CFU colony forming unit
Da Dalton, unit of atomic mass
dbEST database of expressed sequence tag
dNTP deoxyribonucleotide triphosphate
DMSO dimethyl sulfoxide
dsDNA double stranded DNA
DTT dithiothreitol
EBI European Bioinformatics Institute
EDTA ethylenediaminetetraacetic acid
ENA European Nucleotide Archive
FT flow-through fraction obtain in IMAC
GT glycosyltransferase
IF insoluble cell protein fraction
IMAC Immobilized Metal Affinity Chromatography
IPTG isopropyl-beta-D-thiogalactopyranoside
LB medium Luria-Bertani growth medium
LS medium Linsmaier-Skoog growth medium for plants
NCBI National Center for Biotechnology Information
OD optical density
PAGE polyacrylamide gel electrophoresis
RACE rapid amplification of cDNA ends
RLT buffer for lysis of cells and tissues before RNA isolation in kits
RT reverse transcriptase
RW1 membrane-bound RNA wash buffer in kits
SDS Sodium Dodecyl Sulphate
SF Soluble cell protein fraction

V
SOC medium modified super optimal broth
TBE buffer Tris base, Boric acid, EDTA buffer
TEMED N, N, N', N'-tetramethylethylenediamine
Tris tris(hydroxymethyl)aminomethane
UDP uridine diphosphate
X-gal 5-bromo-4-chloro-indolyl-β-D-galactopyranoside
VI
List of figures FIGURE 1: THE GENE SEQUENCE FRAGMENT OBTAINED ONLINE FROM NCBI DATABASE DBEST ............. 8 FIGURE 2: NESTED 3’-RACE SCHEME ..................................................................................................... 18 FIGURE 3: AGAROSE GEL ELECTROPHORESIS OF PCR PRODUCTS AMPLIFIED WITH PHUSION POLYMERASE
........................................................................................................................................................ 38 FIGURE 4: AGAROSE GEL ELECTROPHORESIS OF PCR PRODUCTS AMPLIFIED WITH DREAM TAQ
POLYMERASE .................................................................................................................................. 39 FIGURE 5: AGAROSE GEL ELECTROPHORESIS OF SAMPLES OF MANUALLY ISOLATED PLASMID DNA
(PGEM-T EASY/INSERT) DIGESTED WITH ECORI ........................................................................... 40 FIGURE 6: GENE SEQUENCE OF PUTATIVE GLYCOSYLTRANSFERASE IN AN APPLE (MALUS X DOMESTICA)
WITH ADDITIONALLY ACQUIRED GENE SEQUENCE .......................................................................... 40 FIGURE 7: AGAROSE GEL ELECTROPHORESIS OF PCR PRODUCTS AMPLIFIED WITH DREAM TAQ
POLYMERASE .................................................................................................................................. 42 FIGURE 8: AGAROSE GEL ELECTROPHORESIS OF PCR PRODUCTS AMPLIFIED WITH DREAM TAQ
POLYMERASE .................................................................................................................................. 43 FIGURE 9: AGAROSE GEL ELECTROPHORESIS OF PCR PRODUCTS AMPLIFIED WITH DREAM TAQ
POLYMERASE .................................................................................................................................. 44 FIGURE 10: AGAROSE GEL ELECTROPHORESIS OF PLASMIDS PGEM-T EASY/2-COX AND PGEM-T
EASY/6DCOX DIGESTED WITH ECORI ........................................................................................... 45 FIGURE 11: COMPLETE DNA SEQUENCE OF TARGET PUTATIVE GLYCOSYLTRANSFERASE OBTAINED IN
RACE ............................................................................................................................................. 45 FIGURE 12: AGAROSE GEL ELECTROPHORESIS OF PCR PRODUCT AMPLIFIED WITH DREAM TAQ
POLYMERASE .................................................................................................................................. 47 FIGURE 13: AGAROSE GEL ELECTROPHORESIS OF INSERTEXP AND PLASMIDEXP RESTRICTED WITH SALI
AND KPNI ........................................................................................................................................ 47 FIGURE 14: AGAROSE GEL ELECTROPHORESIS OF THE SECOND PLASMID DIGESTION OF THE PET-52(+) 48 FIGURE 15: AGAROSE GEL ELECTROPHORESIS OF PLASMIDS PET-52(+)/INSERTEXP DIGESTED WITH KPNI
AND SALI ......................................................................................................................................... 49 FIGURE 16: COMPLETE PREDICTED DNA SEQUENCE OF TARGET INSERT SEQUENCE IN THE EXPRESSION
VECTOR PET-52(+)/INSERTEXP ...................................................................................................... 49 FIGURE 17: SDS PAGE OF INSOLUBLE AND SOLUBLE LYSATE FRACTIONS, AND FLOW-THROUGH FROM
IMAC FOR THE RECOMBINANT PROTEIN EXPRESSED IN ROSETTA (DE3) AND ORIGAMI (DE3) EXPRESSION STRAINS ...................................................................................................................... 50
FIGURE 18: SDS PAGE OF WASH AND ELUTION FRACTIONS FROM IMAC FOR THE RECOMBINANT PROTEIN EXPRESSED IN ROSETTA (DE3) EXPRESSION STRAIN ........................................................ 51
FIGURE 19: SDS PAGE OF WASH AND ELUTION FRACTIONS FROM IMAC FOR THE RECOMBINANT PROTEIN EXPRESSED IN ORIGAMI (DE3) EXPRESSION STRAIN ........................................................ 51
FIGURE 20: SDS PAGE OF INSOLUBLE AND SOLUBLE FRACTIONS, AND FLOW-THROUGH FROM IMAC FOR THE RECOMBINANT PROTEIN EXPRESSED IN ARCTIC EXPRESS (DE3) AND TUNER (DE3) EXPRESSION STRAIN ........................................................................................................................ 52
FIGURE 21: SDS PAGE OF WASH AND ELUTION FRACTIONS FROM IMAC FOR THE RECOMBINANT PROTEIN EXPRESSED IN ARCTIC EXPRESS (DE3) EXPRESSION STRAIN ............................................ 52
FIGURE 22: SDS PAGE OF WASH AND ELUTION FRACTIONS FROM IMAC FOR THE RECOMBINANT PROTEIN EXPRESSED IN TUNER (DE3) EXPRESSION STRAIN ............................................................ 53
FIGURE 23: APPLE PROFILIN SEQUENCE .................................................................................................. 54 FIGURE 24: PREDICTED AMINO ACID SEQUENCE OF THE PUTATIVE GLYCOSYLTRANSFERASE ON THE
BASIS OF THE NUCLEOTIDE SEQUENCE OF THE CLONED GENE FROM COX’S ORANGE PIPPIN 3’RACE ........................................................................................................................................................ 57
FIGURE 25: ALIGNMENT OF RACE SEQUENCE AND INSERT SEQUENCE OF THE EXPRESSION VECTOR PET-52(+)/INSERTEXP USING CLUSTAL OMEGA ................................................................................. 59
FIGURE 26: PREDICTED AMINO ACID SEQUENCE OF THE TARGET GLYCOSYLTRANSFERASE ON THE BASIS OF THE SEQUENCE OBTAINED FROM SEQUENCING PET-52(+)/INSERTEXP ...................................... 60
FIGURE 27: THE REACTION CATALYZED BY POLYGALACTURONATE 4-ALPHA- GALACTURONOSYLTRANSFERASE ................................................................................................... 60

VII
List of tables TABLE 1: OD600 AND TIME OF INDUCTION ............................................................................................... 29 TABLE 2: THE COLLECTED FRACTIONS IN ELUTION OF NI2+ AFFINITY COLUMN ....................................... 31
VIII
Povzetek Glikoziltransferaze so encimi, ki katalizirajo prenos sladkorne enote med donorjem, ki je ponavadi z nukleotid difosfatom aktiviran sladkor, in drugo akceptorsko molekulo, med katere spadajo različni sladkorji, lipidi, nukleinske kisline, poliketidi in neribosomalni peptidi, kar se odraža v visoki raznolikosti končnih produktov. Reakcija glikozilacije je vpletena v procese rasti, prenosa signalov, celične adhezije, alelopatskih obrambnih odzivov ter v odpornost pred vročino, nukleazami ter izsušitvijo. Glikoziltransferaze so še posebno pomembne v rastlinah, kjer pretvarjajo končne produkte fotosinteze v disaharide, oligosaharide in polisaharide ter sintetizirajo druge pomembne molekule, kot npr. polisaharide v celični steni, glikoproteine ter različne manjše glikozilirane produkte, kot so glukozinolatni in cianogeni glikozidi. Ti encimi so potencialni kandidati za gensko manipulacijo in ponujajo mnogo možnosti za izboljšavo hrane in poljščin v prihodnosti. Cilj diplomskega dela je bil določiti celotno nukleotidno zaporedje gena domnevne glikoziltransferaze v jablani (Malus x domestica) z že znanim 5’-koncem in poskus izražanja tarčnega encima v različnih bakterijskih sevih E. coli, da bi ugotovili najustreznejši ekspresijski sistem za tarčni protein. 5’ konec tarčnega gena smo pridobili na medmrežju v NCBI-jevi bazi podatkov dbEST (database of expressed sequence tag), 3’ konec tarčnega gena pa z sekvenciranjen amplikona pridobljenega z metodo hitrega kloniranja koncev cDNA (RACE, ang. rapid amplification of cDNA ends). Za matrico smo uporabili celokupno RNA, izolirano iz suspenzijske celične kulture jabolčnih sort “zlati delišes” in “Cox’s Orange Pippin”, ki smo jo prepisali v komplementarno DNA. Suspenzijsko celično kulturo Cox's Orange Pippin smo inducirali z inaktivirano bakterijsko kulturo hruševega ožiga (Erwinia amylovora). Celotno nukleotidno zaporedje smo pomnožili v verižni rekciji s polimerazo in nato vstavili v plazmid. S tako pridobljenim ekspresijskim vektorjem smo transformirali različne ekspresijske seve E. coli (Rosetta (DE3), Origami (DE3), Arctic Express (DE3), Tuner (DE3)). Za izolacijo proteina smo uporabili metodo kovinsko-kelatne afinitetne kromatografije. Za določitev celotnega nukleotidnega zaporedja je bilo potrebno induciranje jabolčne celične kulture z jabolčnim patogenom hruševega ožiga, kar podpira domnevo o vpletenosti encima v obrambni odgovor jablane. Nukleotidno zaporedje tarčnega gena smo primerjali z nukleotidnimi zaporedji proteine-kodirajočih genov v podatkovni bazi UniProt, kjer se je pokazala visoka podobnost proteina z encimom poligalakturonat 4-alfa-galakturonoziltransferazo. Izolacija in čiščenje proteina z metodo kovinsko-kelatne afinitetne kromatografije ni dala zadovoljivih rezultatov, kar pojasnjujemo z vključitvijo stop kodona v zaporedje protismernega začetnega oligonukleotida, ki je bil uporabljen v postopku izdelave ekspresijskega vektorja, in tako je onemogočil prevajanje polihistidinske oznake. Za zaključek lahko povemo, da so poskusi nakazali, da v jablani obstaja do sedaj neznana glikoziltransferaza vpletena v obrambni odgovor jablane ter da je ta encim najverjetneje poligalakturonat 4-alfa-galakturonoziltransferaza.
IX
Abstract
Glycosyltransferases are enzymes, which catalyze the transfer of a sugar moiety from a donor, usually being nucleotide diphosphate activated sugar, to another recipient molecule, which vary from sugars, lipids, proteins, nucleic acids, polyketides, and non-ribosomally synthesized peptides, to produce highly diverse structures. The reaction of glycosylation is involved in development, signal transduction, cell adhesion, alelopathic defense response, and resistance from heat shock, nucleases, and desiccation. Glycosyltransferases are especially important in plants, converting products of photosynthesis into disaccharides, oligosaccharides, and polysaccharides and synthesizing other important molecules like cell-wall polysaccharides, glycoproteins and various small glycosylated molecules such as glucosinolates and cyanogenic glycosides. These enzymes represent suitable candidates for gene manipulation and offer many possibilities for food and crop improvement in the future. The objective of this research was to determine the complete gene sequence of the putative glycosyltransferase in the apple (Malus x domestica) with the 5’ end of the target gene already known and attempt to express the target enzyme in various E. coli strains to identify the optimal expression strain. The 5’ end of the target gene was obtained online from NCBI database dbEST, while the 3’ end was determined by sequencing the amplicon obtained with the method of rapid amplification of complementary DNA ends. As template the total RNA extracted from Golden Delicious suspension culture and Cox’s Orange Pippin suspension culture was used, while the Cox’s Orange Pippin culture was induced with inactivated bacterial culture of Erwinia amylovora. The complete gene sequence was amplified, integrated into plasmid to produce an expression vector, and introduced into various bacterial expression strains of E. coli (Rosetta DE3, Origami DE3, Arctic Express (DE3), Tuner (DE3)). Immobilized metal affinity chromatography was used to isolate the encoded protein. In order to obtain this sequence, the apple cell culture needed the induction with Erwinia amylovora bacterium, thus supporting the theory of the enzyme involvement in apple’s defense response. The complete gene sequence was blasted in the UniProt databank, which showed that the protein is most likely to be a polygalacturonate 4-alpha-galacturonosyltransferase. The protein purification using immobilized metal affinity chromatography did not produce the desired results with the recombinant product not present in elution fractions. In retrospective, a stop codon was included into a sequence of the reverse primer used in construction of the expression vector, which prevented the translation of polyhistidine tag. To conclude, the DNA sequence obtained in the experiments suggested that there is a yet unidentified glycosyltransferase in the apple involved in apple’s defense response, while the enzyme is most likely to be polygalacturonate 4-alpha-galacturonosyltransferase.
INTRODUCTION
1
I. INTRODUCTION
1.1 Function of glycosyltransferases Glycosyltransferases are enzymes that catalyze the transfer of sugars to other
molecules and perform critical functions in all living organisms. They allow storage
of energy in the form of glycogen, synthesize the carbohydrate polymers that maintain
and support bacterial, fungal, and plant cell walls. These enzymes also produce the
cell surface oligosaccharides, which are involved in cell-cell recognition and act as
receptors for hormones, bacterial toxins, viruses, and a multitude of circulating
proteins (1). The reaction of glycosylation is required in development, in signal
transduction, in cell adhesion, while it enhances alelopathic defense response and
offers resistance from heat shock, nucleases, and desiccation (2).
In prokaryotes it was found that glycosyltransferases are involved in regulation of the
activity of various secondary metabolites, including vancomycin, erythromycin, and
daunomycin, while in eukaryotes, they regulate the transcription of numerous genes,
for example gene participating in glucose metabolism. The variety of reactions
involving glycosyltransferases produce highly diverse structures, with
glycosyltransferases attaching sugars to other sugars, to lipids, proteins, nucleic acids,
polyketides, and non-ribosomally synthesized peptides (1).
1.2 Classification of glycosyltransferases The standard nomenclature and classification is based on the reactions catalyzed by
the enzymes. While this principle is used with the majority of enzymes types, it is not
sufficient to categorize glycosyltransferases (GTs) into a reasonable number of
families, because the substrate specificity can change rapidly with a single point
mutation, a conformational shift induced by a regulatory factor, or utilization of
alternative acceptors, without altering the stereochemical mechanism of the transfer or
form of the fold (2).
INTRODUCTION
2
The most prominent classification is based on fold types of catalytic domains. Here,
the majority of glycosyltransferases belong to two different super families named GT-
A and GT-B superfamilies. Another two fold types were predicted named GT-C and
GT-D superfamily, however no examples have been found, while a few enzymes do
not show any resemblance to these fold types and are so far unclassified (2).
Another classification is used to describe the characteristic of glycolsyltransferase
transfer mechanism. Glycosyltransferases, which retain the stereochemistry of the
donor’s anomeric bond (α→α), are named “retaining” enzymes. Similarly, if donor’s
anomeric bond is inverted (α→β), the enzyme is referred as “inverting”. Examples of
retaining and inverting enzymes have been observed in both the GT-A and GT-B type
folds, meaning that the fold type of catalytic domains does not determine the
stereospecifity of the reaction (2).
1.3 Glycosyltransferases in plants These enzymes, while found in most living organisms, are especially important in
plants, where they convert the products of photosynthesis into disaccharides,
oligosaccharides and polysaccharides and produce many important molecules
including cell-wall polysaccharides, glycoproteins and many other different types of
small glycosylated molecules (3).
The glycosyltransferases of plant secondary metabolism transfer nucleotide
diphosphate-activated sugars to low molecular weight substrates, often as the last step
of the product synthesis. The activated sugars used in the transfer are usually UDP-
glucose with UDP-galactose and UDP-rhamnose as possible alternatives (4).
One of the roles of plant glycosyltransferases was found to be in plant’s defensive
response. For example, glucosinolates and cyanogenic glycosides are produced in
plants secondary metabolism, where the attachment of glucose stops spontaneous
degradation to cyanide, aldehydes or isothiocyanates, which are aggressive chemicals.
These glycosides can be safely stored and used in defense response towards a putative
pathogen or herbivore in case of tissue damage (i.e., decompartmentalization and
exposure to glycosidases, which liberate toxic products) (4).
INTRODUCTION
3
1.3.1 APPLICATION POSSIBILITIES OF PLANT GLYCOSYLTRANSFERASES Glycosyltransferase application holds great promise for improvement of food and
crop quality. There appears to be a vast array of suitable candidate
glycosyltransferases to be manipulated with or inserted into a variety of plants. For
example, transforming yeast with a glycoalkaloid GT has been shown to improve
detoxification characteristics and consequently reducing the toxicity of solanidine and
related alkaloids. Another possibility lies in overexpressing specific GTs in plants to
glycosylate herbicides or herbicide metabolites, which should increase the detoxifying
capacity of these plants in a concept called “green liver” (4).
1.4 Plant defense Plant defense response consists of a variety of preexisting or induced mechanisms.
These defenses can also be categorized into structural or chemical. These types of
resistances are present in all plants and its levels vary depending on the attacking
pathogen. This resistance, which consists of preexisting or induced mechanisms, is
controlled by a multitude of genes and is known as polygenic resistance as well as
quantitative, partial, horizontal, multigenic, field, durable, or minor gene resistance,
Plants posses also another type of defense response, which is controlled by one or a
few genes called race-specific, R-gene, major gene or vertical resistance. Here, plants
with specific R-genes trigger defense response towards a particular pathogen
possessing a matching avirulence gene or genes. This defense response can kill the
pathogen and halt the infection, while often the hypersensitive response is triggered
resulting in the demise of cells surrounding the attacked cell (5).
Rapid recognition of a pathogen is an essential criterion in an efficient defense
response, which is achieved through the recognition of specific pathogen- or plant cell
wall-derived signal molecules during the infection process. These molecules are
called elicitors with majority of them being low-molecular-weight compounds
synthesized or released from polymeric precursors and can be categorized according
to its origin into exogenous or endogenous (6).
INTRODUCTION
4
1.5 Apple and fire blight Erwinia amylovora is a Gram-negative bacterium capable of inducing fire blight
belonging to the family of Enterobacteriaceae (7). Fire blight has been suspected to
evolve in North America on native plants in the family Rosaceae, while in later
periods has adapted to infect a wide host range of species in all subfamilies of
Rosaceae. Among commercially important fruits, which can be infected by fire blight,
are apple, pear, quince, cotoneaster and loquat. Fire blight possesses a highly invasive
potential, spreading rapidly and when established in one orchard, it has the potential
to infect all of the nearby orchards. Today, the disease is prevalent throughout the
North and Central America, while it has already spread into New Zealand, British
Isles, continental Europe and the Middle East primarily through human activity via
long-distance shipments of either budwood or trees (8).
1.6 Characterization of glycosyltransferases In the not so distant past, individual GTs were characterized by purifying the enzyme
and then determining the substrate specificity and kinetics. However, low expression
of GTs, their high diversity and lability renders this approach very difficult.
Therefore, the identification of GTs by bioinformatic methodology (i.e., sequence
similarity searches) and the efforts to define enzyme structure with its domains as
well as to predict substrate specificity should represent a valuable alternative.
However, when attempting to predict GT specificity, sequence data should only be
considered informative (4). The problem lies in an enormous variety of
glycosyltransferase products, which makes reliable prediction of function for
thousands of sequences extremely hard with only a small number of enzyme
structures determined. Nevertheless, a higher number of structures and
characterizations of glycosyltransferases determined in the near future will likely
improve this method to make more accurate predictions of function of other genes
encoding glycosyltransferases (9). Until then, the only reliable method of
characterization of GTs is through experiments performed with purified (especially
recombinant) enzymes and suspected substrates.
INTRODUCTION
5
1.7 Polymerase chain reaction The polymerase chain reaction (PCR) is a primer-mediated enzymatic amplification
of DNA sequences using a thermostable DNA polymerase. The reaction requires
template DNA containing the target nucleotide sequence, excess amount of an
oligonucleotide primer pair and all four types of deoxynucleoside triphosphates
(dNTPs). In a buffered solution DNA polymerase produces millions of copies of the
target DNA sequence (10).
The typical PCR program is comprised of the initial 5 minutes long denaturation step
at 94-98 ºC, continued with identical 30 cycles, where each cycle consist of 30
seconds long denaturation step at 94 ºC, 30 seconds long annealing step at 55 ºC or
higher, and 90 seconds long extension step at 72 ºC. Afterwards one additional 5
minutes long extension step at 72 ºC is performed to ensure that the polymerase has
completed its work. The reaction tube is then cooled to 4 ºC to stop the reaction, until
the tube is removed from the thermocycler (11).
Denaturation begins at a temperature of 70 ºC, where the disruption of the Watson-
Cricks bonds between the two DNA strands by the heat causes the separation of the
strands from one another. This process takes place very quickly with the time of 5
seconds enough to separate the DNA strands. This step should be as short as possible,
because all of the components are susceptible to heat (11).
Annealing comes after the denaturation step. Lower temperature is required so that
hybridization of the oligonucleotide primer with the single-stranded DNA template
can occur. The temperature is usually adjusted to the melting temperatures of the used
primers (11).
The extension is carried out at the temperature of 72ºC, which is the optimal
temperature for Taq polymerase. The primer is elongated until a double-stranded
DNA is formed equivalent to the original DNA template, while the time of this step
should be adjusted according to the length of the expected amplicon (11).
INTRODUCTION
6
In theory the amount of DNA template should be doubled in the course of one cycle,
however the average multiplication rate per cycle is estimated to be about 1.6-1.7 with
variations in both directions. The rate is supposed to be smaller at the beginning,
because of the lower probability of the template, primer, and enzyme meeting one
another. This probability is increased with the increased template concentration and
decreased at the end of the reaction because of the inhibition of amplification through
the increase in by-products (pyrophosphate, crumbling nucleotides) and rehybridizing
products (11).
A buffer must accommodate the fact, that the activity of Taq polymerase is maximal
at a pH above 8 with Tris·HCl as the usual choice. The use of KCl or (NH4)2SO4 can
improve the yield of the reaction, while NaCl inhibits the amplification. The enzyme
necessitates free Mg2+ ions for its polymerase activity, while these cations also affect
primer annealing, DNA denaturation, the product specificity, formation of primer
dimers, and the rate of errors. Commercial DNA polymerases come with ready-to-use
prepared buffers for amplification, which normally incorporate these substances (11).
1.7.1 THERMOSTABLE DNA POLYMERASE The standard polymerase used for PCR is the Taq DNA polymerase isolated from
Thermus aquaticus, a bacterial strain which is thermostabile and can thrive in hot
springs at a temperature of 70ºC. This variety of enzymes has 5’-3’ DNA polymerase
activity with maximum activity at 74ºC and pH above 8, while it also possesses a 5’-
3’ exonuclease activity. Taq DNA polymerase has a template-independent activity,
which is responsible for the fact that an additional base is frequently attached to the
end of the newly synthesized strand (usually adenosine) (11).
Another group of DNA polymerases used in PCR derives from Pyrococcus furiosus
(Pfu), from Pyrococcus woesei (Pwo), from Thermotoga maritima (Tma or UITma),
and from Thermococcus litoralis (Tli or Vent). These polymerases demonstrate a
higher temperature stability than that of Taq along with 3’-5’ exonuclease activity,
which makes proofreading possible. Their amplification products have no base
overhang like the Taq-generated products, and the enzymes produce blunt ends
instead (11).
INTRODUCTION
7
Last group of DNA polymerases is obtained from Thermus thermophilus (Tth) and
from Thermus flavus (Tfl). The characteristics of these DNA polymerases are very
similar to that of the Taq polymerase with the difference that these polymerases also
demonstrate relatively high reverse transcriptase activity. These enzymes can
therefore be used for cDNA synthesis as well as PCR (11).
1.8 Molecular cloning The target gene sequence obtained in PCR amplifications is inserted into a vector and
can be transformed into host cells with E. coli bacterium usually used, where the
vector and also the target gene are multiplied. When the host cell divides, the inserted
gene is copied and passed along to the next generation. After a large number of cell
divisions on solid growth medium a colony is produced, which is comprised of
identical cells containing vector carrying the target gene. At this point the target gene
is cloned and can be sequenced or expressed to produce the target protein (12).
RESEARCH OBJECTIVE
8
II. RESEARCH OBJECTIVE In this research we will focus on the putative glycosyltransferase in the apple (Malus
x domestica). The starting point is an apple cDNA fragment found online from NCBI
database dbEST containing a 5’ part of gene sequence highly similar to a sequence of
putative glycosyltransferase found in Arabidopsis thaliana (13). This sequence will be
used to design specific primers for use in 3’ rapid amplification of cDNA ends.
CGAATTCCGTTGCTGTCGGGATTCCGAGTCTCTCACTCGCATTCGCCTTTAGCTTCCATTCCTGTCGTCTCCGATTCCGCAAGATCCCCTCTGTATTTGATCGGCAATGGCGTTGAAGCGGGGGCTATCGAATGCCGGCGCCCACAGGAACCGAGCTTCTGGATCTCGATTCCCTCTCGCGATTCTTATTTTCTTTGCGCTTCTCGTTCCCTTGATTTTCTTCCTCGGCCGTGGCCTCCACATCTCTGATCATAGCGATATCTCATCTGGTCCTGGTGAAAAGAATCTGGATTGGAGAGAAAGGATGGCACTGCAACATGTCAAATCTCTTTTCTCAAAAGAGGTCATTGATGTAATTTCAGCCAGCACGAATGACATGGGGCCTTTGAGCCTTAATTTCTTTAGGAAAAACAATTTGTCAGCTTCATGGAAAGTCATTGGAGAAAATAGTTCGGTTACAGATTCTCAAAAAGATTTGACTGCTGTAAATGCCAGACAAGAGACAGCTAGGGTTAAAGTGGATGATTCTTCAGATGATCACGCTCAAGCTCTTGATCCTGCAAAACTAGCCAGAAGGCAACTAAGAGAGAAAAGGCGTGAAAAGCGTGCAAATGAGTTGGTACAATGGGATGACGAATCAATTGTAAAGCTTGAAACTGCAGCCATTGAGCGGTCCAAATCAGTTGATTCTGCAGTTCTAGGAAAATACAGCATTTGGAGGAAAGAAAATGAGAAC
Figure 1: The gene sequence fragment obtained online from NCBI database dbEST (13).
cDNA will be obtained in reverse transcription of total RNA extracted from apple
callus suspension culture of Golden Delicious and Cox’s Orange Pippin. The putative
glycosyltransferase is suspected to be involved in apple’s defense response
mechanism, therefore induction with Erwinia amylovora will be performed in an
attempt to intensify the target gene expression, which should help to obtain the gene
sequence of the target protein. This DNA will be used as a template in PCR
amplification of the target gene. The target amplicon will be inserted into pGEM T-
Easy plasmid and cloned in XL1 E. coli bacterial strain. The isolated plasmid DNA
will be sequenced, while the sequence will be used to the design the primers for
obtaining the DNA fragment containing the complete gene sequence of the target
protein. This sequence will be inserted into pET-52(+) plasmid to produce an
expression vector, which will be transformed into various E. coli expression strains
(Rosetta (DE3), Origami (DE3), Tuner (DE3), Arctic Express (DE3)). The target
protein will be isolated and purified using immobilized metal affinity
chromatography.
MATERIALS AND METHODS
9
III. MATERIALS AND METHODS If not described otherwise, the products used in the research were set up according to
Molecular Cloning: Laboratory manual (Third edition, Cold Spring Harbor
Laboratory Press, Cold Spring Harbor, New York, 2000) (14).
3.1 Materials
3.1.1 BIOLOGICAL MATERIAL
3.1.1.1 Plant material Suspension cell culture of Malus x domestica cultivars Golden Delicious and Cox’s
Orange Pippin was already established at the department of Pharmaceutical Biology
at TU Braunschweig, Germany. The culture was grown in LS medium in the rotary
shaker (170 rpm) at 25ºC in the dark. Approximately every 10 days a subdivision was
made to maintain the cell line, where the culture was vacuum filtered with the help of
Buchner funnel and distributed in two 250 ml flasks filled with fresh 50 ml of LS-
medium. This procedure was made in a laminar airflow chamber with sterile
equipment to preserve its microbiological quality.
3.1.1.2 Bacterial strains: E. coli Purpose XL1 Blue Rosetta (DE3) Origami (DE3) Arctic Express (DE3) Tuner (DE3)
Insert multiplication Gene expression Gene expression Gene expression Gene expression
3.1.1.2.1 XL1 Blue The XL1 Blue strain allows blue-white color screening for recombinant plasmids and
is a host strain for routine cloning applications using plasmid or lambda vectors. The
XL1 Blue cells are endonuclease deficient, which improves the quality of plasmid
isolation (15).
3.1.1.2.2 Rosetta (DE3) Rosetta host strain is a BL21 derivative designed to enhance the expression of
eukaryotic proteins that contain codons rarely used in E. coli. The original Rosetta
MATERIALS AND METHODS
10
strains supply tRNAs for the codons AUA, AGG, AGA, CUA, CCC, and GGA on a
compatible chloramphenicol-resistant plasmid, pRARE. By supplying rare codons,
the Rosetta strains provide for “universal” translation, where translation would
otherwise be limited by the codon usage of E. coli (16).
3.1.1.2.3 Origami (DE3) Origami host strains are K-12 derivatives that have mutations in both the thioredoxin
reductase and glutathione reductase genes, which enhance disulfide bond formation in
the cytoplasm. Studies have shown that expression in Origami DE3 yielded 10-fold
more active protein than in some other E. coli host strains even though overall
expression levels were similar (16).
3.1.1.2.4 Arctic Express (DE3) Arctic Express cells have been engineered for improved protein processing at low
temperatures. These cells co-express the cold-adapted chaperonins Cpn10 and Cpn 60
from the psychrophilic bacterium, Oleispira antarctica. The Cpn10 and Cpn 60
chaperonins from O. antarctica have 74% and 54% amino acid identity to the E. coli
GroEL and GroES chaperonins, respectively, and show high protein refolding
activities at temperatures of 4–12 °C. When expressed in Arctic Express cells, these
chaperonins confer improved protein processing at lower temperatures, potentially
increasing the yield of active, soluble recombinant protein (17).
3.1.1.2.5 Tuner (DE3) Tuner strains are lacZY deletion mutants of BL21, which enable adjustable levels of
protein expression throughout all cells in a culture. The lac permease (lacY) mutation
allows uniform entry of IPTG into all cells in the population. Unlike lactose (or
arabinose), IPTG is an inducer that can enter E. coli cells independently from
permease pathways. This allows induction with IPTG to occur in a true concentration-
dependent fashion that is exceptionally uniform throughout the culture. By adjusting
the concentration of IPTG, expression can be regulated from very low expression
levels up to the robust, fully induced expression levels commonly associated with
pET vectors. Lower level expression may enhance the solubility and activity of
difficult target proteins. These strains are also deficient in the lon and ompT
proteases, which can degrade recombinant proteins (16).
MATERIALS AND METHODS
11
3.1.1.3 Plasmid vectors pGEM®-T easy Promega (Mannheim, Germany) pET-52(+) Novagen, Merck (Darmstadt, Germany)
3.1.1.4 Enzymes DNA synthesis RevertAi H Minus
M-MuLV RT Thermo Scientific (St. Leon Rot, Germany)
RT-Superscript III Invitrogen (Karlsruhe, Germany) Dream Taq Thermo Scientific (St. Leon Rot, Germany) Phusion Thermo Scientific (St. Leon Rot, Germany) DNA restriction EcoRI Fermentas (St. Leon Rot, Germany) KpnI Fermentas (St. Leon Rot, Germany) SalI Fermentas (St. Leon Rot, Germany) Other RNase A, H Fermentas (St. Leon Rot, Germany) FastAP
Thermosensitive Alkaline Phosphatase
Thermo Scientific (St. Leon Rot, Germany)
T4 DNA Ligase Fermentas (St. Leon Rot, Germany)
3.1.2 PRIMERS
3.1.2.1 Forward gene-specific primers GSP1 5’-AAAACATATGGCGTTGAAGCGGGGGC-3’ MalusGTau 5’-TATTACCTCCTCCCCCTTGAG-3’ MalusGTin 5’-GCTCTCTTCTCGGACAACGTC-3’
3.1.2.2 3’end RACE primers (reverse) Oligo dT18 5’-TTTTTTTTTTTTTTTTTT-3’ 3’-CDS 5’-AAGCAGTGGTAACAACGCAGAGTAC(T)30N-1N-3’ Race Long 5’CTAATACGACTCACTATAAGGGCAAGCAGTGGTAACAACGCAG
AGT-3’ Race Short 5’-CTAATACGACTCACTATAAGGGC-3’
3.1.2.3 Profilin primer Profilin (forward)
5’-ACGACCACCTGATGTGCG-3’
Profilin (reverse)
5’-AGAGACCCTGCTCGATAAGG-3’
3.1.2.4 Expression primers with restriction sites MalGT_kpnI_F (Forward)
5’-AAAGGTACCATGGCGTTGAAGCGGGGGC-3’
MalGT_salI_R (reverse)
5’-TTTGTCGACTTAGCTGCAGCTGCGAAGATAGG-3’
MATERIALS AND METHODS
12
3.1.2.5 Sequencing primers Specific primer 5’-GGTACAATGGGATGACGAATC-3, T7 5’–TAATACGACTCACTATAGGG-3’ T7 term 5’–CTAGTTATTGCTCAGCGGT-3’
Note:
1. GSP1 is forward gene specific primer with Nde I restriction site.
2. Primers 3’-CDS, Race Long and Race Short enable nested PCR amplification.
3. Formula used for primer design: Tm = 4(G + C) + 2(A + T) °C ≥ 64 ºC.
3.1.3 CULTURE MEDIA
3.1.3.1 LB medium LB-Medium composition Tryptone 1 % Yeast extract 0.5 % NaCl 1 % pH = 7.0-7.2 Agar (when required) 1.5 % Ampicillin (100mg/ml) 100 µg/ml *Chloramphenicol_(34mg/ml) 34 µg/ml *Only added to liquid LB medium, when required. LB medium was prepared by autoclaving LB or LB agar medium (20 min, 121 °C, 2
bar), cooling it to about 40-50 ºC and adding 1 µl of stock antibiotic solution (100
mg/ml ampicillin, 34 mg/ml chloramphenicol) for every ml of LB or LB agar. When
preparing LB agar the mixture was poured into the Petri plates in the laminar airflow
chamber, where the plates were cooled to harden and covered.
3.1.3.2 SOC Medium SOC medium composition Tryptone 2 % Yeast Extract 0.5 % NaCl 10 mM KCl 2.5 mM MgCl2 10 mM MgSO4 10 mM *Glucose 20 mM *Note: Glucose (sterile filtered stock solution) is added after autoclaving.
MATERIALS AND METHODS
13
3.1.3.3 Medium for plant cultures LS medium composition [mg/l] NH4NO3 1650. KNO3 1900 MgSO4 180.54 KH2PO4 170. CaCl2 332.02 FeNaEDTA 36.7 H3BO3 6.2 MnSO4 x H2O 16.9 ZnSO4 x 4 H2O 8.6 KI 0.83 Na2MoO4 x 2 H2O 0.25 CuSO4 x 5 H2O 0.025 CoCl2 x 6 H2O 0.025 Thiamine hydrochloride 0.4 Myo-Inositol 100 2,4-Dichlorophenoxyacetic acid (hormone) 0.22 1-Naphtylacetic acid (hormone) 0.186 Sucrose 30000.
Note: The medium was already prepared (18).
3.1.4 BIOCHEMICAL KITS
Operation Kit used Plasmid DNA isolation Plasmid Miniprep Kit ThermoScientific (St. Leon
Rot, Germany) RNA isolation RNeasy Plant Minikit Qiagen (Hilden, Germany) Reverse transcription SuperScript III First-
Strand Synthesis System Invitrogen (Karlsruhe, Germany)
Reverse transcription RevertAid H Minus First Strand cDNA Synthesis Kit
Thermo Scientific (St. Leon Rot, Germany)
DNA gel extraction GeneJET Gel Extraction ThermoScientific (St. Leon Rot, Germany)
3.1.5 BUFFERS AND SOLUTIONS
3.1.5.1 TBE Buffer for agarose electrophoresis Composition of 10xTBE buffer Tris 108 g Boric acid 54 g 0.5 M EDTA (pH = 8.0) 40 ml Deionized H2O Add to total volume of 1000 ml

MATERIALS AND METHODS
14
3.1.5.2 Buffers for plasmid isolation
Buffers used in manual alkaline plasmid isolation protocol Buffer 1 Tris-HCl (pH 8) 25 mM EDTA (pH 8) 10 mM Adjust pH value to 8 with HCl *RNase A 100 µg/ml Buffer 2 NaOH 0.2 M SDS 1 % (w/v) Buffer 3 Potassium acetate 3 M Glacial acetic acid 11.5 % (v/v)
Note: *Add just before use.
3.1.5.3 Buffers and solutions for immobilized metal affinity chromatography (IMAC)
3.1.5.3.1 0.1 M potassium phosphate buffer pH 8 (KPi buffer) Potassium Phosphate buffer of pH=8 and 0.1M (KPi buffer) 94 ml of K2HPO4 1 M solution 6 ml of K2HPO4 1 M solution The volume 94 ml of K2HPO4 1 M solution and 6 ml of K2HPO4 1 M solution were mixed together diluted to 1000 ml and titrated to pH = 8 with 5N NaOH.
3.1.5.3.2 Basic buffer Components of basic buffer Final Concentration KPi buffer 0.5 l 0.050 M NaCl 17.532 g 0.300 M Deionized water 0.5 l /
3.1.5.3.3 Imidazole buffers Imidazole solution of 500 mM was mixed with Basic buffer to produce buffers used in column elution: Imidazole buffers 10 mM 20 mM 50 mM 250 mM Imidazole stock solution 0.2 ml 0.4 ml 1 ml 5 ml Basic buffer 9.8 ml 9.6 ml 9 ml 5 ml
3.1.5.4 Buffer and solutions for SDS PAGE
3.1.5.4.1 3x SDS loading dye 3x SDS loading dye composition H2O 4.4 ml Stacking gel buffer 6.25 ml Glycerol 5 ml (~6.3 g) SDS 1 g Bromophenol blue 21 mg *DTT (1M) 200 mM
*DTT was added just before use to make the final concentration of 200 mM using 1
M stock DTT (stored at 4 °C).
MATERIALS AND METHODS
15
3.1.5.4.2 Polyacrylamide gel The gel was composed of stacking and 10.5 % separation gel following the recipe below: Consistence of one PAA-gel (0.75 mm) Separation gel Stacking gel 10.5% acrylamide 5% acrylamide Separation gel buffer 2.5 ml --- Stacking gel buffer --- 1.25 ml Acrylamide/Bisacrylamide 30:0.8 %
3.5 ml 0.75 ml
H2O 3.8 ml 3ml 10 % SDS Solution 100 µl 50 µl 10 % APS Solution 50 µl 15 µl TEMED 5 µl 5 µl
Separation gel buffer Buffer was made by dissolving 181.5 g of Tris in distilled H2O, adjusting pH to 8.8 with HCl and adding H2O to total volume of 1000 ml. Stacking gel buffer Buffer was made by dissolving 60.5 g of Tris in distilled H2O, adjusting pH to 6.8 with HCl and adding H2O to total volume of 1000 ml.
3.1.5.4.3 SDS PAGE Running buffer Composition of 10x SDS running buffer Tris 30.3 g Glycine 144.0 g SDS 10.0 g H2O add to total volume of 1000 ml
3.1.5.4.4 Coomassie staining Coomassie staining solution Ethanol 500 ml Coomassie brilliant blue R250 0.5 g Acetic acid 100 ml H2O add to total volume of 1000 ml Destaining solution I Destaining solution II Ethanol (denatured) 500 ml 165 ml Acetic acid 100 ml 50 ml H2O add to1000ml add to 1000 ml

MATERIALS AND METHODS
16
3.1.5.5 Markers used in gel electrophoresis
GeneRuler 1 kb DNA Ladder Thermo Scientific (St. Leon Rot, Germany)
Unstained Protein Molecular Weight Marker Fermentas (St. Leon Rot, Germany)
3.1.6 OTHER SOLUTIONS AND REAGENTS
Reagents DMSO Fluka, (Buchs, CH) IPTG Sigma (Deisenhofen, Germany) X-Gal Sigma (Deisenhofen, Germany) dNTPs Fermentas (St. Leon Rot, Germany) Imidazol Roth (Karlsruhe, Germany) NaH2PO4 Roth (Karlsruhe, Germany) Na2HPO4 Roth (Karlsruhe, Germany) Isopropanol Roth (Karlsruhe, Germany) Ethanol Roth (Karlsruhe, Germany) Chloroform Roth (Karlsruhe, Germany) Ethidiumbromid Roth (Karlsruhe, Germany) Tris Roth (Karlsruhe, Germany) Agarose Roth (Karlsruhe, Germany) 6x Loading dye Roth (Karlsruhe, Germany)
Solutions
Lysozyme (stock solution of 10 mg/ml)
3.1.7 EQUIPMENT PCR cycler Eppendorf Mastercycler Personal Biometra T Professional Basic UV spectrophotometer Ultraspec 3100 Pro SDS PAGE electrophoresis module BIO-RAD Mini-PROTEAN Centrifuge Beckmann GS-6R Sigma 1-15K Eppendorf Centrifuge 5415D Ultra-wave cell disrupter/homogenizer Branson Sonifier 250
MATERIALS AND METHODS
17
3.2 Methods
3.2.1 INDUCTION AND HARVESTING OF PLANT SUSPENSION CULTURE Induction Plant cell culture of Malus x domestica Cox’s Orange Pippin was induced with 1 ml
of inactivated solution of Erwinia amylovora (c = 1 000 000 CFU/ml) on the fifth day
after the subdivision was made. The cell culture was harvested after 9 hours.
Harvest
Erlenmeyer flask containing the culture was vacuum filtered in Buchner funnel and
transferred to a mortar. Immediately, liquid nitrogen was added to flash freeze the
material, protecting it from RNA digestion. Then it was ground into a fine powder
preserving it frozen by adding additional liquid nitrogen when necessary. The
material was stored in microcentrifuge tubes and temporarily placed into liquid
nitrogen until it was transferred into a freezer at – 80 ºC.
3.2.2 RAPID AMPLIFICATION OF cDNA ENDS (RACE)
RACE is a procedure where cDNA is used in PCR amplification to obtain the target
gene sequence resulting in amplicons corresponding to the 5’ or 3’ end of the mRNA.
In the 3’ RACE the first step is the mRNA conversion to cDNA using reverse
transcriptase and oligo dT primer. The generated cDNA is then amplified using a
primer capable of annealing to the poly A region and gene-specific primer, which is
designed from pre-existing sequence data (partial cDNA, genomic exon or peptide)
(19).
Another option is the so-called nested 3’ RACE. cDNA synthesis is performed using
a modified oligo dT primer (frequently termed an anchor primer, in this case 3’-CDS),
the 5’ half of which consists of a chosen sequence, which is long enough to permit the
annealing of anchor specific primer (Race Long) in the first PCR amplification. This
primer’s 5’ end also contains long enough another chosen sequence to allow
annealing of a third primer (Race Short), which is used in RACE amplification with
Cox’s Orange Pippin plant material.
MATERIALS AND METHODS
18
Figure 2: Nested 3’-RACE scheme (20).
3.2.2.1 RNA extraction For RNA extraction Qiagen RNeasy Plant Minikit was used following protocol
Purification of Total RNA from Plant Cells and Tissues and Filamentous Fungi from
RNeasy Mini Handbook (21).
First PCR amplification
Second PCR amplification
Amplification of 3’- end
Reverse transcription
MATERIALS AND METHODS
19
Note: Plant material was cooled on ice during the procedure when possible. RLT
buffer used in the protocol was prepared by adding ß-mercapto ethanol (BME) in the
ratio 10 µl of BME to 1 ml of RLT buffer to inhibit RNA degradation. The optional
DNA digestion in step 6 was left out, while additional centrifugation in step 10 was
performed. The DNA was eluted from the membrane in two elution steps with 30 µl
of RNase-free water used in each one. The concentration and purity of the isolated
RNA was accessed with Ultraspec 3100 Pro.
3.2.2.2 Reverse Transcription
3.2.2.2.1 SuperScript III First-Strand Synthesis System Procedure was adapted from protocol supplied with the kit (22).
Note: After the components of the kit were thawed, mixed and briefly centrifuged,
they were stored on ice.
4 µl of RNA template was used combined with 4 µl of oligo dT18 primer and 21 µl of
RNase-free water. The mixture was then incubated at 70˚ C for 10 min and then
cooled down to 40-50 ºC. Next, 10 µl of 5x first strand buffer, 5 µl of 0.1 M DTT and
2.5 µl mixture of 10 mM dNTPs were added, mixed gently, and collected by brief
centrifugation. The mixture was incubated at 40 ºC for 2 minutes before 1.5 µl of RT-
Superscript III was added to the reaction mix and mixed by pipetting. The mix was
incubated at 50 ºC for 60 minutes. The reactions were terminated by incubating the
mix at 70 ˚C for 15 minutes and collected by brief centrifugation. cDNA was stored at
-20 ºC. To one sample of 1.5 µl of RNase H was added and incubated for 20 min at 37
°C to test whether the residual RNA interferes with the PCR amplification.
Reverse transcription mixture composition for RT-Superscript III RNA template 4 µl Primer Oligo dT18 5 µl DTT (0.1 M) 5 µl dNTP’s (each 10 mM) 2.5 µl 5x First strand buffer 10 µl RT-Superscript III 1.5µl RNase-free water Add to 50 µl
MATERIALS AND METHODS
20
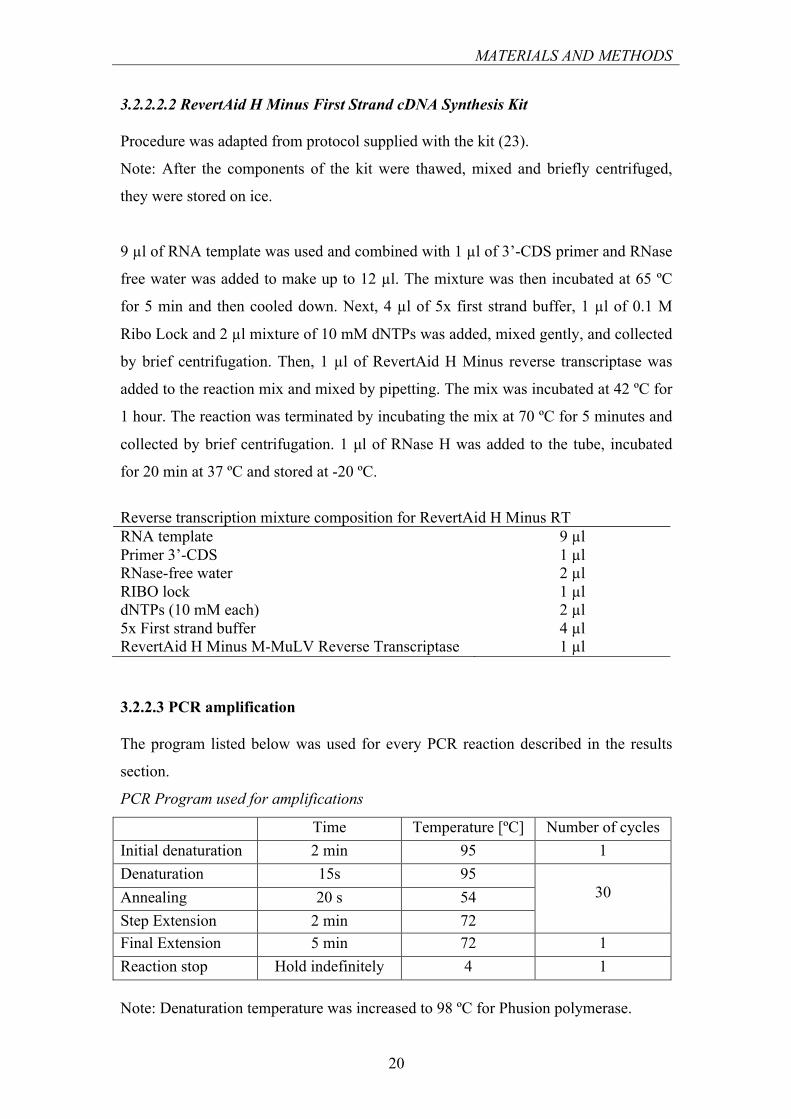
3.2.2.2.2 RevertAid H Minus First Strand cDNA Synthesis Kit Procedure was adapted from protocol supplied with the kit (23).
Note: After the components of the kit were thawed, mixed and briefly centrifuged,
they were stored on ice.
9 µl of RNA template was used and combined with 1 µl of 3’-CDS primer and RNase
free water was added to make up to 12 µl. The mixture was then incubated at 65 ºC
for 5 min and then cooled down. Next, 4 µl of 5x first strand buffer, 1 µl of 0.1 M
Ribo Lock and 2 µl mixture of 10 mM dNTPs was added, mixed gently, and collected
by brief centrifugation. Then, 1 µl of RevertAid H Minus reverse transcriptase was
added to the reaction mix and mixed by pipetting. The mix was incubated at 42 ºC for
1 hour. The reaction was terminated by incubating the mix at 70 ºC for 5 minutes and
collected by brief centrifugation. 1 µl of RNase H was added to the tube, incubated
for 20 min at 37 ºC and stored at -20 ºC.
Reverse transcription mixture composition for RevertAid H Minus RT RNA template 9 µl Primer 3’-CDS 1 µl RNase-free water 2 µl RIBO lock 1 µl dNTPs (10 mM each) 2 µl 5x First strand buffer 4 µl RevertAid H Minus M-MuLV Reverse Transcriptase 1 µl
3.2.2.3 PCR amplification The program listed below was used for every PCR reaction described in the results
section.
PCR Program used for amplifications
Time Temperature [ºC] Number of cycles Initial denaturation 2 min 95 1 Denaturation 15s 95
30 Annealing 20 s 54 Step Extension 2 min 72 Final Extension 5 min 72 1 Reaction stop Hold indefinitely 4 1 Note: Denaturation temperature was increased to 98 ºC for Phusion polymerase.
MATERIALS AND METHODS
21
3.2.2.3.1 Phusion polimerase In Phusion High-Fidelity DNA Polymerases, a unique dsDNA-binding domain is
fused to a Pyrococcus-like polymerase, therefore the enzyme possesses the following
activities: 5´→3´ DNA polymerase activity and 3´→5´ exonuclease (proofreading)
activity. It generates blunt ends in the amplification products (24).
Procedure was adapted from protocol supplied with the kit (24).
Note: All solutions were gently vortexed and briefly centrifuged after thawing. A 25
µl PCR tube was placed on ice and the components were added in the order listed
below with the exception of polymerase, which was added last. PCR reactions were
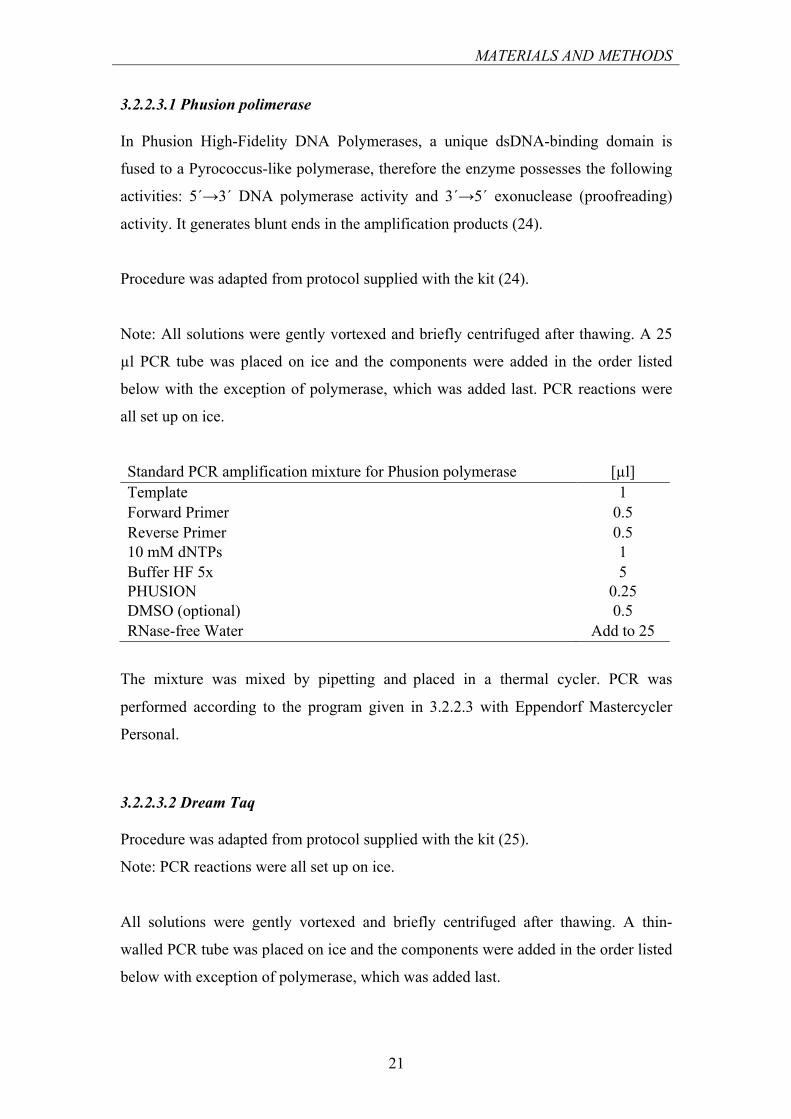
all set up on ice.
Standard PCR amplification mixture for Phusion polymerase [µl] Template 1 Forward Primer 0.5 Reverse Primer 0.5 10 mM dNTPs 1 Buffer HF 5x 5 PHUSION 0.25 DMSO (optional) 0.5 RNase-free Water Add to 25
The mixture was mixed by pipetting and placed in a thermal cycler. PCR was
performed according to the program given in 3.2.2.3 with Eppendorf Mastercycler
Personal.
3.2.2.3.2 Dream Taq Procedure was adapted from protocol supplied with the kit (25).
Note: PCR reactions were all set up on ice.
All solutions were gently vortexed and briefly centrifuged after thawing. A thin-
walled PCR tube was placed on ice and the components were added in the order listed
below with exception of polymerase, which was added last.
MATERIALS AND METHODS
22
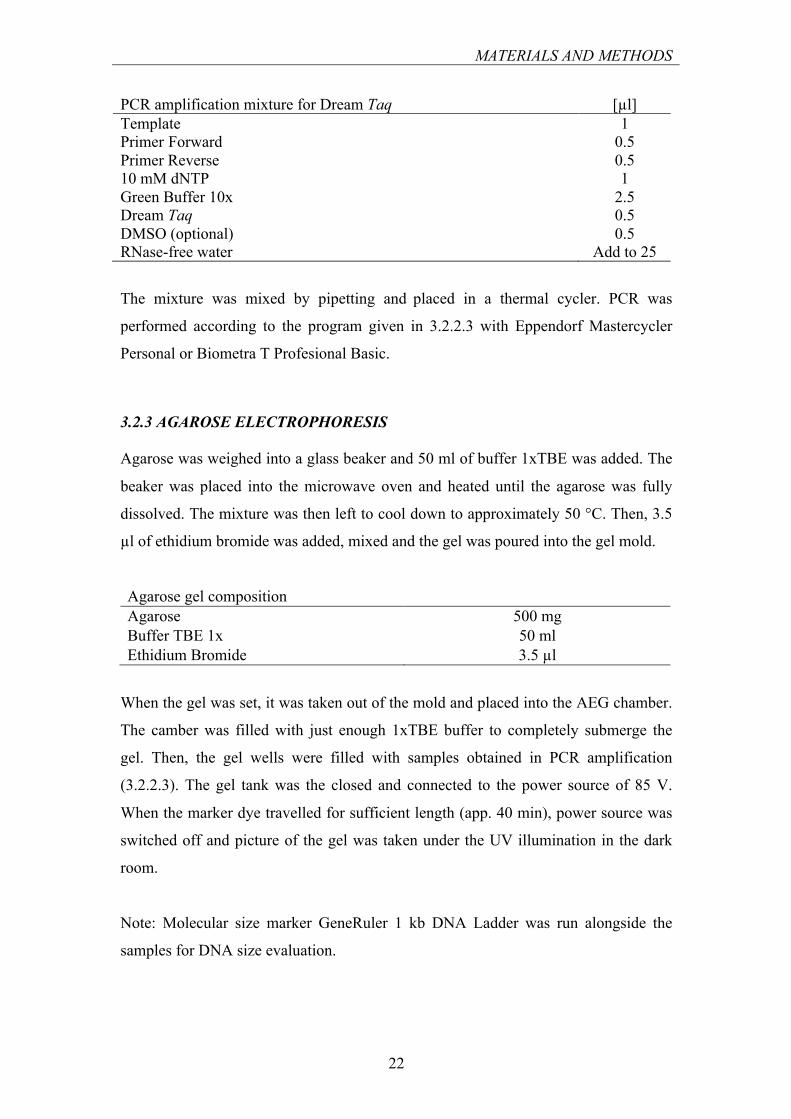
PCR amplification mixture for Dream Taq [µl] Template 1 Primer Forward 0.5 Primer Reverse 0.5 10 mM dNTP 1 Green Buffer 10x 2.5 Dream Taq 0.5 DMSO (optional) 0.5 RNase-free water Add to 25
The mixture was mixed by pipetting and placed in a thermal cycler. PCR was
performed according to the program given in 3.2.2.3 with Eppendorf Mastercycler
Personal or Biometra T Profesional Basic.
3.2.3 AGAROSE ELECTROPHORESIS Agarose was weighed into a glass beaker and 50 ml of buffer 1xTBE was added. The
beaker was placed into the microwave oven and heated until the agarose was fully
dissolved. The mixture was then left to cool down to approximately 50 °C. Then, 3.5
µl of ethidium bromide was added, mixed and the gel was poured into the gel mold.
Agarose gel composition Agarose 500 mg Buffer TBE 1x 50 ml Ethidium Bromide 3.5 µl
When the gel was set, it was taken out of the mold and placed into the AEG chamber.
The camber was filled with just enough 1xTBE buffer to completely submerge the
gel. Then, the gel wells were filled with samples obtained in PCR amplification
(3.2.2.3). The gel tank was the closed and connected to the power source of 85 V.
When the marker dye travelled for sufficient length (app. 40 min), power source was
switched off and picture of the gel was taken under the UV illumination in the dark
room.
Note: Molecular size marker GeneRuler 1 kb DNA Ladder was run alongside the
samples for DNA size evaluation.
MATERIALS AND METHODS
23
3.2.4 DNA FRAGMENT EXTRACTION DNA fragments were extracted from agarose gels using GeneJET Gel Extraction kit
following the protocol supplied in the kit (26).
Note: All steps were carried out at room temperature and all centrifugation was
carried out at >12000g. Steps 4 and 6 of the protocol were left out, while in the last
step the purification column membrane was eluted with 20 µl of elution buffer.
3.2.5 LIGATION OF INSERT INTO A PLASMID VECTOR
3.2.5.1 Plasmid vector pGEM-T Easy Vector pGEM-T Easy was used to clone the sequence of 3’end of target mRNA. The
vector is a high-copy-number vector containing T7 and SP6 RNA polymerase
promoters flanking a multiple cloning region within the α-peptide coding region of
the enzyme β-galactosidase. Insertional inactivation of the α-peptide allows
identification of recombinants by blue/white screening on indicator plates (27).
The pGEM-T Easy plasmid is a linearized vector with a single 3’-terminal thymidine
at both ends. The T-overhangs at the insertion site improve the efficiency of ligation
of PCR products by preventing recircularization of the vector and providing a
compatible overhang for PCR products generated by certain thermostable
polymerases including Dream Taq polymerase (27).
The pGEM-T Easy Vector multiple cloning region is flanked by recognition sites for
the restriction with EcoRI providing single-enzyme digestion for release of the insert
(27).
The pGEM-T Easy Vector, insert DNA and 2x Rapid ligation buffer tubes were
thawed and briefly centrifuged to collect the contents at the bottom of the tubes.
Ligation reaction solution was the set up in the order described below with the T4
ligase added last. Then, solution was mixed by pipetting and incubated for 1 hour at
room temperature or overnight at 4 ºC (27).
MATERIALS AND METHODS
24
Ligation solution composition for pGEM-T Easy [µl] Insert (PCR product amplified with Dream Taq) 3.5 2x Rapid ligation buffer 5 Vector pGEM-T Easy 1 Ligase T4 0.5 RNase-free Water Add to 10
3.2.5.2 Plasmid vector pET-52(+)
Plasmid pET-52+ was used as an expression vector for the target protein. The
multiple cloning region is followed by an optional thrombin recognition site and a C-
terminal His Tag coding sequence. The presence of His Tag coding sequence enables
IMAC protein purification with Ni-agarose possible (28).
Note: The plasmid pET-52(+) needed to be linearized with the same restriction
enzymes as the amplicon to enable subsequent integration of the target insert
sequence.
The plasmid, insert DNA and T4 DNA ligase buffer were thawed and briefly
centrifuged to collect the contents at the bottom of the tubes. Ligation reaction was
the set up in the order described below, except that T4 ligase was added last. The
ligation solution was mixed by pipetting and incubated for 1 hour at room temperature
or overnight at 4 ºC (29).
Ligation solution composition for pET-52(+) [µl] *Amplicon with restriction sites (obtained using MalGT_kpnI_F and MalGT_salI_R)
7.5
10x T4 DNA ligase buffer 1 **Vector pET-52+ 1 Ligase T4 DNA 0.5 RNase-free Water Add to 10 µl *Digested as described in 3.2.8.2.1. **Digested as described in 3.2.8.2.2.
MATERIALS AND METHODS
25
3.2.6 TRANSFORMATION OF E. COLI WITH PLASMID DNA
3.2.6.1 Standard transformation protocol Suspension of competent cells (stored at -80 ºC) was left on ice approximately 10-15
minutes to thaw. The cells were carefully mixed by finger-flicking the tube one to
three times and added to ligation solution in a ratio of 1 to 10, which meant 100 µl of
competent cells to 10 µl of ligation solution. The mixture was left on ice for about 15
minutes so that DNA could anneal to the membrane. The tubes were then heated for
45 seconds in a 42 °C water bath before placing the tubes on ice for 2 min. Next, 400
µL of SOC medium was added to every 50 µl of competent cells and the tube was
placed into an rotary shaker incubator at 37 ºC for at least half an hour for cells to
regenerate and accommodate the newly transformed DNA. 250 µl of cell suspension
was spread onto LB agar plates with appropriate antibiotics to grow colonies
overnight.
The prominent colonies were picked and transferred to a liquid LB medium with the
appropriate selection antibiotic (ampicillin, and when required chloramphenicol).
After 24 hours the cultures were either harvested and plasmid DNA extracted or
inoculated into a larger vessel with LB medium for protein expression.
3.2.6.2 Blue-white screening 30 minutes prior to the transformed XL1-Blue cells were spread on LB agar
ampicillin plate a solution of 40 µl of X-Gal (20 mg/ml) and 10 µL of IPTG (1 M)
diluted in 500-600 µl of H2O was homogenously applied over the surface of Petri
dish.
3.2.7 PLASMID ISOLATION
3.2.7.1 Plasmid Miniprep Kit for plasmid DNA isolation Pelleted bacterial cells are subjected to SDS/alkaline lysis to liberate the plasmid
DNA. The resulting lysate is neutralized, which creates the conditions for binding of
plasmid DNA on the silica membrane in the spin column. Cell debris and SDS
precipitate are pelleted by centrifugation, and the supernatant containing plasmid
MATERIALS AND METHODS
26
DNA is loaded onto the spin column membrane. The adsorbed DNA is washed to
remove contaminants, and then eluted in a small volume (30).
The plasmid DNA was extracted from cells, which were grown as described above
(3.2.6.1), following the procedure from protocol supplied with the kit (30).
Note: In the last step the membrane bound DNA was eluted in two steps using 30 µl
of the elution buffer in the first and 20 µl in the second elution step.
3.2.7.2 Manual Alkaline Plasmid Isolation (a protocol from Susanne Kühle, AG Beerhues) Cells were grown and harvested as described above (3.2.6.1). The culture was
transferred in a 2 ml microcentrifuge tube and harvested by centrifugation at 5000
rpm for 5 min at room temperature. The supernatant carefully was decanted.
The pelleted cells were resuspended by vortexing in 300 µl of the cold Buffer 1 with
added RNAase until no cell clumps remained. A volume of 300 µl of the Buffer 2 was
added and mixed carefully and thoroughly by inverting the tube 4-6 times until the
solution became viscous and slightly clear. The solution was incubated no longer than
5 min at room temperature to avoid denaturation of plasmid DNA. Next, 300 µl of the
Neutralization Solution was added and mixed immediately and thoroughly by
inverting the tube 4-6 times.
The mixture was centrifuged for 10 min at maximum speed to pellet cell debris and
chromosomal DNA. The supernatant was carefully transferred to a new 2 ml
microcentrifuge tube and an equal volume of chloroform was added. The two-phase
system was then centrifuged for 10 minutes at maximum speed.
The supernatant was carefully transferred to a new 2 ml microcentrifuge tube.
Isopropanol was added in ratio of ten parts of supernatant to seven parts of
isopropanol and mixed by vortexing. The suspension was then centrifuged at
maximum speed for 30 minutes.

MATERIALS AND METHODS
27
Then, the supernatant was decanted away. 500 µl of 70 % ethanol was added to wash
the DNA and centrifuged at maximum speed for 5 minutes at room temperature.
The liquid was carefully pipetted away and the DNA was left to dry at room
temperature for around 15 minutes. Finally, 50 µl of Tris Buffer was added and the
plasmid DNA was stored at -20 ºC.
3.2.8 RESTRICTION DIGESTION OF DNA
3.2.8.1 EcoRI digestion procedure The reaction mixture was set up in the order described below with the exception that
EcoRI was added last. The ligation solution was mixed gently by pipetting, spun
down and incubated for 1 hour at 37 ºC (31).
Digestion of plasmid with EcoRI pGEM-T Easy/insert 3 µl Nuclease-free water 5.5 µl 10x Buffer EcoRI 1 µl EcoRI 0.5 µl
3.2.8.2 DoubleDigest procedure with KpnI and SalI
The first digestion was performed in 1X Tango buffer (low salt concentration buffer)
with 4-fold excess of KpnI with incubation at 37 °C for 1 hour. With the first
digestion complete, one-eight volume of starting reaction mixture of 10X Tango
buffer (*equation 1) was added (producing a high salt concentration buffered
reaction). Finally, a 2-fold excess of SalI was added and the reaction was incubated at
37 °C for 1 hour (32).
*V=A/8, (equation 1),
where *V is the volume of the 10x Tango buffer and A is the starting volume of
reaction mixture (32).
MATERIALS AND METHODS
28
3.2.8.2.1 Insert sequence digestion To 30 µl of insert template (DNA sequence amplified with primers given in 3.1.2.4),
4 µl of Tango Buffer and 4 µl of KpnI stock solution were added, mixed by pipetting,
spun down and then incubated at 37ºC for 1 hour. Next, 4 µl of Tango Buffer and 2 µl
of SalI stock solution were added. The mixture was homogenized by pipetting, spun
down and incubated at 37ºC for one hour and a half. 9 µl of 6x Loading Dye was
added just before the agarose gel electrophoresis.
Double digestion of insert amplified using primers given in 3.1.2.4 Insert 30 µl Tango Buffer 4 µl KpnI 4 µl *Tango Buffer 4 µl *SalI 2 µl *Added after the KpnI digestion step.
3.2.8.2.2 Plasmid pET-52(+) Digestion To the volume of 50 µl of plasmid template (circular pET-52(+) plasmid) 8 µl of
Tango Buffer and 15 µl of KpnI stock solution were added. The mixture was
homogenized by pipetting, spinned down and then incubated at 37 ºC for 1 hour.
Next, 8 µl of Tango Buffer and 8 µl of SalI stock solution were added, mixed by
pipetting, spun down and incubated at 37 ºC for 1 hour. Last, 3 µL of FAST alkaline
phosphatase stock solution was added to the mixture which was then mixed by
pipetting, spun briefly and incubated at 37 ºC for 15 minutes. Heating the mixture to
80 ºC for 20 minutes stopped reactions. 18 µl of 6x Loading Dye were added just
before the agarose gel electrophoresis. This procedure was repeated because the first
attempt to ligate the insert into plasmid pET-52(+) failed.
Double restriction of the plasmid First attempt Second attempt Plasmid 50 µl 80 µl Tango Buffer 8 µl 13 µl KpnI 15 µl 15 µl *Tango Buffer 8 µl 13 µl *SalI 8 µl 8 µl **Alkaline Phosphatase 3 µl 3 µl
* Added after the KpnI digestion. ** Added after the SalI digestion.

MATERIALS AND METHODS
29
3.2.8.2.3 Test digestion of isolated plasmid DNA 1 µl of Tango Buffer and 2 µl of KpnI stock solution were added to 3 µl of isolated
plasmid pET-52(+)/target insert. The mixture was homogenized by pipetting, spun
down and then incubated at 37 ºC for 1 hour. Next, 1 µl of Tango Buffer and 1 µl of
SalI stock solution were added. The mixture was again mixed by pipetting, spun down
and incubated at 37 ºC for 1 hour. 2 µl of 6xloading dye was added just before the
agarose gel electrophoresis.
Test digestion of the isolated plasmid pET-52(+)/target insert Plasmid pET-52(+)/insert 3 µl Tango buffer 1 µl KpnI 2 µl *Tango buffer 1 µl *SalI 1 µl * Added after the KpnI digestion.
3.2.9 HETEROLOGOUS EXPRESSION OF TARGET GENE IN E. COLI
3.2.9.1 Expression of the target enzyme A number of E. coli expression host strains were transformed with the plasmid
pET52-(+)/InsertExp and incubated overnight at 37 °C on LB agar plate with
ampicillin and chloramphenicol (for Rosetta (DE3) and Origami (DE3)), or ampicillin
only (for Tuner (DE3) and Arctic express (DE3)). Individual colonies were picked
from each plate, inoculated into 4 ml of LB medium with appropriate antibiotics and
grown at 37 °C overnight with shaking at 200 rpm. After 24 hours the cultures were
diluted 1:50 into 200 ml LB medium with appropriate antibiotics for protein
expression.
Table 1: OD600 and time of induction.
Time Reference [OD600]
Rosetta (DE3) [OD600]
Origami (DE3) [OD600]
Arctic express (DE3) [OD600]
Tuner (DE3) [OD600]
0 0 0.067 0.042 0.056 0.035 2 0 *0.549 0.314 *0.648 0.200 3 0 x *0.616 x 0.664
*Induction with 200 µl of 1M IPTG.
MATERIALS AND METHODS
30
Optical density at 600 nm (OD600) was recorded on an hourly basis (Table 1). When
OD600 reached approximately 0.6, the cultures were induced with 200 µl of 1 M IPTG
and left to grow overnight (20-22 hours at 37 ºC).
3.2.9.2 Protein isolation and purification of 6xHis-tagged target protein with immobilized metal affinity chromatography
The high affinity of the Ni-NTA resins for 6x His-tagged proteins or peptides is due
to both the specificity of the interaction between histidine residues and immobilized
nickel ions and to the strength with which these ions are held to the NTA resin.
QIAexpress nickel-chelating resin utilizes NTA (nitrilotriacetic acid) ligand. NTA has
a tetradentate-chelating group that occupies four of six sites in the nickel coordination
sphere (33).
3.2.9.2.1 Preparation of a cell extract Cell culture obtained in 3.2.9.1 was transferred into 50 ml centrifuge tubes and
centrifuged for 8 min at 3500 rpm and 4 ºC in a Beckmann GS-6R centrifuge.
Supernatant was decanted and the process was repeated adding the remaining cell
culture to harvest all cells. From here on, it was necessary to store the cell material on
ice to prevent protein degradation.
The cell pellets were re-suspended with the lowest amount possible (1-2 ml) of 10
mM imidazole buffer. Lysozyme solution was added to produce the final lysozyme
concentration of 1 mg/ml (~200 µl). Then, the suspension was left on ice for 30 min
to 1 hour.
In the next step cell were lysed by sonification on ice with ultra-wave cell
disrupter/homogenizer Branson Sonifier 250. 45 seconds long cycles alternating cell
disruption and resting/cooling were used. The cycle was repeated three times, with the
duty cycle set at 30 and the output of 2. Lysate was then centrifuged for 30 minutes at
10000 g and 4 ºC with a Sigma 1-15K centrifuge.
MATERIALS AND METHODS
31
The supernatant (soluble fraction) was collected into a fresh tube and was filtered
through a 0.45 µm filter to prevent column clogging. Residual material (insoluble
fraction) was re-suspended in 1 ml of basic buffer and stored on ice for later SDS-
PAGE analysis.
3.2.9.2.2 IMAC First, 500 µl of 50% Ni-NTA-agarose suspension was pipetted into 1.5 ml
microcentrifuge tube. Excess liquid (~250 µl) was carefully removed after short
centrifugation with Eppendorf Centrifuge 5415D. The resin was washed two times
with 250 µl of basic buffer and equilibrated by washing two times with 10 mM
imidazole buffer. Last, 1250 µl of the cleared lysate (soluble fraction of cell lysate)
were added into the microcentrifuge tube with Ni-NTA-agarose, which was then
closed and placed on a multi-rotator Biosan RS24-Multi Bio multi-rotator for one
hour to rotate at 4 ºC.
The lysate-preincubated resin was loaded onto a column with the bottom outlet
capped. When the resin settled at the bottom of the column, bottom cap was removed.
Flow-through was collected and stored for SDS-Page analysis. Then, the column was
washed twice with 500 µl of 20 mM imidazole buffer and twice with 500 µl of 50
mM imidazole buffer. Finally, the protein was eluted four times with 500 µl of 250
mM imidazole buffer, with an optional washing with 375 µl of 500 mM imidazole
stock solution. All wash and elution fractions were collected and stored for SDS
PAGE analysis.
Table 2: The collected fractions in elution of Ni2+ affinity column
Fraction mM Imidazole buffer Volume [µl] Flow-through (FT) x 1250 Wash Fraction 1 (W1) 20 500 Wash Fraction 2 (W2) 20 500 Wash Fraction 3 (W3) 50 500 Wash Fraction 4 (W4) 50 500 Elution Fraction 1 (E1) 250 375 Elution Fraction 2 (E2) 250 375 Elution Fraction 3 (E3) 250 375 Elution Fraction 4 (E4) 250 375 Elution Fraction 5 (E5) *500 mM solution *500 *Optional.
MATERIALS AND METHODS
32
3.2.10 SDS PAGE
3.2.10.1 Sample preparation
Soluble fraction of the cell lysate, insoluble fraction of the cell lysate and flow-
through fraction (obtained in 3.2.9.2.1 and 3.2.9.2.2) were diluted 10- or 20-fold as
described below.
Dilutions of Soluble Fractions (SF), Insoluble Fractions (IF) and Flow-through (FT) Volume of SF, IF and FT [µl] Volume of Basic buffer [µl] Rosetta (DE3) 10 190 Origami (DE3) 10 190 Arctic express (DE3) 20 180 Tuner (DE3) 20 180
5 µl from each elution and wash fraction was taken to make 15 µl of protein solution
by adding 5 µl of 3x SDS loading dye with dithiotreitol (DTT) and 5µl deionized
water. Samples were then incubated at 90ºC for 5-10 min, cooled down and loaded
onto an SDS PAGE gel.
Sample preparation of wash and elution fractions for SDS PAGE Volume [µl] Fraction samples 5 3x Loading dye with DTT 5 Deionized H2O 5
3.2.10.2 SDS PAGE
The glass cassette with the gel was inserted into the BIO-RAD Mini-PROTEAN
electrophoresis module. The inner and outer chamber was filled with SDS running
buffer. The comb was taken out just before the samples and the protein ladder were
loaded. The lid was closed and the module connected to the source of power supply.
The separation was carried out with a voltage of 100 V until the blue dye reached the
bottom of the glass cassette. After the completion of electrophoresis the glass cassette
was taken out of the module and dismantled to obtain the gel.
3.2.10.3 Coomassie staining
The SDS PAGE gel was rinsed with distilled water for 15 min to remove SDS. The
gel was left to stain in the Coomassie staining solution overnight on a tumble table
and then destained for one hour in destaining solution I, followed by 1-2 hours in
destaining solution II.

MATERIALS AND METHODS
33
3.3 Research work schemes
3.3.1 RACE OF GOLDEN DELICIOUS
Harvest of Golden Delicious cell suspension culture not induced with Erwinia amylovora culture (3.2.1)
↓ Total RNA extraction, followed by reverse transcription (3.2.2.1) using Oligo dT18
primer ↓
PCR amplification with Phusion polymerase (3.2.2.3.1) using GSP1, Oligo dT18 and profilin primers
↓ Agarose electrophoresis (3.2.3) and gel extraction of target DNA fragment (3.2.4)
↓ PCR amplification with Dream Taq (3.2.2.3.2) using GSP1 and Oligo dT18
↓ Agarose electrophoresis (3.2.3) and gel extraction of target DNA fragment (3.2.4)
↓ Ligation of the DNA fragment into pGEM-T Easy (3.2.5.1)
↓ Transformation of E. coli XL1 Blue (3.2.6.1) with pGEM-T Easy/insert
↓ Picking the white colonies from blue-white screening (3.2.6.2) to produce overnight
bacterial cultures ↓
Plasmid DNA isolation (3.2.7.2) ↓
EcoRI plasmid test digestion (3.2.8.1), followed by analysis of inserted nucleotide sequence with agarose electrophoresis (3.2.3)
↓ Insert DNA sequencing
↓ Elongating the target gene sequence
↓ Designing new gene-specific primers capable of annealing to the newly acquired part
of the gene
MATERIALS AND METHODS
34
3.3.2 RACE OF COX’S ORANGE PIPPIN
Harvest of Cox’s Orange Pippin cell suspension culture induced with Erwinia
amylowora culture (3.2.1)
↓
Total RNA extraction, followed by reverse transcription (3.2.2.2.2) using 3’-CDS
primer
↓
PCR amplification with Dream Taq polymerase (3.2.2.3.2) using MalusGTau, Race
Long and profilin primers
↓
Agarose electrophoresis (3.2.3) and gel extraction of the target DNA fragment (3.2.4)
↓
PCR amplification with Dream Taq polymerase (3.2.2.3.2) using MalusGTin and
Race Short primers
↓
Agarose electrophoresis (3.2.3) and gel extraction of the target DNA fragment (3.2.4)
↓
Ligation of the target DNA fragment into pGEM-T Easy (3.2.5.1)
↓
Transformation of E. coli XL1 Blue (3.2.6.1) with pGEM-T Easy/insert
↓
Picking the white colonies from blue-white screening (3.2.6.2) to produce overnight
bacterial cultures
↓
Plasmid DNA isolation (3.2.7.1)
↓
EcoRI plasmid test digestion (3.2.8.1), followed by analysis of inserted nucleotide
sequence with agarose electrophoresis (3.2.3)
↓
Insert DNA sequencing
↓
Completion of target gene sequence
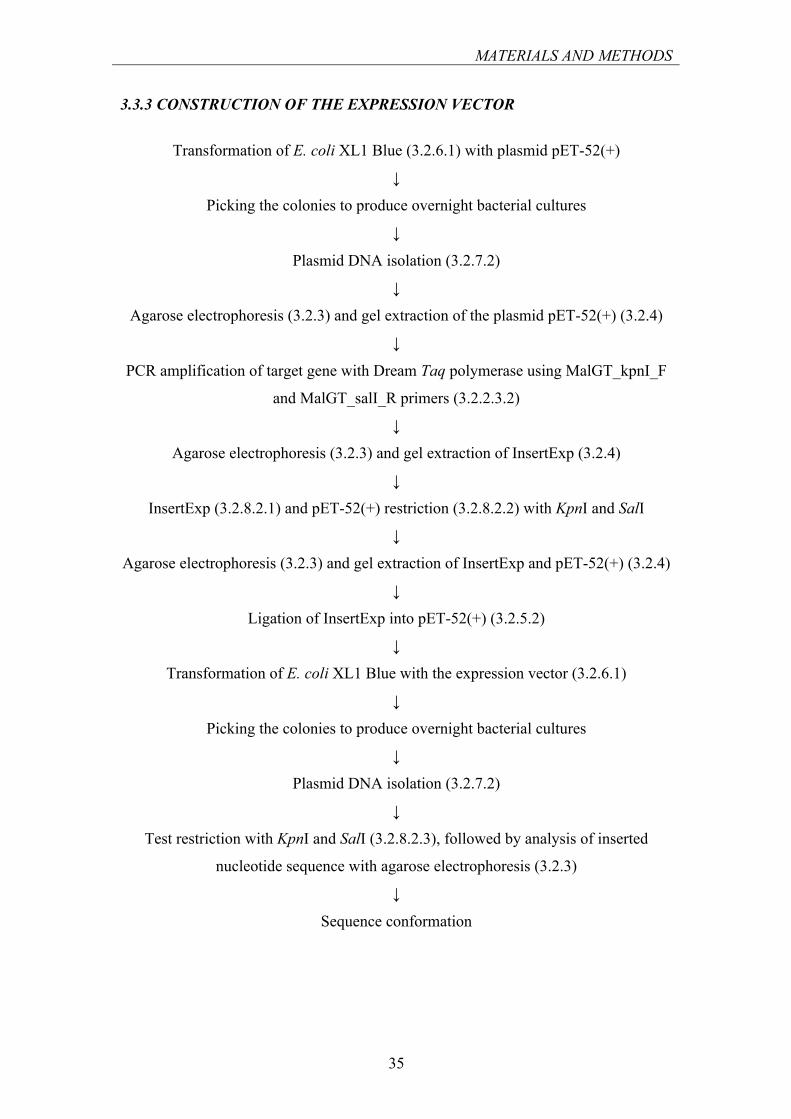
MATERIALS AND METHODS
35
3.3.3 CONSTRUCTION OF THE EXPRESSION VECTOR
Transformation of E. coli XL1 Blue (3.2.6.1) with plasmid pET-52(+)
↓
Picking the colonies to produce overnight bacterial cultures
↓
Plasmid DNA isolation (3.2.7.2)
↓
Agarose electrophoresis (3.2.3) and gel extraction of the plasmid pET-52(+) (3.2.4)
↓
PCR amplification of target gene with Dream Taq polymerase using MalGT_kpnI_F
and MalGT_salI_R primers (3.2.2.3.2)
↓
Agarose electrophoresis (3.2.3) and gel extraction of InsertExp (3.2.4)
↓
InsertExp (3.2.8.2.1) and pET-52(+) restriction (3.2.8.2.2) with KpnI and SalI
↓
Agarose electrophoresis (3.2.3) and gel extraction of InsertExp and pET-52(+) (3.2.4)
↓
Ligation of InsertExp into pET-52(+) (3.2.5.2)
↓
Transformation of E. coli XL1 Blue with the expression vector (3.2.6.1)
↓
Picking the colonies to produce overnight bacterial cultures
↓
Plasmid DNA isolation (3.2.7.2)
↓
Test restriction with KpnI and SalI (3.2.8.2.3), followed by analysis of inserted
nucleotide sequence with agarose electrophoresis (3.2.3)
↓
Sequence conformation
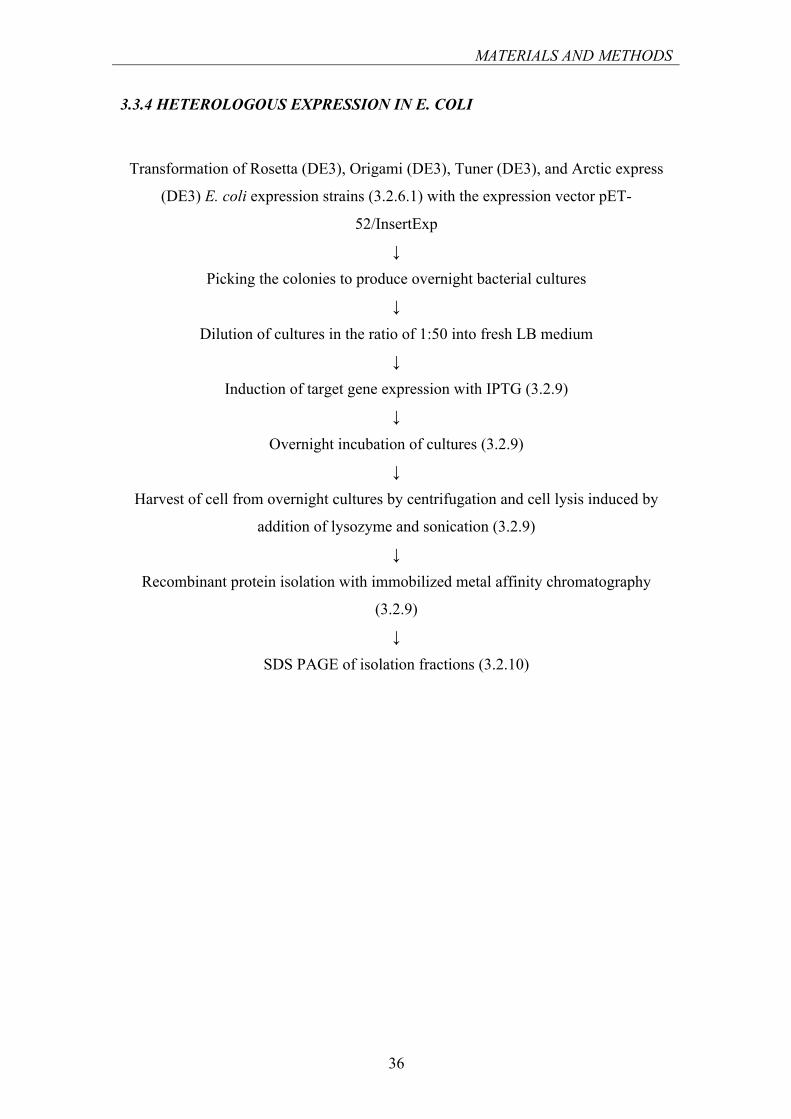
MATERIALS AND METHODS
36
3.3.4 HETEROLOGOUS EXPRESSION IN E. COLI
Transformation of Rosetta (DE3), Origami (DE3), Tuner (DE3), and Arctic express
(DE3) E. coli expression strains (3.2.6.1) with the expression vector pET-
52/InsertExp
↓
Picking the colonies to produce overnight bacterial cultures
↓
Dilution of cultures in the ratio of 1:50 into fresh LB medium
↓
Induction of target gene expression with IPTG (3.2.9)
↓
Overnight incubation of cultures (3.2.9)
↓
Harvest of cell from overnight cultures by centrifugation and cell lysis induced by
addition of lysozyme and sonication (3.2.9)
↓
Recombinant protein isolation with immobilized metal affinity chromatography
(3.2.9)
↓
SDS PAGE of isolation fractions (3.2.10)
RESULTS
37
IV. RESULTS
4.1 RACE of Golden Delicious template Plant cell line of Malus x domestica cultivar Golden Delicious was harvested and
RNA was extracted as described above (3.2.2.1).
Concentration = 500 µg/ml
Purity Ratio (A260/A280) = 1.6
Calculation of the purity ratio (A260/A280) provides an estimate of the purity of the
preparation. A pure sample of RNA has an A260/A280 ratio of 2.0 ± 0.1, while
deviations outside this range generally indicate contaminants. A low A260/A280 usually
indicates a protein contamination that carried over the RNA isolation (34). However,
the protocols for reverse transcription do not emphasize the problem with protein
contamination (22, 23), therefore the template was used in further research.
To obtain the complementary DNA library the extracted RNA was transcribed into
cDNA, while a portion of the sample was digested with RNase H to test whether
residual RNA interferes with downstream operations.
The DNA obtained in the reverse transcription using RT Supescript III (3.2.2.2.1,
RNA digestion executed only for a portion of the reaction mixture) was used in PCR
amplification with polymerase Phusion (described in 3.2.2.3.1). Gene specific primer
1 (GSP1, a forward primer) and oligo dT18 primer were used to amplify the target
gene, while specific profilin primers were added to test the quality of isolated mRNA.
Amplicons were analyzed with agarose electrophoresis.
The 2000 base pair-sized DNA fragments in positions 1 and 2 corresponding to
Figure 3 were extracted from the gel. The extracted fragments were then used in the
next PCR reaction.
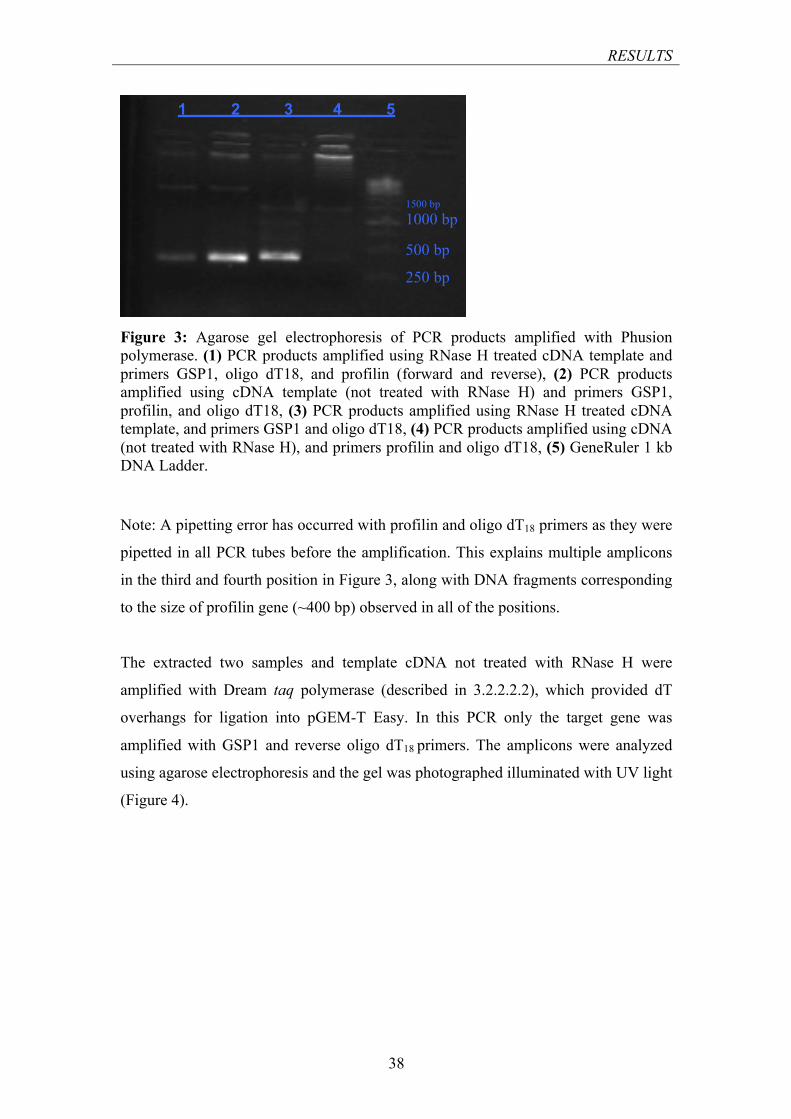
RESULTS
38
Figure 3: Agarose gel electrophoresis of PCR products amplified with Phusion polymerase. (1) PCR products amplified using RNase H treated cDNA template and primers GSP1, oligo dT18, and profilin (forward and reverse), (2) PCR products amplified using cDNA template (not treated with RNase H) and primers GSP1, profilin, and oligo dT18, (3) PCR products amplified using RNase H treated cDNA template, and primers GSP1 and oligo dT18, (4) PCR products amplified using cDNA (not treated with RNase H), and primers profilin and oligo dT18, (5) GeneRuler 1 kb DNA Ladder.
Note: A pipetting error has occurred with profilin and oligo dT18 primers as they were
pipetted in all PCR tubes before the amplification. This explains multiple amplicons
in the third and fourth position in Figure 3, along with DNA fragments corresponding
to the size of profilin gene (~400 bp) observed in all of the positions.
The extracted two samples and template cDNA not treated with RNase H were
amplified with Dream taq polymerase (described in 3.2.2.2.2), which provided dT
overhangs for ligation into pGEM-T Easy. In this PCR only the target gene was
amplified with GSP1 and reverse oligo dT18 primers. The amplicons were analyzed
using agarose electrophoresis and the gel was photographed illuminated with UV light
(Figure 4).
1 2 3 4 5 1500 bp 1000 bp 500 bp
250 bp
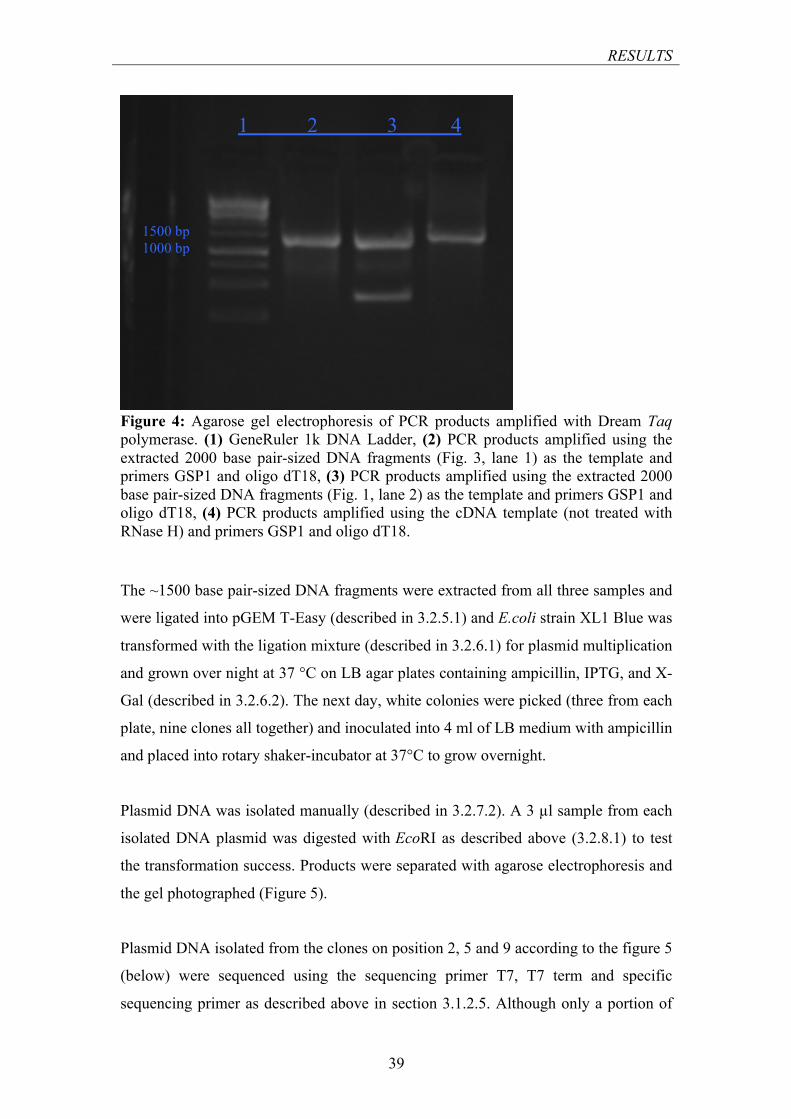
RESULTS
39
Figure 4: Agarose gel electrophoresis of PCR products amplified with Dream Taq polymerase. (1) GeneRuler 1k DNA Ladder, (2) PCR products amplified using the extracted 2000 base pair-sized DNA fragments (Fig. 3, lane 1) as the template and primers GSP1 and oligo dT18, (3) PCR products amplified using the extracted 2000 base pair-sized DNA fragments (Fig. 1, lane 2) as the template and primers GSP1 and oligo dT18, (4) PCR products amplified using the cDNA template (not treated with RNase H) and primers GSP1 and oligo dT18.
The ~1500 base pair-sized DNA fragments were extracted from all three samples and
were ligated into pGEM T-Easy (described in 3.2.5.1) and E.coli strain XL1 Blue was
transformed with the ligation mixture (described in 3.2.6.1) for plasmid multiplication
and grown over night at 37 °C on LB agar plates containing ampicillin, IPTG, and X-
Gal (described in 3.2.6.2). The next day, white colonies were picked (three from each
plate, nine clones all together) and inoculated into 4 ml of LB medium with ampicillin
and placed into rotary shaker-incubator at 37°C to grow overnight.
Plasmid DNA was isolated manually (described in 3.2.7.2). A 3 µl sample from each
isolated DNA plasmid was digested with EcoRI as described above (3.2.8.1) to test
the transformation success. Products were separated with agarose electrophoresis and
the gel photographed (Figure 5).
Plasmid DNA isolated from the clones on position 2, 5 and 9 according to the figure 5
(below) were sequenced using the sequencing primer T7, T7 term and specific
sequencing primer as described above in section 3.1.2.5. Although only a portion of
1500 bp 1000 bp
1 2 3 4
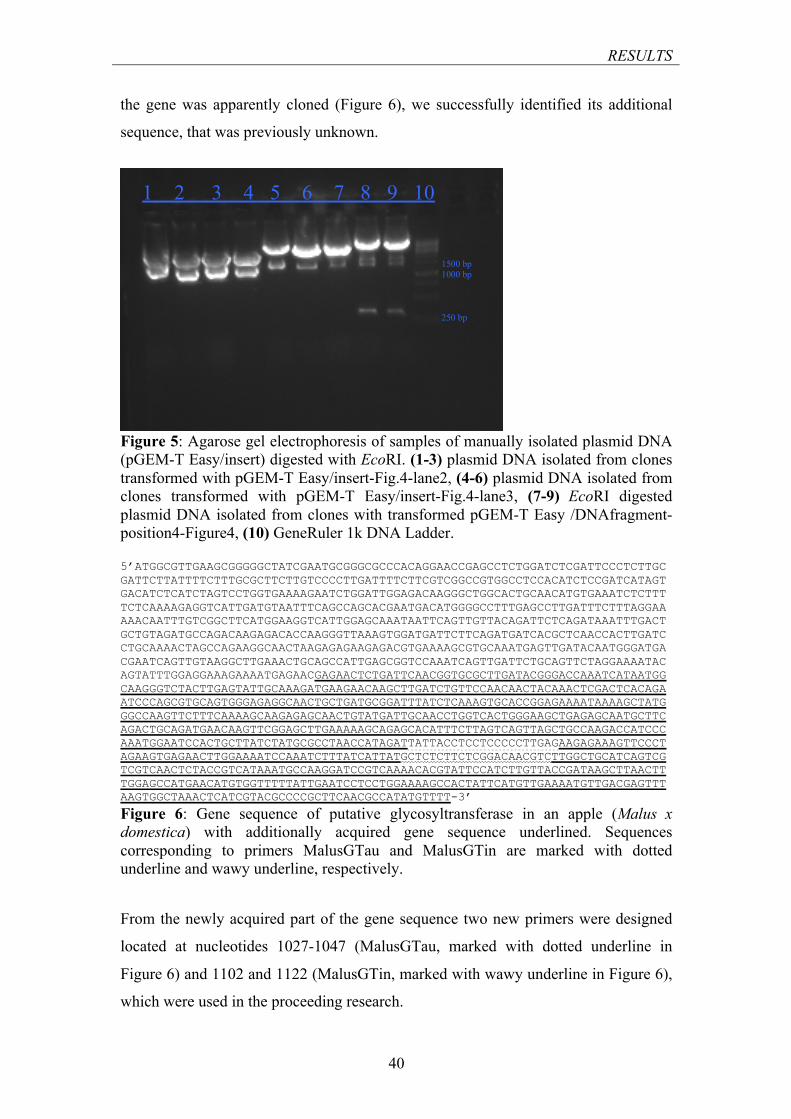
RESULTS
40
the gene was apparently cloned (Figure 6), we successfully identified its additional
sequence, that was previously unknown.
Figure 5: Agarose gel electrophoresis of samples of manually isolated plasmid DNA (pGEM-T Easy/insert) digested with EcoRI. (1-3) plasmid DNA isolated from clones transformed with pGEM-T Easy/insert-Fig.4-lane2, (4-6) plasmid DNA isolated from clones transformed with pGEM-T Easy/insert-Fig.4-lane3, (7-9) EcoRI digested plasmid DNA isolated from clones with transformed pGEM-T Easy /DNAfragment-position4-Figure4, (10) GeneRuler 1k DNA Ladder. 5’ATGGCGTTGAAGCGGGGGCTATCGAATGCGGGCGCCCACAGGAACCGAGCCTCTGGATCTCGATTCCCTCTTGCGATTCTTATTTTCTTTGCGCTTCTTGTCCCCTTGATTTTCTTCGTCGGCCGTGGCCTCCACATCTCCGATCATAGTGACATCTCATCTAGTCCTGGTGAAAAGAATCTGGATTGGAGACAAGGGCTGGCACTGCAACATGTGAAATCTCTTTTCTCAAAAGAGGTCATTGATGTAATTTCAGCCAGCACGAATGACATGGGGCCTTTGAGCCTTGATTTCTTTAGGAAAAACAATTTGTCGGCTTCATGGAAGGTCATTGGAGCAAATAATTCAGTTGTTACAGATTCTCAGATAAATTTGACTGCTGTAGATGCCAGACAAGAGACACCAAGGGTTAAAGTGGATGATTCTTCAGATGATCACGCTCAACCACTTGATCCTGCAAAACTAGCCAGAAGGCAACTAAGAGAGAAGAGACGTGAAAAGCGTGCAAATGAGTTGATACAATGGGATGACGAATCAGTTGTAAGGCTTGAAACTGCAGCCATTGAGCGGTCCAAATCAGTTGATTCTGCAGTTCTAGGAAAATACAGTATTTGGAGGAAAGAAAATGAGAACGAGAACTCTGATTCAACGGTGCGCTTGATACGGGACCAAATCATAATGGCAAGGGTCTACTTGAGTATTGCAAAGATGAAGAACAAGCTTGATCTGTTCCAACAACTACAAACTCGACTCACAGAATCCCAGCGTGCAGTGGGAGAGGCAACTGCTGATGCGGATTTATCTCAAAGTGCACCGGAGAAAATAAAAGCTATGGGCCAAGTTCTTTCAAAAGCAAGAGAGCAACTGTATGATTGCAACCTGGTCACTGGGAAGCTGAGAGCAATGCTTCAGACTGCAGATGAACAAGTTCGGAGCTTGAAAAAGCAGAGCACATTTCTTAGTCAGTTAGCTGCCAAGACCATCCCAAATGGAATCCACTGCTTATCTATGCGCCTAACCATAGATTATTACCTCCTCCCCCTTGAGAAGAGAAAGTTCCCTAGAAGTGAGAACTTGGAAAATCCAAATCTTTATCATTATGCTCTCTTCTCGGACAACGTCTTGGCTGCATCAGTCGTCGTCAACTCTACCGTCATAAATGCCAAGGATCCGTCAAAACACGTATTCCATCTTGTTACCGATAAGCTTAACTTTGGAGCCATGAACATGTGGTTTTTATTGAATCCTCCTGGAAAAGCCACTATTCATGTTGAAAATGTTGACGAGTTTAAGTGGCTAAACTCATCGTACGCCCCGCTTCAACGCCATATGTTTT-3’ Figure 6: Gene sequence of putative glycosyltransferase in an apple (Malus x domestica) with additionally acquired gene sequence underlined. Sequences corresponding to primers MalusGTau and MalusGTin are marked with dotted underline and wawy underline, respectively.
From the newly acquired part of the gene sequence two new primers were designed
located at nucleotides 1027-1047 (MalusGTau, marked with dotted underline in
Figure 6) and 1102 and 1122 (MalusGTin, marked with wawy underline in Figure 6),
which were used in the proceeding research.
1500 bp 1000 bp 250 bp
1 2 3 4 5 6 7 8 9 10
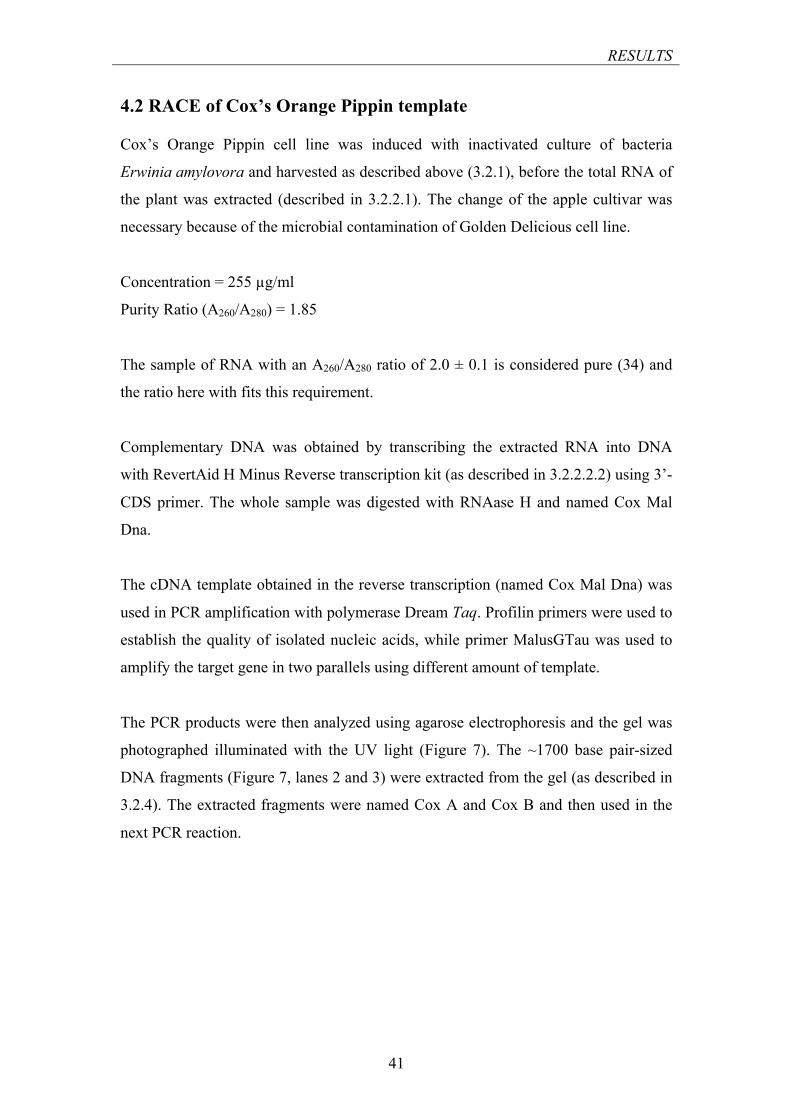
RESULTS
41
4.2 RACE of Cox’s Orange Pippin template Cox’s Orange Pippin cell line was induced with inactivated culture of bacteria
Erwinia amylovora and harvested as described above (3.2.1), before the total RNA of
the plant was extracted (described in 3.2.2.1). The change of the apple cultivar was
necessary because of the microbial contamination of Golden Delicious cell line.
Concentration = 255 µg/ml
Purity Ratio (A260/A280) = 1.85
The sample of RNA with an A260/A280 ratio of 2.0 ± 0.1 is considered pure (34) and
the ratio here with fits this requirement.
Complementary DNA was obtained by transcribing the extracted RNA into DNA
with RevertAid H Minus Reverse transcription kit (as described in 3.2.2.2.2) using 3’-
CDS primer. The whole sample was digested with RNAase H and named Cox Mal
Dna.
The cDNA template obtained in the reverse transcription (named Cox Mal Dna) was
used in PCR amplification with polymerase Dream Taq. Profilin primers were used to
establish the quality of isolated nucleic acids, while primer MalusGTau was used to
amplify the target gene in two parallels using different amount of template.
The PCR products were then analyzed using agarose electrophoresis and the gel was
photographed illuminated with the UV light (Figure 7). The ~1700 base pair-sized
DNA fragments (Figure 7, lanes 2 and 3) were extracted from the gel (as described in
3.2.4). The extracted fragments were named Cox A and Cox B and then used in the
next PCR reaction.
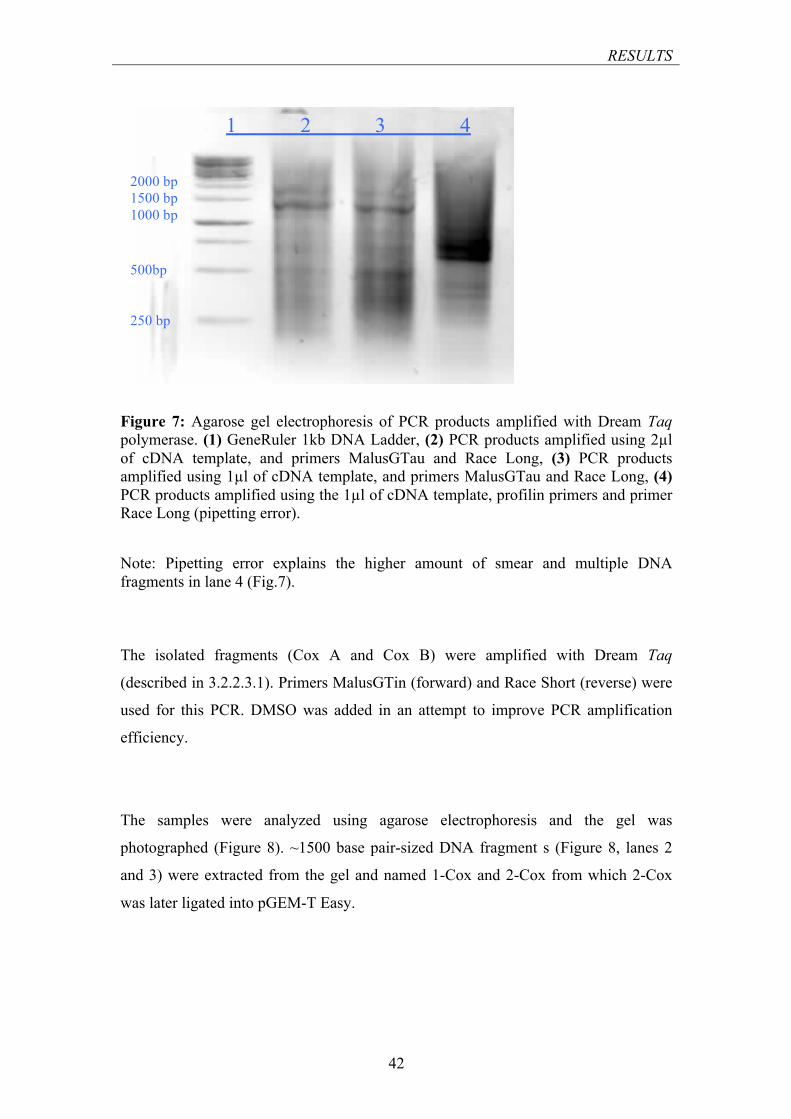
RESULTS
42
Figure 7: Agarose gel electrophoresis of PCR products amplified with Dream Taq polymerase. (1) GeneRuler 1kb DNA Ladder, (2) PCR products amplified using 2µl of cDNA template, and primers MalusGTau and Race Long, (3) PCR products amplified using 1µl of cDNA template, and primers MalusGTau and Race Long, (4) PCR products amplified using the 1µl of cDNA template, profilin primers and primer Race Long (pipetting error).
Note: Pipetting error explains the higher amount of smear and multiple DNA fragments in lane 4 (Fig.7).
The isolated fragments (Cox A and Cox B) were amplified with Dream Taq
(described in 3.2.2.3.1). Primers MalusGTin (forward) and Race Short (reverse) were
used for this PCR. DMSO was added in an attempt to improve PCR amplification
efficiency.
The samples were analyzed using agarose electrophoresis and the gel was
photographed (Figure 8). ~1500 base pair-sized DNA fragment s (Figure 8, lanes 2
and 3) were extracted from the gel and named 1-Cox and 2-Cox from which 2-Cox
was later ligated into pGEM-T Easy.
2000 bp 1500 bp 1000 bp 500bp 250 bp
1 2 3 4
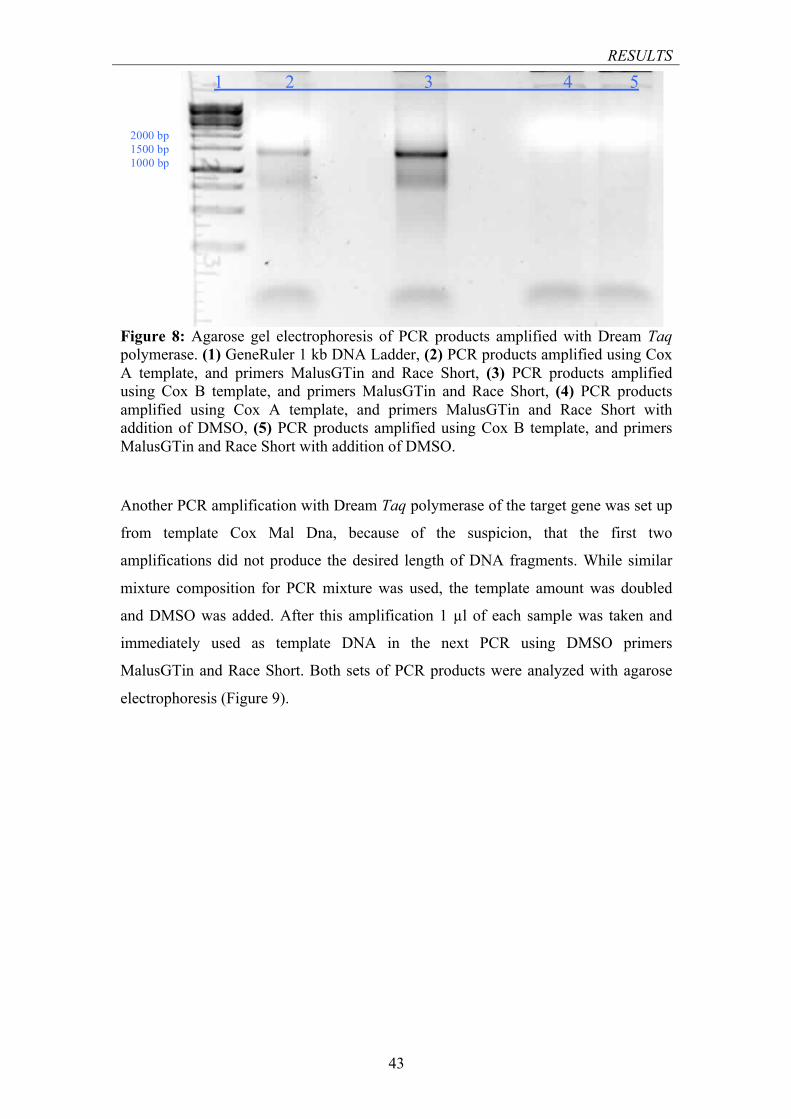
RESULTS
43
Figure 8: Agarose gel electrophoresis of PCR products amplified with Dream Taq polymerase. (1) GeneRuler 1 kb DNA Ladder, (2) PCR products amplified using Cox A template, and primers MalusGTin and Race Short, (3) PCR products amplified using Cox B template, and primers MalusGTin and Race Short, (4) PCR products amplified using Cox A template, and primers MalusGTin and Race Short with addition of DMSO, (5) PCR products amplified using Cox B template, and primers MalusGTin and Race Short with addition of DMSO.
Another PCR amplification with Dream Taq polymerase of the target gene was set up
from template Cox Mal Dna, because of the suspicion, that the first two
amplifications did not produce the desired length of DNA fragments. While similar
mixture composition for PCR mixture was used, the template amount was doubled
and DMSO was added. After this amplification 1 µl of each sample was taken and
immediately used as template DNA in the next PCR using DMSO primers
MalusGTin and Race Short. Both sets of PCR products were analyzed with agarose
electrophoresis (Figure 9).
2000 bp 1500 bp 1000 bp
1 2 3 4 5
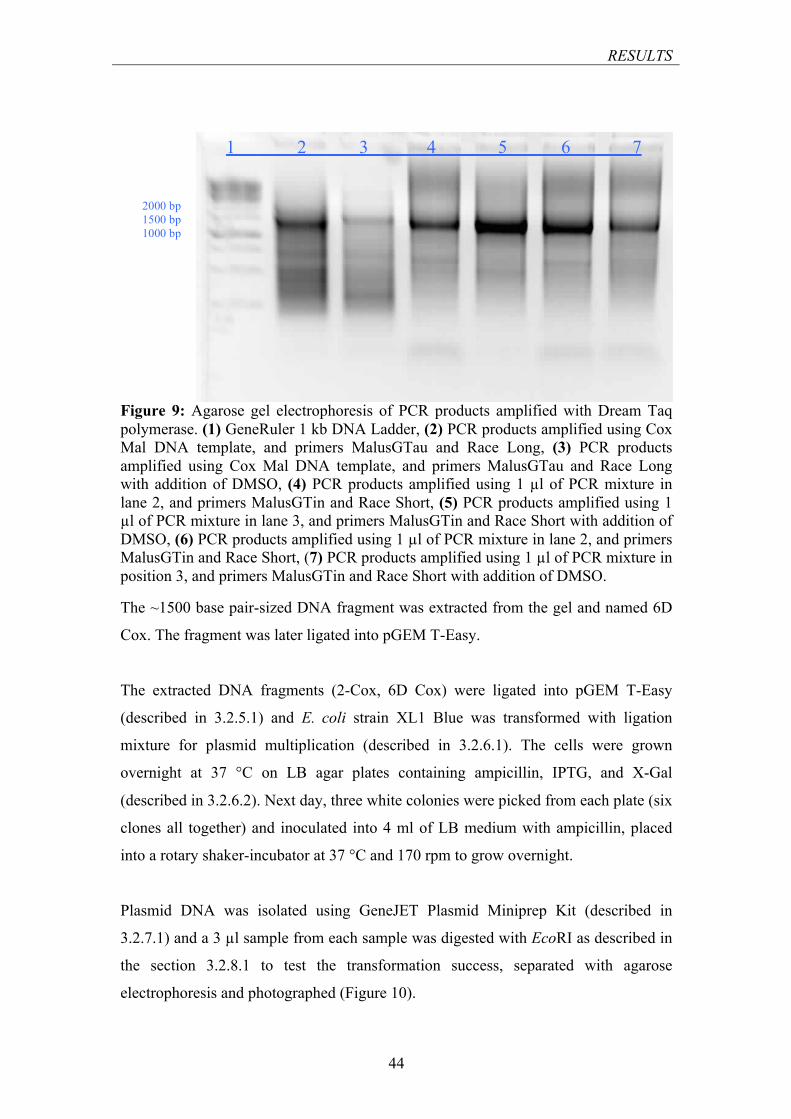
RESULTS
44
Figure 9: Agarose gel electrophoresis of PCR products amplified with Dream Taq polymerase. (1) GeneRuler 1 kb DNA Ladder, (2) PCR products amplified using Cox Mal DNA template, and primers MalusGTau and Race Long, (3) PCR products amplified using Cox Mal DNA template, and primers MalusGTau and Race Long with addition of DMSO, (4) PCR products amplified using 1 µl of PCR mixture in lane 2, and primers MalusGTin and Race Short, (5) PCR products amplified using 1 µl of PCR mixture in lane 3, and primers MalusGTin and Race Short with addition of DMSO, (6) PCR products amplified using 1 µl of PCR mixture in lane 2, and primers MalusGTin and Race Short, (7) PCR products amplified using 1 µl of PCR mixture in position 3, and primers MalusGTin and Race Short with addition of DMSO.
The ~1500 base pair-sized DNA fragment was extracted from the gel and named 6D
Cox. The fragment was later ligated into pGEM T-Easy.
The extracted DNA fragments (2-Cox, 6D Cox) were ligated into pGEM T-Easy
(described in 3.2.5.1) and E. coli strain XL1 Blue was transformed with ligation
mixture for plasmid multiplication (described in 3.2.6.1). The cells were grown
overnight at 37 °C on LB agar plates containing ampicillin, IPTG, and X-Gal
(described in 3.2.6.2). Next day, three white colonies were picked from each plate (six
clones all together) and inoculated into 4 ml of LB medium with ampicillin, placed
into a rotary shaker-incubator at 37 °C and 170 rpm to grow overnight.
Plasmid DNA was isolated using GeneJET Plasmid Miniprep Kit (described in
3.2.7.1) and a 3 µl sample from each sample was digested with EcoRI as described in
the section 3.2.8.1 to test the transformation success, separated with agarose
electrophoresis and photographed (Figure 10).
2000 bp 1500 bp 1000 bp
1 2 3 4 5 6 7

RESULTS
45
Figure 10: Agarose gel electrophoresis of plasmids pGEM-T Easy/2-COX and pGEM-T Easy/6DCOX digested with EcoRI. (1) GeneRuler 1kb DNA Ladder, (2-4) plasmid DNA from clones transformed with pGEM-T Easy/2-COX, (5-7) plasmid DNA from clones transformed with pGEM-T Easy/6DCOX.
Plasmid Dna isolated from clones transformed with pGem-T Easy/2-COX (figure 10)
were sequenced using sequencing primers T7 and T7 term primers (Eurofins Operon
MWG). The results completed the sequence of the target gene.
5’ATGGCGTTGAAGCGGGGGCTATCGAATGCGGGCGCCCACAGGAACCGAGCCTCTGGATCTCGATTCCCTCTTGCGATTCTTATTTTCTTTGCGCTTCTTGTCCCCTTGATTTTCTTCGTCGGCCGTGGCCTCCACATCTCCGATCATAGTGACATCTCATCTAGTCCTGGTGAAAAGAATCTGGATTGGAGACAAGGGCTGGCACTGCAACATGTGAAATCTCTTTTCTCAAAAGAGGTCATTGATGTAATTTCAGCCAGCACGAATGACATGGGGCCTTTGAGCCTTGATTTCTTTAGGAAAAACAATTTGTCGGCTTCATGGAAGGTCATTGGAGCAAATAATTCAGTTGTTACAGATTCTCAGATAAATTTGACTGCTGTAGATGCCAGACAAGAGACACCAAGGGTTAAAGTGGATGATTCTTCAGATGATCACGCTCAACCACTTGATCCTGCAAAACTAGCCAGAAGGCAACTAAGAGAGAAGAGACGTGAAAAGCGTGCAAATGAGTTGATACAATGGGATGACGAATCAGTTGTAAGGCTTGAAACTGCAGCCATTGAGCGGTCCAAATCAGTTGATTCTGCAGTTCTAGGAAAATACAGTATTTGGAGGAAAGAAAATGAGAACGAGAACTCTGATTCAACGGTGCGCTTGATACGGGACCAAATCATAATGGCAAGGGTCTACTTGAGTATTGCAAAGATGAAGAACAAGCTTGATCTGTTCCAACAACTACAAACTCGACTCACAGAATCCCAGCGTGCAGTGGGAGAGGCAACTGCTGATGCGGATTTATCTCAAAGTGCACCGGAGAAAATAAAAGCTATGGGCCAAGTTCTTTCAAAAGCAAGAGAGCAACTGTATGATTGCAACCTGGTCACTGGGAAGCTGAGAGCAATGCTTCAGACTGCAGATGAACAAGTTCGGAGCTTGAAAAAGCAGAGCACATTTCTTAGTCAGTTAGCTGCCAAGACCATCCCAAATGGAATCCACTGCTTATCTATGCGCCTAACCATAGATTATTACCTCCTCCCCCTTGAGAAGAGAAAGTTCCCTAGAAGTGAGAACTTGGAAAATCCAAATCTTTATCATTATGCTCTCTTCTCGGACAACGTCTTGGCTGCATCAGTCGTCGTCAACTCTACCGTCATAAATGCCAAGGATCCGTCAAAACACGTATTCCATCTTGTTACCGATAAGCTTAACTTTGGAGCCATGAACATGTGGTTTTTATTGAATCCTCCTGGAAAAGCCACTATTCATGTTGAAAATGTTGACGAGTTTAAGTGGCTAAACTCATCGTACGCCCCGCTTCAACGCCAGCTTGAGTCTGCTGCAATGAAAAACTATTATTTCAAGGCCGACCATACTACCACTCTCTCATCTGGTGCTTCTAATCTGAAGTACAGGAACCCGAAGTATCTCTCGATGCTTAATCATTTGAGGTTCTATCTTCCACAGGTTTATCCCAAGTTGGATAAGATCTTGTTTCTTGATGATGACATTGTTGTCCAGAAAGACTTAACTGGATTGTGGGCAGTTGATCTACACGGAAAAGTAAATGGTGCAGTAGAAACCTGTGGTGAGAGCTTCCACCGGTTTGACAAGTACCTAAATTTCTCAAATCCTCATATTGCAAGAAACTTTGATCCAAACGCATGTGGATGGGCATATGGGATGAACATGTTTGATCTTAAGGAGTGGAAGAAGAAAGATATTACTGGTATCTATCACAAGTGGCAGAACATGAATGAAGACAGGACACTTTGGAAACTTGGAACATTACCTCCGGGGCTAATTACATTTTATGGGCTGACACGTCCACTACAGAAGTCATGGCATGTACTTGGTTTAGGTTACAACCCAAGTCTTGATCGAGTTGAGATTGACAACGCAGCTGTTGTGCATTATAATGGCAACATGAAACCATGGCTGGAGTTGGCGATGACCAAGTATCGAGGATACTGGACCAAGTACATTAAGTTTGATCATCCCTATCTTCGCAGCTGCAGCTAA-3’ Figure 11: Complete DNA sequence of target putative glycosyltransferase obtained in RACE.
2000 bp 1500 bp
1000 bp
1 2 3 4 5 6 7
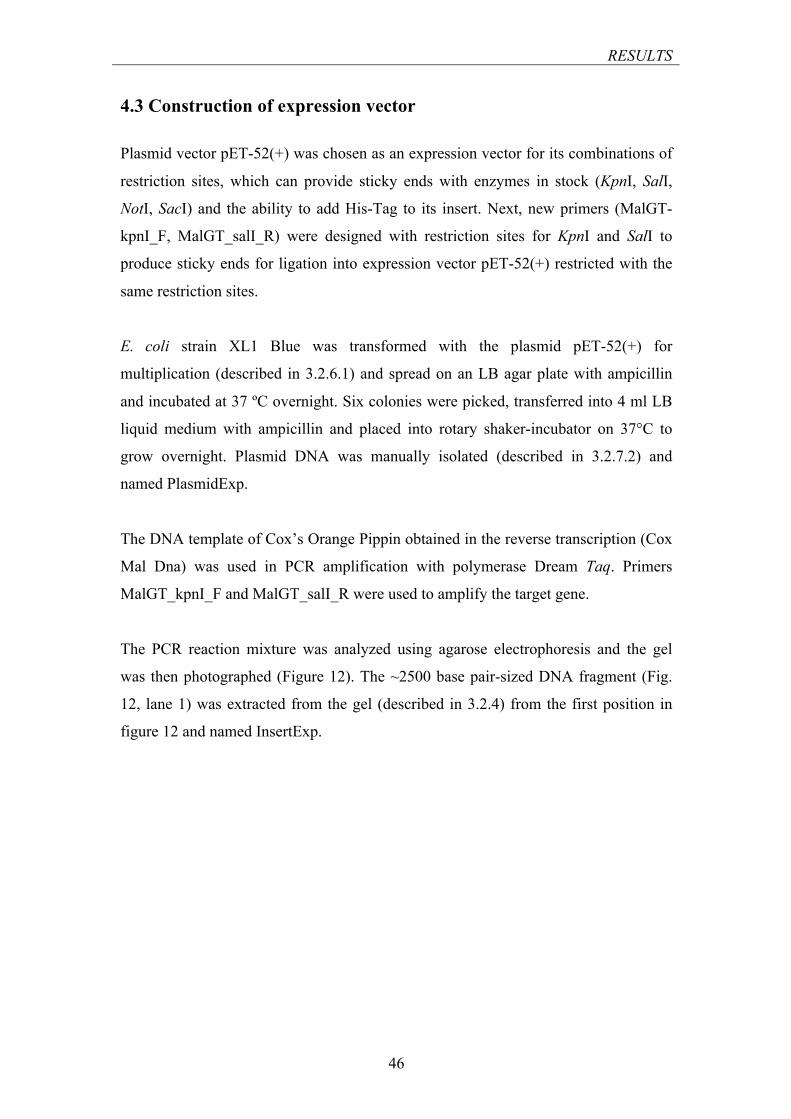
RESULTS
46
4.3 Construction of expression vector
Plasmid vector pET-52(+) was chosen as an expression vector for its combinations of
restriction sites, which can provide sticky ends with enzymes in stock (KpnI, SalI,
NotI, SacI) and the ability to add His-Tag to its insert. Next, new primers (MalGT-
kpnI_F, MalGT_salI_R) were designed with restriction sites for KpnI and SalI to
produce sticky ends for ligation into expression vector pET-52(+) restricted with the
same restriction sites.
E. coli strain XL1 Blue was transformed with the plasmid pET-52(+) for
multiplication (described in 3.2.6.1) and spread on an LB agar plate with ampicillin
and incubated at 37 ºC overnight. Six colonies were picked, transferred into 4 ml LB
liquid medium with ampicillin and placed into rotary shaker-incubator on 37°C to
grow overnight. Plasmid DNA was manually isolated (described in 3.2.7.2) and
named PlasmidExp.
The DNA template of Cox’s Orange Pippin obtained in the reverse transcription (Cox
Mal Dna) was used in PCR amplification with polymerase Dream Taq. Primers
MalGT_kpnI_F and MalGT_salI_R were used to amplify the target gene.
The PCR reaction mixture was analyzed using agarose electrophoresis and the gel
was then photographed (Figure 12). The ~2500 base pair-sized DNA fragment (Fig.
12, lane 1) was extracted from the gel (described in 3.2.4) from the first position in
figure 12 and named InsertExp.
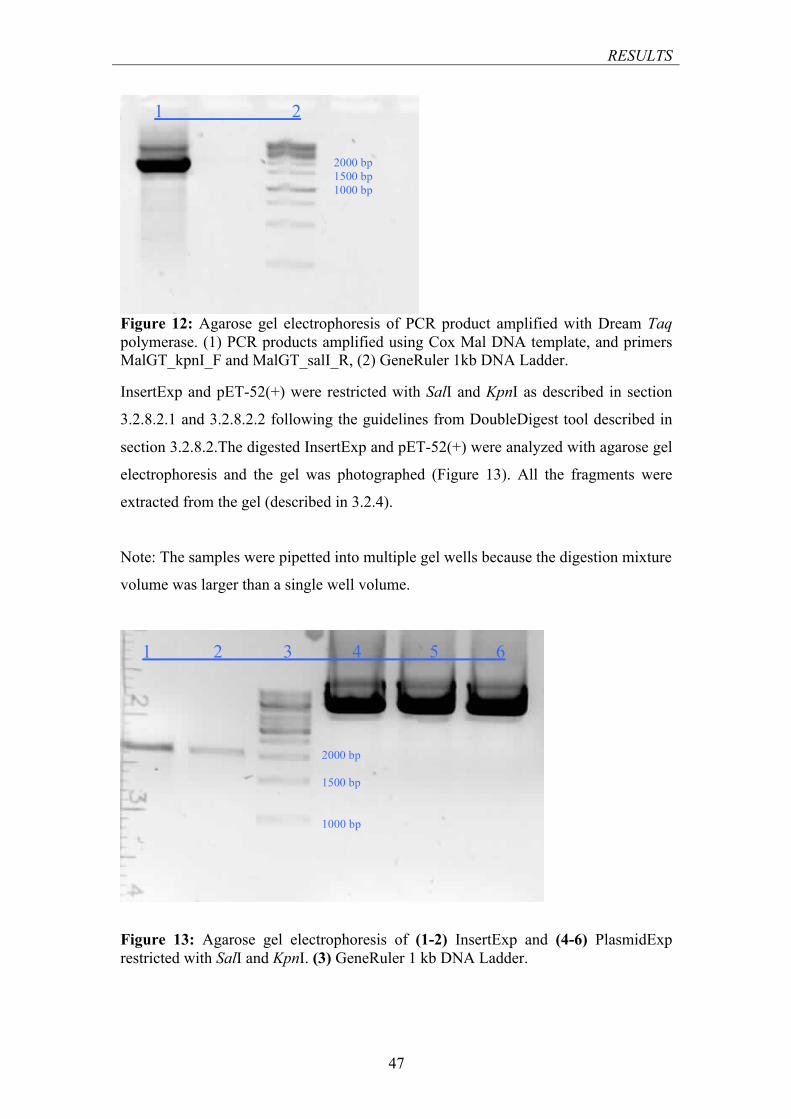
RESULTS
47
Figure 12: Agarose gel electrophoresis of PCR product amplified with Dream Taq polymerase. (1) PCR products amplified using Cox Mal DNA template, and primers MalGT_kpnI_F and MalGT_salI_R, (2) GeneRuler 1kb DNA Ladder.
InsertExp and pET-52(+) were restricted with SalI and KpnI as described in section
3.2.8.2.1 and 3.2.8.2.2 following the guidelines from DoubleDigest tool described in
section 3.2.8.2.The digested InsertExp and pET-52(+) were analyzed with agarose gel
electrophoresis and the gel was photographed (Figure 13). All the fragments were
extracted from the gel (described in 3.2.4).
Note: The samples were pipetted into multiple gel wells because the digestion mixture
volume was larger than a single well volume.
Figure 13: Agarose gel electrophoresis of (1-2) InsertExp and (4-6) PlasmidExp restricted with SalI and KpnI. (3) GeneRuler 1 kb DNA Ladder.
1 2 2000 bp 1500 bp 1000 bp
2000 bp 1500 bp 1000 bp
1 2 3 4 5 6
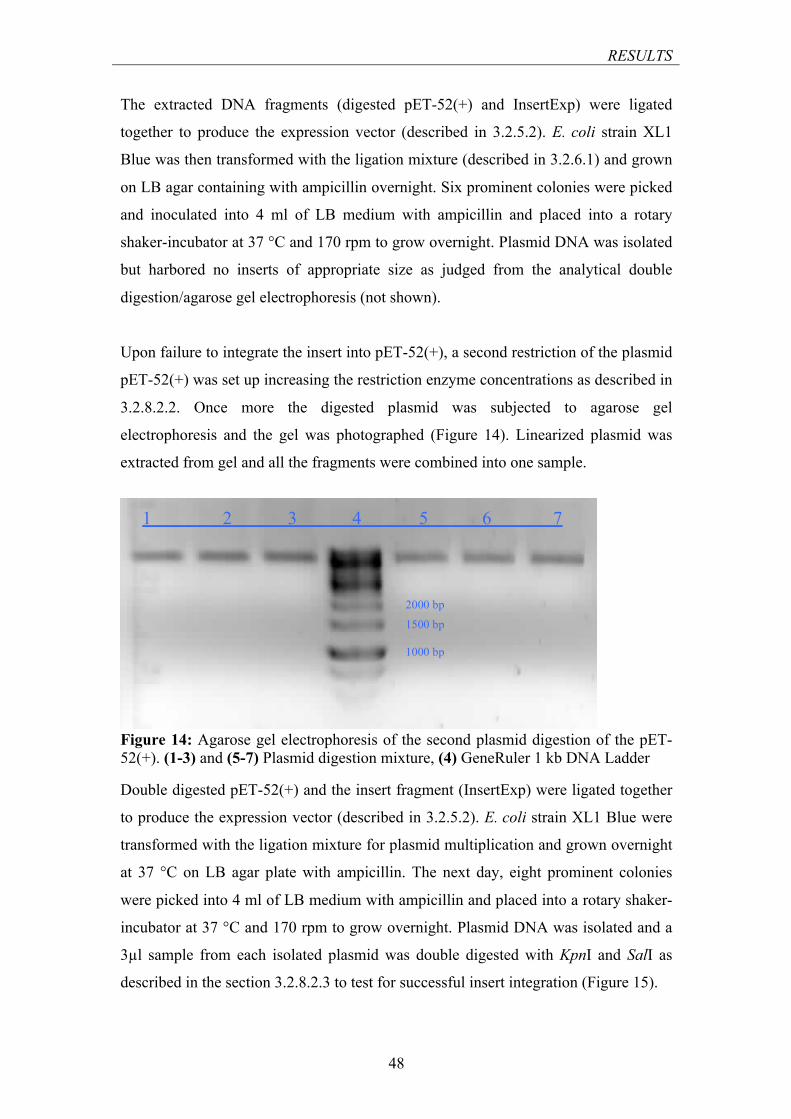
RESULTS
48
The extracted DNA fragments (digested pET-52(+) and InsertExp) were ligated
together to produce the expression vector (described in 3.2.5.2). E. coli strain XL1
Blue was then transformed with the ligation mixture (described in 3.2.6.1) and grown
on LB agar containing with ampicillin overnight. Six prominent colonies were picked
and inoculated into 4 ml of LB medium with ampicillin and placed into a rotary
shaker-incubator at 37 °C and 170 rpm to grow overnight. Plasmid DNA was isolated
but harbored no inserts of appropriate size as judged from the analytical double
digestion/agarose gel electrophoresis (not shown).
Upon failure to integrate the insert into pET-52(+), a second restriction of the plasmid
pET-52(+) was set up increasing the restriction enzyme concentrations as described in
3.2.8.2.2. Once more the digested plasmid was subjected to agarose gel
electrophoresis and the gel was photographed (Figure 14). Linearized plasmid was
extracted from gel and all the fragments were combined into one sample.
Figure 14: Agarose gel electrophoresis of the second plasmid digestion of the pET-52(+). (1-3) and (5-7) Plasmid digestion mixture, (4) GeneRuler 1 kb DNA Ladder
Double digested pET-52(+) and the insert fragment (InsertExp) were ligated together
to produce the expression vector (described in 3.2.5.2). E. coli strain XL1 Blue were
transformed with the ligation mixture for plasmid multiplication and grown overnight
at 37 °C on LB agar plate with ampicillin. The next day, eight prominent colonies
were picked into 4 ml of LB medium with ampicillin and placed into a rotary shaker-
incubator at 37 °C and 170 rpm to grow overnight. Plasmid DNA was isolated and a
3µl sample from each isolated plasmid was double digested with KpnI and SalI as
described in the section 3.2.8.2.3 to test for successful insert integration (Figure 15).
1 2 3 4 5 6 7
2000 bp
1500 bp 1000 bp
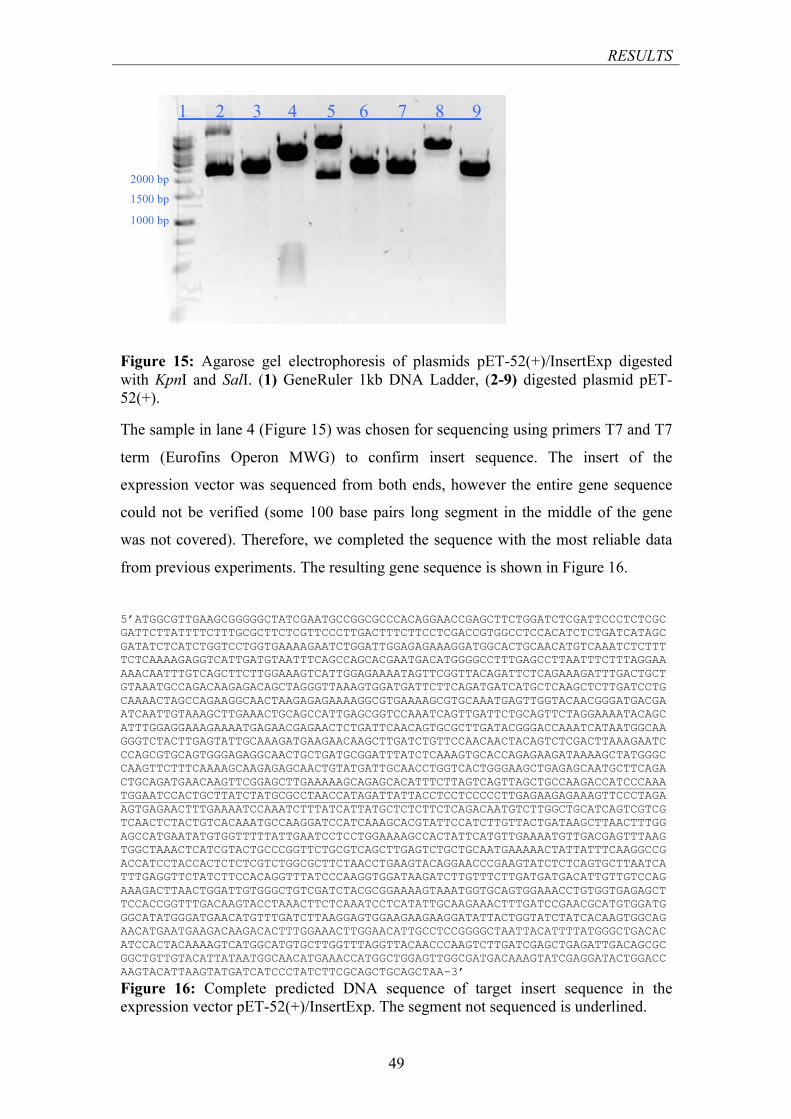
RESULTS
49
Figure 15: Agarose gel electrophoresis of plasmids pET-52(+)/InsertExp digested with KpnI and SalI. (1) GeneRuler 1kb DNA Ladder, (2-9) digested plasmid pET-52(+).
The sample in lane 4 (Figure 15) was chosen for sequencing using primers T7 and T7
term (Eurofins Operon MWG) to confirm insert sequence. The insert of the
expression vector was sequenced from both ends, however the entire gene sequence
could not be verified (some 100 base pairs long segment in the middle of the gene
was not covered). Therefore, we completed the sequence with the most reliable data
from previous experiments. The resulting gene sequence is shown in Figure 16.
5’ATGGCGTTGAAGCGGGGGCTATCGAATGCCGGCGCCCACAGGAACCGAGCTTCTGGATCTCGATTCCCTCTCGCGATTCTTATTTTCTTTGCGCTTCTCGTTCCCTTGACTTTCTTCCTCGACCGTGGCCTCCACATCTCTGATCATAGCGATATCTCATCTGGTCCTGGTGAAAAGAATCTGGATTGGAGAGAAAGGATGGCACTGCAACATGTCAAATCTCTTTTCTCAAAAGAGGTCATTGATGTAATTTCAGCCAGCACGAATGACATGGGGCCTTTGAGCCTTAATTTCTTTAGGAAAAACAATTTGTCAGCTTCTTGGAAAGTCATTGGAGAAAATAGTTCGGTTACAGATTCTCAGAAAGATTTGACTGCTGTAAATGCCAGACAAGAGACAGCTAGGGTTAAAGTGGATGATTCTTCAGATGATCATGCTCAAGCTCTTGATCCTGCAAAACTAGCCAGAAGGCAACTAAGAGAGAAAAGGCGTGAAAAGCGTGCAAATGAGTTGGTACAACGGGATGACGAATCAATTGTAAAGCTTGAAACTGCAGCCATTGAGCGGTCCAAATCAGTTGATTCTGCAGTTCTAGGAAAATACAGCATTTGGAGGAAAGAAAATGAGAACGAGAACTCTGATTCAACAGTGCGCTTGATACGGGACCAAATCATAATGGCAAGGGTCTACTTGAGTATTGCAAAGATGAAGAACAAGCTTGATCTGTTCCAACAACTACAGTCTCGACTTAAAGAATCCCAGCGTGCAGTGGGAGAGGCAACTGCTGATGCGGATTTATCTCAAAGTGCACCAGAGAAGATAAAAGCTATGGGCCAAGTTCTTTCAAAAGCAAGAGAGCAACTGTATGATTGCAACCTGGTCACTGGGAAGCTGAGAGCAATGCTTCAGACTGCAGATGAACAAGTTCGGAGCTTGAAAAAGCAGAGCACATTTCTTAGTCAGTTAGCTGCCAAGACCATCCCAAATGGAATCCACTGCTTATCTATGCGCCTAACCATAGATTATTACCTCCTCCCCCTTGAGAAGAGAAAGTTCCCTAGAAGTGAGAACTTTGAAAATCCAAATCTTTATCATTATGCTCTCTTCTCAGACAATGTCTTGGCTGCATCAGTCGTCGTCAACTCTACTGTCACAAATGCCAAGGATCCATCAAAGCACGTATTCCATCTTGTTACTGATAAGCTTAACTTTGGAGCCATGAATATGTGGTTTTTATTGAATCCTCCTGGAAAAGCCACTATTCATGTTGAAAATGTTGACGAGTTTAAGTGGCTAAACTCATCGTACTGCCCGGTTCTGCGTCAGCTTGAGTCTGCTGCAATGAAAAACTATTATTTCAAGGCCGACCATCCTACCACTCTCTCGTCTGGCGCTTCTAACCTGAAGTACAGGAACCCGAAGTATCTCTCAGTGCTTAATCATTTGAGGTTCTATCTTCCACAGGTTTATCCCAAGGTGGATAAGATCTTGTTTCTTGATGATGACATTGTTGTCCAGAAAGACTTAACTGGATTGTGGGCTGTCGATCTACGCGGAAAAGTAAATGGTGCAGTGGAAACCTGTGGTGAGAGCTTCCACCGGTTTGACAAGTACCTAAACTTCTCAAATCCTCATATTGCAAGAAACTTTGATCCGAACGCATGTGGATGGGCATATGGGATGAACATGTTTGATCTTAAGGAGTGGAAGAAGAAGGATATTACTGGTATCTATCACAAGTGGCAGAACATGAATGAAGACAAGACACTTTGGAAACTTGGAACATTGCCTCCGGGGCTAATTACATTTTATGGGCTGACACATCCACTACAAAAGTCATGGCATGTGCTTGGTTTAGGTTACAACCCAAGTCTTGATCGAGCTGAGATTGACAGCGCGGCTGTTGTACATTATAATGGCAACATGAAACCATGGCTGGAGTTGGCGATGACAAAGTATCGAGGATACTGGACCAAGTACATTAAGTATGATCATCCCTATCTTCGCAGCTGCAGCTAA-3’
Figure 16: Complete predicted DNA sequence of target insert sequence in the expression vector pET-52(+)/InsertExp. The segment not sequenced is underlined.
2000 bp
1500 bp
1000 bp
1 2 3 4 5 6 7 8 9
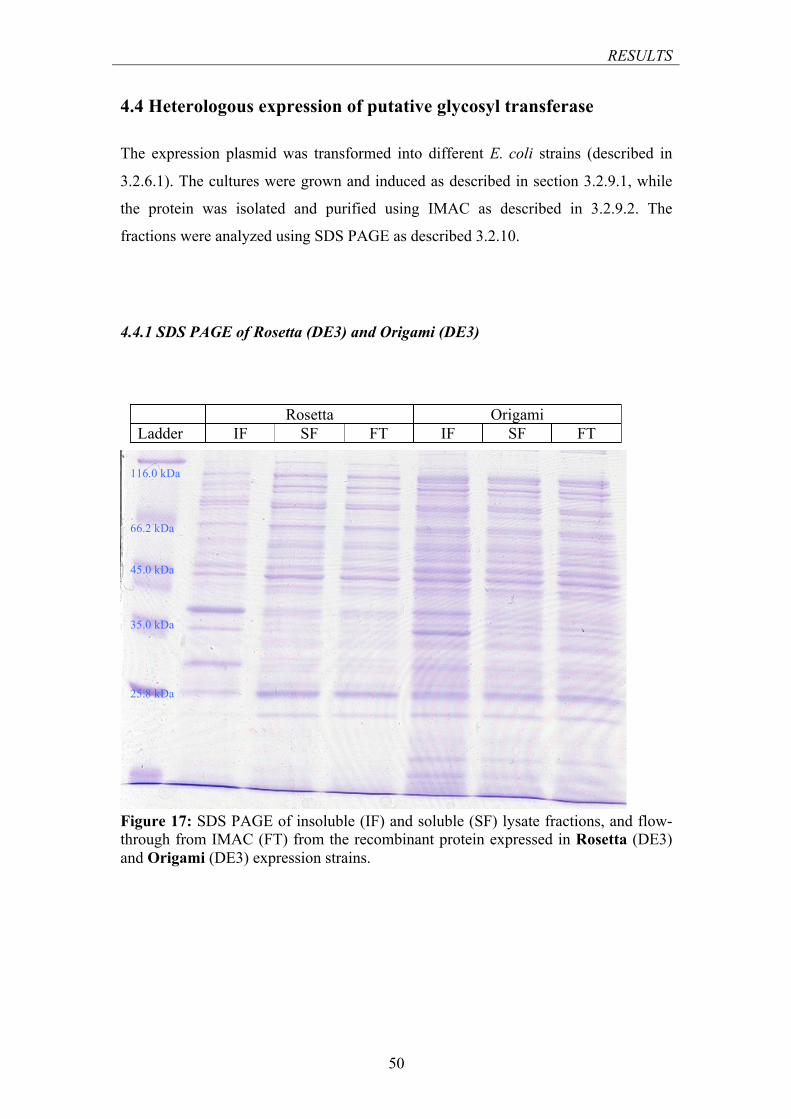
RESULTS
50
4.4 Heterologous expression of putative glycosyl transferase
The expression plasmid was transformed into different E. coli strains (described in
3.2.6.1). The cultures were grown and induced as described in section 3.2.9.1, while
the protein was isolated and purified using IMAC as described in 3.2.9.2. The
fractions were analyzed using SDS PAGE as described 3.2.10.
4.4.1 SDS PAGE of Rosetta (DE3) and Origami (DE3)
Figure 17: SDS PAGE of insoluble (IF) and soluble (SF) lysate fractions, and flow-through from IMAC (FT) from the recombinant protein expressed in Rosetta (DE3) and Origami (DE3) expression strains.
Rosetta Origami Ladder IF SF FT IF SF FT
116.0 kDa 66.2 kDa 45.0 kDa 35.0 kDa 25.8 kDa
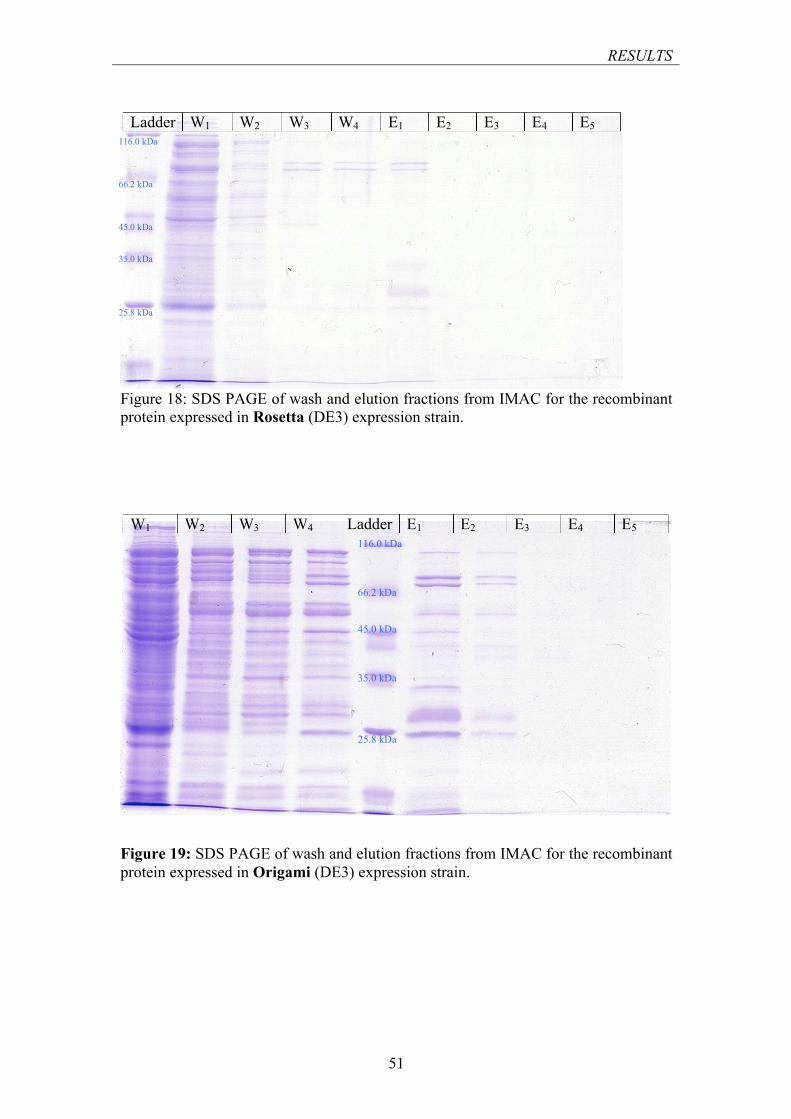
RESULTS
51
Figure 18: SDS PAGE of wash and elution fractions from IMAC for the recombinant protein expressed in Rosetta (DE3) expression strain.
Figure 19: SDS PAGE of wash and elution fractions from IMAC for the recombinant protein expressed in Origami (DE3) expression strain.
Ladder W1 W2 W3 W4 E1 E2 E3 E4 E5 116.0 kDa
66.2 kDa 45.0 kDa 35.0 kDa 25.8 kDa
W1 W2 W3 W4 Ladder E1 E2 E3 E4 E5 116.0 kDa
66.2 kDa 45.0 kDa 35.0 kDa 25.8 kDa
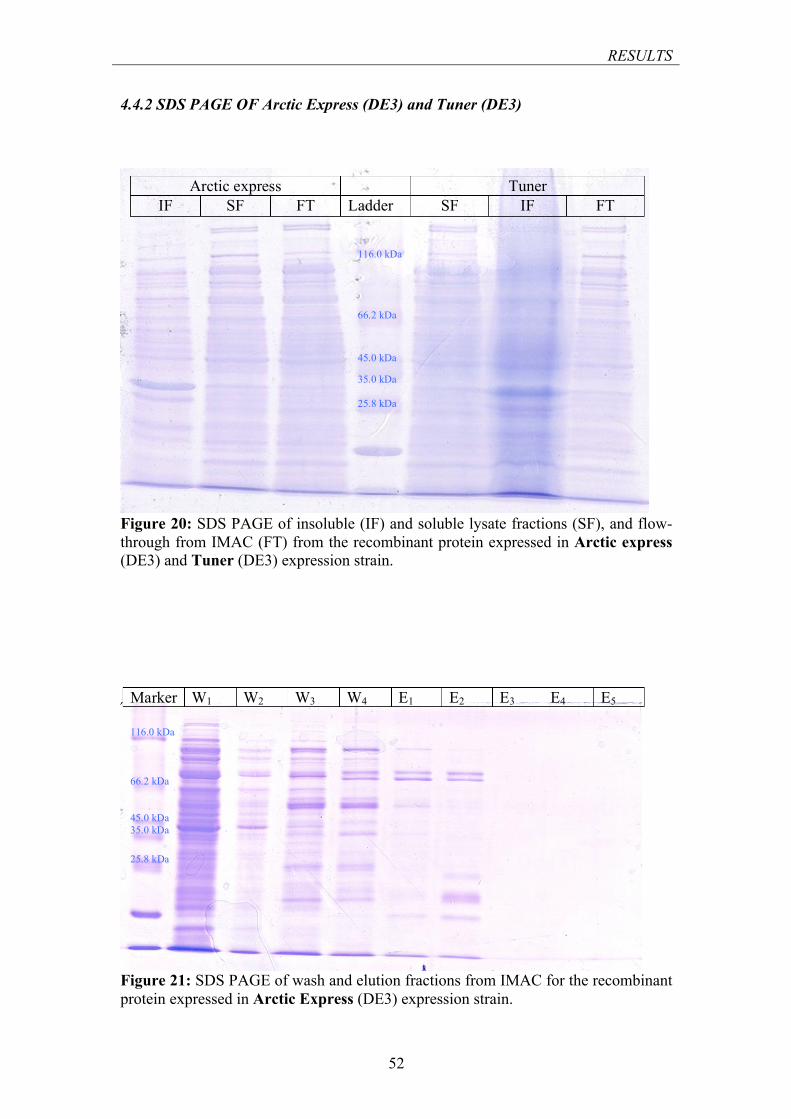
RESULTS
52
4.4.2 SDS PAGE OF Arctic Express (DE3) and Tuner (DE3)
Figure 20: SDS PAGE of insoluble (IF) and soluble lysate fractions (SF), and flow-through from IMAC (FT) from the recombinant protein expressed in Arctic express (DE3) and Tuner (DE3) expression strain.
Figure 21: SDS PAGE of wash and elution fractions from IMAC for the recombinant protein expressed in Arctic Express (DE3) expression strain.
116.0 kDa 66.2 kDa 45.0 kDa 35.0 kDa 25.8 kDa
Marker W1 W2 W3 W4 E1 E2 E3 E4 E5
Arctic express Tuner IF SF FT Ladder SF IF FT
116.0 kDa 66.2 kDa 45.0 kDa 35.0 kDa 25.8 kDa
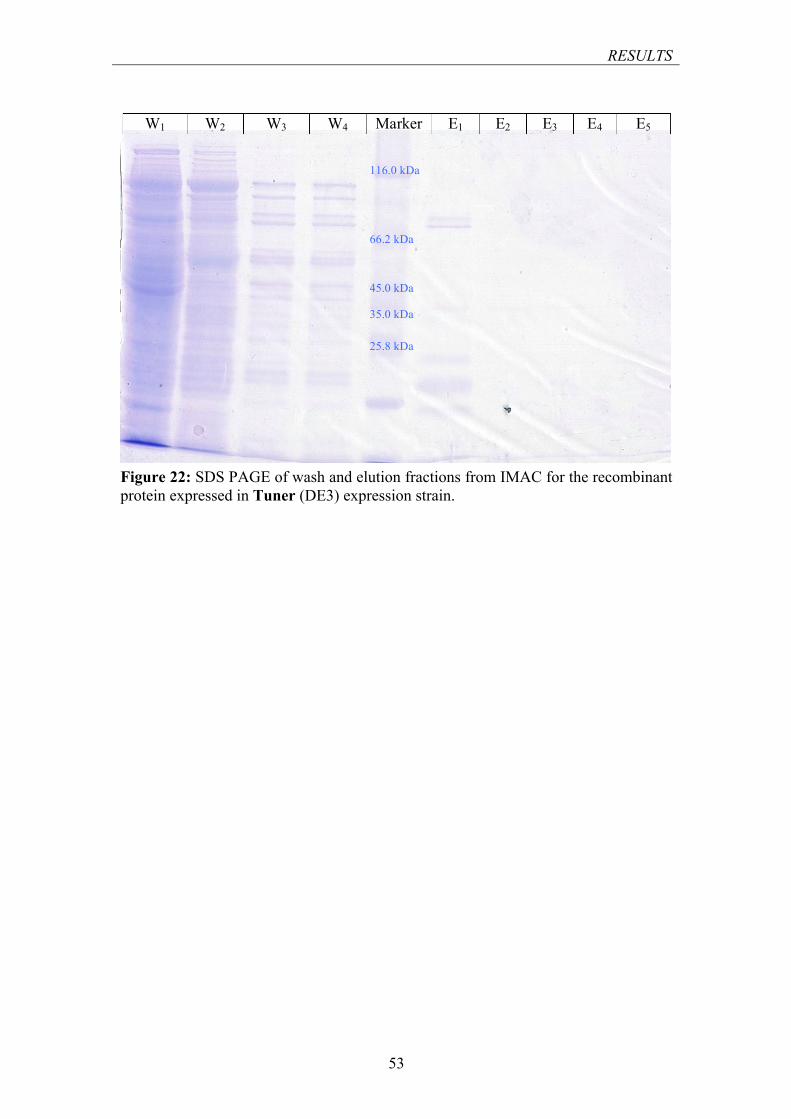
RESULTS
53
Figure 22: SDS PAGE of wash and elution fractions from IMAC for the recombinant protein expressed in Tuner (DE3) expression strain.
W1 W2 W3 W4 Marker E1 E2 E3 E4 E5
116.0 kDa 66.2 kDa
45.0 kDa 35.0 kDa 25.8 kDa
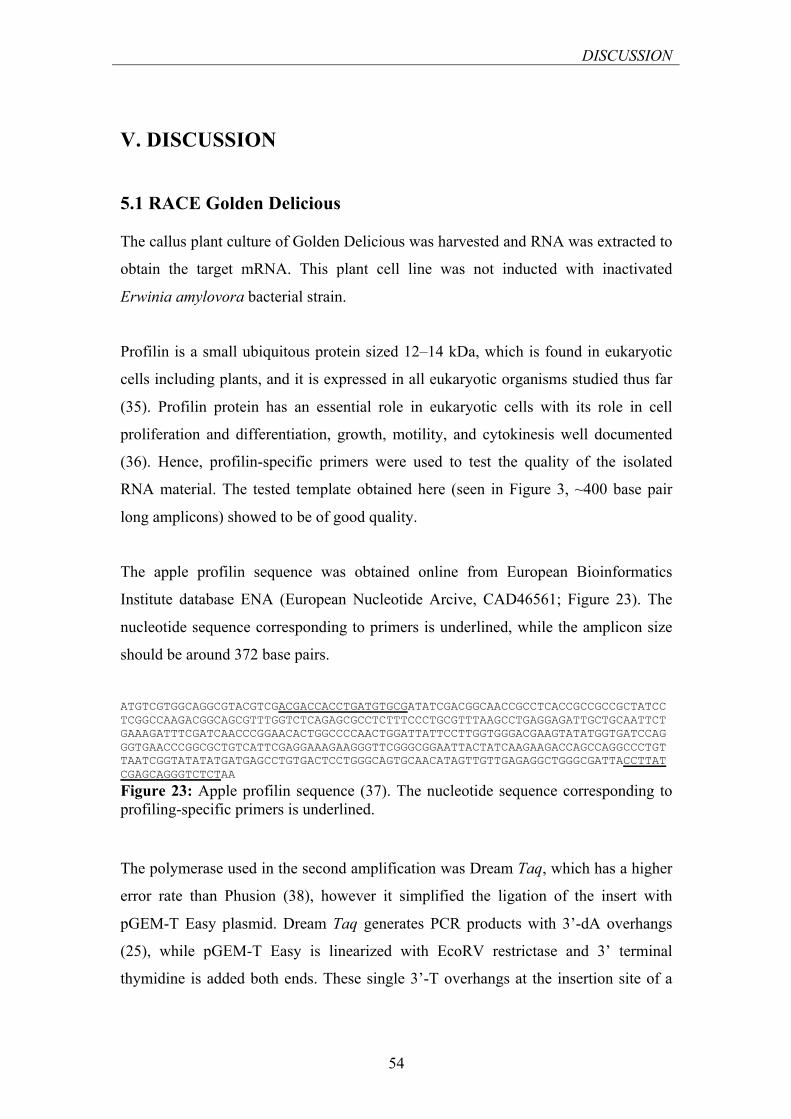
DISCUSSION
54
V. DISCUSSION
5.1 RACE Golden Delicious The callus plant culture of Golden Delicious was harvested and RNA was extracted to
obtain the target mRNA. This plant cell line was not inducted with inactivated
Erwinia amylovora bacterial strain.
Profilin is a small ubiquitous protein sized 12–14 kDa, which is found in eukaryotic
cells including plants, and it is expressed in all eukaryotic organisms studied thus far
(35). Profilin protein has an essential role in eukaryotic cells with its role in cell
proliferation and differentiation, growth, motility, and cytokinesis well documented
(36). Hence, profilin-specific primers were used to test the quality of the isolated
RNA material. The tested template obtained here (seen in Figure 3, ~400 base pair
long amplicons) showed to be of good quality.
The apple profilin sequence was obtained online from European Bioinformatics
Institute database ENA (European Nucleotide Arcive, CAD46561; Figure 23). The
nucleotide sequence corresponding to primers is underlined, while the amplicon size
should be around 372 base pairs.
ATGTCGTGGCAGGCGTACGTCGACGACCACCTGATGTGCGATATCGACGGCAACCGCCTCACCGCCGCCGCTATCCTCGGCCAAGACGGCAGCGTTTGGTCTCAGAGCGCCTCTTTCCCTGCGTTTAAGCCTGAGGAGATTGCTGCAATTCTGAAAGATTTCGATCAACCCGGAACACTGGCCCCAACTGGATTATTCCTTGGTGGGACGAAGTATATGGTGATCCAGGGTGAACCCGGCGCTGTCATTCGAGGAAAGAAGGGTTCGGGCGGAATTACTATCAAGAAGACCAGCCAGGCCCTGTTAATCGGTATATATGATGAGCCTGTGACTCCTGGGCAGTGCAACATAGTTGTTGAGAGGCTGGGCGATTACCTTATCGAGCAGGGTCTCTAA
Figure 23: Apple profilin sequence (37). The nucleotide sequence corresponding to profiling-specific primers is underlined.
The polymerase used in the second amplification was Dream Taq, which has a higher
error rate than Phusion (38), however it simplified the ligation of the insert with
pGEM-T Easy plasmid. Dream Taq generates PCR products with 3’-dA overhangs
(25), while pGEM-T Easy is linearized with EcoRV restrictase and 3’ terminal
thymidine is added both ends. These single 3’-T overhangs at the insertion site of a
DISCUSSION
55
plasmid prevent recircularization of the vector and provide a compatible overhang for
PCR products generated by in this case Dream Taq polymerase (27).
The PCR products sized ~1500 base pairs (Figure 4) were ligated with pGEM-T Easy
and transformed into XL1 Blue. The chosen most prominent isolated vectors were
sequenced, however only a partial sequence was established, indicating that the target
gene is active and transcribed, but the turn-over rate of putative GT’s mRNA is likely
high (i.e., mRNA digestion rate is significant compared to the speed of transcription).
There were two templates used. The first template was digested using RNase H to
eliminate the RNA left over from reverse transcription while the other template was
not. The agarose gel pictures (Figures 4 and 5) show no significant effect of RNase H
digestion, however the best sequencing results originated from the digested template,
which points to benefits of RNA digestion.
The complete gene sequence could not be determined. Therefore, the plant cell lines
were induced with inactivated Erwinia amylovora bacteria to induce apple’s defense
response. However, the information on the newly acquired segment of the target gene
originating from the digested template was used to design new gene specific primers
(MalusGTau, MalusGTin) to focus on the unknown part of the gene sequence.
5.2 RACE Cox’s Orange Pippin
The cell line of Cox’s Orange Pippin was used because of the microbial
contamination of Golden Delicious cell line before we could induce and harvest it.
The plant cell line was induced with inactivated culture of Erwinia amylovora to start
up apples defense response and subsequently increase target glycosyltransferase
expression. Because of the high invasive potential the culture of Erwinia amylovora,
which was used for induction of apple’s defense response, was inactivated.
The combination of 3’-CDS, Race long and Race short primers was used in this order
enables nested PCR, which should provide more specific amplifications.
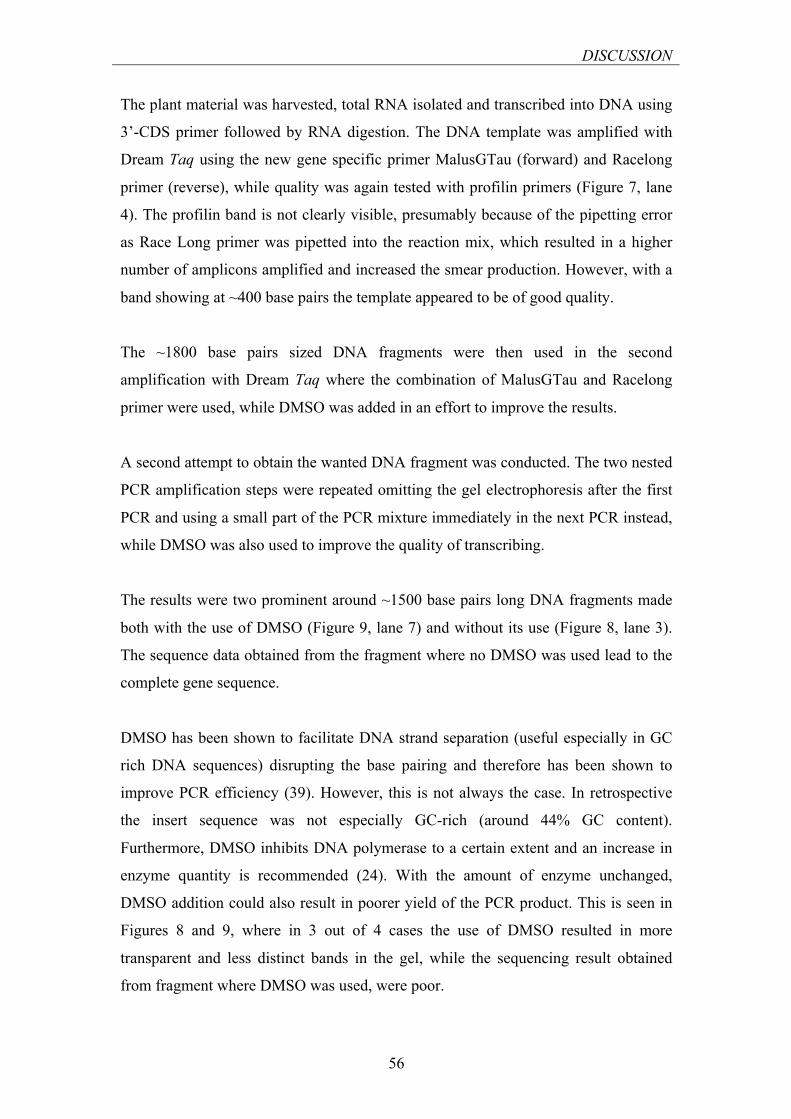
DISCUSSION
56
The plant material was harvested, total RNA isolated and transcribed into DNA using
3’-CDS primer followed by RNA digestion. The DNA template was amplified with
Dream Taq using the new gene specific primer MalusGTau (forward) and Racelong
primer (reverse), while quality was again tested with profilin primers (Figure 7, lane
4). The profilin band is not clearly visible, presumably because of the pipetting error
as Race Long primer was pipetted into the reaction mix, which resulted in a higher
number of amplicons amplified and increased the smear production. However, with a
band showing at ~400 base pairs the template appeared to be of good quality.
The ~1800 base pairs sized DNA fragments were then used in the second
amplification with Dream Taq where the combination of MalusGTau and Racelong
primer were used, while DMSO was added in an effort to improve the results.
A second attempt to obtain the wanted DNA fragment was conducted. The two nested
PCR amplification steps were repeated omitting the gel electrophoresis after the first
PCR and using a small part of the PCR mixture immediately in the next PCR instead,
while DMSO was also used to improve the quality of transcribing.
The results were two prominent around ~1500 base pairs long DNA fragments made
both with the use of DMSO (Figure 9, lane 7) and without its use (Figure 8, lane 3).
The sequence data obtained from the fragment where no DMSO was used lead to the
complete gene sequence.
DMSO has been shown to facilitate DNA strand separation (useful especially in GC
rich DNA sequences) disrupting the base pairing and therefore has been shown to
improve PCR efficiency (39). However, this is not always the case. In retrospective
the insert sequence was not especially GC-rich (around 44% GC content).
Furthermore, DMSO inhibits DNA polymerase to a certain extent and an increase in
enzyme quantity is recommended (24). With the amount of enzyme unchanged,
DMSO addition could also result in poorer yield of the PCR product. This is seen in
Figures 8 and 9, where in 3 out of 4 cases the use of DMSO resulted in more
transparent and less distinct bands in the gel, while the sequencing result obtained
from fragment where DMSO was used, were poor.
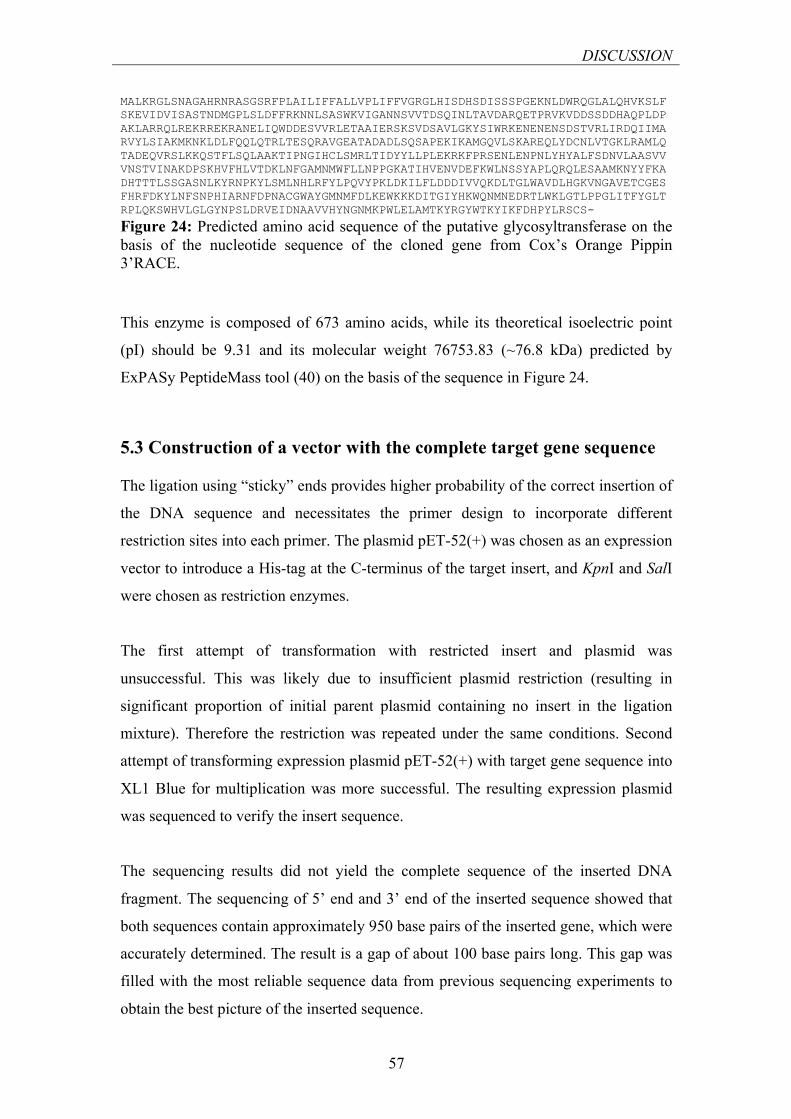
DISCUSSION
57
MALKRGLSNAGAHRNRASGSRFPLAILIFFALLVPLIFFVGRGLHISDHSDISSSPGEKNLDWRQGLALQHVKSLFSKEVIDVISASTNDMGPLSLDFFRKNNLSASWKVIGANNSVVTDSQINLTAVDARQETPRVKVDDSSDDHAQPLDPAKLARRQLREKRREKRANELIQWDDESVVRLETAAIERSKSVDSAVLGKYSIWRKENENENSDSTVRLIRDQIIMARVYLSIAKMKNKLDLFQQLQTRLTESQRAVGEATADADLSQSAPEKIKAMGQVLSKAREQLYDCNLVTGKLRAMLQTADEQVRSLKKQSTFLSQLAAKTIPNGIHCLSMRLTIDYYLLPLEKRKFPRSENLENPNLYHYALFSDNVLAASVVVNSTVINAKDPSKHVFHLVTDKLNFGAMNMWFLLNPPGKATIHVENVDEFKWLNSSYAPLQRQLESAAMKNYYFKADHTTTLSSGASNLKYRNPKYLSMLNHLRFYLPQVYPKLDKILFLDDDIVVQKDLTGLWAVDLHGKVNGAVETCGESFHRFDKYLNFSNPHIARNFDPNACGWAYGMNMFDLKEWKKKDITGIYHKWQNMNEDRTLWKLGTLPPGLITFYGLTRPLQKSWHVLGLGYNPSLDRVEIDNAAVVHYNGNMKPWLELAMTKYRGYWTKYIKFDHPYLRSCS-
Figure 24: Predicted amino acid sequence of the putative glycosyltransferase on the basis of the nucleotide sequence of the cloned gene from Cox’s Orange Pippin 3’RACE.
This enzyme is composed of 673 amino acids, while its theoretical isoelectric point
(pI) should be 9.31 and its molecular weight 76753.83 (~76.8 kDa) predicted by
ExPASy PeptideMass tool (40) on the basis of the sequence in Figure 24.
5.3 Construction of a vector with the complete target gene sequence The ligation using “sticky” ends provides higher probability of the correct insertion of
the DNA sequence and necessitates the primer design to incorporate different
restriction sites into each primer. The plasmid pET-52(+) was chosen as an expression
vector to introduce a His-tag at the C-terminus of the target insert, and KpnI and SalI
were chosen as restriction enzymes.
The first attempt of transformation with restricted insert and plasmid was
unsuccessful. This was likely due to insufficient plasmid restriction (resulting in
significant proportion of initial parent plasmid containing no insert in the ligation
mixture). Therefore the restriction was repeated under the same conditions. Second
attempt of transforming expression plasmid pET-52(+) with target gene sequence into
XL1 Blue for multiplication was more successful. The resulting expression plasmid
was sequenced to verify the insert sequence.
The sequencing results did not yield the complete sequence of the inserted DNA
fragment. The sequencing of 5’ end and 3’ end of the inserted sequence showed that
both sequences contain approximately 950 base pairs of the inserted gene, which were
accurately determined. The result is a gap of about 100 base pairs long. This gap was
filled with the most reliable sequence data from previous sequencing experiments to
obtain the best picture of the inserted sequence.
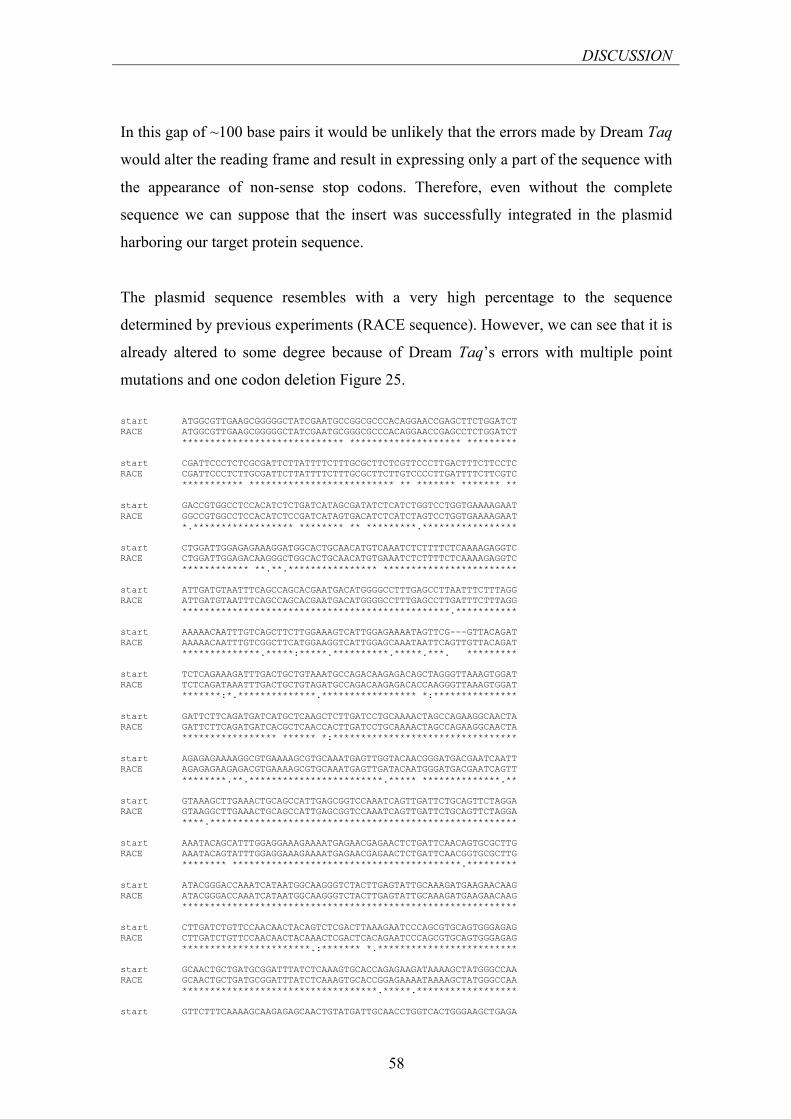
DISCUSSION
58
In this gap of ~100 base pairs it would be unlikely that the errors made by Dream Taq
would alter the reading frame and result in expressing only a part of the sequence with
the appearance of non-sense stop codons. Therefore, even without the complete
sequence we can suppose that the insert was successfully integrated in the plasmid
harboring our target protein sequence.
The plasmid sequence resembles with a very high percentage to the sequence
determined by previous experiments (RACE sequence). However, we can see that it is
already altered to some degree because of Dream Taq’s errors with multiple point
mutations and one codon deletion Figure 25.
start ATGGCGTTGAAGCGGGGGCTATCGAATGCCGGCGCCCACAGGAACCGAGCTTCTGGATCT RACE ATGGCGTTGAAGCGGGGGCTATCGAATGCGGGCGCCCACAGGAACCGAGCCTCTGGATCT ***************************** ******************** ********* start CGATTCCCTCTCGCGATTCTTATTTTCTTTGCGCTTCTCGTTCCCTTGACTTTCTTCCTC RACE CGATTCCCTCTTGCGATTCTTATTTTCTTTGCGCTTCTTGTCCCCTTGATTTTCTTCGTC *********** ************************** ** ******* ******* ** start GACCGTGGCCTCCACATCTCTGATCATAGCGATATCTCATCTGGTCCTGGTGAAAAGAAT RACE GGCCGTGGCCTCCACATCTCCGATCATAGTGACATCTCATCTAGTCCTGGTGAAAAGAAT *.****************** ******** ** *********.***************** start CTGGATTGGAGAGAAAGGATGGCACTGCAACATGTCAAATCTCTTTTCTCAAAAGAGGTC RACE CTGGATTGGAGACAAGGGCTGGCACTGCAACATGTGAAATCTCTTTTCTCAAAAGAGGTC ************ **.**.**************** ************************ start ATTGATGTAATTTCAGCCAGCACGAATGACATGGGGCCTTTGAGCCTTAATTTCTTTAGG RACE ATTGATGTAATTTCAGCCAGCACGAATGACATGGGGCCTTTGAGCCTTGATTTCTTTAGG ************************************************.*********** start AAAAACAATTTGTCAGCTTCTTGGAAAGTCATTGGAGAAAATAGTTCG---GTTACAGAT RACE AAAAACAATTTGTCGGCTTCATGGAAGGTCATTGGAGCAAATAATTCAGTTGTTACAGAT **************.*****:*****.**********.*****.***. ********* start TCTCAGAAAGATTTGACTGCTGTAAATGCCAGACAAGAGACAGCTAGGGTTAAAGTGGAT RACE TCTCAGATAAATTTGACTGCTGTAGATGCCAGACAAGAGACACCAAGGGTTAAAGTGGAT *******:*.**************.***************** *:*************** start GATTCTTCAGATGATCATGCTCAAGCTCTTGATCCTGCAAAACTAGCCAGAAGGCAACTA RACE GATTCTTCAGATGATCACGCTCAACCACTTGATCCTGCAAAACTAGCCAGAAGGCAACTA ***************** ****** *:********************************* start AGAGAGAAAAGGCGTGAAAAGCGTGCAAATGAGTTGGTACAACGGGATGACGAATCAATT RACE AGAGAGAAGAGACGTGAAAAGCGTGCAAATGAGTTGATACAATGGGATGACGAATCAGTT ********.**.************************.***** **************.** start GTAAAGCTTGAAACTGCAGCCATTGAGCGGTCCAAATCAGTTGATTCTGCAGTTCTAGGA RACE GTAAGGCTTGAAACTGCAGCCATTGAGCGGTCCAAATCAGTTGATTCTGCAGTTCTAGGA ****.******************************************************* start AAATACAGCATTTGGAGGAAAGAAAATGAGAACGAGAACTCTGATTCAACAGTGCGCTTG RACE AAATACAGTATTTGGAGGAAAGAAAATGAGAACGAGAACTCTGATTCAACGGTGCGCTTG ******** *****************************************.********* start ATACGGGACCAAATCATAATGGCAAGGGTCTACTTGAGTATTGCAAAGATGAAGAACAAG RACE ATACGGGACCAAATCATAATGGCAAGGGTCTACTTGAGTATTGCAAAGATGAAGAACAAG ************************************************************ start CTTGATCTGTTCCAACAACTACAGTCTCGACTTAAAGAATCCCAGCGTGCAGTGGGAGAG RACE CTTGATCTGTTCCAACAACTACAAACTCGACTCACAGAATCCCAGCGTGCAGTGGGAGAG ***********************.:******* *.************************* start GCAACTGCTGATGCGGATTTATCTCAAAGTGCACCAGAGAAGATAAAAGCTATGGGCCAA RACE GCAACTGCTGATGCGGATTTATCTCAAAGTGCACCGGAGAAAATAAAAGCTATGGGCCAA ***********************************.*****.****************** start GTTCTTTCAAAAGCAAGAGAGCAACTGTATGATTGCAACCTGGTCACTGGGAAGCTGAGA
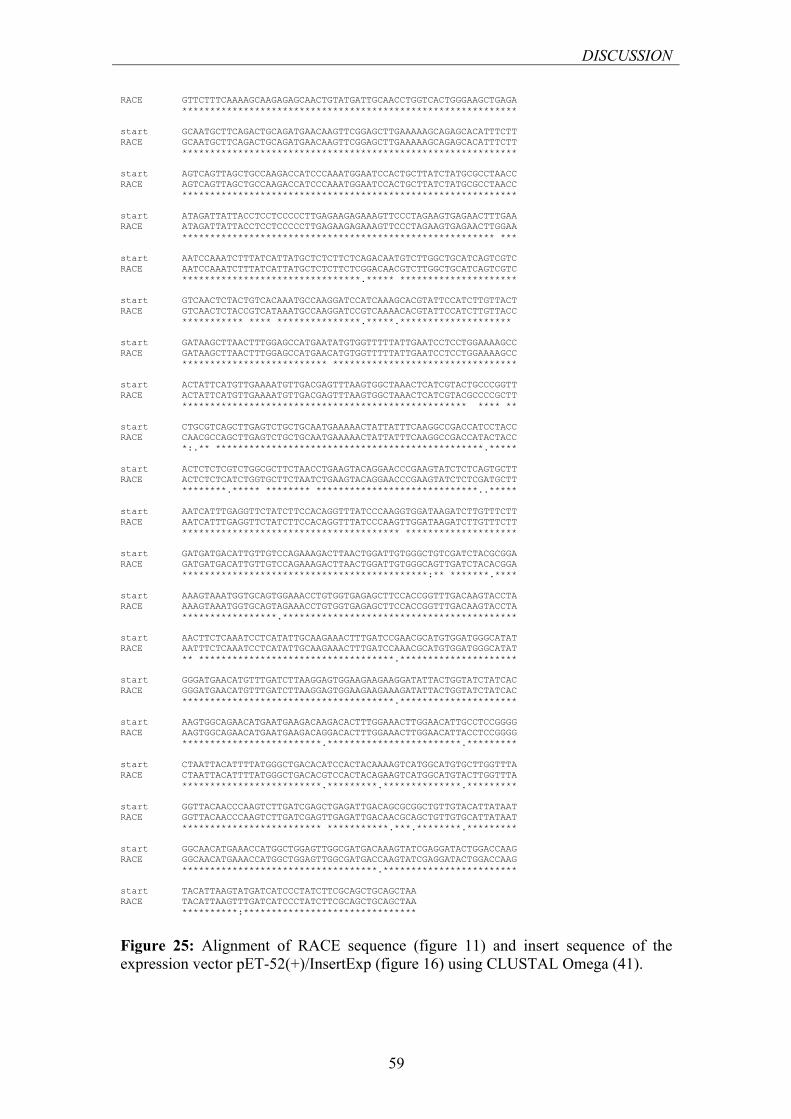
DISCUSSION
59
RACE GTTCTTTCAAAAGCAAGAGAGCAACTGTATGATTGCAACCTGGTCACTGGGAAGCTGAGA ************************************************************ start GCAATGCTTCAGACTGCAGATGAACAAGTTCGGAGCTTGAAAAAGCAGAGCACATTTCTT RACE GCAATGCTTCAGACTGCAGATGAACAAGTTCGGAGCTTGAAAAAGCAGAGCACATTTCTT ************************************************************ start AGTCAGTTAGCTGCCAAGACCATCCCAAATGGAATCCACTGCTTATCTATGCGCCTAACC RACE AGTCAGTTAGCTGCCAAGACCATCCCAAATGGAATCCACTGCTTATCTATGCGCCTAACC ************************************************************ start ATAGATTATTACCTCCTCCCCCTTGAGAAGAGAAAGTTCCCTAGAAGTGAGAACTTTGAA RACE ATAGATTATTACCTCCTCCCCCTTGAGAAGAGAAAGTTCCCTAGAAGTGAGAACTTGGAA ******************************************************** *** start AATCCAAATCTTTATCATTATGCTCTCTTCTCAGACAATGTCTTGGCTGCATCAGTCGTC RACE AATCCAAATCTTTATCATTATGCTCTCTTCTCGGACAACGTCTTGGCTGCATCAGTCGTC ********************************.***** ********************* start GTCAACTCTACTGTCACAAATGCCAAGGATCCATCAAAGCACGTATTCCATCTTGTTACT RACE GTCAACTCTACCGTCATAAATGCCAAGGATCCGTCAAAACACGTATTCCATCTTGTTACC *********** **** ***************.*****.******************** start GATAAGCTTAACTTTGGAGCCATGAATATGTGGTTTTTATTGAATCCTCCTGGAAAAGCC RACE GATAAGCTTAACTTTGGAGCCATGAACATGTGGTTTTTATTGAATCCTCCTGGAAAAGCC ************************** ********************************* start ACTATTCATGTTGAAAATGTTGACGAGTTTAAGTGGCTAAACTCATCGTACTGCCCGGTT RACE ACTATTCATGTTGAAAATGTTGACGAGTTTAAGTGGCTAAACTCATCGTACGCCCCGCTT *************************************************** **** ** start CTGCGTCAGCTTGAGTCTGCTGCAATGAAAAACTATTATTTCAAGGCCGACCATCCTACC RACE CAACGCCAGCTTGAGTCTGCTGCAATGAAAAACTATTATTTCAAGGCCGACCATACTACC *:.** ************************************************.***** start ACTCTCTCGTCTGGCGCTTCTAACCTGAAGTACAGGAACCCGAAGTATCTCTCAGTGCTT RACE ACTCTCTCATCTGGTGCTTCTAATCTGAAGTACAGGAACCCGAAGTATCTCTCGATGCTT ********.***** ******** *****************************..***** start AATCATTTGAGGTTCTATCTTCCACAGGTTTATCCCAAGGTGGATAAGATCTTGTTTCTT RACE AATCATTTGAGGTTCTATCTTCCACAGGTTTATCCCAAGTTGGATAAGATCTTGTTTCTT *************************************** ******************** start GATGATGACATTGTTGTCCAGAAAGACTTAACTGGATTGTGGGCTGTCGATCTACGCGGA RACE GATGATGACATTGTTGTCCAGAAAGACTTAACTGGATTGTGGGCAGTTGATCTACACGGA ********************************************:** *******.**** start AAAGTAAATGGTGCAGTGGAAACCTGTGGTGAGAGCTTCCACCGGTTTGACAAGTACCTA RACE AAAGTAAATGGTGCAGTAGAAACCTGTGGTGAGAGCTTCCACCGGTTTGACAAGTACCTA *****************.****************************************** start AACTTCTCAAATCCTCATATTGCAAGAAACTTTGATCCGAACGCATGTGGATGGGCATAT RACE AATTTCTCAAATCCTCATATTGCAAGAAACTTTGATCCAAACGCATGTGGATGGGCATAT ** ***********************************.********************* start GGGATGAACATGTTTGATCTTAAGGAGTGGAAGAAGAAGGATATTACTGGTATCTATCAC RACE GGGATGAACATGTTTGATCTTAAGGAGTGGAAGAAGAAAGATATTACTGGTATCTATCAC **************************************.********************* start AAGTGGCAGAACATGAATGAAGACAAGACACTTTGGAAACTTGGAACATTGCCTCCGGGG RACE AAGTGGCAGAACATGAATGAAGACAGGACACTTTGGAAACTTGGAACATTACCTCCGGGG *************************.************************.********* start CTAATTACATTTTATGGGCTGACACATCCACTACAAAAGTCATGGCATGTGCTTGGTTTA RACE CTAATTACATTTTATGGGCTGACACGTCCACTACAGAAGTCATGGCATGTACTTGGTTTA *************************.*********.**************.********* start GGTTACAACCCAAGTCTTGATCGAGCTGAGATTGACAGCGCGGCTGTTGTACATTATAAT RACE GGTTACAACCCAAGTCTTGATCGAGTTGAGATTGACAACGCAGCTGTTGTGCATTATAAT ************************* ***********.***.********.********* start GGCAACATGAAACCATGGCTGGAGTTGGCGATGACAAAGTATCGAGGATACTGGACCAAG RACE GGCAACATGAAACCATGGCTGGAGTTGGCGATGACCAAGTATCGAGGATACTGGACCAAG ***********************************.************************ start TACATTAAGTATGATCATCCCTATCTTCGCAGCTGCAGCTAA RACE TACATTAAGTTTGATCATCCCTATCTTCGCAGCTGCAGCTAA **********:*******************************
Figure 25: Alignment of RACE sequence (figure 11) and insert sequence of the expression vector pET-52(+)/InsertExp (figure 16) using CLUSTAL Omega (41).
DISCUSSION
60
The altered sequence could affect the enzyme activity and specificity of the target
protein in the E. coli expression strains. While the expressed protein could be highly
similar to the apple’s native enzyme, the errors made by Dream Taq lower the
possibility of expression of a functional protein. Therefore, the use of a polymerase
with a lower error rate (for example Phusion) to amplify the insert in the future
research would be reasonable. Alternatively, more clones can be produced and
sequenced from which the clone containing the least modified insert would be chosen. MALKRGLSNAGAHRNRASGSRFPLAILIFFALLVPLTFFLDRGLHISDHSDISSGPGEKNLDWRERMALQHVKSLFSKEVIDVISASTNDMGPLSLNFFRKNNLSASWKVIGENSSVTDSQKDLTAVNARQETARVKVDDSSDDHAQALDPAKLARRQLREKRREKRANELVQRDDESIVKLETAAIERSKSVDSAVLGKYSIWRKENENENSDSTVRLIRDQIIMARVYLSIAKMKNKLDLFQQLQSRLKESQRAVGEATADADLSQSAPEKIKAMGQVLSKAREQLYDCNLVTGKLRAMLQTADEQVRSLKKQSTFLSQLAAKTIPNGIHCLSMRLTIDYYLLPLEKRKFPRSENFENPNLYHYALFSDNVLAASVVVNSTVTNAKDPSKHVFHLVTDKLNFGAMNMWFLLNPPGKATIHVENVDEFKWLNSSYCPVLRQLESAAMKNYYFKADHPTTLSSGASNLKYRNPKYLSVLNHLRFYLPQVYPKVDKILFLDDDIVVQKDLTGLWAVDLRGKVNGAVETCGESFHRFDKYLNFSNPHIARNFDPNACGWAYGMNMFDLKEWKKKDITGIYHKWQNMNEDKTLWKLGTLPPGLITFYGLTHPLQKSWHVLGLGYNPSLDRAEIDSAAVVHYNGNMKPWLELAMTKYRGYWTKYIKYDHPYLRSCS-
Figure 26: Predicted amino acid sequence of the target glycosyltransferase on the basis of the nucleotide sequence obtained from sequencing pET-52(+)/InsertExp.
This enzyme is composed of 672 amino acids, while its theoretical isoelectric point
(pI) should be 9.33 and its molecular weight 76658.66 (~76.7 kDa) predicted by
ExPASy PeptideMass tool (41) on the basis of the sequence in Figure 16.
5.4 UniProt BLAST The DNA sequence of the target protein obtained in 3’-RACE (Race sequence) was
blasted in the UniProt database as this should be least affected by Dream Taq’s error
rate. The BLAST results have shown that DNA sequence showed high similarity to a
polygalacturonate 4-alpha-galacturonosyltransferase from Mouse-ear cress
(Arabidopsis thaliana) with 76.7% of identities and 90.8% of positives for Race
sequence. This means that our target protein is likely to possess polygalacturonate 4-
alpha-galacturonosyltransferase enzyme activity, which is involved in pectin
biosynthesis and catalyzes the transfer of galacturonic acid from uridine 5'-
diphosphogalacturonic acid onto the pectic polysaccharide homogalacturonan (42).
UDP-D-galacturonate + → 1,4-α-D-galacturonosyl(n+1) + UDP
1,4-α-D-galacturonosyl(n) Figure 27: The reaction catalyzed by polygalacturonate 4-alpha galacturonosyltransferase (42).
DISCUSSION
61
5.5 Protein expression and isolation Four E. coli strain, each differently modified to enhance protein solubility, were
transformed by the expression plasmid harboring the target insert. The plasmid should
provide the polyhistidine tag to enable Ni affinity chromatography. Therefore, the
expressed protein sized ~76.7 kDa should be located in the elution fractions when
analyzed with SDS PAGE.
The SDS PAGE gels show two protein bands in the wash and first elution fractions
roughly where our protein should appear, however, the assumption, that one of those
two bands is our protein, is very unlikely. In retrospective a mistake was made when
designing reverse primer as we have included a stop codon after the coding sequence.
Therefore, the translation of polyhistidine tag, which would be located on C-end of
the protein, is not possible.
The SDS PAGE gels in which IF, SF and FT fraction were analyzed also contain a
protein band at this length (~77 kDa). However, this band does not significantly
distinct itself from other bands in the gel as it was hoped, which suggests that the
protein (if at all) is expressed relatively evenly throughout these fractions and a
portion of it should be soluble.
Nevertheless, the plasmid did supply the Strep tag located at the N-terminus of the
protein (28). Therefore, a different method of purification would be more appropriate
(for example Strep-tag affinity purification), while a different reverse primer should
be designed for future experiments.
CONCLUSION
62
VI. CONCLUSION The DNA sequence obtained in these experiments from Malus x domestica cultivar
Golden Delicious and Cox’s Orange Pippin plant line suggests that there is a yet
unidentified glycosyltransferase in the apple and according to the results of blasting in
the Uniprot database, the protein is most likely to be polygalacturonate 4-alpha-
galacturonosyltransferase. The apple suspension culture needed to be induced with
inactivated strain of Erwinia amylovora in order to obtain the whole gene sequence of
the target protein, which suggests its involvement in apple’s defense response. To
produce the recombinant enzyme, the future research work requires different DNA
polymerase with lower error rate to be used for PCR amplification of the target
sequence and either a design of a new reverse primer (omitting the stop codon) or a
different method of purification, e.g. an affinity chromatography based on the Strep
Tag.
REFERENCES
63
VII. REFERENCES:
1. Hu Y, Walker S: Remarkable Structural Similarities between Diverse Glycosyltransferases. Chemistry & Biology; (2002); 9(12): 1287–1296. 2. Schuman B, Alfaro JA, Evans SV: Glycosyltransferase Structure and Function. Topics in Current Chemistry; (2007); 272; 217–257. 3. Keegstra K, Raikhel N: Plant glycosyltransferases. Current Opinion in Plant Biology; (2001); 4(3); 219–224. 4. Vogt T, Jones P: Glycosyltransferases in plant natural product synthesis: characterization of a supergene family. Trends in Plant Science; (2000); 5(9): 380-386. 5. Dale W: Plant Defense, First Edition. Blackwell Publishing, New York, (2011): 1-19. 6. Somssich IE, Hahlbrock K: Pathogen defense in plants - a paradigm of biological complexity. Trends in Plant Science; (1998); 3(3): 86-90. 7. Vanneste J: Fire Blight: The Disease and Its Causative Agent, Erwinia Amylovora. CABI Publishing; New York; (2000): 1-5. 8. Khan M A, Zhao Y F, Korban S S: Molecular Mechanisms of Pathogenesis and Resistance to the Bacterial Pathogen Erwinia amylovora, Causal Agent of Fire Blight Disease in Rosaceae. Plant Molecular Biology Reporter; (2012); 30(2): 247-270. 9. Coutinho PM, Deleury E, Davies GJ, Henrissat B: An Evolving Hierarchical Family Classification for Glycosyltransferases. Journal of Molecular biology; (2003); 328: 307–317. 10. Kolmodin LA, Birch DE: PCR Cloning Protocols, Second Edition. Methods in Molecular Biology; (2002); 192; Part I: 3-18. 11. Mülhardt C, EW Beese: Molecular Biology and Genomics. Academic Press; USA; (2007): 66-80. 12. Brown TA: Gene Cloning and DNA Analysis: An Introduction, Sixth Edition. Wiley-Blackwell; Hoboken, NJ, USA; (2010): 1-10. 13. Korban SS: Apple EST Malus x domestica. Unpublished work; dbEST, NCDB; (2005). (http://www.ncbi.nlm.nih.gov/nucest/71825827?report=est)
REFERENCES
64
14. Sambrook J, Russell DW: Molecular Cloning: Laboratory manual, Third edition. Cold Spring Harbor Laboratory Press; Cold Spring Harbor, New York, (2000). 15. XL1-Blue Competent Cells. Stratagene, 2004. 16. Novagen Competent cells User Protocol TB009 Rev. F 0104. Novagen, 2004. 17. ArcticExpress™ Competent Cells and ArcticExpress™ (DE3) Competent Cells Instruction Manual. Stratagene, 2006. 18. Linsmaier EM, Skoog F: Organic growth factor requirements of tobacco tissue cultures. Physiol Plantarum; (1965); 18: 100-127. 19. McPherson MJ, Moller SG: PCR. BIOS Scientific Publishers; Oxford, UK. (2000): 218-225. 20. Kühle S: cDNA-Klonierung einer Prenyltransferase aus der Arzneipflanze Hypericum perforatum. Doctoral dissertation, TU Braunschweig, Institut for Pharmazeutical Biology, (2009). 21. RNeasy Mini Handbook. Qiagen, 2001-2010. 22. SuperScript III First-Strand Synthesis System for RT-PCR. Manual, Invitrogen. 23. RevertAid H Minus First Strand cDNA Synthesis Kit. Manual, Fermentas, Thermo Fisher Scientific Inc., 2011. 24. Phusion™ High-Fidelity DNA Polymerase. Manual, Finnzymes, Thermo Fisher Scientific Inc., 2007. 25. DreamTaq DNA Polymerase. Product information, Fermentas, Thermo Fisher Scientific Inc., 2011. 26. GeneJET™ GeneJET Gel Extraction Kit. Product information, Fermentas Thermo Fisher Scientific Inc., 2011. 27. pGEM®-T and pGEM®-T Easy Vector Systems. Technical Manual, TM042, Promega. 28. pET-52b(+) Vector. Product information, Novagen. h 29. pET System Manual , 11th Edition. Novagen 2006. 30. GeneJET™ Plasmid Miniprep. Product Information Kit, Fermentas, Thermo Fisher Scientific Inc., 2011.
REFERENCES
65
31. EcoRI product information. Fermentas, Thermo Fisher Scientific Inc., 2011. 32. DoubleDigestTM tool, Fermentas. http://www.fermentas.com/en/tools/doubledigest/ 33. Ni-NTA Spin Kit Handbook, Second Edition. Qiagen, 2008. 34. Farrell RE Jr: RNA Methodologies: A Laboratory Guide for Isolation and Characterization, Third Edition. Elsevier Academic Press; USA; (2005):169-177. 35. Moens PDJ: Profilin, in MZ Atassi (ed.) Protein reviews Volume 8: Actin-Binding Proteins and Disease (200-217). Springer Science+Business Media Ltd.; USA; (2008). 36. Krishnan K, Moens: PDJ Structure and functions of profilins. Biophysical Reviews; (2009); 1:71–81. 37. Apple profilin sequence (CAD46561); ENA, EBI. http://www.ebi.ac.uk/ena/data/view/CAD46561 38. Phusion® High-Fidelity DNA Polymerase. Online information site, Fermentas, Thermo Fisher Scientific, 2011. 39. Frackman S, Kobs G, Simpson D and Storts D: Betaine and DMSO: Enhancing Agents for PCR. Promega Notes; (1998); 65, 27. 40. ExPASy PeptideMass tool. (http://web.expasy.org/peptide_mass/) 41. CLUSTAL Omega (1.1.0). Multiple alignment tool. http://www.ebi.ac.uk/Tools/msa/clustalo/ 42. Sterling JD, Atmodjo MA, Inwood SE, Kumar Kolli VS, Quigley HF, Hanh MG, Mohnen D: Functional identification of an Arabidopsis pectin biosynthetic homogalacturonan galacturonosyltransferase. Proceedings of the National Academy of Sciences of the United States of America; (2006); 103:5236-5241.