XXXXX DALAM ANGKA 2020 - PEMERINTAH KOTA ...
297
BADAN PUSAT STATISTIK XXXXX BPS-STATISTICS OF XXXXX XXXXX DALAM ANGKA YYYYY IN FIGURES 2020 Katalog /Catalog: 00000.0000 https://gorontalokota.bps.go.id
-
Upload
khangminh22 -
Category
Documents
-
view
0 -
download
0
Transcript of XXXXX DALAM ANGKA 2020 - PEMERINTAH KOTA ...

BADAN PUSAT STATISTIKXXXXXBPS-STATISTICS OF XXXXX
XXXXXDALAM ANGKAYYYYYIN FIGURES2020
Katalog /Catalog: 00000.0000
https:
//goro
ntalo
kota
.bps.g
o.id

iKota Gorontalo Dalam Angka 2020
KOTA GORONTALODALAM ANGKAGORONTALO MUNICIPALITYIN FIGURES2020
https:
//goro
ntalo
kota
.bps.g
o.id

KOTA GORONTALO DALAM ANGKAGorontalo Municipality in Figures2020
ISSN: 2088-6292No. Publikasi / Publication Number: 75710.2003Katalog / Catalog: 1102001.7571
Ukuran Buku / Book Size: 14,8 cm x 21 cmJumlah Halaman / Number of Pages : xxxiv + 261 hal/pages
Naskah / Manuscript:Badan Pusat Statistik Kota GorontaloBPS-Statistics of Gorontalo Municipality
Penyunting / Editor:Badan Pusat Statistik Kota GorontaloBPS-Statistics of Gorontalo Municipality
Gambar Kover / Cover Design:Badan Pusat Statistik Kota GorontaloBPS-Statistics of Gorontalo Municipality
Ilustrasi Kover / Cover Illustration:Pemandangan Atas Pantai Tanjung Kramat / High Angle View of Tanjung Kramat’s Beach
Diterbitkan oleh / Published by:©BPS Kota Gorontalo BPS-Statistics of Gorontalo Municipality
Dicetak oleh / Printed by:CV. Grafika Karya
Dilarang mengumumkan, mendistribusikan, mengomunikasikan, dan/atau menggandakansebagian atau seluruh isi buku ini untuk tujuan komersil tanpa izin tertulisdari Badan Pusat Statistik.Prohibited to announce, distribute, communicate, and/or copy part or all of this book forcommercial purpose without permission from BPS-Statistics Indonesia.
https:
//goro
ntalo
kota
.bps.g
o.id

PETA WILAYAH KOTA GORONTALOMAP OF GORONTALO MUNICIPALITY
https:
//goro
ntalo
kota
.bps.g
o.id

https:
//goro
ntalo
kota
.bps.g
o.id

KEPALA BPS KOTA GORONTALOCHIEF STATISTICIAN OF GORONTALO MUNICIPALITY
IR. RASJID MASJHUR
https:
//goro
ntalo
kota
.bps.g
o.id

https:
//goro
ntalo
kota
.bps.g
o.id

viiKota Gorontalo Dalam Angka 2020
KATA PENGANTAR
Saat ini tuntutan masyarakat terhadap ketersediaan data dan informasi statistik yang beragam dan berkualitas semakin hari semakin meningkat. Data dan informasi ini sangat bermanfaat karena digunakan terutama untuk mewujudkan sistem perencanaan yang berbasis data, pemanfaatan yang jelas, pengendalian yang cermat, serta prosedur evaluasi yang kritis terhadap kegiatan dan hasil-hasil pembangunan. Publikasi Kota Gorontalo Dalam Angka 2020 merupakan bagian dari sistem data statistik secara keseluruhan, yang bertujuan memberikan informasi rinci mengenai statistik dasar dan statistik sektoral yang kerap kali digunakan oleh perencana dan pengambil keputusan dalam membuat kebijakan.
Kota Gorontalo Dalam Angka 2020 merupakan seri publikasi tahunan yang menyajikan beragam jenis data dari BPS dan institusi lain. Publikasi ini memuat tentang keadaan geografi dan iklim, pemerintahan, serta perkembangan kondisi sosial-geografi dan perekonomian di Kota Gorontalo. Publikasi ini disajikan dalam Bahasa Indonesia dan Bahasa Inggris.
Publikasi ini dapat terwujud berkat bantuan dari berbagai pihak. Kepada semua pihak yang telah memberikan kontribusi, kami sampaikan penghargaan dan terimakasih. Mudah-mudahan statistik yang disajikan memberi manfaat bagi banyak pihak untuk berbagai keperluan. Kami mengharapkan tanggapan dan saran dari pengguna publikasi ini untuk perbaikan edisi yang akan datang.
Gorontalo , April 2020Kepala BPS
Kota Gorontalo
IR. RASJID MASJHUR
Kata Pengantar/Preface ....................................................................................................
https:
//goro
ntalo
kota
.bps.g
o.id

viii Gorontalo Municipality in Figures 2020
P R E F A C E
Nowadays, the public demand for the availability of data and statistical information that is diverse and qualified increasingly day by day. This data and information is very useful because it is used primarily to create a data-driven planning system, distinct utilization, careful control, and critical evaluation procedures for development activities and results. Gorontalo Municipality In Figures 2020 is part of the overall system of statistical data, which aims to provide detailed information on basic statistics and sectoral statistics that are often used by planners and policy makers.
Gorontalo Municipality in Figures 2020 is an annual publication presenting various data from BPS-Statistics of Gorontalo City and other agencies. The publication provides general pictures of geographic and climate conditions, government, and key socio-demographic and economic characteristics of Gorontalo City. This Yearbook is a bilingual publication presented in Indonesian and English.
The release of this comprehensive report has been made possible due to the assistance and contributions of various government institutions, and private organizations. To all parties who have been involved in the preparation of this publication, I would like to express my high appreciation and gratitude. Hopefully this publication will be a useful resource for any purpose. Comments and suggestions to improve the contents of this publication are always welcome.
Gorontalo , April 2020Chief Statistician of
Gorontalo Municipality
IR. RASJID MASJHUR
https:
//goro
ntalo
kota
.bps.g
o.id

ixKota Gorontalo Dalam Angka 2020
Kata Pengantar/Preface .................................................................................................... viiDaftar Isi/Contents .............................................................................................................. ixDaftar Tabel/List of Tables ................................................................................................. xiDaftar Gambar/List of Figures ......................................................................................... xxviiDaftar Singkatan/List of Abbreviations ........................................................................ xxxiii1. Geografi dan Iklim/Geography and Climate ..................................................... 12. Pemerintahan/Government ................................................................................... 153. Penduduk dan Ketenagakerjaan/Population and Employment ................ 394. Sosial dan Kesejahteraan Rakyat/Social and Welfare ................................... 575. Pertanian, Kehutanan, Peternakan, dan Perikanan/Agriculture,
Forestry, Livestock, and Fishery .............................................................................. 1336. Industri, Pertambangan dan Energi/Industry, Mining and Energy ........... 1777. Pariwisata/Tourism ................................................................................................... 1898. Transportasi dan Komunikasi/Transportation and Communication ........ 2019. Perbankan, Koperasi dan Harga-Harga/Banking, Cooperative and Prices 21110. Pengeluaran Penduduk/Population Expenditure ........................................... 22311. Sistem Neraca Regional/System of Regional Accounts ................................. 23112. Perbandingan Antar Kabupaten/Kota/Regency/Municipal Comparison 253
DAFTAR ISI / CONTENTS
HalamanPage
Daftar Isi/Contents ..............................................................................................................
https:
//goro
ntalo
kota
.bps.g
o.id

https:
//goro
ntalo
kota
.bps.g
o.id

xiKota Gorontalo Dalam Angka 2020
DAFTAR TABEL/LIST OF TABLES
Daftar Tabel/List of Tables .................................................................................................
HalamanPage
1 GEOGRAFI DAN IKLIM/GEOGRAPHY AND CLIMATE ................... 11.1 KEADAAN GEOGRAFI .................................................................... 5 GEOGRAPHY CONDITION ............................................................... 51.1.1 Luas Daerah dan Jumlah Pulau Menurut Kecamatan di Kota
Gorontalo, 2019 ..................................................................................................... 5 Total Area and Number of Islands by Subdistrict in Gorontalo
Municipality, 2019 ................................................................................................ 51.1.2 Tinggi Wilayah dan Jarak Ke Ibukota Kabupaten/Kota Menurut
Kecamatan di Kota Gorontalo, 2019 .............................................................. 7 Altitude and Distance to the Capital of Regency/Municipality by
Subdistrict in Gorontalo Muncipality, 2019 ................................................... 71.1.3 Letak Astronomis Kecamatan-Kecamatan di Kota Gorontalo, 2019 .. 8 Astronomical Position of Sub-District in Gorontalo Municipality, 2019 81.1.4 Batas Wilayah Kota Gorontalo, 2019 .............................................................. 9 Borders of Gorontalo Municipality, 2019 ....................................................... 91.1.5 Nama Sungai, Panjang Aliran dan Sungai yang dilalui di Kota
Gorontalo, 2019 ..................................................................................................... 10 Name of River, Length, and District Passed Over of Gorontalo
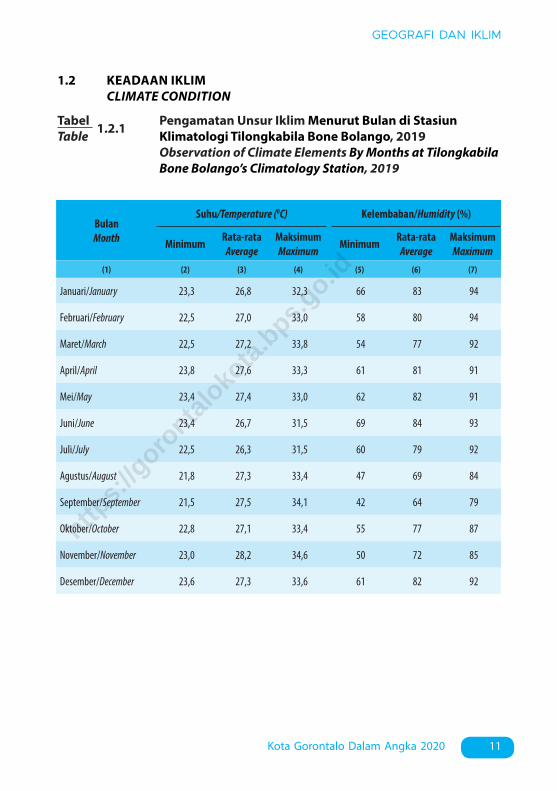
Municipality, 2019 ................................................................................................ 101.2 KEADAAN IKLIM ............................................................................. 11 CLIMATE CONDITION ...................................................................... 111.2.1 Pengamatan Unsur Iklim Menurut Bulan di Stasiun Klimatologi
Tilongkabila Bone Bolango, 2019 ................................................................... 11 Observation of Climate Elements By Months at Tilongkabila Bone
Bolango’s Climatology Station, 2019 .............................................................. 112 PEMERINTAHAN/GOVERNMENT .................................................. 152.1 WILAYAH ADMINISTRATIF ............................................................. 22 ADMINISTRATIVE AREA .................................................................. 222.1.1 Jumlah Desa1/Kelurahan Menurut Kecamatan di Kota Gorontalo,
2015-2019 ................................................................................................................ 22 Number of Villages1/Kelurahan by Subdistrict, 2015-2019 ...................... 22
https:
//goro
ntalo
kota
.bps.g
o.id

xii Gorontalo Municipality in Figures 2020
HalamanPage
2.1.2 Jumlah Kelurahan, RW, dan RT Menurut Kecamatan di Kota Gorontalo, 2019 ..................................................................................................... 23
Number of Urban Village, Hamlet, and Neighborhood by Sub-District in Gorontalo Municipality, 2019 ...................................................................... 23
2.2 DEWAN PERWAKILAN RAKYAT DAERAH ..................................... 24 THE REGIONAL HOUSE OF REPRESENTATIVE ................................ 242.2.1 Jumlah Anggota Dewan Perwakilian Rakyat Daerah Menurut
Partai Politik dan Jenis Kelamin di Kota Gorontalo, 2019 ...................... 24 Number of Members of The Regional House of Representatives By
Political Parties in Gorontalo Municipality, 2019 ......................................... 242.2.2 Jumlah Keputusan Dewan Perwakilan Rakyat Daerah di Kota
Gorontalo, 2015-2019 ........................................................................................ 25 Number of Type of Decision of The Regional House of Representatives
in Gorontalo Municipality, 2015-2019 ............................................................ 252.3 SUMBER DAYA MANUSIA ............................................................... 26 HUMAN RESOURCES ....................................................................... 262.3.1 Jumlah Pegawai Negeri Sipil Menurut Jabatan dan Jenis Kelamin
di Kota Gorontalo, Desember 2018 dan Desember 2019 ..................... 26 Number of Civil Servants by Occupation and Sex in Gorontalo
Municipality ,Desember 2018 dan Desember 2019 .................................... 262.3.2 Jumlah Pegawai Negeri Sipil Menurut Tingkat Pendidikan dan
Jenis Kelamin di Kota Gorontalo, Desember 2018 dan Desember 2019 .......................................................................................................................... 28
Number of Civil Servants by Educational Level and Sex in Gorontalo Municipality, December 2018 and December 2019 ..................................... 28
2.3.3 Jumlah Pegawai Negeri Sipil Menurut Tingkat Kepangkatan dan Jenis Kelamin di Kota Gorontalo, Desember 2018 dan Desember 2019 .......................................................................................................................... 30
Number of Civil Servants by Hierarchy and Sex in Gorontalo Municipality, December 2018 and December 2019 ..................................... 30
2.3.4 Jumlah Pegawai Negeri Sipil Menurut Dinas/Instansi Pemerintah dan Pendidikan Terakhir di Kota Gorontalo, 2019 ................................... 32
Number of Civil Servant by Institution/Office and in Gorontalo Municipality, 2019 ................................................................................................ 32
2.4 KEUANGAN PEMERINTAH ............................................................. 34
https:
//goro
ntalo
kota
.bps.g
o.id

xiiiKota Gorontalo Dalam Angka 2020
HalamanPage
GOVERNMENT FINANCE ................................................................. 342.4.1 Realisasi Pendapatan Pemerintah Kota Gorontalo Menurut Jenis
Pendapatan (miliar rupiah), 2016–2019 ....................................................... 34 Actual Gorontalo Municipal Government Revenues by Kind of
Revenues (billion rupiahs), 2016–2019 ........................................................... 342.4.2 Realisasi Belanja Pemerintah Kota Gorontalo Menurut Jenis
Belanja (miliar rupiah), 2016–2019 ................................................................. 36 Actual Gorontalo Municipality Government Expenditures by Kind of
Expenditures (billion rupiahs), 2016–2019 .................................................... 363 PENDUDUK DAN KETENAGAKERJAAN/POPULATION AND
EMPLOYMENT ................................................................................. 393.1 PENDUDUK...................................................................................... 48 POPULATION ................................................................................... 483.1.1 Penduduk, Laju Pertumbuhan Penduduk per Tahun, Distribusi
Persentase Penduduk, Kepadatan Penduduk, Rasio Jenis Kelamin Penduduk Menurut Kecamatan di Kota Gorontalo, 2019 ...................... 48
Population, Annual Population Growth Rate, Percentage Distribution of Population, Population Density, and Population Sex Ratio by Subdistrict in Gorontalo Municipality, 2019 .................................................. 48
3.2 KETENAGAKERJAAN ...................................................................... 51 EMPLOYMENT ................................................................................. 513.2.1 Jumlah Penduduk Berumur 15 Tahun Keatas Menurut Jenis
Kegiatan Selama Seminggu yang Lalu dan Jenis Kelamin di Kota Gorontalo, 2019 ..................................................................................................... 51
Population Aged 15 Years and Over by Type of Activity During The Previous Week and Sex in Gorontalo Municipality, 2019 ........................... 51
3.2.2 Penduduk Berumur 15 Tahun ke Atas Menurut Pendidikan Tertinggi yang Ditamatkan dan Jenis Kegiatan Selama Seminggu yang Lalu di Kota Gorontalo, 2019 ................................................................. 52
Population 15 Years of Age and Over by Educational Attainment and Type of Activity During the Previous Week in Gorontalo Municipality, 2019 ......................................................................................................................... 52
3.2.3 Penduduk Berumur 15 Tahun Ke Atas yang Bekerja Selama Seminggu Yang Lalu Menurut Status Pekerjaan Utama dan Jenis Kelamin di Kota Gorontalo, 2019 .................................................................... 54
https:
//goro
ntalo
kota
.bps.g
o.id

xiv Gorontalo Municipality in Figures 2020
HalamanPage
Population Aged 15 Years and Over Who Worked During The Previous Week by Main Employment Status and Sex in Gorontalo Municipality, 2019 ......................................................................................................................... 54
3.2.4 Jumlah Penduduk Berumur 15 Tahun Ke atas yang Bekerja Selama Seminggu Terakhir Menurut Lapangan Pekerjaan Utama dan Jenis Kelamin di Kota Gorontalo, 2019 .................................................................... 55
Population Aged 15 Years and Over Who Worked During The Previous Week by Main Business Field and Sex in Gorontalo Municipality, 2019 . 55
4 SOSIAL DAN KESEJAHTERAAN RAKYAT/SOCIAL AND WELFARE ......................................................................................... 57
4.1 PENDIDIKAN ................................................................................... 72 EDUCATION ..................................................................................... 724.1.1 Jumlah Sekolah, Guru, dan Murid Taman Kanak-Kanak (TK) di
Bawah Kementerian Pendidikan dan Kebudayaan Menurut Kecamatan di Kota Gorontalo, 2018/2019 dan 2019/2020 ................... 72
Number of Schools, Teachers, and Pupils in Kindergarten Under The Ministry of Education and Culture by Subdistrict in Gorontalo Municipality, 2018/2019 and 2019/2020 ....................................................... 72
4.1.2 Jumlah Sekolah, Guru, dan Murid Raudatul Athfal (RA) di Bawah Kementerian Agama Menurut Kecamatan di Kota Gorontalo, 2018/2019 dan 2019/2020 ................................................................................ 75
Number of Schools, Teachers, and Pupils in Raudatul Athfal (RA) Under The Ministry of Religious Affairs by Subdistrict in Gorontalo Municipality, 2018/2019 and 2019/2020 ....................................................... 75
4.1.3 Jumlah Sekolah, Guru, dan Murid Sekolah Dasar (SD) di Bawah Kementerian Pendidikan dan Kebudayaan Menurut Kecamatan di Kota Gorontalo, 2018/2019 dan 2019/2020 ................................................ 76
Number of Schools, Teachers, and Pupils in Primary Schools Under The Ministry of Education and Culture by Subdistrict in Gorontalo Municipality, 2018/2019 and 2019/2020 ....................................................... 76
4.1.4 Jumlah Sekolah, Guru, dan Murid Madrasah Ibtidaiyah (MI) di Bawah Kementerian Agama Menurut Kecamatan Menurut Kecamatan di Kota Gorontalo, 2018/2019 dan 2019/2020 ................... 79
Number of Schools, Teachers, and Pupils in Madrasah Ibtidaiyah (MI) Under The Ministry of Religious Affairs by Subdistrict in Gorontalo Municipality, 2018/2019 and 2019/2020 ....................................................... 79
https:
//goro
ntalo
kota
.bps.g
o.id

xvKota Gorontalo Dalam Angka 2020
HalamanPage
4.1.5 Jumlah Sekolah, Guru, dan Murid Sekolah Menengah Pertama (SMP) di Bawah Kementerian Pendidikan dan Kebudayaan Menurut Kecamatan di Kota Gorontalo, 2018/2019 dan 2019/2020 . 80
Number of Schools, Teachers, and Pupils in Junior High Schools Under The Ministry of Education and Culture by Subdistrict in Gorontalo Municipality, 2018/2019 and 2019/2020 ....................................................... 80
4.1.6 Jumlah Sekolah, Guru, dan Murid Madrasah Tsanawiyah (MTs) di Bawah Kementerian Agama Menurut Kecamatan di Kota Gorontalo, 2018/2019 and 2019/2020 .......................................................... 83
Number of Schools, Teachers, and Pupils in Madrasah Tsanawiyah (MTs) Under The Ministry of Religious Affairs by Subdistrict in Gorontalo Municipality, 2018/2019 and 2019/2020 ................................... 83
4.1.7 Jumlah Sekolah, Guru, dan Murid Sekolah Menengah Atas (SMA) di Bawah Kementerian Pendidikan dan Kebudayaan Menurut Kecamatan di Kota Gorontalo, 2018/2019 dan 2019/2020 ................... 84
Number of Schools, Teachers, and Pupils in Senior High Schools Under The Ministry of Education and Culture by Subdistrict in Gorontalo Municipality, 2018/2019 and 2019/2020 ................................... 84
4.1.8 Jumlah Sekolah, Guru, dan Murid Sekolah Menengah Kejuruan (SMK) di Bawah Kementerian Pendidikan dan Kebudayaan Menurut Kecamatan di Kota Gorontalo, 2018/2019 dan 2019/2020 . 87
Number of Schools, Teachers, and Pupils in Vocational High Schools Under The Ministry of Education and Culture by Subdistrict in Gorontalo Municipality, 2018/2019 and 2019/2020 ................................... 87
4.1.9 Jumlah Sekolah, Guru, dan Murid Madrasah Aliyah (MA) di Bawah Kementerian Agama Menurut Kecamatan di Kota Gorontalo, 2018/2019 dan 2019/2020 ................................................................................ 90
Number of Schools, Teachers, and Pupils in Madrasah Aliyah (MA) Under the Ministry of Religious Affairs by Subdistrict in Gorontalo Municipality, 2018/2019 and 2019/2020 ....................................................... 90
4.1.10 Jumlah Desa1/Kelurahan yang Memiliki Fasilitas Sekolah Menurut Kecamatan dan Tingkat Pendidikan di Kota Gorontalo, 2014-2019... 93
Number of Villages1 Having Educational Facilities by Subdistrict and Educational Level in Gorontalo Municipality, 2014-2019 .......................... 93
4.1.11 Angka Partisipasi Murni (APM) dan Angka Partisipasi Kasar (APK) Menurut Jenjang Pendidikan di Kota Gorontalo, 2018 dan 2019 ....... 98
https:
//goro
ntalo
kota
.bps.g
o.id
xvi Gorontalo Municipality in Figures 2020
HalamanPage
Net Envirolment Rate and Gross Enrolment Rate by Educational Level in Gorontalo Municipality, 2018 and 2019 .................................................... 98
4.1.12 Persentase Penduduk Berumur 15 Tahun ke Atas yang Melek Huruf Menurut Kelompok Umur di Kota Gorontalo, 2018 dan 2019 . 99
Percentage of Literate People Aged 15 Years and Over by Age Group in Gorontalo Municipality, 2018 and 2019 .................................................... 99
4.1.13 Persentase Penduduk Usia 7 – 24 Tahun Menurut Jenis Kelamin, Kelompok Umur Sekolah, dan Partisipasi Sekolah di Kota Gorontalo, 2019 ..................................................................................................... 100
Percentage of Population Aged 7 – 24 Years by Sex, Age Group and School Participation in Gorontalo Municipality, 2019 ................................ 100
4.2 KESEHATAN ..................................................................................... 101 HEALTH ............................................................................................. 1014.2.1 Jumlah Kelurahan Yang Memiliki Sarana Kesehatan Menurut
Kecamatan di Kota Gorontalo, 2014–2019 .................................................. 101 Number of Urban Villages1 Having Health Facilities by Sub-District in
Gorontalo Municipality, 2014 – 2019 .............................................................. 1014.2.2 Jumlah Tenaga Kesehatan Menurut Kecamatan di Kota Gorontalo,
2019 ........................................................................................................................... 107 Number of Medical Personnel by Subdistrict in Gorontalo
Municipalty, 2019 ................................................................................................. 1074.2.3 Persentase Penduduk yang Mempunyai Keluhan Kesehatan
Selama Sebulan Terakhir Menurut Kecamatan di Kota Gorontalo, 2014-2019 ................................................................................................................ 108
Percentage of People Who Had Health Complaint During a Month Prior to The Survey by Subdistrict in Gorontalo Municipality, 2014-2019 ......................................................................................................................... 108
4.2.4 Jumlah Rumah Sakit Umum, Rumah Sakit Khusus, Rumah Sakit/Rumah Bersalin, Puskesmas, Klinik/Balai Kesehatan, Posyandu, dan Polindes Menurut Kecamatan di Kota Gorontalo, 2018 dan 2019 ...... 109
Number of General Hospital, Special Hospital, Maternity Hospital and Public Health Center, Medical Clinic, Integrated Service Post, Village maternity Cottage by Subdistrict in Gorontalo Municipality, 2018 and 2019 ......................................................................................................................... 109
4.2.5 Banyaknya Balita yang Pernah Mendapat Imunisasi Menurut
https:
//goro
ntalo
kota
.bps.g
o.id
xviiKota Gorontalo Dalam Angka 2020
HalamanPage
Kelurahan dan Jenis Imunisasi di Kota Gorontalo, 2019 ......................... 112 Number of Children Under Five Years Ever Been Immunized by Urban
Village and Type of Immunization in Gorontalo Municipality, 2019 ....... 1124.2.6 Jumlah Penderita 10 Penyakit Terbanyak di Kota Gorontalo, 2019 .... 115 Number of 10 Most Disease Cases in Gorontalo Municipality, 2019 ....... 1154.2.7 Jumlah Bayi Lahir, Bayi Berat Badan Lahir Rendah (BBLR), BBLR
Dirujuk, dan Bergizi Buruk di Kota Gorontalo, 2015-2019 ..................... 116 Number of Infants Born, Infant Low Birth Weight (LBW), LBW Reffered,
and Malnutrition in Gorontalo Municipality, 2015-2019 ........................... 1164.2.8 Jumlah Ibu Hamil, Melakukan Kunjungan K1, K4, Kurang Energi
Kronis (KEK) dan mendapat Tablet Zat Besi (Fe) di Kota Gorontalo, 2015-2019 ................................................................................................................ 117
Number of Pregnant Womwn, Do Visit K1, Do Visit K4, Less Energy Chronic and Received Iron Tablets in Gorontalo Municipality, 2015-2019 ......................................................................................................................... 117
4.2.9 Jumlah Petugas Keluarga Berencana (KB) dan Pos Pelayanan Keluarga Berencana Desa (PPKBD) Menurut Kelurahan di Kota Gorontalo, 2019 ..................................................................................................... 118
Number of Family Planning Officer and Village Family Planning Service Units by Urban village in Gorontalo Municipality, 2019 .............. 118
4.2.10 Jumlah Pasangan Usia Subur dan Peserta KB Aktif Menurut Kelurahan di Kota Gorontalo, 2019 ................................................................ 119
Number of Eligible Couples and Family Planning Participants by Urban village in Gorontalo Municipality, 2019 ............................................. 119
4.3 AGAMA DAN SOSIAL LAINNYA ..................................................... 121 RELIGION AND OTHER SOCIAL AFFAIRS ........................................ 1214.3.1 Jumlah Penduduk Menurut Kecamatan dan Agama yang Dianut di
Kota Gorontalo, 2019 ........................................................................................... 121 Population by Subdistrict and Religion in Gorontalo Municipality,
2019 ......................................................................................................................... 1214.3.2 Jumlah Tempat Peribadatan Menurut Kecamatan di Kota
Gorontalo, 2019 ..................................................................................................... 122 Number of Places of Worship by Subdistrict and Religion in Gorontalo
Municipality, 2019 ................................................................................................ 1224.3.3 Jumlah Kelurahan yang Mengalami Bencana Alam1 Menurut
https:
//goro
ntalo
kota
.bps.g
o.id

xviii Gorontalo Municipality in Figures 2020
HalamanPage
Kecamatan di Kota Gorontalo, 2014-2019 ................................................... 123 Number of Villages1 that Had Natural Disaster2 by Subdistrict in
Gorontalo Municipality, 2014-2019 ................................................................. 1234.3.4 Angka Harapan Hidup, Harapan Lama Sekolah, Rata - Rata Lama
Sekolah dan Pengeluaran Per Kapita yang Disesuaikan (Rp000) di Kota Gorontalo, 2018 – 2019 ............................................................................ 126
Life Expectancy at Birth, Expected Years of Schooling, Mean Years of Schooling and Adjusted Expenditure Per Capita (Rp000) in Gorontalo Municipality, 2018 – 2019 .................................................................................. 126
4.4 KEMISKINAN ................................................................................... 127 POVERTY .......................................................................................... 1274.4.1 Garis Kemiskinan, Jumlah dan Persentase Penduduk Miskin (P0) Di
Kota Gorontalo, 2010 - 2019 ............................................................................. 127 Poverty Line, Number and Percentage of Poor People (P0) in
Gorontalo Municipality, 2010 - 2019 ............................................................... 1274.4.2 Indeks Kedalaman Kemiskinan (P1) dan Indeks Keparahan
Kemiskinan (P2) di Kota Gorontalo, 2010- 2019 ........................................ 128 Poverty Gap Index (P1) and Poverty Severity Index (P2) in Gorontalo
Municipality, 2010 - 2019 ................................................................................... 1284.5 KRIMINALITAS ................................................................................ 129 CRIMINALITY ................................................................................... 1294.5.1 Jumlah Tindak Pidana Menurut Kepolisian Sektor di Kota
Gorontalo, 2017 – 2019 ...................................................................................... 129 Number of Reported Criminal Cases Worship by District in Police
Office in Gorontalo Municipality 2017 –2019 ............................................... 1294.5.2 Jumlah Penyelesaian Tindak Pidana Menurut Kepolisian Sektor di
Kota Gorontalo, 2017 - 2019 ............................................................................. 130 Total of Crime Clearence by District Police in Gorontalo Municipality
2017 –2019 ............................................................................................................ 1304.5.3 Jumlah 15 Terbesar Tindak Pidana di Kota Gorontalo, 2019 ................. 131 Total of 15 Biggest Crime Cases in Gorontalo Municipality, 2019 ........... 1315 PERTANIAN, KEHUTANAN, PETERNAKAN, DAN PERIKANAN/
AGRICULTURE, FORESTRY, LIVESTOCK, AND FISHERY ................. 1335.1 HORTIKULTURA .............................................................................. 141
https:
//goro
ntalo
kota
.bps.g
o.id

xixKota Gorontalo Dalam Angka 2020
HalamanPage
HORTICULTURE................................................................................ 1415.1.1 Luas Panen Tanaman Sayuran Menurut Kecamatan dan Jenis
Tanaman (ha) di Kota Gorontalo, 2018 dan 2019 ...................................... 141 Harvested Area of Vegetables by Subdistrict and Kind of Plant (ha) in
Gorontalo Municipality, 2018 and 2019 ......................................................... 1415.1.2 Produksi Tanaman Sayuran Menurut Kecamatan dan Jenis
Tanaman (ton) di Kota Gorontalo, 2018 dan 2019 .................................... 144 Production of Vegetables by Subdistrict and Kind of Plant (ton) in
Gorontalo Municipality, 2018 and 2019 ......................................................... 1445.1.3 Luas Panen Tanaman Sayuran dan Buah–buahan Semusim
Menurut Jenis Tanaman (ha) di Kota Gorontalo, 2016-2019 ................. 147 Harvested Area of Seasonal Vegetables and Fruits by Kind of Plant
(ha) in Gorontalo Municipality, 2016-2019 .................................................... 1475.1.4 Produksi Tanaman Sayuran dan Buah–buahan Semusim Menurut
Jenis Tanaman (ton) di Kota Gorontalo, 2016-2019 ................................. 148 Production of Seasonal Vegetables and Fruits by Kind of Plant (ha) in
Gorontalo Municipality, 2016-2019 ................................................................. 1485.1.5 Luas Panen Tanaman Hias Menurut Kecamatan dan Jenis Tanaman
(m2) di Kota Gorontalo, 2018 dan 2019 ......................................................... 149 Harvested Area of Ornamental Plants by Subdistrict and Kind of Plant
(m2) in Gorontalo Municipality, 2018 and 2019 ............................................ 1495.1.6 Produksi Tanaman Hias Menurut Kecamatan dan Jenis Tanaman
(tangkai) di Kota Gorontalo, 2018 dan 2019 ............................................... 151 Production of Ornamental Plants by Subdistrict and Kind of Plant
(stalks) in Gorontalo Municipality, 2018 and 2019 ...................................... 1515.1.7 Luas Panen Tanaman Hias Menurut Jenis Tanaman (m2, pohon) di
Kota Gorontalo, 2016-2019 ............................................................................... 153 Harvested Area of Ornamental Plants by Kind of Plant (m2, tree) in
Gorontalo Municipality, 2016-2019 ................................................................. 1535.1.8 Produksi Tanaman Hias Menurut Jenis Tanaman (pohon/rumpun)
di Kota Gorontalo, 2016-2019 .......................................................................... 154 Production of Ornamental Plants by Kind of Plant (tree/clump) in
Gorontalo Municipality, 2016-2019 ................................................................. 1545.1.9 Produksi Buah-buahan Menurut Kecamatan dan Jenis Tanaman
(ton) di Kota Gorontalo, 2018 dan 2019 ....................................................... 155
https:
//goro
ntalo
kota
.bps.g
o.id
xx Gorontalo Municipality in Figures 2020
HalamanPage
Production of Fruits by Subdistrict and Kind of Plant (ton) in Gorontalo Municipality, 2018 and 2019 ......................................................... 155
5.1.10 Produksi Buah–buahan dan Sayuran Tahunan Menurut Jenis Tanaman (ton) di Kota Gorontalo, 2016-2019 ............................................ 158
Production of Annual Fruits and Vegetables by Kind of Plant (ton) in Gorontalo Municipality, 2016-2019 ................................................................. 158
5.2 PETERNAKAN .................................................................................. 159 LIVE STOCK ...................................................................................... 1595.2.1 Populasi Ternak (ekor) Menurut Kecamatan dan Jenis Ternak di
Kota Gorontalo, 2018 dan 2019 ....................................................................... 159 Livestock Population (unit) by Sub-District and Kind of Livestock in
Gorontalo Municipality, 2018 and 2019 ......................................................... 1595.2.2 Populasi Unggas (ekor) Menurut Kecamatan dan Jenis Unggas di
Kota Gorontalo, 2018 dan 2019 ....................................................................... 161 Poultry Population (unit) by Sub-District and Kind of Poultry in
Gorontalo Municipality, 2018 and 2019 ......................................................... 1615.2.3 Produksi Daging Ternak (kg) Menurut Kecamatan dan Jenis Ternak
di Kota Gorontalo, 2018 dan 2019 .................................................................. 163 Meat Production (kg) by Sub-District and Kind of Livestock in
Gorontalo Municipality, 2018 and 2019 ......................................................... 1635.2.4 Produksi Daging Unggas (kg) Menurut Kecamatan dan Jenis
Unggas di Kota Gorontalo, 2018 dan 2019 .................................................. 165 Poultry Meat Production (kg) by Sub-District and Kind of Poultry in
Gorontalo Municipality, 2018 and 2019 ......................................................... 1655.2.5 Produksi Telur Unggas (kg) Menurut Kecamatan dan Jenis Unggas
di Kota Gorontalo, 2018 dan 2019 .................................................................. 167 Production of Poultry Eggs (kg) by Sub-District and Kind of Poultry in
Gorontalo Municipality, 2018 and 2019 ......................................................... 1675.3 PERIKANAN ..................................................................................... 169 FISHERIES ......................................................................................... 1695.3.1 Jumlah Rumah Tangga Perikanan Tangkap Menurut Kecamatan di
Kota Gorontalo, 2018 dan 2019 ....................................................................... 169 Number of Fish Capture Households by Sub-District in Gorontalo
Municipality, 2018 and 2019 ............................................................................. 1695.3.2 Produksi Perikanan Tangkap (ton) Menurut Kecamatan di Kota
https:
//goro
ntalo
kota
.bps.g
o.id

xxiKota Gorontalo Dalam Angka 2020
HalamanPage
Gorontalo, 2018 dan 2019 ................................................................................. 171 Production of Fish Capture (ton) by Sub-District in Gorontalo
Municipality, 2018 and 2019 ............................................................................. 1715.3.3 Jumlah Rumah Tangga Perikanan Budidaya Menurut Kecamatan
dan Jenis Budidaya di Kota Gorontalo, 2019 .............................................. 173 Number Of Aquaculture Households by Sub-District and Aquaculture
Methods in Gorontalo Municipality, 2019 ..................................................... 1735.3.4 Produksi Perikanan Budidaya (ton) Menurut Kecamatan dan Jenis
Budidaya di Kota Gorontalo, 2019 .................................................................. 174 Production Of Aquaculture (ton) by Sub-District and Aquaculture
Methods in Gorontalo Municipality, 2019 ..................................................... 1745.3.5 Jumlah Perahu / Kapal Menurut Kecamatan dan Jenis Kapal di
Kota Gorontalo, 2019 ........................................................................................... 175 Number Of Fishing Boats by Sub-District and Type of Boat in
Gorontalo Municipality, 2019 ........................................................................... 1756 INDUSTRI, PERTAMBANGAN DAN ENERGI/INDUSTRY, MINING
AND ENERGY ................................................................................... 1776.1 ENERGI ............................................................................................. 183 ENERGY ............................................................................................ 1836.1.1 Jumlah Pelanggan Listrik PT. PLN (Persero) Menurut Bulan pada
Rayon Telaga, 2015-2019 ................................................................................... 183 Number Of Electricity Costumers of State Electricity Company at
Telaga Branch, 2015-2019 ................................................................................. 1836.1.2 Jumlah Daya Tersambung dan Listrik Terjual PT. PLN (Persero)
Menurut Bulan pada Rayon Telaga, 2019 ..................................................... 184 Number Of Connected Capacity, and Electricity Sold of State
Electricity Company at Telaga Branch, 2019 ................................................. 1846.1.3 Jumlah Pelanggan dan Air yang Disalurkan Menurut Jenis
Pelanggan di Kota Gorontalo, 2019 ............................................................... 185 Number Of Costumers and Distributed Clean Water by Type of
Customers in Gorontalo Municipality, 2019 .................................................. 1856.2 INDUSTRI ......................................................................................... 186 INDUSTRY ........................................................................................ 1866.2.1 Jumlah Perusahaan, Tenaga Kerja, dan Nilai Produksi Menurut
Klasifikasi Industri di Kota Gorontalo, 2019 ................................................. 186
https:
//goro
ntalo
kota
.bps.g
o.id
xxii Gorontalo Municipality in Figures 2020
HalamanPage
Number Of Establishment, Employees, and Production Value By Industrial Classification in Gorontalo Municipality, 2019 ......................... 186
6.2.2 Jumlah Perusahaan Menurut Bentuk Badan Hukum di Kota Gorontalo 2015-2019 .......................................................................................... 187
Number Of Establishment by Type of Business Entity in Gorontalo Municipality, 2015-2019 ..................................................................................... 187
7 PARIWISATA/TOURISM .................................................................. 1897.1.1 Jumlah Rumah Makan/Restoran Menurut Kecamatan di Kota
Gorontalo, 2016-2019 ......................................................................................... 196 Number of Restaurants by Subdistrict in Gorontalo Municipality,
2016-2019 .............................................................................................................. 1967.1.2 Jumlah Wisatawan Mancanegara dan Domestik di Kota Gorontalo,
2015-2019 ................................................................................................................ 197 Number of International and Domestic Visitors in Gorontalo
Municipality, 2015-2019 ..................................................................................... 1977.1.3 Banyaknya Hotel, Kamar, dan Tempat Tidur Menurut Jenis Hotel di
Kota Gorontalo, 2016–2019 .............................................................................. 198 Number of Units, Rooms, and Beds of Hotel by Star and Non-Star
Hotel in Gorontalo Municipality, 2016-2019 ................................................ 1987.1.4 Tingkat Penghunian Kamar Tidur Menurut Jenis Hotel di Kota
Gorontalo, 2019 ..................................................................................................... 199 Bedroom Occupancy Rate by Star and Non-Star Hotel in Gorontalo
Municipality, 2019 ................................................................................................ 1997.1.5 Jumlah Tamu Hotel dan Rata-Rata Lama Menginap Menurut Asal
Pengunjung di Kota Gorontalo, 2019 ............................................................ 200 Number of Hotel Visitors and Average Days of Stay According to
Where The Visitors Come From in Gorontalo Municipality, 2019 ............. 2008 TRANSPORTASI DAN KOMUNIKASI/TRANSPORTATION AND
COMMUNICATION .......................................................................... 2018.1 TRANSPORTASI ............................................................................... 206 TRANSPORTATION .......................................................................... 2068.1.1 Panjang Jalan Menurut Kewenangan Pemerintahan di Kota
Gorontalo (km), 2015-2019 ............................................................................... 206 Length of Roads by Level of Government Authority in Gorontalo
Municipality (kilometer), 2015-2019 ............................................................... 206
https:
//goro
ntalo
kota
.bps.g
o.id

xxiiiKota Gorontalo Dalam Angka 2020
HalamanPage
8.1.2 Panjang Jalan Menurut Jenis Permukaan di Kota Gorontalo (km), 2017–2019 ............................................................................................................... 207
Length of Regency Roads by Type Of Road Surface in Gorontalo Municipality (kilometer), 2017–2019 .............................................................. 207
8.1.3 Panjang Jalan Kota Menurut Kondisi Jalan di Kota Gorontalo (km), 2015–2019 ............................................................................................................... 208
Length of Regency Roads by Condition Of Road Surface in Gorontalo Municipality (kilometer), 2015–2019 .............................................................. 208
8.1.4 Banyaknya Kendaraan Bermotor Menurut Jenis Kendaraan di Kota Gorontalo (unit), 2016–2019 ............................................................................. 209
Length of Regency Roads by Condition Of Road Surface in Number of Registered Motor Vehicles by Type of Motor Vehicles In Gorontalo Municipality (units), 2016–2019 ....................................................................... 209
8.2 KOMUNIKASI ................................................................................... 210 COMMUNICATION ........................................................................... 2108.2.1 Banyaknya Produk Pos yang Dikirim dan Diterima di Kota
Gorontalo, 2017–2019......................................................................................... 210 Number of Received and Delivered of Post Product in Gorontalo
Municipality, 2016–2019 .................................................................................... 2109 PERBANKAN, KOPERASI DAN HARGA-HARGA/BANKING,
COOPERATIVE AND PRICES ........................................................... 2119.1 KOPERASI ....................................................................................... 216 COOPERATIVE .................................................................................. 2169.1 Jumlah Koperasi Aktif Menurut Kecamatan di Kota Gorontalo,
2016–2019 ............................................................................................................... 216 Number of Active Cooperative by Subdistrict in Gorontalo
Municipality, 2016–2019 .................................................................................... 2169.2 Jumlah Koperasi Menurut Jenis Koperasi dan Kecamatan di Kota
Gorontalo, 2019 ..................................................................................................... 217 Number of Cooperative by Kind of Cooperative and Subdistrict in
Gorontalo Municipality, 2019 ........................................................................... 2179.2 HARGA-HARGA ............................................................................... 218 PRICES .............................................................................................. 2189.2.1 Indeks Harga Konsumen per Bulan Menurut Kelompok
https:
//goro
ntalo
kota
.bps.g
o.id

xxiv Gorontalo Municipality in Figures 2020
HalamanPage
Pengeluaran di Kota Gorontalo (2012 = 100), 2019 ............................... 218 Monthly Consumer Price Index by Expenditure Group in Gorontalo
Municipality (2012 = 100), 2019 ....................................................................... 2189.2.2 Inflasi Point-to-Point Menurut Bulan di Kota Gorontalo, 2019 ............ 220 Point-to-Point Inflation by Month in Gorontalo Municiplaity, 2019 ....... 2209.2.3 Inflasi Tahunan di Kota Gorontalo, 2013 - 2019 ......................................... 222 Yearly Inflation in Gorontalo Municipality, 2013 - 2019 ............................. 22210 PENGELUARAN PENDUDUK/POPULATION EXPENDITURE ......... 22310.1 Rata-rata Pengeluaran per Kapita Sebulan Menurut Kelompok
Komoditas (rupiah) di Kota Gorontalo, 2018 dan 2019 .......................... 228 Monthly Average Expenditure per Capita by Commodity Group
(rupiahs) in Gorontalo Municipality, 2018 and 2019 .................................. 22810.2 Persentase Pengeluaran per Kapita Sebulan Menurut Kelompok
Komoditas di Kota Gorontalo, 2018 dan 2019 ........................................... 229 Percentage of Monthly Expenditure per Capita by Commodity Group
in Gorontalo Municipality, 2018 and 2019 .................................................... 22910.3 Persentase Penduduk Menurut Golongan Pengeluaran Per Kapita
Sebulan di Kota Gorontalo, 2018 dan 2019 ................................................. 230 Percentage of Population by Per Capita Spending Group a Month in
Gorontalo Municipality, 2018 and 2019 ......................................................... 23011 SISTEM NERACA REGIONAL/SYSTEM OF REGIONAL
ACCOUNTS ...................................................................................... 23111.1 Produk Domestik Regional Bruto Atas Dasar Harga Berlaku
Menurut Lapangan Usaha (miliar rupiah) di Kota Gorontalo, 2015-2019 ........................................................................................................................... 241
Gross Regional Domestic Product at Current Market Prices by Industry (billion rupiahs) in Gorontalo Municipality, 2015-2019.............................. 241
11.2 Produk Domestik Regional Bruto Atas Dasar Harga Konstan 2010 Menurut Lapangan Usaha (miliar rupiah) di Kota Gorontalo, 2015-2019 ........................................................................................................................... 243
Gross Regional Domestic Product at 2010 Constant Market Prices by Industry (billion rupiahs) in Gorontalo Municipality, 2015-2019 ............. 243
11.3 Distribusi Persentase Produk Domestik Regional Bruto Atas Dasar Harga Berlaku Menurut Lapangan Usaha di Kota Gorontalo, 2015-2019 ........................................................................................................................... 245
https:
//goro
ntalo
kota
.bps.g
o.id

xxvKota Gorontalo Dalam Angka 2020
HalamanPage
Percentage Distribution of Gross Regional Domestic Product at Current Market Prices by Industry in Gorontalo Municipality, 2015-2019 ......................................................................................................................... 245
11.4 Laju Pertumbuhan Produk Domestik Regional Bruto Atas Dasar Harga Konstan 2010 Menurut Lapangan Usaha (persen) di Kota Gorontalo, 2016-2019 ......................................................................................... 247
Growth Rate of Gross Regional Domestic Product at 2010 Constant Market Prices by Industry (percent) in Gorontalo Municipality, 2016-2019 ......................................................................................................................... 247
11.5 Produk Domestik Regional Bruto Atas Dasar Harga Berlaku Menurut Jenis Pengeluaran di Kota Gorontalo (miliar rupiah), 2015–2019 ............................................................................................................... 249
Gross Regional Domestic Product at Current Market Prices by Type of Expenditure in Gorontalo Municipality (billion rupiahs), 2015–2019 ..... 249
11.6 Produk Domestik Regional Bruto Atas Dasar Harga Konstan 2010 Menurut Jenis Pengeluaran di Kota Gorontalo (miliar rupiah), 2015–2019 ............................................................................................................... 250
Gross Regional Domestic Product at Constant Market Prices by Type of Expenditure in Gorontalo Municipality (billion rupiahs), 2015–2019 250
11.7 Distribusi Persentase Produk Domestik Regional Bruto Atas Dasar Harga Berlaku Menurut Jenis Pengeluaran di Kota Gorontalo, 2015-2019 ................................................................................................................ 251
Percentage Distribution of Gross Regional Domestic Product at Current Market Prices by Type of Expenditure in Gorontalo Municipality, 2015-2019 ..................................................................................... 251
11.8 Laju Pertumbuhan Produk Domestik Regional Bruto Atas Dasar Harga Konstan 2010 Menurut Jenis Pengeluaran (persen) di Kota Gorontalo, 2016-2019 ......................................................................................... 252
Growth Rate of Gross Regional Domestic Product at 2010 Constant Market Prices by Type of Expenditure (percent) in Gorontalo Municipality, 2016-2019 ..................................................................................... 252
12 PERBANDINGAN ANTAR KABUPATEN/KOTA/ REGENCY/MUNICIPAL COMPARISON .............................................................. 253
12.1 Jumlah Penduduk Menurut Kabupaten/Kota di Provinsi Gorontalo (ribu), 2015–2019 .................................................................................................. 258
Population by Regency/Municipality in Gorontalo Province
https:
//goro
ntalo
kota
.bps.g
o.id

xxvi Gorontalo Municipality in Figures 2020
HalamanPage
(thousand), 2015–2019....................................................................................... 25812.2 Laju Pertumbuhan Produk Domestik Regional Bruto Atas Dasar
Harga Konstan 2010 Menurut Kabupaten/Kota di Provinsi Gorontalo (persen), 2015–2019 ....................................................................... 259
Rate of Growth of Gross Regional Domestic Products at Constant 2010 Prices by Regency/Municipality in Gorontalo Province (percent), 2015–2019 ............................................................................................................. 259
12.3 Jumlah Penduduk Miskin Menurut Kabupaten/Kota di Provinsi Gorontalo (ribu), 2015–2019............................................................................. 260
Number of Poor Population by Regency/Municipality in Gorontalo Province (thousand), 2015–2019 ..................................................................... 260
12.4 Indeks Pembangunan Manusia Menurut Kabupaten/Kota di Provinsi Gorontalo, 2015–2019 ........................................................................ 261
Human Development Index by Regency/Municipality in Gorontalo Province, 2015–2019 ........................................................................................... 261
https:
//goro
ntalo
kota
.bps.g
o.id
xxviiKota Gorontalo Dalam Angka 2020
DAFTAR GAMBAR/LIST OF FIGURES
HalamanPage
1.1 Luas Daerah menurut Kecamatan (%) di Kota Gorontalo, 2019 .......... 4 Area of Subdistrict (%) in Gorontalo Municipality, 2019 ............................ 42.1 Jumlah Kelurahan Menurut Kecamatan di Kota Gorontalo, 2015–
2019 ........................................................................................................................... 20 Number of Urban Village by Sub-District in Gorontalo Municipality,
2015–2019 ............................................................................................................. 202.2 Jumlah Anggota Dewan Perwakilian Rakyat Daerah Menurut
Partai Politik dan Jenis Kelamin di Kota Gorontalo, 2019 ....................... 21 Number of Members of The Regional House of Representatives By
Political Parties in Gorontalo Municipality, 2019 ......................................... 213.1 Jumlah Penduduk Angkatan Kerja, Bukan Angkatan Kerja, di Kota
Gorontalo, 2019 ..................................................................................................... 46 Number of Economically Active and Inactive Population in Gorontalo
Municipality, 2019 ................................................................................................ 463.2 Jumlah Penduduk Menurut Jenis Kelamin dan Kecamatan di Kota
Gorontalo, 2019 ..................................................................................................... 47 Population by Sex and Sub-District in Gorontalo Municipality, 2019 ..... 474.1 Jumlah Tempat Peribadatan Menurut Jenisnya di Kota Gorontalo,
2019 ........................................................................................................................... 70 Number of Places of Worship by Kind in Gorontalo Municipality,
2019 ........................................................................................................................... 704.2 Jumlah Tindak Pidana di Kota Gorontalo, 2019 ........................................ 71 Total of Criminal Cases in Gorontalo Municipality, 2019 ........................... 715.1 Produksi Tanaman Buah–buahan (ton) Menurut Jenis Tanaman di
Kota Gorontalo, 2019 ........................................................................................... 139 Production of Fruits (ton) by Kind of Plants in Gorontalo Municipality,
2019 ......................................................................................................................... 1395.2 Produksi Perikanan Tangkap (ton) di Kota Gorontalo, 2019 ................. 140 Production of Fish Capture (ton) in Gorontalo Municipality, 2019 ......... 1406.1 Jumlah Pelanggan Listrik PT. PLN (Persero) Menurut Bulan pada
Rayon Telaga, 2019 ............................................................................................... 181 Number Of Electricity Costumers of State Electricity Company at
Telaga Branch, 2019 ............................................................................................ 181
Daftar Gambar/List of Figures .........................................................................................
https:
//goro
ntalo
kota
.bps.g
o.id

xxviii Gorontalo Municipality in Figures 2020
HalamanPage
6.2 Jumlah Perusahaan dan Tenaga Kerja Menurut Klasifikasi Industri di Kota Gorontalo, 2019 ..................................................................................... 182
Number Of Establishment and Employees By Industrial; Classification in Gorontalo Municipality, 2019 ...................................................................... 182
7.1 Jumlah Rumah Makan/Restoran di Kota Gorontalo, 2016-2019 ......... 194 Number of Restaurants in Gorontalo Municipality, 2016-2019 ................ 1947.2 Jumlah Tamu Hotel Dalam Negeri di Kota Gorontalo, 2019 ................. 195 Number of Domestic's Hotel Visitors in Gorontalo Municipality, 2019 ... 1958.1 Persentase Panjang Jalan Kota Menurut Kondisi Jalan di Kota
Gorontalo (km), 2019 ........................................................................................... 205 Percentage of Length of Regency Roads by Condition Of Road Surface
in Gorontalo Municipality (kilometer), 2019 ................................................. 2059.1 Inflasi Tahunan di Kota Gorontalo, 2013-2019 .......................................... 215 Yearly Inflation in Gorontalo Municipality, 2013-2019 ............................... 21510.1 Pengeluaran Rata – rata Perkapita Sebulan Menurut Kelompok
Komoditas Makanan di Kota Gorontalo (rupiah), 2019 .......................... 226 Average Expenditure Per Capita Per Month by Food Commodity
Group in Gorontalo Municipality (rupiahs), 2019 ........................................ 22610.2 Pengeluaran Rata – rata Perkapita Sebulan Menurut Kelompok
Komoditas Non-Makanan di Kota Gorontalo (rupiah), 2019 ................ 227 Average Expenditure Per Capita Per Month by Non-Food Commodity
Group in Gorontalo Municipality (rupiahs), 2019 ........................................ 22711.1 Distribusi Persentase Produk Domestik Regional Bruto (PDRB) Atas
Dasar Harga Berlaku Menurut Lapangan Usaha di Kota Gorontalo (persen), 2019 ......................................................................................................... 239
Percentage Distribution of Gross Regional Domestic Product (GRDP) at Current Market Prices by Business Field in Gorontalo Municipality (percent), 2019 ...................................................................................................... 239
11.2 Laju Pertumbuhan Produk Domestik Regional Bruto (PDRB) Atas Dasar Harga Konstan 2010 Menurut Lapangan Usaha di Kota Gorontalo (persen), 2014 – 2019 .................................................................... 240
Growth Rate of Gross Regional Domestic Product (GRDP) at 2010 Constant Market Prices by Business Field in Gorontalo Municipality (percent), 2014 – 2019 ......................................................................................... 240
12.1 Indeks Pembangunan Manusia Menurut Kabupaten/Kota di
https:
//goro
ntalo
kota
.bps.g
o.id

xxixKota Gorontalo Dalam Angka 2020
HalamanPage
Provinsi Gorontalo, 2019 .................................................................................... 257 Human Development Index by Regency/Municipality in Gorontalo
Province, 2019 ....................................................................................................... 257
https:
//goro
ntalo
kota
.bps.g
o.id

https:
//goro
ntalo
kota
.bps.g
o.id

xxxiKota Gorontalo Dalam Angka 2020
PENJELASAN UMUM/EXPLANATORY NOTES
Tanda-tanda, satuan-satuan, dan lain-lainnya yang digunakan dalam publikasi ini adalah sebagai berikut: Symbols, measurement units, and acronyms which are used in this publication, are as follows:
1. TANDA-TANDA/SYMBOLS
Data tidak tersedia/Data not available ........................................................ : ...Tidak ada atau nol /Null or zero ..................................................................... : –
Data dapat diabaikan/Data negligible ........................................................ : 0Tanda decimal/Decimal point ........................................................................ : ,Data tidak dapat ditampilkan/Not applicable .......................................... : NAAngka estimasi/Estimated figures ................................................................. : eAngka diperbaiki/Revised figures ................................................................. : rAngka sementara/Preliminary figures ......................................................... : xAngka sangat sementara/Very preliminary figures ................................ : xxAngka sangat sangat sementara/Very very preliminary figures ........ : xxx
2. SATUAN/UNITS
barel/barrel ..................................................................... : 158,99 liter/litres = 1/6,2898 m3
hektar (ha)/hectare (ha) .............................................. : 10 000 m2
kilometer (km)/kilometres (km) ................................ : 1 000 meter/meters (m)knot/knot ......................................................................... : 1,8523 km/jam (km/hour)kuintal/quintal ............................................................... : 100 kgKWh ................................................................................... : 1 000 Watt hourMWh .................................................................................. : 1 000 KWhliter (untuk beras)/litre (for rice) ............................... : 0,80 kgMMSCF ............................................................................. : 1/35,3 m3
metrik ton (m.ton)/metric ton (m. ton) ................... : 0,98421 long ton = 1 000 kgons/ounce ........................................................................ : 28,31 gram/gramston ...................................................................................... : 1 000 kg
Satuan lain: buah, dus, butir, helai/lembar, kaleng, batang, pulsa, ton kilometer (ton-km), jam, menit, persen (%). Other units: unit, pack, pieces, sheet, tin, pulse, ton-kilometres(ton-km), hour, minute, percent (%).
Perbedaan angka di belakang koma disebabkan oleh pembulatan angka. The difference in decimal numbers is caused by rounding.
https:
//goro
ntalo
kota
.bps.g
o.id

https:
//goro
ntalo
kota
.bps.g
o.id

xxxiiiKota Gorontalo Dalam Angka 2020
DAFTAR SINGKATAN/ LIST OF ABBREVIATIONS
SI : Stasiun IklimSIMPK : Stasiun Meteorologi Pertanian Khusust.t : Tempat tidurBCG : Bacillus Calmette GuerinDPT : Difteri, Pertusis, TetanusTT : Tetanus ToxoidIOT : Industri Obat Tradisional/Traditional Medicine IndustryIKOT : Industri Kecil Obat Tradisional/Traditional Medicine SmallAlkes : Alat kesehatan/Health KitsPKRT : Perbekalan Kesehatan Rumah tangga/Household Health
LogisticsKompl : Komplemen/ComplementIRTP : Industri Pangan Produksi Rumah Tangga/Foods Home IndustryPBF : Pedagang Besar Farmasi/Pharmacy Whole-sellerGFK : Gudang Farmasi Kab/Kota/Regency/Muncipality Pharmacy
WarehouseRB : Rumah Bersalin/Delivery HousePustu : Puskesmas pembantu/Auxiliary Public Health CenterBP : Balai Pengobatan/PolyclinicTPS : Tempat Pembuangan Sementara /landfillJamkesmas : Jaminan kesehatan masyarakat miskin/Poor public health
insurancePJKMU : Program Jaminan Kesehatan Masyarakat UmumSIUP : Surat Ijin Usaha Perdagangan/Trading Permission LetterTDP : Tanda Daftar Perusahaan/Company Registration IdentityAPI : Angka Pengenal Importir/Importer’s Identity Number
Daftar Singkatan/List of Abbreviations
https:
//goro
ntalo
kota
.bps.g
o.id

https:
//goro
ntalo
kota
.bps.g
o.id

1
GEOGRAFI DAN IKLIM
Kota Gorontalo Dalam Angka 2020
1. Geografi dan Iklim/Geography and Climate .....................................................1 GEOGRAFI DAN IKLIM/GEOGRAPHY AND CLIMATE .......................
GEOGRAFI DAN IKLIMGEOGRAPHY AND CLIMATE
01
https:
//goro
ntalo
kota
.bps.g
o.id

https:
//goro
ntalo
kota
.bps.g
o.id

3
GEOGRAFI DAN IKLIM
Kota Gorontalo Dalam Angka 2020
PENJELASAN TEKNIS TECHNICAL NOTES
1. Kota Gorontalo merupakan ibukota Provinsi Gorontalo. Secara geografis mempunyai luas 79,59 km2 atau 0,71 persen dari luas Provinsi Gorontalo. Kota Gorontalo dibagi menjadi 9 kecamatan, terdiri dari 50 kelurahan. Kecamatan dengan luas terbesar adalah kecamatan Kota Barat.
2. Secara astronomis, Kota Gorontalo terletak antara 00 28‘ 17“ - 00 35‘ 36“ Lintang Utara, dan 1220 59‘ 44“ - 1230 5‘ 59“ Bujur Timur.
3. Berdasarkan posisi geografisnya, Kota Gorontalo memiliki batas-batas: Utara – Kecamatan Bulango Selatan Bone Bolango, Selatan – Teluk Tomini, Barat – Sungai Bolango Kabupaten Gorontalo, Timur – Kecamatan Kabila Kabupaten Bone Bolango.
4. Kondisi topografi Kota Gorontalo adalah tanah datar yang dilalui tiga buah sungai yang bermuara di Teluk Tomini, Pelabuhan Gorontalo. Bagian selatan diapit dua pegunungan berbatu kapur/pasir. Ketinggian dari permukaan laut antara 0 sampai 470 meter. Pesisir pantai landai berpasir.
1. Gorontalo Municipality is the capital of Gorontalo province. Geographycally, has a total area of 79.59 sq.km or 0.71 percent of Gorontalo Province area. Gorontalo City is divided into 9 districts, consisting of 50 sub-district. Districts with the largest area is the Kota Barat districts.
2. Astronomically, Gorontalo Municipality is located betwen 00 28‘ 17” - 00 35” 36” North Latitude, and 1220 59‘ 44” - 1230 5 ‘59” East Longitude.
3. In terms of geographic position, Gorontalo Municipality has boundaries as follows North – South Bulango District Bone Bolango Regency, South – Gulf of Tomini, West – Bolango River District of Gorontalo Regency, East – Kabila District of Bone Bolango Regency.
4. Gorontalo Municipality topography is flat land through which the three rivers that empties into Tomini Gulf, Gorontalo Harbour. The south side flanked by two stone flattery/sandy mountains. Altitude between 0 to 470 meters. Coastal sloping sandy beach.
https:
//goro
ntalo
kota
.bps.g
o.id
4
GEOGRAPHY AND CLIMATE
Gorontalo Municipality in Figures 2020
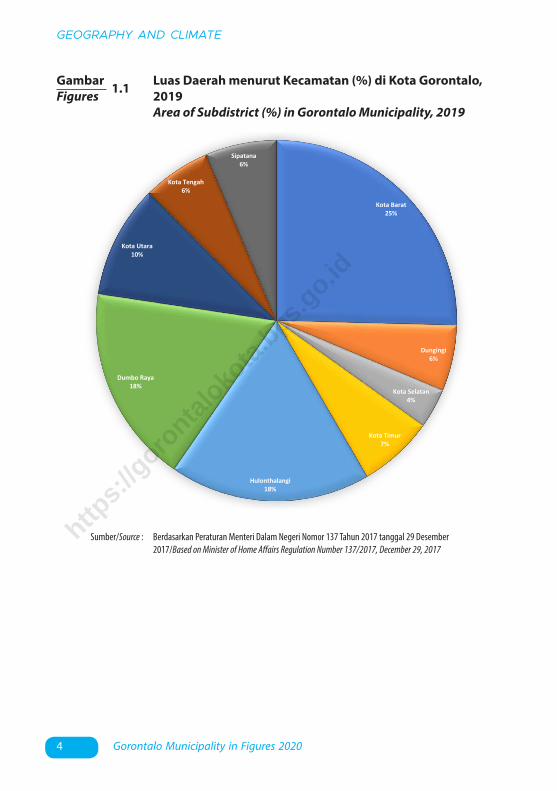
1.1 Luas Daerah menurut Kecamatan (%) di Kota Gorontalo, 2019
Area of Subdistrict (%) in Gorontalo Municipality, 2019
GambarFigures
Sumber/Source : Berdasarkan Peraturan Menteri Dalam Negeri Nomor 137 Tahun 2017 tanggal 29 Desember 2017/Based on Minister of Home Affairs Regulation Number 137/2017, December 29, 2017
Kota Barat 25%
Dungingi6%
Kota Selatan4%
Kota Timur7%
Hulonthalangi18%
Dumbo Raya18%
Kota Utara10%
Kota Tengah6%
Sipatana6%
https:
//goro
ntalo
kota
.bps.g
o.id

5
GEOGRAFI DAN IKLIM
Kota Gorontalo Dalam Angka 2020
TabelTable 1.1.1 Luas Daerah dan Jumlah Pulau Menurut Kecamatan di
Kota Gorontalo, 2019 Total Area and Number of Islands by Subdistrict in
Gorontalo Municipality, 2019
1.1 KEADAAN GEOGRAFI GEOGRAPHY CONDITION
KecamatanSubdistrict
Ibukota KecamatanCapital of Subdistrict
Luas 1 Total Area 1 (km2/sq.km)
(1) (2) (3)
Kota Barat Buladu 20,22
Dungingi Huangobotu 4,70
Kota Selatan Biawu 2,83
Kota Timur Moodu 5,36
Hulonthalangi Tenda 14,33
Dumbo Raya Talumolo 14,14
Kota Utara Dulomo Selatan 8,08
Kota Tengah Pulubala 4,84
Sipatana Molosipat U 5,09
Kota Gorontalo 79,59
https:
//goro
ntalo
kota
.bps.g
o.id

6
GEOGRAPHY AND CLIMATE
Gorontalo Municipality in Figures 2020
KecamatanSubdistrict
Persentase terhadap Luas Kota2
Percentage to Municipality’s Area2Jumlah Pulau
Number of Islands
(1) (4) (5)
Kota Barat 25,41 -
Dungingi 5,91 -
Kota Selatan 3,56 -
Kota Timur 6,73 -
Hulonthalangi 18,01 -
Dumbo Raya 17,77 -
Kota Utara 10,15 -
Kota Tengah 6,09 -
Sipatana 6,36 -
Kota Gorontalo 100,00 -
Catatan/Note: 1 Berdasarkan Peraturan Menteri Dalam Negeri Nomor 137 Tahun 2017 tanggal 29 Desember 2017/Based on Minister of Home Affairs Regulation Number 137/2017, December 29, 2017
Rincian luas wilayah kecamatan menggunakan proporsi dari poin 2 / The breakdown of the total area of a sub-district uses the proportion at point 2
2 Berdasarkan informasi Bagian Tata Pemerintahan Sekretariat Daerah Kota Gorontalo/Based on information from Government Section of Regional Secretariat of Gorontalo Municipality
Sumber/Source: Kementerian Dalam Negeri/Ministry of Home Affairs
Lanjutan Tabel/Continued Table 1.1.1
https:
//goro
ntalo
kota
.bps.g
o.id

7
GEOGRAFI DAN IKLIM
Kota Gorontalo Dalam Angka 2020
KecamatanSubdistrict
Tinggi Wilayah (mdpl)Altitude (m a.s.l)
Jarak ke Ibukota (km)Distance to the Capital (km)
(1) (2) (3)
Kota Barat 11 5,0
Dungingi 10 4,0
Kota Selatan 5 0,3
Kota Timur 6 2,0
Hulonthalangi 9 3,0
Dumbo Raya 5 2,5
Kota Utara 15 6,0
Kota Tengah 11 4,0
Sipatana 18 4,5
Kota Gorontalo 18
Sumber/Source: Kementerian Dalam Negeri/Ministry of Home Affairs
TabelTable 1.1.2 Tinggi Wilayah dan Jarak Ke Ibukota Kabupaten/Kota
Menurut Kecamatan di Kota Gorontalo, 2019 Altitude and Distance to the Capital of Regency/
Municipality by Subdistrict in Gorontalo Muncipality, 2019
https:
//goro
ntalo
kota
.bps.g
o.id

8
GEOGRAPHY AND CLIMATE
Gorontalo Municipality in Figures 2020
TabelTable 1.1.3 Letak Astronomis Kecamatan-Kecamatan di Kota
Gorontalo, 2019 Astronomical Position of Sub-District in Gorontalo
Municipality, 2019
KecamatanSubdistrict
Lintang Utara North Latitude
Bujur TimurEast Longitude
(1) (2) (3)
Kota Barat 0o 32‘ 43“ 123o 1‘ 40“
Dungingi 0o 33‘ 24“ 123o 2‘ 24“
Kota Selatan 0o 32‘ 32“ 123o 3‘ 23“
Kota Timur 0o 32‘ 39“ 123o 4‘ 12“
Hulonthalangi 0o 31‘ 14“ 123o 3‘ 3“
Dumbo Raya 0o 30‘ 39“ 123o 4‘ 32“
Kota Utara 0o 33‘ 35“ 123o 4‘ 44“
Kota Tengah 0o 33‘ 47“ 123o 3‘ 22“
Sipatana 0o 34‘ 42“ 123o 4‘ 7“
Kota Gorontalo 0o 28‘ 17“ - 0o 35‘ 36“ 122o 59‘ 44“ - 123o 5‘ 59“
Sumber/Source: Badan Pertanaham Nasional Kota Gorontalo/National Land Board of Gorontalo Municipality
https:
//goro
ntalo
kota
.bps.g
o.id
9
GEOGRAFI DAN IKLIM
Kota Gorontalo Dalam Angka 2020
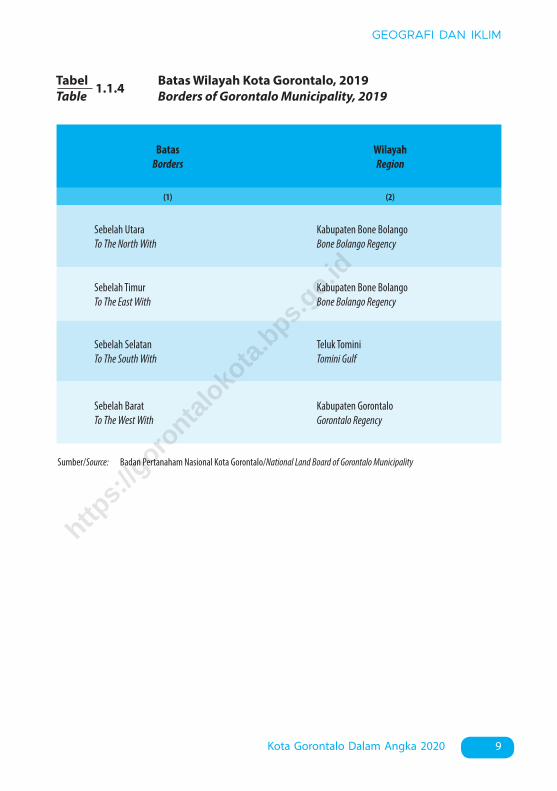
TabelTable 1.1.4 Batas Wilayah Kota Gorontalo, 2019
Borders of Gorontalo Municipality, 2019
BatasBorders
WilayahRegion
(1) (2)
Sebelah UtaraTo The North With
Kabupaten Bone BolangoBone Bolango Regency
Sebelah TimurTo The East With
Kabupaten Bone BolangoBone Bolango Regency
Sebelah SelatanTo The South With
Teluk TominiTomini Gulf
Sebelah BaratTo The West With
Kabupaten GorontaloGorontalo Regency
Sumber/Source: Badan Pertanaham Nasional Kota Gorontalo/National Land Board of Gorontalo Municipality
https:
//goro
ntalo
kota
.bps.g
o.id

10
GEOGRAPHY AND CLIMATE
Gorontalo Municipality in Figures 2020
TabelTable 1.1.5 Nama Sungai, Panjang Aliran dan Sungai yang dilalui di
Kota Gorontalo, 2019 Name of River, Length, and District Passed Over of
Gorontalo Municipality, 2019
Nama SungaiName of River
Panjang Aliran (m)Length (m)
Kecamatan yang DilaluiSub-District that Passed Over
(1) (2) (3)
Sungai Bone ± 4 500Kec. Dumbo Raya / Dumbo Raya Sub-DistrictKec. Kota Timur / Kota Timur Sub-DistrictKec. Hulonthalangi / Hulonthalangi Sub-District
Sungai Bolango ± 11 000
Kec. Sipatana / Sipatana Sub-DistrictKec. Dungingi / Dungingi Sub-DistrictKec. Kota Barat / Kota Barat Sub-DistrictKec. Kota Selatan / Kota Selatan Sub-DistrictKec. Hulonthalangi / Hulonthalangi Sub-District
Sungai Tamalate ± 5 000Kec. Kota Utara / Kota Utara Sub-DistrictKec. Kota Timur / Kota Timur Sub-DistrictKec. Hulonthalangi / Hulonthalangi Sub-District
Sumber/Source: Badan Pertanaham Nasional Kota Gorontalo/National Land Board of Gorontalo Municipality
https:
//goro
ntalo
kota
.bps.g
o.id
11
GEOGRAFI DAN IKLIM
Kota Gorontalo Dalam Angka 2020
TabelTable 1.2.1 Pengamatan Unsur Iklim Menurut Bulan di Stasiun
Klimatologi Tilongkabila Bone Bolango, 2019 Observation of Climate Elements By Months at Tilongkabila
Bone Bolango’s Climatology Station, 2019
1.2 KEADAAN IKLIM CLIMATE CONDITION
BulanMonth
Suhu/Temperature (0C) Kelembaban/Humidity (%)
Minimum Rata-rataAverage
MaksimumMaximum Minimum Rata-rata
AverageMaksimumMaximum
(1) (2) (3) (4) (5) (6) (7)
Januari/January 23,3 26,8 32,3 66 83 94
Februari/February 22,5 27,0 33,0 58 80 94
Maret/March 22,5 27,2 33,8 54 77 92
April/April 23,8 27,6 33,3 61 81 91
Mei/May 23,4 27,4 33,0 62 82 91
Juni/June 23,4 26,7 31,5 69 84 93
Juli/July 22,5 26,3 31,5 60 79 92
Agustus/August 21,8 27,3 33,4 47 69 84
September/September 21,5 27,5 34,1 42 64 79
Oktober/October 22,8 27,1 33,4 55 77 87
November/November 23,0 28,2 34,6 50 72 85
Desember/December 23,6 27,3 33,6 61 82 92
https:
//goro
ntalo
kota
.bps.g
o.id

12
GEOGRAPHY AND CLIMATE
Gorontalo Municipality in Figures 2020
BulanMonth
Kecepatan Angin (knot)Wind Velocity (knots)
Tekanan Udara (mb)Atmospheric Pressure (mb)
Minimum Rata-rataAverage
MaksimumMaximum Minimum Rata-rata
AverageMaksimumMaximum
(1) (8) (9) (10) (11) (12) (13)
Januari/January ... 2 10 ... 1007,5 ...
Februari/February ... 2 10 ... 1009,3 ...
Maret/March ... 2 6 ... 1007,9 ...
April/April ... 2 11 ... 1007,0 ...
Mei/May ... 2 11 ... 1007,5 ...
Juni/June ... 2 8 ... 1006,9 ...
Juli/July ... 3 11 ... 1007,9 ...
Agustus/August ... 4 11 ... 1007,8 ...
September/September ... 4 14 ... 1009,0 ...
Oktober/October ... 3 12 ... 1007,3 ...
November/November ... 3 12 ... 1007,0 ...
Desember/December ... 2 11 ... 1006,8 ...
Lanjutan Tabel/Continued Table 1.2.1
https:
//goro
ntalo
kota
.bps.g
o.id

13
GEOGRAFI DAN IKLIM
Kota Gorontalo Dalam Angka 2020
BulanMonth
Jumlah Curah HujanNumber of Precipitation
(mm)
Jumlah Hari Hujan (hari)
Number of Rainy Days(day)
Penyinaran MatahariDuration of Sunshine
(%)
(1) (14) (15) (16)
Januari/January 74,5 9 41
Februari/February 45,9 6 65
Maret/March 83,0 7 63
April/April 330,7 13 53
Mei/May 51,4 9 63
Juni/June 119,1 13 44
Juli/July 25,6 5 41
Agustus/August 6,7 3 84
September/September 0,0 - 89
Oktober/October 129,9 13 71
November/November 8,2 3 83
Desember/December 173,8 12 63
Lanjutan Tabel/Continued Table 1.2.1
Sumber/Source: Badan Badan Meteorologi, Klimatologi dan Geofisika Gorontalo / Meteorology, Climatology, and Geophysical Agency of Gorontalo
https:
//goro
ntalo
kota
.bps.g
o.id

https:
//goro
ntalo
kota
.bps.g
o.id

15Kota Gorontalo Dalam Angka 2020
PEMERINTAHAN
2. Pemerintahan/Government ...................................................................................
PEMERINTAHANGOVERNMENT
02
https:
//goro
ntalo
kota
.bps.g
o.id

https:
//goro
ntalo
kota
.bps.g
o.id

PEMERINTAHAN
17Kota Gorontalo Dalam Angka 2020
PENJELASAN TEKNIS TECHNICAL NOTES
1. Anggota Dewan Perwakilan Rakyat Daerah (DPRD) dipilih melalui pemilihan umum (pemilu) dan dilantik dalam masa jabatan lima tahun.
2. Susunan pemerintahan Republik Indonesia periode 2019–2024 terdiri dari presiden, wakil presiden, lembaga tinggi negara, kementerian, setingkat menteri, dan Lembaga Pemerintahan Non Kementerian (LPNK).
3. Lembaga tinggi negara terdiri dari Majelis Permusyawaran Rakyat (MPR), Dewan Perwakilan Rakyat (DPR), Badan Pemeriksa Keuangan (BPK), dan Mahkamah Agung (MA), Dewan Perwakilan Daerah (DPD), Mahkamah Konstitusi (MK), dan Komisi Yudisial (KY).
4. Kementerian terdiri dari kementerian koordinator dan kementerian.
5. Kementerian koordinator terdiri dari bidang politik, hukum, dan keamanan (Polhukam), bidang perekonomian, bidang pembangunan manusia dan kebudayaan, dan bidang kemaritiman.
6. Kementerian terdiri dari Kementerian Sekretaris Negara, Kementrian Dalam Negeri, Kementerian Luar Negeri, Kementerian Perencanaan Pembangunan Nasional/Bappenas, Kementerian
1. Regional House of Representatives (DPRD) members are elected through a general election and appointed for a five-years membership.
2. The government structure of the Republic of Indonesia period 2019–2024 consists of president, vice president, state supreme agencies, ministries, ministerial level institutions, and non-ministerial institutions.
3. State supreme agencies consist of The People’s Consultative Assembly, The House of Representative, The Audit Board of the Republic of Indonesia, Supreme Court, Local Councils, Constitutional Court, and Judicial Commision.
4. Ministries consist of coordinating ministry and departmental ministry.
5. Coordinating ministries consist of Coordinating Ministry for Political, Legal, and Security Affairs, Coordinating Ministry for the Economy, Coordinating Ministry for Maritime Affairs, and Coordinating Ministry for Human Development and Culture
6. Departmental Ministries consist of State Secretary; Ministry of Home Affairs; Ministry of Foreign Affairs; Ministry of National Development Planning/Chairperson of National Development Planning Agency; Ministry of Defense; Ministry of
https:
//goro
ntalo
kota
.bps.g
o.id

GOVERNMENT
18 Gorontalo Municipaly in Figures 2020
Pertahanan, Kementerian Hukum dan Hak Asasi Manusia, Kementerian Keuangan, Kementerian Energi dan Sumber Daya Mineral, Kementerian Perindustrian, Kementerian Perdagangan, Kementerian Pertanian, Kementerian Perhubungan, Kementerian Kelautan dan Perikanan, Kementerian Ketenagakerjaan, Kementerian Badan Usaha Milik Negara, Kementerian Koperasi dan UKM, Kementerian Pekerjaan Umum dan Perumahan Rakyat, Kementerian Lingkungan Hidup dan Kehutanan, Kementerian Agraria dan Tata Ruang/Badan Pertanahan Nasional, Kementerian Kesehatan, Kementerian Kebudayaan dan Pendidikan Dasar Menengah, Kementerian Sosial, Kementerian Agama, Kementerian Pariwisata, Kementerian Komunikasi dan Informatika, Kementerian Pendayagunaan Aparatur Negara dan Reformasi Birokrasi, Kementerian Pemuda dan Olahraga, Kementerian Desa, Pembangunan Daerah Tertinggal dan Transmigrasi, Kementerian Riset Teknologi dan Pendidikan Tinggi, dan Kementerian Pemberdayaan Perempuan dan Perlindungan Anak.
7. Setingkat Menteri terdiri dari Kejaksaan Agung, Tentara Nasional Indonesia, dan Kepolisian Negara Republik
Justice and Human Rights; Ministry of Finance; Ministry of Energy and Mineral Resources; Ministry of Industry; Ministry of Trade; Ministry of Agriculture; Ministry of Transportation; Ministry of Maritime Affairs and Fisheries; Ministry of Manpower; Ministry of State Owned Enterprises; Ministry of Cooperatives and Small and Medium Enterprises; Ministry of Public Works and Public Housing; Ministry of Environment and Forestry; Ministry of Agrarian Affairs and Spatial Planning/National Land Agency; Ministry of Health; Ministry of Culture and Elementary & Secondary Education; Ministry of Social Services; Ministry of Religious Affairs; Ministry of Tourism; Ministry of Communication and Informatics; Ministry of Empowerment of State Apparatus and Bureaucracy Reform; Ministry of Youth and Sports Affairs; Ministry of Village Development, Disadvantaged Regions and Transmigration; Ministry of Research, Technology, and Higher Education; and Ministry of Women Empowerment and Child Protection
7. Ministerial Level Officials consist of, Attorney General, Indonesian National Defense Force, and Indonesian National Police.
https:
//goro
ntalo
kota
.bps.g
o.id

PEMERINTAHAN
19Kota Gorontalo Dalam Angka 2020
Indonesia 8. Lembaga Pemerintah Non
Kementerian terdiri dari Arsip Nasional Republik Indonesia, Badan Intelijen Negara, Badan Kepegawaian Negara, Badan Kependudukan dan Keluarga Berencana Nasional, Badan Koordinasi Penanaman Modal, Badan Informasi Geospasial, Badan Meteorologi, Klimatologi, dan Geofisika, Badan Narkotika Nasional, Badan Nasional Penanggulangan Bencana, Badan Nasional Penanggulangan Terorisme, Badan Nasional Penempatan dan Perlindungan Tenaga Kerja Indonesia, Badan Pengawasan Obat dan Makanan, Badan Pengawasan Tenaga Nuklir, Badan Pengawasan Keuangan dan Pembangunan, Badan Pengkajian dan Penerapan Teknologi, Badan Pusat Statistik, Badan SAR Nasional, Badan Standardisasi Nasional, Badan Tenaga Nuklir Nasional, Lembaga Administrasi Negara, Lembaga Ilmu Pengetahuan Indonesia, Lembaga Ketahanan Nasional, Lembaga Kebijakan Pengadaan Barang/Jasa Pemerintah, Lembaga Penerbangan dan Antariksa Nasional, Lembaga Sandi Negara, dan Perpustakaan Nasional Republik Indonesia.
8. Non Ministerial Institutions consist
of National Archive of the Republic of Indonesia, State Intelligence Board, National Civil Service Agency, National Population and Family Planning Board, Investment Coordinating Board, Geospatial Information Agency, Meteorology, Climatology, and Geophysics Agency, National Narcotics Agency, National Agency for Disaster Management, National Counter Terrorism Agency, The National Authority for The Placement and Protection of Indonesian Overseas Workers, National Agency of Drugs and Foods Control, Nuclear Energy Controlling Board, Audit and Development Supervising Agency, Agency for the Assesment and Application Technology, BPS-Statistics Indonesia, National Search and Rescue Agency, National Standardization Board, National Nuclear Energy Board, National Institute of Administration, National Institute of Science, National Resilience Institute, Government Procurement Policy Board, National Institute of Space and Aeronautics, National Crypto Agency, and National Library of Republic of Indonesia.
https:
//goro
ntalo
kota
.bps.g
o.id

20 Gorontalo Municipality in Figures 2020
GOVERNMENT
7
5 5
6
5 5
6 6
5
KOTA BARAT DUNGINGI KOTA SELATAN KOTA TIMUR HULONTHALANGI DUMBO RAYA KOTA UTARA KOTA TENGAH SIPATANA
Jumlah Kelurahan / Number of Urban Village
2.1 Jumlah Kelurahan Menurut Kecamatan di Kota Gorontalo, 2015–2019
Number of Urban Village by Sub-District in Gorontalo Municipality, 2015–2019
GambarFigures
Sumber/Source : Peraturan Kepala Badan Pusat Statistik Nomor 29 Tahun 2018 Tanggal 15 Januari 2018 tentang Perubahan Atas Peraturan Kepala Badan Pusat Statistik Nomor 55 Tahun 2017 tentang Kode dan Nama Wilayah Kerja Statistik Tahun 2017 / Chief Statistician Regulation Number 29/2018, January 15 2018, as a revision of Chief Statistician Regulation Number 55 of 2017 on Code and Name of Regional Level of Data Collection.
https:
//goro
ntalo
kota
.bps.g
o.id

21Kota Gorontalo Dalam Angka 2020
PEMERINTAHAN
Sumber/Source : Sekretariat DPRD Kota Gorontalo / Secretariat of DPRD of Gorontalo
GambarFigures
2.2 Jumlah Anggota Dewan Perwakilian Rakyat Daerah Menurut Partai Politik dan Jenis Kelamin di Kota Gorontalo, 2019
Number of Members of The Regional House of Representatives By Political Parties in Gorontalo Municipality, 2019
https:
//goro
ntalo
kota
.bps.g
o.id

22 Gorontalo Municipality in Figures 2020
GOVERNMENT
TabelTable 2.1.1 Jumlah Desa1/Kelurahan Menurut Kecamatan di Kota
Gorontalo, 2015-2019 Number of Villages1/Kelurahan by Subdistrict, 2015-
2019
2.1 WILAYAH ADMINISTRATIF ADMINISTRATIVE AREA
Catatan/Note: 1 Termasuk kelurahan dan Unit Permukiman Transmigrasi (UPT)/Include Transmigration Settlement Unit Sumber/Source: Peraturan Kepala Badan Pusat Statistik Nomor 29 Tahun 2018 Tanggal 15 Januari 2018 tentang Perubahan Atas
Peraturan Kepala Badan Pusat Statistik Nomor 55 Tahun 2017 tentang Kode dan Nama Wilayah Kerja Statistik Tahun 2017
Chief Statistician Regulation Number 29/2018, January 15 2018, as a revision of Chief Statistician Regulation Number 55 of 2017 on Code and Name of Regional Level of Data Collection.
KecamatanSubdistrict 2015 2016 2017 2018 2019
(1) (2) (3) (4) (5) (6)
Kota Barat 7 7 7 7 7
Dungingi 5 5 5 5 5
Kota Selatan 5 5 5 5 5
Kota Timur 6 6 6 6 6
Hulonthalangi 5 5 5 5 5
Dumbo Raya 5 5 5 5 5
Kota Utara 6 6 6 6 6
Kota Tengah 6 6 6 6 6
Sipatana 5 5 5 5 5
Kota Gorontalo 50 50 50 50 50https:
//goro
ntalo
kota
.bps.g
o.id

23Kota Gorontalo Dalam Angka 2020
PEMERINTAHAN
TabelTable 2.1.2 Jumlah Kelurahan, RW, dan RT Menurut Kecamatan di
Kota Gorontalo, 2019 Number of Urban Village, Hamlet, and Neighborhood by
Sub-District in Gorontalo Municipality, 2019
Sumber/Source: Badan Pusat Statistik Kota Gorontalo / BPS – Statistics Agency of Gorontalo Municipality
KecamatanSubdistrict
KelurahanUrban Village
RWHamlet
RTNeighborhood
(1) (2) (3) (4)
Kota Barat 7 22 44
Dungingi 5 20 52
Kota Selatan 5 16 40
Kota Timur 6 25 51
Hulonthalangi 5 18 39
Dumbo Raya 5 18 38
Kota Utara 6 14 33
Kota Tengah 6 25 66
Sipatana 5 12 28
Kota Gorontalo 50 170 391
https:
//goro
ntalo
kota
.bps.g
o.id

24 Gorontalo Municipality in Figures 2020
GOVERNMENT
2.2 DEWAN PERWAKILAN RAKYAT DAERAH THE REGIONAL HOUSE OF REPRESENTATIVE
TabelTable 2.2.1 Jumlah Anggota Dewan Perwakilian Rakyat Daerah
Menurut Partai Politik dan Jenis Kelamin di Kota Gorontalo, 2019
Number of Members of The Regional House of Representatives By Political Parties in Gorontalo Municipality, 2019
Partai PolitikPolitical Parties
Jenis KelaminSex
Laki-lakiMale
PerempuanFemale
JumlahTotal
(1) (2) (3) (4)
1. GOLKAR 2 2 4
2. PAN 4 - 4
3. DEMOKRAT 4 - 4
4. PPP 3 1 4
5. PDI-P 3 - 3
6. HANURA 1 1 2
7. GERINDRA - 3 3
8. PBB - - -
Jumlah/Total 17 7 24
Sumber/Source: Sekretariat DPRD Kota Gorontalo / Secretariat of TRHR of Gorontalo Municipality
https:
//goro
ntalo
kota
.bps.g
o.id

25Kota Gorontalo Dalam Angka 2020
PEMERINTAHAN
TabelTable 2.2.2 Jumlah Keputusan Dewan Perwakilan Rakyat Daerah di
Kota Gorontalo, 2015-2019 Number of Type of Decision of The Regional House of
Representatives in Gorontalo Municipality, 2015-2019
Jenis KeputusanType of Decision 2015 2016 2017 2018 2019
(1) (2) (3) (4) (5) (6)
1. Peraturan Daerah / Local Regulation 11 13 20 8 9
2. Keputusan DPRD / Decision Of DPRD 17 19 20 15 24
3. Pernyataan / Statement - - - - -
4. Resolusi / Resolution - - - - -
5. Keputusan Pimpinan DPRD / Chief 4 4 7 7 7
6. Rapat Panitia Musyawarah / Congres Committee Meeting
9 14 14 10 13
7. Memorandum / Memorandum - - - - -
8. Rapat Anggaran / Committee of Budget 26 28 37 19 23
9. Seruan / Instruction - - - - -
10. Rapat- rapat / Meetings 230 257 225 225 161
Jumlah/Total 297 335 323 284 237
Sumber/Source: Sekretariat DPRD Kota Gorontalo / Secretariat of TRHR of Gorontalo Municipality
https:
//goro
ntalo
kota
.bps.g
o.id

26 Gorontalo Municipality in Figures 2020
GOVERNMENT
2.3 SUMBER DAYA MANUSIA HUMAN RESOURCES
TabelTable 2.3.1 Jumlah Pegawai Negeri Sipil Menurut Jabatan dan Jenis
Kelamin di Kota Gorontalo, Desember 2018 dan Desember 2019
Number of Civil Servants by Occupation and Sex in Gorontalo Municipality ,Desember 2018 dan Desember 2019
JabatanOccupation
2018
Laki-lakiMale
PerempuanFemale
JumlahTotal
(1) (2) (3) (4)
Fungsional TertentuSpecific Functional
447 1 851 2 298
Fungsional UmumStaf General Functional
581 628 1 209
Struktural/Structural 396 411 807
Eselon V/5th Echelon 5 9 14
Eselon IV/4th Echelon 289 355 640
Eselon III/3rd Echelon 80 41 121
Eselon II/2nd Echelon 22 6 28
Eselon I/1st Echelon - - -
Jumlah/Total 1 424 2 890 4 314
https:
//goro
ntalo
kota
.bps.g
o.id

27Kota Gorontalo Dalam Angka 2020
PEMERINTAHAN
Sumber/Source: Badan Kepegawaian Daerah dan Diklat Kota Gorontalo / Regional Personnel and Training Education Agency of Gorontalo Municipality
KecamatanSubdistrict
2019
Laki-lakiMale
PerempuanFemale
JumlahTotal
(1) (5) (6) (7)
Fungsional TertentuSpecific Functional
438 1 795 2 233
Pelaksana 557 602 1 159
Struktural/Structural 369 393 762
Eselon V/5th Echelon 5 8 13
Eselon IV/4th Echelon 270 342 612
Eselon III/3rd Echelon 75 37 112
Eselon II/2nd Echelon 19 6 25
Eselon I/1st Echelon - - -
Jumlah/Total 1 364 2 790 4 154
Lanjutan Tabel/Continued Table 2.3.1
https:
//goro
ntalo
kota
.bps.g
o.id

28 Gorontalo Municipality in Figures 2020
GOVERNMENT
TabelTable 2.3.2 Jumlah Pegawai Negeri Sipil Menurut Tingkat Pendidikan
dan Jenis Kelamin di Kota Gorontalo, Desember 2018 dan Desember 2019
Number of Civil Servants by Educational Level and Sex in Gorontalo Municipality, December 2018 and December 2019
Tingkat PendidikanEducational Level
2018
Laki-lakiMale
PerempuanFemale
JumlahTotal
(1) (2) (3) (4)
Sampai dengan SDUp to Primary School
18 2 20
SMP/Sederajat General Vocational Junior High School
15 6 21
SMA/SederajatGeneral/Vocational Senior High School
441 440 881
Diploma I, II/Akta I, IIDiploma I, II/Akta I, II
32 105 137
Diploma III/Akta III/Sarjana MudaDiploma III/Akta III/Bachelor
106 364 470
Tingkat Sarjana/Doktor/Ph.DUniversity Graduates
812 1 973 2 785
Jumlah/Total 1 424 2 890 4 314
https:
//goro
ntalo
kota
.bps.g
o.id

29Kota Gorontalo Dalam Angka 2020
PEMERINTAHAN
Sumber/Source: Badan Kepegawaian Daerah dan Diklat Kota Gorontalo / Regional Personnel and Training Education Agency of Gorontalo Municipality
Tingkat PendidikanEducational Level
2019
Laki-lakiMale
PerempuanFemale
JumlahTotal
(1) (2) (3) (4)
Sampai dengan SDUp to Primary School
17 3 20
SMP/Sederajat General Vocational Junior High School
15 4 19
SMA/SederajatGeneral/Vocational Senior High School
380 374 754
Diploma I, II/Akta I, IIDiploma I, II/Akta I, II
31 102 133
Diploma III/Akta III/Sarjana MudaDiploma III/Akta III/Bachelor
104 349 453
Tingkat Sarjana/Doktor/Ph.DUniversity Graduates
817 1 958 2 775
Jumlah/Total 1 364 2 790 4 154
Lanjutan Tabel/Continued Table 2.3.2
https:
//goro
ntalo
kota
.bps.g
o.id

30 Gorontalo Municipality in Figures 2020
GOVERNMENT
TabelTable 2.3.3 Jumlah Pegawai Negeri Sipil Menurut Tingkat
Kepangkatan dan Jenis Kelamin di Kota Gorontalo, Desember 2018 dan Desember 2019
Number of Civil Servants by Hierarchy and Sex in Gorontalo Municipality, December 2018 and December 2019
Pangkat/Golongan/RuangHierarchy
2018
Laki-lakiMale
PerempuanFemale
JumlahTotal
(1) (2) (3) (4)
1. I/A (Juru Muda) - - -
2. I/B (Juru Muda Tingkat I) 7 3 10
3. I/C (Juru) 8 3 11
4. I/D (Juru Tingkat I) 12 3 15
Golongan I/Range I 27 9 36
5. II/A (Pengatur Muda) 38 33 71
6. II/B (Pengatur Muda Tingkat I) 71 86 157
7. II/C (Pengatur) 203 174 377
8. II/D (Pengatur Tingkat I) 42 63 105
Golongan II/Range II 354 356 710
9. III/A (Penata Muda) 125 248 373
10. III/B (Penata Muda Tingkat I) 152 412 564
11. III/C (Penata) 182 404 586
12. III/D (Penata Tingkat I) 252 571 823
Golongan III/Range III 711 1 635 2 346
13. IV/A (Pembina) 137 384 521
14. IV/B (Pembina Tingkat I) 158 485 643
15. IV/C (Pembina Utama Muda) 31 15 46
16. IV/D (Pembina Utama Madya) 3 5 8
17. IV/E (Pembina Utama) 3 1 4
Golongan IV/Range IV 332 890 1 222
Jumlah/Total 1 424 2 890 4 314
https:
//goro
ntalo
kota
.bps.g
o.id

31Kota Gorontalo Dalam Angka 2020
PEMERINTAHAN
Sumber/Source: Badan Kepegawaian Daerah dan Diklat Kota Gorontalo / Regional Personnel and Training Education Agency of Gorontalo Municipality
Pangkat/Golongan/RuangHierarchy
2019
Laki-lakiMale
PerempuanFemale
JumlahTotal
(1) (5) (6) (7)
1. I/A (Juru Muda) - - -
2. I/B (Juru Muda Tingkat I) 6 3 9
3. I/C (Juru) 5 - 5
4. I/D (Juru Tingkat I) 14 4 18
Golongan I/Range I 25 7 32
5. II/A (Pengatur Muda) 20 13 33
6. II/B (Pengatur Muda Tingkat I) 68 69 137
7. II/C (Pengatur) 143 135 278
8. II/D (Pengatur Tingkat I) 87 93 180
Golongan II/Range II 318 310 628
9. III/A (Penata Muda) 102 123 225
10. III/B (Penata Muda Tingkat I) 155 428 583
11. III/C (Penata) 188 445 633
12. III/D (Penata Tingkat I) 246 585 831
Golongan III/Range III 691 1 581 2 272
13. IV/A (Pembina) 137 378 515
14. IV/B (Pembina Tingkat I) 158 492 650
15. IV/C (Pembina Utama Muda) 28 14 42
16. IV/D (Pembina Utama Madya) 3 6 9
17. IV/E (Pembina Utama) 4 2 6
Golongan IV/Range IV 330 892 1 222
Jumlah/Total 1 364 2 790 4 154
Lanjutan Tabel/Continued Table 2.3.3
https:
//goro
ntalo
kota
.bps.g
o.id

32 Gorontalo Municipality in Figures 2020
GOVERNMENT
TabelTable 2.3.4 Jumlah Pegawai Negeri Sipil Menurut Dinas/Instansi
Pemerintah dan Pendidikan Terakhir di Kota Gorontalo, 2019
Number of Civil Servant by Institution/Office and in Gorontalo Municipality, 2019
Dinas/Instansi PemerintahGovernmental Institution
PendidikanEducation
SDPrimary
SMPJr. High
SMASr. High
PTUniv
(1) (2) (3) (4) (5)
1. Sekretariat Daerah Kota Gorontalo 1 2 45 84
2. Sekretariat Korpri - - 2 -
3. Sekretariat KPU - - 1 3
4. Sekretariat DPRD Kota Gorontalo - 1 7 205. Badan Kepegawaian Pendidikan Pelatihan
- - 9 32
6. Inspektorat - - 3 55
7. Badan Kesatuan Bangsa Dan Politik - - 4 14
8. Badan Keuangan - - 14 669. Badan Layanan Umum RSUD Prof. Dr. H. Aloei Saboe Kota Gorontalo
4 4 100 377
10. Badan Penanggulangan Bencana Daerah
- - 17 17
11. Badan Perencanaan, Penelitian Dan Pengembangan Daerah
- - 5 31
12. Dinas Kearsipan Dan Perpustakaan - - 4 1413. Dinas Kelautan, Perikanan Dan Pertanian
2 - 23 64
14. Dinas Kependudukan Dan Pencatatan Sipil
- - 6 18
15. Dinas Kesehatan 2 2 43 39116. Dinas Komunikasi, Informatika Dan Persandian
- - 7 14
17. Dinas Lingkungan Hidup - - 18 28
18. Dinas Pangan - - 5 2219. Dinas Pariwisata, Kepemudaan Dan Olahraga
- - 7 34
https:
//goro
ntalo
kota
.bps.g
o.id

33Kota Gorontalo Dalam Angka 2020
PEMERINTAHAN
Lanjutan Tabel/Continued Table 2.3.4
Dinas/Instansi PemerintahGovernmental Institution
PendidikanEducation
SDPrimary
SMPJr. High
SMASr. High
PTUniv
(1) (2) (3) (4) (5)
20. Dinas Pekerjaan Umum Dan Penataan Ruang
2 1 29 52
21. Dinas Penanaman Modal Dan Perizinan Terpadu Satu Pintu
- - 5 30
22. Dinas Pendidikan Kota Gorontalo 7 - 153 1 46123. Dinas Pengendalian Penduduk, Kb, Pemberdayaan Dan Perlindungan Anak
- - 7 21
24. Dinas Perdagangan Dan Perindustrian - 1 8 24
25. Dinas Perhubungan - - 16 1726. Dinas Perumahan Rakyat Dan Kawasan Pemukiman
- - 6 25
27. Dinas Sosial Dan Pemberdayaan Masyarakat
- - 18 24
28. Dinas Tenaga Kerja, Koperasi Dan Usaha Kecil Menengah
- 1 10 30
29. RSUD Otanaha Kota Gorontalo - - 11 72
30. Satuan Polisi Pamong Praja 1 4 44 22
31. Kantor Kecamatan Dumbo Raya - - 14 26
32. Kantor Kecamatan Dungingi - - 16 38
33. Kantor Kecamatan Hulonthalangi 1 - 14 26
34. Kantor Kecamatan Kota Barat - - 20 31
35. Kantor Kecamatan Kota Selatan - - 12 39
36. Kantor Kecamatan Kota Tengah - - 16 36
37. Kantor Kecamatan Kota Timur - 1 14 37
38. Kantor Kecamatan Kota Utara - - 11 35
39. Kantor Kecamatan Kota Sipatana - 2 10 31
Jumlah/Total 20 19 754 3 361
Sumber/Source: Badan Kepegawaian Daerah dan Diklat Kota Gorontalo / Regional Personnel and Training Education Agency of Gorontalo Municipality
https:
//goro
ntalo
kota
.bps.g
o.id

34 Gorontalo Municipality in Figures 2020
GOVERNMENT
2.4 KEUANGAN PEMERINTAH GOVERNMENT FINANCE
TabelTable 2.4.1 Realisasi Pendapatan Pemerintah Kota Gorontalo
Menurut Jenis Pendapatan (miliar rupiah), 2016–2019 Actual Gorontalo Municipal Government Revenues by Kind
of Revenues (billion rupiahs), 2016–2019
Jenis Pendapatan/Kind of Revenues 2016 2017(1) (2) (3)
1. Pendapatan Asli Daerah (PAD)/Regional Revenue 172,31 182,88 1.1 Pajak Daerah/Regional Tax 45,68 60,66 1.2 Retribusi Daerah/Regional Retribution 15,19 13,81 1.3 Hasil Perusahaan Milik Daerah dan Pengelolaan
Kekayaan Daerah yang Dipisahkan/Regional-Owned Company Revenue and Separated Management of Regional Wealth
1,40 1,59
1.4 Lain-lain PAD yang Sah/Other Regional Revenue 110,04 106,82 2. Dana Perimbangan/Balance Funds 735,55 691,55 2.1 Bagi Hasil Pajak/Tax Sharing Revenue 17,82 14,82 2.2 Bagi Hasil Bukan Pajak/Sumber Daya Alam/Non-Tax
Sharing Revenue/Natural Resources - -
2.3 Dana Alokasi Umum/General Allocation Fund 517,78 508,68 2.4 Dana Alokasi Khusus/Special Allocation Fund 199,95 168,05 3. Lain-lain Pendapatan yang Sah/Other Revenue 40,44 46,90 3.1 Pendapatan Hibah/Grant - - 3.2 Dana Darurat/Emergency Fund - - 3.3 Dana Bagi Hasil Pajak dari Provinsi dan Pemerintah
Daerah Lainnya/Tax Sharing Revenue from Provincial and Other Regional Governments
32,27 36,89
3.4 Dana Penyesuaian dan Otonomi Daerah/Regional Adjustment and Autonomy Fund
3.5 Bantuan Keuangan dari Provinsi atau Pemerintah Daerah Lainnya/Financial Assistance from Provincial or Other Regional Governments
3,16 2,45
3.6 Lainnya/Others 5,01 7,56 Jumlah/Total 948,30 921,33
https:
//goro
ntalo
kota
.bps.g
o.id

35Kota Gorontalo Dalam Angka 2020
PEMERINTAHAN
Lanjutan Tabel/Continued Table 2.4.1
Jenis Pendapatan/Kind of Revenues 2018 2019(1) (4) (5)
1. Pendapatan Asli Daerah (PAD)/Regional Revenue 193,67 197,18 1.1 Pajak Daerah/Regional Tax 61,77 67,42 1.2 Retribusi Daerah/Regional Retribution 12,97 23,79 1.3 Hasil Perusahaan Milik Daerah dan Pengelolaan
Kekayaan Daerah yang Dipisahkan/Regional-Owned Company Revenue and Separated Management of Regional Wealth
2,49 3,96
1.4 Lain-lain PAD yang Sah/Other Regional Revenue 116,44 102,01 2. Dana Perimbangan/Balance Funds 655,70 673,27 2.1 Bagi Hasil Pajak/Tax Sharing Revenue 14,23 10,56 2.2 Bagi Hasil Bukan Pajak/Sumber Daya Alam/Non-Tax
Sharing Revenue/Natural Resources 0,76 0,69
2.3 Dana Alokasi Umum/General Allocation Fund 508,68 540,07 2.4 Dana Alokasi Khusus/Special Allocation Fund 132,03 121,95 3. Lain-lain Pendapatan yang Sah/Other Revenue 91,14 103,66 3.1 Pendapatan Hibah/Grant 23,05 2,00 3.2 Dana Darurat/Emergency Fund - 3.3 Dana Bagi Hasil Pajak dari Provinsi dan Pemerintah
Daerah Lainnya/Tax Sharing Revenue from Provincial and Other Regional Governments
32,97 43,20
3.4 Dana Penyesuaian dan Otonomi Daerah/Regional Adjustment and Autonomy Fund
57,50
3.5 Bantuan Keuangan dari Provinsi atau Pemerintah Daerah Lainnya/Financial Assistance from Provincial or Other Regional Governments
35,00 -
3.6 Lainnya/Others 0,12 0,96 Jumlah/Total 940,51 974,11
Catatan/Note: Data APBD / Data of APBD - Regional Income and Expenditure BudgetSumber/Source: Badan Keuangan Kota Gorontalo / Finance Agency of Gorontalo Municipality
https:
//goro
ntalo
kota
.bps.g
o.id

36 Gorontalo Municipality in Figures 2020
GOVERNMENT
TabelTable 2.4.2 Realisasi Belanja Pemerintah Kota Gorontalo Menurut
Jenis Belanja (miliar rupiah), 2016–2019 Actual Gorontalo Municipality Government Expenditures by
Kind of Expenditures (billion rupiahs), 2016–2019
Jenis PendapatanKind of Revenues 2016 2017
(1) (2) (3)
1. Belanja Tidak Langsung/Indirect Expenditures 455,94 391,03
1.1 Belanja Pegawai/Personnel Expenditures 449,18 376,81
1.2 Belanja Bunga/Interest Expenditures 1,54 0,67
1.3 Belanja Subsidi/Subsidies Expenditures - -
1.4 Belanja Hibah/Grant Expenditures 4,46 12,97
1.5 Belanja Bantuan Sosial/Social Aid Expenditures - -
1.6 Belanja Bagi Hasil/Sharing Fund Expenditure - -
1.7 Belanja Bantuan Keuangan/Financial Aids Expenditures
0,76 0,57
1.8 Belanja Tidak Terduga/Unpredicted Expenditures - 0,01
2. Belanja Langsung/Direct Expenditures 531,84 521,69
2.1 Belanja Pegawai/Personnel Expenditures 28,87 31,00
2.2 Belanja Barang dan Jasa/Goods and Services Expenditures
324,90 341,63
2.3 Belanja Modal/Capital Expenditure 178,07 149,06
Jumlah/Total 987,78 912,72
https:
//goro
ntalo
kota
.bps.g
o.id

37Kota Gorontalo Dalam Angka 2020
PEMERINTAHAN
Lanjutan Tabel/Continued Table 2.4.2
Jenis PendapatanKind of Revenues 2018 2019
(1) (4) (5)
1. Belanja Tidak Langsung/Indirect Expenditures 414,74 420,24
1.1 Belanja Pegawai/Personnel Expenditures 375,64 408,96
1.2 Belanja Bunga/Interest Expenditures 0,03 -
1.3 Belanja Subsidi/Subsidies Expenditures - -
1.4 Belanja Hibah/Grant Expenditures 34,07 5,30
1.5 Belanja Bantuan Sosial/Social Aid Expenditures 4,22 5,41
1.6 Belanja Bagi Hasil/Sharing Fund Expenditure - -
1.7 Belanja Bantuan Keuangan/Financial Aids Expenditures
0,78 0,57
1.8 Belanja Tidak Terduga/Unpredicted Expenditures - -
2. Belanja Langsung/Direct Expenditures 505,07 529,97
2.1 Belanja Pegawai/Personnel Expenditures 43,25 33,76
2.2 Belanja Barang dan Jasa/Goods and Services Expenditures
381,57 405,77
2.3 Belanja Modal/Capital Expenditure 80,25 90,44
Jumlah/Total 919,81 950,21
Catatan/Note: Data APBD / Data of APBD - Regional Income and Expenditure BudgetSumber/Source: Badan Keuangan Kota Gorontalo / Finance Agency of Gorontalo Municipality
https:
//goro
ntalo
kota
.bps.g
o.id

https:
//goro
ntalo
kota
.bps.g
o.id

39Kota Gorontalo Dalam Angka 2020
PENDUDUK DAN KETENAGAKERJAAN
3. Penduduk dan Ketenagakerjaan/Population and Employment ................
PENDUDUK DAN KETENAGAKERJAANPOPULATION AND EMPLOYMENT
03
https:
//goro
ntalo
kota
.bps.g
o.id

https:
//goro
ntalo
kota
.bps.g
o.id

41Kota Gorontalo Dalam Angka 2020
PENDUDUK DAN KETENAGAKERJAAN
PENJELASAN TEKNIS TECHNICAL NOTES
1. Sumber utama data kependudukan adalah sensus penduduk yang dilaksanakan setiap sepuluh tahun sekali. Sensus penduduk telah dilaksanakan sebanyak enam kali sejak Indonesia merdeka, yaitu tahun 1961, 1971, 1980, 1990, 2000, dan 2010.
2. Di dalam sensus penduduk, pencacahan dilakukan terhadap seluruh penduduk yang berdomisili di wilayah teritorial Indonesia termasuk warga negara asing kecuali anggota korps diplomatik negara sahabat beserta keluarganya.
3. Metode pengumpulan data dalam sensus dilakukan dengan wawancara antara petugas sensus dengan responden dan juga melalui e-census. Pencatatan penduduk menggunakan konsep usual residence, yaitu konsep di mana penduduk biasa bertempat tinggal. Bagi penduduk yang bertempat tinggal tetap dicacah di mana mereka biasa tinggal, sedangkan untuk penduduk yang tidak bertempat tinggal tetap dicacah di tempat di mana mereka ditemukan petugas sensus pada malam ‘Hari Sensus’. Termasuk penduduk yang tidak bertempat tinggal tetap adalah tuna wisma, awak kapal berbendera Indonesia, penghuni perahu/rumah apung, masyarakat terpencil/terasing,
1. The main source of demographic data is population census, which is conducted every ten years. Population Census has been conducted six times since Indonesia’s independence: 1961, 1971, 1980, 1990, 2000, and 2010.
2. The population census enumerates all residents who domicile in the entire territory of Indonesia including foreign citizens except the diplomatic corps members and their families.
3. The method of data collection in a population census involves interviewing respondents and conducting e-census. Enumeration of the population uses the concept of “usual residence”, which is the concept of “places where people usually live”. De jure was applied to the permanent residents, while de facto was applied to non-permanent residents. The permanent residents were enumerated in place where they normally live, the non-permanent residents were enumerated where they were found by the enumerators, on the night of ‘Census Date’. The non permanent residents include homeless people, ship crew, boat people, remote area community, and internally
https:
//goro
ntalo
kota
.bps.g
o.id

42 Gorontalo Municipality in Figures 2020
POPULATION AND EMPLOYMENT
dan pengungsi. Bagi mereka yang mempunyai tempat tinggal tetap dan sedang bepergian ke luar wilayah lebih dari enam bulan, tidak dicacah di tempat tinggalnya, tetapi dicacah di tempat tujuannya. Untuk tahun yang tidak dilaksanakan sensus penduduk, data kependudukan diperoleh dari hasil proyeksi penduduk. Proyeksi penduduk merupakan suatu perhitungan ilmiah yang didasarkan pada asumsi dari komponen-komponen perubahan penduduk, yaitu kelahiran, kematian, dan migrasi. Proyeksi penduduk Indonesia 2010–2035 menggunakan data dasar penduduk hasil SP2010.
4. Penduduk Indonesia adalah semua orang yang berdomisili di wilayah teritorial Indonesia selama 6 bulan atau lebih dan atau mereka yang berdomisili kurang dari 6 bulan tetapi bertujuan menetap.
5. Laju pertumbuhan penduduk adalah angka yang menunjukkan persentase pertambahan penduduk dalam jangka waktu tertentu.
6. Kepadatan penduduk adalah rasio banyaknya penduduk per kilometer persegi.
7. Rasio jenis kelamin adalah perbandingan antara penduduk laki-laki dan penduduk perempuan pada suatu wilayah dan waktu tertentu. Biasanya
displaced persons. Those who had permanent residence and had been travelling away from their home for six months or more were not enumerated in their permanent place, but in the place where they were during the census.For the periods where the population census is not conducted, population projection is done to estimate population during those years. The population projection is an estimate based on the demographic components, such as birth, death, and migration. Indonesia’s 2010–2035 population projection used the 2010 Population Census as the base population.
4. The population of Indonesia are all residents of the entire territory of Indonesia who have stayed for six months or longer, and those who intended to stay more than six months even though their length of stay is less than six months.
5. The growth rate of population is the number that show percentage of population growth within a specified period.
6. Population density is ratio of population per square kilometer.
7. Sex ratio is the ratio of males population to females population in a given area and time, usually expressed as the number of males for every 100 females.
https:
//goro
ntalo
kota
.bps.g
o.id

43Kota Gorontalo Dalam Angka 2020
PENDUDUK DAN KETENAGAKERJAAN
dinyatakan dengan banyaknya penduduk laki-laki untuk 100 penduduk perempuan.
8. Distribusi penduduk adalah pola persebaran penduduk di suatu wilayah, baik berdasarkan batas-batas geografis maupun berdasarkan batas-batas administrasi pemerintahan.
9. Komposisi penduduk adalah pola persebaran penduduk menurut karakteristiknya, contoh: penduduk menurut kelompok umur, penduduk menurut jenis kelamin
10. Penduduk usia kerja adalah penduduk yang berumur 15 tahun ke atas.
11. Angkatan kerja adalah penduduk usia kerja (15 tahun ke atas) yang bekerja, punya pekerjaan namun sementara tidak bekerja, dan pengangguran.
12. Bekerja adalah kegiatan ekonomi yang dilakukan oleh seseorang dengan maksud memperoleh atau membantu memperoleh pendapatan atau keuntungan dan lamanya bekerja paling sedikit 1 jam secara terus menerus dalam seminggu yang lalu (termasuk pekerja keluarga tanpa upah yang membantu dalam suatu usaha/kegiatan ekonomi).
13. Jumlah jam kerja seluruhnya adalah jumlah jam kerja yang digunakan untuk bekerja (tidak termasuk jam kerja istirahat resmi dan jam kerja yang digunakan
8. Population distribution is the pattern of population distribution in an area, either by geographic boundaries or by government administrative boundaries.
9. Population compotition is the pattern of population distribution by its characteristics, example: population by age group, population by sex
10. Working age population is persons of 15 years and over.
11. Labor force or economically active are persons of 15 years and over, who in the previous week were working, temporarily absent from work but having jobs, and unemployment.
12. Working is economic activity conducted by a person and intended to earn income by doing work or helping to do work at least one hour continuously during the reference week (including unpaid family worker/s for any economic activity).
13. Total working hours is the total hours spent by an employee to perform all jobs (excluding the time used for other activities which are not classified as work).
https:
//goro
ntalo
kota
.bps.g
o.id

44 Gorontalo Municipality in Figures 2020
POPULATION AND EMPLOYMENT
untuk hal-hal di luar pekerjaan).14. Lapangan usaha adalah bidang
kegiatan dari pekerjaan/tempat bekerja di mana seseorang bekerja. Klasifikasi lapangan usaha mengikuti Klasifikasi Baku Lapangan Usaha Indonesia (KBLI) dalam 1 digit.
15. Status pekerjaan adalah kedudukan seseorang dalam unit usaha/kegiatan dalam melakukan pekerjaan.
16. Berusaha sendiri tanpa dibantu orang lain adalah bekerja atau berusaha dengan menanggung risiko secara ekonomis, yaitu dengan tidak kembalinya ongkos produksi yang telah dikeluarkan dalam rangka usahanya tersebut, serta tidak menggunakan pekerja dibayar maupun pekerja tak dibayar, termasuk yang sifat pekerjaannya memerlukan teknologi atau keahlian khusus.
17. Berusaha dibantu buruh tidak tetap/buruh tidak dibayar adalah bekerja atau berusaha atas risiko sendiri, dan menggunakan buruh/pekerja tak dibayar dan atau buruh/pekerja tidak tetap.
18. Berusaha dibantu buruh tetap/buruh dibayar adalah berusaha atas risiko sendiri dan mempekerjakan paling sedikit satu orang buruh/pekerja tetap yang dibayar.
19. B u r u h / k a r y a w a n / p e g a w a i adalah seseorang yang bekerja pada orang lain atau instansi/kantor/ perusahaan secara tetap
14. Industry is field of a person’s
activity or establishment. The classification of industries follows the Indonesia Standard Industrial Classification (KBLI) in one digit.
15. Employment status is the status of a person at his place of work or establishment where he was employed.
16. Own-account worker is a person who works at his own risk without assisted by paid per mount worker or unpaid worker include technical job or skill job.
17. Employer assisted by temporary workers/unpaid worker is a person who works at his own risk and assisted by temporary worker/unpaid worker.
18. Employer assisted by permanent workers/paid workers is a person who does his business at her/his own risk at least one assisted by paid permanent worker.
19. Employee is a person who work permanently for other people or institution/office/ company and gains some money/cash or goods
https:
//goro
ntalo
kota
.bps.g
o.id
45Kota Gorontalo Dalam Angka 2020
PENDUDUK DAN KETENAGAKERJAAN
dengan menerima upah/gaji baik berupa uang maupun barang. Buruh yang tidak mempunyai majikan tetap, tidak digolongkan sebagai buruh/karyawan, tetapi sebagai pekerja bebas. Seseorang dianggap memiliki majikan tetap jika memiliki 1 (satu) majikan (orang/rumah tangga) yang sama dalam sebulan terakhir, khusus pada sektor bangunan batasannya tiga bulan. Apabila majikannya instansi/lembaga, boleh lebih dari satu.
20. Pekerja bebas adalah seseorang yang bekerja pada orang lain/majikan/institusi yang tidak tetap (lebih dari 1 majikan dalam sebulan terakhir) di usaha pertanian baik berupa usaha rumah tangga maupun bukan usaha rumah tangga, ataupun di nonpertanian atas dasar balas jasa dengan menerima upah atau imbalan baik berupa uang maupun barang, dan baik dengan sistem pembayaran harian maupun borongan
21. Pekerja tak dibayar adalah seseorang yang bekerja membantu usaha untuk memperoleh penghasilan/keuntungan yang dilakukan oleh salah seorang anggota rumah tangga atau bukan anggota rumah tangga tanpa mendapat upah/gaji baik uang maupun barang.
as wage/salary. Labor who have no permanent employer is not categorized as a laborer/ worker/employee but casual worker. A laborers in general is considered to have a permanent employer if he has the same employer during the past month, particularly for building construction sector is 3 months. If the employer is an institution, more than 1 (one) employer is allowed.
20. Casual employee is a person who does not work permanently for other people/employer/ institution (more than 1 employer during the last 1 month) in agricultural sector, either home industry or not home industry, or in non-agricultural sector based on remuneration paid with money or goods, and based on daily or contact payment system.
21. Unpaid worker is a person who intended to work without pa,y either with money or good, in an establishment run by other members of the family, relative or neighbour.
https:
//goro
ntalo
kota
.bps.g
o.id

46 Gorontalo Municipality in Figures 2020
POPULATION AND EMPLOYMENT
3.1 Jumlah Penduduk Angkatan Kerja, Bukan Angkatan Kerja, di Kota Gorontalo, 2019
Number of Economically Active and Inactive Population in Gorontalo Municipality, 2019
GambarFigures
Sumber/Source : Badan Pusat Statistik Kota Gorontalo (Sakernas, 2019) / BPS-Statistics Agency Of Gorontalo Municipality (Sakernas, 2019)
0
20000
40000
60000
80000
100000
120000
Angkatan Kerja / Economically Active Bukan Angkatan Kerja / Economically Inactive
Bekerja, 101654
Pengangguran, 6850
57972
Bekerja Pengangguran Bukan Angkatan Kerja
https:
//goro
ntalo
kota
.bps.g
o.id
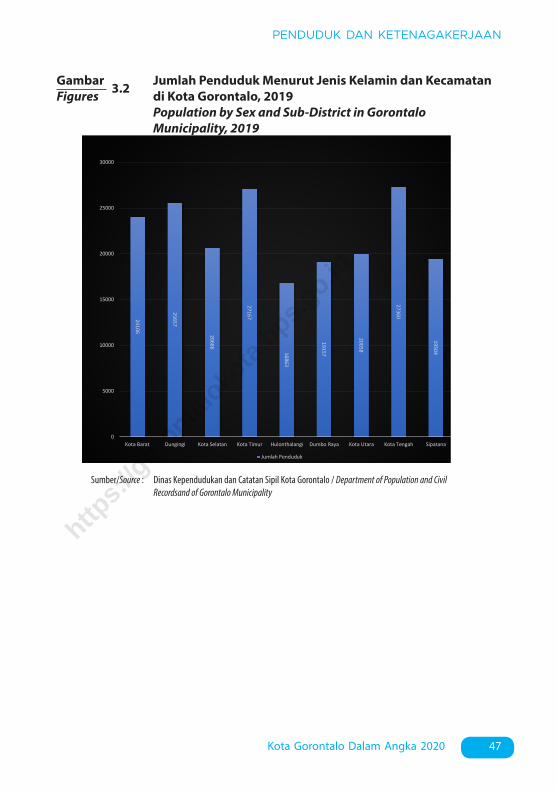
47Kota Gorontalo Dalam Angka 2020
PENDUDUK DAN KETENAGAKERJAAN
Sumber/Source : Dinas Kependudukan dan Catatan Sipil Kota Gorontalo / Department of Population and Civil Recordsand of Gorontalo Municipality
24106
25657
20686
27167
16863
19157
20058
27360
19504
0
5000
10000
15000
20000
25000
30000
Kota Barat Dungingi Kota Selatan Kota Timur Hulonthalangi Dumbo Raya Kota Utara Kota Tengah Sipatana
Jumlah Penduduk
3.2 Jumlah Penduduk Menurut Jenis Kelamin dan Kecamatan di Kota Gorontalo, 2019
Population by Sex and Sub-District in Gorontalo Municipality, 2019
GambarFigures
https:
//goro
ntalo
kota
.bps.g
o.id
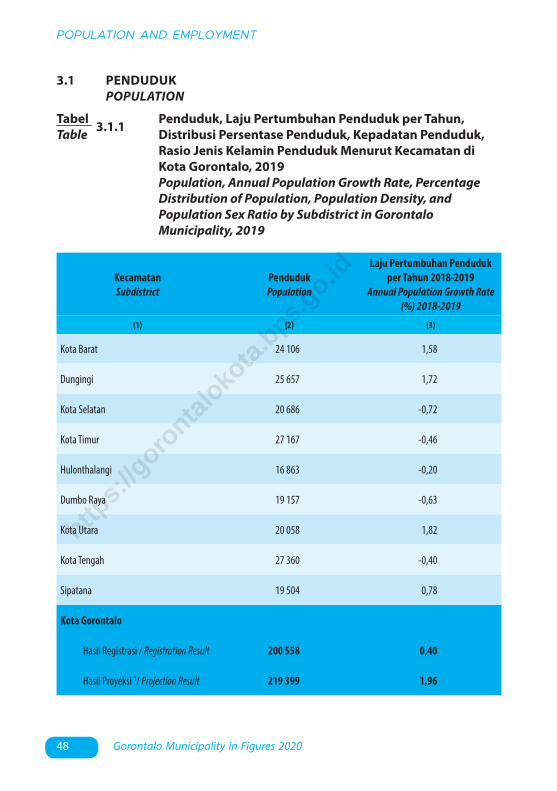
48 Gorontalo Municipality in Figures 2020
POPULATION AND EMPLOYMENT
TabelTable 3.1.1 Penduduk, Laju Pertumbuhan Penduduk per Tahun,
Distribusi Persentase Penduduk, Kepadatan Penduduk, Rasio Jenis Kelamin Penduduk Menurut Kecamatan di Kota Gorontalo, 2019
Population, Annual Population Growth Rate, Percentage Distribution of Population, Population Density, and Population Sex Ratio by Subdistrict in Gorontalo Municipality, 2019
3.1 PENDUDUK POPULATION
KecamatanSubdistrict
PendudukPopulation
Laju Pertumbuhan Penduduk per Tahun 2018-2019
Annual Population Growth Rate (%) 2018-2019
(1) (2) (3)
Kota Barat 24 106 1,58
Dungingi 25 657 1,72
Kota Selatan 20 686 -0,72
Kota Timur 27 167 -0,46
Hulonthalangi 16 863 -0,20
Dumbo Raya 19 157 -0,63
Kota Utara 20 058 1,82
Kota Tengah 27 360 -0,40
Sipatana 19 504 0,78
Kota Gorontalo
Hasil Registrasi / Registration Result 200 558 0,40
Hasil Proyeksi 1/ Projection Result 219 399 1,96
https:
//goro
ntalo
kota
.bps.g
o.id

49Kota Gorontalo Dalam Angka 2020
PENDUDUK DAN KETENAGAKERJAAN
Lanjutan Tabel/Continued Table 3.1.1
KecamatanSubdistrict
Persentase PendudukPercentage of Total Population
Kepadatan Penduduk per km2
Population Density per sq.km
(1) (4) (5)
Kota Barat 12,02 1 200,50
Dungingi 12,79 5 494,00
Kota Selatan 10,31 7 361,57
Kota Timur 13,55 5 106,58
Hulonthalangi 8,41 1 185,03
Dumbo Raya 9,55 1 364,46
Kota Utara 10,00 2 501,00
Kota Tengah 13,64 5 688,15
Sipatana 9,72 3 862,18
Kota Gorontalo
Hasil Registrasi / Registration Result 100,00 2 537,74
Hasil Proyeksi 1/ Projection Result 100,00 2 756,62
https:
//goro
ntalo
kota
.bps.g
o.id

50 Gorontalo Municipality in Figures 2020
POPULATION AND EMPLOYMENT
Lanjutan Tabel/Continued Table 3.1.1
Catatan/Note: 1 Data dari Hasil Proyeksi Penduduk Indonesia 2010-2035 (Pertengahan tahun/Juni) / Data from the result of Indonesia Population Projection 2010-2035 (mid year/June)
Sumber/Source: Dinas Kependudukan dan Pencatatan Sipil Kota Gorontalo / Population and Civil Registration Agency of Gorontalo Municipality
KecamatanSubdistrict
Rasio Jenis KelaminPopulation Sex Ratio
(1) (6)
Kota Barat 100,12
Dungingi 99,06
Kota Selatan 96,75
Kota Timur 97,65
Hulonthalangi 100,04
Dumbo Raya 101,08
Kota Utara 99,90
Kota Tengah 97,53
Sipatana 99,00
Kota Gorontalo
Hasil Registrasi / Registration Result 98,89
Hasil Proyeksi 1/ Projection Result 96,79https:
//goro
ntalo
kota
.bps.g
o.id

51Kota Gorontalo Dalam Angka 2020
PENDUDUK DAN KETENAGAKERJAAN
3.2 KETENAGAKERJAAN EMPLOYMENT
TabelTable 3.2.1 Jumlah Penduduk Berumur 15 Tahun Keatas Menurut
Jenis Kegiatan Selama Seminggu yang Lalu dan Jenis Kelamin di Kota Gorontalo, 2019
Population Aged 15 Years and Over by Type of Activity During The Previous Week and Sex in Gorontalo Municipality, 2019
Kegiatan UtamaMain Activity
Jenis KelaminSex
Laki-lakiMale
PerempuanFemale
JumlahTotal
(1) (2) (3) (4)
Angkatan Kerja / Economically Active 64 479 44 025 108 504
Bekerja / Working 60 407 41 247 101 654
Pengangguran Terbuka / Unemployment 4 072 2 778 6 850
Bukan Angkatan Kerja / Economically Inactive 16 109 41 863 57 972
Sekolah / Attending School 7 685 11 544 19 229
Mengurus Rumah Tangga / Housekeeping 4 858 29 356 34 214
Lainnya / Others 3 566 963 4 529
Jumlah / Total 80 588 85 888 166 476
Sumber/Source: Badan Pusat Statistik Kota Gorontalo (Sakernas, 2019) / BPS-Statistics Agency Of Gorontalo Municipality (Sakernas, 2019)
https:
//goro
ntalo
kota
.bps.g
o.id
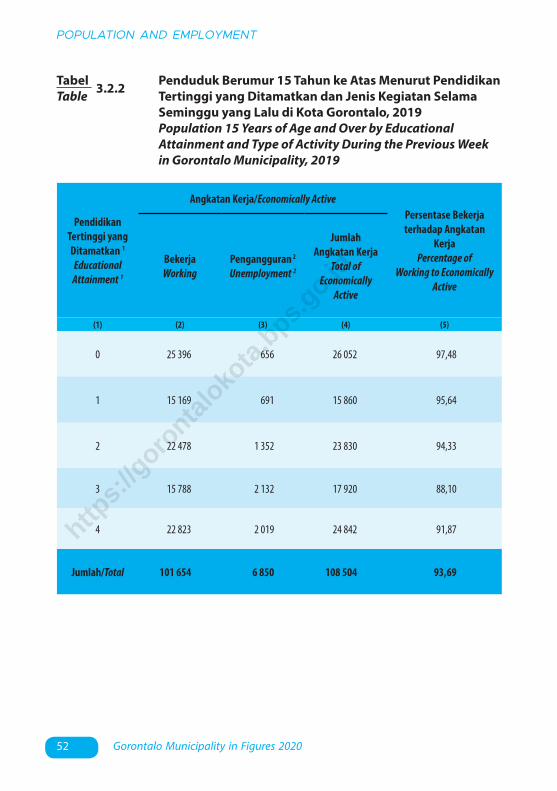
52 Gorontalo Municipality in Figures 2020
POPULATION AND EMPLOYMENT
TabelTable 3.2.2 Penduduk Berumur 15 Tahun ke Atas Menurut Pendidikan
Tertinggi yang Ditamatkan dan Jenis Kegiatan Selama Seminggu yang Lalu di Kota Gorontalo, 2019
Population 15 Years of Age and Over by Educational Attainment and Type of Activity During the Previous Week in Gorontalo Municipality, 2019
Pendidikan Tertinggi yangDitamatkan 1
Educational Attainment 1
Angkatan Kerja/Economically ActivePersentase Bekerjaterhadap Angkatan
KerjaPercentage of
Working to EconomicallyActive
BekerjaWorking
Pengangguran 2
Unemployment 2
JumlahAngkatan Kerja
Total ofEconomically
Active
(1) (2) (3) (4) (5)
0 25 396 656 26 052 97,48
1 15 169 691 15 860 95,64
2 22 478 1 352 23 830 94,33
3 15 788 2 132 17 920 88,10
4 22 823 2 019 24 842 91,87
Jumlah/Total 101 654 6 850 108 504 93,69
https:
//goro
ntalo
kota
.bps.g
o.id

53Kota Gorontalo Dalam Angka 2020
PENDUDUK DAN KETENAGAKERJAAN
Lanjutan Tabel/Continued Table 3.2.2
Pendidikan Tertinggi yangDitamatkan 1
Educational Attainment 1
Bukan Angkatan KerjaNot Economically Active
JumlahTotal
Persentase Angkatan Kerja
terhadap Penduduk Usia Kerja
Percentage of EconomicallyActive to Working Age
Population
(1) (6) (7) (8)
0 11 143 37 195 70,04
1 16 986 32 846 48,29
2 17 569 41 399 57,56
3 8 584 26 504 67,61
4 3 690 28 532 87,07
Jumlah/Total 57 972 166 476 65,18
Catatan/Note: 1 0. ≤ Sekolah Dasar (SD)/≤ Primary School 1. Sekolah Menengah Pertama/Junior High School 2. Sekolah Menengah Atas/Senior High School 3. Sekolah Menengah Atas Kejuruan/ Vacational Senior High School 4. Perguruan Tinggi/Collage 2 1. Mencari pekerjaan/Looking for work 2. Mempersiapkan usaha/Establishing a new business/firm 3. Merasa tidak mungkin mendapat pekerjaan/Hopeless of job 4. Sudah punya pekerjaan tetapi belum mulai bekerja/Have a job in future startSumber/Source: BPS, Survei Angkatan Kerja Nasional (Sakernas) Agustus/BPS-Statistics Indonesia, August National Labor Force Survey
https:
//goro
ntalo
kota
.bps.g
o.id

54 Gorontalo Municipality in Figures 2020
POPULATION AND EMPLOYMENT
TabelTable 3.2.3 Penduduk Berumur 15 Tahun Ke Atas yang Bekerja
Selama Seminggu Yang Lalu Menurut Status Pekerjaan Utama dan Jenis Kelamin di Kota Gorontalo, 2019
Population Aged 15 Years and Over Who Worked During The Previous Week by Main Employment Status and Sex in Gorontalo Municipality, 2019
Status Pekerjaan UtamaMain Employment Status
Jenis KelaminSex
Laki-lakiMale
PerempuanFemale
JumlahTotal
(1) (2) (3) (4)
Berusaha sendiri /Own account worker
16 182 9 766 25 948
Berusaha dibantu buruh tidak tetap atau tak dibayar /Employer assisted by temporary or unpaid worker
3 251 3 647 6 898
Berusaha dibantu buruh tetap atau buruh dibayar /Employer assisted by permanent or paid worker
3 657 1 572 5 229
Buruh, Karyawan, Pegawai /Regular employee
31 371 23 902 55 273
Pekerja bebas di pertanian /Casual employee in agriculture
477 109 586
Pekerja bebas di non-pertanian /Casual employee not in agriclture
2 468 301 2 769
Pekerja keluarga atau tak dibayar /Family worker or unpaid worker
3 001 1 950 4 951
Jumlah / Total 60 407 41 247 101 654
Sumber/Source: Badan Pusat Statistik Kota Gorontalo (Sakernas, 2019) / BPS-Statistics Agency Of Gorontalo Municipality (Sakernas, 2019)
https:
//goro
ntalo
kota
.bps.g
o.id

55Kota Gorontalo Dalam Angka 2020
PENDUDUK DAN KETENAGAKERJAAN
TabelTable 3.2.4 Jumlah Penduduk Berumur 15 Tahun Ke atas yang Bekerja
Selama Seminggu Terakhir Menurut Lapangan Pekerjaan Utama dan Jenis Kelamin di Kota Gorontalo, 2019
Population Aged 15 Years and Over Who Worked During The Previous Week by Main Business Field and Sex in Gorontalo Municipality, 2019
Lapangan Pekerjaan UtamaMain Business Field
Jenis KelaminSex
Laki-lakiMale
PerempuanFemale
JumlahTotal
(1) (2) (3) (4)
Pertanian, Kehutanan, Perburuan, dan Perikanan / Agriculture, Forestry, Hunting, and Fisheries
2 474 109 2 583
Industri Pengolahan / Manufacturing Industry
10 924 5 088 16 012
Lainnya / Another
47 009 36 050 83 059
Jumlah / Total 60 407 41 247 101 654
Sumber/Source: Badan Pusat Statistik Kota Gorontalo (Sakernas, 2019) / BPS-Statistics Agency Of Gorontalo Municipality (Sakernas, 2019)
https:
//goro
ntalo
kota
.bps.g
o.id

https:
//goro
ntalo
kota
.bps.g
o.id
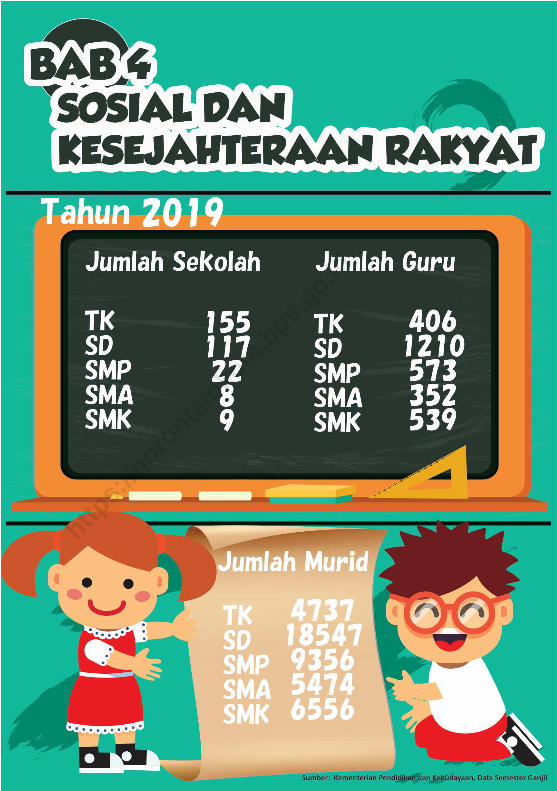
57Kota Gorontalo Dalam Angka 2020
SOSIAL DAN KESEJAHTERAAN RAKYAT
4. Sosial dan Kesejahteraan Rakyat/Social and Welfare ...................................
SOSIAL DAN KESEJAHTERAAN RAKYATSOCIAL AND WELFARE
04
https:
//goro
ntalo
kota
.bps.g
o.id

https:
//goro
ntalo
kota
.bps.g
o.id
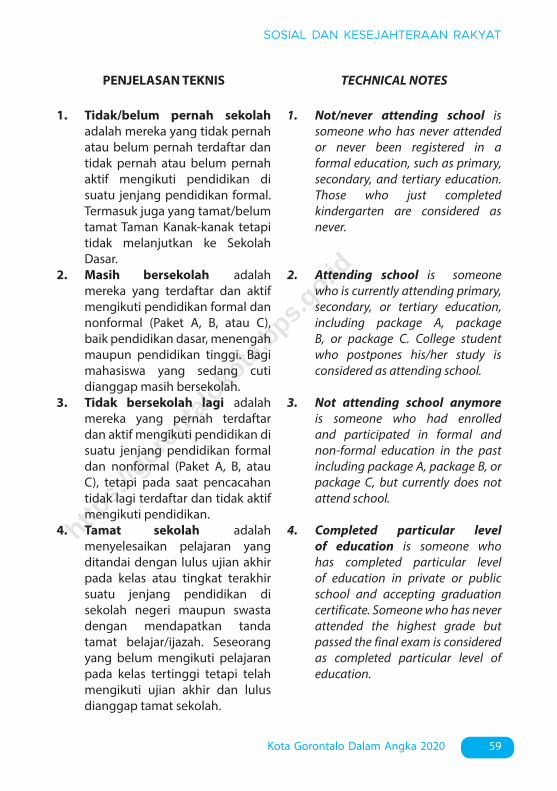
59Kota Gorontalo Dalam Angka 2020
SOSIAL DAN KESEJAHTERAAN RAKYAT
PENJELASAN TEKNIS TECHNICAL NOTES
1. Tidak/belum pernah sekolah adalah mereka yang tidak pernah atau belum pernah terdaftar dan tidak pernah atau belum pernah aktif mengikuti pendidikan di suatu jenjang pendidikan formal. Termasuk juga yang tamat/belum tamat Taman Kanak-kanak tetapi tidak melanjutkan ke Sekolah Dasar.
2. Masih bersekolah adalah mereka yang terdaftar dan aktif mengikuti pendidikan formal dan nonformal (Paket A, B, atau C), baik pendidikan dasar, menengah maupun pendidikan tinggi. Bagi mahasiswa yang sedang cuti dianggap masih bersekolah.
3. Tidak bersekolah lagi adalah mereka yang pernah terdaftar dan aktif mengikuti pendidikan di suatu jenjang pendidikan formal dan nonformal (Paket A, B, atau C), tetapi pada saat pencacahan tidak lagi terdaftar dan tidak aktif mengikuti pendidikan.
4. Tamat sekolah adalah menyelesaikan pelajaran yang ditandai dengan lulus ujian akhir pada kelas atau tingkat terakhir suatu jenjang pendidikan di sekolah negeri maupun swasta dengan mendapatkan tanda tamat belajar/ijazah. Seseorang yang belum mengikuti pelajaran pada kelas tertinggi tetapi telah mengikuti ujian akhir dan lulus dianggap tamat sekolah.
1. Not/never attending school is someone who has never attended or never been registered in a formal education, such as primary, secondary, and tertiary education. Those who just completed kindergarten are considered as never.
2. Attending school is someone who is currently attending primary, secondary, or tertiary education, including package A, package B, or package C. College student who postpones his/her study is considered as attending school.
3. Not attending school anymore is someone who had enrolled and participated in formal and non-formal education in the past including package A, package B, or package C, but currently does not attend school.
4. Completed particular level of education is someone who has completed particular level of education in private or public school and accepting graduation certificate. Someone who has never attended the highest grade but passed the final exam is considered as completed particular level of education.
https:
//goro
ntalo
kota
.bps.g
o.id

60 Gorontalo Municipality in Figures 2020
SOCIAL AND WELFARE
5. Dapat membaca dan menulis artinya dapat membaca dan menulis kata-kata/kalimat sederhana dengan suatu aksara tertentu.
6. Jalur Pendidikan di Indonesia terdiri atas 1) pendidikan formal, 2) pendidikan nonformal, dan 3) pendidikan informal yang ketiganya dapat saling melengkapi dan memperkaya (Undang-Undang No. 20 Tahun 2013 tentang Sistem Pendidikan Nasional).
7. Jenjang Pendidikan Formal terdiri atas pendidikan dasar, pendidikan menengah, dan pendidikan tinggi. Jenis pendidikan yang diajarkan mencakup pendidikan umum, kejuruan, akademik, profesi, vokasi, keagamaan, dan khusus. Pendidikan Dasar berbentuk Sekolah Dasar (SD) dan Madrasah Ibtidaiyah (MI) atau bentuk lain yang sederajat serta Sekolah Menengah Pertama (SMP) dan Madrasah Tsanawiyah (MTs), atau bentuk lain yang sederajat Pendidikan Menengah berbentuk Sekolah Menengah Atas (SMA), Madrasah Aliyah (MA), Sekolah Menengah Kejuruan (SMK), dan Madrasah Aliyah Kejuruan (MAK), atau bentuk lain yang sederajat. Pendidikan Tinggi merupakan jenjang pendidikan setelah pendidikan menengah yang mencakup program pendidikan diploma, sarjana, magister,
5. Able to read and write is the ability to read and write at least a simple sentence in any letter of alphabets.
6. The Education System in Indonesia consists of 1) a formal education, 2) non-formal education, and 3) informal education that all three can be complementary and enriching (Law No. 20 Year 2013 about The National Education System).
7. The Formal Education Level consists of primary education, secondary education, and high education. The kind of education that taught consists of general education, vocational, academic, professional, religious, and specific education. The Primary Education consists of Elementary School and Islamic Elementary School or other equivalent forms and Junior High School and MTs, or other equivalent forms. The Secondary Education consists of the senior high school, MA, Vocational School, and Vocational Madrasah Aliyah, or other equivalent forms. The High Education consists of the education level after the secondary education that consists of diplomas, bachelor, master, specialist, and
https:
//goro
ntalo
kota
.bps.g
o.id

61Kota Gorontalo Dalam Angka 2020
SOSIAL DAN KESEJAHTERAAN RAKYAT
spesialis, dan doktor yang diselenggarakan oleh perguruan tinggi. Perguruan tinggi dapat berbentuk akademi, politeknik, sekolah tinggi, institut, atau universitas.
8. Rumah Sakit adalah tempat pemeriksaan dan perawatan kesehatan, biasanya berada di bawah pengawasan dokter/tenaga medis, yang melayani penderita yang sakit untuk berobat rawat jalan atau rawat inap.
9. Rumah Sakit Bersalin adalah rumah sakit khusus untuk persalinan, dilengkapi pelayanan spesialis pemeriksaan kehamilan, persalinan, rawat inap dan rawat jalan ibu dan anak yang berada di bawah pengawasan dokter spesialis kandungan.
10. Rumah Bersalin adalah sarana pelayanan kesehatan dengan izin sebagai rumah bersalin, dilengkapi pelayanan pemeriksaan kehamilan, persalinan serta pemeriksaan ibu dan anak yang berada di bawah pengawasan bidan senior.
11. Poliklinik adalah sarana kesehatan yang dipakai untuk pelayanan berobat jalan, biasanya berada di bawah pengawasan dokter/tenaga medis.
12. Puskesmas (Pusat Kesehatan Masyarakat) adalah unit pelaksana teknis dinas kesehatan kabupaten/ kota yang mempunyai fungsi
doctoral degrees that are held by the college. The colleges can be academy, polytechnic, high school, institute, or university.
8. Hospital is a place for health check, usually controlled/supervised by doctors/medical personnel to serve the ill patients to get outpatient or inpatient treatment services.
9. Maternity Hospital is a specialized hospital for childbirth, has specialist inspection service to pregnancy, childbirth, hospitalization and outpatient for mothers and children that is under the supervision of an obstetrician.
10. Maternity House is health care facility with a license as a maternity house, equipped with prenatal care, childbirth and examination of mothers and children which is under the supervision of a senior midwife.
11. Polyclinic is a health facility in which to get outpatient services, usually under the control of doctor/medical personnel.
12. Public Health Center is technical implementation unit of regency health department that have the primary function as a first-level health care providers. The
https:
//goro
ntalo
kota
.bps.g
o.id

62 Gorontalo Municipality in Figures 2020
SOCIAL AND WELFARE
utama sebagai penyelenggara pelayanan kesehatan tingkat pertama. Wilayah kerja puskesmas maksimal adalah satu kecamatan dan untuk dapat menjangkau wilayah kerjanya, puskesmas mempunyai jaringan pelayanan yang meliputi unit Puskesmas Pembantu (Pustu), unit Puskesmas Keliling (Puskel), dan unit bidan desa/komunitas (Peraturan Menteri Kesehatan RI No. 75 Tahun 2014 Tentang Pusat Kesehatan Masyarakat).
13. Apotek adalah suatu tempat tertentu yang digunakan untuk melakukan pekerjaan kefarmasian, dan penyaluran/penjualan obat atau bahan farmasi dan perbekalan kesehatan lainnya kepada masyarakat yang dikelola oleh tenaga apoteker (Peraturan Menteri Kesehatan RI No. 1332 Tahun 2002 Tentang Perubahan Atas Peraturan Menteri Kesehatan RI No. 922/MENKES/PER/X/1993 Tentang Ketentuan dan Tata Cara Pemberian Izin Apotek).
14. Imunisasi adalah memasukkan kuman atau racun penyakit tertentu yang sudah dilemahkan (vaksin) ke dalam tubuh dengan cara disuntik atau diminum (diteteskan dalam mulut) dengan maksud agar terjadi kekebalan tubuh terhadap penyakit tersebut.
15. Keluhan kesehatan adalah keadaan seseorang yang mengalami gangguan kesehatan
working area standard of public health center is one district and to reach their working areas, public health centers have a service network covering subsidiary of public health center, mobile public health center units, and midwife units (Regulation of the Minister of Health of Indonesia Number 75 Year 2014 about Public Health Center).
13. Pharmacy is a specific place that is used for pharmaceutical jobs, and distribution/sale of drugs/pharmaceuticals and other medical supplies to people that are administered by trained pharmacist (Regulation of the Minister of Health of Indonesia Number 1332 Year 2002 about the Changes of Regulation of the Minister of Health of Indonesia Number 922/MENKES/PER/X/1993 about Pro-vision and Procedures for Administration of Licensed Pharmacies).
14. Immunization is putting enervated microbe of a certain disease into human body by injection or drinking (dropping into mouth) to make the body immune to that disease.
15. Health complaint is a condition where a person has health or mental problems because of acute
https:
//goro
ntalo
kota
.bps.g
o.id

63Kota Gorontalo Dalam Angka 2020
SOSIAL DAN KESEJAHTERAAN RAKYAT
atau kejiwaan, baik karena penyakit akut, penyakit kronis, kecelakaan, kriminal, atau hal lain.
16. Mengobati sendiri adalah upaya oleh anggota rumah tangga/keluarga dengan melakukan pengobatan sendiri tanpa datang ke tempat fasilitas kesehatan atau memanggil dokter/petugas kesehatan ke rumahnya (misal minum obat modern, jamu, kerokan, kompres, kop, pijat) agar sembuh atau menjadi lebih ringan keluhan kesehatannya.
17. Angka penemuan kasus tuberkulosis adalah jumlah kasus baru tuberkulosis (TB) dan kasus TB yang didiagnosis kambuh yang diobati dalam program penanggulangan TB nasional dan dilaporkan kepada WHO, dibagi dengan perkiraan WHO terhadap jumlah kasus insiden tuberkulosis pada tahun yang sama, dinyatakan sebagai persentase.
18. Angka keberhasilan pengobatan tuberkulosis smear positive/Basil Tahan Asam (BTA) positif adalah proporsi (dinyatakan sebagai persentase) kasus TB BTA positif yang terdaftar di bawah program pengendalian TB nasional pada tahun tertentu yang dinyatakan berhasil menyelesaikan pengobatan. Dengan atau tanpa bukti bakteriologi keberhasilan (“sembuh” dan “menyelesaikan pengobatan” masing-masing).
19. Kasus kumulatif AIDS adalah
illness, chronically illness, accident, crimes, or others.
16. Self treatment is an effort of household members/family to have a health treatment by themselves without visiting health facilities or a doctor/health personnel (for instance, by taking modern medicine, herb medicine, chief with a coin, compress, cupping suction, massage) in order to recover from illness or reduce the health complaint.
17. The case detection rate for all forms of tuberculosis is the number of new and replase tuberculosis cases diagnosed and treated in national tuberculosis control programmes and notified to WHO, divided by WHO’s estimate of the number of incident tuberculosis cases for the same year, expressed as a percentage.
18. The treatment success rate for new pulmonary smear-positive tuberculosis cases is the proportion (expressed as a percentage) of new smear-positive tuberculosis cases registered under a national tuberculosis control programme in a given year that succesfully completed treatment. With or without bacteriological evidence of succes (“cured” and “treatment completed” respectively).
19. Cummulative AIDS case is
https:
//goro
ntalo
kota
.bps.g
o.id

64 Gorontalo Municipality in Figures 2020
SOCIAL AND WELFARE
kumulatif kasus AIDS sampai dengan referensi waktu tertentu.
20. BCG (Bacillus Calmette Guerin) merupakan vaksinasi untuk mencegah penyakit TBC, diberikan pada bayi baru lahir atau anak, dengan suntikan pada kulit pangkal lengan atas. Bekas suntikan kemudian akan membentuk tonjolan kecil jaringan parut pada kulit lengan atas. Suntikan BCG diberikan kepada anak sebanyak 1 kali.
21. DPT (Difteri, Pertusis, Tetanus) merupakan vaksin untuk mencegah penyakit Difteri, Pertusis, dan Tetanus yang diberikan pada bayi berumur 3 bulan ke atas, dengan suntikan pada paha, diulang 1 bulan dan 2 bulan kemudian, sehingga suntikan imunisasi DPT lengkap pada balita berjumlah 3 kali (kadang-kadang selang waktu antar suntikan bisa lebih dari 1 bulan).
22. Luas lantai adalah luas lantai yang ditempati dan digunakan untuk keperluan sehari-hari (sebatas atap).
23. Air leding adalah sumber air yang berasal dari air yang telah melalui proses penjernihan dan penyehatan sebelum dialirkan kepada konsumen melalui instalasi berupa saluran air. Sumber air ini biasanya diusahakan oleh PAM/PDAM/BPAM. Termasuk dalam hal ini air leding yang didapat secara
cummulative AIDS cases with reference to a particular time.
20. BCG (Bacillus Calmette Guerin) is a vaccine to prevent TBC disease, given to newborns or children, by injection at the base of the skin of the upper arm. Injection site will form little bumps of scar tissue in the skin of the upper arm. BCG injections given to children 1 times.
21. DPT (Diphtheria, Pertussis, Tetanus) is a vaccine to prevent the diphtheria, pertussis, and tetanus disease, given to infants aged 3 months and above, with a shot in the thigh, repeated one month and two months later, so that the complete DPT immunization shots at toddler totaling 3 times (sometimes the time interval between injections can be more than 1 month).
22. Floor area is the total area which is occupied and utilized daily.
23. Pipe water is a water source that comes from water that has been through a process of purification and sanitation before distribute to consumers through an instalation of water lines. This water source is usually distributed by PAM/PDAM/BPAM. This include a pipe water that sold at retail.
https:
//goro
ntalo
kota
.bps.g
o.id

65Kota Gorontalo Dalam Angka 2020
SOSIAL DAN KESEJAHTERAAN RAKYAT
eceran.24. Sumur terlindung adalah air
yang berasal dari dalam tanah yang digali dan lingkar sumur tersebut dilindungi oleh tembok paling sedikit 0,8 meter di atas tanah dan 3 meter ke bawah tanah, serta ada lantai semen sejauh 1 meter dari lingkar sumur.
25. Status penguasaan bangunan tempat tinggal milik sendiri adalah jika tempat tinggal tersebut pada waktu pencacahan betul-betul sudah milik kepala rumah tangga atau salah seorang anggota rumah tangga. Rumah yang dibeli secara angsuran melalui kredit bank atau rumah dengan status sewa beli dianggap rumah milik sendiri.
26. Peristiwa tindak pidana yang dilaporkan ialah setiap peristiwa yang diterima kepolisian dari laporan masyarakat, atau peristiwa dimana pelakunya tertangkap tangan oleh kepolisian.
27. Jumlah tindak pidana menggambarkan jumlah kasus tindak pidana yang terjadi pada kurun waktu tertentu. Resiko penduduk terjadi tindak pidana per 100.000 penduduk =(Jumlah tindak pidana tahun t)/(Jumlah penduduk tahun t )×100.000 Resiko penduduk terjadi tindak pidana per 100.000 penduduk mengindikasikan peluang penduduk berisiko
24. Protected wells is water that
comes from the soil were excavated and the circumference of the well was protected by walls at least 0.8 meters above ground and 3 meters underground, and cement floor as far as 1 meter from the well circumference.
25. Own ownership property status is a status of dwelling occupied belongs to the head of household or one of the household member. Houses bought through bank credit or houses with leasing status were also categorized as an own property.
26. Reported crime incidence includes all criminal cases reported and received by police office, and all crimes caught by police.
27. Crime total refers to the number of criminal cases occurring during a given period. Crime rate =(Number of criminal cases year t)/(Total population year t )×100.000 Crime rate indicates the probability of population exposed to risk of crime, expressed in every 100,000 people.
https:
//goro
ntalo
kota
.bps.g
o.id

66 Gorontalo Municipality in Figures 2020
SOCIAL AND WELFARE
terkena tindak pidana. Biasanya dinyatakan dalam setiap 100.000 penduduk. Selang waktu terjadi tindak pidana tahun t =(365 x 24 x 60 x 60)/(Jumlah tindak pidana tahun t )×(detik) Selang waktu terjadi tindak pidana tahun t mengindikasikan selang waktu terjadinya satu tindak kejahatan dengan kejahatan yang lain. Persentase penyelesaian tindak pidana = (Jumlah tindak pidana yang diselesaikan) / (Jumlah peristiwa tindak pidana yang dilaporkan) × 100% Persentase penyelesaian peristiwa tindak pidana menyatakan persentase penyelesaian tindak pidana oleh polisi. Suatu tindak pidana dinyatakan sebagai kasus yang selesai di tingkat kepolisian, apabila: berkas perkaranya sudah siap untuk diserahkan atau telah diserahkan kepada kejaksaan; dalam hal delik aduan, pengaduannya dicabut dalam tenggang waktu yang telah ditentukan menurut undang-undang; telah diselesaikan oleh kepolisian berdasarkan azas plichmatigheid (kewajiban berdasarkan kewenangan hukum); kasus yang dimaksud tidak
Crime clock =(365 x 24 x 60 x 60)/(Number of criminal cases year t)×(second) Crime clock indicates the time interval of occurrence between one crime to another crime. Crime clearance rate =(Number of cleared criminal cases)/( Number of reported criminal cases)×100% Crime clearence rate refers to percentage of crime clearance by police. A criminal case is categorized as a cleared case by police, if: All documents are ready to submit or already submitted to justice court; In the case of attense that warrants complaint, the complaint was withdraw within a given period state in the law; The case was cleared by police based on the principle of plichmatigheid (obligation on the basis of law outhority); The case was not the responsibility
https:
//goro
ntalo
kota
.bps.g
o.id
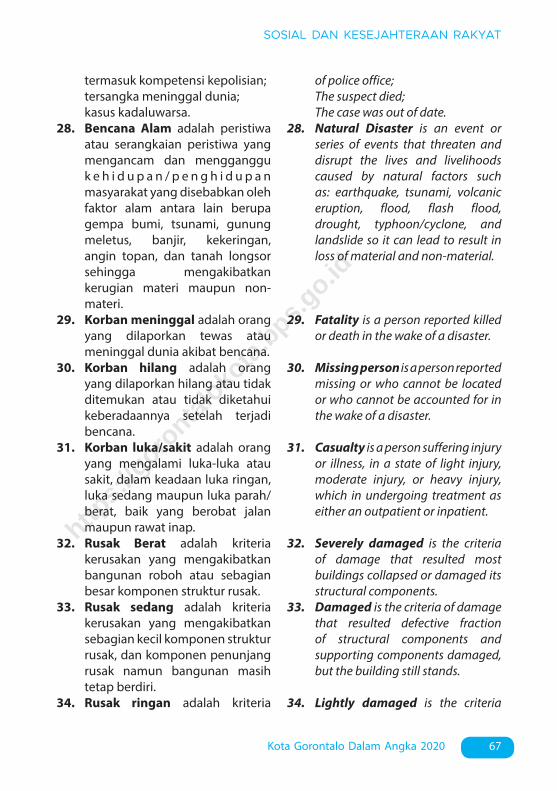
67Kota Gorontalo Dalam Angka 2020
SOSIAL DAN KESEJAHTERAAN RAKYAT
termasuk kompetensi kepolisian; tersangka meninggal dunia; kasus kadaluwarsa.
28. Bencana Alam adalah peristiwa atau serangkaian peristiwa yang mengancam dan mengganggu k e h i d u p a n / p e n g h i d u p a n masyarakat yang disebabkan oleh faktor alam antara lain berupa gempa bumi, tsunami, gunung meletus, banjir, kekeringan, angin topan, dan tanah longsor sehingga mengakibatkan kerugian materi maupun non-materi.
29. Korban meninggal adalah orang yang dilaporkan tewas atau meninggal dunia akibat bencana.
30. Korban hilang adalah orang yang dilaporkan hilang atau tidak ditemukan atau tidak diketahui keberadaannya setelah terjadi bencana.
31. Korban luka/sakit adalah orang yang mengalami luka-luka atau sakit, dalam keadaan luka ringan, luka sedang maupun luka parah/berat, baik yang berobat jalan maupun rawat inap.
32. Rusak Berat adalah kriteria kerusakan yang mengakibatkan bangunan roboh atau sebagian besar komponen struktur rusak.
33. Rusak sedang adalah kriteria kerusakan yang mengakibatkan sebagian kecil komponen struktur rusak, dan komponen penunjang rusak namun bangunan masih tetap berdiri.
34. Rusak ringan adalah kriteria
of police office; The suspect died; The case was out of date.
28. Natural Disaster is an event or series of events that threaten and disrupt the lives and livelihoods caused by natural factors such as: earthquake, tsunami, volcanic eruption, flood, flash flood, drought, typhoon/cyclone, and landslide so it can lead to result in loss of material and non-material.
29. Fatality is a person reported killed or death in the wake of a disaster.
30. Missing person is a person reported missing or who cannot be located or who cannot be accounted for in the wake of a disaster.
31. Casualty is a person suffering injury or illness, in a state of light injury, moderate injury, or heavy injury, which in undergoing treatment as either an outpatient or inpatient.
32. Severely damaged is the criteria of damage that resulted most buildings collapsed or damaged its structural components.
33. Damaged is the criteria of damage that resulted defective fraction of structural components and supporting components damaged, but the building still stands.
34. Lightly damaged is the criteria
https:
//goro
ntalo
kota
.bps.g
o.id

68 Gorontalo Municipality in Figures 2020
SOCIAL AND WELFARE
kerusakan yang mengakibatkan sebagian komponen struktur retak (struktur masih bisa digunakan) dan bangunan masih tetap berdiri.
35. Untuk mengukur kemiskinan, BPS menggunakan konsep kemampuan memenuhi kebutuhan dasar (basic needs approach). Dengan pendekatan ini, kemiskinan dipandang sebagai ketidakmampuan dari sisi ekonomi untuk memenuhi kebutuhan dasar makanan dan bukan makanan yang diukur dari sisi pengeluaran. Metode yang digunakan adalah menghitung Garis Kemiskinan (GK), yang terdiri dari dua komponen yaitu Garis Kemiskinan Makanan (GKM) dan Garis Kemiskinan Non-Makanan (GKNM). Penghitungan Garis Kemiskinan dilakukan secara terpisah untuk daerah perkotaan dan perdesaan.
36. Penduduk miskin adalah penduduk yang memiliki rata-rata pengeluaran per kapita per bulan di bawah Garis Kemiskinan.
37. Garis Kemiskinan Makanan (GKM) merupakan nilai pengeluaran kebutuhan minimum makanan yang disetarakan dengan 2.100 kkalori per kapita per hari. Garis Kemiskinan Non-Makanan (GKNM) adalah kebutuhan minimum untuk perumahan, sandang, pendidikan, kesehatan, dan kebutuhan dasar lainnya.
of damage that resulted partially cracked structural components, but the structure still can be used and the building still stands.
35. To measure poverty, BPS-Statistics Indonesia has used the concept of basic needs approach. Therefore, poverty is viewed as economic inability to fulfill food and non-food basic needs which are measured by consumption/expenditure. The method used is calculating poverty line, which consists of two components that are Food Poverty Line (FPL) and Non-Food Poverty Line (NFPL). The poverty line was calculated separately for urban and rural areas.
36. A person whose expenditure per capita per month is below the poverty line is considered to be poor.
37. The Food Poverty Line refers to the daily minimum requirement of 2,100 kcal per capita per day. The Non-Food Poverty Line refers to the minimum requirement for household necessities for clothing, education, health, and other basic individual needs.
https:
//goro
ntalo
kota
.bps.g
o.id

69Kota Gorontalo Dalam Angka 2020
SOSIAL DAN KESEJAHTERAAN RAKYAT
Ukuran Kemiskinan a. Head Count Index (HCI-P0) adalah persentase penduduk miskin yang berada di bawah Garis Kemiskinan (GK). b. Indeks Kedalaman Kemiskinan (Poverty Gap Index-P1) merupakan ukuran rata-rata kesenjangan pengeluaran masing-masing penduduk miskin terhadap garis kemiskinan. Semakin tinggi nilai indeks, semakin jauh rata-rata pengeluaran penduduk dari garis kemiskinan. c. Indeks Keparahan Kemiskinan (Poverty Severity Index-P2) memberikan gambaran mengenai penyebaran pengeluaran di antara penduduk miskin. Semakin tinggi nilai indeks, semakin tinggi ketimpangan pengeluaran di antara penduduk miskin.
38. Indeks Pembangunan Manusia (IPM) menjelaskan bagaimana penduduk dapat mengakses hasil pembangunan dalam memperoleh pendapatan, kesehatan, pendidikan dan sebagainya. IPM diperkenalkan oleh UNDP pada tahun 1990 dan dipublikasikan secara berkala dalam laporan tahunan Human Development Report (HDR). IPM dibentuk oleh 3 (tiga) dimensi dasar: Umur panjang dan hidup sehat; pengetahuan; dan standar hidup layak.
Poverty Measures a. Head Count Index (HCI-P0) simply measures the percentage of the population that is counted as poor, often denoted by P0. b. Poverty Gap Index-P1 measures the extent to which individuals fall below the poverty line (the poverty gaps) as a proportion of the poverty line. Higher value of the index shows that the gap between average expenditure of the poor and the poverty line is wider. c. Poverty Severity Index-P2 describes inequality among the poor. Higher value of the index shows that inequality among the poor is higher.
38. The Human Development Index (HDI) explains how people can access development results in obtaining income, health, education and so forth. HDI was introduced by United Nations Development Programme (UNDP) in 1990 and published periodically in the annual report of the Human Development Report. HDI was formed by three basic dimensions: a long and healthy life; knowledge; and a decent standard of living.
https:
//goro
ntalo
kota
.bps.g
o.id

70 Gorontalo Municipality in Figures 2020
SOCIAL AND WELFARE
4.1 Jumlah Tempat Peribadatan Menurut Jenisnya di Kota Gorontalo, 2019
Number of Places of Worship by Kind in Gorontalo Municipality, 2019
GambarFigures
Sumber/Source : Kementrian Agama Kota Gorontalo / Ministry of Religion Affairs of Gorontalo Municipality
0
1
2
12
59
306
0 50 100 150 200 250 300 350
Pura
Gereja Katolik / Catholic Church
Vihara
Gereja Protestan / Protestant Church
Mushola / Pray Room
Masjid / Mosque
Jumlah Tempat Peribadatan
https:
//goro
ntalo
kota
.bps.g
o.id
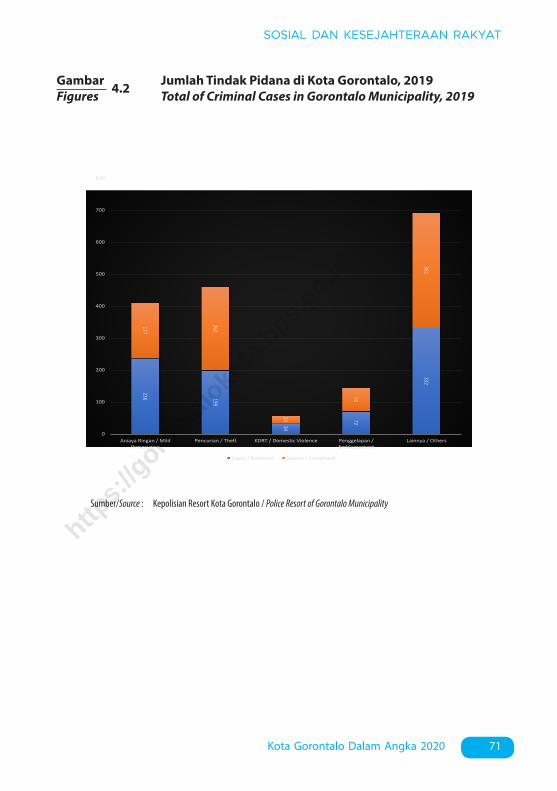
71Kota Gorontalo Dalam Angka 2020
SOSIAL DAN KESEJAHTERAAN RAKYAT
Sumber/Source : Kepolisian Resort Kota Gorontalo / Police Resort of Gorontalo Municipality
236 199
34
72
332
177
262
23
73
361
0
100
200
300
400
500
600
700
800
Aniaya Ringan / MildPersecution
Pencurian / Theft KDRT / Domestic Violence Penggelapan /Emblezzement
Lainnya / Others
Lapor / Reported Selesai / Completed
4.2 Jumlah Tindak Pidana di Kota Gorontalo, 2019 Total of Criminal Cases in Gorontalo Municipality, 2019
GambarFigures
https:
//goro
ntalo
kota
.bps.g
o.id
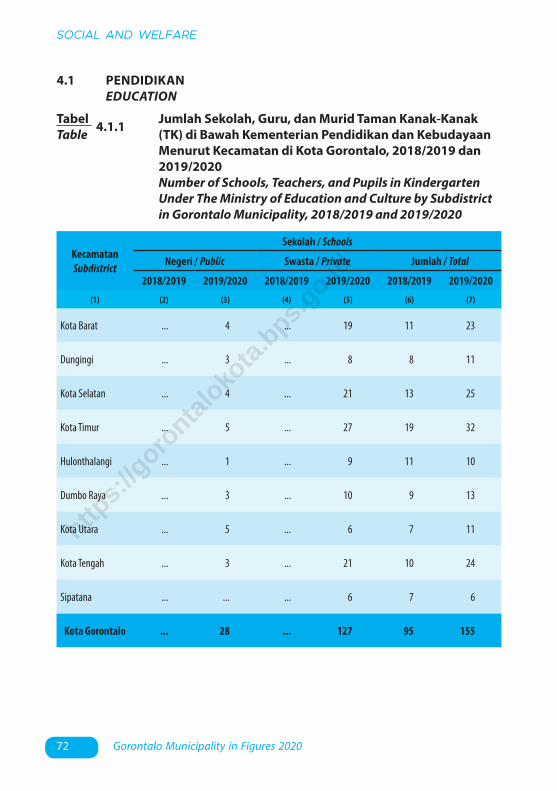
72 Gorontalo Municipality in Figures 2020
SOCIAL AND WELFARE
TabelTable 4.1.1 Jumlah Sekolah, Guru, dan Murid Taman Kanak-Kanak
(TK) di Bawah Kementerian Pendidikan dan Kebudayaan Menurut Kecamatan di Kota Gorontalo, 2018/2019 dan 2019/2020
Number of Schools, Teachers, and Pupils in Kindergarten Under The Ministry of Education and Culture by Subdistrict in Gorontalo Municipality, 2018/2019 and 2019/2020
4.1 PENDIDIKAN EDUCATION
KecamatanSubdistrict
Sekolah / Schools
Negeri / Public Swasta / Private Jumlah / Total
2018/2019 2019/2020 2018/2019 2019/2020 2018/2019 2019/2020
(1) (2) (3) (4) (5) (6) (7)
Kota Barat ... 4 ... 19 11 23
Dungingi ... 3 ... 8 8 11
Kota Selatan ... 4 ... 21 13 25
Kota Timur ... 5 ... 27 19 32
Hulonthalangi ... 1 ... 9 11 10
Dumbo Raya ... 3 ... 10 9 13
Kota Utara ... 5 ... 6 7 11
Kota Tengah ... 3 ... 21 10 24
Sipatana ... ... ... 6 7 6
Kota Gorontalo ... 28 ... 127 95 155
https:
//goro
ntalo
kota
.bps.g
o.id

73Kota Gorontalo Dalam Angka 2020
SOSIAL DAN KESEJAHTERAAN RAKYAT
Lanjutan Tabel/Continued Table 4.1.1
KecamatanSubdistrict
Guru 1 / Teachers 1
Negeri / Public Swasta / Private Jumlah / Total
2018/2019 2019/2020 2018/2019 2019/2020 2018/2019 2019/2020
(1) (8) (9) (10) (11) (12) (13)
Kota Barat ... 13 ... 25 34 38
Dungingi ... 13 ... 26 29 39
Kota Selatan ... 17 ... 47 43 64
Kota Timur ... 17 ... 50 87 67
Hulonthalangi ... 4 ... 29 39 33
Dumbo Raya ... 10 ... 21 29 31
Kota Utara ... 32 ... 22 44 54
Kota Tengah ... 12 ... 53 102 65
Sipatana ... ... ... 15 56 15
Kota Gorontalo ... 118 ... 288 457 406
https:
//goro
ntalo
kota
.bps.g
o.id

74 Gorontalo Municipality in Figures 2020
SOCIAL AND WELFARE
Lanjutan Tabel/Continued Table 4.1.1
Catatan/Note: 1 Jumlah guru termasuk kepala sekolah dan guru/The total of teachers including headmaster and teacherSumber/Source: 2018/2019 - Kementerian Pendidikan dan Kebudayaan, Sistem Data Pokok Pendidikan, data semester ganjil/ Ministry
of Educations and Culture, Basic Education Data System, odd semester 2019/2020 - Kementrian Pendidikan dan Kebudayaan, data semester ganjil 2019/ Ministry of Educations and Culture,
2019 odd semester data
KecamatanSubdistrict
Murid / Pupils
Negeri / Public Swasta / Private Jumlah / Total
2018/2019 2019/2020 2018/2019 2019/2020 2018/2019 2019/2020
(1) (8) (9) (10) (11) (12) (13)
Kota Barat ... 159 ... 370 453 529
Dungingi ... 106 ... 310 361 416
Kota Selatan ... 195 ... 457 717 652
Kota Timur ... 230 ... 569 1 015 799
Hulonthalangi ... 50 ... 349 443 399
Dumbo Raya ... 121 ... 278 423 399
Kota Utara ... 358 ... 206 750 564
Kota Tengah ... 133 ... 645 993 778
Sipatana ... ... ... 201 505 201
Kota Gorontalo ... 1 352 ... 3 385 5 660 4 737
https:
//goro
ntalo
kota
.bps.g
o.id

75Kota Gorontalo Dalam Angka 2020
SOSIAL DAN KESEJAHTERAAN RAKYAT
TabelTable 4.1.2 Jumlah Sekolah, Guru, dan Murid Raudatul Athfal (RA) di
Bawah Kementerian Agama Menurut Kecamatan di Kota Gorontalo, 2018/2019 dan 2019/2020
Number of Schools, Teachers, and Pupils in Raudatul Athfal (RA) Under The Ministry of Religious Affairs by Subdistrict in Gorontalo Municipality, 2018/2019 and 2019/2020
Sumber/Source: 2018/2019 - Kementerian Agama, EMIS, data semester genap laporan sampai dengan 30 Juni 2019/ Ministry of Religious Affairs, EMIS, even semester report data up to 30thJune 2019
2019/2020 - Kementerian Agama, EMIS, data semester ganjillaporan sampai dengan 15 Maret 2020/ Ministry of Religious Affairs, EMIS, odd semester report data up to March 15th, 2020
KecamatanSubdistrict
Sekolah/Schools Guru/Teachers Siswa/Pupils
2018/2019 2019/2020 2018/2019 2019/2020 2018/2019 2019/2020
(1) (2) (3) (4) (5) (6) (7)
Kota Barat ... ... ... ... ... ...
Dungingi ... ... ... ... ... ...
Kota Selatan ... ... ... ... ... ...
Kota Timur ... ... ... ... ... ...
Hulonthalangi ... ... ... ... ... ...
Dumbo Raya ... ... ... ... ... ...
Kota Utara ... 2 ... 9 ... 129
Kota Tengah ... 2 ... 37 ... 328
Sipatana ... 1 ... 4 ... 60
Kota Gorontalo 5 5 53 50 249 517
https:
//goro
ntalo
kota
.bps.g
o.id

76 Gorontalo Municipality in Figures 2020
SOCIAL AND WELFARE
TabelTable 4.1.3 Jumlah Sekolah, Guru, dan Murid Sekolah Dasar (SD)
di Bawah Kementerian Pendidikan dan Kebudayaan Menurut Kecamatan di Kota Gorontalo, 2018/2019 dan 2019/2020
Number of Schools, Teachers, and Pupils in Primary Schools Under The Ministry of Education and Culture by Subdistrict in Gorontalo Municipality, 2018/2019 and 2019/2020
KecamatanSubdistrict
Sekolah / Schools
Negeri / Public Swasta / Private Jumlah / Total
2018/2019 2019/2020 2018/2019 2019/2020 2018/2019 2019/2020
(1) (2) (3) (4) (5) (6) (7)
Kota Barat 17 17 1 1 18 18
Dungingi 10 10 - - 10 10
Kota Selatan 10 10 4 4 14 14
Kota Timur 16 16 1 1 17 17
Hulonthalangi 12 12 1 1 13 13
Dumbo Raya 10 10 - - 10 10
Kota Utara 8 8 1 1 9 9
Kota Tengah 13 13 1 2 14 15
Sipatana 11 11 - - 11 11
Kota Gorontalo 107 107 9 10 116 117
https:
//goro
ntalo
kota
.bps.g
o.id
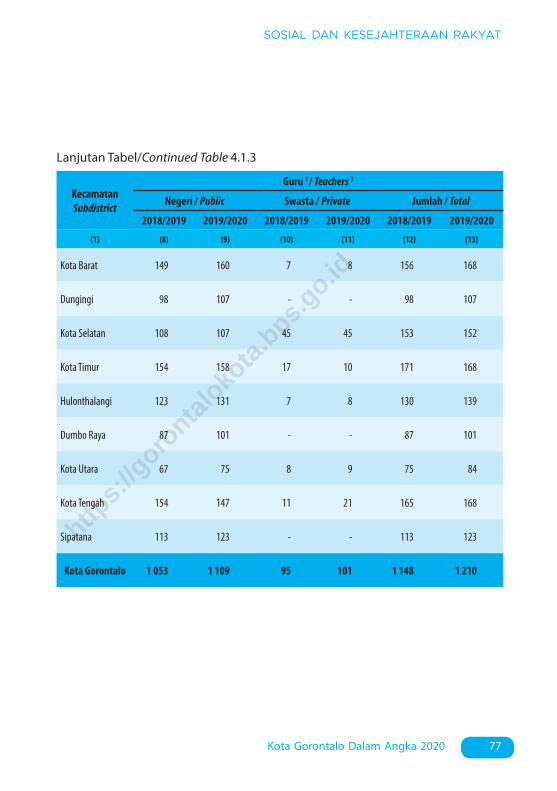
77Kota Gorontalo Dalam Angka 2020
SOSIAL DAN KESEJAHTERAAN RAKYAT
Lanjutan Tabel/Continued Table 4.1.3
KecamatanSubdistrict
Guru 1 / Teachers 1
Negeri / Public Swasta / Private Jumlah / Total
2018/2019 2019/2020 2018/2019 2019/2020 2018/2019 2019/2020
(1) (8) (9) (10) (11) (12) (13)
Kota Barat 149 160 7 8 156 168
Dungingi 98 107 - - 98 107
Kota Selatan 108 107 45 45 153 152
Kota Timur 154 158 17 10 171 168
Hulonthalangi 123 131 7 8 130 139
Dumbo Raya 87 101 - - 87 101
Kota Utara 67 75 8 9 75 84
Kota Tengah 154 147 11 21 165 168
Sipatana 113 123 - - 113 123
Kota Gorontalo 1 053 1 109 95 101 1 148 1 210
https:
//goro
ntalo
kota
.bps.g
o.id

78 Gorontalo Municipality in Figures 2020
SOCIAL AND WELFARE
Lanjutan Tabel/Continued Table 4.1.3
Catatan/Note: 1 Jumlah guru termasuk kepala sekolah dan guru/The total of teachers including headmaster and teacherSumber/Source: Kementerian Pendidikan dan Kebudayaan, Sistem Data Pokok Pendidikan, data semester ganjil/ Ministry of Educations
and Culture, Basic Education Data System, odd semester
KecamatanSubdistrict
Murid / Pupils
Negeri / Public Swasta / Private Jumlah / Total
2018/2019 2019/2020 2018/2019 2019/2020 2018/2019 2019/2020
(1) (8) (9) (10) (11) (12) (13)
Kota Barat 2 075 1 945 87 91 2 162 2 036
Dungingi 1 788 1 732 - - 1 788 1 732
Kota Selatan 1 850 1 758 663 732 2 513 2 490
Kota Timur 2 433 2 306 190 201 2 623 2 507
Hulonthalangi 2 312 2 336 84 60 2 396 2 396
Dumbo Raya 1 675 1 619 - - 1 675 1 619
Kota Utara 1 143 1 158 135 149 1 278 1 307
Kota Tengah 2 288 2 184 107 249 2 395 2 433
Sipatana 2 018 2 027 - - 2 018 2 027
Kota Gorontalo 17 582 17 065 1 266 1 482 18 848 18 547
https:
//goro
ntalo
kota
.bps.g
o.id

79Kota Gorontalo Dalam Angka 2020
SOSIAL DAN KESEJAHTERAAN RAKYAT
TabelTable 4.1.4 Jumlah Sekolah, Guru, dan Murid Madrasah Ibtidaiyah
(MI) di Bawah Kementerian Agama Menurut Kecamatan Menurut Kecamatan di Kota Gorontalo, 2018/2019 dan 2019/2020
Number of Schools, Teachers, and Pupils in Madrasah Ibtidaiyah (MI) Under The Ministry of Religious Affairs by Subdistrict in Gorontalo Municipality, 2018/2019 and 2019/2020
KecamatanSubdistrict
Sekolah / Schools Guru / Teachers Murid / Pupils
2018/2019 2019/2020 2018/2019 2019/2020 2018/2019 2019/2020
(1) (2) (3) (4) (5) (6) (7)
Kota Barat ... 2 ... 18 ... 235
Dungingi ... 1 ... 13 ... 121
Kota Selatan ... 3 ... 36 ... 476
Kota Timur ... 1 ... 11 ... 148
Hulonthalangi ... ... ... ... ... ...
Dumbo Raya ... 1 ... 35 ... 698
Kota Utara ... 2 ... 20 ... 368
Kota Tengah ... 2 ... 77 ... 1 200
Sipatana ... ... ... ... ... ...
Kota Gorontalo 12 12 223 210 3 066 3 246
Sumber/Source: 2018/2019 - Kementerian Agama, EMIS, data semester genap laporan sampai dengan 30 Juni 2019/ Ministry of Religious Affairs, EMIS, even semester report data up to 30thJune 2019
2019/2020 - Kementerian Agama, EMIS, data semester ganjillaporan sampai dengan 15 Maret 2020/ Ministry of Religious Affairs, EMIS, odd semester report data up to March 15th, 2020
https:
//goro
ntalo
kota
.bps.g
o.id

80 Gorontalo Municipality in Figures 2020
SOCIAL AND WELFARE
TabelTable 4.1.5 Jumlah Sekolah, Guru, dan Murid Sekolah Menengah
Pertama (SMP) di Bawah Kementerian Pendidikan dan Kebudayaan Menurut Kecamatan di Kota Gorontalo, 2018/2019 dan 2019/2020
Number of Schools, Teachers, and Pupils in Junior High Schools Under The Ministry of Education and Culture by Subdistrict in Gorontalo Municipality, 2018/2019 and 2019/2020
KecamatanSubdistrict
Sekolah / Schools
Negeri / Public Swasta / Private Jumlah / Total
2018/2019 2019/2020 2018/2019 2019/2020 2018/2019 2019/2020
(1) (2) (3) (4) (5) (6) (7)
Kota Barat 2 2 2 2 4 4
Dungingi 1 1 - - 1 1
Kota Selatan 5 5 1 1 6 6
Kota Timur 1 1 1 1 2 2
Hulonthalangi 2 2 1 1 3 3
Dumbo Raya 1 1 - - 1 1
Kota Utara 1 1 1 1 2 2
Kota Tengah 2 2 - - 2 2
Sipatana 1 1 - - 1 1
Kota Gorontalo 16 16 6 6 22 22
https:
//goro
ntalo
kota
.bps.g
o.id

81Kota Gorontalo Dalam Angka 2020
SOSIAL DAN KESEJAHTERAAN RAKYAT
Lanjutan Tabel/Continued Table 4.1.5
KecamatanSubdistrict
Guru 1 / Teachers 1
Negeri / Public Swasta / Private Jumlah / Total
2018/2019 2019/2020 2018/2019 2019/2020 2018/2019 2019/2020
(1) (8) (9) (10) (11) (12) (13)
Kota Barat 61 59 18 17 79 76
Dungingi 26 28 - - 26 28
Kota Selatan 240 225 14 14 254 239
Kota Timur 27 24 14 14 41 38
Hulonthalangi 28 30 6 10 34 40
Dumbo Raya 20 17 - - 20 17
Kota Utara 19 22 18 16 37 38
Kota Tengah 81 77 - - 81 77
Sipatana 20 20 - - 20 20
Kota Gorontalo 522 502 70 71 592 573
https:
//goro
ntalo
kota
.bps.g
o.id

82 Gorontalo Municipality in Figures 2020
SOCIAL AND WELFARE
Lanjutan Tabel/Continued Table 4.1.5
KecamatanSubdistrict
Murid / Pupils
Negeri / Public Swasta / Private Jumlah / Total
2018/2019 2019/2020 2018/2019 2019/2020 2018/2019 2019/2020
(1) (8) (9) (10) (11) (12) (13)
Kota Barat 933 951 197 255 1 130 1 206
Dungingi 387 384 - - 387 384
Kota Selatan 4 081 4 258 85 109 4 166 4 367
Kota Timur 369 336 192 195 561 531
Hulonthalangi 373 349 71 66 444 415
Dumbo Raya 313 294 - - 313 294
Kota Utara 310 306 209 211 519 517
Kota Tengah 1 300 1 284 - - 1 300 1 284
Sipatana 360 358 - - 360 358
Kota Gorontalo 8 426 8 520 754 836 9 180 9 356
Catatan/Note: 1 Jumlah guru termasuk kepala sekolah dan guru/The total of teachers including headmaster and teacherSumber/Source: Kementerian Pendidikan dan Kebudayaan, Sistem Data Pokok Pendidikan, data semester ganjil/ Ministry of Educations
and Culture, Basic Education Data System, odd semester
https:
//goro
ntalo
kota
.bps.g
o.id
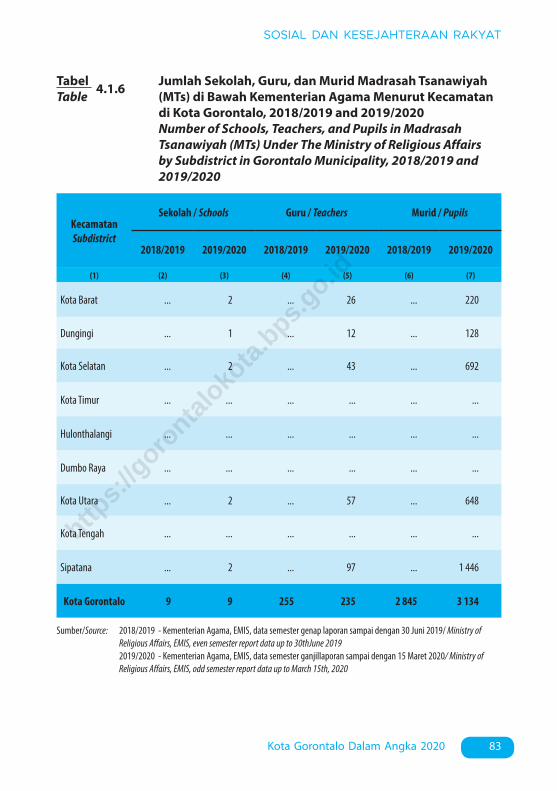
83Kota Gorontalo Dalam Angka 2020
SOSIAL DAN KESEJAHTERAAN RAKYAT
TabelTable 4.1.6 Jumlah Sekolah, Guru, dan Murid Madrasah Tsanawiyah
(MTs) di Bawah Kementerian Agama Menurut Kecamatan di Kota Gorontalo, 2018/2019 and 2019/2020
Number of Schools, Teachers, and Pupils in Madrasah Tsanawiyah (MTs) Under The Ministry of Religious Affairs by Subdistrict in Gorontalo Municipality, 2018/2019 and 2019/2020
KecamatanSubdistrict
Sekolah / Schools Guru / Teachers Murid / Pupils
2018/2019 2019/2020 2018/2019 2019/2020 2018/2019 2019/2020
(1) (2) (3) (4) (5) (6) (7)
Kota Barat ... 2 ... 26 ... 220
Dungingi ... 1 ... 12 ... 128
Kota Selatan ... 2 ... 43 ... 692
Kota Timur ... ... ... ... ... ...
Hulonthalangi ... ... ... ... ... ...
Dumbo Raya ... ... ... ... ... ...
Kota Utara ... 2 ... 57 ... 648
Kota Tengah ... ... ... ... ... ...
Sipatana ... 2 ... 97 ... 1 446
Kota Gorontalo 9 9 255 235 2 845 3 134
Sumber/Source: 2018/2019 - Kementerian Agama, EMIS, data semester genap laporan sampai dengan 30 Juni 2019/ Ministry of Religious Affairs, EMIS, even semester report data up to 30thJune 2019
2019/2020 - Kementerian Agama, EMIS, data semester ganjillaporan sampai dengan 15 Maret 2020/ Ministry of Religious Affairs, EMIS, odd semester report data up to March 15th, 2020
https:
//goro
ntalo
kota
.bps.g
o.id

84 Gorontalo Municipality in Figures 2020
SOCIAL AND WELFARE
TabelTable 4.1.7 Jumlah Sekolah, Guru, dan Murid Sekolah Menengah
Atas (SMA) di Bawah Kementerian Pendidikan dan Kebudayaan Menurut Kecamatan di Kota Gorontalo, 2018/2019 dan 2019/2020
Number of Schools, Teachers, and Pupils in Senior High Schools Under The Ministry of Education and Culture by Subdistrict in Gorontalo Municipality, 2018/2019 and 2019/2020
KecamatanSubdistrict
Sekolah / Schools
Negeri / Public Swasta / Private Jumlah / Total
2018/2019 2019/2020 2018/2019 2019/2020 2018/2019 2019/2020
(1) (2) (3) (4) (5) (6) (7)
Kota Barat 1 1 1 1 2 2
Dungingi - - - - - -
Kota Selatan 1 2 2 1 3 3
Kota Timur 2 2 - - 2 2
Hulonthalangi - - - - - -
Dumbo Raya - - - - - -
Kota Utara 1 1 - - 1 1
Kota Tengah - - - - - -
Sipatana - - - - - -
Kota Gorontalo 5 6 3 2 8 8
https:
//goro
ntalo
kota
.bps.g
o.id
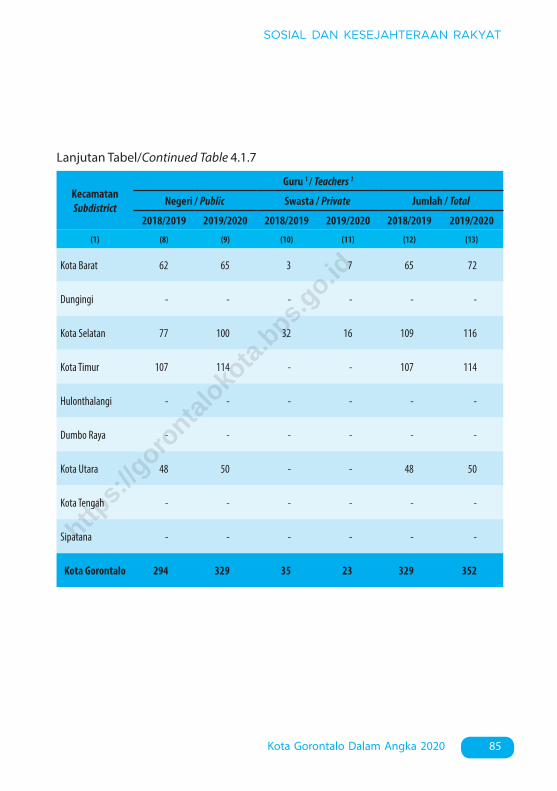
85Kota Gorontalo Dalam Angka 2020
SOSIAL DAN KESEJAHTERAAN RAKYAT
Lanjutan Tabel/Continued Table 4.1.7
KecamatanSubdistrict
Guru 1 / Teachers 1
Negeri / Public Swasta / Private Jumlah / Total
2018/2019 2019/2020 2018/2019 2019/2020 2018/2019 2019/2020
(1) (8) (9) (10) (11) (12) (13)
Kota Barat 62 65 3 7 65 72
Dungingi - - - - - -
Kota Selatan 77 100 32 16 109 116
Kota Timur 107 114 - - 107 114
Hulonthalangi - - - - - -
Dumbo Raya - - - - - -
Kota Utara 48 50 - - 48 50
Kota Tengah - - - - - -
Sipatana - - - - - -
Kota Gorontalo 294 329 35 23 329 352
https:
//goro
ntalo
kota
.bps.g
o.id

86 Gorontalo Municipality in Figures 2020
SOCIAL AND WELFARE
Lanjutan Tabel/Continued Table 4.1.7
KecamatanSubdistrict
Murid / Pupils
Negeri / Public Swasta / Private Jumlah / Total
2018/2019 2019/2020 2018/2019 2019/2020 2018/2019 2019/2020
(1) (8) (9) (10) (11) (12) (13)
Kota Barat 1 059 1 100 44 51 1 103 1 151
Dungingi - - - - - -
Kota Selatan 1 336 1 640 314 134 1 650 1 774
Kota Timur 1 750 1 747 - - 1 750 1 747
Hulonthalangi - - - - - -
Dumbo Raya - - - - - -
Kota Utara 643 802 - - 643 802
Kota Tengah - - - - - -
Sipatana - - - - - -
Kota Gorontalo 4 788 5 289 358 185 5 146 5 474
Catatan/Note: 1 Jumlah guru termasuk kepala sekolah dan guru/The total of teachers including headmaster and teacherSumber/Source: Kementerian Pendidikan dan Kebudayaan, Sistem Data Pokok Pendidikan, data semester ganjil/ Ministry of Educations
and Culture, Basic Education Data System, odd semester
https:
//goro
ntalo
kota
.bps.g
o.id

87Kota Gorontalo Dalam Angka 2020
SOSIAL DAN KESEJAHTERAAN RAKYAT
TabelTable 4.1.8 Jumlah Sekolah, Guru, dan Murid Sekolah Menengah
Kejuruan (SMK) di Bawah Kementerian Pendidikan dan Kebudayaan Menurut Kecamatan di Kota Gorontalo, 2018/2019 dan 2019/2020
Number of Schools, Teachers, and Pupils in Vocational High Schools Under The Ministry of Education and Culture by Subdistrict in Gorontalo Municipality, 2018/2019 and 2019/2020
KecamatanSubdistrict
Sekolah / Schools
Negeri / Public Swasta / Private Jumlah / Total
2018/2019 2019/2020 2018/2019 2019/2020 2018/2019 2019/2020
(1) (2) (3) (4) (5) (6) (7)
Kota Barat 1 1 - - 1 1
Dungingi - - - - - -
Kota Selatan 1 1 1 1 2 2
Kota Timur - - - - - -
Hulonthalangi - - - - - -
Dumbo Raya - - - - - -
Kota Utara - - - - - -
Kota Tengah 2 2 3 3 5 5
Sipatana 1 1 - - 1 1
Kota Gorontalo 5 5 4 4 9 9
https:
//goro
ntalo
kota
.bps.g
o.id
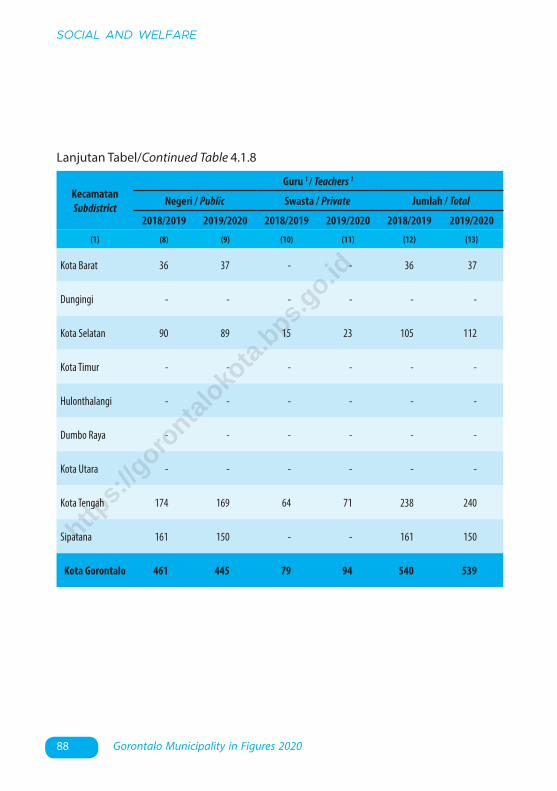
88 Gorontalo Municipality in Figures 2020
SOCIAL AND WELFARE
Lanjutan Tabel/Continued Table 4.1.8
KecamatanSubdistrict
Guru 1 / Teachers 1
Negeri / Public Swasta / Private Jumlah / Total
2018/2019 2019/2020 2018/2019 2019/2020 2018/2019 2019/2020
(1) (8) (9) (10) (11) (12) (13)
Kota Barat 36 37 - - 36 37
Dungingi - - - - - -
Kota Selatan 90 89 15 23 105 112
Kota Timur - - - - - -
Hulonthalangi - - - - - -
Dumbo Raya - - - - - -
Kota Utara - - - - - -
Kota Tengah 174 169 64 71 238 240
Sipatana 161 150 - - 161 150
Kota Gorontalo 461 445 79 94 540 539
https:
//goro
ntalo
kota
.bps.g
o.id

89Kota Gorontalo Dalam Angka 2020
SOSIAL DAN KESEJAHTERAAN RAKYAT
Lanjutan Tabel/Continued Table 4.1.8
Catatan/Note: 1 Guru yang mengajar di 2 sekolah atau lebih dihitung di masing-masing sekolah/The teacher who tought in two schools or more counted in every school
2 Jumlah guru termasuk kepala sekolah dan guru/The total of teachers including headmaster and teacherSumber/Source: Kementerian Pendidikan dan Kebudayaan, Sistem Data Pokok Pendidikan, data semester ganjil/ Ministry of Educations
and Culture, Basic Education Data System, odd semester
KecamatanSubdistrict
Murid / Pupils
Negeri / Public Swasta / Private Jumlah / Total
2018/2019 2019/2020 2018/2019 2019/2020 2018/2019 2019/2020
(1) (8) (9) (10) (11) (12) (13)
Kota Barat 512 520 - - 512 520
Dungingi - - - - - -
Kota Selatan 1 141 1 169 81 107 1 222 1 276
Kota Timur - - - - - -
Hulonthalangi - - - - - -
Dumbo Raya - - - - - -
Kota Utara - - - - - -
Kota Tengah 1 804 1 862 745 861 2 549 2 723
Sipatana 1 930 2 037 - - 1 930 2 037
Kota Gorontalo 5 387 5 588 826 968 6 213 6 556
https:
//goro
ntalo
kota
.bps.g
o.id

90 Gorontalo Municipality in Figures 2020
SOCIAL AND WELFARE
TabelTable 4.1.9 Jumlah Sekolah, Guru, dan Murid Madrasah Aliyah (MA) di
Bawah Kementerian Agama Menurut Kecamatan di Kota Gorontalo, 2018/2019 dan 2019/2020
Number of Schools, Teachers, and Pupils in Madrasah Aliyah (MA) Under the Ministry of Religious Affairs by Subdistrict in Gorontalo Municipality, 2018/2019 and 2019/2020
KecamatanSubdistrict
Sekolah / Schools
Negeri / Public Swasta / Private Jumlah / Total
2018/2019 2019/2020 2018/2019 2019/2020 2018/2019 2019/2020
(1) (2) (3) (4) (5) (6) (7)
Kota Barat ... ... ... 1 ... 1
Dungingi ... ... ... 1 ... 1
Kota Selatan ... ... ... 2 ... 2
Kota Timur ... ... ... ... ... ...
Hulonthalangi ... ... ... ... ... ...
Dumbo Raya ... ... ... ... ... ...
Kota Utara ... ... ... 2 ... 2
Kota Tengah ... ... ... ... ... ...
Sipatana ... 1 ... ... ... 1
Kota Gorontalo 1 1 5 6 6 7
https:
//goro
ntalo
kota
.bps.g
o.id
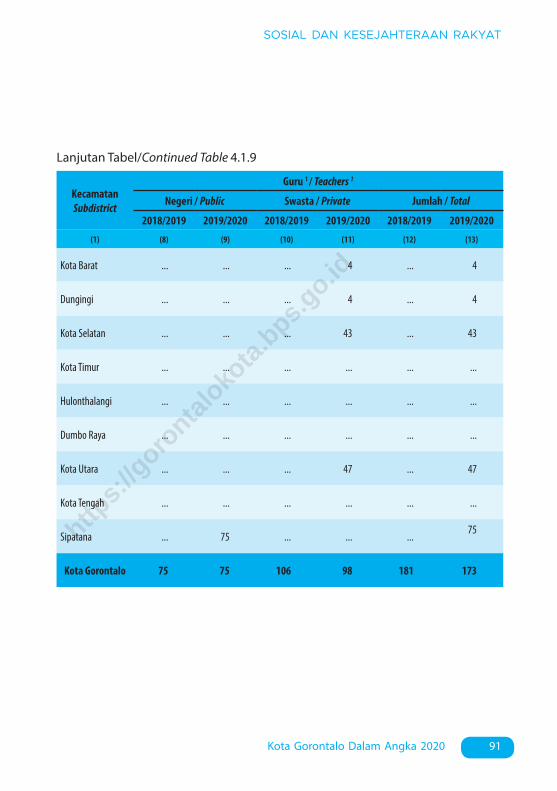
91Kota Gorontalo Dalam Angka 2020
SOSIAL DAN KESEJAHTERAAN RAKYAT
Lanjutan Tabel/Continued Table 4.1.9
KecamatanSubdistrict
Guru 1 / Teachers 1
Negeri / Public Swasta / Private Jumlah / Total
2018/2019 2019/2020 2018/2019 2019/2020 2018/2019 2019/2020
(1) (8) (9) (10) (11) (12) (13)
Kota Barat ... ... ... 4 ... 4
Dungingi ... ... ... 4 ... 4
Kota Selatan ... ... ... 43 ... 43
Kota Timur ... ... ... ... ... ...
Hulonthalangi ... ... ... ... ... ...
Dumbo Raya ... ... ... ... ... ...
Kota Utara ... ... ... 47 ... 47
Kota Tengah ... ... ... ... ... ...
Sipatana ... 75 ... ... ...75
Kota Gorontalo 75 75 106 98 181 173
https:
//goro
ntalo
kota
.bps.g
o.id

92 Gorontalo Municipality in Figures 2020
SOCIAL AND WELFARE
Lanjutan Tabel/Continued Table 4.1.9
KecamatanSubdistrict
Murid / Pupils
Negeri / Public Swasta / Private Jumlah / Total
2018/2019 2019/2020 2018/2019 2019/2020 2018/2019 2019/2020
(1) (8) (9) (10) (11) (12) (13)
Kota Barat ... ... ... 34 ... 34
Dungingi ... ... ... 57 ... 57
Kota Selatan ... ... ... 421 ... 421
Kota Timur ... ... ... ... ... ...
Hulonthalangi ... ... ... ... ... ...
Dumbo Raya ... ... ... ... ... ...
Kota Utara ... ... ... 337 ... 337
Kota Tengah ... ... ... ... ... ...
Sipatana ... 1 068 ... ... ... 1 068
Kota Gorontalo 1 007 1 068 542 849 1 549 1 917
Catatan/Note: 1 Jumlah guru termasuk kepala sekolah dan guru/The total of teachers including headmaster and teacherSumber/Source: Kementerian Pendidikan dan Kebudayaan, Sistem Data Pokok Pendidikan, data semester ganjil/ Ministry of Educations
and Culture, Basic Education Data System, odd semester
https:
//goro
ntalo
kota
.bps.g
o.id
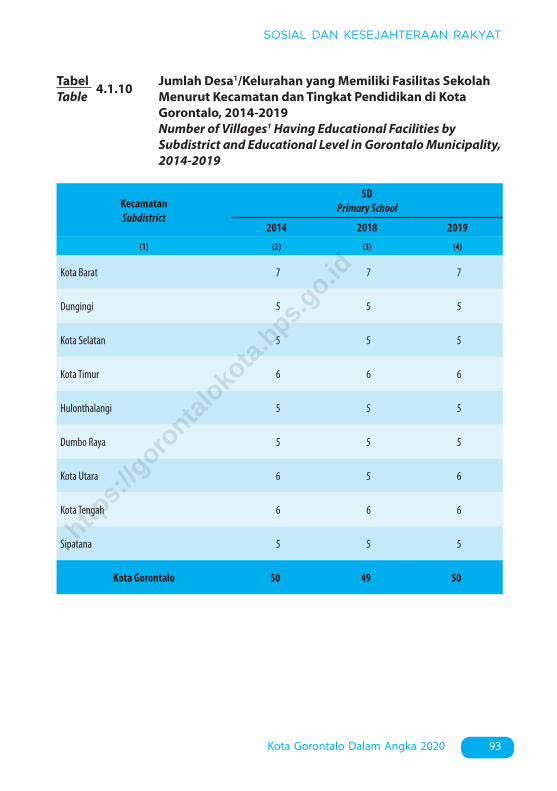
93Kota Gorontalo Dalam Angka 2020
SOSIAL DAN KESEJAHTERAAN RAKYAT
TabelTable 4.1.10 Jumlah Desa1/Kelurahan yang Memiliki Fasilitas Sekolah
Menurut Kecamatan dan Tingkat Pendidikan di Kota Gorontalo, 2014-2019
Number of Villages1 Having Educational Facilities by Subdistrict and Educational Level in Gorontalo Municipality, 2014-2019
KecamatanSubdistrict
SDPrimary School
2014 2018 2019
(1) (2) (3) (4)
Kota Barat 7 7 7
Dungingi 5 5 5
Kota Selatan 5 5 5
Kota Timur 6 6 6
Hulonthalangi 5 5 5
Dumbo Raya 5 5 5
Kota Utara 6 5 6
Kota Tengah 6 6 6
Sipatana 5 5 5
Kota Gorontalo 50 49 50
https:
//goro
ntalo
kota
.bps.g
o.id

94 Gorontalo Municipality in Figures 2020
SOCIAL AND WELFARE
KecamatanSubdistrict
SMPJunior High School
2014 2018 2019
(1) (5) (6) (7)
Kota Barat 3 4 4
Dungingi 2 2 2
Kota Selatan 4 5 4
Kota Timur 2 2 2
Hulonthalangi 3 3 3
Dumbo Raya 1 1 1
Kota Utara 3 2 3
Kota Tengah 2 2 2
Sipatana 3 2 2
Kota Gorontalo 23 23 23
Lanjutan Tabel/Continued Table 4.1.10
https:
//goro
ntalo
kota
.bps.g
o.id
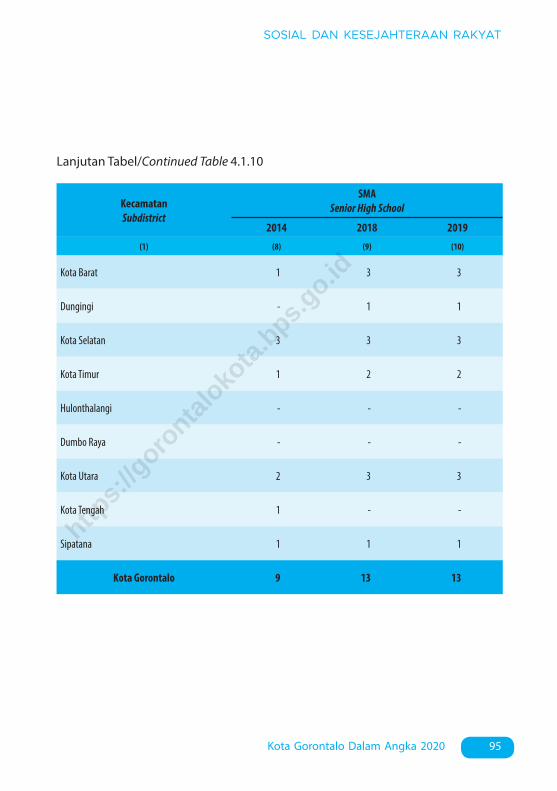
95Kota Gorontalo Dalam Angka 2020
SOSIAL DAN KESEJAHTERAAN RAKYAT
KecamatanSubdistrict
SMASenior High School
2014 2018 2019
(1) (8) (9) (10)
Kota Barat 1 3 3
Dungingi - 1 1
Kota Selatan 3 3 3
Kota Timur 1 2 2
Hulonthalangi - - -
Dumbo Raya - - -
Kota Utara 2 3 3
Kota Tengah 1 - -
Sipatana 1 1 1
Kota Gorontalo 9 13 13
Lanjutan Tabel/Continued Table 4.1.10
https:
//goro
ntalo
kota
.bps.g
o.id

96 Gorontalo Municipality in Figures 2020
SOCIAL AND WELFARE
KecamatanSubdistrict
SMKVocational School
2014 2018 2019
(1) (11) (12) (13)
Kota Barat 1 1 1
Dungingi 1 - 1
Kota Selatan 1 2 1
Kota Timur - - -
Hulonthalangi - - -
Dumbo Raya - - -
Kota Utara - - -
Kota Tengah 1 2 2
Sipatana 1 1 1
Kota Gorontalo 5 6 6
Lanjutan Tabel/Continued Table 4.1.10
https:
//goro
ntalo
kota
.bps.g
o.id

97Kota Gorontalo Dalam Angka 2020
SOSIAL DAN KESEJAHTERAAN RAKYAT
KecamatanSubdistrict
Perguruan TinggiUniversity
2014 2018 2019
(1) (14) (15) (16)
Kota Barat - - -
Dungingi - - -
Kota Selatan 1 1 1
Kota Timur 1 1 1
Hulonthalangi - - -
Dumbo Raya - - -
Kota Utara - - -
Kota Tengah 2 3 3
Sipatana 1 - 1
Kota Gorontalo 5 5 6
Lanjutan Tabel/Continued Table 4.1.10
Catatan/Note: 1 Desa pada tabel ini termasuk Unit Permukiman Transmigrasi (UPT) yang masih dibina oleh kementerian terkait dan nagari di Kabupaten/Kota Sumatera Barat/Villages in this table include Transmigration Settlement Unit which is still fostered by the relevant ministries and the nagari in the Province of Sumatera Barat
Sumber/Source: BPS, Pendataan Potensi Desa (Podes)/ BPS–Statistics Indonesia, Village Potential Data Collection
https:
//goro
ntalo
kota
.bps.g
o.id

98 Gorontalo Municipality in Figures 2020
SOCIAL AND WELFARE
TabelTable 4.1.11 Angka Partisipasi Murni (APM) dan Angka Partisipasi
Kasar (APK) Menurut Jenjang Pendidikan di Kota Gorontalo, 2018 dan 2019
Net Envirolment Rate and Gross Enrolment Rate by Educational Level in Gorontalo Municipality, 2018 and 2019
Jenjang PendidikanEducational Level
Angka Partisipasi Murni (APM)Net Participation Rates
Angka Partisipasi Kasar (APK)Gross Participation Rates
2018 2019* 2018 2019*
(1) (2) (3) (4) (5)
SD/MI Elementary School
99,68 99,66 113,15 110,82
SMP/MTs Junior High School
71,64 72,03 79,61 78,79
SMA/SMK/MA Senior High School
56,30 56,69 83,56 78,98
Perguruan Tinggi/ University
N.A. 42,93 N.A. 54,17
Catatan/Notes: *Angka Sementara / Preliminary figuresSumber/Source: Badan Pusat Statistik Kota Gorontalo, Survei Sosial Ekonomi Nasional 2019 / BPS – Statistics Agency of Gorontalo
Municipality, National Social Economic Survey 2019
https:
//goro
ntalo
kota
.bps.g
o.id

99Kota Gorontalo Dalam Angka 2020
SOSIAL DAN KESEJAHTERAAN RAKYAT
TabelTable 4.1.12 Persentase Penduduk Berumur 15 Tahun ke Atas yang
Melek Huruf Menurut Kelompok Umur di Kota Gorontalo, 2018 dan 2019
Percentage of Literate People Aged 15 Years and Over by Age Group in Gorontalo Municipality, 2018 and 2019
Kelompok UmurAge Group 2018 2019
(1) (2) (3)
15–19 N.A. N.A.
20–24 99,61 N.A.
25–29 N.A. N.A.
30–34 N.A. N.A.
35–39 N.A. N.A.
40–44 97,81 N.A.
45–49 N.A. N.A.
50+ 99,24 99,46
Jumlah/Total 99,56 99,87
15–24 99,78 N.A.
15–44 99,63 N.A.
15+ 99,56 99,87
45+ 99,41 99,60
Sumber/Source: BPS, Survei Sosial Ekonomi Nasional (Susenas)/BPS-Statistics Indonesia, National Socioeconomic Survey
https:
//goro
ntalo
kota
.bps.g
o.id

100 Gorontalo Municipality in Figures 2020
SOCIAL AND WELFARE
TabelTable 4.1.13 Persentase Penduduk Usia 7 – 24 Tahun Menurut Jenis
Kelamin, Kelompok Umur Sekolah, dan Partisipasi Sekolah di Kota Gorontalo, 2019
Percentage of Population Aged 7 – 24 Years by Sex, Age Group and School Participation in Gorontalo Municipality, 2019
Jenis Kelamin danKelompok Umur SekolahSex and School Age Group
Partisipasi SekolahSchool Participation
Tidak atau Belum Pernah Sekolah
Not or Never Attending School
Masih SekolahAttending School
Tidak Sekolah LagiNot Attending
School Anymore
(1) (2) (3) (4)
Laki-laki / Male
7 - 12 0,00 99,96 0,04
13 - 15 0,00 93,29 6,71
16 - 18 1,95 70,45 27,60
19 - 24 0,00 39,22 60,78
Perempuan / Female
7 - 12 0,00 99,99 0,01
13 - 15 0,00 100,00 0,00
16 - 18 0,00 86,33 13,67
19 - 24 0,00 49,57 50,43
Laki-laki + Perempuan /Male + Female
7 - 12 0,00 99,97 0,03
13 - 15 0,00 96,31 3,69
16 - 18 1,02 78,06 20,93
19 - 24 0,00 44,94 55,06
Sumber/Source: Badan Pusat Statistik Kota Gorontalo, Survei Sosial Ekonomi Nasional 2019 / BPS – Statistics Agency of Gorontalo Municipality, National Social Economic Survey 2019
https:
//goro
ntalo
kota
.bps.g
o.id

101Kota Gorontalo Dalam Angka 2020
SOSIAL DAN KESEJAHTERAAN RAKYAT
KecamatanSubdistrict
Rumah SakitHospital
2014 2018 2019
(1) (2) (3) (4)
Kota Barat 1 1 1
Dungingi - - -
Kota Selatan - - -
Kota Timur - 2 2
Hulonthalangi 1 1 1
Dumbo Raya - - -
Kota Utara 1 1 1
Kota Tengah 2 2 2
Sipatana - - -
Kota Gorontalo 5 7 7
TabelTable 4.2.1 Jumlah Kelurahan Yang Memiliki Sarana Kesehatan
Menurut Kecamatan di Kota Gorontalo, 2014–2019 Number of Urban Villages1 Having Health Facilities by Sub-
District in Gorontalo Municipality, 2014 – 2019
4.2 KESEHATAN HEALTH
https:
//goro
ntalo
kota
.bps.g
o.id
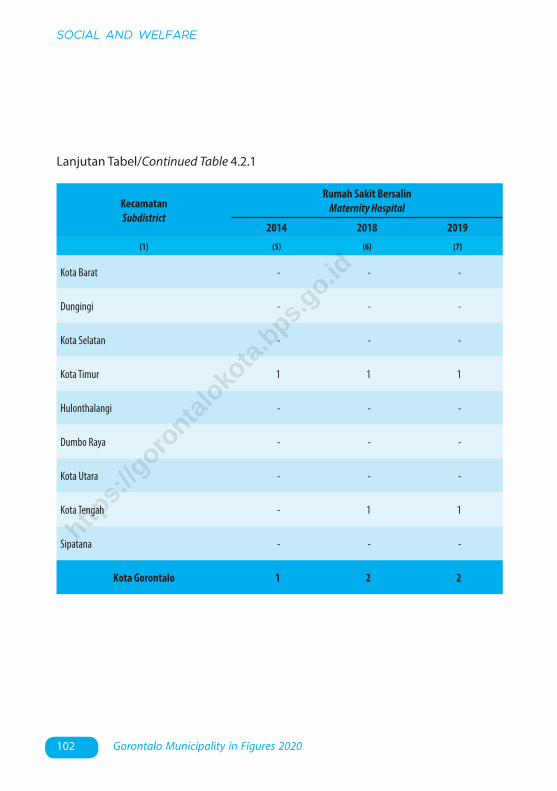
102 Gorontalo Municipality in Figures 2020
SOCIAL AND WELFARE
KecamatanSubdistrict
Rumah Sakit BersalinMaternity Hospital
2014 2018 2019
(1) (5) (6) (7)
Kota Barat - - -
Dungingi - - -
Kota Selatan - - -
Kota Timur 1 1 1
Hulonthalangi - - -
Dumbo Raya - - -
Kota Utara - - -
Kota Tengah - 1 1
Sipatana - - -
Kota Gorontalo 1 2 2
Lanjutan Tabel/Continued Table 4.2.1
https:
//goro
ntalo
kota
.bps.g
o.id

103Kota Gorontalo Dalam Angka 2020
SOSIAL DAN KESEJAHTERAAN RAKYAT
KecamatanSubdistrict
PoliklinikPolyclinic
2014 2018 2019
(1) (8) (9) (10)
Kota Barat - 1 -
Dungingi - 1 -
Kota Selatan 1 3 2
Kota Timur 1 5 4
Hulonthalangi - 2 2
Dumbo Raya 2 2 1
Kota Utara - 2 1
Kota Tengah - 3 2
Sipatana - 2 3
Kota Gorontalo 4 21 15
Lanjutan Tabel/Continued Table 4.2.1
https:
//goro
ntalo
kota
.bps.g
o.id

104 Gorontalo Municipality in Figures 2020
SOCIAL AND WELFARE
KecamatanSubdistrict
PuskesmasPublic Health Center
2014 2018 2019
(1) (11) (12) (13)
Kota Barat 2 2 2
Dungingi 1 1 1
Kota Selatan 1 1 1
Kota Timur 1 1 1
Hulonthalangi 1 1 1
Dumbo Raya 1 1 1
Kota Utara 1 1 1
Kota Tengah 1 1 1
Sipatana 1 1 1
Kota Gorontalo 10 10 10
Lanjutan Tabel/Continued Table 4.2.1
https:
//goro
ntalo
kota
.bps.g
o.id

105Kota Gorontalo Dalam Angka 2020
SOSIAL DAN KESEJAHTERAAN RAKYAT
KecamatanSubdistrict
Puskesmas PembantuSubsidiary of Public Health Center
2014 2018 2019
(1) (14) (15) (16)
Kota Barat 5 5 5
Dungingi 4 4 4
Kota Selatan 2 2 3
Kota Timur 1 1 1
Hulonthalangi 4 4 4
Dumbo Raya 5 5 4
Kota Utara 4 4 3
Kota Tengah 4 4 4
Sipatana 3 3 3
Kota Gorontalo 32 32 31
Lanjutan Tabel/Continued Table 4.2.1
https:
//goro
ntalo
kota
.bps.g
o.id

106 Gorontalo Municipality in Figures 2020
SOCIAL AND WELFARE
KecamatanSubdistrict
ApotekPharmacy
2014 2018 2019
(1) (17) (18) (19)
Kota Barat 2 4 2
Dungingi 3 4 4
Kota Selatan 4 4 4
Kota Timur 3 6 6
Hulonthalangi 1 1 1
Dumbo Raya 1 1 1
Kota Utara 2 2 3
Kota Tengah 4 5 6
Sipatana 2 4 3
Kota Gorontalo 22 31 30
Lanjutan Tabel/Continued Table 4.2.1
Sumber/Source: BPS, Pendataan Potensi Desa (Podes)/BPS-Statistics Indonesia, Village Potential Data Collecting
https:
//goro
ntalo
kota
.bps.g
o.id

107Kota Gorontalo Dalam Angka 2020
SOSIAL DAN KESEJAHTERAAN RAKYAT
KecamatanSubdistrict
DokterDoctor
PerawatNurse
BidanMidwife
FarmasiPharma-ceutical
Ahli GiziNutritionist
(1) (2) (3) (4) (5) (6)
Kota Barat 3 18 11 3 5
Dungingi 1 11 11 1 1
Kota Selatan 4 14 7 1 3
Kota Timur 4 11 8 2 5
Hulonthalangi 1 11 5 1 2
Dumbo Raya 1 7 10 - 2
Kota Utara 3 8 9 2 3
Kota Tengah 3 13 8 2 5
Sipatana 1 8 7 1 5
Kota Gorontalo 21 101 76 13 31
TabelTable 4.2.2 Jumlah Tenaga Kesehatan Menurut Kecamatan di Kota
Gorontalo, 2019 Number of Medical Personnel by Subdistrict in Gorontalo
Municipalty, 2019
Sumber/Source: Kementerian Kesehatan, http://sisdmk.bppsdmk.kemkes.go.idMinistry of Health, http://sisdmk.bppsdmk.kemkes.go.id
https:
//goro
ntalo
kota
.bps.g
o.id
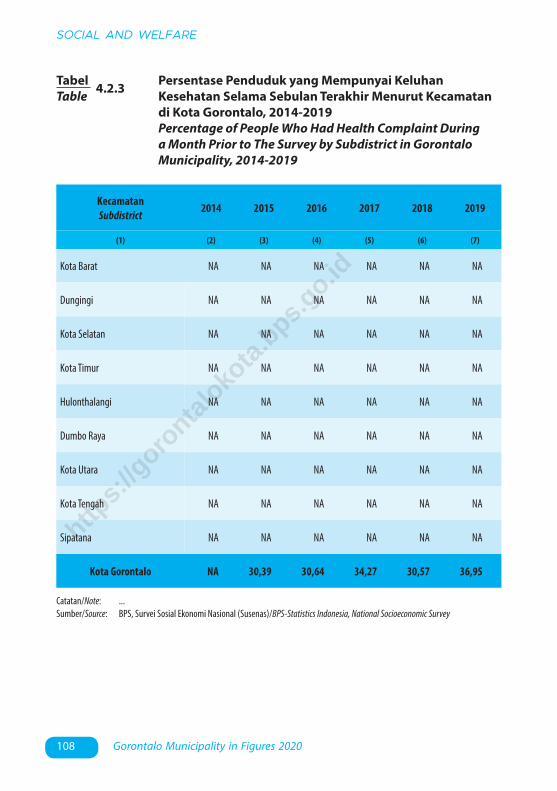
108 Gorontalo Municipality in Figures 2020
SOCIAL AND WELFARE
KecamatanSubdistrict 2014 2015 2016 2017 2018 2019
(1) (2) (3) (4) (5) (6) (7)
Kota Barat NA NA NA NA NA NA
Dungingi NA NA NA NA NA NA
Kota Selatan NA NA NA NA NA NA
Kota Timur NA NA NA NA NA NA
Hulonthalangi NA NA NA NA NA NA
Dumbo Raya NA NA NA NA NA NA
Kota Utara NA NA NA NA NA NA
Kota Tengah NA NA NA NA NA NA
Sipatana NA NA NA NA NA NA
Kota Gorontalo NA 30,39 30,64 34,27 30,57 36,95
TabelTable 4.2.3 Persentase Penduduk yang Mempunyai Keluhan
Kesehatan Selama Sebulan Terakhir Menurut Kecamatan di Kota Gorontalo, 2014-2019
Percentage of People Who Had Health Complaint During a Month Prior to The Survey by Subdistrict in Gorontalo Municipality, 2014-2019
Catatan/Note: ...Sumber/Source: BPS, Survei Sosial Ekonomi Nasional (Susenas)/BPS-Statistics Indonesia, National Socioeconomic Survey
https:
//goro
ntalo
kota
.bps.g
o.id

109Kota Gorontalo Dalam Angka 2020
SOSIAL DAN KESEJAHTERAAN RAKYAT
TabelTable 4.2.4 Jumlah Rumah Sakit Umum, Rumah Sakit Khusus, Rumah
Sakit/Rumah Bersalin, Puskesmas, Klinik/Balai Kesehatan, Posyandu, dan Polindes Menurut Kecamatan di Kota Gorontalo, 2018 dan 2019
Number of General Hospital, Special Hospital, Maternity Hospital and Public Health Center, Medical Clinic, Integrated Service Post, Village maternity Cottage by Subdistrict in Gorontalo Municipality, 2018 and 2019
KecamatanSubdistrict
Rumah Sakit UmumGeneral Hospital
Rumah Sakit KhususSpecial Hospital
2018 2019 2018 2019
(1) (2) (3) (4) (5)
Kota Barat 1 1 . . . . . .
Dungingi . . . . . . . . . . . .
Kota Selatan . . . . . . . . . . . .
Kota Timur 2 2 . . . . . .
Hulonthalangi . . . . . . . . . . . .
Dumbo Raya . . . . . . . . . . . .
Kota Utara 1 1 . . . . . .
Kota Tengah 2 2 . . . . . .
Sipatana . . . . . . . . . . . .
Kota Gorontalo 6 6 . . . . . .
https:
//goro
ntalo
kota
.bps.g
o.id

110 Gorontalo Municipality in Figures 2020
SOCIAL AND WELFARE
KecamatanSubdistrict
Rumah Sakit Bersalin/Rumah Bersalin
Maternity Hospital
PuskesmasPublic Health Center
2018 2019 2018 2019
(1) (6) (7) (8) (9)
Kota Barat . . . . . . 2 2
Dungingi . . . . . . 1 1
Kota Selatan . . . . . . 1 1
Kota Timur . . . . . . 1 1
Hulonthalangi . . . . . . 1 1
Dumbo Raya . . . . . . 1 1
Kota Utara . . . . . . 1 1
Kota Tengah . . . . . . 1 1
Sipatana . . . . . . 1 1
Kota Gorontalo . . . . . . 10 10
Lanjutan Tabel/Continued Table 4.2.4
https:
//goro
ntalo
kota
.bps.g
o.id

111Kota Gorontalo Dalam Angka 2020
SOSIAL DAN KESEJAHTERAAN RAKYAT
KecamatanSubdistrict
Klinik/Balai KesehatanMedical Clinic
PosyanduIntegrated Service
Post
PolindesVillage Maternity
Cottage
2018 2019 2018 2019 2018 2019
(1) (10) (11) (12) (13) (14) (15)
Kota Barat 1 - 19 19 3 3
Dungingi 1 1 10 10 - -
Kota Selatan 3 3 9 9 - -
Kota Timur 5 6 17 17 3 3
Hulonthalangi 2 2 11 11 1 1
Dumbo Raya 2 - 15 15 2 2
Kota Utara 2 1 18 18 3 3
Kota Tengah 3 3 16 16 3 3
Sipatana 2 1 13 13 4 4
Kota Gorontalo 21 17 128 128 19 19
Lanjutan Tabel/Continued Table 4.2.4
Catatan/Note: ...Sumber/Source: Kementerian Kesehatan Kota Gorontalo, Profil Kesehatan Indonesia/Ministry of Health of Gorontalo Municipality,
Health Profile of Indonesia
https:
//goro
ntalo
kota
.bps.g
o.id

112 Gorontalo Municipality in Figures 2020
SOCIAL AND WELFARE
TabelTable 4.2.5 Banyaknya Balita yang Pernah Mendapat Imunisasi
Menurut Kelurahan dan Jenis Imunisasi di Kota Gorontalo, 2019
Number of Children Under Five Years Ever Been Immunized by Urban Village and Type of Immunization in Gorontalo Municipality, 2019
KecamatanSubdistrict
Jenis ImunisasiType of Imunization
HB 0 BCGDPT
I II III
(1) (2) (3) (4) (5) (6)
Kota Barat 462 415 406 401 433
Dungingi 562 421 582 623 666
Kota Selatan 437 310 305 293 303
Kota Timur 499 429 439 415 448
Hulonthalangi 187 463 254 219 192
Dumbo Raya 287 346 304 318 292
Kota Utara 108 314 298 314 269
Kota Tengah 283 492 508 517 372
Sipatana 327 254 245 320 319
Kota Gorontalo 3 152 3 444 3 341 3 420 3 294
https:
//goro
ntalo
kota
.bps.g
o.id

113Kota Gorontalo Dalam Angka 2020
SOSIAL DAN KESEJAHTERAAN RAKYAT
KecamatanSubdistrict
Jenis ImunisasiType of Imunization
Polio
I II III IV
(1) (7) (8) (9) (10)
Kota Barat 418 408 410 416
Dungingi 415 582 622 665
Kota Selatan 311 284 297 307
Kota Timur 430 442 416 443
Hulonthalangi 299 296 269 253
Dumbo Raya 325 308 316 292
Kota Utara 329 295 313 269
Kota Tengah 499 506 515 501
Sipatana 254 254 317 316
Kota Gorontalo 3 280 3 375 3 475 3 462
Lanjutan Tabel/Continued Table 4.2.5
https:
//goro
ntalo
kota
.bps.g
o.id

114 Gorontalo Municipality in Figures 2020
SOCIAL AND WELFARE
KecamatanSubdistrict
Jenis ImunisasiType of Imunization
Hepatitis B CampakMeaslesI II III
(1) (11) (12) (13) (14)
Kota Barat 406 401 433 387
Dungingi 582 623 666 437
Kota Selatan 305 293 303 364
Kota Timur 439 415 448 480
Hulonthalangi 254 219 192 294
Dumbo Raya 304 318 292 316
Kota Utara 298 314 269 329
Kota Tengah 508 517 372 501
Sipatana 245 320 319 382
Kota Gorontalo 3 341 3 420 3 294 3 490
Lanjutan Tabel/Continued Table 4.2.5
Sumber/Source: Kementerian Kesehatan Kota Gorontalo / Ministry of Health of Gorontalo Municipality
https:
//goro
ntalo
kota
.bps.g
o.id

115Kota Gorontalo Dalam Angka 2020
SOSIAL DAN KESEJAHTERAAN RAKYAT
TabelTable 4.2.6 Jumlah Penderita 10 Penyakit Terbanyak di Kota
Gorontalo, 2019 Number of 10 Most Disease Cases in Gorontalo Municipality,
2019
Jenis PenyakitType of Diseases
Jumlah PenderitaNumber of Cases
(1) (2)
1. Demam / Common Cold 34 798
2. Hipertensi Esensial / Essential (Primary) Hypertension 8 960
3. Radang Sendi / Arthritis 7 089
4. Dermatitis Kontak / Contact Dermatitis 5 690
5. Radang Perut / Gastritis 5 184
6. Abses Kulit / Skin Abscesses 4 045
7. Influenza / Influenza 4 297
8. Maag / Dyspepsia 4 839
9. Diare / Dhiarrhea 4 223
10. Tonsilitas Akut / Pharyngitis 4 264
Sumber/Source: Kementerian Kesehatan Kota Gorontalo / Ministry of Health of Gorontalo Municipality
https:
//goro
ntalo
kota
.bps.g
o.id
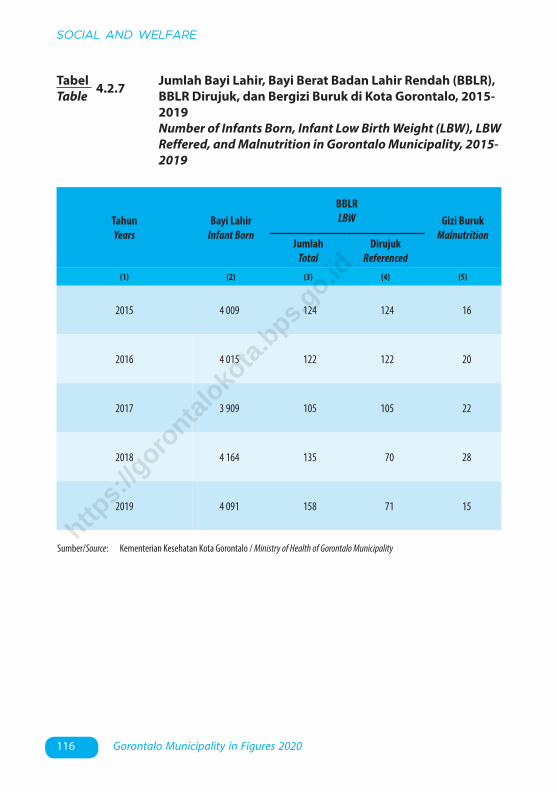
116 Gorontalo Municipality in Figures 2020
SOCIAL AND WELFARE
TabelTable 4.2.7 Jumlah Bayi Lahir, Bayi Berat Badan Lahir Rendah (BBLR),
BBLR Dirujuk, dan Bergizi Buruk di Kota Gorontalo, 2015-2019
Number of Infants Born, Infant Low Birth Weight (LBW), LBW Reffered, and Malnutrition in Gorontalo Municipality, 2015-2019
TahunYears
Bayi LahirInfant Born
BBLRLBW Gizi Buruk
MalnutritionJumlah
TotalDirujuk
Referenced
(1) (2) (3) (4) (5)
2015 4 009 124 124 16
2016 4 015 122 122 20
2017 3 909 105 105 22
2018 4 164 135 70 28
2019 4 091 158 71 15
Sumber/Source: Kementerian Kesehatan Kota Gorontalo / Ministry of Health of Gorontalo Municipalityhttp
s://g
oronta
loko
ta.b
ps.go.id

117Kota Gorontalo Dalam Angka 2020
SOSIAL DAN KESEJAHTERAAN RAKYAT
TahunYears
Jumlah Ibu Hamil
Number of Pregnant
Women
Melakukan Kunjungan K1
Do Visit K1
Melakukan Kunjungan K4
Do Visit K4
Kurang Energi Kronis (KEK)Less Energy
Chronic
Mendapat Zat Besi
Received Iron (Fe) Tablets
(1) (2) (3) (4) (5) (6)
2015 4 321 4 417 4 167 301 3 695
2016 4 365 4 433 4 225 346 3 849
2017 4 406 4 266 3 962 208 3 583
2018 4 442 4 425 4 097 380 3 613
2019 4 475 4 493 4 184 429 3 572
TabelTable 4.2.8 Jumlah Ibu Hamil, Melakukan Kunjungan K1, K4, Kurang
Energi Kronis (KEK) dan mendapat Tablet Zat Besi (Fe) di Kota Gorontalo, 2015-2019
Number of Pregnant Womwn, Do Visit K1, Do Visit K4, Less Energy Chronic and Received Iron Tablets in Gorontalo Municipality, 2015-2019
Sumber/Source: Kementerian Kesehatan Kota Gorontalo / Ministry of Health of Gorontalo Municipalityhttp
s://g
oronta
loko
ta.b
ps.go.id

118 Gorontalo Municipality in Figures 2020
SOCIAL AND WELFARE
KecamatanSubdistrict
Petugas KBFamily Planning
Officer
PPKBDVillage Family
Planning Service Units
Sub-PPKBDSub-Village Family
Planning Service Units
(1) (2) (3) (4)
Kota Barat 2 7 28
Dungingi 2 5 20
Kota Selatan 2 5 20
Kota Timur 2 6 24
Hulonthalangi 2 5 20
Dumbo Raya 2 5 20
Kota Utara 2 6 24
Kota Tengah 2 6 24
Sipatana 2 5 20
Kota Gorontalo 18 50 200
TabelTable 4.2.9 Jumlah Petugas Keluarga Berencana (KB) dan Pos
Pelayanan Keluarga Berencana Desa (PPKBD) Menurut Kelurahan di Kota Gorontalo, 2019
Number of Family Planning Officer and Village Family Planning Service Units by Urban village in Gorontalo Municipality, 2019
Sumber/Source: Badan Pemberdayaan Masyarakat, Perempuan, dan KB Kota Gorontalo / Community Empowerment, Women, Family Planning Agency of Gorontalo Municipality
https:
//goro
ntalo
kota
.bps.g
o.id

119Kota Gorontalo Dalam Angka 2020
SOSIAL DAN KESEJAHTERAAN RAKYAT
KecamatanSubdistrict
Jumlah PUSEligible Couples
Peserta KB AktifFamily Plannning Participants
IUDIUD
MOWMOW
MOPMOP
KondomCondom
(1) (2) (3) (4) (5) (6)
Kota Barat 4 280 436 200 104 2
Dungingi 4 093 305 136 39 29
Kota Selatan 2 374 500 155 15 13
Kota Timur 3 494 374 184 29 14
Hulonthalangi 2 240 345 111 14 0
Dumbo Raya 3 249 638 74 29 57
Kota Utara 3 015 394 172 7 5
Kota Tengah 3 307 360 171 12 10
Sipatana 2 723 292 109 5 3
Kota Gorontalo 28 030 3 644 1 312 254 133
TabelTable 4.2.10 Jumlah Pasangan Usia Subur dan Peserta KB Aktif
Menurut Kelurahan di Kota Gorontalo, 2019 Number of Eligible Couples and Family Planning
Participants by Urban village in Gorontalo Municipality, 2019
https:
//goro
ntalo
kota
.bps.g
o.id

120 Gorontalo Municipality in Figures 2020
SOCIAL AND WELFARE
KecamatanSubdistrict
Peserta KB AktifFamily Plannning Participants
ImplanImplants
SuntikanInjection
PilPill
JumlahTotal
(1) (3) (4) (5) (6)
Kota Barat 688 1 291 814 2 793
Dungingi 631 1 120 744 2 495
Kota Selatan 214 558 411 1 183
Kota Timur 344 928 769 2 041
Hulonthalangi 336 728 367 1 431
Dumbo Raya 1 006 640 273 1 919
Kota Utara 246 806 404 1 456
Kota Tengah 281 804 982 2 067
Sipatana 312 736 406 1 454
Kota Gorontalo 4 058 7 611 5 170 16 839
Sumber/Source: Badan Pemberdayaan Masyarakat, Perempuan, dan KB Kota Gorontalo / Community Empowerment, Women, Family Planning Agency of Gorontalo Municipality
Lanjutan Tabel/Continued Table 4.2.10
https:
//goro
ntalo
kota
.bps.g
o.id
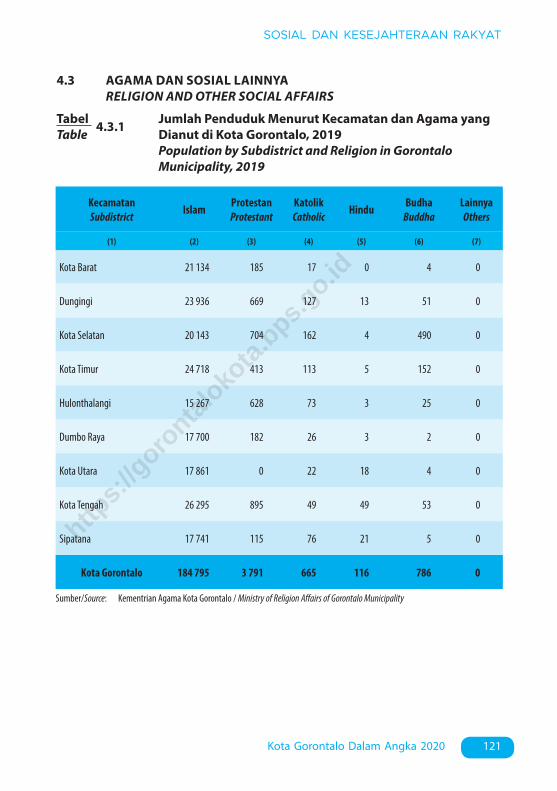
121Kota Gorontalo Dalam Angka 2020
SOSIAL DAN KESEJAHTERAAN RAKYAT
4.3 AGAMA DAN SOSIAL LAINNYA RELIGION AND OTHER SOCIAL AFFAIRS
Sumber/Source: Kementrian Agama Kota Gorontalo / Ministry of Religion Affairs of Gorontalo Municipality
KecamatanSubdistrict Islam Protestan
ProtestantKatolik Catholic Hindu Budha
BuddhaLainnya Others
(1) (2) (3) (4) (5) (6) (7)
Kota Barat 21 134 185 17 0 4 0
Dungingi 23 936 669 127 13 51 0
Kota Selatan 20 143 704 162 4 490 0
Kota Timur 24 718 413 113 5 152 0
Hulonthalangi 15 267 628 73 3 25 0
Dumbo Raya 17 700 182 26 3 2 0
Kota Utara 17 861 0 22 18 4 0
Kota Tengah 26 295 895 49 49 53 0
Sipatana 17 741 115 76 21 5 0
Kota Gorontalo 184 795 3 791 665 116 786 0
TabelTable 4.3.1 Jumlah Penduduk Menurut Kecamatan dan Agama yang
Dianut di Kota Gorontalo, 2019 Population by Subdistrict and Religion in Gorontalo
Municipality, 2019
https:
//goro
ntalo
kota
.bps.g
o.id

122 Gorontalo Municipality in Figures 2020
SOCIAL AND WELFARE
KecamatanSubdistrict
MasjidMosque
MusholaPray
Room
GerejaProtestanProtestant
Church
GerejaKatholikCatholicChurch
PuraTemple Vihara
(1) (2) (3) (4) (5) (6) (7)
Kota Barat 44 10 0 0 0 0
Dungingi 41 3 0 0 0 0
Kota Selatan 31 19 3 1 0 1
Kota Timur 38 4 0 0 0 0
Hulonthalangi 26 3 8 0 0 1
Dumbo Raya 21 5 0 0 0 0
Kota Utara 30 0 0 0 0 0
Kota Tengah 47 11 1 0 0 0
Sipatana 28 4 0 0 0 0
Kota Gorontalo 306 59 12 1 0 2
TabelTable 4.3.2 Jumlah Tempat Peribadatan Menurut Kecamatan di Kota
Gorontalo, 2019 Number of Places of Worship by Subdistrict and Religion in
Gorontalo Municipality, 2019
Sumber/Source: Kementrian Agama Kota Gorontalo / Ministry of Religion Affairs of Gorontalo Municipality
https:
//goro
ntalo
kota
.bps.g
o.id

123Kota Gorontalo Dalam Angka 2020
SOSIAL DAN KESEJAHTERAAN RAKYAT
KecamatanSubdistrict
Banjir/Flood
2014 2018 2019
(1) (2) (3) (4)
Kota Barat 7 4 0
Dungingi 5 1 0
Kota Selatan 5 3 1
Kota Timur 5 2 4
Hulonthalangi 3 3 1
Dumbo Raya 2 3 3
Kota Utara 3 0 0
Kota Tengah 0 0 0
Sipatana 1 1 0
Kota Gorontalo 31 17 9
TabelTable 4.3.3 Jumlah Kelurahan yang Mengalami Bencana Alam1
Menurut Kecamatan di Kota Gorontalo, 2014-2019 Number of Villages1 that Had Natural Disaster2 by
Subdistrict in Gorontalo Municipality, 2014-2019
https:
//goro
ntalo
kota
.bps.g
o.id

124 Gorontalo Municipality in Figures 2020
SOCIAL AND WELFARE
KecamatanSubdistrict
Gempa Bumi/Earthquake
2014 2018 2019
(1) (5) (6) (7)
Kota Barat 0 1 7
Dungingi 0 4 0
Kota Selatan 0 5 2
Kota Timur 0 5 1
Hulonthalangi 0 5 4
Dumbo Raya 0 4 2
Kota Utara 0 6 6
Kota Tengah 0 6 6
Sipatana 0 4 4
Kota Gorontalo 0 40 32
Lanjutan Tabel/Continued Table 4.3.3
https:
//goro
ntalo
kota
.bps.g
o.id

125Kota Gorontalo Dalam Angka 2020
SOSIAL DAN KESEJAHTERAAN RAKYAT
KecamatanSubdistrict
Tanah Longsor/Landslide
2014 2018 2019
(1) (8) (9) (10)
Kota Barat 3 2 1
Dungingi 0 0 0
Kota Selatan 0 0 0
Kota Timur 0 0 0
Hulonthalangi 2 2 1
Dumbo Raya 2 0 2
Kota Utara 0 0 0
Kota Tengah 0 0 0
Sipatana 0 0 0
Kota Gorontalo 7 4 4
Catatan/Note: 1 Terjadi dalam tiga tahun terakhir sampai dengan saat pencacahan/Occured during the last three years by the time of enumeration
Sumber/Source: BPS, Pendataan Potensi Desa (Podes)/BPS-Statistics Indonesia, Village Potential Data Collecting
Lanjutan Tabel/Continued Table 4.3.3
https:
//goro
ntalo
kota
.bps.g
o.id
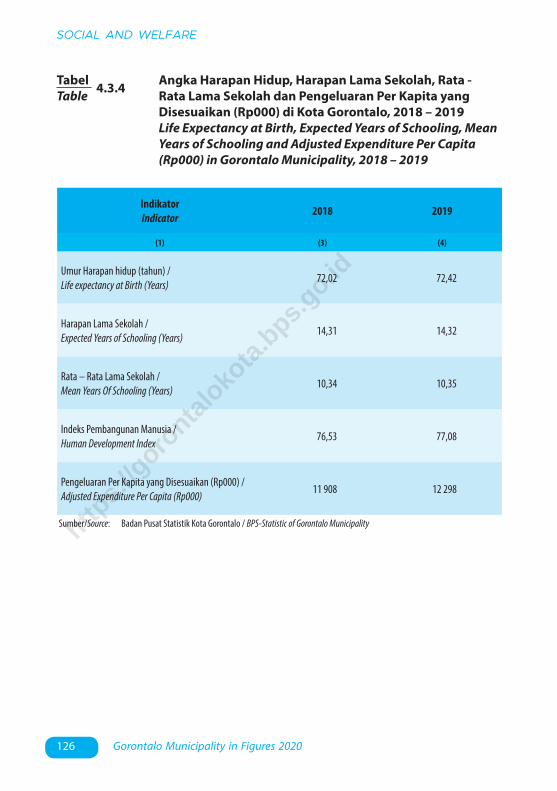
126 Gorontalo Municipality in Figures 2020
SOCIAL AND WELFARE
IndikatorIndicator 2018 2019
(1) (3) (4)
Umur Harapan hidup (tahun) /Life expectancy at Birth (Years)
72,02 72,42
Harapan Lama Sekolah /Expected Years of Schooling (Years)
14,31 14,32
Rata – Rata Lama Sekolah /Mean Years Of Schooling (Years)
10,34 10,35
Indeks Pembangunan Manusia / Human Development Index
76,53 77,08
Pengeluaran Per Kapita yang Disesuaikan (Rp000) /Adjusted Expenditure Per Capita (Rp000)
11 908 12 298
TabelTable 4.3.4 Angka Harapan Hidup, Harapan Lama Sekolah, Rata -
Rata Lama Sekolah dan Pengeluaran Per Kapita yang Disesuaikan (Rp000) di Kota Gorontalo, 2018 – 2019
Life Expectancy at Birth, Expected Years of Schooling, Mean Years of Schooling and Adjusted Expenditure Per Capita (Rp000) in Gorontalo Municipality, 2018 – 2019
Sumber/Source: Badan Pusat Statistik Kota Gorontalo / BPS-Statistic of Gorontalo Municipalityhttps:
//goro
ntalo
kota
.bps.g
o.id

127Kota Gorontalo Dalam Angka 2020
SOSIAL DAN KESEJAHTERAAN RAKYAT
4.4 KEMISKINAN POVERTY
TahunYears
Garis Kemiskinan (rupiah/kapita/bulan)Poverty Line (rupiahs/
capita/month)
Jumlah Penduduk Miskin (ribu)1
Number of Poor People (thousand)1
Persentase Penduduk Miskin (P0)
Percentage of Poor People (P0)
(1) (2) (3) (4)
2010 238 397 9,90 5,49
2011 264 550 11,04 5,97
2012 295 444 10,69 5,61
2013 332 241 11,67 5,99
2014 376 010 11,64 5,85
2015 404 620 12,18 6,05
2016 437 129 12,43 6,05
2017 452 758 12,02 5,70
2018 482 585 11,95 5,57
2019 520 095 11,91 5,45
TabelTable 4.4.1 Garis Kemiskinan, Jumlah dan Persentase Penduduk
Miskin (P0) Di Kota Gorontalo, 2010 - 2019 Poverty Line, Number and Percentage of Poor People (P0) in
Gorontalo Municipality, 2010 - 2019
Catatan/Note: 1 Data dari Hasil Proyeksi Penduduk Indonesia 2010-2035 (Pertengahan tahun/Juni) / Data from the result of Indonesia Population Projection 2010-2035 (mid year/June)
Sumber/Source: Badan Pusat Statistik Kota Gorontalo / BPS-Statistic of Gorontalo Municipality
https:
//goro
ntalo
kota
.bps.g
o.id

128 Gorontalo Municipality in Figures 2020
SOCIAL AND WELFARE
TahunYears
Indeks Kedalaman Kemiskinan (P1)Poverty Gap Index (P1)
Indeks Keparahan Kemiskinan (P2)Poverty Severity Index (P2)
(1) (2) (3)
2010 0,87 0,20
2011 0,98 0,26
2012 0,87 0,18
2013 0,56 0,08
2014 0,76 0,19
2015 0,72 0,15
2016 1,08 0,28
2017 0,60 0,14
2018 0,83 0,19
2019 0,68 0,13
TabelTable 4.4.2 Indeks Kedalaman Kemiskinan (P1) dan Indeks Keparahan
Kemiskinan (P2) di Kota Gorontalo, 2010- 2019 Poverty Gap Index (P1) and Poverty Severity Index (P2) in
Gorontalo Municipality, 2010 - 2019
Sumber/Source: Badan Pusat Statistik Kota Gorontalo / BPS-Statistic of Gorontalo Municipalityhttps:
//goro
ntalo
kota
.bps.g
o.id

129Kota Gorontalo Dalam Angka 2020
SOSIAL DAN KESEJAHTERAAN RAKYAT
4.5 KRIMINALITAS CRIMINALITY
Kepolisian Kepolisan SektorDistrict Police Office 2017 2018 2019
(1) (2) (3) (4)
Kepolisian Sektor Selatan /District Police Office of Selatan
93 71 70
Kepolisian Sektor Utara /District Police Office of Utara
107 104 50
Kepolisian Sektor Barat /District Police Office of Barat
80 63 54
Kepolisian Sektor Timur /District Police Office of Timur
104 89 66
Kepolisian Sektor Tengah /District Police Office of Tengah
149 128 102
Kepolisian Sektor Dungingi /District Police Office of Dungingi
51 66 80
Kepolisian Sektor KPG /District Police Office of Selatan
8 15 10
Polres Kota Gorontalo /Local Police of Gorontalo Municipality
546 642 509
TabelTable 4.5.1 Jumlah Tindak Pidana Menurut Kepolisian Sektor di Kota
Gorontalo, 2017 – 2019 Number of Reported Criminal Cases Worship by District in
Police Office in Gorontalo Municipality 2017 –2019
Sumber/Source: Kepolisian Resort Kota Gorontalo / Police Resort of Gorontalo Municipality
https:
//goro
ntalo
kota
.bps.g
o.id

130 Gorontalo Municipality in Figures 2020
SOCIAL AND WELFARE
Kepolisian Kepolisan SektorDistrict Police Office 2017 2018 2019
(1) (2) (3) (4)
Kepolisian Sektor Selatan /District Police Office of Selatan
252 41 30
Kepolisian Sektor Utara /District Police Office of Utara
223 36 23
Kepolisian Sektor Barat /District Police Office of Barat
64 45 25
Kepolisian Sektor Timur /District Police Office of Timur
200 39 22
Kepolisian Sektor Tengah /District Police Office of Tengah
410 50 40
Kepolisian Sektor Dungingi /District Police Office of Dungingi
105 17 17
Kepolisian Sektor KPG /District Police Office of Selatan
79 6 7
Polres Kota Gorontalo /Local Police of Gorontalo Municipality
514 730 797
TabelTable 4.5.2 Jumlah Penyelesaian Tindak Pidana Menurut Kepolisian
Sektor di Kota Gorontalo, 2017 - 2019 Total of Crime Clearence by District Police in Gorontalo
Municipality 2017 –2019
Sumber/Source: Kepolisian Resort Kota Gorontalo / Police Resort of Gorontalo Municipality
https:
//goro
ntalo
kota
.bps.g
o.id

131Kota Gorontalo Dalam Angka 2020
SOSIAL DAN KESEJAHTERAAN RAKYAT
Jenis Tindak PidanaType of Crime
LaporReported
SelesaiCompleted
(1) (2) (3)
Aniaya ringan dan biasa / Mild and ordinary Persecution 236 177
Pencurian / Theft 199 262
KDRT / Domestic Violence 34 23
Penggelapan / Emblezzement 72 73
Aniaya anak / Child Abuse 53 19
Penipuan / Fraud 60 72
Asusila / Immoral 8 3
Pencurian sepeda motor / Motorcycle Theft 80 149
Pencemaran nama baik / Defamation 16 22
Pengeroyokan / Beating 29 33
Pengrusakan / Destruction 14 14
Pengancaman / Threatening 20 23
Pencabulan anak / Child Molestation 28 13
Jaminan Fidusia / Fiduciary Guarantee 11 4
Senjata Tajam / Sharp Weapon 13 9
TabelTable 4.5.3 Jumlah 15 Terbesar Tindak Pidana di Kota Gorontalo,
2019 Total of 15 Biggest Crime Cases in Gorontalo Municipality,
2019
Sumber/Source: Kepolisian Resort Kota Gorontalo / Police Resort of Gorontalo Municipality
https:
//goro
ntalo
kota
.bps.g
o.id

https:
//goro
ntalo
kota
.bps.g
o.id

133Kota Gorontalo Dalam Angka 2020
PERTANIAN, KEHUTANAN, PETERNAKAN, DAN PERIKANAN
5. Pertanian, Kehutanan, Peternakan, dan Perikanan/Agriculture, Forestry, Livestock, and Fishery ..............................................................................
PERTANIAN, KEHUTANAN, PETERNAKAN, DAN PERIKANAN
AGRICULTURE, FORESTRY, LIVESTOCK,AND FISHERY
05
https:
//goro
ntalo
kota
.bps.g
o.id

https:
//goro
ntalo
kota
.bps.g
o.id

135Kota Gorontalo Dalam Angka 2020
PERTANIAN, KEHUTANAN, PETERNAKAN, DAN PERIKANAN
PENJELASAN TEKNIS TECHNICAL NOTES
1. Lahan sawah adalah lahan pertanian yang berpetak-petak dan dibatasi oleh pematang (galengan), saluran untuk menahan/ menyalurkan air, yang biasanya ditanami padi sawah tanpa memandang dari mana diperoleh atau status lahan tersebut. Lahan yang dimaksud termasuk lahan yang terdaftar di Pajak Bumi Bangunan, Iuran Pembangunan Daerah, lahan bengkok, lahan serobotan, lahan rawa yang ditanami padi dan lahan bekas tanaman tahunan yang telah dijadikan sawah, baik yang ditanami padi, palawija atau tanaman semusim lainnya.
2. Tegal/Kebun adalah lahan pertanian bukan sawah (lahan kering) yang ditanami tanaman semusim atau tahunan dan terpisah dengan halaman sekitar rumah serta penggunaannya tidak berpindah pindah.
3. Ladang/Huma adalah lahan pertanian bukan sawah (lahan kering) yang biasanya ditanami tanaman semusim dan penggunaannya hanya semusim atau dua musim, kemudian akan ditinggalkan bila sudah tidak subur lagi (berpindah pindah). Kemungkinan lahan ini beberapa tahun kemudian akan dikerjakan kembali jika sudah subur.
4. Lahan yang sementara tidak diusahakan adalah lahan yang
1. Wetland is agricultural land that separated by small dykes to resist water,where the main crop is usually wetland paddy without considering where it is got from or the status of the land. It includes the land that is registered at land income tax office, regional development contribution, 'bengkok' land, illegal ownership, swamps for rice cultivation, and annual crop land mark that has been used as rice field, which are both planted with paddy, secondary crops or the other seasonal crops.
2. Dry field/Garden is an dryland (unirrigated land) which is planted with seasonal or annual crops and separately from the yard around the house without shifting.
3. Unirrigated agricultural field /Shifting cultivation land is dryland (unirrigated land) that usually is cultivated for seasonal crops and utilized only for one or two seasons, then it will be left when it is not fertile (shifting). Maybe, this land will be used again in a few years if it has been fertile.
4. Temporarily unused land is land that is regularly used but
https:
//goro
ntalo
kota
.bps.g
o.id

136 Gorontalo Municipality in Figures 2020
AGRICULTURE, FORESTRY, LIVESTOCK, AND FISHERY
biasanya diusahakan tetapi untuk sementara (lebih dari 1 (satu) tahun tetapi kurang dari atau sama dengan 2 (dua) tahun tidak diusahakan, termasuk lahan sawah yang tidak diusahakan selama lebih dari 2 (dua) tahun.
5. Data pokok tanaman pangan yang dikumpulkan adalah luas panen dan produktivitas (hasil per hektar). Produksi tanaman pangan merupakan hasil perkalian antara luas panen dengan produktivitas. Pengumpulan data luas panen dilakukan setiap bulan dengan pendekatan area kecamatan di seluruh wilayah Indonesia. Pengumpulan data produktivitas dilakukan melalui pengukuran langsung pada plot ubinan berukuran 2½ m x 2½ m. Pengumpulan data produktivitas dilakukan setiap subround (empat bulanan) pada waktu panen petani.
6. Data produksi padi dan palawija yang disajikan adalah dalam kualitas: gabah kering giling (padi), pipilan kering (jagung), biji kering (kedelai dan kacang tanah), dan umbi basah (ubi kayu dan ubi jalar).
7. Tanaman sayuran dan buah-buahan semusim a. Tanaman sayuran semusim adalah tanaman sumber vitamin, garam mineral dan lain-lain yang dikonsumsi dari bagian tanaman yang berupa daun, bunga, buah, dan umbinya, yang berumur
temporarily (more than a year but less or equal than twoyears) is unused, it includes wetland that is not cultivated more than two years.
5. The main food crops data collected consists of harvested area and productivity (yield per hectaree). Food crops production is generated by harvested area multiplied by productivity. The harvested area data is collected every month using sub district area approach in all sub district in Indonesia. The productivity data collection is conducted by a direct measurement in 2½m x 2½m crop cutting plot. The productivity measurement is conducted in every subround (four monthly) at the time when farmers are harvesting their crops.
6. Production of paddy and secondary crops data are presented in the form of: dry unhusked rice (paddy), dry loose maize (maize), dry shells crops (soybeans and peanuts), and fresh roots (cassava and sweet potatoes).
7. Seasonal vegetable and fruit plants a. Seasonal vegetable plants are plants which are the sources of vitamin, mineral salt, etc, consumed from the part of the plant in the form of leaf, flower, fruit, and root with the age of less than one year.
https:
//goro
ntalo
kota
.bps.g
o.id
137Kota Gorontalo Dalam Angka 2020
PERTANIAN, KEHUTANAN, PETERNAKAN, DAN PERIKANAN
kurang dari satu tahun. b. Tanaman buah-buahan semusim adalah tanaman sumber vitamin, garam mineral, dan lain-lain yang dikonsumsi dari bagian tanaman yang berupa buah, berumur kurang dari satu tahun, tidak berbentuk pohon/rumpun tetapi menjalar dan berbatang lunak.
8. Tanaman buah-buahan dan sayuran tahunan a. Tanaman buah-buahan tahunan adalah tanaman sumber vitamin, garam mineral, dan lain-lain yang dikonsumsi dari bagian tanaman yang berupa buah dan merupakan tanaman tahunan. b. Tanaman sayuran tahunan adalah tanaman sumber vitamin, garam mineral, dan lain-lain yang dikonsumsi dari bagian tanaman yang berupa daun dan atau buah yang berumur lebih dari satu tahun.
9. Tanaman biofarmaka adalah tanaman yang bermanfaat untuk obat-obatan, kosmetik, dan kesehatan yang dikonsumsi atau digunakan dari bagian-bagian tanaman seperti daun, batang, buah, umbi (rimpang) ataupun akar.
10. Tanaman hias adalah tanaman yang mempunyai nilai keindahan baik bentuk, warna daun, tajuk maupun bunganya, sering digunakan untuk penghias pekarangan dan lain sebagainya.
11. Luas panen tanaman
b. Seasonal fruit plants are plants which are the sources of vitamin, mineral salt, etc, consumed from the part of the plant in the form of fruits. These plants are creeps with the age of less than one year.
8. Annual fruit and vegetable plants a. Annual fruit plants are plants which are the sources of vitamin, contained mineral salt, etc, consumed from the part of plant in the form of fruit and more than one year of age. b. Annual vegetable plants are plants which are the sources of vitamin, contained mineral salt, etc, consumed from the part of the plant in the form of vegetable and more than one year of age.
9. Medicinal plants are plants which are useful for medicine. It is consumed from part of the plant such as leaf, flower, fruit, tubber, and root.
10. Ornamental plants are plants which have a beauty value, either in shape, colour of leaf or crown of flower, and they are often used as a yard decorator.
11. Harvested area of horticulture
https:
//goro
ntalo
kota
.bps.g
o.id

138 Gorontalo Municipality in Figures 2020
AGRICULTURE, FORESTRY, LIVESTOCK, AND FISHERY
hortikultura adalah luas tanaman sayuran, buah-buahan, biofarmaka, dan tanaman hias yang diambil hasilnya/dipanen pada periode pelaporan.
12. Luas panen untuk tanaman sayuran adalah luas tanaman yang dipanen sekaligus/habis/dibongkar dan luas tanaman yang dipanen berkali-kali (lebih dari satu kali)/belum habis.
13. Tanaman yang dipanen sekaligus/ habis/ dibongkar adalah tanaman yang sehabis panen langsung dibongkar/dicabut, terdiri dari bawang merah, bawang putih, bawang daun, kentang, kol/kubis, kembang kol, petsai/sawi, wortel, lobak, dan kacang merah.
14. Tanaman yang dipanen berkali-kali (lebih dari satu kali)/belum habis adalah tanaman yang pemanenannya lebih dari satu kali dan biasanya dibongkar apabila panenan terakhir sudah tidak memadai lagi, terdiri dari: kacang panjang, cabe besar, cabe rawit, jamur, tomat, terung, buncis, ketimun, labu siam, kangkung, bayam, melon, semangka, dan blewah.
15. Produksi hortikultura adalah hasil menurut bentuk produk dari setiap tanaman sayuran, buah-buahan, biofarmaka dan tanaman hias yang diambil berdasarkan luas yang dipanen/tanaman yang menghasilkan pada bulan/triwulan laporan.
is area which vegetable, fruit, medicinal and ornamental plant of crop harvested during the period of report.
12. Harvested area of vegetables is area of entirely plant harvested/demolished and plant harvested several times/undemolished.
13. Entirely plants harvested/ demolished are plants usually harvested once and demolished to be substituted by other plants, consisting of: shallots, garlic, leeks, potato, cabbage, cauli flower, mustard green, carrots, chinese radish, and red kidney beans.
14. Plants harvested several times/ undemolished are plants usually harvested more than once and demolished in the case that the last harvest was economically not profitable. They consist of : yard long beans, chili, small chili, mushroom, tomatoes, egg plant, frech beans, cucumber, pumpkin/chajota, swamp cabbage, spinach, melon, watermelon, and blewah.
15. Horticulture production is the standard production quantity form of vegetable, fruit, medicinal and ornamental plant based on harvested area/the number of production plants reported monthly/quarterly.
https:
//goro
ntalo
kota
.bps.g
o.id

139Kota Gorontalo Dalam Angka 2020
PERTANIAN, KEHUTANAN, PETERNAKAN, DAN PERIKANAN
5.1 Produksi Tanaman Buah–buahan (ton) Menurut Jenis Tanaman di Kota Gorontalo, 2019
Production of Fruits (ton) by Kind of Plants in Gorontalo Municipality, 2019
GambarFigures
Sumber/Source : Dinas Kelautan, Perikanan, Pertanian, dan Ketahanan Pangan Kota Gorontalo / Marine, Fisheries, Agriculture, and Food Security Service of Gorontalo Municipality
0 20 40 60 80 100 120 140 160 180
Lainnya / Others
Nangka / Jack Fruit
Pisang / Banana
Mangga / Mango
46,5
56,7
113,8
167,5
Produksi (ton) / Production
https:
//goro
ntalo
kota
.bps.g
o.id

140 Gorontalo Municipality in Figures 2020
AGRICULTURE, FORESTRY, LIVESTOCK, AND FISHERY
0 2000 4000 6000 8000 10000 12000 14000 16000 18000
Perikanan Umum
Perikanan Laut
335
17960
Ton / Ton
5.2 Produksi Perikanan Tangkap (ton) di Kota Gorontalo, 2019
Production of Fish Capture (ton) in Gorontalo Municipality, 2019
GambarFigures
Sumber/Source : Dinas Kelautan, Perikanan, Pertanian, dan Ketahanan Pangan Kota Gorontalo / Marine, Fisheries, Agriculture, and Food Security Service of Gorontalo Municipality
https:
//goro
ntalo
kota
.bps.g
o.id

141Kota Gorontalo Dalam Angka 2020
PERTANIAN, KEHUTANAN, PETERNAKAN, DAN PERIKANAN
TabelTable 5.1.1 Luas Panen Tanaman Sayuran Menurut Kecamatan dan
Jenis Tanaman (ha) di Kota Gorontalo, 2018 dan 2019 Harvested Area of Vegetables by Subdistrict and Kind of
Plant (ha) in Gorontalo Municipality, 2018 and 2019
5.1 HORTIKULTURA HORTICULTURE
KecamatanSubdistrict
Bawang Merah/Shallot Cabai/Chili
2018 2019 2018 2019
(1) (2) (3) (4) (5)
Kota Barat 1,00 - 5,00 -
Dungingi - - 8,00 8,00
Kota Selatan - - - -
Kota Timur - - 3,00 2,00
Hulonthalangi - - - -
Dumbo Raya - - 1,00 -
Kota Utara - - 2,00 1,00
Kota Tengah - - - -
Sipatana - - 5,00 2,00
Kota Gorontalo 1,00 - 24,00 13,00
https:
//goro
ntalo
kota
.bps.g
o.id
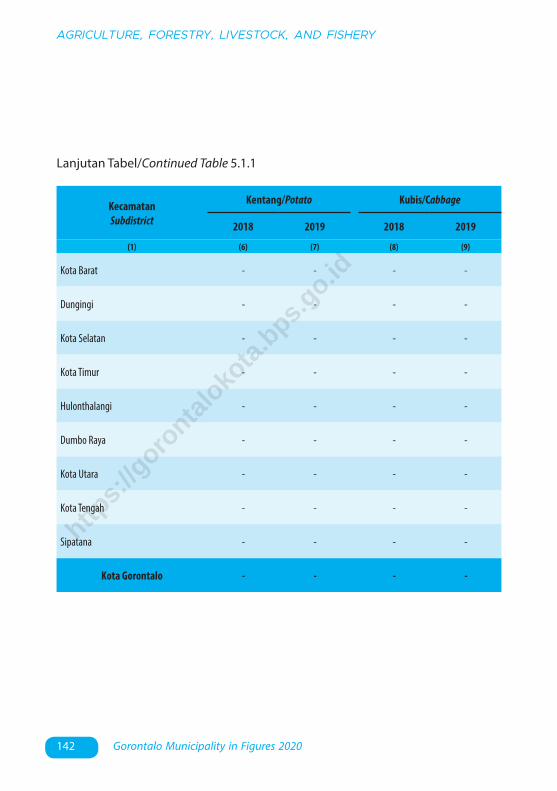
142 Gorontalo Municipality in Figures 2020
AGRICULTURE, FORESTRY, LIVESTOCK, AND FISHERY
KecamatanSubdistrict
Kentang/Potato Kubis/Cabbage
2018 2019 2018 2019
(1) (6) (7) (8) (9)
Kota Barat - - - -
Dungingi - - - -
Kota Selatan - - - -
Kota Timur - - - -
Hulonthalangi - - - -
Dumbo Raya - - - -
Kota Utara - - - -
Kota Tengah - - - -
Sipatana - - - -
Kota Gorontalo - - - -
Lanjutan Tabel/Continued Table 5.1.1
https:
//goro
ntalo
kota
.bps.g
o.id

143Kota Gorontalo Dalam Angka 2020
PERTANIAN, KEHUTANAN, PETERNAKAN, DAN PERIKANAN
Catatan/Note: ...Sumber/Source: BPS, Statistik Pertanian Hortikultura SPH-SBS/BPS-Statistics Indonesia, Agricultural Statistic for Horticulture SPH-SBS
KecamatanSubdistrict
PetsaiChinese Cabbage Tomat/Tomato Bawang Putih
Garlic
2018 2019 2018 2019 2018 2019
(1) (10) (11) (12) (13) (14) (15)
Kota Barat - - - - - -
Dungingi - - - - - -
Kota Selatan - - - - - -
Kota Timur - - - - - -
Hulonthalangi - - - - - -
Dumbo Raya - - - - - -
Kota Utara - - 3,00 2,00 - -
Kota Tengah - - - - - -
Sipatana - - 3,00 1,00 - -
Kota Gorontalo - - 6,00 3,00 - -
Lanjutan Tabel/Continued Table 5.1.1
https:
//goro
ntalo
kota
.bps.g
o.id

144 Gorontalo Municipality in Figures 2020
AGRICULTURE, FORESTRY, LIVESTOCK, AND FISHERY
TabelTable
KecamatanSubdistrict
Bawang Merah/Shallot Cabai/Chili
2018 2019 2018 2019
(1) (2) (3) (4) (5)
Kota Barat 1,20 - 13,00 -
Dungingi - - 29,00 31,10
Kota Selatan - - - -
Kota Timur - - 7,00 15,00
Hulonthalangi - - - -
Dumbo Raya - - 2,70 -
Kota Utara - - 6,00 4,30
Kota Tengah - - - -
Sipatana - - 14,00 4,70
Kota Gorontalo 1,20 - 71,70 55,10
5.1.2 Produksi Tanaman Sayuran Menurut Kecamatan dan Jenis Tanaman (ton) di Kota Gorontalo, 2018 dan 2019
Production of Vegetables by Subdistrict and Kind of Plant (ton) in Gorontalo Municipality, 2018 and 2019
https:
//goro
ntalo
kota
.bps.g
o.id
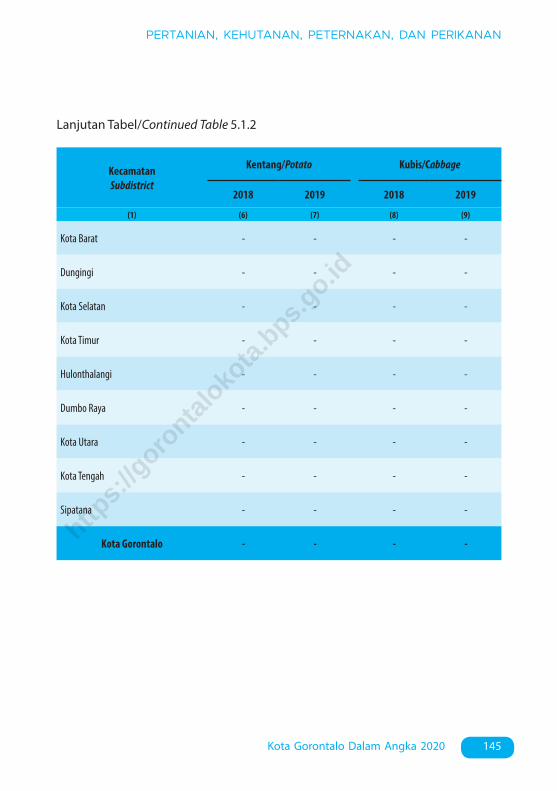
145Kota Gorontalo Dalam Angka 2020
PERTANIAN, KEHUTANAN, PETERNAKAN, DAN PERIKANAN
KecamatanSubdistrict
Kentang/Potato Kubis/Cabbage
2018 2019 2018 2019
(1) (6) (7) (8) (9)
Kota Barat - - - -
Dungingi - - - -
Kota Selatan - - - -
Kota Timur - - - -
Hulonthalangi - - - -
Dumbo Raya - - - -
Kota Utara - - - -
Kota Tengah - - - -
Sipatana - - - -
Kota Gorontalo - - - -
Lanjutan Tabel/Continued Table 5.1.2
https:
//goro
ntalo
kota
.bps.g
o.id

146 Gorontalo Municipality in Figures 2020
AGRICULTURE, FORESTRY, LIVESTOCK, AND FISHERY
Catatan/Note: ...Sumber/Source: BPS, Statistik Pertanian Hortikultura SPH-SBS/BPS-Statistics Indonesia, Agricultural Statistic for Horticulture SPH-SBS
KecamatanSubdistrict
PetsaiChinese Cabbage Tomat/Tomato Bawang Putih
Garlic
2018 2019 2018 2019 2018 2019
(1) (10) (11) (12) (13) (14) (15)
Kota Barat - - - - - -
Dungingi - - - - - -
Kota Selatan - - - - - -
Kota Timur - - - - - -
Hulonthalangi - - - - - -
Dumbo Raya - - - - - -
Kota Utara - - 5,80 10,50 - -
Kota Tengah - - - - - -
Sipatana - - 10,00 4,70 - -
Kota Gorontalo - - 15,80 15,20 - -
Lanjutan Tabel/Continued Table 5.1.2
https:
//goro
ntalo
kota
.bps.g
o.id

147Kota Gorontalo Dalam Angka 2020
PERTANIAN, KEHUTANAN, PETERNAKAN, DAN PERIKANAN
Jenis TanamanKind of Plants 2016 2017 2018 2019
(1) (2) (3) (4) (5)
Bawang Merah / Shallot … … 1,00 . . .
Bawang Putih / Onion … … … …
Cabai Rawit / Chilli 3,00 12,00 24,00 13,00
Cabai Merah / Red Pepper … … … …
Kentang / Potato … … … …
Kubis / Cabbage … … … …
Petsai / Chinese Cabbage … … … …
Tomat / Tomato 7,00 10,00 6,00 3,00
Wortel / Carrot … … … …
Kangkung / Water Spinach … … … …
Bayam / Spinach … … … …
Lainnya / Others … … … …
TabelTable 5.1.3 Luas Panen Tanaman Sayuran dan Buah–buahan Semusim
Menurut Jenis Tanaman (ha) di Kota Gorontalo, 2016-2019
Harvested Area of Seasonal Vegetables and Fruits by Kind of Plant (ha) in Gorontalo Municipality, 2016-2019
Catatan/Note: ...Sumber/Source: BPS, Statistik Pertanian Hortikultura SPH-SBS/BPS-Statistics Indonesia, Agricultural Statistic for Horticulture SPH-SBShttp
s://g
oronta
loko
ta.b
ps.go.id

148 Gorontalo Municipality in Figures 2020
AGRICULTURE, FORESTRY, LIVESTOCK, AND FISHERY
Jenis TanamanKind of Plants 2016 2017 2018 2019
(1) (2) (3) (4) (5)
Bawang Merah / Shallot … … 12,00 …
Bawang Putih / Onion … … … …
Cabai Rawit / Chilli 17,30 43,10 71,70 55,10
Cabai Merah / Red Pepper … … … …
Kentang / Potato … … … …
Kubis / Cabbage … … … …
Petsai / Chinese Cabbage … … … …
Tomat / Tomato 19,30 24,70 15,80 15,20
Wortel / Carrot … … … …
Kangkung / Water Spinach … … … …
Bayam / Spinach … … … …
Lainnya / Others … … … …
TabelTable 5.1.4 Produksi Tanaman Sayuran dan Buah–buahan Semusim
Menurut Jenis Tanaman (ton) di Kota Gorontalo, 2016-2019
Production of Seasonal Vegetables and Fruits by Kind of Plant (ha) in Gorontalo Municipality, 2016-2019
Catatan/Note: ...Sumber/Source: BPS, Statistik Pertanian Hortikultura SPH-SBS/BPS-Statistics Indonesia, Agricultural Statistic for Horticulture SPH-SBShttp
s://g
oronta
loko
ta.b
ps.go.id
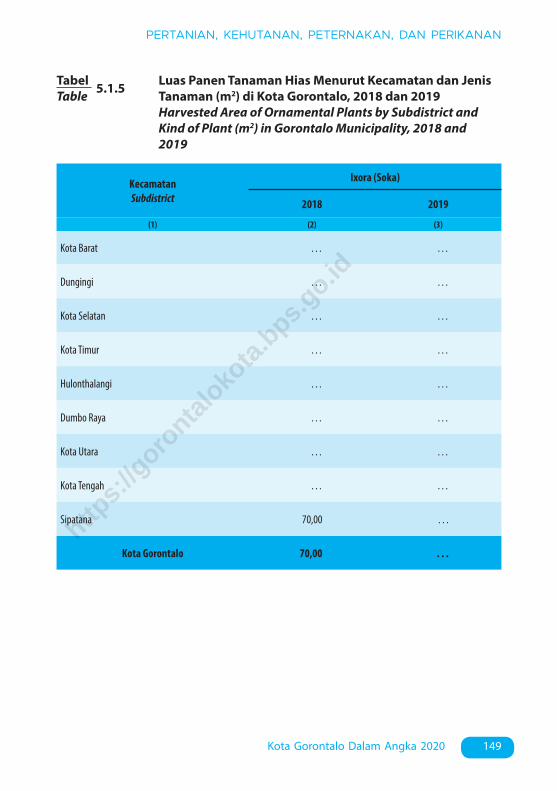
149Kota Gorontalo Dalam Angka 2020
PERTANIAN, KEHUTANAN, PETERNAKAN, DAN PERIKANAN
TabelTable 5.1.5 Luas Panen Tanaman Hias Menurut Kecamatan dan Jenis
Tanaman (m2) di Kota Gorontalo, 2018 dan 2019 Harvested Area of Ornamental Plants by Subdistrict and
Kind of Plant (m2) in Gorontalo Municipality, 2018 and 2019
KecamatanSubdistrict
Ixora (Soka)
2018 2019
(1) (2) (3)
Kota Barat … …
Dungingi … …
Kota Selatan … …
Kota Timur … …
Hulonthalangi … …
Dumbo Raya … …
Kota Utara … …
Kota Tengah … …
Sipatana 70,00 . . .
Kota Gorontalo 70,00 . . .http
s://g
oronta
loko
ta.b
ps.go.id

150 Gorontalo Municipality in Figures 2020
AGRICULTURE, FORESTRY, LIVESTOCK, AND FISHERY
KecamatanSubdistrict
Palem / Palm Sanseviera (Pedang-pedangan) / Tuberose
2018 2019 2018 2019
(1) (6) (7) (8) (9)
Kota Barat . . . . . . … …
Dungingi 650,00 360,00 … …
Kota Selatan 50,00 . . . … …
Kota Timur 25,00 . . . … …
Hulonthalangi 45,00 25,00 … …
Dumbo Raya . . . . . . … …
Kota Utara . . . . . . … …
Kota Tengah 20,00 . . . … …
Sipatana 355,00 . . . 35,00 …
Kota Gorontalo 1 145,00 385,00 35,00 …
Lanjutan Tabel/Continued Table 5.1.5
Catatan/Note: ...Sumber/Source: BPS, Statistik Pertanian Hortikultura SPH-TH/BPS-Statistics Indonesia, Agricultural Statistik for Horticulture SPH-TH
https:
//goro
ntalo
kota
.bps.g
o.id

151Kota Gorontalo Dalam Angka 2020
PERTANIAN, KEHUTANAN, PETERNAKAN, DAN PERIKANAN
TabelTable 5.1.6 Produksi Tanaman Hias Menurut Kecamatan dan Jenis
Tanaman (tangkai) di Kota Gorontalo, 2018 dan 2019 Production of Ornamental Plants by Subdistrict and Kind of
Plant (stalks) in Gorontalo Municipality, 2018 and 2019
KecamatanSubdistrict
Ixora (Soka)
2018 2019
(1) (2) (3)
Kota Barat … …
Dungingi … …
Kota Selatan … …
Kota Timur … …
Hulonthalangi … …
Dumbo Raya … …
Kota Utara … …
Kota Tengah … …
Sipatana 70,00 . . .
Kota Gorontalo 70,00 . . .https:
//goro
ntalo
kota
.bps.g
o.id
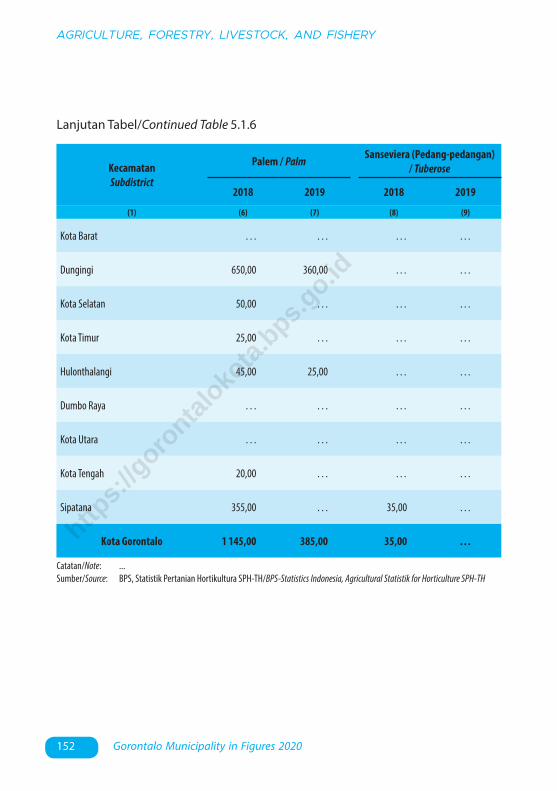
152 Gorontalo Municipality in Figures 2020
AGRICULTURE, FORESTRY, LIVESTOCK, AND FISHERY
Lanjutan Tabel/Continued Table 5.1.6
Catatan/Note: ...Sumber/Source: BPS, Statistik Pertanian Hortikultura SPH-TH/BPS-Statistics Indonesia, Agricultural Statistik for Horticulture SPH-TH
KecamatanSubdistrict
Palem / Palm Sanseviera (Pedang-pedangan) / Tuberose
2018 2019 2018 2019
(1) (6) (7) (8) (9)
Kota Barat . . . . . . … …
Dungingi 650,00 360,00 … …
Kota Selatan 50,00 . . . … …
Kota Timur 25,00 . . . … …
Hulonthalangi 45,00 25,00 … …
Dumbo Raya . . . . . . … …
Kota Utara . . . . . . … …
Kota Tengah 20,00 . . . … …
Sipatana 355,00 . . . 35,00 …
Kota Gorontalo 1 145,00 385,00 35,00 …https:
//goro
ntalo
kota
.bps.g
o.id
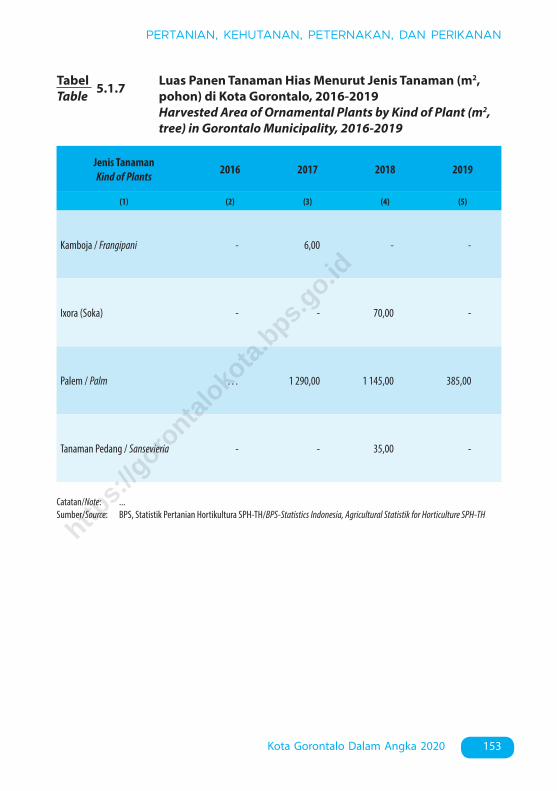
153Kota Gorontalo Dalam Angka 2020
PERTANIAN, KEHUTANAN, PETERNAKAN, DAN PERIKANAN
Jenis TanamanKind of Plants 2016 2017 2018 2019
(1) (2) (3) (4) (5)
Kamboja / Frangipani - 6,00 - -
Ixora (Soka) - - 70,00 -
Palem / Palm … 1 290,00 1 145,00 385,00
Tanaman Pedang / Sansevieria - - 35,00 -
TabelTable 5.1.7 Luas Panen Tanaman Hias Menurut Jenis Tanaman (m2,
pohon) di Kota Gorontalo, 2016-2019 Harvested Area of Ornamental Plants by Kind of Plant (m2,
tree) in Gorontalo Municipality, 2016-2019
Catatan/Note: ...Sumber/Source: BPS, Statistik Pertanian Hortikultura SPH-TH/BPS-Statistics Indonesia, Agricultural Statistik for Horticulture SPH-TH
https:
//goro
ntalo
kota
.bps.g
o.id
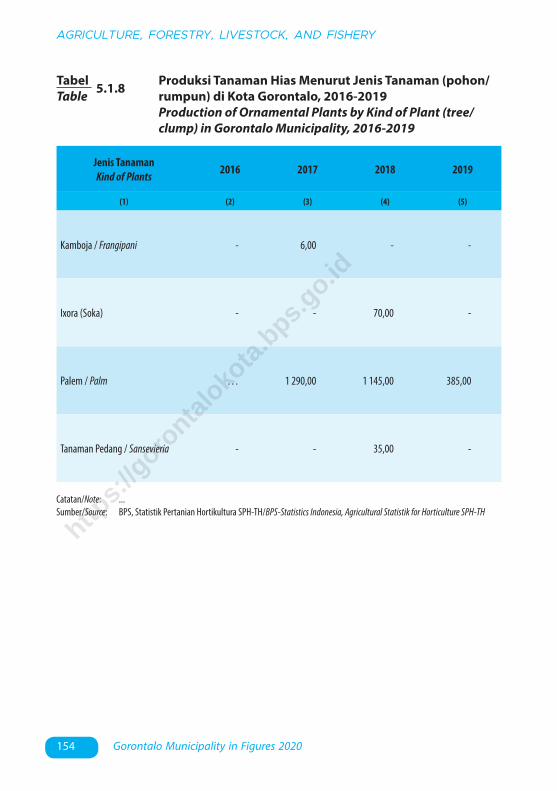
154 Gorontalo Municipality in Figures 2020
AGRICULTURE, FORESTRY, LIVESTOCK, AND FISHERY
TabelTable 5.1.8 Produksi Tanaman Hias Menurut Jenis Tanaman (pohon/
rumpun) di Kota Gorontalo, 2016-2019 Production of Ornamental Plants by Kind of Plant (tree/
clump) in Gorontalo Municipality, 2016-2019
Catatan/Note: ...Sumber/Source: BPS, Statistik Pertanian Hortikultura SPH-TH/BPS-Statistics Indonesia, Agricultural Statistik for Horticulture SPH-TH
Jenis TanamanKind of Plants 2016 2017 2018 2019
(1) (2) (3) (4) (5)
Kamboja / Frangipani - 6,00 - -
Ixora (Soka) - - 70,00 -
Palem / Palm … 1 290,00 1 145,00 385,00
Tanaman Pedang / Sansevieria - - 35,00 -
https:
//goro
ntalo
kota
.bps.g
o.id

155Kota Gorontalo Dalam Angka 2020
PERTANIAN, KEHUTANAN, PETERNAKAN, DAN PERIKANAN
TabelTable 5.1.9 Produksi Buah-buahan Menurut Kecamatan dan Jenis
Tanaman (ton) di Kota Gorontalo, 2018 dan 2019 Production of Fruits by Subdistrict and Kind of Plant (ton) in
Gorontalo Municipality, 2018 and 2019
KecamatanSubdistrict
Mangga/Mango Nangka/Jackfruit
2018 2019 2018 2019
(1) (2) (3) (4) (5)
Kota Barat 19,20 28,10 7,60 22,00
Dungingi 12,80 29,00 24,50 26,70
Kota Selatan 5,00 4,00 . . . . . .
Kota Timur 8,10 24,40 . . . . . .
Hulonthalangi 8,90 17,20 . . . . . .
Dumbo Raya 9,20 27,20 . . . . . .
Kota Utara 6,80 13,20 1,50 2,10
Kota Tengah 6,50 10,30 1,20 1,30
Sipatana 7,90 14,10 4,20 4,60
Kota Gorontalo 84,40 167,50 39,00 56,70https:
//goro
ntalo
kota
.bps.g
o.id
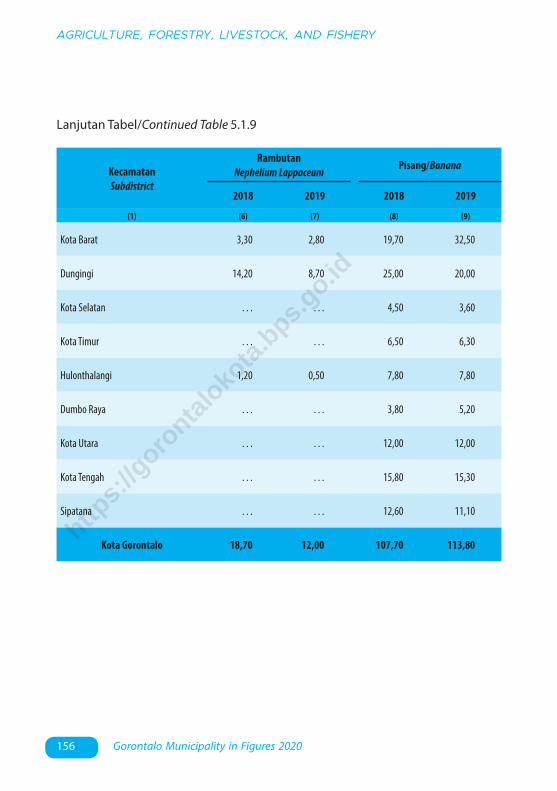
156 Gorontalo Municipality in Figures 2020
AGRICULTURE, FORESTRY, LIVESTOCK, AND FISHERY
KecamatanSubdistrict
RambutanNephelium Lappaceum Pisang/Banana
2018 2019 2018 2019
(1) (6) (7) (8) (9)
Kota Barat 3,30 2,80 19,70 32,50
Dungingi 14,20 8,70 25,00 20,00
Kota Selatan . . . . . . 4,50 3,60
Kota Timur . . . . . . 6,50 6,30
Hulonthalangi 1,20 0,50 7,80 7,80
Dumbo Raya . . . . . . 3,80 5,20
Kota Utara . . . . . . 12,00 12,00
Kota Tengah . . . . . . 15,80 15,30
Sipatana . . . . . . 12,60 11,10
Kota Gorontalo 18,70 12,00 107,70 113,80
Lanjutan Tabel/Continued Table 5.1.9
https:
//goro
ntalo
kota
.bps.g
o.id

157Kota Gorontalo Dalam Angka 2020
PERTANIAN, KEHUTANAN, PETERNAKAN, DAN PERIKANAN
KecamatanSubdistrict
Pepaya/Papaya
2018 2019
(1) (10) (11)
Kota Barat 21,10 19,00
Dungingi . . . . . .
Kota Selatan . . . . . .
Kota Timur . . . . . .
Hulonthalangi . . . . . .
Dumbo Raya . . . . . .
Kota Utara . . . . . .
Kota Tengah . . . . . .
Sipatana 7,70 15,50
Kota Gorontalo 28,80 34,50
Lanjutan Tabel/Continued Table 5.1.9
Catatan/Note: ...Sumber/Source: BPS, Statistik Pertanian Hortikultura SPH-BST/BPS-Statistics Indonesia, Agricultural Statistic for Horticulture SPH-BST
https:
//goro
ntalo
kota
.bps.g
o.id

158 Gorontalo Municipality in Figures 2020
AGRICULTURE, FORESTRY, LIVESTOCK, AND FISHERY
Jenis TanamanKind of Plants 2016 2017 2018 2019
(1) (2) (3) (4) (5)
Mangga / Mango 106,80 38,20 84,40 167,50
Pisang / Banana 91,40 110,10 107,70 113,80
Rambutan / Nephelium Lappaceum . . . . . . 18,70 12,00
Pepaya / Papaya 17,70 20,50 28,80 34,50
Nangka / Jack Fruit 16,10 17,90 39,00 56,70
Nanas / Pineapple 0,10 … … . . .
TabelTable 5.1.10 Produksi Buah–buahan dan Sayuran Tahunan Menurut
Jenis Tanaman (ton) di Kota Gorontalo, 2016-2019 Production of Annual Fruits and Vegetables by Kind of Plant
(ton) in Gorontalo Municipality, 2016-2019
Catatan/Note: ...Sumber/Source: BPS, Statistik Pertanian Hortikultura SPH-BST/BPS-Statistics Indonesia, Agricultural Statistic for Horticulture SPH-BSThttp
s://g
oronta
loko
ta.b
ps.go.id

159Kota Gorontalo Dalam Angka 2020
PERTANIAN, KEHUTANAN, PETERNAKAN, DAN PERIKANAN
5.2 PETERNAKAN LIVE STOCK
TabelTable 5.2.1 Populasi Ternak (ekor) Menurut Kecamatan dan Jenis
Ternak di Kota Gorontalo, 2018 dan 2019 Livestock Population (unit) by Sub-District and Kind of
Livestock in Gorontalo Municipality, 2018 and 2019
KecamatanSubdistrict
Sapi PotongBeef Cattles
Sapi PerahDairy Cows
2018 2019 2018 2019
(1) (2) (3) (4) (5)
Kota Barat 364 374 - -
Dungingi 717 743 - -
Kota Selatan 20 22 - -
Kota Timur 266 281 - -
Hulonthalangi 137 149 - -
Dumbo Raya 286 309 - -
Kota Utara 671 732 - -
Kota Tengah 214 214 - -
Sipatana 809 826 - -
Kota Gorontalo 3 484 3 650 - -
https:
//goro
ntalo
kota
.bps.g
o.id
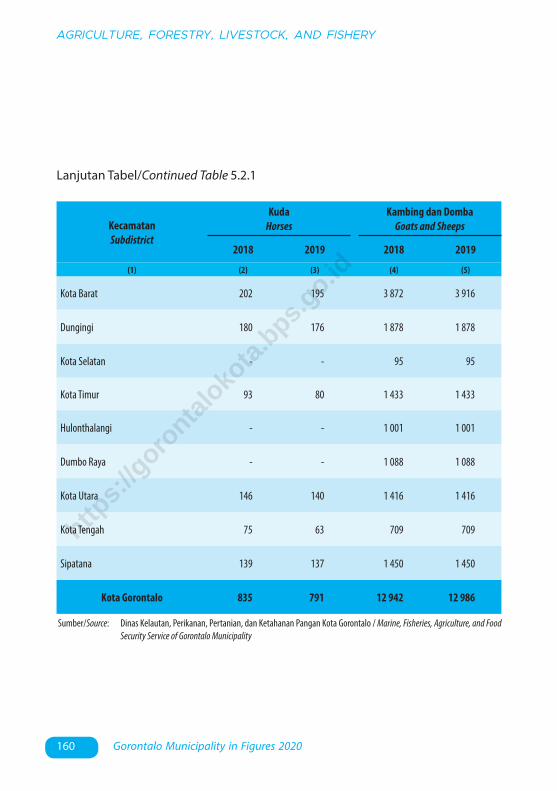
160 Gorontalo Municipality in Figures 2020
AGRICULTURE, FORESTRY, LIVESTOCK, AND FISHERY
Lanjutan Tabel/Continued Table 5.2.1
KecamatanSubdistrict
KudaHorses
Kambing dan DombaGoats and Sheeps
2018 2019 2018 2019
(1) (2) (3) (4) (5)
Kota Barat 202 195 3 872 3 916
Dungingi 180 176 1 878 1 878
Kota Selatan - - 95 95
Kota Timur 93 80 1 433 1 433
Hulonthalangi - - 1 001 1 001
Dumbo Raya - - 1 088 1 088
Kota Utara 146 140 1 416 1 416
Kota Tengah 75 63 709 709
Sipatana 139 137 1 450 1 450
Kota Gorontalo 835 791 12 942 12 986
Sumber/Source: Dinas Kelautan, Perikanan, Pertanian, dan Ketahanan Pangan Kota Gorontalo / Marine, Fisheries, Agriculture, and Food Security Service of Gorontalo Municipality
https:
//goro
ntalo
kota
.bps.g
o.id
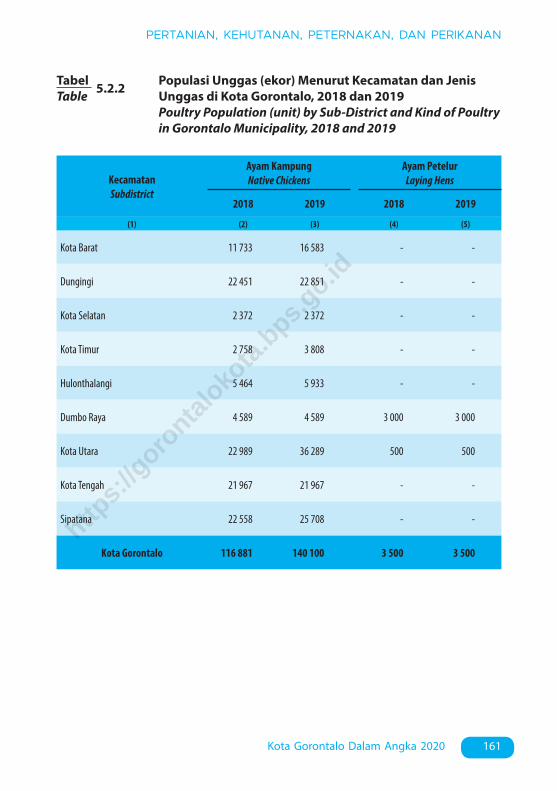
161Kota Gorontalo Dalam Angka 2020
PERTANIAN, KEHUTANAN, PETERNAKAN, DAN PERIKANAN
TabelTable 5.2.2 Populasi Unggas (ekor) Menurut Kecamatan dan Jenis
Unggas di Kota Gorontalo, 2018 dan 2019 Poultry Population (unit) by Sub-District and Kind of Poultry
in Gorontalo Municipality, 2018 and 2019
KecamatanSubdistrict
Ayam KampungNative Chickens
Ayam PetelurLaying Hens
2018 2019 2018 2019
(1) (2) (3) (4) (5)
Kota Barat 11 733 16 583 - -
Dungingi 22 451 22 851 - -
Kota Selatan 2 372 2 372 - -
Kota Timur 2 758 3 808 - -
Hulonthalangi 5 464 5 933 - -
Dumbo Raya 4 589 4 589 3 000 3 000
Kota Utara 22 989 36 289 500 500
Kota Tengah 21 967 21 967 - -
Sipatana 22 558 25 708 - -
Kota Gorontalo 116 881 140 100 3 500 3 500http
s://g
oronta
loko
ta.b
ps.go.id
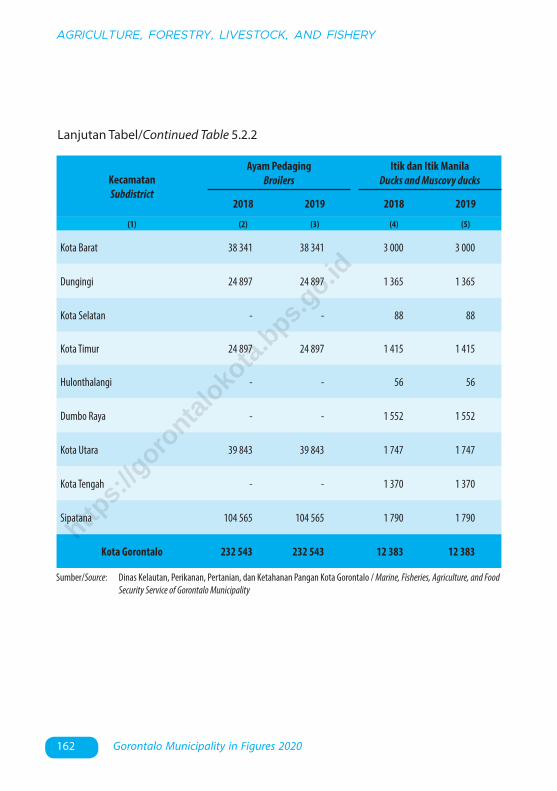
162 Gorontalo Municipality in Figures 2020
AGRICULTURE, FORESTRY, LIVESTOCK, AND FISHERY
Lanjutan Tabel/Continued Table 5.2.2
KecamatanSubdistrict
Ayam PedagingBroilers
Itik dan Itik ManilaDucks and Muscovy ducks
2018 2019 2018 2019
(1) (2) (3) (4) (5)
Kota Barat 38 341 38 341 3 000 3 000
Dungingi 24 897 24 897 1 365 1 365
Kota Selatan - - 88 88
Kota Timur 24 897 24 897 1 415 1 415
Hulonthalangi - - 56 56
Dumbo Raya - - 1 552 1 552
Kota Utara 39 843 39 843 1 747 1 747
Kota Tengah - - 1 370 1 370
Sipatana 104 565 104 565 1 790 1 790
Kota Gorontalo 232 543 232 543 12 383 12 383
Sumber/Source: Dinas Kelautan, Perikanan, Pertanian, dan Ketahanan Pangan Kota Gorontalo / Marine, Fisheries, Agriculture, and Food Security Service of Gorontalo Municipality
https:
//goro
ntalo
kota
.bps.g
o.id

163Kota Gorontalo Dalam Angka 2020
PERTANIAN, KEHUTANAN, PETERNAKAN, DAN PERIKANAN
TabelTable 5.2.3 Produksi Daging Ternak (kg) Menurut Kecamatan dan
Jenis Ternak di Kota Gorontalo, 2018 dan 2019 Meat Production (kg) by Sub-District and Kind of Livestock
in Gorontalo Municipality, 2018 and 2019
KecamatanSubdistrict
Sapi PotongBeef Cattles
Sapi PerahDairy Cows
2018 2019 2018 2019
(1) (2) (3) (4) (5)
Kota Barat 48 295 113 950 - -
Dungingi 39 874 22 687 - -
Kota Selatan 287 195 313 147 - -
Kota Timur 548 953 464 049 - -
Hulonthalangi 11 172 13 578 - -
Dumbo Raya 18 390 24 062 - -
Kota Utara 42 108 101 060 - -
Kota Tengah 89 716 128 043 - -
Sipatana 586 764 493 954 - -
Kota Gorontalo 1 672 467 1 674 529 - -http
s://g
oronta
loko
ta.b
ps.go.id

164 Gorontalo Municipality in Figures 2020
AGRICULTURE, FORESTRY, LIVESTOCK, AND FISHERY
Lanjutan Tabel/Continued Table 5.2.3
KecamatanSubdistrict
KudaHorses
Kambing dan DombaGoats and Sheeps
2018 2019 2018 2019
(1) (2) (3) (4) (5)
Kota Barat - - 26 155
Dungingi - - 78 -
Kota Selatan - - 130 202 129 504
Kota Timur - - 414 207
Hulonthalangi - - 48 266 46 972
Dumbo Raya - - 57 790 63 742
Kota Utara - - 52 129
Kota Tengah - - 414 207
Sipatana - - 52 104
Kota Gorontalo - - 237 035 240 943
Sumber/Source: Dinas Kelautan, Perikanan, Pertanian, dan Ketahanan Pangan Kota Gorontalo / Marine, Fisheries, Agriculture, and Food Security Service of Gorontalo Municipality
https:
//goro
ntalo
kota
.bps.g
o.id

165Kota Gorontalo Dalam Angka 2020
PERTANIAN, KEHUTANAN, PETERNAKAN, DAN PERIKANAN
TabelTable 5.2.4 Produksi Daging Unggas (kg) Menurut Kecamatan dan
Jenis Unggas di Kota Gorontalo, 2018 dan 2019 Poultry Meat Production (kg) by Sub-District and Kind of
Poultry in Gorontalo Municipality, 2018 and 2019
KecamatanSubdistrict
Ayam KampungNative Chickens
Ayam PetelurLaying Hens
2018 2019 2018 2019
(1) (2) (3) (4) (5)
Kota Barat 12 648 17 876 - -
Dungingi 24 202 24 633 - -
Kota Selatan 2 557 2 557 - -
Kota Timur 2 973 4 105 - -
Hulonthalangi 5 890 6 396 - -
Dumbo Raya 4 947 4 947 2 440 2 440
Kota Utara 24 782 39 120 124 124
Kota Tengah 23 680 23 680 - -
Sipatana 24 318 27 713 - -
Kota Gorontalo 125 998 151 028 2 564 2 564http
s://g
oronta
loko
ta.b
ps.go.id

166 Gorontalo Municipality in Figures 2020
AGRICULTURE, FORESTRY, LIVESTOCK, AND FISHERY
Lanjutan Tabel/Continued Table 5.2.4
KecamatanSubdistrict
Ayam PedagingBroilers
Itik dan Itik ManilaDucks and Muscovy ducks
2018 2019 2018 2019
(1) (2) (3) (4) (5)
Kota Barat 34 771 34 771 1 575,00 1575,00
Dungingi 22 579 22 579 908,25 908,25
Kota Selatan - - 92,40 92,40
Kota Timur 22 579 22 579 1 275,75 1 275,75
Hulonthalangi - - 58,80 58,80
Dumbo Raya - - 1 104,60 1 104,60
Kota Utara 36 134 36 134 784,35 784,35
Kota Tengah - - 1 135,05 1 135,05
Sipatana 94 830 94 830 829,50 829,50
Kota Gorontalo 210 893 210 893 7 764,00 7 764,00
Sumber/Source: Dinas Kelautan, Perikanan, Pertanian, dan Ketahanan Pangan Kota Gorontalo / Marine, Fisheries, Agriculture, and Food Security Service of Gorontalo Municipality
https:
//goro
ntalo
kota
.bps.g
o.id

167Kota Gorontalo Dalam Angka 2020
PERTANIAN, KEHUTANAN, PETERNAKAN, DAN PERIKANAN
TabelTable 5.2.5 Produksi Telur Unggas (kg) Menurut Kecamatan dan Jenis
Unggas di Kota Gorontalo, 2018 dan 2019 Production of Poultry Eggs (kg) by Sub-District and Kind of
Poultry in Gorontalo Municipality, 2018 and 2019
KecamatanSubdistrict
Ayam Kampung dan Ayam PedagingNative Chickens and Broilers
2018 2019
(1) (2) (3)
Kota Barat 5 749 5 749
Dungingi 11 001 11 001
Kota Selatan 1 162 1 162
Kota Timur 1 351 1 351
Hulonthalangi 2 677 2 677
Dumbo Raya 2 249 2 249
Kota Utara 11 265 11 265
Kota Tengah 10 764 10 764
Sipatana 11 053 11 053
Kota Gorontalo 57 272 57 272http
s://g
oronta
loko
ta.b
ps.go.id

168 Gorontalo Municipality in Figures 2020
AGRICULTURE, FORESTRY, LIVESTOCK, AND FISHERY
Lanjutan Tabel/Continued Table 5.2.5
KecamatanSubdistrict
Ayam PetelurLaying Hans
Itik dan Itik ManilaDucks and Muscovy ducks
2018 2019 2018 2019
(1) (2) (3) (4) (5)
Kota Barat - - 19 242 19 242
Dungingi - - 8 755 8 755
Kota Selatan - - 564 564
Kota Timur - - 9 076 9 076
Hulonthalangi - - 359 359
Dumbo Raya 22 590 22 590 9 955 9 955
Kota Utara 3765 3765 11 205 11 205
Kota Tengah - - 8 787 8 787
Sipatana - - 11 481 11 481
Kota Gorontalo 26 355 26 355 79 425 79 425
Sumber/Source: Dinas Kelautan, Perikanan, Pertanian, dan Ketahanan Pangan Kota Gorontalo / Marine, Fisheries, Agriculture, and Food Security Service of Gorontalo Municipality
https:
//goro
ntalo
kota
.bps.g
o.id

169Kota Gorontalo Dalam Angka 2020
PERTANIAN, KEHUTANAN, PETERNAKAN, DAN PERIKANAN
5.3 PERIKANAN FISHERIES
TabelTable 5.3.1 Jumlah Rumah Tangga Perikanan Tangkap Menurut
Kecamatan di Kota Gorontalo, 2018 dan 2019 Number of Fish Capture Households by Sub-District in
Gorontalo Municipality, 2018 and 2019
KecamatanSubdistrict
Perikanan LautMarine Fisheries
2018 2019
(1) (2) (3)
Kota Barat - -
Dungingi - -
Kota Selatan 10 10
Kota Timur - -
Hulonthalangi 470 480
Dumbo Raya 428 418
Kota Utara - -
Kota Tengah - -
Sipatana - -
Kota Gorontalo 908 908
https:
//goro
ntalo
kota
.bps.g
o.id
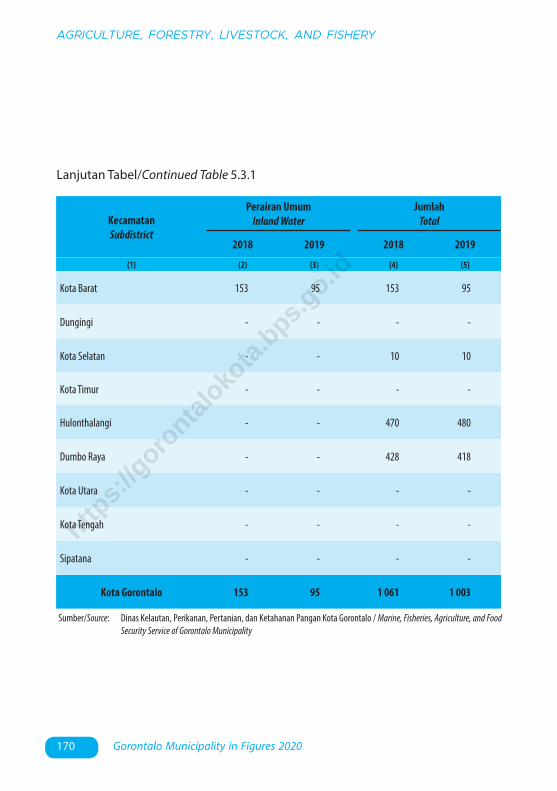
170 Gorontalo Municipality in Figures 2020
AGRICULTURE, FORESTRY, LIVESTOCK, AND FISHERY
Lanjutan Tabel/Continued Table 5.3.1
KecamatanSubdistrict
Perairan UmumInland Water
JumlahTotal
2018 2019 2018 2019
(1) (2) (3) (4) (5)
Kota Barat 153 95 153 95
Dungingi - - - -
Kota Selatan - - 10 10
Kota Timur - - - -
Hulonthalangi - - 470 480
Dumbo Raya - - 428 418
Kota Utara - - - -
Kota Tengah - - - -
Sipatana - - - -
Kota Gorontalo 153 95 1 061 1 003
Sumber/Source: Dinas Kelautan, Perikanan, Pertanian, dan Ketahanan Pangan Kota Gorontalo / Marine, Fisheries, Agriculture, and Food Security Service of Gorontalo Municipality
https:
//goro
ntalo
kota
.bps.g
o.id

171Kota Gorontalo Dalam Angka 2020
PERTANIAN, KEHUTANAN, PETERNAKAN, DAN PERIKANAN
TabelTable 5.3.2 Produksi Perikanan Tangkap (ton) Menurut Kecamatan di
Kota Gorontalo, 2018 dan 2019 Production of Fish Capture (ton) by Sub-District in
Gorontalo Municipality, 2018 and 2019
KecamatanSubdistrict
Perikanan LautMarine Fisheries
2018 2019
(1) (2) (3)
Kota Barat - -
Dungingi - -
Kota Selatan - -
Kota Timur - -
Hulonthalangi 10 432,76 10 510,00
Dumbo Raya 7 320,54 7 450,00
Kota Utara - -
Kota Tengah - -
Sipatana - -
Kota Gorontalo 17 753,30 17 960,00http
s://g
oronta
loko
ta.b
ps.go.id

172 Gorontalo Municipality in Figures 2020
AGRICULTURE, FORESTRY, LIVESTOCK, AND FISHERY
Lanjutan Tabel/Continued Table 5.3.2
KecamatanSubdistrict
Perairan UmumInland Water
JumlahTotal
2018 2019 2018 2019
(1) (2) (3) (4) (5)
Kota Barat 279,92 335,00 279,92 335,00
Dungingi - - - -
Kota Selatan - - - -
Kota Timur - - - -
Hulonthalangi - - 10 432,76 10 510,00
Dumbo Raya - - 7 320,54 7 450,00
Kota Utara - - - -
Kota Tengah - - - -
Sipatana - - - -
Kota Gorontalo 279,92 335,00 18 033,20 18 295,00
Sumber/Source: Dinas Kelautan, Perikanan, Pertanian, dan Ketahanan Pangan Kota Gorontalo / Marine, Fisheries, Agriculture, and Food Security Service of Gorontalo Municipality
https:
//goro
ntalo
kota
.bps.g
o.id

173Kota Gorontalo Dalam Angka 2020
PERTANIAN, KEHUTANAN, PETERNAKAN, DAN PERIKANAN
TabelTable 5.3.3 Jumlah Rumah Tangga Perikanan Budidaya Menurut
Kecamatan dan Jenis Budidaya di Kota Gorontalo, 2019
Number Of Aquaculture Households by Sub-District and Aquaculture Methods in Gorontalo Municipality, 2019
KecamatanSubdistrict
TambakPond
KolamWater Tanks
KerambaFloating
Cage
Jaring Apung
Net Enclosure
SawahPaddy Field
JumlahTotal
(1) (2) (3) (4) (5) (6) (7)
Kota Barat - 2 - 151 - -
Dungingi - - - - - -
Kota Selatan - - - - - -
Kota Timur - - - - - -
Hulonthalangi - - - - - -
Dumbo Raya - - - - - -
Kota Utara - 4 - - - -
Kota Tengah - - - - - -
Sipatana - 2 - - - -
Kota Gorontalo - 8 - 151 - -
Sumber/Source: Dinas Kelautan, Perikanan, Pertanian, dan Ketahanan Pangan Kota Gorontalo / Marine, Fisheries, Agriculture, and Food Security Service of Gorontalo Municipality
https:
//goro
ntalo
kota
.bps.g
o.id

174 Gorontalo Municipality in Figures 2020
AGRICULTURE, FORESTRY, LIVESTOCK, AND FISHERY
TabelTable 5.3.4 Produksi Perikanan Budidaya (ton) Menurut Kecamatan
dan Jenis Budidaya di Kota Gorontalo, 2019 Production Of Aquaculture (ton) by Sub-District and
Aquaculture Methods in Gorontalo Municipality, 2019
KecamatanSubdistrict
TambakPond
KolamWater Tanks
KerambaFloating
Cage
Jaring Apung
Net Enclosure
SawahPaddy Field
JumlahTotal
(1) (2) (3) (4) (5) (6) (7)
Kota Barat - 0,38 - 2 710,71 - -
Dungingi - - - - - -
Kota Selatan - - - - - -
Kota Timur - - - - - -
Hulonthalangi - - - - - -
Dumbo Raya - - - - - -
Kota Utara - 2,74 - - - -
Kota Tengah - - - - - -
Sipatana - 6,21 - - - -
Kota Gorontalo - 9,33 - 2 710,71 - -
Sumber/Source: Dinas Kelautan, Perikanan, Pertanian, dan Ketahanan Pangan Kota Gorontalo / Marine, Fisheries, Agriculture, and Food Security Service of Gorontalo Municipality
https:
//goro
ntalo
kota
.bps.g
o.id
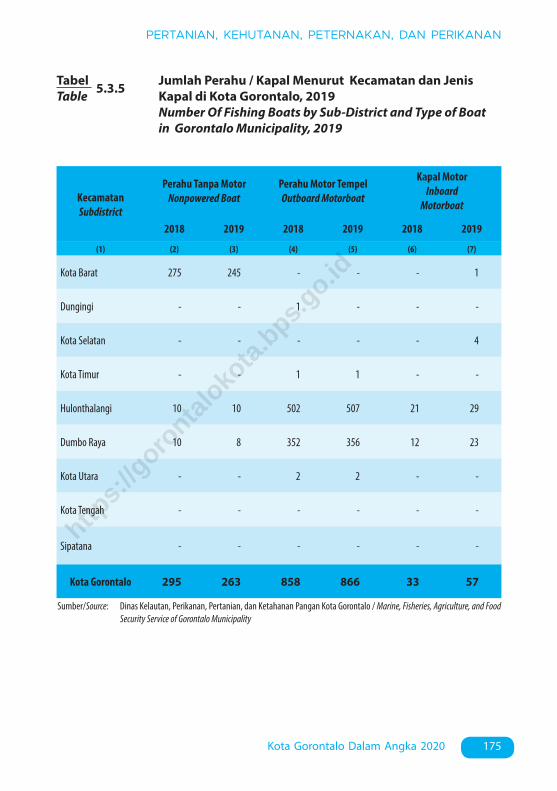
175Kota Gorontalo Dalam Angka 2020
PERTANIAN, KEHUTANAN, PETERNAKAN, DAN PERIKANAN
TabelTable 5.3.5 Jumlah Perahu / Kapal Menurut Kecamatan dan Jenis
Kapal di Kota Gorontalo, 2019 Number Of Fishing Boats by Sub-District and Type of Boat
in Gorontalo Municipality, 2019
KecamatanSubdistrict
Perahu Tanpa MotorNonpowered Boat
Perahu Motor TempelOutboard Motorboat
Kapal MotorInboard
Motorboat
2018 2019 2018 2019 2018 2019
(1) (2) (3) (4) (5) (6) (7)
Kota Barat 275 245 - - - 1
Dungingi - - 1 - - -
Kota Selatan - - - - - 4
Kota Timur - - 1 1 - -
Hulonthalangi 10 10 502 507 21 29
Dumbo Raya 10 8 352 356 12 23
Kota Utara - - 2 2 - -
Kota Tengah - - - - - -
Sipatana - - - - - -
Kota Gorontalo 295 263 858 866 33 57
Sumber/Source: Dinas Kelautan, Perikanan, Pertanian, dan Ketahanan Pangan Kota Gorontalo / Marine, Fisheries, Agriculture, and Food Security Service of Gorontalo Municipality
https:
//goro
ntalo
kota
.bps.g
o.id

https:
//goro
ntalo
kota
.bps.g
o.id

177Kota Gorontalo Dalam Angka 2020
INDUSTRI, PERTAMBANGAN DAN ENERGI
6. Industri, Pertambangan dan Energi/Industry, Mining and Energy ...........
INDUSTRI, PERTAMBANGAN DAN ENERGIINDUSTRY, MINING AND ENERGY
06
https:
//goro
ntalo
kota
.bps.g
o.id

https:
//goro
ntalo
kota
.bps.g
o.id

179Kota Gorontalo Dalam Angka 2020
INDUSTRI, PERTAMBANGAN DAN ENERGI
PENJELASAN TEKNIS TECHNICAL NOTES
1. Pengumpulan data industri besar dan sedang dilakukan melalui Survei Industri Besar dan Sedang yang dilaksanakan setiap tahun secara lengkap (sensus) sejak tahun 1975. Survei Industri Besar dan Sedang mencakup semua perusahaan industri yang mempunyai tenaga kerja 20 orang atau lebih dengan menggunakan kuesioner II A.
2. Klasifikasi industri yang digunakan dalam survei ini berdasar kepada Klasifikasi Baku Lapangan Usaha Indonesia (KBLI). KBLI adalah klasifikasi lapangan usaha yang berdasar kepada International Standard Industrial Classification of All Economic Activities (ISIC) revisi 4 yang telah disesuaikan dengan kondisi Indonesia.
3. Industri manufaktur adalah suatu kegiatan ekonomi yang melakukan kegiatan mengubah suatu barang dasar secara mekanis, kimia, atau dengan tangan sehingga menjadi barang jadi/setengah jadi, dan atau barang yang kurang nilainya menjadi barang yang lebih tinggi nilainya, dan sifatnya lebih dekat kepada pemakai akhir. Termasuk dalam kegiatan ini adalah jasa industri dan pekerjaan perakitan.
4. Jasa industri adalah kegiatan industri yang melayani keperluan pihak lain. Pada kegiatan ini
1. Data collection of large and medium scale manufacturing is conducted through The Large and Medium Manufacturing Establishment Survey that has been done annually for all industries (census) since 1975. Large and Medium Manufacturing Establishment Survey covers all manufactures / industries with 20 workers or more by questionaire II A.
2. The industrial clasification adopted in this survey refers to the Klasifikasi Baku Lapangan Usaha Indonesia (KBLI). KBLI is classification of economic activities based on the International Standard Industrial Classification of All Economic Activities (ISIC rev 4) that has been modified according to the local condition in Indonesia.
3. Manufacturing industry is defined as an economic activity processing basic goods mechanically, chemicals or manually into final or intermediate goods. It is also defined as processing of lower value goods into higher value goods as final or intermediate products. The activities also include services for manufacturing and assembling.
4. Services for manufacturing is defined as a manufac-turing activity which serving other
https:
//goro
ntalo
kota
.bps.g
o.id

180 Gorontalo Municipality in Figures 2020
INDUSTRY, MINING AND ENERGY
bahan baku disediakan oleh pihak lain sedangkan pihak pengolah hanya melakukan pengolahannya dengan mendapat imbalan sebagai balas jasa (upah maklon).
5. Perusahaan atau usaha industri adalah suatu unit (kesatuan) usaha yang melakukan kegiatan ekonomi, bertujuan menghasilkan barang atau jasa, terletak pada suatu bangunan atau lokasi tertentu, dan mempunyai catatan administrasi tersendiri mengenai produksi dan struktur biaya serta ada seorang atau lebih yang bertanggung jawab atas usaha tersebut.
6. Industri manufaktur di kelompok -kan ke dalam 4 golongan berdasarkan banyaknya pekerja, yaitu: industri besar (100 orang pekerja atau lebih), industri sedang/menengah (20–99 orang pekerja), industri kecil (5–19 orang pekerja), dan industri mikro (1–4 orang pekerja).
7. Pelanggan adalah individu atau kelompok, baik rumah tangga, perusahaan atau institusi non profit yang membeli air bersih dari perusahaan air bersih.
8. Air disalurkan adalah volume air bersih dari perusahaan air bersih
manufacturing establishments. In this case, raw materials are supplied by others while the workers are paid as a compensation for processing raw materials.
5. A manufacturing establishment is defined as a production unit engaged in economic activity, producing goods or services, located in a building or in a certain location, keeping a business record concerning the production and cost structure, and having a person or more that are responsible to those activities.
6. Manufacturing industries are categorized into four groups, based on the number of employees: large scale manufacturing (100 employees or more), medium scale manufacturing (20–99 employees), small scale manufacturing (5–19 employees), and micro industry (1–4 employees).
7. Customers are individuals or groups, whether household, company or non-profit institutions that buy water supply from water supply establishment.
8. Distributed water is the volume of water supply from water supply establishment
https:
//goro
ntalo
kota
.bps.g
o.id

181Kota Gorontalo Dalam Angka 2020
INDUSTRI, PERTAMBANGAN DAN ENERGI
Catatan/Notes : Rayon Telaga termasuk Kota Gorontalo dan Kab. Bone Bolango / Branch includes Gorontalo Municipality and Bone Bolango Regency
Sumber/Source : PT. PLN Wilayah VII Suluttenggo Cabang Gorontalo / PT. PLN Region VII Suluttenggo Gorontalo Branch
110108
110638
111069
111690
112351112735
113291
113872
114306
114910
115396
116373
106000
107000
108000
109000
110000
111000
112000
113000
114000
115000
116000
117000
Januari / Ja
n
Februari /
Feb
Maret / M
ar
April / A
pr
Mei / May
Juni / Jun
Juli / Ju
l
Agustu
s / Aug
September /
Sep
Oktober /
Oct
November /
Nov
Desember / Dec
Jumlah Pelanggan
6.1 Jumlah Pelanggan Listrik PT. PLN (Persero) Menurut Bulan pada Rayon Telaga, 2019
Number Of Electricity Costumers of State Electricity Company at Telaga Branch, 2019
GambarFigures
https:
//goro
ntalo
kota
.bps.g
o.id

182 Gorontalo Municipality in Figures 2020
INDUSTRY, MINING AND ENERGY
Sumber/Source : Dinas Perindustrian dan Perdagangan Kota Gorontalo / Industry and Trade of Gorontalo Municipality
0
500
1000
1500
2000
2500
3000
3500
4000
1852
574460 373
256
3604
10641307
901 826
Jumlah Perusahaan / Number of Establishment Tenaga Kerja / Labor
6.2 Jumlah Perusahaan dan Tenaga Kerja Menurut Klasifikasi Industri di Kota Gorontalo, 2019
Number Of Establishment and Employees By Industrial; Classification in Gorontalo Municipality, 2019
GambarFigures
https:
//goro
ntalo
kota
.bps.g
o.id

183Kota Gorontalo Dalam Angka 2020
INDUSTRI, PERTAMBANGAN DAN ENERGI
TabelTable 6.1.1 Jumlah Pelanggan Listrik PT. PLN (Persero) Menurut Bulan
pada Rayon Telaga, 2015-2019 Number Of Electricity Costumers of State Electricity
Company at Telaga Branch, 2015-2019
BulanMonths 2015 2016 2017 2018 2019
(1) (2) (3) (4) (5) (6)
Januari / January … 92 184 98 686 103 893 110 108
Februari / February … 92 943 99 037 104 417 110 638
Maret / March … 93 352 99 367 104 779 111 069
April / April … 94 975 99 680 105 207 111 690
Mei / May … 95 080 100 003 105 598 112 351
Juni / June … 95 997 100 003 105 936 112 735
Juli / July … 96 199 100 724 106 727 113 291
Agustus / August … 96 722 101 816 107 146 113 872
September / September … 97 159 102 797 107 618 114 306
Oktober / October … 97 557 102 797 108 020 114 910
November / November … 97 891 103 402 108 791 115 396
Desember / December … 98 266 103 493 109 371 116 373
Catatan/Note: Rayon Telaga termasuk Kota Gorontalo dan Kab. Bone Bolango / Branch includes Gorontalo Municipality and Bone Bolango Regency
Sumber/Source: PT. PLN Wilayah VII Suluttenggo Cabang Gorontalo / PT. PLN Region VII Suluttenggo Gorontalo Branch
6.1 ENERGI ENERGY
https:
//goro
ntalo
kota
.bps.g
o.id

184 Gorontalo Municipality in Figures 2020
INDUSTRY, MINING AND ENERGY
TabelTable 6.1.2 Jumlah Daya Tersambung dan Listrik Terjual PT. PLN
(Persero) Menurut Bulan pada Rayon Telaga, 2019 Number Of Connected Capacity, and Electricity Sold of State
Electricity Company at Telaga Branch, 2019
BulanMonths
Daya Tersambung (V) Connected Capacity (V)
Listrik Terjual (KWh) Electricity Sold
(KWh)
Nilai Listrik Terjual (Rp) Electricity Sold (Rp)
(1) (2) (3) (4)
Januari / January 152 216 185 23 027 848 25 451 898 138
Februari / February 153 077 785 21 155 867 23 369 055 252
Maret / March 153 773 035 24 023 361 26 469 312 807
April / April 154 850 835 24 348 035 26 817 900 849
Mei / May 155 916 835 25 107 365 27 416 813 302
Juni / June 156 608 335 22 852 113 24 791 063 109
Juli / July 157 498 135 23 524 297 26 197 665 838
Agustus / August 158 183 735 23 760 254 26 305 509 942
September / September 159 614 285 23 215 229 25 718 733 662
Oktober / October 161 815 785 25 191 672 28 037 312 599
November / November 162 485 385 25 551 223 30 179 692 978
Desember / December 163 630 285 28 394 794 32 077 448 965
Catatan/Note: Rayon Telaga termasuk Kota Gorontalo dan Kab. Bone Bolango / Branch includes Gorontalo Municipality and Bone Bolango Regency
Sumber/Source: PT. PLN Wilayah VII Suluttenggo Cabang Gorontalo / PT. PLN Region VII Suluttenggo Gorontalo Branch
https:
//goro
ntalo
kota
.bps.g
o.id
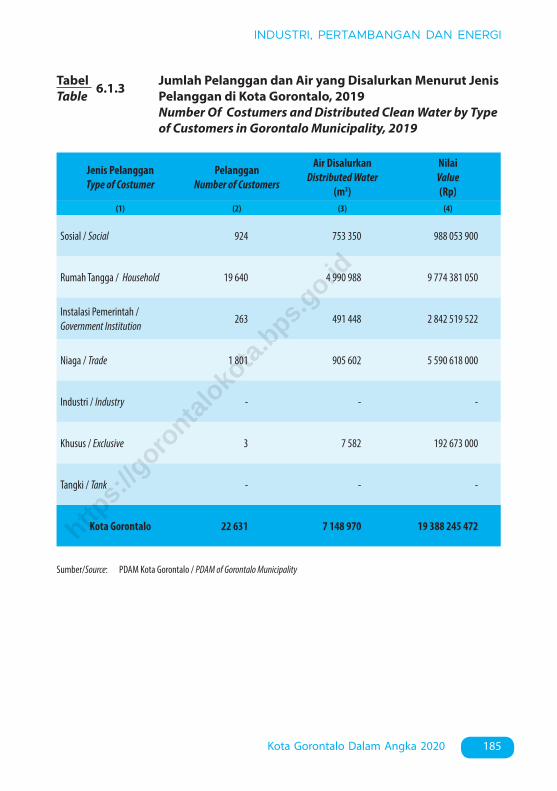
185Kota Gorontalo Dalam Angka 2020
INDUSTRI, PERTAMBANGAN DAN ENERGI
TabelTable 6.1.3 Jumlah Pelanggan dan Air yang Disalurkan Menurut Jenis
Pelanggan di Kota Gorontalo, 2019 Number Of Costumers and Distributed Clean Water by Type
of Customers in Gorontalo Municipality, 2019
Jenis PelangganType of Costumer
PelangganNumber of Customers
Air DisalurkanDistributed Water
(m3)
NilaiValue(Rp)
(1) (2) (3) (4)
Sosial / Social 924 753 350 988 053 900
Rumah Tangga / Household 19 640 4 990 988 9 774 381 050
Instalasi Pemerintah / Government Institution
263 491 448 2 842 519 522
Niaga / Trade 1 801 905 602 5 590 618 000
Industri / Industry - - -
Khusus / Exclusive 3 7 582 192 673 000
Tangki / Tank - - -
Kota Gorontalo 22 631 7 148 970 19 388 245 472
Sumber/Source: PDAM Kota Gorontalo / PDAM of Gorontalo Municipality
https:
//goro
ntalo
kota
.bps.g
o.id

186 Gorontalo Municipality in Figures 2020
INDUSTRY, MINING AND ENERGY
6.2 INDUSTRI INDUSTRY
TabelTable 6.2.1 Jumlah Perusahaan, Tenaga Kerja, dan Nilai Produksi
Menurut Klasifikasi Industri di Kota Gorontalo, 2019 Number Of Establishment, Employees, and Production
Value By Industrial Classification in Gorontalo Municipality, 2019
Jenis Klasifikasi IndustriType of Industry
Classification
Jumlah PerusahaanNumber Of
Establishment
Tenaga KerjaWorkers Engaged
Nilai ProduksiProduction Value
(1) (2) (3) (4)
Industri Pangan /Food Industry
1 852 3 604 74 700 909
Industri Sandang /Clothing Industry
574 1 064 22 416 952
Industri Kimia dan Bahan Bangunan /Chemistry and Material Building
256 826 21 997 344
Industri Kerajinan /Craft Industry
460 1 307 22 970 288
Industri Logam dan Elektronika /Metal and Electronic
373 901 31 002 575
Jumlah / Total 3 515 7 702 173 088 068
Sumber/Source: Dinas Perindustrian dan Perdagangan Kota Gorontalo / Industry and Trade of Gorontalo Municipality
https:
//goro
ntalo
kota
.bps.g
o.id
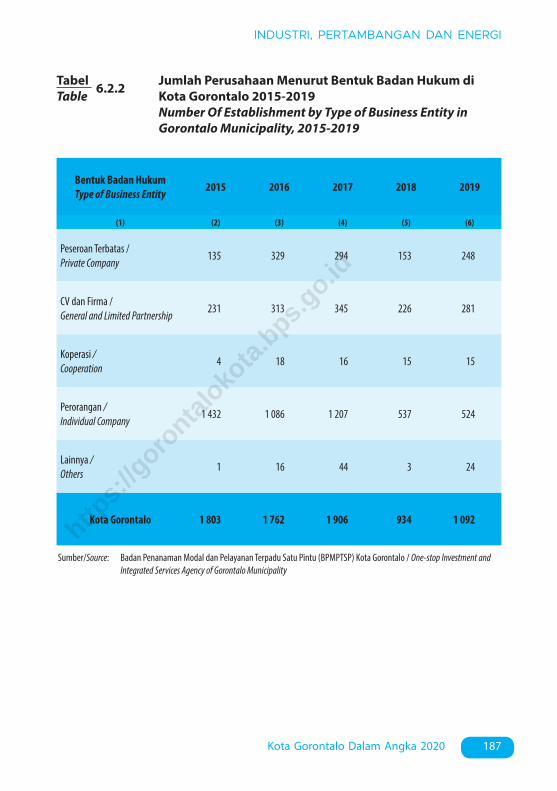
187Kota Gorontalo Dalam Angka 2020
INDUSTRI, PERTAMBANGAN DAN ENERGI
TabelTable 6.2.2 Jumlah Perusahaan Menurut Bentuk Badan Hukum di
Kota Gorontalo 2015-2019 Number Of Establishment by Type of Business Entity in
Gorontalo Municipality, 2015-2019
Bentuk Badan HukumType of Business Entity 2015 2016 2017 2018 2019
(1) (2) (3) (4) (5) (6)
Peseroan Terbatas /Private Company
135 329 294 153 248
CV dan Firma /General and Limited Partnership
231 313 345 226 281
Koperasi /Cooperation
4 18 16 15 15
Perorangan /Individual Company
1 432 1 086 1 207 537 524
Lainnya /Others
1 16 44 3 24
Kota Gorontalo 1 803 1 762 1 906 934 1 092
Sumber/Source: Badan Penanaman Modal dan Pelayanan Terpadu Satu Pintu (BPMPTSP) Kota Gorontalo / One-stop Investment and Integrated Services Agency of Gorontalo Municipality
https:
//goro
ntalo
kota
.bps.g
o.id

https:
//goro
ntalo
kota
.bps.g
o.id

189Kota Gorontalo Dalam Angka 2020
PARIWISATA
7. Pariwisata/Tourism ...................................................................................................
PARIWISATA, TRANSPORTASI, DAN KOMUNIKASITOURISM, TRANSPORTATION, AND COMMUNICATION
07
https:
//goro
ntalo
kota
.bps.g
o.id

https:
//goro
ntalo
kota
.bps.g
o.id

191Kota Gorontalo Dalam Angka 2020
PARIWISATA
PENJELASAN TEKNIS TECHNICAL NOTES
1. Wisatawan mancanegara (wisman) ialah setiap pengunjung yang mengunjungi suatu negara di luar tempat tinggalnya, didorong oleh satu atau beberapa keperluan tanpa bermaksud memperoleh penghasilan di tempat yang dikunjungi dan lamanya kunjungan tersebut tidak lebih dari satu tahun (12 bulan). Definisi ini mencakup 2 (dua) kategori wisatawan mancanegara, yaitu : a. Wisatawan (turis) ialah setiap pengunjung seperti definisi di atas yang tinggal paling sedikit 24 jam, akan tetapi tidak lebih dari 1 (satu) tahun di tempat yang dikunjungi, dengan maksud antara lain: berlibur, rekreasi, olah raga, bisnis, menghadiri pertemuan, studi, dan kunjungan dengan alasan kesehatan. b. Excursionist ialah setiap pengunjung seperti definisi di atas yang tinggal kurang dari 24 jam di tempat yang dikunjungi (termasuk “Cruise passengers”). Cruise Passengers ialah setiap pengunjung yang tiba di suatu negara di mana mereka tidak menginap di akomodasi yang tersedia di negara tersebut, misalnya dengan kapal laut.
2. Rata-rata lama tinggal adalah rata-rata waktu tinggal wisatawan mancanegara di Indonesia untuk satu kali kunjungan.
1. An International Visitor is any person visiting a country other than his usual place of residence for any reason other than for earning income in the country visited, and the length of stay is no more than one year (12 months).This definition covers two categories of foreign visitors, namely: a. “Tourist” is any visitor staying for at least 24 hours, but no more than one year, in the country visited, with the intention of visiting, and for any of these purposes: Pleasure, recreation and sports, Business, visiting friends and relatives, missions, attending meetings, conferences, visit for health reasons and study. b. “Excursionist” is any visitor staying less than 24 hours in the country visited including, “Cruise Passengers”, i.e. visitors arriving in a country without staying in any accommodation available in the visited country.
2. Average length of stay is the average stay duration of foreign visitor in Indonesia for one trip.
https:
//goro
ntalo
kota
.bps.g
o.id

192 Gorontalo Municipality in Figures 2020
TOURISM
3. Usaha penyediaan akomodasi adalah usaha yang menyediakan pelayanan penginapan yang dapat dilengkapi dengan pelayanan pariwisata lainnya. Usaha penyediaan akomodasi dapat berupa hotel, vila, pondok wisata, bumi perkemahan, persinggahan karavan, dan akomodasi lainnya yang digunakan untuk tujuan pariwisata.
4. Hotel adalah penyediaan akomodasi secara harian berupa kamar-kamar di dalam satu bangunan yang dapat dilengkapi dengan jasa pelayanan makan dan minum, kegiatan hiburan dan atau fasilitas lainnya. Hotel terdiri dari hotel berbintang dan hotel non- bintang.
5. Hotel bintang adalah usaha penyediaan jasa pelayanan penginapan, makan minum serta jasa lainnya bagi umum dengan menggunakan sebagian atau seluruh bangunan. Usaha ini dikelola secara komersial serta memenuhi ketentuan persyaratan sebagai hotel bintang (termasuk berlian) yang ditetapkan dalam surat keputusan instansi yang membinanya. Misalnya hotel bintang lima, hotel bintang empat dan seterusnya.
6. Tingkat penghunian kamar hotel adalah persentase banyaknya malam kamar yang dihuni terhadap banyaknya malam kamar yang tersedia.
7. Rata-rata lamanya tamu
3. The business of providing accommodation is a business that provides specialty services that can be equipped with other tourism services. It includes hotel, villa, cottage, camping, caravan stop, and other accommodation that are used for tourism purposes.
4. Hotel is a daily supply of accommodation rooms within a building which can be equipped with eating and drinking services, entertainment activities and/or other facilities. Hotel consists of a classified hotel and a non-classified hotel.
5. A star hotel is the business of providing an accommodation, eating and drinking as well as other services for the public by using a building or a part of a building. It is managed commercially and meets specified requirements as a star hotel (including diamonds) set forth in the decree of fostering agency. For example, five star hotel, four star hotel, and so on.
6. Room occupancy rate is the number of room-nights occupied divided by the number of room-nights available, multiplied by 100 percent.
7. Average length of stay is the
https:
//goro
ntalo
kota
.bps.g
o.id
193Kota Gorontalo Dalam Angka 2020
PARIWISATA
menginap adalah banyaknya malam tempat tidur yang terpakai (malam tamu) dengan banyaknya tamu yang menginap di hotel atau akomodasi lainnya.
number of bed-nights used (guest night) divided by the number of guests coming to spend the night at the accommodation.
https:
//goro
ntalo
kota
.bps.g
o.id

194 Gorontalo Municipality in Figures 2020
TOURISM
Sumber/Source : Dinas Pariwisata, Kepemudaan, dan Olahraga Kota Gorontalo / Tourism, Youth, and Sport Office of Gorontalo Municipality
110
118
125
106
116
95
100
105
110
115
120
125
130
2015 2016 2017 2018 2019
Rumah Makan dan Restoran / Restaurants
7.1 Jumlah Rumah Makan/Restoran di Kota Gorontalo, 2016-2019
Number of Restaurants in Gorontalo Municipality, 2016-2019
GambarFigures
https:
//goro
ntalo
kota
.bps.g
o.id

195Kota Gorontalo Dalam Angka 2020
PARIWISATA
Sumber/Source : Badan Pusat Statistik Kota Gorontalo / BPS – Statistics Agency of Gorontalo Municipality
29124
20059
23227 22844
16124 15918
18989
21492
1856719169 18955
16933
0
5000
10000
15000
20000
25000
30000
35000
Jan Feb Mar Apr Mei Jun Jul Ags Sep Okt Nov Des
Jumlah Tamu Hotel / Number of Hotel Visitors
7.2 Jumlah Tamu Hotel Dalam Negeri di Kota Gorontalo, 2019
Number of Domestic's Hotel Visitors in Gorontalo Municipality, 2019
GambarFigures
https:
//goro
ntalo
kota
.bps.g
o.id

196 Gorontalo Municipality in Figures 2020
TOURISM
TabelTable 7.1.1 Jumlah Rumah Makan/Restoran Menurut Kecamatan di
Kota Gorontalo, 2016-2019 Number of Restaurants by Subdistrict in Gorontalo
Municipality, 2016-2019
Sumber/Source: Dinas Pariwisata, Kepemudaan, dan Olahraga Kota Gorontalo / Tourism, Youth, and Sport Office of Gorontalo Municipality
KecamatanSubdistrict 2016 2017 2018 2019
(1) (2) (3) (4) (5)
Kota Barat 5 5 3 ...
Dungingi 2 7 4 54
Kota Selatan 35 42 42 ...
Kota Timur 28 26 22 20
Hulonthalangi 7 6 3 9
Dumbo Raya 6 11 7 ...
Kota Utara 9 3 1 ...
Kota Tengah 21 18 17 33
Sipatana 3 7 7 ...
Kota Gorontalo 118 125 106 116https:
//goro
ntalo
kota
.bps.g
o.id
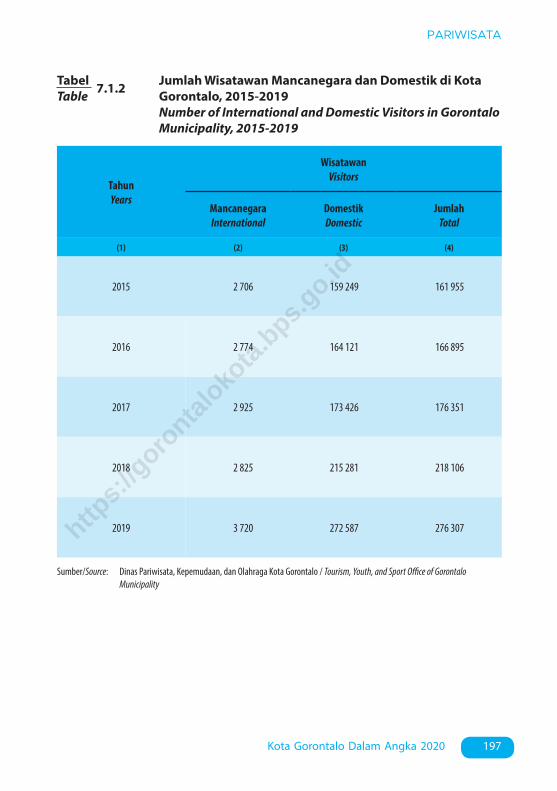
197Kota Gorontalo Dalam Angka 2020
PARIWISATA
TabelTable 7.1.2 Jumlah Wisatawan Mancanegara dan Domestik di Kota
Gorontalo, 2015-2019 Number of International and Domestic Visitors in Gorontalo
Municipality, 2015-2019
Sumber/Source: Dinas Pariwisata, Kepemudaan, dan Olahraga Kota Gorontalo / Tourism, Youth, and Sport Office of Gorontalo Municipality
TahunYears
WisatawanVisitors
MancanegaraInternational
DomestikDomestic
JumlahTotal
(1) (2) (3) (4)
2015 2 706 159 249 161 955
2016 2 774 164 121 166 895
2017 2 925 173 426 176 351
2018 2 825 215 281 218 106
2019 3 720 272 587 276 307https:
//goro
ntalo
kota
.bps.g
o.id
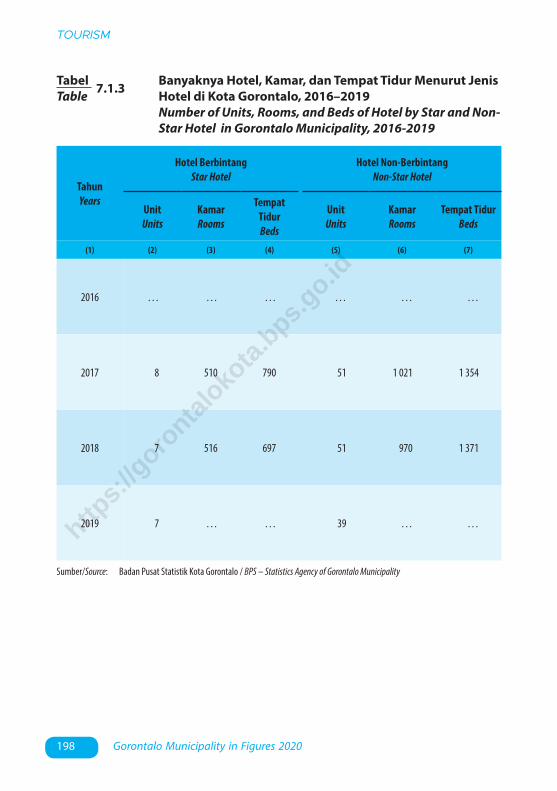
198 Gorontalo Municipality in Figures 2020
TOURISM
TabelTable 7.1.3 Banyaknya Hotel, Kamar, dan Tempat Tidur Menurut Jenis
Hotel di Kota Gorontalo, 2016–2019 Number of Units, Rooms, and Beds of Hotel by Star and Non-
Star Hotel in Gorontalo Municipality, 2016-2019
Sumber/Source: Badan Pusat Statistik Kota Gorontalo / BPS – Statistics Agency of Gorontalo Municipality
TahunYears
Hotel BerbintangStar Hotel
Hotel Non-BerbintangNon-Star Hotel
UnitUnits
KamarRooms
Tempat TidurBeds
UnitUnits
KamarRooms
Tempat TidurBeds
(1) (2) (3) (4) (5) (6) (7)
2016 … … … … … …
2017 8 510 790 51 1 021 1 354
2018 7 516 697 51 970 1 371
2019 7 … … 39 … …https:
//goro
ntalo
kota
.bps.g
o.id

199Kota Gorontalo Dalam Angka 2020
PARIWISATA
TabelTable 7.1.4 Tingkat Penghunian Kamar Tidur Menurut Jenis Hotel di
Kota Gorontalo, 2019 Bedroom Occupancy Rate by Star and Non-Star Hotel in
Gorontalo Municipality, 2019
BulanMonths
Tingkat Penghunian Kamar TidurBedroom Occupancy Rate
Hotel BerbintangStar Hotel
Hotel Non-BintangNon-Star Hotel
KeseluruhanAll
(1) (2) (3) (4)
Januari / January 265 59 324
Februari / February 281 218 499
Maret / March 209 73 282
April / April 344 55 399
Mei / May 454 25 479
Juni / June 171 90 261
Juli / July 339 74 413
Agustus / August 334 170 504
September / September 149 49 198
Oktober / October 98 87 185
November / November 71 31 102
Desember / December 122 34 156
Sumber/Source: Badan Pusat Statistik Kota Gorontalo / BPS – Statistics Agency of Gorontalo Municipality
https:
//goro
ntalo
kota
.bps.g
o.id

200 Gorontalo Municipality in Figures 2020
TOURISM
TabelTable 7.1.5 Jumlah Tamu Hotel dan Rata-Rata Lama Menginap
Menurut Asal Pengunjung di Kota Gorontalo, 2019 Number of Hotel Visitors and Average Days of Stay
According to Where The Visitors Come From in Gorontalo Municipality, 2019
Sumber/Source: Badan Pusat Statistik Kota Gorontalo / BPS – Statistics Agency of Gorontalo Municipality
TahunYears
Jumlah Tamu HotelNumber of Hotel Visitors
Rata-rata Lama MenginapAverage Days of Stay
Dalam Negeri
Domestic
Luar NegeriForeign
SeluruhAll
Dalam Negeri
Domestic
Luar NegeriForeign
SeluruhAll
(1) (2) (3) (4) (5) (6) (7)
Januari / Jan 29 124 324 29 448 2,54 1,74 2,53
Februari / Feb 20 059 499 20 558 2,17 1,70 2,16
Maret / Mar 23 227 282 23 509 1,91 1,78 1,91
April / Apr 22 844 399 23 243 1,92 2,16 1,93
Mei / May 16 124 479 16 603 1,90 2,29 1,91
Juni / Jun 15 918 261 16 179 1,54 1,49 1,54
Juli / Jul 18 989 413 19 402 1,53 1,48 1,52
Agustus / Aug 21 492 504 21 996 1,82 1,66 1,82
September / Sep 18 567 198 18 765 1,61 1,15 1,61
Oktober / Oct 19 169 185 19 354 1,61 1,16 1,61
November / Nov 18 955 102 19 057 1,57 1,28 1,57
Desember / Dec 16 933 156 17 089 1,41 1,11 1,40
https:
//goro
ntalo
kota
.bps.g
o.id

201Kota Gorontalo Dalam Angka 2020
TRANSPORTASI DAN KOMUNIKASI
8. Transportasi dan Komunikasi/Transportation and Communication ........
8 TRANSPORTASI DAN KOMUNIKASI/TRANSPORTATION AND COMMUNICATION ..............................................................................
TRANSPORTASI DAN KOMUNIKASITRANSPORTATION AND COMMUNICATION
08
https:
//goro
ntalo
kota
.bps.g
o.id

https:
//goro
ntalo
kota
.bps.g
o.id

203Kota Gorontalo Dalam Angka 2020
TRANSPORTASI DAN KOMUNIKASI
PENJELASAN TEKNIS TECHNICAL NOTES
1. Kendaraan Bermotor adalah setiap kendaraan yang digerakkan oleh peralatan teknik yang ada pada kendaraan tersebut, biasanya digunakan untuk ngkutan orang atau barang di atas jalan raya selain kendaraan yang berjalan di atas rel. Kendaraan bermotor yang dicatat adalah semua jenis kendaraan kecuali kendaraan bermotor TNI/Polri dan Korps Diplomatik.
2. Mobil Penumpang adalah setiap kendaraan bermotor yang dilengkapi dengan tempat duduk untuk sebanyak-banyaknya delapan orang, tidak termasuk tempat duduk untuk pengemudi, baik dilengkapi atau tidak dilengkapi bagasi.
3. Mobil bis adalah setiap kendaraan bermotor yang dilengkapi dengan tempat duduk untuk lebih dari delapan orang, tidak termasuk tempat duduk untuk pengemudi, baik dilengkapi atau tidak dilengkapi bagasi.
4. Mobil truk adalah setiap kendaraan bermotor yang digunakan untuk angkutan barang, selain mobil penumpang, mobil bis dan kendaraan bermotor roda dua.
5. Kantor pos adalah tempat pemberi pelayanan komunikasi tertulis dan atau surat elektronik, layanan paket, layanan logistik,
1. Motor vehicles are any kind of vehicles motorized by machine set up in those vehicles, they are usually used for transporting peoples or goods on roads except vehicles moving along a railway line. The data cover all kinds of motor vehicles except those belong to Indonesia Army Force Indonesian State Police and Diplomatic Corps.
2. Passenger carsare any motor vehicles with no more than eight seats, excluding seat for driver, it can be with or without hoot.
3. Buses are large passenger cars having seats for more than eight passengers, excluding seat for driver, it can be with or without hoot.
4. Trucksare any motor vehicles used to transport goods excluding passenger cars, buses, and motorcycles.
5. Post Office is a service provider facility of written communication and or electronic mail, parcel service, logistics services, financial
https:
//goro
ntalo
kota
.bps.g
o.id

204 Gorontalo Municipality in Figures 2020
TRANSPORTATION AND COMMUNICATION
layanan transaksi keuangan, dan layanan keagenan pos untuk kepentingan umum. Rumah pos berfungsi sama seperti kantor pos dan kantor pos pembantu, bedanya rumah pos biasanya terletak di daerah terpencil.
transaction services, and postal services to the public. Postal house has the same function as the post office and subsidiary of post office, the difference is that postal house is usually located in remote areas.
https:
//goro
ntalo
kota
.bps.g
o.id

205Kota Gorontalo Dalam Angka 2020
TRANSPORTASI DAN KOMUNIKASI
Sumber/Source : Dinas Pekerjaan Umum dan Kimpraswi Kota Gorontalo / Public Works and Settlements and Infrastruktur Service of Gorontalo Municipality
81%
6%
6%7%
Baik / Good Sedang / Medium Rusak / Damaged Rusak Berat / Severely Damaged
8.1 Persentase Panjang Jalan Kota Menurut Kondisi Jalan di Kota Gorontalo (km), 2019
Percentage of Length of Regency Roads by Condition Of Road Surface in Gorontalo Municipality (kilometer), 2019
GambarFigures
https:
//goro
ntalo
kota
.bps.g
o.id

206 Gorontalo Municipality in Figures 2020
TRANSPORTATION AND COMMUNICATION
8.1 TRANSPORTASI TRANSPORTATION
TabelTable 8.1.1 Panjang Jalan Menurut Kewenangan Pemerintahan di
Kota Gorontalo (km), 2015-2019 Length of Roads by Level of Government Authority in
Gorontalo Municipality (kilometer), 2015-2019
Sumber/Source: Dinas Pekerjaan Umum dan Kimpraswil Kota Gorontalo / Public Works and Settlements and Infrastruktur Service of Gorontalo Municipality
Pemerintah yang Berwenang Mengelola
Level of Government Authority2015 2016 2017 2018 2019
(1) (2) (3) (4) (5) (6)
Negara / State 13,99 19,87 17,06 17,06 22,18
Provinsi / Province 23,94 20,86 33,92 33,92 45,05
Kota/ Municipality 224,29 224,74 237,29 237,29 237,28
Jumlah / Total 262,22 265,48 288,26 288,26 304,51https:
//goro
ntalo
kota
.bps.g
o.id

207Kota Gorontalo Dalam Angka 2020
TRANSPORTASI DAN KOMUNIKASI
TabelTable 8.1.2 Panjang Jalan Menurut Jenis Permukaan di Kota
Gorontalo (km), 2017–2019 Length of Regency Roads by Type Of Road Surface in
Gorontalo Municipality (kilometer), 2017–2019
Sumber/Source: Dinas Pekerjaan Umum dan Kimpraswil Kota Gorontalo / Public Works and Settlements and Infrastruktur Service of Gorontalo Municipality
Jenis Permukaan JalanType Of Road Surface 2017 2018 2019
(1) (2) (3) (4)
Diaspal / Aphalt 226,53 226,53 209,48
Kerikil / Gravel 2,95 2,95 12,10
Tanah / Dirt 0,99 0,99 4,46
Lainnya / Others 6,82 6,82 11,24
Jumlah / Total 237,29 237,29 237,28https:
//goro
ntalo
kota
.bps.g
o.id

208 Gorontalo Municipality in Figures 2020
TRANSPORTATION AND COMMUNICATION
TabelTable 8.1.3 Panjang Jalan Kota Menurut Kondisi Jalan di Kota
Gorontalo (km), 2015–2019 Length of Regency Roads by Condition Of Road Surface in
Gorontalo Municipality (kilometer), 2015–2019
Sumber/Source: Dinas Pekerjaan Umum dan Kimpraswil Kota Gorontalo / Public Works and Settlements and Infrastruktur Service of Gorontalo Municipality
Pemerintah yang Berwenang Mengelola
Level of Government Authority2015 2016 2017 2018 2019
(1) (2) (3) (4) (5) (6)
Baik / Good 165,27 168,36 173,83 177,40 191,91
Sedang / Medium 34,41 30,16 25,43 25,39 13,97
Rusak / Damaged 10,98 14,24 20,70 18,74 14,84
Rusak Berat /Severely Damaged
11,99 11,99 17,32 15,76 16,56
Jumlah / Total 222,65 224,75 237,28 237,29 237,28
https:
//goro
ntalo
kota
.bps.g
o.id

209Kota Gorontalo Dalam Angka 2020
TRANSPORTASI DAN KOMUNIKASI
TabelTable 8.1.4 Banyaknya Kendaraan Bermotor Menurut Jenis
Kendaraan di Kota Gorontalo (unit), 2016–2019 Length of Regency Roads by Condition Of Road Surface
in Number of Registered Motor Vehicles by Type of Motor Vehicles In Gorontalo Municipality (units), 2016–2019
Sumber/Source: Sistem Administrasi Manunggal Satu Atap (Samsat) Kota Gorontalo / One-stop Single Administration System of Gorontalo Municipality
Pemerintah yang Berwenang MengelolaLevel of Government Authority 2016 2017 2018 2019
(1) (2) (3) (4) (5)
Sedan / Sedan 225 228 292 215
St. Wagon / St. Wagon - - - 1
Jip / Jeep 532 574 701 635
Bus / Bus 40 47 22 45
Bus Mikro / Micro Bus 44 43 55 67
Bus Mini / Mini Bus 6 145 8 396 11 092 10 862
Bus Sedang / Light Bus - - 9 -
Mikrolet / Microlet - 16 - -
Oplet / Oplet - - - -
Truk dan L. Truk / Trucks 843 741 1 072 802
Tangki / Tanker 36 49 29 37
Truk Boks / Box Truck 245 280 234 233
Truk Sampah / Dump Truck 356 476 508 403
Pick Up / Pick Up Car 2 318 2 576 3 208 2 975
Wagon Boks / Box Wagon - 7 1 4
Double Cabin / Double Cabin - 53 34 4Alat Berat / Heavy Duty Vehicle - 1 - -Ambulan / Ambulance 3 26 33 51
Pemadam Api / Fire Truck 0 - - -
Sepeda Motor / Motorcycle 40 132 40 370 47 312 36 566
Skuter / Scouter - - - -
Roda 3 dan Bentor / Tricycle 4 500 3 540 4 968 3 220
Jumlah / Total 55 419 57 423 69 570 56 089
https:
//goro
ntalo
kota
.bps.g
o.id

210 Gorontalo Municipality in Figures 2020
TRANSPORTATION AND COMMUNICATION
8.2 KOMUNIKASI COMMUNICATION TabelTable 8.2.1 Banyaknya Produk Pos yang Dikirim dan Diterima di Kota
Gorontalo, 2017–2019 Number of Received and Delivered of Post Product in
Gorontalo Municipality, 2016–2019
Pemerintah yang Berwenang MengelolaLevel of Government Authority 2017 2018 2019
(1) (2) (3) (4)
Dikirim 33 001 … 111 358
Kilat Korporat … … 76 289
Surat Kilat … … -
Surat Kilat Khusus 22 245 133 24 492
Surat Express 6 362 … 1 403
Tercatat (R) LN 4 394 … 23
Paket Pos Biasa … … 678
Paket Pos Kilat … … -
Paket Pos Kilat Khusus … … 4 886
Pake Pos Express … … 468
Paket Pos Cepat LN … … 151
Wesel Pos … 2 968
Diterima 211 244 … 307 924
Surat Kilat … … …
Surat Kilat Khusus … … …
Surat Express … … …Tercatat (R) LN … … …Paket Pos Biasa … … …
Paket Pos Kilat … … …
Paket Pos Kilat Khususu … … …
Paket Pos Express … … …
Paket Pos Cepat LN … … …
Wesel Pos … … 3 587
Jumlah / Total 244 245 133 419 282Sumber/Source: PT. Pos Indoensia Cabang Gorontalo / Postal Services - PT. POS Indonesia Gorontalo
https:
//goro
ntalo
kota
.bps.g
o.id

211
PERBANKAN, KOPERASI DAN HARGA-HARGA
Kota Gorontalo Dalam Angka 2020
9 PERBANKAN, KOPERASI DAN HARGA-HARGA/BANKING, COOPERATIVE AND PRICES ...............................................................
PERBANKAN, KOPERASI DAN HARGA-HARGABANKING, COOPERATIVE AND PRICES
09
9. Perbankan, Koperasi dan Harga-Harga/Banking, Cooperative and Prices .........................................................................................................................................
https:
//goro
ntalo
kota
.bps.g
o.id

https:
//goro
ntalo
kota
.bps.g
o.id

213
PERBANKAN, KOPERASI DAN HARGA-HARGA
Kota Gorontalo Dalam Angka 2020
PENJELASAN TEKNIS TECHNICAL NOTES
1. Inflasi adalah kecenderungan naiknya harga barang dan jasa pada umumnya yang berlangsung secara terus menerus. Jika harga barang dan jasa di dalam negeri meningkat, maka inflasi mengalami kenaikan. Naiknya harga barang dan jasa tersebut menyebabkan turunnya nilai uang. Dengan demikian, inflasi dapat juga diartikan sebagai penurunan nilai uang terhadap nilai barang dan jasa secara umum.
2. IHK merupakan indikator inflasi di Indonesia. Sejak Januari 2014, IHK dihitung berdasarkan Survei Biaya Hidup (SBH) di 82 kota tahun 2012 yang mencakup sekitar 225–462 komoditas.
3. Indeks Harga Konsumen (IHK) adalah Indeks yang menghitung rata-rata perubahan hargadari suatu paket barang dan jasa yang dikonsumsi oleh rumah tangga dalam kurun waktu tertentu. IHK merupakan indikator yang digunakan untuk mengukur tingkat inflasi. Perubahan IHK dari waktu ke waktu menggambarkan tingkat kenaikan (inflasi) atau tingkat penurunan (deflasi) dari barang dan jasa.
4. IHK mencakup 7 kelompok, yaitu: bahan makanan; makanan jadi, minuman,rokok, dan tembakau; perumahan, air, listrik, gas, dan
1. Inflation is the tendency of rising prices of goods and services in general which continue ceaselessly. If the price of goods and services inthe country increases, inflation will rise. The rising prices for goods and services lead to a decline in the value of money hence. Thus, inflation can be also interpreted a deterioration in the value of money towards the value of goods an services in general.
2. CPI is the indicator of inflation in Indonesia. Since January 2014, the CPI has been developed from the 2012 Cost of Living Survey (CLS) of 82 cities which is covering 225–462 commodities.
3. The Consumer Price Index (CPI) is an index that examines the weighted average of prices of a basket of consumer good an services purchased by househoids, in a period. The CPI is an indicator for measuring inflation. Changes in CPI from a different time period illustrate the rate of increase (inflation) or the level of decline (deflation) of prices of goods and services.
4. Commodities of CPI consist of 7 groups as follows: foodstuff; prepare food, beverages, and tobacco products; housing, water,
https:
//goro
ntalo
kota
.bps.g
o.id

214
BANKING, COOPERATIVE AND PRICES
Gorontalo Municipality in Figures 2020
bahan bakar; sandang; kesehatan; pendidikan, rekreasi, dan olahraga; transpor, komunikasi, dan jasa keuangan.
electricity, gas, and fuel; clothing; health; education, recreation, and sports; transport, communication, and financial services.
https:
//goro
ntalo
kota
.bps.g
o.id
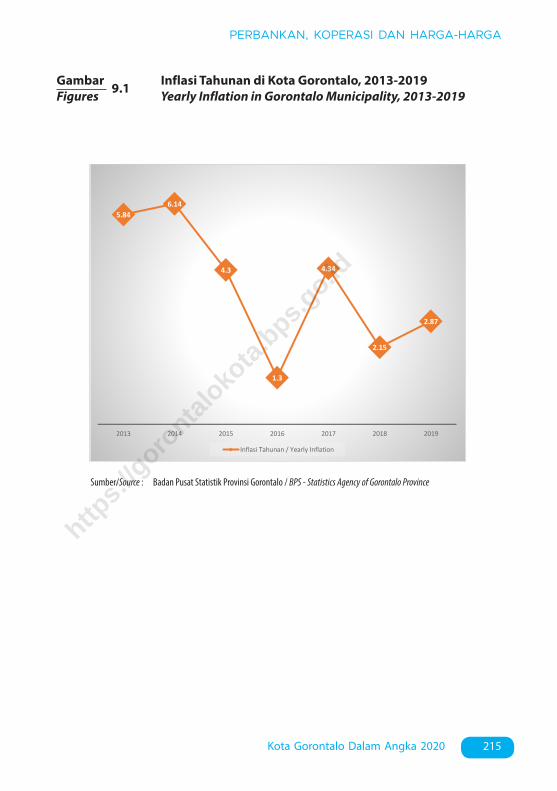
215
PERBANKAN, KOPERASI DAN HARGA-HARGA
Kota Gorontalo Dalam Angka 2020
9.1 Inflasi Tahunan di Kota Gorontalo, 2013-2019 Yearly Inflation in Gorontalo Municipality, 2013-2019
GambarFigures
Sumber/Source : Badan Pusat Statistik Provinsi Gorontalo / BPS - Statistics Agency of Gorontalo Province
5.846.14
4.3
1.3
4.34
2.15
2.87
2013 2014 2015 2016 2017 2018 2019
Inflasi Tahunan / Yearly Inflation
https:
//goro
ntalo
kota
.bps.g
o.id
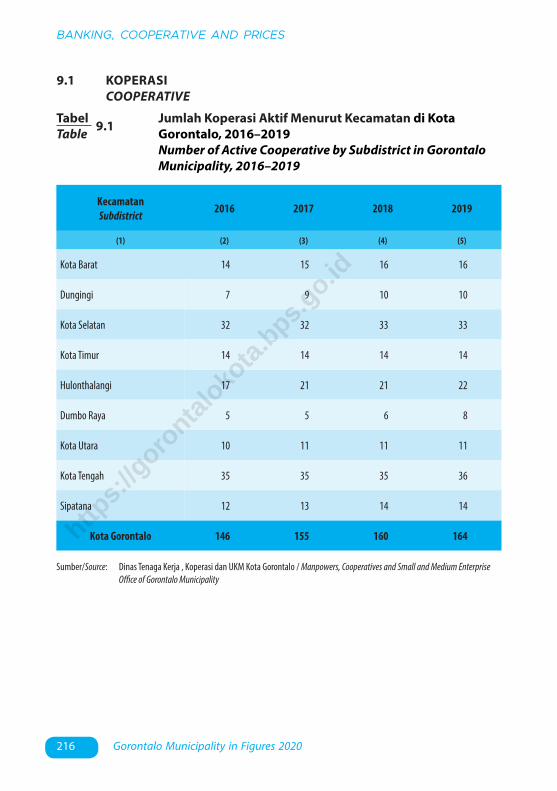
216
BANKING, COOPERATIVE AND PRICES
Gorontalo Municipality in Figures 2020
9.1 KOPERASI COOPERATIVE
TabelTable 9.1 Jumlah Koperasi Aktif Menurut Kecamatan di Kota
Gorontalo, 2016–2019 Number of Active Cooperative by Subdistrict in Gorontalo
Municipality, 2016–2019
Sumber/Source: Dinas Tenaga Kerja , Koperasi dan UKM Kota Gorontalo / Manpowers, Cooperatives and Small and Medium Enterprise Office of Gorontalo Municipality
KecamatanSubdistrict 2016 2017 2018 2019
(1) (2) (3) (4) (5)
Kota Barat 14 15 16 16
Dungingi 7 9 10 10
Kota Selatan 32 32 33 33
Kota Timur 14 14 14 14
Hulonthalangi 17 21 21 22
Dumbo Raya 5 5 6 8
Kota Utara 10 11 11 11
Kota Tengah 35 35 35 36
Sipatana 12 13 14 14
Kota Gorontalo 146 155 160 164https:
//goro
ntalo
kota
.bps.g
o.id

217
PERBANKAN, KOPERASI DAN HARGA-HARGA
Kota Gorontalo Dalam Angka 2020
TabelTable 9.2 Jumlah Koperasi Menurut Jenis Koperasi dan Kecamatan
di Kota Gorontalo, 2019 Number of Cooperative by Kind of Cooperative and
Subdistrict in Gorontalo Municipality, 2019
KecamatanSubdistrict
Jenis KoperasiKind of Cooperative
KUD KPRI KOPKAR KOPPAS LainnyaOther
JumlahTotal
(1) (2) (3) (4) (5) (6) (7)
Kota Barat - 5 1 ... 19 25
Dungingi 1 2 1 ... 21 25
Kota Selatan - 15 5 ... 51 71
Kota Timur 1 6 5 ... 29 41
Hulonthalangi 1 3 3 ... 21 28
Dumbo Raya - 2 ... 16 18
Kota Utara 1 2 1 ... 18 22
Kota Tengah - 19 3 ... 36 58
Sipatana 1 4 1 ... 17 23
Nama Kabupaten/Kota 5 56 22 ... 228 311
Catatan/Note: Termasuk Koperasi Tidak Aktif / Including The Inactive CooperativeSumber/Source: Dinas Tenaga Kerja , Koperasi dan UKM Kota Gorontalo / Manpowers, Cooperatives and Small and Medium Enterprise
Office of Gorontalo Municipality
https:
//goro
ntalo
kota
.bps.g
o.id

218
BANKING, COOPERATIVE AND PRICES
Gorontalo Municipality in Figures 2020
9.2.1 Indeks Harga Konsumen per Bulan Menurut Kelompok Pengeluaran di Kota Gorontalo (2012 = 100), 2019
Monthly Consumer Price Index by Expenditure Group in Gorontalo Municipality (2012 = 100), 2019
9.2 HARGA-HARGA PRICES
TabelTable
BulanMonths
Bahan MakananGroceries
Makanan JadiMinuman Rokok dan TembakauPrepared Food Beverages and
Tobacco Product
Perumahan Air Listrik Gas dan Bahan Bakar
Housing Water Electric
Municipality Gas and Fuel
SandangClothing
(1) (2) (3) (4) (5)
Januari / January 136,12 137,72 123,67 120,05
Februari / February 130,23 140,40 123,71 120,07
Maret / March 130,24 140,39 123,87 120,13
April / April 132,85 140,48 123,65 120,49
Mei / May 141,64 140,63 123,61 120,82
Juni / June 143,36 140,71 123,54 120,85
Juli / July 142,76 141,24 123,57 121,32
Agustus / August 145,54 141,50 123,80 121,95
September / September 143,03 141,47 123,90 122,86
Oktober / October 143,13 141,57 123,82 122,70
November / November 144,40 141,87 123,77 122,71
Desember / December 145,31 142,13 123,64 122,65
https:
//goro
ntalo
kota
.bps.g
o.id

219
PERBANKAN, KOPERASI DAN HARGA-HARGA
Kota Gorontalo Dalam Angka 2020
Lanjutan Tabel/Continued Table 9.2.1
BulanMonths
KesehatanHealth
Pendidikan Rekreasi dan
Olah RagaEducation
Recreation and Sports
Transpor Komunikasi dan Jasa Keuangan
Transport Communication
and Financial Service
UmumGeneral
(1) (6) (7) (8) (9)
Januari / January 128,85 121,41 131,51 130,04
Februari / February 128,90 121,43 131,81 129,16
Maret / March 128,95 121,54 132,12 129,28
April / April 129,57 121,54 132,36 129,92
Mei / May 129,59 121,54 132,69 132,05
Juni / June 129,53 121,55 132,75 132,45
Juli / July 129,77 121,55 132,70 132,42
Agustus / August 129,77 126,50 132,09 133,36
September / September 129,83 126,42 132,45 132,91
Oktober / October 130,69 126,42 132,37 132,94
November / November 130,69 126,38 132,27 133,25
Desember / December 130,73 126,40 132,64 133,53
Sumber/Source: Badan Pusat Statistik Provinsi Gorontalo / BPS - Statistics Agency of Gorontalo Province
https:
//goro
ntalo
kota
.bps.g
o.id

220
BANKING, COOPERATIVE AND PRICES
Gorontalo Municipality in Figures 2020
9.2.2 Inflasi Point-to-Point Menurut Bulan di Kota Gorontalo, 2019
Point-to-Point Inflation by Month in Gorontalo Municiplaity, 2019
TabelTable
BulanMonths
Bahan MakananGroceries
Makanan JadiMinuman Rokok dan TembakauPrepared Food Beverages and
Tobacco Product
Perumahan Air Listrik Gas dan Bahan Bakar
Housing Water Electric
Municipality Gas and Fuel
SandangClothing
(1) (2) (3) (4) (5)
Januari / January 0,40 0,03 0,17 0,19
Februari / February -4,33 1,95 0,03 0,02
Maret / March 0,01 -0,01 0,13 0,05
April / April 2,00 0,06 -0,18 0,30
Mei / May 6,62 0,11 -0,03 0,27
Juni / June 1,21 0,06 -0,06 0,02
Juli / July -0,42 0,38 0,02 0,39
Agustus / August 1,95 0,18 0,19 0,52
September / September -1,72 -0,02 0,08 0,75
Oktober / October 0,07 0,07 -0,06 -0,13
November / November 0,89 0,21 -0,04 0,01
Desember / December 0,63 0,18 -0,11 -0,05
https:
//goro
ntalo
kota
.bps.g
o.id
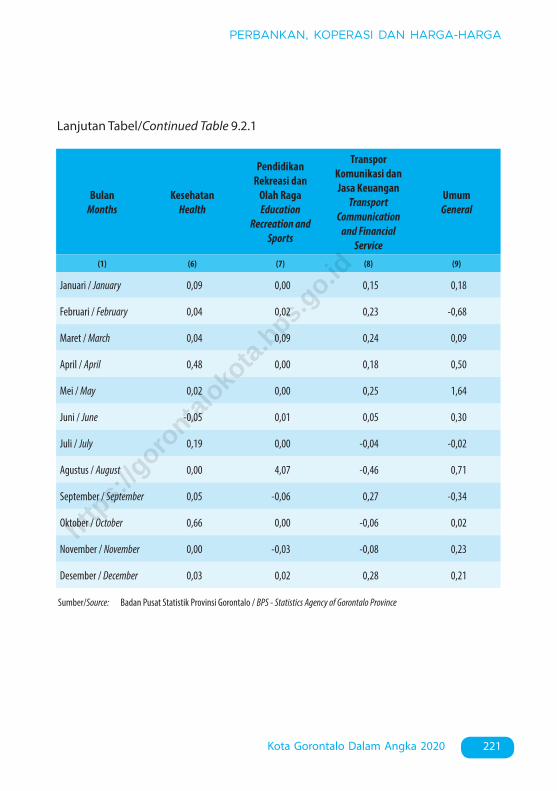
221
PERBANKAN, KOPERASI DAN HARGA-HARGA
Kota Gorontalo Dalam Angka 2020
Lanjutan Tabel/Continued Table 9.2.1
BulanMonths
KesehatanHealth
Pendidikan Rekreasi dan
Olah RagaEducation
Recreation and Sports
Transpor Komunikasi dan Jasa Keuangan
Transport Communication
and Financial Service
UmumGeneral
(1) (6) (7) (8) (9)
Januari / January 0,09 0,00 0,15 0,18
Februari / February 0,04 0,02 0,23 -0,68
Maret / March 0,04 0,09 0,24 0,09
April / April 0,48 0,00 0,18 0,50
Mei / May 0,02 0,00 0,25 1,64
Juni / June -0,05 0,01 0,05 0,30
Juli / July 0,19 0,00 -0,04 -0,02
Agustus / August 0,00 4,07 -0,46 0,71
September / September 0,05 -0,06 0,27 -0,34
Oktober / October 0,66 0,00 -0,06 0,02
November / November 0,00 -0,03 -0,08 0,23
Desember / December 0,03 0,02 0,28 0,21
Sumber/Source: Badan Pusat Statistik Provinsi Gorontalo / BPS - Statistics Agency of Gorontalo Province
https:
//goro
ntalo
kota
.bps.g
o.id

222
BANKING, COOPERATIVE AND PRICES
Gorontalo Municipality in Figures 2020
9.2.3 Inflasi Tahunan di Kota Gorontalo, 2013 - 2019 Yearly Inflation in Gorontalo Municipality, 2013 - 2019
TabelTable
TahunYears
Inflasi (persen)Inflation (percent)
(1) (2)
2013 5,84
2014 6,14
2015 4,30
2016 1,30
2017 4,34
2018 2,15
2019 2,87
Sumber/Source: Badan Pusat Statistik Provinsi Gorontalo / BPS - Statistics Agency of Gorontalo Province
https:
//goro
ntalo
kota
.bps.g
o.id
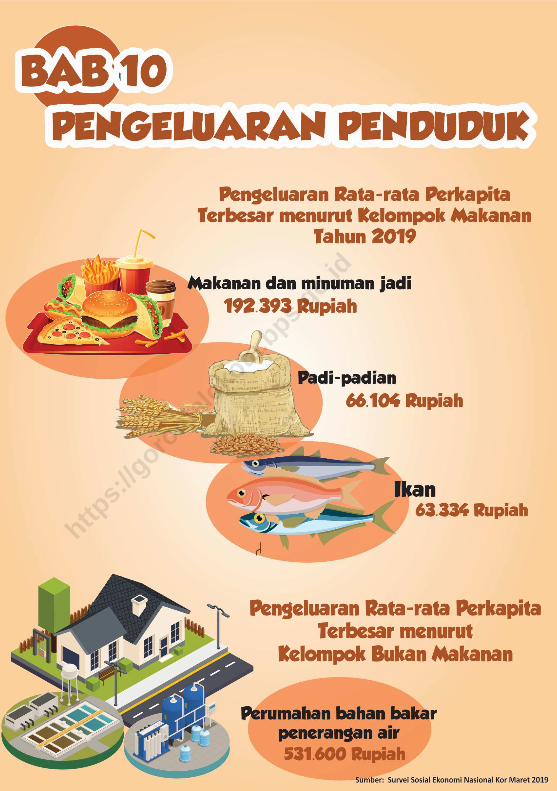
223
PENGELUARAN PENDUDUK
Kota Gorontalo Dalam Angka 2020
10. Pengeluaran Penduduk/Population Expenditure ...........................................
PENGELUARAN PENDUDUKPOPULATION EXPENDITURE
10
https:
//goro
ntalo
kota
.bps.g
o.id

https:
//goro
ntalo
kota
.bps.g
o.id

225
PENGELUARAN PENDUDUK
Kota Gorontalo Dalam Angka 2020
PENJELASAN TEKNIS TECHNICAL NOTES
Pengeluaran rata-rata per kapita adalah biaya yang dikeluarkan untuk konsumsi semua anggota rumah tangga selama sebulan baik yang berasal dari pembelian, pemberian maupun produksi sendiri dibagi dengan banyaknya anggota rumah tangga dalam rumah tangga tersebut.
Per capita Average Expenditure is the cost spent for all household members consumption during the month, whether from purchasing, giving or own production, divided by the number of household members in the household.
https:
//goro
ntalo
kota
.bps.g
o.id

226
POPULATION EXPENDITURE
Gorontalo Municipality in Figures 2020
10.1 Pengeluaran Rata – rata Perkapita Sebulan Menurut Kelompok Komoditas Makanan di Kota Gorontalo (rupiah), 2019
Average Expenditure Per Capita Per Month by Food Commodity Group in Gorontalo Municipality (rupiahs), 2019
GambarFigures
3392
4553
6955
8294
13054
14044
11966
28537
35048
38333
66104
57796
63334
192393
0 50000 100000 150000 200000 250000
Umbi – umbian
Kacang – kacangan
Konsumsi lainnya
Bumbu – bumbuan
Minyak dan lemak
Bahan minuman
Daging
Buah – buahan
Telur dan susu
Sayur – sayuran
Padi – padian
Tembakau dan sirih
Ikan
Makanan dan minuman jadi
Pengeluaran Rata-rata Perkapita Sebulan / Average Expenditure Per Capita Per Month
Sumber/Source: Survei Sosial Ekonomi Nasional Kor Maret 2019 / National Socio Economic Survey kor March 2019https:
//goro
ntalo
kota
.bps.g
o.id

227
PENGELUARAN PENDUDUK
Kota Gorontalo Dalam Angka 2020
10.2 Pengeluaran Rata – rata Perkapita Sebulan Menurut Kelompok Komoditas Non-Makanan di Kota Gorontalo (rupiah), 2019
Average Expenditure Per Capita Per Month by Non-Food Commodity Group in Gorontalo Municipality (rupiahs), 2019
GambarFigures
0
100000
200000
300000
400000
500000
600000
Perumahan bahanbakar penerangan
air
Aneka barang danjasa
Pakaian alas kaki dantutup kepala
Barang yang tahanlama
Pajak, pungutan danpremi asuransi
Keperluan pesta danupacara
531600
238482
5518969147
5188137199
Pengeluaran Rata-rata Perkapita Sebulan (rupiah) / Average Expenditure Per Capita Per Month
Sumber/Source: Survei Sosial Ekonomi Nasional Kor Maret 2019 / National Socio Economic Survey kor March 2019
https:
//goro
ntalo
kota
.bps.g
o.id

228
POPULATION EXPENDITURE
Gorontalo Municipality in Figures 2020
TabelTable 10.1 Rata-rata Pengeluaran per Kapita Sebulan Menurut
Kelompok Komoditas (rupiah) di Kota Gorontalo, 2018 dan 2019
Monthly Average Expenditure per Capita by Commodity Group (rupiahs) in Gorontalo Municipality, 2018 and 2019
Kelompok Komoditas/Commodity Group 2018 2019(1) (2) (3)
Makanan/Food
Padi-padian/Cereals 59 262 66 104
Umbi-umbian/Tubers 3 705 3 392
Ikan/udang/cumi/kerang/Fish/shrimp/common squid/shells 69 961 63 334
Daging/Meat 15 153 11 966
Telur dan susu/Eggs and milk 31 745 35 048
Sayur-sayuran/Vegetables 39 655 38 333
Kacang-kacangan/Legumes 6 083 4 553
Buah-buahan/Fruits 18 713 28 537
Minyak dan kelapa/Oil and coconut 12 790 13 054
Bahan minuman/Beverage stuffs 13 501 14 044
Bumbu-bumbuan/Spices 9 964 8 294
Konsumsi lainnya/Miscellaneous food items 7 786 6 955
Makanan dan minuman jadi/Prepared food and beverages 172 997 192 393
Tembakau dan sirih / Tobacco and betel 62 027 57 796
Jumlah makanan/Total food 523 341 543 803
Bukan makanan/Non-food
Perumahan dan fasilitas rumah tangga/Housing and household facilities
408 880 531 600
Aneka komoditas dan jasa/Goods and services 209 297 238 482
Pakaian, alas kaki, dan tutup kepala/Clothing, footwear, and headgear
44 933 55 189
Komoditas tahan lama/Durable goods 56 678 69 147
Pajak, pungutan, dan asuransi/Taxes and insurance 36 514 51 881
Keperluan pesta dan upacara/kenduri/Parties and ceremonies 21 297 37 199
Jumlah bukan makanan/Total non-food 777 600 983 497
Jumlah/Total 1 300 941 1 527 300
Sumber/Source: BPS, Survei Sosial Ekonomi Nasional (Susenas) Maret/BPS-Statistics Indonesia, National Socioeconomic Survey March
https:
//goro
ntalo
kota
.bps.g
o.id
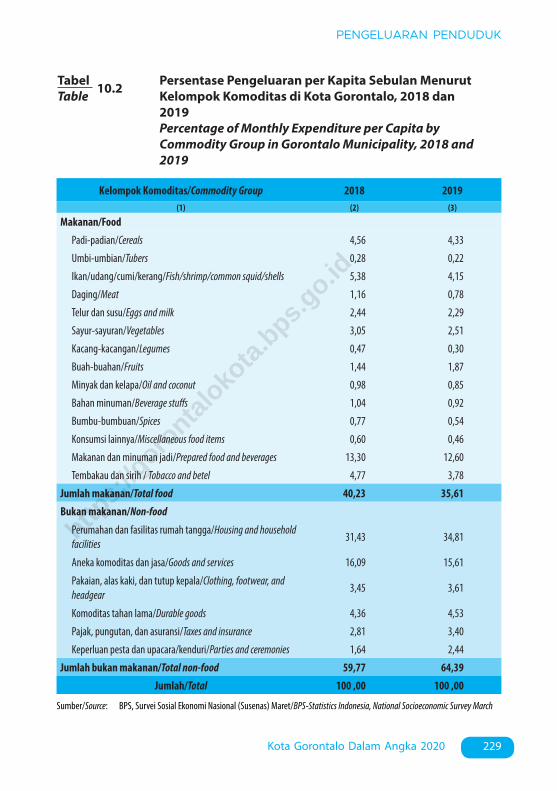
229
PENGELUARAN PENDUDUK
Kota Gorontalo Dalam Angka 2020
TabelTable 10.2 Persentase Pengeluaran per Kapita Sebulan Menurut
Kelompok Komoditas di Kota Gorontalo, 2018 dan 2019
Percentage of Monthly Expenditure per Capita by Commodity Group in Gorontalo Municipality, 2018 and 2019
Kelompok Komoditas/Commodity Group 2018 2019(1) (2) (3)
Makanan/Food
Padi-padian/Cereals 4,56 4,33
Umbi-umbian/Tubers 0,28 0,22
Ikan/udang/cumi/kerang/Fish/shrimp/common squid/shells 5,38 4,15
Daging/Meat 1,16 0,78
Telur dan susu/Eggs and milk 2,44 2,29
Sayur-sayuran/Vegetables 3,05 2,51
Kacang-kacangan/Legumes 0,47 0,30
Buah-buahan/Fruits 1,44 1,87
Minyak dan kelapa/Oil and coconut 0,98 0,85
Bahan minuman/Beverage stuffs 1,04 0,92
Bumbu-bumbuan/Spices 0,77 0,54
Konsumsi lainnya/Miscellaneous food items 0,60 0,46
Makanan dan minuman jadi/Prepared food and beverages 13,30 12,60
Tembakau dan sirih / Tobacco and betel 4,77 3,78
Jumlah makanan/Total food 40,23 35,61
Bukan makanan/Non-food
Perumahan dan fasilitas rumah tangga/Housing and household facilities
31,43 34,81
Aneka komoditas dan jasa/Goods and services 16,09 15,61
Pakaian, alas kaki, dan tutup kepala/Clothing, footwear, and headgear
3,45 3,61
Komoditas tahan lama/Durable goods 4,36 4,53
Pajak, pungutan, dan asuransi/Taxes and insurance 2,81 3,40
Keperluan pesta dan upacara/kenduri/Parties and ceremonies 1,64 2,44
Jumlah bukan makanan/Total non-food 59,77 64,39
Jumlah/Total 100 ,00 100 ,00
Sumber/Source: BPS, Survei Sosial Ekonomi Nasional (Susenas) Maret/BPS-Statistics Indonesia, National Socioeconomic Survey March
https:
//goro
ntalo
kota
.bps.g
o.id

230
POPULATION EXPENDITURE
Gorontalo Municipality in Figures 2020
Golongan PengeluaranSpending Group
(Rp)2018 2019
(1) (2) (3)
< 150 000 0,00 0,00
150 000–199 999 0,00 0,00
200 000–299 999 2,91 1,74
300 000–499 999 14,66 9,45
500 000–749 999 17,84 15,72
750 000–999 999 14,46 13,22
1 000 000–1 499 999 17,28 19,30
> 1 500 000 32,86 40,57
Jumlah/Total 100,00 100,00
TabelTable 10.3 Persentase Penduduk Menurut Golongan Pengeluaran
Per Kapita Sebulan di Kota Gorontalo, 2018 dan 2019 Percentage of Population by Per Capita Spending Group a
Month in Gorontalo Municipality, 2018 and 2019
Sumber/Source: BPS, Survei Sosial Ekonomi Nasional (Susenas) Maret/BPS-Statistics Indonesia, National Socioeconomic Survey Marchhttps:
//goro
ntalo
kota
.bps.g
o.id

231Kota Gorontalo Dalam Angka 2020
SISTEM NERACA REGIONAL
11. Sistem Neraca Regional/System of Regional Accounts .................................
11 SISTEM NERACA REGIONAL/SYSTEM OF REGIONAL ACCOUNTS ..
SISTEM NERACA REGIONALSYSTEM OF REGIONAL ACCOUNTS
11
https:
//goro
ntalo
kota
.bps.g
o.id

https:
//goro
ntalo
kota
.bps.g
o.id

233Kota Gorontalo Dalam Angka 2020
SISTEM NERACA REGIONAL
PENJELASAN TEKNIS TECHNICAL NOTES
1. Penghitungan statistik neraca nasional mengikuti buku petunjuk yang diterbitkan oleh Perserikatan Bangsa Bangsa (PBB) dikenal sebagai Sistem Neraca Nasional (SNN). SNN adalah rekomendasi internasional tentang bagaimana menyusun ukuran aktivitas ekonomi yang sesuai dengan standar neraca baku yang didasarkan pada prinsip-prinsip ekonomi. Rekomendasi yang dimaksud dinyatakan dalam sekumpulan konsep, definisi, klasifikasi, dan aturan neraca yang disepakati secara internasional dalam mengukur indikator tertentu seperti Produk Domestik Bruto (PDB). Salah satu bentuk adaptasi pencatatan statistik nasional adalah melakukan perubahan tahun dasar PDB Indonesia dari tahun 2000 ke 2010. Perubahan tahun dasar PDB dilakukan seiring dengan mengadopsi rekomendasi PBB yang tertuang dalam Sistem Neraca Nasional 2008 (SNA 2008).
2. Produk Domestik Bruto pada tingkat nasional serta Produk Domestik Regional Bruto (PDRB) pada tingkat regional (provinsi) menggambarkan kemampuan suatu wilayah untuk menciptakan nilai tambah pada suatu waktu tertentu. Untuk menyusun PDB maupun PDRB digunakan 2
1. The method used to estimate national accounts statistics is based on the standard guidelines formed by United Nation known as System of National Accounts (SNA). SNA is the internationally agreed standard set of recommendations on how to compile measures of economic activity in accordance with strict accounting conventions based on economic principles. The recommendations are expressed in term of a set of concepts, definitions, classifications and accounting rules that comprise the internationally agreed standard for measuring indicators such as Gross Domestic Product (GDP). One of the improvementin the national statistical system is to rebase GDP form base year 2000 to 2010 in order to capture current economic condition. It is in line with the United Nations (UN) recommendation on 2008 SNA.
2. The basic measure of the value added arising from economic activity is known as Gross Domestic Product at the national level and Gross Regional Domestic Product (GRDP) at the regional level (provinces/regencies/municipalities). To compile these statistics, two approaches
https:
//goro
ntalo
kota
.bps.g
o.id

234 Gorontalo Municipality in Figures 2020
SYSTEM OF REGIONAL ACCOUNTS
pendekatan, yaitu lapangan usaha dan pengeluaran. Keduanya menyajikan komposisi data nilai tambah dirinci menurut sumber kegiatan ekonomi (lapangan usaha) dan menurut komponen penggunaannya. PDB maupun PDRB dari sisi lapangan usaha merupakan penjumlahan seluruh komponen nilai tambah bruto yang mampu diciptakan oleh sektor-sektor ekonomi atas berbagai aktivitas produksinya. Sedangkan dari sisi pengeluaran menjelaskan tentang penggunaan dari nilai tambah tersebut.
3. PDB menurut lapangan usaha mengalami perubahan klasifikasi dari 9 lapangan usaha menjadi 17 lapangan usaha. PDB menurut lapangan usaha dirinci menurut total nilai tambah dari seluruh sektor ekonomi yang mencakup lapangan usaha Pertanian, Kehutanan, dan Perikanan; Pertambangan dan Penggalian; Industri Pengolahan; Pengadaan Listrik dan Gas; Pengadaan Air, Pengelolaan Sampah, Limbah dan Daur Ulang; Konstruksi; Perdagangan Besar dan Eceran, Reparasi Mobil dan Sepeda Motor; Transportasi dan Pergudangan; Penyediaan Akomodasi dan Makan Minum; Informasi dan Komunikasi; Jasa Keuangan dan Asuransi; Real Estat; Jasa Perusahaan; Administrasi Pemerintahan, Pertahanan
have been used, i.e. “production approach” and “expenditure approach”. The first approach is to measure value added produced by various kinds of economic activities, while the second approach is to measure final uses of the country’s output. In other words, GDP/GRDP is the sum of total value added produced by all economic industries (activities) and the way of using it.
3. GDP by industry classification changes from 9 sectors to 17 industries. GDP by industry is classified by types of economic activities such as Agriculture, Forestry and Fishing; Mining and Quarrying; Manufacturing; ElectriMunicipality and Gas; Water supply, Sewerage, Waste Management and Remediation Activities; Construction; Wholesale and Retail Trade; Repair of Motor Vehicles and Motorcycles; Transportation and Storage; Accommodation and Food Service Activities; Information and Communication; Financial and Insurance Activities; Real Estate Activities; Business Activities; Public Administration; Defence and Compulsory Social Security; Education; Human Health and Social Work Activities; and Other
https:
//goro
ntalo
kota
.bps.g
o.id

235Kota Gorontalo Dalam Angka 2020
SISTEM NERACA REGIONAL
dan Jaminan Sosial Wajib; Jasa Pendidikan; Jasa Kesehatan dan Kegiatan Sosial; dan Jasa lainnya.
4. PDB menurut pengeluaran mengalami perubahan klasifikasi dimana pengeluaran konsumsi Lembaga Non Profit yang Melayani Rumah Tangga (LNPRT) yang sebelumnya termasuk bagian dari pengeluaran konsumsi rumah tangga menjadi komponen terpisah. Sehinga klasifikasi PDB menurut pengeluaran dirinci menjadi 7 komponen yaitu komponen pengeluaran konsumsi rumah tangga, pengeluaran konsumsi LNPRT, pengeluaran konsumsi pemerintah, pembentukan modal tetap bruto, perubahan inventori, ekspor barang dan jasa, dan impor barang dan jasa.
5. Pengeluaran konsumsi rumah tangga mencakup berbagai pengeluaran konsumsi akhir rumah tangga atas barang dan jasa untuk memenuhi kebutuhan individu ataupun kelompok secara langsung. Pengeluaran rumah tangga di sini mencakup makanan dan minuman selain restoran; pakaian, alas kaki dan jasa perawatannya; perumahan dan perlengkapan rumah tangga; kesehatan dan pendidikan; transportasi dan komunikasi; restoran dan hotel serta lainnya.
6. Pengeluaran Konsumsi Pemerintah terdiri dari Pengeluaran Konsumsi Individu
Services Activities.
4. GDP by expenditure classification changes where consumption expenditure Non-profit Institutions Serving Households (NPISH) previously included as part of household consumption expenditure is taken out into separate component. So that, GDP by type of expenditures is classified into: household consumption expenditure, NPISH consumption expenditure, government consumption expenditure, gross fixed capital formation, changes in inventories, exports of goods and services, and imports of goods and services.
5. Household consumption expenditures consist of expenditures incurred by households, which are used for both individual or collective needs. Household consumptions are classified into food and beverages other than restaurants; clothing, footwear, and related maintenance services; housing and household equipment; health and education; transport and communication; restaurants and hotels; and others.
6. Government consumption expenditure consists of Individual Consumption Expenditure
https:
//goro
ntalo
kota
.bps.g
o.id
236 Gorontalo Municipality in Figures 2020
SYSTEM OF REGIONAL ACCOUNTS
dan Pengeluaran Konsumsi Kolektif. Barang dan jasa individu merupakan barang dan jasa privat, dimana ciri-ciri barang privat adalah a) Scar Municipality, yaitu ada kelangkaan/keterbatasan dalam jumlah; b) Excludable consumption, yaitu konsumsi suatu barang dapat dibatasi hanya pada mereka yang memenuhi persyaratan tertentu (biasanya harga); c) Rivalrous competition, yaitu konsumsi oleh satu konsumen akan mengurangi atau menghilangkan kesempatan pihak lain untuk melakukan hal serupa. Contoh barang dan jasa yang dihasilkan pemerintah dan tergolong sebagai barang dan jasa individu adalah jasa pelayanan kesehatan pemerintah di rumah sakit/puskesmas dan jasa pendidikan di sekolah/universitas negeri. Sedangkan barang dan jasa kolektif ekuivalen dengan barang publik yang memiliki ciri a) Non rivalry, yaitu penggunaan satu konsumen terhadap suatu barang tidak mengurangi kesempatan konsumen lain untuk juga mengkonsumsi barang tersebut; b) Non excludable, yaitu apabila suatu barang publik tersedia, maka tidak ada yang dapat menghalangi siapapun untuk memperoleh manfaat dari barang tersebut atau dengan kata lain setiap orang memiliki akses ke barang tersebut. Contoh barang dan jasa yang dihasilkan
and Collective Consumption Expenditure. Individual goods and services are private goods and services, which the characteristics of private goods is a) ScarMunicipality, that there is a scarMunicipality/limited in number; b) Excludable consumption, the consumption of goods can be limited only to those who meet certain requirements (usually the price); c) Rivalrous competition, ie consumption by the consumer will reduce or eliminate the chance of another party to do so. Examples of goods and services produced by government and classified as goods and services of individuals is the government health services in hospitals/health centers and education services in schools/universities. Collective goods and services equivalent to public goods characterized by a) Non-rivalry, namely the use of a consumer for an item does not reduce the chance of another consumer to also consume goods; b) Non-excludable, i.e. when a public good available, then nothing can hinder anyone to benefit from the goods or in other words everyone has access to the goods. Examples of goods and services produced by government and classified as collective goods and services is carried military defense services and the police’s security.
https:
//goro
ntalo
kota
.bps.g
o.id

237Kota Gorontalo Dalam Angka 2020
SISTEM NERACA REGIONAL
pemerintah dan tergolong sebagai barang dan jasa kolektif adalah jasa pertahanan yang dilakukan TNI dan keamanan yang dilakukan kepolisian.
7. Pembentukan Modal Tetap Bruto (PMTB) mencakup pengadaan, pembuatan, dan pembelian barang modal. Barang modal dimaksud adalah barang-barang yang digunakan untuk proses produksi, tahan lama atau yang mempunyai umur pemakaian lebih dari satu tahun seperti bangunan, mesin-mesin dan alat angkutan. Termasuk pula di sini perbaikan besar (berat) yang sifatnya memperpanjang umur atau mengubah bentuk atau kapasitas barang modal tersebut. Pengeluaran barang modal untuk keperluan militer juga dicakup sebagai PMTB. Klasifikasi komponen PMTB dibagi menjadi 6 sub komponen yaitu Konstruksi; Mesin dan Peralatan; Kendaraan; Peralatan Lainnya; Cultivated Biological Resources (CBR) dan Produk Kekayaan Intelektual.
8. Ekspor barang dan jasa merupakan transaksi perdagangan barang dan jasa dari penduduk (residen) ke bukan penduduk (nonresiden). Impor barang dan jasa adalah transaksi perdagangan dari bukan penduduk ke penduduk. Ekspor atau impor barang terjadi pada saat terjadi perubahan hak kepemilikan barang antara penduduk dengan bukan
7. Gross Fixed Capital Formation (GFCF) includes procurement, manufacture, and the purchase of capital goods. Capital goods are goods which are used for the production process, durable or have a service life of more than one year such as buildings, machinery, and transportation equipment. Including here: huge improvement that are to extend the life or changing the shape or the capaMunicipality of the capital goods. Capital expenditures for military purposes are also covered as GFCF. GFCF component are classified into six sub-components: Construction; Machinery and Equipment; vehicle; Other equipment; Cultivated Biological Resources (CBR) and Intellectual Property Product.
8. Exports of goods and services consist of transactions of goods and services from residents to non-residents. Imports of goods and services consist of transaction of goods and services from non-residents to residents. Exports and imports of goods occur when there are changes in ownership of goods between residents and non-residents (with or without physical
https:
//goro
ntalo
kota
.bps.g
o.id

238 Gorontalo Municipality in Figures 2020
SYSTEM OF REGIONAL ACCOUNTS
penduduk (dengan atau tanpa perpindahan fisik barang tersebut). Pada PDB dengan tahun dasar 2010, ekspor dan impor barang dirinci menjadi nonmigas dan migas.
9. Produk Domestik Bruto maupun agregat turunannya disajikan dalam 2 (dua) versi penilaian, yaitu atas dasar “harga berlaku” dan atas dasar “harga konstan”. Disebut sebagai harga berlaku karena seluruh agregat dinilai dengan menggunakan harga pada tahun berjalan, sedangkan harga konstan penilaiannya didasarkan kepada harga satu tahun dasar tertentu, dalam publikasi ini digunakan harga tahun 2010.
10. Laju pertumbuhan Produk Domestik Bruto diperoleh dari perhitungan PDB atas dasar harga konstan. Diperoleh dengan cara mengurangi nilai PDB pada tahun ke-n terhadap nilai pada tahun ke n-1 (tahun sebelumnya), dibagi dengan nilai pada tahun ke n-1, dikalikan dengan 100 persen. Laju pertumbuhan menunjukkan perkembangan agregat pendapatan dari satu waktu tertentu terhadap waktu sebelumnya.
movements of goods across frontiers). On the GDP at 2010 basic year, exports and imports of goods specified into non oil and gas and oil and gas.
9. GDP and its aggregations are presented in two forms: at current market prices and at constant base year market prices. In presenting current market prices, all aggregates are valued at current market prices, while base year constant market prices are shown by valuing all aggregates at fixed base year prices. Year of 2010 is used as the base year in this publication.
10. Growth rate of Gross Domestic Product is derived from GDP at constant market prices. It is obtained by subtracting the value of GDP year n with the value of GDP year n-1, divided by the value of GDP year n-1 then multiplied by 100 percent. The growth rate of GDP explains the income growth during the given period.http
s://g
oronta
loko
ta.b
ps.go.id

239Kota Gorontalo Dalam Angka 2020
SISTEM NERACA REGIONAL
11.1 Distribusi Persentase Produk Domestik Regional Bruto (PDRB) Atas Dasar Harga Berlaku Menurut Lapangan Usaha di Kota Gorontalo (persen), 2019
Percentage Distribution of Gross Regional Domestic Product (GRDP) at Current Market Prices by Business Field in Gorontalo Municipality (percent), 2019
GambarFigures
A/4,88
B/0,34
C/5
D/0,05
E/0,21
F/13,17
G/16,77
H/9,08
I/5,26
J/5,8K/8,89
L/4,28
M,N/0,17
O/10,77
P/8,34
Q/4,85
R,S,T,U/2,15
Catatan/Note: Angka sangat sementara / very Preliminary figuresSumber/Source: Badan Pusat Statistik Kota Gorontalo / BPS – Statistics Agency of Gorontalo Municipality
https:
//goro
ntalo
kota
.bps.g
o.id

240 Gorontalo Municipality in Figures 2020
SYSTEM OF REGIONAL ACCOUNTS
7,93
7,23
7,41 7,43
7,016,97
6,4
6,6
6,8
7
7,2
7,4
7,6
7,8
8
8,2
2014 2015 2016 2017 2018 2019
Laju Pertumbuhan PDRB / GRDP Growth Rate
11.2 Laju Pertumbuhan Produk Domestik Regional Bruto (PDRB) Atas Dasar Harga Konstan 2010 Menurut Lapangan Usaha di Kota Gorontalo (persen), 2014 – 2019
Growth Rate of Gross Regional Domestic Product (GRDP) at 2010 Constant Market Prices by Business Field in Gorontalo Municipality (percent), 2014 – 2019
GambarFigures
Catatan/Note: 2018 Angka sementara / 2018 Preliminary figures 2019 Angka sangat sementara / 2019 very Preliminary figuresSumber/Source: Badan Pusat Statistik Kota Gorontalo / BPS – Statistics Agency of Gorontalo Municipality
https:
//goro
ntalo
kota
.bps.g
o.id
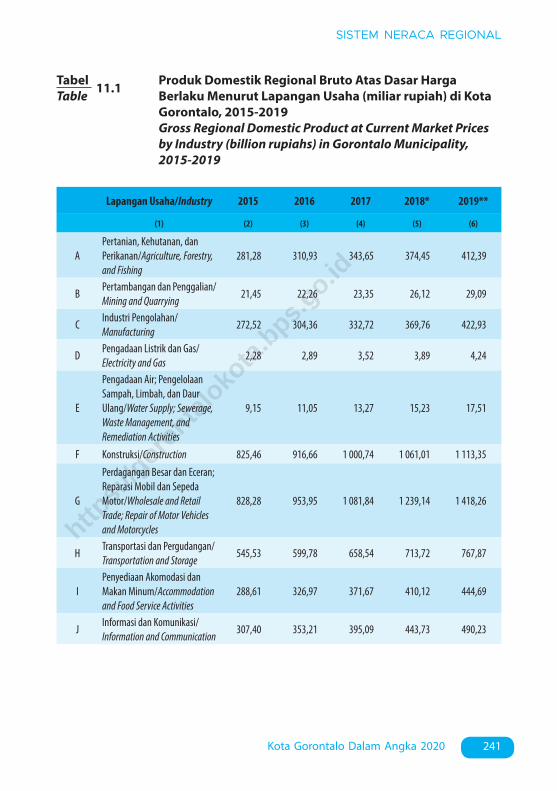
241Kota Gorontalo Dalam Angka 2020
SISTEM NERACA REGIONAL
TabelTable 11.1 Produk Domestik Regional Bruto Atas Dasar Harga
Berlaku Menurut Lapangan Usaha (miliar rupiah) di Kota Gorontalo, 2015-2019
Gross Regional Domestic Product at Current Market Prices by Industry (billion rupiahs) in Gorontalo Municipality, 2015-2019
Lapangan Usaha/Industry 2015 2016 2017 2018* 2019**
(1) (2) (3) (4) (5) (6)
APertanian, Kehutanan, dan Perikanan/Agriculture, Forestry, and Fishing
281,28 310,93 343,65 374,45 412,39
BPertambangan dan Penggalian/Mining and Quarrying
21,45 22,26 23,35 26,12 29,09
CIndustri Pengolahan/Manufacturing
272,52 304,36 332,72 369,76 422,93
DPengadaan Listrik dan Gas/Electricity and Gas
2,28 2,89 3,52 3,89 4,24
E
Pengadaan Air; Pengelolaan Sampah, Limbah, dan Daur Ulang/Water Supply; Sewerage, Waste Management, and Remediation Activities
9,15 11,05 13,27 15,23 17,51
F Konstruksi/Construction 825,46 916,66 1 000,74 1 061,01 1 113,35
G
Perdagangan Besar dan Eceran; Reparasi Mobil dan Sepeda Motor/Wholesale and Retail Trade; Repair of Motor Vehicles and Motorcycles
828,28 953,95 1 081,84 1 239,14 1 418,26
HTransportasi dan Pergudangan/Transportation and Storage
545,53 599,78 658,54 713,72 767,87
IPenyediaan Akomodasi dan Makan Minum/Accommodation and Food Service Activities
288,61 326,97 371,67 410,12 444,69
JInformasi dan Komunikasi/Information and Communication
307,40 353,21 395,09 443,73 490,23
https:
//goro
ntalo
kota
.bps.g
o.id

242 Gorontalo Municipality in Figures 2020
SYSTEM OF REGIONAL ACCOUNTS
Lapangan Usaha/Industry 2015 2016 2017 2018* 2019**
(1) (2) (3) (4) (5) (6)
KJasa Keuangan dan Asuransi/Financial and Insurance Activities
473,89 577,07 663,62 708,94 751,90
L Real Estat/Real Estate Activities 249,63 291,54 313,59 335,20 362,03
M,NJasa Perusahaan/Business Activities
9,89 11,22 12,28 13,18 14,44
O
Administrasi Pemerintahan, Pertahanan, dan Jaminan Sosial Wajib/Public Administration and Defence; Compulsory Social Security
829,83 850,44 855,70 878,85 910,29
P Jasa Pendidikan/Education 439,17 481,71 541,73 620,78 704,97
QJasa Kesehatan dan Kegiatan Sosial/Human Health and Social Work Activities
264,27 299,05 325,07 364,95 409,68
R,S,T,UJasa Lainnya/Other Services Activities
141,79 153,31 160,44 170,13 181,85
Produk Domestik Bruto/Gross Domestic Product 5 790,74 6 466,38 7 096,84 7 749,19 8 455,72
Lanjutan Tabel/Continued Table 11.1
Catatan/Note: * Angka sementara / Preliminary figures ** Angka sangat sementara / very Preliminary figuresSumber/Source: Badan Pusat Statistik Kota Gorontalo / BPS – Statistics Agency of Gorontalo Municipality
https:
//goro
ntalo
kota
.bps.g
o.id

243Kota Gorontalo Dalam Angka 2020
SISTEM NERACA REGIONAL
TabelTable 11.2 Produk Domestik Regional Bruto Atas Dasar Harga
Konstan 2010 Menurut Lapangan Usaha (miliar rupiah) di Kota Gorontalo, 2015-2019
Gross Regional Domestic Product at 2010 Constant Market Prices by Industry (billion rupiahs) in Gorontalo Municipality, 2015-2019
Lapangan Usaha/Industry 2015 2016 2017 2018* 2019**
(1) (2) (3) (4) (5) (6)
APertanian, Kehutanan, dan Perikanan/Agriculture, Forestry, and Fishing
228,85 240,28 259,45 275,78 296,00
BPertambangan dan Penggalian/Mining and Quarrying
17,26 17,74 18,71 20,35 22,14
CIndustri Pengolahan/Manufacturing
210,92 225,14 239,89 258,49 287,44
DPengadaan Listrik dan Gas/Electricity and Gas
3,50 3,86 4,20 4,52 4,87
E
Pengadaan Air; Pengelolaan Sampah, Limbah, dan Daur Ulang/Water Supply; Sewerage, Waste Management, and Remediation Activities
6,77 7,75 9,06 10,34 11,88
F Konstruksi/Construction 658,07 703,23 760,67 796,92 826,38
G
Perdagangan Besar dan Eceran; Reparasi Mobil dan Sepeda Motor/Wholesale and Retail Trade; Repair of Motor Vehicles and Motorcycles
649,71 712,42 787,33 875,44 975,95
HTransportasi dan Pergudangan/Transportation and Storage
457,36 487,44 520,95 556,24 586,83
IPenyediaan Akomodasi dan Makan Minum/Accommodation and Food Service Activities
224,96 245,64 273,94 295,60 315,74
JInformasi dan Komunikasi/Information and Communication
254,33 281,43 314,29 352,43 388,82
https:
//goro
ntalo
kota
.bps.g
o.id

244 Gorontalo Municipality in Figures 2020
SYSTEM OF REGIONAL ACCOUNTS
Lanjutan Tabel/Continued Table 11.2
Lapangan Usaha/Industry 2015 2016 2017 2018* 2019**
(1) (2) (3) (4) (5) (6)
KJasa Keuangan dan Asuransi/Financial and Insurance Activities
367,42 432,74 480,46 499,65 522,61
L Real Estat/Real Estate Activities 200,51 222,78 234,92 248,38 265,42
M,NJasa Perusahaan/Business Activities
7,63 8,24 8,88 9,41 10,03
O
Administrasi Pemerintahan, Pertahanan, dan Jaminan Sosial Wajib/Public Administration and Defence; Compulsory Social Security
682,65 679,99 684,10 698,69 712,03
P Jasa Pendidikan/Education 365,19 386,98 411,55 453,32 497,23
QJasa Kesehatan dan Kegiatan Sosial/Human Health and Social Work Activities
216,19 235,08 251,24 277,57 305,97
R,S,T,UJasa Lainnya/Other Services Activities
124,23 131,04 135,01 139,79 146,08
Produk Domestik Bruto/Gross Domestic Product 4 675,55 5 021,77 5 394,64 5 772,92 6 175,44
Catatan/Note: * Angka sementara / Preliminary figures ** Angka sangat sementara / very Preliminary figuresSumber/Source: Badan Pusat Statistik Kota Gorontalo / BPS – Statistics Agency of Gorontalo Municipality
https:
//goro
ntalo
kota
.bps.g
o.id

245Kota Gorontalo Dalam Angka 2020
SISTEM NERACA REGIONAL
TabelTable 11.3 Distribusi Persentase Produk Domestik Regional Bruto
Atas Dasar Harga Berlaku Menurut Lapangan Usaha di Kota Gorontalo, 2015-2019
Percentage Distribution of Gross Regional Domestic Product at Current Market Prices by Industry in Gorontalo Municipality, 2015-2019
Lapangan Usaha/Industry 2015 2016 2017 2018* 2019**
(1) (2) (3) (4) (5) (6)
APertanian, Kehutanan, dan Perikanan/Agriculture, Forestry, and Fishing
4,86 4,81 4,84 4,83 4,88
BPertambangan dan Penggalian/Mining and Quarrying
0,37 0,34 0,33 0,34 0,34
CIndustri Pengolahan/Manufacturing
4,71 4,71 4,69 4,77 5,00
DPengadaan Listrik dan Gas/Electricity and Gas
0,04 0,04 0,05 0,05 0,05
E
Pengadaan Air; Pengelolaan Sampah, Limbah, dan Daur Ulang/Water Supply; Sewerage, Waste Management, and Remediation Activities
0,16 0,17 0,19 0,20 0,21
F Konstruksi/Construction 14,25 14,18 14,10 13,69 13,17
G
Perdagangan Besar dan Eceran; Reparasi Mobil dan Sepeda Motor/Wholesale and Retail Trade; Repair of Motor Vehicles and Motorcycles
14,31 14,75 15,24 15,99 16,77
HTransportasi dan Pergudangan/Transportation and Storage
9,42 9,28 9,28 9,21 9,08
IPenyediaan Akomodasi dan Makan Minum/Accommodation and Food Service Activities
4,98 5,06 5,24 5,29 5,26
JInformasi dan Komunikasi/Information and Communication
5,31 5,46 5,57 5,73 5,80
https:
//goro
ntalo
kota
.bps.g
o.id
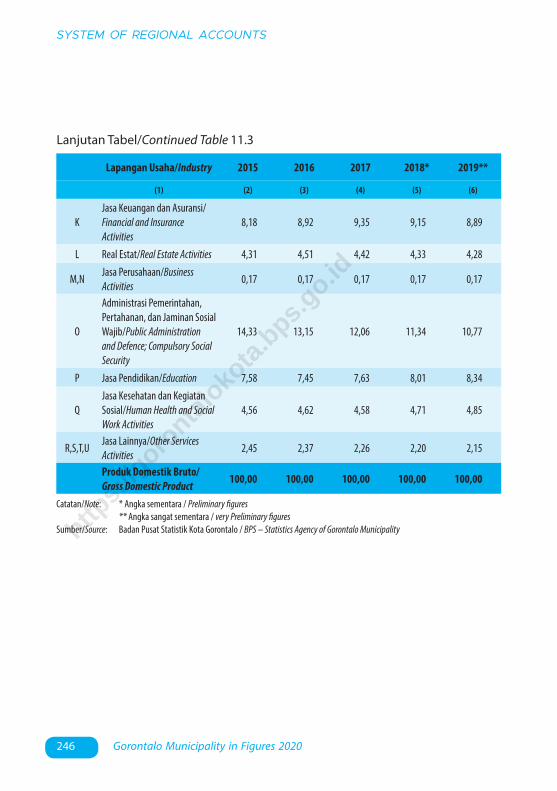
246 Gorontalo Municipality in Figures 2020
SYSTEM OF REGIONAL ACCOUNTS
Lanjutan Tabel/Continued Table 11.3
Lapangan Usaha/Industry 2015 2016 2017 2018* 2019**
(1) (2) (3) (4) (5) (6)
KJasa Keuangan dan Asuransi/Financial and Insurance Activities
8,18 8,92 9,35 9,15 8,89
L Real Estat/Real Estate Activities 4,31 4,51 4,42 4,33 4,28
M,NJasa Perusahaan/Business Activities
0,17 0,17 0,17 0,17 0,17
O
Administrasi Pemerintahan, Pertahanan, dan Jaminan Sosial Wajib/Public Administration and Defence; Compulsory Social Security
14,33 13,15 12,06 11,34 10,77
P Jasa Pendidikan/Education 7,58 7,45 7,63 8,01 8,34
QJasa Kesehatan dan Kegiatan Sosial/Human Health and Social Work Activities
4,56 4,62 4,58 4,71 4,85
R,S,T,UJasa Lainnya/Other Services Activities
2,45 2,37 2,26 2,20 2,15
Produk Domestik Bruto/Gross Domestic Product 100,00 100,00 100,00 100,00 100,00
Catatan/Note: * Angka sementara / Preliminary figures ** Angka sangat sementara / very Preliminary figuresSumber/Source: Badan Pusat Statistik Kota Gorontalo / BPS – Statistics Agency of Gorontalo Municipalityhttp
s://g
oronta
loko
ta.b
ps.go.id

247Kota Gorontalo Dalam Angka 2020
SISTEM NERACA REGIONAL
TabelTable 11.4 Laju Pertumbuhan Produk Domestik Regional Bruto Atas
Dasar Harga Konstan 2010 Menurut Lapangan Usaha (persen) di Kota Gorontalo, 2016-2019
Growth Rate of Gross Regional Domestic Product at 2010 Constant Market Prices by Industry (percent) in Gorontalo Municipality, 2016-2019
Lapangan Usaha/Industry 2016 2017 2018* 2019**
(1) (2) (3) (4) (5)
APertanian, Kehutanan, dan Perikanan/Agriculture, Forestry, and Fishing
5,00 7,98 6,29 7,33
BPertambangan dan Penggalian/Mining and Quarrying
2,79 5,46 8,76 8,80
CIndustri Pengolahan/Manufacturing
6,74 6,56 7,75 11,20
DPengadaan Listrik dan Gas/Electricity and Gas
10,25 8,67 7,81 7,59
E
Pengadaan Air; Pengelolaan Sampah, Limbah, dan Daur Ulang/Water Supply; Sewerage, Waste Management, and Remediation Activities
14,46 16,90 14,18 14,88
F Konstruksi/Construction 6,86 8,17 4,77 3,70
G
Perdagangan Besar dan Eceran; Reparasi Mobil dan Sepeda Motor/Wholesale and Retail Trade; Repair of Motor Vehicles and Motorcycles
9,65 10,52 11,19 11,48
HTransportasi dan Pergudangan/Transportation and Storage
6,58 6,88 6,77 5,50
IPenyediaan Akomodasi dan Makan Minum/Accommodation and Food Service Activities
9,19 11,52 7,91 6,81
JInformasi dan Komunikasi/Information and Communication
10,66 11,67 12,14 10,33
https:
//goro
ntalo
kota
.bps.g
o.id

248 Gorontalo Municipality in Figures 2020
SYSTEM OF REGIONAL ACCOUNTS
Lanjutan Tabel/Continued Table 11.4
Lapangan Usaha/Industry 2016 2017 2018* 2019**
(1) (2) (3) (4) (5)
KJasa Keuangan dan Asuransi/Financial and Insurance Activities
17,78 11,03 3,99 4,60
L Real Estat/Real Estate Activities 11,11 5,45 5,73 6,86
M,NJasa Perusahaan/Business Activities
8,03 7,75 6,01 6,64
O
Administrasi Pemerintahan, Pertahanan, dan Jaminan Sosial Wajib/Public Administration and Defence; Compulsory Social Security
-0,39 0,60 2,13 1,91
P Jasa Pendidikan/Education 5,97 6,35 10,15 9,69
QJasa Kesehatan dan Kegiatan Sosial/Human Health and Social Work Activities
8,74 6,87 10,48 10,23
R,S,T,UJasa Lainnya/Other Services Activities
5,48 3,03 3,54 4,50
Produk Domestik Bruto/Gross Domestic Product 7,41 7,43 7,01 6,97
Catatan/Note: * Angka sementara / Preliminary figures ** Angka sangat sementara / very Preliminary figuresSumber/Source: Badan Pusat Statistik Kota Gorontalo / BPS – Statistics Agency of Gorontalo Municipality
https:
//goro
ntalo
kota
.bps.g
o.id

249Kota Gorontalo Dalam Angka 2020
SISTEM NERACA REGIONAL
TabelTable 11.5 Produk Domestik Regional Bruto Atas Dasar Harga
Berlaku Menurut Jenis Pengeluaran di Kota Gorontalo (miliar rupiah), 2015–2019
Gross Regional Domestic Product at Current Market Prices by Type of Expenditure in Gorontalo Municipality (billion rupiahs), 2015–2019
Jenis PengeluaranType of Expenditure 2015 2016 2017 2018* 2019**
(1) (2) (3) (4) (5) (6)
Pengeluaran Konsumsi Rumah TanggaHousehold Consumption Expenditure
3 763,89 4 182,41 4 630,64 5 055,09 5 533,56
Pengeluaran Konsumsi LNPRTNPISH Consumption Expenditure
34,46 38,56 43,21 48,22 54,04
Pengeluaran Konsumsi PemerintahGovernment Consumption Expenditure
2 245,49 2 322,31 2 520,28 2 665,53 2 809,19
Pembentukan Modal Tetap BrutoGross Fixed Capital Formation
2 132,84 2 328,69 2 496,34 2 680,92 2 848,67
Perubahan InventoriChanges in Inventories
94,42 128,29 148,60 165,95 171,97
Net Ekspor Barang dan JasaNet Exports of Goods and Services
-2 480,37 -2 533,87 -2 742,24 -2 866,53 -2 961,71
Produk Domestik Regional BrutoGross Regional Domestic Product 5 790,74 6 466,38 7 096,84 7 749,19 8 455,72
Catatan/Note: * Angka sementara / Preliminary figures ** Angka sangat sementara / very Preliminary figuresSumber/Source: BPS, berbagai sensus, survei dan sumber lain/BPS-Statistics Indonesia, various census, survey, and other sources
https:
//goro
ntalo
kota
.bps.g
o.id

250 Gorontalo Municipality in Figures 2020
SYSTEM OF REGIONAL ACCOUNTS
TabelTable 11.6 Produk Domestik Regional Bruto Atas Dasar Harga
Konstan 2010 Menurut Jenis Pengeluaran di Kota Gorontalo (miliar rupiah), 2015–2019
Gross Regional Domestic Product at Constant Market Prices by Type of Expenditure in Gorontalo Municipality (billion rupiahs), 2015–2019
Jenis PengeluaranType of Expenditure 2015 2016 2017 2018* 2019**
(1) (2) (3) (4) (5) (6)
Pengeluaran Konsumsi Rumah TanggaHousehold Consumption Expenditure
2 902,44 3 109,95 3 338,33 3 580,22 3 842,64
Pengeluaran Konsumsi LNPRTNPISH Consumption Expenditure
27,24 29,53 32,41 35,38 38,86
Pengeluaran Konsumsi PemerintahGovernment Consumption Expenditure
1 577,23 1 555,69 1 636,37 1 709,38 1 791,09
Pembentukan Modal Tetap BrutoGross Fixed Capital Formation
1 750,91 1 847,62 1 922,71 2 014,25 2 101,58
Perubahan InventoriChanges in Inventories
71,48 73,55 80,17 86,36 87,61
Net Ekspor Barang dan JasaNet Exports of Goods and Services
-1 653,75 -1 594,57 -1 615,34 -1 652,67 -1 686,34
Produk Domestik Regional BrutoGross Regional Domestic Product 4 675,55 5 021,77 5 394,64 5 772,92 6 175,44
Catatan/Note: * Angka sementara / Preliminary figures ** Angka sangat sementara / very Preliminary figuresSumber/Source: BPS, berbagai sensus, survei dan sumber lain/BPS-Statistics Indonesia, various census, survey, and other sources
https:
//goro
ntalo
kota
.bps.g
o.id

251Kota Gorontalo Dalam Angka 2020
SISTEM NERACA REGIONAL
TabelTable 11.7 Distribusi Persentase Produk Domestik Regional Bruto
Atas Dasar Harga Berlaku Menurut Jenis Pengeluaran di Kota Gorontalo, 2015-2019
Percentage Distribution of Gross Regional Domestic Product at Current Market Prices by Type of Expenditure in Gorontalo Municipality, 2015-2019
Jenis PengeluaranType of Expenditure 2015 2016 2017 2018* 2019**
(1) (2) (3) (4) (5) (6)
Pengeluaran Konsumsi Rumah TanggaHousehold Consumption Expenditure
65,00 64,68 65,25 65,23 65,44
Pengeluaran Konsumsi LNPRTNPISH Consumption Expenditure
0,60 0,60 0,61 0,62 0,64
Pengeluaran Konsumsi PemerintahGovernment Consumption Expenditure
38,78 35,91 35,51 34,40 33,22
Pembentukan Modal Tetap BrutoGross Fixed Capital Formation
36,83 36,01 35,18 34,60 33,69
Perubahan InventoriChanges in Inventories
1,63 1,98 2,09 2,14 2,03
Net Ekspor Barang dan JasaNet Exports of Goods and Services
-42,83 -39,19 -38,64 -36,99 -35,03
Produk Domestik Regional BrutoGross Regional Domestic Product 100,00 100,00 100,00 100,00 100,00
Catatan/Note: * Angka sementara / Preliminary figures ** Angka sangat sementara / very Preliminary figuresSumber/Source: BPS, berbagai sensus, survei dan sumber lain/BPS-Statistics Indonesia, various census, survey, and other sources
https:
//goro
ntalo
kota
.bps.g
o.id

252 Gorontalo Municipality in Figures 2020
SYSTEM OF REGIONAL ACCOUNTS
TabelTable 11.8 Laju Pertumbuhan Produk Domestik Regional Bruto Atas
Dasar Harga Konstan 2010 Menurut Jenis Pengeluaran (persen) di Kota Gorontalo, 2016-2019
Growth Rate of Gross Regional Domestic Product at 2010 Constant Market Prices by Type of Expenditure (percent) in Gorontalo Municipality, 2016-2019
Jenis PengeluaranType of Expenditure 2016 2017 2018* 2019**
(1) (3) (4) (5) (6)
Pengeluaran Konsumsi Rumah TanggaHousehold Consumption Expenditure
7,15 7,34 7,25 7,33
Pengeluaran Konsumsi LNPRTNPISH Consumption Expenditure
8,40 9,74 9,16 9,85
Pengeluaran Konsumsi PemerintahGovernment Consumption Expenditure
-1,37 5,19 4,46 4,78
Pembentukan Modal Tetap BrutoGross Fixed Capital Formation
5,52 4,06 4,76 4,34
Perubahan InventoriChanges in Inventories
- - - -
Net Ekspor Barang dan JasaNet Exports of Goods and Services
- - - -
Produk Domestik Regional BrutoGross Regional Domestic Product 7,41 7,43 7,01 6,97
Catatan/Note: * Angka sementara / Preliminary figures ** Angka sangat sementara / very Preliminary figuresSumber/Source: BPS, berbagai sensus, survei dan sumber lain/BPS-Statistics Indonesia, various census, survey, and other sources
https:
//goro
ntalo
kota
.bps.g
o.id

12. Perbandingan Antar Kabupaten/Kota/Regency/Municipal Comparison
12 PERBANDINGAN ANTAR KABUPATEN/KOTA/ REGENCY/MUNICIPAL COMPARISON ......................................................................................
PERBANDINGAN ANTAR KABUPATEN/KOTA REGENCY/MUNICIPAL COMPARISON
12
https:
//goro
ntalo
kota
.bps.g
o.id

https:
//goro
ntalo
kota
.bps.g
o.id

255Kota Gorontalo Dalam Angka 2020
PERBANDINGAN ANTAR KABUPATEN/KOTA
PENJELASAN TEKNIS TECHNICAL NOTES
1. Sumber utama data kependudukan adalah sensus penduduk yang dilaksanakan setiap sepuluh tahun sekali. Sensus penduduk telah dilaksanakan sebanyak enam kali sejak Indonesia merdeka, yaitu tahun 1961, 1971, 1980, 1990, 2000, dan 2010.
2. Laju pertumbuhan Produk Domestik Regional Bruto diperoleh dari perhitungan PDRB atas dasar harga konstan. Diperoleh dengan cara mengurangi nilai PDRB pada tahun ke-n terhadap nilai pada tahun ke n-1 (tahun sebelumnya), dibagi dengan nilai pada tahun ke n-1, dikalikan dengan 100 persen. Laju pertumbuhan menunjukkan perkembangan agregat pendapatan dari satu waktu tertentu terhadap waktu sebelumnya.
3. Penduduk miskin adalah penduduk yang memiliki rata-rata pengeluaran per kapita per bulan di bawah Garis Kemiskinan.
4. Garis Kemiskinan Makanan (GKM)merupakan nilai pengeluaran kebutuhan minimum makanan yang disetarakan dengan 2.100 kkalori per kapita per hari. Garis Kemiskinan Non makanan (GKNM) adalah kebutuhan minimum untuk perumahan, sandang, pendidikan, kesehatan, dan kebutuhan dasar lainnya.
1. The main source of demographic data is population census, which is conducted every ten years. Population Census has been conducted six times since Indonesia’s independence: 1961, 1971, 1980, 1990, 2000, and 2010.
2. Growth rate of Gross Domestic Regional Product is derived from GDRP at constant market prices. It is obtained by subtracting the value of GDRP year n with the value of GDRP year n-1, divided by the value of GDRP year n-1 then multiplied by 100 percent. The growth rate of GDRP explains the income growth during the given period.
3. A person whose expenditure per capita per monthis below the poverty line is considered to be poor.
4. The Food Poverty Line refers to the daily minimum requirement of 2,100 kcal percapita per day. The Non-Food Poverty Line refers to the minimum requirement for household necessities for clothing, education, health, and other basic individual needs.
https:
//goro
ntalo
kota
.bps.g
o.id

256 Gorontalo Municipality in Figures 2020
REGENCY/MUNICIPAL COMPARISON
5. Indeks Pembangunan Manusia (IPM) adalah ukuran ringkas rata-rata capaian/keberhasilan dimensi utama pembangunan manusia, yaitu: umur panjang dan hidup sehat, mempunyai pengetahuan, dan memiliki standar hidup yang layak.
5. The Human Development Index (HDI) is a summary measure of average achievement in key dimensions of human development: a long and healthy life, being knowledgeable, and have a decent standard of living.
https:
//goro
ntalo
kota
.bps.g
o.id

257Kota Gorontalo Dalam Angka 2020
PERBANDINGAN ANTAR KABUPATEN/KOTA
GambarFigures
65,53
66,69
65,27
69,63
64,52
77,08
58
60
62
64
66
68
70
72
74
76
78
80
Boalemo Gorontalo Pohuwato Bone Bolango Gorontalo Utara Kota Gorontalo
Indeks Pembangunan Manusia / Human Development Index
12.1 Indeks Pembangunan Manusia Menurut Kabupaten/Kota di Provinsi Gorontalo, 2019
Human Development Index by Regency/Municipality in Gorontalo Province, 2019
Sumber/Source: Badan Pusat Statistik Provinsi Gorontalo / BPS-Statictics of Gorontalo Province
https:
//goro
ntalo
kota
.bps.g
o.id

258 Gorontalo Municipality in Figures 2020
REGENCY/MUNICIPAL COMPARISON
TabelTable 12.1 Jumlah Penduduk Menurut Kabupaten/Kota di Provinsi
Gorontalo (ribu), 2015–2019 Population by Regency/Municipality in Gorontalo Province
(thousand), 2015–2019
Catatan/Note : Data dari Hasil Proyeksi Penduduk Indonesia 2010-2020 (Pertengahan tahun/Juni) / Data from the result of Indonesia Population Projection 2010-2020 (mid year/June)
Sumber/Source : Badan Pusat Statistik Provinsi Gorontalo / BPS-Statictics of Gorontalo Province
Kabupaten/KotaRegency/Municipality 2015 2016 2017 2018 2019
(1) (2) (3) (4) (5) (6)
Boalemo 149,83 154,01 158,33 162,58 167,02
Gorontalo 370,44 372,86 374,92 377,05 378,53
Pohuwato 146,89 150,38 153,99 157,55 161,37
Bone Bolango 153,17 155,24 157,19 159,19 161,24
Gorontalo Utara 110,70 111,82 112,98 114,04 115,07
Kota Gorontalo 202,20 206,45 210,78 215,09 219,40
Provinsi Gorontalo 1 133,24 1 150,76 1 168,19 1 185,49 1 202,63
https:
//goro
ntalo
kota
.bps.g
o.id

259Kota Gorontalo Dalam Angka 2020
PERBANDINGAN ANTAR KABUPATEN/KOTA
TabelTable 12.2 Laju Pertumbuhan Produk Domestik Regional Bruto Atas
Dasar Harga Konstan 2010 Menurut Kabupaten/Kota di Provinsi Gorontalo (persen), 2015–2019
Rate of Growth of Gross Regional Domestic Products at Constant 2010 Prices by Regency/Municipality in Gorontalo Province (percent), 2015–2019
Catatan/Note: *) Angka Sementara / Preliminary Figures **) Angka Sangat Sementara / Very Preliminary FiguresSumber/Source: Badan Pusat Statistik Provinsi Gorontalo / BPS-Statictics of Gorontalo Province
Kabupaten/KotaRegency/Municipality 2015 2016 2017 2018* 2019**
(1) (2) (3) (4) (5) (6)
Boalemo 6,37 6,29 6,66 6,70 6,72
Gorontalo 6,31 6,62 6,78 6,22 6,24
Pohuwato 6,08 6,64 6,78 6,48 6,29
Bone Bolango 6,52 6,62 7,09 6,48 6,37
Gorontalo Utara 7,30 7,39 7,41 6,94 6,79
Kota Gorontalo 7,23 7,41 7,43 7,01 6,97
Provinsi Gorontalo 6,22 6,52 6,73 6,50 6,41http
s://g
oronta
loko
ta.b
ps.go.id
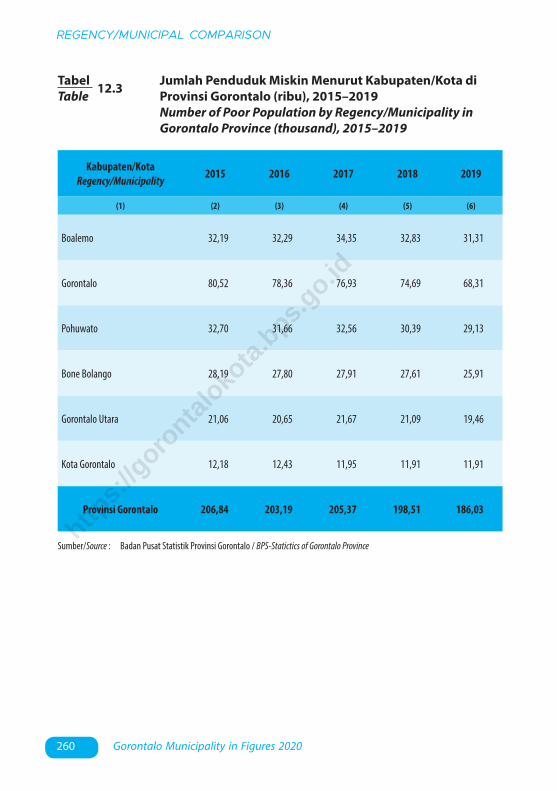
260 Gorontalo Municipality in Figures 2020
REGENCY/MUNICIPAL COMPARISON
TabelTable 12.3 Jumlah Penduduk Miskin Menurut Kabupaten/Kota di
Provinsi Gorontalo (ribu), 2015–2019 Number of Poor Population by Regency/Municipality in
Gorontalo Province (thousand), 2015–2019
Kabupaten/KotaRegency/Municipality 2015 2016 2017 2018 2019
(1) (2) (3) (4) (5) (6)
Boalemo 32,19 32,29 34,35 32,83 31,31
Gorontalo 80,52 78,36 76,93 74,69 68,31
Pohuwato 32,70 31,66 32,56 30,39 29,13
Bone Bolango 28,19 27,80 27,91 27,61 25,91
Gorontalo Utara 21,06 20,65 21,67 21,09 19,46
Kota Gorontalo 12,18 12,43 11,95 11,91 11,91
Provinsi Gorontalo 206,84 203,19 205,37 198,51 186,03
Sumber/Source : Badan Pusat Statistik Provinsi Gorontalo / BPS-Statictics of Gorontalo Provincehttp
s://g
oronta
loko
ta.b
ps.go.id

261Kota Gorontalo Dalam Angka 2020
PERBANDINGAN ANTAR KABUPATEN/KOTA
TabelTable 12.4 Indeks Pembangunan Manusia Menurut Kabupaten/Kota
di Provinsi Gorontalo, 2015–2019 Human Development Index by Regency/Municipality in
Gorontalo Province, 2015–2019
Sumber/Source: Badan Pusat Statistik Provinsi Gorontalo / BPS-Statictics of Gorontalo Province
Kabupaten/KotaRegency/Municipality 2015 2016 2017 2018 2019
(1) (2) (3) (4) (5) (6)
Boalemo 62,86 63,42 64,22 64,99 65,53
Gorontalo 63,63 64,22 64,95 65,78 66,69
Pohuwato 62,50 63,17 63,88 64,44 65,27
Bone Bolango 66,83 67,48 68,11 69,06 69,63
Gorontalo Utara 62,55 63,02 63,52 64,06 64,52
Kota Gorontalo 75,62 75,75 76,09 76,53 77,08
Provinsi Gorontalo 65,86 66,29 67,01 67,71 68,49
https:
//goro
ntalo
kota
.bps.g
o.id
BADAN PUSAT STATISTIKXXXXXBPS-STATISTICS OF XXXXX
Jl. ... Telp.: ... Fax.: ... Homepage: http://...bps.go.id, E-mail: [email protected]
https:
//goro
ntalo
kota
.bps.g
o.id