X-RAY NUCLEAR ACTIVITY IN S 4 G BARRED GALAXIES: NO LINK BETWEEN BAR STRENGTH AND CO-OCCURRENT...
16
arXiv:1307.7709v1 [astro-ph.CO] 29 Jul 2013 Revised version, July 4th 2013 - Accepted for publication in ApJ Preprint typeset using L A T E X style emulateapj v. 5/2/11 X-RAY NUCLEAR ACTIVITY IN S 4 G BARRED GALAXIES: NO LINK BETWEEN BAR STRENGTH AND CO-OCCURRENT SUPERMASSIVE BLACK HOLE FUELING Mauricio Cisternas 1,2 , Dimitri A. Gadotti 3 , Johan H. Knapen 1,2 , Taehyun Kim 3,4,5,6 , Sim´ on D´ ıaz-Garc´ ıa 7 , Eija Laurikainen 7,8 , Heikki Salo 7 , Omaira Gonz´ alez-Mart´ ın 1,2 , Luis C. Ho 6 , Bruce G. Elmegreen 9 , Dennis Zaritsky 10 , Kartik Sheth 4 , E. Athanassoula 11 , Albert Bosma 11 , S´ ebastien Comer´ on 7 , Santiago Erroz-Ferrer 1,2 , Armando Gil de Paz 12 , Joannah L. Hinz 10 , Benne W. Holwerda 13 , Jarkko Laine 7 , Sharon Meidt 14 , Kar´ ın Men´ endez-Delmestre 15 , Trisha Mizusawa 4,16 , Juan-Carlos Mu˜ noz-Mateos 4 , Michael W. Regan 17 , and Mark Seibert 6 1 Instituto de Astrof´ ısica de Canarias, E-38205 La Laguna, Tenerife, Spain 2 Departamento de Astrof´ ısica, Universidad de La Laguna, E-38205 La Laguna, Tenerife, Spain 3 European Southern Observatory, Casilla 19001, Santiago 19, Chile 4 National Radio Astronomy Observatory, 520 Edgemont Road, Charlottesville, VA 22903, USA 5 Astronomy Program, Department of Physics and Astronomy, Seoul National University, Seoul 151-742, Korea 6 The Observatories of the Carnegie Institution for Science, 813 Santa Barbara Street, Pasadena, CA 91101, USA 7 Division of Astronomy, Department of Physical Sciences, University of Oulu, Oulu FIN-90014, Finland 8 Finnish Centre of Astronomy with ESO (FINCA), University of Turku, V¨ais¨antie 20, F1-21500, Piikki¨ o, Finland 9 IBM T. J. Watson Research Center, 1101 Kitchawan Road, Yorktown Heights, NY 10598, USA 10 Steward Observatory, University of Arizona, 933 North Cherry Avenue, Tucson, AZ 85721, USA 11 Aix Marseille Universit, CNRS, LAM (Laboratoire d’Astrophysique de Marseille) UMR 7326, 13388, Marseille, France 12 Departamento de Astrof´ ısica, Universidad Complutense de Madrid, E-28040 Madrid, Spain 13 European Space Agency, ESTEC, Keplerlaan 1, 2200 AG, Noordwijk, the Netherlands 14 Max-Planck-Institut f¨ ur Astronomie, K¨ onigstuhl 17, D-69117 Heidelberg, Germany 15 Observatorio do Valongo, Universidade Federal do Rio de Janeiro, Ladeira Pedro Antˆ onio, 43, CEP 20080-090 Rio de Janeiro, Brazil 16 Florida Institute of Technology, Melbourne, FL 32901, USA and 17 Space Telescope Science Institute, 3700 San Martin Drive, Baltimore, MD 21218, USA Revised version, July 4th 2013 - Accepted for publication in ApJ ABSTRACT Stellar bars can lead to gas inflow toward the center of a galaxy and stimulate nuclear star formation. However, there is no compelling evidence on whether they also feed a central supermassive black hole: by measuring the fractions of barred active and inactive galaxies, previous studies have yielded conflicting results. In this paper, we aim to understand the lack of observational evidence for bar- driven active galactic nucleus (AGN) activity by studying a sample of 41 nearby (d< 35 Mpc) barred galaxies from the Spitzer Survey for Stellar Structure in Galaxies. We use Chandra observations to measure nuclear 2–10 keV X-ray luminosities and estimate Eddington ratios, together with Spitzer 3.6 µm imaging to quantify the strength of the stellar bar in two independent ways: (1) from its structure, as traced by its ellipticity and boxiness, and (2) from its gravitational torque Q b , taken as the maximum ratio of the tangential force to the mean background radial force. In this way, rather than discretizing the presence of both stellar bars and nuclear activity, we are able to account for the continuum of bar strengths and degrees of AGN activity. We find nuclear X-ray sources in 31 out of 41 galaxies with median X-ray luminosity and Eddington ratio of L X =4.3 × 10 38 erg s −1 and L bol /L Edd =6.9 × 10 −6 respectively, consistent with low-luminosity AGN activity. Including upper limits for those galaxies without nuclear detections, we find no significant correlation between any of the bar strength indicators and the degree of nuclear activity, irrespective of galaxy luminosity, stellar mass, Hubble type, or bulge size. Strong bars do not favor brighter or more efficient nuclear activity, implying that at least for the low-luminosity regime, supermassive black hole fueling is not closely connected to large scale features. Subject headings: galaxies: active — galaxies: evolution — galaxies: nuclei — galaxies: structure 1. INTRODUCTION Supermassive black holes (BHs), expected to reside in the centers of most massive galaxies (Kormendy & Richstone 1995; Richstone et al. 1998), experienced the bulk of their growth around 10 billion years ago in short periods of vigorous mass accretion (Lynden-Bell 1969; Soltan 1982; Yu & Tremaine 2002; Ueda et al. 2003; Marconi et al. 2004; Shankar et al. 2004). During these phases, BHs can be observed as quasars, the extremely bright-end of the active galactic nucleus (AGN) family. While compared to earlier times, [email protected] our present-day universe can be considered quiescent in terms of BH activity, there happens to be a very significant fraction of nearby galaxies showing some level of AGN activity: the Palomar spectroscopic survey of local galaxies revealed that ∼40% of them display nuclear activity likely due to BH fueling (Ho et al. 1997a), yet they represent the faint-end of the AGN luminosity function and feature very modest accretion rates (Ho 2009). The mechanisms through which these BHs are fed are still a matter of investigation (for reviews, see Wada 2004; Martini 2004). The basic requirement is that a fraction of the galaxy’s interstellar medium, dis-
Transcript of X-RAY NUCLEAR ACTIVITY IN S 4 G BARRED GALAXIES: NO LINK BETWEEN BAR STRENGTH AND CO-OCCURRENT...

arX
iv:1
307.
7709
v1 [
astr
o-ph
.CO
] 2
9 Ju
l 201
3Revised version, July 4th 2013 - Accepted for publication in ApJPreprint typeset using LATEX style emulateapj v. 5/2/11
X-RAY NUCLEAR ACTIVITY IN S4G BARRED GALAXIES:NO LINK BETWEEN BAR STRENGTH AND CO-OCCURRENT SUPERMASSIVE BLACK HOLE FUELING
Mauricio Cisternas1,2, Dimitri A. Gadotti3, Johan H. Knapen1,2, Taehyun Kim3,4,5,6, Simon Dıaz-Garcıa7,Eija Laurikainen7,8, Heikki Salo7, Omaira Gonzalez-Martın1,2, Luis C. Ho6, Bruce G. Elmegreen9,
Dennis Zaritsky10, Kartik Sheth4, E. Athanassoula11, Albert Bosma11, Sebastien Comeron7,Santiago Erroz-Ferrer1,2, Armando Gil de Paz12, Joannah L. Hinz10, Benne W. Holwerda13, Jarkko Laine7,
Sharon Meidt14, Karın Menendez-Delmestre15, Trisha Mizusawa4,16, Juan-Carlos Munoz-Mateos4,Michael W. Regan17, and Mark Seibert6
1 Instituto de Astrofısica de Canarias, E-38205 La Laguna, Tenerife, Spain2 Departamento de Astrofısica, Universidad de La Laguna, E-38205 La Laguna, Tenerife, Spain
3 European Southern Observatory, Casilla 19001, Santiago 19, Chile4 National Radio Astronomy Observatory, 520 Edgemont Road, Charlottesville, VA 22903, USA
5 Astronomy Program, Department of Physics and Astronomy, Seoul National University, Seoul 151-742, Korea6 The Observatories of the Carnegie Institution for Science, 813 Santa Barbara Street, Pasadena, CA 91101, USA
7 Division of Astronomy, Department of Physical Sciences, University of Oulu, Oulu FIN-90014, Finland8 Finnish Centre of Astronomy with ESO (FINCA), University of Turku, Vaisantie 20, F1-21500, Piikkio, Finland
9 IBM T. J. Watson Research Center, 1101 Kitchawan Road, Yorktown Heights, NY 10598, USA10 Steward Observatory, University of Arizona, 933 North Cherry Avenue, Tucson, AZ 85721, USA
11 Aix Marseille Universit, CNRS, LAM (Laboratoire d’Astrophysique de Marseille) UMR 7326, 13388, Marseille, France12 Departamento de Astrofısica, Universidad Complutense de Madrid, E-28040 Madrid, Spain
13 European Space Agency, ESTEC, Keplerlaan 1, 2200 AG, Noordwijk, the Netherlands14 Max-Planck-Institut fur Astronomie, Konigstuhl 17, D-69117 Heidelberg, Germany
15 Observatorio do Valongo, Universidade Federal do Rio de Janeiro, Ladeira Pedro Antonio, 43, CEP 20080-090 Rio de Janeiro, Brazil16 Florida Institute of Technology, Melbourne, FL 32901, USA and
17 Space Telescope Science Institute, 3700 San Martin Drive, Baltimore, MD 21218, USARevised version, July 4th 2013 - Accepted for publication in ApJ
ABSTRACT
Stellar bars can lead to gas inflow toward the center of a galaxy and stimulate nuclear star formation.However, there is no compelling evidence on whether they also feed a central supermassive blackhole: by measuring the fractions of barred active and inactive galaxies, previous studies have yieldedconflicting results. In this paper, we aim to understand the lack of observational evidence for bar-driven active galactic nucleus (AGN) activity by studying a sample of 41 nearby (d < 35 Mpc) barredgalaxies from the Spitzer Survey for Stellar Structure in Galaxies. We use Chandra observations tomeasure nuclear 2–10 keV X-ray luminosities and estimate Eddington ratios, together with Spitzer3.6 µm imaging to quantify the strength of the stellar bar in two independent ways: (1) from itsstructure, as traced by its ellipticity and boxiness, and (2) from its gravitational torque Qb, taken asthe maximum ratio of the tangential force to the mean background radial force. In this way, ratherthan discretizing the presence of both stellar bars and nuclear activity, we are able to account for thecontinuum of bar strengths and degrees of AGN activity. We find nuclear X-ray sources in 31 outof 41 galaxies with median X-ray luminosity and Eddington ratio of LX = 4.3 × 1038 erg s−1 andLbol/LEdd = 6.9 × 10⁻⁶ respectively, consistent with low-luminosity AGN activity. Including upperlimits for those galaxies without nuclear detections, we find no significant correlation between any ofthe bar strength indicators and the degree of nuclear activity, irrespective of galaxy luminosity, stellarmass, Hubble type, or bulge size. Strong bars do not favor brighter or more efficient nuclear activity,implying that at least for the low-luminosity regime, supermassive black hole fueling is not closelyconnected to large scale features.Subject headings: galaxies: active — galaxies: evolution — galaxies: nuclei — galaxies: structure
1. INTRODUCTION
Supermassive black holes (BHs), expected toreside in the centers of most massive galaxies(Kormendy & Richstone 1995; Richstone et al. 1998),experienced the bulk of their growth around 10 billionyears ago in short periods of vigorous mass accretion(Lynden-Bell 1969; Soltan 1982; Yu & Tremaine 2002;Ueda et al. 2003; Marconi et al. 2004; Shankar et al.2004). During these phases, BHs can be observed asquasars, the extremely bright-end of the active galacticnucleus (AGN) family. While compared to earlier times,
our present-day universe can be considered quiescentin terms of BH activity, there happens to be a verysignificant fraction of nearby galaxies showing somelevel of AGN activity: the Palomar spectroscopic surveyof local galaxies revealed that ∼40% of them displaynuclear activity likely due to BH fueling (Ho et al.1997a), yet they represent the faint-end of the AGNluminosity function and feature very modest accretionrates (Ho 2009).The mechanisms through which these BHs are fed
are still a matter of investigation (for reviews, seeWada 2004; Martini 2004). The basic requirement isthat a fraction of the galaxy’s interstellar medium, dis-

2 CISTERNAS ET AL.
tributed over kiloparsec scales, has to be deprived ofits angular momentum in such a way that is able toreach the innermost regions of the galaxy, close tothe BH. Secular processes, i.e., those that take longerthan a dynamical timescale to be relevant (for a re-view, see Kormendy & Kennicutt 2004), are expectedto be the dominant mechanisms feeding low-luminosityAGNs (LLAGNs) and even moderate luminosity onesout to z ∼ 1 (e.g., Gabor et al. 2009; Georgakakis et al.2009; Cisternas et al. 2011a,b) and even z ∼ 2 (e.g.,Jahnke et al. 2009; Bennert et al. 2011; Kocevski et al.2012). In this regard, non-axisymmetric structures suchas stellar bars can lead to internal instabilities and gasinflows, the necessary elements to bring gas to the centerand, perhaps, fuel the BH.Bars can play a major role in the overall evolu-
tion of a galaxy by driving its gaseous interstellarmedium toward its inner regions. Through their non-axisymmetric potential, large-scale stellar bars exerttorques that accumulate gas and dust at the leadingend of the bar where they get shocked, lose angu-lar momentum, and fall inward the central regions ofthe galaxy (Athanassoula 1992b; Knapen et al. 1995;Regan et al. 1999; Maciejewski et al. 2002; Sheth et al.2002; Kim et al. 2012). A diversity of observa-tional studies support this picture: gas kinematicshave revealed streaming motions inward along thebar (e.g., Regan et al. 1997; Mundell & Shone 1999;Erroz-Ferrer et al. 2012); against their unbarred coun-terparts, barred galaxies show higher central concentra-tions of molecular gas (Sakamoto et al. 1999; Sheth et al.2005), as well as enhanced nuclear star formation rates(e.g., Devereux 1987; Hummel et al. 1990; Martin 1995;Ho et al. 1997b; Sheth et al. 2000; Ellison et al. 2011;Wang et al. 2012), and a higher rate of bulges with youngstellar populations (Coelho & Gadotti 2011). The pos-sibility that these bar-induced inflows could reach thecentral few parsecs and fuel a BH led large-scale bars tobe proposed early-on as a plausible mechanism to triggerAGN activity (Simkin et al. 1980; Shlosman et al. 1989).While the spatial scales involved in transporting gas
from a large-scale bar to a central BH differ by a feworders of magnitude, Hubble Space Telescope (HST)observations of the central regions of barred galaxiesrevealed nuclear dust spiral structure connecting thekiloparsec-scale bar all the way down to the central tensof parsecs, at the resolution limit of these observations(Martini et al. 2003a). These nuclear dust structurestend to be found in a minority of galactic centers, andwith comparable frequencies on both active and inac-tive galaxies. This suggests that (1) the AGN lifetime isless than the inflow time of these spiral structures and(2) no unique fueling mechanism can be traced at theseintermediate spatial scales (Martini et al. 2003b). Onthe other hand, most current dynamical models agreeon long-lived stellar bars (see, e.g., Athanassoula et al.2013), and therefore if the gas being currently consumedby an active BH was initially driven by a large-scale stel-lar bar, one would expect some correlation between barsand galaxies with ongoing nuclear activity.A number of studies have searched for the appealing
“bar-AGN connection”, mainly by looking at samples ofactive and inactive galaxies and measuring their bar frac-tions, or conversely, by studying the AGN fraction among
samples of barred and unbarred galaxies. Results havebeen mixed: while some studies have found tentativeevidence in favor of an observable link between barredgalaxies and AGNs (Arsenault 1989; Knapen et al. 2000;Laine et al. 2002; Maia et al. 2003; Laurikainen et al.2004a; Coelho & Gadotti 2011; Oh et al. 2012), oth-ers have not found a causal connection betweenthe presence of bars and AGN activity (Moles et al.1995; McLeod & Rieke 1995; Mulchaey & Regan 1997;Ho et al. 1997b; Hunt & Malkan 1999; Lee et al. 2012),and others have even found hints for an anti correla-tion between the presence of a bar and nuclear activity(Shlosman et al. 2000; Zhang et al. 2009).In general, the aforementioned studies tend to dis-
cretize either (or both) bars or AGNs. Stellar bars canhave a wide range of properties which will define theirstrength: a strong bar will induce a different level of in-flow than a weak bar. AGNs, on the other hand, have acontinuous distribution in luminosity and BH accretionrate that spans a few orders of magnitude implying thatthere are very different levels of nuclear activity. In thispaper we explore the possibility of a hitherto overlookedlink between bar strength and degree of AGN activity.We select a sample of barred galaxies from the SpitzerSurvey of Stellar Structure in Galaxies (S4G, Sheth et al.2010) and take advantage of the 3.6 µm imaging, a reli-able tracer of the old stellar population which makes upthe bar, to characterize its strength through its structuralproperties and relative torque.To characterize the level of BH activity, we opt to
use Chandra X-ray observations, which offer a num-ber of advantages with respect to optical diagnos-tics when attempting to uniformly study the low-luminosity regime. While optical emission lines suchas Hα can suffer from contamination from extranu-clear sources not related to the central engine, X-rayemission originates much closer to where the accre-tion is taking place, and given Chandra’s high reso-lution, one can identify and isolate the X-ray nuclearsource from other sources of emission. X-ray obser-vations have proven to be highly efficient in revealingpreviously undetected AGNs (e.g., Martini et al. 2002;Tzanavaris & Georgantopoulos 2007; Pellegrini et al.2007; Gallo et al. 2008; Ghosh et al. 2008; Grier et al.2011), most notably in galaxies lacking classicalbulges and conventionally thought to be unlikely BH(and hence AGN) hosts (e.g., Desroches & Ho 2009;Araya Salvo et al. 2012).Starting from a sample of S4G barred galaxies, as de-
scribed in Section 2, we gather all the available archivalChandra data. In Section 3 we present the X-ray dataanalysis and asses the level of nuclear activity, and in Sec-tion 4 we describe how the strength of the stellar barswas quantified. We report our results in Section 5 anddiscuss their implications within the context of previousfindings from the literature in Section 6.
2. SAMPLE AND DATA
In this paper we analyze a sample of barred galaxiesdrawn from the S4G data set with the goal of study-ing whether bar strength and X-ray nuclear activity areconnected. Below we briefly describe the S4G survey, aswell as the parent sample of barred galaxies for which wesearched for archival Chandra X-ray data.

X-ray Nuclear Activity in S4G Barred Galaxies 3
Table 1Sample details and nuclear properties
Galaxy d T -type Nuclear Spec. Obs.ID texp X-ray Counts log LX
(Mpc) Bar/Ring Class (ks) Class (erg s−1)(1) (2) (3) (4) (5) (6) (7) (8) (9) (10)
NGC 255 20.0 4.0 ... ... 7844 4.6 IV <2 <36.4NGC 685 15.1 5.4 ... ... 7857 4.6 IV <3 <37.8NGC 1036 11.1 0.0 ... ... 7119 3.0 IV <2 <36.5NGC 1073 15.1 5.3 ... ... 4686 5.6 I 27 38.3NGC 1097 20.0 3.2 nb,nr L 2339 5.6 II 1828 40.9NGC 1232 18.6 5.0 ... ... 10798 52.9 I 81 38.6NGC 1291 8.6 0.1 nb L 11272 69.0 II 812 39.2NGC 1300 18.0 4.0 nr ... 11775 29.7 II 125 38.6NGC 1302 20.0 0.1 ... ... 7847 4.9 I 13 37.3NGC 1341 16.8 1.2 ... ... 7846 4.9 IV <2 <35.9NGC 1367 23.2 1.1 ... ... 7277 14.8 I 455 40.7NGC 1493 11.3 6.0 ... ... 7145 10.0 I 51 38.5NGC 1637 10.6 5.0 ... ... 766 38.5 I 179 38.2NGC 1640 19.1 3.0 ... ... 7891 5.0 I 23 38.6NGC 1672 14.5 3.2 nr S 5932 39.5 II 91 38.4NGC 2787 10.2 -1.0 nr L 4689 30.7 I 500 40.0NGC 3344 6.0 4.0 ... ... 7087 1.7 I 12 38.0NGC 3351 10.1 3.0 nr ... 5931 39.5 III <32 <37.3NGC 3368 10.8 2.2 nb,nr ... 391 2.0 II 8 36.3NGC 3627 10.0 3.0 ... L 9548 49.5 II 48 37.8NGC 4136 9.6 5.1 ... ... 2921 19.7 I 15 37.4NGC 4245 9.6 0.1 nr ... 7107 2.2 IV <6 <38.2NGC 4303 16.4 4.0 nb,nr S2 2149 28.0 II 154 38.8NGC 4314 9.6 1.0 nr ... 2062 16.1 II 26 37.8NGC 4394 16.7 3.0 ... ... 7864 5.0 III <8 <36.2NGC 4450 16.5 2.4 ... L 3997 3.4 I 479 40.2NGC 4548 16.2 3.0 ... L 1620 2.7 I 27 38.6NGC 4579 19.5 2.9 nr S2 807 33.9 II 26437 41.4NGC 4596 16.7 0.1 ... ... 11785 31.0 I 45 38.3NGC 4639 22.3 3.5 ... S1 408 1.3 I 417 42.0NGC 4713 16.3 6.8 ... ... 4019 4.9 I 9 38.3NGC 4725 13.6 2.2 nb S2 2976 24.6 I 397 41.1NGC 5350 31.2 3.5 ... ... 5903 4.5 II 13 38.8NGC 5371 29.4 4.0 ... S 13006 5.4 I 19 39.2NGC 5584 26.7 6.0 ... ... 11229 7.0 IV <3 <36.0NGC 5728 30.5 1.2 nb,nr S1.9 4077 18.7 II 503 40.2NGC 5964 26.5 6.9 ... ... 12982 9.8 IV <2 <37.8NGC 7479 33.8 4.3 ... S1.9 11230 24.7 I 105 39.0NGC 7552 17.1 2.4 nr H2 7848 5.0 II 131 39.1NGC 7743 21.4 0.1 ... S2 6790 13.8 I 88 38.4PGC 3853 12.6 7.0 ... ... 12981 9.8 IV <6 <37.7
Note. — Column (1): galaxy name; Column (2): redshift independent distances from NED; Column(3): morphological T -type from HyperLeda (Paturel et al. 2003); Column (4): nuclear bars (nb) andnuclear rings (nr) are indicated if present, based on Buta et al. (2010), Laine et al. (2002), Erwin (2004),and Comeron et al. (2010); Column (5): nuclear spectroscopic classification from Ho et al. (1997a),Veron-Cetty & Veron (2006), and Smith et al. (2007). where L=LINER, S=Seyfert, and its attachednumber indicating its particular type, and H2=H ii nucleus; Column (6): Chandra observation ID;Column (7): net exposure time of processed observation; Column (8): X-ray nuclear classification asillustrated in Figure 2; Column (9): effective background-subtracted broadband counts or upper limitwhen no nuclear point source was detected; Column (10): Intrinsic X-ray luminosity in the 2–10 keVband or upper limit.
2.1. S4G Barred Galaxy Sample
S4G is a post-cryogenic Cycle 9 Science ExplorationProgram aiming to provide near-infrared (NIR) imag-ing of over 2300 nearby (d < 40 Mpc) galaxies at 3.6and 4.5 µm with the Infrared Array Camera (IRAC;Fazio et al. 2004) onboard the Spitzer Space Telescope.Galaxy images are uniformly processed with the S4G re-duction pipeline (for details, see Sheth et al. 2010), withthe final mosaics having a 0.′′75/pixel scale and a resolu-tion of 1.′′7.In this paper, we use the parent sample of barred galax-
ies selected by T. Kim et al. (in preparation), in whichthe structure of stellar bars is explored in detail. At thetime of the sample selection (November 2011), over 50percent of the S4G sample had already been processed
by the basic pipelines, providing science-ready images.Barred galaxies were identified as such through a visualinspection of the NIR images by members of the S4Gteam. From these, a total of 144 barred galaxies wereselected based on the following criteria: sample selec-tion focussed firstly on avoiding doubtful cases, galaxieswhich were highly inclined (b/a > 0.5), significantly dis-turbed by an ongoing close interaction or merger, overlyfaint or irregular, or simply unsuitable for image fitting(e.g. because of a bright foreground star in a critical posi-tion). Secondly, the selection was done in a way in whicha good coverage of all disk Hubble types is obtained.While this means that the sample is not complete, theseselection procedures assure that the sample is (1) repre-sentative of the local population of barred galaxies, and(2) suitable for structural analysis via image decompo-

4 CISTERNAS ET AL.
Figure 1. Normalized distributions of morphological T -type forthe parent sample of barred galaxies (unfilled histogram) as wellas for the Chandra subsample (shaded histogram).
sition, meaning that the structural parameters can beaccurately derived.
2.2. Chandra X-ray Data
To identify possible X-ray emission from AGNs we lookfor archival observations carried out with the AdvancedCCD Imaging Spectrometer (ACIS; Garmire et al. 2003)onboard Chandra. Compared to other X-ray observingfacilities, ACIS offers excellent angular resolution, fea-turing a point-spread function (PSF) with a full widthat half maximum of 1′′. This allows us to search forpoint like emission coincident with the NIR center, andat the same time avoid confusion with other X-ray emit-ting sources, such as surrounding diffuse hot gas and un-resolved X-ray binaries.Forty-one out of 144 galaxies from our parent sam-
ple have publicly available ACIS observations from theChandra Data Archive1 (as of October 2012). Whenmore than one observation was available for a givengalaxy, the one with the longest exposure time was se-lected. ACIS consists of 10 CCDs arranged in two config-urations: a 2×2 array (ACIS-I) and a 1×6 array (ACIS-S), with the former designed for imaging, and the latterused for both imaging and grating spectroscopy. Outof the 41 ACIS observations, 39 were carried out withthe S-array and the remaining two (NGC 1232 and NGC5350) with the I-array. The data analysis is performedon data collected by the on-axis chips, meaning both S2and S3 chips for the S-array observations and all of thefour I chips when the I-array was used.Given that these are archival observations from indi-
vidual programs and not part of a uniform X-ray survey,we could in principle be biased towards X-ray luminousactive galaxies. Nevertheless, not all of the Chandra ob-servations analyzed here were designed to study nuclearactivity in nearby galaxies. Many of these galaxies wereobserved with the aim of studying supernovae or otherultra luminous X-ray sources (ULXs), and hence a widerange of luminosities is expected. We also expect a ran-dom sampling in terms of morphological type, but tocheck whether a bias exists, in Figure 1 we compare thedistribution of T -types of the parent sample of barredgalaxies to the Chandra sample, finding that both distri-butions roughly agree with each other and no significant
1 http://cxc.harvard.edu
bias should be present.
3. X-RAY DATA ANALYSIS
The retrieved Chandra/ACIS level 2 event fileswere processed and analyzed uniformly using theChandra Interactive Analysis of Observations (CIAO)v4.3, following the reduction procedure described inGonzalez-Martın et al. (2006). We reprocessed each ob-servation to account for possible background flares thatcould incorrectly enhance the count rate of our sourcesusing the task lc clean.sl. To identify the extrac-tion regions in the ACIS images, we used the posi-tions from the Two Micron All Sky Survey (2MASS;Skrutskie et al. 2006) for all galaxies in our sample ex-cept for NGC 5964, for which we use the position fromLeon & Verdes-Montenegro (2003).Defining the source and background regions will de-
pend on the morphology of the X-ray emission inthe nuclear region. Following the classification fromZhang et al. (2009), we group the nuclear morphologiesinto four distinct classes: (I) a dominant point source,(II) a nuclear point source embedded in extended dif-fuse emission, (III) extended emission without a pointsource, and (IV) no nuclear source or diffuse emissionpresent above the background level. In Figure 2 we giverepresentative examples of these four classes.For class I nuclei, we defined the source region as a 2′′
radius circular aperture. The background region was de-fined as a source-free circular annulus around the nuclearposition, or alternatively, as several circular apertures ifother point-like sources were present in the vicinity. Inthe case of class II nuclei, source regions were definedas 1.5–2′′ radius apertures depending on the extensionof the surrounding diffuse emission. We carefully definedthe background to correctly characterize the spatial vari-ations of the diffuse emission in which the nuclear sourceis embedded. For classes III and IV, in which there isno distinct point source, we derive upper limits on thenuclear source by considering the background-subtractedcounts within a 2′′ aperture at the photometric center. Ina few cases with class IV nuclei and low exposure times,no counts were detected with the standard aperture sizeand hence larger apertures of up to 5′′ were required tocompute upper limits.
3.1. X-ray Luminosities
For all but nine sources (see below) we estimateX-ray luminosities in the hard 2–10 keV band (here-after referred to as LX) by using a single power lawmodel with Galactic interstellar absorption obtained us-ing the nH task included in FTOOLS (Kalberla et al. 2005;Dickey & Lockman 1990). We assumed a typical photonindex for low luminosity AGNs of Γ = 1.8 (Ho et al.2001), which has been shown to derive reliable lumi-nosities when compared against results from a dedicatedspectral fitting (Gonzalez-Martın et al. 2006). All pa-rameters are held fixed expect for the power-law nor-malization, which is found by fitting the aforementionedmodel using XSPEC v12.7.0 (Arnaud 1996).Nine sources in our sample present more than 200
net counts and allow for a detailed characterization oftheir spectra. For these objects, we perform a spec-tral analysis using XSPEC following the approach byGonzalez-Martın et al. (2009), in which an ensemble of

X-ray Nuclear Activity in S4G Barred Galaxies 5
Figure 2. Near-infrared and X-ray images of four example barred galaxies illustrating the different classes of nuclear X-ray morphologies,based on the classification by Zhang et al. (2009): (I) a dominant point source, (II) a point source embedded in diffuse emission, (III)extended diffuse emission without a distinguishable point source, and (IV) no clear emission above the background level. For each of thesefour cases, the left panel shows the Spitzer/IRAC 3.6 µm image of the galaxy processed through the S4G pipeline (Sheth et al. 2010). Thedashed box indicates the area shown on the right, which corresponds to the Chandra/ACIS 0.2–10 keV smoothed image of the centralregion of the galaxy.
Figure 3. Comparison between black hole masses obtained frombulge luminosities against those obtained from central stellar ve-locity dispersions. The solid line shows the exact correspondencebetween both methods, and the dashed lines are offset ±0.4 dex,indicating the typical intrinsic scatter in these scaling relations.
models including both thermal and non-thermal compo-nents is used to better dissect the true nature of oursources contributing to the observed nuclear emission.Details on the modeling and results from the spectralfitting are presented in the Appendix, and the resulting2–10 keV X-ray luminosities for the whole sample arepresented in Table 1.
3.2. Eddington Ratios
While the X-ray luminosity attributed to the BH feed-ing process is a good proxy of the degree of nuclearactivity, a clearer picture of the actual level of accre-tion will come from the Eddington ratio (Lbol/LEdd),where Lbol and LEdd correspond to the bolometric andEddington luminosities respectively. The X-ray bolo-metric correction, Lbol/LX, has been found to dependstrongly on Eddington ratio (Vasudevan & Fabian 2007),with LLAGNs and their modest accretion rates requir-ing lower correction values when compared to higher-luminosity AGNs and quasars. While the Eddington ra-tios of LLAGNs span over six orders of magnitude (10−8–10−2) and adopting a single bolometric correction mightseem too simplistic, the strongest dependence betweenthese two quantities starts above Lbol/LEdd ∼ 10−1, be-low which the behavior of the bolometric correction israther flat. Therefore, we use Lbol/LX=15.8 from Ho(2009), derived from a sample of nearby LLAGNs withrobust spectral energy distributions.The Eddington luminosity will normalize the X-ray
luminosities by BH mass and it is defined as LEdd =1.26× 1038 (MBH/M⊙) erg s−1. Only four galaxies fromour sample (NGC 1300, NGC 2787, NGC 3368, andNGC 4596) have direct MBH measurements derived ei-ther from stellar or gas kinematics. For the remaininggalaxies of the sample, it is possible to predict their BHmasses through the empirical scaling relations betweenMBH and galaxy properties such as bulge luminosity(Kormendy & Richstone 1995; Magorrian et al. 1998),central stellar velocity dispersion (Ferrarese & Merritt2000; Gebhardt et al. 2000; Tremaine et al. 2002), andbulge stellar mass (Marconi & Hunt 2003; Haring & Rix2004). Among these, the correlation between BH massand central stellar velocity dispersion (σ∗) has been

6 CISTERNAS ET AL.
Table 2Black hole masses and Eddington ratios
Galaxy σ∗ Ref. M3.6 B/T log MBH log Lbol/LEdd
(km s−1) (AB) (M⊙)(1) (2) (3) (4) (5) (6) (7)
NGC 255 ... ... -19.26 0.00 ... ...NGC 685 ... ... -19.36 0.00 ... ...NGC 1036 ... ... -17.20 0.00 ... ...NGC 1073 24.7 1 -19.62 0.00 4.3 -2.9NGC 1097 196.0 2 -22.74 0.24 8.1 -4.2NGC 1232 ... ... -21.50 0.04 6.9 -5.3NGC 1291 186.0 3 -21.46 0.38 8.0 -5.8NGC 1300 ... ... -21.06 0.11 7.8a -6.2NGC 1302 158.0 3 -21.06 0.39 7.7 -7.3NGC 1341 80.4 4 -18.95 0.00 6.4 <-7.5NGC 1367 ... ... -21.47 0.13 7.4 -3.6NGC 1493 25.0b 5 -18.82 0.00 4.3 -2.8NGC 1637 ... ... -19.52 0.12 6.6 -5.4NGC 1640 ... ... -20.03 0.25 7.1 -5.4NGC 1672 110.0 6 -21.45 0.28 7.0 -5.6NGC 2787 ... ... -20.06 0.42 7.6c -4.5NGC 3344 73.5 1 -18.90 0.06 6.3 -5.3NGC 3351 119.9 1 -20.82 0.19 7.2 <-6.8NGC 3368 ... ... -21.33 0.29 6.9d -7.5NGC 3627 124.0 1 -21.66 0.12 7.2 -6.4NGC 4136 38.4 1 -18.15 0.03 5.1 -4.7NGC 4245 82.6 1 -19.03 0.36 6.5 <-5.2NGC 4303 84.0 1 -21.53 0.09 6.5 -4.7NGC 4314 117.0 1 -19.86 0.33 7.1 -6.2NGC 4394 115.5 1 -20.44 0.26 7.1 <-7.9NGC 4450 135.0 1 -21.32 0.16 7.4 -4.1NGC 4548 113.4 1 -21.31 0.25 7.1 -5.4NGC 4579 165.0 1 -22.32 0.17 7.8 -3.3NGC 4596 ... ... -21.19 0.28 7.9c -6.6NGC 4639 96.0 1 -20.40 0.17 6.8 -1.7NGC 4713 23.2 1 -19.24 0.00 4.2 -2.8NGC 4725 140.0 1 -21.73 0.19 7.5 -3.3NGC 5350 ... ... -21.09 0.07 7.0 -5.1NGC 5371 179.8 1 -22.00 0.12 7.9 -5.7NGC 5584 ... ... -20.27 0.00 ... ...NGC 5728 209.0 3 -21.76 0.28 8.2 -5.0NGC 5964 ... ... -20.27 0.00 ... ...NGC 7479 154.6 1 -22.30 0.12 7.7 -5.6NGC 7552 104.0 7 -21.31 0.37 6.9 -4.8NGC 7743 89.3 1 -20.47 0.31 6.6 -5.2PGC 3853 ... ... -18.93 0.00 ... ...
Note. — Column (1): galaxy name; Column (2): central stellar velocitydispersion; Column (3): Reference for either σ∗ or MBH: (1) Ho et al. (2009);(2) Lewis & Eracleous (2006); (3) McElroy (1995); (4) Wegner et al. (2003); (5)Walcher et al. (2005); (6) Garcia-Rissmann et al. (2005) (7) Oliva et al. (1995).Column (4): absolute magnitude from Munoz-Mateos et al. (2013); Column (5):bulge-to-total light ratio; Column (6): BH mass derived using the MBH–σ∗ re-lation from equation (1), or if noted, direct BH mass measurement; Column (7):Eddington ratio.a Direct MBH measurement from gas kinematics (Atkinson et al. 2005).b Velocity dispersion of the nuclear star cluster.c Direct MBH measurement from gas kinematics (Sarzi et al. 2001).d Direct MBH measurement from stellar kinematics (Nowak et al. 2010).
found to be the most significant one (Gebhardt et al.2003). Twenty-six of the remaining galaxies have avail-able σ∗ measurements from the literature, allowing us toapply the MBH–σ∗ relation under the assumption that itholds true for the galaxies probed in the present study2.Since the establishment of this scaling relation, the num-ber of MBH measurements has been substantially ex-panded, and hence we opt to use the updated relationfrom Gultekin et al. (2009), given by:
2 We caution that it is still under debate whether the MBH–σ∗ holds universally other than for classical bulges and ellipticalgalaxies (e.g., Kormendy & Ho 2013).
log (MBH/M⊙) = 8.12 + 4.24 log( σ∗
200 kms−1
)
. (1)
For the rest of our sample lacking σ∗ measurements,BH masses can be predicted by employing the correlationwith bulge luminosity at 3.6 µm (Lbul,3.6) obtained bySani et al. (2011):
log (MBH/M⊙) = 8.19 + 0.93 log
(
Lbul,3.6
1011L⊙,3.6
)
. (2)
Bulge luminosities in solar units at 3.6 µm are derivedusing the bulge-to-total light ratios (B/T ) from the two-

X-ray Nuclear Activity in S4G Barred Galaxies 7
dimensional image decomposition (see section 4.1 for de-tails) together with the 3.6 µm absolute magnitude of thegalaxies (Munoz-Mateos et al. 2013). To estimate lumi-nosities in solar units, we use the 3.6 µm solar absolutemagnitude value of M3.6
⊙ = 3.24 derived by Oh et al.(2008). Within these galaxies, six were best-modeledwithout a bulge component (B/T = 0), making it notpossible to estimate their MBH through this method, yetall of them had class IV nuclei, i.e., no X-ray nuclearsource.Both MBH–σ∗ and MBH–Lbul,3.6 relations used here
have an intrinsic scatter of ∼0.4 dex, being the domi-nant source of uncertainty in our MBH estimates. Weassess the consistency of both methods at predicting BHmasses through a direct comparison: in Figure 3, weplot MBH estimates using both methods on 22 galaxieswith σ∗ measurements as well as B/T > 0. In the figure,the solid line indicates the exact correspondence betweenboth methods, and the dashed lines mark the 0.4 dex in-trinsic scatter from the scaling relations. The bulk of thegalaxies obey the relation within the uncertainties, andMBH derived from bulge luminosities are, on average,∼0.1 dex higher than those from σ∗. This is particularlyinteresting, as it has been argued that barred galaxiesappear systematically offset ∼-0.5 dex from the MBH–σ∗
relation (Graham 2008; Gadotti & Kauffmann 2009) andhence these BH masses could be overestimated. At leastfor the galaxies probed here, this effect is not observed,and both methods can be considered consistent withinthe scatter. The resulting BH masses and correspond-ing Eddington ratios, along with the relevant parametersused for their calculation, are presented Table 2.
4. QUANTIFYING BAR STRENGTH
Stellar bars come in very different shapes and sizes, andtherefore it would be unfair to simply categorize them asa single group. Bars have different strengths which willdetermine how efficiently they can drive the interstellarmedium to central regions of the galaxy. As bars evolvewith time, their pattern speeds slow down, allowing themto become more elongated and eccentric, and thereforestronger (for a review, see Athanassoula 2012). Whilethe pattern speed of bars is difficult to measure, theirstructure can be quantified from two-dimensional im-age modeling of the galaxy components. A different ap-proach comes from quantifying the gravitational torquesdue to non-axisymmetric structures (e.g., Stark 1977;Combes & Sanders 1981; Zaritsky & Lo 1986). Giventhat the NIR imaging mostly probes old stars (and hencestellar mass), one can infer the gravitational potentialfrom the bar without the need of defining its structure.Below we describe and apply these two independent ap-proaches at quantifying bar strength: one based on itsstructure and the other on its gravitational potential.
4.1. Bar Structure: Ellipticity and Boxiness
Suggested early on by analytical models as a funda-mental parameter describing a barred galaxy and itsdynamical evolution (Athanassoula 1992a), the depro-jected bar ellipticity was proposed by Martin (1995)as quantifiable measure of bar strength, in the sensethat the smaller the axial ratio, the stronger the non-axisymmetric force the bar will be able to exert. Inter-estingly, Martin found that for a small sample of galax-
Table 3Bar structural properties and maximum relative
torque
Galaxy ǫ c Qb
(1) (2) (3) (4)
NGC 255 0.60 ± 0.02 2.64 ± 0.18 0.51+0.05−0.04
NGC 685 0.63 ± 0.02 2.75 ± 0.61 0.39+0.04−0.03
NGC 1036 0.37 ± 0.01 2.66 ± 0.20 0.34+0.03−0.02
NGC 1073 0.72 ± 0.01 2.78 ± 0.55 0.63+0.07−0.08
NGC 1097 0.45 ± 0.09 2.77 ± 1.19 0.26+0.04−0.04
NGC 1232 0.35 ± 0.01 2.76 ± 1.07 0.13+0.01−0.01
NGC 1291 0.64 ± 0.01 2.78 ± 0.01 0.14+0.02−0.02
NGC 1300 0.75 ± 0.01 3.16 ± 0.20 0.57+0.12−0.10
NGC 1302 0.48 ± 0.01 2.81 ± 0.01 0.10+0.01−0.01
NGC 1341 0.61 ± 0.01 3.00 ± 0.51 0.51+0.04−0.05
NGC 1367 0.54 ± 0.01 2.72 ± 0.28 0.13+0.02−0.02
NGC 1493 0.63 ± 0.03 2.64 ± 0.75 0.41+0.06−0.04
NGC 1637 0.65 ± 0.01 2.73 ± 0.12 0.23+0.04−0.03
NGC 1640 0.65 ± 0.01 2.92 ± 0.28 0.28+0.05−0.04
NGC 1672 0.63 ± 0.09 3.90 ± 2.17 0.37+0.06−0.06
NGC 2787 0.69 ± 0.01 2.77 ± 0.32 0.15+0.02−0.02
NGC 3344 0.46 ± 0.03 2.63 ± 0.62 0.06+0.01−0.01
NGC 3351 0.70 ± 0.02 2.95 ± 0.33 0.24+0.04−0.04
NGC 3368 0.51 ± 0.01 2.51 ± 0.29 0.24+0.03−0.03
NGC 3627 0.67 ± 0.05 2.99 ± 1.14 0.31+0.09−0.06
NGC 4136 0.68 ± 0.05 2.95 ± 0.77 0.11+0.03−0.02
NGC 4245 0.62 ± 0.02 2.83 ± 0.20 0.19+0.03−0.02
NGC 4303 0.57 ± 0.02 3.12 ± 0.17 0.42+0.08−0.08
NGC 4314 0.75 ± 0.01 2.76 ± 0.13 0.45+0.08−0.08
NGC 4394 0.62 ± 0.02 2.85 ± 0.45 0.23+0.04−0.03
NGC 4450 0.34 ± 0.01 3.10 ± 0.15 0.14+0.02−0.02
NGC 4548 0.68 ± 0.06 2.87 ± 0.97 0.28+0.04−0.04
NGC 4579 0.49 ± 0.10 2.68 ± 1.26 0.18+0.03−0.03
NGC 4596 0.68 ± 0.01 2.78 ± 0.41 0.25+0.05−0.04
NGC 4639 0.60 ± 0.01 2.94 ± 0.11 0.27+0.03−0.04
NGC 4713 0.15 ± 0.04 2.78 ± 0.48 0.25+0.04−0.04
NGC 4725 0.54 ± 0.09 3.00 ± 1.74 0.24+0.03−0.03
NGC 5350 0.70 ± 0.01 2.71 ± 0.33 0.44+0.08−0.07
NGC 5371 0.58 ± 0.05 2.97 ± 0.24 0.13+0.03−0.02
NGC 5584 0.61 ± 0.01 2.71 ± 0.25 0.40+0.03−0.03
NGC 5728 0.51 ± 0.02 2.93 ± 0.52 0.41+0.05−0.06
NGC 5964 0.55 ± 0.01 3.04 ± 0.38 0.94+0.16−0.17
NGC 7479 0.68 ± 0.01 2.80 ± 0.43 0.54+0.11−0.10
NGC 7552 0.64 ± 0.01 2.60 ± 0.07 0.36+0.08−0.07
NGC 7743 0.54 ± 0.04 2.68 ± 0.81 0.19+0.02−0.02
PGC 3853 0.63 ± 0.04 2.78 ± 0.68 0.45+0.05−0.05
Note. — Column (1): galaxy name; Column (2):deprojected bar ellipticity; Column (3): bar boxiness;Column (4): maximum relative torque.
ies with nuclear starbursts, the majority were hosted bygalaxies with highly eccentric bars. Bar ellipticity hasbeen widely used in the literature (e.g., Rozas et al. 1998;Abraham et al. 1999; Aguerri 1999; Knapen et al. 2000;Shlosman et al. 2000; Laine et al. 2002; Gadotti 2011;Wang et al. 2012) and has the advantage of being read-ily available from photometric images and is indepen-dent on assumptions of the galaxy’s physical properties.Additionally, N-body simulations have shown that as abar grows stronger, it does not only get more eccentricbut also more boxy in shape (Athanassoula & Misiriotis
8 CISTERNAS ET AL.
2002). This was observed by Gadotti (2011) who foundthat bar ellipticity and boxiness were correlated, and de-fined their product as a proxy for bar strength.In this paper, we use the structural parameters de-
rived for the parent sample of S4G barred galaxies to bepresented in detail in T. Kim et al. (in preparation).The two-dimensional image decomposition code BUDDA
(de Souza et al. 2004; Gadotti 2008) was used to modelthe galaxies: three components, described by concentricellipses, were used to represent the bulge, disk, and bar.When necessary, a central point source component wasincluded to account for a bright AGN or nuclear starcluster. In some cases, nuclear rings were masked anddisk breaks, i.e., disk light profiles with two slopes, wereaccounted for. The careful procedures adopted assurethat the structural properties of the bar are always ac-curately measured. The structural parameters of inter-est are derived from the equation of a generalized ellipse(Athanassoula et al. 1990):
(
|x|
a
)c
+
(
|y|
b
)c
= 1, (3)
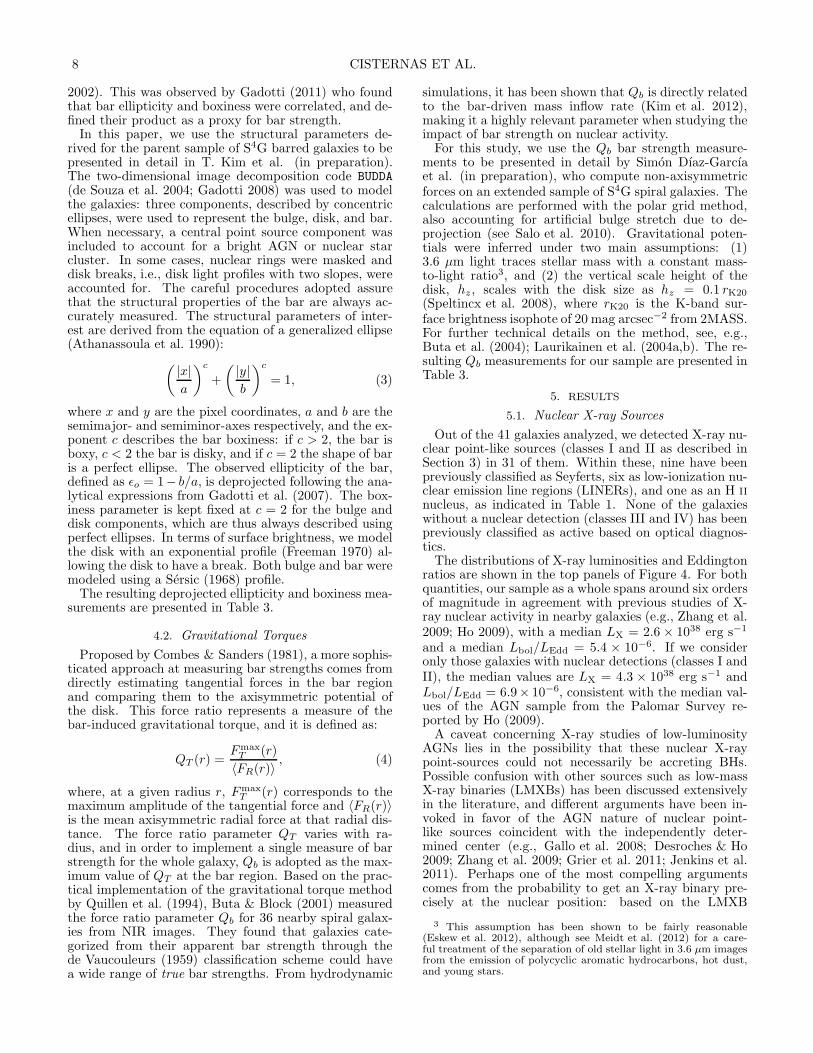
where x and y are the pixel coordinates, a and b are thesemimajor- and semiminor-axes respectively, and the ex-ponent c describes the bar boxiness: if c > 2, the bar isboxy, c < 2 the bar is disky, and if c = 2 the shape of baris a perfect ellipse. The observed ellipticity of the bar,defined as ǫo = 1− b/a, is deprojected following the ana-lytical expressions from Gadotti et al. (2007). The box-iness parameter is kept fixed at c = 2 for the bulge anddisk components, which are thus always described usingperfect ellipses. In terms of surface brightness, we modelthe disk with an exponential profile (Freeman 1970) al-lowing the disk to have a break. Both bulge and bar weremodeled using a Sersic (1968) profile.The resulting deprojected ellipticity and boxiness mea-
surements are presented in Table 3.
4.2. Gravitational Torques
Proposed by Combes & Sanders (1981), a more sophis-ticated approach at measuring bar strengths comes fromdirectly estimating tangential forces in the bar regionand comparing them to the axisymmetric potential ofthe disk. This force ratio represents a measure of thebar-induced gravitational torque, and it is defined as:
QT (r) =FmaxT (r)
〈FR(r)〉, (4)
where, at a given radius r, FmaxT (r) corresponds to the
maximum amplitude of the tangential force and 〈FR(r)〉is the mean axisymmetric radial force at that radial dis-tance. The force ratio parameter QT varies with ra-dius, and in order to implement a single measure of barstrength for the whole galaxy, Qb is adopted as the max-imum value of QT at the bar region. Based on the prac-tical implementation of the gravitational torque methodby Quillen et al. (1994), Buta & Block (2001) measuredthe force ratio parameter Qb for 36 nearby spiral galax-ies from NIR images. They found that galaxies cate-gorized from their apparent bar strength through thede Vaucouleurs (1959) classification scheme could havea wide range of true bar strengths. From hydrodynamic
simulations, it has been shown that Qb is directly relatedto the bar-driven mass inflow rate (Kim et al. 2012),making it a highly relevant parameter when studying theimpact of bar strength on nuclear activity.For this study, we use the Qb bar strength measure-
ments to be presented in detail by Simon Dıaz-Garcıaet al. (in preparation), who compute non-axisymmetricforces on an extended sample of S4G spiral galaxies. Thecalculations are performed with the polar grid method,also accounting for artificial bulge stretch due to de-projection (see Salo et al. 2010). Gravitational poten-tials were inferred under two main assumptions: (1)3.6 µm light traces stellar mass with a constant mass-to-light ratio3, and (2) the vertical scale height of thedisk, hz, scales with the disk size as hz = 0.1 rK20
(Speltincx et al. 2008), where rK20 is the K-band sur-face brightness isophote of 20 mag arcsec−2 from 2MASS.For further technical details on the method, see, e.g.,Buta et al. (2004); Laurikainen et al. (2004a,b). The re-sulting Qb measurements for our sample are presented inTable 3.
5. RESULTS
5.1. Nuclear X-ray Sources
Out of the 41 galaxies analyzed, we detected X-ray nu-clear point-like sources (classes I and II as described inSection 3) in 31 of them. Within these, nine have beenpreviously classified as Seyferts, six as low-ionization nu-clear emission line regions (LINERs), and one as an H iinucleus, as indicated in Table 1. None of the galaxieswithout a nuclear detection (classes III and IV) has beenpreviously classified as active based on optical diagnos-tics.The distributions of X-ray luminosities and Eddington
ratios are shown in the top panels of Figure 4. For bothquantities, our sample as a whole spans around six ordersof magnitude in agreement with previous studies of X-ray nuclear activity in nearby galaxies (e.g., Zhang et al.2009; Ho 2009), with a median LX = 2.6 × 1038 erg s−1
and a median Lbol/LEdd = 5.4 × 10⁻⁶. If we consideronly those galaxies with nuclear detections (classes I andII), the median values are LX = 4.3 × 1038 erg s−1 andLbol/LEdd = 6.9× 10⁻⁶, consistent with the median val-ues of the AGN sample from the Palomar Survey re-ported by Ho (2009).A caveat concerning X-ray studies of low-luminosity
AGNs lies in the possibility that these nuclear X-raypoint-sources could not necessarily be accreting BHs.Possible confusion with other sources such as low-massX-ray binaries (LMXBs) has been discussed extensivelyin the literature, and different arguments have been in-voked in favor of the AGN nature of nuclear point-like sources coincident with the independently deter-mined center (e.g., Gallo et al. 2008; Desroches & Ho2009; Zhang et al. 2009; Grier et al. 2011; Jenkins et al.2011). Perhaps one of the most compelling argumentscomes from the probability to get an X-ray binary pre-cisely at the nuclear position: based on the LMXB
3 This assumption has been shown to be fairly reasonable(Eskew et al. 2012), although see Meidt et al. (2012) for a care-ful treatment of the separation of old stellar light in 3.6 µm imagesfrom the emission of polycyclic aromatic hydrocarbons, hot dust,and young stars.

X-ray Nuclear Activity in S4G Barred Galaxies 9
population study by Gilfanov (2004), the analyses byGallo et al. (2008) and Zhang et al. (2009) estimate ofthe order of 10−2 LMXBs brighter than ∼1038 erg s−1
within an aperture of the size of the Chandra PSF. To-gether with the excellent agreement between the nuclearand NIR position, comparable to their astrometric un-certainties of ∼1′′, as well as the lack of other point-likeX-ray sources in the immediate vicinity (∼5′′) for thevast majority of our sample, the existence of any sig-nificant contamination from LMXBs can be likely ruledout.
5.2. Bar Strength Versus Nuclear Activity
In Figure 4, we plot the different measurements of barstrength against nuclear activity as described in the pre-vious sections. Deprojected ellipticity ǫ, boxiness c, theirproduct ǫ×c, and gravitational torque parameter Qb areshown from top to bottom; on the left-side panels against2–10 keV X-ray luminosity LX, and on the right-side pan-els against Eddington ratio Lbol/LEdd. One can immedi-ately observe that no clear correlations are present: forany given luminosity or Eddington ratio there is a widerange of possible bar strengths, as quantified through thefour methods presented before. To better explore possi-ble trends in our sample, a more practical representationof our results is shown in Figure 5. Here, we plot the me-dian of each bar strength indicator versus AGN activity,binning our sample in both X-ray luminosity and Edding-ton ratio with boundaries at LX = 1038, 1040 erg s−1 andLbol/LEdd = 10−6, 10−4 respectively. In this plot, thelack of any relevant positive trend between bar strengthand AGN activity is even more evident. On the con-trary, in a few cases there seems to be a negative trendof bar strength with increasing AGN luminosity or ac-cretion rate, yet the large dispersions cast doubt on theirsignificance.To quantitatively investigate whether any of these
trends are significant and could reveal a link betweenbar strength and nuclear activity, we test the dependencebetween X-ray luminosity and Eddington ratio againstthe different bar strength proxies using Spearman’s rankcorrelation. Besides performing this statistical test forour entire sample, we also test for correlations exclud-ing galaxies with nuclear classes III or IV: even thoughwe are operating under the assumption that all of thesegalaxies have a BH at their centers, we account for thepossibility that the lack of detection in those cases forwhich we present upper limits may be due to the lackof a BH. In such a case, these galaxies should not bepart of the correlation and might be affecting the overallresult. Therefore, we test this possibility by perform-ing the correlation test only on those galaxies with nu-clear detections (classes I and II). Additionally, we testwhether any correlation shows up when probing differentsubsamples based on luminosity, morphological T -type,and bulge-to-total light ratio cuts at their respective me-dian values. The effect of bar strength on nuclear activityin different galaxy luminosity –and hence stellar mass–regimes is tested by defining “Faint” and “Bright” sub-samples based on a luminosity cut atM3.6=-20.82, whichcorresponds to M∗ ∼ 2.8×10¹⁰M⊙ following the conver-sion presented in the Appendix of Munoz-Mateos et al.(2013); “Early” and “Late” morphological subsamplesare defined dividing at T -type = 3.1; and “Bulgy” and
Figure 4. The top panels show the distributions of 2–10 keV X-ray luminosities (left) and Eddington ratios (right). Below, fromtop to bottom, deprojected ellipticity ǫ, boxiness c, their productǫ × c, and gravitational torque parameter Qb, are plotted againstLX and Lbol/LEdd. The arrows represent upper limits, i.e., nuclearclasses III and IV. On the top left corner of each panel, we showthe mean measurement uncertainties.
Figure 5. Median bar strength of our sample as a function ofAGN activity, binned in X-ray luminosity (left) and Eddington ra-tio (right), with boundaries set at LX = 1038, 1040 erg s−1 andLbol/LEdd = 10−6, 10−4 respectively, and centered at the medianvalues of their respective bin. From top to bottom, the median ofdeprojected ellipticity, boxiness, their product ǫ × c, and gravita-tional torque, are plotted following the Y-axis ranges as in Figure 4.Vertical error bars correspond to the median absolute deviations.
“Disky” subsamples based on the bulge-to-total light ra-

10 CISTERNAS ET AL.
Table 4Correlation tests
All galaxies Classes I+II “Faint” (M3.6 > -20.82) “Bright” (M3.6 < -20.82)ρ Significance ρ Significance ρ Significance ρ Significance
LX vsǫ -0.11 0.51 -0.20 0.28 0.16 0.50 -0.36 0.11c 0.12 0.44 0.14 0.45 -0.02 0.93 -0.08 0.72
ǫ× c -0.10 0.54 -0.21 0.25 0.09 0.72 -0.40 0.07Qb -0.19 0.24 0.01 0.97 -0.31 0.18 -0.09 0.70
Lbol/LEdd vsǫ -0.28 0.11 -0.28 0.13 -0.15 0.60 -0.42 0.06c -0.17 0.33 -0.08 0.65 -0.13 0.67 -0.06 0.78
ǫ× c -0.34 0.04 -0.31 0.09 -0.30 0.30 -0.40 0.07Qb -0.03 0.87 0.00 1.00 -0.04 0.89 0.00 0.98
“Early” (T -type < 3.1) “Late” (T -type > 3.1) “Bulgy” (B/T > 0.13) “Disky” (B/T < 0.13)ρ Significance ρ Significance ρ Significance ρ Significance
LX vsǫ -0.37 0.10 0.15 0.51 -0.35 0.14 0.05 0.82c 0.09 0.71 0.21 0.37 0.15 0.52 0.14 0.54
ǫ× c -0.34 0.13 0.17 0.48 -0.32 0.16 0.06 0.79Qb -0.06 0.79 -0.02 0.94 0.00 0.99 -0.11 0.62
Lbol/LEdd vsǫ -0.36 0.11 -0.17 0.55 -0.35 0.13 -0.23 0.40c 0.04 0.85 -0.48 0.08 0.12 0.63 -0.50 0.06
ǫ× c -0.36 0.11 -0.31 0.27 -0.35 0.13 -0.36 0.18Qb -0.08 0.74 -0.12 0.69 0.00 0.99 -0.14 0.62
Note. — Spearman’s rank correlation coefficient ρ and its significance are measured for the whole sample as well as for subsamples excludingupper limits, and divided according to the median 3.6 µm absolute magnitude, morphological T -type, and bulge-to-total light ratio of the sample:M3.6=-20.82 (or M∗ ∼ 2.8 × 10¹⁰M⊙), T -type = 3.1, and B/T = 0.13 respectively. When a perfect correlation (or anticorrelation) occurs, ρadopts 1 (or -1), whereas ρ = 0 if no correlation is present. The significance of the correlation is a value within [0,1], and should be consistentwith zero in case of a significant correlation.
tio from the image decomposition are defined by a cut atB/T = 0.13.In Table 4, we show the Spearman’s rank correlation
coefficient ρ and its significance for every combinationof bar strength and AGN activity measurement for theeight samples analyzed, i.e., whole sample, galaxies withnuclear X-ray point source, and subsamples divided by3.6 µm absolute magnitude, morphological T -type, andbulge-to-total light ratio. No significant correlation isobtained in any of the subsamples. The Spearman’s co-efficient and significance values for the whole sample re-flect the trends shown in Figure 5, and no major changeshappen by excluding upper limits from the analysis. Di-viding the sample of galaxies by their 3.6 µm absolutemagnitude does not particularly change the trends, yetit strengthens the, albeit still not significant, anticor-relation between ǫ × c and AGN activity as traced byboth X-ray luminosity and Eddington ratio for the moreluminous, massive end of our sample. As one could ex-pect from the correspondence between Hubble type andbulge extent relative to the galaxy, both pairs of sub-samples, “Early”/“Bulgy” and “Late”/“Disky” show avery good agreement in terms of their correlation scores.However, no significant correlation shows up in neitherof them, suggesting that the presence or absence of a sig-nificant bulge component does not affect the influence ofthe stellar bar on the nuclear fueling. This is particularlyinteresting for the case of Qb, which is directly affectedby the bulge: the relative torque parameter is diluted inthe presence of a stronger axisymmetric component, i.e.,a more massive bulge. Therefore, if there was a directconnection between the non-axisymmetric gravitationalpotential from the stellar bar and the level of AGN ac-tivity, one would have expected to see it at least in the
subsample of galaxies with less massive bulges.In summary, no significant correlation is found for any
of the subsamples probed, and therefore our analysis in-dicates an independence between bar strength and de-gree of nuclear activity irrespective of galaxy luminosity,stellar mass, morphology, or bulge relative size.
6. DISCUSSION
From the point of view of both, simulations and obser-vations, stellar bars have been shown to be able to drivematerial toward the central regions of a galaxy. The no-tion that bars are also able to feed a BH however, hasnot been supported by empirical results. Most studiesinvestigating whether bars had any impact on AGN ac-tivity did so by measuring bar fractions among samplesof active and inactive galaxies, or alternatively, by mea-suring the AGN fraction between barred and unbarredgalaxies. Since bars have a wide range of strengths, andAGN activity has a continuous distribution in luminosityand mass accretion rate spanning a few orders of magni-tude, perhaps most previous attempts at connecting barsand AGN oversimplified on their approach by discretizingthese quantities. Among the few studies taking this intoaccount, Ho et al. (1997b) investigated AGN luminositydistributions, as traced by the nuclear Hα emission, onbarred and unbarred galaxies finding that the presence ofa bar had no influence on the observed nuclear luminos-ity. On the other hand, Laurikainen et al. (2002, 2004a)quantified bar strengths using the gravitational torqueparameterQb for samples of barred active and non-activegalaxies and found no evidence that would suggest thatstronger bars, as traced by Qb, tend to favor AGN hostgalaxies. In fact, they found weaker Qb values amongactive galaxies against their inactive counterparts, yet

X-ray Nuclear Activity in S4G Barred Galaxies 11
they highlight that this is a side-effect of Qb being tied toHubble type, in the sense that a more massive bulge rel-ative to the disk will induce a stronger axisymmetric po-tential, washing out the bar-induced torque. Therefore,early-type spirals, where the optically classified AGNsanalyzed in these studies were preferentially found, willhave intrinsically weak bars according to Qb. The in-verse effect was observed by Laurikainen et al. (2004a)when comparing m = 2 Fourier amplitude of density ofthe bar, in the sense that early-type spirals have largervalues when compared to later-types, in which inactivegalaxies were mostly found. Both effects, however, goaway if Hubble-type is kept fixed, with active and in-active galaxies showing comparable values of these barstrength indices.In the context of BH accretion rates, Crenshaw et al.
(2003) compared the fraction of bars between two sub-classes of active galaxies: narrow-line and broad-lineSeyfert 1s (NLS1s and BLS1s respectively). At a fixedluminosity, the former have lower-mass BHs comparedto the latter, and given their near-Eddington accretionrates, NLS1s are thought to be AGNs in an early stageof their activity (Mathur 2000). Additionally, NLS1stend to host pseudo-bulges (Orban de Xivry et al. 2011;Mathur et al. 2012), making them ideal test-cases for thestudy of secular processes driving the evolution of galaxyand BH. Crenshaw et al. found that bars are indeed morefrequent in NLS1s, suggesting a scenario in which theirhigher accretion rates are related to the bar-induced fuel-ing. Other studies have tackled the impact of bars on theEddington ratio using large samples of galaxies from theSloan Digital Sky Survey (York et al. 2000) with mixedresults: while Alonso et al. (2013) argue that barred ac-tive galaxies show higher mean accretion rates againsttheir unbarred counterparts, Lee et al. (2012) found thatboth barred and unbarred active galaxies have consistentEddington ratio distributions.A connection between AGN activity and host galaxy
on kiloparsec scales has been pursued not only from thepoint of view of stellar bars, but also from the perspec-tive of the kinematics of the galaxy. On a compari-son between the stellar and gaseous kinematics withinthe central kiloparsec of Seyfert and inactive galaxies,Dumas et al. (2007) found no remarkable differences onlarge scales, with both stars and gas showing regular ro-tation patterns and a general alignment with each other.On smaller scales however, within the inner few hundredparsecs, the ionized gaseous component of active galax-ies is more disturbed compared to their inactive coun-terparts, leading to the reasonable conclusion that sig-natures of the ongoing BH feeding can only be found inthe innermost regions of the galaxy.In this respect, HST programs have targeted the
nuclear regions of active galaxies to study their nu-clear dust structure (e.g., Regan & Mulchaey 1999;Martini & Pogge 1999). The morphology of the circum-nuclear dust can reveal whether the influence of the barextends to the unresolved nucleus in the shape of straightdust lanes. Surprisingly, these studies found these signa-tures only in a minority of active galaxies, and foundthat another observed mechanism, nuclear dust spirals,might be responsible of driving the gas further down toparsec scales. Nevertheless, comparisons between the cir-cumnuclear dust structure of active and inactive galaxies
have shown that nuclear dust spirals are equally commonon both samples, without a preference for active nuclei(Martini et al. 2003b), hinting at the possibility that thelifetime of AGN activity has to be less than the inflowtime from these structures. Furthermore, there is no cor-relation between the structure of the circumnuclear dustand the strength of the stellar bar: Peeples & Martini(2006) found that strongly barred galaxies can have awealth of nuclear dust morphologies, ranging from aclearly defined nuclear dust spiral to a chaotic structureunlikely to be able to drive material to the very centralregions, suggesting that a strong bar does not necessarilyimply an efficient nuclear fueling.
6.1. On the Stability of Bars
Based on the results presented here, nuclear luminosityand BH accretion rate are not influenced by the strengthof the large-scale bar. Do our findings imply that barsplay no role in driving the gas that would eventually fuelan AGN? The only safe conclusion one can draw fromour results is that the current strength of the stellar barhas no impact on the level of co-occurrent AGN activity,and hence, if bars were to weaken over time while drivinggas down to the galactic centers, we could be missing itstrue influence on nuclear activity.Early simulations of the dynamical evolution of bars
in galaxies suggested that bar-induced gas inflows ini-tiate the growth of a central (r . 250 pc) mass con-centration, which in turn can dramatically decrease thestrength of the bar: as the central mass increases itcan significantly perturb and eventually destroy the or-bital structure supporting the bar (Hasan & Norman1990; Pfenniger & Norman 1990; Friedli & Benz 1993).It has been argued, however, that the sole central con-centration of mass is not enough to significantly weakenthe bar unless its mass is a few percent of the diskmass (Shen & Sellwood 2004; Athanassoula et al. 2005),which is inconsistent with BHs by at least one orderof magnitude on the conservative side. On the otherhand, models incorporating the gas response revealedthat a frequently overlooked bar-weakening mechanism,namely the transfer of angular momentum between thestellar bar and the infalling gas, can have a significantimpact on the bar dissolution, which can take .2 Gyr(Bournaud et al. 2005). Interestingly, Bournaud et al.also showed that a noticeable increase in the central massonly happens once the bar has significantly weakened.These results would imply that a bar-driven build-up ofgas in the central regions of the galaxy can be hardlyconnected to the current strength of the bar. If said gaswas eventually expected to reach and feed the centralBH, then it would not surprising that our results showno relation between nuclear activity and the strength ofthe bar.In the context of our findings, the above scenario would
be particularly appealing. However, most recent simula-tions from various groups converge toward long-lived andstable bars. Models in which bars are destroyed tend touse rigid halos, not allowing for angular momentum re-distribution which promotes bar growth (Athanassoula2002). When live halos are used, neither the central massconcentration nor the transfer of angular momentumfrom the gas to the stellar bar are able to significantlyweaken them (Berentzen et al. 2007; Villa-Vargas et al.

12 CISTERNAS ET AL.
2010; Kraljic et al. 2012; Athanassoula et al. 2013), andtherefore bar weakening can be likely ruled out as thecause of the disconnection between bar strength and on-going nuclear activity.
6.2. Nuclear Bars and Nuclear Rings
Shlosman et al. (1989) proposed a cascade of instabili-ties in a galaxy as a possible way of fueling BH activity–the “bars within bars” scenario. Gas inflows driven by alarge-scale bar would result in a circumnuclear gaseousdisk, which could in turn suffer from further instabili-ties and form a randomly-oriented nested bar within thelarge-scale bar. This nuclear bar could drive gaseous ma-terial further down into the galactic nucleus and feed anAGN. HST observations of nearby Seyfert galaxies, how-ever, have found nuclear bars in only a minority of them(Martini et al. 2001; Laine et al. 2002).Nuclear rings can be found in around one fifth
of barred galaxies (Comeron et al. 2010). They arethought to be signposts of inflowing gas slowing downnear the inner Lindblad resonances (Simkin et al. 1980;Combes & Gerin 1985; Knapen et al. 1995). Their rela-tion to the fueling of nuclear activity could be twofold:as they trace a recent gas inflow to the nuclear regions,nuclear rings could be expected to be more common inactive galaxies (e.g., Knapen 2005), or alternatively, theycould indicate that the bulk of the inflowing gas is pil-ing up at the resonances, hindering further significantinflows to smaller scales beyond the nuclear ring (e.g.,Garcıa-Burillo et al. 2005). The latest observational re-sults show that the fraction of galaxies with nuclear ringsthat also exhibit nuclear activity is consistent with theoverall fraction of active galaxies in the nearby universe(Comeron et al. 2010).We check whether the degree of nuclear activity of
those galaxies from our sample with either of these nu-clear features differs from the average by resorting tothe morphological classifications by Buta et al. (2010).In their study, a preliminary sample of roughly 10% ofthe S4G galaxies were classified using the de Vaucouleursrevised Hubble-Sandage system (de Vaucouleurs 1959),which accounts for the presence of nuclear rings as wellas nuclear bars among various other features. Currently,classifications exist for the bulk of the S4G sample (R.Buta, private communication), and hence we are ableto assess whether the presence of any of these nuclearfeatures makes a difference in the nuclear fueling. Wecomplement the classifications with those in the catalogson nuclear bars by Laine et al. (2002) and Erwin (2004),and on nuclear rings by Comeron et al. (2010).In Table 1, we indicate which galaxies present nuclear
bars and/or rings based on the classifications mentionedabove. Only six galaxies in our sample have nuclear bars,with their median X-ray luminosities and Eddington ra-tios being LX = 1.5 × 1040 erg s−1 and Lbol/LEdd =10−5 respectively, meaning higher luminosities than theaverage, yet their accretion rates are similar to those ofthe parent sample. Their median morphological T -typeof 2.2 indicates a mild preference for earlier-types whencompared to the parent sample. Hence, the detectednuclear bars are preferentially found in more massive,earlier-type spirals, implying more massive BHs whichin turn accounts for the higher X-ray luminosities yetordinary Eddington ratios.
Twelve galaxies in our sample feature nuclear rings,with a median T -type of 2.9, typical for galaxies host-ing nuclear rings (Comeron et al. 2010), and consistentwith the parent sample. Their median X-ray luminositiesand Eddington ratios are LX = 6.5 × 1038 erg s−1 andLbol/LEdd = 10−5 respectively, suggesting that the levelof nuclear activity in galaxies those hosting nuclear ringsis not different from those in the general population.
6.3. How to Sustain Low-luminosity AGN Activity
Early simulations suggested typical bar-driven gas in-flow rates into the inner kiloparsec of the order of 0.1–10 M⊙ yr−1 (Friedli & Benz 1993). These numbers wereempirically confirmed by Sakamoto et al. (1999), who es-timated a lower limit for the inflow rate into the cen-tral kiloparsec of 0.1–1 M⊙ yr−1 from their observa-tions of molecular gas on nearby spiral galaxies. Downto smaller scales, the influence of the non-axisymmetricstellar potential on the gas content of nearby activegalaxies has been observed to be efficient at driving thegas down to ∼100 parsec at rates of 0.01–50 M⊙ yr−1
(Garcıa-Burillo et al. 2005; Haan et al. 2009). At thesescales, these studies have observed that gas inflows arehalted and gravity torques can be positive. From thatpoint on, other competitive mechanisms such as vis-cous torques could be responsible of driving gas down tosmaller scales and potentially reach the BH (e.g., Combes2001).The mass accretion rates required to sustain typical
low-luminosity AGNs, however, are minuscule in com-parison to the previously mentioned bar-driven inflowrates: LLAGN activity is thought to be the product ofBHs being fed through radiatively inefficient accretionflows (for a review, see Narayan & McClintock 2008).In this model of mass accretion, for the typical bolo-metric luminosities and Eddington ratios of our sample,i.e., Lbol ∼ 1040 erg s−1 and Lbol/LEdd ∼ 10−5 respec-tively, Ho (2009) estimates mass accretion rates of the
order of M ∼ 10−6–10−5M⊙ yr−1. In the context ofthese extremely modest accretion rates, Ho (2009) ar-gues that most galaxies have their innermost regions areadily available steady supply of fuel in the form of (1)stellar mass loss from evolved stars, and (2) Bondi ac-cretion of hot gas. These fuel sources can exceed theestimated BH mass accretion rates by ∼2 orders of mag-nitude, and hence bar-driven gas inflows, while sufficient,might not be a necessary condition to sustain typical low-level AGN activity observed in the nearby universe andcould account for the independence between nuclear ac-tivity and bar strength found in the present study.
7. CONCLUSIONS
In this work, we quantified both the bar strengths of asample of 41 nearby barred galaxies from Spitzer/IRACimaging, and the level of BH activity using Chan-dra/ACIS archival data. Based on the observational andtheoretical evidence that bars drive material toward thecentral regions of a galaxy, our goal was to determinewhether bar strength has an impact on the level of BHfueling by investigating possible correlations between dif-ferent measures of bar strength and AGN activity. Ourfindings can be summarized as follows:
1. We found a nuclear X-ray point source coincident
X-ray Nuclear Activity in S4G Barred Galaxies 13
with the NIR position in 31 out of 41 galaxies in-dicative of ongoing BH fueling. The median 2–10keV X-ray luminosity and Eddington ratio of LX
= 4.3 × 1038 erg s−1 and Lbol/LEdd = 6.9 × 10⁻⁶
respectively are consistent with the levels of low-luminosity nuclear activity in the nearby universe(Ho 2009). For those sources without detections,upper limits were derived.
2. We estimated the strength of the stellar bar in twoindependent ways: from its structure, as traced byits ellipticity and boxiness, and from its maximumrelative gravitational torque. No significant corre-lation was found between any of the bar strengthproxies and the level of AGN activity: statisticaltests on our sample did not reveal any significanttrend between bar strength and BH fueling, irre-spective of galaxy luminosity, stellar mass, Hubbletype, or bulge size. This suggests that the strengththe stellar bar, and therefore the extent of the bar-driven inflow, is not directly connected with thedegree of ongoing BH fueling, at least for the low-luminosity regime probed here.
3. We checked whether the presence of nuclear ringsand/or nuclear bars had any impact on the ongoingBH fueling. We found that galaxies with nuclearrings show similar levels of nuclear activity com-pared to the parent sample, while galaxies withnuclear bars tend to have slightly higher luminosi-ties yet ordinary Eddington ratios, mainly becausethey tend to be found in earlier-type galaxies withhigher mass BHs.
4. Assessing our findings in the broader context ofprevious results from the literature, we discuss pos-sible scenarios concluding that (1) because strongbars are not necessarily related to more efficient BHfueling, the mechanisms responsible for LLAGN ac-tivity can not be traced on scales larger than a
few hundred parsec; and (2) the mass accretionrates required to sustain LLAGN activity are mi-nuscule in comparison to the observed bar-driveninflow rates, and therefore other sources readilyavailable at the centers of most galaxies must pro-vide a steady supply of fuel without the need ofkiloparsec scale inflows.
M.C. thanks Professor Ron Buta for providing morpho-logical classifications for the sample, and the anonymousreferee for useful suggestions. D.A.G. thanks MichaelWest for useful discussions. E.A. and A.B. acknowl-edge the CNES (Centre National d’Etudes Spatiales -France) for financial support. We acknowledge financialsupport to the DAGAL network from the People Pro-gramme (Marie Curie Actions) of the European Union’sSeventh Framework Programme FP7/2007-2013/ underREA grant agreement number PITN-GA-2011-289313.This work was co-funded under the Marie Curie Ac-tions of the European Commission (FP7-COFUND).The National Radio Astronomy Observatory is a fa-cility of the National Science Foundation operated un-der cooperative agreement by Associated Universities,Inc. This research is based in part on observationsmade with the Spitzer Space Telescope, and makes use ofthe NASA/IPAC Extragalactic Database (NED), bothof which are operated by the Jet Propulsion Labora-tory, California Institute of Technology under a con-tract with the National Aeronautics and Space Adminis-tration. We acknowledge the usage of the HyperLedadatabase (http://leda.univ-lyon1.fr). This publicationmakes use of data products from the Two Micron AllSky Survey, which is a joint project of the University ofMassachusetts and the Infrared Processing and AnalysisCenter/California Institute of Technology, funded by theNational Aeronautics and Space Administration and theNational Science Foundation.Facilities: CXO, Spitzer (IRAC).
APPENDIX
A. SPECTRAL MODELING
For the nine sources in our sample with more than 200 net counts, we perform a spectral analysis using XSPEC v12.7.0(Arnaud 1996). The spectra were binned using the GRPPHA task included in FTOOLS so that each spectral bin had atleast 20 counts, allowing us to use χ2 statistics to select a best fitting model. While a single power law model is a goodrepresentation of the AGN emission, bright sources with high count rates require a more detailed analysis in order toproperly characterize their nature and disentangle additional components contributing to the observed emission, e.g.,thermal plasma emission or a prominent iron line at 6.4 KeV. An ensemble of five models, as in Gonzalez-Martın et al.(2009), is used to better represent the true nature of the emitting source. These correspond to: a power-law model(PL) with intrinsic absorption, accounting for non-thermal AGN emission; a single-temperature thermal plasma model(MEKAL) to account for emission from unresolved binaries or supernova remnants; a combined MEKAL+PL modelin which the spectrum shows a contribution from both thermal and non-thermal emission mechanisms in the softand hard X-rays respectively; a double power-law model (2PL), in which a second power law is used to account forpossible AGN continuum emission scattered off the surrounding medium and showing up in the soft X-rays, with bothdescribed by the same spectral index; and a MEKAL+2PL model, similar as the previous one but adding a thermalcomponent also at lower energies.In order to choose the best model, we require the resulting parameters to have realistic values with a physical meaning,
e.g., photon index Γ = 0–3 for the PL and temperature kT = 0–2 keV for the MEKAL model. In the case that multiplemodels return reasonable parameters, preference is given to the simplest model (ie., the one with the least number ofcomponents) by checking that the quality of the fit does not improve significantly by adding additional componentsusing the F -test task within XSPEC. In order to discern between models with the same number of components, theone with the χ2
ν closest to unity is chosen. The best-fitting models together with their corresponding parameters are

14 CISTERNAS ET AL.
10.5 2 5
0.01
0.1
Cts
/s/k
eV
Energy (keV)
NGC1097
10.5 2 5
10−
35×
10−
42×
10−
35×
10−
3
Cts
/s/k
eV
Energy (keV)
NGC1291
1 2 5
10−
30.
012×
10−
35×
10−
3
Cts
/s/k
eV
Energy (keV)
NGC1367
10.5 2 5
10−
30.
015×
10−
42×
10−
35×
10−
30.
02
Cts
/s/k
eV
Energy (keV)
NGC2787
10.5 2 5
0.01
0.1
Cts
/s/k
eV
Energy (keV)
NGC4450
10.5 2 5
10−
30.
010.
1
Cts
/s/k
eV
Energy (keV)
NGC4579
10.5 2 5
0.01
0.1
0.02
0.05
0.2
Cts
/s/k
eV
Energy (keV)
NGC4639
10.5 2 5
10−
30.
01
Cts
/s/k
eV
Energy (keV)
NGC4725
10.5 2 5
10−
30.
015×
10−
42×
10−
35×
10−
30.
02
Cts
/s/k
eV
Energy (keV)
NGC5728
Figure 6. Nuclear X-ray spectra and best-fitting models for the subsample of sources with more than 200 counts.
Table 5Best fit models and parameters
Galaxy Model NH,1 NH,2 Γ kT χ2ν
(1022 cm−2) (1022 cm−2) (keV)(1) (2) (3) (4) (5) (6)
NGC 1097 PL 0.04+0.04−0.03 ... 1.64+0.13
−0.12 ... 0.96
NGC 1291 MEPL 0.67+0.27−0.35 1.87+1.02
−0.63 1.89+0.63−0.39 0.18+0.10
−0.06 0.80
NGC 1367 PL 2.42+1.02−0.46 ... 1.15+0.55
−0.13 ... 0.97
NGC 2787 PL 0.10+0.08−0.08 ... 2.29+0.40
−0.37 ... 1.13
NGC 4450 PL 0.04+0.07−0.04 ... 2.18+0.37
−0.26 ... 1.24
NGC 4579 2PL 1.89+0.31−0.32 0.01+0.02
−0.01 1.61+0.06−0.06 ... 1.40
NGC 4639 PL 0.03+0.07−0.03 ... 1.34+0.29
−0.24 ... 0.88
NGC 4725 PL 0.01+0.08−0.01 ... 3.34+1.22
−0.28 ... 0.98
NGC 5728 2PL 0.01+0.81−0.01 100.62+17.45
−22.03 2.41+0.40−0.37 ... 1.56
Note. — Column(1): galaxy name; Column (2): best-fitting model, in these caseseither an absorbed power-law (PL) or a double power-law (2PL) model; Columns (3)and (4) : HI column densities of model components; Column (5): spectral photon index;Column (6): temperature of the thermal plasma; Column (7): reduced χ2.
presented in Table 5; the spectra together with the chosen model are shown in Figure 6; and our findings are brieflydiscussed below:NGC 1367 - We report spectral modeling of the X-ray nuclear source in NGC 1367 for the first time, finding that its

X-ray Nuclear Activity in S4G Barred Galaxies 15
nuclear spectrum is best-fit by a single power-law with a rather hard photon index. Regarded as a non-active galaxy,it was observed with Chandra to study SN2005ke (Immler et al. 2006).NGC 1097, NGC 2787, and NGC 4450 - The X-ray nuclei of these galaxies are best-fit by single power-law models
characteristic of LLAGNs. Optically, the nuclei of these three galaxies have been found to belong to the LINERfamily by Phillips et al. (1984), Heckman et al. (1980), and Ho et al. (1997a) respectively, an indication of the likelynon-thermal nature of the nuclear emission on this class of active nuclei.NGC 1291 - The nucleus of this galaxy is a LINER as well (Smith et al. 2007), and is best-fit by a MEKAL+PL
model, in which the thermal plasma component accounts for the soft X-ray excess. Model parameters are in agreementwith the detailed study of the X-ray source population of this galaxy by Luo et al. (2012).NGC 4579 - Similarly, NGC 4579 also features a LINER nucleus (Stauffer 1982) which is best-fit by a 2PL
model. Eracleous et al. (2002) modeled the nuclear X-ray source as a single unabsorbed power law, whileGonzalez-Martın et al. (2009) find that the nuclear source is best-fit by a MEKAL+PL model. The main differ-ences seem to arise in the soft X-ray part of the spectrum, and the 2–10 keV luminosities derived from these studiesand ours agree among each other.NGC 4639 and NGC 4725 - Both of these galaxies host Seyfert nuclei (Ho et al. 1997a) and are best-fit by single
power-law models, in agreement with their known AGN nature.NGC 5728 - The X-ray nuclear source in NGC 5728 is best-fit by the 2PL model together with a Gaussian to account
for the strong FeKα feature at 6.4 KeV. The hard power law shows an absorption two orders of magnitude largerwhen compared to the rest of the sources from our sample, and just at the limit for being considered Compton-thick,at NH,2 ∼ 1024 cm−2. This is in agreement with the value already reported by Comastri et al. (2010) from Suzakuobservations.
REFERENCES
Abraham, R. G., Merrifield, M. R., Ellis, R. S., Tanvir, N. R., &Brinchmann, J. 1999, MNRAS, 308, 569
Aguerri, J. A. L. 1999, A&A, 351, 43Alonso, M. S., Coldwell, G., & Lambas, D. G. 2013, A&A, 549,
A141Araya Salvo, C., Mathur, S., Ghosh, H., Fiore, F., & Ferrarese, L.
2012, ApJ, 757, 179Arnaud, K. A. 1996, in Astronomical Society of the Pacific
Conference Series, Vol. 101, Astronomical Data AnalysisSoftware and Systems V, ed. G. H. Jacoby & J. Barnes, 17
Arsenault, R. 1989, A&A, 217, 66Athanassoula, E. 1992a, MNRAS, 259, 328—. 1992b, MNRAS, 259, 345—. 2002, ApJ, 569, L83—. 2012, arXiv:1211.6752Athanassoula, E., Lambert, J. C., & Dehnen, W. 2005, MNRAS,
363, 496Athanassoula, E., Machado, R. E. G., & Rodionov, S. A. 2013,
MNRAS, 429, 1949Athanassoula, E., & Misiriotis, A. 2002, MNRAS, 330, 35Athanassoula, E., Morin, S., Wozniak, H., Puy, D., Pierce, M. J.,
Lombard, J., & Bosma, A. 1990, MNRAS, 245, 130Atkinson, J. W., et al. 2005, MNRAS, 359, 504Bennert, V. N., Auger, M. W., Treu, T., Woo, J.-H., & Malkan,
M. A. 2011, ApJ, 742, 107Berentzen, I., Shlosman, I., Martinez-Valpuesta, I., & Heller,
C. H. 2007, ApJ, 666, 189Bournaud, F., Combes, F., & Semelin, B. 2005, MNRAS, 364, L18Buta, R., & Block, D. L. 2001, ApJ, 550, 243Buta, R., Laurikainen, E., & Salo, H. 2004, AJ, 127, 279Buta, R. J., et al. 2010, ApJS, 190, 147Cisternas, M., et al. 2011a, ApJ, 726, 57—. 2011b, ApJ, 741, L11+Coelho, P., & Gadotti, D. A. 2011, ApJ, 743, L13Comastri, A., Iwasawa, K., Gilli, R., Vignali, C., Ranalli, P.,
Matt, G., & Fiore, F. 2010, ApJ, 717, 787Combes, F. 2001, in Advanced Lectures on the Starburst-AGN,
ed. I. Aretxaga, D. Kunth, & R. Mujica, 223Combes, F., & Gerin, M. 1985, A&A, 150, 327Combes, F., & Sanders, R. H. 1981, A&A, 96, 164Comeron, S., Knapen, J. H., Beckman, J. E., Laurikainen, E.,
Salo, H., Martınez-Valpuesta, I., & Buta, R. J. 2010, MNRAS,402, 2462
Crenshaw, D. M., Kraemer, S. B., & Gabel, J. R. 2003, AJ, 126,1690
de Souza, R. E., Gadotti, D. A., & dos Anjos, S. 2004, ApJS, 153,411
de Vaucouleurs, G. 1959, Handbuch der Physik, 53, 275
Desroches, L.-B., & Ho, L. C. 2009, ApJ, 690, 267Devereux, N. 1987, ApJ, 323, 91Dickey, J. M., & Lockman, F. J. 1990, ARA&A, 28, 215Dumas, G., Mundell, C. G., Emsellem, E., & Nagar, N. M. 2007,
MNRAS, 379, 1249Ellison, S. L., Nair, P., Patton, D. R., Scudder, J. M., Mendel,
J. T., & Simard, L. 2011, MNRAS, 416, 2182Eracleous, M., Shields, J. C., Chartas, G., & Moran, E. C. 2002,
ApJ, 565, 108Erroz-Ferrer, S., et al. 2012, MNRAS, 427, 2938Erwin, P. 2004, A&A, 415, 941Eskew, M., Zaritsky, D., & Meidt, S. 2012, AJ, 143, 139Fazio, G. G., et al. 2004, ApJS, 154, 10Ferrarese, L., & Merritt, D. 2000, ApJ, 539, L9Freeman, K. C. 1970, ApJ, 160, 811Friedli, D., & Benz, W. 1993, A&A, 268, 65Gabor, J. M., et al. 2009, ApJ, 691, 705Gadotti, D. A. 2008, MNRAS, 384, 420—. 2011, MNRAS, 415, 3308Gadotti, D. A., Athanassoula, E., Carrasco, L., Bosma, A., de
Souza, R. E., & Recillas, E. 2007, MNRAS, 381, 943Gadotti, D. A., & Kauffmann, G. 2009, MNRAS, 399, 621Gallo, E., Treu, T., Jacob, J., Woo, J.-H., Marshall, P. J., &
Antonucci, R. 2008, ApJ, 680, 154Garcıa-Burillo, S., Combes, F., Schinnerer, E., Boone, F., &
Hunt, L. K. 2005, A&A, 441, 1011Garcia-Rissmann, A., Vega, L. R., Asari, N. V., Cid Fernandes,
R., Schmitt, H., Gonzalez Delgado, R. M., &Storchi-Bergmann, T. 2005, MNRAS, 359, 765
Garmire, G. P., Bautz, M. W., Ford, P. G., Nousek, J. A., &Ricker, Jr., G. R. 2003, in Society of Photo-OpticalInstrumentation Engineers (SPIE) Conference Series, Vol. 4851,Society of Photo-Optical Instrumentation Engineers (SPIE)Conference Series, ed. J. E. Truemper & H. D. Tananbaum,28–44
Gebhardt, K., et al. 2000, ApJ, 539, L13—. 2003, ApJ, 583, 92Georgakakis, A., et al. 2009, MNRAS, 397, 623Ghosh, H., Mathur, S., Fiore, F., & Ferrarese, L. 2008, ApJ, 687,
216Gilfanov, M. 2004, MNRAS, 349, 146Gonzalez-Martın, O., Masegosa, J., Marquez, I., Guainazzi, M., &
Jimenez-Bailon, E. 2009, A&A, 506, 1107Gonzalez-Martın, O., Masegosa, J., Marquez, I., Guerrero, M. A.,
& Dultzin-Hacyan, D. 2006, A&A, 460, 45Graham, A. W. 2008, ApJ, 680, 143Grier, C. J., Mathur, S., Ghosh, H., & Ferrarese, L. 2011, ApJ,
731, 60Gultekin, K., et al. 2009, ApJ, 698, 198

16 CISTERNAS ET AL.
Haan, S., Schinnerer, E., Emsellem, E., Garcıa-Burillo, S.,Combes, F., Mundell, C. G., & Rix, H.-W. 2009, ApJ, 692, 1623
Haring, N., & Rix, H. 2004, ApJ, 604, L89Hasan, H., & Norman, C. 1990, ApJ, 361, 69Heckman, T. M., Crane, P. C., & Balick, B. 1980, A&AS, 40, 295Ho, L. C. 2009, ApJ, 699, 626Ho, L. C., Filippenko, A. V., & Sargent, W. L. W. 1997a, ApJ,
487, 568—. 1997b, ApJ, 487, 591Ho, L. C., Greene, J. E., Filippenko, A. V., & Sargent, W. L. W.
2009, ApJS, 183, 1Ho, L. C., et al. 2001, ApJ, 549, L51Hummel, E., van der Hulst, J. M., Kennicutt, R. C., & Keel,
W. C. 1990, A&A, 236, 333Hunt, L. K., & Malkan, M. A. 1999, ApJ, 516, 660Immler, S., et al. 2006, ApJ, 648, L119Jahnke, K., et al. 2009, ApJ, 706, L215Jenkins, L. P., et al. 2011, ApJ, 734, 33Kalberla, P. M. W., Burton, W. B., Hartmann, D., Arnal, E. M.,
Bajaja, E., Morras, R., & Poppel, W. G. L. 2005, A&A, 440,775
Kim, W.-T., Seo, W.-Y., & Kim, Y. 2012, ApJ, 758, 14Knapen, J. H. 2005, A&A, 429, 141Knapen, J. H., Beckman, J. E., Heller, C. H., Shlosman, I., & de
Jong, R. S. 1995, ApJ, 454, 623Knapen, J. H., Shlosman, I., & Peletier, R. F. 2000, ApJ, 529, 93Kocevski, D. D., et al. 2012, ApJ, 744, 148Kormendy, J., & Ho, L. C. 2013, ARA&A, in press
(arXiv:1304.7762)Kormendy, J., & Kennicutt, Jr., R. C. 2004, ARA&A, 42, 603Kormendy, J., & Richstone, D. 1995, ARA&A, 33, 581Kraljic, K., Bournaud, F., & Martig, M. 2012, ApJ, 757, 60Laine, S., Shlosman, I., Knapen, J. H., & Peletier, R. F. 2002,
ApJ, 567, 97Laurikainen, E., Salo, H., & Buta, R. 2004a, ApJ, 607, 103Laurikainen, E., Salo, H., Buta, R., & Vasylyev, S. 2004b,
MNRAS, 355, 1251Laurikainen, E., Salo, H., & Rautiainen, P. 2002, MNRAS, 331,
880Lee, G.-H., Woo, J.-H., Lee, M. G., Hwang, H. S., Lee, J. C.,
Sohn, J., & Lee, J. H. 2012, ApJ, 750, 141Leon, S., & Verdes-Montenegro, L. 2003, A&A, 411, 391Lewis, K. T., & Eracleous, M. 2006, ApJ, 642, 711Luo, B., et al. 2012, ApJ, 749, 130Lynden-Bell, D. 1969, Nature, 223, 690Maciejewski, W., Teuben, P. J., Sparke, L. S., & Stone, J. M.
2002, MNRAS, 329, 502Magorrian, J., et al. 1998, AJ, 115, 2285Maia, M. A. G., Machado, R. S., & Willmer, C. N. A. 2003, AJ,
126, 1750Marconi, A., & Hunt, L. K. 2003, ApJ, 589, L21Marconi, A., Risaliti, G., Gilli, R., Hunt, L. K., Maiolino, R., &
Salvati, M. 2004, MNRAS, 351, 169Martin, P. 1995, AJ, 109, 2428Martini, P. 2004, in IAU Symposium, Vol. 222, The Interplay
Among Black Holes, Stars and ISM in Galactic Nuclei, ed.T. Storchi-Bergmann, L. C. Ho, & H. R. Schmitt, 235–241
Martini, P., Kelson, D. D., Mulchaey, J. S., & Trager, S. C. 2002,ApJ, 576, L109
Martini, P., & Pogge, R. W. 1999, AJ, 118, 2646Martini, P., Pogge, R. W., Ravindranath, S., & An, J. H. 2001,
ApJ, 562, 139Martini, P., Regan, M. W., Mulchaey, J. S., & Pogge, R. W.
2003a, ApJS, 146, 353—. 2003b, ApJ, 589, 774Mathur, S. 2000, MNRAS, 314, L17Mathur, S., Fields, D., Peterson, B. M., & Grupe, D. 2012, ApJ,
754, 146McElroy, D. B. 1995, ApJS, 100, 105McLeod, K. K., & Rieke, G. H. 1995, ApJ, 441, 96Meidt, S. E., et al. 2012, ApJ, 744, 17Moles, M., Marquez, I., & Perez, E. 1995, ApJ, 438, 604Munoz-Mateos, J. C., et al. 2013, ApJ, 771, 59Mulchaey, J. S., & Regan, M. W. 1997, ApJ, 482, L135Mundell, C. G., & Shone, D. L. 1999, MNRAS, 304, 475
Narayan, R., & McClintock, J. E. 2008, New Astron. Rev., 51, 733
Nowak, N., Thomas, J., Erwin, P., Saglia, R. P., Bender, R., &Davies, R. I. 2010, MNRAS, 403, 646
Oh, S., Oh, K., & Yi, S. K. 2012, ApJS, 198, 4Oh, S.-H., de Blok, W. J. G., Walter, F., Brinks, E., & Kennicutt,
Jr., R. C. 2008, AJ, 136, 2761Oliva, E., Origlia, L., Kotilainen, J. K., & Moorwood, A. F. M.
1995, A&A, 301, 55Orban de Xivry, G., Davies, R., Schartmann, M., Komossa, S.,
Marconi, A., Hicks, E., Engel, H., & Tacconi, L. 2011, MNRAS,417, 2721
Paturel, G., Petit, C., Prugniel, P., Theureau, G., Rousseau, J.,Brouty, M., Dubois, P., & Cambresy, L. 2003, A&A, 412, 45
Peeples, M. S., & Martini, P. 2006, ApJ, 652, 1097Pellegrini, S., Siemiginowska, A., Fabbiano, G., Elvis, M.,
Greenhill, L., Soria, R., Baldi, A., & Kim, D. W. 2007, ApJ,667, 749
Pfenniger, D., & Norman, C. 1990, ApJ, 363, 391Phillips, M. M., Pagel, B. E. J., Edmunds, M. G., & Diaz, A.
1984, MNRAS, 210, 701Quillen, A. C., Frogel, J. A., & Gonzalez, R. A. 1994, ApJ, 437,
162Regan, M. W., & Mulchaey, J. S. 1999, AJ, 117, 2676Regan, M. W., Sheth, K., & Vogel, S. N. 1999, ApJ, 526, 97Regan, M. W., Vogel, S. N., & Teuben, P. J. 1997, ApJ, 482, L143Richstone, D., et al. 1998, Nature, 395, A14+Rozas, M., Knapen, J. H., & Beckman, J. E. 1998, MNRAS, 301,
631Sakamoto, K., Okumura, S. K., Ishizuki, S., & Scoville, N. Z.
1999, ApJ, 525, 691Salo, H., Laurikainen, E., Buta, R., & Knapen, J. H. 2010, ApJ,
715, L56Sani, E., Marconi, A., Hunt, L. K., & Risaliti, G. 2011, MNRAS,
413, 1479Sarzi, M., Rix, H.-W., Shields, J. C., Rudnick, G., Ho, L. C.,
McIntosh, D. H., Filippenko, A. V., & Sargent, W. L. W. 2001,ApJ, 550, 65
Sersic, J. L. 1968, Atlas de galaxias australes, ed. J. L. SersicShankar, F., Salucci, P., Granato, G. L., De Zotti, G., & Danese,
L. 2004, MNRAS, 354, 1020Shen, J., & Sellwood, J. A. 2004, ApJ, 604, 614Sheth, K., Regan, M. W., Vogel, S. N., & Teuben, P. J. 2000,
ApJ, 532, 221Sheth, K., Vogel, S. N., Regan, M. W., Teuben, P. J., Harris,
A. I., & Thornley, M. D. 2002, AJ, 124, 2581Sheth, K., Vogel, S. N., Regan, M. W., Thornley, M. D., &
Teuben, P. J. 2005, ApJ, 632, 217Sheth, K., et al. 2010, PASP, 122, 1397Shlosman, I., Frank, J., & Begelman, M. C. 1989, Nature, 338, 45Shlosman, I., Peletier, R. F., & Knapen, J. H. 2000, ApJ, 535, L83Simkin, S. M., Su, H. J., & Schwarz, M. P. 1980, ApJ, 237, 404Skrutskie, M. F., et al. 2006, AJ, 131, 1163Smith, J. D. T., et al. 2007, ApJ, 656, 770Soltan, A. 1982, MNRAS, 200, 115Speltincx, T., Laurikainen, E., & Salo, H. 2008, MNRAS, 383, 317Stark, A. A. 1977, ApJ, 213, 368Stauffer, J. R. 1982, ApJ, 262, 66Tremaine, S., et al. 2002, ApJ, 574, 740Tzanavaris, P., & Georgantopoulos, I. 2007, A&A, 468, 129Ueda, Y., Akiyama, M., Ohta, K., & Miyaji, T. 2003, ApJ, 598,
886Vasudevan, R. V., & Fabian, A. C. 2007, MNRAS, 381, 1235Veron-Cetty, M.-P., & Veron, P. 2006, A&A, 455, 773Villa-Vargas, J., Shlosman, I., & Heller, C. 2010, ApJ, 719, 1470Wada, K. 2004, Coevolution of Black Holes and Galaxies, 186Walcher, C. J., et al. 2005, ApJ, 618, 237Wang, J., et al. 2012, MNRAS, 423, 3486Wegner, G., et al. 2003, AJ, 126, 2268York, D. G., et al. 2000, AJ, 120, 1579Yu, Q., & Tremaine, S. 2002, MNRAS, 335, 965Zaritsky, D., & Lo, K. Y. 1986, ApJ, 303, 66Zhang, W. M., Soria, R., Zhang, S. N., Swartz, D. A., & Liu,
J. F. 2009, ApJ, 699, 281