Seasonal Dynamics of a Microtidal Pocket Beach with Posidonia oceanica Seabeds (Mallorca, Spain
Geomorphology 132 (2011) 87–98
Contents lists available at ScienceDirect
Geomorphology
j ourna l homepage: www.e lsev ie r.com/ locate /geomorph
Controls on sediment dynamics and medium-term morphological change in a barredmicrotidal beach (Cala Millor, Mallorca, Western Mediterranean)
Lluís Gómez-Pujol a,b,⁎,1, Alejandro Orfila a, Amaya Álvarez-Ellacuría a,b, Joaquín Tintoré a,b
a IMEDEA (CSIC-UIB), Mediterranean Institute for Advanced Studies, Miquel Marquès 21, 07190 Esporles, Balearic Islands, Spainb SOCIB, Balearic Islands Coastal Observing and Forecasting System, Parc Bit, Ed. Naorte, Bloc A, 07121 Palma, Balearic Islands, Spain
⁎ Corresponding author at: IMEDEA (CSIC-UIB) MediteStudies, Miquel Marquès 21, 07190 Esporles, Balearic Isl231; fax: +34 971 611 761.
E-mail addresses: [email protected], lgomez-puj1 Current address: SOCIB, Balearic Islands Coastal Obs
Parc Bit, Ed. Naorte, Bloc A, 07121 Palma, Balearic Islandsfax: +34 971 439 979.
0169-555X/$ – see front matter © 2011 Elsevier B.V. Adoi:10.1016/j.geomorph.2011.04.026
a b s t r a c t
a r t i c l e i n f oArticle history:Received 30 March 2009Received in revised form 18 April 2011Accepted 24 April 2011Available online 30 April 2011
Keywords:Carbonate beach sedimentsBeach morphologyWave climateBalearic Islands
This paper describes the sedimentological andmorphological evolution of amicrotidal beach over aneight-monthperiod under varying hydrodynamic conditions. During the monitoring a set of transverse to crescentic barsmigrated onshore welded to the upper beach and then they were flattened under energetic wave conditions. Thegrain size distribution of surficial sediments did vary consistently across the beachprofile and temporal changes inthe sedimentologyweremostly related to the seasonalmorphological response. Fromour resultswe can state thatchanges in the beach morphology resulting from erosion and deposition might induce, at least to some degree,concomitant changes in the beach when hydrodynamics exceed some intensity and duration levels (HsN1 m).Wave climate, rather thanwave forcing is themajor control on sediment andmorphological change co-variation.
rranean Institute for Advancedands, Spain. Tel.: +34 971 611
[email protected] (L. Gómez-Pujol).erving and Forecasting System,, Spain. Tel.: +34 971 439 906;
ll rights reserved.
© 2011 Elsevier B.V. All rights reserved.
1. Introduction
A major focus in beach geomorphology and nearshore research is torelate sediment transport rates to beach morphological change. Beachesrespond rapidly to varying wave conditions by means of the redistribu-tion of sediments resulting in spatial patterns of erosion and accretion.These changes modify the beach plan form as well as their cross-shoreprofile by the formation, modification, destruction and/or migration ofsecondary morphological features, such as berms, beach cups, ripchannels and bars. In this sense, the existence of sediment texturalgradientsdue todifferenthydrodynamicprocesses along thebeachcross-shore profile is well established from earlier studies (Bascom, 1951;Imman, 1953; Emery, 1978; Guillén and Palanques, 1996; Komar, 1998).For instance the role of sandbars on wave breaking and the resultingcoastal erosion or accretion has been widely studied (Gallagher et al.,1998; Hoefel and Elgar, 2003). It has been observed that in a dynamicallystable beach configuration, sandbars usuallymove offshore during stormepisodes, when strong seawards currents (undertows) dominate thesediment transport phenomena. Onshore sandbar migration occursbetween stormeventswhenwave energy is lower. Nevertheless Aagaardet al. (1998) and latelyHouser andGreenwood (2007) have documentedthe onshore sand bar migration under storm conditions. In any case, the
waves breaking over the bar tend to remove finer sediments to themorequiescent troughwhere sediment are generally finer and less well sortedthan sediments from the bars (Greenwood and Davidson-Arnott, 1972;vanHouwelingen et al., 2006). Similarly, the step is the coarsest andmostpoorly sorted sediment unit of beaches due to the presence of energeticbreaking wave conditions (Short, 1999).
The textural characteristics of beach sediments are not constant,but change substantially over space and time. This is an importantissue, since it is widely known that sediment size plays a key role insediment transport processes and, hence, in beach morphologicalchange. The sediment transport rate is directly related to the bedshear stress, which usually is assumed to depend on both the nearbottom velocity and the friction coefficient controlled by the sedimentsize (van Rijn, 1993). Additionally, some authors relate the spatialgradient of grain size statistical parameters (grain size, skewness,sediment type, etc.) to transport (McLaren and Bowles, 1985; Gao andCollins, 1991; Le Roux, 1994; Plomaritis et al., 2008). Moreover, theseauthors consider that all changes in the beach morphology resultingfrom erosion and deposition might induce, at least to some degree,concomitant changes in the beach sedimentology. Nevertheless,sediment transport and beach response models often assume aconstant value for the sediment and their attributes because thespatial and temporal variability of beach sediments are generallypoorly understood. This assumption represents a limiting factor inbeach evolution models (Soulsby, 1997) since uncertainties related tograin parameters or temporal changes in grain attributes may besignificant. Different authors highlight that the consideration of grainsize changes as well as in grain size statistical parameters in beachevolution models, will improve the forecasting of nearshore changes(Gallagher et al., 1998; Masselink et al., 2007, 2008a, 2008b).

88 L. Gómez-Pujol et al. / Geomorphology 132 (2011) 87–98
Previous studies have suggested that sediment size and beachmorphological changes have a covariability which reinforces thedynamics of morphological features and sediment transport modesrelated to those features by feedback processes (Sherman et al., 1993;Rubin and Topping, 2001; Buscombe and Masselink, 2006; Masselinket al., 2008b; Austin and Buscombe, 2008). However, temporal changesand trends in sediment size are often hard to discern. Indeed thisscenario results in a conflict between those authors who argue thatchanges in grain size are not correlated through time (e.g. Davis, 1985;Liu and Lazarillo, 1989), and those researchers who find that there aresome conservative properties of sediment grain size along the profile(e.g. Losada et al., 1992). Nevertheless there is an intermediate point of
Fig. 1. Location of Cala Millor site at northeast
view in which, assuming the role of geological factors on sediment sizesupply, data analysis reveal that morphological change results in somevariability of sediment size although there is some kind of temporalpersistence and the observed variationsfluctuate around amaster time-averaged grain size distribution (Medina et al., 1994; Guillén andPalanques, 1996). Therefore, the latter cases support the suggestion thatgrain size characteristics have amorphodynamic role that contributes toexplaining morphological change.
Additionally, recent contributions highlight the role of othercontrols rather than hydrodynamic forcing on beach morphody-namics (Jackson et al., 2005; Gómez-Pujol et al., 2007; Jackson andCooper, 2009); reflecting that geological setting can be amajor control
ern coast of Mallorca, and survey profiles.

89L. Gómez-Pujol et al. / Geomorphology 132 (2011) 87–98
on coastal response attending to Quaternary sea level evolution, thenature of sediments and the physical framework.
The aim of this study is to describe the morphological andsedimentological evolution of a mictrotidal carbonate beach over amonthly (medium term) field campaign and to elucidate whether themorphological changes are reflected in sediment characteristics or ifthere are other controls other than hydrodynamic forcing thatcontribute to sediment changes and nearshore morphology.
2. Materials and methods
2.1. Field site
Afieldmonitoringwasperformed fromMay2004 toDecember 2004in Cala Millor beach, Mallorca, Western Mediterranean (Fig. 1). CalaMillor is located in the eastern coast of Mallorca Island and bounded bytwo rocky headlands, Cap Pinar northwards and Punta de n'Amersouthwards. It is a sandy beach near 1700m longwith a concave shape,backed by a boulevard, hotels and residential houses (Tintoré et al.,2009). From a morphodynamic point of view, Cala Millor is anintermediate beach with a configuration of transverse and crescenticbars (Gómez-Pujol et al., 2007). The beach is subjected to awave climateof prevailing NE and ESE swell with an average significant wave heightof 0.5 to 1 m, and typical significantwave heights during stormsof 2.5 maccounting for only 2% of days of the year (Tintoré et al., 2009). Forcingby tides is almost negligible in the Mediterranean with a spring tidalrange of less than 0.25 m, although combined changes between tides,atmospheric pressure and wind setup can account for sea-levelelevations close to ±1 m from mean sea level (Basterretxea et al.,2004). The sediment consists of medium carbonate bioclastic sands,being the median sediment size (D50) on the beach around 1.8ϕ. Atdepths from 6 to 35 m the seabed is covered by a seagrass meadow ofPosidonia oceanica, which acts as a cover to sediment exchange and as afriction obstacle to waves (Infantes et al., 2009). Tintoré et al. (2009)
Fig. 2. Schematic diagram of the beach study approach. Circles indicat
from the analysis of the morphodynamic state of the Cala Millor beach,highlight that, despite human and economic impacts, the beach remainsa dynamic system in an equilibrium state.
2.2. Beach morphology
Traditional elevation and bathymetric surveys were performedusing a differential RTK for the subaerial and submerged beach(between the shoreline and 0.5 m in depth) with sub-metricresolution. Additionally, for the submerged beach, bathymetric datawere obtained using a Biosonics DE-4000 echosounder with a GPS,mounted on a boat, which allows high resolution mapping from 0.5 to10 m in depth (Orfila et al., 2005). Therefore, this data-set covered thearea between the boulevard sea wall and the lower shoreface (Fig. 1).Beach morphology was measured monthly. Elevations were refer-enced to the Balearic Islands Ordnance Survey mean sea level, and thehorizontal position was referenced to UTM coordinates systems. Foreach survey a Digital Terrain Model Terrain (DTM) was created. Inaddition 18 cross-shore beach profiles spaced 20 m apart wereextracted from DTMs in order to explore beach profile evolutionand morphology (Fig. 2).
The beach morphology data were analyzed using a systematicapproach that couples bulk statistics on the beach's DTM features andEmpirical Orthogonal Function analysis, EOF (Kroon et al., 2008). Forthis reason, each DTM was interpolated into 1 m equidistant pointsand data and the different surveys arranged into amatrix of depths yi,j,where i states the cross-shore position and j the time. Prior to EOFanalysis, basic statistical properties were calculated including themean, the standard deviation and the range defined as the envelope ofprofile variation over the duration of the study (Miller and Dean,2007) using the 18 cross-shore profiles extracted from DTMs. Tofurther investigate the similarity of the variability of the beachmorphological configuration, spatial EOFs were calculated from DTMsfollowing the same approach as Principal Components Analysis
e methods used for each dataset and rectangles related products.
90 L. Gómez-Pujol et al. / Geomorphology 132 (2011) 87–98
(Jackson, 1991). This is a technique of linear statistical predictors thathave been widely applied in coastal geomorphology (e.g. Winantet al., 1975; Medina et al., 1994; Larson et al., 2003; Houser et al.,2008; Kroon et al., 2008; Álvarez-Ellacuría et al., 2011). The analysiswas based on the covariance matrix, for which the overall averagevalue for all DTM was subtracted prior to computing its eigenvaluesand eigenvectors (Larson and Krauss, 1994, 1995).
2.3. Hydrodynamics
Data provided by the Spanish Harbour Authority (Puertos delEstado) were used to analyze the wave climate. One point locatednear Cala Millor beach, “WANA 20760737”, in the northern part at50 m depth offers daily wave forecast outputs from the WAM wavemodel (Günter et al., 1992); these values were calibrated and fit wellwith deep water buoys (Cañellas et al., 2010a, 2010b) . The waverecords analyzed cover the field campaign from May to December2004 and consist of significant spectral wave height (Hs), spectralpeak or wave period (Tp) and mean wave direction (θ) reported every3 h. Due to the location and the water depth of the WANA point, it isrepresentative of offshore deep-water wave conditions at Cala Millor,and for this study nearshore wave conditions have to be computed.Wave conditions at 5 m depth, were obtained by means of a mildslope parabolic model which includes all the processes for the
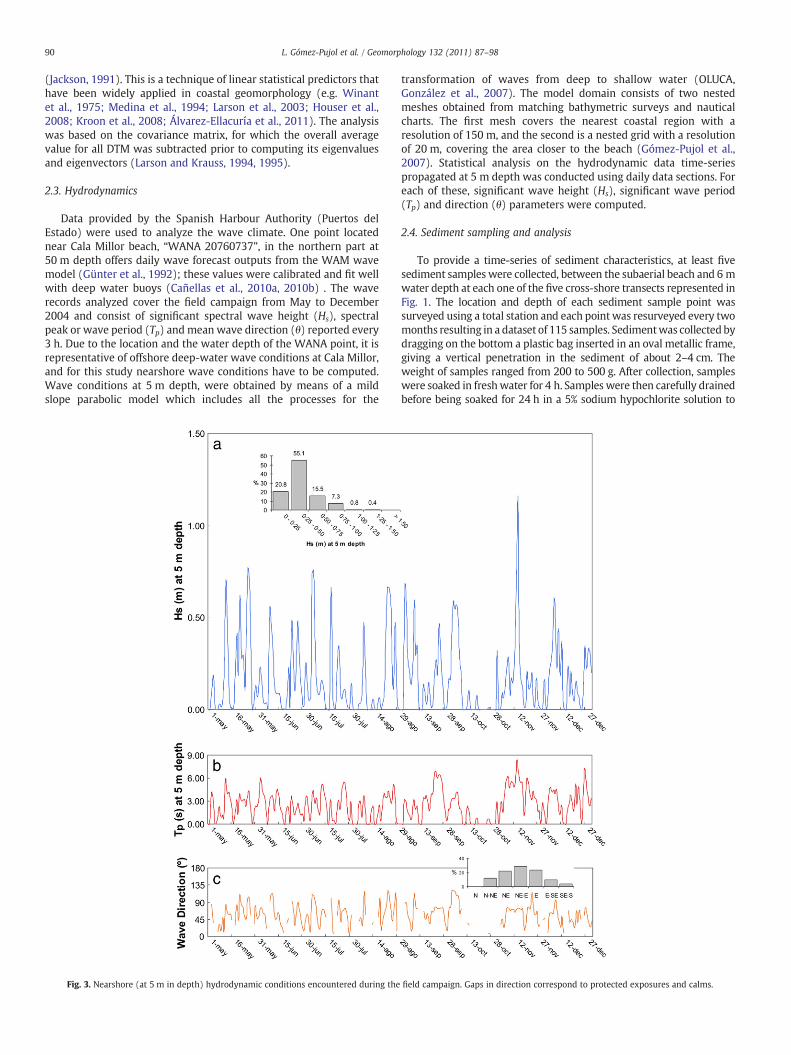
Fig. 3. Nearshore (at 5 m in depth) hydrodynamic conditions encountered during the
transformation of waves from deep to shallow water (OLUCA,González et al., 2007). The model domain consists of two nestedmeshes obtained from matching bathymetric surveys and nauticalcharts. The first mesh covers the nearest coastal region with aresolution of 150 m, and the second is a nested grid with a resolutionof 20 m, covering the area closer to the beach (Gómez-Pujol et al.,2007). Statistical analysis on the hydrodynamic data time-seriespropagated at 5 m depth was conducted using daily data sections. Foreach of these, significant wave height (Hs), significant wave period(Tp) and direction (θ) parameters were computed.
2.4. Sediment sampling and analysis
To provide a time-series of sediment characteristics, at least fivesediment samples were collected, between the subaerial beach and 6 mwater depth at each one of the five cross-shore transects represented inFig. 1. The location and depth of each sediment sample point wassurveyed using a total station and each point was resurveyed every twomonths resulting in a dataset of 115 samples. Sedimentwas collected bydragging on the bottom a plastic bag inserted in an oval metallic frame,giving a vertical penetration in the sediment of about 2–4 cm. Theweight of samples ranged from 200 to 500 g. After collection, sampleswere soaked in freshwater for 4 h. Samples were then carefully drainedbefore being soaked for 24 h in a 5% sodium hypochlorite solution to
field campaign. Gaps in direction correspond to protected exposures and calms.
91L. Gómez-Pujol et al. / Geomorphology 132 (2011) 87–98
neutralize organic material. Samples were oven dried at 105 °C during24 h, and divided into sub-samples for sieving analysis. Laboratoryanalysis was undertaken to establish textural characteristics of thesediment by dry sieving using a series of sieves ranging in mesh sizefrom−2 to 4ϕ at half phi intervals. Each sample of approximately 200 gwas shaken for 15 min and each fraction was sieved, weighted andsaved in separate bags. The calculation of grain size parameters wasobtained through the Folk and Ward (1957) method by means ofGRADISTAT© software (Blott and Pye, 2001). Thus, the grain sizestatistical parameters are reported logarithmically based on a log-normal distribution with phi size values. In order to address sedimentvariability, 10 random samples were sieved for 5 trials, the averagecoefficient of variation for that test was of 0.25% and 0.92% for themeansize and sorting respectively. Additionally, at least 4 subsamples of 10different samples were compared for characterizing sampling repre-sentativeness. The average coefficient of variation associated with
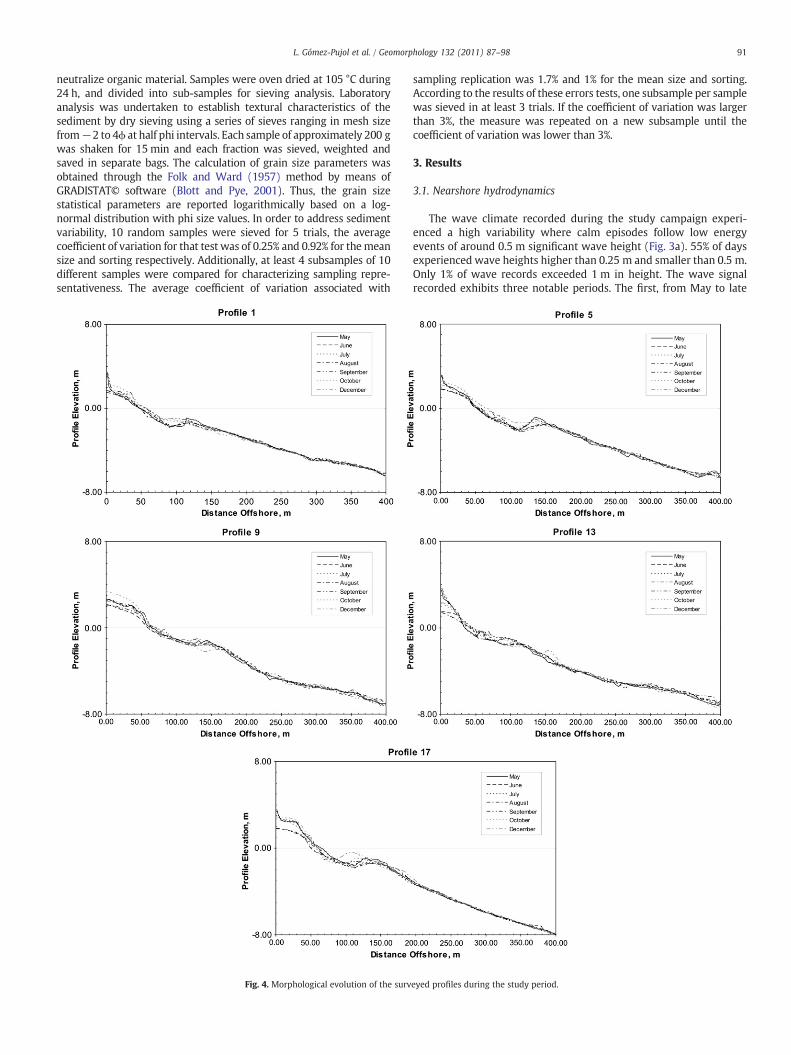
Fig. 4. Morphological evolution of the surv
sampling replication was 1.7% and 1% for the mean size and sorting.According to the results of these errors tests, one subsample per samplewas sieved in at least 3 trials. If the coefficient of variation was largerthan 3%, the measure was repeated on a new subsample until thecoefficient of variation was lower than 3%.
3. Results
3.1. Nearshore hydrodynamics
The wave climate recorded during the study campaign experi-enced a high variability where calm episodes follow low energyevents of around 0.5 m significant wave height (Fig. 3a). 55% of daysexperienced wave heights higher than 0.25 m and smaller than 0.5 m.Only 1% of wave records exceeded 1 m in height. The wave signalrecorded exhibits three notable periods. The first, from May to late
eyed profiles during the study period.

Fig. 5. Elevation change between consecutively surveyed profiles for a representative survey line (profile 5). Dots indicate the sediment sampling positions.
92 L. Gómez-Pujol et al. / Geomorphology 132 (2011) 87–98
September 2004, the significant wave height fluctuates from calmconditions or average heights around 0.25 m to events approximatelyof 0.5 m to 0.75 m being of a couple of days in duration. The secondperiod is characterized by very calm conditions during most ofOctober, and the third period during November exhibits an event withwave heights over 1 m. It should be noticed that this event duplicatedin few days the mean significant wave height of the entire monitoringperiod. Otherwise, the wave period recorded throughout the studysurvey reflected these distinct periods with Tp fluctuating from smallvalues up to 6 s until November and increasing further 9 s after thispoint (Fig. 3b). In addition to the wave height and period, thedominant wave direction indicated that waves related to heightslarger than 05 m approached from the north-eastern and easternsectors (Fig. 3c). The surf similarity parameter ξb=tanβ/(Hb/Lo)0.5
where H and L are the inshore wave height and wave length,respectively, classifies the beach as intermediate and predicts theoccurrence of spilling and plunging breakers and exceptionallysurging waves related with the November event (Battjes, 1974).
3.2. Morphological response
The nearshore profiles at Cala Millor beach are characterized bythe presence of a quasi-permanent nearshore bar nearly at 1 m depthand between 100 and 150 m away from the shoreline. Althoughprofiles of the 18 survey lines have a similar shape, resulting in afragmented longshore bar and trough intermediate beach, a longshorespatial variability is apparent. Northern and southern survey linesexhibit well developed bars, whereas survey lines in the middle of thebay display more gentle and smoothed profiles (Fig. 4). Time-series ofcross-shore profiles, from May to December, and differences inaverage profile elevation with respect to the previous profile exhibitchanges in sediment volume and in bar location (Fig. 5). From May toSeptember there is a clear runnel and bar configuration, although
Table 1Summary of sediment grain size parameters (phi units).
Mean St. Dev. Minimum Maximum N
Mean size 1.86 0.60 0.16 2.81 115Sorting 0.72 0.19 0.46 1.56 115Skewness −0.07 0.14 −0.33 0.27 115Kurtosis 1.03 0.22 0.58 1.41 115D10 0.89 0.80 −1.29 2.09 115D50 1.90 0.57 0.20 2.69 115D90 2.73 0.52 1.19 3.87 115
from November to the last survey the profiles adopt a subduedtopography and bars tend to disappear and to pass to wide, lowgradient swash and surf zones. In terms of net profile change, most ofthe elevation change concentrates between the shoreline and depthsof 2–2.5 m, with depth differences between successive beach profilesranging from 0.30 to 1 m; whereas from depths deeper than 2.5 m thedifferences between successive beach profiles are within surveyingaccuracy and, therefore, they can be considered as negligible.
EOFs were computed to investigate the characteristics patternsthat governed spatial and temporal beach DTM response. The resultsof the EOF analysis show that the first few eigenfunctions explain themajor part of the variance of the beach DTM. The first eigenfunctionaccounts for over 99% of the total variability, while the first threetypically account for the 100%. The first spatial EOF (Fig. 5) can beinterpreted as the mean or modal beach morphology. Cross-shorebeachmorphology exhibits an S-shape form reflecting the presence ofa single bar. The temporal amplitude of the first eigenfunction (Fig. 5)is positive, although with some variations, indicating a majoraccentuation or attenuation of the modal beach morphology. Thesecond EOF (Fig. 5), which shows large spatial gradients, can berelated to the sediment supply provided by the bar system. Thispattern is related to the morphological change and exchange ofmaterial across the profile during the study period. The temporalmorphological change is mainly bounded within the bar-berm area(Fig. 5c, d). Seawards of the bar, about 200 m from the shoreline, thesecond EOF exhibits small variations. It is widely accepted that in adynamically stable beach configuration, sandbars usually moveoffshore during storm episodes when strong seaward currents(undertow) dominate the sediment transport phenomena, andonshore sandbar migration occurs between storm events whenwave energy is lower (Hoefel and Elgar, 2003). Thereby positivevalues of the temporal amplitude of the second eigenvectorcorrespond to accretion processes associated with mild waves
Table 2ANOVAs for mean sediment size and sorting on different season sampling (28 or 29samples×4 samplings).
Sediment parameter df MS F p
Mean size 3 1.55 4.78 0.004Sorting 3 0.07 1.88 0.138
Note: n = group size, df = degrees of freedom; MS =mean square variance; F = ratioof variance; p = significance.
93L. Gómez-Pujol et al. / Geomorphology 132 (2011) 87–98
conditions and positive values and negative ones to erosion afterstorm events with offshore sandbar migration.
Descriptive and EOF approaches highlight that the morphologicalresponse of the beach was very similar across and between profiles,implying that the observed morphological changes were mainly two-dimensional chaining onshore–offshore bar migration and bardestruction jointly with a gentle rotation in bar alignment respect tothe coastline (Fig. 5b). Indeed, not much morphological changeoccurred between June and August and from September to October(Fig. 4). During the survey intervals fromMay to June and fromAugustto September a weak bar flattening and a trough infilling can beobserved in addition to the smoothing of the subaerial beach. Theseepisodes are related to the persistence and duration of the events withwave heights (at 5 m depth) higher than 0.5 m. Finally majormorphological change took place after November and early Decemberstorms when wave heights were around 1 m, and cross-shore erosionoccurred resulting in bar destruction smoothing the profile.
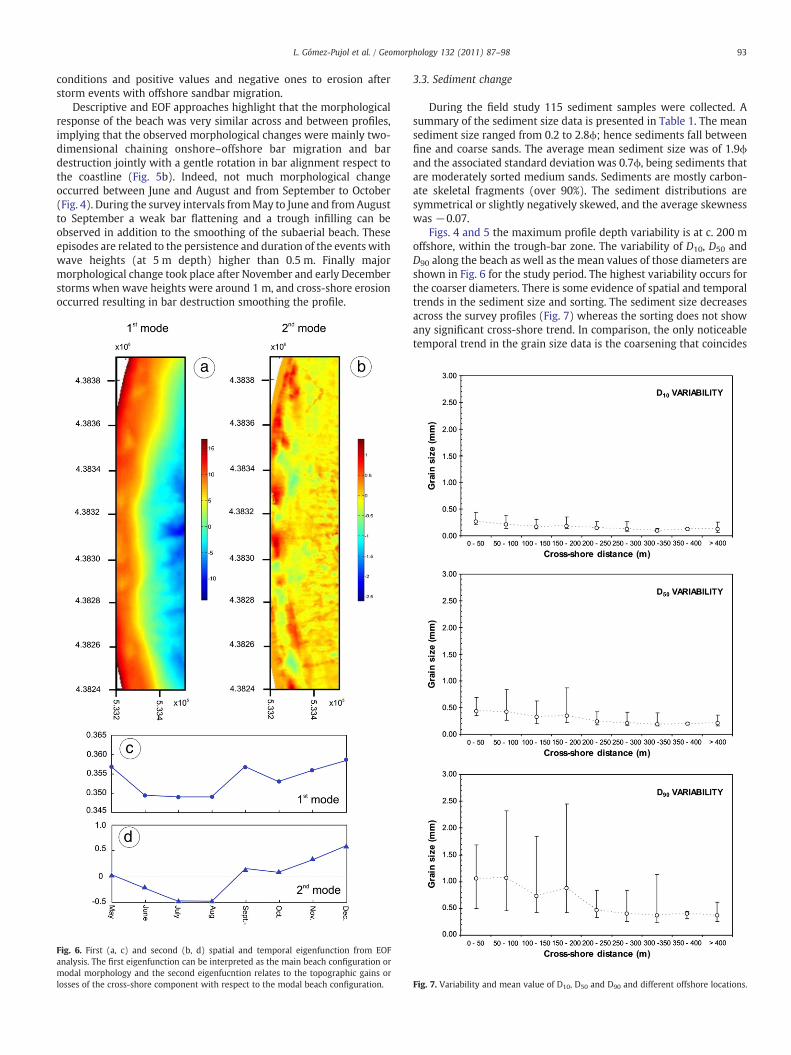
Fig. 6. First (a, c) and second (b, d) spatial and temporal eigenfunction from EOFanalysis. The first eigenfunction can be interpreted as the main beach configuration ormodal morphology and the second eigenfucntion relates to the topographic gains orlosses of the cross-shore component with respect to the modal beach configuration.
3.3. Sediment change
During the field study 115 sediment samples were collected. Asummary of the sediment size data is presented in Table 1. The meansediment size ranged from 0.2 to 2.8ϕ; hence sediments fall betweenfine and coarse sands. The average mean sediment size was of 1.9ϕand the associated standard deviation was 0.7ϕ, being sediments thatare moderately sorted medium sands. Sediments are mostly carbon-ate skeletal fragments (over 90%). The sediment distributions aresymmetrical or slightly negatively skewed, and the average skewnesswas −0.07.
Figs. 4 and 5 the maximum profile depth variability is at c. 200 moffshore, within the trough-bar zone. The variability of D10, D50 andD90 along the beach as well as the mean values of those diameters areshown in Fig. 6 for the study period. The highest variability occurs forthe coarser diameters. There is some evidence of spatial and temporaltrends in the sediment size and sorting. The sediment size decreasesacross the survey profiles (Fig. 7) whereas the sorting does not showany significant cross-shore trend. In comparison, the only noticeabletemporal trend in the grain size data is the coarsening that coincides
Fig. 7. Variability and mean value of D10, D50 and D90 and different offshore locations.

Table 3Tukey HSD comparisons for sediment mean size on different season sampling.
Sampling (i) Sampling (j) MD Std. Error p 95% confidenceinterval
Lowerbound
Upperbound
April July 1.17 0.15 0.66 −2.19 0.562September 0.20 0.15 0.85 −2.70 0.510December 5.42⁎ 0.15 0.00 0.149 0.936
July April −0.17 0.15 0.66 −0.562 0.219September −0.51 0.15 0.98 −0.441 0.339December 0.37⁎ 0.15 0.04 −0.023 0.765
September April −0.12 0.15 0.85 −0.510 0.270July 0.05 0.15 0.98 −0.339 0.441December 0.42⁎ 0.15 0.03 0.028 0.816
December April −5.42⁎ 0.15 0.00 −0.936 −0.149July −0.37⁎ 0.15 0.04 −0.765 0.023September −0.42⁎ 0.15 0.03 −0.816 −0.028
Note: MD = mean difference; p = significance.⁎ mean difference significant at 0.05 level.
Table 5ANOVAs for mean sediment size and sorting on different season sampling and beachmorphological domains.
Season sampling at EOF1 Season sampling at EOF 2
df MS F p df MS F p
Mean size 3 1.40 5.27 0.002 3 0.30 2.40 0.08Sorting 3 0376 1.68 0.180 3 0.01 0.53 0.67
Note: n = group size, df = degrees of freedom; MS =mean square variance; F = ratioof variance; p = significance.EOF1 = morphology dynamic sector; EOF2 = non-dynamic morphologic sector.
94 L. Gómez-Pujol et al. / Geomorphology 132 (2011) 87–98
with November sea storm events. The inspection of the completegrains size distribution – obtained averaging the size distributions ofsamples taken at each survey, rather than the summary statistics –
reveals that there are two specific grain size spectra that do notexhibit the same modal size and tail extension (Table 2). May, Juneand September have a modal fine sands grain size but characterizedby a coarser tail. The coarser tail is 1–2ϕ and relates to the presence ofangular shell fragments. Additionally, the December averaged sizedistribution shows a different mode (a 1 phi shift), whose sorting andtail shape is quite comparable (Fig. 8). A parametric one-way ANOVAtest has been applied to evaluate significant temporal differences inmean size parameters. Table 3 shows the critical levels and thesignificance of the test for samples grouped by seasonal surveys.Results enable rejection of the hypothesis that average mean size isequal across temporal sampling groups, whereas one cannot rejectthat for sediment sorting attributes. Additionally, post-hoc compar-isons (Tukey's HSD) between coupled seasons for sediment mean sizeand sorting highlight that sediments sampled after the November seastorm event differs from the rest in size but not in sorting. This reflectsthan the sediment parameters experienced a coarsening from meansize values of 1.5 (April) to 2.1ϕ (December), whereas sorting justranges from 0.7 to 0.8ϕ, respectively.
Sediment data were taken from six locations at five survey profilesover four bimonthly field campaigns. In order to further examinecross-shore sediment change, those sediment samples were separat-ed according to the variability of the second spatial EOF discerningbetween: (a) a dynamic sector of the beach, where the second EOF up-crosses and down-crosses zero, and (b) a non-dynamicmorphologicaldomain where the second eigenvector shows negligible changes(Fig. 5). The complete grain distributions for both domains show thatthere are differences in grain size spectra between morphologicalregions. In the dynamic sector of the beach, the December completegrain size distribution has a modal distribution coarser than thosecorresponding to May–July–September (Fig. 8). Nevertheless thesamples show similar sorting and a coarse tail shape. The differencesbetween complete grain distributions between samples are largely
Table 4ANOVAs for mean sediment size and sorting on different beach morphological domains(dynamic vs non-dynamics sector).
Sediment parameter df MS F p
Mean size 1 12.11 47.96 0.000Sorting 1 0.21 6.09 0.015
Note: n = group size, df = degrees of freedom; MS =mean square variance; F = ratioof variance; p = significance.
attenuated in the non-dynamic morphological domain. Modaldistributions are quite similar although the December spectrum hasa larger coarser tail (Fig. 8). For this reason, a one-way ANOVA wasalso used in order to discern significant differences between thesezones in terms of sediment mean size and sorting. The results(Table 4) clearly show that there are significant differences insediment properties between cross-shore domains, the samples ofthe morphological variable sector being coarser than those from theless dynamic domain (average mean size and sorting of 1.5 vs 2.2ϕand 0.7 vs 0.8ϕ respectively). Otherwise temporal contrasts betweenzones defined by the second spatial EOF show that sediment sizeexhibits significant differences betweenDecember survey and the restof the year over the dynamic sector of the profile, whereas sedimentsorting did not experience any significant change (Table 5). Bothsediment size and sorting did not exhibit significant differencesbetween surveys in the non-dynamic morphological domain.
4. Discussion
The field measurements presented in this paper describes themorpho-sedimentary variation of a microtidal carbonate sand beachover an 8 months survey. During the monitoring a set of transverse tocrescentic barsmigrated onshore, welded to the upper beach and thenflattened under energetic wave conditions (Fig. 8). From May toSeptember, coinciding with the summer conditions (Hs from 0.25 to0.5 m), the balance of the mass movement of the sandy material –calculated from differences in bathymetries –was of 30,130 m3 or of c.17 m2 per m of beach length. Whereas for winter conditions (Hs
roughly or larger than 1 m), experienced from October to December,the mass balance resulted in — 33,707 m3 or c. 20 m2 per m of beachlength. Thesewave conditions are the classical pattern of sea storms inthis sector of the Balearic Sea (Cañellas et al., 2007). The annual beach-wide balance is considerably small, 3.570 m3, that represents onlyminor changes, c. 2 m2, per m of beach length. The grain sizedistribution of surface sediments did vary across the beach andtemporal changes in sedimentology were mostly related to shifts inenvironmental energy. Changes occurring in the beach shape andsediment distributions are clearly seasonal and the wave conditions,characterized by a marked seasonally, provided the main forcingfunction for this nearshore morphological change. Therefore, thecoarsening of the sediments since November, correlated with waveconditions, can be explained in terms of removal of fine material dueto the combination of cross-shore and longshore transport gradients(McLaren and Bowles, 1985).
Referring to themeasuredmorphological change, it is evident fromthe sediment volumes (Fig. 9), that most of the gross morphologicalchange is constrained between the beach and upper shoreface. Duringsummer conditions bars move alongshore and cross-shore accordingto wave pulses, resulting in a general beach accretion. It can beappreciated that most of this bottom variation was constrained in a200 m wide band from the emerged beach. The comparison betweensediment attributes between different summer bathymetries showsthat there are not significant differences in mean grain size andsorting. In comparison, matching up with winter wave conditions,
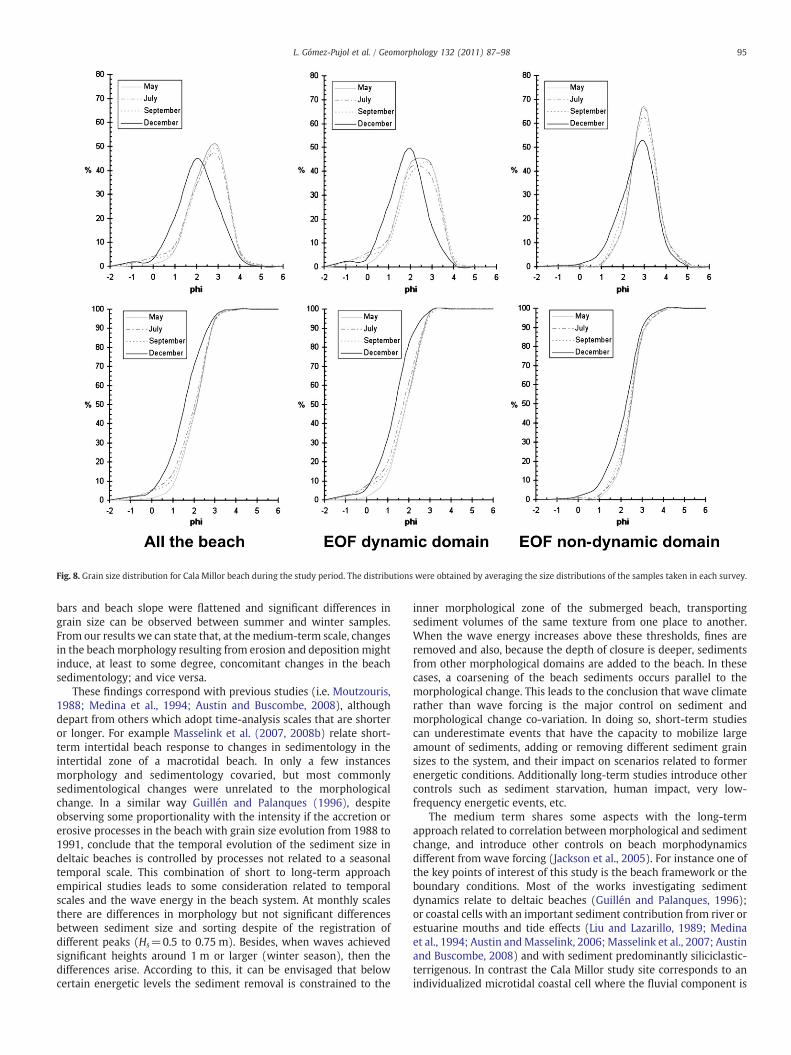
Fig. 8. Grain size distribution for Cala Millor beach during the study period. The distributions were obtained by averaging the size distributions of the samples taken in each survey.
95L. Gómez-Pujol et al. / Geomorphology 132 (2011) 87–98
bars and beach slope were flattened and significant differences ingrain size can be observed between summer and winter samples.From our results we can state that, at the medium-term scale, changesin the beach morphology resulting from erosion and deposition mightinduce, at least to some degree, concomitant changes in the beachsedimentology; and vice versa.
These findings correspond with previous studies (i.e. Moutzouris,1988; Medina et al., 1994; Austin and Buscombe, 2008), althoughdepart from others which adopt time-analysis scales that are shorteror longer. For example Masselink et al. (2007, 2008b) relate short-term intertidal beach response to changes in sedimentology in theintertidal zone of a macrotidal beach. In only a few instancesmorphology and sedimentology covaried, but most commonlysedimentological changes were unrelated to the morphologicalchange. In a similar way Guillén and Palanques (1996), despiteobserving some proportionality with the intensity if the accretion orerosive processes in the beach with grain size evolution from 1988 to1991, conclude that the temporal evolution of the sediment size indeltaic beaches is controlled by processes not related to a seasonaltemporal scale. This combination of short to long-term approachempirical studies leads to some consideration related to temporalscales and the wave energy in the beach system. At monthly scalesthere are differences in morphology but not significant differencesbetween sediment size and sorting despite of the registration ofdifferent peaks (Hs=0.5 to 0.75 m). Besides, when waves achievedsignificant heights around 1 m or larger (winter season), then thedifferences arise. According to this, it can be envisaged that belowcertain energetic levels the sediment removal is constrained to the
inner morphological zone of the submerged beach, transportingsediment volumes of the same texture from one place to another.When the wave energy increases above these thresholds, fines areremoved and also, because the depth of closure is deeper, sedimentsfrom other morphological domains are added to the beach. In thesecases, a coarsening of the beach sediments occurs parallel to themorphological change. This leads to the conclusion that wave climaterather than wave forcing is the major control on sediment andmorphological change co-variation. In doing so, short-term studiescan underestimate events that have the capacity to mobilize largeamount of sediments, adding or removing different sediment grainsizes to the system, and their impact on scenarios related to formerenergetic conditions. Additionally long-term studies introduce othercontrols such as sediment starvation, human impact, very low-frequency energetic events, etc.
The medium term shares some aspects with the long-termapproach related to correlation between morphological and sedimentchange, and introduce other controls on beach morphodynamicsdifferent from wave forcing (Jackson et al., 2005). For instance one ofthe key points of interest of this study is the beach framework or theboundary conditions. Most of the works investigating sedimentdynamics relate to deltaic beaches (Guillén and Palanques, 1996);or coastal cells with an important sediment contribution from river orestuarine mouths and tide effects (Liu and Lazarillo, 1989; Medinaet al., 1994; Austin andMasselink, 2006; Masselink et al., 2007; Austinand Buscombe, 2008) and with sediment predominantly siliciclastic-terrigenous. In contrast the Cala Millor study site corresponds to anindividualized microtidal coastal cell where the fluvial component is

Fig. 9. Cala Millor morphological change between May–December 2004.
96 L. Gómez-Pujol et al. / Geomorphology 132 (2011) 87–98
weak. Permanent rivers are absent and continental sedimentationinputs are negligible (Fornós and Ahr, 2006). Additionally, regionalstudies of beach and shelf sediments highlight that the predominantbiogenic sediment is derived from communities that thrive in theseagrass meadows of Posidonia oceanica (Alonso et al., 1988; Jaumeand Fornós, 1992; Canals and Ballesteros, 1997; Fornós and Ahr, 1997)
which are the main constituents (ca. 95%) of beach and dunesediments. All this background has different implications for ourstudy. First of all, the input velocities of new sediment to the beachsediment budget are larger than seasonal or yearly time-scale (Canalsand Ballesteros, 1997; de Falco et al., 2003). Therefore, disturbancesrelated with new sedimentary budgets or with tides can be subtracted

97L. Gómez-Pujol et al. / Geomorphology 132 (2011) 87–98
from morphological and sediment change co-variation analysis.Secondly, theminor presence of red algal and coralligenous bryozoansfragments, as well as of rhodolites (maërl), among dominant bulkcomponents of foraminifera, echinoids and molluscs highlights aweak sediment intrabasinal contribution from benthic biota habitatsbetween 20 and 50 m in depth (Fornós and Ahr, 2006). It is knownfrom the analysis of 44 years of wave data to the beach (Gómez-Pujolet al., 2007) that the waves necessary for carrying these coarsesediments inshore only have probabilities of occurrence during somewinter gales (Cañellas et al., 2007).
The results from this work are in agreement with those authorswho argue that changes in grain size remain correlated with time or,in other words, with morphological change (Davis, 1985; Liu andLazarillo, 1989; Austin and Buscombe, 2008). Nevertheless, aspects ofbeach composition or similar modal distributions that become slightlyshifted apart after an energetic event and/or season, cannot discountthe existence of a spatial and temporal averaged master grain sizedistribution in the sense of Medina et al. (1994) and Guillén andPalanques (1996).
5. Conclusions
This study has demonstrated that in carbonate microtidal beacheswith negligible fluvial contribution, the spatial distributions ofindividual sediment grain sizes can reflect the beach morphologicalchange when hydrodynamics exceed some intensity and durationlevels (HsN1 m). When waves do not exceed this threshold there isevidence of morphological change constrained between the emergedbeach and the rear of the bar, and sediment volumes of the sametextural properties are transported from one place to another. Thisleads to the conclusion that wave climate rather than wave forcing isthe major control on sediment and morphological change co-variation. Additionally the sediment nature and composition, as wellas the physiographical constrain for the study site, highlightgeological factor as a secondary control on the beach morphody-namics at the medium-term temporal scale.
Acknowledgements
We would like to thank Pau Balaguer, Gotzon Basterretxea,Benjamín Casas, Tomeu Cañellas, Antonia Fornés, Marta Fuster, AntoniJordi, Rosario Simonet and Guillermo Vizoso for their assistance in thefield. This research was sponsored by the “Conselleria de MediAmbient” from the Government of the Balearic Islands and by theproject CTM2006-12072 from theMICINN. Collaboration from Puertosdel Estados is also gratefully acknowledged. LGP is indebted to the“Consejo Superior de Investigaciones Científicas” (CSIC) for thefunding provided in the JAE-Doc Program. We would like to thanktwo anonymous reviewers and Dr. A. Plater whose commentsimproved the manuscript.
References
Aagaard, T., Nielsen, J., Greenwood, B., 1998. Suspended sediment transport andnearshore bar formation on a shallow intermediate-state beach. Mar. Geol. 148,203–225.
Alonso, B., Guillén, J., Canals, A., Serra, J., Acosta, J., Herranz, P., Sanz, J.L., Calafat, J.,Catafau, E., 1988. Los sedimentos de la plataforma continental Balear. Acta Geol.Hispanica 23, 185–196.
Álvarez-Ellacuría, A., Orfila, A., Gómez-Pujol, L., Simarro, G., Obregón, N., 2011. Decouplingspatial and temporal patterns in short-termbeach shoreline response towave climate.Geomorphology 128, 199–208. doi:10.1016/j.geomorph.2011.01.008.
Austin, M.J., Buscombe, D., 2008. Morphological change and sediment dynamics of thebeach step on a macrotidal gravel beach. Mar. Geol. 249, 167–183.
Austin, M.J., Masselink, G., 2006. Observations of morphological change and sedimenttransport on a steep gravel beach. Mar. Geol. 229, 59–77.
Bascom, W.N., 1951. The relationship between sand size and beach-face slope. Trans.Am. Geophys. Union 32, 866–874.
Basterretxea, G., Orfila, A., Jordi, A., Casas, B., Lynett, P., Liu, P.L., Duarte, C., Tintoré, J.,2004. Seasonal dynamics of a microtidal pocket beach with Posidonia oceanicaseabeds (Mallorca, Spain). J. Coast. Res. 20, 1155–1164.
Battjes, J.A., 1974. Surf similarity. Proceedings 14th International Conference on CoastalDynamics: ASCE, pp. 466–480.
Blott, S.J., Pye, K., 2001. Gradistat, a grain size distribution and statistics package for theanalysis of unconsolidated sediments. Earth Surf. Process. Land. 26, 1237–1248.
Buscombe, D., Masselink, G., 2006. Concepts in gravel beach dynamics. Earth Sci. Rev.79, 1–22.
Canals, M., Ballesteros, E., 1997. Production of carbonate particles by phytobenthiccommunities on the Mallorca–Menorca shelf, northwestern Mediterranean sea.Deep Sea Res. II. 44, 611–629.
Cañellas, B., Orfila, A., Méndez, F.J., Menéndez, M., Gómez-Pujol, L., Tintoré, J., 2007.Application of a POT model to estimate the extreme significant wave height levelsaround the Balearic Sea (Western Mediterranean). J. Coast. Res. SI 50, 329–333.
Cañellas, B., Orfila, A., Méndez, F., Álvarez, A., Tintoré, J., 2010a. Influence of the NAO onthe northwestern Mediterranean wave climate. Scientia Marina 74, 55–64.
Cañellas, B., Balle, S., Tintoré, J., Orfila, A., 2010b. Wave height prediction in the westernMediterranean using genetic algorithms. Ocean Engineering 37, 742–748.
Davis, D.A., 1985. Coastal Sedimentary Environments. Springer, New York, USA.de Falco, G., Molinaroli, E., Baroli, M., Bellacicco, S., 2003. Grain size and compositional
trens of sediments from Posidonia oceanica meadows to the beach shore, Sardinia,western Mediterranean. Estuar. Coast Shelf Sci 58, 299–309.
Emery, K.O., 1978. Grain-size in laminae of beach sand. J. Sed. Petrol. 48, 1203–1212.Folk, R.L., Ward, W.C., 1957. Brazos river bar: a study in the significance of grain size
parameters. J. Sediment. Petrol. 27, 3–26.Fornós, J.J., Ahr, W.M., 1997. Temperate carbonates on a modern, low-energy, isolated
ramp, the Balearic Platform. Spain. J. Sediment. Res. 67, 364–373.Fornós, J.J., Ahr, W.M., 2006. Present-day temperate carbonate sedimentation on the
Balearic Platform, western Mediterranean, compositional and textural variationalong a low-energy isolated ramp. In: Pedley, H.M., Carannante, G. (Eds.), Cool-Water Carbonates, Depositional Systems and Palaeoenvironmental Controls. Geol.Soc., 255. Spec. Pub, London, pp. 71–84.
Gallagher, E.L., Elgar, S., Guza, R.T., 1998. Observations of sand bar evolution on a naturalbeach. J. Geophys. Res. 103 (C2), 3203–3215.
Gao, S., Collins, M.B., 1991. Analysis of grain-size trends, for defining sediment transportpathways in marine environments. J. Coastal Res. 10, 70–78.
Gómez-Pujol, L., Orfila, A., Cañellas, B., Álvarez-Ellacuría, A., Méndez, F.J., Medina, R.,Tintoré, J., 2007. Morphodynamic classification of sandy beaches in low energeticmarine environment. Mar. Geol. 242, 235–246.
González, M., Medina, R., González-Ondina, J., Osorio, A., Méndez, F.J., 2007. Anintegrated coastal modelling system for analyzing beach processes and beachrestoration projects, SMC. Computers Geosciences 33, 916–931.
Greenwood, B., Davidson-Arnott, R.G.D., 1972. Textural variations in sub-environments ofthe shallow water wave zone, Kouchibouguac Bay. N.B. Can. J. Earth Sci. 9, 679–688.
Guillén, J., Palanques, A., 1996. Short- and medium-term grain size changes in deltaicbeaches (Ebro Delta, NW Mediterranean). Sedimentary Geology 101, 55–67.
Günter, H., Hasselmann, S., Janssen, P.A.E.M., 1992. The WAM model cycle 4. Deutsch.Klim. Rechenzentrum, Techn. Rep. 4. Hamburg, Germany.
Hoefel, F., Elgar, S., 2003. Wave-induced sediment transport and sandbar migration.Science 299, 1885–1887.
Houser, C., Greenwood, B., 2007. Onshore migration of a swash bar during a storm.J. Coast. Res. 23, 1–14.
Houser, C., Hapke, C., Hamilton, S., 2008. Controls on coastal dune morphology,shoreline erosion and barrier island tesponse to extreme storms. Geomorphology100, 223–240.
Imman, D.L., 1953. Areal and seasonal variations in beach and nearshore sediments atLa Jolla, California. US Army Corps Eng. Beach Erosion Board Tech. Mem. 39 134 pp.
Infantes, E., Terrados, J., Orfila, A., Cañellas, B., Álvarez-Ellacuria, A., 2009. Wave energyand the upper depth limit distribution of Posidonia oceanica. Bot. Mar. 52, 419–427.doi:10.1515/BOT.2009.050.
Jackson, J.E., 1991. A User's Guide to Principal Components. John Wiley & Sons, NewYork, USA.
Jackson, D.W.T., Cooper, J.A.G., 2009. Geological control on beach form: accommodationspace and contemporary dynamics. J. Coast. Res. SI. 56, 69–72.
Jackson, D.W.T., del Cooper, J.A.G., Río, L., 2005. Geological control of beachmorphodynamic state. Mar. Geol. 216, 297–314.
Jaume, C., Fornós, J.J., 1992. Composició i textura dels sediments de platja del litoralmallorquí. Boll. Soc. Hist. Nat. Balears 35, 93–110.
Komar, P.D., 1998. Beach Processes and Sedimentation, 2nd edn. Prentice Hall, NewJersey, USA.
Kroon, A., Larson, M., Möller, I., Yokoki, H., Rozynski, G., Cox, J., Larroude, P., 2008.Statistical analysis of coastal morphological data sets over seasonal to decadal timescales. Coast. Eng. 55, 581–600.
Larson, M., Krauss, N.C., 1994. Temporal and spatial scales of beach profile change, Duck.Carolina. Mar. Geo. 117, 75–94.
Larson, M., Krauss, N.C., 1995. Prediction of cross-shore sediment transport at differentspatial and temporal scales. Mar. Geo. 126, 1–127.
Larson, M., Capobianco, M., Jansen, H., Rózyński, G., Southgate, H.N., Stive, M.,Wijjnberg, K.M., Hulscher, S., 2003. Analysis and modelling of field data on coastalmorphology evolution over yearly and decadal time scales. Part 1: Background andlinear techniques. J. Coastal Research 19, 760–775.
Le Roux, J.P., 1994. An alternative approach to the identification of net sedimenttransport paths based on grain size trends. Sed. Geol. 94, 97–107.
Liu, J.T., Lazarillo, G.A., 1989. Distribution of grain sizes across a trangressive shoreface.Mar. Geol. 87, 121–136.

98 L. Gómez-Pujol et al. / Geomorphology 132 (2011) 87–98
Losada, M.A., Medina, R., Vidal, C., Roldán, A.J., 1992. Temporal and spatial cross-shoredistributions of sediment at “El Puntal” spit, Spain. Proc. 23rd Int. Conf. Coast. Eng.ASCE, New York, pp. 224–2251.
Masselink, G., Auger, N., Russell, P., O'Hare, T., 2007. Short-term morphological changeand sediment dynamics in the intertidal zone of a macrotidal beach. Sedimentology54, 39–53.
Masselink, G., Austin, M., Tinker, J., O'Hare, T., Russell, P., 2008a. Cross-shore sedimenttransport and morphological response on a macrotidal beach with intertidal barmorphology, Truc Vert. France. Mar. Geol. 251, 141–155.
Masselink, G., Buscombe, D., Austin, M., O'Hare, T., Russell, P., 2008b. Sediment trendmodels fail to reproduce small-scale sediment transport patterns on an intertidalbeach. Sedimentology 55, 667–687.
McLaren, P., Bowles, D., 1985. The effects of sediment transport on grain-sizedistributions. J. Sed. Petrol. 51, 611–624.
Medina, R., Losada, M.A., Losada, I.J., Vidal, C., 1994. Temporal and spatial relationshipbetween sediment grain size and beach profile. Mar. Geol. 118, 195–206.
Miller, J.K., Dean, R.G., 2007. Shoreline variability via empirical orthogonal functionanalysis: Part I Temporal and spatial characteristics. Coast. Eng. 54, 111–113.
Moutzouris, C.I., 1988. Longshore sediment transport rate vs. cross-shore distribution ofsediment grain sizes. In: Edge, B.L. (Ed.), Coastal Engineering. Proceedings of theInternational 21st Coastal Engineering Conference, ASCE, NewYork, pp. 1959–1973.
Orfila, A., Jordi, A., Basterretxea, G., Vizoso, G., Marbà, N., Duarte, C.N., Werner, F.E.,Tintoré, J., 2005. Residence time and Posidonia oceanica in Cabrera ArchipielagoNational Park. Spain. Cont. Shelf. Res. 25, 1339–1352.
Plomaritis, T.A., Paphitis, D., Collins, M., 2008. The use of grain size trend analysisi inmacrotidal areas with breakwaters: implications of settling velocity and spatialsampling density. Mar. Geol. 253, 132–148.
Rubin, D.M., Topping, D.J., 2001. Quantifying the relative importance of flow regulationand grain size resolution of suspended sediment transport and tracking changes ingrain size of bed sediment. Water Resour. Res. 37, 133–146.
Sherman, D.J., Orford, J.D., Carter, R.W.G., 1993. Development of cusp related, gravel sizeand shape facies at Malin Head, Ireland. Sedimentology 40, 1139–1152.
Short, A.D., 1999. Handbook of Beach and Shore Morphodynamics. Wiley and Sons,London, UK. 379 pp.
Soulsby, R., 1997. Dynamics of Marine Sands. HR Wallingford, Thomas Telford, London,UK.
Tintoré, J., Medina, R., Gómez-Pujol, L., Orfila, A., Vizoso, G., 2009. Integrated andinterdisciplinaru scientific approach to coastal management. Ocean Coast Manage.52, 493–505.
van Houwelingen, S.T., Masselink, G., Bullard, J.E., 2006. Characteristics and dynamics ofmultiple intertidal bars, north Lincolnshire. England. Earth Surf. Proc. Land. 31,428–443.
van Rijn, L.C., 1993. Principle of Sediment Transport in Rivers. Aqua Publications,Amsterdam, Estuaries and Coastal seas.
Winant, C.D., Inman, D.L., Nordstrom, C.E., 1975. Descriptions of seasonal beach changesusing empirical eigenfunctions. J. Geophysical Research 80, 1979–1986.
Copyright © 2022 FDOKUMEN