Weak gravitational lensing by fourth order gravity black holes

arX
iv:0
902.
4051
v1 [
astr
o-ph
.CO
] 24
Feb
200
9
Mon. Not. R. Astron. Soc.000, 000–000 (0000) Printed 24 February 2009 (MN LATEX style file v2.2)
X-ray and strong lensing mass estimate of MS2137.3–2353
A. Donnarumma1,2,3⋆, S. Ettori2,3, M. Meneghetti2,3, L. Moscardini1,3
1 Dipartimento di Astronomia, Universita di Bologna, via Ranzani 1, I-40127 Bologna, Italy2 INAF-Osservatorio Astronomico di Bologna, via Ranzani 1, I-40127 Bologna, Italy3 INFN, Sezione di Bologna, viale Berti Pichat 6/2, I-40127 Bologna, Italy
Accepted ???. Received ???
ABSTRACTWe present new mass estimates of the cluster of galaxies MS2137.3–2353, inferred fromX-ray and strong lensing analyses. This cluster exhibits anoutstanding strong lensingconfiguration and indicates a well-relaxed dynamical state, being most suitable for a massreconstruction which combines both techniques. Despite this, several previous studies haveclaimed a significant discrepancy between the X-ray and the strong lensing mass estimates.The primary aim of this paper is to address and explain this mismatch.For this purpose, we have analysedChandra observations to recover the profiles of theintra-cluster medium properties and, assuming a functional form for the matter density,the total mass distribution. The notable strong–lensing features of MS2137.3 allow usto reconstruct its projected mass in the central regions with good accuracy, by takingadvantage of the lensing inversion codeLenstool. We compare the results obtained for bothmethods. Our mass estimates for MS2137.3 are in agreement within errors, leading to amean, extrapolated value ofM200 ≃ 4.4 ± 0.3 × 10
14M⊙, under the assumption of the
Navarro-Frenk-White (NFW) mass profile. However, the strong lensing mass estimate isaffected by the details of the BCG mass modeling, since the radial arc is a very sensitiveprobe of the total mass derivative in the central region. In particular, we do not find ev-idence for a high concentration for the NFW density profile, as reported in some earlier works.
Key words: galaxies: clusters: individual, MS2137.3-2353 – cosmology: dark matter, gravi-tational lensing – X-ray: galaxies: clusters.
1 INTRODUCTION
According to the hierarchical growth of cosmic structures im-plied by the concordance model, clusters of galaxies are themost recent gravitationally-relaxed structures. They areideal cos-mological tools (see e.g. Voit 2005; Borgani 2006; Tozzi 2007;Diaferio, Schindler & Dolag 2008), provided we have a reliablemeasument of their masses. The most promising techniques forestimating cluster masses are via X-ray and gravitational lensinganalyses.Cluster X-ray luminosity is mainly due to diffuse plasma emis-sion: the deep potential wells produced by the dark matter com-ponent heat the intra-cluster medium (ICM) to temperaturesofsome keV, at which point X-ray photons are emitted through ther-mal bremsstrahlung. The X-ray emissivity is proportional to thesquare of the gas density, thus it is an excellent tracer of the three–dimensional cluster potential. However, X-ray measurements ofcluster masses imply the assumption of hydrostatic equilibrium ofthe ICM with the dark matter potential and of spherical symmetryof the cluster mass distribution. Hence the total mass profile can be
⋆ E-mail: [email protected]
inferred from the radial profiles of temperature and gas density.On the contrary, the gravitational lensing effect, i.e. thelight deflec-tion due to the space–time curvature induced by massive objects,allows for the determination of the projected surface mass densityof the lens, regardless of its dynamical state or the nature of the in-tervening matter. However, this effect is determined by allmassivestructures along the line of sight, so lensing mass measurementsare subject to foreground and background contaminations. More-over, the lensing effect is very sensitive to features of themass dis-tribution such as its ellipticity and asymmetry, as well as to thepresence of substructures (Meneghetti et al. 2007), which compli-cate the mass reconstruction.The X-ray and lensing methods are clearly complementary, al-lowing in principle to combine 2- and 3-dimensional constraintsto obtain a reliable mass estimate (see for example Allen 1998;Ettori & Lombardi 2003; Bradac et al. 2008); a limit to sucha comparative analysis is the significant disagreement betweenstrong lensing and X-ray mass estimates claimed in the lit-erature (Wu & Fang 1996; Smail et al. 1997; Ota et al. 2004;Voigt & Fabian 2006; Gitti et al. 2007; Halkola et al. 2008). Manyconvincing explanations have been suggested, but to date, the dis-crepancy between X-ray and strong lensing results appears to be an

2 A. Donnarumma et al.
issue.Moreover, galaxy clusters enable one to determine dark matter(DM) halo density profiles, being mainly composed by dark mat-ter. As a consequence, they could help in verifying the CDM modelpredictions for the formation of cosmic structures: for example, ifDM density profiles can be approximated on all mass scales by“universal” profiles, such as the Navarro-Frenk-White (NFW) pro-file (Navarro, Frenk & White 1995, 1997), as predicted by N–bodysimulations of structure formation in hierarchical collapse mod-els. In particular, the inner DM density slope is a very debatedissue: several studies have argued that it could deviate from theNFW predictions (Moore et al. 1998; Jing & Suto 2000; Gao et al.2008). Galaxy clusters play a crucial role in solving this issue,since they allow to distinguish between cuspy and flat profilesdue to their low concentrations. An emblematic case in both ofthese debates is MS2137.3-2353: even though this cluster has arelaxed appearence, there is still disagreement both regarding itsinner slope value (Dalal & Keeton 2003; Sand et al. 2004; Gavazzi2005a; Sand et al. 2008) and the X-ray and strong lensing massestimates (Gavazzi et al. 2003; Gavazzi 2005b; Comerford etal.2006; Comerford & Natarajan 2007).In this work we will focus on the latter topic. We present new X-ray and strong lensing mass estimates, based respectively on a non-parametric analysis of gas density and temperature profilesthroughChandraobservations, and on a strong lensing reconstruction, per-formed using theLenstoolanalysis software (Kneib et al. 1996;Jullo et al. 2007).This paper is organised as follows. In§ 2 we will discuss our X-ray analysis, focusing on data reduction and on the method appliedto recover the total and gas mass profiles, and we will summarizeour X-ray results. The strong lensing analysis is presentedin § 3,where we will briefly discuss our main findings. We will comparethe X-ray and strong lensing results in§ 4: a comparison with pre-vious analyses can be found in§ 5. Finally, we will summarize ourresults and draw our conclusions in§ 6.Throughout this work we assume a flatΛCDM cosmol-ogy, with matter density parameterΩm=0.3, cosmological con-stant density parameterΩΛ=0.7, and Hubble constantH0 =70 h−1km s−1Mpc−1. Unless otherwise stated, all uncertaintiesare referred to a68% confidence level.
2 X-RAY ANALYSIS
2.1 X-ray data reduction
MS2137.3–2353 is a rich, X-ray luminous cluster atz = 0.313(Stocke et al. 1991): within a radius of≃ 0.7 Mpc, its luminosityin the [0.5–8.0] keV band1 is ≃ 1.4 × 1045 erg s−1. This clusterexhibits several indications of a well relaxed dynamical state, forinstance the absence of evident substructures and a centralX-raysurface brightness peak, associated with a cool core. Thesecharac-teristics support the hypothesis of hydrostatic equilibrium underly-ing our X-ray mass estimate.
We performed our X-ray analysis on two datasets retrievedfrom theChandraarchive (see Table 1 for observation log); boththe observations were telemetered in Very Faint mode, and werereduced accordingly. AnotherChandradataset is currently avail-able (ID 4974, start date: 2003-11-13, total exposure time:58.0 ks,
1 The X-ray luminosity was derived fitting the cluster integrated spectra inthe radial range[0 − 0.7] Mpc using theXSPECanalysis package.
Figure 1. True colour image of MS2137; red, green and blue colours cor-respond to [0.5–2.0], [2.0–4.0], [4.0–8.0] keV bands, respectively. The sizeof the field of view is200′′ × 200′′.
Table 1.Chandraobservations summary.
Obs.ID Start Time Total Net PIExpos. [ks] Expos.[ks] name
928 1999-11-18 08:37:37 44.17 20.7 Wise5250 2003-11-18 20:06:43 41.09 25.0 Allen
PI: Allen). The background light curve of this observation presentspronounced flares and a variable quiescent rate. A careful back-ground light curve screening could solve the flaring issue, allowingto disentangle the ICM emission from the spurious signal. How-ever, unlike the observations we used for our analysis, Obs.4974presents a widely-scattered and variable quiescent count rate. Thisfeature makes it hard to distinguish the cluster emission from pos-sible spurious events, and could affect the background estimate.Moreover, the final net exposure time for this dataset was only≃ 16 ks. So, to prevent systematic errors associated with an in-correct background estimate, we decided to discard this dataset.
The data were reduced using theCIAO data analysis package(version 3.4) and the calibration database CALDB 3.4.2; here wesummarize briefly the reduction procedure2.We reprocessed the level-1 event files to include the appropriategain maps and calibration products and to reduce the ACIS quies-cent background3 . We used theacis process events tool tocheck for the presence of cosmic-ray background events, correctfor spatial gain variations due to charge transfer inefficiency andre-compute the event grades. We selected the events flagged with
2 See theCIAO analysis guides for the data reduction:cxc.harvard.edu/ciao/guides/.3 For a complete discussion on this topic, seecxc.harvard.edu/cal/Acis/Cal prods/vfbkgrnd/index.html.

Mass estimate of MS2137 3
grades0, 2, 3, 4 and filtered for the Good Time Intervals associatedwith the observations. We identified bright point sources using thescriptvtpdetect; the results were subsequently checked throughvisual inspection. We masked out the point sources and correctedfor the discarded area.A careful screening of the background light curve is necessaryto identify background flares (Markevitch et al. 2003). The back-ground light curve was extracted with a time bin size of≃ 1 ks inthe energy range [2.5–7] keV, which is the most sensitive to com-mon flares for the S3 BI chip, where the cluster was centered inboth observations. We applied the scriptanalyze ltcrv to in-clude only the time periods inside the 3σ range. We compared theS3 background light curve with the one extracted in the S1 chipsusing the energy range [2.5–6] keV, to check for undectectedfaintflares, that were not identified. The S3 background light curve wasexamined using theChIPSfacilities to identify and exclude furtherflaring events; finally we selected only time bins within a factor 1.2of the apparent quiescent rate, through the scriptlc clean. At theend of the light curve screening, almost half of the initial exposuretime was discarded (see Tab. 1).
2.2 X-ray analysis
Cluster mass measurements derived under the hydrostatic equilib-rium hypothesis are strongly dependent on the temperature profile,as demonstrated by Rasia et al. (2006); therefore, any temperaturebias could affect the mass estimates. We extracted the backgroundspectrum from the blank-field background data sets providedbythe ACIS calibration team, to derive ARF and RESPONSE ma-trices consistent both with the source and the background spec-trum. The blank-sky observations underwent a reduction procedurecomparable to the one applied to the cluster data, after being re-projected onto the sky according to the observation aspect infor-mation. We derived the background re-normalization factorin the[9.5–11.5] keV band for the Observation 5250 and in the [8.0–9.8]keV band for the Observation 928. The normalization factor wasderived in different bands for the two observations becauseof adifference in the energy upper limit of the FEF (FITS EmbeddedFunction) calibration files associated to the observations(for thelatter observation, the upper limit is≃ 9.8 kev). Currently, the en-ergy range defined for the spectrum extraction must match theonein the FEF files to derive a RESPONSE matrix using theCIAOpackage tools4. However, the observed flux in both these bands canbe safely attributed to the background component, so the differencein the blank-sky renormalization bands has a negligible impact inthe subsequent analysis.The background in the soft band is variable both in time and inspace, so we verified whether the soft X-ray background derived bythe blank-sky datasets is consistent with the observed one.If theywere significantly different, one should take into account this factorin the X-ray spectral fitting. For both datasets we extracteda spec-trum in a region free of cluster emission, to which we subtracted aspectrum derived in the same region of the blank-field dataset. Wefitted the residuals in the [0.4–1] keV energy band with a MEKALmodel, without an absorption component and broadening the nor-malization fitting range to negative values. The results indicate thata corrective component is not necessary.
4 See cxc.harvard.edu/ciao/bugs/mkwarf.html.
2.3 Spectral fitting
We derived the cluster X-ray flux image through the combined,point-source removed images in the energy range [0.3-8.0] keV,properly dividing by the exposure maps for the two observations.The spectra were extracted on concentric, circular annuli centredon the X-ray surface brightness centroid, sized to contain at least5000 net source counts, up to a net count rate of≃ 40%. We se-lected 7 annuli, up to 2.45 arcmin. The X-ray emission appearswell centred on the brightest cluster galaxy (BCG). The shift be-tween the estimated X-ray centroid and the BCG center is≃ 1arcsec: the uncertainty on the X-ray centroid estimate is compa-rable to the applied smoothing scale (1.5 arcsec). We used theCIAO specextract tool both to extract the source and back-ground spectra and to construct ancillary-response and responsematrices. The spectra were fitted in the [0.6–7.0] keV range,ex-cept for the last annulus, where, due to the higher backgroundlevel, we restricted the analysis to the range [0.6–5.0] keV. Weused theXSPECsoftware package (Arnaud 1996) to analyse thespectra, that were fitted adopting an optically-thin plasmaemis-sion model (theMEKALmodel; Mewe et al. 1985; Kaastra & Mewe1993), with an absorption component, described by the Tubingen–Boulder model (tbabs model; Wilms et al. 2000), to take into ac-count the effect of Galactic absorption on the observed flux.The Galactic absorption was fixed to the value inferred from ra-dio HI maps in Dickey & Lockman (1990), i.e.3.55× 1020 cm−2,with the cluster-averaged values of Galactic absorption derivedfrom the X-ray spectra fit being consistent with the radio value(3.9±0.8×1020cm−2 and4.2±0.9×1020cm−2 for the Observa-tions 928 and 5250, respectively). Thus the free parametersin ourmodel were the temperature, the metallicity and the normalizationof the thermal spectrum.The spectral data were not rebinned to keep a high spectral reso-lution: we only grouped the channels to have at least one count ineach channel. As a consequence, we applied thec-statstatistic tothe spectral fitting.The two observations were at first analysed individually, toassessthe consistency of the datasets and to exclude any systematic effectsthat could influence the combined analysis. A significant differencewas detected in the spectral fit results for the most distant radialbin, supposedly for the higher background in Obs.5250. Thusthespectrum relative to Obs.5250 was discarded. We proceeded withthe joint analysis of the two datasets, tying the temperature andmetallicity parameters and leaving the normalization unlinked. Thefit results from the spectral analysis of the two combined datasetsare listed in Tab. 2. The resulting metal abundance profile presentsa central peak with a smooth external decline, as is generally ob-served for dynamically relaxed clusters. Moreover, the temperaturedecrease in the central region associated with the cluster cool coreis evident in Fig. 2. Several earlier studies stated that thepresenceof a cool core, if neglected, could be a possible source of error inthe X-ray mass estimate, resulting in an underestimate of the clus-ter virial temperature and mass (Allen 1998; Hallman et al. 2006;Rasia et al. 2006). On the contrary, if the gas temperature decre-ment is properly taken into account, cool core clusters should beideal targets for mass analyses, being typically dynamically relaxedsystems. Since our X-ray mass estimate relies directly on the mea-sured gas temperature profile, the temperature decrement in thecenter is not an issue in the mass derivation.
4 A. Donnarumma et al.
Table 2.X-ray spectral fit results. The analysis was performed in the[0.6–7.0] keV energy range except for the last annulus, where we consideredthe range [0.6–5.0] keV. The columns list the outer radius ofthe annuluswhere the spectral extraction was performed, the best-fit values obtained forthe free parameters of the model (i.e. the intra-cluster gastemperature, thenormalization of the X-ray spectrum and the metallicity) and thec-statisticresult (the degrees of freedom for each annulus are in squarebrackets).
SPECTRAL FIT RESULTS
Rout Tgas Normalization Metal abundance Goodness of fit[arcmin] [keV] ×104 [Z⊙]
0.065 4.33+0.20−0.19 7.03+0.25
−0.27 0.60+0.13−0.11 459.2[567]
0.114 4.22+0.19−0.18 7.62+0.28
−0.29 0.58+0.13−0.11 514.8[552]
0.17 4.66+0.23−0.21 7.43+0.25
−0.26 0.52+0.12−0.11 578.7[579]
0.26 5.35+0.28−0.26 8.67+0.25
−0.27 0.50+0.12−0.10 597.0[615]
0.45 5.88+0.29−0.28 11.17+0.28
−0.30 0.41+0.10−0.09 670.3[679]
1.0 5.03+0.25−0.23 12.15+0.32
−0.33 0.38+0.10−0.09 658.3[740]
2.45a 3.63+0.59−0.43 6.50+0.54
−0.56 0.40+0.30−0.21 348.0[291]
a The results obtained for the last annulus refer to a fit performed for Obs.928 only.
Figure 2. (Top panel) The X-ray spectrum of MS2137, obtained combiningObs. 928 and Obs. 5250. The spectrum was reduced from an aperture of2.45 arcmin, and shows the energy range[0.6 − 5.0] keV. We fixed theGalactic absorption to the value reported in Dickey & Lockman (1990). Thenormalization of the model was left as a free parameter for both datasets.The plotted spectrum was derived with a grouping of 20 countsper bin. Thebest fit for aMEKAL model with untied normalizations is shown as a solidline. (Bottom panel) Fit residuals.
2.4 X-ray mass profile
In this work we recover the deprojected profiles of gas tempera-ture and density without any parametrization of the ICM proper-ties, which could introduce considerable systematic errors in themass measurement results (Rasia et al. 2006). Our estimate relieson the assumptions of spherical symmetry and hydrostatic equilib-rium and on the choice of an analytic model for the total mass.In the case of MS2137 these assumptions seem to be reasonable,since, e.g., the strongly peaked central surface brightness and aroughly circular X-ray emission can generally suggest a relaxeddynamical state.Here we summarize the most relevant aspects of the techniquewe have applied; for full details, see Ettori, De Grandi & Molendi
(2002); Morandi, Ettori & Moscardini (2007); Morandi & Ettori(2007).From the spectral analysis we derived for each annulus the pro-jected gas temperatureTring, metal abundanceZring and the nor-malizationK of the model; the latter provides an estimate for theEmission IntegralEI =
R
nenpdV ≃ 0.82R
n2e dV. To derive
the value of these quantities in volume shells, one has to calcu-late the intersection of each volume shell with 2-dimensional an-nuli. Geometrical considerations (Kriss, Cioffi & Canizares 1983;Buote 2000) allow to evaluate the intersections through an uppertriangular matrix (V) where the last pivot represents the outermostannulus, under the assumption of spherical symmetry. In this waywe can recover the deprojected values applying some array opera-tions.To calculate the deprojected density profile, we combined the spec-tral information and the cluster X-ray surface brightness (hereafterSB) profile. The SB provides an estimate of the volume-countsemissivityFbin ∝ n2
e binT(bin)1/2/D2L. By comparing this ob-
served profile to the values predicted by a thermal plasma model(with temperature and metallicity equal to the measured quantitiesand taking into account the effect of Galactic absorption) one cansolve for the electron density. In this way, we obtain a gas densityprofile which is better resolved than a spectral–only profile(see thetop panel of Fig. 3). We computed the SB in 35 circular annuli.They were derived from the X-ray flux image in the energy range[0.5-2.0] keV, thus similarly to the spectral extraction annuli (see§ 2.3), but applying a binning of 1000 counts. The X-ray centroidis the same for both profiles. We rederived the mass estimate calcu-lating the SB profile over the range[0.3 − 8.0] keV, to verify if theenergy range choice would affect our results.The total mass was then constrained as follows. The observedde-projected temperature profile in volume shellsTshell was obtainedthrough the relations:
ne =h
(VolT )−1#(EI/0.82)
i1/2
, (1)
ǫ = (VolT )−1#Lring, (2)
ǫTshell = (VolT )−1#(LringTring), (3)
ǫZshell = (VolT )−1#(LringZring), (4)
where the symbol# indicates a matrix product.We compare it to the predicted temperature profileTpred, obtainedby inverting the equation of hydrostatic equilibrium between thedark matter potential and the potential of the intraclusterplasma,i.e.:
− GµmpneMtot,model(< r)
r2=
d (ne × kTpred)
dr; (5)
where ne is the deprojected electron density. Our best-fit massmodel was determined by comparing the observedT obs profile tothe predicted one, which depends on the mass model parameters.So we minimized:
χ2 =X
rings
„
T obs − T pred
σ obs
«2
. (6)
TheTpred profile was rebinned to the spectral scale. In the bottompanel of Fig. 3 we show the projected temperature profile as deter-mined by the spectral analysis, the deprojected best-fit profile andthe deprojected, rebinned profile.
We assumed an NFW density profile, which can be expressedas:
ρNFW(r)
ρc
=δc
(r/rs)(1 + r/rs)2, (7)

Mass estimate of MS2137 5
10 100Radius [kpc]
0.0001
0.0010
0.0100
0.1000
1.0000
n e [c
m-3]
10 100Radius [kpc]
1
2
3
4
5
6
7
T [k
eV]
Figure 3. (Top panel) Deprojected gas density profile. Red circles mark thevalues determined by the normalization of the thermal spectra, diamondsrepresent the gas density values obtained combining both spectral and sur-face brightness measurements; the dashed line shows the best-fit profile.(Bottom panel) ICM temperature profile. Here we show the observed tem-perature profile (red circles,Tobs in the text), directly inferred from thespectral analysis, the deprojected temperature values (diamonds,Tpred inthe text), rebinned to the same intervals of the observed profile, and thedeprojected best-fit profile (dashed line).The small scale fluctuations ofthe temperature best-fit profile reflect the local variationsin the gas den-sity, since the condition of hydrostatic equilibrium is imposed between thesmooth total mass profile and the gas pressure profilePgas ∝ ngas ×Tgas
(see Eq. 5 in the text).
where rs is the scale radius of the halo,δc is its characteristicoverdensity andρc is the critical density of the universe. We willdefine the NFW profile using the scale radius and the concentrationparameterc200, i.e. the ratio of the radius where the halo matterdensity is 200 times the critical density (r200) to the scale radius:c200 = r200/rs.The best-fit values are determined by minimizing the statisticalestimator defined in Eq. 6. A first minimization is performed inthe ranges0.5 6 c200 6 20.0 and 10 kpc 6 rs 6 Rspat (whereRspat ≃ 676 kpc is the outer radius of the surface brightnessprofile). In this way a first estimate of the best-fit values is obtained.A second minimization is then performed in theXi ± 3σ range,beingXi the mean values inferred through the first minimization.The mass model parameters obtained through our X-ray anal-ysis, deriving the SB profile in the energy range[0.5−2.0] keV, are:
BEST FIT X-RAY RESULTS
rs c200 M200 R200 χ2red[d.o.f.]
[kpc] [1014M⊙] [Mpc]
162.72+18.6−16.3 8.68+0.7
−0.9 4.4 ± 0.3 1.41 ± 0.03 2.1[5]
The confidence levels for the NFW parameters are shown in Fig.5.The choice of the energy range over which the surface brightnessis estimated does not significantly affect our results: for example,deriving the SB profile in the wider range[0.3 − 8.0] keV weobtain the following values:
(i) rs = 153.8+17.2−20.7 kpc,
(ii) c = 8.93+1.0−0.6,
(iii) M200 = 4.1 ± 0.3 × 10¹⁴ M⊙,(iv) χ2
red[d.o.f.] = 3.1[5].
The gas mass profile and the total mass profile are shown inFig.4. To indicate how much the X-ray mass profile dependson the choice of the density profile, in Fig.4 we show alsothe mass profiles derived assuming two other parametric mod-els, i.e. the Rasia-Tormen-Moscardini (hereafter RTM) profile(Rasia, Tormen & Moscardini 2004) and the King profile (King1962). The RTM model was deduced from the direct analysis ofnon-radiativeN -body hydro-simulations, without any assumptionon the gas equation of state or on the cluster dynamical equilibrium.The resulting DM density distribution is:
ρR(r) =ρ0,R
r(r + r⋆)1.5. (8)
The King profile (King 1966; Rood et al. 1972) was derived underthe assumption of an isothermal particle distribution, andcan beexpressed as:
ρK(r) =ρ0,K
(1 + (r/rc)2)3/2. (9)
The mass estimates which were obtained adopting the RTMand the King mass model areM200,RTM = 5.1±0.3×10¹⁴M⊙ andM200,King = 2.2±0.2×10¹⁴M⊙. The correspondingχ2
red valuesare3.7 and4.1 (over 5 degrees of freedom), respectively. When as-suming the RTM or the King density profile, the surface brightnesswas estimated in the energy range[0.3 − 8.0] keV. The best-fittingmodel is the NFW profile, even though the RTM profile is not a sig-nificantly worse fit. Clearly, the extrapolated mass derivedthrougha profile shallower in the external regions is lower than the massestimates obtained with more cuspy parametrizations.
We have compared our X-ray estimate with thevalue predicted by theM − TX relation. For instance,Arnaud, Pointecouteau & Pratt (2005), through the analysisof 10 nearby, relaxed galaxy clusters observed withXMM-Newton,deduced the following relations for clusters withkT > 3.5 keV:
h(z)M200 = 5.74 ×kT
5 keV
1.49
,
h(z)M500 = 4.10 ×kT
5 keV
1.49
,
whereh(z) is the Hubble constant normalised to its local valueandkT is the spectroscopic temperature over the[0.1 − 0.5] R200
region (corresponding to[0.15 − 0.75] R500)5. The authors de-
5 Accurate predictions on the X-ray scaling relations are also presentedin Nagai, Kravtsov & Vikhlinin (2007), through the results obtained byVikhlinin et al. (2006) analysingChandraobservations of 13 low redshift,

6 A. Donnarumma et al.
10 100 500 800 1500Radius [kpc]
1011
1012
1013
1014
1015
Mto
t[Msu
n]
Rspec
Gas massKingRTMNFW
Figure 4. MS2137 total mass profiles, as determined through the X-rayanalysis for different choices of parametrised mass models. The verticalline indicates the boundary of the spectral extraction, thefilled circles markthe value ofR200 for the corresponding mass profile. The measured gasmass profile is also shown as a green solid line.
7 8 9 10C200
100
120
140
160
180
200
220
NF
W s
cale
rad
ius
rs [
kpc]
Figure 5. Confidence levels determined through the X-ray analysis fortheNFW profile parametersc200 andrs. The contours indicate the1σ, 2σ and3σ c.l., and the black circle marks the best-fit values.
rived the temperatureTX from a single-temperature fit to the in-tegrated spectrum. The highest redshift cluster in the sample is
relaxed clusters. The scaling relations in Nagai et al. (2007) are calibratedwith the gas temperature derived in the wider radial range70 kpc < r <R500. We applied the scaling relations found by Arnaud et al. (2005) to re-fer to a spatial range where our spectroscopic temperature estimate is morerobust. However, Arnaud et al. (2005) asserted that their scaling relationestimates are very similar to those derived in Nagai et al. (2007), so ourconclusions would be unchanged.
at z ≃ 0.15. We estimated the value ofkT in a similar man-ner to Arnaud et al. (2005): we extracted the X-ray spectrum inthe energy interval[0.6 − 5] keV and in the same radial range[0.1 − 0.5]R200. We derived the value ofR200 = 1.37 ± 0.04Mpc fitting the data with an NFW profile for a density contrastδ=200. We considered only the Obs. 928, due to the higher back-ground in the external regions for Obs. 5250 (see§ 2.3). The spec-troscopic gas temperature over the spatial range[0.1 − 0.5] R200
is TX = 4.1 ± 0.3 keV (the c−statistic value for the spectralfit is 293.2 over 296 degrees of freedom). This value leads toM200,scal ≃ 3.7×10¹⁴M⊙ andM500,scal ≃ 2.6×10¹⁴M⊙. Theseestimates are lower than ours (i.e.M200 ≃ 4.4 ± 0.3 × 10¹⁴M⊙
andM500 ≃ 3.5±0.2×10¹⁴M⊙), but are compatible at a4σ levelwith our results. The X-ray mass of MS2137 seems to be consistentwith theM−TX scaling relation found for relaxed galaxy clusters.
3 STRONG LENSING ANALYSIS
3.1 Overview
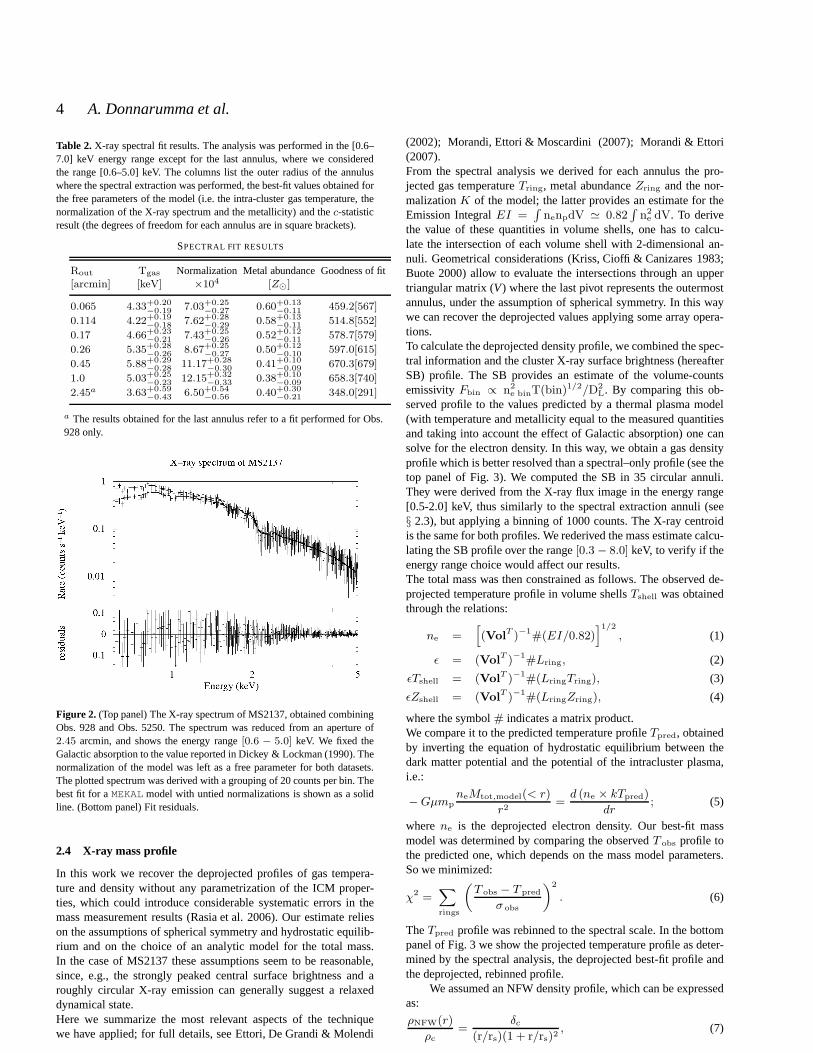
MS2137.3–2353 is a well-known lensing system; the radial featurein its double-arc configuration is the first ever detected (Fort et al.1992). The radial arc may be very useful in constraining the clustercentral density slope. For axially simmetric lenses, the radialand tangential critical curves arise ifλr = 1 − (d/dx)(m/x)and λt = 1 − m/x2 vanish, respectively,λr and λt being theeigenvalues of the Jacobian matrix of the lens mapping (seeBartelmann & Narayan 1995 for an extended review). Thus, thetangential and radial arc positions allow one to constrain the en-closed total mass and the mass distribution derivative, respectively.We carried out a strong lensing analysis on deep HST dataretrieved from the Space Telescope Archive6. The data consistsof a WFPC2 association image, taken with the F702W filter andobtained combining 10 exposures for a total integration time of22.2 ks7 (a portion of the HST image is shown in Fig. 6).The tangential and radial arc distances from the BCG center are≃ 15 and≃ 5 arcsec: the former is composed of two images withreverse parity (A01 and A02 in Fig. 6, following the notationofGavazzi 2005b), associated with the counter-images A2 and A3.A fifth demagnified image lying near the center of the BCG ispredicted if the central density slope is shallower than theisother-mal model slope. Thus the position of the central image wouldprovide an additional constraint on the inner density (for example,see the results of Gavazzi, Fort, Mellier, Pello & Dantel-Fort2003), and as a consequence on the BCG mass. However, theBCG-subtracted image presents residuals in the central region,where the fifth image, if present, is predicted. The noise level afterthe BCG subtraction makes a clear identification of the centralimage difficult. For these reasons the central counter-image wasnot included as an additional constraint.Spectroscopic measurements (Sand, Treu & Ellis 2002) statedthat the two groups of images arise from 2 different sourcesat redshift ztang = 1.501 and zrad = 1.502; recent data(Soucail, Covone & Kneib 2007) confirmed that the counter-imageof the radial arc B1 is the feature B2 (see Fig. 6).In the next section we will present a parametric strong lensingreconstruction of the cluster mass distribution, performed using the
6 archive.stsci.edu/7 Proposal ID: 5402; PI: I.Gioia.
Mass estimate of MS2137 7
Figure 6. Multiple image interpretation of the lens system, overplotted onthe HST/WFPC2 image of MS2137 (filter: F702W; number of combinedimages: 10; total integration time: 22.2 ks; proposal ID: 5402; PI: I.Gioia).The size of the field of view is≃ 42 arcsec × 45 arcsec; the coordinatesof the images used as constraints in the strong lensing analysis are listed inTable 3.
Table 3. Coordinates of the multiple images considered in the MS2137strong lensing modeling. Coordinates are in arcsec with respect to the BCGcenter. We did not include as constraint the fifth central image, that was notclearly identified. Spectroscopic measurements (Sand, Treu, Smith & Ellis2004) indicate a redshift ofztang = 1.501 andzrad = 1.502 for the firstand the second system, respectively.
MULTIPLE-IMAGE SYSTEMS
Id Im.1 Im.2 Im.3 Im.4
1.a -5.20 13.87 2.61 14.86 13.59 -1.08 -12.03 -15.291.b -4.88 13.98 2.31 14.89 13.46 -1.26 -12.36 -14.941.c -7.32 13.68 0.04 15.77 13.06 -2.96 -13.32 -13.631.d -7.45 12.74 4.69 14.80 13.62 -2.13 -11.83 -15.001.e -3.79 14.52 0.27 15.06 13.33 -1.40 -12.62 -14.711.f -6.85 13.86 -1.35 15.71 12.93 -2.78 -13.51 -13.681.g -7.81 13.26 1.32 15.82 12.86 -3.28 -13.32 -13.501.h -5.70 14.55 -2.14 15.60 12.80 -3.06 -13.55 -13.531.i 13.13 -1.23 -13.28 -14.451.j 12.01 -2.12 -15.13 -12.801.k -14.17 -13.40 12.50 -2.012.a 0.04 6.79 0.33 3.41 -7.28 -22.492.b 0.00 6.44 0.27 3.88 -7.22 -22.752.c -0.06 5.87 0.17 4.21 -7.05 -22.882.d -0.03 5.28 0.10 4.50 -6.92 -23.04
Lenstool8 analysis software (Kneib et al. 1996; Jullo et al. 2007).
3.2 Lens modeling
To identify the multiple image systems, we started by referring tothe configuration provided by Gavazzi (2005b) (hereafter G05), the
8 The code is available at the url www.oamp.fr/cosmology/lenstool.
most detailed knots catalogue available in the literature.We theniteratively refined the system by selecting several sets of ellipses,likely belonging to a common source area (their coordinatesarelisted in Table 3).Our lens mass model consists of a cluster–scale mass componentand of two galaxy–scale components, namely the BCG and thegalaxy near the tangential arc. The latter (flagged01 in Fig. 6)was included to account for its likely perturbative effect,due to itsproximity to the tangential arc (Meneghetti et al. 2007). Wemod-eled the cluster scale component using an elliptical NFW profile,as implementend in theLenstoolcode (for a detailed discussion onthe lens properties of this density profile, see Bartelmann 1996;Meneghetti, Bartelmann & Moscardini 2003b: for full details onthe elliptical NFW implementation inLenstoolthe reader can re-fer to Golse & Kneib 2002).Our main clump model has seven free parameters: the coordinatesof the center of mass (xc, yc), the ellipticity of the mass distribution(e), the position angle (θ), the characteristic velocity dispersionσ0
and the NFW profile parameters (the concentrationc200 and thescale radiusrs). The center of mass was initially set to the BCGcentroid, but it was allowed to vary by±15 arcsec; the ellipticityand the position angle of the dark matter clump were also, as afirstestimate, set equal to the BCG values, then were optimized intheranges[0.0 6 e 6 0.5] and[130.0 6 θ 6 160.0] degrees. The op-timization ranges for the scale radius and the concentration param-eter are[50 6 rs 6 650] kpc and[0.5 6 c200 6 20.0]. The choiceof these intervals is motivated by cluster analysis resultsfrom pre-vious studies. Of course, strong lensing allows to constrain onlythe inner matter distribution, so the estimate of the virialradius -and therefore of the concentration parameter - using stronglensingalone is less robust; however, we decided not to fix any mass distri-bution parameter, but rather to sample them in wide ranges toavoidbiasing our results.The galaxies were modeled either as dual Pseudo Isothermal El-liptical Mass Distribution - hereafter dPIE - with a null core ra-dius, or as elliptical singular isothermal sphere - hereafter SIE(see Natarajan & Kneib 1997, Limousin, Kneib & Natarajan 2005,Elıasdottir et al. 2007 for the properties of these potentials and forfull details on their implementation in theLenstoolcode). Un-like the studies of Gavazzi (2005b); Sand et al. (2008), we did notmodel the BCG stellar velocity distribution in our analysis. We as-sumed a parametric model for the BCG mass (dPIE or SIE), soits mass is determined by the central velocity dispersion (and thescale/core radius values in the dPIE case). We are aware thatstellardynamics data would help to solve the existing degeneracy betweenthe stellar mass and the mass of DM and gas in the cluster center.However, here we are more interested in determining the shape ofthe total mass profile at radii larger than those where the stellarmass is a non negligible mass component.
We fixed the galaxies ellipticity and orientation to thevalues derived by the HST image, using the IRAF externalpackageisophote of the stsdas distribution. When mod-eling the galaxies as dPIE mass distribution, the values weimposed to the dPIE scale radius are almost the same ofSand, Treu, Ellis, Smith & Kneib (2008), sorcut,BCG= 22 kpc andrcut,gal= 5 kpc. The other free parameter in the galaxy optimiza-tion was the central velocity dispersionσ0; the spectroscopic mea-surements obtained by Sand, Treu & Ellis (2002) with the EchelleSpectrograph and Imager on the Keck II telescope indicate a cen-tral value for the BCG stellar velocity ofσmeasured,BCG ≃ 325 ±
35 km s−1. However, the cD measured velocity dispersion cannotbe directly related to the “characteristic” one in galaxy mass mod-

8 A. Donnarumma et al.
Figure 7. Images predicted by our best-fit lens model. In this case thegalaxies included in the fit (i.e. the BCG and the galaxy flagged 01 inFig. 6) were modeled as dPIE potentials. The size of the imageis ≃
42 arcsec×45 arcsec. The red [yellow] lines represent the critical [caustic]lines.
els, since the observed dispersion depends upon the unknowndarkmatter potential contribution to the stellar dynamics. Theuncer-tainty on the velocity dispersion parameter could potentially intro-duce additional errors in the strong lensing modelling (Wu 1993).Despite of this, the BCG stellar mass is an important lens compo-nent (Meneghetti, Bartelmann & Moscardini 2003a, Hilbert et al.2008), especially when modeling radial arcs, which, due to theirposition very close to the cluster center, are extremely sensitiveto the cuspy distribution of luminous matter (see the earlier find-ings of Miralda-Escude 1995 on this topic). We thus imposed themeasuredσmeasured,BCG as an upper limit for the velocity dis-persion optimization range, and set as lower limit the valueofσ0,BCG = 230 km s−1, that is plausible given the high luminosityof the BCG. A discussion on the effect of this choice on the lensingresults is presented in§ 3.3.The optimization procedure of theLenstoolcode is performed inthe source plane, by mapping the positions of the input multipleimages back to the source plane, and requiring they have a minimalscatter (Jullo et al. 2007). The goodness-of-fit is evaluated throughthe followingχ2 estimator:
χ2=X
j
χ2pos(j), (10)
where the subscriptj refers to the multiply imaged systems.We assumed the uncertainty in the lensed image positions to
beσI = 0.3′′: mapping it back to the source plane one obtains anestimate of the error in the source plane.
3.3 Strong lensing results
The optimization and the error measurement are performed throughthe Bayesian optimization method implemented inLenstool, im-
Figure 8. Confidence levels for the NFW mass model parameters deter-mined through a strong lensing analysis. The contours show the parameternon-marginalized probability density, and refer to the model [1] in Table4. [Left panel] NFW concentration parameterc200 vs the scale radiusrs;[right panel] the concentration parameter vs the cluster total massM200,extrapolated up toR200.
Table 5.Best fit parameters for the galaxies included in the lens system. Thegalaxies were parameterized as dPIE or SIE potentials in thelens model [1]and [2], respectively (in Tab. 4 we list the fit results for theother parametersof the lens model). We report the mode of the distributions, with the68%statistical errors, and the best-fit values enclosed in round brackets. Valuesin square brackets were not optimized.
.
GALAXY MODEL PARAMETERS
Model Halo Ellipticity Rcut σ0
[kpc] [km s−1]
[1] BCG [0.18] [22.0] 230.7+11.2−0.49(230.5)
Galaxy [0.38] [5.0] 150.2+26.5−23.9(159.2)
[2] BCG [0.18] - 231.4+33.3−1.0 (240.3)
Galaxy [0.38] - 124.5+12.9−16.5(124.2)
posing an optimization rate ofδλ = 0.1.A summary of the best-fit values for two lens configurations isre-ported in Table 4.
In Table 5 we list the galaxy model values inferred throughthe strong lensing optimization. The configuration we will take asa reference in the following is labelled[1].The lensed images predicted by the reference model are showninFig.7 and the corresponding likelihood contour levels for the NFWparameters are shown in Fig.8. In Table 6 are reported theχ2 andthe mean scatter for each image system.
The curvature of the radial arc, peculiar of this strong lensingsystem, is not well reproduced by our lens models. Due to its po-sition very close to the cluster center, the radial arc is affected bythe BCG mass and dynamics. Thus a possible explanation of theoffset between the predicted and the observed radial arc curvaturecould be, e.g., the effect of a potential with non-constant ellipticityor position angle, that cannot be taken into account with thecur-rent mass model implementations (see Gavazzi et al. 2003). Otherfeatures of the arc (like its position or its radial extension) are quitewell reproduced by our models. So, despite of the uncertainty onits curved shape, the radial arc provides indeed a tight constraint onthe position of the radial critical line, and as a consequence on thetotal mass derivative in the cluster central region.
Resuming the strong lensing results, the best-fit models indi-cate a negligible shift of the cluster center with respect tothe BCGcentroid, and a slight offset between the BCG and the clusterhaloprojected orientation,∆θ ∼= 5, which is lower than the∆θ ∼= 13
found by G05 and by Sand et al. (2008). Such a misalignment couldhave either a geometrical explanation (e.g. the projectioneffect

Mass estimate of MS2137 9
Table 4.Best fit parameters, obtained for different lens models. Hereafter, we will refer to the first model as the reference model. Quoted errors correspond to1σ confidence level. The columns indicate the lens configuration (the cluster halo model + the galaxy model), the coordinates of the center of mass, expressed inarcsec with respect to the BCG centroid, the ellipticity andposition angle (WCS aligned) of the cluster clump, the scaleradius and the concentration parameter(both referred to a halo overdensity of 200), the extrapolated mass up toR200 , the characteristic velocity dispersion of the NFW profile implementation inLenstooland the totalχ2, calculated over 15 knots systems, for a total of 50 image areas. When the best-fit value is significantly different from the mode ofthe distribution, the former is reported enclosed in brackets. The errors onxc, yc and on the ellipticity are≃ 0.1 and≃ 0.01, respectively. Ellipticityehere isexpressed as(a2 − b2)/(a2 + b2).
BEST FIT STRONG LENSING RESULTS
Model xc yc e θ rs c200 M200 σ0 χ2tot[d.o.f.]
[arcsec] [arcsec] [deg] [kpc] [1014M⊙] [km s−1]
[1] NFW+dPIE 0.0 0.0 0.10 147.2+0.6−0.4[147.4] 148.9+22.0
−24.7[143.5] 9.50+1.29−0.87[9.76] 4.11+0.75
−0.46[4.31] 1377.3+26.9−36.2 [1366.4] 17.6[61]
[2] NFW+SIE 0.1 −0.1 0.10 149.3 ± 0.7[149.2] 118.3+26.0−14.3[117.3] 10.47+1.26
−1.23[10.98] 3.38+0.59−0.35[3.36] 1291.2+28.9
−20.5 10.9[61]
Table 6. The results of the source plane optimization performed withtheLenstoolcode for our reference model, labelled [1] in Table 4. The columnslist the knots system, theχ2 of the system, the root-mean-square computedin the source plane (rmss) and the corresponding one in the image plane(rmsi). The last row reports the totalχ2 estimator, referring to a modelwith 61 degrees of freedom.
GOODNESS OF FIT
System χ2 rmss[′′] rmsi[′′]
1.a 0.48 0.034 0.271.b 1.72 0.064 0.371.c 2.18 0.075 0.221.d 0.90 0.053 0.231.e 1.80 0.062 0.501.f 1.61 0.062 0.861.g 1.06 0.057 0.371.h 0.21 0.021 0.251.i 0.11 0.030 0.081.l 0.16 0.038 0.101.m 0.14 0.034 0.07
2.a 3.40 0.168 0.332.b 1.97 0.114 0.352.c 1.13 0.078 0.282.d 0.75 0.057 0.44
Total χ2 [d.o.f] rmss[′′] rmsi[′′]
17.62 [61] 0.072 0.39
of a prolate halo -see G05- or the difference of halos triaxialities(Keeton, Kochanek & Seljak 1997)) or a dynamical origin, linkedto the BCG formation process (Quadri, Moller & Natarajan 2003;see also Minor & Kaplinghat 2007).To estimate the magnitude of the systematic error on the lensingmass introduced by the uncertainty on the velocity dispersion, weoptimized again the lens model imposing as lower limitσ0,BCG =
325 km/s. Under these conditions we derived the following values:
Parameter Unit Mode Best fit
xc arcsec 0.2 ± 0.1yc arcsec 0.2 ± 0.1e 0.11 ± 0.01θ deg 146.2+0.4
−0.4
rs kpc 153.1+23.3−19.5 [160.1]
c200 9.21+0.92−0.86 [8.93]
M200 1014M⊙ 4.40+0.6−0.5 [4.59]
σ0,halo km s−1 1359.0+31.3−25.5
σ0,BCG km s−1 327.0+3.2−0.15 [325.4]
χ2tot[d.o.f.] 61.1[61]
The values in square brackets indicate the best-fit results ifthey are significantly different from the mode of the distribution.The parameter values in this case are within2σ respect to the onespresented in Tab. 4. The results obtained decreasing the BCGveloc-ity dispersion (and thus its mass) are shown in§ 5. So, consideringthe results obtained for the two boundary conditions (no halo con-tribution to the BCG potential well and no mass in the BCG) wecan estimate that, regard to the strong lensing mass, the systematicerrors associated with the uncertainty in the BCG mass account foran additional≃ 25% in the final error budget. We would like tostress again that this additional error component arises inthe caseof galaxy clusters with central lensed features, when trying to dis-entangle the central galaxy mass from the underlying halo massandwhen no additional constraint(e.g. the BCG stellar dynamics)is included.Anyway the NFW parameters are quite well constrained by thecluster strong lensing features, and we did not detect a highconcen-tration for this cluster, as stated in previous works in the literature(see Comerford & Natarajan 2007 and§ 5 for further discussion).
4 X-RAY AND STRONG LENSING COMPARISON
Coupling the X-ray and lensing mass estimates is not a trivial task,as already stated by G05, due to their different dependencies on thecharacteristics of galaxy clusters (like asphericity) as well as forthe still incomplete treatment of the biases that could affect bothmeasurements. Though joint analyses of homogeneous effects (e.g.weak and strong lensing) often supply converging estimates, lead-
10 A. Donnarumma et al.
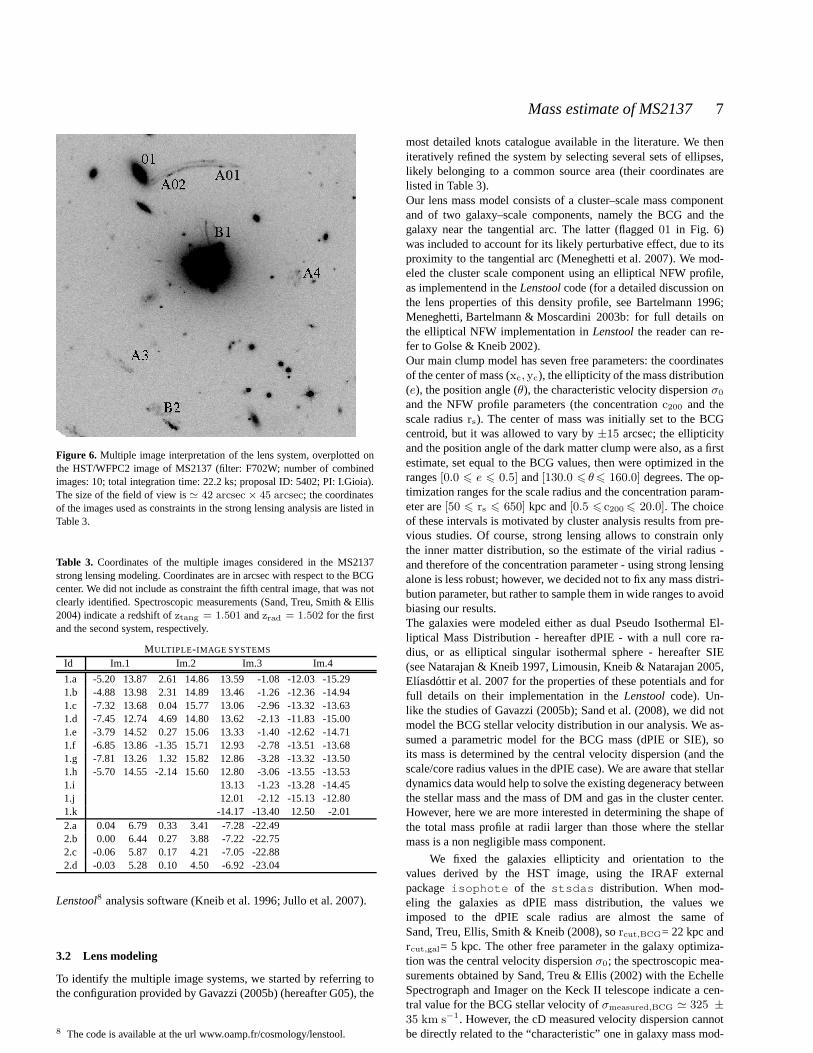
Table 7. Best fit parameters for the NFW profile. The strong lensing results refer to the reference model, labeled [1] in Tab. 4. Quoted errors correspond to1σ confidence level. For a comparison, we reported the results obtained in some earlier representative studies: the original values were converted according tocommon definitions. We list here the findings obtained by Allen et al. (2001) and Schmidt & Allen (2007) through the X-ray analysis ofChandradata (columnsA01 and S07, respectively) and by Gavazzi (2005b) and Comerford et al. (2006) through a strong lensing study (columns G05and C06, respectively). Here,again,e = (a2 − b2)/(a2 + b2).
COMPARISON WITH PREVIOUS RESULTS
X-RAY SL A01 S07 G05 C06 Units
rs 162.72+18.60−16.27 148.9+22.0
−24.7 160.0 ± 30 180.0 ± 20.0 158.0+15−13 91.4 ± 3 kpc
c200 8.68+0.71−0.91 9.50+1.29
−0.87 8.71+1.22−0.92 8.19+0.54
−0.56 11.92+0.77−0.74 13.0 ± 1.0 -
M200 4.43 ± 0.25 4.11+0.75−0.46 - - 7.56+0.63
−0.54 2.9 ± 0.4 1014M⊙
e - 0.1 ± 0.01 - - 0.25 0.12 -
ing to remarkable results (Bradac et al. 2005, 2006; Limousin et al.2007; Merten et al. 2008), comparing 2- and 3-dimensional mea-surements requires further caution. Recently, several interestingattempts have been made to infer cluster masses through multi-wavelength, combined analysis (Mahdavi et al. 2007), in somecases suggesting that a direct comparison needs further investiga-tion (Lemze et al. 2008). We decided instead to perform two paral-lel analyses to understand if these methods lead to discrepant massestimates for MS2137.We found that our X-ray and strong lensing results are in goodagreement: both the extrapolated value of the total massM200 andthe mass model parameters agree within the2σ range. The param-eter probability distributions are mutually consistent (see the leftpanel of Figure 9), although the concentration inferred from thelensing analysis is slightly higher than the X-ray one. A mild elon-gation of the cluster along the line of sight could be a possible ex-planation, as already suggested by G05. Another reason could bethe additional uncertainty associated to the BCG mass. To evaluatethe differences between the X-ray and the strong lensing results, weshow in the right panel of Figure 9 the projected total mass enclosedin concentric cylinders inferred from both analyses. The assessmentof the errors on the strong lensing mass was performed by stacking500 mass map realizations, obtained through theLenstoolBayesianoptimization, and computing the standard deviation at eachmappoint.
5 COMPARISON WITH PREVIOUS STUDIES
In this section we will briefly compare our results with some pre-vious studies, namely the findings obtained by Schmidt & Allen(2007) (hereafter S07) and Allen, Schmidt & Fabian (2001) (here-after A01) through the X-ray analysis ofChandra data, andthose inferred through a strong lensing analysis by G05 andComerford et al. (2006) (hereafter C06: see also Gavazzi et al.2003; Comerford & Natarajan 2007; Shu et al. 2008).S07 studied the same twoChandra datasets considered in thiswork, whereas the analysis of A01 was carried out on the onlyChandradataset available at that epoch (Obs. 928). The methodapplied in their studies are similar to ours. Briefly, S07 andA01derived the observed X-ray surface brightness profile and the de-projected X-ray gas temperature profile, and combined them todetermine the gas mass and total mass profile of the galaxy clus-ter, under the assumptions of hydrostatic equilibrium and spheri-
cal symmetry9 (for more details, see also White, Jones & Forman1997; Allen, Ettori & Fabian 2001). The gas temperature and den-sity profiles for the single case of MS2137 were not listed in S07and A01, since in both cases the authors presented the results ofcareful analyses of large samples of objects. Thus a direct compar-ison of the derived profiles was not possible. Concerning thefinalestimates of the NFW parameters, there is a good matching be-tween our results and the values presented both in S07 and A01.Despite some differences in the analyses (for example the spectralbinning and the X-ray background estimate) the results are mutu-ally consistent within a2σ level (see Tab.7).A comparison with the previous strong lensing analyses in-volves an extended discussion, since, as already stated byComerford & Natarajan (2007), the scatter in the differing resultsfound in the literature regarding this cluster is quite large. A com-plete discussion on this topic is beyond the aim of this paper: herewe will simply compare the results and the methods of analysis,and possibly suggest some explanations. For full details onthe ba-sis of the optimization methods, the reader can refer to the relatedpapers, Gavazzi (2005b) and Comerford et al. (2006) respectively.Both the analyses of G05 and C06 were performed exploiting theirown inversion codes. The source planeχ2 estimator adopted inG05 follows theχ2
s definition in thelensmodel software (Keeton2001a,b). G05 reported a value for the scale radiusrs consistentwith our estimate, whereas there is disagreement between our esti-mates of the halo concentration and mass. We couldn’t find a con-vincing explanation for the difference in our results.The code utilised in C06 optimizes the lens model parametersbyminimizing a figure-of-merit function, defined as the sum of threecomponents both in the image and in the source planes. The op-timization procedure is meant to shrink: (i) the distance betweeneach data point position and the nearest predicted one, (ii)the dis-tance between the predicted point positions and the nearestdatapoint (thus penalising models that produce unobserved images) and(iii) the size and noncompactness of the predicted sources (see C06and Shu et al. 2008 for a detailed discussion).
This fitting technique is very accurate: however, in their anal-ysis C06 modeled the lens as a single elliptical NFW potential,not including any galaxy component. Thus, the free parameters oftheir lens model are the scale radiusrs, the ellipticity, the posi-tion angleθ and the scale convergenceks ≡ ρsrs/Σcrit, where
9 S07 carried out two separate mass analyses, deriving a mass estimate ofthe cluster total matter and of its three components (dark matter, gas andcD galaxy). In the following, we will refer to the results obtained in the firstcase.

Mass estimate of MS2137 11
100
120
140
160
180
200
220
7 8 9 10 11 12 13
Sca
le r
adiu
s r s [k
pc]
Concentration c200
Strong lensingX-ray
X-ray best fitStrong lensing best fit
50 100 500 800 1500Radius [kpc]
1013
1014
1015
M2D
(<R
)[M
sun]
Strong lensing rangeX-ray range
Strong lensingX-ray
Figure 9. [Left panel] 3σ marginalized probability distribution for the NFW parameters - concentration and scale radius. The regions refer to the the X-ray(drawn in green) and strong lensing (drawn in red) results. The square [triangle] indicates the X-ray [strong lensing] best fit values. [Right panel] Projectedtotal mass enclosed in cylinders of radius R. The solid greenline represents the projected total mass profile derived through the X-ray analysis (the grey areaindicates the1σ region), the red line with error bars show the result of the strong lensing analysis. The error bars indicate the1σ errors inferred from theBayesian optmization. The green [red] dashed horizontal line indicates the spatial range over which the X-ray [strong lensing] analysis has been performed.
as usualΣcrit represents the critical surface mass density. The re-sulting MS2137 mass parameters arers ≃ 91.4 ± 3 kpc andc ≃ 13.0 ± 1.0, leading to a total mass extrapolated up toR200
of M200 ≃ 2.9 ± 0.4 × 10¹⁴ M⊙. Thus, the total mass and scaleradius estimates of C06 are lower and their inferred concentrationparameter is higher than our best-fit values.We performed a single mass component analysis, in analogy withC06 and Shu et al. (2008). The best-fit values we obtained in thiscase are:
(i) rs = 92.8 ± 10.0 kpc,(ii) c = 13.5 ± 1.1,(iii) M200 = 3.1 ± 0.3 × 10¹⁴ M⊙,
which are in excellent agreement with the C06 values; the to-tal χ2 is 29.6 for 63 d.o.f. This result highlights once again thatthe BCG has a non-negligible effect on strong lensing properties(Hilbert et al. 2008) when dealing with lensed features sensitive tothe central mass distribution, such as radial arcs. Ignoring the BCGstellar mass component can return an “artificial” high-concentratedprofile, to account for the missing central galactic component.
6 DISCUSSIONS AND CONCLUSIONS
We have presented new X-ray and strong lensing mass measure-ments for the galaxy cluster MS2137.3-2353, taking advantagesof the high-resolutionChandraand HST data. Our X-ray analy-sis benefits from a non-parametric study of the gas temperature anddensity profiles. By combining them, we have recovered the clustermass profile adopting the NFW model, under the assumptions ofspherical symmetry and hydrostatic equilibrium.The strong lensing reconstruction was performed through the pub-licly available codeLenstool(Kneib et al. 1996; Jullo et al. 2007),which allowed for a parametric analysis comparable to our X-raystudy. Our mass estimates are consistent within the errors,lead-ing to a mean value of the total mass, extrapolated up toR200,of ≃ 4.4 ± 0.3 × 10¹⁴M⊙. We did not find a strong discrepancybetween the strong lensing and the X-ray NFW parameter results,since the best-fit values mutually agree at a3σ confidence level.The probability distributions are mutually compatible. The slight
difference in the allowed parameter space could be explained, forexample, by a mild cluster elongation along the line of sight, whichwould affect mainly the strong lensing results. Moreover, the uncer-tainty on the BCG mass determination could introduce a systematicbias in the lensing measurements that we could quantify as anaddi-tional uncertainty of≃ 25%, since the extrapolated strong lensingmass estimate in this case depends upon the BCG stellar mass bud-get.The agreement between these two mass estimates for a relaxedcluster, like MS2137, supports the statement that, for thiskind ofsystem, both the strong lensing and the X-ray analyses provide anunbiased way to estimate the cluster mass. As a general observationon the physics of this cluster, the convergence of these massresultsimplies that its main pressure support mechanism against gravityis the thermal pressure, so the assumption of hydrostatic equilib-rium is verified. Non-thermal processes, such as turbulent motionsor magnetic field effects, seemingly have little impact on the equi-librium state for this cluster, that appears a good example of relaxedcluster prototype. To verify if MS2137 represents a peculiar case inthe cluster mass discrepancy debate, or if the relaxed dynamicalstate constitutes a sufficient condition for the convergence of thestrong lensing and X-ray mass estimates, further investigations ofboth single cluster cases and large uniform samples are fundamen-tal, and would provide new, useful insights on the galaxy clusterphysics.
7 ACKNOWLEDGMENTS
We would like to thank Raphael Gavazzi, Bernard Fort, MarioRadovich, Fabio Gastaldello, Giovanni Covone, Eric Jullo andMarceau Limousin for their help and suggestions. We are gratefulto Matthias Bartelmann for reading the paper and providing use-ful comments. We thank the anonymous referee for useful com-ments and remarks that improved the presentation of our work. ADacknowledges the support of European Association for Researchin Astronomy (MEST-CT-2004-504604 Marie Curie - EARA ESTfellowship), and thanks Raphael Gavazzi and Bernard Fort for theirkind hospitality during the visit at IAP - Institut d’Astrophysiquede Paris. AD also thanks Daniela Crociani and Ashley J. Ruiter

12 A. Donnarumma et al.
for their help and support. We thank Jean Paul Kneib and theLenstooldevelopers for making their lensing software public. Thisresearch has made use of data obtained from theChandraDataArchive and of the software provided by theChandraX-ray Cen-ter (CXC), and ofHSTdata obtained from the MAST archive. Weacknowledge the financial contribution from contracts ASI-INAFI/023/05/0, I/088/06/0 and I/016/07/0.
REFERENCES
Allen S. W., 1998, MNRAS, 296, 392Allen S. W., Ettori S., Fabian A. C., 2001, MNRAS, 324, 877Allen S. W., Schmidt R. W., Fabian A. C., 2001, MNRAS, 328,L37
Arnaud K. A., 1996, in Jacoby G. H., Barnes J., eds, AstronomicalData Analysis Software and Systems V Vol. 101 of AstronomicalSociety of the Pacific Conference Series, XSPEC: The First TenYears. pp 17–+
Arnaud M., Pointecouteau E., Pratt G. W., 2005, A&A, 441, 893Bartelmann M., 1996, A&A, 313, 697Bartelmann M., Narayan R., 1995, in Holt S. S., Bennett C. L.,eds, Dark Matter Vol. 336 of American Institute of Physics Con-ference Series, Gravitational Lensing and the Mass Distributionof Clusters. pp 307–+
Borgani S., 2006, ArXiv e-prints, astro-ph/0605575Bradac M., Clowe D., Gonzalez A. H., Marshall P., Forman W.,Jones C., Markevitch M., Randall S., Schrabback T., Zaritsky D.,2006, ApJ, 652, 937
Bradac M., Erben T., Schneider P., Hildebrandt H., LombardiM., Schirmer M., Miralles J.-M., Clowe D., Schindler S., 2005,A&A, 437, 49
Bradac M., Schrabback T., Erben T., McCourt M., Million E.,Mantz A., Allen S., Blandford R., Halkola A., Hildebrandt H.,Lombardi M., Marshall P., Schneider P., Treu T., Kneib J.-P.,2008, ApJ, 681, 187
Buote D. A., 2000, ApJ, 539, 172Comerford J. M., Meneghetti M., Bartelmann M., Schirmer M.,2006, ApJ, 642, 39
Comerford J. M., Natarajan P., 2007, MNRAS, 379, 190Dalal N., Keeton C. R., 2003, ArXiv e-prints, astro-ph/0312072Diaferio A., Schindler S., Dolag K., 2008, Space Science Re-views, 134, 7
Dickey J. M., Lockman F. J., 1990, ARA&A, 28, 215Elıasdottir A., Limousin M., Richard J., Hjorth J., Kneib J.-P.,Natarajan P., Pedersen K., Jullo E., Paraficz D., 2007, ArXive-prints, astro-ph/07105636, 710
Ettori S., De Grandi S., Molendi S., 2002, A&A, 391, 841Ettori S., Lombardi M., 2003, A&A, 398, L5Fort B., Le Fevre O., Hammer F., Cailloux M., 1992, ApJ, 399,L125
Gao L., Navarro J. F., Cole S., Frenk C. S., White S. D. M.,Springel V., Jenkins A., Neto A. F., 2008, MNRAS, 387, 536
Gavazzi R., 2005a, in Mellier Y., Meylan G., eds, GravitationalLensing Impact on Cosmology Vol. 225 of IAU Symposium,Lensing & Dynamics in the Galaxy Cluster MS2137-23. pp 179–184
Gavazzi R., 2005b, A&A, 443, 793Gavazzi R., Fort B., Mellier Y., Pello R., Dantel-Fort M., 2003,A&A, 403, 11
Gitti M., Piffaretti R., Schindler S., 2007, A&A, 472, 383Golse G., Kneib J.-P., 2002, A&A, 390, 821
Halkola A., Hildebrandt H., Schrabback T., Lombardi M., BradacM., Erben T., Schneider P., Wuttke D., 2008, A&A, 481, 65
Hallman E. J., Motl P. M., Burns J. O., Norman M. L., 2006, ApJ,648, 852
Hilbert S., White S. D. M., Hartlap J., Schneider P., 2008, MN-RAS, pp 471–+
Jing Y. P., Suto Y., 2000, ApJ, 529, L69Jullo E., Kneib J.-P., Limousin M., ElıasdottirA., Marshall P. J.,Verdugo T., 2007, New Journal of Physics, 9, 447
Kaastra J. S., Mewe R., 1993, A&A Supp., 97, 443Keeton C. R., 2001a, ArXiv e-prints, astro-ph/0102341Keeton C. R., 2001b, ArXiv e-prints, astro-ph/0102340Keeton C. R., Kochanek C. S., Seljak U., 1997, ApJ, 482, 604King I., 1962, AJ, 67, 274King I. R., 1966, AJ, 71, 64Kneib J.-P., Ellis R. S., Smail I., Couch W. J., Sharples R. M.,1996, ApJ, 471, 643
Kriss G. A., Cioffi D. F., Canizares C. R., 1983, ApJ, 272, 439Lemze D., Barkana R., Broadhurst T. J., Rephaeli Y., 2008, MN-RAS, 386, 1092
Limousin M., Kneib J.-P., Natarajan P., 2005, MNRAS, 356, 309Limousin M., Richard J., Jullo E., Kneib J.-P., Fort B., SoucailG., ElıasdottirA., Natarajan P., Ellis R. S., Smail I., Czoske O.,Smith G. P., Hudelot P., Bardeau S., Ebeling H., Egami E., Knud-sen K. K., 2007, ApJ, 668, 643
Mahdavi A., Hoekstra H., Babul A., Sievers J., Myers S. T., HenryJ. P., 2007, ApJ, 664, 162
Markevitch M., Bautz M. W., Biller B., Butt Y., Edgar R., GaetzT., Garmire G., Grant C. E., Green P., Juda M., Plucinsky P. P.,Schwartz D., Smith R., Vikhlinin A., Virani S., Wargelin B. J.,Wolk S., 2003, ApJ, 583, 70
Meneghetti M., Argazzi R., Pace F., Moscardini L., Dolag K.,Bartelmann M., Li G., Oguri M., 2007, A&A, 461, 25
Meneghetti M., Bartelmann M., Moscardini L., 2003a, MNRAS,346, 67
Meneghetti M., Bartelmann M., Moscardini L., 2003b, MNRAS,340, 105
Merten J., Cacciato M., Meneghetti M., Mignone C., BartelmannM., 2008, ArXiv e-prints, astro-ph/0806196, 806
Mewe R., Gronenschild E. H. B. M., van den Oord G. H. J., 1985,A&A Supp., 62, 197
Minor Q. E., Kaplinghat M., 2007, ArXiv e-prints, astro-ph/07112537, 711
Miralda-Escude J., 1995, ApJ, 438, 514Moore B., Governato F., Quinn T., Stadel J., Lake G., 1998, ApJ,499, L5+
Morandi A., Ettori S., 2007, MNRAS, pp 708–+Morandi A., Ettori S., Moscardini L., 2007, MNRAS, 379, 518Nagai D., Kravtsov A. V., Vikhlinin A., 2007, ApJ, 668, 1Natarajan P., Kneib J.-P., 1997, MNRAS, 287, 833Navarro J. F., Frenk C. S., White S. D. M., 1995, MNRAS, 275,720
Navarro J. F., Frenk C. S., White S. D. M., 1997, ApJ, 490, 493Ota N., Pointecouteau E., Hattori M., Mitsuda K., 2004, ApJ,601,120
Quadri R., Moller O., Natarajan P., 2003, ApJ, 597, 659Rasia E., Ettori S., Moscardini L., Mazzotta P., Borgani S.,DolagK., Tormen G., Cheng L. M., Diaferio A., 2006, MNRAS, 369,2013
Rasia E., Tormen G., Moscardini L., 2004, MNRAS, 351, 237Rood H. J., Page T. L., Kintner E. C., King I. R., 1972, ApJ, 175,627

Mass estimate of MS2137 13
Sand D. J., Treu T., Ellis R. S., 2002, ApJ, 574, L129Sand D. J., Treu T., Ellis R. S., Smith G. P., Kneib J.-P., 2008,ApJ, 674, 711
Sand D. J., Treu T., Smith G. P., Ellis R. S., 2004, ApJ, 604, 88Schmidt R. W., Allen S. W., 2007, MNRAS, 379, 209Shu C., Zhou B., Bartelmann M., Comerford J. M., Huang J. .,Mellier Y., 2008, ArXiv e-prints, astro-ph/08051148, 805
Smail I., Ellis R. S., Dressler A., Couch W. J., Oemler A. J.,Sharples R. M., Butcher H., 1997, ApJ, 479, 70
Soucail G., Covone G., Kneib J.-P., 2007, in Kissler-Patig M.,Walsh J. R., Roth M. M., eds, Science Perspectives for 3D Spec-troscopy A VIMOS-IFU Survey of z∼ 0.2 Massive LensingGalaxy Clusters: Constraining Cosmography. pp 181–+
Stocke J. T., Morris S. L., Gioia I. M., Maccacaro T., Schild R.,Wolter A., Fleming T. A., Henry J. P., 1991, ApJS, 76, 813
Tozzi P., 2007, in Papantonopoulos L., ed., The Invisible Uni-verse: Dark Matter and Dark Energy Vol. 720 of Lecture Notes inPhysics, Berlin Springer Verlag, Cosmological ParametersfromGalaxy Clusters: An Introduction. pp 125–+
Vikhlinin A., Kravtsov A., Forman W., Jones C., Markevitch M.,Murray S. S., Van Speybroeck L., 2006, ApJ, 640, 691
Voigt L. M., Fabian A. C., 2006, MNRAS, 368, 518Voit G. M., 2005, Reviews of Modern Physics, 77, 207White D. A., Jones C., Forman W., 1997, MNRAS, 292, 419Wilms J., Allen A., McCray R., 2000, ApJ, 542, 914Wu X.-P., 1993, ApJ, 411, 513Wu X.-P., Fang L.-Z., 1996, ApJ, 467, L45+
Copyright © 2022 FDOKUMEN