Writing history backwards or sideways: towards a consensus on African population, 1850-2010
25
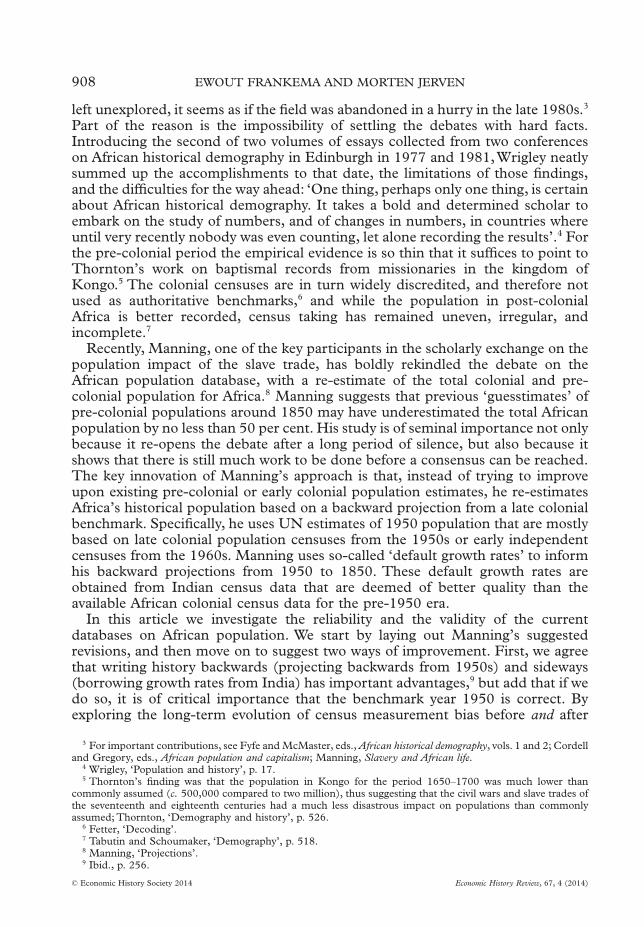
Writing history backwards or sideways: towards a consensus on African population, 1850–2010 1 By EWOUT FRANKEMA and MORTEN JERVEN* This article aims to make an empirical and theoretical contribution towards the creation of a continent-wide dataset on African population extending into the pre- 1950 era. We investigate the reliability and the validity of the current population databases with the aim of working towards a consensus on the long-term series of African total population with a reliable 1950 benchmark. The cases of Kenya, Nigeria, and Ghana are explored to show the uneven coverage of census taking in colonial and post-colonial Africa and to demonstrate the need for an upward adjust- ment of the conventional 1950 benchmark. In addition, we discuss the advantages and disadvantages of Manning’s approach of projecting population growth estimates backwards in time by adopting the available Indian census data as African ‘default growth rates’, and we propose an alternative approach by incorporating the demo- graphic experiences of tropical land-abundant countries in South-East Asia. T he lack of reliable historical population estimates for large parts of Africa, and sub-Saharan Africa in particular, continues to hamper long-term analyses of African social and economic development. Denominator problems complicate the reconstruction of historical GDP per capita and make it hard to assess the timing and incidence of changes in development indicators such as child mortality, life expectancy, educational attainment, tax pressure, and so on. 2 However, despite its obvious importance, African historical demography has been largely neglected for nearly two decades. Judging by the loose ends left behind and the paths of research *Author Affiliations: Ewout Frankema, University of Utrecht; Morten Jerven, Simon Fraser University. 1 We thank the participants of the session ‘New African economic history—approaches to long term African economic development’ at the XVIth World Economic History Conference 2012 (Stellenbosch, 10 July 2012), the African Studies Association UK (Leeds, 8 Sept. 2012), and the African Economic HistoryWorkshop (Geneva, 11 Sept. 2012). Special thanks to Gareth Austin, Patrick Manning, Alexander Moradi, and three anonymous referees for in-depth comments on previous drafts of this study.We are grateful to Sanne Mirck and Aske Bonde for excellent research assistance. Ewout Frankema acknowledges financial support from the European Research Council under the European Community’s Seventh Framework Programme for the project ‘Is poverty destiny? A new empirical foundation for long-term African welfare analysis’ (ERC grant agreement no. 313114), and from the Dutch Science Foundation for the project ‘Is poverty destiny? Exploring long term changes in African living standards in global perspective’ (NWO VIDI grant no. 016.124.307). Morten Jerven acknowledges financial support from the Social Sciences and Humanities Research Council of Canada Insight Grant for the project ‘African states and development: a historical perspective on state legitimacy and development capacity, 1890–2010’. 2 For recent work on African historical national accounts, see Jerven, ‘Users and producers’; idem, ‘Contro- versy, facts and assumptions’. For recent living standard studies see Bowden, Chiripanhura, and Mosley, ‘Measuring and explaining poverty’; Moradi, ‘Towards an objective account’; Frankema, and vanWaijenburg, ‘Structural impediments’; Frankema, ‘Origins’. Economic History Review, 67, 4 (2014), pp. 907–931 © Economic History Society 2014. Published by John Wiley & Sons Ltd, 9600 Garsington Road, Oxford OX4 2DQ, UK and 350 Main Street, Malden, MA 02148, USA.
Transcript of Writing history backwards or sideways: towards a consensus on African population, 1850-2010

Writing history backwards or sideways:towards a consensus on African
population, 1850–20101
By EWOUT FRANKEMA and MORTEN JERVEN*
This article aims to make an empirical and theoretical contribution towards thecreation of a continent-wide dataset on African population extending into the pre-1950 era. We investigate the reliability and the validity of the current populationdatabases with the aim of working towards a consensus on the long-term series ofAfrican total population with a reliable 1950 benchmark. The cases of Kenya,Nigeria, and Ghana are explored to show the uneven coverage of census taking incolonial and post-colonial Africa and to demonstrate the need for an upward adjust-ment of the conventional 1950 benchmark. In addition, we discuss the advantagesand disadvantages of Manning’s approach of projecting population growth estimatesbackwards in time by adopting the available Indian census data as African ‘defaultgrowth rates’, and we propose an alternative approach by incorporating the demo-graphic experiences of tropical land-abundant countries in South-East Asia.
The lack of reliable historical population estimates for large parts of Africa, andsub-Saharan Africa in particular, continues to hamper long-term analyses of
African social and economic development. Denominator problems complicate thereconstruction of historical GDP per capita and make it hard to assess the timingand incidence of changes in development indicators such as child mortality, lifeexpectancy, educational attainment, tax pressure, and so on.2 However, despite itsobvious importance, African historical demography has been largely neglected fornearly two decades. Judging by the loose ends left behind and the paths of research
*Author Affiliations: Ewout Frankema, University of Utrecht; Morten Jerven, Simon Fraser University.1 We thank the participants of the session ‘New African economic history—approaches to long term African
economic development’ at the XVIth World Economic History Conference 2012 (Stellenbosch, 10 July 2012),the African Studies Association UK (Leeds, 8 Sept. 2012), and the African Economic HistoryWorkshop (Geneva,11 Sept. 2012). Special thanks to Gareth Austin, Patrick Manning, Alexander Moradi, and three anonymousreferees for in-depth comments on previous drafts of this study.We are grateful to Sanne Mirck and Aske Bondefor excellent research assistance. Ewout Frankema acknowledges financial support from the European ResearchCouncil under the European Community’s Seventh Framework Programme for the project ‘Is poverty destiny?A new empirical foundation for long-term African welfare analysis’ (ERC grant agreement no. 313114), and fromthe Dutch Science Foundation for the project ‘Is poverty destiny? Exploring long term changes in African livingstandards in global perspective’ (NWO VIDI grant no. 016.124.307). Morten Jerven acknowledges financialsupport from the Social Sciences and Humanities Research Council of Canada Insight Grant for the project‘African states and development: a historical perspective on state legitimacy and development capacity,1890–2010’.
2 For recent work on African historical national accounts, see Jerven, ‘Users and producers’; idem, ‘Contro-versy, facts and assumptions’. For recent living standard studies see Bowden, Chiripanhura, and Mosley,‘Measuring and explaining poverty’; Moradi, ‘Towards an objective account’; Frankema, and van Waijenburg,‘Structural impediments’; Frankema, ‘Origins’.
bs_bs_banner
Economic History Review, 67, 4 (2014), pp. 907–931
© Economic History Society 2014. Published by John Wiley & Sons Ltd, 9600 Garsington Road, Oxford OX4 2DQ, UK and 350 MainStreet, Malden, MA 02148, USA.
left unexplored, it seems as if the field was abandoned in a hurry in the late 1980s.3
Part of the reason is the impossibility of settling the debates with hard facts.Introducing the second of two volumes of essays collected from two conferenceson African historical demography in Edinburgh in 1977 and 1981,Wrigley neatlysummed up the accomplishments to that date, the limitations of those findings,and the difficulties for the way ahead: ‘One thing, perhaps only one thing, is certainabout African historical demography. It takes a bold and determined scholar toembark on the study of numbers, and of changes in numbers, in countries whereuntil very recently nobody was even counting, let alone recording the results’.4 Forthe pre-colonial period the empirical evidence is so thin that it suffices to point toThornton’s work on baptismal records from missionaries in the kingdom ofKongo.5 The colonial censuses are in turn widely discredited, and therefore notused as authoritative benchmarks,6 and while the population in post-colonialAfrica is better recorded, census taking has remained uneven, irregular, andincomplete.7
Recently, Manning, one of the key participants in the scholarly exchange on thepopulation impact of the slave trade, has boldly rekindled the debate on theAfrican population database, with a re-estimate of the total colonial and pre-colonial population for Africa.8 Manning suggests that previous ‘guesstimates’ ofpre-colonial populations around 1850 may have underestimated the total Africanpopulation by no less than 50 per cent. His study is of seminal importance not onlybecause it re-opens the debate after a long period of silence, but also because itshows that there is still much work to be done before a consensus can be reached.The key innovation of Manning’s approach is that, instead of trying to improveupon existing pre-colonial or early colonial population estimates, he re-estimatesAfrica’s historical population based on a backward projection from a late colonialbenchmark. Specifically, he uses UN estimates of 1950 population that are mostlybased on late colonial population censuses from the 1950s or early independentcensuses from the 1960s. Manning uses so-called ‘default growth rates’ to informhis backward projections from 1950 to 1850. These default growth rates areobtained from Indian census data that are deemed of better quality than theavailable African colonial census data for the pre-1950 era.
In this article we investigate the reliability and the validity of the currentdatabases on African population. We start by laying out Manning’s suggestedrevisions, and then move on to suggest two ways of improvement. First, we agreethat writing history backwards (projecting backwards from 1950s) and sideways(borrowing growth rates from India) has important advantages,9 but add that if wedo so, it is of critical importance that the benchmark year 1950 is correct. Byexploring the long-term evolution of census measurement bias before and after
3 For important contributions, see Fyfe and McMaster, eds., African historical demography, vols. 1 and 2; Cordelland Gregory, eds., African population and capitalism; Manning, Slavery and African life.
4 Wrigley, ‘Population and history’, p. 17.5 Thornton’s finding was that the population in Kongo for the period 1650–1700 was much lower than
commonly assumed (c. 500,000 compared to two million), thus suggesting that the civil wars and slave trades ofthe seventeenth and eighteenth centuries had a much less disastrous impact on populations than commonlyassumed; Thornton, ‘Demography and history’, p. 526.
6 Fetter, ‘Decoding’.7 Tabutin and Schoumaker, ‘Demography’, p. 518.8 Manning, ‘Projections’.9 Ibid., p. 256.
908 EWOUT FRANKEMA AND MORTEN JERVEN
© Economic History Society 2014 Economic History Review, 67, 4 (2014)
colonial rule, we argue that the 1950 estimate for the total African populationshould be adjusted upwards from 220 to 240 million.10 We substantiate thisadjustment using case studies of Kenya, Nigeria, and the Gold Coast.
Our second contribution is to discuss the advantages and disadvantages ofprojecting population growth estimates backwards in time using India as com-parator. We agree that the strategy of backward projection is valuable, but we donot think it is wise to throw away the informational content of colonial censusesaltogether in the process.We argue that the case of Ghana (Gold Coast) shows thatcensus taking has been uneven, but that the historical census documents and thereports and commentaries made by contemporary observers provide valuableinsights. We also propose an alternative approach based on the demographicexperiences of tropical land-abundant countries in South-East Asia. The Asiancomparative perspective reveals that the Indian growth rates are in the lowerbound, and shows that if we adjust the growth rate between 1850 and 1950upwards in line with other Asian demographic histories, we end up with an 1850estimate closer to the conventional 100 million than Manning’s revised estimate of150 million. Our revised population data are available in the data repository of therecently established African Economic History Network.11
I
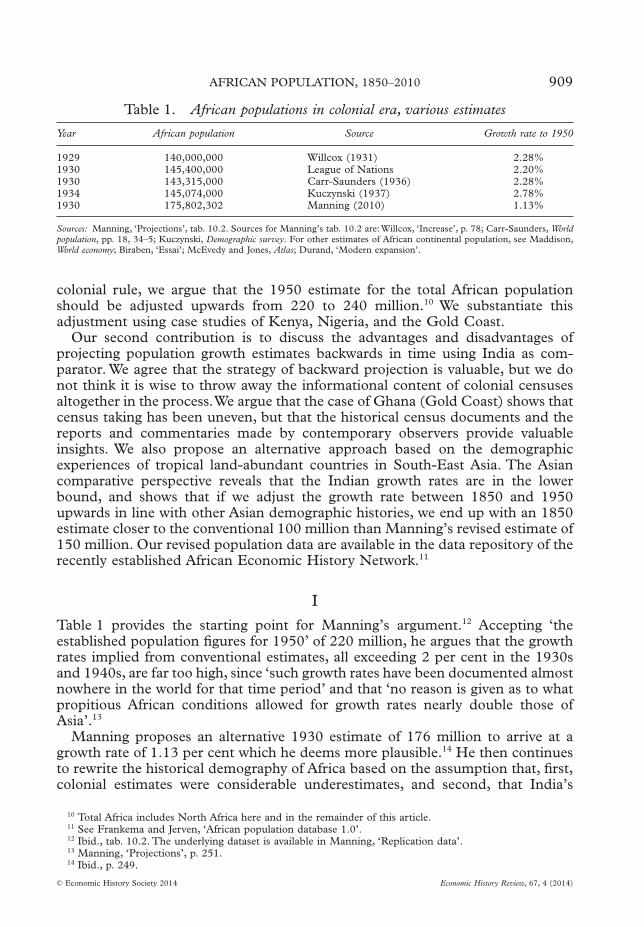
Table 1 provides the starting point for Manning’s argument.12 Accepting ‘theestablished population figures for 1950’ of 220 million, he argues that the growthrates implied from conventional estimates, all exceeding 2 per cent in the 1930sand 1940s, are far too high, since ‘such growth rates have been documented almostnowhere in the world for that time period’ and that ‘no reason is given as to whatpropitious African conditions allowed for growth rates nearly double those ofAsia’.13
Manning proposes an alternative 1930 estimate of 176 million to arrive at agrowth rate of 1.13 per cent which he deems more plausible.14 He then continuesto rewrite the historical demography of Africa based on the assumption that, first,colonial estimates were considerable underestimates, and second, that India’s
10 Total Africa includes North Africa here and in the remainder of this article.11 See Frankema and Jerven, ‘African population database 1.0’.12 Ibid., tab. 10.2. The underlying dataset is available in Manning, ‘Replication data’.13 Manning, ‘Projections’, p. 251.14 Ibid., p. 249.
Table 1. African populations in colonial era, various estimates
Year African population Source Growth rate to 1950
1929 140,000,000 Willcox (1931) 2.28%1930 145,400,000 League of Nations 2.20%1930 143,315,000 Carr-Saunders (1936) 2.28%1934 145,074,000 Kuczynski (1937) 2.78%1930 175,802,302 Manning (2010) 1.13%
Sources: Manning, ‘Projections’, tab. 10.2. Sources for Manning’s tab. 10.2 are: Willcox, ‘Increase’, p. 78; Carr-Saunders, Worldpopulation, pp. 18, 34–5; Kuczynski, Demographic survey. For other estimates of African continental population, see Maddison,World economy; Biraben, ‘Essai’; McEvedy and Jones, Atlas; Durand, ‘Modern expansion’.
AFRICAN POPULATION, 1850–2010 909
© Economic History Society 2014 Economic History Review, 67, 4 (2014)
demographic record offers a reasonable proxy for African population growth.Theformer is close to a truism in African history, though it has not been numericallysubstantiated for all regions and countries, nor has it been established whether theunderestimates are of the order of 10, 20, or perhaps even 50 per cent.15
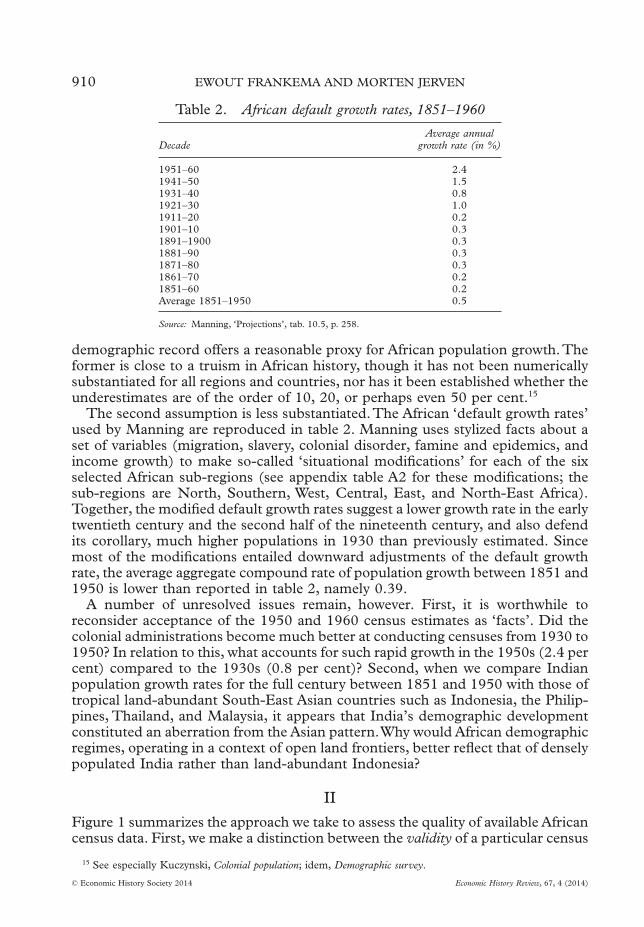
The second assumption is less substantiated.The African ‘default growth rates’used by Manning are reproduced in table 2. Manning uses stylized facts about aset of variables (migration, slavery, colonial disorder, famine and epidemics, andincome growth) to make so-called ‘situational modifications’ for each of the sixselected African sub-regions (see appendix table A2 for these modifications; thesub-regions are North, Southern, West, Central, East, and North-East Africa).Together, the modified default growth rates suggest a lower growth rate in the earlytwentieth century and the second half of the nineteenth century, and also defendits corollary, much higher populations in 1930 than previously estimated. Sincemost of the modifications entailed downward adjustments of the default growthrate, the average aggregate compound rate of population growth between 1851 and1950 is lower than reported in table 2, namely 0.39.
A number of unresolved issues remain, however. First, it is worthwhile toreconsider acceptance of the 1950 and 1960 census estimates as ‘facts’. Did thecolonial administrations become much better at conducting censuses from 1930 to1950? In relation to this, what accounts for such rapid growth in the 1950s (2.4 percent) compared to the 1930s (0.8 per cent)? Second, when we compare Indianpopulation growth rates for the full century between 1851 and 1950 with those oftropical land-abundant South-East Asian countries such as Indonesia, the Philip-pines, Thailand, and Malaysia, it appears that India’s demographic developmentconstituted an aberration from the Asian pattern.Why would African demographicregimes, operating in a context of open land frontiers, better reflect that of denselypopulated India rather than land-abundant Indonesia?
II
Figure 1 summarizes the approach we take to assess the quality of available Africancensus data. First, we make a distinction between the validity of a particular census
15 See especially Kuczynski, Colonial population; idem, Demographic survey.
Table 2. African default growth rates, 1851–1960
DecadeAverage annual
growth rate (in %)
1951–60 2.41941–50 1.51931–40 0.81921–30 1.01911–20 0.21901–10 0.31891–1900 0.31881–90 0.31871–80 0.31861–70 0.21851–60 0.2Average 1851–1950 0.5
Source: Manning, ‘Projections’, tab. 10.5, p. 258.
910 EWOUT FRANKEMA AND MORTEN JERVEN
© Economic History Society 2014 Economic History Review, 67, 4 (2014)
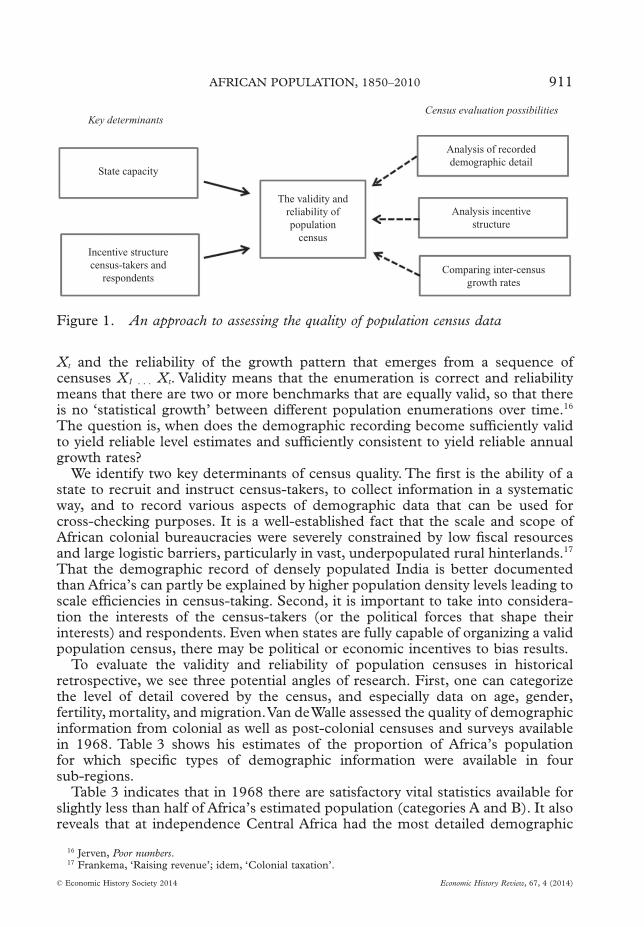
Xt and the reliability of the growth pattern that emerges from a sequence ofcensuses X1 . . . Xt. Validity means that the enumeration is correct and reliabilitymeans that there are two or more benchmarks that are equally valid, so that thereis no ‘statistical growth’ between different population enumerations over time.16
The question is, when does the demographic recording become sufficiently validto yield reliable level estimates and sufficiently consistent to yield reliable annualgrowth rates?
We identify two key determinants of census quality. The first is the ability of astate to recruit and instruct census-takers, to collect information in a systematicway, and to record various aspects of demographic data that can be used forcross-checking purposes. It is a well-established fact that the scale and scope ofAfrican colonial bureaucracies were severely constrained by low fiscal resourcesand large logistic barriers, particularly in vast, underpopulated rural hinterlands.17
That the demographic record of densely populated India is better documentedthan Africa’s can partly be explained by higher population density levels leading toscale efficiencies in census-taking. Second, it is important to take into considera-tion the interests of the census-takers (or the political forces that shape theirinterests) and respondents. Even when states are fully capable of organizing a validpopulation census, there may be political or economic incentives to bias results.
To evaluate the validity and reliability of population censuses in historicalretrospective, we see three potential angles of research. First, one can categorizethe level of detail covered by the census, and especially data on age, gender,fertility, mortality, and migration.Van deWalle assessed the quality of demographicinformation from colonial as well as post-colonial censuses and surveys availablein 1968. Table 3 shows his estimates of the proportion of Africa’s populationfor which specific types of demographic information were available in foursub-regions.
Table 3 indicates that in 1968 there are satisfactory vital statistics available forslightly less than half of Africa’s estimated population (categories A and B). It alsoreveals that at independence Central Africa had the most detailed demographic
16 Jerven, Poor numbers.17 Frankema, ‘Raising revenue’; idem, ‘Colonial taxation’.
Key determinantsCensus evaluation possibilities
State capacity
Incentive structurecensus-takers and
respondents
The validity andreliability ofpopulation
census
Analysis of recordeddemographic detail
Analysis incentivestructure
Comparing inter-censusgrowth rates
Figure 1. An approach to assessing the quality of population census data
AFRICAN POPULATION, 1850–2010 911
© Economic History Society 2014 Economic History Review, 67, 4 (2014)
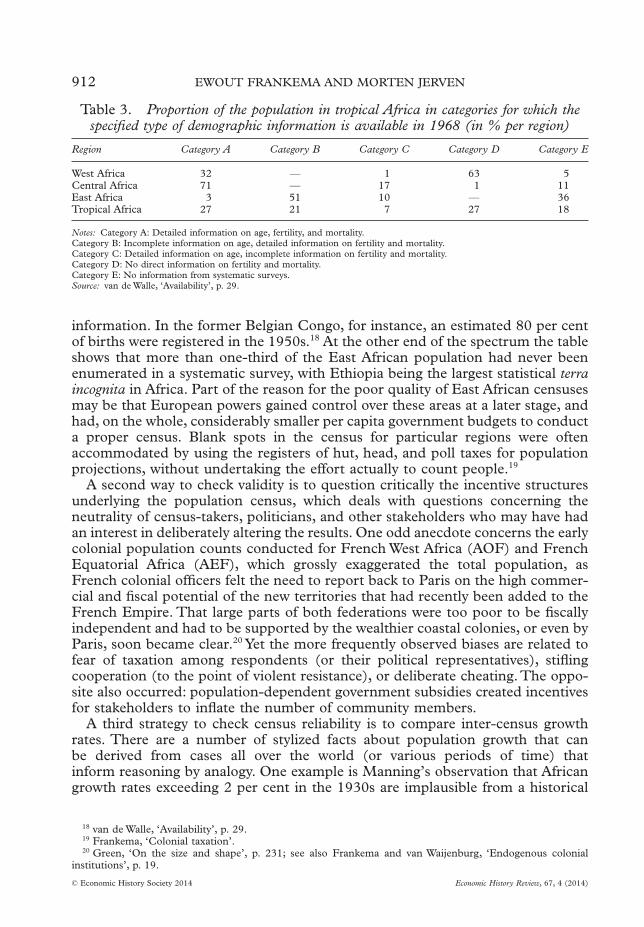
information. In the former Belgian Congo, for instance, an estimated 80 per centof births were registered in the 1950s.18 At the other end of the spectrum the tableshows that more than one-third of the East African population had never beenenumerated in a systematic survey, with Ethiopia being the largest statistical terraincognita in Africa. Part of the reason for the poor quality of East African censusesmay be that European powers gained control over these areas at a later stage, andhad, on the whole, considerably smaller per capita government budgets to conducta proper census. Blank spots in the census for particular regions were oftenaccommodated by using the registers of hut, head, and poll taxes for populationprojections, without undertaking the effort actually to count people.19
A second way to check validity is to question critically the incentive structuresunderlying the population census, which deals with questions concerning theneutrality of census-takers, politicians, and other stakeholders who may have hadan interest in deliberately altering the results. One odd anecdote concerns the earlycolonial population counts conducted for French West Africa (AOF) and FrenchEquatorial Africa (AEF), which grossly exaggerated the total population, asFrench colonial officers felt the need to report back to Paris on the high commer-cial and fiscal potential of the new territories that had recently been added to theFrench Empire. That large parts of both federations were too poor to be fiscallyindependent and had to be supported by the wealthier coastal colonies, or even byParis, soon became clear.20 Yet the more frequently observed biases are related tofear of taxation among respondents (or their political representatives), stiflingcooperation (to the point of violent resistance), or deliberate cheating. The oppo-site also occurred: population-dependent government subsidies created incentivesfor stakeholders to inflate the number of community members.
A third strategy to check census reliability is to compare inter-census growthrates. There are a number of stylized facts about population growth that canbe derived from cases all over the world (or various periods of time) thatinform reasoning by analogy. One example is Manning’s observation that Africangrowth rates exceeding 2 per cent in the 1930s are implausible from a historical
18 van de Walle, ‘Availability’, p. 29.19 Frankema, ‘Colonial taxation’.20 Green, ‘On the size and shape’, p. 231; see also Frankema and van Waijenburg, ‘Endogenous colonial
institutions’, p. 19.
Table 3. Proportion of the population in tropical Africa in categories for which thespecified type of demographic information is available in 1968 (in % per region)
Region Category A Category B Category C Category D Category E
West Africa 32 — 1 63 5Central Africa 71 — 17 1 11East Africa 3 51 10 — 36Tropical Africa 27 21 7 27 18
Notes: Category A: Detailed information on age, fertility, and mortality.Category B: Incomplete information on age, detailed information on fertility and mortality.Category C: Detailed information on age, incomplete information on fertility and mortality.Category D: No direct information on fertility and mortality.Category E: No information from systematic surveys.Source: van de Walle, ‘Availability’, p. 29.
912 EWOUT FRANKEMA AND MORTEN JERVEN
© Economic History Society 2014 Economic History Review, 67, 4 (2014)
comparative perspective.21 The adoption of Indian population growth rates as‘default rates’ for Africa is a similar strategy. Adopting such a strategy filters outgrowth rates that challenge biological constraints to human reproduction or ratesthat are so volatile that some benchmark estimates will have to be invalid.
By applying these three assessment methods in various ways, the literature hasyielded two generally accepted conclusions thus far. First, there is widespreadconsensus that African colonial censuses, with some notable exceptions, underes-timated total population, mainly because of the weak capacity of the state (man-power, counting skills of indigenous chiefs, and logistical barriers) to conduct avalid census.22 Following the declarations of independence in the 1960s, thenumber of universal censuses carried out in the former colonies increased. Theinevitable consequence is that the historical record misleads us to believe that therewas high population growth between early colonial estimates, and more accurate,though not necessarily perfect, post-colonial census results. In fact, conductingcomprehensive birth and death registrations to obtain representative populationgrowth rates adjusted for migration was a tall order for colonial as well as post-colonial states in sub-Saharan Africa. The second conclusion, related to the first,is the widespread agreement that the quality of post-colonial censuses has variedenormously (see table 3).
This yields an important point for making backward projections of population:if we agree that there was a bias leading to the underestimation of populations inthe 1930s, when would this bias eventually have disappeared? Tabutin andSchoumaker reported that 28 censuses were carried out between 1960 and 1969in the 48 countries in sub-Saharan Africa.23 This number increased to 41 in theperiod between 1970 and 1979.24 However, this number includes countries withthree to eight censuses (Kenya, Ghana, Burkina Faso, Senegal, Cameroon, andZambia) as well as many countries without any (Democratic Republic of theCongo, Congo, Guinea, Gabon, Chad, Somalia, and Swaziland).25 Bondestamnotes that between 1950 and 1971, 11 countries conducted three censuses, 20countries two, and 6 countries one, leaving almost one-third of African countrieswithout any census data. According to Bondestam, ‘the obvious difficulties incarrying out censuses are further illustrated by the fact that out of 21 listed withplans to carry out censuses in 1970 only 5 succeeded in doing so’.26
According to the United Nations Statistics Division in the 1990 Census round,nine sub-Saharan countries did not enumerate their populations. The situationthen again deteriorated and 15 countries failed to complete the 2000 Censusround.27 For the 2010 round, the UN only expected three African countries to beunable to carry out a census within the specified time period, namely Somalia,Eritrea, and Western Sahara.28 This expectation may very well turn out to be too
21 Manning, ‘Projections’, p. 248.22 Manning, ‘Projections’, p. 248; see also Fetter, ‘Decoding’, p. 84.23 This number includes censuses carried out in countries or territories that had not yet gained independence.
Furthermore it double-counts countries in which more than one census took place in that decade. Consequently,the actual number of censuses carried out in independent countries is a mere 10.
24 Tabutin and Schoumaker, ‘Demography’, p. 463.25 Ibid., p. 463.26 Bondestam, ‘Some notes on African statistics’, p. 10.27 United Nations Statistics Division, ‘Census dates for all countries’.28 United Nations Statistics Division, ‘Progression’.
AFRICAN POPULATION, 1850–2010 913
© Economic History Society 2014 Economic History Review, 67, 4 (2014)
optimistic, but overall the increasing number of successful censuses is partlycaused by the fact that a significantly smaller part of the continent was plagued bycivil war in the 2000s as compared to the 1990s.
In other words, census taking-practices have certainly improved in the course ofthe twentieth century, but these improvements were neither equally spread acrosscountries, nor did they occur in a linear fashion. A brief comparison of the four‘conventional’ databases underlines this point.The Penn World Tables (PWT), theUnited Nations World Population Prospects (UN), the World Development Indi-cators (WDI), and the Maddison dataset of historical statistics (MAD) rely ondifferent source materials and have adopted different adjustment methods to dealwith inconsistencies. Because Maddison has taken his population data from thePennWorldTables, and the UN andWDI population data for Africa have also beenequalized, we have compared the series of ‘PWT-MAD’ with ‘UN-WDI’ andselected all the countries for which the level-difference exceeds 5 per cent. For1950 it turns out that in the sample of 53 countries there are 28 countries,representing a total share of 57 per cent of the African population, exceeding the5 per cent threshold (see appendix table A1). There does not seem to be a clearpattern in the direction of the bias. In 2009 we find 19 countries, togethercomprising c. 21 per cent of the total African population. Indeed, the conventionaldatabases are slowly moving towards a consensus based on more reliable censusfigures, but there is still a considerable degree of disagreement.
III
If it is true that the problem of underestimation due to lack of state capacity andnon-neutral incentive structures has carried on into the postwar era, Manning’s220 million benchmark estimate for 1950 cannot be taken for granted. In addition,the arrival of new national governments at independence may have changedincentive structures. In this section we explore the cases of Kenya, Nigeria, andGhana (Gold Coast). Each of these three cases illustrates a different aspect of theassessment methods outlined in section II. Taken together, these three cases alsooffer a rough indication for the possible range of upward adjustment of the latecolonial population benchmark of 220 million.
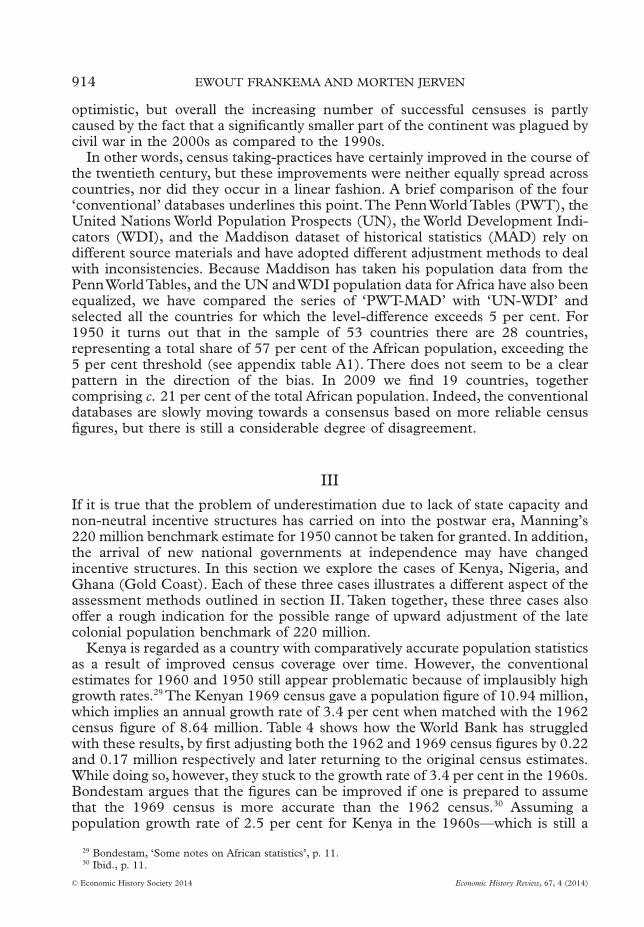
Kenya is regarded as a country with comparatively accurate population statisticsas a result of improved census coverage over time. However, the conventionalestimates for 1960 and 1950 still appear problematic because of implausibly highgrowth rates.29 The Kenyan 1969 census gave a population figure of 10.94 million,which implies an annual growth rate of 3.4 per cent when matched with the 1962census figure of 8.64 million. Table 4 shows how the World Bank has struggledwith these results, by first adjusting both the 1962 and 1969 census figures by 0.22and 0.17 million respectively and later returning to the original census estimates.While doing so, however, they stuck to the growth rate of 3.4 per cent in the 1960s.Bondestam argues that the figures can be improved if one is prepared to assumethat the 1969 census is more accurate than the 1962 census.30 Assuming apopulation growth rate of 2.5 per cent for Kenya in the 1960s—which is still a
29 Bondestam, ‘Some notes on African statistics’, p. 11.30 Ibid., p. 11.
914 EWOUT FRANKEMA AND MORTEN JERVEN
© Economic History Society 2014 Economic History Review, 67, 4 (2014)
rather high rate—and taking the 11.1 million as a reliable estimate of the 1969level, one has to adjust the 1962 estimate to 9.35 million (an upward adjustmentof 8 per cent).
There are good historical arguments that support such a revision. In Kenya,census enumerations of the non-native population were made in 1911, 1921,1926, and 1931, but as in the rest of British Eastern Africa, the native populationwas not counted until 1948.The first official estimates were made by two colonialpioneers.31 Sir Arthur Hardinge estimated the population of the East AfricanProtectorate (Kenya) at 2.5 million in 1897. Sir Henry Johnston placed theestimate for Uganda at 4 million in 1900 (prior to the territorial transfer of theEastern Province of Uganda to Kenya in 1902).The earliest estimate for Tanzaniain 1913 came to 4.1 million. But most of these early estimates were obtained bymultiplying the number of adult male taxpayers by a factor representing theproportion of dependents. According to the 1931 Colonial Office report forKenya:
No accurate census of the native population has yet been made.The population figuresare based on estimates made by the administrative authorities, and related to thenumber of male adult taxpayers in the various districts.They are in consequence subjectto a comparatively wide margin of error. The estimated native population in 1931 was2,966,993 as compared with an estimate in 1926 of 2,682,848 which represents anincrease over that period of 10.5 per cent. No reliable figures of births, deaths, andinfantile mortality are obtainable.32
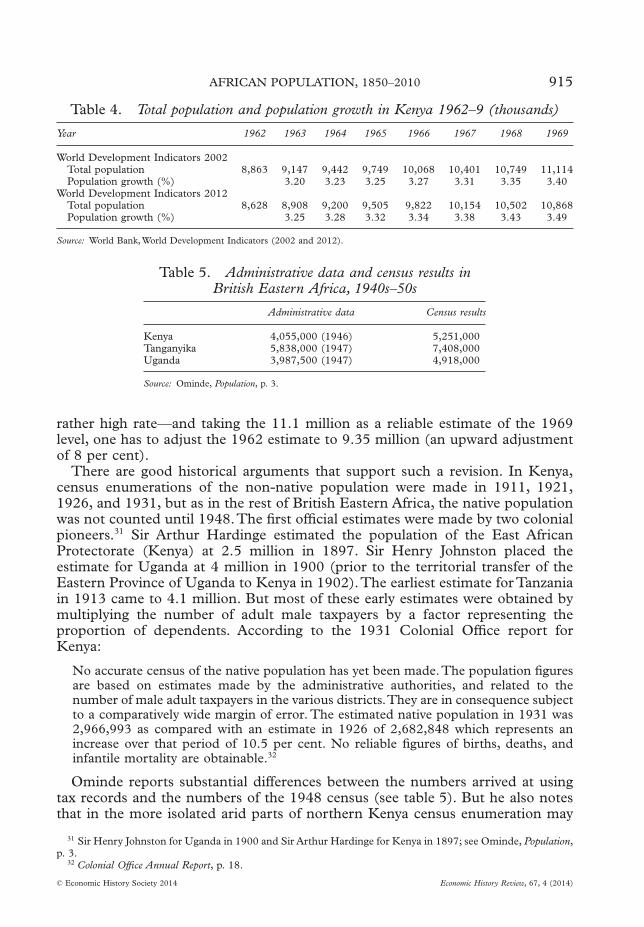
Ominde reports substantial differences between the numbers arrived at usingtax records and the numbers of the 1948 census (see table 5). But he also notesthat in the more isolated arid parts of northern Kenya census enumeration may
31 Sir Henry Johnston for Uganda in 1900 and Sir Arthur Hardinge for Kenya in 1897; see Ominde, Population,p. 3.
32 Colonial Office Annual Report, p. 18.
Table 4. Total population and population growth in Kenya 1962–9 (thousands)
Year 1962 1963 1964 1965 1966 1967 1968 1969
World Development Indicators 2002Total population 8,863 9,147 9,442 9,749 10,068 10,401 10,749 11,114Population growth (%) 3.20 3.23 3.25 3.27 3.31 3.35 3.40
World Development Indicators 2012Total population 8,628 8,908 9,200 9,505 9,822 10,154 10,502 10,868Population growth (%) 3.25 3.28 3.32 3.34 3.38 3.43 3.49
Source: World Bank, World Development Indicators (2002 and 2012).
Table 5. Administrative data and census results inBritish Eastern Africa, 1940s–50s
Administrative data Census results
Kenya 4,055,000 (1946) 5,251,000Tanganyika 5,838,000 (1947) 7,408,000Uganda 3,987,500 (1947) 4,918,000
Source: Ominde, Population, p. 3.
AFRICAN POPULATION, 1850–2010 915
© Economic History Society 2014 Economic History Review, 67, 4 (2014)
not have been complete. Varying degrees of coverage in the 1948 and 1962censuses thus make a direct comparison problematic. After allowing for the prob-lems of enumeration, Ominde considered the rate of growth of the African popu-lation of Kenya (excluding the Northern Province) between 1948 and 1962 to besomewhere between 2.5 and 3 per cent per annum.33 According to vanZwanenberg:
During the early colonial period it seems from the evidence that the growth of popu-lation was brought to a halt and possibly declined to some extent between 1890 and theearly 1920’s. From around 1923/1924 the growth of population began to recover slowlyuntil the early 1940’s, when the rapid population increase of the 19th century againbegan to reassert itself.34
Hence, the Kenyan experience suggests, first, higher rates of growth in the 1930sthan assumed by Manning, and second, a 1948 and 1962 census underestimatingthe total Kenyan population, casting doubt on the validity of the UN estimates of6.1 and 8.1 million, in 1950 and 1960 respectively, as a starting point for backwardprojections.
Kenya is only a ‘minor case’ compared to Nigeria. Nigeria is important becauseit accounted for c. 15 per cent of the total African population in 1950 and thisshare has not declined since.The Nigerian case displays how the political incentivestructure can bias the population count and also suggests that the conventional1950 estimate of 220 million, if anything, is a lower-bound estimate.We argue thatthe Nigerian census estimate for the early 1950s may be as much as 28 per cent offthe actual mark and this alone would add c. 8.5 million to the original censusestimate of 1953 and c. 4.5 million to the UN figures.
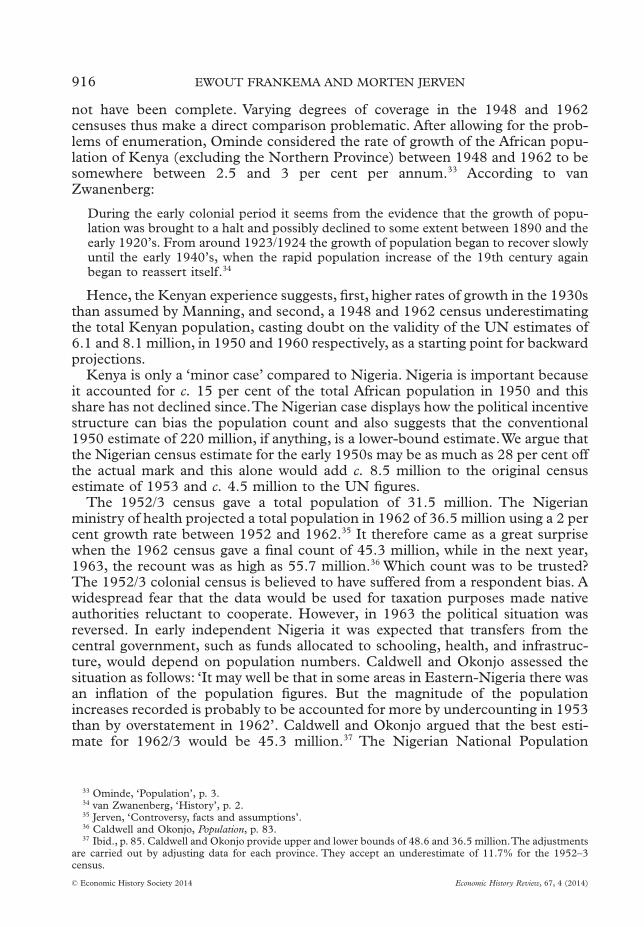
The 1952/3 census gave a total population of 31.5 million. The Nigerianministry of health projected a total population in 1962 of 36.5 million using a 2 percent growth rate between 1952 and 1962.35 It therefore came as a great surprisewhen the 1962 census gave a final count of 45.3 million, while in the next year,1963, the recount was as high as 55.7 million.36 Which count was to be trusted?The 1952/3 colonial census is believed to have suffered from a respondent bias. Awidespread fear that the data would be used for taxation purposes made nativeauthorities reluctant to cooperate. However, in 1963 the political situation wasreversed. In early independent Nigeria it was expected that transfers from thecentral government, such as funds allocated to schooling, health, and infrastruc-ture, would depend on population numbers. Caldwell and Okonjo assessed thesituation as follows: ‘It may well be that in some areas in Eastern-Nigeria there wasan inflation of the population figures. But the magnitude of the populationincreases recorded is probably to be accounted for more by undercounting in 1953than by overstatement in 1962’. Caldwell and Okonjo argued that the best esti-mate for 1962/3 would be 45.3 million.37 The Nigerian National Population
33 Ominde, ‘Population’, p. 3.34 van Zwanenberg, ‘History’, p. 2.35 Jerven, ‘Controversy, facts and assumptions’.36 Caldwell and Okonjo, Population, p. 83.37 Ibid., p. 85. Caldwell and Okonjo provide upper and lower bounds of 48.6 and 36.5 million.The adjustments
are carried out by adjusting data for each province. They accept an underestimate of 11.7% for the 1952–3census.
916 EWOUT FRANKEMA AND MORTEN JERVEN
© Economic History Society 2014 Economic History Review, 67, 4 (2014)
Commission also had ‘serious reservations’ concerning the use of the 1963 censusfigure for estimating the inter-census growth rate.38
There is then a gap of almost 40 years between the 1953 census and the 1991census.The latter gave a total of 89.0 million inhabitants.The National PopulationCommission opts for a population growth of 2.83 per cent based on the 1953 and1991 censuses.TheWorld Bank (WDI), however, chooses a higher growth rate anda higher baseline estimate (or final estimate—depending on whether the popula-tion number is derived by projecting backwards or forwards). The discrepancybetween the official Nigerian numbers and the World Bank figures is alarming.While the World Bank and the National Population Commission take a compa-rable growth rate, the WDI reports a population of 99.0 million in 1991, approxi-mately 10 million higher than the census estimate.
Table 6 shows the different census estimates for colonial and post-colonialNigeria and the implied annual population growth rates. It reaffirms the discon-tinuity between the 1953 and 1962/3 censuses, but also points to long-termproblems of census reliability.39 The 1973 to 1991 growth rate is implausibly low,which could be interpreted as a sign of overshooting of both the 1962/3 and 1973censuses, although the World Bank considered the 1991 census to be an under-estimate. What is particularly striking is the shaky overall pattern of growth thatemerges from table 6 and the intriguing observation that population growth in theyears 1911–63 outpaced growth in the 1963–2006 period. But to what extent isthis caused by post-colonial cheating or colonial undercounting?
A more reliable account of the Nigerian population may be obtained by relyingon four stylized facts of demographic development in sub-Saharan Africa. First,post-1950 population growth rates were substantially higher than pre-1950 ratesbecause the pace and the timing of the decline in (infant) mortality rates hasoutweighed and preceded the decline in fertility rates. In the majority of countries
38 Nigeria, National Population Commission: Census ’91, p. 1.39 Jerven, ‘Controversy, facts and assumptions’.
Table 6. Nigerian population estimated in census yearsand implied compound annual growth rates, 1911–2006
(millions)
Year North South Census totalAnnual growth ratefrom previous census
1911 8.12 7.93 16.051921 10.56 8.16 18.72 1.551931 11.44 8.62 20.06 0.691953 16.84 13.58 30.42 1.911962 22.01 23.28 45.29 4.521963 29.78 25.88 55.66 22.9a
1973 51.38 28.38 79.76 3.661991 47.37 41.62 88.99 0.612006 n.a. n.a. 140 3.021911–63 2.391963–2006 2.14
Note: a The implied growth rate from 1953 to 1963 is 6.23%Sources: Suberu, Federalism, p. 169, adapted from R. K. Udo, ‘Geography and popu-lation censuses in Nigeria’, in Areola and Okafor, eds., Fifty years, p. 356, and ‘Reportof Nigeria’s National Population Commission’.
AFRICAN POPULATION, 1850–2010 917
© Economic History Society 2014 Economic History Review, 67, 4 (2014)
in sub-Saharan Africa, a structurally declining trend in fertility can only beobserved since the 1990s.40 Second, as a result of the former, the majority ofcountries in sub-Saharan Africa reached a peak rate of population growth between1960 and 1990, such depending on the timing and incidence of mortality andfertility declines. Third, for sub-Saharan Africa as a whole a decadal growth peakin 1975–85 has been estimated at 2.8 per cent per annum.The peak rate may havelocally exceeded rates of 3.0 per cent.41 Fourth, the post-1990 decline in growthhas been faster than the pre-1960 rise in growth, because modern means of fertilitycontrol are more readily applicable than the hard-won gains in disease and mor-tality prevention in the colonial era.
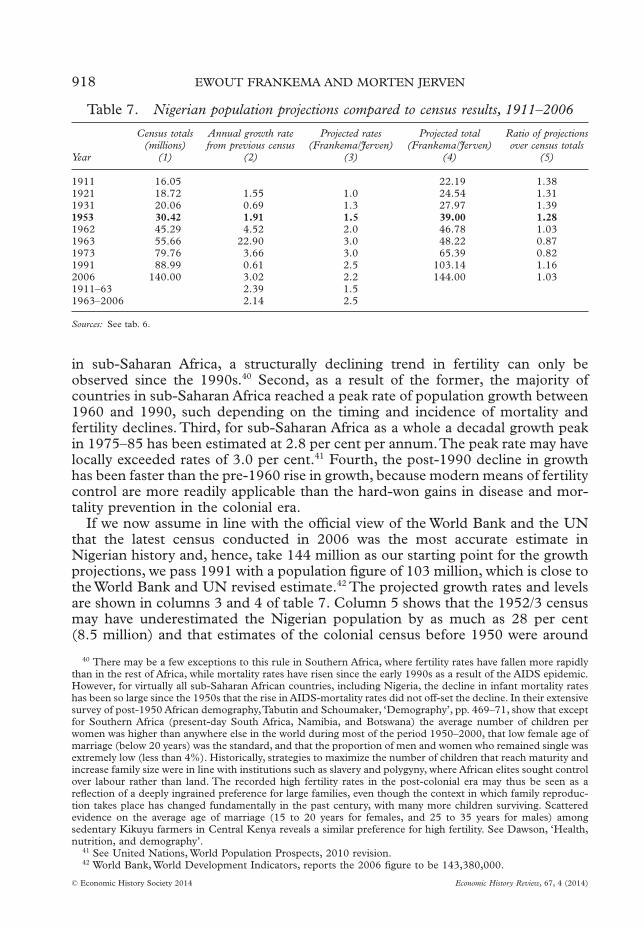
If we now assume in line with the official view of the World Bank and the UNthat the latest census conducted in 2006 was the most accurate estimate inNigerian history and, hence, take 144 million as our starting point for the growthprojections, we pass 1991 with a population figure of 103 million, which is close tothe World Bank and UN revised estimate.42 The projected growth rates and levelsare shown in columns 3 and 4 of table 7. Column 5 shows that the 1952/3 censusmay have underestimated the Nigerian population by as much as 28 per cent(8.5 million) and that estimates of the colonial census before 1950 were around
40 There may be a few exceptions to this rule in Southern Africa, where fertility rates have fallen more rapidlythan in the rest of Africa, while mortality rates have risen since the early 1990s as a result of the AIDS epidemic.However, for virtually all sub-Saharan African countries, including Nigeria, the decline in infant mortality rateshas been so large since the 1950s that the rise in AIDS-mortality rates did not off-set the decline. In their extensivesurvey of post-1950 African demography,Tabutin and Schoumaker, ‘Demography’, pp. 469–71, show that exceptfor Southern Africa (present-day South Africa, Namibia, and Botswana) the average number of children perwomen was higher than anywhere else in the world during most of the period 1950–2000, that low female age ofmarriage (below 20 years) was the standard, and that the proportion of men and women who remained single wasextremely low (less than 4%). Historically, strategies to maximize the number of children that reach maturity andincrease family size were in line with institutions such as slavery and polygyny, where African elites sought controlover labour rather than land. The recorded high fertility rates in the post-colonial era may thus be seen as areflection of a deeply ingrained preference for large families, even though the context in which family reproduc-tion takes place has changed fundamentally in the past century, with many more children surviving. Scatteredevidence on the average age of marriage (15 to 20 years for females, and 25 to 35 years for males) amongsedentary Kikuyu farmers in Central Kenya reveals a similar preference for high fertility. See Dawson, ‘Health,nutrition, and demography’.
41 See United Nations, World Population Prospects, 2010 revision.42 World Bank, World Development Indicators, reports the 2006 figure to be 143,380,000.
Table 7. Nigerian population projections compared to census results, 1911–2006
Year
Census totals(millions)
Annual growth ratefrom previous census
Projected rates(Frankema/Jerven)
Projected total(Frankema/Jerven)
Ratio of projectionsover census totals
(1) (2) (3) (4) (5)
1911 16.05 22.19 1.381921 18.72 1.55 1.0 24.54 1.311931 20.06 0.69 1.3 27.97 1.391953 30.42 1.91 1.5 39.00 1.281962 45.29 4.52 2.0 46.78 1.031963 55.66 22.90 3.0 48.22 0.871973 79.76 3.66 3.0 65.39 0.821991 88.99 0.61 2.5 103.14 1.162006 140.00 3.02 2.2 144.00 1.031911–63 2.39 1.51963–2006 2.14 2.5
Sources: See tab. 6.
918 EWOUT FRANKEMA AND MORTEN JERVEN
© Economic History Society 2014 Economic History Review, 67, 4 (2014)
31–9 per cent too low. It should be mentioned that the 2006 census estimate has alsobeen called into question, and that it is most frequently considered too low.43
Specifically, there were complaints about the count of 9 million for Lagos state.Stateofficials proposed that their own headcount of 17.5 million was correct, and that thiswould considerably raise the national total.44 So when we accept the World Bank2006 estimate of 144 million, we adopt a conservative estimate. A higher 2006 levelwould drive up the 1953 re-estimate even further, which would only furtherstrengthen our point that the 220 million benchmark in 1950 for Africaas a whole is disputable. Although the growth rates we impose are stilleducated guesses, we do obtain a long-term picture of growth for the 1911–63 (1.49per cent) and 1963–2006 (2.54 per cent) periods that makes much more sense.
The upward adjustments of Nigerian colonial census estimates are substantial,but they remain a far cry from the adjustments of over 100 per cent that Manningapplies to some colonial censuses, including the 1911 Gold Coast census to whichwe will now turn. African colonial censuses may have many shortcomings, but wefollow the advice of Fetter, that they should not be entirely dismissed either.45
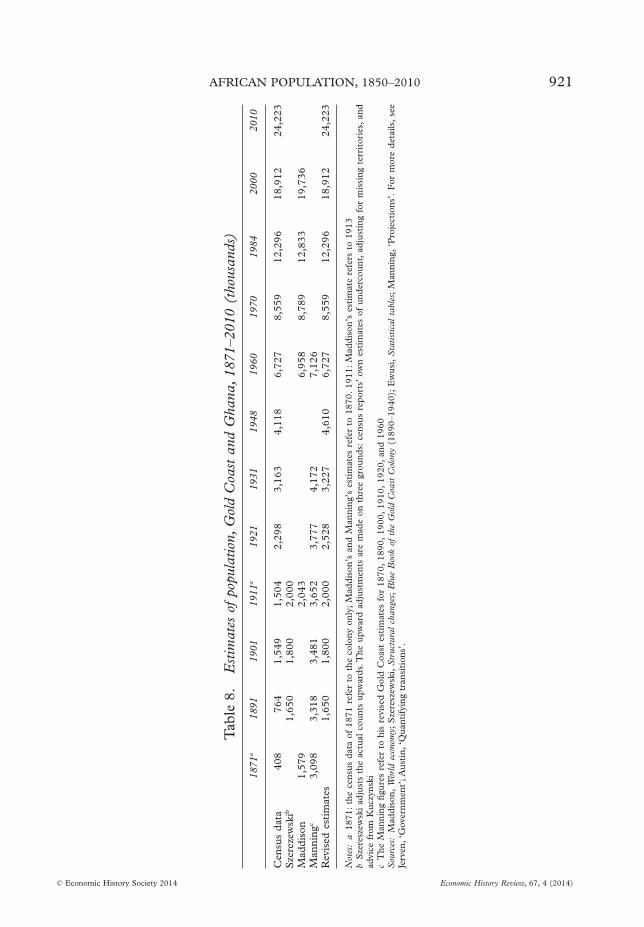
Side-stepping the colonial census estimates, Manning suggests revising the GoldCoast population upwards to 4.2 million for 1931 compared to the official censusresult of 3.2 million and upgrading the 1911 census from 1.5 million to3.3 million.46 This does not square with direct evaluations of the census evidence.
De Graft-Johnson provides an account of all the official population counts in theGold Coast (Ghana) between 1846 and 1967 and suggests that the census data arein need of some revision, but not of the order suggested by Manning.47 Accordingto De Graft-Johnson, the 1931 census was considered a 1 or 2 per cent under-statement by Dowden, the census commissioner in 1948, while Kuczynski did notfind any direct evidence of the census being an undercount.48 Cardinall alsosuspected a slight, but unspecified, understatement in 1931.49 In a comparativestudy of the censuses in 1948 and 1960 Gaisie suggests that the 1948 Gold Coastcensus was an underestimate of 13.3 per cent.50 In comparison, the 1960 censusdata are considered to be in good standing.51 According to Gaisie, if the 1960census was off the mark, it may have been a slight overcount. The scenariosdiscussed by Gaisie are between 0.6 and 2.5 per cent. Gaisie makes use of thecensus data and post-enumeration data and suggests that the most likely popula-tion growth rate (including natural increase and migration) was 3.1 per centbetween 1948 and 1960. If the 1948 census data are revised upwards in keepingwith this growth rate, this gives us 4.6 million in 1948, which is in line with Gaisie’ssuggestion of a 13.3 per cent undercount in 1948.
To summarize, De Graft-Johnson argues that the correct count could have beencloser to 5 million. By adopting 4.6 million we are opting for the middle ground,
43 Jerven, Poor numbers.44 ‘Report of Nigeria’s National Population Commission’, p. 207.45 Fetter, ‘Decoding’.46 Manning, ‘Projections’, p. 249. In his tab. 10.3 Manning offers a figure of 3.3 million. His dataset gives 3.6
million, because it includes Togoland with c. 350,000 inhabitants.47 De Graft-Johnson, ‘Population of Ghana’.48 Kuczynski, Demographic survey, quoted in De Graft-Johnson, ‘Population of Ghana’, p. 7.49 Cardinall and Gold Coast Census Office, Gold Coast, 1931, p. 123.50 Gaisie, ‘Dynamics’, p. 53.51 De Graft-Johnson, ‘Population of Ghana’, p. 9.
AFRICAN POPULATION, 1850–2010 919
© Economic History Society 2014 Economic History Review, 67, 4 (2014)
and furthermore, this estimate is in line with population growth rates of 3 per centwhich were well substantiated in Gaisie’s study of fertility and mortality rates.Accepting the 1931 census with a 2 per cent adjustment yields a growth rate of2.1 per cent between 1931 and 1948. Manning’s suggestion of 4.1 million in 1931would imply an implausibly low growth rate of 0.5 per cent in the same period,which is inconsistent with other observations. Moving to the 1911 estimate, wesuggest that the census estimate of 1.5 million should be adjusted upwards by500,000 to 2 million.This is in accordance with the opinion of Kuczynski and alsoSzereszewski, who described this upward adjustment as ‘fairly conservative’.52
Austin has suggested an upward revision to almost 2.2 million, but that is stillmore than one million less than suggested by Manning (see table 8).53
In sum, some colonial censuses may have produced (large) underestimates, as inthe cases of Kenya and Nigeria, but this does not have to be true for all places allthe time. In the words of Kuczynski, ‘Official data on the total population areavailable for every colony in the world. Some of the figures are fairly accurate whileothers may be wide off [sic] the mark’.54 Moreover, Manning’s claim that the totalAfrican population estimate of 220 million in 1950 offers a comparatively solidstarting point speaks against the radical upward adjustments of census estimatesthat were produced under similar colonial regimes before 1950.
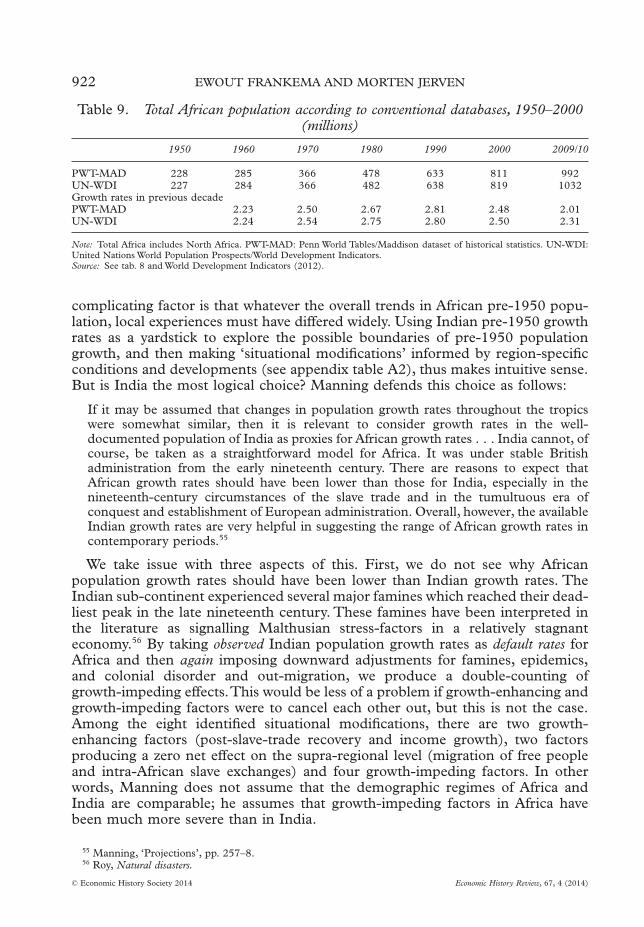
Despite the variation in individual country estimates, all the official datasets arein close agreement on a total figure of 227–8 million for 1950, as we can see intable 9. Consequently, Manning’s African default growth rate of 2.4 per cent in the1950s is higher than those of the conventional datasets (2.2 per cent). In view ofthe tendency to overstate growth as a result of underreporting in late colonialcensuses, this rate of growth is probably too high, while the changes in the growthrate between 1930 and 1960 have been less dramatic than Manning suggests. Ouradjustment for Nigeria alone will drive the conventional estimates of 227–8 millionup by about 4.5 million. Such large upward adjustments are not applicable tothe rest of Africa. For the Gold Coast, we estimate an upward adjustment of12 per cent and for Kenya an upward adjustment of 8 per cent. Based on theseorders of magnitude, it is reasonable to assume that the 1950 benchmark of 220million has to be adjusted by c. 10 per cent, up to 240 million. After our discussionof these three cases this may still seem somewhat conservative, but we should alsobear in mind that the estimates for some of the populous North and SouthernAfrican countries are probably more accurate than for most Sub-saharan Africancountries. We will pursue this argument in the next section.
IV
The data situation for the post-1950 era may not be rosy, but compared to whatlittle we know for the pre-1950 era it still seems the best departure-point formaking historical projections. For Mauritius, South Africa, and some NorthAfrican countries, more or less reliable pre-1950 census figures exist. For theremaining parts of sub-Saharan Africa we only have some vague ideas about theoverall trends and levels, but hardly any precise figures to underpin those ideas. A
52 Szereszewski, Structural changes, p. 125.53 Austin, ‘Quantifying transitions’, p. 7.54 Kuczynski, Colonial population, p. 1.
920 EWOUT FRANKEMA AND MORTEN JERVEN
© Economic History Society 2014 Economic History Review, 67, 4 (2014)
Tab
le8.
Est
imat
esof
popu
latio
n,G
old
Coa
stan
dG
hana
,187
1–20
10(t
hous
ands
)
1871
a18
9119
0119
11a
1921
1931
1948
1960
1970
1984
2000
2010
Cen
sus
data
408
764
1,54
91,
504
2,29
83,
163
4,11
86,
727
8,55
912
,296
18,9
1224
,223
Sze
reze
wsk
ib1,
650
1,80
02,
000
Mad
diso
n1,
579
2,04
36,
958
8,78
912
,833
19,7
36M
anni
ngc
3,09
83,
318
3,48
13,
652
3,77
74,
172
7,12
6R
evis
edes
tim
ates
1,65
01,
800
2,00
02,
528
3,22
74,
610
6,72
78,
559
12,2
9618
,912
24,2
23
Not
es:
a18
71:
the
cens
usda
taof
1871
refe
rto
the
colo
nyon
ly;
Mad
diso
n’s
and
Man
ning
’ses
tim
ates
refe
rto
1870
.19
11:
Mad
diso
n’s
esti
mat
ere
fers
to19
13b
Sze
resz
ewsk
iad
just
sth
eac
tual
coun
tsup
war
ds.T
heup
war
dad
just
men
tsar
em
ade
onth
ree
grou
nds:
cens
usre
port
s’ow
nes
tim
ates
ofun
derc
ount
,ad
just
ing
for
mis
sing
terr
itor
ies,
and
advi
cefr
omK
uczy
nski
cT
heM
anni
ngfig
ures
refe
rto
his
revi
sed
Gol
dC
oast
esti
mat
esfo
r18
70,
1890
,19
00,
1910
,19
20,
and
1960
Sou
rces
:M
addi
son,
Wor
ldec
onom
y;S
zere
szew
ski,
Str
uctu
ral
chan
ges;
Blu
eB
ook
ofth
eG
old
Coa
stC
olon
y(1
890–
1940
);E
wus
i,S
tatis
tical
tabl
es;
Man
ning
,‘P
roje
ctio
ns’.
For
mor
ede
tails
,se
eJe
rven
,‘G
over
nmen
t’;A
usti
n,‘Q
uant
ifyi
ngtr
ansi
tion
s’.
AFRICAN POPULATION, 1850–2010 921
© Economic History Society 2014 Economic History Review, 67, 4 (2014)
complicating factor is that whatever the overall trends in African pre-1950 popu-lation, local experiences must have differed widely. Using Indian pre-1950 growthrates as a yardstick to explore the possible boundaries of pre-1950 populationgrowth, and then making ‘situational modifications’ informed by region-specificconditions and developments (see appendix table A2), thus makes intuitive sense.But is India the most logical choice? Manning defends this choice as follows:
If it may be assumed that changes in population growth rates throughout the tropicswere somewhat similar, then it is relevant to consider growth rates in the well-documented population of India as proxies for African growth rates . . . India cannot, ofcourse, be taken as a straightforward model for Africa. It was under stable Britishadministration from the early nineteenth century. There are reasons to expect thatAfrican growth rates should have been lower than those for India, especially in thenineteenth-century circumstances of the slave trade and in the tumultuous era ofconquest and establishment of European administration. Overall, however, the availableIndian growth rates are very helpful in suggesting the range of African growth rates incontemporary periods.55
We take issue with three aspects of this. First, we do not see why Africanpopulation growth rates should have been lower than Indian growth rates. TheIndian sub-continent experienced several major famines which reached their dead-liest peak in the late nineteenth century. These famines have been interpreted inthe literature as signalling Malthusian stress-factors in a relatively stagnanteconomy.56 By taking observed Indian population growth rates as default rates forAfrica and then again imposing downward adjustments for famines, epidemics,and colonial disorder and out-migration, we produce a double-counting ofgrowth-impeding effects.This would be less of a problem if growth-enhancing andgrowth-impeding factors were to cancel each other out, but this is not the case.Among the eight identified situational modifications, there are two growth-enhancing factors (post-slave-trade recovery and income growth), two factorsproducing a zero net effect on the supra-regional level (migration of free peopleand intra-African slave exchanges) and four growth-impeding factors. In otherwords, Manning does not assume that the demographic regimes of Africa andIndia are comparable; he assumes that growth-impeding factors in Africa havebeen much more severe than in India.
55 Manning, ‘Projections’, pp. 257–8.56 Roy, Natural disasters.
Table 9. Total African population according to conventional databases, 1950–2000(millions)
1950 1960 1970 1980 1990 2000 2009/10
PWT-MAD 228 285 366 478 633 811 992UN-WDI 227 284 366 482 638 819 1032Growth rates in previous decadePWT-MAD 2.23 2.50 2.67 2.81 2.48 2.01UN-WDI 2.24 2.54 2.75 2.80 2.50 2.31
Note: Total Africa includes North Africa. PWT-MAD: Penn World Tables/Maddison dataset of historical statistics. UN-WDI:United Nations World Population Prospects/World Development Indicators.Source: See tab. 8 and World Development Indicators (2012).
922 EWOUT FRANKEMA AND MORTEN JERVEN
© Economic History Society 2014 Economic History Review, 67, 4 (2014)

Our second point is connected to the first.There is little evidence suggesting that‘changes in population growth rates throughout the tropics were somewhatsimilar’.57 India represents a comparatively densely populated sub-continent withland–labour ratios that were incomparable to African conditions. Indian labourersand entrepreneurs migrated to East and Southern Africa under British rule,because of limited access to land at home. According to Roy, emigration fromIndia to other parts of the world accounted for 0.3 per cent of the 1881 population,which comes down to approximately 0.8 million emigrants, which is much higherthan the total annual African slave exports in this period.58 South Africa, EastAfrica, and Mauritius were all recipients of Indian emigration. But more impor-tantly, when compared to more land-abundant tropical countries in South-EastAsia such as Indonesia, the Philippines, Thailand, and Malaysia, India appears tobe an atypical case of low population growth in the 1850–1950 era.59
Land-abundant tropical Asia resembles the resource endowment conditions insub-Saharan Africa much better than India. African farmers and pastoralists werefacing open land frontiers, which did not necessarily make them less vulnerable toclimate shocks, tropical diseases, or ecological disasters, but they did give themaccess to more varied diets in ‘normal’ years, with larger average amounts ofanimal protein, fruit, and vegetables. Evidence from recent empirical studies ofhistorical African living standards seems to underline the idea that Africans hadaccess to comparatively varied diets, that they were relatively tall, and that thepurchasing power of the wages they earned during the colonial era rose and,especially in British West Africa, rose substantially above the real wages earned inIndia.60
Appendix table A3 offers an overview of the aggregate population growth ratesthat can be derived from historical census records in Indonesia and the Philip-pines. Of course, these census figures are susceptible to similar weaknesses as thecolonial African census data, in the sense that they may overstate populationgrowth between certain points in time as a result of improved census-takingpractices. However, for Indonesia and the Philippines adjusted estimates have beenproduced to correct for this, taking into account additional information on fertilityrates, (child) mortality rates, and marriage patterns—from church records, amongother sources—combined with information on changes in the frequency andquality of enumeration practices.61 The modified population series show thatgrowth rates exceeding 1.5 per cent per annum were hardly exceptional for the1850–1950 era.62
There are several reasons why Indonesia and the Philippines may have recordedhigher growth rates than tropical Africa. European colonial rule did bring anumber of advantages in terms of disease prevention (for instance, smallpox
57 Manning, ‘Projections’, p. 257.58 Roy, Economic history, pp. 354–5.59 Population growth in Japan in this period was at least twice as high as well, but Japan is atypical for other
reasons. See Maddison, ‘Historical statistics on world population’.60 Moradi, ‘Towards an objective account’; Frankema and van Waijenburg, ‘Structural impediments’; Allen,
Bassino, Ma, Moll-Murata, and van Zanden, ‘Wages, prices, and living standards’.61 For Indonesia, see Boomgaard and Gooszen, Changing economy; and for the Philippines, see Doeppers and
Xenos, Population and history.62 For Thailand and Malaysia one can find even higher rates of population growth, but these are less
informative. The Thai figures are unadjusted for flaws in census taking practices and the Malayan data are, inaddition, affected by high immigration rates that obscure natural rates of population growth.
AFRICAN POPULATION, 1850–2010 923
© Economic History Society 2014 Economic History Review, 67, 4 (2014)
inoculation started in Java in the early nineteenth century) and famineprevention—which were not necessarily intentional—as a result of improveddomestic and international Asian market integration.63 Such factors are likely tohave reduced mortality rates earlier and more profoundly than in tropical Africa.In addition, South-East Asia received regular influxes of Indian and Chineselabour migrants, which added to the natural rate of growth. But this does not takeaway our point that the choice for India or South-East Asia as a template forAfrican historical demography makes a vast difference for historical African popu-lation projections.
Third, if the argument is that African default growth rates should be derivedfrom other tropical countries, because they are likely to be comparable, why shouldwe then accept Indian growth rates for the non-tropical regions in North andSouthern Africa? These regions were less affected by tropical diseases such asmalaria, trypanosomiasis, and yellow fever. In our view, it would be better to adoptdifferent default rates for tropical and non-tropical Africa. North and SouthernAfrica together accounted for c. 27 per cent of total African population in 1950,and the available census data for these regions indicate that their growth curveswere much steeper than in India. For instance, whereas Manning assumes that theEgyptian population grows at rates between 0.2 and 0.5 per cent before 1920,census estimates point to averages between 1.0 and 2.0 per cent.We end this studyby presenting the changes in Manning’s estimates that result from these critiques,using the six African sub-regions of North, Southern, West, Central, East, andNorth-East Africa.64
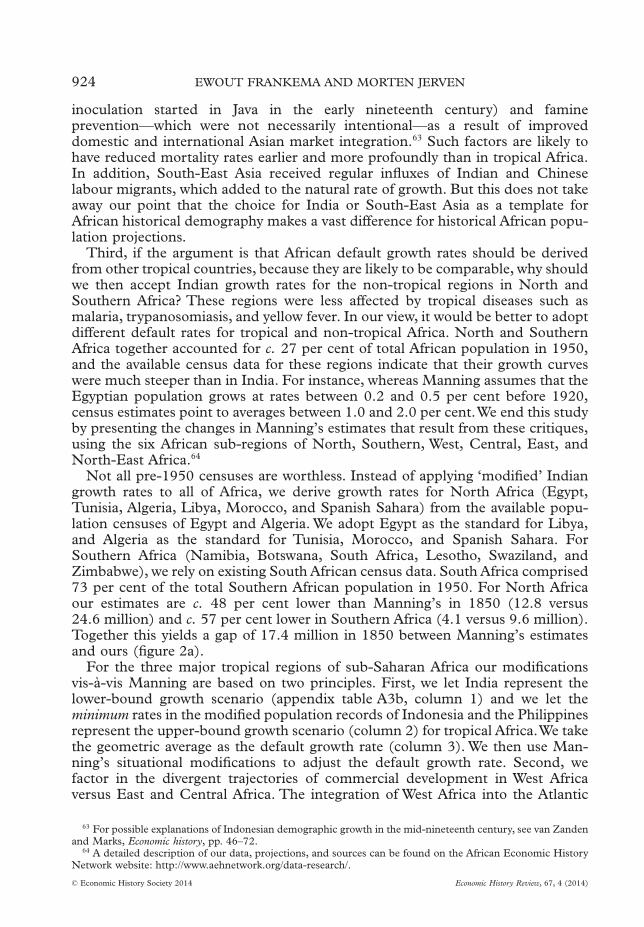
Not all pre-1950 censuses are worthless. Instead of applying ‘modified’ Indiangrowth rates to all of Africa, we derive growth rates for North Africa (Egypt,Tunisia, Algeria, Libya, Morocco, and Spanish Sahara) from the available popu-lation censuses of Egypt and Algeria. We adopt Egypt as the standard for Libya,and Algeria as the standard for Tunisia, Morocco, and Spanish Sahara. ForSouthern Africa (Namibia, Botswana, South Africa, Lesotho, Swaziland, andZimbabwe), we rely on existing South African census data. South Africa comprised73 per cent of the total Southern African population in 1950. For North Africaour estimates are c. 48 per cent lower than Manning’s in 1850 (12.8 versus24.6 million) and c. 57 per cent lower in Southern Africa (4.1 versus 9.6 million).Together this yields a gap of 17.4 million in 1850 between Manning’s estimatesand ours (figure 2a).
For the three major tropical regions of sub-Saharan Africa our modificationsvis-à-vis Manning are based on two principles. First, we let India represent thelower-bound growth scenario (appendix table A3b, column 1) and we let theminimum rates in the modified population records of Indonesia and the Philippinesrepresent the upper-bound growth scenario (column 2) for tropical Africa.We takethe geometric average as the default growth rate (column 3). We then use Man-ning’s situational modifications to adjust the default growth rate. Second, wefactor in the divergent trajectories of commercial development in West Africaversus East and Central Africa. The integration of West Africa into the Atlantic
63 For possible explanations of Indonesian demographic growth in the mid-nineteenth century, see van Zandenand Marks, Economic history, pp. 46–72.
64 A detailed description of our data, projections, and sources can be found on the African Economic HistoryNetwork website: http://www.aehnetwork.org/data-research/.
924 EWOUT FRANKEMA AND MORTEN JERVEN
© Economic History Society 2014 Economic History Review, 67, 4 (2014)
economy through the so-called cash-crop revolution had been much furtheradvanced in 1900 than the integration of other parts of tropical Africa in either theAtlantic or Indian Ocean trade networks.65
The split in Manning’s growth rates between the early period of colonial rulefrom 1880 to 1920 and the later period from 1920 to 1960 is, in our view, toosharp for West Africa. Colonial ‘pacification’ came earlier in West Africa. It stabi-lized political relations and reduced investment risks. Via its impact on labourspecialization, international trade was also associated with growing domestic com-mercialization of rural and urban economies. This process of commercializationcreated more favourable conditions for populations in West Africa to flourish. Incomparison, in East and Central Africa the disruptions of the Indian Ocean slavetrade carried on to a later date. Other studies of colonial trade and tax revenuedemonstrate that East and Central Africa reached similar proportions some two tothree decades later.66 The practice of smallpox inoculation which spread acrossAfrica in the wake of pre-colonial commerce and colonial occupation came earlierto West Africa than elsewhere.67 The import of soap tended to increase along withrising exports and is likely to have had a positive impact on disease prevention. Inaddition,West Africa did not suffer as much from the devastating rinderpest in the1890s, nor from the prolonged crises in the Congo Free State.
65 Frankema and van Waijenburg record a ratio of 10:1 in per capita exports of British West Africa againstBritish East Africa; see ‘Structural impediments’, p. 916. Coquery-Vidrovitch, ‘Economic development’, presentsevidence that French Equatorial Africa ‘was the poor relation among the French colonies’; ibid., p. 190. For ageneral overview, see Hopkins, Economic history. For the cash-crop revolution, see Tosh, ‘Cash-crop revolution’.
66 Frankema and van Waijenburg, ‘Structural impediments’.67 Schneider, ‘Smallpox in Africa’, p. 199.
60,000,000
50,000,000
40,000,000
30,000,000
Popu
lati
on s
ize
20,000,000
10,000,000
0
1850
1860
1870
1880
1890
1900
1910
1920
1930
1940
1950
1960
North Africa (FJ) North Africa (M)Southern Africa (FJ) Southern Africa (M)
a
Figure 2a. Estimated populations of North and Southern Africa, 1851–1960Note: M = Manning; FJ = Frankema and Jerven.Source: Manning, ‘Projections’, apps.; Frankema and Jerven, ‘African population database 1.0.
AFRICAN POPULATION, 1850–2010 925
© Economic History Society 2014 Economic History Review, 67, 4 (2014)
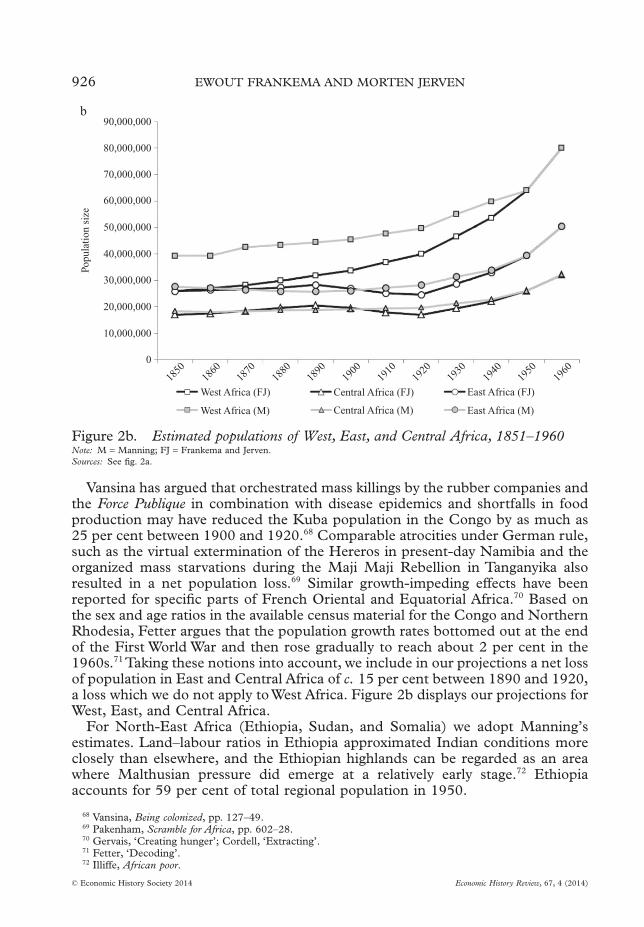
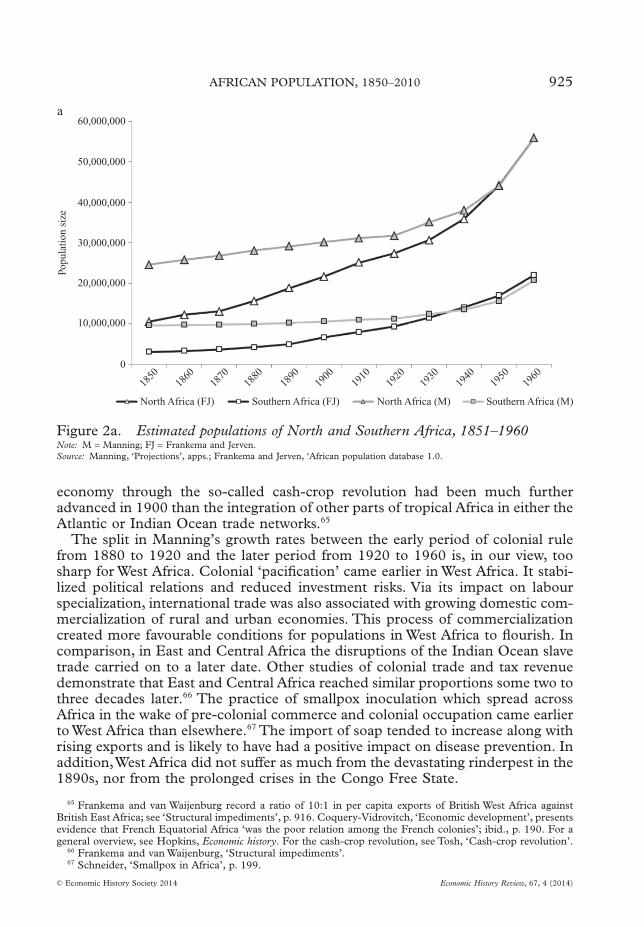
Vansina has argued that orchestrated mass killings by the rubber companies andthe Force Publique in combination with disease epidemics and shortfalls in foodproduction may have reduced the Kuba population in the Congo by as much as25 per cent between 1900 and 1920.68 Comparable atrocities under German rule,such as the virtual extermination of the Hereros in present-day Namibia and theorganized mass starvations during the Maji Maji Rebellion in Tanganyika alsoresulted in a net population loss.69 Similar growth-impeding effects have beenreported for specific parts of French Oriental and Equatorial Africa.70 Based onthe sex and age ratios in the available census material for the Congo and NorthernRhodesia, Fetter argues that the population growth rates bottomed out at the endof the First World War and then rose gradually to reach about 2 per cent in the1960s.71 Taking these notions into account, we include in our projections a net lossof population in East and Central Africa of c. 15 per cent between 1890 and 1920,a loss which we do not apply to West Africa. Figure 2b displays our projections forWest, East, and Central Africa.
For North-East Africa (Ethiopia, Sudan, and Somalia) we adopt Manning’sestimates. Land–labour ratios in Ethiopia approximated Indian conditions moreclosely than elsewhere, and the Ethiopian highlands can be regarded as an areawhere Malthusian pressure did emerge at a relatively early stage.72 Ethiopiaaccounts for 59 per cent of total regional population in 1950.
68 Vansina, Being colonized, pp. 127–49.69 Pakenham, Scramble for Africa, pp. 602–28.70 Gervais, ‘Creating hunger’; Cordell, ‘Extracting’.71 Fetter, ‘Decoding’.72 Illiffe, African poor.
Popu
lati
on s
ize
90,000,000
80,000,000
70,000,000
60,000,000
50,000,000
40,000,000
30,000,000
20,000,000
10,000,000
0
1850
1860
1870
1880
1890
1900
1910
1920
1930
1940
1950
1960
West Africa (FJ) Central Africa (FJ)
Central Africa (M)West Africa (M) East Africa (M)
East Africa (FJ)
b
Figure 2b. Estimated populations of West, East, and Central Africa, 1851–1960Note: M = Manning; FJ = Frankema and Jerven.Sources: See fig. 2a.
926 EWOUT FRANKEMA AND MORTEN JERVEN
© Economic History Society 2014 Economic History Review, 67, 4 (2014)
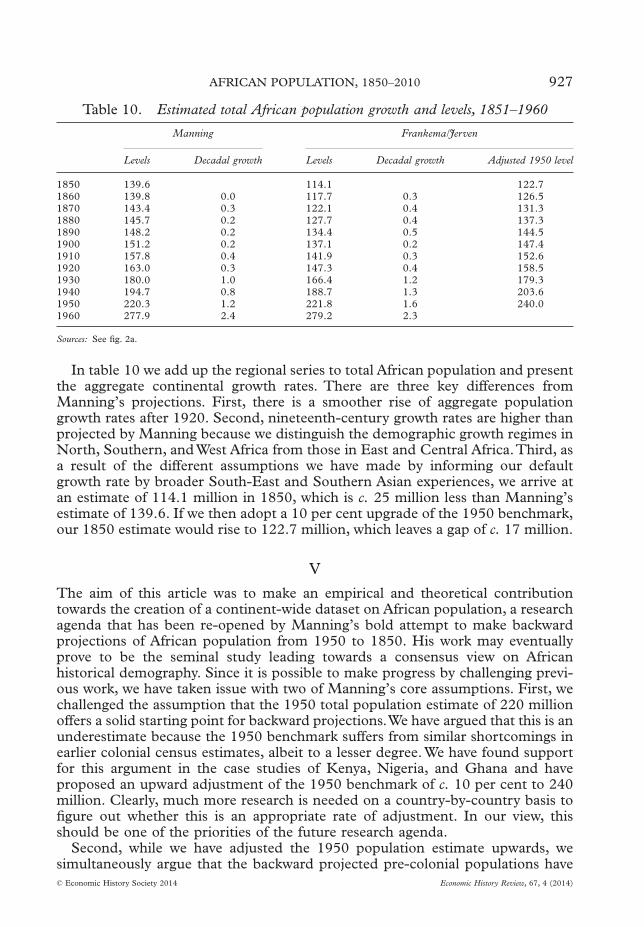
In table 10 we add up the regional series to total African population and presentthe aggregate continental growth rates. There are three key differences fromManning’s projections. First, there is a smoother rise of aggregate populationgrowth rates after 1920. Second, nineteenth-century growth rates are higher thanprojected by Manning because we distinguish the demographic growth regimes inNorth, Southern, and West Africa from those in East and Central Africa.Third, asa result of the different assumptions we have made by informing our defaultgrowth rate by broader South-East and Southern Asian experiences, we arrive atan estimate of 114.1 million in 1850, which is c. 25 million less than Manning’sestimate of 139.6. If we then adopt a 10 per cent upgrade of the 1950 benchmark,our 1850 estimate would rise to 122.7 million, which leaves a gap of c. 17 million.
V
The aim of this article was to make an empirical and theoretical contributiontowards the creation of a continent-wide dataset on African population, a researchagenda that has been re-opened by Manning’s bold attempt to make backwardprojections of African population from 1950 to 1850. His work may eventuallyprove to be the seminal study leading towards a consensus view on Africanhistorical demography. Since it is possible to make progress by challenging previ-ous work, we have taken issue with two of Manning’s core assumptions. First, wechallenged the assumption that the 1950 total population estimate of 220 millionoffers a solid starting point for backward projections.We have argued that this is anunderestimate because the 1950 benchmark suffers from similar shortcomings inearlier colonial census estimates, albeit to a lesser degree. We have found supportfor this argument in the case studies of Kenya, Nigeria, and Ghana and haveproposed an upward adjustment of the 1950 benchmark of c. 10 per cent to 240million. Clearly, much more research is needed on a country-by-country basis tofigure out whether this is an appropriate rate of adjustment. In our view, thisshould be one of the priorities of the future research agenda.
Second, while we have adjusted the 1950 population estimate upwards, wesimultaneously argue that the backward projected pre-colonial populations have
Table 10. Estimated total African population growth and levels, 1851–1960
Manning Frankema/Jerven
Levels Decadal growth Levels Decadal growth Adjusted 1950 level
1850 139.6 114.1 122.71860 139.8 0.0 117.7 0.3 126.51870 143.4 0.3 122.1 0.4 131.31880 145.7 0.2 127.7 0.4 137.31890 148.2 0.2 134.4 0.5 144.51900 151.2 0.2 137.1 0.2 147.41910 157.8 0.4 141.9 0.3 152.61920 163.0 0.3 147.3 0.4 158.51930 180.0 1.0 166.4 1.2 179.31940 194.7 0.8 188.7 1.3 203.61950 220.3 1.2 221.8 1.6 240.01960 277.9 2.4 279.2 2.3
Sources: See fig. 2a.
AFRICAN POPULATION, 1850–2010 927
© Economic History Society 2014 Economic History Review, 67, 4 (2014)
been at a lower level than suggested by Manning. Manning used observed populationgrowth rates from India as a proxy for African default growth rates. Our intuitionis that these growth rates are too low, first, because other countries in tropical Asiawith more comparable factor endowments had much higher population growthrates than India and, secondly, because the non-tropical areas of North andSouthern Africa probably experienced distinctively different demographic condi-tions.This opens up an important research agenda for the future in teasing out theparticular features (fertility, mortality, living standards, endowments structures,and ecological shocks) of demographic regimes in varying African regions.
Another implication of our study is the need to redirect attention from thedemographic impact of the various slave trades, towards the potentially muchbigger shocks produced by the increased exposure of Africans to Eurasian diseases(smallpox, Spanish flu, and rinderpest) in the late nineteenth century, as well as theprevention measures that have been developed in response. After a collapse ofpopulation in some areas, living standards improved in the early twentieth century,and then markedly more so after the 1920s. Modest but steady improvements inhealth, education, and urbanization underpinned higher rates of populationgrowth. This was the clear pattern in some areas of Africa, though it needs to benoted that such gains may not have been universal.These offer exciting avenues forresearch to validate and question the broader regional trends. Finally, this studypoints to the importance of understanding the logistical problems and politicalincentive structures of census taking, an issue that is still highly relevant forbuilding African statistical capacity at present.
Date submitted 4 December 2012Revised version submitted 31 May 2013Accepted 15 August 2013
DOI: 10.1111/1468-0289.12041
Footnote referencesAllen, R. C., Bassino, J.-P., Ma, D., Moll-Murata, C., and van Zanden, J. L., ‘Wages, prices, and living standards
in China, 1738–1925: in comparison with Europe, Japan, and India’, Economic History Review, 64, S1 (2011),pp. 8–38.
Areola, O. and Okafor, S. I., eds., Fifty years of geography in Nigeria: the Ibadan story (Ibadan, 1998)Austin, G., ‘Quantifying transitions in labour history in Ghana 1800–2000’, paper presented to the Third Africa
Workshop, Global Collaboratory on the History of Labour Relations, Addis Ababa (13–14 Jan. 2012).Biraben, J.-N., ‘Essai sur l’évolution du nombre des hommes’, Population, 34 (1979), pp. 13–25.Bondestam, L., ‘Some notes on African statistics: collection, reliability and interpretation’, Scandinavian Institute
of African Studies, research report no. 18 (Uppsala, 1973).Boomgaard, P. and Gooszen, A. J., Changing economy in Indonesia, 11: Population trends 1795–1942 (Amsterdam,
1991).Bowden, S., Chiripanhura, B., and Mosley, P., ‘Measuring and explaining poverty in six African countries: a
long-period approach’, Journal of International Development, 20 (2008), pp. 1049–79.Caldwell, J. C. and Okonjo, C., The population of tropical Africa (1968).Cardinall, A.W. and Gold Coast Census Office, The Gold Coast,1931:a review of conditions in the Gold Coast in 1931
as compared with those of 1921, based on figures and facts collected by the Chief Census Officer of 1931 (Accra, 1932).Carr-Saunders, A. M., World population: past growth and present trends (1964).Coquery-Vidrovitch, C., ‘Economic development in FrenchWest Africa’, in Z. A. Konczacki and J. M. Konczacki,
eds., An economic history of tropical Africa, 1: The pre-colonial period (1977), pp. 51–9.Cordell, D. D., ‘Extracting people from precapitalist production: French Equatorial Africa from the 1890s to the
1930s’, in D. D. Cordell and J.W. Gregory, eds., African population and capitalism:historical perspectives (Boulder,Co., 1987), pp. 137–52.
Cordell, D. D. and Gregory, J.W., eds., African population and capitalism:historical perspectives (Boulder, Co., 1987).
928 EWOUT FRANKEMA AND MORTEN JERVEN
© Economic History Society 2014 Economic History Review, 67, 4 (2014)
Dawson, M.,‘Health, nutrition, and demography in central Kenya, 1890–1945’, in D. D. Cordell and J.W. Gregory,eds., African population and capitalism: historical perspectives (Boulder, Co., 1987), pp. 201–20.
De Graft-Johnson, J. C., ‘The population of Ghana 1846–1967’, Transactions of the Historical Society of Ghana, X(1969), pp. 1–12.
Doeppers, D. F. and Xenos, P., Population and history: the demographic origins of the modern Philippines (Manila,1998).
Durand, J. D., ‘The modern expansion of world population’, Proceedings of the American Philosophical Society, 111(1967), pp. 136–59.
Ewusi, K., Statistical tables on the economy of Ghana, 1950–1985 (Legon, Ghana, 1986).Fetter, B., ‘Decoding and interpreting African census data: vital evidence from an unsavory witness’, Cahiers
d’Etudes Africaines, XXVII, 105–6 (1987), pp. 83–105.Frankema, E., ‘Raising revenue in the British Empire, 1870–1940: how “extractive” were colonial taxes?’, Journal
of Global History, 5 (2010), pp. 447–77.Frankema, E., ‘Colonial taxation and government spending in British Africa, 1880–1940: maximizing revenue or
minimizing effort?’, Explorations in Economic History, 48 (2011), pp. 136–49.Frankema, E., ‘The origins of formal education in sub-Saharan Africa: was British rule more benign?’, European
Review of Economic History, 16 (2012), pp. 335–55.Frankema, E. and Jerven, M., ‘African population database 1.0’ (2014), http://www.aehnetwork.org/data-research/
(accessed on 30 Jan. 2014).Frankema, E. and van Waijenburg, M., ‘Structural impediments to African growth? New evidence from real wages
in British Africa, 1880–1965’, Journal of Economic History, 72 (2012), pp. 892–926.Frankema, E. and van Waijenburg, M., ‘Endogenous colonial institutions. Lessons from fiscal capacity building in
British and French Africa, 1880–1940’, African Economic History Network working paper no. 11 (2013).Fyfe, C. and McMaster, D., eds., African historical demography: proceedings of a seminar held in the Centre of African
Studies, 2 vols. (Edinburgh, 1977, 1981).Gaisie, S. K., ‘Dynamics of population growth in Ghana’, Ghana Population Studies, no. 1 (Legon, 1969).Gervais, R., ‘Creating hunger: labor and agricultural policies in Southern Mosi, 1919–1940’, in D. D. Cordell and
J.W. Gregory, eds., African population and capitalism: historical perspectives (Boulder, Co., 1987), pp. 109–21.Green, E., ‘On the size and shape of African states’, International Studies Quarterly, 56 (2012), pp. 229–44.Heston, A., Summers, R., and Aten, B., Aten, Penn World Tables, version 7.0 (2011), https://pwt.sas.upenn.edu/
php_site/pwt70/pwt70_form.php (accessed on 30 Jan. 2014).Hopkins, A. G., An economic history ofWest Africa (1973).Illiffe, J., The African poor: a history (NewYork, 1987).Jerven, M., ‘Controversy, facts and assumptions: lessons from estimating long term growth in Nigeria, 1900–2007’,
School for International Studies, Simon Fraser University,Vancouver, Simons Papers in Security and Develop-ment, 13 (2011).
Jerven, M., ‘Users and producers of African income: measuring the progress of African economies’, African Affairs,110, 439 (2011), pp. 169–90.
Jerven, M., ‘Government, trade, population and economic growth in the Gold Coast and Ghana, c. 1890–2010’,presented at the African Economic History Workshop, Geneva (10–12 Sept. 2012).
Jerven, M., Poor numbers:how we are misled by African development statistics and what to do about it (Ithaca, NY, 2013).Kuczynski, R. R., Colonial population (Oxford, 1937).Kuczynski, R. R., Demographic survey of the British Colonial Empire, I:West Africa (Oxford, 1948).Kuczynski, R. R., Demographic survey of the British Colonial Empire, II: East Africa (Oxford, 1949).McEvedy, C. and Jones, R., Atlas of world population history (Harmondsworth, 1978).Maddison, A., The world economy: historical statistics (Paris, 2003).Maddison, A., ‘Historical statistics on world population, GDP and per capita GDP, 1–2008 AD’ (2010),
http://www.ggdc.net/maddison/maddison-project/data.htm%20(accessed on 10 March 2012).Manning, P., Slavery and African life: occidental, oriental, and African slave trades (Cambridge, 1990).Manning, P., ‘Replication data for African population estimates, 1850–1960’ (2009),World-Historical Dataverse
[Distributor] V1 [Version], http://hdl.handle.net/1902.1/15281 (accessed on 4 Sept. 2009).Manning, P., ‘African population: projections, 1850–1960’, in K. Ittmann, D. D. Cordell, and G. H. Maddox, eds.,
The demographics of empire: the colonial order and the creation of knowledge (Athens, O., 2010), pp. 245–75.Moradi, A., ‘Towards an objective account of nutrition and health in colonial Kenya: a study of stature in African
army recruits and civilians, 1880–1980’, Journal of Economic History, 96 (2009), pp. 720–55.Ominde, S. H., The population of Kenya,Tanzania and Uganda (Nairobi, 1975).Pakenham, T., The scramble for Africa:white man’s conquest of the dark continent from 1876 to 1912 (NewYork, 1992).Roy, T., The economic history of India, 1857–1947 (New Delhi, 2000).Roy, T., Natural disasters and Indian history (New Delhi, 2012).Schneider, W. H., ‘Smallpox in Africa during colonial rule’, Medical History, 53 (2009), pp. 193–227.Suberu, R.T., Federalism and ethnic conflict in Nigeria (Washington, DC, 2001).Szereszewski, R., Structural changes in the economy of Ghana, 1891–1911 (1965).Tabutin, D. and Schoumaker, B., ‘The demography of sub-Saharan Africa from the 1950s to the 2000s: a survey
of changes and a statistical assessment’, Population (English edn.), 59 (2004), pp. 457–556.
AFRICAN POPULATION, 1850–2010 929
© Economic History Society 2014 Economic History Review, 67, 4 (2014)
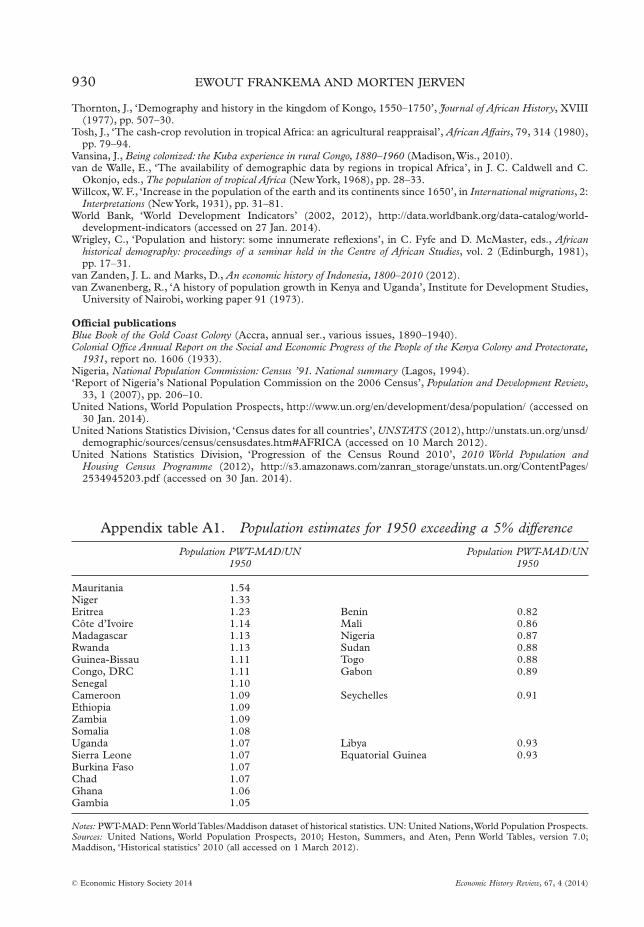
Thornton, J., ‘Demography and history in the kingdom of Kongo, 1550–1750’, Journal of African History, XVIII(1977), pp. 507–30.
Tosh, J., ‘The cash-crop revolution in tropical Africa: an agricultural reappraisal’, African Affairs, 79, 314 (1980),pp. 79–94.
Vansina, J., Being colonized: the Kuba experience in rural Congo, 1880–1960 (Madison,Wis., 2010).van de Walle, E., ‘The availability of demographic data by regions in tropical Africa’, in J. C. Caldwell and C.
Okonjo, eds., The population of tropical Africa (NewYork, 1968), pp. 28–33.Willcox, W. F., ‘Increase in the population of the earth and its continents since 1650’, in International migrations, 2:
Interpretations (NewYork, 1931), pp. 31–81.World Bank, ‘World Development Indicators’ (2002, 2012), http://data.worldbank.org/data-catalog/world-
development-indicators (accessed on 27 Jan. 2014).Wrigley, C., ‘Population and history: some innumerate reflexions’, in C. Fyfe and D. McMaster, eds., African
historical demography: proceedings of a seminar held in the Centre of African Studies, vol. 2 (Edinburgh, 1981),pp. 17–31.
van Zanden, J. L. and Marks, D., An economic history of Indonesia, 1800–2010 (2012).van Zwanenberg, R., ‘A history of population growth in Kenya and Uganda’, Institute for Development Studies,
University of Nairobi, working paper 91 (1973).
Official publicationsBlue Book of the Gold Coast Colony (Accra, annual ser., various issues, 1890–1940).Colonial Office Annual Report on the Social and Economic Progress of the People of the Kenya Colony and Protectorate,
1931, report no. 1606 (1933).Nigeria, National Population Commission: Census ’91. National summary (Lagos, 1994).‘Report of Nigeria’s National Population Commission on the 2006 Census’, Population and Development Review,
33, 1 (2007), pp. 206–10.United Nations, World Population Prospects, http://www.un.org/en/development/desa/population/ (accessed on
30 Jan. 2014).United Nations Statistics Division, ‘Census dates for all countries’, UNSTATS (2012), http://unstats.un.org/unsd/
demographic/sources/census/censusdates.htm#AFRICA (accessed on 10 March 2012).United Nations Statistics Division, ‘Progression of the Census Round 2010’, 2010 World Population and
Housing Census Programme (2012), http://s3.amazonaws.com/zanran_storage/unstats.un.org/ContentPages/2534945203.pdf (accessed on 30 Jan. 2014).
Appendix table A1. Population estimates for 1950 exceeding a 5% difference
Population PWT-MAD/UN1950
Population PWT-MAD/UN1950
Mauritania 1.54Niger 1.33Eritrea 1.23 Benin 0.82Côte d’Ivoire 1.14 Mali 0.86Madagascar 1.13 Nigeria 0.87Rwanda 1.13 Sudan 0.88Guinea-Bissau 1.11 Togo 0.88Congo, DRC 1.11 Gabon 0.89Senegal 1.10Cameroon 1.09 Seychelles 0.91Ethiopia 1.09Zambia 1.09Somalia 1.08Uganda 1.07 Libya 0.93Sierra Leone 1.07 Equatorial Guinea 0.93Burkina Faso 1.07Chad 1.07Ghana 1.06Gambia 1.05
Notes: PWT-MAD: PennWorldTables/Maddison dataset of historical statistics. UN: United Nations,World Population Prospects.Sources: United Nations, World Population Prospects, 2010; Heston, Summers, and Aten, Penn World Tables, version 7.0;Maddison, ‘Historical statistics’ 2010 (all accessed on 1 March 2012).
930 EWOUT FRANKEMA AND MORTEN JERVEN
© Economic History Society 2014 Economic History Review, 67, 4 (2014)

Appendix table A2. Situational modifications to African population growth rate
Type of modification Maximum annual magnitude (%)
1 Slave trade disorder –0.22 Sub-Saharan slave exchanges + or – 0.33 Sub-Saharan slave exports –0.64 Post-slave-trade recovery +0.45 Colonial disorder –0.46 Income growth +0.27 Migration of free people + or – 0.68 Epidemic and famine –0.5
Source: Manning, ‘African population. Projections’, tab. 10.6, p. 259.
Appendix table A3a. Population growth rates in Indonesia and the Philippines
Indonesia
Java Outer Islands The Philippines
1820–9 2.36 1591–1817 0.541830–9 1.75 1818–76 1.541840–9 1.11 1877–1903 1.231850–9 2.83 1904–39 2.081860–9 2.61 1940–59 2.541870–9 2.111880–9 1.721890–9 1.791900–5 1.131906–19 0.951920–9 1.78 2.841850–1929 1.85 1877–1939 1.71
Sources: Data for Indonesia from Boomgaard and Gooszen, Changing economy. Data for the Philippines from Doeppers andXenos, Population and history.
Appendix table A3b. A new default growth rate for sub-Saharan Africa
Decade
Decadal averagegrowth rate India
Minimum growth rate,Indonesia/Philippines
Default growth rate,sub-Saharan Africa
(%) (%) (%)
1951–60 2.4 2.5 2.451941–50 1.5 2.0 1.751931–40 0.8 2.0 1.401921–30 1.0 2.0 1.501911–20 0.2 1.0 0.601901–10 0.3 1.0 0.651891–00 0.3 1.0 0.651881–90 0.3 1.0 0.651871–80 0.3 1.0 0.651861–70 0.2 1.0 0.601851–60 0.2 1.0 0.601851–1950 0.5 1.3 0.91
Sources: See tab. 2 and app. tab. A3a.
AFRICAN POPULATION, 1850–2010 931
© Economic History Society 2014 Economic History Review, 67, 4 (2014)