Worldfish - CORE
32
.... ·· -- Worldfish brought to you by CORE View metadata, citation and similar papers at core.ac.uk provided by Aquatic Commons
-
Upload
khangminh22 -
Category
Documents
-
view
3 -
download
0
Transcript of Worldfish - CORE

.... ·· ~
--
Worldfish
brought to you by COREView metadata, citation and similar papers at core.ac.uk
provided by Aquatic Commons

Published by WorldFish (ICLARM) - Economy and Environment Program for Southeast Asia (EEPSEA) EEPSEA Philippines Office, WorldFish Philippines Country Office, SEARCA bldg., College, Los Baños, Laguna 4031 Philippines; Tel: +63 49 536 2290 loc. 196; Fax: +63 49 501 7493; Email: [email protected] EEPSEA Research Reports are the outputs of research projects supported by the Economy and Environment Program for Southeast Asia. All have been peer reviewed and edited. In some cases, longer versions may be obtained from the author(s). The key findings of most EEPSEA Research Reports are condensed into EEPSEA Policy Briefs, which are available for download at www.eepsea.net. EEPSEA also publishes the EEPSEA Practitioners Series, case books, special papers that focus on research methodology, and issue papers. ISBN: 978-971-9994-17-6 The views expressed in this publication are those of the author(s) and do not necessarily represent those of the Economy and Environment Program for Southeast Asia or its sponsors. This publication may be reproduced without the permission of, but with acknowledgement to, WorldFish-EEPSEA. Front cover photo credit: Flordeliza Bordey (main), www.pinoy-ofw.com (top)

Linking Climate Change, Rice Yield and Migration: The Philippine Experience
Flordeliza H. Bordey
Cheryll C. Launio Eduardo Jimmy P. Quilang
Charis Mae A. Tolentino Nimfa B. Ogena
March, 2013

Comments should be sent to: Dr. Flordeliza. H. Bordey, Philippine Rice Research Institute, Maligaya, Science City of Munoz, Nueva Ecija, Philippines Tel: 63 44 4560258 loc. 226 Fax: 63 44 4560394 loc. 514 Email: [email protected]
The Economy and Environment Program for Southeast Asia (EEPSEA) was established in May 1993
to support research and training in environmental and resource economics. Its objective is to enhance local capacity to undertake the economic analysis of environmental problems and policies. It uses a networking approach that involves attendance in courses and meetings, technical support, access to literature, and opportunities for comparative research. Member countries are Thailand, Malaysia, Indonesia, the Philippines, Vietnam, Cambodia, Lao PDR, China, Myanmar, and Papua New Guinea.
EEPSEA is supported by the International Development Research Centre (IDRC) and the Swedish
International Development Cooperation Agency (Sida). WorldFish (ICLARM) of the CGIAR consortium has been administering EEPSEA since November 2012.
EEPSEA publications are also available online at http://www.eepsea.net.

ACKNOWLEDGEMENTS We sincerely express our gratefulness to the Economy and Environment Program for Southeast
Asia which funded this study and to the Philippine Rice Research Institute for allowing us to undertake it. We are also grateful to the Philippine Atmospheric Geophysical Astronomical Services Administration (PAGASA) for sharing with us their weather data on selected sites in the Philippines. We also thank Ms. Charis Mae A. Tolentino whose assistance to this research has been invaluable. Finally, our utmost gratitude is due to Dr. Jeff Vincent whose research guidance helped us tremendously in completing this study.

TABLE OF CONTENTS EXECUTIVE SUMMARY
1.0 INTRODUCTION 1
1.1 Research Problem 1
1.2 Research Objectives 2
2.0 LITERATURE REVIEW 2
2.1 Climate Change and Rice Productivity 2
2.2 Climate Change and Migration 3
3.0 METHODOLOGY 3
3.1 Estimating Migration Using Panel Data 3
3.2 Projecting Climate Change Impacts on Migration Using Hindcast 4
3.3 Data and Sources 4
4.0 TRENDS IN PHILIPPINE MIGRATION, RICE PRODUCTION AND WEATHER PATTERNS 6
4.1 Overseas Filipino Workers 6
4.2 Regional Migration 8
4.3 Trends in Rice Production 8
4.4 Weather Patterns 10
5.0 RESULTS AND DISCUSSIONS 11
5.1 Impacts of Climate Change on Rice Productivity 11
5.2 Impacts of Rice Productivity Change on Overseas Migration 12
5.3 Impacts of Rice Productivity Change on Domestic Migration 14
5.4 A Hindcast of Climate Change Impacts on Migration 15
6.0 CONCLUSIONS & POLICY RECOMMENDATIONS 16
REFERENCES 17
APPENDICES 19
Appendix 1. Regional groupings of provinces in the Philippines, 1995-2009 19
Appendix 2. Deriving measures of domestic migration 20
Appendix 3. Weather stations per region 21
Appendix 2. Additional results 22

LIST OF TABLES
Table 1. Variables used in the migration and rice productivity equations 5
Table 2. Distribution of OFWs by major group of islands (1995 and 2009) 7
Table 3. Five-year averages of value of paddy rice production and gross income per hectare (1995 and 2009)
10
Table 4. Five-year averages of weather variables in the Philippines (1995 and 2009) 10
Table 5. Regression results of rice productivity on weather variables 11
Table 6. Regression results of the number of total OFWs per thousand population on rice productivity variables
12
Table 7. Regression results of the number of female OFWs per thousand female population on rice productivity variables
13
Table 8. Regression results of the number of male OFWs per thousand male population on rice productivity variables
13
Table 9. Regression results of the number of domestic regional migrants per thousand population on rice productivity variables
14
LIST OF FIGURES
Figure 1. Number of OFWs by sex (1995-2009) 6
Figure 2. Distribution of OFWs by sex and major occupation (2009) 7
Figure 3. Five-year average of rice yield in the Philippines (1995-2009) 8
Figure 4. Five-year average of rice area harvested in the Philippines (1995-2009) 9
Figure 5. Five-year average of paddy rice production in the Philippines (1995-2009) 9
Figure 6. Domestic migrants and total OFWs per 1000 population versus per capita rice harvest area and value of rice production
15

1
Economy and Environment Program for Southeast Asia
LINKING CLIMATE CHANGE, RICE YIELD, AND MIGRATION: THE PHILIPPINE EXPERIENCE
Flordeliza H. Bordey, Cheryll C. Launio,
Eduardo Jimmy P. Quilang, Charis Mae A. Tolentino
and Nimfa B. Ogena
EXECUTIVE SUMMARY This study tests the hypothesis that climate change, through its rice productivity impacts, induces
out-migration in the Philippines. Results show that climate change effects such as increasing night time temperature and extreme rainfall pattern, by way of reduction in rice yield and farm revenues, significantly increases the number of Overseas Filipino Workers. Findings also show that overseas migration of female workers is more sensitive to climate and rice productivity changes compared to male overseas migration. However, unlike overseas migration, the reduction in yield and farm revenues act as a constraint to domestic migration.
1.0 INTRODUCTION
1.1 Research Problem Climate change is now globally recognized as one of the most pressing environmental issues of the
21st century that can significantly impact all aspects of life. According to the successive reports of the Intergovernmental Panel on Climate Change (IPCC 1990, 2007), climate has changed over the past century and is expected to continue changing in the future. The Fourth Assessment Report of IPCC projected further increase in atmospheric temperature, rising sea level, disappearance of arctic summer sea ice, and likely occurrences of heat waves and intense tropical storms in the 21st century. These can lead to: increased risk of extinction of 20-30% of all plant and animal species; reduced availability of water supplied by melted glaciers and snow cover; large regional variability in crop yield changes; and decline in agricultural output in rainfed areas (IPCC 2007). These events can affect human lives—their means of livelihood due to loss of habitable areas, increased food insecurity, and reduced access to drinking water. Unfortunately, the impacts of climate change have more severe effects on the developing world where adaptive capacity is wanting.
The Philippines is one of the most vulnerable countries in Southeast Asia (Yusuf and Francisco
2009). Unlike other countries in the region, the Philippines is exposed to multiple hazards such as tropical cyclones, floods, landslides, and droughts. These natural hazards affect agricultural output. Since 34% of the country’s labor force is involved in agriculture, the livelihood of a large share of the population is at risk due to climate changes.
In particular, rice is one of the crops that can be extremely affected by changing weather patterns
brought about by climate change. Rice growth and production are affected by extreme weather events such as warmer nights, more rainy days, and prolonged period of drought (Centeno and Wassmann 2010). These extreme weather events can cause spikelet sterility, flower abortion, higher transpiration, leaf folding, root rotting, less energy for photosynthesis, submerged crop stand, and higher incidence of pests and diseases—these all lead to lower yield. In addition, flood and drought can cause reduction in area harvested of rice. Since rice contributes 28% of agriculture’s gross value added, policymakers must be provided with information about the extent of the impacts of climate change on the rice sector.

2
Linking Climate Change, Rice Yield, and Migration: The Philippine Experience
Aside from measuring the direct impacts of climate change in rice productivity, it is also useful to learn the farmers’ strategy in coping with the changes in their rice income. Migration, whether international or domestic, is an important livelihood strategy of Filipinos. Since the government has been encouraging overseas work, the Philippines has become one of the major sources of migrant workers in the world (Semyonov and Gorodzeisky 2002). According to Quisumbing and McNiven (2005), 26% and 13% of urban and rural households received remittances from migrant parents or children, respectively. As of 2009, there are 1.91 million Overseas Filipino Workers (OFWs) whose remittances reach a total of US$17.45 billion. Domestic migration is also significant in the Philippines. The 2009 Family Income and Expenditure Survey indicated that domestic remittances constitute 3% of the total family income. It will be valuable to learn if change in rice productivity, as driven by climate change, will lead to a change in migration behavior of the farming sector. This information can guide policymakers in designing mechanisms to adapt to climate change.
1.2 Research Objectives In this study, the impact of change in rice productivity, which is driven by climate change, on
international and domestic migration in the Philippines was determined. Specifically, this study:
1. Measured and compared the responses of international and domestic migration to changes in rice productivity induced by climate change;
2. Determined if climate change affects migration of women more than men; and
3. Determined the possible migration scenario under climate change.
2.0 LITERATURE REVIEW 2.1 Climate Change and Rice Productivity
The Second Assessment Report of IPCC (1995) indicated that climate change will significantly affect
crop productivity but effects will vary considerably across different locations. In particular, productivity was projected to decrease in the tropics and subtropics. The IPCC estimated that rice yield can decrease to as low as 22% or increase to as high as 28%. This was derived by using the general circulation model of climate change at doubled equivalent CO2 equilibrium conditions based on data from Bangladesh, India, the Philippines, Thailand, and Indonesia.
In the Philippines, Peng, et al. (2004) found that higher night temperature from global warming had
diminished rice yields. Using irrigated field experiment data from 1992 to 2003, grain yield declined by 10% per centigrade increase in the minimum temperature during the dry season. However, maximum temperature was found to have no significant effect on rice yield These results were supported by a rice crop simulation study using Decision Support System for Agrotechnology Transfer or DSSAT crop model (Lansigan 2010). Crop modeling has shown that the probability of rice yield exceeding a certain level is lower under warmer climate condition. This is expected since warmer nights lead to increased maintenance respiration resulting in lower yield.
A similar case in India was established by Auffhammer, Ramanathan, and Vincent (2006) where a 1%
increase in minimum temperature during October to November led to 0.87% decline in rice yield. Meanwhile, a 1% increase in rainfall during June to September led to 0.32% increase in rice yield. All these evidences imply that the impacts of climate change on rice yield are real and have already happened.

3
Economy and Environment Program for Southeast Asia
2.2 Climate Change and Migration Several studies have demonstrated that people use migration as an adaptive response to actual and
perceived impacts of climate change. Deshingkar and Start (2003) investigated seasonal and circular migration of labor in India and found that labor migration was one of most durable components of the livelihood strategies in the rural areas. One of the key findings show that migration was increasingly opening-up to women especially those from lower castes.
In a case study of migration from Eastern Oklahoma to California in the 1930s, Mcleman and Smit (2006) found that exposure to crop failure due to drought or flood influences the potential for migration. Furthermore, adaptive capacity, such as access to capital, social network, health, and ingenuity of family members was found to differentiate migrants from non-migrants.
Massey, Axinn, and Ghimire (2007) found that measures of environmental deterioration, such as
declines in agricultural productivity and land cover predict short-distance migration among lower and non-Hindu castes in Nepal. There was no similar link between environmental degradation and international migration established, as findings were confined in particular castes in Nepal only.
Shrestha and Bhandari (2007), however, reported a positive link between increased environmental
insecurity and the likelihood of labor migration in Nepal. In this case, environmental insecurity was measured in terms of access to forest resources. The study provided evidence that labor migration was used as a means of diversifying the earning opportunities of households.
Results of the study by Feng, Krueger, and Oppenheimer (2010) showed that climate change can
induce cross-border migration from Mexico to the United States. Specifically, a 10% reduction in crop yields would lead to an addional 2% increase in Mexican emigration. Climate change was predicted to induce emigration of approximately 1.4 to 6.7 million Mexican adults by 2080 as a result of declining agricultural productivity due to climate change.
Although migration is an important phenomemon in the Philippines, empirical evidence that links
the country’s migration pattern to declining rice productivity due to climate change remained scarce. Moreover, there is limited evidence that declining rice productivity induced by climate change affects women migration more than men. These are the contributions of this study.
3.0 METHODOLOGY
3.1 Estimating Migration Using Panel Data Following Feng, Krueger and Oppenheimer (2010), a two-stage model that uses variations in
climate to explain the variability in rice productivity across regions was estimated. The model was used consequently to explain out-migration. Patterned after the methods used by other studies (Auffhammer, Ramanathan, and Vincent 2006; Deschenes and Greenstone 2007; and Feng, Krueger and Oppenheimer 2010), the fluctuations in weather over time were used to identify the effects of climate change on rice productivity within a region. The rice productivity and migration equations used were specified as follows:
Ait = d + Zg + ft +gi +nit (Equation 1)
Mit = α + βAit + ht + k i+ εit
(Equation 2) where i denotes region, t denotes year, Ait is a rice productivity variable (either rice yield or gross revenue per hectare), Z is a vector of weather variables, Mit is the number of migrants per thousand population, ht and ft are year fixed effects, gi and ki are region fixed effects, eit and nit are error terms, and d, g, a and b are the parameters to be estimated. g is a vector of parameters that measure the marginal effects of weather variables on rice productivity while b gives the marginal effects of rice productivity on migration.

4
Linking Climate Change, Rice Yield, and Migration: The Philippine Experience
The inclusion of region and year fixed effects, ht and ft controls for unobserved effects that are unique to a region or a time period. By inclusion of these, other confounding factors that affect migration in each region for a specific year were accounted for. This model, however, accounts only for short run adaptations and results could not be used to forecast effects of climate change far into the future. Instead, the results can be appropriately used to hindcast migration and rice productivity scenarios if climate change had not occurred in the past.
The rice productivity variable in equation 2 is likely to be endogenous since migration can also affect productivity (e.g., out-migration of skilled farmers can lower rice productivity in a certain region). To address endogeneity, Fixed – Effects Two Stage Least Squares (FE-2SLS) approach was used to estimate equation 2. Weather variables, such as dry and wet seasons minimum temperature, maximum rainfall, total rainfall, share of wetdays in a year, share of irrigated area, and interaction of irrigated area share with total rainfall were used as instruments for the rice productivity variable.
Both international and domestic forms of out-migration were considered as dependent variables in
equation 2. Separate equations for male and female international migration were also estimated. The magnitude of female and male migration responses to rice productivity change were compared.
3.2 Projecting Climate Change Impacts on Migration Using Hindcast The extent of international and domestic migration that were induced by changes in rice
productivity due to weather changes since 1995 were estimated. To do this, the calculated changes in weather variables from 1995 to 2009 were plugged in the rice productivity equation to determine how much it changed in the same period. Finally, the change in rice productivity was multiplied by b to measure the induced migration. Mathematically, this is expressed as:
itit it
it
AY ZZ
bæ ö
D = Dç ÷¶è ø
(Equation 3)
where DYit is the change in migration and DZit is the change in weather variables.
3.3 Data and Sources The out-migration experience and rice productivity in the Philippines were analyzed for the period
1995 to 2009 using data from all rice-producing regions in the country. The changes in regional groupings over the coverage period resulted in an unbalanced panel with 216 observations1.
Table 1 provides description of the variables used in the regression. The international migration
was expressed in terms of number of OFWs per thousand population. The data on the number of OFWs per region was obtained from the Survey of Overseas Filipinos (SOF), which was conducted by the National Statistics Office. The SOF is a rider survey to the October round of the Labor Force Survey every year. This survey collects data on the number of OFWs who are abroad in the last five-year reference period2. The population in the last five years (expressed in thousands) was used as the denominator.
1 The details in regional groupings were listed in Appendix 1. 2 For more detailed information about the Survey of Overseas Filipinos, see http://www.census.gov.ph/content/technical-notes-survey-overseas-filipinos-sof.

5
Economy and Environment Program for Southeast Asia
Table 1. Variables used in the migration and rice productivity equations
Variable Definition
TMIG
Total number of OFWs in the region per 1000 population [OFWs are those who are abroad within the last five-year reference period (i.e., if the reference period is September 1995, the last five-year period refers to October 1991 to September 1995). The population in the last five years ago used as denominator.]
FMIG Total number of female OFWs in the region per 1000 female population
MMIG Total number of male OFWs in the region per 1000 male population
RMIG Total number of domestic out-migrants per 1000 population Σ
MINLS1
Five-year average of lowest recorded temperature during January to June (dry season) based on observations in different weather stations located in the region (°C)
(i.e. MNLS11995 = Minimum Temperature t /5)
MINLS2 Five-year average of lowest recorded temperature during July to December (wet season) based on observations in different weather stations located in the region (°C)
MAXRS1 Five-year average of highest recorded daily rainfall during January to June (dry season) as observed in the weather stations per region (mm)
MAXRS2 Five-year average of highest recorded daily rainfall during July to December (wet season) as observed in the weather stations per region (mm)
TRAINS1 Five-year average of cumulative rainfall during January to June (dry season) as observed in the weather stations per region (mm)
TRAINS2 Five-year average of cumulative rainfall during July to December (wet season) as observed in the weather stations per region (mm)
SWET Share of days with more than 5 mm rainfall in a year (%)
SIA Share of irrigated area to total area harvested to rice (%)
SIATR Interaction of SIA to five-year average of cumulative rainfall in a year
YIELD Five-year average of rice production per unit area (mt/ha)
GRPH Five year average of yield multiplied by the real price of paddy rice (PhP 1,000/ha)
The domestic migration was expressed in terms of number of domestic out-migrants per thousand
population in each region. To derive this data, the out-migration rate per region were calculated from the 2000 Census of Population and Housing using the information on current region of residence and region of residence in the last five years. To estimate the number of domestic out-migrants per region in a particular year, the out-migration rates were multiplied by the average of a specific year population and population in the last five years3. Similar to the international migration, the population in the last five years (expressed in thousands) was also used as the denominator.
Rice productivity variables were expressed in terms of five-year averages since migration variables
were relevant for the past five years. Data on regional rice production and area harvested were obtained from the Palay (paddy rice) and Corn Production Survey of the Bureau of Agricultural Statistics4. For each year, production was divided by area harvested to obtain annual yield. The average yield for the past five years was then calculated. To derive a measure of gross revenue per hectare, the annual yield was multiplied by the consumer price index-adjusted price of paddy rice. Then, the five-year average of the gross revenue per hectare was computed.
3 Details of the calculation of the regional out-migration rate are described in Appendix 2. 4 For more detailed information about the Palay and Corn Survey of the BAS, see http://countrystat.bas.gov.ph/?cont=2.

6
Linking Climate Change, Rice Yield, and Migration: The Philippine Experience
Similarly, weather variables were expressed as five-year averages to suit the time coverage of rice productivity. Weather data in selected agrometeorological stations were acquired from the Philippine Atmospheric, Geophysical, and Astronomical Services Administration (PAGASA). The stations were selected based on their proximity to major rice growing areas in each region5. Weather variables include daily minimum temperature and rainfall. Using the rainfall data, the five-year average of cumulative rainfall per annum as well as the five-year average of maximum rainfall per year were obtained. The annual number of wetdays, which is defined as days with rainfall greater than 5 mm was calculated. This was used to compute for the five-year average of share of wetdays in a year.
4.0 TRENDS IN PHILIPPINE MIGRATION, RICE PRODUCTION, AND WEATHER PATTERNS
4.1 Overseas Filipino Workers The estimated number of OFWs rose from 0.80 million in 1995 to 1.912 million in 2009 (Figure 1). In
the last 15 years, the share of male OFWs was 52% while female OFWs accounted for 48%. The number of female OFWs increased by an average of 6.4% while male OFWs increased by 5.5% annually. In 2009, about 32% of OFWs were laborers and unskilled workers, 15% were involved in service and market sales, another 15% were involved in trade-related work, and 14% were plant and machine operators and assemblers.
0
200
400
600
800
1000
1200
1995 1997 1999 2001 2003 2005 2007 2009
Male OFW Female OFW
Number (in 1000)
416379
1010
901
Source of basic data: National Statistics Office
Figure 1. Number of OFWs by sex (1995-2009) Male OFWs were mostly concentrated in trade-related works (27%) as well as plant and machinery
operation and assembly (25%). On the other hand, majority of female OFW were laborers and unskilled workers (56%), who provided housekeeping-related services (Figure 2).
5 The selected PAGASA stations in each region are listed in Appendix 3.

7
Economy and Environment Program for Southeast Asia
7.3
18.2
11.8
26.7
24.9
11.1
8.2
14.3
18.1
1.8
1.5
56.1
7.7
16.4
14.8
14.9
13.9
32.3
0 20 40 60
Others
Professionals, Technicians and associate professionals
Service workers and shop and market sales workers
Trade and related workers
Plant and machine operators and assemblers
Laborers and unskilled workers
Both Female Male
Percent (%)
Source of basic data: National Statistics Office
Figure 2. Distribution of OFWs by sex and major occupation (2009) Since 1995, majority of OFWs come from the Luzon island excluding the National Capital Region
(NCR)6. Luzon’s share decreased from 60% in 1995 to only 52% in 2009 (Table 2). In contrast, the shares of Visayas and Mindanao increased to 18% and 16%, in the same year, respectively. This implies that the nature of origin of OFW is shifting from urban to rural areas.
Table 2. Distribution of OFWs by major group of islands (1995 and 2009)
Region
1995 2009
Both %
Male %
Female %
Both %
Male %
Female %
National Capital Region (NCR) 15 20 9 14 16 11
Luzon (minus NCR) 60 55 65 52 54 50
Visayas 13 14 11 18 19 18
Mindanao 12 11 15 16 11 21
6 National Capital Region was excluded in the analysis because it is not a rice-producing region.

8
Linking Climate Change, Rice Yield, and Migration: The Philippine Experience
4.2 Regional Migration From 1995 to 2009, the average number of domestic out-migrants per region increased by 23%
from 65,892 to 80,967. In comparison, the average number of OFWs per region has doubled in the same period, from 50,846 to 106,733. This shows that migration pattern in the Philippines is recently favoring international destinations compared to domestic ones. This is due to more attractive wage compensation abroad. For example, a household helper working abroad can receive as much as PhP 20,000 per month whereas, in a similar nature of work in Metro Manila, he/she can only earn a minimum wage compensation of about PhP 2,500 monthly.
4.3 Trends in Rice Production The five-year average of rice yield in the Philippines showed an increasing trend from 1995 to 2009
with an annual increase of 63 kg/ha (Figure 3). After stagnating in the late 1990s, faster growth in yield was observed since 2000. This was due to government programs on increasing utilization of high quality seeds including promotion of hybrid rice varieties and investments on irrigation facilities (Bordey 2010). The rise in the share of farmers who have attended rice production-related trainings has also contributed to improved rice yields. From 1995 to 2009, Central Luzon and Central Visayas have the highest and lowest average yields, respectively (BAS 2011).
Figure 3. Five-year average rice yield in the Philippines (1995-2009)
The five-year average rice area harvested increased from 3.38 Mha in 1995 to 4.22 Mha in 2009,
growing annually by 56,000 ha (Figure 4). Despite near stagnation in physical rice area, the area harvested expanded due to the increase in cropping intensity brought about by public and private investments in irrigation systems. The Casecnan Multi-purpose Irrigation and Power Project that diverts water from Casecnan and Taan river in Cagayan Valley region to Pantabangan dam in Central Luzon is one of the big irrigation projects implemented from 1995 to 2009. As a result, Central Luzon region has the largest area harvested to rice during this period. In contrast, Cordillera Administrative Region (CAR) has the smallest rice harvest area in the same period.
y = 0.0627x - 122.42R² = 0.8659
2.50
2.90
3.30
3.70
4.10
4.50
1994 1996 1998 2000 2002 2004 2006 2008 2010
Metric Tons/Hectare

9
Economy and Environment Program for Southeast Asia
Figure 4. Five-year average rice area harvested in the Philippines (1995-2009)
Because of the improvement in yield and expansion of rice area harvested, the five-year average
paddy rice production in the Philippines increased annually by 0.42 million metric tons (Mmt) from 9.62 Mmt to 15.50 Mmt (Figure 5). The apparent slowdown in production growth in the early 2000s was brought about by the El Nino phenomenon in 1998.
Figure 5. Five-year average of paddy rice production in the Philippines (1995-2009)
The five-year average of the value of paddy rice production at the national and regional level
increased by 59% and 38% from 1995 to 2009, respectively (Table 3). The less than proportionate increase in value compared to increase in production level was due to the decreasing real farmgate price of paddy rice. In the same period, the five-year averages of national and regional gross revenue per hectare both increased by 27%.

10
Linking Climate Change, Rice Yield, and Migration: The Philippine Experience
Table 3. Five-year averages of value of paddy rice production and gross income per hectare (1995 and 2009)
Particulars 1995 2009 Percent Change
National Five-Year Average
Production (metric tons) 9,618,748 15,496,447 61.11
Value of Production (PhP billion) 86.83 137.95 58.87
Gross Revenue per Hectare (PhP/hectare) 25,742 32,683 26.96
Regional Five-Year Average
Production (metric tons) 706,932 995,258 40.79
Value of Production (PhP billion) 6.45 8.91 38.13
Gross Revenue per Hectare (PhP/hectare) 25,267 32,152 27.25
4.4 Weather Patterns Weather patterns in the Philippines have changed in the last 15 years (Table 4). In particular, the
five-year average of minimum or night time temperature in the first and second semesters of the year have both increased by nearly 1OC. This is consistent with the findings of PAGASA (2011) which indicated a 1OC increase in the annual mean of minimum temperature from 1951 to 2010.
Table 4. Five-year averages of weather variables in the Philippines (1995 and 2009)
Particulars 1995 2009 Change
Minimum Temperature (OC)
January-June (Semester 1) 18.12 19.05 0.93
July-December (Semester 2) 18.91 19.73 0.82
Maximum Rainfall (mm)
January-June (Semester 1) 109 127 18
July-December (Semester 2) 156 169 13
Total Rainfall (mm)
January-June (Semester 1) 640 927 287
July-December (Semester 2) 1381 1553 172
Share of Wet days in a Year (%) 23.00 26.80 3.80 The first semester of the year, which coincides with the dry season, has become wetter as indicated
by bigger changes in daily maximum and cumulative rainfall. The second semester, which represents the wet season, has also become wetter over the years although, the magnitude of change is lower compared to that of the first semester. This is accounted for by the 4.0 percentage points increase in the share of wetdays in a year.

11
Economy and Environment Program for Southeast Asia
5.0 RESULTS AND DISCUSSIONS
5.1 Impacts of Climate Change on Rice Productivity Table 5 summarizes the estimates of the rice productivity equation. Two models were estimated for
both equations of rice yield and gross revenue per hectare. Models 1 and 3 contained all weather variables, while models 2 and 4 did not include the share of irrigated area and its interaction with rainfall. The R2 values in all models are high (≈0.89) indicating a good fit of the estimated models. The F-statistics also show that coefficients of all weather variables are significant in each rice productivity model.
Table 5. Regression results of rice productivity on weather variables
Explanatory Variables
Dependent Variable
Yield Gross Revenue per Hectare
Model 1 Model 2 Model 3 Model 4
Minimum Temperature (Semester 1) 0.60635** 0.58207** 3.02425 2.30944
Minimum Temperature (Semester 1)2 -0.01783** -0.01744** -0.0852 -0.06846
Minimum Temperature (Semester 2) -0.55581 -0.61072 -3.25016 -2.99011
Minimum Temperature (Semester 2)2 0.01646 0.01788 0.08938 0.08427
Maximum Rainfall (Semester 1) -0.00034 -0.00021 -0.01925 -0.03182
Maximum Rainfall (Semester 1)2 0.00001 0.00001 0.0001 0.00013
Maximum Rainfall (Semester 2) 0.00036 -0.00043 0.00214 0.00036
Maximum Rainfall (Semester 2)2 0.00000 0.00000 -0.00002 -0.00002
Total Rainfall (Semester 1) 0.0001 -0.00013 0.00192 -0.00136
Total Rainfall (Semester 1)2 0.00000 0.00000 0.00000 0.00000
Total Rainfall (Semester 2) 0.00074 0.00059 0.01077** 0.00598
Total Rainfall (Semester 2)2 0.00000 0.00000 0.00000 0.00000
Share of Wet Days -0.03844*** -0.03570*** -0.36598*** -0.35588***
Share of Irrigated Area -0.21337
17.93986*
Share of Irrigated Area x Total Rainfall -0.00029
-0.0068
Constant 2.69415 3.39667 19.58266 36.05072*
Region FE YES YES YES YES
Year FE YES YES YES YES
F-Statistic (Joint Significance Test of All Weather Variables)
22.27*** 26.78*** 18.63*** 11.62***
R-squared 0.889 0.885 0.894 0.887
Number of regcode 20 20 20 20
Observations 216 216 216 216
Note: Significance based on robust p-values, *** p<0.01, ** p<0.05, * p<0.1 To interpret the estimated coefficients, the simpler models 2 and 4 of yield and gross revenue per
hectare equations were used7. As expected, the minimum temperature during the dry season has a negative effect on the average rice yield. In particular, a 1oC increase in minimum temperature during summer decreases yield by 64 kg/ha8. Higher minimum temperature increases the respiration rate and uses
7 Other insignificant weather variables were excluded in the model but results did not change much (see Appendix 4). 8 This is computed as:

12
Linking Climate Change, Rice Yield, and Migration: The Philippine Experience
energy that could be potentially used for plant growth. This results in reduced tillers per plant, lower plant height and biomass, and greater number of unfilled grains leading to a decline in yield (Ziska et al. 1997).
Similarly, rice yield diminishes by 36 kg/ha for every 1% increase in the share of wetdays. This is in
relation to lower solar radiation during wetdays which results in lower energy for photosynthetic activity (Centeno and Wassmann 2010). The average gross income per hectare also has a negative correlation to the increase in the share of wetdays. On average, a 1% increase in the share of wetdays decreases farm income by Php 356.00 per hectare9.
5.2 Impacts of Rice Productivity Change on Overseas Migration Table 6 shows the result of the second stage of the FE-2SLS estimation of the migration equation.
With R2 value of 0.94, all models show a high goodness of fit. In addition, all models also passed the underidentification test as indicated by the significant Kleibergen-Paap rk LM statistics at 99% confidence level.
However, only models 2 and 4 have passed the overidentification test. The insignificant Hansen J
statistics imply that the estimated coefficients of these models are free of biases arising from use of weak instruments. Table 6. Regression results of the number of total OFWs per thousand population on rice productivity variables
Explanatory Variables
Dependent Variable: Total OFWs/1000 Population Yield Gross Revenue per Hectare
Model 1 Model 2 Model 3 Model 4
Yield -4.76570** -6.24139***
[0.03302] [0.00696]
Gross Revenue per Hectare
-0.72369** -0.92964***
[0.01985] [0.00410]
Constant 17.36179*** 20.72297*** 19.80468*** 23.58906***
[0.00073] [0.00009] [0.00062] [0.00008] Region FE YES YES YES YES Year FE YES YES YES YES
Kleibergen-Paap rk LM statistic 43.06*** 37.95*** 40.06*** 36.48*** Hansen J statistic 24.77** 17.90 21.41* 15.00 R-squared 0.939 0.937 0.938 0.936 Observations 216 216 216 216
Note: Robust p-values in brackets; *** p<0.01, ** p<0.05, * p<0.1 Results show that changes in rice yield and gross revenue per hectare due to extreme weather
changes significantly affect overseas migration. In particular, the number of total OFW by increased by five persons per thousand population for every one metric tonne decrease in average yield. Similarly, the number of total OFW rose by one person per thousand population for every PhP 1,000 decline in the average gross revenue per hectare .
The estimated models of female overseas migration also show high R2 value of 0.94. The significant
Kleibergen-Paap rk LM statistics at 99% confidence level indicates that all female migration models are not underidentified. Except for model 1, all other models have an insignificant Hansen J statistics implying that these models are not overidentified. Based on the results of model 2, the number of female OFWs increased by seven per thousand female population when a one metric tonne decrease in average yield was observed (Table 7). Likewise, one female OFW per thousand population migrated-out for every PhP 1,000 decline in gross revenue per hectare. 9 The average peso-dollar exchange rate in 2011 is PhP43.31/US$. Source: http://ricestat.irri.org.

13
Economy and Environment Program for Southeast Asia
Table 7. Regression results of the number of female OFWs per thousand female population on rice productivity variables
Explanatory Variables
Dependent Variable: Female OFWs/1000 Female Population Yield Gross Revenue per Hectare
Model 1 Model 2 Model 3 Model 4 Yield
-5.49324** -7.09157**
[0.04388] [0.01525]
Gross Revenue per Hectare -1.17834*** -1.09822**
[0.00414] [0.01017]
Constant 18.52544*** 22.16599*** 27.66546*** 26.19316***
[0.00327] [0.00085] [0.00035] [0.00106] Region FE YES YES YES YES Year FE YES YES YES YES
Kleibergen-Paap rk LM statistic 43.06*** 37.95*** 40.06*** 36.48*** Hansen J statistic 25.69** 11.75 15.66 9.35 R-squared 0.937 0.936 0.936 0.937 Observations 216 216 216 216
Note: Robust p-values in brackets; *** p<0.01, ** p<0.05, * p<0.1 Table 8 shows the results of estimating male overseas migration. The male migration models also
indicate high R2 value of 0.92 and Kleibergen-Paap rk LM statistics show that these models are not underidentified. Only model 4 has an insignificant Hansen J statistics at confidence level of 95% implying that it is the only model of male migration that is not overidentified.
The coefficient of gross revenue per hectare, as instrumented by weather variables, is not significant at 95% confidence level. This provides evidence that compared to overseas migration of male workers, the female overseas migration is more affected by weather-related decline in rice productivity. Table 8. Regression results of the number of male OFWs per thousand male population on rice productivity variables
Explanatory Variables
Dependent Variable: Male OFWs/1000 Male Population Yield Gross Revenue per Hectare
Model 1 Model 2 Model 3 Model 4
Yield -4.11519 -5.38409*
[0.16247] [0.07067]
Gross Revenue per Hectare
-0.24743 -0.73932*
[0.50817] [0.05963]
Constant 16.32150** 19.21168*** 11.49486* 20.53326*** [0.01579] [0.00542] [0.09761] [0.00472]
Region FE YES YES YES YES Year FE YES YES YES YES
Kleibergen-Paap rk LM statistic 43.06*** 37.95*** 40.06*** 36.48*** Hansen J statistic 30.28*** 23.36** 31.86*** 20.58* R-squared 0.922 0.92 0.922 0.917 Observations 216 216 216 216
Note: Robust p-values in brackets; *** p<0.01, ** p<0.05, * p<0.1 The result can be driven by a large proportion of female OFWs who were involved in unskilled work,
such as housekeeping services. There is greater probability that many of these unskilled female OFWs come from rural areas and were somehow involved in farming activities in the past. On the contrary, a greater proportion of male OFWs were involved in trade-related services as well as plant and machinery operations.

14
Linking Climate Change, Rice Yield, and Migration: The Philippine Experience
With higher level of skills, it is less likely that male OFWs were mainly involved in farming activities prior to migration. This could explain why climate change, as it operates on productivity change, has greater impact on overseas migration of women than men in the Philippines.
This result on women migration is consistent with the findings of some case studies on gender and
migration in the Philippines. McKay (2005) found that women usually worked as exchange and household labor for planting and harvesting (non-waged), and were involved in unpaid activities, such as weeding. Given a negligible opportunity cost, women are enticed to work abroad to get higher value for their labor while their male counterparts continue farming.
5.3 Impacts of Rice Productivity Change on Domestic Migration Table 9 shows the effect of weather-induced change in rice productivity on domestic regional
migration. At 0.98 level of R2, the estimated models of domestic migration show a very good fit. Similarly, based on Kleibergen-Paap rk LM statistics at 99% confidence level, all domestic migration models are not underidentified. However, only model 4 is not overidentified at 95% level of confidence. Using model 4, the number of domestic (inter-regional) migrants decreased by less than one person per thousand population for every PhP 1,000 decrease in average gross income per hectare. Thus, contrary to the observed effects in overseas migration, a decline in rice productivity could actually reduce domestic migration. However, this result should be further verified when panel data on inter-regional migration rates becomes available.
Table 9. Regression results of the number of domestic regional migrants per thousand population on rice productivity variables
Explanatory Variables
Dependent Variable: Domestic Migrants/1000 Population Yield Gross Revenue per Hectare
Model 1 Model 2 Model 3 Model 4
Yield 2.05493*** 1.75133***
[0.00077] [0.00022]
Gross Revenue per Hectare
0.18353** 0.17539***
[0.01853] [0.00294]
Constant 19.54413*** 20.23564*** 20.85227*** 21.00194***
[0.00000] [0.00000] [0.00000] [0.00000] Region FE YES YES YES YES Year FE YES YES YES YES
Kleibergen-Paap rk LM statistic 43.06*** 37.95*** 40.06*** 36.48*** Hansen J statistic 23.95** 22.07** 25.82** 20.80* R-squared 0.98 0.981 0.979 0.979 Observations 216 216 216 216
Note: Robust p-values in brackets; *** p<0.01, ** p<0.05, * p<0.1 There is a seeming paradox on the effects of weather-related change in rice productivity on
overseas and domestic migration. Why would Filipino households send a member to work overseas rather than in other regions of the country when rice yield or revenue decline due to weather changes? It is very likely that the nature of farming households sending members to work abroad are different from those that send members to local regions. The former could have more access to resources like land. Given larger expected returns from overseas work compared to work in other local regions, a relatively wealthier farming household can pool resources to send a member abroad, thereby diversify its sources of livelihood. It is a usual scenario in the Philippines when a farming household pawns its land to raise the needed resources to send a member overseas to work. Consequently, remittances from abroad are used to regain access to the pawned land.
On the other hand, farming households that send out members locally are the relatively poorer
ones. Thus, a decline in rice yield or gross revenue may act as constraint from sending members to other

15
Economy and Environment Program for Southeast Asia
regions within the country. Figure 6 demonstrates that on average, regions with larger per capita rice harvest area and value of rice production have more OFWs and have less domestic out-migrants.
Figure 6. Domestic migrants and total OFWs per 1000 population versus
per capita rice harvest area and value of rice production
5.4 A Hindcast of Climate Change Impacts on Migration The significant coefficients of minimum temperature during January to June and share of wetdays
in a year were used to project the impact of climate change on rice yield from 1995 to 2009. During this period, the dry season minimum temperature has increased by 0.93 oC leading to a 60 kg/ha decline in five-year average of rice yield. Similarly, the share of wet days in a year has risen by 3.8 percentage points translating into 136 kg/ha decrease in yield. Given the combined effect of 195 kg/ha decline in yield and at a national average of 3.8 million hectares of rice harvest area, this means that the country lost about 742,000 mt from 1995 to 2009 due to the increases in dry season minimum temperature and share of wetdays in a year. At the national level, this translates to almost 99,000 individuals who migrated overseas to find work, among whom are 57% female.
Similarly, the 3.8% points increase in the share of wet days from 1995 to 2009 translates in a
reduction in gross revenue by PhP 1,352 per hectare. Multiplying it by the national average of rice harvest area of 3.8 million hectares, this translates to PhP 5.14 billion revenue loss in the last 15 years. Further, projection shows that about 102,000 OFWs were induced to work abroad by climate change as it operates through a decline in rice gross revenue per hectare. In addition, about 19,000 individuals were not able to migrate inter-regionally due to the reduced rice gross revenue per hectare, as affected by increased share of wetdays in a year.
010
2030
40do
mes
tic m
igra
nts/
1000
pop
ulat
ion
0 2000 4000 6000value of rice production per capita
010
2030
40to
tal O
FWs/
1000
pop
ulat
ion
0 2000 4000 6000value of rice production per capita
010
2030
40do
mes
tic m
igra
nts/
1000
pop
ulat
ion
0 2000 4000 6000rice harvest area per capita
010
2030
40to
tal O
FWs/
1000
pop
ulat
ion
0 2000 4000 6000rice harvest area per capita

16
Linking Climate Change, Rice Yield, and Migration: The Philippine Experience
6.0 CONCLUSIONS AND RECOMMENDATIONS Evidence was found that climate change, which caused reduction in rice productivity, has induced
overseas migration of Filipinos in the last 15 years. In addition, overseas migration of women are more affected than those of men. For households that have access to resources for start-up cost, overseas migration could have been used as a strategy to diversify income and adapt to the negative effects of climate change on rice yield and revenues. Thus, with climate expected to be warmer and wetter in the succeeding decades, it is expected that migration of overseas workers will intensify.
As the number of overseas migrants from rural areas increases, remittances are expected to flow
back in these areas. This could potentially revolutionize the agricultural financing system in the rural areas. The increase in liquidity can provide the capital needed to adopt new technologies, counter the negative effects of climate change, and improve rice productivity in the long run. Thus, it is important to keep information on the latest rice technologies flowing into rural areas as well as into OFWs who act as financiers. The use of information and communication technologies such as the Internet and short messaging service (SMS) can help in this aspect. Opportunely, the Philippines has already established electronic learning modules for rice production and put up SMS centers intended for rice farmers.
Unfortunately, overseas migration has a huge social cost despite its economic benefits. For
instance, the Office of the Solicitor General reported that the number of marriage annulment cases filed in the Philippines has increased by 40% from 2004 to 2010. While this cannot be attributed to the increase in overseas migration alone, the latter might have contributed to increasing cases of marriage dissolution. In addition, overseas migration can negatively affect children’s growth especially when mothers have to work overseas. These imply that society has to to endure the social burden of higher migration of women.
To address this, the government can intensify its social services in the form of providing early
childhood care and education especially in the rural areas. Currently, the Republic Act 8980 of 2000 mandates the institutionalization of a comprehensive, integrated, and sustainable National System for Early Childhood Care and Development. However, there are a few early childhood care centers established in rural areas compared to urban areas. In addition, the present curiculum for early childhood care and education does not fully consider cases of migrant parents. Even the basic elementary education system in the country does not take into account the reality that there is an increasing number of children who are growing with absentee parents. With migration becoming the norm rather than the exception, increasing the number of day-care centers in the rural areas as well as improving the curicula of early childhood and basic education could help in easing the social burden of migration.
It was also found that weather-related decline in rice productivity can reduce the number of
domestic migrants. If the affected households are in fact the relatively poorer ones, then these people will become more income vulnerable and food insecure since they have lesser opportunities to diversify their income. Given the availability of household labor, these type of households are good target for training on rice-based farming systems. Crop diversification will lessen their vulnerability to productivity losses due to climate change.
Finally, research and development (R&D) provides technology options that can offset the negative
effects of climate change on rice yield and income. Thus, it will be important to intensify rice R&D as well as the promotion of its products so that there will be greater adoption of technology. This will somehow help mitigate the impacts of climate change on rice productivity and migration.

17
Economy and Environment Program for Southeast Asia
REFERENCES
Aufhammer, M.; V. Ramanathan; and J. Vincent. 2006. Integrated models show that atmospheric brown clouds and greenhouse gases have reduced rice yields in India. http://www.pnas.org_cgi_doi_10.1073_pnas.0609584104.
Bardsley, D.K. and G.J. Hugo. 2010. Migration and climate change: examining thresholds of change to guide
effective adaptation decision-making. Population Environment. Vol. 32, pp. 238-262. Bureau of Agricultural Statistics. http://countrystat.bas.gov.ph (accessed on January 5, 2011) Bordey, F.H. 2010. The impacts of research on Philippine Rice Production. University of Illinois. PhD
dissertation., Centeno, H.G.S., and R. Wassmann. 2010. Reviewing impacts of climate change and climate variability on rice
production in the Philippines. In Adaptation to climate change and variability. Lansigan, F.P. (ed). Asia Rice Foundation, College, Laguna, Philippines. pp. 1-20.
Deschenes, O., and M. Greenstone. 2007. The economic impacts of climate change: evidence from
agricultural output and random fluctuations in weather. American Economic Review 97(1):354-385. Deshingkar, P., and D. Start. 2003. Seasonal migration for livelihoods in India: coping, accumulation and
exclusion. Overseas Development Institute, London. Working paper 220. Feng, S.; A.B. Krueger; and M. Oppenheimer. 2010. Linkages among climate change, crop yields and Mexico-
US cross-border migration. http://www.pnas.org/cgi/doi/10.1073/pnas.1002632107. First Assessment Report. 1990. Intergovernmental Panel on Climate Change.
http://www.ipcc.ch/publications_and_data/publications_and_data_reports.shtml . Fourth Assessment Report. 2007. Intergovernmental Panel on Climate Change.
http://www.ipcc.ch/publications_and_data/publications_ipcc_fourth_assessment_report_synthesis_report.htm
Kolmannskog, V. 2009. Climate change, disaster, displacement and migration: initial evidence from Africa.
Policy Development and Evaluation Service, United Nations High Commissioner for Refugees. Research Paper No 180..
Lansigan, F.P. 2010. Responding to changing climate in rice production in the Philippines.” In .” In Adaptation
to climate change and variability. Asia Rice Foundation, College, Laguna, Philippines. pp. 21-46 Massey, D.S.; W.G. Maxinn; and D.J. Ghimire. 2010. Environmental change and out-migration: evidence from
Nepal. Population and Environment, Vol. 32, pp. 109-136. McLeman, R. and B. Smit. 2006. Migration as adaptation to climate change. Climatic Change, Vol. 76, pp. 31-
53. McKay, D. 2005. Reading remittance landscapes: Female migration and agricultural transition in the
Philippines. Danish Journal of Geography 105(1):89-99. National Framework Strategy on Climate Change 2010-2022. Office of the President of the Philippines,
Malacañang. Climate Change Commission, pp 9-11. PAGASA (Philippine Atmospheric, Geophysical and Astronomical Services Administration). 2011. Climate
Change in the Philippines. Quezon City, Philippines.

18
Linking Climate Change, Rice Yield, and Migration: The Philippine Experience
Peng, S.B.; J.L. Huang; J.E. Sheehy; R.C. Laza; R.M. Visperas; X.H. Zhong; G.S. Centeno; G. S. Khush; and K.G. Cassman. 2004. Rice yields decline with higher night temperature from global warming. http://www.pnas.org/content/101/27/9971.short
Quisumbing, A.R. and S. McNiven. 2005. Migration and the rural-urban continuum: evidence from the rural
Philippines. Food Consumption and Nutrition Division, International Food Policy Research Institute, Washington DC.
Raleigh C.; L. Jordan; and I. Salehyan. 2008. Assessing the impact of climate change on migration and
conflict. The Social Development Department. The World Bank Group, Washington, DC. Second Assessment Report. 1995. Intergovernmental Panel on Climate Change.
http://www.ipcc.ch/pdf/climate-changes-1995/ipcc-2nd-assessment/2nd-assessment-en.pdf Semyonov M., and A. Gorodzeisky. 2004. Occupational destinations and economic mobility of Filipino
overseas workers. International Migration Review, Vol. 38, Issue 1, March 2004, pp.5-25. University of Adelaide, et al. 2009. Climate change and migration in Asia and the Pacific. Asian Development
Bank, Mandaluyong City. Philippines. Yusuf, A.A., and H. A. Francisco. 2009. Climate change vulnerability mapping for Southeast Asia. Economy
and Environment Program for Southeast Asia. Ziska, L.H.; O.S. Namuco; T. B. Moya; and E.J.P. Quilang. 1997. Growth and yield response of field grown
tropical rice to increasing carbon dioxide and air temperature. Agronomy Journal 89:45-53.

19
Economy and Environment Program for Southeast Asia
APPENDICES Appendix 1. Regional groupings of provinces in the Philippines, 1995-2009
REGION ABBREVIATION YEAR PROVINCES Cordillera Administrative Region
CAR 1995-2009 Benguet, Kalinga, Apayao, Abra, Ifugao, Mountain Province
Ilocos Region ILOCOS 1995-2009 Ilocos Norte, Ilocos Sur, Pangasinan, La Union
Cagayan Valley CVALLEY 1995-2009 Isabela, Nueva Vizcaya, Cagayan, Quirino, Batanes
Central Luzon CLUZON1 1995-2002 Bataan, Bulacan, Nueva Ecija, Pampanga, Zambales, Tarlac
Central Luzon CLUZON2 2003-2009 Aurora, Bataan, Bulacan, Nueva Ecija, Pampanga, Zambales, Tarlac
Southern Tagalog STAGALOG 1995-2002 Aurora, Cavite, Laguna, Batangas, Rizal, Quezon, Occidental Mindoro, Oriental Mindoro, Marinduque, Romblon, Palawan
Region IV-A CALABARZON 2003-2009 Cavite, Laguna, Batangas, Rizal, Quezon
Region IV-B MIMAROPA 2003-2009 Occidental Mindoro, Oriental Mindoro, Marinduque, Romblon, Palawan
Bicol Region BICOL 1995-2009 Albay, Camarines Norte, Camarines Sur, Masbate, Sorsogon
Western Visayas WVISAYAS 1995-2009 Aklan, Guimaras, Iloilo, Negros Occidental, Capiz, Antique
Central Visayas CVISAYAS 1995-2009 Cebu, Negros Oriental, Bohol, Siquijor
Eastern Visayas EVISAYAS 1995-2009 Biliran, Eastern Samar, Leyte, Northern Samar, Samar, Southern Leyte
Western Mindanao WMINDANAO 1995-2009 Zamboanga del Norte, Zamboanga del Sur, Zamboanga Sibugay
Northern Mindanao NMINDANAO1 1995-2002 Bukidnon, Camiguin, Misamis Occidental, Misamis Oriental
Northern Mindanao NMINDANAO2 2003-2009 Bukidnon, Camiguin, Lanao del Norte, Misamis Occidental, Misamis Oriental
Central Mindanao CMINDANAO 1995-2001 Lanao del Norte, North Cotabato
Southern Mindanao SMINDANAO 1995-2001
Davao City, Davao del Norte, Davao Oriental, Davao del Sur, Sarangani, South Cotabato, Sultan Kudarat, (General Santos City – part of South Cotabato during this period. It was not considered as an autonomous city before the creation of SOCCSKSARGEN in 2001)
Davao Region DAVAO 2002-2009 Davao City, Davao del Norte, Davao Oriental, Davao del Sur
SOCCSKSARGEN SOCCSKSARGEN 2002-2009 South Cotabato, North Cotabato, Sultan Kudarat, Sarangani, General Santos
CARAGA CARAGA 1996-2009 Agusan del Norte, Agusan del Sur, Surigao del Norte, Surigao del Sur
20
Linking Climate Change, Rice Yield, and Migration: The Philippine Experience
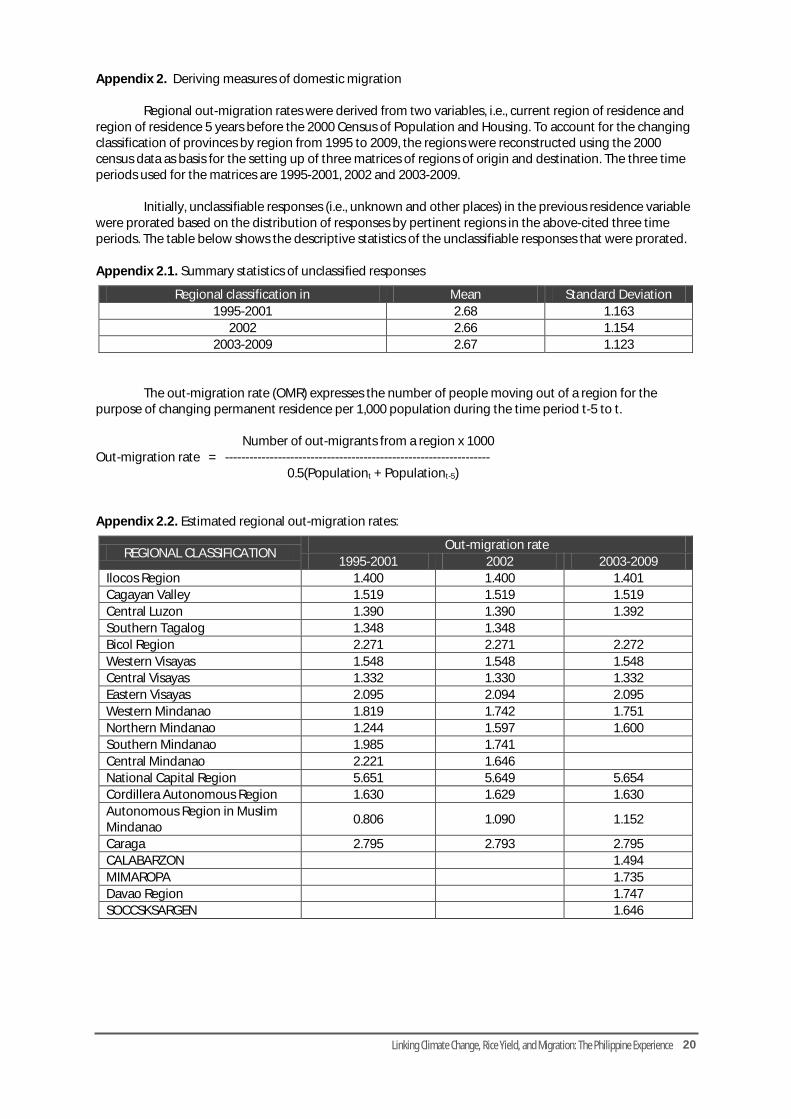
Appendix 2. Deriving measures of domestic migration Regional out-migration rates were derived from two variables, i.e., current region of residence and
region of residence 5 years before the 2000 Census of Population and Housing. To account for the changing classification of provinces by region from 1995 to 2009, the regions were reconstructed using the 2000 census data as basis for the setting up of three matrices of regions of origin and destination. The three time periods used for the matrices are 1995-2001, 2002 and 2003-2009.
Initially, unclassifiable responses (i.e., unknown and other places) in the previous residence variable
were prorated based on the distribution of responses by pertinent regions in the above-cited three time periods. The table below shows the descriptive statistics of the unclassifiable responses that were prorated.
Appendix 2.1. Summary statistics of unclassified responses
Regional classification in Mean Standard Deviation 1995-2001 2.68 1.163
2002 2.66 1.154 2003-2009 2.67 1.123
The out-migration rate (OMR) expresses the number of people moving out of a region for the
purpose of changing permanent residence per 1,000 population during the time period t-5 to t.
Number of out-migrants from a region x 1000 Out-migration rate = -----------------------------------------------------------------
0.5(Populationt + Populationt-5) Appendix 2.2. Estimated regional out-migration rates:
REGIONAL CLASSIFICATION Out-migration rate
1995-2001 2002 2003-2009 Ilocos Region 1.400 1.400 1.401 Cagayan Valley 1.519 1.519 1.519 Central Luzon 1.390 1.390 1.392 Southern Tagalog 1.348 1.348 Bicol Region 2.271 2.271 2.272 Western Visayas 1.548 1.548 1.548 Central Visayas 1.332 1.330 1.332 Eastern Visayas 2.095 2.094 2.095 Western Mindanao 1.819 1.742 1.751 Northern Mindanao 1.244 1.597 1.600 Southern Mindanao 1.985 1.741 Central Mindanao 2.221 1.646 National Capital Region 5.651 5.649 5.654 Cordillera Autonomous Region 1.630 1.629 1.630 Autonomous Region in Muslim Mindanao
0.806 1.090 1.152
Caraga 2.795 2.793 2.795 CALABARZON
1.494
MIMAROPA
1.735 Davao Region
1.747
SOCCSKSARGEN
1.646

21
Economy and Environment Program for Southeast Asia
Appendix 3. Weather stations per region.
REGION Weather Stations CAR Aparri, Cagayan ILOCOS Laoag, Ilocos Norte; Vigan, Ilocos Sur CVALLEY Tuguegarao, Cagayan
CLUZON1 Cabanatuan, Nueva Ecija; Iba, Zambales CLUZON2 Cabanatuan, Nueva Ecija; Iba, Zambales; Baler, Aurora
STAGALOG Baler, Aurora; Infanta, Quezon; Tayabas, Quezon; Coron, Palawan; Puerto Princesa, Palawan; Romblon, Romblon
CALABARZON Infanta, Quezon; Tayabas, Quezon
MIMAROPA Coron, Palawan; Puerto Princesa, Palawan; Romblon, Romblon BICOL Daet, Camarines Norte; Legaspi City, Albay; Virac Synop, Catanduanes WVISAYAS Iloilo, Iloilo; Roxas City, Aklan CVISAYAS Dumaguete, Negros Oriental; Tagbilaran, Bohol
EVISAYAS Catarman, Northern Samar; Catbalogan, Western Samar; Maasin, Southern Leyte; Tacloban, Leyte
WMINDANAO Dipolog, Zamboanga del Norte (1990-2003); Zamboanga City, Zamboanga del Norte (2004-2009)
NMINDANAO1 Malaybalay City, Bukidnon NMINDANAO2 Malaybalay City, Bukidnon
CMINDANAO Cotabato City, Maguindanao SMINDANAO Davao City, Davao del Sur DAVAO Davao City, Davao del Sur SOCCSKSARGEN Cotabato City, Maguindanao CARAGA Butuan City, Agusan del Norte; Surigao, Surigao del Norte

22
Linking Climate Change, Rice Yield, and Migration: The Philippine Experience
Appendix 4. Additional Results
The researchers tried to further reduce the number of explanatory variables in the rice productivity
equation to see whether this would result in the exact identification of the male migration equation. In this model, only the following were included: minimum temperature during January to June and July to December and their squared terms; maximum rainfall during January to June and its squared term; total rainfall during July to December and its squared term; and share of wet days in a year.
A joint test for the significance of weather variable and its squared term was used in deciding which
pair of explanatory variables to maintain. Because of high correlation with minimum temperature during January to June, the minimum temperature during July to December and its squared term were maintained even though they are not jointly significant in both models of yield and gross revenue per hectare
Results show that all weather variables are jointly significant in both models although the F-
Statistics in the gross revenue per hectare equation has significantly declined compared to the model described in the main text. The high R2 show a very good fit of the models (Appendix 4.1).
The significant Kleibergen-Paap rk LM statistic at 99% confidence level shows that all migration
models are not under-identified. Based on the Hansen J statistic, only the estimated equations of total OFWs and female OFWs per thousand population on rice yield are not over-identified at 95% confidence level (Appendix 4.2). When using the gross revenue per hectare as explanatory variable, only the equation of male OFWs per thousand population have remained over-identified at the 95% confidence level (Appendix 4.3). These are similar to the results obtained from the regression presented in the main text showing that the increase in the number of instruments used does not necessary lead to over-identification of model.

23
Economy and Environment Program for Southeast Asia
Appendix 4.1. Regression results of rice productivity on weather variables
Explanatory Variables
Dependent Variable
Yield Gross Revenue
Per Hectare
Minimum Temperature (Semester 1) 0.54762** 2.10248 [0.01602] [0.23021]
Minimum Temperature (Semester 1)2 -0.01654** -0.06402 [0.02264] [0.24852]
Minimum Temperature (Semester 2) -0.57545 -2.18455 [0.10874] [0.32693]
Minimum Temperature (Semester 2)2 0.01697 0.06324
[0.11646] [0.33805]
Maximum Rainfall (Semester 1) -0.00046 -0.0309 [0.87659] [0.18923]
Maximum Rainfall (Semester 1)2 0.00001 0.00014*
[0.37321] [0.09970]
Total Rainfall (Semester 2) 0.00055 0.00471
[0.20541] [0.20922]
Total Rainfall (Semester 2)3 0.0000 0.0000
[0.40091] [0.53254]
Share of Wet days -0.03648*** -0.32292***
[0.00002] [0.00356]
Constant 3.35002* 30.51589* [0.09401] [0.08218]
Region FE YES YES Year FE YES YES F-Statistic (Joint Significance Test of All Weather Variables) 20.65*** 3.29** R-squared 0.885 0.885
Number of regcode 20 20 Observations 216 216 Note: Robust p-values in brackets, *** p<0.01, ** p<0.05, * p<0.1

24
Linking Climate Change, Rice Yield, and Migration: The Philippine Experience
Appendix 4.2. Regression results of international and domestic migration on rice yield
Explanatory Total OFWs/ Female OFWs/ Male OFWs/ Domestic Migrants/
Variables 1000 Population 1000 Population 1000 Population 1000 Population
Yield -6.45592*** -7.42796** -5.47370* 1.80294***
[0.00492] [0.01082] [0.06459] [0.00017]
Constant 21.21162*** 22.93217*** 19.41580*** 20.11809***
[0.00005] [0.00056] [0.00469] [0.00000]
Region FE YES YES YES YES
Year FE YES YES YES YES
Kleibergen-Paap rk LM statistic
37.16*** 37.16*** 37.16*** 37.16***
Hansen J statistic 14.02* 7.49 22.71*** 18.42**
R-squared 0.937 0.936 0.92 0.981
Observations 216 216 216 216
Note: Robust p-values in brackets, *** p<0.01, ** p<0.05, * p<0.1
Appendix 4.3. Regression results of international and domestic migration on rice gross revenue per hectare
Explanatory Variables Total
OFWs/1000 Population
Female OFWs/1000 Population
Male OFWs/1000 Population
Domestic Migrants/1000
Population
Gross Revenue Per Hectare -1.01952*** -1.25350*** -0.75885* 0.21595***
[0.00237] [0.00578] [0.05772] [0.00162]
Constant 25.24062*** 29.04648*** 20.89208*** 20.25668***
[0.00004] [0.00066] [0.00464] [0.00000]
Region FE YES YES YES YES
Year FE YES YES YES YES
Kleibergen-Paap rk LM statistic
37.16*** 37.16*** 37.16*** 37.16***
Hansen J statistic 11.91 5.36 19.93** 15.40*
R-squared 0.934 0.935 0.917 0.979
Observations 216 216 216 216
Note: Robust p-values in brackets, *** p<0.01, ** p<0.05, * p<0.1

StveVtgtMeVtiVtg local capacity iVt tMe ecoVtoW\ic aVtalysis of eVtvivoVtW\eVttal issues
Recent EEPSEA Research Reports
Exploring the Forestry Carbon Finance Potential for an Indigenous Cultural Community in the Philippines Margaret M. Calderon, Nathaniel C. Bantayan, Floren cia B. Pulhin, and Lourdes J. Cruz 2013-RR1
Response of Fishermen to Fishing Control Policies in Southern Songkhla Lake, Thailand: A Field Experiment Kunlayanee Pornpinatepong, Pathomwat Chantarasap, Jumtip Seneerattanaprayul, and Wittawat Hemtanon, and Papitchaya Saelim 2013-RR2
Economic Analysis of Multi-pollutant Control in Coal-fired Electricity Plants in China Wu Dan and Xie Xuxuan 2013-RR3
Impact of Piped Water on Household Welfare in Vietnam Nguyen Viet Cuong, Vu Thieu, Pham Minh Thu, and Nguyen Xuan Truong 2013-RR4
Evaluating the Pilot Implementation of Payment for Forest Environmental Services in Lam Dong, Vietnam Nguyen Thi Y Ly 2013-RRS
To Burn or not to Burn: Making the Burning of Chocolate Hills of Bohol, Philippines Carbon Neutral Nathaniel C. Bantayan, Margaret M. Calderon, Florencia B. Pulhin, Canesio D. Predo, and Rose Ann C. Barruga 2013-RR6
~ ~ Sida
An Economic Analysis of the Use of Water Hyacinth for Phytoremediation and Biogas Production in Dianchi Lake, China Zanxin Wang and Jin Wan 2013-RR7
Economic Analysis of Rice Straw Management Alternatives and Understanding Farmers' Choices Cheryl/ C. Launio, Constancio A. Asis, Jr., Rowena G. Mana/iii, and Evelyn F. Javier 2013-RRS
Impact of Eco-Labelling on Indonesia's Smallholder Coffee Farmers Nuva, Yusif, Nia Kurniawati H., and Hanna 2013-RR9
Linking Climate Change, Rice Yield and Migration: The Philippine Experience Flordeliza H. Bordey, Cheryl/ C. Launio, Eduardo Jimmy P. Quilang, Charis Mae A. Tolentiono and Nimfa B. Ogena 2013-RR1 0
Determinants of Flashflood Evacuation Choices and the Assessment of Preferences for Flashflood Warning Channels: The Case ofThailand Kannika Thampanishvong 2013-RR11
Insurance Approach for Financing Extreme Climate Event Losses in China: A Status Analysis Haitao Yin 2013-RR12
The Way to C02
Emission Reduction and the Co-benefits of Local Air Pollution Control in China's Transportation Sector: A Policy and Economic Analysis Mao Xianqiang, Yang Shuqian, and Liu Qin 2013-RR13
IDRC ~ CRDI