
"~1 - CORE
287
A thesis entitled The Determination of Trace Metals by High Performance Liquid Chromatography with Photometric Detection Presented by Philip John Hobbs, M.Sc, C.Chem, M.R.S.C. In part fulfilment of the requirements for the degree of DOCTOR of PHILOSOPHY of the COUNCIL for NATIONAL ACADEMIC AWARDS Department of Environmental Sciences Plymouth Polytechnic, Drake Circus, Plymouth PL4 8AA _ ! ^^^^ In collaboration with j British Drug House Chemi'caTs"L'td77~ • Broom Road, Poole, Dorset BH12 4NN "~1
-
Upload
khangminh22 -
Category
Documents
-
view
3 -
download
0
Transcript of "~1 - CORE
A t h e s i s e n t i t l e d The Determination of T r a c e Metals by
High Performance L i q u i d Chromatography w i t h Photometric D e t e c t i o n
Presented by P h i l i p John Hobbs, M.Sc, C.Chem, M.R.S.C.
I n p a r t f u l f i l m e n t of the requirements
f o r the degree of
DOCTOR of PHILOSOPHY
of the
COUNCIL f o r NATIONAL ACADEMIC AWARDS
Department of Environmental S c i e n c e s
Plymouth P o l y t e c h n i c ,
Drake C i r c u s ,
Plymouth PL4 8AA _
! ^^^^
I n c o l l a b o r a t i o n w i t h j
B r i t i s h Drug House Chemi'caTs"L'td77~ • Broom Road,
Poole,
Dorset BH12 4NN
"~1
P L Y M O U T H POmECK>JIC L I B R A R Y
Class T 5 " ' * - 6 . 3 HOB
' -:ntl.

This work has not been accepted i n substance f o r any other degree, and i s not c o n c u r r e n t l y being submitted f o r any other degree.
Candidate
Date
This i s to c e r t i f y t h a t the work has been c a r r i e d out by the candidate himself.
Candidate
Date
Supervisor
Date a"?

Trace Metal Analysis by High Performance L i q u i d Chromatography.
by Hobbs P.J.
Abstract.
The importance of trace metals and t h e i r species i s reviewed and i t i s recognised t h a t improved methods of determination are r e q u i r e d . High performance l i q u i d chromatography has grown i n importance as a technique, e s p e c i a l l y since the synthesis of b e t t e r column packings. The a d a p t a b i l i t y of reverse phase and i o n chromatography w i t h new post-column reagents f o r photometric d e t e c t i o n f o r the determination of t r a n s i t i o n metal c a t i o n s , i s discussed.
Separation of d i v a l e n t t r a n s i t i o n metal by high performance chromatography was improved by eluents used i n column i o n chromatography, new eluents were also assessed. Lactate eluents were p a r t i c u l a r l y e f f e c t i v e and t a r t r a t e , oxalate and t h i o m a l i c b u f f e r s also showed proniise.
Two photometric reagents, d i t h i z o n e and eriochrome black T were used as post-column reagents, s e n s i t i v i t y and c a l i b r a t i o n c h a r a c t e r i s t i c s are determined. A novel method of photometric d e t e c t i o n , observes the decrease i n absorbance of the metallochromic i n d i c a t o r used.
Using l a c t a t e eluent w i t h the Eriochrome Black T posj-column d e t e c t o r , l i n e a r c a l i b r a t i o n s from 10 pg ml to 5 ng ml f o r cadmium, c o b a l t , copper, indium, i r p n ( I X I ) , i r o n ( l l ) , l e a d , magnesium, manganese, n i c k e l and zinc were achieved w i t h l i m i t s of d e t e c t i o n between 0.5 and 5 ng.
The d i t h i z o n e post-column r e a l t o r achieved q u a n t i t a t i v e analysis from 10 ng ml to 10 pg ml f o r cadmium, c o b a l t , copper, indium, lead, n i c k e l and zinc w i t h l i m i t s of d e t e c t i o n f o r the l a c t a t e eluent between 1 and 8 ng except f o r lead(A5 ng).
A p p l i c a t i o n s of the eriochrome black T d e t e c t o r are shown f o r the s p e c i a t i o n of i r o n and the determination of t r a n s i t i o n metals i n r i v e r water and the a n a l y s i s of a l l o y s .
The separation of oxyanions i s discussed w i t h d e t e c t i o n by a pyrocatechol v i o l e t ternary complex. The p o s s i b i l i t y of f l u o r e s c e n t metal d e t e c t i o n w i t h 8-hydroxyquinoline-5-sulphonic acid and photometric d e t e c t i o n w i t h a water soluble d e r i v a t i v e of d i t h i z o n e i s shown.
CONTENTS Chapter One Page
Contents. L i s t of Tables L i s t of Figures
1 I n t r o d u c t i o n . 1.1 The Role of Trace Metals. 1.2 Importance of Trace Metal Species. 1.3 Review of Trace Metal Analysis. l.A Present Methods. 1.5 Multi-element and Speciation A n a l y s i s . 1.6 L i q u i d Chromatographic Determination of Trace Metals. 1.7 Chromatographic Parameters. 1.8 Resolution. 1.9 Development of High Performance L i q u i d Chromatography Column M a t e r i a l s . 1.10 Review of High Performance L i q u i d Chromatography of Trace Metals. l . U P a r t i t i o n and S i l i c a Separations. 1.12 Reverse Phase Separations. 1.13 Reverse Phase Ion Pair Separations. 1.14 Speciation Analysis by Reverse Phase. 1.15 Review of High Performance Ion Exchange Chromatography. 1.16 High Performance L i q u i d Chromatography Detectors. 1.17 Electrochemical Detectors. 1.18 Spectrophotometric Detectors. 1.19 Photometric Post Column Reactors. 1.20 Post Column Reactor Design-1.21 Photometric Post Column Reaction Detectors f o r Metals. 1.22 Fluorescent Post Column Reaction Detection f o r metals. 1.23 D i r e c t i o n of Research and Present I n t e n t i o n s f o r the Determination of Trace Metal Species by High Performance L i q u i d Chromatography.
I 5 7 9 9 10 13 14 16
18 17 21
22
24 24 27 28 29
30
35 37 38 39 41
43
53
54
Chapter Two
2 Instrumentation and Experimental 2.1 I n t r o d u c t i o n . 2.2 Pumps. 2.3 I n j e c t o r System. 2.4 A n a l y t i c a l Column. 2.5 Post-Column Reactor. 2*6 Detector. 2.7 Reagents. 2.8 Contamination C o n t r o l .
56 56 57 59 59 60 61 62 63

Chapter Three Page
3 Chromatography of Metal Ions. 65 3.1 I n t r o d u c t i o n . 65 3.2 Physical Properties of Ion Exchange M a t e r i a l s . 69 3.3 Choice of Cat i o n i c Chromatographic Substrate. 72 3.4 Choice of Cation Column Eluent. 74 3.5 C i t r a t e E l u t i o n . 76 3.6 T a r t r a t e E l u t i o n . 80 3.7 Oxalate E l u t i o n . 83 3.8 Lactate E l u t i o n . 86 3.9 Succinate E l u t i o n . 91 3.10 Maleate E l u t i o n . 91 3.11 Pyruvate E l u t i o n . 93 3.12 Formate E l u t i o n . 94 3.13 E f f e c t of The Counter-Ion and The Counter-Ion Concentration. 94 3.14 E f f e c t of Sodium Chloride Concentration on E l u t i o n . 98 3.15 E f f e c t of Ethanol on E l u t i o n . 100 3.16 A l t e r n a t i v e Eluents. 101 3.17 Glycine E l u t i o n . 102 3.18 A s p a r t i c E l u t i o n . 103 3.19 Mercaptosuccinate E l u t i o n . 104 3.20 Anion Exchange Separation of Metals. 106 3.21 Conclusion and Discussion. 108
Chapter Four
4 Eriochrome Black T Post Column Detector. 117 4.1 I n t r o d u c t i o n . 4.2 Pro p e r t i e s of Eriochrome Black T 4.3 Response w i t h Metals. 119 4.4 Eriochrome Black T as a Post Column Reactant. 4.5 Solvent and Instrumental Considerations- 133 4.6 Optimisation Data. 137 4.7 Responses f o r a C i t r a t e Eluent. 140 4.8 Results w i t h a C i t r a t e Eluent. 140 4.9 Discussion of Optimisation Data w i t h the C i t r a t e Eluent. 154 4.10 Metal Responses f o r a Lactate Eluent. 158 4.11 Results and Discussion. 159 4.12 Conclusion.
Chapter Five
5 The Dithizone Post Column Reactor System. 175 5.1 Int r o u u c u i o u . 175 5.2 Properties of Dithizone. 175 5.3 Response w i t h Metals. 176
117 118
124

Page 5.4 Dithizone Response w i t h Organometallic Compounds. 176 5.5 Dithizone as a Post Column Bteactant. 178 5.6 Optimisation Data f o r the Dithizone Post Column Reactor. 181 5.7 Response w i t h a Lactate Eluent. 182 5.8 Optimisation Results. 182 5-9 Response w i t h a T a r t r a t e Eluent- 189 5-10 Results w i t h a T a r t r a t e Eluent. 189 5-11 Response w i t h Thlomalate Eluent- 192 5.12 Results w i t h a Thiomalate Eluent. 192 5- 13 Discussion. 198 5.14 Conclusion. 202
Chapter Six
6 A p p l i c a t i o n s of the Eriochrome Black T Post Column Detector- 204 6.1 I n t r o d u c t i o n . 204 6.2 Analysis of Monel and Magnetic A l l o y s . 205 6.3 Preparation of Samples and Standards. 205 6.4 Analysis of Hycomax I I I Permanent Magnetic Alloy(BSC No.384). 205 6.5 Analysis o f Monel A l l o y 400(BSC No.363/1). 206 6.6 Results of A l l o y Analysis. 206 6- 7 Discussion of A l l o y a n a l y s i s . 210 6.8 Analysis of Camon River Estuary f o r Trace Metals. 211 6.9 Sampling Technique. 212 6.10 Methods- 213 6-11 HPLXEC Method- 213 6.12 Flame Atomic Absorption Spectrophotometric Method. 215 6.13 Photometric Method. 216 6.14 Comparison of Results. 216 6-15 I r o n Speciation i n the River Carnon. 218 6.18 Analysis of a Simulated Pressure Water Reactor Primary Coolant. 225 6.19 Method of Preconcentration. 227 6.20 Results of the Analysis of a Simulated Coolant from the Pressurised Water Reactor- 227 6- 21 Discussion and Conclusion. 231
Chapter Seven
7 I n i t i a l Studies of A l t e r n a t i v e Systems, Suggestions f o r Further Work and Conclusions. 236
7.1 I n i t i a l Studies of A l t e r n a t i v e Systems. 236 7- 2 Dithizone-S Post Column Ueactor bysteiu. 23y

Page 7.3 Pyrocatechol V i o l e t as a Detector f o r Anions and Cations. 240 7.4 Pyrocatechol V i o l e t as a Post Column Reactant. 242 7.5 Solvent and Instrumental Considerations. 244 7.6 Results and Discussion. 244 7.8 Chromatographic Separation of Oxyanions. 246 7.9 F l u o r i m e t r i c Trace High Performance L i q u i d Chromatography Determinations. 250 7.10 Fluorescent Post Column Reactor Detection w i t h 8-Hydroxyquinoline-5-Sulphonic Acid. 251 7.11 Conclusions as to Future Work. 252 7.12 General Conclusions. 253 Appendix 1. 255 Appendix I I . 258 References. 274 Acknowledgements. 283
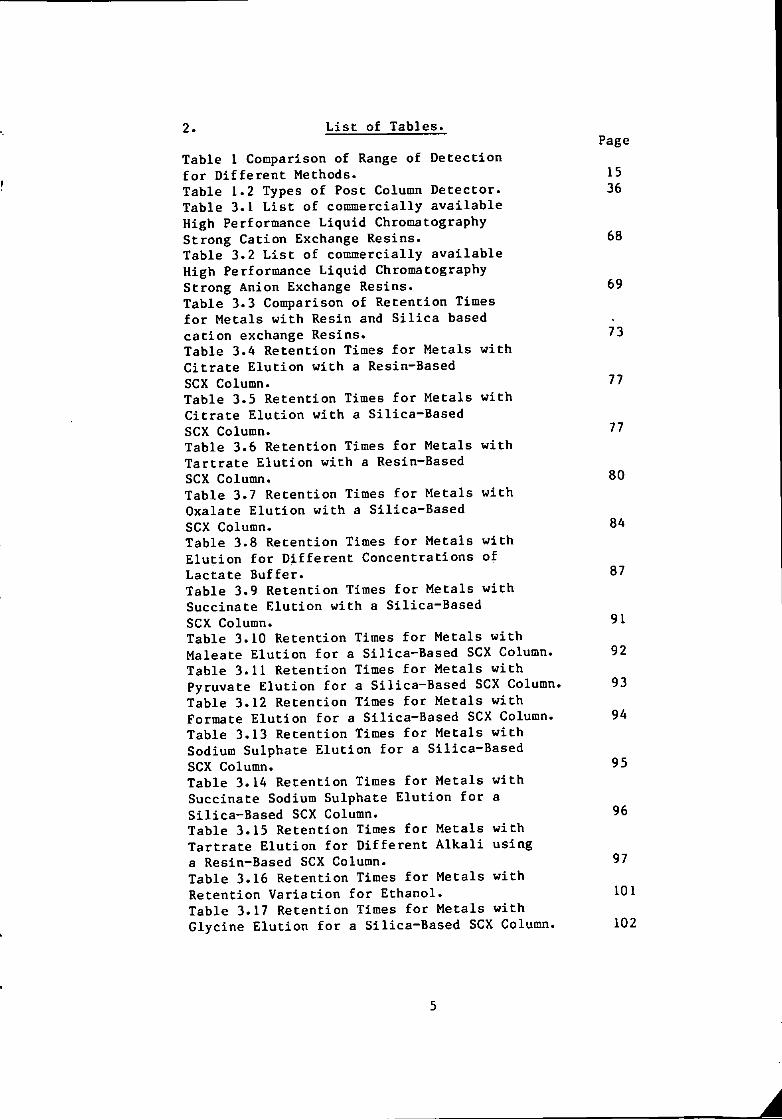
2. L i s t of Tables.
Table 1 Comparison of Range of Detection f o r D i f f e r e n t Methods. Table 1.2 Types o f Post Column Detector. Table 3.1 L i s t of commercially a v a i l a b l e High Performance L i q u i d Chromatography Strong Cation Exchange Resins. Table 3.2 L i s t of commercially a v a i l a b l e High Performance L i q u i d Chromatography Strong Anion Exchange Resins. Table 3.3 Comparison of Retention Times f o r Metals w i t h Resin and S i l i c a based c a t i o n exchange Resins. Table 3.4 Retention Times f o r Metals w i t h C i t r a t e E l u t i o n w i t h a Resin-Based sex Column. Table 3.5 Retention Times f o r Metals w i t h C i t r a t e E l u t i o n w i t h a Silica-Based sex Column. Table 3.6 Retention Times f o r Metals w i t h T a r t r a t e E i u t i o n w i t h a Resin-Based sex Column. Table 3.7 Retention Times f o r Metals w i t h Oxalate E l u t i o n w i t h a Silica-Based sex Column. Table 3.8 Retention Times f o r Metals w i t h E l u t i o n f o r D i f f e r e n t Concentrations of Lactate B u f f e r . Table 3.9 Retention Times f o r Metals w i t h Succinate E l u t i o n w i t h a Silica-Based sex Column. Table 3.10 Retention Times f o r Metals w i t h Maleate E l u t i o n f o r a Silica-Based SCX Column. Table 3.11 Retention Times f o r Metals w i t h Pyruvate E l u t i o n f o r a Silica-Based SCX Column Table 3.12 Retention Times f o r Metals w i t h Formate E l u t i o n f o r a Silica-Based SCX Column. Table 3.13 Retention Times f o r Metals w i t h Sodium Sulphate E l u t i o n f o r a Silica-Based SCX Column. Table 3.1A Retention Times f o r Metals w i t h Succinate Sodium Sulphate E l u t i o n f o r a Silica-Based SCX Column. Table 3.15 Retention Times f o r Metals w i t h T a r t r a t e E l u t i o n f o r D i f f e r e n t A l k a l i using a Resin-Based SCX Column. Table 3.16 Retention Times f o r Metals w i t h Retention V a r i a t i o n f o r Ethanol. Table 3.17 Retention Times f o r Metals w i t h Glycine E l u t i o n f o r a Silica-Based SCX Column.
Page
15 36
68
69
73
77
77
80
84
87
91
92
93
94
95
96
97
101
102
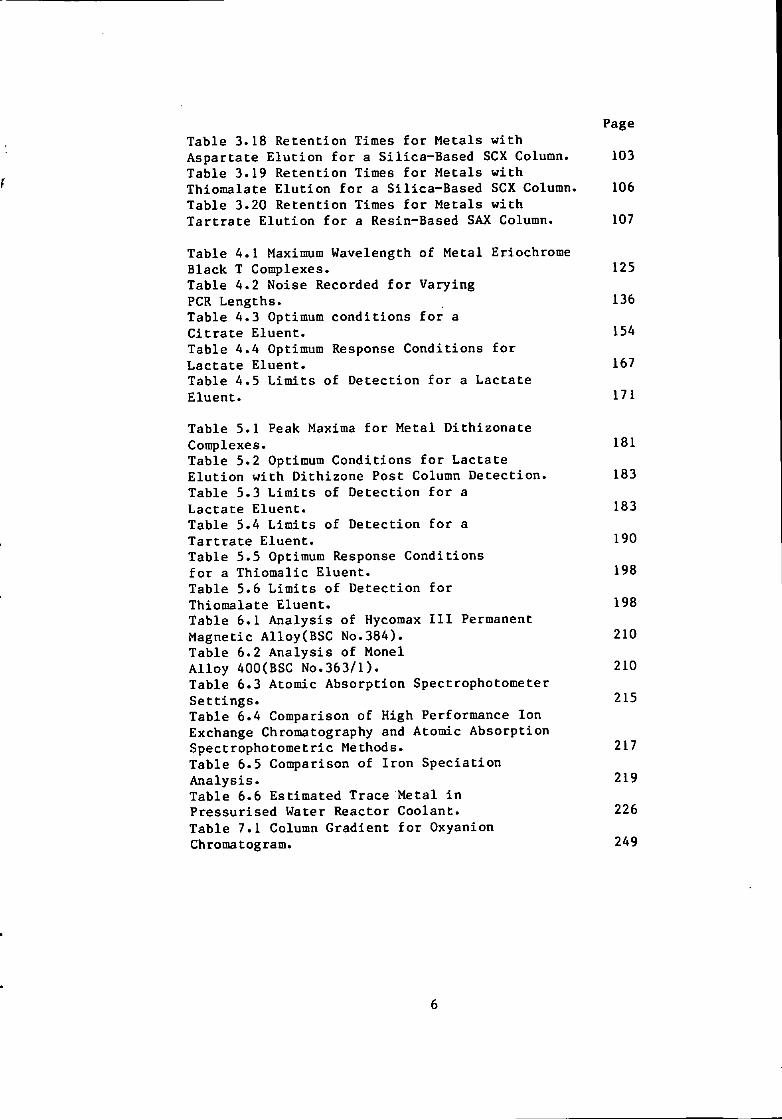
Page Table 3.18 Retention Times f o r Metals w i t h Aspartate E l u t i o n f o r a Silica-Based SCX Column. 103 Table 3-19 Retention Times f o r Metals w i t h Thiomalate E l u t i o n f o r a Silica-Based SCX Column. 106 Table 3.20 Retention Times f o r Metals w i t h T a r t r a t e E l u t i o n f o r a Resin-Based SAX Column. 107
Table 4.1 Maximum Wavelength of Metal Eriochrome Black T Complexes- 125 Table 4.2 Noise Recorded f o r Varying PGR Lengths- 136 Table 4.3 Optimum c o n d i t i o n s f o r a C i t r a t e Eluent. 154 Table 4.4 Optimum Response Conditions f o r Lactate Eluent. 167 Table 4.5 L i m i t s of Detection f o r a Lactate Eluent. 171
Table 5.1 Peak Maxima f o r Metal D i t h i z o n a t e Complexes- 181 Table 5.2 Optimum Conditions f o r Lactate E l u t i o n w i t h Dithizone Post Column Detection. 183 Table 5.3 L i m i t s of Detection f o r a Lactate Eluent. 183 Table 5.4 L i m i t s of Detection f o r a T a r t r a t e Eluent- 190 Table 5.5 Optimum Response Conditions f o r a Thiomalic Eluent. 198 Table 5.6 L i m i t s o f Detection f o r Thiomalate Eluent- 198 Table 6.1 Analysis of Hycomax I I I Permanent Magnetic Alloy(BSC No.384). 210 Table 6.2 Analysis of Monel A l l o y 400(BSC No.363/1). 210 Table 6.3 Atomic Absorption Spectrophotometer S e t t i n g s . 215 Table 6.4 Comparison of High Performance Ion Exchange Chromatography and Atomic Absorption Spectrophotometric Methods. 217 Table 6.5 Comparison of I r o n Speciation Analysis. 219 Table 6.6 Estimated Trace Metal i n Pressurised Water Reactor Coolant. 226 Table 7.1 Column Gradient f o r Oxyanion Chromatogram. 249

3. L i s t of Figures. Page
Figure 1.1 S t r u c t u r e of 1(2-pyridylazo)-2-naphthol and 4 - ( 2 - p y r i d y l a z o ) r e s o r t i n o l . 49 Figure 1.2 S t r u c t u r e o f Arsenazo I and I I I . 50 Figure 2.1 Schematic Diagram of High Performance L i q u i d Chromatography Inst r u m e n t a t i o n . 58 Figure 3.1 Separation w i t h a C i t r a t e Eluent. 78 Figure 3.2 Separation w i t h a C i t r a t e Eluent. 79 Figure 3.3 Separation w i t h a T a r t r a t e Eluent. 81 Figure 3.4 Separation w i t h a T a r t r a t e Eluent. 82 Figure 3-5 Separation w i t h an Oxalate Eluent. 85 Figure 3.6 Separation w i t h a Lactate Eluent. 88 Figure 3.7 Separation w i t h a Lactate Eluent. 89 Figure 3.8 Separation w i t h a L actate Eluent. 90 Figure 3.9 Separation w i t h a Thiomalate Eluent. 99 Figure 4.1 Copper Eriochrome Black T Spectra. 121 Figure 4.2 Magnesium Eriochrome Black T Spectra. 122 Figure 4.3 Ferrous Eriochrome Black T Spectra. 123 Figure 4.4 Chromatogram w i t h Detection a t 420 nm. 128 Figure 4.5 Chromatogram w i t h Detection a t 460 nm. 129 Figure 4.6 Chromatogram w i t h Detection a t 500 nm. 130 Figure 4.7 Chromatogram w i t h Detection at 540 nm. 131 Figure 4.8 Chromatogram w i t h Detection a t 610 nm- 132 Figure 4.9 Eriochrome Black T Response versus Temperature f o r a C i t r a t e Eluent. 142 Figure 4.10 Eriochrome Black T Response versus Post Column Reagent Flow Rate f o r a C i t r a t e Eluent. 143 Figure 4.11 Eriochrome Black T Response versus Absorbance a t 610 nm f o r a C i t r a t e Eluent. 144 Figure 4.12 Eriochrome Black T Response versus Post Column Reactor Residence Time f o r a C i t r a t e Eluent. 145 Figure 4.13 Eriochrome Black T Response versus Post Column Reactor pH f o r a C i t r a t e Eluent. 146 Figure 4.14 Eriochrome Black T Response versus Post Column pH f o r a C i t r a t e Eluenc. 147 Figure 4-15 Eriochrome Black T Response versus Post Column pH f o r a C i t r a t e Eluent. 148 Figure 4.16 C a l i b r a t i o n f o r a C i t r a t e Eluent. 149 Figure 4.17 C a l i b r a t i o n f o r a C i t r a t e Eluent. 150 Figure 4.18 C a l i b r a t i o n f o r a C i t r a t e Eluent. 151 Figure 4.19 E f f e c t of Flow on Eriochrome Black T Post Column Absorbance f o r a Lactate Eluent. 152 Figure 4.20 D i l u t i o n of Analyte by Increased Post Column Reagent Flow Rate f o r a Lactate Eluent. 153 Figure 4.21 Eriochrome Black T Response versus Post Column Absorbance f o r a Lactate Eluent. 160 Figure 4.22 Eriochrome Black T Response versus Post Coluan pH f o r a Lactate Eluent. 161 Figure 4.23 Eriochrome Black T Response versus Post Column Temperature f o r a Lactate Eluent. 162 Figure 4.24 Eriochrome Black T Response versus Post Column Reagent Flow Rate f o r a Lactate Eluent. 163 Figure 4.25 C a l i b r a t i o n f o r a Lactate Eluent. 164

Page
Figure 4.26 C a l i b r a t i o n f o r a Lactate Eluent. 165 Figure 4.27 C a l i b r a t i o n f o r a Lactate Eluent- 166 Figure 5.1 Dithizone Detection Response versus Temperature f o r a Lactate Eluent. 184 Figure 5.2 Dithizone Detection Response versus Post Column Absorbance f o r a Lactate Eluent. 185 Figure 5.3 Dithizone Detection Response versus Post Column pH f o r a Lactate Eluent. 186 Figure 5.4 C a l i b r a t i o n f o r a Lactate Eluent. 187 Figure 5.5 C a l i b r a t i o n f o r a Lactate Eluent. 188 Figure 5.6 C a l i b r a t i o n f o r a T a r t r a t e Eluent. 191 Figure 5.7 Dithizone Detection Response versus Post Column Reactor pH f o r a Thiomalate Eluent- 193 Figure 5.8 Dithizone Detection Response versus Post Column Reactor Absorbance a t 595 nm f o r a Thiomalate Eluent. 194 Figure 5.9 Dithizone Detection Response versus Post column Reactor Temperature f o r a Thiomalate Eluent. 195 Figure 5.10 Dithizone Detection Response versus Post column Reactor Flow Rate f o r a Thiomalate Eluent- 196 Figure 5-11 Dithizone Detector C a l i b r a t i o n f o r a Thiomalate Eluent. 197 Figure 6.1 Chromatogram of Monel A l l o y A n a l y s i s . 208 Figure 6.2 Chromatogram of Magnetic A l l o y Analysis. 209 Figure 6.3 Chromatogram from Carnon River Sample- 220 Figure 6-4 Copper i n The Carnon by High Performance Ion Exchange Chromatography and Atomic
Absorption Spectroscopy- 221 Figure 6.5 Manganese i n The Carnon by High Performance Ion Exchange Chromatography and Atomic Absorption Spectroscopy. 222 Figure 6.6 Zinc i n The Carnon by High Performance Ion Exchange Chromatography and Atomic Absorption Spectroscopy. 223 Figure 6.7 Ferrous and F e r r i c Ratios by The Ferrozine Method. 224 Figure 6.8 Ferrous and F e r r i c Ratios by High Pressure L i q u i d Ion Exchange Chromatography. 224 Figure 6.9 Chromatogram Obtained A f t e r Trace Enrichment of Simulated Reactor Coolant- 229 Figure 6.10 Trace Enrichment C a l i b r a t i o n Curves of a Simulated Pressurised Water Reactor- 320 Figure 7.1 Chromatogram w i t h Dithizone-S Detection. 238 Figure 7.2 Chromatogram w i t h Pyrocatechol Detection of Divalent Metal Cations- 243 Figure 7.3 Chromatogram w i t h Pyrocatechol V i o l e t Detection of Oxyanions. 248
1 I n t r o d u c t i o n .
1.1 The Role of Trace Metals-
Over the l a s t few decades the importance of trace
a n a l y s i s f o r metals has been recognised. The impact of a
trace q u a n t i t y can cause s i g n i f i c a n t e f f e c t s e s p e c i a l l y
regarding h e a l t h and malignant d i s e a s e s ( l ) . Physical
defects can also occur I n manufactured s o l i d s because of
the presence of trace contaminants. This i s c r i t i c a l i n
high technology i n d u s t r i e s t h a t r e q u i r e a high degree of
p u r i t y , e s p e c i a l l y i n the production of semi-conductors
and f i b r e o p t i c s - The chemical i n d u s t r y i s dependant
upon the c a t a l y s i s of chemical reactions where f o r
example the chemical v e r s a t i l i t y of the d-block
t r a n s i t i o n metals make t h e i r complexes i d e a l f o r organic
synthesis. A quick and accurate assessment of c a t a l y s t
l i f e t i m e and the degree of poisoning i s an a i d f o r lower
energy requirements and higher y i e l d s . Major areas of
concern f o r trace a n a l y s i s are raw m a t e r i a l s and
production q u a l i t y c o n t r o l of chemicals, e s p e c i a l l y
since the i n t r o d u c t i o n of recent E-E.C. l e g i s l a t i o n .
Recently more concern has been shown i n the
i n v e s t i g a t i o n of trace q u a n t i t i e s e s p e c i a l l y r e l a t i n g t o
t h e i r impact as d i f f e r e n t species. As the r o l e of metal
species has become e v i d e n t , medical and c l i n i c a l
s t u d i e s , and the monitoring of p o l l u t a n t s has become
9

i n c r e a s i n g l y important. A trace element may play a
s p e c i a l r o l e i n h e a l t h and disease as:
i ) an e s s e n t i a l n u t r i e n t t o higher m^ammals, such as
c o b a l t , copper, chromium, i r o n , manganese, zinc and
molybdenum(2);
i i ) a causative agent, such as mercury, cadmium,
n i c k e l and lead i n t o x i c o l o g y ;
i i i ) t h e r a p e u t i c agents such as gold and platinum.
Trace element pathways and cycles i n the environment
have become in c r e a s i n g important as more instances of
p o l l u t i o n have occurred. Also f o r a b e t t e r understanding
of the eco-system and the g e o l o g i c a l processes we need
to f o l l o w the pathways between the various environments,
and the dynamic r e l a t i o n s h i p s of the c o n s t i t u e n t
components of each.
Thus trace metals can have s i g n i f i c a n t e f f e c t i n a
wide v a r i e t y of f i e l d s and the development of s c i e n t i f i c
models i n fundamental research i s o f t e n dependant upon
the a b i l i t y t o measure low concentrations of a metal or
m e t a l l i c species.
1.2 Importance of Trace Metal Species.
The s p e c i a t i o n , or chemical form, of an element can
have a dramatic e f f e c t on i t s t o x i c i t y and a v a i l a b i l i t y
as an e s s e n t i a l trace element. For example, chromium an
e s s e n t i a l element, which maintains normal glucose
10

metabolism(3), i s much more t o x i c i n the hexavalent
s t a t e , as a carcinogen, than i n the t r i v a l e n t s t a t e .
Chromium e s s e n t i a l element a c t i v i t y i s l i m i t e d t o the
t r i v a l e n t s t a t e , however r a d i o a c t i v e t r a c e r work
i n d i c a t e s t h a t chromium(VI) i s absorbed b e t t e r than
c h r o m i u m ( l l l ) , r e a d i l y passing through the red blood
c e l l s to become adsorped to the g l o b u l i n f r a c t i o n of the
haemoglobin(4). This i s one of numerous examples and i t
i s evident t h a t we need to know more than the q u a n t i t y
of metal present. I t may be necessary t o know:
i ) the o x i d a t i o n s t a t e ( s ) ;
i i ) the degree and type of complexation;
i i i ) the presence of organo-metallic forms.
Organo-metallic species can have many times the
t o x i c i t y of the purely i o n i c species. The s o l u b i l i t y of
the organo-metallic species enhances the t o x i c i t y and
l i p i d s o l u b i l i t y leads t o b i o l o g i c a l reconcentration i n
the f a t t y t i s s u e . So the d i l u t i o n e f f e c t of f o r instance
the sea, maybe countered by t h i s reconcentration e f f e c t .
For higher animals the form and consequent
a v a i l a b i l i t y of an element i s important. Hence f o r one
element i t i s possible t o have a s i t u a t i o n of severe
d e f i c i e n c y through a range of adequacy, t o
11
pharmacological e f f e c t s , t o acute t o x i c i t y ( 5 ) . To assess
the long term t o x i c i t y and observe i n d i c a t o r s a need to
study the s u b - c l i n i c a l l e v e l s a r i s e s . Such st u d i e s
require more s e n s i t i v e means of d e t e c t i o n i n terms of
con c e n t r a t i o n and s p e c i a t i o n .
The t o x i c i t y of cadmium, copper, mercury and lead are
w e l l documented by authors and government
p u b l i c a t i o n s ( 6 - l l ) . Lead and mercury form
organo-metallic compounds that have a greater t o x i c i t y
than the element. The t o x i c i t y of organo-lead compounds
to the b r a i n and l i v e r , and the e f f e c t organo-mercurials
on genetic mutation make them the subjects of i n t e n s i v e
study(12).
So there i s i n c r e a s i n g need f o r methods capable of
multi-element and s p e c i a t i o n determinations on the same
sample. One f i e l d of research has been to develop
chromatographic techniques using modern high performance
l i q u i d chromatography(HPLC). P r i m a r i l y the concern of
t h i s t h e s i s i s w i t h t r a n s i t i o n metal c a t i o n i c species
and t h e i r separation by ion chromatography w i t h
d e t e c t i o n by photometric reagents. I t i s hoped to show
t h a t i t i s possible to determine cadmium, chromium,
c o b a l t , copper, indium, i r o n , lead, manganese,
magnesium, molybdenum, n i c k e l , tungsten, vanadium and
zinc and to jefe/Pf*^C them i n environmental as w e l l as
i n d u s t r i a l samples. These elements are given good
coverage i n the l i t e r a t u r e f o r t h e i r environmental,
12
g e o l o g i c a l and b i o l o g i c a l r o l e s ( 1 3 - 1 5 ) .
1,3 Review of Trace Metal Analysis.
The range of trace a n a l y s i s and u l t r a - t r a c e a n a l y s i s
can be defined as concentrations of 1 t o 100 pg g ^
and less than 1 pg g ^, r e s p e c t i v e l y . Because of the
low concentrations there are i n h e r e n t problems; such as
m a t r i x removal. A t o p o l o g i c a l problem, involved w i t h f o r
example, small areas of c o r r o s i o n may require a s p e c i a l
probe so the choice of method i s normally determined by
the problem. Often the trace element plays a v i t a l r o l e
and a n a l y s i s may i n v o l v e determining a r a r e , t o x i c , or
unstable species. Sampling, and pretreatment of a sample
may a f f e c t ( a n d o f t e n does a f f e c t ) the observation, and
has t o be taken i n t o account. The major associated
problems(16) are those o f ; contamination,
i n t e r f e r e n c e ( s ) , preparation of an accurate standard and
loss of sample or standard d u r i n g the a n a l y t i c a l
procedure, where adsorption occurs on a container
surface. Contamination may occur from the a i r , the
analyst or using ^a sample container that i s not
s u i t a b l e .
Early q u a n t i t a t i v e elemental determinations which were
the precursors of i n s t r u m e n t a l techniques were
m i c r o - a n a l y t i c a l methods(17), c h i e f l y concerned w i t h
g r a v i m e t r i c and t i t r i m e t r i c procedures. Colourimetry and
13

nephelometry were the f i r s t to be measured w i t h
e l e c t r i c a l a ssistance(18). The general lack of
s e l e c t i v i t y and s e n s i t i v i t y of these methods le d to the
development of other techniques such as those based on
atomic spectroscopy and voltammetry-
1.4.Present Methods.
There are many s o l u t i o n and s o l i d techniques
a v a i l a b l e ; a few are compared i n Table 1. The number of
elements determinable w i t h l i m i t s of d e t e c t i o n of 10
p.p.b. or less are quoted i n Table.1, absolute weights
are used to give a b e t t e r comparison. Flame
spectrophotometry approaches the picogram l e v e l of
d e t e c t i o n f o r about ten elements.
14

Table.1.
Comparison of range of Detection L i m i t s f o r D i f f e r e n t A n a l y t i c a l Methods.
Method Range of Detection
L i m i t / pg
Molecular Absorption
Molecular Fluorescence
Flame Atomic Absorption
1-0.1
0.01-0.001
0.1-0.0001
Electrothermal Atomic Absorption 0.001-0.000001
Flame Emission
Plasma Emission
ICP-MS
Neutron A c t i v a t i o n
Pulse Polarography
Anodic S t r i p p i n g Voltammetry:
Mercury drop
Thin Film
1-0.1
0.01-0.001
0.01-0.000001
0.0001-0.00001
0.01-0.001
0.01-0.0001
0.0001-0.00001
There are over 20 methods of electrochemical a n a l y s i s
some of which have p.p.b. d e t e c t i o n l i m i t s .
Emission techniques are commonly used f o r s o l i d
samples, spark source mass spectrometry has a l i m i t of
d e t e c t i o n of 100 picograms f o r over 70 elements.
A c t i v a t i o n a n a l y s i s approaches the same s e n s i t i v i t y , but
15
f o r fewer elements. X-ray a n a l y s i s , o f t e n of s o l i d
surfaces and s o l i d samples has l i m i t s of d e t e c t i o n
around 0.1 pg.g ^.
1.5.Multi-element and Speclation Analysis.
Many a n a l y t i c a l i n v e s t i g a t i o n s now require the
determination of several elements i n an a n a l y t e ,
excessive time i s involved i f the elements have to be
q u a n t i f i e d i n d i v i d u a l l y . Because of t h i s multi-element
methods have become popular, but e i t h e r the number of
elements determined i s l i m i t e d or the i n s t r u m e n t a t i o n i s
r e l a t i v e l y expensive due to the high degree of
s o p h i s t i c a t i o n necessary.
Atomic emission and i n d u c t i v e l y coupled plasma o p t i c a l
emission spectroscopy(ICP-OES) instruments w i t h
simultaneous multi-element c a p a b i l i t i e s are now
a v a i l a b l e ; ICP-OES can determine some seventy elements,
b e t t e r i n g the s e n s i t i v i t y of other emission techniques
f o r some elements by orders of magnitude.
Anodic s t r i p p i n g voltammetry(ASV) or
chronopotentiometry, e f f e c t s the sequential
polarographic s t r i p p i n g of metals by reversing the
p o l a r i t y a f t e r d e p o s i t i o n . A l i q u i d mercury e l e c t r o d e ,
which has the voltage reversed f o r a n a l y s i s , prevents
the t r a p p i n g of minor c o n s t i t u e n t s . I t i s one of the
most s e n s i t i v e methods because of the concentration step
16

and can determine elements i n the pg ml
concentration range, but i s u s u a l l y l i m i t e d t o 3 t o 6
elements i n a p a r t i c u l a r determination-
Although ICP-OES and ASV are very s e n s i t i v e they have
l i m i t e d s p e c i a t i o n c a p a b i l i t y , e s p e c i a l l y ICP-OES. The
area of s p e c i a t i o n requires p a r t i c u l a r a t t e n t i o n and
t h i s r o l e as w e l l as having multi-element c a p a b i l i t y may
be f i l l e d w i t h HPLC methods, e s p e c i a l l y w i t h the recent
rapid development of column m a t e r i a l s .
An i n c r e a s i n g demand f o r s e n s i t i v e multi-element
determinations i s evident i n high technology. E.E.C.
l e g i s l a t i o n has implemented s t r i n g e n t l i m i t s f o r
concentrations of c e r t a i n t o x i c elements, a c t i v e
pharmaceutical i n g r e d i e n t s and food a d d i t i v e s . Research
also requires a l t e r n a t i v e s w i t h less investment,
o f f e r i n g chemical s p e c i a t i o n and multi-element a n a l y s i s .
L i q u i d chromatography(LC), can play a r o l e i n f i l l i n g
t h i s a n a l y t i c a l niche. Early LC techniques were slow,
but forced-flow and HPLC have i l l u s t r a t e d t h a t more
metals can be determined w i t h quicker e l u t i o n times. The
HPLC of metals was not p r e v i o u s l y s e r i o u s l y considered,
because of the dominance, i n terms of s e l e c t i v i t y and
s e n s i t i v i t y of electrochemical and atomic spectroscopic
techniques.
Metal determinations and s p e c i a t i o n studies w i t h gas
chromatography(GC) coupled t o atomic absorption
detectorsC19) have the disadvantage t h a t only the
17

v o l a t i l e metal d e r i v a t i v e s are separable. LC can be used
to separate v o l a t i l e and n o n - v o l a t i l e m e t a l l i c species.
I t i s hoped t o show th a t t h i s i s possible w i t h modern
io n exchange and n e u t r a l l i q u i d column chromatography
m a t e r i a l s , f o r the separation of cations and t r a n s i t i o n
metal anions.
1.6.Liquid Chromatographic Determination of Trace
Metals.
Chromatography(20,21) p h y s i c a l l y separates chemically
d i f f e r e n t substances as a dynamic process. The varying
a t t r a c t i o n s of a substance f o r the chromatographic
substrate i n an eluent f l o w are responsible f o r the
separation. Choice of column packing m a t e r i a l and
v a r i a t i o n of the eluent composition are the main
v a r i a b l e s f o r r e s o l v i n g mixtures.
The notable pioneer of LC techniques was M i k h a i l
Semenovich Tsvet who i n 1903 separated p l a n t pigments
using a s i l i c a s u b s t r a t e ( 2 2 ) . However, research reveals
t h a t as e a r l y as 1850, Way experimented w i t h the i o n
exchange a b i l i t y of a column of s o i l ( 2 1 ) . Thin l a y e r
chromatography has considerable usage, but i s not
considered f u r t h e r i n t h i s t h e s i s .
Since the l a t e 1960's b e t t e r determinations and
separations have been developed. To understand LC and
HPLC processes and recent improvements, a b r i e f
18

discussion of chromatographic parameters i s necessary.
1.7.Chromatographic Parameters(20,21).
Retention of an e l u t e , n e g l e c t i n g peak broadening and
n o n - l i n e a r i t y , i s measured as the r e t e n t i o n f a c t o r or
capacity f a c t o r ( k ) ;
where the r e t e n t i o n time or volume of the
e l u t e ( t ^ ) i s given a dimensionless value using the
column void parameter of the same di m e n s i o n s ( t ^ ) .
This i s an allowance f o r the chromatographic delay
w i t h i n the column. A n o n - i n t e r a c t i v e substance t h a t can
enter the i n t e r s t i t i a l and i n t r a p a r c i c u l a t e spaces
occupied by the mobile phase i s used to determine the
void q u a n t i t y . This has been i n debate r e c e n t l y , as the
supposedly n o n - i n t e r a c t i n g deuterated solvents were
g i v i n g f a l s e values(23). The adjusted r e t e n t i o n q u a n t i t y
has important p r a c t i c a l and t h e o r e t i c a l s i g n i f i c a n c e ,
equations normally express these fundamental
r e l a t i o n s h i p s as volumes.
V = V (1+k) r o
19

Where V and V are the r e t e n t i o n and void r o volumes r e s p e c t i v e l y . There i s a d i r e c t r e l a t i o n s h i p t o
thermodynamic values between the s t a t i o n a r y ( V ^ ) and
mobile phase volumes i n the column f o r the e l u t e d
species,
V = V + KV r o s
p r o v i d i n g t h a t a l i n e a r r e l a t i o n s h i p i s observed
between the concentration of the component on the
substrate(C ) and the mobile phase(C ) ( 2 1 ) . s m Linear e l u t i o n s o r p t i o n chromatography i s a mathematical
model and the column i s considered a GotLssian operator
on the introduced sample g i v i n g a symmetrical peak.
Langmuir and anti-Langmuir s o r p t i o n isotherms of C s
versus demonstrate t a i l i n g and f r o n t i n g of the
chromatographic peak, r e s p e c t i v e l y . Column overloading
frequent i n ion chromatography i s u s u a l l y because of low
c a p a c i t i e s and i s i n d i c a t e d by peak f r o n t i n g .
20

1.8.Resolution.
The e f f e c t i v e n e s s of the separation may be measured as
the r e s o l u t i o n R . Consider two peaks of adjusted
r e t e n t i o n time t ^ , and t ^ , . Then:
R = t - t , s r 0.5(w + w')
Where 0.5(w+w*) i s the mean band wi d t h at the base of
the peaks. I f a GoUssian chromatographic peak i s
observed the mean peak width i s expressed as 4 standard
d e v i a t i o n s . The r e s o l u t i o n of a column i s a f u n c t i o n of
s e l e c t i v i t y , r e t e n t i o n and e f f i c i e n c y of the column.
S e l e c t i v i t y ( a ) i s a f u n c t i o n of the r a t i o of the
thermodynamic e q u i l i b r i u m constants associated w i t h the
r e t e n t i o n and should be greater than 1, t h i s may be
expressed as a r e l a t i v e . r e t e n t i o n f u n c t i o n t o an
ascribed e l u t e , which should also be gr e a t e r than 1 f o r
separation.
Column e f f i c i e n c y i s measured as the r e l a t i v e
narrowness of peaks, by the r a t i o of the r e t e n t i o n time
t o peak width. E f f i c i e n c y u n i t s are expressed i n terms
of t h e o r e t i c a l p l a t e s ( N ) . The required number of pl a t e s
i n terms of column length f o r a separation can be
c a l c u l a t e d .
The square roo t o f the required p l a t e s f o r the
separation of two peaks i s expressed as:
21

N^^^ = M a ) ( k + l ) T^).TkT
The e f f i c i e n c y of the column has an inverse geometric
r e l a t i o n s h i p w i t h p a r t i c l e s i z e . Band broadening i s
re l a t e d t o u n i f o r m i t y and size of the p a r t i c l e . Major
c o n t r i b u t o r s being eddy d i f f u s i o n , molecular d i f f u s i o n
and mass t r a n s f e r ( 2 4 ) . Although other models e x i s t the
r e l a t i o n s h i p s defined above f o r adsorption
chromatography may also be applied t o c l a s s i c a l as w e l l
as high performance l i q u i d i o n exchange
chromatography(HPLIEC). Small diameter s p h e r i c a l
p a r t i c l e s give rapid mass t r a n s f e r and b e t t e r
r e s o l u t i o n . C l a s s i c a l column chromatography used large
diameter p a r t i c l e s and i t was not u n t i l the technology
i n v o l v i n g high pressure pumps and small diameter column
ma t e r i a l s was a v a i l a b l e t h a t an improvement i n column
e f f i c i e n c y t r a n s p i r e d , which considerably increased the
separating power and speed of a n a l y s i s .
1.9.Development of HPLC Column M a t e r i a l s .
Early HPLC m a t e r i a l s were of s i l i c a and used c h i e f l y
f o r organic separations. The p a r t i c l e s were u s u a l l y
greater than 20 pm i n diameter and the subsequent slow
22

d i f f u s i o n i n the porous s t a t i o n a r y phase was to the
detriment of r e s o l u t i o n . Resolution was improved f o r
microporous m a t e r i a l s by using an i n e r t non-porous core,
known as a p e l l i c u l a r phase or a l t e r n a t i v e l y by using a
smaller p a r t i c l e . The surface of p e l l i c u l a r p a r t i c l e s
can have various groups attached t o form reverse phase
or i o n exchange s t a t i o n a r y phases. A p e l l i c u l a r i o n
exchanger was developed i n the l a t e 1960*s f o r the
separation of n u c l e o t i d e s ( 2 5 ) , but large p a r t i c l e s gave
a l a r g e eddy d i f f u s i o n term t h a t c o n t r i b u t e d
considerably t o band broadening. Better HPLIEC i s
obtained w i t h smaller sized bonded i o n s t a t i o n a r y
phases.
The t r a n s i t i o n t o HPLC from LC was easier f o r s i l i c a
s t a t i o n a r y phase substrates since i o n exchange resins
have problems of s w e l l i n g and slow mass t r a n s p o r t r a t e s .
A channelled p a r t i c l e was developed f o r l i q u i d
chromatography, known as m a c r o r e t i c u l a r i o n exchanger,
which increased the mass t r a n s f e r as a r e s u l t of smaller
l e n g t h micropores. Some macroporous resins are a v a i l a b l e
f o r HPLIEC, but as yet have proven unsuccessful. HPLIEC
uses p a r t i a l l y sulphonated m a t e r i a l s of t y p i c a l
c a p a c i t i e s between 0.005 and 0.1 meq.g ^. Resins can
withstand concentrated a c i d , a l k a l i or a decimolar EDTA
s o l u t i o n making them easy t o regenerate a f t e r poisoning
and g i v i n g a v i r t u a l u n l i m i t e d choice of eluent. S i l i c a
exchangers operate between pH 2 to 7 and are almost
23

impossible t o regenerate. Swelling of the r e s i n i n an
organic solvent was a problem, but i s minimised w i t h a
higher degree of c r o s s - l i n k i n g .
A good c a t i o n exchanger should have a low c a p a c i t y ,
0-005 to 0.05 meq.g ^ ;pH s t a b i l i t y over a wide
range w i t h a wide range of s e l e c t i v i t i e s .
Anion exchange resins are manufactured as a r i g i d core
of styrene d i v i n y l benzene polymer converted to a c a t i o n
exchange r e s i n by sulphonation and then an aninated
l a t e x i s agglomerated t o the sulphonated bead, t o form a
quaternary anionic exchanger. However developments i n
the manufacture of polymer based i o n exchange m a t e r i a l s
remain behind s i l i c a - b a s e d m a t e r i a l s i n terms of column
e f f i c i e n c y .
The HPLC of trace metals i s dependant upon s e n s i t i v e
multi-element d e t e c t i o n , however metal separation had to
be improved before the technique could be considered a
v i a b l e a l t e r n a t i v e t o spectroscopic and electrochemical
techniques.
1.10 Review of HPLC of Trace Metals.
1.11 P a r t i t i o n and S i l i c a Separations.
Numerous l i q u i d chromatographic techniques on
d i f f e r e n t substrates were developed since Tsvet, but
p r i m a r i l y , adsorption chromatography using s i l i c a and
2A

alumina substrates was adapted f o r HPLC, because of
t h e i r previous successes w i t h column chromatography- The
HPLC of trace metals a t th a t time was not considered a
serious contender t o atomic spectroscopy and
electrochemical methods.
Forced flow and e a r l y HPLC techniques showed
considerable p o s s i b i l i t i e s as i n reviews by Schwedt(26)
and F r i t 2 ( 2 7 ) where the primary concern was w i t h the
separation of metals as t h e i r complexes. Veening also
reviewed HPLC of organo-metallic species and metal
complex chemistry, but mostly f o r s y n t h e t i c
coraplexes(28).
One of the e a r l i e s t HPLC separations involved metals
as t h e i r acetylacetonates. This was achieved w i t h an
i s o c r a t i c l i q u i d / l i q u i d separation, using diatomaceous
e a r t h p a r t i c l e s ( 5 t o 10 pm diameter) as the substrate
f o r the aqueous phase and an ethanol
2,2,4-trimethylpentane mixture as the mobile phase(29).
T o l l i n c h e ( 3 0 ) reported on the separation of d i - and
t r i v a l e n t metals as t h e i r beta-diketonates on a s i l i c a
s u b s t r a t e .
Early separations mostly performed on s i l i c a r e q u i red
the pretreatment of samples, which may include a
preconcentration step using organic s o l v e n t ( s ) .
D e r i v a t i s e d complexes were then i n j e c t e d onto the column
top, u s u a l l y i n t o an organic eluent. Those c h e l a t i n g
agents t h a t gave the greater number of complexes and of
25
highest a b s o r p t i v i t y were found t o be p a r t i c u l a r l y
s uccessful, e s p e c i a l l y d i t h i z o n a t e s and
d i e t h y l d i t h i o c a r b a m a t e s O l ) . Cobalt, copper, mercury,
and n i c k e l d i t h i z o n a t e s were separated on a 30 \im s i l i c a
g e l column(32). Lohmuller also reported r e t e n t i o n data
f o r more metals w i t h numerous other solvents. Glass
l i n e d s t a i n l e s s s t e e l columns have been used w i t h p o l a r
m o d i f i e r s such as a c e t i c acid to avoid using aromatic
e l u e n t s ( 3 3 ) , Heizmann(3A) i n v e s t i g a t e d the metal
complexing agents 1,2-diketobisthiosemicarbazone,
d i a l k y l d i t h i o c a r b a m a t e and
1,2-diketobisthiobenzhydrazone. Four metal complexes
were separated i n f o r t y minutes and t h i s was improved t o
10 minutes by gradient e l u t i o n . Nanogram l e v e l s were
detectable. D i f f e r e n t c h e l a t i n g agent s u b s t i t u e n t s were
found t o a l t e r the r e t e n t i o n time. Schwedt(35) reported
t r a n s i t i o n metals separated by adsorption chromatography
as acetylacetonates, cyclopentadienyl and
triphenylphosphine complexes, quoting references t o the
separation and d e t e c t i o n techniques. Schwedt drew an
obvious p a r a l l e l between TLC and the HPLC of
dithiocarbamates and went on to s t a t e t h a t p r a c t i c a l
a n a l y t i c a l problems have yet t o be solved by HPLC
although some separations had been thoroughly
i n v e s t i g a t e d ( 3 6 ) . 0*Liska(37) demonstrated the best
separation of nine d i e t h y l dithiocarbamates on a 10 pm
s i l i c a i n 20 minutes. The e l u t i o n sequence of the
26

s u b s t i t u t e d d i t h i o d i e t h y l c a r b a m a t e s was s t a t e d f o r
various chloroform cyclohexane mixtures. Chromatographic
separations of mixtures of b i s - d i a l k y l d i t h i o c a r b a m a t e s
i l l u s t r a t e d t h a t l i g a n d exchange reactions occurred w i t h
ease during the separation process(38).
1.12 Reverse Phase Separations.
A non-polar s t a t i o n a r y phase of hydrocarbonaceous
l i g a t e s attached t o a s i l i c a base using a siloxane bond
i s known as a reverse phase substrate. This type of
packing has C to C a l k y l chain length capped
s i t e s on the s i l i c a substrate and can e x h i b i t higher
e f f i c i e n c i e s than s i l i c a s u b strates.
Separation depends upon the v a r y i n g degree of
p o l a r i z a t i o n of the molecules to be separated, a more
polar eluent encourages the hydrophobic complexes to be
re t a i n e d . Medium to high p o l a r i t y compounds may also be
separated i f p a r t of the molecule i s hydrophobic.
The d i e t h y l d i t h i o c a r b a m a t e s of c h r o m i u m ( I I I ) , c o b a l t ,
copper, lead, mercury, n i c k e l , selenium, and zinc were
i n v e s t i g a t e d . Lead and copper co-eluted, a v a r i a b l e
wavelength was necessary f o r d e t e c t i o n ( 3 9 ) . Cadmium,
c o b a l t , copper, lead, mercury, n i c k e l and zinc were
separated as t h e i r tetramethylenedithiocarbamates(40).
Pre-column complexation and phase separation of an
aqueous analyte was avoided, w i t h a d i r e c t i n j e c t i o n
27

onto a H y p e r s i l CDS column and a 0.5% m/v sodium
d i e t h y l d i t h i o c a r b a m a t e e l u e n t ( 4 1 ) . Such time saving
allows dynamically unstable samples to be determined.
Some d i f f i c u l t y oiay be encountered w i t h bonded phases
because of chemisorption on the uncapped s i t e s as f o r
example, i n the determination of beta-diketonates(30).
1.13 Reverse Phase Ion Pair Separations.
A charged species can form an i o n p a i r w i t h a compound
that has a hydrophobic f r a c t i o n which i s attached t o the
reverse phase. The a t t r a c t i o n of the reverse phase by
t h i s eluent molecule i s the basis f o r d i f f e r e n t i a l
r e t e n t i o n . Normally a quaternary ammonium s a l t i s used
f o r anions and a long chain sulphonate or a sulphate f o r
ca t i o n s .
A r e l a t e d technique uses dynamically coated columns
f o r the separation of metal ions and anions by paired
i o n chromatography(42,A3). The i o n p a i r i n g agent,
u s u a l l y a s u r f a c t a n t w i t h a hydrophobic carbon chain,
present i n the eluent can be passed through the column
using an organic solvent to keep a constant
concentration on the s o l i d phase, higher chain members
maybe deposited on the column p r i o r to separation.
Columns coated w i t h a carbon chain c o n t a i n i n g 12 atoms
gave the same e f f i c i e n c y as a carbon chain c o n t a i n i n g 20
atoms, however the former was not retained on the
28

column- Peak broadening can occur because of the
accumulation of the exchanger at the column top. The
r e p r o d u c i b i l i t y f o r anionic separations was i n v e s t i g a t e d
by Cassidy(44), he concluded t h a t reverse phase dynamic
coating i s more v e r s a t i l e than bonded i o n exchangers and
more reproducible. I t was thought t h a t higher chain
members(C to C,-) e x h i b i t e d surface i o n
exchange p r o p e r t i e s and those below about C8 form i o n
p a i r s . A more complex explanation s t a t e s that a dynamic
e q u i l i b r i u m e x i s t s between the species present and the
hydrophobic substrate and i s described as i o n
i n t e r a c t i o n chromatography(45).
T a r t r a t e has been used i n con j u n c t i o n w i t h a
sulphonate t o separate cadmium, c o b a l t , copper,
manganese, n i c k e l , lead and z i n c . An improved e f f i c i e n c y
of 50 to 90 % i s obtained w i t h Cg sulphonate over
the long chain sulphates. Whether i t i s due to the chain
length or the f u n c t i o n a l group was u n c l e a r ( 4 6 ) .
1.14 Speciation Analysis by Reverse Phase.
Any molecule or f r a c t i o n of a molecule t h a t i s
hydrophobic lends i t s e l f t o reverse phase separation.
This could be u s e f u l f o r organo-metallic s p e c i a t i o n
s t u d i e s . Brinkmann compared UV d e t e c t i o n w i t h flameless
AAS a f t e r separation by HPLC of a l k y l and aromatic
organo-mercurials(A7). The determination of a r s e n i c ,
29
lead, mercury, t i n and t h e i r organo-metallic species by
HPLC and a coupled technique are described. Numerous
s y n t h e t i c organo-metallic compounds have been separated-
But few environmentally Important species have been
determined- A technique f o r the determination o f a l k y l
and aromatic mercury compounds has been .assessed(47,48).
1.15 Review of High Performance Ion Exchange
Chromatography.
Before the discussion of HPLIEC, LC i o n exchange has
t o be mentioned because i t has considerable bearing on
the column m a t e r i a l s and eluents chosen, also a l l metals
mentioned f u r t h e r i n t h i s t h e s i s are : d i v a l e n t unless
otherwise s t a t e d .
I n the 1930*s column chromatography was beginning to
be recognised as an a n a l y t i c a l technique. Ion exchange
chromatography was brought t o the a t t e n t i o n o f the
s c i e n t i f i c world i n 1935 a f t e r the synthesis of a
sulphonated phenol-formaldehyde r e s i n . This r a p i d l y
developed because of great i n t e r e s t i n lanthanoid and
a c t i n o i d f i s s i o n products d u r i n g the 1940's which were
separated as t h e i r c i t r a t e s ( 2 1 ) .
Mineral a c i d s , e s p e c i a l l y h y d r o c h l o r i c acid enabled
the separation of t r a n s i t i o n metals, but as t h e i r
anionic complexes. Gradient e l u t l o n was necessary as
i r o n ( I H ) i s held on almost a 100 times stronger than
30

z l n c ( 2 0 ) - Hydrochloric acid eluent was employed w i t h a
sulphonated column t o separate t r a n s i t i o n metals(49). An
acetone/hydrochloric acid mixture was also
e f f e c t i v e ( 5 0 ) .
Organic acids eluents gave good separations on anionic
and c a t i o n exchange m a t e r i a l s , thus avoiding the use of
corro s i v e mineral acids. Numerous papers revealed t h a t
the combination of c a t l o n i c columns and organic acid
eluents resolved many t r a n s i t i o n metals, e.g.
c i t r a t e ( 5 1 ) and malonate(52) eluents f o r a l k a l i earths
separations. Acetate and ammonium c h l o r i d e eluent was
assessed f o r c e r i u m ( l l l ) , l a n t h a n u m ( l l l ) , i n d i u m ( I I I ) ,
and mercury and was found t o give q u a n t i t a t i v e
separations(53). Succinate(5A) and malate(55) eluents
f o r t r a n s i t i o n metal separations have been i n v e s t i g a t e d .
The merits of alpha-hydroxy-isobutyrate(HlBA) as an
eluent were recognised i n the c a t i o n i c displacement
chromatography f o r the separation of barium, calcium,
c e r i u m ( I I l ) and strontium(56,57)•
Although low pH obtained by mineral acids are normally
used t o separate the h i g h l y charged c a t i o n s ,
t i t a n i u m ( l V ) , vanadium(V), i r o n ( I I I ) , nobium(V), and
u r a n y l ( I l ) , the p o s s i b i l i t y of separation was
i n v e s t i g a t e d f o r fo r m i c , o x a l i c , t a r t a r i c and c i t r i c
acid e l u e n t s , d i s t r i b u t i o n c o e f f i c i e n t s were also
determined(58)«
The advantage i n terms of column e f f i c i e n c y of forced
31
flow e l u t i o n w i t h smaller diameter ion exchangers was
r e a l i s e d . A low capacity m a c r o r e t i c u l a r r e s i n was
i n v e s t i g a t e d f o r c a t i o n i c separations under forced flow
c o n d i t i o n s ( 5 9 ) . A s i m i l a r work used h y d r o c h l o r i c acid
and an acetone mixture w i t h more success(60).
Anionic exchange column chromatography was
i n v e s t i g a t e d t o separate uranium and thorium w i t h a
c i t r a t e e l u e n t ( 6 1 ) . T a r t r a t e showed the most promise f o r
t r a n s i t i o n metals, achieving the separation o f c o b a l t ,
i r o n , manganese, molybdenum and nlck.el(62). P i t s t i c k
also separated c o b a l t , copper, I r o n ( I I I ) , manganese and
zinc w i t h a t a r t r a t e e l u e n t ( 6 3 ) .
I t was not u n t i l the development of p e l l i c u l a r i o n
exchangers which have surface only exchange s i t e s t h a t a
higher e f f i c i e n c y was evldent(6A). P e l l i c u l a r m a t e r i a l s
can also withstand a higher column pressure g r a d i e n t .
Early HPLIEC was i n i t i a l l y performed on sulphonated
s i l i c a substrates- Resins were used at a l a t e r stage
because of the temporary advantages of forced flow
c o n d i t i o n s . P o l a r eluents are necessary f o r HPLIEC
separations because the method r e l i e s upon d i f f e r e n t i a l
i o n i c a t t r a c t i o n s . Mineral acids and e s p e c i a l l y
h y d r o c h l o r i c acid have been used at varying s t r e n g t h s ,
these could now be used w i t h r e s i n exchangers. Although
e a r l y column chromatography used mineral a c i d s ,
d i f f i c u l t y was experienced i n t r a n s f e r r i n g t o HPLIEC
systems, because of the c o r r o s i o n of the metal
32

components w i t h i n the HPLIEC system. Some h y d r o c h l o r i c
acid separations were used. However, a t the outset of LC
less c o r r o d i b l e e l u t i n g agents were i n v e s t i g a t e d .
Organic acids gave good separations and as a consequence
a preference f o r column packing m a t e r i a l s of lower
c a p a c i t i e s was shown.
Takata(65) i l l u s t r a t e d and thoroughly i n v e s t i g a t e d the
use of a s u p e r i o r s t r o n g c a t i o n exchange(SCX) r e s i n
H i t a c h i No.2611 w i t h a t a r t r a t e e l u e n t . The e f f e c t of
the degree of c r o s s - l i n k i n g , sodium c h l o r i d e
c o n c e n t r a t i o n , pH of the t a r t r a t e , f l o w v e l o c i t y through
the column and the e f f e c t of temperature were shown. The
separation of s i x metals using a 40 by 6 mm column w i t h
a 5-8 pm r e s i n i n two minutes i l l u s t r a t e s HPLIEC
c a p a b i l i t i e s .
Sevenich(66) i l l u s t r a t e s the advantages of adding
ethylene diamine t o the t a r t r a t e eluent t o sharpen the
peaks and increase the number of metals t h a t can be
separated. The improved chromatography obtained by using
the ethylene diammonium i o n was reviewed by F r i t 2 ( 6 7 ) .
Succinic acid eluent was studied f o r the c a t i o n
exchange separation of cadmium, c o b a l t , i r o n ( I I I ) , and
z i n c ( 6 8 ) .
Hwang et a l . ( 6 9 ) studied eluents on a l i g h t l y
sulphonated SCX Vidac column showing a comparison of
r e t e n t i o n times of c i t r a t e , t a r t r a t e , l a c t a t e and HIBA
f o r bismuth, cadmium, c o b a l t , copper, i r o n ( H ) & ( I I I ) ,
33

lead, manganese, n i c k e l , and zi n c . Another thorough
study by Takata(70) using l a c t a t e eluent separated
six t e e n rare earths using coulometric d e t e c t i o n . Some of
the rare earths could be separated without a complexing
agent present i n the e l u e n t . A comparison of column SCX
materi a l s i s made w i t h HIBA eluent f o r P a r t i s i l ,
N u c l e o s i l and Aminex A5, f o r the lanthanoids.
The e f f e c t s of sodium c h l o r i d e , ethanol and a mixture
of two SCX m a t e r i a l s has also been i n v e s t i g a t e d ( 7 1 ) •
Ethanol broadened the peaks and gave a longer r e t e n t i o n
time. Sodium c h l o r i d e decreased the r e t e n t i o n except f o r
cadmium.
Few organo-metallic separations have been performed on
a c a t i o n exchange column, however, methyl mercury and
the t r i a l k y l t i n s have been separated on a P a r t i s i l SCX
column w i t h a 60% v/v methanol and 0.042 M ammonium
acetate eluent a t pH 5.3(72).
Anion exchange(73,44) has found l i t t l e a p p l i c a t i o n i n
HPLIEC metal separations and has not had the success of
c a t i o n exchange chromatography. Organic and i n o r g a n i c
acids have been used as anionic complexing agents. A low
capacity anion exchanger was used f o r a notable
separation of chromate, molybdate, tungstate and
arsenate anions, w i t h a sodium carbonate, potassium
hydroxide e l u e n t ( 7 4 ) .
Some advantages are o f f e r e d by raicrobore
chromatography using 1 t o 2 mm I.D. columns.
34
Considerably less solvent and packing m a t e r i a l are
r e q u i r e d . However smaller p a r t i c l e s i z e m a t e r i a l s can
give up to a f i v e times increase i n s e n s i t i v i t y , but low
volume p r e c i s i o n pumps and d e t e c t i o n c e l l s are r e q u i r e d .
I s h i i and co-workers(75) performed a micro-scale
HPLIEC separation of 16 rare earths using HIBA eluent
and a 6 pm diameter resin-based sulphonated exchanger i n
a 0.5 by 75 mm column w i t h an HIBA e l u e n t . A
micro-feeder, which consisted of a small synchronous
motor, gears and screws was used as a d e l i v e r y pump w i t h
+ 0.01 m i c r o l i t r e accuracy. A H i t a c h i No.2610 SCX r e s i n
w.a.s used by the same author to separate the
radionuclides of sodium, potassium, rubidium and
caeslum(76).
1.16 High Performance L i q u i d Chromatography Detectors.
There are numerous techniques t h a t can be adapted to
detect an analyte i n a continuous f l o w by physical and
chemical means. Methods adapted f o r HPLC d e t e c t i o n by
post-column(PC) r e a c t i o n are analogous to f l o w i n j e c t i o n
a nalysis and automatic a n a l y s i s . A l l may o f f e r
p o s s i b i l i t i e s of i n v e s t i g a t i n g k i n e t i c parameters- Most
post-column reactor(PCR) d e t e c t o r requirements are
v i r t u a l l y the same. P r i m a r i l y , detectors should have
streamline f l o w , low volume, wide l i n e a r response range
35

and an i n s e n s i t i v i t y t o f l o w r a t e and temperature
f l u c t u a t i o n s . Detector baseline I n s t a b i l i t y does occur
and compensating measures are necessary f o r lower l i m i t s
of d e t e c t i o n . This may be termed noise and i s a major
problem f o r low l e v e l s of d e t e c t i o n and i s c h i e f l y
associated w i t h the e l e c t r o n i c s i g n a l , pump p u l s a t i o n
and t o a les s e r extent data a s s i m i l a t i o n .
There are many types of d e t e c t o r , o u t l i n e d i n Table
1.2 measuring spectroscopic, electrochemical and
phys i c a l p r o p e r t i e s of the column e f f l u e n t . Some such as
the mass, GC and mass spectrometric detectors r e q u i r e a
phase change of the elu e n t .
Table 1.2.
Property Measured
Spectrophotometrie
U.V. / v i s i b l e Fluorescent I n f r a r e d A.A. methods Nuclear Magnetic Resonance Elec t r o n Spin Resonance
Electrochemical
P e r m i t t i v i t y C o n d u c t i v i t y Potentiometric Voltammetric
Physical
R e f r a c t i v e Index R a d i o a c t i v i t y O p t i c a l A c t i v i t y Low angle Laser L i g h t S c a t t e r i n g Mass spectrometric GC Mass
There are also other d e t e c t o r s f o r HPLC that are not
used very much, these are discussed i n comprehensive
reviews by White(77) and others(26,27 ,78). They Include
radiochemical(75) and photoacoustlc(78) d e t e c t o r s .
36
1.17 Electrochemical Detectors.
Electrochemical d e t e c t o r s can measure a change of one
of the f o l l o w i n g ; capacitance, r e s i s t a n c e , voltage or
current of the column e f f l u e n t . Coulometrlc i s the most
popular and has ng ml ^ to ng ml ^ range of
s e n s i t i v i t i e s f o r most analytes.
Ions can be detected conductometrically by observing a
decrease i n the resistance of a f l o w c e l l .
Conductometric c e l l s have been used since Small, Stevens
and Baumann(79) developed a technique t h a t excluded the
HPLIEC i o n i c b u f f e r i n a suppressor column to a l l o w an
increase i n s e n s i t i v i t y . Ethylene diammonium t a r t r a t e
eluent has also been used as i t shows a lower
conductance than the detected p o l y v a l e n t metal c a t i o n s
to give a b e t t e r s e n s i t i v i t y ( 6 6 ) .
C o n d u c t i v i t y d e t e c t o r s detect i n the pg ml ^
range, but d i f f i c u l t y may be experienced i n o b t a i n i n g a
steady baseline. An a l t e r n a t i n g c u r r e n t may be used,
however, capacitance and heat e f f e c t s are s t i l l
n o t i c e a b l e . Molner(A2) also reduced the l i m i t of
d e t e c t i o n by an improved design.
Takata(65) introduced a coulometric detector f o r ions
phenols and sugars. Takata concluded i t was v i r t u a l l y
f l o w rate independant and ng ml ^ l e v e l s are e a s i l y
detected. Coulometric c e l l s were employed t o detect r a r e
earths(70) showing the a p p l i c a t i o n s of a c o n t r o l l e d
37

p o t e n t i a l and v i r t u a l e l i m i n a t i o n of heavy metal
i n t e r f e r a n t s by using constant sodium c h l o r i d e
c oncentration. Cadmium, c o b a l t , copper, lead, mercury,
n i c k e l , were separated a t concentrations i n the 10
M range(65).
A dropping mercury electrode d e t e c t o r has re c e n t l y been
developed and was discussed i n a review by White on
Electrochemical and Spectroscopic d e t e c t i o n i n HPLC(77).
1.18 Spectrophotometric Detectors.
Spectroscopic measurements o f f e r the l a r g e s t range of
detectors and include photometric, f l u o r e s c e n t and
atomic spectroscopic techniques. U l t r a v i o l e t , i n f r a r e d ,
nuclear magnetic and e l e c t r o n s p in resonance are w e l l
reviewed i n other l i t e r a t u r e sources(77,78).
Flame atomic absorption spectroscopy(80,81) can be
d i r e c t l y coupled f o r s i n g l e element determinations as
the a s p i r a t i o n r a t e i s approximately compatible w i t h
HPLC e f f l u e n t f l o w r a t e . Some m e t a l l o i d s require hydride
production f o r low s e n s l t i v l t i e s ( 1 9 ) . Analysis of t o x i c
elements i n the environment by atomic absorption methods
were reviewed by Van Loon(82) and Fuwa(83). N e b u l l s a t l o n
i s also necessary f o r ICP-OES where the plasma produces
an e x c i t e d s t a t e of the analyte. An advanced o p t i c a l
system allows multi-element determinations. This was
demonstrated i n the i n v e s t i g a t i o n of the a s s o c i a t i o n and
q u a n t i f i c a t i o n of carbon, copper, i r o n , manganese,
38

phosphorous and zinc t o p r o t e i n s using exclusion
chroma tography(78).
1.19 Photometric Post Column Reactors.
Improved chromatographic separations have brought
exacting demands on d e t e c t i o n and consequently a renewed
i n t e r e s t i n pre-column and PCR techniques, because of
the improved a n a l y t i c a l v e r s a t i l i t y and s e n s i t i v i t y .
Pre-column d e r i v a t i s a t i o n techniques, discussed e a r l i e r
can give an enhanced response, but have disadvantages,
such as possible *ghost peaks' or a r t i f a c t peak
formation and o f t e n time consuming sample p r e p a r a t i o n .
These l i m i t a t i o n s a r i s e because the technique has to
separate d e r i v a t i s e d products which i s o f t e n d i f f i c u l t ,
and t h i s may be the reason t h a t i t has not achieved
l a r g e r a p p l i c a b i l i t y .
An improvement of chromatographic f i t t i n g s and design
has produced a notable renewed i n t e r e s t i n PCR de t e c t o r s
i n recent years(84). Smaller q u a n t i t i e s are required f o r
analysis e.g. s p i n a l f l u i d i n which u l t r a - t r a c e amounts
have t o be determined. Numerous t r i e d and tested
techniques f o r pre- and PC reacti o n s p r i o r to d e t e c t i o n
of organic analytes are discussed f o r the trace a n a l y s i s
of carbonyl, amines and amino acids i n a review of HPLC
trace a n a l y s i s by K i r k l a n d ( 8 5 ) . Few studies of PCRs f o r
trace metal ions have been undertaken because the
39

separation of trace amounts was not possible u n t i l
r e c e n t l y .
For f a s t PC react i o n s a h i g h l y e f f i c i e n t system can be
designed because of minimal peak broadening, most
in o r g a n i c r e a c t i o n s f i t t h i s d e s c r i p t i o n . However the
PGR de t e c t o r has some drawbacks. An eluent or a gr a d i e n t
e l u t i o n may a f f e c t the k i n e t i c s of the reagent w i t h the
determinand, or render i t i r r e p r o d u c i b l e . A time delay
and/or heating bath may be necessary to e f f e c t g r e a t e r
s e n s i t i v i t y , t h i s may complicate d e t e c t i o n . However
there are many p o s s i b i l i t i e s w i t h PC reactants t o o b t a i n
higher s e n s i t i v i t i e s and b e t t e r s e l e c t l v i t i e s .
I n t e r f e r i n g components may co-elute and a reagent can
p r e f e r e n t i a l l y react w i t h the determinand- A v a r i a b l e
s e l e c t i v i t y could also give the det e c t o r advantages. I n
p r a c t i c e very few problems seem to be encountered. Metal
PC r e a c t i o n d e t e c t i o n systems have considerable scope
f o r development. Such an approach appears t o o f f e r
g r e a t e r p o s s i b i l i t i e s considering the large amount o f
in f o r m a t i o n a v a i l a b l e on the photometric determination
of trace metals. Each metallochromic reagent w i l l
r e q u i r e a d i f f e r e n t PGR design according t o the k i n e t i c
and thermodynamic parameters.
40

1.20 Post Column Reactor Design.
Metal cations separated on ion exchange m a t e r i a l i n an aqueous media w i l l e l u t e from the column as complexes w i t h l i t t l e or no absorbance i n the v i s i b l e r e g i o n , which i s the c h i e f region of absorbance f o r metal complexes. Metal ions can be converted i n t o h i g h l y absorbing complexes by i n t r o d u c i n g a photometric reagent to react w i t h the e f f l u e n t and be monitored a t the s p e c i f i e d wavelength. A PCR should extend the range and v e r s a t i l i t y of d e t e c t i o n f o r a p a r t i c u l a r species which does not absorb or f l u o r e s c e a t s u f f i c i e n t l e v e l s i n the UV v i s i b l e regions. Chromatographic r e s o l u t i o n should be retained as f a r as possible f o r maximum s e n s i t i v i t y . The k i n e t i c s of a r e a c t i o n w i l l s t r o n g l y i n f l u e n c e the reactor design. Precise c o n t r o l of the flow rates f o r the a d d i t i o n of reagents becomes important as a concentration change of reagent or the determinands may r e s u l t i n a non-reproducible response. Heating the PCR to decrease the r e a c t i o n time and reduce the length of PCR tubing may r e t a i n some chromatographic r e s o l u t i o n and the highest temperature should be used p r o v i d i n g the r e a c t i o n products are not unstable or side rea c t i o n s are not l i m i t i n g . This would suggest a mobile phase w i t h a high b o i l i n g p o i n t , i t should also not quench the s i g n a l or slow the r e a c t i o n .
There are three PCR designs adopted to minimise band
41

broadening. These are d i v i d e d according to the r e a c t i o n
time necessary. Narrow diameter t u b i n g f o r a delay time
of 10 to 30 seconds, where c l a s s i c a l f l o w dynamics are
observed- Here two phenomena are p r i m a r i l y responsible
f o r a r e s u l t i n g Guassian conc e n t r a t i o n p r o f i l e of a
square shaped 'plug o f i n j e c t i o n . The a x i a l f l o w i s not
uniform and a cross s e c t i o n of a tubular r e a c t o r i s
considered laminar w i t h the maximum flow rate o c c u r r i n g
at the centre. This process would give considerable band
broadening problems i f i t were not f o r the counter
d i f f u s i o n process t h a t i s r a d i a l i n d i r e c t i o n . Narrower
tubing has a g r e a t e r r a d i a l component. Band broadening
becomes a considerable problem w i t h a long s t r a i g h t
t u b i n g , t h i s can be reduced by c o i l i n g the t u b i n g ,
because a r e s u l t i n g c e n t r i f u g a l force gives two
hemispherical secondary f l o w components which increase
r a d i a l mixing. This was i n v e s t i g a t e d w i t h the i n t e n t i o n
of designing a PGR t h a t has a s p i r a l l i n g tube c o n t a i n i n g
the e f f l u e n t w i t h i n a l a r g e r tube(86). A column packed
w i t h small diameter p a r t i c l e s can give a PC delay time
of 30 seconds t o 3 minutes(87). C l a s s i c a l
chromatographic processes are obeyed, however d i f f i c u l t y
can be experienced i n f i n d i n g a n o n - i n t e r a c t i n g column
which does not reduce the d e t e c t o r s i g n a l . A long l e n g t h
of narrow tubing w i t h a i r segmentation i s necessary t o
minimise d i f f u s i o n f o r r e a c t i o n times greater than 4
minutes and can provide a r e a c t i o n time of up t o 20
a2
mlnutes(87). A i r segmentation also allows the
p o s s i b i l i t y of column e f f l u e n t storage. The c h i e f
sources of d i f f u s i o n here i s r e l a t e d t o the w e t t i n g of
the tube surface. I t was suggested t h a t a non-wetting
tubing arrangement should be implemented(84)*
Small r e a c t i o n - d e t e c t o r resident times re q u i r e an
e f f e c t i v e mixing procedure. I t i s necessary f o r small
q u a n t i t i e s of reactant t o be added to the column
e f f l u e n t t o give the maximum response because then the
e l u t e can v i r t u a l l y r e t a i n i t s i n i t i a l c o n c e n t r a t i o n ,
ensuring a b e t t e r response. With a PC reagent solvent
t h a t has d i f f i c u l t y i n mixing w i t h the eluent a zero
dead volume mixing u n i t i s necessary. The angle of
mixing was found t o be i m p o r t a n t ( 8 4 ) , although a 180
degree angle f o r the incoming flows w i t h the outgoing
e f f l u e n t at 90 degrees was e f f e c t i v e f o r e a s i l y m l s c i b l e
eluentS; mixing a t an acute angle was necessary f o r less
m i s c i b l e solvents. This was p a r t i c u l a r l y so f o r the
d e t e c t i o n of organic analytes. For PC d e t e c t i o n , these
reactions g e n e r a l l y take longer than metal i o n
c o l o u r i m e t r i c reactions*
1.21 Photometric Post Column Reaction Detectors f o r
Metals.
The enhanced d e t e c t i o n obtained by the complexation of
metals w i t h organic reagents has been stud i e d
43

thoroughly, because they have been used f o r many years
as spectrophotometric reagents, c o l o u r i m e t r i c spot t e s t
reagents and as metallochromlc i n d i c a t o r s . However i t I s
only r e c e n t l y t h a t they have been u t i l i s e d f o r PC
reagents and i t i s necessary t o summarise some of the
spectrophotometric approaches.
Spectrophotometry i s s t i l l a popular technique f o r
some trace metal determinations, although a few of the
methods have been superseded. However, there are many
p u b l i c a t i o n s on organic reagents f o r metals(over 600 i n
1975 according t o A n a l y t i c a l A b s t r a c t s ) . Comprehensive
coverage i n books, by Sandell and 0 n i s h i ( 8 8 ) , S n e l l ( 8 9 )
(who describes many p r a c t i c a l a p p l i c a t i o n s ) and
Hopkins(90) are a v a i l a b l e f o r photometric reagents. The
t o p i c was also reviewed by Savvin(91) and Marczenko(92).
I t has always been the aim to synthesize organic
reagents t h a t are element s p e c i f i c , these would have
a n a l y t i c a l and economic advantages. Due t o the general
nature of the coordinate bond t h i s aim has been
d i f f i c u l t and e l i m i n a t i v e techniques were necessary t o
stop i n t e r f e r e n c e from competing elements. However
chromatography would give the necessary s e l e c t i v i t y
because the elements can be separated.
Photometric q u a n t i f i c a t i o n , whether i t i s by a
ph o t o c e l l or a p h o t o c e l l i n conj u n c t i o n w i t h a PGR
depends upon measuring the r e l a t i v e i n t e n s i t y of
electromagnetic r a d i a t i o n absorbed, u s u a l l y at a
44

wavelength of maximum absorbance of the determinand.
This i s normally i n the v i s i b l e range f o r metal
complexes. I n f r a r e d i s r e l a t i v e l y i n s e n s i t i v e f o r trace
determination purposes and i s associated w i t h the
r o t a t i o n a l and v i b r a t i o n a l f i n e s t r u c t u r e t r a n s i t i o n s -
Beer and Lambert showed t h a t f o r many solutes i n
p r a c t i c a l l y transparent s o l v e n t s :
Abs = ^°8jQ i£ =
Where the log of the absorbance(Abs) was p r o p o r t i o n a l
to the c o n c e n t r a t i o n ( c ) expressed as m o l a r i t y f o r a
given path l e n g t h ( l ) i n cm(93)- The e x t i n c t i o n
c o e f f i c i e n t ( h e r e as 6 ) i s o f t e n expressed i n terms of
molar a b s o r p t i v i t y (l.mole ^.cm
Deviations from the law can occur because of
t u r b i d i t y , l i g h t s c a t t e r i n g and fluorescence w i t h i n the
s o l u t i o n being measured. Nevertheless only severe
d e v i a t i o n s would p r o h i b i t q u a n t i t a t i v e determinations.
The r e l a t i v e accuracy of q u a n t i f i c a t i o n s f o r trace
amounts i s poorer than f o r higher concentrations. Trace
determinations can have a 10% e r r o r and u l t r a - t r a c e
a n a l y s i s , a f t e r pre-concentration can be around 30%(92).
S i m i l a r l y p r e c i s i o n s u f f e r s f o r trace q u a n t i t i e s .
Absorbance i s normally less than 0.2. Photometric
instruments give an e l e c t r i c a l response t h a t i s d i r e c t l y
p r o p o r t i o n a l t o the r a d i a t i o n f a l l i n g on the p h o t o c e l l .
The smallest detectable amount w i l l be independent of
45

the absolute value of t h a t power of the s i g n a l . So small
changes o f absorbance a t the lower absorbance range
represents a la r g e f r a c t i o n of the t o t a l c o n c e n t r a t i o n .
At a higher absorbance range a small change i n
absorbance represents a l a r g e r imprecision i n
conc e n t r a t i o n , a compromise i s mathematically i n the
region of 0-43 absorbance(94).
A colour c o n t r a s t between the complex and the organic
reagent i s necessary, i f an overlap of reagent and
complex colour i s observed the range of response w i l l be
decreased, s e n s i t i v i t y i s not a f f e c t e d . The photometric
s e n s i t i v i t y i s measured i n terms of molar a b s o r p t i v i t y
£. S e n s i t i v e reagents have a r e s u l t i n g complex w i t h £
gr e a t e r than 10,000 l.mole ^.cm - Using a 2 cm
c e l l g i v i n g an absorbance of 0.05 w i t h a of 100
and 6 50000 l.mole ^.cm then the detected
amount i s O.OSug ml . According t o quantum theory, E
cannot exceed 150,000 l.mole ^.cm ^ f o r d i r e c t
methods although i n p r a c t i c e they r a r e l y exceed 80,000
l.mole ^.cm ^. Some i o n a s s o c i a t i o n methods,
which are discussed l a t e r may exceed t h i s value.
The s e l e c t i v i t y of a trace photometric method i s
p r i m a r i l y c o n t r o l l e d by the s t r u c t u r e of an organic
reagent, the pH, presence of masking agents(92) and, i f
necessary, e x t r a c t i o n procedure(95). Consequently the
p r e r e q u i s i t e s f o r photometric t r a c e a n a l y s i s are: high
s e n s i t i v i t y of the reagent;
46

s p e c i f i c i t y of the organic reagent or s e l e c t i v i t y of the
method; r e p r o d u c i b i l i t y ; s t a b i l i t y of the r e s u l t i n g
complex; a c a l i b r a t a b l e response; s i m p l i c i t y of
operation and r e l i a b l e i n s t r u m e n t a t i o n - Except f o r
element s e l e c t i v i t y these are a l s o the demands imposed
on a PC reagent. Consequently s e l e c t i v i t y I s less
important f o r a PCR and t h i s completely revises the
approach to the research of PC reagents s i n c e ,
s e l e c t i v i t y i s not a major d i f f i c u l t y . Thus reagents
t h a t have been r e j e c t e d i n the past because of t h e i r
poor s e l e c t i v i t y , w i l l have to be reconsidered.
There are various types of c o l o u r i m e t r i c systems f o r
spectrophotometrlc determinations. A s e n s i t i v e
c o l o u r i m e t r i c response normally occurs w i t h the a d d i t i o n
of an organic reagent t h a t has a c h e l a t i n g a c t i o n , which
w i l l form a s t a b l e 5 or 6 membered r i n g complex- The
molecule also has a chromophoric f r a c t i o n such as an
azo-dye, t r i p h e n y l methane or a p-quinoid group. The
group should be e l e c t r o n i c a l l y a f f e c t e d i n the r e a c t i o n
w i t h a metal to give a c o l o u r change. Photometric
reagents normally form a b i n a r y complex which i s
q u a n t i t a t i v e l y measured.
A c o n s t i t u e n t of the binary complex may have an i o n i c
group t h a t forms an ion-associate w i t h the respective
c a t l o n i c or anionic s u r f a c t a n t t o give a bathochromlc
response. The r e s u l t i n g i o n associate i s known as a
t e r n a r y complex.
47

I n d i r e c t methods are o f t e n a means of analysing a
d i f f i c u l t species(96). Some of these are a m p l i f i c a t i o n
methods and can Involve redox or an exchange
r e a c t i o n ( 9 7 ) . However these have not y e t been found
adaptable as PC reagents.
As discussed e a r l i e r HPLIEC e f f l u e n t s g e n e r a l l y
contain organic acids t h a t weakly complex the metal
a n a l y t e . The weakly complexed ions present i n the column
b u f f e r e f f l u e n t , r e a d i l y form coloured complexes w i t h
the organic reagents, and few problems are encountered
w i t h response times w i t h such reagents as
A-(2-pyridylazo) resorcinol(PAR), which belongs t o the
py r i d y l - a z o group of reagents as does
l(2-pyridylazo)-2-naphthol(PAN), these are shown i n
Figure 1.1 and have been used as PC reactants. Both are
un s e l e c t i v e , although h i g h l y s e n s i t i v e . 4 - ( 2 - p y r i d y l a z o )
r e s o r c i n o l can be used as metallochromic i n d i c a t o r f o r
cadmium, c o b a l t , copper, n i c k e l and zinc w i t h a back
t i t r a t i o n , normally using copper and can be used as a PC
reagent, forming water s o l u b l e complexes w i t h 20 metals
to give a red or r e d - v i o l e t coloured complex(98). L i m i t s
of d e t e c t i o n f o r PAR as a PC reagent w i t h cadmium,
c o b a l t , copper, i r o n ( I H ) , lead, magnesium, manganese,
n i c k e l , and zinc were found t o be less than 10 ng,
except f o r lead and cadmium, which were 15 and 20 ng
r e s p e c t i v e l y ( 6 9 ) . A displacement r e a c t i o n w i t h a zinc
EDTA complex a t pH 11 was used t o detect
48
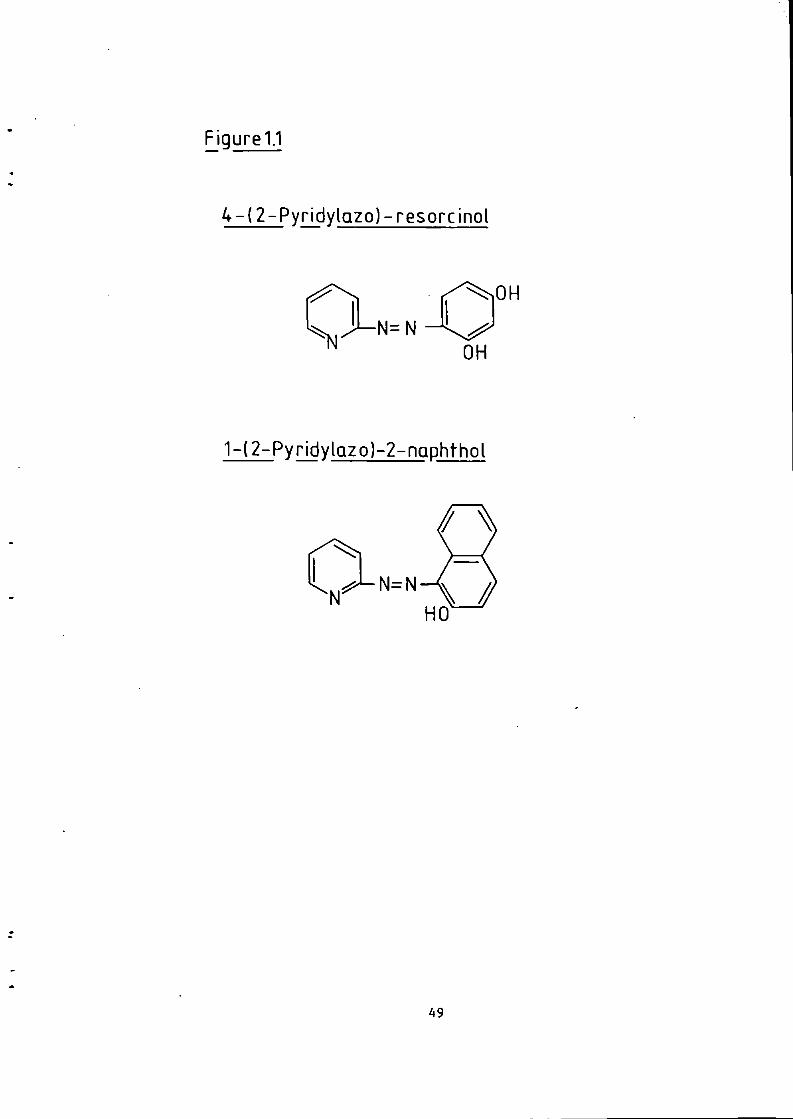
F i g u r e l l
4 - (2 -Py r i dy [azo ) - reso rc i no l
N = N
OH
OH
1-(2-PyridylQZo)-2-naphthol
N=N
49
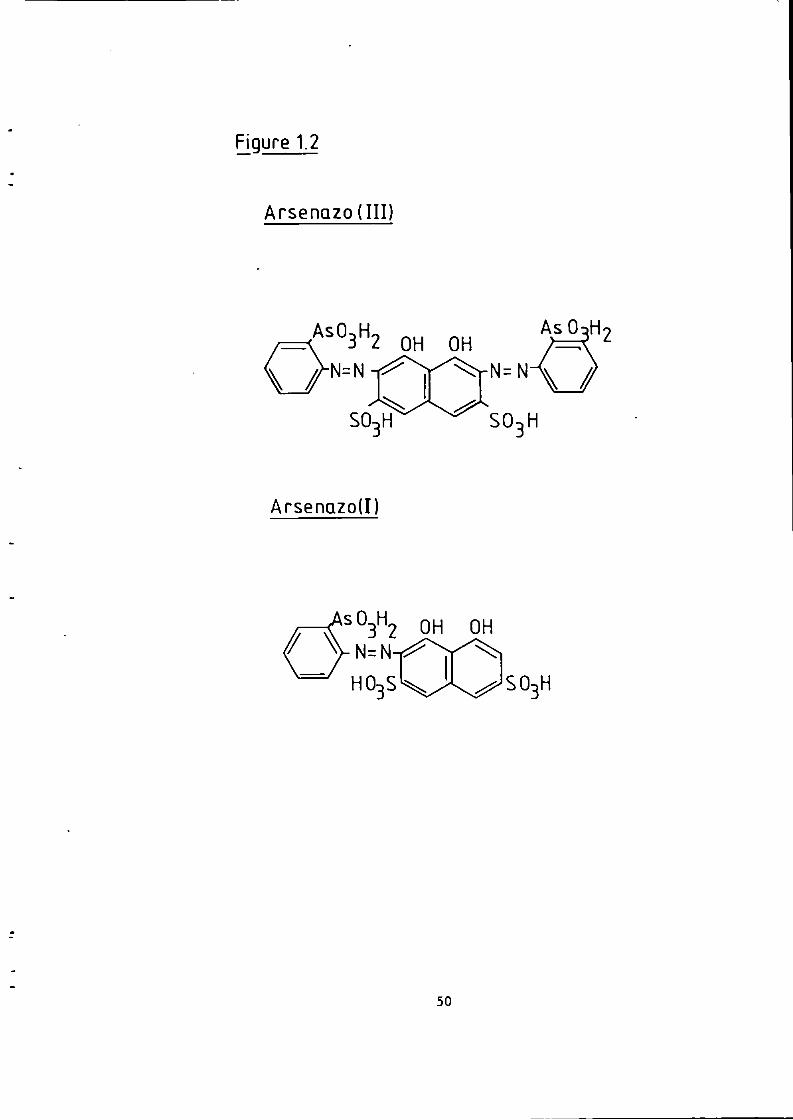
Figure 1.2
Arsenazo ( I I I )
ASO3H2 ASO3H2
SO-,H
Arsenazod)
^ °3^2 OH OH
50

the a l k a l i e a r t h metals barium, calcium, magnesium,
and s t r o n t i u m which do not react w i t h PAR alone and an
improved response was also obtained f o r lead and
manganese(99). However the authors noted a decrease of
response f o r d e t e c t i o n of some t r a n s i t i o n metals because
of hydroxy species competition a t high pH and suggest
th a t a high PAR c o n c e n t r a t i o n would counter the low
response. The a p p l i c a b i l i t y of PAR was demonstrated w i t h
the a n a l y s i s of trace metals of nuclear m a t e r i a l s , the
uranium response w i t h PAR was masked w i t h the presence
of 0.3M carbonate(lOO).
Superior d e t e c t i o n a b i l i t i e s of PAR were compared w i t h
arsenazo I and 111(59) which have one or two arsonic
groups attached i n the o r t h o p o s i t i o n to the azo
conjugate, r e s p e c t i v e l y as shown i n Figure 1.2. The PC
reagents were introduced i n t o the forced flow column
e f f l u e n t w i t h a i r pressure assistance. The most
v e r s a t i l e and convenient was found t o be PAR, responding
to most t r a n s i t i o n metal cations(69,101,102).It does not
r e q u i r e precise acid pH c o n t r o l l i k e arsenazo I I I .
Although Cassidy and Elchuk(I03) separated 14 rare e a r t h
metals w i t h a g r a d i e n t e l u t i o n i n 28 minutes using
arsenazo I as the PC reagent. The baseline d r i f t e d a
l i t t l e , but i t i l l u s t r a t e d t h a t i t i s possible t o use a
g r a d i e n t e l u t i o n w i t h a PCR.
Fewer metals react w i t h PAN than PAR and consequently
i s l i t t l e used as a PC reagent, but can detect zinc and
51

cadmium(104).
Few reagents have been used as PC reagents although
the d e t e c t i o n by x y l e n o l orange was reported f o r
lanthanoids(105). Zincon was used by F r e l ( 8 4 ) f o r
a l u m i n i u m ( l l l ) , b e r y l l i u m , c o b a l t , cadmium,
chromlum(XIl), copper, i r o n ( I I I ) , manganese, molybdenum,
n i c k e l and t i t a n i u m c a t i o n s .
Zenkl(106) adopted an unusual procedure,
chlorophosphonazo ( I I I ) , the photometric reagent, was
added d i r e c t l y to the s u l p h o s a l i c y l l c acid e l u e n t , pH
c o n t r o l was e a s i e r , but the reagent concentration should
be less than 0.00005 M t o allow the separation of metal
ions.
I f photometric reagents are t o be used as PC reagents
they should have a low a b s o r p t i v i t y a t the metal
complexes wavelength of maximum absorbance. The complex
should form q u i c k l y t o reduce the complications of slow
k i n e t i c s and the formation constant should be high f o r a
r e s u l t i n g photometric complex t o De s t a b l e . I f p o s s i b l e
the pH operating range should be l a r g e t o minimise the
complications of adding a b u f f e r which may r e q u i r e
precise f l o w r a t e c o n t r o l .
52
1.22 Fluorescent Post Column Reaction Detection f o r
metals.
Although fluorescence i s p o t e n t i a l l y a more s e n s i t i v e
technique there are l i m i t a t i o n s because of accuracy and
pr e c i s i o n e r r o r s , long associated w i t h t h i s technique.
Only a few metals can be q u a n t i f i e d by t h i s approach.
Such methods may o f f e r a 100 times b e t t e r s e n s i t i v i t y .
Metal ions as t h e i r complex w i t h an a n i l i n e d e r i v a t i v e
of EDTA were detected w i t h the PC reagent
fluorescamine(107). The l i m i t s of d e t e c t i o n were 60 to
80 pg f o r cadmium, lead and z i n c . I t was stated t h a t
sub-femtomole concentrations could be reached w i t h l a s e r
induced fluorescence.
Chemiluminescence i s the i n d u c t i o n of fluorescence
w i t h chemical energy and requires no l i g h t source.
Chemiluminescence reactions can be catalysed by
t r a n s i t i o n metals and are known t o be very s e n s i t i v e ,
however, t h i s enhanced luminescence procedure means t h a t
i m p u r i t i e s c o n s t i t u t e a considerable source of e r r o r .
The a d d i t i o n of several PC reagents was found necessary.
Notable reactants f o r PCRs are luminol and l u c i g e n i n
w i t h hydrogen peroxide or oxygen(26,108,109).
53

1.23 D i r e c t i o n of Research and Present I n t e n t i o n s f o r
the Determination of Trace Metal Species by HPLC.
Increasing numbers of important trace metal
determinations are required on m a t e r i a l s , f o r reasons
o u t l i n e d e a r l i e r , which are present i n a varying range
of matrices. Fast q u a n t i t a t i v e knowledge o f organic
compounds has been shown t o be f e a s i b l e by HPLC, but not
f o r metals and t h e i r species. HPLC i s s t i l l i n i t s
infancy regarding t h i s area, consequently p o t e n t i a l f o r
e s s e n t i a l development i n the areas of separation and
d e t e c t i o n has a r i s e n . I t i s hoped f i r s t l y to improve the
e f f i c i e n c y of i o n exchange separations by using b e t t e r
column packings w i t h organic acids eluents t h a t have
shown promise i n c l a s s i c a l i o n exchange l i q u i d
chromatography. Chromatographic p o s s i b i l i t i e s w i t h
n e u t r a l and anionic columns w i n v e s t i g a t e d .
The subsequent d e t e c t i o n a f t e r separation of the metal
ions may be e f f e c t e d w i t h a d i f f e r e n t PC reagent f o r a
more s e n s i t i v e photometric response. There are a vast
number of pr e v i o u s l y i n v e s t i g a t e d metallochromic
reagents t o chose from, but only a few have been
reported as PC reagents. I t i s hoped t o improve
d e t e c t i o n by look i n g a t t h i s new area which has been
l e f t unexplored u n t i l the recent manufacture of more
e f f i c i e n t HPLC m a t e r i a l s . The p o s s i b i l i t y of
considerable improvement of s e l e c t i v i t y , s e n s i t i v i t y and
54

Increased number of species i s evident. I t i s also hoped
to improve the PCR technique f o r metals so t h a t more
metals can be detected by Improved PCR design and
o p t i m i s a t i o n procedures.
55
2 Instrumentation and Experimental
2.1 I n t r o d u c t i o n ,
There are numerous types of HPLC equipment a v a i l a b l e
and a problem of choice confronts the experimenter.
Because the new d e t e c t i o n technique proposed depends
upon measuring a decrease i n absorbance of the
post-column reagent r a t h e r than an increase, a major
problem was pump p u l s a t i o n s . The mixing of two eluent
streams has t o be r e l a t i v e l y pulse f r e e as i t i s
emphasised by the detector as the column e f f l u e n t stream
i s v i r t u a l l y transparent a t wavelengths using
metallochromic reagents, consequently the design i s
or i e n t a t e d around minimising systematic noise.
A t y p i c a l HPLC system was used, as i n Figure 2.1. This
shows two pumps one of which pumps the PCR reagent and
the other the mobile phase they are c o - o r d i n a t e l y
operated w i t h a microprocessor c o n t r o l u n i t ( C o n t r o l
Command Module, Laboratory Data C o n t r o l , R i v i e r a Beach,
FL.33404). The accumulated data from the
spectrophotometric d e t e c t o r was temporarily stored and
could be assessed as peak height or area. The
chromatogram and the data were p r i n t e d on a thermal
p r i n t e r p l o t t e r ( T h e r m a l P r i n t e r P l o t t e r Model E6220-1,
Houston Instrument, A u s t i n , Texas, U.S.A.) w i t h the
optio n of storage on a IEEE-488 i n t e r f a c e d dual f l o p p y
56

d i s c unit(Commodore 8050, Commodore Business Machines
Inc. , 3330 Scott Boulevard, Santa Clara, C a l i f o r n i a ,
95051) f o r possible f u r t h e r i n t e r p r e t a t i o n .
2.2 Pumps.
High pressure d e l i v e r y pumps were used (Constametric
I I I ; L.D.C. ), p r o v i d i n g a constant volume at pressures
below 5000 p sl between 0.1 to 10.0 ml mln . A cam
dr i v e s two p o s i t i v e displacement sapphire p i s t o n s 180
degrees apart. A phase locked loop c o n t r o l l e r gives a +
0.3% r e p e t i t i v e f l o w - r a t e accuracy. The post-column
reactant was pumped v i a a dual p i s t o n system (Model AA
Dual Piston Eldex pump; Eldex L a b o r a t o r i e s , 3551 Haven
Avenue, Menlo Park, C.A. 94025), through a pressure
r e s t r l c t o r from the high s e n s i t i v i t y accessory of a
Waters HPLC pump(Waters Associates I n c . , M i l f o r d ,
Massachusetts, U.S.A.) t o reduce the pump pu l s a t i o n s and
then t o the T j u n c t i o n w i t h 2 m of 0.8mm I.D. PIPE
tubing .
Both pumps have 5 pm f i l t e r s on the eluent i n l e t s t o
c u r t a i l pump wear and increase the column o p e r a t i o n a l
time.
57

I . *
Figure 2.1 Schemafic Diagram of Hpic System with PCR
00
Microprocessor
Column Pump
Injector Column PCR
Water Bath
PCR
Pump. Pressure Restrictor
tecto 1 1
1 1 1 1
Plo t te r^
Floppy. Disc Unit
Reservoir

2.3 I n j e c t o r System.
A Rheodyne i n j e c t o r valve 7125 (Rheodyne, C o t a t i ,
C.A,94928) t h a t can be f i t t e d w i t h various volume loops
from 5 to 200 p i f o r d i f f e r e n t analyte concentrations
was used. A 100 m i c r o l i t r e metal f i t t e d S.G.E, syringe
was used i n i t i a l l y and changed l a t e r to an a l l p l a s t i c
s u b s t i t u t e t o minimise contamination problems.
2.4 A n a l y t i c a l Column.
Two d i f f e r e n t dimension a n a l y t i c a l columns were
used; one f o r a s i l i c a based c a t i o n exchanger i n a 25 by
0-46 cm column and another f o r resin-based m a t e r i a l s i n
a 10 by 0.4 cm column. Both columns were manufactured i n
s t a i n l e s s s t e e l and 2 pm pore s t a i n l e s s s t e e l f r i t s were
placed a t e i t h e r end of the columns.
The s i l i c a based c a t i o n exchanger (Whatman P a r t i s i l 10
s e x , Whatman L t d . , S p r i n g f i e l d M i l l , Maidstone, Kent,
ME142LE England.) has benzene sulphonated groups bonded
t o 10 }jm s i l i c a p a r t i c l e s .
Column packing c o n d i t i o n s are c r i t i c a l f o r trace
determinations. A Shandon Column Packing
Instrument(Shandon Southern Instruments In c . , 515 Broad
S t r e e t , Sewickley P-A., 15143 U.S.A.) was used t o pack
both m a t e r i a l s . The s i l i c a substrates were packed as a
25 % s l u r r y , a f t e r an h a l f an hour vacuum or sonic
59
degassing, w i t h a (1+3)-methanol and i s o p r o p y l a l c o h o l
s o l v e n t , r e s p e c t i v e l y . The i n v e r t e d column,was packed
w i t h 150 ml of a l c o h o l i c solvent and then a 100 ml
water, followed by 150 ml of the intended eluent a t a
pressure of 7-10,000 p s i . The column has I t s top end
placed upwards a f t e r 75ml to ensure a s o l i d column top.
Channelling i s a major packing problem and i f g r a v i t y i s
opposite to the f l o w t h i s may be avoided, a more uniform
p a r t i c l e size d i s t r i b u t i o n i s also assured.
The resin-based m a t e r i a l s should be degassed as an
eluent s l u r r y under vacuum f o r a t l e a s t 2 hours. The
eluent should be at i t s highest concentration and i t s
lowest pH f o r the Aminex A-9 11 jim c a t i o n exchange
sulphonated d i v i n y l benzene copolymer (Bio-Rad
L a b o r a t o r i e s , 32 & G r i f f i n , Richmond. C a l i f o r n i a ,
U.S.A.) and the highest pH f o r the Benson 7-10 pm anion
exchanger(Benson Company, P.O. Box 12812 Reno, Nevada
89510, U.S.A.), An i n i t i a l pressure of 500 p s i was used
which minimised p h y s i c a l f r a c t u r i n g of the beads. A f t e r
50 ml the pressure was raised to 5-7,000 p s i f o r a 200
ml volume; again column i n v e r s i o n ensured column top
u n i f o r m i t y .
2.5 Post-Column Reactor.
A v a r i e t y of PCR lengths were-used depending on the
desired r e a c t i o n time which was u s u a l l y less than '
60

a minute- A f t e r p r e l i m i n a r y i n v e s t i g a t i o n s the best
o p t i o n was to use various lengths of 0.8 mm I.D. PTFE
tubing. Zero dead volume f i t t i n g s connected pumps,
column and detector. S t a i n l e s s s t e e l tubing(0.3mm I.D.)
p r i o r to the column was s u b s t i t u t e d f o r 0.8mm I.D. PTFE
tubing a f t e r the column. Where po s s i b l e , PTFE t u b i n g and
f e r r u l e s were implemented at pressures up to 1,500 p s l
t o minimise trace i m p u r i t i e s .
The eluent was mixed w i t h the post-column reactant a t
180 degrees a t a T j u n c t i o n . I f necessary the r e s u l t i n g
e f f l u e n t tubing was placed i n a t h e r m o s t a t i c a l l y
c o n t r o l l e d water bath(Grant Instruments(Cambridge) L t d . ,
Harrington, Cambridge CB2 5QZ, England-).
2.6 Detector.
The post-column e f f l u e n t was connected d i r e c t l y t o the
0.3 mm I-D. tubing of a metal block t h a t acts as a heat
exchanger t o reduce temperature f l u c t u a t i o n s - The double
beam UV/visible spectrophotometric f l o w
monitor(SF770;Schoeffel Instrument Corporation, Westwood
N.J,) has two 10 \il volume f l o w c e l l s of 1 cm l e n g t h ,
one of which was an a i r reference c e l l . The mechanism
incorporated a chopper double channel system t h a t
d i s c r i m i n a t e s against noise and unchopped s t r a y
r a d i a t i o n . Stop f l o w s p e c t r a l scans are possible f o r
wavelengths up to 700 nm and v a r i a b l e time constant
61

f i l t e r s some output s i g n a l noise
2.7 Reagents
D i s t i l l e d deionised water was prepared i n a glass
s t i l l and the d i s t i l l a t e passed through an E l g a s t a t
d e i o n i s e r ( E l g a Products L t d . , Lane End, Bucks.,
England.) t o give a c o n d u c t i v i t y less A micro-ohms -1
cm A n a l y t i c a l grade reagents(BDH, Poole, Dorset, England)
were used throughout- Stock organic acid solutlons(2M)
were prepared by mixing the ac i d w i t h d i s t i l l e d
deionised water; at t h i s c o n c e n t r a t i o n b i o l o g i c a l
growths d i d not form. The required organic acid e luent
was d i l u t e d and the pH adjusted w i t h a mixture of 2 M
sodium and ammonium hydroxides(2+3). The eluent was
degassed w i t h a helium bubbler or by plac i n g i n a sonic
bath.
Stock Eriochrome Black T reagent was prepared as a
0.4g per 100 ml s o l u t i o n i n O.IM ammonium hydroxide.
Dithizone s o l u t i o n was prepared by d i s s o l v i n g
s u f f i c i e n t i n a (:4+.1) acetone and water solvent
r e s p e c t i v e l y , t o give the required absorbance at 595 nm.
Spectrosol(BDH) metal s o l u t i o n s prepared i n IN n i t r i c
a c i d .
A few 1000 ^g g ^ stock metal s o l u t i o n s were
prepared by d i s s o l v i n g 1 g of the metal i n a (1+1) mixture
62
of concentrated n i t r i c acid and d i s t i l l e d deionised
water, d i l u t e d t o 1 l i t r e w i t h d i s t i l l e d deionised
water. Indium and bismuth were d i l u t e d w i t h a 0.2M
t a r t a r i c acid s o l u t i o n . Storage of metal s o l u t i o n s does
pose problems due to evaporation, even i n a sealed
container as w e l l as adsorption onto the con t a i n e r
surface- To minimise t h i s a polyethylene container w i t h
a screw cap was used f o r stock s o l u t i o n s ( 1 6 ) and
s o l u t i o n s down t o 5 pg ml W any of lower
concentrations were made f r e s h each day t h i s a l l e v i a t e d
any problems associated w i t h the i n s t a b i l i t y of d i l u t e
s o l u t i o n s . These d i l u t i o n s were made using v o l u m e t r i c
f l a s k s and the same p i p e t t e a f t e r prolonged washing w i t h
deionised d i s t i l l e d water so t h a t the minimum
comparative e r r o r between the metal ions was introduced.
2.8 Contamination C o n t r o l .
Probably the gr e a t e s t d i f f i c u l t i e s encountered when
analysing u l t r a - t r a c e q u a n t i t i e s are those from
contamination. This includes t h a t from the l a b o r a t o r y
atmosphere, the surfaces of co n t a i n e r s , HPLC f i t t i n g s ,
i n j e c t i o n systems and sampling procedure.
To minimised these i n s t r u m e n t a t i o n was placed i n a
la b o r a t o r y e x c l u s i v e l y f o r trace HPLC work. The
de i o n i s e r was only used f o r the purpose of preparing
water f o r trace metal a n a l y s i s s o l u t i o n s and organic
63

acid e l u ents. The same p i p e t t e s and glassware was used,
w i t h metals s o l u t i o n s being repeatedly prepared and
stored i n the same low d e n s i t y polyethylene c o n t a i n e r .
Low d e n s i t y polyethylene i s p r e f e r a b l e to the high
d e n s i t y product which i s manufactured i n a c a t a l y t i c
process which uses t r a n s i t i o n metal oxides(16),
PTFE tubing minimises contamination and was p r e f e r a b l e
t o s t a i n l e s s s t e e l , however a t pressures g r e a t e r than
1500 p s i , PTFE was not strong enough f o r continuous use.
Preconcentration work revealed t h a t s t a i n l e s s s t e e l
released i r o n i n t o the eluent or sample e s p e c i a l l y a t
lower pH. This problem also arose i n the sampling loop
as w e l l as w i t h the I n j e c t i o n syringe. An aluminium
needle i s recommended to be used i n conju n c t i o n w i t h a
disposable p l a s t i c syringe. Where outdoor sampling was
necessary new polyethylene containers were used and the
so l u t i o n s were made acid by using a p l a s t i c tipped
repeatable p i p e t t e t h a t could d e l i v e r constant volumes
of a c i d . Samples were f i l t e r e d a f t e r repeated washings
w i t h the sample s o l u t i o n and placed Immediately i n t o the
polyethylene containers- Samples were kept i n a
r e f r i g e r a t o r f o r a minimal time u n t i l r e q u i r e d .
64
3 Chromatography of Metal Ions
3.1 I n t r o d u c t i o n .
The rapid advancement of HPLIEC column packings has
made f u r t h e r i n v e s t i g a t i o n s i n t o column eluent systems
necessary. Speed of chemical a n a l y s i s i s o f t e n
synonymous w i t h inaccuracy and imprecision of r e s u l t s ,
but the opposite i s t r u e of HPLC determinations and t h i s
i s a major p o i n t i n favour of HPLC. One of the major
aims of t h i s t h e s i s i s to improve and adapt l i q u i d
chromatographic procedures t h a t have been successful i n
the past, using present HPLC technology- P r e l i m i n a r y
observations showed that the c o r r e c t choice of column
m a t e r i a l was extremely important f o r good chromatography
as there i s a l a r g e v a r i e t y of m a t e r i a l s on the market.
Various column packing m a t e r i a l s and eluents t h a t were
found successful are discussed.
Although chromatography c o n t r o l s the number of metals
analysed i n one i n j e c t i o n , the c h i e f aim of t h i s work i s
to i n v e s t i g a t e and develop s e n s i t i v e PC metal d e t e c t o r s .
I t i s impossible t o consider d e t e c t i o n i n i s o l a t i o n from
the chromatography, f o r example, considerable
i n t e r f e r e n c e was found w i t h h i g h l y conducting eluents
when using conductometric d e t e c t o r s ( 4 3 ) - Previous papers
suggest t h a t l i t t l e or no i n t e r a c t i o n occurs w i t h the
eluent using PC reagent d e t e c t i o n , but t h i s i s not
65
assumed here. The chromatography was developed f i r s t ,
d e t e c t o r response i s then assessed at a l a t e r stage-
Early development o f the chromatography was considered
the most l o g i c a l approach- Although some de t e c t o r
response anomalies may occur because the system i s not
optimised as a whole complications a r i s i n g from
Improving both the chromatography and the det e c t o r may
be complex, but could be performed i f necessary.
The chromatography was considered i n t h e o r e t i c a l terms
t o compare separations- Retention was used to c a l c u l a t e
capacity f a c t o r s using the column void time. As
discussed e a r l i e r i n chapter one improved column
parameter determinations require the measurement of the
column void using the solvent f r o n t and not a r e t e n t i o n
measurement from the chromatogram s t a r t i n g p o i n t - This
has t o be measured a c c u r a t e l y , normally using a
c a l i b r a t e d eyepiece, as r e s u l t i n g large e r r o r s i n
ca l c u l a t e d column parameters may occur- Although i t was
necessary t o assess and optimise the chromatography,
some v a r i a b i l i t y occurred a f t e r a column was packed,
making assessment more d i f f i c u l t . The exact c o n d i t i o n s
chosen depended upon the number of metal species t o be
separated and the capacity of the p a r t i c u l a r batch.
Batch t o batch v a r i a t i o n s i n the manufacture of high
e f f i c i e n c y ion-exchange m a t e r i a l s can s t i l l be
s i g n i f i c a n t and i t was found t h a t a new batch sometimes
required a d i f f e r e n t pH of organic acid b u f f e r or even a
66

d i f f e r e n t nominal concentration t o achieve the same
separation as the previous batch.
I t was not the i n t e n t i o n here t o manufacture new
column m a t e r i a l s , however, some new eluents w i l l be
compared i n terms of speed, s e l e c t i v i t y and s e n s i t i v i t y
w i t h a p a r t i c u l a r PC reagent.
Chromatographic e f f e c t s are r e l a t e d t o the eluents
c h e l a t i n g p r o p e r t i e s , i t s conce n t r a t i o n and pH.
Adjustment of the pH was made by adding a l k a l i , however
the c a t i o n present i n the a l k a l i w i l l compete w i t h the
analyte f o r i o n i c s i t e s and i s known as the counter i o n .
The e f f e c t of concentration of counter i o n , ethanol and
sodium c h l o r i d e w i l l also be assessed w i t h the view t o
maximising column e f f i c i e n c y .
S e l e c t i v i t y f o r metal analyte ions i n the presence of
a complexing agent i s p a r t i a l l y dependant upon three
f a c t o r s :
i . the r e l a t i v e coraplexation of the metal,
i i . the competition o f the counter i o n ;
i i i . a f f i n i t y f o r the s t a t i o n a r y phase.
Ligand complexation i s a major c o n t r i b u t o r t o
separation and i s discussed w i t h regards t o q u a n t i f y i n g
67

a r e l a t i o n s h i p t o e l u t i o n order.
C l a s s i c a l i o n chromatography shows t h a t the charge
density of an e l u t i n g metal ion i s p r o p o r t i o n a l t o the
a t t r a c t i o n f o r the s t a t i o n a r y s i t e , consequently size
and charge governs the primary e l u t i o n order. Highly
charged ions may complicate the order by having a
s o l v a t i o n l a y e r which d i f f u s e s the charge d e n s i t y .
Another important c o n s i d e r a t i o n i s the e f f e c t of
enthalpy change f o r the e q u i l i b r i u m r e a c t i o n w i t h the
c h e l a t i n g e l u e n t , which may have a large impact on the
Gibb's f r e e energy of the exchange r e a c t i o n .
Table 3.1
Strong Cation Exchange M a t e r i a l s
Name 1 Ma n u f a c tu re r me q. g dry mass
Diameter / pm
Lichrosorb KAT Merck 1.2 10 Aminex AA,A5,A6,A7, Bio-Rad 2.0 v a r i a b l e w i t h i n A8,A9,Q155,Q150S. defined l i m i t s Benson BA-XIO Benson 1.6 7-10 P a r t i s i l 10 Whatman Quoted as 10
HETP 0.09mm Nuc l e o s i l SA Merck 1.0 10 & 5 Vydac c a t i o n exchange Applied 0.1 30 to 40
Science
68

Table 3.2.
Strong Anion Exchange M a t e r i a l s .
Name Manufacturer meq.g ^ Diameter dry mass* / pm
Lichrosorb AN Merck 0.55 10 Aminex A14,A25, 1.2 as f o r A27,A28,A29. SCX resins Benson BC-XIO 1.3 7-10 P a r t i s i l 10 Whatman Quoted as 10
HETP 0.045mm Nuc l e o s i l SB Merck 1.0 10 & 5 Vydac anion exchange Applied 0 .I 30 t o 40
Science
Obtained from reference (110)
3.2 Physical Properties of Ion Exchange M a t e r i a l s .
The most commonly used commercial high e f f i c i e n c y i o n
exchange m a t e r i a l s are presented i n Tables3.1 and 3.2.
V i r t u a l l y a l l HPLC exchange re s i n s are polystyrene based
ma t e r i a l s w i t h divinylbenzene c r o s s - l i n k i n g . The Vydac
beads are based on a polymer l a y e r on glass s o l i d core
sphere. Only the Whatman and N u c l e o s l l exchangers have a
s i l i c a base- Lichrosorb i s an I r r e g u l a r porous
s i l i c a - b a s e d m a t e r i a l . Anion exchangerj*use a quaternary
ammonium group and the c a t i o n exchangers an aromatic
sulphonated moiety. The HPLIEC res i n s can withstand
temperatures up t o 150 °C and the ionogenic groups can
t o l e r a t e very high and low eluent pH, The s t r u c t u r e
and size of the r e s i n has considerable impact upon the
chromatography.
Although s i l i c a substrates are only s t a b l e a t
69
intermediate pH the s t r u c t u r e has no n o t i c e a b l e
chromatographic e f f e c t s . Resin-based m a t e r i a l s have
chromatographic e f f e c t s dependant on the degree of
c r o s s - l i n k i n g . Increased c r o s s - l i n k i n g diminishes the
s w e l l i n g of a r e s i n and the water content. The pore size
of the bead reduces to give a molecular sieve e f f e c t
that p a r t i a l l y increases s e l e c t i v l t y ( 1 1 0 ) . T a k a t a ( l l l )
compared 8, 10 and 12 % c r o s s - l i n k e d sulphonated r e s i n
separations w i t h a t a r t r a t e eluent and i l l u s t r a t e d t h a t
heavier metals, cadmium and lead, were i n c r e a s i n g l y
retained compared to other metals, such t h a t lead
separates from n i c k e l w i t h 10 % divinylbenzene
c r o s s - l i n k i n g .
Perhaps the most d i s t i n g u i s h i n g f e a t u r e of
resin-based exchanger from s i l i c a - b a s e d m a t e r i a l i s
the g r e a t e r k i n e t i c r a t e of exchange and the lower
capacity. Resins are sulphonated at the centre of the
r e s i n as w e l l as the e x t e r i o r , s i l i c a - b a s e d i o n
exchangers have surface-bonded benzene sulphonic acid
f u n c t i o n a l groups.
Improved chromatography r e s u l t s from using small
p a r t i c l e size s t a t i o n a r y phases but w i l l r equire higher
pressures to maintain flow r a t e s . A macroporous r e s i n
also has less substrate to d i f f u s e through and should
have a r a p i d r a t e of d i f f u s i o n . A t h i n f i l m present on
the p a r t i c l e i s less of a b a r r i e r w i t h smaller
p a r t i c l e s , and i t s e f f e c t i s s i m i l a r l y diminished w i t h
70

o
temperature. A temperature increase from 25 to 50 C
doubles the d i f f u s i o n c o e f f i c i e n t which i s normally the
rate c o n t r o l l i n g process, hence doubling the exchange
ra t e ( 1 1 2 ) . A l a r g e r analyte ion gives a slower d i f f u s i o n
rate which i s to some extent c o n t r o l l e d by the degree of
c r o s s - l i n k i n g . Highly charged ions also produce a slower
r a t e of exchange. A high capacity i o n exchanger would
consequently have a g r e a t e r a f f i n i t y and slow the i o n
exchange r e a c t i o n . Thus a higher capacity or degree of
c r o s s - l i n k i n g does not mean t h a t a b e t t e r e f f i c i e n c y i s
obtained.
D i f f u s i o n i s an important f a c t o r when considering i o n
exchange processes as i t i s o f t e n the rate l i m i t i n g
step, making the e f f e c t of column temperature important.
The P a r t i s i l SCX and e s p e c i a l l y the Aminex A9 SCX
columns have a considerable g a i n i n e f f i c i e n c y w i t h
temperature. The P a r t i s i l 10 SCX column was operated a t o
temperatures up to 56 C, however the increase i n
e f f i c i e n c y i s accompanied by an i n c r e a s i n g
s o l u b i l i s a t i o n of s i l i c a . This problem may be
circumvented by a s a c r i f i c i a l guard column of cheaper
s i l i c a m a t e r i a l , which saturates the eluent stream w i t h o
s i l i c a . A compromise temperature of 40 C was used
without a guard column present. o
Styrene based SCX columns are s t a b l e u n t i l over 120 C
and are more e f f i c i e n t at high temperatures, because the
cations can enter the bead at g r e a t e r rates to reduce 71
peak broadening processes. For t h i s work the s i l i c a o O
column was used at 40 Cand the r e s i n column a t 60 C
unless otherwise s t a t e d .
3.3 Choice of Cationic Chromatographic Substrate-
I n i t i a l l y i t was intended to separate about ten trace
metals as c a t i o n i c species. Table 3.1 l i s t s the choice
of commercially a v a i l a b l e HPLC c a t i o n exchangers. Few
metal separations by HPLIEC are known and at present
there are few c a t i o n exchangers that can be considered
to be o f s u f f i c i e n t q u a l i t y f o r the o b j e c t i v e s o f t h i s
t h e s i s .
The a b i l i t y t o separate t r a n s i t i o n metals w i t h H i t a c h i
No.2611 & 2613 and the CK 10 and 12 r e s i n s ( M i t s u b i s h i
Chemical I n d u s t r i e s , Japan) has been w e l l demonstrated
by T a k a t a ( l l l ) . Takata also showed the separation of
rare earths w i t h a H i t a c h i 2611 15 pm diameter SCX
r e s i n ( 7 0 ) . These resins were unobtainable here. American
manufactured Dionex c a t i o n exchangers could only be
purchased w i t h the whole chromatographic system. I t was
t h e r e f o r e decided to use the r e a d i l y a v a i l a b l e
s i l i c a - b a s e d P a r t i s i l 10 SCX as a low capacity exchanger
and the high capacity h i g h l y c r o s s - l i n k e d Aminex A9
r e s i n t h a t o f f e r s higher e f f i c i e n c i e s w i t h a c l o s e l y
defined 11 + 0.5 pro p a r t i c l e s i z e . The lower cap a c i t y
exchanger would n a t u r a l l y require a lower con c e n t r a t i o n
72

b u f f e r f o r e l u t i o n - This o p t i o n covers the extremes of
the b u f f e r concentration range necessary w i t h good
separations- This wide range of b u f f e r concentrations
can then be used to assess d e t e c t o r performance which i s
discussed i n the next two chapters. The r e s i n and
si l i c a - b a s e d SCX m a t e r i a l s w i l l be used i n columns w i t h
dimensions of 10 by 0.46 cm and 25 by 0.46 cm
r e s p e c t i v e l y , unless otherwise s t a t e d .
Table 3-3,
Comparison of S i l i c a and Resin Based SCX M a t e r i a l s
S i l i c a SCX PIO Resin SCX A9 Resin SCX Dionex
Metal RT^ RRT^ RT RRT RT RRT / min / mln / min
void 1.52 0.72 0.65 Copper 2.90 1-00 3.84 1.00 3.29 1.00 Zinc 6.08 3.69 5.97 1-68 9.04 3.04 Nickel 6.86 3.88 7.63 2.21 9.70 3.42 Cobalt 8-02 4.72 13.0 3.94 17.1 6.23 Cadmium 9.77 5.99 20.2 6.14 25.4 9.37
T a r t r a t e Cone. / M 0-04 0.2 . 0.02
pH 3.66 4.52 4.5
f denotes the void time of the column unless otherwise s t a t e d . a r e t e n t i o n time(RT) b r e l a t i v e r e t e n t i o n time(RRT) The column dimensions f o r the l i g h t l y sulphonated Dionex r e s i n SCX column was 25 by 0.46 cm.
The r e t e n t i o n times f o r a l l metal ions e l u t e d are
tabulated t o the second decimal place of a minute unless
otherwise s t a t e d , i n p r a c t i c e a v a r i a t i o n of +_ 0.01
minutes was observed. To all o w f o r r e t e n t i o n v a r i a t i o n
73

w i t h i n a chromatographic system the r e l a t i v e r e t e n t i o n
time(RRT) was used where the r a t i o e d r e t e n t i o n time(RT)
against copper was c a l c u l a t e d . I n each r a t i o the column
void time was subtracted from the copper and metal e l u t e
r e t e n t i o n times.
3.4 Choice of Cation Column Eluent.
C l a s s i c a l c a t i o n exchange chromatography mainly used
mineral acids t o e l u t e t r a n s i t i o n metals. Smaller
p a r t i c l e size and th e r e f o r e more e f f i c i e n t i o n exchange
ma t e r i a l s f o r HPLIEC were manufactured t h a t gave b e t t e r
separations w i t h organic acid eluents. Although EDTA,
n i t r i c and s u l p h u r i c acids have been used, c a r b o x y l i c
acids were found t o be more successful f o r c a t i o n
exchange chromatography(113). Cation exchange
chromatography of metal ions was considerably improved
by using p o l y - f u n c t i o n a l c a r b o x y l i c acid e l u e n t s .
Retention times were much s h o r t e r and the separation of
ions w i t h s i m i l a r size and charge was enhanced. This was
normally performed w i t h an i s o c r a t i c rather than the
f a m i l i a r step g r a d i e n t e l u t i o n , except f o r some
lanthanoid separations.
The capacity of the c a t i o n exchanger determined the
elue n t . A high capacity required c a r b o x y l i c acids w i t h
l a r g e r metal s t a b i l i t y constants t o maintain s h o r t
r e t e n t i o n times. Thus c a t i o n exchange mate r i a l s based on
74
high capacity c r o s s - l i n k e d polystyrene resins tend to
use the more s t r o n g l y c h e l a t i n g t a r t a r i c and c i t r i c
acids.
The capacity of the Whatman s i l i c a SCX i s considerably
lower than the Aminex A9 r e s i n and thus a weaker
complexing acid or a strong complexing acid at a lower
concentration can be used.
Carboxylic acids such as t a r t a r i c and c i t r i c e l u e n t s
gave poor separations w i t h c l a s s i c a l column
chromatography, however i t may be possible to take
b e t t e r advantage of them f o r HPLIEC separations. I f only
a few metals are to be determined then i t may be
possible t o use an eluent which only separates the
necessary metals thus speeding up the analysis time as
the remainder e l u t e together and q u i c k l y . To separate
d i f f i c u l t peaks or samples the p o s s i b i l i t y of mixing
mobile phases can combine the advantages of both
e l u e n t s , which may make the chromatography more
e f f i c i e n t . P lots of i n v e r s e l y varying concentrations of
eluents against r e t e n t i o n could be used to a s c e r t a i n the
c o r r e c t combination^ these are known as window diagrams.
For t h i s work many acids were studied as a base, i n the
b e l i e f t h a t such i n f o r m a t i o n may be u s e f u l f o r window
diagrams(114)- Window techniques could be developed not
only f o r mobile phases, but also f o r combined s t a t i o n a r y
phases as they have f o r GC. Therefore i t was thought
prudent to study metal r e t e n t i o n w i t h the weakly
75

complexing acids, a c e t i c , f o r m i c , l a c t i c , maleic and
suc c i n i c acids as w e l l as the more f a m i l i a r t a r t a r i c and
c i t r i c acids using the P a r t i s i l 10 SCX column-
Other acids were considered as a l t e r n a t i v e eluents t o
assess t h e i r a b i l i t y t o separate and change the e l u t i o n
order, as w e l l as t h e i r possible use i n combined
eluents. New eluents were chosen on the basis t h a t the
metal s t a b i l i t y constants should be of the same
magnitude as the c a r b o x y l i c acids t h a t were successful.
Comparison of s t a b i l i t y constants are shown i n Appendix
1. For each eluent studied only those that gave good
separations are i l l u s t r a t e d , o thers are t a b u l a t e d .
A l t e r n a t i v e eluents were chosen by adopting the
f o l l o w i n g separation o p t i m i s a t i o n s t r a t e g y :
i. a pH i n the range 2 to A.5 was used and the
concentration of the organic acid eluent a l t e r e d t o
achieve maximum separation;
i i - f o r a given t o t a l c o ncentration of a c i d ,
precise c o n t r o l o f e l u t i o n speed was achieved by pH
adjustment w i t h the a d d i t i o n of a (3+2) mixture of 2M
NH^0H:Na0H, r e s p e c t i v e l y -
3.5 C i t r a t e E l u t i o n .
C i t r i c acid i s a t r i v a l e n t c a r b o x y l i c acid and forms
strong complexes w i t h most metals, e s p e c i a l l y the f e r r i c
76

i o n . This i s r e f l e c t e d i n a change of e l u c i o n order when
compared to sodium sulphate or weak organic acid e l u e n t .
Poor separation occurs even w i t h the r e s i n c a t i o n
exchanger shown i n Figure 3.1, because of the strong
complexes formed. I t i s b e t t e r when used w i t h the
P a r t i s i l 10 SCX column and Figure 3.2 shows the best
r e s o l u t i o n of peaks f o r the P a r t i s i l 10 SCX column w i t h
a 0.04M c i t r a t e eluent a t pH 3.2 which gives indium(2.30
min) copper(2.57 min) e l u t i n g together as do zinc(5.26
min) and cobalt(5.79 min). I r o n (8.78 min) and
manganese(11.4 min) e l u t e separately.
Table 3.4.
C i t r a t e E l u t i o n w i t h a Resin-Based SCX Column.
Metal Retention Time / min
Void time 0.96 Bismuth 1.11 Copper 1.28 Zinc 1.55 Nickel 1.92 Lead 3.12 Cobalt 8.32
Table 3.5.
C i t r a t e E l u t i o n w i t h a Silica-Based SCX Column.
Metal Retention Time / min.
Void time 1.41 Indium 2.30 Copper 2.57 Zinc 5.26 Cobalt 5.79 I r o n 8.78 Manganese 11.4
77

Figure 3.1
Cu
Ni
Zn /
mm
C i t r a t e E l u t i o n from a
Cation Exchange Column.
The separation of a 100 p i of 2 pg ml ^
copper(l.^2 rain) and n i c k e l ( 3 . 2 min) and 10 pg ml ^
of zinc(7.A9 rain) using a 0.2M c i t r a t e eluent a t pH 3.75
w i t h an Amlnex A9 SCX column. Detection was at 595 nm
wit h an EBT reactant i n .5M ammonia s o l u t i o n . Most metals
co-elute w i t h zinc- Cobalc(1.52 min) co-elutes w i t h
copper.
78

Figure 3.2
0 16
mi n
C i t r a t e E l u t i o n from a S i l i c a
Based Cation Exchange Column. Cu \
In ( in)
Zn
Co \
i
Fe
Mn
-1 The separation of a 100 ^1 of 3 pg ml
of lndiam(2.30 min) 1.2 pg ml ^ of copper(2.57 min),
zlnc(5.26 min) cobalt(5.79 min), Fe(8.78 min) and
manganeseC1l.A min) using a O.O M c i t r a t e eluent at pH
3.17 w i t h a P a r t i s i l 10 SCX column. Detection was at 610
nm w i t h EBT as a post-column reactant i n a .AM ammonia
s o l u t i o n and a F.S.D. of 0.2 absorbance. Lead(A.9A
min) and nickel(A.33 min) co- e l u t e .
79

3.6 T a r t r a t e E l u t i o n .
This i s a d i v a l e n t organic acid t h a t I s a s l i g h t l y weaker complexing agent than c i t r a t e and, as Appendix 1 demonstrates, has l a r g e r d i f f e r e n c e s i n metal s t a b i l i t y constants. This was r e f l e c t e d i n b e t t e r chromatographic d i f f e r e n t i a t i n g powers. I t i s amenable to use w i t h P a r t l s l l 10 and Aminex A9 SCX columns. However the l a t e e l u t i o n of peaks decreases s e n s i t i v i t y because of peak broadening as Figure 3.3 shows f o r the Aminex SCX r e s i n . To separate lead from n i c k e l i t was necessary to reduce the pH t o 4.25, w i t h cadmium e l u t i n g a t 23.58 minutes. The metals e l u t e w i t h b e t t e r e f f i c i e n c y using a s i l i c a based SCX column as shown i n Figure 3.4
Table 3.6.
T a r t r a t e E l u t i o n w i t h a Resin-Based SCX Column.
Metal Retention Time / mln
Void time 0.45 Copper 3.37 Zinc 6.93 N i c k e l 8.88 Lead 9.98 Cobalt 15.73 Cadmium 23.09
80

Figure 3.3
Cu \
V
/ Co
2n
Ni ./
T a r t r a t e E l u t i o n from a Resin
Based Cation Exchange Column.
The separation of a 100 p i of I pg ml -1
-1
of copper(2.09 min), 2 pg ml ^ of zinc(5.63 min) A
pg ml * of nickel(7.10 min), 3 pg ml ^ of
cobalt(12.31 min) and 1 pg ml ^ of cadmium(19.68
min) using a 0.2M t a r t r a t e eluent at pH A.32 using an
Aminex column. Detection was at 595 nm w i t h d i t h i z o n e i n
acetone 80:20 water and 1 % a c e t i c acid as the
post-column reactant and the F.S.D. was 0.1 absorbance
81
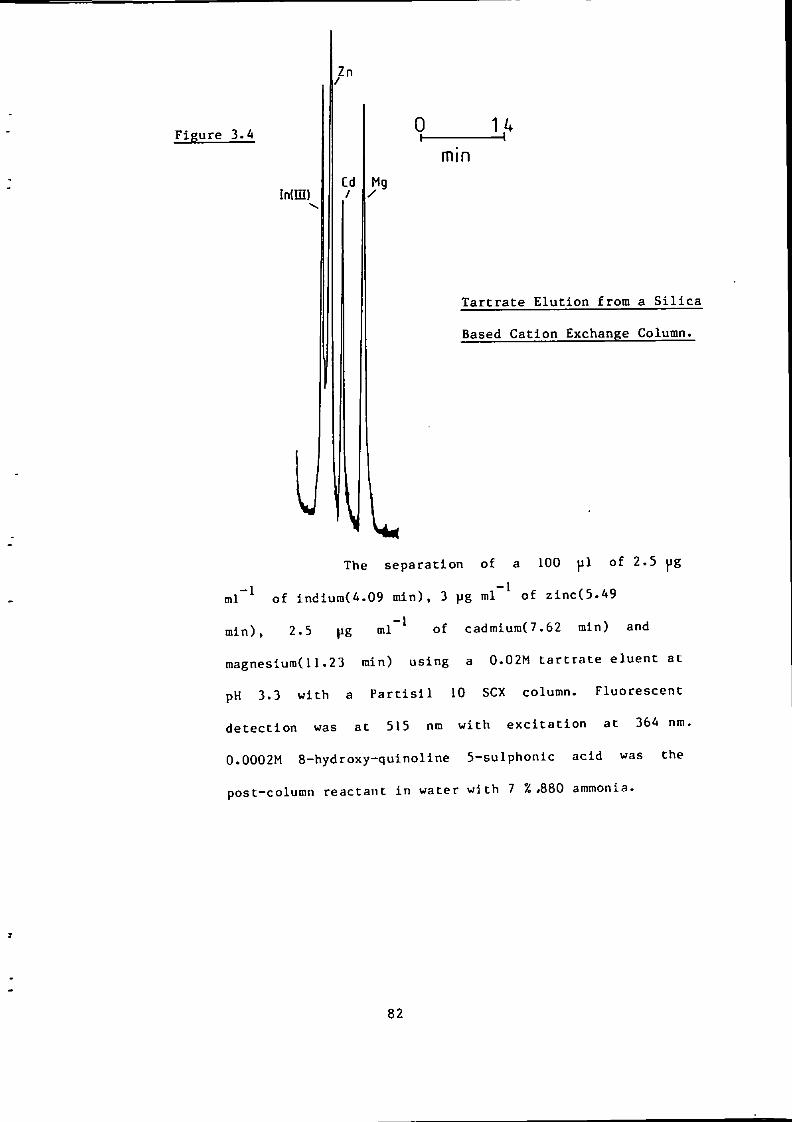
Figure 3.^
Inim)
0 1} mm
T a r t r a t e E l u t i o n from a S i l i c a
Based Cation Exchange Column.
The separation of a 100 p i of 2.5 pg
ml"^ of indiura(A.09 min), 3 pg ml~^ of zinc(5.49
min), 2.5 pg ml * of cadmium(7,62 mln) and
magnesiura(11.23 min) using a 0.02M t a r t r a t e e l uent at
pH 3.3 w i t h a P a r t i s i l 10 SCX column. Fluorescent
d e t e c t i o n was at 515 nm w i t h e x c i t a t i o n at 364 nm.
0.0002M 8-hydroxy-quinoline 5-sulphonic acid was the
post-column reactant i n water w i t h 7 %/880 ammonia-
82

3.7 Oxalate E l u t i o n .
This i s another d i v a l e n t a c i d which i s comparable t o t a r t r a t e f o r separations, but has the problem of forming i n s o l u b l e calcium compounds at higher concentrations and was considered second to the t a r t r a t e system because calcium i s present i n most environmental samples.
A 0.02M concentration was necessary t o e f f e c t a
separation at pH 2.5 on a P a r t i s i l 10 SCX column. The
peaks i n Figure 3.5 i l l u s t r a t e a high e f f i c i e n c y and
s e l e c t i v i t y f o r t h i s e l u t i o n system. Table 3.7 shows i t
i s possible t o separate copper and i r o n ( I I I ) from
n i c k e l , lead, zinc and cadmium, c o b a l t , i r o n , manganese
i n 38 minutes as w e l l as the l a t e e l u t i n g magnesium and
calcium i n a s i n g l e i n j e c t i o n . However the large time
span requires an i n v e s t i g a t i o n of gra d i e n t e l u t i o n . An
anomaly a r i s e s when the pH i s increased to 3.5, where
coba l t which p r e v i o u s l y e l u t e d a f t e r z i n c , n i c k e l ,
cadmium and lead now e l u t e s before t h i s s e r i e s .
P r e l i m i n a r y studies showed th a t a more concentrated
oxalate eluent may separate manganese, a l u m i n i u m ( I I I ) ,
magnesium and calcium.
83
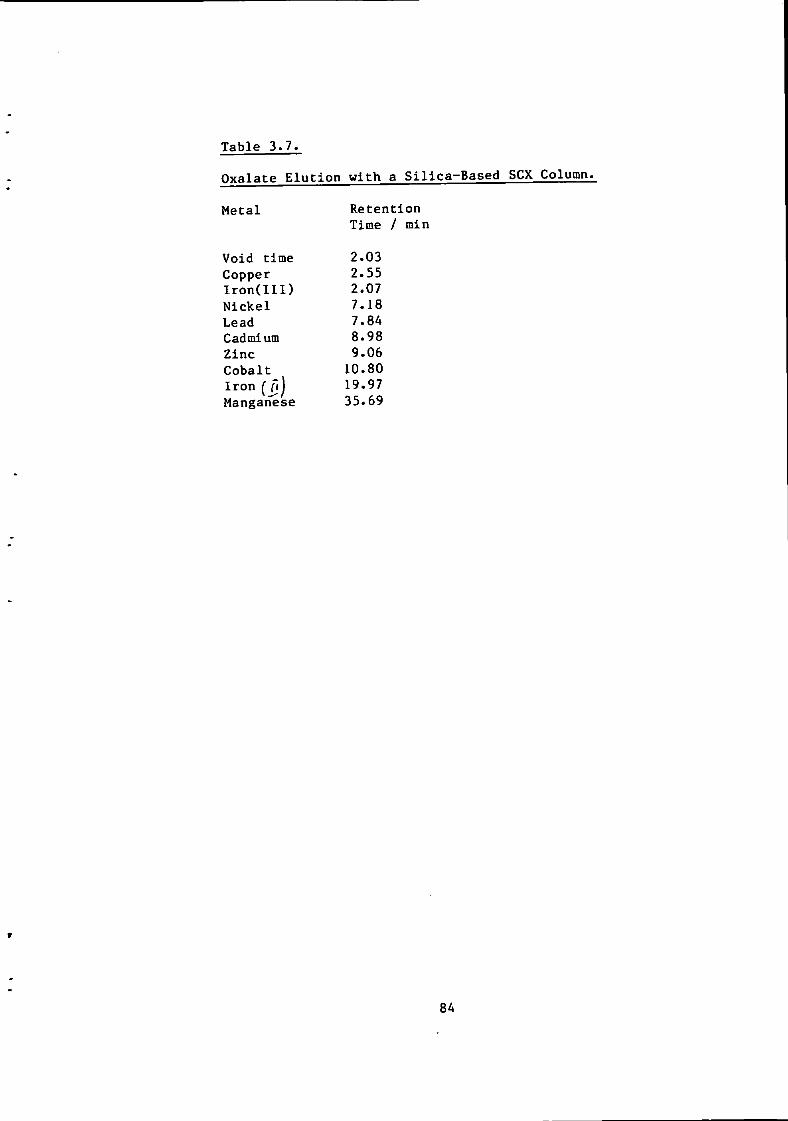
Table 3.7.
Oxalate E l u t i o n w i t h a Silica-Based SCX Column.
Metal Retention Time / m i n
Void time 2.03 Copper 2.55 I r o n ( I I I ) 2.07 Nick e l 7.18 Lead 7.84 Cadmium 8.98 Zinc 9.06 Cobalt 10.80 I r o n ( j i j 19.97 Manganese 35.69
84
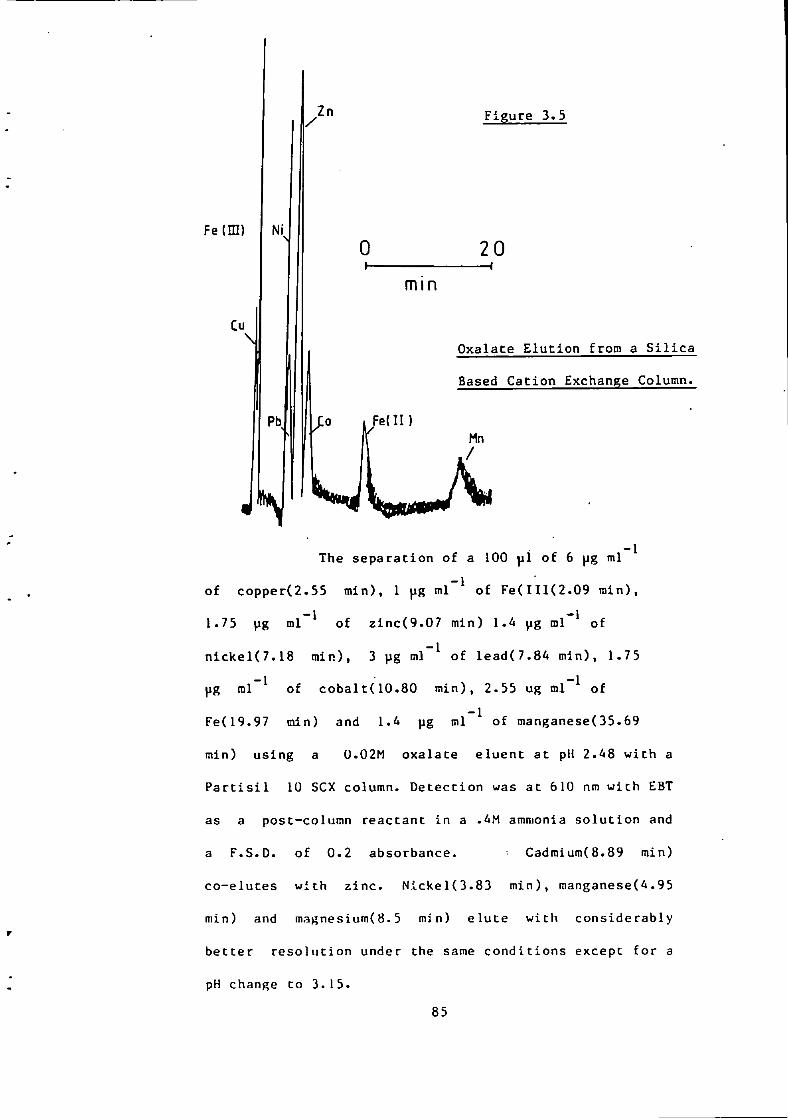
Feim)
Cu
Ni
Pb
Zn Figure 3.5
0 I -
20 —* mm
0 i F e d l )
Oxalate E l u t i o n from a S i l i c a
Based Cation Exchange Column.
The se p a r a t i o n of a 100 yl of 6 pg ml
of copper(2.55 min), 1 pg ml" of F e ( H l ( 2 . 0 9 rain),
1.75 pg ml ^ of zinc(9.07 min) l.A pg ml * of
ni c k e l ( 7 . 1 8 rain), 3 pg ml"^ of lead(7.84 min), 1.75
pg ral"^ of c o b a l t ( l 0 . 8 0 m in), 2.55 ug ml"^ of
Fe(19.97 min) and 1.4 pg ml ^ of manganese(35.69
min) using a 0.02M oxalate e l u e n t a t pH 2.48 w i t h a
P a r t i s i l 10 SCX column. De t e c t i o n was at 610 nm w i t h EBT
as a post-column reactant i n a .4M ammonia s o l u t i o n and
a F.S.D. of 0.2 absorbance. Cadmium(8.89 min)
co-elutes w i t h z i n c . Nickel(3.83 min), manganese(4.95
min) and magnesium(8.5 min) e l u t e w i t h considerably
b e t t e r r e s o l u t i o n under the same c o n d i t i o n s except f o r a
pH change to 3.15.
85
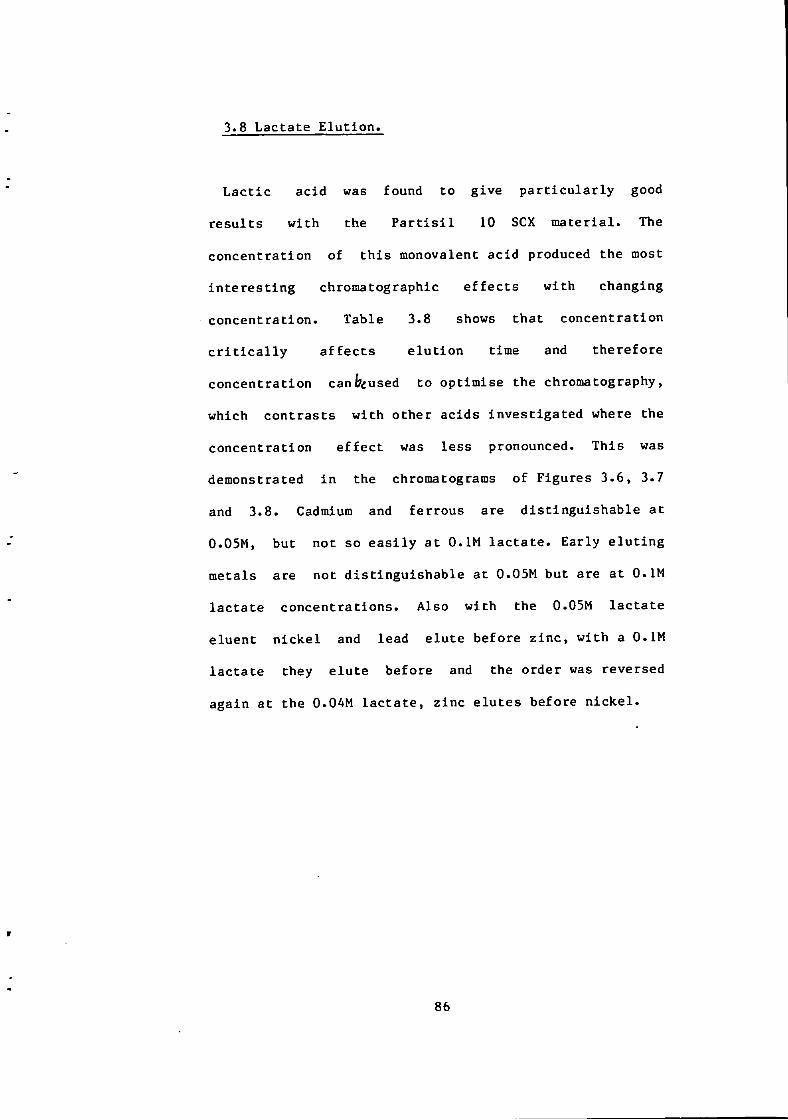
3.8 Lactate E l u t i o n .
L a c t i c acid was found t o give p a r t i c u l a r l y good r e s u l t s w i t h the P a r t i s i l 10 SCX m a t e r i a l . The concentration of t h i s monovalent acid produced the most i n t e r e s t i n g chromatographic e f f e c t s w i t h changing con c e n t r a t i o n . Table 3.8 shows t h a t concentration c r i t i c a l l y a f f e c t s e l u t i o n time and the r e f o r e concentration canfceused t o optimise the chromatography, which c o n t r a s t s w i t h other acids i n v e s t i g a t e d where the concentration e f f e c t was less pronounced. This was demonstrated i n the chromatograms of Figures 3.6, 3.7 and 3.8. Cadmium and fe r r o u s are d i s t i n g u i s h a b l e a t 0.05M, but not so e a s i l y a t O.IM l a c t a t e . Early e l u t i n g metals are not d i s t i n g u i s h a b l e a t 0.05M but are at O.IM l a c t a t e concentrations. Also w i t h the 0.05M l a c t a t e eluent n i c k e l and lead e l u t e before z i n c , w i t h a O.IM l a c t a t e they e l u t e before and the order was reversed again at the 0.04M l a c t a t e , zinc e l u t e s before n i c k e l .
86

Table 3.8.
Comparison of E l u t i o n Times f o r D i f f e r e n t Concentrations of Lactate B u f f e r .
Metal Retention Time / min
Conc-of Lactate / M 0.04 0.05 0.1
Void time 2.74 1.51 1.23 Indium 21.10 2.16 4.14 Copper 6.75 2.20 3.50 I r o n ( I I I ) 11.70 1.29 4.80 Zinc 16.70 4.26 7.54 Nick e l 18.60 3.56 8.44 Lead 3.90 8.48 Cobalt 5.42 10.44 I r o n 8.23 11.40 Cadmium 11-0 12.30 Manganese 12.3 13.90 Magnesium 16.0 15.40
Those th a t have l a r g e r r e t e n t i o n
recorded.
87

Figure 3.6 Fe(III)
In(ni)
20 — I
mi n
E f f e c t of 0.04M Concentration
of Lactate Eluent on E l u t i o n .
The separation of a 100 p i of 0-9 pg
ml ^ of copper<6.75 min), 0.9 pg ml ' of
F e ( l I I ( l l , 7 0 min), 6 pg ml"^ of z l n c ( I 6 . 7 0 mln) 0.9
pg ml"* of n i c k e l ( l 8 . 6 0 min) and 2.2 ^ig ml * of
indium(21.10 min) using a. 0.04M l a c t a t e eluent at pH
3.55 w i t h a P a r t i s i l 10 SCX column. Detection was at 610
nm w i t h EBT as a post-column reactant i n a -4M ammonia
s o l u t i o n and a F.S.D. of 0.02 absorbance.;
88
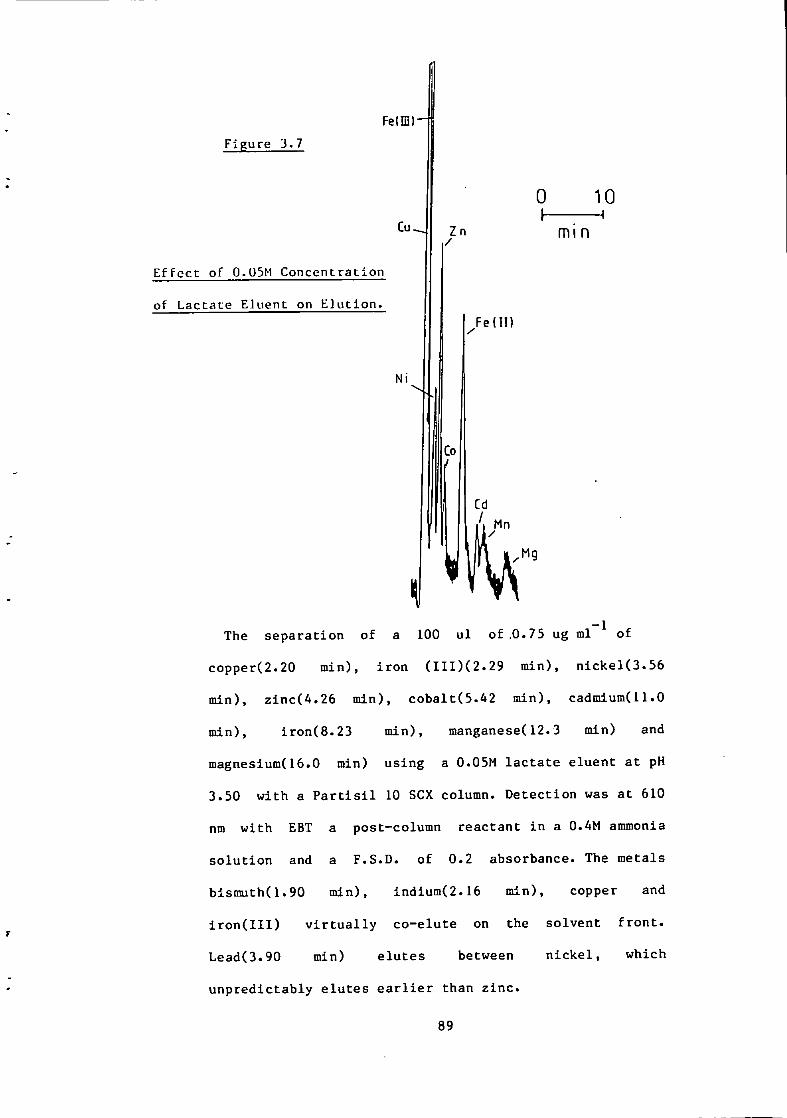
F i g u r e 3.7
E f f e c t of Q.05M C o n c e n t r a t i o n
of L a c t a t e E l u e n t on E l u t i o n . Fe(ll)
10
mi n
The separation of a 100 u l of .0.75 ug ml of
copper(2.20 min), i r o n ( I I I ) ( 2 . 2 9 min), n i c k e l ( 3 . 5 6
min), zinc(4.26 min), cobalt(5.42 min), cadmlum(11.0
min), iron(8.23 min), manganese(12.3 min) and
magnesiumC16.0 min) using a 0.05M l a c t a t e eluent a t pH
3.50 w i t h a P a r t i s i l 10 SCX column. Detection was a t 610
nm w i t h EBT a post-column reactant i n a 0.4M ammonia
s o l u t i o n and a F.S.D. of 0.2 absorbance. The metals
blsmuth(1.90 min), indium(2.16 min), copper and
i r o n ( I I I ) v i r t u a l l y co-elute on the solvent f r o n t .
Lead(3.90 min) e l u t e s between n i c k e l , which
u n p r e d i c t a b l y e l u t e s e a r l i e r than z i n c .
89

Figure 3.8
E f f e c t of O.IOM Concentration
of Lactate Eluent on E l u t i o n .
0 10 min
The separation of a 100 \xl of I pg ral
of indiuro(4.14 m i n ) , copper(3.50 m i n ) , F e ( U I ( 4 . 8 0 m i n ) ,
zinc(7.54 min) ni c k e l ( 8 . 4 4 min). cobalt(10.44 min).
manganeseC13.90 min) and magnesium(15.40 min) using a.
O.IM l a c t a t e e l u e n t a t pH 3.5 w i t h a column. De t e c t i o n
was at 610 nm w i t h EBT as a post-column re a c t a n t In a
.4M ammonia s o l u t i o n and a F.S.D. of 0.2 absorbance.
CadmiumC12.30 min). and K e ( l l . 4 0 min) co-eluce ac
11.94 min. Lead a l s o co-eluces w i t h n i c k e l .
Traces of calcium are seen(16.85 min).
90

3.9 Succinate E l u t i o n .
Table 3.9 shows t h a t a O.IM succinate b u f f e r at pH A.35 gave a d i f f e r e n t order of r e t e n t i o n from most organic acids i n t h a t indlum(12.76 mln) and bismuth(16.89 mln) eluted l a t e r than most species on a P a r t i s i l 10 SCX column. Lead(A.7A mln) and iron(6.89 mln) also e l u t e d e a r l i e r than zlnc(8.97 mln) and nlckel(8.38 mln). An attempt t o use lower concentrations of succinate gave unstable chromatography and hence v a r i a b l e metal r e t e n t i o n values.
Table 3.9,
Succinate E l u t i o n w i t h a Silica-Based SCX Column
Metal Retention Time / m l n
Void time 2.13 Bismuth 16.89 Indium 12.76 Copper 4.55 Zinc 8.38 Ni c k e l 8.97 Lead 4.74 Cobalt 9.69 Cadmium 6.89
3.10.Maleate E l u t i o n .
Retention times are given i n Table 3.10 f o r the
optimum separation c o n d i t i o n s f o r varying malelc acid
concentrations and pH values using a P a r t i s i l 10 SCX
column. The optimum c o n d i t i o n s were a t 0.04M maleate and
91

pH 2.50. No d i s t i n c t i v e separations are shown which
would f u l f i l the I n i t i a l i n t e r e s t .
A O.IM maleate b u f f e r a t pH 3.63 shows poor
chromatographic separation and a d i l u t i o n to 0.04M, a t
pH 3.75, d i d not Improve the s i t u a t i o n . Metals d i d not
el u t e a t ex a c t l y the same times, but merely e l u t e d a t a
l a t e r stage t o give the same c l o s e l y k n i t c o n f i g u r a t i o n .
Table 3.10.
Maleate E l u t i o n w i t h a Silica-Based SCX Column,
Metal Retention Time / min
Void time 1.38 Indium 9.32 Copper 5.72 Zinc 8.85 Nickel 9.12 Lead 10.20 C o l b a l t 9.40 I r o n ( I I ) 9.17 Cadmium 9.15 Manganese 9.27 Magnesium 9.12
92

3.11 Pyruvate E l u t i o n .
This acid i s c l o s e l y r e l a t e d to l a c t i c a c i d and
changing the f u n c t i o n a l group i n the alpha p o s i t i o n t o
the carboxylate system may e f f e c t a d i f f e r e n t e l u t i o n
order. The optimum c o n d i t i o n s f o r t h i s acid using a
P a r t i s i l 10 SCX column were 0.04M pyruvate a t pH 3.05
Table 3.11 shows r e t e n t i o n s f o r poorly separated metal
species a t two pH values w i t h a 0.0AM pyruvate e l u e n t .
Table 3.11.
Pyruvate E l u t i o n w i t h a Silica-Based SCX Column.
Metal Retention Retention Time / min Time / m i n
pH 3.05 3.A1
Void time 1.64 1.6A Copper 3.72 A.75 I r o n ( H l ) 5.33 7.25 Zinc A.45 6.38 Nick e l 5.03 6.95 Co l b a l t 5.15 6.92 I r o n ( I X ) 5.33 Cadmium A.82 Manganese 5.1A Magnesium 5.05
I f the pH or the pyruvic acid
decreased then the metal ions only increased t h e i r
r e t e n t i o n without improving the separation.
93

3.12 Formate E l u t i o n .
This i s the weakest complexing organic acid i n the
s e r i e s , Table 3.12 shows that the optimum c o n d i t i o n s
using a P a r t i s i l 10 SCX column were at pH 4.25 and
0.075M.
Table 3.12-
Formate E l u t i o n w i t h a Silica-Based SCX Column,
Metal Retention Time / min
Void time 1.50 Copper 3.57 Zinc 5.38 Ni c k e l 5.51 I r o n ( I I ) 6.18 Cadmium 4.67 Manganese 5.62
Again the acid has too weak a s e l e c t i v i t y e f f e c t t o be
of any chromatographic use on i t s own. Copper e l u t e d
e a r l i e r and i r o n l a t e r , separating from z i n c , n i c k e l ,
manganese, lead and i r o n ( I l l ) .
3.13 E f f e c t of The Counter-Ion and The Counter-Ion
Concentration.
Metal Ions have a p r e f e r e n t i a l order of complex
formation w i t h a l i g a n d according t o the I r v i n g - W i l l i a m s
order, which i s magnesium <manganese <i r o n <cobalt
< n i c k e l <copper > z i n c . This i s r e l a t e d t o charge
density and i n the case of t r a n s i t i o n metals i s also
94

r e l a t e d to the l i g a n d - f i e l d s t a b i l i s a t i o n energy. I t
t h e r e f o r e f o l l o w s t h a t w i t h ions of the same charge,
e l u t i o n order f o l l o w s decreasing s i z e . E l u t i o n i s also
dependant upon competition w i t h a counter-ion f o r column
i o n i c s i t e s , i t should t h e r e f o r e f o l l o w that the size
and charge of the counter-ion w i l l c o n t r o l the speed and
possibly the degree of separation. A knowledge of the
counter-ion w i l l give a b e t t e r comprehension of the
organic acid e l u e n t s e l e c t i v i t y . E l u t i o n was t h e r e f o r e
attempted without an organic complexing agent present.
The sulphate i o n has r e l a t i v e l y l i t t l e complexing
a b i l i t y so the sodium and hydrogen ions can completely
c o n t r o l the separation- The di-sodium s a l t was used and
the a c i d i t y was adjusted w i t h s u l p h u r i c acid to a pH of
3.70-
Table 3.13.
Sodium Sulphate E l u t i o n w i t h a Silica-Based SCX Column-
Retention Time / min
Sulphate M o l a r i t y
Metal 0.02 0.01 0.005
Copper 2.15 3-00 6.90 Zinc 2.1A 3-04 7.10 Manganese 2.25 3.17 7.20 Magnesium 2.24 3.27 7.54
The competing counter-ion causes an expected
exponential decrease i n r e t e n t i o n w i t h i n c r e a s i n g
c o n c e n t r a t i o n , Table 3.13 shows th a t r e t e n t i o n r e l a t i v e
95

to copper remains constant. D i s t i n c t i v e r e t e n t i o n
d i f f e r e n t i a l s are shown and although the peaks are not
completely separated the expected e l u t i o n order obtained
was s i m i l a r to t h a t of a weak organic complexing a c i d ,
i l l u s t r a t i n g a minimal complexing e f f e c t f o r some
organic acids which was only j u s t s u f f i c i e n t f o r
separation.
The counter-ion e f f e c t was f u r t h e r i n v e s t i g a t e d
because the nature of i t s a c t i o n may be a l t e r e d i n the
presence of a complexing agent. To assess t h i s aspect a
0.04M succinate b u f f e r at pH 3.70 was used. I t s
d i f f e r e n t i a l separating a b i l i t y on a P a r t i s i l SCX column
was found to be i n s u f f i c i e n t f o r the easier t r a n s i t i o n
metal separations, a l l o w i n g any e f f e c t of the
counter-ion to be n o t i c e d .
Table 3.14.
Succinate Sodium Sulphate E l u t i o n w i t h a Silica-Based SCX Column,
Sulphate M o l a r i t y 0.0 0,001 0.002 0.004
Metal Retention Time / min
Copper 11,2 6.69 5.02 3.64 Zinc 19.9 9.64 7,03 4.49 N i c k e l 21.7 9.93 7.75 4,59 Manganese 21.7 10.2 8,00 4,84
As shown i n Section 3-9 succinate gave peaks t h a t were
b e t t e r separated, but the e l u t i o n time was longer. An
increase of sodium i n the eluent as sodium sulphate
96
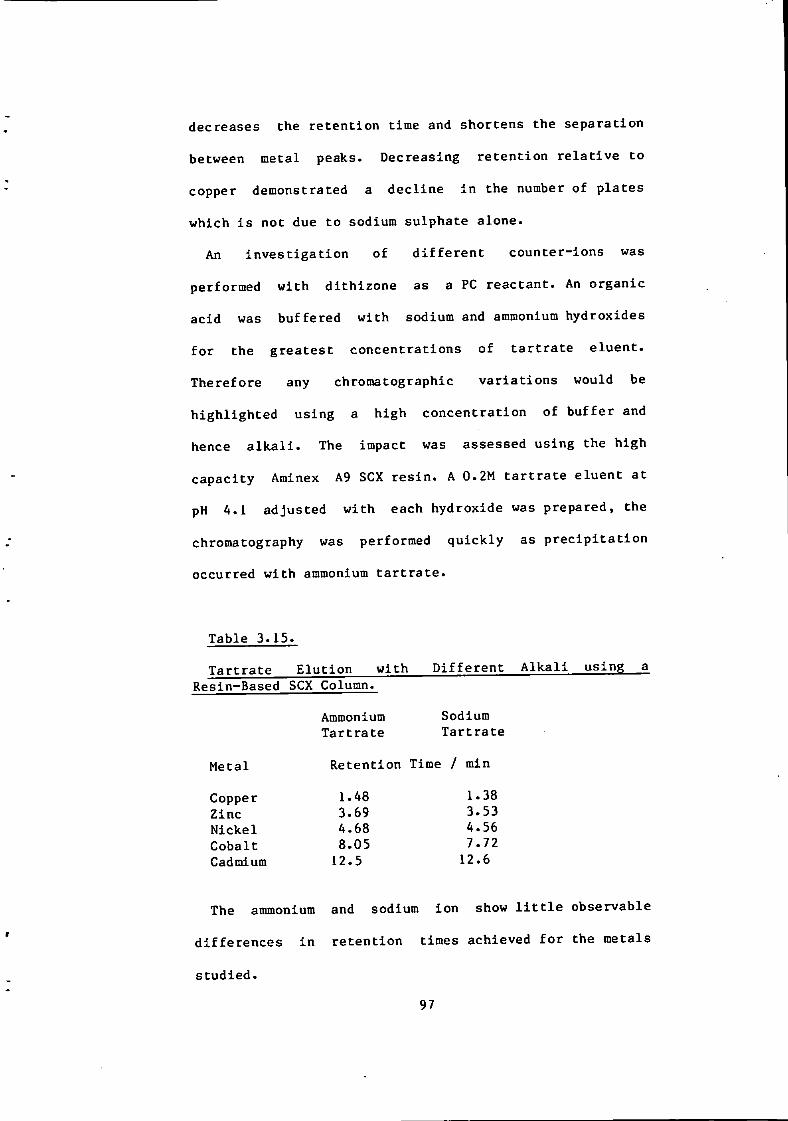
decreases the r e t e n t i o n time and shortens the separation
between metal peaks. Decreasing r e t e n t i o n r e l a t i v e t o
copper demonstrated a d e c l i n e i n the number of p l a t e s
which i s not due to sodium sulphate alone-
An i n v e s t i g a t i o n of d i f f e r e n t counter-ions was
performed w i t h d i t h i z o n e as a PC reactant. An organic
acid was buffered w i t h sodium and ammonium hydroxides
f o r the g r e a t e s t concentrations of t a r t r a t e e l u e n t .
Therefore any chromatographic v a r i a t i o n s would be
h i g h l i g h t e d using a high c o n c e n t r a t i o n of b u f f e r and
hence a l k a l i . The impact was assessed using the high
capacity Aminex A9 SCX r e s i n . A 0.2M t a r t r a t e e l uent a t
pH A.l adjusted w i t h each hydroxide was prepared, the
chromatography was performed q u i c k l y as p r e c i p i t a t i o n
occurred w i t h ammonium t a r t r a t e .
Table 3.15.
T a r t r a t e E l u t i o n w i t h D i f f e r e n t A l k a l i using a Resin-Based SCX Column.
Ammonium Sodium T a r t r a t e T a r t r a t e
Metal Retention Time / min
Copper 1.48 1.38 Zinc 3.69 3.53 Nickel A.68 A.56 Cobalt 8.05 7.72 Cadmium 12.5 12.6
The ammonium and sodium i o n show l i t t l e observable
d i f f e r e n c e s i n r e t e n t i o n times achieved f o r the metals
st u d i e d .
97
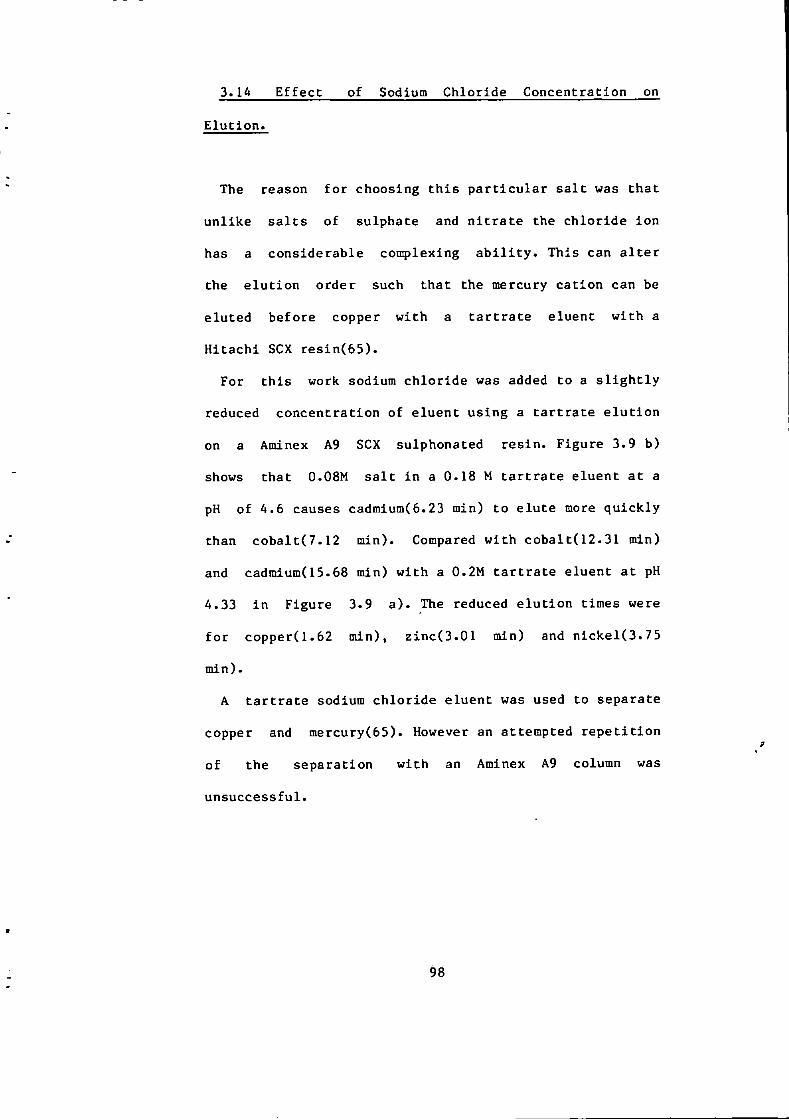
3.14 E f f e c t of Sodium Chloride Concentration on
E l u t i o n .
The reason f o r choosing t h i s p a r t i c u l a r s a l t was t h a t
u n l i k e s a l t s of sulphate and n i t r a t e the c h l o r i d e i o n
has a considerable conqilexing a b i l i t y . This can a l t e r
the e l u t i o n order such t h a t the mercury c a t i o n can be
e l u t e d before copper w i t h a t a r t r a t e eluent w i t h a
H i t a c h i SCX r e s i n ( 6 5 ) .
For t h i s work sodium c h l o r i d e was added to a s l i g h t l y
reduced concentration of eluent using a t a r t r a t e e l u t i o n
on a Aminex A9 SCX sulphonated r e s i n - Figure 3.9 b)
shows that 0.08M s a l t i n a 0.18 M t a r t r a t e eluent at a
pH of 4.6 causes cadmium(6.23 min) to e l u t e more q u i c k l y
than cobalt(7-12 min). Compared w i t h cobalt(12.31 min)
and cadmlum(15.68 min) w i t h a 0.2M t a r t r a t e eluent at pH
4.33 i n Figure 3.9 a ) . The reduced e l u t i o n times were
f o r copper(1.62 min), zinc(3.01 min) and n i c k e l ( 3 . 7 5
min) -
A t a r t r a t e sodium c h l o r i d e eluent was used to separate
copper and mercury(65). However an attempted r e p e t i t i o n
of the separation w i t h an Aminex A9 column was
unsuccessful.
98

Figure 3,9
E f f e c t of Sodium Chloride
on Metal Ion E l u t i o n .
Q. b.
Co
C d
Figure 3,9 a) shows a chromatogram which no sodium
c h l o r i d e i n the eluent and Figure 3.9 b) shows the
quicker e l u t i o n w i t h 0.08 M sodium c h l o r i d e present i n
the t a r t r a t e eluent as d e t a i l e d i n 3.14,
99

3.15 E f f e c t of Ethanol on E l u t i o n .
Ion exchange i n mixtures of organic and aqueous
solvents require p a r t i a l i o n i c a b i l i t y of that s o l v e n t .
Organic solvents are known to reduce the i o n exchange
rate by orders of magnitude u s u a l l y to the detriment of
chromatography(llO), e s p e c i a l l y as regards s w e l l i n g
e f f e c t s upon resin-based exchangers, however, organic
solvents might reduce organic contamination from samples
and prevent b a c t e r i a l growth. Miwi and Yamabe(7l)
i n v e s t i g a t e d the e f f e c t on mixtures of resin-based
c a t i o n exchangers and found ethanol reduced column
e f f i c i e n c y .
Here a 0.05M l a c t a t e eluent a t pH 3.5 was used i n
con j u n c t i o n w i t h a P a r t i s i l 10 SCX s i l i c a column w i t h
the i n t e n t i o n of observing minimum chromatographic
i n t e r f e r e n c e s t h a t would a l l o w a water i n s o l u b l e PC
reactant to be used. Peak broadening f o r i n c r e a s i n g
ethanol concentrations of 2.5, 5, and 10 % v/v ethanol
eluents was observed. Only the f e r r i c i o n a l t e r e d i t s
r e l a t i v e r e t e n t i o n by e l u t i n g nearer t o copper. K i n e t i c
i o n exchange processes were demonstrated by quicker o
e l u t i o n w i t h a temperature r i s e t o 40 C from ambient
temperatures.
100

Table 3-16,
Retention V a r i a t i o n w i t h Ethanol.
% Ethanol 0 2.5 5-0 10
Metal Retention Time / m i n
Copper 3-25 3,39 4-13 4.62 I r o n ( I I I ) 6-34 5.61 4.62 4.62 Zinc 7.50 7-32 10.3 13,7 N i c k e l 8,25 8.06 11-2 15,7 Cobalt 9.53 9-78 14,0 19,4 Manganese 11,7 12,5 17.9 25.5 Magnesium 12.5 13-0 17.9 25,5
3.16 A l t e r n a t i v e Eluents.
There i s always a search t o f i n d eluents t h a t give a
f a s t e r a n a l y s i s time, separate d i f f i c u l t species or
extend the range of metals species t h a t can be
separated. Various organic c h e l a t i n g agents were
selected on the basis of t h e i r f i r s t metal s t a b i l i t y
constants(Kj^) because not a l l the values f o r higher
complexes are known. These are shown i n appendix 1.
Those w i t h a value of l o g ^ ^ f o r most metal
complexes of less than 7 or 8 were found to o f f e r
promise- The basis f o r t h i s choice i s t h a t these values
are s i m i l a r t o those f o r the best organic acid e l u e n t s
discussed p r e v i o u s l y and i f a f u n c t i o n a l group of the
c h e l a t o r i s d i f f e r e n t then the e l u t i o n order may change.
Normally c a r b o x y l i c acids are used, so i f we could use a
c h e l a t o r w i t h an a d d i t i o n a l group to t h i s or a
completely new group then the e l u t i o n order may change.
101

Unfortunately i t i s o f t e n only above values of
8 t h a t other c h e l a t i n g groups which are stronger are
found and d i f f i c u l t y was encountered f i n d i n g a l t e r n a t i v e
complexing eluents f o r t h i s very reason. Many acids were
s c r u t i n i s e d , but only the more successful e l u t i o n
systems are mentioned below.
3.17 Glycine E l u t i o n .
Table 3.17 shows the r e t e n t i o n s obtained w i t h a 0.04M
g l y c i n e eluent used at varying pH w i t h a P a r t i s i l 10 SCX
column, to demonstrate t h a t as the pH Increased then the
e l u t i o n time increased r a t h e r than decrease^ as w i t h
e l u t i n g agents c o n t a i n i n g the c a r b o x y l i c acid f u n c t i o n a l
group alone.
Table 3.17.
Glycine E l u t i o n w i t h a Silica-Based SCX Column.
pH 2.22 2-64 3.03 5-70
Metal Retention Time / min
Copper 3.6 6-4 17.0 >50 Zinc 3.8 8.1 25.5 >50 Ni c k e l 3.9 8-0 Cobalt 4.0 8-0 Manganese 4.0 6-8 Lead 4.6 10.9 I r o n 4.2 8.2
Late r e l u t i n g peaks demonstrated considerable peak
broadening and s e l e c t i v i t y was not good, although
magnesium(4.0 min), indium(7.1 min) and i r o n ( I I I ) ( 1 7 - 5
102

min) eluted i n a d i f f e r e n t order t o usual organic acid
r e t e n t i o n s . An i n t e r e s t i n g p a t t e r n emerged which
reversed the usual increase of r e t e n t i o n w i t h decreasing
pH associated w i t h organic a c i d e l u e n t s . Z w i t t e r i o n
formation s t e a d i l y increases t o an optimum w i t h
i n c r e a s i n g pH to a s p e c i f i c pH value, presumably the
c a t i o n i c moiety assumed the dominant e l u t i o n r o l e .
3.18 Aspartic E l u t i o n ,
The i n v e s t i g a t i o n of t h i s d i b a s i c amino acid as an
eluent may show i t t o have b e t t e r chromatographic
separating a b i l i t i e s than g l y c i n e . Table 3.18 shows a
0.04M a s p a r t i c acid eluent at pH 3.6 e l u t i n g seven
metals, which were i n two groups w i t h a P a r t i s i l 10 SCX
column.
Table 3.18.
Aspartate E l u t i o n w i t h a Silica-Based SCX Column.
Retention Metal Time / min
Copper 2.46 I r o n ( l I I ) 3.90 Zinc 3.18 Indium 5.76 Cobalt 15.3 Manganese 16.4 I r o n ( l l ) 16.7
The peaks were of a very broad nature and cannot be
considered f o r use alone although there may be
103
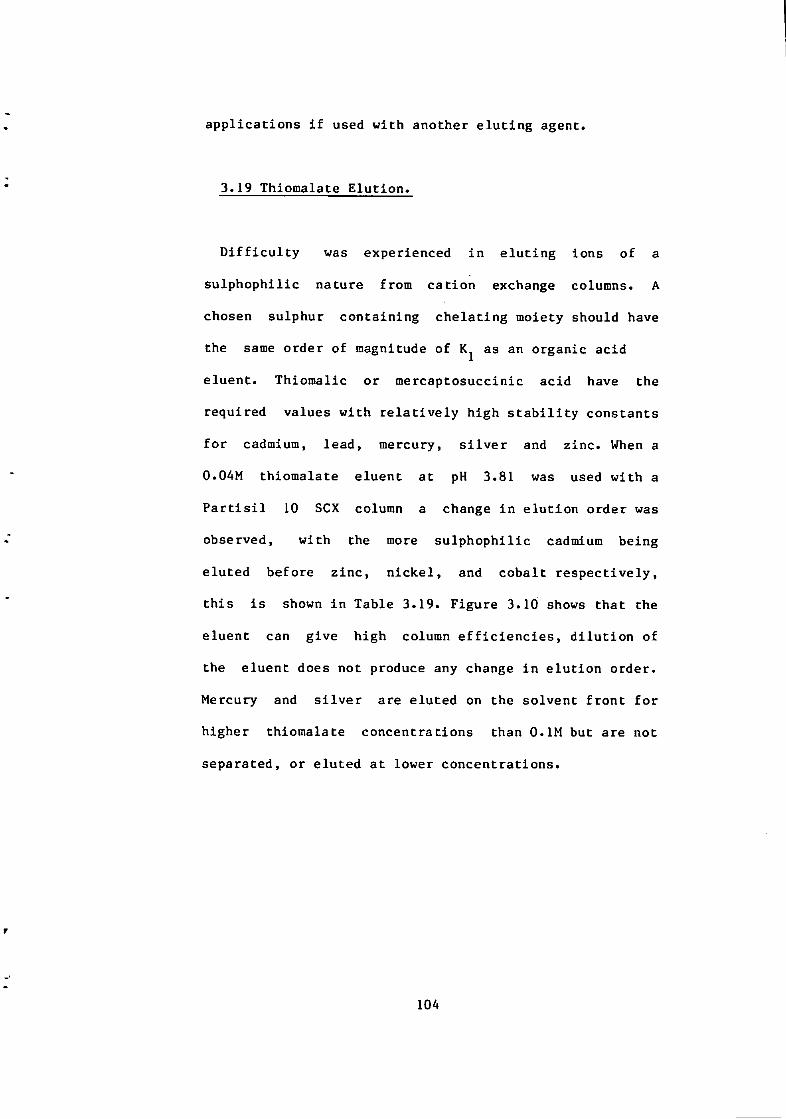
a p p l i c a t i o n s i f used w i t h another e l u t i n g agent
3.19 Thiomalate E l u t i o n .
D i f f i c u l t y was experienced i n e l u t i n g ions of a
s u l p h o p h i l i c nature from c a t i o n exchange columns. A
chosen sulphur c o n t a i n i n g c h e l a t i n g moiety should have
the same order of magnitude of as an organic acid
eluenC- Thiomalic or mercaptosuccinic acid have the
required values w i t h r e l a t i v e l y high s t a b i l i t y constants
f o r cadmium, lead, mercury, s i l v e r and zinc. When a
0.04M thiomalate eluent at pH 3.81 was used w i t h a
P a r t i s i l 10 SCX column a change i n e l u t i o n order was
observed, w i t h the more s u l p h o p h i l i c cadmium being
e l u t e d before z i n c , n i c k e l , and coba l t r e s p e c t i v e l y ,
t h i s i s shown i n Table 3.19. Figure 3.10 shows th a t the
eluent can give high column e f f i c i e n c i e s , d i l u t i o n of
the eluent does not produce any change i n e l u t i o n order.
Mercury and s i l v e r are el u t e d on the solvent f r o n t f o r
higher thiomalate concentrations than O.IM but are not
separated, or e l u t e d a t lower concentrations.
104

Figure 3.10
Thiomalate E l u t i o n from
a Cation Exchange Column
Cd.
Zn
i 1^
0 10 k \
min
Co
The s e p a r a t i o n of a 100 p i of 2,5 pg g ^
of zinc(4,60 min) n i c k e l ( 8 . 0 0 m i n ) , c o b a l t ( l O , 3 5 min)
and cadmium(2,60 min) using a 0,04M thiomalate eluent
at pH 3.93 w i t h a P a r t i s i l iO SCX column (25 by .46 cm) o
a t 40 C Detection was a t 595 nm w i t h d i t h i z o n e as a
post-column reactanc i n a acetone (4+1) water and 1 %
a c e t i c acid w i t h a F,S.D, of 0.4 absorbance.
105

Table 3.19 Thiomalate E l u t i o n w i t h a Silica-Based SCX Column,
Retention Metal Time / min
Void time 1.16 Copper 1.50 Cadmium 2.49 Zinc 5.48 Ni c k e l 10.71 Cobalt 13.71 I r o n ( I I ) 14.4 Manganese 16.5 Magnesium 16.6
3.20 Anion Exchange Separation of Metals.
Anion exchange uses the d i f f e r e n t i a l a t t r a c t i o n s of
d i f f e r e n t metal anionic complexes f o r the SAX column
m a t e r i a l . Higher complexation f o r m a t i o n e f f e c t s g r e a t e r
r e t e n t i o n . I t has had considerable success i n the past
w i t h i n o r g a n i c acid e l u e n t s , however the determination
of \ig ml ^ l e v e l s of metal i n a s o l u t i o n by HPLIEC
i s d i f f i c u l t w i t h a c o r r o s i v e a c i d . Modern HPHEC
demands a new approach to anion exchange separations
w i t h a less c o r r o s i v e eluent media. Chapter one mentions
the use of some organic acids f o r column chromatography.
I n p r e l i m i n a r y studies w i t h a P a r t i s i l 10 SAX column 25
by 0.46 cm few peaks separated w i t h any organic a c i d and
then w i t h considerable peak broadening and consequently
was not experimented w i t h f u r t h e r . Only the 16 by O.A6cm
resin-based Benson SAX was p a r t i a l l y successful. C i t r i c ,
l a c t i c , t a r t a r i c and a c e t i c acids were i n v e s t i g a t e d and
only t a r t r a t e eluents were capable of separating a few
106

metals, they are l i s t e d i n Table 3.20
Table 3.20.
T a r t r a t e E l u t i o n w i t h a Resin-Based SAX Column.
T a r t r a t e M o l a r i t y 0.02 0-04 0.1 0.2
Metal Retention Time / min
Copper 57.5 42-5 18 21 Zinc 8.5 8.75 6.25 20 N i c k e l 6.75 9.0 5.0 £ Cobalt 3.0 2.75 1.75 3.5 Cadmium 2.5 2.5 1.25 2-75
£ denote s d i f f i c u l t y i n o b t a i n i n g r e l i a b l e r e s u l t -
Retentions times are a t a minimum around 0-1 M. This
would suggest that a complex formed a t lower t a r t r a t e
concentrations has less competition f o r the c a t i o n i c
f u n c t i o n a l group on the SAX r e s i n . At higher
concentrations higher r e t e n t i o n s suggest t h a t an anionic
complex o f g r e a t e r charge i s formed and t h e r e f o r e has a
gr e a t e r a f f i n i t y f o r the SAX r e s i n s i t e s . The
chromatographic e q u i l i b r i u m processes are more complex
and t h i s may be the reason f o r the considerable peak
wi d t h . B e t t e r SAX column m a t e r i a l s may overcome t h i s
problem.
107

3.21 Conclusion and Discussion.
I t i s d i f f i c u l t not to discuss the q u a n t i t a t i v e
aspects of HPLIEC. Good chromatography doubtless
c o n t r i b u t e s to s t a t i s t i c a l l y b e t t e r r e s u l t s , however
these aspects w i l l be discussed i n Chapters f o u r and
f i v e as PGR response i s c l o s e l y l i n k e d w i t h the
preceding chromatography. With the o b j e c t i v e of
assessing the PGR a f t e r s e p a r a t i o n , the main
chromatographic aspects are brought to a conclusion
f i r s t i n t h i s chapter.
I n the coming years microprocessor-controlled
chromatography systems w i l l be able t o r e a d i l y assess
chromatographic parameters f o r o p t i m i s a t i o n . This may
include mixing i o n exchange eluents and g r a d i e n t
e l u t i o n . Here the aforementioned s t r a t e g y was adopted t o
assess each e l u e n t . I n c o r r e c t values of t h e o r e t i c a l
p l a t e numbers and capacity f a c t o r s can be r e a l i s t i c a l l y
assessed by using the r e l a t i v e r e t e n t i o n of an e l u t i n g
metal, which i s more rep r e s e n t a t i v e of the
chromatographic processes. This overcomes the inaccurate
determination of the void time by using a r e l a t i v e
r e t e n t i o n f a c t o r which has been introduced using copper
as a marker. Copper e l u t e s i n most chromatograms and can
be used as a c a l i b r a t i n g r e t e n t i o n because i t u s u a l l y
gives an accurate r e t e n t i o n time, because of a
comparatively small peak width associated w i t h an e a r l y
108

e l u t i o n and f a s t column processes.
Guard columns can be used and such a c t i o n has economic
rewards, they are normally associated w i t h pre-column
concentration procedures i n the i n j e c t o r loop, which are
discussed i n Chapter 6. The s a t u r a t i o n of the eluent
stream w i t h s i l i c a can reduce column degradation due t o
d i s s o l u t i o n . S i l i c a s a t u r a t i o n of the eluent can be
achieved w i t h a le s s e r grade m a t e r i a l .
Figure 3.4 demonstrates that a b e t t e r separation can
be achieved w i t h a t a r t r a t e eluent using the
si l i c a - b a s e d exchanger over the r e s i n SCX m a t e r i a l s
shown i n Figure 3.2. Whatman s i l i c a SCX g e n e r a l l y
performed b e t t e r than the r e s i n . A comparison of the
s i l i c a and resin-based exchangers shows the advantages
of using a lower capacity column. The resin-based Aminex
A9 has a gr e a t e r capacity than the Dionex or
si l i c a - b a s e d Whatman P a r t i s i l 10 SCX m a t e r i a l s . The
P a r t i s i l 10 SCX gave the best separations e s p e c i a l l y f o r
the l a c t a t e e l u e n t . Although resin-based m a t e r i a l s can
be cleaned by a recommended procedure using strong acid
and a l k a l i they were not so p h y s i c a l l y durable as the
s i l i c a - b a s e d SCX columns. Without a guard column the
Whatman SCX column could endure three weeks continuous
use w i t h a l a c t a t e e l u e n t . The resin-based m a t e r i a l
showed signs of compaction w i t h i n the column making the
use of longer column lengths i m p r a c t i c a b l e . A
microscopic examination revealed bead fragmentation had
109
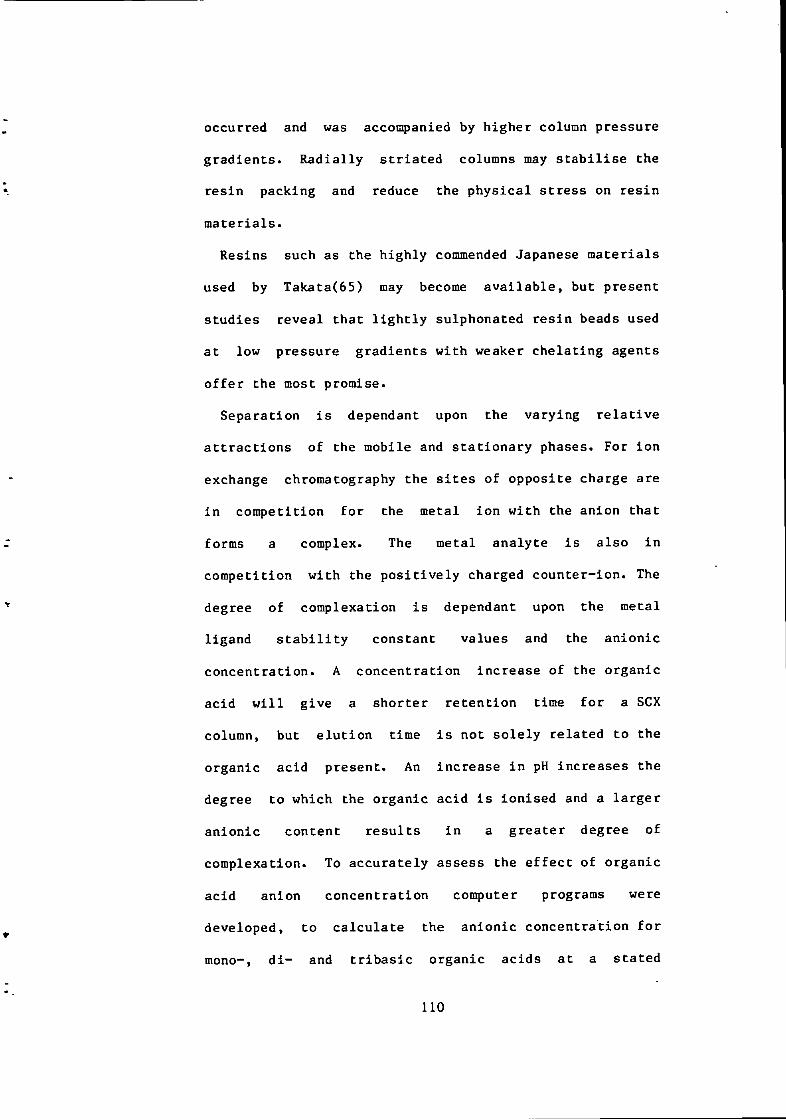
occurred and was accompanied by higher column pressure
g r a d i e n t s . R a d i a l l y s t r i a t e d columns may s t a b i l i s e the
r e s i n packing and reduce the p h y s i c a l stress on r e s i n
m a t e r i a l s .
Resins such as the h i g h l y commended Japanese m a t e r i a l s
used by Takata(65) may become a v a i l a b l e , but present
studies reveal t h a t l i g h t l y sulphonated r e s i n beads used
at low pressure gradients w i t h weaker c h e l a t i n g agents
o f f e r the most promise.
Separation i s dependant upon the varying r e l a t i v e
a t t r a c t i o n s of the mobile and s t a t i o n a r y phases. For i o n
exchange chromatography the s i t e s of opposite charge are
i n c o m petition f o r the metal i o n w i t h the anion t h a t
forms a complex. The metal analyte i s also i n
competition w i t h the p o s i t i v e l y charged counter-ion. The
degree of complexation i s dependant upon the metal
li g a n d s t a b i l i t y constant values and the anionic
c o n c e n t r a t i o n . A conc e n t r a t i o n increase of the organic
acid w i l l give a shor t e r r e t e n t i o n time f o r a SCX
column, but e l u t i o n time i s not s o l e l y r e l a t e d t o the
organic acid present. An increase i n pH increases the
degree t o which the organic acid i s i o n i s e d and a l a r g e r
a nionic content r e s u l t s i n a gr e a t e r degree of
complexation. To accurately assess the e f f e c t of organic
acid anion concentration computer programs were
developed, t o c a l c u l a t e the anionic concentration f o r
mono-, d i - and t r i b a s l c organic acids at a s t a t e d
110

i n i t i a l organic acid concentration and varying pH,
Varying concentrations of an i o n i c species can be
immediately c a l c u l a t e d and any c o r r e l a t i o n w i t h the
chromatography assessed.
C i t r i c acid i s the only t r i v a l e n t c a r b o x y l i c acid used
and forms stronger complexes w i t h most metals,
e s p e c i a l l y the f e r r i c ion- The st r e n g t h of the
complexing a b i l i t y i s r e f l e c t e d i n the change of e l u t i o n
order when a comparison i s made w i t h sodium sulphate or
a weak organic acid eluent- Poor separation was shown i n
Figure 3.1 w i t h the r e s i n c a t i o n exchanger, p o s s i b l y
because a lesser chromatographic a b i l i t i e s of c i t r a t e
f o r the metals. Zinc has an e a r l i e r e l u t i o n at higher pH
between 3.7 and ^.3, suggesting at th a t c r i t i c a l
c o n c e n t r a t i o n , a d i f f e r e n t complex st o i c h i o m e t r y may
form and account f o r t h i s e r r a t i c behaviour. The.
P a r t i s i l 10 SCX column i n Figure 3.2 shows the best
r e s o l u t i o n of peaks using a 0.04M c i t r a t e e luent.
The o x a l a t e anion forms weaker complexes than the
c i t r a t e anion, separating more metals w i t h the s i l i c a
SCX column. Although g r e a t e r s e l e c t i v i t y was
demonstrated, the l a t e r peaks e l u t e d more slo w l y
suggesting g r a d i e n t e l u t i o n may be necessary f o r f a s t e r
e l u t i o n . P r e l i m i n a r y I n v e s t i g a t i o n s suggest that i t may
o f f e r novel separations at higher concentrations.
T a r t r a t e e l u t i o n separates copper, z i n c , n i c k e l ,
c o b a l t and cadmium w e l l , but I t was d i f f i c u l t t o
111

separate lead from n i c k e l and changing the pH or the
t a r t r a t e concentration d i d not improve the s i t u a t i o n .
T a r t r a t e e l u t i o n also led to l a t e e l u t i n g peaks f o r
manganese and magnesium. However the complexing power of
the t a r t r a t e eluent proved to be the best f o r the A9 SCX
r e s i n .
Several g e n e r a l i s a t i o n s can be made about the order of
e l u t i o n and separation regarding , shown i n
appendix 1. P r i m a r i l y should not exceed 7 and
e l u t i o n order g e n e r a l l y f o l l o w s a decreasing value of
K^. The g r e a t e r the magnitude of the d i f f e r e n c e
between f o r each metal the b e t t e r the separation.
Although l a c t i c acid has smaller values than most
i t has the best separations f o r t h i s reason. Generally
the t r i v a l e n t metal Ions, of bismuth, indium and i r o n
e l u t e f i r s t (demonstrating t h a t as aqueous ions there i s
a greater a t t r a c t i o n t o complex r a t h e r than a t t a c h to
the c a t i o n exchange s i t e s ) and copper between them. Zinc
n i c k e l and lead are then f o l l o w e d by c o b a l t , cadmium,
i r o n , manganese and magnesium although not n e c e s s a r i l y
i n t h a t order.
Other organic acid eluents were scanned. Succinic acid
was found to e l u t e i n d i u m ( l l l ) and b i s m u t h ( I I I ) l a t e ,
and w e l l separated from other metals* Maleic acid e l u t e d
copper e a r l i e r followed by an unseparated mass of
t r a n s i t i o n metals.
Weaker acids are used w i t h the s i l i c a - b a s e d SCX
112

column, possibly because of the lower capacity. The
l a c t a t e eluent was the most e f f i c i e n t mobile phase of
the a c i d s , s e p a r a t i n g , i n e l u t i o n order, copper,
i r o n ( I I l ) , i n d i u m ( I I l ) , z i n c , n i c k e l , c o b a l t , cadmium,
manganese and magnesium. Table 3.8 shows how the
concentration was used t o o b t a i n an order of separation
w i t h the f i n e adjustment being made by pH change.
However care has to be taken i n i d e n t i f y i n g the peaks of
lead, n i c k e l and zinc from one another as w e l l as
cadmium from i r o n . Hwang and co-workers have
demonstrated t h a t the l a c t a t e eluent performs b e t t e r
than the c l o s e l y r e l a t e d HIBA e l u e n t ( 6 9 ) . A Vydac column
which i s a s u p e r f i c i a l l y porous SCX r e s i n was also
demonstrated w i t h a 0.12M l a c t a t e eluent-
Changing p h y s i c a l e f f e c t s upon the column were
i n v e s t i g a t e d . Raising the temperature was the most
i n f l u e n t i a l f o r both columns t o gi v e more Guassian
shaped peaks as opposed t o t a i l i n g peaks. Only i r o n ( I I I )
p e r s i s t e d i n demonstrating a broad based t a i l i n g peak,
e s p e c i a l l y w i t h a l a c t a t e e l u e n t . I r o n ( I l I ) forms
gr e a t e r than 1 % hydroxo complexes above pH 1 and t h i s
may i n h i b i t i t passage through the column bed.
Increased concentrations of counter-ion were found t o
improve the e f f i c i e n c y , w i t h quicker e l u t i o n and
consequently sharper peaks which could not be performed
w i t h i n c r e a s i n g pH or decreased c h e l a t i n g agent
.concentration. The e f f e c t on the column of a s a l t e luent
113
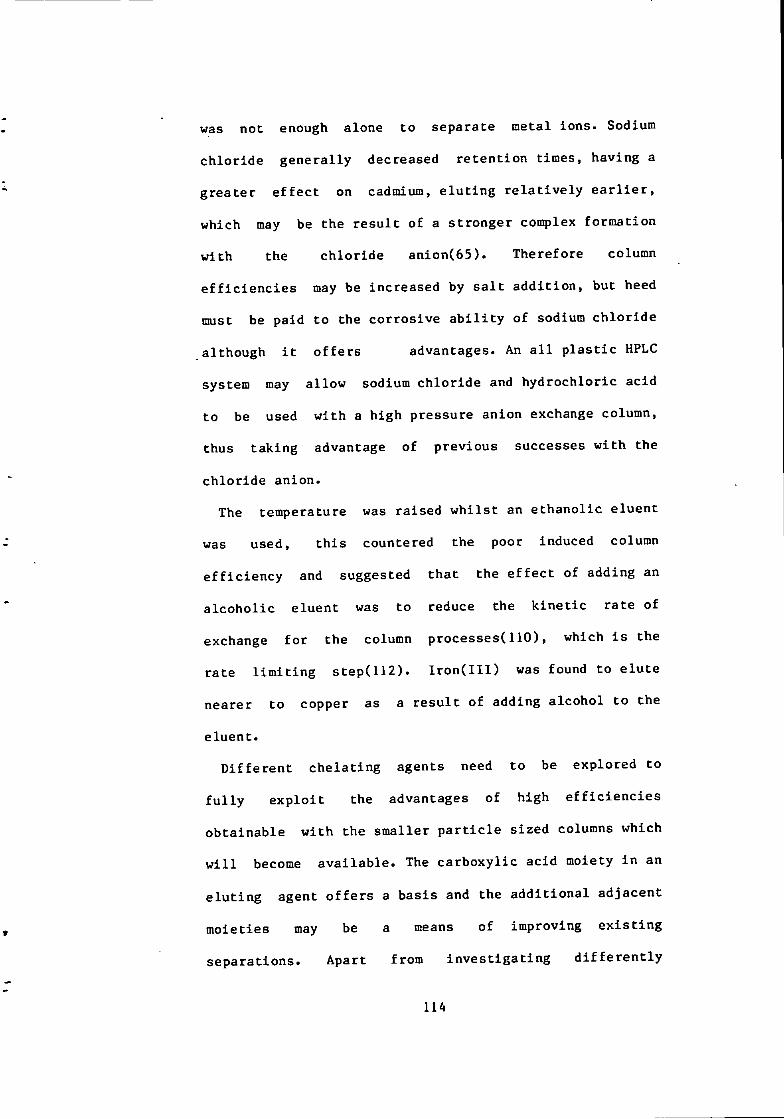
was not enough alone t o separate metal ions- Sodium
c h l o r i d e g e n e r a l l y decreased r e t e n t i o n times, having a
greater e f f e c t on cadmium, e l u t i n g r e l a t i v e l y e a r l i e r ,
which may be the r e s u l t of a stron g e r complex formation
w i t h the c h l o r i d e anion(65). Therefore column
e f f i c i e n c i e s may be Increased by s a l t a d d i t i o n , but heed
must be paid t o the co r r o s i v e a b i l i t y of sodium c h l o r i d e
although i t o f f e r s advantages. An a l l p l a s t i c HPLC
system may a l l o w sodium c h l o r i d e and h y d r o c h l o r i c acid
to be used w i t h a high pressure anion exchange column,
thus t a k i n g advantage of previous successes w i t h the
c h l o r i d e anion.
The temperature was raised w h i l s t an e t h a n o l i c eluent
was used, t h i s countered the poor Induced column
e f f i c i e n c y and suggested t h a t the e f f e c t of adding an
a l c o h o l i c eluent was to reduce the k i n e t i c r a t e of
exchange f o r the column processesC110), which i s the
rate l i m i t i n g step(112). I r o n ( I I I ) was found t o e l u t e
nearer t o copper as a r e s u l t of adding a l c o h o l t o the
el u e n t .
D i f f e r e n t c h e l a t i n g agents need t o be explored t o
f u l l y e x p l o i t the advantages of high e f f i c i e n c i e s
obtainable w i t h the smaller p a r t i c l e sized columns which
w i l l become a v a i l a b l e . The c a r b o x y l i c acid moiety i n an
e l u t i n g agent o f f e r s a basis and the a d d i t i o n a l adjacent
moieties may be a means of improving e x i s t i n g
separations. Apart from i n v e s t i g a t i n g d i f f e r e n t l y
114

s t r u c t u r e d organic acids those w i t h d i f f e r e n t elements
i n adjacent p o s i t i o n s t o the c a r b o x y l i c acid were
i n v e s t i g a t e d . A r a d i c a l change i n the c h e l a t i n g agents
s t r u c t u r e t o a completely d i f f e r e n t molecule such as
n i t r i l o - t r i a c e t i c acid was found t o give l i t t l e or no
separation. Small s t a b i l i t y constants(K^) w i t h
p a r t i a l l y - i o n i s e d c h e l a t i n g groups t h a t are s e n s i t i v e t o
pH adjustment o f f e r the best a l t e r n a t i v e s . Careful
c o n s i d e r a t i o n should be paid to the choice of acid
regarding the magnitude and d i f f e r e n c e i n magnitude of
the s t a b i l i t y constants which i m p l i e s any possible
success as an elu e n t .
Thiomalic acid which has s u l p h o p h i l i c tendencies gave
h i g h l y e f f i c i e n t separations and v i r t u a l l y reversed the
e l u t i o n order expected of a c a r b o x y l i c a c i d . This eluent
can o f f e r a s l i g h t l y reducing environment and may be
able t o separate the * s o f t acid* metal i o n s . The
successful separation of cadmium, z i n c , n i c k e l and
copper suggests t h a t f u r t h e r s t u d i e s w i t h t h i o m a l i c acid
are necessary, possibly w i t h anionic and n e u t r a l
columns.
The simplest amino-acid, g l y c i n e , has l i k e most
amino-acids, a c a t i o n i c ammonium group on the same
molecule and o f f e r s new separation p o s s i b i l i t i e s w i t h
the ammonium group and anionic carboxylate i o n being
d i r e c t l y opposed i n chromatography e f f e c t , although
w i t h i n the same molecule. E l u t i o n of metal ions becomes
115
slower w i t h i n c r e a s i n g pH, which i n d i c a t e s a gr e a t e r
a f f i n i t y f o r the column. There are two possible
explanations, one where the a t t r a c t i o n by the anionic
component of the eluent appears t o be dominant, and
secondly where the ammonium moiety of the g l y c i n e
molecule i s a t t r a c t e d t o the sulphonate f u n c t i o n a l group
w h i l s t blocking the metal f o r that s i t e .
A s p a r t i c acid which i s a di b a s i c amino-acid a k i n t o
succinic a c i d , causes b e t t e r r e s o l v i n g power w i t h broad
peaks f o r the l a t e r e l u t i n g c o b a l t , i r o n and manganese.
I t may be possible that the complexing a b i l i t i e s of
many organic acids confuse the attempted separation by
the SCX column because of p r e f e r e n t i a l or d i f f e r i n g
complexing s t r e n g t h .
The requirements of c a t i o n HPLIEC have r e c e n t l y
focused on low capacity columns using an organic
c h e l a t i n g acid eluent w i t h i n a concentration of range
0.01 t o 0.2M. Chromatography can only be improved w i t h
the advancement of column m a t e r i a l s i n conjunction w i t h
b e t t e r knowledge of f u n c t i o n a l groups a v a i l a b l e . Many
f u n c t i o n a l groups have been i n v e s t i g a t e d but none seem
capable of surpassing the c a p a b i l i t y of the sulphonate
moiety, used w i t h a c h e l a t i n g organic a c i d .
Although combined eluents were considered,
chromatograms w i t h the t a r t r a t e and l a c t a t e eluents
allow i s o c r a t i c e l u t i o n to p r e v a i l g i v i n g steady
c o n d i t i o n s t o t e s t the PC reac t a n t s .
116
4 Eriochrome Black T Post Column Detector.
A-1 I n t r o d u c t i o n .
Before r e p o r t i n g upon EBT and d i t h i z o n e i t i s
necessary to o u t l i n e why they were chosen. The
advantages of PCR systems have been o u t l i n e d i n chapter
one- Many o f the metal chromatography systems employing
PC reagents use a wavelength which i s not n e c e s s a r i l y
the one th a t gives the grea t e s t response f o r a
p a r t i c u l a r group of el u t e d metals- This i s because
d i f f e r e n t metal-complexes absorb at d i f f e r e n t
wavelengths. A compromise may exclude some metals and
give a wide range of s e n s i t i v i t i e s f o r the metals i n an
i n j e c t e d sample.
The problem required a new approach, i f we are t o take
f u l l advantage of using one wavelength. The
metallochromic i n d i c a t o r molecule can be observed at one
wavelength and a decrease of the uncomplexed molecule
occurs when the metal i s being complexed- Therefore the
decrease of the absorbance of the i n d i c a t o r should be
p r o p o r t i o n a l t o the concentration of the metal. This can
be performed w i t h t h i s d e t e c t o r by measuring the
absorbance decrease at the wavelength a t which the
metallochromic i n d i c a t o r absorbs. I n t h i s work w i t h PCRs
i t i s hoped to prove t h a t the metal i o n concentration i s
p r o p o r t i o n a l t o the decrease i n absorbance of the
117

i n d i c a t o r . There are r e s t r i c t i n g q u a l i f i c a t i o n s placed
on the choice of a reagent which must f u l f i l c e r t a i n
s p e c t r a l c o n d i t i o n s i f the c a p a b i l i t y of the
chromatographic d e t e c t i o n i s to be improved by using
t h i s inverse photometric method. F i r s t l y the reagent
must complex w i t h metals to be determined. Secondly the
reagent molecule must absorb s t r o n g l y at low
concentrations, and t h i r d l y i t must absorb a t a
wavelength t h a t does not overlap too much w i t h the
spectra of any of the analytes or any possible
i n t e r f e r i n g e l u t e d species.
There are a number of organic reagents t h a t f i t the
requirements. Eriochrome Black T was chosen because i t
chelates through n i t r o g e n and oxygen and t h e r e f o r e
reacts w i t h a wider range of metals. S i m i l a r l y d i t h i z o n e
was chosen and I s discussed i n chapter f i v e , d i t h i z o n e
reacts w i t h the more s u l p h o p h i l i c metals and shows a
h i g h l y s e n s i t i v e photometric response to those metals,
such as mercury and cadmium which have a high t o x i c i t y .
4.2 Properties of Eriochrome Black T.
Eriochrome Black T i s sodium
l-(l-hydroxy-2-naphthylazo)-6-nltro-2-naphthol-4-sulphon-
-ate also known as Solochrome black. Mordant black I I
and C.I.No.14645. I t I s a brownish-black s l i g h t l y
granular s o l i d t h a t d i ssolves r a p i d l y i n m i l d l y a l k a l i n e
118

s o l u t i o n s and slowly i n water t o give an u l t r a m a r i n e
blue coloured s o l u t i o n . I t can be used as a
metallochromic or acid-base i n d i c a t o r ( 1 1 5 ) .
I t i s one of the most commonly used of the
dihydroxyazo dyes, mostly as a metallochromic i n d i c a t o r
f o r EDTA t i t r a t i o n s . Eriochrome Black T can be
represented as H D below pH 6.5, where D
represents the n e u t r a l EBT molecule and H s u b s c r i p t
i n d i c a t e s the number of i o n i s a b l e protons attached t o
the molecule. The sulphonic group i s ionised before pH
7. The pKa values of the two phenolic groups are 6.3 and
11.5 r e s p e c t i v e l y ( 1 1 6 ) . The two colour changes occur at
pH 6.5 (wine-red to blue) and blue to orange at pH
11.5(116).
The a d d i t i o n of a r e a c t i v e metal gives a wine-red
colour by displacement of a proton, consequently the pH
has to between 7 and 11, to give the reagent a c o n t r a r y
blue colour.
4.3 Response w i t h Metals.
Eriochrome Black T has been reported to react w i t h
numerous metals, these are a l u m i n i u m ( I I I ) , cadmium,
c o b a l t , copper, calcium, g a l l i u m ( I I I ) , i n d i u m ( I I I ) ,
i r o n , i r o n ( I I I ) , l a n t h a n o i d s , lead, magnesium,
manganese, mercury, t i t a n i u m ( I V ) , z inc and the platinum
nietals(115,n6). Foster Dee S n e l l ( 8 9 ) reports t h a t EBT
119

also reacts w i t h molybdenum, the rare earths, thorium,
tungsten, uranium and vanadium.
Erlochrome Black T was f i r s t used by Schwarzenbach and
BiedermannC117,118) as a metallochromlc i n d i c a t o r f o r
EDTA t i t r a t i o n s f o r magnesium and calcium
determinations. Several other metals give v i r t u a l l y
i d e n t i c a l colour responses. Cadmium, manganese, lead and
zinc may also be t i t r a t e d . Schwarzenbach quotes the mole
r a t i o s of 1:1 f o r magnesium and calcium and a 1:2 r a t i o
f o r z i n c , some authors suggest otherwise(119,120).
Aluminium(IXI), copper and n i c k e l form such strong
complexes t h a t they i n h i b i t the i n d i c a t o r a c t i o n .
Eriochrome Black T forms a 1:2:2 ternary complex w i t h
rare earths and diphenyl guanidine r e s p e c t i v e l y , i n an
acetate b u f f e r ( 8 9 ) .
Eriochrome Black T i s also s e n s i t i v e to o x i d a t i o n i n
a l k a l i n e c o n d i t i o n s , manganese(IV) and cerlum(IV)
o x i d i s e EBT under these c o n d i t i o n s , r e s u l t i n g I n r a p i d
d i s c o l o u r a t i o n of the reagent. A s o l u t i o n of the dye has
to be made Immediately before use because i t degrades i n
acid and a l k a l i . I n s t r o n g l y a c i d i c c o n d i t i o n s the dye
polymerises to a red-brown product and i s r a r e l y used
below pH 6.5. Calmagite, a more st a b l e analogue of EBT
i s considered t o be an a l t e r n a t i v e t o EBT, but i s not
regarded as superior to EBT f o r t i t r i m e t r l c
purposes(90).
120
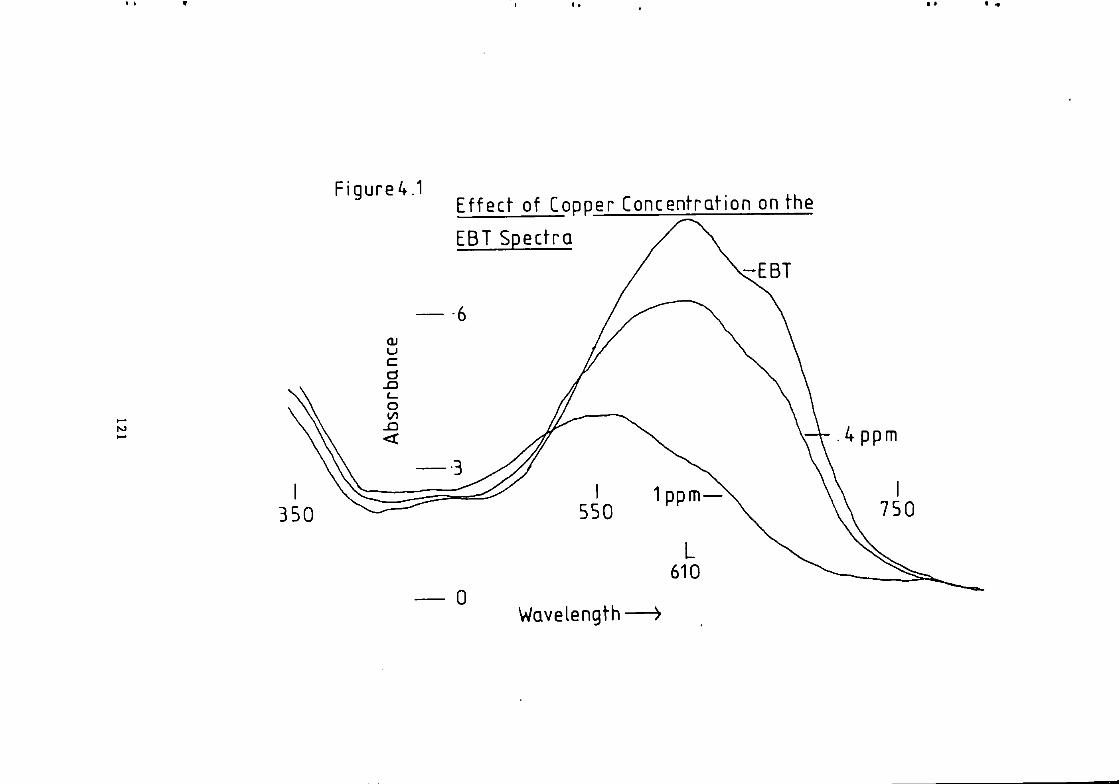
Figured.1
350
Ef fec t of Copper Concenfrai-ion on the
EBT Spectra / \
c-EBT
Wavelength

9 -
Figure 4.2
Effect of Magnesium Concentrgj-ion on the
E B T S p e c t a
_/ \ ^ - 1 p p m
QJ
c a C-O 00 <
6 -
3 -
0 -650
Wavelength

Figure 3
- 9
-•7
QJ L J C CJ c_ O I/)
<
- • 5
— 3
—-1
Effect of Fer rous ion Concentrat ion on the
EBT Spectra / \ E B T
530 610
.5ppm
Wavelength nm

4.4 Eriochrome Black T as a Post Column Reactant.
To assess a PC reactant i t was necessary to perform
elementary experiments t o ob t a i n the best wavelength and
s o l u t i o n c o n d i t i o n s . A l a r g e hypsochromlc e f f e c t i s the
best f o r observing a decrease i n absorbance, although
only s p e c t r a l measurement w i l l reveal i f there i s
considerable r e s i d u a l absorption at the i n d i c a t o r
absorbance peak maximum, which could a f f e c t the
s e n s i t i v i t y or l i n e a r i t y of response. Greater responses
were obtained a t higher EBT concentrations although
d e t e r i o r a t i o n of the absorbance occurred w i t h time.
Metal-EBT complex spectra were p l o t t e d f o r the s o l u b l e
metal s a l t s i n a s o l u t i o n b u ffered t o between pH 9 and
10.5 w i t h ammonia, those of copper, magnesium and i r o n
are shown i n Figures 4.1 to 4-3 r e s p e c t i v e l y . Other
spectra were recorded showing decreases at 610 nm w i t h
l i t t l e absorbance f o r the metal-EBT complex and were
s i m i l a r t o those i n Figures 4.1.to 4.3* Figures 4*1 t o
4*3 show the extremes of s p e c t r a l absorbance f o r
d i f f e r i n g f i n a l concentrations of metal i o n s , from the
r e l a t i v e l y h i g h l y absorbing metal-EBT species such as
those obtained w i t h magnesium and f e r r o u s ions to the
v i r t u a l l y non-absorbing copper-EBT complex*
The peak maxima f o r metal-EBT complexes are shown I n
Table 4.1 along w i t h the observed decrease i n absorbance
at 610 nm f o r each metal f o r 0.1 fig ml ^. Lower
124
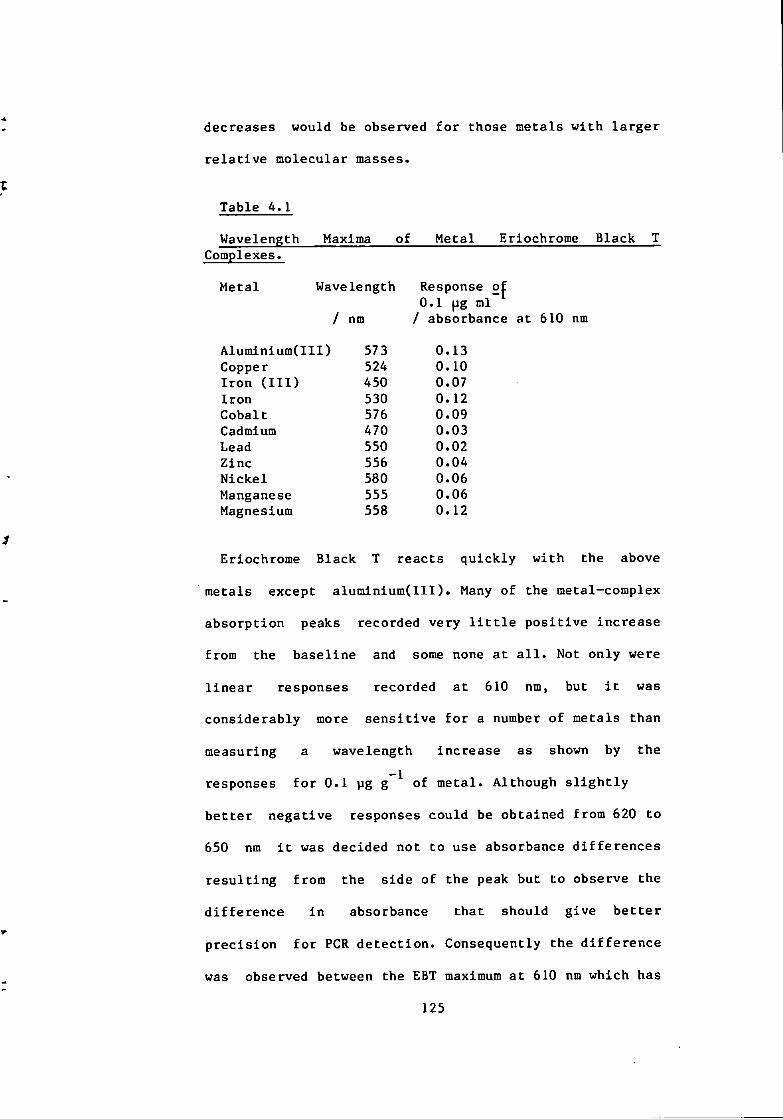
decreases would be observed f o r those metals w i t h l a r g e r
r e l a t i v e molecular masses.
Table A.l
Wavelength Maxima of Metal Eriochrome Black T Complexes.
Metal Wavelength Response o j 0.1 \ig ml
/ nm / absorbance at 610 nm
A l u m i n i u m ( l l l ) 573 0.13 Copper 524 O.IO I r o n ( I I I ) 450 0.07 I r o n 530 0.12 Cobalt 576 0.09 Cadmium 470 0.03 Lead 550 0.02 Zinc 556 0.04 Ni c k e l 580 0.06 Manganese 555 0.06 Magnesium 558 0.12
Eriochrome Black T reacts q u i c k l y w i t h the above
metals except a l u m l n i u m ( I I I ) , Many of the metal-complex
absorption peaks recorded very l i t t l e p o s i t i v e increase
from the baseline and some none at a l l . Not only were
l i n e a r responses recorded at 610 nm, but i t was
considerably more s e n s i t i v e f o r a number of metals than
measuring a wavelength increase as shown by the
responses f o r 0.1 pg g ^ of metal. Although s l i g h t l y
b e t t e r negative responses could be obtained from 620 to
650 nm i t was decided not to use absorbance d i f f e r e n c e s
r e s u l t i n g from the side of the peak but t o observe the
d i f f e r e n c e i n absorbance t h a t should give b e t t e r
p r e c i s i o n f o r PCR d e t e c t i o n . Consequently the d i f f e r e n c e
was observed between the EBT maximum a t 610 nm which has
125
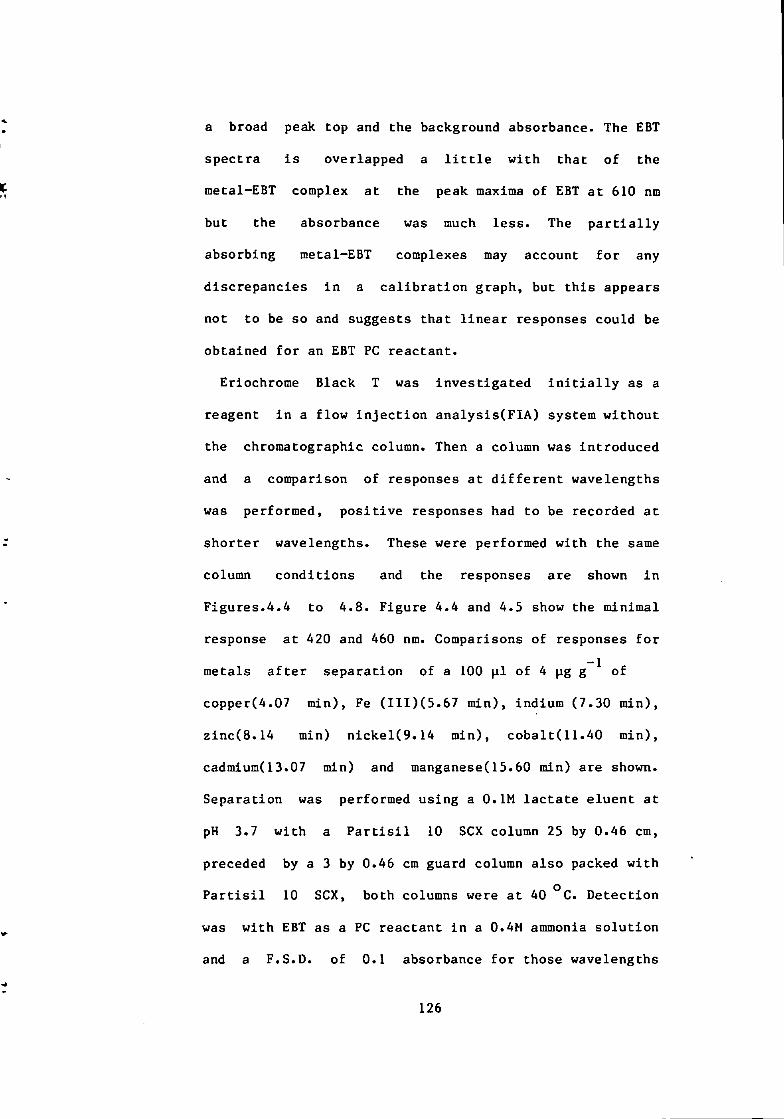
a broad peak top and the background absorbance. The EBT
spectra i s overlapped a l i t t l e w i t h t h a t of the
metal-EBT complex at the peak maxima of EBT a t 610 nm
but the absorbance was much less . The p a r t i a l l y
absorbing metal-EBT complexes may account f o r any
discrepancies i n a c a l i b r a t i o n graph, but t h i s appears
not to be so and suggests t h a t l i n e a r responses could be
obtained f o r an EBT PC reactant.
Eriochrome Black T was i n v e s t i g a t e d i n i t i a l l y as a
reagent i n a f l o w i n j e c t i o n a n a l y s i s ( F I A ) system w i t h o u t
the chromatographic column. Then a column was Introduced
and a comparison of responses at d i f f e r e n t wavelengths
was performed, p o s i t i v e responses had to be recorded a t
s h o r t e r wavelengths. These were performed w i t h the same
colunin c o n d i t i o n s and the responses are shown i n
Figures.4.4 to 4.8. Figure 4.4 and 4.5 show the minimal
response at 420 and 460 nm. Comparisons of responses f o r
metals a f t e r separation of a 100 p i of 4 jig g ^ of
copper(4.07 min), Fe ( I I I ) ( 5 . 6 7 min), indium (7.30 min),
zinc(8.14 min) nickel(9.14 min), cobalt(11.40 min),
cadmium(13.07 min) and manganese(15.60 min) are shown.
Separation was performed using a O.IM l a c t a t e e luent at
pH 3.7 w i t h a P a r t i s i l 10 SCX column 25 by 0.46 cm,
preceded by a 3 by 0.46 cm guard column also packed w i t h
P a r t i s i l 10 SCX, both columns were a t 40 °C. Detection
was w i t h EBT as a PC reactant i n a 0.4M ammonia s o l u t i o n
and a F.S.D. of 0.1 absorbance f o r those wavelengths
126
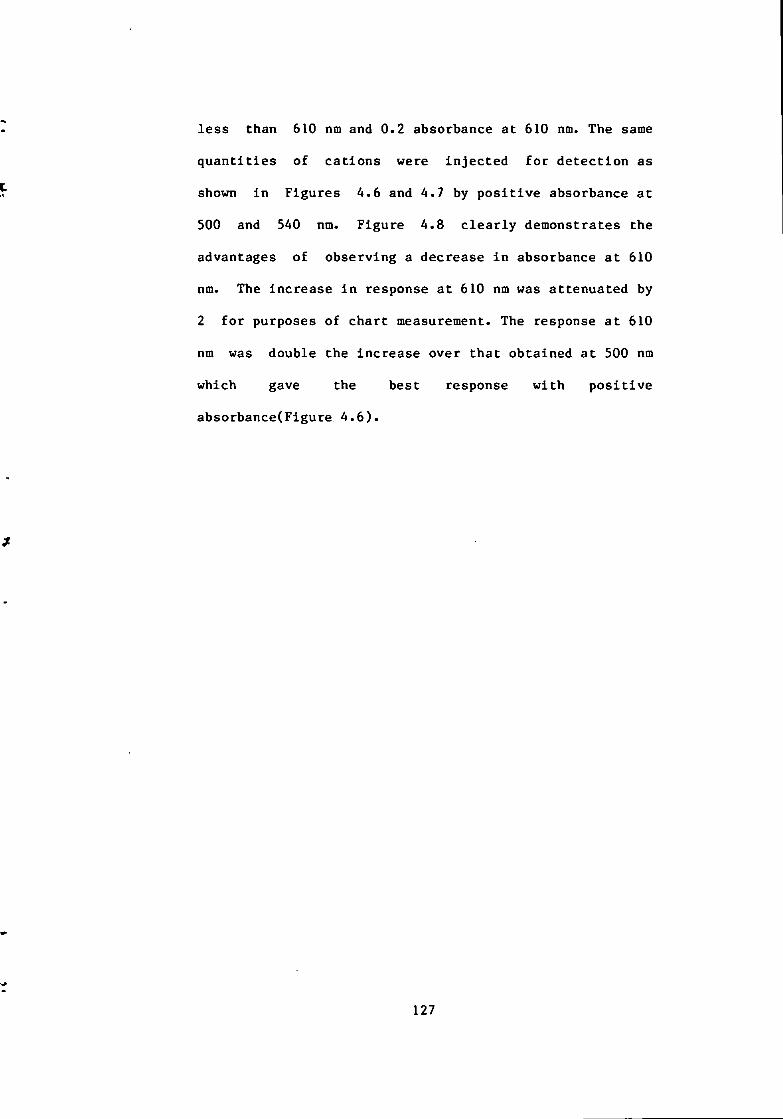
less Chan 610 nm and 0.2 absorbance at 610 nm. The same
q u a n t i t i e s of cations were i n j e c t e d f o r d e t e c t i o n as
shown i n Figures A.6 and 4.7 by p o s i t i v e absorbance at
500 and 540 nm. Figure 4.8 c l e a r l y demonstrates the
advantages of observing a decrease i n absorbance a t 610
nm- The increase i n response a t 610 nm was attenuated by
2 f o r purposes of chart measurement. The response a t 610
nm was double the increase over t h a t obtained a t 500 nm
which gave the best response w i t h p o s i t i v e
absorbance(Figure 4.6).
127
Figure 4. U Chromaf ogram wifh
EBT D e t e c t i o n a t 420 nm
0 1 0 min
128

Figure 4.5 Chromatogram w i th
EBT Detection at 460nm
1 10
mm
129

Figure 4.6 Chromatogram with
EBT Defect ion at SOOnm
130
F igure 4.7 Chromatogram with
EBT De fec t i on at 540 nm
0 10 1 \
min
131
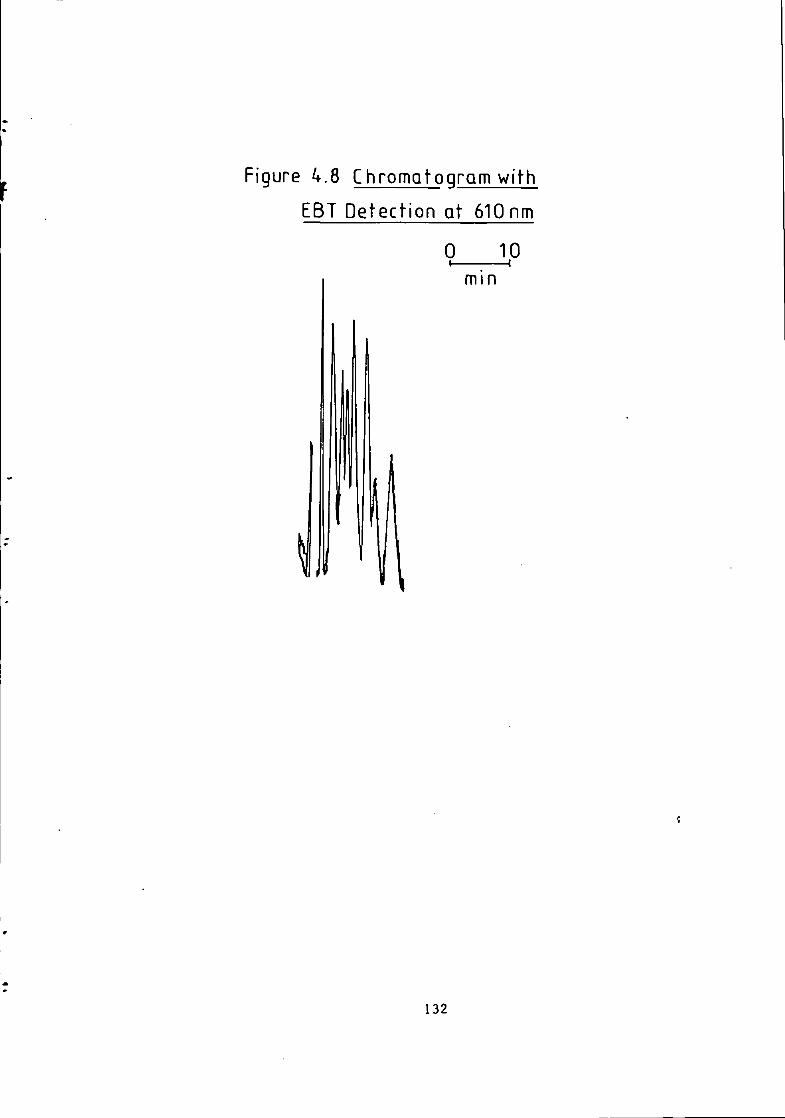
Figure 4.8 Chromatogram with
EBT Detect ion at 610 nm
0 10 — I
mm
132
4.5 Solvent and Instrumental Considerations.
No s p e c i a l a t t e n t i o n f o r EBT PC reactant was
necessary, except f o r d a i l y preparation and ensuring
t h a t the glassware and pumping systems were r e l a t i v e l y
c l e a r of metal contamination. An advantage of measuring
a decrease of absorbance i n the a PC reactant i s t h a t
constant backgrounds of metals i n the system can be
t o l e r a t e d , t h i s may solve d i f f i c u l t contamination
problems when a p p l i c a t i o n s of the detector are being
considered-
A s p e c t r a l scan of EBT w i t h an associated eluent
reveals that f o r organic acids a peak maximum of 610 nm
i s a t an optimum absorbance i n the pH range of 10 t o
10.5.
When observing a decrease i n absorbance f o r metal
d e t e c t i o n the baseline was very s e n s i t i v e t o pump
pul s a t i o n s and to a lesser extent other f l u c t u a t i o n s
from temperature and shot noise from the
p h o t o m u l t i p l i e r . There are three general approaches t o
counter the l a r g e s t source of noise which are associated
w i t h systematic HPLC pump p u l s a t i o n s . For each method i t
i s necessary t o consider which i s the best pump to be
used i n co n j u n c t i o n w i t h each approach. Several
p r a c t i c a l methods of t a c k l i n g t h i s problem were adopted.
133

i ) The p o s s i b i l i t i e s of using the PGR tubing as a pulse
dampener was i n v e s t i g a t e d . A 10 m length of 0.8 mm l.D.
tubing before and a f t e r the T j u n c t i o n mixer had l i t t l e
impact, except t o broaden the peaks when r e p l a c i n g a
shorte r l e n g t h PGR.
Experiments w i t h a b u f f e r volume of a i r of 2 t o 10 ml
adjacent to the PGR tubing w i t h a pressure r e s t r i c t i o n
placed on the tubing d i d not give a quick enough
response to pressure changes from the pump p u l s a t i o n s .
The reagent pump has very l i t t l e back pressure and a
Waters 500 i n - l i n e pressure r e s t r i c t o r accessory was the
most e f f e c t i v e of those considered. However, i n an
e f f o r t t o reduce t h i s f u r t h e r , various pumps were
examined f o r p u l s a t i o n s . The Eldex model AA pump gave
the l e a s t noise even though the coloured reagent pulses
could be seen d i r e c t l y a f t e r the mixing T j u n c t i o n .
The. quick pulses seem to escape the d e t e c t i o n although
the PGR emitted the e f f l u e n t i n sp u r t s .
i i ) E l e c t r o n i c a l l y p l a c i n g a choke device between the
detec t o r and the recorder|computer i n the wire
connection. This approach appears the e a s i e s t , however
i t would be necessary t o quench complex impedances
r e s u l t i n g from p l a c i n g a choke i n ser i e s w i t h the
detec t o r s i g n a l o u t p u t , such impedances r e q u i r e
considerable e l e c t r o n i c e x p e r t i s e to counter.
134
l i i ) T h e s i g n a l can be e l e c t r o n i c a l l y or computer
manipulated to cancel baseline noise. Hydrodynamic pulse
dampening requires large volumes and as i t i s necessary
to minimise p r e i n j e c t i o n volume, Fourier transform
analysis of the d e t e c t o r s i g n a l appears a b e t t e r o p t i o n .
Fourier a n a l y s i s transforms a complex s i g n a l of
waveshapes which by nature are systematic, from the time
to the frequency domain g i v i n g a r e s u l t i n g graph of
amplitude versus frequency. The waveforms may be
represented as a s e r i e s of simple harmonic f u n c t i o n s ,
the frequencies are i n t e g r a l m u l t i p l e s of the o r i g i n a l
s i g n a l . Once the major higher i n t e r f e r i n g frequencies
are defined then they can be e l i m i n a t e d by computer or
by f i l t e r i n g the s i g n a l e l e c t r o n i c a l l y .
A paper by Weber(121) describes how to minimise f l o w
associated noise i n electrochemical detectors f o r HPLC.
Detectors using PCR systems are s e n s i t i v e to flow r a t e
changes of an e r r a t i c or systematic nature. F o u r i e r
transforms have been performed using Fortran on a main
frame computer w i t h a f a s t r o u t i n e techniqueC122).
Another approach was t o do a round averaging
c a l c u l a t i o n i n which a running average was c a r r i e d
through, where f o r example p o i n t 3 i s the average of
p o i n t 2,3, and 4. However there was a major drawback
regarding the microprocessor here, which was t h a t data
p o i n t s from the chromatogram could only be c o l l e c t e d at
15 p o i n t s mln ^ and t h i s gave a vague and e r r a t i c
135
chromatographic reproduction on r e t r i e v a l from the
floppy d i s c . A b e t t e r computing I n t e g r a t o r may also
reduce the p e r i o d i c noise.
A PCR c o i l has an in c r e a s i n g noise reduction e f f e c t
w i t h i n c r e a s i n g l e n g t h . A t y p i c a l e f f e c t i s i l l u s t r a t e d
i n Table 4.2 f o r a Aminex A9 SCX column which operated
at a low pressure g r a d i e n t of 400 p s i and constant flow
r a t e of 2 ml min w i t h a constant PC reactant f l o w
rate of 0.7ml min -
Table.4.2
Noise Recorded f o r Varying Post Column Reactor Lengths.
Tubing l e n g t h Noise at baseline
/ m /mm
0.5 3.5 1.0 1.2 1.5 0.4 2.0 0.3
There are several ways of overcoming noise and perhaps
the best would be i n the design of the pump, although
f o r many of the pumps operating a t low back pressure,
incorporated feedback loops were i n e f f e c t i v e and
s p e c i a l l y designed PCR systems may be necessary.
For r e a c t i o n s t h a t take time, f l o w - s p l i t t i n g has been
suggested, t h i s approach could also be used as a
c o n t r o l l e d leak which may a l l o w pulses t o be contained.
S p l i t t i n g the PCR e f f l u e n t and passing one stream
through the reference c e l l of a double beam instrument
may considerably reduce the noise(123). However to date
136

the best and quickest approach i s the one adopted i n
t h i s t h e s i s , using an Eldex pump and a pressure
r e s t r i c t o r . For f u t u r e development F r i t z * s ( 5 9 ) approach
which uses a i r pressure t o supply the PC reagent may
work f o r low l e v e l d e t e c t i o n as t h i s has no p u l s i n g
i n p u t , however i t may be prone t o baseline I n s t a b i l i t y .
A pressurised container which allows the reactant t o
d i f f u s e through a membrane i n t o the column e f f l u e n t may
also s t a b i l i s e the baseline noise.
The nature of reverse mode photometric d e t e c t i o n makes
baseline noise a considerable problem f o r h i g h l y
s e n s i t i v e work, but t h i s should be q u i c k l y overcome w i t h
the advent of b e t t e r pumps and PC d e l i v e r y systems.
4.6 Optimisation Data.
There are numerous methods a v a i l a b l e to optimise
i n s t r u m e n t a l methods i n chemical a n a l y s i s , some, such as
simplex o p t i m i s a t i o n ( 1 9 ) are mathematical. This method
was developed f o r organic r e a c t i o n o p t i m i s a t i o n t o
produce the maximum y i e l d from a set of reactants. This
technique depends upon a geometrical r e p r e s e n t a t i o n of
the system under study. Performance r e s u l t s are used and
the projected parameters are t e s t e d . The new parameters
are projected on the basis of the cumulative expression
and the cycle i s repeated u n t i l there i s no advantage t o
be gained from c o n t i n u i n g . This technique was considered
137
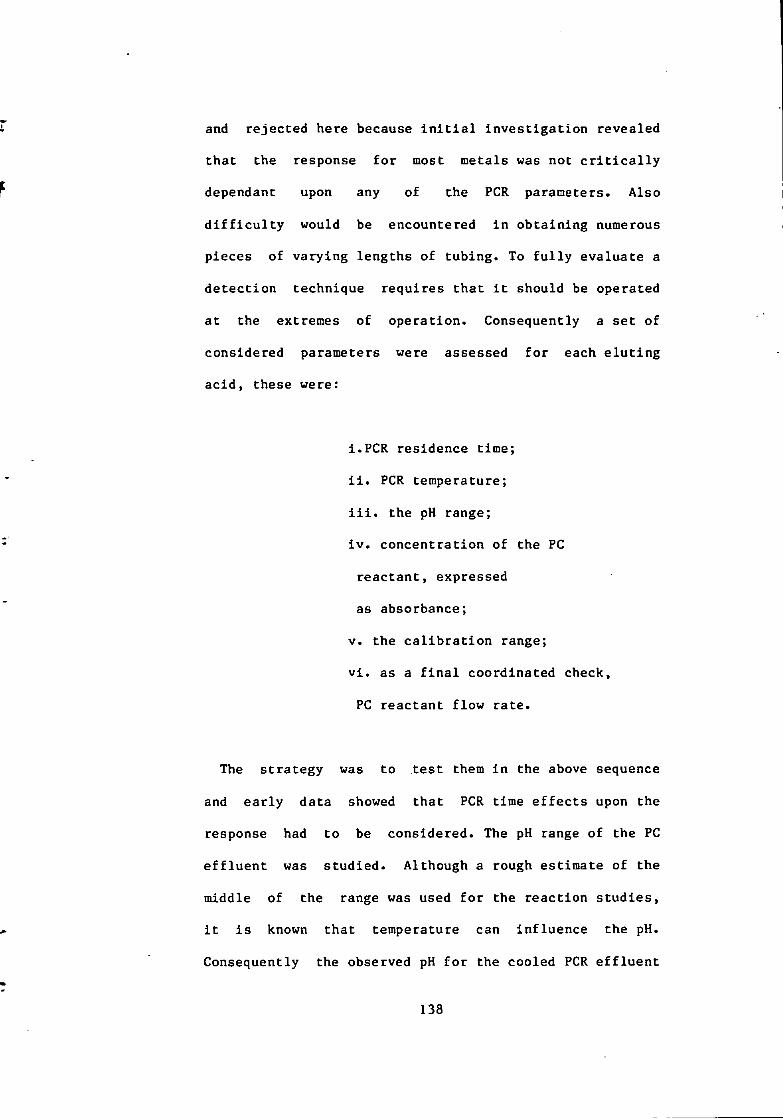
and r e j e c t e d here because i n i t i a l i n v e s t i g a t i o n revealed
t h a t the response f o r most metals was not c r i t i c a l l y
dependant upon any of the PGR parameters. Also
d i f f i c u l t y would be encountered i n o b t a i n i n g numerous
pieces of varying lengths of t u b i n g . To f u l l y evaluate a
d e t e c t i o n technique requires t h a t i t should be operated
at the extremes of ope r a t i o n . Consequently a set of
considered parameters were assessed f o r each e l u t i n g
a c i d , these were:
i . PGR residence time;
i i . PGR temperature;
i i i . the pH range;
i v . c o n c e n t r a t i o n of the PC
r e a c t a n t , expressed
as absorbance;
V, the c a l i b r a t i o n range;
v i . as a f i n a l coordinated check,
PC reactant f l o w r a t e .
The s t r a t e g y was to t e s t them i n the above sequence
and e a r l y data showed t h a t PGR time e f f e c t s upon the
response had t o be considered. The pH range of the PC
e f f l u e n t was s t u d i e d . Although a rough estimate of the
middle of the range was used f o r the r e a c t i o n s t u d i e s ,
i t i s known t h a t temperature can i n f l u e n c e the pH.
Consequently the observed pH f o r the cooled PGR e f f l u e n t
138

was not necessarily the one i n the PCR system and the
value was only used as a means of o b t a i n i n g the
optimised c o n d i t i o n f o r pH. The concentration of EBT
t h a t gave a PC e f f l u e n t absorbance range of between 0.2
and 1.4 absorbance was i n v e s t i g a t e d by measuring the PCR
e f f l u e n t absorbance at 610 nm f o r the preceding
o p t i m i s a t i o n s t u d i e s . This was followed by a check on
the response by changing the PC reactant f l o w r a t e which
simultaneously a f f e c t s most of the v a r i a b l e s t h a t
c o n t r i b u t e t o the o p t i m i s a t i o n .
139

4.7 Responses f o r a C i t r a t e Eluent.
The maximum i n t e r f e r e n c e f o r the formation of the metal-EBT complex was found f o r a high concentration of c i t r a t e , which was used as an eluent w i t h the Aminex A9 SCX column. Lower capacity columns would not perform the separations a t a 0.2M co n c e n t r a t i o n w i t h such a stron g c h e l a t i n g agent. This strong complexing agent does not separate many metals and two chromatographic runs were necessary, one f o r copper, n i c k e l and zinc; the other f o r cobalt and i r o n ( I I I ) .
4.8 Results w i t h a C i t r a t e Eluent.
The graphs of response c a l c u l a t e d from peak area,
against varying c o n d i t i o n s o f ; pH, PCR residence time,
EBT concentration as absorbance, PCR temperature and
f i n a l l y the c a l i b r a t i o n are presented i n Figures 4.9-18.
Table 4.3 summarises the best c o n d i t i o n s f o r each
metal. A l i q u o t s of a 100 p i c o n t a i n i n g 2 pg ml ^ of
I r o n ( I I I ) and coba l t i n one and copper, n i c k e l and 10
pg ml ^ of zinc i n the other were i n j e c t e d .
A p l o t of PC reactant f l o w r a t e versus response
confirms the data obtained from changing one parameter
and any d e v i a t i o n s from the expected can be f u r t h e r
assessed by comparison of graphs of subsequent decrease
i n metal elua t e concentration w i t h i n c r e a s i n g EBT
140

concentration obtained w i t h increased PC reactant f l o w
r a t e as i n Figure 4.19-20. The n i c k e l response t o PC
reactant flow r a t e i s not presented here as there was no
change of response.
Linear responses using peak area were p l o t t e d f o r a l l
the metals examined i n Figures 4.16-18, however no
l i m i t s of d e t e c t i o n were c a l c u l a t e d . I n p r a c t i c e l i t t l e
d i f f e r e n c e was observed between recording response i n
terms of peak area or peak height.
141

Figure 4.9
5-, EBT Defect ion with Q Citrate Eiuent
PCR Temperature
100

Figare 4.10
E BT Detection wi th a Citrate Eluent 12
C o CL l/) OJ CC
0 0
Fedll)
5 1. 1.5 2 2-5 Flow of Post Column Reactant ml min"''
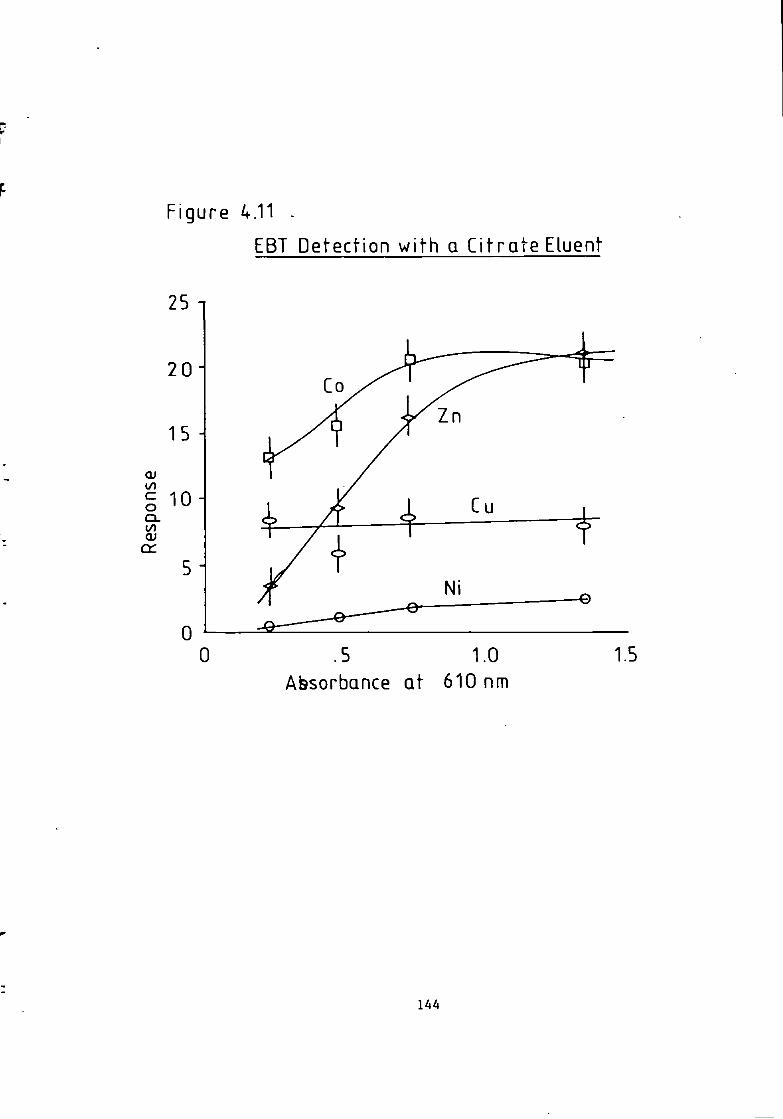
Figure 4.11 -
EBT Detection with Q C i t ra te Eluent
25
20H
15
I/)
§ 10 CL to cc
0 0 .5 1.0
Absorbance at 610 nm 1.5
144

Figure 4.12
3H
QJ 2 i to cz o o. i / )
Cd 1
0
EBT Detection with d Citrate Eiuent
0 .1 .2 .3 .k
PCR Residence Time min

Figure 4.13
6^
3 I/) c o to Z QJ
9-5
EBTDetection with Citrate Eluent
10 10-5 11
pH of PGR Effluent
Tv5
1A6
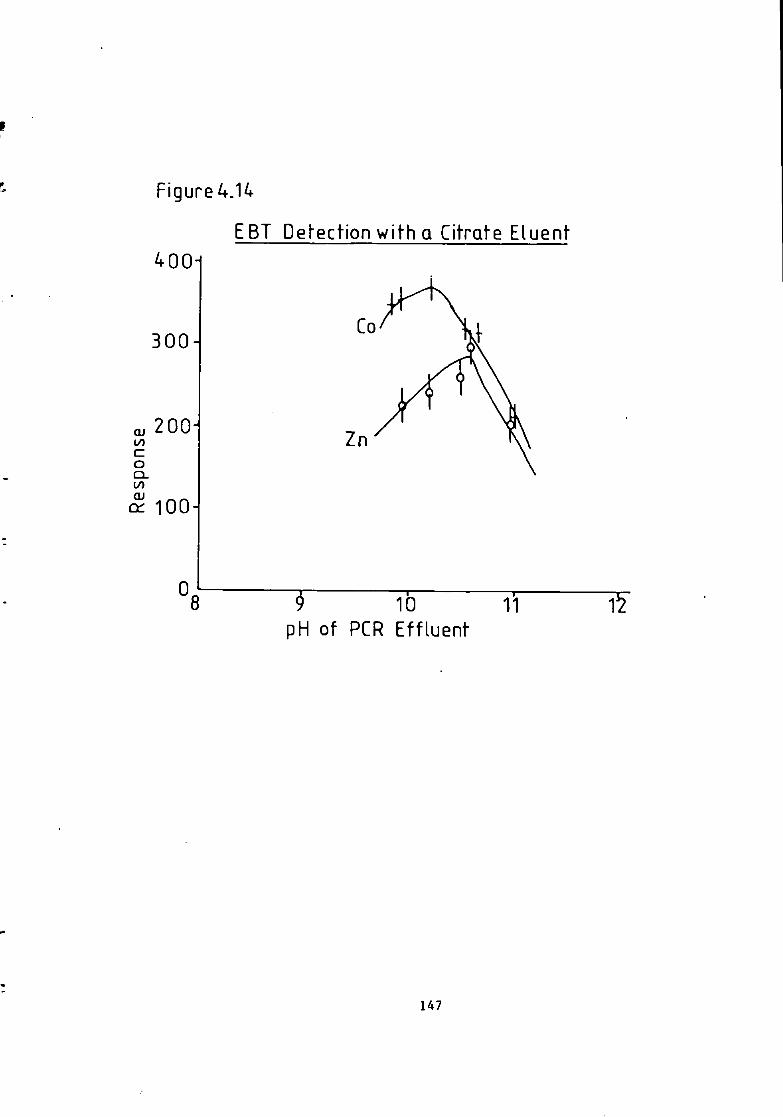
Figure^.14
EBT Del-ection with g Citrate Eluent 400
300-^
oj 200 to c o CL
I 100
0 8 1 10
pH of PCR Effluent 11 1Y
147

Figure 4.15
EBT Defecfion with Q Citrate Eluent
12
10
8
00
o
cr
0
Fedl l )
8 9 10 pH of PCR Effluent
11 12

Figure 4.16 EBT Detector Calibration with a Citrate Eiuent
(/) c o D.
0
Fe in
5 10 Metal Conientration pg.ml

o
Figure 4.17
EBT Detector Calibration with a Citrate Eluent
10 20 30 40
Metal Concentration pg.ml"' '
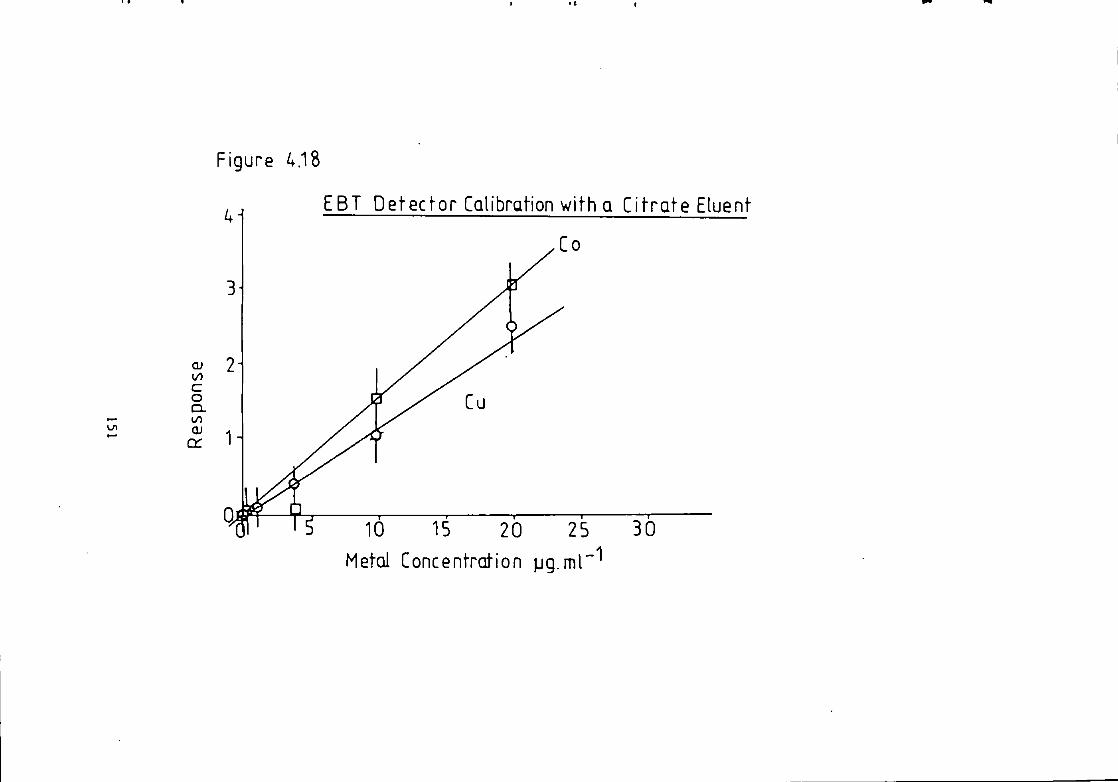
Figure 4.18
EBT Detec tor Calibration with Q C i t ra te Eluent
to o CL UO QJ Q:
^ 10 15 20 25 30
Metal Concentration pg.mr''

Figure 4.19
PCR Flow Etfect on EBT
E1-5 C o 2 1-3 'a
^ 1-1
S 0 <
1 2 Flow rate ml min"''

Figure 4.20
Dilution of Analyte bv PCR Flow
to
O
c C o
Flow rate, ml min

Table 4>3
Optimum co n d i t i o n s f o r Eriochrome Black T PC Reactant w i t h C i t r a t e Eiuent.
Parameter
metal
Copper I r o n ( I I I ) Cobalt Zinc N i c k e l
PCR time
/ min
0.2 0.2 >0.1 0.2 >0.2
E f f l u e n t PH
9.5-10.5 9.5-11 9.8-10.3 10.5-10.7 10.4-11
* as absorbance
EBT* cone
>0.4 >0.7 >0.7 >0.7 >1.4
PCR temp
30-50 30-50 <10 <10 >80
PC reactant f l o w r a t e
/ ml min
>2.0 1.2 1-1.75 >1 >0.5
1
4*9 Discussion of Opt i m i s a t i o n Data w i t h the C i t r a t e
Eiuent.
Before discussing the data there are some important
p o i n t s t h a t emerge from the studies t h a t have already
been performed on l i g a n d exchange reac t i o n s . These have
to be considered here because the metal ion i s involved
i n an exchange between the r e s u l t a n t e l u t i n g organic
a c i d , the hydroxide i o n complex or complexes and the PC
reac t a n t . The exchange rates f o r the hydroxy l i g a n d are
considered f a s t f o r a l l metals e l u t e d . Larger ions
exchange hydroxyl groups more q u i c k l y . Lesser charged
ions also have a higher exchange r a t e . There are
numerous f a c t o r s to be considered f o r the r a t e of a
re a c t i o n f o r a metal-complex(124). Excluding the e f f e c t
of c a t a l y s i s and temperature, the most important f a c t o r s
are:
154

i . the nature of the c e n t r a l metal i o n ;
i i . the nature of the l e a v i n g l i g a n d ;
i i i . the nature of the e n t e r i n g l i g a n d ;
i v . the nature of other l i g a n d s attached t o the
c e n t r a l metal i o n ;
V. the charge on the complex;
v i , the nature of the solv e n t ;
v i i . the presence of other metal ions or ligands i n
the s o l v e n t .
Some d i f f i c u l t y was encountered . w i t h n i c k e l f o r the
d i t h i z o n e PC r e a c t a n t , t h i s i s discussed i n chapter
f i v e , however i t was thought t h a t an ammonium buffered
eluent would quicken the r e a c t i o n r a t e f o r most metals,
as was the case f o r the d i t h i z o n e PC rea c t a n t , and a
respective (3+2) 2M ammonium and sodium hydroxide
mixture f o r pH adjustment of the organic acid was used.
The same mixture was used f o r the EBT detector f o r
comparison.
Before the discussion of each metal response i t i s
necessary t o mention some general trends. Figure 4.4 t o
4.8 show t h a t EBT has an absorbance maximum a t 610 nm
between pH 8 and 11. The chromatographic response does
not n e c e s s a r i l y r e f l e c t the t r u e response, t h a t would be
b e t t e r obtained on a FIA system, because the
chromatographic separation gives broader peaks as
155

r e t e n t i o n time increases, which means poorer
s e n s i t i v i t i e s f o r the l a t e r e l u t i n g metals.
The temperature change gave a gen t l e response curve
f o r copper and i r o n ( l l l ) w i t h a maximum value i n the
range 30 t o 50 ^C. N i c k e l , c o b a l t and zinc gave a l i n e a r
response w i t h e i t h e r a negative or p o s i t i v e slope w i t h
temperature as shown i n Figure 4.9» I t i s d i f f i c u l t t o
draw conclusions about k i n e t i c and thermodynamic
r e a c t i o n parameters as they are i n t e r a c t i v e w i t h PCR
temperature, pH and residence time, and as the study of
them i s not the i n t e n t i o n of t h i s work only comparisons
w i l l be made w i t h other PCR systems.
Figure 4.10 shows an increase of response f o r copper
w i t h an increased PC reactant f l o w r a t e , which d i l u t e s
the c i t r a t e c oncentration and lessens the s t r e n g t h of
the complex, w h i l s t i n c r e a s i n g the EBT concentration as
shown i n Figure 4.19. However there comes a point where
the analyte i s d i l u t e d considerably and the d i l u t i o n
e f f e c t no longer aids response as i n the case f o r
i r o n ( I I I ) i n Figure 4,10. Zinc response shows a s l i g h t
i n t e r f e r e n c e and then the s i g n a l diminishes w i t h
increased PC reactant f l o w r a t e . Copper and c o b a l t were
not p l o t t e d as they gave a s i m i l a r curve to zinc.
Figure 4-11 shows the v a r i a b l e response w i t h d i f f e r i n g
EBT absorbances of the PCR e f f l u e n t . Cobalt, n i c k e l and
zinc show curves t h a t peak t o a p l a t e a u , t h i s suggests
the possible formation of higher complexes, which are
156

known to occur f o r zinc- The f e r r i c ion gives v a r i a b l e
response at d i f f e r e n t EBT concentrations (although not
p l o t t e d ) . This was also the case f o r the PGR residence
time response curve f o r i r o n ( I I I ) suggesting t h a t
m u l t i p l e complex formation may occur. However f o r a set
of given c o n d i t i o n s a l i n e a r response curve was recorded
f o r i r o n ( I I I ) as i n Figure 4.16.
Figure 4.12 shows a very s l i g h t increase f o r c o b a l t
response concerning PGR time and the expected decrease
i n response associated w i t h an increase i n PG reactant
f l o w r a t e confirms t h i s . A negative l i n e a r response f o r
c o b a l t i s shown i n Figure 4.9 against temperature where
a h a l f response was achieved over 86 * C, however i t i s
d i f f i c u l t t o draw any thermodynamic conclusions.
Zinc s i m i l a r l y has a f a s t response as i n Figure 4.12
t h i s i s evident i n Figure 4.10 where the increased PC
reactant flow r a t e revealed the expected decrease i n
response a t g r e a t e r PG reactant flow r a t e s . Figure 4.20
shows the expected decrease of analyte c o n c e n t r a t i o n
which should be c o n s i s t e n t w i t h response f o r no
i n t e r f e r e n c e . An increased response shown i n Figure 4.9
by a f a c t o r of two occurs w i t h 54 °G lowering of
temperature.
N i c k e l response increases considerably w i t h
temperature as i n Figure 4.9, compared to other metals
i n v e s t i g a t e d . The response t o n i c k e l was increased by a o
f a c t o r of f o u r over a 45 G r i s e , also an unusual 3
157

times greater response was recorded at pH 10.6 over pH
10 as i n Figure 4.13. Cobalt and n i c k e l show a b e t t e r
response as i n Figure 4.14 a t pH 10 to 10.5- Copper and
i r o n ( I I l ) show i n Figure 4-15 an extended o p t i m i s a t i o n
range t o pH lower than 10.
At optimum co n d i t i o n s the c a l i b r a t i o n curves i n
Figures 4.15-18 confirm t h a t q u a n t i t a t i v e data can be
obtained f o r 100 p i i n j e c t i o n s of the above mentioned
metal ions. A rough observation of equal molar
r e a c t i v i t y i s shown given t h a t some v a r i a t i o n should be
expected f o r ions t h a t have d i f f e r i n g r e t e n t i o n times.
This i s w i t h the exception of i r o n ( I I I ) which gave a
l a r g e r response and again, suggests the formation of a
higher complex. An advantage of reverse mode photometric
d e t e c t i o n i s that the upper range of d e t e c t i o n i s not so
l i m i t e d as i n the p o s i t i v e increase of absorbance
because higher concentrations of EBT could be used, t o
measure small absorbances f o r more accurate
determinations-
4.10 Metal Responses f o r a Lactate Eluent.
L a c t i c acid i s a much weaker complexing agent, but has
been shown to be the best eluent separating more metals
as shown i n chapter three and p u b l i c a t i o n s by the
author(125,126 see appendix 2 ) . The same PCR
i n v e s t i g a t i v e technique mentioned above was adopted f o r
158

d e t e c t i o n w i t h t h i s eluent. The metals cadmium, c o b a l t ,
copper, i r o n ( I I I ) , lead, magnesium, manganese and zinc
are a l l separated w i t h 0.IM l a c t a t e on a P a r t i s i l 10 SCX
column i n one i n j e c t i o n .
A.11 Results and Discussion.
Table 4.A records the optimum c o n d i t i o n s f o r metals,
calcium e l u t e s a f t e r magnesium, but the response was
approximately 20 times l e s s and was not considered here
f o r trace a n a l y s i s by HPLIEC. Indium and i r o n ( I I )
co-elute w i t h I r o n ( I I I ) and cadmium r e s p e c t i v e l y , but
the data f o r the c a l i b r a t i o n curves (Figures 4.25 t o
A.27) was recorded i n separate i n j e c t i o n s . The
c o - e l u t i n g p a i r s mentioned above require a lower
conc e n t r a t i o n of l a c t a t e f o r separation and f u r t h e r
response data f o r them was t h e r e f o r e not considered f o r
t h i s reason. Nine metals should give s u f f i c i e n t data to
optimise the det e c t o r as the o v e r a l l best response was
the o b j e c t i v e of the work. Only those responses t h a t are
d i f f e r e n t or representative of a set of metals are
g r a p h i c a l l y i l l u s t r a t e d here.
159
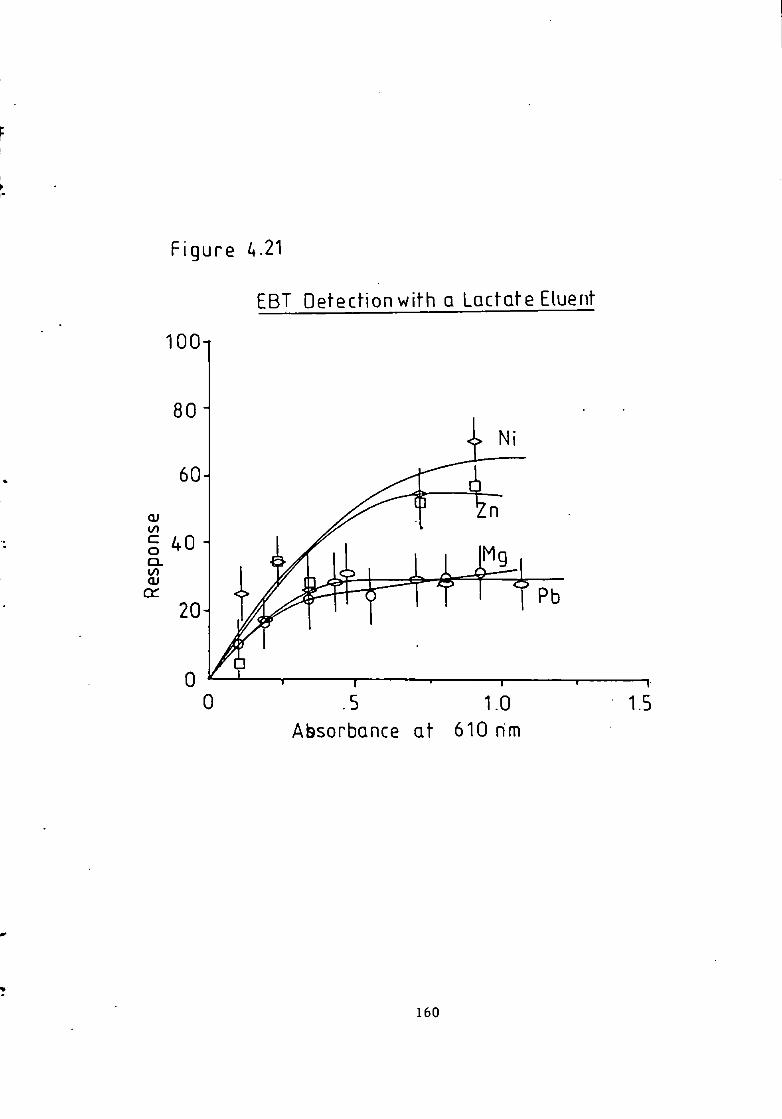
Figure A.21
EBT Detecfion with Q Lactate Eluent
100
.5 1.0 Absorbance at 610 rim
160
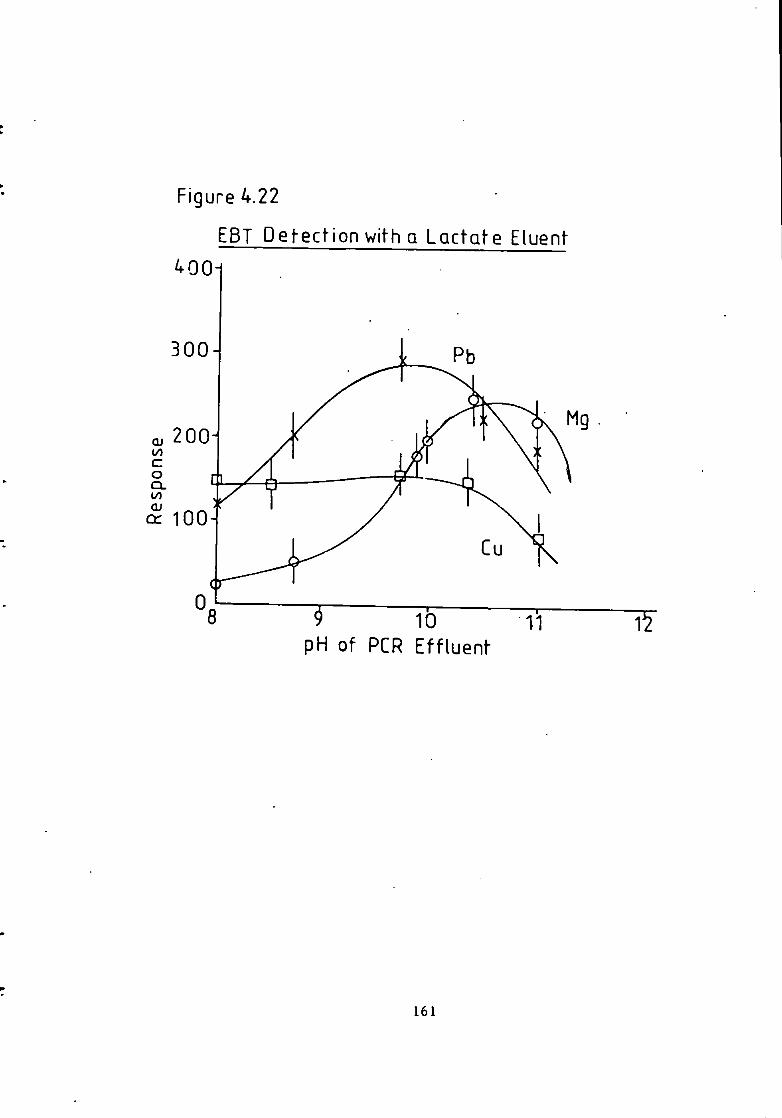
Figure 4.22
EBT Detect ion with g Lactate Eluent
4 0 0 i
300-^
a. 200
cc 100-
9 10 11 pH ot PGR Effluent
1Y
161

0
Figured.23 EBT Detection with a Lactate Eluent
100
100
PGR Temperature C

F igure 4.24 EBT Defect ion with a Lactate Eiuenf
12 .
QJ to cz o Q. CO <U
0 5 1. 1.5 2 2-5 Flow of Post Column Reactanf ml min"''
163
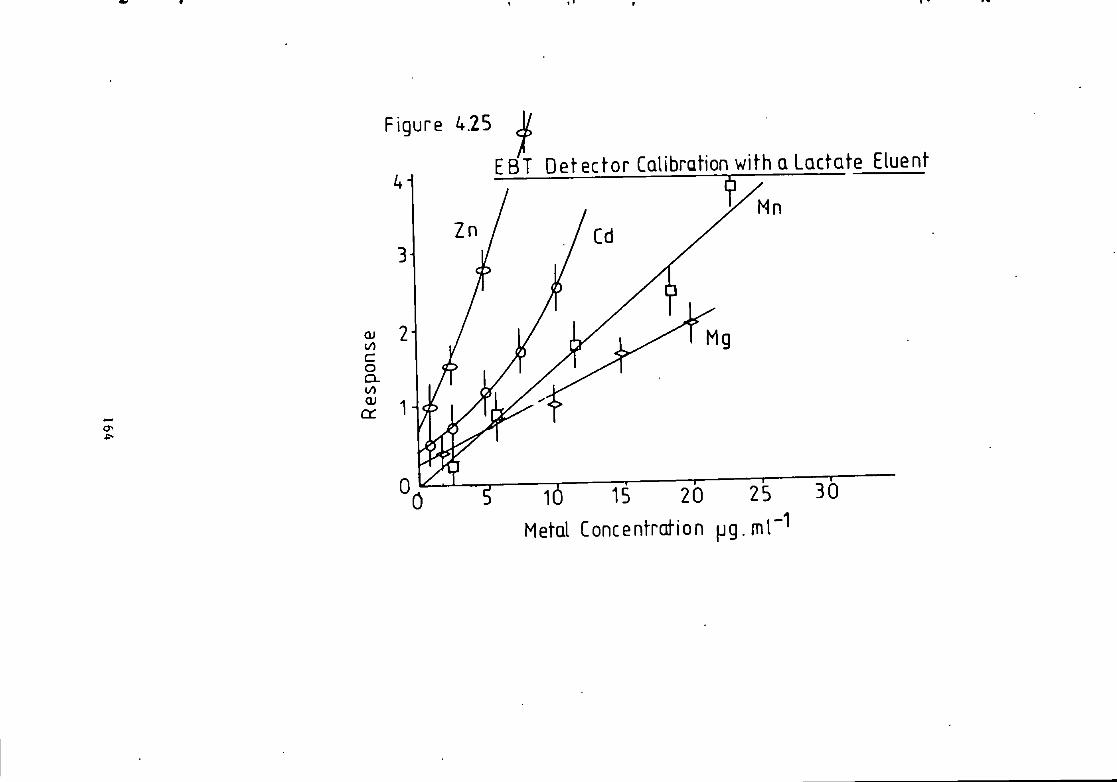
Figure 4,25 V
EBT Defector Calibration with a Lactate Eiuenf
Zn
r 10 15 20
Metal Concentration j jg .ml
25 30 -1

Figure 4.26
EBT Detector CQlibration with QLactate Eiuent
Metal Concentration jjg.ml
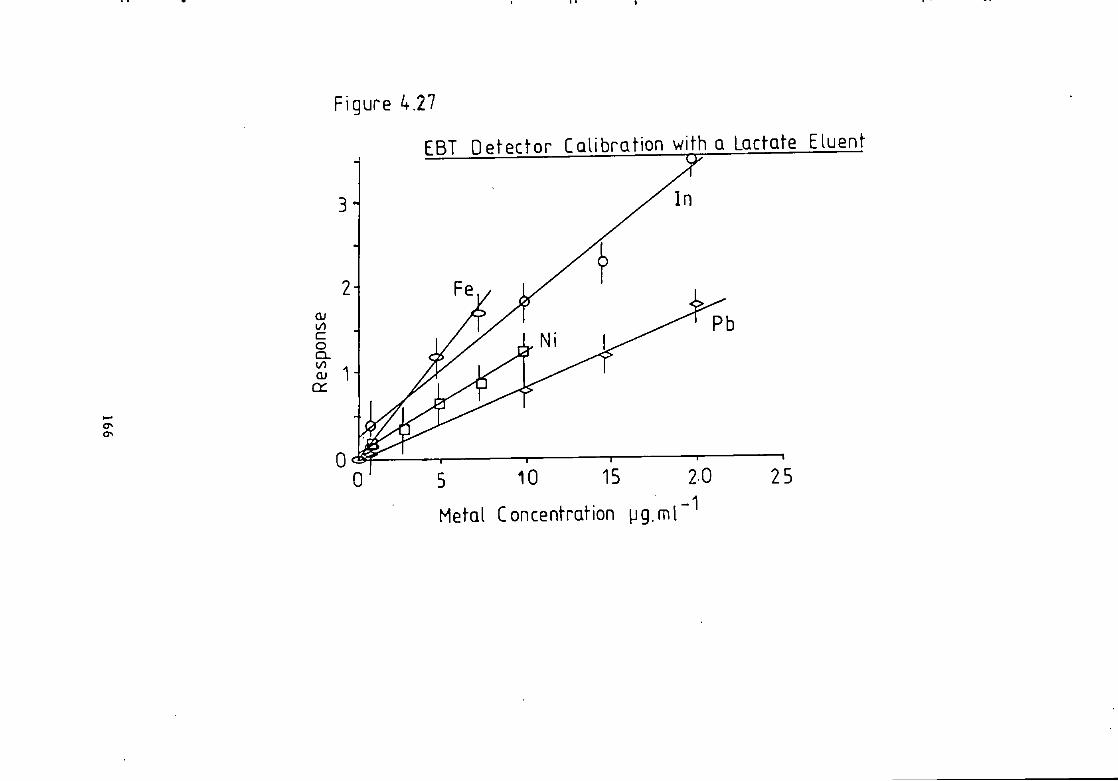
ON
Figure ^.27
EBT Defector Calibration with Q Lacfate Eiuent
5 10 15
Metal Concentration pg.ml

Table 4.4
Optimum Response Conditions f o r Lactate e f f l u e n t w i t h the Eriochrome ack T Post Columin Reactor.
Parameter PCR E f f l u e n t .EBT* PCR PC reactant time pH absorbance temp fl o w r a t e
metal / min / ° c / ml min. ^
Cadmium >0.1 9.5-11 >0.2 50-70 1-1.4 Cobalt >0.3 8-10.5 >0.5 40-70 0.5-1.2 Copper >0.1 8-10 >0.2 0-80 0.5-2.0 I r o n ( I I I ) >0.1 8-10 >0.4 30-70 >0.5 Lead 0.3 9.5-10.5 >0.4 0-10 0.5-1.5 Magnesium 0.25--0.4 10-11 >0.8 20-60 1.5-2 Manganese 0.3-0.4 8.5-10 >0.4 40-70 1.3-1.7 Ni c k e l <0.3 8.10.5 >1 <40 1-1.8 Zinc 0.05 8-10 >0.9 <10 0.7-1.3
* measured as absorbance.
Cadmium, i r o n ( I I I ) and copper show v i r t u a l l y no
response to an EBT conc e n t r a t i o n increase as i n Figure
4.21, suggesting a d i f f e r e n t r e a c t i o n mechanism or
sto i c h i o m e t r y f o r those metals i . e . t h a t more than one
higher order complex may be formed.
Only a high pH appears to i n h i b i t the copper response
i n Figure 4.22, which i s s i m i l a r t o t h a t of i r o n ( I I I )
and zinc pH response curve. N i c k e l , c o b a l t and manganese
show a g e n t l e curvature o p t i m i s i n g around pH 9 t o 10.
Magnesium and lead show i n Figure 4.22 more acute
curvatures, as does manganese. Only cadmium has an
increase above pH 11.
N i c k e l , zinc and lead show a decrease of response w i t h
temperature i n Figure 4.23. Only copper shows no e f f e c t
of response w i t h temperature. Other metals g i v e a
167
v a r i a t i o n of response w i t h an optimum temperature value-
By comparing response p l o t s f o r d i f f e r e n t parameters
general trends f o r each metal can be ascertained. The
response of co b a l t was quick w i t h a r e l a t i v e l y lower
dependence on EBT c o n c e n t r a t i o n and b e t t e r responses
were obtained w i t h PGR residence times greater than 0.3
minutes. A negative slope against temperature was
observed f o r those metals i n Figure 4.23, i n d i c a t i n g
e i t h e r degradation of EBT, or a r e a c t i o n which has
preference a t higher temperatures, however f o r most
metals a g e n t l e curve showing an optimum a t 40 t o 70° C
or a l i n e a r response was observed.
With the l a c t a t e eluent only a 20 % change occurred
f o r response w i t h d i f f e r i n g r e a c t o r response times from
0.1 t o 0.4 minutes, w i t h the exception of n i c k e l which
f e l l by 50 % from 0.3 to 0.4 minutes-
The m a j o r i t y of the graphs of response versus PC
reactant flow r a t e show an increase due to the EBT
con c e n t r a t i o n increase followed by a decrease as the
metal e l u a t e i s d i l u t e d according to Figure 4.20. The
optimum f o r most metals occurs around 1.5 ml.min ^,
w i t h the exception of those shown i n Figure 4.24. Copper
reacts r e a d i l y w i t h no parameter causing a noteable
change of response, however the PC reactant f l o w r a t e
causes a s l i g h t decrease i n response f o r copper and the
f e r r i c i o n .
Another f a c t o r t o be considered i s the r a t i o of PC
168

reagent t o the column eluent f l o w r a t e and i t s e f f e c t on
the d e t e c t o r performance- Increasing the PC reagent w i l l
d i l u t e the organic acid eluent and so reduce any
l i m i t i n g e f f e c t by the organic acid on the metal-EBT
response. I f the percentage a d d i t i o n becomes too large
t h i s b e n e f i c i a l e f f e c t w i l l be o f f s e t by increased
d i l u t i o n of the metal peaks e l u t i n g from the column,
countering e f f e c t s are show i n Figure 4.24.
Although a high EBT c o n c e n t r a t i o n i s p r e f e r r e d , too
high an EBT concentration gives a baseline
absorbanceCsay above 1.5 absorbance) that would r e s u l t
i n very low i n t e n s i t y r a d i a t i o n f a l l i n g on the p h o t o c e l l
and consequently an increased baseline noise and poorer
s e n s i t i v i t y as o u t l i n e d i n chapter one. However, before
t h i s baseline absorbance was reached a more serious
noise problem arose from pump p u l s a t i o n s . This showed
i t s e l f as a complex sine wave superimposed on the
baseline, becoming p a r t i c u l a r l y evident above 0.9
absorbance.
I f h igh s e n s i t i v i t i e s are required they could be
achieved by reducing EBT c o n c e n t r a t i o n . This was indeed
found to be the case f o r most metals down to a baseline
absorbance of 0.2. Below t h i s absorbance, l i n e a r i t y and
d e t e c t i o n l i m i t s s t a r t t o d e t e r i o r a t e as metal response
decreased.
A possible explanation i s t h a t i f the EBT
c o n c e n t r a t i o n i s too low then the l a c t a t e w i l l begin t o
169
compete more e f f e c t i v e l y f o r the metal i o n , thus
reducing the s e n s i t i v i t y of the EBT r e a c t i o n , even
though the s t a b i l i t y constants of metal-EBT complexes
are much gr e a t e r . I n many respects an in c r e a s i n g EBT
concen t r a t i o n i n the PGR system demonstrates a s i m i l a r
response t o t h a t obtained i n the Methods of Mole Ratios,
where the li g a n d concentration i s increased w i t h
constant metal i on concentration t o give a coloured
complex, t h i s i s used t o g r a p h i c a l l y determine s o l u t i o n
e q u i l i b r i a between a metal i o n and a complexing
l i g a n d ( 1 2 7 ) . However f o r a PGR system a time l i m i t i s
placed upon the response and consequently no conclusive
constants can be obtained, although a w e l l defined edge
to a plateau i n d i c a t i n g complex formation shows a
s t r o n g l y formed complex and an apparent v a r i a t i o n i n
t h i s region at the plateau edge i n d i c a t e s a higher
complexes may be formed w i t h other species absorbing i n
the same region. Here the i m p l i c a t i o n i s the same even
though a reverse photometric mode a t 610 nm was used-
As Table 4.4 shows the average optimum c o n d i t i o n s f o r o
the metals was 0.3 min r e t e n t i o n time; a PGR at 50 C; a
pH between 10 t o 10.5; a PG reac t a n t f l o w r a t e of 1.5 ml
min ^ and an EBT PC reactant absorbance of 0.5 t o
0.9 at 610 nm. These c o n d i t i o n s were used t o determine
the s e n s i t i v i t y and c a l i b r a t i o n curve of each metal.
C a l i b r a t i o n curves were obtained f o r the metals
mentioned. Only cadmium and c o b a l t gave s l i g h t l y curved
170
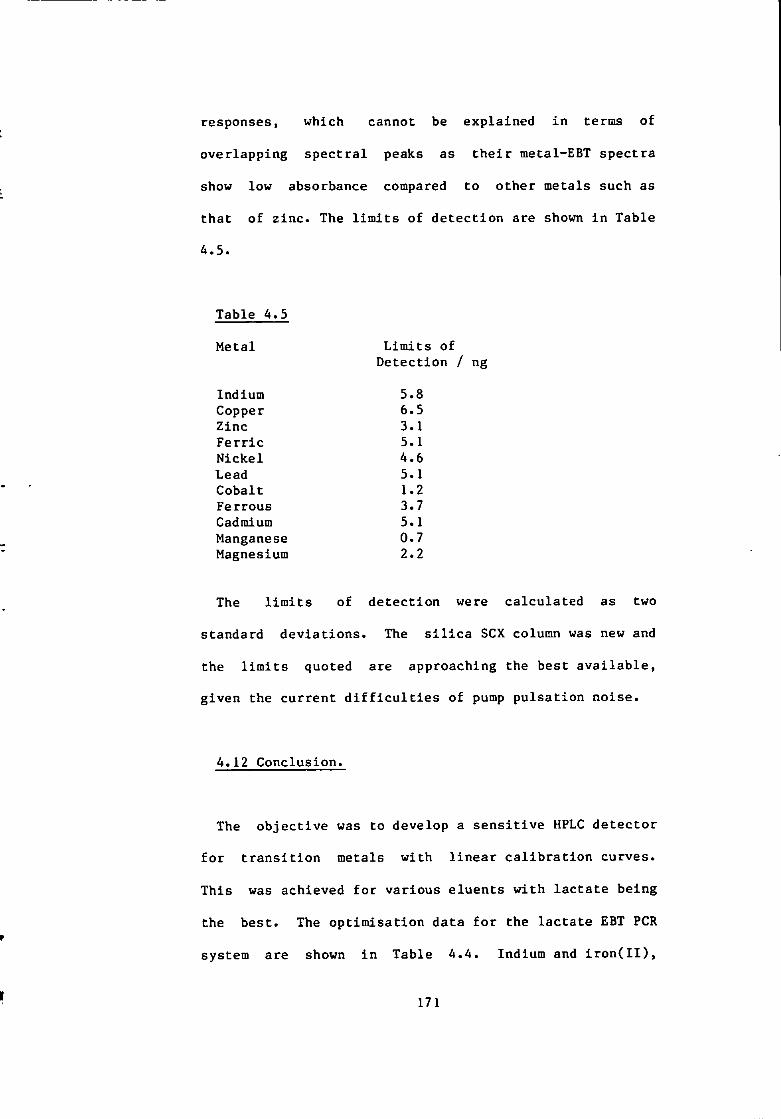
responses, which cannot be explained i n terms of
overlapping s p e c t r a l peaks as t h e i r metal-EBT spectra
show low absorbance compared to other metals such as
t h a t of z i n c . The l i m i t s of d e t e c t i o n are shown i n Table
4.5.
Table 4.5
Metal L i m i t s of Detection / ng
Indium 5.8 Copper 6.5 Zinc 3.1 F e r r i c 5.1 Ni c k e l 4.6 Lead 5.1 Cobalt 1.2 Ferrous 3.7 Cadmium 5.1 Manganese 0.7 Magnesium 2.2
The l i m i t s of d e t e c t i o n were c a l c u l a t e d as two
standard d e v i a t i o n s . The s i l i c a SCX column was new and
the l i m i t s quoted are approaching the best a v a i l a b l e ,
given the c u r r e n t d i f f i c u l t i e s of pump p u l s a t i o n noise.
4.12 Conclusion.
The o b j e c t i v e was to develop a s e n s i t i v e HPLC d e t e c t o r
f o r t r a n s i t i o n metals w i t h l i n e a r c a l i b r a t i o n curves.
This was achieved f o r various eluents w i t h l a c t a t e being
the best. The o p t i m i s a t i o n data f o r the l a c t a t e EBT PGR
system are shown i n Table 4.4. Indium and i r o n ( I I ) ,
171

although not optimised gave good l i n e a r ranges a t the
optimum c o n d i t i o n s of the other metals b r i n g i n g the
t o t a l number determinable t o eleven. Although l i m i t s of
d e t e c t i o n were not c a l c u l a t e d f o r c i t r a t e e l u e n t ,
c a l i b r a t i o n curves i n Figures 4.16 to 4.18 were p l o t t e d .
Radical changes of response were not found f o r t h i s
method measuring a decrease i n absorbance so extending
the range of operation. Q u a n t i t a t i v e d e t e c t i o n has
therefore proved e f f e c t i v e f o r both strong and weak
c h e l a t i n g e l uents.
The EBT PC reactant has been shown to be s e n s i t i v e
from pH 9.8 t o 10.8 without a s i g n i f i c a n t decrease i n
the EBT absorbance at 610 nm over t h i s pH range. To
o b t a i n responses f o r greater metal elua t e
concentrations, higher concentrations of EBT are
necessary. High absorbances however gave greater s i g n a l
to noise r a t i o , although i t was not s u f f i c i e n t t o
counter the accuracy and the expected decrease of the
c o e f f i c i e n t of v a r i a t i o n was obtained.
Lactate was the best eluent w i t h l i n e a r c a l i b r a t i o n s
from 10 |ig ml ^ t o 5 ng ml ^ f o r cadmium, c o b a l t ,
copper, indium, i r o n ( I I I ) , i r o n , l ead, magnesium,
manganese, n i c k e l and z i n c . L i m i t s of d e t e c t i o n were i n
the range of 0.5 to 5 ng and as expected appear
dependant upon the speed of e l u t i o n , because r a p i d l y
e l uted peaks have a smaller peak width*
I n chapter s i x a p p l i c a t i o n s of the l a c t a t e EBT PGR
172
system show the determination of c o b a l t , copper, i r o n ,
manganese and n i c k e l i n two standard a l l o y s . Together
w i t h ng ml ^ concentrations i n estuarine
environmental samples and simulated primary coolant of a
pressurised water nuclear reactor.
I n p r a c t i c a l terms the EBT PGR was simple to set up
and very s t a b l e i n operation. Eriochrome Black T does
d e t e r i o r a t e slowly i n s o l u t i o n due to o x i d a t i o n , but
d a i l y p r e p a r a t i o n of the PC reactant s o l u t i o n was
s u f f i c i e n t t o maintain d e t e c t o r response. Calmaglte, an
analogue of EBT without the n i t r o group i s much more
st a b l e and could possibly be used i n i t s place where
long term s t a b i l i t y i s r e q u i r e d , although i n i t i a l t r i a l s
showed t h a t by observing a decrease i n response i t has
approximately h a l f the s e n s i t i v i t y of EBT f o r the b e t t e r
responses of co b a l t and n i c k e l . A comparison w i t h a PAR
PGR d e t e c t i o n system, where an increase i n the
wavelength was observed at 540 nm shows that although
good responses are achieved f o r n i c k e l and co b a l t on a
lower o p t i c a l F.S.D. s e t t i n g because of less baseline
noise, there was a four f o l d s e n s i t i v i t y improvement
w i t h EBT, Other metals show a considerably g r e a t e r
improvement.
The q u a n t i t a t i v e performance of the EBT PGR system has
been shown to be s e n s i t i v e and easy to use, f o r the
determination of trace metals, proving t h a t the
determination of metal eluate by monitoring the decrease
173

i n absorbance of the reagent i s a u s e f u l technique and
could be of more general a p p l i c a t i o n w i t h other water
soluble metallochromic i n d i c a t o r s ( 1 2 8 ) or by
synt h e s i s i n g some e s p e c i a l l y f o r PGR d e t e c t i o n . A
p a r t i c u l a r advantage of t h i s inverse photometric system
i s t h a t a l l metals which react w i t h the same
stoi c h i o m e t r y w i l l give approximately the same molar
response, i f the PGR parameters of each metal are
s i m i l a r and most are, w i t h the exception of aluminium,
which i s slow to react. The EBT PGR system should be
capable of determining more metal species than those
i n v e s t i g a t e d i n c l u d i n g a l u m l n i u m ( l l l ) , titanium(DO and
the platinum metals. N a t u r a l l y t h i s w i l l depend on the
development of other chromatographic systems.
A disadvantage of t h i s d e t e c t i o n system was t h a t
Increased baseline noise, tended t o amplify pump
pu l s a t i o n s . However t h i s noise could be f u r t h e r reduced
by using b e t t e r pulse f r e e n o n - r e c i p r o c a t i n g pumps, or
very f a s t r e c i p r o c a t i n g pumps, such as the Eldex type,
where the frequency o f the pulse i s too f a s t f o r
d e t e c t i o n .
174
5 The Dithizone Post Column Reactor System.
5.1 I n t r o d u c t i o n .
Of the many organometallic reagents d i t h i z o n e i s one
of the most used and w e l l documented(129-131). The
reactions and p r o p e r t i e s of d i t h i z o n e and i t s analogues
have been e x t e n s i v e l y reported since being introduced to
trace metal a n a l y s i s by Fischer i n 1925(132)- I t i s used
f o r trace metal determinations mostly as an e x t r a c t a n t
from aqueous media, which may i n v o l v e a preconcentration
stage- The absorbance can then be measured i n the
organic solvent i n which the d i t h i z o n e i s d i s s o l v e d .
5.2 P r o p e r t i e s of Dithizone.
Dithizone (Dz) also known as diphenylthiocarbazone i s
a black or black-purple c r y s t a l l i n e powder t h a t i s water
and acid i n s o l u b l e ; s p a r i n g l y s o l u b l e i n e t h a n o l , and
soluble i n a l k a l i , carbon d i s u l p h i d e , carbon
t e t r a c h l o r i d e , chloroform and hexane. Enol-keto
tautomerism i s e x h i b i t e d -
Dithizone i s a d i b a s i c a c i d w i t h a weak secondary
d i s s o c i a t i o n constant. Solutions are green i n acid media
and yellow above pH 5.5-
175

5.3 Response w i t h Metals.
Primary and secondary d i t h i z o n a t e s are formed when one
or two hydrogens are replaced, r e s p e c t i v e l y . A l l metals
th a t react form primary d i t h i z o n a t e s , w i t h only a few
forming the secondary s t r u c t u r e . Metal ions i n i t i a l l y
react t o form primary d i t h i z o n a t e s f o r s i l v e r ( l ) ,
g o l d ( l ) & ( I I I ) , a r s e n i c ( I I I ) , b i s m u t h ( I I I ) , cadmium,
c o b a l t ( I I ) & ( I I I ) , c o p p e r ( I ) & ( I I ) , g a l l i u m ( I I l ) ,
m ercury(I) & ( I I ) , i n d i u m ( l l l ) , n i c k e l , lead, palladium,
polonium, platinum, selenium(IV), t e l l u r i u m ( I V ) ,
t h a l l i u m ( I ) and zinc(129-131).
I n excess metal media secondary d i t h i z o n a t e s are
formed w i t h s i l v e r ( I ) , cadmium, c o p p e r ( I ) , mercury(X) &
( I I ) , n i c k e l , osmium(MI), lead and zi n c .
Others such as i r o n , manganese and t i n al s o form
d i t h i z o n a t e s ( 1 2 9 ) , but are e i t h e r unstable i n a i r due t o
o x i d a t i o n or give a poor s p e c t r a l response.
5.4 Dithizone Response w i t h Organometallic Compounds.
A d i t h i z o n a t e complex i s formed when an organometallic
species has at l e a s t one p o s i t i v e charge* The
te'tra-organic s u b s t i t u t e d metal compounds such as those
of lead and t i n do not r e a c t , although d i t h i z o n e has
been used as a spray reagent i n T.L.C. t o d i s t i n g u i s h
such compounds(133).
176

Dithizone reacts w i t h d i - and t r i e t h y l t i n t o give
yellow and orange complexes r e s p e c t i v e l y , t e t r a c h l o r o
and t e t r a e t h y l give no r e a c t i o n . D i b u t y l t i n also reacts
but the wavelength maximum depended upon pH,
concentration and the composition of the b u f f e r
employed(134) t h i s was subsequently explained(135) as
(Butyl2Sn)2Dz2 forming i n the phosphate
b u f f e r and a mono-substituted d i t h i z o n a t e being formed
i n the ch l o r a c e t a t e b u f f e r . Both a l k y l and phenyl t i n s
react a f t e r separation(129).
Organo-lead d i t h i z o n a t e s are formed. The
t e t r a - d e r i v a t i v e s do not react but may be found by
d i f f e r e n c e a f t e r adding i o d i n e i n an ammonia b u f f e r to
decompose the tetraorgano-lead. This technique i s
ap p l i c a b l e t o a l k y l and phenyl s u b s t i t u t e d
organo-leads(129,131)-
Organo-mercury d i t h i z o n a t e s are formed from the
mono-substituted organo-mercurials. I r v i n g ( 1 2 9 ) quotes
Kiwan f o r the determination of a mixture of two
mono-substituted organo-mercury species and d i v a l e n t
inorganic mercury by e x t r a c t i n g from a known amount of
d i t h i z o n a t e d s o l v e n t . The excess of d i t h i z o n e i s
determined at 620 nm to f i n d the t o t a l mercury, then
reading o f f a mixed c a l i b r a t i o n curve t o determine the
organo-mercury content.
The incomplete o r g a n i c a l l y s u b s t i t u t e d compounds of
t h a l l i u m , g a l l i u m and indium also form d i t h i z o n a t e s .
177
5.5 Dithizone as a Post Column Reactant.
Dithizone i s l i g h t s e n s i t i v e and requires p r o v i s i o n s
to be made f o r use as a PC reactant because of
i n s o l u b i l i t y i n aqueous solvents- Dithizone undergoes
photodecomposition and i s slowly oxidized to form
diphenylthiocarbadiazone and r e l a t e d o x i d a t i o n products
to give a y e l l o w brown s o l u t i o n . Dithizonates are a l s o
photochemically degraded i n d i f f u s e l i g h t and the r a t e
i s increased w i t h temperature. Despite these problems
d i t h i z o n e has been used s u c c e s s f u l l y to detect a l k y l and
a r y l mono-substituted m e r c u r i a l s ( 1 3 6 ) , but t h i s was i n
organic solvents and s p e c i a l considerations f o r
d i t h i z o n e used as a metal PC reactant f o r aqueous
eluents are necessary. Degassing the PC reactant solvent
and keeping the d i t h i z o n e s o l u t i o n i n an opaque
container reduces the degradation process. A p l a s t i c
container i s recommended as a glass container increases
degradation. The d i t h i z o n e PC reactant should be
replaced d a i l y .
Several organic solvents were considered f o r the
d i s s o l u t i o n of the PC reactant- They also have to be
e a s i l y m i s c i b l e w i t h an aqueous organic acid s a l t .
Acetone, one of the more polar and e a s i l y water m i s c i b l e
solvents was i n v e s t i g a t e d i n various mixtures w i t h
water. With PGR mixtures of less than 80 % v/v acetone
178

metal d i t h i z o n a t e s p r e c i p i t a t e d and formed a l i n i n g
i n s i d e the PGR tube. Any mixtures w i t h less than 20 %
v/v water gave p r e c i p i t a t i o n of t a r t r a t e s a l t s .
Consequently an acetone water mixture was used as a
(4+1) mixture r e s p e c t i v e l y .
I n i t i a l work showed th a t ammonia was b e t t e r f o r pH
adjustment because of i t s b u f f e r i n g a b i l i t i e s . Also i t
has been found t h a t the a d d i t i o n of a n i t r o g e n base
speeds the r e a c t i o n of water complexed metals by
dehydrating the aquo-complex(137)- The slow response of
n i c k e l was considerably reduced and was s u f f i c i e n t f o r
the purposes of PGR d e t e c t i o n when using an ammonia
t a r t r a t e b u f f e r at pH 3, whereas an a c e t i c acid media
revealed a h a l f l i f e of over 8 minutes. However an
ammonium t a r t r a t e b u f f e r e v e n t u a l l y gave p r e c i p i t a t i o n
problems o b s t r u c t i n g the PC reactant flow. Sodium
t a r t r a t e has a higher s o l u b i l i t y i n water and was
i n v e s t i g a t e d i n conjunction w i t h ammonia f o r the
i n t e n t i o n of using a mixture to f i n d the highest
permissible content of ammonia f o r which no
p r e c i p i t a t i o n occurs. The best r a t i o f o r 2M ammonium and
sodium hydroxide was as a (3+2) mixture r e s p e c t i v e l y .
D e t e r i o r a t i o n of the r e s i d u a l d i t h i z o n e occurred
q u i c k l y d u r i n g t e s t tube experiments. The response a t
f a s t PGR residence times showed l i t t l e d e t e r i o r a t i o n as
baseline d r i f t . No responses were recorded f o r
i r o n ( I I I ) , i r o n , manganese, magnesium and calcium
179

although t h e i r e x t r a c t i o n i s documented.
Spectrophotometric response f o r these metals w i t h the
exception of calcium and magnesium have been noted but
i n organic solvent media.
The nature o f metal d i t h i z o n a t e spectra show t h a t the
same arguments f o r using a reverse mode d e t e c t i o n w i t h
EBT as a PC reagent as stated i n chapter four can be
applied t o d i t h i z o n e .
Spectra reveal t h a t some metal d i t h i z o n a t e peaks
overlap w i t h the d i t h i z o n e peak and although the peak
maxima of metal d i t h i z o n a t e s are given i n a monograph by
I r v i n g ( 1 2 9 ) i t was necessary t o v e r i f y i f any peak s h i f t
occurred i n the (1+1) v/v acetone water mixture. Table
5.1 shows the peak maxima recorded f o r the metal
d i t h i z o n a t e complexes and shows l i t t l e d e v i a t i o n from
those reported i n organic media- L i t t l e p o s i t i v e
increase from the baseline was recorded and some gave no
absorbance at 595 nm demonstrating the p o s s i b i l i t y of
observing a decrease i n absorbance f o r metal
determination- Early work shows that l i n e a r responses
were recorded at 595 nm, which was by f a r the more
s e n s i t i v e wavelength, consequently the d i f f e r e n c e i n
absorbance was observed at 595 nm.
180

Table 5.1.
Peak Maxima f o r Metal D i t h i z o n a t e Complexes
Metal Dit h i z o n a t e Maxima / nm
Bismuth 486 Cadmium 440 Cobalt 558 Lead 485 Copper 438 Indium 510 Nickel 500 Mercury 450 S i l v e r 495 Zinc 510
5.6 O p t i m i s a t i o n Data f o r the Dithizone Post Column
Reactor-
The same methodology f o r the EBT PCR d e t e c t i o n
parameters i n chapter f o u r was adopted. Detector
response was assessed, f i r s t l y f o r the weaker complexing
l a c t a t e eluent f o r which a lower concentration of O.IM
was favoured, because i t decreases p o s s i b i l i t y of
p r e c i p i t a t i o n , and then w i t h t a r t a r i c r a t h e r than c i t r i c
a c i d , because more metals can be e l u t e d from the Aminex
sex column.
A new eluent t h i o m a l i c acid was found to e l u t e metals
i n a d i f f e r e n t order w i t h a preference f o r s u l p h o p h i l i c
metals- This required a stronger complexing PC reactant
as t h i o m a l i c acid(a s u l p h o p h i l i c d e r i v a t i v e of s u c c i n i c
a c i d ) should compete more f o r the s u l p h o p h i l i c metals
th a t react w i t h d i t h i z o n e . A c o n c e n t r a t i o n of d i t h i z o n e
t h a t gave a PC e f f l u e n t absorbance range of 0.2 and 1.4
181
absorbance at 595 nm was used f o r o p t i m i s a t i o n studies
and the pH of the PC e f f l u e n t was reduced by adding
a c e t i c acid t o the PC reactant.
5.7 Response w i t h a Lactate Eluent.
A 0-lM l a c t a t e eluent a t pH 3.4 was used w i t h the
P a r t l s i l sex column. Two s o l u t i o n s f o r i n j e c t i o n were
prepared each of a 100 \il a l i q u o t , one co n t a i n i n g 2.5pg
ml ^ of c o b a l t , cadmium, n i c k e l and zinc- The other
s o l u t i o n contains 10 pg ml ^ of lead and 2.5 pg
ml ^ of copper-
5.8 O p t i m i s a t i o n Results w i t h a Lactate Eluent.
The r e a c t i o n parameters are g r a p h i c a l l y i l l u s t r a t e d i n
Figures 5.1 to 5.A. Table 5.2 summarises the optimum
co n d i t i o n s assessed from the graphs f o r each metal.
182

Table 5.2.
Optimum Conditions f o r Lactate E l u t i o n w i t h the Dithizone Post Column Reactor.
PGR pH Dithizone PGR PC reactant Time Gone* Temp Flow Rate
metal / mln / C / ml min
Cadmium 0.4 3.5-3.8 >0.1 20-40 1.0-1.5 Copper 0.1-0.4 3.5-4.5 >0.5 <20 2.0-3.0 Cobalt 0.4 4.2-4.6 >0.7 None 1.7-2-1 Lead 0.3-0.4 3.8-4.7 1-1.5 <20 1.2-1.7 Nickel 0.4 4.2-4.4 >1.2 60-90 1.5-2.2 Zinc 0.4 4.2-4.7 >0.7 20-40 1.0-2.0
* expressed as absorbance
The s e n s i t i v i t y expressed as 2 standard d e v i a t i o n s
using Bessels c o r r e c t i o n f a c t o r f o r samples of low
frequency are as shown i n Table 5. 3
Table 5.3.
L i m i t s of Detection f o r a Lactate Eluent,
Metal L i m i t s of Detection / ng
Copper 5.2 Zinc 2.8 Nickel 5.1 Lead 45 Cobalt 2.1 Cadmium 8.0
183
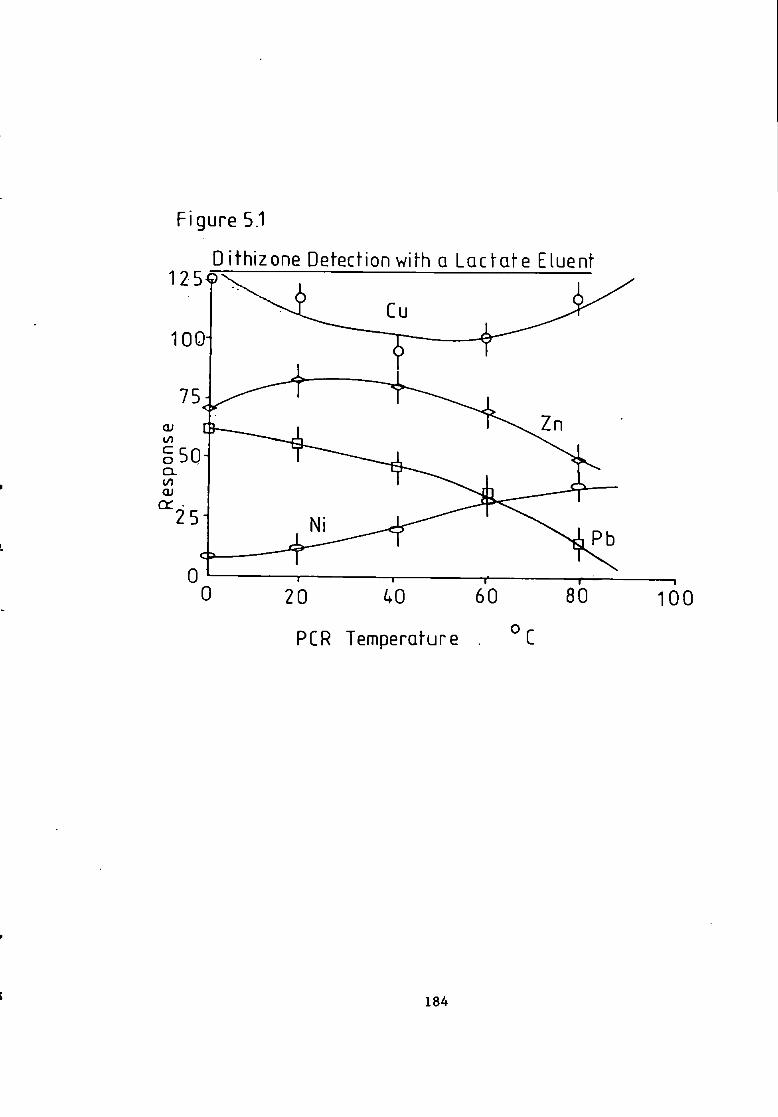
Figure 5.1
Dithizone Detection wifh a L a c t a t e Eluent 1 2 5 9
100
PCR Temperature .
184
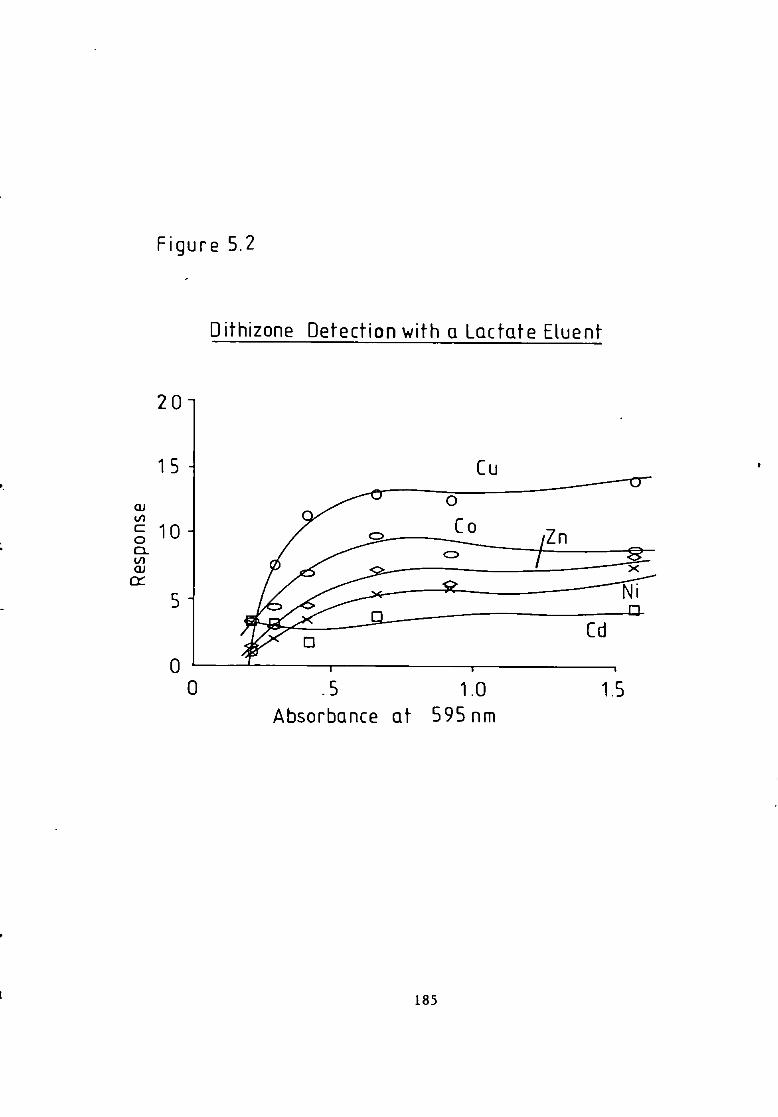
Figure 5.2
Dithizone Detect ion wi th a Lactate Eluent
.5 1.0 Absorbance a t 595 nm
1.5
185

Figure 5.3
Difhizone Det-ection wifh Q Loc fa fe Eluenf
~ 8 0
60-^
UO OJ C/) c: o Q_ I/) OJ
cc 20
0 L 3.0 3.5 4.0
pH of PCR Eff luent 4.5 5.0
186

F igure 5.4 D i th izone D e t e c t i o n wifh Q L a c t a f e Eiuenf
12~
0 5 1. 1.5 2 2-5 3 Flow of Post Column Reac tan t ml min"''
187

00 00
Figure 5.5
Di th izone Detector Calibration with Q Lactate Eiuent
Metal Concentration pg.ml

5.9 Response w i t h a T a r t r a t e Eluent.
T a r t a r i c a c i d i s a stronger complexing agent and i t
was used i n c o n j u n c t i o n w i t h a Aminex A9 column a t a
0.2M c o n c e n t r a t i o n , as shown by the authctr i n a
paper(138) demonstrating the d i t h i z o n e PGR. Data reveals
parameters are s i m i l a r t o those obtained f o r a l a c t a t e
eluent and t h e r e f o r e only a b r i e f o u t l i n e of the
i n v e s t i g a t i o n i s given. An i n j e c t e d s o l u t i o n c o n s i s t i n g
of a 100 j i l a l i q u o t c o n t a i n i n g 2.5fig ml ^ of c o b a l t ,
cadmium, copper, n i c k e l and zinc was used.
Reaction parameters are not i l l u s t r a t e d but
f e a s i b i l i t y of the system was assessed i n terms of
c a l i b r a t i o n curve response i n Figure 5.6 and the
s e n s i t i v i t y .
5.10 Results w i t h a T a r t r a t e Eluent.
For both t a r t r a t e and l a c t a t e eluents d i t h i z o n e
changes from l i g h t blue through grey-blue t o a
grey-brown from pH 4.0 Co 5.3. Absorbance a t 595 nm was
reduced w i t h the accompanying change i n colour. A pink
colour i s produced by r e a c t i o n w i t h a metal.
Metals gave d i f f e r e n t responses at v a r y i n g pH. Three
pH values of A.3, A.8 and 5.2 were used, any lower pH
r e s u l t e d i n p r e c i p i t a t i o n of the ammonium t a r t r a t e s a l t .
The o v e r a l l s e n s i t i v i t y was b e t t e r at pH 4.8 t o 5.0.
189

N i c k e l and lead showed l i t t l e response a t the lower pH,
The PC reactant f l o w r a t e was optimised t o 1.5 times the
column f l o w r a t e .
The l i n e a r range of the det e c t o r was established using
d i f f e r e n t values o f d i t h i z o n e c o n c e n t r a t i o n , which gave
absorbances of 0.2 to 0.7 a t 395 nm, t h i s extended the
range up to 20 pg i n j e c t a b l e q u a n t i t i e s f o r z i n c ,
n i c k e l , c o b a l t and cadmium.
Table.5.A shows the s e n s i t i v i t y expressed as 2
standard d e v i a t i o n s , again using Bessels c o r r e c t i o n
f a c t o r -
Table 5.A.
L i m i t s of Detection f o r a T a r t r a t e Eluent
Metal L i m i t s of Detection / ng
Copper 1.4 Zinc 6.5 Nick e l 8.2 Cobalt A.3 Cadmium A.7 Lead 100
190

Figure 5. 6
Dithizone Detector Calibration with aTartrate Eluent
Co
0.5 1.0 1.5
Metal Concentration pg.ml
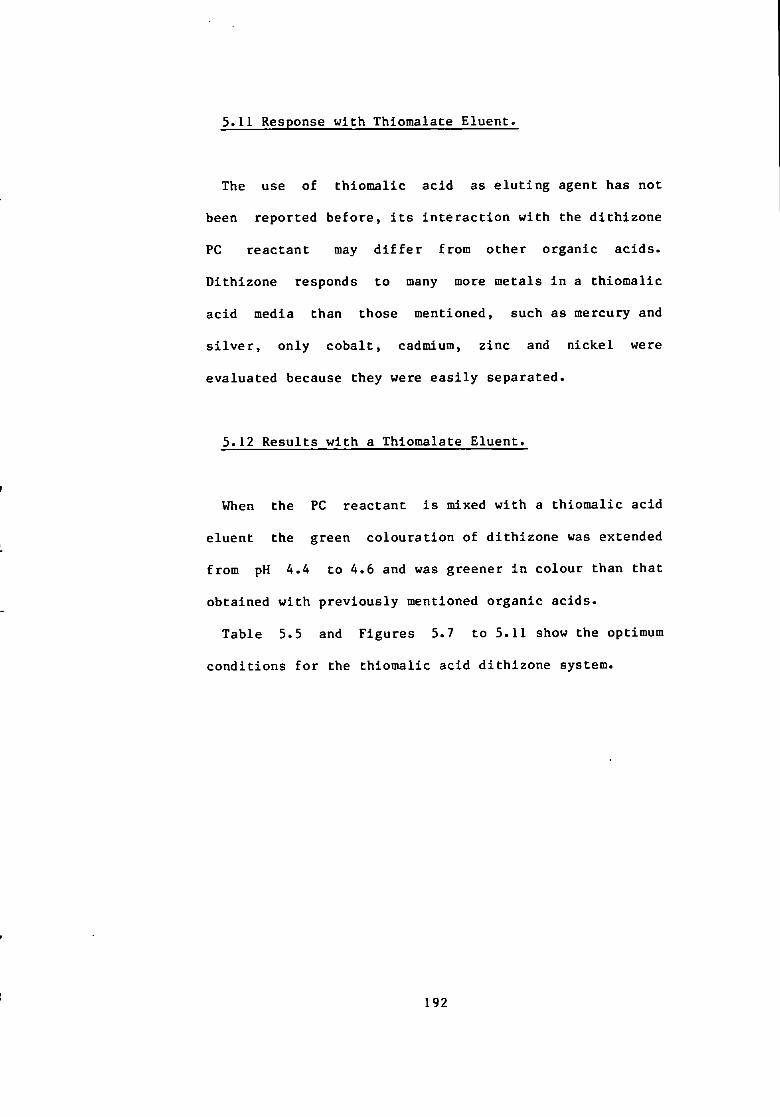
5.11 Response w i t h Thiomalate Eluent*
The use of t h i o m a l i c acid as e l u t i n g agent has not
been reported before, i t s i n t e r a c t i o n w i t h the d l t h i z o n e
PC reactant may d i f f e r from other organic acids.
Dithlzone responds to many more metals i n a t h i o m a l i c
acid media than those mentioned, such as mercury and
s i l v e r , only c o b a l t , cadmium, zinc and n i c k e l were
evaluated because they were e a s i l y separated.
5.12 Results w i t h a Thiomalate Eluent.
When the PC reactant i s mixed w i t h a t h i o m a l i c acid
eluent the green c o l o u r a t i o n of d i t h i z o n e was extended
from pH 4.4 to 4.6 and was greener i n colour than t h a t
obtained w i t h p r e v i o u s l y mentioned organic acids.
Table 5.5 and Figures 5.7 to 5.11 show the optimum
co n d i t i o n s f o r the t h i o m a l i c acid d i t h i z o n e system.
192

Figure 5.7
Difhizone Detecf ion with g 200-j Thiomalate Eluenf
3 4 PH of PCR Eff luent
193
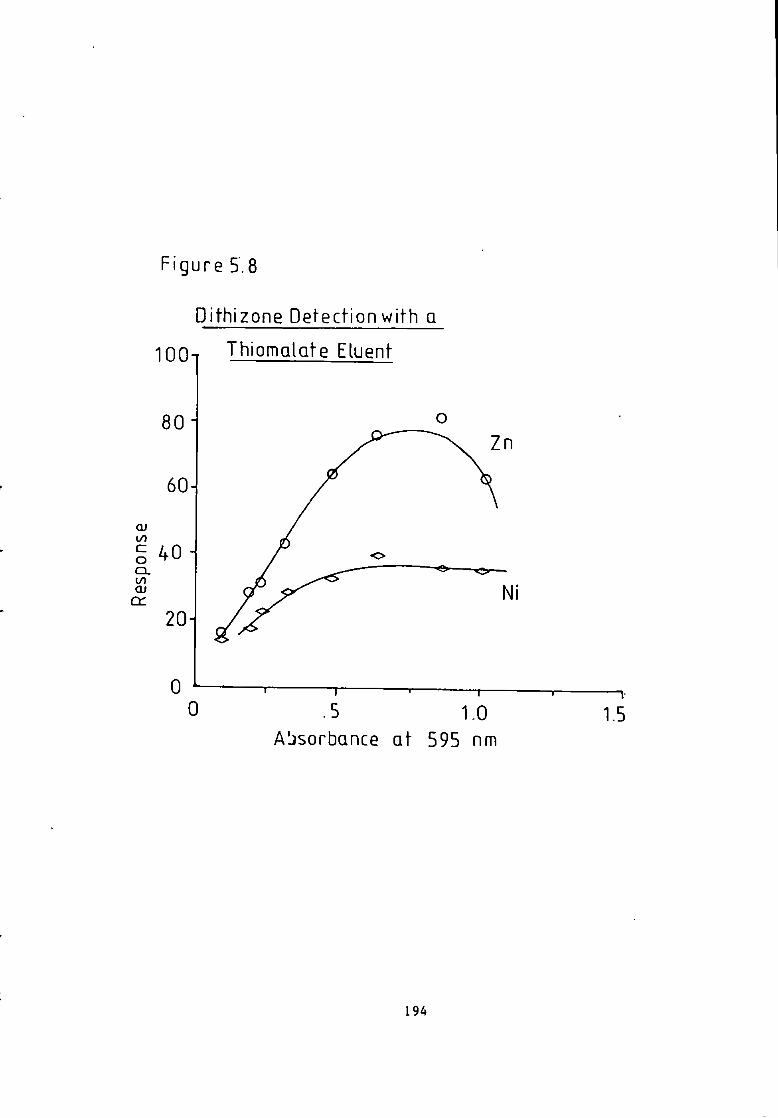
F i g u r e 5.8
Difhizone Detection with Q
IOOT Thiomalote Fluent
80
60
I/) g 40 cx to cr
20
0 0 .5 1.0
Absorbance at 595 nm -L5
194

Figure 5.9
100 -D i th i zone Defection with a Thiomalate Eluent
80-
60^
00 § 4 0
OJ
0 0 20 60 80 1 0 0
PCR TemperaturG

F i g u r e 5.10
0
12 -,
00 c o Q.
cr
8
0 0
Dithizone Detect-ion\^ith Q
Thiomalate Eluent
5 1. 1.5 2 2-5
Flow of Post Column R e a c t a n t ml min"''
Figure 5.11
Di th izone Detec tor Calibration with a
Thiomalate Eluent
Metal Concentration pg.ml

Table 5.5.
Optimum Response Conditions f o r the Thiomalic Eluent.
PCR pH Dithizone PCR PC reactant Time Cone* Temp Flow Rate
Metal / min / C / ml mln
Cadmium >0.1 3.0-4.0 >0.4 10-70 1.0-1.5 Cobalt 0.4 4.0-4.25 >0.6 20-40 1.0-2.0 Ni c k e l 0.35-0.45 3.75-4.5 >0.6 >30 1.0-1.5 Zinc >0.1 4.0-4.25 0.6-0.9 >30 1.0-1.7
* expressed as absorbance
Table 5.6.
L i m i t s of Detection f o r Thiomalate Eluent.
Metal L i m i t s of Detection / ng
Cobalt 23.6 Cadmium 7.9 Nicke l 17.4 Zinc 4.5
The l i m i t s of d e t e c t i o n shown i n Table 5.5 were again
c a l c u l a t e d on the basis of two standard d e v i a t i o n s using
Bessels c o r r e c t i o n f a c t o r .
5.13 Discussion.
The c a p a b i l i t y of the d i t h i z o n e PC reactant has been
shown using three organic acid e l u e n t s . The l a c t a t e
e l u e n t , as expected has a les s e r i n t e r f e r i n g e f f e c t .
Figures 5.1 t o 5.4 demonstrate the response showing
grapns f o r PCR time, temperacure pH, PC reactaut f l o w
r a t e and d i t h i z o n e c o n c e n t r a t i o n f o r the l a c t a t e e l u e n t .
A s l i g h t decrease of response was recorded w i t h PCR
198

temperature f o r c o b a l t and cadmium s i m i l a r t o t h a t
obtained f o r z i n c , however d i t h i z o n e i s known to degrade
q a i c k l y and probably does so i n a heated PCR. The r a t e
of degradation may be e f f e c t e d by the metal analyte-
Conclusions as to the e f f e c t of temperature should
t h e r e f o r e be t r e a t e d w i t h c a u t i o n .
Lead shows a s i m i l a r increase of response as f o r
n i c k e l and zinc shown i n Figure 5.2, w i t h a^increase of
d i t h i z o n e c o n c e n t r a t i o n using a l a c t a t e e l u e n t . Other
metal responses l e v e l o f f w i t h the exception of cadmium
which shows an independance of response w i t h i n c r e a s i n g
d i t h i z o n e c o n c e n t r a t i o n a f t e r a l e v e l l i n g at 0.6
absorbance. Zinc and n i c k e l show an optimal response a t
pH A.3 as does cob a l t i n Figure 5.3. Copper and cadmium
also give a plateau of response down to pH 3.5, w i t h
only lead showing a decrease of response w i t h decreasing
pH. Lower pH e f f l u e n t s were not i n v e s t i g a t e d because of
the r i s k of p r e c i p i t a t i o n , however the best o v e r a l l
response f o r the metals i n question was a t a pH of A.3
to A.5. No p l o t s of PCR residence time versus response
are shown, i n most cases the best response was between
0.3 t o O.A seconds- An i n c r e a s i n g PC reactant f l o w r a t e
gave an increased dichlzone absorbance from 0.16 a t 1 ml
min~^ to 0.8 a t 2.2 ml mln"^ Figure 5.A shows
only cadmium decreasing i n response, presumably due t o
the non-dependance of response upon d i t h i z o n e
c o n c e n t r a t i o n , which confirms the Independance of
199

response obtained i n Figure 5.2. Lead and copper give
response curves s i m i l a r t o t h a t f o r zinc w i t h i n c r e a s i n g
PC reactant flow r a t e .
The optimum c o n d i t i o n s f o r the l a c t a t e eluent w i t h a
d i t h i z o n e PGR system i s a 0-A second residence time; a
d i t h i z o n e absorbance at 595 nm of g r e a t e r than 0.5
absorbance; a PC reagent f l o w r a t e of 1.5 ml min S
a PGR temperature of AO °C and a pH of A.A.
Figure 5.5 shows only n i c k e l t o have a non-linear
c a l i b r a t i o n response curve and suggests t h a t n i c k e l
degrades d i t h i z o n e . Lead gives a l i n e a r response from A
ng to 20 pg ml ^, having one t h i r d the s e n s i t i v i t y
of z i n c . C a l i b r a t i o n graphs are shown f o r 100 p i
i n j e c t i o n s f o r cadmium, copper, c o b a l t , n i c k e l and zinc
from 1 ng t o 10 ng.
T a r t r a t e e l u t i o n does not e f f e c t metal c a l i b r a t i o n ,
except t o give a s l i g h t curvature f o r cobalt as i n
Figure 5.6. The l i m i t s of d e t e c t i o n reveal d e t e r i o r a t e d
values f o r the less e f f i c i e n t Amlnex A9 SCX column.
However a t such high concentrations of t a r t r a t e
p r e c i p i t a t i o n d i f f i c u l t i e s were encountered f o r low pH
e f f l u e n t s . However low pH eluents gave decreasing
responses f o r a l l metals, e s p e c i a l l y f o r n i c k e l below pH
A.3. A general decrease was observed f o r metal responses
above pH 5.0, copper was not det e c t a b l e a t pH 5*2.
Figure 5.7 shows an optimum response f o r cadmium,
c o b a l t , n i c k e l and zinc a t pH 3.8 t o A.2 f o r t h i o m a l i c
200
a c i d , t h i s c o n t r a s t s w i t h t h a t obtained f o r the l a c t a t e
eluent which almost has l e v e l response curves. Cadmium
shows a s i m i l a r response to n i c k e l , cobalt was also
s i m i l a r t o zinc i n curvature f o r i n c r e a s i n g d i t h i z o n e
absorbance a t constant pH, as i n Figure 5.8. An optimum
temperature of 40 to°60 C was recorded i n Figure 5.9
f o r the f o u r metals. Thiomalic acid eluent demonstrates
more c l e a r l y defined optimum PGR parameters and t h i s was
e s p e c i a l l y so f o r PC reactant flow r a t e , w i t h an optimum
value of 1.5 ml min ^. However the c a l i b r a t i o n
curves i n Figure 5.11 reveal downward curvatures f o r
zinc and co b a l t above 100 p i i n j e c t i o n concentrations of
8 pg ml ^.
Thiomalic acid does not i n h i b i t the response of
n i c k e l , which gave a b e t t e r response than cadmium w i t h a
t a r t r a t e eluent. Zinc has a decrease of response w i t h
temperature increase, i n f e r r i n g t h a t some other r e a c t i o n
mechanism or parameter i s oper a t i n g . The l i m i t s of
d e t e c t i o n vary more than f o r other organic acid eluents
and t h i s i s r e f l e c t e d i n v a r i a b l e c a l i b r a t i o n curves. A
continued green colour w i t h i n c r e a s i n g pH to 5.6 may
extend the pH range of the d e t e c t o r .
Bismuth and indium also respond but were not
considered f o r c a l i b r a t i o n or o p t i m i s a t i o n , because
bismuth e l u t e s on the solvent f r o n t and indium only
e l u t e s on the s i l i c a SCX column w i t h a l a c t a t e e l u e n t .
201

5.14 Conclusion.
A simple PC reactor based on d i t h i z o n e has been demonstrated to determine trace q u a n t i t i e s of copper, z i n c , n i c k e l , l e a d , c o b a l t and cadmium a f t e r separation on a P a r t l s i l 10 SCX column w i t h thiomalate and l a c t a t e b u f f e r s , and also w i t h a t a r t r a t e b u f f e r using a Aminex A9 column. This demonstrates t h a t varying strengths of d i f f e r e n t organic acid eluents can be used w i t h the d i t h i z o n e PCR d e t e c t o r . The PCR pH can be adjusted t o s e l e c t i v e l y react w i t h metals t h a t may c o - e l u t e , e s p e c i a l l y f o r a t a r t r a t e e l u e n t . Q u a n t i t a t i v e a n a l y s i s of a l l e l u t e d metals was achieved w i t h three eluents w i t h c a l i b r a t i o n s up to 10 pg ml ^ f o r cadmium, c o b a l t , copper, indium, lead, n i c k e l and zinc w i t h l i m i t s of d e t e c t i o n i n the range of 1 to 10 ng except f o r lead w i t h a 100 ng l i m i t .
The a b i l i t y of d i t h i z o n e to react w i t h many metals and
t h e i r organometallic d e r i v a t i v e s may widen the
v e r s a t i l i t y of t h i s PCR d e t e c t o r . Organometallic
derlvatlves(129-131) t h a t respond t o d i t h i z o n e such as
those of g a l l i u m , indium, lead, mercury, t h a l l i u m and
t i n were not i n v e s t i g a t e d , because although they respond
i t was the i n t e n t i o n of t h i s work to p r i m a r i l y separate
i o n i c species. A completely new approach would be
necessary f o r the separation of organometallic species
using organic solvents and n e u t r a l l y charged column
202

packings.
Other metals of note such as indium and g a l l i u m react
and are used e x t e n s i v e l y i n the semiconductor i n d u s t r y .
Manganese and I r o n ( I I I ) were shown to react s l i g h t l y
w i t h d i t h i z o n e , probably because of the o x i d a t i o n of
d i t h i z o n e ( 1 2 9 ) . Decomposition r e a c t i o n s may also be used
to detect species as they s i m i l a r l y give a decrease i n
d i t h i z o n e absorbance a t 595 nm. Of d i t h i z o n e and EBT the
l a t t e r i s more s t a b l e , however one o f the advantages of
PGR d e t e c t i o n i s t h a t there i s i n s u f f i c i e n t time f o r
degradation of reagents because of f a s t d e t e c t i o n w i t h i n
an enclosed PGR system and i f they are r a p i d l y o x i d i s e d
i t does not appear to e f f e c t q u a n t i f i c a t i o n . For some
samples d e t e c t i o n of overlapping e l u t l n g metals may
prevent assay of the sample- The d i t h i z o n e PGR pH can be
adjusted to a lower pH thus e l i m i n a t i n g the response of
copper or n i c k e l making determinations of other c l o s e l y
e l u t l n g metals p o s s i b l e .
This d e t e c t o r has a great number of a p p l i c a b l e
a n a l y t i c a l p o s s i b i l i t i e s , because of the wide spectrum
of metal ions and organometallic species w i t h which i t
responds. However, s o l u b i l i t y l i m i t a t i o n s i n h i b i t
development f o r metal i o n d e t e c t i o n f o r concentrations
of organic acids g r e a t e r than O.lM and the synthesis of
a water soluble d e r i v a t i v e would enhance the range of
eluents t h a t could perform w i t h t h i s d e t e c t o r .
203
6 A p p l i c a t i o n s of the Eriochrome Black T Post Column
Detector.
6.1 I n t r o d u c t i o n .
There are many repor t s of metal a n a l y s i s by HPLG,
however few determinations of r e a l samples are evident
although rare earths have been determined i n Monazite
sand and rare e a r t h oxides by HPLIEC(139). I n t h i s
chapter i t i s hoped to o u t l i n e the v e r s a t i l i t y of HPLIEC
w i t h EBT PC d e t e c t i o n i n the i n d u s t r i a l sphere, w i t h the
ana l y s i s of Magnetic and Monel a l l o y s , which were
supplied w i t h c e r t i f i e d values. Environmental samples
from the Carnon r i v e r estuary were analysed and the data
compared w i t h that from conventional atomic
spectroscopy.
For reasons mentioned i n chapter one lower l i m i t s of
de t e c t i o n are always being sought. Thus preconcentration
of the analyte was i n v e s t i g a t e d f o r HPLIEC by using a
column of i o n exchange m a t e r i a l through which large
volumes of sample can be passed. This may lead t o low
concentrations of analyte being a c c u r a t e l y determined.
The U.K.A.E.A., ( W i n f r i t h ) are i n t e r e s t e d i n u l t r a - t r a c e
metals present i n the primary coolant of a nuclear
pressurised water reactor(PWR) by t h i s technique.
204

6.2 Analysis of Monel and Magnetic A l l o y s .
The EBT PGR system was used i n conjunction w i t h the
P a r t i s i l 10 SCX column t o determine c o b a l t , copper,
i r o n , manganese and n i c k e l i n Monel and Magnetic a l l o y s .
The microprocessor was preprogrammed to adjust the
a t t e n u a t i o n of the s i g n a l f o r the minor metal
components. Sample s o l u t i o n s were d i l u t e d where
necessary f o r a more accurate assay.
6.3 Preparation of Samples and Standards.
The sample s o l u t i o n s were prepared by d i s s o l v i n g I g of
the reference m a t e r i a l (from Che Bureau of Analysed
Samples L t d , Newham H a l l , Mlddlesborough, England.) i n a
(1+1) mixture of d i s t i l l e d water and AnalaR n i t r i c a c i d .
The r e s u l t i n g mixture was then made up t o 1 l i t r e i n a
volumetric f l a s k t o give a IM n i t r i c acid c o n c e n t r a t i o n .
Mixed metal standard s o l u t i o n s were prepared t o give
s i m i l a r r a t i o s t o those i n the c e r t i f i c a t e of a n a l y s i s .
Working standards were prepared as requi r e d .
6.4 Analysis of Hycomax I I I Permanent Magnetic
AlloyCBSC N0.38A).
This was analysed w i t h two s e r i e s of i n j e c t i o n s , one
at 100 times d i l u t i o n t o give a 10 \ig ml ^ nominal
205

s o l u t i o n f o r the major c o n s t i t u e n t s , copper, I r o n ( I l I ) ,
n i c k e l and c o b a l t , and one at 20 times d i l u t i o n Co give
a 50 pg ml ^ nominal s o l u t i o n f o r the determination
of manganese* The composition was obtained by comparison
w i t h those chromatograms obtained from mixed metal
standards d i l u t e d t o give s i m i l a r concentrations- The
microprocessor was programmed to change the
a m p l i f i c a t i o n a t 8 minutes. Immediately a f t e r the c o b a l t
peak was eluted -
6>5 Analysis of Monel A l l o y 400(BSC No.363/1).
This was analysed i n a s i m i l a r way to the above w i t h
i n j e c t i o n s of the stock s o l u t i o n d i l u t e d to a 10 pg
ml ^ nominal s o l u t i o n . More concentrated s o l u t i o n s
were not necessary t o determine c o b a l t , a minor
c o n s t i t u e n t , as s u f f i c i e n t s e n s i t i v i t y was a v a i l a b l e .
The microprocessor was programmed t o change the
a m p l i f i c a t i o n a t 6.2 minutes, j u s t before the c o b a l t
peak was e l u t e d .
6.6 Results of A l l o y Analysis.
Chromatograms shown i n Figures 6.1 and 6.2 are those
obtained from the an a l y s i s of Monel and Magnetic a l l o y s ,
r e s p e c t i v e l y , using 0.1 ml i n j e c t i o n s of 10 pg ml ^
nominal s o l u t i o n s .
206

A O.IM l a c t a t e eluent a t pH 3.5 and a f l o w rate of 1.5
ml mln"^ through a P a r t i s i l 10 SCX column at a o
temperature o f 40 C was used.
Conditions f o r the ana l y s i s of the Magnetic a l l o y were
such t h a t the PC a d d i t i o n of 0.5 ml min gave an
absorbance of 0.77 at 610 nm and a cha r t F.S.D. of 0.2
absorbance. The manganese content was too low f o r
accurate determination and a separate i n j e c t i o n was
performed w i t h a f i v e times g r e a t e r concentration of
a l l o y i n s o l u t i o n . The s i g n a l a m p l i f i c a t i o n was
increased t o 0.05 F.S.D. f o r t h i s minor metal
c o n s t i t u e n t .
For the Monel a l l o y the PGR co n d i t i o n s gave a
r e s u l t a n t absorbance of 0.54 at 610 nm, the scale change
was from 0.5 to 0.05 F.S.D. f o r c o b a l t and manganese
determinations.
207

Figure 6.1 Chromat-pgram of Monel Alloy Analysis
Fe(in)
mm
15
208

Figure 6.2
Chromatogram of Magnetic Alloy Analysis
Fe(III)
Cu
Ni
1
Co
0 10 min
Mn
209

Table 6.1.
Analysis of Hycomax I I I Permanent Magnetic Alloy(BSC No.384).
Metal Found C o e f f i c i e n t s C e r t i f i e d Value / % m/m of V a r i a t i o n / % m/m
Cobalt 33.7 1.3 33.7 Copper 3.06 5.2 3.06 I r o n 34.6 2.4 Manganese 0.10 11.5 0.10 N i c k e l 1A.8 4.4 14.6
$ % R.S.D. of r e p l i c a t e i n j e c t i o n s . * I r o n has no c e r t i f i e d value,but the value c a l c u l a t e d
f d i f f e r e n c e was 35.6 % m/m.
Table 6.2.
Analysis of Monel A l l o y AOO(BSC No.363/1)
Metal Found C o e f f i c i e n t £ C e r t i f i e d Value / % m/m of V a r i a t i o n / % m/m
Cobalt 0.033 8.3 0.032 Copper 31.5 3.0 31.9 I r o n 1.73 9.2 1.86 Manganese 1.17 9.4 1.26 Nick e l ' 64.2 1.6 64.7
£ % R.S.D. of r e p l i c a t e i n j e c t i o n s .
6.7 Discussion of A l l o y A n a l y s i s .
A f t e r the appropriate d i l u t i o n , up to 10 r e p l i c a t e
i n j e c t i o n s were c a r r i e d out w i t h mixed.metal standards
being i n j e c t e d on every f o u r t h a n a l y s i s . The average
assay was then c a l c u l a t e d f o r each element together w i t h
the c o e f f i c i e n t of v a r i a t i o n . The r e s u l t s of the
Magnetic and Monel a l l o y a n a l y s i s are shown on Tables
6.1 and 6.2. The composition agrees very c l o s e l y w i t h
the c e r t i f i c a t e values and applies t o both major and
210

minor elements whose conc e n t r a t i o n range vary by up to
three orders of magnitude. No c e r t i f i c a t e value f o r i r o n
was quoted so a value was c a l c u l a t e d by d i f f e r e n c e . A
lower value was found, but t h i s may be possible since
I m p u r i t i e s i n the a l l o y may not be accounted f o r i n the
c e r t i f i e d a n a l y s i s . The p r e c i s i o n f o r each element i s
shown by the c o e f f i c i e n t s of v a r i a t i o n which as expected
becomes p r o g r e s s i v e l y poorer f o r the minor components
and reveals t h a t the r e s u l t s f o r the Monel a l l o y are not
as close to the c e r t i f i c a t e values as obtained f o r the
Magnetic a l l o y . However t h i s study shows the
q u a n t i t a t i v e c a p a b i l i t y of HPLIEC w i t h an EBT PC
d e t e c t i o n system where reasonable accuracy and p r e c i s i o n
can be obtained f o r some t r a n s i t i o n metals which have
concentration ranges over three orders of magnitude.
6.8 Analysis of The Carnon River Estuary Samples f o r
Trace Metals.
The s i t e of sampling was a t r i b u t a r y of the Falmouth
Estuary, South Cornwall, which extends from the Carnon
r i v e r and contains water from the Carnon Downs. This i s
a m e t a l l i f e r o u s area of high i r o n and t r a n s i t i o n metal
content, because of t h i s i t was thought a good area f o r
i n i t i a l s t u d i e s . A high i r o n content should make i t
easier t o o b t a i n the i r o n ( I I ) , i r o n ( I I I ) r a t i o which may
act as an i n d i c a t o r of the o x i d a t i o n s t a t e of the s a l t
211
wedge.
The a n a l y s i s was performed by both HPLIEC and atomic
absorption spectroscopy f o r f e r r o u s , f e r r i c , copper,
zinc and manganese c a t i o n s ( o n l y the t o t a l f o r i r o n can
be obtained w i t h AAS). A photometric method using
f e r r o z i n e f o r i r o n ( I I ) and ( I I I ) was a l s o compared.
6.9 Sampling Technique.
Environmental samples are by nature dynamic and
d i f f i c u l t t o analyse. Possible r e a c t i o n s t h a t the
analyte may undergo must be considered before the
sampling i s performed so t h a t adequate p r o v i s i o n s can be
made t o s t a b i l i z e the sample. For example where the
primary concern i s the p r e s e r v a t i o n of the i r o n species,
a low pH i s necessary. Low pH should also keep other
d i v a l e n t c a t i o n s i n s o l u t i o n . A r o u t i n e procedure was
adopted f o r a l l environmental samples f o r the
preservation of sample i n t e g r i t y by adding 1 ml of 6 %
v/v concentrated h y d r o c h l o r i c acid i n d i s t i l l e d water t o
a 20 ml sample. The sample was f i l t e r e d through a Swinex
f i l t e r of 0.A5 pm pore diameter. A 0.22 pm f i l t e r was
used f o r some selected samples to check i f p a r t i c l e
sizes between 0.A5 and 0.22 pm play a r o l e i n the water
chemistry. F i l t e r i n g should remove p a r t i c u l a t e s , which
may d i s s o l v e on a c i d i f i c a t i o n - C o l l o i d a l i r o n and i r o n
attached t o p a r t i c u l a t e matter should be r e t a i n e d . This
212
should not a f f e c t the measurement of the a c l d i f i a b l e
d issolved i r o n species r a t i o which should r e f l e c t the
o x i d a t i o n s t a t e of the sample, because dissolved species
are, i n thermodynamic terms, r e l a t i v e l y i s o l a t e d from
the s o l i d s t a t e . S t a b i l i t y s tudies of an a c i d i f i e d
environmental sample revealed t h a t the sample remains
s t a b l e over a two week period w h i l s t stored a t 5 °C.
Photometric and HPLIEC methods were performed
simultaneously. The AAS a n a l y s i s was performed w i t h i n
the next 2 days. I n a l l instances the same standards
were used w i t h each an a l y s i s f o r d i r e c t comparison of
techniques.
6.10 Methods.
6.11 High Performance L i q u i d Ion Exchange
Chromatographic Method.
Separation by HPLC was performed w i t h the SCX
P a r t i s i l 10 column and d e t e c t i o n by the EBT PGR as
previou s l y described.
Many environmental samples contained low q u a n t i t i e s of
metal ions t h a t cannot be determined accurately by a 0.1
ml i n j e c t i o n , various approaches have been adopted.
Preconcentration methods by packing a column w i t h the
same SCX m a t e r i a l has been suggested by Cassidy and
E l c h u k ( l O l ) f o r large volumes where small concentrations
213

are to be determined. Another approach i s to increase
the i n j e c t o r loop volume, a 2 ml i n j e c t i o n can be
accommodated on a P a r t i s i l 10 SCX column without any
appreciable d e t e r i o r a t i o n of chromatographic r e s o l u t i o n .
Preconcentration was not necessary here because of the
r e l a t i v e l y high metal content.
214
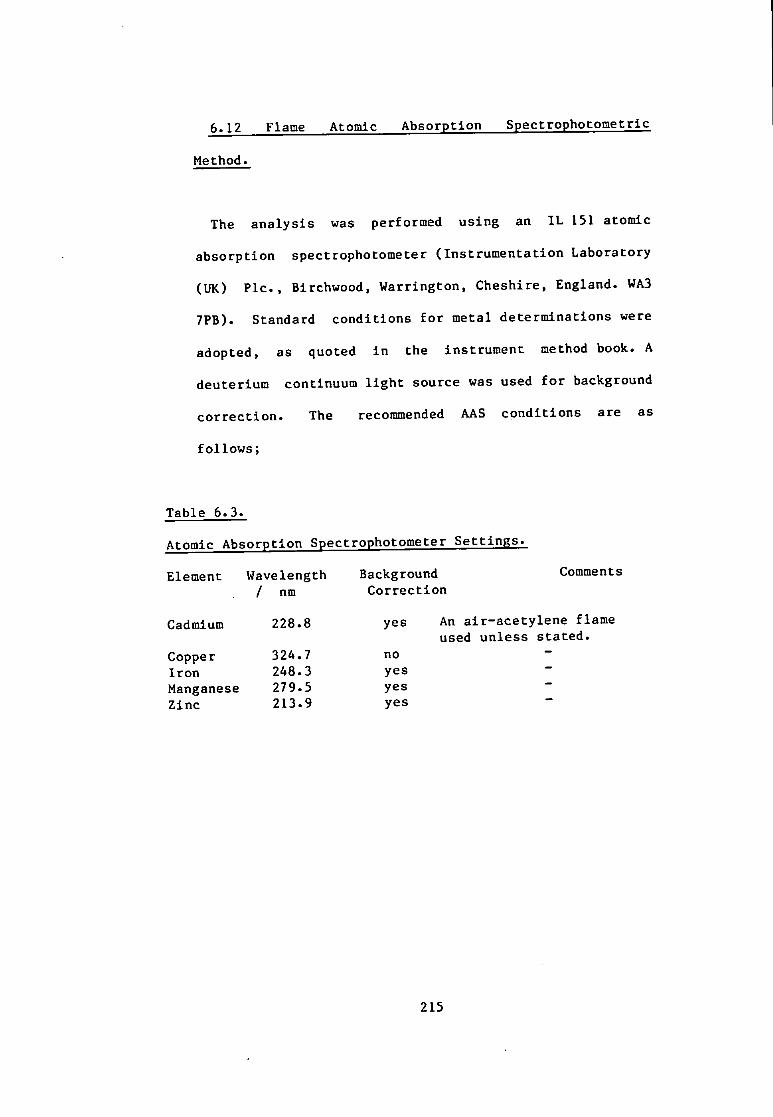
6.12 Flame Atomic Absorption Spectrophotometric
Method.
The a n a l y s i s was performed using an I L 151 atomic
absorption spectrophotometer ( I n s t r u m e n t a t i o n Laboratory
(UK) P i c , Birchwood, Warrington, Cheshire, England. WA3
7PB). Standard c o n d i t i o n s f o r metal determinations were
adopted, as quoted i n the instrument method book. A
deuterium continuum l i g h t source was used f o r background
c o r r e c t i o n . The recommended AAS c o n d i t i o n s are as
f o l l o w s ;
Table 6.3.
Atomic Absorption Spectrophotometer S e t t i n g s .
Element Wavelength Background Comments / nm Co r r e c t i o n
Cadmium 228.8 yes An a i r - a c e t y l e n e flame used unless st a t e d .
Copper 324.7 no I r o n 248.3 yes Manganese 279.5 yes Zinc 213.9 yes
215

6.13 Photometric Method.
Ferrozine was used t o determine the f e r r o u s content i n an aqueous sample i n a method devised by Gibbs(140) who f u r t h e r suggested adding a reducing agent; hydroxylamine hydrochloride t o reduce the f e r r i c i o n t o give t o t a l i r o n content, t h i s technique was adopted.
To determine the t o t a l i r o n content 5 ml of sample was
added t o 0.8 ml of 5M h y d r o c h l o r i c acid and 2 ml of 10 %
m/v hydroxylamine hydrochloride i n O.OIM h y d r o c h l o r i c
a c i d . A f t e r 2 minutes 2 ml of 0.075 % m/v f e r r o z i n e
s o l u t i o n also i n O.OIM h y d r o c h l o r i c acid was added,
which was again l e f t f o r 2 minutes, f o l l o w e d by 5 ml of
acetate b u f f e r . The acetate b u f f e r contained 473g of
sodium acetate t r i h y d r a t e plus 115 ml of g l a c i a l a c e t i c
a c i d , made up t o 1 l i t r e w i t h d i s t i l l e d water.
The f e r r o u s content was determined by not adding the
reducing agent. F e r r i c content can be c a l c u l a t e d by
d i f f e r e n c e .
6.14 Comparison of Results.
A l a c t a t e eluent makes the separation and
determination of 10 metals p o s s i b l e . However as Figure
6.3 shows only copper, i r o n ( I I ) , i r o n ( I I I ) , manganese,
zinc magnesium and calcium were found by HPLIEC i n a
more concentrated sample, denoted as A l . Sample volumes
216

of 0.1 ml were used. Those of s a l i n i t y greater than 10
part s per thousand were i n j e c t e d as 20 j i l a l i q u o t s t o
stop d i s t o r t i o n of the chromatography by the high s a l t
content. Table 6.4 shows samples presented i n i n c r e a s i n g
order of s a l i n i t y i n a cross s e c t i o n of the s a l t wedge.
Table.6.4.
Comparison of High Performance L i q u i d Ion Exchange Chromatography and Atomic Absorption Spectrophotometric Methods.
Element Copper Manganese Zinc@
Method HPLC AAS HPLC AAS HPLC AAS
Sample Metal found / pg ml .
18 0.50 0.47 2.7 2.6 10.0 8.0
C12 0.50 0.78 2.8 2.7 8.3 7.9
Al 0.47 0.56 2.8 2.7 8.1 8.0
9 0.50 0.60 2.7 2.8 10.3 7.9
C8 0.60 0.63 * n 9.7 7.2
3 0.00 0.48 0.4 2.5 4.7 6.3
A5 0.30 0.45 * 2.3 6.5 6.0
1 0.00 0.56 0.77 2.2 1.4 n
2 0.17 0.37 * 1.7 4.3 6.2
4 0.14 0.30 0.84 1.1 2.4 0.0
5 - 0.1 0.65 0.64 0.80 n
6 - n 0.37 n 0.0
7 0.11 * 0.17 2.2 n
@ d i l u t e d t e n f o l d f o r a n a l y s i s . - none detected. * manganese co-eluted w i t h magnesium, t h i s masked
manganese i n samples of high magnesium content.
217
n not determined.
The observed content of the Camon f o r z i n c , manganese
and copper i s g r a p h i c a l l y I l l u s t r a t e d i n Figures 6.4 t o
6.6, where metal c o n c e n t r a t i o n detected i s p l o t t e d
against s a l i n i t y . Manganese l e v e l s are p a r t i c u l a r l y
v a r i a b l e . This may be due to the high magnesium content
making chromatographic peak e v a l u a t i o n , as shown i n
Figure 6-3. d i f f i c u l t . Other metals such as n i c k e l ,
c o b a l t and cadmium were below the l i m i t s of d e t e c t i o n
f o r HPLIEC and many were not detected by AAS. L i t t l e
d i f f e r e n c e was observed between samples from the same
sampling s i t e using the two d i f f e r e n t sized f i l t e r s
mentioned i n the sampling technique.
6.15 I r o n Speclation i n the River Carnon.
To a s c e r t a i n any possible d e v i a t i o n or d i f f e r e n c e
between HPLIEC and photometric methods a comparison was
c a r r i e d out using a c i d i f i e d deionised water s o l u t i o n s
c o n t a i n i n g varying concentrations of I r o n ( I I ) and ( I I I ) ,
I n v e r s e l y v a r y i n g concentrations of the two species i n
Jig ml ^ were prepared and are g r a p h i c a l l y
i l l u s t r a t e d i n Figures 6.7 and 6.8 which shows of a p l o t
of i n c r e a s i n g f e r r i c c o n c e n t r a t i o n w i t h decreasing
f e r r o u s concentration. The graphs reveal good
c o r r e l a t i o n f o r the I n v e r s e l y v a r y i n g c o n c e n t r a t i o n s ,
although Figure 6.7 revealed t h a t the f e r r o z i n e method
218
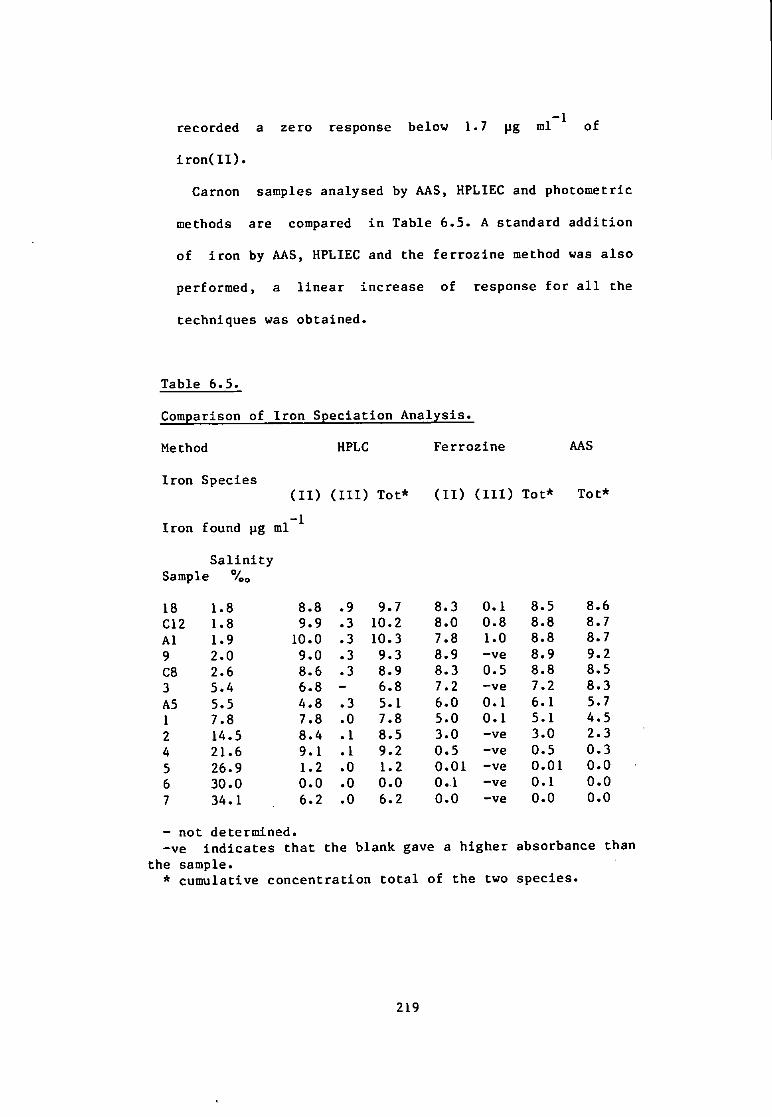
recorded a zero response below 1-7 pg ml ^ of
i r o n ( I l ) .
Carnon samples analysed by AAS, HPLIEC and photometric
methods are compared i n Table 6.5. A standard a d d i t i o n
of i r o n by AAS, HPLIEC and the f e r r o z i n e method was al s o
performed, a l i n e a r increase of response f o r a l l the
techniques was obtained.
Table 6.5.
Comparison of I r o n Speciation Analysis.
Method HPLC Ferrozine AAS
I r o n Species
I r o n found pg ml
S a l i n i t y Sample %o
( I I ) ( I I I ) Tot* -1
( I I ) ( I I I ) Tot* Tot*
18 1.8 8.8 .9 9.7 8.3 0.1 8.5 8.6 C12 1.8 9.9 .3 10.2 8.0 0-8 8.8 8.7 Al 1.9 10.0 .3 10.3 7.8 1.0 8.8 8.7 9 2.0 9.0 .3 9.3 8.9 -ve 8.9 9.2 C8 2.6 8.6 .3 8.9 8.3 0-5 8.8 8.5 3 5.4 6.8 - 6.8 7.2 -ve 7.2 8.3 A5 5.5 4.8 .3 5.1 6.0 0.1 6.1 5.7 1 7.8 7.8 .0 7.8 5.0 0.1 5.1 4.5 2 14.5 8.4 .1 8.5 3.0 -ve 3.0 2.3 4 21.6 9.1 .1 9.2 0.5 -ve 0.5 0.3 5 26.9 1.2 .0 1.2 0.01 -ve 0.01 0.0 6 30.0 0.0 .0 0.0 0.1 -ve 0.1 0.0 7 34.1 6.2 .0 6.2 0.0 -ve 0.0 0.0
- not determined. -ve i n d i c a t e s t h a t the blank gave a higher absorbance than
the sample. * cumulative concentration t o t a l of the two species.
219

Figure 6.3
ChromgtoqrQm from Carnon River Sample
Fe
Zn
Fe(III)
Mg
220
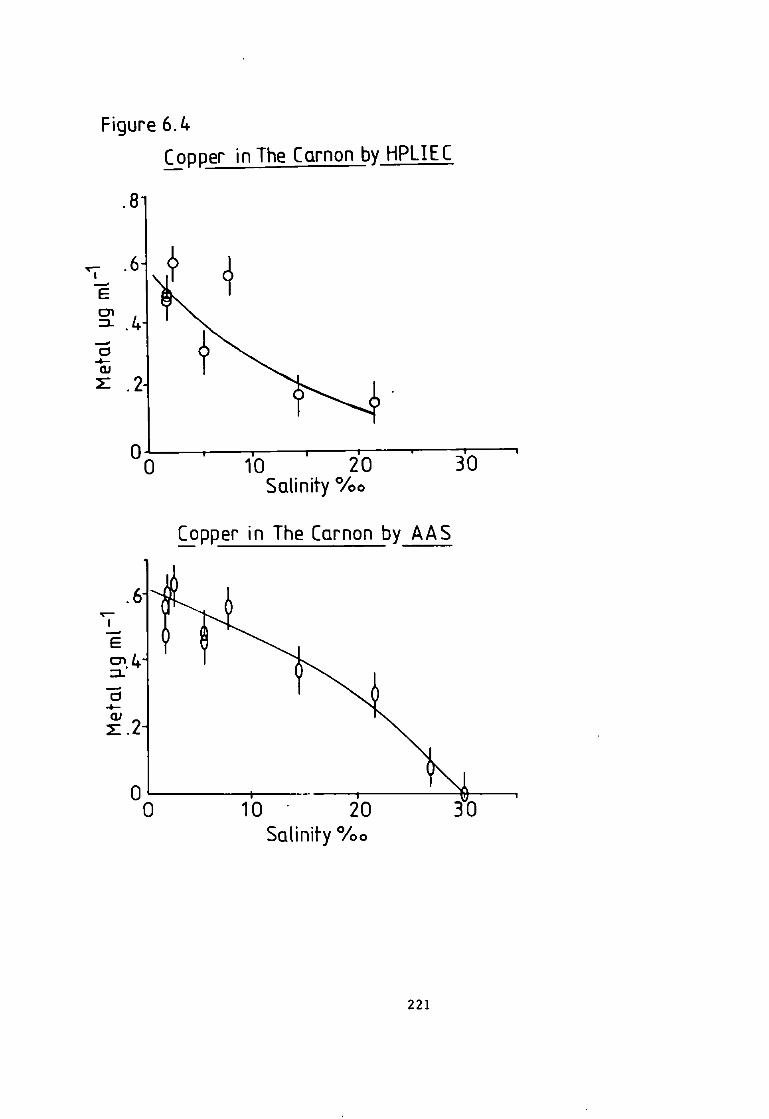
Figure 6.4 Copper in The Carnon by HPLIEC
.81
E cn
.6
.4
2
0 0
1 r 10 20 30 Salinity % o
Copper in The Carnon by AAS
0 10 20 Salinity % o
221
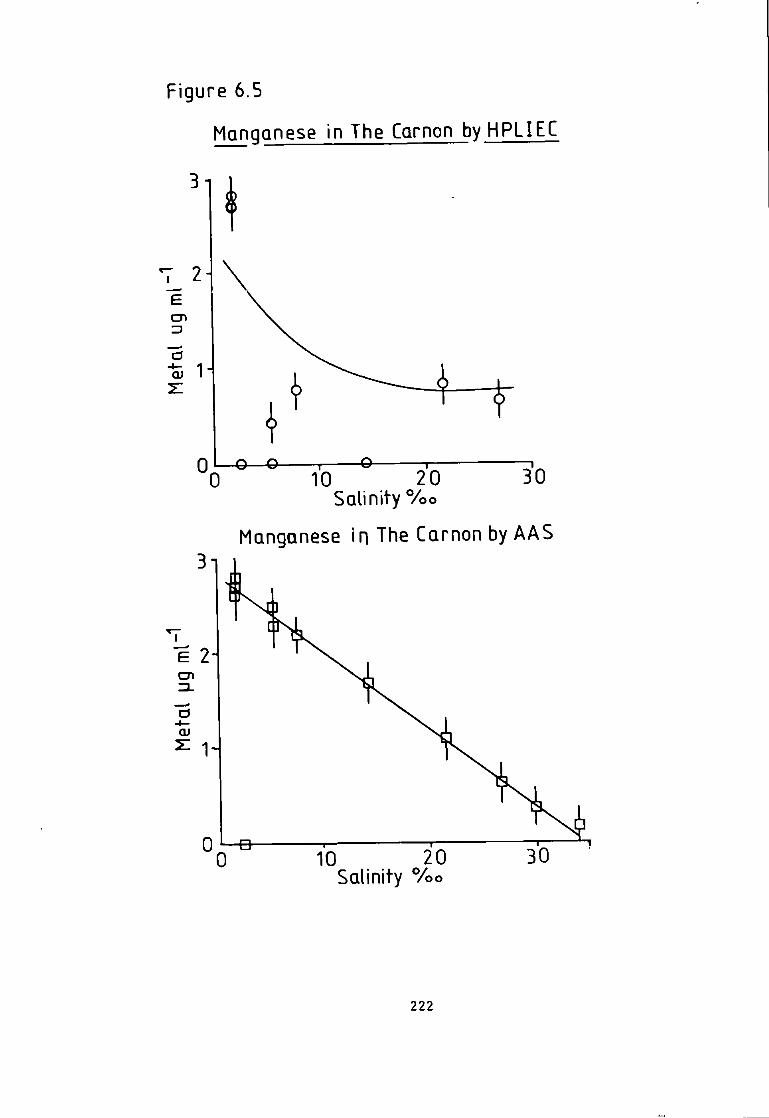
Figure 6.5
Manganese in The Carnon by HPLIEC
01 o o 0 10 20 30 Salinity % o
Manganese in The Carnon by AAS
2-cn
"3 H
0 i - B 0 10 20
Salinity % o
222

Figure 6.6
Zinc in The Carnon by HPLIEC
10
10 20 Salinity % o
Zinc in The Carnon by AAS
30
10 20 Salinity % o
223

Figure 6.7
F p r r o u s and Ferric by Ferrozine
Ferrous pg ml '
Ferric pg ml Figure 6.8
Ferrous and Ferric bv HPLIEC 10 9 ^ > ?
100
80 Ferrous pg ml
2 ^ 1 6 Ferric pg ml~^
22A
6.18 Analysis of a Simulated Pressure Water Reactor
Primary Coolant.
Much of the p i p i n g i n the heat t r a n s f e r system of a
reactor i s made of minimally corroding s t a i n l e s s s t e e l
t u b i n g . The coolant contains 1500 pg ml boron as
borate added as a neutron moderator. Although boron
decays t o l i t h i u m and helium a f t e r neutron bombardment
i n a reactor the coolant also has 1.5 \ig ml of
l i t h i u m added t o the coolant. Although a reducing
atmosphere of hydrogen i s introduced wherever p o s s i b l e ,
a number of metal species are found i n the primary
coolant at very low concentrations. These are i n t u r n
exposed t o high l e v e l s o f nuclear r a d i a t i o n which form
r a d i o a c t i v e n u c l i d e s . Some have a short h a l f l i f e and
emit r a d i o a c t i v i t y s t r o n g l y . Cobalt 60 i s a gamma ray
em i t t e r and must be kept t o a minimum concentration t o
reduce operator exposure. Concern was also expressed by
A.E.E. W i n f r i t h about the nuclides of i r o n , n i c k e l ,
manganese copper and chromium, although c o r r o s i o n was
the main reason f o r wanting t o determine the i r o n
species w i t h i n the primary coolant. A major problem i n
the a n a l y s i s was i n s i t u sampling of t h i s superheated
water a t 300 °C. By a c o n s t r u c t i o n of high pressure
tubing i t was hoped t o overcome t h i s problem and ob t a i n
d i r e c t concentrations. A l i s t o f approximate
concentrations f o r the above mentioned metals are
225

tabulated i n Table 6-6. A borate placebo primary coolant
s o l u t i o n t h a t was not i r r a d i a t e d and contains v i r t u a l l y
no t r a n s i t i o n metals was obtained from W i n f r i t h .
Simulated s o l u t i o n s were prepared and used t o estimate
the f e a s i b i l i t y of a HPLIEC method before t e s t i n g the
method w i t h r a d i o a c t i v e samples. Such ra d i o n u c l i d e s pose
obvious t h r e a t s and an enclosed l i q u i d system would
prevent t h e i r escape i n t o the atmosphere u n l i k e f o r
example w i t h AAS.
Table 6-6-
Estimated Trace Metal i n Pressurised Water Reactor Coolant.
Metal concentration ng ml
Chromium 0.5 Cobalt 0.05 I r o n ( I I ) & ( I I I ) 0.5 Manganese 0.5 Nicke l 0.5
The concentration of the metal species was below t h a t
which can be detected w i t h i n j e c t i o n s up t o 2 ml and
the r e f o r e determination was attempted by conc e n t r a t i n g
the metal ions. By passing the sample through a
preconcentration column c o n t a i n i n g the same exchange
m a t e r i a l as the separating column i t may be possible t o
e l u t e them using the same elu e n t . There are
chromatographic problems presented by t h i s approach,
such as the choice of preconcentration column dimensions
and the c a t i o n load imposed upon i t .
226
6.19 Method of Preconcentration.
For the sake of ease of e l u t i o n the same m a t e r i a l as
i n the analyte column, Aminex SCX A9 r e s i n , was
i n i t i a l l y used i n the preconcentracion column. Metals
are best separated w i t h a t a r t r a t e b u f f e r . A 5 by 0.46
cm column was placed w i t h i n the i n j e c t i o n loop. The back
pressure was too large t o pump a syringe sample through,
t h e r e f o r e a L.D.C. HPLC pump was used at a set flow r a t e
and i t s operating time recorded w i t h the microprocessor.
Two disadvantages are, f i r s t l y the metal contamination
from p i p i n g and pumping sources and secondly, the
inaccuracy of analyte volume measurement, because HPLC
pumps do not have constant f l o w rates a t low back
pressures.
A procedure was adopted w i t h the sample s o l u t i o n
c o n t a i n i n g 10 ng ml n i c k e l and i r o n ( I I ) and 1 ng
ml ^ c o b a l t QJ^ 1.5 ml min . Detection was w i t h
the EBT PGR as described i n chapter f o u r .
6.20 Results of the Analysis of a Simulated Coolant of
the Pressurised Water Reactor.
A chromatogram of low con c e n t r a t i o n analytes i n the
simulated coolant i s shown i n Figure 6.9. I r o n and
n i c k e l were added as 10 ng ml and co b a l t as 1 ng
227
ml ^. Figure 6.10 shows graphs of metal detected
versus time of flow of sample onto the preconcentratlon
column f o r the above concentrations. An upward curvature
i s noted f o r n i c k e l and f e r r o u s ions. Cobalt gave a more
v a r i a b l e response f o r increased preconcentration times
although l i n e a r preconcentration response was achievable
a t a low con c e n t r a t i o n of 1 ng ml ^. Data obtained
f o r concentrations less than 10 pg ml ^ were subject
to considerable v a r i a t i o n and subsequent i n v e s t i g a t i o n s
revealed t h a t contamination from the sample d e l i v e r y
system and HPLIEC f i t t i n g s was comparatively l a r g e .
228

Figure 6.9 Chromatogram af ter Trace Enrichment of Simulated
PWR Coolant 0
mm
Fe(II)
Mn
229
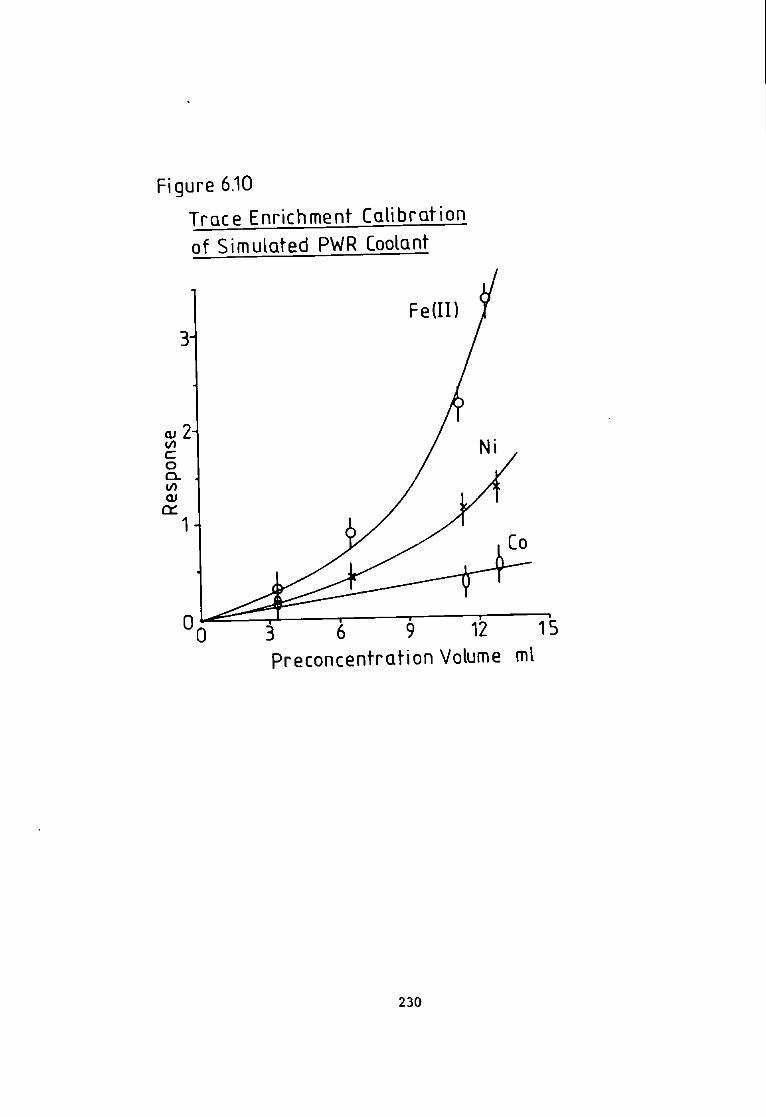
Figure 6.10
Trace Enrichment Calibration of Simulated PWR Coolant
3 6 9 12 15 Preconcentration Volume ml
230

6.21 Discussion and Conclusion.
Samples t h a t can con t a i n small p a r t i c u l a t e s or
c o l l o i d a l m a t e r i a l may escape f i l t r a t i o n . Such p a r t i c l e s
may adhere t o the HPLC column* m a t e r i a l and not be
detected. Although HPLIEC and AAS methods can be
compared, r e s u l t s may d i f f e r because AAS r e s u l t s may
include a c o n t r i b u t i o n from the analyte ions bound t o
any suspended m a t e r i a l . Chromatography may th e r e f o r e
o f f e r a s i m i l a r defined c l a s s i f i c a t i o n of ions i n
s o l u t i o n t o e l e c t r o a n a l y t i c a l techniques.
Estuarine samples were compared using AAS and HPLIEC
techniques f o r copper, zinc and manganese. Samples
analysed are g r a p h i c a l l y i l l u s t r a t e d i n Figure 6.4 t o
6.6. Standard a d d i t i o n f o r the AAS method w i t h z i n c ,
manganese and copper reveal no discrepancies and
corroborate the AAS data obtained. Good agreement was
shown between the two methods f o r samples of low
s a l i n i t y . Figure 6.5 revealed t h a t samples of
intermediate s a l i n i t y show agreement f o r manganese
determination between HPLIEC and AAS methods. At high
s a l i n i t i e s HPLC data v a r i e d , p o s s i b l y because of a
smaller I n j e c t e d volume. Higher magnesium content and
higher i o n i c s t r e n g t h of the h i g h l y s a l i n e samples may
upset the chromatographic s t a b i l i t y f o r manganese.
L i t t l e agreement between the methods i s shown f o r
z i n c , although a sharp decrease o f zi n c content was
231

noticed f o r AAS a t s a l i n i t i e s g r e a t e r than 20 to l e v e l s
below the l i m i t of d e t e c t i o n . A gradual decrease was
noted i n Figure 6.6 showing the HPLIEC data which i s
c o n s i s t e n t w i t h the metal decrease expected i n s a l t
wedge samples. This suggests there may be i n t e r f e r e n c e
from the d i s s o l u t i o n of metal from the HPLIEC t u b i n g
e f f e c t e d by s a l t i n the estuarine samples.
Perhaps the most d i s t i n g u i s h i n g f e a t u r e from the
copper and zinc data, was t h a t when r e s u l t s are
compared, AAS has higher r e s u l t s . Possibly because of
complexation of the metal w i t h i n the organic humic
content or because of a chemisorption or p h y s i c a l
t r a p p i n g on a p a r t i c u l a t e i n the r i v e r water, which may
have escaped the f i l t e r . Consequently when a sample
co n t a i n i n g p a r t i c u l a t e s i s placed i n a flame the
s t r u c t u r e breaks up or the chelate i s broken down,
rele a s i n g metal f o r d e t e c t i o n . This may be a way of
d i s t i n g u i s h i n g p a r t i c u l a t e attached species; and those
that are chelated t o the organic content of the water
from chat which w i l l more r e a d i l y take p a r t i n exchange
processes, dynamic or otherwise w i t h i n e s t u a r i n e waters.
Analysis of pore waters from a lake w i t h laminated
sediment, Loe Pool, showed the p o s s i b i l i t y of measuring
the degree of erosion by c a l c u l a t i n g the r a t i o of
calcium t o magnesium; a higher r a t i o of calcium
i n d i c a t e s a g r e a t e r degree of erosion according to
Mackerbeth(lAl). Mackerbeth also s t a t e d t h a t the
232
manganese / i r o n r a t i o i n sediment can record the redox
s t a t e as manganese i s more e a s i l y transported i n
reducing c o n d i t i o n s .
Perhaps the greatest problem encountered w i t h
environmental samples i s to comprehend the complex
mechanisms. With an e a s i l y o x i d l s a b l e and hydrolysable
metal such as i r o n , which also adsorjjs other t r a n s i t i o n
metals(142), considerable care has t o be taken when
drawing any conclusions. The determination of i r o n
species i s fraught w i t h d i f f i c u l t i e s , mostly because of
hydroxy formation which begins above pH 1. With s a l i n e
samples of high pH, around 8, p r e c i p i t a t i o n of the i r o n
could cause complications. Generally i r o n concentrations
obtained by HPLIEC f o r the estuary waters were higher
than those obtained by the f e r r o z i n e or AAS methods.
High HPLIEC r e s u l t s may be due to c o r r o s i o n of the s t e e l
f i t t i n g s i n the system to g i v e , i n i t i a l l y i r o n ( l l ) . A
s a l i n e sample l e f t i n the sample loop confirmed t h i s
hypothesis. Higher i r o n r e s u l t s are shown f o r the
photometric method compared to the AAS method. The low
pH obtained w i t h the f e r r o z i n e method by adding
h y d r o c h l o r i c acid may e x p l a i n the presence of more i r o n
f o r the r e l a t i v e l y higher r e s u l t s . Ferrozine and AAS
methods compare favourably and although the HPLIEC data
was e r r a t i c the trend of the slope was the same. Be t t e r
c o r r e l a t i o n was observed f o r i r o n ( I I I ) between HPLIEC
and the f e r r o z i n e method. The poor c o r r e l a t i o n of the
233
i r o n ( I I ) suggested t h a t s a l i n i t y may a f f e c t HPLIEC
r e s u l t s f o r the reason stated above. To minimise the
high s a l i n i t y e f f e c t upon the chromatography a 20 j i l
volume was used instead of a 0.1 ml i n j e c t i o n . However
the concentrations found v a r i e d , although some v a r i a t i o n
was expected w i t h a smaller i n j e c t i o n .
Preconcentratlon of simulated PWR primary coolant
water showed t h a t low concentrations can be determined
i n a borate buffered background down to 1 ng ml ^,
although the sample was a c i d i f i e d by the a d d i t i o n of
metal s o l u t i o n s . I n s i t u assessment of the coolant by
monitoring s t a i n l e s s s t e e l c o r r o s i o n may be d i f f i c u l t
because a t pH 6 the coolant may c o n t a i n c o l l o i d a l or
p a r t i c u l a t e matter. Employing a preconcentration column
gave b e t t e r c a l i b r a t i o n s down to 1 ng ml ^
concentrations- However the problem t h a t gave the curved
c a l i b r a t i o n should f i r s t be resolved. Q u a n t i f i a b l e
measurements below t h i s c o n c e n t r a t i o n require t h a t
f u r t h e r studies should be performed because of
v a r i a b i l i t y obtained from contamination sources of the
HPLIEC f i t t i n g s and pump. Schmidt and Scott(143)
reported i r o n contamination from f e r r u l e s , t u b i n g
connections and sample loop. Cassidy and Elchuk used
T e f l o n , polypropylene or Kel-F f i t t i n g s on a l l wetted
surfaces(100,101). An a l l non-metal system may also
overcome sample contamination problems w h i l s t
i n t r o d u c i n g the sample, although some s a l i n e samples may
234

s t i l l leach r e s i d u a l metal contamination from the
surface.
235

7 I n i t i a l Studies of A l t e r n a t i v e Systems, Suggestions
f o r Further Work and Conclusions.
7.1 I n i t i a l Studies of A l t e r n a t i v e Systems.
When i n i t i a t i n g the design of a new PC r e a c t o r ,
d e t e c t i o n of t o x i c or environmentally harmful metal
species i s normally experimented w i t h t o o b t a i n lower
l i m i t s of d e t e c t i o n . Many metallochromic i n d i c a t o r s are
a v a i l a b l e , but only those t h a t o f f e r the advantages of
high s e n s i t i v i t y and react w i t h a broad spectrum of
metals can be considered, unless s p e c i a t i o n studies of a
selected metal are Intended. I n the f o l l o w i n g discussion
i t i s hoped to o u t l i n e work showing the way forward by
using d i f f e r e n t photometric techniques. P r i m a r i l y a very
s e n s i t i v e reagent such as d i t h i z o n e was taken advantage
of by the afore mentioned novel approach, however
d i t h i z o n e i s water i n s o l u b l e and t h i s l i m i t a t i o n f o r
d i t h i z o n e and others(128) may be improved by using water
soluble d e r i v a t i v e s . The s y n t h e t i c preparation of a
non-s p e c i f i c PCR organometallic reagent may be possible.
This may lead t o a higher e x t i n c t i o n c o e f f i c i e n t and
response w i t n many more metals* Previous reagents were
e a r l y organometallic i n d i c a t o r s , but most researchers
are now concerned w i t h the synthesis of s p e c i f i c
reagents(91).
Although EBT has been shown to react w i t h many metals
236
i n the inverse mode of photometric d e t e c t i o n , some
reagents react w i t h more metals. Pyrocatechol
violet(PCV) i s such a compound and reacts w i t h h i g h l y
charged c a t i o n s as w e l l as oxyanlons of t r a n s i t i o n
metals and can be used w i t h a c a t i o n i c s u r f a c t a n t t o
form a t e r n a r y complex- Such a ter n a r y system has the
advantage of forming complexes t h a t absorb at v i r t u a l l y
the same wavelength, which i s normally over 600 nm and
i s d i s t a n t from the parent and metal-complex spectra of
the binary complex. Fluorescence i s the most s e n s i t i v e
method of d e t e c t i o n , however t r a n s i t i o n metals and most
of t h e i r complexes do not fluorescence and as w i t h many
techniques of high s e n s i t i v i t y , contamination problems
pose considerable d i f f i c u l t i e s . E i t h e r d e r i v a t i v e
complexing agents or s u b s t i t u t i o n reactions have t o be
used to overcome non-fluorescing metals or
metal-complexes.
Perhaps the grea t e s t d i f f i c u l t y i s th a t separation
from a matrix may prevent the d e t e c t i o n of a species and
consequently any p r o p e r t i e s t h a t can be a t t r i b u t e d t o i t
are not q u a n t i f i a b l e . This may be e s p e c i a l l y so f o r
t r a n s i t i o n metal oxyanions species which are pH
dependant. I n t h i s work a chromatographic technique f o r
the separation of oxyanions i s proposed and i n i t i a l work
reveals t h a t low l i m i t s of d e t e c t i o n may be possible
w i t h a pyrocatechol violet(PCV) PC reagent.
237

Figure.7.1
Chromatogram with Dithizone-S Post
Column Detection
Co
Cu \ 10
mm
238

7.2 Dithizone-S Post Column Reactor System.
A major d i f f i c u l t y w i t h the d i t h i z o n e PGR as discussed
p r e v i o u s l y i s the i n s o l u b i l i t y of the d i t h i z o n a t e s and
organic acid s a l t s i n the PC reactant mixture- The
immediate answer i s t o make a water soluble d e r i v a t i v e
of d i t h i z o n e . A recent paper by Zhang, et a l . (144)
shows th a t a sulphonated molecule can be prepared which
i s water soluble and i s known as dithizone-S. A
c o l o u r i m e t r i c response was recorded f o r s i l v e r ( I ) ,
m e rcury(I) & ( I I ) , lead, n i c k e l , manganese, i r o n ( I I I )
and c h r o m i u m ( l l l ) . The suggested synthesis using
s u l p h a n i l i c acid i n a d i a z o t i s a t i o n r e a c t i o n was
attempted and was confirmed as successful
s p e c t r o s c o p i c a l l y . Elementary PC d e t e c t i o n i n Figure 7.1
shows a p o s i t i v e absorbance response at 580 nm to metals
from a 100 p i i n j e c t i o n of 0.4 pg ml ^ of copper,
z i n c , n i c k e l and 0.6 pg ml~^ of c o b a l t . The PGR pH
was adjusted to 9.5 by the a d d i t i o n of ammonia to the
dithizone-S reagent s o l u t i o n , i n these c o n d i t i o n s
secondary d i t h i z o n a t e s are probably formed w i t h peak
maxima between 575 and 590 nm and may have higher
c o e f f i c i e n t s of e x t i n c t i o n , because of two dithizone-S
molecules i n the complex. Good responses are shown f o r
copper, n i c k e l and e s p e c i a l l y c o b a l t w i t h a 0.4 F.S.D.
Separation was performed on a P a r t i s i l SGX column a t 40
°G w i t h a O.IM l a c t a t e eluent a t pH 3.5. The dithizone-S
239
used was s u f f i c i e n t l y concentrated to give a PGR
absorbance f o r the metal-complexes of greater than 0.5
absorbance a t 580 nm at the unoptimised PC reactant f l o w
rate of l.A ml mln -
7.3 Pyrocatechol V i o l e t as a Detector f o r Anions and
Cations.
Of the organic c h e l a t i n g agents surveyed PCV appears
to o f f e r considerable promise f o r the s e n s i t i v e
d e t e c t i o n of d i v a l e n t c a t i o n s and t r a n s i t i o n metal
oxyanions. I t i s a dark red s o l i d , triphenylmethane dye,
c o n t a i n i n g f o u r phenolic and two sulphonic acid groups.
A 0.1% m/v s o l u t i o n i s s t a b l e I n d e f i n i t e l y . I t i s
s u i t a b l e f o r a wide range of m e t a l l i c t i t r a t i o n s ,
e s p e c i a l l y w i t h EDTA i n a c i d i c or a l k a l i media f o r
a l u m i n i u m ( I I I ) , b i s m u t h ( I I I ) , n i c k e l , manganese,
thorium, cobalt and cadmium metals. I t i s considered
i n f e r i o r t o EBT f o r t i t r a t i o n i n a l k a l i n e media, but i t
i s not blocked by heavy m e t a l s ( l A 5 ) . Like the m a j o r i t y
of the phenolic type organic reagents there i s a g r e a t e r
s e l e c t i v i t y f o r the h i g h l y charged oxyanion species a t
low pH. PCV changes colour according to the pH;
Red pH 1.5 < Yellow pH 6 < V i o l e t
A blue complex i s obtained w i t h b i s m u t h ( I I I ) ,
240

I r o n ( l I I ) , g a l l i u m C l I I ) , Mo02 '*', niobium(V)( 146),
t i n ( I V ) , thorium(IV) and ZrO^'^(147), Responses are
also recorded w i t h chromate, molybdate, tungstate and
vanadate(148) oxyanlons as w e l l as a n t i m o n y ( I I I ) ,
a l u minium(III)(149,150) and oth e r s ( 1 5 1 ) ; which t o t a l
over t h i r t y metals. Spectrophotometric a c t i v i t y i s due
to the p-quinoid group. Subsequent ternary complexes are
formed from the binary metal PCV complex a f t e r the
a d d i t i o n of an i o n i c s u r f a c t a n t t o form an i o n
associate. Such i o n associates are normally i n s o l u b l e i n
aqueous media and are e x t r a c t e d i n t o an organic phase
before measuring the absorbance. The r e s u l t a n t i o n
associate has a hyperchromic e f f e c t on the binary
complex and a large e x t i n c t i o n c o e f f i c i e n t due to size
making i t one of the most s e n s i t i v e spectrophotometric
methods w i t h approaching 150,000
l.mole ^.cm ^. A bathochromic e f f e c t gives a
peak maximum around 650 nm.
For c a t i o n i c associates the c r i t i c a l m i c e l l e
c o n c e n t r a t i o n does not have to be reached before the i o n
associate can be formed, however Fogg et a l . (150)
recommend t h a t a l a r g e r c o n c e n t r a t i o n of s u r f a c t a n t be
used f o r a b e t t e r response.
Examples and a p p l i c a t i o n s of t h i s type of s e n s i t i s e d
reactions are numerous. Aluminium i s detected w i t h
eriochrome cyanine R and c e t y l t r i m e t h y l ammonium
chlorideC152). Rare earths w i t h x y l e n o l orange and c e t y l
241
p y r i d i n i u m c h l o r i d e ( 1 5 3 ) . Metals may form mixed l i g a n d
complexes w i t h triphenylmethane dyes. I n some Instances
t h i s enhances the s e n s i t i v i t y and s e l e c t i v i t y ( 1 5 1 ) .
Cetyl t r i m e t h y l ammonium bromide CCAB) and c e t y l
p y r i d i n i u m bromide (CPB) are the most used c a t i o n
s u r f a c t a n t s . The determination of t i n i n s t e e l w i t h PCV
and CAB f o r example, uses a 1:2 complex w i t h PCV and
then a CAB molecule attaches t o each of the two PCV
molecules t o give an e x t i n c t i o n c o e f f i c i e n t of 9A,000
l.mole ^cm ^ and a peak maximum at 662 nm(150).
Further d e t a i l s of these reac t i o n s and t h e i r mechanism
may be found i n reviews by MarcEenko(92) and Savvin(91).
7.A Pyrocatechol V i o l e t as a Post Column Reactant.
The c r i t e r i o n f o r a good PGR are e x h i b i t e d by PCV i f
an i o n associate complex i s formed. Many PCV c a t i o n i c
d i v a l e n t metal te r n a r y systems absorb l i g h t a t the same
wavelength of 650 nm, t h i s should e l i m i n a t e any
v a r i a t i o n i n d e t e c t i o n l i m i t s because of d i f f e r e n t peak
maxima, as observed f o r binar y metal PCV species and
give a d e t e c t i o n system t h a t responses w i t h more metals.
PGV was i n v e s t i g a t e d f o r the d e t e c t i o n of h i g h l y charged
oxyanions of t r a n s i t i o n metals. This would g r e a t l y
reduce the noise problems associated w i t h measuring a
decrease i n absorbance.
242

Figure 7.2
Chromatogram with Pyrocatacohol
Violet Post Column Detection
Fe(in)
243

7.5 Solvent and Instrumental Considerations.
The PCV s o l u t i o n and s u r f a c t a n t have to be mixed a t a T j u n c t i o n p r i o r t o being mixed w i t h the eluent stream because a b e t t e r r e p r o d u c i b i l i t y and response can be obtained. A d i f f e r e n t s o l u t i o n of s u r f a c t a n t has to be prepared f o r anion and c a t i o n d e t e c t i o n t o give the c o r r e c t PGR pH, which was more c r i t i c a l f o r d i v a l e n t c a t i o n s . The response was r e l a t i v e l y quick and no sp e c i a l PGR apparatus was necessary, although basic o p t i m i s a t i o n procedures were used. The operating wavelength were 700 and 640 nm f o r both c a t i o n i c and anionic species r e s p e c t i v e l y and although 700 nm i s near the end of most det e c t o r s * response range, many instruments can now be purchased t h a t go beyond these l i m i t s .
7.6 Results and Discussion.
F e a s i b i l i t y studies performed i n t e s t tubes and by FIA
f o r both c a t i o n i c and anionic PGR d e t e c t i o n show t h a t i t
i s possible t o have a very s e n s i t i v e PGV PGR d e t e c t i o n
system. The flow rates of PC reactant s o l u t i o n s were
optimised, these s o l u t i o n s contained ammonia or a c e t i c
acid i n the s u r f a c t a n t t o b u f f e r the pH which prevents
the PGV degrading. Figure 7.2 shows the chromatogram of
a 100 p i i n j e c t i o n of 4 pg ml ^ of copper i r o n ( I I I ) ,
244

indium, z i n c , n i c k e l , cobalt and 8 pg ml~^ of
cadmium and manganese. A 0-lM l a c t a t e eluent at pH 3.35
was used w i t h a P a r t i s i l 10 SCX column a t 40 ?C. The
best operating c o n d i t i o n s were w i t h the f l o w r a t e of a
0.1% w/v PCV s o l u t i o n a t 0.4 ml min"^ and a 0.2% w/v
CAB s o l u t i o n buffered w i t h ammonia to give a 2M a l k a l i
s o l u t i o n a t 0.5 ml min ^, t h i s gave a r e s u l t i n g PGR
pH of 9.3, good responses were achieved f o r copper i r o n ,
indium, z i n c , c o b a l t and manganese w i t h a F.S.D. of 0.2
absorbance at 700 nm. An 8 pg ml ^ s o l u t i o n was
necessary to obt a i n a response from cadmium, which gave
no response when the PC reactant f l o w rates were
increased, p o s s i b l y due to a r e a c t i o n parameter f a c t o r -
No reference i n c l a s s i c a l t e x t s t o the response of
cobal t has been made but a response of some s e n s i t i v i t y
was found i f the pH was c o n t r o l l e d c a r e f u l l y , so t h a t
the pH does not exceed 10, w i t h a peak maxima at 750 nm
f o r the tern a r y complex. A comparison w i t h the EBT
detec t o r shows a three times g r e a t e r response f o r copper
and z i n c . Cobalt and n i c k e l gave s i m i l a r responses t o
those f o r an EBT PCR. The c a l i b r a t i o n curve appears t o
be l i n e a r i n the 1 t o 10 pg ml ^ range.
Work on i n i t i a l o p t i m i s a t i o n data f o r both systems
y i e l d e d good s e n s i t i v i t i e s (responses are i l l u s t r a t e d i n
Figure 7.3) f o r anionic d e t e c t i o n . Because of the
ter n a r y nature of the complex i t i s recommended to use a
simplex o p t i m i s a t i o n program t h a t includes an o v e r a l l
245

chromatographic response f a c t o r f o r those metals of poor
d e t e c t i o n . This introduces a l i m i t a t i o n of minimal
response f o r any one metal so as not to bias the
o p t i m i s a t i o n i n favour of othe r s .
7.8 Chromatographic Separation of Oxyanions.
Many metals can e x i s t as an oxy or hydroxy a n i o n i c
complex and f o r b e t t e r r e p r e s e n t a t i o n of t h e i r e f f e c t on
the environment i t i s b e t t e r to analyse f o r such species
rather, than o b t a i n a t o t a l assay, as f o r example w i t h
AAS. To separate those metals which form anionic species
requires an anion exchange column, however many
separations have considerable d i f f e r e n c e s i n r e t e n t i o n
time and consequently give mg s e n s i t i v i t y . Zolotov et
a l . (154) separated oxyanions of a r s e n i c , molybdenum,
chromium, selenium and tungsten i n 48 minutes. A reverse
phase separation of chromium and vanadium
8-hydroxyquinolates has also performed by Lajunen(155).
For higher s e n s i t i v i t i e s and s h o r t e r a n a l y s i s times,
another approach was necessary. Ion p a i r
chromatography(42,44,45,46,156), where a c a t i o n i c moiety
i s d issolved i n the eluent t o form an i o n p a i r w i t h the
anionic analyte was attempted.
Although good separations have been achieved w i t h
longer quaternary ammonium carbon chain lengths over
C,, where the c a t i o n i c s u r f a c t a n t was deposited on a i o
246
hydrophobic column w i t h p a r t i a l l y aqueous solvent p r i o r
t o s e p a r a t i o n ( 4 6 ) , here the s u r f a c t a n t CAB, was a t a
constant c o n c e n t r a t i o n . Figure 7.3 shows how the
oxyanions of tungsten, vanadium, chromium and molybdenum
as t u n g s t a t e , vanadate, chromate and molybdate can be
separated on a d i v i n y l benzene c r o s s - l i n k e d polystyrene
polymer r e s i n m a t e r i a l , using an a l k a l i s o l u t i o n of CAB.
An a l k a l i e l u e n t at pH 10 s i m p l i f i e s the s e p a r a t i o n
because a v a r i e t y of polymeric and o t h e r oxyanion
species are formed i n a c i d i c media to give broad peaks.
Conditions f o r t h i s s e p a r a t i o n were as f o l l o w s .
Column e l u e n t A: 0.28 g CAB 0.13g sodium sulphate
and 8 ml of 2M ammonia i n 1 l i t r e of deionised d i s t i l l e d
water.
Column el u e n t B: Deionised d i s t i l l e d water.
A Hamilton PRP-1 m a t e r i a l i n a 10 by 0.46 cm column at
60 ^G was used w i t h a 2ml min ^ f l o w r a t e .
PC r e a c t a n t 1; 0.05g of PCV i n 1 l i t r e of deionised
d i s t i l l e d water-
PC r e a c t a n t 2; 0.5g of CAB i n 1 l i t r e of 15 % g l a c i a l
a c e t i c acid i n d i s t i l l e d d eionised water.
The PC s o l u t i o n gave a r e s u l t a n t pH of 3.5.
247
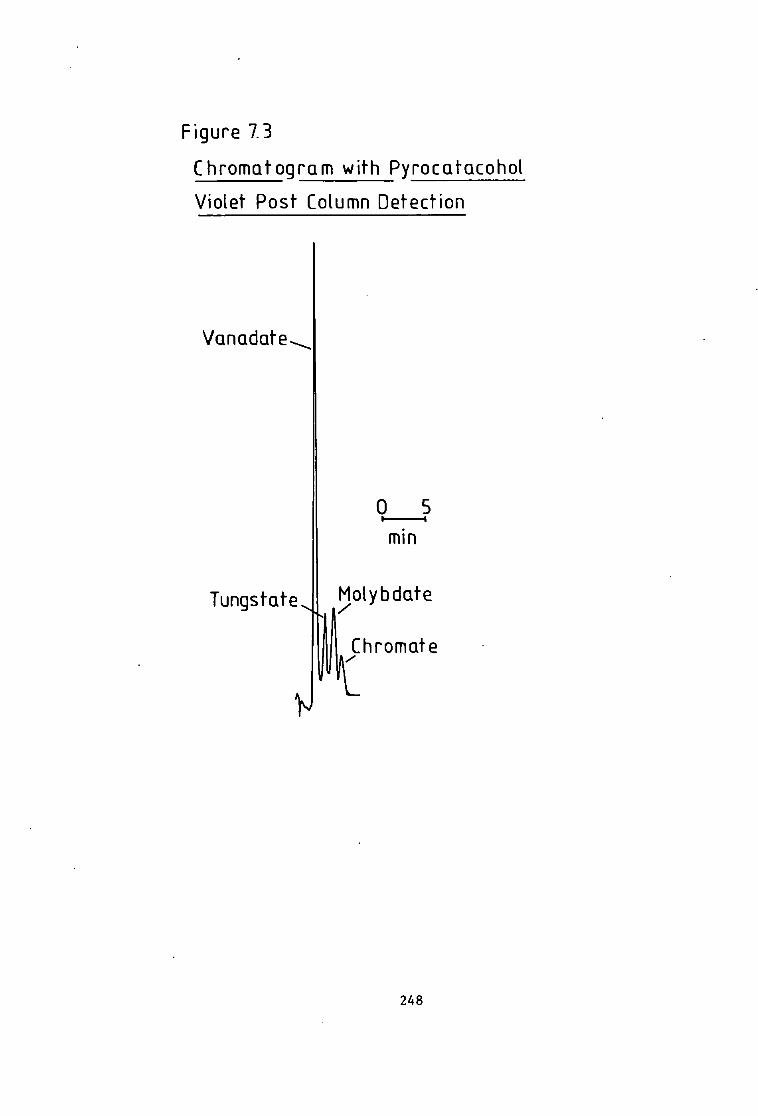
Figure 7.3
Chromatogram with PyrocQt-Qcohoi
Violet Post Column Detection
Vanadate
0 5
mm
TungstateJ Molybdate
Chromate
248

Table 7.1
Column Gradient f o r Oxyanion Chromatogram.
Time % flow
min. pump B
0 5 3.5 5 4.5 80 6.5 60 8.8 5
As c o n d i t i o n s reveal i n Table 7.1 separation was
complex and found t o be s e n s i t i v e to pH change. Peak
i n t e g r i t y a l t e r s w i t h pH, molybdate s p l i t i n t o two peaks
at lower pH. I f the CAB eluent i s not increased then
the chromate peak e l u t e s very l a t e and broad. Any lower
i n i t i a l c o n c e n t r a t i o n of CAB merges vanadate and
tungstate peaks, w i t h the vanadate peak becoming
considerably broader and l i k e molybdate showing a
disregard f o r usual chromatographic r u l e s concerning
peak broadening and column separation.
The method appeared not to give very s t a b l e r e t e n t i o n
times and suspicions were aroused when responses v a r i e d .
However t h i s may be due t o chromatographic i n s t a b i l i t y
because of n o n - e q u i l i b r i u m c o n d i t i o n s between the column
and e l u e n t . Decomposition of the i n j e c t e d anions could
also have occurred. The appearance of the column top
suggested t h a t the deep red purple colour was due to the 2-
f e r r a t e complex (FeO^] which i s s t a b l e i n
basic s o l u t i o n and may be the r e s u l t of o x i d a t i o n by the
249

chromate anion of s t e e l . This strong o x i d i s i n g agent
appears t o a t t a c k the column top, because i t had to be
p e r i o d i c a l l y replaced. However work showed promise, w i t h
these f o u r d i f f i c u l t species e l u t i n g q u i c k l y and w i t h
high e f f i c i e n c y . <
7.9 F l u o r i m e t r i c Trace High Performance L i q u i d
Chromatography Determinations.
I n a search f o r lower d e t e c t i o n l i m i t s fluorescence
has t o be considered f o r i t can be over a 100 times more
s e n s i t i v e than conventional photometric techniques- This
i s e s p e c i a l l y so w i t h the emergence of l a s e r e x c i t e d
fluorescence. However t h i s s e n s i t i v e method cannot be
applied d i r e c t l y t o metal d e t e c t i o n as most metals do
not f l u o r e s c e on t h e i r own, notable exceptions are some
lanthaniods and uranium. Paramagnetism i n h i b i t s
t r a n s i t i o n metal ions from f l u o r e s c i n g , however, they
can be q u a n t i f i e d by t h e i r quenching e f f e c t ( 1 5 7 ) . Some
metal-complexes do f l u o r e s c e and they may be very
s e n s i t i v e f o r HPLIEC metal d e t e c t i o n .
8-Hydroxyquinoline(8HQ) i s known to form complexes w i t h
many metals which fluoresces i n a l k a l i n e c o n d i t i o n s and
may the r e f o r e be a good PC reagent, forming complexes
w i t h a metal by bonding through the oxygen and n i t r o g e n
atoms*
Although 8HQ has been used as an e x t r a c t i n g agent i t
250

has a low e x t i n c t i o n c o e f f i c i e n t ( f o r c h r o m i u m ( I I I ) and
vanadium(VI) does not exceed 10,000 l.mole ^
cm ^) and i s of l i t t l e use i n trace determinations
by absorption. However, many complexes do f l u o r e s c e , of
which eleven can be determined a n a l y t i c a l l y C 1 5 8 ) they
are; a l u m i n i u m ( I I I ) , g a l l i u m ( I I I ) , i n d i u m ( I I I ) ( 1 5 9 ) ;
cadmium(160), hafnium, magnesium(161), scandium,
t i n ( I I ) , y t t r i u m , zinc and zirconium(162)-
However 8HQ i s not water soluble and complicates the
PGR procedure. This may be overcome by using an
analogue, 8-Hydroxyquinoline 5 sulphonic acid(8HQ5SA),
which has been used f o r the f l u o r e s c e n t determination of
cadmium and magnesium(163,164). T i n also fluoresces
s t r o n g l y i n aqueous s o l u t i o n w i t h 8HQ5SA i n the d i - or
t e t r a v a l e n t s t a t e (165).
7.10 Fluorescent Post Column Reactor Detection w i t h
8-Hydroxyquinoline-5-Sulphonic Acid.
This water soluble compound forms many complexes and
i t i s hoped t o show t h a t fluorescence d e t e c t i o n of
indium, z i n c , cadmium and magnesium can be performed
w i t h HPLIEC and a 8HQ5SA PC reactant s o l u t i o n , which i s
buffered t o an a l k a l i n e pH- The chromatogram i n Figure
3.4 (page 82) demonstrates the d e t e c t i o n of f l u o r e s c e n t
species of f o u r metals w i t h good s e n s i t i v i t y , c e r t a i n l y
below the pg ml l e v e l s . The background, although
251

s l i g h t l y noisy here i s considerably b e t t e r than t h a t
achieved i n conventional p h o t o c e l l measurements, because
the o f t e n large background l i g h t l e v e l s are e l i m i n a t e d .
A 0.04M t a r t r a t e b u f f e r at pH 3.3 w i t h a I ml min"^
fl o w r a t e has l i t t l e e f f e c t on d e t e c t i o n . A I ml
min ^ PC reactant mixture of a 0.002M 8HQ5SA
s o l u t i o n i n an aqueous 7 % v/v s o l u t i o n of 0.88 ammonia
gave a PGR pH of 8.2. The f l u o r e s c e n t e x c i t a t i o n and
emission wavelengths were averaged and the e x c i t a t i o n
was at 364 nm and emission at 515 nm.
The wide l i n e a r response range of the fluorescence
method makes i t an a t t r a c t i v e o p t i o n f o r metal d e t e c t i o n
w i t h high s e n s i t i v i t y . However many metals do not
f l u o r e s c e . Some authors have overcome t h i s problem by a
displacement r e a c t i o n where a k i n e t i c a l l y quick c a t i o n
of high thermodynamic s t a b i l i t y replaces a
non-fluorescing c a t i o n of l e s s e r complexing a b i l i t y . A
good example i s given by Beckett and Nelson(107) where
b e t t e r s e n s i t i v i t i e s are be achieved. The authors
f u r t h e r suggest t h a t g r e a t e r s e n s i t i v i t i e s can be
obtained w i t h l a s e r e x c i t a t i o n .
7.11 Conclusions as to Future Work.
As more knowledge of s p e c i a t i o n i s required lower
l i m i t s of d e t e c t i o n are necessary. The above work shows
the p o s s i b i l i t i e s of improved d e t e c t i o n and separation
252

o f o x y a n i o n s p e c i e s . However t h e c h r o m a t o g r a p h y r e q u i r e s
f u r t h e r i n v e s t i g a t i o n t o o b t a i n more r e p r o d u c i b l e
r e s u l t s - The d e t e c t i o n o f o x y a n i o n s and o t h e r h i g h l y
c h a r g e d s p e c i e s by t h e PCV PC r e a c t a n t shows p r o m i s e
a l t h o u g h o p t i m i s a t i o n may be more d i f f i c u l t t h a n f o r a
b i n a r y s y s t e m .
S i m i l a r l y t h e f l u o r e s c e n t d e t e c t o r may o f f e r
c o n s i d e r a b l y i m p r o v e d d e t e c t i o n l i m i t s f o r some m e t a l s ,
b u t c h r o m a t o g r a p h i c sys tems s h o u l d a l s o be d e v e l o p e d t o
s e p a r a t e o t h e r m e t a l s t h a t r e spond w i t h 8HQ5SA.
7 .12 G e n e r a l C o n c l u s i o n s .
New methods o f t r a n s i t i o n m e t a l c a t i o n s e p a r a t i o n and
d e t e c t i o n a r e o u t l i n e d w i t h two new PC r e a c t a n t s . A
n o v e l a p p r o a c h was a d o p t e d t o engage t h e use o f w e l l
known o r g a n i c r e a g e n t s d i t h i z o n e ( 1 2 5 , 1 2 6 ) and
E B T ( 1 2 6 , 1 3 8 ) . A r e v e r s e mode o f p h o t o m e t r i c d e t e c t i o n
f o r w h i c h a dec rease o f absorbance was f o u n d t o be
p r o p o r t i o n a l t o t h e m e t a l q u a n t i t y d e t e c t e d was u s e d .
The a p p l i c a b i l i t y and a d a p t a b i l i t y o f HPLIEC w i t h
d e t e c t i o n by t he se r e a c t a n t s has been d e m o n s t r a t e d f o r
t r a c e a n a l y s i s . The a n a l y s i s o f m e t a l a l l o y s ( 1 2 5 ) and
s a l i n e samples i l l u s t r a t e d good agreement w i t h c e r t i f i e d
v a l u e s and those d e t e r m i n e d by c o n v e n t i o n a l a t o m i c
s p e c t r o s c o p y t e c h n i q u e s .
A l t h o u g h t h e above m e n t i o n e d d e t e c t o r s show l o w l e v e l s
253
o f d e t e c t i o n an improvemen t e s p e c i a l l y f o r t h e i n v e r s e
mode o f d e t e c t i o n by r e d u c i n g t h e n o i s e w o u l d l o w e r t h e
d e t e c t i o n l i m i t s f u r t h e r beyond those o f o t h e r
p h o t o m e t r i c d e t e c t o r s . Improvement o f HPLIEC n a t u r a l l y
i n v o l v e s b e t t e r s e n s i t i v i t y , s e p a r a t i o n and r e l i a b i l i t y .
When c o n s i d e r i n g ways o f o b t a i n i n g b e t t e r s e n s i t i v i t y ,
co lumn e f f i c i e n c y and l o w e r d e t e c t i o n l i m i t s a r e
I n t i m a t e l y l i n k e d . As co lumn p a r t i c l e s o f l o w e r r e g u l a r
d i a m e t e r a r e b e i n g m a n u f a c t u r e d b e t t e r d e t e c t i o n l i m i t s
s h o u l d f o l l o w .
254

A p p e n d i x I .
S t a b i l i t y C o n s t a n t s f o r M e t a l Complexes .
The I s c s t a b i l i t y c o n s t a n t e x p r e s s e d as l -og^^ f o r m e t a l e l u t i n g agen t complexes a re shown be low and a re i n o r d e r o f t h a t f o r most e l u t i n g a g e n t s t o a s s i m i l a t e c o m p a r i s o n -
L i g a n d C i t r a t e T a r t r a t e O x a l a t e
M e t a l
Hydrogen 5.7 4 . 5 3 .8
I o n 4 . 3 2 .9
2 . 8
B i s m u t h I n d i u m 6 .2 4 . 5 3 . 1 Copper 5 .9 2 .6 6 .3 I r o n I I I 11 .4 6 .9 9 . 4 Z i n c 5 . 0 2 .7 4 . 9 N i c k e l 5 .4 5 .3 Lead 4 . 3 2 . 9 C o b a l t 5 .0 2 .8 3 .7 Cadmium 3 .7 3 .7 3 .7 I r o n 4 . 4 2 . 2 4 . 7 Manganese 2 , 8 1,4 3 .9 Magnesium 3.7 1.9 3 .4 C a l c i u m 3 . 4 2 . 1 3 . 0 M e r c u r y 10 .9 S i l v e r 2 . 4
255
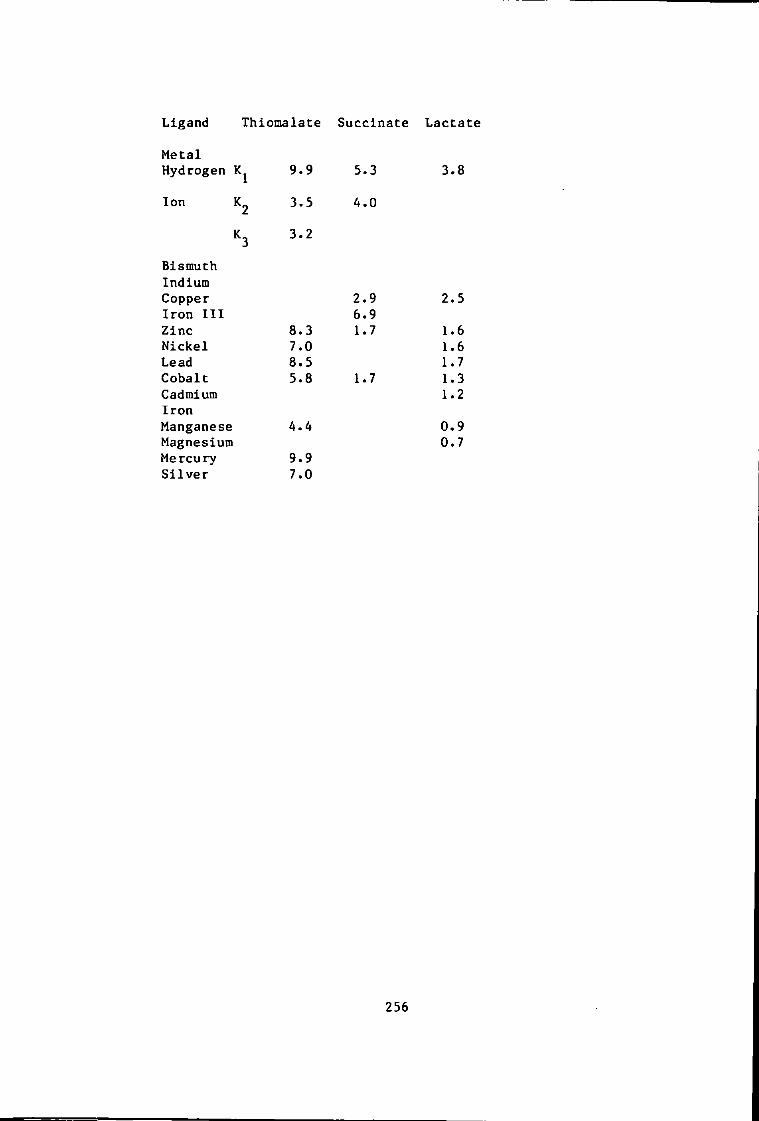
L i g a n d T h i o m a l a t e S u c c i n a t e L a c t a t e
M e t a l
Hydrogen 9.9 5.3 3.8
I o n 3.5 4.0 3.2
B i s m u t h I n d i u m Copper 2.9 2.5 I r o n m 6.9 Z i n c 8.3 1.7 1.6 N i c k e l 7.0 1.6 Lead 8.5 1.7 C o b a l t 5.8 1.7 1.3 Cadmium 1.2 I r o n Manganese 4.4 0.9 Magnesium 0.7 M e r c u r y 9.9 S i l v e r 7.0
256
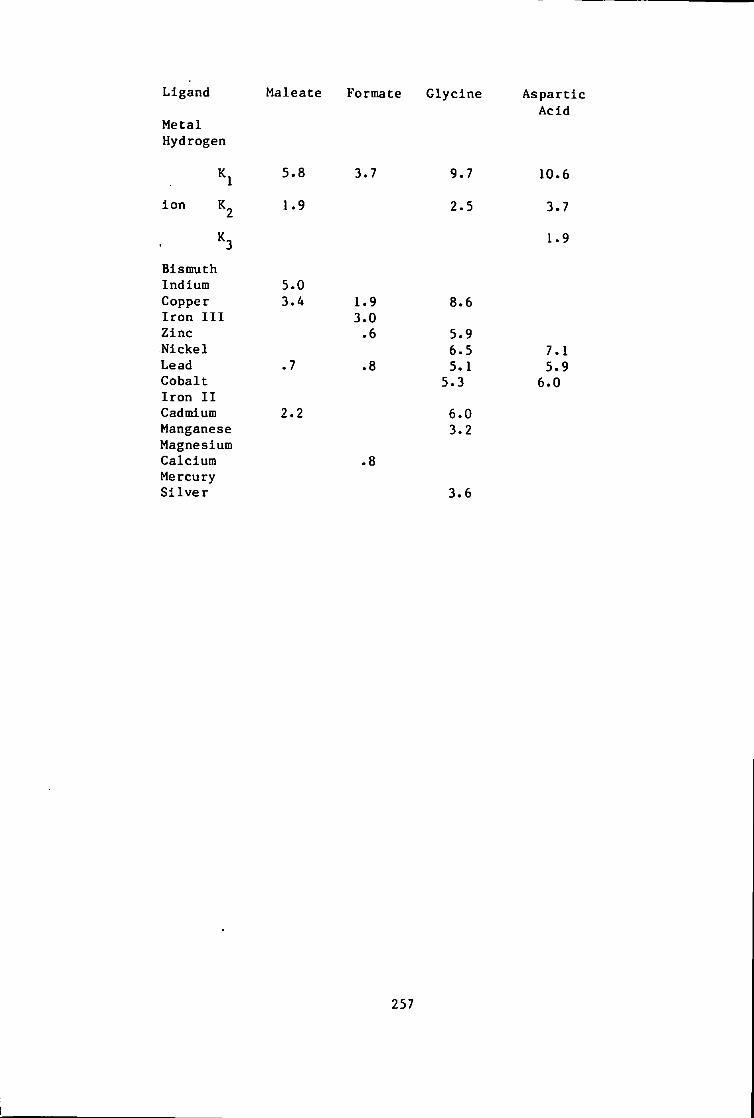
L i g a n d M a l e a t e Formate G l y c i n e A s p a r t i c A c i d
M e t a l Hydrogen
5 .8 3 .7 9 .7 10 .6
i o n 1.9 2 .5 3 .7
B i s m u t h I n d i u m 5 .0 Copper 3 .4 1.9 8 .6 I r o n I I I 3 .0 Z i n c . 6 5 .9 N i c k e l 6-5 7 . 1 Lead .7 .8 5 . 1 5 .9 C o b a l t 5 .3 6 .0 I r o n I I Cadmium 2 .2 6 . 0 Manganese 3 .2 Magnesium C a l c i u m .8 M e r c u r y S i l v e r 3 . 6
257
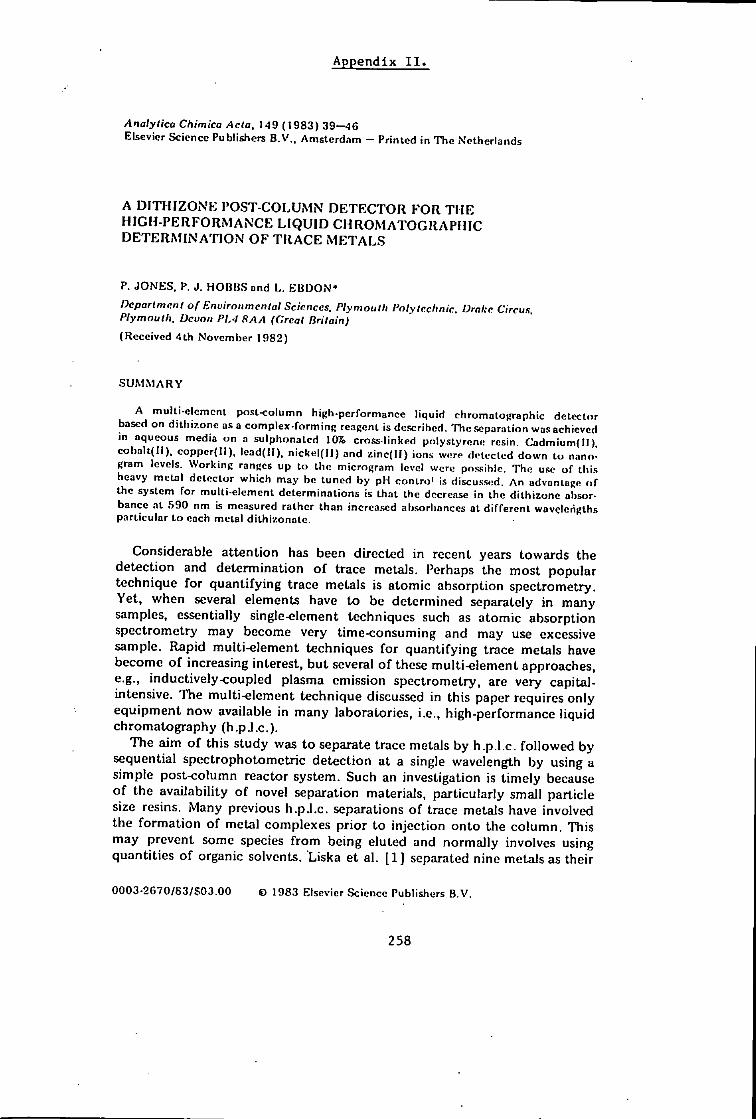
A p p e n d i x I I
Anatytica Chimica Acta, 149 ( 1 9 8 3 ) 3 9 - 4 6 Elsevier Science Publishers B . V . . Amsterdam - Printed in T h e Netherlands
A D I T H I Z O N K POST-COLUMN DETECTOR FOR T H E HIGH-PERFORMANCE L I Q U I D C H R O M A T O G R A P H I C D E T E R M I N A T I O N OF T R A C E M E T A L S
P. J O N E S , P. J . H O B B S ond L . E B D O N *
Department of Environmental Sciences. Plymouth Polytechnic. Drake Ci Plymouth. Devon PL^i HAA (Great Britain)
(Received 4th November 1982)
S U M M A R Y
A multi-element posl-column high-performance liquid chromotopraphic detector based on dithiKonc as a complex-forming reagent is described. T h e separation was achieved in aqueous media o n a sulphonatcd 10% cross-linked polystyrene resin. C a d m i u m ( I l ) , cobalt(n), copper{I I ) , l ead(II ) , n i c k e l ( I I ) and z i n c ( I I ) ions werf detected down to nanogram levels. Working ranges up to the microgram level were possible. T h e use of this heavy metal detector which may be tuned by p H contro' is di5cuss4;d. A n udvanloge of the system for multi-element determinations is that the decrease in the dithizone absor-bancc at 590 nm is measured rather than increased alisorbanccs at different wavelengths pari icular to each metal d)lhi7.onatc.
Considerable attention has been directed in recent years towards the detection and determination o f trace metals. Perhaps the most popular technique for quant i fy ing trace metals is atomic absorption spectrometry. Yet» when several elements have to be determined separately in many samples, essentially single-element techniques such as atomic absorption spectrometry may become very time-consuming and may use excessive sample. Rapid multi-element techniques fo r quant i fy ing trace metals have become o f increasing interest, bu t several o f these multi-element approaches, e.g., inductively-coupled plasma emission spectrometry, are very capital-intensive. The multi-element technique discussed in this paper requires only equipment now available in many laboratories, i.e., high-performance l iqu id chromatography ( h . p j . c ) .
The aim o f this study was to separate trace metals by h.p.l.c. fo l lowed by sequential spectropho tome trie detection at a single wavelength by using a simple post-column reactor system. Such an investigation is t imely because o f the availabili ty o f novel separation materials, particularly small particle size resins. Many previous h.pJ.c. separations o f trace metals have involved the fo rmat ion of metal complexes prior to inject ion onto the co lumn. This may prevent some species f r o m being eluted and normally involves using quantities of organic solvents. Liska et al. [ I J separated nine metals as their
0 0 0 3 - 2 G 7 0 / 6 3 / S 0 3 . 0 0 © 1983 KIscvier Science Publishers B . V .
258

40
diethyldithiocarbamates. using LiChrosorb Si-60 (10 ^ m ) and 10% chlorofo rm in cyclohexane as the eluent. Similarly, strong complexing reagents such as dithizone | 2 ] and 8-mercaptoquinoline ( 3 ] have been used w i t h pre-column preparation. Further examples o f this approach have been discussed in a comprehensive review by Schwedt [ 4 ] o f inorganic trace analysis by chromatography. Many environmental samples are dynamic in nature and injection wi thou t sample pretreatment has obvious advantages.
Takata and Muto | 5 1 separated six metals on a cation-exchange resin column wi th tartaric acid as the eluting agent. The e f f luen t was passed through a coulometric detector w i t h the addit ion o f electrolytes to stabilize the detector signal. While few laboratories have access to coulometric detectors, most h.p.l.c. systems incorporate a spectrophotomctric detector. Thus the systems employing separation and then reaction w i t h a colour- forming reagent perhaps o f fe r more ready applicabil i ty. Careful choice o f the reagent and wavelength should allow either selective or general detect ion w i t h acceptable sensitivity. Other advantages o f post-column derivatisation are that i t is readily automated and that defined products and completed reactions are not essential. Significantly fo r environmental applications, the separation is now based upon the parent species.
Fritz and Story (6) found that arsenazo-I formed coloured species in a post-column reactor w i t h calcium, magnesium and several other ions. Arsenazo-lII gave coloured species w i t h eleven metals and the lanthanides, whereas 4-(2-pyridylazo)-resorcinol (PAR) formed coloured species w i t h sixteen metals ( 6 ) ; PAR has also been used by Cassidy and Elchuk | 7 ] . Kawazu ( 8 ] separated ten metals w i t h a macroreticular resin (Amberl i te 200) and again PAR was used to detect these species after a 35-min separat ion . Polystyrene cross-linked resins are increasingly being used because of their stability between pH 1 and 13. Kawazu and Fri tz [ 9 ] separated cadmium and zinc on a macroreticular resin, using l-(2-pyridylazo)-2-naphthol as a post-column reactant.
Beckett and Nelson [ 1 0 ] described a detector that o f fe red improved sensitivity based on derivatisation w i t h an ethylenediaminetetraacetic acid ( E D T A ) analogue; the E D T A molecule had an aniline moiety attached and the separated metal-ligand species reacted w i t h fluorescamine in the post-column reactor to give fluorescent detection in the sub-picomolar range. However, pre-column derivatisation was necessary and the co lumn separat ion was effected in acetate media.
Chromatographic systems also o f f e r considerable potential fo r the investigation o f metal speciation. Interest in d i f fe rent ia t ing inorganic and organic mercury in environmental samples led Cast and Kraak ( 1 1 | to develop a method whereby the mercury species were separated on a reversed-phase column wi th acetonitrile and 0.1 M sodium bromide as the mobile phase and then detected w i t h a dithizone post-column reaction system set at 480 nm.
In the work described here, a general detector was based on moni tor ing the decrease o f absorbance of unreacted di thizone. This report is concerned
259

41
wi th the separation o f cadmium, cobalt, copper, lead, nickel and zinc and their detection by a post-column reaction. The current l imi ts o f detection and linear work ing ranges are reported and the possibilities o f the method are discussed. The most successful approach was to separate the analyte species on a polystyrene-based cation-exchange resin wi th an aqueous tartaric acid eluent. Dithizone dissolved in acetone was added to the column ef f luen t which then proceeded i n t o a reactor coil pr ior to the detector. The decrease in absorbancc at 590 nm was used to quan t i fy the trace metal levels.
E X P E R I M E N T A L
Apparatus A schematic diagram o f the main components is shown in Fig. 1. A double-
beam u.v./visibic spectrophotometric f low moni tor (SF 770; Schoeffel Instrument Corporat ion, Westwood, NJ) was equipped w i t h a tungsten lamp and the wavelength was set to 590 nm. A 1-cm cell was used w i t h a 10-pl volume. The pumps (Constametric M l ; Laboratory Data Cont ro l , Riviera Beach, F L 33404) were operated f rom a central microprocessor control un i t (Control Command Module, L.D.C.) . Samples were injected on to the cation-exchange resin (Aminex A 9 , 11.0 ± 0.5 p m , Bio-Had) in a 90 mm X 5 mm co lumn, wi th an inject ion valve (Rhcodyne Model 7125; Rheodyne, Cota t i , C A 94928) and a IOO-/2I sampling loop.
The cation-exchange column was prepared by degassing the beads in a vacuum whi ls t in a beaker containing the eluent at the highest concentration to be used to separate the metal species. The eluent has also to be at the lowest pH at which i t w i l l be required to func t ion . A standard packing pro-
microprocGSsor amplifier \ detector
Plotter^
m u m n s
pumps
F I R . I . Schemotic diap-am of the apparatus. Solid lines represent liquid Hows- dashed lines represent electrical connections. T h e ions arc separated on co lumn D (Aminex A 9 cation-exchange resm) with the tartrate eluent pumped by pump A. T h e post-column reactant (dtthizone) is pumped by pump B to meet the efnuent in reactor coil E . C o l u m n C packed with silica RCI is inserted into the dithizone line to provide back-pressure.
260
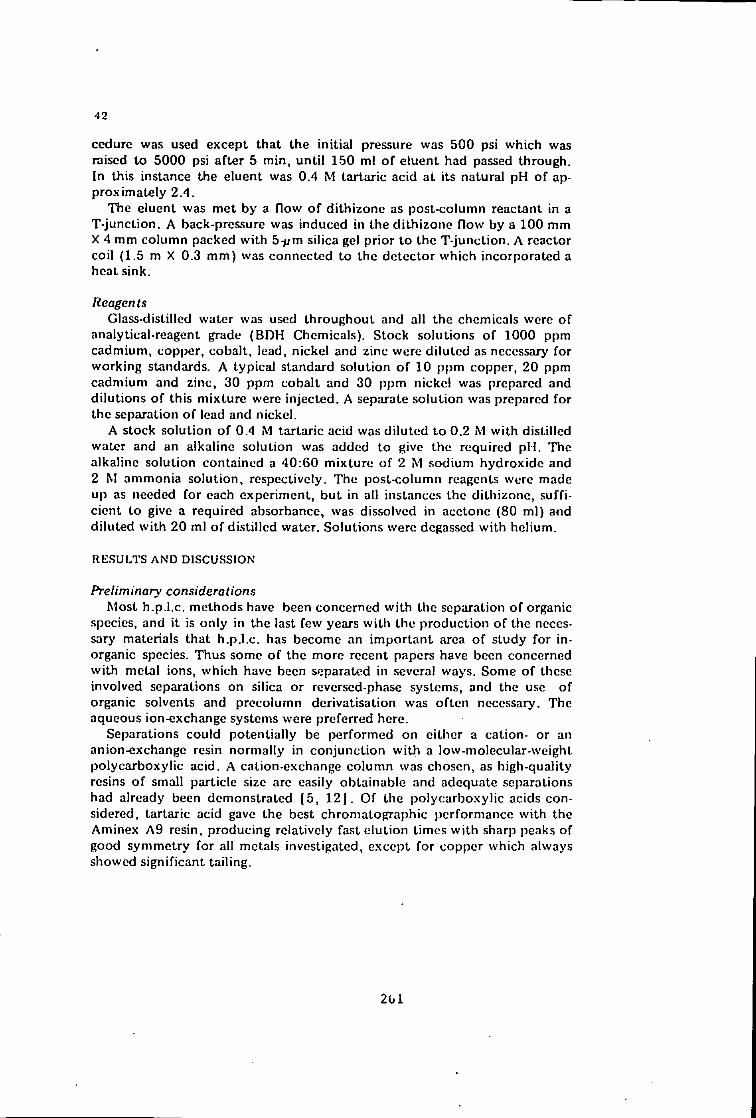
42
ccdure was used except that the ini t ia l pressure was 500 psi which was raised to 5000 psi after 5 min , unt i l 150 m! o f eluent had passed through. In this instance the eluent was 0.4 M tartaric acid at its natural pH o f approximately 2.4.
The eluent was met by a f low o f dithizone as post-column reactant in a T- junct ion. A back-pressure was induced in the di thizone f low by a 100 mm X 4 mm column packed wi th 5-;im silica gel prior to the T- junct ion. A reactor coil (1.5 m X 0.3 m m ) was connected to the detector which incorporated a heat sink.
Reagents Glass-distilled water was used throughout and all the chemicals were o f
analytical-reagent grade (BDH Chemicals). Stock solutions o f 1000 ppm cadmium, copper, cobalt, lead, nickel and zinc wore di luted as necessary fo r working standards. A typical standard solution o f 10 ppm copper, 20 ppm cadmium and zinc, 30 ppm cobalt and 30 ppm nickel was prepared and di lut ions o f this mixture were injected. A separate solution was prepared for the separation o f lead and nickel.
A stock solution of 0.4 M tartaric acid was di luted to 0.2 M w i t h distilled water and an alkaline solution was added to give the required p l l . The alkaline solution contained a 40:60 mixture of 2 M sodium hydroxide and 2 M ammonia solut ion, respectively. The post-column reagents were made up as needed for each experiment, bu t in all instances the dithizone, suf f i cient to give a required absorbance, was dissolved in acetone (80 ml ) and diluted wi th 20 ml o f distilled water. Solutions were degassed w i t h hel ium.
R E S U L T S A N D D I S C U S S I O N
Preliminary considerations Most h.p.l.c. methods have been concerned w i t h the separation o f organic
species, and i t is only in the last few years w i t h the product ion of the necessary materials that h.p.l.c. has become an impor tan t area o f study fo r inorganic species. Thus some o f the more recent papers have been concerned w i t h metal ions, which have been separated in several ways. Some o f these involved separations on silica or reversed-phasc systems, and the use of organic solvents and precolumn derivatisation was o f t en necessary. The aqueous ion-exchange systems were preferred here.
Separations could potentially be performed on cither a cation- or an anion-exchange resin normally in conjunc t ion w i t h a low-molecular-weight polycarboxylic acid. A cation-exchange column was chosen, as high-quality resins o f small particle size are easily obtainable and adequate separations had already been demonstrated [ 5 , 1 2 ] . Of the polycarboxyl ic acids considered, tartaric acid gave the best chromatographic performance w i t h the Aminex A9 resin, producing relatively fas te lu t ion times w i t h sharp peaks of good symmetry for all metals investigated, except for copper which always showed significant tail ing.
201
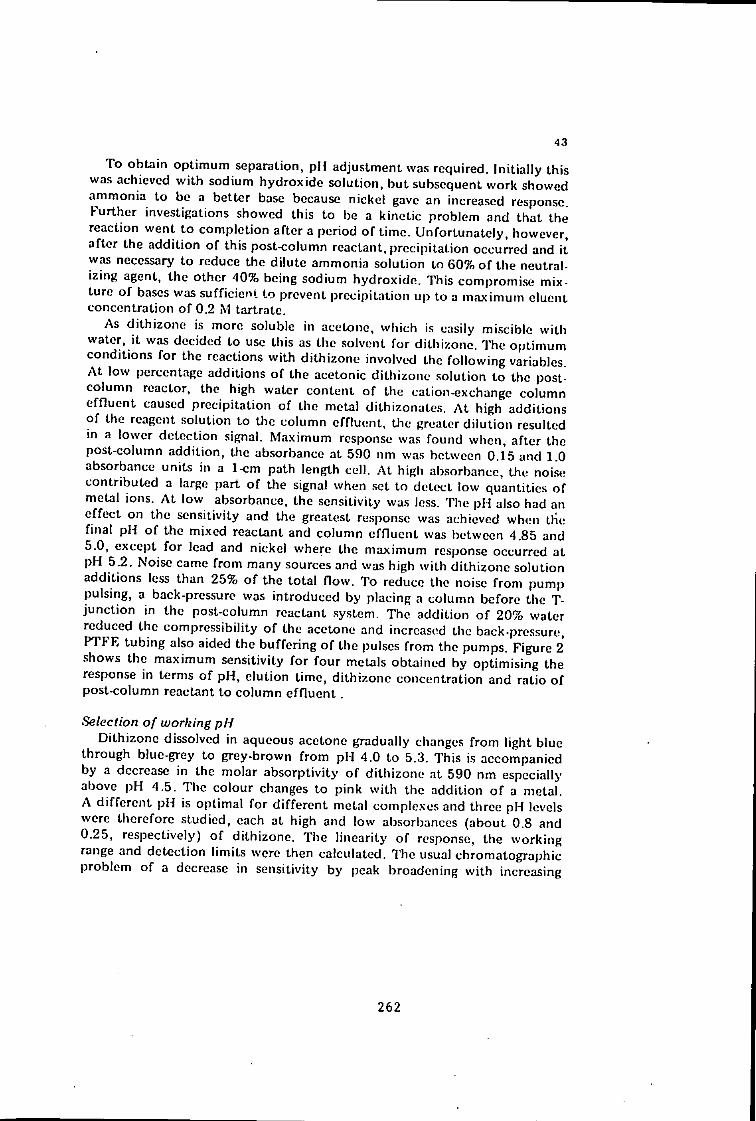
43
To obtain op t imum separation, pH adjustment was required. In i t ia l ly this was achieved w i t h sodium hydroxide solution, but subsequent work showed ammonia t o be a better base because nickel gave an increased response. Further investigations showed this to be a kinetic problem and that the reaction went to completion after a period o f t ime. Unfor tunate ly , however, after the addit ion of this post-column reactant, precipitation occurred and i t was necessary to reduce the dilute ammonia solution to 607o o f the neutralizing agent, the other 40% being sodium hydroxide . This compromise mixture of bases was suff icient to prevent precipitation up to a maximum cluent concentration o f 0.2 M tartrate.
As dithizone is more soluble in acetone, wl i ich is easily misciblc wi th water, i t was decided to use this as the solvent fo r di thizonc. The op t imum conditions fo r the reactions w i t h di thizone involved the fo l lowing variables. A t low percentage additions o f the acetonic di thizonc solution to the post-co lumn reactor, the high water content o f the cation-exchange column e f f luen t caused precipitation of the metal dithizonates. A t high additions of the reagent solution to the column eff luent , the greater d i lu t ion resulted in a lower detection signal. Maximum rcspon.se was found when, after the post-column addi t ion, the absorbance at 590 nm was between 0.15 and 1.0 absorbancc units in a 1-cm path length cell. A t high absorbancc, the noise contr ibuted a large part of the signal when set to detect low quantities of metal ions. A t low absorbance, the sensitivity was loss. The pH also had an effect on the sensitivity and the greatest response was achieved when the f inal pH o f the mixed reactant and column e f f luen t was between 4.85 and 5.0, except fo r lead and nickel where the maximum response occurred at pH 5.2. Noise came f r o m many sources and was high w i t h di thizone solution additions less than 25% o f the to ta l f l o w . To reduce the noise f r o m pump pulsing, a back-pressure was introduced by placing a column before the T-junc t ion in the post-column rcactant system. The addi t ion o f 20% water reduced the compressibility o f the acetone and incrca.sod the back-pressure, PTFE tubing also aided the buf fe r ing o f the pulses f r o m the pumps. Figure 2 shows the maximum sensitivity fo r fou r metals obtained by optimising the response in terms o f p H , elution t ime, dithizone concentration and ratio o f post-column reactant t o co lumn e f f l u e n t .
Selection of working pH Dithizone dissolved in aqueous acetone gradually changes f rom light blue
through blue-grey to grey-brown f r o m pH 4.0 to 5.3. This is accompanied by a decrease in the molar absorptivity o f di thizone at 590 nm especially above pH 4.5. The colour changes to pink w i t h the addit ion o f a metal. A d i f f e r en t pH is opt imal f o r d i f f e ren t metal complexes and three pH levels were therefore studied, each at high and low absorbanccs (about 0.8 and 0.25, respectively) o f dithizone. The linearity o f response, the working range and detection l imits were then calculated. The usual chromatographic problem of a decrease in sensitivity by peak broadening wi th increasing
262
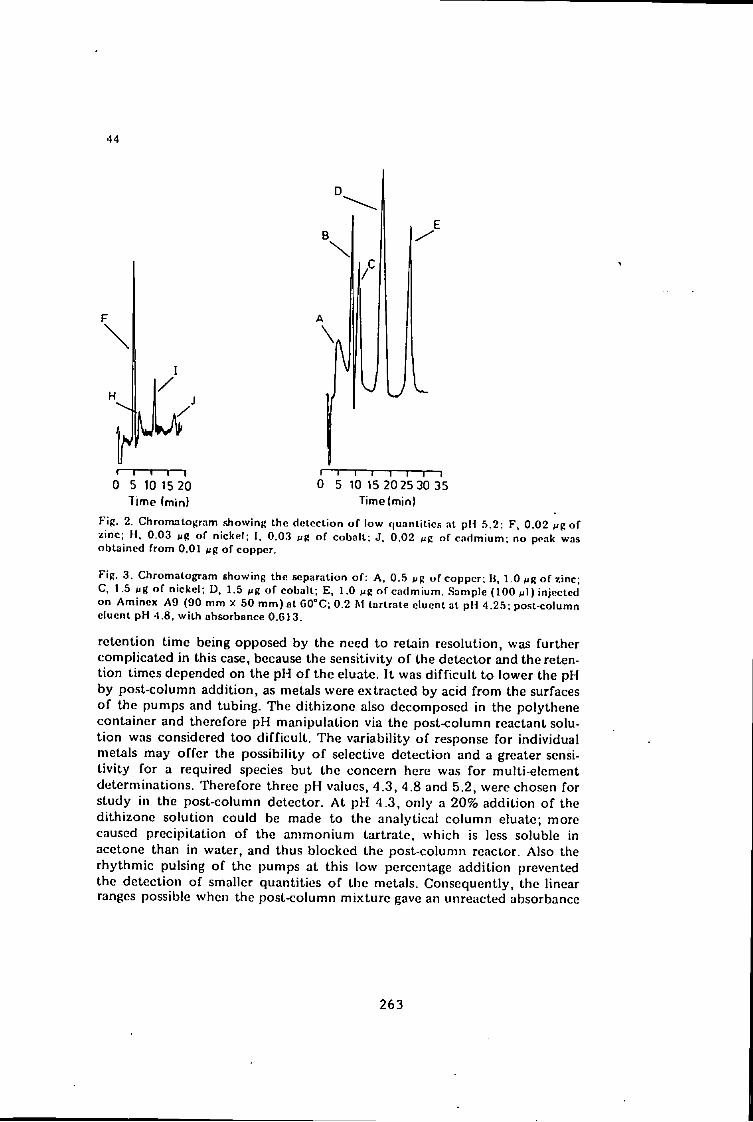
44
\ 0
i—I—I—r—I
0 5 10 15 20 Time (mini
"T I I I I — I — I
5 10 15 20 25 30 35 Time(min)
Fig. 2. Chromatogram .showing the detection of low quantities at pH 5.2; F , 0 .02 of z inc; H , 0.03 / i g of nickel; I , 0.03 ; i g of cobalt; J . 0.02 M R of c a d m i u m ; no peak was obtained from 0.01 ^g of copper.
Fig. 3 . Chromatogram showing the separation of: A , 0.5 nR o f copper; B, 1.0 of zinc; C , 1.5 AJg o f nickel; D, 1.5 * ig o f cobalt; E , 1.0 Mg of cadmium. .Sample (100 p i ) injected on Amincx A 9 (90 mm X 50 m m ) at GO^C; 0.2 M tartrate e lucni at pH 4 .25; post-column eluent pH -1.8. wi ih absorbance 0 .613 .
retention t ime being opposed by the need to retain resolution, was fur ther complicated in this case, because the sensitivity o f the detector and the retent ion times depended on the pH o f the eluate. I t was d i f f i c u l t to lower the pH by post-column addi t ion, as metals were extracted by acid f r o m the surfaces o f the pumps and tubing. The di thizone also decomposed in the polythene container and therefore pH manipulat ion via the post-column reactant solut ion was considered too d i f f i c u l t . The variabi l i ty o f response fo r individual metals may o f fe r the possibility o f selective detection and a greater sensit iv i ty for a required species bu t the concern here was for multi-element determinations. Therefore three pH values, 4.3, 4.8 and 5.2, were chosen for study in the post-column detector. A t p i ! 4.3, only a 20% addit ion o f the dithizone solut ion could be made t o the analytical co lumn eluate; more caused precipitation of the ammonium tartrate, which is less soluble in acetone than in water, and thus blocked the post-column reactor. Also the rhythmic pulsing o f the pumps at this low percentage addi t ion prevented the detection o f smaller quantities o f the metals. Consequently, the linear ranges possible when the post-column mix ture gave an unreacted absorbance
263

45
of 0.25 at 590 nm were f r o m 200 ng to 3 ijg for cobalt, copper and zinc, and f r o m 200 ng to 1 j jg f o r cadmium. A t this low p l l the sensitivity to nickel is poor and lead docs not respond.
The post-column reactor was at its most sensitive at pM 4.8—5.0. By adjustment o f the di thizonc concentration in the post-column reactant mix ture , the working range could be extended. When the analytical column e f f luen t was mixed in a 3:2 ratio w i t h the dithizone .solution in the post-column reactor and when this ratio was varied so that the absorbancc o f the f inal unrcactcd e f f luen t at 590 n m was 0.2 at one extreme and 0.6 at the other, a working range for the five metals o f 10 ng—20 fjg was obtained. The l imi t s o f detection (2 o ) in the order o f their e lu t ion were 1 ng of copper, 6 ng of zinc, 8 ng o f nickel, 4 ng of cobalt and 5 ng of cadmium.
Analytical performance A comparison o f the responses at pH 4.8 and 5.2 is shown in Figs. 3 and 4,
where the absence o f a copper peak and the generally decreased response at
T — I — r
5 10 15 20 25 Time (min)
4
1 r
M
r—r 0 5 10 15 Time (mini
F I R . 4. Chromotogram of the same solul ion as in Fifi . 3 under the same condit ions except that the 0.2 M tartrate eluent was at p H 4.55 and the post-column p H was 5.2, with ahsorbance of 0.-19. Response to copper is negligible.
F ig . 5. Chromalogram under the same condit ions as F ig . 3: K , O.OG Mg of z inc; L , 0 .093 *J6 of n ickel ; iM, 0.5 ng of lead.
46
pH b2 can be noted (Fig. 4) . A t the higher p H , the linear work ing range was f rom 20 ng to 2 ^g for all metals except lead, w i t h a lower l i m i t o f 100 ng and zinc wi th an upper l i m i t o f 1 f i g . Figure 5 shows the d i f f i c u l t yet quantifiable separation of lead f r o m nickel. In contrast t o the other metals, the response for lead and nickel was at an o p t i m u m at a post-column pH o f 5.2.
An anomaly that occurred throughout the pH range was the slight negative curvature of the cobalt calibration graphs irrespective o f the quanti ty injected. Copper gives a broad peak although i t emerges f i rs t and this is more pronounced when the column is not heated, suggesting a kinetic interaction wi th the cross-linked sulphonated resin.
The abi l i ty o f dithizone to react w i t h many metals is well known and investigation into the detection o f other metals is in progress. Bismuth, gold, ind ium, mercury, palladium, p la t inum, silver and t in react wi th d i th i zone, as do some of their organic derivatives 113 ] . Bismuth and indium were eluted on the solvent f r o n t f r o m the column used at all pH values in the present study. Manganese and i ron species reacted bu t w i t h l i t t le sensitivity. In the case o f i r o n ( I I I ) , the response was probably due to loss o f dithizone by oxida t ion . While manganese(II) may f o r m a complex o f low stabil i ty, the complex is susceptible to oxida t ion and decomposition at the pH used. The loss of dithizone by oxidat ion or by the format ion o f unstable complexes may be exploited by moni to r ing the decreased dithizone absorption as in this detector. The instabil i ty o f some metal complexes may also be countered by the rapid air-free detection system reported here. The detector may also be adapted to the specific requirements o f an operator, by pH adjustment or by altering the di th izone absorbance in the f ina l eluted mixture .
Work is cont inuing on this promising approach to the h.p.l.c. o f metal ions w i t h a view to bo th improving the separation by studying other chromatographic systems and to exploi t ing the u t i l i t y o f this versatile di thizone post-column detector.
We thank the S.E.R.C. f o r the award o f a grant towards equipment used in this work .
R E F E R E N C E S
1 O. LiSka , J . Lehotay . E . BrandStetcrova, G . G u i o c h o n and H. C o l i n , J . Chromatogr. , 172 ( 1 9 7 9 ) 3 8 4 .
2 J . O'LauRhl in and T . P. O'Brien . Anal . Le t t . , A l l ( 1 9 7 8 ) 8 2 9 . 3 K . - H . Kcinie, H . - U . E h m c k e , G . Schnccwc i s and B. Ste inbrech, Fresenius Z . Anal .
C h e m . , 297 ( 1 9 7 9 ) 41 1. 4 G . S c h w e d l . T o p . Curr . C h e m . . 8 5 ( 1 9 7 9 ) 160. 5 Y . Takata and G . Muto, Anal . C h e m . . 45 ( 1 9 7 3 ) 18C4. 6 J . S. Fr i t z and J . N. Story , Anal . C h e m . . 46 ( 1 9 7 4 ) 8 2 5 . 7 R. M. Cassidy and S. L . E i c h u k . J . Chromatogr. Sc i . , 18 ( 1 9 8 0 ) 2 1 7 . 8 K . K a w a z u . J . Chromatop- . , 137 ( 1 9 7 7 ) 3 8 1 . 9 K . Kawazu and J . S. F r i t z . J . ChromatoRr. . 77 ( 1 9 7 3 ) 397 .
10 J . R . Beckett and D. A. Nelson, Anal . C h e m . , 53 (1981 ) 9 0 9 . 11 C . H. G a s l and J . C . Kraak , Int. J . E n v i r o n . A n a l . C h e m . : 6 ( 1 9 7 9 ) 2 9 7 . 12 Y . Takata and K . Fus i ta . J . Chromatogr. , 108 ( 1 9 7 5 ) 255 . 13 H . M. N. H . Irving. Dithizonc, The Chemica l Society , I^ondon, 1977.
265

A.N'Al.VST. JUNE I 9 S J . VOL. UN my
Inverse Photometric Detector, Based on Eriochrome Black T, for Trace Metal Determination by High-performance Liquid Chromatography Phi l ip J o n e s . Ph i l ip J . H o b b s a n d L e s E b d o n Department of Environmental Sciences, Plymouth Polytechnic, Drake Circus. Plymouth, Devon. PL4 8AA.
A simpre posi-column reactor based on Eriochrome Black T (EBTl has been developed lo determine trace meiats after separation on a silica-based caiion-eKChange colurrn. Quantitative detection is performed by measuring the decrease in the absorbance of the p o s K o l u m n reaciani. Quantitative analysis of nine melals in 16 min can be achieved. Linear calibrations up lo 10 p.p.m. for cadmium, cobalt, copper, indium, irondil), iron(il). magnes ium, manganese, nickel and zinc are possible with limits of detection of 2-5.ng. The relationship of the cation ion-exchange chromatography a n d the organic acid eluent to the post-column reactor is discussed. The system was used to determine cobalt, copper, iron, manganese and nickel in standard alloys and the accuracy of the method is shown to be very good with coefficients of variation in the range l - n % .
Keywords; Inverse photometric detection: trace metal determination; Eriochrome Black T; high-performance liquid chromatography; alloy analysis
A large number of investigations now require the delermina-lion of several elements in a single sampk. In many instances (he wmple analj-sis time will be excessive if ihe elements have 10 be quantified individually. Thus ihcre has been an increasing demand for sensiti%'e techniques capable of rapid mulli-elemenl determinations. Atomic-emission spectroscopic techniques have always been capable of simultaneous multi-element analysis and highly sophisticated inductively coupled plasma ( I C F ) instruments arc now available for the determination of as many as SO elements. A n alternative approach, involving much less capital cost and offering more scope for the investigation of chemical species is the use of liquid chromatographic techniques for rapid sequential multielement determination.
Until recently liiile attention had been focused on this area, panicularly for the determination of groups of metals, as classical liquid chromatography processes using columns v^cre very slow and no convenient sensitive on-line metal detection systems were available. The development of highly efficient column packing materials for use in high-performance liquid chromatography (I I P L C ) systems has considerably increased the speed of liquid chromatographic analysis and lately several workers have demonstrated the feasibility of using H P L C instrumentation for the rapid sequential analysis of groups of metal cations.
.Most papers describe the use of ion-exchange systems to separate metal ions in aqueous media using polyfunctional carboxylic acids as eluting agents. Takata and Fujita' described the separation of seven metals on small particle size polystyrene-based cation-exchange resins using tartaric acid as the eluiing system. Cossidy and Elchuk' used a citrate eluent to compare column packing materials for the separation of metal tons and their subsequent applicability to trace enrichment methods.
Metal detection systems still allow considerable scope for development and two approaches in particular have been successful. One involves electrochemical detection of metal completes using coulomctric principles' and the other photometric detection of metal complexes.' The latter approach appears to offer the most versatility, considering the large amount of information available on the photometric determination of trace melals. Metal cations separated on ion-exchange material in aqueous media will elute from the column generally as carboxylic acid completes with little or no absorbance in the U V • visible region. These metal species can be converted into highly absorbing complexes by introducing a
chromophoric reagent at the column outlet to mix with the effluent. After allowing sufficient time for reaction, the mixture is passed through the detector and the absorhancc of the metal complexes monitored at a specified wavelength. Post-column reactor systems although adding to the complexity of the apparatus, allow a tremendous range of reagent type and conditions to be used and the determination of most metals, if chromatographic systems can be developed to separate them. Many of the systems reported in the literature measure the absorbanccs of the metal complexes formed in the post-column reactor. Unfortunately, for a particular group of metal complexes the wavelength maximum can vary over a u-ide range and it is difficult to choose a compromise wavelength to achieve optimum sensitivity for every metal. Another more no%'el approach is to monitor the decrease in the absorbance of the reagent as each metal reacts with it. This procedure was pioneered in our laboratories and a dithizonc post-column reactor was reported that gave a good quantitative performance for six separated metal species.* For good sensitivity and low detection limits monitoring based on measurement of the decrease in absorbance of the photometric reagent requires that the reagent itself absorbs very strongly and dithizone is ideal for this purpose. Dilhizone is particularly suitable for the determination of the sulphnphilic metals, but reacts slightly or not at all with many of the more oxophilic metals. It was. therefore, considered that a more general metal detection system was needed and a number of chelating agents were investigated for use in post-column reactors. Eriochrome Black T ( E B T ) looked particularly promising as it reacts with a wide range of oxophilic and sulphophilic metals and is itself strongly absorbent at blO nm.
This paper describes the performance of an E B T post-column reaction system when used for the determination of a group of melals separated by cation exchange. Two certified reference metal alloy samples were analysed and the accuracy and precision of the detector assessed for boih the major and minor constituents.
Kxperimental
Apparatus
A typical isocratic high-peifotmance liquid chromatographic system was used (Fig. I ) . A high-pressure pump (Consta-metric I I I . Laboratory Data Control. Riviera Beach. F L . U S A ) at a constant flow-rate was connected via an injection valve {Rheodyne. MixIel7I25, Rhcodync. Cotali. C A . U S A )
266
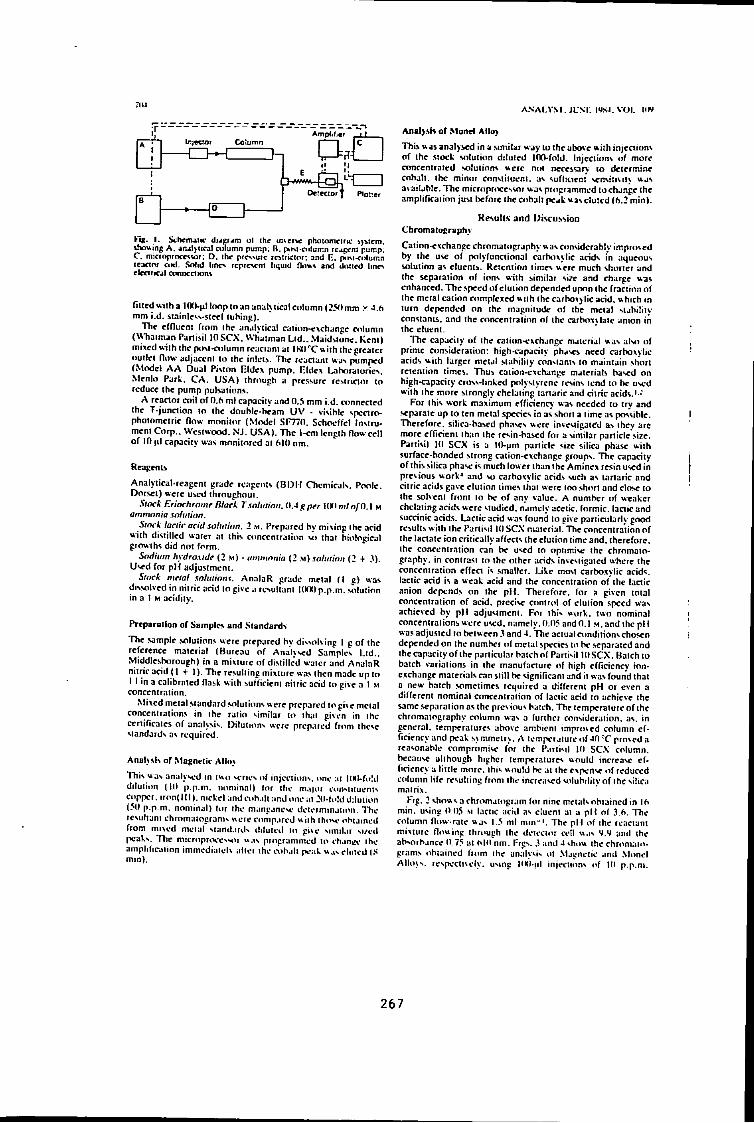
A N A L V S I . JLSL IMSJ. V O L IlW
trjecujr Ca'asmn - r n - H
Ampl.f.tr i t
teciof y Oetecior { Z D
Ploi-er
t i j . I . Schcmalic duzi^m oi (he uixcrw phoionwirtc *jMcm. ihowing A . anji j i ica] culutnn pump. B. p t t M - a r f u m n r c j p c n i pump. C. micfoprocc^wi: D . the prcs^.utc m i r i c i o i ; a n d Fi. piisKnIumn tenant CIKI. Solid lines r c p r w n i l i q u i d (Uw^ and d o n c d l i n o cIcctrK^I C O T n e c t K W i s
finedwitha in(Mlooptnunun;il\licalcnlumn(25<>mm x 4.h mm i.d. stain1e^s-stccl tubing).
The effluent frnm the unalyiical ralinn-e\chjn^e cnlumn (V^'halmanPani<.il l O S C X . Wliaiman L i d . . Maidsiune. Keni) mi \cd %iih the p«>si-c»>lumn rcaciam at \m'C>».ith thegiealcr outlet (low adjaccni lo ihe inlei>. The rcactant w-as pumped (Model A A Dual PiMon Eldcx pump. EldcK Lahriratories. Mcnlii Park. C A . U S A ) lhn)uch a pressure re'.lncior lo reduce the pump pulsations.
A reaclnr coil of 0.6 ml capacily and (1.5 mm i.d. connected Ihe T-junction to the doublc-hcam U V - visible ^pcaro-photometric flow monitor (Model S F ^ O . Schocffcl Insinj-meni Corp. . Wcslw-txxl. NJ . U S A ) . The 1-cm lengih flow cell of in MI capacity was monitored al h|(> nm.
Kraj;tnts
Anaiyiical-reageni grade reapciits ( B I ) H Chemicals. Poole. Dofsci) were Uicd throughoui.
Slock Eriochromf Black Tsnluiinn. HAgper UmmtofOA M ammonia .Kolution.
Stock laclic acid solution. 2 M . Prepared by mixing the acid with distilled water at this concentration so that biological growths did not form.
Sodium hydroxide (2 M ) • ammonia (2 w) solution (2 + .'*). Used for p l l adjustment.
Stock metal solutions. AnalaR grade metal (1 g) was dissolved in nitric acid logivc .i rcsullani KMX) p.p.m. solulion in a I M acidity.
Preparation or Samples and Standards
The sample solutions were prepared by disM>Kinp 1 g of the reference material (Bureau of Analysed Samples Ltd . . Middleshorough) in a mixture of distilled water and AnalaR nitric acid (1 + 1). The resullrng mixture was Ihen made up lo I I in a calibrated flask with sufficieni nitric acid lo give a I M concentration.
Mixed metal standard solutions were prepared to give mclal cnncenlrations in ihe ratio similar to that given in the ceniflcaics of analysis. Dilutions were prepared from ihcv: standards as required.
Anal>sls or Magnetic Alloy
This uas analysed in ivso series of injections, one ;il lll(^f^Id dilution (10 p.p.m. nominal) Inr ihc m.ijoi oinsiituenls copper. iron(III) . nickel andcohatt and one at 20-fi<]d dilution (50 p.p.m. nominal) tor the manganese deietmmjlinn. The tesultani chromalograms « e r e cimipjtcd wiih ihme ohiamu-d from mived meial siand.irds ililuteil to gi^e similar si/ed peaks. Tht microprtvessor was pioprammed to ch.mee the amplificalion immediaieK allei the citbali pi-iik \^asel^lled (S mm).
AnalysK of Monei Alloy
This analysed in a simiUr way to the above » i l h injectiuns of the stock solution diluted lOO-foId. Injections of more concentrated solutions ^^cre not necessary to determine cobalt, the minor constituent, as suffioeni sensitivity uas a\ ailjhle. The micrtiprwessor was programmed lo change the ampUfication juvl before (hecobalt peat uascluted (6.2 mini.
Results and l>tscussion Chroma toeraphy
Cation-exchange chromatography uas considerably improved by the use of polyfunctional carboxvlic acids in aqueous solution as eluents. Retention times uere much shorter and Ihe separation of ions uith similar si/e and charge uas enhanced. The speed ofclution depended upon the fraction of the metal cation complexed uith the cathoxylic acid, which in turn depended on the magmlude of the metal stability constants, and the concentration of the carhoxvlate anion in the eluent.
The capacity of the cation-exchange material uas also of prime consideration: high-capacity phases need carboxvlic acids uith larger metal stability constants lo maintain short retention times. Thus cation*exchange materials based on high-capacity cross-linked polystyrene resins tend lo he used u-ith ihe more strongly chelating tartaric and citric acids.'--
For this work maximum efficiency was needed to try and separate up to ten metal species in as short a lime as possible. Therefore, silica-based phases uerc investigated as they arc more efficient than the resin-based for a similar panicle size. Panisil HI S C X is a lO-jim panicle size silica phase uith surface-bonded strong cation-exchange groups. The capacity of this silica phase is much lower than the Aminex resin used in previous work' and su carhoxylic acids such as lanaric and citric acids gave elution times that were too short and close to the solvent from to be of any value. A number of weaker chelating acids were studied, namely ucciic. formic, lactic and succinic acids. Lactic acid was found to give panicularly good results with Ihe Partisil 10 S C X material. The concentration of the lactate ion critically affecis the elution time and. therefore, the concentration can be used to optimise the chromatography, in contrast to the other acids investigated where the concentration effea is smaller. IJke most carbo.xylic acids, lactic acid is a weak acid and Ihe conceniraiion of the laaic anion depends on the pH. Tlietefore. for a given total concentration of acid, precise cnntrol of elution speed was achieved by pH adjustment. For this woik. two nominal concentrations were used, namely. 0.05 and 0.1 M . and thepH was adjusted to between? and The actualcimditionschosen depended on the numbei of metal species (o be separated and the capacity of the paniculnr batch of Partivil 10 S C X . Batch to batch variations in the manufacture of high efficiency ion> exchange materials can still be significant and it was found that a new batch sometimes required a different pH or even a different nominal concentration of laclic arid to achieve the same separation as the previous hatch. The temperature of the chromatography column was a further consideration, as, in general, temperatures above ambient imprmed column efficiency and peak s>mmetrv, A temper jtuie<if 40 ^C proved a reasonable compromise for the Panisil 10 S C X column, because although higher temperatures uould increase efficiency a tittle more, this v^ould be at the expense of reduced colunm life resulting from the increased soluhiliiv of the silica matrix.
Fig. 2 shou s a chiomatogram for nine metals obtained in 11 min. using 0 ()5 M l.ictic acid as eluent at a pH of 3.6. The column flow-rate uas | ,s ml nun"'. The p l l of the reactant mixture flouing through the detector cell was y.v and the absorbance 0.75 a l 610 nm. Figs. .1 and J sh»iw the chromaio. grams obtained from the analysis ul .Mjgnetic and .Monel Al lo \s . rcspcctivelv. using llRI-iil injections of 10 p.p.m.
267
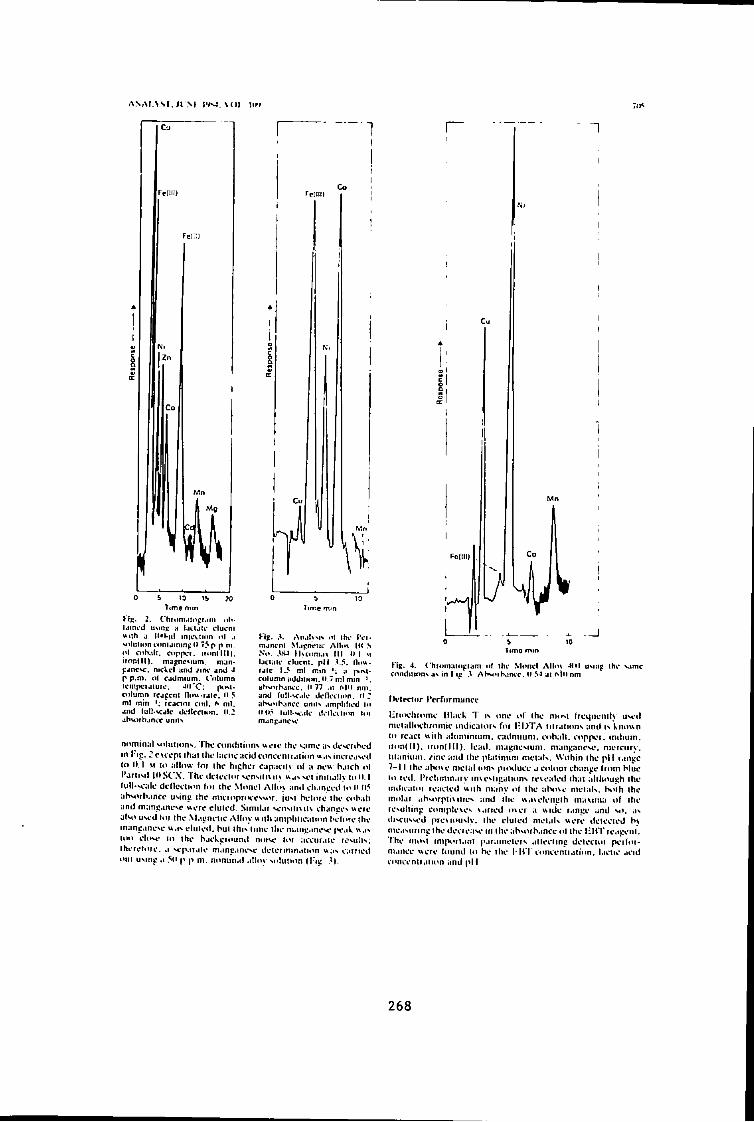
A N A I \ S I , J I M I ' I M . M i l
o b IQ lb 30 Time mm
2. (.'hioni.tiitpr.ini iih-i j incJ uvini: ;< Ua^ic clurni wilh J l l i i ^ f i l inic^lHin nl j uiluiton m n i j i n i n p (I 7S p p m <>l C i t h . i l i . O ' p p o i . imndMl . irnnOl). mayncMum. m;m-p ^ n c M T . n i c k e l UIHI / i n r ^ n d J p p . m . o l c j d m i u m . f n t u m n i c r t i p c i a i U K - . -iirc: p » M . C ' l l u m n r c j g c n l f l n w - r j i c . <l ?• m l min r c a r i o i c i n l , m l ; a n d l u l l - ' < j l c d L - n c c i m n . I " ,;
Feflll)
Hg. AI I . IUMV 111 the IV i -mjnirni M.ipnciu- AHiu lt( N Ni>. M>tnm.t\ I I I n 1 M Ijctaic rlucnt. pH (Inu-iJtc I . . ^ ml mil) u ptiM-culumn uddmon.U 7ml min absrtrhjm-c. (I 77 ,ti (i |n nm. and futt-scjk- dcflrcintn. 0 2 ahM*ih,mrc uniK .implilird lit I H ) > tiiII-**-..k- dv-lkMi.in Itii
n n m ( n ; i l •.ululinnv. The omdninns u c i c ihc >.ami.- dcNCnK-d in I 'lC. 2c \ccp l i hy i ihe k i i ' i n , - i i c i J c i M K c r n r . i l i o n incu'dscd In 0.1 M to : i l l im for the highci cjp: ici lv : i ncu h j : c h nt I ' J U I M I inSC'.X. I h t OciiviMr M;nsi l i \n \ ud\M.' i iniiuillv l u l l . |
l u l l - . f ; i l c ( Icf lci ' l inu tof i h f M o n c l Alti»> i i n t l d i . m t f i l \o H 11^ :ih*Hiih . incc u*-ini: ihc m i t i o p i m ' C S M t r , |usi h t ln rc ihc t n K i h and oi;ini;.ini".e wore elutcd Simil. i i SCMMIIMIN chaniicv « f n r U I M I ust'tl U M (he M.viincnc A l lny 'AiiU ;impliUCia(imK 'U<ff the in;ini:.tnc».c w.i-' t l i i t c i t . hut Ihi*. IIMK- l lu- in.inu.i»i's<.' | v . i k w . i ^ i tm cltiNf i n the b j f k e i n i i n i l n^tl^^,• i m acctir.iU' ic-ull*-. ihofct im. ' . .1 Nop.it.ili.' ni.int;.int."»c i k - i o r m m . i t m t i u . i v v-iniotl oti i u M i i t : .1 |> p m nuniin.i l M ' h i l i n n ( I ' l i : } } .
~1
y\z- 4. <'hr4im:iln^ijm nf the Mtmcl All<>\ - t ' l l UMFI^ ihc vjmc cnndmon% a M f i ! l Ahsmh-imc n ui MM nm
I V l r c t i i r I ' c r fo r inanr i '
Un»K:hromi' H l . i fk T c UML- o f ihc rmr.t t i cq i i c ru l \ u*.o(l mcii i l lnchromic iiKlic;itors for l i D T A tilr.itii)n<< :inil known lo read u i l h i i l tmi in ium. cattniiun], o i h . i l l . coppoi . m i h u m . i r o n ( [ l ) . t t o n ( I I I ) . Icail . niau;nc*>iuni. miinj:anv\o. nicri.-iiiy. l i l an iu in . /\t\c a i i j the plattnuni nictaK. With in iht.- p i l ran^c 7-11 i h i ! ahovf metal ion \ prinlnce a colour change l i o m blue lo te i l . r rchni inary in\e ' - l ipj l ion'» leveaU'd ih . i l although I h f indn-aiot leaetcil u n h many ot the a luue nicl. i l- . . bolh ihe niolai ah'.orptivitre'^ and the v\aveleni:th niavmia of ihe tCNultm}: eonipteves \ . i r ied o^er a u ide ra!ii:e and M \ a--discussed |uevtoiislv. Ihe eluled nielaK were ileteeted h \ n ieas i i i in t ihcdecieavoiM (he ahMuhance ol the l i M T i e a i i e n i . The inoNt mipoi tant pafanieiet ' . alleelinc delector ( v i l o r -ni . i i ice were tound to K- i h e l -MT l O i K V n t i . i i i o n . l a i l ie .leid toneenlrai ion and p i I
268
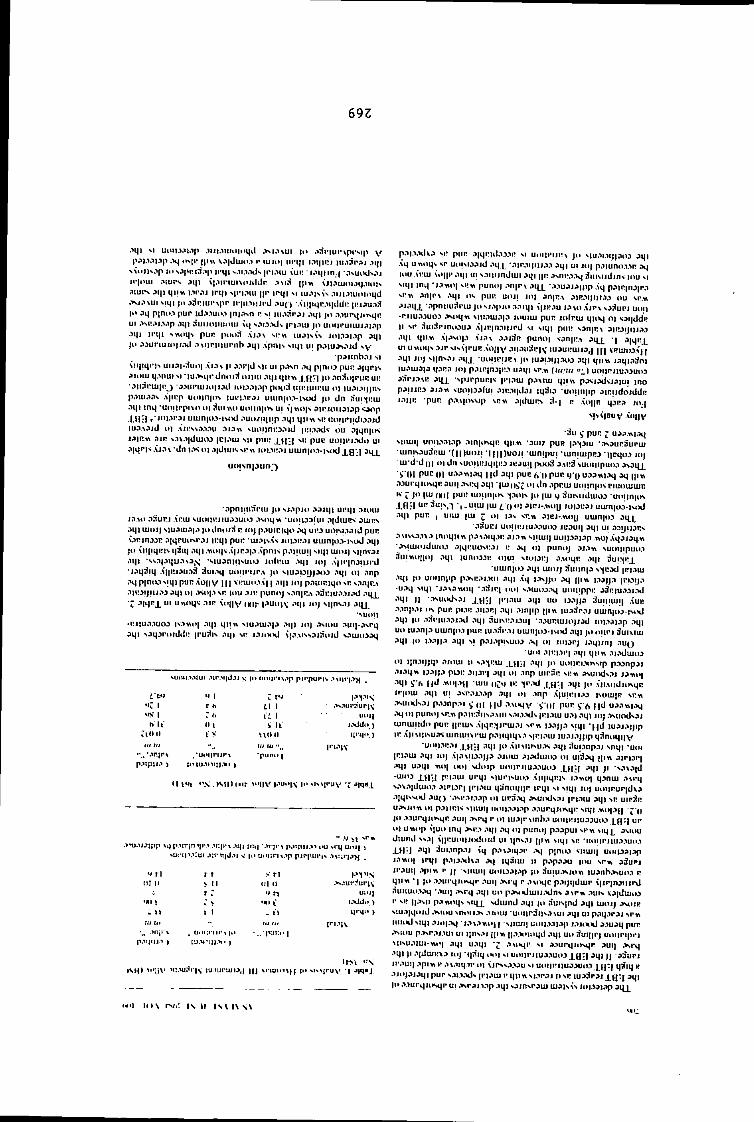
6 9 Z
. i g i \ i u i > u - i . i l . i p . n i i . » i i n i i o m l . > . i . i \ u i | o . i r f r i u i - \ p i ' s i p y
p . ' ^ l . M i - i p .v^ twn' ijiw \.^iJ\un.i I' iui(t| u i ' q i i . m i H J III.»SP;>J
s x o j i ^ . i p t«> ^ . •>pr i : i . ip j i ' q i N . i i .wK | i * | . ^ i u v u c i . ' t q i i n j ^^^u^Hl'..•»l
i r j i i t i i . t t u i - s p q i \ | , ^ l i ' i u i \ i > u U r :>M^ ( p w \ j | . i t u o i . i q . i i i i l s
j i u i ^ q i m i.iiMi i r q i ^[vmu H"' n * ! ! ! ••' iu.tiN\N . i i i i : n u » t u i q d
.-Kj.i\ui Mqi )i> ,>driin'\pr ip|n,»u>'iJ .tiio Aii | iqr.>i)d[ln p - i . t u . ' ) ^
H» :i4 p i m o p u r i d . i . i u i O | n | > . n n NI i i i . i n > . i i . i q i j o . M u r q u t s u p
ui .iNP.ij.i.ip j q i Suimiiuiuii uj ••.H.I.'KJS |p|.itu ji> u m n ' u i i u j j i . i p
M\l l i ' m - . w n q s p u r p o n n " s r w lu.iisis l O L L H O p , i q i
p ) .^3ur iu i i> ) t .x l . ' > \ i i n i i | u r i i h ;>ij) . \ p n i s u i p . i ) u : » s . t j d \ v
- p ^ j i n h . u < i i | iq r> )s u i L ' t i - l f u i i ] Ai:>\ | i . x i i - | U MI u i p > . n p|n>o p u r 0 | q r i s
; > i o u j q . M i u i 'lU.'VNqr J n t i i T t m i i t i . i q t t i t m i f p i ( o . m ^ t i i i ' u R ui<-
• . i l i S p u j i r j - . i . i u p u j j i i i i . x l u»i.i . '»l. '»p p t H > S u i i ! i u i i ! i u o i iu.ii.ii)jn'»
p,')iu:>.')s . - i p r p u o i ) n | i t % iui ' l .^r . iJ u i u n i o . v i - n x J j n d n riui>|i;ui
am i n q • m i i i r p i x o t n ^ u i w o u u i i i H i K u i \ \ . ' > U M 0 U J 1 3 p "^Jt ip
.1*1:1 t ' l t H ^ i ' s i umnitw-iMHl . i u i ) / i i i i t p ^ j i v * MT uonntdo. i jJ
IU:>A;)JJ OI AJI SS I.-I.- U M.in s u n | i n t > j . - ) | j |ni.-i;Kl^ o u .-i|qn[iK
ijilRvk . t i n s J \ . i | d u j o j i c i . t i u sii ptii! p u c u u n r i x l u u i
. i | q p b AJ.i\ dn i.-K i>i . i i d i i n * . M!« l o i . i p . t j u i u n | o . v i s o d Xa';l
u i i j s n p u o ^
' . - i p n i i i d ' i M u JO s i . t p j o .t3it|i u r q i oioiu
i.i>4i . i f i u r j A P i u s u d i i r i i u . i ^ u i o .tM)q>\ ' u t t i i j a f u i . t | d m r s ; ) U j r s
.iqi l u o i j MU.iiu.n.inidndi:) i; i i> j p o u i r i q t t - X J UP.I Ul>1 . , ld p u p
( j i T j n j j p .tmPunNP-ij ii:qi p u r 'lu-iivix j ) i i : > p . i i u u j n i o > i s i > d .tqi
JO \ i i p q p i s q 3 i q M\i .•MM\\ \\l^..t\.^ .\[)ni\ p.nnui\ s i i j i u i o i ) s i i D - i d J
.11]) -ss.-i|.tqu.'>\3,>s; ' M u a n i n s u o j J o f i ' i u .tqi l o ) A ' | n - | n j i M P d
*j.iq:i!q .\)|RJ9U.t ^Su^.t^^ UOIIPIIP.\ JO s i u . t O j j j . ' M O .tqi m . m p
.tqpinojiNiq) p u R A O | | V 1|] VPUIO.IA| | . u p l o ) p ; i u i [ ! i q o s p s.ininA
- i l P J i j i i i . t J . i t | i o i . v u i i . i \r. l o u .UP p u n o j > . i i i i r . \ . idr iu . i . i i . -K l :>m_
• r j i u . t . t u o j i o « n | .iqi qii« \iu.-ttu.-i|.-> .tqi l o j . • K r o u .iui|-.ts,pi4
jqi s . i q j i ' o i d d i ; | r u r f i \ . n j i SP I.IIIHHJ Ai.tAiss.uauid o i u K J a q
-.UiHI .ilui .ilr.li|j3| y |<> Iit>i)i-M.ip pii'pun-. .iMirt-t)!
•1 1 : r i ' i : 1 r h L\ 1 .>i..>ui*3ijri\' «»>• 1 Z (1 i t 1 Ul>l| h ll <l t i.xldtt )
i V t U H l II'•*)<».)
Iff III (// III " „
*u<<iii*iir\ 'punit 1 IU.1I1I1). | )
.iMJ-iJ-iJiiji \i|p.iit-iniii*».ii:n'\ .xqi jriq .irii'* p.ittiii.i> i>u vrg ui>j| j vurii'.''ui JirtijJ.ti V (n Uiniri\.iji pirpui'i* .•t\i;ri.ijj
•> rl r r s ri 1*1 ^'S l i t iJ M tt] 1)
: r : n iii>i]
I I.XIJK ) L \l t 1 . i i llr^l. >
;ii !u tij tif
, Uiii;riii' \ [It - .. piii:..l p.' iJUl-i >
p . i l . i . x l v . i sp p t i r .nqpid.i.i.ip M U.IIIPIJP\ JO siii.ii.iij(.ioj ;iqi
Aq u n o q s v n uoiM.t.tid .iq | .iir.iqiu.M am u i Jn| p.iiuno.-i.tr :>q
l o u A'PUJ ioiiP .iqi UI s a i i u n d i u i .tqi | | n .•>^^l^•^.•K^ S t u s i i d j n s lou s i
Mqi mq 'j^inoi sp« p u n o j .tn[r\ ;iq_L ' . t . i u . u J i p p . \ q p:»tP|nj|P.i
•.!•« , n;p^ .iqi ov pui! U i t J i i n ] .•»n|I;.^ . t i r . i i j i iM . t o u SP«
:»j.iqj ' . t p n i i u ^ P i u jOM.ipio .i.uqi \'|IIMU JJ\O.\JP\ N UPJ U(HI
• r i i u . i . t u o j .tM qn «iu.iuj.i|.i louiiu p u t : j o l r u i q n K j ni s j i j d d p
II sr ^ u i i i p m o 3 u . - i . \ | j p | n ? i i i p d M s i q i p u P s9n|P\ 3ipjiji|j^3
.iqi qii« \pMip AiA\ .lAiHv p u n o j s.in|rA ;>\ii •\ ampj,
UI uwoqs,ijPsis<]PUP \ o | | V OII.IU3P|\' l u a u p t u i a j \ \ \ \ p u i n j A ' | (
:»qi joj sijns..>i .iqj • u o M r r j P \ j i t l u a p i j j X O 9qi qii*v J3qi.->dni
t u . t i u a p q . t p s io) p . i i P i n j p M ujqi sp.vt (tH/ii/ •>;,) uo i i rJ iu . t juoD
j S r j . i \ i ! - s p i p p u r i - i p ' l . t i u p;iMUJ qiiiA p j ^ i . x J s i ^ I u i ino
p ; * u i P 3 suoii3»lui .tir.-xidoi iql^tj - u i t n i i | i p d i r u d o j d d i !
j.-Ht'! 'puf- p.tAiov'.ip spw .i|duii:s r .\O|IR qjn;> j o . |
<i pur ^ u .i.ni.'vq
siiuiij u n i t . l . t u t p ;iin|osqR qii.Yv ' 3 u i 7 puR • . - K . t u r S u P u i
-ujni'..->udruj * ( | | ) u o i i ' ( | | | ) u o i i ' u i n i p u i ' l u n i u i p r o ' i | c q o j lO)
uj d d 01 o i dn s u o i i i u q u p j JiiJuq poo3 3AI!3 s u u t i i p u o o asaqj.
•<;-U\ p u r (II u.->:iirt|jq | { d J q i p u c 6 II pu> 'U u^^^l-'*^ *1 11"«
.i,iUfqio-.qpauii .Tsirq a q i ' l U J o i t o u l n . i p r m u o i m i m e i u o u j u i R
K ^ JO |uj ()()[ pup luiiirqm - i . - in is ) o |tu 9 t l u i s u d u i o ) ' u i i i t n | i > \
X H : I ^ufs,') ' i - U i i u |U] £ ' ( ) o i aiPi-.Muy l O L i r a i uiun|oa-|s(HJ
. t q i p u r , uiiu |iu 3 0 1 i - i s s r . v i aicj-nou u u i n | o 3 3q_[^
' . i ^ u r i u o i i p j i u . x t u o j J u a u f i aqi ui a j y u . i r ^ i
. i M s s a j x a i n n q i i ' n p.iA.tiqjn JJ.ttv s i i u i i ] u u i p a i a p n O ) .vqajoqn
' a s i L U O j d i u o j . i i q r u u s r . i i r aq ol p u n o j aj.iw M i o i i i p u n . t
Sut«oiiii) .' qi l u n i O J R o i u i MOIJPJ .lAoqr aqj Sui^irj^
• u u i n | o j . t q i u i o j j d u i i n [ , i N-jR-xl [RLIIU
.iqi |t> u o i i n j i p p.'KP.ij.Mi| .iq] .vq i . » s ) j o .xj ||ivi i.i.->|]a |PI.IIJ.T
-u."»q s i q i - j . - t v a w o q '.idjpi 0 0 1 - . . lu io j . iq u m i i p p r a3riu.t3i.xJ
. t q i J] -.tsmKis.tj .1.(1:1 p ' l . t u i a q i uo ia . t j j a d u n i u j i i .\UR
.t.tnp.ti OS p u R pi.tn J u a r i .iqi . t m i i p lu.t^p.ti uuin|oa-ivHJ
sqi ( o .tSviu.tM.td .tqj 3 i i i N r . t j . t u i • . t . i u p u i j o j i a d ioi.>a),tp . t q j
u o iu.tn|.-> u u j n | i o p u n iu.t:Ti'.ti u u i n j o j - i s o d aqi | o o i i r i d u i x i m
. t q i pi i.t.t)| .t . t q i Ni p . - i j . t p i s u o a ,iq 0 1 m u r j j . i q i i n j .IUQ
u o i .iiPl.iPi M\\ q i i t ^ .ILHIUIOJ
0 1 i i n a i j j i p . t i o i u i> s . t ^ i r u j aqi jo u o n r i . t o s s i p p a ^ n p a i
.ii.tqvi |3.->)I*'* p i J i ; .ii|JP| a q i 0 1 -mp uirSp s r w a s u o d ^ . t i jat>o|
••'M' S' h u J « t » i m ( i t « » I'- i.H'l ••'M' J»' A|iAiidn»sqr
i r | i t i u .tqi VI asr.tj.t.ip a q i 0 1 . m p . < | u i r i i . - > j |SOUJ|R \ r «
.•»sUods.tj p . t j n p . t i •; ()[ | | d . t u i q v s"'IM P"* S'6 ua,it\|.X]
.tq 0 1 p u n o j \ r . « p.i|pdiis.tAUi \.ti . i .xJs pii.nu u.ti .tqi j o j . i s u o d s - u
u i n u i i i d o p u r {]RUi>. .\|qR^)rui.tj s r v t l a a j j a <>iqi '\\\S l u a i . t j j t p
IP .\ii\i|i<<u.'K u i n u i i y p u j p.-i|iqiq\.t s]ri.->ui l u . t i . t f j i p q ^ n o q i j v
-utiii.tp.ti I (|:) a q i jo . \ | i \ i i i s u . > s a q i ^ u i 3 n p . i j s n q i ' u o i
(Pi.tui , i q i loj A i . t M i M j j a . t i o i u a L x l u j i t j 0 1 ui3.tq •'>in:>n
-iqi u.tqi tin| 0 0 1 \ d o j p U011PIIU.WUOJ L H H J ' "vn-ttd
- u i i o XH-I [ ' - ' • ' 'UJ upqi s iu 'Msuo . t A n p q p i s i . twc t i q . i n u i .t\t'i\
\.^\.y\tlwi>y . t i P i j r i [Pi.Mu qdnnqiiP irqi M s i q i i o j uoi |PUP|d\a
.iiqi'.Mid . i U ( ) •.v.p.ti.t.tp 0 1 urs-tq .•KUods.-ti (Pi.tui sr. UIPSR
U3Mnt\ 0 1 p . t l i r i s M i i u t ) uiii|.t.i|.tp . i . t u r q u t s q r s i q i .'nt>|.t{| j j)
JO . taurqj iv^qp a u i ) >..pq r oi iu.i]p\inb.t UOIIPIIUSJUO.I XH- I
oj u«op ( j u o inq a s r . t . t q i .tq 01 p u n o j p.-).-ipui sm \ i m a s i i K j
d t u n d s \ . t | \|iPUiii|Ji>doid U i l\n\,ii s i q i sR *itoi|PJiti.t.Mio.i
.iqi d u i j n p . n \ q p.t\.vq.n' .X] p jmo •.moi) u i n w j a p
i . i « o | irqi p.i]a.xK.-i aq i q a i u i ii p.tp.tau j o u SP» a i u p j
ip.tut] .tpivk p II s i i i u i i unilJ.->i . tp | 0 i iu iu -v t ion l u a n h . t s u o . t r
qii« 'I ( o . v u p q i t i % q r a u i ] ."Ki-q P . i \ o q r paijiidujp \tiP|naiiird
n u i i u o . x x ] ' . t u i ] .>\rq .iqi m» pasiHJiuN.xJn\ .t\p« au(^• v a i d u j t O
p sP li-tNii p - t n o q s >tm s J u i u J a q i | o ^u i^ ind a q i t u o i j a s j i i r
M u a j q o i d . > » i o u >niiii.>s . n o m • u n u p d i i s . - > % u i sqi ui p.iq.tp.ii s r «
l u i o d Niqi .>iH).X{ ' i . t v . t n o i i siiuiij u o i i j . i i . > ( > t.tiiHiJ » u a q p u r
, > s i n u pjsp.tj.iui UI i p K . t j [ j i w i p x i o q d .iqi ui> d u i i J P j u o i i P i p r j
M i s u a i u i - w * ! .iqi u.tqi . t v o q p -.i a . t u p q i i > s q p a u q .>vpq
.iqi p -Hd lUPV- t mj 'ip'iq ooj M UOIIPJIU.I.IUO3 J.H:I 'M' Jl M u f ^
i p . i i u i .tpiYv p .•>\.iiq_iPiii \ i p s \ . w u M u o i i P i i u o j u o a I (PI q^iq B
- t j o j a j ^ q i pur s . m . x l s (Pi.tiu P q i m M . i p a i n %r l u a S r a i X H : I aqi
| o . v i L P q i o s q p UI . > \ r a i i . t p .iqi s p i n s P i u j m a i s \ s lo iu iap a q j ^
t-p) I I I \ r * ^ : | \ 11 I s ^ i\ \ , \

D e t e r m i n a t i o n of Trace M e t a l s by High-performance Liquid Chromatographic Separation and S p e c t r o p h o t o m e t r i c D e t e c t i o n P. J. Hobbs, P. Jones and L. Ebdon l)i-f>itttititiil '1/ /Ciivhoniui-nlii/ Scifncts. Plynnmlli /'•'/V/<TA((IV. Plv>»<'itth. Devon. I ' f A S.-l .•(
I'lii" i f c c n t ri'nc\\'i-il i n l e r c s l in t l ic i l o l cnn in i i l i nn of i i i c ia l s j i c c i c s l>y I 'u iuid-cl i rDinalographic tccl i i i i i iucs is due. in |K i r l . to l l i c ava i l ab i l i t y of more oflicicnt c l i ron ia lo^rap l i i c mater ia ls a n d to the devc'lopment of sensi t ive on- l ine tnclal detect ion s y s t e m s . A n i iml ier of approaol ies l iave been reporlcf l for i l ie efTirii-nt separat ion of grt>ui)s of meta l ions inc lud ing the .'ieparation of metal chelates in uoii-a<piL-ous me<lia using s i l ica c o l u n m s . ' Ik -cause the m a j o r i t y of sample preparat ion iitrtlMxIs n s u l t in aipurous solut ions of the meta ls , it w a s considered that ion r x c h a n g e might he a more gt:nerally app l icab le separa t ion m e d i m n . Severa l sensi t ive met:d deteeiur s \ ' s l r m s have recrn t lv lieeii descr i i ied . some ut i l is ing e lec t rochemica l properties su« h as coulorni ' trv- and some ut i l is ing the spectroph(»metrir. propert ies of meta l chelates." ' .Many of these photortielrii: syst<:ins are based on the add i t ion of a reagent to the c o h u n n d i luen t (p()st-c()]uum reactors} t"> produce s t rong ly absorb ing meta l contple.xes. w h i c h are then de lec ted at a speciCu-d wave leng th . T h e o p t i m u m absorbance of meta l che la tes c a n v a r y signif icant ly from metal to meta l and in m a n y ins tances it is ditficult to choose a compromise
2 7 0

KI-SIiAHCM AND 1>I-VI-I.OI'MI-.NT TOI'r<''^ liiiil. I'roc. Vol. JO
wav'clcnRth for tlio f lc tcr tor . A inori ' novel nppnKir l i oui l ino*! in this work is t«) intTisuro the (kM-rcasc in absor lx inro of t l ir p l i f i lo inolr i r rc i f ic iU as a < | i ia iU i la l i \T lura- inrr itf tin- inr ta l ion present. 'riii> pa|K*r <irsrrihr> the pcrf ' i r in . inn- of two p l id ion i r i r i r p.t^t-rolnnni rea r i ion sys tems n)U|)Ii (i to an i-ni-. x r l i a n ^ c h i f j l i - p e r l o n n a m v l i ipi i ' l e l i ronia lnKraj j I iy ( I I I M J ) sv^ l r tn (or l l ie d e l e n n i n a l i o n of me la l ions in aqiieou-v nir<iia.
Appara tus
A s r l i e m a t i r i l ia^rain of tlie a p p a r a t u s is ^hown in I-'i ;. I. T in - isorM'.itir I I I ' L C ! s v s t e n i consisted of a l .ahnratorv D a t a C o n l n * ! ( I . D C ) Const . i im l r i r I I I p iunp . a Kli . -oi lvne in jeetor va lve w i th a I*H>-/il Irmp. a stn- l eoli i inn and a K r a l n s var iab le wav . i •ll ^tll U \ ' - v is ih l r spci ' t ro-pliotonietrie <lelc<"tor w i th a lO-/ i l llou- ec l l , A pos l -eo lu inn p u m p w a s nefd«*d to supply the p l io lometr i r reaf^i-nt soUition l»i mix w i l l i tin: r o l u m n e l l l u e n l . A short reae i ion eoil f<illowi-d the mixiuf:; T- junet ion to al low a sullieient t ini f for the metal eii inplrx'es lo form hefore t l i jwjnj; throu/^h the d e l e r t o r ce l l , i t w a s adv isah le to inelude a rest r ie lur in the pos l - ro lunm p u m p outlet to reduce p u m p pulsat ions.
Reactor coil
HPLC pump Inj. Column h-r -VWWH UV - vis
detector — Recorder
Posi-column pump
' L C app . i r . i i i i s w i t h )>nst-i.oliiini) n-.tcior.
ChromatOf^raphic S y s t e m
T h e factors rontrollinf^ the separat ion of meta l ions on rat io i i -exrhanj^e media art' r i 'asonal) Iy well understood a n d , in i i i s l a n c i s w l ie iv the lueta l ittus l iave s i m i l a r si/,e a n d rlwir(;e. the presence of re la t ive lv w r a k rompIcx inR aj^eiits in the e lut ion s y s t e m c a n eons idr rab ly i m p r o v e the separa t ion . Usii i f j these pr inciples T a k a t a and l-'ujita- demonst ra ted the fasi and elTirit'ut l U ' L C . separat ion of s ix meta l ca t ions on smal l par t ic le sizi^ ca t ion -exchange resins usiiif; t a r ta r ic ac id as the con ip iex ing agent . I'or this work two types of cat ion-excl iat ige mate r ia l were used (Mitd^ad .Ainiuex Mi. I I / i n i p o l v s l v r e i i c hase<l res in , a m i I 'art isi l 10 S ( ^ \ . 10 ^ i n surface l>r>tided s i l ica based par t ic les) , and their per formance w a s eornjiared when used w i th a number of seleirted car l )oxyl ie ac ids . Tlie chnjmatograj>hic behav iour of the two mate r ia ls was fouii' l to be s im i la r , except that the silii 'a baseti ntaterial ha<l a m u c h lower e x c h a n g e c a p a c i t y . 'Wt ^unui iar ise . the e lut ion ordi-r of the <livalt'nt meta l species was rssen t i a l l y the .sami' regardless of the e lu l ing ac id used (assuming - ( ! O O I I and O i l were lh<' o idv funct ional groups present) a n d retention t imes decreased w i th increase in p l l or concent ra t ion of the a c i d . A s a con.setpieuce of the higher exchange I 'apar i tv of the . \ m i n e x A!> resin compared wi th the Par t is i l 10 S C X mater ia l , higlier concent ra t ions tif more s t rong lv che la t ing ac ids were nerdi-d to obta in s im i la r retent ion t imes.
Detection S y s t e m
Di th izonc P o s t - c o l u m n Reactor iJithiz.one is a wel l known photometr ic reagent react ing sens i t i ve ly w i th up to JO m e t a l s
inc lud ing a n u m b e r of orgai iometal l ie species. The r ragen l itself absorbs v e r v .sironglv an^l was therefore consi<Iered par t i cu la r lv su i tab le for use in a post - roUuun react*tr s y s t e m w h e r e the d f r r a s r in a b s o r b a n c e o f tin- l e a g e n t w a s us.-d as a i p i a u l i t a t i v e me isurc of tlie s e p a r a t i d met:d ions. T h e main probli 'ui was the iusolubil i t v of dithi/.ont* a n d its r o m p l e x e s in a<pieous med ia . T h i s w a s overcome by using acetone - water i n i x i m e - in the post -co lumn s y s t e m . I'or
2 7 1

Dcccmhcr. IflSS HI>I:AH( II AN'fi i>i;vi:i,or'Mi NT Ttn-irs
nu»>i (IctiTininatifiM'' tlu- MdntiuM of (l it l i ix/uic in i i r r tono wa^^ mixod w i t h lite ro l i imn I'fUuont to t^Wv ;i water to a r r l i o i r tavii>»»( aj>]>r'>xiniatrlv 4 : 1 . ihv c x a r t ra t io ( I r )n 'ni l in^ on t l i r r o n -( •rnlra l ion of tlii- a r id ami tin- p H of the cl i i l io i i s<iIvi n L * Tl i f d i t l i i /o iK- ronct n l ra t io i i was a d j i i s t n l s(i thai on i l i lu l ion wi i l i t l ic riTtuciit it won]<] ^ i v r a t iasc- i inr a l isor l ia i ic r at nm of lu ' iwr r i i It.I : i iul I. A n v m c l a l r rac l in j^ w i i l i tlu- ( l i l l i i / .oiu! w<uii(l t l i r i i proiUwv a lU-Kalivt* al>soiliantt' peak <»n l l ic nrordinf, ' s \ s i r n i . I'lir s c n ^ i i i v i i v of tl ic n i r t a l s var ies wi th |>II and a reasonaMt* roniproii i isi* was fouiifl to IK* pM Of t l i r meta ls inves t iga ted , n a m e l y , h i ,
("d. ( ii. C o . I n , N i . I*lt and Z n , all f;ave f iMid l inear <-alil»ralions for up to 10 p.p .m. e . \ rep l r o h a l l . wl i i r l i showed a >lif;lit r u r v a t n r e under al l eoi id i l lons. I'or I'lrj-^tl in ject ions ahsolute detcrt i fni l imits xv<-re lietween '2 and l(» iif except for lead, w h i c h w a s MM) n/^. A n e x a m p l e of the M paratioi i of five i n e l a K followed l>y dil ln/.oiK- p o s i - c o j u n m detect ion is shown in I'if;. 'J and was achieved on an A m i n e x A*.' c o l n m n (l(Hi •. 'l.f» m m ) n^ing If.'J M ta r ta r ic ac id at a p l l <tf 4.!( as the ehitiiif^ a^'ent.
K r i o c h r o m e Hlack T P o s t - c o l u m n Reactor
AlthoMKh ditli i / .one is a par t icu lar ly p K x I reaf^eiU for the sn ip l iophi l ic meta ls it reacts wi th few of (he ttiore oxyphili<- nietaN. O i l i e r rea^^enls were investi^'ated to ex tend the ran^'i- of mi-tals ihat can he determined hv this techni((ne and I ' lr iochrome HIack ('(IvH 1) was part ien-lar ly promising'. { 'sji i |^ the principle of measur ing a d c c i c a s e in the a l w i r h a n c e of the rea^;ent a> a means of d(-le<-tion. I'lH I' was fonnd to react with a wi<le raiij^e of meta ls inch id in^ ma|^-nesinni . man^anesi - ;iiid i ron. T h e pos i -cohnnn rea^^enl, an a<[neons a m m o n i a sotnl ion of l'"IVr. w.is itiixed wi th the cohnnn effhietit in the usual w a w The concent ra t ion ttl was
Co C< I
10 20
Time m m 30
Fe(lll) & Cu
Fedll
Mn
Mg
I 1 ^ ' ~ S<-|),ii.itiiiii of ti\i' III) i.il> on .\iiiiiu-.\
iisiiit; •luhi/iiiif coliiiiiii ttfU-ctinii.
b 10 15 20 T ime 'min
'A. Scp;ir;niniifif iiiiiu met.lis on I'arltsil In St 'X iisiiik' ]n»st.to!iiiiin (Ii-U-tliim .Hid .( lact.ili; •.-IIKMH.
2 7 2

1*1 S l . X U r n . \ N I M M . V I l .oi 'MI NT r n i ' i r s , \ , i u / . I'rnr. Vol. -JO
adjusted to^;iv,. luekjir id absMi Iuiice. :it (iin ,„„. ,.f |„.t een fM*. and l» li :,| :» nil ..f |o I--' Ih. n.el.d.( u.(-.,( d. l-effi). |-. (lll)..\|g..\Iu..\,. l'bandZuthede,ee,i.,„ h.uMs (MM.„i mjeenM.is) were. |M.e l.. Ml u- exeepi for nu^^ne.i ;...d m.mg.oieM-. whi. h w.-.e ne uvr l! n . I he hiieanlv of . ahbratiunv up to Hi p.p.m w.i- j ...,d ... per II
a^ent l-i;^.:UhMW . t lM-^.,u...liMn..f l-eflll). (•„. Ni. Zn . (M. |-e(l I ) . Cd. .Mn and M- ;.| ihe ,urts
|H-r millM.n level nn a I'.MMMI Ml SCX e.. „ (j.Vi . i.ii ,) UM,,^, U-,;,- .. ..,;„i„,
C^onclusion The ititlii / . i ine delei IMI \^ pjrliciil.nlv •^nit;lble .1 vei v M'ii>ilive ^ V N i i t n for the r i M r e
-^iilphopliilie Mu i . iU. r i ie l*!l '• r f l e l . - i - t " i , .di Imnf^li p ' M e r . d h * l*-"-' • en-il \ w . le.n wil h a wider laii^^e of iitelaU meliidin;^ t h e mme ••wpliilii- I \ pe .MKI - how pi»tenli.il a-- a iihtir p-nei.d me|:il d e t e C l M r . I'M e\p|<iil tlli-^ t h e i-|il'>m;i|M: l.ipl)V will be i l l \ e « l i .< led furllxl h i ilielude s M U i e of the anionit- rnel.d - pecie- .
Rcfercncos
I. I . i ^ k . i . <i . l . r l i M t . i v I . l'.r.iii.l".i, i . - i . . \ . i . 1-; < I d i . x l i . t t) C . . .111.I ( ' . . h n . I I . / ( /j»..pimJ..^-» . \\\'\\. 1 7 2 .
r . i k . i l . i , ^' . . i i n l K . / . ( 7v(.<(;/.»/.«;'j , IHT.'i. lUH, J . * . . ' . :t f . . - > i . U - . l : M. . i r i . l 1.1. I n n k. S I.. / tln..,it,tl..-i . s , ; . l ' . i > f t IH. I ' l T •I l o t i c 1 ' , IIMIIII-S. I' I . .111.1 I ' . l o l n n . I. . . l i i i i f I Jinn \'J<K, MM. .'I'.t.
2 7 3
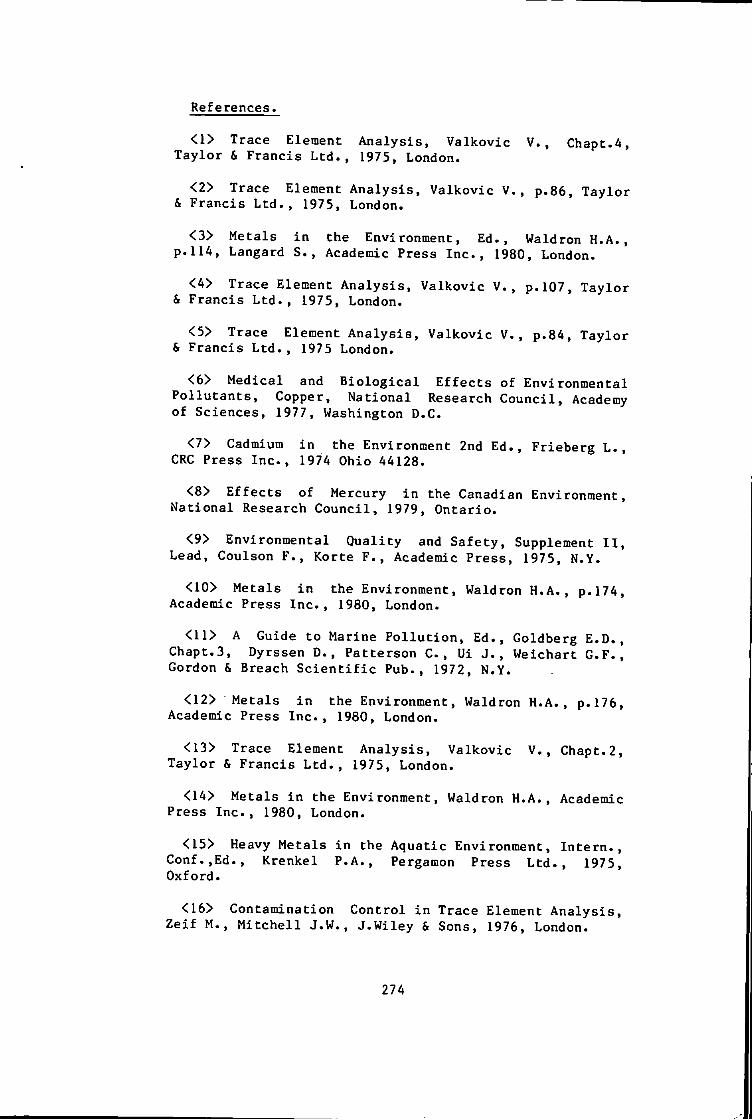
References.
<1> Trace Element A n a l y s i s , Valkovic V., Chapt-4, Taylor & Francis L t d . , 1975, London.
<2> Trace Element A n a l y s i s , Valkovic V,, p.86, Taylor & Francis L t d . , 1975, London.
<3> Metals i n the Environment, Ed., Waldron H.A-, p . l l 4 , Langard S., Academic Press I n c . , 1980, London.
<4> Trace Element A n a l y s i s , Valkovic V., p.107 , Taylor & Francis L t d . , 1975, London.
<5> Trace Element A n a l y s i s , Valkovic V., p.84, Taylor & Francis L t d . , 1975 London.
<6> Medical and B i o l o g i c a l E f f e c t s of Environmental P o l l u t a n t s , Copper, National Research Council, Academy of Sciences, 1977, Washington D.C.
<7> Cadmium i n the Environment 2nd Ed., Frieberg L., CRC Press I n c . , 1974 Ohio 44128.
<8> E f f e c t s of Mercury i n the Canadian Environment, National Research Council, 1979, Ontario.
<9> Environmental Q u a l i t y and Safety, Supplement I I , Lead, Coulson F., Korte F., Academic Press, 1975, N.Y.
<10> Metals i n the Environment, Waldron H.A,, p.174, Academic Press I n c . , 1980, London.
<11> A Guide to Marine P o l l u t i o n , Ed., Goldberg E.D., Chapt.3, Dyrssen D., Patterson C,, Ui J., Weichart G.F., Gordon & Breach S c i e n t i f i c Pub., 1972, N.Y.
<12> Metals i n the Environment, Waldron H.A., p.176, Academic Press I n c . , 1980, London.
<13> Trace Element A n a l y s i s , Valkovic V., Chapt.2, Taylor & Francis L t d . , 1975, London.
<14> Metals i n the Environment, Waldron H.A., Academic Press I n c . , 1980, London.
<15> Heavy Metals i n the Aquatic Environment, I n t e r n . , Conf.,Ed-, Krenkel P.A., Pergamon Press L t d . , 1975, Oxford.
<16> Contamination C o n t r o l i n Trace Element A n a l y s i s , Z e i f M., M i t c h e l l J.W., J.Wiley & Sons, 1976, London.
274
<17> Comprehensive A n a l y t i c a l Chemistry, V o l - I I I , Wilson & Wilson, Chapt.l, Trace Analysis, Togl G., Ed. Svehla G,, 1975, E l s e v i e r .
<18> Instrumental Methods of Analysis, Ewing G.W., 4th Edn., McGraw-Hill Kogakusha, L t d . . 1975, Tokyo.
<19> Novel Approaches t o Metal Speciatlon Ward. R,, Ph.D Thesis, 1983, Plymouth Polytechnic, Plymouth.
<20> Fundamentals and Techniques, Heftmann E., 3rd Edn., Pt-A, Chapt.7, Van Nostrand-Reinhold, 1975, New York.
<21> Journal of Chromatography L i b r a r y , Heftmann E., Horvath C., Melander W.R., Pt.A, E l s e v i e r Pub. Co., 1983, Amsterdam.
<22> Tvet M.S., Proc- Warsaw Soc. Nat. S c i - , B i o l . S e c , 6 ,1903,14,
<23> Majors R.E., Barth H.G., Lochmuller C.H., Anal. Chem., 56 ,1984,300R.
<24> I n t r o d u c t i o n t o High Performance L i q u i d Chromatography, Hamilton R.J., Sewell P.A., 1977, Chapman & H a l l , London.
<25> Hovarth C.G.,Priess B.A., Lipsky S.R., Anal. Chem., 39 ,1967,1422.
<26> Chrotnatographic Methods of Inorganic A n a l y s i s , Schwedt G., 1981, Verlag,Heidelberg.
<27> Ion Chromatography, F r i t z J.S. , Gjerde D.T., Pohlandt C, 1982, Verlag, Heidelburg.
<28> Veening H. , W i l l e f o r d B.R-, Rev. In o r g . Chem., \_ ,1979,281
<29> Huber J.F.K., Kraak J.C., Veening H., Anal. Chem., 44 ,1972,1554.
<30> T o l l i n c h e C.A., Risby T.H., J. Chromatogr. S c i . , 16 ,1978,448.
<31> Uden P.C., Bigley I.E., Anal. Chim. Acta., 94 ,1977,29.
<32> Lohmuller M., Heizmann P., Ba l l s c h m i t e r K. , J. Chromacogr., 137^ ,1977,165.
<33> Henderson D.E., Chaffee R., Novak F.P., J. Ciii-oiuatogr. 6 c i . , 19^ ,1981,79.
275

<34> Heizmann, P., Ballschm l t e r K., J. Chromatogr., 137 ,1977,153.
<35> Schwedt G. , ChromatograpMa. , 12(9) ,1979.613.
<36> Chromatographic Methods i n Inorganic Analysis, Schwedt G., p-26, Verlag, 1981, Heidelburg.
<37> Liska 0., Lehotay J., Brandstererova E., Guiochon G-, Col i n H., J. Chromatogr., _172 .1979,38A-
<38> Lehotay J., Liska 0., Brandsteterova E,, J. Chromatogr., 172^ ,1979,379.
<39> Schwedt G., Chromatographia., 11(3) ,1978,145-
<A0> Schwedt G., Chromatographia., ,1979,289.
<A1> Smith R.M., Yankey L.E., Analyst, .1982,7AA.
<A2> Molnar.I., Knauer H. , Wilk D. , J. Chromatogr., 201 ,1980,225.
<43> Reeve R.N., J. Chromatogr., 177_ ,1979,393.
<4A> Cassidy R.M., Elchuk S., J. Chromatogr. S c i . , 21 ,1983,454.
<45> Iskandarani Z,, Ple t r z y k D.J., Anal. Chem., 54 .1982,1065.
<46> Cassidy R.M.. Elchuk S.. Anal. Chem., 54 .1982.1558.
<47> Brinkmann F.E. . J. Chromatogr. S c i . , 15^ ,1977,493,
<48> Cast C.H.. Kraak J.C., I n t e r n . J. Environ. Anal. Chem. , 6 ,1979,297.
<49> Kim D.W. , Park S.R. , Kang Y.W. , Rhee N.K.. J. Korean Chem S o c , 24 ,1980,361.
<50> Kawaza K., J. Chromatogr., UT^ ,1977 ,381.
<51> Strelow F.W.E., Boshoff M.D., Talanta 18 ,1971,983.
<52> Strelow F.W.E., Van Zyl C.R., Anal. Chim. Acta., 40 ,1968.145.
<53> Srivastave U., Mahan A., Chose A.K., Dey A.K., Sep. Sc i . , Techn., _15 ,1980,1779.
<54> Dadone A., B a f f i P., Frache R., Chromatographia., 12 ,1979,38.
276

<55> Dadone A., B a f f i F., Frache R-, Cosma B. , Chromatographia., ,1981,32.
<56> Wish L., Anal. Chem., 33 ,1961,53.
<57> P o l l a r d F.E., Nickless G-, Spincer D., J. Chromatogr., J3 ,1964,224.
<58> Qureshi M., Varshney K.G., Kaushik R.C., Anal. Chem,, 45 ,1973.2433-
<59> F r i t z J.S,, Story J.N., Anal. Chem., 46 ,1974,825.
<60> Kawazu K. Kakiyama H., J. Chromatogr., 151 ,1978,339.
<61> Korkisch J., Krivanec H., Tala n t a , 23 ,1976,295.
<62> Morie G.P., Sweet T.R., J. Chromatogr., 16 .1964,201.
<63> P i t s t i c k F.G., Sweet T. R., Morie P.M., Anal. Chem., 35 ,1963.995.
<64> Hovarth C.G., Priess B.A., Llpsky S.R., Anal. Chem., 39 ,1967,1422.
<65> Takata Y., Muto G.. Anal. Chem., 45,(11) ,1973,1864.
<66> Sevenich G.J., F r i t z J.S., Anal. Chem., 55_ ,1983,13.
<67> Chromatographic Methods, F r i t z J.S. , Gjerde D.T., Pohlandt C.,p.l62, Verlag, 1982, Heidelburg.
<68> Mancang L., Biwei F., Zhide H., J. L i q . Chromatogr., 5 ,1982,63,
<69> Hwang J.M., Chang F.C, Yeh Y.C., J. Chinese Chem. Soc. 30 ,1983.167.
<70> Takata Y., Awikawa Y.. Bunseki Kagaku., 24 ,1975.762.
<71> Miwa Y., Yamabe T., J. Chromatogr.. j j ^ ,1975,276.
<72> MacCrehan W.A., Anal. Chem,, 53 ,1981,74.
<73> Girard J,E., Glatz J,A., I n t e r n Lab,, Nov.,1981,62.
<74> Zolotov Y.A., ShpigunO.A., Dokl. Akad. Nauk., 266 ,1982,369.
<75> I s h i i D., Hirose A., Iwasaki Y., J. Radioanal. Chem,, 46 ,1978,41.
277

<76> I s h i i J. Chromatogr., ,1980,43.
<77> White P.C. , Analyst, iO± .1984, Pc. I 677 & I I 973.
<78> Abbott S.R., Tusa J., J. L i q . Chromatogr., 6 ,1983.77
<79> Small H., Stevens T.S., Baumann W.O., Anal. Chem., 47 ,1975.1801.
<80> Spectrochemical Analysis by Atomic Spectroscopy, Price W.J., 1979, Heyden & Son, London.
<81> An I n t r o , t o Atomic Spectroscopy, Ebdon L.C., 1982, Heyden & Son L t d , London.
<82> Van Loon J.C., Radziuk B., Kahn N., Lichwa J., Femadez F.J., Kerber J.D. , At. Absorpt. Newsl. , 16(4) ,1977,79
<83> Fuwa K., Haraguchi H., Morita M., Van Loon J.C., Bunko Kenkyu, 31^ ,1982,289.
<84> Chemical D e r i v a t i s a t i o n i n A n a l y t i c a l Chemistry. Vol. 1 Chromatography, Frei.R.W., Lawrence J.F. , 1981, Plenum Press, N.Y.
<85> K i r k l a n d J.J., Analyst. _99, 1974,859.
<86> Katz E.D., Scott R.P-W., J. Chromatogr., 268 .1983,169.
<87> I n t r o d u c t i o n t o Modern L i q u i d Chromatography. Ki r k l a n d J.J.. Snyder L.R., 1979, J. Wiley & Sons., London.
<88> Photometric Determination of Trace Metals, Sandell E.B., Onishi H., J. Wiley & Sons, Inc.1978 London
<89> Photometric and F l u o r i m e t r i c Methods of Analysis Snell.F.D., Pt. 2, J. Wiley & Sons, 1971, London.
<90> Organic Reagents f o r Metals, Johnson W.C., Hopkins & Williams L t d . , 1964, Essex, England.
<91> Organic Reagents i n Photometric Analysis, Savvin S.B., CRC C r i t . Rev. Anal. Chem., 1979,55.
<92> Spectrophotometric Determination of Trace Elements, Marczenko Z., CRC G r i t - Rev. Anal. Chem.1981,195.
<93> Physical Chemistry, Moore W.J., Longman L t d . , 4th Ed. ,1970.
278

<94> Instrumental Methods of Ana l y s i s . , 4 t h Edn., Ewing G.W., p.44, 1975, McGraw-Hill Kogakusha L t d . , Tokyo.
<95> Photometric Determination of Trace Metals, Sandell E.B., Onishi H., P t . l , p.812, J. Wiley & Sons, 1978, N.Y.
<96> Photometric Determination of Trace Metals, Sandell E.B., Onishi H., P t . l , p.197, J.Wiley & Sons, 1978, N.Y.
<97> Belcher R., Talanta 24 ,1977,533.
<98> Photometric Determination of Trace Metals, Sandell E.B., Onishi H., P t . l , p.482, J. Wiley & Sons, 1978, N.Y.
<99> Jezorek J.R. , F r e i s e r H., Anal. Chem., _5L ,1979,373.
<100> Cassidy R.M., Elchuk S., J. L i q . Chromatogr., 4(3) ,1981,379.
<101> Cassidy R.M., Elchuk S, , J, Chrotnatogr, S c i . , 18 ,1980,217.
<102> Cassidy R.M., Elchuck S., J. Chromatogr. S c i . , 19 ,1981,503.
<103> Elchuk S., Cassidy R.M,, Anal. Chem., 5^ ,1979,1434.
<104> Kawazu K., F r i t z J.S. , J. Chromatogr., 77 ,1973,397.
<105> Hlrose A., Iwasaki Y,, Iwata X., Ueda K., I s h i i D., J. High. Resolut- Chromatogr., 4 ,1981,530.
<106> Zenki M., Anal. Chem., 53 ,1981,968.
<107> Beckett J.R., Nelson D.A., Anal. Chem., 53 ,1981,909.
<108> Water & Water P o l l u t i o n Handbook, L.L.Ciacco Ed., Vol.3, J. Wiley & Sons, 1972, N.Y.
<109> Seitz W.R., Suuydam W.W-, Hercules D.M., Anal. Chem., 44 ,1972,957.
<110> Separation and Preconcentration Methods i n Inorganic Trace Analysis, Chapt.6, Minczewski J., Chwastowska J.. Dybczynski R., 1982, John Wiley & Sons, N.Y.
<111> Takata Y.. Muto G., J. Chromatogr., lOS ,1975,225
<112> Ion Exchange i n A n a l y t i c a l Chemistry, Rieman W., Walton H.F., 1970, Pergamon Press, N.Y.
279
<113> Fundamentals and Techniques, Heftmann E., 3rd Edn., Pt.A, p.A20, Van Nostrand-Reinhold, 1975, New York.
<114> Pur n e l l J.H., Vargas de Andrade J.M., J. Am. Chem. S o c , 9]_ ,1975,3585.
<115> Schwartzenbach C, Biedermann W., Helv. Chim. Acta., 31_ ,1948,678.
<116> Vogel.A.I., Q u a n t i t a t i v e Inorganic a n a l y s i s , p.424, 1956, 3rd Ed., Longmans, London.
<117> Complexometric T i t r a t i o n s , Schwarzenbach G., 1957, Pitman Press, Bath.
<118> Schwarzenbach G. , Biedermann W. , Chimia, 2_ ,1948,56.
<119> Young A., Sweet T.R., Anal. Chem., 27 ,1955,418.
<120> Diehl H., Lindstrom F., Anal. Chem., 2 i .1959,414.
<121> Weber, S.G., Anal, Chem. 54 ,1982,2126.
<122> S i n g l e t o n , R.C. Commum. , A.CM., 10_ ,1967,647.
<123> Van Der Wal. S j . , J. L i q . Chromatogr., 6 ,1983.37
<124> Day M C, Selbin J., T h e o r e t i c a l Inorganic Chemistry, 2nd Ed., 1962, Reinhold Book Corp., N.Y.
<125> Jones P,. Hobbs P.J., Ebdon L., Analyst, 109 ,1984,703.
<126> Hobbs P.J., Jones P., Ebdon L., Anal, Proc., 20 ,1983.613.
<127> Yoe J.A., Jones A.L., Ind. Eng. Chem, Anal. Ed., 18 ,1944,11
<128> Anderson R.G., Nickless G., Analyst, 93 ,1968,13
<129> I r v i n g H.M.N,H., Di t h i z o n e , The Chemical Society, London. 1977,
<130> Das D i t h i z o n und seine Anwendung i n der Mikro- und Spurenanalyse, 2nd. Ed., 1972. Verlag Chemie, Weinhiem, Germany.
<131> Photometric & Fluorometric methods of a n a l y s i s , Dee Sn e l l F., 1970, Wiley. London.
<132> Fischer H.. Wiss. Verof f e n t l i c h . Seimens-Werken. 4 .1925.158.
280

<133> Braun D., Heinmes H.Th., Z. Analyt. Chem , 239 ,1968,6
<134> Kahara T., Takei S., J. Ino r g . Chem., 33 ,1971,4129.
<135> Skeel R.T. , Bri c k e r C.E. , Anal. Chem. 32 .19^.^28
<136> Cast C.H., Kraak J.C., I n t . J. Environ. Anal. Chem., 53 ,1979,297.
<137> Math K.S., Anal. Chem., 41_ ,1969,1682.
<138> Jones P., Hobbs P.J., Ebdon L-, Anal. Chim. Acta., 149 .1983.39.
<139> Hwang J.M.. Shih J-S., Yeh Y-C., Wu S-C., Analyst 106 ,1981,869
<140> Gibbs M.M., Water Res.. _11 ,1979,295.
<141> Makerbeth F.J.H.. P h i l . Trans. Roy. S o c , 250 ,1966,165
<142> Mi l l w a r d G.E. , Moore R.M., Water Res., _ l i ,1982,981
<143> Schmidt G.J.. Scott R.P.W. , Analyst ig9_ ,1984,997
<144> Zhang Sunei. Haxue S h i j i , 4 ,1982,335
<145> Q u a n t i t a t i v e Inorganic A n a l y s i s , p 261. Belcher R., Nuttens A.J., 3rd Ed. 1970 Butterworths, London.-
<146> Nakashima R., Sasaki S-, Shibata S., Japan Analyst 22 ,1973,723
<147> Photometric Determination of Trace Metals, Sandell E.B., Onishi H., P t . l , p 320, J. Wiley & Sons. 1978, N.Y.
<148> Valero J., A f i n i d a d , 40 ,1983,P.288
<149> Marczenko Z., Jarosz M. , Analyst, _107 ,1982.1431
<150> Ashton.A. , Fogg.A.G. , Bums.D.T. , Analyst, 98 ,1973.202
<151> Tikhonov V.N., Zh. Anal. Khim., 32 ,1977,1140.
<152> Photometric Determination of Trace Metals, Sandell E.B., Onishi H.. P t . l , p.651, J. Wiley & Sons. 1978. N.Y.
281

<153> De Wet W.J., Brethens G.B., Anal. Chem., 40 ,1968,p 200.
<154> Zolotov Y.A., Shpigun O.A., Bubchikova L.A., Dokl. Akad. Nauk., 266 ,1982,369
<155> Lajunen L.H.J., E i j a r v i E., Kenakkala T., Analyst 109 ,1984,699
<156> Journal of Chromatography L i b r a r y , Heftmann E., Horvath C., Melander W.R., Pt.A, p.253, El s e v i e r Pub. Co., 1983, Amsterdam.
<157> Bums D.T., U.V.Spectrom.Group B u l l . 25. .1982,14
<158> Stevens H.M. , Anal. Chem Acta 20 ,1959.389
<159> Nishikawa Y., H i r a k i K,, Takahashii K.M.K., Shigematsu T. , Nogami T. , Japan Analyst 25_ ,1976,459
<160> Ryan D.E., P i t t s A.E., Cassidy R.M., Anal. Chim. Acta., 34 ,1966,491
<161> Nakashima R., Sasaki S-, Shibata S., Japan Analyst-, 22 ,1973,723
<162> Santen R.T.. Schlewitz J-H.. Toy C.H.. Anal. Chim. Acta., 33 ,1965,593
<163> Schatchter D., J. Lab & C l i n i c a l Med., 58 ,1961,495.
<164> Ryan .E., P i t t s A.E-, Cassidy R.M., Anal. Chim. Acta., 34 .1966,491.
<165> Photometric Determination of Trace Metals, Sandell E.B., Onishi H., P t . l , p.435, J. Wiley & Sons, 1978, N.Y.
282

Ackrtowledgemejits.
I would l i k e to thank the following;
Dr P. Jones for h i s valuable supervision.
Dr L. Ebdon for h i s enthusiasm.
B r i t i s h Drug House(Poole) for acting as the collaborating establishment.
Dr E. Newman for h i s advice and travels to Plymouth.
Mr R. Evens and Dr L. Brown.
Mr T. Ingrain for providing a quick computer repair service.
Mr .Pearson and Mr A, Tonkin for help with reagent synthesis.
S.E.R.C. for a grant for which t h i s work would not have been possible.
Devon L.E.A, for my salary.