
RSC_CP_C2CP40699C 1..8 - CORE
8
This journal is c the Owner Societies 2012 Phys. Chem. Chem. Phys., 2012, 14, 5945–5952 5945 Cite this: Phys. Chem. Chem. Phys., 2012, 14, 5945–5952 Layered Na 0.71 CoO 2 : a powerful candidate for viable and high performance Na-batteriesw Massimiliano D’Arienzo,* a Riccardo Ruffo,* a Roberto Scotti, a Franca Morazzoni, a Claudio Maria Mari a and Stefano Polizzi b Received 5th March 2012, Accepted 6th March 2012 DOI: 10.1039/c2cp40699c The present study reports on the synthesis and the electrochemical behavior of Na 0.71 CoO 2 , a promising candidate as cathode for Na-based batteries. The material was obtained in two different morphologies by a double-step route, which is cheap and easy to scale up: the hydrothermal synthesis to produce Co 3 O 4 with tailored and nanometric morphology, followed by the solid-state reaction with NaOH, or alternatively with Na 2 CO 3 , to promote Na intercalation. Both products are highly crystalline and have the P2-Na 0.71 CoO 2 crystal phase, but differ in the respective morphologies. The material obtained from Na 2 CO 3 have a narrow particle length (edge to edge) distribution and 2D platelet morphology, while those from NaOH exhibit large microcrystals, irregular in shape, with broad particle length distribution and undefined exposed surfaces. Electrochemical analysis shows the good performances of these materials as a positive electrode for Na-ion half cells. In particular, Na 0.71 CoO 2 thin microplatelets exhibit the best behavior with stable discharge specific capacities of 120 and 80 mAh g 1 at 5 and 40 mA g 1 , respectively, in the range 2.0–3.9 V vs. Na + /Na. These outstanding properties make this material a promising candidate to construct viable and high-performance Na-based batteries. Introduction Lithium ion batteries dominate the market of secondary power sources for wireless electronic equipment as they offer both high energy and good power density. Today, about 100 million lithium ion cells are produced monthly with a consumption of about 1000 tons of cathode materials. The strategic market of the automotive industry is looking to the lithium ion system as a power source for the next generation of Hybrid Electric Vehicles (HEVs) and for the future development of full electric cars. In this context, a new and unprecedented issue stands out: the massive consumption of lithium sources which could limit the future dreams of large urban air depollution and better fuel management. In fact recent calculations have pointed out that the production of Li 2 CO 3 is currently about half of what would be needed to convert all cars every year produced (about 50 million) into HEVs (with an electric motor powered by a 7 kWh battery) and the demand will become astronomical considering that full electric vehicles require an onboard battery of around 40 kWh. 1 A deep evaluation on the effective availability of lithium raw materials concerns geologists (see for example the debate between R. Keith Evans and William Tahil 2 ) and it is beyond the scope of the present paper; however, no doubt that the cost of lithium is increasing, and the strong future demand will make the situation even dimmer. For instance, the price of Li 2 CO 3 exported from Chile increased threefold in the five-year period 2003–2008. 3 A possible solution to the above reported drawbacks is the development of different battery systems, as recently reported by several research. 4 In this framework, growing interest lies in the sodium based systems, which were already investigated at the early stage of lithium ion technology, but after the commercialization of the first Sony battery (1990), have been almost totally abandoned. Lithium has three times larger specific capacity than sodium (3.86 vs. 1.08 Ah g 1 , respectively), but only one-tenth of this capacity is used at the battery anode and one-twentieth at the cathode. Cost and natural abundance, which are not favorable to the lithium future, are promising in the case of sodium because Na raw material (NaCl) has wider distribution than Li on the earth’s crust (75% of primary lithium sources are estimated to be in South America). The growth of a sodium based technology implies the development of electrode materials which can react in a fast and reversible way with sodium ions. 5 Although the larger Na + ionic radius compared to Li + (0.98 vs. 0.68 A ˚ , respectively) might be a crucial obstacle to overcome because the high Na + diffusion coefficient may negatively affect the reaction kinetic, a Department of Materials Science, University of Milano Bicocca, via R. Cozzi 53, I-20125 Milan, Italy. E-mail: [email protected], riccardo.ruff[email protected] b Dipartimento di Scienze Molecolari e Nanosistemi, Universita ` Ca’ Foscari Venezia, via Torino 155/b, I-30172 Venezia, Italy w Electronic supplementary information (ESI) available: Details on the EDX analysis performed on Na 0.71 CoO 2 phases are reported in Fig. S1. See DOI: 10.1039/c2cp40699c PCCP Dynamic Article Links www.rsc.org/pccp PAPER Downloaded by UNIVERSITA CA FOSCARI DI VENEZIA on 13 April 2012 Published on 06 March 2012 on http://pubs.rsc.org | doi:10.1039/C2CP40699C View Online / Journal Homepage / Table of Contents for this issue
-
Upload
khangminh22 -
Category
Documents
-
view
6 -
download
0
Transcript of RSC_CP_C2CP40699C 1..8 - CORE
This journal is c the Owner Societies 2012 Phys. Chem. Chem. Phys., 2012, 14, 5945–5952 5945
Cite this: Phys. Chem. Chem. Phys., 2012, 14, 5945–5952
Layered Na0.71CoO2: a powerful candidate for viable and high
performance Na-batteriesw
Massimiliano D’Arienzo,*aRiccardo Ruffo,*
aRoberto Scotti,
aFranca Morazzoni,
a
Claudio Maria Mariaand Stefano Polizzi
b
Received 5th March 2012, Accepted 6th March 2012
DOI: 10.1039/c2cp40699c
The present study reports on the synthesis and the electrochemical behavior of Na0.71CoO2,
a promising candidate as cathode for Na-based batteries. The material was obtained in two
different morphologies by a double-step route, which is cheap and easy to scale up: the
hydrothermal synthesis to produce Co3O4 with tailored and nanometric morphology, followed by
the solid-state reaction with NaOH, or alternatively with Na2CO3, to promote Na intercalation.
Both products are highly crystalline and have the P2-Na0.71CoO2 crystal phase, but differ in the
respective morphologies. The material obtained from Na2CO3 have a narrow particle length
(edge to edge) distribution and 2D platelet morphology, while those from NaOH exhibit large
microcrystals, irregular in shape, with broad particle length distribution and undefined exposed
surfaces. Electrochemical analysis shows the good performances of these materials as a positive
electrode for Na-ion half cells. In particular, Na0.71CoO2 thin microplatelets exhibit the best
behavior with stable discharge specific capacities of 120 and 80 mAh g�1 at 5 and 40 mA g�1,
respectively, in the range 2.0–3.9 V vs. Na+/Na. These outstanding properties make this material
a promising candidate to construct viable and high-performance Na-based batteries.
Introduction
Lithium ion batteries dominate the market of secondary power
sources for wireless electronic equipment as they offer both
high energy and good power density. Today, about 100 million
lithium ion cells are produced monthly with a consumption of
about 1000 tons of cathode materials. The strategic market of
the automotive industry is looking to the lithium ion system as
a power source for the next generation of Hybrid Electric
Vehicles (HEVs) and for the future development of full electric
cars. In this context, a new and unprecedented issue stands
out: the massive consumption of lithium sources which could
limit the future dreams of large urban air depollution and
better fuel management. In fact recent calculations have
pointed out that the production of Li2CO3 is currently about
half of what would be needed to convert all cars every year
produced (about 50 million) into HEVs (with an electric motor
powered by a 7 kWh battery) and the demand will become
astronomical considering that full electric vehicles require an
onboard battery of around 40 kWh.1 A deep evaluation on the
effective availability of lithium raw materials concerns geologists
(see for example the debate between R. Keith Evans andWilliam
Tahil2) and it is beyond the scope of the present paper; however,
no doubt that the cost of lithium is increasing, and the strong
future demand will make the situation even dimmer. For
instance, the price of Li2CO3 exported from Chile increased
threefold in the five-year period 2003–2008.3
A possible solution to the above reported drawbacks is the
development of different battery systems, as recently reported
by several research.4 In this framework, growing interest lies in
the sodium based systems, which were already investigated at
the early stage of lithium ion technology, but after the
commercialization of the first Sony battery (1990), have been
almost totally abandoned. Lithium has three times larger specific
capacity than sodium (3.86 vs. 1.08 Ah g�1, respectively), but
only one-tenth of this capacity is used at the battery anode and
one-twentieth at the cathode. Cost and natural abundance,
which are not favorable to the lithium future, are promising in
the case of sodium because Na raw material (NaCl) has wider
distribution than Li on the earth’s crust (75% of primary lithium
sources are estimated to be in South America).
The growth of a sodium based technology implies the
development of electrode materials which can react in a fast
and reversible way with sodium ions.5 Although the larger Na+
ionic radius compared to Li+ (0.98 vs. 0.68 A, respectively)
might be a crucial obstacle to overcome because the high Na+
diffusion coefficient may negatively affect the reaction kinetic,
aDepartment of Materials Science, University of Milano Bicocca,via R. Cozzi 53, I-20125 Milan, Italy.E-mail: [email protected], [email protected]
bDipartimento di Scienze Molecolari e Nanosistemi, Universita Ca’Foscari Venezia, via Torino 155/b, I-30172 Venezia, Italy
w Electronic supplementary information (ESI) available: Details onthe EDX analysis performed on Na0.71CoO2 phases are reported inFig. S1. See DOI: 10.1039/c2cp40699c
PCCP Dynamic Article Links
www.rsc.org/pccp PAPER
Dow
nloa
ded
by U
NIV
ER
SIT
A C
A F
OSC
AR
I D
I V
EN
EZ
IA o
n 13
Apr
il 20
12Pu
blis
hed
on 0
6 M
arch
201
2 on
http
://pu
bs.r
sc.o
rg |
doi:1
0.10
39/C
2CP4
0699
CView Online / Journal Homepage / Table of Contents for this issue

5946 Phys. Chem. Chem. Phys., 2012, 14, 5945–5952 This journal is c the Owner Societies 2012
the barriers for Na+ migration can potentially be lower than
that for Li+ migration in some particular layered structures.
This behavior has been recently demonstrated by computational
studies.6
The above results clearly indicate sodium ion intercalation
compounds as really promising electrode materials for the
sodium based batteries. Several structures have been proposed
right now, especially in the last few years: NASICON,7,8
alluaudite phases,9 olivines,10,11 and tunnel oxides.12–17
The Na analogous of lithiated mixed oxides, which are
commonly used as positive electrode materials in lithium
based batteries, are seldom investigated.13,16,17 NaxCoO2 was
first studied back in the 1980’s18–20 as a rechargeable electrode,
and its structural behavior during the sodium intercalation
and de-intercalation was described in a recent seminal paper.21
P2-NaxCoO2 (x D 0.7) (for the nomenclature of these phases
see ref. 21) is a p-type oxide and its crystalline structure
changes with the sodium content, assuming the g-phase in
the range x = 0.65–0.74. This phase displays hexagonal lattice
consisting of layers of edge-sharing CoO6 octahedrons, separated
by sodium ions in two different crystallographic sites (see inset of
Fig. 1). These adjacent sites are too close considering the Na+
ionic radius and therefore cannot be occupied simultaneously,
leading to the presence of vacant positions in the interslab
space. Slight changes in Na+ ion amount (1 or 2%) can induce
a new cation distribution and structural rearrangements even at
room temperature. Therefore the sodium content plays a key role
in determining the electrochemical properties of the system.21
Although several electrochemical characterizations have
already been made, further investigations on P2-Na0.7CoO2
are needed to fully understand its potential application as
battery material. A brief description of the electrochemical
data available for this phase is reported hereafter. In 1981,
Delmas et al.18 studied the Na+ intercalation and deintercalation
in the solid state obtained NaxCoO2 with different starting
compositions and reported the first potential/composition profile
during the first cycle. The P2-phase profile showed reversible
behavior between 2.0 and 3.5 V vs. Na+/Na, a change in
composition aroundDx=0.35 in NaxCoO2 with a corresponding
specific capacity of about 85 mAh g�1. The same group more
recently attempted deeper investigation on the structure–property
relationship,21 however in both cases no data are reported about
the use of the material for more cycles. In 1988 Shacklette et al.20
showed the first cyclability data for several NaxCoO2 phases
(P2 and P3) obtained by solid state reaction. The best behavior
in terms of capacity retention was displayed by the P2 phase
with a projected capacity fading by 50% after 1000 cycles at
low current. However, the measurements were obtained in a
reduced potential range (1.5–3.3 V vs. Na+/Na) and no data
were reported on the material specific capacity. In 1993
Ma et al.23 used the same solid state obtained P2-Na0.7CoO2
in a battery using metallic sodium or Na15Pb4 as the counter
electrode and a solid-polymer electrolyte. The measurements
were performed at 90 1C showing promising results, but once
again, data about the material specific capacity upon cycling
were missing (authors claimed that the initial capacity was
corresponding to about x= 0.6 in NaxCoO2, i.e. 150 mAh g�1).
Recently, Bhide and Hariharan24 tried to correlate the material
morphology with its electrical and electrochemical properties.
In particular, they prepared P2-Na0.71CoO2 by three different
routes: solid-state reaction, sol–gel condensation by acetate
precursors, and high energy ball-milling procedure followed by
short thermal treatment. The electrochemical characterization
was performed in a cell using metallic Na as the counter
electrode and plasticized polymer electrolyte; the cell was only
discharged from OCV to 1.75 V vs. Na+/Na without any
further characterization and no data about the specific capacity
were reported. The best discharge properties were observed in
cells with the cathode materials prepared by the sol–gel route.
This was related to the small particle size and to the large
surface area of the sol–gel obtained mixed oxide, both favoring
the stability of the electrode–electrolyte interface and thereby
the discharge properties.24
In this inhomogeneous and incomplete scenario, the aim of
the present paper is to report, for the first time, a detailed
electrochemical analysis of the P2-Na0.7CoO2 in half cell vs.
metallic Na, through cyclic voltammetry measurements,
potential/capacity profiles and cyclability data at different
current rates. Moreover the relations among the synthesis
procedure, the material morphology and the electrochemical
properties were investigated, in order to lay the groundwork
for a rationale design of these materials.
Two different samples were prepared starting from the same
hydrothermal nanometric Co3O4 precursor. The former material
was obtained by conventional solid-state reaction of Co3O4 with
Fig. 1 XRD patterns of (a) Co3O4 hydrothermal nanocrystals,
(b) Na0.71CoO2 (II) and (c) Na0.71CoO2 (I). The inset shows the
structure of the P2-NaxCoO2 phases. Nae and Naf depict two sodium
ions in two different crystallographic sites (Reprinted with permission
from R. Berthelot, D. Carlier and C. Delmas,Nat. Mater. 2011, 10, 74.
Copyright 2010 Nature Publishing Group).
Dow
nloa
ded
by U
NIV
ER
SIT
A C
A F
OSC
AR
I D
I V
EN
EZ
IA o
n 13
Apr
il 20
12Pu
blis
hed
on 0
6 M
arch
201
2 on
http
://pu
bs.r
sc.o
rg |
doi:1
0.10
39/C
2CP4
0699
C
View Online
This journal is c the Owner Societies 2012 Phys. Chem. Chem. Phys., 2012, 14, 5945–5952 5947
Na2CO3; due to the use of the nanosized Co3O4 precursor, the
thermal treatment in air was performed for a relatively short
time. The latter was produced by using NaOH in water as the
Na source, followed by calcination of the dried precursors.
The structural and morphological features of the cobalt oxide
precursor and of both mixed-oxides were investigated in detail
and showed the presence of well crystallized particles with a
controlled morphology and nanometric or sub-micrometric size.
The electrochemical characterization revealed good kinetics of
the de-intercalation–intercalation processes with a very small ohmic
drop and excellent energy efficiency. In particular, Na0.71CoO2 with
2D platelet structure exhibited the best behavior with a stable
discharge specific capacity of 120 and 80 mAh g�1 at 5 and
40 mA g�1, respectively, in the range 2.0–3.9 V. These perfor-
mances are significantly better than those of current state-of-the-art
NaxCoO2-based batteries and therefore make this material suitable
to develop highly efficient Na-ion batteries.
Experimental
Chemicals
Cobalt carbonate hydrate (CoCO3�xH2O 99.998%), sodium
hydroxide (NaOH, Z 98%), hydrogen peroxide solution
(H2O2, 30%) and sodium carbonate anhydrous (Na2CO3,
99.999%) were all purchased from Aldrich and used as
received without further purification.
Preparation of Na0.71CoO2 samples
The cathode materials have been prepared by a two-step approach
involving the hydrothermal synthesis of Co3O4 nanocrystals and
the successive reaction either with NaOH (sample I) or with
Na2CO3 (sample II) to form Na0.71CoO2 powders.
Hydrothermal synthesis of Co3O4 nanopowders
In a typical synthesis of Co3O4 nanocrystals, 0.67 g of CoCO3�xH2O were slowly added to an aqueous solution of 3 M
sodium hydroxide (NaOH) at room temperature and under
vigorous stirring. The resulting pink suspension of Co(OH)2was stirred for 15 minutes and then oxidized by adding drop
wise 2 mL of a hydrogen peroxide solution (H2O2 30%). The
obtained dark brown suspension was stirred for 15 minutes and
then transferred into a 60 mL Teflon lined stainless steel autoclave
and heated to 180 1C for 2 h in an oven. The autoclave was cooled
in air and, after decantation, Co3O4 nanopowders were recovered
by centrifugation, washed with water and acetone and finally
dried under vacuum (p o 10�2 mbar).
Preparation of Na0.71CoO2 (I)
Na2CO3 and hydrothermally obtained Co3O4 nanocrystals
were mixed thoroughly and the mixture was subjected to
thermal annealing in air at 800 1C for 16 h. According to the
sodium volatility, the initial 5 wt% excess of Na2CO3 was used.
Preparation of Na0.71CoO2 (II)
Co3O4 hydrothermal powders were suspended under ultrasound
in 10 mL of 0.3 M NaOH aqueous solution. The solvent was
then removed on a rotary evaporator and the wet powders
were dried in air at 60 1C, then calcined at 800 1C for 16 hours.
Characterization methods
The X-ray diffraction (XRD) patterns of hydrothermally
obtained Co3O4 nanocrystals and Na0.71CoO2 powders were
collected with a Bruker D8 Advance diffractometer (Cu Karadiation) operating in the range 10–701 2y (2y step 0.0201,
counting time 2 s per step).
Scanning electron microscopy (SEM) measurements were
performed by a Vega TS5136 XM Tescan microscope in a high
vacuum configuration. The electron beam excitation was 30 kV
at a beam current of 25 pA, and the working distance was
12 mm. In this configuration the beam spot was 38 nm. Prior to
SEM analysis, samples were gold-sputtered.
High-resolution transmission electron microscopy (HRTEM)
and electron diffraction (SAED) measurements were performed
using a Jeol 3010 apparatus operated at 300 kV with a high-
resolution pole piece (0.17 nm point-to-point resolution) and
equipped with a Gatan slow-scan 794 CCD camera. The powders
were suspended in isopropanol, and a 5 mL drop of this suspension
was deposited on a holey carbon film supported on a 3mm copper
grid for TEM investigation.
The elemental composition was determined by Atomic
Absorption Spectroscopy (AAS, PerkinElmer 100). Roughly
10 mg of powder were dissolved in acid solution (HCl 37%/
HNO3 63% = 6 : 1) and the composition was determined
from the Na/Co ratio (assuming no oxygen deficiencies).
The electrochemical characterization was carried out using
three electrode Swagelok cells. Active material electrodes were
fabricated bymixing the powderedNa0.71CoO2 with carbon black
(SuperP MMM Carbon) and an organic binder (PVDF-HF,
Solvay) in an 8 : 1 : 1 weight ratio. The mixture was dispersed
in n-methyl-pyrrolidone (NMP) to obtain dense slurry which was
casted directly on the stainless steel current collector of the
Swagelok cell. The active material load was around 3 mg cm�2.
Metallic sodium discs were pasted at the top of the two different
current collectors, and they were used as reference and counter
electrodes. All the potentials are reported versus the couple
Na+/Na. The small gap among the electrodes was filled with
the electrolyte which was NaClO4 (1 M) in propylene carbonate.
This cell arrangement minimizes the number of materials used in
cell assembling; thus the result is directly relatable to the material
performances. For this reason, the cell was kept in an Ar filled
glove box ([O2] o 1 ppm) during all the measurements. Both
cyclic voltammetries (CV) and galvanostatic cycling with
potential limitation (GCPL) were performed. CVs were carried
out at 0.1 mV s�1 in the 2.0–4.0 V potential range. GCPL were
performed at different current rates using 2.0 and 3.9 V as low
and high cut off voltage, respectively. The gravimetric current
density values are reported as the corresponding C rates, using
the value of 249.9 mAh g�1 as theoretical specific capacity for
the intercalation and de-intercalation of 1 mol of Na+ ions in
NaxCoO2 where x = 0.71 is the initial composition (1 C
corresponds to 249.9 mA g�1).
Results and discussion
Structural and morphological characterization
Fig. 1 shows the XRD patterns of hydrothermally obtained
Co3O4 nanocrystals (a) and of Na0.71CoO2 powders (b and c).
Dow
nloa
ded
by U
NIV
ER
SIT
A C
A F
OSC
AR
I D
I V
EN
EZ
IA o
n 13
Apr
il 20
12Pu
blis
hed
on 0
6 M
arch
201
2 on
http
://pu
bs.r
sc.o
rg |
doi:1
0.10
39/C
2CP4
0699
C
View Online

5948 Phys. Chem. Chem. Phys., 2012, 14, 5945–5952 This journal is c the Owner Societies 2012
In particular, the diffraction peaks of both samples I and II
have been indexed based on the hexagonal crystal system with
space group P63/mmc and lattice parameters a = 2.833 A and
c = 10.880 A, which agree with the values reported for the
phase g-Na0.71Co0.96O2 (JCPDS file no. 30-1182, see the structure
in Fig. 1). It is interesting to note that the Na0.71CoO2 phase was
obtained by a relatively short thermal treatment (16 h in air
instead 24 h at 850 1C under oxygen flow as reported in ref. 20),
due to the nanometric morphology of the Co3O4 precursor.
The distance between the two cobalt oxide layers is about
5.45 A. The Co–O distance in g-Na0.71Co0.96O2 (1.941 A) is
very similar to those in LiCoO2,25,26 but the Na–O distance
(2.381 A) is greater than the Li–O one. Therefore, the larger
Na+ ions have suitable space to diffuse through layered
structures. This is not the case of rigid poly-anionic systems
such as poly-phosphate (FePO4), where phosphate tetrahedrons
bridge the FeO6 octahedrons creating a stable three dimensional
structure where the alkaline ions have to diffuse through.
TEM and HRTEM micrographs of Co3O4 nanocrystals are
reported in Fig. 2. No internal pores or amorphous surface
layers were detectable. Particles are single nanocrystals, with
pronounced faceting, organized in irregular aggregates
(Fig. 2a). The nanoparticles mainly show elongated prismatic
shape with the major dimension ranging from 140 to 190 nm
and the minor from 45 to 70 nm (see Fig. 2b and c). High-
resolution (HRTEM) image of Co3O4 nanocrystals (Fig. 2d)
evidences that the lattice fringes have a spacing of 0.290 nm,
which matches the interplanar distance of the (220) plane of
the cubic cobalt oxide (JCPDS file no. 42-1467).
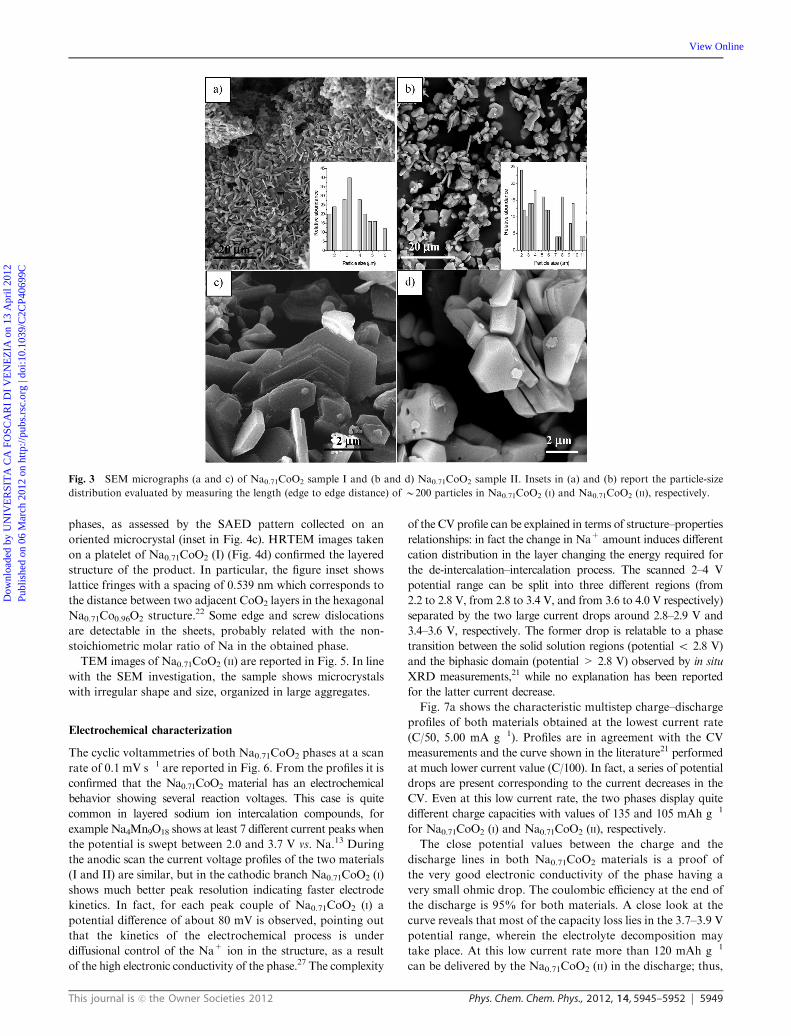
Fig. 3 summarizes the SEMmicrographs performed on both
Na0.71CoO2 materials. Sample I (Fig. 3a and c) displays crystals
with 2D platelet shape, entirely exposed sheet edges, exposed flat
surfaces, thickness ranging from 250 to 500 nm and edge to edge
distance (length) centered at 3.2 mm (see inset of Fig. 3a). In some
micrometric zones of the sample, several hexagonal particles can
be easily detected (see Fig. 3c). SEMmicrographs of Na0.71CoO2
sample II (Fig. 3b and d) instead show microcrystals with
irregular shape, undefined exposed surfaces, higher length and
broader length distribution (inset of Fig. 3b).
From the EDX analysis (Fig. S1, ESIw) carried out over
about 40 different particles of both the obtained materials, the
Na/Co atomic ratio resulted is 0.71, in agreement with the
chemical composition of g-Na0.71Co0.96O2 phase. Accordingly,
elemental analyses performed by atomic absorption spectro-
scopy (AAS) revealed that the Na/Co molar ratio is 0.69 for
Na0.71CoO2 (I) and about 0.74 for Na0.71CoO2 (II), confirming
the successful synthesis of g-Na0.71Co0.96O2.
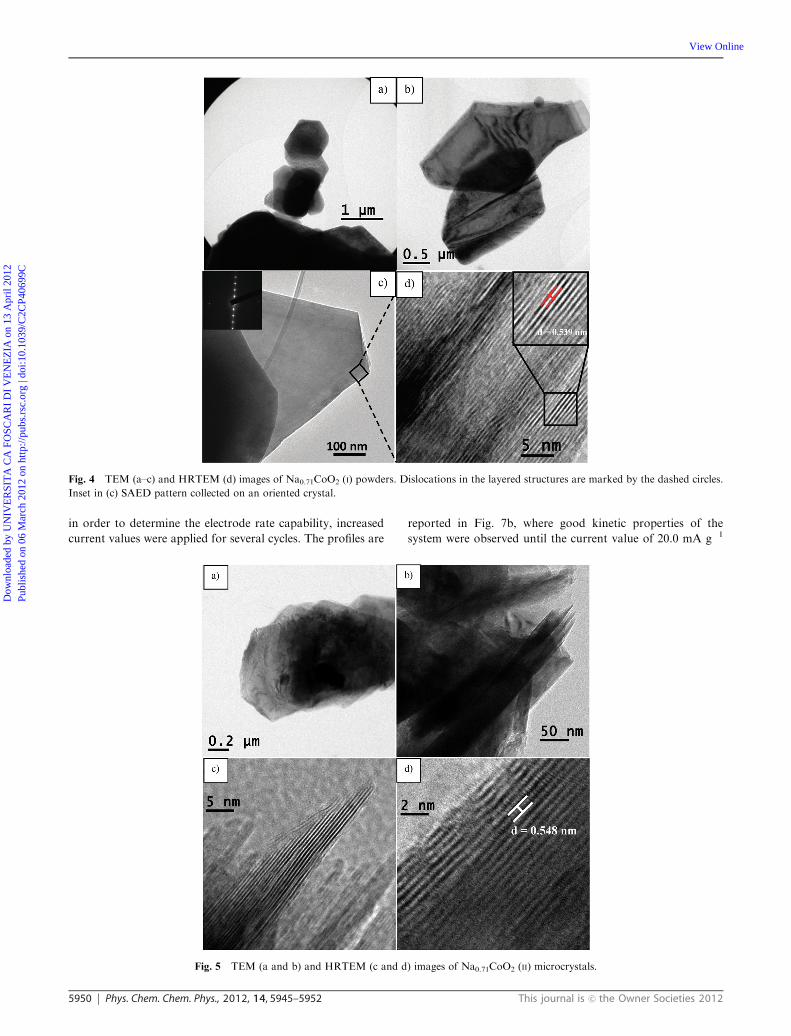
In accordance with the SEM images, TEM investigation
performed onNa0.71CoO2 (I) showed aggregates of micrometric
particles with hexagonal shape (Fig. 4a).
At higher magnification, crystals appear well faceted
(Fig. 4b and c) and free of surface impurities or secondary
Fig. 2 TEM (a–c) and HRTEM (d) images of hydrothermally obtained Co3O4 nanocrystals. Details on crystallographic planes detected are
showed in the inset of (d).
Dow
nloa
ded
by U
NIV
ER
SIT
A C
A F
OSC
AR
I D
I V
EN
EZ
IA o
n 13
Apr
il 20
12Pu
blis
hed
on 0
6 M
arch
201
2 on
http
://pu
bs.r
sc.o
rg |
doi:1
0.10
39/C
2CP4
0699
C
View Online
This journal is c the Owner Societies 2012 Phys. Chem. Chem. Phys., 2012, 14, 5945–5952 5949
phases, as assessed by the SAED pattern collected on an
oriented microcrystal (inset in Fig. 4c). HRTEM images taken
on a platelet of Na0.71CoO2 (I) (Fig. 4d) confirmed the layered
structure of the product. In particular, the figure inset shows
lattice fringes with a spacing of 0.539 nm which corresponds to
the distance between two adjacent CoO2 layers in the hexagonal
Na0.71Co0.96O2 structure.22 Some edge and screw dislocations
are detectable in the sheets, probably related with the non-
stoichiometric molar ratio of Na in the obtained phase.
TEM images of Na0.71CoO2 (II) are reported in Fig. 5. In line
with the SEM investigation, the sample shows microcrystals
with irregular shape and size, organized in large aggregates.
Electrochemical characterization
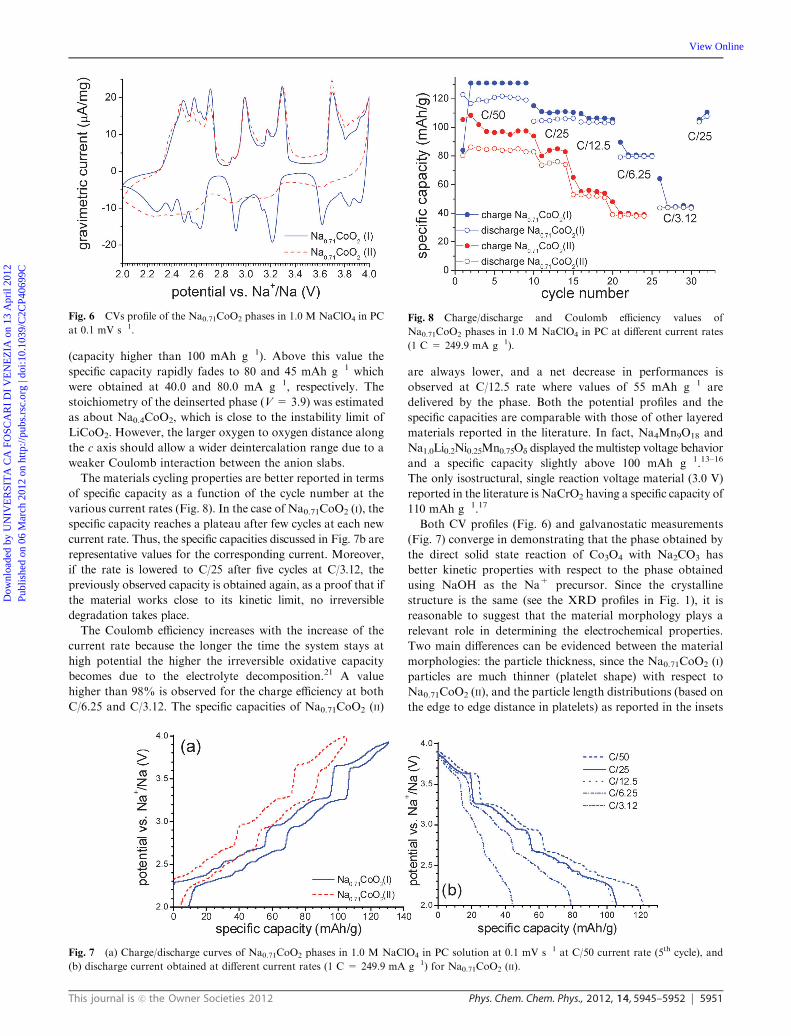
The cyclic voltammetries of both Na0.71CoO2 phases at a scan
rate of 0.1 mV s�1 are reported in Fig. 6. From the profiles it is
confirmed that the Na0.71CoO2 material has an electrochemical
behavior showing several reaction voltages. This case is quite
common in layered sodium ion intercalation compounds, for
example Na4Mn9O18 shows at least 7 different current peaks when
the potential is swept between 2.0 and 3.7 V vs. Na.13 During
the anodic scan the current voltage profiles of the two materials
(I and II) are similar, but in the cathodic branch Na0.71CoO2 (I)
shows much better peak resolution indicating faster electrode
kinetics. In fact, for each peak couple of Na0.71CoO2 (I) a
potential difference of about 80 mV is observed, pointing out
that the kinetics of the electrochemical process is under
diffusional control of the Na+ ion in the structure, as a result
of the high electronic conductivity of the phase.27 The complexity
of the CV profile can be explained in terms of structure–properties
relationships: in fact the change in Na+ amount induces different
cation distribution in the layer changing the energy required for
the de-intercalation–intercalation process. The scanned 2–4 V
potential range can be split into three different regions (from
2.2 to 2.8 V, from 2.8 to 3.4 V, and from 3.6 to 4.0 V respectively)
separated by the two large current drops around 2.8–2.9 V and
3.4–3.6 V, respectively. The former drop is relatable to a phase
transition between the solid solution regions (potential o 2.8 V)
and the biphasic domain (potential > 2.8 V) observed by in situ
XRD measurements,21 while no explanation has been reported
for the latter current decrease.
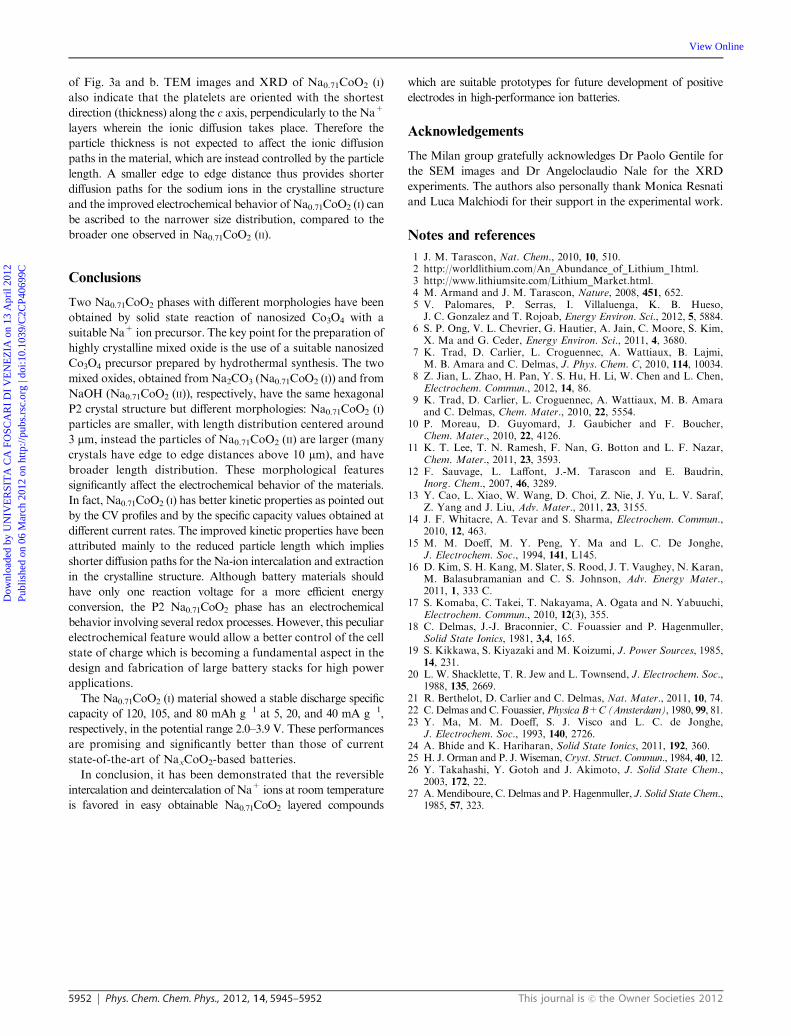
Fig. 7a shows the characteristic multistep charge–discharge
profiles of both materials obtained at the lowest current rate
(C/50, 5.00 mA g�1). Profiles are in agreement with the CV
measurements and the curve shown in the literature21 performed
at much lower current value (C/100). In fact, a series of potential
drops are present corresponding to the current decreases in the
CV. Even at this low current rate, the two phases display quite
different charge capacities with values of 135 and 105 mAh g�1
for Na0.71CoO2 (I) and Na0.71CoO2 (II), respectively.
The close potential values between the charge and the
discharge lines in both Na0.71CoO2 materials is a proof of
the very good electronic conductivity of the phase having a
very small ohmic drop. The coulombic efficiency at the end of
the discharge is 95% for both materials. A close look at the
curve reveals that most of the capacity loss lies in the 3.7–3.9 V
potential range, wherein the electrolyte decomposition may
take place. At this low current rate more than 120 mAh g�1
can be delivered by the Na0.71CoO2 (II) in the discharge; thus,
Fig. 3 SEM micrographs (a and c) of Na0.71CoO2 sample I and (b and d) Na0.71CoO2 sample II. Insets in (a) and (b) report the particle-size
distribution evaluated by measuring the length (edge to edge distance) of B200 particles in Na0.71CoO2 (I) and Na0.71CoO2 (II), respectively.
Dow
nloa
ded
by U
NIV
ER
SIT
A C
A F
OSC
AR
I D
I V
EN
EZ
IA o
n 13
Apr
il 20
12Pu
blis
hed
on 0
6 M
arch
201
2 on
http
://pu
bs.r
sc.o
rg |
doi:1
0.10
39/C
2CP4
0699
C
View Online
5950 Phys. Chem. Chem. Phys., 2012, 14, 5945–5952 This journal is c the Owner Societies 2012
in order to determine the electrode rate capability, increased
current values were applied for several cycles. The profiles are
reported in Fig. 7b, where good kinetic properties of the
system were observed until the current value of 20.0 mA g�1
Fig. 4 TEM (a–c) and HRTEM (d) images of Na0.71CoO2 (I) powders. Dislocations in the layered structures are marked by the dashed circles.
Inset in (c) SAED pattern collected on an oriented crystal.
Fig. 5 TEM (a and b) and HRTEM (c and d) images of Na0.71CoO2 (II) microcrystals.
Dow
nloa
ded
by U
NIV
ER
SIT
A C
A F
OSC
AR
I D
I V
EN
EZ
IA o
n 13
Apr
il 20
12Pu
blis
hed
on 0
6 M
arch
201
2 on
http
://pu
bs.r
sc.o
rg |
doi:1
0.10
39/C
2CP4
0699
C
View Online
This journal is c the Owner Societies 2012 Phys. Chem. Chem. Phys., 2012, 14, 5945–5952 5951
(capacity higher than 100 mAh g�1). Above this value the
specific capacity rapidly fades to 80 and 45 mAh g�1 which
were obtained at 40.0 and 80.0 mA g�1, respectively. The
stoichiometry of the deinserted phase (V = 3.9) was estimated
as about Na0.4CoO2, which is close to the instability limit of
LiCoO2. However, the larger oxygen to oxygen distance along
the c axis should allow a wider deintercalation range due to a
weaker Coulomb interaction between the anion slabs.
The materials cycling properties are better reported in terms
of specific capacity as a function of the cycle number at the
various current rates (Fig. 8). In the case of Na0.71CoO2 (I), the
specific capacity reaches a plateau after few cycles at each new
current rate. Thus, the specific capacities discussed in Fig. 7b are
representative values for the corresponding current. Moreover,
if the rate is lowered to C/25 after five cycles at C/3.12, the
previously observed capacity is obtained again, as a proof that if
the material works close to its kinetic limit, no irreversible
degradation takes place.
The Coulomb efficiency increases with the increase of the
current rate because the longer the time the system stays at
high potential the higher the irreversible oxidative capacity
becomes due to the electrolyte decomposition.21 A value
higher than 98% is observed for the charge efficiency at both
C/6.25 and C/3.12. The specific capacities of Na0.71CoO2 (II)
are always lower, and a net decrease in performances is
observed at C/12.5 rate where values of 55 mAh g�1 are
delivered by the phase. Both the potential profiles and the
specific capacities are comparable with those of other layered
materials reported in the literature. In fact, Na4Mn9O18 and
Na1.0Li0.2Ni0.25Mn0.75Od displayed the multistep voltage behavior
and a specific capacity slightly above 100 mAh g�1.13–16
The only isostructural, single reaction voltage material (3.0 V)
reported in the literature is NaCrO2 having a specific capacity of
110 mAh g�1.17
Both CV profiles (Fig. 6) and galvanostatic measurements
(Fig. 7) converge in demonstrating that the phase obtained by
the direct solid state reaction of Co3O4 with Na2CO3 has
better kinetic properties with respect to the phase obtained
using NaOH as the Na+ precursor. Since the crystalline
structure is the same (see the XRD profiles in Fig. 1), it is
reasonable to suggest that the material morphology plays a
relevant role in determining the electrochemical properties.
Two main differences can be evidenced between the material
morphologies: the particle thickness, since the Na0.71CoO2 (I)
particles are much thinner (platelet shape) with respect to
Na0.71CoO2 (II), and the particle length distributions (based on
the edge to edge distance in platelets) as reported in the insets
Fig. 6 CVs profile of the Na0.71CoO2 phases in 1.0 M NaClO4 in PC
at 0.1 mV s�1.
Fig. 7 (a) Charge/discharge curves of Na0.71CoO2 phases in 1.0 M NaClO4 in PC solution at 0.1 mV s�1 at C/50 current rate (5th cycle), and
(b) discharge current obtained at different current rates (1 C = 249.9 mA g�1) for Na0.71CoO2 (II).
Fig. 8 Charge/discharge and Coulomb efficiency values of
Na0.71CoO2 phases in 1.0 M NaClO4 in PC at different current rates
(1 C = 249.9 mA g�1).
Dow
nloa
ded
by U
NIV
ER
SIT
A C
A F
OSC
AR
I D
I V
EN
EZ
IA o
n 13
Apr
il 20
12Pu
blis
hed
on 0
6 M
arch
201
2 on
http
://pu
bs.r
sc.o
rg |
doi:1
0.10
39/C
2CP4
0699
C
View Online
5952 Phys. Chem. Chem. Phys., 2012, 14, 5945–5952 This journal is c the Owner Societies 2012
of Fig. 3a and b. TEM images and XRD of Na0.71CoO2 (I)
also indicate that the platelets are oriented with the shortest
direction (thickness) along the c axis, perpendicularly to the Na+
layers wherein the ionic diffusion takes place. Therefore the
particle thickness is not expected to affect the ionic diffusion
paths in the material, which are instead controlled by the particle
length. A smaller edge to edge distance thus provides shorter
diffusion paths for the sodium ions in the crystalline structure
and the improved electrochemical behavior of Na0.71CoO2 (I) can
be ascribed to the narrower size distribution, compared to the
broader one observed in Na0.71CoO2 (II).
Conclusions
Two Na0.71CoO2 phases with different morphologies have been
obtained by solid state reaction of nanosized Co3O4 with a
suitable Na+ ion precursor. The key point for the preparation of
highly crystalline mixed oxide is the use of a suitable nanosized
Co3O4 precursor prepared by hydrothermal synthesis. The two
mixed oxides, obtained from Na2CO3 (Na0.71CoO2 (I)) and from
NaOH (Na0.71CoO2 (II)), respectively, have the same hexagonal
P2 crystal structure but different morphologies: Na0.71CoO2 (I)
particles are smaller, with length distribution centered around
3 mm, instead the particles of Na0.71CoO2 (II) are larger (many
crystals have edge to edge distances above 10 mm), and have
broader length distribution. These morphological features
significantly affect the electrochemical behavior of the materials.
In fact, Na0.71CoO2 (I) has better kinetic properties as pointed out
by the CV profiles and by the specific capacity values obtained at
different current rates. The improved kinetic properties have been
attributed mainly to the reduced particle length which implies
shorter diffusion paths for the Na-ion intercalation and extraction
in the crystalline structure. Although battery materials should
have only one reaction voltage for a more efficient energy
conversion, the P2 Na0.71CoO2 phase has an electrochemical
behavior involving several redox processes. However, this peculiar
electrochemical feature would allow a better control of the cell
state of charge which is becoming a fundamental aspect in the
design and fabrication of large battery stacks for high power
applications.
The Na0.71CoO2 (I) material showed a stable discharge specific
capacity of 120, 105, and 80 mAh g�1 at 5, 20, and 40 mA g�1,
respectively, in the potential range 2.0–3.9 V. These performances
are promising and significantly better than those of current
state-of-the-art of NaxCoO2-based batteries.
In conclusion, it has been demonstrated that the reversible
intercalation and deintercalation of Na+ ions at room temperature
is favored in easy obtainable Na0.71CoO2 layered compounds
which are suitable prototypes for future development of positive
electrodes in high-performance ion batteries.
Acknowledgements
The Milan group gratefully acknowledges Dr Paolo Gentile for
the SEM images and Dr Angeloclaudio Nale for the XRD
experiments. The authors also personally thank Monica Resnati
and Luca Malchiodi for their support in the experimental work.
Notes and references
1 J. M. Tarascon, Nat. Chem., 2010, 10, 510.2 http://worldlithium.com/An_Abundance_of_Lithium_1html.3 http://www.lithiumsite.com/Lithium_Market.html.4 M. Armand and J. M. Tarascon, Nature, 2008, 451, 652.5 V. Palomares, P. Serras, I. Villaluenga, K. B. Hueso,J. C. Gonzalez and T. Rojoab, Energy Environ. Sci., 2012, 5, 5884.
6 S. P. Ong, V. L. Chevrier, G. Hautier, A. Jain, C. Moore, S. Kim,X. Ma and G. Ceder, Energy Environ. Sci., 2011, 4, 3680.
7 K. Trad, D. Carlier, L. Croguennec, A. Wattiaux, B. Lajmi,M. B. Amara and C. Delmas, J. Phys. Chem. C, 2010, 114, 10034.
8 Z. Jian, L. Zhao, H. Pan, Y. S. Hu, H. Li, W. Chen and L. Chen,Electrochem. Commun., 2012, 14, 86.
9 K. Trad, D. Carlier, L. Croguennec, A. Wattiaux, M. B. Amaraand C. Delmas, Chem. Mater., 2010, 22, 5554.
10 P. Moreau, D. Guyomard, J. Gaubicher and F. Boucher,Chem. Mater., 2010, 22, 4126.
11 K. T. Lee, T. N. Ramesh, F. Nan, G. Botton and L. F. Nazar,Chem. Mater., 2011, 23, 3593.
12 F. Sauvage, L. Laffont, J.-M. Tarascon and E. Baudrin,Inorg. Chem., 2007, 46, 3289.
13 Y. Cao, L. Xiao, W. Wang, D. Choi, Z. Nie, J. Yu, L. V. Saraf,Z. Yang and J. Liu, Adv. Mater., 2011, 23, 3155.
14 J. F. Whitacre, A. Tevar and S. Sharma, Electrochem. Commun.,2010, 12, 463.
15 M. M. Doeff, M. Y. Peng, Y. Ma and L. C. De Jonghe,J. Electrochem. Soc., 1994, 141, L145.
16 D. Kim, S. H. Kang, M. Slater, S. Rood, J. T. Vaughey, N. Karan,M. Balasubramanian and C. S. Johnson, Adv. Energy Mater.,2011, 1, 333 C.
17 S. Komaba, C. Takei, T. Nakayama, A. Ogata and N. Yabuuchi,Electrochem. Commun., 2010, 12(3), 355.
18 C. Delmas, J.-J. Braconnier, C. Fouassier and P. Hagenmuller,Solid State Ionics, 1981, 3,4, 165.
19 S. Kikkawa, S. Kiyazaki and M. Koizumi, J. Power Sources, 1985,14, 231.
20 L. W. Shacklette, T. R. Jew and L. Townsend, J. Electrochem. Soc.,1988, 135, 2669.
21 R. Berthelot, D. Carlier and C. Delmas, Nat. Mater., 2011, 10, 74.22 C. Delmas and C. Fouassier,Physica B+C (Amsterdam), 1980, 99, 81.23 Y. Ma, M. M. Doeff, S. J. Visco and L. C. de Jonghe,
J. Electrochem. Soc., 1993, 140, 2726.24 A. Bhide and K. Hariharan, Solid State Ionics, 2011, 192, 360.25 H. J. Orman and P. J. Wiseman, Cryst. Struct. Commun., 1984, 40, 12.26 Y. Takahashi, Y. Gotoh and J. Akimoto, J. Solid State Chem.,
2003, 172, 22.27 A.Mendiboure, C. Delmas and P. Hagenmuller, J. Solid State Chem.,
1985, 57, 323.
Dow
nloa
ded
by U
NIV
ER
SIT
A C
A F
OSC
AR
I D
I V
EN
EZ
IA o
n 13
Apr
il 20
12Pu
blis
hed
on 0
6 M
arch
201
2 on
http
://pu
bs.r
sc.o
rg |
doi:1
0.10
39/C
2CP4
0699
C
View Online