SELECTION AMONG EMPLOYER-SPONSORED PENSION PLANS: THE ROLE OF INDIVIDUAL DIFFERENCES
Upload
independentCategory
view
0download
0
1
Eutrophic Conditions at the Salton Sea
A topical paper from the Eutrophication Workshop convened atthe University of California at Riverside, September 7-8, 2000
Editedby
Jim Setmire1
Contributions from:
Chris Holdren2
Dale Robertson3
Chris Amrhein4
John Elder3
Roy Schroeder5
Geoff Schladow6
Hank McKellar7
Rick Gersberg8
Workshop sponsored by the Salton Sea Authority, the SaltonSea Science Office, and the U.S. Bureau of Reclamation
1. Jim Setmire – Hydrologist, U.S. Geological Survey on detail to the U.S. Bureau ofReclamation, Temecula, CA.2. Chris Holdren – Limnologist, U.S. Bureau of Reclamation, Denver, CO.3. Dale Robertson – Research Hydrologist, U.S. Geological Survey, Middleton, WI.3. John Elder - Research Hydrologist, U.S. Geological Survey, Middleton, WI.4. Chris Amrhein - Professor, University of California, Riverside5. Roy Schroeder - Research Hydrologist, U.S. Geological Survey, San Diego, CA.6. Geoff Schladow - Associate Professor of Water Resources and Environmental Engineering,University of California, Davis7. Hank McKellar - Associate Professor, Dept. Environmental Health, Sciences, University ofSouth Carolina8. Rick Gersberg - Professor, San Diego State University, San Diego, CA

2
EUTROPHIC CONDITIONS AT THE SALTON SEA
BACKGROUND:
LOCATION AND HISTORY OF SALTON SEA
The Salton Sea is located in the southeastern desert of California. It occupies
the northern part of the Salton Trough that includes the Coachella and Imperial
Valleys of California and the Mexicali Valley of Mexico. The current Salton Sea
was formed during the 17 months from October 1905 to February 1907 following
summer flooding and the failure of a temporary diversion of the Colorado River.
During the 17 months, most of discharge of the Colorado River flowed into the
Salton Trough. At the closure of the break, the Salton Sea’s elevation was
-195 ft Mean Sea Level (MSL) and the surface area was 520 square miles.
Evaporation and lack of significant tributary inflow caused the Sea’s elevation to
gradually recede to a low of -250 ft MSL by 1925. From 1925 to the mid 1980’s,
the elevation of the Salton Sea gradually increased to its current level at about
-227 ft MSL as a result of increased agricultural discharge. The current Sea
occupies about 365 mi2.
Climate is an important factor controlling many of the physical, chemical and
biological processes affecting the Salton Sea. The Imperial Valley, one of the
most arid areas in the United States, has an average annual rainfall of 3 in. The
maximum temperature exceeds 100 0F more than 110 days per year. The
average annual temperature is 74 0F. Evaporation in the Salton Sea is estimated
at 5.78 ft/yr (Hely and others, 1966). At its current elevation, about 1.34 million
acre-ft of water annually is lost from the Salton Sea by evaporation. This loss is
balanced by tributary inflow.

3
Agriculture in the Coachella and Imperial Valleys is sustained by Colorado River
water diverted at the Imperial Dam and delivered via the All-American and the
Coachella Canals. There are 481,000 acres (1995) of irrigated farmland in the
Imperial Valley where agriculture and livestock grossed one billion dollars in
1995. The New and Alamo Rivers carry agricultural discharge from the Imperial
Valley to the Salton Sea. The New River also carries agricultural discharge and
municipal and industrial effluent from Mexicali, Mexico. The Whitewater River
carries agricultural discharges, municipal and industrial effluent, and stormwater
runoff from the Coachella Valley. Agricultural discharges from the Imperial,
Coachella, and Mexicali Valleys along with municipal and industrial effluent
maintain the elevation of the Salton Sea.
SALTON SEA HISTORY
Visitor use at the Salton Sea was at its peak levels during the 1950’s and 1960’s
when the number of visitor days at the Salton Sea exceeded visitor use at
Yosemite National Park. The boom period at the Sea saw development of
marinas, a golf course, major recreational use, and the beginnings of home
construction with the paving and naming of roads. Fishing and boating were at
their peak, with record numbers of corvina caught. However, as a result of the
continual loading of agricultural and municipal discharges, the very high
evaporation rates, and no outlet for the Sea, the salinity continued to increase
and the elevation to rise. The rising water level inundated many of the new
structures and the salinity threatened the fishery. As the 1960’s ended, the next
decade seemed to bring forebodings of the demise of the Sea. Visitor use began
to taper off, the stability of the Sea’s elevation was uncertain, and the effects of
eutrophication became more pronounced. Each succeeding decade seemed to
heighten the previous decades problems, especially as the tilapia found their way
into the Sea. The 1990’s brought major bird die-offs, fish kills in the millions and
concern for the health of the Sea’s ecosystem. With no control over the
increasing salinity, the uncertainty of the elevation, massive fish and bird kills,
odor problems, shores lined with the skeletons of dead fish, and incredible algal

4
blooms, the economic future of the area was bleak and the ability of the
ecosystem to support a healthy fishery for the many fish-eating birds
questionable.
SALTON SEA RESTORATION
The Salton Sea Restoration Project authorized under the Salton Sea
Reclamation act of 1998 (Public Law 105-372) directs the Secretary of the
Interior to: “complete all studies, including, but not limited to environmental and
other reviews, of the feasibility and cost-benefit of various options that permit the
continued use of the Salton Sea as a reservoir for irrigation drainage and: (i)
reduce and stabilize the overall salinity of the Salton Sea, (ii) stabilize the surface
elevation of the Salton Sea, (iii) reclaim, in the long term, healthy fish and wildlife
resources and their habitats, and (iv) enhance the potential for recreational uses
and economic development of the Salton Sea.”
The current project builds upon decades of previous efforts to develop a means
to address the increasing salinity of the Salton Sea and stabilization of its
elevation. This focus has been driven by the impacts of these factors on
recreational use of the Sea and on shoreline development. Other factors such as
eutrophication, which impact the current Restoration Project, have not benefited
from previous focused attention. As a result there has been no foundation to
build upon. Solutions to the eutrophication of the Salton Sea have been
comparatively intractable and/or costly. However, to meet the goals of the
restoration project, a means to decrease the eutrophic character of the Salton
Sea is needed. To these ends a workshop was convened as an initial evaluation
of whether or not eutrophication was a problem meriting action, and if so, could it
be addressed.
5
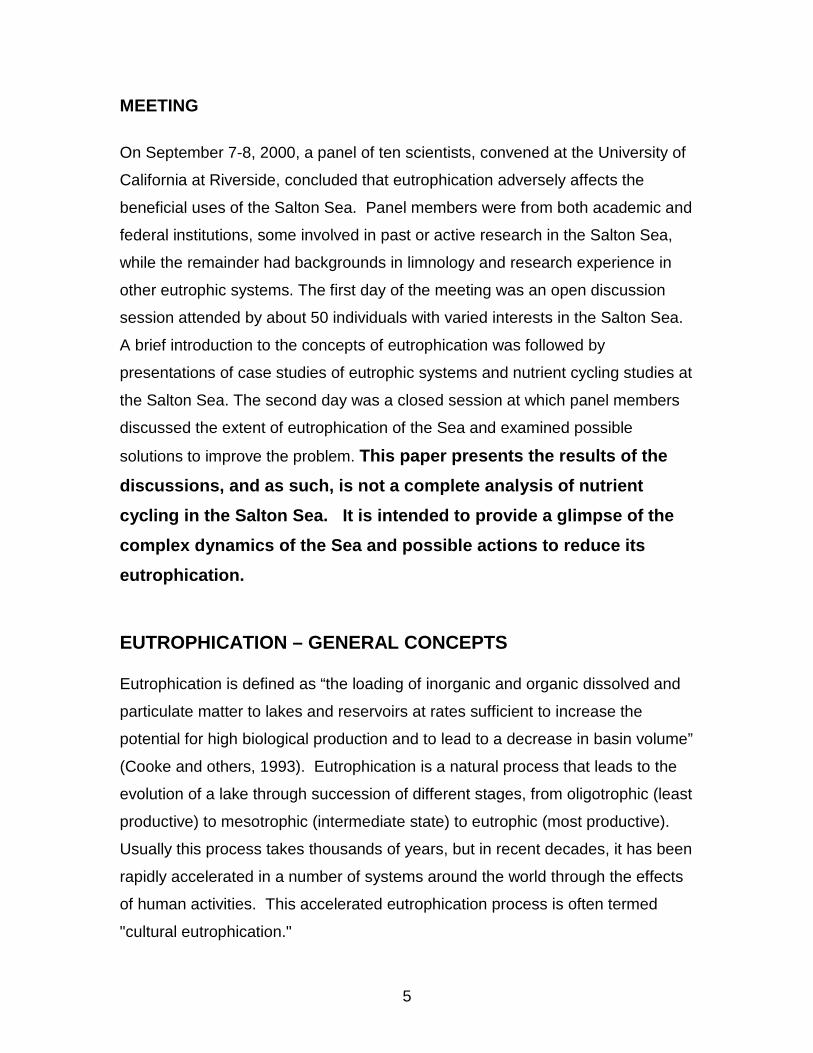
MEETING
On September 7-8, 2000, a panel of ten scientists, convened at the University of
California at Riverside, concluded that eutrophication adversely affects the
beneficial uses of the Salton Sea. Panel members were from both academic and
federal institutions, some involved in past or active research in the Salton Sea,
while the remainder had backgrounds in limnology and research experience in
other eutrophic systems. The first day of the meeting was an open discussion
session attended by about 50 individuals with varied interests in the Salton Sea.
A brief introduction to the concepts of eutrophication was followed by
presentations of case studies of eutrophic systems and nutrient cycling studies at
the Salton Sea. The second day was a closed session at which panel members
discussed the extent of eutrophication of the Sea and examined possible
solutions to improve the problem. This paper presents the results of thediscussions, and as such, is not a complete analysis of nutrientcycling in the Salton Sea. It is intended to provide a glimpse of thecomplex dynamics of the Sea and possible actions to reduce itseutrophication.
EUTROPHICATION – GENERAL CONCEPTS
Eutrophication is defined as “the loading of inorganic and organic dissolved and
particulate matter to lakes and reservoirs at rates sufficient to increase the
potential for high biological production and to lead to a decrease in basin volume”
(Cooke and others, 1993). Eutrophication is a natural process that leads to the
evolution of a lake through succession of different stages, from oligotrophic (least
productive) to mesotrophic (intermediate state) to eutrophic (most productive).
Usually this process takes thousands of years, but in recent decades, it has been
rapidly accelerated in a number of systems around the world through the effects
of human activities. This accelerated eutrophication process is often termed
"cultural eutrophication."

6
OligotrophicOligotrophic lakes generally are clear with low inputs of nutrients. The aquatic community of oligotrophic lakes ischaracterized by low biomass and low productivity. Because of the low productivity in the system, only small populationdensities of rooted vegetation (macrophytes), zooplankton, benthic invertebrates, and fish are supported.
MesotrophicMesotrophic lakes show increased biological productivity, supported by higher inflows of nutrients. Although occasionalalgal blooms can occur, losses of dissolved oxygen in the deeper water are generally not severe or of an extendedduration. Fisheries in many of these systems are excellent, with relatively high abundance of several desirable species.Moderate populations of rooted macrophytes, zooplankton, and benthic invertebrates are supported.
EutrophicEutrophic systems, like the Salton Sea, typically are highly turbid. Productivity and biomass are very high which canbecome a problem if the biomass exceeds the capacity of the system to support it. One of the most commonmanifestations of this excess is the development of extensive oxygen depletion (anoxic conditions), caused by decay ofaccumulated senescent biological material. These conditions stress the aquatic life and may cause extensive fish kills,leading to even further oxygen depletion along with unpleasant odors.
Because of the high biological and chemical oxygen demand, anoxia can develop at almost any time in the hypolimnion.The lack of oxygen is not only a major biological stressor; it also has the important chemical effect of creating reducingconditions. The reducing environment leads to many chemical changes, including the transformation of sulfates tosulfides (including hydrogen sulfide gas that has a strong odor of rotten eggs) and reduction of nitrate to ammonia, which,at high concentrations, can be toxic to fish and other biota.
Algal communities in eutrophic systems commonly include populations of blue-green algae, some species of which arelikely to produce extensive nuisance blooms. Fish species are generally limited to those with a tolerance for low dissolvedoxygen, and other stresses; those species may indeed thrive under these conditions, finding plenty of food to supportrapid metabolism and growth. Although they are subject to population crashes when the conditions become too stressful,they usually are able to recover quickly. Systems with very high turbidity that experience frequent algal blooms and fishkills are considered hypereutrophic.
Eutrophication is principally a function of nutrient inflow, but is often associated with sediment inflow; sediments flowinginto a lake carry nutrients with them and, once they become part of the bottom material, they act as a nutrient reservoir inthe lake, from which nutrients can be released to the water column.
A common misconception about eutrophication is that it correlates to toxicological problems in the same water body. Infact, eutrophication is not necessarily associated with toxic substances in the system. In some watersheds, where thenutrient sources are also toxicant sources, increases in nutrients and toxic substances might happen simultaneously, butin others, there is no relationship whatsoever. Eutrophic systems may or may not have elevated concentrations of toxicsubstances, and toxic-contaminated systems may or may not be eutrophic.
Limiting nutrientsNitrogen and phosphorus are nearly always the chemical elements that act as the primary nutrients capable of stimulatingprimary productivity in aquatic systems. The ratio of their concentrations (the "N:P ratio") provides an indication of when asystem changes from a potential imitation by one nutrient to a potential limitation by the other. This threshold ratio isdetermined by the needs of the primary producers, the algae and the macrophytes. Their needs are a function of the N:Pratio within their tissues. The "Redfield ratio" (Redfield et al. 1963) – often cited as a reference value by which to judgenutrient limitation – gives a ratio of 7.2:1 as the relative abundance of nitrogen and phosphorus (by weight) in marinephytoplankton. For freshwater systems, and for other organisms, this number can fluctuate considerably, but areasonable estimate for most systems is 10:1. If the N:P ratio in the water is much higher than 20:1, P is nearly alwaysthe potential limiting nutrient; if it is lower than 10:1, N would likely be the limiting nutrient. Between these values, eithernitrogen or phosphorus can become deficient, either in fresh water or salt water (Guildford and Hecky 2000). Light alsocould be locally limiting, especially during periods of intense algal blooms.
SALTON SEA AND EUTROPHICATION
CHARACTERISTICS
The Salton Sea is a eutrophic to hypereutrophic water body characterized by
high nutrient concentrations, high algal biomass as demonstrated by high

7
chlorophyll a concentrations, high fish productivity, low clarity, frequent very low
dissolved oxygen concentrations, massive fish kills, and noxious odors. Water
quality of the Salton Sea is summarized in the following tables, which were
constructed from data collected from July 1968 to May 1969 (U.S. Department of
the Interior Federal Water Quality Administration, 1970) and during 1999 from the
Salton Sea Restoration Project (C. Holdren, USBR, 2000, written
communication).
Salton Sea – Nutrient concentrations at the center of the Salton Sea
* Average mean concentration of three sites (4 depths sampled during summer)
In 1968-9, average seasonal total phosphorus concentrations near the surface in
the Sea range between about 0.04 and 0.12 mg/L. For samples collected during
1999 from three sites in the Salton Sea, total phosphorus concentrations in water
ranged from a low of <0.005 mg/L to a high of 0.222 mg/L with a median of 0.071
mg/L in the surface waters and a median of 0.059 mg/L in the bottom water.
Concentrations are generally highest in the winter and spring and lowest in the
Depth Season Ortho-P Total P NH3-N NO3/NO2-N TKN Total NN:PRatio
mg/L mg/L mg/L mg/L mg/L mg/LSurface 1968-69
Summer 0.04 0.06 0.22 0.11 3.0 3.1 52:1Fall 0.02 0.05 0.36 0.22 3.3 3.5 70:1Winter 0.03 0.07 0.25 0.16 1.5 1.6 23:1Spring 0.06 0.20 0.27 0.49 4.5 5.0 25:1
1999
SurfaceAnnualmean* 0.024 0.087 1.3 0.1 3.6 5.0 104:1Summer 0.013 0.067 1.6 0.1 4.1 5.8 192:1Fall 0.032 0.043 1.2 0.1 4.2 5.5 137:1Winter 0.040 0.120 1.5 0.2 2.5 4.2 24:1Spring 0.012 0.116 0.9 0.2 3.7 4.8 64:1
BottomAnnualmean 0.016 0.061 1.6 0.1 3.7 5.4 213:1Summer 0.003 0.056 2.5 0.1 5.3 7.9 430:1Fall 0.015 0.027 1.4 0 4.0 5.4 288:1Winter 0.037 0.079 1.5 0.1 1.8 3.4 25:1Spring 0.011 0.083 0.9 0.1 3.7 4.7 108:1

8
summer and fall. Ortho phosphorus is quite variable representing 10 percent
(spring) to 75 percent (fall) of the total phosphorus. Phosphorus concentrations
slightly decrease with increasing depth in the Sea, indicating little net release of
phosphorus from the sediments (discussed later). Phosphorus concentrations in
water, although high, appear to be unchanged from the 1969 to 1999.
Total nitrogen concentrations in the Salton Sea range from about 4 to 6 mg/L
(see table). Concentrations are slightly higher during the summer and fall than in
the winter and spring. Organic nitrogen is the main form (about 75 percent) of
nitrogen in the water column possibly reflecting the algal population and algal
breakdown. Ammonia (NH3) generally represents about 25 percent of the total
nitrogen; very little nitrate was measured. By comparison, nitrate is by far the
dominant form of nitrogen in the tributaries, followed by organic nitrogen.
Although ammonia is present in the tributaries, especially in the New River,
ammonia is the dominant redox-indicating form of nitrogen in the Sea. In the
1960’s, ammonia concentrations, averaging 0.2-0.3 mg/L, were significantly
lower than in 1999. This increase in ammonia (greater than one order of
magnitude) is one of the most obvious changes in nutrient concentrations that
have occurred in the Salton Sea. Ammonia concentrations in 1999 are higher in
the bottom water, especially in summer months with seasonal averages as high
as 2.8 mg/L. The presence of ammonia clearly indicates that reducing conditions
are often present in the Salton Sea. It is unclear what effect these levels of
ammonia have on the fish. Overall, total nitrogen concentrations appear to have
increased by about 50 percent since the 1960’s, primarily as a result of
increasing ammonia concentrations.
Limiting nutrient
Water samples collected from the surface and bottom of the water column at
three sites in the Salton Sea during 1999 had an overall mean N:P mass ratio of
185:1. Data were summarized seasonally. There was significant seasonal
variation in the N:P ratio with the highest ratios (from about 200:1 to over 400:1)

9
occurring during summer when total phosphorus was limiting, especially in the
bottom water. The overall ratios show that phosphorus is by far the potential
limiting nutrient in the Salton Sea. Even though the lowest nitrogen to total
phosphorus ratios (23:1 to 28.7:1) during winter approach the threshold above
which phosphorus would become limiting (about 25:1), the SRP:TIN ratio of
154:1 still strongly indicates potential phosphorus limitation. Winter has the
greatest variability in total phosphorus concentrations, having both the maximum
and minimum concentrations. Any efforts to reduce eutrophication in the Salton
Sea needs to focus on phosphorus removal, especially the SRP (soluble reactive
phosphorus) portion of total phosphorus.
High algal populations result in high chlorophyll a concentrations, a parameter
often used to estimate phytoplankton biomass (Cooke and others, 1993; Wetzel,
1983). Chlorophyll a concentrations in the Sea are usually over 25 µg/L. Water
clarity is generally fairly poor as measured by Secchi depths, which were usually
less than 5 feet.
Salton Sea nutrient concentrations, chlorophyll a, and transparencyConstituent/year Summer Autumn Winter SpringTotal N (mg/L)1968-9 3.13 3.48 1.61 4.961999 4.2 4.2 2.5 3.5Total P (mg/L)1968-9 0.06 0.05 0.07 0.21999 0.053 0.026 0.107 0.087Chlorophyll a , µg/L1968-9 - 50.4 35.7 48.21999 27Transparency (ft)1968-9 3.6 4.1 3.4 3.51999 3.0 2.4 2.9 2.5
One method of classifying the water quality or productivity of water bodies is by
computing water-quality indices (Trophic State Indices, or TSI’s). These indices,
based on near-surface concentrations of total phosphorus, chlorophyll a, and on
Secchi depths, were developed by Carlson (1977). TSI’s place each water-

10
quality characteristic on the same scale. TSI’s less than 40 are considered
oligotrophic water bodies, between 40 and 50 are mesotrophic systems, and
greater than 50 are considered eutrophic systems. Water bodies with TSI’s
greater than 60 are usually considered hypereutrophic.
All three indices indicate that the Salton Sea is generally eutrophic and often
hypereutrophic. Chlorophyll a concentrations in 1968-9 give a TSI of between 60
and 70. A single sample collected during 2000 had a chlorophyll a concentration
of 27 µg/L also would classify the Salton Sea as eutrophic. The Secchi depth in
the Salton Sea for both 1968-69 and 1999 translates to a TSI of 60-70). The total
phosphorus concentrations in 1968-9 translate to a TSI of between 50 in the
autumn to over 80 in the spring placing the Salton Sea in the eutrophic to
hypereutrophic category. In 1999, total phosphorus concentrations were variable.
Calculated TSI’s averaged between 50 and 70.
Nitrogen concentrations also can provide an indication of the trophic state of a
water body. If the system is phosphorus limited, however, increases in nitrogen
concentration will not be reflected by increases in productivity as indicated by
Secchi depth or chlorophyll a concentration. Total nitrogen concentrations also
place the Salton Sea in the eutrophic category.
Throughout much of the year, dissolved oxygen (DO) in the surface waters
(epilimnion) is supersaturated during daylight hours. Dissolved oxygen, however,
is nearly absent in the deep water (hypolimnion) when the water is stratified (C.
Holdren, USBR, 2000, written communication). Occasionally the DO within
certain areas of the Sea is absent from the top of the water column to the bottom.
These episodes are usually associated with or follow algal blooms (described by
others as green water) and often result in massive fish kills. The presumption is
that algae in the bloom die and the subsequent aerobic bacterial breakdown
depletes the available DO in the water column.

11
Much of the Salton Sea is a wind driven system (Cook and others, 1998), and
fish kills also occur associated with wind shifts. The prevailing wind direction is
from the west-northwest (Cook and others, 1998). Because the Sea is 35 miles
long, wind direction and velocity at the southern end are different than those at
the north or center (Cook and others, 1998). Major shifts in the direction and
velocity in the southern end appear to be associated with fish kills. Strong winds
from the south agitate the anaerobic sediments creating an immediate oxygen
demand in an area that already has DO depleted water in the lower part of the
water column. As this water is turned over and mixed with the upper water
column, the entire water column of these shallow water areas is depleted of DO,
killing the fish. As prevailing winds reestablish, windrows of dead fish often are
found off of the New and Alamo River deltas. Although fish kills have been
common at the Salton Sea for a long time, during the past decade die-offs are
more numerous and many of the die-offs number several million fish. Tilapia, the
most abundant fish in the Salton Sea, also is the species most often involved in
kills. Other fish such as sargo and croakers also have experienced large die-
offs, but none of the magnitude of those involving tilapia. The following table
presents fish kills during the past year.
Date Total Dead TilapiaDead
CroakerDead
CorvinaDead
16-Jan-00 50,000 50,000 0 021-Jan-00 100,000 100,000 0 010-Feb-00 2,600,000 2,600,000 0 004-May-00 40,000 40,000 0 018-May-00 83,000 83,000 0 029-May-00 50,000 0 50,000 030-May-00 5,000 0 5,000 001-Jun-00 1,000 0 0 1,00006-Jun-00 120,000 100,000 17,000 1,20016-Jun-00 5,800 1,200 4,600 027-Jun-00 55,000 25,000 30,000 030-Jun-00 10,000 10,000 0 010-Jul-00 100,000 100,000 0 013-Jul-00 55,000 49,500 5,500 0

12
03-Aug-00 120,000 120,000 0 003-Aug-00 25,000 0 25,000 015-Aug-00 2,500,000 2,500,000 0 018-Aug-00 5,200,000 5,200,000 0 025-Aug-00 115,000 25,000 90,000 026-Sep-00 3,090,000 3,000,000 90,000 0Source: Tahni Johnson, Salton Sea Authority; Compiled byJacquie Lesch, Digital Library Administrator, University of
Redlands
The eutrophic state of the Salton Sea with its high biomass translates to high fish
production, especially for forage fish such as tilapia. If the Salton Sea were less
eutrophic, there likely would be fewer tilapia, fewer and different algal blooms,
and fewer occasions of fish kills associated with anoxic conditions.
Another problem associated with eutrophication in the Salton Sea is the
objectionable odor that is so pervasive. This odor, that directly impacts
recreational use, likely results from a unique combination of factors. The
massive numbers of dead and decaying fish in the water and on the shores, algal
decay, hydrogen sulfide from anoxic areas within the Sea, the Sea being saltier
than the ocean, geothermal plants and agriculture all contribute to the smell near
the Salton Sea. A significant reduction in the eutrophic state of the Sea likely
would cause a reduction in the odor and a change in its character. There would
be fewer dead fish, fewer algal blooms and hopefully less anoxic sediments. The
Salton Sea would still have a unique smell, but hopefully not the noxious odor of
decay that currently is so unpleasant.
SOURCES OF NUTRIENT LOADING
The eutrophic condition of the Salton Sea is controlled or limited by phosphorus;
therefore, we need to examine where the phosphorus in the Sea is coming from.
Possible sources of phosphorus to the Sea include external loading from
inflowing tributaries, ground water, precipitation, and from internal loading from
the sediments.

13
Tributary loadingThe major tributaries to the Salton Sea are the New, Alamo, and Whitewater
Rivers. These rivers currently account for about 46, 32, and 6 percent of the
inflow to the Salton Sea (J. Agajanian, USGS, 1998, written communication).
Imperial Valley drains discharging directly to the Sea account for an 8 percent of
the inflow. Tributary loading supplies the majority of nutrients to the Sea. The
following table presents average historical and current phosphorus and nitrogen
concentrations and loading to the Salton Sea in 1968-69 and 1999. Trends in
annual loading and changes in nutrient sources can be evaluated by comparing
data from 1968-9 with data from 1999.
Comparison of nutrient concentrations and loads to the Salton SeaSite Org.-N NH3-N NO2-N NO3-N O-P T-P T-N Q, in acre-ftAlamo River,1968-69, in mg/L 1.23 0.58 0.32 6.00 0.20 0.33 8.13load, in kgX106 0.966 0.454 0.249 4.72 0.176 0.258 6.39 637,700
1999, in mg/L 1.5 1.26 NM 6.42 0.408 0.719 9.2 617,130load, in kgX106 1.14 0.959 4.89 0.310 0.574 7.08
New River,1968-69, in mg/L 0.97 0.47 0.22 4.48 0.29 0.60 6.14load, in kgX106 0.50 0.240 0.113 2.28 0.15 0.304 3.13 413,000
1999, in mg/L 1.0 3.72 NM 3.55 0.697 1.11 8.2 488,080load, in kgX106 0.482 2.24 2.14 0.50 0.660 4.96
Whitewater River,1968-69, mg/L 0.83 0.16 0.06 6.28 0.26 0.58 7.33load, in kgX106 0.077 0.014 0.0045 0.59 0.024 0.054 0.686 76,300
1999, in mg/L 1.2 0.729 NM 14.3 0.710 0.865 16.3 52,983load, in kgX106 0.078 0.048 0.935 0.046 0.053 1.03
1999 loads in this table were based on mean concentrations and total annual discharge fromC.Holdren, USBR, 2000 (Written Communication). 1968-69 data were from U.S. Department ofthe Interior Federal Water Quality Administration, 1970.org-N = organic nitrogen, NH3-N = ammonia nitrogen, NO2-N = nitrite nitrogen, NO3-N = nitratenitrogen, O-P = ortho phosphate, T-P= total phosphorus, Q = discharge, and NM = not measured
In the Alamo River, total phosphorus concentrations and loads increased by
about 120% from 1968-9 to 1999 and ortho phosphate increased about 85%. In
the New River, total phosphorus loads increased by about 80% and ortho
phosphorus loads increased by 230%. The total annual phosphorus load

14
discharged to the Salton Sea in 1968-69 by tributaries was estimated to be 0.660
X106 kg, one-half of the current load.
In the New River, ortho phosphorus comprised 75% of the total phosphorus load
in 1999 compared to 50% in 1968-9. Municipal and industrial waste discharges
to the New and Alamo Rivers contributed 0.179 X10⁶ kg of ortho-phosphate to
the Salton Sea in 1964 (Regional Board,1964, written communication).
Mexicali’s contribution was estimated to be 48 percent of this load. Insufficient
data are available for the year 2000 to evaluate changes in total phosphorus and
ortho phosphorus loading from municipal and industrial effluent. Advances in
sewage treatment technology make comparisons between the 1960’s and today
less indicative of basin wide changes. Elimination of phosphorus containing
detergents also has impacted phosphorus loading from treatment plants. Similar
changes were observed in the Whitewater River; however, ortho phosphate has
become less important in the Alamo River.
Nitrogen concentrations and loads are presented in the above table for
comparison and perspective, but will not be discussed. Because the Salton Sea
is phosphorus limited, control of nitrogen, given the tremendous loading, cannot
possibly be reduced to a level where eutrophication of the Sea can be reversed.
Agricultural drainsAgricultural drains that discharge directly to the Sea account for about 8 percent
of the inflow. If it is assumed that the total phosphorus concentration in these
drains is similar to the Alamo River (0.712 mg/L; it is expected that this is a high
estimate), direct drains would then supply about 91,000 kg/yr to the Sea.
Ground water and precipitation
Ground water accounts for less than 5 percent of the inflow to the Salton Sea,
the majority of which comes from the Coachella Valley. Concentrations of total
phosphorus in ground water are usually very low and, therefore, phosphorus

15
loading to the Sea is expected to be insignificant. Only about 4 inches of
precipitation falls on the Sea per year. Phosphorus concentrations in precipitation
are also usually very low and, therefore, phosphorus loading from precipitation is
also thought to be insignificant.
Internal sediment releaseChemical compounds that reach the sediments do not necessarily remain there
permanently. In many lake systems, sediments function as a reservoir or
temporary resting place for certain elements such as phosphorus, which can be
released back into the water column with changing environmental conditions.
Depletion of dissolved oxygen in the overlying water of these lakes produces a
reducing environment that can result in remobilization of phosphorus from the
bottom sediments. This process termed “internal loading” is calculated in
mg/m2/day. Estimates of the net internal phosphorus loading from column
studies using sediments from the Salton Sea range from –5 mg/m2/day for deep-
water sediments to –10 mg/m2/day for shallow-water sediment (C. Amrhein,
UCR, 2000, written communication). These internal loading estimates indicate
the potential for a tremendous negative flux, or a sink for phosphorus in the
sediments at certain times of the year rather than a source of phosphorus.
These, however, are instantaneous values from chambers where the input of
external phosphorus is stopped and the sediment interface is oxygenated. The
continuous high phosphorus loading, diffusive fluxes, and the lack of increased
near-bottom phosphorus concentrations indicate that there is a significant
phosphorus loss to the sediments.
Total phosphorus loading
Therefore the current total phosphorus loading to the Salton Sea is about 1.385
million kg/yr:
Alamo River* 574,000 kg/yr
New River* 660,000 kg/yr
Whitewater River* 52,000 kg/yr
16
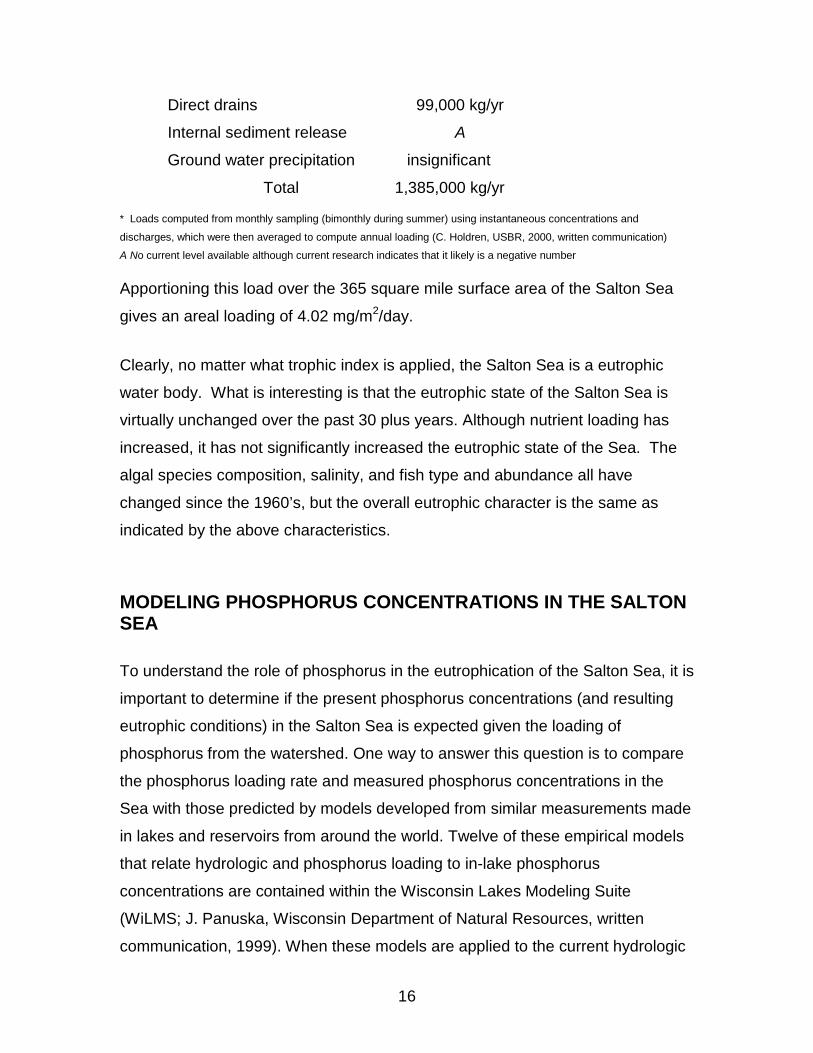
Direct drains 99,000 kg/yr
Internal sediment release A
Ground water precipitation insignificant
Total 1,385,000 kg/yr
* Loads computed from monthly sampling (bimonthly during summer) using instantaneous concentrations and
discharges, which were then averaged to compute annual loading (C. Holdren, USBR, 2000, written communication)A No current level available although current research indicates that it likely is a negative number
Apportioning this load over the 365 square mile surface area of the Salton Sea
gives an areal loading of 4.02 mg/m2/day.
Clearly, no matter what trophic index is applied, the Salton Sea is a eutrophic
water body. What is interesting is that the eutrophic state of the Salton Sea is
virtually unchanged over the past 30 plus years. Although nutrient loading has
increased, it has not significantly increased the eutrophic state of the Sea. The
algal species composition, salinity, and fish type and abundance all have
changed since the 1960’s, but the overall eutrophic character is the same as
indicated by the above characteristics.
MODELING PHOSPHORUS CONCENTRATIONS IN THE SALTONSEA
To understand the role of phosphorus in the eutrophication of the Salton Sea, it is
important to determine if the present phosphorus concentrations (and resulting
eutrophic conditions) in the Salton Sea is expected given the loading of
phosphorus from the watershed. One way to answer this question is to compare
the phosphorus loading rate and measured phosphorus concentrations in the
Sea with those predicted by models developed from similar measurements made
in lakes and reservoirs from around the world. Twelve of these empirical models
that relate hydrologic and phosphorus loading to in-lake phosphorus
concentrations are contained within the Wisconsin Lakes Modeling Suite
(WiLMS; J. Panuska, Wisconsin Department of Natural Resources, written
communication, 1999). When these models are applied to the current hydrologic

17
and phosphorus loading of the Salton Sea, all but one of these models predict
the phosphorus concentrations in the Sea should be much higher than that
measured (the other model predicts a concentration of 0.095 mg/L, slightly higher
than that measured).Model Predicted P (mg/L)
Walker, 1987 Reservoir 0.598Canfield-Bachmann, 1981 Natural Lake 0.181Canfield-Bachmann, 1981 Artificial Lake 0.095Rechow, 1979 General 0.120Rechow, 1977 Anoxic 1.133Rechow, 1977 water load<50m/year 0.188Walker, 1977 General 3.491Vollenweider, 1982 Combined OECD 0.905Dillon-Rigler-Kirchner 7.323Vollenweider, 1982 Shallow Lake/Res. 0.950Larsen-Mercier, 1976 2.365Nurnberg, 1984 Oxic 5.474
PROCESSES CONTROLLING PHOSPHORUS DYNAMICSSince modeling results indicate that phosphorus concentrations in the Sea
should be higher than observed concentrations, there appears to be processes
controlling phosphorus concentrations in the water column of the Salton Sea.
Typically following this modeling exercise one can determine what type of loading
reduction is required to result in a specified change in P concentrations in a lake
(Sea). In this case, it is obvious that the Sea responds much differently than most
other systems and has other factors controlling the phosphorus concentrations in
the Sea.
Geochemical PrecipitationInitial geochemical modeling (C. Holdren, 2000, U.S. Bureau of Reclamation,
written communication) indicates that Salton Sea water is supersaturated with
respect to hydroxyapatite when phosphorus concentrations are greater than
0.005 mg/L. While formation of this mineral is kinetically hindered, it often forms
on calcite nuclei and is likely to be forming in the Salton Sea. As such,
precipitation of hydroxyapatite could also represent one possible sink for
phosphorus. To quantify phosphorus cycling from the bottom sediments, water

18
samples were collected from “peepers” placed at multiple depths in bottom
sediments (C. Amrhein, UC Riverside, 2000, written communication). The
phosphorus concentrations in pore water were about 10 times higher than that in
the overlying water; therefore, a concentration gradient exists and phosphorus
should diffuse into the water column whenever anoxic conditions are present at
the interface. However, monitoring data does not show accumulation of
phosphorus in the hypolimnion even during anoxic periods. Bottom sediments
from cores collected during the summer of 2000 (C. Amrhein, UCR, 2000, written
communication) are high in organic carbon in the deepest parts of the Salton
Sea. In these areas of fine grain sediments, Calcite (CaCO3) is 35% of the
material composition, which also includes barnacles and other precipitates.
There also are areas of high phosphorus in coarse material in the northern end of
the Sea, which may be attributed to the accumulation of Ca5(PO4)3OH. The
median total phosphorus concentration in sediments is 672 mg/kg, which is
typical of calcareous lake sediments.
In 1910, three years after the Salton Sea was formed, the composition of the
water was clearly dominated by dissolution of sodium chloride salts in the Salton
Trough. The ionic composition was significantly different from the Colorado River
water that formed it. The ionic composition of the Salton Sea and its sources of
water are shown in the table below (In the table, ion ratios are calculated on an
atomic basis rather than a mass ratios because mass ratios are strongly affected
by heavier ions such as sulfate and carbonate). The percent of sodium has
decreased as magnesium increased, and the percent chloride has decreased as
sulfate increased from 1948 to 1989. The solubility and equilibrium chemistry of
sulfate, sodium, calcium and magnesium likely have controlled their
concentrations as the salinity increased. Based on the solubility of sulfate,
gypsum should be found in the bottom sediments (Hely and others, 1966). X-ray
diffraction analysis and dissolution studies of bottom sediment samples collected
in 2000 indicate the presence of an amorphous precipitate containing Na, Ca,
SO4, and possibly CO3. The formation of this precipitate in the sediments of the

19
Salton Sea could account for the apparent loss of the compound’s constituents
from the water column. At this time, it is unknown whether or not there is any
phosphate associated with this compound.
Source Ca Mg Na K Alk SO4 Cl TDSColorado River 1989 1
mg/L 76 31 10 4.1 152 290 100 737% 17 12 4 1 14 27 25
Salton Sea 1910 2mg/L 137 98 1,893 35 64 764 2,809 5,600% 2 2 46 0.5 0.5 4 44
Salton Sea 1948 2mg/L 804 992 11,824 192 192 7,550 16,990 38,550% 2 4 45 0.4 0.3 7 42
Salton Sea 1955 2mg/L 764 951 9,938 224 180 6,806 14,422 33,290% 2 4 44 0.6 0.3 7 42
Salton Sea 1988 1mg/L 950 1,300 11,000 220 185 10,000 17,000 43,700% 2 5 42 0.4 0.2 9 42
Salton Sea 1999 *mg/L 942 1,400 12,340 259 249 10,520 17,470 43,920% 2 6 44 0.5 0.2 9 40
Ocean 1989 3mg/L 403 1,260 10,500 390 120 2,650 18,900 34,200% 1 5 42 1 0.1 2.5 49
Alamo at Outlet1mg/L 180 100 430 12 212 910 580 2,500% 8 7 34 0.6 4 17 29
1999 mg/L* 166 83 389 8.2 259 762 443 2,020%
New at Outlet1mg/L 180 90 600 15 227 800 880 2,850% 6 5 37 0.5 3 12 35
1999 mg/L* 177 82.8 566 12.6 300 716 724 2,440% 10 8.4 24.4 0.5 6.4 19.5 30.6
Whitewater at Outlet*1999 mg/L 122 32 303 9 245 527 235 1,553
% 9 4 41 0.7 7.6 17 20.5
Schroeder, Rivera, and others, 1993
2 Walker, 1961
3. Scripps Pier, published in Schroeder, Rivera, and others, 1993: Ca = calcium, Mg =magnesium, Na = sodium, K =
potassium, Alk = alkalinity as calcium carbonate, SO4 = sulfate, Cl = chloride, and TDS = total dissolved solids
.* C. Holdren, USBR, 2000
Phosphorus Release from the SedimentsIn many lakes, phosphorus released from the sediments is transported to the
surface water during lake overturn as the anoxic bottom water from a stratified

20
lake is mixed with upper oxygenated water. Bacterial processes in the
hypolimnion remove oxygen from bottom water gradually producing anoxic
conditions that release phosphorus from the sediments and settling particles. In
the Salton Sea, this process is not likely important due to the high sulfide
concentrations.
Biological ProcessesIt appears, however, that algae and tilapia may play a significant role in cycling
phosphorus in the Salton Sea. In order to determine the relative importance of
algae and tilapia, it is important to compare their potential contributions with the
overall content of phosphorus in the water column.
The average mass of phosphorus in the Salton Sea is 6.3 X 10⁵ kg using a
weighted average total phosphorus concentration of 68 µg/L and a weighted
average volume of 7.48 X 10⁶ acre-ft for 1999 (C. Holdren, USBR, written
communication). Overall net phosphorus in the water column remains about the
same from year to year although major spikes and drops occur within a year.
These changes likely occur following major algal blooms when most of the total
phosphorus incorporated in the algae settles to the bottom. As the algae die,
bacteria use the available oxygen to breakdown the settling biomass, leaving
behind a very low total phosphorus concentration in the water column. This
phosphorus is likely stored as organic compounds in the bacteria. Much of this
phosphorus may become available as the wind driven system stirs up the
sediments and causes additional algal blooms.
The number of tilapia in the Salton Sea, which appears to have increased
dramatically since the 1980’s, further complicate the cycling of phosphorus.
Recent studies show there are about 90 million tilapia present in the Salton Sea
(B. Costa-Pierce, Mississippi-Alabama Sea Grant Consortium, written
communication). Tilapia tie up a portion of the phosphorus in their tissues that is
eventually released as the tilapia die and decompose. The average tilapia is

21
about 0.5 kg, comprised of about 76 percent water and 2.9 percent phosphorus
(Tan, 1971 and Costa-Pierce, 2000). Therefore, the mass of phosphorus tied up
in tilapia is
9.0 X 10⁷ tilapia X 0.5 kg/tilapia X 24 % dry weight X 2.9 % P in tilapia = 3.13 X 10⁵ kg,
representing about 25 percent of the annual external phosphorus loading to the
Salton Sea. Therefore, harvesting of tilapia may be an option and has been
discussed as a means of removing phosphorus from the Sea.
When fish in the Salton Sea die, phosphorus in their bones may be lost from the
system and not remineralize because of the high salinity of the water. With a life
span in the Salton Sea of approximately two years, about 45 million tilapia die
each year. If we assume that 75 percent of the dry weight of tilapia is bone,
about 1.2 X 10⁵ kg of phosphorus is deposited in the bones of dead fish each
year and removed from the system. This amount is 10 percent of the total
phosphorus loading to the Salton Sea. Tilapia, therefore, not only tie-up a
significant mass of phosphorus in the Salton Sea, but in their death, may
permanently remove a small portion of the external phosphorus load. In addition,
the large number of tilapia and their bottom feeding habits coupled with the
increasing salinity also could affect the species type and abundance of the
plankton population and in turn affect the water clarity of the Sea.
This discussion shows that tilapia appear to play an important role in phosphorus
cycling in the Salton Sea. If the salinity of the Salton Sea is allowed to increase
to a point where the tilapia no-longer can survive, the effect on the eutrophication
of the Sea could be significant.
A similar calculation for the Salton Sea in 1968-9 (elevation –232 ft. MSL) using a
maximum total phosphorus concentration in the spring of 0.2 mg/L gives a total
phosphorus mass in the Sea of 1.6 X 10⁶ kg. This mass, resulting from an
external loading of 6.241 X 10⁵ kg, is about the same as current mass. In other

22
words, at twice the total phosphorus loading today, the total phosphorus in the
Sea is about the same as it was in 1968-69. This similarity in total phosphorus
mass indicates that a phosphorus removal mechanism in the bottom sediments
or incorporation into the fish and other macro organisms has accommodated the
additional phosphorus. The implication is that to reduce the eutrophic state of
the Salton Sea, a reduction in phosphorus loading of greater than 50 percent is
necessary.
REDUCING EUTROPHICATION
Based on the above discussion that phosphorus is the limiting nutrient in the
Salton Sea, and external loading is significantly larger than internal loading, it
appears that reducing the external phosphorus loading may reduce
eutrophication problems in the Salton Sea. The major limitation is that because
some unknown process seems to be controlling phosphorus in the Sea,
phosphorus concentrations are about the same now as they were in the 1960’s in
spite of a doubling of the phosphorus loading. Therefore it is difficult to quantify
the exact response of the Sea to various loading reduction scenarios. Because
there has been no apparent change in the eutrophic character of the Sea since
the 1960’s (based on this limited evaluation), it is very likely that a greater than
50 percent reduction in external loading will be necessary to achieve a marked
reduction in eutrophication. A reduction of at least 80 percent probably will be
required.
POSSIBLE SOLUTIONS
Alum, aluminum sulfate, Al2(SO4)3, has been added to lakes and reservoirs since
the 1950’s to control algal blooms by reducing internal phosphorus loading
(Cooke, 1986). When added to water, the aluminum forms aluminum hydroxide
which is a colloidal, amorphous flocculent with high phosphorus adsorption
properties (Cooke, 1986). Typically, alum is added directly to lakes to adsorb the

23
phosphorus and form a barrier on the sediments, limiting internal phosphorus
loading. The sheer size of the Salton Sea makes such alum treatment
impractical. However, alum may be able to be added to the tributaries to tie-up
phosphorus before the water enters the Salton Sea. A significant amount of
phosphorus is associated with fine suspended particles in the tributaries to the
Salton Sea. These fine particles likely have a high percent of the phosphorus
adsorbed to their surfaces. Various polymers have been added to river water to
increase the settling rate of fine particles. Another way to reduce the phosphorus
loading to the Sea may be to increase the settling rate of the fine particles by the
addition of a specific polymer and increasing the settling rate of the fine particles
in the tributaries.
The panel recommends:
1. Alum and/or polymer addition to the New and Alamo Rivers at or near their
outlets to the Salton Sea could remove significant loads of phosphorus and
decrease the eutrophication of the Salton Sea.
2. Experiments should be initiated to investigate the ratio of aluminum to
phosphorus and the possible addition of polymers needed to remove at least 80
percent of incoming phosphorus and to determine the effects of the flocculent
when it mixes with the saline water of the Salton Sea. Available information
indicates that the high sediment concentrations in the Alamo River (>300 mg/L)
interfere with alum removal of phosphorus. Experiments to test multiple
upstream injection sites to maximize the effectiveness of sediment and
phosphorus removal and minimize the volume of alum and/or polymers need to
be performed. A proposal, “Reducing Eutrophic Conditions of the Salton Sea,” to
test and evaluate the efficiency of sediment and phosphorus removal from
tributaries to the Salton Sea has been approved for Proposition 13 funding by the
State Water Resources Control Board’s Nonpoint Source Pollution Control
Program.

24
OTHER POSSIBLE SOLUTIONS
Other possible solutions may eventually reduce the amount of alum and/or
polymers needed to treat the tributaries to the Salton Sea. However, in the
absence of direct phosphorus removal from the tributaries these solutions are not
expected to cause major improvements in the eutrophic nature of the Sea. These
possible solutions include:
1. Reduction in loading to tributariesNutrient loading to tributaries is from three major components: 1) treatment
plant effluent; 2) agricultural discharge; and 3) municipal and industrial
effluent from Mexicali. Municipal effluent from both the United States and
Mexicali will continue to contribute an ever-increasing load of ortho
phosphorus as populations in the area continue to grow. Controlling these
sources, however, is expensive. Agricultural phosphorus inputs need to be
further evaluated to determine: 1) what component of the total phosphorus
contributed by tailwater runoff is bio-available after reaching the Salton Sea;
and 2) how much of the phosphorus applied in fertilizers washes off during
irrigation. To be effective in reducing eutrophication in the Sea, 50 to 75
percent (rough estimate) of the farmers in the Imperial Valley would have to
participate in phosphorus reduction efforts.
Total maximum daily loads (TMDL’s) currently are being implemented in the
Salton Sea area. The sediment TMDL may remove some of the phosphorus
associated with the sediment, but whether or not this phosphorus is
biologically available is unknown.
2. Wetland treatmentWetland treatment to remove various contaminants from water is gaining in
popularity worldwide. The consensus of the panel was that wetlands
constructed along tributaries or in deltas of the rivers would not significantly
change the eutrophication of the Salton Sea. Wetlands are effective at

25
removing nitrogen, but not effective at removing phosphorus. Wetlands
primarily affect a small portion of the total flow, and if present in substantial
acreage, will reduce the water inflow to the Sea because of increased
evaporation. The wetlands do promote other benefits such as creating
habitat and possibly removing some nitrogen, selenium, and sediment.
3. Fish HarvestingFish harvesting has been proposed as a means to remove phosphorus from
the Salton Sea. From the previous discussion, it is clear that tilapia may play
a significant role in tying up and removing phosphorus. Even if about 50
percent of the fish are harvested each year, it has been calculated that
harvesting could remove only 10 percent of the external loading of
phosphorus from the Sea. If this were the only solution, it would have
minimal impact on eutrophication. However, coupled with other possible
solutions, it could prove to be helpful. Fish harvesting also might be feasible
for economic reasons, but it is possible that it may increase the productivity of
the Sea by reducing grazing by tilapia on phytoplankton.
CONDITIONAL RECOMMENDATIONS
Eutrophication of the Salton Sea has severely impacted its beneficial uses,
including recreation and fish and wildlife resources. Some of the effects of
eutrophication include high algal biomass, high fish productivity, low clarity,
frequent very low dissolved oxygen concentrations, massive fish kills, and
noxious odors. Salinity increase also is threatening the survival of corvina, the
major sport fish, and eventually the other fish in the Sea. External loading of
nutrients, particularly phosphorus, to the Salton Sea from agricultural discharges
and from municipal and industrial effluent is responsible for the eutrophication of
the Salton Sea. Because internal phosphorus loading in the Salton Sea appears
to be very low and external phosphorus loading to the Sea is high, reduction of
tributary phosphorus loading to the Salton Sea may reduce eutrophication. The

26
reduction in tributary loading is not expected to have an immediate effect on the
state of eutrophication but may have an effect within 5 years.
To reduce phosphorus loading to the Salton Sea, the workshop panel thinks the
best solution is to evaluate and test the addition of alum to the tributaries, forming
an aluminum-phosphate flocculent. The flocculent should settle as river water
mixes with water in the Sea, thereby removing phosphorus from the biological
cycle. Also, addition of polymers to the tributaries may increase the settling of
fine particles with adsorbed phosphorus.
Other solutions that we think may help to reduce phosphorus loading to the
Salton Sea are to:
1. Require tertiary treatment of all municipal effluent in the basin.
2. Initiate Best Management Practices to reduce phosphorus originating
from agricultural fields, feed lots, and fish farms.
3. Harvest fish in the Salton Sea to remove their phosphorus
Additional solutions to reduce phosphorus loading to the Salton Sea that we
considered, but felt to be minimally promising are to:
1. Control golf course phosphorus applications, septic systems, and lawn
fertilizers.
2. Evaporation ponds for salinity control and removal of phosphorus.
3. Wetlands intercepting tributary inflow to remove phosphorus.
Finally, to better understand eutrophication of the Salton Sea and prior to trying
to correct the eutrophication process, we suggest that the following information
be collected:
1. A detailed phosphorus budget for the Salton Sea needs to be
developed which includes the complete physical and biogeochemical
cycling of phosphorus.

27
2. Temporal trends in phosphorus loading to the Salton Sea should be
evaluated to better understand its relation to eutrophication in the Sea
(chlorophyll a concentrations).
3. Temporal trends of phosphorus in the Salton Sea should be evaluated
to determine how chlorophyll a concentrations are related to the observed
changes in eutrophication.
4. Develop a one-dimensional vertical model of the Salton Sea to
determine how changes in hydrologic management will affect water levels
and stratification of the Salton Sea.
5. Explore the geochemistry of the alum and polymer complexes to
determine the fate of the aluminum-phosphate and other complexes as
they enter the saline environment of the Sea.
6. Develop a monitoring program to evaluate the success of the
eutrophication reduction program to include measurement of Secchi
depth, chlorophyll a, total phosphorus and C14 based primary productivity
rates.

28
SELECTED REFERENCES
Cook, C.B., Huston, D.W., Orlob, G.T., King, I.P., and Schladow, S.G., 1998,Salton Sea Project Phase II Final Report – Data collection and analysis forcalibration and verification of a three-dimensional hydrodynamic model:Water Resources and Environmental Modeling Group, Department of Civiland Environmental Engineering, and the Center for Environmental andWater Resources Engineering of the University of California, Davis.Report 98-2, 109p.
Cooke, D.G., Welch, E.B., Peterson, S.A., Newroth, P.R., 1993, Restoration and management of lakes and reservoirs: Lewis Publishers, New York, 533 p.
Guildford, S.J. and R.E. Hecky, 2000, Total nitrogen, total phosphorus, andnutrient limitation in lakes and oceans; Is there a common relationship?Limnology and Oceanography, 45 (6): 1213-1223.
Hely, A.G., Hughes, G.H., and Irelan, Burdge, 1966, Hydrologic regimen ofSalton Sea: U.S. Geological Survey Professional Paper 486-C, 32p.
Redfield, A.C., Ketchum, B.H., and Richards, F.A., 1963, The influence oforganisms on the composition of sea water. In: N.Hill (ed.), The Sea, vol.2, Interscience, pp. 26-77
Schroeder, R.A., Rivera, Mick, and others, 1993, Physical, chemical, andbiological data for detailed study of irrigation drainage in the Salton Seaarea, California, 1988-90: U.S. Geological Survey Open-File Report 93-83,179 p.
U.S. Department of the Interior, Federal Water Quality Administration, PacificSouthwest Region, 1970, Salton Sea, California – Water quality andecological management considerations: 54 p
Walker, B.W., 1961, The ecology of the Salton Sea, California, in relation to thesport fishery; Fish Bulletin no. 113, State of California , Department ofFish and Game, 204 p.
Welch, E.B., 1992, Ecological Effects of Wastewater; Applied limnology andpollutant effects, 2nd edition, Chapman and Hall, London, 425p.
Wetzel, R.G., 1983, Limnology: Saunders College Publishing, 767 p.
.
Copyright © 2022 FDOKUMEN