2016-17 Sponsored Funding Annual Report - Nevada System of ...
29
PREPARED BY THE OFFICE OF SPONSORED PROGRAMS AND EPSCOR SEPTEMBER 2018 University of Nevada, Las Vegas University of Nevada, Reno Nevada State College College of Southern Nevada Great Basin College Truckee Meadows Community College Western Nevada College Desert Research Institute 2016-17 Sponsored Funding Annual Report NEVADA SYSTEM OF HIGHER EDUCATION
-
Upload
khangminh22 -
Category
Documents
-
view
4 -
download
0
Transcript of 2016-17 Sponsored Funding Annual Report - Nevada System of ...

PREPARED BY THE OFFICE OF SPONSORED PROGRAMS AND EPSCOR SEPTEMBER 2018
University of Nevada, Las Vegas University of Nevada, Reno
Nevada State College College of Southern Nevada
Great Basin College Truckee Meadows Community College
Western Nevada College Desert Research Institute
2016-17 Sponsored Funding Annual Report
NEVADA SYSTEM OF HIGHER EDUCATION

1
Board of Regents
Mr. Kevin J. Page, Chairman
Dr. Jason Geddes, Vice Chairman
Dr. Andrea Anderson Dr. Patrick R. Carter
Mrs. Carol Del Carlo Dr. Mark W. Doubrava
Mr. Trevor Hayes Mr. Sam Lieberman
Mrs. Cathy McAdoo Mr. John T. Moran
Ms. Allison Stephens Mr. Rick Trachok
Mr. Anthony L. Williams
Dean Gould, Chief of Staff and Special Counsel to the Board of Regents
OFFICERS OF THE NEVADA SYSTEM OF HIGHER EDUCATION
Dr. Thom Reilly, Chancellor
Dr. Marta Meana, Acting President Dr. Marc Johnson, President University of Nevada, Las Vegas University of Nevada, Reno Dr. Kristen Averyt, President Mr. Bart Patterson, President Desert Research Institute Nevada State College Dr. Frederico Zaragoza, President Ms. Joyce Helens, President College of Southern Nevada Great Basin College Dr. Karin Hilgersom, President Dr. Vincent Solis, President Truckee Meadows Community College Western Nevada College

2
TableofContentsExecutive Summary ...................................................................................................................... 3
2016-17 Sponsored Funding Annual Report Highlights ................................................................ 5
NSHE Total Sponsored Funding – FY 2016 - FY 2017 Awarded and Change in Reporting for FY 2016 .…...…………………………………………………………. 5
NSHE Total Sponsored Funding – FY 2017 Funding Distribution ................................................ 6
NSHE Research Ranking Nationally ............................................................................................. 6
NSHE Institutions: Total Awarded FY 2016 to FY 2017 .............................................................. 7
UNLV and UNR ....................................................................................................................... 7
DRI and NSC .......................................................................................................................... 8
CSN and GBC .......................................................................................................................... 9
TMCC ….….………………………………………………………………………………………….10
WNC…….……………………………….……………………………………………………….…. 11
NSHE Intra-Institutional Collaboration – FY 2017 Projects and Awards ..................................... 11
NSHE Proposals Submitted and Awarded – FY 2017 ................................................................ 12
Distribution of State Special Projects Matching Funds – FY 2017 .............................................. 12
List of Appendices……….…………………………..………………………………………………….13
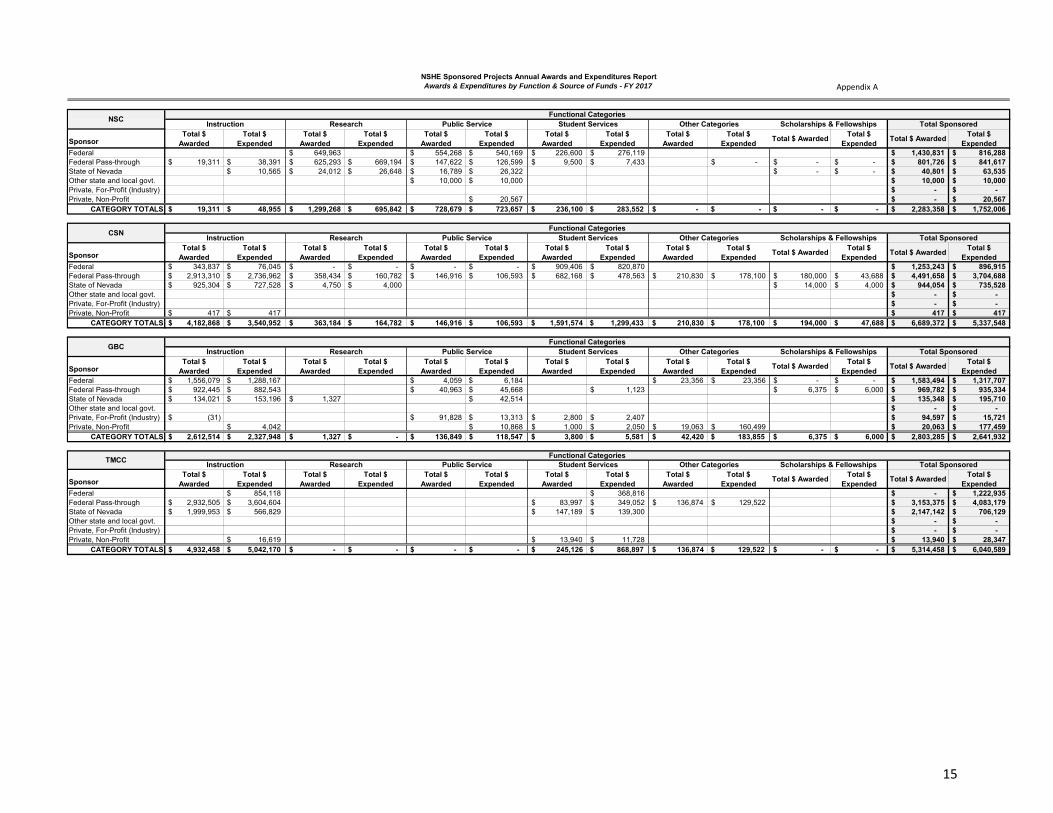
Appendix A - Annual Awards and Expenditures by Function & Source of Funds - FY 2017...…14
Appendix B - Direct Awards by Federal Funding Agency and Purpose - FY 2017………………17
Appendix C - Number of Annual Proposal Submitted and Received - FY 2017.…………….......21
Appendix D - Distribution of State Special Projects Matching Funds - FY 2017…………………23
Appendix E - NSHE Sponsored Projects Awards and Expenditures Report: FY 2016 - FY 2017..................................................................................................................... 24
Appendix F - Current Nevada EPSCoR Projects - FY 2017…….……………………………….…26
Appendix G - Function Definitions………………………………………….………………………....27
Appendix H - Sponsor Definitions……………………………………………………………………..28

3
ExecutiveSummaryThe information for the FY 2017 Sponsored Funding Annual Report is self-reported by each institution. The charts and tables included in this report highlight the information compiled within the appendices. The NSHE sponsored programs information covers awards and expenditures, direct federal funding, number of annual proposals, intra-institution collaborations, and state special projects matching.
This report ties to NSHE Strategic Goal 5: Research with the metric: co-develop solutions to the critical solutions facing 21st century Nevada and raise the overall research profile. As UNLV and UNR work towards Carnegie R1 status, research expenditures are one metric that is used in the rankings. Sponsored funding also increases the metric of non-faculty researchers involved in research at the institution, as funding allows hiring of more graduate assistants. Many of the state and community colleges are also working to increase research funding to give students early research experiences, which may lead to interest in advanced degrees.
Sponsored programs also fund activities that support NSHE Strategic Goals 1: Access and 3: Closing the Achievement Gap by providing preparatory services to low income and first-generation college students. Funding for Student Services also affects NSHE Strategic Goal 2: Success for programs that include counseling, tutoring and other student programs. Sponsored programs funding also ties into the NSHE Strategic Goal 4: Workforce as the NSHE institutions receive funding to support workforce development programs tied to industry needs in the state.
For FY 2017, total sponsored funding was $217.2 million. It is critical to note that following the publishing of the 2014-2015 report, a technical review of the reporting categories identified an inconsistency within the Scholarships & Fellowships category. In prior reports, this category included Title IV funding (Teach, Direct Loan, Nevada’s Millennium Scholarship, Pell, SEOG and FWS, for example), which technically is financial aid, not sponsored programs. Therefore, in keeping with the context of this report, the Title IV funding is now removed, and only sponsored funding is captured under this functional category now. As a result, the total sponsored funding reported for FY 2016 and 2017 is substantially lower than prior years. Going forward, the awarded programs under Scholarships & Fellowships, as it relates to sponsored funding, includes GEAR UP scholarships, National Science Foundation (NSF) Fellowships, NSF EPSCoR Scholarships, NASA Space Grant Scholarships and Fellowships, and other specific scholarships awarded through sponsored programs. The 2015-2016 fiscal year report is now the baseline for future reporting years for comparison, thus only two years of funding are highlighted in this report.
This report focuses on awards received per fiscal year; however, the expenditures are not necessarily tied to the awards received. For example, awards per fiscal year may fluctuate across multiple fiscal years thus providing spikes in funding levels while the level of expenditures reflects the activity per project more accurately for that fiscal year. There is also a small fluctuation of plus/minus that is expected with the larger institutions on multi-year awards where they may receive full funding in the first year of the project.
Additionally, this report provides information on number of proposals submitted and received. This information was first reported in FY 2014, and indicates an increase in submitted

4
proposals, which has a direct impact on the number of proposals being awarded. Overall the NSHE institutions submitted over 2,100 proposals for FY 2017.
The FY 2017 NSHE Sponsored Funding Annual Report and appendices provide highlights for each of the NSHE institutions and the successes and/or challenges that directly impact their funding increase or decrease and provide overall context for each institution. The last section of the report shows the intra-collaborations among NSHE and the required State special projects match that is leveraged to the federal sponsored projects to include NSF and NASA EPSCoR, Department of Education, and NASA Space Grant Consortium, which are state-wide and system-wide programs.
In summary, the overall funding of sponsored programs steadily increased since FY 2012 and the institutions are meeting their respective missions of research and student-based activities.

5
2016‐17SponsoredFundingAnnualReportHighlights Following are highlights from Appendices A-F that include detailed data on the 2016-17 (FY 2017) sponsored projects awards and expenditures and direct federal funding, including the number of proposals submitted and received and intra institutional collaborations.
NSHETotalSponsoredFunding–FY2016‐FY2017AwardedandChangeinReportingforFY2016 NSHE experienced increased sponsored awards in FY 2017. It is critical to note that following the publishing of 2014-15 report, a technical review of the reporting categories identified an inconsistency within the Scholarships & Fellowships category. In prior reports, this category included Title IV funding (Teach, Direct Loan, Nevada’s Millennium Scholarship, Pell, SEOG and FWS, for example), which technically is financial aid, not sponsored programs. Therefore, in keeping with the context of this report, the Title IV funding is now removed, and only sponsored funding is captured under this functional category now. Going forward, the awarded programs under Scholarships & Fellowships, as it relates to sponsored funding, includes GEAR UP scholarships, National Science Foundation (NSF) Fellowships, NSF EPSCoR Scholarships, NASA Space Grant Scholarships and Fellowships, and other specific scholarships awarded through sponsored programs. The 2016 fiscal year report is now the baseline for future reporting years for comparison and is not directly comparable to prior years.
Total awards received NSHE-wide increased 5% between FY 16 and FY 17 to $217.2M.

6
NSHETotalSponsoredFunding–FY2017FundingDistributionThe research institutions (UNLV, UNR, and DRI) received the majority of funds awarded in FY 2017 ($198.4 million). See Appendix A for additional detail on the funding distribution for each institution by functional categories (instruction, research public service, student services) and by sponsor (direct federal, federal pass-through, State of Nevada, other state and local governments, private/for profit [industry], and private/non-profit). See Appendix B for detail on direct awards of federal funding by agency and purpose.
NSHEResearchRankingNationallyAccording to the National Science Foundation (NSF) Higher Education Research and Development Survey1, FY 2016, out of 640 institutions tracked, NSHE research institutions held the following rankings for R&D expenditures:
R & D Expenditures – Rank: University of Nevada, Reno 152 University of Nevada, Las Vegas 177 Desert Research Institute 234
UNLV’s ranking increased from 208 to 177, and DRI’s ranking increased from 257 to 234, while UNR had a two-point decrease. In comparison, the following are the overall NSF rankings for R&D expenditures at universities in surrounding states:
Neighboring States R & D Expenditures - Rank: University of Utah 63 Arizona State University 44 University of Idaho 147 University of New Mexico 92
It is important to keep in mind that Nevada is an EPSCoR state; therefore, Nevada receives less than 1% of NSF’s total funding. Of the neighboring states, Idaho and New Mexico were EPSCoR jurisdictions in FY 17, while other neighboring states are not. 1 National Science Foundation Higher Education Research and Development short form fiscal Year 2016 https://ncsesdata.nsf.gov/herd/2016/html/HERD2016_DST_21.html
Institution 2004 2005 2006 2007 2008 2009 2010 2011 2012 2013 2014 2015 2016
UNR 84,917 97,306 100,643 99,286 104,841 109,151 95,423 89,740 85,726 89,797 87,324 90,138 95,475
UNLV 45,429 49,564 58,618 57,768 53,320 41,652 44,457 39,526 34,543 35,935 39,448 42,000 62,825
DRI 34,783 34,570 38,511 40,238 38,045 36,490 34,367 35,331 33,056 27,695 23,778 22,103 29,422
(Dollars in thousands)
National Science Foundation
National Center for Science and Engineering Statistics HERD Survey – FY 2016

7
NSHEInstitutions:TotalAwardedFY2016toFY2017 Following is an overview of the total awarded for each NSHE institution from FY 2016 to FY 2017. See Appendices A - E for more information.
UNLVUNLV experienced an increase of direct federal funding of approximately $15.5M in FY17 due to new awards from the US Army Research Office, US Department of Transportation, and Nevada Department of Health and Human Services. UNLV received more awards in FY17 than in FY16 and increased overall funding of 29% and a 30% increase in Research. UNLV also received increases on several current projects which includes awards from NSF EPSCoR, the National Institutes of Health IDEA CTR-IN.
UNR UNR experienced a decrease in federal funding of $1.6M. Awards for Instruction activity increased overall by 20%. Awards from Other State and Local Government entities for Research awards increased 166% whereas Research awards from the State of Nevada decreased 86% from 2016 to 2017. Decreases in awards from Industry and Non-Profit entities also contributed to the low percentage increase in overall awards for Research. New research awards from federal pass through, other state entities, and local governments of $3.79 million were reported in FY 2017. Research awards for ongoing federal projects received continuation funding of $14.48 million for projects: INBRE, COBRE, BioEnergy, Climate Resiliency, Nuclear Facilities and Systems, Geological Fault Studies, and NSF EPSCoR projects. Non-research funding for ongoing Public Service projects totaled $6.3 million for FY 2017, projects NV-FSNE, NV State Health Lab, CASAT Prevention Technologies, and Early Head Start.
Total Awarded
Total Expended
Total AwardedTotal
ExpendedTotal
AwardedTotal
ExpendedTotal
AwardedTotal
ExpendedTotal
AwardedTotal
ExpendedTotal
AwardedTotal
ExpendedTotal Awarded Total Expended
2016 $ 1,600,204 $ 1,886,274 $ 34,493,983 $ 30,530,900 $ 4,113,114 $ 5,251,142 $11,365,375 $10,479,171 $ - $ 155,231 $ 1,785,018 $ 691,582 $ 53,357,694 $ 48,994,299 2017 $ 3,575,293 $ 2,218,967 $ 44,924,000 $ 34,157,131 $ 4,139,707 $ 4,210,266 $14,841,024 $11,253,870 $ - $ 339,956 $ 615,917 $ 404,185 $ 68,095,941 $ 52,584,375
University of Nevada, Las Vegas
Fiscal Year Total
Functional Categories
Instruction Research Public Service Student Services Other Categories Scholarships & Fellowships Total Sponsored
$53.4M$68.1M
2016 2017
Millions
UNLV ‐ Total Awarded FY 2016‐2017

8
DRIDRI reported an overall increase to 32.9 million in FY 2017. DRI experienced a slight decrease in Research of $0.7M or 2.87%; however, DRI had a $1.9M increase in Public Service due to the Western Regional Climate Center Service Contract increase from the Department of Commerce.
DRI also received increased funding from the federal Department of Defense, and National Aeronautics & Space Administration, and Department of Agriculture.
NSCNSC had an overall increase in awards of 26% in FY 2017. There was a major increase of 85% in Research, and minor increases in Public Service and Student Services contributed to the increase.
NSC received a National Science Foundation 60-month award: Mentoring to Accelerate Retention and Change Outcomes in Science of $649K which will guide talented students to a biology degree.
Total Awarded
Total Expended
Total AwardedTotal
ExpendedTotal
AwardedTotal
ExpendedTotal
AwardedTotal
ExpendedTotal
AwardedTotal
ExpendedTotal
AwardedTotal
ExpendedTotal Awarded Total Expended
2016 $ 3,194,714 $ 2,635,172 $ 65,548,515 $ 59,708,996 $29,210,125 $25,298,760 $ 1,790,452 $ 1,870,456 $ - $ - $ 730,690 $ 429,226 $ 100,474,496 $ 89,942,610 2017 $ 3,832,328 $ 2,836,352 $ 61,647,166 $ 62,491,845 $29,922,596 $27,407,257 $ 1,305,371 $ 1,295,437 $ - $ - $ 662,815 $ 206,289 $ 97,370,276 $ 94,237,180
University of Nevada, Reno
Fiscal Year Total
Functional Categories
Instruction Research Public Service Student Services Other Categories Scholarships & FellowshipsTotal Sponsored
Projects
Total Awarded
Total Expended
Total AwardedTotal
ExpendedTotal
AwardedTotal
ExpendedTotal
AwardedTotal
ExpendedTotal
AwardedTotal
ExpendedTotal
AwardedTotal
ExpendedTotal Awarded Total Expended
2016 $ - $ - $ 23,704,497 $ 24,567,741 $ 8,031,198 $ 7,474,459 $ - $ - $ - $ - $ - $ - $ 31,735,694 $ 32,042,199 2017 $ - $ - $ 23,025,289 $ 24,615,495 $ 9,918,978 $ 9,845,361 $ - $ - $ - $ - $ - $ - $ 32,944,267 $ 34,460,856
Student Services Other Categories Scholarships & Fellowships
Desert Research Institute
Total Sponsored ProjectsFiscal
Year Total
Functional Categories
Instruction Research Public Service

9
CSNCSN experienced a decrease in federal funding of $573K from FY 2016 to FY 2017. State funding increased by $71K with projects from the Governor’s Office of Science, Innovation, and Technology and the WINN Faraday Future Workforce project funded by the Office of Economic Development.
CSN received increases in Research, Student Services, and Other with decreases in Instruction, Public Service and Scholarships. Research grants awarded increased as CSN began to compete when feasible for research grants, which included receiving a UNR-Idea Network Mini-Grant and NASA Research Infrastructure grant. TAACCCT 2 grant was completed in September 2016.
GBCGBC experienced a decrease in federal funding of $711K from FY 2016 to FY 2017. GBC had a large increase of federal pass-through of $85K.
GBC reported increases in Research and Public Service decreases in Instruction, Scholarships and Other Categories with Student Services fairly flat. TAACCCT Round 3 ended with successful completion of training of
Total Awarded
Total Expended
Total AwardedTotal
ExpendedTotal
AwardedTotal
ExpendedTotal
AwardedTotal
ExpendedTotal
AwardedTotal
ExpendedTotal
AwardedTotal
ExpendedTotal Awarded Total Expended
2016 $ 72,057 $ 385,870 $ 702,923 $ 119,579 $ 707,603 $ 683,807 $ 220,000 $ 64,165 $ - $ - $ 140,000 $ 42,250 $ 1,842,583 $ 1,295,670 2017 $ 19,311 $ 48,955 $ 1,299,268 $ 695,842 $ 728,679 $ 723,657 $ 236,100 $ 283,552 $ - $ - $ - $ - $ 2,283,358 $ 1,752,006
Nevada State College
Fiscal Year Total
Functional Categories
Instruction Research Public Service Student Services Other Categories Scholarships & FellowshipsTotal Sponsored
Projects
Total Awarded
Total Expended
Total AwardedTotal
ExpendedTotal
AwardedTotal
ExpendedTotal
AwardedTotal
ExpendedTotal
AwardedTotal
ExpendedTotal
AwardedTotal
ExpendedTotal Awarded Total Expended
2016 $ 5,073,328 $ 4,149,698 $ 339,810 $ 142,766 $ 341,649 $ 270,293 $ 1,228,489 $ 1,091,374 $ 190,312 $ 182,695 $ 500,000 $ 87,000 $ 7,673,588 $ 5,923,826 2017 $ 4,182,868 $ 3,540,952 $ 363,184 $ 164,782 $ 146,916 $ 106,593 $ 1,591,574 $ 1,299,433 $ 210,830 $ 178,100 $ 194,000 $ 47,688 $ 6,689,372 $ 5,337,548
College of Southern Nevada
Fiscal Year Total
Functional Categories
Instruction Research Public Service Student Services Other Categories Scholarships & FellowshipsTotal Sponsored
Projects

10
144 students. TAACCCT Round 4 expanded the nursing program into online courses to reach rural areas.
TMCCTMCC experienced a significant decrease to $0 in federal funding from FY 2017 due to the recognition of the $2.9M American Apprenticeship Grant from the Department of Labor for a five-year project in FY16. Instruction, Student Services and Scholarships all had decreases with Other Categories remaining flat. TMCC was awarded three Workforce Innovation grants for a total of $1,417,142 to support students and the management of the Panasonic Preferred Pathway (P3) Program.
TMCC had 40% increase in the number of awards from the State of Nevada over the prior year, which increased the amount of dollars received by 80%. TMCC received designation as a Hispanic Serving Institution by the US Department of Education which makes TMCC eligible for certain federal funding opportunities.
WNCWNC’s federal funding of remained flat at $0 from FY 2016 to FY 2017. Overall WNC had an increase of 13% in awards via Instruction and Public Service while Research, Other Categories, Student Services and Scholarships decreased.
Total Awarded
Total Expended
Total AwardedTotal
ExpendedTotal
AwardedTotal
ExpendedTotal
AwardedTotal
ExpendedTotal
AwardedTotal
ExpendedTotal
AwardedTotal
ExpendedTotal Awarded Total Expended
2016 $ 2,719,072 $ 2,873,013 $ - $ 1,327 $ 68,363 $ 48,437 $ 3,526 $ 2,315 $ 287,466 $ 159,642 $ 32,304 $ 11,194 $ 3,110,731 $ 3,095,928 2017 $ 2,612,514 $ 2,327,948 $ 1,327 $ - $ 136,849 $ 118,547 $ 3,800 $ 5,581 $ 42,420 $ 183,855 $ 6,375 $ 6,000 $ 2,803,285 $ 2,641,932
Great Basin College
Fiscal Year Total
Functional Categories
Instruction Research Public Service Student Services Other Categories Scholarships & FellowshipsTotal Sponsored
Projects
Total Awarded
Total Expended
Total AwardedTotal
ExpendedTotal
AwardedTotal
ExpendedTotal
AwardedTotal
ExpendedTotal
AwardedTotal
ExpendedTotal
AwardedTotal
ExpendedTotal Awarded Total Expended
2016 $ 6,288,904 $ 4,564,541 $ - $ - $ - $ - $ 697,117 $ 1,087,651 $ 136,590 $ 1,996,088 $ 296,000 $ 59,250 $ 7,418,611 $ 7,707,530 2017 $ 4,932,458 $ 5,042,170 $ - $ - $ - $ - $ 245,126 $ 868,897 $ 136,874 $ 129,522 $ - $ - $ 5,314,458 $ 6,040,589
Truckee Meadows Community College
Fiscal Year Total
Functional Categories
Instruction Research Public Service Student Services Other Categories Scholarships & FellowshipsTotal Sponsored
Projects

11
Adult Literacy & Language increased its overall funding through FY20 for transitioning adults into career pathways certification programs. TAACCCT 2 grant was completed in September 2016.
NSHEIntra‐InstitutionalCollaboration–FY2017ProjectsandAwardsAs reported in the table below, in FY 2017 there were 135 collaborative NSHE subawards and $13 million in NSHE intra-institutional collaborations. In addition to the direct collaborations among the institutions reported below, the NSHE System Sponsored Programs and EPSCoR office administers system-wide programs including the NSF EPSCoR, NASA EPSCoR, NASA Space Grant Consortium, NeCoTIP, and GEAR UP.
Total Awarded
Total Expended
Total AwardedTotal
ExpendedTotal
AwardedTotal
ExpendedTotal
AwardedTotal
ExpendedTotal
AwardedTotal
ExpendedTotal
AwardedTotal
ExpendedTotal Awarded Total Expended
2016 $ 1,356,786 $ 4,579,971 $ 60,138 $ 2,605 $ 38,500 $ 65,019 $ - $ - $ 43,250 $ 33,250 $ 29,500 $ 9,688 $ 1,528,174 $ 4,690,532 2017 $ 1,661,703 $ 4,327,298 $ - $ 51,033 $ 41,711 $ 46,756 $ - $ - $ 21,479 $ 24,732 $ 14,750 $ 5,247 $ 1,739,643 $ 4,455,065
Scholarships & FellowshipsTotal Sponsored
Projects
Western Nevada College
Fiscal Year Total
Functional Categories
Instruction Research Public Service Student Services Other Categories
Total $ Subawarded
# of Projects that are
Subawards
Total $ Subawarded
# of Projects that are
Subawards
Total $ Subawarded
# of Projects that are
Subawards
Total $ Subawarded
# of Projects that are
Subawards
Total $ Subawarded
# of Projects that are
Subawards
UNLV $ - 0 $ 1,816,099 7 $ 10,363 1 $ - $ 2,544,015 27
UNR $ 522,729 7 $ - 0 $ 46,590 6 $ - $ 2,752,102 30
DRI $ 297,400 2 $ 234,440 4 $ - 0 $ - $ 1,292,716 17
NSC $ 114,438 5 $ 461,146 2 $ - 0 $ - $ 154,592 6
CSN $ 7,014 2 $ 168,149 1 $ - 0 $ - $ 283,560 4
GBC $ - 0 $ 244,393 2 $ - 0 $ 750,858 1 $ 83,182 3
TMCC $ - 0 $ 333,080 1 $ - 0 $ 833,690 1 $ 133,997 3
WNC $ - 0 $ - 0 $ - 0 $ - 0 $ 51,711 3
Total $ 941,581 $ 16 $ 3,257,307 $ 17 $ 56,953 $ 7 $ 1,584,548 $ 2 $ 7,295,875 $ 93
Subawards to:
UNLV UNR DRI WNC NSHE - SSPO/EPSCoR

12
NSHEProposalsSubmittedandAwarded–FY2017The table below reports the number of proposals submitted and awarded by each institution in FY 2017. See Appendix C for more detail pertaining to sponsors.
DistributionofStateSpecialProjectsMatchingFunds–FY2017This figure reports the distribution of state special projects matching funds. Programs matched include NSF EPSCoR, NASA EPSCoR, the Department of Education, NASA Space Grant, and EPSCoR infrastructure. “Pending” funds are retained by the Sponsored Programs and EPSCoR Office for matching system-wide initiatives, such as scholarship and fellowship solicitations, faculty startups, and research development. Matching funds are released through subawards to the institutions upon completion of competitions as they occur and are reported within this report by institution once they receive the funds. See Appendix D for more information.
Institution Submitted Received Total Amount Awarded
UNLV 679 413 $ 68,095,941
UNR 1,062 760 $ 97,370,276
DRI 300 118 $ 32,944,267
NSC 29 25 $ 2,283,358
CSN 20 19 $ 5,513,195
GBC 27 24 $ 2,803,284
TMCC 26 27 $ 5,314,457
WNC 18 18 $ 1,739,643
Total 2,161 1,404 216,064,421$

13
Appendices NSHE Sponsored Projects Annual Report
A –Annual Awards & Expenditures by Function and Source of Funds – FY 2017 B –Direct Awards of Federal Funding by Agency & Purpose – FY 2017 C – NSHE Proposals Submitted & Received – FY 2017 D – Distribution of State Special Projects Matching Funds – FY 2017 E – NSHE Sponsored Projects Awards and Expenditures Report FY 2016 - FY 2017 F – NSHE System Sponsored Project – Current Nevada EPSCoR Projects – FY 2017 G – Functional Definitions H – Sponsor Definitions

SponsorTotal $
AwardedTotal $
ExpendedTotal $
AwardedTotal $
ExpendedTotal $
AwardedTotal $
ExpendedTotal $
AwardedTotal $
ExpendedTotal $
AwardedTotal $
ExpendedTotal $ Awarded
Total $ Expended
Total $ AwardedTotal $
ExpendedFederal $ 1,695,711 $ 1,155,654 $ 28,105,312 $ 18,694,057 $ 1,440,056 $ 1,434,805 14,528,007$ 10,962,535$ 161,450$ 66,667$ 95,000$ 45,835,753$ 32,503,502$ Federal Pass-through $ 1,417,000 $ 745,915 $ 9,220,458 $ 10,477,596 $ 1,656,359 $ 1,507,614 277,779$ 234,573$ 145,462$ 534,000$ 294,185$ 13,105,596$ 13,405,345$ State of Nevada $ 451,182 $ 254,105 $ 4,450,815 $ 3,272,976 $ 320,790 $ 366,379 -$ 32,000$ 5,064$ 14,250$ -$ 5,237,037$ 3,930,524$ Other state and local govt. $ - $ 48,071 $ 756,772 $ 135,604 $ 182,836 $ 267,523 -$ 21,785$ -$ -$ -$ 939,608$ 472,983$ Private, For-Profit (Industry) $ - $ - $ 1,905,163 $ 1,068,928 $ 110,000 $ 36,099 -$ -$ -$ -$ -$ 2,015,163$ 1,105,027$ Private, Non-Profit $ 11,400 $ 15,223 $ 485,480 $ 507,969 $ 429,666 $ 597,846 35,238$ 2,976$ 27,980$ 1,000$ 15,000$ 962,784$ 1,166,995$
CATEGORY TOTALS $ 3,575,293 $ 2,218,967 $ 44,924,000 $ 34,157,131 $ 4,139,707 $ 4,210,266 $ 14,841,024 $ 11,253,870 $ - $ 339,956 $ 615,917 $ 404,185 68,095,941$ 52,584,375$
SponsorTotal $
AwardedTotal $
ExpendedTotal $
AwardedTotal $
ExpendedTotal $
AwardedTotal $
ExpendedTotal $
AwardedTotal $
ExpendedTotal $
AwardedTotal $
ExpendedTotal $ Awarded
Total $ Expended
Total $ AwardedTotal $
ExpendedFederal $ - -$ -$ Federal Pass-through $ 25,598 $ 21,448 25,598$ 21,448$ State of Nevada -$ -$ Other state and local govt. -$ -$ Private, For-Profit (Industry) -$ -$ Private, Non-Profit -$ -$
CATEGORY TOTALS $ - $ - $ - $ - $ 25,598 $ 21,448 $ - $ - $ - $ - $ - $ - 25,598$ 21,448$
SponsorTotal $
AwardedTotal $
ExpendedTotal $
AwardedTotal $
ExpendedTotal $
AwardedTotal $
ExpendedTotal $
AwardedTotal $
ExpendedTotal $
AwardedTotal $
ExpendedTotal $ Awarded
Total $ Expended
Total $ AwardedTotal $
ExpendedFederal $ 2,036,821 $ 1,765,841 $ 39,590,399 $ 39,970,742 $ 12,237,113 $ 12,365,704 1,266,210$ 1,229,104$ -$ -$ 205,815$ 94,519$ 55,336,358$ 55,425,910$ Federal Pass-through $ 183,999 $ 208,825 $ 14,851,669 $ 13,128,561 $ 15,011,105 $ 12,690,727 39,161$ 66,333$ -$ -$ 450,000$ 111,770$ 30,535,934$ 26,206,216$ State of Nevada $ 843,096 $ 444,818 $ 570,516 $ 3,948,859 $ 2,137,621 $ 1,785,571 -$ -$ -$ -$ -$ -$ 3,551,233$ 6,179,248$ Other state and local govt. $ - $ - $ 2,792,199 $ 1,431,149 $ 241,099 $ 225,575 -$ -$ -$ -$ -$ -$ 3,033,298$ 1,656,724$ Private, For-Profit (Industry) $ 23,065 $ 20,496 $ 2,219,646 $ 2,522,292 $ 5,000 $ 42,806 -$ -$ -$ -$ -$ -$ 2,247,711$ 2,585,594$ Private, Non-Profit $ 745,347 $ 396,372 $ 1,622,737 $ 1,490,242 $ 290,658 $ 296,874 -$ -$ -$ -$ 7,000$ -$ 2,665,742$ 2,183,488$
CATEGORY TOTALS $ 3,832,328 $ 2,836,352 $ 61,647,166 $ 62,491,845 $ 29,922,596 $ 27,407,257 $ 1,305,371 $ 1,295,437 $ - $ - $ 662,815 $ 206,289 97,370,276$ 94,237,180$
SponsorTotal $
AwardedTotal $
ExpendedTotal $
AwardedTotal $
ExpendedTotal $
AwardedTotal $
ExpendedTotal $
AwardedTotal $
ExpendedTotal $
AwardedTotal $
ExpendedTotal $ Awarded
Total $ Expended
Total $ AwardedTotal $
ExpendedFederal $ - $ - $ 13,965,903 $ 15,609,848 $ 2,482,093 $ 2,272,828 -$ -$ -$ -$ -$ -$ 16,447,996$ 17,882,676$ Federal Pass-through $ - $ - $ 1,782,874 $ 1,569,593 $ 2,351,039 $ 2,212,809 -$ -$ -$ -$ -$ -$ 4,133,913$ 3,782,402$ State of Nevada $ - $ - $ - $ - $ 15,013 $ 13,168 -$ -$ -$ -$ -$ -$ 15,013$ 13,168$ Other state and local govt. $ - $ - $ 288,760 $ 347,360 $ - $ (0) -$ -$ -$ -$ -$ -$ 288,760$ 347,360$ Private, For-Profit (Industry) $ - $ - $ 931,937 $ 1,796,165 $ - $ - -$ -$ -$ -$ -$ -$ 931,937$ 1,796,165$ Private, Non-Profit $ - $ 2,850 $ 515,944 $ 419,932 $ - $ - -$ -$ -$ -$ 7,000$ -$ 522,944$ 422,782$
CATEGORY TOTALS $ - $ 2,850 $ 17,485,418 $ 19,742,898 $ 4,848,145 $ 4,498,805 $ - $ - $ - $ - $ 7,000 $ - 22,340,563$ 24,244,553$
SponsorTotal $
AwardedTotal $
ExpendedTotal $
AwardedTotal $
ExpendedTotal $
AwardedTotal $
ExpendedTotal $
AwardedTotal $
ExpendedTotal $
AwardedTotal $
ExpendedTotal $ Awarded
Total $ Expended
Total $ AwardedTotal $
ExpendedFederal $ - $ 14,964,622 $ 13,810,815 $ 3,207,400 $ 4,021,058 18,172,022$ 17,831,873$ Federal Pass-through $ - $ 4,331,266 $ 4,865,654 $ 3,097,147 $ 3,256,697 7,428,413$ 8,122,351$ State of Nevada $ - $ 1,202,886 $ 3,073,288 $ 183,200 $ 21,302 1,386,086$ 3,094,591$ Other state and local govt. $ - $ 1,144,379 $ 1,047,714 $ 2,247,720 $ 1,495,681 3,392,099$ 2,543,394$ Private, For-Profit (Industry) $ - $ 559,792 $ 1,261,558 $ 999,737 $ 341,103 1,559,529$ 1,602,661$ Private, Non-Profit $ - $ 822,344 $ 556,467 $ 183,774 $ 709,520 1,006,118$ 1,265,986$
CATEGORY TOTALS $ - $ - $ 23,025,289 $ 24,615,495 $ 9,918,978 $ 9,845,361 $ - $ - $ - $ - $ - $ - 32,944,267$ 34,460,856$
***THESE FUNDS ARE RECORDED IN OVERALL UNR, BUT BROKEN OUT TO SHOW UNSOM SPECIFICALLY***
NSHE Sponsored Projects Annual Awards and Expenditures ReportAwards & Expenditures by Function & Source of Funds - FY 2017
Functional CategoriesUNR
UNR UNSOM
UNLVFunctional Categories
Instruction Research Public Service Student Services Other Categories
Instruction Research Public Service Student Services
UNLV UNSOMInstruction Research Public Service Student Services Other Categories Total Sponsored
***THESE FUNDS ARE RECORDED IN OVERALL UNLV, BUT BROKEN OUT TO SHOW UNSOM SPECIFICALLY***
Scholarships & Fellowships
Scholarships & Fellowships
Scholarships & FellowshipsTotal Sponsored
Projects
Other Categories Scholarships & Fellowships Total Sponsored
DRIFunctional Categories
Instruction Research Public Service Student Services Other Categories Scholarships & Fellowships Total Sponsored
Total Sponsored Projects
Other CategoriesInstruction Public ServiceResearch Student Services
Appendix A
14
NSHE Sponsored Projects Annual Awards and Expenditures ReportAwards & Expenditures by Function & Source of Funds - FY 2017 Appendix A
SponsorTotal $
AwardedTotal $
ExpendedTotal $
AwardedTotal $
ExpendedTotal $
AwardedTotal $
ExpendedTotal $
AwardedTotal $
ExpendedTotal $
AwardedTotal $
ExpendedTotal $ Awarded
Total $ Expended
Total $ AwardedTotal $
ExpendedFederal $ 649,963 $ 554,268 $ 540,169 226,600$ 276,119$ 1,430,831$ 816,288$ Federal Pass-through $ 19,311 $ 38,391 $ 625,293 $ 669,194 $ 147,622 $ 126,599 9,500$ 7,433$ -$ -$ -$ 801,726$ 841,617$ State of Nevada $ 10,565 $ 24,012 $ 26,648 $ 16,789 $ 26,322 -$ -$ 40,801$ 63,535$ Other state and local govt. $ 10,000 $ 10,000 10,000$ 10,000$ Private, For-Profit (Industry) -$ -$ Private, Non-Profit $ 20,567 -$ 20,567$
CATEGORY TOTALS $ 19,311 $ 48,955 $ 1,299,268 $ 695,842 $ 728,679 $ 723,657 $ 236,100 $ 283,552 $ - $ - $ - $ - 2,283,358$ 1,752,006$
SponsorTotal $
AwardedTotal $
ExpendedTotal $
AwardedTotal $
ExpendedTotal $
AwardedTotal $
ExpendedTotal $
AwardedTotal $
ExpendedTotal $
AwardedTotal $
ExpendedTotal $ Awarded
Total $ Expended
Total $ AwardedTotal $
ExpendedFederal $ 343,837 $ 76,045 $ - $ - $ - $ - 909,406$ 820,870$ 1,253,243$ 896,915$ Federal Pass-through $ 2,913,310 $ 2,736,962 $ 358,434 $ 160,782 $ 146,916 $ 106,593 682,168$ 478,563$ 210,830$ 178,100$ 180,000$ 43,688$ 4,491,658$ 3,704,688$ State of Nevada $ 925,304 $ 727,528 $ 4,750 $ 4,000 14,000$ 4,000$ 944,054$ 735,528$ Other state and local govt. -$ -$ Private, For-Profit (Industry) -$ -$ Private, Non-Profit $ 417 $ 417 417$ 417$
CATEGORY TOTALS $ 4,182,868 $ 3,540,952 $ 363,184 $ 164,782 $ 146,916 $ 106,593 $ 1,591,574 $ 1,299,433 $ 210,830 $ 178,100 $ 194,000 $ 47,688 6,689,372$ 5,337,548$
SponsorTotal $
AwardedTotal $
ExpendedTotal $
AwardedTotal $
ExpendedTotal $
AwardedTotal $
ExpendedTotal $
AwardedTotal $
ExpendedTotal $
AwardedTotal $
ExpendedTotal $ Awarded
Total $ Expended
Total $ AwardedTotal $
ExpendedFederal $ 1,556,079 $ 1,288,167 $ 4,059 $ 6,184 23,356$ 23,356$ -$ -$ 1,583,494$ 1,317,707$ Federal Pass-through $ 922,445 $ 882,543 $ 40,963 $ 45,668 1,123$ 6,375$ 6,000$ 969,782$ 935,334$ State of Nevada $ 134,021 $ 153,196 $ 1,327 $ 42,514 135,348$ 195,710$ Other state and local govt. -$ -$ Private, For-Profit (Industry) $ (31) $ 91,828 $ 13,313 2,800$ 2,407$ 94,597$ 15,721$ Private, Non-Profit $ 4,042 $ 10,868 1,000$ 2,050$ 19,063$ 160,499$ 20,063$ 177,459$
CATEGORY TOTALS $ 2,612,514 $ 2,327,948 $ 1,327 $ - $ 136,849 $ 118,547 $ 3,800 $ 5,581 $ 42,420 $ 183,855 $ 6,375 $ 6,000 2,803,285$ 2,641,932$
SponsorTotal $
AwardedTotal $
ExpendedTotal $
AwardedTotal $
ExpendedTotal $
AwardedTotal $
ExpendedTotal $
AwardedTotal $
ExpendedTotal $
AwardedTotal $
ExpendedTotal $ Awarded
Total $ Expended
Total $ AwardedTotal $
ExpendedFederal $ 854,118 368,816$ -$ 1,222,935$ Federal Pass-through $ 2,932,505 $ 3,604,604 83,997$ 349,052$ 136,874$ 129,522$ 3,153,375$ 4,083,179$ State of Nevada $ 1,999,953 $ 566,829 147,189$ 139,300$ 2,147,142$ 706,129$ Other state and local govt. -$ -$ Private, For-Profit (Industry) -$ -$ Private, Non-Profit $ 16,619 13,940$ 11,728$ 13,940$ 28,347$
CATEGORY TOTALS $ 4,932,458 $ 5,042,170 $ - $ - $ - $ - $ 245,126 $ 868,897 $ 136,874 $ 129,522 $ - $ - 5,314,458$ 6,040,589$
Student Services Other Categories Scholarships & Fellowships Total Sponsored
CSN
GBCFunctional Categories
Instruction Research Public Service Scholarships & Fellowships Total Sponsored
Research Public Service
Other Categories
TMCCFunctional Categories
Scholarships & Fellowships Total Sponsored Other CategoriesInstruction Public Service
Functional CategoriesOther Categories Scholarships & Fellowships Total Sponsored Instruction Research Public Service Student Services
Student Services
Instruction
Research Student ServicesNSC
Functional Categories
15

NSHE Sponsored Projects Annual Awards and Expenditures ReportAwards & Expenditures by Function & Source of Funds - FY 2017 Appendix A
SponsorTotal $
AwardedTotal $
ExpendedTotal $
AwardedTotal $
ExpendedTotal $
AwardedTotal $
ExpendedTotal $
AwardedTotal $
ExpendedTotal $
AwardedTotal $
ExpendedTotal $ Awarded
Total $ Expended
Total $ AwardedTotal $
ExpendedFederal $ - $ 2,847,607 $ - $ - $ - $ - -$ -$ -$ -$ -$ -$ -$ 2,847,607$ Federal Pass-through $ 1,392,067 $ 1,228,956 $ - $ 51,033 $ 41,711 $ 46,756 -$ -$ 11,979$ 11,979$ 14,750$ 5,247$ 1,460,507$ 1,343,970$ State of Nevada $ 269,636 $ 217,936 $ - $ - $ - $ - -$ -$ -$ -$ -$ -$ 269,636$ 217,936$ Other state and local govt. $ - $ 29,398 $ - $ - $ - $ - -$ -$ 9,500$ 9,500$ -$ -$ 9,500$ 38,898$ Private, For-Profit (Industry) $ - $ - $ - $ - $ - $ - -$ -$ -$ -$ -$ -$ -$ -$ Private, Non-Profit $ - $ 3,401 $ - $ - $ - $ - -$ -$ -$ 3,253$ -$ -$ -$ 6,654$
CATEGORY TOTALS $ 1,661,703 $ 4,327,298 $ - $ 51,033 $ 41,711 $ 46,756 $ - $ - $ 21,479 $ 24,732 $ 14,750 $ 5,247 1,739,643$ 4,455,065$
SponsorTotal $
AwardedTotal $
ExpendedTotal $
AwardedTotal $
ExpendedTotal $
AwardedTotal $
ExpendedTotal $
AwardedTotal $
ExpendedTotal $
AwardedTotal $
ExpendedTotal $ Awarded
Total $ Expended
Total $ AwardedTotal $
ExpendedFederal $ 5,632,448 $ 7,987,432 $ 83,310,296 $ 72,475,614 $ 17,442,896 $ 18,367,920 16,930,223$ 13,657,444$ 23,356$ 184,807$ 272,482$ 189,519$ 123,611,702$ 112,862,736$ Federal Pass-through $ 9,780,637 $ 9,446,197 $ 29,387,120 $ 29,352,820 $ 20,141,822 $ 17,780,653 1,092,605$ 1,137,078$ 359,683$ 465,062$ 1,185,125$ 460,890$ 61,946,991$ 58,642,701$ State of Nevada $ 4,623,192 $ 2,374,976 $ 6,254,307 $ 10,325,771 $ 2,658,400 $ 2,242,088 147,189$ 171,300$ -$ 5,064$ 28,250$ 4,000$ 13,711,338$ 15,123,200$ Other state and local govt. $ - $ 77,469 $ 4,693,350 $ 2,614,467 $ 2,681,655 $ 1,998,779 -$ 21,785$ 9,500$ 9,500$ -$ -$ 7,384,505$ 4,721,999$ Private, For-Profit (Industry) $ 23,034 $ 20,496 $ 4,684,601 $ 4,852,778 $ 1,206,565 $ 433,321 2,800$ 2,407$ -$ -$ -$ -$ 5,917,000$ 5,309,002$ Private, Non-Profit $ 757,164 $ 436,074 $ 2,930,561 $ 2,554,678 $ 904,098 $ 1,635,675 50,178$ 16,755$ 19,063$ 191,732$ 8,000$ 15,000$ 4,669,064$ 4,849,913$
CATEGORY TOTALS $ 20,816,475 $ 20,342,644 $ 131,260,234 $ 122,176,128 $ 45,035,436 $ 42,458,436 $ 18,222,995 $ 15,006,769 $ 411,602 $ 856,165 $ 1,493,857 $ 669,409 217,240,599$ 201,509,551$
SponsorTotal $
AwardedTotal $
ExpendedTotal $
AwardedTotal $
ExpendedTotal $
AwardedTotal $
ExpendedTotal $
AwardedTotal $
ExpendedTotal $
AwardedTotal $
ExpendedTotal $ Awarded
Total $ Expended
Total $ AwardedTotal $
ExpendedFederal $ - $ 91,745 $ 383,903 $ 726,651 $ 847,085 818,396$ 1,230,988$ Federal Pass-through $ 131,547 $ 115,971 4,000$ 1,623$ 135,547$ 117,594$ State of Nevada -$ -$ Other state and local govt. -$ -$ Private, For-Profit (Industry) -$ -$ Private, Non-Profit -$ -$
CATEGORY TOTALS $ - $ - $ 91,745 $ 383,903 $ 858,198 $ 963,056 $ 4,000 $ 1,623 $ - $ - $ - $ - 953,943$ 1,348,583$
Other Categories Scholarships & Fellowships Total Sponsored
WNCFunctional Categories
Instruction Research Public Service Student Services Other Categories Scholarships & Fellowships Total Sponsored
NSHE - SSPO/EPSCoRFunctional Categories
Instruction Research Public Service Student Services Other Categories Scholarships & Fellowships Total Sponsored
***TOTAL FUNDS AWARDED ARE NOT REPORTED IF THEY ARE ISSUED OUT AS SUBAWARDS TO NSHE INSTITUTIONS, THESE ARE REPORTED UNDER THE INSTITUTION***
TOTAL ALL NSHEFunctional Categories
Instruction Research Public Service Student Services
16

Federal Agency: ResearchOther Sponsored
ProjectsTotal Research
Other Sponsored Projects
Total ResearchOther Sponsored
ProjectsTotal
Dept. of Agriculture (USDA) $ 1,945,623 $ - $ 1,945,623 $ 3,884,882 $ 881,752 $ 4,766,634 $ 808,464 $ - $ 808,464 Dept. of Commerce (DoC) $ - $ - $ - $ - $ 1,829,073 $ 1,829,073 $ 280,433 $ 1,344,914 $ 1,625,347 Dept. of Defense (DoD) $ 7,763,274 $ - $ 7,763,274 $ 1,449,627 $ 57,495 $ 1,507,122 $ 5,979,455 $ 854,380 $ 6,833,835 Dept. of Education (USDE) $ - $ 14,984,791 $ 14,984,791 $ - $ 2,474,748 $ 2,474,748 $ - $ - $ - Dept. of Energy (DOE) $ 3,630,212 $ - $ 3,630,212 $ 4,301,785 $ - $ 4,301,785 $ 4,717,084 $ - $ 4,717,084 Dept. of Health & Human Services (DHHS)
National Institutes of Health (NIH) $ 7,956,657 $ 194,693 $ 8,151,350 $ 19,011,483 $ 55,911 $ 19,067,394 $ - $ - $ - DHHS, Other $ - $ 1,345,333 $ 1,345,333 $ 290,000 $ 8,169,281 $ 8,459,281 $ - $ - $ -
Dept. of Homeland Security (DHS) $ - $ 62,500 $ 62,500 $ - $ - $ - $ - $ - $ - Dept. of Housing & Urban Development (HUD) $ - $ - $ - $ - $ - $ - $ - $ - $ - Dept. of Justice (DoJ) $ - $ - $ - $ 31,974 $ - $ 31,974 $ - $ - $ - Dept. of Labor (DoL) $ - $ - $ - $ - $ - $ - $ - $ - $ - Dept. of the Interior (DoI) $ 640,711 $ - $ 640,711 $ 3,914,673 $ 89,034 $ 4,003,707 $ 1,235,015 $ 753,158 $ 1,988,173 Dept. of Transportation (DOT) $ 1,402,200 $ - $ 1,402,200 $ 298,299 $ - $ 298,299 $ - $ - $ - Dept. of Veterans Affairs (VA) $ - $ - $ - $ - $ - $ - $ - $ - $ - Environmental Protection Agency (EPA) $ - $ - $ - $ - $ 172,364 $ 172,364 $ - $ - $ - National Aeronautics & Space Administration (NASA) $ 574,633 $ - $ 574,633 $ 274,270 $ 149,904 $ 424,174 $ 1,901,552 $ - $ 1,901,552 National Endowment for the Arts (NEA) $ - $ - $ - $ - $ - $ - $ - $ - $ - National Endowment for the Humanities (NEH) $ - $ 210,000 $ 210,000 $ - $ - $ - $ - $ - $ - National Science Foundation (NSF) $ 4,192,002 $ 866,457 $ 5,058,459 $ 5,410,596 $ - $ 5,410,596 $ 42,619 $ 254,948 $ 297,567 Small Business Administration (SBA) $ - $ - $ - $ - $ 1,157,885 $ 1,157,885 $ - $ - $ -
United States Agency for International Development (USAID) $ - $ - $ - $ 722,810 $ - $ 722,810 $ - $ - $ -
Other Federal Agencies* $ - $ 66,667 $ 66,667 $ - $ 708,512 $ 708,512 $ - $ - $ - Totals $ 28,105,312 $ 17,730,441 $ 45,835,753 $ 39,590,399 $ 15,745,959 $ 55,336,358 $ 14,964,622 $ 3,207,400 $ 18,172,022
NSHE Sponsored Projects Annual Report - Federal Awards(Direct Awards of Federal Funding by Agency & Purpose) - FY 2017
UNR DRIUNLV
Appendix B
17

NSHE Sponsored Projects Annual Report - Federal Awards(Direct Awards of Federal Funding by Agency & Purpose) - FY 2017 Appendix B
Federal Agency: ResearchOther Sponsored
ProjectsTotal Research
Other Sponsored Projects
Total ResearchOther Sponsored
ProjectsTotal
Dept. of Agriculture (USDA) $ - $ - $ - $ - $ - $ - $ - $ - $ - Dept. of Commerce (DoC) $ - $ - $ - $ - $ - $ - $ - $ - $ - Dept. of Defense (DoD) $ - $ - $ - $ - $ - $ - $ - $ - $ - Dept. of Education (USDE) $ - $ 780,868 $ 780,868 $ - $ 909,406 $ 909,406 $ - $ - $ - Dept. of Energy (DOE) $ - $ - $ - $ - $ - $ - $ - $ - $ - Dept. of Health & Human Services (DHHS)
National Institutes of Health (NIH) $ - $ - $ - $ - $ - $ - $ - $ - $ - DHHS, Other $ - $ - $ - $ - $ - $ - $ - $ 23,356 $ 23,356
Dept. of Homeland Security (DHS) $ - $ - $ - $ - $ - $ - $ - $ - $ - Dept. of Housing & Urban Development (HUD) $ - $ - $ - $ - $ - $ - $ - $ - $ - Dept. of Justice (DoJ) $ - $ - $ - $ - $ - $ - $ - $ - $ - Dept. of Labor (DoL) $ - $ - $ - $ - $ 280,867 $ 280,867 $ - $ 1,556,079 $ 1,556,079 Dept. of the Interior (DoI) $ - $ - $ - $ - $ - $ - $ - $ - $ - Dept. of Transportation (DOT) $ - $ - $ - $ - $ - $ - $ - $ - $ - Dept. of Veterans Affairs (VA) $ - $ - $ - $ - $ - $ - $ - $ - $ - Environmental Protection Agency (EPA) $ - $ - $ - $ - $ - $ - $ - $ - $ - National Aeronautics & Space Administration (NASA) $ - $ - $ - $ - $ - $ - $ - $ - $ - National Endowment for the Arts (NEA) $ - $ - $ - $ - $ - $ - $ - $ 4,059 $ 4,059 National Endowment for the Humanities (NEH) $ - $ - $ - $ - $ 62,970 $ 62,970 $ - $ - $ - National Science Foundation (NSF) $ 649,963 $ - $ 649,963 $ - $ - $ - $ - $ - $ - Small Business Administration (SBA) $ - $ - $ - $ - $ - $ - $ - $ - $ -
United States Agency for International Development (USAID) $ - $ - $ - $ - $ - $ - $ - $ - $ -
Other Federal Agencies* $ - $ - $ - $ - $ - $ - $ - $ - Totals $ 649,963 $ 780,868 $ 1,430,831 $ - $ 1,253,243 $ 1,253,243 $ - $ 1,583,494 $ 1,583,494
NSC CSN GBC
18

NSHE Sponsored Projects Annual Report - Federal Awards(Direct Awards of Federal Funding by Agency & Purpose) - FY 2017 Appendix B
ResearchOther Sponsored
ProjectsTotal
$ 6,638,969 $ 881,752 $ 7,520,721 $ 280,433 $ 3,173,987 $ 3,454,420 $ 15,192,356 $ 911,875 $ 16,104,231
TMCC and WNC did not have any direct federal $ - $ 19,149,813 $ 19,149,813 awards in FY017 $ 12,649,081 $ - $ 12,649,081 This total does not include NSHE-SSPO/EPSCoR
$ 26,968,140 $ 250,604 $ 27,218,744 $ 290,000 $ 9,537,970 $ 9,827,970 $ - $ 62,500 $ 62,500 $ - $ - $ - $ 31,974 $ - $ 31,974 $ - $ 1,836,946 $ 1,836,946 $ 5,790,399 $ 842,192 $ 6,632,591 $ 1,700,499 $ - $ 1,700,499 $ - $ - $ - $ - $ 172,364 $ 172,364 $ 2,750,455 $ 149,904 $ 2,900,359 $ - $ 4,059 $ 4,059 $ - $ 272,970 $ 272,970 $ 10,295,180 $ 1,121,405 $ 11,416,585 $ - $ 1,157,885 $ 1,157,885 $ 722,810 $ - $ 722,810 $ - $ 775,179 $ 775,179 $ 83,310,296 $ 40,301,405 $ 123,611,701
TOTAL NSHE INSTITUITIONS
19

NSHE Sponsored Projects Annual Report - Federal Awards(Direct Awards of Federal Funding by Agency & Purpose) - FY 2017 Appendix B
Federal Agency: ResearchOther Sponsored
ProjectsTotal
Dept. of Agriculture (USDA) $ - $ 493,351 $ 493,351 Dept. of Commerce (DoC) $ - $ - $ - Dept. of Defense (DoD) $ - $ - $ - Dept. of Education (USDE) $ - $ 152,938 $ 152,938 Dept. of Energy (DOE) $ - $ - $ - Dept. of Health & Human Services (DHHS)
National Institutes of Health (NIH) $ - $ - $ - DHHS, Other $ - $ - $ -
Dept. of Homeland Security (DHS) $ - $ - $ - Dept. of Housing & Urban Development (HUD) $ - $ - $ - Dept. of Justice (DoJ) $ - $ - $ - Dept. of Labor (DoL) $ - $ - $ - Dept. of the Interior (DoI) $ - $ - $ - Dept. of Transportation (DOT) $ - $ - $ - Dept. of Veterans Affairs (VA) $ - $ - $ - Environmental Protection Agency (EPA) $ - $ - $ - National Aeronautics & Space Administration (NASA) $ 21,945 $ 215,909 $ 237,854 National Endowment for the Arts (NEA) $ - $ - $ - National Endowment for the Humanities (NEH) $ - $ - $ - National Science Foundation (NSF) $ 69,800 $ - $ 69,800 Small Business Administration (SBA) $ - $ - $ -
United States Agency for International Development (USAID) $ - $ - $ -
Other Federal Agencies* $ - $ - $ - Totals $ 91,745 $ 862,198 $ 953,943
NSHE - SSPO/EPSCoR
20

SponsorNumber of
Grants/Contracts Submitted
Number of Grants/Contracts
Received Total Amount Awarded SponsorNumber of
Grants/Contracts Submitted
Number of Grants/Contracts
Received Total Amount Awarded
Federal 301 144 45,835,753 Federal 537 275 55,336,358Federal Pass-through 201 156 13,105,596 Federal Pass-through 289 306 30,535,934
State of Nevada 60 48 5,184,435 State of Nevada 69 67 3,551,233
Other state and local govt. 21 13 992,210 Other state and local govt. 16 27 3,033,298
Private, For-Profit (Industry) 28 22 2,015,163 Private, For-Profit (Industry) 43 36 2,247,711
Private, Non-Profit 68 30 962,784 Private, Non-Profit 108 49 2,665,742
Total 679 413 68,095,941 Total 1062 760 97,370,276
SponsorNumber of
Grants/Contracts Submitted
Number of Grants/Contracts
Received Total Amount Awarded SponsorNumber of
Grants/Contracts Submitted
Number of Grants/Contracts
Received Total Amount Awarded
Federal 137 31 18,172,022 Federal 8 4 1,430,831Federal Pass-through 18 24 7,428,413 Federal Pass-through 16 16 801,726
State of Nevada 28 8 1,386,086 State of Nevada 4 4 40,801
Other state and local govt. 52 25 3,392,099 Other state and local govt. 1 1 10,000
Private, For-Profit (Industry) 36 17 1,559,529 Private, For-Profit (Industry) 0 0 0
Private, Non-Profit 29 13 1,006,118 Private, Non-Profit 0 0 0
Total 300 118 32,944,267 Total 29 25 2,283,358
NSHE Proposals Submitted and Received - FY 2017
UNLV UNR
DRI NSC
Appendix C
21

NSHE Proposals Submitted and Received - FY 2017 Appendix C
SponsorNumber of
Grants/Contracts Submitted
Number of Grants/Contracts
Received Total Amount Awarded SponsorNumber of
Grants/Contracts Submitted
Number of Grants/Contracts
Received Total Amount Awarded
Federal 2 2 856,315 Federal 9 8 1,583,494Federal Pass-through 14 13 4,190,213 Federal Pass-through 8 8 969,782
State of Nevada 4 4 466,667 State of Nevada 6 4 135,348
Other state and local govt. 0 0 0 Other state and local govt. 0 0 0
Private, For-Profit (Industry) 0 0 0 Private, For-Profit (Industry) 1 1 94,597
Private, Non-Profit 0 0 0 Private, Non-Profit 3 3 20,063
Total 20 19 5,513,195 Total 27 24 2,803,284
SponsorNumber of
Grants/Contracts Submitted
Number of Grants/Contracts
Received Total Amount Awarded SponsorNumber of
Grants/Contracts Submitted
Number of Grants/Contracts
Received Total Amount Awarded
Federal 2 0 0 Federal 0 0 - Federal Pass-through 13 15 3,153,375 Federal Pass-through 13 13 1,460,507
State of Nevada 11 11 2,147,142 State of Nevada 3 3 269,636
Other state and local govt. 0 0 0 Other state and local govt. 2 2 9,500
Private, For-Profit (Industry) 0 0 0 Private, For-Profit (Industry) 0 0 -
Private, Non-Profit 0 1 13,940 Private, Non-Profit 0 0 -
Total 26 27 5,314,457 Total 18 18 1,739,643
SponsorNumber of
Grants/Contracts Submitted
Number of Grants/Contracts
Received Total Amount Awarded Institution Submitted Received Total Amount Awarded
Federal 996 464 123,214,773 UNLV 679 413 $ 68,095,941
Federal Pass-through 572 551 61,645,546 UNR 1,062 760 $ 97,370,276
State of Nevada 185 149 13,181,348 DRI 300 118 $ 32,944,267
Other state and local govt. 92 68 7,437,107 NSC 29 25 $ 2,283,358
Private, For-Profit (Industry) 108 76 5,917,000 CSN 20 19 $ 5,513,195
Private, Non-Profit 208 96 4,668,647 GBC 27 24 $ 2,803,284
Total 2,161 1,404 216,064,421 TMCC 26 27 $ 5,314,457
WNC 18 18 $ 1,739,643
Total 2,161 1,404 216,064,421$
TOTAL ALL NSHE INSTITUTIONS
TMCC WNC
TOTAL ALL NSHE INSTITUTIONS BY SPONSOR
CSN GBC
22

Program DRI UNLV UNRNSC, CSN, WNC,
GBC, TMCCNSHE - SA
competitive subawards*(pending)
Total
NSF EPSCoR 67,341$ 113,230$ 109,247$ 396,300$ 109,882$ 796,000$
NASA EPSCoR 50,923$ 26,841$ 29,513$ -$ 38,957$ 216,462$ 362,696$
DOE EPSCoR -$
Dept. of Education 192,882$ 192,882$
NASA Space Grant 43,094$ 30,405$ 66,484$ 12,039$ 41,709$ 83,411$ 277,142$
EPSCoR Infrastructure 67,206$ 67,206$
Total 228,564$ 170,476$ 205,244$ 12,039$ 669,848$ 409,755$ 1,695,926$
Percentage of Distribution 13% 10% 12% 1% 39% 24%
Distribution of State Special Projects Matching Funds FY 2017
*Funds retained by the Sponsored Programs and EPSCoR Office are for matching system‐wide initiatives, such as scholarships and fellowship
solicitations, faculty startups, and research development. Matching funds are released through subawards to the institutions upon completion
of competitions as they occur. The EPSCoR Infrastructure funds are delegated to the EPSCoR programs for administration of the awards to
include staffing, conferences, operations, and etc. and expended through the NSHE SPO/EPSCoR office.
In addition, the appropriation legislation allows for commitment of funds for two additional years after the end of the year in which the funds
are appropriated. Amounts committed for allocation after 06/30/2017 are included in this total.
Appendix D
23

Total Awarded
Total Expended
Total Awarded Total ExpendedTotal
AwardedTotal
ExpendedTotal
AwardedTotal
ExpendedTotal
AwardedTotal
ExpendedTotal
AwardedTotal
ExpendedTotal Awarded Total Expended
2016 $ 1,600,204 $ 1,886,274 $ 34,493,983 $ 30,530,900 $ 4,113,114 $ 5,251,142 $ 11,365,375 $ 10,479,171 $ - $ 155,231 $ 1,785,018 $ 691,582 $ 53,357,694 $ 48,994,299 2017 $ 3,575,293 $ 2,218,967 $ 44,924,000 $ 34,157,131 $ 4,139,707 $ 4,210,266 $ 14,841,024 $ 11,253,870 $ - $ 339,956 $ 615,917 $ 404,185 $ 68,095,941 $ 52,584,375
Total Awarded
Total Expended
Total Awarded Total ExpendedTotal
AwardedTotal
ExpendedTotal
AwardedTotal
ExpendedTotal
AwardedTotal
ExpendedTotal
AwardedTotal
ExpendedTotal Awarded Total Expended
2016 $ 3,194,714 $ 2,635,172 $ 65,548,515 $ 59,708,996 $ 29,210,125 $ 25,298,760 $ 1,790,452 $ 1,870,456 $ - $ - $ 730,690 $ 429,226 $ 100,474,496 $ 89,942,610 2017 $ 3,832,328 $ 2,836,352 $ 61,647,166 $ 62,491,845 $ 29,922,596 $ 27,407,257 $ 1,305,371 $ 1,295,437 $ - $ - $ 662,815 $ 206,289 $ 97,370,276 $ 94,237,180
Total Awarded
Total Expended
Total Awarded Total ExpendedTotal
AwardedTotal
ExpendedTotal
AwardedTotal
ExpendedTotal
AwardedTotal
ExpendedTotal
AwardedTotal
ExpendedTotal Awarded Total Expended
2016 $ - $ - $ 23,704,497 $ 24,567,741 $ 8,031,198 $ 7,474,459 $ - $ - $ - $ - $ - $ - $ 31,735,694 $ 32,042,199 2017 $ - $ - $ 23,025,289 $ 24,615,495 $ 9,918,978 $ 9,845,361 $ - $ - $ - $ - $ - $ - $ 32,944,267 $ 34,460,856
Total Awarded
Total Expended
Total Awarded Total ExpendedTotal
AwardedTotal
ExpendedTotal
AwardedTotal
ExpendedTotal
AwardedTotal
ExpendedTotal
AwardedTotal
ExpendedTotal Awarded Total Expended
2016 $ 72,057 $ 385,870 $ 702,923 $ 119,579 $ 707,603 $ 683,807 $ 220,000 $ 64,165 $ 140,000 $ 42,250 $ 1,842,583 $ 1,295,670 2017 $ 19,311 $ 48,955 $ 1,299,268 $ 695,842 $ 728,679 $ 723,657 $ 236,100 $ 283,552 $ - $ - $ - $ - $ 2,283,358 $ 1,752,006
Total Awarded
Total Expended
Total Awarded Total ExpendedTotal
AwardedTotal
ExpendedTotal
AwardedTotal
ExpendedTotal
AwardedTotal
ExpendedTotal
AwardedTotal
ExpendedTotal Awarded Total Expended
2016 $ 5,073,328 $ 4,149,698 $ 339,810 $ 142,766 $ 341,649 $ 270,293 $ 1,228,489 $ 1,091,374 $ 190,312 $ 182,695 $ 500,000 $ 87,000 $ 7,673,588 $ 5,923,826 2017 $ 4,182,868 $ 3,540,952 $ 363,184 $ 164,782 $ 146,916 $ 106,593 $ 1,591,574 $ 1,299,433 $ 210,830 $ 178,100 $ 194,000 $ 47,688 $ 6,689,372 $ 5,337,548
Total Awarded
Total Expended
Total Awarded Total ExpendedTotal
AwardedTotal
ExpendedTotal
AwardedTotal
ExpendedTotal
AwardedTotal
ExpendedTotal
AwardedTotal
ExpendedTotal Awarded Total Expended
2016 $ 2,719,072 $ 2,873,013 $ - $ 1,327 $ 68,363 $ 48,437 $ 3,526 $ 2,315 $ 287,466 $ 159,642 $ 32,304 $ 11,194 $ 3,110,731 $ 3,095,928 2017 $ 2,612,514 $ 2,327,948 $ 1,327 $ - $ 136,849 $ 118,547 $ 3,800 $ 5,581 $ 42,420 $ 183,855 $ 6,375 $ 6,000 $ 2,803,285 $ 2,641,932
NSHE Sponsored Projects Awards and Expenditures ReportTwo Year Snapshot FY 2016 - FY 2017
University of Nevada, Las Vegas
Fiscal Year Total
Functional CategoriesInstruction Research Public Service Student Services Other Categories Scholarships & Fellowships Total Sponsored
Other Categories Scholarships & Fellowships
University of Nevada, Reno
Fiscal Year Total
Functional Categories
Instruction Research Public Service Student Services Other Categories Scholarships & FellowshipsTotal Sponsored
Projects
Desert Research Institute
Total Sponsored ProjectsFiscal
Year Total
Functional Categories
Instruction Research
College of Southern Nevada
Nevada State College
Fiscal Year Total
Functional Categories
Instruction Research Public Service Student Services Other Categories Scholarships & FellowshipsTotal Sponsored
Projects
Public Service Student Services
Fiscal Year Total
Functional Categories
Instruction Research Public Service Student Services Other Categories Scholarships & FellowshipsTotal Sponsored
Projects
Great Basin College
Fiscal Year Total
Functional Categories
Instruction Research Public Service Student Services Other Categories Scholarships & FellowshipsTotal Sponsored
Projects
Appendix E
24

NSHE Sponsored Projects Awards and Expenditures ReportTwo Year Snapshot FY 2016 - FY 2017
Appendix E
Total Awarded
Total Expended
Total Awarded Total ExpendedTotal
AwardedTotal
ExpendedTotal
AwardedTotal
ExpendedTotal
AwardedTotal
ExpendedTotal
AwardedTotal
ExpendedTotal Awarded Total Expended
2016 $ 6,288,904 $ 4,564,541 $ - $ - $ - $ - $ 697,117 $ 1,087,651 $ 136,590 $ 1,996,088 $ 296,000 $ 59,250 $ 7,418,611 $ 7,707,530 2017 $ 4,932,458 $ 5,042,170 $ - $ - $ - $ - $ 245,126 $ 868,897 $ 136,874 $ 129,522 $ - $ - $ 5,314,458 $ 6,040,589
Total Awarded
Total Expended
Total Awarded Total ExpendedTotal
AwardedTotal
ExpendedTotal
AwardedTotal
ExpendedTotal
AwardedTotal
ExpendedTotal
AwardedTotal
ExpendedTotal Awarded Total Expended
2016 $ 1,356,786 $ 4,579,971 $ 60,138 $ 2,605 $ 38,500 $ 65,019 $ - $ - $ 43,250 $ 33,250 $ 29,500 $ 9,688 $ 1,528,174 $ 4,690,532 2017 $ 1,661,703 $ 4,327,298 $ - $ 51,033 $ 41,711 $ 46,756 $ - $ - $ 21,479 $ 24,732 $ 14,750 $ 5,247 $ 1,739,643 $ 4,455,065
Total Awarded
Total Expended
Total Awarded Total ExpendedTotal
AwardedTotal
ExpendedTotal
AwardedTotal
ExpendedTotal
AwardedTotal
ExpendedTotal
AwardedTotal
ExpendedTotal Awarded Total Expended
2016 $ 20,305,065 $ 21,074,538 $ 124,849,866 $ 115,073,915 $ 42,510,552 $ 39,091,916 $ 15,304,959 $ 14,595,132 $ 657,618 $ 2,526,906 $ 3,513,512 $ 1,330,189 $ 207,141,571 $ 193,692,596 2017 $ 20,816,475 $ 20,342,644 $ 131,260,234 $ 122,176,128 $ 45,035,436 $ 42,458,436 $ 18,222,995 $ 15,006,769 $ 411,602 $ 856,165 $ 1,493,857 $ 669,409 $ 217,240,599 $ 201,509,551
Truckee Meadows Community College
Fiscal Year Total
Functional Categories
Instruction Research Public Service Student Services Other Categories Scholarships & FellowshipsTotal Sponsored
Projects
Western Nevada College
Fiscal Year Total
Functional Categories
Instruction Research Public Service Student Services Other Categories
Scholarships & FellowshipsTotal Sponsored
Projects
Scholarships & FellowshipsTotal Sponsored
Projects
Nevada System of Higher Education - All Institutions Total
Fiscal Year Total
Functional Categories
Instruction Research Public Service Student Services Other Categories
25

TitleAward Period Award #
Sponsor Total Amount
Incrementally funded/year
NSF ‐ Track 1 ‐ Solar‐Energy‐Water‐Env. Nexus 2013‐2018 IIA‐1301726 20,000,000$ 4,000,000$
NSF ‐ Track 2 ‐ WC WAVE 2013‐2017 IIA‐1329469 2,000,000$
NSF ‐ Track 3 ‐ CLASSP (Schrader) 2013‐2017 1348401 749,000$
NASA ‐ RID 2015‐2017 NNX15AK48A 375,000$ 125,000$
NASA ‐ CAN ‐ Transport Technologies/Control Systm (Greiner) 2015‐2018 NNX15AM77A 750,000$
NASA ‐ CAN ‐ Aerospace Robotic (Kwang) 2013‐2017 NNX13AN15A 750,000$
NASA ‐ CAN ‐ Planetary Exploration (Bebis) 2009‐2015 NNX11AM09A 750,000$
NASA ‐ CAN ‐ Snow Capacity 2014‐2017 NNX14AN24A 750,000$
26,124,000$
NSHE System Sponsored Project - Current NV EPSCoR Projects FY 2017
TOTAL EPSCoR
Appendix F
26
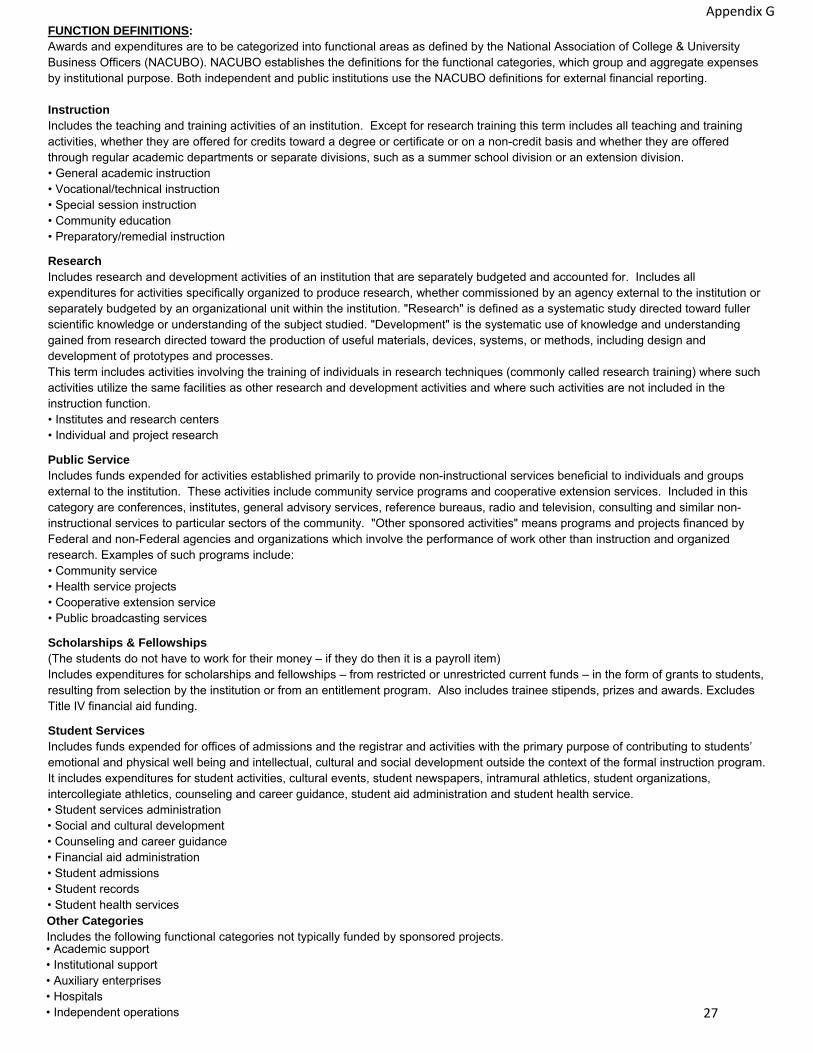
FUNCTION DEFINITIONS: Awards and expenditures are to be categorized into functional areas as defined by the National Association of College & University Business Officers (NACUBO). NACUBO establishes the definitions for the functional categories, which group and aggregate expenses by institutional purpose. Both independent and public institutions use the NACUBO definitions for external financial reporting.
Instruction Includes the teaching and training activities of an institution. Except for research training this term includes all teaching and training activities, whether they are offered for credits toward a degree or certificate or on a non-credit basis and whether they are offered through regular academic departments or separate divisions, such as a summer school division or an extension division. • General academic instruction• Vocational/technical instruction• Special session instruction• Community education• Preparatory/remedial instruction
Research Includes research and development activities of an institution that are separately budgeted and accounted for. Includes all expenditures for activities specifically organized to produce research, whether commissioned by an agency external to the institution or separately budgeted by an organizational unit within the institution. "Research" is defined as a systematic study directed toward fuller scientific knowledge or understanding of the subject studied. "Development" is the systematic use of knowledge and understanding gained from research directed toward the production of useful materials, devices, systems, or methods, including design and development of prototypes and processes. This term includes activities involving the training of individuals in research techniques (commonly called research training) where such activities utilize the same facilities as other research and development activities and where such activities are not included in the instruction function. • Institutes and research centers• Individual and project research
Public Service Includes funds expended for activities established primarily to provide non-instructional services beneficial to individuals and groups external to the institution. These activities include community service programs and cooperative extension services. Included in this category are conferences, institutes, general advisory services, reference bureaus, radio and television, consulting and similar non-instructional services to particular sectors of the community. "Other sponsored activities" means programs and projects financed by Federal and non-Federal agencies and organizations which involve the performance of work other than instruction and organized research. Examples of such programs include: • Community service• Health service projects• Cooperative extension service• Public broadcasting services
Scholarships & Fellowships (The students do not have to work for their money – if they do then it is a payroll item) Includes expenditures for scholarships and fellowships – from restricted or unrestricted current funds – in the form of grants to students, resulting from selection by the institution or from an entitlement program. Also includes trainee stipends, prizes and awards. Excludes Title IV financial aid funding.
Student Services Includes funds expended for offices of admissions and the registrar and activities with the primary purpose of contributing to students’ emotional and physical well being and intellectual, cultural and social development outside the context of the formal instruction program. It includes expenditures for student activities, cultural events, student newspapers, intramural athletics, student organizations, intercollegiate athletics, counseling and career guidance, student aid administration and student health service. • Student services administration• Social and cultural development• Counseling and career guidance• Financial aid administration• Student admissions• Student records• Student health servicesOther CategoriesIncludes the following functional categories not typically funded by sponsored projects.• Academic support• Institutional support• Auxiliary enterprises• Hospitals• Independent operations
Appendix G
27

Sponsor Definitions:
Federal ‐ Funds awarded directly from a federal agency to the University
Federal Pass‐through ‐ Funds awarded by a federal agency to a recipient (public or private) and then
subcontracted to the institution.
NOTE: All EPSCoR and other federal funds awarded by NSHE are "Federal Pass‐through."
State of Nevada ‐ Funds from state of Nevada agencies (excluding federal pass‐through funds).
NOTE: All State Matching Funds awarded by NSHE are "State of Nevada."
Other State & local Government ‐ non‐Nevada state funding (excluding federal pass‐through funds)
Private, For‐Profit ‐ Industry, (excluding federal pass‐through funds)
Private, Non‐Profit ‐ Foundations, Associations, etc. (excluding federal pass‐through funds)
Appendix H
28