nevada state board of pharmacy license verification list as of
Upload
khangminh22Category
view
0download
0
STATE OF NEVADA
Single Audit Report For the Year Ended
June 30, 2010


STATE OF NEVADA SINGLE AUDIT REPORT FOR THE YEAR ENDED JUNE 30, 2010
TABLE OF CONTENTS Page Independent Auditor’s Report ................................................................................................................................. 1 Management's Discussion and Analysis .................................................................................................................... 3 Basic Financial Statements Government-Wide Financial Statements Statement of Net Assets ................................................................................................................................ 14 Statement of Activities .................................................................................................................................. 16 Fund Financial Statements Balance Sheet - Governmental Funds ........................................................................................................... 18 Reconciliation of the Governmental Funds Balance Sheet to the Statement of Net Assets ........................................................................................................................... 20 Statement of Revenues, Expenditures, and Changes in Fund Balances - Governmental Funds ............................................................................................................................... 21 Reconciliation of Revenues, Expenditures, and Changes in Fund Balances of Governmental Funds to the Statement of Activities ............................................................ 23 Statement of Net Assets - Proprietary Funds ................................................................................................ 24 Statement of Revenues, Expenses, and Changes in Fund Net Assets - Proprietary Funds ....................................................................................................................... 26 Statement of Cash Flows - Proprietary Funds ............................................................................................... 27 Statement of Fiduciary Net Assets - Fiduciary Funds ................................................................................... 29 Statement of Changes in Fiduciary Net Assets - Fiduciary Funds ................................................................ 30 Notes to Financial Statements ............................................................................................................................ 31 Required Supplementary Information Budgetary Comparison Schedule - General Fund and Major Special Revenue Funds .............................................................................................................................................. 66 Notes to Required Supplementary Information - Budgetary Reporting ............................................................. 68 Schedule of Funding Progress – Pension Plans .................................................................................................. 69 Schedule of Infrastructure Condition and Maintenance Data ............................................................................. 70 Independent Auditor's Report on Internal Control over Financial Reporting and on Compliance and Other Matters Based on an Audit of Financial Statements Performed in Accordance with Government Auditing Standards ...................................................................... 71 Independent Auditor's Report on Compliance with Requirements that Could Have a Direct and Material Effect on Each Major Program and on Internal Control over Compliance in Accordance with OMB Circular A-133 ............................................................................. 73 Schedule of Expenditures of Federal Awards .......................................................................................................... 75 Notes to the Schedule of Expenditures of Federal Awards ................................................................................... 111 Schedule of Findings and Questioned Costs .......................................................................................................... 113 Summary Schedule of Prior Audit Findings .......................................................................................................... 225

Independent Auditor’s Report
The Honorable Kim Wallin, CMA, CFM, CPA State Controller We have audited the accompanying financial statements of the governmental activities, the business-type activities, the aggregate discretely presented component units, each major fund, and the aggregate remaining fund information of the State of Nevada, as of and for the year ended June 30, 2010, which collectively comprise the State of Nevada’s basic financial statements as listed in the table of contents. These financial statements are the responsibility of the State of Nevada’s management. Our responsibility is to express opinions on these financial statements based on our audit. We did not audit: Government-Wide Financial Statements
the financial statements of the Housing Division, which represent 63.17 percent of the assets and 3.50 percent of the revenues of the business-type activities;
the financial statements of the Nevada System of Higher Education and the Colorado River
Commission, both of which are discretely presented component units.
Fund Financial Statements the financial statements of the Housing Division Enterprise Fund;
the financial statements of the Self Insurance and Insurance Premiums Internal Service Funds, which
represent less than one percent of the assets and 4.92 percent of the revenues of the aggregate remaining fund information;
the financial statements of the Pension Trust Funds and the Other Employee Benefit Trust Fund –
State Retirees’ Fund, which in the aggregate represent 73.50 percent of the assets and 46.61 percent of the revenues of the aggregate remaining fund information;
the financial statements of the Nevada College Savings Plan – Private Purpose Trust Fund, which
represent 17.80 percent of the assets and 30.65 percent of the revenues of the aggregate remaining fund information;
the financial statements of the Retirement Benefits Investment Fund, which represent less than one
percent of the assets and revenues of the aggregate remaining fund information. Those financial statements were audited by other auditors whose reports thereon have been furnished to us, and our opinion, insofar as it relates to the amounts included for the above-mentioned funds and entities, is based on the reports of the other auditors. We conducted our audit in accordance with auditing standards generally accepted in the United States of America and the standards applicable to financial audits contained in Government Auditing Standards, issued by the

2
Comptroller General of the United States. Those standards require that we plan and perform the audit to obtain reasonable assurance about whether the financial statements are free of material misstatement. The financial statements of the Higher Education Tuition Trust Enterprise Fund, the Self Insurance and Insurance Premiums Internal Service Funds, the Pension Trust Funds and the Other Employee Benefit Trust Fund – State Retirees’ Fund, the Nevada College Savings Plan – Private Purpose Trust Fund, and the Retirement Benefits Investment Fund were not audited in accordance with Government Auditing Standards. An audit includes examining, on a test basis, evidence supporting the amounts and disclosures in the financial statements. An audit also includes assessing the accounting principles used and significant estimates made by management, as well as evaluating the overall financial statement presentation. We believe that our audit and the reports of other auditors provide a reasonable basis for our opinions. In our opinion, based on our audit and the reports of other auditors, the financial statements referred to above present fairly, in all material respects, the respective financial position of the governmental activities, the business-type activities, the aggregate discretely presented component units, each major fund, and the aggregate remaining fund information of the State of Nevada, as of June 30, 2010, and the respective changes in financial position and, cash flows, where applicable, thereof for the year then ended in conformity with accounting principles generally accepted in the United States of America. In accordance with Government Auditing Standards, we have also issued our report dated December 17, 2010 on our consideration of the State of Nevada’s internal control over financial reporting and on our tests of its compliance with certain provisions of laws, regulations, contracts, and grant agreements and other matters. The purpose of that report is to describe the scope of our testing of internal control over financial reporting and compliance and the results of that testing, and not to provide an opinion on the internal control over financial reporting or on compliance. That report is an integral part of an audit performed in accordance with Government Auditing Standards and should be considered in assessing the results of our audit. Management’s discussion and analysis on pages 3 through 13, the budgetary comparison schedule, the notes to required supplementary information-budgetary reporting, the schedule of funding progress and the schedule of infrastructure condition and maintenance data, collectively on pages 66 through 70, are not required parts of the basic financial statements but are supplementary information required by accounting principles generally accepted in the United States of America. We and the other auditors have applied certain limited procedures, which consisted principally of inquiries of management regarding the methods of measurement and presentation of the required supplementary information. However, we did not audit the information and express no opinion on it. Our audit was conducted for the purpose of forming opinions on the financial statements that collectively comprise the State of Nevada’s basic financial statements. The accompanying Schedule of Expenditures of Federal Awards is presented for purposes of additional analysis as required by U.S. Office of Management and Budget Circular A-133, Audits of States, Local Governments, and Not-for-Profit Organizations, and is not a required part of the basic financial statements. Such information has been subjected to the auditing procedures applied in the audit of the basic financial statements and, in our opinion, is fairly stated in all material respects in relation to the basic financial statements taken as a whole. As discussed in Note 1 to the Schedule of Expenditures of Federal Awards on page 111, the Federal award programs of the Nevada System of Higher Education are not included in the accompanying Schedule of Expenditures of Federal Awards. Federal award programs of the Nevada System of Higher Education will be reported on separately. Reno, Nevada December 17, 2010

ManageMent’s Discussion anD analysis
State of Nevada management provides this discussion and analysis of the State of Nevada’s Comprehensive Annual Financial Report (CAFR) for readers of the State’s financial statements. This narrative overview and analysis of the financial activities of the State of Nevada is for the fiscal year ended June 30, 2010. We encourage readers to consider this information in conjunction with the additional information furnished in the letter of transmittal.
HigHligHtsGovernment-wide:Net Assets – The assets of the State exceeded its liabilities at the close of the fiscal year ended June 30, 2010 by $4.2 billion (reported as net assets). Of the $4.2 billion in net assets, $1.1 billion was restricted and not available to meet the State’s general obligations. Also unavailable to meet the State’s general obligations is the $3.6 billion invested in capital assets, net of related debt.
Changes in Net Assets – The State’s total net assets decreased by $527.4 million in fiscal year 2010. Net assets of governmental activities increased by $123.5 million (a 3.1% increase) and net assets of the business-type activities decreased by $650.9 million (an 80.0% decrease).
Fund-level:At the close of the fiscal year, the State’s governmental funds reported a combined ending fund balance of $1.6 billion, a decrease of $34.9 million from the prior year. Of this amount, $485.5 million represents the unreserved fund balance.
The State’s enterprise funds reported combined ending net assets of $164.3 million, a decrease of $651.2 million from the prior year, attributable primarily to a decrease of $672.2 in net assets of the Unemployment Compensation fund. Of the combined ending net assets, $303.8 million represents a deficit in unrestricted net assets of which $301.9 is from the Unemployment Compensation fund.
The State’s fiduciary funds reported combined ending net assets of $27.8 billion, an increase of $3.4 billion from the prior year. This increase is due primarily to the change in the fair value of investments in the Pension Trust Funds.
Long-term Debt (government-wide):The net increase in the State’s long-term debt obligations was $495.1 million (an 11.5% increase) during the current fiscal year.
overview of tHe financial stateMents
This discussion and analysis is an introduction to the State of Nevada’s basic financial statements which is comprised of three components: 1) government-wide financial statements, 2) fund financial statements, and 3) notes to the financial statements. The Comprehensive Annual Financial Report also contains other supplementary information in addition to the basic financial statements.
Government-wide Financial Statements:The government-wide financial statements are designed to provide readers with a broad overview of the State of Nevada’s finances in a manner similar to the private sector. They take into account all revenues and expenses connected with the fiscal year regardless of when cash is received or paid. The government-wide financial statements include the following two statements:
The statement of net assets presents all of the State’s assets and liabilities, with the difference between the two reported as “net assets.” The statement combines and consolidates all of the State’s current financial resources with capital assets and long-term obligations. Over time, increases and decreases in net assets measure whether the State’s financial position is improving or deteriorating.
The statement of activities presents information showing how the State’s net assets changed during the most recent fiscal year. The statement reveals how much it costs the State to provide its various services, and whether the services cover their own costs through user fees, charges, grants, or are financed with taxes and other general revenues. All changes in net assets are reported
3
as soon as the underlying event occurs, regardless of the timing of cash flows. Therefore, some revenue and expenses reported in this statement will not result in cash flows until future fiscal periods (e.g., uncollected taxes and earned but unused leave).
Both government-wide statements above report three types of activities:
Governmental Activities – Taxes and intergovernmental revenues primarily support these activities. Most services normally associated with State government fall into this category, including general government, health and social services, education and support services, law, justice and public safety, regulation of business, transportation, recreation and resource development, interest on long-term debt and unallocated depreciation.
Business-type Activities – These activities are intended to recover all, or a significant portion, of the costs of the activities by charging fees to customers. The Housing Division and Unemployment Compensation are examples of the State’s business-type activities.
Discretely Presented Component Units – Component units are legally separate organizations for which the elected officials of the government are financially accountable or have significant influence in governing board appointments. The State has two discretely presented component units – the Nevada System of Higher Education and the Colorado River Commission. Complete financial statements of the individual component units can be obtained from their respective administrative offices.
Fund Financial Statements:A fund is an accounting entity consisting of a set of self-balancing accounts to track funding sources and spending for a particular purpose. The State’s funds are broken down into three types:
Governmental funds – Most of the State’s basic services are reported in governmental funds. These funds focus on short-term inflows and outflows of expendable resources as well as balances left at the end of the fiscal year available to finance future activities. These funds are reported using the flow of current financial resources measurement focus and the modified accrual basis of accounting.
The governmental fund financial statements focus on major funds and provide additional information that is not provided in the government-wide financial statements. It is useful to compare the information presented for governmental funds with similar information presented for governmental activities in the government-wide financial statements. By doing so, readers may better understand the long-term impact of the government’s near-term financing decisions. A reconciliation is provided between the governmental fund statements and the governmental activities in the government-wide financial statements.
Proprietary funds – When the State charges customers for the services it provides, whether to outside customers (enterprise funds) or to other State agencies (internal service funds), the services are generally reported in the proprietary funds. Proprietary funds apply the accrual basis of accounting utilized by private sector businesses, and there is a reconciliation between the government-wide financial statement business-type activities and the enterprise fund financial statements. Because internal service fund operations primarily benefit governmental funds, they are included with the governmental activities in the government-wide financial statements.
Fiduciary funds – These funds are used to account for resources held for the benefit of parties outside the state government. For instance, the State acts as a trustee or fiduciary for its employee pension plans, and it is also responsible for other assets that, because of a trust arrangement, can be used only for the trust beneficiaries. Fiduciary funds are reported using the accrual basis of accounting. The government-wide statements exclude fiduciary fund activities and balances because these assets are restricted in purpose and do not represent discretionary assets of the State to finance its operations.
Notes to the Financial Statements:The notes to the financial statements provide additional information that is essential to a full understanding of the data provided in both the government-wide and fund financial statements.
Required Supplementary Information:The required supplementary information includes budgetary comparison schedules for the General Fund and major special revenue funds, along with notes and a reconciliation of the statutory and generally accepted accounting principles (GAAP) fund balances at fiscal year-end. This section also includes a schedule of funding progress for certain pension trust funds and a schedule of infrastructure condition and maintenance data.
4

TotalChange
2010 2009 2010 2009 2010 2009 2010-2009
AssetsCurrent and other assets 3,299,428$ 3,390,666$ 1,904,758$ 2,040,393$ 5,204,186$ 5,431,059$ (226,873)$ Net capital assets 5,330,157 5,198,108 10,986 10,360 5,341,143 5,208,468 132,675
Total assets 8,629,585 8,588,774 1,915,744 2,050,753 10,545,329 10,639,527 (94,198)
LiabilitiesCurrent liabilities 1,399,495 1,458,110 78,624 79,965 1,478,119 1,538,075 (59,956)Long-term liabilities 3,148,576 3,172,628 1,672,864 1,153,620 4,821,440 4,326,248 495,192
Total liabilities 4,548,071 4,630,738 1,751,488 1,233,585 6,299,559 5,864,323 435,236
Net AssetsInvested in capital assets, net of related debt 3,622,787 3,492,205 3,615 3,286 3,626,402 3,495,491 130,911Restricted 683,526 702,743 464,346 819,348 1,147,872 1,522,091 (374,219)Unrestricted (deficit) (224,799) (236,912) (303,705) (5,466) (528,504) (242,378) (286,126)
Total net assets 4,081,514$ 3,958,036$ 164,256$ 817,168$ 4,245,770$ 4,775,204$ (529,434)$
Activities Activities Total
State of Nevada's Net Assets-Primary Government(expressed in thousands)
Governmental Business-type
Other Supplementary Information:Other supplementary information includes combining financial statements for non-major governmental, non-major enterprise, all internal service and all fiduciary funds. The non-major funds are added together, by fund type, and presented in single columns in the basic financial statements. Other supplementary information also contains budgetary schedules of total uses for the General Fund and special revenue fund budgets, as well as a schedule of sources for non-major special revenue fund budgets.
governMent-wiDe financial analysis
The State’s overall financial position and operations for the fiscal years ended June 30, 2010 and 2009 for the primary government are summarized in the following statements based on the information included in the government-wide financial statements.
Net Assets:As noted earlier, net assets may serve over time as a useful indicator of a government’s financial position. The State’s combined net assets (governmental and business-type activities) totaled $4.2 billion at the end of 2010, compared with $4.8 billion at the end of the previous year.
The largest portion of the State’s net assets ($3.6 billion or 85%) reflects its investment in capital assets such as land, buildings, improvements other than buildings, equipment, construction in progress, infrastructure and rights-of-way, less any related debt still outstanding that was used to acquire those assets. The State uses these capital assets to provide services to its citizens; consequently, these assets are not available for future spending. Although the State’s investment in its capital assets is reported net of related debt, it should be noted that the resources needed to repay this debt must be provided from other sources, since the capital assets themselves cannot be used to liquidate these liabilities.
An additional portion of the State’s net assets of $1.1 billion or 27% represents resources that are subject to external restrictions on how they may be used. At the close of the fiscal year, the State reported an unrestricted net assets deficit of $528.5 million or -12%, as compared to a $242.4 million deficit in the prior year. Although general revenues in the form of gaming taxes, sales and use taxes, and motor taxes were lower, total government-wide revenues increased over the prior year, due primarily to additional federal funds received through the American Recovery and Reinvestment Act which includes stimulus, Medicaid and unemployment compensation programs. Even so, the unrestricted net assets deficit occurred because the increase in government-wide expenses exceeded the revenues received. The majority of the increase in government-wide expenses was due to the $897 million increase in unemployment insurance benefits paid. Nevada’s unemployment rate is significantly higher
5

than the national average, and the State continues to deal with the effects of lower levels of consumer spending and tourism. Nevertheless, at the end of the current fiscal year, the State is able to report positive balances in two of the three categories of net assets, both for the government as a whole, as well as for its governmental activities and the business-type activities.
Changes in Net Assets:Governmental activities –The net assets increased by $123.5 million or 3.1%. Approximately 46% of the total revenue came from taxes, while 42% was in the form of grants and contributions (including federal aid). Charges for various goods and services provided 10% of the total revenues (see chart below). The State’s governmental activities expenses cover a range of services and the largest expenses were for health and social services (40%) and education (32%) (see chart below). In 2010, governmental activities expenses exceeded program revenues, resulting in the use of $3.6 billion in general revenues, which were generated to support the government.
TotalChange
2010 2009 2010 2009 2010 2009 2010-2009Revenues Program revenues Charges for services 797,028$ 794,893$ 87,356$ 105,244$ 884,384$ 900,137$ (15,753)$ Operating grants and contributions 3,141,986 2,544,032 1,335,177 525,550 4,477,163 3,069,582 1,407,581 Capital grants and contributions 56,719 19,608 - - 56,719 19,608 37,111 General revenues Sales and use taxes 870,474 943,787 - - 870,474 943,787 (73,313) Gaming taxes 844,470 883,054 - - 844,470 883,054 (38,584) Modified business taxes 381,300 281,605 - - 381,300 281,605 99,695 Insurance premium taxes 233,280 241,252 - - 233,280 241,252 (7,972) Property and transfer taxes 266,878 278,881 - - 266,878 278,881 (12,003) Motor and special fuel taxes 268,554 272,614 - - 268,554 272,614 (4,060) Other taxes 620,834 374,704 314,657 342,588 935,491 717,292 218,199 Investment earnings (1,246) 9,026 - - (1,246) 9,026 (10,272) Other 169,024 181,086 - - 169,024 181,086 (12,062)
Total Revenues 7,649,301 6,824,542 1,737,190 973,382 9,386,491 7,797,924 1,588,567Expenses General government 375,219 389,943 - - 375,219 389,943 (14,724) Health and social services 3,017,013 2,667,419 - - 3,017,013 2,667,419 349,594 Education and support services 2,430,923 2,475,416 - - 2,430,923 2,475,416 (44,493) Law, justice and public safety 690,104 687,410 - - 690,104 687,410 2,694 Regulation of business 100,380 118,086 - - 100,380 118,086 (17,706) Transportation 644,976 762,610 - - 644,976 762,610 (117,634) Recreation and resource development 161,048 165,741 - - 161,048 165,741 (4,693) Interest on long-term debt 132,238 138,304 - - 132,238 138,304 (6,066) Unallocated depreciation 1,448 976 - - 1,448 976 472 Unemployment insurance - - 2,233,382 1,336,043 2,233,382 1,336,043 897,339 Housing - - 57,342 44,382 57,342 44,382 12,960 Water loans - - 14,697 6,218 14,697 6,218 8,479 Workers' compensation and safety - - 26,084 26,801 26,084 26,801 (717) Higher education - - 14,051 13,103 14,051 13,103 948 Other - - 23,175 16,967 23,175 16,967 6,208Total Expenses 7,553,349 7,405,905 2,368,731 1,443,514 9,922,080 8,849,419 1,072,661 Excess (deficiency) in net assets before contributions to permanent funds and transfers 95,952 (581,363) (631,541) (470,132) (535,589) (1,051,495) 515,906 Contributions to permanent fund 8,165 7,019 - - 8,165 7,019 1,146 Transfers 19,361 23,912 (19,361) (23,912) - - -
Change in net assets 123,478 (550,432) (650,902) (494,044) (527,424) (1,044,476) 517,052
Net assets - beginning of year 3,958,036 4,508,468 817,168 1,311,212 4,775,204 5,819,680 (1,044,476)Change in reporting entity - - (2,010) - (2,010) - (2,010)Net assets - beginning of year (restated) 3,958,036 4,508,468 815,158 1,311,212 4,773,194 5,819,680 (1,046,486)
Net assets - end of year 4,081,514$ 3,958,036$ 164,256$ 817,168$ 4,245,770$ 4,775,204$ (529,434)$
Activities Activities Total
Changes in State of Nevada's Net Assets-Primary Government(expressed in thousands)
Governmental Business-type
6
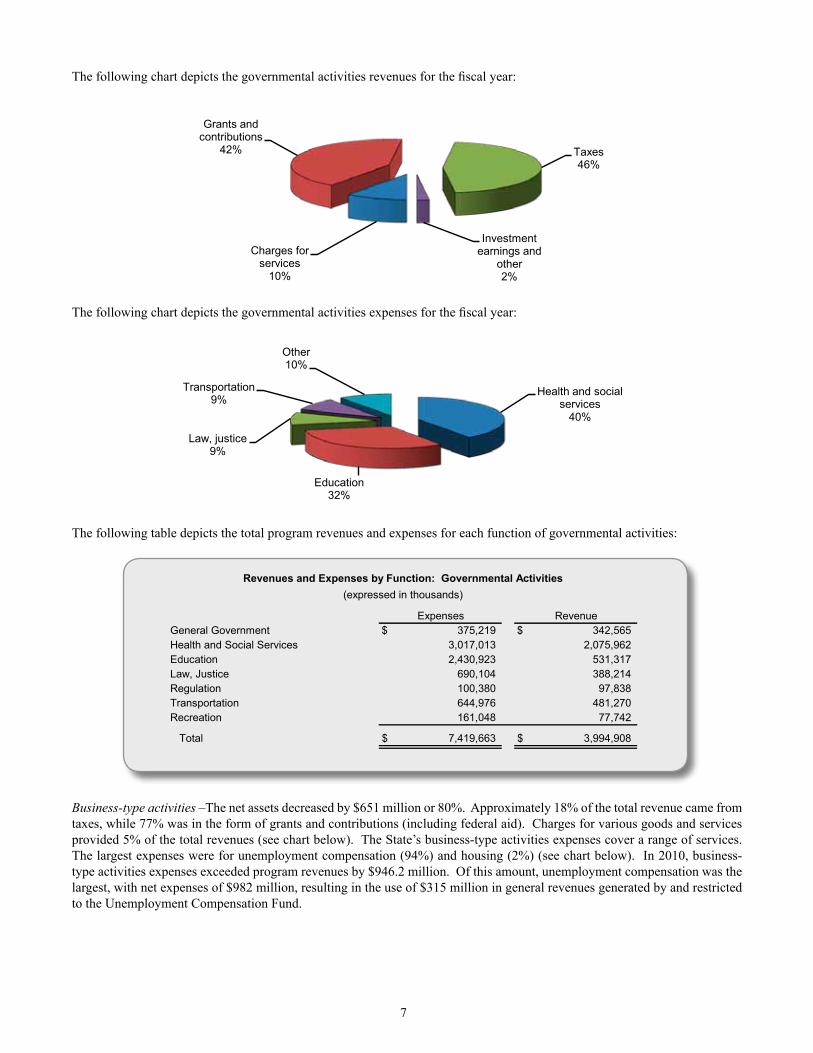
The following chart depicts the governmental activities revenues for the fiscal year:
The following chart depicts the governmental activities expenses for the fiscal year:
The following table depicts the total program revenues and expenses for each function of governmental activities:
Business-type activities –The net assets decreased by $651 million or 80%. Approximately 18% of the total revenue came from taxes, while 77% was in the form of grants and contributions (including federal aid). Charges for various goods and services provided 5% of the total revenues (see chart below). The State’s business-type activities expenses cover a range of services. The largest expenses were for unemployment compensation (94%) and housing (2%) (see chart below). In 2010, business-type activities expenses exceeded program revenues by $946.2 million. Of this amount, unemployment compensation was the largest, with net expenses of $982 million, resulting in the use of $315 million in general revenues generated by and restricted to the Unemployment Compensation Fund.
Health and social services 3,017,013 39.94% 40%Education 2,430,923 32.18% 32%Law, justice 690,105 9.14% 9%Transportation 644,976 8.54% 9%Other 770,332 10.20% 10%Total 7,553,349 100% 100%
Health and social services
40%
Education32%
Law, justice 9%
Transportation9%
Other10%
Charges for services 797,028 10.42% 10%Grants and contributions 3,198,705 41.82% 42%Taxes 3,485,790 45.57% 46%Investment earnings and other 167,778 2.19% 2%Total 7,649,301 100% 100%
Charges for services
10%
Grants and contributions
42% Taxes46%
Investment earnings and
other2%
Expenses RevenueGeneral Government 375,219$ 342,565$ Health and Social Services 3,017,013 2,075,962Education 2,430,923 531,317Law, Justice 690,104 388,214Regulation 100,380 97,838Transportation 644,976 481,270Recreation 161,048 77,742
Total 7,419,663$ 3,994,908$
Revenues and Expenses by Function: Governmental Activities(expressed in thousands)
7
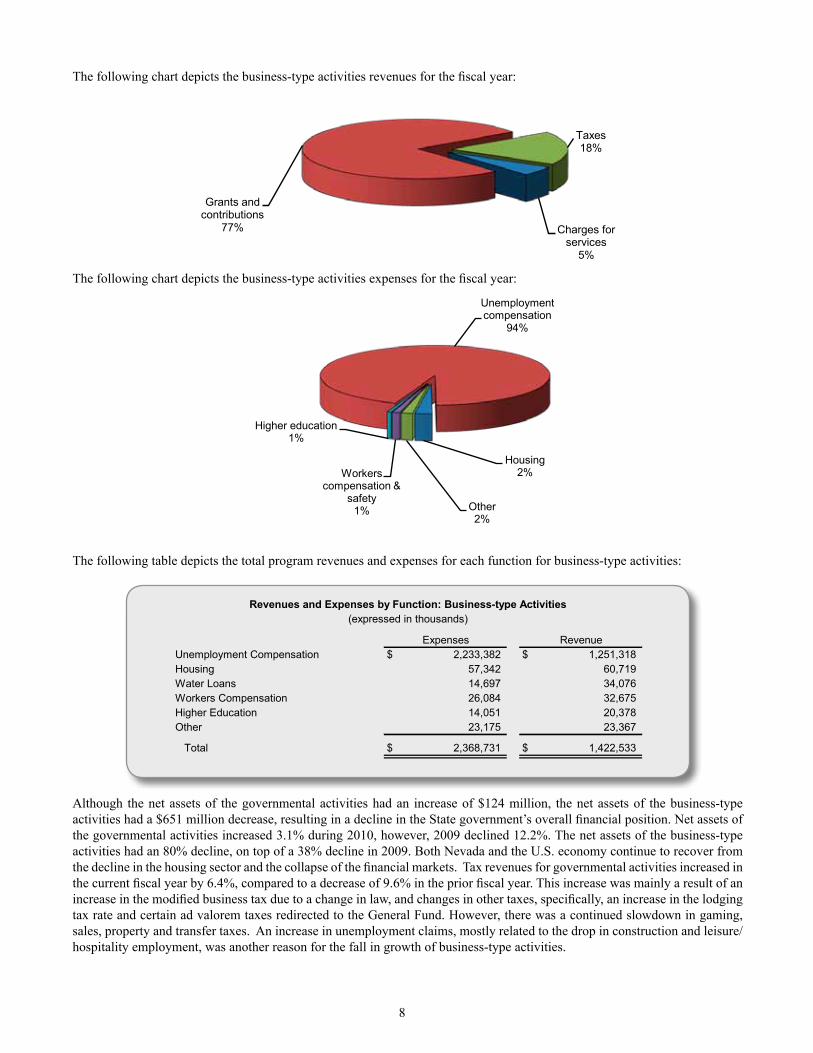
The following chart depicts the business-type activities revenues for the fiscal year:
The following chart depicts the business-type activities expenses for the fiscal year:
The following table depicts the total program revenues and expenses for each function for business-type activities:
Although the net assets of the governmental activities had an increase of $124 million, the net assets of the business-type activities had a $651 million decrease, resulting in a decline in the State government’s overall financial position. Net assets of the governmental activities increased 3.1% during 2010, however, 2009 declined 12.2%. The net assets of the business-type activities had an 80% decline, on top of a 38% decline in 2009. Both Nevada and the U.S. economy continue to recover from the decline in the housing sector and the collapse of the financial markets. Tax revenues for governmental activities increased in the current fiscal year by 6.4%, compared to a decrease of 9.6% in the prior fiscal year. This increase was mainly a result of an increase in the modified business tax due to a change in law, and changes in other taxes, specifically, an increase in the lodging tax rate and certain ad valorem taxes redirected to the General Fund. However, there was a continued slowdown in gaming, sales, property and transfer taxes. An increase in unemployment claims, mostly related to the drop in construction and leisure/hospitality employment, was another reason for the fall in growth of business-type activities.
Charges for services 87,356 5.03% 5%Grants and contributions 1,335,177 76.86% 77%Taxes and other 314,657 18.11% 18%Total 1,737,190 100% 100%
Charges for services
5%
Grants and contributions
77%
Taxes18%
Unemployment compensation 2,233,382 94%Housing 57,342 2%Other 37,873 2%Workers compensation & safety 26,084 1%Higher education 14,050 1%Total 2,368,731 100%
Unemployment compensation
94%
Housing2%
Other2%
Workers compensation &
safety1%
Higher education1%
Expenses RevenueUnemployment Compensation 2,233,382$ 1,251,318$ Housing 57,342 60,719Water Loans 14,697 34,076Workers Compensation 26,084 32,675Higher Education 14,051 20,378Other 23,175 23,367
Total 2,368,731$ 1,422,533$
Revenues and Expenses by Function: Business-type Activities(expressed in thousands)
8

financial analysis of tHe state’s funDsGovernmental Funds:As of the end of the current fiscal year, the State’s governmental funds reported combined ending fund balances of $1.58 billion, a decrease of $35 million in comparison with the prior year. Approximately 30.8% of this total amount constitutes unreserved fund balance, which is available for spending in the coming year. The remainder of fund balance is reserved to indicate it is not available for new spending because it has already been committed to liquidate contracts and purchase orders of the prior fiscal year, to pay debt service, to be held in permanent trust funds or for a variety of other purposes. The major governmental funds are discussed individually below:
The General Fund is the chief operating fund of the State. At the end of the current fiscal year, the total General Fund fund balance was $234.6 million. The fund balance increased by $41.7 million during the current fiscal year, which is a 21.6% increase from the prior year. The reasons for this increase are discussed in further detail below.
The following schedule presents a summary of revenues of the General Fund for the fiscal years ended June 30, 2010 and 2009 (expressed in thousands). Other financing sources are not included.
The total General Fund revenues increased 13.2%. The largest increase in revenue sources was $487 million or 21.9% in intergovernmental revenue. These are revenues received from the federal government, and the most significant increases were from the stimulus and Medicaid programs. The stimulus program was implemented as a result of the American Recovery and Reinvestment Act (ARRA), which was signed into law on February 17, 2009 by President Obama. The intent of ARRA was to grant additional monies to all the states to stimulate economic growth. During fiscal year 2010 the major stimulus funds received were $194.6 million for Medicaid and $256.9 million for stabilization. Of this, 70% has been awarded for fiscal stabilization and entitlements. The State expects to receive more than $3.16 billion in total stimulus funds from the start of the program in 2009 through 2014. Other increases in General Fund revenue sources were $107.6 or 38.8% in modified business taxes and $227.8 million or 72.2% in other taxes. The largest declines in revenue sources were $82.6 million or 8.7% in sales tax, $37.9 million or 4.4% in gaming taxes, fees and licenses, and $12.6 million or 19.1% in property and transfer taxes, all due to the continued slow down of the economy and lingering effects from the collapse of the security and real estate markets.
The following schedule presents a summary of expenditures by function of the General Fund for the fiscal years ended June 30, 2010 and 2009 (expressed in thousands). Other financing uses are not included.
Amount Percent Amount Percent Amount Percent Gaming taxes, fees and licenses 827,681$ 13.7% 865,609$ 16.3% (37,928)$ -4.4%Sales taxes 870,539 14.5% 953,112 18.0% (82,573) -8.7%Modified business taxes 385,110 6.4% 277,516 5.2% 107,594 38.8%Insurance premium taxes 233,906 3.9% 238,524 4.5% (4,618) -1.9%Property and transfer taxes 53,315 0.9% 65,922 1.2% (12,607) -19.1%Motor and special fuel taxes 3,016 0.1% 3,135 0.1% (119) -3.8%Intergovernmental 2,708,799 45.0% 2,221,824 41.8% 486,975 21.9%Other taxes 543,573 9.0% 315,726 5.9% 227,847 72.2%Licenses, fees and permits 244,507 4.1% 209,250 3.9% 35,257 16.8%Sales and charges for services 53,333 0.9% 54,304 1.0% (971) -1.8%Interest and investment income 11,657 0.2% 7,606 0.1% 4,051 53.3%Other revenues 81,500 1.3% 103,979 2.0% (22,479) -21.6% Total revenues 6,016,936$ 100.0% 5,316,507$ 100.0% 700,429$ 13.2%
General Fund Revenues (expressed in thousands)
2010 2009 Increase (Decrease)
Amount Percent Amount Percent Amount PercentGeneral government 91,485$ 1.5% 97,675$ 1.7% (6,190)$ -6.3%Health and social services 2,716,246 44.6% 2,428,459 42.0% 287,787 11.9%Education and support services 56,712 0.9% 57,077 1.0% (365) -0.6%Law, justice and public safety 462,314 7.6% 450,076 7.8% 12,238 2.7%Regulation of business 84,885 1.4% 83,253 1.4% 1,632 2.0%Recreation, resource development 108,135 1.8% 111,828 1.9% (3,693) -3.3%Intergovernmental 2,568,947 42.2% 2,552,842 44.2% 16,105 0.6%Debt service 1,747 0.0% 1,532 0.0% 215 14.0% Total expenditures 6,090,471$ 100.0% 5,782,742$ 100.0% 307,729$ 5.3%
General Fund Expenditures (expressed in thousands)
2010 2009 Increase (Decrease)
9

The total General Fund expenditures increased 5.3%. Health and social services expenditures increased $287.8 million or 11.9%. The largest portion of this amount was for Health Care Financing & Policy, Medicaid, food stamps, and energy assistance programs. Intergovernmental expenditures increased $16.1 million or .6% primarily due to intergovernmental expenditures for education.
The State Highway Fund is a special revenue fund used to account for the maintenance, regulation and construction of public highways and is funded through vehicle fuel taxes, federal funds, other charges and bond revenue. The fund balance decreased $38.8 million during the current fiscal year, which is a 12.5% decrease from the prior year. This decrease is primarily due to increased intergovernmental payments. The unreserved fund balance is a negative $243.3 million and the reserved balance is a positive $513.9 million.
The Municipal Bond Bank Fund is a special revenue fund used to account for revenues and expenditures associated with buying local government bonds with proceeds of State general obligation bonds. The fund balance decreased by $14.6 million during the current fiscal year, which is a 4.5% decrease from the prior year. This decrease was primarily due to a decrease in debt service payments received from entities as a result of lower principal balances.
The Consolidated Bond Interest and Redemption Fund is a debt service fund used to accumulate monies for the payment of leases and principal and interest on general obligation bonds of the State. The fund balance decreased by $.8 million during the current fiscal year, which is a .5% decrease from the prior year.
Proprietary Funds:The State’s proprietary funds provide the same type of information found in the government-wide financial statements, but in more detail. Proprietary funds are comprised of two types: enterprise funds and internal service funds. Enterprise funds are used when goods or services are provided primarily to parties outside of the State while internal service funds are used when goods or services are provided primarily to State agencies.
Enterprise Funds – There are three major enterprise funds: Housing Division Fund, Unemployment Compensation Fund and Water Projects Loans Fund. The combined net assets of the three major funds comprise 81% of the total combined net assets of all enterprise funds. The combined net assets of the enterprise funds decreased by $651.2 million in 2010. The major enterprise funds are discussed below:
The Housing Division Fund provides low interest loans to first-time homebuyers with low or moderate household incomes. The net assets increased by $3.4 million or 1.9% during the current fiscal year, and the results of operations were down 7% from last year, due to the downturn of the housing market.
The Unemployment Compensation Fund accounts for the payment of unemployment compensation benefits to unemployed State citizens. The net assets decreased by $672 million during the current fiscal year, which is a 182% decrease from the prior year. An increase in unemployment due to the slowdown in the economy and the drop in construction and hospitality/leisure employment resulted in a 67% increase in operating expenses compared to the previous year.
The Water Projects Loans Fund issues loans to governmental, as well as private entities for two programs: safe drinking water and water pollution control. The federal EPA matches the State’s bond proceeds to make loans to governmental entities; only federal funds are loaned to private entities. Total revenues exceeded expenses and transfers by $17.9 million during the current fiscal year, for final net assets of $251.2 million, which is a 7.7% increase from the prior year.
10
Internal Service Funds – The internal service funds charge State agencies for goods and services such as building maintenance, purchasing, printing, insurance, data processing and motor pool in order to recover the costs of the goods or services. Rates charged to State agencies for the operations of internal service funds are adjusted in following years to offset gains and losses. Because these are allocations of costs to other funds, they are not included separately in the government-wide financial statements but are eliminated and reclassified as either governmental activities or business-type activities. In 2010, total internal service fund net assets increased by $5.6 million, for a final net asset balance of $54 million. The two largest funds are:
The Self-Insurance Fund accounts for group health, life and disability insurance for State employees and retirees and certain other public employees. The fund had an increase in net assets of $3.1 million for the year as compared to a decrease in net assets of $11.9 million in the prior year, with final net assets of $54.7 million. This year’s gain resulted from a 6% increase in insurance premium income.
The Insurance Premiums Fund accounts for general, civil (tort), auto and property casualty liabilities of State agencies. The deficit improved by $4.2 million or 15% during fiscal year 2010, to a total deficit of $24.1 million. This year’s increase from operations was caused primarily by a 30% decrease in claims expense, and a 6% increase in premium income. NRS 331.187 provides that if money in the Fund is insufficient to pay a tort claim, the claim is to be paid from the reserve for statutory contingency account.
analysis of general funD BuDget variations
The General Fund total sources were $555 million or 7.1% less than the final budget. This was due primarily to actual intergovernmental revenues received that were less than the final budgeted amount.
The net increase in the General Fund expenditures and other uses budget from original to final was $738 million. Some of the differences originate because the original budget consists only of budgets subject to legislative approval through the General Appropriations Act and the Authorizations Bill. Also, non-executive budgets, not subject to legislative approval, only require approval by the Budget Division and if approved after July 1, are considered to be revisions.
Increases due to the revisions discussed above were approximately $923 million. Other budget revisions included: $253 million decrease in appropriations per AB6 of the 26th Special Session of the Nevada Legislature; $23.7 million decrease for legislatively approved transfer of appropriations to fiscal year 2009; $38.8 million decrease for legislatively approved transfer of appropriations to fiscal year 2011; and $130 million increase for legislatively approved transfers from fiscal year 2011.
capital assets anD DeBt aDMinistrationCapital Assets:The State’s capital assets for its governmental and business-type activities as of June 30, 2010, amount to $6.2 billion, net of accumulated depreciation of $888 million, leaving a net book value of $5.3 billion. This investment in capital assets includes land, buildings, improvements other than buildings, equipment, software costs, infrastructure, rights-of-way, and construction in progress. Infrastructure assets are items that are normally immovable, such as roads and bridges.
As allowed by GASB Statement No. 34, the State has adopted an alternative process for recording depreciation expense on selected infrastructure assets. Under this alternative method, referred to as the modified approach, the State expenses certain maintenance and preservation costs and does not report depreciation expense on infrastructure. Utilization of this approach requires the State to: 1) commit to maintaining and preserving affected assets at or above a condition level established by the State; 2) maintain an inventory of the assets and perform periodic condition assessments to ensure that the condition level is being maintained; and 3) make annual estimates of the amounts that must be expended to maintain and preserve assets at the predetermined condition levels. To monitor the condition of the roadways the State uses the International Roughness Index (IRI). The State has set a policy that it will maintain a certain percentage of each category of its roadways with an IRI of less than 80 and will also maintain its bridges so that not more than 10% are structurally deficient or functionally obsolete. The Department of Transportation conducts a biennial condition assessment of roadways and bridges in odd numbered calendar years. The following table shows the State’s policy and the condition level of the roadways and bridges:
11

The substandard condition of bridges, for the most current condition assessment, is the result of a change in bridge reporting and inspection methodologies. The estimated amount necessary to maintain and preserve infrastructure assets at target condition levels exceeded the actual amounts of expense incurred for fiscal year 2010 by $29.6 million. Even though actual spending for maintenance and preservation of infrastructure assets fell below estimated, condition levels are expected to continue to meet or exceed the target condition levels, as the most recent condition assessment indicates that the State already exceeds the established benchmarks in the roadway category. The State is considering revising its policy for bridges to allow for the changes in reporting and inspection methodologies. Additional information on the State’s infrastructure can be found in the Schedule of Infrastructure Condition and Maintenance Data in the Required Supplementary Information section to the financial statements.
To keep pace with the demands of the population, the State also has a substantial capital projects program. The following is a summary of major projects in progress during 2010 (expressed in millions):
The total increase in the State’s capital assets for the primary government for the current fiscal year was $399.1 million. This increase included current expenditures to purchase capital assets and completed projects from construction in progress. Depreciation charges for the year totaled $78 million.
Additional information on the State’s capital assets can be found in Note 7 to the financial statements.
I II III IV V
State Policy-minimum percentage 70% 65% 60% 40% 10%
Actual results of 2009 condition assessment 82% 82% 87% 56% 21%Actual results of 2007 condition assessment 82% 82% 88% 61% 25%Actual results of 2005 condition assessment 81% 78% 89% 61% 26%
2009 2007 2005
State Policy-maximum percentage 10% 10% 10%
Actual results condition assessment 15% 4% 3%
Percentage of substandard bridges
Condition Level of the Roadways
Percentage of roadways with an IRI of less than 80
Condition Level of the Bridges
Category
Expended byJune 30, 2010 Total Budget
High Desert State Prison Phase 5 48.9$ 49.6$ SNWCC 300 Bed Expansion 41.9 43.1 Indian Springs Conservation Camp 40.1 40.9 Unified Tax System 34.4 40.5 GSF/Campos Office Building 39.2 39.7 Readiness Center North Las Vegas 1.00 35.8 Housing Units - Pre-Engineered 29.1 29.3 SDCC Housing Unit & Planning 20.2 28.9 Las Vegas Readiness Center 24.2 25.9 Las Vegas Readiness Center - Field Maintenance Shop - 24.3
12

This page intentionally left blank.

Debt Administration:As of year-end, the State had $4.8 billion in long-term liabilities outstanding, compared to $4.3 billion last year, an increase of $495.2 million or 11.5% during the current fiscal year. This increase was due primarily to the issuance of special obligation bonds.
The most current bond ratings from Fitch, Moody’s Investor Service and Standard and Poor’s were AA+, Aa1 and AA+, respectively. These ratings are an indication of high quality obligations and a reflection of sound financial management. The Constitution of the State limits the aggregate principal amount of the general obligation debt to 2% of the total reported assessed property value of the State.
New bonds and certificates of participation issued during the 2010 fiscal year were (expressed in thousands):
This list of new bonds and certificates of participation does not agree completely with the schedule of additions as seen in Note 8 to the financial statements, due to the inclusion of accreted interest, deferred items and bonds redeemed prior to year-end.
Additional information on the State’s long-term debt obligations can be found in Note 8 to the financial statements and in the Statistical Section.
Requests for InformationThis financial report is designed to provide a general overview of the State of Nevada’s finances for all those with an interest in the government’s finances. Questions concerning any of the information provided in this report or requests for additional financial information should be addressed to: State of Nevada, Office of the State Controller, 101 N. Carson Street, Suite 5, Carson City, NV 89701-4786 or visit our website at: www.controller.nv.gov.
General Obligation Capital Improvements 11/17/09A 68,000$ General Obligation Capital Improvements and Cultural Affairs and Refunding 11/17/09B 34,990 General Obligation Natural Resources and Refunding 11/17/09C 14,680 General Obligation Open Space, Parks and Cultural Resources 11/17/09D 5,000 General Obligation Open Space, Parks and Natural Resources 11/17/09E 8,240 General Obligation Natural Resources 06/24/10A 4,675 General Obligation Water Refunding 06/24/10B 7,405 COPS Juvenile Treatment Facility Project Refunding 12/10/2009 7,900 Housing Single-Family 2009 Issue B 11/19/2009 22,651 Housing Single-Family 2009 Issue I, Variable 12/28/2009 102,340 Housing Multi-Unit Series A 12/28/2009 24,500
13

NEVA
DA
Gov
ernm
enta
l Ac
tiviti
esB
usin
ess-
type
Ac
tiviti
esTo
tal
Col
orad
o R
iver
C
omm
issi
onN
evad
a Sy
stem
of
Hig
her E
duca
tion
Asse
tsC
ash
and
pool
ed in
vest
men
ts1,
466,
778
$
159,
832
$
1,
626,
610
$
4,
196
$
172,
487
$
Inve
stm
ents
578,
475
804,
915
1,38
3,39
0-
785,
162
Inte
rnal
bal
ance
s6,
138
(6,1
38)
--
-D
ue fr
om th
e st
ate
--
-28
91,8
28A
ccou
nts
rece
ivab
le49
,674
6,03
355
,707
16,8
5132
,107
Taxe
s/as
sess
men
ts re
ceiv
able
712,
860
131,
495
844,
355
--
Inte
rgov
ernm
enta
l rec
eiva
bles
449,
615
1,87
745
1,49
2-
39,3
97A
ccru
ed in
tere
st a
nd d
ivid
ends
5,56
913
,129
18,6
9820
-C
ontra
cts
rece
ivab
le-
18,4
3518
,435
--
Mor
tgag
es re
ceiv
able
-59
5,21
859
5,21
8-
-N
otes
/loan
s re
ceiv
able
520
23,7
7224
,292
-12
,359
Oth
er re
ceiv
able
s17
623
-56
,046
Inve
ntor
y13
,714
1,45
215
,166
-6,
369
Pre
paid
exp
ense
s2,
614
72,
621
33,7
87-
Def
erre
d ch
arge
s13
,454
4,27
017
,724
--
Res
trict
ed a
sset
s: C
ash
--
-10
,950
8,71
6 I
nves
tmen
ts-
145,
793
145,
793
--
Oth
er a
sset
s-
4,66
24,
662
-41
,738
Cap
ital a
sset
s: L
and,
infra
stru
ctur
e an
d co
nstru
ctio
n in
pro
gres
s4,
073,
686
9,04
44,
082,
730
-21
2,66
3 O
ther
cap
ital a
sset
s, n
et1,
256,
471
1,94
21,
258,
413
56,5
771,
757,
329
T
otal
ass
ets
8,62
9,58
51,
915,
744
10,5
45,3
2912
2,40
93,
216,
201
Liab
ilitie
sA
ccou
nts
paya
ble
707,
760
53,3
8076
1,14
011
,399
35,9
59A
ccru
ed p
ayro
ll an
d re
late
d lia
bilit
ies
55,4
2287
856
,300
-29
,444
Inte
rgov
ernm
enta
l pay
able
s92
,811
473
93,2
84-
7,07
4In
tere
st p
ayab
le25
,793
9,42
835
,221
1,36
111
,140
Due
to c
ompo
nent
uni
ts60
,019
2960
,048
--
Con
tract
s/re
tent
ions
pay
able
39,0
00-
39,0
00-
-U
near
ned
reve
nues
350,
886
9,72
436
0,61
058
736
,894
Oth
er li
abili
ties
67,8
044,
712
72,5
164,
199
24,5
69
Prim
ary
Gov
ernm
ent
Com
pone
nt U
nits
Sta
tem
ent o
f Net
Ass
ets
Ass
ets
June
30, 2
010 (
Expr
essed
in Th
ousa
nds)
Liab
ilitie
s
14

Long
-term
liab
ilitie
s: P
ortio
n du
e or
pay
able
with
in o
ne y
ear:
Res
erve
for l
osse
s51
,467
-51
,467
--
Obl
igat
ions
und
er c
apita
l lea
ses
3,23
2-
3,23
2-
2,46
9 C
ompe
nsat
ed a
bsen
ces
70,3
251,
197
71,5
2221
830
,910
Ben
efits
pay
able
-10
,000
10,0
00-
- B
onds
pay
able
198,
717
22,6
7122
1,38
85,
669
20,1
38 C
ertif
icat
es o
f par
ticip
atio
n pa
yabl
e70
3-
703
--
Arb
itrag
e re
bate
liab
ility
195
-19
5-
- P
ortio
n du
e or
pay
able
afte
r one
yea
r: F
eder
al u
nem
ploy
men
t adv
ance
-43
8,32
543
8,32
5-
- R
eser
ve fo
r los
ses
28,1
69-
28,1
69-
- O
blig
atio
ns u
nder
cap
ital l
ease
s30
,614
-30
,614
-6,
244
Com
pens
ated
abs
ence
s33
,248
698
33,9
4691
15,1
44 B
enef
its p
ayab
le-
121,
505
121,
505
--
Bon
ds p
ayab
le2,
641,
008
1,07
8,40
43,
719,
412
91,1
1048
9,72
0 C
ertif
icat
es o
f par
ticip
atio
n pa
yabl
e56
,067
-56
,067
--
Due
to c
ompo
nent
uni
t31
,808
-31
,808
--
Arb
itrag
e re
bate
liab
ility
3,02
364
3,08
7-
-
Tot
al li
abili
ties
4,54
8,07
11,
751,
488
6,29
9,55
911
4,63
470
9,70
5
Net
Ass
ets
Inve
sted
in c
apita
l ass
ets,
net
of r
elat
ed d
ebt
3,62
2,78
73,
615
3,62
6,40
2(4
,224
)1,
452,
875
Res
trict
ed fo
r: S
ecur
ity o
f out
stan
ding
obl
igat
ions
-17
9,97
417
9,97
4-
- W
orke
rs' c
ompe
nsat
ion
-32
,313
32,3
13-
- C
apita
l pro
ject
s-
--
-97
,463
Deb
t ser
vice
35,8
41-
35,8
41-
13,0
48 E
duca
tion
and
supp
ort s
ervi
ces
3,93
6-
3,93
6-
- T
rans
porta
tion
260,
220
-26
0,22
0-
- R
ecre
atio
n an
d re
sour
ce d
evel
opm
ent
52,8
4925
1,15
930
4,00
8-
- L
aw, j
ustic
e an
d pu
blic
saf
ety
11,1
04-
11,1
04-
- H
ealth
and
soc
ial s
ervi
ces
8,58
0-
8,58
0-
- R
egul
atio
n of
bus
ines
s9,
704
900
10,6
04-
- M
unic
ipal
sec
uriti
es1,
353
-1,
353
--
Sch
olar
ship
s-
--
-24
0,25
8 L
oans
--
--
7,41
2 O
pera
tions
and
mai
nten
ance
--
-71
0-
Fun
ds h
eld
as p
erm
anen
t inv
estm
ents
:
Non
expe
ndab
le29
9,91
9-
299,
919
-26
5,60
4
Exp
enda
ble
20-
20-
-U
nres
trict
ed (d
efic
it)(2
24,7
99)
(303
,705
)(5
28,5
04)
11,2
8942
9,83
6
Tot
al n
et a
sset
s4,
081,
514
$
164,
256
$
4,
245,
770
$
7,
775
$
2,50
6,49
6$
The
note
s to
the
finan
cial
sta
tem
ents
are
an
inte
gral
par
t of t
his
stat
emen
t.
Net
Ass
ets
15

NEVA
DA
Expe
nses
Cha
rges
for
Serv
ices
Ope
ratin
g G
rant
s an
d C
ontr
ibut
ions
Cap
ital
Gra
nts
and
Con
trib
utio
nsG
over
nmen
tal
Activ
ities
Bus
ines
s-ty
pe
Activ
ities
Tota
l
Col
orad
o R
iver
C
omm
issi
on
Nev
ada
Syst
em o
f H
ighe
r Ed
ucat
ion
Func
tions
/Pro
gram
s
Pr
imar
y go
vern
men
t
Gov
ernm
enta
l act
iviti
es:
G
ener
al g
over
nmen
t37
5,21
9$
285,
927
$
56
,617
$
21$
(32,
654)
$
-$
(32,
654)
$
-
$
-
$
Hea
lth a
nd s
ocia
l ser
vice
s3,
017,
013
131,
408
1,94
4,55
4-
(941
,051
)-
(941
,051
)-
-
Edu
catio
n an
d su
ppor
t ser
vice
s2,
430,
923
3,35
152
7,96
6-
(1,8
99,6
06)
-(1
,899
,606
)-
-
Law
, jus
tice
and
publ
ic s
afet
y69
0,10
423
6,00
414
9,45
12,
759
(301
,890
)-
(301
,890
)-
-
Reg
ulat
ion
of b
usin
ess
100,
380
67,4
9830
,340
-(2
,542
)-
(2,5
42)
--
T
rans
porta
tion
644,
976
36,5
4439
1,71
453
,012
(163
,706
)-
(163
,706
)-
-
Rec
reat
ion
and
reso
urce
dev
elop
men
t16
1,04
836
,296
40,5
1992
7(8
3,30
6)-
(83,
306)
--
I
nter
est o
n lo
ng-te
rm d
ebt
132,
238
-82
5-
(131
,413
)-
(131
,413
)-
-
Una
lloca
ted
depr
ecia
tion
1,44
8-
--
(1,4
48)
-(1
,448
)-
-
Tot
al g
over
nmen
tal a
ctiv
ities
7,55
3,34
979
7,02
83,
141,
986
56,7
19(3
,557
,616
)-
(3,5
57,6
16)
--
B
usin
ess-
type
act
iviti
es:
U
nem
ploy
men
t ins
uran
ce2,
233,
382
1,66
91,
249,
649
--
(982
,064
)(9
82,0
64)
--
H
ousi
ng57
,342
23,6
9337
,026
--
3,37
73,
377
--
W
ater
loan
s14
,697
8,40
925
,667
--
19,3
7919
,379
--
W
orke
rs' c
ompe
nsat
ion
and
safe
ty26
,084
30,1
442,
531
--
6,59
16,
591
--
H
ighe
r edu
catio
n14
,051
8920
,289
--
6,32
76,
327
--
O
ther
23,1
7523
,352
15-
-19
219
2-
-
Tot
al b
usin
ess-
type
act
iviti
es2,
368,
731
87,3
561,
335,
177
--
(946
,198
)(9
46,1
98)
--
To
tal p
rimar
y go
vern
men
t9,
922,
080
$
884,
384
$
4,
477,
163
$
56
,719
$
(3,5
57,6
16)
(946
,198
)(4
,503
,814
)-
-
C
ompo
nent
Uni
ts
Col
orad
o R
iver
Com
mis
sion
85,1
37$
84
,336
$
-$
-
$
--
-(8
01)
-
Nev
ada
Sys
tem
of H
ighe
r Edu
catio
n1,
517,
039
524,
767
600,
318
6,89
2-
--
-(3
85,0
62)
To
tal c
ompo
nent
uni
ts1,
602,
176
$
609,
103
$
60
0,31
8$
6,
892
$
-
--
(801
)(3
85,0
62)
Net
(Exp
ense
s) R
even
ues
and
Cha
nges
in N
et A
sset
sPr
ogra
m R
even
ues
Prim
ary
Gov
ernm
ent
Com
pone
nt U
nits
Sta
tem
ent o
f Act
iviti
es
For t
he F
iscal
Year
End
ed Ju
ne 30
, 201
0 (Ex
press
ed in
Thou
sand
s)
Func
tions
/Pro
gram
s
Pri
mar
y G
over
nmen
t
Com
pone
nt U
nits
16

810,
758
-81
0,75
8-
-78
4,28
3-
784,
283
--
381,
300
-38
1,30
0-
-23
3,28
0-
233,
280
--
53,3
15-
53,3
15-
-3,
016
-3,
016
--
509,
912
-50
9,91
2-
-
-31
4,65
731
4,65
7-
-
86,1
91-
86,1
91-
-33
,712
-33
,712
--
186,
714
-18
6,71
4-
-89
,298
-89
,298
--
22,1
45-
22,1
45-
-
27,0
40-
27,0
40-
-
26,8
49-
26,8
49-
-39
,405
-39
,405
--
176,
240
-17
6,24
0-
-40
,503
-40
,503
--
3,97
4-
3,97
4-
-37
,993
-37
,993
--
(1,2
46)
-(1
,246
)50
84,4
4610
8,88
6-
108,
886
626
-8,
165
-8,
165
-20
,009
--
--
458,
616
--
-(3
70)
-19
,361
(19,
361)
--
-
3,68
1,09
429
5,29
63,
976,
390
306
563,
071
123,
478
(650
,902
)(5
27,4
24)
(495
)17
8,00
9
3,95
8,03
681
5,15
84,
773,
194
8,27
02,
328,
487
4,08
1,51
4$
164,
256
$
4,24
5,77
0$
7,
775
$
2,
506,
496
$
The
note
s to
the
finan
cial
sta
tem
ents
are
an
inte
gral
par
t of t
his
stat
emen
t.
Mot
or a
nd s
peci
al fu
el
G
ener
al re
venu
es:
T
axes
:
G
amin
g
S
ales
and
use
Mod
ified
bus
ines
s
In
sura
nce
prem
ium
Pro
perty
and
tran
sfer
Oth
er ta
xes
Oth
er
Res
trict
ed fo
r une
mpl
oym
ent c
ompe
nsat
ion:
Oth
er ta
xes
R
estri
cted
for e
duca
tiona
l pur
pose
s:
S
ales
and
use
taxe
s
G
amin
g ta
xes
R
estri
cted
for d
ebt s
ervi
ce p
urpo
ses:
Pro
perty
and
tran
sfer
taxe
s
M
otor
and
spe
cial
fuel
taxe
s
O
ther
R
estri
cted
for r
ecre
atio
n an
d re
sour
ce d
evel
opm
ent p
urpo
ses:
C
ontri
butio
ns to
per
man
ent f
unds
R
estri
cted
for h
ealth
and
soc
ial s
ervi
ces
purp
oses
:
P
rope
rty a
nd tr
ansf
er ta
xes
Oth
er ta
xes
R
estri
cted
for t
rans
porta
tion
purp
oses
:
M
otor
and
spe
cial
fuel
taxe
s
O
ther
taxe
s
Res
trict
ed fo
r reg
ulat
ion
purp
oses
:
O
ther
taxe
s
Tob
acco
set
tlem
ent i
ncom
e
Unr
estri
cted
inve
stm
ent e
arni
ngs
O
ther
gen
eral
reve
nues
N
et a
sset
s - e
ndin
g
P
aym
ents
from
Sta
te o
f Nev
ada
S
peci
al it
em -
aban
donm
ent l
oss
Tr
ansf
ers
T
otal
gen
eral
reve
nues
, spe
cial
item
s, a
nd tr
ansf
ers
Cha
nge
in n
et a
sset
s
N
et a
sset
s - b
egin
ning
(as
rest
ated
)
17

Balance SheetGovernmental Funds
June 30, 2010
General Fund State Highway Municipal Bond BankAssetsCash and pooled investments: Cash with treasurer 513,480,030$ 279,433,088$ 345,722$ Cash in custody of other officials 2,821,631 180,406 -Investments 7,826,340 - 311,565,000Receivables: Accounts receivable 18,365,182 4,434,281 - Taxes receivable 663,464,529 43,662,555 - Intergovernmental receivables 277,212,539 24,454,314 - Accrued interest and dividends 2,804,706 - 1,420,588 Notes/loans receivable 386,735 - - Other receivables 15,830 - -Due from other funds 42,822,559 2,994,496 3,966Due from fiduciary funds 110,329 - -Due from component units 539,989 - -Inventory - 12,308,833 -Advances to other funds 7,325,057 - -Prepaid items 1,677,341 11,800 - Total assets 1,538,852,797$ 367,479,773$ 313,335,276$
Liabilities and Fund BalancesAccounts payable and accruals: Accounts payable 286,137,409$ 26,069,564$ -$ Accrued payroll and related liabilities 36,308,556 13,948,612 - Intergovernmental payables 83,017,970 7,758,265 - Interest payable - - - Contracts/retentions payable 503,898 25,978,361 -Due to other funds 69,270,886 2,193,276 417,731Due to fiduciary funds 369,581,473 732,504 -Due to component units 9,487,211 209,125 -Deferred revenues 383,986,756 18,741,421 1,421,203Bonds payable - - -Other liabilities 66,000,588 1,249,361 - Total liabilities 1,304,294,747 96,880,489 1,838,934
Fund balances:Reserved: Encumbrances and contracts 3,073,785 501,570,976 - Inventories - 12,308,833 - Advances 7,325,057 - - Funds held as permanent investments - - - Fiscal emergency - - - Debt service - - - Other 2,064,076 11,800 -Unreserved, designated for balances forward 219,988,894 - -Unreserved, designated for approved capital projects 2,106,238 - -Unreserved, designated, reported in nonmajor: Special revenue funds - - - Capital project funds - - -Unreserved, undesignated - (243,292,325) 311,496,342Unreserved, undesignated, reported in nonmajor: Special revenue funds - - - Permanent funds - - -(5) 2 1 Total fund balances 234,558,050 270,599,284 311,496,342 Total liabilities and fund balances 1,538,852,797$ 367,479,773$ 313,335,276$
The notes to the financial statements are an integral part of this statement.
Assets
Liabilities and Fund Balances
18

NEVADA
Consolidated Bond Interest and Redemption
Other Governmental Funds
Total Governmental Funds
161,614,681$ 346,152,335$ 1,301,025,856$ - 43,137,649 46,139,686- 259,083,450 578,474,790
- 21,634,031 44,433,494- 5,733,304 712,860,388
132,258,124 9,430,573 443,355,550- 1,343,250 5,568,544- 23,069 409,804- 1,000 16,830
4,753,143 66,078,682 116,652,846- 422,492 532,821
5,775,000 86,000 6,400,989- 1,125,257 13,434,090
1,506,366 - 8,831,423- 98,629 1,787,770
305,907,314$ 754,349,721$ 3,279,924,881$
74,421$ 12,158,207$ 324,439,601$ - 3,868,250 54,125,418
4,234 1,990,817 92,771,2863,090,091 - 3,090,091
- 12,517,964 39,000,2235,096,665 43,540,671 120,519,229
- 128,588 370,442,565- 58,810,153 68,506,489
137,261,414 21,422,377 562,833,171360,000 - 360,000
- 553,932 67,803,881145,886,825 154,990,959 1,703,891,954
- 22,543,073 527,187,834- 1,125,257 13,434,090
1,506,366 - 8,831,423- 299,919,132 299,919,132- 41,321,014 41,321,014
158,514,123 35,840,821 194,354,944- 3,383,938 5,459,814- - 219,988,894- - 2,106,238
- 1,200,000 1,200,000- 59,943,263 59,943,263- 68,204,017
- 134,062,087 134,062,087- 20,177 20,177- (7) (9)
160,020,489 599,358,762 1,576,032,927305,907,314$ 754,349,721$ 3,279,924,881$
19

This page intentionally left blank.

NEVADA
3
Reconciliation of the Governmental Funds Balance Sheet to the Statement of Net Assets
June 30, 2010
Total fund balances - governmental funds 1,576,032,927$
Amounts reported for governmental activities in the statement of net assets are differentbecause:
Capital assets used in governmental activities are not financial resources and thereforeare not reported in the funds. These assets consist of:
Land 138,205,139$ Construction in progress 178,010,275 Infrastructure assets 3,164,498,164 Rights-of-way 592,841,789 Buildings 1,477,385,017 Improvements other than buildings 113,730,011 Furniture and equipment 322,278,777 Software costs 136,534,764 Accumulated depreciation/amortization (819,957,767) Total capital assets 5,303,526,169
Some of the State's revenues will be collected after year-end but are not availablesoon enough to pay for the current period's expenditures and therefore are deferredin the funds. 212,045,613
Intergovernmental receivable not providing current resources. 221,045
Judicial Retirement System of Nevada has been funded in excess of the annual required contributions, creating a year-end asset. This asset is not a current availableresource and is not reported in the funds. 10,002
Amounts due to component unit for bonds authorized to be issued are not reported inthe funds as they are not due and payable. (31,808,146)
Internal service funds are used by management to charge the costs of certain activitiesto individual funds. The assets and liabilities of the internal service funds are includedin governmental activities in the statement of net assets. 53,941,028
The deferred loss on early retirement of debt is reported as a deferred charge on thestatement of net assets and is amortized over the original remaining life of the old debt, or the life of the new debt, whichever is less. 56,428
Certain bond costs are reported as a deferred charge on the statement of net assetsand are amortized over the life of the debt. 13,397,723
Some liabilities are not due and payable in the current period and therefore are not reported in the funds. Those liabilities consist of:
Bonds payable (2,831,548,535) Accrued interest on bonds (22,702,568) Arbitrage rebate liability (3,218,353) Certificates of participation (56,769,427) Capital leases (31,278,680) Compensated absences (100,390,896) Total long-term liabilities (3,045,908,459)
Net assets of governmental activities 4,081,514,330$
The notes to the financial statements are an integral part of this statement.
20

General Fund State Highway Municipal Bond BankRevenuesGaming taxes, fees, licenses 827,680,915$ -$ -$ Sales taxes 870,539,400 - -Modified business taxes 385,109,788 - -Insurance premium taxes 233,905,463 - -Property and transfer taxes 53,315,435 - -Motor and special fuel taxes 3,016,433 176,239,691 -Other taxes 543,572,499 36,836,963 -Intergovernmental 2,708,798,531 456,360,042 -Licenses, fees and permits 244,507,249 176,973,817 -Sales and charges for services 53,333,461 14,269,289 -Interest and investment income 11,656,783 1,177,073 15,982,947Tobacco settlement income - - -Land sales - - -Other 81,500,177 17,208,658 - Total revenues 6,016,936,134 879,065,533 15,982,947
ExpendituresCurrent: General government 91,484,990 - - Health and social services 2,716,246,448 - - Education and support services 56,711,860 - - Law, justice and public safety 462,313,820 155,251,120 - Regulation of business 84,884,651 - - Transportation - 691,931,012 - Recreation and resource development 108,134,772 - -
Intergovernmental 2,568,947,426 58,526,718 -Capital outlay - - -
Debt service: Principal 933,089 99,801 - Interest, fiscal charges 697,681 10,544 - Debt issuance costs 115,962 - - Total expenditures 6,090,470,699 905,819,195 - Excess (deficiency) of revenues over expenditures (73,534,565) (26,753,662) 15,982,947
Other Financing Sources (Uses)Capital leases 18,209,075 - -Sale of general obligation bonds 15,975,709 - -Sale of general obligation refunding bonds - - -Premium on general obligation bonds 663,275 - -Payment to refunded bond agent - - -Sale of refunding certificates of participation - - -Premium on certificates of participation - - -Payment to refunded certificates of participation agent - - -Sale of capital assets 70,558 15,515 -Transfers in 191,822,884 1,784,992 -Transfers out (111,470,972) (13,840,542) (30,609,062) Total other financing sources (uses) 115,270,529 (12,040,035) (30,609,062)
Net change in fund balances 41,735,964 (38,793,697) (14,626,115)Fund balances, July 1 192,822,086 309,392,981 326,122,457Fund balances, June 30 234,558,050$ 270,599,284$ 311,496,342$
The notes to the financial statements are an integral part of this statement.
Revenues
Expenditures
Statement of Revenues, Expenditures and Changes in Fund BalancesGovernmental Funds
For the Fiscal Year Ended June 30, 2010
Other Financing Sources (Uses)
21

NEVADA
Consolidated Bond Interest and Redemption
Other Governmental Funds
Total Governmental Funds
-$ 14,678,019$ 842,358,934$ - - 870,539,400- - 385,109,788- - 233,905,463
186,714,280 26,848,669 266,878,384- 89,297,677 268,553,801- 40,133,870 620,543,332
8,472,085 99,635,725 3,273,266,383- 31,356,427 452,837,493
191,356 16,628,028 84,422,134(284,453) 9,322,931 37,855,281
- 41,962,948 41,962,948- 964,965 964,965- 14,019,331 112,728,166
195,093,268 384,848,590 7,491,926,472
257,346 46,251,608 137,993,944- 116,958,029 2,833,204,477- 484,527 57,196,387- 16,325,234 633,890,174- 22,260,041 107,144,692- - 691,931,012- 22,665,407 130,800,179
389,769 76,825,557 2,704,689,470- 59,520,431 59,520,431
121,720,000 54,229,265 176,982,155105,674,261 34,112,485 140,494,971
832,378 785,939 1,734,279228,873,754 450,418,523 7,675,582,171
(33,780,486) (65,569,933) (183,655,699)
- - 18,209,075597,216 92,670,837 109,243,762
33,746,240 - 33,746,2402,166,174 1,098,902 3,928,351
(35,677,139) - (35,677,139)- 7,900,000 7,900,000- 742,775 742,775- (8,465,569) (8,465,569)- 5,315 91,388
47,195,511 117,309,241 358,112,628(15,000,000) (168,195,235) (339,115,811)33,028,002 43,066,266 148,715,700
(752,484) (22,503,667) (34,939,999)160,772,973 621,862,429 1,610,972,926160,020,489$ 599,358,762$ 1,576,032,927$
22

This page intentionally left blank.
NEVADA
3
Reconciliation of Revenues, Expenditures, and Changes in Fund Balances of Governmental Funds to the Statement of Activities
For the Fiscal Year Ended June 30, 2010Net change in fund balances - total governmental funds (34,939,999)$ Amounts reported for governmental activities in the statement of activities are different because:
Capital outlays are reported as expenditures in governmental funds. However, in thestatement of activities, the cost of capital assets is allocated over their estimated usefullives as depreciation expense. In the current period, the amounts are:
Capital outlay 209,722,823$ Depreciation expense (70,874,342) Excess of capital outlay over depreciation expense 138,848,481
Debt proceeds provide current financial resources to governmental funds; however, issuingdebt increases long-term liabilities in the statement of net assets. In the current period,proceeds were received from:
Bonds issued (142,990,002) Refunding certificates of participation issued (7,900,000) Premiums on debt issued (4,671,126) Total bond proceeds (155,561,128)
Some capital additions were financed through capital leases. In the governmental funds, a capital lease arrangement is considered a source of financing, but in the statement of netassets, the lease obligation is reported as a liability. (18,209,075)
Repayment of long-term debt is reported as an expenditure in governmental funds, but therepayment reduces long-term liabilities in the statement of net assets. In the current year, these amounts consist of:
Bond principal retirement 165,034,096 Certficates of participation retirement 1,370,000 Payments to the bond refunding agent 44,142,708 Capital lease payments 1,036,746 Total long-term debt repayment 211,583,550
Internal service funds are used to charge the costs of certain activities to individual funds.The net revenue (loss) of the internal service funds is reported with governmental activities. 5,325,208
Because some revenues will not be collected for several months after the State's fiscal yearend, they are not considered "available" revenues and are deferred in the governmental funds. 2,515,457
Revenue in the statement of activities that does not provide current financial resources. 221,045
In the statement of activities, the gain or loss on the sale of assets is reported, whereas in thegovernmental funds, only the proceeds from the sale increase financial resources. Thus, thethe change in net assets differs from the change in fund balance by the cost of the asset sold. (2,383,167)
In the statement of activities, bond issuance costs are deferred and amortized over the life ofthe bonds, whereas in governmental funds the entire expenditure is recognized. 1,734,279
Amortization of bond issuance costs is reported as an expense for the statement of activities. (1,020,794)
Amortization of deferred loss on early retirement of debt is reported as an expense for thestatement of activities. (791,906)
Amortization of premiums on bonds and certificates of participation is reported as a reductionof interest expense for the statement of activities. 10,119,473
Some items reported in the statement of activities do not require the use of current financialresources and therefore are not reported as expenditures in governmental funds. Theseactivities consist of:
Decrease in pension obligation 10,002 Decrease in accrued interest 1,354,708 Increase in compensated absences (875,600) Increase in arbitrage liability (2,643,787) Increase in long term due to component unit (31,808,146) Total additional expenditures (33,962,823)
Change in net assets of governmental activities 123,478,601$
The notes to the financial statements are an integral part of this statement.
23

Housing Division
Unemployment Compensation
Water Projects Loans
Other Enterprise
Funds Total
Internal Service Funds
AssetsCurrent assets:Cash and pooled investments: Cash with treasurer 251,672$ -$ 76,521,995$ 44,767,356$ 121,541,023$ 119,612,618$ Cash in custody of other officials 545,419 36,728,044 - 1,017,130 38,290,593 100Investments 159,404,615 - - 106,364,432 265,769,047 -Receivables: Accounts receivable - - - 6,025,527 6,025,527 1,983,427 Assessments receivable - 131,495,322 - - 131,495,322 - Intergovernmental receivables - - 1,492,751 384,554 1,877,305 6,038,407 Contracts receivable - - - 4,400,000 4,400,000 - Mortgages receivable 10,898,920 - - - 10,898,920 - Accrued interest and dividends 9,056,322 - 3,557,468 515,805 13,129,595 - Notes/loans receivable - - - - - 10,000 Trades pending settlement - - - 5,609 5,609 -Due from other funds 30,898 - 251,541 857,994 1,140,433 6,360,108Due from fiduciary funds - - - 7,177 7,177 2,723,881Due from component units - - - 533 533 2,106,221Inventory - - - 1,451,733 1,451,733 279,585Prepaid expenses - - - 6,516 6,516 816,626Deferred outflow of resources 4,647,460 - - - 4,647,460 -Restricted assets: Investments 118,335,720 - - - 118,335,720 - Total current assets 303,171,026 168,223,366 81,823,755 165,804,366 719,022,513 139,930,973Noncurrent assets:Investments 292,306,742 - 246,839,652 - 539,146,394 -Receivables: Contracts receivable - - - 14,035,024 14,035,024 - Mortgages receivable 584,318,629 - - - 584,318,629 - Notes/loans receivable - - 23,771,807 - 23,771,807 100,000Deferred charges 2,973,093 - 1,202,375 94,475 4,269,943 -Restricted assets: Investments 27,456,817 - - - 27,456,817 -Other assets - - - 15,000 15,000 -Capital assets: Land - - - 567,812 567,812 130,954 Buildings - - - 3,388,840 3,388,840 22,078,621 Improvements other than buildings - - - 630,647 630,647 713,667 Furniture and equipment 373,523 - 35,280 5,194,663 5,603,466 48,634,512 Software costs - - - - - 15,323,810 Construction in progress - - - 8,476,095 8,476,095 - Less accumulated depreciation/ amortization (357,527) - (34,135) (7,288,931) (7,680,593) (60,250,222) Total noncurrent assets 907,071,277 - 271,814,979 25,113,625 1,203,999,881 26,731,342 Total assets 1,210,242,303 168,223,366 353,638,734 190,917,991 1,923,022,394 166,662,315
Enterprise Funds
Assets
Statement of Net AssetsProprietary Funds
June 30, 2010
24

NEVADA
Housing Division
Unemployment Compensation
Water Projects Loans
Other Enterprise
Funds Total
Internal Service Funds
Current liabilities:Accounts payable and accruals: Accounts payable 19,708,882$ 31,590,395$ 76,892$ 1,831,168$ 53,207,337$ 7,283,029$ Accrued payroll and related liabilities 87,034 - 15,317 775,753 878,104 1,296,601 Interest payable 7,543,179 - 1,855,647 29,038 9,427,864 - Intergovernmental payables - - 458,920 13,979 472,899 39,751 Trades pending settlement - - - 53,393 53,393 -Bank overdraft - - - - - 5,580,929Due to other funds 3,686 216,841 369,049 1,413,260 2,002,836 1,631,322Due to fiduciary funds - - 82,924 89,707 172,631 14,755Due to component units - - - 29,904 29,904 19,171Unearned revenues - - - 9,723,495 9,723,495 98,151Derivative instrument - interest rate swap 4,647,460 - - - 4,647,460 -Other liabilities - - - 11,509 11,509 -Short-term portion of long-term liabilities: Reserve for losses - - - - - 51,466,753 Compensated absences 163,450 - 28,054 1,005,788 1,197,292 2,050,229 Benefits payable - - - 10,000,000 10,000,000 - Bonds payable 14,256,000 - 8,272,806 141,710 22,670,516 513,323 Obligations under capital leases - - - - - 1,309,397 Total current liabilities 46,409,691 31,807,236 11,159,609 25,118,704 114,495,240 71,303,411Noncurrent liabilities:Advances from funds - - - 5,351,256 5,351,256 3,480,167Federal Unemployment Advance - 438,325,470 - - 438,325,470 -Reserve for losses - - - - - 28,168,951Compensated absences 136,141 - 16,285 544,889 697,315 1,132,274Benefits payable - - - 121,505,000 121,505,000 -Bonds payable 979,936,615 - 91,238,438 7,229,236 1,078,404,289 7,302,864Obligations under capital leases - - - - - 1,257,774Arbitrage rebate liability - - 63,962 - 63,962 - Total noncurrent liabilities 980,072,756 438,325,470 91,318,685 134,630,381 1,644,347,292 41,342,030 Total liabilities 1,026,482,447 470,132,706 102,478,294 159,749,085 1,758,842,532 112,645,441
Net AssetsInvested in capital assets, net of related debt 15,996 - 1,145 3,598,180 3,615,321 16,451,309Restricted for: Security of outstanding obligations 179,974,459 - - - 179,974,459 - Workers' compensation - - - 32,312,658 32,312,658 - Revolving loans - - 251,159,295 - 251,159,295 - Regulation of business - - - 900,368 900,368 -Unrestricted (deficit) 3,769,401 (301,909,340) - (5,642,300) (303,782,239) 37,565,565 Total net assets 183,759,856$ (301,909,340)$ 251,160,440$ 31,168,906$ 164,179,862 54,016,874$
Some amounts reported for business-type activities in the statement of net assets are different because certain internal service fund assets and liabilities are included with 75,846 business-type activities. Net assets of business-type activities 164,255,708$
The notes to the financial statements are an integral part of this statement.
Enterprise Funds
Liabilities
Net Assets
25

This page intentionally left blank.

NEVADA
Housing Division
Unemployment Compensation
Water Projects Loans
Other Enterprise
Funds TotalInternal
Service Funds
Operating RevenuesNet premium income -$ -$ -$ -$ -$ 367,196,083$ Sales - - - 13,661,341 13,661,341 2,768,661Assessments - 314,656,925 - 23,906,566 338,563,491 -Charges for services - - 137,914 13,894,374 14,032,288 42,083,186Rental income - - - 165,936 165,936 20,091,594Interest income on loans/notes 19,329,081 - 8,268,637 - 27,597,718 -Federal government - 1,246,970,205 25,988,385 - 1,272,958,590 -Licenses, fees and permits - - - 3,258,378 3,258,378 -Fines - - - 2,859,844 2,859,844 -Other 4,363,870 1,669,396 2,562 3,967,470 10,003,298 4,205,076 Total operating revenues 23,692,951 1,563,296,526 34,397,498 61,713,909 1,683,100,884 436,344,600
Operating ExpensesSalaries and benefits 2,004,427 - 435,220 28,278,903 30,718,550 32,583,902Operating 3,970,475 - 9,764,779 12,198,113 25,933,367 35,386,842Claims and benefits expense - 2,233,381,579 - 20,360,741 2,253,742,320 251,937,071Interest on bonds payable 33,236,040 - - - 33,236,040 -Materials or supplies used - - - 2,094,412 2,094,412 1,103,068Servicers' fees 123,652 - - - 123,652 -Depreciation 17,989 - 1,476 441,686 461,151 5,591,796Amortization - - - - - 857,853Bond issuance costs amortization 449,839 - 160,417 - 610,256 -Insurance premiums - - - - - 103,990,195 Total operating expenses 39,802,422 2,233,381,579 10,361,892 63,373,855 2,346,919,748 431,450,727
Operating income (loss) (16,109,471) (670,085,053) 24,035,606 (1,659,946) (663,818,864) 4,893,873
Nonoperating Revenues (Expenses)Interest and investment income 19,268,879 2,678,819 (321,287) 12,342,332 33,968,743 216,544Interest expense - - (4,345,698) (166,000) (4,511,698) (118,480)Bond issuance costs amortization - - - (3,446) (3,446) -Federal grant revenue 17,756,895 - - 2,359,495 20,116,390 -Federal grant expense (17,557,436) - - - (17,557,436) -Gain (loss) on disposal of assets - - - 3,510 3,510 222,189Arbitrage rebate - - 8,200 - 8,200 - Total nonoperating revenues (expenses) 19,468,338 2,678,819 (4,658,785) 14,535,891 32,024,263 320,253
Income (loss) before transfers 3,358,867 (667,406,234) 19,376,821 12,875,945 (631,794,601) 5,214,126
TransfersTransfers in - - - 429,293 429,293 364,100Transfers out - (4,780,041) (1,500,657) (13,509,513) (19,790,211) -
Change in net assets 3,358,867 (672,186,275) 17,876,164 (204,275) (651,155,519) 5,578,226Net assets, July 1 (as restated) 180,400,989 370,276,935 233,284,276 31,373,181 48,438,648
Net assets, June 30 183,759,856$ (301,909,340)$ 251,160,440$ 31,168,906$ 54,016,874$
Some amounts reported for business-type activities in the statement of activities are different because the net revenue (expense) of certain internal service funds is reported with business-type activities. 253,018 Change in net assets of business-type activities (650,902,501)$
The notes to the financial statements are an integral part of this statement.
Enterprise Funds
Operating Revenues
Operating Expenses
Statement of Revenues, Expenses and Changes in Fund Net AssetsProprietary Funds
For the Fiscal Year Ended June 30, 2010
Nonoperating Revenues (Expenses)
Transfers
26

Statement of Cash FlowsProprietary Funds
For the Fiscal Year Ended June 30, 2010
Water Other InternalHousing Unemployment Projects Enterprise ServiceDivision Compensation Loans Funds Totals Funds
Cash flows from operating activitiesReceipts from customers and users 12,856,524$ 305,009,527$ 140,604$ 56,808,959$ 374,815,614$ 91,921,826$ Receipts for interfund services provided - 2,995,134 - 3,063,805 6,058,939 267,336,400 Receipts from component units - - - - - 76,624,627 Receipts of principal on loans/notes 17,655,701 - 21,691,824 - 39,347,525 5,000 Receipts of interest on loans/notes 19,894,622 - 7,578,693 - 27,473,315 - Receipts from federal government - 1,246,970,205 25,358,348 - 1,272,328,553 - Payments to suppliers, other governments and beneficiaries (7,310,886) (2,240,598,197) (9,105,635) (18,299,308) (2,275,314,026) (382,028,300) Payments to employees (1,850,809) - (454,701) (28,187,987) (30,493,497) (32,610,580) Payments for interfund services (196,382) - (130,239) (5,222,771) (5,549,392) (16,616,000) Payments to component units - - - (3,507,467) (3,507,467) (171,973) Purchase of loans and notes (26,931,154) - (19,282,688) - (46,213,842) -
Net cash provided by (used for) operating activities 14,117,616 (685,623,331) 25,796,206 4,655,231 (641,054,278) 4,461,000
Cash flows from noncapital financing activitiesGrant receipts 17,756,895 - - 2,542,286 20,299,181 - Advances from federal government - 438,325,470 - - 438,325,470 - Proceeds from sale of bonds 149,491,400 - - - 149,491,400 - Transfers and advances from other funds - - - 5,433,829 5,433,829 2,446,412 Principal paid on noncapital debt (67,081,785) - (7,860,000) - (74,941,785) - Interest paid on noncapital debt (33,581,352) - (4,639,201) - (38,220,553) - Transfers and advances to other funds - (4,709,718) (1,667,734) (13,905,501) (20,282,953) - Other noncapital financing activities (18,190,433) - - - (18,190,433) (40)
Net cash provided by (used for) noncapital financing activities 48,394,725 433,615,752 (14,166,935) (5,929,386) 461,914,156 2,446,372
Cash flows from capital and related financing activitiesProceeds from sale of capital assets - - - 3,510 3,510 226,934 Purchase of capital assets - - - (298,920) (298,920) (2,038,167) Principal paid on capital debt - - - (150,090) (150,090) (3,694,234) Interest paid on capital debt - - - (353,480) (353,480) (118,440) Payments on construction projects - - - (1,008,466) (1,008,466) - Net cash provided by (used for) capital and related financing activities - - - (1,807,446) (1,807,446) (5,623,907)
Cash flows from investing activitiesProceeds from sale of investments 470,545,136 - - 124,427,620 594,972,756 - Purchase of investments (551,915,711) - - (136,243,404) (688,159,115) - Interest, dividends and gains (losses) 19,447,636 6,318,572 (36,125) 3,122,979 28,853,062 593,449
Net cash provided by (used for) investing activities (61,922,939) 6,318,572 (36,125) (8,692,805) (64,333,297) 593,449
Net increase (decrease) in cash 589,402 (245,689,007) 11,593,146 (11,774,406) (245,280,865) 1,876,914 Cash and cash equivalents, July 1 207,689 282,417,051 64,928,849 57,558,892 405,112,481 117,735,804
Cash and cash equivalents, June 30 797,091 $ 36,728,044 $ 76,521,995 $ 45,784,486 $ 159,831,616 $ 119,612,718 $
Enterprise Funds
27

NEVADA
Water Other InternalHousing Unemployment Projects Enterprise ServiceDivision Compensation Loans Funds Totals Funds
Enterprise Funds
Reconciliation of operating income (loss) to net cash provided by (used for) operating activitiesOperating income (loss) (16,109,471)$ (670,085,053)$ 24,035,606 $ (1,659,946)$ (663,818,864)$ 4,893,873 $
Adjustments to reconcile operating income (loss) to net cash provided by (used for) operating activitiesDepreciation 17,989 - 1,476 441,686 461,151 5,591,796 Amortization - - 160,417 - 160,417 857,853 Bond issuance costs amortization 449,839 - - - 449,839 - Interest on bonds payable 33,236,040 - - - 33,236,040 - Decrease (increase) in loans and notes receivable (8,501,496) - 2,409,136 - (6,092,360) 5,000 Decrease (increase) in accrued interest and receivables 20,442 (8,321,660) (1,319,853) (2,495,082) (12,116,153) (540,118) Decrease (increase) in inventory, deferred charges, other assets - - - 672,335 672,335 (636,684) Increase (decrease) in accounts payable, accruals, other liabilities 5,004,273 (7,216,618) 509,424 7,696,238 5,993,317 (5,710,720)
Total adjustments 30,227,087 (15,538,278) 1,760,600 6,315,177 22,764,586 (432,873)
Net cash provided by (used for) operating activities 14,117,616 $ (685,623,331)$ 25,796,206 $ 4,655,231 $ (641,054,278)$ 4,461,000 $
Noncash investing, capital and financing activitiesGain (loss) on disposal of assets -$ -$ -$ -$ -$ 5,656$ Increase (decrease) in fair value of investments 21,917 - (901,188) 9,374,278 8,495,007 (200,571)
The notes to the financial statements are an integral part of this statement.
28

NEVADA
Pension and Other Employee
Benefit Trust Funds
Investment Trust Funds
Private-Purpose Trust Funds Agency Funds
AssetsCash and pooled investments: Cash with treasurer 29,257,133$ 73$ 4,773,745$ 113,502,269$ Cash in custody of other officials 390,365,603 5,969,877 5,320,660 83,989,850
Investments: Investments 760,739 963,410,224 5,885,633,932 175,661,293 Fixed income securities 6,199,713,956 - - - Marketable equity securities 7,862,126,972 - - - International securities 5,072,204,652 - - - Mortgage loans 4,378 - - - Real estate 853,999,874 - - - Alternative investments 575,344,723 - - -
Collateral on loaned securities 2,942,675,281 - - -
Receivables: Accrued interest and dividends 97,638,614 1,648,334 7,000 - Taxes receivable - - - 10,503,877 Trades pending settlement 251,977,372 - 11,666,158 - Intergovernmental receivables 89,183,954 - 65,333 - Contributions receivable - - 4,710,000 - Other receivables - - - 33,837,971
Due from other funds 1,253,180 82,924 173,747 369,120,100Due from fiduciary funds 17,964,909 - - 11,206,802Due from component unit 1,312,085 - - -Other assets 2,053,010 - - -Furniture and equipment 35,321,293 - - -Accumulated depreciation (31,031,992) - - - Total assets 24,392,125,736 971,111,432 5,912,350,575 797,822,162
LiabilitiesAccounts payable and accruals: Accounts payable 11,222,200 147,579 1,896,594 - Accrued payroll and related liabilities - - - 43,901 Intergovernmental payables - 8,973 13,474 447,142,988 Redemptions payable - - 1,954,521 - Trades pending settlement 372,694,790 5,475,724 15,222,321 -
Bank overdraft - - 4,000 -Obligations under securities lending 3,021,077,050 - - -Due to other funds 2,723,693 454 539,732 -Due to fiduciary funds - - 12,687 29,159,024Other liabilities: Deposits - - - 315,732,893 Other liabilities - - - 5,743,356 Total liabilities 3,407,717,733 5,632,730 19,643,329 797,822,162
Net assetsHeld in trust for: Employees' pension benefits 20,954,512,748 - - - OPEB benefits 29,895,255 - - - Pool participants - 965,478,702 - - Individuals - - 5,892,707,246 - Total net assets 20,984,408,003$ 965,478,702$ 5,892,707,246$ -$
The notes to the financial statements are an integral part of this statement.
Statement of Fiduciary Net AssetsFiduciary Funds
June 30, 2010
Assets
Liabilities
Net Assets
29
NEVADA
Pension and Other Employee Benefit
Trust FundsInvestment Trust
FundsPrivate-Purpose Trust
FundsAdditionsContributions: Employer 1,321,831,595$ -$ -$ Plan members 99,714,452 - - Participants - - 1,743,092,803 Repayment and purchase of service 26,890,242 - -Total contributions 1,448,436,289 - 1,743,092,803
Investment income: Net increase (decrease) in fair value of investments 1,427,660,203 (77,526) 450,178,644 Interest, dividends 597,067,096 14,620,191 138,843,674 Net securities lending income 1,726,152 - - Other 66,326,682 - -
2,092,780,133 14,542,665 589,022,318Less investment expense: Other (23,910,107) (9,922) -Net investment income 2,068,870,026 14,532,743 589,022,318
Other: Investment from local governments - 785,559,606 - Reinvestment from interest income - 1,211,961 - Other 1,979,997 53 -Total other 1,979,997 786,771,620 - Total additions 3,519,286,312 801,304,363 2,332,115,121
DeductionsPrincipal redeemed - 877,250,011 972,973,972Benefit payments 1,336,702,874 - 17,640,812Refunds 20,270,764 - -Contribution distributions 429,264 - -Dividends to investors - 1,282,640 -Administrative expense 11,263,655 560,261 21,623,909 Total deductions 1,368,666,557 879,092,912 1,012,238,693 Change in net assets 2,150,619,755 (77,788,549) 1,319,876,428Net assets, July 1 18,833,788,248 1,043,267,251 4,572,830,818
Net assets, June 30 20,984,408,003$ 965,478,702$ 5,892,707,246$
The notes to the financial statements are an integral part of this statement.
Statement of Changes in Fiduciary Net AssetsFiduciary Funds
For the Fiscal Year Ended June 30, 2010
Additions
Deductions
30

NEVADA
Notes to Financial StatementsFor the Fiscal Year Ended June 30, 2010
Note 1 - Summary of Significant Accounting Policies
A. ReportingEntityThe accompanying financial statements of the State of Nevada (the State) have been prepared in conformity with accounting principles generally accepted in the United States of America (GAAP) as applied to government units. The Governmental Accounting Standards Board (GASB) is the accepted stan-dard setting body for establishing governmental accounting and financial reporting principles. As required by GAAP, the State’s reporting entity includes the “primary government” and its “component units.” The primary government includes all funds, departments, agencies, and those authorities that are considered an integral part of the primary government. Compo-nent units are legally separate governmental organizations for which the State’s elected officials are financially accountable. The State’s component units have a June 30 year-end.
Financial accountability is defined in GASB Statement No. 14, The Financial Reporting Entity, as amended by GASB Statement No. 39, Determining Whether Certain Organiza-tions are Component Units. The State is financially account-able for those entities in which the State appoints a voting majority of an organization’s governing authority, and either is able to impose its will upon the entity or there exists a finan-cial benefit or burden relationship with the State. For those entities in which the State does not appoint a voting majority of the governing authority, GASB Statement No. 14 requires inclusion in the reporting entity if they are fiscally dependent on the State or if it would be misleading to exclude the entity.
BlendedComponentUnits: The following blended compo-nent units are entities that are legally separate from the State. However, since the State Legislature retains certain signifi-cant governing powers over these entities, they are reported as if they are part of the primary government under the provi-sions of GASB Statement No. 14.
The Public Employees’ Retirement System (PERS), the Legislators’ Retirement System (LRS) and the Judicial Retirement System (JRS) are administered by a seven-member board appointed by the Governor. PERS is the administrator of a cost-sharing, multiple-employer, defined benefit public employees’ retirement system established by the Nevada Legislature in 1947 to provide a reasonable base income to qualified employees who have been employed by a public employer and whose earning capacities have been removed or substantially impaired by age or disability. LRS is the administrator of a single-employer public employees’ defined benefit retirement system established in 1967 by the Nevada Legislature to provide a reasonable base income to Legislators at retirement. JRS is the administrator of an agent multiple-employer public employees’ defined benefit retirement system established by the Nevada Legislature to provide a reasonable base income to justices of the Supreme Court, district judges, municipal court judges, and justices of the peace at retirement.
The Retirement Benefits Investment Fund (RBIF) was creat-ed by NRS 355.220 (2) for the sole purpose of providing an investment vehicle for monies belonging to either the State or
local government other post employment benefit trust funds. RBIF is administered by the Retirement Benefits Investment Board, which consists of the same members of the Public Employees’ Retirement Board.
Nevada Real Property Corporation is a legally separate enti-ty whose board of directors are exclusively State employees or officials. It was incorporated to finance certain construc-tion projects. Such projects include office buildings, a tran-sitional residential facility and a warehouse, all financed by the issuance of certificates of participation. Upon comple-tion of construction, the Corporation leases the facilities to the State. The State reports these financial transactions as part of the primary government using the blended method.
Discretely Presented Component Units: Per the provi-sions of GASB Statement No. 14, a component unit should be included in the reporting entity financial statements using the discrete presentation method if the component unit’s govern-ing body is not substantively the same as the governing body of the primary government, and the component unit does not provide services entirely or almost entirely to the primary government. The following discretely presented component units are reported in separate columns in the government-wide financial statements to emphasize they are legally separate from the State.
The Nevada System of Higher Education (NSHE) is governed by a Board of Regents elected by the voters. However, NSHE is fiscally dependent upon the State because of appropriations from the State Legislature, the Legislative approval of the budget for those appropriations, the levying of taxes, if necessary, and the issuance of debt to support NSHE. Because NSHE has a separate govern-ing body and does not provide services entirely or almost entirely to the primary government, it is presented discrete-ly in the financial statements.
The Colorado River Commission (CRC) is a legally sepa-rate entity responsible for managing Nevada’s interests in the water and power resources available from the Colorado River. It is governed by seven commissioners, a majority of whom are appointed by the State: four are appointed by the Governor and three appointed by the board of direc-tors of the Southern Nevada Water Authority. Bonds issued by the CRC are backed by the full faith and credit of the State of Nevada, which creates the potential for a finan-cial burden to the State. CRC provides services to citizens through the distribution and sale of electric power. As CRC has a separate governing body and does not provide servic-es entirely or almost entirely to the primary government, it is presented discretely in the financial statements.
Complete financial statements for each of the individual component units, with the exception of the Nevada Real Prop-erty Corporation, which has no other financial activity than that described above, may be obtained at that entity’s admin-istrative offices:
• Public Employees’ Retirement SystemCarson City, NV
31

Notes to Financial StatementsFor the Fiscal Year Ended June 30, 2010
NEVADA(Note 1 Continued)
• Retirement Benefits Investment FundCarson City, NV
• Legislators’ Retirement SystemCarson City, NV
• Judicial Retirement SystemCarson City, NV
• Nevada System of Higher Education Reno, NV
• Colorado River CommissionLas Vegas, NV
Related Organizations: The Governor is responsible for appointing the members of many occupational licensing boards. The State’s accountability for these boards does not extend beyond making the appointments and thus these boards are excluded from this report. The State does not exercise financial or administrative control over the excluded occupa-tional licensing boards.
B. Government-WideandFundFinancialStatementsGovernment-Wide Financial Statements: The Statement of Net Assets and the Statement of Activities report informa-tion on all non-fiduciary activities of the primary government and its component units. For the most part, the effect of inter-fund activity has been removed from these statements. Inter-fund receivables and payables between governmental funds and enterprise funds are reported as internal balances in the government-wide statement of net assets. Primary govern-ment activities are distinguished between governmental and business-type activities. Governmental activities generally are financed through taxes, intergovernmental revenues, and other non-exchange revenues. Business-type activities are financed in whole or in part by fees charged to external parties for goods or services.
The Statement of Net Assets presents the reporting entity’s non-fiduciary assets and liabilities with the difference report-ed as net assets. Net assets are reported in three categories:
Invested in capital assets, net of related debt consists of capital assets, net of accumulated depreciation and reduced by outstanding balances for bonds, notes, and other debt that are attributed to the acquisition, construction, or improvement of those assets.
Restricted net assets result when constraints placed on net asset use are either externally imposed by creditors, grant-ors, contributors, and the like, or imposed by law through constitutional provisions or enabling legislation. Addition-al disclosure related to the amount of net assets restricted by enabling legislation is provided in Note 11.
Unrestricted net assets consist of net assets that do not meet the definition of the two preceding categories. Unrestricted net assets often are designated to indicate that manage-ment does not consider them to be available for general operations. Unrestricted net assets often have constraints on resources that are imposed by management but can be removed or modified.
The Statement of Activities demonstrates the degree to which the direct expenses of a given function or segment are offset by program revenues. Direct expenses are those that are clearly identifiable within a specific function. Certain centralized costs have been included as part of the program expenses reported for the various functions and activities. Program revenues include: 1) charges to customers or applicants who purchase, use or directly benefit from goods, services or privileges provided by a given function, and 2) grants and contributions that are restrict-ed to meeting the operational or capital requirements of a partic-ular function. Taxes and other items not meeting the definition of program revenues are instead reported as general revenues. In general, internal activity has been eliminated from the State-ment of Activities. Overhead costs have been removed to mini-mize the double counting of internal activities, but interfund services provided and used have been retained, as their elimi-nation would distort the measurement of the cost of individual functional activities. Internal activities of a reimbursement type nature reduce the expenses of the reimbursed programs.
FundFinancialStatements: Separate financial statements are provided for governmental funds, proprietary funds, and fiduciary funds, even though the latter are excluded from the government-wide statements. Major individual governmental funds and major individual proprietary funds are reported as separate columns in the fund financial statements with non-major funds being combined into a single column.
C. Measurement Focus, Basis of Accounting andFinancialStatementPresentationMeasurement Focus and Basis of Accounting: The government-wide statements are reported using the economic resources measurement focus and the accrual basis of account-ing, as are the proprietary and fiduciary fund financial state-ments. Revenues are recorded when earned and expenses are recorded when a liability is incurred, regardless of the timing of cash flows. Property taxes are recognized as revenues in the year for which they are levied. Grants and similar items are recognized as revenues as soon as all eligibility require-ments imposed by the provider have been met.
Private-sector standards of accounting and financial report-ing issued prior to December 1, 1989 generally are followed in both the government-wide and proprietary fund financial statements to the extent that those standards do not conflict with or contradict guidance of the Governmental Account-ing Standards Board. Governments also have the option of following subsequent private-sector guidance for their busi-ness-type activities and enterprise funds, subject to this same limitation. The State has elected not to follow subsequent private-sector guidance.
Proprietary funds distinguish operating revenues and expenses from nonoperating items. Operating revenues and expenses generally result from providing services and producing and deliv-ering goods in connection with a proprietary fund’s principal, ongoing operations. All revenues and expenses not meeting this definition are reported as nonoperating revenues and expenses.
32

Notes to Financial StatementsFor the Fiscal Year Ended June 30, 2010
NEVADA(Note 1 Continued)
Governmental fund statements are reported using the current financial resources measurement focus and the modified accrual basis of accounting. Revenues are recognized when susceptible to accrual; that is, when they become both measur-able and available. “Measurable” means the amount of the transaction can be determined, and “available” means collect-ible within the current period or soon thereafter. The State considers revenues as available if they are collected within 60 days after year-end. Those revenues susceptible to accrual are gaming revenues, sales taxes, other taxes as described in Note 12, interest revenue and charges for services. Fines and permit revenues are not susceptible to accrual because they are generally not measurable until received in cash.
Expenditures generally are recorded when the related fund liability is incurred. However, expenditures for principal and interest on long-term debt are recorded as fund liabilities only when due or when amounts have been accumulated in the debt service fund for payments to be made early in the following year. Inventories and prepaids are reported using the consumption method.
The State reports deferred revenue on its governmental funds balance sheet. Deferred revenues arise when potential revenue does not meet both the “measurable” and “available” criteria for recognition in the current period. Deferred revenues also arise when resources are received by the State before it has a legal claim to them, as when grant monies are received before the incurrence of qualifying expenditures. In subsequent peri-ods, when both revenue recognition criteria are met, or when the State has a legal claim to the resources, the liability for deferred revenue is removed from the governmental funds balance sheet and revenue is recognized.
Restricted revenues are those monies that are legally segre-gated for specific purposes. For example, a portion of a particular property tax levy may be legally pledged to support debt service. The general policy of the State is to expend unrestricted revenues first in a fund, followed by restricted revenues. However, there are exceptions to this policy in the Consolidated Bond Interest and Redemption fund and all the Capital Projects funds.
Financial Statement Presentation: The State reports the following major governmental funds:
The General Fund is the State’s primary operating fund. It accounts for all financial resources of the general govern-ment except those required to be accounted for in another fund.
The State Highway Fund accounts for the maintenance, regulation, and construction of public highways and is funded through vehicle fuel taxes, federal funds, and other charges.
The Municipal Bond Bank Fund accounts for revenues and expenditures associated with buying local governments’ bonds with proceeds of State general obligation bonds.
The Consolidated Bond Interest and Redemption Fund accu-mulates monies for the payment of leases and of principal and interest on general obligation bonds of the State.
The State reports the following major enterprise funds:
The Housing Division Fund accounts for the State program to assist private lenders in providing low interest hous-ing loans to low- and moderate-income households. This program is financed through the sale of bonds.
The Unemployment Compensation Fund accounts for the payment of unemployment compensation benefits.
The Water Projects Loans Fund accounts for revenues and expenses associated with operating a revolving fund to finance local government pollution control projects, and with operat-ing revolving and set-aside program funds to finance local public water systems’ safe drinking water projects.
Additionally, the State reports the following fund types:
ProprietaryFundTypes:Enterprise Funds - report the activities for which fees are charged to external users for goods or services such as work-ers’ compensation, insurance, prison industry and higher education tuition trust.
Internal Service Funds - provide goods or services primar-ily to other agencies or funds of the State rather than to the general public. These goods and services include account-ing, communications, information technology, motor pool, personnel, printing, property management, purchasing and risk management. In the government-wide statements, inter-nal service funds are included with governmental activities.
FiduciaryFundTypes:Pension and Other Employee Benefit Trust Funds - report resources that are required to be held in trust for the members and beneficiaries of the State’s defined benefit pension plans and other post-employment benefit plans.
Investment Trust Funds - report resources received from local governments that are either pooled in an external investment portfolio for the benefit of all participants or separated into subaccounts of identified investments allocated to specific participating local governments. Examples include the Local Government Investment Pool, the Nevada Enhanced Savings Term and the Retirement Benefits Investment Fund.
Private Purpose Trust Funds - report resources of all other trust arrangements in which principal and income benefit indi-viduals, private organizations, or other governments. Exam-ples include the Prisoners’ Personal Property and the Nevada College Savings Plan.
Agency Funds - report assets and liabilities for deposits and investments entrusted to the State as an agent for others. Examples of funds in this category include motor vehicle, veterans’ custodial and child welfare.
33
Notes to Financial StatementsFor the Fiscal Year Ended June 30, 2010
NEVADA(Note 1 Continued)
D. Assets,LiabilitiesandNetAssets/FundBalanceCash and Pooled Investments - The State Treasurer manages a cash pool where all temporary surplus cash is invested. These investments are reported on the Statement of Net Assets and Balance Sheet as cash and pooled investments. Earnings from these pooled investments are credited to the General Fund and certain other funds that have specific statutory authority to receive a prorated share based on daily cash balances. Also included in this category is cash held by departments in petty cash funds and in bank accounts outside the Treasurer’s cash management pool. The operations and investments of the cash pool are described in Note 3.
Cash and cash equivalents are defined as bank accounts, petty cash, money market demand accounts and certificates of deposit with original maturities of three months or less. Cash and cash equivalents are reported in the Statement of Cash Flows for proprietary fund types.
Investments - Investments are stated at fair value. Fair value is defined as the price at which an asset passes from a will-ing seller to a willing buyer. It is assumed that both buyer and seller are rational and have a reasonable knowledge of relevant facts. Short-term investments are generally reported at cost, which approximates fair value. Securities, traded on a national or international exchange, are valued at the last reported sale price of the day. International securities prices incorporate end-of-day exchange rates. The fair value of real estate investments is based on estimated current value, and MAI (Member Appraisal Institute) independent appraisals. Investments that do not have an established market are report-ed at estimated fair value.
The Local Government Investment Pool, the Nevada Enhanced Savings Term Investment Trust and the Retirement Benefits Investment Fund are investment trust funds as defined in Governmental Accounting Standards Board Statement No. 31, Accounting and Financial Reporting for Certain Investments and for External Investment Pools. The investments of the Local Government Investment Pool and the Nevada Enhanced Savings Term Investment Trust are subject to the general limi-tation of section 355.170 of Nevada Revised Statutes. The investments of the Retirement Benefits Investment Fund are governed by the prudent person standard, as set forth by NRS 286.682. Security transactions are accounted for on the trade date (the date the order to buy or sell is executed). Interest income is determined on an accrual basis with discounts earned and premiums paid being amortized. Realized gains and losses, if any, on sales of securities are calculated using the amortized cost basis at the date of sale. The fair value of the position in the pool is the same as the value of the pool shares. Wells Fargo Trust Operations is the custodian and transfer agent for both the Local Government Investment Pool and the Nevada Enhanced Savings Term Investment Trust funds. The Bank of New York Mellon is the custodian and transfer agent for the Retirement Benefits Investment Fund.
Derivative securities are priced and accounted for at fair value. For exchange-traded securities, such as futures and options, closing prices from the securities exchanges are used. For fixed income derivatives, such as collateralized mortgage obligations (CMO), mortgage backed securities, and asset backed securities, commercial pricing services (where avail-able) or bid-side prices from a broker/dealer are used. Foreign exchange forward contracts are valued at the price at which the transaction could be settled by offset in the forward markets. Investments are discussed further in Note 3.
Receivables - Receivables represent amounts due to the State at June 30, which will be collected sometime in the future. In the government-wide financial statements, a correspond-ing amount is recorded as revenue. In the governmental fund financial statements, the portions considered “available” (i.e., received by the State within approximately 60 days after year-end) are recorded as revenue; the remainder is recorded as deferred revenue. Receivables in proprietary fund types have arisen in the ordinary course of business. All receivables are shown net of an allowance for uncollectible accounts.
Property taxes are levied July 1 on property values assessed by the prior January 1. Property tax billings are payable in quarterly installments on the third Monday in August and the first Monday in October, January and March, after which time the bill is delinquent.
Significant receivable balances not expected to be collected within one year are presented in Note 4.
Interfund Transactions - The State has two types of interfund transactions:
1. Services rendered and employee benefit contribu-tions are accounted for as revenues, expenditures/expenses in the funds involved.
2. Operating appropriations and subsidies are account-ed for as transfers in the funds involved.
Transfers and due from/due to other funds are presented in Note 5.
Inventories - Inventories are stated at cost on the first-in, first-out basis. Inventory in the State Highway Fund, a special revenue fund, consists of expendable supplies held for consumption. The cost is recorded as an expenditure at the time individual inventory items are consumed. Inventory items in the funds are offset by a fund balance reserve to indi-cate that they are unavailable for appropriation.
Prepaid Expenses – Prepaid expenses reflect payments for costs applicable to future accounting periods and are record-ed in both government-wide and fund financial statements. Prepaid items in the funds are offset by a fund balance reserve to indicate that they are unavailable for appropriation.
Advances to Other Funds - Long-term interfund advances are recorded by the advancing fund as a receivable and as a reser-vation of fund balance to maintain the accountability and to disclose properly the amount available for appropriation (unre-
34

Notes to Financial StatementsFor the Fiscal Year Ended June 30, 2010
NEVADA(Note 1 Continued)
served fund balance). Repayments are credited to the receiv-able and corresponding reductions are made in the reserve. A summary of interfund advances is presented in Note 5.
Capital Assets and Depreciation - An inventory of State-owned land, buildings and equipment was developed in 1985. All capital assets are recorded in the Statement of Net Assets at historical cost or estimated historical cost, based on acquisi-tion of comparable property or agency records, if actual histor-ical cost is not available. Donated capital assets are stated at appraised fair value at the time of donation or estimated fair value at time of donation, based on acquisition of comparable property, if appraised fair value is not available. The govern-ment defines capital assets as assets with a unit cost of $5,000 or more for furniture and equipment, or $100,000 or more for buildings and improvements, and an estimated useful life in excess of one year. Interest incurred during construction is only capitalized in proprietary funds.
Most capital assets are depreciated principally on a straight-line basis over estimated useful lives of 40 years for structures and 3 to 30 years for improvements, furniture and equipment. The State’s significant infrastructure assets utilize the modi-fied approach in which costs to maintain and preserve these assets are expensed and no depreciation expense is recorded. This approach is discussed further in the Required Supple-mentary Information portion of this report.
In the Nevada System of Higher Education, capital assets are defined as assets with an initial unit cost of $5,000 or more and an estimated useful life in excess of one year. Such assets are stated at cost at the date of acquisition or fair value at date of donation in the case of gifts. Depreciation is computed on a straight-line basis over estimated useful lives of 40 years for buildings, 15 years for land improvements and 3 to 18 years for library books, machinery and equipment. Additional disclosure related to capital assets is provided in Note 7.
Compensated Absences - Compensated absences are account-ed for in accordance with GASB Statement No. 16, Account-ing for Compensated Absences, which requires that a liabil-ity for compensated absences relating to services already rendered and that are not contingent on a specified event be accrued as employees earn the rights to the benefits. Compen-sated absences relating to future services or that are contin-gent on a specified event will be accounted for in the period those services are rendered or those events take place. Propri-etary fund types report accrued compensated absences as liabilities in the appropriate funds. Governmental funds report compensated absences expected to be liquidated with expend-able available financial resources as an expenditure and a fund liability in the fund financial statements. On the Statement of Net Assets, the total accrued compensated absences for both proprietary and governmental fund types is reported.
Deferred Revenues - Deferred revenues in the General Fund consist primarily of refundable gaming taxes and fees and nonexchange transactions for which the revenue is measur-
able but not available. Deferred revenue in the debt service funds consists primarily of amounts due from other govern-ments to retire long-term debt.
Long-Term Obligations - In the government-wide state-ments and proprietary fund financial statements, long-term debt and other long-term liabilities are reported as liabilities. Bond premiums and discounts, as well as issuance costs, are deferred and amortized over the life of the bonds using the straight-line method. Bonds payable are reported net of the applicable bond premium or discount. Bond issuance costs are reported as deferred charges.
In the fund financial statements, governmental fund types recog-nize bond premiums and discounts, as well as bond issuance costs, during the current period. The face amount of the debt issued is reported as other financing sources. Premiums received on debt issuances are reported as other financing sources while discounts on debt issuances are reported as other financing uses. Issuance costs, whether or not withheld from the actual debt proceeds, are reported as debt service expenditures. Long-Term Obligations are more fully described in Note 8.
Net Assets/Fund Balance - The difference between fund assets and liabilities is “Net Assets” on the government-wide, propri-etary and fiduciary fund statements, and “Fund Balance” on governmental fund statements.
Fund Balance Reservations and Designations – In the fund financial statements, governmental funds classify fund balanc-es as either reserved or unreserved. Reserved fund balances are those amounts that are not available for appropriation or are legally restricted by outside parties for a specific use. Unreserved fund balances reflect the balances available for appropriation for the general purposes of the fund. Manage-ment may designate a portion of the unreserved fund balance for a specific purpose, but designations are tentative manage-ment plans that are subject to change.
The nature of reserved and designated fund balances is ex-plained below:
“Encumbrances and contracts” indicates assets required to meet future payment obligations.
“Inventory” indicates consumable supplies held in stock by governmental fund types.
“Advances” indicates assets, which have been advanced to other funds on a long-term basis.
“Funds held as permanent investments” indicates assets per-manently invested for the purpose of the fund.
“Fiscal emergency” indicates assets restricted for use in a State fiscal emergency as declared by the Legislature and the Governor.
“Debt service” indicates assets reserved for the retirement of long-term obligations.
35

Notes to Financial StatementsFor the Fiscal Year Ended June 30, 2010
NEVADA(Note 1 Continued)
Note 2 - Budgetary and Legal Compliance
“Other” generally indicates assets that, because of their nature, are unavailable for expenditures.
“Balances forward” indicates unexpended funds brought forward to the next year, which are designated for general government; health and social services; education and support services; law, justice and public safety; regulation of busi-ness; transportation or recreation and resource development purposes.
Note 11 provides a disaggregation of governmental fund balances, reserved for other, and governmental fund balances, unreserved, designated.
E. IntergovernmentalAssistanceProgramsThe State participates in various federal award programs. Federal awards are received by the State in both cash and noncash forms. Federal reimbursement type grants are record-ed as revenues when the related expenditures are recognized (as they become susceptible to accrual [measureable and avail-able] under the modified accrual basis of accounting). The State considers revenues as available if they are collected within 60 days after year-end. Certain grants have matching requirements in which the State must contribute a proportion-ate share of the total costs of a program. Use of grant resourc-es is conditioned upon compliance with terms of the grant agreements and applicable federal regulations, which include subjecting grants to financial and compliance audits.
BudgetaryProcessandControlThe Governor must submit his proposed budget for the Exec-utive Branch to the State Legislature not later than 14 calen-dar days before each regular session, which convenes every odd-numbered year. The presented budget spans the next two fiscal years and contains the detailed budgetary estimates of revenues and expenditures. The Legislature enacts the budget through passage of the General Appropriations Act, which allows expenditures from unrestricted revenues, and the Authorized Expenditures Act, which allows expenditures from revenues collected for specific purposes. Once passed and signed, the budget becomes the State’s financial plan for the next two fiscal years.
The legal level of budgetary control, the level at which appro-priations are approved and the level at which over expenditure of appropriations or transfers of appropriated amounts may not occur without Legislative action, is at the total program level within each department or agency.
Limited budgetary revisions may be made without Legisla-tive action through the following management/administrative procedures. After obtaining the approval of the Governor, or his designee, the Budget Director, Legislative Interim Finance Committee (LIFC) approval is required of those revisions in excess of $20,000 which have the affect, when taken into consideration with all other changes during the fiscal year, of increasing or decreasing any legislatively approved expendi-ture level by 10% or $50,000, whichever is less. Revisions not exceeding this threshold require only budget director approval. The LIFC approval is not equivalent to governing body approval, as total appropriations for a program may not be increased except as follows. The Legislature appropri-ates limited funds to the Contingency Fund, a Special Reve-nue Fund, which may be allocated to programs by the LIFC upon recommendation of the Board of Examiners. Alloca-tions totaling $36,907,078 were made in the 2010 fiscal year.
Unencumbered appropriations lapse at the end of each fiscal year unless specific authority to carry forward is granted in the Appropriations Act. Unexpended authorized resources, under the Authorized Expenditures Act, are carried forward for expenditure in the next fiscal period.
Budgets are legally adopted for the General Fund and Special Revenue Funds, except for the Nevada Real Property Corpo-ration special revenue fund. In addition, certain activity within such funds may be unbudgeted. The State’s budget is prepared principally on a modified accrual basis with the following exceptions:
1. Cash placed in petty cash funds or outside bank accounts is considered expended for budgetary purposes.
2. Advances to other funds are considered expenditures. Repayments of such advances are considered revenues.
3. Certain prepaid/deferred assets are considered expend-ed for budgetary purposes. Inventory is an expendi-ture for budgetary purposes. Certain deferred revenue is considered revenue for budgetary purposes.
4. Expenditures are only recognized if the liability is liquidated within 45 days after the fiscal year end.
5. Revenue from grants is only recognized when it is received in cash.
6. Encumbrances for goods or services not received by fiscal year end are considered an expenditure of the current period if received and paid within 45 days.
The Budgetary Comparison Schedule is presented as Required Supplementary Information (RSI) in this report. Actual amounts in this schedule are presented on a budgetary basis. Because this basis differs from accounting principles general-ly accepted in the United States of America (GAAP), a recon-ciliation between the budgetary and GAAP basis is presented in the RSI.
36

Notes to Financial StatementsFor the Fiscal Year Ended June 30, 2010
NEVADANote 3 - Deposits and Investments
The Nevada Revised Statutes and Nevada Administrative Code, as well as procedures approved by the State Board of Finance, govern deposits and investing activities for the prima-ry government and its discretely presented component units. The Office of the State Treasurer is responsible for oversight of the deposits and investments for the State of Nevada.
A. DepositsPrimary Government, Private Purpose Trust, Pension and Other Employee Benefit Trust, and Investment Trust Funds - the State minimizes its custodial credit risk by legislation establishing a program to monitor a collateral pool for public deposits. Custodial credit risk for deposits is the risk that in the event of a bank failure, the State’s deposits may not be recovered. The Nevada Revised Statutes direct the Office of the State Treasurer to deposit funds into any state, or national bank, credit union or savings and loan association covered by federal depository insurance. For those deposits over and above the federal depository insurance maximum balance, sufficient collateral must be held by the financial institution to protect the State of Nevada against loss. The pooled collateral for deposits program maintains a 102% pledged collateral for all public deposits. As of June 30, 2010, the bank balance of the primary government, private purpose trust, pension and other employee benefit trust, and investment trust funds totaled $57,045,151, of which $2,677,891 was uncollateral-ized and uninsured.
Component Units - cash and cash equivalents of the Nevada System of Higher Education (NSHE) are stated at cost, which approximates market, and consist of deposits in money market funds, which are not federally insured, and cash in the bank. At June 30, 2010 NSHE’s deposits in money market funds totaled $117,128,000 and cash in bank was $7,390,000. Of these balances, $250,000 are covered by the Federal Deposi-tory Insurance Corporation (FDIC); the remaining deposits are uncollateralized and uninsured.
B. InvestmentsNevada Revised Statute (NRS) 355.140 details the types of securities in which the State may invest. In general, autho-rized investments include: certificates of deposit, asset-backed securities, bankers’ acceptances and commercial paper, collat-eralized mortgage obligations, corporate notes, money market mutual funds whose policies meet the criteria set forth in the statute, United States treasury securities, and specific securi-ties implicitly guaranteed by the federal government. Addi-tionally, the State may invest in limited types of repurchase agreements; however, statutes generally prohibit the State
from entering into reverse-repurchase agreements. The State’s Permanent School Fund is further limited by statute as to the types of investments in which it may invest (NRS 355.060). Cash and Investments are also discussed at Note 1 under Assets, Liabilities and Net Assets/Fund Balance.
The State Board of Finance reviews the State’s investment policies at least every four months. The Board is comprised of the Governor, the State Controller, the State Treasurer and two members appointed by the governor, one of which must be actively engaged in commercial banking in the State.
Investments held in the Local Government Investment Pool (LGIP), Retirement Benefits Investment Fund (RBIF), and Nevada Enhanced Savings Term (NVEST) are specifically identifiable investment securities and are included in the following tables. LGIP, RBIF, and NVEST are investment trust funds and discussed further under Note 1, Assets, Liabilities and Net Assets/Fund Balance. LGIP and NVEST are governed by the Nevada State Board of Finance and administered by the Nevada State Treasurer. Complete financial statements for LGIP and NVEST may be obtained from the State Treasurer’s Office, 101 N. Carson Street, Suite 4, Carson City, NV 89701. RBIF is administrated by the Retirement Benefits Invest-ment Board. The audited financial statements of RBIF may be obtained from the Public Employees’ Retirement System, 693 West Nye Lane, Carson City, Nevada 89703.
InterestRateRisk: Interest rate risk is the risk that chang-es in interest rates will adversely affect the fair value of an investment.
Primary Government, Pension and Other Employee Benefit Trust, and Investment Trust Funds - The State does not have a written interest rate risk policy. However, the benchmark used by the State Treasurer to determine whether competitive market yields are being achieved is the 90 day U.S. Treasury Bill’s average over the previous three month period (Rolling 90 day T-Bill). Investment policies for the pension and other employee benefit trust funds authorize all securities within the Barclays Capital Aggregate Index benchmark. If secu-rities are purchased outside the Barclays Capital Aggregate Index, they must be of investment grade rating by at least two of Moody’s, Standard & Poor’s or Fitch (BBB- or better by Standard & Poor’s/Fitch, Baa3 or better by Moody’s). The following table provides information about the interest rate risks associated with the State’s investments as of June 30, 2010 (expressed in thousands):
37

Notes to Financial StatementsFor the Fiscal Year Ended June 30, 2010
NEVADA(Note 3 Continued)
Private Purpose Trust - Nevada College Savings Plan, a private purpose trust, currently has no formal investment poli-cy with regard to interest rate risk for the investments. Invest-ments having interest rate risk are all invested in mutual funds with various maturities from 13 days to 9.2 years and are not included in the table above.
Component Units – The Nevada System of Higher Education’s (NSHE) policy for reducing its exposure to interest rate risk is to have an average investment life of at least two years for fixed income securities within both the endowment and operating investment pools. With regard to the trusts included in endow-ment investments, NSHE is not the trustee of these invest-ments and, therefore, currently has no policies with regard to interest rate risk for these investments. Investments having interest rate risk are principally invested in mutual funds and private commingled funds. The following table provides the segmented time distribution for these investments at June 30, 2010 (expressed in thousands):
CreditRisk: Credit risk is the risk that an issuer or other counterparty to an investment will not fulfill its obligations to the State of Nevada.
Primary Government, Private Purpose Trust, Pension and Other Employee Benefit Trust, and Investment Trust Funds -
NRS 355.140, the State Treasurer’s investment policy, and investment policies of the pension and other employee bene-fit trust and investment trust funds all address credit risk. A summary of the policies is presented as follows:
• Commercial paper, Negotiable Certificates of Deposit, and Bankers’ Acceptances are rated by a nationally recognized rating service as “A-1,” “P-1” or its equivalent, or better,
• Notes, bonds and other unconditional obligations issued by corporations in the U.S. are rated by a nationally recog-nized rating service as “A” or its equivalent, or better,
• Money market mutual funds are SEC registered 2(A)7 and rated by a nationally recognized rating service as “AAA” or its equivalent,
• Collateralized mortgage obligations and asset-backed securities are rated by a nationally recognized rating service as “AAA” or its equivalent,
• Repurchase agreements with banks or registered broker-dealers provided the agreement is collateralized by 102% with U.S. Treasuries or U.S. government agency securities on a delivery basis.
In addition to the above provisions, investment policies for the pension and other employee benefit trust funds allow investment in corporate bonds, assets-related instruments, and foreign debt issued in the U.S. rated by at least two of the following: Moody’s, Standard & Poor’s, or Fitch (BBB- or better by Standard & Poor’s/Fitch, Baa3 or better by Moody’s). Nevada College Savings Plan, a private purpose trust, currently has no formal investment policy with regard to credit risk for the investments. Investments having credit risk are all invested in unrated mutual funds that are included in the table below.
Fair Value Less Than 1 1-5 6-10 More Than 10U. S. Treasury securities 4,938,307$ 316,214$ 1,439,061$ 706,995$ 2,476,037$ Negotiable certificate of deposit 14,999 14,999 - - - U. S. agencies 2,262,181 1,539,676 390,916 36,146 295,443 Mutual funds 7,242 7,242 - - - Asset backed corporate securities 133,761 20,000 73,336 17,685 22,740 Corporate bonds and notes 1,045,868 22,745 22,383 592,729 408,011 Commercial paper 44,999 44,999 - - - Fixed income securities 23,767 23,767 - - - International investments 1,290,621 52,087 474,722 391,204 372,608 Municipal bonds 558,405 - 17,907 30,006 510,492 Investment agreements 38,028 - - 525 37,503 Other short-term investments 1,043,126 498,426 544,700 - - Collateralized mortgage obligations 369,724 1,355 10,020 58,363 299,986 Total 11,771,028$ 2,541,510$ 2,973,045$ 1,833,653$ 4,422,820$
Maturities in Years
Less than 1 year 479,634$ 1 to 5 years 21,673 6 to 10 years 15,218 More than 10 years 20,486 Total 537,011$
38

Notes to Financial StatementsFor the Fiscal Year Ended June 30, 2010
NEVADA(Note 3 Continued)
The State’s investments as of June 30, 2010 were rated by Standard & Poor’s and/or an equivalent national rating organization, and the ratings are presented below using the Standard & Poor’s rating scale (at fair value, expressed in thousands):
As of June 30, 2010, the State of Nevada held debt obligations of Lehman Brothers Holdings Inc. On September 14, 2008, Lehman Brothers Holdings Inc. declared bankruptcy. The ulti-mate value of the State’s debt securities will not be known until the bankruptcy proceedings are completed. However, debt obligations of Lehman Brothers Holdings Inc. held by the State were marked to market at June 30, 2010.
Component Unit - the Nevada System of Higher Education’s (NSHE) policy for reducing its exposure to credit risk is to maintain a weighted average credit rating of AA or better, and never below A, for investments with credit risk within both the endowment and operating investment pools. With regard to the trusts included in endowment investments, NSHE is not the trustee of these investments and therefore, it currently has no policies with regard to credit risk for these investments. The credit risk profile for NSHE operating and endowment invest-ments at June 30, 2010 is as follows (expressed in thousands):
Concentration of Credit Risk: Concentration of credit risk is the risk of loss that may be attributed to the magni-tude of a government’s investment in a single issuer. The NRS 355.140, 355.060, and the State Treasurer’s investment policy limit the investing in any one issuer to 5% of the total par value of the portfolio, with the exception of the Hous-ing Division and the Investment Trust Funds. At June 30, 2010, the following investments exceeded 5% of the Primary Government and Investment Trust Funds’ total investments (expressed in thousands):
At June 30, 2010, the following investments exceeded 5% of the Higher Education Tuition Trust’s total investments (expressed in thousands):
AAA AA A BBB BB B CCC CC UnratedNegotiable certificate of deposit -$ -$ 14,999$ -$ -$ -$ -$ -$ -$ U.S. agencies 859,007 - 1,334,764 - - - - - - Mutual funds 6,618 - - - - - - - 5,885,662 Asset backed corporate securities 98,977 3,700 23,600 800 - 4,100 500 - - Corporate bonds and notes 54,789 194,894 710,067 525,400 20,000 1,200 - - 12,400 Commerical paper - - 44,999 - - - - - - Fixed income securities - - - - - - - - 23,679 International investments 447,158 601,255 181,336 43,800 9,451 - - - 78,922 Municipal bonds - 558,405 - - - - - - - Investment agreements 847 5,701 30,433 - 756 - - - 291 Other short-term investments 132,442 - - - - - - - 507,575 Collateralized mortgage obligations 176,797 16,900 29,900 20,800 1,800 8,100 23,500 4,200 26,000 Total 1,776,635$ 1,380,855$ 2,370,098$ 590,800$ 32,007$ 13,400$ 24,000$ 4,200$ 6,534,529$
Quality Rating
Fair Value UnratedMutual funds publicly traded 204,983$ 204,983$ Partnerships 186,154 186,154 Equities 6,191 6,191 Endowment cash/cash equivalents 1,406 1,406 Trust(s) 5,264 5,264 Private commingled funds 133,013 133,013 Total 537,011$ 537,011$
Fair Value PercentagePrimary government
Federal Farm Credit Bank 218,637$ 7.42%Federal Home Loan Bank 433,130 14.71%Federal National Mortgage Assoc 356,168 12.09%Federal Home Loan Mortgage Corp. 340,597 11.57%So Nevada Water Authority 234,840 7.97%
Investment Trust FundsFederal National Mortgage Assoc 224,280 23.11%Federal Home Loan Bank 205,142 21.14%Federal Home Loan Mortgage Corp. 219,984 22.67%
Fair Value PercentageFederal Home Loan Mortgage Corporation 7,087$ 6.66%Federal National Mortgage Association 11,859 11.15%
39

Notes to Financial StatementsFor the Fiscal Year Ended June 30, 2010
NEVADA(Note 3 Continued)
The Housing Division currently places no limit on the amount it may invest in any one issuer provided their ratings are in the highest two general rating categories. However, the Divi-sion monitors rating changes on all issuers. If warranted, more concentrated investments may have to be diluted to alterna-tive providers. As of June 30, 2010, the Housing Division’s investments in Fannie Mae and Ginnie Mae are 16.24% and 30.24% respectively, of Housing Division’s total investments. The Fannie Mae and Ginnie Mae investments are in mortgage backed securities matched to the interest rate and maturity of the underlying bonds. Because such investments are matched to concomitant liabilities, the Division is less concerned about a concentration risk on these investments.
ForeignCurrencyRisk: Foreign currency risk is the risk that changes in exchange rates will adversely affect the fair value of an investment or deposit.
Primary Government, Pension and Other Employee Benefit Trust Funds, and Investment Trust Funds - the primary govern-ment does not have a policy regarding foreign currency risk; however, the State Treasurer’s office does not have any depos-its or investments in foreign currency. The Public Employees’ Retirement System of Nevada, the Legislators’ Retirement System of Nevada, the Judicial Retirement System of Nevada, and the Retirement Benefits Investment Fund do have foreign currency policies for deposit and investments, which may be used for portfolio diversification and hedging. Highly specu-lative positions in currency are not permitted. The follow-ing table summarizes the pension and other employee benefit trust funds and investment trust funds’ exposure to foreign currency risk in U.S. dollars as of June 30, 2010 (expressed in thousands):
Fixed Income Equity Derivatives Cash TotalAustralian Dollar 9,525$ 269,100$ -$ 2,210$ 280,835$ British Pound Sterling 86,076 689,000 1,400 4,121 780,597Canadian Dollar 32,409 - - 2,810 35,219Danish Krone 10,229 33,500 1,600 905 46,234Euro 502,212 980,500 (13,000) 2,513 1,472,225Hong Kong Dollar - 84,600 - 500 85,100Israeli Shekel - 28,000 - 100 28,100Japanese Yen 517,062 771,300 (6,200) 10,121 1,292,283Malaysian Ringgit 2,822 - - 302 3,124New Zealand Dollar - 3,300 - 100 3,400Norwegian Krone 3,308 23,900 - 201 27,409Polish Zloty 9,528 - - 4 9,532Singapore Dollar 3,911 55,900 - 905 60,716Swedish Krona 7,421 98,000 - 303 105,724Swiss Franc 3,418 265,600 - 405 269,423Total 1,187,921$ 3,302,700$ (16,200)$ 25,500$ 4,499,921$
Currency by Investment and Fair Value
Component Unit - the Nevada System of Higher Education does not directly invest in foreign currency investments and is therefore not subject to foreign currency risk. However, it has $71,151,000 in mutual funds in both the operating and endowment pools that are primarily invested in international equities at June 30, 2010.
C. SecuritiesLendingPrimary Government and Investment Trust Funds - NRS 355.135 authorizes the State Treasurer to lend securities from the investment portfolio of the State if collateral received from the borrower is at least 102% of market value of the underlying securities and the value of the securities borrowed is determined on a daily basis.
There were no securities on loan at June 30, 2010 (excluding PERS).
Public Employees’ Retirement System (PERS) – The system also maintains a securities lending program under the author-ity of the “prudent person” standard of NRS 286.682. Securi-ties loaned under this program consist of U.S. Treasury Obli-gations, corporate fixed income securities, international fixed income securities, equity securities, and international equity securities. Collateral received consists of cash and securities issued by the U.S. Government, its agencies or instrumen-talities. Collateral received for the lending of U.S. securities must equal at least 102% of market value, plus accrued inter-est in the case of fixed income securities. Collateral received for the lending of international securities must equal at least 105% of market value, plus accrued interest in the case of fixed income securities.
40

Notes to Financial StatementsFor the Fiscal Year Ended June 30, 2010
NEVADA(Note 3 Continued)
At year-end, PERS has no credit risk exposure to borrowers because the amount PERS owes to borrowers exceeds the amounts the borrowers owe to PERS. PERS has no discre-tionary authority to sell or pledge collateral received or secu-rities loaned. The contract with the securities lending agent requires the agent to indemnify PERS for all losses relating to securities lending transactions. There were no losses resulting from borrower default during the period nor were there any recoveries of prior period losses.
PERS may only loan up to 33 1/3% of its total portfolio. Either PERS or the borrower can terminate all securities loans on demand. The securities lending agent is authorized to invest collateral only in high quality, short-term investment vehicles in accordance with PERS’ Investment Objectives and Poli-cies. The maturities of the investments made with cash collat-eral generally match the maturities of the securities loaned.
The fair value of underlying securities on loan at June 30, 2010 is $2,890,340,441. Cash collateral received in securities lending arrangements is reported on the Statement of Fidu-ciary Net Assets as an asset with a related liability. At June 30, 2010, PERS has collateral consisting of cash and securi-ties issued by the U.S. Government, its agencies or instrumen-talities, in excess of the market value of investments held by brokers/dealers under a securities lending agreement.
D. DerivativesPrimary Government and Investment Trust Funds - There was no exposure to derivatives as of June 30, 2010.
Public Employees’ Retirement System (PERS) - Foreign exchange forward contracts are periodically employed by PERS to hedge currency risk of investments in foreign curren-cies. No other derivatives are permitted within the PERS port-folio. Generally, derivatives are subject both to market risk and to counterparty risk. The derivatives utilized by PERS typical-ly have no greater market risk than their physical counterparts and, in many cases, are offset by exposures elsewhere in the portfolio. Counterparty risk, the risk that the “other party” to a contract will default, is managed by careful screening of coun-terparties. Derivative securities are priced and accounted for at fair value. Foreign exchange forward contracts are valued at the price at which the transaction could be settled by offsets in the forward markets. PERS derivative transactions for fiscal year 2010 are summarized in the following table (expressed in thousands):
PurchasesRealized
Gain / Loss SellsRealized
Gain / Loss
Total Realized
Gain / LossAustralian Dollar 57,206$ 473$ (39,822)$ 150$ 623$ British Pound Sterling 155,464 574 (122,798) (28) 546Canadian Dollar 14,330 (11) (2,456) 94 83Danish Krone 17,016 (16) (11,870) 27 11Euro 454,601 709 (347,724) (481) 228Hong Kong Dollar 13,511 18 (16,627) (9) 9Israeli Shekel 29,403 (123) - - (123)Japanese Yen 267,825 (19) (109,972) (768) (787)Malaysian Ringgit 496 3 - - 3New Zealand Dollar 932 (9) (556) 8 (1)Norwegian Krone 13,385 (1) (13,161) (56) (57)Polish Zloty 3,845 10 (1,015) 24 34Singapore Dollar 16,208 (17) (11,546) 37 20Swedish Krona 28,694 (116) (23,604) (8) (124)Swiss Franc 51,229 (43) (47,597) (7) (50)Total 1,124,145$ 1,432$ (748,748)$ (1,017)$ 415$
Foreign Exchange Contracts
41

Notes to Financial StatementsFor the Fiscal Year Ended June 30, 2010
NEVADA(Note 3 Continued)
The PERS derivative pending transactions as of June 30, 2010, are summarized in the following table (expressed in thousands):
Management believes that it is unlikely that any of the derivatives in the PERS portfolio could have a material adverse effect on their financial condition. In addition, the credit, market, or legal risks are not above and beyond those risks apparent by the nature of the type of investment for any of the securities contained within the portfolio.
Legislators’ Retirement System (LRS) and Judicial Retirement System (JRS) - foreign exchange forward contracts are periodi-cally employed by LRS and JRS to hedge currency risk of investments in foreign currencies. There was no exposure to deriva-tives as of June 30, 2010.
PurchasesUnrealized Gain / Loss Sells
Realized Gain / Loss
Total Unrealized Gain / Loss
British Pound Sterling 1,384$ -$ -$ -$ -$ Danish Krone 1,588 - - - -Euro 8,620 (137) (21,640) 760 623Japanese Yen - - (6,223) (300) (300)Total 11,592$ (137)$ (27,863)$ 460$ 323$
Foreign Exchange Contracts
Governmental Nevada System ofFunds Higher Education
As shown on financial statements:Intergovernmental receivables 443,355$ 39,397$ Notes/loans receivable 410 12,359 Due from Component Unit 6,401 -
Total 450,166$ 51,756$
Classified:Current portion 310,360$ 41,110$ Noncurrent portion:
Intergovernmental receivables 134,057 - Notes/loans receivable 389 10,646 Due from Component Unit 5,360 - Total noncurrent portion 139,806 10,646 Total 450,166$ 51,756$
Note 4 - Receivables
Receivable balances are disaggregated by type and presented separately in the financial statements. Significant receivable balances not expected to be collected within one year and not already classified in the fund financials are presented below (expressed in thousands):
Not included in the receivable balances are amounts considered to be uncollectible. In the governmental funds, uncollectible taxes receivable are estimated at $50 million, and uncollectible accounts receivable are estimated at $71.6 million. The propri-etary funds have $31.5 million in uncollectible accounts receivable of which $13.7 million are from uninsured employer’s fines and penalties, and $16.8 million are from unemployment contributions and benefit overpayments.
42

NEVADA
Notes to Financial StatementsFor the Fiscal Year Ended June 30, 2010
Note 5 - Interfund Transactions
ConsolidatedBond Interest
General and Redemption TotalAdvances ToNonmajor enterprise 5,351$ -$ 5,351$ Internal service 1,974 1,506 3,480
Total other funds 7,325$ 1,506$ 8,831$
Major FundsAdvances From
A. InterfundAdvancesA summary of interfund advances at June 30, 2010, follows (expressed in thousands):
Interfund advances are the portions of interfund balances that are not expected to be repaid within one year. The interfund balances that are expected to be repaid within one year are shown in the Due From/Due To summary below.
Advances are generally made to finance capital expenditures or as a loan for operating purposes.
Cons BondState Municipal Interest and Nonmajor Total
General Highway Bond Bank Redemption Governmental GovernmentalDue FromMajor Governmental Funds:
General -$ 2,824$ 4$ 260$ 60,152$ 63,240$ State Highway 999 - - - 258 1,257 Municipal Bond Bank 9 - - 409 - 418 Consolidated Bond Interest and Redemption 14 - - - 5,083 5,097
Nonmajor governmental 39,056 28 - 3,933 340 43,357 Total Governmental 40,078 2,852 4 4,602 65,833 113,369 Major Enterprise Funds:
Housing Division - - - - - - Unemployment Comp - - - - 217 217 Water Projects Loans 369 - - - - 369
Nonmajor enterprise 1,312 5 - - 3 1,320 Total Enterprise 1,681 5 - - 220 1,906 Internal Service 1,064 137 - 151 26 1,378 Total other funds 42,823$ 2,994$ 4$ 4,753$ 66,079$ 116,653$ Fiduciary 110$ -$ -$ -$ 423$ 533$ Component Units:
Nevada System of Higher Education 540$ -$ -$ 5,775$ 86$ 6,401$ Colorado River Commission - - - - - -
Total Component Units 540$ -$ -$ 5,775$ 86$ 6,401$
Due ToMajor Governmental Funds
B. DueFrom/DueToOtherFundsandComponentUnitsA summary of due from and due to other funds and component units at June 30, 2010, is shown below (expressed in thousands):
43

Notes to Financial StatementsFor the Fiscal Year Ended June 30, 2010
NEVADA(Note 5 Continued)
Housing Water Projects Nonmajor Total Internal TotalDivision Loans Enterprise Enterprise Service Other Funds Fiduciary
Due FromMajor Governmental Funds:
General 31$ 251$ 827$ 1,109$ 4,921$ 69,270$ 369,581$ State Highway - - 23 23 913 2,193 733 Municipal Bond Bank - - - - - 418 - Consolidated Bond Interest and Redemption - - - - - 5,097 -
Nonmajor governmental - - 1 1 183 43,541 129 Total Governmental 31 251 851 1,133 6,017 120,519 370,443 Major Enterprise Funds:
Housing Division - - - - 4 4 - Unemployment Comp - - - - - 217 - Water Projects Loans - - - - - 369 83
Nonmajor enterprise - - 4 4 89 1,413 90 Total Enterprise - - 4 4 93 2,003 173
Internal Service - - 3 3 250 1,631 15 Total other funds 31$ 251$ 858$ 1,140$ 6,360$ 124,153$ 370,631$
Fiduciary -$ -$ 7$ 7$ 2,724$ 3,264$ 29,172$ Component Units:
Nevada System of Higher Education -$ -$ 1$ 1$ 2,103$ 8,505$ 1,312$ Colorado River Commission - - - - 3 3 -
Total Component Units -$ -$ 1$ 1$ 2,106$ 8,508$ 1,312$
Due ToMajor Enterprise Funds
Nevada System of Colorado River Total ComponentHigher Education Commission Units
Due FromPrimary Government:
Governmental Activities for long term receivable 31,808$ -$ 31,808$ Major Governmental Funds:
General 9,457 30 9,487 State Highway 209 - 209
Nonmajor governmental 58,810 - 58,810 Total Governmental Funds 68,476 30 68,506 Nonmajor enterprise 30 - 30 Internal Service 19 1 20 Total 100,333$ 31$ 100,364$
Due ToComponent Units
The balances result primarily from timing differences between the date goods and services are provided or reimbursable expenses occur, and the date the transactions are recorded in the accounting system and payment is made. An exception is the long term receivable due to the Nevada System of Higher Education (NSHE) from the Primary Government in the amount of $31,808,146. This represents the remaining amount of State of Nevada general obligation bonds that may be issued, as autho-rized during the 2009 Legislative Session, for NSHE capital improvements.
44

Notes to Financial StatementsFor the Fiscal Year Ended June 30, 2010
NEVADA(Note 5 Continued)
Cons BondState Municipal Interest and Nonmajor Total
General Highway Bond Bank Redemption Governmental GovernmentalTransfers In/FromMajor Governmental Funds:
General -$ 10,577$ 9$ 15,000$ 151,323$ 176,909$ State Highway 382 - - - 1,403 1,785 Consolidated Bond Interest and Redemption 2,668 - 30,600 - 13,928 47,196
Nonmajor governmental 107,788 3,264 - - 1,381 112,433 Total Governmental 110,838 13,841 30,609 15,000 168,035 338,323
Nonmajor enterprise 429 - - - - 429
Internal Service 204 - - - 160 364
Total other funds 111,471$ 13,841$ 30,609$ 15,000$ 168,195$ 339,116$
Major Governmental FundsTransfers Out/To
Unemployment Water Projects Nonmajor Total TotalCompensation Loans Enterprise Enterprise Other Funds
Transfers In/FromMajor Governmental Funds:
General -$ 1,501$ 13,413$ 14,914$ 191,823$ State Highway - - - - 1,785 Consolidated Bond Interest and Redemption - - - - 47,196
Nonmajor governmental 4,780 - 96 4,876 117,309 Total Governmental 4,780 1,501 13,509 19,790 358,113 Nonmajor enterprise - - - - 429
Internal Service - - - - 364
Total other funds 4,780$ 1,501$ 13,509$ 19,790$ 358,906$
Transfers Out/To
Major Enterprise Fund
C. TransfersFrom/TransfersToOtherFundsA summary of transfers between funds for the year ended June 30, 2010, is shown below (expressed in thousands):
The general purpose for transfers is to move monies from funds required by statute to collect them to the funds required by statute or budget to expend them, and to move monies collected for debt service purposes to the debt service fund required to make the payment. The exceptions were:
1. Transfer to the General Fund of $122 million from certain funds and accounts to offset the difference between projected revenues and collections.
2. Transfer of $24.7 million from the Retirement Bene-fits Investment Fund to the State Retirees’ Health and Welfare Benefits Fund to pay a portion of the costs for health and welfare benefits for state retirees during fiscal year 2010-2011.
3. Transfer of $41.3 million from the General Fund to the Stabilize the Operations of State Government (“Rainy Day”) fund.
The Nevada Legislature approved the first and second transfer during the 26th Special Session (2010), and the third trans-fer was triggered when the General Fund unrestricted fund balance reached a certain level as defined by statute.
In addition, the Nevada Legislature approved appropriations for the support of the Nevada System of Higher Education (NSHE), a component unit. Net payments to NSHE of $458.6 million are reported as education and support service expens-es in the Statement of Activities and as intergovernmental expenditures in the Statement of Revenues, Expenditures, and Changes in Fund Balances – Governmental Funds. A corre-sponding amount is reported as general revenue of NSHE in the Statement of Activities.
45

NEVADA
Notes to Financial StatementsFor the Fiscal Year Ended June 30, 2010
Business-Type Activities
Total Primary Government
Component Units
Restricted:Cash -$ -$ 19,666$ Investments 145,793 145,793 - Total 145,793$ 145,793$ 19,666$
Restricted for:Debt service 145,793$ 145,793$ 3,185$ Construction - - 10,203Other purposes - - 6,278 Total 145,793$ 145,793$ 19,666$
Various debt service, operation and mainte-nance, capital improvement and construction (acquisition) funding requirements of bond covenants, and trust indentures are recorded as restricted assets on the Statement of Net Assets. The components of restricted assets at June 30, 2010 are as follows (expressed in thousands):
Note 7- Capital Assets
Beginning EndingBalance Increases Decreases Balance
Governmental activities:Capital assets, not being depreciated
Land 137,100$ 1,236$ -$ 138,336$ Construction in progress 269,147 94,627 (185,764) 178,010 Infrastructure 3,125,559 38,939 - 3,164,498 Rights-of-way 522,486 70,480 (124) 592,842
Total capital assets, not being depreciated 4,054,292 205,282 (185,888) 4,073,686 Capital assets, being depreciated/amortized
Buildings 1,325,368 176,409 (2,313) 1,499,464 Improvements other than buildings 113,618 826 - 114,444 Furniture and equipment 375,128 14,345 (18,560) 370,913 Software costs 151,563 750 (455) 151,858
Total capital assets, being depreciated/amortized 1,965,677 192,330 (21,328) 2,136,679
Less accumulated depreciation/amortization for:Buildings (366,104) (33,254) 1,687 (397,671) Improvements other than buildings (59,536) (4,800) - (64,336) Furniture and equipment (264,020) (30,633) 16,837 (277,816) Software costs (132,201) (8,637) 453 (140,385)
Total accumulated depreciation/amortization (821,861) (77,324) 18,977 (880,208)
Total capital assets, being depreciated/amortized, net 1,143,816 115,006 (2,351) 1,256,471 Governmental activities capital assets, net 5,198,108$ 320,288$ (188,239)$ 5,330,157$
Business-type activities:Capital assets, not being depreciated
Land 568$ -$ -$ 568$ Construction in progress 7,687 1,202 (413) 8,476
Total capital assets, not being depreciated 8,255 1,202 (413) 9,044
Capital assets, being depreciatedBuildings 3,389 - - 3,389 Improvements other than buildings 631 - - 631 Furniture and equipment 5,403 306 (106) 5,603
Total capital assets, being depreciated 9,423 306 (106) 9,623
Less accumulated depreciation for:Buildings (2,312) (103) - (2,415) Improvements other than buildings (551) (9) - (560) Furniture and equipment (4,455) (349) 98 (4,706)
Total accumulated depreciation (7,318) (461) 98 (7,681) Total capital assets, being depreciated, net 2,105 (155) (8) 1,942
Business-type activities capital assets, net 10,360$ 1,047$ (421)$ 10,986$
Capital asset activity of the primary government for the year ended June 30, 2010, was as follows (expressed in thousands):
Note 6 - Restricted Assets
46

Notes to Financial StatementsFor the Fiscal Year Ended June 30, 2010
NEVADA
Current period depreciation and amortization expense was charged to functions of the primary government as follows (expressed in thousands):
Capital asset activity of the Nevada System of Higher Education for the year ended June 30, 2010, was as follows (expressed in thousands):
Governmental activities:General government 7,174$ Education, support services 2,169Health, social services 10,759Law, justice, public safety 28,164Recreation, resource development 6,545Transportation 13,244Regulation of business 1,371Unallocated 1,448Depreciation and amortization on capital assets held by the State's internal service funds is charged to the various functions based on their use of the assets 6,450 Total depreciation/amortization expense - governmental activities 77,324$
Business-type activities:Enterprise 461$ Total depreciation expense - business-type activities 461$
Beginning EndingBalance Increases Decreases Balance
Nevada System of Higher Education:Capital assets, not being depreciated
Construction in progress 126,858$ 13,408$ (95,940)$ 44,326$ Land 81,821 - (261) 81,560 Intangibles - 808 - 808 Collections 9,697 76,286 (14) 85,969
Total capital assets, not being depreciated 218,376 90,502 (96,215) 212,663 Capital assets, being depreciated
Buildings 2,049,840 106,566 (1,339) 2,155,067 Land and improvements 100,648 4,972 (1,163) 104,457 Machinery and equipment 301,212 30,843 (18,370) 313,685 Intangibles - 6,702 - 6,702 Library books and media 113,118 7,753 (677) 120,194
Total capital assets, being depreciated 2,564,818 156,836 (21,549) 2,700,105 Less accumulated depreciation for:
Buildings (494,231) (51,428) 100 (545,559) Land and improvements (75,180) (3,754) 939 (77,995) Machinery and equipment (199,270) (27,254) 15,959 (210,565) Intangibles - (1,369) - (1,369) Library books and media (99,101) (8,854) 667 (107,288)
Total accumulated depreciation (867,782) (92,659) 17,665 (942,776) Total capital assets, being depreciated, net 1,697,036 64,177 (3,884) 1,757,329
Nevada System of Higher Education activity capital assets, net 1,915,412$ 154,679$ (100,099)$ 1,969,992$
(Note 7 Continued)
47

NEVADA
Notes to Financial StatementsFor the Fiscal Year Ended June 30, 2010
A. ChangesinLong-TermLiabilitiesThe following is a summary of changes in long-term obligations of the primary government for the fiscal year ended June 30, 2010 (expressed in thousands):
Beginning Ending Due WithinBalance Additions Reductions Balance One Year
Governmental activities:Bonds payable:
General obligation bonds 2,079,805$ 142,990$ (155,180)$ 2,067,615$ 131,790$ Special obligation bonds 722,880 - (54,040) 668,840 56,795
Subtotal 2,802,685 142,990 (209,220) 2,736,455 188,585 Issuance premiums on bonds 109,407 3,928 (10,065) 103,270 10,132
Total bonds payable 2,912,092 146,918 (219,285) 2,839,725 198,717
Certificates of participation 58,030 7,900 (9,850) 56,080 605 Issuance premiums on certificates of participation - 743 (53) 690 98
Total certificates of participation 58,030 8,643 (9,903) 56,770 703 Other Governmental long-term activities:
Obligations under capital leases 17,916 18,209 (2,279) 33,846 3,232 Compensated absences obligations 102,546 75,476 (74,449) 103,573 70,325 Arbitrage rebate liability 575 2,643 - 3,218 195
Total other governmental long term activities 121,037 96,328 (76,728) 140,637 73,752 Governmental activities long-term obligations 3,091,159$ 251,889$ (305,916)$ 3,037,132$ 273,172$
Business-type activities:Bonds payable
General obligation bonds 113,055$ -$ (7,995)$ 105,060$ 8,255$ Special obligation bonds 911,783 149,340 (67,079) 994,044 14,251
Subtotal 1,024,838 149,340 (75,074) 1,099,104 22,506 Issuance premiums 1,987 151 (167) 1,971 165
Total bonds payable 1,026,825 149,491 (75,241) 1,101,075 22,671 Compensated absences obligations 1,792 1,464 (1,361) 1,895 1,197 Federal unemployment advance - 438,325 - 438,325 - Tuition benefits payable 124,931 11,225 (4,651) 131,505 10,000 Arbitrage rebate liability 72 10 (18) 64 -
Business-type activities long-term obligations 1,153,620$ 600,515$ (81,271)$ 1,672,864$ 33,868$
Note 8 - Long-Term Obligations
The General Fund, special revenue funds and internal service funds in which the leases are recorded typically liquidate the capital lease obligations. The compensated absence obliga-tions are typically liquidated by the funds incurring the relat-ed salaries and wages costs. The debt service funds typically liquidate the arbitrage obligations.
B. BondsPayableThe State issues general obligation bonds for the acquisition, construction and improvement of major capital facilities; buying local governments’ bonds in the municipal bond bank fund; protection of natural resources; cultural affairs projects; the construction, reconstruction, improvement and mainte-nance of highways; and for refunding purposes. General obli-gation bonds are direct obligations and pledge the full faith and credit of the State.
Special obligation highway improvement revenue bonds provide funds for property acquisition and construction of highway projects. Special obligation housing bonds in the aggregate have a debt limit of $5,000,000,000 and are used for housing loans or to purchase mortgage loans having both fixed and variable interest rates. Special obligation bonds are payable solely from gross pledged revenues and are not gener-al obligations of the State.
General obligation bonds and special obligation bonds of the primary government outstanding at June 30, 2010 are comprised of the following (expressed in thousands):
48

Notes to Financial StatementsFor the Fiscal Year Ended June 30, 2010
NEVADA
Interest Original PrincipalRates Amount Outstanding
Governmental activities:General obligation bonds:
Subject to Constitutional Debt Limitation 2.0-7.0% 1,690,580$ 1,375,790$ Exempt from Constitutional Debt Limitation 1.6-7.0% 1,428,415 691,825
Special obligation bonds:Exempt from Constitutional Debt Limitation- Highway Improvement Revenue Bonds 3.5-6.0% 963,925 668,840 Subtotal 4,082,920 2,736,455
Issuance premiums 153,950 103,270 Governmental activities bonds payable 4,236,870 2,839,725
Business-type activities:General obligation bonds:
Exempt from Constitutional Debt Limitation 2.0-6.5% 144,180 105,060 Special obligation bonds:
Housing Bonds *.8-8.02% 1,612,470 994,044 Subtotal 1,756,650 1,099,104
Issuance premiums 3,081 1,971 Business-type activities bonds payable 1,759,731 1,101,075
Total bonds payable 5,996,601$ 3,940,800$
*Many Housing bonds have variable rates of interest. The tax exempt bonds track the SIFMA Indexwhile the federally taxable debt tracks the one-month LIBOR Index.
Year EndingJune 30 Principal Interest Principal Interest
2011 188,585$ 131,628$ 22,506$ 34,305$ 2012 162,180 122,418 19,847 33,175 2013 179,640 114,270 20,846 32,273 2014 187,515 105,350 21,910 31,307 2015 172,130 96,404 22,338 30,264
2016-2020 834,420 357,660 139,579 133,816 2021-2025 695,100 169,819 155,675 95,949 2026-2030 312,405 23,464 152,083 60,849 2031-2035 3,640 774 204,518 29,716 2036-2040 840 42 162,982 9,325 2041-2045 - - 150,010 1,500 2046-2050 - - 2,310 198 2051-2055 - - 24,500 -
Total 2,736,455$ 1,121,829$ 1,099,104$ 492,677$
Governmental Activities Business-Type Activities
Debt service requirements (principal and interest) for all long-term bonds and notes outstanding at June 30, 2010, of the primary government are summarized in the table following (expressed in thousands):
C. ConstitutionalDebtLimitationsSection 3, Article 9, of the State Constitution (as amended) limits the aggregate principal amount of the State’s public debt to two percent (2%) of the assessed valuation of the State. Exempt from this limitation are debts authorized by the Legislature that are incurred for the protection and preservation of, or for obtaining the benefits of, any property or natural resources within the State. At June 30, 2010, the debt limitation and its unused portion are computed as follows (expressed in thousands):
(Note 8 Continued)
49

Notes to Financial StatementsFor the Fiscal Year Ended June 30, 2010
NEVADA(Note 8 Continued)
D. NevadaMunicipalBondBankGeneral obligation bonds have been issued through the Nevada Municipal Bond Bank, a special revenue fund, as authorized by NRS 350A. These bonds are subject to statutory limitation of $1.8 billion and are exempt from the Constitutional Debt Limitation. Proceeds from the bonds are used to purchase validly issued general obligation bonds of the State’s local governments to finance projects related to natural resources. The State anticipates that the debt service revenue it receives from the participating local governments will be sufficient to pay the debt service requirements of the State bonds as they become due. Twenty-two projects were funded through the Nevada Municipal Bond Bank as of June 30, 2010, and total investments in local governments amounted to $311,565,000.
E. RefundedDebtandRedemptionsOn November 17, 2009 the State issued General Obliga-tion (Limited Tax) Capital Improvement, Cultural Affairs and Refunding Bonds Series 2009B and General Obligation (Limited Tax) Natural Resources and Refunding Bonds Series 2009C. Series 2009B was issued to refund $25,365,000 of General Obligation (Limited Tax) Refunding Bonds Series 1999A and $905,000 General Obligation (Limited Tax) Cultural Affairs Bonds, Series 1998C. Series 2009C was issued to refund $1,400,000 of General Obligation (Limited Tax) Refunding Bonds, Series 1999B.
On December 10, 2009 the Nevada Real Property Corpora-tion issued $7,900,000 State of Nevada General Obligation (Limited Tax) Certificates to prepay all of the 1999 Nevada Real Property Corporation Certificates balance of $8,480,000.
On June 24, 2010 the State issued General Obligation (Limit-ed Tax) (Revenue Supported) Water Refunding Bonds Series 2010B to refund the following General Obligation (Limited Tax) (Revenue Supported) Water Refunding Bonds Series: $2,210,000 Series 1997B, $455,000 Series 2003C, $4,495,000 Series 2006D.
The reacquisition price exceeded the carrying amount of the old debt by $828,474. This amount is being reported as a deferred charge and amortized over the remaining life of the refunded debt, which is shorter than the life of the new debt. The refunding increased the aggregate debt service payments by $440,648; however the State completed the refunding to obtain an economic gain or present value gain of $2,002,908.In current and prior years, the State defeased certain general obligations and other bonds by placing the proceeds of new
bonds and other monies in an irrevocable trust to provide for all future debt service payments on the old bonds. Accord-ingly, the trust account assets and the liability for the defeased bonds are not included in the State’s financial statements. The total outstanding amount of defeased issues at June 30, 2010 is $31,564,310.
F. Amounts Available and Amounts to beProvidedforDebtServiceAt June 30, 2010, the amount available to service debt in the Consolidated Bond Interest and Redemption debt service fund is $158,514,123. At June 30, 2010, the amount available to service debt in the Highway Revenue Bonds debt service fund is $35,840,821. At June 30, 2010, the amount available to service the debt in the Municipal Bond Bank special revenue fund is $311,496,342.
The amount to be provided by other governments of $131,470,000 is due from the Southern Nevada Water Authority (SNWA). Until January 1, 1996 the Colorado River Commission (CRC), a component unit responsible for manag-ing Nevada’s interest in the water and power resources avail-able from the Colorado River, operated the Southern Nevada Water System (SNWS). In accordance with Chapter 393 of the 1995 Legislature, certain rights, powers, duties and liabili-ties of SNWS were transferred from the State and CRC to the SNWA effective January 1, 1996. These rights, powers, duties and liabilities included, but were not limited to, the State of Nevada general obligation bonds, the existing water user contracts, the Service Contract between CRC and the Las Vegas Valley Water District, and all other contracts related to the SNWS including contracts for capital improvement. Accordingly, the State records the general obligation bonds previously reported in CRC and an associated amount to be provided by other governments in the government-wide finan-cial statements.
G. BondIndentureProvisionsThere are restrictions and limitations contained in the various bond indentures. The State is in compliance with the require-ments of the bond covenants.
H. CapitalLeasesThe State has entered into various agreements for the lease of equipment and improvement of buildings. Assets of the primary government acquired under such leases at June 30, 2010, include equipment with a historical cost of $7,894,000 with accumulated depreciation of $6,223,000, building improvements of $11,149,000 with accumulated depreciation of $1,114,000, and construction in progress of $12,318,577.
For all capital leases of the primary government, the gross minimum lease payments and the present value of the net mini-mum lease payments as of June 30, 2010 follow (expressed in thousands):
Debt limitation (2% of total assessed valuation) 1,900,366$ Less : Bonds and leases payable as of June 30, 2010, subject to limitation (1,410,211)
Remaining debt capacity 490,155$
50

Notes to Financial StatementsFor the Fiscal Year Ended June 30, 2010
NEVADA(Note 8 Continued)
I. CertificatesofParticipationIn fiscal year 2010, the Nevada Real Property Corporation, a blended component unit, issued $7,900,000 of general obli-gation certificates of participation at 5.0-5.125% interest to prepay the remaining outstanding balance of the 1999 issue of the Nevada Real Property Corporation. The original 1999 issue of $15,000,000 was to finance the acquisition, construc-tion, installation and equipping of a secured juvenile treat-ment facility that is currently operating. The 2010 issue is a direct general obligation of the State to which the full faith and credit of the State is pledged. The State is required to make payments from general (ad valorem) taxes in the Consolidated Bond Interest and Redemption debt service fund that approxi-mate the interest and principal payments made by trustees to certificate holders.
In fiscal year 2004, the Nevada Real Property Corporation issued $21,550,000 of Lease Revenue Certificates of Participa-tion at 4.0-5.0% interest to finance the construction of an office building in Carson City. In fiscal year 2005, the Nevada Real Property Corporation issued $22,435,000 of Lease Revenue Certificates of Participation at 3.0-5.0% interest to finance the acquisition of a site for and the construction of a new correc-tional facility in Las Vegas. In fiscal year 2007, the Nevada Real Property Corporation issued $5,760,000 of Lease Reve-nue Certificates of Participation at 4.0-5.0% interest to finance the design and construction of a warehouse addition to the Legislative Counsel Bureau’s existing State Printing Office building in Carson City and resurfacing of the exterior of the existing building, together with related improvements on the premises. Under the lease revenue certificates of participa-tion financing arrangements, the certificates are not general obligations of the State and are not backed by the faith and credit or the taxing power of the State. The State’s obligation to pay base rent and make other payments to the trustee under the financing leases is subject to appropriation by the State. However, the payment of principal and interest on both issues of certificates is being guaranteed by an insurance policy.
The following schedule presents future certificates of partici-pation payments as of June 30, 2010 (expressed in thousands):
J. TuitionBenefitsPayableThe Higher Education Tuition Trust Fund, an enterprise fund, reports benefits payable as shown in Section A based upon the actuarial present value (APV) of the future tuition obligations and administrative expenses that will be paid in future years. The present value calculation includes the effects of project-ed tuition and fee increases and termination of contracts as follows:
The actuarial valuation used an investment yield assumption of 6.75% per year and tuition growth assumptions as follows:
K.ArbitrageRebateRequirementThe Tax Reform Act of 1986 imposes a rebate requirement with respect to some bonds issued by the State. Under this requirement, an amount equal to the sum of (a) the excess of the aggregate amount earned on all investments (other than certain specified exceptions) over the amount that would have been earned if all investments were invested at a rate equal to the yield on the bonds, and (b) any income earned on the excess described in (a) must be rebated to the United States Treasury, in order for the interest on the bonds to be excluded from gross income for federal income tax purposes. In accordance with the Internal Revenue Service Regulations, arbitrage rebate liability has been calculated as of June 30, 2010, and changes for the fiscal year then ended is presented in Section A of this note.L. ConduitDebtObligationsThe State has issued Industrial Revenue Bonds to provide financial assistance to private-sector entities for the acquisi-tion and construction of commercial facilities deemed to be in the public interest. The bonds are secured by the prop-erty financed and are payable solely from payments received
Year EndingJune 30 Principal Interest
2011 605$ 2,634$ 2012 1,660 2,563 2013 1,815 2,488 2014 1,975 2,406 2015 2,150 2,314
2016-2020 10,905 10,051 2021-2025 11,655 7,852 2026-2030 17,315 4,638 2031-2035 8,000 594
Total 56,080$ 35,540$
APV of the future tuition obligation $131,505,000Net assets available 121,796,839Net assets as a percentage of tuition benefits obligation 92.62%
Universities Community CollegesFall 2011 9.81% 9.92%Fall 2012 0.00% 0.00%Fall 2013 and later 6.00% 4.00%
Year Ending Governmental June 30 Activities
2011 4,703$ 2012 3,6582013 2,8882014 2,9302015 3,003
2016-2020 16,3842021-2025 12,2482026-2030 48
Total minimum lease payments 45,862Less: amount representing interest (12,016)Obligations under capital leases 33,846$
51

Notes to Financial StatementsFor the Fiscal Year Ended June 30, 2010
NEVADA(Note 8 Continued)
on the underlying mortgage loans. Upon repayment of the bonds, ownership of the acquired facilities transfers to the private-sector entity served by the bond issuance. The State is not obligated in any manner for the repayment of the bonds. Accordingly, the bonds are not reported as liabilities in the accompanying financial statements.
As of June 30, 2010, there are nineteen series of Industrial Revenue Bonds outstanding, with an aggregate principal amount payable of $1,023,805,032. Included in this amount is $693,861,665 payable from the Las Vegas Monorail Company that filed Chapter 11 bankruptcy protection on January 13, 2010 in order to restructure the company’s debt through this process.
M. PledgedRevenuePledged motor vehicle and special fuel tax - The State has pledged a portion of future motor vehicle fuel and special fuel tax revenues as well as federal aid for eligible projects to repay $668,840,000 in outstanding Highway Improve-ment Revenue Bonds that were issued from December 2000 through April 2008 for highway construction projects and property acquisition. Total principal and interest remain-ing on the bonds is $888,864,905 payable through Decem-ber 2025. Upon completion of eligible projects, federal aid of $237,552,243 is expected to be received in fiscal year 2011. For the current year, principal and interest paid was $87,915,760, and total motor vehicle fuel and special fuel tax revenues were $265,537,368.
Pledged Nevada Housing Division program funds - The single-family bonds are payable from, and secured by, a pledge of the proceeds derived from the sale of bonds; the rights and interest of the Housing Division in all mortgage loans purchased under the various bond certificates; reve-
nues which primarily include mortgage repayments and the net income, if any, derived as a result of foreclosure or other action taken in the event of a default on such a mortgage loan; curtailments, consisting generally of all amounts representing monthly principal payments with respect to mortgage loans which are received in advance of the scheduled amortization thereof; and all earnings realized by the investment of monies in all funds and accounts as well as all funds and accounts created by the various bond certificates.
The multi-unit bonds are payable from, and secured by, a pledge of the proceeds derived from the sale of bonds; all earnings realized from the investment of bond proceeds; after permanent financing, all revenues received from the develop-ment including housing assistance and rental payments made by tenants, notes receivable collateralized by deeds of trust and the rights to FHA insurance, draws on bank letters of credit, private mortgage and hazard insurance and condemna-tion proceeds.
Substantially all program fund assets are pledged in trust for the benefit of the bondholders.
N.InterestRateSwapAgreementsObjective - The Nevada Housing Division has entered into six pay-fixed, receive-variable interest rate swaps in order to provide lower cost fixed rate financing for its single-family loan production needs. The Nevada Housing Division policy requires hedging of all variable rate debt issuances through synthetic fixed rate structures.
Terms, Fair Values and Credit Ratings - The terms, fair values, and credit ratings of the outstanding swaps as of June 30, 2010 were as follows (expressed in thousands):
Associated Current Fixed Counter-Single-Family Notional Effective Rate Variable Rate Termination Party Fair
Bond Issue Amount Date Paid Received Date Rating Value
2006 Issue A 4,500$ 09/23/08 4.720% 68% of USD-LIBOR-BBA 04/01/37 Aaa (577)$
2006 Issue B 4,500 09/23/08 4.230% 68% of USD-LIBOR-BBA 10/01/41 Aaa (502)
2007 Issue A 4,500 09/23/08 4.246% 68% of USD-LIBOR-BBA 04/01/42 Aaa (547)
2007 Issue B 8,000 10/09/07 4.340% 68% of USD-LIBOR-BBA 04/01/42 Aaa (1,016)
2008 Issue A 14,700 04/03/08 3.736% 68% of USD-LIBOR-BBA 10/01/39 Aaa (1,330)
2008 Issue B 7,500 09/25/08 3.670% 68% of USD-LIBOR-BBA 04/01/39 Aaa (675)
Total Single-Family 43,700$ (4,647)$
The notional amounts of the swaps match the principal amounts of the associated debt. Except as discussed under rollover risk, the Housing Division’s swap agreements contain scheduled reductions to outstanding notional amounts that are expected to approximately follow scheduled or anticipated reductions in the associated “bonds payable” category.
Credit Risk – All of the Housing Division’s swaps rely upon the performance of the third parties who serve as swap counter-parties, and as a result the Housing Division is exposed to credit risk. Credit risk is the risk that a swap counterparty fails to
52

Notes to Financial StatementsFor the Fiscal Year Ended June 30, 2010
NEVADA
perform according to contractual obligations. The appropri-ate measurement of this risk at the reporting date is the fair value of the swaps as detailed above. To mitigate this credit risk, the Housing Division maintains strict credit standards for swap counterparties, and requires the counterparties to be rated in the AA or higher category by either Moody’s or Standard & Poor’s at the time the contract is entered into. The Housing Division has executed its swap transactions with two counterparties. The counterparties are rated Aaa/A1. The swap agreements contain a collateral agreement with the counterparty, and require full collateralization of the fair value of the swap should the counterparty’s credit rating fall below the requirement. Eligible collateral on the swaps can include cash or U.S. government securities held by a third-party custodian.
Basis Risk – The Housing Division is exposed to basis risk when the relationship between LIBOR and BMA converges, changing the synthetic rate on the bonds. When exposed to basis risk, the net interest expense incurred on the combina-tion of the swap agreement and the associated variable rate debt may be higher or lower than anticipated. As of June 30, 2010, the BMA rate was .25% and 68% of the LIBOR was .23694%.
Termination Risk – The Housing Division’s swap agreements do not contain any out-of-the-ordinary termination events that would expose it to significant termination risk. In keep-ing with market standards, the Housing Division or the coun-terparty may terminate each swap if the other party fails to perform under the terms of the contract. In addition, the swap documents allow either party to terminate in the event of a significant loss of creditworthiness. The Housing Division views the likelihood of such events to be remote at this time. If at the termination a swap has a negative value, the Housing Division would be liable to the counterparty for a payment equal to the fair value of such swap.
Rollover Risk – The Housing Division is exposed to rollover risk on swaps that mature or may be terminated at the counter-
party’s option prior to the maturity of the associated debt. As of June 30, 2010, the Division is not exposed to any rollover risk.
Swap Payments and Associated Debt - Using interest rates as of June 30, 2010, debt service requirements of the Hous-ing Division’s outstanding variable-rate debt and net swap payments are as follows (expressed in thousands):
As rates vary, variable-rate interest rate payments on the bonds and net sweep payments will change.
O.FederalUnemploymentAdvanceDuring fiscal year 2010, the Unemployment Compensation Trust Fund obtained repayable federal advances in the amount of $438,325,000 from the U.S. Department of Labor in accor-dance with provisions of Title XII, Section 1201 of the Social Security Act. No interest accrues on these federal advances until after December 31, 2010.
P.ComponentUnitObligationsNevada System of Higher Education (NSHE) – Bonds, notes, capital leases and compensated absences payable by NSHE at June 30, 2010, and the changes for the year then ended, consist of the following (expressed in thousands):
(Note 8 Continued)
Year Ending Swaps,June 30 Principal Interest Net Total
2011 -$ 109$ 1,662$ 1,771$ 2012 - 109 1,662 1,771 2013 - 109 1,662 1,771 2014 - 109 1,662 1,771 2015 - 109 1,662 1,771
2016-2020 - 546 8,310 8,856 2021-2025 - 546 8,310 8,856 2026-2030 2,490 538 8,185 11,213 2031-2035 13,580 436 6,723 20,739 2036-2040 24,280 160 2,302 26,742 2041-2045 3,350 4 58 3,412
Total 43,700$ 2,775$ 42,198$ 88,673$
Beginning Ending Due WithinBalance Additions Reductions Balance One Year
Bonds and notes payable 517,435$ 9,814$ (28,397)$ 498,852$ 19,578$ Issuance premiums 11,210 - (475) 10,735 474 Total bonds payable 528,645 9,814 (28,872) 509,587 20,052
Obligations under capital leases 8,702 1,537 (2,777) 7,462 2,077 Compensated absences obligations 43,072 30,290 (27,321) 46,041 30,897 Total 580,419$ 41,641$ (58,970)$ 563,090 53,026 Discretely presented component units of the NSHE: Capital leases 1,251 392 Compensated absences obligations 13 13 Long-term debt 271 86 Total 564,625$ 53,517$
53

Notes to Financial StatementsFor the Fiscal Year Ended June 30, 2010
NEVADA(Note 8 Continued)
Year Ending June 30 Principal Interest
2011 20,052$ 23,052$ 2012 19,517 22,292 2013 20,005 21,479 2014 21,241 20,606 2015 21,692 19,818
2016-2020 107,953 83,302 2021-2025 89,122 60,435 2026-2030 90,568 39,041 2031-2035 91,517 16,679 2036-2040 27,920 1,804
Total 509,587$ 308,508$
Year Ending June 30 Amount2011 2,410$ 2012 1,5552013 1,5282014 1,1942015 959
2016-2019 753Total minimum lease payments 8,399Less: amount representing interest (937)Obligations under capital leases 7,462$
Tuition and fees, auxiliary enterprises’ revenue and certain other revenue as defined in the bond indentures secure the revenue bonds.
The following table presents annual principal and interest payments for bonds and notes payable outstanding by NSHE at June 30, 2010 (expressed in thousands):
Future net minimum rental payments which are required under the capital leases by NSHE for the years ending June 30 are as follows (expressed in thousands):
Colorado River Commission (CRC) – Bonds and compensated absences payable by CRC at June 30, 2010, and the changes for the year then ended, consist of the following (expressed in thousands):
Beginning Ending Due WithinBalance Additions Reductions Balance One Year
Bonds payable:General obligation bonds 104,060$ -$ (5,490)$ 98,570$ 5,770$ Issuance premiums 2,904 - (247) 2,657 247 Issuance discounts (2) - 2 - - Unamortized refunding charges (4,796) - 348 (4,448) (348)
Total bonds payable 102,166 - (5,387) 96,779 5,669 Compensated absences obligations 273 164 (128) 309 218
Total 102,439$ 164$ (5,515)$ 97,088$ 5,887$
Scheduled maturities for bonds payable by CRC for the years ending June 30 are as follows (expressed in thousands):
Year Ending June 30 Principal Interest2011 5,770$ 4,792$ 2012 6,065 4,482 2013 6,400 4,156 2014 6,735 3,812 2015 7,100 3,450
2016-2020 31,225 11,598 2021-2025 19,140 6,188 2026-2030 16,135 1,430
Total 98,570$ 39,908$
54

NEVADA
Notes to Financial StatementsFor the Fiscal Year Ended June 30, 2010
Note 9 - Pensions and Other Employee Benefits
The Nevada Legislature created various plans to provide benefits to qualified employees and certain elected officials of the State as well as employees of other public employers. The Public Employees’ Retirement Board administers the Public Employees’ Retirement System of Nevada (PERS), the Legis-lators’ Retirement System of Nevada (LRS) and the Judicial Retirement System of Nevada (JRS). A summary description of the plans follows.
A. PERSPlan Description - All full-time State employees and full-time employees of participating local government entities in the State are members in the PERS, a defined benefit cost-sharing, multiple-employer public employees’ retirement system established in 1947 by the Nevada Legislature. PERS provides a reasonable base income to qualified employees who have been employed by a public employer and whose earning capacities have been removed or substantially impaired by age or disability. Any government employer in the State may elect to have its regular and police/fire employees covered by PERS. At June 30, 2010, there were 183 participating employers and other contributing entities.
PERS’ issues a stand-alone financial report that includes finan-cial statements and required supplementary information. The State reports PERS as a pension trust fund. PERS’ financial report may be obtained from the Public Employees’ Retirement System, 693 West Nye Lane, Carson City, Nevada 89703.
Benefits, as required by statute, are determined by the number of years of accredited service at the time of retirement and the member’s highest average compensation in any 36 consecu-tive months with special provisions for members entering the System on or after January 1, 2010. Benefit payments to which participants or their beneficiaries may be entitled under the plan include pension benefits, disability benefits and survivor benefits. Monthly benefit allowances for regular members are computed at 2.5% of average compensation for each accred-ited year of service prior to July 1, 2001. For service earned after July 1, 2001, this multiplier is 2.67% of average compen-sation. However, for members entering the System on or after January 1, 2010, there is only a 2.5% multiplier. PERS offers several alternatives to the unmodified service retirement allow-ance which, in general, allows the retired employee to accept a reduced service retirement allowance payable monthly during his or her lifetime and various optional monthly payments to a named beneficiary after his or her death.
Summary of Significant Accounting Policies – PERS uses the economic resources measurement focus and the accrual basis of accounting. Revenues are recorded in the accounting period in which they are earned and become measurable. Per statute, employee and employer contributions are recognized
in the reporting period for which they are due. Expenses are recorded when the corresponding liabilities are incurred, regardless of when payment is made. Benefits and refunds are recognized when due and payable in accordance with the terms of the plan. Unfunded portions of actuarially deter-mined liabilities for retirement benefits are not recorded in the financial statements.
Investments are reported at fair value. Securities traded on national or international exchanges are valued at the last reported sales price at current exchange rates. The fair value of real estate investments is based on estimated current values and Member Appraisal Institute independent appraisals. For private equity partnership investments, estimated fair value is determined in good faith by the general partner of the respec-tive investment partnership. In addition, each partnership undergoes an independent audit on an annual basis.
Contributions - The authority for establishing and amending the obligation to make contributions, and member contribu-tion rates, is provided by statute. New hires of the State of Nevada and public employers, who did not elect the employ-er-pay contribution plan prior to July 1, 1983, have the option of selecting either the employee/employer contribution plan or the employer-pay contribution plan. One plan provides for matching employee and employer contributions while the other plan provides for employer-pay contributions only.
Funding Policy - PERS’ basic funding policy provides for periodic contributions at a level pattern of cost as a percent-age of salary throughout an employee’s working lifetime in order to accumulate sufficient assets to pay benefits when due. Although PERS receives an actuarial valuation on an annual basis indicating the contribution rates required to fund PERS on an actuarial reserve basis, contributions actually made are in accordance with the required rates established by the Legis-lature. These statutory rates are increased or decreased pursu-ant to NRS 286.421 and 286.450.
Required contribution rates for employers and for active plan members, as a percentage of covered payroll, for the fiscal year ended June 30, 2010 were as follows:
The State’s contribution requirements for the current fiscal year and each of the two preceding years were (expressed in thousands):
Employer EmployeesRegular employees: Employer-pay plan 21.50% na Employee/employer plan (matching rate) 11.25% 11.25%Police and Fire employees: Employer-pay plan 37.00% na Employee/employer plan (matching rate) 19.00% 19.00%
Statutory Rate
55

Notes to Financial StatementsFor the Fiscal Year Ended June 30, 2010
NEVADA(Note 9 Continued)
B. LRSPlan Description - All State Legislators are members in the Legislators’ Retirement System (LRS), a defined benefit, single-employer public employees’ retirement system estab-lished in 1967 by the Nevada Legislature to provide a reason-able base income to Legislators at retirement. LRS is legislat-ed by and functions in accordance with State laws established by the Nevada Legislature. Benefits, as required by statute, are determined by the number of years of accredited service at the time of retirement. Service years include the entire elec-tion term whether or not the Legislature is in session. Benefit payments to which participants may be entitled under the plan include pension benefits and death benefits. Monthly benefit allowances are $25 for each year of service up to thirty years.
LRS issues a stand-alone financial report that includes finan-cial statements and required supplementary information. The State reports LRS as a pension trust fund. LRS financial report may be obtained from the Public Employees’ Retirement System, 693 West Nye Lane, Carson City, Nevada 89703.
Summary of Significant Accounting Policies – LRS uses the economic resources measurement focus and the accrual basis of accounting. Revenues are recorded in the account-ing period in which they are earned and become measurable.
Per statute employee and employer contributions are recog-nized in the reporting period for which they are due. Expenses are recorded when the corresponding liabilities are incurred, regardless of when payment is made. Benefits and refunds are recognized when due and payable in accordance with the terms of the plan. Unfunded portions of actuarially deter-mined liabilities for retirement benefits are not recorded in the financial statements.
Investments are reported at fair value. The fair values of investments in securities are generally based on published market prices and quotations from major investment firms. In general, fixed income securities are valued based on yield currently available on comparable securities of issuers with similar credit ratings.
Contributions - The Legislator contribution of 15% of compensation is paid by the Legislator only when the Legisla-ture is in session, as required by statute. The Legislature holds sessions every two years. Prior to 1985, the employee contri-butions were matched by the employer. The 1985 Legislators’ Retirement Act includes NRS 218C.390(2) which states, “The Director of the Legislative Counsel Bureau shall pay to the Board from the Legislative Fund an amount as the contribu-tion of the State of Nevada as employer which is actuarially determined to be sufficient to provide the System with enough money to pay all benefits for which the System will be liable.” The Legislature appropriated $401,732 for fiscal years 2009 and 2010, which is the required State contribution as deter-mined by the actuary. This amount was paid by the State of Nevada to the Legislative fund during fiscal 2009, of which $200,866 (half) was recognized as employer contributions in the fiscal year 2009, and the other half was recognized in fiscal year 2010. Employee contributions of $61,201 were received in fiscal year 2009, of which, $30,600 (half) was recorded as employee contributions in the fiscal year 2009, and the remaining $30,601 was recorded in fiscal year 2010.
Actuarial Information - Actuarial valuations of the LRS are prepared every two years to determine State contributions required to fund the system on an actuarial basis. Actuarial methods and significant assumptions used in the July 1, 2010, actuarial valu-ation include the following:
2010 2009 2008Primary Government 164,630$ 153,768$ 146,754$ Component Units: Colorado River Commission 470 443 448 Nevada System of Higher Education 28,274 28,030 27,269Total component units 28,744 28,473 27,717Total reporting entity 193,374$ 182,241$ 174,471$ Contributions as % of covered payroll 17% 16% 16%Percentage of pension costs contributed 100% 100% 100%
Actuarial Cost Method: Entry age normalAmortization Method: Year-by-year closed with each amortization period set at 20 yearsAsset Valuation Method: Five year smoothed marketActuarial Assumptions:
Investment yield 8%Projected salary increases None
Retirement Age for Active Members: Legislators become fully vested at age 60 with eight years of service with service credit before July 1, 1985, or at age 60 with ten years of service without service credit before July 1, 1985.
(Continued on next page)
56

Notes to Financial StatementsFor the Fiscal Year Ended June 30, 2010
NEVADA(Note 9 Continued)
Actuarial Valuation Annual State Contribution Net PensionDate Pension Cost Made Obligation
1/1/2008 185$ 185$ -$ 1/1/2009 201 201 -7/1/2010 201 201 -100%
Percentage of Annual
100%100%
Pension Cost Contributed
Assumed Mortality Rate: 1983 Group Annuity Mortality TableCost of Living (Post-Retirement) Increases: 2% after 3 years of receiving benefits 3% after 6 years of receiving benefits 3.5% after 9 years of receiving benefits 4% after 12 years of receiving benefits 5% after 14 years of receiving benefits * Cap based on CPI if benefits outpace inflation
*Does not apply to retirees who enter the LRS on or after January 1, 2010.
Funded Status and Funding Progress – As of July 1, 2010, the most recent actuarial valuation date, the LRS was 74% funded. The actuarial accrued liability for benefits was $5.6 million, and the actuarial value of assets was $4.1 million, resulting in an unfunded actuarial accrued liability (UAAL) of $1.5 million. The covered payroll (annual payroll of active employees covered by the plan) was $ .4 million, and the ratio of the UAAL to the covered payroll was 411%.
The schedule of funding progress, presented as Required Supplementary Information following the notes to the financial statements, presents multiyear trend information about whether the actuarial value of plan assets are increasing or decreasing over time relative to the actuarial accrued liability for benefits.
C. JRSPlan Description - The Judicial Retirement System of Nevada (JRS) is the administrator of an agent multiple-employer public employees defined benefit retirement system estab-lished in 2001 by the Nevada Legislature. The JRS is legis-lated by and functions in accordance with laws established by the Nevada Legislature. The JRS was established to provide benefits in the event of retirement, disability, or death of justices of the Supreme Court, district judges, municipal court judges and justices of the peace, funded on an actuarial reserve basis. As of July 1, 2010, the Supreme Court and ten municipalities in Nevada elected to participate in JRS.
JRS issues a stand-alone financial report that includes finan-cial statements and required supplementary information. The State reports JRS as a pension trust fund. JRS financial report may be obtained from the Public Employees’ Retirement System, 693 West Nye Lane, Carson City, Nevada 89703.
Benefits are paid according to various options contained in pertinent statutes, dependent upon whether a member was serving as a judge before November 5, 2002. Retiring members who were serving as a judge before November 5, 2002 may select among the two benefit options below. Retir-ing members who began serving as a justice or judge on or after November 5, 2002 may select only the first option below.
Option 1 - 2003 Benefit Plan: Benefits, as required by stat-ute, are computed at 3.4091% per year of accredited service at the time of retirement to a maximum of 75% with 22 years, times the member’s highest average compensation in any 36 consecutive months. Benefit payments to which partici-pants may be entitled under the plan include pension benefits, disability benefits and survivor benefits.
Option 2 – Previous Benefit Plan: Retiring members who were serving as a judge prior to November 5, 2002 may select the following benefit: Benefit payments are computed at 4.1666% for the first five years of service and 4.1666% for each addi-tional year of service, up to a total maximum of 22 years, times the member’s compensation for their last year of service.
Summary of Significant Accounting Policies – JRS uses the economic resources measurement focus and the accrual basis of accounting. Revenues are recorded in the accounting period in which they are earned and become measurable. Per statute, contributions are recognized in the reporting period for which they are due. Expenses are recorded when the corresponding liabilities are incurred, regardless of when payment is made. Benefits and refunds are recognized when due and payable in accordance with the terms of the plan. Unfunded portions of actuarially determined liabilities for retirement benefits are not recorded in the financial statements.
Trend Information - Three-year trend information follows (expressed in thousands):
(Continued from previous page)
57

Notes to Financial StatementsFor the Fiscal Year Ended June 30, 2010
NEVADA(Note 9 Continued)
Investments are reported at fair value. The fair values of investments in securities are generally based on published market prices and quotations from major investment firms. In general, fixed income securities are valued based on yields currently available on comparable securities of issuers with similar credit ratings.
Contributions – The JRS is an employer-paid plan and there is no contribution from active members. The participating employers submit the percentage of compensation deter-
mined by the actuary to pay the normal costs and administra-tive expenses. Annually, the participating employers pay to the JRS an amount on the unfunded liability which is actuari-ally determined to be sufficient to enable the JRS to pay all current benefits for which the JRS is liable.
Actuarial Information – Actuarial valuations of the JRS are prepared annually on a fiscal year basis. Significant actuarial assumptions used in the July 1, 2010 valuation include the following:
2010 2009 2008Annual required contribution 5,043$ 3,740$ 3,453$ Interest on net pension obligation (40) (24) (6)Adjustment to annual required contribution 116 69 19Annual pension cost 5,119 3,785 3,466State contribution made (4,624) (3,992) (3,680)Increase (decrease) in net pension obligation 495 (207) (214)Net pension obligation (asset) at beginning of year (505) (298) (84)Net pension obligation (asset) at end of year (10)$ (505)$ (298)$
Percentage of annual pension costs contributed 90% 105% 106%
Actuarial Cost Method: Entry age normal Amortization Method: Level percent of pay (3% payroll growth assumed) over a declining
amortization period of: 30 years for Supreme Court and District Judges 20 years for each non-state agencyAsset Valuation Method: 5-year smoothed marketActuarial Assumptions:
Investment yield 8%Projected salary increases 1 to 4 years of service increase of 3% per year
5 years of service increase of 11% per year6 to 12 years of service increase of 5% per year13 or more years of service increase of 3% per year
Retirement Age for Active Members: Retirement rates after completion of five years of service and attain-ment of the following ages:
AgeRateperAge 60—64 35% 65—67 50% 68—69 75% 70 100%
Assumed Mortality Rate: RP-2000 Male Combined Healthy TableRP-2000 Female Combined Healthy Table set forward one year
Cost of Living (Post-Retirement) Increases: 2% after 3 years of receiving benefits 3% after 6 years of receiving benefits 3.5% after 9 years of receiving benefits 4% after 12 years of receiving benefits 5% after 14 years of receiving benefits* Cap based on CPI if benefits outpace inflation
* Does not apply to retirees who enter the JRS on or after January 1, 2010.
Trend Information - Three-year trend information for the current fiscal year and each of the two preceding fiscal years follows (expressed in thousands):
58

Notes to Financial StatementsFor the Fiscal Year Ended June 30, 2010
NEVADA(Note 9 Continued)
Funded Status and Funding Progress – As of July 1, 2010, the most recent actuarial valuation date, the JRS was 59% funded. The actuarial accrued liability for benefits was $80.4 million, and the actuarial value of assets was $47.3 million, resulting in an unfunded actuarial accrued liability (UAAL) of $33.2 million. The covered payroll (annual payroll of active employees covered by the plan) was $15.3 million, and the ratio of the UAAL to the covered payroll was 217%.
The schedule of funding progress, presented as Required Supplementary Information following the notes to the financial statements, presents multiyear trend information about whether the actuarial value of plan assets are increasing or decreasing over time relative to the actuarial accrued liability for benefits.
D. OtherPostemploymentBenefitsPlan Description – The State Retirees’ Health and Welfare Benefits Fund, Public Employees’ Benefits Program (“PEBP”) of the State of Nevada (“Retirees’ Fund”) was created in 2007 by the Nevada Legislature to account for the financial assets designated to offset the portion of current and future costs of health and welfare benefits paid on behalf of state retirees. NRS 287.0436 established the Retirees’ Fund as an irrevocable trust fund for the purpose of providing retirement benefits other than pensions. The Retirees’ Fund is a multiple-employer cost shar-ing defined postemployment benefit plan with three participat-ing employers, and is administered by the Board of the Public Employees’ Benefits Program of the State of Nevada. The Retirees’ Fund provides benefits other than pensions to eligible retirees and their dependents through the payment of subsidies to the PEBP. PEBP administers a group health and life insur-ance program for covered employees, both active and retired, of the State, and certain other participating public employers within the State of Nevada. NAC 287.530 establishes the bene-fit upon the retiree. All Nevada public employees who retire with at least five years of public service and who have State service are eligible to receive benefits from the Retirees’ Fund. State service is defined as employment with any Nevada State agency, the Nevada System of Higher Education and any State Board or Commission. A portion of the monthly premiums are deducted from pension checks and paid to the PEBP. The cost varies depending on which health plan the retiree chooses, as well as the amount of subsidy they receive.
The Retirees’ Fund issues a stand-alone financial report that includes financial statements and required supplementary information. The State reports the Retiree’s Fund as a trust fund. The Retirees’ Fund financial report may be obtained from Public Employees’ Benefits Program, 901 South Stewart Street, Suite 1001, Carson City, NV 89701.
Summary of Significant Accounting Policies - The financial state-ments of the Retirees’ Fund have been prepared using the accrual basis of accounting. Employer contributions are recognized when due and the employer has made a formal commitment to provide the contributions. Benefits and refunds are recognized when due and payable in accordance with the terms of the plan. The Retirees’ Fund does not receive member contributions.
Method Used to Value Investments – Investments are reported at fair value, which is defined as the price at which an asset passes from a willing seller to a willing buyer. Investments are held with the Retirement Benefits Investment Fund (RBIF), which values participants’ shares according to the contributions of each entity, and accordingly, earnings and expenses are allocated to each enti-ty in proportion to the participants’ share in the RBIF.
Contributions and Funding Policy - NRS 287.046 establishes a subsidy to pay an amount toward the cost of the premium or contribution for the persons retired from the State. Contribu-tions to the Retirees’ Fund are paid by the State of Nevada through an assessment of actual payroll paid by each State entity. For the period from July 1, 2009 through June 30, 2010 the rate assessed was 2.296% of annual covered payroll. The assessment is based on an amount provided by the Legisla-ture each biennium in session law. For the year ended June 30, 2010, the State and its component units contributed $33,406,435 to the plan, which is 100% of the contractually required contribution. For the year ended June 30, 2009, the State and its component units contributed $38,683,119 to the plan, including $32,256,720, which is 100% of the contrac-tually required contribution, and an additional $6,426,399 to prefund benefits. For the year ended June 30, 2008, the State and its component units contributed $59,263,078 to the plan, including $39,590,702, which is 100% of the contractu-ally required contribution, and an additional $19,672,376 to prefund benefits.
59

NEVADA
Notes to Financial StatementsFor the Fiscal Year Ended June 30, 2010
Self InsuranceInsurance Premiums
Fund Fund
Balance June 30, 2008 32,634$ 43,802$ Claims and changes in estimates 238,691 18,999Claim payments (235,444) (17,213)Balance June 30, 2009 35,881 45,588 Claims and changes in estimates 238,725 13,212Claim payments (240,133) (13,637)Balance June 30, 2010 34,473$ 45,163$
Due Within One Year 34,473$ 16,994$
Note 10 - Risk Management
The State of Nevada established the Self-Insurance and Insur-ance Premiums funds in 1983 and 1979, respectively. Both funds are classified as internal service funds.
Interfund premiums are reported as interfund services provid-ed and used. All State funds participate in the insurance program. Changes in the claims liabilities during the past two fiscal years were as follows (expressed in thousands):
These liabilities are recorded in accordance with GASB State-ment No. 10. This statement requires that a liability for claims be reported if information received before the issuance of the financial statements indicates it is probable a liability has been incurred at the date of the financial statements and the amount of the loss can be reasonably estimated. These liabilities include incremental claims adjustment costs. A reserve for losses has been established in both funds to account for these liabilities and is included in the liability section of the State-ment of Net Assets.
There was no insurance coverage for excess liability insurance.
There are several pending lawsuits or unresolved disputes involving the State or its representatives at June 30, 2010. The estimated liability for these claims has been factored into the calculation of the reserve for losses and loss adjustment expenses developed.
A. Self-InsuranceFundThe Self-Insurance Fund administers the group health, life and disability insurance for covered employees, both active and retired, of the State and certain other participating public employers within the State. All public employers in the State are eligible to participate in the activities of the Self-Insurance Fund and currently, in addition to the State, there are fifteen public employers whose employees are covered under the plan. Additionally, all retirees of public employ-ers contracted with the Self-Insurance Fund to provide cover-age to their active employees are eligible to join the program subsequent to their retirement. Public employers are required to subsidize their retirees who participate in the plan in the same manner the State subsidizes its retirees. Currently, one hundred twenty-seven public employers are billed for retiree subsidies. The Self-Insurance Fund is overseen by the Public Employees’ Benefit Program Board. The Board is composed of nine members: eight members appointed by the Governor,
and the Director of the Department of Administration or his designee.
The Self-Insurance Fund is self-insured for medical, dental, vision, mental health and substance abuse benefits and assumes all risk for claims incurred by plan participants. Fully insured HMO products are also offered. Accidental death and dismem-berment, travel accident, long-term disability and life insur-ance benefits are fully insured by outside carriers. For the self-insured benefits, fund rate-setting policies have been established after consultation with an actuary. The participat-ing public employers, with the exception of the State, are not subject to supplemental assessment in the event of deficiencies.
The management of the Self-Insurance Fund establishes claims liabilities based on estimates of the ultimate cost of claims (including future claim adjustment expenses) that have been reported but not settled and of claims that have been incurred but not reported. Because actual claims costs depend on such complex factors as inflation, changes in doctrines of legal liabil-ity and damage awards, the process used in computing claims liabilities does not necessarily result in an exact amount. Upon consultation with an actuary, claims liabilities are recomputed annually using a variety of actuarial and statistical techniques to produce current estimates that reflect recent settlements, claim frequency and other economic and social factors. A provision for inflation in the calculation of estimated future claims costs is implicit in the calculation, because reliance is placed both on actual historical data that reflect past inflation and on other factors that are considered to be appropriate modifiers of past experi-ence. Adjustments to claims liabilities are charged or credited to expense in the periods in which claims are made.
B. InsurancePremiumsFundThe Insurance Premiums Fund provides general, civil (tort), and auto liability insurance to State agencies, workers’ compensation insurance for State employees, and auto physi-cal damage and property insurance for State agencies.
For the period beginning January 1, 2001, and for each calen-dar year thereafter, the Fund purchased a high deductible policy for workers’ compensation. For the year ended June 30, 2010, the loss retention for this policy was $1,500,000. Effective January 1, 2001 NSHE and PERS were excluded from coverage under this policy. Liabilities in the amount of $35,246,832 as of June 30, 2010 were determined using stan-dard actuarial techniques as estimates for the case, reserves, incurred but not reported losses and allocated loss adjustment expenses under the plan as of June 30, 2010.
The Fund is financed by the State. The State has a maximum exposure of $50,000 through October 1, 2007 and $75,000 thereafter for each general liability claim, with the exception of claims that are filed in other jurisdictions, namely, federal court. Those claims filed in federal court are not subject to the limit. The State statutory tort recovery limit will increase to $100,000 effective October 1, 2011. Per State statute, if,
60

Notes to Financial StatementsFor the Fiscal Year Ended June 30, 2010
NEVADA
A. NetAssetsRestrictedbyEnablingLegislationThe government-wide statement of net assets reports $1,147,872,387 of restricted net assets for the primary government of which $113,961,050 is restricted by enabling legislation.
B. GovernmentalFundBalancesGovernmental fund balances, reserved for other at June 30, 2010, are explained as follows (expressed in thousands):
Governmental fund balances, unreserved, designated, reported in nonmajor funds at June 30, 2010, are explained as follows (expressed in thousands):
(Note 10 Continued)as the result of future general liability or catastrophic losses, fund resources are exhausted, coverage is first provided by the reserve for statutory contingency account and would then revert to the General Fund.
The Fund is fully self-insured for general, civil and vehicle liability. The fund is also self-insured for comprehensive and collision loss to automobiles, self-insured to $250,000 for property loss with commercial insurance purchased to cover the excess above this amount, and commercially insured for losses to boilers and machinery and certain other risks.
At June 30, 2010, incurred but not reported claims liability for general, civil and auto liability insurance is based upon stan-dard actuarial techniques, which take into account financial data, loss experience of other self-insurance programs and the insurance industry, the development of known claims, esti-mates of the cost of reported claims, incurred but not reported claims, and allocated loss adjustment expenses. The incurred but not reported claims liability for property casualty insur-ance is based upon the estimated cost to replace damaged property. The liabilty for estimated losses from reported and unreported claims in excess of the amounts paid for the work-ers’ compensation policies is determined using standard actu-arial tecniques, which take into account claims history and loss development factors for similar entities. This liability is further adjusted for a non-working escrow deposit on-hand
with the insurer which is restricted for use as collateral against future losses and a loss fund on-hand with the insurer that is restricted for payment of claims. Incurred but not reported claims liabilities are included in the reserve for losses.
The State is contingently liable for the cost of post retirement heart disease benefits payable under the Nevada Occupation-al Disease Act. Any fireman or police officer that satisfies the five-year employment period requirement under this act is eligible for coverage under Workers’ Compensation for heart disease. A range of estimated losses from $9,647,700 to $40,118,200 has been determined using standard actuarial techniques. Due to the high degree of uncertainty surround-ing this coverage, no accrual for these losses is reflected in the financial statements.
At June 30, 2010 total liabilities exceeded total assets by $24,131,446. The Fund is liable for approximately $25,000,000 as of June 30, 2010 in potential claims settle-ments, which have yet to be funded through premium contri-butions. As NRS 331.187 provides that if money in the Fund is insufficient to pay a tort claim, the claim is to be paid from the reserve for statutory contingency account, and, as manage-ment assesses premiums to cover current claims payments, management believes that this provides the opportunity for the Fund to satisfy these liabilities.
Note 11 - Fund Balances and Net Assets
General State Highway Other Governmental TotalFund balances, reserved for other:
Reserved for prepaid items 1,677$ 12$ 99$ 1,788$ Reserved for noncurrent receivables - notes 387 - 23 410 Reserved for specific purpose private contributions - - 165 165 Reserved for legislatively approved allocations - - 3,097 3,097
Total fund balances, reserved for other 2,064$ 12$ 3,384$ 5,460$
Other GovernmentalFund balances, unreserved, designated, reported in nonmajor:
Special revenue funds: Designated for waiver of furloughs and increased costs associated with compensated absences due to upcoming Legislative Session 1,200$ Capital project funds: Designated for approved capital projects 59,943
Total fund balances, unreserved, designated, reported in nonmajor funds 61,143$
61

Notes to Financial StatementsFor the Fiscal Year Ended June 30, 2010
NEVADA(Note 11 Continued)
Note 12 - Principal Tax Revenues
The principal taxing authorities for the State of Nevada are the Nevada Tax Commission and the Nevada Gaming Commission.
The Nevada Tax Commission was created under NRS 360.010 and is the taxing and collecting authority for most non-gaming taxes. The following are the primary non-gaming tax revenues:
Sales and Use Taxes are imposed at a minimum rate of 6.85%, with county and local option up to an additional 1.25%, on all taxable sales and taxable items of use. The State receives tax revenue of 2% of total sales with the balance distributed to local governmental entities and school districts.
Modified Business Tax is imposed at a tiered rate for businesses other than financial institutions. If the sum of all taxable wages paid by the employer does not exceed $62,500 for the calendar quarter, the amount of tax is 0.5% of the sum of the wages. If the sum of all the wages paid by the employer exceeds $62,500 for the calendar quarter, the tax is $312.50 plus 1.17% of the amounts the wages exceed $62,500. Modified Business Tax is imposed on financial institutions at 2% on gross wages paid by the employer during the calendar quarter. There is an allow-able deduction from the gross wages for amounts paid by the employer for qualified health insurance or a qualified health benefit plan.
Insurance Premium Tax is imposed at 3.5% on insurance premiums written in Nevada. A “Home Office Credit” is given to insurance companies with home or regional offices in Nevada, but not to exceed 80% of the taxes due.
Motor Vehicle Fuel Tax is levied at 24.805 cents per gallon on gasoline and gasohol sales. 17.65 cents of the tax goes to the State Highway Fund, .75 cents goes to the Clean-ing Up Petroleum Discharges Fund, .055 cents goes to the General Fund and the remaining 6.35 cents goes to the counties. The counties have an option to levy up to an additional 9 cents per gallon.
Other Sources of tax revenues include: Cigarette Tax, Controlled Substance Tax, Estate Tax, Jet Fuel, Liquor Tax, Live Entertainment Tax (non-gaming establishments), Lodging Tax, Business License Fees, Motor Carrier Fees, Motor Vehicle Registration Fees, Net Proceeds of Minerals Tax, Property Tax, Real Property Transfer Tax, Short-Term Lessor Fees and Tire Tax.
The Nevada Gaming Commission was created under NRS 463.022 and is charged with collecting State gaming taxes and fees. The following sources account for gaming tax revenues:
Percentage Fees are the largest of several State levies on gaming. They are based upon gross revenue and are collected monthly. The fee is applied on a graduated basis at the following monthly rates: 3.5% of the first $50,000 of gross revenue; 4.5% of the next $84,000 of gross revenue; and 6.75% of the gross revenue in excess of $134,000.
Live Entertainment Taxes are imposed at 10% of all amounts paid for admission, food, merchandise or refresh-ment, while the establishment is providing entertainment in facilities with less than occupancy/seating of 7,500. A 5% rate is imposed for facilities with at least 7,500 occu-pancy/seating.
Flat Fee Collections are levied on the number of gambling games and slot machines operated. Licensees pay fees at variable rates on the number of gaming devices operated per quarter.
Other Sources of gaming tax revenues include: Annu-al State Slot Machine Taxes, Annual License Fees and Miscellaneous Collections, which consists of penalties and fines, manufacturer’s, distributor’s and slot route opera-tor’s fees, advance payments, race wire fees, pari-mutuel wagering tax and other nominal miscellaneous items.
C. IndividualFundDeficitsNonmajorEnterpriseFundsNevada Magazine - The Nevada Magazine Fund accounts for the operation of the publication, Nevada Magazine, which is published to promote tourism. The fund shows an increase in net assets of $62,561 for the fiscal year ended June 30, 2010, resulting in net liabilities (negative net assets) of $73,084 at June 30, 2010.
Higher Education Tuition Trust - The Higher Education Tuition Trust Fund accounts for the receipts and disbursements related to prepaid tuition contracts that allow the cost of tuition to be
paid in advance of enrollment at an institution of higher educa-tion. The fund shows an increase in net assets of $6,755,683 for the fiscal year ended June 30, 2010, resulting in net liabilities (negative net assets) of $9,708,161 at June 30, 2010.
InternalServiceFundInsurance Premiums - The Insurance Premiums Fund allo-cates the cost of fidelity insurance, property insurance and workers’ compensation insurance to State agencies. The fund recorded an increase in net assets of $4,150,903 for the year ended June 30, 2010, resulting in net liabilities (negative net assets) of $24,131,446 at June 30, 2010.
62

NEVADA
Notes to Financial StatementsFor the Fiscal Year Ended June 30, 2010
Note 13 - Works of Art and Historical Treasures
Note 14 - Commitments and Contingencies
The State possesses certain works of art, historical treasures, and similar assets that are not included in the capital assets shown in Note 7. The mission of the Lost City Museum in Overton is to study, preserve, and protect prehistoric Pueblo sites found in the Moapa Valley and adjacent areas and to interpret these sites through exhibits and public programs. In Reno, the Nevada Historical Society exhibits and maintains a large number of historical collections preserving the cultural heritage of Nevada. These collections are divided into four sections: library, manuscripts, photography, and museum. The Nevada State Museum in Carson City collects, preserves, and documents three general types of collections: anthropol-ogy, history, and natural history as it relates to Nevada and the Great Basin. The mission of the Nevada State Museum, Las Vegas, is to inspire and educate a diverse public about the history and natural history of Nevada. Its major collec-tions include transportation, mining, and tourism as well as daily artifacts such as clothing, historical correspondence, business records, and photography. The Nevada State Rail-road Museum, which is located in Carson City, preserves the
rich railroad heritage of Nevada, including locomotives and cars of the famous Virginia & Truckee Railroad. The East Ely Depot Museum, located in the historic Nevada Northern Rail-road Depot building, exhibits artifacts, documents, and photo-graphs of early Eastern Nevada mining and railroad transpor-tation. The Nevada Arts Council with locations in Carson City and Las Vegas exhibits artwork. Its mission is to enrich the cultural life of the state and make excellence in the arts acces-sible to all Nevadans.
These collections are not capitalized by the State because they are:
• Held for public exhibition, education or research in furtherance of public service, rather than financial gain,
• Protected, kept unencumbered, cared for and preserved, and
• Subject to an organizational policy that requires the proceeds from sales of collection items to be used to acquire other items for collections.
A. PrimaryGovernmentLawsuits - The State Attorney General’s Office reported that the State of Nevada or its officers and employees were parties to numerous lawsuits, in addition to those described below. In view of the financial condition of the State, the State Attor-ney General is of the opinion that the State’s financial condi-tion will not be materially affected by this litigation, based on information known at this time.
Several of the actions pending against the State are based upon the State’s (or its agents’) alleged negligence in which the State must be named as a party defendant. However, there is a statutory limit to the State’s liability of $50,000 per cause of action through October 1, 2007 and $75,000 per cause of action thereafter. Such limitation does not apply to federal actions such as civil rights actions under 42 U.S.C. Section 1983 brought under federal law or to actions in other states. Tort claims are handled in accordance with NRS 41. Building and contents are insured on a blanket replacement cost basis for all risk except certain specified exclusions.
The State and/or its officers and employees are parties to a number of lawsuits filed under the federal civil rights statutes. However, the State is statutorily required to indemnify its offi-cers and employees held liable in damages for acts or omis-sions on the part of its officers and employees occurring in the course of their public employment. Several claims may thus be filed against the State based on alleged civil rights viola-tions by its officers and employees. Since the statutory limit of liability (discussed above) does not apply in federal civil rights cases, the potential liability of the State is not ascer-
tainable at the present time. Currently, the State is involved in several actions alleging federal civil rights violations that could result in substantial liability to the State.
In litigation filed against the Department of Taxation, the plaintiff is seeking a declaration that the Live Entertainment Tax is unconstitutional on its face and that they do not have to pay the tax. The Live Entertainment Tax is collected by the Department of Taxation as well as the Gaming Control Board. The Gaming Control Board’s collection of the Live Entertain-ment Tax has not been challenged. Should a refund be grant-ed, the estimated amount to date is $60.8 million. However, if the tax is found to be unconstitutional on its face, the statute may be completely stricken.
The State instituted a claim for declaratory relief relating to its actions in 2008 in terminating a forward delivery invest-ment agreement between it and Lehman Brothers Commer-cial Bank, a Utah industrial bank (“LBCB”). When the State entered into the forward delivery investment agreement in June of 2002, it received a fee of $20.5 million in exchange for agreeing to purchase certain specified US treasury securi-ties of various maturities and principal amounts from LBCB at different times between June 30, 2002 and May 15, 2028. The State was required to purchase the securities at their matured values, or par value if discount securities were purchased. LBCB would realize revenue at the time of delivery to the custodian. In January of 2009, LBCB (now known as Wood-lands Commercial Bank) filed an answer to the State’s declar-atory judgement action and a counterclaim requesting a judge-ment in favor of LBCB in the declaratory relief claim, and
63
Notes to Financial StatementsFor the Fiscal Year Ended June 30, 2010
NEVADA
For the YearEnding June 30 Amount
2011 30,214$ 2012 22,5482013 16,4902014 10,3412015 6,704
2016-2020 7,6792021-2025 2,100
Total 96,076$
(Note 14 Continued)
seeking other relief, including an award of damages against the State. While the State believes it has a meritorious claim for declaratory relief and meritorious defenses to LBCB’s counterclaim, the State cannot at this time predict the outcome of this action.
PERS - The Public Employees’ Retirement System (PERS) has entered into investment funding commitments related to private markets to fund an additional $533.3 million at some future date.
Leases - The State is obligated by leases for buildings and equipment accounted for as operating leases. Operating leas-es do not give rise to property rights as capital leases do. There-fore, the results of the lease agreements are not reflected in the Statement of Net Assets. Primary government lease expense for the year ended June 30, 2010 amounted to $36 million. The following is the primary government’s schedule of future mini-mum rental payments required under operating leases that have initial or remaining noncancelable lease terms in excess of one year as of June 30, 2010 (expressed in thousands):
Federal Grants - The State receives significant financial assis-tance from the federal government in the form of grants and entitlements, which are generally conditioned upon compli-ance with terms and conditions of the grant agreements and applicable federal regulations, including the expenditure of the resources for eligible purposes. Substantially all grants are subject to financial and compliance audits by federal agencies. Any disallowance as a result of these audits could become a liability of the State. As of June 30, 2010, the State is unable to estimate the amount, if any, of expenditures that may be disallowed, although the State expects such amounts, if any, to be immaterial.
Rebate Arbitrage - The Federal Tax Reform Act of 1986 imposes a rebate requirement with respect to some bonds
issued by the State. Under this requirement, an amount equal to the sum of (a) the excess of the aggregate amount earned on all investments (other than certain specified exceptions) over the amount that would have been earned if all invest-ments were invested at a rate equal to the yield on the bonds, and (b) any income earned on the excess described in (a) is required to be rebated to the U.S. Treasury, in order for the interest on the bonds to be excluded from gross income for federal income tax purposes. Rebatable arbitrage is computed as of each installment computation date. The present value of the rebatable arbitrage is $3,282,000 and has been recorded as a liability in the Statement of Net Assets at June 30, 2010. Future calculations might result in different rebatable arbi-trage amounts.
Construction Commitments – As of June 30, 2010, the Nevada Department of Transportation had total contractual commitments of approximately $478.4 million for construc-tion of various highway projects. Other major non-highway construction commitments for the primary government’s budgeted capital projects funds total $23.3 million.
B. DiscretelyPresentedComponentUnitsNevada System of Higher Education (NSHE) – As of June 30, 2010, NSHE had entered into various investment agreements with private equity partnerships and private commingled funds. Under the terms of certain of these investment agree-ments, NSHE is obligated to make additional investments in these partnerships of $4,827,000.
NSHE is a defendant or co-defendant in legal actions. Based on present knowledge and advice of legal counsel, NSHE management believes any ultimate liability in these matters, in excess of insurance coverage, will not materially affect the net assets, changes in net assets or cash flows of NSHE.
The estimated cost to complete property authorized or under construction at June 30, 2010 is $127,884,000. These costs will be financed by State appropriations, private donations, available resources and/or long-term borrowings.
Colorado River Commission (CRC) - The CRC may from time to time be a party in various litigation matters. It is manage-ment’s opinion, based upon advice from legal counsel, that the risk of financial losses to CRC from such litigation, if any, will not have a material adverse effect on CRC’s future financial position, results of operations or cash flows. Accordingly, no provision has been made for any such losses.
The CRC does not accrue for estimated future legal defense costs, if any, to be incurred in connection with outstanding or threatened litigation and other disputed matters but rather, records such as period costs when the services are rendered.
64

This page intentionally left blank.

NEVADA
Notes to Financial StatementsFor the Fiscal Year Ended June 30, 2010
Note 15 - Subsequent Events
Note 16 - Accounting Changes and Restatements
Net assets as of July 1, 2009 have been restated in the enterprise funds and business type activities to reflect a change in the reporting of the WICHE Student Loan Fund (enterprise fund). WICHE Student Loan Fund is no longer part of the primary government, and is reported by the Nevada System of Higher Education (component unit) beginning July 1, 2009. The result is a reduction in beginning net assets of $2,010,098.
PrimaryGovernmentBonds – On December 8, 2010 the State executed purchase agreements for the following bonds, which are scheduled to close on December 21, 2010:
$121,920,000 Series 2010C General Obligation (Limited Tax), Capital Improvement and Refunding Bonds (subject to the Constitutional Debt Limit)
$20,170,000 Series 2010D General Obligation (Limited Tax), Natural Resources and Refunding Bonds (not subject to the Constitutional Debt Limit)
$4,535,000 Series 2010G General Obligation (Limited Tax), Water Pollution Control Revolving Fund Matching Bonds (not subject to the Constitutional Debt Limit)
$4,625,000 Series 2010H, Subseries 1 (Tax-Exempt) General Obligation (Limited Tax), Water Pollution Control Revolving Fund Leveraged Refunding Bonds (not subject to the Constitutional Debt Limit)
$3,725,000 Series 2010H, Subseries 2 (Taxable) General Obligation (Limited Tax), Water Pollution Control Revolving Fund Leveraged Refunding Bonds (not subject to the Constitutional Debt Limit)
$6,235,000 Series 2010I General Obligation (Limited Tax), Safe Drinking Water Revolving Fund Matching and Refunding Bonds (not subject to the Constitutional Debt Limit)
Advances from the Federal Unemployment Account – The State drew repayable advances of $141.4 million between July1, 2010 and November 30, 2010. The State has applied for and may still draw up to $270 million to meet State unemployment insurance obligations through March 31, 2011. Thereafter loan requests may be submitted every 90 days.
65

For the Fiscal Year Ended June 30, 2010
Budgetary Comparison ScheduleGeneral Fund and Major Special Revenue Funds
Original Budget Final Budget ActualVariance with Final Budget
SOURCES OF FINANCIAL RESOURCESFund balances, July 1 477,958,549$ 477,958,549$ 477,958,549$ -$
Revenues: Sales taxes 831,058,800 758,074,300 784,348,571 26,274,271 Gaming taxes, fees, licenses 856,907,929 793,888,829 789,608,373 (4,280,456) Intergovernmental 2,169,665,619 2,716,130,421 2,237,855,390 (478,275,031) Other taxes 1,349,075,833 1,300,239,513 1,325,144,697 24,905,184 Sales, charges for services 223,283,905 217,965,676 181,384,891 (36,580,785) Licenses, fees and permits 492,775,654 495,435,579 497,356,970 1,921,391 Interest 14,202,179 17,964,032 4,939,938 (13,024,094) Other 222,125,156 239,550,158 216,116,335 (23,433,823)
Other financing sources: Proceeds from sale of bonds - 16,521,898 16,523,022 1,124 Transfers 292,211,880 750,697,611 694,982,282 (55,715,329) Reversions from other funds - - 3,249,831 3,249,831
Total sources 6,929,265,504 7,784,426,566 7,229,468,849 (554,957,717)
USES OF FINANCIAL RESOURCESExpenditures and encumbrances: Constitutional agencies 291,523,030 478,256,379 400,733,325 77,523,054 Finance and administration 74,959,435 76,962,746 62,961,540 14,001,206 Education 2,667,381,791 2,844,498,591 2,603,053,645 241,444,946 Human services 2,829,480,385 2,983,570,791 2,755,876,129 227,694,662 Commerce and industry 155,188,779 210,394,019 137,448,452 72,945,567 Public safety 434,700,215 528,019,818 400,592,933 127,426,885 Infrastructure 262,374,898 324,844,059 145,193,108 179,650,951 Special purpose agencies 37,878,103 45,180,595 34,563,193 10,617,402Other financing uses: Transfers to other funds 60,028,571 59,501,928 59,501,928 - Reversions to other funds - - 1,175,148 (1,175,148)Projected reversions (53,500,000) (53,500,000) - (53,500,000)
Total uses 6,760,015,207 7,497,728,926 6,601,099,401 896,629,525
Fund balances, June 30 169,250,297$ 286,697,640$ 628,369,448$ 341,671,808$
General Fund
Sources of Financial Resources
Uses of Financial Resources
66

NEVADA
Original Budget Final Budget Actual
Variance with Final
BudgetOriginal Budget Final Budget Actual
Variance with Final
Budget
295,089,004$ 295,089,004$ 295,089,004$ -$ -$ -$ -$ -$
- - - - - - - -- - - - - - - -
362,396,583 537,052,820 440,919,912 (96,132,908) - - - -284,232,340 284,279,760 302,324,379 18,044,619 - - - -21,725,190 16,323,338 16,130,971 (192,367) - - - -
165,068,439 161,470,066 177,454,612 15,984,546 - - - -8,051,793 3,051,793 3,106,451 54,658 30,618,109 30,618,109 30,148,333 (469,776)
44,263,591 33,005,124 37,354,061 4,348,937 - - - -
- - - - - - - -15,772,197 21,264,676 14,623,963 (6,640,713) - - - -
- - - - - - - -
1,196,599,137 1,351,536,581 1,287,003,353 (64,533,228) 30,618,109 30,618,109 30,148,333 (469,776)
- - - - - - - -- - - - - - - -- - - - - - - -- - - - - - - -- - - - - - - -
201,540,407 211,291,925 190,318,430 20,973,495 - - - -720,249,174 935,801,864 744,200,816 191,601,048 - - - -
- - - - - - - -
89,297,677 94,053,726 94,053,724 2 30,618,109 30,618,109 30,146,884 471,225- - 34,335 (34,335) - - - -- - - - - - - -
1,011,087,258 1,241,147,515 1,028,607,305 212,540,210 30,618,109 30,618,109 30,146,884 471,225
185,511,879$ 110,389,066$ 258,396,048$ 148,006,982$ -$ -$ 1,449$ 1,449$
Highway Fund Municipal Bond Bank
67

NEVADAFor the Fiscal Year Ended June 30, 2010
Notes to Required Supplementary InformationBudgetary Reporting
8
Total fund balance (budgetary basis) 628,369$ Restricted funds (317,940)
Unrestricted fund balance (budgetary basis) 310,429$
General State MunicipalFund Highway Bond Bank
Fund balances (budgetary basis) June 30, 2010 628,369$ 258,396$ 1$ Adjustments:Basis differences: Petty cash or outside bank accounts (13,956) 180 - Investments not recorded on the budgetary basis 7,826 - 311,565 Accrual of certain other receivables 154,660 4,780 2 Inventory - 12,309 - Advances to other funds 8,342 2 - Accrual of certain accounts payable and other liabilities (284,281) - - Deferred revenues (252,429) (1) - Encumbrances 3,074 1,884 - Other (17,047) (6,951) (72)
Fund balances (GAAP basis) June 30, 2010 234,558$ 270,599$ 311,496$
The accompanying Budgetary Comparison Schedule – General Fund and Major Special Revenue Funds presents both the origi-nal and the final legally adopted budgets, as well as actual data on a budgetary basis. (Note 2 of the basic financial statements identifies the budgeting process and control.)
The original budget is adopted through passage of the General Appropriations Act, which allows for expenditures from unre-stricted revenues, while the Authorized Expenditures Act allows for expenditures from revenues collected for specific purposes (restricted revenues). For programs financed from restricted revenues, spending authorization is generally contingent upon recognition of the related revenue. Reductions of spending authority occur if revenues fall short of estimates. If revenues exceed the estimate, supplemental appropriations are required before the additional resources can be spent.
Generally Accepted Accounting Principles (GAAP) require that the final legal budget be reflected in the “final budget” column. Therefore, updated revenue estimates available for appropriations as of September 10 are reported instead of the amounts disclosed in the original budget. The September 10, 2010 date is used because this is the date for which the Legislative Interim Finance Committee affected the last changes to the fiscal year ended June 30, 2010 budget as permitted by NRS 353.220.
Since the budgetary and GAAP presentations of actual data differ, a reconciliation of ending fund balances is presented below (expressed in thousands):
Total fund balance on the budgetary basis in the General Fund at June 30, 2010, is composed of both restricted funds, which are not available for appropriation, and unrestricted funds as follows (expressed in thousands):
There were no expenditures in excess of appropriations or authorizations in the individual budget accounts for the year.
68

NEVADAFor the Fiscal Year Ended June 30, 2010
Schedule of Funding ProgressPension Plans
8
Legislator’sRetirementSystem(LRS)Schedule of Funding Progress - Actuarial valuations of the LRS are prepared every two years to determine State contributions required to fund the system on an actuarial basis. During the fiscal year, the Plan changed the actuarial valuation date from a calendar year to a fiscal year to be consistent with the financial statements. A schedule of funding progress follows (expressed in thousands):
Trends can be affected by investment experience (favorable or unfavorable), salary experience, retirement experience or chang-es in demographic characteristics of employees. Changes in benefits provisions and in actuarial methods and assumptions can also affect trends. Actuarial valuation is performed biennially; plans with biennial valuations need not present duplicate information for the intervening years.
LRS issues a stand-alone financial report which may be obtained from the Public Employees’ Retirement System, 693 West Nye Lane, Carson City, Nevada 89703.
JudicialRetirementSystem(JRS)Schedule of Funding Progress - Actuarial valuations of the JRS are prepared annually on a fiscal year basis to determine State contributions required to fund the system on an actuarial basis. During the fiscal year, the Plan changed the actuarial valuation date from a calendar year to a fiscal year to be consistent with the financial statements. A schedule of funding progress follows (expressed in thousands):
Trends can be affected by investment experience (favorable or unfavorable), salary experience, retirement experience or chang-es in demographic characteristics of employees. Changes in benefits provisions and in actuarial methods and assumptions can also affect trends.
Actuarial UAAL as a %Valuation Ratio of of Annual
Date Assets to AAL Covered Payroll
01/01/07 $ 5,884 $ 4,323 $ 1,561 73% $ 328 476%01/01/09 5,955 4,229 1,726 71% 351 492%07/01/10 5,608 4,134 1,474 74% 359 411%
AnnualCoveredPayroll
Actuarial AccruedLiability (AAL)
Actuarial Valueof Assets
UnfundedActuarial AccruedLiability (UAAL)
Actuarial UAAL as a %Valuation Ratio of of Annual
Date Assets to AAL Covered Payroll
01/01/08 $ 62,067 $ 40,076 $ 21,991 65% $ 11,492 191%01/01/09 67,192 39,764 27,428 59% 11,368 241%07/01/10 80,447 47,281 33,166 59% 15,315 217%
AnnualCoveredPayroll
Actuarial AccruedLiability (AAL)
Actuarial Valueof Assets
UnfundedActuarial AccruedLiability (UAAL)
69

NEVADA
The State has adopted the modified approach for reporting infrastructure assets defined as a single roadway network that includes bridges. Bridges are not considered a subsystem as they are included in the cost of road construction. Under this approach, the State expenses certain maintenance and preservation costs and does not report depreciation expense. The single roadway network accounted for under the modified approach includes the combination of approximately 5,300 centerline miles of roads and approximately 1,100 bridges.
The State manages its roadway network by dividing the roadway system into five categories based on the traffic load. The categories range from category I, representing the busiest roadways and interstates, to category V, representing the least busy rural routes with an average daily traffic of less than 200 vehicles. In odd numbered calendar years the State completes a condi-tion assessment of its roadways. To monitor the condition of the roadways the State uses the International Roughness Index (IRI). IRI measures the cumulative deviation from a smooth surface. The lower the IRI value, the better the condition of the roadway. The State has set a policy that it will maintain a certain percentage of each category of its roadways with an IRI of less than 80. The State has set a policy that it will maintain its bridges so that not more than 10 percent are structurally deficient or functionally obsolete. During the current reporting period some of the bridge reporting and inspection methodologies changed. In prior years, bridges that were functionally obsolete and not eligible for federal funding were not reported as functionally obsolete. These bridges are now reported as functionally obsolete. In addition, the inspection methodologies have been refined, resulting in an increase of functionally obsolete bridges. These changes caused the State to exceed its 10 percent policy. The State is considering revising its policy to allow for these changes in reporting. The following tables show the State’s policy and the condition level of the roadways and bridges.
The following table shows the State’s estimate of spending necessary to preserve and maintain the roadway network at, or above, the established condition level and the actual amount spent during the past five fiscal years.
Maintenance and preservation costs are primarily funded with the fuel taxes, vehicle registration and license fees. The funding level for maintenance and preservation costs is affected by the amount of taxes and fees collected and the amount appropriated for construction of new roadways.
For the Fiscal Year Ended June 30, 2010
Schedule of Infrastructure Condition and Maintenance Data
8
I II III IV V
State Policy-minimum percentage 70% 65% 60% 40% 10%
Actual results of 2009 condition assessment 82% 82% 87% 56% 21%Actual results of 2007 condition assessment 82% 82% 88% 61% 25%Actual results of 2005 condition assessment 81% 78% 89% 61% 26%
Condition Level of the RoadwaysPercentage of roadways with an IRI of less than 80
Category
2009 2007 2005State Policy-maximum percentage 10% 10% 10%
Actual results condition assessment 15% 4% 3%
Percentage of substandard bridgesCondition Level of the Bridges
2010 2009 2008 2007 2006Estimated 181,054$ 124,926$ 155,051$ 243,191$ 207,751$
Actual 151,448 121,798 146,507 218,923 196,080
Maintenance and Preservation Costs(Expressed in Thousands)
70

71
Independent Auditor’s Report on Internal Control over Financial Reporting and on Compliance and Other Matters Based on an Audit of Financial Statements
Performed in Accordance with Government Auditing Standards
The Honorable Kim Wallin, CMA, CFM, CPA State Controller We have audited the financial statements of the governmental activities, the business-type activities, the aggregate discretely presented component units, each major fund, and the aggregate remaining fund information of the State of Nevada (the State), as of and for the year ended June 30, 2010, which collectively comprise the State’s basic financial statements and have issued our report thereon dated December 17, 2010. Our report includes a reference to other auditors. We conducted our audit in accordance with auditing standards generally accepted in the United States of America and the standards applicable to financial audits contained in Government Auditing Standards, issued by the Comptroller General of the United States. Other auditors audited the financial statements of the Nevada System of Higher Education and the Colorado River Commission, discretely presented component units; the Housing Division Enterprise Fund, the Self Insurance and Insurance Premiums Internal Service Funds, the Pension Trust Funds and the Other Employee Benefit Trust Fund – State Retirees’ Fund, the Nevada College Savings Plan – Private Purpose Trust Fund, and the Retirement Benefits Investment Fund as described in our report on the State’s financial statements. This report does not include the results of the other auditors’ testing of internal control over financial reporting or compliance and other matters that are reported on separately by some of those auditors. The financial statements of the Higher Education Tuition Trust Enterprise Fund, the Self Insurance and Insurance Premiums Internal Service Funds, the Pension Trust Funds and the Other Employee Benefit Trust Fund – State Retirees’ Fund, the Nevada College Savings Plan – Private Purpose Trust Fund, and the Retirement Benefits Investment Fund were not audited in accordance with Government Auditing Standards. Internal Control Over Financial Reporting: In planning and performing our audit, we considered the State’s internal control over financial reporting as a basis for designing our auditing procedures for the purpose of expressing our opinions on the financial statements, but not for the purpose of expressing an opinion on the effectiveness of the State’s internal control over financial reporting. Accordingly, we do not express an opinion on the effectiveness of the State’s internal control over financial reporting. A deficiency in internal control exists when the design or operation of a control does not allow management or employees, in the normal course of performing their assigned functions, to prevent or detect and correct misstatements on a timely basis. A material weakness is a deficiency, or combination of deficiencies, in internal control such that there is a reasonable possibility that a material misstatement of the entity’s financial statements will not be prevented, or detected and corrected on a timely basis.

72
Our consideration of the internal control over financial reporting was for the limited purpose described in the first paragraph of this section and was not designed to identify all deficiencies in internal control over financial reporting that might be deficiencies, significant deficiencies or material weaknesses. We did not identify any deficiencies in internal control over financial reporting that we consider to be material weaknesses, as defined above. Compliance and Other Matters: As part of obtaining reasonable assurance about whether the State’s financial statements are free of material misstatement, we performed tests of its compliance with certain provisions of laws, regulations, contracts and grant agreements, noncompliance with which could have a direct and material effect on the determination of financial statement amounts. However, providing an opinion on compliance with those provisions was not an objective of our audit and, accordingly, we do not express such an opinion. The results of our tests disclosed no instances of noncompliance or other matters that are required to be reported under Government Auditing Standards. This report is intended solely for the information and use of the Nevada Legislature, management of the State, and Federal awarding agencies and pass-through entities and is not intended to be and should not be used by anyone other than these specified parties. Reno, Nevada December 17, 2010

73
Independent Auditor’s Report on Compliance with Requirements that Could Have a Direct and Material Effect on Each Major Program and on Internal Control
over Compliance in Accordance with OMB Circular A-133
Legislative Auditor Legislative Counsel Bureau Capitol Complex Carson City, Nevada 89710 Compliance We have audited the State of Nevada’s (the State’s) compliance with the types of compliance requirements described in the U. S. Office of Management and Budget (OMB) Circular A-133 Compliance Supplement that could have a direct and material effect on each of the State’s major Federal programs for the year ended June 30, 2010. The State’s major Federal programs are identified in the summary of auditor’s results section of the accompanying Schedule of Findings and Questioned Costs. Compliance with the requirements of laws, regulations, contracts, and grants applicable to each of its major Federal programs is the responsibility of the State’s management. Our responsibility is to express an opinion on the State’s compliance based on our audit. As described in our report dated December 17, 2010, portions of the audit of the basic financial statements were performed by other auditors, whose reports were furnished to us. We conducted our audit of compliance in accordance with auditing standards generally accepted in the United States of America; the standards applicable to financial audits contained in Government Auditing Standards, issued by the Comptroller General of the United States; and OMB Circular A-133, Audits of States, Local Governments, and Non-Profit Organizations. Those standards and OMB Circular A-133 require that we plan and perform the audit to obtain reasonable assurance about whether noncompliance with the types of compliance requirements referred to above that could have a direct and material effect on a major Federal program occurred. An audit includes examining, on a test basis, evidence about the State’s compliance with those requirements and performing such other procedures as we considered necessary in the circumstances. We believe that our audit provides a reasonable basis for our opinion. Our audit does not provide a legal determination of the State’s compliance with those requirements. In our opinion, the State complied, in all material respects, with the requirements referred to above that could have a direct and material effect on each of its major Federal programs for the year ended June 30, 2010. However, the results of our auditing procedures disclosed an instance of noncompliance with those requirements that is required to be reported in accordance with OMB Circular A-133 and which is described in the accompanying Schedule of Findings and Questioned Costs as Finding 10-6.

74
Internal Control over Compliance Management of the State is responsible for establishing and maintaining effective internal control over compliance with the requirements of laws, regulations, contracts and grants applicable to Federal programs. In planning and performing our audit, we considered the State’s internal control over compliance with the requirements that could have a direct and material effect on a major Federal program in order to determine our auditing procedures for the purpose of expressing our opinion on compliance and to test and report on internal control over compliance in accordance with OMB Circular A-133, but not for the purpose of expressing an opinion on the effectiveness of internal control over compliance. Accordingly, we do not express an opinion on the effectiveness of the State’s internal control over compliance. A deficiency in internal control over compliance exists when the design or operation of a control over compliance does not allow management or employees, in the normal course of performing their assigned functions, to prevent, or detect and correct, noncompliance with a type of compliance requirement of a Federal program on a timely basis. A material weakness in internal control over compliance is a deficiency, or combination of deficiencies, in internal control over compliance, such that there is a reasonable possibility that material noncompliance with a type of compliance requirement of a Federal program will not be prevented, or detected and corrected, on a timely basis. Our consideration of the internal control over compliance was for the limited purpose described in the first paragraph in this section and was not designed to identify all deficiencies in internal control over compliance that might be deficiencies, significant deficiencies or material weaknesses. We did not identify any deficiencies in internal control over compliance that we consider to be material weakness, as defined above. However, we identified certain deficiencies in internal control over compliance that we consider to be significant deficiencies as described in the accompanying Schedule of Findings and Questioned Costs as Findings 10-1 through 10-5 and 10-7 through 10-32. A significant deficiency in internal control over compliance is a deficiency, or a combination of deficiencies, in internal control over compliance with a type of compliance requirement of a Federal program that is less severe than a material weakness in internal control over compliance, yet important enough to merit attention by those charged with governance. The State’s responses to the findings identified in our audit are included in the accompanying Schedule of Findings and Questioned Costs. We did not audit the State’s responses, and accordingly, we express no opinion on the responses. This report is intended solely for the information and use of the Nevada Legislature, management of the State, and Federal awarding agencies and pass-through entities and is not intended to be and should not be used by anyone other than these specified parties. Reno, Nevada March 17, 2011

Fede
ral G
rant
or /
Pass
-Thr
ough
Gra
ntor
CFD
AAw
ard
or P
ass-
Paym
ents
to
Pro
gram
Titl
eN
umbe
rTh
roug
h N
umbe
rEx
pend
iture
s S
ubre
cipi
ents
____
____
____
____
____
____
____
____
____
____
____
____
____
____
____
___
____
____
___
____
____
____
____
____
____
____
____
____
____
____
____
____
____
____
____
____
____
____
____
____
__D
epar
tmen
t of A
gric
ultu
re
Res
earc
h an
d D
evel
opm
ent C
LUST
ER
Agr
icul
tura
l Res
earc
h_B
asic
and
App
lied
Res
earc
h10
.001
58-5
325-
5-69
125
,359
$
-$
Rur
al D
evel
opm
ent,
Fore
stry
, and
Com
mun
ities
10.6
7204
-DG
-110
4600
0-04
94,
229
-
Tot
al R
esea
rch
and
Dev
elop
men
t CLU
STER
29,5
88
-
Tot
al D
epar
tmen
t of A
gric
ultu
re29
,588
-
Dep
artm
ent o
f the
Inte
rior
Res
earc
h an
d D
evel
opm
ent C
LUST
ER
Out
door
Rec
reat
ion_
Acq
uisi
tion,
Dev
elop
men
t and
Pla
nnin
g15
.916
FFY
200
16,
311
-
Out
door
Rec
reat
ion_
Acq
uisi
tion,
Dev
elop
men
t and
Pla
nnin
g15
.916
FFY
200
225
,840
25,0
00
Out
door
Rec
reat
ion_
Acq
uisi
tion,
Dev
elop
men
t and
Pla
nnin
g15
.916
FFY
200
484
,185
-
Out
door
Rec
reat
ion_
Acq
uisi
tion,
Dev
elop
men
t and
Pla
nnin
g15
.916
FFY
200
536
7,32
2
23
6,25
0
Out
door
Rec
reat
ion_
Acq
uisi
tion,
Dev
elop
men
t and
Pla
nnin
g15
.916
FFY
200
613
,200
12,7
41
Out
door
Rec
reat
ion_
Acq
uisi
tion,
Dev
elop
men
t and
Pla
nnin
g15
.916
FFY
200
791
,507
76,7
75
Out
door
Rec
reat
ion_
Acq
uisi
tion,
Dev
elop
men
t and
Pla
nnin
g15
.916
FFY
200
88,
613
-
Out
door
Rec
reat
ion_
Acq
uisi
tion,
Dev
elop
men
t and
Pla
nnin
g15
.916
FFY
200
925
,000
-
621,
978
350,
766
Tot
al R
esea
rch
and
Dev
elop
men
t CLU
STER
621,
978
350,
766
Tot
al D
epar
tmen
t of t
he In
terio
r62
1,97
8
35
0,76
6
Dep
artm
ent o
f Tra
nspo
rtat
ion
Res
earc
h an
d D
evel
opm
ent C
LUST
ER
Hig
hway
Pla
nnin
g an
d C
onst
ruct
ion
20.2
05S
FY 1
072
5,19
8
-
Sta
te P
lann
ing
and
Res
earc
h20
.515
NV
-80-
X015
-00
356,
147
356,
147
Tot
al R
esea
rch
and
Dev
elop
men
t CLU
STER
1,08
1,34
5
356,
147
Tot
al D
epar
tmen
t of T
rans
port
atio
n1,
081,
345
35
6,14
7
Envi
ronm
enta
l Pro
tect
ion
Agen
cy
Res
earc
h an
d D
evel
opm
ent C
LUST
ER
Sur
veys
, Stu
dies
, Inv
estig
atio
ns D
emon
stra
tions
and
Spe
cial
Pur
pose
A
ctiv
ities
Rel
atin
g to
the
Cle
an A
ir A
ct66
.034
PM
-989
6270
1-4
4,87
0
-
Sur
veys
, Stu
dies
, Inv
estig
atio
ns D
emon
stra
tions
and
Spe
cial
Pur
pose
A
ctiv
ities
Rel
atin
g to
the
Cle
an A
ir A
ct66
.034
XA-9
6962
801-
348
,627
-
53,4
97
-
R
egio
nal W
etla
nd P
rogr
am D
evel
opm
ent G
rant
s66
.461
CD
-969
7330
1-0
23,4
93
-
Tot
al R
esea
rch
and
Dev
elop
men
t CLU
STER
76,9
90
-
Tot
al E
nviro
nmen
tal P
rote
ctio
n Ag
ency
76,9
90
-
STA
TE O
F N
EVA
DA
SCH
EDU
LE O
F EX
PEN
DIT
UR
ES O
F FE
DER
AL A
WAR
DS
FOR
TH
E YE
AR E
ND
ED J
UN
E 30
, 201
0
75

Fede
ral G
rant
or /
Pass
-Thr
ough
Gra
ntor
CFD
AAw
ard
or P
ass-
Paym
ents
to
Pro
gram
Titl
eN
umbe
rTh
roug
h N
umbe
rEx
pend
iture
s S
ubre
cipi
ents
____
____
____
____
____
____
____
____
____
____
____
____
____
____
____
___
____
____
___
____
____
____
____
____
____
____
____
____
____
____
____
____
____
____
____
____
____
____
____
____
__
STA
TE O
F N
EVA
DA
SCH
EDU
LE O
F EX
PEN
DIT
UR
ES O
F FE
DER
AL A
WAR
DS
FOR
TH
E YE
AR E
ND
ED J
UN
E 30
, 201
0
Dep
artm
ent o
f Edu
catio
n
Res
earc
h an
d D
evel
opm
ent C
LUST
ER
Sta
tew
ide
Dat
a S
yste
ms
84.3
72R
372A
0700
101,
578,
624
$
-
$
Tot
al R
esea
rch
and
Dev
elop
men
t CLU
STER
1,57
8,62
4
-
Tot
al D
epar
tmen
t of E
duca
tion
1,57
8,62
4
-
Dep
artm
ent o
f Hea
lth a
nd H
uman
Ser
vice
s
Res
earc
h an
d D
evel
opm
ent C
LUST
ER
Sta
te a
nd T
errit
oria
l and
Tec
hnic
al A
ssis
tanc
e C
apac
ity D
evel
opm
ent
Min
ority
HIV
/AID
S D
emon
stra
tion
Pro
gram
93.0
065
STT
MP
0510
09-0
410
,183
-
Sta
te a
nd T
errit
oria
l and
Tec
hnic
al A
ssis
tanc
e C
apac
ity D
evel
opm
ent
Min
ority
HIV
/AID
S D
emon
stra
tion
Pro
gram
93.0
065
STT
MP
0510
09-0
592
,613
-
102,
796
-
Prim
ary
Car
e S
ervi
ces_
Res
ourc
e C
oord
inat
ion
and
Dev
elop
men
t93
.130
1 U
68H
P11
441-
0244
,044
-
Prim
ary
Car
e S
ervi
ces_
Res
ourc
e C
oord
inat
ion
and
Dev
elop
men
t93
.130
1H5M
MC
1087
2-01
55,3
84
55
,384
Prim
ary
Car
e S
ervi
ces_
Res
ourc
e C
oord
inat
ion
and
Dev
elop
men
t93
.130
1H5M
MC
1087
2-02
185,
675
184,
477
285,
103
239,
861
Inju
ry P
reve
ntio
n an
d C
ontro
l Res
earc
h an
d S
tate
and
Com
mun
ity
Bas
ed P
rogr
ams
93.1
361
VF1
CE
0011
37-0
313
8,61
4
12
3,56
2
Inju
ry P
reve
ntio
n an
d C
ontro
l Res
earc
h an
d S
tate
and
Com
mun
ity
Bas
ed P
rogr
ams
93.1
361
VF1
CE
0011
37-0
414
6,52
4
13
8,79
6
Inju
ry P
reve
ntio
n an
d C
ontro
l Res
earc
h an
d S
tate
and
Com
mun
ity
Bas
ed P
rogr
ams
93.1
365U
17C
E92
4825
-04
33,7
95
-
Inju
ry P
reve
ntio
n an
d C
ontro
l Res
earc
h an
d S
tate
and
Com
mun
ity
Bas
ed P
rogr
ams
93.1
365U
17C
E92
4825
-05
78,3
53
5,
000
397,
286
267,
358
Chi
ld S
uppo
rt E
nfor
cem
ent R
esea
rch
93.5
6490
FD01
3601
38,8
54
38
,854
Cen
ters
for M
edic
are
and
Med
icai
d S
ervi
ces
(CM
S) R
esea
rch,
D
emon
stra
tions
and
Eva
luat
ions
93.7
7911
-P-2
0199
-9/1
736
8,12
0
18
9,12
8
Cen
ters
for M
edic
are
and
Med
icai
d S
ervi
ces
(CM
S) R
esea
rch,
D
emon
stra
tions
and
Eva
luat
ions
93.7
791L
OC
MS
0301
8020
,086
-
Cen
ters
for M
edic
are
and
Med
icai
d S
ervi
ces
(CM
S) R
esea
rch,
D
emon
stra
tions
and
Eva
luat
ions
93.7
791N
0CM
S02
0199
-18-
0056
,868
-
Cen
ters
for M
edic
are
and
Med
icai
d S
ervi
ces
(CM
S) R
esea
rch,
D
emon
stra
tions
and
Eva
luat
ions
93.7
79IX
OC
MS
0304
09-0
112
,150
12,1
50
457,
224
201,
278
Tot
al R
esea
rch
and
Dev
elop
men
t CLU
STER
1,28
1,26
3
747,
351
Tot
al D
epar
tmen
t of H
ealth
and
Hum
an S
ervi
ces
1,28
1,26
3
747,
351
Gra
nd T
otal
Res
earc
h an
d D
evel
opm
ent C
LUST
ER4,
669,
788
1,
454,
264
76

Fede
ral G
rant
or /
Pass
-Thr
ough
Gra
ntor
CFD
AAw
ard
or P
ass-
Paym
ents
to
Pro
gram
Titl
eN
umbe
rTh
roug
h N
umbe
rEx
pend
iture
s S
ubre
cipi
ents
____
____
____
____
____
____
____
____
____
____
____
____
____
____
____
___
____
____
___
____
____
____
____
____
____
____
____
____
____
____
____
____
____
____
____
____
____
____
____
____
__
STA
TE O
F N
EVA
DA
SCH
EDU
LE O
F EX
PEN
DIT
UR
ES O
F FE
DER
AL A
WAR
DS
FOR
TH
E YE
AR E
ND
ED J
UN
E 30
, 201
0
Dep
artm
ent o
f Agr
icul
ture
Chi
ld N
utrit
ion
CLU
STER
Sch
ool B
reak
fast
Pro
gram
10.5
537N
V30
0NV
314
,962
,483
$
14,7
40,0
70$
Nat
iona
l Sch
ool L
unch
Pro
gram
10.5
557N
V30
0NV
366
,912
,369
66,5
52,1
24
Nat
iona
l Sch
ool L
unch
Pro
gram
10.5
55S
FY10
/X/9
947,
157,
537
7,
106,
712
74,0
69,9
06
73
,658
,836
Spe
cial
Milk
Pro
gram
for C
hild
ren
10.5
567N
V30
0NV
395
,131
95,1
31
Sum
mer
Foo
d S
ervi
ce P
rogr
am fo
r Chi
ldre
n10
.559
7NV
300N
V3
1,22
7,45
1
1,22
7,45
1
Sum
mer
Foo
d S
ervi
ce P
rogr
am fo
r Chi
ldre
n10
.559
SFY
10/X
/994
5,10
7
5,10
7
1,23
2,55
8
1,23
2,55
8
Tot
al C
hild
Nut
ritio
n C
LUST
ER90
,360
,078
89,7
26,5
95
Emer
genc
y Fo
od A
ssis
tanc
e C
LUST
ER
Em
erge
ncy
Food
Ass
ista
nce
Pro
gram
(Adm
inis
trativ
e C
osts
)10
.568
7NV
810N
V8
480,
077
184,
306
Em
erge
ncy
Food
Ass
ista
nce
Pro
gram
(Adm
inis
trativ
e C
osts
)10
.568
SFY
10/X
/994
59,8
08
59
,808
AR
RA
- E
mer
genc
y Fo
od A
ssis
tanc
e P
rogr
am (A
dmin
istra
tive
Cos
ts)
10.5
68A
7NV
840N
V8-
020
0,52
6
-
740,
411
244,
114
Em
erge
ncy
Food
Ass
ista
nce
Pro
gram
(Foo
d C
omm
oditi
es)
10.5
69S
FY10
/X/9
944,
741,
491
4,
722,
508
AR
RA
- E
mer
genc
y Fo
od A
ssis
tanc
e P
rogr
am (F
ood
Com
mod
ities
)10
.569
AS
FY10
/X/9
9455
6,60
3
55
3,76
5
5,29
8,09
4
5,27
6,27
3
Tot
al E
mer
genc
y Fo
od A
ssis
tanc
e C
LUST
ER6,
038,
505
5,
520,
387
SNAP
CLU
STER
Sup
plem
enta
l Nut
ritio
n A
ssis
tanc
e P
rogr
am (S
NA
P)
10.5
51S
FY 2
010
387,
320,
917
-
Sta
te A
dmin
istra
tive
Mat
chin
g G
rant
s fo
r Sup
plem
enta
l Nut
ritio
n A
ssis
tanc
e P
rogr
am10
.561
7NV
4004
NV
16,6
50,0
69
-
Sta
te A
dmin
istra
tive
Mat
chin
g G
rant
s fo
r Sup
plem
enta
l Nut
ritio
n A
ssis
tanc
e P
rogr
am10
.561
7NV
430N
V7
121,
029
-
AR
RA
- S
tate
Adm
inis
trativ
e M
atch
ing
Gra
nts
for t
he S
uppl
emen
tal
Nut
ritio
n A
ssis
tanc
e P
rogr
am10
.561
A7N
V44
0NV
4-0
1,74
7,66
8
-
18,5
18,7
66
-
Tot
al S
NAP
CLU
STER
405,
839,
683
-
Scho
ols
and
Roa
ds C
LUST
ER
Sch
ools
and
Roa
ds_G
rant
s to
Sta
tes
10.6
65N
/A5,
209,
154
5,
209,
154
Tot
al S
choo
ls a
nd R
oads
CLU
STER
5,20
9,15
4
5,20
9,15
4
77

Fede
ral G
rant
or /
Pass
-Thr
ough
Gra
ntor
CFD
AAw
ard
or P
ass-
Paym
ents
to
Pro
gram
Titl
eN
umbe
rTh
roug
h N
umbe
rEx
pend
iture
s S
ubre
cipi
ents
____
____
____
____
____
____
____
____
____
____
____
____
____
____
____
___
____
____
___
____
____
____
____
____
____
____
____
____
____
____
____
____
____
____
____
____
____
____
____
____
__
STA
TE O
F N
EVA
DA
SCH
EDU
LE O
F EX
PEN
DIT
UR
ES O
F FE
DER
AL A
WAR
DS
FOR
TH
E YE
AR E
ND
ED J
UN
E 30
, 201
0
Pla
nt a
nd A
nim
al D
isea
se, P
est C
ontro
l, an
d A
nim
al C
are
10.0
2504
-857
6-08
36-C
A31
5,42
4$
-
$
Pla
nt a
nd A
nim
al D
isea
se, P
est C
ontro
l, an
d A
nim
al C
are
10.0
2508
-973
2-17
21-C
A10
,750
-
Pla
nt a
nd A
nim
al D
isea
se, P
est C
ontro
l, an
d A
nim
al C
are
10.0
2509
-857
6-00
16-C
A14
7,91
4
-
Pla
nt a
nd A
nim
al D
isea
se, P
est C
ontro
l, an
d A
nim
al C
are
10.0
2509
-857
6-05
26-C
A12
,275
-
Pla
nt a
nd A
nim
al D
isea
se, P
est C
ontro
l, an
d A
nim
al C
are
10.0
2509
-857
6-05
96-C
A67
,971
-
Pla
nt a
nd A
nim
al D
isea
se, P
est C
ontro
l, an
d A
nim
al C
are
10.0
2509
-857
6-10
85-C
A15
3,18
0
-
Pla
nt a
nd A
nim
al D
isea
se, P
est C
ontro
l, an
d A
nim
al C
are
10.0
2509
-857
6-11
53-C
A24
,313
15,6
27
Pla
nt a
nd A
nim
al D
isea
se, P
est C
ontro
l, an
d A
nim
al C
are
10.0
2509
-973
2-14
55-C
A13
,532
-
Pla
nt a
nd A
nim
al D
isea
se, P
est C
ontro
l, an
d A
nim
al C
are
10.0
2509
-973
2-15
41-C
A19
,407
-
Pla
nt a
nd A
nim
al D
isea
se, P
est C
ontro
l, an
d A
nim
al C
are
10.0
2509
-973
2-17
16-C
A9,
847
-
Pla
nt a
nd A
nim
al D
isea
se, P
est C
ontro
l, an
d A
nim
al C
are
10.0
2509
-973
2-17
21-C
A46
,779
-
Pla
nt a
nd A
nim
al D
isea
se, P
est C
ontro
l, an
d A
nim
al C
are
10.0
2509
-973
2-19
50-C
A45
,790
-
Pla
nt a
nd A
nim
al D
isea
se, P
est C
ontro
l, an
d A
nim
al C
are
10.0
2509
-973
2-19
51-C
A22
,971
-
Pla
nt a
nd A
nim
al D
isea
se, P
est C
ontro
l, an
d A
nim
al C
are
10.0
2510
-857
6-00
16-C
A38
,490
-
Pla
nt a
nd A
nim
al D
isea
se, P
est C
ontro
l, an
d A
nim
al C
are
10.0
2510
-857
6-05
26-C
A4,
272
-
Pla
nt a
nd A
nim
al D
isea
se, P
est C
ontro
l, an
d A
nim
al C
are
10.0
2510
-857
6-05
96-C
A32
,487
-
Pla
nt a
nd A
nim
al D
isea
se, P
est C
ontro
l, an
d A
nim
al C
are
10.0
2510
-857
6-11
53-C
A24
4
-
Pla
nt a
nd A
nim
al D
isea
se, P
est C
ontro
l, an
d A
nim
al C
are
10.0
2510
-973
2-15
41-C
A1,
882
-
Pla
nt a
nd A
nim
al D
isea
se, P
est C
ontro
l, an
d A
nim
al C
are
10.0
2510
-973
2-20
35-C
A1,
959
-
969,
487
15,6
27
Avi
an In
fluen
za In
dem
nity
Pro
gram
10.0
2909
-710
0-01
56-C
A39
,833
-
Mar
ket P
rote
ctio
n an
d P
rom
otio
n10
.163
12-2
5-A
-490
315
,573
-
Mar
ket P
rote
ctio
n an
d P
rom
otio
n10
.163
12-2
5-A
-495
25,
916
-
Mar
ket P
rote
ctio
n an
d P
rom
otio
n10
.163
12-2
5-A
-500
43,
727
3,
456
Mar
ket P
rote
ctio
n an
d P
rom
otio
n10
.163
12-2
5-A
-505
47,
210
-
Mar
ket P
rote
ctio
n an
d P
rom
otio
n10
.163
12-2
5-A
-525
06,
117
-
38,5
43
3,
456
Spe
cial
ty C
rop
Blo
ck G
rant
Pro
gram
10.1
6912
-25-
B-0
873
17,2
80
17
,280
Spe
cial
ty C
rop
Blo
ck G
rant
Pro
gram
10.1
6912
-25-
G-0
524
239
-
Spe
cial
ty C
rop
Blo
ck G
rant
Pro
gram
10.1
6912
-25-
G-0
659
29,9
63
29
,963
47,4
82
47
,243
Spe
cial
ty C
rop
Blo
ck G
rant
Pro
gram
- Fa
rm B
ill10
.170
12-2
5-B
-080
136
,723
36,7
11
Spe
cial
ty C
rop
Blo
ck G
rant
Pro
gram
- Fa
rm B
ill10
.170
12-2
5-B
-093
612
,433
12,4
33
49,1
56
49
,144
78

Fede
ral G
rant
or /
Pass
-Thr
ough
Gra
ntor
CFD
AAw
ard
or P
ass-
Paym
ents
to
Pro
gram
Titl
eN
umbe
rTh
roug
h N
umbe
rEx
pend
iture
s S
ubre
cipi
ents
____
____
____
____
____
____
____
____
____
____
____
____
____
____
____
___
____
____
___
____
____
____
____
____
____
____
____
____
____
____
____
____
____
____
____
____
____
____
____
____
__
STA
TE O
F N
EVA
DA
SCH
EDU
LE O
F EX
PEN
DIT
UR
ES O
F FE
DER
AL A
WAR
DS
FOR
TH
E YE
AR E
ND
ED J
UN
E 30
, 201
0
Hom
elan
d S
ecur
ity_A
gric
ultu
ral
10.3
0407
-002
558-
0725
,627
$
-$
Mea
t, P
oultr
y an
d E
gg P
rodu
cts
Insp
ectio
n10
.477
12-2
5-A
-328
723
,978
-
Spe
cial
Sup
plem
enta
l Nut
ritio
n P
rogr
am fo
r Wom
en, I
nfan
ts, a
nd
Chi
ldre
n10
.557
7NV
700N
V1
174,
986
-
Spe
cial
Sup
plem
enta
l Nut
ritio
n P
rogr
am fo
r Wom
en, I
nfan
ts, a
nd
Chi
ldre
n10
.557
7NV
700N
V7
41,9
16,7
77
-
42,0
91,7
63
-
Chi
ld a
nd A
dult
Car
e Fo
od P
rogr
am10
.558
7NV
300N
V3
4,07
4,75
0
4,07
4,75
0
Sta
te A
dmin
istra
tive
Exp
ense
s fo
r Chi
ld N
utrit
ion
10.5
607N
V30
0NP
220
0,54
9
-
Sta
te A
dmin
istra
tive
Exp
ense
s fo
r Chi
ld N
utrit
ion
10.5
607N
V30
0NV
381
0,73
2
81
0,73
2
1,01
1,28
1
810,
732
Com
mod
ity S
uppl
emen
tal F
ood
Pro
gram
10.5
657N
V81
0NV
141
5,62
0
35
7,58
0
Com
mod
ity S
uppl
emen
tal F
ood
Pro
gram
10.5
65S
FY10
/X/9
941,
555,
308
1,
555,
308
1,97
0,92
8
1,91
2,88
8
Food
Dis
tribu
tion
Pro
gram
on
Indi
an R
eser
vatio
ns10
.567
7NV
400N
P4
225,
722
-
Food
Dis
tribu
tion
Pro
gram
on
Indi
an R
eser
vatio
ns10
.567
SFY
10/X
/994
301,
317
-
527,
039
-
Sen
ior F
arm
ers
Mar
ket N
utrit
ion
Pro
gram
10.5
767N
V81
0NV
216
3,01
4
14
6,16
3
Chi
ld N
utrit
ion
Dis
cret
iona
ry G
rant
s Li
mite
d A
vaila
bilit
y10
.579
7NV
300N
V3
15,4
50
15
,450
AR
RA
- C
hild
Nut
ritio
n D
iscr
etio
nary
Gra
nts
Lim
ited
Ava
ilabi
lity
10.5
79A
7NV
340N
V3-
032
7,69
5
32
7,69
5
343,
145
343,
145
Fres
h Fr
uit a
nd V
eget
able
Pro
gram
10.5
827N
V30
0NV
364
9,44
4
64
9,44
4
Coo
pera
tive
Fore
stry
Ass
ista
nce
10.6
6405
-DG
-110
1000
0-01
07,
381
-
Coo
pera
tive
Fore
stry
Ass
ista
nce
10.6
6405
-DG
-110
4600
0-05
130
3,30
8
31
,697
Coo
pera
tive
Fore
stry
Ass
ista
nce
10.6
6405
-DG
-110
4600
0-06
542
,779
-
Coo
pera
tive
Fore
stry
Ass
ista
nce
10.6
6405
-FI-1
1046
000-
005
87,2
03
-
Coo
pera
tive
Fore
stry
Ass
ista
nce
10.6
6406
-DG
-110
1000
0-01
97,
343
-
Coo
pera
tive
Fore
stry
Ass
ista
nce
10.6
6406
-DG
-110
4600
0-60
727
6,25
7
10
3,51
0
Coo
pera
tive
Fore
stry
Ass
ista
nce
10.6
6407
-DG
-110
4600
0-60
432
7,53
3
63
,280
Coo
pera
tive
Fore
stry
Ass
ista
nce
10.6
6407
-DG
-110
4600
0-61
243
,939
38,0
39
Coo
pera
tive
Fore
stry
Ass
ista
nce
10.6
6408
-DG
-110
4600
0-60
712
0,59
2
-
Coo
pera
tive
Fore
stry
Ass
ista
nce
10.6
6408
-DG
-110
4600
0-61
813
7,47
5
-
Coo
pera
tive
Fore
stry
Ass
ista
nce
10.6
6409
-DG
-110
4600
0-60
144
7,49
9
-
Coo
pera
tive
Fore
stry
Ass
ista
nce
10.6
6409
-DG
-110
4600
0-60
45,
145
5,
000
Coo
pera
tive
Fore
stry
Ass
ista
nce
10.6
6409
-DG
-110
4600
0-60
71,
066,
329
16
4,89
6
79
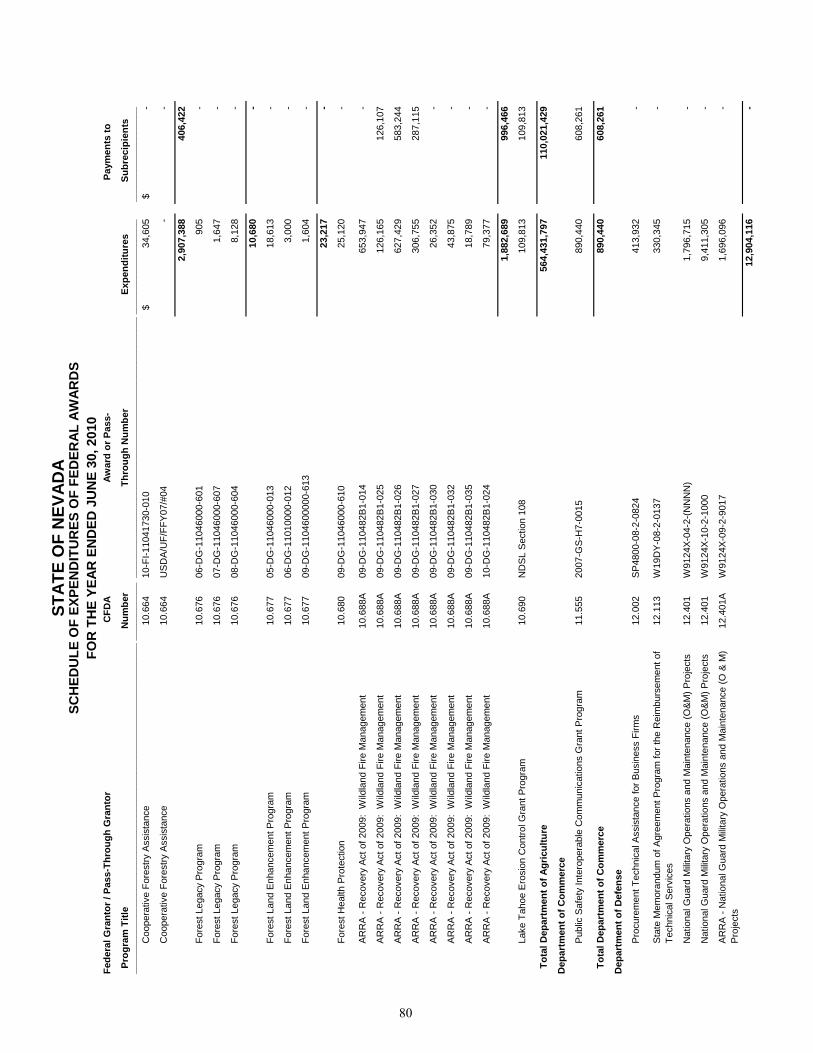
Fede
ral G
rant
or /
Pass
-Thr
ough
Gra
ntor
CFD
AAw
ard
or P
ass-
Paym
ents
to
Pro
gram
Titl
eN
umbe
rTh
roug
h N
umbe
rEx
pend
iture
s S
ubre
cipi
ents
____
____
____
____
____
____
____
____
____
____
____
____
____
____
____
___
____
____
___
____
____
____
____
____
____
____
____
____
____
____
____
____
____
____
____
____
____
____
____
____
__
STA
TE O
F N
EVA
DA
SCH
EDU
LE O
F EX
PEN
DIT
UR
ES O
F FE
DER
AL A
WAR
DS
FOR
TH
E YE
AR E
ND
ED J
UN
E 30
, 201
0
Coo
pera
tive
Fore
stry
Ass
ista
nce
10.6
6410
-FI-1
1041
730-
010
34,6
05$
-
$
Coo
pera
tive
Fore
stry
Ass
ista
nce
10.6
64U
SD
A/U
F/FF
Y07
/#04
-
-
2,90
7,38
8
406,
422
Fore
st L
egac
y P
rogr
am10
.676
06-D
G-1
1046
000-
601
905
-
Fore
st L
egac
y P
rogr
am10
.676
07-D
G-1
1046
000-
607
1,64
7
-
Fore
st L
egac
y P
rogr
am10
.676
08-D
G-1
1046
000-
604
8,12
8
-
10,6
80
-
Fore
st L
and
Enh
ance
men
t Pro
gram
10.6
7705
-DG
-110
4600
0-01
318
,613
-
Fore
st L
and
Enh
ance
men
t Pro
gram
10.6
7706
-DG
-110
1000
0-01
23,
000
-
Fore
st L
and
Enh
ance
men
t Pro
gram
10.6
7709
-DG
-110
4600
000-
613
1,60
4
-
23,2
17
-
Fore
st H
ealth
Pro
tect
ion
10.6
8009
-DG
-110
4600
0-61
025
,120
-
AR
RA
- R
ecov
ery
Act
of 2
009:
Wild
land
Fire
Man
agem
ent
10.6
88A
09-D
G-1
1048
2B1-
014
653,
947
-
AR
RA
- R
ecov
ery
Act
of 2
009:
Wild
land
Fire
Man
agem
ent
10.6
88A
09-D
G-1
1048
2B1-
025
126,
165
126,
107
AR
RA
- R
ecov
ery
Act
of 2
009:
Wild
land
Fire
Man
agem
ent
10.6
88A
09-D
G-1
1048
2B1-
026
627,
429
583,
244
AR
RA
- R
ecov
ery
Act
of 2
009:
Wild
land
Fire
Man
agem
ent
10.6
88A
09-D
G-1
1048
2B1-
027
306,
755
287,
115
AR
RA
- R
ecov
ery
Act
of 2
009:
Wild
land
Fire
Man
agem
ent
10.6
88A
09-D
G-1
1048
2B1-
030
26,3
52
-
AR
RA
- R
ecov
ery
Act
of 2
009:
Wild
land
Fire
Man
agem
ent
10.6
88A
09-D
G-1
1048
2B1-
032
43,8
75
-
AR
RA
- R
ecov
ery
Act
of 2
009:
Wild
land
Fire
Man
agem
ent
10.6
88A
09-D
G-1
1048
2B1-
035
18,7
89
-
AR
RA
- R
ecov
ery
Act
of 2
009:
Wild
land
Fire
Man
agem
ent
10.6
88A
10-D
G-1
1048
2B1-
024
79,3
77
-
1,88
2,68
9
996,
466
Lake
Tah
oe E
rosi
on C
ontro
l Gra
nt P
rogr
am10
.690
ND
SL
Sec
tion
108
109,
813
109,
813
Tot
al D
epar
tmen
t of A
gric
ultu
re56
4,43
1,79
7
110,
021,
429
Dep
artm
ent o
f Com
mer
ce
Pub
lic S
afet
y In
tero
pera
ble
Com
mun
icat
ions
Gra
nt P
rogr
am11
.555
2007
-GS
-H7-
0015
890,
440
608,
261
Tot
al D
epar
tmen
t of C
omm
erce
890,
440
608,
261
Dep
artm
ent o
f Def
ense
Pro
cure
men
t Tec
hnic
al A
ssis
tanc
e fo
r Bus
ines
s Fi
rms
12.0
02S
P48
00-0
8-2-
0824
413,
932
-
Sta
te M
emor
andu
m o
f Agr
eem
ent P
rogr
am fo
r the
Rei
mbu
rsem
ent o
f Te
chni
cal S
ervi
ces
12.1
13W
19D
Y-0
8-2-
0137
330,
345
-
Nat
iona
l Gua
rd M
ilitar
y O
pera
tions
and
Mai
nten
ance
(O&
M) P
roje
cts
12.4
01W
9124
X-04
-2-(
NN
NN
)1,
796,
715
-
Nat
iona
l Gua
rd M
ilitar
y O
pera
tions
and
Mai
nten
ance
(O&
M) P
roje
cts
12.4
01W
9124
X-10
-2-1
000
9,41
1,30
5
-
AR
RA
- N
atio
nal G
uard
Milit
ary
Ope
ratio
ns a
nd M
aint
enan
ce (O
& M
) P
roje
cts
12.4
01A
W91
24X-
09-2
-901
71,
696,
096
-
12,9
04,1
16
-
80

Fede
ral G
rant
or /
Pass
-Thr
ough
Gra
ntor
CFD
AAw
ard
or P
ass-
Paym
ents
to
Pro
gram
Titl
eN
umbe
rTh
roug
h N
umbe
rEx
pend
iture
s S
ubre
cipi
ents
____
____
____
____
____
____
____
____
____
____
____
____
____
____
____
___
____
____
___
____
____
____
____
____
____
____
____
____
____
____
____
____
____
____
____
____
____
____
____
____
__
STA
TE O
F N
EVA
DA
SCH
EDU
LE O
F EX
PEN
DIT
UR
ES O
F FE
DER
AL A
WAR
DS
FOR
TH
E YE
AR E
ND
ED J
UN
E 30
, 201
0
Com
mun
ity E
cono
mic
Adj
ustm
ent P
lann
ing
Ass
ista
nce
for J
oint
Lan
d U
se S
tudi
es12
.610
EN
0815
-09-
0141
8$
41
8$
Tot
al D
epar
tmen
t of D
efen
se13
,648
,811
418
Dep
artm
ent o
f Hou
sing
and
Urb
an D
evel
opm
ent
CD
BG
_Sta
te A
dmin
iste
red
Smal
l Citi
es P
rogr
am C
LUST
ER
Com
mun
ity D
evel
opm
ent B
lock
Gra
nts/
Sta
te's
Pro
gram
14.2
28B
-07-
DC
-32-
0001
1,07
4,15
4
1,04
6,35
7
Com
mun
ity D
evel
opm
ent B
lock
Gra
nts/
Sta
te's
Pro
gram
14.2
28B
-08-
DC
-32-
0001
2,72
9,19
4
2,58
7,86
7
Com
mun
ity D
evel
opm
ent B
lock
Gra
nts/
Sta
te's
Pro
gram
14.2
28B
-08-
MN
-32-
0001
10,7
15,0
87
10
,694
,159
Com
mun
ity D
evel
opm
ent B
lock
Gra
nts/
Sta
te's
Pro
gram
14.2
28B
-09-
DC
-32-
0001
903,
898
895,
160
15,4
22,3
33
15
,223
,543
Tot
al C
DB
G_S
tate
Adm
inis
tere
d Sm
all C
ities
Pro
gram
CLU
STER
15,4
22,3
33
15
,223
,543
Em
erge
ncy
She
lter G
rant
s P
rogr
am14
.231
S-0
9-D
C-3
2-00
0133
4,15
4
33
4,15
4
She
lter P
lus
Car
e14
.238
NV
0005
C9T
0008
0181
6,36
1
-
She
lter P
lus
Car
e14
.238
NV
0006
C9T
0008
0113
2,32
2
-
She
lter P
lus
Car
e14
.238
NV
0006
C9T
0008
0235
,191
-
She
lter P
lus
Car
e14
.238
NV
0007
C9T
0008
0127
9,16
8
-
She
lter P
lus
Car
e14
.238
NV
0018
C9T
0108
0139
6,88
9
-
She
lter P
lus
Car
e14
.238
NV
01C
4010
0241
,161
-
She
lter P
lus
Car
e14
.238
NV
01C
5000
0117
0,40
7
-
1,87
1,49
9
-
HO
ME
Inve
stm
ent P
artn
ersh
ips
Pro
gram
14.2
39M
04-S
G32
0100
229,
000
229,
000
HO
ME
Inve
stm
ent P
artn
ersh
ips
Pro
gram
14.2
39M
05-S
G32
0100
357,
434
131,
590
HO
ME
Inve
stm
ent P
artn
ersh
ips
Pro
gram
14.2
39M
06-S
G32
0100
81,1
82
81
,182
HO
ME
Inve
stm
ent P
artn
ersh
ips
Pro
gram
14.2
39M
07-S
G32
0100
285,
116
285,
116
HO
ME
Inve
stm
ent P
artn
ersh
ips
Pro
gram
14.2
39M
08-S
G32
0100
466,
777
466,
777
HO
ME
Inve
stm
ent P
artn
ersh
ips
Pro
gram
14.2
39M
09-S
G32
0100
54,0
00
54
,000
1,47
3,50
9
1,24
7,66
5
Hou
sing
Opp
ortu
nitie
s fo
r Per
sons
with
AID
S14
.241
NV
H07
-F99
913
,582
13,5
82
Hou
sing
Opp
ortu
nitie
s fo
r Per
sons
with
AID
S14
.241
NV
H08
-F99
956
,927
56,9
27
Hou
sing
Opp
ortu
nitie
s fo
r Per
sons
with
AID
S14
.241
NV
H09
-F99
932
,476
32,4
76
102,
985
102,
985
AR
RA
- H
omel
ess
Pre
vent
ion
and
Rap
id R
e-H
ousi
ng P
rogr
am
Tech
nica
l Ass
ista
nce
14.2
62A
SFY
10
HP
RP
525,
826
525,
826
AR
RA
- A
ssis
ted
Hou
sing
Sta
bilit
y an
d E
nerg
y an
d G
reen
Ret
rofit
In
vest
men
ts P
rogr
am14
.318
A86
9/1
0203
3,97
9,89
9
3,97
9,89
9
Tot
al D
epar
tmen
t of H
ousi
ng a
nd U
rban
Dev
elop
men
t23
,710
,205
21,4
14,0
72
81

Fede
ral G
rant
or /
Pass
-Thr
ough
Gra
ntor
CFD
AAw
ard
or P
ass-
Paym
ents
to
Pro
gram
Titl
eN
umbe
rTh
roug
h N
umbe
rEx
pend
iture
s S
ubre
cipi
ents
____
____
____
____
____
____
____
____
____
____
____
____
____
____
____
___
____
____
___
____
____
____
____
____
____
____
____
____
____
____
____
____
____
____
____
____
____
____
____
____
__
STA
TE O
F N
EVA
DA
SCH
EDU
LE O
F EX
PEN
DIT
UR
ES O
F FE
DER
AL A
WAR
DS
FOR
TH
E YE
AR E
ND
ED J
UN
E 30
, 201
0
Dep
artm
ent o
f the
Inte
rior
Fish
and
Wild
life
CLU
STER
Spo
rt Fi
sh R
esto
ratio
n15
.605
F-20
-45
1,39
9,31
4$
-$
S
port
Fish
Res
tora
tion
15.6
05F-
30-A
E-2
135
0,08
2
-
Spo
rt Fi
sh R
esto
ratio
n15
.605
F-32
-D-1
91,
561,
243
-
S
port
Fish
Res
tora
tion
15.6
05F-
38-D
-470
0,00
0
-
S
port
Fish
Res
tora
tion
15.6
05F-
43-B
-131
,548
-
Spo
rt Fi
sh R
esto
ratio
n15
.605
F-44
-B-1
33,8
82
-
S
port
Fish
Res
tora
tion
15.6
05F-
45-B
-148
,670
-
Spo
rt Fi
sh R
esto
ratio
n15
.605
F-46
-B-1
13,6
91
-
S
port
Fish
Res
tora
tion
15.6
05F-
47-B
-115
,502
-
Spo
rt Fi
sh R
esto
ratio
n15
.605
F-49
-B-1
142,
617
-
Spo
rt Fi
sh R
esto
ratio
n15
.605
F-50
-B-1
83,9
90
-
S
port
Fish
Res
tora
tion
15.6
05F-
52-B
-121
,000
-
Spo
rt Fi
sh R
esto
ratio
n15
.605
FW-1
-CP
-10-
F22
,213
-
Spo
rt Fi
sh R
esto
ratio
n15
.605
FW-3
-T-2
8-F
243,
426
-
Spo
rt Fi
sh R
esto
ratio
n15
.605
FW-4
-D-1
6-F
194,
433
-
Spo
rt Fi
sh R
esto
ratio
n15
.605
Y-3
-D-1
100,
000
-
4,96
1,61
1
-
Wild
life
Res
tora
tion
15.6
11FW
-1-C
P-1
0-W
22,2
13
-
Wild
life
Res
tora
tion
15.6
11FW
-3-T
-28-
W67
9,59
1
-
Wild
life
Res
tora
tion
15.6
11FW
-4-D
-16-
W91
9,79
5
-
Wild
life
Res
tora
tion
15.6
11W
-48-
R-4
12,
212,
335
-
Wild
life
Res
tora
tion
15.6
11W
-51-
HS
-34-
H55
,318
-
Wild
life
Res
tora
tion
15.6
11W
-51-
HS
-35-
H64
7,18
0
-
Wild
life
Res
tora
tion
15.6
11W
-58-
D-2
055
8,66
9
-
Wild
life
Res
tora
tion
15.6
11W
-61-
D-1
315
9,33
5
-
Wild
life
Res
tora
tion
15.6
11W
-64-
R-1
036
8,16
8
-
Wild
life
Res
tora
tion
15.6
11W
-67-
D-1
255,
323
-
5,87
7,92
7
-
Tot
al F
ish
and
Wild
life
CLU
STER
10,8
39,5
38
-
Cul
tura
l Res
ourc
e M
anag
emen
t15
.224
FAA
0600
0317
,998
-
Dis
tribu
tion
of R
ecei
pts
to S
tate
and
Loc
al G
over
nmen
ts15
.227
L08A
C14
110
7,80
0
-
Dis
tribu
tion
of R
ecei
pts
to S
tate
and
Loc
al G
over
nmen
ts15
.227
SFY
10
220,
261
220,
261
Dis
tribu
tion
of R
ecei
pts
to S
tate
and
Loc
al G
over
nmen
ts15
.227
SFY
10
Min
eral
Lea
ses
8,11
6,84
6
8,11
6,84
6
8,34
4,90
7
8,33
7,10
7
82

Fede
ral G
rant
or /
Pass
-Thr
ough
Gra
ntor
CFD
AAw
ard
or P
ass-
Paym
ents
to
Pro
gram
Titl
eN
umbe
rTh
roug
h N
umbe
rEx
pend
iture
s S
ubre
cipi
ents
____
____
____
____
____
____
____
____
____
____
____
____
____
____
____
___
____
____
___
____
____
____
____
____
____
____
____
____
____
____
____
____
____
____
____
____
____
____
____
____
__
STA
TE O
F N
EVA
DA
SCH
EDU
LE O
F EX
PEN
DIT
UR
ES O
F FE
DER
AL A
WAR
DS
FOR
TH
E YE
AR E
ND
ED J
UN
E 30
, 201
0
Nat
iona
l Fire
Pla
n - W
ildla
nd U
rban
Inte
rface
Com
mun
ity F
ire
Ass
ista
nce
15.2
28FA
A08
0042
7,50
0$
-$
Nat
iona
l Fire
Pla
n - W
ildla
nd U
rban
Inte
rface
Com
mun
ity F
ire
Ass
ista
nce
15.2
28FA
A08
0086
145,
280
145,
280
Nat
iona
l Fire
Pla
n - W
ildla
nd U
rban
Inte
rface
Com
mun
ity F
ire
Ass
ista
nce
15.2
28FA
A08
0087
304,
897
304,
897
Nat
iona
l Fire
Pla
n - W
ildla
nd U
rban
Inte
rface
Com
mun
ity F
ire
Ass
ista
nce
15.2
28L0
8AC
1323
713
4,07
3
-
591,
750
450,
177
Wild
Hor
se a
nd B
urro
Res
ourc
e M
anag
emen
t15
.229
FAA
0601
8016
8,46
3
-
Wild
Hor
se a
nd B
urro
Res
ourc
e M
anag
emen
t15
.229
L09A
C14
023
75,0
00
-
243,
463
-
Fish
, Wild
life
and
Pla
nt C
onse
rvat
ion
Res
ourc
e M
anag
emen
t15
.231
FAA
0602
0912
,000
-
Fish
, Wild
life
and
Pla
nt C
onse
rvat
ion
Res
ourc
e M
anag
emen
t15
.231
FAA
0700
2019
,848
-
31,8
48
-
Sou
ther
n N
evad
a P
ublic
Lan
d M
anag
emen
t Act
15.2
3507
-BV
P-0
146
-
Sou
ther
n N
evad
a P
ublic
Lan
d M
anag
emen
t Act
15.2
35L0
9AC
1529
836
,584
-
Sou
ther
n N
evad
a P
ublic
Lan
d M
anag
emen
t Act
15.2
35L0
9AC
1542
817
1,89
8
-
208,
528
-
Nat
iona
l Fire
Pla
n - R
ural
Fire
Ass
ista
nce
15.2
42L0
8AC
1335
743
,880
-
Nat
iona
l Fire
Pla
n - R
ural
Fire
Ass
ista
nce
15.2
42L0
8AC
1409
217
,250
-
61,1
30
-
Wat
er R
ecla
mat
ion
and
Reu
se P
rogr
am15
.504
04FG
2040
6048
,070
-
Pro
vidi
ng W
ater
to A
t-Ris
k N
atur
al D
eser
t Ter
min
al L
akes
15.5
08R
09A
P20
026
110,
303
-
Fish
and
Wild
life
Coo
rdin
atio
n A
ct15
.517
06FG
2021
052,
300
-
Fish
and
Wild
life
Coo
rdin
atio
n A
ct15
.517
06FG
3000
2468
,280
-
70,5
80
-
Fish
and
Wild
life
Man
agem
ent A
ssis
tanc
e15
.608
1432
04J3
5249
,470
-
Fish
and
Wild
life
Man
agem
ent A
ssis
tanc
e15
.608
8424
0-7-
J003
32,9
82
-
Fish
and
Wild
life
Man
agem
ent A
ssis
tanc
e15
.608
8424
0-9-
G01
32,
978
-
Fish
and
Wild
life
Man
agem
ent A
ssis
tanc
e15
.608
8432
0-5-
J308
62,2
58
-
Fish
and
Wild
life
Man
agem
ent A
ssis
tanc
e15
.608
8432
0-8-
J512
18,9
55
-
Fish
and
Wild
life
Man
agem
ent A
ssis
tanc
e15
.608
8432
09J4
318,
378
-
Fish
and
Wild
life
Man
agem
ent A
ssis
tanc
e15
.608
8442
0-8-
J010
6,95
6
-
181,
977
-
83

Fede
ral G
rant
or /
Pass
-Thr
ough
Gra
ntor
CFD
AAw
ard
or P
ass-
Paym
ents
to
Pro
gram
Titl
eN
umbe
rTh
roug
h N
umbe
rEx
pend
iture
s S
ubre
cipi
ents
____
____
____
____
____
____
____
____
____
____
____
____
____
____
____
___
____
____
___
____
____
____
____
____
____
____
____
____
____
____
____
____
____
____
____
____
____
____
____
____
__
STA
TE O
F N
EVA
DA
SCH
EDU
LE O
F EX
PEN
DIT
UR
ES O
F FE
DER
AL A
WAR
DS
FOR
TH
E YE
AR E
ND
ED J
UN
E 30
, 201
0
Coo
pera
tive
End
ange
red
Spe
cies
Con
serv
atio
n Fu
nd15
.615
E-1
-2-1
-A17
,629
$
-$
Coo
pera
tive
End
ange
red
Spe
cies
Con
serv
atio
n Fu
nd15
.615
E-1
-23
106,
989
-
Coo
pera
tive
End
ange
red
Spe
cies
Con
serv
atio
n Fu
nd15
.615
E-1
-3-1
7,96
7
-
Coo
pera
tive
End
ange
red
Spe
cies
Con
serv
atio
n Fu
nd15
.615
E-1
-3-2
120,
845
-
Coo
pera
tive
End
ange
red
Spe
cies
Con
serv
atio
n Fu
nd15
.615
E-1
-3-3
55,9
13
-
Coo
pera
tive
End
ange
red
Spe
cies
Con
serv
atio
n Fu
nd15
.615
E-1
-3-4
5,07
3
-
Coo
pera
tive
End
ange
red
Spe
cies
Con
serv
atio
n Fu
nd15
.615
E-1
-3-5
2,69
8
-
Coo
pera
tive
End
ange
red
Spe
cies
Con
serv
atio
n Fu
nd15
.615
E-1
-3-6
20,6
29
-
Coo
pera
tive
End
ange
red
Spe
cies
Con
serv
atio
n Fu
nd15
.615
E-1
-3-7
3,15
5
-
Coo
pera
tive
End
ange
red
Spe
cies
Con
serv
atio
n Fu
nd15
.615
EW
-3-1
122
,967
-
363,
865
-
Wild
life
Con
serv
atio
n an
d A
ppre
ciat
ion
15.6
1714
320-
4-J3
4967
,396
-
Hun
ter E
duca
tion
and
Saf
ety
Pro
gram
15.6
26W
-51-
HS
-35-
J80
,000
-
Land
owne
r Inc
entiv
e15
.633
I-1-2
74,0
61
-
Land
owne
r Inc
entiv
e15
.633
I-9-2
131,
434
-
205,
495
-
Sta
te W
ildlif
e G
rant
s15
.634
FW-1
-CP
-10-
IN2,
471
-
Sta
te W
ildlif
e G
rant
s15
.634
FW-3
-T-2
8-IN
103,
674
-
Sta
te W
ildlif
e G
rant
s15
.634
T-1-
150
6,67
4
-
Sta
te W
ildlif
e G
rant
s15
.634
T-3-
P-1
87,2
55
-
Sta
te W
ildlif
e G
rant
s15
.634
U-8
-R-1
10,2
26
-
710,
300
-
Mig
rato
ry B
ird C
onse
rvat
ion
15.6
4710
154-
6-J1
0348
,903
-
His
toric
Pre
serv
atio
n Fu
nd G
rant
s-In
-Aid
15.9
0432
-07-
2163
211
5,66
0
-
His
toric
Pre
serv
atio
n Fu
nd G
rant
s-In
-Aid
15.9
0432
-08-
2173
331
0,96
4
-
His
toric
Pre
serv
atio
n Fu
nd G
rant
s-In
-Aid
15.9
0432
-09-
2183
418
6,26
8
-
612,
892
-
Riv
ers,
Tra
ils a
nd C
onse
rvat
ion
Ass
ista
nce
15.9
21H
8360
0600
1754
,869
-
Riv
ers,
Tra
ils a
nd C
onse
rvat
ion
Ass
ista
nce
15.9
21H
8360
0600
185,
034
-
Riv
ers,
Tra
ils a
nd C
onse
rvat
ion
Ass
ista
nce
15.9
21H
8420
0906
2517
,247
-
77,1
50
-
Tot
al D
epar
tmen
t of t
he In
terio
r22
,916
,093
8,78
7,28
4
84

Fede
ral G
rant
or /
Pass
-Thr
ough
Gra
ntor
CFD
AAw
ard
or P
ass-
Paym
ents
to
Pro
gram
Titl
eN
umbe
rTh
roug
h N
umbe
rEx
pend
iture
s S
ubre
cipi
ents
____
____
____
____
____
____
____
____
____
____
____
____
____
____
____
___
____
____
___
____
____
____
____
____
____
____
____
____
____
____
____
____
____
____
____
____
____
____
____
____
__
STA
TE O
F N
EVA
DA
SCH
EDU
LE O
F EX
PEN
DIT
UR
ES O
F FE
DER
AL A
WAR
DS
FOR
TH
E YE
AR E
ND
ED J
UN
E 30
, 201
0
Dep
artm
ent o
f Jus
tice
Sta
te a
nd L
ocal
Dom
estic
Pre
pare
dnes
s E
xerc
ise
Rep
ort
16.0
0920
10-9
516
,963
$
-$
Pris
oner
Ree
ntry
Initi
ativ
e D
emon
stra
tion
(Offe
nder
Ree
ntry
)16
.202
2007
-RE
-CX-
0012
231,
608
127,
752
Pris
oner
Ree
ntry
Initi
ativ
e D
emon
stra
tion
(Offe
nder
Ree
ntry
)16
.202
2008
-RE
-CX-
0020
276,
892
117,
394
508,
500
245,
146
Juve
nile
Acc
ount
abilit
y In
cent
ive
Blo
ck G
rant
s16
.523
2005
-JB
-FX-
0043
4,53
9
4,53
9
Juve
nile
Acc
ount
abilit
y In
cent
ive
Blo
ck G
rant
s16
.523
2006
-JB
-FX-
0048
5,17
8
5,17
8
Juve
nile
Acc
ount
abilit
y In
cent
ive
Blo
ck G
rant
s16
.523
2007
-JB
-FX-
0036
10,6
27
10
,627
Juve
nile
Acc
ount
abilit
y In
cent
ive
Blo
ck G
rant
s16
.523
2008
-JB
-FX-
0020
167,
649
167,
649
Juve
nile
Acc
ount
abilit
y In
cent
ive
Blo
ck G
rant
s16
.523
2009
-JB
-FX-
0018
230,
149
182,
609
418,
142
370,
602
Juve
nile
Jus
tice
and
Del
inqu
ency
Pre
vent
ion_
Allo
catio
n to
Sta
tes
16.5
4020
08-J
F-FX
-001
620
7,79
6
-
Juve
nile
Jus
tice
and
Del
inqu
ency
Pre
vent
ion_
Allo
catio
n to
Sta
tes
16.5
4020
09-J
F-FX
-001
133
1,63
8
-
539,
434
-
Title
V_D
elin
quen
cy P
reve
ntio
n P
rogr
am16
.548
2007
-JP
-FX-
0042
15,7
71
13
,663
Nat
iona
l Crim
inal
His
tory
Impr
ovem
ent P
rogr
am (N
CH
IP)
16.5
5420
09-R
U-B
X-K
011
4,96
2
-
Crim
e V
ictim
Ass
ista
nce
16.5
7520
08-V
A-G
X-00
411,
929,
212
1,
889,
891
Crim
e V
ictim
Ass
ista
nce
16.5
7520
09-V
A-G
X-00
411,
329,
590
1,
304,
476
3,25
8,80
2
3,19
4,36
7
Crim
e V
ictim
Com
pens
atio
n16
.576
2009
-VC
-GX-
0044
25,8
59
-
Crim
e V
ictim
Com
pens
atio
n16
.576
2010
-VC
-GX-
0054
2,24
5,30
2
-
AR
RA
- C
rime
Vic
tim C
ompe
nsat
ion
16.5
76A
2009
-SF-
B9-
0128
544,
273
-
2,81
5,43
4
-
Vio
lenc
e A
gain
st W
omen
For
mul
a G
rant
s16
.588
2007
-WE
-AX-
0016
171,
253
171,
162
Vio
lenc
e A
gain
st W
omen
For
mul
a G
rant
s16
.588
2008
-WF-
AX-
0054
735,
882
708,
198
Vio
lenc
e A
gain
st W
omen
For
mul
a G
rant
s16
.588
2009
-WE
-AX-
0005
294,
184
227,
810
AR
RA
- V
iole
nce
Aga
inst
Wom
en F
orm
ula
Gra
nts
16.5
88A
2009
-EF-
S6-
0006
645,
706
570,
385
1,84
7,02
5
1,67
7,55
5
Gra
nts
to E
ncou
rage
Arr
est P
olic
ies
16.5
9020
09-W
E-A
X-00
1012
0,63
5
8,
058
Res
iden
tial S
ubst
ance
Abu
se T
reat
men
t for
Sta
te P
rison
ers
16.5
9320
08-R
T-B
X-00
3822
,907
-
Res
iden
tial S
ubst
ance
Abu
se T
reat
men
t for
Sta
te P
rison
ers
16.5
9320
09-R
T-B
X-00
4572
,326
-
95,2
33
-
85

Fede
ral G
rant
or /
Pass
-Thr
ough
Gra
ntor
CFD
AAw
ard
or P
ass-
Paym
ents
to
Pro
gram
Titl
eN
umbe
rTh
roug
h N
umbe
rEx
pend
iture
s S
ubre
cipi
ents
____
____
____
____
____
____
____
____
____
____
____
____
____
____
____
___
____
____
___
____
____
____
____
____
____
____
____
____
____
____
____
____
____
____
____
____
____
____
____
____
__
STA
TE O
F N
EVA
DA
SCH
EDU
LE O
F EX
PEN
DIT
UR
ES O
F FE
DER
AL A
WAR
DS
FOR
TH
E YE
AR E
ND
ED J
UN
E 30
, 201
0
Sta
te C
rimin
al A
lien
Ass
ista
nce
Pro
gram
16.6
0620
09-G
2751
-NV
-AP
3,35
4,38
6$
-$
Bul
letp
roof
Ves
t Par
tner
ship
Gra
nt16
.607
07-B
VP
-07
354
-
Com
mun
ity P
rose
cutio
n an
d P
roje
ct S
afe
Nei
ghbo
rhoo
ds16
.609
2008
-GP
-CX-
0084
32,0
42
27
,058
Com
mun
ity P
rose
cutio
n an
d P
roje
ct S
afe
Nei
ghbo
rhoo
ds16
.609
2009
-GP
-BX-
0010
57,2
98
-
89,3
40
27
,058
Pub
lic S
afet
y P
artn
ersh
ip a
nd C
omm
unity
Pol
icin
g G
rant
s16
.710
2008
CK
WX0
854
484,
470
484,
470
Pub
lic S
afet
y P
artn
ersh
ip a
nd C
omm
unity
Pol
icin
g G
rant
s16
.710
2009
CS
WX0
016
102,
131
-
586,
601
484,
470
Enf
orci
ng U
nder
age
Drin
king
Law
s P
rogr
am16
.727
2008
-AH
-FX-
0053
350,
000
350,
000
Enf
orci
ng U
nder
age
Drin
king
Law
s P
rogr
am16
.727
2008
-AH
-FX-
0067
218,
458
218,
458
568,
458
568,
458
Edw
ard
Byr
ne M
emor
ial J
ustic
e A
ssis
tanc
e G
rant
Pro
gram
16.7
3820
05-D
J-B
X-00
1854
,232
54,2
32
Edw
ard
Byr
ne M
emor
ial J
ustic
e A
ssis
tanc
e G
rant
Pro
gram
16.7
3820
06-D
J-B
X-00
2811
3,84
7
8,
044
Edw
ard
Byr
ne M
emor
ial J
ustic
e A
ssis
tanc
e G
rant
Pro
gram
16.7
3820
07-D
J-B
X-00
6821
8,31
6
37
,704
Edw
ard
Byr
ne M
emor
ial J
ustic
e A
ssis
tanc
e G
rant
Pro
gram
16.7
3820
08-D
J-B
X-00
314,
113
4,
113
Edw
ard
Byr
ne M
emor
ial J
ustic
e A
ssis
tanc
e G
rant
Pro
gram
16.7
3820
08-D
J-B
X-07
4415
,000
15,0
00
Edw
ard
Byr
ne M
emor
ial J
ustic
e A
ssis
tanc
e G
rant
Pro
gram
16.7
3820
09-D
J-B
X-03
302,
103,
386
1,
975,
263
2,50
8,89
4
2,09
4,35
6
Sta
tew
ide
Aut
omat
ed V
ictim
Info
rmat
ion
Not
ifica
tion
(SA
VIN
) Pro
gram
16.7
4020
09-V
N-C
X-00
1482
,481
-
Pau
l Cov
erde
ll Fo
rens
ic S
cien
ces
Impr
ovem
ent G
rant
Pro
gram
16.7
4220
08-C
D-B
X-00
2513
,411
11,6
34
Pau
l Cov
erde
ll Fo
rens
ic S
cien
ces
Impr
ovem
ent G
rant
Pro
gram
16.7
4220
09-C
D-B
X-00
2157
,189
57,1
35
70,6
00
68
,769
Con
gres
sion
ally
Rec
omm
ende
d A
war
ds16
.753
2009
-DI-B
X-01
5416
,372
-
AR
RA
- E
dwar
d B
yrne
Mem
oria
l Jus
tice
Ass
ista
nce
Gra
nt (J
AG
) P
rogr
am/G
rant
s to
Sta
tes
and
Terr
itorie
s16
.803
A20
09-S
U-B
9-00
431,
696,
592
82
3,74
3
Tot
al D
epar
tmen
t of J
ustic
e18
,614
,979
9,57
6,24
5
Dep
artm
ent o
f Lab
or
Empl
oym
ent S
ervi
ce C
LUST
ER
Em
ploy
men
t Ser
vice
/Wag
ner-
Pey
ser F
unde
d A
ctiv
ities
17.2
07E
S-1
7580
-08-
55-A
-32
634,
197
-
Em
ploy
men
t Ser
vice
/Wag
ner-
Pey
ser F
unde
d A
ctiv
ities
17.2
07E
S-1
9221
-09-
55-A
-32
5,30
1,40
5
-
Em
ploy
men
t Ser
vice
/Wag
ner-
Pey
ser F
unde
d A
ctiv
ities
17.2
07M
I-171
02-0
8-60
-A-3
217
8,68
6
-
AR
RA
- E
mpl
oym
ent S
ervi
ce/W
agne
r-P
eyse
r Fun
ded
Act
iviti
es17
.207
AE
S-1
7580
-08-
55-A
-32
2,25
3,64
7
-
8,36
7,93
5
-
86

Fede
ral G
rant
or /
Pass
-Thr
ough
Gra
ntor
CFD
AAw
ard
or P
ass-
Paym
ents
to
Pro
gram
Titl
eN
umbe
rTh
roug
h N
umbe
rEx
pend
iture
s S
ubre
cipi
ents
____
____
____
____
____
____
____
____
____
____
____
____
____
____
____
___
____
____
___
____
____
____
____
____
____
____
____
____
____
____
____
____
____
____
____
____
____
____
____
____
__
STA
TE O
F N
EVA
DA
SCH
EDU
LE O
F EX
PEN
DIT
UR
ES O
F FE
DER
AL A
WAR
DS
FOR
TH
E YE
AR E
ND
ED J
UN
E 30
, 201
0
Dis
able
d V
eter
ans'
Out
reac
h P
rogr
am (D
VO
P)
17.8
01D
V-1
9662
-10-
55-5
-32
473,
620
$
-$
Dis
able
d V
eter
ans'
Out
reac
h P
rogr
am (D
VO
P)
17.8
01E
-9-5
-9-5
087
181,
977
-
655,
597
-
Loca
l Vet
eran
s' E
mpl
oym
ent R
epre
sent
ativ
e P
rogr
am17
.804
DV
-196
62-1
0-55
-5-3
245
4,22
8
-
Loca
l Vet
eran
s' E
mpl
oym
ent R
epre
sent
ativ
e P
rogr
am17
.804
E-9
-5-9
-508
717
6,78
6
-
631,
014
-
Tot
al E
mpl
oym
ent S
ervi
ce C
LUST
ER9,
654,
546
-
WIA
CLU
STER
WIA
Adu
lt P
rogr
am17
.258
AA
-160
47-0
7-55
-A-3
212
0,73
4
2,
074
WIA
Adu
lt P
rogr
am17
.258
AA
-171
40-0
8-55
-A-3
254
3,68
5
-
WIA
Adu
lt P
rogr
am17
.258
AA
-186
60-0
9-55
-A-3
25,
050,
379
4,
786,
283
AR
RA
- W
IA A
dult
Pro
gram
17.2
58A
AA
-171
40-0
8-55
-A-3
24,
312,
560
4,
005,
068
10,0
27,3
58
8,
793,
425
WIA
You
th A
ctiv
ities
17.2
59A
A-1
6047
-07-
55-A
-32
117,
428
2,19
0
WIA
You
th A
ctiv
ities
17.2
59A
A-1
7140
-08-
55-A
-32
1,84
0,81
6
1,53
6,89
1
WIA
You
th A
ctiv
ities
17.2
59A
A-1
8660
-09-
55-A
-32
2,17
7,42
6
1,91
4,01
4
AR
RA
- W
IA Y
outh
Act
iviti
es17
.259
AA
A-1
7140
-08-
55-A
-32
6,17
4,52
9
5,49
0,15
5
10,3
10,1
99
8,
943,
250
WIA
Dis
loca
ted
Wor
kers
17.2
60A
A-1
6047
-07-
55-A
-32
141,
527
2,71
6
WIA
Dis
loca
ted
Wor
kers
17.2
60A
A-1
7140
-08-
55-A
-32
2,32
0,64
0
2,07
7,81
5
WIA
Dis
loca
ted
Wor
kers
17.2
60A
A-1
8660
-09-
55-A
-32
5,03
7,72
4
3,78
7,76
6
WIA
Dis
loca
ted
Wor
kers
17.2
60E
H-1
7647
-08-
55-A
-32
79,3
63
-
WIA
Dis
loca
ted
Wor
kers
17.2
60E
H-1
9254
-09-
55-A
-32
272,
634
272,
634
AR
RA
- W
IA D
islo
cate
d W
orke
rs17
.260
AA
A-1
7140
-08-
55-A
-32
6,16
7,54
6
4,87
3,51
9
14,0
19,4
34
11
,014
,450
Tot
al W
IA C
LUST
ER34
,356
,991
28,7
51,1
25
Labo
r For
ce S
tatis
tics
17.0
02LM
-184
32-0
9-75
-J-3
230
4,11
3
-
Labo
r For
ce S
tatis
tics
17.0
02LM
-184
32-1
0-75
-J-3
283
0,97
5
-
1,13
5,08
8
-
Com
pens
atio
n an
d W
orki
ng C
ondi
tions
17.0
05O
S-1
7931
-09-
75-J
-32
10,3
82
-
Com
pens
atio
n an
d W
orki
ng C
ondi
tions
17.0
05O
S-1
8476
-10-
75-J
-32
46,8
63
-
57,2
45
-
Une
mpl
oym
ent I
nsur
ance
17.2
25U
.I. T
rust
Fun
d1,
371,
587,
823
-
Une
mpl
oym
ent I
nsur
ance
17.2
25U
I-158
17-0
7-55
12,0
23
-
Une
mpl
oym
ent I
nsur
ance
17.2
25U
I-180
39-0
9-55
-A-3
221
,163
,893
-
87
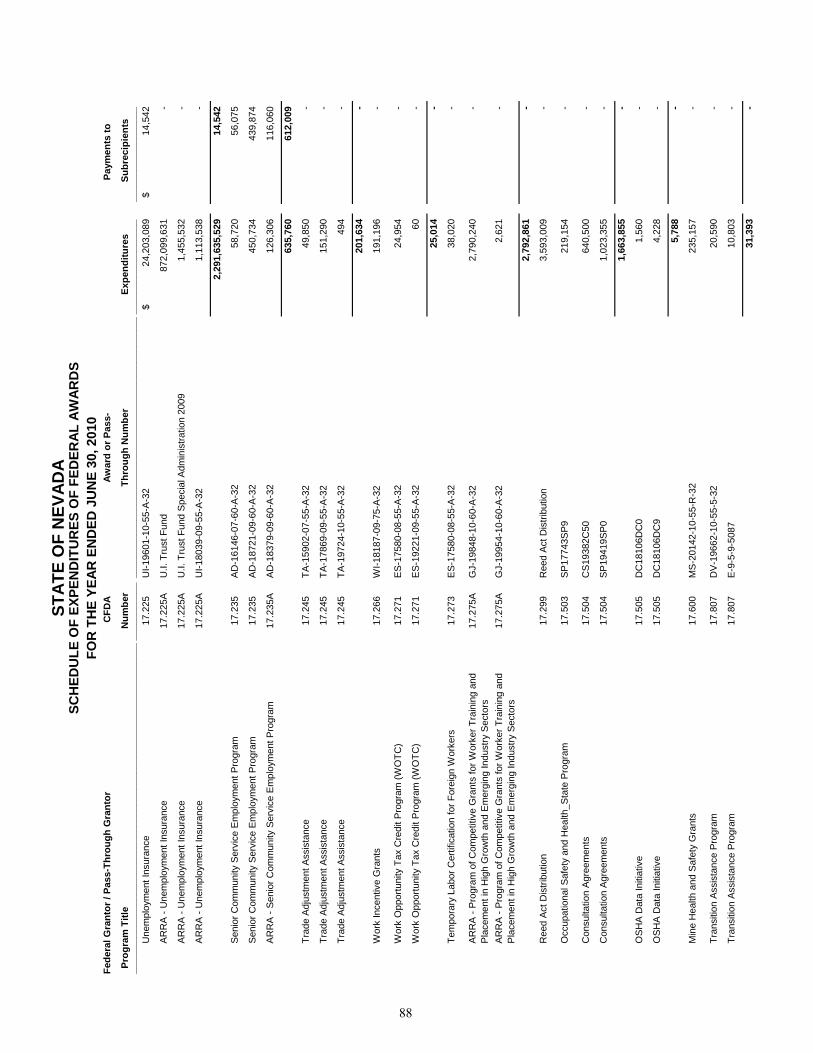
Fede
ral G
rant
or /
Pass
-Thr
ough
Gra
ntor
CFD
AAw
ard
or P
ass-
Paym
ents
to
Pro
gram
Titl
eN
umbe
rTh
roug
h N
umbe
rEx
pend
iture
s S
ubre
cipi
ents
____
____
____
____
____
____
____
____
____
____
____
____
____
____
____
___
____
____
___
____
____
____
____
____
____
____
____
____
____
____
____
____
____
____
____
____
____
____
____
____
__
STA
TE O
F N
EVA
DA
SCH
EDU
LE O
F EX
PEN
DIT
UR
ES O
F FE
DER
AL A
WAR
DS
FOR
TH
E YE
AR E
ND
ED J
UN
E 30
, 201
0
Une
mpl
oym
ent I
nsur
ance
17.2
25U
I-196
01-1
0-55
-A-3
224
,203
,089
$
14,5
42$
AR
RA
- U
nem
ploy
men
t Ins
uran
ce17
.225
AU
.I. T
rust
Fun
d87
2,09
9,63
1
-
AR
RA
- U
nem
ploy
men
t Ins
uran
ce17
.225
AU
.I. T
rust
Fun
d S
peci
al A
dmin
istra
tion
2009
1,45
5,53
2
-
AR
RA
- U
nem
ploy
men
t Ins
uran
ce17
.225
AU
I-180
39-0
9-55
-A-3
21,
113,
538
-
2,29
1,63
5,52
9
14
,542
Sen
ior C
omm
unity
Ser
vice
Em
ploy
men
t Pro
gram
17.2
35A
D-1
6146
-07-
60-A
-32
58,7
20
56
,075
Sen
ior C
omm
unity
Ser
vice
Em
ploy
men
t Pro
gram
17.2
35A
D-1
8721
-09-
60-A
-32
450,
734
439,
874
AR
RA
- S
enio
r Com
mun
ity S
ervi
ce E
mpl
oym
ent P
rogr
am17
.235
AA
D-1
8379
-09-
60-A
-32
126,
306
116,
060
635,
760
612,
009
Trad
e A
djus
tmen
t Ass
ista
nce
17.2
45TA
-159
02-0
7-55
-A-3
249
,850
-
Trad
e A
djus
tmen
t Ass
ista
nce
17.2
45TA
-178
69-0
9-55
-A-3
215
1,29
0
-
Trad
e A
djus
tmen
t Ass
ista
nce
17.2
45TA
-197
24-1
0-55
-A-3
249
4
-
201,
634
-
Wor
k In
cent
ive
Gra
nts
17.2
66W
I-181
87-0
9-75
-A-3
219
1,19
6
-
Wor
k O
ppor
tuni
ty T
ax C
redi
t Pro
gram
(WO
TC)
17.2
71E
S-1
7580
-08-
55-A
-32
24,9
54
-
Wor
k O
ppor
tuni
ty T
ax C
redi
t Pro
gram
(WO
TC)
17.2
71E
S-1
9221
-09-
55-A
-32
60
-
25,0
14
-
Tem
pora
ry L
abor
Cer
tific
atio
n fo
r For
eign
Wor
kers
17.2
73E
S-1
7580
-08-
55-A
-32
38,0
20
-
AR
RA
- P
rogr
am o
f Com
petit
ive
Gra
nts
for W
orke
r Tra
inin
g an
d P
lace
men
t in
Hig
h G
row
th a
nd E
mer
ging
Indu
stry
Sec
tors
17.2
75A
GJ-
1984
8-10
-60-
A-3
22,
790,
240
-
AR
RA
- P
rogr
am o
f Com
petit
ive
Gra
nts
for W
orke
r Tra
inin
g an
d P
lace
men
t in
Hig
h G
row
th a
nd E
mer
ging
Indu
stry
Sec
tors
17.2
75A
GJ-
1995
4-10
-60-
A-3
22,
621
-
2,79
2,86
1
-
Ree
d A
ct D
istri
butio
n17
.299
Ree
d A
ct D
istri
butio
n3,
593,
009
-
Occ
upat
iona
l Saf
ety
and
Hea
lth_S
tate
Pro
gram
17.5
03S
P17
743S
P9
219,
154
-
Con
sulta
tion
Agr
eem
ents
17.5
04C
S19
382C
5064
0,50
0
-
Con
sulta
tion
Agr
eem
ents
17.5
04S
P19
419S
P0
1,02
3,35
5
-
1,66
3,85
5
-
OS
HA
Dat
a In
itiat
ive
17.5
05D
C18
106D
C0
1,56
0
-
OS
HA
Dat
a In
itiat
ive
17.5
05D
C18
106D
C9
4,22
8
-
5,78
8
-
Min
e H
ealth
and
Saf
ety
Gra
nts
17.6
00M
S-2
0142
-10-
55-R
-32
235,
157
-
Tran
sitio
n A
ssis
tanc
e P
rogr
am17
.807
DV
-196
62-1
0-55
-5-3
220
,590
-
Tran
sitio
n A
ssis
tanc
e P
rogr
am17
.807
E-9
-5-9
-508
710
,803
-
31,3
93
-
88

Fede
ral G
rant
or /
Pass
-Thr
ough
Gra
ntor
CFD
AAw
ard
or P
ass-
Paym
ents
to
Pro
gram
Titl
eN
umbe
rTh
roug
h N
umbe
rEx
pend
iture
s S
ubre
cipi
ents
____
____
____
____
____
____
____
____
____
____
____
____
____
____
____
___
____
____
___
____
____
____
____
____
____
____
____
____
____
____
____
____
____
____
____
____
____
____
____
____
__
STA
TE O
F N
EVA
DA
SCH
EDU
LE O
F EX
PEN
DIT
UR
ES O
F FE
DER
AL A
WAR
DS
FOR
TH
E YE
AR E
ND
ED J
UN
E 30
, 201
0
WIA
Dis
loca
ted
Wor
kers
Nat
. Res
. - T
AT
17.9
99M
I-171
02-0
8-60
-A-3
219
2,17
7$
-
$
Tot
al D
epar
tmen
t of L
abor
2,34
6,66
4,41
7
29
,377
,676
Dep
artm
ent o
f Tra
nspo
rtat
ion
Fede
ral T
rans
it C
LUST
ER
Fede
ral T
rans
it_C
apita
l Inv
estm
ent G
rant
s20
.500
NV
-04-
0008
97,7
55
97
,755
Fede
ral T
rans
it_Fo
rmul
a G
rant
s20
.507
NV
-90-
X052
163,
838
163,
838
Tot
al F
eder
al T
rans
it C
LUST
ER26
1,59
3
26
1,59
3
Hig
hway
Pla
nnin
g an
d C
onst
ruct
ion
CLU
STER
Hig
hway
Pla
nnin
g an
d C
onst
ruct
ion
20.2
05S
FY 1
032
8,77
2,54
4
43,4
47,9
13
AR
RA
- H
ighw
ay P
lann
ing
and
Con
stru
ctio
n20
.205
AS
FY 1
053
,437
,473
3,29
1,92
8
382,
210,
017
46
,739
,841
Rec
reat
iona
l Tra
ils P
rogr
am20
.219
NR
T-00
01 (0
01)-
2005
125,
721
125,
721
Rec
reat
iona
l Tra
ils P
rogr
am20
.219
NR
T-00
01 (0
01)-
2006
97,2
87
76
,206
Rec
reat
iona
l Tra
ils P
rogr
am20
.219
NR
T-00
725
7,36
4
19
8,45
4
Rec
reat
iona
l Tra
ils P
rogr
am20
.219
NR
TP-0
0834
7,68
8
25
4,44
7
Rec
reat
iona
l Tra
ils P
rogr
am20
.219
NR
TP-0
0970
,650
168,
738
898,
710
823,
566
Tot
al H
ighw
ay P
lann
ing
and
Con
stru
ctio
n C
LUST
ER38
3,10
8,72
7
47,5
63,4
07
Hig
hway
Saf
ety
CLU
STER
Sta
te a
nd C
omm
unity
Hig
hway
Saf
ety
20.6
00U
S D
OT
(NH
TSA
) FFY
081,
971,
746
94
8,58
1
Sta
te a
nd C
omm
unity
Hig
hway
Saf
ety
20.6
00U
S D
OT
(NH
TSA
) FFY
092,
906,
741
58
9,37
2
Sta
te a
nd C
omm
unity
Hig
hway
Saf
ety
20.6
00U
S D
OT
(NH
TSA
) FFY
1062
0,16
1
62
0,16
1
5,49
8,64
8
2,15
8,11
4
Tot
al H
ighw
ay S
afet
y C
LUST
ER5,
498,
648
2,
158,
114
Tran
sit S
ervi
ces
Prog
ram
s C
LUST
ER
Cap
ital A
ssis
tanc
e P
rogr
am fo
r Eld
erly
Per
sons
and
Per
sons
with
D
isab
ilitie
s20
.513
NV
-04-
0006
57,0
75
57
,075
Cap
ital A
ssis
tanc
e P
rogr
am fo
r Eld
erly
Per
sons
and
Per
sons
with
D
isab
ilitie
s20
.513
NV
-16-
0033
251,
568
251,
568
Cap
ital A
ssis
tanc
e P
rogr
am fo
r Eld
erly
Per
sons
and
Per
sons
with
D
isab
ilitie
s20
.513
NV
-16-
0035
399,
152
399,
152
Cap
ital A
ssis
tanc
e P
rogr
am fo
r Eld
erly
Per
sons
and
Per
sons
with
D
isab
ilitie
s20
.513
NV
-16-
0036
317,
000
317,
000
1,02
4,79
5
1,02
4,79
5
89

Fede
ral G
rant
or /
Pass
-Thr
ough
Gra
ntor
CFD
AAw
ard
or P
ass-
Paym
ents
to
Pro
gram
Titl
eN
umbe
rTh
roug
h N
umbe
rEx
pend
iture
s S
ubre
cipi
ents
____
____
____
____
____
____
____
____
____
____
____
____
____
____
____
___
____
____
___
____
____
____
____
____
____
____
____
____
____
____
____
____
____
____
____
____
____
____
____
____
__
STA
TE O
F N
EVA
DA
SCH
EDU
LE O
F EX
PEN
DIT
UR
ES O
F FE
DER
AL A
WAR
DS
FOR
TH
E YE
AR E
ND
ED J
UN
E 30
, 201
0
Job
Acc
ess_
Rev
erse
Com
mut
e20
.516
NV
-37-
X007
33,0
49$
33
,049
$
Job
Acc
ess_
Rev
erse
Com
mut
e20
.516
NV
-37-
X015
227,
364
227,
364
Job
Acc
ess_
Rev
erse
Com
mut
e20
.516
NV
-37-
X016
49,5
83
49
,583
309,
996
309,
996
New
Fre
edom
Pro
gram
20.5
21N
V-5
7-X0
01-0
03,
374
3,
374
Tot
al T
rans
it Se
rvic
es P
rogr
ams
CLU
STER
1,33
8,16
5
1,33
8,16
5
Airp
ort I
mpr
ovem
ent P
rogr
am20
.106
3-32
-000
-006
192,
835
-
Airp
ort I
mpr
ovem
ent P
rogr
am20
.106
3-32
-000
-008
5,52
0
-
Airp
ort I
mpr
ovem
ent P
rogr
am20
.106
ND
OT/
Airp
ort I
mpr
ovem
ent P
rogr
am1,
650
-
200,
005
-
Nat
iona
l Mot
or C
arrie
r Saf
ety
20.2
1827
XX32
MC
0832
1578
019
5,71
3
-
Nat
iona
l Mot
or C
arrie
r Saf
ety
20.2
18M
C09
3210
0000
01,
240,
833
-
Nat
iona
l Mot
or C
arrie
r Saf
ety
20.2
18M
H09
3230
0000
0039
,780
-
Nat
iona
l Mot
or C
arrie
r Saf
ety
20.2
18M
H09
3240
0000
0024
0,84
4
-
Nat
iona
l Mot
or C
arrie
r Saf
ety
20.2
18M
N09
3210
0000
0012
9,85
9
-
Nat
iona
l Mot
or C
arrie
r Saf
ety
20.2
18M
N10
3210
0000
007,
901
-
1,85
4,93
0
-
Com
mer
cial
Veh
icle
Info
rmat
ion
Sys
tem
s an
d N
etw
orks
20.2
37C
VIS
N07
238,
732
-
Form
ula
Gra
nts
for O
ther
Tha
n U
rban
ized
Are
as20
.509
NV
-18-
X023
-00
56,3
34
56
,334
Form
ula
Gra
nts
for O
ther
Tha
n U
rban
ized
Are
as20
.509
NV
-18-
X024
597,
362
577,
362
Form
ula
Gra
nts
for O
ther
Tha
n U
rban
ized
Are
as20
.509
NV
-18-
X025
1,47
9,44
8
1,43
9,35
1
Form
ula
Gra
nts
for O
ther
Tha
n U
rban
ized
Are
as20
.509
NV
-18-
X026
1,59
8,55
8
1,59
8,55
8
Form
ula
Gra
nts
for O
ther
Tha
n U
rban
ized
Are
as20
.509
NV
-86-
X000
13,
319,
162
3,
319,
162
7,05
0,86
4
6,99
0,76
7
Pip
elin
e S
afet
y20
.700
DTP
H56
-09-
G-P
HP
G26
406,
358
-
Inte
rage
ncy
Haz
ardo
us M
ater
ials
Pub
lic S
ecto
r Tra
inin
g an
d P
lann
ing
Gra
nts
20.7
03H
M-H
MP
-003
7-09
-01-
0039
,605
38,3
76
Inte
rage
ncy
Haz
ardo
us M
ater
ials
Pub
lic S
ecto
r Tra
inin
g an
d P
lann
ing
Gra
nts
20.7
03H
ME
NV
8008
160
73,9
34
72
,993
113,
539
111,
369
PH
MS
A P
ipel
ine
Saf
ety
Pro
gram
One
Cal
l Gra
nt20
.721
DTP
H56
-09-
G-P
HP
C18
22,5
00
-
PH
MS
A P
ipel
ine
Saf
ety
Pro
gram
One
Cal
l Gra
nt20
.721
DTP
H56
-10-
G-P
HP
C20
22,5
00
-
45,0
00
-
Tot
al D
epar
tmen
t of T
rans
port
atio
n40
0,11
6,56
1
58,4
23,4
15
90

Fede
ral G
rant
or /
Pass
-Thr
ough
Gra
ntor
CFD
AAw
ard
or P
ass-
Paym
ents
to
Pro
gram
Titl
eN
umbe
rTh
roug
h N
umbe
rEx
pend
iture
s S
ubre
cipi
ents
____
____
____
____
____
____
____
____
____
____
____
____
____
____
____
___
____
____
___
____
____
____
____
____
____
____
____
____
____
____
____
____
____
____
____
____
____
____
____
____
__
STA
TE O
F N
EVA
DA
SCH
EDU
LE O
F EX
PEN
DIT
UR
ES O
F FE
DER
AL A
WAR
DS
FOR
TH
E YE
AR E
ND
ED J
UN
E 30
, 201
0
Dep
artm
ent o
f Tre
asur
y
Nat
iona
l For
eclo
sure
Miti
gatio
n C
ouns
elin
g P
rogr
am21
.000
PL1
11-8
:95X
1350
273,
691
$
258,
502
$
AR
RA
- H
ousi
ng T
ax C
redi
ts21
.000
ATP
D20
09G
RN
V45
13,9
63,0
61
13
,963
,061
14,2
36,7
52
14
,221
,563
Tot
al D
epar
tmen
t of T
reas
ury
14,2
36,7
52
14
,221
,563
Equa
l Em
ploy
men
t Opp
ortu
nity
Com
mis
sion
Em
ploy
men
t Dis
crim
inat
ion_
Sta
te a
nd L
ocal
Fai
r Em
ploy
men
t P
ract
ices
Age
ncy
Con
tract
s30
.002
EE
CC
N09
0067
338,
200
-
Tot
al E
qual
Em
ploy
men
t Opp
ortu
nity
Com
mis
sion
338,
200
-
Gen
eral
Ser
vice
s Ad
min
istr
atio
n
Don
atio
n of
Fed
eral
Sur
plus
Per
sona
l Pro
perty
39.0
03S
FY 1
0 Fe
dera
l Sur
plus
Pro
perty
1,94
4,63
2
1,51
3,57
4
Ele
ctio
n R
efor
m P
aym
ents
39.0
11S
FY 1
026
1,43
4
-
Tot
al G
ener
al S
ervi
ces
Adm
inis
trat
ion
2,20
6,06
6
1,51
3,57
4
Nat
iona
l Fou
ndat
ion
on th
e Ar
ts a
nd th
e H
uman
ities
Pro
mot
ion
of th
e A
rts_P
artn
ersh
ip A
gree
men
ts45
.025
09-6
100-
2053
736,
588
548,
563
AR
RA
- P
rom
otio
n of
the
Arts
- P
artn
ersh
ip A
gree
men
ts45
.025
A09
-618
8-20
9827
1,22
2
24
9,61
7
1,00
7,81
0
798,
180
Pro
mot
ion
of th
e H
uman
ities
_We
the
Peo
ple
45.1
68N
evad
a H
uman
ities
200
9-12
2,50
0
-
Gra
nts
to S
tate
s45
.310
LS-0
0-08
-002
9-08
551,
666
109,
083
Gra
nts
to S
tate
s45
.310
LS-0
0-09
-002
9-09
1,37
4,99
9
593,
665
Gra
nts
to S
tate
s45
.310
LS-0
0-10
-002
9-10
14,1
75
14
,175
1,94
0,84
0
716,
923
Laur
a B
ush
21st
Cen
tury
Lib
raria
n P
rogr
am45
.313
RE
-01-
06-0
023-
0664
,321
16,5
17
Tot
al N
atio
nal F
ound
atio
n on
the
Arts
and
the
Hum
aniti
es3,
015,
471
1,
531,
620
Dep
artm
ent o
f Vet
eran
s Af
fairs
Gra
nts
to S
tate
s fo
r Con
stru
ctio
n of
Sta
te H
ome
Faci
litie
s64
.005
V.A
. Hom
es S
FY 1
06,
500
-
Sta
te C
emet
ery
Gra
nts
64.2
03N
V 0
2-09
-02
792,
716
-
Tot
al D
epar
tmen
t of V
eter
ans
Affa
irs79
9,21
6
-
Envi
ronm
enta
l Pro
tect
ion
Agen
cy
Sta
te In
door
Rad
on G
rant
s66
.032
K1-
9696
3510
-022
9,07
1
-
Cle
an S
choo
l Bus
US
A66
.036
EM
-832
9660
1-0
263,
110
-
Sta
te C
lean
Die
sel G
rant
Pro
gram
66.0
40D
S-9
6965
801-
228
0,32
5
-
AR
RA
- S
tate
Cle
an D
iese
l Gra
nt P
rogr
am66
.040
A2D
-00T
0680
1-2
1,70
0,93
7
1,69
7,37
0
1,98
1,26
2
1,69
7,37
0
91

Fede
ral G
rant
or /
Pass
-Thr
ough
Gra
ntor
CFD
AAw
ard
or P
ass-
Paym
ents
to
Pro
gram
Titl
eN
umbe
rTh
roug
h N
umbe
rEx
pend
iture
s S
ubre
cipi
ents
____
____
____
____
____
____
____
____
____
____
____
____
____
____
____
___
____
____
___
____
____
____
____
____
____
____
____
____
____
____
____
____
____
____
____
____
____
____
____
____
__
STA
TE O
F N
EVA
DA
SCH
EDU
LE O
F EX
PEN
DIT
UR
ES O
F FE
DER
AL A
WAR
DS
FOR
TH
E YE
AR E
ND
ED J
UN
E 30
, 201
0
Reg
ion
9 M
ulti-
Med
ia a
nd G
eogr
aphi
c P
riorit
y P
roje
cts
66.1
17R
9-98
9440
014,
882
$
-
$
Wat
er P
ollu
tion
Con
trol_
Sta
te a
nd In
ters
tate
Pro
gram
Sup
port
66.4
19I-9
7933
606
1,12
2,18
7
1,12
2,18
7
Wat
er P
ollu
tion
Con
trol_
Sta
te a
nd In
ters
tate
Pro
gram
Sup
port
66.4
19I-9
8972
809
183,
831
183,
831
1,30
6,01
8
1,30
6,01
8
Sta
te P
ublic
Wat
er S
yste
m S
uper
visi
on66
.432
F-00
9105
10-1
824,
000
76,1
52
Sta
te U
nder
grou
nd W
ater
Sou
rce
Pro
tect
ion
66.4
33G
-009
4560
985
,500
-
Wat
er Q
ualit
y M
anag
emen
t Pla
nnin
g66
.454
C6-
9796
5909
10,9
09
10
,909
Wat
er Q
ualit
y M
anag
emen
t Pla
nnin
g66
.454
C6-
9796
5910
35,1
73
-
AR
RA
- W
ater
Qua
lity
Man
agem
ent P
lann
ing
66.4
54A
2P-0
0T05
209-
012
1,18
7
45
,000
167,
269
55,9
09
Cap
italiz
atio
n G
rant
s fo
r Cle
an W
ater
Sta
te R
evol
ving
Fun
ds66
.458
CS
-320
001-
0318
0,13
4
14
1,45
6
Cap
italiz
atio
n G
rant
s fo
r Cle
an W
ater
Sta
te R
evol
ving
Fun
ds66
.458
CS
-320
001-
0421
5,59
3
21
5,59
3
Cap
italiz
atio
n G
rant
s fo
r Cle
an W
ater
Sta
te R
evol
ving
Fun
ds66
.458
CS
-320
001-
0529
0,04
1
29
0,04
1
Cap
italiz
atio
n G
rant
s fo
r Cle
an W
ater
Sta
te R
evol
ving
Fun
ds66
.458
CS
-320
001-
0694
3,28
2
76
8,49
9
Cap
italiz
atio
n G
rant
s fo
r Cle
an W
ater
Sta
te R
evol
ving
Fun
ds66
.458
CS
-320
001-
0728
,336
-
Cap
italiz
atio
n G
rant
s fo
r Cle
an W
ater
Sta
te R
evol
ving
Fun
ds66
.458
CS
-320
001-
083,
850,
334
3,
850,
334
Cap
italiz
atio
n G
rant
s fo
r Cle
an W
ater
Sta
te R
evol
ving
Fun
ds66
.458
CS
-320
001-
092,
572,
341
2,
572,
341
Cap
italiz
atio
n G
rant
s fo
r Cle
an W
ater
Sta
te R
evol
ving
Fun
ds66
.458
CS
-320
001-
104,
007
4,
007
AR
RA
- C
apita
lizat
ion
Gra
nts
for
Cle
an W
ater
Sta
te R
evol
ving
Fun
ds66
.458
A2W
3200
0209
5,52
4,31
7
5,51
9,99
3
13,6
08,3
85
13
,362
,264
Non
poin
t Sou
rce
Impl
emen
tatio
n G
rant
s66
.460
C9-
9790
8105
497,
637
497,
637
Non
poin
t Sou
rce
Impl
emen
tatio
n G
rant
s66
.460
C9-
9790
8107
321,
875
306,
095
Non
poin
t Sou
rce
Impl
emen
tatio
n G
rant
s66
.460
C9-
9790
8108
293,
923
276,
290
Non
poin
t Sou
rce
Impl
emen
tatio
n G
rant
s66
.460
C9-
9790
8109
849,
296
66,4
33
Non
poin
t Sou
rce
Impl
emen
tatio
n G
rant
s66
.460
C9-
9790
8110
53,1
37
53
,137
2,01
5,86
8
1,19
9,59
2
Cap
italiz
atio
n G
rant
s fo
r Drin
king
Wat
er S
tate
Rev
olvi
ng F
unds
66.4
68FS
-999
9600
617
9,45
7
12
8,16
8
Cap
italiz
atio
n G
rant
s fo
r Drin
king
Wat
er S
tate
Rev
olvi
ng F
unds
66.4
68FS
-999
9600
71,
233,
168
1,
215,
600
Cap
italiz
atio
n G
rant
s fo
r Drin
king
Wat
er S
tate
Rev
olvi
ng F
unds
66.4
68FS
-999
9600
81,
754,
121
73
,516
Cap
italiz
atio
n G
rant
s fo
r Drin
king
Wat
er S
tate
Rev
olvi
ng F
unds
66.4
68FS
-999
9601
035
3,29
1
40
,394
AR
RA
- C
apita
lizat
ion
Gra
nts
for D
rinki
ng W
ater
Sta
te R
evol
ving
Fu
nds
66.4
68A
2F00
T049
098,
859,
964
8,
820,
404
12,3
80,0
01
10
,278
,082
92

Fede
ral G
rant
or /
Pass
-Thr
ough
Gra
ntor
CFD
AAw
ard
or P
ass-
Paym
ents
to
Pro
gram
Titl
eN
umbe
rTh
roug
h N
umbe
rEx
pend
iture
s S
ubre
cipi
ents
____
____
____
____
____
____
____
____
____
____
____
____
____
____
____
___
____
____
___
____
____
____
____
____
____
____
____
____
____
____
____
____
____
____
____
____
____
____
____
____
__
STA
TE O
F N
EVA
DA
SCH
EDU
LE O
F EX
PEN
DIT
UR
ES O
F FE
DER
AL A
WAR
DS
FOR
TH
E YE
AR E
ND
ED J
UN
E 30
, 201
0
Sta
te G
rant
s to
Rei
mbu
rse
Ope
rato
rs o
f Sm
all W
ater
Sys
tem
s fo
r Tr
aini
ng a
nd C
ertif
icat
ion
Cos
ts66
.471
CT-
9690
0301
127,
232
$
-$
Wat
er P
rote
ctio
n G
rant
s to
the
Sta
tes
66.4
74W
P-9
6957
901-
180
,023
52,1
89
Wat
er P
rote
ctio
n G
rant
s to
the
Sta
tes
66.4
74W
P-9
7941
201-
527
,271
27,2
71
107,
294
79,4
60
Per
form
ance
Par
tner
ship
Gra
nts
66.6
05B
G-9
7958
808
1,50
9,93
3
-
Env
ironm
enta
l Inf
orm
atio
n E
xcha
nge
Net
wor
k G
rant
Pro
gram
and
R
elat
ed A
ssis
tanc
e66
.608
OS
-832
6080
110
,004
-
Env
ironm
enta
l Inf
orm
atio
n E
xcha
nge
Net
wor
k G
rant
Pro
gram
and
R
elat
ed A
ssis
tanc
e66
.608
OS
-833
0360
199
1
-
Env
ironm
enta
l Inf
orm
atio
n E
xcha
nge
Net
wor
k G
rant
Pro
gram
and
R
elat
ed A
ssis
tanc
e66
.608
OS
-833
4820
171
,228
-
Env
ironm
enta
l Inf
orm
atio
n E
xcha
nge
Net
wor
k G
rant
Pro
gram
and
R
elat
ed A
ssis
tanc
e66
.608
OS
-834
2320
1-0
30,0
00
-
112,
223
-
Con
solid
ated
Pes
ticid
e E
nfor
cem
ent C
oope
rativ
e A
gree
men
ts66
.700
E-0
0915
409-
122
,214
-
Con
solid
ated
Pes
ticid
e E
nfor
cem
ent C
oope
rativ
e A
gree
men
ts66
.700
E-0
0915
410-
025
9,13
6
-
Con
solid
ated
Pes
ticid
e E
nfor
cem
ent C
oope
rativ
e A
gree
men
ts66
.700
E-0
0959
509-
04,
462
-
Con
solid
ated
Pes
ticid
e E
nfor
cem
ent C
oope
rativ
e A
gree
men
ts66
.700
E-0
0959
510-
024
,911
-
310,
723
-
Mul
ti-m
edia
Cap
acity
Bui
ldin
g G
rant
s fo
r S
tate
s an
d Tr
ibes
66.7
09E
A-9
6991
101
84,6
91
-
Und
ergr
ound
Sto
rage
Tan
k P
reve
ntio
n, D
etec
tion
and
Com
plia
nce
Pro
gram
66.8
04L-
00T0
9601
-024
9,07
7
75
,000
Leak
ing
Und
ergr
ound
Sto
rage
Tan
k Tr
ust F
und
Pro
gram
66.8
05LS
-00T
0940
1-0
528,
414
82,0
00
AR
RA
- Le
akin
g U
nder
goun
d S
tora
ge T
ank
Trus
t Fun
d C
orre
ctiv
e A
ctio
n P
rogr
am66
.805
A2L
-00T
2050
1-0
502,
124
-
1,03
0,53
8
82,0
00
Sta
te a
nd T
ribal
Res
pons
e P
rogr
am G
rant
s66
.817
RP
-00T
1000
1-0
493,
345
-
Env
ironm
enta
l Pol
icy
and
Sta
te In
nova
tion
Gra
nts
66.9
40E
I-969
0110
162
,894
-
Tot
al E
nviro
nmen
tal P
rote
ctio
n Ag
ency
36,9
53,3
16
28
,211
,847
Dep
artm
ent o
f Ene
rgy
Sta
te E
nerg
y P
rogr
am81
.041
DE
-FG
26-0
5R02
1610
239,
866
45,0
00
AR
RA
- S
tate
Ene
rgy
Pro
gram
81.0
41A
DE
-EE
-000
0084
1,33
7,50
7
390,
600
1,57
7,37
3
435,
600
Wea
ther
izat
ion
Ass
ista
nce
for L
ow-In
com
e P
erso
ns81
.042
DE
-FG
26-R
O21
683
2,54
2,53
8
2,35
9,67
4
AR
RA
- W
eath
eriz
atio
n A
ssis
tanc
e fo
r Low
-Inco
me
Per
sons
81.0
42A
DE
-EE
0000
081
13,1
48,6
42
12
,958
,903
15,6
91,1
80
15
,318
,577
93

Fede
ral G
rant
or /
Pass
-Thr
ough
Gra
ntor
CFD
AAw
ard
or P
ass-
Paym
ents
to
Pro
gram
Titl
eN
umbe
rTh
roug
h N
umbe
rEx
pend
iture
s S
ubre
cipi
ents
____
____
____
____
____
____
____
____
____
____
____
____
____
____
____
___
____
____
___
____
____
____
____
____
____
____
____
____
____
____
____
____
____
____
____
____
____
____
____
____
__
STA
TE O
F N
EVA
DA
SCH
EDU
LE O
F EX
PEN
DIT
UR
ES O
F FE
DER
AL A
WAR
DS
FOR
TH
E YE
AR E
ND
ED J
UN
E 30
, 201
0
Nuc
lear
Was
te D
ispo
sal S
iting
81.0
65Y
ucca
Mtn
FFY
2006
App
ropr
iatio
n A
ct2,
498,
239
$
-
$
Offi
ce o
f Env
ironm
enta
l Was
te P
roce
ssin
g81
.104
DE
-FG
08-9
9NV
1356
852
2,24
5
-
Offi
ce o
f Env
ironm
enta
l Was
te P
roce
ssin
g81
.104
DE
-FG
52-9
9NV
1356
754
0,71
1
-
1,06
2,95
6
-
Sta
te E
nerg
y P
rogr
am S
peci
al P
roje
cts
81.1
19D
E-F
C51
-02R
0213
926,
058
6,
058
AR
RA
- E
lect
ricity
Del
iver
y an
d E
nerg
y R
elia
bilit
y, R
esea
rch,
D
evel
opm
ent
and
Ana
lysi
s81
.122
AD
E-O
E00
0006
853
,715
-
AR
RA
- E
lect
ricity
Del
iver
y an
d E
nerg
y R
elia
bilit
y, R
esea
rch,
D
evel
opm
ent
and
Ana
lysi
s81
.122
AD
E-O
E00
0013
299
,886
-
153,
601
-
AR
RA
- E
nerg
y E
ffici
ent A
pplia
nce
Reb
ate
Pro
gram
(EE
AR
P)
81.1
27A
DE
-EE
0001
728
1,23
6,98
5
-
AR
RA
- E
nerg
y E
ffici
ency
and
Con
serv
atio
n B
lock
Gra
nt P
rogr
am
(EE
CB
G)
81.1
28A
DE
-EE
0000
687
8,15
2,54
6
8,05
8,64
2
Mis
cella
neou
s Fe
dera
l Act
iviti
es A
ctio
ns81
.502
DE
-FG
52-0
0NV
1380
444
2,15
9
44
2,15
9
Mis
cella
neou
s Fe
dera
l Act
iviti
es A
ctio
ns81
.502
DE
-FG
52-9
9NV
1356
983
,892
89,8
92
526,
051
532,
051
Tot
al D
epar
tmen
t of E
nerg
y30
,904
,989
24,3
50,9
28
Dep
artm
ent o
f Edu
catio
n
Early
Inte
rven
tion
Serv
ices
(ID
EA) C
LUST
ER
Spe
cial
Edu
catio
n-G
rant
s fo
r Inf
ants
and
Fam
ilies
84.1
81H
181A
0800
1977
2,65
7
-
Spe
cial
Edu
catio
n-G
rant
s fo
r Inf
ants
and
Fam
ilies
84.1
81H
181A
0900
192,
363,
873
1,
057
3,13
6,53
0
1,05
7
AR
RA
- S
peci
al E
duca
tion
- Gra
nts
for I
nfan
ts a
nd F
amilie
s, R
ecov
ery
Act
84.3
93A
H39
3A09
0019
1,95
0,59
5
-
Tot
al E
arly
Inte
rven
tion
Serv
ices
(ID
EA) C
LUST
ER5,
087,
125
1,
057
Educ
atio
n of
Hom
eles
s C
hild
ren
and
Yout
h C
LUST
ER
Edu
catio
n of
Hom
eles
s C
hild
ren
and
You
th84
.196
S19
6A07
0029
48,1
73
26
,355
Edu
catio
n of
Hom
eles
s C
hild
ren
and
You
th84
.196
S19
6A08
0029
201,
903
107,
745
Edu
catio
n of
Hom
eles
s C
hild
ren
and
You
th84
.196
S19
6A09
0029
133,
383
131,
623
383,
459
265,
723
AR
RA
- E
duca
tion
for H
omel
ess
Chi
ldre
n an
d Y
outh
, Rec
over
y A
ct84
.387
AS
387A
0900
2925
4,06
9
25
4,06
9
Tot
al E
duca
tion
of H
omel
ess
Chi
ldre
n an
d Yo
uth
CLU
STER
637,
528
519,
792
Educ
atio
nal T
echn
olog
y St
ate
Gra
nts
CLU
STER
Edu
catio
n Te
chno
logy
Sta
te G
rant
s84
.318
S31
8X07
0028
87,0
95
87
,095
Edu
catio
n Te
chno
logy
Sta
te G
rant
s84
.318
S31
8X08
0028
1,15
8,16
3
1,12
5,99
8
Edu
catio
n Te
chno
logy
Sta
te G
rant
s84
.318
S31
8X09
0028
434,
467
402,
368
1,67
9,72
5
1,61
5,46
1
94

Fede
ral G
rant
or /
Pass
-Thr
ough
Gra
ntor
CFD
AAw
ard
or P
ass-
Paym
ents
to
Pro
gram
Titl
eN
umbe
rTh
roug
h N
umbe
rEx
pend
iture
s S
ubre
cipi
ents
____
____
____
____
____
____
____
____
____
____
____
____
____
____
____
___
____
____
___
____
____
____
____
____
____
____
____
____
____
____
____
____
____
____
____
____
____
____
____
____
__
STA
TE O
F N
EVA
DA
SCH
EDU
LE O
F EX
PEN
DIT
UR
ES O
F FE
DER
AL A
WAR
DS
FOR
TH
E YE
AR E
ND
ED J
UN
E 30
, 201
0
AR
RA
- E
duca
tion
Tech
nolo
gy S
tate
Gra
nts,
Rec
over
y A
ct84
.386
AS
386A
0900
283,
743,
264
$
3,
697,
268
$
Tot
al E
duca
tiona
l Tec
hnol
ogy
Stat
e G
rant
s C
LUST
ER5,
422,
989
5,
312,
729
Inde
pend
ent L
ivin
g Se
rvic
es fo
r Old
er In
divi
d C
LUST
ER
Reh
abilit
atio
n S
ervi
ces_
Inde
pend
ent L
ivin
g S
ervi
ces
for O
lder
In
divi
dual
s W
ho a
re B
lind
84.1
77H
177B
0900
2811
2,85
5
-
AR
RA
- In
depe
nden
t Liv
ing
Ser
vice
s fo
r Old
er In
divi
dual
s W
ho a
re
Blin
d, R
ecov
ery
Act
84.3
99A
H39
9A09
0028
32,5
72
-
Tot
al In
depe
nden
t Liv
ing
Serv
ices
for O
lder
Indi
vid
CLU
STER
145,
427
-
Inde
pend
ent L
ivin
g St
ate
Gra
nts
CLU
STER
Inde
pend
ent L
ivin
g S
tate
Gra
nts
84.1
69H
169A
0900
1331
2,98
4
10
,350
Inde
pend
ent L
ivin
g S
tate
Gra
nts
84.1
69H
169A
1000
1323
4,73
8
10
1,64
6
547,
722
111,
996
AR
RA
- In
depe
nden
t Liv
ing
Sta
te G
rant
s, R
ecov
ery
Act
84.3
98A
H39
8A09
0013
140,
710
140,
628
Tot
al In
depe
nden
t Liv
ing
Stat
e G
rant
s C
LUST
ER68
8,43
2
25
2,62
4
Scho
ol Im
prov
emen
t Gra
nts
CLU
STER
Sch
ool I
mpr
ovem
ent G
rant
s84
.377
S37
7A07
0029
155
-
Sch
ool I
mpr
ovem
ent G
rant
s84
.377
S37
7A08
0029
1,12
0,94
5
1,11
7,82
1
1,12
1,10
0
1,11
7,82
1
Tot
al S
choo
l Im
prov
emen
t Gra
nts
CLU
STER
1,12
1,10
0
1,11
7,82
1
Spec
ial E
duca
tion
CLU
STER
Spe
cial
Edu
catio
n_G
rant
s to
Sta
tes
84.0
27H
027A
0700
431,
684,
463
1,
348,
778
Spe
cial
Edu
catio
n_G
rant
s to
Sta
tes
84.0
27H
027A
0800
4315
,558
,590
13,9
36,2
78
Spe
cial
Edu
catio
n_G
rant
s to
Sta
tes
84.0
27H
027A
0900
4345
,391
,310
45,0
14,4
23
62,6
34,3
63
60
,299
,479
Spe
cial
Edu
catio
n_P
resc
hool
Gra
nts
84.1
73H
173A
0700
4613
1,53
5
13
1,29
0
Spe
cial
Edu
catio
n_P
resc
hool
Gra
nts
84.1
73H
173A
0800
4672
9,85
3
61
8,91
4
Spe
cial
Edu
catio
n_P
resc
hool
Gra
nts
84.1
73H
173A
0900
461,
299,
510
1,
283,
601
2,16
0,89
8
2,03
3,80
5
AR
RA
- S
peci
al E
duca
tion
Gra
nts
to S
tate
s, R
ecov
ery
Act
84.3
91A
H39
1A09
0043
32,9
06,4
70
32
,906
,470
AR
RA
- S
peci
al E
duca
tion
- Pre
scho
ol G
rant
s, R
ecov
ery
Act
84.3
92A
H39
2A09
0046
1,43
4,57
4
1,43
4,57
4
Tot
al S
peci
al E
duca
tion
CLU
STER
99,1
36,3
05
96
,674
,328
95

Fede
ral G
rant
or /
Pass
-Thr
ough
Gra
ntor
CFD
AAw
ard
or P
ass-
Paym
ents
to
Pro
gram
Titl
eN
umbe
rTh
roug
h N
umbe
rEx
pend
iture
s S
ubre
cipi
ents
____
____
____
____
____
____
____
____
____
____
____
____
____
____
____
___
____
____
___
____
____
____
____
____
____
____
____
____
____
____
____
____
____
____
____
____
____
____
____
____
__
STA
TE O
F N
EVA
DA
SCH
EDU
LE O
F EX
PEN
DIT
UR
ES O
F FE
DER
AL A
WAR
DS
FOR
TH
E YE
AR E
ND
ED J
UN
E 30
, 201
0
Stat
e Fi
scal
Sta
biliz
atio
n Fu
nd C
LUST
ER
AR
RA
- S
tate
Fis
cal S
tabi
lizat
ion
Fund
(S
FSF)
- Edu
catio
n S
tate
G
rant
s, R
ecov
ery
Act
84.3
94A
S39
4A09
0029
184,
778,
621
$
18
4,77
8,62
1$
AR
RA
- S
tate
Fis
cal S
tabi
lizat
ion
Fund
(SFS
F) -
Gov
ernm
ent
Ser
vice
s, R
ecov
ery
Act
84.3
97A
S39
7A09
0029
72,1
78,0
69
-
Tot
al S
tate
Fis
cal S
tabi
lizat
ion
Fund
CLU
STER
256,
956,
690
18
4,77
8,62
1
Title
I, P
art A
CLU
STER
Title
I G
rant
s to
Loc
al E
duca
tiona
l Age
ncie
s84
.010
S01
0A07
0028
144,
781
-
Title
I G
rant
s to
Loc
al E
duca
tiona
l Age
ncie
s84
.010
S01
0A08
0028
10,3
13,5
95
8,
797,
253
Title
I G
rant
s to
Loc
al E
duca
tiona
l Age
ncie
s84
.010
S01
0A09
0028
56,6
32,7
00
55
,891
,804
67,0
91,0
76
64
,689
,057
AR
RA
- Ti
tle I
Gra
nts
to L
ocal
Edu
catio
nal A
genc
ies,
Rec
over
y A
ct84
.389
AS
389A
0900
2822
,409
,488
22,3
41,9
96
Tot
al T
itle
I, Pa
rt A
CLU
STER
89,5
00,5
64
87
,031
,053
Voca
tiona
l Reh
abili
tatio
n C
LUST
ER
Reh
abilit
atio
n S
ervi
ces_
Voc
atio
nal R
ehab
ilitat
ion
Gra
nts
to S
tate
s84
.126
H12
6A09
0041
4,97
8,39
8
-
Reh
abilit
atio
n S
ervi
ces_
Voc
atio
nal R
ehab
ilitat
ion
Gra
nts
to S
tate
s84
.126
H12
6A10
0041
9,47
8,93
6
-
Reh
abilit
atio
n S
ervi
ces_
Voc
atio
nal R
ehab
ilitat
ion
Gra
nts
to S
tate
s84
.126
Pro
gram
Inco
me
SS
AS
T08
32,5
27
-
Reh
abilit
atio
n S
ervi
ces_
Voc
atio
nal R
ehab
ilitat
ion
Gra
nts
to S
tate
s84
.126
Pro
gram
Inco
me
SS
AS
T09
320,
698
-
14,8
10,5
59
-
AR
RA
- R
ehab
ilitat
ion
Ser
vice
s - V
ocat
iona
l Reh
abilit
atio
n G
rant
s to
S
tate
s, R
ecov
ery
Act
84.3
90A
H39
0A09
0041
587,
826
-
Tot
al V
ocat
iona
l Reh
abili
tatio
n C
LUST
ER15
,398
,385
-
Adu
lt E
duca
tion_
Sta
te G
rant
Pro
gram
84.0
02V
002A
0700
289,
420
9,
420
Adu
lt E
duca
tion_
Sta
te G
rant
Pro
gram
84.0
02V
002A
0800
2818
3,10
0
11
1,65
6
Adu
lt E
duca
tion_
Sta
te G
rant
Pro
gram
84.0
02V
002A
0900
284,
668,
663
4,
529,
954
4,86
1,18
3
4,65
1,03
0
Mig
rant
Edu
catio
n_S
tate
Gra
nt P
rogr
am84
.011
S01
1A07
0028
17,8
46
17
,846
Mig
rant
Edu
catio
n_S
tate
Gra
nt P
rogr
am84
.011
S01
1A08
0028
161,
530
161,
408
Mig
rant
Edu
catio
n_S
tate
Gra
nt P
rogr
am84
.011
S01
1A09
0028
60,7
62
-
240,
138
179,
254
Title
I P
rogr
am fo
r Neg
lect
ed a
nd D
elin
quen
t Chi
ldre
n84
.013
S01
3A07
0028
2,32
3
2,06
8
Title
I P
rogr
am fo
r Neg
lect
ed a
nd D
elin
quen
t Chi
ldre
n84
.013
S01
3A08
0028
67,2
91
65
,054
Title
I P
rogr
am fo
r Neg
lect
ed a
nd D
elin
quen
t Chi
ldre
n84
.013
S01
3A09
0028
137,
113
137,
048
206,
727
204,
170
96

Fede
ral G
rant
or /
Pass
-Thr
ough
Gra
ntor
CFD
AAw
ard
or P
ass-
Paym
ents
to
Pro
gram
Titl
eN
umbe
rTh
roug
h N
umbe
rEx
pend
iture
s S
ubre
cipi
ents
____
____
____
____
____
____
____
____
____
____
____
____
____
____
____
___
____
____
___
____
____
____
____
____
____
____
____
____
____
____
____
____
____
____
____
____
____
____
____
____
__
STA
TE O
F N
EVA
DA
SCH
EDU
LE O
F EX
PEN
DIT
UR
ES O
F FE
DER
AL A
WAR
DS
FOR
TH
E YE
AR E
ND
ED J
UN
E 30
, 201
0
Car
eer a
nd T
echn
ical
Edu
catio
n_B
asic
Gra
nts
to S
tate
s84
.048
V04
8A07
0028
1,55
8$
1,55
8$
Car
eer a
nd T
echn
ical
Edu
catio
n_B
asic
Gra
nts
to S
tate
s84
.048
V04
8A08
0028
1,36
1,16
3
768,
211
Car
eer a
nd T
echn
ical
Edu
catio
n_B
asic
Gra
nts
to S
tate
s84
.048
V04
8A09
0028
6,24
7,86
6
6,01
4,91
5
7,61
0,58
7
6,78
4,68
4
Leve
ragi
ng E
duca
tiona
l Ass
ista
nce
Par
tner
ship
84.0
69N
069A
0900
2985
,277
85,2
77
Leve
ragi
ng E
duca
tiona
l Ass
ista
nce
Par
tner
ship
84.0
69N
069B
0900
2568
,146
68,1
46
153,
423
153,
423
Mig
rant
Edu
catio
n_C
oord
inat
ion
Pro
gram
84.1
44S
144F
0700
2832
,226
32,2
26
Mig
rant
Edu
catio
n_C
oord
inat
ion
Pro
gram
84.1
44S
144F
0800
2811
4,38
7
11
3,07
6
Mig
rant
Edu
catio
n_C
oord
inat
ion
Pro
gram
84.1
44S
144F
0900
287,
343
-
Mig
rant
Edu
catio
n_C
oord
inat
ion
Pro
gram
84.1
44S
144G
0700
2831
,573
8,54
3
185,
529
153,
845
Reh
abilit
atio
n S
ervi
ces_
Clie
nt A
ssis
tanc
e P
rogr
am84
.161
H16
1A09
0029
63,0
49
-
Reh
abilit
atio
n S
ervi
ces_
Clie
nt A
ssis
tanc
e P
rogr
am84
.161
H16
1A10
0029
78,9
96
-
142,
045
-
Byr
d H
onor
s S
chol
arsh
ips
84.1
85P
185A
0800
3013
5,07
7
13
5,07
7
Byr
d H
onor
s S
chol
arsh
ips
84.1
85P
185A
0900
3015
6,67
4
15
6,67
4
291,
751
291,
751
Saf
e an
d D
rug-
Free
Sch
ools
and
Com
mun
ities
_Sta
te G
rant
s84
.186
Q18
6A07
0029
1,87
3
-
Saf
e an
d D
rug-
Free
Sch
ools
and
Com
mun
ities
_Sta
te G
rant
s84
.186
Q18
6A08
0029
573,
460
543,
977
Saf
e an
d D
rug-
Free
Sch
ools
and
Com
mun
ities
_Sta
te G
rant
s84
.186
Q18
6A09
0029
320,
139
320,
139
Saf
e an
d D
rug-
Free
Sch
ools
and
Com
mun
ities
_Sta
te G
rant
s84
.186
Q18
6B09
0030
186,
460
186,
460
1,08
1,93
2
1,05
0,57
6
Sup
porte
d E
mpl
oym
ent S
ervi
ces
for I
ndiv
idua
ls w
ith S
ever
e D
isab
ilitie
s84
.187
H18
7A08
0042
75,6
25
-
Sup
porte
d E
mpl
oym
ent S
ervi
ces
for I
ndiv
idua
ls w
ith S
ever
e D
isab
ilitie
s84
.187
H18
7A09
0042
300,
000
-
Sup
porte
d E
mpl
oym
ent S
ervi
ces
for I
ndiv
idua
ls w
ith S
ever
e D
isab
ilitie
s84
.187
H18
7A10
0042
50,7
06
-
426,
331
-
Eve
n S
tart_
Sta
te E
duca
tiona
l Age
ncie
s84
.213
S21
3A08
0029
105,
458
103,
463
Eve
n S
tart_
Sta
te E
duca
tiona
l Age
ncie
s84
.213
S21
3A09
0029
237,
525
222,
645
342,
983
326,
108
Fund
for t
he Im
prov
emen
t of E
duca
tion
84.2
15U
215K
0802
6214
,882
1,88
2
Ass
istiv
e Te
chno
logy
84.2
24H
224A
0800
2815
,539
15,5
39
Ass
istiv
e Te
chno
logy
84.2
24H
224A
0900
2835
3,58
9
27
7,29
7
369,
128
292,
836
97

Fede
ral G
rant
or /
Pass
-Thr
ough
Gra
ntor
CFD
AAw
ard
or P
ass-
Paym
ents
to
Pro
gram
Titl
eN
umbe
rTh
roug
h N
umbe
rEx
pend
iture
s S
ubre
cipi
ents
____
____
____
____
____
____
____
____
____
____
____
____
____
____
____
___
____
____
___
____
____
____
____
____
____
____
____
____
____
____
____
____
____
____
____
____
____
____
____
____
__
STA
TE O
F N
EVA
DA
SCH
EDU
LE O
F EX
PEN
DIT
UR
ES O
F FE
DER
AL A
WAR
DS
FOR
TH
E YE
AR E
ND
ED J
UN
E 30
, 201
0
Tech
-Pre
p E
duca
tion
84.2
43V
243A
0800
2821
,463
$
21,4
63$
Tech
-Pre
p E
duca
tion
84.2
43V
243A
0900
2849
3,62
0
46
7,24
5
515,
083
488,
708
Reh
abilit
atio
n Tr
aini
ng_S
tate
Voc
atio
nal R
ehab
ilitat
ion
Uni
t In-
Ser
vice
84.2
65H
265A
0500
1723
,181
-
Twen
ty-F
irst C
entu
ry C
omm
unity
Lea
rnin
g C
ente
rs84
.287
S28
7A07
0028
98,9
92
31
,056
Twen
ty-F
irst C
entu
ry C
omm
unity
Lea
rnin
g C
ente
rs84
.287
S28
7A08
0028
3,33
8,58
1
3,08
6,51
8
Twen
ty-F
irst C
entu
ry C
omm
unity
Lea
rnin
g C
ente
rs84
.287
S28
7A09
0028
1,97
8,06
4
1,97
3,70
4
5,41
5,63
7
5,09
1,27
8
Inno
vativ
e E
duca
tion
Pro
gram
Stra
tegi
es84
.298
S29
8A07
0028
165,
869
144,
649
Spe
cial
Edu
catio
n_S
tate
Pro
gram
Impr
ovem
ent G
rant
s fo
r Chi
ldre
n w
ith D
isab
ilitie
s84
.323
H32
3A07
0024
388,
550
112,
700
Adv
ance
d P
lace
men
t Pro
gram
84.3
30S
330B
0900
1125
6,83
0
25
6,83
0
Gra
nts
to S
tate
s fo
r Inc
arce
rate
d Y
outh
Offe
nder
s84
.331
Q33
1A07
0029
118,
452
-
Gra
nts
to S
tate
s fo
r Inc
arce
rate
d Y
outh
Offe
nder
s84
.331
Q33
1A08
0029
174,
180
-
292,
632
-
Gai
ning
Ear
ly A
war
enes
s an
d R
eadi
ness
for U
nder
grad
uate
Pro
gram
s84
.334
P33
4S06
0002
1,56
2,81
8
1,31
4,36
9
Rea
ding
Firs
t Sta
te G
rant
s84
.357
S35
7A07
0029
1,53
2,24
2
1,47
0,21
1
Rea
ding
Firs
t Sta
te G
rant
s84
.357
S35
7A08
0029
1,93
8,84
8
1,71
4,50
1
3,47
1,09
0
3,18
4,71
2
Eng
lish
Lang
uage
Acq
uisi
tion
Gra
nts
84.3
65S
365A
0700
2811
3,07
5
27
,060
Eng
lish
Lang
uage
Acq
uisi
tion
Gra
nts
84.3
65S
365A
0800
281,
641,
578
1,
481,
745
Eng
lish
Lang
uage
Acq
uisi
tion
Gra
nts
84.3
65S
365A
0900
284,
765,
826
4,
765,
826
6,52
0,47
9
6,27
4,63
1
Mat
hem
atic
s an
d S
cien
ce P
artn
ersh
ips
84.3
66S
366A
0700
299,
541
9,
541
Mat
hem
atic
s an
d S
cien
ce P
artn
ersh
ips
84.3
66S
366A
0800
2979
0,04
7
72
8,81
4
Mat
hem
atic
s an
d S
cien
ce P
artn
ersh
ips
84.3
66S
366A
0900
2916
7,91
5
15
7,41
6
967,
503
895,
771
Impr
ovin
g Te
ache
r Qua
lity
Sta
te G
rant
s84
.367
S36
7A07
0027
28,3
98
28
,398
Impr
ovin
g Te
ache
r Qua
lity
Sta
te G
rant
s84
.367
S36
7A09
0027
11,9
49,5
19
11
,828
,447
11,9
77,9
17
11
,856
,845
98

Fede
ral G
rant
or /
Pass
-Thr
ough
Gra
ntor
CFD
AAw
ard
or P
ass-
Paym
ents
to
Pro
gram
Titl
eN
umbe
rTh
roug
h N
umbe
rEx
pend
iture
s S
ubre
cipi
ents
____
____
____
____
____
____
____
____
____
____
____
____
____
____
____
___
____
____
___
____
____
____
____
____
____
____
____
____
____
____
____
____
____
____
____
____
____
____
____
____
__
STA
TE O
F N
EVA
DA
SCH
EDU
LE O
F EX
PEN
DIT
UR
ES O
F FE
DER
AL A
WAR
DS
FOR
TH
E YE
AR E
ND
ED J
UN
E 30
, 201
0
Gra
nts
for E
nhan
ced
Ass
essm
ent I
nstru
men
ts84
.368
S36
8A08
0005
1,19
8,56
0$
1,19
8,56
0$
Gra
nts
for S
tate
Ass
essm
ents
and
Rel
ated
Act
iviti
es84
.369
S36
9A07
0029
5,55
6
-
Gra
nts
for S
tate
Ass
essm
ents
and
Rel
ated
Act
iviti
es84
.369
S36
9A08
0029
4,57
1,28
2
2,17
2
Gra
nts
for S
tate
Ass
essm
ents
and
Rel
ated
Act
iviti
es84
.369
S36
9A09
0029
1,45
3,56
7
-
6,03
0,40
5
2,17
2
Tot
al D
epar
tmen
t of E
duca
tion
528,
807,
738
42
0,59
8,80
9
Nat
iona
l Arc
hive
s an
d R
ecor
ds A
dmin
istr
atio
n
Nat
iona
l His
toric
al P
ublic
atio
ns a
nd R
ecor
ds G
rant
s89
.003
NA
R09
-RC
-100
64-0
94,
244
-
Tot
al N
atio
nal A
rchi
ves
and
Rec
ords
Adm
inis
trat
ion
4,24
4
-
Elec
tion
Assi
stan
ce C
omm
issi
on
Hel
p A
mer
ica
Vot
e A
ct R
equi
rem
ents
Pay
men
ts90
.401
HA
VA
- S
FY 1
01,
095,
694
-
Hel
p A
mer
ica
Vot
e M
ock
Ele
ctio
n P
rogr
am90
.402
E40
5879
8C13
,720
-
Tot
al E
lect
ion
Assi
stan
ce C
omm
issi
on1,
109,
414
-
Dep
artm
ent o
f Hea
lth a
nd H
uman
Ser
vice
s
Agin
g C
LUST
ER
Spe
cial
Pro
gram
s fo
r the
Agi
ng_T
itle
III, P
art B
_Gra
nts
for S
uppo
rtive
S
ervi
ces
and
Sen
ior C
ente
rs93
.044
09-A
A-N
V-T
3SP
2,71
3,99
0
2,67
0,48
5
Spe
cial
Pro
gram
s fo
r the
Agi
ng_T
itle
III, P
art B
_Gra
nts
for S
uppo
rtive
S
ervi
ces
and
Sen
ior C
ente
rs93
.044
10A
AN
VT3
SP
416,
815
88,6
40
3,13
0,80
5
2,75
9,12
5
Spe
cial
Pro
gram
s fo
r the
Agi
ng_T
itle
III, P
art C
_Nut
ritio
n S
ervi
ces
93.0
4508
-AA
-NV
-T3S
P34
6,97
0
34
6,97
0
Spe
cial
Pro
gram
s fo
r the
Agi
ng_T
itle
III, P
art C
_Nut
ritio
n S
ervi
ces
93.0
4509
-AA
-NV
-T3S
P1,
963,
210
1,
733,
277
Spe
cial
Pro
gram
s fo
r the
Agi
ng_T
itle
III, P
art C
_Nut
ritio
n S
ervi
ces
93.0
4510
AA
NV
T3S
P2,
062,
335
1,
421,
762
4,37
2,51
5
3,50
2,00
9
Nut
ritio
n S
ervi
ces
Ince
ntiv
e P
rogr
am93
.053
08A
AN
VN
SIP
14,5
61
14
,561
Nut
ritio
n S
ervi
ces
Ince
ntiv
e P
rogr
am93
.053
09A
AN
VN
SIP
495,
676
495,
676
Nut
ritio
n S
ervi
ces
Ince
ntiv
e P
rogr
am93
.053
10A
AN
VN
SIP
600,
986
600,
986
1,11
1,22
3
1,11
1,22
3
AR
RA
- A
ging
Hom
e-D
eliv
ered
Nut
ritio
n S
ervi
ces
for S
tate
s93
.705
A09
AA
NV
C2R
R24
2,16
8
24
2,16
8
AR
RA
- A
ging
Con
greg
ate
Nut
ritio
n S
ervi
ces
for S
tate
s93
.707
A09
AA
NV
C1R
R48
3,46
4
41
0,01
4
Tot
al A
ging
CLU
STER
9,34
0,17
5
8,02
4,53
9
CC
DF
CLU
STER
Chi
ld C
are
and
Dev
elop
men
t Blo
ck G
rant
93.5
75G
0901
NV
CC
DF
6,94
2,01
2
-
Chi
ld C
are
and
Dev
elop
men
t Blo
ck G
rant
93.5
75G
1001
NV
CC
DF
3,97
3,39
1
-
10,9
15,4
03
-
99

Fede
ral G
rant
or /
Pass
-Thr
ough
Gra
ntor
CFD
AAw
ard
or P
ass-
Paym
ents
to
Pro
gram
Titl
eN
umbe
rTh
roug
h N
umbe
rEx
pend
iture
s S
ubre
cipi
ents
____
____
____
____
____
____
____
____
____
____
____
____
____
____
____
___
____
____
___
____
____
____
____
____
____
____
____
____
____
____
____
____
____
____
____
____
____
____
____
____
__
STA
TE O
F N
EVA
DA
SCH
EDU
LE O
F EX
PEN
DIT
UR
ES O
F FE
DER
AL A
WAR
DS
FOR
TH
E YE
AR E
ND
ED J
UN
E 30
, 201
0
Chi
ld C
are
Man
dato
ry a
nd M
atch
ing
Fund
s of
the
Chi
ld C
are
and
Dev
elop
men
t Fun
d93
.596
G09
01N
VC
CD
F3,
750,
669
$
-
$
Chi
ld C
are
Man
dato
ry a
nd M
atch
ing
Fund
s of
the
Chi
ld C
are
and
Dev
elop
men
t Fun
d93
.596
G10
01N
VC
CD
F12
,850
,859
-
16,6
01,5
28
-
AR
RA
- C
hild
Car
e an
d D
evel
opm
ent B
lock
Gra
nt93
.713
AG
0901
NV
CC
D7
8,37
8,37
0
-
Tot
al C
CD
F C
LUST
ER35
,895
,301
-
CSB
G C
LUST
ER
Com
mun
ity S
ervi
ces
Blo
ck G
rant
93.5
69G
-09B
1NV
CO
SR
2,47
8,59
4
2,44
0,47
1
Com
mun
ity S
ervi
ces
Blo
ck G
rant
93.5
69G
-10B
1NV
CO
SR
1,23
6,41
3
1,10
8,78
5
3,71
5,00
7
3,54
9,25
6
AR
RA
- C
omm
unity
Ser
vice
s B
lock
Gra
nts
93.7
10A
G-0
901N
VC
OS
24,
053,
065
4,
053,
065
Tot
al C
SBG
CLU
STER
7,76
8,07
2
7,60
2,32
1
Hea
d St
art C
LUST
ER
Hea
d S
tart
93.6
0009
CD
0009
/04
62,0
70
9,
572
Tot
al H
ead
Star
t CLU
STER
62,0
70
9,
572
Imm
uniz
atio
n C
LUST
ER
Imm
uniz
atio
n G
rant
s93
.268
5H23
IP92
2549
-07
1,47
6,16
1
902,
925
Imm
uniz
atio
n G
rant
s93
.268
5H23
IP92
2549
-08
1,14
7,29
5
693,
584
Imm
uniz
atio
n G
rant
s93
.268
Dire
ct A
ssis
tanc
e25
,041
,077
-
27,6
64,5
33
1,
596,
509
AR
RA
- Im
mun
izat
ion
93.7
12A
AR
RA
- D
irect
Ass
ista
nce
1,00
6,52
9
-
Tot
al Im
mun
izat
ion
CLU
STER
28,6
71,0
62
1,
596,
509
Med
icai
d C
LUST
ER
Sta
te M
edic
aid
Frau
d C
ontro
l Uni
ts93
.775
01-0
901-
NV
-505
018
6,74
7
-
Sta
te M
edic
aid
Frau
d C
ontro
l Uni
ts93
.775
01-1
001-
NV
-505
01,
015,
723
-
1,20
2,47
0
-
Sta
te S
urve
y an
d C
ertif
icat
ion
of H
ealth
Car
e P
rovi
ders
and
Sup
plie
rs93
.777
05-0
905-
NV
-500
041
2,62
5
-
Sta
te S
urve
y an
d C
ertif
icat
ion
of H
ealth
Car
e P
rovi
ders
and
Sup
plie
rs93
.777
05-0
905-
NV
-500
240
,255
-
Sta
te S
urve
y an
d C
ertif
icat
ion
of H
ealth
Car
e P
rovi
ders
and
Sup
plie
rs93
.777
05-1
005-
NV
-500
01,
264,
584
-
Sta
te S
urve
y an
d C
ertif
icat
ion
of H
ealth
Car
e P
rovi
ders
and
Sup
plie
rs93
.777
05-1
005-
NV
-500
284
,386
-
100

Fede
ral G
rant
or /
Pass
-Thr
ough
Gra
ntor
CFD
AAw
ard
or P
ass-
Paym
ents
to
Pro
gram
Titl
eN
umbe
rTh
roug
h N
umbe
rEx
pend
iture
s S
ubre
cipi
ents
____
____
____
____
____
____
____
____
____
____
____
____
____
____
____
___
____
____
___
____
____
____
____
____
____
____
____
____
____
____
____
____
____
____
____
____
____
____
____
____
__
STA
TE O
F N
EVA
DA
SCH
EDU
LE O
F EX
PEN
DIT
UR
ES O
F FE
DER
AL A
WAR
DS
FOR
TH
E YE
AR E
ND
ED J
UN
E 30
, 201
0
Sta
te S
urve
y an
d C
ertif
icat
ion
of H
ealth
Car
e P
rovi
ders
and
Sup
plie
rs93
.777
5-09
05N
V50
0111
6,00
4$
-
$
Sta
te S
urve
y an
d C
ertif
icat
ion
of H
ealth
Car
e P
rovi
ders
and
Sup
plie
rs93
.777
5-10
05N
V50
0135
0,00
5
-
2,26
7,85
9
-
Med
ical
Ass
ista
nce
Pro
gram
93.7
7805
-090
5NV
5028
185,
555,
176
-
Med
ical
Ass
ista
nce
Pro
gram
93.7
7805
-100
5NV
QU
AL
2,46
1,89
7
-
Med
ical
Ass
ista
nce
Pro
gram
93.7
785-
0905
NV
5048
12,0
37,7
58
-
Med
ical
Ass
ista
nce
Pro
gram
93.7
785-
1005
NV
5AD
M38
,717
,617
-
Med
ical
Ass
ista
nce
Pro
gram
93.7
785-
1005
NV
5MA
P56
3,50
3,07
9
-
AR
RA
- M
edic
al A
ssis
tanc
e P
rogr
am93
.778
A05
-090
5NV
AR
RA
(MA
P)
47,0
54,9
88
-
AR
RA
- M
edic
al A
ssis
tanc
e P
rogr
am93
.778
A05
-090
5NV
MD
SH
1,13
2,65
9
-
AR
RA
- M
edic
al A
ssis
tanc
e P
rogr
am93
.778
A05
-100
5NV
AR
RA
142,
460,
135
-
AR
RA
- M
edic
al A
ssis
tanc
e P
rogr
am93
.778
A5-
1005
NV
HIT
A7,
298
-
992,
930,
607
-
Tot
al M
edic
aid
CLU
STER
996,
400,
936
-
TAN
F C
LUST
ER
Tem
pora
ry A
ssis
tanc
e fo
r Nee
dy F
amilie
s93
.558
G-0
902N
VTA
NF
28,8
63,8
33
-
Tem
pora
ry A
ssis
tanc
e fo
r Nee
dy F
amilie
s93
.558
G-1
002N
VTA
NF
12,4
72,7
78
-
41,3
36,6
11
-
AR
RA
-Em
erge
ncy
Con
tinge
ncy
Fund
for T
empo
rary
Ass
ista
nce
for
Nee
dy F
amilie
s (T
AN
F) S
tate
Pro
gram
93.7
14A
G09
01N
VTA
N2
4,84
8,05
2
-
AR
RA
-Em
erge
ncy
Con
tinge
ncy
Fund
for T
empo
rary
Ass
ista
nce
for
Nee
dy F
amilie
s (T
AN
F) S
tate
Pro
gram
93.7
14A
G10
01N
VTA
N2
9,79
7,45
6
-
14,6
45,5
08
-
AR
RA
- Te
mpo
rary
Ass
ista
nce
for N
eedy
Fam
ilies
(TA
NF)
S
uppl
emen
tal G
rant
s93
.716
AG
1002
NV
TAN
215
0,00
0
-
Tot
al T
ANF
CLU
STER
56,1
32,1
19
-
Spe
cial
Pro
gram
s fo
r the
Agi
ng_T
itle
VII,
Cha
pter
3_P
rogr
ams
for
Pre
vent
ion
of E
lder
Abu
se, N
egle
ct, a
nd E
xplo
itatio
n93
.041
09-A
A-N
V-T
7SP
9,84
9
947
Spe
cial
Pro
gram
s fo
r the
Agi
ng_T
itle
VII,
Cha
pter
3_P
rogr
ams
for
Pre
vent
ion
of E
lder
Abu
se, N
egle
ct, a
nd E
xplo
itatio
n93
.041
10A
AN
VT7
SP
24,7
92
-
34,6
41
94
7
Spe
cial
Pro
gram
s fo
r the
Agi
ng_T
itle
VII,
Cha
pter
2_L
ong
Term
Car
e O
mbu
dsm
an S
ervi
ces
for O
lder
Indi
vidu
als
93.0
4209
-AA
-NV
-T7S
P40
,061
15,4
67
Spe
cial
Pro
gram
s fo
r the
Agi
ng_T
itle
VII,
Cha
pter
2_L
ong
Term
Car
e O
mbu
dsm
an S
ervi
ces
for O
lder
Indi
vidu
als
93.0
4210
AA
NV
T7S
P85
,461
2,11
5
125,
522
17,5
82
101
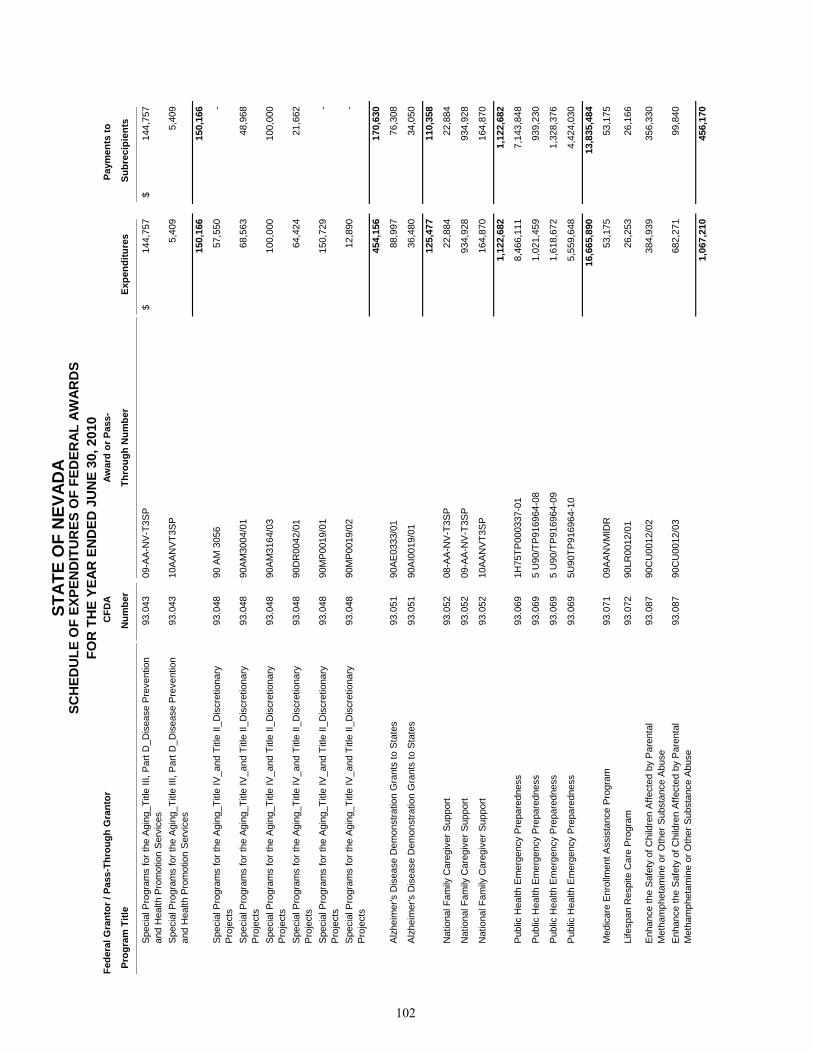
Fede
ral G
rant
or /
Pass
-Thr
ough
Gra
ntor
CFD
AAw
ard
or P
ass-
Paym
ents
to
Pro
gram
Titl
eN
umbe
rTh
roug
h N
umbe
rEx
pend
iture
s S
ubre
cipi
ents
____
____
____
____
____
____
____
____
____
____
____
____
____
____
____
___
____
____
___
____
____
____
____
____
____
____
____
____
____
____
____
____
____
____
____
____
____
____
____
____
__
STA
TE O
F N
EVA
DA
SCH
EDU
LE O
F EX
PEN
DIT
UR
ES O
F FE
DER
AL A
WAR
DS
FOR
TH
E YE
AR E
ND
ED J
UN
E 30
, 201
0
Spe
cial
Pro
gram
s fo
r the
Agi
ng_T
itle
III, P
art D
_Dis
ease
Pre
vent
ion
and
Hea
lth P
rom
otio
n S
ervi
ces
93.0
4309
-AA
-NV
-T3S
P14
4,75
7$
14
4,75
7$
Spe
cial
Pro
gram
s fo
r the
Agi
ng_T
itle
III, P
art D
_Dis
ease
Pre
vent
ion
and
Hea
lth P
rom
otio
n S
ervi
ces
93.0
4310
AA
NV
T3S
P5,
409
5,
409
150,
166
150,
166
Spe
cial
Pro
gram
s fo
r the
Agi
ng_T
itle
IV_a
nd T
itle
II_D
iscr
etio
nary
P
roje
cts
93.0
4890
AM
305
657
,550
-
Spe
cial
Pro
gram
s fo
r the
Agi
ng_T
itle
IV_a
nd T
itle
II_D
iscr
etio
nary
P
roje
cts
93.0
4890
AM
3004
/01
68,5
63
48
,968
Spe
cial
Pro
gram
s fo
r the
Agi
ng_T
itle
IV_a
nd T
itle
II_D
iscr
etio
nary
P
roje
cts
93.0
4890
AM
3164
/03
100,
000
100,
000
Spe
cial
Pro
gram
s fo
r the
Agi
ng_T
itle
IV_a
nd T
itle
II_D
iscr
etio
nary
P
roje
cts
93.0
4890
DR
0042
/01
64,4
24
21
,662
Spe
cial
Pro
gram
s fo
r the
Agi
ng_T
itle
IV_a
nd T
itle
II_D
iscr
etio
nary
P
roje
cts
93.0
4890
MP
0019
/01
150,
729
-
Spe
cial
Pro
gram
s fo
r the
Agi
ng_T
itle
IV_a
nd T
itle
II_D
iscr
etio
nary
P
roje
cts
93.0
4890
MP
0019
/02
12,8
90
-
454,
156
170,
630
Alz
heim
er's
Dis
ease
Dem
onst
ratio
n G
rant
s to
Sta
tes
93.0
5190
AE
0333
/01
88,9
97
76
,308
Alz
heim
er's
Dis
ease
Dem
onst
ratio
n G
rant
s to
Sta
tes
93.0
5190
AI0
019/
0136
,480
34,0
50
125,
477
110,
358
Nat
iona
l Fam
ily C
areg
iver
Sup
port
93.0
5208
-AA
-NV
-T3S
P22
,884
22,8
84
Nat
iona
l Fam
ily C
areg
iver
Sup
port
93.0
5209
-AA
-NV
-T3S
P93
4,92
8
93
4,92
8
Nat
iona
l Fam
ily C
areg
iver
Sup
port
93.0
5210
AA
NV
T3S
P16
4,87
0
16
4,87
0
1,12
2,68
2
1,12
2,68
2
Pub
lic H
ealth
Em
erge
ncy
Pre
pare
dnes
s93
.069
1H75
TP00
0337
-01
8,46
6,11
1
7,14
3,84
8
Pub
lic H
ealth
Em
erge
ncy
Pre
pare
dnes
s93
.069
5 U
90/T
P91
6964
-08
1,02
1,45
9
939,
230
Pub
lic H
ealth
Em
erge
ncy
Pre
pare
dnes
s93
.069
5 U
90/T
P91
6964
-09
1,61
8,67
2
1,32
8,37
6
Pub
lic H
ealth
Em
erge
ncy
Pre
pare
dnes
s93
.069
5U90
TP91
6964
-10
5,55
9,64
8
4,42
4,03
0
16,6
65,8
90
13
,835
,484
Med
icar
e E
nrol
lmen
t Ass
ista
nce
Pro
gram
93.0
7109
AA
NV
MID
R53
,175
53,1
75
Life
span
Res
pite
Car
e P
rogr
am93
.072
90LR
0012
/01
26,2
53
26
,166
Enh
ance
the
Saf
ety
of C
hild
ren
Affe
cted
by
Par
enta
l M
etha
mph
etam
ine
or O
ther
Sub
stan
ce A
buse
93.0
8790
CU
0012
/02
384,
939
356,
330
Enh
ance
the
Saf
ety
of C
hild
ren
Affe
cted
by
Par
enta
l M
etha
mph
etam
ine
or O
ther
Sub
stan
ce A
buse
93.0
8790
CU
0012
/03
682,
271
99,8
40
1,06
7,21
0
456,
170
102

Fede
ral G
rant
or /
Pass
-Thr
ough
Gra
ntor
CFD
AAw
ard
or P
ass-
Paym
ents
to
Pro
gram
Titl
eN
umbe
rTh
roug
h N
umbe
rEx
pend
iture
s S
ubre
cipi
ents
____
____
____
____
____
____
____
____
____
____
____
____
____
____
____
___
____
____
___
____
____
____
____
____
____
____
____
____
____
____
____
____
____
____
____
____
____
____
____
____
__
STA
TE O
F N
EVA
DA
SCH
EDU
LE O
F EX
PEN
DIT
UR
ES O
F FE
DER
AL A
WAR
DS
FOR
TH
E YE
AR E
ND
ED J
UN
E 30
, 201
0
Em
erge
ncy
Sys
tem
for A
dvan
ce R
egis
tratio
n of
Vol
unte
er H
ealth
P
rofe
ssio
nals
93.0
896
U3R
EP
0904
01-0
1-02
41,4
31$
37
,475
$
Mat
erna
l and
Chi
ld H
ealth
Fed
eral
Con
solid
ated
Pro
gram
s93
.110
5 H
18M
C00
032-
1653
,248
-
Mat
erna
l and
Chi
ld H
ealth
Fed
eral
Con
solid
ated
Pro
gram
s93
.110
5 H
18M
C00
032-
17-0
043
,331
-
96,5
79
-
Pro
ject
Gra
nts
and
Coo
pera
tive
Agr
eem
ents
for T
uber
culo
sis
Con
trol
Pro
gram
s93
.116
2U52
PS
9078
55-1
919
2,20
3
12
6,38
9
Pro
ject
Gra
nts
and
Coo
pera
tive
Agr
eem
ents
for T
uber
culo
sis
Con
trol
Pro
gram
s93
.116
5U52
PS
9078
55-1
838
9,22
5
28
1,89
5
581,
428
408,
284
Em
erge
ncy
Med
ical
Ser
vice
s fo
r Chi
ldre
n93
.127
6 H
33M
C06
694-
0417
3,00
0
13
,000
Em
erge
ncy
Med
ical
Ser
vice
s fo
r Chi
ldre
n93
.127
6 H
33M
C06
694-
0545
,645
-
218,
645
13,0
00
Pro
ject
s fo
r Ass
ista
nce
in T
rans
ition
from
Hom
eles
snes
s (P
ATH
)93
.150
2X06
SM
0600
29-0
818
0,24
1
17
8,45
2
Pro
ject
s fo
r Ass
ista
nce
in T
rans
ition
from
Hom
eles
snes
s (P
ATH
)93
.150
2X06
SM
0600
29-0
933
8,30
3
33
5,20
3
518,
544
513,
655
Fam
ily P
lann
ing_
Ser
vice
s93
.217
5 FP
HP
A09
1175
-34
723,
264
55,0
39
Abs
tinen
ce E
duca
tion
Pro
gram
93.2
35G
-090
1NV
AE
GP
45,0
00
45
,000
Sub
stan
ce A
buse
and
Men
tal H
ealth
Ser
vice
s_P
roje
cts
of R
egio
nal
and
Nat
iona
l Sig
nific
ance
93.2
435
HR
1 S
M05
8080
-02
28,6
69
-
Sub
stan
ce A
buse
and
Men
tal H
ealth
Ser
vice
s_P
roje
cts
of R
egio
nal
and
Nat
iona
l Sig
nific
ance
93.2
435
U79
SP
0111
79-0
53,
332,
569
2,
702,
337
Sub
stan
ce A
buse
and
Men
tal H
ealth
Ser
vice
s_P
roje
cts
of R
egio
nal
and
Nat
iona
l Sig
nific
ance
93.2
435H
R1S
M05
8080
-03
41,8
67
-
Sub
stan
ce A
buse
and
Men
tal H
ealth
Ser
vice
s_P
roje
cts
of R
egio
nal
and
Nat
iona
l Sig
nific
ance
93.2
435H
S5S
M05
6551
-05
195,
571
188,
017
3,59
8,67
6
2,89
0,35
4
Uni
vers
al N
ewbo
rn H
earin
g S
cree
ning
93.2
515
H61
MC
0009
6-07
43,8
70
-
Uni
vers
al N
ewbo
rn H
earin
g S
cree
ning
93.2
515
H61
MC
0009
6-08
143,
992
56,8
60
187,
862
56,8
60
Sta
te H
ealth
Acc
ess
Pro
gram
93.2
566
H2P
HS
1650
3-01
-01
847,
079
769,
751
Cen
ters
for D
isea
se C
ontro
l and
Pre
vent
ion_
Inve
stig
atio
ns a
nd
Tech
nica
l Ass
ista
nce
93.2
831
U58
/DP
0015
35-0
125
,922
3,19
3
Cen
ters
for D
isea
se C
ontro
l and
Pre
vent
ion_
Inve
stig
atio
ns a
nd
Tech
nica
l Ass
ista
nce
93.2
831
U58
/DP
0015
35-0
225
6,61
6
14
,904
Cen
ters
for D
isea
se C
ontro
l and
Pre
vent
ion_
Inve
stig
atio
ns a
nd
Tech
nica
l Ass
ista
nce
93.2
831U
58D
P00
2003
-01
14,5
98
-
Cen
ters
for D
isea
se C
ontro
l and
Pre
vent
ion_
Inve
stig
atio
ns a
nd
Tech
nica
l Ass
ista
nce
93.2
831U
58D
P00
2003
-02
174,
801
51,4
33
103

Fede
ral G
rant
or /
Pass
-Thr
ough
Gra
ntor
CFD
AAw
ard
or P
ass-
Paym
ents
to
Pro
gram
Titl
eN
umbe
rTh
roug
h N
umbe
rEx
pend
iture
s S
ubre
cipi
ents
____
____
____
____
____
____
____
____
____
____
____
____
____
____
____
___
____
____
___
____
____
____
____
____
____
____
____
____
____
____
____
____
____
____
____
____
____
____
____
____
__
STA
TE O
F N
EVA
DA
SCH
EDU
LE O
F EX
PEN
DIT
UR
ES O
F FE
DER
AL A
WAR
DS
FOR
TH
E YE
AR E
ND
ED J
UN
E 30
, 201
0
Cen
ters
for D
isea
se C
ontro
l and
Pre
vent
ion_
Inve
stig
atio
ns a
nd
Tech
nica
l Ass
ista
nce
93.2
833U
50C
I000
489-
03S
219
6,52
2$
-
$
Cen
ters
for D
isea
se C
ontro
l and
Pre
vent
ion_
Inve
stig
atio
ns a
nd
Tech
nica
l Ass
ista
nce
93.2
833U
58D
P00
2003
-01S
165
,130
56,7
74
Cen
ters
for D
isea
se C
ontro
l and
Pre
vent
ion_
Inve
stig
atio
ns a
nd
Tech
nica
l Ass
ista
nce
93.2
835
U50
CI0
0048
9-03
542,
818
354,
724
Cen
ters
for D
isea
se C
ontro
l and
Pre
vent
ion_
Inve
stig
atio
ns a
nd
Tech
nica
l Ass
ista
nce
93.2
835
U51
/PS
0008
74-0
250
,473
50,1
98
Cen
ters
for D
isea
se C
ontro
l and
Pre
vent
ion_
Inve
stig
atio
ns a
nd
Tech
nica
l Ass
ista
nce
93.2
835U
51P
S00
0874
-03
37,5
93
21
,131
Cen
ters
for D
isea
se C
ontro
l and
Pre
vent
ion_
Inve
stig
atio
ns a
nd
Tech
nica
l Ass
ista
nce
93.2
835U
58D
P00
0804
-02
114,
046
10,2
19
Cen
ters
for D
isea
se C
ontro
l and
Pre
vent
ion_
Inve
stig
atio
ns a
nd
Tech
nica
l Ass
ista
nce
93.2
835U
58D
P00
0804
-03
2,99
4,67
4
153,
245
Cen
ters
for D
isea
se C
ontro
l and
Pre
vent
ion_
Inve
stig
atio
ns a
nd
Tech
nica
l Ass
ista
nce
93.2
835U
R3D
D00
0411
-02
117,
003
-
Cen
ters
for D
isea
se C
ontro
l and
Pre
vent
ion_
Inve
stig
atio
ns a
nd
Tech
nica
l Ass
ista
nce
93.2
83P
rogr
am In
com
e77
,981
-
Cen
ters
for D
isea
se C
ontro
l and
Pre
vent
ion_
Inve
stig
atio
ns a
nd
Tech
nica
l Ass
ista
nce
93.2
83U
58/D
P00
2003
-01
1,19
0,18
9
784,
510
5,85
8,36
6
1,50
0,33
1
AR
RA
- S
tate
Prim
ary
Car
e O
ffice
s93
.414
A1
U6A
HP
1657
3-01
-00
16,6
42
-
Pro
mot
ing
Saf
e an
d S
tabl
e Fa
milie
s93
.556
G-0
611N
VFP
SS
125,
240
106,
936
Pro
mot
ing
Saf
e an
d S
tabl
e Fa
milie
s93
.556
G-0
801N
VFP
SS
831,
060
781,
218
Pro
mot
ing
Saf
e an
d S
tabl
e Fa
milie
s93
.556
G-0
811N
VFP
CV
3,26
5
-
Pro
mot
ing
Saf
e an
d S
tabl
e Fa
milie
s93
.556
G-0
901N
VFP
SS
766,
797
664,
925
Pro
mot
ing
Saf
e an
d S
tabl
e Fa
milie
s93
.556
G-0
911N
VFP
CV
23,0
80
23
,080
1,74
9,44
2
1,57
6,15
9
Chi
ld S
uppo
rt E
nfor
cem
ent
93.5
6308
04N
V40
041,
941,
235
1,
438,
566
Chi
ld S
uppo
rt E
nfor
cem
ent
93.5
6309
04N
V40
045,
612,
442
3,
039,
004
Chi
ld S
uppo
rt E
nfor
cem
ent
93.5
6310
04N
V40
0427
,902
,982
20,2
39,0
22
AR
RA
- C
hild
Sup
port
Enf
orce
men
t93
.563
A09
04N
V40
0233
4,97
7
33
4,97
7
AR
RA
- C
hild
Sup
port
Enf
orce
men
t93
.563
A10
04N
V40
024,
762,
554
3,
787,
142
40,5
54,1
90
28
,838
,711
Low
Inco
me
Hom
e E
nerg
y A
ssis
tanc
e93
.568
G-0
9B1N
VLI
EA
9,63
5,14
2
-
Low
Inco
me
Hom
e E
nerg
y A
ssis
tanc
e93
.568
G-1
0B1N
VLI
EA
11,4
12,5
15
75
6,31
5
21,0
47,6
57
75
6,31
5
Ref
ugee
and
Ent
rant
Ass
ista
nce_
Dis
cret
iona
ry G
rant
s93
.576
90ZE
0075
/04
37,3
94
37
,394
Ref
ugee
and
Ent
rant
Ass
ista
nce_
Dis
cret
iona
ry G
rant
s93
.576
90ZE
0075
/05
107,
606
107,
606
145,
000
145,
000
104

Fede
ral G
rant
or /
Pass
-Thr
ough
Gra
ntor
CFD
AAw
ard
or P
ass-
Paym
ents
to
Pro
gram
Titl
eN
umbe
rTh
roug
h N
umbe
rEx
pend
iture
s S
ubre
cipi
ents
____
____
____
____
____
____
____
____
____
____
____
____
____
____
____
___
____
____
___
____
____
____
____
____
____
____
____
____
____
____
____
____
____
____
____
____
____
____
____
____
__
STA
TE O
F N
EVA
DA
SCH
EDU
LE O
F EX
PEN
DIT
UR
ES O
F FE
DER
AL A
WAR
DS
FOR
TH
E YE
AR E
ND
ED J
UN
E 30
, 201
0
Sta
te C
ourt
Impr
ovem
ent P
rogr
am93
.586
G-0
701N
VS
CID
56,5
98$
-
$
Sta
te C
ourt
Impr
ovem
ent P
rogr
am93
.586
G-0
701N
VS
CIP
35,9
84
-
Sta
te C
ourt
Impr
ovem
ent P
rogr
am93
.586
G-0
701N
VS
CIT
22,9
43
-
Sta
te C
ourt
Impr
ovem
ent P
rogr
am93
.586
G-0
801N
VS
CID
65,0
69
-
Sta
te C
ourt
Impr
ovem
ent P
rogr
am93
.586
G-0
801N
VS
CIP
91,9
06
-
Sta
te C
ourt
Impr
ovem
ent P
rogr
am93
.586
G-0
801N
VS
CIT
95,6
08
-
Sta
te C
ourt
Impr
ovem
ent P
rogr
am93
.586
G-0
901N
VS
CIP
48,3
46
-
416,
454
-
Com
mun
ity-B
ased
Chi
ld A
buse
Pre
vent
ion
Gra
nts
93.5
90G
0901
NV
FRP
G37
3,03
2
29
4,31
1
Gra
nts
to S
tate
s fo
r Acc
ess
and
Vis
itatio
n P
rogr
ams
93.5
9709
01N
VS
AV
P55
,524
-
Gra
nts
to S
tate
s fo
r Acc
ess
and
Vis
itatio
n P
rogr
ams
93.5
97G
-080
1NV
SA
VP
29,0
69
-
84,5
93
-
Cha
fee
Edu
catio
n an
d Tr
aini
ng V
ouch
ers
Pro
gram
(ETV
)93
.599
0801
NV
CE
TV11
2,47
7
11
2,47
7
Cha
fee
Edu
catio
n an
d Tr
aini
ng V
ouch
ers
Pro
gram
(ETV
)93
.599
0901
NV
CE
TV30
7,76
8
30
6,17
4
420,
245
418,
651
Ado
ptio
n In
cent
ive
Pay
men
ts93
.603
0801
NV
AI9
910
4,74
2
84
,205
Ado
ptio
n In
cent
ive
Pay
men
ts93
.603
0901
NV
AIP
P1,
575
-
106,
317
84,2
05
Vot
ing
Acc
ess
for I
ndiv
idua
ls w
ith D
isab
ilitie
s_G
rant
s to
Sta
tes
93.6
17G
-060
3NV
VO
TE28
,547
-
Dev
elop
men
tal D
isab
ilitie
s B
asic
Sup
port
and
Adv
ocac
y G
rant
s93
.630
G-0
801N
VA
DB
S10
5,49
2
-
Dev
elop
men
tal D
isab
ilitie
s B
asic
Sup
port
and
Adv
ocac
y G
rant
s93
.630
G-0
901N
VA
DB
S29
9,12
4
14
8,20
8
404,
616
148,
208
Chi
ldre
n's
Just
ice
Gra
nts
to S
tate
s93
.643
G-0
701N
VC
JA1
88,5
52
81
,166
Chi
ldre
n's
Just
ice
Gra
nts
to S
tate
s93
.643
G-0
801N
VC
JA1
87,6
83
37
,441
176,
235
118,
607
Chi
ld W
elfa
re S
ervi
ces_
Sta
te G
rant
s93
.645
G-0
901N
V14
0059
9,67
1
62
,005
Chi
ld W
elfa
re S
ervi
ces_
Sta
te G
rant
s93
.645
G-1
001N
V14
001,
818,
753
18
6,01
4
2,41
8,42
4
248,
019
Fost
er C
are_
Title
IV-E
93.6
5809
01N
V14
017,
483,
058
6,
992,
961
Fost
er C
are_
Title
IV-E
93.6
5810
01N
V14
0126
,669
,732
21,5
65,9
91
AR
RA
- Fo
ster
Car
e_Ti
tle IV
-E93
.658
A09
01N
V14
0286
6,89
6
74
0,02
9
AR
RA
- Fo
ster
Car
e_Ti
tle IV
-E93
.658
A10
01N
V14
021,
283,
501
1,
198,
726
36,3
03,1
87
30
,497
,707
105

Fede
ral G
rant
or /
Pass
-Thr
ough
Gra
ntor
CFD
AAw
ard
or P
ass-
Paym
ents
to
Pro
gram
Titl
eN
umbe
rTh
roug
h N
umbe
rEx
pend
iture
s S
ubre
cipi
ents
____
____
____
____
____
____
____
____
____
____
____
____
____
____
____
___
____
____
___
____
____
____
____
____
____
____
____
____
____
____
____
____
____
____
____
____
____
____
____
____
__
STA
TE O
F N
EVA
DA
SCH
EDU
LE O
F EX
PEN
DIT
UR
ES O
F FE
DER
AL A
WAR
DS
FOR
TH
E YE
AR E
ND
ED J
UN
E 30
, 201
0
Ado
ptio
n A
ssis
tanc
e93
.659
0901
NV
1407
1,94
1,62
1$
1,88
1,33
7$
Ado
ptio
n A
ssis
tanc
e93
.659
1001
NV
1407
12,4
19,7
08
11
,844
,049
AR
RA
- A
dopt
ion
Ass
ista
nce
93.6
59A
0901
NV
1403
843,
877
795,
857
AR
RA
- A
dopt
ion
Ass
ista
nce
93.6
59A
1001
NV
1403
1,37
3,81
8
1,28
7,42
4
16,5
79,0
24
15
,808
,667
Soc
ial S
ervi
ces
Blo
ck G
rant
93.6
6710
01N
VS
OS
R11
,391
,817
888,
477
Soc
ial S
ervi
ces
Blo
ck G
rant
93.6
67G
-090
1NV
SO
S2
1,26
0,51
4
1,04
4,48
7
Soc
ial S
ervi
ces
Blo
ck G
rant
93.6
67G
-090
1NV
SO
SR
4,69
4,70
1
517,
543
17,3
47,0
32
2,
450,
507
Chi
ld A
buse
and
Neg
lect
Sta
te G
rant
s93
.669
G-0
501N
VC
A01
10,2
67
8,
526
Chi
ld A
buse
and
Neg
lect
Sta
te G
rant
s93
.669
G-0
601N
VC
A01
218,
519
112,
261
Chi
ld A
buse
and
Neg
lect
Sta
te G
rant
s93
.669
G-0
701N
VC
A01
138,
333
138,
309
367,
119
259,
096
Fam
ily V
iole
nce
Pre
vent
ion
and
Ser
vice
s/G
rant
s fo
r Bat
tere
d W
omen
's S
helte
rs_G
rant
s to
Sta
tes
and
Indi
an T
ribes
93.6
71G
-080
1NV
FVP
S19
0,62
1
18
8,43
6
Fam
ily V
iole
nce
Pre
vent
ion
and
Ser
vice
s/G
rant
s fo
r Bat
tere
d W
omen
's S
helte
rs_G
rant
s to
Sta
tes
and
Indi
an T
ribes
93.6
71G
-090
1NV
FVP
S87
1,55
0
83
2,04
6
1,06
2,17
1
1,02
0,48
2
Cha
fee
Fost
er C
are
Inde
pend
ence
Pro
gram
93.6
74G
-080
1NV
1420
673,
589
671,
932
Cha
fee
Fost
er C
are
Inde
pend
ence
Pro
gram
93.6
74G
-090
1NV
1420
687,
272
639,
805
1,36
0,86
1
1,31
1,73
7
AR
RA
- P
reve
ntin
g H
ealth
care
-Ass
ocia
ted
Infe
ctio
ns93
.717
A3U
50C
I000
489-
03S
132
,313
-
AR
RA
- S
tate
Gra
nts
to P
rom
ote
Hea
lth In
form
atio
n Te
chno
logy
93.7
19A
90H
T003
7/01
81,9
08
-
AR
RA
- P
reve
ntio
n an
d W
elln
ess
- Sta
te, T
errit
orie
s an
d P
acifi
c Is
land
s93
.723
A3U
58D
P00
2003
-01S
25,
889
-
AR
RA
-Com
mun
ities
Put
ting
Pre
vent
ion
to W
ork:
Chr
onic
Dis
ease
Sel
f-M
anag
emen
t Pro
gram
93.7
25A
90R
A00
42/0
11,
635
-
Sta
te C
hild
ren'
s In
sura
nce
Pro
gram
93.7
6707
-050
5NV
5021
5,79
4,59
2
-
Sta
te C
hild
ren'
s In
sura
nce
Pro
gram
93.7
6708
-050
5NV
5021
18,0
41,2
76
-
23,8
35,8
68
-
Med
icai
d In
frast
ruct
ure
Gra
nts
To S
uppo
rt th
e C
ompe
titiv
e E
mpl
oym
ent o
f Peo
ple
with
Dis
abilit
ies
93.7
685-
1QA
C30
324A
365,
465
86,6
25
Med
icai
d In
frast
ruct
ure
Gra
nts
To S
uppo
rt th
e C
ompe
titiv
e E
mpl
oym
ent o
f Peo
ple
with
Dis
abilit
ies
93.7
685-
1QA
CM
S03
0324
/02
218,
484
55,3
88
583,
949
142,
013
106

Fede
ral G
rant
or /
Pass
-Thr
ough
Gra
ntor
CFD
AAw
ard
or P
ass-
Paym
ents
to
Pro
gram
Titl
eN
umbe
rTh
roug
h N
umbe
rEx
pend
iture
s S
ubre
cipi
ents
____
____
____
____
____
____
____
____
____
____
____
____
____
____
____
___
____
____
___
____
____
____
____
____
____
____
____
____
____
____
____
____
____
____
____
____
____
____
____
____
__
STA
TE O
F N
EVA
DA
SCH
EDU
LE O
F EX
PEN
DIT
UR
ES O
F FE
DER
AL A
WAR
DS
FOR
TH
E YE
AR E
ND
ED J
UN
E 30
, 201
0
Nat
iona
l Bio
terr
oris
m H
ospi
tal P
repa
redn
ess
Pro
gram
93.8
891
U3R
EP
0800
68-0
194
6,50
0$
79
6,79
9$
Nat
iona
l Bio
terr
oris
m H
ospi
tal P
repa
redn
ess
Pro
gram
93.8
891
U3R
EP
0902
11-0
126
5,48
7
23
6,22
5
Nat
iona
l Bio
terr
oris
m H
ospi
tal P
repa
redn
ess
Pro
gram
93.8
891
U3R
EP
0902
20-0
12,
642,
562
1,
875,
312
Nat
iona
l Bio
terr
oris
m H
ospi
tal P
repa
redn
ess
Pro
gram
93.8
896
U3R
EP
0700
18-0
152
7,82
8
50
9,10
1
Nat
iona
l Bio
terr
oris
m H
ospi
tal P
repa
redn
ess
Pro
gram
93.8
896
U3R
EP
0755
7-01
281,
328
76,5
96
4,66
3,70
5
3,49
4,03
3
HIV
Car
e Fo
rmul
a G
rant
s93
.917
2 X0
7HA
0000
1-19
6,10
7,05
7
5,67
6,20
0
HIV
Car
e Fo
rmul
a G
rant
s93
.917
2 X0
7HA
0000
1-20
1,65
2,61
2
1,51
2,57
9
HIV
Car
e Fo
rmul
a G
rant
s93
.917
SFY
10
- Pro
gram
Inco
me
(Reb
ate
Inco
me)
1,11
8,71
6
1,03
5,69
3
8,87
8,38
5
8,22
4,47
2
Spe
cial
Pro
ject
s of
Nat
iona
l Sig
nific
ance
93.9
281
H97
HA
1056
7-01
101,
851
-
Coo
pera
tive
Agr
eem
ents
to S
uppo
rt C
ompr
ehen
sive
Sch
ool H
ealth
P
rogr
ams
to P
reve
nt th
e S
prea
d of
HIV
and
Oth
er Im
porta
nt H
ealth
P
robl
ems
93.9
38U
87/D
P00
1227
-02
164,
108
59,0
29
Coo
pera
tive
Agr
eem
ents
to S
uppo
rt C
ompr
ehen
sive
Sch
ool H
ealth
P
rogr
ams
to P
reve
nt th
e S
prea
d of
HIV
and
Oth
er Im
porta
nt H
ealth
P
robl
ems
93.9
38U
87/D
P00
1227
-03
47,9
94
-
212,
102
59,0
29
HIV
Pre
vent
ion
Act
iviti
es_H
ealth
Dep
artm
ent B
ased
93.9
402U
62P
S92
3483
-06
1,16
8,25
0
967,
134
HIV
Pre
vent
ion
Act
iviti
es_H
ealth
Dep
artm
ent B
ased
93.9
40U
62/C
CU
9234
83-0
5R33
,422
27,2
58
HIV
Pre
vent
ion
Act
iviti
es_H
ealth
Dep
artm
ent B
ased
93.9
40U
62/C
CU
9234
83-0
5S1
1,61
6,07
9
1,32
9,27
9
2,81
7,75
1
2,32
3,67
1
Hum
an Im
mun
odef
icie
ncy
Viru
s (H
IV)/A
cqui
red
Imm
unod
efic
ienc
y V
irus
Syn
drom
e (A
IDS
) Sur
veilla
nce
93.9
445U
62P
S00
1038
-02
284,
519
144,
181
Hum
an Im
mun
odef
icie
ncy
Viru
s (H
IV)/A
cqui
red
Imm
unod
efic
ienc
y V
irus
Syn
drom
e (A
IDS
) Sur
veilla
nce
93.9
445U
62P
S00
1038
-03
222,
013
114,
088
506,
532
258,
269
Blo
ck G
rant
s fo
r Com
mun
ity M
enta
l Hea
lth S
ervi
ces
93.9
583B
09S
M01
0039
-08
140,
510
7,23
6
Blo
ck G
rant
s fo
r Com
mun
ity M
enta
l Hea
lth S
ervi
ces
93.9
583B
09S
M01
0039
-09
3,38
9,66
3
383,
688
3,53
0,17
3
390,
924
Blo
ck G
rant
s fo
r Pre
vent
ion
and
Trea
tmen
t of S
ubst
ance
Abu
se93
.959
3B08
TI01
0039
-08S
332
3,84
1
16
9,70
8
Blo
ck G
rant
s fo
r Pre
vent
ion
and
Trea
tmen
t of S
ubst
ance
Abu
se93
.959
3B08
TI01
0039
-09S
35,
235,
275
4,
045,
519
Blo
ck G
rant
s fo
r Pre
vent
ion
and
Trea
tmen
t of S
ubst
ance
Abu
se93
.959
3B08
TI01
0039
-10S
36,
631,
051
6,
569,
597
12,1
90,1
67
10
,784
,824
107
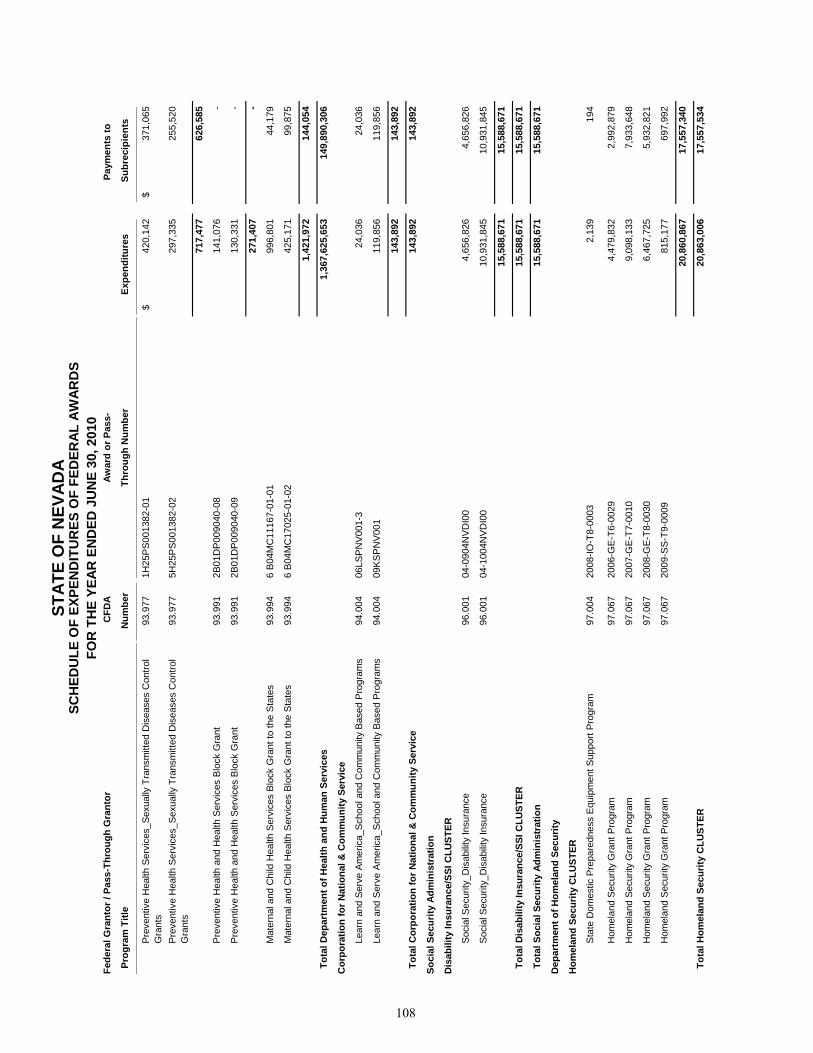
Fede
ral G
rant
or /
Pass
-Thr
ough
Gra
ntor
CFD
AAw
ard
or P
ass-
Paym
ents
to
Pro
gram
Titl
eN
umbe
rTh
roug
h N
umbe
rEx
pend
iture
s S
ubre
cipi
ents
____
____
____
____
____
____
____
____
____
____
____
____
____
____
____
___
____
____
___
____
____
____
____
____
____
____
____
____
____
____
____
____
____
____
____
____
____
____
____
____
__
STA
TE O
F N
EVA
DA
SCH
EDU
LE O
F EX
PEN
DIT
UR
ES O
F FE
DER
AL A
WAR
DS
FOR
TH
E YE
AR E
ND
ED J
UN
E 30
, 201
0
Pre
vent
ive
Hea
lth S
ervi
ces_
Sex
ually
Tra
nsm
itted
Dis
ease
s C
ontro
l G
rant
s93
.977
1H25
PS
0013
82-0
142
0,14
2$
37
1,06
5$
Pre
vent
ive
Hea
lth S
ervi
ces_
Sex
ually
Tra
nsm
itted
Dis
ease
s C
ontro
l G
rant
s93
.977
5H25
PS
0013
82-0
229
7,33
5
25
5,52
0
717,
477
626,
585
Pre
vent
ive
Hea
lth a
nd H
ealth
Ser
vice
s B
lock
Gra
nt93
.991
2B01
DP
0090
40-0
814
1,07
6
-
Pre
vent
ive
Hea
lth a
nd H
ealth
Ser
vice
s B
lock
Gra
nt93
.991
2B01
DP
0090
40-0
913
0,33
1
-
271,
407
-
Mat
erna
l and
Chi
ld H
ealth
Ser
vice
s B
lock
Gra
nt to
the
Sta
tes
93.9
946
B04
MC
1116
7-01
-01
996,
801
44,1
79
Mat
erna
l and
Chi
ld H
ealth
Ser
vice
s B
lock
Gra
nt to
the
Sta
tes
93.9
946
B04
MC
1702
5-01
-02
425,
171
99,8
75
1,42
1,97
2
144,
054
Tot
al D
epar
tmen
t of H
ealth
and
Hum
an S
ervi
ces
1,36
7,62
5,65
3
14
9,89
0,30
6
Cor
pora
tion
for N
atio
nal &
Com
mun
ity S
ervi
ce
Lear
n an
d S
erve
Am
eric
a_S
choo
l and
Com
mun
ity B
ased
Pro
gram
s94
.004
06LS
PN
V00
1-3
24,0
36
24
,036
Lear
n an
d S
erve
Am
eric
a_S
choo
l and
Com
mun
ity B
ased
Pro
gram
s94
.004
09K
SP
NV
001
119,
856
119,
856
143,
892
143,
892
Tot
al C
orpo
ratio
n fo
r Nat
iona
l & C
omm
unity
Ser
vice
143,
892
143,
892
Soci
al S
ecur
ity A
dmin
istr
atio
n
Dis
abili
ty In
sura
nce/
SSI C
LUST
ER
Soc
ial S
ecur
ity_D
isab
ility
Insu
ranc
e96
.001
04-0
904N
VD
I00
4,65
6,82
6
4,65
6,82
6
Soc
ial S
ecur
ity_D
isab
ility
Insu
ranc
e96
.001
04-1
004N
VD
I00
10,9
31,8
45
10
,931
,845
15,5
88,6
71
15
,588
,671
Tot
al D
isab
ility
Insu
ranc
e/SS
I CLU
STER
15,5
88,6
71
15
,588
,671
Tot
al S
ocia
l Sec
urity
Adm
inis
trat
ion
15,5
88,6
71
15
,588
,671
Dep
artm
ent o
f Hom
elan
d Se
curit
y
Hom
elan
d Se
curit
y C
LUST
ER
Sta
te D
omes
tic P
repa
redn
ess
Equ
ipm
ent S
uppo
rt P
rogr
am97
.004
2008
-IO-T
8-00
032,
139
19
4
Hom
elan
d S
ecur
ity G
rant
Pro
gram
97.0
6720
06-G
E-T
6-00
294,
479,
832
2,
992,
879
Hom
elan
d S
ecur
ity G
rant
Pro
gram
97.0
6720
07-G
E-T
7-00
109,
098,
133
7,
933,
648
Hom
elan
d S
ecur
ity G
rant
Pro
gram
97.0
6720
08-G
E-T
8-00
306,
467,
725
5,
932,
821
Hom
elan
d S
ecur
ity G
rant
Pro
gram
97.0
6720
09-S
S-T
9-00
0981
5,17
7
69
7,99
2
20,8
60,8
67
17
,557
,340
Tot
al H
omel
and
Secu
rity
CLU
STER
20,8
63,0
06
17
,557
,534
108

Fede
ral G
rant
or /
Pass
-Thr
ough
Gra
ntor
CFD
AAw
ard
or P
ass-
Paym
ents
to
Pro
gram
Titl
eN
umbe
rTh
roug
h N
umbe
rEx
pend
iture
s S
ubre
cipi
ents
____
____
____
____
____
____
____
____
____
____
____
____
____
____
____
___
____
____
___
____
____
____
____
____
____
____
____
____
____
____
____
____
____
____
____
____
____
____
____
____
__
STA
TE O
F N
EVA
DA
SCH
EDU
LE O
F EX
PEN
DIT
UR
ES O
F FE
DER
AL A
WAR
DS
FOR
TH
E YE
AR E
ND
ED J
UN
E 30
, 201
0
Urb
an A
reas
Sec
urity
Initi
ativ
e97
.008
2007
-TU
-XM
-001
529
2,83
7$
28
7,83
7$
Boa
ting
Saf
ety
Fina
ncia
l Ass
ista
nce
97.0
1219
.01.
3237
2,22
1
-
Boa
ting
Saf
ety
Fina
ncia
l Ass
ista
nce
97.0
1220
.01.
321,
263,
016
-
1,63
5,23
7
-
Pre
-Dis
aste
r Miti
gatio
n (P
DM
) Com
petit
ive
Gra
nts
97.0
17E
MF-
2006
-PC
-000
614
,589
14,5
89
Pre
-Dis
aste
r Miti
gatio
n (P
DM
) Com
petit
ive
Gra
nts
97.0
17E
MF-
2007
-PC
-000
325
,306
24,5
19
39,8
95
39
,108
Com
mun
ity A
ssis
tanc
e P
rogr
am_S
tate
Sup
port
Ser
vice
s E
lem
ent
(CA
P-S
SS
E)
97.0
23E
MF-
2009
-GR
-090
443
,761
-
Com
mun
ity A
ssis
tanc
e P
rogr
am_S
tate
Sup
port
Ser
vice
s E
lem
ent
(CA
P-S
SS
E)
97.0
23E
MF-
2010
-GR
-100
441
,594
-
85,3
55
-
Dis
aste
r Gra
nts
- Pub
lic A
ssis
tanc
e (P
resi
dent
ially
Dec
lare
d D
isas
ters
)97
.036
EM
F-20
04-M
P-4
006
39,8
94
3,
445
Dis
aste
r Gra
nts
- Pub
lic A
ssis
tanc
e (P
resi
dent
ially
Dec
lare
d D
isas
ters
)97
.036
FEM
A-1
583-
DR
1,15
0,84
4
1,14
2,18
4
Dis
aste
r Gra
nts
- Pub
lic A
ssis
tanc
e (P
resi
dent
ially
Dec
lare
d D
isas
ters
)97
.036
FEM
A-1
629-
DR
273,
886
224,
674
Dis
aste
r Gra
nts
- Pub
lic A
ssis
tanc
e (P
resi
dent
ially
Dec
lare
d D
isas
ters
)97
.036
FEM
A-1
738-
DR
107,
299
103,
458
1,57
1,92
3
1,47
3,76
1
Nat
iona
l Dam
Saf
ety
Pro
gram
97.0
4120
09-R
C-5
5-00
2611
,680
-
Nat
iona
l Dam
Saf
ety
Pro
gram
97.0
41E
MW
-200
8-G
R-0
657
24,8
46
-
36,5
26
-
Em
erge
ncy
Man
agem
ent P
erfo
rman
ce G
rant
s97
.042
2008
-EM
-E8-
0044
349,
017
348,
248
Em
erge
ncy
Man
agem
ent P
erfo
rman
ce G
rant
s97
.042
2009
-EP
-E9-
0018
2,86
8,15
3
1,45
4,17
4
3,21
7,17
0
1,80
2,42
2
Sta
te F
ire T
rain
ing
Sys
tem
s G
rant
s97
.043
2009
-RB
-63-
0142
16,0
43
-
Sta
te F
ire T
rain
ing
Sys
tem
s G
rant
s97
.043
EM
W-2
008-
GR
-068
012
,101
-
28,1
44
-
Inte
rope
rabl
e E
mer
genc
y C
omm
unic
atio
ns97
.055
2009
-IP-T
9-00
2239
,900
37,6
29
Rai
l and
Tra
nsit
Sec
urity
Gra
nt P
rogr
am97
.075
2006
-RL-
T6-0
007
85,4
01
85
,401
Rai
l and
Tra
nsit
Sec
urity
Gra
nt P
rogr
am97
.075
2007
-RL-
T7-0
103
104,
963
101,
867
190,
364
187,
268
109

Fede
ral G
rant
or /
Pass
-Thr
ough
Gra
ntor
CFD
AAw
ard
or P
ass-
Paym
ents
to
Pro
gram
Titl
eN
umbe
rTh
roug
h N
umbe
rEx
pend
iture
s S
ubre
cipi
ents
____
____
____
____
____
____
____
____
____
____
____
____
____
____
____
___
____
____
___
____
____
____
____
____
____
____
____
____
____
____
____
____
____
____
____
____
____
____
____
____
__
STA
TE O
F N
EVA
DA
SCH
EDU
LE O
F EX
PEN
DIT
UR
ES O
F FE
DER
AL A
WAR
DS
FOR
TH
E YE
AR E
ND
ED J
UN
E 30
, 201
0
Buf
fer Z
one
Pro
tect
ion
Pla
n (B
ZPP
)97
.078
2006
-BZ-
T6-0
059
10,8
90$
10
,890
$
Buf
fer Z
one
Pro
tect
ion
Pla
n (B
ZPP
)97
.078
2007
-BZ-
T7-0
010
62,7
50
62
,750
Buf
fer Z
one
Pro
tect
ion
Pla
n (B
ZPP
)97
.078
2008
-BZ-
T8-0
026
379,
196
378,
313
Buf
fer Z
one
Pro
tect
ion
Pla
n (B
ZPP
)97
.078
2009
-BF-
T9-0
002
883
-
453,
719
451,
953
Rea
l ID
Pro
gram
97.0
8920
08 ID
T 80
019
1,14
6,32
2
-
Rea
l ID
Pro
gram
97.0
8920
09-ID
-MX-
0009
118,
971
-
1,26
5,29
3
-
Tot
al D
epar
tmen
t of H
omel
and
Secu
rity
29,7
19,3
69
21
,837
,512
Tota
l Fed
eral
Fin
anci
al A
ssis
tanc
e5,
427,
116,
082
$
917,
551,
786
$
The
acco
mpa
nyin
g no
tes
are
an in
tegr
al p
art o
f thi
s sc
hedu
le.
110

STATE OF NEVADA NOTES TO THE SCHEDULE OF EXPENDITURES OF FEDERAL AWARDS FOR THE YEAR ENDED JUNE 30, 2010
111
1. SUMMARY OF SIGNIFICANT ACCOUNTING POLICIES
Basis of Reporting – The accompanying Schedule of Expenditures of Federal Awards is used as a managerial tool by the State Controller’s office, primarily to monitor compliance with the Cash Management Improvement Act. As such, the Schedule separately identifies the expenditures for each Federal program at the grant award level. The Schedule has been prepared on the modified accrual basis of accounting. The “Expenditures” column includes the amounts reported in the “Payments to Subrecipients” column. The Federal award programs of the Nevada System of Higher Education are not included in the accompanying Schedule of Expenditures of Federal Awards. Federal award programs of the Nevada System of Higher Education will be reported on separately.
2. NATIONAL SCHOOL LUNCH PROGRAM (10.555) FOOD DISTRIBUTION PROGRAM ON INDIAN RESERVATIONS (10.567) EMERGENCY FOOD ASSISTANCE PROGRAM (10.569) ARRA - EMERGENCY FOOD ASSISTANCE PROGRAM (10.569A) NUTRITION SERVICES INCENTIVE PROGRAM (93.053)
The expenditures for these programs include the dollar value of food commodities distributed to eligible recipients during the year. The value of commodities is determined by the U.S. Department of Agriculture.
3. SUPPLEMENTAL NUTRITION ASSISTANCE PROGRAM (10.551)
The expenditures reported for the Supplemental Nutrition Assistance Program (formerly the Food Stamp Program) consist of the value of the benefits transferred to program participants through the EBT system. The reported expenditures for benefits under the Supplemental Nutrition Assistance Program (SNAP) (CFDA No. 10.551) are supported by both regularly appropriated funds and incremental funding made available under section 101 of the American Recovery and Reinvestment Act of 2009. The portion of total expenditures for SNAP benefits that is supported by Recovery Act funds varies according to fluctuations in the cost of the Thrifty Food Plan, and to changes in participating households' income, deductions, and assets. This condition prevents USDA from obtaining the regular and Recovery Act components of SNAP benefits expenditures through normal program reporting processes. As an alternative, USDA computed a weighted average percentage to be applied to the national aggregate SNAP benefits provided to households in order to allocate an appropriate portion thereof to Recovery Act funds for Federal fiscal year ended September 30, 2009. This methodology generates valid results at the national aggregate level but not at the individual State level. Therefore, we cannot validly disaggregate the regular and Recovery Act components of our reported expenditures for SNAP benefits. At the national aggregate level, however, Recovery Act funds account for approximately 15 percent of USDA's total expenditures for SNAP benefits in the Federal fiscal year ended September 30, 2009. An updated national aggregate Recovery Act percentage for the Federal fiscal year ended September 30, 2010 has not yet been provided.

STATE OF NEVADA NOTES TO THE SCHEDULE OF EXPENDITURES OF FEDERAL AWARDS FOR THE YEAR ENDED JUNE 30, 2010
112
4. UNEMPLOYMENT INSURANCE PROGRAM (17.225 and 17.225A)
The expenditures reported on the Schedule of Expenditures of Federal Awards include both Federal funds and State funds, as required. The State funds represent the amounts expended from the Unemployment Trust Fund. The following identifies the State and Federal portions of the expenditures reported: State Funds $1,371,587,823 State Funds - ARRA 872,099,631 Federal Funds 45,379,005 Federal Funds - ARRA 2,569,070 Total Reported $2,291,635,529
5. IMMUNIZATION GRANTS PROGRAM (93.268)
The expenditures for this program include vaccines received in lieu of cash. The direct assistance has been estimated at the budgeted amounts since actual amounts were not available.
6. SPECIAL SUPPLEMENTAL NUTRITION PROGRAM FOR WOMEN, INFANTS, AND CHILDREN (10.557) The expenditures for this program include the cost of food vouchers in the amount of $27,842,721. 7. DONATION OF FEDERAL SURPLUS PERSONAL PROPERTY PROGRAM (39.003)
The amounts recorded for donated surplus property represent the total value of property received from the Federal Government.
8. DISCLOSURE OF AMERICAN RECOVERY AND REINVESTMENT ACT EXPENDITURES
As a recipient of American Recovery and Reinvestment Act (ARRA) funds, the State has agreed to separately identify the expenditures for Federal awards under ARRA on the Schedule of Expenditures of Federal Awards (SEFA) by identifying those expenditures on separate lines and by inclusion of the prefix “ARRA-” in the name. For additional transparency, the State has elected to include the suffix “A” with the Catalog of Federal Domestic Assistance number on the SEFA.
STATE OF NEVADA SCHEDULE OF FINDINGS AND QUESTIONED COSTS FOR THE YEAR ENDED JUNE 30, 2010
113
A. SUMMARY OF AUDIT RESULTS
1. The Auditor’s report expresses an unqualified opinion on the basic financial statements of the State of Nevada for the year ended June 30, 2010.
2. No significant deficiencies or material weaknesses were disclosed during the audit of the financial
statements. 3. The audit disclosed no instances of noncompliance which were material to the financial statements of
the State of Nevada.
4. Significant deficiencies, not identified as material weaknesses, in the internal control over major Federal award programs were disclosed.
5. The Auditor’s report on compliance with the major Federal award programs for the State of Nevada
expresses an unqualified opinion.
6. Audit findings relative to the major Federal award programs for the State of Nevada, which are required to be reported under Section .510(a) of OMB Circular A-133, are reported in Part C of this Schedule.
7. The programs tested as major programs included:
U.S. Department of Agriculture: Supplemental Nutrition Assistance Program (SNAP) Cluster:
Supplemental Nutrition Assistance Program, CFDA 10.551 State Administrative Matching Grants for Supplemental Nutrition, CFDA 10.561 ARRA – State Administrative Matching Grants for Supplemental Nutrition, CFDA 10.561A Child Nutrition Cluster: School Breakfast Program, CFDA 10.553 National School Lunch Program, CFDA 10.555 Special Milk Program for Children, CFDA 10.556 Summer Food Service Program for Children, CFDA 10.559
U.S. Department of Justice: Violence Against Women Formula Grants:
Violence Against Women Formula Grants, CFDA 16.588 ARRA – Violence Against Women Formula Grants, CFDA 16.588A
U.S. Department of Labor:
Employment Service Cluster: Employment Service/Wagner-Peyser Funded Activities, CFDA 17.207 ARRA – Employment Service/Wagner-Peyser Funded Activities, CFDA 17.207A Disabled Veterans’ Outreach Program (DVOP), CFDA 17.801 Local Veterans’ Employment Representative Program, CFDA 17.804 Unemployment Insurance: Unemployment Insurance, CFDA 17.225 ARRA – Unemployment Insurance, CFDA 17.225A Workforce Investment Act (WIA) Cluster: WIA Adult Program, CFDA 17.258 ARRA – WIA Adult Program, CFDA 17.258A

STATE OF NEVADA SCHEDULE OF FINDINGS AND QUESTIONED COSTS FOR THE YEAR ENDED JUNE 30, 2010
114
WIA Youth Activities, CFDA 17.259 ARRA – WIA Youth Activities, CFDA 17.259A WIA Dislocated Workers, CFDA 17.260 ARRA – WIA Dislocated Workers, CFDA 17.260A
U.S Department of Transportation: Highway Planning and Construction Cluster: Highway Planning and Construction, CFDA 20.205 ARRA – Highway Planning and Construction, CFDA 20.205A Recreational Trails Program, CFDA 20.219
U.S. Department of Education:
Early Intervention Services (IDEA) Cluster: Special Education–Grants for Infants and Families with Disabilities, CFDA 84.181 ARRA – Special Education–Grants for Infants and Families, Recovery Act, CFDA 84.393A State Fiscal Stabilization Cluster: ARRA – State Fiscal Stabilization Fund (SFSF) – Education State Grants, Recovery Act, CFDA 84.394A ARRA – State Fiscal Stabilization Fund – Governmental Services, Recovery Act, CFDA 84.397A Special Education Cluster: Special Education_Grants to States, CFDA 84.027 Special Education_Preschool Grants, CFDA 84.173 ARRA – Special Education Grants to States, CFDA 84.391A ARRA – Special Education – Preschool Grants, CFDA 84.392A Title I, Part A Cluster: Title I Grants to Local Educational Agencies, CFDA 84.010 ARRA – Title I Grants to LEAs, CFDA 84.389A Vocational Rehabilitation Cluster: Rehabilitation Services_Vocational Rehabilitation Grants to States, CFDA 84.126 ARRA – Rehabilitation Services – Vocational Rehabilitation Grants to States, Recovery Act, CFDA 84.390A
U.S. Department of Health and Human Services:
Immunization Cluster: Immunization Grants, CFDA 93.268 ARRA – Immunization, CFDA 93.712A Child Care and Development Fund (CCDF) Cluster: Child Care and Development Block Grant, CFDA 93.575 Child Care Mandatory and Matching Funds of the Child Care and Development Grant, CFDA 93.596 ARRA – Child Care and Development Block Grant, CFDA 93.713A HIV Care Formula Grants, CFDA 93.917 Low Income Home Energy Assistance, CFDA 93.568 Medicaid Cluster: State Medicaid Fraud Control Units, CFDA 93.775 State Survey and Certification of Health Care Providers and Suppliers, CFDA 93.777 Medical Assistance Program, CFDA 93.778 ARRA – Medical Assistance Program, CFDA 93.778A

STATE OF NEVADA SCHEDULE OF FINDINGS AND QUESTIONED COSTS FOR THE YEAR ENDED JUNE 30, 2010
115
Public Health Emergency Preparedness, CFDA 93.069 Social Services Block Grant, CFDA 93.667 State Children’s Insurance Program, CFDA 93.767 Temporary Assistance to Needy Families (TANF) Cluster: Temporary Assistance to Needy Families, CFDA 93.558 ARRA-Emergency Contingency Fund for Temporary Assistance for Needy Families (TANF) State Program, CFDA 93.714A ARRA – Temporary Assistance for Needy Families (TANF) Supplement Grants, CFDA 93.716A
8. The dollar threshold used to distinguish between Type A and Type B programs for the year ended
June 30, 2010, was $16,281,348. 9. The State of Nevada qualified as a low risk auditee for the year ended June 30, 2010 under the criteria
set forth in Section .530 of OMB Circular A-133. B. FINDINGS – FINANCIAL STATEMENT AUDIT
There were no findings relating to the financial statement audit.
C. FINDINGS AND QUESTIONED COSTS – MAJOR FEDERAL AWARD PROGRAMS AUDIT
See pages 116 through 224.

116
STATE OF NEVADA SCHEDULE OF FINDINGS AND QUESTIONED COSTS FOR THE YEAR ENDED JUNE 30, 2010 U.S. DEPARTMENT OF TRANSPORTATION: Finding 10-1: Highway Planning and Construction Cluster: Highway Planning and Construction, CFDA 20.205: ARRA – Highway Planning and Construction, CFDA 20.205A: Recreational Trails Program, CFDA 20.219:
Grant Award Number: Potentially affects all grant awards included under CFDA 20.205 and 20.205A (in the Highway Planning and Construction Cluster) on the Schedule of Expenditures of Federal Awards.
Criteria: The OMB Circular A-133 Compliance Supplement requires that non-
Federal entities include in their construction contracts subject to the Davis-Bacon Act, a requirement that the contractor and subcontractors comply with the requirements of the Davis-Bacon Act, and the DOL regulations (29 CFR Part 5.5(a)(3)(ii)(A), “Labor Standards Provisions Applicable to Contracts Governing Federally Financed and Assisted Construction”). This includes a requirement for the contractor and subcontractors to submit to the non-Federal entity weekly, for each week in which any contract work is performed, a copy of the payroll and a statement of compliance (certified payrolls).
Condition and Context: Our testing of construction contracts included reviewing the bid
documents and contracts for the Davis-Bacon provisions, and reviewing the payroll data received and monitored by Nevada Department of Transportation personnel. Although the certified weekly payrolls were submitted, we noted several instances where multiple weeks were submitted at once, rather than each week being submitted separately and timely.
Questioned Cost: None.
Effect: Material noncompliance with the Davis-Bacon Act by a contractor
could occur and not be detected or followed up on by the Nevada Department of Transportation in a timely manner.
Cause: Adequate control procedures were not in place to ensure that all
required certified payrolls were timely received as prescribed by the Davis-Bacon Act.
Recommendation: We recommend that the Nevada Department of Transportation enhance
procedures to ensure that certified payrolls are received as prescribed by the Davis-Bacon Act.
Management’s Response: See management’s response on page 118.

117
STATE OF NEVADA SCHEDULE OF FINDINGS AND QUESTIONED COSTS FOR THE YEAR ENDED JUNE 30, 2010 U.S. DEPARTMENT OF TRANSPORTATION: Finding 10-2: Highway Planning and Construction Cluster: Highway Planning and Construction, CFDA 20.205: ARRA – Highway Planning and Construction, CFDA 20.205A: Recreational Trails Program, CFDA 20.219:
Grant Award Number: Potentially affects all grant awards included under CFDA 20.205 and 20.205A (in the Highway Planning and Construction Cluster) on the Schedule of Expenditures of Federal Awards.
Criteria: The OMB Circular A-133 Compliance Supplement requires that non-
Federal entities must have a quality assurance program for construction projects on the National Highway System to ensure that materials and workmanship conform to approved plans and specifications. Verification sampling must be performed by qualified testing personnel employed by the State Department of Transportation, or by its designated agent, excluding the contractor (23 CFR sections 637.201, 637.205, and 637.207).
Condition and Context: Our procedures included reviewing documentation of test results to
verify that tests were being performed in accordance with the quality assurance program. One of seven Federally funded construction projects completed during the year was tested. We noted that samples of piping, which represented five of 23 materials used in the project that were subject to quality assurance testing, were not submitted to the materials lab for testing. As a result, the minimum number of tests required under the quality assurance program was not performed for those materials.
Questioned Cost: None.
Effect: Noncompliance with the quality assurance program could result in
construction project deficiencies.
Cause: Adequate procedures were not in place to ensure that all required tests were performed as prescribed by the quality assurance program.
Recommendation: We recommend that the Nevada Department of Transportation enhance
procedures to ensure that all required tests are performed as prescribed by the quality assurance program.
Management’s Response: See management’s response on page 119.

118

119

120
STATE OF NEVADA SCHEDULE OF FINDINGS AND QUESTIONED COSTS FOR THE YEAR ENDED JUNE 30, 2010 U.S. DEPARTMENT OF LABOR: Finding 10-3: Unemployment Insurance, CFDA 17.225: ARRA – Unemployment Insurance, CFDA 17.225A:
Grant Award Number: Potentially affects all grant awards included under CFDA 17.225 and 17.225A on the Schedule of Expenditures of Federal Awards.
Criteria: U.S. Department of the Treasury (Treasury) regulations at 31 CFR part
205, which defines the Cash Management Improvement Act of 1990, as amended (Pub. L. No. 101-453; 31 USC 6501 et seq.), require State recipients to enter into agreements that prescribe specific methods of drawing down Federal funds (funding techniques) for selected large programs.
Condition and Context: The Unemployment Insurance – Federal Benefit Account and
Administrative Costs program (17.225F) is covered by the State of Nevada Amended Treasury State Agreement No. 1 for fiscal year 2010. The terms of this agreement specify that the recipient, Nevada Department of Employment, Training and Rehabilitation (DETR), will request Federal funds in accordance with the Actual Clearance, Zero Balance Account-Automated Clearing House (ZBA-ACH) funding technique.
During our testing, we noted that DETR did not follow the funding technique specified in the Treasury-State Agreement. The Actual Clearance, ZBA-ACH funding technique specifies that the State shall request funds such that they are deposited by ACH in a State account on the settlement date of payments issued by the State. However, DETR requested Federal funds based on expenditures recorded as issued in the accounting system, regardless of the settlement dates for outstanding payroll and vendor check disbursements. As such, requests for funds were not always based on the amount of funds that cleared the State of Nevada’s account on the settlement date.
Questioned Costs: None.
Effect: Federal funds may have been drawn in advance of the settlement date
and this could have resulted in an interest liability for the State.
Cause: DETR did not adhere to the funding technique described in the Treasury-State Agreement, and DETR did not request that the Treasury-State Agreement be amended to reflect the actual funding technique used.
Recommendation: We recommend that DETR ensure that the Treasury-State Agreement
reflects the actual funding technique used, and adhere to the approved funding technique.
Management’s Response: See management’s response on page 130.

121
STATE OF NEVADA SCHEDULE OF FINDINGS AND QUESTIONED COSTS FOR THE YEAR ENDED JUNE 30, 2010 U.S. DEPARTMENT OF LABOR: Finding 10-4: Unemployment Insurance, CFDA 17.225: ARRA – Unemployment Insurance, CFDA 17.225A:
Grant Award Number: Potentially affects all grant awards included under CFDA 17.225 and 17.225A on the Schedule of Expenditures of Federal Awards.
Criteria: The OMB Circular A-133 Compliance Supplement states that under
State Unemployment Insurance laws, a worker’s benefit right depends on the amount of the worker’s wages and/or weeks of work in covered employment in a “base period.” In Nevada, the base period is defined as the first four of the last five completed calendar quarters immediately preceding the initial claim for benefits.
Condition and Context: During our testing, we reviewed the benefit amounts paid to 40
individuals to ensure benefit payments were calculated correctly. We noted that one individual’s benefits were incorrectly calculated, resulting in a benefit amount that was less than what the individual was entitled to. The weekly and maximum benefit amounts were calculated using the correct quarters of the base period. However, subsequent to the individual’s initial claim for Unemployment Compensation, the Nevada Department of Employment, Training and Rehabilitation identified an error in the information reported by the employer, and increased the wages for one quarter to correct that error. Although the wage information was updated, the weekly benefit amount and maximum benefit amount related to the individual’s initial Unemployment Compensation claim and subsequent Emergency Unemployment Compensation claim were not recalculated to reflect the revision. The calculated weekly and maximum benefit amounts were understated by $3 and $841, respectively.
Questioned Costs: None.
Effect: An individual received benefit amounts that were less than they were
entitled to.
Cause: Adequate controls were not in place at the Nevada Department of Employment, Training and Rehabilitation to ensure unemployment claim benefit payments amounts were recalculated to reflect changes to claim information.
Recommendation: We recommend the Nevada Department of Employment, Training and
Rehabilitation implement controls to ensure benefit payments are recalculated to reflect changes to claim information, as applicable.
Management’s Response: See management’s response on page 130.
122
STATE OF NEVADA SCHEDULE OF FINDINGS AND QUESTIONED COSTS FOR THE YEAR ENDED JUNE 30, 2010 U.S. DEPARTMENT OF LABOR: Finding 10-5: Unemployment Insurance, CFDA 17.225: ARRA – Unemployment Insurance, CFDA 17.225A:
Grant Award Number: Potentially affects all grant awards included under CFDA 17.225 and 17.225A on the Schedule of Expenditures of Federal Awards.
Criteria: The OMB Circular A-133 Compliance Supplement provides that State
responsibilities include determining claimant eligibility and disqualification provisions.
Condition and Context: The Nevada Department of Employment, Training and Rehabilitation
Manual of Operations, Chapter 1300, contains a policy to assist in detecting and preventing the filing of fraudulent unemployment claims called the Identity Cross-match Program. This program requires the claimant’s data to be matched to the data maintained by the Nevada Department of Motor Vehicles. In the event the claimant data does not match, documentation of the resolution of any validation issues is to be included in the General Unemployment Insurance Development Effort (GUIDE) system.
As part of our testing over eligibility, we reviewed a sample of 40 Unemployment Insurance benefit cases for documentation of the identity cross-match and the resolution of any validation issues, if applicable. In two of the 40 cases, there was a conflict identified by the identity cross-match program. However, we could find no documentation that resolution of the issues was included in the GUIDE system.
Questioned Costs: Undetermined.
Effect: Unemployment Insurance payments may have been made to ineligible
individuals.
Cause: The Nevada Department of Employment, Training and Rehabilitation did not follow the established procedures included in the Manual of Operations, Chapter 1300.
Recommendation: We recommend the Nevada Department of Employment, Training and
Rehabilitation adhere to the procedures in the Manual of Operations, and ensure that all resolutions of discrepancies resulting from the identity cross-match program are documented.
Management’s Response: See management’s response on page 131.

123
STATE OF NEVADA SCHEDULE OF FINDINGS AND QUESTIONED COSTS FOR THE YEAR ENDED JUNE 30, 2010 U.S. DEPARTMENT OF LABOR: Finding 10-6: Unemployment Insurance, CFDA 17.225: ARRA – Unemployment Insurance, CFDA 17.225A:
Grant Award Number: Potentially affects all grant awards included under CFDA 17.225 and 17.225A on the Schedule of Expenditures of Federal Awards.
Criteria: The ET Handbook No. 395, 5th Edition, Benefit Accuracy Measurement
State Operations Handbook, Chapter VII, Section 2 (Handbook) states that each case file must contain, at a minimum, a copy of all agency documents from the claimant’s original claim file in addition to any documents pertaining to the Benefit Accuracy Measurement (BAM) investigation that were utilized. This includes documentation of National Directory of New Hires crossmatch.
Condition and Context: As part of our testing over the BAM program, we reviewed the
requirements relating to the investigative process and data collection in the Handbook. We noted that the National Directory of New Hires crossmatch documentation was an additional requirement added to the Handbook, effective November 17, 2009. The sample tested to ensure that the minimum documentation required for records and reporting was maintained included 18 case files selected for BAM quality control investigation subsequent to November 19, 2009. We noted that one case file, selected for BAM investigation in January 2010, did not contain documentation of National Directory of New Hires crossmatch. As a result of the required peer review, the Nevada Department of Employment, Training and Rehabilitation implemented the new records procedure in March 2010. Accordingly, this condition appears to represent noncompliance during the isolated period between the effective date of the new procedure per the Handbook and implementation of the new records procedure at the Nevada Department of Employment, Training and Rehabilitation.
Questioned Costs: None.
Effect: Unemployment Insurance payments may have been made to ineligible individuals.
Cause: The Nevada Department of Employment, Training and Rehabilitation
did not did not implement the requirements of the Handbook timely, and did not obtain the required documentation on a retroactive basis.
Recommendation: We recommend the Nevada Department of Employment, Training and
Rehabilitation ensure timely implementation of revisions to the Handbook for the Unemployment Insurance BAM program, and obtain required documentation on a retroactive basis, if necessary.
Management’s Response: See management’s response on page 131.
124
STATE OF NEVADA SCHEDULE OF FINDINGS AND QUESTIONED COSTS FOR THE YEAR ENDED JUNE 30, 2010 U.S. DEPARTMENT OF LABOR: Finding 10-7: Workforce Investment Act (WIA) Cluster: WIA Adult Program, CFDA 17.258: ARRA – WIA Adult Program, CFDA 17.258A: WIA Youth Activities, CFDA 17.259: ARRA – WIA Youth Activities, CFDA 17.259A: WIA Dislocated Workers, CFDA 17.260: ARRA – WIA Dislocated Workers, CFDA 17.260A:
Grant Award Number: Potentially affects all grant awards included under CFDA 17.258, 17.258A, 17.259, 17.259A, 17.260, and 17.260A on the Schedule of Expenditures of Federal Awards.
Criteria: OMB Circular A-133 requires that reports submitted to the Federal
awarding agency include all activity of the reporting period, and are presented in accordance with program requirements.
Condition and Context: The Nevada Department of Employment, Training and Rehabilitation is
required to submit quarterly ETA-9130 Financial Reports for Workforce Investment Act Cluster awards.
During testing of a quarterly ETA-9130 report submitted for the quarter ended March 31, 2010 for grant award AA-17140-08-55-A-32, we noted a formula error in a supporting spreadsheet that caused the Federal share of expenditures reported to be understated by $221,542.
Questioned Costs: None. Effect: Inaccurate information was reported to the Federal granting agency. Cause: The Nevada Department of Employment, Training and Rehabilitation
did not have adequate reconciliation and review procedures in place to ensure that amounts included in the ETA-9130 Financial Report were presented in accordance with program requirements and included all activity of the reporting period.
Recommendation: We recommend the Nevada Department of Employment, Training and
Rehabilitation enhance the procedures over the reporting process to ensure that all amounts included in the ETA-91330 Financial Report are presented in accordance with program requirements and include all activity of the reporting period.
Management’s Response: See management’s response on page 131.

125
STATE OF NEVADA SCHEDULE OF FINDINGS AND QUESTIONED COSTS FOR THE YEAR ENDED JUNE 30, 2010
U.S. DEPARTMENT OF LABOR:
Finding 10-8:
Workforce Investment Act (WIA) Cluster: WIA Adult Program, CFDA 17.258: ARRA – WIA Adult Program, CFDA 17.258A: WIA Youth Activities, CFDA 17.259: ARRA – WIA Youth Activities, CFDA 17.259A: WIA Dislocated Workers, CFDA 17.260: ARRA – WIA Dislocated Workers, CFDA 17.260A:
Grant Award Number: Potentially affects all grant awards included under CFDA 17.258, 17.258A, 17.259, 17.259A, 17.260, and 17.260A on the Schedule of Expenditures of Federal Awards.
Criteria: OMB Circular A-133 requires that reports submitted to the Federal awarding agency include all activity of the reporting period, data elements are supported by underlying records, and are presented in accordance with program requirements.
Condition and Context: The Nevada Department of Employment, Training and Rehabilitation is required to submit the ETA-9091 WIA Annual Report for the Workforce Investment Act Cluster awards.
During testing of key line items of WIA Standardized Record Data (WIASRD) submitted during fiscal year 2010, which support the information tables in the ETA-9091 report, we noted certain wage amounts, specifically of earnings prior to registration and dislocation, included in WIASRD did not agree to the underlying records in the General Unemployment Insurance Development Effort (GUIDE) system.
Questioned Costs: None.
Effect: Inaccurate information was reported to the Federal granting agency.
Cause: The Nevada Department of Employment, Training and Rehabilitation did not have procedures in place to ensure all wages were included in WIASRD, and subsequently, the ETA-9091 WIA Annual Report.
Recommendation: We recommend the Nevada Department of Employment, Training and Rehabilitation enhance the procedures for populating WIASRD to ensure that the ETA-9091 WIA Annual Report includes complete and accurate wage information.
Management’s Response: See management’s response on page 132.

126
STATE OF NEVADA SCHEDULE OF FINDINGS AND QUESTIONED COSTS FOR THE YEAR ENDED JUNE 30, 2010 U.S. DEPARTMENT OF LABOR:
Finding 10-9: Workforce Investment Act (WIA) Cluster: WIA Adult Program, CFDA 17.258: ARRA – WIA Adult Program, CFDA 17.258A: WIA Youth Activities, CFDA 17.259: ARRA – WIA Youth Activities, CFDA 17.259A: WIA Dislocated Workers, CFDA 17.260: ARRA – WIA Dislocated Workers, CFDA 17.260A:
Grant Award Number: Potentially affects all grant awards included under CFDA 17.258A, 17.259A, and 17.260A on the Schedule of Expenditures of Federal Awards.
Criteria: The OMB Circular A-133 Compliance Supplement requires that recipients agree to separately identify to each subrecipient, and document at the time of the subaward and disbursement of funds, the Federal award number, Catalog of Federal Domestic Assistance (CFDA) number, and the amount of American Recovery and Reinvestment Act (ARRA) funds.
Condition and Context: As part of our testing, we reviewed the WIA contracts with subrecipients that included ARRA funds and tested disbursements of ARRA funds to subrecipients. During this testing, we identified a contract that did not include the Federal award number, a specific CFDA number, or the amount of ARRA funds. In addition, ARRA funds were not identified as such at the time of disbursement to subrecipients.
Questioned Costs: None.
Effect: Subrecipients may be unaware of specific Federal award information and requirements, which could result in noncompliance at the subrecipient level that is not detected by the State.
Cause: The Nevada Department of Employment, Training and Rehabilitation did not have procedures in place to ensure that all required aspects of the ARRA funds were communicated to subrecipients.
Recommendation: We recommend the Nevada Department of Employment, Training and Rehabilitation implement procedures to ensure that all information required to be provided to subrecipients under ARRA is communicated.
Management’s Response: See management’s response on page 132.

127
STATE OF NEVADA SCHEDULE OF FINDINGS AND QUESTIONED COSTS FOR THE YEAR ENDED JUNE 30, 2010
U.S. DEPARTMENT OF LABOR:
Finding 10-10
Workforce Investment Act (WIA) Cluster: WIA Adult Program, CFDA 17.258: ARRA – WIA Adult Program, CFDA 17.258A: WIA Youth Activities, CFDA 17.259: ARRA – WIA Youth Activities, CFDA 17.259A: WIA Dislocated Workers, CFDA 17.260: ARRA – WIA Dislocated Workers, CFDA 17.260A:
Grant Award Number: Potentially affects all grant awards included under CFDA 17.258A, 17.259A, and 17.260A on the Schedule of Expenditures of Federal Awards.
Criteria: The OMB Circular A-133 Compliance Supplement requires that recipients and their first-tier subrecipients maintain current registrations in the Central Contractor Registration (CCR) at all times during which they have active federal awards funded with American Recovery and Reinvestment Act (ARRA) funds.
Condition and Context: As part of our testing over ARRA subawards, we reviewed whether the Nevada Department of Employment, Training and Rehabilitation ensured subrecipients receiving ARRA funds maintained current CCR registrations and performed periodic checks to ensure that subrecipients were updating information, as necessary. We noted that one subrecipient did not register in the CCR and the current status of information maintained in the CCR registration by another subrecipient was not monitored.
Questioned Costs: None.
Effect: Noncompliance at the subrecipient level occurred and was not detected by the State.
Cause: The Nevada Department of Employment, Training and Rehabilitation did not have procedures in place to properly monitor subrecipients for this requirement of the ARRA funds.
Recommendation: We recommend the Nevada Department of Employment, Training and Rehabilitation implement procedures to properly monitor subrecipients as required under ARRA.
Management’s Response: See management’s response on page 133.

128

129

130

131
132

133

134

135

136

137

138

139

140

141

142

143

144

145

146

147

148

149

150

151

152

153

154

155

156

157

158
STATE OF NEVADA SCHEDULE OF FINDINGS AND QUESTIONED COSTS FOR THE YEAR ENDED JUNE 30, 2010 U.S. DEPARTMENT EDUCATION: Finding 10-11: Vocational Rehabilitation Cluster: Rehabilitation Services_Vocational Rehabilitation Grants to States, CFDA 84.126: ARRA – Rehabilitation Services_Vocational Rehabilitation Grants to States, Recovery Act, CFDA 84.390A:
Grant Award Number: Potentially affects all grant awards included under CFDA 84.126 and 84.390A on the Schedule of Expenditures of Federal Awards.
Criteria: OMB Circular A-133 requires that reports submitted to the Federal
awarding agency include all activity of the reporting period, and are presented in accordance with program requirements.
Condition and Context: The Nevada Department of Employment, Training and Rehabilitation is
required to submit annual RSA-2 Program Cost Reports, as well as quarterly SF-425 Federal Financial Reports for the Vocational Rehabilitation Cluster awards.
During testing of the annual RSA-2 report submitted during fiscal year 2010, we noted a formula error in a supporting worksheet that caused total expenditures reported to be understated by $1,550,383. In addition, during testing of the SF-425 report for grant award H126A100041 submitted for the quarter ending March 31, 2010, we noted a formula error in the supporting worksheet that caused the total Federal share of expenditures to be understated by $477,113.
Questioned Costs: None. Effect: Inaccurate information was reported to the Federal granting agency. Cause: The Nevada Department of Employment, Training and Rehabilitation
did not have adequate reconciliation and review procedures in place to ensure that amounts included in the RSA-2 Program Cost Report and SF-425 Federal Financial Report were supported by the underlying accounting records.
Recommendation: We recommend the Nevada Department of Employment, Training and
Rehabilitation enhance the procedures over the reporting process to ensure that all reports are reviewed and that a reconciliation of total expenditures to the underlying accounting records is performed prior to the submission.
Management’s Response: See management’s response on pages 161 through 164.

159
STATE OF NEVADA SCHEDULE OF FINDINGS AND QUESTIONED COSTS FOR THE YEAR ENDED JUNE 30, 2010 U.S. DEPARTMENT OF EDUCATION: Finding 10-12: Vocational Rehabilitation Cluster: Rehabilitation Services_Vocational Rehabilitation Grants to States, CFDA 84.126: ARRA – Rehabilitation Services_Vocational Rehabilitation Grants to States, Recovery Act, CFDA 84.390A:
Grant Award Number: Potentially affects all grant awards included under CFDA 84.126 and 84.390A on the Schedule of Expenditures of Federal Awards.
Criteria: OMB Circular A-133 requires the State to prepare a Schedule of
Expenditures of Federal Awards (SEFA) showing total Federal expenditures for the year; to report program income, as prescribed by the Federal awarding agency; and maintain internal control over Federal programs that provides reasonable assurance that the auditee is managing Federal awards in compliance with the provisions of contracts or grant agreements that could have a material effect on each of its Federal programs.
Condition and Context: The State of Nevada has assigned the responsibility for accumulating
the information to prepare the SEFA to the Controller’s Office. The Controller’s Office compiles this information from award information provided by agencies who administer the various Federal award programs. During our reconciliation of the Vocational Rehabilitation Cluster expenditures to the SEFA, we noted that program income related to the Vocational Rehabilitation Cluster was not included on the SEFA under the correct CFDA number and title. Instead, it was reported as an unrelated program with an inaccurate CFDA number.
Questioned Costs: None. Effect: Program income was not reported on the SEFA under the correct
CFDA number and title, which resulted in Vocational Rehabilitation Cluster expenditures being understated and may be an indicator that the State is not managing the funds in accordance with the grant agreements.
Cause: The Nevada Department of Employment, Training and Rehabilitation
did not communicate the CFDA number and title for the program income to the Controller’s Office.
Recommendation: We recommend the Nevada Department of Employment, Training and
Rehabilitation implement procedures to ensure the CFDA number and title for program income are communicated to the Controller’s Office to ensure that Federal expenditures are reported completely and accurately on the SEFA.
Management’s Response: See management’s response on pages 161 and 165 through 167.

160
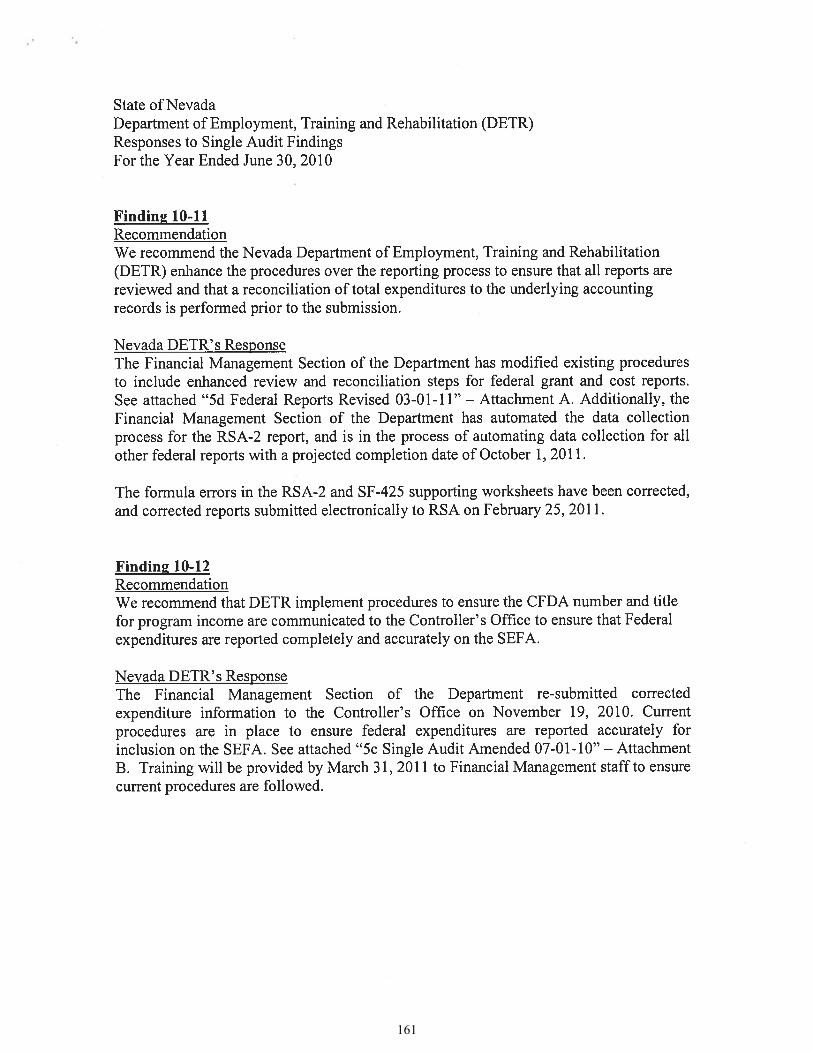
161

162

163

164

165

166

167

168
STATE OF NEVADA SCHEDULE OF FINDINGS AND QUESTIONED COSTS FOR THE YEAR ENDED JUNE 30, 2010 U.S. DEPARTMENT OF LABOR: Finding 10-13: Employment Services Cluster: Employment Service/Wagner-Peyser Funded Activities, CFDA 17.207: ARRA - Employment Service/Wagner-Peyser Funded Activities, CFDA 17.207A: Disabled Veterans’ Outreach Program (DVOP), CFDA 17.801: Local Veterans’ Employment Representation Program , CFDA 17.804:
Grant Award Number: Potentially affects all grant awards included under CFDA 17.207, 17.207A, 17.801, and 17.804 on the Schedule of Expenditures of Federal Awards.
Criteria: OMB Circular A-133 requires the State to prepare a Schedule of Expenditures of Federal Awards (SEFA) showing total Federal expenditures for the year and to maintain internal control over Federal programs that provides reasonable assurance that the State is managing Federal awards in compliance with laws, regulations, and the provisions of contracts or grant agreements that could have a material effect on each of its Federal programs.
Condition and Context: The State has assigned the responsibility for accumulating the
information to prepare the SEFA to the Controller’s Office. The Controller’s Office compiles this information from award information provided by individuals who administer the various federal award programs. The pertinent information is provided using a State developed form entitled Single Audit Reporting Form (SARF).
During our testing and reconciliation of the SARFs to the SEFA, we
found instances where expenditures related to other Federal award programs were incorrectly reported to the Controller’s Office as being expended under CFDA’s 17.207 and 17.804. This caused the amounts included on the SEFA under the Employment Services Cluster to be overstated.
Questioned Costs: None. Effect: The SEFA could be inaccurate, incomplete, and possibly misstated. Cause: The Nevada Department of Employment, Training and Rehabilitation
does not have adequate controls in place to ensure Federal expenditures are accurately reported for inclusion on the SEFA under the correct Federal award program.

169
Recommendation: We recommend the Nevada Department of Employment, Training and Rehabilitation enhance controls to ensure Federal expenditures are reported accurately for inclusion on the SEFA.
Management’s Response: See management’s response on page 133.

170
STATE OF NEVADA SCHEDULE OF FINDINGS AND QUESTIONED COSTS FOR THE YEAR ENDED JUNE 30, 2010 U.S. DEPARTMENT OF AGRICULTURE: U.S. DEPARTMENT OF EDUCATION: Finding 10-14: Child Nutrition Cluster: School Breakfast Program, CFDA 10.553: National School Lunch Program, CFDA 10.555: Special Milk Program for Children, CFDA 10.556: Summer Food Service Program for Children, CFDA 10.559: Title I, Part A Cluster: Title I Grants to Local Educational Agencies, CFDA 84.010: ARRA – Title I Grants to Local Educational Agencies, Recovery Act, CFDA 84.389A: Special Education Cluster: Special Education – Grants to States, CFDA 84.027: Special Education – Preschool Grants, CFDA 84.173: ARRA – Special Education – Grants to States, Recovery Act, CFDA 84.391A: ARRA – Special Education – Preschool Grants, Recovery Act, CFDA 84.392A:
Grant Award Number: Potentially affects all grant awards included under CFDA numbers 10.555, 84.010, and 84.027 on the Schedule of Expenditures of Federal Awards.
Criteria: U.S. Department of the Treasury (Treasury) regulations at 31 CFR part
205, which defines the Cash Management Improvement Act of 1990 (CMIA), as amended (Pub. L. No. 101-453; 31 USC 6501 et seq.), require State recipients to enter into agreements that prescribe specific methods of drawing down Federal funds (funding techniques) for selected large programs.
Condition and Context: The National School Lunch Program (CFDA 10.555), Title I Grants to
Local Educational Agencies (CFDA 84.010), and Special Education – Grants to States (CFDA 84.027) are covered by the State of Nevada Amended Treasury State Agreement No. 1 for fiscal year 2010. The terms of this agreement specify that the recipient, Nevada Department of Education, will request Federal funds in accordance with the Average Clearance, 3-5 day funding technique for the programs listed above.
During our testing, we performed procedures to determine whether the State of Nevada complied with the terms and conditions of the Treasury-State Agreement. We noted that the Nevada Department of Education did not always adhere to the specified funding techniques. The Average Clearance funding technique provides that the State shall request funds such that they are deposited via Automated Clearing House (ACH) in a State account on the dollar-weighted average day of clearance for the disbursement, in accordance with the clearance

171
pattern specified for the program. The specified clearance patterns are as follows:
10.555 - National School Lunch Program – 5 days 84.010 – Title I Grants to Local Educational Agencies – 4 days (administrative component only) 84.027 – Special Education – Grants to States – 3 days (administrative component only)
However, the State calculates the requests for Federal funds based on payroll check dates and expenditures recorded as issued in the accounting system, rather than following the clearance patterns listed above.
Questioned Costs: None.
Effect: Because requests for Federal funds were not made in accordance with
the terms of the Treasury-State Agreement, an interest liability for the State could result.
Cause: The Nevada Department of Education did not adhere to the funding
technique described in the Treasury-State Agreement, and did not request that the Treasury-State Agreement be amended to reflect the actual funding technique used.
Recommendation: We recommend the Nevada Department of Education ensure that the
Treasury-State Agreement reflects the actual funding technique used, and adhere to the approved funding technique.
Management’s Response: See management’s response on page 173.

172

173
174
STATE OF NEVADA SCHEDULE OF FINDINGS AND QUESTIONED COSTS FOR THE YEAR ENDED JUNE 30, 2010 U.S. DEPARTMENT OF EDUCATION:
Finding 10-15: Title I, Part A Cluster: Title I Grants to Local Educational Agencies, CFDA 84.010: ARRA – Title I Grants to Local Educational Agencies, Recovery Act, CFDA 84.389A: Special Education Cluster: Special Education – Grants to States, CFDA 84.027: Special Education – Preschool Grants, CFDA 84.173: ARRA – Special Education – Grants to States, Recovery Act, CFDA 84.391A: ARRA – Special Education – Preschool Grants, Recovery Act, CFDA 84.392A:
Grant Award Number: Potentially affects all grant awards included under CFDA 84.389A, 84.391A, and 84.392A on the Schedule of Expenditures of Federal Awards (SEFA).
Criteria: The OMB Circular A-133 Compliance Supplement requires that recipients agree to (1) separately identify to each subrecipient, and document at the time of the subaward and disbursement of funds, the Federal award number, Catalog of Federal Domestic Assistance (CFDA) number, and the amount of American Recovery and Reinvestment Act (ARRA) funds; and (2) require subrecipients to provide identification of ARRA awards in their SEFA and Data Collection Form.
Condition and Context: As part of our testing, we reviewed the Title I and Special Education contracts with subrecipients that included ARRA funds and tested disbursements of ARRA funds to subrecipients. During this testing, we noted that the assurances included in the State’s online system of subrecipient communication, electronic Plans, Applications, Grants and Expenditures (ePAGE), did not identify the Federal award number, the CFDA number or the requirement that the expenditures be identified as ARRA expenditures on the subrecipients' SEFAs and Data Collection Forms. In addition, ARRA funds were not identified as such at the time of disbursement to the subrecipient.
Questioned Costs: None.
Effect: Subrecipients may be unaware of specific Federal award information and requirements, which could result in noncompliance at the subrecipient level that is not detected by the State.
Cause: The Nevada Department of Education did not have procedures in place to ensure that all required aspects of the ARRA funds were communicated to subrecipients.

175
Recommendation: We recommend the Nevada Department of Education implement procedures to ensure that all information required to be provided to subrecipients under the ARRA is communicated.
Management’s Response: See management’s response on pages 176 through 177.

176

177
178
STATE OF NEVADA SCHEDULE OF FINDINGS AND QUESTIONED COSTS FOR THE YEAR ENDED JUNE 30, 2010 U.S. DEPARTMENT OF EDUCATION: Finding 10-16: Title I, Part A Cluster: Title I Grants to Local Educational Agencies, CFDA 84.010: ARRA – Title I Grants to Local Educational Agencies, Recovery Act, CFDA 84.389A: Special Education Cluster: Special Education – Grants to States, CFDA 84.027: Special Education – Preschool Grants, CFDA 84.173: ARRA – Special Education – Grants to States, Recovery Act, CFDA 84.391A: ARRA – Special Education – Preschool Grants, Recovery Act, CFDA 84.392A:
Grant Award Number: Potentially affects all grant awards included under CFDA 84.010, 84.389A, 84.027, 84.173, 84.391A, and 84.392A on the Schedule of Expenditures of Federal Awards.
Criteria: OMB Circular A-133 provides that a pass-through entity is responsible for communicating certain Federal award information to each subrecipient, including informing each subrecipient of the Catalog of Federal Domestic Assistance (CFDA) title and number, award name and number, and name of the Federal awarding agency.
Condition and Context: As part of our testing over subrecipient monitoring, we reviewed
subrecipient awards in the State’s online electronic Plans, Applications, Grants and Expenditures (ePAGE) system, for communication of required information, and noted that the assurances included for the awards did not include the CFDA title and number, award name and number, or the name of the Federal awarding agency.
Questioned Costs: None.
Effect: Subrecipients may be unaware of specific Federal award information
and requirements, which could result in noncompliance at the subrecipient level.
Cause: The Nevada Department of Education did not have adequate
procedures in place to ensure subrecipient awards made through the ePAGE system contained all of the required information.
Recommendation: We recommend the Nevada Department of Education implement
procedures to ensure subrecipient awards made through the ePAGE system contain all of the required information.
Management’s Response: See management’s response on pages 179 through 180.

179

180

181
STATE OF NEVADA SCHEDULE OF FINDINGS AND QUESTIONED COSTS FOR THE YEAR ENDED JUNE 30, 2010 U.S. DEPARTMENT OF EDUCATION: Finding 10-17: Special Education Cluster: Special Education – Grants to States, CFDA 84.027: Special Education – Preschool Grants, CFDA 84.173: ARRA – Special Education – Grants to States, Recovery Act, CFDA 84.391A: ARRA – Special Education – Preschool Grants, Recovery Act, CFDA 84.392A:
Grant Award Number: Potentially affects all grant awards included under CFDA 84.391A and
84.392A on the Schedule of Expenditures of Federal Awards. Criteria: Section 1512 of the American Recovery and Reinvestment Act (ARRA)
includes reporting requirements for awards received directly from the Federal awarding agency. Prime recipients are required to report the cumulative draws/funds requested and the cumulative expenditure amounts in the quarterly Section 1512 ARRA report.
Condition and Context: During testing of the Section 1512 ARRA reports submitted for the
quarter ended March 31, 2010, we noted that $10,594, an amount representing a payment to a subrecipient, was incorrectly included as an expenditure and funds invoiced/received amount on the report for grant H391A090043A, and conversely, was excluded from the expenditure and funds invoiced/received amount on the report for grant award H392A090046A.
Questioned Costs: None. Effect: Inaccurate information was reported to the Federal granting agency.
Cause: The Nevada Department of Education did not have adequate controls
and review procedures in place to ensure the Section 1512 ARRA reports were accurate. The amounts reported were not reconciled to the underlying accounting system.
Recommendation: We recommend the Nevada Department of Education enhance controls
and review procedures to ensure reports are accurate, and that the amounts reported as expenditures and receipts are reconciled to the underlying accounting system.
Management’s Response: See management’s response on pages 182 through 183.

182

183

184
STATE OF NEVADA SCHEDULE OF FINDINGS AND QUESTIONED COSTS FOR THE YEAR ENDED JUNE 30, 2010 U.S. DEPARTMENT OF HEALTH AND HUMAN SERVICES: Finding 10-18: Child Care and Development Fund Cluster: Child Care and Development Block Grant, CFDA 93.575:
Child Care Mandatory and Matching Funds of the Child Care and Development Fund, CFDA 93.596: ARRA - Child Care and Development Block Grant, CFDA 93.713A:
Grant Award Number: Potentially affects all grant awards under CFDA 93.575, 93.596, and
93.713A on the Schedule of Expenditures of Federal Awards.
Criteria: The OMB Circular A-133 Compliance Supplement for the Child Care and Development Fund Cluster provides that individuals must meet certain eligibility requirements in order to receive child care subsidies. Further, the State agency must maintain adequate documentation of eligibility determination, and have verification and internal control procedures to ensure the accuracy of the data used in determining the child care subsidy.
Condition and Context: As part of our audit procedures, we selected a sample of payments for
individuals for whom child care subsidies were paid. The Nevada Division of Welfare and Supportive Services was unable to obtain the information used for determining eligibility and subsidy amounts from a contracted service provider for three of the 40 payments selected for testing. The unsupported payments amounted to $1,120.
Questioned Costs: Undetermined. Effect: Amounts may have been paid for ineligible individuals.
Cause: The Nevada Division of Welfare and Supportive Services did not have
adequate controls in place to ensure that documentation was available to support eligibility determinations performed by contracted service providers.
Recommendation: We recommend the Nevada Division of Welfare and Supportive
Services enhance controls to ensure that documentation is available to support eligibility determinations performed by contracted service providers.
Management’s Response: See management’s response on page 186.

185
STATE OF NEVADA SCHEDULE OF FINDINGS AND QUESTIONED COSTS FOR THE YEAR ENDED JUNE 30, 2010 U.S. DEPARTMENT OF HEALTH AND HUMAN SERVICES: Finding 10-19: Child Care and Development Fund Cluster: Child Care and Development Block Grant, CFDA 93.575: Child Care Mandatory and Matching Funds of the Child Care and Development Fund, CFDA 93.596: ARRA - Child Care and Development Block Grant, CFDA 93.713A:
Grant Award Number: Potentially affects all grant awards included under CFDA 93.575, 93.596 and 93.713A on the Schedule of Expenditures of Federal Awards.
Criteria: OMB Circular A-133 requires that reports submitted to the Federal
awarding agency include all activity of the reporting period, and are presented in accordance with program requirements.
Condition and Context: The Nevada Division of Welfare and Supportive Services is required to
submit quarterly ACF-696 Child Care and Development Fund Financial Reports for the Child Care and Development Fund Cluster.
During testing of the quarterly ACF-696 report for the quarter ended
March 31, 2010, we noted an error in which the ending amounts from the prior quarter report, which had been amended, were not carried forward properly, resulting in an understatement of the cumulative expenditures by $74,941. The amounts carried forward were those included on the original prior quarter report.
Questioned Costs: None. Effect: Inaccurate information was reported to the Federal granting agency. Cause: The Nevada Division of Welfare and Supportive Services did not have
adequate reconciliation and review procedures in place to ensure that amounts included in the ACF-696 Child Care and Development Fund Financial Report were supported by the underlying accounting records prior to submission.
Recommendation: We recommend the Nevada Division of Welfare and Supportive
Services enhance the procedures over the reporting process to ensure that all reports are reviewed and that a reconciliation of total expenditures to the underlying accounting records is performed prior to submission.
Management’s Response: See management’s response on pages 186 through 187.

186

187

188
STATE OF NEVADA SCHEDULE OF FINDINGS AND QUESTIONED COSTS FOR THE YEAR ENDED JUNE 30, 2010 U.S. DEPARTMENT OF HEALTH AND HUMAN SERVICES: Finding 10-20: Public Health Emergency Preparedness, CFDA 93.069: HIV Care Formula Grants, CFDA 93.917: Immunization Cluster: Immunization Grants, CFDA 93.268: ARRA – Immunization, CFDA 93.712A:
Grant Award Number: Potentially affects all grant awards included under CFDA 93.069, 93.917, and 93.268 on the Schedule of Expenditures of Federal Awards.
Criteria: As noted in OMB Circular A-133, a pass-through entity is responsible
for ensuring required audits are completed within nine months of the end of the subrecipient’s audit period, issuing a management decision on audit findings within six months after receipt of the subrecipient’s audit report, and ensuring that the subrecipient takes timely and appropriate corrective action on all audit findings.
Condition and Context: The Nevada State Health Division did not actively monitor its
subrecipients’ audit reports to identify findings, issue management decisions, and ensure corrective actions are taken on audit findings.
As part of our audit procedures, we tested a sample of subrecipients to
verify that the Nevada State Health Division ensured that required audits were completed, issued management decisions on audit findings, and ensured corrective actions were taken on audit findings. We noted that the Nevada State Health Division did not review audit reports for findings for all subrecipients.
Questioned Costs: None. Effect: Noncompliance at the subrecipient level may occur and not be detected
by the State. Cause: The Nevada State Health Division did not have adequate procedures in
place to ensure that subrecipient audit reports were completed timely, management decisions were issued for subrecipient findings, and corrective actions were taken on audit findings.
Recommendation: We recommend the Nevada State Health Division implement
procedures to ensure subrecipient audits are completed timely, audit findings related to subrecipients are identified, and appropriate action is taken within the designated timeframe.
Management’s Response: See management’s responses on pages 191 through 192, 194 through
195, 197 through 198 and 199 through 200.

189
STATE OF NEVADA SCHEDULE OF FINDINGS AND QUESTIONED COSTS FOR THE YEAR ENDED JUNE 30, 2010 U.S. DEPARTMENT OF HEALTH AND HUMAN SERVICES: Finding 10-21: Public Health Emergency Preparedness, CFDA 93.069:
Grant Award Number: Potentially affects all grant awards included under CFDA 93.069 on the Schedule of Expenditures of Federal Awards.
Criteria: OMB Circular A-133 requires that reports submitted to the Federal
awarding agency include all activity of the reporting period, and are presented in accordance with program requirements.
Condition and Context: The Nevada State Health Division is required to submit an annual SF-
269 Financial Status Report for the Public Health Emergency Preparedness awards.
For grant award number 5 U90/TP916964-09, an original and several
revised versions of the project period final SF-269 report were submitted during fiscal year 2010. We selected the original report to test, but the Nevada State Health Division was unable to provide supporting documentation for that report. We subsequently tested the final revised version which was submitted in November 2010, and we noted that the amounts reported could not be reconciled to the accounting system.
Questioned Costs: None.
Effect: Inaccurate information may have been reported to the Federal granting
agency. Cause: The Nevada State Health Division did not have adequate procedures in
place to ensure that amounts included in the SF-269 report could be reconciled to the underlying accounting system and that supporting documentation was retained.
Recommendation: We recommend the Nevada State Health Division implement
procedures to ensure that all reports are reconciled to the underlying accounting system and that supporting documentation is appropriately retained.
Management’s Response: See management’s response on pages 192 through 193.

190
STATE OF NEVADA SCHEDULE OF FINDINGS AND QUESTIONED COSTS FOR THE YEAR ENDED JUNE 30, 2010 U.S. DEPARTMENT OF HEALTH AND HUMAN SERVICES: Finding 10-22: HIV Care Formula Grants, CFDA 93.917:
Grant Award Number: Potentially affects all grant awards included under CFDA 93.917 on the Schedule of Expenditures of Federal Awards.
Criteria: As noted in OMB Circular A-87 Cost Principles for State, Local, and Indian Tribal Governments, amounts charged to Federal programs must be for allowable costs. To be allowable under Federal awards the cost must (1) be adequately documented; and (2) be allocable to the Federal award.
Condition and Context: As part of our testing over Allowable Costs/Cost Principles, we tested a
sample of transactions for conformance with the criteria contained in the “Basic Guidelines” section of OMB Circular A-87. For one of the transactions selected, no supporting documentation was available. The expenditure was for recurring monthly information technology services which are allocated based on the number of personnel assigned to the program activities. Subsequently, we obtained documentation of the previous month’s information technology services transaction in order to establish the reasonableness of the unsupported charge, and we noted that the amount was calculated based on seven personnel positions. However, of the seven individuals, one individual was assigned to work 50 percent on this Federal award, and 50 percent on another Federal award. As a result, amounts not allocable to the HIV Care Formula Grants were charged to the award.
Questioned Costs: None. Effect: Unallowable costs could be charged to the Federal program. Cause: The Nevada State Health Division did not follow the policies and
procedures in place to ensure that amounts charged to the Federal program were appropriately allocated, and that adequate supporting documentation was retained.
Recommendation: We recommend that the Nevada State Health Division follow the
policies and procedures in place to ensure that amounts charged to Federal programs are appropriately allocated and that adequate documentation is retained to support the allowability of costs.
Management’s Response: See management’s response on pages 195 through 196.

191

192

193

194

195

196

197

198

199

200

201
STATE OF NEVADA SCHEDULE OF FINDINGS AND QUESTIONED COSTS FOR THE YEAR ENDED JUNE 30, 2010 U.S. DEPARTMENT OF HEALTH AND HUMAN SERVICES: Finding 10-23: HIV Care Formula Grants, CFDA 93.917:
Grant Award Number: Potentially affects all grant awards included under CFDA 93.917 on the Schedule of Expenditures of Federal Awards.
Criteria: OMB Circular A-133 requires the State to prepare a Schedule of
Expenditures of Federal Awards (SEFA) showing total Federal expenditures for the year; to report program income as prescribed by the Federal awarding agency; and maintain internal control over Federal programs that provides reasonable assurance that the State is managing Federal awards in compliance with laws, regulations, and the provisions of contracts or grant agreements that could have a material effect on each of its Federal programs.
Condition and Context: The State of Nevada has assigned the responsibility for accumulating the information to prepare the SEFA to the Controller’s Office. The Controller’s Office compiles this information from award information provided by agencies who administer the various Federal award programs. Federal expenditures should include the receipt and use of program income. During our reconciliation of the HIV Care Formula Grant expenditures to the SEFA, we noted that program income transferred to and expended by the Nevada Aging and Disability Services Division was not included on the SEFA, which resulted in Federal expenditures being understated and may be an indicator that the State is not managing the funds in accordance with the grant agreements.
Questioned Costs: None. Effect: All program income expenditures were not reported on the SEFA. Cause: The Nevada Aging and Disability Services Division did not
communicate information regarding the expenditure of funds transferred from the Nevada Health Division to the Controller’s Office for inclusion on the SEFA.
Recommendation: We recommend the Nevada Aging and Disability Services Division
implement procedures to ensure information regarding the expenditure of funds transferred from the Nevada Health Division is communicated to the Controller’s Office to ensure that Federal expenditures are included on the SEFA.
Management’s Response: See management’s response on pages 202 through 203.

202

203

204
STATE OF NEVADA SCHEDULE OF FINDINGS AND QUESTIONED COSTS FOR THE YEAR ENDED JUNE 30, 2010 U.S. DEPARTMENT OF HEALTH AND HUMAN SERVICES: Finding 10-24: Immunization Cluster: Immunization Grants, CFDA 93.268: ARRA – Immunization Grants, CFDA 93.712A:
Grant Award Number: Affects the Direct Assistance amounts included under CFDA 93.268 and 93.712A on the Schedule of Expenditures of Federal Awards.
Criteria: OMB Circular A-133 requires the State to prepare a Schedule of
Expenditures of Federal Awards (SEFA) showing total Federal expenditures for the year. This should include, in either the SEFA or a note to the SEFA, the value of Federal awards expended in the form of non-cash assistance. While not required, it is preferable to present this information in the schedule.
Condition and Context: The State of Nevada has assigned the responsibility for accumulating the information to prepare the SEFA and the note to the SEFA to the Controller’s Office. The Controller’s Office compiles this information from award information provided by the State agencies who administer the various Federal award programs. Federal expenditure information provided should include the receipt of use of non-cash assistance. During our testing and reconciliation of the SEFA, we noted that the amount for Immunization program non-cash assistance was not included on the SEFA. When the omission was identified, the Nevada State Health Division provided the non-cash amounts to the Controller’s Office, but did not identify the related CFDA numbers, and portions of the amount subsequently included on the SEFA were listed under an inaccurate CFDA number in the cluster.
Questioned Costs: None. Effect: The non-cash expenditures were not reported on the SEFA, which
resulted in Federal expenditures being understated. Cause: The Nevada State Health Division did not have adequate procedures in
place to ensure the amount of non-cash assistance and related CFDA numbers were provided to the Controller’s Office.
Recommendation: We recommend the Nevada State Health Division implement
procedures to provide non-cash assistance information related to Federal awards to the Controller’s Office to ensure that Federal expenditures are reported completely and accurately on the SEFA.
Management’s Response: See management’s responses on pages 198 and 200.

205
STATE OF NEVADA SCHEDULE OF FINDINGS AND QUESTIONED COSTS FOR THE YEAR ENDED JUNE 30, 2010 U.S. DEPARTMENT OF HEALTH AND HUMAN SERVICES:
Finding 10-25: Social Services Block Grant, CFDA 93.667:
Grant Award Number: Potentially affects all grant awards included under CFDA 93.667 on the
Schedule of Expenditures of Federal Awards.
Criteria: As noted in OMB Circular A-133, a pass-through entity is responsible for ensuring required audits are completed within nine months of the end of the subrecipient's audit period, issuing a management decision on audit findings within six months after receipt of the subrecipient's audit report, and ensuring that the subrecipient takes timely and appropriate corrective action on all audit findings.
Condition and Context: During our testing of subrecipient monitoring, we noted that the
Nevada Department of Health and Human Services did not have procedures in place to monitor the receipt and review of required audit information from subrecipients.
As part of our audit procedures, we tested a sample of three
subrecipients to verify that the Nevada Department of Health and Human Services had procedures in place to ensure that audits were completed when required, management decisions were issued when appropriate and corrective actions on all audit findings were taken by the subrecipients. We noted that the Nevada Department of Health and Human Services did not review audit reports and issue management decisions when required, for findings included in the audit reports of the two subrecipients tested who were found to be subject to OMB Circular A-133.
Questioned Cost: None.
Effect: Noncompliance at the subrecipient level may occur and not be detected
by the State. Cause: The Nevada Department of Health and Human Services did not have
adequate procedures in place to ensure that subrecipient audit reports were received and reviewed when required.
Recommendation: We recommend the Nevada Department of Health and Human Services
implement procedures to ensure that subrecipient audits are obtained and reviewed when required.
Management’s Response: See management’s response on page 207.
206
STATE OF NEVADA SCHEDULE OF FINDINGS AND QUESTIONED COSTS FOR THE YEAR ENDED JUNE 30, 2010 U.S. DEPARTMENT OF HEALTH AND HUMAN SERVICES: Finding 10-26: Social Services Block Grant, CFDA 93.667:
Grant Award Number: Potentially affects all grant awards included under CFDA 93.667 on the Schedule of Expenditures of Federal Awards.
Criteria: As noted in OMB Circular A-133, a pass-through entity is responsible
for communicating certain Federal award information to each subrecipient, including informing each subrecipient of the Catalog of Federal Domestic Assistance (CFDA) title and number.
Condition and Context: As part of our testing over subrecipient monitoring, we tested a sample
of subrecipient awards made during fiscal year 2010 for communication of required information, and noted that the awards did not include the CFDA title and number.
Questioned Costs: None.
Effect: Subrecipients may be unaware of specific Federal award information
and requirements, which could result in noncompliance at the subrecipient level.
Cause: The Nevada Department of Health and Human Services did not have
adequate procedures in place to ensure subrecipient awards contained all of the required information.
Recommendation: We recommend the Nevada Department of Health and Human Services
implement procedures to ensure subrecipient awards contain all of the required information.
Management’s Response: See management's response on pages 207 through 208.

207

208

209
STATE OF NEVADA SCHEDULE OF FINDINGS AND QUESTIONED COSTS FOR THE YEAR ENDED JUNE 30, 2010 U.S. DEPARTMENT OF EDUCATION: Finding 10-27: Early Intervention Services (IDEA) Cluster: Special Education_Grants for Infants and Families with Disabilities, CFDA 84.181: ARRA - Special Education_Grants for Infants and Families with Disabilities, CFDA 84.393A:
Grant Award Number: Potentially affects all grant awards under CFDA 84.181 and 84.393A on the Schedule of Expenditures of Federal Awards.
Criteria: The OMB Circular A-87, Cost Principles for State, Local, and Indian
Tribal Governments, compliance requirements state that where employees are expected to work solely on a single Federal award or cost objective, charges for their salaries and wages will be supported by periodic certifications that the employees worked solely on that program for the period covered by the certification. These certifications will be prepared at least semi-annually and will be signed by the employee or supervisory official having first hand knowledge of the work performed by the employee. Where employees work on multiple activities or cost objectives, a distribution of their salaries or wages will be supported by personnel activity reports that reflect an after-the-fact distribution of the actual activity, be prepared at least monthly, and must be signed by the employee. Budget estimates or other distribution percentages determined before the services are performed do not qualify as support for charges to Federal awards.
Condition and Context: During our testing of salary and benefit charges to this program for
employees at the Nevada State Health Division, it was noted that personnel submitted exception-only time cards that were signed by the employee and a supervisor. Some personnel were charged solely to the IDEA program and some were charged to multiple activities, including the IDEA program. We noted that not all personnel indicated on the time cards the program(s) worked on or the time allocation. Because the time cards did not identify the Federal programs and time allocation on them, the time cards did not meet the standards for documentation to serve as certification by the employee or supervisor. The Nevada State Health Division does not have alternate procedures for obtaining employee and supervisor certifications.
During our testing of salary and benefit charges to this program for
employees at the Nevada Aging and Disability Services Division (ADSD), we tested support for employees charged to the IDEA program for two pay periods. For the pay period ended in August 2009, it was noted that the personnel submitted exception-only time cards that were signed by the employee and a supervisor. All of those employees were charged solely to the IDEA program, and we noted that they did not identify on the time cards the program they had worked on. For the second pay period tested for those employees, which ended in May

210
2010, we noted that in addition to the time cards, all employees had completed a Time Allocation Report for the pay period, which reflected an after-the-fact distribution of the actual activity and was signed by both the employee and a supervisor. Pursuant to changes made by the 2009 Legislature, the Nevada Office of Disabilities Services, which previously administered the IDEA program, merged into the Nevada ADSD. Beginning January 1, 2010 the Nevada ADSD management implemented the requirement for Time Allocation Reports to be completed by ADSD personnel charged to the IDEA program. It appears that adequate procedures for payroll certification were in place for those personnel by June 30, 2010 at the Nevada ADSD.
Questioned Costs: Undetermined. Effect: Unallowable costs could be charged to the Federal program. Cause: Adequate procedures were not in place throughout the year to ensure
costs charged to the Federal program were supported by required documentation and certifications.
Recommendation: We recommend that the Nevada State Health Division implement
procedures to ensure amounts charged to Federal programs are supported by the required documentation and certifications, and that, in the future, the ADSD implement procedures timely to ensure amounts charged to Federal programs are supported by required documentation and certifications.
Management’s Response: See management's responses on pages 212 and 214 through 215.

211
STATE OF NEVADA SCHEDULE OF FINDINGS AND QUESTIONED COSTS FOR THE YEAR ENDED JUNE 30, 2010 U.S. DEPARTMENT OF EDUCATION: Finding 10-28: Early Intervention Services (IDEA) Cluster: Special Education_Grants for Infants and Families with Disabilities, CFDA 84.181: ARRA - Special Education_Grants for Infants and Families with Disabilities, CFDA 84.393A:
Grant Award Number: Affects the grant award included under CFDA 84.393A on the Schedule of Expenditures of Federal Awards.
Criteria: Section 1512 of the American Recovery and Reinvestment Act (ARRA)
includes reporting requirements for awards received directly from the Federal awarding agency. Prime recipients are required to report the cumulative draws/funds requested and the cumulative expenditure amounts in the quarterly Section 1512 ARRA report.
Condition and Context: During testing of the Section 1512 ARRA report submitted for the
quarter ended March 31, 2010 for grant award H393A090019A, we noted the supporting documentation did not reconcile to the accounting system, which caused total expenditures reported to be understated by approximately $6,600.
Questioned Costs: None. Effect: Inaccurate information was reported to the Federal granting agency. Cause: The Nevada Aging and Disability Services Division did not have
adequate reconciliation procedures in place to ensure that amounts included in the Section 1512 ARRA report were supported by the underlying accounting records.
Recommendation: We recommend the Nevada Aging and Disability Services Division
enhance the procedures over the reporting process to ensure that all amounts reported are reconciled to the underlying accounting records prior to submission.
Management’s Response: See management’s response on page 213.
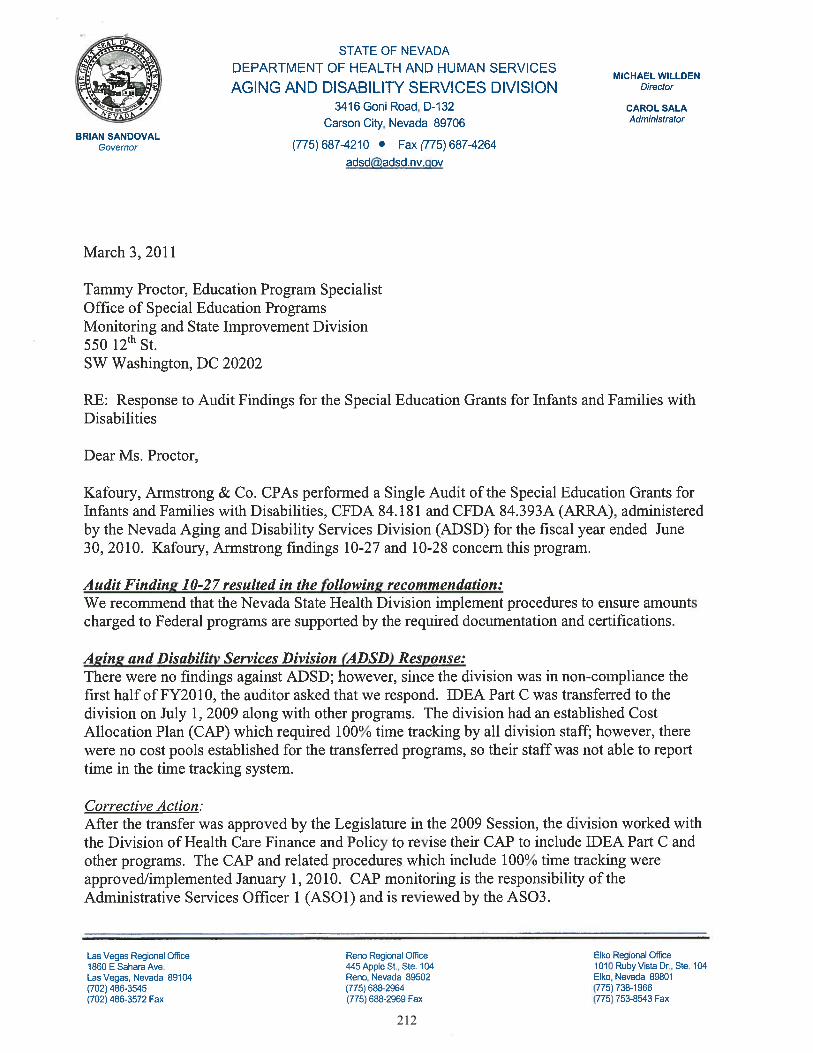
212

213

214

215
216
STATE OF NEVADA SCHEDULE OF FINDINGS AND QUESTIONED COSTS FOR THE YEAR ENDED JUNE 30, 2010 U.S. DEPARTMENT OF HEALTH AND HUMAN SERVICES: Finding 10-29: Medicaid Cluster: State Medicaid Fraud Control Units, CFDA 93.775: State Survey and Certification of Health Care Providers and Suppliers, CFDA 93.777: Medical Assistance Program, CFDA 93.778: ARRA – Medical Assistance Program, CFDA 93.778A:
Grant Award Number: Affects grant awards included under CFDA 93.775 on the Schedule of Expenditures of Federal Awards.
Criteria: OMB Circular A-133 requires that reports submitted to the Federal
awarding agency include all activity of the reporting period, and are presented in accordance with program requirements.
Condition and Context: The Nevada Office of the Attorney General is required to submit
quarterly SF-269 Financial Status Reports. During testing of two quarterly SF-269 Financial Status Reports
submitted during fiscal year 2010, we noted a formula error in the supporting spreadsheets that caused total program income reported to be understated by $102,698 and $200,987 for the December 31, 2009 and March 31, 2010 reports, respectively.
Questioned Costs: None. Effect: Inaccurate information was reported to the Federal granting agency. Cause: The Nevada Office of the Attorney General did not have adequate
reconciliation procedures in place to ensure that amounts included in the SF-269 Financial Status Report were supported by the underlying accounting records.
Recommendation: We recommend the Nevada Office of the Attorney General enhance the
procedures over the reporting process to ensure that all amounts required to support the reported amounts are reconciled to the underlying accounting records.
Management’s Response: See management’s response on pages 217 through 218.

217

218
219
STATE OF NEVADA SCHEDULE OF FINDINGS AND QUESTIONED COSTS FOR THE YEAR ENDED JUNE 30, 2010 U.S. DEPARTMENT OF JUSTICE: Finding 10-30: Violence Against Women Formula Grants, CFDA 16.588: ARRA - Violence Against Women Formula Grants, CFDA 16.588A:
Grant Award Number: Affects the grant award included under CFDA 16.588A on the Schedule of Expenditures of Federal Awards.
Criteria: Section 1512 of the American Recovery and Reinvestment Act (ARRA)
includes reporting requirements for awards received directly from the Federal awarding agency. Prime recipients are required to report the cumulative draws/funds requested and the cumulative expenditure amounts in the quarterly Section 1512 ARRA report.
Condition and Context: During testing of the Section 1512 ARRA report submitted for the
quarter ended March 31, 2010 for grant award 2009-EF-S6-0006, we noted the supporting documentation did not reconcile to the accounting system which caused total expenditures reported to be understated by approximately $107,000. We also noted that the total Federal ARRA funds received/invoiced amount reported represented the expenditure amount rather than the amount received/invoiced.
Questioned Costs: None. Effect: Inaccurate information was reported to the Federal granting agency. Cause: The Nevada Office of the Attorney General did not have adequate
reconciliation procedures in place to ensure that amounts included in the Section 1512 ARRA report were supported by the underlying accounting records.
Recommendation: We recommend the Nevada Office of the Attorney General enhance the
procedures over the reporting process to ensure that all amounts included on the Section 1512 ARRA report are reconciled to the underlying accounting records prior to submission.
Management’s Response: See management’s response on page 222.

220
STATE OF NEVADA SCHEDULE OF FINDINGS AND QUESTIONED COSTS FOR THE YEAR ENDED JUNE 30, 2010 U.S. DEPARTMENT OF JUSTICE: Finding 10-31: Violence Against Women Formula Grants, CFDA 16.588: ARRA - Violence Against Women Formula Grants, CFDA 16.588A:
Grant Award Number: Potentially affects all grant awards included under CFDA 16.588 and 16.588A on the Schedule of Expenditures of Federal Awards.
Criteria: OMB Circular A-133 requires that reports submitted to the Federal
awarding agency include all activity of the reporting period, and are presented in accordance with program requirements.
Condition and Context: The Nevada Office of the Attorney General is required to submit
quarterly SF-425 Federal Financial Reports for the Violence Against Women Grants awards.
During testing of SF-425 reports submitted for the quarter ended March
31, 2010 for grant awards 2009-EF-S6-0006, 2008-WE-AX-0054, and 2007-WE-AX-0016, we noted that amounts reported did not agree to the accounting records which caused total expenditures reported to be overstated by $10,282, $16,963, and $26,393, respectively.
Questioned Costs: None. Effect: Inaccurate information was reported to the Federal granting agency. Cause: The Nevada Office of the Attorney General did not have adequate
reconciliation procedures in place to ensure that amounts included in the SF-425 Federal Financial Reports were supported by the underlying accounting records.
Recommendation: We recommend the Nevada Office of the Attorney General enhance the
procedures over the reporting process to ensure that all amounts included in the SF-425 Federal Financial Reports are reconciled to the underlying accounting records prior to the submission.
Management’s Response: See management’s response on page 223.

221
STATE OF NEVADA SCHEDULE OF FINDINGS AND QUESTIONED COSTS FOR THE YEAR ENDED JUNE 30, 2010 U.S. DEPARTMENT OF JUSTICE:
Finding 10-32: Violence Against Women Formula Grants, CFDA 16.588: ARRA - Violence Against Women Formula Grants, CFDA 16.588A:
Grant Award Number: Affects the grant award included under CFDA 16.588A on the Schedule of Expenditures of Federal Awards.
Criteria: The OMB Circular A-133 Compliance Supplement requires that recipients agree to separately identify to each subrecipient, and document at the time of the subaward and disbursement of funds, the Federal award number, Catalog of Federal Domestic Assistance (CFDA) number, and the amount of American Recovery and Reinvestment Act (ARRA) funds.
Condition and Context: As part of our audit procedures we tested disbursements of ARRA funds paid to subrecipients. During this testing, we noted that the Federal award number, CFDA number and the amount of ARRA funds were not identified as such at the time of the disbursement to subrecipients.
Questioned Costs: None.
Effect: Subrecipients may be unaware of specific Federal award information, which could result in noncompliance at the subrecipient level.
Cause: The Nevada Office of the Attorney General did not have procedures in place to ensure that all information required to be provided to subrecipients under the ARRA was communicated to subrecipients at the time of disbursement of funds.
Recommendation: We recommend the Nevada Office of the Attorney General implement procedures to ensure that all information required to be provided to subrecipients under the ARRA is communicated to subrecipients at the time of disbursement of funds.
Management’s Response: See management’s response on pages 223 through 224.

222

223

224

225

226

227

228

229

230
231

232

233

234

235

236

237

238

239
240
241

242

243
244
245

246

247

248

249

250

251

252

253
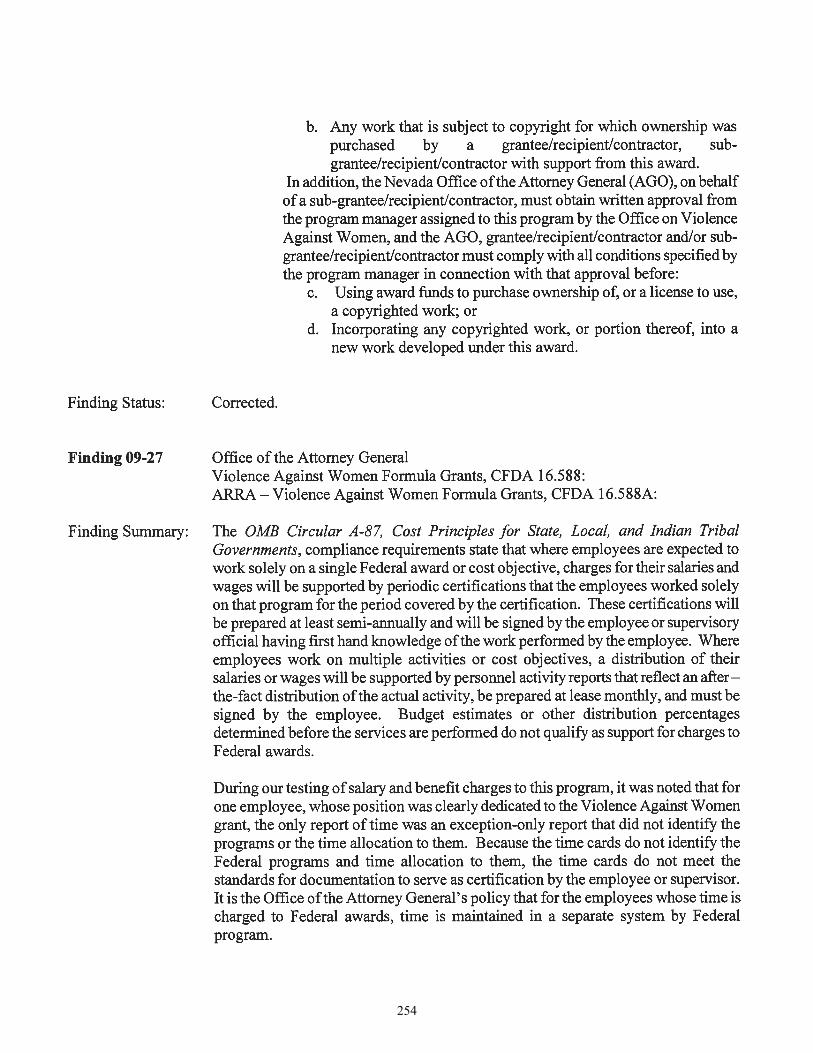
254

255

256

257

258
259

260

261

262

263

264
265

266

267

268
Copyright © 2022 FDOKUMEN