
Summative Evaluation of the Nevada Educational Technology ...
132
Summative Evaluation of the Nevada Educational Technology Implementation Fund Grant Prepared for: The Nevada Department of Education and The Nevada Commission on Educational Technology Prepared by: Wexford Institute August 2011
-
Upload
khangminh22 -
Category
Documents
-
view
3 -
download
0
Transcript of Summative Evaluation of the Nevada Educational Technology ...

Summative Evaluation of the Nevada Educational Technology Implementation Fund Grant
Prepared for: The Nevada Department of Education and
The Nevada Commission on Educational Technology
Prepared by: Wexford Institute
August 2011
Table of Contents
Executive Summary 1
Introduction 9
Part One: Data Collection 11
Part Two: Grant Implementation by Funding Category 15
High Quality Content Material 15
Professional Development 15
Pilot Project 17
Technical Services 17
Infrastructure 18
Part Three: Outcomes by Funding Category 19
High Quality Content Material 19
Professional Development 32
Pilot Project 53
Technical Services 59
Infrastructure 64
Recommendations 70
Part Four: District Implementation Summaries 71
Carson City 71
Churchill County 76
Clark County 79
Douglas County 89
Elko County 94
Esmeralda County 96
Eureka County 98
Humboldt County 101
Lander County 105
Nevada Educational Technology Implementation Fund Grant Year 2 Report i

Lincoln County 106
Lyon County 110
Mineral County 114
Pershing County 118
Storey County 120
Washoe County 123
White Pine 128
Nevada Educational Technology Implementation Fund Grant Year 2 Report ii

Executive Summary
The Nevada Educational Technology Implementation Fund Grant (ETIF) was a two-year award given in fall
2009 to school districts across the state through a competitive RFP process. The total allocation, approved
by the state legislature, was just over $4,000,000. In response to the RFP, 16 districts formed a consortium
and submitted one proposal in which each participating district described its plan for utilizing grant funds
within the scope of five funding categories: High Quality Content Material, Professional Development,
Technical Services, Infrastructure, and Pilot Projects. Lincoln County School District submitted its own
proposal. Both proposals were approved by the Nevada Commission on Educational Technology and
grantees received awards ranging from just under $40K in a few very small districts like Eureka County,
Lander County, Esmeralda County, Pershing County, and White Pine County, to over $2,000,000 awarded to
Clark County. This summative report of the ETIF Grant presents a statewide overview of outcomes relative to
each funding category, as well as an appended summary of implementation by district.
Districts were awarded funds to address needs across all five funding categories, though the majority used
grant funds for technical services (i.e., workstations, servers, interactive whiteboards, laptops, iPods, etc.).
Less than half of the districts used ETIF Grant funds to support professional development, and two school
districts used funds exclusively for infrastructure upgrades. Two districts, Lincoln County and Washoe
County, proposed implementing pilot projects (1:1 laptop and cloud computing initiatives, respectively), but
only Lincoln County School District was able to implement this component of its proposal. Nye County was
the only school district allowed to draw down its entire award for use in Year 1. These funds were used to
pay the salary of one Technology Integration Specialist (TIS) at Pahrump Valley High School. The position was
only funded for one year, and at the end of Year 1 the project director retired, the TIS left the district, and no
data were collected from the high school teachers during Year 2.
The statewide evaluation of the ETIF Grant posed two main challenges for evaluators. First, the disparity in
districts’ implementation plans required a more generalized focus for data collection in order to generate
sufficient common data points upon which to draw conclusions about the statewide impact of the grant.
Second, the level of districts’ implementation (i.e., technology acquisition in the absence of a professional
development component) and the length of time grantees had to implement their proposed plans, dictated
the scope of the evaluation and the ability of evaluators to gather much more than anecdotal data on the
extent to which grant funded activities had an impact on students. It is important for the reader to note that
while the funding for the ETIF Grant spanned two academic years (2009-10 and 2010-11), most grantees
did not roll out their projects until late in the fall of 2009 and some districts, particularly those that used funds
to upgrade infrastructure, did not begin their projects until summer 2010. The reasons for the delayed roll out
varied by district, but in many instances it was dictated by circumstance (i.e, delayed draw down of funds in
Year 1 and waiting for bid approval) rather than by design (i.e., waiting to install network routers and switches
in the summer to avoid disrupting existing network usage). The reader is advised to view the outcomes within
the scope of this diminished implementation period.
Nevada Educational Technology Implementation Fund Grant Year 2 Evaluation 1

Final Awards by District
District 2-Year Award
Carson $83,851.66
Churchill $52,032.29
Clark $2,658,346.11
Douglas $60,193.23
Elko $89,452.00
Esmeralda $38,725.83
Eureka $37,283.23
Humboldt $46,309.20
Lander $39,315.30
Lincoln $245,196.61
Lyon $83,101.50
Mineral $39,174.20
Nye $62,638.75
Storey $40,105.20
Pershing $37,700.83
Washoe $552,023.80
White Pine $35,770.83
Total $4,201,220.57
Project Directors’ Satisfaction with Grant Implementation
In general, project directors indicated that they were satisfied with what had been accomplished with grant
funds in their respective district. In many instances the ETIF Grant was used to address districts’ immediate
needs. This was the case more so in districts that used funds to replace computers that were anywhere from
five to 12 years old. Satisfaction was just as high, if not more so, in districts that used the ETIF Grant to
supplement a technology-related area in which it was already focused. This is the case for districts such as
Carson City that already had SMART Boards in teachers’ classrooms but wanted to support teachers’ use of
the boards by implementing a professional development model, as well as Esmeralda County where the
district is heavily invested in providing teachers and students with the most current technology tools to keep
them competitive and as connected as students in larger districts.
Lessons Learned from Grant Implementation
The “lessons learned” shared by project directors varied depending on the focus area of the grant, but most
project directors indicated a need to focus on teacher professional development (PD). This was cited as a
Nevada Educational Technology Implementation Fund Grant Year 2 Evaluation 2

priority even for districts that had not used grant funds to support technology-related professional
development. The Carson City project director cited the high quality of the SMART Board trainers as the
“critical component” to the district’s success in implementing the grant. As it relates to the tuition
reimbursement of teachers who completed online professional development, the Clark County project
director, in retrospect, feels that the district needed to align this PD opportunity to district initiatives. As she
stated, “I think it’s the instructional support I wish I could have allocated differently. I think that the
professional development pieces need to be tied directly and obviously to our district technology plan. For
example, for the tuition reimbursement the course options could have been narrowed down to areas of focus
and alignment with what the district initiatives are. The PD needs to be tied to improving math and reading.”
The Pershing County project director also expressed a need for grant funds to support teacher professional
development. She shared that not only do the teachers trying to use the iPods need more training, but she
indicated that the eMints teachers (who received new computers with ETIF funds) have reached a plateau
and “haven’t learned anything new in a few years.”
In Humboldt County, a district that did not use grant funds to support teacher professional development, the
project director felt that this was a missing component. She shared the following comment related to her
desire to make PD a more integral component of future technology acquisitions. “It’s sad about the number
of teachers who don’t get professional development so they don’t know how to use them [the computers]
more...We try to be flexible with the schedule but they feel that they don’t have the time to do it. I’d like to
see any way to get the PD. I think that if the teachers want it in their classroom they should have to attend
PD. The more they can get trained the better.”
Other lessons learned had to do with planning for technology support needs. The Lincoln County project
director indicated that more planning should have gone into preparing for technical support needs before the
technology was deployed. He stated, “I really think that its more critical than I realized to nail down what the
tech support needs to look like in advance.” Not doing so had implications related to such things as
establishing and managing secure space for students to save their files, building an infrastructure for wireless
computing, and dealing with inadequate bandwidth issues when all students tried to access the Internet at
the same time. Much of what Lincoln County implemented in terms of technical support problem-solving
strategies and solutions came out of a “learn as you go” model. As such, the lessons learned are offered
more as a cautionary tale to other small districts that might consider a similar undertaking more so than
regret that things had not been done differently.
Eureka County also had lessons learned regarding addressing the technical support needs of a small district.
In discussing his decision to outsource the implementation of the district's wireless network, the project
director said, “My intent with going with Dell was to have someone else do it because I’m pretty busy. I didn’t
have the expertise with wireless so it made sense to subcontract.” However, this turned out not to meet the
district’s needs because it took the better part of the school year to get everything installed and working
properly. When the project director was interviewed in early May 2011, he indicated that after establishing a
relationship with Dell in November 2010 to configure the wireless network, it took until late April to get it
installed. The following quote describes the district’s experience in outsourcing the work.
Nevada Educational Technology Implementation Fund Grant Year 2 Evaluation 3

I had them [Dell] do the implementation. I did that in November and it’s been a long process to get that all figured out and installed. It just got installed last week. I would not recommend them again as
a vendor. They are too big. Getting their implementation team going and meshing with us over here just took a lot of time. There was a lot of back and forth. They ended up subcontracting with an outfit in Texas and then they subcontracted with another outfit in Las Vegas and then to install the access
points they subcontracted with a local guy.
Challenges
It is well known that the ETIF Grant was not sufficient to address the full scope of districts’ technology
equipment, infrastructure, and professional development needs. Therefore, barring districts’ persistent
financial need, the greatest challenge faced by districts in implementing the grant was limited human
resources. In many districts one person is responsible for juggling multiple technology-related responsibilities
and project directors lamented that they were hindered by this staffing issue. This is the case in Esmeralda
County, where one person is responsible for technology for the whole district, which only has 100 students,
but has its three schools up to 75 miles away from one another. As the Esmeralda County project director/
Technology Director stated, “Being the only technician for three school and 100 kids, I tend to run a lot. It’s
just being the only technician in the school district that makes it hard to get things done when two different
people in two different places both need you.” The Washoe County project director expressed a similar
concern. In his dual role as Professional Development Director, he indicated that “one person is not effective”
in meeting teachers’ training needs. This human resource issue is important in understanding the contextual
factors that impacted districts’ grant implementation. In Carson City and Douglas County teachers served in
a supplemental training support role to assist teachers in using their interactive whiteboard. No one served in
that capacity in Washoe County so teachers did not get what the project director referred to as “process
time,” and the difference in implementation is reflected in the outcomes discussed in further detail within the
report. In Humboldt County, with only three IT staff, the project director reported that it took most of the
2010-11 school year to install all of the new computers. This was also the case in Lyon County where the
network upgrade was all done “in house.” The Lyon County project director reported that the biggest
challenge the district faced in implementing the grant was not having enough staff. To get all of the work
done he reported that people had to be pulled from their regular positions to help complete the job.
Impact on Students and Changes in Classroom Instruction
Most of the impact and teacher change data are anecdotal reports shared by teachers in response to
Technology Use Survey questions and interview questions. Other data are summarized from implementation
data provided by Clark County School District’s FASSTMath Coordinator and surveys administered to
students in Churchill County and Lincoln County. The majority of teachers reported an increase in student
engagement when using technology. Other student outcomes, as reported by teachers included: better
retention of content, increased participation in the learning process, increased use of technology to develop
student projects, increased access to online content to supplement classroom instruction, and increased
student achievement. The most notable self-reported increases in classroom teaching included: an increased
comfort level with facilitating student-centered learning, using technology for better student assessment, and
using technology to facilitate differentiated instruction.
Nevada Educational Technology Implementation Fund Grant Year 2 Evaluation 4
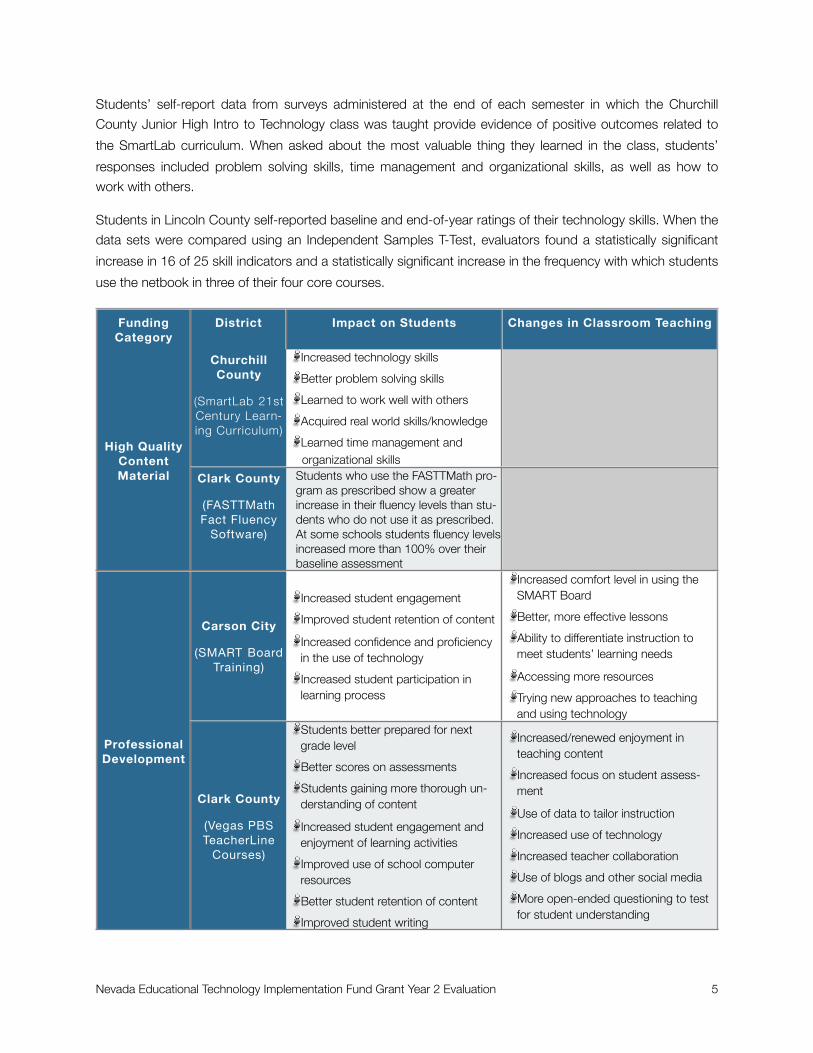
Students’ self-report data from surveys administered at the end of each semester in which the Churchill
County Junior High Intro to Technology class was taught provide evidence of positive outcomes related to
the SmartLab curriculum. When asked about the most valuable thing they learned in the class, students’
responses included problem solving skills, time management and organizational skills, as well as how to
work with others.
Students in Lincoln County self-reported baseline and end-of-year ratings of their technology skills. When the
data sets were compared using an Independent Samples T-Test, evaluators found a statistically significant
increase in 16 of 25 skill indicators and a statistically significant increase in the frequency with which students
use the netbook in three of their four core courses.
Funding Category
District Impact on Students Changes in Classroom Teaching
High Quality Content Material
Churchill County
(SmartLab 21st Century Learn-ing Curriculum)
High Quality Content Material Clark County
(FASTTMath Fact Fluency
Software)
Professional Development
Carson City
(SMART Board Training)
Professional Development
Clark County
(Vegas PBS TeacherLine
Courses)
Increased technology skills
Better problem solving skills
Learned to work well with others
Acquired real world skills/knowledge
Learned time management and organizational skills
Students who use the FASTTMath pro-gram as prescribed show a greater increase in their fluency levels than stu-dents who do not use it as prescribed. At some schools students fluency levels increased more than 100% over their baseline assessment
Increased student engagement
Improved student retention of content
Increased confidence and proficiency in the use of technology
Increased student participation in learning process
Increased comfort level in using the SMART Board
Better, more effective lessons
Ability to differentiate instruction to meet students’ learning needs
Accessing more resources
Trying new approaches to teaching and using technology
Students better prepared for next grade level
Better scores on assessments
Students gaining more thorough un-derstanding of content
Increased student engagement and enjoyment of learning activities
Improved use of school computer resources
Better student retention of content
Improved student writing
Increased/renewed enjoyment in teaching content
Increased focus on student assess-ment
Use of data to tailor instruction
Increased use of technology
Increased teacher collaboration
Use of blogs and other social media
More open-ended questioning to test for student understanding
Nevada Educational Technology Implementation Fund Grant Year 2 Evaluation 5

Funding Category
District Impact on Students Changes in Classroom Teaching
Professional Development
Douglas County
(Promethean Board, ActivS-late, ActivEx-
pression Train-ing)
Professional Development
Elko/White Pine
(Nevada Path-way Project)
Professional Development
Washoe
(Promethean Board
Training)
Pilot Project
Lincoln County
(1:1 laptop project)
Technical Services
Clark County
(New Worksta-tions and Servers)
Increased student engagement
Increased instructional time
Increased planned and “on the fly” testing for student understanding
Increased student participation in learning process
More meaningful whole class discus-sions
Better prepared and more organized for each class
Increased awareness of classroom activity
Increased interactivity of lessons
Increased time spent on lesson plans
Increased student-centered learning
Increased use of supplemental materi-als to support student learning
Increased use of technology as a re-source in their everyday learning.
Increased student engagement
Increased pride as a result of complet-ing projects
Focus on TPACK
Empowering students to become self-guided learners
Overall increase in use of technology
Increased student engagement
Increased interaction with teachers during lesson
Increased motivation to share work with the class
Increased use of ActivExpression
Adding interactive components to lessons
Increased efficiency as a result of sav-ing Flipchart lessons
Decrease in the amount of paper ma-terials handed out to students
Increase in the amount of supplemen-tal material added to lessons
Increased use of technology
Anytime/anywhere learning
Increased student engagement
Increased motivation of low-achieving students
Statistically significant increase in stu-dents technology skills and use of technology in core content classes
Increased comfort with student-centered learning
Increased use of supplemental mate-rial
Increased use of web apps for student assignments
Increased organization and efficiency
Students learned how to do Internet searches
Increased confidence in navigating the Internet
Increased use of educational games
Students becoming independent learners
Increased engagement
Increase in number of student tech-nology projects
Increase in the use of technology for differentiated instruction
Increased use of software
Ability to connect the computer to a projector/document camera
Quicker access to websites
Increased efficiency
Nevada Educational Technology Implementation Fund Grant Year 2 Evaluation 6

Funding Category
District Impact on Students Changes in Classroom Teaching
Technical Services
Esmeralda County
(Interactive Slates)
Technical Services
Eureka County
(New Worksta-tions)
Technical Services
Humboldt County
(New Worksta-tions)
Technical Services
Pershing County
(iPods)
Technical Services
Storey County
(New Worksta-tions)
Increased student engagement
Increased student interactivity during lessons
Improved ability of students’ to “visual-ize” what they are learning
Being able to move around the room to monitor students
Ease in displaying information
Increased student engagement
Improved student collaboration (i.e., sharing and editing during writing process)
Learning from online content not pre-viously accessible on older computers
Increase in assignments requiring time in the computer lab
Using textbook CDs instead of pur-chasing new books
Increased access to content-related material
Use of streaming video
Increased use of online testing and homework submission
Students able to quickly access infor-mation on teachers’ classroom com-puter rather than having to plan/schedule time in the computer lab
Increased use of classroom SMART-Board
Better understanding of content when computer is used to provide visual representations
Increased efficiency with faster com-puter
Increased use of computer for instruc-tional purposes
Increased use of projector and SMART Board
Using computer to access content not available in outdated texts
Accessing more online supplemental teaching resources
Increased ability to quickly search the Internet to respond to students’ re-search questions
Students become instantly engaged when using technology.
Students are more eager to work on tasks on the iPod touch than on paper.
Increased integration of technology into lessons
Use Apps for students to work inde-pendently on skills
Connecting visual learning with nu-merical learning
More access to the Internet
Increased interaction with the SMART Board
Teacher computer provides an extra workstation for students
Shorter lectures and more visual communication
Increased use of the SMART Board
Nevada Educational Technology Implementation Fund Grant Year 2 Evaluation 7

Funding Category
District Impact on Students Changes in Classroom Teaching
Infrastructure
Lyon County
(Network up-grade)
Infrastructure
Mineral County
(Web and SPAM Filter-ing, servers)
Increased use of classroom computers and computer lab
Increase in the number of research-related project students do
Increased opportunity for individualized instruction
Improved MAPS scores
Increased use of Internet resources due to faster connection
Increased time spent looking for sup-plemental Internet resources
More efficient communication between staff
Increased use of technology based on network reliability
Accessing more resources
Trying new approaches to teaching and using technology
Improved access to needed resources pushed to desktop
Increased use of computer
Increased efficiency
Significant decrease in SPAM/easier to use email
More websites blocked than prior to upgrade; requires principal approval to request that sites be unblocked
Growth and Sustainability Outcomes
The ETIF grant served as seed money for a few districts to build on their respective technology plans. In
Douglas County, the district used recommendations from the Year 1 Interim report to refine its professional
development plan. The revised PD plan was then incorporated into a proposal that the district submitted to a
private donor. Douglas County received a $1M grant from which it allocated funds to support a cohort of
teachers’ participation in a 4-day training course that prepared them to provide Promethean Board training
for teachers at their respective school sites. This donor-funded grant also supported additional vendor-
provided PD, which supplemented the training teachers received from Washoe County.
Lyon County School District used its $83K in ETIF grant funds as matching in its application for ARRA
Broadband Technology Opportunity Program (BTOP) monies. In September 2010 the district received
$750,000, which was used to fund six new computer centers to serve the entire community and provide
technology training for county residents.
Even in the absence of a major infusion of additional technology dollars, districts are making plans to expand
on what they implemented with the ETIF Grant. In Carson City School District the Technology Committee is
considering adopting the SMART Board training model (i.e., using Master Teachers to provide the training
and making Site Trainers available at each school site) to implement its training on Web 2.0 and 21st Century
Learning Tools. The Churchill County School District has expanded implementation of the SmartLab into its
high school and has been asked by the developers of the SmartLab curriculum to participate in an
elementary school pilot program. The Lincoln County School District has decided to grow the 1:1 laptop
program until each 5th-12th grade students is equipped with a netbook computer. The program expanded
from one middle school in Year 1 to all 6th-8th grade students in the district in Year 2.
Nevada Educational Technology Implementation Fund Grant Year 2 Evaluation 8

Introduction
Recap of Year 1 Implementation and Outcomes
In July 2010, Wexford Institute submitted an Interim Evaluation Report on the statewide implementation and
short term outcomes of the Nevada Educational Technology Implementation Fund (ETIF) Grant. Using data
collected from each district’s project director, evaluators reported that over 250 schools, 1100 teachers, and
42,000 students were impacted by the grant in some capacity including, but not limited to, upgraded wired
or wireless connectivity, upgraded network capability, receipt of new hardware, software, and/or peripheral
devices, and teacher professional development.
The report also included an overview of district implementation across funding categories and a summary of
grant-funded expenditures which showed that the greatest percentage (63%) of the $2.1 million allocated in
Year 1 was spent on technical services, followed by 17 percent for infrastructure, 14 percent for professional
development, and six percent for high quality content.
Table 1. District Awards by Funding Category
District High Quality Content Material
Professional Development
Pilot Project Technical Services
Infrastruc-ture
Carson City X
Churchill County X
Clark County X X X X
Douglas County X
Elko County X
Esmeralda County X
Eureka County X X
Humboldt County X
Lander County X
Lincoln County X X X X X
Lyon County X
Mineral County X
Nye County X
Pershing County X
Storey County X
Washoe County X X X
White Pine County X X
Nevada Educational Technology Implementation Fund Grant Year 2 Evaluation 9
Evaluators reported that teachers who participated in structured professional development sessions, had, on
average, just 21 hours of training for the entire school year. This ranged from a low of 7.5 hours to a high of
over 45 hours for teachers who participated in the Nevada Pathway Project. In terms of training hours
provided by Technology Integration Specialists (TIS), evaluators analyzed time sheets to determine that
regardless of TIS full-time (in Nye County) or part-time (in Lincoln County) status, staff in this position
provided less than 10 percent of their paid time in direct training to teachers. Evaluators noted that there
were contextual factors related to the TIS outcomes, namely start date and time needed to build rapport with
teachers. The overall recommendation related to PD was that, given the ratio of districts that received money
for equipment to those that used grant funds to support teacher professional development, future funding
include a requirement that a minimum percentage of the award be allocated toward professional
development.
The student outcomes for Year 1 primarily included reports of increased student engagement, collaboration,
and quality of work. There were also reports of a decrease in behavior problems. The outcomes for teachers
at the end of Year 1 included technology integration by previously reluctant teachers, use of technology to
complete administrative tasks, changes toward more student-centered learning, increased use of web-based
resources, increased collaboration among staff, and an increase in overall productivity. Evaluators also
reported the results of survey data in which teachers were asked to indicate the amount of time they and
their students spent, in a given class period, using the technology that was purchased with grant funds.
Nearly one-third of the 560 teachers who responded to the survey reported that they (30%) and their
students (31%) used their grant-funded technology at least half of the class period.
Year 2 Evaluation
Evaluators focused the Year 2 evaluation on capturing common data points across districts that would
provide an overview of the statewide impact of the funds awarded through the ETIF Grant. Administering an
online survey and conducting phone interviews with project directors was the primary means by which
evaluators collected data; however, site visits were conducted in five districts. Common areas upon which
data were collected included: frequency of technology use by teachers and students, teachers’ perceptions
about changes in their teaching practice, teachers’ level of agreement with statements about how
technology is used at their school, and, for those whom it was applicable, teachers’ feedback on the
professional development in which they participated. Questions included in the project director interview
protocol focused on satisfaction with grant implementation, lessons learned, concerns about sustainability,
and plans for expanding on ETIF grant-funded initiatives. The reader will find that this summative report of the
Nevada Educational Technology Implementation Fund Grant provides sufficient data upon which to
determine the outcomes of the grant, collectively across the state, and within each district.
Report Outline
The remainder of this report is divided into four parts. Part One provides an overview of the methods used to
collect data during the 2010-11 school year. Part Two provides a brief overview of Year 2 grant
implementation by funding categories. Part Three provides an overview of outcomes based on funding
categories, and Part Four of the report provides an implementation summary for each district.
Nevada Educational Technology Implementation Fund Grant Year 2 Evaluation 10

Part One: Data Collection
Year 2 Data Collection Overview
Evaluators administered online teacher and student surveys, conducted face-to-face and telephone
interviews with project directors, conducted site visits, which included interviews and observations, and
analyzed additional data sources. Table 1 shows the data collection strategies used for each district. The
evaluation budget, paired with an assessment of implementation from Year 1 dictated the number of site
visits that occurred in Year 2. Evaluators determined that sites in which a significant amount of professional
development took place, warranted a repeat visit in Year 2. Therefore, between February-May 2011,
evaluators conducted site visits to schools in the following districts: Carson City, Clark County, Douglas
County, Lincoln County, and Washoe County.
Table 1. Data Collection Strategy by District
DistrictTeacher Survey
Student Survey
Teacher Interview
Project Director
Interview
Other Staff Interviews
Classroom Observa-
tion
Additional Data
Carson City X X X X X
Churchill X X X
Clark County X X X X
Douglas X X X X
Elko X X X
Esmeralda X X
Eureka X X
Humboldt X X
Lander X
Lincoln X X X X X X
Lyon X X
Mineral X X X
Pershing X X
Storey X X
Washoe X X X X
White Pine X X X
Nevada Educational Technology Implementation Fund Grant Year 2 Evaluation 11
Online Surveys
Consistent with the Year 1 evaluation plan, evaluators designed an online Technology Use Survey for the
purpose of gathering common data across districts. With a few exceptions, all of the online surveys were
administered to teachers in May 2011. As in Year 1, two forms of the survey were developed; one was
administered to teachers who received grant-funded professional development, and the other was
administered to teachers whose district had used grant funds to purchase equipment, instructional
programs, and/or upgrade network infrastructure. Depending on the district, teachers received a link to the
online survey either directly from SurveyMonkey or in an email disseminated by their project director.
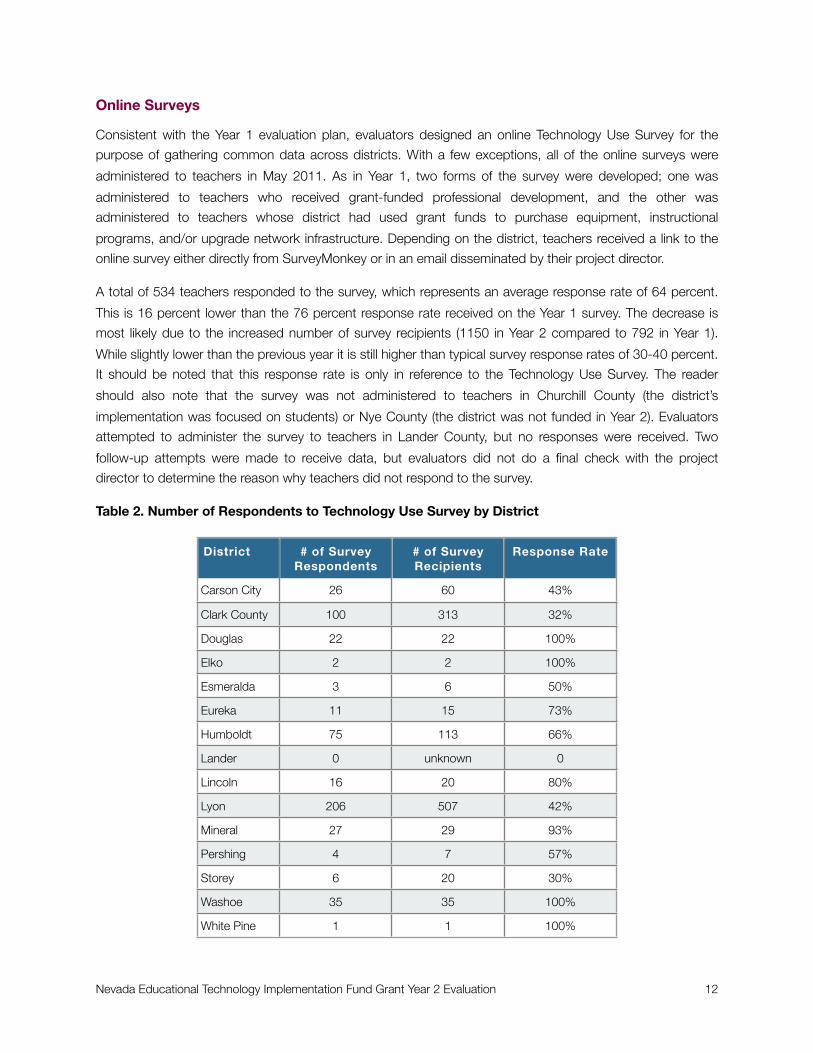
A total of 534 teachers responded to the survey, which represents an average response rate of 64 percent.
This is 16 percent lower than the 76 percent response rate received on the Year 1 survey. The decrease is
most likely due to the increased number of survey recipients (1150 in Year 2 compared to 792 in Year 1).
While slightly lower than the previous year it is still higher than typical survey response rates of 30-40 percent.
It should be noted that this response rate is only in reference to the Technology Use Survey. The reader
should also note that the survey was not administered to teachers in Churchill County (the district’s
implementation was focused on students) or Nye County (the district was not funded in Year 2). Evaluators
attempted to administer the survey to teachers in Lander County, but no responses were received. Two
follow-up attempts were made to receive data, but evaluators did not do a final check with the project
director to determine the reason why teachers did not respond to the survey.
Table 2. Number of Respondents to Technology Use Survey by District
District # of Survey Respondents
# of Survey Recipients
Response Rate
Carson City 26 60 43%
Clark County 100 313 32%
Douglas 22 22 100%
Elko 2 2 100%
Esmeralda 3 6 50%
Eureka 11 15 73%
Humboldt 75 113 66%
Lander 0 unknown 0
Lincoln 16 20 80%
Lyon 206 507 42%
Mineral 27 29 93%
Pershing 4 7 57%
Storey 6 20 30%
Washoe 35 35 100%
White Pine 1 1 100%
Nevada Educational Technology Implementation Fund Grant Year 2 Evaluation 12

The following is a list of surveys administered at other times during Year 2 of the grant.
District Survey Date Administered Grant Participant
Churchill CountyChurchill County
Clark CountyClark CountyClark County
Lincoln CountyLincoln CountyLincoln County
Retrospective Course Feedback Survey
October 20109th grade students who completed the Intro to Tech class in 2009-10
Intro to Tech Class Feedback Survey
December 2010May 2011
Students who completed the course each semester
TeacherLine Follow Up Survey Feb. 2011Teachers who completed courses in 2009-10
TeacherLine Feedback Survey Feb. 2011Teachers who completed courses in fall 2010
FASTTMath Feedback Survey March 2011Teachers who received FASTTMath accounts in Year 1 or Year 2
Baseline Technology Skills and Motivation Survey
October 2010 6th-8th grade students
Technology Needs Assessment Survey
October 2010 6th-8th grade teachers
Student End-of-Year Technology Skills and Motivation Survey
May 2011 6th-8th grade students
Teacher Interviews
During site visits in February, April, and May 2011 evaluators conducted a combined total of 45 face-to-face
interviews with teachers in Carson City, Clark County, Douglas County, Lincoln County, and Washoe County.
Evaluators used a structured interview protocol to conduct one-on-one and small group interviews that
lasted between 10-30 minutes.
School District Number of Teacher Interviews
Carson City 18
Clark County 12
Douglas County 5
Lincoln County 7
Washoe County 3
Project Director Interviews
Evaluators used a structured interview protocol to conduct interviews with project directors in each district.
Thirteen of these interviews were conducted over the phone (or via Skype) and three were conducted face-
to-face during site visits. Each interview lasted between 20-60 minutes.
Nevada Educational Technology Implementation Fund Grant Year 2 Evaluation 13

Additional Interviews
In addition to teacher and project director interviews, evaluators conducted semi-structured interviews with
people in the following positions: the project coordinator in Carson City, Master Teachers who provided
training in Carson City, the SmartLab facilitator in Churchill County, the Technology Integration Specialists in
Lincoln County, and the district Superintendent in Mineral County. Evaluators also conducted a focus group
with Educational Computing Specialists from Clark County.
Classroom Observations
Evaluators conducted classroom observations in Carson City, Douglas County, Lincoln County, and Washoe
County. Teachers selected for observation were a combination of those who volunteered and those selected
by their project director/coordinator.
School District Number of Classroom
Observations
Carson City 12
Douglas County 5
Lincoln County 6
Washoe County 3
Additional Data
Evaluators received additional data from Clark County in the form of Implementation and Summary reports
generated by the district’s FASTTMath administrator. On behalf of Mineral County, Oasis Online provided a
report of the district’s web traffic that included the education and reference sites most frequently visited.
Evaluators also received the survey data provided by researchers at UNLV for the three teachers (two in Elko,
one in Washoe County) who participated in the Nevada Pathway Project.
Nevada Educational Technology Implementation Fund Grant Year 2 Evaluation 14
Part Two: Grant Implementation by Funding Category
High Quality Content Material
Churchill County: SmartLab 21st Century Skills Curriculum
Churchill County continued to offer its SmartLab computer class for 8th grade students at the junior high
school. The course is one full semester, and is taken as an elective. The purpose of the SmartLab activities is
to guide students through a series of engagements that teach and reinforce 21st Century Learning skills. The
content of the engagements is STEM-based, but the intent of the engagements is not to teach new content;
rather, students are encouraged to work in pairs, establish daily objectives, make their own decisions about
which level of engagement (there are three) they want to complete, and reflect on what they have learned.
Students’ activities are managed through the web-based portfolio that is part of the SmartLab package, and
their use of SmartLab equipment (i.e., hardware, software, and science-related tools needed to complete the
engagements) is facilitated by the classroom teacher.
In Year 2 of the grant, Churchill County offered three sections of the course. One section was offered in fall
2010, one in spring 2011, and they also piloted a full-year course with a group of students who had been
selected for participation by their math, science, and/or computer teacher.
Clark County: FASTTMath Fact Fluency Software
FASTTMath is a software program designed to help elementary and middle school students achieve math
facts fluency in addition, subtraction, multiplication, and division. During Year 1 the software was purchased
for 10 schools; during Year 2 grant funds were used to support 10 additional schools. The producers of
FASTTMath recommend that students use the program three times per week, at least 15 minutes each time
to reach fluency with a given operation. After completing a placement assessment, which includes the
program making adjustments for individual students’ typing speed, students work through a series of games,
activities, and timed drills until the program indicates that they have reached fluency.
Professional Development
Carson City: SMART Board Training
Carson City School District continued to offer SMART Board training. In Year 1, the training program was
provided almost exclusively to elementary teachers, though some middle school teachers participated in
both Year 1 and Year 2. In Year 2 the program expanded to Carson High School. A total of 60 teachers (19
high school, two middle school, and 29 elementary) participated in one of three training programs. Each
round of training provided 17.5 hours of professional development across seven 3.5 hour sessions offered on
consecutive Friday evenings from 3:30-7:00PM.
Nevada Educational Technology Implementation Fund Grant Year 2 Evaluation 15
Teachers were required to complete five of the seven sessions in order to receive one professional growth
credit and one recertification credit. Each teacher, whether new to the training program or returning from Year
1 was required to participate in the “Stop and Share” session, in which each teacher presented two SMART
Board lessons they had done in their class. At the end of the class, all participants received a thumb drive
with all of the lessons developed by teachers in their respective cohort. The professional development was
provided by 10 Master Teachers (fall of whom are district staff, and five of whom are SMART Board certified
trainers). Site Trainers (one at each elementary school and four at the high school) provided technical and
skills support to teachers enrolled in the training program.
Clark County: Vegas PBS TeacherLine Online Professional Development
Clark County used a portion of its grant funds to provide tuition reimbursement to over 260 teachers who
completed Vegas PBS TeacherLine courses in fall 2010 and spring 2011. Courses are offered in five focus
areas: Instructional Strategies, Instructional Technology, Reading/Language Arts, Mathematics, and Science.
Elementary school teachers made up the greatest percentage (43%) of teachers who were reimbursed for
courses. Some teachers completed three or more courses during the school year; most completed just one.
Lincoln County: Technology Integration Specialists
Lincoln County retained the part-time (20 hours/week) Technology Integration Specialist (TIS) hired during
Year 1 and hired a second part-time (15 hours/week) TIS to provide just-in-time training support to 6th-8th
grade teachers at the district’s five elementary and middle schools. The purpose of the TIS training model
was to provide teachers with one-on-one personalized, rather than group, support to address their
immediate needs related to integrating use of the netbooks into their curriculum. The TIS hired in Year 1
supported teachers at four schools and the TIS hired in Year 2 supported teachers in Pahranagat Valley.
Washoe County: Promethean Interactive Device Training
A portion of Washoe County’s grant funds were used to pay the salary of the district’s Professional
Development Coordinator who was also the project director in Year 2. In the role of PD Coordinator, he
provided over 100 hours of training to teachers on how to use the Promethean interactive whiteboard at
beginning and advanced levels. The training was offered to teachers through a series of training sessions
including one hour PD provided twice a month during PLC meetings, 1.5 hour sessions offered during early
release days, and eight hour training sessions on ActivBoard Core Essentials and ActivBoard Intermediate
Essentials. For the purposes of documenting impact of the professional development, only the 35 teachers
who received a new interactive whiteboard are considered grant participants, but it is important to note that
grant funds facilitated the training of hundreds of teachers in the district.
Professional Development Facilitated by Grant-Funded Technology Acquisition
While other funds covered the professional development expense for teachers in Douglas County, Elko
County and White Pine County, evaluators collected PD feedback data from these teachers because their
participation in the PD would not have been possible without the use of the ETIF Grant to purchase the
technology on which they were trained. For the purposes of this evaluation this includes 22 teachers from
Douglas County who participated in interactive whiteboard (Promethean), document camera (ActiView), and
Nevada Educational Technology Implementation Fund Grant Year 2 Evaluation 16

student response system (ActivExpression) training as well as two teachers from Elko County and one from
White Pine County who participated in the Nevada Pathway Project.
Pilot ProjectLincoln County was the only school district that planned and implemented a pilot project funded by the ETIF
Grant. In Year 1, the district launched a pilot of its 1:1 laptop program at one middle school. The
implementation built upon planning that had been happening at the school prior to receipt of the grant such
as curriculum redesign that included a focus on cross-curricular projects; the integration of technology into
core content areas to reinforce development of 21st Century Skills; a move toward online textbook adoption
and increased use of web-based instructional content and resources; and an overall interest in improving the
home/school connection by providing students with access to technology at home. In Year 2 the project
expanded from one middle school to all 6th-8th grade students in the district.
Technical ServicesThe majority of districts used grant funds to complete the technology purchasing plans put in place during
Year 1. The figure below shows the type of equipment districts purchased with ETIF Grant money in Year 2.
District Equipment Purchased Purchased For
Clark CountyTeacher WorkstationsSchool Servers
180 units dispersed among 10 schools
Douglas CountyInteractive whiteboardsLearner Response SystemiPads
Purchased for teachers who did not receive equipment in Year 1
Elko County Flip video cameras Two teachers
Esmeralda CountyiPadsLaptop computers
Purchased 23 units toward fulfilling plan for 1:1 student and teacher iPads
Humboldt County Teacher Workstations 75 teachers
Lincoln CountyTeacher and Student netbook computers
All 6th-8th grade students and teachers in the district
Pershing County Teacher Workstations eMints teachers
Storey County Classroom Computers20 units dispersed to 1st-5th grade classrooms
Washoe County Interactive whiteboards35 units for teachers who did not receive in Year 1
White Pine CountyStudent LaptopsStudent iPods
One teacher to facilitate 1:1
Nevada Educational Technology Implementation Fund Grant Year 2 Evaluation 17

InfrastructureDistricts that used grant funds to maintain or upgrade infrastructure included Clark County, Eureka County,
Lander County, Lyon County, and Mineral County. Of the five districts, only Clark County used grant funds to
renew its filtering and Novell licenses. Eureka County installed a wireless network at all three of its campuses.
Lander County completed the installation of new switches to improve network speed and reliability. Lyon
County completed its plan to improve network functionality and reliability. Mineral County completed
configuration of new servers that allow the IT staff to push content directly to teacher and student
workstations.
Nevada Educational Technology Implementation Fund Grant Year 2 Evaluation 18
Part Three: Outcomes by Funding Category
High Quality Content Material
Churchill County: SmartLab 21st Century Skills Curriculum
Evaluators gathered course feedback from four cohorts of students: 9th graders who had completed the
course in 2009-10, 8th graders who completed the course in fall 2010, 8th graders who completed the
course in spring 2011, and a small cohort of 8th graders who piloted a full year implementation of the
course.
9th Grade Retrospective on Intro to Technology Class
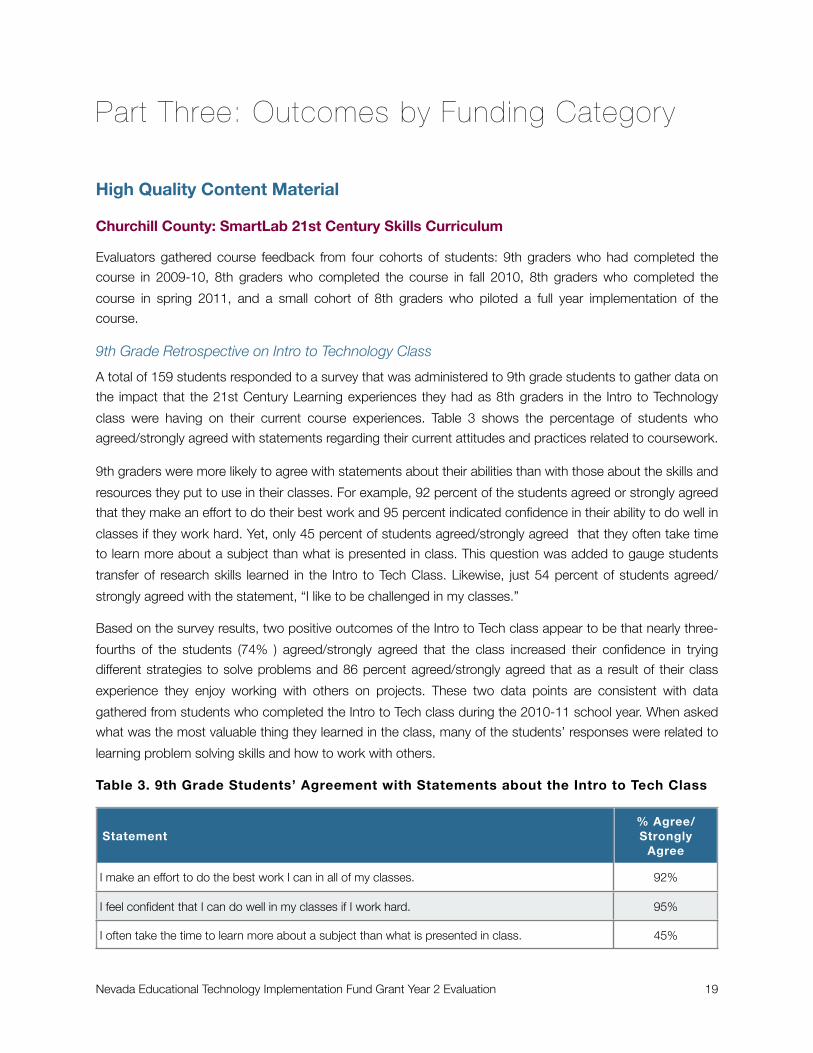
A total of 159 students responded to a survey that was administered to 9th grade students to gather data on
the impact that the 21st Century Learning experiences they had as 8th graders in the Intro to Technology
class were having on their current course experiences. Table 3 shows the percentage of students who
agreed/strongly agreed with statements regarding their current attitudes and practices related to coursework.
9th graders were more likely to agree with statements about their abilities than with those about the skills and
resources they put to use in their classes. For example, 92 percent of the students agreed or strongly agreed
that they make an effort to do their best work and 95 percent indicated confidence in their ability to do well in
classes if they work hard. Yet, only 45 percent of students agreed/strongly agreed that they often take time
to learn more about a subject than what is presented in class. This question was added to gauge students
transfer of research skills learned in the Intro to Tech Class. Likewise, just 54 percent of students agreed/
strongly agreed with the statement, “I like to be challenged in my classes.”
Based on the survey results, two positive outcomes of the Intro to Tech class appear to be that nearly three-
fourths of the students (74% ) agreed/strongly agreed that the class increased their confidence in trying
different strategies to solve problems and 86 percent agreed/strongly agreed that as a result of their class
experience they enjoy working with others on projects. These two data points are consistent with data
gathered from students who completed the Intro to Tech class during the 2010-11 school year. When asked
what was the most valuable thing they learned in the class, many of the students’ responses were related to
learning problem solving skills and how to work with others.
Table 3. 9th Grade Students’ Agreement with Statements about the Intro to Tech Class
Statement% Agree/Strongly
Agree
I make an effort to do the best work I can in all of my classes. 92%
I feel confident that I can do well in my classes if I work hard. 95%
I often take the time to learn more about a subject than what is presented in class. 45%
Nevada Educational Technology Implementation Fund Grant Year 2 Evaluation 19

Statement% Agree/Strongly
Agree
I feel the Intro to Tech class increased my confidence in trying different strategies to solve problems. 74%
I like to be challenged in my classes. 54%
As a result of my experience in the Intro to Tech class, I enjoy working with other classmates on projects
86%
I feel the Intro to Tech class increased my ability to communicate my thoughts to my teachers. 56%
I feel the Intro to Tech class increased my ability to communicate my thoughts to my peers. 67%
I feel confident in my ability to express my thoughts in writing to my teachers. 59%
I feel confident in my ability to express my thoughts in writing to my peers. 60%
I sometimes use skills I learned in the Intro to Tech class to complete assignments in the classes I have now.
65%
When given a class project, I take the time to set objectives for how I am going to accomplish the goals of the project.
68%
2010-11 8th Grade Course Feedback
The following data are gathered from survey responses of over 260 students who completed the Intro to
Tech class during the 2010-11 school year. Students completed an online course feedback survey at the end
of each semester (December 2010 and May 2011), in which they responded to questions related to the
SmartLab “engagements,” working with a partner, transfer of skills into other classes, and what they found
most valuable about the course experience. Students who participated in they full year pilot also responded
to questions similar to those presented to students on the 9th grade survey in order to establish a baseline
by which the district can measure impact of the course on this cohort as they move through high school.
Table 4. Number of Intro to Tech Class Survey Responses by Cohort
Cohort Response Count
Fall 2010 120
Spring 2010 117
Full Year Cohort (2010-11) 32
SmartLab Engagements
Engagements are the projects that students work on at each station in the SmartLab. They are presented at
three difficulty levels for each topic and student pairs are able to self-select the level at which they will
complete the tasks for a given engagement. As reported by the SmartLab Facilitator, most students begin at
the first level and, time permitting, move on to the increasingly difficult challenges presented in the
subsequent levels. The Facilitator estimated that students spent four to five days working on an engagement
before moving to the next station.
Nevada Educational Technology Implementation Fund Grant Year 2 Evaluation 20

Not surprisingly, students who took the class all year completed more engagements than those who took the
class for one semester. While the data in Table 5, below, show that students in the full year cohort
completed, on average, just two to three more engagements than either semester cohort, the Facilitator
indicated that, “the all year group does so much more. They get into deeper levels. They get to create their
own engagements and project ideas.” There are a total of 15 engagements in the SmartLab curriculum. In
Year 1 students only completed about 10 engagements. The Facilitator reported that as he becomes more
comfortable with the engagements and refines his student orientation to the class he is able to increase the
amount of time students have to spend on each engagement. His hope is that students will be able to
complete all 15 engagements during the 2011-12 school year.
Table 5. Number of Engagements Completed by Cohort
Cohort Average Mode
Fall 2010 11 11
Spring 2011 12 13
Full Year Cohort 14 15
Engagements that Students Enjoyed Most
While evaluators did not gather information about the full scope of activities involved with each of the
engagements, a list of those that students most enjoyed is presented in the table below to provide an
overview of the types of technology in which students are engaged based on the title of each engagement.
Students’ interest varied, with just one or two students picking a particular engagement as their favorite;
however, Stop Motion Animation, Sound Engineering, and Photoshop were selected as most enjoyable by
students in the fall and spring cohorts.
Table 6. Engagements that Students Found Most Enjoyable
Engagement
CohortCohort
EngagementFall 2010:
N=120Spring 2011:
N=149
Stop Motion Animation w/ Frames 25% 28%
Sound Engineering w/ Sony Acid 23% 27%
Drawing, Painting, and Photo Editing w/ Photoshop 22% 22%
Video Editing and Production with Sony Vegas 17% 26%
Principles of Flight w/ Flight Simulator 16% 18%
Pneumatic Circuits f/ the Pneumatics Lab Kit 14% 23%
Mechanical Engineering f/ fischertechnik 14% 21%
Robotics featuring Lego NXT 13% 22%
Nevada Educational Technology Implementation Fund Grant Year 2 Evaluation 21

What Students Found Memorable about the Engagements
Evaluators asked students to comment on what they found most memorable about the engagements. In
analyzing the responses, most students’ comments fell into two categories: having a sense of
accomplishment (i.e., the reward of hard work) and having new experiences with hands-on activities (e.g., “I
remember how fun it was to build and test our lego car”). Note that many of the STEM-based engagements
require students to build and test something.
Sense of Accomplishments
I remember when we finally put it to the test on the zip line and when we finally got it to work and it felt so good
I remember the Fischertechnik the best because that was the en-gagement that me and my partner got it done on time, and did great on it.
Making the fan move, it was really hard but really fun at the same time.
Hands-on Activity/New Experience
Making a movie
How we made the movie about what we like
Learning about Bernoulli’s Principle
Making funny pictures. And learning how to use photoshop
I liked playing with the little ball and trying to make it stay in the air for a
long time.
Making and listening to the music we make
I remember building things, and it was really fun.
Taking the pictures for the stop motion animation.
When we were at the Sim City station I remember creating our city and
then destroying it with natural disasters
We got to make cookies with the sun
Students’ Feedback on Intro to Tech Class Partnerships
Students work in pairs and do self- and peer-evaluations on their partnership. Communication and
collaboration in the partnership are key 21st Century skills that the school district wants to develop in its
students. Evaluators asked students to indicate their level of agreement with statements about their
partnership. Students were fairly consistent in their level of agreement across cohorts. For example, most
students (81%-86%) agreed or strongly agreed that they enjoyed working with a partner, that they had a
good partner (78%-84%), and that they were a good partner (81%-88%). Although students indicated that
they enjoyed working with a partner, the percentage of students who agreed or strongly agreed that they
want to work with a partner in other classes drops to a low of 59 percent for students in the spring 2010
cohort and 69 percent for students in the full year cohort. Students were also less likely to agree/strongly
agree with the statement, “I learned more from the engagements by working with a partner;” however, those
Nevada Educational Technology Implementation Fund Grant Year 2 Evaluation 22

that did agree with the statement represent the majority, which is consistent with students’ comments about
the value of working in a partnership.
Table 7. Students’ Level of Agreement with Statements about Working with a Partner
Statement
Percent Who Agree/Strongly AgreePercent Who Agree/Strongly AgreePercent Who Agree/Strongly Agree
Statement Fall 2010(N=120)
Spring 2011(N=117)
Full Year Cohort(N=32)
I enjoyed working with a partner. 86% 81% 84%
I had a good partner. 84% 81% 78%
I was a good partner. 88% 85% 81%
I want to do more work with partners in my other classes. 72% 59% 69%
I learned more from the engagements by working with a partner. 73% 73% 66%
Transfer of Problem Solving Skills to Science Class
Evaluators asked students to indicate the frequency with which they applied problem solving skills used in
the Intro to Tech class to solve problems in their science class. As shown in Figure 1 on the following page,
students in the full year cohort were twice as likely as students in either semester cohort to report the transfer
of skills “many times.” The majority of students in the full year cohort (84%) also agreed/strongly agreed with
the statement, “I sometimes use skills I learned in the Intro to Tech class to complete assignments in my
other classes.”
Most Valuable Thing Students Learned in the Intro to Tech Class
When students were asked to indicate the most valuable thing they learned in the Intro to Tech class, their
responses fell into six categories: technology skills, problem solving skills, how to work with others, real-
world skills/knowledge, persistence/determination, and time management/organization skills. Figure 2, on the
following page, includes student quotes related to each of the categories.
Nevada Educational Technology Implementation Fund Grant Year 2 Evaluation 23

Figure 1. Frequency of Students’ Transfer of Intro to Tech Skills to Science Class
Figure 2. Student Comments about the Most Valuable Thing They Learned in the Intro to Tech Class
Student Quotes
Technology Skills
How to use the various computer programs
How to do Photoshop
How to work with technology in an efficient way
Working with Others
The most valuable thing that I learned in this class was learning how to work with a partner and having both of us doing something instead of one of us doing all
the work.
If you don’t get along with your partner, you’re not going to get very far.
Real world skills/Knowledge
How to do circuitry because that could make up a real job.
How to conserve energy by using solar energy
Time Management and Organizational Skills
I learned how to manage my time more effectively and ways to toy around with things I don’t know about to learn what they do
Time management is the most important thing I learned
I learned that you have to stay organized in order to do things simple and easily.
Not at All A Few Times Many Times
0%
25%
50%
75%
100%
Fall 2010 Spring 2011 2010-11
41%20%22%
38%
53%54%
22%27%24%
Nevada Educational Technology Implementation Fund Grant Year 2 Evaluation 24

Student Quotes
Problem Solving Skills
How to work with our partner and not be told how to do everything. We had to lear it on our own.
The most valuable thing that i learned is that sometimes when your working with
a program it can be frustrating because you never used it before and you don't know what each tool does . i learned to never give on something just because it is hard. just keep on trying and you will figure it out sometime.
That you always cant just get the answer. You have to figure a way to do it.
How to work with our partner and not be told how to do everything. We had to
lear it on our own.
Persistence and determination
How to work together and how to do a lot of the things I couldn’t figure to how to do earlier
That building stuff is really fun. And girls can do anything a boy can and I really
enjoy that
That you can do anything if you put your mind to it
Don't give up and always look for solutions
Students Overall Rating of the Intro to Tech Class
Students’ overall rating of the Intro to Tech class was consistent across all cohorts. Nearly all of the students
from each cohort (90%-95%) rated the class “good” or “great.”
Table 8. Students’ Rating of the Intro to Tech Class by Cohort
StatementFall 2010(N=120)
Spring 2011(N=117)
Full Year Cohort(N=32)
Needs Improvement <1% 1% 6%
Satisfactory 4% 9% 3%
Good 28% 29% 28%
Great 67% 61% 63%
Clark County: FASTT Math Fact Fluency Software
Grant funds were used to support implementation of FASTTMath at 10 schools in Year 1 of the grant and 10
more in Year 2. The outcome data presented below represent 19 schools because one of the schools never
started using the program. The implementation data are summarized from program-generated
Implementation and Summary reports that evaluators received from the FASTTMath District Coordinator;
feedback data are summarized from evaluator-administered surveys and face-to-face teacher interviews.
Nevada Educational Technology Implementation Fund Grant Year 2 Evaluation 25
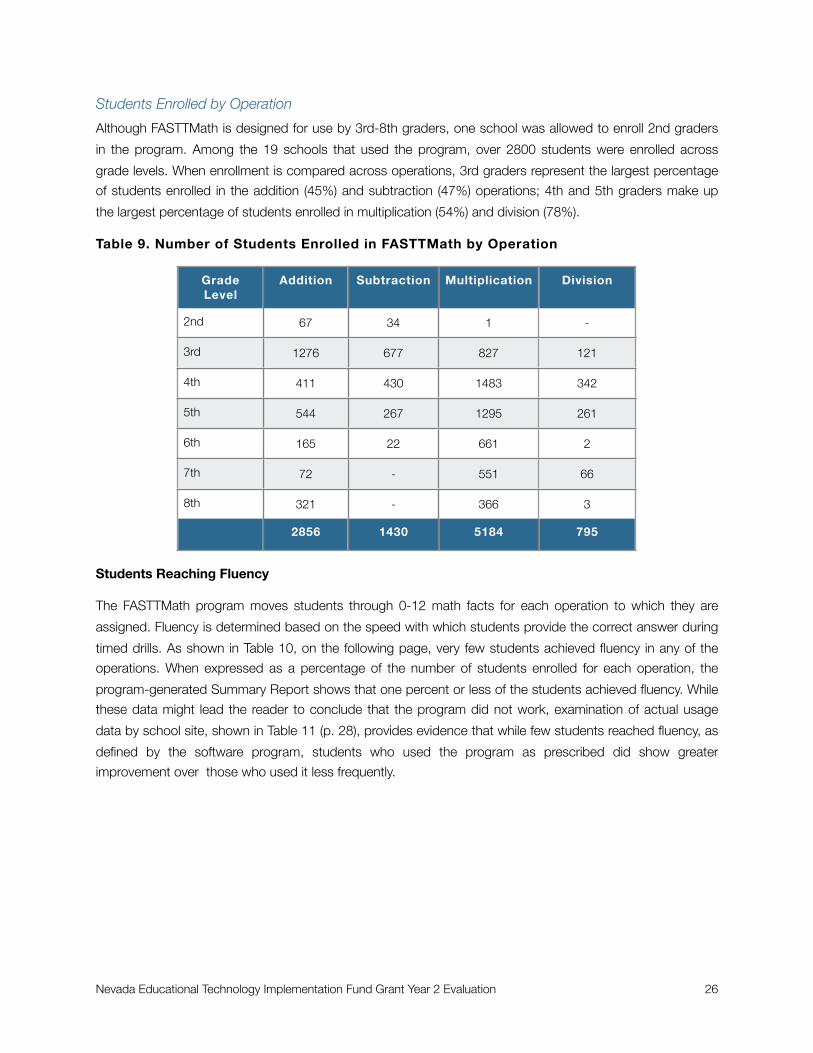
Students Enrolled by Operation
Although FASTTMath is designed for use by 3rd-8th graders, one school was allowed to enroll 2nd graders
in the program. Among the 19 schools that used the program, over 2800 students were enrolled across
grade levels. When enrollment is compared across operations, 3rd graders represent the largest percentage
of students enrolled in the addition (45%) and subtraction (47%) operations; 4th and 5th graders make up
the largest percentage of students enrolled in multiplication (54%) and division (78%).
Table 9. Number of Students Enrolled in FASTTMath by Operation
Grade Level
Addition Subtraction Multiplication Division
2nd 67 34 1 -
3rd 1276 677 827 121
4th 411 430 1483 342
5th 544 267 1295 261
6th 165 22 661 2
7th 72 - 551 66
8th 321 - 366 3
2856 1430 5184 795
Students Reaching Fluency
The FASTTMath program moves students through 0-12 math facts for each operation to which they are
assigned. Fluency is determined based on the speed with which students provide the correct answer during
timed drills. As shown in Table 10, on the following page, very few students achieved fluency in any of the
operations. When expressed as a percentage of the number of students enrolled for each operation, the
program-generated Summary Report shows that one percent or less of the students achieved fluency. While
these data might lead the reader to conclude that the program did not work, examination of actual usage
data by school site, shown in Table 11 (p. 28), provides evidence that while few students reached fluency, as
defined by the software program, students who used the program as prescribed did show greater
improvement over those who used it less frequently.
Nevada Educational Technology Implementation Fund Grant Year 2 Evaluation 26

Table 10. Number of Students Reaching Fluency by Grade Level & Operation
Grade Addition Subtraction Multiplica-tion
Division
2nd 0 0 0 0
3rd 4 1 3 1
4th 1 0 10 1
5th 4 1 9 2
6th 0 0 7 1
7th 2 0 16 2
8th 0 0 9 2
Total 11 2 54 8
% of Students Enrolled in Operation
0.4% 0.1% 1% 1%
Table 11 (p. 28) shows that when students use the program as prescribed, (three or more times per week for
at least 15 minutes each time) they have a greater increase in their current fluency compared to their baseline
placement assessment. Five of the schools where students used the program in this way showed a 100%
increase in the percentage of students who improved their fluency levels. For example (refer to the
highlighted row in the Table 11), after taking the placement assessment, students at Craig Elementary School
were determined to have about 25 percent mastery of their math facts. At the end of the 2010-11 school
year, students who used the program three or more times a week had reached 54 percent mastery of their
math facts, compared to students who had used the program less than three times per week reaching 40
percent mastery of their math facts. In another example, students at Hinman Elementary School who used
the program as prescribed saw a 111 percent increase in mastery of their math facts compared to a 59
percent increase for students who used the program less than the prescribed amount of time.
To further illustrate the success of the program in helping students improve their math facts fluency, Table 11
shows that, on average, students who used the program as prescribed saw a 72 percent increase in their
fluency growth rate compared to an average 37 percent increase in fluency growth for students who used
the program less than three times per week. Based on data evaluators gathered during teacher interviews,
one explanation for the low number of students determined to be fluent in a given operation is that students
are not using the program for the following reasons: 1) limited access to computers to properly implement; 2)
teachers’ concerns about students losing instructional time; and 3) competition with other math programs
teachers are already using. Other plausible explanations are students’ limited keyboarding skills that make it
difficult to enter their response quickly enough for the program to determine the student knows the math
fact. Also, technical problems that teachers had with the program early in the school year (i.e., the server
went down, problems enrolling new students, and the program forcing students to repeat operations they
had already mastered) may have turned teachers off from using the program.
Nevada Educational Technology Implementation Fund Grant Year 2 Evaluation 27
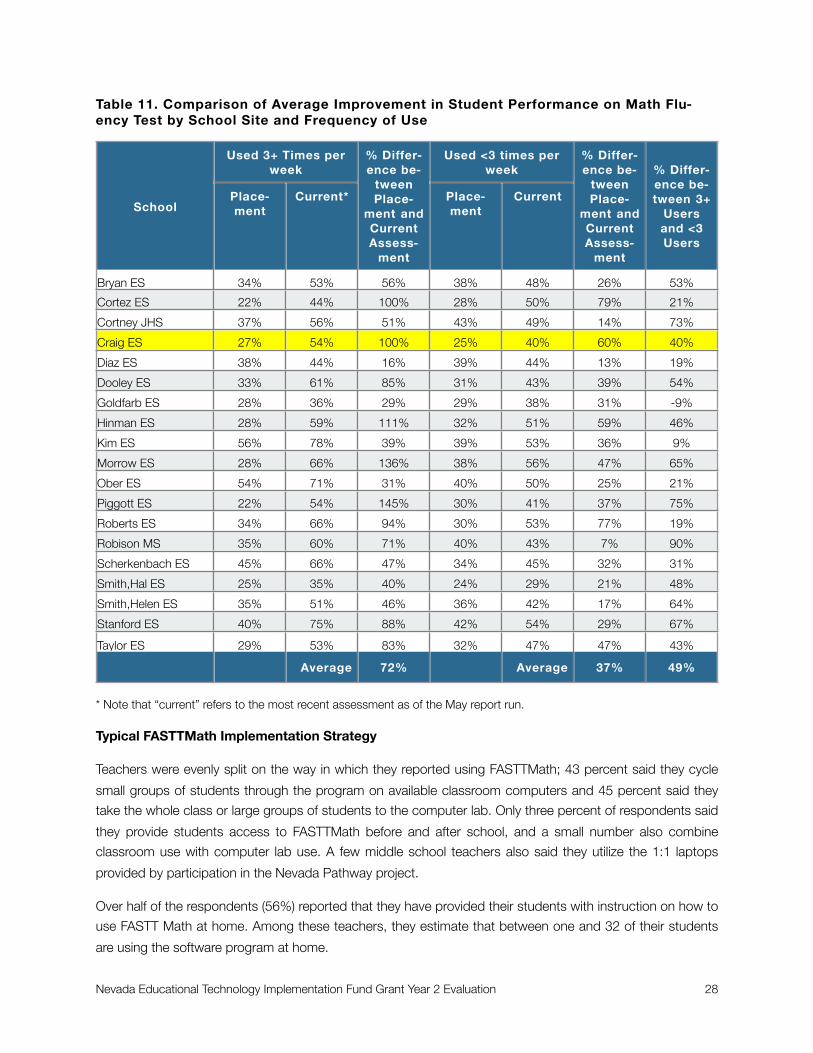
Table 11. Comparison of Average Improvement in Student Performance on Math Flu-ency Test by School Site and Frequency of Use
School
Used 3+ Times per week
Used 3+ Times per week
% Differ-ence be-
tween Place-
ment and Current Assess-
ment
Used <3 times per week
Used <3 times per week
% Differ-ence be-
tween Place-
ment and Current Assess-
ment
% Differ-ence be-tween 3+
Users and <3 Users
SchoolPlace-ment
Current*
% Differ-ence be-
tween Place-
ment and Current Assess-
ment
Place-ment
Current
% Differ-ence be-
tween Place-
ment and Current Assess-
ment
% Differ-ence be-tween 3+
Users and <3 Users
Bryan ES 34% 53% 56% 38% 48% 26% 53%
Cortez ES 22% 44% 100% 28% 50% 79% 21%
Cortney JHS 37% 56% 51% 43% 49% 14% 73%
Craig ES 27% 54% 100% 25% 40% 60% 40%
Diaz ES 38% 44% 16% 39% 44% 13% 19%
Dooley ES 33% 61% 85% 31% 43% 39% 54%
Goldfarb ES 28% 36% 29% 29% 38% 31% -9%
Hinman ES 28% 59% 111% 32% 51% 59% 46%
Kim ES 56% 78% 39% 39% 53% 36% 9%
Morrow ES 28% 66% 136% 38% 56% 47% 65%
Ober ES 54% 71% 31% 40% 50% 25% 21%
Piggott ES 22% 54% 145% 30% 41% 37% 75%
Roberts ES 34% 66% 94% 30% 53% 77% 19%
Robison MS 35% 60% 71% 40% 43% 7% 90%
Scherkenbach ES 45% 66% 47% 34% 45% 32% 31%
Smith,Hal ES 25% 35% 40% 24% 29% 21% 48%
Smith,Helen ES 35% 51% 46% 36% 42% 17% 64%
Stanford ES 40% 75% 88% 42% 54% 29% 67%
Taylor ES 29% 53% 83% 32% 47% 47% 43%
Average 72% Average 37% 49%
* Note that “current” refers to the most recent assessment as of the May report run.
Typical FASTTMath Implementation Strategy
Teachers were evenly split on the way in which they reported using FASTTMath; 43 percent said they cycle
small groups of students through the program on available classroom computers and 45 percent said they
take the whole class or large groups of students to the computer lab. Only three percent of respondents said
they provide students access to FASTTMath before and after school, and a small number also combine
classroom use with computer lab use. A few middle school teachers also said they utilize the 1:1 laptops
provided by participation in the Nevada Pathway project.
Over half of the respondents (56%) reported that they have provided their students with instruction on how to
use FASTT Math at home. Among these teachers, they estimate that between one and 32 of their students
are using the software program at home.
Nevada Educational Technology Implementation Fund Grant Year 2 Evaluation 28

Figure 3. Teachers’ Estimate of the Number of Students Using FASTTMath at Home
Teachers’ Satisfaction with FASTTMath
Teachers were asked to indicate their level of satisfaction with various expected outcomes of using the
software. Over two-thirds of the teachers indicated that they were satisfied or very satisfied that FASTTMath
increased student motivation to learn math facts (68%) and improved students’ math facts fluency (66%).
However, when asked about their level of satisfaction that using FASTTMath helped students with knowledge
transfer, only 55 percent reported that they were satisfied or very satisfied that students were able to transfer
math facts fluency to either their daily math work or to teacher-created assessments. Below are comments
from teacher interviews in which they share their thoughts on the FASTTMath program helping students with
knowledge transfer.
I have felt like a lot of my students who didn’t know their facts going in are doing a lot better. I had some that I thought would move through a lot faster. I still have some on multiplication 2s , 3s and
4s. When we started out they were progressing pretty fast and now it’s slowing down. I thought they would be able to transfer more into our every day lessons. Some can only do it in the fM setting. Some kids still have trouble. But the majority of the class is able to apply some of the facts, but the
transfer isn’t complete.
As for the fluency I think it’s gotten better but I still want to see them make those connections. They
know it discretely, but if you turn it around on them they can’t do it as fast. They know 7x8 is 56, but if you ask them what is the relation of 56 and 7 they can’t answer it.
I had one student who at placement only had mastered zeros and ones and now she’s on 9’s. It took
all year but she moved along.
I would say with my fifth graders I see a transfer. Because they have a command of their multiplica-
tion facts it makes it easier to teach things like equivalent fractions and multiplication of fractions. Plus two-digit by two-digit transfer. To see that transition was amazing. With my fourth graders it took longer to see the transfer. I’m seeing it now because we’ve been doing it all year. We’re going
back to revisit long division and I see a difference because they’re not searching for those numbers to use.
1-5 6-10 11-15 16-20 20+
7%9%
8%
20%
56%
Nevada Educational Technology Implementation Fund Grant Year 2 Evaluation 29
One of my lowest girls in math I noticed that she was really moving along. And then I asked if she was doing it at home and she said yes. Now she’s in division. She’s a bout a C student, but she’s
blowing it out of the water compared to my other students.
Recommending FASTTMath to Other Teachers
Most of the teachers (88%) said that they would recommend FASTTMath to other teachers interested in
improving their students’ math facts fluency, but some of these positive recommendations came with
caveats. Teachers who indicated that they would not recommend FASTTMath also shared reasons why they
would not do so. Among these were the amount of time it takes to implement use of the program. One
teacher commented, “It is time consuming. For home use it is fine. When the students are taking 10-15 min.
each, it takes a long time to get to every student. It also keeps them from what we are learning for a longer
period of time.” This seemed to be a common sentiment among teachers who were interviewed. Evaluators
did not interview any teachers who adopted FASTTMath as a replacement for what they were previously
doing to help students learn their math facts. Teachers who were required to allocate time to FASTTMath
expressed some resentment that this requirement was infringing on their instructional time. Also some
teachers did not feel that FASTTMath helped students any better than paper/pencil drills or other software
programs that they were already using. To that end, teachers considered FASTTMath a supplemental
program that they used because students liked to play the games.
Another caveat attached to recommending use of FASTTMath had to do with they type of computer upon
which it would be used. Teachers whose students use FASTTMath on laptops feel that their students are at a
disadvantage on the timed drills because the placement of numbers on the laptop keyboard is not the same
as on an extended keyboard used with a desktop computer. These teachers felt that their students
“languished” at lower levels for long periods of time, not because they did not know the facts, but because
they were taking too long to identify the numbers on the keyboard. Keyboarding issues also seemed to be a
problem for students in lower grades.
Comments in Favor of Recommending FASTTMath
I have used other math programs in my class. I never saw the same level of excitement about math as I did when I started using Fastt Math. The students loved to play the games on the program.
This helps with automaticity and students like the program.
It provides the facts practice that I can't provide in class.
It's easy to use and it works.
Comments Against Recommending FASTTMath
I think it is trying to be too much. It is fine for improving fluency, but your implementation guide talks about using small groups, grouping, worksheets, reports,.interventions at particular skill deficiencies;
not stuff I have time for when this is just a fact practice program. I think it is probably too expensive for being really a glorified worksheet for unmotivated kids who won't practice at home. I already have
a math program, several in fact, don't need another. If you want to be a comprehensive math curricu-lum, than do so, but no teacher has time for two math programs a day.
Nevada Educational Technology Implementation Fund Grant Year 2 Evaluation 30
This program is ineffective in improving student performance. Part of the problem may be that we use
primarily laptop computers therefore numbers on keyboard slow the students down significantly.
It works very well as long as you continue. I noticed during crts and we didn't have as much time they
lost some of their facts.
Summary of Outcomes for Investment in High Quality Content
SmartLab
The overall outcomes for the investment in high quality content were positive. In the case of the SmartLab
implementation, the project director and the SmartLab Facilitator are pleased with the implementation of the
Intro to Technology class and plan to continue offering the option of taking the course all year long for a small
cohort of students. Notable outcomes for Churchill County include the following:
By their own report, students have learned important 21st Century skills such as collaboration and problem solving
The majority of students who took the class for a whole year indicated that they transferred the skills learned in the Intro to Tech class to their other classes
The district is using county bond money to expand the SmartLab to the high school
The district has been selected to pilot a proposed SmartLab implementation for elementary students
One of the project director’s goals for the 2011-12 school year is to develop a final exam for the class in an
effort to quantify student learning outcomes. In terms of long term sustainability, the project director’s biggest
concern is limited funds to replace the SmartLab computers in 3-5 years.
FASTTMath
It is fair to say that for as many teachers who had negative comments about FASTTMath, there were an
equal number who liked it and expressed appreciation for having access to it as an added resource. In a
request for final comments related to using the program, one teacher wrote, “Please let us continue the
program for next year,” and another wrote, “ I really dislike this program and feel it is a waste of precious
classroom time.” Teachers’ anecdotal data about students being upset if they did not get to use FASTTMath
were matched against other teacher reports that their students were bored by the games. Given the available
data points regarding FASTTMath implementation, evaluators believe that in subsequent years there will
continue to be disparity in the extent to which teachers use the program. With evidence that using the
program as prescribed does lead to knowledge gain for students, and knowing that some schools are better
equipped and some teachers are more likely to use the program, evaluators recommend that Clark County
consider transferring product licenses from schools that had low or no usage to schools that are interested in
using the program and have the capacity to support the prescribed usage.
Nevada Educational Technology Implementation Fund Grant Year 2 Evaluation 31
Professional Development
Structured, Face-to-Face Professional Development: Carson City, Douglas County,
Washoe County
The outcomes for teacher professional development on the use of interactive whiteboards and other
technologies varied depending on the structure of the professional development model. In Carson City and
Douglas County school districts, teachers participated in sequential training sessions that continued to build
upon their skill set. In between group training sessions teachers had support in the form of Site Trainers in
Carson City and mentors in Douglas County. In Washoe County, the PD model, by circumstance of having
just one trainer in the district, was to train as many teachers as possible; however, these teachers received
fewer hours of training and did not have ongoing site-based support from other teachers. The availability of
site-based support appears to be critical to the frequency and degree to which teachers use their interactive
whiteboard. In Washoe County, most of the teachers who responded to the feedback survey were those that
had been trained only in Year 2 as was the case with teachers in Carson CIty. The difference, however, in
observed use between the two districts was stark. With teachers in all three districts rating their training very
highly, the difference in outcomes does not appear to be the quality of the training or the trainer, as much as
the availability of ongoing support from peers. In Carson City, Site Trainers provide just-in-time support to
teachers and in Douglas County a cohort of teachers who were trained in Year 1 participated in a four-day
training session that prepared them to serve as Level 1 trainers on the use of the Promethean Board and the
ActivInspire software back at their school site. This level of support was not available to teachers in Washoe
County.
Evaluators made site visits to all three districts where classroom observation and teacher interview data were
gathered. Observation data reveal that teachers in Carson City and Douglas County are making use of their
interactive technologies (SMART Boards in Carson City and interactive slates, student response systems,
and whiteboards in Douglas County) at a more advanced level than teachers in Washoe County. To be fair,
only three classroom observations were conducted in Washoe County because of last minute scheduling
conflicts of which they evaluator was not aware until she showed up. However, during his interview with the
evaluator, the project director expressed concern that teacher use of the whiteboards had not progressed
much from Year 1.
Examples of Observed Teacher and Student Use of Interactive Technology
Carson City School District
Evaluators observed various uses of the SMART Board ranging from teacher lesson management (i.e.,
posting lesson objectives and vocabulary words) to teacher-directed instruction aided by SMART Board
tools, to student interaction with the board. The ways that teachers used the board for instructional purposes
included using it as a projector to display worksheets that were placed on the document camera, playing
educational videos, using the “reveal” tools to make question and answer sessions interactive, and
customizing the various games included with the SMART Board software to teach concepts. Below are short
Nevada Educational Technology Implementation Fund Grant Year 2 Evaluation 32

summaries of some of the ways evaluators observed the SMART Board being used in elementary and high
school classrooms.
In a high school classroom with students who have mild to sever mental disabilities, evaluators observed
engaging uses of the SMART Board. These included student-guided use of tools and games to move
through bell work such as the calendar activity in which students manipulate items on the board to select the
date and day of the month. Students also went to the SMART Board to do a weather activity and a math
counting game where they placed “coins” into a bank. The teacher in this classroom did an excellent job of
integrating the SMART Board with students at varying ability levels. Two of the students in her class are non-
verbal, but with the help of an aide they were engaged in the class activity. The students with mild disabilities
were completely engaged in the lesson activities. They are comfortable using the technology and the teacher
does very little hands on at the board, allowing students to manipulate interactive features of the SMART
Board to move through the lesson.
In a 3rd grade class a teacher was observed doing a lesson on compound words. A clue (e.g. “a place to
play at school”) was shown on the board and students had to write down the compound word on a sheet of
paper. Then a student was randomly selected (using an embedded SMART Board tool) to come up to the
board and “reveal” the answer. The teacher also used the board to project a Discovery Education video.
A similar activity was observed in a 1st grade classroom where the teacher used the SMART Board to assist
in teaching sound recognition and spelling. The teacher had her lesson completely organized in a series of
Notebook pages so when one activity was completed she was able to quickly move to the next activity by
tapping the board to “flip” the page. The activities on the board corresponded with a workbook that students
were using and included animated flash cards, audio “word sound” files, and an interactive assessment
where students respond out loud to the question and the teacher slid the “finger detective” graphic across
the board to reveal the answer.
Douglas County School District
Teachers were observed using the Promethean tools to actively engage students in lesson activities.
Evaluators observed a great deal of comfort among teachers in allowing students to “take charge” of the
lesson. Students, more than teachers, were observed interacting with the Promethean Board. Most notable
in characterizing what was observed during the site visit was the seamless use of the various tools. Students
knew which tools to use, how to use them, and when to use them. It was remarkable that teachers did not
make a lot of announcements indicating a transition to another technology tool (e.g., “Now take out your
responder). Instead teachers just taught their lesson and students were able to follow along and use the
ActivExpression responders in the same way they might pick up a pen or pencil to take a test on paper. This
high level of use was primarily observed in the classrooms of teachers who had participated in two years of
training. The one teacher who was interviewed/observed that had only been trained during Year 2, had a
more basic and teacher-directed use of the tools.
An evaluator observed a 5th grade social studies class in which students were reviewing the causes of the
Revolutionary War. Students were in groups and each group had a turn to respond to questions displayed on
the Flipchart review the teacher had developed. Each group discussed its answers and chose one student to
Nevada Educational Technology Implementation Fund Grant Year 2 Evaluation 33
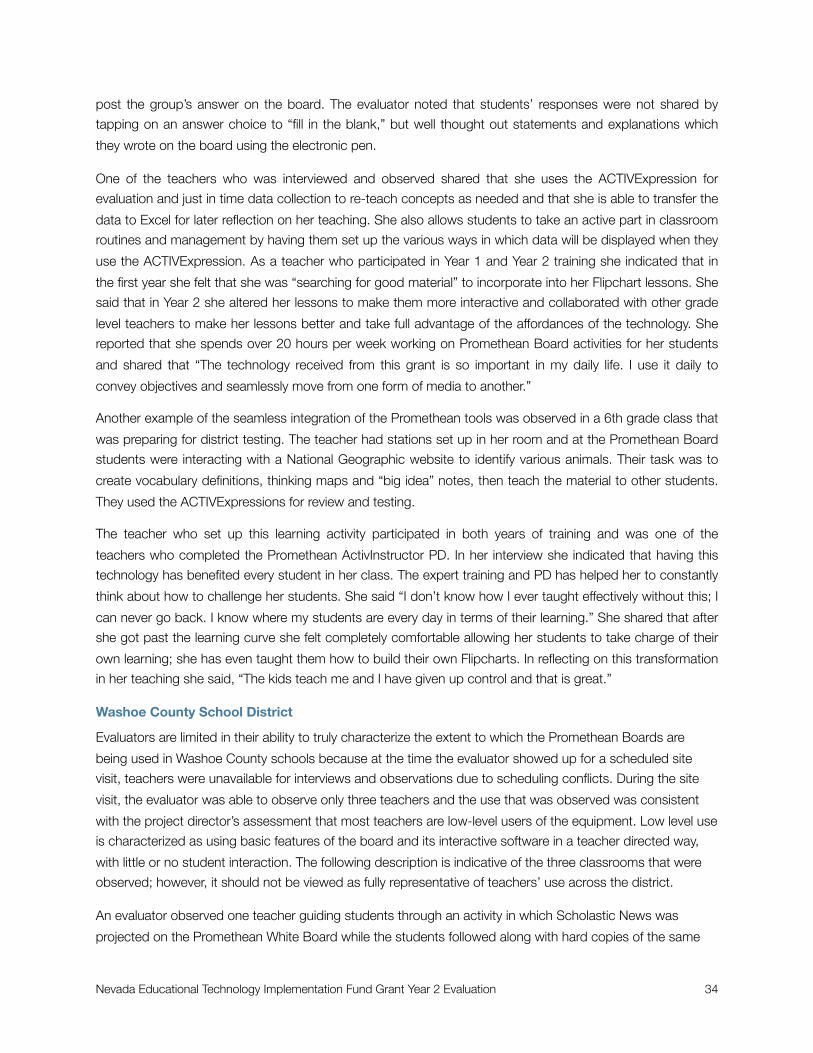
post the group’s answer on the board. The evaluator noted that students’ responses were not shared by
tapping on an answer choice to “fill in the blank,” but well thought out statements and explanations which
they wrote on the board using the electronic pen.
One of the teachers who was interviewed and observed shared that she uses the ACTIVExpression for
evaluation and just in time data collection to re-teach concepts as needed and that she is able to transfer the
data to Excel for later reflection on her teaching. She also allows students to take an active part in classroom
routines and management by having them set up the various ways in which data will be displayed when they
use the ACTIVExpression. As a teacher who participated in Year 1 and Year 2 training she indicated that in
the first year she felt that she was “searching for good material” to incorporate into her Flipchart lessons. She
said that in Year 2 she altered her lessons to make them more interactive and collaborated with other grade
level teachers to make her lessons better and take full advantage of the affordances of the technology. She
reported that she spends over 20 hours per week working on Promethean Board activities for her students
and shared that “The technology received from this grant is so important in my daily life. I use it daily to
convey objectives and seamlessly move from one form of media to another.”
Another example of the seamless integration of the Promethean tools was observed in a 6th grade class that
was preparing for district testing. The teacher had stations set up in her room and at the Promethean Board
students were interacting with a National Geographic website to identify various animals. Their task was to
create vocabulary definitions, thinking maps and “big idea” notes, then teach the material to other students.
They used the ACTIVExpressions for review and testing.
The teacher who set up this learning activity participated in both years of training and was one of the
teachers who completed the Promethean ActivInstructor PD. In her interview she indicated that having this
technology has benefited every student in her class. The expert training and PD has helped her to constantly
think about how to challenge her students. She said “I don’t know how I ever taught effectively without this; I
can never go back. I know where my students are every day in terms of their learning.” She shared that after
she got past the learning curve she felt completely comfortable allowing her students to take charge of their
own learning; she has even taught them how to build their own Flipcharts. In reflecting on this transformation
in her teaching she said, “The kids teach me and I have given up control and that is great.”
Washoe County School District
Evaluators are limited in their ability to truly characterize the extent to which the Promethean Boards are
being used in Washoe County schools because at the time the evaluator showed up for a scheduled site
visit, teachers were unavailable for interviews and observations due to scheduling conflicts. During the site
visit, the evaluator was able to observe only three teachers and the use that was observed was consistent
with the project director’s assessment that most teachers are low-level users of the equipment. Low level use
is characterized as using basic features of the board and its interactive software in a teacher directed way,
with little or no student interaction. The following description is indicative of the three classrooms that were
observed; however, it should not be viewed as fully representative of teachers’ use across the district.
An evaluator observed one teacher guiding students through an activity in which Scholastic News was
projected on the Promethean White Board while the students followed along with hard copies of the same
Nevada Educational Technology Implementation Fund Grant Year 2 Evaluation 34

content. Students had no interaction with the board during this activity. Instead they sat in their seats telling
the teacher what to underline as the correct answer to the questions on their handout. Eventually they were
called to the board to drag and sort animals based on the content of the readings in the articles. The rest of
the class was asked to agree or disagree with the choice made by the student at the board who then tapped
it to reveal if the answer was correct.
Highlights of Teacher Survey Data: Carson City, Douglas County, Washoe County
When asked how comfortable they felt using the interactive whiteboard in Year 2 of the grant compared to
their comfort level in Year 1, 74 percent of the teachers indicated that they were “comfortable” or “very
comfortable.” Nearly all of the teachers (90%) from Carson City, Douglas County and Washoe County school
districts, who responded to the Technology Use Survey, indicated that they use their interactive whiteboard
daily and nearly half of those respondents (49%) reported that they use the board more than half of a given
class period. While teachers reported that students’ use of the interactive whiteboard is less frequent than
their own use, 90 percent of teachers agreed or strongly agreed with the statement, “Students are using
technology more this year than they did last year,” and 97 percent of respondents agreed or strongly agreed
with the statement, “I am often looking for ways to increase students’ use of technology.”
Figure 4. Frequency of Teachers’ Technology Use in a Given Class Period
Less than 1/2 of the period Half of the periodMore than 1/2 of the period The whole period
13%
49%
19%
19%
Nevada Educational Technology Implementation Fund Grant Year 2 Evaluation 35
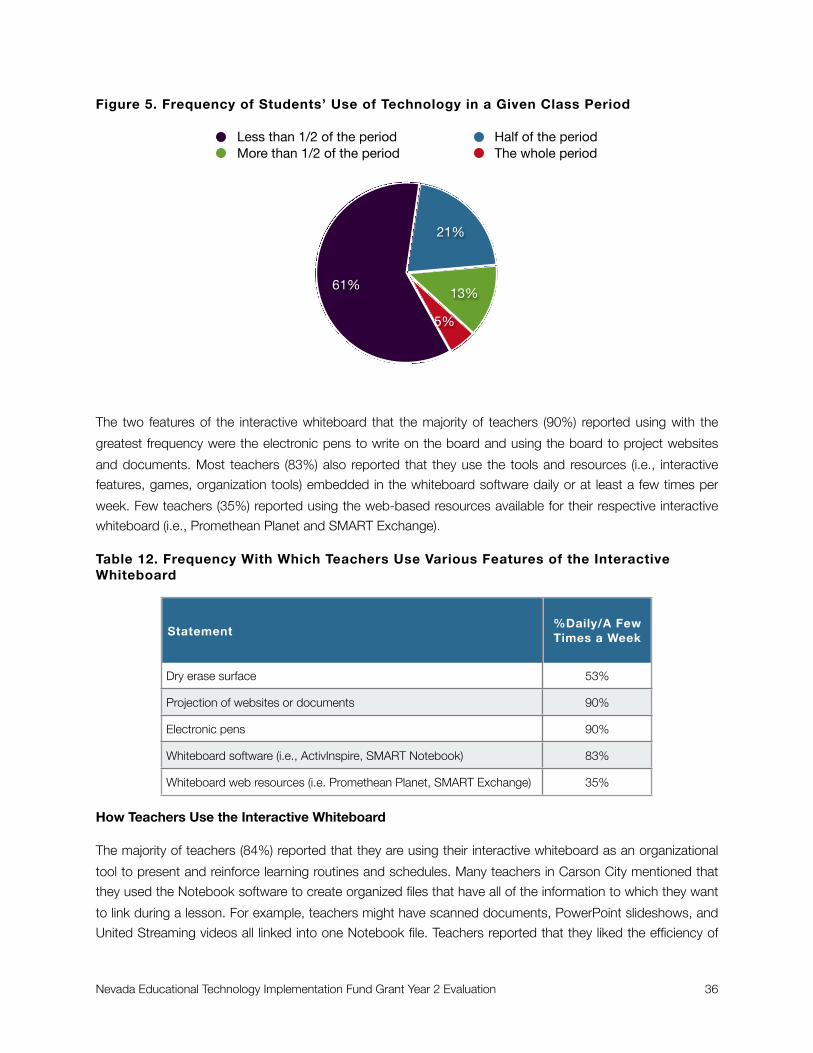
Figure 5. Frequency of Students’ Use of Technology in a Given Class Period
The two features of the interactive whiteboard that the majority of teachers (90%) reported using with the
greatest frequency were the electronic pens to write on the board and using the board to project websites
and documents. Most teachers (83%) also reported that they use the tools and resources (i.e., interactive
features, games, organization tools) embedded in the whiteboard software daily or at least a few times per
week. Few teachers (35%) reported using the web-based resources available for their respective interactive
whiteboard (i.e., Promethean Planet and SMART Exchange).
Table 12. Frequency With Which Teachers Use Various Features of the Interactive Whiteboard
Statement%Daily/A Few Times a Week
Dry erase surface 53%
Projection of websites or documents 90%
Electronic pens 90%
Whiteboard software (i.e., ActivInspire, SMART Notebook) 83%
Whiteboard web resources (i.e. Promethean Planet, SMART Exchange) 35%
How Teachers Use the Interactive Whiteboard
The majority of teachers (84%) reported that they are using their interactive whiteboard as an organizational
tool to present and reinforce learning routines and schedules. Many teachers in Carson City mentioned that
they used the Notebook software to create organized files that have all of the information to which they want
to link during a lesson. For example, teachers might have scanned documents, PowerPoint slideshows, and
United Streaming videos all linked into one Notebook file. Teachers reported that they liked the efficiency of
Less than 1/2 of the period Half of the periodMore than 1/2 of the period The whole period
5%
13%
21%
61%
Nevada Educational Technology Implementation Fund Grant Year 2 Evaluation 36
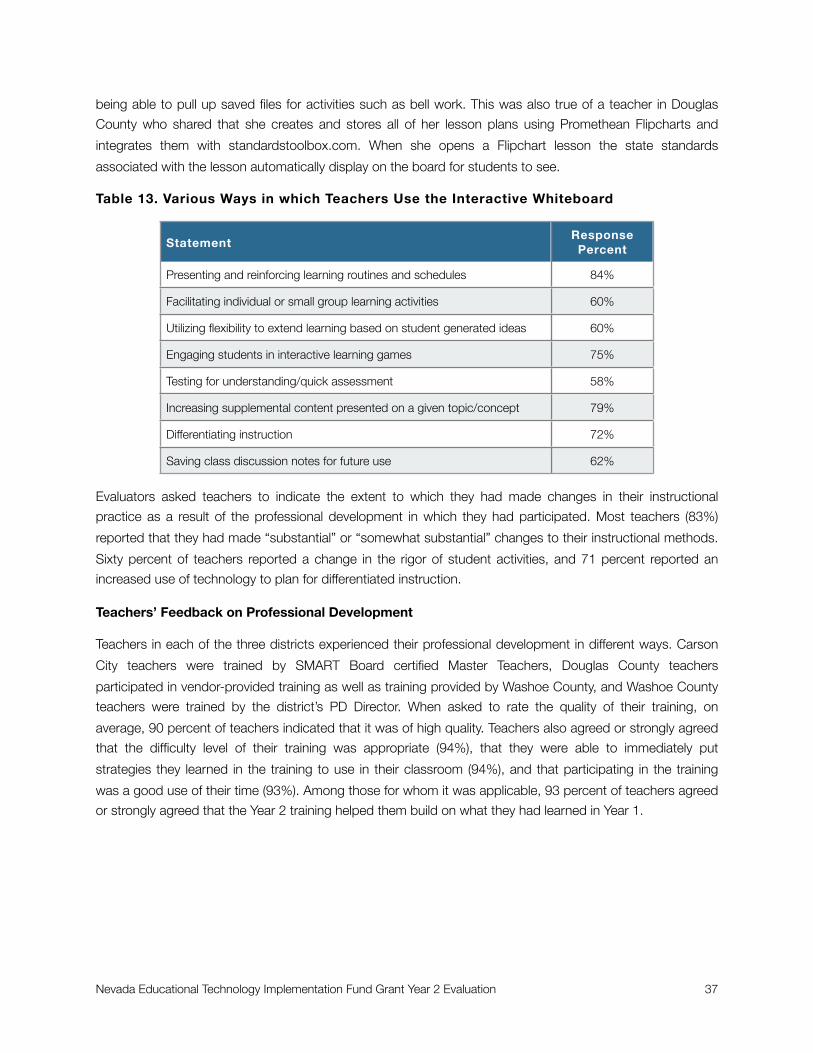
being able to pull up saved files for activities such as bell work. This was also true of a teacher in Douglas
County who shared that she creates and stores all of her lesson plans using Promethean Flipcharts and
integrates them with standardstoolbox.com. When she opens a Flipchart lesson the state standards
associated with the lesson automatically display on the board for students to see.
Table 13. Various Ways in which Teachers Use the Interactive Whiteboard
StatementResponse
Percent
Presenting and reinforcing learning routines and schedules 84%
Facilitating individual or small group learning activities 60%
Utilizing flexibility to extend learning based on student generated ideas 60%
Engaging students in interactive learning games 75%
Testing for understanding/quick assessment 58%
Increasing supplemental content presented on a given topic/concept 79%
Differentiating instruction 72%
Saving class discussion notes for future use 62%
Evaluators asked teachers to indicate the extent to which they had made changes in their instructional
practice as a result of the professional development in which they had participated. Most teachers (83%)
reported that they had made “substantial” or “somewhat substantial” changes to their instructional methods.
Sixty percent of teachers reported a change in the rigor of student activities, and 71 percent reported an
increased use of technology to plan for differentiated instruction.
Teachers’ Feedback on Professional Development
Teachers in each of the three districts experienced their professional development in different ways. Carson
City teachers were trained by SMART Board certified Master Teachers, Douglas County teachers
participated in vendor-provided training as well as training provided by Washoe County, and Washoe County
teachers were trained by the district’s PD Director. When asked to rate the quality of their training, on
average, 90 percent of teachers indicated that it was of high quality. Teachers also agreed or strongly agreed
that the difficulty level of their training was appropriate (94%), that they were able to immediately put
strategies they learned in the training to use in their classroom (94%), and that participating in the training
was a good use of their time (93%). Among those for whom it was applicable, 93 percent of teachers agreed
or strongly agreed that the Year 2 training helped them build on what they had learned in Year 1.
Nevada Educational Technology Implementation Fund Grant Year 2 Evaluation 37

Table 14. Teachers’ Rating of Professional Development
Statement% Agree/Strongly
Agree
The difficulty level of the training was appropriate 94%
The training was adequately paced 90%
The training was well organized 90%
There was an adequate balance between information gathering and hands-on activity 90%
Participating in the training was a good use of my time. 93%
The breadth and depth of the training content met my expectations 89%
The training helped me build on what I learned last year (n=47) 93%
The focus of the training was directly linked to new things I'm trying/would like to try in my classroom. 86%
The training provided me with strategies that I could immediately put to use in my classroom 94%
Overall, the training was of high quality 90%
Online Professional Development: Clark County, Elko County and White Pine County
TeacherLine Course Takers
In February 2011, evaluators administered two online surveys to Clark County teachers for whom grant funds
had been used to reimburse them for TeacherLine courses they completed. The first survey was
administered to teachers who had completed TeacherLine courses during the 2009-10 school year. The
focus of the survey questions was on gathering information about how teachers were using what they had
learned in the course(s) they had taken. The second TeacherLine survey was administered to teachers who
completed TeacherLine courses in fall 2010; this survey included questions to gather feedback on the course
experience. Over 100 teachers responded to the follow up survey (n=115) and 72 teachers responded to the
feedback survey.
Number of TeacherLine Courses for which Reimbursement was Received
Over half of the respondents (52%) to the TeacherLine Follow Up Survey reported that they were reimbursed
for one TeacherLine course during the 2009-10 school year. The remainder of respondents were reimbursed
for two to six courses, with 41 percent of those reimbursements being for two or three courses. Three
teachers were reimbursed for four courses, one teacher was reimbursed for five courses, and two teachers
were reimbursed for six courses. Nearly three-fourths (74%) of the teachers reimbursed for TeacherLine
courses in fall 2010 completed one course. Twenty one percent of teachers completed two courses, and the
remainder completed three (2%) or four (2%) classes.
Nevada Educational Technology Implementation Fund Grant Year 2 Evaluation 38

TeacherLine courses are offered in five main course categories: Instructional Strategies, Instructional
Technology, Mathematics, Reading/Language Arts, and Science. The majority of respondents (44%)
completed courses in Reading/Language Arts, followed by Instructional Technology (34%), Instructional
Strategies (32%), Mathematics (20%), and Science (7%).
Continuing TeacherLine Professional Development
Evaluators asked teachers who took the Follow Up Survey if they had signed up for TeacherLine courses in
the 2010-11 school year. Less than one quarter of the respondents (24%) indicated that they had done so.
The main reasons that teachers gave for not signing up for another course were being too busy with school
commitments (44%) and personal commitments (41%), and some teachers cited negative experiences with
the course (i.e., trouble completing the coursework, not liking the instructor or how the course was run).
Table 15. Reasons Why Teachers Did Not Sign Up for TeacherLine Courses in 2010-11
Reasons Response Percent
I was busy with school commitments. 44%
I was busy with personal commitments. 41%
I've already obtained my re-certification. 18%
I was taking other professional development. 17%
I didn't need/was not interested in any of the courses that were offered. 15%
I didn't know I could submit another tuition reimbursement 15%
I'm enrolled in a Master's Degree program. 6%
I don't like taking online courses. 0%
I didn't find my previous TeacherLine course(s) useful. 0%
Other (please specify) 9%
• Reached my goals for now
• I was taking university classes required for my license• Finished all the credits I was working toward
• I have had problems completing online course content
• Teacher did not answer questions in a timely manner to complete course work, grade
comments did not reflect assignment work, when mistakes were made and admitted
grade did not change.
• I got to my masters +32 pay grade.• I couldn't afford another class.
• I really didn't like the way the course I took was run, so I am taking classes elsewhere.
Nevada Educational Technology Implementation Fund Grant Year 2 Evaluation 39

Enhanced Skills and Knowledge
Most teachers indicated that the TeacherLine course(s) they took enhanced or greatly enhanced their skill
and knowledge in many areas. In particular, 89 percent of teachers felt that the course(s) they took enhanced
their ability to identify content appropriate resources and 85 percent reported that the course(s) enhanced or
greatly enhanced their instructional methods. To that end, 93 percent of teachers reported that during the
2010-11 school year, they implemented strategies they learned in a TeacherLine course they took the
previous school year.
Table 16. Teachers’ Perception of the Extent to Which TeacherLine Courses Enhanced Their Skills and Knowledge (N=115)
% Responding
Enhanced/Greatly Enhanced
Instructional methods 85%
Ability to identify content appropriate resources to assist in lesson planning. 89%
Using technology to address students' learning needs. 83%
Strategies for planning differentiated instruction. 82%
Strategies for implementing and managing differentiated instruction. 80%
Theory-based understanding of your content area. 78%
Learning theory (i.e., how students learn) related to your content area. 83%
Improving student assessment. 81%
Below are some of the outcomes that teachers reported related to implementing new strategies learned in
their TeacherLine course:
Having a better understanding of students’ capabilities
Better scores on assessments
Students gaining more thorough understanding of content
Increased student engagement and enjoyment of learning activities
Improved use of school computer resources
Teacher collaboration around differentiated instruction
Better student retention of course content
Improved student writing
TeacherLine Course Feedback
Consistent with data gathered during Year 1, the great majority of teachers (93%) agreed or strongly agreed
that their TeacherLine course was of high quality. An important aspect of any learning experience is the ability
to receive feedback; 96 percent of respondents agreed/strongly agreed that their course experience included
Nevada Educational Technology Implementation Fund Grant Year 2 Evaluation 40

adequate opportunities for feedback. Most teachers also agreed/strongly agreed that the course provided
them with strategies they could immediately put to use in their classroom (92%), that the difficulty level of the
course was appropriate (93%) and that participating in the class was a good use of their time (93%).
Table 17. Teachers’ Feedback on TeacherLine Professional Development (N=72)
Statement% Agree/Strongly
Agree
The course objectives were clear. 92%
The difficulty level of the course was appropriate. 93%
There were adequate opportunities to ask questions. 94%
There were adequate opportunities to receive feedback. 96%
The feedback I received was useful. 93%
Participating in the course was a good use of my time. 93%
The breadth and depth of the course content met my expectations. 89%
The course provided me with strategies that I could immediately put to use in my classroom. 92%
Overall, the course was of high quality. 93%
Change in Teaching Practice
Evaluators asked teachers to indicate the extent to which they were making adjustments to their teaching
since completing their TeacherLine course. In reviewing the responses, it should be noted that the teachers
who completed this survey in February 2011 had just completed their course in December 2010. Given that
timeframe, the percentage of teachers who reported making various changes to their teaching is remarkable.
For example, about one-third of respondents reported that “on a regular basis” they were modifying their
lessons to incorporate strategies they had learned in the class (31%), modifying their instruction based on
strategies they learned (31%), evaluating the impact of the new strategies on students (29%), and seeking
out additional information to build on what they had learned (35%). Less than 10 percent of respondents
indicated that they were not currently making any of these changes, and between six and 11 percent
reported that they were “considering” making these changes.
Elko County & White Pine County: Nevada Pathway Project
The Nevada Pathway Project is an online professional development program that consists of four training
modules. Each module focuses on a different area and requires a 45-hour time commitment. The teacher
participation incentive is either a $750 stipend or three UNLV credits upon successful completion of each
module. The topics for each module are as shown in Figure 6 on the following page.
Nevada Educational Technology Implementation Fund Grant Year 2 Evaluation 41

Figure 6. Content Covered in Nevada Pathway Project Modules
Module Content
Module 1: Building 21st Century Knowledge and Skills
Curriculum Mapping
Lesson Planning with NETS-S, TPACK
Exploring iPods and Web 2.0 Tools
Module 2: Setting Goals and Project Planning
Writing Goal Statements
Content Area Unit Planning
Wikis and Blogs
RSS
Learning Communities
Project-based Learning
Module 3: 21st Century Skills in Action
Implementation of Action Research
Assessment of Project Based Learning
Students as Consumers and Producers of
Content
Maximizing the Potential of the Web, Social
Tools, Literacy
Cultural awareness, assistive technology
State Technology Conference
Module 4: Reflecting for Change
Evaluating Action Research
Role as a technology leader/21st Century
teacher
Nevada themed project
Presentation to staff
Researchers at UNLV who are leading the evaluation of the Nevada Pathway Project made the survey data
for the three participating teachers available to Wexford evaluators. Participants completed a survey prior to
starting the Pathway Project modules and again at the end of each module. For the purposes of
summarizing outcome data, Wexford only reviewed data from the baseline survey and the survey
administered at the end of Module 4. The survey measures four constructs: teacher attitudes about
technology tools, teacher attitudes about teaching with technology, self-efficacy related to technology, and
Technology Pedagogy and Content Knowledge (TPACK).
When evaluators ran a T-test to look for any statistically significant difference between baseline and end-of-
module-4 responses there was only one item for which a statistically significant difference was found. In the
list of survey items related to Technology Pedagogy and Content Knowledge (TPACK), teachers’ mean
response to the statement “I have the technical skills I need to use technology” was significantly greater at
the end of Module 4 than it was at baseline. There were no other pre/post comparisons for which a
statistically significant difference was found; however, as shown Tables 18-21 on the following pages, there
Nevada Educational Technology Implementation Fund Grant Year 2 Evaluation 42

were areas on the Module 4 survey where teachers’ ratings of their attitudes and skills was greater than their
baseline response.
Teachers also responded to open-ended questions each time they completed the survey. On the baseline
survey teachers were asked to indicate the goals they had for participating in the Pathway Project. A
summary of their combined responses is listed below.
Learn to use new technology
Learn ways to incorporate existing technology
Learn how to use technology efficiently and effectively
Increase student understanding based on teachers’ use of technology
Help students in their preparation for future careers
I want to learn how to efficiently and effectively use the technology
Learn from and share with colleagues
Better understand 21st Century learners
Teachers’ Responses to Open-Ended Questions at the End of Module 4
Teachers were asked to respond to three open-ended questions at the end of the Module 4 survey: List
three things you think went well with the project, list three things you would improve, and list three things you
learned. As shown in the figure below, teachers enjoyed collaborating with others, learning how to integrate
technology, and learning how to use technology tools. In terms of what they would improve, teachers
suggested having more time to learn fewer technologies, a focus on group projects, and changes to the
communication structure (i.e. email versus only posting to the forum). When asked to list things that they
learned after completing all of the modules, one teacher commented that she became aware of the
technology that she did not like. All of the teachers commented on their increased knowledge of educational
games and how to incorporate them into their instruction.
Question Response
List 3 things you think went well with the Pathway Project
Building the web page
Using technology in my classroom
Learning about TPACK and 21st Century Learning skills
Learning how to implement use of Flip cameras
Collaborating
Researching ways to incorporate technology
Keeping everything organized for us!
Nevada Educational Technology Implementation Fund Grant Year 2 Evaluation 43
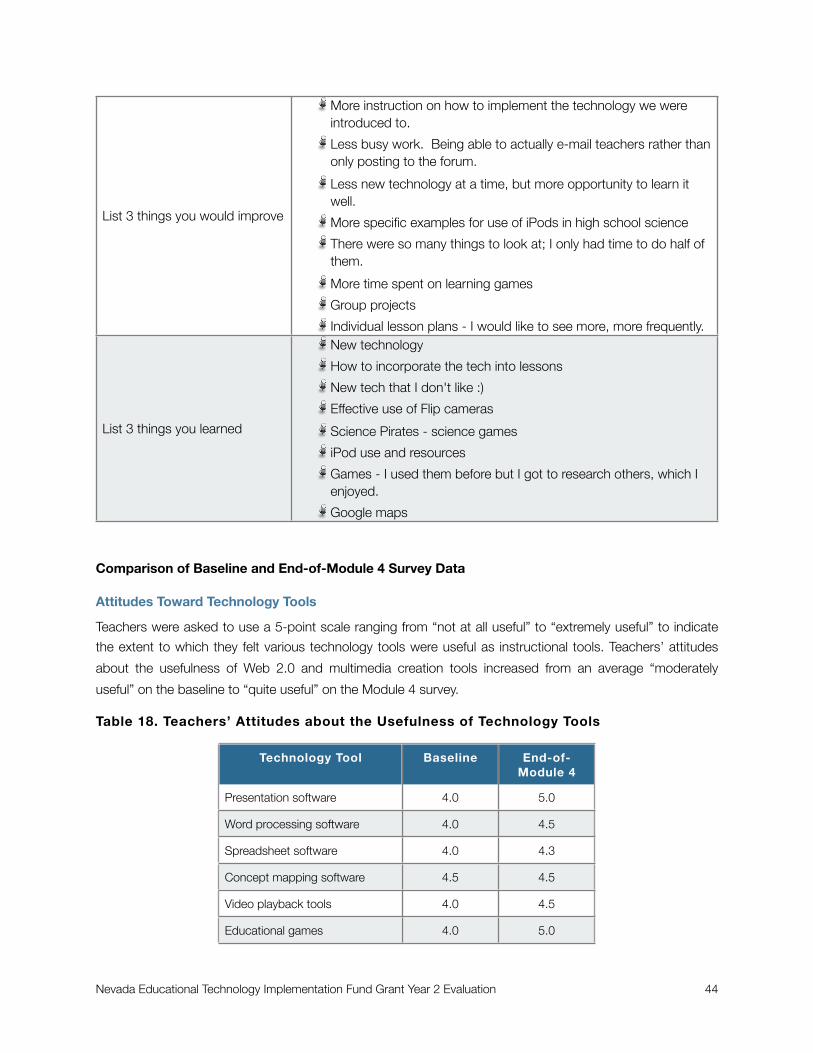
List 3 things you would improve
More instruction on how to implement the technology we were introduced to.
Less busy work. Being able to actually e-mail teachers rather than only posting to the forum.
Less new technology at a time, but more opportunity to learn it well.
More specific examples for use of iPods in high school science
There were so many things to look at; I only had time to do half of them.
More time spent on learning games
Group projects
Individual lesson plans - I would like to see more, more frequently.
List 3 things you learned
New technology
How to incorporate the tech into lessons
New tech that I don't like :)
Effective use of Flip cameras
Science Pirates - science games
iPod use and resources
Games - I used them before but I got to research others, which I enjoyed.
Google maps
Comparison of Baseline and End-of-Module 4 Survey Data
Attitudes Toward Technology Tools
Teachers were asked to use a 5-point scale ranging from “not at all useful” to “extremely useful” to indicate
the extent to which they felt various technology tools were useful as instructional tools. Teachers’ attitudes
about the usefulness of Web 2.0 and multimedia creation tools increased from an average “moderately
useful” on the baseline to “quite useful” on the Module 4 survey.
Table 18. Teachers’ Attitudes about the Usefulness of Technology Tools
Technology Tool Baseline End-of-Module 4
Presentation software 4.0 5.0
Word processing software 4.0 4.5
Spreadsheet software 4.0 4.3
Concept mapping software 4.5 4.5
Video playback tools 4.0 4.5
Educational games 4.0 5.0
Nevada Educational Technology Implementation Fund Grant Year 2 Evaluation 44

Technology Tool Baseline End-of-Module 4
Online courseware 2.7 3.0
Instant message tools 2.5 3.0
World Wide Web 4.5 5.0
Website creation tools 3.0 3.5
Web 2.0 tools 3.0 4.0
Multimedia creation tools 3.5 4.5
Digital cameras 4.5 4.5
Probeware 5.0 5.0
Interactive simulations 5.0 5.0
Scale: 1=Not at all Useful, 2=Slightly Useful, 3=Moderately Useful, 4=Quite Useful, 5=Extremely Useful
Dispositions Toward Teaching with Technology
Teachers were asked to use a 5-point agree/disagree Likert-scale to indicate the extent to which they agreed
with statements regarding their disposition toward teaching with technology. Teachers’ level of agreement
about the ability of technology to help students complete their homework and build online communities of
students changed from an average “slightly agree” on the baseline survey to an average “strongly agree” on
the Module 4 survey.
Table 19. Teachers’ Attitudes about Teaching with Technology
Disposition Statement Baseline End-of-Module 4
Technology can help students learn 4.7 4.7
Technology can promote deep understanding 5.0 5.0
Technology can help students complete homework 4.3 5.0
Technology can help students locate information 4.7 5.0
Technology can help verify information 4.7 4.7
Technology can enhance communication 4.7 5.0
Technology should be central to instruction 4.3 4.0
Technology can facilitate planning 4.0 4.7
Technology enhances record keeping 5.0 5.0
Technology permits the free exchange of ideas 5.0 4.7
Technology can enrich instruction 4.7 5.0
Nevada Educational Technology Implementation Fund Grant Year 2 Evaluation 45

Disposition Statement Baseline End-of-Module 4
Technology is an effective instructional support 4.7 5.0
Technology can build online communities of students 4.3 5.0
Technology can build online communities of practitioners 4.7 4.7
Technology can create inclusive learning environments 4.3 4.7
Scale: 1=Strongly Disagree, 2=Slightly Disagree, 3=Neither agree nor Disagree, 4=Slightly Agree, 5=Strongly Agree
Technology Confidence
Teachers were asked to rate their confidence in performing various technology-related tasks using a 5-point
scale ranging from “not confident” to “extremely confident.” The notable differences in teachers’ rating of
their comfort level with various technology skills/tasks include their baseline rating of “not confident” to
“slightly confident” in using track changes in a Word document and utilizing distance learning tools compared
to the “quite confident” rating on the Module 4 survey. Teachers also reported an increased comfort in
creating interactive presentations, capturing digital video, and sharing audio files online. The two ares in
which teachers ended up rating themselves as “extremely confident” on the Module 4 survey were creating a
web page (baseline measure was “slightly confident”) and creating an electronic quiz (baseline measure was
“moderately confident).
Table 20. Teachers’ Confidence in Their Ability to Perform Various Technology Tasks
Technology Confidence Statements BaselineEnd-of-
Module 4
Check email 4.7 5.0
Enter student grades 5.0 5.0
Locate information online 5.0 5.0
Create an interactive presentation 3.7 4.7
Send attachments 5.0 4.3
Resize a digital image 4.0 4.3
Capture digital video 2.7 4.7
Share an audio file online 3.0 4.3
Create web page 2.3 5.0
Start a vide-chat session 1.7 3.7
Track changes in a Word document 1.7 4.3
Collaborate using a wiki 2.7 3.3
Utilize distance learning tools 1.7 4.3
Nevada Educational Technology Implementation Fund Grant Year 2 Evaluation 46

Technology Confidence Statements BaselineEnd-of-
Module 4
Use an interactive smart board 4.0 5.0
Create an electronic quiz 3.0 5.0
Scale: 1=Not Confident, 2=Slightly Confident, 3=Moderately Confident, 4=Quite Confident, 5=Extremely Confident
Technology Pedagogy and Content Knowledge (TPACK)
Teachers used a 5-point agree/disagree to respond to statements related to each of the six constructs that
comprise the TPACK (Technological Pedagogical Content Knowledge) framework. Responses to each
subset are presented in Table 21a and Table 21b, below. The data table is split only for formatting purposes.
On the baseline survey teachers indicated that they neither agreed nor disagreed with the statements “I keep
up with important new technologies,” “I know about a lot of different technologies,” “I can choose
technologies that enhance the teaching approaches for a lesson,” and “I can choose technologies that
enhance students’ learning for a lesson.” Teachers’ level of agreement with these statements on the Module
4 survey was “slightly agree.” Teachers also went from slightly disagreeing to slightly agreeing with the
statement “I have the technical skills I need to use technology.”
Table 21a. Teachers’ Agreement with Statements Related to TPACK
Knowledge Statement Baseline End-of-
Module 4
Technology KnowledgeTechnology KnowledgeTechnology Knowledge
I know how to solve my own technical problems 3.0 4.0
I can learn technology easily 4.3 4.3
I keep up with important new technologies 3.5 4.5
I frequently play around with technology 4.0 4.7
I know about a lot of different technologies 3.3 4.3
I have the technical skills I need to use technology 2.7 4.3
I have had sufficient opportunities to work with different technologies 3.7 4.3
Content KnowledgeContent KnowledgeContent Knowledge
I have sufficient knowledge about [my content area] 4.7 5.0
I can use a “[my content area]” way of thinking 4.7 5.0
I have various ways to develop my understanding in [content area] 4.7 5.0
Pedagogical KnowledgePedagogical KnowledgePedagogical Knowledge
I know how to assess student performance in a classroom 4.3 5.0
I can adapt my teaching based upon what students currently understand or do not understand 4.0 5.0
Nevada Educational Technology Implementation Fund Grant Year 2 Evaluation 47
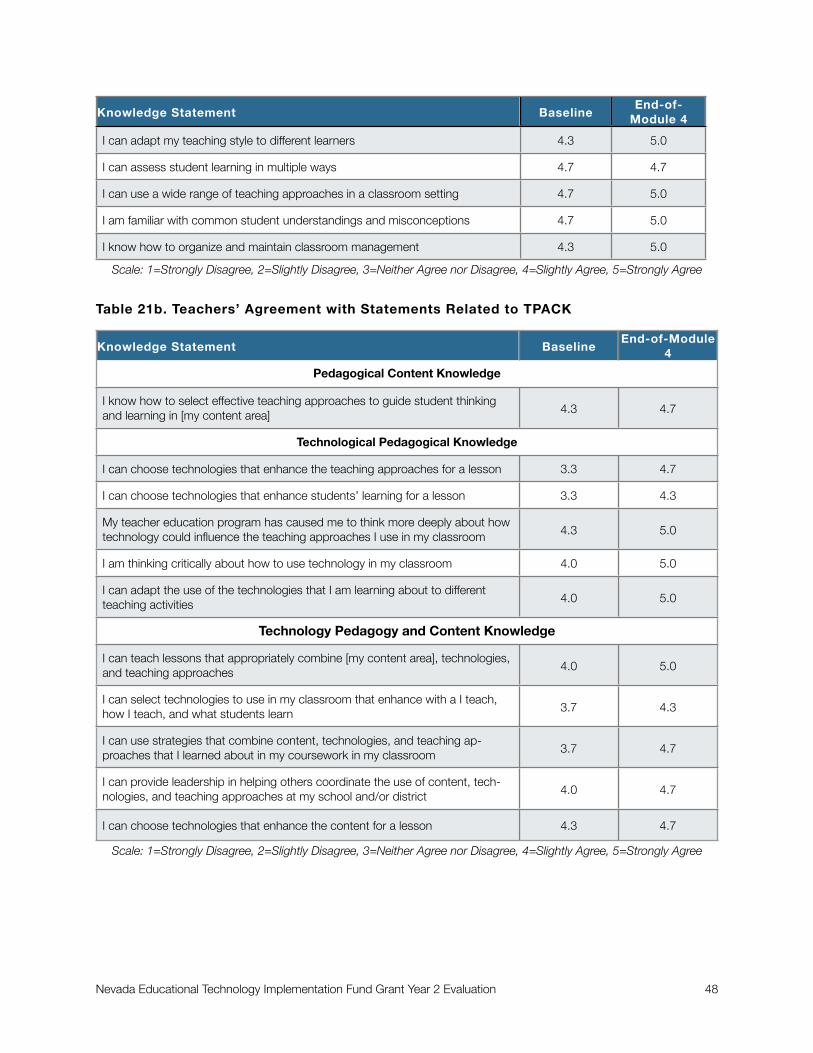
Knowledge Statement Baseline End-of-
Module 4
I can adapt my teaching style to different learners 4.3 5.0
I can assess student learning in multiple ways 4.7 4.7
I can use a wide range of teaching approaches in a classroom setting 4.7 5.0
I am familiar with common student understandings and misconceptions 4.7 5.0
I know how to organize and maintain classroom management 4.3 5.0
Scale: 1=Strongly Disagree, 2=Slightly Disagree, 3=Neither Agree nor Disagree, 4=Slightly Agree, 5=Strongly Agree
Table 21b. Teachers’ Agreement with Statements Related to TPACK
Knowledge Statement Baseline End-of-Module
4
Pedagogical Content KnowledgePedagogical Content KnowledgePedagogical Content Knowledge
I know how to select effective teaching approaches to guide student thinking and learning in [my content area] 4.3 4.7
Technological Pedagogical KnowledgeTechnological Pedagogical KnowledgeTechnological Pedagogical Knowledge
I can choose technologies that enhance the teaching approaches for a lesson 3.3 4.7
I can choose technologies that enhance students’ learning for a lesson 3.3 4.3
My teacher education program has caused me to think more deeply about how technology could influence the teaching approaches I use in my classroom 4.3 5.0
I am thinking critically about how to use technology in my classroom 4.0 5.0
I can adapt the use of the technologies that I am learning about to different teaching activities 4.0 5.0
Technology Pedagogy and Content KnowledgeTechnology Pedagogy and Content KnowledgeTechnology Pedagogy and Content Knowledge
I can teach lessons that appropriately combine [my content area], technologies, and teaching approaches 4.0 5.0
I can select technologies to use in my classroom that enhance with a I teach, how I teach, and what students learn 3.7 4.3
I can use strategies that combine content, technologies, and teaching ap-proaches that I learned about in my coursework in my classroom 3.7 4.7
I can provide leadership in helping others coordinate the use of content, tech-nologies, and teaching approaches at my school and/or district 4.0 4.7
I can choose technologies that enhance the content for a lesson 4.3 4.7
Scale: 1=Strongly Disagree, 2=Slightly Disagree, 3=Neither Agree nor Disagree, 4=Slightly Agree, 5=Strongly Agree
Nevada Educational Technology Implementation Fund Grant Year 2 Evaluation 48
Lincoln County: Technology Integration Specialists
Lincoln County school district expanded its grant implementation from one middle school in Year 1 to six
schools (two middle and four elementary) in Year 2. The addition of new schools required hiring another part-
time Technology Integration Specialist (TIS). Evaluators received the “Time and Effort” logs of the two TIS and
used these data to quantify the amount of time they spent providing one-on-one support to teachers. In the
Year 1 evaluation evaluators quantified this time and found that it was a small percentage of the TIS’s overall
time. The Year 2 data are similar; however, in speaking with both TIS and teachers, evaluators feel it would
be a misguided interpretation of the value of the TIS based solely on the one-on-one training hours provided.
Teachers find the TIS extremely valuable as a resource for identifying relevant technology tools and
resources, and are less likely to expect a lot of hand holding. In a needs assessment survey administered to
teachers at the beginning of the school year, 58 percent of teachers disagreed or strongly disagreed with the
statement, “I want my Technology Integration Specialist to touch base by visiting my classroom every time
he/she is at the school.” Furthermore, 79 percent of teachers indicated that even when they don’t see their
TIS they want to receive information from him/her by email and 85 percent agreed or strongly agreed with the
statement, “I prefer to try and figure things out on my own first before contacting my Technology Integration
Specialist for assistance.”
In interviews conducted during the site visit, teachers were complimentary of the timelines and relevance of
the resources that their TIS shared with them. In some cases the TIS would take the initiative to research
software and web-based programs based on his/her own observations of what the teacher was doing in the
classroom and in other instances teachers would make direct requests. The TIS also served the roll of testing
out various technology options and presenting the pros and cons so that teachers did not have to spend
time doing that. The time that the TIS saved teachers was extremely valuable to them. As expressed by one
teacher, “Help has been offered to help find resources...I don’t want more training, I want more resources.”
This type of support that Technology Integration Specialists provided is fully documented in their respective
“time and effort” logs. In reviewing the logs, evaluators found that a good amount of time each week was
spent researching technology solutions, whether it be for a technical or instructional use. Many entries indi-
cate the TIS reviewing software or Web 2.0 tools to make a recommendation about the appropriateness,
reliability, and ease of use, based on the teachers’ request. The following is a selected sample of entries from
the Time and Effort Logs.
Set up e-mail accounts for teachers and administrators.
Set up teacher web pages on school website and sent out memo to teachers on how to update them.
Researched royalty free music options that students and teachers can use for visual presentations without violating copyright law.
Researched freeware options
Worked on PVES website and new website for PVMS journalism class.
Assisted in set up of Moodle accounts
Nevada Educational Technology Implementation Fund Grant Year 2 Evaluation 49

Assistance in setting up Google Apps accounts (teachers and students used Goggle Docs and Google EDU email
Researched Skype and other videoconferencing options
Researched ways to use technology in the school library
Table 22. Teachers’ Attitudes about Working with a Technology Integration Specialist
StatementPercent Agree/Strongly Agree
I want my Technology Integration Specialist to check in with me regularly by email to see if I need help with anything.
55%
I want my Technology Integration Specialist to touch base by visiting my classroom every time he/she is at the school. 42%
I prefer to initiate contact with my Technology Integration specialist on an as-needed basis. 69%
Even if I don't see my Technology Integration Specialist regularly, I want to receive regular email from him/her with tips, ideas, resources, etc. 79%
I prefer to try and figure things out on my own first before contacting my Technology Integra-tion Specialist for assistance. 85%
Although most of the teachers reported on the Technology Needs Assessment survey that they did not need
to see their TIS every time he/or she was on campus, making regular classroom visits was part of the TIS job
description. Below is a sample entry from one such site visit that depicts the TIS assessment of what she
observed as well as reflections on how to provide follow up assistance. The teachers’ names have been re-
moved to protect their identity.
Teacher 1 – High level utilization of technology in her class. i.e. Edmodo for bell work exercise, over-head projector, class website, copy/paste into Open Office document, save in T drive, do work and
save for grading. One area of potential is for digital storytelling. Shot email and provided hard-copy of sample material.
Teacher 2 – Working with old books that have no supporting material. His greatest desire would be
for me to find him some text book options, primarily digital – for Physical and Earth Sciences and potentially Life Science. He printed up an assignment from internet materials and then created his
own questions.
Teacher 3 – Used netbooks and the internet to pull up poems by Edgar Alan Poe and then had stu-dents read along as she played an LP record on “antique” record player. Very engaging. Her goals
are to get a class website up and be able to provide content. If I can provide additional lesson mate-rial on poetry it would probably be appreciated.
Teacher Feedback on Technology Integration Specialists
The majority of Lincoln County teachers who responded to the Technology Use Survey agreed/strongly
agreed that their TIS provided them with an adequate amount of one-on-one training (94%) and email
support (94%), that their TIS regularly visits their classroom (88%), and is tuned in and responsive to their
Nevada Educational Technology Implementation Fund Grant Year 2 Evaluation 50
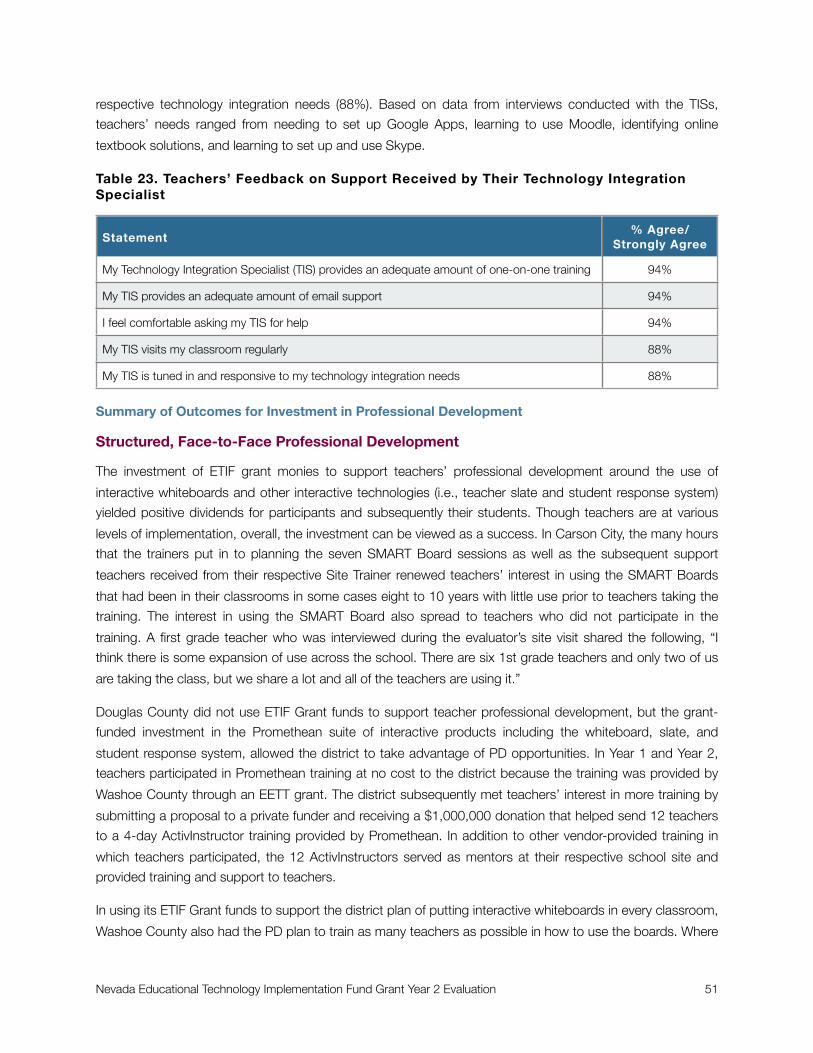
respective technology integration needs (88%). Based on data from interviews conducted with the TISs,
teachers’ needs ranged from needing to set up Google Apps, learning to use Moodle, identifying online
textbook solutions, and learning to set up and use Skype.
Table 23. Teachers’ Feedback on Support Received by Their Technology Integration Specialist
Statement% Agree/
Strongly Agree
My Technology Integration Specialist (TIS) provides an adequate amount of one-on-one training 94%
My TIS provides an adequate amount of email support 94%
I feel comfortable asking my TIS for help 94%
My TIS visits my classroom regularly 88%
My TIS is tuned in and responsive to my technology integration needs 88%
Summary of Outcomes for Investment in Professional Development
Structured, Face-to-Face Professional Development
The investment of ETIF grant monies to support teachers’ professional development around the use of
interactive whiteboards and other interactive technologies (i.e., teacher slate and student response system)
yielded positive dividends for participants and subsequently their students. Though teachers are at various
levels of implementation, overall, the investment can be viewed as a success. In Carson City, the many hours
that the trainers put in to planning the seven SMART Board sessions as well as the subsequent support
teachers received from their respective Site Trainer renewed teachers’ interest in using the SMART Boards
that had been in their classrooms in some cases eight to 10 years with little use prior to teachers taking the
training. The interest in using the SMART Board also spread to teachers who did not participate in the
training. A first grade teacher who was interviewed during the evaluator’s site visit shared the following, “I
think there is some expansion of use across the school. There are six 1st grade teachers and only two of us
are taking the class, but we share a lot and all of the teachers are using it.”
Douglas County did not use ETIF Grant funds to support teacher professional development, but the grant-
funded investment in the Promethean suite of interactive products including the whiteboard, slate, and
student response system, allowed the district to take advantage of PD opportunities. In Year 1 and Year 2,
teachers participated in Promethean training at no cost to the district because the training was provided by
Washoe County through an EETT grant. The district subsequently met teachers’ interest in more training by
submitting a proposal to a private funder and receiving a $1,000,000 donation that helped send 12 teachers
to a 4-day ActivInstructor training provided by Promethean. In addition to other vendor-provided training in
which teachers participated, the 12 ActivInstructors served as mentors at their respective school site and
provided training and support to teachers.
In using its ETIF Grant funds to support the district plan of putting interactive whiteboards in every classroom,
Washoe County also had the PD plan to train as many teachers as possible in how to use the boards. Where
Nevada Educational Technology Implementation Fund Grant Year 2 Evaluation 51
a core group of teachers in Carson City and Douglas County had in-depth training, the Washoe County
model was focused on breadth, training more teachers than in either of the other districts. Over the course of
the 2010-11 school year, the district’s PD Director facilitated more than 100 hours of PD, in over 30 training
sessions, many of them one or 1.5 hour training sessions offered on early release days or during PLC
meetings. While teachers in Washoe County have received some whiteboard training, there is concern about
the extent to which training opportunities will continue to be available. The district’s Educational Technology
Department was eliminated and the PD department was subsumed under the district’s HR department. At
the time interviews were conducted in May 2011, in addition to uncertainty about continued funding for his
own position, the PD Director expressed concern over the HR Department’s commitment to the ongoing
professional development that he feels teachers need.
Online Professional Development
Teachers who participated in online professional development, either by taking a TeacherLine course (or
courses) or completing the four Modules of the Nevada Pathway Project, were seeking to gain skills and
knowledge to improve their teaching and expand learning experiences for students. In that regard, though
the PD was different in terms of scope and sequence, teachers reported positive outcomes from their
experience including: an increased use of technology, more thoughtful planning and efficient lesson
implementation, and changes in student assessment practices. Most teachers also found the online format
suitable to their learning style.
Professional Development Provided by Technology Integration Specialists
The Technology Integration Specialists in Lincoln County play an important and time-saving role for teachers.
Teachers eager to take full of advantage of the affordances of every student having an Internet-connected
laptop, but short on time to find relevant tools and resources to integrate into their lessons, appreciate that
the TISs do this heavy lifting for them and make recommendations regarding the feasibility of using the
resources. Most often the TIS is recommending resources that teachers can immediately put to use in their
classroom. As one teacher shared, “[The TIS] is great. She walks in and discovers that I’m using something
that she didn’t know I was using and she’ll support me by looking into it and seeing how I can use it more
and better...She’s figures out the glitches and gets it all smoothed out for me.”
While the teacher feedback on the support they received from their TIS is positive, there is still room to grow
in terms of using the TIS for maximum benefit. The TIS who started at Meadow Valley Middle School in Year
1 reported that she did less tech support and had time for more one-one-one support of teachers in Year 2,
but as one teacher who is part of the district-wide Technology Committee reported, for teachers new to the
grant, most of the PD so far has been focused on technology skills rather than technology integration. This
finding is supported by a statement made by the TIS who was hired in Year 2 to work with two of the
expansion schools. He shared, “They [teachers] need to know how to do something and I go in and show
them how to do it.” Teachers have expressed a preference for figuring things out on their own before
reaching out to the TIS for support; however, evaluators recommend that as the district expands the netbook
program, it consider using the TIS to train teachers on the software that is installed on the netbooks, with an
emphasis on how it, along with Web 2.0 tools can be used to support teachers’ curriculum.
Nevada Educational Technology Implementation Fund Grant Year 2 Evaluation 52

Pilot ProjectData gathered over the two years of the ETIF Grant indicate that Lincoln County School District was
successful in implementing the pilot project outlined in its funded proposal. Lincoln County School District set
out to build upon momentum at one middle school and expand its vision of providing 21st Century
technology and learning opportunities to all students in the district. The means by which the district intended
to do this was by building and supporting a 1:1 laptop program that included an “anytime/anywhere”
learning component, which allowed students to take their laptop home. The plan also included supporting
teachers’ integration of the laptops in their respective courses by giving them access to individualized, just-
in-time support provided by a Technology Integration Specialist.
Implementation
The Year 1 implementation of the pilot project began with providing netbook computers to all teachers and
students at Meadow Valley Middle School and hiring a part-time Technology Integration Specialist to support
the teachers. Much of the first year was characterized by “learn as you go” trial and error related to building a
wireless infrastructure, dealing with bandwidth issues, finding free software appropriate and sufficient to
meeting learning goals and objectives, imaging computers, educating parents about the program and getting
them on board with allowing students to take the netbooks home, establishing an acceptable use policy for
using the netbooks, and training teachers. Building on lessons learned from Year 1, during the 2010-11
school year the district rolled out the 1:1 program in all of its 6th-8th grade classrooms. As the project
director described in his Year 2 interview, “I think the model that we put in place worked well in terms of
piloting here where we already had the support, where we were already actively working toward the 21st
century approach. The technology just pulled it all together. We were able to address the parental support
and address concerns that were there. We were able to develop policies and procedures so when it was
time to expand in the second year it went a lot smother at the other sites. They may not recognize it, but
most of them took the work we did up front with polices.”
Challenges
Many of the challenges faced in implementing the pilot project are problems inherent to small districts.
Primary among them is limited staff and insufficient expertise among available staff to efficiently address
technology support issues. As described by the project director, “With the pilot we took care of a lot of things
ourselves, when we expanded we didn’t have the expertise to address all of the concerns and issues. There
was only so much we could ask people to do. People have many job responsibilities and only so much
expertise.” To that end, the project director shared that “we are still figuring out some of the wireless issues
as a district.” Also related to the issue of limited human resources is the use of the TIS in more of a technical
support role than was originally envisioned. The new TIS in Pahranagat Valley shared that he was drawn into
a tech support role out of necessity. During his interview he stated, “It wasn’t in my job description to set up
the netbooks and hand them out. But I did it anyway because the person whose job it is is a full time teacher
and it would have taken too long.”
The district also faced, but is now, through other funding sources, addressing, bandwidth issues. Prior to
giving every middle school student a netbook, the district had sufficient bandwidth to manage the extent to
Nevada Educational Technology Implementation Fund Grant Year 2 Evaluation 53
which students and teachers were accessing the Internet. After the netbooks were in all of the classrooms,
accessing information on the Internet took too long when everyone was trying to get on the network at the
same time. Dealing with this issue required planning and communication amongst teachers to ensure that
students could get online when they needed to.
As discussed in the Year 1 Interim Report, Lincoln County does not have the financial resources to install
software such as Microsoft Office on all of the netbooks, so it has opted for low and no-cost software
solutions. For the most part this is a smart and sensible solution, but it does create issues such as students
doing paper/pencil work instead of typing on their netbooks because teachers do not know how to use
Open Office. A few teachers commented that they want to use the netbooks more, but they “need time to
figure out how to use it [Open Office] and figure out how it’s different from Word.” This was more so the case
with teachers who started participating in the project in Year 2 than with teachers who participated both
years and indicated that their students use the netbook for writing “all the time.”
To protect the netbooks the decision was made to install a program called DeepFreeze on all of the student
computers. It is a program that reboots the netbook to its original configuration every time it is started.
Students must constantly save their work to ThawSpace, which resides on a district server, to maintain
access to their work. Anything that is not saved on ThawSpace is lost, which is a problem that students have
encountered.
Outcomes
The obvious and most significant outcome is that students have technology in their hands and can use it
when needed to enhance their classroom instruction and increase their involvement in project-based
learning. With the exception of a few students whose parents will not allow them to take the netbook home,
students have 24/7 access to the netbook. In class they use it to do research, develop projects using Web
2.0 tools, communicate with their teachers and peers using email and online collaborative tools such as
Edmodo, and access their math textbook. When asked about how access to the netbooks has affected
students, one teacher commented, “They don’t groan when I say it’s social studies time. They seem to be
more excited.” The netbooks have also afforded the teachers and students access to resources not available
in textbooks. The same teacher went on to say, “I don’t think I’m even going to pull out the science book
next year. The Internet information is readily available, more accurate, and more hands on than with the
book. I don’t have to say ‘here’s how DNA splits,’ on the computer they can actually see an animation.”
Teachers are moving students away from traditional paper/pencil work and note taking as well as the
traditional “poster” created at the end of a unit to depict what students have learned. Teachers are using
Moodle and Edmodo to allow students to build on what they are learning over the course of a unit, update
and modify their projects, collaborate with peers, and share what they have learned not only with
classmates, but with students in other countries. The following quote captures the renewed enthusiasm for
teaching and learning that is facilitated by access to the netbooks.
It’s definitely changed the way I teach. I think I’m lucky because I was always sort of wanting my
class to not be focused on the teacher, but focused on the kids. The netbooks have completely supported that. The students are working all the time and producing things. The netbooks have
Nevada Educational Technology Implementation Fund Grant Year 2 Evaluation 54

made that very easy. I’m so excited about it that I’m considering a Masters degree in instructional technology. It connects the kids with what they’re interested in. The kids are more comfortable learn-
ing on the computer. You give them a netbook and it just takes off from there, faster than a teacher can do it.
Another teacher shared that he planned to have students develop a portfolio using Moodle. “For NV history
their entire portfolio will be on their computer. Their text documents, their maps, everything we do. It’s a six
week course. Moodle portfolio.” Teachers also noted that having access to the netbooks has made the
district increasingly more paperless. As described by this teacher, ”A lot of their homework is now over the
internet. We’re not paperless completely, but any book assignment or quiz is all done online and they send it
to me. The communication with students is the big difference. We’ve cut down at least 50% on papered
homework.”
In response to questions on the survey administered to teachers in May 2011, all of the teachers agreed or
strongly agreed with the statement, “Students are using technology more this year than they did last year.”
The majority of teachers (94%) also agreed/strongly agreed that teacher collaboration and support for
technology use had increased, that they have a good understanding of the best ways to use technology in
their content area (81%), and that they are often looking for ways to increase students’ use of technology
(88%).
The most significant outcome of the pilot project is the growth plan approved by the district Superintendent.
Based on teacher interest and the success of the pilot project the district is planning an expansion to 5th and
9th grade classrooms in the 2011-12 school year; state textbook money will be used to support the
expansion. The students who were 6th and 8th graders during the 2010-11 school year will get new
computers when they advance to 7th and 9th grade, respectively. Advancing 8th graders will keep their
netbooks, and 5th and 9th graders will get new netbooks. To facilitate the expansion the district has
developed a Technology Leadership Committee with representation from all schools in the district. As the
project director described, “The Leadership Committee was formed for making decisions and centralizing
what needed to be done [from an IT perspective] so people had some ownership and buy-in about what
happens at their school.” The project director feels strongly that addressing the technical support issues is
critical to a successful expansion. “Tech support is the challenge because we can’t expand our staff to
address that need. So we developed a committee to figure out how tech support will work in the district.”
Statistically Significant Differences for Students
The results of statistical analysis comparing students’ responses on the baseline technology survey
administered in October 2010 and the end-of-year survey administered in May 2011 reveal that students’
technology skills improved significantly on 16 out of 25 indicators. Statistical analysis also revealed a
significant increase in the frequency with which students used their netbook in three out of four core courses,
and a significant increase in the frequency with which they engaged in seven out of 10 technology-related
activities. The baseline and end-of-year mean for each item is presented in Table 24-Table 26, below. The
final column of each table indicates whether the difference in the average responses is statistically significant.
Table 25 is split for formatting purposes.
Nevada Educational Technology Implementation Fund Grant Year 2 Evaluation 55

Students rated their technology skills using a 5-point Likert-scale ranging from “I don’t know what this is” to
“I can do this well.” Frequency of use was measured on a 6-point scale ranging from “never” to “daily.” In
both English Language Arts and social studies, students’ use of their netbook in class increased to an
average of “once or twice a week.”
Table 24. Frequency of Students’ Netbook Use in Core Content Areas
Core Courses Baseline End-of-YearSignificant Difference?
Science 2.7 3.2 Yes
English Language Arts 3.5 4.1 Yes
Mathematics 2.9 3.1 No
Social Studies 3.2 4.2 Yes
Scale: 1 = “never,” 2 = “a few times a year,” 3 = “a few times a month,” 4 = “once or twice a week,” 5 = “almost daily,” 6 = “daily”
Some of the technology skill areas where students saw a significant increase in their ability include: using a
video camera and video editing software, using spreadsheet data to create graphs, and creating a slideshow
presentation. It should be noted that student computers do not have PowerPoint installed so students create
their presentations with a free Web 2.0 tool called Prezi.
Table 25a. Students’ Self-Rating of Technology Skills
Skill Baseline End-of-YearSignificant Difference?
Enter information using proper keyboarding skills 4.1 4.0 No
Open, create, change, print, and save documents 4.2 4.4 Yes
Upload pictures from a camera into the computer 3.6 4.0 Yes
Use a video camera to capture video 3.9 4.3 Yes
Use video editing software to make a video 3.0 3.4 Yes
Attach a file to an email I want to send 3.8 4.4 Yes
Use a spreadsheet to do math calculations 2.7 3.5 Yes
Create a graph using spreadsheet data 2.9 3.5 Yes
Create bookmarks to save websites I want to return to later 3.7 3.9 No
Use online search engines to find information 4.3 4.2 No
Use keywords to narrow my online searches 3.7 3.9 No
Create a slideshow presentation 3.8 4.3 Yes
Scale: 1 = “I don’t know what this is”, 2 = “I can’t do this,” 3 = “I can do this with assistance,” 4 = “I can do this on my own,” 5 = “I can do this well”
Nevada Educational Technology Implementation Fund Grant Year 2 Evaluation 56
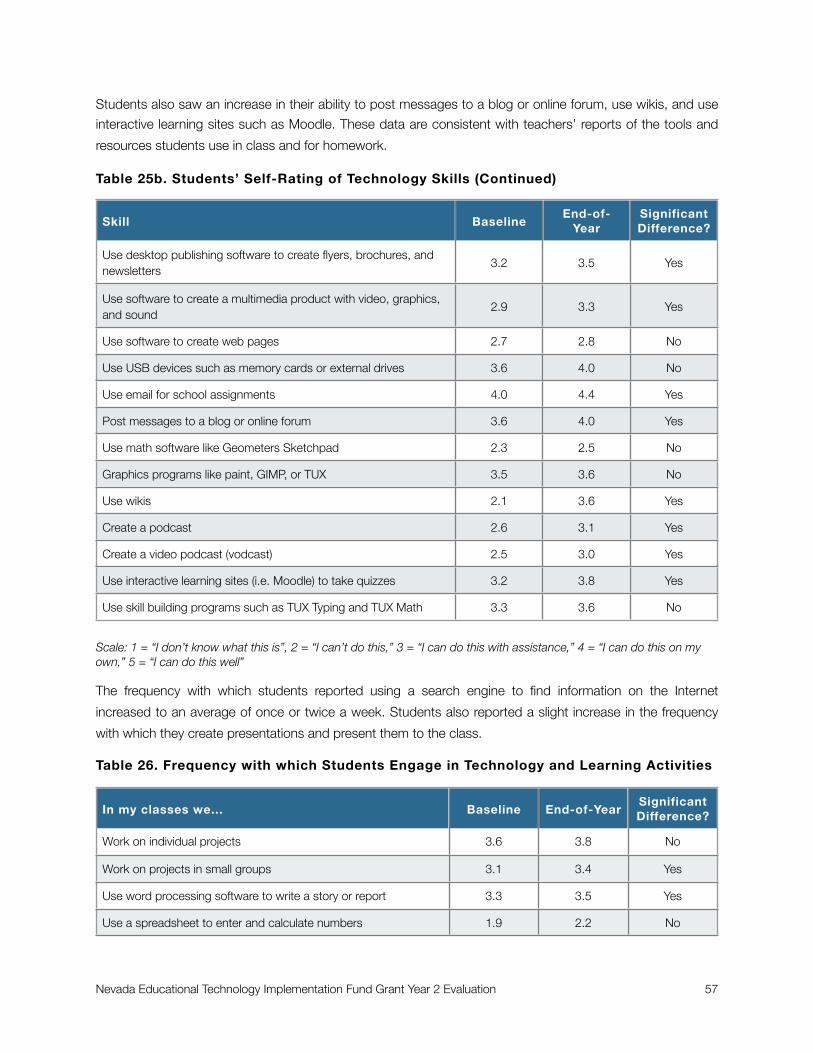
Students also saw an increase in their ability to post messages to a blog or online forum, use wikis, and use
interactive learning sites such as Moodle. These data are consistent with teachers’ reports of the tools and
resources students use in class and for homework.
Table 25b. Students’ Self-Rating of Technology Skills (Continued)
Skill BaselineEnd-of-
YearSignificant Difference?
Use desktop publishing software to create flyers, brochures, and newsletters
3.2 3.5 Yes
Use software to create a multimedia product with video, graphics, and sound
2.9 3.3 Yes
Use software to create web pages 2.7 2.8 No
Use USB devices such as memory cards or external drives 3.6 4.0 No
Use email for school assignments 4.0 4.4 Yes
Post messages to a blog or online forum 3.6 4.0 Yes
Use math software like Geometers Sketchpad 2.3 2.5 No
Graphics programs like paint, GIMP, or TUX 3.5 3.6 No
Use wikis 2.1 3.6 Yes
Create a podcast 2.6 3.1 Yes
Create a video podcast (vodcast) 2.5 3.0 Yes
Use interactive learning sites (i.e. Moodle) to take quizzes 3.2 3.8 Yes
Use skill building programs such as TUX Typing and TUX Math 3.3 3.6 No
Scale: 1 = “I don’t know what this is”, 2 = “I can’t do this,” 3 = “I can do this with assistance,” 4 = “I can do this on my own,” 5 = “I can do this well”
The frequency with which students reported using a search engine to find information on the Internet
increased to an average of once or twice a week. Students also reported a slight increase in the frequency
with which they create presentations and present them to the class.
Table 26. Frequency with which Students Engage in Technology and Learning Activities
In my classes we... Baseline End-of-YearSignificant Difference?
Work on individual projects 3.6 3.8 No
Work on projects in small groups 3.1 3.4 Yes
Use word processing software to write a story or report 3.3 3.5 Yes
Use a spreadsheet to enter and calculate numbers 1.9 2.2 No
Nevada Educational Technology Implementation Fund Grant Year 2 Evaluation 57
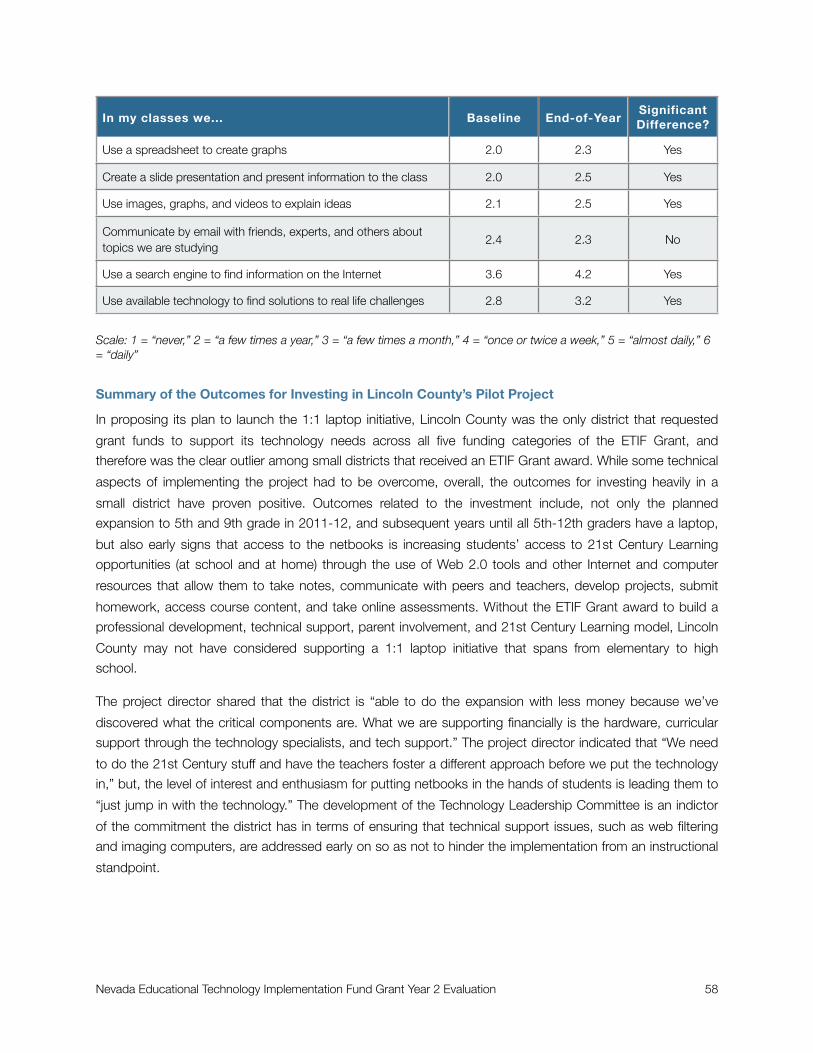
In my classes we... Baseline End-of-YearSignificant Difference?
Use a spreadsheet to create graphs 2.0 2.3 Yes
Create a slide presentation and present information to the class 2.0 2.5 Yes
Use images, graphs, and videos to explain ideas 2.1 2.5 Yes
Communicate by email with friends, experts, and others about topics we are studying
2.4 2.3 No
Use a search engine to find information on the Internet 3.6 4.2 Yes
Use available technology to find solutions to real life challenges 2.8 3.2 Yes
Scale: 1 = “never,” 2 = “a few times a year,” 3 = “a few times a month,” 4 = “once or twice a week,” 5 = “almost daily,” 6 = “daily”
Summary of the Outcomes for Investing in Lincoln County’s Pilot Project
In proposing its plan to launch the 1:1 laptop initiative, Lincoln County was the only district that requested
grant funds to support its technology needs across all five funding categories of the ETIF Grant, and
therefore was the clear outlier among small districts that received an ETIF Grant award. While some technical
aspects of implementing the project had to be overcome, overall, the outcomes for investing heavily in a
small district have proven positive. Outcomes related to the investment include, not only the planned
expansion to 5th and 9th grade in 2011-12, and subsequent years until all 5th-12th graders have a laptop,
but also early signs that access to the netbooks is increasing students’ access to 21st Century Learning
opportunities (at school and at home) through the use of Web 2.0 tools and other Internet and computer
resources that allow them to take notes, communicate with peers and teachers, develop projects, submit
homework, access course content, and take online assessments. Without the ETIF Grant award to build a
professional development, technical support, parent involvement, and 21st Century Learning model, Lincoln
County may not have considered supporting a 1:1 laptop initiative that spans from elementary to high
school.
The project director shared that the district is “able to do the expansion with less money because we’ve
discovered what the critical components are. What we are supporting financially is the hardware, curricular
support through the technology specialists, and tech support.” The project director indicated that “We need
to do the 21st Century stuff and have the teachers foster a different approach before we put the technology
in,” but, the level of interest and enthusiasm for putting netbooks in the hands of students is leading them to
“just jump in with the technology.” The development of the Technology Leadership Committee is an indictor
of the commitment the district has in terms of ensuring that technical support issues, such as web filtering
and imaging computers, are addressed early on so as not to hinder the implementation from an instructional
standpoint.
Nevada Educational Technology Implementation Fund Grant Year 2 Evaluation 58

Technical ServicesIn most cases, regardless of the size of the district, grant funds were used to replace computers that were
well over five years old. In Year 2 Clark County School District utilized grant funds to place over 180
workstations and servers in schools with the greatest need. While the number of workstations purchased is
minimal compared to the need across the district, the purchase nevertheless had an impact on students and
teachers. As the project director noted, “It was really really helpful to put more servers out in the schools
because those are very expensive infrastructure pieces to replace. Some that we replaced were 7-8 years
old so replacing them impacted a huge number of students like 900-1000 kids and their teachers. That’s
bang for your buck.” In Douglas County the project director was able to take advantage of special pricing
deals that allowed the district to purchase additional equipment including ActivExpressions (student
response system) for all of the teachers who did not get them in Year 2. As the project director shared, by
getting a deal on the equipment, “the $60K plus really gave us between $80K and $90K in buying power.”
In Humboldt County and Pershing County district funds were matched with grant funds to complete the
district’s replacement plan for teacher workstations. The project director from Humboldt County said, “There
is so much need for computers and technology. All of the computers were at least 5 years old. This year it
would have been 6+ years.” Because of the district’s need for new computers, it has repurposed the old
teacher computers for student use because “the student computers are over 10 years old.” The project
director for Pershing County summed up her thoughts about the grant by saying, “The money did what we
needed it to do and helped the teachers get what they needed.”
Overall, districts were able to use the Year 2 ETIF grant funds to meet their varied technical support needs.
The project director in Storey County reported that the district had used its grant money to “replace some
really old computers in the classroom that were 8 or 9 years old.” He stretched the grant funds to meet the
technology need by purchasing refurbished computers at about half the cost of full-priced machines. In
Esmeralda County the project director used grant funds to purchase iPads and laptops for students and
teachers to support district plans to expand the Nevada Pathway Project technology implementation model
to all grade levels. White Pine County also used its Year 2 grant funds to expand on its implementation of the
Nevada Pathway Project by purchasing additional student laptops and iPods to create a 1:1 implementation
model in the high school math teacher’s classroom.
Teacher Use of Grant-Funded Technology
Teachers in each of the districts that used grant funds to purchase hardware devices, were asked to
complete a Technology Use Survey. The majority of teachers (85%) agreed/strongly agreed that the new
technology increased their interest in doing more to integrate technology into the curriculum, increased the
overall frequency with which technology is used during class (82%), and increased their overall productivity
(86%). Over three-fourths of the respondents (76%) agreed/strongly agreed that the technology increased
the time they spend on the Internet looking for content-specific resources.
Nevada Educational Technology Implementation Fund Grant Year 2 Evaluation 59

Table 27. Teachers’ Level of Agreement with Statements about the Use of Technology
Statement% Agree/Strongly
Agree
The overall frequency with which technology is used during class 82%
The time I spend on the Internet looking for content-specific resources. 76%
The frequency with which I use a projector to display web-based or other information to the class. 73%
My use of presentation software to create slide shows for my class. 61%
The overall frequency with which students access the Internet during class. 68%
The frequency of student Internet research. 63%
My use of email to communicate with teachers, parents and/or students. 82%
My use of technology for administrative tasks 86%
My use of school and/or district-provided software programs 81%
My overall productivity 86%
My interest in doing more to integrate technology into my curriculum. 85%
Frequency of Teachers’ Technology Use in a Given Class Period
Nearly half of the teachers who received new equipment (47%) reported that they use it less than half of a
given class period and nearly two-thirds of the teachers (63%) reported that their students use it less than
half of a given class period. There is slight variability in the latter statistic, when compared by district,
presumably because some districts replaced teacher workstations, not classroom computers for students.
Figure 7. Frequency with which Teachers Use Grant-Funded Technology in a Given Class Period
Less than 1/2 of the period Half of the periodMore than 1/2 of the period The whole period
9%
28%
16%
47%
Nevada Educational Technology Implementation Fund Grant Year 2 Evaluation 60

Figure 8. Frequency with which Students’ Use Grant-Funded Technology in a Given Class Period
Changes in Teachers’ Classroom Practices as a Result of Having New Equipment
Teachers were asked to indicate the extent to which they had made changes in their classroom as a result of
having new equipment. The two areas where a greater percentage of teachers reported making substantial
or somewhat substantial changes were integrating technology into their teaching (75%) and using technology
to facilitate differentiated instruction (72%). Just over half (57%) of the teachers said they were sharing more
with other teachers as a result of having the new technology.
Figure 9. Percentage of Teachers Reporting Substantial or Somewhat Substantial Change in Their Teaching Practice
Less than 1/2 of the period Half of the periodMore than 1/2 of the period The whole period
5%
15%
17%
63%
Substantial Change Somewhat Substantial Change
Integrating technology into teaching
Students’ hands-on time with technology
Sharing ideas and activities with other teachers
Time spent seeking additional information
Using technology for differentiated instruction
0% 13% 25% 38% 50%
46%
41%
37%
36%
38%
26%
27%
20%
29%
37%
Nevada Educational Technology Implementation Fund Grant Year 2 Evaluation 61

Teacher Quotes Expressing Changes in Teaching and Student Learning
Most significant TEACHING change related to having access to new computers
Clark CountyI can guide students in learning how to do research and give them additional resources for learning.
Having access to a new computer has changed the way I teach in that I try to find ways for the stu-dent to use the technology to create something that is related to what they are doing in real life.
I am able to access Internet and grade book much more quickly -- it does not take 20 minutes to boot up.
I am able to provide software-based interventions for students. I am also able to provide research time for students on many of our learning topics in Science and Social Studies.
EurekaI am able to use virtual field trips and virtual business situations to meet class objectives.
I am able to access various sites to assist in the re-teaching and differentiating of instruction for my special education students to provide new and varied modes of teaching and learning difficult con-
cepts.
HumboldtMy prep work and administrative tasks are much faster and easier to accomplish.
Having a newer and nicer computer makes all of my basic management of grades, attendance, and
lesson planning easier.
The ability to search for new content area ideas and activities has improved my teaching.
The most significant change is my use of the related resources for my textbooks and making power point presentations in which to teach.
Most significant STUDENT LEARNING change related to having access to new computers
Clark CountyStudents have more and immediate access to information that they would not normally have. They
have access to computer programs that enhance their learning as well.
Students are confident to navigate the web, type up reports with clipart or media files, and they are
able to complete tasks in an efficient manner.
I feel that students are becoming more independent learners, and often branching off of the main sub-ject to find more information. Students also share their work in different ways, which can help them
understand different methods of doing something.
Students have the ability to practice reading and math skills on a regular basis and have improved
their skill level.
Students are able to access more information, because they have more time due to the speed of the computers.
EurekaStudents can access and utilize web based programs and sites that provide more than one way of pre-senting and practicing new concepts. Additionally, we are able to use the computers to read books
online via bookshare, an audible site that allows students with print disabilities to access thousands of books. The laptops allow them to listen to them anywhere, comfortably and privately.
Nevada Educational Technology Implementation Fund Grant Year 2 Evaluation 62

In math, we are able to review, step by step, difficult math concepts as many times as needed so that
students can master the concepts and complete homework correctly. In writing, we are able to share, edit, and revise papers within and among the entire class.
Humboldt Students really have more access to Internet sites that serve their individual needs in reading and math. They feel more confident with the math curriculum this year than ever before.
I have seen an increase in test and quiz scores because the students are receiving more visual repre-
sentation of material.
Summary of Outcomes for the Investment in Technical Services
The greatest expenditure of ETIF Grant funds was on technical services, and statewide, this investment had
an impact on over 1100 teachers and 42,000 students. Districts used grant funds to address their immediate
technology acquisition needs and in small districts this was sufficient to meet the needs of all teachers; in
mid-sized districts the funds were often matched against other funding sources such as grants, bonds, and
private donations, to complete a purchasing plan in line with the district’s technology plan.
In Esmeralda County, the Mobi devices purchased with ETIF grant funds afford teachers the freedom to
move about the room to “see a problem students are having and immediately jump back in the lesson and
show them where they are missing a certain step.” This is something that teachers felt the were not able to
do as frequently when they were teaching almost exclusively from the front of the classroom. Furthermore,
the project director feels using Year 2 funds to purchase iPads will have a tremendous impact on district
plans to increasingly integrate students’ hands-on time with technology.
In Humboldt County, district funds were matched with the ETIF Grant award to provide every teacher in the
district with a new computer. However, the district still faces some networking issues that affect teachers’
ability to use the computers to their full potential. Given the district’s network configuration, the project
director stated that “the computers aren’t slow, but they are limited to what they can do so that they don’t
run slowly. We are hopeful that with eRate funds in July [2011] we can move our schools to fiber optic so we
don’t have the network bandwidth issues.” Currently, because of limited bandwidth, sites that have Flash
animation, and streaming video and audio (with the exception of United Streaming and Scholastic) are
restricted.
In Pershing County, the project director indicated that she is satisfied with the grant implementation by
stating that “the money did what we needed it to do and helped get the teachers what they needed. The
teachers who were using iPods [in Year 1] are still using them and the eMints teachers got their computers
upgraded. These were things that needed to be done.”
The project director in Storey County is pleased that grant funds made it possible to replace very old
classroom computers. According to the project director and data from teachers, the computers are getting a
lot of use. Although the district purchased refurbished computers, the project director expects the computers
to last for at least 3-4 years before they need replacing.
In the largest district, Clark County, the infusion of technology made no less of an impact than that compared
to smaller districts. Schools had a need and ETIF Grant funds were used to meet that need. To gather data
Nevada Educational Technology Implementation Fund Grant Year 2 Evaluation 63

on the extent to which the technology investment had an impact on teachers and students, evaluators
conducted a focus group with Educational Computing Specialists from Clark County schools that had
received new grant-funded computers. The purpose of the focus group was to gather data directly from the
ECS on teachers’ and students’ use of the new workstations. All of the participants indicated that the new
computers were used daily or almost daily, which was a significant increase over the prior school year. One
ECS was quoted as saying that in the past “teachers avoided using the older machines” because they were
slow, unreliable, and the software they wanted to use did not run properly on them. Another ECS shared that
“the speed of the old computers discouraged teachers from projects that incorporated pictures and videos”
and another said, “the old computers were slow and elementary school students were not willing to wait.”
The ECSs reported that the speed and reliability of the new computers had the following impact at their
school site:
[The new computers] changed they type of product for students to demo knowledge/master. [Now they are] able to use PowerPoint, video editing, brochures
Now because of the new computers our lab is booked solid. That was not the case when we had [the old computers]
Teachers are more willing to include technology
Teachers want to be in the lab more
Better access to video streaming websites
Additionally, ECS’s from three of the schools that are not Title I said “this grant provided computers our
school would never have had.”
Providing teachers with the equipment they need is the first step, making sure they have sufficient
professional development is the next step. On the Technology Use Survey, 74 percent of teachers who
received equipment, but no PD, agreed/strongly agreed that they need technology-related professional
development to make better use of the equipment they received.
InfrastructureThe ETIF Grant supported major infrastructure upgrades in Eureka County, Lander County, Lyon County, and
Mineral County. The outcomes for this investment are, for the most part, positive; however, this was the one
funding category in which the most negative teacher feedback was collected. The teacher data are only from
Lyon County and Mineral County because Eureka County did not have its wireless infrastructure in place until
late spring 2011 and evaluators determined that teachers would not be able to sufficiently comment on the
impact wireless computing had on their classroom instruction. There are no teacher data from Lander
County because none of the teachers took the Technology Use Survey that was administered in May 2011;
evaluators believe there was a miscommunication about how and to whom the survey should have been
disseminated.
As stated in the Executive Summary, Eureka County outsourced the job of configuring and installing its
wireless network, which resulted in a full-year roll out. While it took the better part of the 2010-11 school year
Nevada Educational Technology Implementation Fund Grant Year 2 Evaluation 64
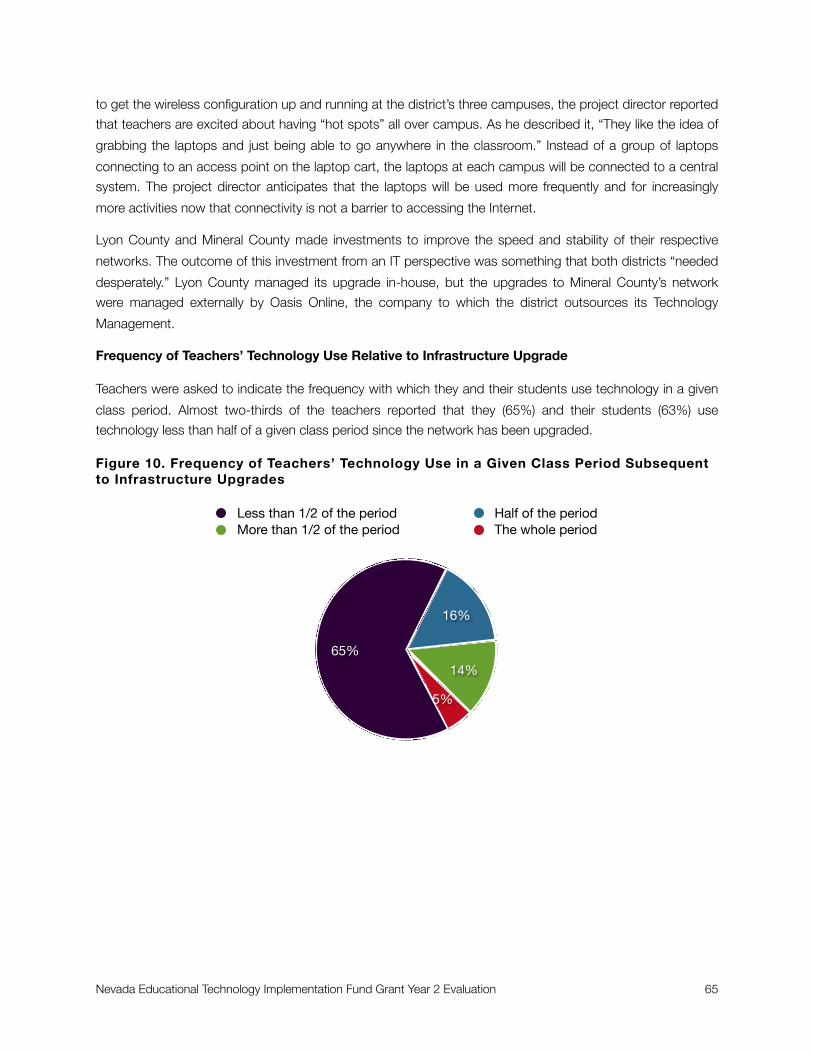
to get the wireless configuration up and running at the district’s three campuses, the project director reported
that teachers are excited about having “hot spots” all over campus. As he described it, “They like the idea of
grabbing the laptops and just being able to go anywhere in the classroom.” Instead of a group of laptops
connecting to an access point on the laptop cart, the laptops at each campus will be connected to a central
system. The project director anticipates that the laptops will be used more frequently and for increasingly
more activities now that connectivity is not a barrier to accessing the Internet.
Lyon County and Mineral County made investments to improve the speed and stability of their respective
networks. The outcome of this investment from an IT perspective was something that both districts “needed
desperately.” Lyon County managed its upgrade in-house, but the upgrades to Mineral County’s network
were managed externally by Oasis Online, the company to which the district outsources its Technology
Management.
Frequency of Teachers’ Technology Use Relative to Infrastructure Upgrade
Teachers were asked to indicate the frequency with which they and their students use technology in a given
class period. Almost two-thirds of the teachers reported that they (65%) and their students (63%) use
technology less than half of a given class period since the network has been upgraded.
Figure 10. Frequency of Teachers’ Technology Use in a Given Class Period Subsequent to Infrastructure Upgrades
Less than 1/2 of the period Half of the periodMore than 1/2 of the period The whole period
5%
14%
16%
65%
Nevada Educational Technology Implementation Fund Grant Year 2 Evaluation 65
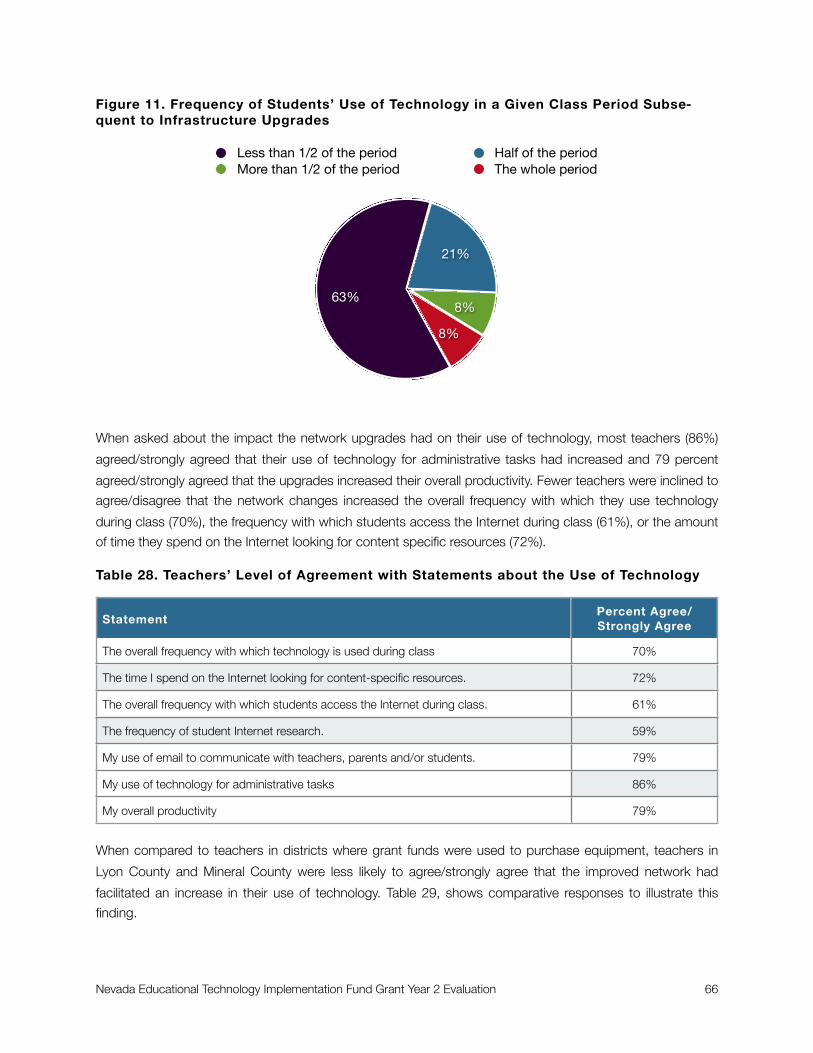
Figure 11. Frequency of Students’ Use of Technology in a Given Class Period Subse-quent to Infrastructure Upgrades
When asked about the impact the network upgrades had on their use of technology, most teachers (86%)
agreed/strongly agreed that their use of technology for administrative tasks had increased and 79 percent
agreed/strongly agreed that the upgrades increased their overall productivity. Fewer teachers were inclined to
agree/disagree that the network changes increased the overall frequency with which they use technology
during class (70%), the frequency with which students access the Internet during class (61%), or the amount
of time they spend on the Internet looking for content specific resources (72%).
Table 28. Teachers’ Level of Agreement with Statements about the Use of Technology
StatementPercent Agree/Strongly Agree
The overall frequency with which technology is used during class 70%
The time I spend on the Internet looking for content-specific resources. 72%
The overall frequency with which students access the Internet during class. 61%
The frequency of student Internet research. 59%
My use of email to communicate with teachers, parents and/or students. 79%
My use of technology for administrative tasks 86%
My overall productivity 79%
When compared to teachers in districts where grant funds were used to purchase equipment, teachers in
Lyon County and Mineral County were less likely to agree/strongly agree that the improved network had
facilitated an increase in their use of technology. Table 29, shows comparative responses to illustrate this
finding.
Less than 1/2 of the period Half of the periodMore than 1/2 of the period The whole period
8%
8%
21%
63%
Nevada Educational Technology Implementation Fund Grant Year 2 Evaluation 66

Table 29. Funding Category Comparison of Teacher Survey Responses to Statements about the Use of Technology
Infrastructure/Technical Services has increased... InfrastructureTechnical Services
The overall frequency with which technology is used during class 70% 82%
The time I spend on the Internet looking for content-specific resources. 72% 76%
The overall frequency with which students access the Internet during class. 61% 68%
My overall productivity 79% 86%
Teachers in both counties had positive and negative comments to share related to the changes. Most of the
negative comments were related to teachers’ frustration with blocked access to sites that were previously
accessible prior to the network changes. Positive comments from teachers were related to increased use of
the Internet attributed to the speed and reliability of the network, decreased SPAM, better email
communication between professional peers, use of Skype for video conferencing, and improved efficiency of
administrative tasks.
Teacher Quotes Expressing Changes in Teaching and Student Learning
Most significant TEACHING change since the network was upgraded
Teachers Noticing a Positive Change
I am able to do more and do it quicker.
At first it was frustrating for me as I would develop a lesson integrating technology, educational videos, tunes, games, etc., at home then only to find when I bring it up at school it would be blocked. The
district has entrusted us to freely monitor the sites students now have access to. This is very helpful in bringing us to the 21st century.
The SPAM burden has diminished substantially.
I have less inappropriate material sent to me. I'm happy about that.
I am able to use the computer more and have students use the computers.
It is easier to get and receive e-mail communications between other teachers and professionals.
At the beginning of this school year, our network was so incredibly slow that I was unable to even take roll in a timely manner, not to mention use technology in other more innovative ways. I am now able
to take roll and log onto the network consistently (previously also a problem).
I am able to use videos to show the relevancy of mathematics in real life and need less time for load-
ing then it would have taken before the upgrade.
Teachers Frustrated with Restricted Access to Websites
We have fewer resources available due to stupid filtering of harmless sites.
The filtering doesn't allow us as teachers to pull up as much information, or video clips for our stu-dents. I find it more limiting than helpful.
Nevada Educational Technology Implementation Fund Grant Year 2 Evaluation 67
It is more difficult to have students online when so much has been blocked and I then need clearance
from tech in order to move along. I get tired of playing a game of wait and see, so I don't use the computer as much as I would like.
The technology that has been "Upgraded" in my classroom has made it almost IMPOSSIBLE to use the technology I was integrating into curriculum like the many years before!
Teachers spending more time trying to get through the walls to access a site that they could access
before the upgrade and also spending more time finding new sites that the system will allow through.
To address teachers’ concerns in Mineral County, the district, in collaboration with IT support from Oasis
Online, developed a policy for releasing blocked sites. According to the Superintendent, it took the better
part of the 2010-11 school year to establish the compromise position in which a teacher may request, with
principal approval, that a URL be opened. Upon receiving the request, a network administrator from Oasis
Online will make the content available on student and teacher computers; when YouTube video sites are
released, they are accessible only on the teacher’s computer. This allows the teacher to use the SMART
Board to project the web content that he or she wants. The process of releasing blocked websites does not
happen automatically, and therefore requires advance planning on the part of teachers. While this is a newly
implemented policy, it does seem to be meeting teachers needs. As one teacher shared, “At first it was
frustrating for me as I would develop a lesson integrating technology, educational videos, tunes, games, etc.,
at home then only to find when I bring it up at school it would be blocked. The district has entrusted us to
freely monitor the sites students now have access to. This is very helpful in bringing us to the 21st century.”
Most significant STUDENT LEARNING change since the network was upgraded
I believe it is the experience and knowledge students receive when they watch educational videos
(weather, animal behavior, or such) that the lesson otherwise is not able to produce. Some students are visual learning and having the option to show a video is a great benefit to the students.
They are able to navigate through information quickly and do not seem to get as frustrated by loading delays.
Students can easily access their online record keeping assignments that are required for my classes.
The students have better access to the electronic card catalog for the library.
Students are able to get instant feedback to their learning as well as be able to see images, pictures,
and videos of current events. It has also allowed students to participate in online sites
Students can access to what they need more directly without having to search through so much indi-rectly related material.
Students are able to log into the computers without pop-ups.
Students know specific sites where they can obtain information on various topics. Some students are
more comfortable using the technology than their teachers.
Summary of Outcomes for Investing in Infrastructure
From an IT perspective the investment in upgrading districts’ infrastructure achieved the objective of
providing students and teachers with secure, reliable, and fast computing capabilities. From the perspective
of some teachers, this came at a cost, namely an increase in restricted websites. Mineral County addressed
Nevada Educational Technology Implementation Fund Grant Year 2 Evaluation 68

these concerns by creating a process by which teachers can request that sites be opened on their
computer, though not on students’ computers.
As with other districts, Mineral County School District was able to use the ETIF Grant to set the foundation
for growing its technology plans. The superintendent indicated that in using its ETIF Grant for infrastructure
the district could now focus on the instructional uses of technology. With funding from other grants the
district purchased iPods and Android tablets for students, and is installing wireless access points so that
each campus has full wireless connectivity. Because the cost of its servers was less than expected, Mineral
County was able to purchase an additional server, which provides infrastructure for the whole district, without
having to look for another funding source to purchase the third server. There is concern, however, that in five
years the district will not have funds to purchase new servers again. The superintendent describes the
district’s budget as “bare bones” and shared that “funding opportunities like this are invaluable for little
districts like Mineral. It’s the only way we can get technology.”
Lyon County’s project director rated his satisfaction with the grant implementation a “12” on a scale from
1-10. He shared that because of the improved stability of the network teachers were using it so much that
the district ran into a bandwidth issue. Bandwidth issues had not been a problem prior to upgrading the
network because, according to the project director, teachers tended to use the network a lot less frequently
due to its unreliability. As a result of the upgrade, teachers began increasingly accessing streaming video,
which slowed down the network. According to the project director, “They are using it more and now it’s slow
again. They were trying to use some software and we didn’t have enough bandwidth. The network
infrastructure improved but then our Internet bandwidth was not enough, but now that’s being addressed.”
The district received eRate funds that it will use to increase bandwidth for classroom computing. Currently
classrooms have one wireless drop with bandwidth ranging from 10-45Mbps. eRate funds will increase the
number of drops to four per classroom and provide wireless connectivity throughout all of the schools at the
increased speed of 100Mbps.
Nevada Educational Technology Implementation Fund Grant Year 2 Evaluation 69

Recommendations
Wexford Institute offers the following recommendations to the Nevada Department of Education and the
Nevada Commission on Educational Technology as suggested considerations should the state award
competitive educational technology focused grants in the future.
Support cross-district collaboration by hosting a virtual post-award grantees meeting to facilitate
information and resource sharing so grantees can benefit sooner rather than later from others’ lessons
learned in implementing similar projects.
Continue to support grantees via the monthly calls hosted by Dr. Kim Vidoni. Project directors
expressed appreciation for these meetings and one person indicated that they were invaluable as they
created a forum “for the little guys to be able to hear what the big guys were doing.”
Ideally, include a requirement in future competitive grant RFPs that a percentage of the grant award be
used toward technology-related professional development. Alternatively, ask grantees to show
evidence of matching funds to support professional development related to their ETIF proposal. In
addition to having applicants agree with a compliance statement, proposals should include a
professional development plan.
Develop a template for and require grantees to submit a quarterly progress report to identify
successes and barriers to implementation. Rather than being punitive, this quarterly status check will
facilitate grantees’ requesting budget amendments should it be determined that some post-award
plans are not feasible.
Consider allocating more funds to fewer districts over a longer period of time. Lincoln County serves
as an example of the district-wide impact larger awards can have for small rural districts that would
not otherwise be able to implement full-scale technology reform.
Nevada Educational Technology Implementation Fund Grant Year 2 Evaluation 70

Part Four: District Implementation Summaries
Carson City
Year 2 Grant Activities
Carson City School District used its Educational Technology Implementation Fund grant to continue
supporting its SMART Board professional development program. The Year 2 training program included the
implementation of two additional training sessions and the inclusion of high school participants. The district
also allocated funds toward the purchase of new computers for teachers participating in the training
program. Being able to purchase the new computers met a critical need for the district because the project
director indicated that “a lot of our workstations were pushing toward 7 years old and didn’t have the
memory to work efficiently with the SMART Board. It was good that we had the money to replace the
workstations.”
With Year 2 grant funds, a total of 19 high school teachers, two middle school teachers, and 29 elementary
school teachers participated in one of three training sessions. During Year 1 sessions were offered
concurrently at multiple campuses. In Year 2, all sessions for elementary and middle school teachers were
offered at one elementary school and all high school teachers were trained at Carson HS. The training was
expanded from four sessions in Year 1 to seven sessions in Year 2. The increased training sessions were
designed to provide advanced training for teachers who returned from Year 1 as well as to provide teachers
with increased opportunity to practice what they had learned and benefit from focused support from Master
Teachers. Each session was 3.5 hours long and included 90 minutes of direct instruction followed by two
hours of hands-on exploration. Each teacher, whether new to the training program or returning from Year 1
was required to participate in the “Stop and Share” session, in which each teacher presented two SMART
Board lessons they had done in their class. Teachers were required to complete five sessions (17.5 hours of
training) in order to receive a thumb drive with all of the lessons created by participants, one professional
growth credit, and one recertification credit.
Highlights of Technology Use Survey Data
At which grade level do you teach?At which grade level do you teach?
Answer OptionsN=26 Response Percent
Elementary 92%
Middle School 4%
High School 0%
Middle School & High School 4%
Nevada Educational Technology Implementation Fund Grant Year 2 Evaluation 71
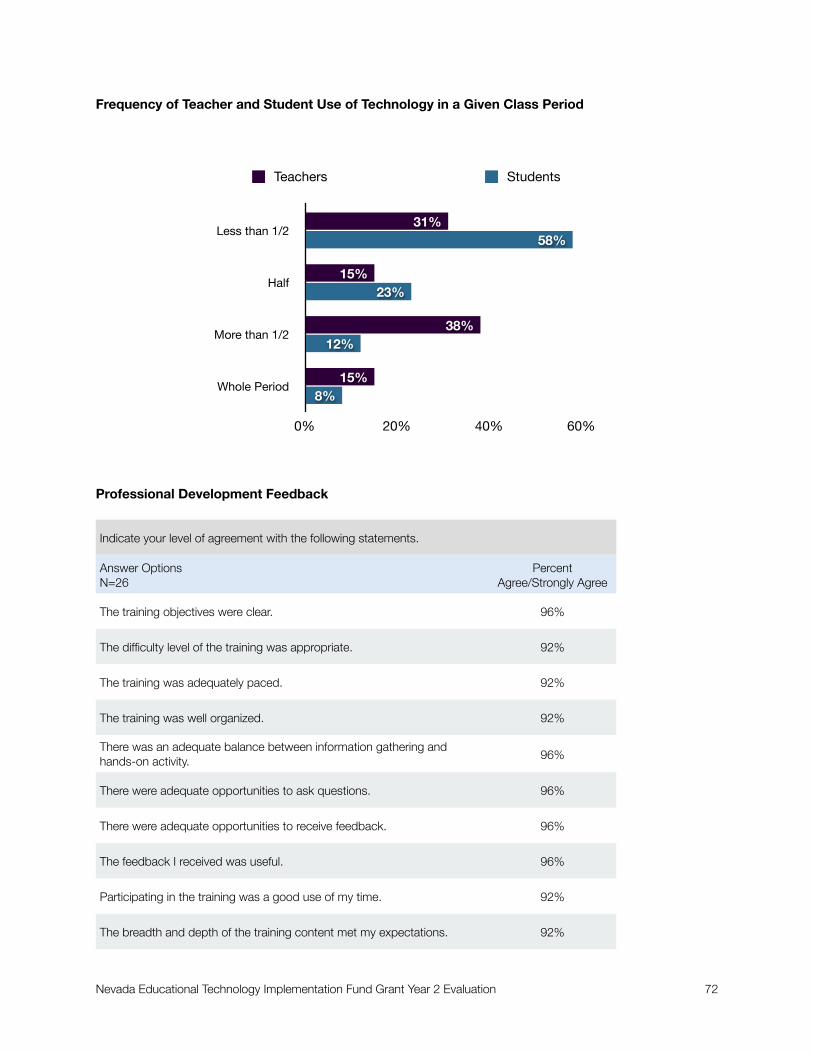
Frequency of Teacher and Student Use of Technology in a Given Class Period
Professional Development Feedback
Indicate your level of agreement with the following statements. Indicate your level of agreement with the following statements.
Answer OptionsN=26
PercentAgree/Strongly Agree
The training objectives were clear. 96%
The difficulty level of the training was appropriate. 92%
The training was adequately paced. 92%
The training was well organized. 92%
There was an adequate balance between information gathering and hands-on activity. 96%
There were adequate opportunities to ask questions. 96%
There were adequate opportunities to receive feedback. 96%
The feedback I received was useful. 96%
Participating in the training was a good use of my time. 92%
The breadth and depth of the training content met my expectations. 92%
Teachers Students
Less than 1/2
Half
More than 1/2
Whole Period
0% 20% 40% 60%
8%
12%
23%
58%
15%
38%
15%
31%
Nevada Educational Technology Implementation Fund Grant Year 2 Evaluation 72

Indicate your level of agreement with the following statements. Indicate your level of agreement with the following statements.
Answer OptionsN=26
PercentAgree/Strongly Agree
The training helped me build on what I learned last year. 95%
The focus of the training was directly linked to new things I'm trying/would like to try in my classroom. 92%
The training provided me with strategies that I could immediately put to use in my classroom. 96%
Overall, the training was of high quality. 92%
Changes in Teaching Practices as a Result of Participating in the SMART Board Training
Teachers’ Perceptions about the Use of Technology
Indicate the extent to which you agree with the following statements. Indicate the extent to which you agree with the following statements.
Answer OptionsN=26
% Agree/Strongly Agree
Students are using technology more this year than they did last year. 96%
Substantial Change Somewhat Substantial Change
Content area Curriculum
Instructional methods
Rigor of student activities
Integrating technology into teaching
Students’ hands-on time with technology
Sharing ideas and activities with other teachers
Time spent seeking additional information
Using technology for differentiated instruction
0% 15% 30% 45% 60%
50%
50%
35%
46%
46%
54%
54%
58%
23%
19%
27%
23%
38%
12%
31%
15%
Nevada Educational Technology Implementation Fund Grant Year 2 Evaluation 73
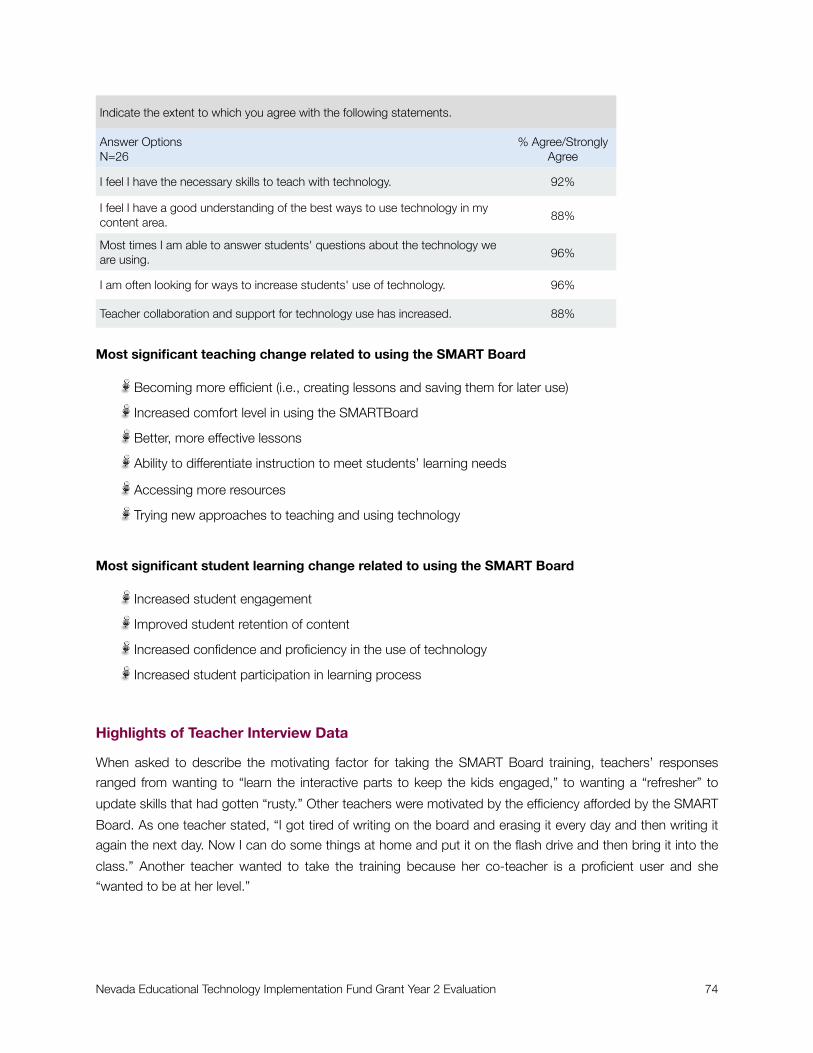
Indicate the extent to which you agree with the following statements. Indicate the extent to which you agree with the following statements.
Answer OptionsN=26
% Agree/Strongly Agree
I feel I have the necessary skills to teach with technology. 92%
I feel I have a good understanding of the best ways to use technology in my content area. 88%
Most times I am able to answer students' questions about the technology we are using. 96%
I am often looking for ways to increase students' use of technology. 96%
Teacher collaboration and support for technology use has increased. 88%
Most significant teaching change related to using the SMART Board
Becoming more efficient (i.e., creating lessons and saving them for later use)
Increased comfort level in using the SMARTBoard
Better, more effective lessons
Ability to differentiate instruction to meet students’ learning needs
Accessing more resources
Trying new approaches to teaching and using technology
Most significant student learning change related to using the SMART Board
Increased student engagement
Improved student retention of content
Increased confidence and proficiency in the use of technology
Increased student participation in learning process
Highlights of Teacher Interview Data
When asked to describe the motivating factor for taking the SMART Board training, teachers’ responses
ranged from wanting to “learn the interactive parts to keep the kids engaged,” to wanting a “refresher” to
update skills that had gotten “rusty.” Other teachers were motivated by the efficiency afforded by the SMART
Board. As one teacher stated, “I got tired of writing on the board and erasing it every day and then writing it
again the next day. Now I can do some things at home and put it on the flash drive and then bring it into the
class.” Another teacher wanted to take the training because her co-teacher is a proficient user and she
“wanted to be at her level.”
Nevada Educational Technology Implementation Fund Grant Year 2 Evaluation 74

The teachers who returned for a second year of training indicated that they signed up for the classes in order
to have “time to work” on SMART Board lessons as well as to learn skills that they did not “completely
absorb or didn’t remember or master” during the first round of training.
Site Trainer Interviews
Site trainers were asked to characterize the types of assistance they provide teachers. Those who were
working with teachers that participated in both years of training reported that they provided more “how do
you do this?” support, as teachers in their second year of training tended to be more confident and capable
of doing their own troubleshooting. Those who worked with teachers in their first year of training said they
were providing more technical support such as doing software updates.
Site Trainers reported that a benefit of their position was that it allowed them to spend more time on their
own lessons as well as learning by answering other teachers’ questions and seeing the lessons that they
developed. They also said that being a trainer increased their confidence in using the board and increased
the depth of their use. One teacher shared, “Just because I’m the computer teacher doesn’t mean I always
used it to its full advantage. I think I was maybe using a small percentage of the capability and now I use it a
lot more.” Below are some of the other comments teachers shared about the training.
It’s probably the best teacher training that I’ve gone to. And a huge part of it is the work time they build in So many times you go to a workshop and they show it to you and then you get back and
don’t know what to do with it. But we actually sit there and work on it and get to build things.
[We need] a PD day just so we can develop lessons. The Sit & Soaks were really good because you could hear the discussions about how [other teachers] could adapt things for their own grade level.
The thing that our district needs to hunt for is to have the upkeep of the tools and all that it needs. The SMART Boards are in round one of SMART Board and they’re older and they need to be re-
placed. The projectors need to be replaced because the bulbs go dim. How can the district write into the grant…now that we have all of this wonderful training and tools, that we can keep them?
Project Director & Project Coordinator Perspective
The project coordinator sees “the fact that they [teachers] wanted to take the class again for five Friday
nights” as a clear indicator of the success of the training program. According to the project coordinator, who
is also one of the Master Teachers, the teachers who returned for a second year of training “are into the
stage of adapting instead of adopting. You hear them talking about curriculum application more than talking
about frustrations about not knowing how to use the tool.”
The project director attributes the success of the training program to the strength of the trainers. “Because
our trainers were so strong, that was a critical component. We relied on them to roll it out and counted on
their expertise. Because they did such a good job the program went really well.” Upon reflecting on
observations he has made in classrooms, the project director said, “I’ve noticed that they are using it as a
smart board and not just a whiteboard or a projection board. I’m seeing this across content areas.”
In terms of sustaining what was accomplished with the grant, Carson City passed a bond that in 2013 will
provide funds to update the equipment.
Nevada Educational Technology Implementation Fund Grant Year 2 Evaluation 75

Churchill County
Year 2 Grant Activities
Churchill County continued to offer its Intro to Technology class for 8th grade students at the junior high
school. The class uses the SmartLab STEM-based curriculum which the district purchased with ETIF Grant
funds. In the class students work in pairs to move through a series of 15 engagements. The role of the
Facilitator is to ensure that students have the tools they need to complete the engagements, but most of the
class, after the Facilitator provides the students with an orientation to the course, is student guided. Student
manage their progress through the engagements using the web-based portfolio that is part of the SmartLab
package. Each day students are required to write daily objectives, update their ePortfolio, and write a
summary of what they learned.
At the end of Year 1, the assistant principal at the junior high, along with the SmartLab facilitator, decided to
offer a year-long course to a select group of 8th graders. Recommendations were provided by content-area
teachers as well as the computer teacher and a cohort of incoming 8th graders was selected to pilot the
year-long elective during the 2010-11 school year.
Highlights of Student Survey Data
Students’ Feedback on Intro to Tech Class Partnerships
Indicate how much you agree with the following statements. Indicate how much you agree with the following statements. Indicate how much you agree with the following statements. Indicate how much you agree with the following statements.
Answer Options
Percent WhoAgree/Strongly Agree
Percent WhoAgree/Strongly Agree
Percent WhoAgree/Strongly Agree
Answer OptionsFall 2010(N=120)
Spring 2010(N=117)
Year Long Cohort(N=32)
I enjoyed working with a partner. 86% 81% 84%
I had a good partner. 84% 81% 78%
I was a good partner. 88% 85% 81%
I want to do more work with partners in my other classes. 72% 59% 69%
I learned more from the engagements by work-ing with a partner. 73% 73% 66%
Nevada Educational Technology Implementation Fund Grant Year 2 Evaluation 76
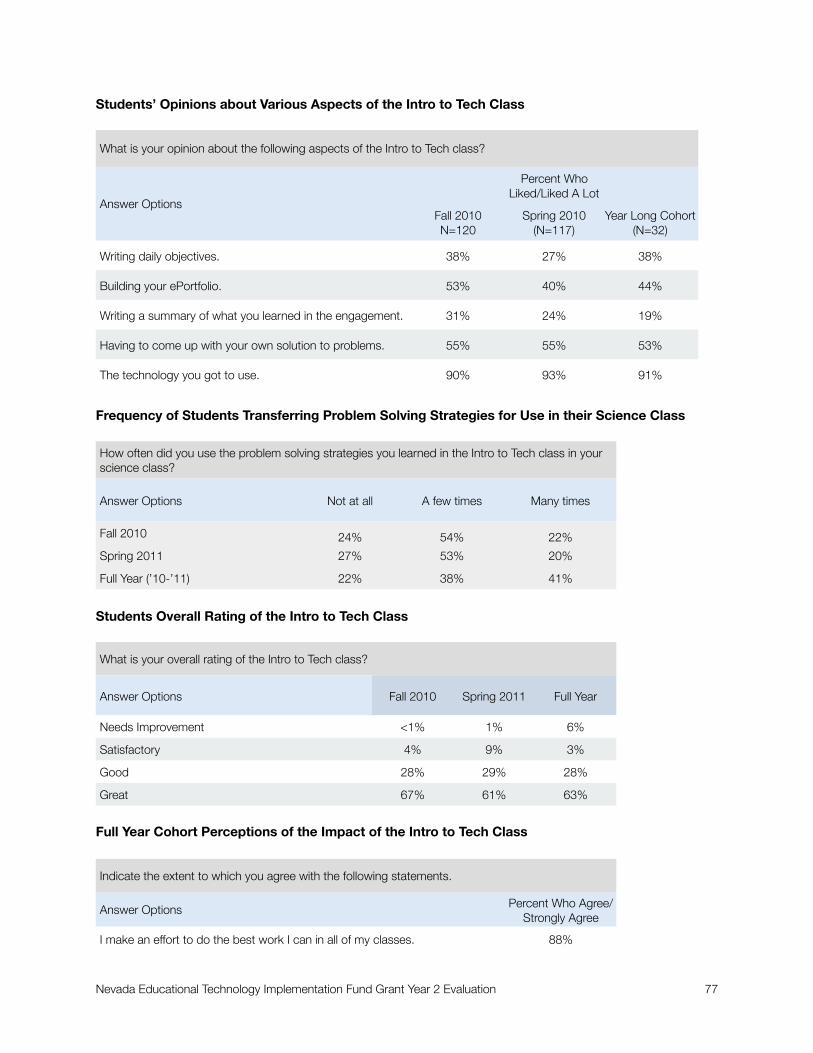
Students’ Opinions about Various Aspects of the Intro to Tech Class
What is your opinion about the following aspects of the Intro to Tech class?What is your opinion about the following aspects of the Intro to Tech class?What is your opinion about the following aspects of the Intro to Tech class?What is your opinion about the following aspects of the Intro to Tech class?
Answer Options
Percent WhoLiked/Liked A Lot
Percent WhoLiked/Liked A Lot
Percent WhoLiked/Liked A Lot
Answer OptionsFall 2010N=120
Spring 2010(N=117)
Year Long Cohort(N=32)
Writing daily objectives. 38% 27% 38%
Building your ePortfolio. 53% 40% 44%
Writing a summary of what you learned in the engagement. 31% 24% 19%
Having to come up with your own solution to problems. 55% 55% 53%
The technology you got to use. 90% 93% 91%
Frequency of Students Transferring Problem Solving Strategies for Use in their Science Class
How often did you use the problem solving strategies you learned in the Intro to Tech class in your science class?How often did you use the problem solving strategies you learned in the Intro to Tech class in your science class?How often did you use the problem solving strategies you learned in the Intro to Tech class in your science class?How often did you use the problem solving strategies you learned in the Intro to Tech class in your science class?
Answer Options Not at all A few times Many times
Fall 2010 24% 54% 22%
Spring 2011 27% 53% 20%
Full Year (’10-’11) 22% 38% 41%
Students Overall Rating of the Intro to Tech Class
What is your overall rating of the Intro to Tech class?What is your overall rating of the Intro to Tech class?What is your overall rating of the Intro to Tech class?What is your overall rating of the Intro to Tech class?
Answer Options Fall 2010 Spring 2011 Full Year
Needs Improvement <1% 1% 6%
Satisfactory 4% 9% 3%
Good 28% 29% 28%
Great 67% 61% 63%
Full Year Cohort Perceptions of the Impact of the Intro to Tech Class
Indicate the extent to which you agree with the following statements. Indicate the extent to which you agree with the following statements.
Answer Options Percent Who Agree/Strongly Agree
I make an effort to do the best work I can in all of my classes. 88%
Nevada Educational Technology Implementation Fund Grant Year 2 Evaluation 77

Indicate the extent to which you agree with the following statements. Indicate the extent to which you agree with the following statements.
Answer Options Percent Who Agree/Strongly Agree
I feel confident that I can do well in my classes if I work hard. 91%
I often take the time to learn more about a subject than what is presented in class. 66%
I feel the Intro to Tech class increased my confidence in trying different strate-gies to solve problems. 78%
I like to be challenged in my classes. 78%
As a result of my experience in the Intro to Tech class, I enjoy working with other classmates on project. 88%
I feel the Intro to Tech class increased my ability to communicate my thoughts to my teachers. 66%
I feel the Intro to Tech class increased my ability to communicate my thoughts to my peers. 75%
I feel confident in my ability to express my thoughts in writing to my teachers. 53%
I feel confident in my ability to express my thoughts in writing to my peers. 59%
I sometimes use skills I learned in the Intro to Tech class to complete assign-ments in my other classes. 84%
Project Director and SmartLab Facilitator Perspectives
The project director and the teacher who served as the SmartLab Facilitator are pleased with the
implementation of the Intro to Technology class and plan to continue offering the option of taking the course
all year long for a small cohort of students. One of the project director’s goals for the 2011-12 school year is
to develop a final exam for the class. He is interested in quantifying student learning outcomes. In terms of
long term sustainability, the project director’s biggest concern is limited funds to replace the computers in 3-5
years.
The project facilitator’s goal is to have students get through all 15 engagements, which they have not yet
been able to do. He reported that he feels more comfortable with the equipment and has a better sense of
how much time he needs to spend prepping the kids before they start the first engagement. He feels that
next year he will be able to shorten the orientation period which will allow more time for engagements.
Nevada Educational Technology Implementation Fund Grant Year 2 Evaluation 78
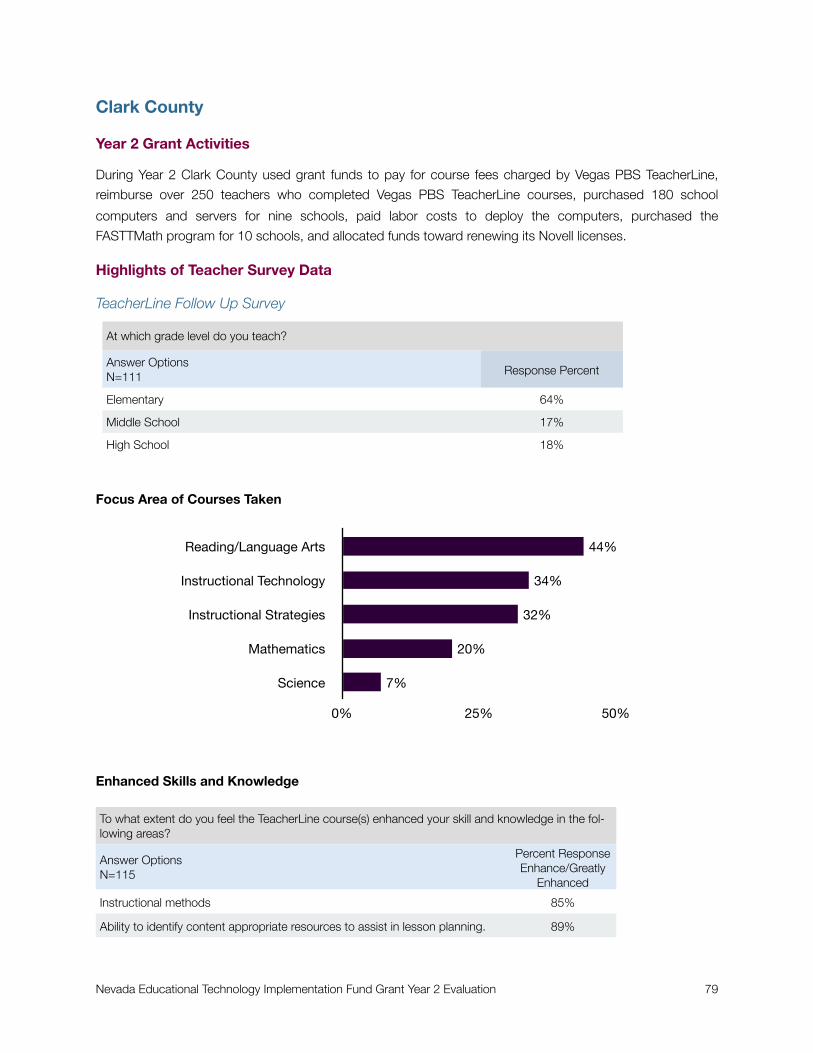
Clark County
Year 2 Grant Activities
During Year 2 Clark County used grant funds to pay for course fees charged by Vegas PBS TeacherLine,
reimburse over 250 teachers who completed Vegas PBS TeacherLine courses, purchased 180 school
computers and servers for nine schools, paid labor costs to deploy the computers, purchased the
FASTTMath program for 10 schools, and allocated funds toward renewing its Novell licenses.
Highlights of Teacher Survey Data
TeacherLine Follow Up Survey
At which grade level do you teach?At which grade level do you teach?
Answer OptionsN=111 Response Percent
Elementary 64%
Middle School 17%
High School 18%
Focus Area of Courses Taken
Enhanced Skills and Knowledge
To what extent do you feel the TeacherLine course(s) enhanced your skill and knowledge in the fol-lowing areas?To what extent do you feel the TeacherLine course(s) enhanced your skill and knowledge in the fol-lowing areas?
Answer OptionsN=115
Percent ResponseEnhance/Greatly
Enhanced
Instructional methods 85%
Ability to identify content appropriate resources to assist in lesson planning. 89%
Reading/Language Arts
Instructional Technology
Instructional Strategies
Mathematics
Science
0% 25% 50%
7%
20%
32%
34%
44%
Nevada Educational Technology Implementation Fund Grant Year 2 Evaluation 79

Using technology to address students' learning needs. 83%
Strategies for planning differentiated instruction. 82%
Strategies for implementing and managing differentiated instruction. 80%
Theory-based understanding of your content area. 78%
Learning theory (i.e., how students learn) related to your content area. 83%
Improving student assessment. 81%
Below are some of the outcomes that teachers reported related to implementing new strategies learned in
their TeacherLine course:
Having a better understanding of students’ capabilities
Better scores on assessments
Students gaining more thorough understanding of content
Increased student engagement and enjoyment of learning activities
Improved use of school computer resources
Teacher collaboration around differentiated instruction
Better student retention of course content
Improved student writing
Changes in Teaching Practices
Substantial Change Somewhat Substantial Change
Content area Curriculum
Rigor of student activities
Integrating technology into teaching
Students’ hands-on time with technology
Sharing ideas and activities with other teachers
Time spent seeking additional information
0% 13% 25% 38% 50%
43%
43%
37%
43%
44%
39%
20%
23%
22%
24%
19%
14%
Nevada Educational Technology Implementation Fund Grant Year 2 Evaluation 80

Most significant teaching change related to taking TeacherLine Course
Increased/renewed enjoyment in teaching content
More planning
Increased focus on student assessment and using data to tailor instruction
Increased use of technology
Increase in student-centered learning
Increased collaboration among teachers
Use of blogs and other social media
More open-ended questioning to test for student understanding
Most significant student learning change related to using the SMARTBoard
Increased student engagement
Increased student motivation
Students better prepared for next grade level
TeacherLine Feedback Survey: Fall 2010
At which grade level do you teach?At which grade level do you teach?
Answer OptionsN=72 Response Percent
Elementary 56%
Middle School 25%
High School 19%
Professional Development Feedback
Indicate your level of agreement with the following statements. Indicate your level of agreement with the following statements.
Answer OptionsN=72
PercentAgree/Strongly Agree
The course objectives were clear. 92%
The difficulty level of the course was appropriate. 93%
There were adequate opportunities to ask questions. 94%
There were adequate opportunities to receive feedback. 96%
The feedback I received was useful. 93%
Participating in the course was a good use of my time. 93%
Nevada Educational Technology Implementation Fund Grant Year 2 Evaluation 81

The breadth and depth of the course content met my expectations. 89%
The course provided me with strategies that I could immediately put to use in my classroom. 92%
Overall, the course was of high quality. 93%
Change in Teaching Practice
Choose the response that best describes your action. Since completing the course are you...Choose the response that best describes your action. Since completing the course are you...Choose the response that best describes your action. Since completing the course are you...Choose the response that best describes your action. Since completing the course are you...Choose the response that best describes your action. Since completing the course are you...Choose the response that best describes your action. Since completing the course are you...
Answer OptionsN=72
Not currently doing this
Considering doing this
Preparing to do this
Have done this once/a few times
Doing this on a regular
basis
Modifying your lesson plans to incorporate strategies you learned in the course? 6% 8% 10% 46% 31%
Modifying your instructional practice based on information/strategies you learned in the course?
6% 7% 13% 44% 31%
Evaluating the impact of newly adopted instruc-tional strategies on student learning? 6% 6% 24% 36% 29%
Seeking out additional information to build on what you learned in the course? 7% 7% 13% 39% 35%
Sharing what you learned in the course with other grade/subject level teachers at your school?
10% 11% 13% 38% 29%
FASTTMath Teacher Survey
Number of Respondents by Grade Level
At what grade level do you teach?At what grade level do you teach?
Answer Options Response Percent
3 43%
4 29%
5 31%
6 4%
7 4%
8 3%
Nevada Educational Technology Implementation Fund Grant Year 2 Evaluation 82

Teachers’ Perceptions of the Ease/Difficulty of Implementing FASTTMath
Indicate the extent to which the following aspects of FASTT Math have been easy or difficult for you.Indicate the extent to which the following aspects of FASTT Math have been easy or difficult for you.Indicate the extent to which the following aspects of FASTT Math have been easy or difficult for you.Indicate the extent to which the following aspects of FASTT Math have been easy or difficult for you.Indicate the extent to which the following aspects of FASTT Math have been easy or difficult for you.Indicate the extent to which the following aspects of FASTT Math have been easy or difficult for you.Indicate the extent to which the following aspects of FASTT Math have been easy or difficult for you.
Answer Options Very Easy Easy Somewhat Easy
Somewhat Difficult
Difficult Very Difficult
Adequate access to computers 38% 27% 16% 12% 3% 4%
Finding time to regularly implement FASTT Math 15% 26% 24% 23% 5% 6%
Managing logistical implementation of FASTT Math 16% 34% 29% 15% 4% 2%
Generating student reports 20% 29% 27% 16% 4% 5%
Analyzing student reports and data 20% 27% 28% 16% 4% 4%
Using student data to improve implemen-tation 14% 28% 27% 21% 5% 5%
Using strategies in the implementation guide 11% 20% 35% 23% 3% 8%
Despite indications, from the data presented in the table above, that implementing FASTTMath was relatively
easy, teachers’ responses to an open-ended question about other implementation issues revealed that there
were a few areas where teachers had a great deal of frustration. These include:
Access problems due to the server being down
Problems un-enrolling students who left the school and enrolling new students
System-related problems where students who completed an operation were not advanced to the next level (i.e. a student mastered addition facts for “3s” but the program would not move them to “4s”)
Managing student time related to doing the math drills versus spending time playing the games
Below are teachers’ comments related to problems they had with FASTTMath
We have too many math programs, Fastmath is only useful/usable for facts. Using it for intervention would probably be great but there's only so much time in a day, I don't have another 1/2 hr to de-
vote to the lowest of the low. I don't need any more lessons or videos on how great it is, just practi-cal ways of implementing it in the classroom.
There were too many times when the program was not available because your server was down.
There were too many times when the program was not available because your server was down.
I didn't know we had a guide or practice sheets
This program was a complete waste of 1 and 1/2 hours of math instruction per week. Other teach-ers stopped going. I wish I had followed their lead and stopped going as well. I thought we HAD to
use the program. My students would have done much better with their math facts if I had stopped going as well. All the teachers have been complaining about what a waste of time it is because stu-
Nevada Educational Technology Implementation Fund Grant Year 2 Evaluation 83

dents who can easily complete 100 math problems in 2 minutes fail to score as adequate on your program. It keeps kids adding 1 +0 for months...when it only takes minutes to master that skill.
Having trouble getting into the computer lab was one problem and not having very many class com-puters would be the next big issue with 4 computers for 26 children it was hard to get through eve-ryone in one day
Students who are laggards...don't pursue the program with enthusiasm. With a computer program I don't mind monitoring, but I can't stand there watching every student to see if they are really giving it
their best effort.
Teachers’ Satisfaction with FASTTMath
Teachers were asked to indicate their level of satisfaction with various expected outcomes of using the
software. Over two-thirds of the teachers indicated that they were satisfied or very satisfied that FASTTMath
increased student motivation to learn math facts (68%) and improved students’ math facts fluency (66%).
However, when asked about their level of satisfaction that using FASTTMath helped students with knowledge
transfer, only 55 percent reported that they were satisfied or very satisfied that students’ were able to transfer
math facts fluency to either their daily math work or to teacher-created assessments.
Comments in Favor of Recommending FASTTMath
I have used other math programs in my class. I never saw the same level of excitement about math as I did when I started using Fastt Math. The students loved to play the games on the program.
This helps with automaticity and students like the program.
It provides the facts practice that I can't provide in class.
It's easy to use and it works.
Comments against Recommending FASTTMath
I think it is trying to be too much. It is fine for improving fluency, but your implementation guide talks
about using small groups, grouping, worksheets, reports,.interventions at particular skill deficiencies; not stuff I have time for when this is just a fact practice program. I think it is probably too expensive
for being really a glorified worksheet for unmotivated kids who won't practice at home. I already have a math program, several in fact, don't need another. If you want to be a comprehensive math cur-riculum, than do so, but no teacher has time for two math programs a day.
This program is ineffective in improving student performance. Part of the problem may be that we use primarily laptop computers therefore numbers on keyboard slow the students down significantly.
It works very well as long as you continue. I noticed during crts and we didn't have as much time they lost some of their facts.
Teachers’ Training Needs
Accessing and utilizing student reports
Managing student lists (enrolling and un-enrolling students)
Classroom management strategies when rotating small groups through the program
Helping students access FASTTMath at home
Nevada Educational Technology Implementation Fund Grant Year 2 Evaluation 84

How to use the support materials
Better understanding of how to use the placement assessment
Technology Use Survey
At which grade level do you teach?At which grade level do you teach?
Answer OptionsN=28 Response Percent
Elementary 93%
Middle School 7%
Teachers’ Technology Use
Indicate your level of agreement with the following statements. Indicate your level of agreement with the following statements.
Answer OptionsN=27
PercentAgree/Strongly Agree
The overall frequency with which technology is used during class. 100%
The time I spend on the Internet looking for content-specific resources. 84%
The frequency with which I use a projector to display web-based or other information to the class. 88%
My use of presentation software to create slide shows for my class. 81%
The overall frequency with which students access the Internet during class. 96%
The frequency of student Internet research. 92%
The number of technology-related projects students work on in my class. 93%
My use of email to communicate with teachers, parents, and/or students. 79%
My use of technology for administrative tasks (i.e., attendance, grading) 83%
My use of school and/or district-provided software programs. 93%
My overall productivity. 96%
My interest in doing more to integrate technology into my curriculum. 100%
Nevada Educational Technology Implementation Fund Grant Year 2 Evaluation 85
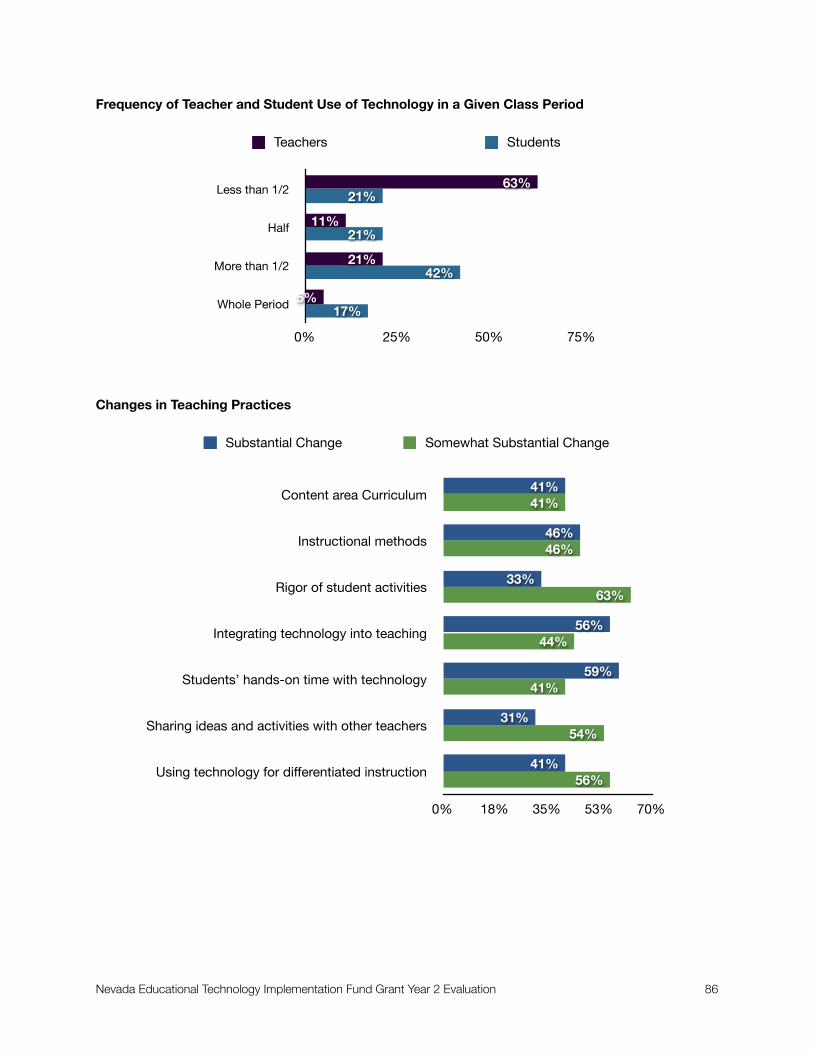
Frequency of Teacher and Student Use of Technology in a Given Class Period
Changes in Teaching Practices
Teachers Students
Less than 1/2
Half
More than 1/2
Whole Period
0% 25% 50% 75%
17%
42%
21%
21%
5%
21%
11%
63%
Substantial Change Somewhat Substantial Change
Content area Curriculum
Instructional methods
Rigor of student activities
Integrating technology into teaching
Students’ hands-on time with technology
Sharing ideas and activities with other teachers
Using technology for differentiated instruction
0% 18% 35% 53% 70%
56%
54%
41%
44%
63%
46%
41%
41%
31%
59%
56%
33%
46%
41%
Nevada Educational Technology Implementation Fund Grant Year 2 Evaluation 86

Teachers’ Perceptions about the Use of Technology
Indicate the extent to which you agree with the following statements. Indicate the extent to which you agree with the following statements.
Answer OptionsN=27 % Agree/Strongly Agree
Students are using technology more this year than they did last year. 100%
I feel I have the necessary skills to teach with technology. 81%
I feel I have a good understanding of the best ways to use technology in my content area. 81%
Most times I am able to answer students' questions about the technology we are using. 89%
I am often looking for ways to increase students' use of technology. 100%
Teacher collaboration and support for technology use has increased. 89%
I feel like I need technology-related professional development to make better use of the new computer 73%
Most significant teaching change as a result of having new computers
Increase in the use of technology for differentiated instruction
Increased use of software
Ability to connect the computer to a projector/document camera
Quicker access to websites
Increased efficiency
Most significant student learning change as a result of having new computers
Students learned how to do Internet searches
Increased confidence in navigating the Internet
Increased time using educational games
Students become independent learners
Increased engagement
Increase in student technology projects
Project Director Perspective
The project director is satisfied with what the district was able to accomplish with the grant funds and
appreciated that the grant funded a two-year program. At the end of Year 1 she expressed some concern
about using Year 2 funds to purchase FASTTMath for more schools based on the usage reports. However,
on reflecting on two years of supporting FASTTMath she believes the district “made a good faith effort” to
pilot the program. She feels very strongly that grant funds were put to good use in the replacement of
Nevada Educational Technology Implementation Fund Grant Year 2 Evaluation 87

workstations and servers at schools that were most in need of this equipment. She also shared that teachers
are so appreciative of the new computers that her department sometimes gets thank you cards from
classrooms.
In reflecting on lessons learned related to the grant implementation, the project director expressed regret that
in relation to the immediate needs of the district (i.e. renewing the district’s Novell licensing), she did not have
enough “people money.” She indicated that if she had enough funding she would have had someone
working with the teachers who were part of the grant. She feels that in order to have real impact related to
the investment, the district needed to have someone working with teachers to provide more instructional
support. While she indicated that the district will continue to reimburse teachers who complete TeacherLine
courses, she is interested in looking at how to make some changes in which courses are eligible for
reimbursement because she believes ”that the professional development pieces need to be tied directly and
obviously to [the] district technology plan.”
The project director indicated that she has “huge concerns” about limited funding for technology. As she
stated, “There’s never enough money to get our foot in the door with what we need...We’ll continue to buy
servers as we can scramble money together. That need never goes away in a district this large. We’d really
like to keep our classroom computers within 5 years old. We don’t know if we’ll be able to do that, but that’s
always the goal.”
Nevada Educational Technology Implementation Fund Grant Year 2 Evaluation 88

Douglas County
Year 2 Grant Activities
During Year 2 of the ETIF Grant, funds were used to buy ActivExpression for eight teachers who did not
receive them in Year 1 as well as iPads, which were used for data collection. Douglas County continued to
support teachers through a series of professional development sessions centered around the use of the
Promethean suite of products including the Promethean interactive whiteboard, ActivInspire software,
ActivExpression (student response system), ActivSlate, and ActiView (document camera). During Year 1,
Douglas County teachers received training on these devices exclusively from the technology trainer in
Washoe County. In Year 2, the training model was expanded based on Year 1 teachers’ interest and
willingness to serve as mentors for other teachers in the district. As a result, funds from a $1 million
Community Foundation for Western Nevada donation were used to support 12 teachers’ participation in a 4-
day ActivInstructor course that took place in August 2010. Teachers received 30 hours of training in which
they learned how to deliver the Core Essentials and Beyond the Essentials workshops to other teachers in
the district. In addition to this training teachers participated in two additional vendor-provided training
sessions as well as two sessions provided by Washoe County.
Highlights of Teacher Survey Data
At which grade level do you teach?At which grade level do you teach?
Answer OptionsN=22 Response Percent
Elementary 41%
Middle School 36%
High School 14%
Middle School & High School 9%
Teachers’ Comfort with the Promethean Board
Compared to last school year, how would you rate your comfort level in using the following technology?Compared to last school year, how would you rate your comfort level in using the following technology?Compared to last school year, how would you rate your comfort level in using the following technology?Compared to last school year, how would you rate your comfort level in using the following technology?
Answer OptionsN=22 Promethean ActivSlate ActivExpression
Not Comfortable 0% 9% 9%
Somewhat Comfortable 9% 14% 27%
Comfortable 9% 27% 14%
Very Comfortable 82% 50% 50%
Nevada Educational Technology Implementation Fund Grant Year 2 Evaluation 89

Frequency of Teachers’ Use of Promethean and ActivSlate in a Given Class Period
Frequency of Students’ Use of Promethean and ActivExpression in a Given Class Period
Professional Development Feedback
Indicate your level of agreement with the following statements. Indicate your level of agreement with the following statements.
Answer OptionsN=22
PercentAgree/Strongly Agree
The training objectives were clear. 95%
The difficulty level of the training was appropriate. 95%
The training was adequately paced. 95%
The training was well organized. 95%
Promethean ActivSlate
Less than 1/2
Half
More than 1/2
Whole Period
0% 35% 70%
9%
27%
64%
23%
59%
18%
Promethean ActivExpression
Less than 1/2
Half
More than 1/2
Whole Period
0% 40% 80%
5%
19%
76%
5%
21%
32%
42%
Nevada Educational Technology Implementation Fund Grant Year 2 Evaluation 90

Indicate your level of agreement with the following statements. Indicate your level of agreement with the following statements.
Answer OptionsN=22
PercentAgree/Strongly Agree
There was an adequate balance between information gathering and hands-on activity. 100%
There were adequate opportunities to ask questions. 100%
There were adequate opportunities to receive feedback. 100%
The feedback I received was useful. 90%
Participating in the training was a good use of my time. 95%
The breadth and depth of the training content met my expectations. 90%
The training helped me build on what I learned last year. 80%
The focus of the training was directly linked to new things I'm trying/would like to try in my classroom. 95%
The training provided me with strategies that I could immediately put to use in my classroom. 100%
Overall, the training was of high quality. 90%
Changes in Teaching Practices
Substantial Change Somewhat Substantial Change
Content area Curriculum
Instructional methods
Rigor of student activities
Integrating technology into teaching
Students’ hands-on time with technology
Sharing ideas and activities with other teachers
Time spent seeking additional information
Using technology for differentiated instruction
0% 23% 45% 68% 90%
50%
59%
45%
45%
14%
59%
32%
23%
32%
36%
41%
55%
86%
27%
68%
55%
Nevada Educational Technology Implementation Fund Grant Year 2 Evaluation 91
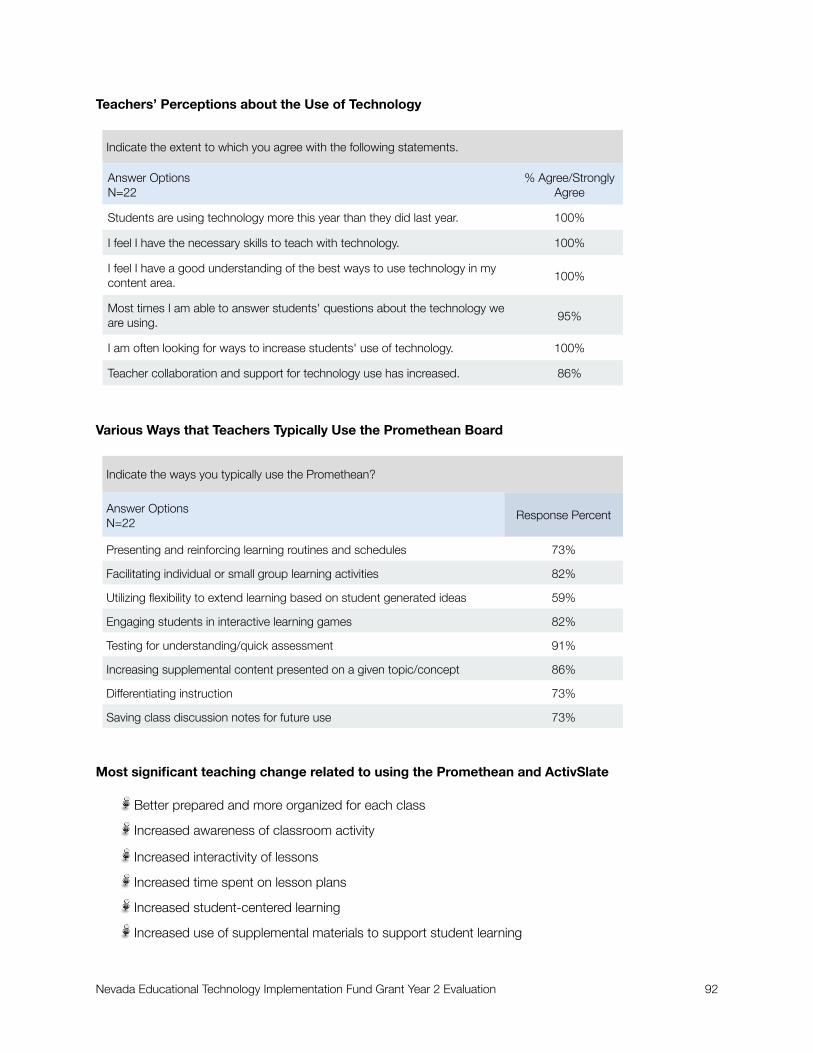
Teachers’ Perceptions about the Use of Technology
Indicate the extent to which you agree with the following statements. Indicate the extent to which you agree with the following statements.
Answer OptionsN=22
% Agree/Strongly Agree
Students are using technology more this year than they did last year. 100%
I feel I have the necessary skills to teach with technology. 100%
I feel I have a good understanding of the best ways to use technology in my content area. 100%
Most times I am able to answer students' questions about the technology we are using. 95%
I am often looking for ways to increase students' use of technology. 100%
Teacher collaboration and support for technology use has increased. 86%
Various Ways that Teachers Typically Use the Promethean Board
Indicate the ways you typically use the Promethean? Indicate the ways you typically use the Promethean?
Answer OptionsN=22
Response Percent
Presenting and reinforcing learning routines and schedules 73%
Facilitating individual or small group learning activities 82%
Utilizing flexibility to extend learning based on student generated ideas 59%
Engaging students in interactive learning games 82%
Testing for understanding/quick assessment 91%
Increasing supplemental content presented on a given topic/concept 86%
Differentiating instruction 73%
Saving class discussion notes for future use 73%
Most significant teaching change related to using the Promethean and ActivSlate
Better prepared and more organized for each class
Increased awareness of classroom activity
Increased interactivity of lessons
Increased time spent on lesson plans
Increased student-centered learning
Increased use of supplemental materials to support student learning
Nevada Educational Technology Implementation Fund Grant Year 2 Evaluation 92

Most significant student learning change related to using the Promethean and ActivExpression
Increased student engagement
Increased instructional time
Increased planned and “on the fly” testing for student understanding
Increased student participation in learning process
More meaningful whole class discussions
Project Director Perspective
The project director is satisfied with the implementation of the grant, giving credit to the success in Year 2 to
what was learned in the first year about how to effectively deliver professional development. He credits some
of the changes that were made (i.e., expanding into vendor provided training and having teachers serve as
mentors) to feedback the district received from the evaluator’s comments in the Year 1 Interim Report. As he
described the Year 2 implementation, “We had better training, better direction as to where we were going,
more teacher commitment. We had a PD cadre of year 1 teachers who committed to be trainers and
mentors; we had more people using what they learned in their classrooms as there was more collaborating;
we had middle school teachers whose students had these whiteboard experiences in elementary school and
expected same, so teachers looked for PD and found what they needed from their peers and from district
PD improvement.”
While the project director is pleased, overall, with the increased use of technology, he stills sees room for
improvement. When asked about his opportunities to observe teachers using the Promethean equipment in
their room, he indicated that technology use varies depending on grade level and site. As was the case in
Year 1, elementary teachers are further along in the frequency and instructional ways they use the tools,
“middle school teachers are coming along, and high school teachers are still using it more as a ‘glorified’
white board.”
In summing up the implementation of the grant, the project director indicated that the district is fully
committed to funding additional professional development and that the teacher mentor model will continue.
He did not indicate any concerns related to being able to sustain what was accomplished in the grant. In a
final statement during his interview he shared, “The purchase part was easy; getting the professional
development right was the most challenging. After last year’s evaluation suggestions, we worked over the
summer to make changes by adding multiple levels and multiple types of training. We provided better
“menu” options for teachers and had a better roll out of the whole program.”
Nevada Educational Technology Implementation Fund Grant Year 2 Evaluation 93
Elko County
Year 2 Grant Activities
Elko County continued its use of Ed Tech Grant funds to support two teachers’ (one middle school and one
high school) participation in the Nevada Pathway Project. Specifically, Flip video cameras were purchased
and funds were used to support teachers’ attendance at the Florida Educational Technology Conference and
the Nevada State Ed Tech Conference in October 2010.
Highlights of Teacher Survey Data
As participants in the Nevada Pathway Project, teachers received a class set of laptop computers and iPods.
Both teachers reported that, compared to their first year in the project, they felt very comfortable integrating
students’ use of laptops. One teacher reported feeling “comfortable” and the other one reported feeling “very
comfortable” integrating students’ use of the iPods.
In terms of the amount of time that students spend using the laptops and iPods in a given class period, both
teachers reported that their students use the laptops more than half of the class period and the iPods less
than half of the class period.
Changes in Teaching Practices
Both teachers indicated that as a result of their participation in the Nevada Pathway Project they made
somewhat substantial or substantial changes in the following areas of their teaching practice:
Content area curriculum
Instructional methods
Rigor of student activities
Integrating technology into their teaching
Integrating students’ hands-on time with technology
Sharing ideas and activities they learned in their training with other teachers at their school
Time they spend seeking out additional information to build on what they learned in the training
Using technology to plan for differentiated instruction
Teachers’ Perceptions about the Use of Technology
Both teachers agreed or strongly agreed with the following statements about the use of technology:
Students are using technology more this year than they did last year
I feel I have the necessary skills to teach with technology
I feel I have a good understanding of the best ways to use technology in my content area
Most times I am able to answer students’ questions about the technology we are using
I am often looking for ways to increase students’ use of technology
Nevada Educational Technology Implementation Fund Grant Year 2 Evaluation 94

Professional Development Feedback
Indicate your level of agreement with the following statements. Indicate your level of agreement with the following statements. Indicate your level of agreement with the following statements. Indicate your level of agreement with the following statements.
Answer OptionsN=2
One Agree/One Disagree
Both Disagree
Both Agree
The training objectives were clear. X
The difficulty level of the training was appropriate. X
The training was adequately paced. X
The training was well organized. X
There was an adequate balance between information gathering and hands-on activity. X
There were adequate opportunities to ask questions. X
There were adequate opportunities to receive feedback. X
The feedback I received was useful. X
Participating in the training was a good use of my time. X
The breadth and depth of the training content met my expectations. X
The training helped me build on what I learned last year. X
The focus of the training was directly linked to new things I'm trying/would like to try in my classroom. X
The training provided me with strategies that I could im-mediately put to use in my classroom. X
Overall, the training was of high quality. X
Project Director Perspective
At the end of the 2009-10 school year, the project director for the ETIF Grant retired. During end-of-year
follow up with all project directors, evaluators conducted a phone interview with the new project director. He
did not have much information to share about the project because he, admittedly, had been only minimally
involved with the project during Year 2. It appears that the level of involvement was primarily dictated by the
nature of the grant activities. Given that equipment had already been purchased and teachers were
participating in a structured statewide professional development program, grant oversight was seemingly
minimal.
As a result of the discontinuity in grant management, evaluators were not able to obtain an overall
retrospective on satisfaction with grant implementation and any lessons learned. When asked about district
plans to expand on what was implemented with the grant, the project director shared that there are plans to
align the transition to the Common Core standards with a district-wide adoption of integrating digital
instruction into the core curriculum.
Nevada Educational Technology Implementation Fund Grant Year 2 Evaluation 95

Esmeralda County
Year 2 Grant Activities
Esmeralda County’s implementation of the ETIF Grant was slightly non-conventional in that during both Year
1 and Year 2 of the grant, most of the district’s grant money was expended toward the end of the school
year. In Year 1 the district purchased Mobi devices for teachers to remotely interface with their SMART
Boards. In Year 2, the project director purchased iPads, iPod Nano devices, and laptop computers for
teachers and students.
In speaking with the project director, evaluators found that each teacher received, on average about 5 hours
of one-on-one training related to using the Mobi slate. As the project director, who is also the district’s
technology coordinator described, “Because I have such a flexible job in the district when I go to each school
I touch base with each teacher and when they ask for help I’m able to provide it.” He indicated that the
teachers are not all at the same skill level and frequency of use, but even reluctant users are “coming
around..when they see the kids engaged in another classroom where teachers are using it they want more
[training] because they see how the kids are learning.”
Summary of Year 2 Data Collection
Evaluators administered an online survey to all six teachers in the district. Three teachers accessed the online
survey; however, only one teacher fully completed the survey. Evaluators believe this is most likely a result of
instrument error. The survey questions were developed with an understanding that evaluators had of project
implementation based on the interview with the Technology Coordinator; namely that teachers had received
professional development. However, when questions about the PD were posed, two of the teachers reported
that they never had training and one teacher did not answer the question. Based on this response, the “skip
logic” built into the online survey advanced these respondents past the PD questions so there is only
feedback on professional development from one teacher. Given this low response rate, no summary data are
provided here.
Most significant teaching change related to using the Mobi
Being able to move around the room
Ease in displaying information
Most significant student learning change related to using the Mobi
Increased student engagement
Increased student interactivity during lessons
Improved ability of students’ to “visualize” what they are learning
Project Director Perspective
When asked about teachers’ use of the Mobi slate, the project director shared that teachers are using the
board to provide direct instruction by projecting the content from CDs associated with their texts. “Teachers
are brining in their CDs from Harcourt and other companies and they are teaching directly from the CD and
Nevada Educational Technology Implementation Fund Grant Year 2 Evaluation 96

interacting with the students so the students are getting the most up to date learning from the creators of the
books.” He also shared that some teachers allow students to use the Mobi and manipulate what the class is
able to see on the board. According to the project director, what teachers enjoy most about the Mobi is not
being “tethered to the board.”
District plans to expand what was implemented with the ETIF Grant include supporting the district-wide
adoption of Apple products, including 1:1 iPads for students and Macbook computers for teachers. The
district will continue to use its 1:1 PCs that are in classrooms, but the project director was so impressed with
the work students were able to do with Mac products (through the Nevada Pathway Project) that he sees
them as a must have for the students.
There is some concern about having enough funds to sustain what was accomplished with the grant. The
project director shared that, “At this point we have everything running but I do worry if something goes out.
With the few students that we have we don’t have a large general fund. If we had to purchase a new board
or some other equipment it would be hard to get without the funds we have now to support what we are
doing. It worries me that the state might cut technology money. If things get cut then we could lose the best
thing we’ve got going, which is the technology.”
Nevada Educational Technology Implementation Fund Grant Year 2 Evaluation 97

Eureka County
Year 2 Grant Activities
Eureka County used its Year 2 Ed Tech Grant money to fund its wireless project. The district outsourced the
work directly with Dell, which ended up subcontracting out the work. The process took a lot longer than the
district's Technology Director anticipated and based on the experience he would not recommend working
with Dell in the future. Prior to taking on the project of upgrading the wireless capability at the district’s three
campuses, teachers were limited to access points that were connected to individual laptop carts. Typically,
connectivity only extended to a few classrooms down or across the hall from wherever the laptop cart was
stationed. This configuration was very restrictive and limited teachers’ ability to get students online.
Highlights of Teacher Survey Data
Evaluators determined that because the upgrade to the wireless system had taken most of the school year,
teachers would not have used it long enough to provide feedback on how the upgrade was affecting their
computing capabilities, and subsequently their instruction. Therefore, the Technology Use Survey was only
administered to teachers who received new computers purchased with ETIF Grant money.
At which grade level do you teach?At which grade level do you teach?
Answer OptionsN=10 Response Count
Junior High 1
High School 2
Junior High & High School 7
Student and Teacher Use of New Computers
Indicate the extent to which you agree with the following statements. Indicate the extent to which you agree with the following statements.
Answer OptionsN=10
Percent Who Agree/Strongly Agree
The frequency with which I take my students to the lab has increased 90%
The amount of Internet-research students do for my class has increased 100%
The number of technology-related projects students complete for my class has increased 89%
Students' use of district-provided software has increased. 78%
The amount of time I spend looking for web-based resources to support my curriculum has increased 100%
I have had problems scheduling the lab when I want to use it with my class(es) 30%
I feel like I need technology-related professional development to make better use of the lab 50%
Nevada Educational Technology Implementation Fund Grant Year 2 Evaluation 98

Frequency of Teacher and Student Use of Computers During a Given Class Period
On average, how much time in a given class period are computers used for instructional purposes?On average, how much time in a given class period are computers used for instructional purposes?On average, how much time in a given class period are computers used for instructional purposes?On average, how much time in a given class period are computers used for instructional purposes?On average, how much time in a given class period are computers used for instructional purposes?
Answer OptionsN=10
Less than 1/2 of the period
Half of the period More than 1/2 of the period
The whole period
Teacher 80% 20% 0% 0%
Students 40% 30% 10% 20%
Changes in Teaching Practices
Teachers’ Perceptions about the Use of Technology
Indicate the extent to which you agree with the following statements. Indicate the extent to which you agree with the following statements.
Answer OptionsN=10
% Agree/Strongly Agree
Students are using technology more this year than they did last year. 78%
I feel I have the necessary skills to teach with technology. 80%
I feel I have a good understanding of the best ways to use technology in my content area. 70%
Substantial Change Somewhat Substantial Change
Content area Curriculum
Instructional methods
Rigor of student activities
Integrating technology into teaching
Students’ hands-on time with technology
Sharing ideas and activities with other teachers
Using technology for differentiated instruction
0% 15% 30% 45% 60%
30%
20%
50%
40%
60%
60%
20%
20%
10%
30%
40%
20%
20%
20%
Nevada Educational Technology Implementation Fund Grant Year 2 Evaluation 99
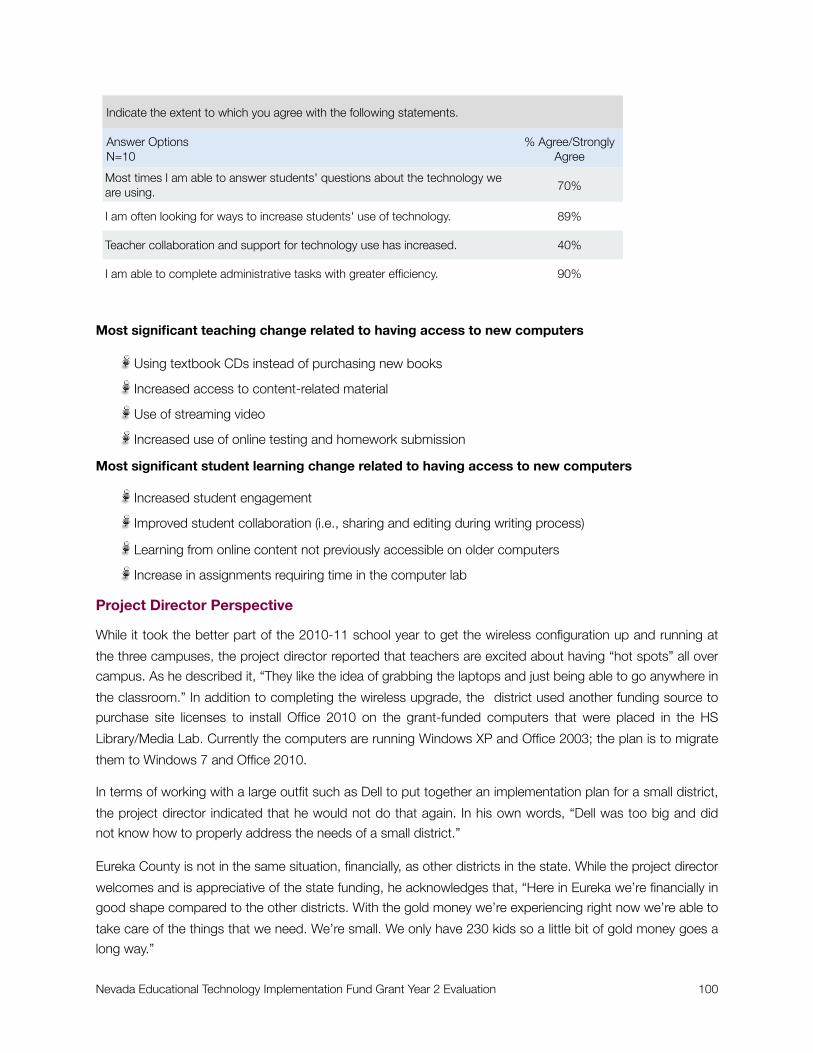
Indicate the extent to which you agree with the following statements. Indicate the extent to which you agree with the following statements.
Answer OptionsN=10
% Agree/Strongly Agree
Most times I am able to answer students' questions about the technology we are using. 70%
I am often looking for ways to increase students' use of technology. 89%
Teacher collaboration and support for technology use has increased. 40%
I am able to complete administrative tasks with greater efficiency. 90%
Most significant teaching change related to having access to new computers
Using textbook CDs instead of purchasing new books
Increased access to content-related material
Use of streaming video
Increased use of online testing and homework submission
Most significant student learning change related to having access to new computers
Increased student engagement
Improved student collaboration (i.e., sharing and editing during writing process)
Learning from online content not previously accessible on older computers
Increase in assignments requiring time in the computer lab
Project Director Perspective
While it took the better part of the 2010-11 school year to get the wireless configuration up and running at
the three campuses, the project director reported that teachers are excited about having “hot spots” all over
campus. As he described it, “They like the idea of grabbing the laptops and just being able to go anywhere in
the classroom.” In addition to completing the wireless upgrade, the district used another funding source to
purchase site licenses to install Office 2010 on the grant-funded computers that were placed in the HS
Library/Media Lab. Currently the computers are running Windows XP and Office 2003; the plan is to migrate
them to Windows 7 and Office 2010.
In terms of working with a large outfit such as Dell to put together an implementation plan for a small district,
the project director indicated that he would not do that again. In his own words, “Dell was too big and did
not know how to properly address the needs of a small district.”
Eureka County is not in the same situation, financially, as other districts in the state. While the project director
welcomes and is appreciative of the state funding, he acknowledges that, “Here in Eureka we’re financially in
good shape compared to the other districts. With the gold money we’re experiencing right now we’re able to
take care of the things that we need. We’re small. We only have 230 kids so a little bit of gold money goes a
long way.”
Nevada Educational Technology Implementation Fund Grant Year 2 Evaluation 100
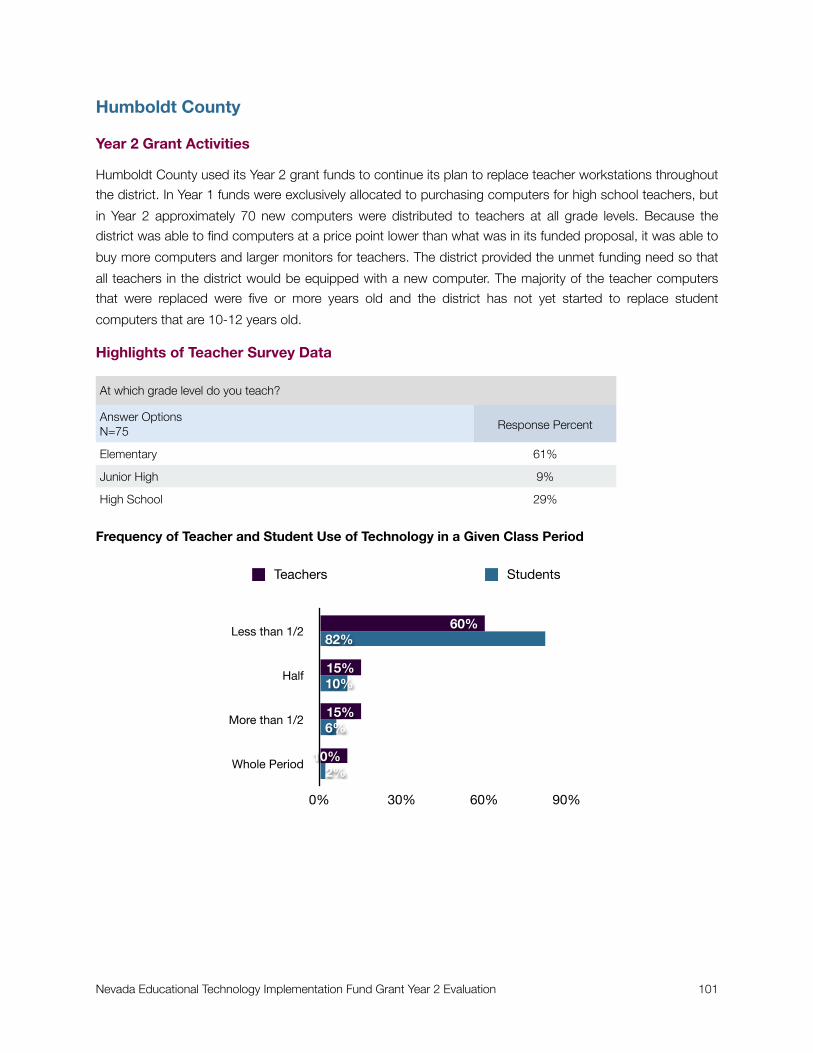
Humboldt County
Year 2 Grant Activities
Humboldt County used its Year 2 grant funds to continue its plan to replace teacher workstations throughout
the district. In Year 1 funds were exclusively allocated to purchasing computers for high school teachers, but
in Year 2 approximately 70 new computers were distributed to teachers at all grade levels. Because the
district was able to find computers at a price point lower than what was in its funded proposal, it was able to
buy more computers and larger monitors for teachers. The district provided the unmet funding need so that
all teachers in the district would be equipped with a new computer. The majority of the teacher computers
that were replaced were five or more years old and the district has not yet started to replace student
computers that are 10-12 years old.
Highlights of Teacher Survey Data
At which grade level do you teach?At which grade level do you teach?
Answer OptionsN=75 Response Percent
Elementary 61%
Junior High 9%
High School 29%
Frequency of Teacher and Student Use of Technology in a Given Class Period
Teachers Students
Less than 1/2
Half
More than 1/2
Whole Period
0% 30% 60% 90%
2%
6%
10%
82%
10%
15%
15%
60%
Nevada Educational Technology Implementation Fund Grant Year 2 Evaluation 101
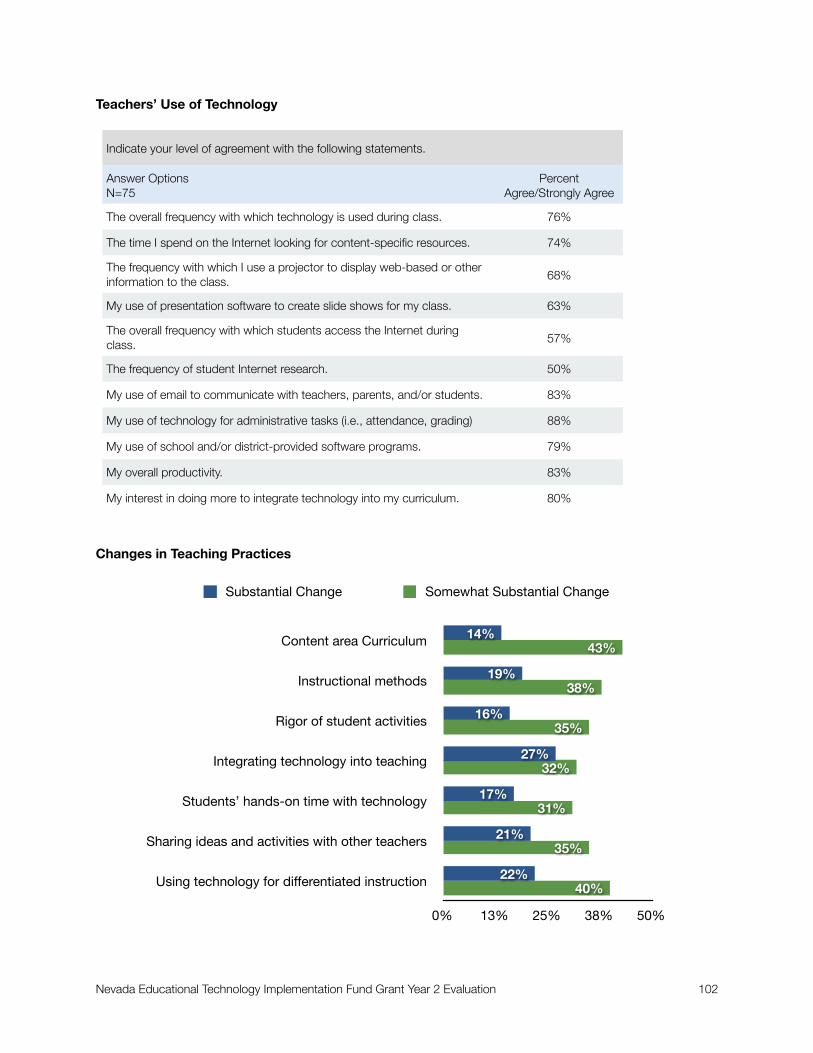
Teachers’ Use of Technology
Indicate your level of agreement with the following statements. Indicate your level of agreement with the following statements.
Answer OptionsN=75
PercentAgree/Strongly Agree
The overall frequency with which technology is used during class. 76%
The time I spend on the Internet looking for content-specific resources. 74%
The frequency with which I use a projector to display web-based or other information to the class. 68%
My use of presentation software to create slide shows for my class. 63%
The overall frequency with which students access the Internet during class. 57%
The frequency of student Internet research. 50%
My use of email to communicate with teachers, parents, and/or students. 83%
My use of technology for administrative tasks (i.e., attendance, grading) 88%
My use of school and/or district-provided software programs. 79%
My overall productivity. 83%
My interest in doing more to integrate technology into my curriculum. 80%
Changes in Teaching Practices
Substantial Change Somewhat Substantial Change
Content area Curriculum
Instructional methods
Rigor of student activities
Integrating technology into teaching
Students’ hands-on time with technology
Sharing ideas and activities with other teachers
Using technology for differentiated instruction
0% 13% 25% 38% 50%
40%
35%
31%
32%
35%
38%
43%
22%
21%
17%
27%
16%
19%
14%
Nevada Educational Technology Implementation Fund Grant Year 2 Evaluation 102

Teachers’ Perceptions about the Use of Technology
Indicate the extent to which you agree with the following statements. Indicate the extent to which you agree with the following statements.
Answer OptionsN=75
% Agree/Strongly Agree
Students are using technology more this year than they did last year. 74%
I feel I have the necessary skills to teach with technology. 77%
I feel I have a good understanding of the best ways to use technology in my content area. 72%
Most times I am able to answer students' questions about the technology we are using. 88%
I am often looking for ways to increase students' use of technology. 85%
Teacher collaboration and support for technology use has increased. 73%
I feel like I need technology-related professional development to make better use of the new computer. 64%
Most significant teaching change related to having a new computer
Increased efficiency with faster computer
Increased use of computer for instructional purposes
Increased use of projector and SMARTBoard
Using computer to access content not available in outdated texts
Accessing more online supplemental teaching resources
Increased ability to quickly search the Internet to respond to students’ research questions
Most significant student learning change related to having a new computer
Students able to quickly access information on teachers’ classroom computer rather than having to plan/schedule time in the computer lab
Increased use of classroom SMARTBoard
Better understanding of content when computer is used to provide visual representations
Project Director Perspective
In addition to replacing outdated workstations, installing new computers facilitated the district’s ability to
purchase the A+Learning program. The Project Director reported that the new computers were the first to
get A+ Learning (an online courseware program that facilitates course recovery and remediation).
Nevada Educational Technology Implementation Fund Grant Year 2 Evaluation 103

While it was a significant accomplishment to provide every teacher in the district with a new computer, there
are some networking issues that affect teachers’ ability to use the computers to their full potential. Currently,
many teachers are using the computers for administrative rather than instructional purposes because of
efforts to manage web traffic due to limited bandwidth. The district has submitted an eRate application to
increase bandwidth by moving the schools from a T1 line to fiber optic. The district has also partnered with
local business and mines to receive donations of used computers that replace very old student computers.
The project director shared that in addition to using their new computers for administrative tasks, teachers
were also using them to connect to projectors or SMART Boards, though she admitted that the level of use
depends on the teacher. “Some only do grades and email.” Humboldt County did not intend to use grant
funds to provide teachers with professional development related to using the new computers for instructional
purposes; however, the project director admits that she would like to see more PD offerings for teachers.
According to the project director, limited human resources was the biggest challenge the district faced in
implementing the grant. Because the technology staff is limited it took the entire school year to install all of
the new computers. Tech staff had to balance completing the computer swap with their already full tech
support and maintenance schedule. At the time of the interview in early May 2011, the last computers were
still being installed.
The biggest sustainability concerns are with “what the future holds for replacing these computers next time
around” and with meeting teachers’ technology support needs. The Project Director feels that because the
staff is so small (three people) that they “can never be caught up” and that “it’s hard when teachers have to
wait to get their computers repaired.”
Nevada Educational Technology Implementation Fund Grant Year 2 Evaluation 104
Lander County
Year 2 Grant Activities
The implementation of Lander County’s Ed Tech Grant took place primarily “behind the scenes,” with Oasis
Online handling the ordering and installation of new switches and routers. The roll out for installing the new
equipment began in summer 2010 and continued into the spring of 2011. Because of the gradual roll out it
was difficult for evaluators to capture outcome data related to grant implementation.
Year 2 Data Collection Activities
Evaluators conducted a phone interview with the project director, Dan Slentz, who is also co-owner of Oasis
Online, the company that provides Technology Management services for the district. In an attempt to get
impact data directly from district staff, evaluators sent multiple emails and left voicemail with the district
superintendent requesting an interview; there was no response to these requests. Evaluators also attempted
to collect feedback from teachers on the Technology Use Survey, but there were no responses to the survey
request. As a last attempt to collect data from teachers, evaluators contacted Dr. Kim Vidoni, Educational
Technology Coordinator for the Nevada Department of Education, for assistance in getting teachers to
respond to the survey. Dr. Vidoni sent an email to Mr. Slentz, requesting that he disseminate the survey link to
teachers. Mr. Slentz confirmed that he would send the survey link to teachers, but this effort also failed to
yield any responses to the teacher survey.
In a final attempt to gather outcome data, evaluators were in communication with Mr. Slentz in hopes that he
would be able to generate reports that would show how the network is functioning with the upgraded
switches and routers compared to how it was previously functioning. Mr. Slentz researched the availability of
such reports, but was unable to generate these data.
Project Director Perspective
The project director indicated that the new switches and routers installed over the two-years of the grant
were a much needed upgrade to Lander County School District’s computing network. While there is no
quantifiable or teacher anecdotal data to include in this report, the project director reported that the
noticeable change that teachers would see as a result of the upgrade is increased speed and improved
performance of the network. He also shared that while teachers would notice a tremendously more reliable
network, the upgrade also provided an added benefit behind the scenes. IT staff can more easily monitor
network traffic, which in turn makes it easier to troubleshoot and deal with problems before they take down
the network.
Nevada Educational Technology Implementation Fund Grant Year 2 Evaluation 105

Lincoln County
Year 2 Grant Activities
During Year 2 of the ETIF Grant, grant, Lincoln County expanded its 1:1 laptop initiative from one middle
school that served as the pilot site in Year 1 to five additional campuses. This expansion included all 6th-8th
grade students in the district. Netbooks were purchased for teachers and students and an additional part-
time Technology Integration Specialist was hired. Other Year 2 activities included hosting a Parent Night to
explain the 1:1 netbook project, supporting teacher attendance at the CUE conference in Palm Springs, and
development of a district-wide Technology Leadership Committee to provide oversight to the planned
expansion of 1:1 netbooks across all grade levels.
Highlights of Teacher Survey Data
Teacher Needs Assessment Survey: Fall 2010
Indicate the extent to which you agree with the following statements. Indicate the extent to which you agree with the following statements.
Answer OptionsN=20
Percent Agree/Strongly Agree
Developing student activities that require the use technology for discussing ideas and reflecting on learning experiences. 75%
Developing student activities that require the use technology for collecting, manipulating, and ana-lyzing data. 88%
Developing student activities that require the use of technology for peer collaboration. 69%
Using technology to develop/enhance students' problem-solving skills. 81%
Using technology to develop/enhance students' critical thinking skills. 88%
Using technology to develop/enhance students' creative expression. 81%
Technology Use Survey
Hours of TIS Training on Various Topics
Since the beginning of the school year, how much time has your Technology Integration Specialist spent helping you with the following uses of technology? Since the beginning of the school year, how much time has your Technology Integration Specialist spent helping you with the following uses of technology? Since the beginning of the school year, how much time has your Technology Integration Specialist spent helping you with the following uses of technology? Since the beginning of the school year, how much time has your Technology Integration Specialist spent helping you with the following uses of technology?
Answer Options 1-10 11-20 20+
Internet searching for content area resources. 25% 25% 19%
Student Internet searching for assignments. 19% 19% 6%
Student use of email to submit assignments. 38% 13% 13%
Online submission of homework/reports 31% 13% 13%
Student use of email to collaborate on assignments. 31% 13% 13%
Nevada Educational Technology Implementation Fund Grant Year 2 Evaluation 106

Since the beginning of the school year, how much time has your Technology Integration Specialist spent helping you with the following uses of technology? Since the beginning of the school year, how much time has your Technology Integration Specialist spent helping you with the following uses of technology? Since the beginning of the school year, how much time has your Technology Integration Specialist spent helping you with the following uses of technology? Since the beginning of the school year, how much time has your Technology Integration Specialist spent helping you with the following uses of technology?
Answer Options 1-10 11-20 20+
Student use of online apps (web-based tools) to collaborate on assignments. 13% 19% 19%
Student-developed slide presentations as part of an assignment. 19% 25% 19%
Student use of video as part of an assignment 25% 19% 19%
Digital storytellng as part of an assignment. 13% 6% 19%
Frequency of Teacher and Student Use of Technology in a Given Class Period
Teachers’ Perceptions about the Use of Technology
Indicate the extent to which you agree with the following statements. Indicate the extent to which you agree with the following statements.
Answer OptionsN=16
% Agree/Strongly Agree
Students are using technology more this year than they did last year. 100%
I feel I have the necessary skills to teach with technology. 88%
I feel I have a good understanding of the best ways to use technology in my content area. 81%
Most times I am able to answer students' questions about the technology we are using. 93%
I am often looking for ways to increase students' use of technology. 88%
Teacher collaboration and support for technology use has increased. 94%
Teachers Students
Less than 1/2
Half
More than 1/2
Whole Period
0% 25% 50% 75% 100%
6%
19%
25%
50%
19%
13%
69%
Nevada Educational Technology Implementation Fund Grant Year 2 Evaluation 107

Changes in Teaching Practices
Most significant teaching change related to having 1:1 netbooks
Increased comfort with student-centered learning
Increased use of supplemental material
Increased use of web apps for student assignments
Increased organization and efficiency
Most significant student learning change related to having 1:1 netbooks
Increased student engagement
Increased motivation of low-achieving students
Increased use of technology
Netbooks facilitate anytime/anywhere learning
Project Director Perspective
From the project director’s perspective, the impact of the 1:1 laptop initiative has been “pretty substantial.”
He sees the benefit of having piloted the roll out at one school before expanding the initiative throughout the
district. The slow roll out allowed the district to figure out, in some cases “the hard way” and through trial and
error, what the technical support issues would be. This is the one area that the project director indicated
Substantial Change Somewhat Substantial Change
Content area Curriculum
Instructional methods
Rigor of student activities
Integrating technology into teaching
Students’ hands-on time with technology
Sharing ideas and activities with other teachers
Time spent seeking additional information
Using technology for differentiated instruction
0% 18% 35% 53% 70%
69%
50%
31%
50%
44%
31%
69%
44%
6%
25%
6%
38%
38%
13%
6%
6%
Nevada Educational Technology Implementation Fund Grant Year 2 Evaluation 108
needed to be “nailed down” in order to lay the groundwork for a successful expansion into additional schools
and grade levels.
He indicated that communication and clearly defining roles related to various responsibilities and decision
making associated with the expansion were critical. He is confident that the formation of the Technology
Leadership Committee was the right way to go in terms of ensuring that all stakeholders (teachers,
administrators, and IT staff) have a voice in how the implementation and ongoing support of the laptop
expansion will occur.
In terms of meeting the needs of teachers, the project director is satisfied that the Technology Integration
Specialist training model works and the district will continue to support the positions in the upcoming school
year. As it relates to the impact on students, the project director indicated that they are benefiting in many
ways; key among them is the ability to take the netbook home. After a successful Parent Night in which the
laptop program was explained and parents’ concerns about Internet safety were addressed, the project
director reports that there are very few, if any, issues related to students’ care of the computers or abuse of
the privilege of taking the computers home. The availability of the netbook at home has changed how
students submit their homework (i.e., many submit their assignments online). He also remarked on how the
students have been self-starters in terms of learning how to use the new equipment. Students receive no
formal instruction on how to make video projects, yet when given the equipment they are able to work
independently or in groups to figure things out and share with others.
Nevada Educational Technology Implementation Fund Grant Year 2 Evaluation 109
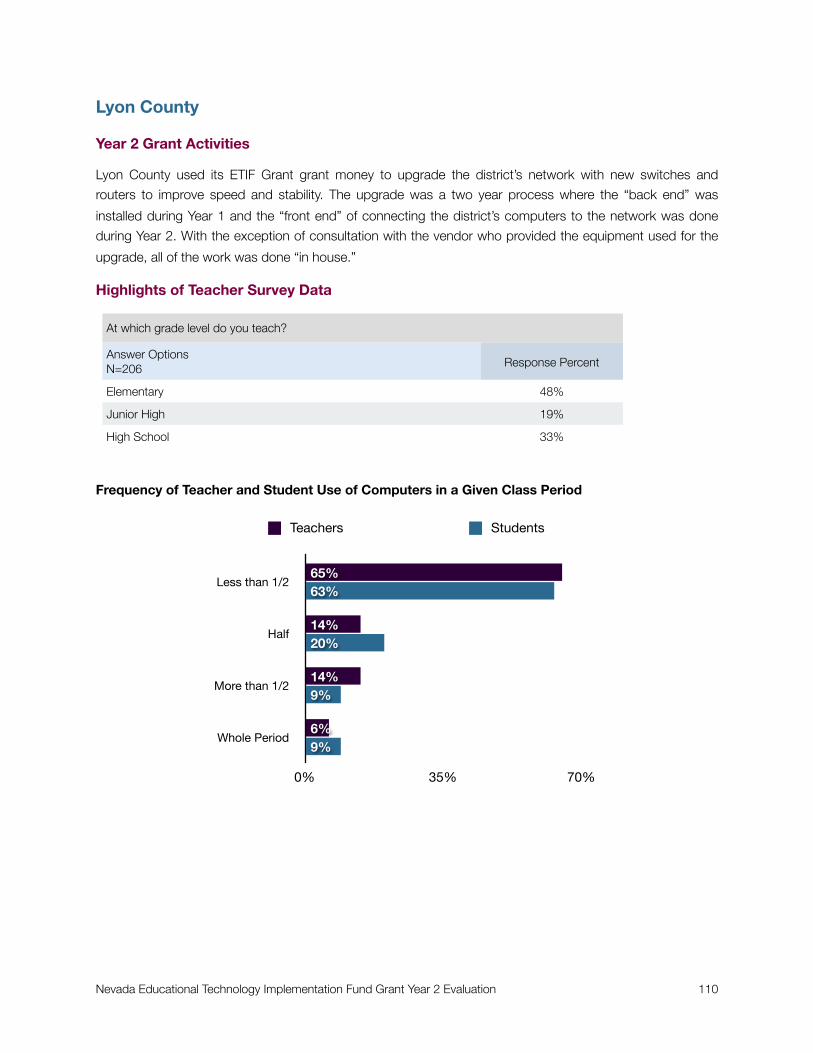
Lyon County
Year 2 Grant Activities
Lyon County used its ETIF Grant grant money to upgrade the district’s network with new switches and
routers to improve speed and stability. The upgrade was a two year process where the “back end” was
installed during Year 1 and the “front end” of connecting the district’s computers to the network was done
during Year 2. With the exception of consultation with the vendor who provided the equipment used for the
upgrade, all of the work was done “in house.”
Highlights of Teacher Survey Data
At which grade level do you teach?At which grade level do you teach?
Answer OptionsN=206 Response Percent
Elementary 48%
Junior High 19%
High School 33%
Frequency of Teacher and Student Use of Computers in a Given Class Period
Teachers Students
Less than 1/2
Half
More than 1/2
Whole Period
0% 35% 70%
9%
9%
20%
63%
6%
14%
14%
65%
Nevada Educational Technology Implementation Fund Grant Year 2 Evaluation 110

Teachers’ Use of Technology as a Result of Upgrades to the Network
The upgrades to the network have increased...The upgrades to the network have increased...
Answer OptionsN=206
PercentAgree/Strongly Agree
The overall frequency with which technology is used during class. 71%
The time I spend on the Internet looking for content-specific resources. 73%
The overall frequency with which students access the Internet during class. 62%
The frequency of student Internet research. 56%
My use of email to communicate with teachers, parents, and/or students. 80%
My overall productivity. 80%
Changes in Teaching Practices
Substantial Change Somewhat Substantial Change
Content area Curriculum
Instructional methods
Rigor of student activities
Integrating technology into teaching
Students’ hands-on time with technology
Sharing ideas and activities with other teachers
Using technology for differentiated instruction
0% 10% 20% 30% 40%
31%
29%
28%
30%
29%
30%
30%
20%
15%
14%
22%
18%
16%
14%
Nevada Educational Technology Implementation Fund Grant Year 2 Evaluation 111
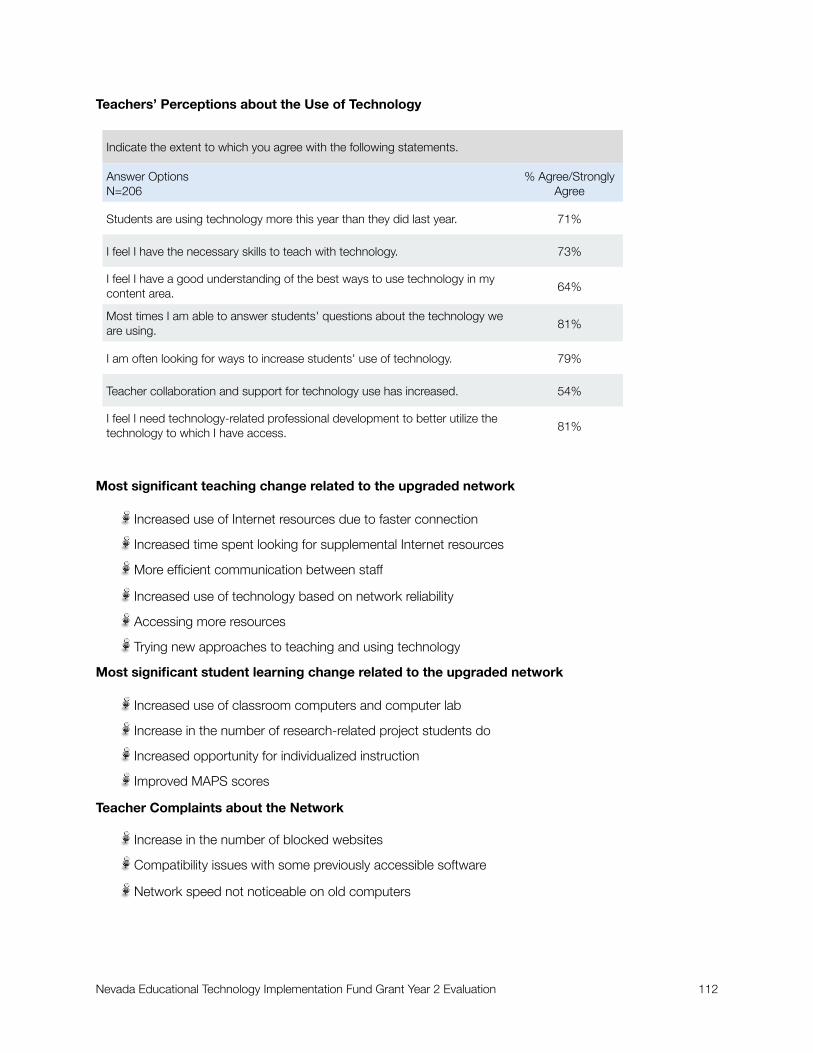
Teachers’ Perceptions about the Use of Technology
Indicate the extent to which you agree with the following statements. Indicate the extent to which you agree with the following statements.
Answer OptionsN=206
% Agree/Strongly Agree
Students are using technology more this year than they did last year. 71%
I feel I have the necessary skills to teach with technology. 73%
I feel I have a good understanding of the best ways to use technology in my content area. 64%
Most times I am able to answer students' questions about the technology we are using. 81%
I am often looking for ways to increase students' use of technology. 79%
Teacher collaboration and support for technology use has increased. 54%
I feel I need technology-related professional development to better utilize the technology to which I have access. 81%
Most significant teaching change related to the upgraded network
Increased use of Internet resources due to faster connection
Increased time spent looking for supplemental Internet resources
More efficient communication between staff
Increased use of technology based on network reliability
Accessing more resources
Trying new approaches to teaching and using technology
Most significant student learning change related to the upgraded network
Increased use of classroom computers and computer lab
Increase in the number of research-related project students do
Increased opportunity for individualized instruction
Improved MAPS scores
Teacher Complaints about the Network
Increase in the number of blocked websites
Compatibility issues with some previously accessible software
Network speed not noticeable on old computers
Nevada Educational Technology Implementation Fund Grant Year 2 Evaluation 112

Project Director Perspective
While some teachers are very disgruntled over the restricted access to sites and software which were
previously accessible, the project director rated his satisfaction with the grant implementation a “12” on a
scale from 1-10. According to the project director, “They are using it [the network] more and now it’s slow
again. They were trying to use some software and we didn’t have enough bandwidth. The network
infrastructure improved but then our Internet bandwidth was not enough, but now that’s being addressed.”
The district received eRate funds that it will use to increase bandwidth for classroom computing.
The biggest challenge that the district faced in implementing the grant was not having enough staff. Because
the work was done in house, people had to be pulled from their regular positions to help complete the job.
Now, even though the district is reportedly losing students, Lyon County’s commitment to providing
bandwidth for families and training parents is bolstered by the infusion of BTOP money, and there are plans
to hire new technology staff to address this need.
As mentioned in the Year 1 Interim Report, Lyon County was able to use the ETIF Grant as seed money that
generated a domino effect in terms of its ability to secure additional funding to meet its technology needs.
According to the project director, because the district was able to upgrade its Internet functionality, that
made it possible to apply for ARRA Broadband Technology Opportunity Program (BTOP) monies because
they were able to show the $83K in state grant money as in-kind on their BTOP application. The project
director pointed out that Lyon County was the only district in the state to receive a BTOP grant. This award
for $750,000, given in September 2010, was used to fund six new public computer centers with
approximately 120 workstations to serve the entire community and provide technology training for county
residents. The district also received $350,000 in FIE earmark money and is planning to apply for a $500,000
distance learning grant.
Given the tremendous influx of recent technology dollars into the county, the project director sums it up by
saying, “We were so far behind, but now we are teetering on being outstanding instead of just average.”
Nevada Educational Technology Implementation Fund Grant Year 2 Evaluation 113

Mineral County
Year 2 Grant Activities
During Year 2 of the Ed Tech Fund grant, Mineral County continued to improve the district’s network
infrastructure by switching from a Windows to Novell environment. The district was able to purchase its new
servers for less than originally budgeted for in its proposal. This made it possible for the district to purchase a
third server and meet its infrastructure needs without having to look for additional funds to meet the need.
Highlights of Teacher Survey Data
At which grade level do you teach?At which grade level do you teach?
Answer OptionsN=27 Response Percent
Elementary 59%
Junior High 22%
High School 19%
Frequency of Teacher and Student Use of Technology in a Given Class Period
Teachers’ Agreement with Statements about the Use of Technology
Indicate your level of agreement with the following statements. Indicate your level of agreement with the following statements.
Answer OptionsN=26
PercentAgree/Strongly Agree
The overall frequency with which technology is used during class. 57%
Teachers Students
Less than 1/2
Half
More than 1/2
Whole Period
0% 35% 70%
4%
9%
26%
61%
17%
29%
54%
Nevada Educational Technology Implementation Fund Grant Year 2 Evaluation 114

Indicate your level of agreement with the following statements. Indicate your level of agreement with the following statements.
Answer OptionsN=26
PercentAgree/Strongly Agree
The time I spend on the Internet looking for content-specific resources. 59%
The overall frequency with which students access the Internet during class. 52%
The frequency of student Internet research. 58%
My use of email to communicate with teachers, parents, and/or students. 71%
My overall productivity. 67%
Changes in Teaching Practices
Teachers’ Perceptions about the Use of Technology
Indicate your level of agreement with the following statements. Indicate your level of agreement with the following statements.
Answer OptionsN=27
PercentAgree/Strongly Agree
Students are using technology more this year than they did last year. 81%
I feel I have the necessary skills to teach with technology. 81%
Substantial Change Somewhat Substantial Change
Content area Curriculum
Instructional methods
Rigor of student activities
Integrating technology into teaching
Students’ hands-on time with technology
Sharing ideas and activities with other teachers
Using technology for differentiated instruction
0% 8% 15% 23% 30%
8%
20%
30%
26%
25%
17%
10%
25%
8%
17%
17%
17%
21%
24%
Nevada Educational Technology Implementation Fund Grant Year 2 Evaluation 115
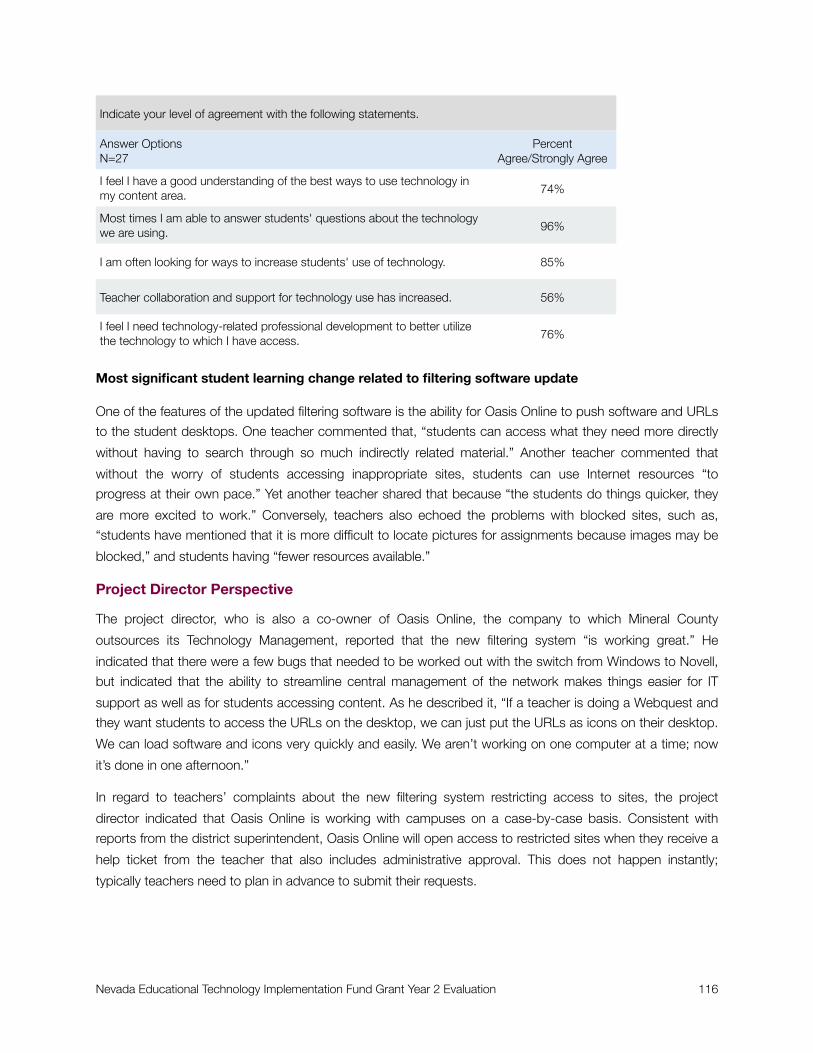
Indicate your level of agreement with the following statements. Indicate your level of agreement with the following statements.
Answer OptionsN=27
PercentAgree/Strongly Agree
I feel I have a good understanding of the best ways to use technology in my content area. 74%
Most times I am able to answer students' questions about the technology we are using. 96%
I am often looking for ways to increase students' use of technology. 85%
Teacher collaboration and support for technology use has increased. 56%
I feel I need technology-related professional development to better utilize the technology to which I have access. 76%
Most significant student learning change related to filtering software update
One of the features of the updated filtering software is the ability for Oasis Online to push software and URLs
to the student desktops. One teacher commented that, “students can access what they need more directly
without having to search through so much indirectly related material.” Another teacher commented that
without the worry of students accessing inappropriate sites, students can use Internet resources “to
progress at their own pace.” Yet another teacher shared that because “the students do things quicker, they
are more excited to work.” Conversely, teachers also echoed the problems with blocked sites, such as,
“students have mentioned that it is more difficult to locate pictures for assignments because images may be
blocked,” and students having “fewer resources available.”
Project Director Perspective
The project director, who is also a co-owner of Oasis Online, the company to which Mineral County
outsources its Technology Management, reported that the new filtering system “is working great.” He
indicated that there were a few bugs that needed to be worked out with the switch from Windows to Novell,
but indicated that the ability to streamline central management of the network makes things easier for IT
support as well as for students accessing content. As he described it, “If a teacher is doing a Webquest and
they want students to access the URLs on the desktop, we can just put the URLs as icons on their desktop.
We can load software and icons very quickly and easily. We aren’t working on one computer at a time; now
it’s done in one afternoon.”
In regard to teachers’ complaints about the new filtering system restricting access to sites, the project
director indicated that Oasis Online is working with campuses on a case-by-case basis. Consistent with
reports from the district superintendent, Oasis Online will open access to restricted sites when they receive a
help ticket from the teacher that also includes administrative approval. This does not happen instantly;
typically teachers need to plan in advance to submit their requests.
Nevada Educational Technology Implementation Fund Grant Year 2 Evaluation 116

District Superintendent Perspective
The district superintendent holds the position that the level of satisfaction with grant implementation is
probably higher for the IT staff at Oasis Online than it is for her instructional staff. She is very attentive to
teachers’ concerns and needs related to being able to make professional decisions about the content they
need and being able to access it when they need it. She understands that teachers are frustrated when they
plan at home where access is unrestricted and then cannot implement their lesson because a site is
blocked. She admits that teachers are adjusting and that “it’s getting better, but the teachers are still
frustrated with access.”
According to the superintendent, it took the better part of the 2010-11 school year to establish a
compromise position between Oasis Online and the school district. Under the compromise agreement,
which absolves Oasis Online of any liability related to students accessing inappropriate content, with the
principal’s approval, a teacher may request that a URL be opened and Oasis Online will make it accessible.
The superintendent indicated that under this arrangement “the professional liability lies with the principal and
the teacher...If they misuse it they will get fired.”
While the ETIF Grant met the district’s need for three Novell servers, the Superintendent is concerned that in
five years the district will not have funds to purchase new servers again. She described the district’s budget
as “bare bones” and shared that “funding opportunities like this [ETIF Grant] are invaluable for little districts
like Mineral. It’s the only way we can get technology.”
Nevada Educational Technology Implementation Fund Grant Year 2 Evaluation 117

Pershing County
Year 2 Grant Activities
Pershing County used its Year 2 ETIF Grant money to continue replacing outdated computers for its eMints
teachers at the elementary school and middle school. During Year 1, funds were used to replace computers
for a few teachers who received them during the 2009-10 school year, but most of the eMints teachers did
not receive their new computer until the 2010-11 school year. The project director wanted to have the
computers ordered and configured at the same time so she held the bulk of the Year 1 award in reserve until
she could draw down the Year 2 award in July 2011 and put in one order. No additional ETIF Grant funds
were used in Year 2 to purchase additional iPod Touch for elementary and middle school teachers. Because
the replacement of computers was associated with a group of teachers who were already immersed in
technology integration through their eMints training, evaluators chose to focus on gathering technology use
data only from the few teachers who received iPod Touch devices.
Highlights of Teacher Survey Data
Two elementary and two middle school language arts teachers responded to the Technology Use Survey. In
the first year of the grant the only had enough money to buy one iPod Touch for the eight teachers who
wanted to try them out. Through a combination of reallocating devices and purchasing additional devices
from another funding source, a few teachers ended up with more than one iPod Touch in Year 2. Among the
four teachers who responded to the survey, one teacher reported having eight iPod Touch, two reported
having five each, and one teacher has one iPod.
Frequency of Teacher and Student Use of Technology in a Given Class Period
When asked how much the iPod Touch devices are used for instructional purposes, three of the teachers
reported that they and their students use the iPod Touch, on average, less than half of a given class period.
One teacher reported that she uses her iPod Touch at least half of a given class period, and the teacher who
has just one iPod Touch selected the “not applicable” response to this question.
When asked to quantify the iPod Touch use in terms of hours per week, two teachers responded “less than
30 minutes,” one teacher responded 30-60 minutes, and one teacher responded one to two hours.
Changes in Teaching Practices
As it relates to integrating technology into their teaching and integrating students’ hands-on time with
technology, two teachers reported that they had made very little change and two reported that they had
made substantial changes. Two teachers also reported that having the iPod Touch resulted in a substantial
change to how they use technology to plan for differentiated instruction. Three of the four teachers reported
that they had made somewhat substantial changes to the rigor of student activities as a result of having the
iPods. Additional evidence to support teachers’ report of increased rigor of student activities is a review of
the iPod Apps that teachers reported using most frequently. These included Apps to support learning in
math, reading, and social studies, such as See Read Say, Word Magic, Froggy Math, Math Dr., Pocket
Phonics, Stack the Countries, and U.S. States and Capitals.
Nevada Educational Technology Implementation Fund Grant Year 2 Evaluation 118

Most significant teaching change related to using the SMARTBoard
Incorporating technology into the lesson.
I only have one iPod Touch device. I use it more as an incentive when [students are] finished with their class assignment.
I use them mainly during center time. The children are excited to use them. Everyone gets a turn when I just have 5 iPod Touch.
I can give an iPod touch to a student who is done, and have them work independently on skills while I am helping others.
Most significant student learning change related to using the SMARTBoard
Students become instantly engaged when using technology.
Students are more eager to work on tasks on the iPod touch than on paper.
Project Director Perspective
The project director indicated that she is satisfied with the grant implementation. In addition to the iPods that
were purchased with the grant, the project director was able to use $20,000 in Title I money that the
elementary school principal had to create a mini-class set of iPods for the five teachers who received on iPod
Touch in Year 1. That money was also used to purchase a set of 20 iPods for the elementary computer lab,
so students have a lot more access to these devices. Given the positive feedback from the teachers who
used the iPods in Year 1, more teachers were interested in using them in Year 2 so it was easy to make the
decision to allocate some of the Title 1 funds toward purchasing more iPods. The Title I funds were also
used to purchase mounted projectors and interactive whiteboards, which make it easier for teachers to share
iPod content with the entire class. The district does not have a budget for replacing damaged iPods, but the
project director indicated that teachers are taking very good care of them; they all used their own money to
buy protective cases.
The project director did not indicate any major challenges to implementing the grant. The plan was fairly
straightforward to meet the immediate need of replacing old computers; however, she did mention that grant
funds did not fully cover the replacement because enrollment went up and more computers needed to be
purchased. Finally, in hindsight, the project director reported that the one thing she was not able to
accomplish with the grant was providing teachers with professional development.
One contextual change of note for Pershing County School District is that the project director, who provided
technology support to the district, transitioned out of that role in December 2010 and the district
subsequently contracted with Oasis Online to meet their technology management needs. The project
director indicated that teachers were having to adjust to that change.
Nevada Educational Technology Implementation Fund Grant Year 2 Evaluation 119

Storey County
Year 2 Grant Activities
Storey County used its Year 2 funds to replace classroom computers that were 8-9 years old. Given the
availability of funding, the district purchased 20 three-year-old refurbished machines that came with 17”
monitors at a price point of approximately $500 per machine compared to $1000 for new machines. The
computers were placed in 1st through 5th grade classrooms, with a few going to middle school and high
school classrooms.
Highlights of Teacher Survey Data
Six teachers responded to the Technology Use survey. The respondents included two elementary, two
middle school and two high school teachers. Among the middle and high school teachers, two of them
teach math and two of them teach social studies.
Teachers’ Agreement with Statements about the Use of Their New Computer
Access to a new classroom computer has increased...Access to a new classroom computer has increased...
Answer OptionsN=6
Number Who Agree/Strongly Agree
The overall frequency with which technology is used during class. 6
The time I spend on the Internet looking for content-specific resources. 5
The frequency with which I use a projector to display web-based or other information to the class. 5
My use of presentation software to create slide shows for my class. 2
The overall frequency with which students access the Internet during class. 4
The frequency of student Internet research. 4
My use of email to communicate with teachers, parents, and/or students. 5
My use of technology for administrative tasks (i.e., attendance, grading) 5
My use of school and/or district-provided software programs. 5
My overall productivity. 6
My interest in doing more to integrate technology into my curriculum. 6
Nevada Educational Technology Implementation Fund Grant Year 2 Evaluation 120
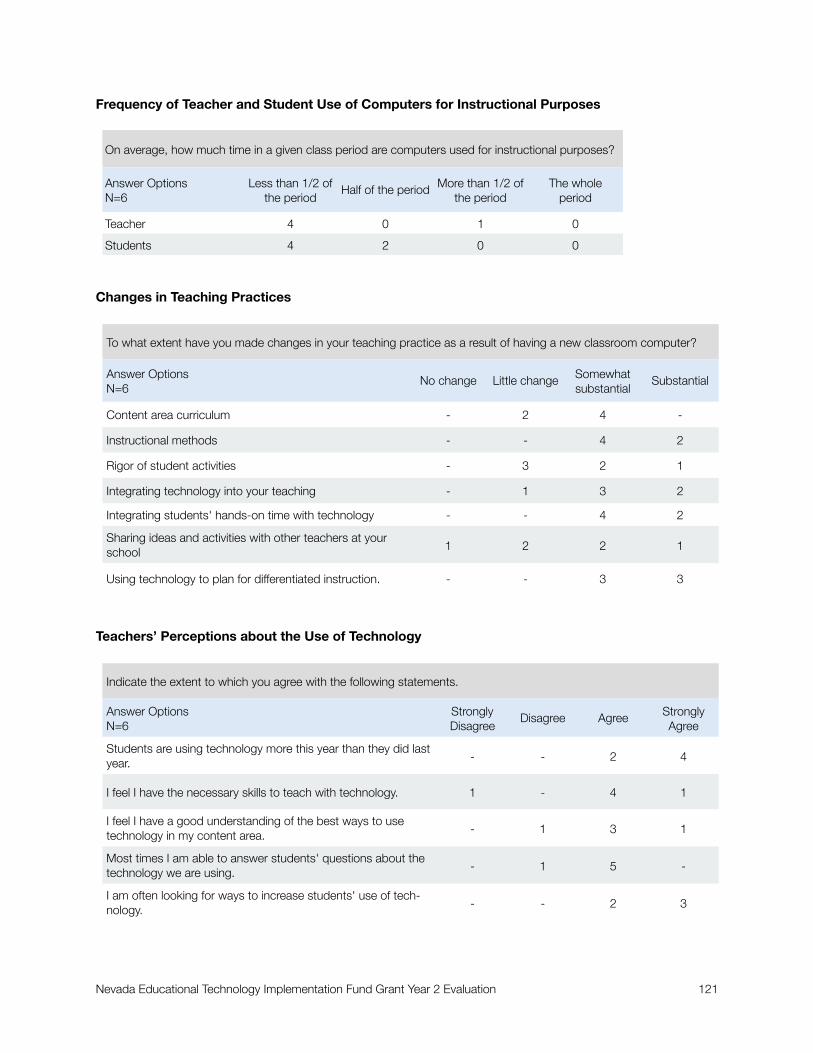
Frequency of Teacher and Student Use of Computers for Instructional Purposes
On average, how much time in a given class period are computers used for instructional purposes?On average, how much time in a given class period are computers used for instructional purposes?On average, how much time in a given class period are computers used for instructional purposes?On average, how much time in a given class period are computers used for instructional purposes?On average, how much time in a given class period are computers used for instructional purposes?
Answer OptionsN=6
Less than 1/2 of the period
Half of the period More than 1/2 of the period
The whole period
Teacher 4 0 1 0
Students 4 2 0 0
Changes in Teaching Practices
To what extent have you made changes in your teaching practice as a result of having a new classroom computer?To what extent have you made changes in your teaching practice as a result of having a new classroom computer?To what extent have you made changes in your teaching practice as a result of having a new classroom computer?To what extent have you made changes in your teaching practice as a result of having a new classroom computer?To what extent have you made changes in your teaching practice as a result of having a new classroom computer?
Answer OptionsN=6
No change Little change Somewhat substantial
Substantial
Content area curriculum - 2 4 -
Instructional methods - - 4 2
Rigor of student activities - 3 2 1
Integrating technology into your teaching - 1 3 2
Integrating students' hands-on time with technology - - 4 2
Sharing ideas and activities with other teachers at your school 1 2 2 1
Using technology to plan for differentiated instruction. - - 3 3
Teachers’ Perceptions about the Use of Technology
Indicate the extent to which you agree with the following statements. Indicate the extent to which you agree with the following statements. Indicate the extent to which you agree with the following statements. Indicate the extent to which you agree with the following statements. Indicate the extent to which you agree with the following statements.
Answer OptionsN=6
StronglyDisagree
Disagree Agree Strongly Agree
Students are using technology more this year than they did last year. - - 2 4
I feel I have the necessary skills to teach with technology. 1 - 4 1
I feel I have a good understanding of the best ways to use technology in my content area. - 1 3 1
Most times I am able to answer students' questions about the technology we are using. - 1 5 -
I am often looking for ways to increase students' use of tech-nology. - - 2 3
Nevada Educational Technology Implementation Fund Grant Year 2 Evaluation 121

Indicate the extent to which you agree with the following statements. Indicate the extent to which you agree with the following statements. Indicate the extent to which you agree with the following statements. Indicate the extent to which you agree with the following statements. Indicate the extent to which you agree with the following statements.
Answer OptionsN=6
StronglyDisagree
Disagree Agree Strongly Agree
Teacher collaboration and support for technology use has in-creased. - - 4 1
I feel like I need technology-related professional development to make better use of the new computer. - 3 2 1
Most significant teaching change related to having access to new computers
Shorter lectures and more visual communication
We use the SMART Board throughout class to explore math concepts and applications.
I can help students to achieve because it gives me one more computer to use myself or to use for with the SMART Board or for student use.
Since the computers are in the classroom, some students can work on computer programs or research, while I work with other students.
Most significant student learning change related to using the SMARTBoard
Connecting visual learning with numerical learning
More access to the Internet
They like using the SMART Board more than just seeing things in a textbook.
Students can work individually on programs when there are more computers. It increases their confidence as well.
The students are more eager to research and learn outside information.
Project Director Perspective
The project director is pleased with the decision to use ETIF grant funds to replace classroom computers.
Although the district purchased refurbished computers, the project director is satisfied that he can get twice
as many computers by doing so and expects the computers to last for at least 3-4 years before they need
replacing.
While there is no foreseeable funding source to support the superintendent’s plans, the project director
reported that the district is interested in trying a 1:1 laptop program at the elementary schools and
purchasing online curriculum from Pearson. The Superintendent is also interested in doing a 1:1 program at
the middle school with either netbooks or iPads.
Nevada Educational Technology Implementation Fund Grant Year 2 Evaluation 122
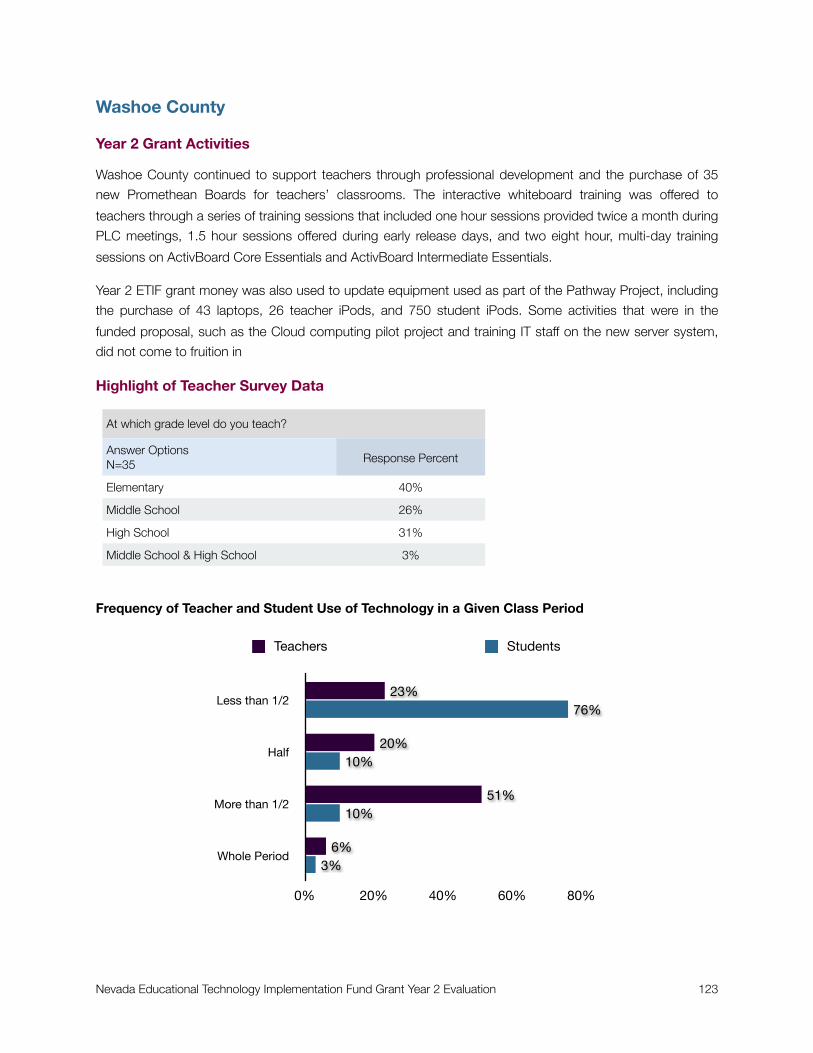
Washoe County
Year 2 Grant Activities
Washoe County continued to support teachers through professional development and the purchase of 35
new Promethean Boards for teachers’ classrooms. The interactive whiteboard training was offered to
teachers through a series of training sessions that included one hour sessions provided twice a month during
PLC meetings, 1.5 hour sessions offered during early release days, and two eight hour, multi-day training
sessions on ActivBoard Core Essentials and ActivBoard Intermediate Essentials.
Year 2 ETIF grant money was also used to update equipment used as part of the Pathway Project, including
the purchase of 43 laptops, 26 teacher iPods, and 750 student iPods. Some activities that were in the
funded proposal, such as the Cloud computing pilot project and training IT staff on the new server system,
did not come to fruition in
Highlight of Teacher Survey Data
At which grade level do you teach?At which grade level do you teach?
Answer OptionsN=35 Response Percent
Elementary 40%
Middle School 26%
High School 31%
Middle School & High School 3%
Frequency of Teacher and Student Use of Technology in a Given Class Period
Teachers Students
Less than 1/2
Half
More than 1/2
Whole Period
0% 20% 40% 60% 80%
3%
10%
10%
76%
6%
51%
20%
23%
Nevada Educational Technology Implementation Fund Grant Year 2 Evaluation 123
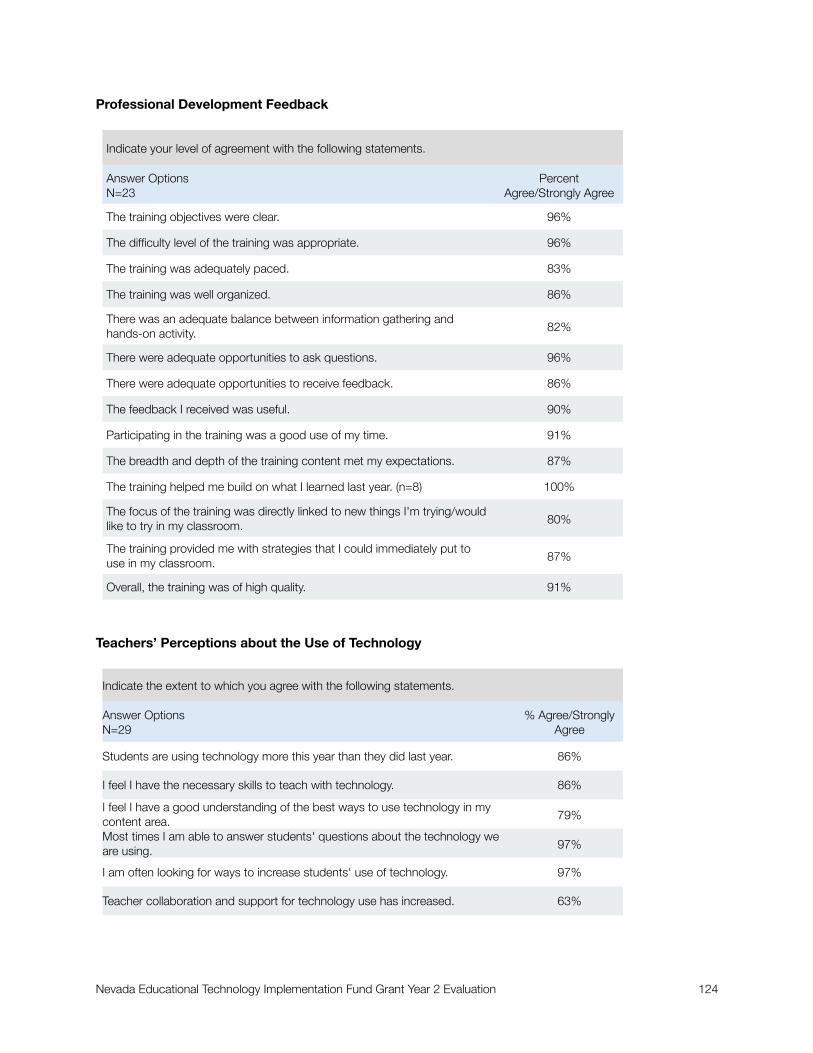
Professional Development Feedback
Indicate your level of agreement with the following statements. Indicate your level of agreement with the following statements.
Answer OptionsN=23
PercentAgree/Strongly Agree
The training objectives were clear. 96%
The difficulty level of the training was appropriate. 96%
The training was adequately paced. 83%
The training was well organized. 86%
There was an adequate balance between information gathering and hands-on activity. 82%
There were adequate opportunities to ask questions. 96%
There were adequate opportunities to receive feedback. 86%
The feedback I received was useful. 90%
Participating in the training was a good use of my time. 91%
The breadth and depth of the training content met my expectations. 87%
The training helped me build on what I learned last year. (n=8) 100%
The focus of the training was directly linked to new things I'm trying/would like to try in my classroom. 80%
The training provided me with strategies that I could immediately put to use in my classroom. 87%
Overall, the training was of high quality. 91%
Teachers’ Perceptions about the Use of Technology
Indicate the extent to which you agree with the following statements. Indicate the extent to which you agree with the following statements.
Answer OptionsN=29
% Agree/Strongly Agree
Students are using technology more this year than they did last year. 86%
I feel I have the necessary skills to teach with technology. 86%
I feel I have a good understanding of the best ways to use technology in my content area. 79%
Most times I am able to answer students' questions about the technology we are using. 97%
I am often looking for ways to increase students' use of technology. 97%
Teacher collaboration and support for technology use has increased. 63%
Nevada Educational Technology Implementation Fund Grant Year 2 Evaluation 124

Changes in Teaching Practices
Frequency with which Teachers Use their Promethean Board
Substantial Change Somewhat Substantial Change
Content area Curriculum
Instructional methods
Rigor of student activities
Integrating technology into teaching
Students’ hands-on time with technology
Sharing ideas and activities with other teachers
Time spent seeking additional information
Using technology for differentiated instruction
0% 18% 35% 53% 70%
38%
28%
34%
28%
45%
38%
62%
24%
28%
38%
17%
34%
45%
10%
21%
10%
Once a week A few times a week Daily
0%
30%
60%
90%
86%
11%3%
Nevada Educational Technology Implementation Fund Grant Year 2 Evaluation 125
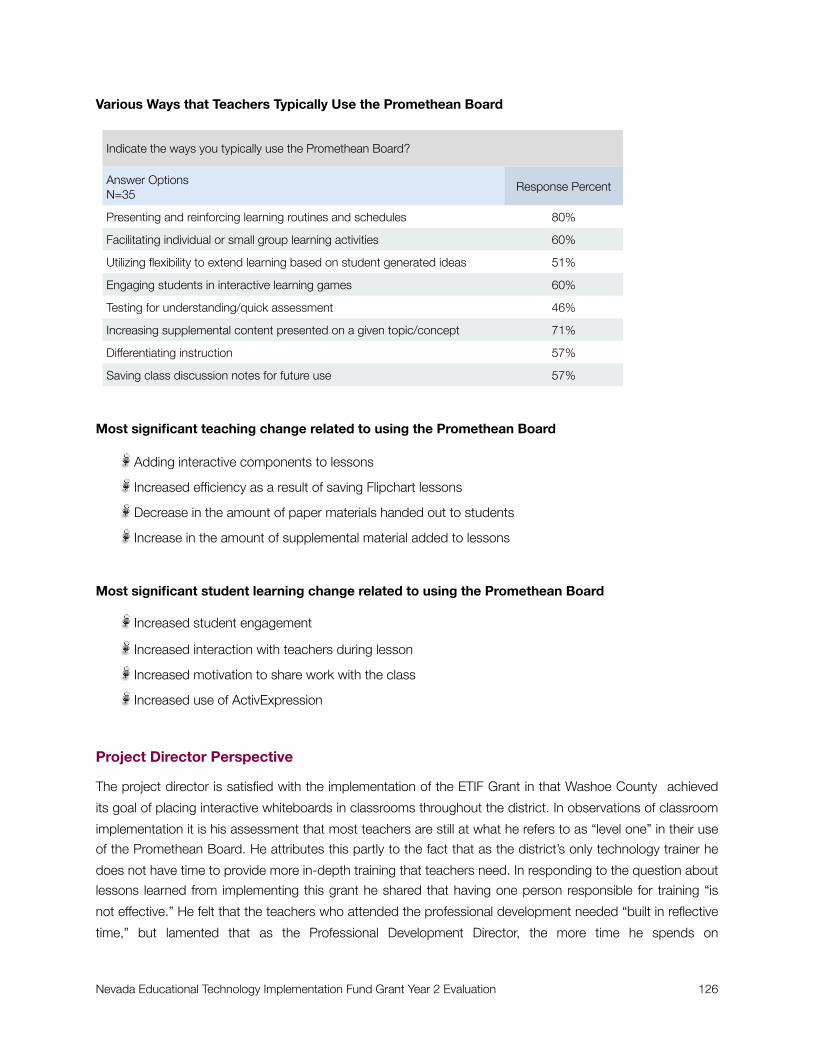
Various Ways that Teachers Typically Use the Promethean Board
Indicate the ways you typically use the Promethean Board? Indicate the ways you typically use the Promethean Board?
Answer OptionsN=35
Response Percent
Presenting and reinforcing learning routines and schedules 80%
Facilitating individual or small group learning activities 60%
Utilizing flexibility to extend learning based on student generated ideas 51%
Engaging students in interactive learning games 60%
Testing for understanding/quick assessment 46%
Increasing supplemental content presented on a given topic/concept 71%
Differentiating instruction 57%
Saving class discussion notes for future use 57%
Most significant teaching change related to using the Promethean Board
Adding interactive components to lessons
Increased efficiency as a result of saving Flipchart lessons
Decrease in the amount of paper materials handed out to students
Increase in the amount of supplemental material added to lessons
Most significant student learning change related to using the Promethean Board
Increased student engagement
Increased interaction with teachers during lesson
Increased motivation to share work with the class
Increased use of ActivExpression
Project Director Perspective
The project director is satisfied with the implementation of the ETIF Grant in that Washoe County achieved
its goal of placing interactive whiteboards in classrooms throughout the district. In observations of classroom
implementation it is his assessment that most teachers are still at what he refers to as “level one” in their use
of the Promethean Board. He attributes this partly to the fact that as the district’s only technology trainer he
does not have time to provide more in-depth training that teachers need. In responding to the question about
lessons learned from implementing this grant he shared that having one person responsible for training “is
not effective.” He felt that the teachers who attended the professional development needed “built in reflective
time,” but lamented that as the Professional Development Director, the more time he spends on
Nevada Educational Technology Implementation Fund Grant Year 2 Evaluation 126
administrative tasks, the less time he has to do his training job. He believes that offering quality online
professional development will be the key to moving teachers further along in their use of the whiteboards.
Furthermore he believes that, “We must also raise the profile of Professional Development initiatives from just
small site stuff to an emphasis on district level commitment.”
One significant change in the school district which could potentially impact future professional development
is the folding of these services into the Human Resources Department. This move came about when the
district’s Educational Technology Department (under which PD previously resided) was disbanded after the
director retired. The project director expressed uncertainty about the HR Department’s commitment to the
ongoing professional development that teachers need.
He is also concerned about the district’s IT support needs. One of the greatest challenges he faced in
implementing the grant in Year 2 was transitioning solely to a professional development role without having
the troubleshooting technical support he had in Year 1 when PD was part of the Ed Tech Department. He
indicated that “It is very frustrating trying to do PD and having to worry about how to get the equipment
running and keep it running.”
In reflecting on what was not accomplished with the grant the Project Director indicated that, “We did not do
all that we should’ve, but we did do some IT training.” The district ended up buying only one server for
Compass Learning, but, by the Project Director’s account, “[they] didn’t buy the software in a timely way.” At
the time of the interview in early May 2011 he predicted that the installation of the software and migration to
the server would be completed in June and the software available to students in fall 2011.
Nevada Educational Technology Implementation Fund Grant Year 2 Evaluation 127
White Pine
Year 2 Grant Activities
White Pine County School District used its Year 2 grant funds to continue supporting the one high school
math teacher who participated in the Nevada Pathway Project. Specifically, the Year 2 grant allocation was
used to purchase additional iPods and laptops for a 1:1 student implementation as well as covering the
travel expenses for the teacher to attend the State Educational Technology Conference held in Clark County
in October 2010. Year 2 funds were also used to purchase USB drives, a laptop cart, and books used for
professional development.
The high school teacher who participated in the Pathway project implemented the program with her Honors
students and allowed them to take the iPod Touch home.
Highlights of Teacher Survey Data
The teacher reported that compared to Year 1 she is comfortable integrating students’ use of laptops and
iPods into her instruction. On average, in a given class period, the laptops are used for about half of the
period and iPods are used less than half of the period.
As a result of participating in the Pathway Project, the teacher feels that she has made somewhat substantial
change in her instructional methods, the extent to which she integrates technology into her teaching, the
extent to which students have hands-on time with technology, sharing of ideas with other teachers, and
using technology to plan for differentiated instruction.
The teacher also agreed with the following statements:
Students are using technology more this year than they did last year
I feel I have the necessary skills to teach with technology
I feel I have a good understanding of the best ways to use technology in my content area
Most times I am able to answer students’ questions about the technology we are using
I am often looking for ways to increase students’ use of technology
Most significant teaching change related to using the SMARTBoard
Just using the technology more - always looking for ways to incorporate it. Before, I wasn't able to do that on a daily basis.
Most significant student learning change related to using the SMARTBoard
I actually did a research project on it. I came to the conclusion that students do enjoy working on the technology and like our activities better when its included.
Nevada Educational Technology Implementation Fund Grant Year 2 Evaluation 128
Project Director Perspective
The project director, who was assigned the responsibility at the end of Year 1 when the previous project
director left the district, indicated that her primary responsibilities were expending the grant funds and
handing out equipment. In that role she did not observe teacher and student use of the iPods and laptops
and was not involved with monitoring the teachers participation in the professional development nor her
instructional use of the technology.
She shared that the ETIF grant was enough to support one teacher with 1:1 iPods and laptops for one class
of students. The district wants to expand to all high school classrooms, but they would need to look for
funding to do so. She shared that only two people in the district work on grants; one person writes the
proposals and she handles the finance side. She said that “it can get overwhelming” for the two of them and
that because the district is so small, “the most difficult part is the matching funds that are required.” She also
shared that given their demographics, much of their technology investments are in career and technical
education so students can get the skills they would be using in fields such as auto repair and construction.
Nevada Educational Technology Implementation Fund Grant Year 2 Evaluation 129