CBSE Board Class X Summative Assessment – II Mathematics ...
Upload
khangminh22Category
view
1download
0
Take Stock in Children Summative Evaluation 2020-2021
1
Take Stock in Children Summative Evaluation Results 2020-2021

Take Stock in Children Summative Evaluation 2020-2021
2
Table of Contents
Executive Summary 3 Table 1 – End of Year Progress Towards End of Year Grant Objectives 5
Program Overview 6 Methodology 9
Table 2 – Summative Assessment Selected Data Points 10 Program Data 12
Table 3 – Student Distribution by Gender 12 Table 4 – Student Distribution by Race 12 Table 5 – Student Distribution by Ethnicity 12 Table 6 – Student Distribution by Grade Level 12 Table 7 – Student Enrollment 13 Table 8 – Recruitment Activities 15 Table 9 – Mentors/Staff Recruited, Screened, Trained, and Approved 16 Table 10 – Average Number of Mentor Sessions for Students
with Returning Mentor Matches 17
Table 11 – Average Number of Sessions for Students with Newly Matched Mentors (Per Month/Per Student) 19
Table 12 – Total Number of Mentor Sessions 21 Table 13 – Total Number of Students Mentored/Mentees Served 22 Table 14 – Students in Grades 6-12 Meeting College Success Coach Visit
KPI Requirements 24
Table 15 – Number of College Readiness Workshops Conducted 26 Table 16 – College Readiness Workshop Topics 27 Table 17 – Sites Conducting Mentor Training 29 Table 18 – Professional Development/Trainings Quarters 1-4 30 Table 19 – Student Unweighted GPA for Semesters 1 and 2 34 Table 20 – Unexcused Absences by County 35 Table 21 – Take Stock in Children Graduation Rate 37
Achievement of FLDOE Quarterly Deliverables 39 Table 22 – Florida Department of Education Quarterly Grant Deliverables & Activities 39
Observations: Student, Parent, and Mentor Feedback 40 Tables 23-30 & Figures 1-73 – Student, Parent, and Mentor Feedback 44-96
Observations: Evaluation Questions 97 Table 31 – Model Fidelity 98
Recommendations 100 Summative Evaluation Conclusion 101 Guiding Research 102
Effects of COVID-19 Pandemic on Low-Income Students 102 Youth Mentoring, College Readiness, and College Completion 103
Appendix A – Evaluation Plan Table 105 Appendix B – Take Stock in Children Logic Model 106 Appendix C – Further Research: Mentoring, College Readiness, and College Success 107

Take Stock in Children Summative Evaluation 2020-2021
3
Executive Summary Take Stock in Children is a nonprofit organization that provides mentoring, college readiness services, and college scholarships to low-income, at-risk youth across the state of Florida. Its mission is to break the cycle of poverty through education and ensure students achieve postsecondary degree attainment. Take Stock in Children’s unique model reflects current research and best practices for mentoring and college readiness, resulting in college, career, and life success for its students. Founded in 1995, Take Stock in Children has grown to serve nearly 38,000 students successfully. For more than 26 years, Take Stock in Children has been using its unique model to help Florida students in poverty graduate and successfully enter a career by providing caring volunteer mentors, intensive college readiness programming, and college scholarships. Take Stock in Children’s innovative multi-year model helps those children most often overlooked and underserved by serving students in 6th through 12th grades who sign a contract promising to achieve academic and personal goals. These include meeting with their mentor weekly, maintaining good grades, remaining drug-free and crime-free, demonstrating good behavior and attendance, and participating in college readiness workshops. When students reach high school graduation, they are awarded a Florida Prepaid Project STARS scholarship to a Florida state college, university, or state vocational/technical school. Over the years, Take Stock in Children utilized an affiliate approach to deliver programming, resulting in partnerships with community education foundations, community colleges, other nonprofit organizations, and school districts throughout the state of Florida to deliver this exceptional program to nearly 38,000 children in approximately 700 Florida schools. A total of 45 affiliate organizations implement the Take Stock in Children model. Take Stock in Children also benefits from a public/private partnership with the state of Florida. The state matches every private dollar raised for scholarships 1:1. This partnership results in approximately $7 million in private funding raised each year to support about $14 million in scholarship purchases for Take Stock students. Take Stock in Children is proud of its programmatic impact and success. According to the most recent data collected: • 97% of Take Stock in Children students graduate high school on time. • 96% of Take Stock in Children students enter postsecondary. • 70% of Take Stock in Children students complete postsecondary, compared to the state
average of 17% for at-risk students in poverty.

Take Stock in Children Summative Evaluation 2020-2021
4
Both Take Stock in Children and the state of Florida are dedicated to continuous improvement of the program to increase its impact. To achieve this, Take Stock in Children conducts an annual evaluation to ensure alignment with state performance requirements as outlined in the Florida Department of Education grant by measuring program fidelity and impact. Two evaluations were conducted during the 2020-2021 grant year (July 1, 2020, through June 30, 2021.) The first evaluation was a Formative Evaluation. The second assessment, a Summative Evaluation, was conducted at the end of the grant year to determine whether or not Take Stock in Children had met all of the grant objectives. The following report details both the achievement of grant objectives and recommendations on improving performance and model fidelity in the next year. This report concludes whether Take Stock in Children implemented their programs with fidelity and consistently aligned with grant requirements throughout the 2020-2021 grant year. The report also considers the particular impact that the COVID- 19 pandemic has had on both local and statewide performance. During this time, many schools and businesses were closed. School closures caused limited access to campus for students, mentors, and College Coaches. Efforts during this time were focused on expanding virtual mentoring and college readiness support services needed to serve the at-risk student population. This evaluation will analyze the impact of the COVID-19 pandemic and the effectiveness of expanded virtual student support services. This Summative Evaluation analysis concluded that Take Stock in Children has achieved the grant objectives exceeding targets on all metrics. The following table summarizes the required end-of-year grant deliverables and Take Stock in Children’s performance. Additional detail highlighting quarterly progress made towards all end-of-year objectives can be found in Table 22 on page 39.

Take Stock in Children Summative Evaluation 2020-2021
5
Table 1 – End of Year Progress Made Towards End of Year Grant Objectives
Deliverable End of Year Objective End of Year Achievement
Evidence
1. Student Enrollment
By the end of the year, Take Stock in Children will serve at least 8,000 students. Exceeded
As of June 30, 2021, a total of 8,198 students were active in the program (Table 3).
2. Mentor Match The Mentor-to-student match rate will average at least 90% statewide. Exceeded The average year-end mentor match
rate is 97%. 3. Recruitment Activities
A total of 4 multi-regional mentor recruitment activities will be conducted (one per quarter). Exceeded
A total of ten (10) multi-regional activities were conducted in Quarters 1 through 4 (Table 8).
4. Mentor Recruitment and Training
A minimum of 1,400 new mentors will be recruited, screened, and trained by the end of the grant year.
Exceeded A total of 1,514 new mentors were recruited, screened, and trained by the end of the grant year (Table 9).
5. Mentoring Sessions (Returning Matches)
Students who have been matched with a mentor for the entire grant year will receive an average of 15 mentor sessions by the end of the school year.
Exceeded
An average of 19 mentoring sessions per student were conducted during Quarters 1 through 4 (Table 10).
6. Mentoring Sessions (New Matches)
Students with new mentor matches will conduct an average of 2 mentor sessions per each month. Exceeded
An average of 3 mentoring sessions were conducted each month for students with new mentors (Table 11).
7. College Success Coaches Visits
Visits will average 1 per semester for grades 6-10, and 2 per semester for grades 11-12 Exceeded
An average total of 98% of students received target services during Quarters 1 through 4 (Table 14).
8. College Readiness Workshops
A total of 4 college readiness workshops will be conducted at each site per year (including 2 sessions focused on college readiness and financial aid procedures for seniors), plus a new student orientation where applicable.
Exceeded
A total of 45 sites (100%) reported offering 4 or more college readiness workshops during Quarters 1 through 4 (Tables 15-16).
9. Professional Development
A total of 15 professional development opportunities will be provided for staff by the end of the year, with five (5) in Q1, three (3) in Q2, four (4) in Q3, and three (3) in Q4. Exceeded
A total of 29 professional development workshops were offered to staff during Quarter 1; 21 were offered during Quarter 2; 25 were offered during Quarter 3; and 11 were offered during Quarter 4. (Table 18).
10. Student Academic Performance
A total of 90% of students will improve or maintain a G.P.A. at or above 2.0.
Exceeded
A total of 95% of students maintained a grade point average of at least 2.0 for Semester 1 and 95% for Semester 2. The average GPA for the network is 3.25 (Table 19).
11. Student School Attendance
A total of 90% of students will improve or maintain satisfactory school attendance. Exceeded
A total of 92% of students had fewer than 17 unexcused absences for the 2020–2021 academic year (Table 20).
12. Graduation Rate A total of 90% of seniors will successfully complete the Take Stock in Children program and graduate from high school.
Exceeded A total of 97% of seniors completed the TSIC program and graduated from high school on time (Table 21).

Take Stock in Children Summative Evaluation 2020-2021
6
Program Overview Organization History Children in poverty are often confronted with overwhelming hurdles that make access to higher education a challenge. Many of these students lack the resources available to their higher socioeconomic peers, resulting in lower high school graduation rates and postsecondary attendance. Without higher education, they are prevented from realizing many of the opportunities presented by the 21st-century economy. As a result, many will remain in poverty for much or all of their adult lives. In 1995, education, business, and community leaders including, Charlie Rice, Chairman and CEO of Barnett Bank; Howard Jenkins, Founder of Publix; and Dr. Donald Pemberton, President of the Pinellas County Education Foundation, saw these hurdles and founded Take Stock in Children, a nonprofit organization built on a public-private partnership aimed at breaking down many of these barriers and instilling hope in deserving, low-income youth. During the first year, the program served 500 students; more than a quarter-century later, Take Stock in Children has served nearly forty thousand low-income, at-risk children in every county in Florida. This staggering accomplishment has occurred through the unique opportunities that Take Stock offers to low-income, academically qualified students. The Take Stock in Children multi-year model assists students by setting high expectations for their academic future, providing supports to help students graduate from high school in strong academic standing, and mitigating financial barriers to higher education. Today, Take Stock in Children is known as one of the nation’s pre-eminent mentoring, college readiness, and scholarship organizations. In 2008, the achievements of Take Stock in Children were recognized by the U.S. Department of Education through an Investing in Innovation (I3) Grant. The result was a deep expansion into college-readiness programming. By 2010, affiliates statewide were ensuring that students not only graduated from high school but were now prepared to succeed in postsecondary education, and an increased emphasis was placed on data, metrics, and measuring success for Take Stock students. Through another I3 grant partnership with the U.S. Department of Education, Take Stock in Children was able to design, develop and deploy the Take Stock Innovation Collection in 2019, a suite of innovations designed to modernize the model and increase efficiency and impact throughout the Take Stock network. This collection of innovations would significantly benefit Take Stock’s ability to pivot to a virtual model at the onset of the global pandemic. In 2018, Take Stock launched its postsecondary degree attainment program Take Stock in College. Take Stock in College aims to ensure that every student achieves degree attainment at a college or university or achieves a career certification at a Florida vocational or technical college. Take Stock currently has a 70% college graduation rate, and our goal is to see our college graduation rate mirror our high school graduation rate.

Take Stock in Children Summative Evaluation 2020-2021
7
Throughout the 2020-2021 grant year, Take Stock in Children continued to respond with a proven model of support when the COVID-19 pandemic hit this most vulnerable population particularly hard. Data released from the National College Attainment Network (NCAN) on November 27, 2020, indicates that FAFSA rates have fallen by 16.23% in comparison to FAFSA completion during the same timeframe in 2019. The biggest impact has been on low-income students and minority students, with completion rates currently down by 20% in Title 1 Schools, 22.3% in high minority high schools, and 22.4% in small towns and rural areas (DeBaun). The National Student Clearinghouse Research Center reports that 1 in 5 students from the high school class of 2020 who should have enrolled in college this fall did not. That number is 1 in 3 for students from low-income high schools (NSCRC-NCAN 12-2020 Report). This is the first graduating class impacted by the COVID-19 pandemic, the resulting economic downturn, and a time of exacerbated inequities in health, education, and opportunity. While the many impacts of the COVID-19 pandemic are yet to be fully realized, Take Stock in Children is reporting a decrease of only 1% in achieving a high school graduation rate of 97%. Take Stock Model of Support Take Stock is a national leader in improving college readiness and degree completion for students in poverty. It begins with selecting diverse students between the 6th and 9th grades who meet Take Stock’s guidelines for being 1) low-income and 2) at-risk of not completing high school and attending or completing postsecondary. From the moment of recruitment, Take Stock begins preparing students for postsecondary entry. Students are partnered with a caring volunteer mentor, a professional College Success Coach, must attend college preparation workshops, and are awarded a Florida Prepaid Project STARS Scholarship. In return, students pledge to maintain good grades and attendance, and sign a contract to remain drug-free and crime-free. This model is implemented through a network of 45 local affiliate organizations, with the ability to serve students in all 67 of Florida’s counties. Please refer to the Take Stock in Children Logic Model (Appendix B) for additional detail on the program model. These organizations work hard to deliver Take Stock in Children’s services to many deserving youths by: • Developing local K-12 and higher education partnerships; • Recruiting, training, and stewarding community volunteer mentors; • Annually raising private funds for scholarships and operational costs; and • Providing college readiness services (including coaching and workshops) to all students. The state of Florida has maintained a close connection to Take Stock in Children and provides the organization with exceptional support as a key partner. In past years, this partnership has included programmatic support for Take Stock in Children’s work statewide and a 1:1 matching program with the Florida Prepaid College Foundation that matches every private scholarship dollar raised by Take Stock in Children and its affiliated organizations. Take Stock’s three-pronged approach of a volunteer mentor, college readiness services, and college scholarship are the unique combination that sets it apart from other programs. The

Take Stock in Children Summative Evaluation 2020-2021
8
combination of these components contributes to an evidence-based framework that focuses on students’ postsecondary success from the very beginning, including: • Increasing college readiness via an exclusive curriculum designed to build academic,
social, and emotional readiness for college in each student; • Consistent monitoring of lead indicators for each student to determine when a youth is
struggling, then immediately collaborating with the student’s family, school, and mentor to ensure each scholar stays on course for postsecondary;
• Supporting students with the management of the many tasks associated with applying to
and attending postsecondary; and • Reducing or eliminating the burden of significant postsecondary debt by providing a
Florida Prepaid Project STARS scholarship, thereby instilling a foundational aspiration for postsecondary attainment beginning in middle school and extending into high school.
The model also sets high expectations for students’ academic futures, provides supports to help students graduate from high school in strong academic standing, and helps to mitigate financial barriers to higher education. Every step of the process aims to equip students with resources similar to those of their higher-income peers. With Take Stock in Children’s comprehensive approach and unwavering mission to break the cycle of poverty for low-income, academically qualified students, this organization ensures each student's success, both in school and throughout life.

Take Stock in Children Summative Evaluation 2020-2021
9
Methodology The purpose of the Take Stock in Children evaluation is to answer the following questions: 1. What is the level of program participation?
2. What is the program impact on key indicators of high school completion and college
readiness?
3. Is Take Stock in Children’s model being implemented with fidelity?
4. How can Take Stock in Children improve the effectiveness and the efficiency of implementation to reflect the significant return on investment of the program for the state of Florida?
5. How has the COVID-19 pandemic affected program outcomes, and how has
implementing virtual service enhancements to the Take Stock model mitigated any negative impact?
The 2020-2021 Take Stock in Children evaluation is divided into two parts: the Formative Evaluation and the Summative Evaluation. This report results from the Summative Evaluation process and is an end-of-year assessment of the achievement of grant goals and metrics. In addition to making observations about the achievement of established objectives, the evaluation team also offers suggested areas and strategies for implementation improvement for the organization to pursue during the next grant year. The evaluation plan table in Appendix A presents the metrics and sources, methods of analysis, comparison data, and reference points. All data was collected from STAR, the proprietary Take Stock in Children database. Required program data is entered into STAR by all 45 affiliates and is closely monitored by Take Stock in Children’s State Office team. For quality assurance purposes, webinars and trainings on how to accurately enter data are regularly conducted. The STAR system is set up with ‘safeguards’ that include a number of required data entry choices, which force essential information to be submitted, thereby preventing inaccuracies or duplicate entries. The evaluation began with Take Stock in Children staff and leadership, creating an evaluation plan, and working together to ensure that the evaluation process and procedures were straightforward and that each team member's role was established. During these initial discussions, the team set clear deadlines and expectations around data collection and analysis. The team also determined protocols on how it would function to ensure that the evaluation yielded optimal value for Take Stock in Children, as the organization strives to maintain its achievements and make improvements where needed. Next, a thorough review was conducted of the latest research in mentoring, college readiness, and college success. This is an essential aspect of the evaluation process. It allows for the confirmation of the validity of the Take Stock in Children model and ensures

Take Stock in Children Summative Evaluation 2020-2021
10
that Take Stock in Children has the research updates necessary to evolve programming. The details of this research can be found in Appendix C. The summative evaluation process and the resulting report reflect all data for the 2020-2021 grant year. This evaluation determines whether Take Stock in Children implemented their programs with fidelity and in alignment to grant requirements consistently throughout all four quarters of the year, including a full assessment of whether annual targets were achieved. Additional data collected to support the Summative Evaluation includes surveys with students, parents, and mentors. The Summative Evaluation also includes recommendations on how Take Stock in Children can continue to develop its areas of strength and includes recommendations for how programming may be improved going forward. The following table presents the quantitative data that was selected and analyzed during the summative evaluation process to indicate the achievement of end-of-year grant metrics and goals.
Table 2 – Summative Assessment Selected Data Points Data Points*
Student Distribution by Gender, Race, Ethnicity, and Grade Level New Student Enrollment Mentor Match Rates Mentor Recruitment Mentor Sessions Students Mentored College Coach Visits with Students College Readiness Workshops Mentor Training Staff Training Opportunities Academic Indicators (GPA, attendance, graduation rates) Stakeholder Surveys (students, parents, mentors)
The data presented reflects all measures year-to-date and includes some previously unreported data. This is due to late data entry by some programs after the quarter had closed. The analysis of the above data points resulted in this report, which includes: • Details on student enrollment in Take Stock in Children and participation in services; • Synopsis of program operations, activities, and services provided to students, families,
and mentors; • Observations on programmatic progress, as determined via objective data analysis; and • Recommendations on how to continue achievement and/or how to enhance current
results. Take Stock in Children is expected to achieve at least 85% of each objective by the end of the grant year.

Take Stock in Children Summative Evaluation 2020-2021
11
Evaluation Data Types: Both the formative and summative evaluation types were based on the following data:
1) Artifacts: The Take Stock State Office reviewed plans, documents, reports, communication tools, trainings, and other documents from throughout the year.
2) STAR Database: Take Stock in Children’s proprietary database, where all 45 affiliates report data.
3) Survey data: The Take Stock State Office collected surveys reflecting student, mentor, and parent experience with the Take Stock in Children program. Take Stock in Children leadership designed these surveys to reflect the guiding questions posited in this evaluation accurately. Specifically, Take Stock sought to know 1) How effective and efficient is program implementation?; 2) How did the COVID-19 pandemic impact program implementation; and 3) How can Take Stock in Children improve program implementation? These surveys were completed in March 2021.

Take Stock in Children Summative Evaluation 2020-2021
12
Program Data Student Demographics Student demographic data is tracked through the STAR proprietary database. The data presented in Tables 3-6 below was obtained on July 9, 2021 and reflects the most recent demographics.
Table 3 – Student Distribution by Gender (as of 7/09/2021) Gender Number of Students Percentage
Female 5,143 63% Male 3,051 37% Gender Diverse 4 0% Grand Total 8,198 100%
Table 4 – Student Distribution by Race (as of 7/09/2021) Race Percentage Hispanic 34% Black or African American 29% White 26% Multiracial 6% Asian 3% American Indian/Native Alaskan/Native Pacific Islander 1% Other 1% Grand Total 100%
Table 5 – Student Distribution by Ethnicity (as of 7/09/2021) Ethnicity Percentage Hispanic 34% Non-Hispanic 66% Grand Total 100%
Table 6 – Student Distribution by Grade Level (as of 7/09/2021) Grade Level Percentage 6th Grade 2% 7th Grade 4% 8th Grade 10% 9th Grade 19.5% 10th Grade 24% 11th Grade 21.5% 12th Grade 19% Grand Total 100%

Take Stock in Children Summative Evaluation 2020-2021
13
Deliverable 1 – Student Enrollment End of Year Objective: The Take Stock in Children program will serve a minimum of 8,000 students by the end of the 2020-2021 grant year, combining both students receiving mentoring and other college readiness services. Progress: Exceeded Take Stock in Children exceeded the grant deliverable, as a total of 8,198 students were enrolled, as indicated by annual peak enrollment, with the addition of 1,631 new students to the program.
Table 7 – Peak Student Enrollment/New Students Enrolled
County/Region Peak Student
Enrollment New Students
Enrolled Alachua 322 69 Baker, Columbia, Dixie, Gilchrist, Union 126 35 Bay 124 23 Bradford 37 10 Brevard 220 38 Broward 230 43 Calhoun, Holmes, Jackson, Liberty, Washington 67 19 Charlotte 52 10 Citrus, Levy 55 4 Clay 56 12 Collier- Champions for Learning 217 55 Collier - Immokalee 130 30 DeSoto, Hardee, Highlands 118 19 Duval 337 31 Escambia 144 28 Flagler 96 21 Franklin 8 1 Gadsden, Leon, Wakulla 58 5 Hendry 8 5 Hernando 28 11 Hillsborough 370 81 Indian River, Martin, Okeechobee, St. Lucie 236 45 Lake, Sumter 178 41 Lee 173 39 Madison 47 10 Manatee 217 61 Marion 245 55 Miami-Dade 285 7 Monroe 319 68 Nassau 163 33
The data presented reflects all measures year-to-date and includes some previously unreported data. This is due to late data entry by some programs after the quarter had closed.

Take Stock in Children Summative Evaluation 2020-2021
14
Okaloosa 70 19 Orange 460 78 Osceola 171 1 Palm Beach 497 126 Pasco 115 36 Pinellas 1,315 228 Polk 140 38 Putnam 16 14 Santa Rosa 134 25 Sarasota 244 72 Seminole 128 29 St. Johns 79 16 Suwannee 28 7 Volusia 97 26 Walton 38 7 Grand Total 8,198 1,631
The data presented reflects all measures year-to-date and includes some previously unreported data. This is due to late data entry by some programs after the quarter had closed.
Mentors Take Stock in Children collects mentor information for each county/region in the following key areas: • The number of mentor hours (recorded as sessions); • Students receiving mentor sessions; • New mentors recruited, screened, trained, approved; and • Mentor match rate. Deliverable 2 – Mentor-Match End of Year Objective: Mentor-to-student match rate will average at least 90% statewide. Progress: Exceeded. The average mentor-match rate for the entire grant year was 97%.

Take Stock in Children Summative Evaluation 2020-2021
15
Deliverable 3 – Recruitment Activities The grant requires that staff complete a multi-regional recruitment activity each quarter. (Table 8). End of Year Objective: Four multi-regional mentor recruitment activities will be conducted (one per quarter). Progress: Exceeded Take Stock in Children conducted two (2) multi-regional mentor recruitment activities in Quarters 1, 2, and 3. Four (4) activities were conducted in Quarter 4 for a total of ten (10) multi-regional mentor recruitment activities. This total exceeds the requirement by 6 events.
Table 8 – Recruitment Activities Quarter Activity
1
• Launched Take Stock App 2.0 for use throughout the Take Stock network. The App gives mentors new opportunities for mentoring with Take Stock in Children.
• Mentor recruitment campaign via social media promoted on multiple social channels.
2
• Created and distributed a mentor recruitment video highlighting new virtual mentoring opportunities.
• Continued to develop Take Stock App Virtual Chat feature to offer more mentoring options to potential mentors to expand our pool of potential volunteers.
3
• Created and distributed a mentor video highlighting training information for new virtual mentoring opportunities.
• Launched Take Stock App Video Chat feature to offer more virtual mentoring
options to potential mentors to expand our pool of potential volunteers.
4
• Promoted the need for mentoring through social media posts on multiple platforms.
• Promoted the need for mentoring through local print media. • Packaged and distributed to 45 affiliates social media posts to promote
mentoring through Volunteer Appreciation month (April) • Created e-version of Mentor Toolkit to facilitate new mentor training.

Take Stock in Children Summative Evaluation 2020-2021
16
Deliverable 4 – Mentor Recruitment and Training End of Year Objective: A minimum of 1,400 new mentors will be recruited and trained by the end of the grant year (Table 9). Progress: Exceeded A total of 1,498 new mentors were recruited, screened, and trained by the end of Quarter 4 (Table 9). Please note that there were challenges with recruiting, onboarding, and training new mentors throughout the grant year as a result of COVID-19. These challenges included everything from mentors' ability to go in schools to conduct in-person mentoring to school district availability to conduct background checks, finger printing, and security screenings.
Table 9 – Mentors Recruited, Screened, Trained, and Approved (2020-2021) Mentors
Screened/Trained Mentors Approved County/Region YTD YTD Alachua 130 130 Baker, Columbia, Dixie, Gilchrist, Union 43 46 Bay 11 11 Bradford 13 13 Brevard 48 48 Broward 37 33 Calhoun, Holmes, Jackson, Liberty, Washington 13 13
Charlotte 8 8 Citrus, Levy 5 4 Clay 17 17 Collier - Champions for Learning 53 49 Collier - Immokalee 23 23 DeSoto, Hardee, Highlands 16 18 Duval 39 37 Escambia 32 27 Flagler 9 17 Franklin 5 5 Gadsden, Leon, Wakulla 5 5 Hendry 2 2 Hernando 0 0 Hillsborough 112 112 Indian River, Martin, Okeechobee, St. Lucie 14 16 Lake, Sumter 31 27 Lee 30 30 Madison 0 0 Manatee 57 59
The data presented reflects all measures year-to-date and includes some previously unreported data. This is due to late data entry by some programs after the quarter had closed. Approval and screening/training does not always occur in the same quarter. The difference in the number of mentors screened/trained and approved can be attributed to this delay.

Take Stock in Children Summative Evaluation 2020-2021
17
Marion 17 17 Miami-Dade 11 13 Monroe 54 52 Nassau 22 23 Okaloosa 18 14 Orange 164 158 Osceola 4 4 Palm Beach 87 85 Pasco 15 15 Pinellas 232 232 Polk 5 5 Putnam 7 7 Santa Rosa 14 16 Sarasota 65 65 Seminole 24 20 St. Johns 0 0 Suwannee 3 3 Volusia 17 17 Walton 2 2 Grand Total 1,514 1,498
The data presented reflects all measures year-to-date and includes some previously unreported data. This is due to late data entry by some programs after the quarter had closed. Approval and screening/training does not always occur in the same quarter. The difference in the number of mentors screened/trained and approved can be attributed to this delay
Deliverable 5 – Mentoring Sessions (Returning Matches) End of Year Objective: Students who have been matched with a mentor for the entire grant year will receive an average of 15 mentor sessions by the end of the school year. Progress: Exceeded. An average of 19 mentoring sessions per student were conducted for students with returning mentors during the grant year (Table 10).
Table 10 – Average Number of Mentor Sessions for Students with Returning Mentor Matches Quarters 1-4 (2020-2021)
Average Number of Sessions County/Region Quarters 1-4 Alachua 18 Baker, Columbia, Dixie, Gilchrist, Union 15 Bay 16 Bradford 17 Brevard 21 Broward 22
The data presented reflects all measures year-to-date and includes some previously unreported data. This is due to late data entry by some programs after the quarter had closed.

Take Stock in Children Summative Evaluation 2020-2021
18
Calhoun, Holmes, Jackson, Liberty, Washington 16 Charlotte 20 Citrus, Levy 23 Clay 19 Collier- Champions for Learning 20 Collier - Immokalee 20 Desoto, Hardee, Highlands 18 Duval 18 Escambia 19 Flagler 20 Franklin 15 Gadsden, Leon, Wakulla 24 Hendry 19 Hernando 22 Hillsborough 18 Indian River, Martin, Okeechobee, St. Lucie 18 Lake, Sumter 18 Lee 18 Madison 18 Manatee 21 Marion 16 Miami-Dade 19 Monroe 21 Nassau 26 Okaloosa 18 Orange 17 Osceola 20 Palm Beach 22 Pasco 17 Pinellas 22 Polk 17 Putnam N/A** Santa Rosa 22 Sarasota 25 Seminole 21 St. Johns 16 Suwanee 16 Volusia 18 Walton 19 Average 19
The data presented reflects all measures year-to-date and includes some previously unreported data. This is due to late data entry by some programs after the quarter had closed. N/A**: This program did not have any returning mentor matches and therefore did not have sessions for students with returning mentor matches to report.

Take Stock in Children Summative Evaluation 2020-2021
19
Deliverable 6 – Mentoring Sessions (New Matches) End of Year Objective: New Matches are pairings that have not been matched for the entire school year. Take Stock in Children tracks these sessions to ensure the mentors-mentees meet regularly and expect students with new mentor matches to complete an average of 2 mentor sessions per month. Progress: Exceeded An average of 3 mentoring sessions were conducted each month for students with new mentor matches (Table 11).
Table 11 – Average Number of Sessions for Students with Newly Matched Mentors (Per Month/Per Student)*
Average Number of Sessions County/Region Quarters 1-4 Alachua 3 Baker, Columbia, Dixie, Gilchrist, Union 1 Bay 2 Bradford 2 Brevard 3 Broward 3 Calhoun, Holmes, Jackson, Liberty, Washington 2 Charlotte 2 Citrus 3 Clay 2 Collier - Champions for Learning 4 Collier - Immokalee 4 Desoto, Hardee, Highlands 3 Duval 2 Escambia 3 Flagler 2 Franklin 2 Gadsden, Leon, Wakulla 4 Hendry N/A** Hernando 2 Hillsborough 2 Indian River, Martin, Okeechobee, St. Lucie 2 Lake, Sumter 2 Lee 2 Madison 3 Manatee 3 Marion 3 Miami-Dade 2 Monroe 3
Take Stock in Children Summative Evaluation 2020-2021
20
The data presented reflects all measures year-to-date and includes some previously unreported data. This is due to late data entry by some programs after the quarter had closed. N/A**: This program did not have students with new mentor matches and therefore did not have sessions to report.
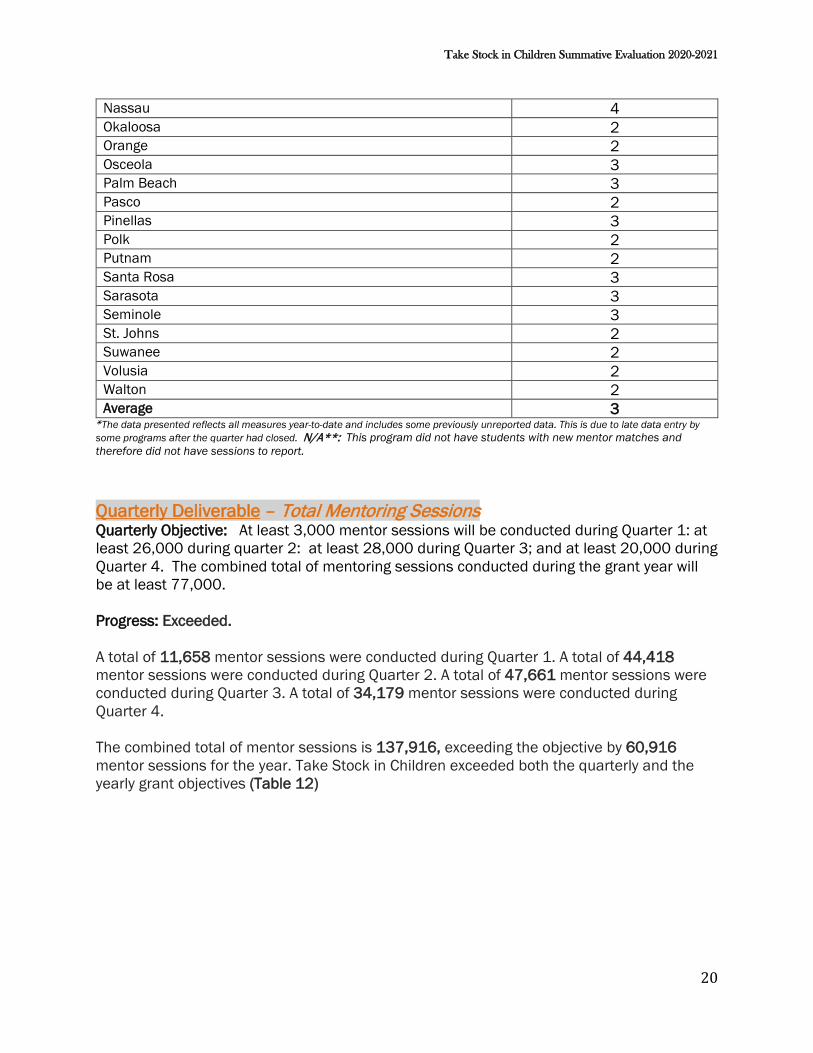
Quarterly Deliverable – Total Mentoring Sessions Quarterly Objective: At least 3,000 mentor sessions will be conducted during Quarter 1: at least 26,000 during quarter 2: at least 28,000 during Quarter 3; and at least 20,000 during Quarter 4. The combined total of mentoring sessions conducted during the grant year will be at least 77,000. Progress: Exceeded. A total of 11,658 mentor sessions were conducted during Quarter 1. A total of 44,418 mentor sessions were conducted during Quarter 2. A total of 47,661 mentor sessions were conducted during Quarter 3. A total of 34,179 mentor sessions were conducted during Quarter 4. The combined total of mentor sessions is 137,916, exceeding the objective by 60,916 mentor sessions for the year. Take Stock in Children exceeded both the quarterly and the yearly grant objectives (Table 12)
Nassau 4 Okaloosa 2 Orange 2 Osceola 3 Palm Beach 3 Pasco 2 Pinellas 3 Polk 2 Putnam 2 Santa Rosa 3 Sarasota 3 Seminole 3 St. Johns 2 Suwanee 2 Volusia 2 Walton 2 Average 3

Take Stock in Children Summative Evaluation 2020-2021
21
Table 12 – Total Number of Mentor Sessions Number of Sessions
County/Region Quarter 1 Quarter 2 Quarter 3 Quarter 4 Alachua 503 1,759 2,020 1,327 Baker, Columbia, Dixie, Gilchrist, Union 172 401 536 246 Bay 96 602 585 331 Bradford 61 175 178 127 Brevard 506 1,376 1,502 1,098 Broward 369 1,258 1,433 1,216 Calhoun, Holmes, Jackson, Liberty, Washington 31 204 229 317 Charlotte 95 272 332 242 Citrus, Levy 145 380 399 261 Clay 64 281 302 173 Collier- Champions for Learning 371 1,084 1,134 1,105 Collier - Immokalee 165 603 663 626 Desoto, Hardee, Highlands 423 659 602 180 Duval 472 1,793 1,891 1,237 Escambia 97 876 910 675 Flagler 144 556 548 186 Franklin 0 7 42 49 Gadsden, Leon, Wakulla 86 476 481 374 Hendry 14 17 16 11 Hernando 22 83 147 74 Hillsborough 549 1,952 1,897 1,570 Indian River, Martin, Okeechobee, St. Lucie 145 1,016 1,193 817 Lake, Sumter 253 736 969 490 Lee 167 889 821 611 Madison 68 230 216 154 Manatee 303 1,177 1,316 956 Marion 415 1,147 783 946 Miami-Dade 247 1,442 2,155 1,369 Monroe 501 1,789 2,125 1,505 Nassau 362 1,093 1,198 975 Okaloosa 32 279 375 239 Orange 649 2,347 2,908 2,010 Osceola 344 1,041 1,044 928 Palm Beach 1,080 2,929 3,484 2,478 Pasco 50 551 539 380
The data presented reflects all measures year-to-date and includes some previously unreported data. This is due to late data entry by some programs after the quarter had closed.

Take Stock in Children Summative Evaluation 2020-2021
22
Pinellas 1,565 8,630 7,898 5,564 Polk 224 613 513 335 Putnam 0 0 2 28 Santa Rosa 174 757 835 605 Sarasota 260 1,134 1,644 1,160 Seminole 183 860 722 323 St. Johns 66 380 294 253 Suwanee 73 90 108 66 Volusia 90 347 458 338 Walton 22 127 214 224 Grand Total 11,658 44,418 47,661 34,179
The data presented reflects all measures year-to-date and includes some previously unreported data. This is due to late data entry by some programs after the quarter had closed. Quarterly Deliverable – Students Mentored/Mentees Served Quarterly Objective: At least 3,000 students will be mentored during Quarter 1; at least 5,450 students will be mentored during Quarter 2; at least 5,600 students will be mentored during Quarter 3; and at least 5,000 students will be mentored during Quarter 4. Progress: Exceeded A total of 5,115 students were mentored during Quarter 1. A total of 6,767 students were mentored during Quarter 2. A total of 7,062 students were mentored during Quarter 3. A total of 7,065 students were mentored during Quarter 4 (Table 13). Table 13 – Number of Students Mentored/Mentees Served
Number of Students County/Region Quarter 1 Quarter 2 Quarter 3 Quarter 4 Alachua 205 279 298 276 Baker, Columbia, Dixie, Gilchrist, Union 62 82 109 71 Bay 96 102 102 99 Bradford 26 34 35 35 Brevard 175 211 213 203 Broward 178 192 203 226 Calhoun, Holmes, Jackson, Liberty, Washington 24 48 47 50 Charlotte 34 47 52 50 Citrus, Levy 49 50 52 53 Clay 34 44 44 41 Collier – Champions for Learning 147 169 193 212 Collier - Immokalee 53 70 96 97 Desoto, Hardee, Highlands 93 99 100 56
The data presented reflects all measures year-to-date and includes some previously unreported data. This is due to late data entry by some programs after the quarter had closed.

Take Stock in Children Summative Evaluation 2020-2021
23
Duval 209 287 302 294 Escambia 61 121 145 142 Flagler 45 72 72 49 Franklin 0 9 8 8 Gadsden, Leon, Wakulla 45 52 55 54 Hendry 3 3 3 3 Hernando 11 18 18 15 Hillsborough 230 333 351 346 Indian River, Martin, Okeechobee, St. Lucie 102 174 180 159 Lake, Sumter 105 138 141 133 Lee 104 137 136 132 Madison 33 37 35 35 Manatee 125 193 198 217 Marion 168 193 177 227 Miami-Dade 170 262 275 254 Monroe 208 291 305 304 Nassau 125 131 157 161 Okaloosa 17 49 53 51 Orange 384 463 464 455 Osceola 140 168 169 168 Palm Beach 333 428 490 469 Pasco 33 96 94 86 Pinellas 771 1,027 1,012 1,112 Polk 85 102 97 127 Putnam 0 0 1 2 Santa Rosa 96 113 113 111 Sarasota 125 171 184 196 Seminole 90 99 99 97 St. Johns 41 60 61 69 Suwanee 21 21 20 18 Volusia 41 64 71 69 Walton 18 28 32 33 Grand Total 5,115 6,767 7,062 7,065
The data presented reflects all measures year-to-date and includes some previously unreported data. This is due to late data entry by some programs after the quarter had closed.

Take Stock in Children Summative Evaluation 2020-2021
24
College Success Coaches Take Stock in Children requires that College Success Coaches visit twice per semester with students in 11th and 12th grade and once per semester with students in 6th through 10th grades. Key Performance Indicators (KPIs) are used at each site to measure compliance with these requirements. Table 14 shows the percentage of students that met the KPI. Deliverable 7 – Students Meeting the College Success Coach Visit KPI Requirements End of Year Objective: College Success Coach visits will average 1 per semester for grades 6-10 and 2 per semester for grades 11-12. Take Stock in Children is expected to achieve at least 85% of the objective by the end of the grant year. Progress: Exceeded. An average total of 98% of students received the annual dosage of target services during the grant year (Table 14)
Table 14 – Students in Grades 6-12 Meeting College Success Coaching Visits KPI Requirements
County/ Region
Number of Students
Meeting KPI
Total Number of Students*
% of Students Alachua 299 299 100 Baker, Columbia, Dixie, Gilchrist, Union 111 114 97
Bay 99 101 98
Bradford 31 33 94
Brevard 217 218 99
Broward 222 222 100 Calhoun, Holmes, Jackson, Liberty, Washington 48 48 100
Charlotte 52 52 100
Citrus 52 52 100
Clay 43 43 100
Collier – Champions for Learning 213 217 98
Collier – Immokalee 130 130 100
DeSoto, Hardee, Highlands 99 99 100
Duval 316 316 100
Escambia 144 144 100
Flagler 75 75 100
Franklin 7 7 100
Gadsden, Leon, Wakulla 55 58 95
Hendry 3 3 100

Take Stock in Children Summative Evaluation 2020-2021
25
Hernando 15 17 88
Hillsborough 367 368 99 Indian River, Martin, Okeechobee, St. Lucie 185 191 97
Lake, Sumter 134 137 98
Lee 131 134 98
Madison 34 37 92
Manatee 197 197 100
Marion 233 242 96
Miami-Dade 279 279 100
Monroe 302 303 99
Nassau 161 161 100
Okaloosa 52 53 98
Orange 454 459 99
Osceola 169 170 99
Palm Beach 484 492 98
Pasco 91 97 94
Pinellas 1,044 1,087 96
Polk 102 102 100
Putnam 2 2 100
Santa Rosa 110 110 100
Sarasota 182 182 100
Seminole 99 99 100
St. Johns 60 63 95
Suwannee 19 21 90
Volusia 70 71 99
Walton 33 33 100
Grand Total 7,225 7,338 98% *Students enrolled late in Semester 2 are not required to receive coaching visits.

Take Stock in Children Summative Evaluation 2020-2021
26
College Readiness Workshops Take Stock in Children local affiliate programs are responsible for designing and coordinating workshops to prepare students for the requirements of preparing for, applying to, attending, and succeeding in postsecondary experiences. Local affiliate programs are required to conduct at least 4 College Readiness Workshops per year. Deliverable 8 – College Readiness Workshops End of Year Objective: A total of 4 college readiness workshops will be conducted at each site per year (including 2 sessions focused on college readiness and financial aid procedures for seniors), plus a new student orientation where applicable. Take Stock in Children is expected to achieve at least 85% of each objective by the end of the grant year. Progress: Exceeded A total of 44 sites (98%) offered 4 or more College Readiness Workshops during quarters 1-4; and 45 sites (100%) offered New Student Orientation by the end of the grant year.
Table 15 – Number of College Readiness Workshops Conducted
County/Region
Number of Workshops
Quarters 1-4 Alachua 6 Baker, Columbia, Dixie, Gilchrist, Union 6 Bay 7 Bradford 4 Brevard 5 Broward 5 Calhoun, Holmes, Jackson, Liberty, Washington 6 Charlotte 6 Citrus, Levy 9 Clay 8 Collier-Champions for Learning 15 Collier - Immokalee 7 Desoto, Hardee, Highlands 5 Duval 4 Escambia 4 Flagler 13 Franklin 6 Gadsden, Leon, Wakulla 10 Hendry 4 Hernando 8 Hillsborough 6 Indian River, Martin, Okeechobee, St. Lucie 5 Lake, Sumter 5
The data presented reflects all measures year-to-date and includes some previously unreported data. This is due to late data entry by some programs after the quarter had closed.

Take Stock in Children Summative Evaluation 2020-2021
27
Lee 5 Madison 7 Manatee 9 Marion 5 Miami-Dade 4 Monroe 14 Nassau 8 Okaloosa 6 Orange 10 Osceola 5 Palm Beach 9 Pasco 5 Pinellas 4 Polk 6 Putnam 2 Santa Rosa 5 Sarasota 13 Seminole 5 St. Johns 5 Suwanee 4 Volusia 5 Walton 4 Grand Total 294
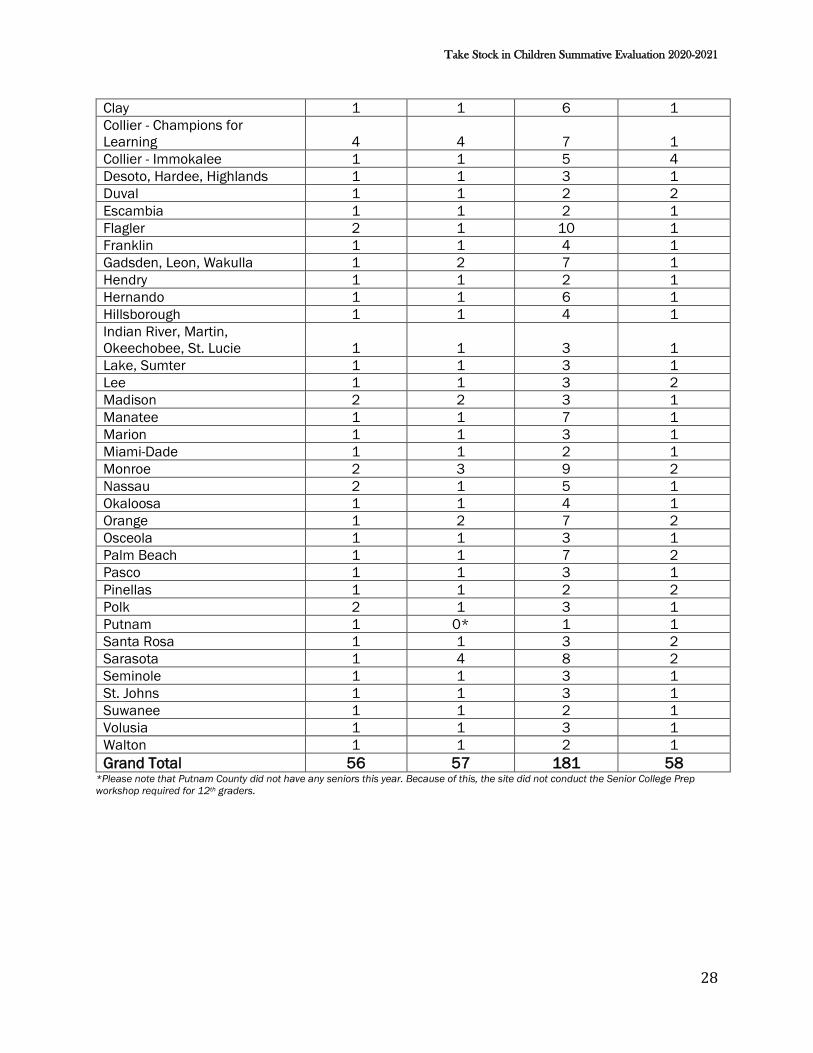
Table 16 shows the topics of College Readiness Workshops offered by each program site. The grant requirements state that by the end of the year, each site must offer one (1) workshop focused on financial aid, one (1) focused on senior college readiness, and two (2) other workshops with topics determined by the needs of students. Programs enrolling new students are also required to hold new student orientations. Please note, some programs will not offer senior workshops due to not having any seniors enrolled in the program.
Table 16 – College Readiness Workshop Topics (Quarters 1-4 combined)/New Student Orientation
County/Region Financial Aid Senior College Prep
College Readiness
New Student Orientation
Alachua 2 1 3 2 Baker, Columbia, Dixie, Gilchrist, Union 2 1 3 1 Bay 1 2 4 1 Bradford 1 1 2 1 Brevard 1 1 3 1 Broward 1 1 3 1 Calhoun, Holmes, Jackson, Liberty, Washington 1 1 4 2 Charlotte 2 2 2 1 Citrus, Levy 1 1 7 1
Take Stock in Children Summative Evaluation 2020-2021
28
Clay 1 1 6 1 Collier - Champions for Learning 4 4 7 1 Collier - Immokalee 1 1 5 4 Desoto, Hardee, Highlands 1 1 3 1 Duval 1 1 2 2 Escambia 1 1 2 1 Flagler 2 1 10 1 Franklin 1 1 4 1 Gadsden, Leon, Wakulla 1 2 7 1 Hendry 1 1 2 1 Hernando 1 1 6 1 Hillsborough 1 1 4 1 Indian River, Martin, Okeechobee, St. Lucie 1 1 3 1 Lake, Sumter 1 1 3 1 Lee 1 1 3 2 Madison 2 2 3 1 Manatee 1 1 7 1 Marion 1 1 3 1 Miami-Dade 1 1 2 1 Monroe 2 3 9 2 Nassau 2 1 5 1 Okaloosa 1 1 4 1 Orange 1 2 7 2 Osceola 1 1 3 1 Palm Beach 1 1 7 2 Pasco 1 1 3 1 Pinellas 1 1 2 2 Polk 2 1 3 1 Putnam 1 0* 1 1 Santa Rosa 1 1 3 2 Sarasota 1 4 8 2 Seminole 1 1 3 1 St. Johns 1 1 3 1 Suwanee 1 1 2 1 Volusia 1 1 3 1 Walton 1 1 2 1 Grand Total 56 57 181 58
*Please note that Putnam County did not have any seniors this year. Because of this, the site did not conduct the Senior College Prep workshop required for 12th graders.

Take Stock in Children Summative Evaluation 2020-2021
29
Training for Mentors and Staff Both the State Office of Take Stock in Children and its affiliate organizations provide regular and periodic development sessions for affiliate staff and training for mentors. Tables 17 and 18 present the Take Stock State Office and Affiliate professional development and training activities for affiliate staff and mentors. Quarterly Deliverable – Mentor Trainings Quarterly Objectives: At least 31 sites will conduct mentor trainings during Quarter 1 and Quarters 2, respectively, as reported to the Take Stock in Children State Office. At least 26 sites will conduct mentor trainings during Quarter 3, and at least 25 sites will conduct mentor trainings during Quarter 4. Progress: Exceeded A total of 43 sites offered training during Quarter 1, 40 sites during Quarter 2, 44 sites during Quarter 3, and 44 sites during Quarter 4 (Table 17).
Table 17 – Sites Conducting Mentor Training* Training Offered (Yes/No)
County/Region Quarter 1 Quarter 2 Quarter 3 Quarter 4 Alachua Yes Yes Yes Yes Baker, Columbia, Dixie, Gilchrist, Union Yes Yes Yes Yes Bay Yes Yes Yes Yes Bradford Yes No Yes Yes Brevard Yes Yes Yes Yes Broward Yes Yes Yes Yes Calhoun, Holmes, Jackson, Liberty, Washington Yes Yes Yes Yes
Charlotte Yes Yes Yes Yes Citrus, Levy Yes Yes Yes Yes Clay Yes Yes Yes Yes Collier - Champions for Learning Yes Yes Yes Yes Collier - Immokalee Yes Yes Yes Yes Desoto, Hardee, Highlands Yes Yes Yes Yes Duval Yes Yes Yes Yes Escambia Yes Yes Yes Yes Flagler Yes Yes Yes Yes Franklin No Yes Yes Yes Gadsden, Leon, Wakulla Yes Yes Yes Yes Hendry No No No Yes Hernando Yes Yes Yes Yes Hillsborough Yes Yes Yes Yes Indian River, Martin, Okeechobee, St. Lucie Yes Yes Yes Yes Lake, Sumter Yes Yes Yes Yes Lee Yes Yes Yes Yes Madison Yes No Yes No

Take Stock in Children Summative Evaluation 2020-2021
30
Manatee Yes Yes Yes Yes Marion Yes Yes Yes Yes Miami-Dade Yes Yes Yes Yes Monroe Yes Yes Yes Yes Nassau Yes Yes Yes Yes Okaloosa Yes Yes Yes Yes Orange Yes Yes Yes Yes Osceola Yes No Yes Yes Palm Beach Yes Yes Yes Yes Pasco Yes Yes Yes Yes Pinellas Yes Yes Yes Yes Polk Yes Yes Yes Yes Putnam Yes No Yes Yes Santa Rosa Yes Yes Yes Yes Sarasota Yes Yes Yes Yes Seminole Yes Yes Yes Yes St. Johns Yes Yes Yes Yes Suwanee Yes Yes Yes Yes Volusia Yes Yes Yes Yes Walton Yes Yes Yes Yes Grand Total of Sites Offering Training 43 40 44 44
*The data presented reflects all measures year-to-date and includes some previously unreported data. This is due to late data entry by some programs after the quarter had closed.
Deliverable 9 – Professional Development End of Year Objective: A total of 15 professional development opportunities will be provided for staff by the end of the year, with 5 opportunities in Quarter 1, 3 opportunities in Quarter 2, 4 opportunities in Quarter 3, and 3 opportunities in Quarter 4. Progress: Exceeded A total of 29 professional development opportunities were offered to staff during Quarters 1; 21 during Quarter 2; 25 during Quarter 3; and 11 during Quarter 4 (Table 18). A combined total of 86 professional development opportunities were provided to staff, exceeding the objective by 71 professional development opportunities for Quarters 1 through 4. TABLE 18 – Professional Development/ Staff Training Quarters 1-4Staff Training - Quarter 1
Date (Q1) Topic 7/9/2020 STAR Database 101 for New Staff
7/16/2020 STAR Database: Mentor Login & Recording Sessions
7/21/2020 Understanding New Florida Prepaid CDR

Take Stock in Children Summative Evaluation 2020-2021
31
7/23/2020 STAR Database: Using the STAR Record Importer
7/28/2020 Back to School Series: Virtual & Group Mentoring
7/29/2020 Back to School Series: College Success Coaching
7/30/2020 Back to School Series: Workshops
7/31/2020 Back to School Series: Planning for 2020-2021
8/4/2020 Back to School Series: Next Steps- Put Plan in Action
8/6/2020 Back to School Series: CDR Training & Peer Panel
8/10/2020 Back to Basics: TSIC Student Recruitment/Selection
8/11/2020 Utilizing Scheduling Apps & Multiple Mentor Sessions
8/13/2020 Utilizing Scheduling Apps & Multiple Mentor Sessions
8/18/2020 Script App Training on Workflows
8/24/2020 Back to Basics: TSIC Student Transfer Policy
8/25/2020 STAR Database 101 for New Staff
8/25/2020 STAR Database 102 Advanced
8/26/2020 Take Stock App Refresher Training
8/27/2020 STAR Database 101 for New Staff
8/27/2020 STAR Database 102 Advanced
9/1/2020 Take Stock App Re-Launch - Affiliate Portal
9/2/2020 Take Stock App Re-Launch - Mentor/Mentee View
9/3/2020 Take Stock App Re-Launch - FAQs & Troubleshooting
9/9/2020 TSIC 101 for New Staff
9/15/2020 FLDOE Deliverables & Mentoring Options
9/24/2020 STAR Database 101 for New Staff
9/29/2020 TSIC Training for New Student Services Coordinators
9/29/2020 TSIC Training for New Mentor Coordinators
9/29/2020 TSIC Training for New College Success Coaches
Staff Training - Quarter 2 Date (Q2) Topic
10/6/2020 2021-2022 FAFSA
10/20/2020 SMARTS Program & BSC Update
10/21/2020 Best Practices- Virtual Operations/ COVID Response
10/21/2020 Best Practices- Virtual Operations/ COVID Response
10/21/2020 Best Practices- Virtual Operations/ COVID Response
10/21/2020 Best Practices- Virtual Operations/ COVID Response

Take Stock in Children Summative Evaluation 2020-2021
32
10/21/2020 Best Practices- Virtual Operations/ COVID Response
10/27/2020 TSIC Training for New Student Services Coordinators
10/27/2020 TSIC Training for New Mentor Coordinators
10/27/2020 TSIC Training for New College Success Coaches
10/27/2020 TSIC Training for New Database Specialists
10/27/2020 Strategic Planning
10/28/2020 Strategic Planning
10/28/2020 Strategic Planning
11/3/2020 Essential Financial Aid
11/10/2020 Take Stock Convening - Student Recruitment
11/22/2020 College Readiness Contact Trackers for CSCs
12/1/2020 Staff Training - First in Innovative Solutions Series
12/4/2020 STAR Database for New Employees
12/7/2020 Take Stock Convening - Social Media Awareness
12/15/2020 National Mentoring Month & Legislative Engagement
Staff Training - Quarter 3 Date (Q3) Topic 1/5/2021 Staff Training Second in Innovation Solutions Series
1/6/2021 Staff Training - Take Stock App Affiliate Portal Training
1/7/2021 Staff Training - Take Stock App Training the Mentors & Mentees
1/8/2021 Staff Training - Take Stock App Video Chat - Wrap Up Training
1/12/2021 Take Stock Convening - Mentor Recruitment
1/14/2021 STAR Database for New Employees
1/19/2021 TSIC Legislative Week Training
1/26/2021 TSIC Training for New Student Services Coordinators
1/26/2021 TSIC Training for New Mentor Coordinators
1/26/2021 TSIC Training for New Database Specialists
1/26/2021 TSIC Training for New College Success Coaches
2/2/2021 Staff Training - Third Innovative Solutions Series
2/9/2012 Take Stock Convening - Florida Prepaid Foundation
2/11/2021 STAR Database for New Employees
2/24/2021 Best Practices - Student & Mentor Recruitment (Session 1)
2/24/2021 Best Practices - Student & Mentor Recruitment (Session 2)
2/24/2021 Best Practices - Student & Mentor Recruitment (Session 3)

Take Stock in Children Summative Evaluation 2020-2021
33
2/24/2021 Best Practices - Student & Mentor Recruitment (Session 4)
2/25/2021 Strategic Planning (Session 1)
2/25/2021 Strategic Planning (Session 2)
3/2/2021 Staff Training - Fourth Innovative Solutions Series
3/9/2021 Take Stock Convening - Student & Mentor Recruitment
3/11/2021 STAR Database for New Employees
3/16/2021 Machen Florida Opportunity Scholars Program Training
3/30/2021 Take Stock in Children Training for New Employees
Staff Training - Quarter 4 Date (Q4) Topic 4/6/2021 Staff Training Boost Your Mental Fitness Part 2
4/8/2021 Take Stock Convening - Connecting & Engaging Students
4/28/2021 Staff Training - BigFutures Virtual College Fairs
5/4/2021 Staff Training - Final Boost Your Mental Fitness Part 3
5/13/2021 STAR Database for New Employees
6/15/2021 Staff Training - Leaders for Life Fellowship Process
6/17/2021 STAR Database for New Employees
Apr. 1 - June 30 TSIC Training for New Student Services Coordinators
Apr. 1 - June 30 TSIC Training for New Mentor Coordinators
Apr. 1 - June 30 TSIC Training for New Database Specialists
Apr. 1 - June 31 TSIC Training for New College Success Coaches

Take Stock in Children Summative Evaluation 2020-2021
34
Deliverable 10 – Student Academic Performance End of Year Objective: 90% of Take Stock in Children student program participants will improve or maintain satisfactory academic performance as evidenced by Semester 1 and 2 student G.P.A. reported on student report cards. Progress: Exceeded An average of 95% of students had an unweighted Semester 1 G.P.A. above 2.0. An average of 95% of students had an unweighted Semester 2 G.P.A. above 2.0. The average unweighted Semester 1 and Semester 2 G.P.A. across the network is 3.25 (Table 19).
Table 19 – Student Unweighted GPA for Semesters 1 and 2
County/Region
% of Students Above 2.0 GPA
(S1 unweighted)
% of Students Above 2.0 GPA
(S2 unweighted)
Average S1 and S2
GPA Alachua 93% 93% 3.12 Baker, Columbia, Dixie, Gilchrist, Union 91% 92% 3.10 Bay 90% 92% 3.18 Bradford 100% 88% 3.06 Brevard 94% 97% 3.33 Broward 94% 91% 3.18 Calhoun, Holmes, Jackson, Liberty, Washington 94% 97% 3.10 Charlotte 100% 100% 3.32 Citrus, Levy* ** 90% 95% 3.10 Clay 91% 93% 3.08 Collier- Champions for Learning * 99% 100% 3.51 Collier - Immokalee 91% 97% 3.34 Desoto, Hardee, Highlands 92% 95% 3.39 Duval 92% 91% 3.02 Escambia 95% 94% 3.22 Flagler 88% 94% 3.14 Franklin 100% 100% 3.15 Gadsden, Leon, Wakulla 93% 98% 3.19 Hendry 100% 100% 3.23 Hernando 100% 88% 3.14 Hillsborough* 94% 95% 3.24 Indian River, Martin, Okeechobee, St. Lucie 95% 97% 3.34 Lake, Sumter 99% 94% 3.37 Lee 98% 99% 3.50 Madison 100% 100% 3.46 Manatee 91% 97% 3.33 Marion 91% 94% 3.21 Miami-Dade 97% 96% 3.29 Monroe 98% 95% 3.29 Nassau 99% 100% 3.50 Okaloosa 100% 94% 3.31

Take Stock in Children Summative Evaluation 2020-2021
35
Orange 90% 89% 3.12 Osceola 97% 93% 3.32 Palm Beach 99% 97% 3.33 Pasco 88% N/A 3.12 Pinellas 89% 96% 3.16 Polk 97% 95% 3.26 Putnam 100% 100% 3.54 Santa Rosa 98% 94% 3.26 Sarasota 93% 93% 3.16 Seminole 97% 96% 3.19 St. Johns 94% N/A 3.13 Suwanee 90% 95% 3.12 Volusia 89% 94% 3.29 Walton 100% 100% 3.43 Grand Total 95% 95% 3.25
*Schools in these counties report cumulative GPA rather than semester 1 and 2 averages for the year. ** Data analyzed was incomplete due to delays at the school district level in processing final Semester 2 grades. Sites listed as N/A were unable to provide Semester 2 data due to delays at the school district level in processing final Semester 2 grades.
Deliverable 11 – Student Attendance End of Year Objective: 90% of Take Stock in Children student program participants will improve or maintain satisfactory school attendance as evidenced by Semester 1 and 2 student attendance records reported on student report cards. Progress: Exceeded A total of 92% of students had less than 17 unexcused absences during the grant year (Table 20). Student attendance and attendance tracking were impacted by virtual learning throughout the state in semester 1. Local school systems tracked attendance in varying ways during this time period leading to inconsistencies in data.
Table 20 – Unexcused Absences by County
County/Region
Students with more than 17 unexcused absences
Students with less than 17 unexcused absences
Number Percent Number Percent Alachua 18 6% 304 94% Baker, Columbia, Dixie, Gilchrist, Union 9 7% 117 93% Bay 1 1% 123 99% Bradford 10 27% 27 73% Brevard 12 6% 206 94% Broward 5 2% 224 98% Calhoun, Holmes, Jackson, Liberty, Washington 18 27% 49 73% Charlotte 3 6% 49 94% Citrus, Levy 0 0% 55 100% Clay 2 4% 54 96%

Take Stock in Children Summative Evaluation 2020-2021
36
Collier- Champions for Learning 6 3% 212 97% Collier – Immokalee 7 7% 91 93% Desoto, Hardee, Highlands 8 7% 110 93% Duval 23 7% 315 93% Escambia 17 12% 127 88% Flagler 9 9% 87 91% Franklin 1 12% 7 88% Gadsden, Leon, Wakulla 2 3% 56 97% Hendry 1 12% 7 88% Hernando 3 11% 25 89% Hillsborough 94 25% 277 75% Indian River, Martin, Okeechobee, St. Lucie 28 12% 208 88% Lake, Sumter 7 4% 171 96% Lee 11 6% 162 94% Madison 2 4% 45 96% Manatee 16 7% 201 93% Marion 14 6% 231 94% Miami-Dade 53 19% 232 81% Monroe 3 1% 316 99% Nassau 5 3% 158 97% Okaloosa 4 6% 66 94% Orange 76 17% 384 83% Osceola 2 1% 169 99% Palm Beach 25 5% 472 95% Pasco 6 5% 109 95% Pinellas 121 9% 1,211 91% Polk 17 12% 123 88% Putnam 0 0% 16 100% Santa Rosa 8 6% 125 94% Sarasota 27 11% 217 89% Seminole 14 11% 114 89% St. Johns 2 3% 77 97% Suwanee 5 18% 23 82% Volusia 7 7% 90 93% Walton 0 0% 38 100% Grand Total 702 8% 7,480 92%

Take Stock in Children Summative Evaluation 2020-2021
37
Deliverable 12 – Graduation Rate End of Year Objective: 90% of program participants will successfully complete the Take Stock in Children program and meet all Take Stock in Children standards- maintain satisfactory G.P.A./attendance, remain crime/drug-free, and graduate from high school as evidenced by school district academic records. Progress: Exceeded The Take Stock in Children program completion rate for the 2020-2021 grant year was 97% with a total of 1,566 students graduating from the Take Stock program (Table 21).
Table 21 – Take Stock in Children Graduation Rate
County/Region Total Number of Graduates
Graduates Terminated % Graduated Alachua 59 5 92% Baker, Columbia, Dixie, Gilchrist, Union 28 1 97% Bay 15 0 100% Bradford 7 0 100% Brevard 68 0 100% Broward 56 0 100% Calhoun, Holmes, Jackson, Liberty, Washington 15 0 100%
Charlotte 8 0 100% Citrus, Levy 12 0 100% Clay 9 1 90% Collier- Champions for Learning 45 7 87% Collier - Immokalee 32 1 97% Desoto, Hardee, Highlands 18 0 100% Duval 67 6 92% Escambia 19 0 100% Flagler 24 0 100% Franklin 1 0 100% Gadsden, Leon, Wakulla 8 2 80% Hendry 2 0 100% Hernando 6 0 100% Hillsborough 75 0 100% Indian River, Martin, Okeechobee, St. Lucie 47 1 98% Lake, Sumter 39 4 91% Lee 34 1 97% Madison 12 0 100% Manatee 35 1 97% Marion 48 1 98% Miami-Dade 110 5 96% Monroe 57 1 98% Nassau 32 1 97% Okaloosa 14 0 100%

Take Stock in Children Summative Evaluation 2020-2021
38
Orange 67 3 96% Osceola 32 0 100% Palm Beach 111 1 99% Pasco 16 0 100% Pinellas 175 3 98% Polk 33 0 100% Putnam 0 0 N/A Santa Rosa 16 0 100% Sarasota 45 0 100% Seminole 23 0 100% St. Johns 17 0 100% Suwanee 7 0 100% Volusia 16 0 100% Walton 6 0 100% Grand Total 1,566 45 97%

Take Stock in Children Summative Evaluation 2020-2021
39
Achievement of FLDOE Quarterly Deliverables
Table 22 – Florida Department of Education Quarterly Grant Deliverables and Activities
Activity/Task Deliverable Target Q1 – Q4 Combined
Performance Q1 - Q4 Combined Outcome
Mentor Recruiting Activity 4 Multi-Region
Activities 10 Multi-Region
Activities Exceeded
Mentor Screenings/ Background Checks 1,400 Mentors 1,514 Mentors Exceeded
Mentoring Sessions 77,000 Mentoring
Sessions 137,916 Mentoring
Sessions Exceeded
Mentees Served 19,050 Students
Mentored 26,009 Students
Mentored Exceeded
Mentee Trainings (College Readiness Workshops Conducted)
165 Mentee Trainings
352 Mentee Trainings Exceeded
New Student Orientation 45 Sites Conducting
Trainings 45 Sites Conducting
Trainings Exceeded
Mentor Trainings
Q1- 31 Q2- 31 Q3- 26 Q4- 25
Sites Conducting Trainings
Q1- 43 Q2- 40 Q3- 44 Q4- 44
Sites Conducting Trainings Exceeded
Staff Trainings 15 Training
Opportunities 86 Training
Opportunities Exceeded

Take Stock in Children Summative Evaluation 2020-2021
40
Observations: Student, Parent & Mentor FeedbackSurveys The following section presents observations based on data collected from students, parents, and mentors through interactions and observations collected throughout the year and via online surveys. Take Stock leadership and staff reviewed the surveys to ensure they accurately reflected the guiding questions posited in this evaluation. Specifically, Take Stock sought to know 1) How effective and efficient is program implementation? 2) How did the COVID-19 pandemic impact program implementation, and 3) How can Take Stock in Children improve program implementation? These surveys were completed in March 2021. A total of 1,125 students; 849 parents; and 1,103 mentors responded to the survey. Figures 1-3 illustrate the 1) grade level of student respondents, 2) the grade level of Take Stock students as reported by the parents participating in the survey, and 3) the grade level of students that mentors reported mentoring. Observations Based on Qualitative Data A set of seven observations resulted from the analysis of the qualitative data collected through surveys:
1. Take Stock in Children students, parents, and mentors report high levels of satisfaction.
2. The most pressing concern for students and parents regarding postsecondary completion is related to college affordability.
3. Further supporting the reports of concern over postsecondary affordability, survey respondents reported wanting to spend more time learning about Financial Planning. Additionally, respondents indicated wanting to spend more time learning about the college application process.
4. Take Stock students, parents, and mentors feel connected and supported by their local programs.
5. There continues to be a high level of interest in the field of health and medicine among Take Stock students.
6. Take Stock mentors feel very confident about their ability to support the social-emotional needs of their mentees. In alignment with student and parent responses, mentors would like additional support in helping students apply for college/university and with financial planning.
7. Take Stock students, parents, and mentors responded positively to Take Stock virtual service enhancements and expressed the desire to implement a hybrid service model in the new school year combining both in-person and virtual service opportunities.

Take Stock in Children Summative Evaluation 2020-2021
41
1% 1%4%
17%
27% 24% 26%
0%
5%
10%
15%
20%
25%
30%
6th 7th 8th 9th 10th 11th 12th
Figure 1: Students: What is your current grade? (n=1,125)
GRADE
1%
4%7%
19%
26%23%
20%
0%
5%
10%
15%
20%
25%
30%
6th 7th 8th 9th 10th 11th 12th
Figure 2: Parents: What grade is your child in now? (n=849)
GRADE
1% 3%5%
14%
24% 23%29%
1%0%5%
10%15%20%25%30%35%
6th 7th 8th 9th 10th 11th 12th I am notcurrentlymatched
with amentee.
Figure 3: Mentors: What grade is your mentee in now? (n=1,103)
GRADE

Take Stock in Children Summative Evaluation 2020-2021
42
Participation In Take Stock in Children Most students and parents who responded to the survey reported they or their child was in 8th or 9th grade when they entered the Take Stock in Children program (Figures 4 & 5).
11%13%
34%29%
9%4%
0%5%
10%15%20%25%30%35%40%
6th 7th 8th 9th 10th 11th
Figure 4: Students: What grade were you in when you entered the Take Stock in Children Program? (n=1,125)
GRADE
16%17%
34%
25%
6%2%
0%
5%
10%
15%
20%
25%
30%
35%
40%
6th 7th 8th 9th 10th 11th
Figure 5: Parents: In which grade did your child enroll in the Take Stock in Children program? (n=849)
GRADE

Take Stock in Children Summative Evaluation 2020-2021
43
About half of the mentors who responded to the survey are returning mentors who have been mentoring for 3 or more years. A total of 23% of mentors who responded have been volunteering for six or more years (FIGURE 6).
8%10%
22%
37%
16%
4% 3%
0%
5%
10%
15%
20%
25%
30%
35%
40%
Less than 6months
6 months to 1year
1 to 2 years 3 to 5 years 6 to 10 years 11 to 15 years More than 15years
Figure 6: Mentors: How long have you been a volunteer mentor with Take Stock in Children? (n=1,103)

Take Stock in Children Summative Evaluation 2020-2021
44
Students, parents, and mentors were also asked how they first learned about the Take Stock in Children program. Over half of student and parent respondents noted that they were informed about the program by a teacher or school. Most mentors reported hearing about it either through their place of work or by word of mouth from friends or family. Several students, parents, and mentors that selected “other” described another option already provided in the survey when asked to share more (TABLES 23-25). Table 23 – Take Stock in Children - Student Participation (n=1,125) STUDENTS: How did you first learn about the Take Stock in Children program? Percent “My teacher(s)/school counselor told me about it.” 62% “My parent or other family member told me about it.” 22% “My friends told me about it.” 3% “I learned about it on social media (Facebook, Twitter, etc.).” .5% “I saw/heard an advertisement for the program and found out more information.” 3.5% Other 9% Grand Total 100%
Table 24 – Take Stock in Children -Parent Participation (n=849) PARENTS: How did you first learn about the Take Stock in Children program? Percent “My child’s teacher(s)/school counselor told me about it.” 52% “My child told me about it.” 20% “My friends told me about it.” 8% “I learned about it on social media (Facebook, Twitter, etc.).” 1% “I saw/heard an advertisement for the program and found out more information.” 5% Other 14% Grand Total 100%
Table 25 – Take Stock in Children – Mentor Participation (n=1,103) MENTORS: How did you first learn about the Take Stock in Children program? Percent “I heard about it through my place of work.” 28% “My friend or other family told me about it.” 32% “I learned about it on social media (Facebook, Twitter, etc.).” 3% “I saw/heard an advertisement for the program and found out more information.” 10% “I am a graduate of the Take Stock in Children Program.” 2% Other 25% Grand Total 100%

Take Stock in Children Summative Evaluation 2020-2021
45
Mentoring All survey respondents were asked to share their feedback on the mentoring component of the Take Stock in Children program. Over 90% of each type of respondent indicated that they (or their child if they are a parent) are currently matched with a mentor/mentee (FIGURES 7-9).
92%
8%
Figure 7: Students: Do you currently have a mentor? (n=1,125)
Yes
No
91%
5%4%
Figure 8: Parents: Does your child currently have a mentor? (n=849)
Yes
No
I'm notsure.

Take Stock in Children Summative Evaluation 2020-2021
46
98%
1%1%
Figure 9: Mentors: Are you currently mentoring a student? (n=1,103)
Yes
No
I am waiting tobe matched.

Take Stock in Children Summative Evaluation 2020-2021
47
On the survey, when students, parents, and mentors were asked how long they have been matched with their mentor or mentee, over half of each group reported being matched at least one or more years (FIGURES 10-12).
17%
21%
26%29%
6%
1%
LESS THAN 6 MONTHS
SIX MONTHS TO A YEAR
1-2 YEARS 2+ YEARS I DON'T HAVE A MENTOR.
I HAVE NEVER HAD A MENTOR.
Figure 10: Students: How long have you been with your current mentor?
(n=1,125)
17%
22%24%
27%
5% 4%1%
LESS THAN 6 MONTHS
SIX MONTHS TO A YEAR
1-2 YEARS 2+ YEARS I'M NOT SURE. MY CHILD DOES NOT
HAVE A MENTOR.
MY CHILD HAS NEVER HAD A
MENTOR.
Figure 11: Parents: How long has your child been with their current mentor?
(n=849)

Take Stock in Children Summative Evaluation 2020-2021
48
14%17%
28%
40%
1%
LESS THAN 6 MONTHS
SIX MONTHS TO A YEAR
1-2 YEARS 2+ YEARS I DON'T HAVE A MENTEE RIGHT
NOW.
Figure 12: Mentors: How long have you been matched with your mentee?
(n=1,103)

Take Stock in Children Summative Evaluation 2020-2021
49
On the survey, when students and mentors were asked what grade they (or their mentees) were in when their current mentor-mentee pairing was established, the majority of both types of respondents reported that it began 9th grade (FIGURES 13-14).
3% 6%
14%
40%
19%
8%4% 6%
0%5%
10%15%20%25%30%35%40%45%
6th 7th 8th 9th 10th 11th 12th I am notcurrently
matched witha mentor.
Figure 13: Students: What grade were you in when you first started working with your current mentor?
(n=1,125)
GRADE
4% 11%14%
40%
20%7% 3% 1%
0%10%20%30%40%50%
6th 7th 8th 9th 10th 11th 12th I am notcurrentlymatched
with amentee.
Figure 14: Mentors: What grade was your mentee in when you first started working with your student?
(n=1,103)
GRADE

Take Stock in Children Summative Evaluation 2020-2021
50
High School Seniors, Parents of Seniors & Mentors of Seniors The survey included specific questions for high school seniors that would cover information about their postsecondary preparation activities and reflections on readiness. All survey participants were first asked about the status and awareness of FAFSA applications. A total of 88% of students reported completing their FAFSA, 84% of parents reported that their child had completed it, and 88% of mentors reported that their mentee had completed it (FIGURES 15-17). Student survey respondents indicated that they were aware of the FAFSA and received assistance with the FAFSA application, with one respondent saying that Take Stock “motivated me to go to college and complete the FAFSA and feel comfortable with both processes”. Another student indicated that the FAFSA resources provided were helpful stating, “so many questions about the FAFSA were answered in the workshop...as well as how the scholarship can help (me) complete college.”
88%
7% 5%
Figure 15 Senior Students: Did you complete the FAFSA (Free Application for Federal Student Aid)?
(n=290)
Yes
No
I'm not sure.

Take Stock in Children Summative Evaluation 2020-2021
51
84%
10%6%
Figure 16: Parents of Seniors: Has your child completed the FAFSA (Free Application for Federal
Student Aid)? (n=174)
Yes
No
I'm not sure.
88%
5% 7%
Figure 17: Mentors of Seniors: Has your mentee completed the FAFSA (Free Application for Federal
Student Aid)? (n=325)
Yes
No
I'm not sure.

Take Stock in Children Summative Evaluation 2020-2021
52
Students and their parents and mentors were then asked to reflect on SAT and/or ACT exam completion on the survey. A total of 93% of senior students reported that they had completed one of these exams, 90% of parents reported that their child had completed one of the exams, and 89% of mentors reported that their mentees had completed one of these exams (FIGURES 18-20). Parent respondents indicated that both the mentor and program provided helpful information on the SAT/ACT, with one parent saying, “My child’s mentor helped her know where and how to apply to her colleges, SAT/ACT info, and what would look best on her applications for colleges.”
93%
7%
Figure 18: Senior Students: Have you taken the SAT and/or ACT exam? (n=290)
Yes
No

Take Stock in Children Summative Evaluation 2020-2021
53
90%
6%
4%
Figure 19: Parents of Seniors: Has your child taken the SAT and/or ACT exam? (n=174)
Yes
No
I'm not sure.
89%
5%6%
Figure 20: Mentors of Seniors: Has your mentee taken the SAT and/or ACT exam? (n=325)
Yes
No
I'm not sure.

Take Stock in Children Summative Evaluation 2020-2021
54
On the survey, senior students and their parents and mentors also reported on postsecondary plans, including enrollment in college or university for the 2020–2021 academic year and selecting postsecondary institutions. Over 90% of respondents from all three groups reported that they, their child, or the student they mentor is planning on enrolling in postsecondary institutions. The majority of respondents also indicated that a postsecondary institution had been selected (FIGURES 21–26). Most survey respondents also reported that students not only intended to enroll in postsecondary institutions but also had a specific career path and/or university in mind. Many students had already been provided with information on courses they should be taking to pursue their chosen career path at their specific academic institution. One parent respondent stated, “Take Stock made him think about his future career and a path to take from the time he was in Take Stock.” One student confirmed their gratitude for assistance in career planning by stating, “Thank you for helping me set and plan a career path.” A mentor concurred, “It has been very satisfying seeing my students choose to further their education.”
96%
1%
3%
Figure 21: Senior Students: Are you planning to enroll in college or university for the 2021-2022 academic
year? (n=290)
Yes
No
I'm not sure.

Take Stock in Children Summative Evaluation 2020-2021
55
95%
2%3%
Figure 22: Parents of Seniors: Is your child planning to enroll in college or university for the 2021-2022
academic year? (n=174)
Yes
No
I'm notsure.
93%
4%3%
Figure 23: Mentors of Seniors: Is your mentee planning to enroll in college or university for the 2021-
2022 academic year? (n=325)
Yes
No
I'm not sure.

Take Stock in Children Summative Evaluation 2020-2021
56
71%
29%
Figure 24: Senior Students: Have you selected a college or university to attend after high school graduation?
(n=290)
Yes
No
69%
22%
9%
Figure 25: Parents of Seniors: Has your child selected a college or university to attend after high school
graduation? (n=174)
Yes
No
I'm notsure.

Take Stock in Children Summative Evaluation 2020-2021
57
Respondents to the survey also reflected on how well Take Stock in Children has prepared students for enrolling in and completing college or university. The majority of all respondents indicated that they feel Take Stock has prepared students well. It appears that students felt this the most, as 91% of them answered in the affirmative (FIGURES 27–29). Overall, respondents reported that Take Stock is effective in preparing students for enrolling in postsecondary education. In data collected, Take Stock Alums credited much of their postsecondary and career success to participation in the Take Stock programming. One student discussed the help he received through the Take Stock program and believes that he would not have gone to college and achieved his law degree without the Take Stock program’s help in understanding financial aid, scholarships, and help in preparing for the SAT. Another student indicated, “I feel like I’ve had many experiences that have better prepared me for high school and college that I would’ve never received had it not been for Take Stock in Children. I’ve also benefited from many costs being covered as I don’t have to be held back by my financial situation.” One mentor respondent indicated that Take Stock has made her mentee “much more confident and prepared.”
69%
23%
8%
Figure 26: Mentors of Seniors: Has your mentee selected a college or university to attend after high
school graduation? (n=325)
Yes
No
I'm not sure.

Take Stock in Children Summative Evaluation 2020-2021
58
91%
2%7%
Figure 27: Senior Students: Do you feel that Take Stock in Children has prepared you well for enrolling in and
successfully completing college or university? (n=290)
Yes
No
I'm notsure.
87%
3%
10%
Figure 28: Parents of Seniors: Do you feel that Take Stock in Children has prepared our child well for
enrolling in and successfully completing college or university? (n=174)
Yes
No
I'm notsure.

Take Stock in Children Summative Evaluation 2020-2021
59
Finally, on the survey, senior students and mentors of seniors were asked if mentor-mentee communication will continue beyond high school. If so, what means of communication do they plan to use. According to the survey, over half of senior students and mentors of seniors plan to stay in touch after high school. For Senior student respondents, 64% indicated that they plan to stay in touch with their mentor, while 73% of mentor respondents indicated that they plan to stay in touch with their mentee. Among both groups, text messaging was the most popular contact methodology (FIGURES 30 & 31; TABLES 26 & 27).
88%
1%
11%
Figure 29: Mentors of Seniors: Do you feel that Take Stock in Children has prepared your mentee well for enrolling in and successfully completing college or
university? (n=325)
Yes
No
I'm not sure.
64%
4%
32%
Figure 30: Senior Students: Do you and your mentor plan on staying in touch after you graduate from high
school? (n=290)
Yes
No
I'm notsure.

Take Stock in Children Summative Evaluation 2020-2021
60
Table 26 – Senior Students
If you plan on staying in touch with your mentor after high school graduation, how will you communicate? (Please select all that apply).
Percent
E-mail 48% Phone Calls 51% Text Messaging 77% Social Media (Facebook, Instagram, Snapchat, etc.) 11% Written Letter 5% In-person Visits 25% Video Calling (Zoom, Facetime, Skype, etc.) 32% N/A – I don’t plan on staying in touch with my mentor. 5% Other (please specify) 3%
Table 27– Mentors of Seniors
If you plan on staying in touch with your mentee after high school graduation, how will you communicate? (Please select all that apply).
Percent
E-mail 46% Phone Calls 45% Text Messaging 82% Social Media (Facebook, Instagram, Snapchat, etc.) 12% Written Letter 1% In-person Visits 22% Video Calling (Zoom, Facetime, Skype, etc.) 32% N/A – I don’t plan on staying in touch with my mentor. 4% Other (please specify) 5%
73%1%
26%
Figure 31: Mentors of Seniors: Do you and your mentee plan on staying in touch after your mentee
graduates from high school? (n=325)
Yes
No
I'm not sure.

Take Stock in Children Summative Evaluation 2020-2021
61
On the survey, parents of seniors were also asked to reflect on whether or not they felt their child still needed support from Take Stock in Children while in postsecondary. A total of 91% of respondents to this question felt that their child would benefit from continued support from Take Stock after high school (FIGURE 32). Take Stock has responded to this by implementing its Take Stock in College postsecondary support program to partner with colleges and universities to help ensure students take advantage of the existing support systems to reach degree attainment.
91%
3%6%
Figure 32: Parents of Seniors: Do you feel your child would benefit from continued support from Take Stock
after high school? (n=174)
Yes
No
I'm notsure.

Take Stock in Children Summative Evaluation 2020-2021
62
TAKE STOCK IN CHILDREN PROGRAM EFFECTIVENESS Throughout the survey, all three groups of respondents were asked to share their perspectives on the overall effectiveness of the Take Stock in Children program model. They were also asked questions about the effectiveness of the individual program elements. When asked to identify the most important program element, all three groups indicated that receiving a Florida Prepaid Scholarship is most important. Many students and parents expressed that the Florida Prepaid Scholarship was most significant because it created an opportunity for students to pursue postsecondary education, which would not have been possible without the scholarship. One student communicated, “They offered me a scholarship which is my only way of paying for college.” Another Take Stock student stated, “I fight every day to improve and keep my grades up for this scholarship and to make my mentor proud.” Parents agree with many reporting that “the scholarship gives my child hope for affording college” and “I would not have been able to afford to send my children to college if not for Take Stock in Children.”
Parents and Students also praised the importance and effectiveness of Take Stock’s high-quality mentorship program. One student reported that, “I decided to take part in this program because I thought it would be beneficial to have someone there who can help me prepare for college and someone to talk to when I have a problem.” Most students reported having very few concerns about postsecondary success with sufficient guidance from their mentors. Another Take Stock student conveyed that, “My mentor has taught me so much. He's shown me leadership skills, how to manage my time, and how to treat people around me. He's taught me so much, and I'm going to make sure I apply it into the adult world.” The majority of students placed a great deal of value on their relationship with their mentors. Finally, one student summed up the importance and effectiveness of the Take Stock program, “My mentor has been with me since the 6th grade, and this has impacted me greatly. My mentor is amazing, and I have learned so much from her, and I am thankful for this experience and feel prepared to go to college.” Parent respondents were equally appreciative of the guidance provided by mentors. One parent noted, “I loved the concept of having mentors and people outside of our home.” One mentor stated, “I believe this is an essential program in helping young people succeed.” Students, parents, and mentors alike described the mentorship experience as extremely helpful and essential to the overall success of the students.

Take Stock in Children Summative Evaluation 2020-2021
63
FIGURES 33 - 35 present the ranking of each Take Stock in Children program element on a scale of importance, with 1 being the highest ranking and 4 being the lowest.
2.6
3.3
1.8
2.3
0 0.5 1 1.5 2 2.5 3 3.5
Meeting with my mentor
Receiving a Florida Prepaid Scholarship
Participating in college readiness workshops
Meeting with a College Success Coach to preparefor college
Figure 33: Students: Please rank the following elements of the Take Stock in Children program in order of importance. (1 = Most Important and 4 = Least Important) (n=1,125)
Rank
2.4
3.4
1.9
2.3
0 0.5 1 1.5 2 2.5 3 3.5 4
My child meets with a mentor.
My child receives a Florida Prepaid Scholarship.
My child participates in college readiness workshops.
My child meets with a College Success Coach toprepare for college.
Figure 34: Parents: Please rank the following elements of the Take Stock in Children program in order of importance. (1 = Most Important and 4 = Least Important) (n=849)
Rank

Take Stock in Children Summative Evaluation 2020-2021
64
2.6
3.1
2
2.3
0 0.5 1 1.5 2 2.5 3 3.5
My mentee participates in mentor sessions withme.
My mentee receives a Florida PrepaidScholarship.
My mentee participates in college readinessworkshops.
My mentee meets with a College Success Coachto prepare for college.
Figure 35: Mentors: Please rank the following elements of the Take Stock in Children program in order of importance. (1 = Most Important and 4 = Least Important) (n=1,103)
Rank

Take Stock in Children Summative Evaluation 2020-2021
65
MENTOR EFFECTIVENESS The survey then asked about the mentoring experience and the helpfulness of mentors in specific areas of support such as social skills, academic performance, applying for college or university, making good behavior choices, financial planning, managing stress, and career planning. Students felt that mentors are most helpful to them in making good behavior choices and career planning. Mentors feel the most confident with helping their students make good behavior choices (FIGURES 36–37).
4%
9%
6%
9%
6%
4%
8%
4%
4%
5%
20%
27%
21%
34%
20%
13%
32%
23%
23%
21%
76%
64%
73%
57%
74%
83%
60%
73%
73%
74%
0% 10% 20% 30% 40% 50% 60% 70% 80% 90%
Career Planning (helping to think about careerpaths and choices)
Navigating Family or Personal Issues
Stress Management and Problem Solving
Financial Planning (understanding how to makecollege affordable)
Mental Health and Wellness
Behavior Choices (staying on the right track)
College or University Application (deciding whereto apply, etc.)
Academic Planning (choosing course of study inhigh school)
Academic Performance (study skills, getting andmaintaining good grades)
Social Skills (getting along with friends and peers)
Figure 36: Students: Please indicate your mentor's helpfulness in the following areas:
(n=1,125)
Very Helpful Somewhat Helpful Not Helpful

Take Stock in Children Summative Evaluation 2020-2021
66
2%
6%
2%
10%
4%
2%
6%
4%
3%
2%
24%
40%
30%
45%
34%
13%
37%
33%
22%
18%
74%
54%
68%
45%
62%
85%
57%
63%
75%
80%
0% 10% 20% 30% 40% 50% 60% 70% 80% 90%
Career Planning (helping to think about careerpaths and choices)
Navigating Family or Personal Issues
Stress Management and Problem Solving
Financial Planning (understanding how to makecollege affordable)
Mental Health and Wellness
Behavior Choices (staying on the right track)
College or University Application (deciding whereto apply, etc.)
Academic Planning (choosing course of study inhigh school)
Academic Performance (study skills, getting andmaintaining good grades)
Social Skills (getting along with friends and peers)
Figure 37: Mentors: Please indicate your confidence in your ability level to help your child with the following
areas: (n=1,103)
Confident Somewhat Confident Not Confident

Take Stock in Children Summative Evaluation 2020-2021
67
Parent respondents were also asked to comment on how confident they are in their own abilities to help their child in the same areas. They were most confident with helping their children make good behavior choices, followed by helping them with their social skills (FIGURE 38).
11%
5%
8%
14%
4%
2%
16%
8%
4%
2%
40%
30%
43%
46%
23%
14%
43%
33%
26%
22%
49%
65%
49%
40%
73%
84%
41%
59%
70%
76%
0% 10% 20% 30% 40% 50% 60% 70% 80% 90%
Career Planning (helping to think about careerpaths and choices)
Navigating Family or Personal Issues
Stress Management and Problem Solving
Financial Planning (understanding how to makecollege affordable)
Mental Health and Wellness
Behavior Choices (staying on the right track)
College or University Application (deciding whereto apply, etc.)
Academic Planning (choosing course of study inhigh school)
Academic Performance (study skills, getting andmaintaining good grades)
Social Skills (getting along with friends and peers)
Figure 38: Parents: Please indicate your confidence level to help your child with the following areas:
(n=849)
Confident Somewhat Confident Not Confident

Take Stock in Children Summative Evaluation 2020-2021
68
As part of the survey, students and mentors reported the amount of time they would like to spend on selected areas during their mentor sessions. For most areas, the students and mentors reported they spend enough time on these areas. Students indicated that they would like to spend more time working on financial and career planning and their college or university applications (i.e., deciding where to apply and completing the paperwork). Much like the students, most mentors reported that they would like to spend more time helping their students in the area of financial planning (FIGURES 39-40).
4%
6%
21%
9%
9%
13%
17%
6%
6%
16%
52%
47%
64%
64%
47%
66%
71%
62%
70%
73%
44%
47%
15%
27%
44%
21%
12%
32%
24%
11%
0% 10% 20% 30% 40% 50% 60% 70% 80%
Career Planning (helping to think about careerpaths and choices)
College or University Application (deciding whereto apply, etc.)
Navigating Family or Personal Issues
Stress Management and Problem Solving
Financial Planning (understanding how to makecollege affordable)
Mental Health and Wellness
Behavior Choices (staying on the right track)
Academic Planning (choosing course of study inhigh school)
Academic Performance (study skills, getting andmaintaining good grades)
Social Skills (getting along with friends and peers)
Figure 39: Students: Please indicate how much time you would like to/should spend on the following topics with
your mentor: (n=1,125)
More Time We spend sufficient time on this Less Time

Take Stock in Children Summative Evaluation 2020-2021
69
4%
8%
9%
3%
8%
6%
8%
6%
3%
6%
63%
61%
74%
72%
51%
71%
79%
68%
77%
82%
33%
31%
17%
25%
41%
23%
13%
26%
20%
12%
0% 10% 20% 30% 40% 50% 60% 70% 80% 90%
Career Planning (helping to think about careerpaths and choices)
College or University Application (deciding whereto apply, etc.)
Navigating Family or Personal Issues
Stress Management and Problem Solving
Financial Planning (understanding how to makecollege affordable)
Mental Health and Wellness
Behavior Choices (staying on the right track)
Academic Planning (choosing course of study inhigh school)
Academic Performance (study skills, getting andmaintaining good grades)
Social Skills (getting along with friends and peers)
Figure 40: Mentors: Please indicate how much time you would like to spend on the following topics with your
mentee: (n=1,103)
More Time We spend sufficient time on this Less Time

Take Stock in Children Summative Evaluation 2020-2021
70
Parents also indicated that they felt their child needed the most support in the area of financial planning (FIGURE 41). On the survey, parents, like mentors, also expressed concern about the college application process. Several parents responded that they would like their students to receive more support with the college application process when asked how Take Stock could further support your student. The survey results highlight that Take Stock in Children students are the first generation in their families to pursue postsecondary education and, as such, parents were uncertain how to best support their children through the application process.
10%
8%
23%
15%
8%
27%
33%
15%
20%
29%
14%
15%
34%
21%
13%
31%
39%
21%
28%
35%
48%
45%
33%
46%
48%
30%
21%
48%
37%
27%
28%
32%
10%
18%
31%
12%
7%
16%
15%
9%
0% 10% 20% 30% 40% 50% 60%
Career Planning (helping to think about career pathsand choices)
College or University Application (deciding where toapply, etc.)
Navigating Family or Personal Issues
Stress Management and Problem Solving
Financial Planning (understanding how to makecollege affordable)
Mental Health and Wellness
Behavior Choices (staying on the right track)
Academic Planning (choosing course of study in highschool)
Academic Performance (study skills, getting andmaintaining good grades)
Social Skills (getting along with friends and peers)
Figure 41: Parents: Please indicate the level of support that your child needs in the following areas. If you don't feel that
your child needs help in an area, please select, N/A. (n=849)
A Lot of Support Some Support Not as Much Support N/A

Take Stock in Children Summative Evaluation 2020-2021
71
POSTSECONDARY ENROLLMENT & COMPLETION Take Stock in Children also collected data from all survey respondents regarding their perspectives on postsecondary readiness and expectations from students, parents, and mentors. On the survey, when students, parents, and mentors were asked about their belief in whether or not students will attend college or university, at least 90% of respondents in each group answered: “yes” (FIGURES 42–44).

Take Stock in Children Summative Evaluation 2020-2021
72

Take Stock in Children Summative Evaluation 2020-2021
73
All three groups surveyed also shared their perspective on the likelihood that students will complete postsecondary education. Again, over 90% of parents and students answered that they believe that students would complete. A total of 79% of mentors who responded to this question believed that their mentee would complete college; however, 20% were not sure, while only 1% believed that they would not (FIGURES 45 - 47). Respondents generally had a positive outlook on postsecondary completion and seemed confident that students would be successful.

Take Stock in Children Summative Evaluation 2020-2021
74

Take Stock in Children Summative Evaluation 2020-2021
75
To better understand how Take Stock students will navigate some of the common challenges that may arise as they work to complete postsecondary, all three survey groups were asked to select all of the challenges they believe would most likely prevent students from postsecondary completion. The results showed that the top two reasons for students and parents were related to college affordability. A total of 32% of mentors who responded to the question indicated that they did not believe any of the challenges listed would prevent their mentee from completing postsecondary. This response had the highest percentage for mentors compared to the other options (TABLES 28-30).
Table 28 – Student Take Stock in Children Postsecondary Enrollment & Completion Which of the following statements best describe how you feel about challenges that would prevent you from attending and completing college or university? (Check all that apply. If none apply, check “None of the above.”) (n=1125) Percent “I am worried that I won’t be able to afford college tuition.” 59% “I’m afraid that I won’t be able to get into the college of my choice because my grades aren’t good enough.” 25% “My family doesn’t believe that college is important.” .4% “I don’t think I will be able to get to classes because I don’t have a car or can’t take public transportation.” 13% “I’m not sure how I’ll pay for things like food and other basic expenses while I’m going to school.” 42% “I don’t think I’ll fit in with people or make friends in college.” 20% “I’m afraid that the coursework will be too difficult, and I won’t be able to get good grades.” 46% “I’m nervous about going to college because I’ve never been away from home for a long time before.” 22% “I’m worried about how my family will make enough money to pay bills if I am going to school instead of getting a job to help out.” 21% “If the current pandemic environment continues, I am worried about being successful in college or university should virtual learning continue.” 50% “If the current pandemic environment continues, I am concerned about my health should I attend college or university and interact on a campus environment.” 26% “If the pandemic environment continues, I am concerned the financial expense will outweigh the full academic benefit of attending college or university during this time.” 37% None of the above. 11%

Take Stock in Children Summative Evaluation 2020-2021
76
Table 29 – Parents Take Stock in Children Postsecondary Enrollment & Completion Which of the following statements best describe how you feel about challenges that would prevent your child from attending and completing college or university? (Check all that apply. If none apply, check “None of the above.”) (n=849) Percent “I am worried that we won’t be able to afford college tuition.” 65% “I’m afraid that my child won’t be able to get into the college of their choice because their grades aren’t good enough.” 13% “I’m not sure that college is important.” .5% “I don’t think my child will be able to get to classes because they don’t have a car or can’t take public transportation.” 8% “I’m not sure how my child will pay for things like food and other basic expenses while they going to school.” 36% “My child is worried they won’t fit in with people or make friends in college.” 9% “I’m afraid that the coursework will be too difficult, and my child won’t be able to get good grades.” 12% “I’m nervous about my child going to college because my child has never been away from home for a long time before.” 32% “I’m worried about how my family will make enough money to pay bills if my child is going to school instead of getting a job to help out.” 14% “If the current pandemic environment continues, I am worried about my child being successful in college or university should virtual learning continue.” 35% “If the current pandemic environment continues, I am concerned for my child’s health if they attend college or university and are interacting on a campus environment.” 26% “If the pandemic environment continues, I am concerned the financial expense will outweigh the full academic benefit of my child attending college or university during this time.” 26% None of the above. 15%
While respondents expressed confidence in the ability of students to complete their postsecondary education, all three groups expressed a desire for additional information and training on financial planning and scholarship information. This was a consistent theme amongst all three survey groups related to students being financially prepared and ready for college or university. However, many parents, students, and mentors also expressed appreciation for the workshops and activities Take Stock currently has to help prepare students. Still, the overall sense is that all three groups would like to see additional information and assistance in this area.

Take Stock in Children Summative Evaluation 2020-2021
77
Table 30 – Mentors Take Stock in Children Postsecondary Enrollment & Completion Which of the following statements best describe how you feel about challenges that would prevent your mentee from attending and completing college or university? (Check all that apply. If none apply, check “None of the above.”) (n=1,103) Percent “I am worried that my mentee won’t be able to afford college tuition.” 31% “I’m afraid that my mentee won’t be able to get into the college of their choice because their grades aren’t good enough.” 13% “My mentee’s family doesn’t believe that college is important.” 4% “I don’t think my mentee will be able to get to classes because they don’t have a car or can’t take public transportation.” 7% “I’m not sure how my mentee will pay for things like food and other basic expenses while they are going to school.” 30% “I’m concerned that my mentee doesn’t feel like they’ll fit in with people or make friends in college.” 8% “My mentee is afraid that the course work will be too difficult, and they won’t be able to get good grades.” 6% “I’m nervous about my mentee going to college because my mentee has never been away from home for a long time before.” 20% “I am concerned about how my mentee’s family will make enough money to pay bills if my mentee is going to school instead of getting a job to help out.” 18% “If the current pandemic environment continues, I am worried about my mentee being successful in college or university should virtual learning continue.” 28% “If the current pandemic environment continues, I am concerned for my mentee’s health if they attend college or university and are interacting on a campus environment.” 10% “If the pandemic environment continues, I am concerned the financial expense will outweigh the full academic benefit of my mentee attending college or university during this time.” 16% None of the above. 32%
As part of the survey, students and parents were asked to rank statements indicating a commitment to the value of a postsecondary education. Almost all of the statements received a “true” rating of over 80%. While most students indicated that they did not believe that their teachers would help them apply for college, students did indicate commitment from their parent and mentor regarding college attendance. Parent responses aligned with their students, indicating that they were committed to their student’s college attendance (FIGURES 48 & 49).

Take Stock in Children Summative Evaluation 2020-2021
78
91% 86%
48%
82%89%
9% 12%
38%
14% 10%0% 2% 14% 4% 1%0%
10%20%30%40%50%60%70%80%90%
100%
"Myparent(s)/familyare committed to
me attendingcollege."
"Myparent(s)/family
talk about meattendingcollege."
"My teachers willhelp me withapplying to
college."
"My mentor talksto me about
attendingcollege."
"Adults in my life(parent(s),
teacher(s), andmy mentor) value
a collegeeducation."
Figure 48: Students: Please indicate if you believe the following statements are true:
(n=1,125)
TRUE Somewhat True Not True
98% 97%
29%
77%
96%
2% 3%
44%
17% 3%0% 0% 27% 6% 1%0%
20%
40%
60%
80%
100%
120%
"I am committedto my childattendingcollege."
"I talk to my childabout attending
college."
"My child'steachers will helpwith applying to
college."
"My child'smentor talks with
my child aboutattendingcollege."
"I value a collegeeducation."
Figure 49: Parents: Please indicate if you believe the following statements are true:
(n=849)
TRUE Somewhat True Not True

Take Stock in Children Summative Evaluation 2020-2021
79
CAREER READINESS Throughout the survey and data collection process, the general level of understanding of future career options as well as activities to prepare students to successfully select and pursue a career was explored. Students were asked to select the career field in which they are most interested. Additionally, parents were asked to select the career field in which their student was interested. Mentor survey respondents were asked to comment on their current employment areas and the areas of career interest of their mentees. While mentor career fields are broad and diverse, many mentors are retired with the highest concentration of mentors working in education. Students, parents, and mentors report that students have the greatest interest in the field of health and medicine (FIGURES 50-53).
1%
1%
1%
1%
2%
2%
2%
5%
5%
7%
8%
10%
11%
15%
29%
0% 5% 10% 15% 20% 25% 30% 35%
COMMUNICATIONS
ENVIRONMENT
GOVERNMENT
SOCIAL IMPACT/COMMUNITY SERVICE
EDUCATION
TECHNOLOGY
ARCHITECTURE, PLANNING & ENVIRONMENTAL …
NOT SURE
SCIENCES - BIOLOGICAL AND PHYSICAL
LAW & PUBLIC POLICY
ARTS, CULTURE, & ENTERTAINMENT
ENGINEERING & COMPUTER SCIENCE
BUSINESS
OTHER
HEALTH & MEDICINE
Figure 50: Students: Please select the career field that MOST interests you. (n=1,125)

Take Stock in Children Summative Evaluation 2020-2021
80
1%1%
1%1%
1%2%3%
6%6%6%
8%9%
12%17%
26%
0% 5% 10% 15% 20% 25% 30%
GOVERNMENTENVIRONMENT
COMMUNICATIONSSOCIAL IMPACT/COMMUNITY SERVICE
ARCHITECTURE, PLANNING, & ENVIRONMENTAL …EDUCATION
TECHNOLOGYLAW & PUBLIC POLICY
ARTS, CULTURE, & ENTERTAINMENTSCIENCES - BIOLOGICAL AND PHYSICAL
BUSINESSENGINEERING & COMPUTER SCIENCE
OTHERNOT SURE
HEALTH & MEDICINE
Figure 51: Parents: What career field is your child interested in? (If you don't know, please select "Not
Sure" from the list.) (n=849)
1%1%
1%1%
2%3%3%3%
5%6%
8%9%
15%15%
27%
0% 5% 10% 15% 20% 25% 30%
GOVERNMENTENVIRONMENT
COMMUNICATIONSARCHITECTURE, PLANNING, & ENVIRONMENTAL …
SOCIAL IMPACT/COMMUNITY SERVICEEDUCATION
TECHNOLOGYARTS, CULTURE, & ENTERTAINMENT
SCIENCES - BIOLOGICAL AND PHYSICALLAW & PUBLIC POLICY
BUSINESSENGINEERING & COMPUTER SCIENCE
OTHERNOT SURE
HEALTH & MEDICINE
Figure 52: Mentors: What career field is your mentee interested in? (If you don't know, please select "Not
Sure" from the list.) (n=1,103)

Take Stock in Children Summative Evaluation 2020-2021
81
Students, parents, and mentors were also asked to share their knowledge about how attaining a postsecondary degree impacts their careers. Take Stock students, parents, and mentors believe that a postsecondary degree is necessary to pursue the student's career and secure a high-paying job. Survey results also indicated that students could benefit from a greater understating of the financial aid process (FIGURE 54-56).
1%
1%
1%
1%
1%
2%
2%
2%
3%
3%
3%
8%
9%
9%
22%
32%
0% 5% 10% 15% 20% 25% 30% 35%
ENVIRONMENT
ARCHITECTURE, PLANNING, & ENVIRONMENTAL …
ARTS, CULTURE, & ENTERTAINMENT
SCIENCES - BIOLOGICAL AND PHYSICAL
COMMUNICATIONS
TECHNOLOGY
ENGINEERING & COMPUTER SCIENCE
TECHNOLOGY
GOVERNMENT
SOCIAL IMPACT/COMMUNITY SERVICE
LAW & PUBLIC POLICY
HEALTH & MEDICINE
BUSINESS
OTHER
I AM RETIRED.
EDUCATION
Figure 53: Mentors: Please indicate your field of employment. (n=1,103)

Take Stock in Children Summative Evaluation 2020-2021
82
3%
10%
3%
2%
20%
11%
5%
3%
13%
1%
24%
28%
17%
17%
35%
29%
21%
21%
38%
9%
73%
62%
80%
81%
45%
60%
74%
76%
49%
90%
0% 10% 20% 30% 40% 50% 60% 70% 80% 90%100%
"I KNOW THE DIFFERENCE BETWEEN JOBS ATTAINABLE WITH A HIGH SCHOOL DIPLOMA AND
THOSE ONLY ATTAINABLE WITH A COLLEGE DEGREE."
"I BELIEVE A COLLEGE DEGREE IS NECESSARY FOR A HIGH PAYING JOB."
"I BELIEVE A COLLEGE DEGREE IS NECESSARY FOR THE CAREER FIELD I WANT TO PURSUE."
"I AM THINKING ABOUT THE CAREER PATH I WILL TAKE AFTER I COMPLETE COLLEGE OR
UNIVERSITY."
"I UNDERSTAND THE FINANCIAL AID PROCESS AND AM COMFORTABLE WITH APPLYING."
"I AM AWARE OF COLLEGE OPTIONS OUTSIDE OF MY COMMUNITY."
"I AM AWARE OF COLLEGE OPTIONS IN MY COMMUNITY.
"I AM FAMILIAR WITH THE GRADE POINT AVERAGE REQUIREMENTS FOR COLLEGE ACCEPTANCE."
"I UNDERSTAND THE COLLEGE APPLICATION PROCESS."
"I UNDERSTAND THE STATE OF FLORIDA GRADUATION REQUIREMENTS AND THE
GRADUATION REQUIREMENTS OF HE HIGH SCHOOL THAT I'M ATTENDING OR PLAN TO ATTEND."
Figure 54: Students: Please indicate if you agree or disagree with the following statements:
(n=1,125)
Agree Somewhat Agree Disagree

Take Stock in Children Summative Evaluation 2020-2021
83
10%
3%
2%
20%
11%
5%
3%
13%
1%
28%
17%
17%
35%
29%
21%
21%
38%
9%
62%
80%
81%
45%
60%
74%
76%
49%
90%
0% 10% 20% 30% 40% 50% 60% 70% 80% 90%100%
"I BELIEVE A COLLEGE DEGREE IS NECESSARY FOR MY CHILD TO OBTAIN A HIGH PAYING JOB."
"I BELIEVE A COLLEGE DEGREE IS NECESSARY FOR THE CAREER FIELD MY CHILD WANTS TO PURSUE."
"I HELP MY CHILD THINK ABOUT THE CAREER PATH THEY WILL TAKE AFTER COMPLETING
COLLEGE OR UNIVERSITY."
"MY CHILD UNDERSTANDS THE FINANCIAL AID PROCESS AND I AM COMFORTABLE WITH HELPING
THEM APPLY."
"MY CHILD IS AWARE OF COLLEGE OPTIONS OUTSIDE OF MY COMMUNITY."
"MY CHILD IS AWARE OF COLLEGE OPTIONS IN MY COMMUNITY.
"MY CHILD IS FAMILIAR WITH THE GRADE POINT AVERAGE REQUIREMENTS FOR COLLEGE
ACCEPTANCE."
"MY CHILD UNDERSTANDS THE COLLEGE APPLICATION PROCESS."
"MY CHILD UNDERSTANDS THE STATE OF FLORIDA GRADUATION REQUIREMENTS AND THE
GRADUATION REQUIREMENTS OF THE HIGH SCHOOL THEY ATTEND OR PLAN TO ATTEND."
Figure 55: Parents: Please indicate if you agree or disagree with the following statements:
(n=849)
Agree Somewhat Agree Disagree

Take Stock in Children Summative Evaluation 2020-2021
84
6%
3%
4%
17%
5%
3%
4%
4%
6%
28%
19%
25%
48%
32%
18%
25%
31%
29%
66%
78%
71%
35%
63%
79%
71%
65%
65%
0% 10% 20% 30% 40% 50% 60% 70% 80% 90%
"I BELIEVE A COLLEGE DEGREE IS NECESSARY FOR MY MENTEE TO OBTAIN A HIGH PAYING JOB."
"I BELIEVE A COLLEGE DEGREE IS NECESSARY FOR THE CAREER FIELD MY MENTEE WANTS TO
PURSUE."
"I HELP MY MENTEE THINK ABOUT THE CAREER PATH THEY WILL TAKE AFTER COMPLETING
COLLEGE OR UNIVERSITY."
"MY MENTEE UNDERSTANDS THE FINANCIAL AID PROCESS AND I AM COMFORTABLE WITH HELPING
MY MENTEE APPLY."
"I AM AWARE OF COLLEGE OPTIONS OUTSIDE OF MY COMMUNITY."
"I AM AWARE OF COLLEGE OPTIONS IN MY COMMUNITY.
"I AM FAMILIAR WITH THE GRADE POINT AVERAGE REQUIREMENTS FOR COLLEGE ACCEPTANCE."
"I UNDERSTAND THE COLLEGE APPLICATION PROCESS."
"I UNDERSTAND THE STATE OF FLORIDA GRADUATION REQUIREMENTS AND THE
REQUIREMENTS AT THE HIGH SCHOOL MY MENTEE ATTENDS OR PLANS TO ATTEND."
Figure 56 : Mentors: Please indicate if you agree or disagree with the following statements:
(n=1,103)
Agree Somewhat Agree Disagree

Take Stock in Children Summative Evaluation 2020-2021
85
COMMUNICATION & CONNECTEDNESS Take Stock in Children is interested in understanding how students, parents, and mentors connect with the Take Stock program and how they prefer to communicate with the program and each other. This understanding ensures Take Stock leadership has information to help make the best decisions about communication techniques and methods. As part of the survey, students, parents, and mentors were asked to share information about how connected they feel to the Take Stock program and their most preferred method of communication. A total of 94% of student survey respondents reported that they feel somewhat or very connected to local Take Stock in Children staff. Parents reported feeling somewhat or very connected at a rate of 88%, while mentors reported feeling somewhat or very connected at a rate of 95% (FIGURES 57–59 ). The overall consensus among respondents was that the local Take Stock in Children program offices are very responsive and involved. One parent respondent stated, “My child has had a great relationship with the staff of Take Stock. They have given him the proper guidance needed to be successful in school and to be prepared for college.” Mentors reported feeling incredibly connected to their local Take Stock staff and reported that staff is supportive and responsive to students and mentors. One respondent stated, “Whenever I have a concern, and I call the Take Stock office, I always get a response then, or they return my call in a timely manner.” Connectedness to Take Stock was felt among student respondents as well. As expressed by one student, “It is very easy to communicate with my local Take Stock in Children program staff if I have any questions, comments, or concerns.”
46%
48%
6%
Figure 57: Students: How connected do you feel to your local Take Stock in Children program staff?
(n=1,125)
Very Connected
SomewhatConnected
Not Connected

Take Stock in Children Summative Evaluation 2020-2021
86
46%
42%
12%
Figure 58: Parents: How connected do you feel to your local Take Stock in Children program staff?
(n=849)
Very Connected
SomewhatConnected
Not Connected
64%
31%
5%
Figure 59: Mentors: How connected do you feel to your local Take Stock in Children program staff?
(n=1,103)
Very Connected
SomewhatConnected
Not Connected

Take Stock in Children Summative Evaluation 2020-2021
87
One reason students, parents, and mentors felt more connected to Take Stock is the level of training and support they received. All three survey groups were asked to reflect on the support, training, and materials offered by Take Stock in Children, and the majority of respondents to this question reported high levels of support. Students and parents both indicated high levels of support received. Mentors were also asked to assess support, training, and materials on several different items. Mentors expressed the highest levels of support with the regular communication provided by Take Stock and knowing who to contact if their mentee has a problem. One mentor stated, “the quality and communication skills of TSIC staff has been excellent.” Another responded, “my thanks for all the support I receive. Let's carry on together!” Of mentors surveyed, 99% of mentors indicated that they would highly recommend mentoring with Take Stock to others. (FIGURE 60-62).
33%38%
23%
5% 1%0%5%
10%15%20%25%30%35%40%
A great deal A lot A moderateamount
A little None at all
Figure 60: Students: Please indicate the level of support you received through College Readiness trainings and materials offered by Take Stock in
Children. (n=1,125)
31%
22%
28%
13%
6%0%
5%
10%
15%
20%
25%
30%
35%
A great deal A lot A moderateamount
A little None at all
Figure 61: Parents: Please indicate the level of support your child received through College
Readiness trainings and materials offered by the Take Stock in Children program. (n=849)

Take Stock in Children Summative Evaluation 2020-2021
88
1%
12%
13%
8%
1%
1%
1%
2%
6%
48%
21%
36%
5%
7%
11%
20%
93%
40%
66%
56%
94%
92%
88%
78%
0% 10% 20% 30% 40% 50% 60% 70% 80% 90% 100%
"I WOULD HIGHLY RECOMMEND MENTORING WITH TAKE STOCK IN CHILDREN TO OTHERS."
"I FIND THE MONTHLY MENTOR LUNCH AND LEARN TRAININGS HELPFUL."
"IT IS EASY TO LOG MY MENTOR SESSIONS THROUGH THE TAKE STOCK APP AND I FEEL COMFORTABLE
DOING IT."
"THE MENTOR TOOLKIT PROVIDED BY TAKE STOCK IN CHILDREN HELPS ME PLAN MY MENTOR
SESSIONS."
"I KNOW WHO TO CONTACT IF I AM HAVING A PROBLEM WITH MY MENTEE."
"I RECEIVE REGULAR UPDATES AND COMMUNICATION FROM TAKE STOCK IN CHILDREN."
"I FEEL SUPPORTED BY MY LOCAL TAKE STOCK IN CHILDREN OFFICE AND STAFF."
"THE INITIAL MENTOR TRAINING OFFERED BY TAKE STOCK IN CHILDREN AS A NEW MENTOR WAS
HELPFUL AND EFFECTIVE."
Figure 62: Mentors: Please indicate the level of support you received through mentor training and materials
offered by the Take Stock in Children program? (n=1,103)
Agree Somewhat Agree Disagree

Take Stock in Children Summative Evaluation 2020-2021
89
As noted above, determining how students, parents, and mentors prefer to communicate is critical to maintaining effective programming, communication, and connectedness. On the survey, students, parents, and mentors reported that they prefer to receive communication from Take Stock first via email and second via text messages (FIGURES 63 - 65).
56%
4%
1%
39%
0%
Figure 63: Students: How do you prefer to receive communication from Take Stock in Children?
(n=1,125)
Phone
Letter
TextMessageSocial Media
77%
4%
2%
17% 0%
Figure 64: Parents: How do you prefer to receive communication from Take Stock in Children?
(n=849)
Phone
Letter
TextMessageSocial Media

Take Stock in Children Summative Evaluation 2020-2021
90
One issue that can sometimes prevent efficient and effective online or remote communication for children in poverty is a lack of access to the internet and electronic devices in the home. The pandemic created an increased need for virtual learning and support services, which created a necessity for students to have internet access and connectivity. To understand if and how this access may have impacted Take stock students, the survey measured if students, parents, and mentors have a computer or tablet and internet access at home (FIGURES 66 & 67). Over 93% of student, parent, and mentor survey respondents indicated that they have a computer/tablet at home, and 98% indicated that they have internet access at home.
91%
1%
0%8%
0%
Figure 65: Mentors: How do you prefer to receive communication from Take Stock in Children?
(n=1,103)
Phone
Letter
TextMessageSocial Media

Take Stock in Children Summative Evaluation 2020-2021
91
93%
7%
95%
5%
99%
1%0%
10%
20%
30%
40%
50%
60%
70%
80%
90%
100%
Yes No
Figure 66: Students (n=1,125)/Parents (n=849)/Mentors (n-1,103): Do you have a
computer or tablet at home?
Students Parents Mentors
98%
2%
98%
2%
99%
1%0%
10%
20%
30%
40%
50%
60%
70%
80%
90%
100%
Yes No
Figure 67: Students (n=1,125)/Parents (n=849)/Mentors (n-1,103): Do you have internet
connection/access at home?
Students Parents Mentors

Take Stock in Children Summative Evaluation 2020-2021
92
In addition to understanding Take Stock students, parents, and mentors' access to the internet and a computer/tablet, the survey also investigated access to a smartphone and mobile device technology. This information is helpful to Take Stock as the program has developed a Take Stock App that includes texting, video chatting, and session scheduling/reporting and continues to pursue innovations that rely on smartphone technology and applications (FIGURE 68). According to the survey, 98% or more of students, parents, and mentors use a smartphone or mobile device daily.
IMPACT OF COVID 19 PANDEMIC At the onset of the COVID-19 pandemic, the Take Stock in Children program quickly pivoted a 25-year in-person in-school service model to incorporate virtual service methodologies to ensure continued support to students during one of education’s most challenging times. Students, parents, and mentors were asked to assess each virtual service model enhancement as part of this year’s survey. The majority of students, parents, and mentors indicated that each virtual enhancement was effective to very effective. All three survey groups expressed a preference that Take Stock should move forward in the new school year with a hybrid student support service model, combining both in-person and virtual service opportunities (FIGURES 69-73).
98%
2%
99%
1%
99%
1%0%
10%20%30%40%50%60%70%80%90%
100%
Yes No
Figure 68: Students (n=1,125)/Parents (n=849)/Mentors (n-1,103): Do you have a
smartphone or mobile device that you use on a daily basis?
Students Parents Mentors

Take Stock in Children Summative Evaluation 2020-2021
93
3%
3%
10%
10%
3%
3%
3%
5%
6%
16%
16%
6%
8%
5%
21%
26%
29%
30%
23%
28%
18%
36%
38%
27%
24%
39%
38%
40%
35%
27%
18%
20%
29%
23%
34%
0% 5% 10% 15% 20% 25% 30% 35% 40% 45%
ONLINE/E-SIGNATURE PLATFORM
ONLINE RESOURCES (TRAINING VIDEOS, WEBINARS)
TAKE STOCK APP VIDEO CHAT
TAKE STOCK APP TEXT CHAT
VIRTUAL COLLEGE SUCCESS COACHING SESSIONS
VIRTUAL COLLEGE READINESS WORKSHOPS
VIRTUAL MENTOR SESSIONS VIA VIRTUAL PLATFORM (ZOOM, TEAMS, WEBEX, ETC.)
Figure 69: Students: Due to COVID-19, Take Stock has adapted its model to include additional virtual service options. How would you rate the effectiveness of each virtual enhancement alternative to in-person student
support services listed below.
VERY EFFECTIVE EFFECTIVE SOMEWHAT EFFECTIVE
NOT-SO-EFFECTIVE NOT-AT-ALL EFFECTIVE

Take Stock in Children Summative Evaluation 2020-2021
94
3%
5%
6%
7%
5%
4%
2%
4%
7%
8%
9%
8%
8%
7%
15%
24%
23%
24%
26%
24%
18%
40%
36%
37%
35%
34%
36%
39%
38%
28%
26%
25%
27%
28%
34%
0% 5% 10% 15% 20% 25% 30% 35% 40% 45%
ONLINE/E-SIGNATURE PLATFORM
ONLINE RESOURCES (TRAINING VIDEOS, WEBINARS)
TAKE STOCK APP VIDEO CHAT
TAKE STOCK APP TEXT CHAT
VIRTUAL COLLEGE SUCCESS COACHING SESSIONS
VIRTUAL COLLEGE READINESS WORKSHOPS
VIRTUAL MENTOR SESSIONS VIA VIRTUAL PLATFORM (ZOOM, TEAMS, WEBEX, ETC.)
Figure 70: Parents: Due to COVID-19, Take Stock has adapted its model to include additional virtual service options. How would you rate the effectiveness of each virtual enhancement alternative to in-person student
support services listed below.
VERY EFFECTIVE EFFECTIVE SOMEWHAT EFFECTIVE
NOT-SO-EFFECTIVE NOT-AT-ALL EFFECTIVE

Take Stock in Children Summative Evaluation 2020-2021
95
5%
2%
12%
12%
2%
3%
1%
4%
5%
17%
18%
7%
7%
7%
17%
27%
24%
25%
30%
31%
21%
39%
43%
28%
28%
43%
46%
41%
35%
23%
19%
17%
18%
13%
30%
0% 5% 10% 15% 20% 25% 30% 35% 40% 45% 50%
ONLINE/E-SIGNATURE PLATFORM
ONLINE RESOURCES (TRAINING VIDEOS, WEBINARS)
TAKE STOCK APP VIDEO CHAT
TAKE STOCK APP TEXT CHAT
VIRTUAL COLLEGE SUCCESS COACHING SESSIONS
VIRTUAL COLLEGE READINESS WORKSHOPS
VIRTUAL MENTOR SESSIONS VIA VIRTUAL PLATFORM (ZOOM, TEAMS, WEBEX, ETC.)
Figure 71: Mentors: Due to COVID-19, Take Stock has adapted its model to include additional virtual service options. How would you rate the effectiveness of each virtual enhancement alternative to in-person student
support services listed below.
VERY EFFECTIVE EFFECTIVE SOMEWHAT EFFECTIVE
NOT-SO-EFFECTIVE NOT-AT-ALL EFFECTIVE

Take Stock in Children Summative Evaluation 2020-2021
96
35%
8%
57%
37%
7%
56%
100% IN-PERSON SERVICES 100% VIRTUAL SERVICES HYBRID MODEL OF BOTH IN-PERSON AND VIRTUAL SERVICES
Figure 72: Students (n=1,125) and Parents (n=849): When the COVID-19 pandemic passes, my preference
would be for the Take Stock program to conduct student support:
Students Parents
40%
4%
56%
100% IN-PERSON SERVICES 100% VIRTUAL SERVICES HYBRID MODEL OF BOTH IN-PERSON AND VIRTUAL SERVICES
Figure 73: Mentors (n=1,103): When the COVID-19 pandemic passes, my preference would be for the
Take Stock program to conduct mentoring:
Mentors
Take Stock in Children Summative Evaluation 2020-2021
97
Observations: Evaluation Questions Take Stock in Children reviewed the data presented above and compared it to the data on program execution in 2020-2021. A performance assessment along with the associated evaluation questions (included in Appendix A) are presented below. Evaluation Question 1 – What is the level of program participation? Metric: Student enrollment data and demographic information as presented in Tables 3-7. Assessment: By the end of the 2020-2021 grant year, there were 8,198 students enrolled in Take Stock in Children. New student recruitment challenges have been noted due to postponements at the start of the school year and increased online learning limiting access to students at their school site due to the COIVD-19 pandemic. New strategies and technologies have been introduced to transition new student recruitment from in-person to online. While annual enrollment has declined, Take Stock in Children has exceeded the end-of-year enrollment requirement of 8,000 students for the 2020-2021 grant year. Evaluation Question 2 – What is the program impact on key indicators of high school completion and college readiness? Metric: Student grade point average, attendance rate, and graduation rate from the STAR database report. Assessment: Take Stock in Children exceeded all three metrics. A total of 95% of students achieved a GPA of at least 2.0 for Semester 1, and 95% of students maintained at least a 2.0 for Semester 2. A total of 92% of students had fewer than 17 unexcused absences for the 2020-2021 school year. Finally, 97% of seniors completed the Take Stock in Children program and graduated from high school on time.

Take Stock in Children Summative Evaluation 2020-2021
98
Evaluation Question 3 – Is Take Stock in Children’s model being implemented with fidelity? Metric: Meeting at least 85% of grant objectives by the end of the grant year. Assessment: The data presented in this evaluation indicated that Take Stock in Children has implemented model fidelity based on the key grant objectives listed in Table 31.
Table 31- Analysis of Model Fidelity Based on Key Grant Objectives
Deliverable End of Year Objective Model Fidelity Achieved
1. Student Enrollment
By the end of the year, TSIC will serve at least 8,000 students. Yes
2. Mentor Match Mentor-to-student match rate will average at least 90% statewide. Yes 3. Recruitment Activities
A total of 4 multi-regional mentor recruitment activities will be conducted (one per quarter).
Yes
4. Mentor Recruitment and Training
A minimum of 1,400 new mentors will be recruited, screened, and trained by the end of the grant year.
Yes
5. Mentoring Sessions (Returning Matches)
Students who have been matched with a mentor for the entire grant year will receive an average of 15 mentor sessions by the end of the school year.
Yes
6. Mentoring Sessions (New Matches)
Students with new mentor matches will conduct an average of 2 mentor sessions per each month.
Yes
7. College Success Coaches Visits
Visits will average 1 per semester for grades 6-10, and 2 per semester for grades 11-12
Yes
8. College Readiness Workshops
A total of 4 college readiness workshops will be conducted at each site per year (including 2 sessions focused on college readiness and financial aid procedures for seniors), plus a new student orientation where applicable.
Yes
9. Professional Development
A total of 15 professional development opportunities will be provided for staff by the end of the year with five (5) in Q1, three (3) in Q2, four (4) in Q3, and three (3) in Q4.
Yes
10. Student Academic Performance
A total of 90% of students will improve or maintain a G.P.A. at or above 2.0.
Yes
11. Student School Attendance
A total of 90% of students will improve or maintain satisfactory school attendance.
Yes
12. Graduation Rate A total of 90% of seniors will successfully complete the Take Stock in Children program and graduate from high school.
Yes

Take Stock in Children Summative Evaluation 2020-2021
99
Evaluation Question 4 – How can Take Stock in Children improve the effectiveness and efficiency of implementation? Metric: Data on model fidelity and key indicators of student impact as detailed in Table 1 and the Program Data section. Assessment: The data presented in this evaluation indicates that Take Stock in Children has exceeded all grant deliverable targets for the 2020-2021 year. This evaluation also assesses the Take Stock in Children support model in light of current research in the field of mentoring and postsecondary readiness. This evaluation finds that Take Stock in Children employs several research-based model elements that produce positive student outcomes. Evaluation Question 5: How has the COIVD-19 pandemic affected program outcomes, and how has implementing virtual service enhancements to the Take Stock model mitigated any negative impact? Metric: Meeting at least 85% of grant objectives by the year-end and customer feedback provided through annual survey data. Assessment: Data analyzed as part of this Summative evaluation indicates that Take Stock in Children exceeded program deliverables by the end of the grant year (as detailed in Table 1). Based on the data collected, it appears that Take Stock has been able to successfully mitigate much of the negative impact of the COVID-19 pandemic by implementing virtual service enhancements. The program impact noted thus far has been outlined below. Take Stock also reported customer feedback on its virtual student service support enhancements as conveyed through student, parent, and mentor surveys conducted in March 2021 and reported as part of the Student, Parent, and Mentor Feedback section of this Summative Evaluation. Impacts of the COVID-19 Pandemic on Take Stock program metrics:
• Mentor Recruitment: Take Stock in Children quickly pivoted to provide virtual training and student support services and provided all the materials electronically to each affiliate program. Mentor, student, and staff training materials were conducted using virtual platforms. In addition, supplementary resources were made available to local affiliate programs via the Take Stock in Children App or website to ensure these essential items were received and utilized correctly. As new resources were introduced and implemented, the number of mentors recruited increased to meet annual deliverable requirements.
• Mentor Training: Many of the initial mentor training dates were postponed due to
school start delays due to the COVID-19 pandemic, and as a result, many mentors were unable to secure training, clearance, and access to their mentees during Quarter 1 in particular. Despite these roadblocks, Take Stock in Children not only met but also exceeded the deliverable target for this metric. Virtual mentor training

Take Stock in Children Summative Evaluation 2020-2021
100
has been implemented as and where needed, and background clearance procedures resumed as normal throughout most areas of the state.
• New Student Enrollment: New student recruitment and enrollment were challenged
by school start delays and remote learning, making it increasingly difficult to reach those potential eligible Take Stock students in need. Despite these variables, Take Stock in Children met the end-of-year objective for this deliverable. New strategies and technologies were introduced to transition new student recruitment from in-person to online, resulting in increased student recruitment in the later part of the school year.
• Mentor Sessions: Prior to the onset of the COVID-19 pandemic, Take Stock in
Children developed the Take Stock App to provide mentors and students with ease and consistency of mentor session scheduling and reporting. The Take Stock State Office quickly enhanced the Take Stock App to include secure virtual mentoring capabilities, allowing mentors and mentees to maintain their connection while in-person mentoring opportunities remained limited. Despite the challenges, Take Stock in Children not only met the mentor session deliverable but exceeded the deliverable target for all quarters producing more mentoring sessions than in previous grant years.
• College Readiness Workshops: Due to the COIVD-19 pandemic, Take Stock has
enhanced opportunities for virtual learning through live-online workshops and recorded video content. Utilizing new content delivery methodology, Take Stock in Children exceeded grant workshop requirements for the 2020-2021 grant year.
Recommendations This evaluation finds that Take Stock in Children has exceeded all program requirements of the 2020-2021 grant year based on the data provided. It is recommended that the Take Stock in Children organization and its program affiliates continue to implement the program with the same level of fidelity and quality that it has throughout this grant year. This is no small feat considering the continued challenges brought on by the COVID-19 pandemic and the unprecedented disruptions for students, parents, mentors, and education professionals to the academic year and daily life. Take Stock in Children provided continued support services through a hybrid model of in-person and virtual support services to all Take Stock in Children students across the network. As the organization moves into the 2021-2022 academic year, Take Stock in Children will continue to consider how the benefits of innovations used and learned during the pandemic can be expanded to help the organization grow or provide more effective and efficient service. The following are programmatic recommendations for Take Stock in Children to consider as they work to continue the successful implementation of the program.

Take Stock in Children Summative Evaluation 2020-2021
101
1. Continue to offer and enhance virtual service opportunities in the areas of student recruitment, mentoring sessions, college coaching, mentor training, professional development, and student college readiness workshops.
2. Consider expansion of support and training for students, mentors, and parents in the area of financial preparedness for college/university.
3. Continue to monitor academic indicators to ensure that students meet all requirements and receive the necessary support to maintain and improve their progress.
4. Continue to initiate, develop, and sustain partnerships to leverage the investment made by the state of Florida to help more students connect with Take Stock in Children support.
5. Continue to invest in technology and data platform advancements to facilitate organizational growth or provide more effective and efficient service.
While Take Stock in Children continues to exceed grant objectives and requirements, there are some areas where additional capacity could be built and programmatic improvements made as detailed in the recommendations above.
Summative Evaluation Conclusion Take Stock in Children exceeded grant deliverables despite challenges faced due to the COVID-19 pandemic. The Take Stock in Children program continues to be implemented with fidelity. The transition to virtual student support services has played a critical role in maintaining high-level services to students and mentors. It also appears to have been well-received throughout the Take Stock network based on analysis, including affiliate feedback and student, parent, and mentor survey results included in this Summative Evaluation Report.

Take Stock in Children Summative Evaluation 2020-2021
102
Guiding Research Guiding Research: Effects of COVID-19 Pandemic on Low-Income Students There were already many inequalities to quality education between students in urban and rural areas and students from families with higher and lower socioeconomic status. Even before the COVID-19 pandemic, first-generation students were 71% more likely than continuing generation students to drop out between their first and second year of postsecondary study (Atherton, 2014; Ishitani, 2003). COVID-19 furthered this divide. Early data indicates first-generation, low-income students were disproportionately affected by the unprecedented global health crisis (Goldrick-Rab et al.;, 2020). Complicating this discouraging trend, even more, completion of the FAFSA (Free Application for Federal Student Aid) is down (DeBaun, 2020). In the early months of 2020, school closures were widely instituted across the United States as a containment measure for the coronavirus disease 2019 (COVID-19). These school closures increased the inequalities between students in rural areas and from disadvantaged families that lacked access to technology, internet access, and educational resources. As the closures have lingered, the negative impact on education and postsecondary attainment has continued to grow. Though all students have been adversely affected by this disruption somehow, it has become exceedingly clear that pre-existing inequalities in educational attainment have been spotlighted and exacerbated by the pandemic (Bott-Hansson and Tonkin). Research shows that the Free Application for Federal Student Aid (FAFSA) completion rate is positively associated with college enrollment. The FAFSA completion rate is also an important indicator of postsecondary early access and success (Reeves and Guyot). Historically students of color, students from low-income backgrounds, and those who are first in their families to attend college experience disproportionately lower postsecondary success rates. Low-income students are 29% less likely to enroll in postsecondary education directly after high school than students from high-income families (Ma, Jennifer, et al.). Data released from the National College Attainment Network (NCAN) on November 27, 2020, indicates that FAFSA rates have fallen by 16.23% compared to FAFSA completion during the same timeframe in 2019. The most significant impact has been on low-income students and minority students, with completion rates currently down by 20% in Title 1 Schools, 22.3% in high minority high schools, and 22.4% in small towns and rural areas (DeBaun). The National Student Clearinghouse Research Center reports that 1 in 5 students from the high school class of 2020 who should have enrolled in college this fall did not. That number is 1 in 3 for students from low-income high schools (NSCRC-NCAN 12-2020 Report). This is the first graduating class impacted by COVID-19, the resulting economic downturn, and a time of exacerbated inequities in health, education, and opportunity.

Take Stock in Children Summative Evaluation 2020-2021
103
Guiding Research: Youth Mentoring, College Readiness, and College Completion This section presents highlights from the research conducted in youth mentoring, college readiness, college success, and completion. Specifically, a current and comprehensive perspective was applied to the evaluation. The evaluation team carefully examined significant studies released in recent years, given the changing landscape and dynamics. The information presented in this report builds upon the research conducted for previous evaluation reports. It is inclusive of information presented in past years and new information discovered for 2020–2021. Take Stock in Children utilizes this information to ensure that its programming reflects the most current trends in the body of research with Youth Mentoring, College Readiness, and College Success & Completion. For an expanded discussion of these points, please refer to Appendix C of this report. Youth Mentoring Positive Impacts – At-risk youth participating in mentoring typically experience the following positive impacts, as confirmed by current research:
• Improvement in self-esteem; • Better parental and peer relationships; • Greater connectedness to school; • Improved academic performance (including grade point average and test scores); • Reductions in substance use, violence, and other risky behaviors; and • Mitigation of the impact of certain risk factors, such as having an incarcerated parent
or being a foster youth.
Match Qualities – Mentor-mentee matches that are consistent, close, and enduring have positive impacts. Youth are most positively affected when their mentor makes them feel they matter and are important. Challenges for Mentoring Programs – The most significant vulnerability for the effectiveness of programs mentoring at-risk youth is premature match closure, defined as an abrupt end to a previously successful mentor-mentee pairing. Race, Culture, and Ethnicity – In matches where the mentor and mentee are from different races, ethnicities, or cultures, there is some concern about whether the mentor will empathize with their mentee's ethnic and racial identity. College Readiness Positive Impacts on College Readiness – At-risk youth who are mentored report setting high educational goals more frequently than their peers without mentors. Mentoring is a highly effective practice for increasing college readiness in youth, particularly for students who do not have college readiness support from family members or school staff. Also, mentors help students set career goals.

Take Stock in Children Summative Evaluation 2020-2021
104
Role of Secondary Schools – Secondary institutions can create conditions that foster college readiness in students, such as aligning their curriculum with college coursework and encouraging critical thinking to help in decision-making during college.
Students with Diverse Learning Needs and in Foster Care – The current research on students with diverse learning needs indicates low levels of college readiness among this population. Additionally, research suggests that youth in foster care are interested in having opportunities in high school to prepare them for addressing the logistics of transitioning into higher education. College Success and Completion Barriers to Students in Poverty – Research shows that the most significant barriers to higher education faced by students in poverty include:
• Financial pressures; • Lack of adequate student supports; • Non-traditional experiences (e.g., parental incarceration); and • Lower rates of school engagement.
Supports for Students in Poverty – Research suggests that the following supports are most effective for encouraging postsecondary college completion for students in poverty. This information is essential for programs working with high school students to understand the obstacles students face when they reach college and university.
• Mentoring in both high school and college; • Automated and personalized text messaging to provide students with behavioral
“nudges;.” • Activities to improve confidence and self-efficacy for completing college-level work
and an area of study; • Intensive college advising; • Appropriate college matching; • Improved academic preparation for college-level work; • Additional financial aid for college; • Increased transfer rates from two- to four-year colleges; • Easing the transition to college by creating an early connection to college and
information on what students should expect when they attend; • Encouraging engagement on the college campus; and • Promoting entry for young and re-entry for working adults.
Role of Postsecondary Institutions – Postsecondary institutions can create guided pathways that make the college experience more transparent and accessible. Like the Take Stock in Children mentors in high school, the college advisor plays a critical role in ensuring that students’ needs are met. Students must prepare for the role the advisor will play when they arrive at college or university.

Take Stock in Children Summative Evaluation 2020-2021
105
Appendix A – Evaluation Plan Table
Evaluation Question Metrics & Sources1 Method of Analysis Comparison Data and Reference Points2 1. What is the level of program participation?
Student enrollment in Take Stock in Children and participation in mentoring and coaching services with College Success Coaches; and College Success Workshops, as well as demographic data from STAR database report
• Frequencies for county/region and state-level enrollment and demographic data.
Evaluation results as reported in the 2020-2021 Take Stock in Children Formative and Summative Evaluation reports.
2. What is the program impact on key indicators of high school completion and college readiness?
Student grade point average, attendance rate, and graduation rate from STAR database report.
• Arithmetic means of state and county/region level average rates.
• Frequencies and modes to detect outlying data and overall distribution.
• Comparing averages at the county/region, state, and national levels.
Evaluation results as reported in the 2020-2021 Take Stock in Children Formative and Summative evaluation reports. Data on district, statewide, and national rates.
3. Is Take Stock in Children’s model being implemented with fidelity?
Mentor recruitment, participation, and training; mentor match rates; College Success Coach workshops and student meetings data; progress toward program sustainability through program partnerships, and professional development data from STAR database report.
• Frequencies for county/region and state level mentor recruitment activities, program participation, training, and match rates, College Success Coach workshop and student meeting data, and professional development data.
Evaluation results as reported in the 2020-2021 Take Stock in Children Formative and Summative evaluation reports. Meeting at least 85% of state of Florida grant objectives, specifically: a minimum of 1,400 new mentors will be recruited and trained; 90% mentor match rate; students who have been matched with a mentor for the entire grant year will receive an average of 15 or more mentor sessions by the end of the school year; students with new mentor matches will receive an average of 2 mentor sessions per month; College success coach visits (1 per semester grades 6-10, 2 per semester grades 11-12); College readiness workshops conducted in each site (4 per year); and evidence of program partnership development, partner maintenance, and contributions. Recommendations for all objectives where progress is not being achieved or is not likely to be achieved by the end of the program year (June 30).
4. How can Take Stock in Children improve the effectiveness and the efficiency of implementation?
Interviews with (respectively) students, mentors, and parents and Take Stock in Children survey data.
• Content analysis to identify literal and reflexive patterns and relationships
Evaluation results as reported in the 2020-2021 Take Stock in Children Formative and Summative evaluation reports. Review of national research on college readiness, mentoring, and college success landscape and best practices.
5. How has the COVID pandemic affected program outcomes, and how has implementing virtual service enhancements to the Take Stock model mitigated any negative impact?
Interviews with (respectively) students, mentors, and parents and Take Stock in Children survey data.
• Content analysis to identify literal and reflexive patterns and relationships
Evaluation results as reported in the 2020-2021 Take Stock in Children Formative and Summative evaluation reports. Review of national research on college readiness, mentoring, and college success landscape and best practices on how the COVID-19 pandemic has impacted low-income student success. 3
1 STAR database reports will be pulled by the Take Stock in Children State Office staff as indicated in the implementation section of the evaluation plan. STAR data on student GPA and attendance is entered by Take Stock in Children affiliate staff on a semi-annual basis in March and June of the given year. 2 All state of Florida and national data will be pulled from the state’s website as indicated in the implementation section of the evaluation plan. 3 A Review of innovations and research in the mentoring and college readiness fields will be conducted to provide a reference point of Take Stock in Children program practices nationally and the impact of the COVID-19 pandemic on low-income students.

Take Stock in Children Summative Evaluation 2020-2021
106
Appendix B – Take Stock in Children Logic Model
Needs Inputs Activities Desired Results Short-term Long-term
• Academic Readiness
• Connection to career options
• Funding to afford higher education
• Metacognitive skills for success in education and professional careers
• Support and guidance in navigating secondary completion and accessing higher education
• Public and Private Funding for Florida Prepaid Scholarships
• Volunteer mentors
• College Success Coaches
• Community-based affiliated organizations across Florida
• Parent/student contract committing to remain drug-free and to prepare for and attend college
• Purchase of Florida Prepaid scholarships
• Academic support
• Development of metacognitive skills
• Development of the value of, aspiration to attend, and skills needed for success in higher education
• Early intervention to keep students on track for college
• Career exploration and pathway development
• Increased College Readiness (academic, social, and emotional)
• Graduation from High School
• Entry into Higher Education
• Completion of a college or university program
• Entry into a well-paying career
• A poverty-free future

Take Stock in Children Summative Evaluation 2020-2021
107
Appendix C – Further Research: Mentoring, College Readiness, and College Success
Introduction The research was conducted on the latest advances in youth mentoring, college readiness, and postsecondary success to benchmark the overall evaluation and a context for Take Stock in Children’s work. This external research builds on research collected in previous Take Stock in Children statewide evaluations and adds studies recently conducted to ensure currency in perspective.
Due to the comprehensive nature of Take Stock in Children’s model, the research is divided into three categories: Mentoring (specifically of at-risk youth); College Readiness (the possession of the skills necessary to enter postsecondary and
complete postsecondary-level work); and College Success (the capability to complete postsecondary and earn a credential or
degree).
MENTORING The literature demonstrating the positive impact of mentoring on at-risk youth is extensive. Research shows that the mentoring of at-risk youth typically leads to the following:
• Improved self-esteem; • Improved parental and peer relationships; • Greater connectedness to school; • Improved academic performance (including grades and test scores)4; and • Reduced substance use, violence, and other risky behaviors.5
Furthermore, research has shown that mentoring can help mitigate certain risk factors' impact on students' capacity to achieve. For example, recent studies have shown that quality mentoring practice has the power to improve the likelihood that youth with incarcerated parents achieve positive outcomes.6
Mentoring is a particularly impactful intervention for increasing college readiness in youth, particularly those who do not receive college readiness support or preparation via other means, such as family members or school guidance staff.7
It is important to note that studies have consistently shown that “dosage” is a factor. That is, the longer the mentorship, the stronger the outcomes.8

Take Stock in Children Summative Evaluation 2020-2021
108
A 2017 assessment of Project K Youth Development Program (which showed positive development outcomes)9 and another on Friends of the Children10 (which showed decreased child behavior issues and higher emotional resiliency) confirmed these outcomes. Further, ample evidence exists that identifies the elements of a highly effective mentoring program. One such study, The Effectiveness of Mentoring Programs for Youth, a meta-analytic review including 55 evaluations, identified and summarized some key factors of successful mentoring programs:
• Monitoring program implementation • Providing structured activities for mentors and youth to engage in • Setting firm requirements around the expected frequency of mentor-mentee
contact • Providing ongoing training for mentors • Recruiting mentors with experience in a helping role or profession • Selecting an appropriate setting for the mentoring program • Encouraging parental support and involvement11
Fernandes-Alcantara’s even more recent meta-analysis of research on mentoring programs highlights the need for strong infrastructure to support relationships, such as good recruiting with an eye on the traits of a successful mentor and clear expectations on the part of both mentor and student. When mentoring relationships are close, consistent, and enduring, they lead to positive outcomes for youth, including the following:
• Improved educational outcomes • Reduction in some negative behaviors, including some criminal behavior • Improved social and emotional development12
There have been few longitudinal studies to determine whether these outcomes are sustained over time, presenting future research opportunities. Furthermore, a “mentoring gap” exists for some special populations, including older youth, homeless and runaway youth, and youth in foster care and the juvenile justice system.13
A “mentor gap” refers to the challenge of matching mentors with students who have specific challenges and need specific support from their mentor. Research on natural mentorships — informal mentors outside of a young person’s relatives — sheds light on the qualities of a successful formal mentorship as well. Kelly and Lee found that when young people feel they matter — in other words, that they are valuable and important to others — then delinquency and dangerous behaviors decrease. Also, the need for female mentors as positive role models was apparent.14
The greatest vulnerability for the effectiveness of programs that mentor at-risk youth is premature match closure, defined as the mentor match ending abruptly. This may occur for many reasons, including but not limited to the following: a poor mentor/mentee fit (e.g., they do not like each other), relocation, the mentor feeling disengaged or intimidated by the

Take Stock in Children Summative Evaluation 2020-2021
109
challenge, or parental concern about the mentor. As even the most recent studies show, premature match closure continues to be the most significant factor hampering successful outcomes.15 The research on the specific reasons why matches end prematurely is emerging. Still, one 2018 study showed a strong link to mentee criminality, engagement in risky behavior, and problems with self-regulation — all behaviors outside the scope of most mentoring programs, even those for at-risk students — due to the need for specialized supports.16 A 2018 study showed that premature match closure is particularly prevalent for mentees in foster care.17
The cutting edge of mentoring research assesses the impact of race, culture, and ethnicity on mentoring. Current studies suggest that while matches of the same race, ethnicity, or culture can prove beneficial, the races of the mentors and mentees can differ and still be effective. The critical variable for efficacy is the mentor’s capacity for empathy with the ethnic and racial identity of their mentee.18
COLLEGE READINESS College readiness is a highly desired outcome for mentoring at-risk youth. This characteristic is often considered a gateway to better-paying jobs (and a life out of poverty), both now and into the foreseeable future.19 Many definitions of college readiness are prevalent; however, most experts define college readiness as the skills that contribute to a student’s capacity to:
• Graduate from high school. • Take high school courses that postsecondary institutions require to acquire the
necessary skills. • Demonstrate basic literacy skills.20
Specific to at-risk youth, the report Keeping College Within Reach: Sharing Best Practices for Serving Low-Income and First-Generation Students highlights research to demonstrate that low-income and first-generation students also need the following to prepare for the postsecondary experience successfully:
• Cognitive strategies such as intellectual openness, inquisitiveness, analytical skills, the constructing of well-reasoned arguments, evaluation skills, the formulating of hypotheses, and problem-solving;
• Content knowledge in core academic subjects; • Academic behaviors such as self-awareness, self-monitoring, and self-control; and • Contextual skills and awareness such as understanding how colleges function
and navigating postsecondary processes such as registration, financial aid, etc.21 Emergent research finds two specific practices highly predictive of four-year college enrollment rates: high teacher expectations during the secondary school experience and access to a college preparatory curriculum. These themes point to strategies that secondary schools can employ to further prepare students for college enrollment.22 David Conley writes

Take Stock in Children Summative Evaluation 2020-2021
110
that secondary schools can help increase the number of college-ready students by employing four strategies:
• Align the high school curriculum and instruction with college expectations of knowledge, skills, and habits of mind.
• Develop high-quality syllabi in all up-to-date courses, model communication within and between departments, and are aligned with college expectations.
• Implement senior seminars to help keep students engaged throughout their entire senior year.
• Add missing content to high school courses, such as a targeted focus on writing, problem-solving, critical thinking, and interpreting of sources.23
Mentoring has been shown to positively impact building college readiness in at-risk youth. For example, one study found the following: “Young people who had mentors report setting higher educational goals and are more likely to attend postsecondary than those without mentors. High expectations and higher educational attainment are key factors in life success.”24 More recent research has revealed that at-risk students who receive mentoring develop an increased capacity for setting career goals, which has a synergistic effect on the chances of completing higher education.25 Additionally, experts in the field of college readiness are examining the relationship between college readiness and students with particular risk factors. For example, the research on students with disabilities cites low levels of college readiness among this population.26
POSTSECONDARY SUCCESS & COMPLETION This section outlines the challenges that students face when they enter postsecondary. This information is critical for programs serving high school students to consider as they prepare them for the postsecondary transition.
Numerous studies have shown that students in poverty have a significantly higher chance of not completing a postsecondary education program than better-resourced peers.27 More specifically, research has identified the most significant barriers faced by students in poverty:
• Financial pressures: Many lower-income students need to work while also attending school. This is also common for first-generation college students, a higher percentage of whom left college without credentials because they could not afford to keep going to school, compared to students with at least one parent with a bachelor’s degree or higher.28 Low-income students who received “no strings attached” need-based grant aid are more likely than their peers to stay continuously enrolled in postsecondary, graduate within six years, and accumulate credits at a quicker pace.29

Take Stock in Children Summative Evaluation 2020-2021
111
• Lack of adequate student supports: Students living in poverty are less likely to have family members with direct relevant knowledge of how to traverse the postsecondary-related processes and make optimal postsecondary-related decisions.30
• Non-traditional experiences: Lower-income students are more likely to have multiple obligations outside postsecondary, such as family and work, which limit their full participation in the postsecondary experience.31
• Less engagement with postsecondary life: Lower-income students are less likely to be engaged in the academic and social experiences that foster success in postsecondary, such as studying in groups, interacting with faculty and other students, participating in extracurricular activities, and using support services. They are also more likely to live and work off-campus and to take classes part-time while working full-time, which limit the amount of time they spend on campus.32
Conversely, research has revealed the supports most likely to ensure students in poverty succeed in higher education:
• Having a mentor in both postsecondary and high school allowed students to cope more effectively with the stresses associated with higher education.33 Research has shown that mentored students experience higher motivation throughout the school year. Mentored students also present with lower levels of depression and stress during the school year than students who are not mentored.34
• Automated and personalized text messaging to remind students about pre-postsecondary tasks and processes and connect them with counselor-based support.35
• Evidence suggests that intensive postsecondary advising results in increases in overall four-year enrollment and persistence through the first two years of postsecondary.36
• Appropriate postsecondary matching and an understanding of the full range of higher education options available can be remedied by intensive college counseling to improve informed decision-making. Intensive college advising substantially guides students toward the four-year colleges that best suit each student’s individualized needs and interests.37
High school behaviors and successes as early as 9th grade are predictive of postsecondary outcomes for all students. Even more powerfully than test scores do, 9th grade GPA predicts the following: 11th grade GPA (which, in turn, plays a role in college admission), high school graduation, college enrollment, and one-year college retention.38 This cycle is also connected with school attendance, as strong attendance is correlated with strong grades.39 The report Moving Beyond Access, College Success for Low-Income, First-Generation Students makes a number of recommendations to improve postsecondary completion and success for low-income and first-generation students. Echoing the research on the importance of early grades, many of these recommendations emphasize needs that should be addressed pre-college enrollment:

Take Stock in Children Summative Evaluation 2020-2021
112
• Improve academic preparation for postsecondary: Taking a rigorous high school
curriculum and including advanced mathematics greatly increases the chances that low-income and first-generation students will attend postsecondary, particularly four-year institutions. Early indicators such as “college-ready” score levels on 11th-grade tests (or earlier) can help identify students who need additional support in high school. Colleges and high schools can work together to develop content for 12th-grade students not yet college-ready.40
• Provide additional financial aid for postsecondary: With adequate resources, low-income, first-generation students can better afford to enroll in four-year institutions or attend postsecondary full-time, both of which increase their chances of earning four-year degrees.41
• Increase transfer rates to four-year colleges: The reality is that many low-income,
first-generation students have to begin their studies in the two-year sector. Thus, a greater emphasis on increasing transfer rates from two- to four-year colleges is crucial.42
• Ease the transition to postsecondary: Low-income, first-generation students need
considerable academic and social, and emotional support as they transition to postsecondary.43 Recent research shows that students who are exposed to campus life and/or college-level coursework during their high school years are more likely to feel comfortable navigating the postsecondary environment, both physically and academically.44
• Encourage engagement on the college campus: Colleges must remove the
barriers (primarily financial) that prevent low-income, first-generation students from fully engaging in the experiences associated with success.45
• Promote entry for young adults and reentry for working adults: To meet economic
competitiveness needs, young working adults need support to get back on the postsecondary track after dropping out or failing to enter immediately following high school graduation.46
Some recent studies focus on guided pathways toward postsecondary success, specifically at community colleges. Guided pathways map student end goals by defining meta-majors – broad career-focused fields – along with sequential course guides, milestones, field-specific math requirements, certificates embedded in the degree pathway, and clear connections for career and transfer opportunities.47 These clearly defined curricular pathways, coupled with integrated student advising, can lead to student success. Guided pathways “encourage thoughtful major selection and program planning by each student early in a student’s academic career and thus rely on the ability of each student’s assigned academic advisor to help each student make well-informed decisions.”48 Early adopters of guided pathways are beginning to see positive outcomes in early indicators such as the number of college credits

Take Stock in Children Summative Evaluation 2020-2021
113
earned in the first year, completion of first-year gateway math and English classes, and the number of courses in a program completed in the first year. This approach accounts for the dynamic nature of decision-making; making a choice about something like a college major happens over time, not all at once, thus heightening the importance of the student-advisor relationship and understanding how a student uses available resources. One key characteristic to consider is the student’s tolerance for ambiguity. Those with high levels of ambiguity tolerance will use many resources available to them; advisors can guide them to think critically about their choices. Others with lower levels of ambiguity tolerance will often look to others to make decisions for them; they benefit from advising that helps them grow confidence and self-efficacy. 49
The latest financial aid research indicates that additional financial aid supports postsecondary completion by increasing the number of credits attempted each semester (since students are less constrained by price) and the amount of time worked outside of school.50 Another recent study in Texas led to the same conclusions, finding levels of aid correlated with credit load, work, and completion.51 Recent postsecondary success studies have focused on the impact financial aid has on degree completion and postsecondary success, specifically among Hispanic students. As the number of Hispanic students in colleges and universities increases, there have been many studies on the factors specifically affecting Hispanic college completion. Hispanics are much less likely than other racial and cultural groups to attend a four-year school and complete their program. Some recent studies have focused on how Hispanic students select colleges, especially programs designed to mitigate potential under-matching. For example, one study that examined efforts to recruit Hispanic students to four-year colleges and universities with few existing Hispanic students found that Hispanic students needed additional financial aid to attend school away from home but had no issue adjusting to the culture of unfamiliar parts of the nation or a four-year program.52 Other studies have focused on specific success factors for Hispanic students. This research has revealed the influence of academic experience; demographic, personal, and family characteristics; as well as cultural factors in Hispanic postsecondary success.53
RESEARCH CONCLUSION The research presented above frames the context of the Take Stock in Children model. It also offers evidence regarding the validity of the model’s elements and their relevance to the fields of youth mentoring, college readiness, and postsecondary completion.
In the field of mentoring, research confirms that at-risk youth experience several benefits when working with a mentor. Also, the extent of the impact of mentoring is directly correlated to the dosage amount (i.e., how long a relationship has been established and how often the mentor and mentee meet). Research also indicates that the greatest threat to successful and impactful mentoring programs is premature match closure or the abrupt discontinuation of the mentor-mentee relationship. The implication of this finding on mentoring programs like Take Stock in Children is that mentor engagement and retention

Take Stock in Children Summative Evaluation 2020-2021
114
are extremely important to long-term student success and the overall impact of the model. Mentor training to help students feel important can also lead to more positive outcomes. In addition to having basic academic and literacy skills, students who are “college-ready” also need to have developed positive behaviors, solid cognitive strategies, and an understanding and awareness of life in an institution of higher education. As indicated above, recent research places additional focus on the importance of developing these skills for specific groups of students, such as those in foster care or those with learning disabilities. As college readiness programs like Take Stock in Children continue to evolve their programming in response to new research, it is critical that their services prepare students according to their individual needs to transition to life in higher education. Secondary schools can also employ deliberate strategies to align with college courses and identify students early who may need additional support to be college-ready. Finally, research confirms that students in poverty face significant barriers to becoming college-ready and completing higher education. However, it also indicates that many highly effective interventions can be pursued while students are in high school to combat these challenges. As noted above, these interventions primarily focus on early preparation measures, initiating student engagement with postsecondary environments, and increasing access to financial supports. Additionally, research shows that engaging in college success and completion approaches that are culturally sensitive can increase the likelihood that students from underrepresented groups will fully access the supports available to them. Colleges can also design guided pathways to help foster students’ decision-making processes and simplify the process to secure a credential and/or transfer to a four-year institution. College readiness programs like Take Stock in Children can nurture students’ self-efficacy and confidence, so they are better prepared for college. In conclusion, the fields of youth mentoring, college readiness, and college success and completion are continually evolving. Additional research builds the field’s understanding of the specific impacts that interventions can have on students with various characteristics. As a result, youth mentoring and college readiness programs like Take Stock in Children can use this new knowledge to ensure that their models and services are having the most positive impact on the students they serve.

Take Stock in Children Summative Evaluation 2020-2021
115
Appendix C – Further Research: Mentoring, College Readiness, and College Success Bibliography/ References 4 Campbell, S. L. (2019). Capitalizing on Achievement: A Critical Examination of School-Based Mentoring Programs and Student Achievement. In Mentoring Students of Color (pp. 13-35). Brill Sense. 5 T. Cavell, D. DuBois, M. Karcher, T. Keller, and J. Rhodes. (2009). Policy Brief: Strengthening Mentoring Opportunities for At‐Risk Youth. National Mentoring Project. 6 Hagler, M. A., Zwiebach, L., Rhodes, J. E., & Rappaport, C. D. (2019). Mentoring Interventions for Children of Incarcerated Parents. In Handbook on Children
with Incarcerated Parents (pp. 205-217). Springer, Cham. 7 Carrell, S., & Sacerdote, B. (2018). College Mentoring Supports College Enrollment and Persistence. 8 M. Bruce and J. Bridgeland. (2014). The Mentoring Effect: Young People’s Perspectives on the Outcomes and Availability of Mentoring. Civic Enterprises. 9 C.M. Chapman, K.L. Deane, N. Harré, M.G. Courtney, and J. Moore. (2017). Engagement and Mentor Support as Drivers of Social Development in the Project
K Youth Development Program. Journal of Youth and Adolescence, 46(3), 644-655. 10 J.M. Eddy, C.R. Martinez, Jr, J.B. Grossman, J.J. Cearley, D. Herrera, A.C. Wheeler, J.S. Rempel, D. Foney, J.M. Gau, B.O. Burraston, T.W. Harachi, K.P. Haggerty, and J.R. Seeley. (2017). A Randomized Controlled Trial of a Long-Term Professional Mentoring Program for Children at Risk: Outcomes Across the First 5 Years. Prevention Science May 3, 2017. 11 D.L. DuBois, et al. (2002) Effectiveness of Mentoring Programs for Youth: A Meta-Analytic Review. American Journal of Community Psychology Volume 30 pp. 157-197. 12 A. Fernandes-Alcantara (2018). Vulnerable Youth: Federal Mentoring Programs and Issues (CRS Report No. RL34306). Retrieved from Congressional Research Service website: https://fas.org/sgp/crs/misc/RL34306.pdf. 13 Ibid. 14 M.S. Kelly, and M.J. Lee (2018). When Natural Mentors Matter: Unraveling the Relationship with Delinquency. Children and Youth Services Review, vol. 91,
pp 319-328. 15 D.L. DuBois and T.E. Keller (2017). Investigation of the Integration of Supports for Youth Thriving into a Community-Based Mentoring Program. Child
Development, vol. 88, issue 5 pp 1480-1491. 16 J.B. Kupersmidt, K.N Stump, R.L. Stelter, J.E. Rhodes, (2017). Predictors of Premature Match Closure in Youth Mentoring Relationships. American Journal
of Community Psychology Volume 59fpp 25-35. 17 R.L. Stelter, J.B. Kupersmidt, K.N. Stump (2018). Supporting Mentoring Relationships of Youth in Foster Care: Do Program Practices Predict Match Length?
American Journal of Community Psychology, Volume 61, Issue 3-4, pp 398-410. 18 J.S. Peifer, E.C. Lawrence, J.L. Williams, J. Leyton-Armakan (2016). The Culture of Mentoring: Ethnocultural Empathy and Ethnic Identity in Mentoring for Minority Girls. Cultural Diversity and Ethnic Minority Psychology, Volume 22, 19 J. Ma and P. Matea (2016). Education Pays 2016. The College Board. 20 J.P. Greene and G. Forster. Public High School Graduation and College Readiness Rates in the United States. New York, NY: Center for Civic Innovation at
the Manhattan Institute, 2003. No. 3. 21 A. Duke-Benfield (2014). Keeping College Within Reach: Sharing Best Practices for Serving Low-Income and First-Generation Students. Recommendations for Reauthorization of the Higher Education Act. 22 V. Coca K. Black (2017). Working paper: The Significance of High School Practices for Students’ Four-Year College Enrollment. New York City: The New
York City Partnership for College Readiness and Success. 23 D. Conley (2007). The Challenge of College Readiness. Educational Leadership. Volume 64, Issue 7, pp 23-29. 24 T Cavell, D. DuBois, M. Karcher, T. Keller, and J. Rhodes (2009). 25 W.S. Lau, X.C. Zhou, S.M. Lai (2017). The Development of Mentoring-Relationship Quality, Future-Planning Style, and Career Goal-Setting Among
Adolescents from a Disadvantaged Background. PsyCh Journal, Volume 6, issue 1 pp. 76-82. 26 J.R. Mahler and Kathrine Slate. Differences in College Readiness Rates in Two School Years for Students in Special Education. Global Journal of Human-Social Science Research, March 2017. 27 Gregory C Wolniak & Rekoutis Panagiotis. Factors Associated with College Coping Among High Achieving Scholarship Recipients from Adverse
Backgrounds. New York, NY: Teachers College Record, 2016. 28 J. Redford and K.M. Hoyer (2017). First-Generation and Continuing-Generation College Students: A Comparison of High School and Post-Secondary Experiences. American Institutes for Research. September 2017. 29 A. Duke-Benfield (2014). Keeping College Within Reach: Sharing Best Practices for Serving Low-Income and First-Generation Students. Recommendations for Reauthorization of the Higher Education Act. 30 J. Engle and V. Tinto (2008). Moving Beyond Access: College Success for Low-Income, First-Generation Students. Washington, DC: The Pell Institute for the Study of Opportunity in Higher Education. 31 Ibid. 32 Ibid. 33 Gregory C. Wolniak, v118 n1. 34 J.S. Phinney, Campos, et al. Processes and Outcomes of a Mentoring Program for Latino College Freshmen. Journal of Social Issues 67(3) (2011). 599-621. Print. 35 Castleman, Benjamin L., and Lindsay C. Page. “Summer Nudging: Can Personalized Text Messages and Peer Mentor Outreach Increase College Going Among Low-Income High School Graduates?.” Center for Education Policy and Workforce Competitiveness Working Paper 9 (2013). 36 Benjamin Castleman and Joshua Goodman, Intensive College Counseling and the College Enrollment Choices of Low-Income Students (June 1, 2014). HKS Working Paper No. RWP14-031.

Take Stock in Children Summative Evaluation 2020-2021
116
37 Ibid. 38 J.Q. Easton, E. Johnson, & L. Sartain (2017). The Predictive Power of Ninth-Grade GPA. Chicago, IL: University of Chicago Consortium on School Research. 39 The To & Through Project. Data and Insights. Retrieved from https://toandthrough.uchicago.edu/data-insights, October 6, 2018. 40 S. Gilkey (2017). Post-Secondary Success Starts in High School. Chronicles of Higher Education. Volume 63. Issue 31. 41 Castleman and Goodman. 42 Ibid. 43 Castleman and Goodman. 44 D’Angelo, P. (2019). Early College Coursework and College Readiness: Evidence from HMTCA. 45 Castleman and Goodman. 46 Ibid. 47 D. Jenkins, H. Lahr, J. Fink, and E. Ganga (2018). What Are We Learning About Guided Pathways? Columbia University: Community College Resource
Center. April 2018. 48 E. Kopko, M. Ramos, and M. Karp (2018). Why Do Some Community College Students Use Institutional Resources Differently Than Others in Program
Selection and Planning? (CCRC Working Paper No. 101) Columbia University: Community College Resource Center. 49 Ibid. 50 J.T. Denning (2017). Born Under a Lucky Star: Financial Aid, College Completion, Labor Supply, and Credit Constraints. Upjohn Institute working paper. 51 M.U. Villarreal (2017). Making Ends Meet: Student Grant Aid, Cost Saving Strategies, College Completion, and Labor Supply, a working paper, University of
Texas, Austin. 52 J. Smith, M. Hurwitz, O. Gurantz (2017). Education Next, Volume 17, Issue 3. 53 J.P. Murphy and S.A. Murphy (2017) Get Ready, Get In, Get Through: Factors That Influence Latino College Student Success. Journal of Latinos in Education. February 2017, pp 1-15.
Copyright © 2022 FDOKUMEN