Working Paper No. 341: Economic globalisation, inequality
28
Organisation for Economic Co-operation and Development DEV/DOC/WKP(2017)7 Unclassified English - Or. English 30 November 2017 Development Centre Working Paper No. 341: Economic globalisation, inequality and the role of social protection By Andreas Bergh, Alexandre Kolev and Caroline Tassot Authorised for publication by Mario Pezzini, Director of the OECD Development Centre. JT03423930 This document, as well as any data and map included herein, are without prejudice to the status of or sovereignty over any territory, to the delimitation of international frontiers and boundaries and to the name of any territory, city or area.
-
Upload
khangminh22 -
Category
Documents
-
view
1 -
download
0
Transcript of Working Paper No. 341: Economic globalisation, inequality

Organisation for Economic Co-operation and Development
DEV/DOC/WKP(2017)7
Unclassified English - Or. English
30 November 2017
Development Centre
Working Paper No. 341: Economic globalisation, inequality and the role of social
protection
By Andreas Bergh, Alexandre Kolev and Caroline Tassot
Authorised for publication by Mario Pezzini, Director of the OECD Development Centre.
JT03423930
This document, as well as any data and map included herein, are without prejudice to the status of or sovereignty over any territory, to the
delimitation of international frontiers and boundaries and to the name of any territory, city or area.

2 │ DEV/DOC/WKP(2017)7
Working Paper No. 341: Economic globalisation, inequality and the role of social protection Unclassified
DEVELOPMENT CENTRE
WORKING PAPERS
This series of working papers is intended to disseminate the Development Centre’s
research findings rapidly among specialists in the field concerned. These papers are
generally available in the original English or French, with a summary in the other
language.
OECD Working Papers should not be reported as representing the official views of the OECD or
of its member countries. The opinions expressed and arguments employed are those of the
authors.
This document, as well as any data and map included herein, are without prejudice to the status of
or sovereignty over any territory, to the delimitation of international frontiers and boundaries and
to the name of any territory, city or area.
Working Papers describe preliminary results or research in progress by the author(s) and are
published to stimulate discussion on a broad range of issues on which the OECD works.
Comments on Working Papers are welcomed, and may be sent to the OECD Development
Centre, 2 rue André Pascal, 75775 PARIS CEDEX 16, France; or to [email protected].
Documents may be downloaded from: www.oecd.org/dev/wp.
©OECD (2017)
Applications for permission to reproduce or translate all or part of this document should
be sent to [email protected].
CENTRE DE DÉVELOPPEMENT
DOCUMENTS DE TRAVAIL
Cette série de documents de travail a pour but de diffuser rapidement auprès des
spécialistes dans les domaines concernés les résultats des travaux de recherche du Centre
de développement. Ces documents ne sont disponibles que dans leur langue originale,
anglais ou français ; un résumé du document est rédigé dans l’autre langue.
Les documents de travail de l’OCDE ne doivent pas être présentés comme exprimant les vues
officielles de l’OCDE ou de ses pays membres. Les opinions exprimées et les arguments
employés sont ceux des auteurs.
Ce document, ainsi que les données et cartes qu'il peut comprendre, sont sans préjudice du statut
de tout territoire, de la souveraineté s’exerçant sur ce dernier, du tracé des frontières et limites
internationales, et du nom de tout territoire, ville ou région.
Les documents de travail exposent des résultats préliminaires ou des travaux de recherche en
cours menés par l’auteur/les auteurs et sont publiés pour stimuler le débat sur un large éventail de
questions sur lesquelles l’OCDE travaille. Les commentaires sur les documents de travail sont
bienvenus et peuvent être adressés au Centre de développement de l’OCDE, 2 rue André Pascal,
75775 PARIS CEDEX 16, France; ou à [email protected]. Les documents peuvent être
téléchargés à partir de: www.oecd.org/dev/wp.
©OCDE (2017)
Les demandes d'autorisation de reproduction ou de traduction de tout ou partie de ce
document devront être envoyées à [email protected].

DEV/DOC/WKP(2017)7 │ 3
Working Paper No. 341: Economic globalisation, inequality and the role of social protection
Unclassified
Table of contents
Acknowledgements ................................................................................................................................ 4
Preface .................................................................................................................................................... 5
Résumé ................................................................................................................................................... 6
Abstract .................................................................................................................................................. 6
1. Introduction ....................................................................................................................................... 7
2. Income inequality and social protection: Definitions and data challenges ................................ 10
3. Econometric specification ............................................................................................................... 16
4. Results............................................................................................................................................... 17
5. Concluding discussion ..................................................................................................................... 19
Annex A. ............................................................................................................................................... 20
References ............................................................................................................................................ 25
Other titles in the series ...................................................................................................................... 28

4 │ DEV/DOC/WKP(2017)7
Working Paper No. 341: Economic globalisation, inequality and the role of social protection Unclassified
Acknowledgements
This paper was prepared by the Social Cohesion Unit of the OECD Development Centre
as part of the European Union Social Protection Systems Programme.
The authors1 would like to thank for their comments on previous versions of this paper
Mario Pezzini, Naoko Ueda, Michael Forster, Marco Mira D’Ercole, Fabrice Murtin and
Ana Llena Nozal.
The European Union Social Protection Systems Programme is co-financed by the
European Union, the OECD and the government of Finland.
1 Andreas Bergh (Lund University School of Economics and Management and Research Institute of Industrial
Economics Stockholm), Alexandre Kolev (OECD Development Centre) and Caroline Tassot (OECD
Development Centre).

DEV/DOC/WKP(2017)7 │ 5
Working Paper No. 341: Economic globalisation, inequality and the role of social protection
Unclassified
Preface
Economic globalisation – the integration of the world economy through the liberalisation
of trade and finance – is arguably one of the most important trends shaping the world
today, one that is impacting human well-being in different ways across the world and
income groups.
The importance of looking at the role of social protection in the inequality-globalisation
nexus follows directly from the consideration that when economic globalisation creates
both winners and losers, the demand for social protection may increase, leading to a rise
in public social spending that could mitigate the impact of economic globalisation on
inequality. Testing such hypotheses requires research aimed at identifying how economic
globalisation and social protection relates to inequality across countries.
This paper uses different measures of inequality to shed light on the empirical association
between within-country income inequality, economic globalisation, and social protection.
While examining the links between income inequality on the one hand, and economic
globalisation and social protection spending on the other hand, the paper further assesses
the sensitivity of the results to the use of different income inequality data.
Overall, the evidence produced in this analysis confirms previous findings that economic
globalisation, especially economic flows, is associated with higher income inequality, and
that social protection expenditure is negatively associated with inequality. While the
sample is too small to appropriately capture an interaction between social protection and
globalisation and thus to draw conclusions on the potential cushioning effect of social
protection expenditure in the globalisation-inequality nexus, descriptive findings suggest
that among countries with high social protection expenditure, the more globalised
countries display lower levels of inequality.
This paper was produced as part of the research component of the EU Social Protection
Systems Programme implemented by the OECD Development Centre and the
government of Finland’s National Institute for Health and Welfare (THL). We hope that
it will enrich the evidence-based knowledge on the role of social protection in promoting
inclusive growth.
Mario Pezzini
Director, OECD Development Centre
and Special Advisor to the OECD Secretary-General on Development

6 │ DEV/DOC/WKP(2017)7
Working Paper No. 341: Economic globalisation, inequality and the role of social protection Unclassified
Résumé
Cette analyse examine les liens entre la mondialisation économique, les dépenses en
protection sociale, et les taux d’inégalités de revenus au sein des pays. Nous mesurons
cette relation en utilisant les données de l’Étude sur les Revenus de Luxembourg (LIS) et
la base de données des inégalités de revenus standardisée (SWIID). Les résultats basés
sur la LIS confirment une relation positive entre la mondialisation économique, en
particuliers les flux commerciaux, et le niveau d’inégalités économiques. La protection
sociale est au contraire associée à un niveau plus faible des inégalités.
Mots clés : Globalisation, Inégalités de Revenus, Protection Sociale
Classification JEL : D63, F61, H53.
Abstract
This paper examines the link between economic globalisation, social protection
expenditure, and within-country income inequality. We examine the relationship using
income inequality data from both the Luxembourg Income Study (LIS) and the
Standardized World Income Inequality Database (SWIID). The results based on the LIS
data confirm previous findings that economic globalisation, especially economic flows,
associates with higher income inequality, and that social protection expenditure are
negatively associated with inequality.
Keywords: D63, F61, H53.
JEL classification: Globalisation, Income Inequality, Social Protection

DEV/DOC/WKP(2017)7 │ 7
Working Paper No. 341: Economic globalisation, inequality and the role of social protection
Unclassified
1. Introduction
Globalisation – the process by which different economies and societies become more
closely integrated – is arguably one of the most important trends shaping the world today.
As indicated in a recent survey by Potrafke (2015), globalisation has been linked to a
number of desirable social and economic outcomes, such as spurring economic growth,
promoting gender equality and improving human rights, without some of the sometimes
feared downsides. Potrafke concludes that globalisation has not eroded welfare state
activities or labour market institutions. A study of OECD countries found that neither
rising trade integration nor financial openness had a significant impact on wage
inequality, but rather that institutional and technological changes did (OECD, 2011).
Several papers, however, have found that economic globalisation – liberalisation of trade
rules and increasing trade flows – associates with higher within-country income
inequality (e.g. see Dreher and Gaston, 2008b; Bergh and Nilsson, 2010; Martinez-
Vazquez et al., 2012). In OECD countries for instance, globalisation may widen
inequality due to offshoring and labour income inequality, including a boosting of top
incomes (OECD, 2012). The link between economic globalisation and income inequality
is however not robust across studies (for a thorough review of evidence see Foerster and
Toth, 2015). In a recent survey, Marsh (2016) concludes that “thus far, we cannot argue
that the globalisation of trade and finance is a major cause of inequality because, though
the most common finding is that globalisation increases inequality, it is almost as
common for studies to find that it has no net effect”. The pattern thus suggests an over-
arching research question: Why is economic globalisation found to be associated with
higher within-country income inequality in several studies, whereas no significant effect
is found in other studies?
A possible explanation is variation between studies when it comes to time period, sample
size and data sources. But there are also more fundamental reasons that could account for
the variation in the empirical results, suggesting heterogeneity in the association between
globalisation and income inequality. First, standard trade theory suggests that the effect of
economic globalisation on the within-country income distribution is likely to depend on
the level of development, i.e. to vary between developed and developing countries.
Second, the so-called compensation hypothesis (Katzenstein, 1985) is often invoked to
suggest that some countries develop social insurance institutions to mitigate the adverse
distributional effects of globalisation, suggesting that the association between
globalisation and inequality is weaker in countries with higher social protection
expenditure. In other words, there may be a cushioning effect in the sense that social
expenditure acts as a cushion that dampens the inequality increasing effect of
globalisation.
The importance of the level of development follows the standard analysis of trade
liberalisation and inequality in the Heckscher-Ohlin trade model, for which Kremer
(2006) and Kremer and Maskin (2003) provide accessible descriptions and overviews.
Simply put, the model suggests that developed countries with a high skilled to unskilled
workers ratio will see the wages of the skilled workers fall when trade opens with
developing countries with low skilled to unskilled workers ratios. Conversely, unskilled
workers would see their wage rise in developing countries when opening trade with
developed countries. This equalisation of factors will lead to a decrease in inequality in
developing countries but rising inequality in developed countries.
8 │ DEV/DOC/WKP(2017)7
Working Paper No. 341: Economic globalisation, inequality and the role of social protection Unclassified
The importance of social protection follows most directly from the definition of social
protection expenditure: as globalisation creates both winners and losers, countries with
higher social protection expenditure should see smaller income differences induced by
globalisation. Joumard et al. (2012) for example find cash transfers to reduce inequality
by about 19% in OECD countries in the late 2000s, although noting important variations
in the level of redistributive impact reflecting difference in their size and progressivity.
The direct link between social protection expenditure and globalisation is analysed in the
literature on the so-called compensation hypothesis, which asserts that globalisation raises
(externally generated) economic instability, thereby increasing public demand for social
protection. The compensation hypothesis has been used to explain the positive correlation
between economic openness and social security institutions, and is often attributed to
Rodrik (1998) or Katzenstein (1985). Cameron (1978) explained the positive association
between trade exposure and the size of government by suggesting that small open
economies faced incentives to shelter their economies from the competitive risks of the
international economy. A similar reasoning appears also in Lindbeck (1975).
Several links in the compensation hypothesis have been questioned on both empirical and
theoretical grounds. Garrett (2001) notes that the correlation between openness and social
spending holds in levels, but not for changes. Down (2007) points to a more fundamental
theoretical problem with the compensation hypothesis, in that economic theory suggests
that expansion of international trade should give rise to risk diversification, and thus
should promote (rather than reduce) stability. The openness-volatility link is questioned
on similar theoretical grounds also by Kim (2007). Both Kim and Down present empirical
evidence against the compensation hypothesis, suggesting that more open economies are
in fact not more volatile. More recently, Dallinger (2014) shows that the more open the
economy of a country is, the lower the demand for social security of its citizens – thus,
according to the compensation hypothesis, the correlation should have the opposite sign.
This paper uses data on social expenditure to shed light on the empirical association
between economic globalisation, income inequality and social protection.
In summary, we test the following two hypotheses:
H1: Economic globalisation is associated with higher within-country inequality of
net income.
H2: Social protection expenditure is associated with lower within-country
inequality of net income.
Similar work has been conducted by Rudra (2004), though using a sample of countries
and using Gini coefficients that were not comparable across countries and time (as
discussed further below). Moreover, Rudra (2004) focused on economic flows (i.e. trade
and investment), while we examine separately the effects of economic regulations and of
economic flows. The main differences between Rudra’s study and this paper are
summarised in Table 1.
DEV/DOC/WKP(2017)7 │ 9
Working Paper No. 341: Economic globalisation, inequality and the role of social protection
Unclassified
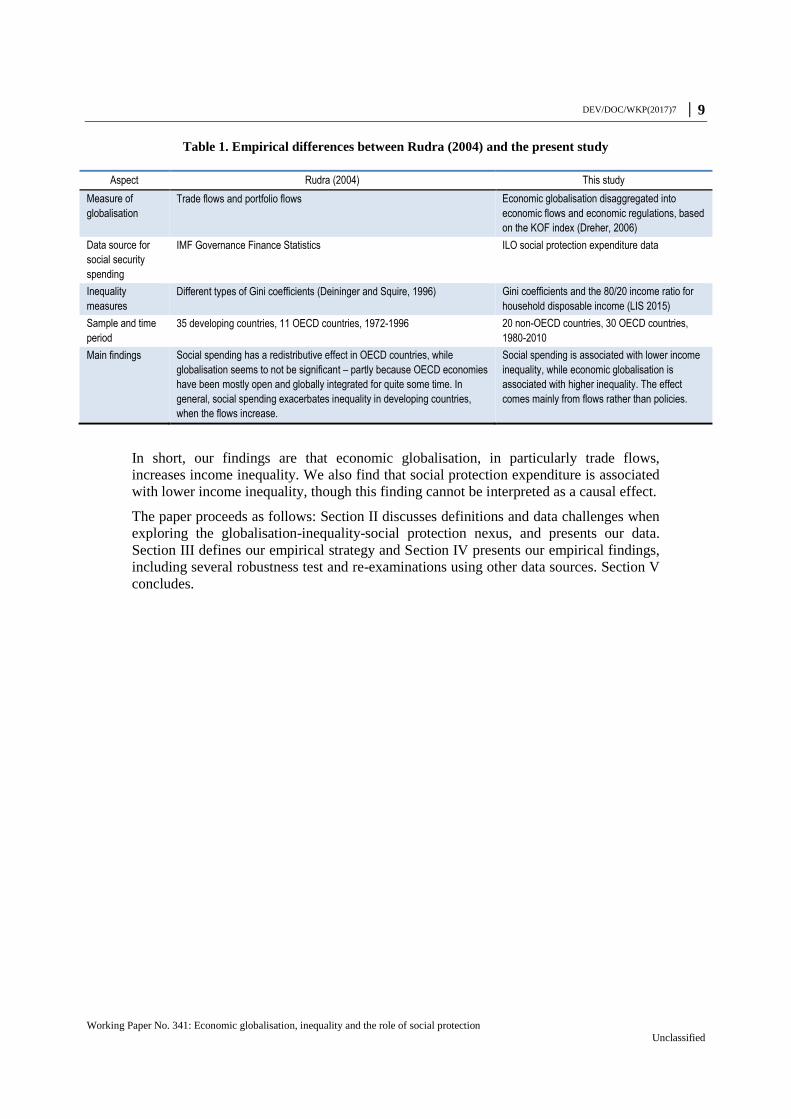
Table 1. Empirical differences between Rudra (2004) and the present study
Aspect Rudra (2004) This study
Measure of
globalisation
Trade flows and portfolio flows Economic globalisation disaggregated into
economic flows and economic regulations, based
on the KOF index (Dreher, 2006) Data source for
social security
spending
IMF Governance Finance Statistics ILO social protection expenditure data
Inequality
measures
Different types of Gini coefficients (Deininger and Squire, 1996) Gini coefficients and the 80/20 income ratio for
household disposable income (LIS 2015) Sample and time
period
35 developing countries, 11 OECD countries, 1972-1996 20 non-OECD countries, 30 OECD countries,
1980-2010 Main findings Social spending has a redistributive effect in OECD countries, while
globalisation seems to not be significant – partly because OECD economies
have been mostly open and globally integrated for quite some time. In
general, social spending exacerbates inequality in developing countries,
when the flows increase.
Social spending is associated with lower income
inequality, while economic globalisation is
associated with higher inequality. The effect
comes mainly from flows rather than policies.
In short, our findings are that economic globalisation, in particularly trade flows,
increases income inequality. We also find that social protection expenditure is associated
with lower income inequality, though this finding cannot be interpreted as a causal effect.
The paper proceeds as follows: Section II discusses definitions and data challenges when
exploring the globalisation-inequality-social protection nexus, and presents our data.
Section III defines our empirical strategy and Section IV presents our empirical findings,
including several robustness test and re-examinations using other data sources. Section V
concludes.

10 │ DEV/DOC/WKP(2017)7
Working Paper No. 341: Economic globalisation, inequality and the role of social protection Unclassified
2. Income inequality and social protection: Definitions and data challenges
2.1. Economic globalisation
Globalisation is a multidimensional phenomenon that typically refers to the process by
which different economies and societies become more closely integrated. Economic
globalisation refers to flows of trade and investments, as well as to trade rules such as
tariffs and non-tariff trade barriers. This paper uses what has become known as the KOF-
index of globalisation introduced by Dreher (2006) that provides annually comparable
country-level data on globalisation for most countries in the world from 1970 onwards,
normalised to an index that ranges from 0 to 100. In addition to the broad country
coverage, the index allows economic globalisation to be separated into economic policies
(such as trade barriers, tariffs, quotas, and investment regulations) and economic flows
(reflecting imports, exports, foreign portfolio investment, and foreign direct investment).
Globalisation in general has been increasing over the most recent decades, but some
countries have been affected more than others. Based on calculations of the median for
economic globalisation as measured by the KOF-index in 1990 and 2005, Figure 1
illustrates highly globalised countries that were above the median value both in 1990 and
2005, low globalised countries that were below the median both years, fast globalisers
that were below the 1990 median and above the 2005 median, and finally countries that
were above the 1990 median but below the 2005 median. Most developed countries
belong to the group of highly globalised countries, while there is substantial variation
among other countries.
Figure 1. The dynamics of economic globalisation 1990-2005
Source: Dreher (2006), “Does Globalization Affect Growth? Empirical Evidence from a new Index”.

DEV/DOC/WKP(2017)7 │ 11
Working Paper No. 341: Economic globalisation, inequality and the role of social protection
Unclassified
2.2. Income inequality
The most commonly used measure of inequality is the Gini coefficient, which has a
straightforward interpretation: for completely egalitarian income distributions in which
the whole population has the same income, the Gini coefficient would take a value of
zero; conversely, a value of one would indicate that all income within country is
concentrated by one person. Figure 2 illustrates variation in the Gini coefficient of net
income inequality (income after accounting for direct taxes and public cash transfers)
across countries. We focus on net income (after direct taxes and transfers), because it
includes the effect of public redistribution, and because it is the distribution that actually
matters for peoples’ consumption possibilities (for a further discussion, see Brady and
Sosnaud 2009).
Figure 2. Inequality of disposable income worldwide in 2005, percentage
Source: Standardized World Income Inequality Database 4.0.
Gini coefficients can be calculated for gross income (before taxes and transfers), for net
income (after taxes and transfers), for consumption expenditure, for individuals or for
households, and they may or may not include capital gains. The large variety of
definitions means that coefficients from different sources cannot directly be compared.
The lack of comparable Gini coefficients both between countries and over time has long
been a problem in inequality research. While Figure 2 uses data from the SWIID (the
Standardized World Income Inequality Database, created by Solt, 2009), our baseline
findings rely on data from the Luxembourg Income Study (LIS). The LIS data are based
on reliable micro-data from national household income surveys. The downside of this
source is that the LIS focuses mainly on high and middle income countries, and the
sample covers 45 countries at the time of writing. Many scholars therefore turn to the data
from Deininger and Squire (1996) and later versions thereof. It must be noted that this
database combines Gini coefficients of many different types and from many different
sources, which means that they cannot be used “out of the box”, directly from the
database. For instance, Deininger and Squire (1996) recommend adding three points to
net-income-based inequality observations to make them comparable with the gross-
income-based observations. Such a constant adjustment procedure is a bit crude, because

12 │ DEV/DOC/WKP(2017)7
Working Paper No. 341: Economic globalisation, inequality and the role of social protection Unclassified
the difference between the gross and net income Gini coefficients depends both on the
degree to which taxes and transfers are progressive and on how people’s behaviour adapts
to such redistribution. A bigger problem, however, is that such advice has been customary
ignored, with many studies using the data available in the Deininger and Squire (1996)
database “as is”. Rudra (2004) is one such case, which emphasises the need to re-examine
the theoretical question in point.
The goal of the SWIID is to convert available Gini coefficients of different types for all
countries into the LIS standard, relying on the fact that different types of Gini coefficients
display systematic relationships. Whether such adjusted inequality data can be trusted or
not has been debated (see Jenkins, 2015; Ferreira, et al. 2015; Solt, 2015). For this reason,
we run an additional robustness check of our findings where the LIS data are replaced by
data from the SWIID, while keeping the sample fixed to the countries covered by the
Luxembourg Income Study. As discussed further in Section IV, the SWIID data produce
somewhat different results. We conclude that the wisest strategy for the purposes of this
study is to rely on the data from the LIS, despite the small number of countries included.
Another advantage of using LIS-data is that we can also study the income quintile ratio
(the 80s/20s ratio). The income quintile ratio is calculated as the ratio of income received
by the top quintile of the population (20% with the highest income) to that received by
the bottom quintile (20% with the lowest income). Using this measure reduces the effect
on the statistics of outliers at the very top and bottom of the distribution; obviously, it also
does not reflect inequality changes in the middle 60% of the income distribution. In
summary, by using LIS-data we accept a smaller sample but we can say with great
certainty what happens to the income distribution.
Table 2 presents summary statistics on income inequality illustrating differences between
OECD and non-OECD sub-samples.
Table 2. Summary statistics of inequality data
Variables / Source Obs. Countries Mean SD Min Max
OECD countries
LIS Gini coefficient (LIS 2016) 110 30 29.20 5.33 20.50 48.07
LIS Income quintile ratio 80/20 (LIS 2016) 110 30 2.39 0.48 1.73 4.30
SWIID Gini coefficient (Solt, 2009) 110 30 29.41 5.24 20.84 48.60
Non-OECD countries
LIS Gini coefficient (LIS 2016) 32 20 38.64 10.25 18.90 59.05
LIS Income quintile ratio 80/20 (LIS 2016) 32 20 3.57 1.45 1.68 7.26
SWIID Gini coefficient (Solt, 2009) 32 20 39.05 9.95 22.53 59.40
Note: The summary statistics are calculated for the operative sample, conditional on a full set of control variables. The SWIID
Gini is used only as a robustness test. Number of observations reflect countries x year.
Source: Authors’ calculations.
2.3. Social protection expenditure
Several sources provide information on country-level social protection expenditure. Our
baseline specification relies on the ILO Social Expenditure Database (International
Labour Organization, 2014), which includes aggregate and disaggregated data on public
social spending. Estimates in the ILO database are based on various sources, including
National statistics, the OECD Social Expenditure Database (SOCX2), the IMF
2 For more information see Adema, Fron and Ladaique, 2011.

DEV/DOC/WKP(2017)7 │ 13
Working Paper No. 341: Economic globalisation, inequality and the role of social protection
Unclassified
Government Finance Statistics,3 the European Commission Social Protection Database
(ESSPROS), Asian Development Bank indicators for Asia and the Pacific. Total annual
public social protection expenditure is defined by the ILO as the sum of expenditure
(including benefit expenditure and administration costs) of all existing public social
security/social protection schemes or programmes in a country. The scope of the
indicators corresponds to the Social Security (Minimum Standards) Convention, 1952
(No. 102) which established nine classes of benefits: medical care, sickness benefit,
unemployment benefit, old-age benefit, employment injury benefit, family benefit,
maternity benefit, invalidity benefit, survivors’ benefit, plus other income support and
assistance programmes, including conditional cash transfers, available to the poor and not
included under the above classes.
To account for country size and level of development, social expenditure is measured
relative to GDP. Our baseline thus uses one of the most common ways to compare social
protection efforts across countries. Figure 3 illustrates the cross-country variation in
social protection expenditure. Social spending is highest in Europe (where it typically
amounts to 25-30% of GDP), and lowest in Africa and South-East Asia (where it is
typically less than 10% of GDP).
Figure 3. Public social protection expenditure worldwide in 2010, percentage of GDP
Source: ILO (2014), World Social Protection Report 2014/15.
Table 3 summarises the sources, time period, and some basic descriptive statistics for
social protection spending in OECD and non-OECD countries.
3 For more information see IMF, 2014.

14 │ DEV/DOC/WKP(2017)7
Working Paper No. 341: Economic globalisation, inequality and the role of social protection Unclassified
Table 3. Summary statistics of social protection spending data for OECD
and non-OECD countries
Variables / Source Obs. Countries Period Mean SD Min Max
OECD countries
Social protection expenditure (including health), % of GDP 110 30 1990-2010 21.31 5.47 4.33 32.03
Non-OECD countries
Social protection expenditure (including health), % of GDP 32 20 1990-2010 13.38 6.55 1.54 25.10
Source: ILO (2014), World Social Protection Report 2014/15.
Figures 2 and 3 together highlight the fact that countries with higher social protection
expenditure tend to be countries with lower income inequality. This relationship is also
found in more detailed studies, such as Bradley et al. (2003) and Bergh and Bjørnskov
(2014). In terms of whether social protection expenditure could moderate the relationship
between globalisation and income inequality, Figure 4 shows that the cross-country
relationship between globalisation and income inequality differs a lot between countries
with high and low social protection expenditure. Among high-protection countries, more
globalised countries have lower income inequality. Among low-protection countries,
there is no clear linear pattern (although the data might suggest an inverse-U
relationship).
Figure 4. Globalisation and inequality among countries with high and low social protection
expenditure in 2010
Source: Authors’ calculations.
2.4. Control variables
The baseline specification includes several control variables; all suggested by previous
empirical research on the determinants of income inequality (see Bergh and Nilsson
2010). The log of GDP per capita (PPP adjusted, in constant USD) and age dependency
ratio are taken from the WDI database (World Bank, 2016). While more developed
countries typically have higher levels of welfare state, numerous studies suggest that the
DEV/DOC/WKP(2017)7 │ 15
Working Paper No. 341: Economic globalisation, inequality and the role of social protection
Unclassified
ratio of the non-working age population (ages 0-14 and 65 and above) to the total labour
force could drive inequality levels up due to lower productivity levels, shrinking domestic
savings and tax payments, and changing consumption structure. We also include the
percentage of adult population (age > 15) who completed secondary education (Barro and
Lee, 201 3. Based on the idea of a Kuznets-curve, we would expect that a higher share of
educated people will be correlated with higher inequality in poor countries, and with
lower inequality in rich countries (as discussed by Bergh and Fink, 2008).
Additional controls are used as robustness checks, including an index of overall economic
freedom and freedom to trade internationally from the Economic Freedom of the World
Index (Gwartney, et al. 2015), employment in industry and employment in services as a
share of total employment (World Bank, 2016), political rights and civil liberties rating
(Freedom House, 2015), as well as technological change (measured through investments
in innovation and communication technologies or research and development, World
Bank, 2016).
Descriptive statistics for all control variables are shown in the Annex (Table A.1).

16 │ DEV/DOC/WKP(2017)7
Working Paper No. 341: Economic globalisation, inequality and the role of social protection Unclassified
3. Econometric specification
Our baseline model uses ordinary least squares (OLS) in a model that includes country
and time fixed effects:
𝐼𝑛𝑒𝑞𝑢𝑎𝑙𝑖𝑡𝑦𝑖𝑡 = 𝐺𝑙𝑜𝑏𝑖𝑡 + 𝐸𝑐𝑜𝑛𝑜𝑚𝑦𝑖𝑡 + 𝑆𝑃𝐸𝑖𝑡 + 𝜗𝑖 + 𝜏𝑡 + 𝜀𝑖𝑡 (1)
In equation (1) 𝐼𝑛𝑒𝑞𝑢𝑎𝑙𝑖𝑡𝑦 is the Gini index of net income inequality or the 80s/20s
quintile ratio, depending on the model specification, 𝐺𝑙𝑜𝑏 is an index of globalisation
(economic globalisation, economic flows, or economic restrictions, depending on
specification), and 𝐸𝑐𝑜𝑛𝑜𝑚𝑦 is a set of conventional economic factors affecting income
inequality, including log of GDP per capita, age dependency ratio, and the share of
population who completed secondary education. 𝑆𝑃𝐸 stands for social protection
expenditure, 𝜗𝑖 and 𝜏𝑡 are country and time fixed effects, and 𝜀𝑖𝑡 is an error term. Data are
grouped in five year intervals, starting in 1970 or 1990 (as indicated in Table 3) and
ending in 2010.
Since Figure 4 gives us reason to expect that the effect of globalisation on inequality may
be non-linear, we also estimate a curvilinear regression as a robustness check:
𝐼𝑛𝑒𝑞𝑢𝑎𝑙𝑖𝑡𝑦𝑖𝑡 = 𝐺𝑙𝑜𝑏𝑖𝑡 + 𝐺𝑙𝑜𝑏𝑖𝑡2 + 𝐸𝑐𝑜𝑛𝑜𝑚𝑦𝑖𝑡 + 𝑆𝑃𝐸𝑖𝑡 + 𝜗𝑖 + 𝜏𝑡 + 𝜐𝑖𝑡 (2)
where 𝐺𝑙𝑜𝑏2 is the quadratic expression for the globalisation index and 𝜐𝑖𝑡 is the non-
linear error term.
Further robustness checks include various economic and institutional measures that can
intervene in the globalisation-inequality interplay, resulting in the following equation:
𝐼𝑛𝑒𝑞𝑢𝑎𝑙𝑖𝑡𝑦𝑖𝑡 = 𝐺𝑙𝑜𝑏𝑖𝑡 + 𝐸𝑐𝑜𝑛𝑜𝑚𝑦𝑖𝑡 + 𝐶𝑜𝑢𝑛𝑡𝑟𝑦𝐶ℎ𝑎𝑟𝑖𝑡 + 𝑆𝑃𝐸𝑖𝑡 + 𝜗𝑖 + 𝜏𝑡 + 𝜀𝑖𝑡 (3)
where 𝐶𝑜𝑢𝑛𝑡𝑟𝑦𝐶ℎ𝑎𝑟 stands for economic freedom, political rights and civil liberties,
share of employment in industry and services, or infant mortality, depending on the
model.

DEV/DOC/WKP(2017)7 │ 17
Working Paper No. 341: Economic globalisation, inequality and the role of social protection
Unclassified
4. Results
4.1. The effect on economic globalisation and social expenditure on inequality
We first examine the effect of globalisation on income inequality. This allows examining
whether results for 78 countries in Bergh and Nilsson (2010) also hold in our sample with
higher quality data from the LIS. Baseline results for the full sample are presented in
Table 4.
In the full sample of countries, economic globalisation is significantly associated with
higher inequality, as measured by the Gini coefficient. The effect on the 80/20 ratio is
lower but more significant. Analysing the effect of trade flows and economic restrictions
separately suggests that the positive effect on income inequality is mainly driven by
flows. The coefficient on social protection expenditure is negative and significant,
indicating that social protection expenditure is associated with lower income inequality in
the full sample of countries. Among the control variables, the effect of economic
development is negative and significant, suggesting that developed countries have lower
income inequality. The dependency ratio and secondary education variables are both
generally insignificant, as expected in a sample that pools developed and developing
countries. All specifications include country- and time-fixed effects with year dummies
being jointly significant.
Table 4. Globalisation, social protection spending and inequality (LIS Gini coefficient
and LIS 80/20 quintile ratio)
(1) (2) (3) (4)
LIS Gini LIS 80/20 Ratio
Social protection expenditure -0.260** -0.241* -0.024** -0.022**
[0.122] [0.121] [0.010] [0.010]
Economic globalisation 0.094** 0.006
[0.045] [0.005]
Economic flows 0.076* 0.007**
[0.041] [0.003]
ln GDPpc -7.356** -6.432** -0.832*** -0.813**
[3.315] [3.180] [0.300] [0.307]
Dependency ratio -0.067 -0.076 -0.010* -0.011*
[0.090] [0.091] [0.006] [0.006]
Population with secondary education -0.002 -0.008 -0.004 -0.005
[0.028] [0.028] [0.003] [0.003]
Constant 104.339*** 97.254*** 11.486*** 11.311***
[35.551] [34.874] [3.192] [3.212]
Observations 142 142 142 142
R-squared 0.344 0.336 0.221 0.240
Number of countries 43 43 43 43
R-squared adj. 0.299 0.291 0.168 0.189
Note: Robust standard errors in brackets. *** p<0.01, ** p<0.05, * p<0.1.
Source: Authors’ calculations.

18 │ DEV/DOC/WKP(2017)7
Working Paper No. 341: Economic globalisation, inequality and the role of social protection Unclassified
4.2. Robustness tests
The positive relationship between economic globalisation and income inequality in our
baseline is robust to several changes in the econometric specification, including the
introduction of additional controls that capture institutional differences between
countries. The same holds for the relationship between expenditure on social protection
and income inequality. Table 5 summarises various robustness tests that we implemented,
while full results are shown in Tables A.2-A.5 in the Annex.
Table 5. Robustness of the main results
Robustness test Findings
Adding a quadratic globalisation term, allowing the globalisation-inequality
relationship to be non-linear
Economic globalisation is related to higher inequality, but at a
decreasing rate
Controlling for infant mortality Main results remain. Controlling for political rights and civil liberties Main results remain. Coefficient on civil liberties is always positive. Controlling for economic freedom (aggregate index and freedom to trade
internationally)
Main results remain.
Controlling for employment shares in industry and service sector Main results remain. Employment shares are always negative. Lagging social expenditure Main results remain Replacing LIS data with SWIID data Main results remain Controlling for technological change (innovation and communication
technologies investment or R&D costs
Main results remain
In Table A.5 in the Annex, we replicate the results for the Gini coefficients presented in
Table 4 using the data from the SWIID instead of the LIS. As expected, and as indicated
by the descriptive statistics in Table 2, the two data sources are very highly correlated
(r = 0.98). Results are qualitatively unchanged: social protection expenditure is still
negatively associated with income inequality, while economic globalisation is positively
associated with income inequality.
One limitation of our approach lies in the potential for social protection expenditure to be
themselves a function of income inequality levels, corresponding to an issue of
endogeneity. The likely bias resulting from such endogeneity would however be upwards,
as countries are more likely to spend more on social protection when income inequality
increases. The negative coefficient of social protection expenditure on income inequality
in the presence of a potential upwards bias thus further strengthens our finding of a
negative relationship between social protection and income inequality. More so, given
that we use net income as the basis for income inequality, the effect of social protection
expenditure on inequality captures dimensions beyond direct cash transfers, such as
services, and as such may further be underestimated.

DEV/DOC/WKP(2017)7 │ 19
Working Paper No. 341: Economic globalisation, inequality and the role of social protection
Unclassified
5. Concluding discussion
The global trend towards increasing globalisation since the 1990s seems to have two
different distributional consequences: on the one hand, income inequality between
countries has declined, while economic inequality within countries has increased
(Bourguignon, 2016). Lakner and Milanovic (2015) show that the global growth
incidence curve (showing which parts of the global distribution benefited the most and
the least during globalisation) has a distinct supine S shape, with gains highest around the
median and the top. For most inequality measures this implies that inequality within
countries is not rising fast enough to offset the decline in inequality between countries.
Against this background, it is natural to wonder whether countries could enjoy the
benefits of economic globalisation without suffering adverse effects on the within-
country income distribution. We find that higher social protection expenditure is
significantly related to lower income inequality, and that higher economic globalisation is
linked to higher income inequality – in line with previous findings in the literature. While
the sample is too small to capture an interaction between social protection and
globalisation, and thus to draw conclusions on the cushioning effect of social protection
expenditure in the globalisation-inequality nexus, descriptive findings suggest that more
globalised countries display lower levels of income inequality in the sample of countries
with high social protection expenditure.
An important limitation revealed by this work lies in the availability and quality of
indicators for both social protection and inequality. While the direction of the relationship
between inequality on the one hand, and economic globalisation and social protection on
the other hand appears robust across databases, the association is no longer statistically
significant with the SWIID data indicating that one should be careful about interpretation
of the results based on the latter database. This issue may be resolved in the future when
the LIS expands its coverage, but for now we should acknowledge the persisting
uncertainty about the income inequality data.
The issue of data harmonisation is perhaps even more worrisome in the case of social
protection expenditure indicators. Conceptually, social protection expenditure can be
problematic in their interpretation, due to their imperfect correlation with coverage, their
potential countercyclical nature, changes in the needs of the population – say lower
demand for unemployment benefits with rising employment rates –, and unequal
distribution of benefits across the population. Beyond this conceptual issue however,
although social protection has been recognised as a goal in the Sustainable Development
Goals agenda, measurement issues, and in particular the harmonisation of indicators
across countries and regions, appear to remain important.

20 │ DEV/DOC/WKP(2017)7
Working Paper No. 341: Economic globalisation, inequality and the role of social protection
Unclassified
Annex A.
Table A.1. Descriptive statistics
Variable OECD sample Non-OECD sample Source
Obs. Mean SD Min Max Obs. Mean SD Min Max
KOF Economic Index of Globalisation 110 76.53 11.65 47.88 98.03 32 60.89 13.34 39.40 90.34 Dreher, 2006
KOF economic flows 110 69.56 18.52 24.21 100.00 32 58.91 13.94 32.17 91.84 Dreher, 2006
KOF economic regulations 110 84.15 9.45 54.78 98.26 32 62.87 15.99 35.97 94.73 Dreher, 2006
Ln GDP per capita 110 10.42 0.57 8.89 11.55 32 8.98 0.72 6.92 10.22 World Bank, 2016
Age dependency ratio (% of working-age population) 110 49.41 5.01 37.61 68.96 32 53.34 9.66 38.09 77.20 World Bank, 2016
Secondary complete education (% of population aged 25+) 110 34.01 14.48 6.63 73.00 32 31.69 12.99 9.09 56.33 Barro and Lee, 2013
EFW Economic Freedom of the World Index 108 7.49 0.59 5.80 8.60 30 6.35 1.12 3.50 8.00 Gwartney et al., 2015
EFW freedom to trade internationally 108 8.35 0.72 6.40 9.60 30 7.31 1.01 5.00 9.00 Gwartney et al., 2015
Employment in industry (% of total employment) 110 26.72 5.77 12.70 41.80 32 27.31 7.09 14.90 43.40 World Bank, 2016
Employment in services (% of total employment) 110 67.06 7.24 50.90 81.20 32 57.22 13.76 25.20 75.70 World Bank, 2016
Political rights rating 110 1.06 0.37 1 4 32 2.38 1.68 1 7 Freedom House, 2015
Innovation and communication technologies investment (% of total investment)
110 36.61 32.57 0 93.39 32 19.66 17.97 0 61.45 World Bank, 2016
Research & development cost (% of GDP) 72 1.77 0.91 .32 3.93 21 1.04 1.07 .04 4.04 World Bank, 2016
Note: The summary statistics are calculated for the operative sample, conditional on a full set of control variables.
Source: Authors’ calculations.

DEV/DOC/WKP(2017)7 │ 21
Working Paper No. 341: Economic globalisation, inequality and the role of social protection
Unclassified
Table A.2. Globalisation, inequality, and social protection expenditure – robustness
(1) (2) (3) (4) (5) (6) (7) (8) (9) (10) (11) (12) (13) (14)
Social protection expenditure -0.260** -0.330*** -0.197 -0.278** -0.274** -0.258* -0.305** -0.485*** -0.295* [0.122] [0.121] [0.122] [0.126] [0.124] [0.134] [0.138] [0.104] [0.155]
Economic globalisation 0.061 0.091* 0.091* 0.092* 0.094** 0.116** 0.425** 0.108** 0.099** 0.073 0.095 0.109** 0.034 0.050
[0.047] [0.050] [0.049] [0.046] [0.045] [0.053] [0.194] [0.044] [0.045] [0.044] [0.060] [0.043] [0.048] [0.100]
ln GDPpc -4.517* -5.879* -5.888* -7.356** -6.831* -6.425* -8.355*** -6.319** -7.707** -7.344** -6.536** -6.243* -7.753
[2.287] [3.318] [3.323] [3.315] [3.910] [3.260] [2.792] [2.997] [3.280] [3.337] [2.797] [3.222] [6.215]
Dependency ratio -0.068 -0.068 -0.067 -0.050 -0.031 -0.168* -0.024 -0.053 -0.067 -0.119 0.147 -0.028
[0.090] [0.091] [0.090] [0.115] [0.086] [0.099] [0.087] [0.091] [0.095] [0.081] [0.110] [0.147]
Population with secondary education -0.003 -0.002 0.009 -0.005 -0.001 0.005 -0.003 -0.002 -0.010 -0.026 -0.031
[0.030] [0.028] [0.034] [0.029] [0.025] [0.031] [0.029] [0.028] [0.031] [0.027] [0.024]
Social protection expenditure (t-1) -0.195*
[0.111]
Economic globalisation^2 -0.002*
[0.001]
Infant mortality 0.253**
[0.115]
Political rights -1.055
[0.692]
Civil liberties 0.469
[0.571]
Economic freedom overall 0.402
[0.411]
Freedom to trade internationally -0.021
[0.549]
Employment in industry -0.314***
[0.103]
Employment in service -0.028
[0.081]
Research and development cost -0.792
[1.147]
Innovations and communications investment -0.009
[0.066]
Observations 142 142 142 142 142 122 142 142 142 138 138 142 93 72
R-squared 0.245 0.282 0.291 0.291 0.344 0.217 0.367 0.382 0.360 0.349 0.344 0.409 0.350 0.251
Number of countries 43 43 43 43 43 43 43 43 43 39 39 43 41 17
Note: Robust standard errors in brackets. *** p<0.01, ** p<0.05, * p<0.1, Column 5 reproduces baseline results to aid comparisons.
Source: Authors’ calculations.

22 │ DEV/DOC/WKP(2017)7
Working Paper No. 341: Economic globalisation, inequality and the role of social protection Unclassified
Table A.3. Robustness tests – Economic flows
(1) (2) (3) (4) (5) (6) (7) (8) (9)
LIS Gini
Social protection expenditure -0.239* -0.181 -0.262** -0.267** -0.268* -0.257* -0.472*** -0.282*
[0.120] [0.121] [0.125] [0.129] [0.135] [0.141] [0.109] [0.153]
Economic flows 0.098* 0.053 0.085** 0.083* 0.057 0.066 0.088** 0.042 -0.001
[0.054] [0.056] [0.041] [0.042] [0.041] [0.041] [0.042] [0.050] [0.063]
ln GDPpc -6.218 -6.974** -7.188** -5.244* -7.310** -7.184** -5.356* -6.397** -7.603
[3.726] [3.452] [2.707] [2.873] [3.220] [3.201] [2.690] [3.075] [6.818]
Dependency ratio -0.072 -0.077 -0.170* -0.026 -0.054 -0.063 -0.138 0.134 -0.012
[0.115] [0.092] [0.101] [0.083] [0.088] [0.088] [0.085] [0.115] [0.159]
Population with secondary education 0.002 -0.007 -0.007 -0.004 -0.009 -0.007 -0.013 -0.029 -0.033
[0.030] [0.028] [0.024] [0.031] [0.029] [0.028] [0.028] [0.027] [0.025]
Social protection expenditure (t-1) -0.210*
[0.115]
Economic globalisation^2 0.000
[0.000]
Infant mortality 0.233*
[0.116]
Political rights -1.169*
[0.686]
Civil liberties 0.402
[0.579]
Economic freedom overall 0.568
[0.467]
Freedom to trade internationally 0.416
[0.429]
Employment in industry -0.321***
[0.110]
Employment in service -0.073
[0.093]
Research and development cost -0.893
[1.213]
Innovations and communications investment -0.019
[0.068]
Observations 122 142 142 142 138 138 142 93 72
R-squared 0.212 0.340 0.369 0.357 0.349 0.347 0.397 0.412 0.351
Number of countries 43 43 43 43 39 39 43 41 17
R-squared 0.156 0.290 0.321 0.302 0.298 0.295 0.346 0.356 0.244
Note: Robust standard errors in brackets. *** p<0.01, ** p<0.05, * p<0.1.
Source: Authors’ calculations.
DEV/DOC/WKP(2017)7 │ 23
Working Paper No. 341: Economic globalisation, inequality and the role of social protection
Unclassified
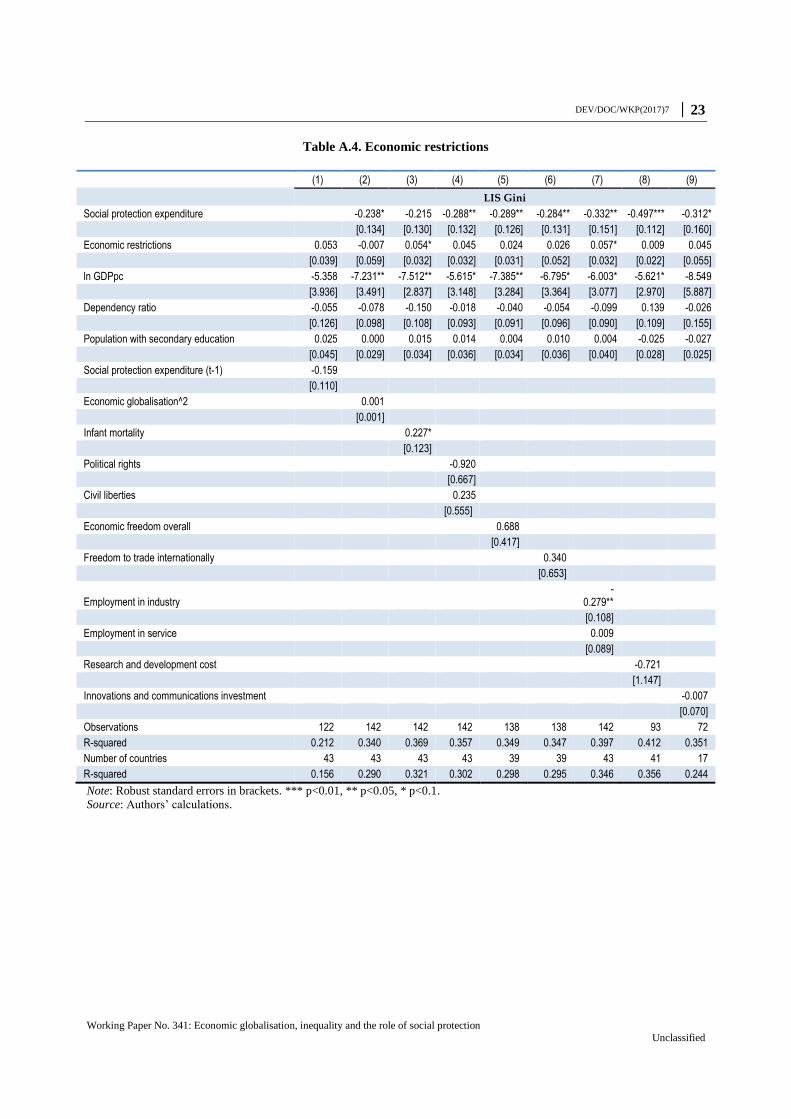
Table A.4. Economic restrictions
(1) (2) (3) (4) (5) (6) (7) (8) (9)
LIS Gini
Social protection expenditure -0.238* -0.215 -0.288** -0.289** -0.284** -0.332** -0.497*** -0.312*
[0.134] [0.130] [0.132] [0.126] [0.131] [0.151] [0.112] [0.160]
Economic restrictions 0.053 -0.007 0.054* 0.045 0.024 0.026 0.057* 0.009 0.045
[0.039] [0.059] [0.032] [0.032] [0.031] [0.052] [0.032] [0.022] [0.055]
ln GDPpc -5.358 -7.231** -7.512** -5.615* -7.385** -6.795* -6.003* -5.621* -8.549
[3.936] [3.491] [2.837] [3.148] [3.284] [3.364] [3.077] [2.970] [5.887]
Dependency ratio -0.055 -0.078 -0.150 -0.018 -0.040 -0.054 -0.099 0.139 -0.026
[0.126] [0.098] [0.108] [0.093] [0.091] [0.096] [0.090] [0.109] [0.155]
Population with secondary education 0.025 0.000 0.015 0.014 0.004 0.010 0.004 -0.025 -0.027
[0.045] [0.029] [0.034] [0.036] [0.034] [0.036] [0.040] [0.028] [0.025]
Social protection expenditure (t-1) -0.159
[0.110]
Economic globalisation^2 0.001
[0.001]
Infant mortality 0.227*
[0.123]
Political rights -0.920
[0.667]
Civil liberties 0.235
[0.555]
Economic freedom overall 0.688
[0.417]
Freedom to trade internationally 0.340
[0.653]
Employment in industry -
0.279**
[0.108]
Employment in service 0.009
[0.089]
Research and development cost -0.721
[1.147]
Innovations and communications investment -0.007
[0.070]
Observations 122 142 142 142 138 138 142 93 72
R-squared 0.212 0.340 0.369 0.357 0.349 0.347 0.397 0.412 0.351
Number of countries 43 43 43 43 39 39 43 41 17
R-squared 0.156 0.290 0.321 0.302 0.298 0.295 0.346 0.356 0.244
Note: Robust standard errors in brackets. *** p<0.01, ** p<0.05, * p<0.1.
Source: Authors’ calculations.

24 │ DEV/DOC/WKP(2017)7
Working Paper No. 341: Economic globalisation, inequality and the role of social protection Unclassified
Table A.5. Globalisation and inequality (SWIID Gini Coefficient)
(1) (2) (3)
SWIID Gini
full sample
Social protection expenditure -0.111 -0.102 -0.117
[0.146] [0.145] [0.149]
Economic globalisation 0.049
[0.042]
Economic flows 0.037
[0.033]
Economic restrictions 0.025
[0.034]
ln GDPpc -3.733 -3.206 -3.399
[3.931] [3.675] [4.130]
Dependency ratio 0.035 0.030 0.038
[0.108] [0.109] [0.110]
Population with secondary education -0.021 -0.024 -0.014
[0.036] [0.037] [0.036]
Constant 64.524 60.524 62.244
[42.901] [41.291] [44.531]
Observations 142 142 142
R-squared 0.219 0.215 0.211
Number of countries 43 43 43
R-squared adj. 0.166 0.161 0.157
Note: Robust standard errors in brackets. *** p<0.01, ** p<0.05, * p<0.1.
Source: Authors’ calculations.

DEV/DOC/WKP(2017)7 │ 25
Working Paper No. 341: Economic globalisation, inequality and the role of social protection
Unclassified
References
Adema, W., P. Fron and M. Ladaique (2011), “Is the European Welfare State Really More Expensive?:
Indicators on Social Spending, 1980-2012; and a Manual to the OECD Social Expenditure Database
(SOCX)”, OECD Social, Employment and Migration Working Paper No. 124, OECD Publishing,
Paris.
Barro, R. J. and J. W. Lee (2013), “A new data set of educational attainment in the world, 1950–2010”,
Journal of Development Economics, Vol. 104, pp. 184-198.
Bergh, A. and C. Bjørnskov (2014), “Trust, welfare states and income equality: Sorting out the
causality”, European Journal of Political Economy, Vol. 35, pp. 183-199.
Bergh, A. and G. Fink (2008), “Higher Education Policy, Enrollment, and Income Inequality”, Social
Science Quarterly, Vol. 89, pp. 217-235.
Bergh, A. and T. Nilsson (2010), “Do liberalization and globalization increase income inequality?”
European Journal of Political Economy, Vol. 26, pp. 488-505.
Bergh, A., I. Mirkina and T. Nilsson (2016), “Do the poor benefit from globalization regardless of
institutional quality?”, Applied Economics Letters, Vol. 23/10, pp. 708-712.
Bourguignon, F. (2016), “Inequality and Globalization. How the rich get richer as the poor catch up”,
Foreign Affairs, Vol. 95, pp. 11-16.
Brady, D. and B. Sosnaud. (2009), “The Politics of Economic Inequality”, in Handbook of Politics, eds.
K. T. Leicht and J. C. Jenkins, Springer.
Bradley, D., E. Huber, S. Moller, F. Nielsen and J.D. Stephens (2003), “Distribution and Redistribution
in Postindustrial Democracies”, World Politics, Vol. 55, pp. 193-228.
Cameron, D.R. (1978), “The Expansion of the Public Economy: A Comparative Analysis”, American
Political Science Review, Vol. 72, pp. 1243-1261.
Dallinger, U. (2014), “Globalization and demand for social security: A critical examination of the
domestic demand approach”, Berliner Journal fur Soziologie, Vol. 24, pp. 59-88.
Deininger, K. and L. Squire (1996), “A new data set measuring income inequality”, The World Bank
Economic Review, Vol. 10/3, pp. 565-591.
Down, I. (2007), “Trade Openness, Country Size and Economic Volatility: The Compensation
Hypothesis Revisited”, Business and Politics, Vol. 9, pp. 1–22.
Dreher, A. (2006), “Does Globalization Affect Growth? Empirical Evidence from a new Index”, Applied
Economics, Vol. 38, pp. 1091-1110.
Ferreira, F.H., N. Lustig and D. Teles (2015), “Appraising cross-national income inequality databases:
An introduction”, The Journal of Economic Inequality, Vol. 13, pp. 497-526.

26 │ DEV/DOC/WKP(2017)7
Working Paper No. 341: Economic globalisation, inequality and the role of social protection Unclassified
Foerster, M. and I. Toth (2015), “Cross-Country Evidence of the Multiple Causes of Inequality Changes
in the OECD area”, in Handbook of Income Distribution, Volume 2, eds. A.B. Atkinson and F.
Bourguignon, Elsevier, Oxford.
Freedom House (2015), Freedom in the World 2015: The Annual Survey of Political Rights and Civil
Liberties, Rowman & Littlefield, Lanham.
Garrett, G. (2001), “Globalization and Government Spending around the World”, Studies in Comparative
International Development, Vol. 35, pp. 3-29.
Gwartney, J., R. Lawson and J. Hall (2015), Economic Freedom of the World: 2015 Annual Report,
Fraser Institute, Vancouver.
ILO (2014), World Social Protection Report 2014/15, International Labour Organization, Geneva.
IMF (2014), Government Finance Statistics Manual, International Monetary Fund, Washington, DC.
Jenkins, S.P. (2015), “World income inequality databases: an assessment of WIID and SWIID”, Journal
of Economic Inequality, Vol. 13, pp. 629–671.
Joumard, I., M. Pisu and D. Bloch (2012), “Tackling income inequality: The role of taxes and transfers”,
OECD Journal: Economic Studies, Paris, http://dx.doi.org/10.1787/eco_studies-2012-5k95xd6l65lt.
Katzenstein, P. (1985), Small States in World Markets: Industrial Policy in Europe, Cornell University
Press, Ithaca.
Kim, S.Y. (2007), “Openness, External Risk, and Volatility: Implications for the Compensation
Hypothesis”, International Organization, Vol. 61, pp. 181-216.
Kremer, M. (2006), Globalization of Labor Markets and Inequality, Brookings Trade Forum, pp. 211-
228.
Kremer, M. and E. Maskin (2003), Globalization and Inequality, Mimeo.
Lakner, C. and B. Milanovic (2015), “Global Income Distribution: From the Fall of the Berlin Wall to
the Great Recession”, The World Bank Economic Review.
Lindbeck, A. (1975), “Business Cycles, Politics, and International Economic Dependence”,
Skandinaviska Enskilden Bank Quarterly Review, Vol. 2, pp. 53-68.
LIS (2016), LIS Inequality and Poverty Key Figures, www.lisdatacenter.org (accessed on 6 June 2016),
LIS Cross-National Data Center, Luxembourg.
Marsh, R.M. (2016), “What Have We Learned from Cross-National Research on the Causes of Income
Inequality?”, Comparative Sociology, Vol. 15, pp. 7-36.
Martinez-Vazquez, J., B. Moreno-Dodson and V. Vulovic (2012), “The impact of tax and expenditure
policies on income distribution: Evidence from a large panel of countries”, Working Paper,
International Center for Public Policy, Atlanta.
OECD (2012), Going for Growth. Economic Policy Reforms 2012, OECD Publishing, Paris,
http://dx.doi.org/10.1787/growth-2012-en.
OECD (2011), Divided We Stand. Why Inequality Keeps Rising, OECD Publishing, Paris,
http://dx.doi.org/10.1787/9789264119536-en.
Potrafke, N. (2015), “The Evidence on Globalisation”, The World Economy, Vol. 38, pp. 509-552.
Rodrik, D. (1998), “Why do more open economies have bigger governments?”, The Journal of Political
Economy, Vol. 106, pp. 997-1032.
DEV/DOC/WKP(2017)7 │ 27
Working Paper No. 341: Economic globalisation, inequality and the role of social protection
Unclassified
Rudra, N. (2004), “Openness, welfare spending, and inequality in the developing world”, International
Studies Quarterly, Vol. 48, pp. 683-709.
Solt, F. (2009), “Standardizing the world income inequality database”, Social Science Quarterly,
Vol. 90/2, pp. 231-242.
Solt, F. (2015), “On the assessment and use of cross-national income inequality datasets”, The Journal of
Economic Inequality, Vol. 13/4, pp. 683-691.
World Bank (2015), Poverty and Inequality Database (PovCalNet), World Bank Group, Washington,
DC.
World Bank (2016), World Development Indicators Database, World Bank Group, Washington, DC.

28 │ DEV/DOC/WKP(2017)7
Working Paper No. 341: Economic globalisation, inequality and the role of social protection Unclassified
Other titles in the series
The former series known as “Technical Papers” and “Webdocs” merged in November
2003 into “Development Centre Working Papers”. In the new series, former Webdocs 1-
17 follow former Technical Papers 1-212 as Working Papers 213-229.
All these documents may be downloaded from:
www.oecd-ilibrary.org/development/oecd-development-centre-working-papers_18151949
or obtained via e-mail ([email protected]).
Recent working papers:
Working Paper No. 340, “No sympathy for the devil! Policy priorities to overcome the middle-income trap in Latin America”, by Angel Melguizo, Sebastián Nieto-Parra, José Ramón Perea and Jaime Ariel Perez, September 2017.
Working Paper No. 339, “The grant element method of measuring the concessionality of loans and debt relief”, by Simon
Scott, May 2017.
Working Paper No. 338, “Revisiting personal income tax in Latin America: Evolution and impact”, by Alberto Barreix,
Juan Carlos Benítez and Miguel Pecho, March 2017.
Working Paper No. 337, “The pursuit of happiness: Does gender parity in social institutions matter?”, by Gaelle Ferrant, Alexandre Kolev and Caroline Tassot, March 2017.
Working Paper No. 336, “Fiscal policy and the cycle in Latin America: The role of financing conditions and fiscal rules”,
by Enrique Alberola, Iván Kataryniuk, Ángel Melguizo and René Orozco, February 2017.
Working Paper No. 335, “The economic effects of labour immigration in developing countries: A literature review”, by
Marcus H. Böhme and Sarah Kups, January 2017.
Working Paper No. 334, “Harnessing the digital economy for developing countries”, by Carl Dahlman, Sam Mealy and
Martin Wermelinger, December 2016.
Working Paper No. 333, “The cost of air pollution in Africa”, by Rana Roy, September 2016.
Working Paper No. 332, “Can investments in social protection contribute to subjective well-being? A cross-country analysis”, by Alexandre Kolev and Caroline Tassot, May 2016.
Working Paper No. 331, “Understanding student performance beyond traditional factors: Evidence from PISA 2012”, by
Rolando Avendano, Felipe Barrera-Osorio, Sebastián Nieto-Parra and Flora Vever, May 2016.