The Effect of Working Capital Management on Firms Profitability
Upload
khangminh22Category
view
0download
0
WORKING CAPITAL MANAGEMENT PRACTICES AND
FINANCIAL PERFORMANCE OF TEA PROCESSING FIRMS IN
KENYA
ISAAC KIBET KIPTOO
A RESEARCH PROJECT SUBMITTED IN THE SCHOOL OF
BUSINESS AND ECONOMICS IN PARTIAL FULFILMENT OF
THE REQUIREMENTS FOR THE AWARD OF THE DEGREE OF
MASTER OF BUSINESS ADMINISTRATION IN THE
UNIVERSITY OF EMBU
AUGUST, 2017

ii
DECLARATION
This research project is my own original work and has not been presented for award of a
degree in any other University.
Signed: ___________________________ Date: _________________
Isaac Kibet Kiptoo
Department of Business and Economics
D530/1020/2013
This research project has been submitted for examination with our approval as the
University supervisors.
Signed: ___________________________ Date: _________________
Dr. Samuel Kariuki
Department of Business and Economics
University of Embu
Signed: ___________________________ Date: _________________
Dr. Kimani E. Maina
Department of Business and Economics
University of Embu

iii
DEDICATION
I dedicate this project to my wife Cecilia and my parents, brothers and sisters for their
invaluable support, encouragement and prayers.

iv
ACKNOWLEDGEMENT
This research project would not have been possible without the guidance and
contribution of several individuals who in one way or another extended their valuable
support in the preparation of this project.
First, I thank the Almighty God for giving me the strength and ability to undertake this
research. My gratitude also goes to my supervisors Dr. Samuel Kariuki and Dr. Kimani
E. Maina who offered me great guidance and encouragement during research topic
formulation, identification of objectives and reviewing of the document to ensure that I
progress successfully.
Finally to my family and classmates for the moral support, may the Almighty God Bless
you.

v
TABLE OF CONTENTS
Page
DECLARATION ............................................................................................................ ii
DEDICATION ............................................................................................................... iii
ACKNOWLEDGEMENT ............................................................................................ iv
LIST OF TABLES ........................................................................................................ vii
LIST OF FIGURES ..................................................................................................... viii
LIST OF APPENDICES ............................................................................................... ix
ABBREVIATIONS AND ACRONYMS ...................................................................... x
DEFINITIONS OF TERMS ......................................................................................... xi
ABSTRACT .................................................................................................................. xii
CHAPTER ONE ............................................................................................................. 1
INTRODUCTION .......................................................................................................... 1
1.1 Background of the Study ....................................................................................... 1
1.2 Statement of the Problem ....................................................................................... 4
1.3 General Objective .................................................................................................. 6
1.4 Research Questions ................................................................................................ 6
1.5 Scope of the Study ................................................................................................. 6
1.6 Significance of the Study ....................................................................................... 7
CHAPTER TWO ............................................................................................................ 8
LITERATURE REVIEW .............................................................................................. 8
2.1 Introduction ............................................................................................................ 8
2.2 Theoretical Review ................................................................................................ 8
2.3 Conceptual Framework .......................................................................................... 9
2.4 Empirical Review ................................................................................................. 12
2.5 Summary of Literature Review ............................................................................ 14
2.6 Research Gaps ...................................................................................................... 14
CHAPTER THREE ...................................................................................................... 15
RESEARCH METHODOLOGY ................................................................................ 15
3.1 Introduction .......................................................................................................... 15
3.2 Research Design ................................................................................................... 15

vi
3.3 Target Population ................................................................................................. 15
3.4 Sampling Technique and Sample Size ................................................................. 15
3.5 Data Collection Instruments ................................................................................ 16
3.6 Data Collection Procedures .................................................................................. 16
3.7 Pretesting of Research Tools ............................................................................... 16
3.8 Data Processing and Analysis .............................................................................. 17
CHAPTER FOUR ........................................................................................................ 19
RESEARCH FINDINGS AND DISCUSSIONS ........................................................ 19
4.1 Introduction .......................................................................................................... 19
4.2 Response Rate ...................................................................................................... 19
4.3 Pre-testing Results for Research Instruments ...................................................... 20
4.4 Background Information of the Respondents ...................................................... 21
4.5 Descriptive Statistics ............................................................................................ 24
4.6 Correlation Analysis ............................................................................................. 41
4.7 Regression Analysis ............................................................................................. 43
CHAPTER FIVE .......................................................................................................... 47
SUMMARY, CONCLUSION AND RECOMMENDATIONS ................................ 47
5.1 Introduction ........................................................................................................... 47
5.2 Summary of the Findings ..................................................................................... 47
5.3 Conclusions .......................................................................................................... 49
5.4 Recommendations ................................................................................................ 51
5.5 Limitation of the study ......................................................................................... 52
5.6 Suggestion for further study ................................................................................. 53
REFERENCES ............................................................................................................. 54
APPENDICES ............................................................................................................... 59

vii
LIST OF TABLES
Page
Table 3.1: Sample Selection……………………………………………………….......16
Table 3.2: Statistical Analysis Table………………………………………………......18
Table 4.1: Response Rate per Region……………………………………………….…20
Table 4.2: Cronbach Alpha for Reliability Assessments……………………………....20
Table 4.3: Aspects of Cash Management Practices as affecting the
Financial Performance of a Firm…………………………………………...27
Table 4.4: Aspects of Inventory Management Practices as affecting the
Financial Performance of a Firm…………………………………………...30
Table 4.5: Aspects of Accounts Receivables Management Practices as
affecting the Financial Performance of a firm……………………………...33
Table 4.6: Aspects of Payables Management Practices as affecting
the Financial Performance of a firm………………………………………..36
Table 4.7: Aspects of Working Capital Management Practices as
Affecting the Financial Performance of a Firm…………………………....38
Table 4.8: Correlation between Cash Management Practices and
Financial Performance…………………………………………….…….….41
Table 4.9: Correlation between Inventory Management Practices
and Financial Performance……………………………………..……….….42
Table 4.10: Correlation between Receivables Management Practices
and Financial Performance………………………………………..……….43
Table 4.11: Correlation between Payables Management Practices
and Financial Performance…………………………………………..…...43
Table 4.12: Model Summary………………………………………………………..…44
Table 4.13: ANOVA…………………………………………….…………………….44
Table 4.14: Coefficients…………………………………………….…………………45

viii
LIST OF FIGURES
Page
Figure 2.1: Conceptual Framework …..........................................................................10
Figure 4.1: Response Rate …........................................................................................19
Figure 4.3: Gender Distribution of the Respondents ....................................................21
Figure 4.4: Distribution of the Respondents by Age Brackets .....................................22
Figure 4.5: length of service of the respondents ….......................................................23
Figure 4.6: Respondents’ Level of Education …...........................................................23
Figure 4.7: Number of Years of Firms’ Operation …...................................................24
Figure 4.8: Effect of Cash Management Policy on Financial Performance..................25
Figure 4.9: Effect of Inventory Management Policy on Financial Performance ..........28
Figure 4.10: Effects of Receivables Management Practices on Financial
Performance ….........................................................................................32
Figure 4.11: Effect of Payables Management Practices on Financial
Performance ….........................................................................................35
Figure 4.12: Factors hindering tea processing firms from optimizing
their returns through management of their working capital.......................39

ix
LIST OF APPENDICES
Page
Appendix I Questionnaires ………………………………………………………... 59
Appendix II Record Survey Sheet…………………………………………….……. 65

x
ABBREVIATIONS AND ACRONYMS
ECM Efficiency of Cash Management
EOQ Economic Order Quantity
ERM Efficiency of Inventory Management
ERM Efficiency of Receivables Management
KTDA Kenya Tea Development Agency
NSE Nairobi Securities Exchange
ROA Return on Assets
ROI Return on Investment
SPSS Statistical Package for Social Sciences
SSE Small Scale Enterprises
TSE Tehran Stock Exchange
WCM Working Capital Management

xi
DEFINITIONS OF TERMS
Working Capital
These are current assets and liabilities that can be liquidated within a year (Gunay &
Kesimli, 2011).
Working Capital Management
Management of the short-term investments and financing of a company which include
current assets and current liabilities (Ross, Westerfield, & Jordan, 2010)
Working Capital Management Practice
The basic guidelines and principles the firms use to control and manage their Working
Capital (Nazir & Afza, 2009).
Cash Management
The determination of the optimal cash to hold in consideration to the trade-off between
the opportunity cost of holding too much and the cost of holding too little amount
(Ross, Westerfield, & Jordan, 2010)
Account Receivable Management
This is the maintaining of a given level of receivables that will attain the twin objectives
of profitability and liquidity (Dunn, 2009).
Inventory Management
A set of controls and policies that monitors the levels of inventory and determine when
to replenish, quantity to order and levels to be maintained (Chandra, 2008)
Account Payables Management
Payables management entails the decision to balance the benefits of trade credit against
the cost associated with the credit which include the cost of late payment penalties and
foregoing cash discounts (Van-Horne & Wachowicz, 2004).
Financial Performance
This is a measure of the outcomes of a firm's operations and policies in monetary terms
(Kassim, 2011).

xii
ABSTRACT
The tea sector is the most important agricultural sub-sector in Kenya contributing about
26 percent of the total foreign exchange earnings. The sector has been listed by the
government as one of the pillars of achieving Vision 2030. Despite the great
contribution, the performance of the tea processing firms has not been satisfactory to the
farmers due to wide variation of bonus payment from one firm to another. KTDA
attributes this variation to working capital management among other factors.
Management of working capital aims at maintaining an ideal balance between each of
the components of working capital which include cash, receivables, inventory and
payables. Therefore, the objective of this study was to determine the effect of working
capital management practices on the financial performance of the tea processing firms
in Kenya. The study employed a cross-sectional descriptive research design. The target
population was 54 tea processing firms in Kenya managed by KTDA. A sample of 48
tea processing firms was used in the study. Stratified random sampling method was
used to select the sample. Primary data was collected by use of a questionnaire whereas
the secondary data was collected by use of a record survey sheet. Pretesting was done to
determine the reliability and validity of the questionnaire. The data collected was
analyzed using Statistical Package for Social Sciences (SPSS). The study utilized both
descriptive and inferential statistics. In descriptive analysis, mean, standard deviation
and percentages of the responses were calculated. Under inferential statistics, Pearson’s
correlation, regression and ANOVA analyses were adopted. The findings of the study
indicated that working capital management practices significantly affected the financial
performance of tea processing firms. In particular, receivables and inventory
management practices had a negative and significant effect on the financial performance
of tea processing firms. Similarly, payables and cash management practices had a
positive and significant effect on the financial performance of tea processing firms. The
study therefore recommends tea processing firms to minimize the number of days
accounts receivable is outstanding and inventory turnover in order to increase
profitability. The firms should also lag creditors’ payments and increase the cash
conversion period in order to improve the financial performance. Managers and policy
makers should also come up with desirable working capital management practices that
will enable the firms to hold optimal levels and maximize the shareholders’ interests

1
CHAPTER ONE
INTRODUCTION
1.1 Background of the Study
Working capital management is the management of the short-term financing and
investments of a firm (Ross, Westerfield, & Jordan, 2010). It is the management of
investments which are required in order to finance day to day operations of the firm
(Nkwankwo & Osho, 2010). These investments are the current liabilities and current
assets which can be liquidated within a year or less and they are very vital for firm’s
day-to-day operations (Gunay & Kesimli, 2011). The management entails planning and
controlling of the current assets and current liabilities in a way that avoids unnecessary
investments and eliminates the risk of failing to meet organizations short term
obligation (Eljelly, 2004). Efficient management of working capital especially in
manufacturing firms, where a significant part of the investments is composed of current
assets is very vital (Van-Horne & Wachowicz, 2004).
In Kenya, most manufacturing organizations have huge investments of funds in working
capital, thus the way working capital is managed substantially impact on the
profitability of the company (Makori & Jagongo, 2013). In addition to the magnitude of
the working capital, surveys carried out have indicated that managers spend much of
their time solving issues that involve working capital decisions (Raheman & Nasr,
2007). This is due to the fact that in order to find an optimal level of working capital, a
firm has to achieve a balance between risks and efficiency (Filbeck & Kruger, 2005).
Several finance theories have therefore been proposed to guide managers on how to
maintain an optimal level of working capital. These theories include Keynesian liquidity
preference theory (Keynes, 1936) which guides managers to properly manage their cash
or liquidity, financing advantage theory (Schwartz, 1974) which enables managers to
set up an adequate receivables management policy, transaction cost theory (Ferris,
1984) which assists managers to efficiently manage their payables and economic order
quantity theory of inventory management (Harris, 1913) provides managers approaches
that ensure proper management of inventory is achieved.

2
1.1.1 Working Capital Management Practices
Working capital management practice refers to the basic principles and guidelines that
firms use when controlling their working capital. Financial risks of a firm can be
minimized and overall performance improved if well thought working capital
management practices are employed (Nazir & Afza, 2009). Pandey (2010) considered
working capital management practices as ways in which firms finance their current
assets. Proper management of working capital guarantees a company sufficient cash
flow to meet its operating expenses and short-term obligations (Waithaka, 2012).
Therefore, executing an effective working capital management practice facilitates firms
to improve their earnings.
To ensure an ideal level of working capital is achieved, there are four management
practices that can be considered: cash management, inventory management, account
receivables management and account payables management practices. Cash
management involves the determination of optimal cash to hold bearing in mind the
tradeoff between cost of holding too little cash and the opportunity cost of holding too
much (Ross et al., 2010). A firm should therefore monitor and plan its cash flows so as
to determine the optimum cash to maintain (Atrill, 2006). Inventory management is a
set of controls and guidelines that monitor the levels of inventory and determine what
levels should be held, when to replenish, and the quantity of each order (Chandra,
2008). Too much stock causes additional costs in form of potential spoilage,
obsolescence and storage costs (Brooks, 2013).
Management of accounts receivable is crucial to a firm because investment in account
receivables has both costs and benefits. A firm should therefore strive to maintain such
a level of receivables that will achieve the twin objectives of profitability and liquidity
(Dunn, 2009). Payables management entails the decision to balance the benefits of trade
credit against the costs associated with the credit (Van-Horne & Wachowicz, 2004).
Efficient management of accounts payables will optimize the cash outflow that will
ensure the firm’s liquidity is not adversely affected and ultimately the profitability of
the firm will not be affected in the long run (Uremadu, Egbide & Enyi, 2012).

3
1.1.2 Financial Performance
Financial performance is a measure of the outcomes of a firm's operations and policies
in monetary terms. These outcomes are revealed in the firm's accounting profitability,
return on investment (ROI), shareholders value and return on assets (ROA) (Kassim,
2011). Return on Assets measures how efficiently a firm utilizes the resources at its
disposal to generate revenue. Profitability is a measure that indicates whether a firm is
performing satisfactorily. Profitability is also used to determine a firm’s performance
relative to its competitors, identify whether a firm is a worthwhile investment
opportunity and measure the performance of management (Sushma & Bhupesh, 2007).
The common dilemma in the management of firms’ finances is to attain a preferred
trade- off between solvency, liquidity and profitability (Lazaridis & Tryponidis, 2006).
The study used return on assets, net profit and sales to assess financial performance.
1.1.3 Working Capital Management Practices and Financial Performance
Working capital management practices employed by a firm can make a significant
difference between its success and failure (Kwame, 2007). This is because working
capital, for most firms especially manufacturing firms constitutes a big chunk of their
investment thus tying up cash in working capital is as much as an investment as is tying
up cash in plant and equipment (Louderback & Dominic, 2000). Increasing investment
on working capital is considered as cash outflow since the money is locked and thus
cannot be used in other business area (Autukaite & Molay, 2011). It is therefore
expected that a restricted lean-and-mean current asset investment generally provides the
highest expected return (Brigham & Houston, 2007).
In the United States and United Kingdom, weak financial management, particularly
poor working capital management practices is the primary cause of failure among firms
(Bradley & Rubach, 2002). In Kenya, some private and public firms have been under
statutory management. The firms include the Ngenye Kariuki Stockbrokers, Uchumi
Supermarket and Pan Paper Mills. The major cause of failure of these companies was
due to their inability to meet their current financial obligations when they fall due
(Nairobi Securities Exchange 2013). This study therefore investigated the effect of
working capital on the financial performance of tea processing firms.

4
1.1.4 Tea Processing Firms
GWL Caine introduced tea in Kenya in the year 1903. Commercialization of the tea was
done in 1924 and subsequently Kenya became a major producer. Kenya is third in tea
production after India and China. Tea is one of the top foreign exchange earners in
Kenya alongside horticulture, coffee and tourism. The management of most tea
processing firms in Kenya is done by KTDA. The tea firms are managed by KTDA
through contractual agreements intended to ensure efficient production, processing and
marketing. KTDA manages 54 tea processing firms serving more than 500,000 small
scale farmers in Kenya.
KTDA members produce 60% of the tea in Kenya while large scale farmers produce the
rest (KTDA, 2016). KTDA has grouped the processing firms into seven regions
depending on geographical location. The regions are, Kisii Highlands, Kericho
Highlands, Nyambene Hills, Mt. Kenya, Aberdare Ranges, Nandi Hills and Western
highlands (KTDA, 2016). The farmers in the different regions have raised concerns due
to wide variation of bonus payments from one region to another. KTDA has attributed
this variation to working capital management practices employed by the different
factories (KTDA, 2016). Therefore, this study investigated the working capital applied
by the different factories and their effect on financial performance.
1.2 Statement of the Problem
The tea sector in Kenya is the second leading foreign exchange earner and the most
important agricultural sub-sector contributing twenty six percent of the total foreign
exchange earnings (KTDA, 2016). Due to this contribution to the economy, Kenyan
government listed the tea sector as one of the pillars of achieving the government’s
Vision 2030. Although the tea industry plays a significant role in Kenyan economy, the
performance of the tea processing firms over the years has not been satisfactory to the
farmers due to poor returns and wide variation of bonus payment from one firm to
another. The variation between the highest and the lowest paying tea processing firm
was 39%, 67% and 41% in the year 2013, 2014 and 2015 respectively.

5
The farmers earning the lowest bonus have threatened to abandon tea farming or sell
their tea to the highest paying bidders unless KTDA harmonizes the bonus payments.
KTDA has attributed the poor returns and the variation in bonus payment among the tea
processing firms to working capital management practices adopted by the various firms
(KTDA, 2016).
A number of studies relating to working capital management have been conducted both
in Kenya and in other economies. Raheman, Afza, Qayyum and Bodla (2010) examined
the effect of working capital management on firm’s performance in Pakistan and found
that working capital management significantly affected the performance of the firms.
This is supported by a study conducted in Kenya by Gakure, Cheluget, Onyango and
Keraro (2012) on the relationship between working capital management and
performance of manufacturing firms listed at Nairobi securities exchange. The study
found that there is a strong negative relationship between the liquidity of a firm and its
financial performance.
.However, a study by Oladipupo and Okafor (2013) on the implications of a firm’s
working capital management practices on profitability of manufacturing firms listed in
Nigeria Stock Exchange found that the effect of working capital was statistically
insignificant. Moreover, a study by Kotut (2009) on working capital management
practices adopted by Kenyan firms using listed firms in Nairobi securities exchange
found that working capital management practices affected firm’s profitability in variant
proportions depending on the sector the firms operated in as well the sizes of the firm.
Extant literature reveals that the studies on working capital management give
conflicting results, some concluding that there is a significant effect of working capital
management on financial performance, while others find that the effect was
insignificant and others find that the effect varies from one industry to another. Many
studies also targeted firms listed in stock exchange using secondary data and minimal
studies have been done in tea processing firms in Kenya. The present study was an
attempt to fill these gaps by investigating the effect of working capital management
practices on financial performance of tea processing firms in Kenya using both primary
and secondary data.

6
1.3 General Objective
The general objective of the study was to investigate the effect of working capital
management practices on financial performance of tea processing firms in Kenya.
1.3.1 Specific Objectives
i. To investigate the effect of cash management practices on the financial
performance of tea processing firms in Kenya.
ii. To evaluate the effect of receivables management practices on the financial
performance of tea processing firms in Kenya.
iii. To ascertain the effect of payables management practices on the financial
performance of tea processing firms in Kenya.
iv. To assess the effect of inventory management practices on the financial
performance of tea processing firms in Kenya.
1.4 Research Questions
i. What is the effect of Cash Management Practices on the financial performance
of tea processing firms in Kenya?
ii. What is the effect of Receivables Management Practices on the financial
performance of tea processing firms in Kenya?
iii. What is the effect of Payables Management Practices on the financial
performance of tea processing firms in Kenya?
iv. What is the effect of Inventory Management Practices on the financial
performance of tea processing firms in Kenya?
1.5 Scope of the Study
The study focused on the effect of working capital management practices on the
financial performance of 54 tea processing firms in Kenya managed by KTDA. The
working capital management practices were cash management, receivables
management, inventory management and payables working capital management
practices. The financial performance measures were return on assets (ROA), net profit
and sales.

7
1.6 Significance of the Study
The study will equip managers and policy makers with desirable working capital
management practices that will maximize the shareholders’ interests. Researchers and
scholars will use the study to identify the effects of the various practices on financial
performance. The study will also contribute to existing literature in the area of corporate
finance and open up areas for further research.

8
CHAPTER TWO
LITERATURE REVIEW
2.1 Introduction
This chapter reviews literature relating to working capital management practices and
financial performance. The sections are organized to cover the theoretical and empirical
literature on working capital management practices and its effect on financial
performance. The section also highlights the conceptual framework, summary of
literature and research gaps.
2.2 Theoretical Review
There are several economic theories that can be used to explain the relationship between
working capital management practices and the financial performance of firms. This
study adopted four theories namely: Keynesian liquidity preference theory, Economic
Quantity Model of inventory management, Financing advantage theory and Transaction
cost theory.
2.2.1 Keynesian Liquidity Preference Theory
The theory was proposed by Keynes in 1936 and identified three reasons why cash
management practices are vital for a firm. The theory argues that cash is required for
precautionary, speculative and transaction motives. Precautionary motive is the need for
a safety supply of cash and financial reserve. The speculative motive is the necessity to
hold cash in order to take advantage of investment opportunities. Transaction motive is
the requirement to have cash on hand to pay bills which include the payment of salaries,
dividends, trade debts and taxes. Pandey (2010) supported this theory and suggested
that the need for cash to run the daily operations of a firm cannot be ignored. Entities
should therefore invest adequate available funds in current assets for the success of its
operations. The theory highlights why different approaches are adopted in managing
cash and therefore enables the study to establish how the various firms have utilized
these approaches and its effect on their financial performance. However, this theory
does not give the optimum amount of cash that can be held at a given time or a model
that can be used to arrive at optimum amount.

9
2.2.2 Financing Advantage Theory
The theory was put forward by Schwartz in 1974 and guides managers in setting up an
effective receivables management practice. The theory asserts that a supplier may have
an advantage over traditional lenders by investigating the credit worthiness of his
clients, monitoring the repayments and forcing repayment of credit in case of default.
This may offer a number of cost advantages over financial institutions in lending to its
customers which include salvaging value from existing assets, information acquisition
and controlling the buyer (Joana, Vitorino & Moreira, 2011). A firm should therefore
set up a creditors management practice that will ensure the recovery of the credit
offered. The theory highlights different practices that can be applied in managing
receivables. This enables the study to establish the approaches used by the various firms
to manage their receivables and its effect on their financial performance.
2.2.3 Transactions Costs Theory
Transactions Costs theory was put forward by Ferris in 1981. It asserts that payables
management can lower the transactions costs of paying bills. A firm may wish to
cumulate commitments and pay them on monthly or quarterly basis rather than paying
them every time goods are delivered. This enables a firm to separate the payment cycle
from the delivery schedule (Williamson, 2013). Furthermore, the firm may have to
build up large inventories through credit in order to maintain smooth product cycle.
However, this attracts costs of warehousing the inventory and the cost of financing it.
Managers should therefore design a strategy that will minimize costs and increase
profits. The theory enables the study to find out the practices adopted by the various
firms in managing their payables and inventories their effect on financial performance
of the firms.
2.3 Conceptual Framework
The dependent variable in this study is the financial performance of tea processing firms
while the independent variables are the working capital management practices which
are cash, inventory, receivables and payables working capital management practice as
shown in Figure 2.1

10
Figure 2.1 Conceptual framework of the effect of working capital management
practices on financial performance of tea processing firms in Kenya
2.3.1 Cash Management Practices
Cash management is the process of making sure that sufficient cash is available to meet
the daily expenses and purposes to reducing the cash holding costs of a company
(Naser, Nuseibel & Al-Hadeya, 2013). It involves the process of controlling and
planning cash flows within, into and out of a firm and the cash balances held by the firm
at a given point in time (Pandey, 2010). It also involves the determination of the ideal
cash to hold in consideration to the tradeoff between the opportunity cost of holding too
much cash and the trading cost of holding too little (Ross et al., 2010). Therefore there
is need for managers to careful plan and monitor the cash flows over time in order to
determine the optimal cash to hold (Atrill, 2006). The key elements of cash
Dependent variable Independent Variables
Cash management practices
Cash budget preparation
Cash budget review
Setting optimal Cash balance
Inventory management practices
Inventory budget
Inventory levels review
Setting EOQ levels
Receivables management practices
Debt management policies
Monitoring accounts receivables
Debts collection policy
Payables management practices
Credit policies
Monitoring credit payments
Reviewing credit policies
Financial
performance of Tea
processing firms
ROA
Sales
Net profit

11
management are administration of cash receipts, disbursements, balances and internal
controls which include bank reconciliations (Gitman, 2009).
2.3.2 Inventory Management Practices
Inventory is the stock procured with the aim of selling at a profit and represents the
largest cost to a manufacturing firm. Inventory consists of between 20% and 30% of the
total investment in a manufacturing firm (Garcia & Martinez, 2007). Efficient
management of inventory is therefore important in order to facilitate the firm’s
operations. Kwame (2007) established that most firms prepare inventory budgets and
also review their inventory levels. Enhancing the inventory management enables firms
to avoid tying excess capital in idle stock at the expense of other viable ventures
(Lazaridis & Tryponidis, 2006).
2.3.3 Receivable Management Practices
Selling on credit is inevitable to a firm as long as there is competition in the industry. If
a firm does not extend credit to its customers it will definitely lose them to its
competitors. Investment in receivables therefore might not be an issue of choice but a
key matter for survival (Kakuru, 2011). To ensure optimal investment in receivables, a
firm must have an appropriate receivables management policy. The policy gives the
guidelines on how to decide the customers to be offered sales on open account, payment
terms, set the limits on outstanding balances and how to handle delinquent accounts
(Filbeck & Krueger, 2005).
2.3.4 Accounts Payable Management Practice
The most significant source of short-term finance is trade credit. It is relatively easy to
obtain; varies with the amount granted; informal and unstructured source of finance. It
does not also require any negotiations and form of agreement or restrictions which is
common in other sources of finance (Gitman, 2009). Management of accounts payables
involves the balancing of the benefits of trade credit against the costs of foregoing cash
discounts, late payment penalties, opportunity cost associated with deterioration in
credit standing and chance of increase in the price that can be imposed by the seller on
the buyer (Van-Horne & Wachowicz, 2004). The ultimate effect of managing accounts
payables efficiently is to maintain cash outflow which ensures a firm’s liquidity is not

12
adversely affected and consequently the firms profitability also will not be affected
(Uremadu et al., 2012).
2.4 Empirical Review
Studies relating to working capital management have been done in Kenya and other
economies. Maradi, Salehi and Arianpoor (2012) did a comparison of the impact of
working capital on performance of firms operating in medicine and chemical industries
quoted in Tehran Stock Exchange. The results of the study showed that debt ratio has
more impact on the reduction of net liquidity in medicine compared to chemical
industry. Raheman et al., (2010) investigated the effect of working capital management
on the financial performance of firms in Pakistan. The study found that net trade cycle,
inventory turnover and cash conversion cycle affected the firms’ performance
significantly. The study also found that the firms are faced with challenges due to the
payments and collection policies adopted. The study therefore suggested that sound
policies should be formulated for each component of working capital. Oladipupo and
Okafor (2013) conducted a study to determine the impact of working capital
management practices to the dividend payout ratio and profitability of 12 manufacturing
firms listed in the Nigeria Stock Exchange. The study found that the impact of working
capital management on the profitability of a firm was insignificant at 5% confidence
level.
In Kenyan context, Budambula (2014) examined the effect of working capital
management on profitability of tea trading firms a case of Chai Trading Company
Limited. The study found that the firm had put in place robust working capital
management practices which positively impacted the company’s profitability. The study
observed that debtors’ management had the most significant effect followed by
creditors’ management, inventories management and overdraft management in
decreasing order of effect. Nyabwanga, Ojera, Lumumba, Odondo, and Otieno (2012)
investigated the effect of working capital management practices on the financial
performance of small scale enterprises in Kisii South District, Kenya. The study found
that the financial performance of the SSE was positively related to efficiency of cash
management, receivables management and inventory management.

13
Waweru (2011) studied the relationship between working capital management and the
value of firms quoted in the Nairobi securities exchange. The study used secondary data
from financial reports and average stock price to measure the firms’ value. The
regression model indicated that there was relationship between working capital
management and the firm’s value while the result of the Pearson correlation indicated a
negative relationship between average cash collection period, inventory turnover in
days, cash conversion cycle and the value of the firm. Bowen, Morara, and Mureithi
(2009) carried out a study on management of business challenges among small and
micro enterprises in Nairobi. The study found that working capital management is one
of the serious challenges facing these enterprises.
Gakure et al., (2012) did a study on the relationship between working capital
management and the performance of manufacturing firms listed in the Nairobi securities
exchange (NSE) using secondary data. The results showed that there is a strong
negative relationship between a firm’s liquidity and its performance. The study also
found a negative coefficient relationship between average payments period, accounts
collection period, inventory holding period and profitability and positive correlation
between cash conversion cycle and profitability. However, the independent variables
except average payment period had no statistical significant effect even though the
overall model was statistically significant.
Kotut (2009) conducted a study on working capital management practices adopted by
firms listed in NSE. The study concluded that working capital management practices
affected the profitability of the firms in variant proportions depending on the industry
the firms operated in and their sizes. Wainaina (2010) did a study on the relationship
between working capital and profitability of small and medium enterprises in Kenya.
The firms were drawn from Information Communication and Technology (ICT),
General Trade and Construction sectors. The study revealed that there was no
relationship between profitability and cash conversion cycle for firms in the
construction, ICT and transport sectors. However, there was a positive relationship
between profitability and cash conversion for firms in the General Trade.
14
2.5 Summary of Literature Review
Keynesian liquidity preference theory enables managers to understand the need for
proper management of cash. The theory provides that liquidity should be maintained for
speculative, precautionary and transaction motives. Financing advantage theory enables
firms to come up with effective receivable management system which will enable the
firm to have cost advantages over financial institutions in offering credit facilities.
Transactions costs theory helps managers to understand that trade credit may reduce
transactions costs of paying bills. Furthermore, a firm can maintain smooth product
cycle by obtaining goods on credit. Economic Order Quantity Model helps managers to
hold optimal level of inventory which will minimize costs associated with inventory.
The model also enables an organization to put in place an effective stock management
system.
2.6 Research Gaps
The theories on working capital management reveal that working capital management is
an important element of corporate finance since it affects the liquidity and profitability
of a firm. An optimal management of working capital contributes positively to firm’s
performance and creation of a firm’s value. Existing literature also reveal that some of
the studies suggested that working capital management significantly affects the
performance of a firm.
However, other studies observed that the impact of working capital management on
corporate profitability is statistically insignificant while others concluded that working
capital management influenced corporate profitability in variant proportions depending
on the sector the firms operated. This therefore reveals that there exists conflicting
findings from one study to another. Furthermore, few studies relate to tea industry
especially processing firms managed by KTDA in Kenya. Therefore, the present study
is an attempt to fill these gaps and establish the working capital management practices
adopted by tea processing firms in Kenya and the effect on financial performance of the
firms.

15
CHAPTER THREE
RESEARCH METHODOLOGY
3.1 Introduction
This chapter covers the research design, target population, sampling technique and
sample size, data collection and procedures, pretesting, data processing and analysis
3.2 Research Design
The study adopted cross sectional descriptive research design. This design was used
because it necessitates an economical way of data collection at one point in time which
is fundamental for objective analysis owing to timing similarity as recommended by
Polit and Beck, 2010. This design also enables the identification and exposure of the
relationship between the independent and the dependent variables. The uniqueness of
each processing firm was also considered as each firm was expected to employ different
working capital management practice.
3.3 Target Population
The target population of the study composed of the 54 tea processing firms managed by
KTDA in Kenya. The firms are grouped into seven regions depending on geographical
location. The regions are Kisii Highlands, Kericho Highlands, Nyambene Hills, Mt.
Kenya, Aberdare Ranges, Nandi Hills and Western highlands.
3.4 Sampling Technique and Sample Size
Stratified random sampling technique was adopted in choosing the sample for this
study. The technique was appropriate because the tea processing firms are grouped into
7 regions by KTDA. The technique also increases sample’s statistical efficiency and
provides adequate data for analyzing sub populations as recommended by Cooper &
Schindler (2011). To have an adequate sample size relative to the objectives of the
study, Slovin’s formula as shown in Equation 3.1 was adopted (Ellen, 2012). This
resulted to a sample size of 48 firms to be studied. Stratified random sampling was then
employed to select the 48 tea processing firms from the seven regions as shown in
Table 3.1.

16
n = N/ [1 + N (e) 2
]. ……………………………………………………....Equation 3.1
Where n is the sample size, N is the total population and e is the error tolerance which
is 5%
Table 3.1: Sample Selection
Region Population Sample Percentage
Aberdare Ranges(a) 11 10 20
Aberdare Ranges(b) 9 8 17
Mt. Kenya 8 7 15
Nyambene Hills 7 6 13
Kericho Highlands 7 6 13
Kisii Highlands 9 8 17
Nandi Hills/Western Highlands 3 3 6
Total 54 48 100
3.5 Data Collection Instruments
The study used both secondary and primary sources of data. Self-administered semi-
structured questionnaire was used to collect the primary data. The secondary data was
collected from the audited financial statements of the tea processing firms and KTDA
website. This supplemented the primary data.
3.6 Data Collection Procedures
The primary data was collected from the heads of finance of the tea processing firms
using self-administered semi structured questionnaire. A total of 48 questioners were
administered using drop and pick later method. The questionnaires were delivered at the
offices of the respondents, given ample time to fill their response then collected.
3.7 Pretesting of Research Tools
Pretesting was conducted in five tea processing firms in order to determine the
reliability and the validity of the research instruments. This is 10% of the sample
population as recommended by Cooper and Schindler (2011). The firms used in
pretesting were omitted in the final study.

17
3.7.1 Reliability
The study applied internal consistency technique to measure the reliability of the data.
In this method, scores attained from different items in the questionnaire were correlated
and Cronbach’s Alpha Coefficient (Cronbach, 1951) was then computed to determine
the correlation between the items. The results of the Cronbach‘s alpha coefficients for
the different items tested were between 0.737 to 0.804. The instruments therefore met
the threshold value of 0.7 recommended by Cooper and Schindler (2011) thus they were
reliable.
3.7.2 Validity
To establish validity of the research instruments, content validity was used. The
opinions of experts in the field of study especially the study’s supervisor and lecturers
in the department of finance were sought. This facilitated the necessary modification
and revision of the research instruments in order to enhance their validity.
3.8 Data Processing and Analysis
The questionnaires were checked to ensure completeness once collected from the
respondents and coded prior to entering into the computer. The data were then analyzed
using descriptive statistics by use of Statistical Package for Social Sciences (SPSS) as
shown in Table 3.2. To establish the relationship between the independent and
dependent variables, a multiple linear regression model was used. The overall
significance of the model was tested using analysis of variance by use of F statistics at
95% confidence level. Coefficient of determination R2 was used to show the
contribution of the independent variables on the dependent variable. The regression
model in equation 3.2 was used.
Y= β0 + β1X1 + β2X2 + β3X3 +β4X4 + ԑ ……………………………………Equation 3.2
Where; Y is the financial performance of tea processing firms, β0 is the Intercept
constant, X1 is Cash Working Capital Management Practice, X2 is inventory working
capital management practice, X3 is receivable working capital management practice, X4
is payables working capital management practice, β1 – β4 is the corresponding
coefficients of the independent variables and ԑ is the error term.

18
Table 3.2: Statistical Analysis Table
Objective Independent
variable
Dependent
variable
Statistical tools Means of
data
collection
To investigate the
effect of cash
management
practices on the
financial
performance of tea
processing firms in
Kenya.
Cash
management
practices
Financial
performance
of tea
processing
firms in
Kenya
Mean, standard
deviation,
Pearson
correlation
analysis and
regression
analysis
Questionnaire
and
Record
survey sheet
To evaluate the
effect of receivables
management
practices on the
financial
performance of tea
processing firms in
Kenya.
Receivables
management
practices
Financial
performance
of tea
processing
firms in
Kenya
Mean, standard
deviation,
Pearson
correlation
analysis and
regression
analysis
Questionnaire
and
Record
survey sheet
To ascertain the
effect of payables
management
practices on the
financial
performance of tea
processing firms in
Kenya.
Payables
management
practices
Financial
performance
of tea
processing
firms in
Kenya
Mean, standard
deviation,
Pearson
correlation
analysis and
regression
analysis
Questionnaire
and
Record
survey sheet
To assess the effect
of inventory
management
practices on the
financial
performance of tea
processing firms in
Kenya.
Inventory
management
practices
Financial
performance
of tea
processing
firms in
Kenya
Mean, standard
deviation,
Pearson
correlation
analysis and
regression
analysis
Questionnaire
and
Record
survey sheet

19
CHAPTER FOUR
RESEARCH FINDINGS AND DISCUSSIONS
4.1 Introduction
This chapter presents the analysis and findings of the study as set out in the research
methodology. The chapter covers the response rate, background information of the
respondents, descriptive statistics, and correlation and regression analysis.
4.2 Response Rate
The study administered 48 questionnaires to the respondents who were the heads of
finance in each of the tea processing firms. A total of 37 questionnaires were filled and
collected from the respondents which translates to 77% response rate as shown in
Figure 4.1. Babbie (2010) recommended that a 60% return rate is good and a 70%
return rate is very good. The distribution of the response rate per region is as shown in
Table 4.1. The results show that the response rate ranged between 63% and 83% per
region. This indicates that the response rate per region was sufficient and falls within
the recommended threshold.
Figure 4.1: Response Rate

20
Table 4.1: Response Rate per Regions
Region Sample size
Response
Received
Response
Rate
Aberdare Ranges(a) 10 8 80%
Aberdare Ranges(b) 8 6 75%
Mt. Kenya 7 5 71%
Nyambene Hills 6 5 83%
Kericho Highlands 6 5 83%
Kisii Highlands 8 6 75%
Nandi Hills /Western Highlands 3 2 67%
Total 48 37 77%
4.3 Pre-testing Results for Research Instruments
The study sought to determine the reliability of the research instruments. The results are
as shown in table 4.2. The results of the Cronbach‘s alpha coefficients for the different
items tested were between 0.737 to 0.804. The instruments therefore met the threshold
value of 0.7 recommended by Cooper and Schindler (2011) thus they were reliable.
Table 4.2: Cronbach Alpha for Reliability Assessments
Variables Number of items
Cronbach Alpha
Values
Cash Management Practices Statement 4 0.742
Inventory Management Practices Statement 4 0.767
Receivables Management Practices Statement 4 0.737
Payables Management Practices Statement 4 0.752
Financial Performance Statement 3 0.804

21
4.4 Background Information of the Respondents
The study sought to find out the background information of the respondents in terms of
gender, age, length of service, their level of education and the number of years their
firms have been in operation. This information was useful in determining the
understanding of the respondents on the issues sought by the study.
4.4.1 Gender Distribution of the Respondents.
The respondents sampled in this study were expected to comprise of both male and
female. The study therefore required the respondents to indicate their gender by ticking
on the spaces provided in the questionnaire. Figure 4.3 shows the distribution of the
respondents by gender. The figure shows that 59% of the respondents were male while
41% were female. This indicates that majority of the heads of finance in the tea
processing firms are male. The findings also show that the tea processing firms had both
male and female members of staff and the ratio is within the 1/3rd
rule provided in the
Kenyan Constitution. The findings also imply that the views expressed in the study are
gender sensitive and can be taken as representative of the opinions of both genders as
regards to the effect of working capital management practices on financial performance
of tea processing firms in Kenya
Figure 4.3: Gender Distribution of the Respondents.

22
4.4.2 Age of the Respondents
The study sought to establish the composition of the respondents in terms of age. Figure
4.4 shows the distribution of the respondents by age bracket. The figure indicates that
54% of the respondents were aged between 25-35 years, 32% were aged between 36-45
years, while 14% of were aged above 45 years. It is clear from the results that the
respondents were of different ages and most of them were below 35 years. The study
therefore represents the views of young and aged finance officers with different
knowledge and experience.
Figure 4.4: Distribution of the Respondents by Age Brackets
4.4.3 Length of Service
The study sought to find out the length of time that the respondents had been serving in
their current position in order to establish their familiarity of the issues sought by the
study. The results presented in Figure 4.5 shows that 48% of the respondents had served
for a period of 6-10 years, 28% between 11-15 years while 17% had served for over 15
years and 7% had served in their current position for between 0-5 years. The length of
service in an organization can determine the extent to which an employee is familiar
with issues relating to their area of work or performance of their organization. The
findings indicate that majority of the respondents had served for over 6 years and thus
they were conversant with the issues sought by the study.

23
Figure 4.5: length of service of the respondents
4.4.4 Level of Education
The study was carried out in different tea processing firms who recruit staff depending
on their policies which would differ from one firm to another. It was therefore expected
that the employees could have different qualification depending on the policies adopted
by the different firms. The level of education could also influence the application of
certain working capital management practices by the firms due to the different skills or
knowledge attained by the staff. This difference could therefore contribute to
differences in the responses given by the respondents. The study therefore sought to
establish the education level of the respondents. The distribution of the level of
education of the respondents is presented in Figure 4.6. It is evident from the figure that
43% of the respondents had attained Certificate/Diploma, 38% had attained
undergraduate degree while 19% had attained postgraduate degree. This results show
that the respondents had attained a variety of knowledge and thus knowledgeable to
contribute positively in this study.
Figure 4.6: Respondents’ Level of Education

24
4.4.5 Number of Years of Firms’ Operation
The number of years a firm has been in operation can indicate the performance of a firm
and the level of experience. The study therefore sought to establish the number of years
the firms had been in operation. The results presented in Figure 4.7 reveal that a
significant majority (78%) of the respondents indicated that their firms had operated for
more than 15 years. A few (19%) had operated for between 11-15 years and 3% had
operated for between 6-10 years. This shows that most of the firms had been in
operation for more than 15 years and therefore the firms had sufficient information on
the effect of working capital management practices on financial performance.
Figure 4.7: Number of Years of Firms’ Operation
4.5 Descriptive Statistics
The objective of this study was to investigate the effect of working capital management
practices on financial performance of tea processing firms in Kenya. As such the study
sought to establish the extent to which the respondents agreed with a given aspects of
working capital management practices as affecting the financial performance of a firm.
A scale of 5 to 1 where 5 is Strongly Agree, 4 is Agree, 3 is Neither agree nor Disagree,
2 is Disagree and 1 is strongly disagree was provided. This section presents the results
of how the respondents agreed with the different aspects of working capital
management practices which were cash, inventory, accounts receivables and accounts
payables management practices. The section also presents the descriptive results of the
secondary data sought through the record survey sheet.

25
4.5.1 Cash Management Practices
The study sought to establish if the firms had put in place a cash management policy
and how it affected their financial performance. All the 37 firms indicated that they had
put in place a cash management policy. The study also sought the views of the
respondents on the effect of the policy on the financial performance of the tea
processing firms. The findings revealed that the opinions of the respondents varied as
presented in Figure 4.8.
Figure 4.8: Effect of Cash Management Policy on Financial Performance
Majority (85%) of the respondents concurred that cash management policies enables a
firm to reduce or mitigate liquidity risks. This implies that if a firm puts in place a cash
management policy, the firm will be able to mitigate cost associated with cash shortage
like borrowing costs or shortage of supplies due to lack of cash to purchase them. This
will in turn lead to better financial performance of the firm. This view is consistent with
a study by Naser et al., (2013) which concluded that cash management process ensures
that sufficient cash is available to meet daily expenses and purposes to reducing the
cash holding costs of a firm.

26
The findings also indicated that 52% of the respondents were of the opinion that cash
management policy anabled the firms to increase production which in turn increased the
turnover and profits. This implies that proper management of cash enables a firm to
have sufficient cash to discharge its operations without any disruption which may
include lack of stock or labour due to inability to pay supliers or wages and other costs.
The findings also show that 43% of the respondents concurred that cash management
policy assists a firm to increase its inestment income. The respondents asserted that the
policy enables a firm to maintain an optimum amount of cash and invest any excess
amount in income generating ventures like treasury bills thus increase investment
income. This can be interprated that the policy enables a firm to determine the level of
cash to maintain at a given period and any amount that is not required is invested in
order to generate income. The findings conform with a study by Ross et al., (2010)
which asserted that cash management involves the determination of ideal cash to hold in
consideration to the tradeoff between the opportunity cost of holding too much cash and
the trading cost of holding too little.
The findings from secondary data indicated that the average cash conversion cycle for
the tea processing firms is 85 days. This means that the net time interval between cash
collections from sales of the firms’ products and cash payments for the resources
acquired by the firm is 85 days. A similar study by Davis (2016) found that the cash
conversion cycle for tea processing firms in Nandi county was 62.30 Tea processing
firms therefore require a certain level of cash to facilitate the operations of the firm
since it can take some time before stock or sale are converted into cash.
4.5.1.1 Aspects of Cash Management Practices as affecting the Financial
Performance of a Firm
The study sought to establish the extent to which the respondents agreed with a given
aspects of cash management practices as affecting the financial performance of a firm.
The results are presented in Table 4.3.

27
Table 4.3: Aspects of Cash Management Practices as affecting the Financial
Performance of a Firm
Cash Management
Practices Statement
stro
ngly
agre
e
Agre
e
Nei
ther
agre
e
nor
Dis
agre
e
Dis
agre
e
Str
on
gly
Dis
agre
e
Mea
n
Std
. D
ev
Cash budget enables a firm to
maintain an optimum amount
of cash that will meet the
operations of the firm
56.8% 32.4% 5.4% 5.4% 0.0% 4.41 .832
The Cash budget is reviewed
regularly to enable a firm to
meet changes in cash
requirements
40.5% 54.1% 5.4% 0.0% 0.0% 4.35 .588
Optimal cash balance is set to
ensure adequate liquidity is
maintained at all times.
32.4% 56.8% 5.4% 5.4% 0.0% 4.16 .764
Cash flow prediction aids in
proper financial planning
45.9% 40.5% 10.8% 2.7% 0.0% 4.30 .777
Results in Table 4.2 reveals that majority of the respondents agreed with all the aspects
of cash management practices as affecting the financial performance. In particular, it
was evident that most of the firms regularly reviewed cash budgets in order to meet
changes in cash requirement operations with 94.6% of the respondents being in
agreement with the statement (mean = 4.31, std. dev = 0.588). Similarly, 89.2%% of the
respondents concurred that the firms prepared cash budgets in order to maintain
optimum amount of cash that will meet daily (mean = 4.41, std. dev = 0.832).
The findings also reveal that optimal cash balance is set to ensure adequate liquidity is
maintained at all times with 89.2% of the respondents agreeing with the statement
(mean = 4.16, std. dev = 0.764). Most of the respondents (86.4% also affirmed that cash
flow prediction aids in proper financial planning with (mean = 4.30, std. dev. = 0.777).
The findings imply that a firm needs to prepare a budget for all its cash requirements for
a given period in order to enable the firm to discharge its daily cash obligations which
include procurement of supplies, payment of wages and bills.

28
In addition, a firm needs review the budget regularly in order to meet unexpected
demands which might not have been unforeseen during the preparation of the budget for
instance delay by customers to pay their obligation or rise in demand which will require
more resources.
A firm is expected to set a certain level of cash to maintain at a given period. The level
must be sufficient to meet daily cash requirements which include payment of bills and
invest any unnecessary amount. A firm also needs to predict the cash required or
generated in a given period in order to decide whether to borrow for more cash or invest
any amount that might not be required. These findings are in agreement with a study by
Kwame (2007) which established that putting in place a cash balance policy ensures
prudent cash budgeting and investment of surplus cash. Kung’u (2017) established that
firms embraced cash budgeting as a useful tool in cash management. Gryglewicz (2011)
argued that cash flow which is cash receipts and cash payments determined the ability
of a firm to generate profit and continue their operations.
4.5.2 Inventory Management Practices
The study sought to find out if the firms had put in place an inventory management
policy and how it affected their financial performance. All the respondents indicated
that the firms had established an inventory management policy and gave their opinion
on how it affected their financial performance which was analyzed as shown in Figure
4.9.
Figure 4.9: Effect of Inventory Management Policy on Financial Performance.

29
The figure shows that 73% of the respondents concurred that maintaining an inventory
policy enables an organization to reduce costs associated to stock which in turn increase
profitability. This implies that when a firm puts in place an inventory policy, the firm
will be able to reduce cost of stock which include ordering costs, storage costs,
pilferage, insurance and stock out costs.
It was also evident that 66% of the respondents were of the opinion that the policy
enables a firm to increase its investment income. This can be interpreted that an
inventory policy enables a firm to maintain only sufficient inventory which is required
to facilitate production at a given time. This means that no idle stock is maintained in
the firm and thus resources are released to other income generating investments.
Similarly, 54% of the respondents indicated that the policy can help in increasing the
firms’ production. This implies that maintaining the inventory policy enables the firm to
have sufficient stock at all times which in turn lead to un- interrupted production.
Brooks (2013) asserted that too much stock causes additional costs in form of potential
spoilage, obsolescence and storage costs.
The findings from secondary data indicate that the average inventory conversion period
for the tea processing firms is 72 days. This shows that the firms maintain stock that can
last for 72 days before they are sold. A study by Okungu (2014) found that the average
inventory collection period for sugar processing firms was 70.61 days. This indicates
that firms maintain a certain level of stock which requires to be managed in order to
ensure only sufficient amount is maintained. Enhancing the inventory management
enables firms to avoid tying excess capital in idle stock at the expense of other viable
ventures (Lazaridis et al., 2006).
4.5.2.1 Aspects of Inventory Management Practices as affecting the Financial
Performance of a Firm
The study sought to ascertain the extent to which the respondents agree with a given
aspects of inventory management practices as affecting the financial performance of a
firm. The findings are presented in Table 4.4

30
Table 4.4: Aspects of Inventory Management Practices as affecting the Financial
Performance of a Firm
Inventory Management
Practices Statement
stro
ngly
agre
e
Agre
e
Nei
ther
agre
e n
or
Dis
agre
e
Dis
agre
e
Str
on
gly
Dis
agre
e
Mea
n
Std
. D
ev
Inventory budget is prepared
to ensure adequate inventory
is available for smooth
operations of the firm
29.7%
51.4%
8.1%
10.8%
0%
4.0
.913
The level of inventory is
reviewed to ensure optimal
stock is maintained
45.9%
40.5%
8.1%
5.4%
0%
4.27
.838
The level of EOQ is set to
enable a firm to order
sufficient inventory at
minimal costs
35.1%
48.6%
5.4%
10.8%
0%
4.08
.924
Inventory control system
assists in efficient
management of inventory
32.4%
56.8%
10.8%
0%
0%
4.22
.630
The findings in Table 4.3 shows that majority (89.2%) of the respondents agreed with
the statement that inventory control system assists in efficient management of inventory
(mean = 4.22, std. dev. = 0.630). In regards with the statement that the level of
inventory is reviewed to ensure optimal stock is maintained at all times, majority
(86.4%) of the respondents agreed with the statement (mean = 4.27, std. dev. = 0.838 ).
Most (83.7%) of the respondents also concurred that the level of EOQ is set to enable a
firm to order sufficient inventory at minimal costs (mean = 4.08, std. dev. = 0.924). It
was also evident that inventory budget is prepared to ensure adequate inventory is
available for smooth operations of the firm with 81.1% of the respondents indicating
that they agreed with the statement (mean = 4.0, std. dev. = 0.913).

31
The findings imply that a firm needs to prepare an inventory budget which will detail
the inventory required in a given period. The budget will ensure adequate inventory is
available to facilitate the operation of the firm and avoid cases of stock outs. The level
of inventory also need to be reviewed regularly in order to meet unforeseen factors that
might not have been covered by the budget for instance increased demands at a given
period may lead to increased usage of inventory in order to meet the demands. A firm
also needs to set an economical level of inventory to order at given time. This will
minimize costs associated to stock which include ordering costs, storage costs,
insurance costs and also avoid tying resources in unnecessary stock. Firms also need to
come up with an inventory control system that will guide the firm on how much stock to
order, what level to maintain at a given period and how to store the inventory.
These findings concurred with the findings by Kwame (2007) which found that firms
reviewed their inventory levels and prepared inventory budgets. Nyabwanga et al
(2012) also found that firms often prepare inventory budgets and reviewed their
inventory levels. This enabled the firms to maintain an optimal level of inventory which
reduces the cost of possible interruptions or loss of business due to the scarcity of
products, reduce costs of supplies and protect the firm against fluctuations of prices.
Pandey (2010) also recommended that a firm should put in place a control system in
order to manage its inventory effectively.
4.5.3 Accounts Receivable Management Practices
The study sought to ascertain the effect of payables management practices on the
financial performance of tea processing firms in Kenya. In this regard the study required
the respondents to indicate if they had established an accounts management policy and
how it affected their financial performance. All the respondents indicated that they had
established the policy and the same affected the financial performance as presented in
Figure 4.10.

32
Figure 4.10 Effects of Receivables Management Practices on Financial
Performance.
It is evident that majority of the respondents (81%) indicated that the policy reduced
costs associated with debtors. This implies that the policy enables a firm to properly
manage its debtors thus avoid costs which may result due to bad debts, delayed
payments by debtors and debt collection costs which include debt collectors wages or
factoring costs.
Majority (75%) of the respondents asserted that accounts receivable policy enables a
firm to increase its sales turnover. This can be interpreted to mean that the policy
enables a firm to offer credit facilities to deserving customers thus increase the sales of
the firm. Offering credit also can enable a firm to have a competitive edge over its
competitors who do not offer credit. Similarly, 52% of the respondents indicated that
the policy assists a firm to reduce liquidity risks. This means that if a firm maintains
accounts receivable policy, debtors will be monitored to ensure they pay as per the
credit terms.

33
The findings agree with a study by Dunn (2009) which asserted that investment in
receivables has both benefits and costs; it becomes important to have such a level of
investment in receivables at the same time observing the twin objectives of liquidity and
profitability. The findings from secondary data affirmed that the firms offered credit
facilities. The average accounts collection period was 54 days which implies that the
firms offered credit facilities to their customers and it took the firms an average of 54
days to receive payment from the customers. A study by Davis (2016) found that
accounts receivables period for tea processing firms in Nandi County was 62.500. There
is therefore need to have a policy to ensure the accounts receivable are properly
managed in order to realize the benefits of investing in accounts receivables.
4.5.3.1 Aspects of Accounts Receivables Management Practices as affecting the
Financial Performance of a firm
The study sought to establish the extent to which the respondents agree with a given
aspects of accounts receivables management practices as affecting the financial
performance of a firm. The findings are presented in Table 4.5.
Table 4.5: Aspects of Accounts Receivables Management Practices as affecting the
Financial Performance of a firm
Accounts Receivables
Management Practices
Statement
stro
ngly
agre
e
Agre
e
Nei
ther
agre
e n
or
Dis
agre
e
Dis
agre
e
Str
on
gly
Dis
agre
e
Mea
n
Std
. D
ev
Receivables management
policies are put in place to
enable a firm to regulate the
credit allowed and recovery of
debtors
51.4% 40.5% 8.1% 0.0% 0.0% 4.43 .647
Monitoring of accounts
receivable ensures timely
recovery of debts
37.8% 56.8% 2.7% 2.7% 0.0% 4.30 .661
Receivables collection policies
are set to assist in reduction of
bad debts
54.1% 40.5% 5.4% 0.0% 0.0% 4.49 .607
The length of credit period to
customers has an influence on
sales
43.2% 43.2% 2.7% 10.8% 0.0% 4.19 .938

34
The findings in Table 4.4 show that most of the respondents agreed with the aspects of
accounts receivable. Majority (94.6%) of the respondents concurred that monitoring of
accounts receivable ensures timely recovery of debts (mean = 4.30, std. dev. = 0.661).
Similarly, majority (94.6%) of the respondents agreed with the statement that
receivables collection policies are set to assist in reduction of bad debts (mean = 4.49,
std. dev. = 0.607). It was also evident that majority (91.9%) of the respondents agreed
with the statement that receivables management policies are put in place to enable a
firm to regulate the credit allowed and recovery of debtors (mean = 4.43, std. dev. =
0.647). Most of the respondents (86.4%) also agreed with the statement that the length
of credit period to customers has an influence on sales (mean = 4.19, std. dev. = 0.938).
The findings imply that a firm needs to come up with a policy that will guide in offering
credit facilities. This policy will provide the criteria that will be followed before
granting credit to customers. The policy will also guide on the amount and time that the
customers will be required to pay their debts. Once credit is offered to customers, a firm
is expected to monitor the repayment of the debts. This will enable the firm to know if
the debtors are repaying as agreed and those who do not comply are noted and
necessary action is taken to avoid bad debts. A firm is also need to consider giving its
debtors sufficient time to pay their debts since it will encourage them to purchase more
due to the ability to repay small amounts for a longer period.
The findings concur with a study by Lazaridis et al., (2006) which found that credit
period granted to customers had a positive impact on profitability. Owolabi and Obida
(2012) argued that where goods are sold on credit, a monitoring system is important
because without it, receivables will build up to excessive levels and bad debts will
offset profit on sales. Elliots (2009) recommended that management should review and
revise their credit policies periodically in order to incorporate changes in strategic
direction and risk tolerance or market conditions. Dunn (2009) on the other hand
suggested that customers who may not honor their obligation should not be offered
credit and credit selection and standards should be applied in determining the customers
to be offered credit and only credit worthy customers should access credit.

35
4.5.4 Payables Management Practices
The study sought to find out whether the respondents had established payables
management policy and the effect of the policy on their financial performance. The
results indicated that all the firms had payables management policy in place and the
same affected the financial performance as shown in figure 4.11.
Figure 4.11 Effects of Payables Management Practices on Financial Performance
Majority of the respondents (76%) indicated that payables policy enables a firm to
increase its production. This implies that when a firm manages its accounts payables it
will be able to borrow when need arises and also pay the creditors within the expected
time. This will enable the firm to have good relationship with suppliers and thus be
supplied with goods and services promptly and also be offered credit facilities and
discounts.
The findings also indicate that 64% of the respondents indicated that the policy enables
a firm to reduce costs of borrowing. This implies that when a firm utilizes credit
facilities, the cost of borrowing reduces because credit facilities are cheaper than other
sources of capital like borrowing from banks which charge higher interest rates. It was
also evident that the policy enabled the firms to avoid liquidity risks. When a firm is
faced with cash shortages during the course of its operations for instance inability to
purchase raw materials, the firm can organize with suppliers to deliver the raw materials
and pay them later. The policy can help the firm to decide how much and when to
procure in credit in order to avoid liquidity risks and also avoid interruption of its
production process.

36
Findings from the secondary data indicate that the average accounts payable period was
43 days. This means that the firms utilized credit facilities and it took 43 days for the
firms to pay the suppliers for the goods delivered. Chebet (2015) found that the average
payment period for manufacturing firms in Nairobi County was 113.05 days. The firms
therefore require a policy to manage the accounts payable. Uremadu et al., (2012)
asserted that the ultimate effect of managing accounts payables efficiently is to maintain
cash outflow which ensures a firm’s liquidity is not adversely affected and consequently
the firm’s profitability also will not be affected.
4.5.4.1 Aspects of Payables Management Practices as affecting the Financial
Performance of a firm
The study sought to find out the extent to which the respondents agreed with a given
aspects of payable management practices as affecting the financial performance of a
firm. The findings were presented in Table 4.6.
Table 4.6: Aspects of Payables Management Practices as affecting the Financial
Performance of a firm
Payables Management
Practices Statement
stro
ngly
agre
e
Agre
e
Nei
ther
agre
e
nor
Dis
agre
e
Dis
agre
e
Str
on
gly
Dis
agre
e
Mea
n
Std
. D
ev
Payables/credit policies
enables a firm to avoid
liquidity risks
40.5% 45.9% 8.1% 5.4% 0% 4.22 .821
Payables/ credit payments are
monitored to ensure timely
supply of goods and services
29.7% 67.6% 2.7% 0% 0% 4.27 .508
Credit policies are reviewed
to ensure optimal credit is
maintained at all times
32.4% 64.9% 2.7% 0% 0% 4.30 .520
Credit facilities enables a
firm to adequately finance its
operations
37.8% 45.9% 5.4% 10.8% 0% 4.11 .936
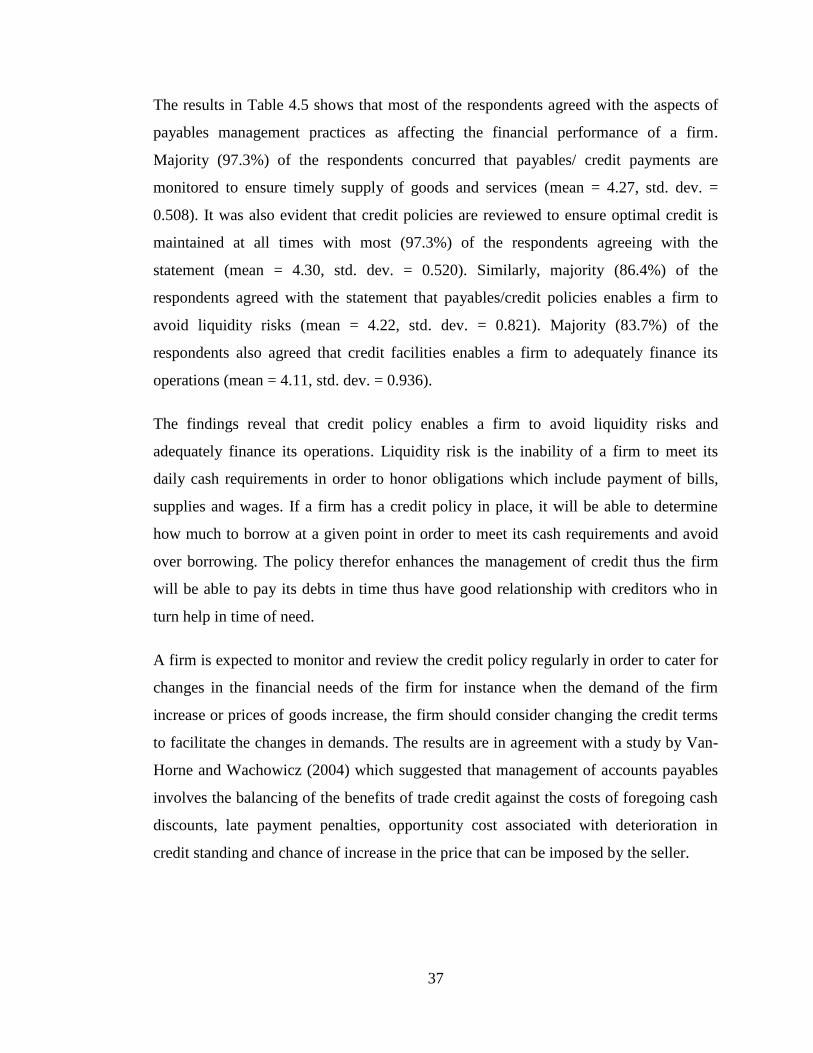
37
The results in Table 4.5 shows that most of the respondents agreed with the aspects of
payables management practices as affecting the financial performance of a firm.
Majority (97.3%) of the respondents concurred that payables/ credit payments are
monitored to ensure timely supply of goods and services (mean = 4.27, std. dev. =
0.508). It was also evident that credit policies are reviewed to ensure optimal credit is
maintained at all times with most (97.3%) of the respondents agreeing with the
statement (mean = 4.30, std. dev. = 0.520). Similarly, majority (86.4%) of the
respondents agreed with the statement that payables/credit policies enables a firm to
avoid liquidity risks (mean = 4.22, std. dev. = 0.821). Majority (83.7%) of the
respondents also agreed that credit facilities enables a firm to adequately finance its
operations (mean = 4.11, std. dev. = 0.936).
The findings reveal that credit policy enables a firm to avoid liquidity risks and
adequately finance its operations. Liquidity risk is the inability of a firm to meet its
daily cash requirements in order to honor obligations which include payment of bills,
supplies and wages. If a firm has a credit policy in place, it will be able to determine
how much to borrow at a given point in order to meet its cash requirements and avoid
over borrowing. The policy therefor enhances the management of credit thus the firm
will be able to pay its debts in time thus have good relationship with creditors who in
turn help in time of need.
A firm is expected to monitor and review the credit policy regularly in order to cater for
changes in the financial needs of the firm for instance when the demand of the firm
increase or prices of goods increase, the firm should consider changing the credit terms
to facilitate the changes in demands. The results are in agreement with a study by Van-
Horne and Wachowicz (2004) which suggested that management of accounts payables
involves the balancing of the benefits of trade credit against the costs of foregoing cash
discounts, late payment penalties, opportunity cost associated with deterioration in
credit standing and chance of increase in the price that can be imposed by the seller.

38
4.5.5 Working Capital Management Practices and Financial Performance
The study sought to establish the extent to which the respondents agreed with a given
aspects of working capital management practices as affecting the financial performance
of a firm. The findings were presented in Table 4.7.
Table 4.7: Aspects of Working Capital Management Practices as Affecting the
Financial Performance of a Firm
Working Capital
Management Practices
Statement st
ron
gly
agre
e
Agre
e
Nei
ther
agre
e n
or
Dis
agre
e
Dis
agre
e
Str
on
gly
Dis
agre
e
Mea
n
Std
. D
ev
Proper working capital
management practices
ensures high rate of Return
on Assets of a firm
45.9% 51.4% 2.7% 0% 0% 4.43 .555
Employing sound Working
Capital management
practices results to increased
Sales Revenue of a firm
37.8% 56.4% 5.4% 0% 0% 4.32 .580
Efficient working capital
management practices
improves the Net Profit of a
firm
29.7% 67.6% 2.7% 0% 0% 4.27 .508
The findings reveal that most of the respondents indicated that they agreed with the
statements. In particular, majority (97.3%) of the respondents agreed with the statement
that proper working capital management practices ensures high rate of return on assets
of a firm (mean = 4.43, std. dev. = 0.555). It was also evident that majority (97.3%) of
the respondents agreed with the statement that efficient working capital management
practices improves the net profit of a firm (mean = 4.27, std. dev. = 0.508). Most
(94.2%) of the respondents also agreed that employing sound working capital
management practices results to increased sales revenue of a firm (mean = 4.32, std.
dev. = 0.580).

39
The results shows that proper management of working capital enables a firm to improve
its financial performance which can be measured in terms of return on assets, sales and
profit. The working capital management practices are cash, inventory, receivables and
payables management practices. This means that coming up with ideal working capital
management practices will positively contribute to better financial performance of a
firm. These findings are in agreement with a study by Kwame (2007) which found that
he working capital management practices employed by a firm can make a significant
difference between its success and failure. Nazir and Afza (2009) asserted that financial
risks of a firm can be minimized and overall performance improved if well thought
working capital management practices are employed.
4.5.5.1 Factors which hinder tea processing firms from optimizing their returns
through management of their working capital
The study sought to establish factors hindering tea processing firms from optimizing
their returns through the management of working capital. The findings were
summarized and presented in Figure 4.12.
Figure 4.12: Factors hindering tea processing firms from optimizing their returns
through management of their working capital

40
The figure indicates that majority (82%) of the respondents concurred that
unpredictable demand, supply and prices of their products contributed negatively to the
firms optimizing their returns through management of working capital. This implies that
the firms are faced with unpredictable changes in demand, supply and prices of both the
raw materials and products. This means that even though the firms prepare budget for
the working capital needs, any change in the market for instance prices of the demand
of their final product will lead to need for more cash or raw materials to facilitate the
firm produce more for the increased demand. This may lead to the firm not being able
to honor its obligation or even be force to withdraw savings before they mature in order
to meet the rise in demand.
Most (73%) of the respondents also indicated that high cost of short term borrowing
affected the firms from achieving their goals through management of working capital. A
firm needs to borrow in order to facilitate its operations when it doesn’t have enough
working capital. If the cost of borrowing is high than the income generated, a firm will
be forced to avoid the loan. This will therefore lead to lack of enough funds to continue
with the firms operations thus lead to reduced production and loss of revenue.
Majority (66%) of the respondents also indicated that low investments opportunities for
short term savings hindered the firms from optimizing their returns through
management of their working capital. When a firm has surplus cash at a given period,
the money need to be invested in order to generate income. If the income generated
from the savings is lower than expected, the profitability of a firm will be low. The
respondents (55%) also indicated that inadequate capital hindered the firms from
optimizing their returns through management of their working capital. If a firm does not
have sufficient capital, it will be forced to rely on loans in order to facilitate its
operations. The firm will also not be able to offer credit facilities or have surplus funds
to invest in order to generate income.
The findings are consistent with other studies which found that both firm specific or
internal variables and macroeconomic or external variables affected the efficiency of
working capital management (Caballero et al., 2009; Zariyawati et al., 2010).

41
4.6 Correlation Analysis
Pearson correlation analysis was undertaken in order to ascertain the linear relationship
and the strength of associations between the variables. This enabled the study to
establish which variables best explains the effect of working capital management
practices on the financial performance of tea processing firms.
4.6.1 Correlation between Cash Management Practices and Financial
Performance
The results in Table 4.8 indicates that there is a positive significant linear relationship
between cash management practices and financial performance of tea processing firms
(r =0.669, p<0.05). This implies that if tea processing firms increase the time difference
between procurement of raw materials and other inputs, and the receiving of cash from
finished products then the financial performance of the firms will improve. This
conforms to results of the study done by Sharma and Kumar (2011) which found a
positive correlation between cash conversion cycle and financial performance. The
positive relationship between liquidity management practices and profitability suggests
that through proper management of cash, the managers are able to create high profits
and improve the financial performance of their firms.
Table 4.8: Correlation between Cash Management Practices and Financial
Performance
Financial Performance
Cash Management
practices
Pearson Correlation .669**
Sig. (2-tailed) .000
N 37
**. Correlation is significant at the 0.05 level (2-tailed).
4.6.2 Correlation between Inventory Management Practices and Financial
Performance
Results in Table 4.9 reveals that a moderate negative correlation exists between
inventory management practices and the financial performance of tea processing firms
(r =-0.530, p<0.01).

42
The findings imply that there is an inverse linear relationship between the inventory
management and financial performance. Therefore, a tea processing firm is expected to
make less returns if it takes a long time to process raw materials to finished goods and
consequently into sales. These findings conform to the study by Sharma and Kumar
(2011) which found a negative correlation between inventory management practices and
financial performance.
Table 4.9: Correlation between Inventory Management Practices and Financial
Performance
Financial Performance
Inventory Management
practices
Pearson Correlation -.530**
Sig. (2-tailed) .001
N 37
**. Correlation is significant at the 0.01 level (2-tailed).
4.6.3 Correlation between Receivables Management Practices and Financial
Performance
The results of the correlation between receivables management practices and financial
performance are presented in Table 4.10. The correlation is positive and significant but
moderately weak (r = -0.449, p<0.05). These results conform to previous studies done
by Gill, Biger and Mathur (2010) which found that firms that maintain accounts
receivables at optimal level are able to create and maximize their profits. Gakure et al.,
(2012) also found that the number of days accounts receivables exhibit a negative
relationship with corporate profitability. This indicates that the more days accounts
remain unpaid will lead to reduction in the profitability of a firm. This is because cash
will be locked in receivables instead of being invested in income generating ventures.

43
Table 4.10: Correlation between Receivables Management Practices and Financial
Performance
Financial Performance
Receivables Management
practice
Pearson Correlation
-.449**
Sig. (2-tailed) .005
N 37
**. Correlation is significant at the 0.05 level (2-tailed).
4.6.4 Correlation between Payables Management Practices and Financial
Performance
The correlation between payables management practices and financial performance is
presented in Table 4.11. The results indicates that there exists a strong and significant
positive relationship between payables management practices and financial performance
(r = 0.747; p < 0.05). The positive relationship can be interpreted that the longer it takes
to settle creditors’ results to increase in financial performance and vice versa. The
findings agree with the results of studies by Mathuva (2010) which found a highly
significant positive relationship between average payment period and profitability.
Table 4.11: Correlation between Payables Management Practices and Financial
Performance
Financial Performance
Accounts Payable
Management practice
Pearson Correlation .747**
Sig. (2-tailed) .000
N 37
**. Correlation is significant at the 0.05 level (2-tailed).
4.7 Regression Analysis
Regression analysis was conducted to determine whether there was a significant
relationship between working capital management practices and financial performance
of the tea processing firms. The results in Table 4.12 shows that the coefficient of
determination (R2) was 73.5% meaning that the model estimated explains 73.5% of the
variations in the financial performance of tea processing firms.

44
Table 4.12: Model Summary
Model R R Square
Adjusted R
Square
Std. Error of
the Estimate
.857a .735 .702 3.33725
a. Predictors: (Constant), Receivables Management Practices, Inventory Management
Practices, Payables Management Practices, Cash Management Practices
4.7.1 Analysis of Variance
The results of the Analysis of Variance (ANOVA) indicated in Table 4.13 shows that
the relationship between the independent variables and dependent variable was
significant (F = 22.164, p value <.05). This reveals that the independent variables
significantly affect the returns of tea processing firms. The independent variables (cash,
inventory, receivables and payables management practices) are therefore statistically
acceptable as useful in predicting the financial performance of the tea processing firms.
This is supported by a P value of 0.000 which is less than the conventional value of
0.05.
Table 4.13: ANOVAa
Model
Sum of
Squares df
Mean
Square F Sig.
Regression 987.398 4 246.850 22.164 .000
b
Residual 356.392 32 11.137
Total 1343.790 36
a. Dependent Variable: Financial Performance
b. Predictors: (Constant), Receivables Management Practices, Inventory Management
Practices, Payables Management Practices, Cash Management Practices
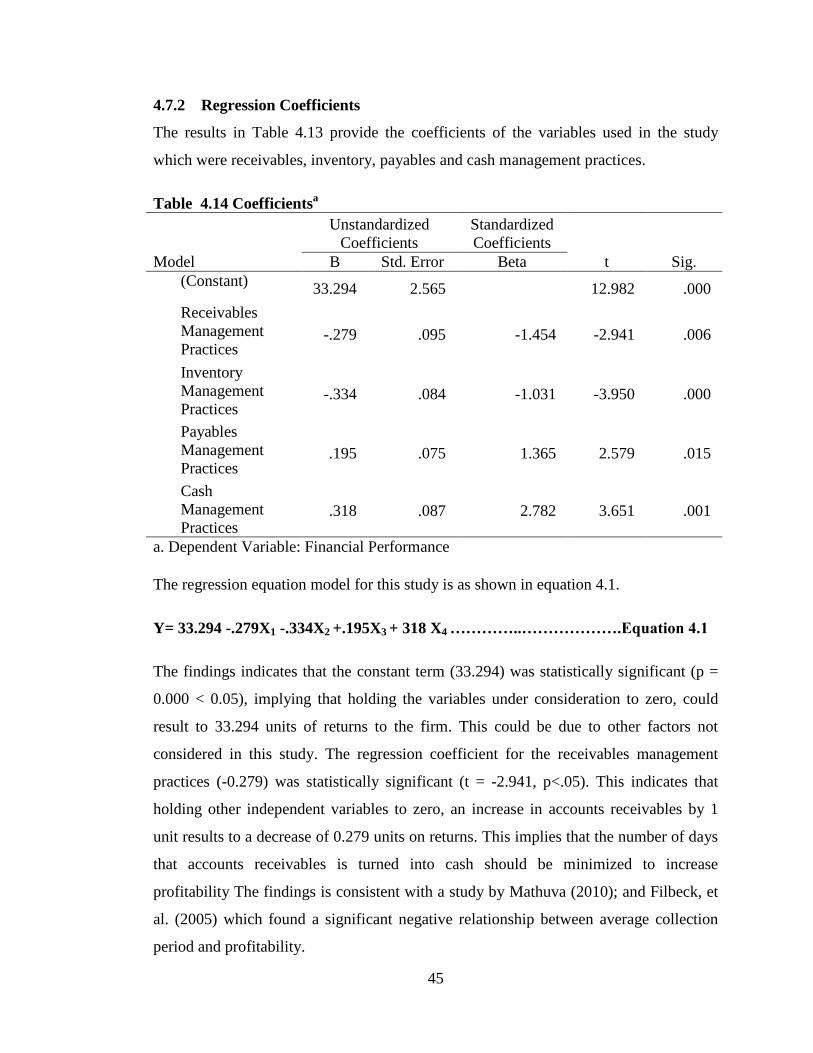
45
4.7.2 Regression Coefficients
The results in Table 4.13 provide the coefficients of the variables used in the study
which were receivables, inventory, payables and cash management practices.
Table 4.14 Coefficientsa
Model
Unstandardized
Coefficients
Standardized
Coefficients
t Sig. B Std. Error Beta
(Constant) 33.294 2.565
12.982 .000
Receivables
Management
Practices -.279 .095 -1.454 -2.941 .006
Inventory
Management
Practices -.334 .084 -1.031 -3.950 .000
Payables
Management
Practices .195 .075 1.365 2.579 .015
Cash
Management
Practices .318 .087 2.782 3.651 .001
a. Dependent Variable: Financial Performance
The regression equation model for this study is as shown in equation 4.1.
Y= 33.294 -.279X1 -.334X2 +.195X3 + 318 X4 …………..……………….Equation 4.1
The findings indicates that the constant term (33.294) was statistically significant (p =
0.000 < 0.05), implying that holding the variables under consideration to zero, could
result to 33.294 units of returns to the firm. This could be due to other factors not
considered in this study. The regression coefficient for the receivables management
practices (-0.279) was statistically significant (t = -2.941, p<.05). This indicates that
holding other independent variables to zero, an increase in accounts receivables by 1
unit results to a decrease of 0.279 units on returns. This implies that the number of days
that accounts receivables is turned into cash should be minimized to increase
profitability The findings is consistent with a study by Mathuva (2010); and Filbeck, et
al. (2005) which found a significant negative relationship between average collection
period and profitability.

46
The coefficient for the inventory management practices (-0.334) was statistically
significant (t = -3.95, p<.05). This indicates that holding other independent variables to
zero, an increase in inventory days by1 unit results to a decrease of 0.334 units on
returns. It implies that the total number of days taken before inventories are sold should
be minimized to boost returns. This is consistent with studies done by Sharma and
Kumar (2011), Padachi (2006), Garcia and Martinez (2007), Deloof (2003), Raheman
and Nasr (2007) and Raheman et al., (2010).
The coefficient for the payables management practices (0.195) was statistically
significant (t = 2.579, p<.05). This indicates that holding other independent variables to
zero, an increase in payables period by 1 unit results to an increase of 0.195 units on
returns. It implies that the period taken to settle account payables should be longer to
increase profitability of these firms. These findings hold that more profitable firms wait
longer to pay their bills. This implies that the firms withhold their payment to suppliers
so as to take advantage of the cash available to meet the firms’ other working capital
needs. This findings are consistent with studies done by Makori and Jagongo (2013) and
Mathuva (2010) who found that the longer a firm takes to pay its creditors, the more profitable
the firm is.
The coefficient for the cash management practices (0.318) was statistically significant (t
= 3.651, p<.05). This indicates that holding other independent variables to zero, an
increase in cash conversion period by 1 unit results to an increase of 0.318 units on
returns. This implies that the time difference between procurement of raw materials and
other inputs, and the receiving of cash from finished products should be longer in order
to improve the financial performance of the firms. These findings agree with the
findings of a study by Amalendu and Sri (2011) which found that there is a positive
relationship between cash management and profitability.

47
CHAPTER FIVE
SUMMARY, CONCLUSION AND RECOMMENDATIONS
5.1 Introduction
The chapter presents the summary of the findings, conclusion, recommendations,
limitations, and suggestions for further research.
5.2 Summary of the Findings
This study sought to investigate the effect of working capital management practices on
financial performance of tea processing firms in Kenya. This section presents the
summary of findings in regards to the effect of cash, inventory, receivables and
payables management practices on the financial performance of tea processing firms.
5.2.1 Cash Management Practices and Financial Performance
The study established that all the tea processing firms had put in place a cash
management policy. The policies adopted by the firms also affected the financial
performance of the firms. The policy enables a firm to reduce or avoid liquidity risks,
increases the firms’production and investment income. The results also revealed that
most of the firms prepare cash budgets in order to maintain optimum amount of cash
that will meet daily operations. Similarly, majority of the firms reviewed the cash
budget regularly in order for the firms to meet changes in cash requirement. It was also
evident that optimal cash balance is set to ensure adequate liquidity is maintained at all
times. Most of the respondents also affirmed that cash flow prediction aids in proper
financial planning. The study also established that a positive significant linear
relationship exists between cash management practices and financial performance of tea
processing firms.
5.2.2 Inventory Management Practices and Financial Performance
The findings revealed that tea processing firms had established an inventory
management policy. The policy enabled the firms to reduce costs associated to stock
which in turn improve their financial performance. Furthermore, the policy assisted in
increasing the firms’ production and investment income since lean stock is maintained.

48
Majority of the respondents also affirmed that inventory budget is prepared to ensure
adequate inventory is available for smooth operations of the firm. The level of inventory
should also be reviewed regularly to ensure optimal stock is maintained at all times. The
respondents also concurred that the level of EOQ is set to enable a firm to order
sufficient inventory at minimal costs. It was also evident that inventory control system
should be put in place to assists in efficient management of inventory. The study also
found that a negative relationship exists between inventory management practices and
the financial performance of tea processing firms.
5.2.3 Receivables Management Practices and Financial Performance
The findings showed that tea processing firms had established an accounts receivable
policy. Majority of the firms indicated that the policy reduced costs associated with
debtors’ collection. The policy also enabled the firms to increase sales turnover and
minimize borrowing costs. It was also evident that receivables management policies are
put in place to enable a firm to regulate the credit allowed and recovery of debtors. The
firms also monitored accounts receivable to ensure timely recovery of debts.
Receivables collection policies are also set to assist in reduction of bad debts .Most of
the respondents also affirmed that the length of credit period to customers has an
influence on sales. The study also established that a negative relationship exists between
receivables management practices and financial performance.
5.2.4 Payables Management Practices and Financial Performance
The study found that tea processing firms had established payables management policy.
Majority of the respondents indicated that payables policy assists a firm in reducing
costs of borrowing. The policy also enables a firm to increase production and avoid
liquidity risks. It was also evident that that payables/ credit payments should be
monitored to ensure timely supply of goods and services. The credit policies should also
be reviewed to ensure optimal credit is maintained at all times. The respondents also
affirmed that credit facilities enable a firm to adequately finance its operations. The
study also established that a positive relationship exists between payables management
practices and financial performance.

49
5.2.5 Working Capital Management Practices and Financial Performance
The study found that majority of the respondents concurred that that proper working
capital management practices ensures high rate of return on assets of a firm. The
respondents also affirmed that employing sound working capital management practices
and results to increased sales revenue of a firm. Majority of the respondents concurred
that unpredictable demand, supply and prices of their products contributed negatively to
the firms optimizing their returns through management of working capital. Inadequate
capital, high costs of borrowing and low investments opportunities also hindered the tea
processing firms from optimizing their returns through management of their working
capital.
5.3 Conclusions
The study investigated the effect of working capital management practices on financial
performance of tea processing firms. From the analysis of the data collected and the
findings, the study makes the following conclusions in line with the objectives of the
study.
5.3.1 Cash Management Practices and Financial Performance
Cash management policy has a positive relationship with financial performance of tea
processing firms. In this regard, long time difference between procurement of raw
materials and other inputs, and the receiving of cash from finished products improves
the financial performance of a firm. In addition, cash policy enables a firm to reduce or
avoid liquidity risks, increase production and investment income. The study further
noted that cash budgets are prepared in order to maintain optimum amount of cash that
will meet daily operations of a firm. The budget is also reviewed regularly in order for
the firms to meet changes in cash requirement and optimal cash balance is set to ensure
adequate liquidity is maintained at all times.
5.3.2 Inventory Management Practices and Financial Performance
Inventory management policy has a negative relationship with the financial
performance of the tea processing firms. Therefore, minimizing the total number of
days taken before inventories are sold therefore improve the returns of a firm.

50
Inventory management policy reduces the costs associated to stock which in turn
improve the financial performance. The policy also assists in increasing the firms’
production and investment income. Tea processing firms prepare inventory budget in
order to maintain adequate inventory for smooth operations of the firm. The firms also
review the level of inventory regularly to ensure optimal stock is maintained at all
times. The level of EOQ is also set to enable a firm to order sufficient inventory at
minimal costs and an inventory control system is put in place to assists in efficient
management of inventory.
5.3.3 Receivables Management Practices and Financial Performance
Accounts receivables have a negative relationship with financial performance.
Minimizing the number of days taken to turn accounts receivables into cash therefore
increases the returns of a firm. Receivables management policy enables a firm to reduce
costs associated with debtors’ collection, increase sales turnover and minimize
borrowing costs. The policy also enables a firm to regulate the credit allowed and
recovery of debtors. The policy is set to assist in reduction of bad debts. The study also
noted that accounts receivables are also monitored to ensure timely recovery of debt and
the length of credit period to customers has an influence on sales.
5.3.4 Payables Management Practices and Financial Performance
Payables management practices had positive relationship with financial performance of
tea processing firms. The longer the period taken to settle account payables therefore
increased profitability of a firm. Payables management policy assists a firm in reducing
costs of borrowing, increase production and avoid liquidity risks. Reviewing the
policies regularly ensures optimal credit is maintained at all times. In addition, utilizing
credit facilities enables a firm to adequately finance its operations and monitoring
payables also ensures timely supply of goods and services.
5.3.5 Working Capital Management Practices and Financial Performance
Proper working capital management practices ensures high rate of return on assets of a
firm. Consequently, firms that employ sound working capital management practices
increase their sales revenue and profits.
51
Unpredictable demand, supply and prices of tea processing firms’ products contributed
negatively to the firms optimizing their returns through management of working capital.
In addition, inadequate capital, high costs of borrowing and low investments
opportunities also hindered the tea processing firms from optimizing their returns
through management of their working capital. Working capital management practices
significantly affect the financial performance of tea processing firms.
5.4 Recommendations
The study makes the following recommendations regarding cash management practices,
inventory management practices, receivables management practices and payables
management practices based on the findings.
5.4.1 Cash Management Practices
Cash budgets should be prepared in order to maintain optimum amount of cash that will
meet daily operations of a firm. The budget should also be reviewed regularly in order
for the firms to meet changes in cash requirement and optimal cash balance should be
set to ensure adequate liquidity is maintained at all times. Firms ensure the time
difference between procurement of raw materials and other inputs, and the receiving of
cash from finished products are longer in order to improve the financial performance.
Firms should also come up with cash management policies that will enable the firm to
reduce liquidity risks, increase production and investment income
5.4.2 Inventory Management Practices
A firm should ensure the total number of days taken before inventories are sold is
minimized in order to boost the returns of the firm. The firms should also prepare
inventory budgets in order to maintain adequate inventory for smooth operations of the
firm. The inventory level should be reviewed regularly to ensure optimal stock is
maintained at all times. Firms should set the level of EOQ to ensure sufficient inventory
is ordered at minimal costs. The firms should also establish an inventory control system
to assists in efficient management of inventory.

52
5.4.3 Receivables Management Practices
Firms should monitor accounts receivables to ensure timely recovery of debts and
reduction of bad debts. The number of days taken to turn accounts receivables into cash
should also be minimized as much as possible in order for a firm to increase its returns.
The firm should also design policies that will enable it to regulate the credit allowed,
reduce costs associated with debtors’ collection, increase sales turnover and minimize
liquidity risks.
5.4.4 Payables Management Practices
Firms should regularly review payables management policies to ensure optimal credit is
maintained at all times. Similarly, payables should be monitored to ensure timely supply
of goods and services. Firms should also seek for credit facilities in order to adequately
finance its operations. In addition, firms should take longer period to settle account
payables in order to increase profitability.
5.4.5 Working Capital Management Practices and Financial Performance
Firms should come up with working capital management practices that will encounter
unpredictable demand, supply and prices of their products in order to optimizing their
returns through management of working capital. In addition, capital should be enhanced
and cheaper sources of capital should be sought in order to boost working capital. A
firm should also seek for better investment opportunities to invest any excess funds and
invest prudently in order to increase its returns.
5.5 Limitation of the study
The study was conducted in tea processing firms in Kenya which are managed by
KTDA. The firms are privately owned and hence do not publicly avail their financial
statements. Getting the reports from the firms was therefore difficult since the reports
were regarded as confidential. The respondents were therefore assured that the data
collected will be used for academic purposes only. The firms were also situated in
remote areas due to their nature of operation thus accessing the firms was a challenging
task. Ample time was therefore allocated in data collection stage and where necessary,
well trained research assistants were hired to assist in data collecting exercise.

53
5.6 Suggestion for further study
This study was limited to tea processing firms operating in Kenya and managed by
KTDA. The study therefore suggests that there is need for further studies on the same
area but covering all the firms undertaking tea processing in Kenya in order to obtain an
industry wise analysis of the effect of working capital management practices on
financial performance. The relationship between working capital management and other
aspects such as growth and investments can also be measured over and above
profitability.

54
REFERENCES
Amalendu, B. I. & Sri, B. B. (2011). Importance of Liquidity Management and
Profitability. Asian Journal of Business Management, 3(2), 108-117.
Atrill, P. (2006). Financial Management for Decision Makers. New York: Financial
Times.
Autukaite, R. & Molay, P. (2011). Cash holding, working capital and firm value:
Evidence from France, International conference of the French Finance
association (AFFI), 11-13.
Babbie, E. (2010). The Practice of Social Research Wadsworth Cengage
Learning. International Edition.
Baños‐Caballero, S., García‐Teruel, P. J., & Martínez‐Solano, P. (2010). Working
capital management in SMEs. Accounting & Finance, 50(3), 511-527.
Bowen, M., Morara, M., & Mureithi, S. (2009). Management of business challenges
among small and micro enterprises in Nairobi-Kenya. KCA journal of business
management, 2(1), 16-31.
Bradley, D. B., & Rubach, M. J. (2002). Trade Credit and Small Businesses: A cause of
business failures. University of Central Arkansas.
Brigham, F. & Houston J. (2007). Fundamentals of Financial Management. Boston:
Cengage Learning.
Brooks, R. (2013). Financial management. Delhi: Pearson Education Limited.
Budambula, V. T. (2014). Effects of working capital management on profitability of tea
trading companies – A case of Chai Trading Company Limited. Research
Journal of Finance and Accounting 5(7), 86-93.
Chandra, C. & Kachhal, S.K. (2008). Managing Health Care Supply Chain: Trends,
Issues, and Solutions from a Logistics Perspective, Proceedings of the Sixteenth
Annual Society of Health Systems Management Engineering Forum, February
20-21, Orlando, Florida.
Chebet, R. (2015). The effect of working capital management practices on the financial
performance of manufacturing firms in Nairobi County. Unpublished MBA
project, University of Nairobi.
Cooper, D. R. & Schindler, P. S. (2011). Business Research Methods. Boston: McGraw-
Hill Irwin.
Cronbach, L. J. (1951). Co-efficient Alpha and Internal Structure of Tests:
Psychometrika, 16, 297 - 334.

55
Davis, C. K. (2016). Working Capital Management And Firms’ Financial Performance
In Tea Processing Companies In Nandi County. Unpublished MBA project,
University of Nairobi.
Dunn, M. (2009). Why you need a credit policy. Retrieved May 13, 2016, From
http://www.entreprenuer.com/
Eeljelly, A. (2004). Liquidity-Profitability Tradeoff: An Empirical Investigation in an
Emerging Market, International Journal of Commerce & Management, 14(2),
48-61.
Ellen, S. (2012). Slovin's Formula Sampling Techniques. Fort Worth: Dryden Press.
Ferris, J. S. (1981). A transactions theory of trade credit use. The Quarterly Journal of
Economics, 96(2), 243-270.
Filbeck, G. & Krueger, T. (2005. Analysis of working capital management results
across industries. Mid-American Journal of Business, 20(2), 11-20
Gakure, R., Cheluget, K.J. Onyango, J.A. & Keraro, V. (2012). Working capital
management and profitability of manufacturing firms listed at the Nairobi stock
exchange. Prime Journal of Business Administration and Management (BAM),
2(9), 680-686.
Garcia, T. & Martinez, S. (2007). Effects of working capital management on SME
profitability. International Journal of management finance, 3(1), 164-177.
Gill, A., Biger, N., & Mathur, N. (2010). The relationship between working capital
management and profitability: Evidence from the United States. Business and
Economics Journal, 10(1), 1-9.
Gitman, L.A. (2009). Principles of Managerial Finance (11th Ed.), New York, NY:
Addison Wesley Inc.
Gryglewicz, S. (2011). A theory of corporate financial decisions with liquidity and
solvency concerns. Journal of Financial Economics, 99(2), 365-384.
Gunay, S., & Kesimli, I. (2011). The impact of the global economic crisis on working
capital of real sector in Turkey. Business and Economic Horizons, 1(04), 52-69.
Harris, F. M. (1913) How Many Parts to Make at Once, Factory, The Magazine of
Management 10(2), 135–136, 152.
Joana, G. F., Vitorino, M. F. & Moreira, B. E. (2011). FEP-Working Papers. Retrieved
10 01, 2013, from FEP - Working Papers - Universidade do Porto:
http://wps.fep.up.pt/wps/wp438.pdf
Kakuru, J. (2011). Financial Decisions and the Business. Kampala: The Business
Publishing Group.

56
Kassim, H. (2011). The relationship between working capital management and financial
performance of supermarkets in Nairobi County. MBA Research project,
University of Nairobi.
Keynes, J. M. (1936). The General Theory of Employment, Interest and Money. New
York: Harcout Brace and World. Inc.
Kotut, P. (2009). Working capital management practices by Kenyan firms: A case study
of firms listed in the NSE. Unpublished MBA project: Egerton University.
KTDA (2016). Chai News Bulletin. (5th
ed). Nairobi: Kenya Tea Development Agency
Ltd.
Kung’u, J. N. (2017). Effect of Liquidity Management Practices on Profitability of
Manufacturing Industry in Kenya. Journal of Economics and Finance, 8(01),
84-89.
Kwame, K. (2007). Working capital management practices of small firms in the Ashanti
region of Ghana. Available from http://www.ssrn.com. Accessed on 23rd
January 2016.
Lazaridis, J. & Tryfonidis, D. (2006). Relationship between Working Capital
Management and Profitability of Listed Companies in the Athens Stock
Exchange. Journal of Financial Management Analysis, 19, 26-35.
Louderback, J.S. & Dominic, G.F. (2000). Managerial Accounting (9th
ed), Singapore:
South- Western college Publishing.
Makori, D. M. & Jagongo, A. (2013). Working Capital Management and Firm
Profitability: Empirical Evidence from Manufacturing and Construction Firms
listed on Nairobi Securities Exchange, Kenya. International Journal of
Accounting and Taxation, 1(1), 1-14.
Maradi, M., Salehi, M. & Arianpoor, A. (2012). A comparison of working capital
management of chemical and medicine listed companies in Tehran Stock
Exchange. International Journal of Business and Behavioral Science, 2 (5), 62-
78.
Markowitz, H. (1952). Portfolio selection. The journal of finance, 7(1), 77-91.
Mathuva, D. M. (2013). Determinants of corporate inventory holdings: Evidence from a
developing country. The international journal of applied economics and finance,
7(1),1-22.
Nairobi Securities Exchange. (2013). NSE Handbook. Nairobi: Nairobi Securities
Exchange.
Naser, K., Nuseibel, R. & Al-Hadeya, A. (2013). Working Capital Management and
Financial Performance on manufacturing sector in Sri Lanka. European Journal
of Business Management, 4(15), 23-30.

57
Nazir, M. S., & Afza, T. (2009). Impact of aggressive working capital management
policy on firms' profitability. IUP Journal of Applied Finance, 15(8), 19.
Nkwankwo, O. & Osho, G. S. (2010). An Empirical Analysis of Corporate Survival and
Growth: Evidence from Efficient Working Capital Management. International
Journal of Scholarly Academic Intellectual Diversity, 12 (1), 1-13.
Nyabwanga, R.N., Ojera, P., Lumumba, M., Odondo, A.J., & Otieno, S. (2012). Effect
of working capital management practices on financial performance: A study of
small scale enterprises in Kisii South District, Kenya. African Journal of
Business Management, 6 (18) 5807-5817.
Okungu, D. H. (2014). The relationship between working capital management and
profitability of sugar producing companies in Kenya. Unpublished MBA project,
University of Nairobi.
Oladipupo, A.O. & Okafor, C.A. (2013). Relative contribution of working capital
management to corporate profitability and dividend payout ratio: Evidence from
Nigeria. International Journal of Business and Finance Research, 3(2), 11-20.
Owolabi, S. A., & Obida, S. S. (2012). Liquidity management and corporate
profitability: Case study of selected manufacturing companies listed on the
Nigerian stock exchange. Business Management Dynamics, 2(2), 10-25.
Padachi, K. (2006). Trends in Working Capital Management and its Impact on Firm
Performance: An Analysis of Mauritian Small Manufacturing Firms.
International Review of Business Research papers, 2(2), 45-58.
Pandey, I. M. (2010). Financial management (10th Ed). New Delhi: Vikas Publishing
House Pvt Ltd.
Polit D.F. & Beck C.T. (2010). Essentials of Nursing Research, 7th ed. Wolters Kluwer
Health Lippincott Williams & Wilkins, Philadelphia.
Raheman, A. & Nasr, M. (2007). Working Capital Management and Profitability: Case
of Pakistani Firms, International Review of Business Research Papers, 3(1) 279-
300
Raheman, A., Afza, T., Qayyum, A. & Bodla, M.A. (2010). Working Capital
Management and Corporate Performance of Manufacturing Sector in Pakistan.
International Research Journal of Finance and Economics, 1(47), 151-163.
Ross, S. A., Westerfield, R. W. & Jordan, B. D. (2010). Fundamentals of Corporate
Finance. New York, NY: McGraw-Hill Irwin.
Saleem, Q. & Rehman, R. U. (2011). Impact of Liquidity Ratios on Profitability: Case
of Oil and Gas Companies in Pakistan. Interdisciplinary Journal of Research in
Business, 1 (7), 95-98.

58
Schwartz, R. A. (1974). An economic model of trade credit. Journal of financial and
quantitative analysis, 9(04), 643-657.
Sharma, A. K., & Kumar, S. (2011). Effect of working capital management on firm
profitability empirical evidence from India. Global Business Review, 12(1), 159-
173.
Sushma, V. & Bhupesh, S. (2007). Effect of Working Capital Management Policies on
Corporate Performance. Global Business Review, 8-267.
Tea Board of Kenya (TBK). 2016 Annual Report and Accounts Tea Board of Kenya
2014-2015. Nairobi, Kenya, Tea Board of Kenya
Uremadu, S. O., Egbide, B. C. & Enyi, P. E. (2012). Working Capital Management,
Liquidity and Corporate Profitability among quoted firms in Nigeria: Evidence
from the Productive Sector. International Journal of Academic Research in
Accounting, Finance and Management Science, 2 (1), 80-97.
Van Horne, J. C. & Wachowicz, J. M. (2004). Fundamentals of financial, management.
New York: Prentice Hall Publishers.
Wainaina, C. (2010). The relationship between profitability and working capital of
small and medium enterprises in Kenya. Unpublished MBA project, University
of Nairobi.
Waithaka, A. (2012). The relationship between working capital management practices
and financial performance of agricultural companies listed at the Nairobi
Securities Exchange. Unpublished Master’s thesis, University of Nairobi.
Waweru, C. G. (2011). The relationship between working capital Management and
Value of Companies quoted at the NSE. Unpublished MBA project, University
of Nairobi.
Williamson, O. E. (2013). The transaction cost economics project. Cheltenham: Edward
Elgar.
Zariyawati, M. A., Taufiq, H., Annuar, M. N., & Sazali, A. (2010, June). Determinants
of working capital management: Evidence from Malaysia. In Financial Theory
and Engineering (ICFTE), 2010 International Conference on (pp. 190-194).
IEEE.

59
APPENDICES
APPENDIX I: QUESTIONNAIRES
Kindly answer the following questions by ticking in the appropriate box or filling the
spaces provided. Information obtained will be used for academic purposes only and will
therefore be handled with the highest level of confidentiality. Your corporation will be
highly appreciated.
Part A: Respondent Details and Bio-Data
1. Please indicate your gender
Male [ ] Female [ ]
2. Indicate your age bracket
Below 25 years [ ] 25-35 years [ ]
36-45 years [ ] above 45 years [ ]
3. How long have you served in the current position?
0-5 yrs [ ] 5-10 yrs [ ]
10-15 [ ] Over 15 yrs [ ]
4. To date, what has been your highest formal qualification?
Secondary School Level [ ] Certificate/ Diploma [ ]
Undergraduate [ ] Post graduate level [ ]
Other
(Specify)…………………………………………………………………………
……………………
5. When was the tea processing firm incorporated?
………………..………………………………………………………………………
………………………………………………………………………..
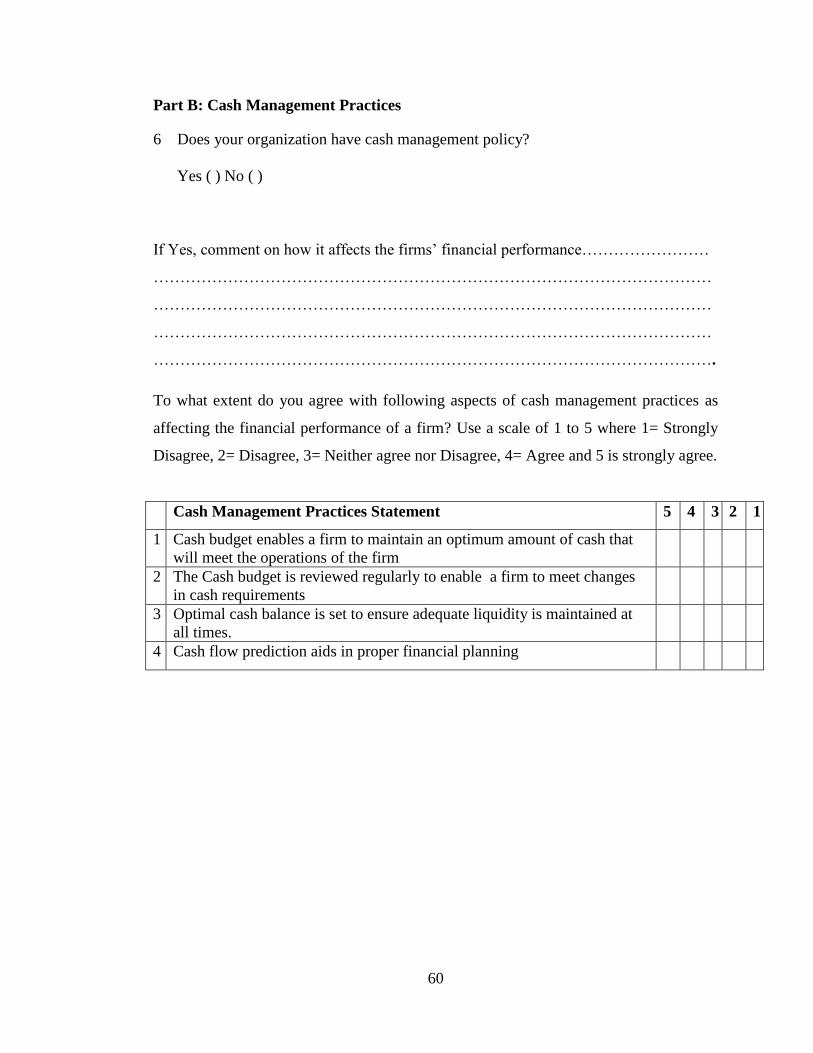
60
Part B: Cash Management Practices
6 Does your organization have cash management policy?
Yes ( ) No ( )
If Yes, comment on how it affects the firms’ financial performance……………………
……………………………………………………………………………………………
……………………………………………………………………………………………
……………………………………………………………………………………………
…………………………………………………………………………………………….
To what extent do you agree with following aspects of cash management practices as
affecting the financial performance of a firm? Use a scale of 1 to 5 where 1= Strongly
Disagree, 2= Disagree, 3= Neither agree nor Disagree, 4= Agree and 5 is strongly agree.
Cash Management Practices Statement 5 4 3 2 1
1 Cash budget enables a firm to maintain an optimum amount of cash that
will meet the operations of the firm
2 The Cash budget is reviewed regularly to enable a firm to meet changes
in cash requirements
3 Optimal cash balance is set to ensure adequate liquidity is maintained at
all times.
4 Cash flow prediction aids in proper financial planning

61
Part C: Inventory Management Practices
4 Does your organization have Inventory management policy?
Yes ( ) No ( )
If Yes, comment on how it affects the firms’ financial performance……………………
……………………………………………………………………………………………
……………………………………………………………………………………………
……………………………………………………………………………………………
To what extent do you agree with following aspects of the Inventory management
practices as affecting the financial performance of a firm? Use a scale of 1 to 5 where
1= Strongly Disagree, 2= Disagree, 3= Neither agree nor Disagree, 4= Agree and 5 is
strongly agree.
Inventory Management Practices Statement 5 4 3 2 1
1 Inventory budget is prepared to ensures adequate inventory is available
for smooth operations of the firm
2 The level of inventory is reviewed to ensures optimal stock is maintained
at all times
3 The level of EOQ is set to enable a firm to order sufficient inventory at
minimal costs
4 inventory control system assists in efficient management of inventory

62
Part D: Receivables Management Practices
5 Does your organization have Accounts Receivable Management policy?
Yes ( ) No ( )
If Yes, comment on how it affects the firms’ financial performance……………………
……………………………………………………………………………………………
……………………………………………………………………………………………
……………………………………………………………………………………………
To what extent do you agree with following aspects of receivable management practices
as affecting the financial performance of a firm? Use a scale of 1 to 5 where 1=
Strongly Disagree, 2= Disagree, 3= Neither agree nor Disagree, 4= Agree and 5 is
strongly agree.
Receivables Management Practices Statement 5 4 3 2 1
1 Receivables management policies are put in place to enable a
firm to regulate the credit allowed and recovery of debtors
2 Monitoring of accounts receivable ensures timely recovery of
debts
3 Receivables collection policies are set to assist in reduction of
bad debts
4 The length of credit period to customers has an influence on
sales

63
Part E: Payables Management Practices
6 Does your organization have an Accounts Payable Management policy?
Yes ( ) No ( )
If Yes, comment on how it affects the firms’ financial performance……………………
……………………………………………………………………………………………
……………………………………………………………………………………………
…………………………………………………………………………………………
To what extent do you agree with following aspects of Payables management practices
as affecting the financial performance of a firm? Use a scale of 1 to 5 where 1=
Strongly Disagree, 2= Disagree, 3= Neither agree nor Disagree, 4= Agree and 5 is
strongly agree.
Payables Management Practices Statement 5 4 3 2 1
1 Payables/credit policies enables a firm to avoid liquidity risks
2 Payables/ credit payments are monitored to ensure timely supply of goods
and services
3 Credit policies are reviewed to ensure optimal credit is maintained at all
times
4 Credit facilities enables a firm to adequately finance its operations

64
Part F: Financial Performance
To what extent do you agree with following aspects of working capital management
practices as affecting the financial performance of tea processing firms? Use a scale of 1
to 5 where 1= Strongly Disagree, 2= Disagree, 3= Neither agree nor Disagree, 4= Agree
and 5 is strongly agree
Financial Performance Statement 5 4 3 2 1
1 Proper working capital management practices ensures high rate of Return
on Assets of a firm
2 Employing sound Working Capital management practices results to
increased Sales Revenue of a firm
3 Efficient working capital management practices improves the Net Profit
of a firm
7 From your experience, what hinders tea processing firms from optimizing their
returns through management of their working capital?
……………………………………………………………………………………………
……………………………………………………………………………………………
……………………………………………………………………………………………
………………………………………………………………………………………….
8 What advice would you give to finance practitioners in the industry regarding
working capital management?
……………………………………………………………………………………………
……………………………………………………………………………………………
……………………………………………………………………………………………
……………………………………………………………………………………………
Thank You

65
APPENDIX II
Record Survey Sheet
The information required in the matrix will be obtained from annual reports of the tea
processing firms for the period 2012 to 2015.
2012
( In Ksh
Million)
2013
( In Ksh
Million)
2014
( In Ksh
Million)
2015
( In Ksh
Million)
Sales
Cost of sales
Profit before tax &
interest
Bonus ( Ksh Per Kg)
Current Assets
Current Liabilities
Non-current assets
Accounts Payable
Accounts Receivable
Inventories
Cash and Bank Balance
Return on Assets
(ROA)
Copyright © 2022 FDOKUMEN