WORKING CAPITAL MANAGEMENT OF NEPAL SALT ...
117
1 CHAPTER – I INTRODUCTION 1.1 Background of the study In the contest of Nepal, it is one of the poorest countries of the world. More than 80% of the people live on low income level. Their income is only sufficient to fulfill their basic needs but not their safety needs. In this contest industrialization is necessary and it is possible only with the support to financial institution. To develop well established economic activities of any country can hardly be carried forward without the assistance and support of financial institution. It collects scattered financial resources from the mass and invests them among those engaged commercial and economic activities of the country. The underdeveloped and land locked mountainous country Nepal lies on lap of highest mountain range of the Himalayas having very low cultivated lands, High growth rate of population and limited resources of the world with low per capita income of U.S. $ 253. The various factors which are responsible for the slow development of the nation such as major obstruction land locked position, poor resources endowment, Institutional weakness and lack of appropriate economics policies due to political instability events. Nepal being the poorest country and the lowest per capita income in the world, industrialization has multiplier significant to up sift the economic standard of people create more employment opportunities earn foreign exchange through export promotion and reduce the dependency on import. Industrial development is the back bone of the nation. It plays an important role in the economy. It makes higher living standard and
-
Upload
khangminh22 -
Category
Documents
-
view
2 -
download
0
Transcript of WORKING CAPITAL MANAGEMENT OF NEPAL SALT ...

1
CHAPTER – I
INTRODUCTION
1.1 Background of the study
In the contest of Nepal, it is one of the poorest countries of the world.
More than 80% of the people live on low income level. Their income is only
sufficient to fulfill their basic needs but not their safety needs. In this contest
industrialization is necessary and it is possible only with the support to
financial institution. To develop well established economic activities of any
country can hardly be carried forward without the assistance and support of
financial institution. It collects scattered financial resources from the mass and
invests them among those engaged commercial and economic activities of the
country.
The underdeveloped and land locked mountainous country Nepal lies on
lap of highest mountain range of the Himalayas having very low cultivated
lands, High growth rate of population and limited resources of the world with
low per capita income of U.S. $ 253. The various factors which are responsible
for the slow development of the nation such as major obstruction land locked
position, poor resources endowment, Institutional weakness and lack of
appropriate economics policies due to political instability events.
Nepal being the poorest country and the lowest per capita income in the
world, industrialization has multiplier significant to up sift the economic
standard of people create more employment opportunities earn foreign
exchange through export promotion and reduce the dependency on import.
Industrial development is the back bone of the nation. It plays an
important role in the economy. It makes higher living standard and

2
comfortable life by increasing wealth of nation and it provides essential and
luxurious goods and services. We cannot imagine the real world in the absence
of industrial development. So, it is the lifeblood of the nation. Nepal is a small,
poor, landlocked country. It is lies between China and India. India is
surrounded from east, west and south and China is surrounded from north.
Today, we are running in the mouth of scientific age. It was
developed from the previous Stone Age after discovering or innovating new
thing for new problems. Every movement of time, it will bring change for
anything. Today, market is out homogenous, it is heterogonous. Different
people have different response and behavior. One kind of goods of services
may or may not be taken long market. So that different shorts of goods or
services have to be provided to run our business firms.
The economic survey of 2004-2005 published by HMG Ministry of
finance, the economic growth rate of the world was 5.1% in 2004 and 4.3% in
2005. The newly industrialized economics of Asian remarkably improve to
6.5%. At present 10th plan is running but due to poor performance negative
return, Lack of efficiency, inefficient in management, government has
emphasized on privation. So that public enterprises could be competitive,
efficient, and profitable. By the help of private companies the government will
reduce it’s investment in public sector. Which are incurring continuously at
loss. So a total of 24 public enterprises have been privatized under different
modalities in three phases. More enterprises are in the pipeline for privatization
in the government policy and programs.1
Public enterprises in a institution operating a service of an economic
character on behalf of the government but as an independent legal entity,
largely autonomous in its management. Though responsible to the public
1 Ministry of Finance, " Economic Survey Report 2004-2005. P.N. 14-15

3
through government and parliament and subject to some direction by the
government. According to Laxmi Narayan, public enterprises are autonomous
bodies which are owned and managed by the government and which provide
goods and services for a price the ownership with the government should be
51% or more to make entity public enterprises.
Manufacturing means any industries that make products form raw
materials by the use of manual labor or machinery and that is usually carried
out systematically with a division of labor. In a more limited sense
manufacturing denotes the fabrication or assembly of components into finished
productive enterprises or organization that produces or supplies goods,
services, or sources of income.
The research sector is trading companies, trading signifies a market and
a means by which the exchange of goods and services take place as a result of
buyers and sellers being in contact with each other, either directly or through
mediating agents or institutions. Thus, the regarding means the flow of goods
and services from producer and consumers. The role of manufacturing
industries and trading companies is marginal for the economic growth rate of
the nation. The developing nation will remain associated with various farms of
backwardness. Unless they tackle the problems of economic backwardness
through industrialization.2 In other wards, industrialization helps to create a
country’s economic in fracture and gives a path of diversification into a new
area of activity. One of the merits of industrialization is that it makes it
possible for countries to satisfy their own requirement to a greater degree. 3 It
is ahteate major instrument of progress, modernization and social changes in
2 Eskstein Alexander, "china's Economic Development (Michigan: The university of Michigan press. 1976.
p.p. 62-633 United Nations. "Industrialization for New Development Needs." (New york 1674) P.I

4
development countries4. Maximum utilization of human, capital and other
natural resources of the country could take benefit from the formation of
industries. Increasing the job opportunities, it will increase the income of the
people. It also facilitates the agricultural development by reducing the pressure
on land and creating demand for agricultural raw materials. The reason for
emphasizing industrialization is that industrial development would absorb
rural under employed persons to these field of production where higher
productivity is possible without reducing agricultural outputs.
Trading companies play a vital role for the development of the
manufacturing industries. It supplies the necessary items like raw materials,
human resources, advance technology and many more things to industries.
And distribute product items to the required consumers in the appropriate
markets.
Recently, Nepal has also been affected indirectly by economic crisis.
Nepal prepares its budget consulting with the IMF (International Monetary
Fund), world Bank , Asian Development Bank and many other donor countries
for the necessary Loans, grants and assistance, this reflects Nepal’s economy is
not satisfactory due to the Lack of sound economic basis business sectors.
Trade policy 1992 is established to enhance the contributions of trade
sector to national economy by promoting internal and international trade with
the increased participation of private sector through the creation of an open and
liberal atmosphere. Emphasis will be given on modernizing management and
technology on promoting market and attracting direct forignforeign investment
in order to indentigyidentity and develop new products, as well as to raise the
production and quality of the traditional products.
4 Ibid

5
1.1.1 Historical Background of Salt Trading Corporation.
Salt trading corporation Limited is one of the organization which was
established in 1963 A.D. (2020 B.S.) with 14 individuals under the Nepal
company act with the joint efforts of HMG/Nepal and the private sector to
ensure proper supply and distribution of essential consumer item; throughout
the country. It is one of the pioneer trading organizations occupying 41 years
of history working in multiple capacities of rendering bettor services and
providing quality goods to the public its first task was to make edible salt
promptly available. But the distribution system during the passage of time
discordereddisordered and became unreliable. However, attempts were made
to reduce irregularity through the organized supply and delivery systems. The
organization gradually improved its ability not only meet the demand but also
to maintain quality. Latecr, the corporation started to provide iodized salt to
prevent goiter when the organization assigned the responsibility of
implementing the Nepal-India goiter control project in 1972.
The establishment of STCL has taken place with joint participation of
private and Government sector of Nepal. So, it is also called a "best
combination of the both World private and public." The head office of STCL is
in Kathmandu. Branch offices of STCL are spread all over Nepal. It has all
together 93 zonal office, Branch office, Depots and contact offices through out
Nepal. Thus the salt Trading corporation Ltd. has developed a lot since its
establishment. It is apparent from its name STCL that what it is doing of
course it deals initially with only the the trading of salt but no longer had it
remained limited with a product. It expanded its trading with the passage of
time and distribution of assorted product like salt, sugar, honey, Banaspati
ghee and oil, Maida, suji flour, choker, tyres, tubes, flap, agriculture tools,
pesticides, fertilizer cement and others.

6
STCL has almost monopoly in the trade of salt. STCL also does social
works. It sometime organize social welfare program. It also provides
scholarship to bonafidebonfire students of the country. STCL has
extablishedestablished salt trading agriculture development center for the
country's more theanthan 80 percent agriculture dependent people. STCL has
also started to export vegetables and fruits to the gulf countries which in result
may increase income of farmers of the country. In this way STCL is serving
people with both goods and service.
Salt Trading Corporation Ltd is managingg by board of directors. Mr.
Kamalmani Dixit is the president of STCL. Mr. Parmeshwar Mahaseth is the
CEO of STCL. Beside these there are several personalities doing the
management work for STCL.
The authorixed capitalof STCL is Rs. 1000000000. (10000000 shares @
Rs. 100 each) The issued capital is Rs. 1000000000 (10000000 shares @ Rs.
100 each). The paid up capital is Rs. 24777700 (82574 ordinary shares @ Rs.
100 each and 165203 Bonus shares Rs. 100 each).
Establishment of Industries/ organizations.
After corporation has extablishedestablished it is necessary goods
it helps in the economy development of country by establishing several
industrial corporations and has become able to keep its position in a group of
industrial enterprises, after the corporation has established STCL in industrial
sector, it has invested its money in finance and insurance sector to improve
economic condition.
By observing the strong management of corporation, our government of
Nepal has transferred the management of different organization of this
corporation (STCL).

7
Family group of Salt Trading Corporation Ltd.
Salt Trading Corporation LTD. Kalimati, Kathmandu.
Khadya Udhyog Ltd. Industrial Area, Hetauda.
Sagarmatha Insurance Company Ltd. Kathmandu.
Nepal vegetables Ghee Inndustray Ltd. Industrial Area, hetauda.
Gorkhali Rubber Udhyog Ltd. Anbook Khaireni, Gorkha.
National Finance company Ltd. Basantapur, Kathmandu.
Hitkari Guthi, Kalimati, Kathmandu.
Suwarna Pharmeceuticals Ltd. Kathmandu.
EXIM International, Kathmandu.
Nepal Coal Limited, Birgunj.
But some years ago Nepal Banaspati Ghee Udhyog limited was
privatized by the corporation.
The main reason of difference form other commercial group is the
corporation is able to supply qualitative groups which are essentials through
out the country whole a years and is capable for managing goods through out
the country.
Thirty seven years of dedication and services to the nation and
people has to day made Salt Trading Corporation Ltd. a major catalyst in
bringing about the desired economic changes and growth in Nepal ? Therefore,
the present study has reference to salt, particularyparticularly the focuses area.
The active participation of government excitement of private
sector is mainly the reason success of STCL.

8
Organizational Structure of the Corporation
1.1.2 Conceptual Framework of Working capital
Working capital management is the most important aspects of any
organization. Organization may successor fail because of its working capital
management. In this regard, how gar Nepalese organization is able to manage
working capital is essential to study. National income is sum total of the
contribution made by various sectors of the economy including agriculture,
manufacturing, tourism, hotel and restaurant, construction, financial institution
and communication etc. The working capital is compared as life blood of
companies. It is a controlling nerve of business. Hence, the success and fail of
any company depends on working capital management. The inefficient
management of working capital leads to loss of profit in the short-run but it
ultimately leads to the dawn fall of the organization in the long-run.
"Working capital management is concerned with the problems that arise
in attemtingattempting to manage the current assets, current liabilities and inter
relationship between them."
Chief Executive
Deputy General Manager
StaffDepartment
BusinessDepartment
AccountingDepartment
AdministrationDepartment
Internal auditingDepartment
Zonal Branch Dep. Contact office

9
Working capital management practices in Nepalese manufacturing
enterprises provide totally a different picture. The past trend of many
manufacturing and trading companies had given emphasis in fixed assets. So,
they are facing financial problem all the time. The government policy to
concerntrateconcentrate more in fixed assets has overlooked the financing of
working capital. So in order to create the culture of risk beringbearing ability
through commercial prudence and professionalism, the aspect of working
capital should be treated in the same way as fixed capital. While deciding the
structure of the manufacturing and trading companies, recently short term
financial decision has never received much attention in the literature of
finance. Because of earlier emphasis of financial management was more Long-
term financial decision. Which led to growth and development of many useful
theories concerning these decisions as compared to short-term financial
decision? 5
In most Nepalese enterprises the management of working capital has
been misunderstood as the "Management of Money" and the managers are
found over conscious about the working of money rather than its efficient
utilization.6 At the same time they never think of the source of working capital
and usually depend on HMG for some of PES have used depreciation fund and
utilized surpluses to overcome the scarcity of working capital. Thus the
existing problems are iIn the management of working capital rather than in any
other area.
Working capital is lifeblood of enterprises. The inefficient management
of working capital will lead to loss of profits in the short-run but it will lead to
down fall of the enterprises in the long-run. A deeper understanding of the
importance of working capital and its satisfactory provision can lead not only
5 Pradhan, Radhe shyam "Management of working capital" (New Delhi, Nation book organization, 1986)6 Acharya, Dr. K. " The management of working capital in PES of Nepal" (Nepalese Dev. Studies. 1988)

10
to material saving as well as economic use of capital but can also assert in
furthering the ultimate aim of business.
So, maintaining the optimal level of working capital is crux problem as
its strongly related to the trade off between risk and return. The aspect of
determine appropriate proportion of working capital in the structure of total
assets comes under the preview of working capital policy. The unnecessary
blocking of working capital. Administrative negligence in day-to-day
operation and serious liquidity problem are the main causes to failure of any
companies of Nepal. Most of Nepalese companies are operating in loss
through they are following aggressive opproachapproach of working capital
management.
1.2 Focus of the study
This study focuses how the Nepal salt Trading Corporation utilized the
available working capital funds very well. No business can operate
successfully and effectively without effective management of working capital.
Organizations were established with the objective of rapid socioeconomic
development of the country by utilizing the resources available because the
private sector could not set up al the basic and feasible industries capable of
fulfilling national goals and objectives due to unattractive profit, necessity of
huge investment, high-risk involved and long gestation period.
Working capital in the business is comparable to the blood of the human
body. Like blood, it gives strength and life i.e. profit and solvency to the
business organization. Working capital is a organization's investment in current

11
assets such as cash, marketable security, inventory, accounts receivable and
also administration of current liabilities.7
Working capital management is concerned with the problems that arise
in attempting to manage the current assets, current liabilities, and
interrelationship between them.8 The basic total of working capital
management is to manage the current assets and current liabilities of a firm in
such a way that the satisfactory several of working capital is maintained i.e.
these are neither inadequate nor excessive.
Working capital increases in two conditions, by increasing on current
assets or decreasing current liabilities. So it is assumed that the greater the
amount of net working capital. Less risky the firm is. By increasing the
working capital, the firm will be more liquidity position. The chances of
insolvent will be low in that case. In same ways if the working capital
decressesdecreases. The risk increase and side-by-side these will be more
chance of insolvent. The immediate effect of inadequate working capital may
be:
i) Low Liquidity
ii) Low profitability
iii) High interest charge
iv) Credit worthiness
v) Goodwill
vi) Solvency position.
The main focus of the present study is, therefore, to evaluate the size
and efficiency with which each component of current assets is being utilized in
7 Sherlakar, S.A. and V.S sherlekar, Modern Business organization and Management system approach",
Himalyayn puplishing House, 1990, p.7.458 Smith, op. cit., K.U. (1994), pg.5

12
the Nepal Salt Trading Corporation Ltd. to judge its liquidity position both the
conmcepts of the working capital i.e. gross working capital and net working
capital have been considered in the study. It therefore, examines the current
assets as well as the liquidity position of the salt Trading Corporation Ltd.
1.3 Statement of the Problem
Working capital is the circulation capital, which is compared as life
blood of the human beings for the organization. As working capital is the size
of investment each type of current assets each of these current assets should be
managed efficiently and effectively. It is because decision regarding working
capital not only affects profitability of the organization in the short-run but also
affects the survival in the long-run.
Many firm's in the event of the failerfrailer of a business the shortage or
working capital funds is given out on its root cause. But, in the ultimate
analysis it may be the mismanagement of working capital funds of the business
that could have converted as otherwise successful business into an
unsuccessful one. We know that we management became difficult in Nepalese
organization. Here, we are trying to find out why communication sector
organization are not able to manage the working capital of the company and
they have not followed good approach of the working capital management
working capital management decision is a significant managerial decision
Various factors affects the working capital management of the business
organization. If the firm wants to maintain sound financial position, it should
maintain optimal level of working capital.
Though, most of the communication organization in Nepal have well
recognized the importance of proper management, they are still facing the
problem of working capital management due to the various factors related to it.

13
Managers still focus their attention on the procurement aspect of working
capital but not on the efficient utilization of fund. The deficiency we practices,
administrative negligence's in day to day operations, liquidity problem, lower
turnover of asses, negative rate of return and poor collection and payable
policy are the major problem facing in Nepalese organization.
As we know that investors want to earn return from their investment.
Therefore any organization should make profit for investors but profit is not
only the indicator of proper management of financing. So basically, this study
has tried to find out the issue of working capital management in Nepal Salt
Trading Corporation Ltd. The research study has tried to find out the answer to
the following questions.
1. Is the investment of Nepal Salt Trading Corporation Ltd in current assets
appropriate to its total assets level?
2. What is the structure of working capital in Nepal Salt Trading Corporation?
Are there proper investments in working capital?
3. Is the working capital policy appropriately followed by Nepal Salt Trading
Corporation Ltd?
4. Are their sound liquidity positions in Nepal salt Trading Corporation?
5. Is the Nepal salt Trading Corporation beingablebeing able to utilize their
current assets properly? What is the nature of working capital utilization?
6. Is overall profitability of this organization satisfactory ?
A general observation of their past performance and form the latest
available computed comparative balance sheet and profit and loss account out
show the working capital policy is not effective and to find out major bleeps
and suggestive recommendation to solve the working capital management that
selected corporation's objective can be achieved At last one of the major

14
problems of that these selected company are facing ill management of working
capital.
1.4 Objective of the Study
Working capital generally refers the current assets and net working
capital refers the difference between current assets and current liabilities. The
balanced working capital is most important for every organization. The excess
and inadequate working capital is very harmful. The success and failer of
organization depends upon the amount of working capital. The working capital
management refers to maintaining a balanced working capital. The main
objective of this study is to examine the overall working capital management
of STCL.
Each and every research study is conducted with a view of achieving
some objectives. The major objective of this study is to evaluate the working
capital position of Nepal salt Trading Corporation. The other objectives of this
study are to throw light on the importaceimportance of the proper management
of working capital and to make suggestion about how to manage working
capital of Nepal salt Trading Corporation from the long-range view point. The
specific objectives are as follows:
1. To calculate the liquidity, profitability and turnover ratios of the company.
2. To find out the need to control investment in each type of current assets
over the study period.
3. To analyze the effect of working capital on liquidity and profitability.
4. To suggest and recommend for the improvement in working capital
management of trading company.
5. To show how working capital determines the strength and weakness of the
organization.

15
1.5 Significance of the Study
The need for working capital to run day-to-day business activities
operations can not be overemphasized. "Working capital management has been
looked upon as driving seat of finance manager."9 Efficient management of
working capital not only maintains proper liquidity but also increase
profitability. Management of working capital is perhaps more important than
even management of profit. Proper management and development of working
capital are important aspect of financial management of the companies. Since
they have significant bearing on the optimization of the rate of investment,
besides it is high time that greater attention is given to the working capital
management in the Nepal salt Trading Corporation.
This study will also help as a literature for the future study about the
relating topic, apart from this corporation can also follow the suggestion of this
study to make their policy and strategy more practical and scientific.
In conclusion it can be said that this has most importance. Some of them
are as follows:
1. A large proportion of the financial manager's time is allocated to working
capital management.
2. More than half of the total assets are typically invested in current assets.
3. The relation between sales growth and the need to invest in current assets.
4. This study is also expected to help the teachers and students for further
study of relating sector as literature.
9 Kulkarn, P.V., "financial Management." Himalaya publishing House, India, 1983, pg. 393
16
1.6 Limitation of the Study
The study attempts to compare the working capital management of
STCL. There are some limitations, which weaken the generalization e.g.
inadequate coverage of industries, time period taken, reliability of statistical
tools used and other variation.
None of the study can go beyond the boundary of limitations and this
study is also not an exception. This study is mainly based on secondary data,
which have been collected from books, financial statements, and reports of the
relevant companies and web sites.
No can be free from constraints such as economic resources time etc.
The present study of working capital management has the following
assumption and limitations.
1. Due to time constraint, not all the related areas are possible to cover in
depth.
2. The data published in the annual reports have been assumed to be correct
and true.
3. Oral interview given by the officers of the firm is assumed to be correct and
true.
4. This study is limited to working capital management of STCL.
5. Basically, the data and financial statement provided is secondary in nature.
6. The study is only for the partial fulfillment of MBS.
7. This study is only suggestive rather than directive.
1.7 Organization of the Study

17
The whole study on is divided into five main chapters:
Chapter 1. Introduction
Chapter one deals with the general background of the study with the
subject matter of the study. This chapter consists of following topics:
General background of the study
Focus of the study
Statement of the problem
Objectives of the study
Significance of the study
Limitations of the study
Organization of the study
Chapter 2. Review of Literature
This chapter deals with the review of different books, reports,
dissertation and journal, articles related to the topic of the study.
Chapter 3. Research Methodology
This chapter deals with research design, research methods, sources of
data, data collection techniques and data analysis tools to be used and methods
of analysis are included.
Chapter 4. Presentation and Data Analysis
This chapter deals the required for the study will be presented,
analyzed and interpreted by using various tools and techniques to present the
result relating to the study.

18
Chapter 5. Summary, Conclusion and Recommendation
The fifth chapter will be the final chapter the study that contain
summary of the research this chapter. This chapter will try to fetch out a
conclusion from the finding of the study and will attempt to offer analytical
and critical view on performance of the stock selected company and present
various suggestions and recommendation for present and prospective investors.
Bibliography abbreviations, appendix and a vita sheet have been also
presented at end of the study.
1.8 Terminology Used in the Study
The following terms are used in this research report.
1. current Assets: The assets which can be converted into cash within an
accounting year or within the operating cycle of the business is current
assets, current assets include cash and those assets, which can be
converted into cash within a year, such as marketable securities, debtors
and stock, prepaid expenses should also be included in current assets.
2. Current Liabilities: Liabilities, which are to be repaid with in one year of
the data of balance sheet, are known as current liabilities. It represents the
obligation of the business and arises in the ordinary course of operating
business. Sundry creditors, bills payable, bank overdraft, accrued
expenses, received in advance, cash credit etc. are example of current
liabilities.
3. Fixed Assets: It represents tangible physical properties, which have and
anticipated working life of more than one year in the regular operations of

19
the business. Examples of fixed assets are land and building, Plant and
machinery, equipment, furniture and fixtures, loose tools, vehicles etc.
4. Total Assets: It is total sum of current and fixed assets.
5. Net Working Capital: The difference between current assets and current
liabilities is called net working capital.
6. Working Capital: The term working capital here refers to the gross working
capital. It includes the total volume of current assets.
7. Inventory: Inventory is the most important assets of the firm. It keeps to
meet its requirement of production and sales. It includes the inventory of
raw materials, chemicals and finished goods inventory.
8. Quick Assets: Quick assets represent the current assets minus inventory of
the firm. It is part of current assets, which are considered as highly liquid.
9. Receivables: It includes the sales debtors and other debtors only.
10. Cash and Bank balance: It includes the cash in hand and cash at bank.
11. Fiscal year: Fiscal year is the period of 12 months from 1st shrawan to
31st Ashad.
12. Total Fund: Total fund refers the total of long-term debt as well as short-
term debt.
13. Income Statement: It is a summary of firm's revenue and expenses over
specific period.
14. Balance sheet: Balance sheet may be defined as a statement prepared with
view to measure the exact financial position of a business firm on a
certain fixed date.

20
CHAPTER – II
REVIEW OF LITERATURE
2.4.2.1 Concept of Working Capital:
A business firm needs not only fixed capital but also the working capital
for day-to-day operation of the concern, it finances in some of the assets of
short-term nature like inventories, accounts receivable (sundry debtors), cash
and marketable securities etc. when all these short-term assets are put together
it is called working capital. This working capital and total current assets are
synonymous. It is therefore, said that working capital is related with short-term
financing.
The assets such as cash; marketable securities, accounts receivables and
inventories which are known as current assets are required to be maintained at
a certain level depending upon the volume of production and sales. The cash
and marketable securities are respectively considered as purely liquid and near
liquid assets where as the accounts receivable and inventories are not.
However they can be liquidated as and when necessary with a period of less
tan one year. The capital invested on these assets is known as working capital.
In short, the working capital is the sources of financing current assets and it
includes short as well as long term financing "working capital refers to a firm
investment in short-term securities. Account receivable and inventories"10
10 Hampton, Johan J., as quoted by Dongol, R.M., Parajuli, K.P. "Accounts of financial analysis and
planning."
Formatted: Font: 15 pt, Bold, Underline,Complex Script Font: 15 pt, Condensed by 0.1pt
Formatted: Indent: Left: -0.5", Space Before:Auto, Line spacing: 1.5 lines, Outline
numbered + Level: 2 + Numbering Style: 1, 2,3, … + Start at: 1 + Alignment: Left + Alignedat: 0.5" + Tab after: 1" + Indent at: 1", Tabstops: Not at 0.5" + 1"
Formatted: Font: Bold, Condensed by 0.1 pt

21
The use of the term working capital indicates that its flow is circular in
nature. Because of the circular nature of current assets Working capital is
sometimes called circulating capital.
There are two major concepts of working capital net working capital and
gross working capital when accountants use the term of working capital, they
are generally referred to net working capital. When is the dollar difference
between current assets and current liabilities. This is one measure of the extent
to which is the firm protected from liquidity problems. From the management
view point. It however makes little sense to take about trying to actively
manage a net difference between current assets and current liabilities,
particularly when that difference is continuously changing.
Financial analysis, on the other hand, means current assets when they
speak working capital. Therefore their focus is on gross working capital.
Since it makes sense for the financial manager to be involved with
providing the current of current assets for the firm at all time. We will adopt
the concept of gross working capital. As the discussion of working capital
management unfolds our will be to consider the administration of the firm's
current assets, cash and marketable securities, receivable and inventory and the
financing (current liabilities) needed to support current assets.
The term current assets refers to those assets, which can be converted
into cash within an accounting year or operating cycle, and include cash, short-
term securities, debtors, bills receivable, inventory and prepaid expenses.
Current liabilities are those claims outsiders which are expected to mature for
payment within an accounting year and include an account payable, creditors,
bills payable, bank overdraft, and outstanding expenses. "Each of current
assets must be managed efficiently in order to maintain to liquidity for the firm

22
by not keeping to high level of any one of them. The interaction between
current assets and current liabilities is, therefore the main theme of the theory
of working capital management."11
"Working capital has a volatile nature. The nature presents some
problems and constrains in financing working capital need. The volatile nature
of working capital refers to the change in total current assets."12
Working capital is essentially circulating in nature. It can be compared
with a river, in which water level is constantly changing. Thus, the nature of
working capital is not fixed; it is changeable at different times on the basis of
transaction of goods.
The working capital is the capital needed to conduct day-to-day
operations of business. Working capital is therefore a broader term and
chances of misunderstanding it. If business enterprises manager clear cut
concept of working capital, liquidity crisis could have been avoided.
Deficiency of knowledge about working capital concepts has often brought a
lot of liquidity crises. In fact, there are two concepts of working capital.
(i) Gross concept
(ii) Net concept
2.1.1 Gross Concept of Working Capital :-
The gross concept of working capital refers to total current assets;
current assets are those assets, which in ordinary course of business can be
converted into cash within short period of morally one accounting year.
11 Khan, M.Y. and P.K. Jain, op. cit. P.61312 1bid. p. 48

23
R.S. Pradhan and K.D. Koirala express their view about gross concept
of working capital as "If all the expenses needed to run the day-to-day
operation of business such as amount to be invested in the form of cash,
finished goods, receivable etc, are put together it is called working capital. This
working capital and total current assets are synonymous."13
"The gross working capital concept focuses on two aspect of current
assets management:
i. Optimum investment in current assets.
ii. Financing of current assets.
The consideration of the level of investment should avoid two danger
points excessive and inadequate investment in current assets should be just
adequate, not more not loss, to the need of business firm…another aspect of
gross working capital points to the need of arranging funds to finance current
assets."14
Current assets included:-
i. Cash in hand
ii. Cash at bank
iii. Bills receivable
iv. Sundry debtors (less provision for bad debts)
v. Inventories or stock as
Raw Material
Work in progress
Stores and Spares
Finished goods
13 Pradhan, R.S., and Korirala, K.D., some reflection on working capital Management in Nepalese
corporation Management Dynamics, vol. 3 No. 114 Pandey, I.M., Financial Management, Vikash publishing House PVt. Ltd., New Delhi, Third reprint July
1992, p.800.

24
vi. Temporary invest of surplus founds
vii. Prepaid Expenses
viii. Accrued income
Supporters of this concept argue that the real working operation of
public enterprise solely rely on current assets. Moreover, there is a logical
reasoning that explains if fixed assets imply fixed capital, than current assets
imply on working capital. As working capital is evaluated in terms of
utilization of current assets, it is naturally on current assets only. Current
liabilities are not entered into picture. While judging the turnover of current
assets. But reformer of this is a concept incomplete in itself, the management
of working capital gives erroneous result if public enterprises do not consider
current liabilities. Again, it they rely on this concept, the true financial position
of the enterprise does not disclose.
2.1.2 Net Concept of Working Capital :-
Net working capital is commonly defined as the difference between
current assets and current liabilities. "The term net working capital can be
defined in two capitals can be defined in two ways'.
i. The most common definition of net working capital is the difference
between current assets and current liabilities.
ii. And Alliterative definition of working capital is that portion of firm's
current assets, which is financed with long-term funds. Current liabilities
are those liabilities which are intended to be paid in the ordinary course of
business with in a short period of normally one accounting year out of
current assets or the income of the business.
Current liabilities Included:

25
i. Bills payable
ii. Sundry creditors
iii. Accounts payable
iv. Accrued outstanding expenses
v. Short-term loan, Advantages and deposit
vi. Dividend policy
vii. Bank overdraft
The gross concept is a financial or going concern where as net working
capital concept is as accounting concept of working capital.
These two concepts emphasis that excessive investment in current assets
affects profitability as idle investment yield nothing. Similarly inadequate
investment in current assets intakes in difficultle of carrying out day-to-day
operations of business smoothly
The net working capital, being the difference between current assets and
current liabilities, indicates the liquidity position and suggest the extent to
which working capital needs may be financed by the permanent source of
funds.Net working capital can be negative or positive. A positive net working
capital will arise when current assets exceed current liabilities. A negative net
working capital occurs when current liabilities are in excess of current assets.
The need for net concept of working capital arises due to the fact that
short-term creditors want an enterprise to maintain current assets at a higher
level as compared to current liabilities. It shows the extent of protection
provided to short-term liabilities.
"In fact, the choice of particular concept depends upon the purpose in
view. Thus, of the two concepts, the net is more useful, if the purpose is to find
out the liquidity position of an enterprise. If on the other hand, the interest lies

26
in finding out where the total current assets of an enterprise are being put to
maximum use, the gross concept is preferable.15
2.2 Nature of Working Capital:-
Working capital management is concerned with the problems that arise
in attempting to manage the current assets, current liabilities and the
relationship that exist between them.5 The nature of working capital is
described with the help of nature of cash cycle or operation cycle of them
firm. Current assets are usually converted into cash within an accounting year
(operation cycle). Conversion of current assets into cash in the subject matter
of cash cycle. The process of cash starts when a firm uses cash to purchase raw
material and pay for other manufacturing cost of produce goods. These goods
are carried as inventory for sometime till they are sold. These goods are either
sold on cash or accounts receivable are created. Account receivable is collected
from debtor which brings cash into the firm. In this way cash cycle is complete
and new process of cash cycle starts again. The major current assets are cash,
marketable securities, accounts receivable, inventories etc. Current liabilities
are those liabilities which are expected to nature for payment within an
accounting year. The basic current liabilities are account payable, creditors,
bills payable, bandk overdraft and outstanding expenses.16
Nature and interrelationship of working capital can be best understood
by operating cycle of the firm. A firm begins with cash that is used for
purchase of raw materials and bought in components. Materials and other
operating supplies can also be purchased on credit that in turn generates
accounts payable. Further cash is extended to pay the labor and other
manufacturing costs and further trade credit obtained to enable production of
15 Saly, S.M., financial Management of public enterprises. Hand and company Ltd., New Delhi, 1984. p. -9016 Jain, P.K., and Khan, M.Y., Financial Management, Tax and problem Tata Mc Graw Hill publishing Ltd.
New Delhi.

27
finished goods; which are eventually sold on credit giving rise to account
receivables. The collection of receivables brings cash into the firm and
creditors are paid. The average time, which elapses between the acquisitions of
materials or services entering into cash, realization constitutes on operating
cycle. The operating cycle can be depicted as given below.
Working Capital Cycle
In order to reduce the requirement of working capital, the management
should buy to reduce the period of the operating cycle. This underlines erecting
working capital so as to get the optimal result. This leads use to the discussion
of structure of working capital.
2.3 Needs and Objectives of Working Capital:
Working capital is the lifeblood of nerve system of every business
concern. It is needed to run the day to day business activities. Working capital
must be still at a certain level for the daily business operation. The needs for
working capital arise due to the time gap between production and realization of
cash from sales. Business organization has an aim to maximize the share
holder's investment. In order to accomplish this objective, the business
organization should earn sufficient return for its operations. Earring a steady
Cash
DebtorsPurchase of material and
componentsAccounts Payable
Production
Inventory(Finished goods)
Sales
Formatted: Font: 15 pt, Underline, ComplexScript Font: 15 pt, Condensed by 0.1 pt
Formatted: Font: 15 pt, Underline, ComplexScript Font: 15 pt, Condensed by 0.1 pt
Formatted: Font: 15 pt, Underline, ComplexScript Font: 15 pt, Condensed by 0.1 pt

28
amount of profit requires successful sales activity. "sales do not convert into
cash instantly; there is invariably a time-lag between the sales of goods and
receipt of cash There is therefore, a need for working capital in the form of
current assets to deal with the problem arising out of the lack of immediate
realization of cash against goods sold."17 Thus, sufficient working capital is
necessary to sustain sales activity. It is also necessary to solve the problems or
to pay for liabilities like creditors, short-term loan etc.
Each and every firm needs sufficient volume of working capital in order
to run the business smoothly. We will hardly find a business firm which does
not require any amount of working capital. Firms differ in their requirement of
the working capital.
Needs and objectives of working capital can be listed as follows:
i. To provide credit facilities to the customers.
ii. To pay wages and salaries.
iii. For the purchase of raw materials, components and spares.
iv. To maintain day-to-day expenses and overhead cost such as fuel,
power, and office expenses.
v. To meet the selling expenses as packing, advertising etc.
vi. To maintain the inventory of raw materials, work-in-progress,
stores, spares and finished stock etc.
vii. To pay the short-term debt and bank loan in time.
viii. To keep the business in solvency position.
ix. To face for the economic depression and emergencies.
x. To grab the opportunity.
xi. To get regular return and to make the shareholders intension well
towards the organization.
17 Khan, M.Y., and Jain, P.K., Financial Management, Op. cit. p. 621

29
2.4. Principle of Working Capital:-
2.6
The following are the general principles of sound working capital
management:18
i. Principle of risk variation.
ii. Principle of cost of capital.
iii. Principle of maturity of payments.
iv. Principle of equity position.
The first principle refers to the risk associated with the amount working
capital employed. The second principle is concerned with the problems of
determining the ideal levels of working capital. The third principle is
concerned with the risk directly repeated to the type of capital used for
financing working capital requirements and debt equity ratio and the fourth
principle is concerned with maturity dates relatively more import and for risk
of insolvency.
2.5. Importance of Working Capital:-
2.5. Importance of Working capital:-
Every business needs capital for two purpose i.e. long-term and short-
term purpose. To operate business a firm needs capital or working capital.
Firms can't be sustained without cash. Working capital is very essential t
Formatted: Indent: Left: -0.5", Line spacing:1.5 lines, Outline numbered + Level: 2 +Numbering Style: 1, 2, 3, … + Start at: 4 +Alignment: Left + Aligned at: 0.63" + Tabafter: 1.13" + Indent at: 1.13", Tab stops:Not at 0.5" + 1.13"
Formatted: Indent: First line: 0.5", Linespacing: 1.5 lines, No bullets or numbering
Formatted: Indent: Left: -0.5", Line spacing:1.5 lines, Outline numbered + Level: 2 +Numbering Style: 1, 2, 3, … + Start at: 4 +Alignment: Left + Aligned at: 0.63" + Tabafter: 1.13" + Indent at: 1.13", Tab stops:Not at 0.5" + 1.13"
Formatted: Indent: Left: 0", First line: 0.5",Line spacing: 1.5 lines, Outline numbered +Level: 2 + Numbering Style: 1, 2, 3, … + Startat: 1 + Alignment: Left + Aligned at: 0.5" +Tab after: 1" + Indent at: 1"

30
maintain smooth operation of business. No business can run successfully
without sufficient and adequate amount of working capital. In this 21st century
competition arises rapidly, day-to-day competition grew up so business sector
is very complex. Now a days so working capital play the vital role to
run/operate the business smoothly.
Every business firms keeps their objectives either maximum their wealth
or shareholder return or higher profit. To maximize their target goals, they
have to invest their capital different profiles to minimized risk and to
maximized return. So that working capital is required to be studied. Working
capital is important for this reason:-
i. A large proportion of financial manager's time is allocated to working
capital.
ii. More than the half of the total assets is typically invested in current
asset is close and direct.
iii. The relationship between sales growth and need to invest in current
assets is close and direct.
iv. Investment is fixed assets may be reduced by renting or leasing but
investment in inventories and receivable is usually available.
v. Small firm may be minimized their investment in fixed assets by
teasing but they can't avoid investment in cash receivable and
inventories.
Working capital is important due to:-
i. Adequacy of working capital creates a felling of securities and
continuous confidence.
ii. Adequacy of working capital is a must for maintain solvency and
continuing production.

31
iii. Creation of sound goodwill.
iv. Facility of off-season purchasing.
v. Regular supply of off-season purchasing.
vi. General rise in management moral.
vii. Easy availability of cash discount.
viii. Easy loan from bank.
ix. Quick and steady return to the investor.
The firm has to pay wages, pay for the raw materials, pay bills and so
on. To maintain day to day expenses and overhead, cost such as power and
office expenses and provide credit facility to the customer working capital is
useful.
2.6 Determinations of Working Capital:-
Determinations of working capital:-
Working capital is a wide concept to management. It is a part of
management accounting. Working capital plays an important role in a
business. To maintain a particular level of operation, the working capital must
be analyzed sufficiently. But it is not easy to determining or estimate the
required amount of working capital. Both over and under working capital are
dangerous for the business concern.
There are no set rules or formulate to determine the working capital
requirements of the firm. A most number of factors influence the working
capital necessary of the firm. Working capital requirement must be sufficient
to achieve maximum profit and the successful run of the business enterprises.
So that it must be inadequate volume. To determinate total working capital
Formatted: Indent: Left: -0.5", Hanging:0.5", Line spacing: 1.5 lines, Outline numbered+ Level: 2 + Numbering Style: 1, 2, 3, … +Start at: 6 + Alignment: Left + Aligned at:1.13" + Tab after: 1.38" + Indent at: 1.38",Tab stops: Not at 1.38"
Formatted: Level 1, Indent: Left: 0", Firstline: 0.5", Line spacing: 1.5 lines, Outlinenumbered + Level: 3 + Numbering Style: 1, 2,3, … + Start at: 1 + Alignment: Left + Alignedat: 1" + Tab after: 1.5" + Indent at: 1.5"

32
requirement a wide variety of factors into existence. However, the following
factors are to determinate working capital.
i. Nature and size of business: - Working capital requirements of the firm
are basically affected by the nature and size of its business. Greater the
size of the business will be the working capital need. Trading and
financial firms have a very less investment in fixed assets but requires a
large amount of working capital. Public utilities comparatively limited
need for working capital and have to invest abundantly fixed assets. The
working capital needs must of the manufacturing concerns between the
2 extreme of trading firms and public utilities. So, the size of business
has an important impact on its working capital needs. Size may be
measured in terms of the scale of operations. A firm with large scale of
operation will need more working capital than a small one.
ii. Manufacturing cycle: - Longer the manufacturing cycle large will be the
firm's working capital requirements.
iii. Business Fluctuation:- Business fluctuation leads to cycicalcyclical and
seasonal changes which in turn, cause a shift in the working capital
position, particularly for temporary working capital requirement,
naturally the recession need more working capital than in the period of
boom.
iv. Growth and expansion activities: - Larger amount of working capital is
needed if the firm is in growth phase and expanding itself.
v. Credit policy: - Liberal credit policy tends to increase in working capital
requirements more than the strict policy does.
vi. Price level changes: - Generally, rising price levels will require a firm to
maintain higher amount of working capital. The same level of current
assets will need increased investment when price are increasing.

33
However the product praises with rising price levels won't face a serve
working capital problem.
vii. Credit market situation:- Credit market situation also plays vital role in
determining working capital need of a company. Easy accessibility
sound and favorable creditors market relatively as we need a firm.
viii. If the supplies are available regularly less amount of working capital
will be needed. But if supplies are irregular the business is required to
have large Quantities of stock in order to ensure uninterrupted flow of
production. This will require more amount of working capital.
ix. Rising price level will require a firm to maintain higher amount of
working capital.
x. If the firm is looking forward growth in naturally cost more working
capital will need.
xi. There are also other factors as dividend policy profit level,
financyfinance change etc.
The quantum of working capital is also determined by the management
attitude towards risk. If the management perceives risk, current assets are not
sufficiently maintained to match current liabilities during maturity and enhance
the desired level of sales, greater the management adheres to risk the lesser
becomes the need for holding large size of working capital.
Thus for the effective and efficient management of working capital,
finance manager should pay particular attention to major determining factors
as state above.
2.7 Classification of Working Capital:-
Classification of Working Capital:-
Formatted: Indent: Left: -0.5", Hanging:0.5", Line spacing: 1.5 lines, Outline numbered+ Level: 2 + Numbering Style: 1, 2, 3, … +Start at: 6 + Alignment: Left + Aligned at:1.13" + Tab after: 1.38" + Indent at: 1.38",Tab stops: Not at 1.38"

34
Working capital can be classified into 2 ways they are:- on the basis of
concept and on the basis of time. The 1st classification is relasted with gross
working capital and net working capital which 2 concepts discussed earlier on
the basis of time working capital can be divided into 2 ways.
i. On the basis of concept.
ii. On the basis of time.
i. On the basis of concept:-
This classification is concerned with gross working capital and net
working capital discussed earlier. This classification is important since it
categories the various area of financial responsibilities. For example, funds
invested in cash, inventories and receivables require careful planning and
control if the company is to maximize its return on investment. But this
classification does not take into account on time element. It is important in the
procurement policies.
ii. On the basis of time:-
This classification can be divided into two parts:
a. Permanent or Fixed working capital.
b. Variable or Temporary or Fluctuation working capital.
a. Permanent or fixed Working Capital:-
Permanent working capital is that kind of working capital which is
required to maintain as current assets for the successful operation of the
business activities. It is the amount of fund required for production of goods
and services to satisfy the demand. Permanent working capital is the portion of
working capital, which remains in the same Level of the business forever. "A
Formatted: Level 1, Indent: First line: 0.5",Line spacing: 1.5 lines
Formatted: Indent: Left: 0", First line: 0.5",Line spacing: 1.5 lines, Numbered + Level: 1 +Numbering Style: i, ii, iii, … + Start at: 1 +Alignment: Left + Aligned at: 0.5" + Tab after:1" + Indent at: 1", Tab stops: 0.75", List tab
+ Not at 1"
Formatted: Font: Bold, Underline, Condensedby 0.1 pt
Formatted: Indent: First line: 0.5", Linespacing: 1.5 lines
Formatted: Font: Bold, Underline, Condensedby 0.1 pt
Formatted: Indent: Left: 0", First line: 0",Line spacing: 1.5 lines, Numbered + Level: 1 +Numbering Style: i, ii, iii, … + Start at: 1 +Alignment: Left + Aligned at: 0.25" + Tabafter: 0.75" + Indent at: 0.75", Tab stops:0.5", List tab + Not at 0.75"
Formatted: Level 1, Indent: First line: 0.5",Line spacing: 1.5 lines
Formatted: Indent: Left: 0", First line: 0.5",Line spacing: 1.5 lines, Numbered + Level: 5 +Numbering Style: a, b, c, … + Start at: 1 +Alignment: Left + Aligned at: 2.75" + Tabafter: 3" + Indent at: 3", Tab stops: Not at 3"
Formatted: Font: Bold, Underline, Condensedby 0.1 pt
Formatted: Indent: First line: 0.5", Linespacing: 1.5 lines

35
firm's permanent working capital is the amount of current assets is
continuously required by the firm to meet long-term minimum needs."
The operating cycle is a continuous process an therefore the current
assets are felt constantly. But the magnitude of current assets needed is not
always same: it is increase and decrease over time.
There is always minimum level of working capital, which continuously
required by a firm in order to maintain its activities. Every firm has to maintain
a minimum level of inventories cash and other current assets which are needed
to conduct a business even during the dullest season of the year. The minimum
level of working capital is called permanent capital. It is permanent in the same
way as the firms fixed assets. Depending upon the changes in production and
sales, the need for working capital over and above permanent. Working capital
will fluctuate. For example, extra inventory of finished goods will have to be
maintained to support the peak periods of sale and investment in debtors may
also increase during such periods. On the other hand, investment in raw
materials, work in progress, and finished goods will fall if the market is slack.
"Permanent working capital also knows as Hard core working capital.
Hard care working capital is the minimum working capital through, out the
year to support the normal operation of the business." (Van Horn and
Wachiwiz, 1997:204).
b. Variable or Temporary and Fluctuation Working Capital:-
Working capital, which is convertible as per sales volume of business is
termed as temporary working capital. In each and every business unit,
temporary working capital is also provisioned side by side with permanent
working capital. Temporary working capital is required for short period to
meet some special exigencies and seasonal demand. Variable working capital
Formatted: Underline, Condensed by 0.1 pt
Formatted: Indent: Left: 0", First line: 0",Line spacing: 1.5 lines, Numbered + Level: 1 +Numbering Style: a, b, c, … + Start at: 1 +Alignment: Left + Aligned at: 0.5" + Tab after:1" + Indent at: 1", Tab stops: 0.5", Left +
Not at 1"

36
represents the certain amount of fluctuations in current assets within a short
period. Temporary working capital changes its form from cash to inventory
and inventory to receivables and then to cash; business, which one of seasonal
nature required more temporary working capital. This will working capital
changes its form from cash to inventory and inventory to receivables and then
to cash: business which one of seasonal nature require more temporary
working capital. This will increase the turnover of investment resulting
inefficient use of capital.
Variable working capital represents additional assets required at certain
times during the year. Added inventory must be maintained to support peak
selling periods; receivables will increase and must be financed after a period of
high sales. Extra cash may be needed to pay for increased supplies preceding
high activity.
Any amount of working capital over and above the permanent level of
working capital is temporary or variable working capital is temporary or
variable working capital. It is required for short period and cannot be
permanently employed gainfully is the business.
Working capital is required in order to meet the requirements arising out
of fluctuation in sales and this additional amount is known as temporary of
variable working capital. The amount of working capital arises at the time of
busy or brisk season and goes down at the slack season. It also called seasonal
working capital.
Time
Temporary W/C
Permanent working capital
Am
ount
of
W/C
(R
s.)

37
Permanent working capital is stable over time or fairly constant while
temporary working capital is fluctuating. Sometimes increasing and sometime
decreasing. However, the permanent capital line need not be horizontal if the
firm's requirement for permanent capital is increasing or decreasing over a
period.
2.8 Structure of Working Capital:-
Structure of working capital includes a study of the elements of current
assets and current liabilities. The important elements of current assets are
inventory, receivables, cash and bank balance and short-term investment other
the trade investment. Current liabilities usually includes trade creditor, bank
borrowing, accrued expenses, accrued tax and up paid decides.
The detail descriptions of three major components; as cash, marketable
securities, inventory and receivables.
i. Cash:-
"Cash is the crucial components of the working capital of concern
cash like blood streams in the human body give strength to business units.
Without it the firm in notable to pounce the other resource that it needs to
continue the operation of business unit to a stem still. Management has a duty.
Formatted: Indent: Left: 0", First line: 0.5",Line spacing: 1.5 lines
Formatted: Font: Not Bold, No underline,Condensed by 0.1 pt
Formatted: Font: 15 pt, Bold, Underline,Complex Script Font: 15 pt, Condensed by 0.1pt
Formatted: Font: 15 pt, Bold, Complex ScriptFont: 15 pt, Condensed by 0.1 pt
Formatted: Indent: Left: 0", First line: 0",Line spacing: 1.5 lines, Numbered + Level: 1 +Numbering Style: i, ii, iii, … + Start at: 1 +Alignment: Left + Aligned at: 0.5" + Tab after:1" + Indent at: 1", Tab stops: Not at 0.5" +
1"

38
Therefore to see that the firms it manage sufficient cash balance at all times to
meet its day-to-day requirements."18
Cash is one of the most important factors for the business
organization. Without the procurement and proper management of cash on
business organization has the outflow and inflow of cash. The inflow of cash
increase the liquidity and outflow the decrease it .The main source of cash
inflow for a business organization are sale of goods and service, interest in
advance etc and the outflow is necessary for the payment of trade creditors;
administrative expansions wages, interest, creation installment of loans,
different types of cash purchase selling and distribution expenses etc. So, there
should be proper balance between cash inflow and cash outflow. In other
words, there should be an adequate amount of cash in the firm but not excess
cash them requirement is not profitable for business firm.
The important objective in managing cash should be trade off
liquidity and profitability must be balanced in such a way that the organization
retains its liquidity and at the same time maximize is profitability.
ii. Receivables.
Generally receivables mean amount due from customers is known as
receivables. Sales made on credit involve the creation of receivable. Sales
made on credit the creation of receivables that must be converted to cash.
Since the cash isn't firmly in hand until the money is collected. Receivable
represents an exposure that must be analyzed and managed. Receivable is an
important component of working capital management. Account receivables
play a major role in the conduct of business for most firms. To meet the
competition the receivable are very important. Account receivable are known
18 Sharma, R.K., and Gupta, S.K. Management Accounting, Kalyani publisher, New Delhi.
Formatted: Font: Bold, Underline, Condensedby 0.1 pt
Formatted: Indent: Left: 0", First line: 0",Line spacing: 1.5 lines, Numbered + Level: 1 +Numbering Style: i, ii, iii, … + Start at: 1 +Alignment: Left + Aligned at: 0.5" + Tab after:1" + Indent at: 1"

39
as account receivable, trade receivable, customers receivable, sundry debtors,
trade debtors, book debt, bills receivable etc.
To increase the profit the company has to increase the sales. To increase
the sales the goods are to be sold in credit. The credit management refers to
how much credit create should be allowed to customers and soon. To take such
type of decision in a big company there is a separate credit department the
decision is taken by company cost and benefits.
The greater the level of sales and longer the term of credit given to
customers the more will be the quantum of investment in receivable. If the firm
has a relatively liberal credit policy it will have a still higher quantum of
investment in receivable than a firm which has followed a stricter credit policy.
A liberal credit policy encourage customer to delay statement of their cost.
i.iii. Marketable Securities:-
"Marketable securities are short-term money market instruments like treasury
bills, quoted, corporate share, debenture etc. that can easily be converted into
cash when the cash is needed in the business."19
Now-a-days it has become a practice with business concern to invest
their surplus cash in marketable securities. Marketable securities usually given
19 Jain, S.P., and Narang; K.L., op. cit. P-b-182
Formatted: Font: Bold, Underline, Condensedby 0.1 pt
Formatted: Font: Bold, Condensed by 0.1 pt
Formatted: Indent: Left: 0", First line: 0.5",Line spacing: 1.5 lines

40
lower yield them firm's operating assets. There are two reasons for making
investment in these securities.
a. There serve as a substitute for larger cash balance liquidation part of
securities to increase the cash balance when cash outflows exceed. Cash
inflows.
b. Their also used as temporary investments to meet known financial
requirement of the firm in near future.
iv. Inventory:-
Inventory represents a major current assets investment in most
manufacturing firms ranging from perhaps 25 to 75 percent of their current
assets depending upon the magnitude of the firm and the types of industry.
Inventories management involves planning of the optimum level of
materials and cost control of material cost supported by an appropriate
organization structure. An inventory is the stock of any idle item or resources
in a firm for future use. In manufacturing organizations, typically have
inventories of raw materials, components, sub-assembles-tools and equipment,
semi-finished goods, finished goods etc.
"Inventory may consist of raw material, work-in-progress and finished
goods awaiting sale and shipment."20
In this way next concepts of inventory is "Adequate inventories
facilitate smooth production activities and help to provide off shelf delivery to
customers on other hand, excessive inventory is idea resource of the firm and
can prove costly because it lies up working capital unnecessarily which could
20 Brealy, R.A., and Myers, S.C., principle of corporate Finance. Tata Mc Grow Hill publishing co. Ltd.
New Delhi. 4th ed. 1996. page 63
Formatted: Font: Bold, Condensed by 0.1 pt
Formatted: Indent: Left: 0", Line spacing:1.5 lines, Tab stops: 1", Left
Formatted: Font: Bold, Underline, Condensedby 0.1 pt
Formatted: Font: Bold, Condensed by 0.1 pt

41
have been better used it has been utilized for some other purpose. The major
problem of inventory management therefore should be to arrive at an optimal
balance between too much inventory and too little inventory. The optimum
level if inventory is decided keeping in view the costs associated with holding
inventories. There are two types of these cost, ordering cost and carrying cost.
A system for effective management of inventories involves there sub system
economic order quantity record point and stock level."
2.9 Adequacy of Working Capital:-
The firm should maintain a sound working capital
position. It should have adequate working capital to run its business operation.
Both excessive as well as inadequate working capital positions are dangerous
from the firm's point of view. Excessive working capital means idle funds
which earn no profits for the firm. Paucity of working capital not only impairs
firm's profitability but also results in production interruptions and
inefficiencies.
The dangers of excessive working capital are as follows:
i. It results in unnecessary accumulation of inventories. Thus, chances of
inventory mishandling, waste, theft, and losses increase.
ii. It is an indication of defective credit policy and slack collection period.
Consequently, higher incidence of bad debts result which adversely
affects profits.
iii. Excessive working capital makes management compliment which
degenerates into managerial inefficiency.
Formatted: Font: 15 pt, Bold, Underline,Complex Script Font: 15 pt, Condensed by 0.1pt
Formatted: Font: 15 pt, Bold, Complex ScriptFont: 15 pt, Condensed by 0.1 pt
Formatted: Level 1, Indent: Left: 0", Firstline: 0.13", Line spacing: 1.5 lines

42
iv. Tendencies of accumulating inventories to make speculative profits grow.
This may tend to make dividend policy liberal and difficult to cope with
in future when the firm is unable to make speculative profits.
Inadequate working capital is also bad and has the following dangers:
i. It stagnate growth: it becomes difficult for the undertake profitable
projects for non-availability of working capital funds.
ii. It becomes difficult to implement operating plans and achieve the firm's
profit target.
iii. Operating inefficiencies creep in when it becomes difficult even to meet
day-to-day commitments.
iv. Fixed assets are not efficiently utilized for the lack of working capital
funds. Thus, the firm profitability would deteriorate.
v. Paucity of working capital funds renders the firm unable to avail attractive
credit opportunities etc.
vi. The firm loses its reputation when it is not in position to honors its short-
term obligation. As a result, the firms tight credit terms.
An enlightened management should, therefore, maintain a tight amount
of working capital on a continuous basis. A firm's net working capital on a
continuous basis. A firm's net working capital position is not only important as
index of liquidity but it is also used as a measure of the firm's risk. Risk in this
regard means chances of the firm being unable to meet its obligations on due
date. Lender considers a positive net working as a measure of safety. All other
things equal, the more the net working a firm has, the less likely that it will
default in meeting its current financial obligations. Lenders such as
commercial banks insist that the firm should maintain a minimum net working
capital position.

43
2.10 Financing of Working Capital:-
The firm working capital assets policy is never set in a vacuum it is
always established in conjunction with the firm working capital financing
policy. Firm can adopt different financing policies in relation to current assets,
three types of financing may mainly be identified, that are long-term, short-
term and spontaneous financing. Long-term financing includes share
debenture. Preference share and retained earning and long term debt from
financing institutions etc.
The real choice of financing current assets in between short-term and
long-term sources which are different regarding the cost and flexibility. So, far
as financing mix of these two sources is concerned there are three approaches,
viz. hedging or matching approach, conservative approach and aggressive
approach.
i. Hedging (Matching) Approach.
ii. Conservation Approach.
iii. Aggressive Approach.
i. Hedging (Matching) Approach:-
Under this approach, a firm uses long-term financing to finance fixed
assets and permanent current assets and short term financing to finance
temporary or variable assets. In other words, with reference to an appropriate
financing mix, the term hedging can be said to refer to a process of matching
maturities of debt with the maturities of financial need.
The Justification for the exact matching is that since the purpose of
financing is to pay for assets, the financing should be relinquished when the
Formatted: Font: 15 pt, Bold, Underline,Complex Script Font: 15 pt, Condensed by 0.1pt
Formatted: Font: 15 pt, Bold, Underline,Complex Script Font: 15 pt, Condensed by 0.1pt
Formatted: Font: 15 pt, Bold, Underline,Complex Script Font: 15 pt, Condensed by 0.1pt
Formatted: Font: 15 pt, Bold, Complex ScriptFont: 15 pt, Condensed by 0.1 pt
Formatted: Font: Not Bold, Condensed by 0.1pt
Formatted: Font: Bold, Underline, Condensedby 0.1 pt
Formatted: Indent: Left: 0", First line: 0",Line spacing: 1.5 lines, Numbered + Level: 1 +Numbering Style: i, ii, iii, … + Start at: 1 +Alignment: Left + Aligned at: 0.25" + Tabafter: 0.75" + Indent at: 0.75", Tab stops:0.38", List tab + Not at 0.5" + 0.75"
Formatted: Font: Bold, Condensed by 0.1 pt

44
assets is expected to be relinquished when the assets is expected to be
relinquished using long-term financing, for short-term assets is expensive as
the funds will not be utilized for the full period. Similarly, financing long-term
assets with long-term financing is costly as well as inconvenient as
arrangement for the new short-term financing will have to be made as a
continuing for the new short-term financing will have to make as a continuing
basis. Thus, when the firm follows matching approach long-term financing
will be used to finance fixed assets and permanent assets and short-term
financing to finance temporary or variable current assets. But this situation
may not be realized due to the uncertainty about the expected lives of assets.
So, this approach is not practical.
ii. Conservative Approach:-
This approach suggests that the estimated requirement of total funds
should be met from long-run sources, the use of short-term funds should be
restricted to only emergency situation, or when there is an unexpected outflow
of funds. Under a conservative plan, the firm finances its permanents with
long-term financing. This, in periods when the firms have not temporary
current assets; it stores liquidity by investing surplus funds into marketable
securities. The conservative plan relies heavily on long-term financing and
therefore, is less risky.
Time
Temporary current Assets
Permanent current Assets
Fixed Assets
Long-termfinancing
short-termfinancing
asse
ts
Financing under matching plan(Source:IM. pandey)
Formatted: Indent: Left: 0", First line: 0.5",Line spacing: 1.5 lines, Tab stops: Not at 0.5"
Formatted: Font: Bold, Underline, Condensedby 0.1 pt
Formatted: Font: Bold, Condensed by 0.1 pt

45
iii. Aggressive Approach:-
Under an aggressive policy, the firm finances a part of its permanent
current assets with short-term financing. The greater the portion of the
permanent fund requirement finances with short-term debt, the more
aggressive the financing is said to be as there is more risky. The aggressive
financing policy is illustrated below:
Working capital management involves deciding upon the amount and
composition of current assets low to finance these assets. These decisions
involve trade off between risk and profitability. The greater the relative
proportions of liquid assets the lesser the risk of running out of cash all other
things being equal. Profitability, unfortunately, also will be loss. The longer the
composite maturity schedules of securities risk of the cash insolvency, all other
things being equal. Again the profits of the firm are likely to be les. Resolution
of the trade off between risk, and profitability with respect to those decisions
depends upon the risk preference of management.
Temporary CA
Permanent current Assets
Fixed Assets
Time
short-termfinancing
asse
ts
Conservative Finance(Source: I.M. Pandey)
Marketable securities
Temporary Current Assets
Permanent current Assets
Fixed Assets
Time
Short-termfinancing
Aggressive Financing(Source: I.M. pandey)
Long-termfinancing
Formatted: Font: Bold, Underline, Condensedby 0.1 pt
Formatted: Indent: Left: 0", First line: 0",Line spacing: 1.5 lines, Numbered + Level: 1 +Numbering Style: i, ii, iii, … + Start at: 1 +Alignment: Left + Aligned at: 0.25" + Tabafter: 0.75" + Indent at: 0.75", Tab stops:0.5", List tab + Not at 0.75"
Formatted: Font: Bold, Condensed by 0.1 pt

46
2.11 Review of Literature:-
Review of literature means reviewing research studies in the related area
of study. Studies cover the topic review of related research studies, their
conclusion and deficiencies may be known and further research can be
conducted.
Working capital is the effective life blood and controlling nerve center
of any business. Hence, the management of working capital plays a vital role
for the success and failer of any enterprise. So, far as the management of
working capital in Nepalese enterprise is concerned, different management
experts and students of MBS describing the working capital management of
various enterprises have under taken a number of studies. The purpose of this
chapter is to provide an insight into working capital management and give a
bird's eye view of different experts thought regarding the theory of working
capital. This chapter aimed is to review the available literature on working
capital management.
2.11.2 Review of Books
In this section, different view expressed by different person, authors,
professors, executive etc. in their publication and working capital management
for making the easier to the researcher. In the study researcher receive some
Formatted: Font: Bold, Underline, Condensedby 0.1 pt
Formatted: Indent: Left: -0.5", Hanging: 1",Line spacing: 1.5 lines, Outline numbered +Level: 2 + Numbering Style: 1, 2, 3, … + Startat: 6 + Alignment: Left + Aligned at: 1.13" +Tab after: 1.38" + Indent at: 1.38", Tabstops: Not at 0.5" + 1.38"
Formatted: Font: Bold, Condensed by 0.1 pt
Formatted: Font: Bold, Condensed by 0.1 pt
Formatted: Font: Bold, Underline, Condensedby 0.1 pt

47
theoretical concept on the working capital from Van Horne. "Working capital
management usually is considered to involved the administration of current
assets namely cash, marketable securities, receivable and inventories and
administration of current liabilities."21
Indian famous professor I.M. pandey has described some conceptual
frame works, which are bases on his various researchers. We can learn various
lessons from it and also helpful for this study; indeed. He has described various
aspects of working capital management into five chapters. The first chapter
deals with the concept determinate of working capital, dimension of working
capital, need of working capital management. In second chapter he has
described the management of cash and marketable securities, where he has
deals with facts of cash management, motives for holding cash, cash planning
investment in marketable securities. In the third chapter he has described the
management of receivable in which he has dealt with the goals of credit
management, optimum credit policy. In the fourth chapter, on inventory
management he has described need to hold inventories, objective of
inventories management, inventory management techniques, selective
inventories control, he has described the commercial recommendation on the
fifth chapter with reference to the above problems and findings they
recommended the need to control investment in working capital as a whole for
manufacturing co-operation has been trying to control investment in cash and
inventory. But manufacturing co-operation should pay sufficient to control the
investment in inventory.
Professor Weston and Brigham have given some theoretical insights into
working capital management after their various research studies on it.
Conceptual finding of their studies provides sound knowledgeable and
21 Horne, Van, C, James, and Watchowic2, J.M. Fundamental of Financial Management (9th edition),
prentice hall of India Pvt. Ltd, New Delhi. 1996

48
guidance for the future. On the field of management of working capital in any
guidance for the study as well. They explain the importance of working capital,
financial of working capital the use of short-term vs. long-term debt,
relationship current assets to fixed assets. They have explained the major
source and the firm of short-term financing such trade credit, loan from
commercial bank, commercial papers.
Proper management of working capital must ensure, adequate amount of
working capital as per need of business firms. It should be in good health and
efficiency circulated. To have adequate, healthy, and efficient circulation of
working capital it is necessary that working capital be properly determined and
allocated to its various segments, effectively controlled and regularly reviewed.
Surendra pradhan, in this book "Basic of Financial Management", has
shed light financing of working capital as, "There are two ways of financing
working capital requirements i.e. internal and external sources. Internal source
includes use of retained earning, depreciation fund and share capital. External
source includes trade credit, advances from customer, short-term government
loan etc."22 Generally sources or a combination of various sources of financing
to be used depend on the type of current assets (permanent and variable) to
maintain. The long-term sources such as stock issues, debts and bonds are
appropriate to use for the permanent type of current assets only if the
spontaneous type of short-term sources are not enough to not available to cover
the required of permanent current assets.
2.11.3 Review of Journals/Articles:-
22 Pradhan, (Dr.) Surendra, Basic of Financial Management; Tata Mc Grow Hill publishing co. Ltd. New
Delhi, 2nd edition 1993
Formatted: Font: Bold, Condensed by 0.1 pt
Formatted: Font: Bold, Underline, Condensedby 0.1 pt
Formatted: Font: Bold, Condensed by 0.1 pt

49
Articles, Journals, and bulletins are great significances for thesis writing,
so various published articles by different management export, and journals
bulletins relating to working capital management have been considered.
Dr. Radhe S.Pradhan conducted a research named by "working capital
management" with special reference to 10 Nepalese public enterprises. Some
major conclusions drawn by the research are mentioned below.
i. Most of the selected enterprise have been achieving a trade-off bellowed
risk and return there by a following neither aggressive nor conservative
approach.
ii. Almost all selected enterprises have a positive net working capital the
negative net working capital has been observed in few cases.
iii. When quick assets are compared with current liabilities it is revealed that
the former are in sufficient to cover current liabilities on many occasions.
iv. The standard current ratio is to be taken as 2:1 most of selected
enterprises have current ratio of greater then two.
v. The low level of current and quick ratio need not indicate poor liquidity
position. They may still be considered good if the enterprises can generate
cash flow sufficient to pay their current debt therefore the liquidity measure
that consider cash flow have been employed in the study for all their
enterprises for which current ratio are greater than current assets and quick
assets. The measure however showed a poor liquidity position of the
enterprises. The poor liquidity position has been noticed of the enterprise
have either negative cash flow or negative earning before tax or the
excessive net current debts which can't be paid with in year.
The Nepalese manufacturing public enterprise has on an average half of
their total assets in the firm of current assets on an average in largest followed
by receivables, and cash in most of selected enterprises. Since inventory

50
occupies a major share in current assets and its hare has increase overtime.
Nepalese public enterprises should be pay more attention to management of
inventories. The study of the turnover ratio computed over a period of time
shows that there has been an improvement in utilization of current assets by
the majority of manufacturing public enterprises of Nepal but this is not the
case with net working capital utilization.
The pooled regression result of this study contradicts unitary of more
then unitary sales elasticity hypothesis of firmed man. Meltzer whalesn.
DeAllessi and Vogel and Moddala with respect to the demand for cash by
Nepalese enterprises. The presence of economics of scale in cash holding is to
same extent consists with the conclusion of Baurm. Tobin, Frager, Nadiri and
coates. The regression result also show that the level of working capital and its
components an enterprises desire to hold depend not only on sale but on
holding as it's also. The capital cost co-efficient is all statistically significant
with the theoretically correcting. The adjustment speed of actual to desired
balance has been observed as highest for cash followed by inventories net
working capital receivables and gross working capital.
"A comparative study of problem and impediment in the management of
working capital of Nepalese enterprise."23 24 has conducted Dr. K Acharya
state that is most of enterprise the management of working capital has been
misunderstood as the management money rather than is efficient utilization.
Thus the existing problems in the finance are mostly directed towards the
management of working capital rather than increase. In his number of studies it
has been repeatedly fund that the gross inefficient exist in the operation of
enterprises. He has stressed on high cost of production which have left these
manufacturing concern is less reduced position. Thus he further added the cost23 Acharya, Khangendra, working capital Management of Manufacturing pubic Enterprises in Nepal with
special reference to NTDC" unpublished Ph.D. thesis submitted to Allhabad University, 1986, as Quotedin the thesis of Nischal subedi

51
reduction program is highly associate with the optimization of working capital.
He has focused some operational and organization problem of Nepalese public
enterprises like aggregate corrected liabilities which is increased quickly than
their current assets public enterprises not following traditional norms 2:1
between their current assets (C/A) and current liabilities (C/L) low rate. of
inventory turn over change in W/C in relation to fixed capital has very low
impact over the profitability debt equity as 1:1 then transmutation of capital
perforation information tools and techniques and working capital management
has never been consider a managerial job. The overall adequateness of
inventory in NTDC discloses that the growth of W/C and inventory in the
corporation are negatively corrected. NIDC is expected to improve its
prevalent system of inventory management regarding the planning and
purchasing of spare parts manures insecticides, fuels etc.
The credit policy which is not clean in its self has not been followed by
the corporation which collecting the over due account. Receivables are
growing rapidly than the corresponding growth as sales volume. Monitoring
the propone funding working capital management has never been induced in
the managerial job all the related PEs with no exception to NTDC during the
study period. The break even analysis of NTDC reveals that due to insufficient
W/C the corporation has been selling its product as for below rate than it's
Break even. Dr. A.K. Mukharjee had W/C management of public enterprise in
Indian 1988. This study cover 20 manufacturing public sector undertaking
owned wholly or partly by the control government. The scope of this study
was limited to manufacturing of public enterprises and the period was limited
to 5 years.
2.11.4 Review of Research Works:-Formatted: Font: Bold, Condensed by 0.1 pt
Formatted: Font: Bold, Underline, Condensedby 0.1 pt
Formatted: Font: Bold, Condensed by 0.1 pt

52
Under this section, an effort is being made to scrutinize some of the
research outcomes performed under the heading working capital management.
Dr. Khagendra Acharya had studied the working capital management of
manufacturing public enterprises. Some major out-comes of this study are
mentioned here.
- Inventory constitutes the most important and larger element of W/C in
NTDC. The overall adequacy of inventory in NTDC discloses that the
growth of W/C and inventory in the corporate are negative correlated.
- Receivables are growing rapidly than the corresponding growth on sales
volume.
- The break even analysis of NTDC reveals that due to insufficient working
capital, the corporation has been selling its products at a far below rate than
its breakeven.
- Monitoring the proper functioning of W/C management has been included
in the managerial job in all the selected PEs, with not exception to NTDC
during the study period.
- NTDC is expected to improve its prevalent system of inventory
management regarding the planning and purchasing of spare parts manures,
insecticides, fuels etc.
- There should be closed liaison between the production unites of different
estates and central materials management department.
- The corporation while collecting the overdue accounts has not followed the
credit policy, which is not clear in it.
- Dr. Puspa Raj Sharma, reader of T.U., conducted a research named by' W/C
management in BRT jute Mill and Raghupati Jute Mill Limited.' He had
under taken all together 10 years starting from fiscal year 2026/27 to

53
2035/36 some of his important conclusions and recommendations are as
follows.24
- The nature of management of current assts in both the mills is almost same.
However the management stocks and debtors in biratnagar jute Mills seems
better and cash management seem better in Raghupati Jute Mills.
- The nature of management of inventory in both the mills is same. The
turnover ratios are relatively lower in the later years of the study.
- The management of cash in Raghupati Jute Mills is compared to Biratnagar
Jute Mills is efficient in utilizing its cash and bank balance but not effective
in maintains its liquidity.
- The indice of total current liabilities of both Biratnagar Jute Mills and
Raghupati Jute Mills indicated that they had rather an increasing.
- Both the Jute has faced an acute shortage of liquidity in the later year.
- Both the jute Mills make their selling effective so that heavy stocks of
finished goods would be minimum for this; both the mills should make
their selling units efficient.
- Inventory management should be given highest priority by the top
management of both mills.
- The debt collection efficiency of both mills should be improved. Greater
attention should be given to collect the debts from institution.
24 Sharma, Puspa Raj, working capital Management in BRT Jute Mill and Raghupati Jute Mill Limited,
unpublished thesis,

54
CHAPTER – III
RESEARCH METHODOLOGY
3. Research Methodology
In previous chapter, we have discussed on working capital and review of
related literature concerned with the working capital management. In this
chapter, we discussed and highlight population and sample size, research
design, research method, sources of data and collection strategy, analysis of
data and tools used and methods of data analysis.

55
3.1 Introduction:-
After completion of introduction and review of literature chapters, it is
now to deal with Research Methodology. In this chapter, various sequential
steps are being adopted while studying a problem with certain objective in
view. Research Methodology deals with the methods and process applied in
the entire aspect of the study.
The basic objectives of this study are to evaluate the working capital
position of STCL the study covers a period of 5 years. To fulfill the objectives
following methodology has been adopted. The main objectives of this study
are to analyze, examine highlights, and interpret the working capital position of
STCL. Over the years and recommend suggestions improvements. So the
purpose of this chapter is to analyze and fulfill the state objectives. The
methodology for obtaining above objectives consists of source of data, data
collection procedure, and tools and techniques of analysis.
3.2 Research Design:-
The research design provides the framework to a study. Actually, it is
the outline of a plan to test the hypothesis and the research design is a also
known as the conceptual structure within which research is conducted.
Research design is an organized approach for the collection and analysis
of data, which guides the researcher in formulating, implementing, and
controlling the study. Research design is the plan, structure, and strategy of
investigation conceived so as to obtain answers to research questions and to
control variance.

56
To answer the research questions i.e. to fulfill the research objectives,
descriptive research and analytical research designs have been used, and based
mainly on the disk research to extract more pertinent information. Descriptive
research have been used to portray the facts of collection data, its classification
and correlated data to describe the exist, even though it does not predict and
explain the phenomena behave as they do entire process of planning and
carrying out a research study. The research design asks what approach the
problem should be taken. What methods will be used? What strategies will be
most effective? Identification, selection, and formulation of a research problem
may be considered as the planning stage of a research. The remaining activity
refers to the designs, operation, and completion of the research study.
The research design is the strategy for conducting research. It describes
the general framework for collecting, analyzing, and evaluating data after
identifying. (i) What the researcher wants to know and (ii) what has to be deal
with in order to obtain required in formation.
Research design is plan, structure and strategy of investigation
conceives so as to obtain answers to research questions and to control the
variance. The plan is the overall scheme or program of the research. It includes
on outline of what the investigation will do from writing the hypothesis and
there operational implications to the final analysis of data. The structure of the
research is more specific. It is the outline, the scheme and the paradigm that
outline the variables and their relation; we build structural schemes for
accomplishing operational research process. Strategy, as used here, is also
more specific than plan. In other words, strategy how the research objective
will be researched and how the problems. Encountered in the research will be
tackled.

57
The research design has basically two purposes that the first one is to
answer the research question or test the research hypothesis and next one is to
control the variance. There are many types of research design such as historical
research, descriptive research, case study research, field study research,
correlation research, departmental research etc.
This research study is considered to analysis the working capital
management of salt trading corporation. Under this, historical research design
is applied because historical research design is concerned with past
phenomena. It is a process of collecting, evaluating, verifying, and
synthesizing past evidence systematically and objectively to research a
conclusion.
Analytical research had been applied to examine facts that had adopted
by using some statistical and accounting tools.
3.3 Population and Sample:-
There are many trading companies, which are actively operating their
business in market. It is not possible to study all of them regarding the research
topic therefore among them; one reputed trading company is taken as a sample
company from population for this research study.
Population is a total unit about which we are going to study or research
where as sample is the number of representatives about of total population. It is
difficult to analyze all the published financial statement of the population
financial year from 2020 to 2065 of salt trading corporation. A sample has
been chosen for the study which will represent the total population. The
research has taken only 5 years data from 2061 to 2065 fiscal year are very
important for the study.

58
3.4 Nature and Sources of Data
This study is based upon secondary data, which are published by the salt
trading corporation limited. For this study more than five years balance sheet,
profit and loss accounting, related appendix and auditor's reports have been
collected. Other related information has been collected through the direct
interview and question arises with company's account officer. These data are
essential and important for the study at the time of research. This study is
primary based upon secondary data. Which are publishing by the company
during the fiscal year 2061 to 2065.
3.5 Data Collections Procedure:-
Collection data is the connecting line to the word of reality for the
researcher. The data collection actively and consists of taking ordered
information form reality and transferring it in to some recording system so that
it can later be examined and analyzed for partners. Research as a media can be
interpreted as having a content of data and process of methodology.
3.6 Data Gathering Instruments:-
Data recording system of STCL is scientific and systematic type of
record keeping has been found because most of the personnel are trained and
effective directions from the general manager.
The published data relating to the working capital management position
of STCL have been obtained from account department. The balance sheet and
profit and loss account and other related documents, which are secondary
nature, are directly collected form the corporation account department.

59
3.7 Use of Statistical and Analytical Tools:-
It helps to analyze the financial strength and weakness of a firm. Tools
like ratio analysis are used for financial analysis. Even though there are many
ratios to analyze and interpret the financial statement. Only those ratios that are
related to the investment operation of the corporation have been covered in the
study. Financial ratios are the mathematical relationship between two
accounting figures. Ratio analysis is a part of the whole process of analysis of
financial statement of any business or industrial concern especially to take
output and credit decision. Among the various tools and techniques ratio
analysis is one. Which helps both the investor as well as management to
predict the firm future earnings and dividends. According to investor financial
statement analysis is useful both as way to anticipate future condition and more
important as starting point for planning actions that will influence the future
course of events.
Ratio analysis shows the relationship between two figures of different
terms of balance sheet or Income statement. It indicates the quotient of various
accounting data. It is a powerful tool of financial analysis and has been used in
this study to find out its prolonged objectives. In financial analysis, ratio is
used as an index of yardstick for evaluating the financial position and
performance of the firm. It is a technique of analysis and interpreting of
financial statements. it helps to make decision as it helps to establish to
relationship between various ratios and interpret there on.
According to Kohlar, "a ratio is relationship of on amount to another.
Expressed as the ratio of as a simple fraction, integar, decimal fraction or
percentage. The use of ratio as a tool of financial analysis involves their
comparison. For a single ratio, like absolute figure fails to reveal the true

60
position. Under the analysis of ratio, there are only taken as profitability ratio
and activity ratio. etc.
3.7.1.2 Comparison of Working Capital:-
Our main focus of the research is about the working capital
management. Thus we have to discuss about the management of funds and
relationship between them. Their relation can be analyzing by the comparison
of various individual assets to total assets and total current liabilities. The
comparison of individual assets to current assets and fixed assets as follow.
i. Current assets to total current assets (CATA):-
Current assets to total current assets expressed the relationship between
the total assets and total current assets. This ratio is calculated by:
If this ratio increase, the risk and profitability of the firm would decrease
and decreasing ratios indicate the higher risk and profitability.
ii. Current assets to fixed assets (CAFA):-
The ratio between current assets to fixed assets determines the
relationship between current assets and fixed assets, which can be calculated
by:
iii. Cash and Bank balance to current assets:-
Total assets
Total current assetsCurrent assets to total current assets = x 100%
Fixed assets
Current assetsCurrent assets to fixed assets = x 100%

61
The ratio of cash and bank balance to current assets shows the
relationship between cash and bank balance (liquid assets) to current assets.
The small ratio of its show the sound management and vice-versa. Thus, the
working capital is directly affected by it. It is calculated by:
Higher of this ratio indicates, idle cash is collected in the firm. So,
higher of this ratio implies the poor cash management of the firm.
iv. Cash and bank balance to total assets:-
The ratio of cash and bank balance to total assets shows the
relationship between cash and bank balance to total assets. So, it indicates that
what percentage of total assets is invested in cash and bank balance. It is
calculated by:
If the ratio increases, risk and profitability would decrease. If it is
increased, the working capital would also increase.
v. Receivable to current assets:-
The receivable to current assets shows the relationship between
receivable and current assets. It is calculated by:
X 100%Current assets
Cash and Bank balanceCash and Bank balance to current assets: =
x 100%Total assets
Cash and Bank balanceCash and Bank balance to Total assets: =
x 100%Current assets
ReceivableReceivable to current assets =

62
Increases in the ratio shows the inability of the firm to collect the
receivables quickly and decreasing ratio is preferable which shows the ability
of the firm to collect receivables quickly.
vi. Receivable to Total assets:-
The ratio shows the relationship between receivables and total assets. It
indicates how volume of assets should be maintained to how volume of
receivables. It is calculated by:
Increasing ratio implies the liberal credit policy and decreasing ratio
implies the tight credit policy.
vii. Inventory to current assets:-
Inventory is an inseparable part of working capital which represents the
share of inventory on current assets. It is calculated by:
Higher of this ratio indicates the liberal inventory policy followed by the
firm and lower ratio indicates the tight inventory policy followed by the firm.
viii. Inventory to Total assets:-
The ratio of inventory to total assets shows the relationship between
inventories to total assets. On the other hand it shows the relation between
x 100%Total assets
ReceivableReceivable to Total assets =
x 100%Current assets
InventoryInventory to current assets =
x 100%Total assets
InventoryInventory to Total assets =

63
how volume of inventory must be kept to how volume of total assets. It is
calculated by:
If this ratio increases, the working capital is also increase and decreasing
ratios indicates the decreasing working capital. Increasing ratio indicates the
blockage of materials in the factory and implies that the factory (firm) uses the
liberal inventory policy.
ix. Networking capital financing:-
Net working capital financing indicates the amount of networking
capital, which can be invested in other aspects. Networking capital indicates
total current assets less total current liabilities.
Higher the Networking capital, higher will be the possibility of idle
amount for financing. Financing is a good opportunity will be profitable for the
firm.
3.7.1.2.1 Liquidity Ratio:-
Liquidity ratio measures the short-term solvency of the firm. Under
these, two ratios are computed.
I. Current Ratio:-
It is the test of liquidity and it shows the ability of the firm to meet its
short-term obligations.
Networking capital financing = Total current assets - Total current liabilities

64
Its standard is 2:1
II. Liquid/Quick/Acid test Ratio:-
Liquid ratio measures the short-term liquidity of the firm but it emphasis
by instant debts paying capacity of the firm. Liquid assets include current
assets less prepaid expenses.
Its standard is 1:1 for the better position.
3.7.1.3 Profitability Ratio:-
This ratio shows the end result of business activities. The overall
efficiency of business concerned profitability, if main factor to measure how
effectively firm is operated and have managed. Under this the following ratio
should be analyzed.
i. Gross profit Margin:-
Gross profit margin ratio expresses the relationship between gross profit
and sales. It is worked out as follows:-
High gross profit ratio to sale is a sign of good management that implies
the cost of production is lower.
x TimesCurrent Liabilities
Current assetsCurrent assets
=
x TimesCurrent Liabilities
Liquid assetsLiquid Ratio =
x 100% =…..%Sales
Gross profitGross profit Margin =

65
ii. Net profit margin:-
This ratio measures the overall profitability of the firm by establishing
the relationship between net profit and total sales. it is calculated by:
A high profit margin would enable the form to withstand adverse
economic condition and a low margin will have opposite implication.
iii. Return on Total Assets:-
This ratio measures the productivity of the assets, which measures the
relationship between net profit and assets.
Higher ratio shows the higher returns on assets use in the business there
by indicating effective use of the resources available and vice versa.
iv. Return on current Assets:-
Return on current assets indicates the relationship between net profit
after tax and current assets. it measures the profit of the firm with respect to its
total current assets. So, it measures the effectiveness of the utilization of
current assets. It can be calculated by:
x 100 =…..%Sales
Net profitNet profit Margin =
x 100 =…..%Total assets
Net profit after taxReturn on Total Assets =
x 100 =…..%Total current assets
Net profit after taxReturn on current Assets =

66
Increasing ratio indicates the effective utilization of working capital to
capital to earn profit.
3.7.1.4 Activity Ratio:-
Activity ratio is including the following ratios.
i) Inventory Turnover Ratio:-
Inventory turnover ratio explains whether investments in inventories are
within proper limits or not. It indicates marketability of inventory and
reasonableness of quality of hand.
A high inventory turnover ratio indicates efficient management of
inventory because more frequently the stocks are sold the lesser amount of
capital is required to finance the inventory.
ii) Receivable Turnover Ratio:-
This ratio indicates the velocity of debt collection of a firm. In other
words, it indicates the number of times average debtors are turned over during
a year. It is calculated by:
Higher the volume of receivable turnover ratio is more efficient
management of receivables.
iii) Average collection period:-
=…..%Inventory
SalesInventory turnover Ratio =
=…..%Total sales
Debtors (Receivables)Receivable Turnover ratio =

67
Average collection period is calculated to know the average number of
day or months for which a firm has to wait before trade debtors are converted
into cash.
iv) Fixed Assets Turnover Ratio:-
Fixed Assets turnover ratio indicates the extent to which the investment
in fixed assets contributes towards sales.
Higher fixed assets turnover ratio indicates better business performance
and lower ratio, inefficient utilization of available fixed assets.
v) Total Assets Turnover Ratio:-
Total assets turnover ratio is the relationship between total sales and
total net assets.
Where,
Total Net Assts= current Assets + Fixed Assets + Intangible
assets (-) Less Depreciation and write off.
=…..DayReceivable turnover ratio
Days in a yearAverage collection period =
=…..TimesNet fixed assets
SalesFixed Assets Turnover Ratio =
Net Fixed Assets = Total Assets - Depreciations
=…..Times
Total net sales
SalesTotal Assets Turnover ratio =

68
Higher total assets turnover ratio indicates the proper utilization of the
firm's assets.
vi) Networking capital Turnover Ratio:-
Networking capital turnover ratio is related to sales. It implies the
velocity of utilization of working capital. It is calculated by:
Lower the Networking capital turnover ratio in effective management of
working capital and higher shows the effective management of working
capital.
3.7.2 Statistical Tools
The various statistical tools under have been used for the
analysis and interpretation of data. Ranges of statistical tools are also used to
analyze the collected data and to achieve the objectives of the study. The
sample data collected 5 years from fiscal years. In spite of statistical analysis
the arithmetic mean, correlation coefficient, probable error, standard deviation,
co-efficient of variation is used to analysis the salt trading corporation ltd.
3.7.2.1. Arithmetic Mean (Average):-
=…..TimesNet working capital
SalesNetworking capital Turnover ratio =

69
The most popular and commonly used in average which
represents the entire data by a single value. It is the value obtained adding
together all times and by dividing this total by number of items observed.
Average provides us the gist and gives a bird's eye view of the use mass of un
widely numerical data. Its can be computed by using the following formula.
Where,
= Arithmetic mean
= Sum of the values
= Number of observation.
3.7.2.2. Correlation Co-efficient (r):-
The most important method of measuring the correlation between the
two variables is Karl Pearson's co-efficient measuring the degree of association
between the two variables. The formula for calculating simple correlation co-
efficient (r) by Karl person’s method is :
2222r
To interpret the value of correlation, the relationship between
variables is positive if the value or ‘r’ is greater then O and it is negative if the
relationship between variables is less then O. Similarly, if the value of ‘r’ is +1,
the relationship is perfect positive and if it is -1, the relationship is perfectly
negative. If the value of ‘r’ is O, the relationship between variables is zero.

70
3.7.2.3. Probable Error (P.E.):-
Probable Error of the correlation coefficient by denoted by
P.E. It is calculated under as:
21
6745.0PEr
If ‘r’ is less than its P.E. It is not all significant and greater
than –0.5 than considered signification.
3.7.2.4. Standard Deviation:-
The standard deviation is an important and widely used measure of
dispersion. The measurement of the scatter ness of the mass of figures in a
series about average is known as dispersion. The standard deviation is an
absolute measurement of dispersion in which the drawbacks present in other
measures of dispersion are removed. The high amount of dispersion reflects
high standard deviation. The small standard deviation means the high degree of
homogeneity of the observations. It is calculated for selected dependent and
independent variables specified. It is the positive square root of the arithmetic
mean of the square deviation from arithmetic mean. It is denoted by the letter
(sigma). In this study standard deviation of different ratios are calculated:
S.D () =22
Where,
= Standard Deviation.
2
= Sum of squares of observation
2
= Sum of squares of Mean

71
3.7.2.5. Co-efficient of variation (C.V):-
C.V is the relation measure based on the standard deviation
and it defined as the ratio of the standard deviation to the mean expressed in
present.
C.V. = X 100%
CHAPTER – IV
PRESENTATION AND ANALYSIS OF DATA
4.1 Introduction:
The main objective of this study is to analysis the working capital
management of STCL. This chapter has been organized to present the results,
analyze, and interpret them accordingly. The presentation and analysis of the
data in this study has been done to evaluate the working capital position
through the financial reports from the fiscal year 2061 to 2065.

72
Efforts have been made to analysis working capital management in
terms of composition of current assets, turnover position, liquidity position,
and profitability position of STCL. The composition of current assets is
analyzed by making relationship of each component of currents with fixed
assets, total assets etc. The turnover position is analyzed with the help of
current assets turnover, net working capital turnover, turnover of cash,
receivables, and inventory. The liquidity position is analyzed with the help of
gross profit margin, net profit margin, return on total assets, and return
working capital.
Data collected for the analysis of working capital management are
presented in the tabular form and they are analyzed with the help of financial
tools and techniques and statistical tools.
4.2 Position of Current Assets:-
Any types of business organization require fixed assets as well as
current assets. Each and every business organization has financed their capital
in the assets like cash, marketable securities, inventories, receivable and so on
for day-to-day operation of business organization. Total current assets which is
known as working capital as per in gross concept. Most of the organization
requires some amount of working capital and this requirement differ according
to the size of the organization. Therefore, current assets are those assets or
resources of a firm, which are either held in the form of cash or are converted
in cash with in accounting period a year of the business.
A firm needs working capital (gross) because the production, sale, and
cash flow are not instantaneous. The firm needs cash to purchase raw materials
and pay expenses those may not be perfect matching between cash in flow and
out flow. Cash may also be held to meet the future expenses. The stocks of raw

73
materials are kept in order to ensure smooth production and to protect against
the risk of non-availability of raw materials. The firm has to invest enough
funds in current assets for the success of the sales activities. Current assets are
needed because sales do not convert into cash instantly. Earning a steady
amount of profit requires successful sales activities.
Therefore it can be studied that the efficient management of current
assets is an integral part of overall financial management and has to greater
impact on maximization of owner’s capital. In this context it is necessary to
have proper analysis for current assets management therefore firstly the overall
current assets are analyzed.
Table-1
Position of current Assets
Particular Average
%
2061 2062 2063 2064 2065
Inventory
% 38.082
470.67
30.48
789.89
45.06
876.58
44.48
714.44
37.76
611.63
32.63
Debtors
% 11.32
177.07
11.47
203.88
11.63
196.26
10
218.94
11.57
224.31
11.96
Bank and cash 76.55 51.67 65.07 80.29 62.95

74
% 3.762 4.96 2.95 3.30 4.24 3.36
Loan, Advance
and Deposit
% 46.36
819.65
53.09
707.41
40.36
832.84
42.26
878.27
46.42
975.64
52.05
Total 1543.94 1752.86 1970.75 1891.97 1874.53
Indices of C/A 100%
Source: Appendix no.I to V
Current Assets
The above table no. 1 represents the current assets position of the
company. The above table shows investment pattern of the company in the
current assets and their fluctuation in years. As per the table, investment in
inventories and Loan, advance and deposit have been found as major in
comparison to other current assets. Sometimes the percentage share of loan,
advance, and deposit is greater where as sometimes the percentage of share of
inventory more the former. In this way, it can’t be ignored contribution debtors
and cash and bank balance is covered share of current assets respectively.

75
The percentage share of all current assets indicates that there is not
consistency in yearly change rather there exists a few fluctuations. It has
adopted some time increasing and decreasing trend. The maximum percentage
share of loan, advance and deposit is seemed in fiscal year 2061 i.e. 53.09%
and 30.48% respectively and in as whole it covers 38.082 current assets.
Sundry debtors are also in fluctuation trend. The percentage of share in
2065 seems maximum and in 2063 seems minimum i.e. 11.96% and 10%
respectively and in as whole it covers 11.32% current assets.
Position of cash and bank balance also is in fluctuating trend.
Sometimes it increases and sometimes it decreases low percentage of cash
shows the higher turnover of stock realization of more cash and sound liquidity
of the company.
In total current assets of salt trading corporation limited is increasing
trend.
4.3 Percentage of Current Assets on Total Assets
As the requirement of the current assets depends upon the nature of the
business, it is required to meet the working capital, which is required to run
day to day activities. Higher percentages of current assets in total assets denote
greater liquidity position of the firm as well as lower the risk being in solvent
and vice-versa. The table no.2 given below represents the percentage of current
assets to total assets.
Table No.2
Current Assets to total Assets
Year Current
Assets
Total Assets Ratio% %
change

76
2061
2062
2063
2064
2065
1543.94
1752.86
1970.75
1891.97
1874.53
2161.70
3587.77
3719.54
3638.46
3622.27
71.43
48.86
52.98
51.99
51.75
-
(22.57)
4.12
(0.99)
(0.24)
Total 9034.05 16729.74 54 -
Source: Appendix no.I to V
The above table shows the percentage of current assets to total assets of
STCL. The ratio represents the proportion of current assets investment to total
assets investment of STCL for selected 5 years of study period Five year’s
period the above table shows that the proportion of current assets of total assets
in fluctuating. In 2069 current assets volume is Rs. 1543.94 (Million). This is
71.43% of total assets. It has decreased by 22.57% in the year 2062. It has
increased in the year 2063 by 4.12%. But decreased in the year 2065 by 0.99%
and 0.24% respectively. The percentage of current assets is highest in the year
2061 which is 71.43% of total assets. This increase in mainly due to the
holding of highest amount of inventory and loan, advance and deposit.
The relation between current assets and total assets are not uniform
highest level of current assets indicates good liquidity position but it adversely
effect the profitability of the company because idle earn nothing.
4.4 Percentage of Current Assets on Fixed Assets:-
This ratio shows the relationship between current assets and fixed assets.
An actual proportion of current assets and fixed assets can be determined
through it has the lower ratio denotes slackness in trading activities and higher
mechanization. On the other hand, an increase in ratio may reveal that

77
inventories and debtors have been intensively used; increase in this ratio means
increase in profit and expansion of business activities. In such situation relative
size of working capital of salt trading corporation limited is analyses in the
following table.
Table No-3
Current Assets to Fixed Assets
Rs. in Million
Year Current Assets Fixed Assets Ratio
2061
2062
2063
2064
2065
1543.94
1752.86
1970.75
1891.97
1874.53
465.99
1393.16
1379.61
1377.87
1361.46
331.32
125.82
142.85
137.31
137.68
Total:- 9034.05 5978.09 -
Average:- 1806.81 1195.618 151.12
Source: Appendix no.I to V
From the above table we can say that there are 5 years current assets and
fixed assets but all of them the highest current assets and fixed assets are Rs.
1970.75 and Rs. 1393.16 (Million). Similarly, the lowest current assets and
fixed assets are Rs. 1543.94 (Million) and Rs. 465.99 (Million). The above
table also shows that the lowest % of current assets and fixed assets is
125.83% in year 2062 and highest % is 331.32 in year 2061, where the average
ratio is 151.12%.
4.5 Analysis of Current Assets to Sales:-
The relationship between current assets to sales can be further presented
to analysis the size of working capital. There is essential relationship between

78
current assets to sales because current assets include cash, Bank, receivable,
marketable securities etc. Sales are depending upon cash and credit sales.
Policy of STCL is high than its sales will be high. The help of STCL in a table
as below can understand the relationship between current assets to sales.
Table No-4
Current Assets to sales
Rs. in Million
Year Total CA Sales Ratio %
2061
2062
2063
2064
2065
1543.94
1752.86
1970.75
1891.97
1874.53
3898.94
2193.94
1850.55
1916.22
2138.96
39.60
79.90
106.49
98.73
87.64
Total:- 9034.05 11998.61 -
Average:- 1806.81 2399.722 75.29
Source: Appendix no.I to X
The above table of current assets to sales clearly shows that the lowest
part f current assets is Rs. 1543.94 (Million) in the fiscal year 2061 and highest
part Rs.1970.75 (Million) in the fiscal year 2063. Similarly, the lowest part of
sales of STCL during last 5 years is Rs.1850.55 and highest sales is Rs.
.898.94 (Million) in the fiscal years 2063 and 2061 respectively. The average
current assets and average sales are Rs.1806.81 (Million) and Rs 23.99.722
(Million) respectively. In fiscal 2062, 2063, 2064 and 2065 the actual sales is
less than its average sales Rs. 2399.722 (Million). On the other hand, the ratio
of current assets to sales for the fiscal year 2061 is 39.60% and the highest
ratio is 106.49% for the year 2063. The average ratio of all of the 5 years is
75.29%.

79
4.6 Proportion of Inventory to Current Assets and Total Assets:-
Inventory is the most important element of current assets. A firm may
require inventory of raw material, work-in-progress, finished goods and spare
parts. Inventory of raw material and work-in-progress and spare parts are
required to ensure smooth and regular production while finished goods
inventory is needed to facilitate sales. Therefore a firm should invest optimal in
inventory to ensure its production and sales. Both excessive and inadequate
level of inventory is harmful to the firm. The excessive level of inventories
consumes the funds of the firm. Which can't be used for any other purpose and
thus, involve an opportunity cost. Similarly, inadequate inventory is also
helpful due to the fact that is poses the change of production hold-up and
failure to meet delivery commitment. Therefore, the inventory position must be
optimal so that neither it causes to problem of excess inventory nor the
problem of short.
The table presented below reveals the proportion of inventory on current
assets and total assets it's average position during the study period.
Table No-5
Current Assets to sales
Rs. in Million
Year Inventory CA Ratio% TA Ratio%
2061
2062
2063
2064
470.67
789.89
876.58
714.44
1543.14
1752.86
1970.75
1891.97
30.48%
45.06%
44.47%
37.76%
2161.70
3587.77
2427.86
3638.46
21.77%
22.02%
36.10%
19.64%

80
2065 611.62 1874.53 32.63% 3622.27 16.88%
Total 3463.2 9034.05 - 15438.06 -
Average 692.64 1806.81 38.33% 3087.62 22.43%
Source: Appendix no.I to V
From the above table it is clear that the inventory to current assets and
total assets are fluctuating trend. The proportion of inventory to current assets
during the fiscal year 2061 to 2065 is 3048%, 45.06%, 44.47, 37.76%, and
32.63%. In this period the average of inventory to current assets is 38.33%.
Similarly, the proportion of inventory on total assets is 21.77%, 22.02%,
36.10%, 19.64%, and 16.88% during the fiscal year 2061 to 2065 respectively.
Again average proportion of inventory to total assets is found 22.43%.
4.7 Proportion of Inventory to Sales:-
Inventory is one of the components of current assets. This
should be maintained efficiently. It has already been stated that the working
capital, production, and sales are correlated in general case. The production
should be increased to meet higher level of sales target. To produce more raw
materials will be required. The stock level of raw material requirement should
be properly maintained to meet the raw material requirement for higher level
of production. Hence, to fulfill this requirement the company has to increase its
working capital.
Inventory turnover ratio indicates the number of times inventory is
replaced during the years. It measures the relationship between sales and the
inventory level. The inventory turnover ratio tests the efficiency on inventory
management. It is valuable measure of selling efficiency and inventory quality. A
low inventory turnover may be due to a variety of reasons like poor merchandise,
over valuation of closing stock, a large stock of un saleable goods over-buying and

81
anticipated future increase in sales etc in the last case, low inventory turnover may
be desirable in terms of its effect on sales and profits.
On the other hand, substantially higher rate of inventory turnover may
disclose conservation pricing of closing inventory, inventory valuation at a
point when it is unusually low, a real shortage of inventory for required sales, a
contemplated on sales, etc. It is thus, worth nothing that a high inventory may
not by itself be desirable.
The proportion of inventory to sales has been presented below:-
Table No-6
Proportion of Inventory to sales
Rs. in Million
Year Sales Inventory Ratio %
2061
2062
2063
2064
2065
3898.94
2193.94
1850.55
1916.22
2138.96
470.67
789.89
876.58
714.44
611.62
12.07%
36%
47.37%
37.28%
28.59%
Total:- 11998.61 3463.2 -
Average:- 2399.722 692.64 28.86%
Source: Appendix no.I to X
The above table shows that the proportion of inventory to sale is
maximum in the year 2063. The proportion of inventory to sales in this year is
47.37% where the sales amount is Rs. 1850.55 (million) only but the inventory
amount is Rs. 876.58 (million). The proportion of inventory is sales is
minimum is the year 2061. Which is only to sales is minimum in the year
2061, which is only 12.07%, where the sales amount is Rs. 3898.94 (million)
and inventory amount is Rs. 470.67 (million) only.

82
4.8 Cash and Bank Balance to Current Assets:-
Cash and Bank balance both are liquid assets of STCL. This assures the
sale increase or decrease. Cash and bank of STCL is necessary for the
increment of business volume. The relationship between cash and bank
balance to current asset is like as "Nail and Meat".
The following table shows the ratio of cash and bank balance to current
assets for 5-years.
Table No-7
Cash and Bank to current Assets
Rs. in Million
Year Cash and Bank Current Assets Ratio %
2061
2062
2063
2064
2065
76.55
51.68
65.07
80.29
62.95
1543.94
1752.86
1970.75
1891.97
1874.53
4.96
2.95
3.30
4.24
3.35
Total:- 336.54 9034.05 -
Average:- 67.31 1806.81 3.72%
Source: Appendix no.I to V
The above table shows that the proportion of cash and bank to current
assets is high in 2061. The cash and bank balance of STCL is fluctuating trend.
The average cash and bank balance is Rs. 67.31 (million) which is less than
2061, and 2064 and greater than 2062, 2063 and 2065 which is Rs. 51.68, Rs.
65.07 and Rs 62.95 (million).
4.9 Correlation Analysis:-

83
Correlation analysis deals with determining the degree of relationship
between two variables. This analysis describes not only the magnitude of
relationship but also its direction. The measure of correlation co-efficient
summarizes in one figure, the direction and degree of correlation. Thus,
correlation analysis refers to the techniques used in measuring the relationship
between the variables. Correlation analysis between the different variables of
STCL is measured and tested by Karl Pearson's method, popularly known as
coefficient of correlation and is denoted by symbol 'r'. The value of r lies in
between +1 and -1.
4.9.1 Correlation Analysis between Current Assets and Current Liabilities:-
The following table shows the necessary values of
variables. Which are to be used in determining the value of correlation
coefficient between current assets and current liabilities.
Table No-8
Current Assets and Current Liabilities
Rs. in Million
Year Current Assets
X
Current Liab.
Y 2 2 XY
2061 15.44 11.91 238.39 141.85 183.89

84
2062
2063
2064
2065
17.53
19.71
18.92
18.75
16.54
18.65
18.16
18.06
307.30
388.48
387.96
351.56
273.57
347.82
329.78
326.16
289.94
367.59
343.58
338.62
x=90.35 y=1643.69 2 =
1643.69
2 =
1419.182
xy=
1523.62
Source: Appendix no.I to V
Now, we calculate correlation coefficient ‘r’ using Karl person’s
correlation coefficient.
78.97.039.1244.7
14.90
32.8318.1419535.9069.16435
32.8335.9062.15235
r
22
2222
The correlation coefficient 'r' between current assets and current
liabilities is 0.9778. This reveals that these are positive and high degree of
relationship between current assets and current liabilities. Thus increase
decrease in current assets results increase decrease in current liabilities.
To test the significance of value of correlation coefficient calculated
above. We calculate probable error (PE).
We know that,

85
0133.02361.20297.0
5
)9778.0(16745.0
16745.0PE
2
2
r
4.9.2 Correlation Analysis Between Current Assets and Total Assets:-
The following table shows the necessary values of
variables, which are to be used in determining the value of correlation
coefficient between current assets and total assets.
Table No-9
Current Assets and Total Assets
Year CA
X
TA
Y 2 2 XY
2061
2062
2063
2064
2065
1543.94
1752.86
1970.86
1891.97
1874.53
2161.70
3587.77
3719.54
3638.46
3622.27
23833719.84
3072518.18
3883855.56
3579436.96
3513862.72
46722946.89
1272093.57
13834977.81
12238391.17
12120839.95
3337535.09
6288858.52
7330283.45
6883857.16
6790053.78
x=
9034.05
y=
16729.74
2 =
37883393.26
2 =
99789249.39
xy=
30630588
Source: Appendix no.I to V
Now, we calculate correlation coefficient 'r using Karl person's
correlation coefficient.

86
02.075.1480083.10383
4.2015632
74.1672939.99789249505.903426.378833935
74.1672905.9034306305885
r
22
2222
The correlation coefficient 'r' between current assets and total
assets is 0.02. This reveals that there is positive and very high degree
relationship between current assets and total assets. Thus increase / decrease in
current assets results increase/ decrease in total assets.
To test the significance of value of correlation coefficient
calculated above. We calculate probable error (PE).
3015.05
6742302.05
)002.0(16745.0
16745.0PE
2
2
r
Here, we find that r< SPE. Hence, the value of 'r' calculated above is not
significant.
4.9.3 Correlation Analysis Between Current Assets and Sales:-

87
The following table shows the necessary values of variables. Which are
to be used in determining the value of correlation coefficient between current
assets (gross working capital) and sales.
Table No-10
Current Assets and Sales
Rs. in Million
Year CA
X
Sales
Y 2 2 XY
2061
2062
2063
2064
2065
15.44
17.53
19.71
18.92
18.75
38.99
21.94
18.51
19.16
21.39
238.39
307.30
388.48
357.96
351.56
1520.22
481.36
342.62
367.11
457.53
602.01
384.61
364.83
362.51
401.06
x=90.35 y=119.99 2 =
1643.69
2 =
3168.84
xy=
2115.02
Source: Appendix no.I to X
Now, we calculate correlation coefficient 'r' using Karl person's
correlation coefficient.
9398.004.3844.7
99.265
99.11984.3168535.9069.16435
99.11935.9002.21155
r
22
2222

88
The correlation coefficient 'r' between current assets and sales is -
0.9398. This reveals that these in negative relationship between current assets
and sales. Thus, increase in current assets does not result increase in sales.
To test the significance of value of correlation coefficient
calculated above. We calculated probable error (PE)
We Know that
035.023606.207876.0
5
)9398.0(16745.0
16745.0PE
2
2
r
Here, we find that r<1. Hence there is no correlation between current
assets and sales.
4.9.4 Correlation Analysis Between Inventory and Sales:-
The following table shows the necessary values of variables. Which are
to be used in determining the value of correlation coefficient between
inventory and sales.

89
Table No-11
Analysis between inventory and Sales
Rs. in Million
Year Inventory
X
Sales
Y 2 2 XY
2061
2062
2063
2064
2065
4.71
7.90
8.76
7.14
6.12
38.99
21.94
18.51
19.16
21.39
22.1841
62.41
76.7376
50.9796
37.4544
1520.22
481.36
342.62
367.11
457.53
183.65
173.32
162.14
136.81
130.91
x=34.63 y=119.99 2 =
249.76
2 =
3168.84
xy=
786.83
Source: Appendix no.I to X
Now, we calculate correlation coefficient 'r' using Karl person's
correlation coefficient.
8257.004.3804.7
11.221
99.11984.3168563.3476.2495
99.11963.3483.7865
r
22
2222
The correlation coefficient 'r' between inventory and sales is -0.8257.
This reveals that there is negative relationship between inventory and sales.
Thus increase in inventory does not increase in sales.
To test significance of value of correlation coefficient calculated above.

90
We calculate probable error. (PE)
0958.05
2146.05
)8257.0(16745.0
16745.0PE
2
2
r
Here, we find that r<PE. Hence there is no correlation between
inventory and sales.
4.9.5 Correlation Analysis Between Cash and Sales:-
The following table shows the necessary values of variables. Which are to
be used in determining the value of correlation coefficient between cash and sales.
Table No-12
Analysis Between Cash and Sales
Rs. in Million
Year Cash
X
Sales
Y 2 2 XY
2061
2062
2063
2064
2065
0.765
0.516
0.650
0.803
0.629
38.99
21.94
18.51
19.16
21.39
0.585
0.266
0.422
0.645
0.395
1520.22
481.36
342.62
367.11
357.53
29.83
11.32
12.031
15.38
13.45
x=3.363 y=119.9
9
2 =
2.31
2 =
3168.84
xy=
82.011
Source: Appendix no.I to X

91
Now, we calculate correlation coefficient 'r' using Karl person's
correlation coefficient.
3397.004.385052.0
5286.6
99.11984.31685363.3313.25
99.119363.301.825
r
22
2222
The correlation coefficient 'r' between cash sales is 0.3397. This reveals
that there is positive relationship between cash and sales. Thus
increase/decrease in cash results increase/decrease in sales.
To test significance of value of correlation coefficient calculated above.
We calculate probable error. (PE)
2668.02361.25966.0
5
)3377.0(16745.0
16745.0PE
2
2
r
Here, we find that r>PE. Hence there is significant correlation between
NWC and sales.

92
4.9.6 Correlation Analysis Between Net Working Capital and Sales:-
The following table shows the necessary values of variables. which are
to be used in determining the value of correlation coefficient between net
working capital and sales.
Table No-13
Analysis Between Net Working Capital and Sales
Rs. in Million
Year NWC
X
Sales
Y 2 2 XY
2061
2062
2063
2064
2065
3.53
0.99
1.55
0.76
0.69
38.99
21.94
18.51
19.16
21.39
12.46
0.9801
2.4025
0.5776
0.4761
1520.22
481.36
342.62
367.11
357.53
137.64
21.72
28.69
14.56
14.76
x=7.52 y=119.9
9
2 =
16.89
2 =
3168.84
xy=
217.39
Source: Appendix no.I to X
Now, we calculate correlation coefficient 'r' using Karl person's
correlation coefficient.
345..004.3828.5
52.184
99.11984.3168552.789.165
99.11952.737.2175
r
22
2222

93
The correlation coefficient 'r' between NWC and sales is 0.0345. This
reveals that these are positive relationship between NWC and sales. Thus
increase in NWC does result increase in sales.
To test the significance of value of correlation calculated above, we
calculate probable error (PE).
2981.02361.26665.0
5
)0345.0(16745.0
16745.0PE
2
2
r
Here, we find that r<PE. Hence there is no correlation between NWC
and sales.
4.10 Analysis of Liquidity Ratio:-
The ability of a firm to meet its obligation in the short-term is known as
liquidity. It reflects the short-term is known as liquidity. It reflects the short-
term financial strength of the organization. A firm should ensure that it does
not suffer from Lack of liquidity and also that it has not too much liquidity.
The failer of a company to meet its obligations due to Lack of liquidity will
result in bad credit ratings, loss of creditor's confidence or even in lawsuits
resulting the closure of the company. A very high degree of liquidity is also
bad as idle assets earn nothing. Therefore, it is necessary to strike a proper
balance between liquidity and lack of liquidity.
Here we go through current ratio and quick ratio to evaluate and analyze
the liquidity of the firm.

94
4.10.1 Current Ratio:-
Current ratio is frequently used to measure the liquidity position of the
firm. This ratio shows the availability of current assets in rupees for every one
Rupee of current liabilities. Generally, the current assets of the firm should be
twice the current obligation to be technically solvent. Technically solvent
means the ability of the firm to meet current obligation duly as they become
matured. A relatively high value of current ratio is considered as an indication
that the firm is liquid and has the ability to pay it's bill and vice versa.
Table No-14
Analysis of Current Ratio
Rs. in Million
Year CA CL CR(CA/CL)
2061
2062
2063
2064
2065
15.44
17.53
19.71
18.92
18.75
11.91
16.54
18.65
18.16
18.08
1.30
1.06
1.06
1.05
0.67
Total 90.35 64.69 -
Average 18.07 12.938 1.40
Source: Appendix no.I to V
Current ratio is found fluctuation during the study period. It is
observed highest 1.30:1 times in fiscal year 2061 and the lowest 0.67:1 times
in fiscal year 2065. Average current ratio is 1.40:1 times. If the standard
current ratio (2:1) is taken. It can be said that STCL hold weak liquidity
position. In each year current ratio is lower than normal ratio 2:1 thus it is not
satisfactory condition.

95
The current ratio of STCL reflects the higher liquidity maintained by the
firm or there is lower risk of short term or there is lower risk of short term
solvency. Excess current assets are not beneficial to the company because it
shows the investment in unproductive assets and working nothing.
4.10.2 Acid-Test Ratio/Quick Assets:-
The acid test ratio or quick ratio is the relationship between quick assets
and current liabilities. The ratio is measure of liquidity designed to overcome
the defect of the current ratio. It is a measurement of company's ability to
convert its current assets quickly into cash in order to meet its current
liabilities. Higher is the ratio better is the ability to honor current obligation.
The quick ratio is finding out by dividing quick assets by current
liabilities.
Quick Ratio=
Table No-15
Analysis of Current Ratio
Rs. in Million
Year Quick Assets Current Liab. Quick Raito
(QA/CL)
2061
2062
2063
2064
2065
10.74
9.63
10.95
11.77
12.66
11.91
16.54
18.65
18.16
18.08
0.91
0.58
0.58
0.65
0.71
Total 55.75 64.69 -
Average 11.15 12.938 0.86
Source: Appendix no.I to V
Current liabilities
Quick Assets

96
Quick ratio is fluctuating during the study period. The average quick
ratio is found to be 0.86:1 times. The quick ratios calculated above are
observed lower than standard level (1:1) each year. This is not satisfactory
condition.
4.11 Profitability Position:-
i. Gross Profit Margin Ratio:-
This ratio shows the end result of business activities. The overall
efficiency of business concerned profitability, if main factor to measure how
effectively firm is operated and have managed.
The difference between net sales and lost of good sold is a very
significant terms, because it represents the margin of gross profit on sales. It is
generally contended that the margin of gross profit should be sufficient enough
to recover all operation expenses and other expenses and also to leave adequate
amount as net income in relation to sales and owner’s equity. The gross profit
margin reflects the efficiency of operations of the company.
Gross profit Margin= Sales
Gross profitX 100

97
Table No-16
Analysis of Gross Profit Margin
Rs. in Million
Year Sales Gross profit Ratio
2061
2062
2063
2064
2065
38.99
21.94
18.51
19.16
21.39
2.96
2.57
2.58
2.72
2.58
7.59%
11.71
1394
14.19
12.06
Total 119.99 13.41 -
Average 23.998 2.682 11.17%
Source: Appendix no.VI to X
The above table shows the gross profit margin of STCL for fiscal year
2061 to 2065, which are 7.59%, 11.71%, 13.94%, 14.19%, and 12.06%
respectively. The corporation’s average gross profit margin is 11.17%. In the
last four years. The gross profit margins and higher than the average but in the
first year this is at lower side. This shows that the company is more efficient in
manufacturing each unit of its products in last four years rather than in the first
year of the study period.
ii. Net profit Margin Raito:-
Net profit is the profit which comes after deducting operation expenses
and income tax form gross profit. This ratio is the relationship on net profit
after tax to sales. This ratio on net profit after tax to sales. This ratio shows the
ability of management to operate business with sufficient success. The ratio of
net profit to sales essentially expenses the cost price effectiveness of the
operation. The operating expenses mainly affect the net profit of the company.

98
Net Profit ratio=
Table No-17
Analysis of Net profit Margin
Rs. in Million
Year Sales Net profit Ratio
2061
2062
2063
2064
2065
38.99
21.94
18.51
19.16
21.39
0.73
0.49
0.29
(1.04)
0.13
1.87
2.23
1.57
(5.43)
0.7
Total 119.99 0.6 -
Average 23.998 0.12 0.50%
Source: Appendix no.VI to X
The net profit margin calculated above shows that firm is able to earn
profit in the fiscal year 2061 to 2065. The corporation has loss in the year
2064. Net profit margin is the highest in 2.23% fiscal year 2.23 and the lowest
(5.43)% in the fiscal year 2064. Average net profit margin of the corporation
over the study period is 0.50%. Corporation’s net profit margins from fiscal
year 2061 to 2063 are at satisfactory level since the margins are higher than the
average in these years. But it is loss in fiscal year 2064.
Sales
Gross profitX 100

99
CHAPTER-V
SUMMARY, CONCLUSION AND RECOMMENDATION
5.1 Summary
In partial fulfillment of the requirements for the degree of master of
business studies (MBS) thesis writing is compulsory. This thesis is also written
for the same purpose. This thesis is about the “study of working capital
management efficiency of salt trading corporation Ltd.” In this report of STCL
is analyzed using certain financial and statistical tools in order to know the
working capital efficiency of STCL.
This research report contains five chapters, introduction, review of
literature, research methodology, presentation, and analysis of data and last
summary, conclusion and recommendation.
Chapter one deals with the background of the study, focus of the study,
statement of the problem, objective of the study, significance of the study,
limitation of the study, organization of the study and terminology used in the
study.
Chapter two deals with review of literature of relevant topics. It includes
review of publications relating to the working capital and other related research
study.
Chapter three deals with research methodology adopted to achieve the
objectives of the study.
Chapter four is the main part of the study, which deals with presentation
and analysis of relevant data using appropriate tools.

100
Chapter five is the present chapter which deals with summary of the
study, conclusions of the study and the recommendations. This study has
focused on the liquidity position, profitability position and efficiency of
working capital and overall working capital management policy of STCL. To
accomplish these objectives of the study, different financial variables, and
statistical tools like mean, coefficient of correlation and probable error has
been used for the meaningful interpretation of the data. The analysis found out
that high amount of current assets to STCL. STCL has not maintained the
current assets properly. Similarly, STCL could not able to maintain the
operating efficiency, which indicates that companies have to improve overall
working capital policy to survive in present competitive market.
The term working capital management is a very sensitive area of
financial management abundantly used by trading sectors to improve their
efficiency for the betterment of their organization. “A study of working capital
management of trading companies with respect to salt trading corporation
Limited” is an exciting and challenging study. The basic objective of this study
is to examine the management of working capital position of trading company.
5.2 Conclusion:-
In conclusion, it can be said that working capital is most important part
of trading companies and its should be neglected. The need for working capital
to run day-to-day business activities operations can not be we emphasized.
Working capital management has been looked upon as driving seat of finance
manager. Efficient management of working capital not only maintains proper
liquidity but also increase profitability management of working capital is
perhaps more important than even management f profit. While pinpointing to
the sample companies, we can found that investment in current assets is high
with respect to its total assets and net fixed assets and it has been stated after

101
analyzing various turnover ratio that current assets is not properly utilized in
the company. However, liquidity position of STCL is weak; it shows that there
are not excess current assets.
Similarly, after analyzing the various profitability ratios, it can be
conclude that is operating inefficiency in Sample Company and overall return
position of the company is also not in favorable condition because of
inefficient utilization of current assets, total assets and shareholders wealth.
Very short period is also not good for the company because the company can’t
get the credit due to the delay in paying obligation.
Although trading companies are following aggressive financing policy.
Which comprises higher risk and higher return and low liquidity position are
not in condition of following this policy. Being unsteady in financial situation.
Company will be unsuccessful to take high risk and if an attempt has been
made to take risk-return trade off is not matched in Nepalese trading
companies. Hence, from our overall financial analysis, it can be said that the
Nepalese Trading companies are not in tremendous condition. They are
suffering from sickness.
The correlation coefficient of the variables selected for the statistical
analysis shows that STCL has significant and positive correlation with each
other except with net profit and net working capital and sales. As we know that
positive correlation means both the variables are moving towards the direction.
Above stated finding also helps to conclude that STCL is financially steady
and better during the study period. It seems that main sources of cash of STCL
are sales of goods and loan from bank. Besides this, corporation receives
miscellaneous income like interest, commission, dividend, and sales of fixed
assets. Corporation uses cash at huge amount for purchase of commodities

102
paid bonus, interest, income tax, purchase of fixed assets, selling expenses etc.
The corporation holds cash for transaction motives.
During the study period, average current ratio of the company is
recorded 1.40:1 times. If the company standard current ratio i.e. 2:1 is taken, it
can be concluded that STCL hold weak Liquidity position. In each year current
ratio is lower than the standard bevel. Hence, current ratio of STCL refers the
lower liquidity maintained by the company.
5.3 Recommendation
Based on findings of the analysis mentioned above, the researcher has
forwarded some practicable recommendation for the improvement of the
working capital management of trading company.
1. The working capital policy followed by company unjustifiable to their
liquidity, profitability and turnover position. To correct this problem, comp
any requires to manage their assets so effectively that leads to high or quick
turnover which in turn increases the profitability. Working capital
forecasting, planning and management is crucial for the success of
company. the working capital policy to be justifiable the firm should
forecast working capital need and its sources using the different methods
like percentage of sales, regression methods etc.
2. STCL is following aggressive financing policy. It has poor return and
turnover position which means that risk and return trade off is not matched
in trading company. So company better have to follow the mix financing
policy between moderate and aggressive financing policy to reduce the risk
and earn some profit.
3. Negative working capital represents the poor financing management of the
company. Therefore, to cradicate this situation, suitable working capital

103
should be formulated and implemented. Keeping optimum size of
investment in current check of working capital could do it.
4. To run day to day business activities and earn maximum profit current
assets should be properly managed. Inventory is consisting largest portion
in total current assets. Therefore, the huge amount of inventory kept by the
company should be reduced or optimum level should be adjusted according
to the sale. In this regard management is advised to improve its marketing
policy and should be integrated with credit policy. The credit policy has
highly influence to the sales. So, certain target would be set for credit
policy.
5. Simple regression result suggests that net working capital has no any
impact upon profits. So the company is suggested to guide their liquidity
decisions towards profit maximization. Like wise working capital turnover,
current assets ratio and total assets turnover ratio should be managed in
such a way that contributes something towards profit.
6. The management should give attention towards the unnecessary expenses,
misuses of facilities, over staffing, heavy expenses on overheads ore the
major caused for high operation cost. To overcome such short comings
management should be strict for use of facilities, not only these but also
right number of workers in right place providing necessary training also
contribute for lower administrative and operating cost.
7. Management is backbone of the company and success and failure of the
company depends upon the managerial skill. So, company should allocate
some money for training of financial employees to produce skilled and
experienced manpower.
8. It should adopt strength credit policy especially for its staff and workers for
effective credit and collection performances as low total receivable. One of
the reasons of lower turnover and high collection period arise due to more
advances to corporation employees.

104
9. Corporation should manage its cash affairs in such a way as to keep cash
balances to a minimum level and to invest the surplus cash funds in
profitable opportunities.
10. This study is based on secondary data it is better to use survey and other
methods to collect primary data and to use them in making precise
conclusion.
11. It is recommended to use other methods of analysis by taking them from
the literature to make the analysis of working capital more useful.

105
BIBLIOGRAPHY
Annual Reports of STCL.
Acharya, Khangendra, Working Capital Management of manufacturing
Enterprise in Nepal With Special Reference to NIDC, Thesis submitted to
Allhabad University, India 1986
Anthony, Robert N., Management Accounting Homewood, lllinois, 3rd
edition, 1964.
Bajrachrya, B.C, Business Statistics and Mathematics, M.K. Publishers and
Distributors, Kathmandu. 1st Edition 2053.
Brealy, R.A., and Myers, S.C., Principle of Corporate Finance, Tata Mc
Grow Hill Publishing Co. Ltd. New Delhi 4th ed. 1996. page-63.
Chaudhary,A.K., Business Statistics, Bhudipuran Prakashan, Kathmandu,
Nepal, 11th edition,2063.
Dangol, Ratna Man, Financial Management, Taleju Prakashan, Bhotahity,
Kathmandu Revised Edition 2050.
Encyclopedia Britannica 2008.
Gitman, L.G., Principle of Management Finance, Harper and Row, New
York, 1976.
Hampton, Johan J. as quoted by Dongol, R.M., Parajuli, K.P., “Accounts of
Financial Analysis and Planning.”
Horne,Van, James, Financial Management and Policy, Prentice Hall of
India, New Delhi, 1973.
Jain, P.K., and Khan, M.Y., Financial Management Problems, Tata Mc
Grew Hill Inc, New York, 1963.
Jain, S.P., and Narang, K.L., Financial Management Accounting, Kalyani
Publishers, New Delhi, 1998.
Jain, P.K., and Khan, M.Y., Financial Management, Tax and problems
Tata Mc Graw Hill Publishing Ltd. New Delhi, 1995.

106
KC, F.B., Business Finance, Sukunda Pustak Bhawan, Bhotahity,
Kathmandu, 1990.
Kothare, C.R., Research Methodology, Methods and Techniques, New
Delhi, Wishwa Prakashan, 2nd edition, 1990.
Kulkarni, P.V., “Financial Management.” Himalaya Publishing House,
India, 1983, pg. 393.
Michael, Firth, Management of Working Capital, Macmillan Press Ltd.
London, 1985.
Mukherajee, A.K., Management of Working Capital, Vohara Publication
and Distributors, Allahabad, 1988.
OP. cit., Smith K.O. (1994), pr.5
Pandey, I.M., Financial Management, Vikash Publishing House (Pvt.) Ltd.,
New Delhi, 3rd reprit, July 1992.
Pandey, I.M, Financial Management Accounting, Sahitya Bhawan Agra,
Edition 1988.
Pradhan, Radheshyam (Dr.), Management of working capital, Natural Book
Organization New Delhi 198.
Pradhan, (Dr.) Surendra, Basis of Financial Management, Tata Mc Graw
Hill publishing Co. Ltd. New Delhi, 2nd edition 1993.
Pradhan, R.S. and Koirala, K.D., Some Reflection of Working Capital
Management in Nepalese Corporation Management Dynamics, Vol. 3 No. 1.
Smith, K.U., Management of Working Capital, West Publishing Company,
New York 1974.
Shrestha, K.N., Mathematics and statistic Management, Valley publishers
KTM, 7th edition 2048.
Sharma, R.K and Gupta, S.K., Management Accounting Principle and
Practice. 7th edition, New Delhi, 1996.
Shrestha, Sunity and Silwal, Dhurba, Statistical Method in Management,
Taleju Prakashan Kathmandu, 2000.

107
Smith, K.V., Management of Working Capital, West Publishing Company,
New York 1974.
Sharma, Puspa Raj, Working Capital Management in BRT Jute Mill and
Raghupati Jute Mill limited, Unpublished Thesis, as Quoted in Nishal.
Salay, S.M., Financial Management of Public enterprises. Hand and
Company Ltd.,New Delhi, 1984. P.-90.
Sherlekar, S.A., and Sherlekar, V.S., Modern Business Organization and
Management System approach”, Himalaya publishing House, 1990, p.745.
Thapa, Kiran and koirala Narayan, Corporate Financial Management
Theory and Practice, Khanal Books Publishers and Distributors,
Kathmandu, 3rd edition, 2062.
United Nations. “Industrialization for New Development Needs.” (New
York 1674 Jp.)
Westorn, J.F., and Brigham, E.F., Essential of Managerial Finance, The
Dryden press 11th edition.
Wagle, K.N., and Dahal, R.K., Management Accounting, Khanal Books
and Stationary, Kathmandu, 1st edition, 2004.

108
Appendix I
Source: Annual Report of STCL
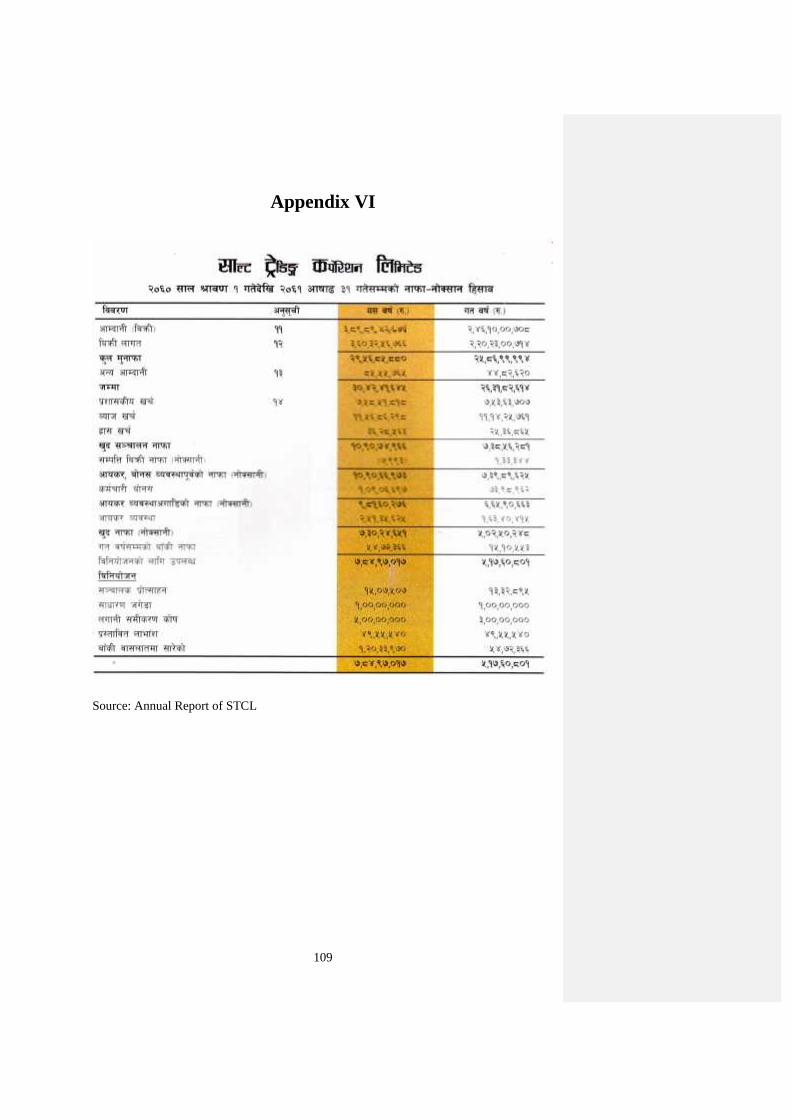
109
Appendix VI
Source: Annual Report of STCL

110
Appendix II
Source: Annual Report of STCL

111
Appendix VII
Source: Annual Report of STCL

112
Appendix III
Source: Annual Report of STCL

113
Appendix VIII
Source: Annual Report of STCL

114
Appendix IV
Source: Annual Report of STCL

115
Appendix IX
Source: Annual Report of STCL

116
Appendix V
Source: Annual Report of STCL

117
Appendix X
Source: Annual Report of STCL