
effect of working capital management on firm value - UoN ...
86
EFFECT OF WORKING CAPITAL MANAGEMENT ON FIRM VALUE OF COMPANIES LISTED AT THE NAIROBI SECURITY EXCHANGE, KENYA BY ABDISHAKUR AHAMED MOHAMED A RESEARCH PROJECT PRESENTED IN PARTIAL FULFILLMENT OF THE REQUIREMENTS FOR THE AWARD OF THE DEGREE OF MASTER OF SCIENCE IN FINANCE, SCHOOL OF BUSINESSUNIVERSITY OF NAIROBI OCTOBER 2020
-
Upload
khangminh22 -
Category
Documents
-
view
1 -
download
0
Transcript of effect of working capital management on firm value - UoN ...

EFFECT OF WORKING CAPITAL MANAGEMENT ON FIRM VALUE
OF COMPANIES LISTED AT THE NAIROBI SECURITY EXCHANGE,
KENYA
BY
ABDISHAKUR AHAMED MOHAMED
A RESEARCH PROJECT PRESENTED IN PARTIAL FULFILLMENT OF
THE REQUIREMENTS FOR THE AWARD OF THE DEGREE OF
MASTER OF SCIENCE IN FINANCE, SCHOOL OF
BUSINESSUNIVERSITY OF NAIROBI
OCTOBER 2020

ii
DECLARATION
This research project is my original work and it has never been presented in any other university
for the award of any degree
Signature __________________________ Date ___________________________
Abdishakur Ahamed Mohamed
D63/11774/2018
Supervisor
This research project has been prepared and submitted for examination with our approval as the
University Supervisors.
Signature___________________________ Date__________________________
Mr. James Karanja
Senior Lecturer, School of Business,
University of Nairobi

iii
ACKNOWLEDGEMENT
I thank God for providing me with an opportunity, strength, health, knowledge and favor to
complete this research project. I am heartily thankful and appreciate my supervisor Mr. James
Karanja without whose guidance and supervision, this project would not have been accomplished.
I also thank my very special friends Khadra Ahmed, Salim Mohamed and Amal Kalif for their
help and encouragement.
Lastly and not least, am also indebted to my MSC. Finance colleagues and friends and all those
who assisted me in one way or another throughout this period of study and though I may not name
each one of you individually, your contribution is recognized and appreciated immensely. I owe
you my gratitude. To you all, God bless

iv
DEDICATION
This work is dedicated to my dear brother Ilyas Ahmed, my mother Asho Dahir, my father Ahmed
Mohamed and all my family members for their assistance in terms of financial and love.

v
TABLE OF CONTENTS
ACKNOWLEDGEMENT ........................................................................................................... iii
DEDICATION.............................................................................................................................. iv
ABBREVIATIONS ...................................................................................................................... xi
ABSTRACT ................................................................................................................................. xii
CHAPTER ONE: INTRODUCTION ......................................................................................... 1
1.1 Background of the Study .................................................................................................. 1
1.1.1 Working Capital Management ....................................................................................... 2
1.1.2 Value of the Firm ........................................................................................................... 4
1.1.3 Working Capital Management and the Value of the Firm ............................................. 5
1.1.4 Firms Listed at the Nairobi Securities Exchange ........................................................... 6
1.2 Research Problem ................................................................................................................. 7
1.3 Research Objective ............................................................................................................... 9
1.4 Value of the Study ................................................................................................................ 9
CHAPTER TWO: LITERATURE REVIEW .......................................................................... 10
2.1 Introduction ......................................................................................................................... 10
2.2 Theoretical Review ............................................................................................................. 10
2.2.1 Keynesian Liquidity Preference Theory ...................................................................... 10
2.2.2 The Conservative Theory of Working Capital............................................................. 11
2.2.3 Aggressive Theory of Working Capital ....................................................................... 11

vi
2.3 Determinants of the working capital ................................................................................... 12
2.3.1 Working capital management ...................................................................................... 12
2.3.2 Nature of business ........................................................................................................ 13
2.3.3 Firm Size ...................................................................................................................... 13
2.2.4 Terms of credit ............................................................................................................. 14
2.2.5 Seasonal requirements ................................................................................................. 15
2.4 Empirical Literature Review ............................................................................................... 15
2.6 Conceptual Framework ....................................................................................................... 19
2.5 Summary of Literature and Research Gaps ........................................................................ 19
CHAPTER THREE: RESEARCH METHODOLOGY ......................................................... 21
3.1 Introduction ......................................................................................................................... 21
3.2 Research Design.................................................................................................................. 21
3.3 Target Population ................................................................................................................ 21
3.4 Data Collection ................................................................................................................... 21
3.5 Data Analysis ...................................................................................................................... 22
3.5.1 Model Specification ..................................................................................................... 22
3.5.2 Operationalization of Variables ................................................................................... 23
3.5.3 Test of Significance ..................................................................................................... 23
3.5.4 Diagnostic Tests ........................................................................................................... 24
CHAPTER FOUR: DATA ANALYSIS, RESULTS, AND FINDINGS ................................ 26

vii
4.1 Introduction ......................................................................................................................... 26
4.2 Diagnostic Tests .................................................................................................................. 26
4.2.1 Normality Test ............................................................................................................. 26
4.2.2 Homoscedacity Test ..................................................................................................... 27
4.2.3 Test for Multicollinearity ............................................................................................. 28
4.2.4 Tests for Autocorrelation ............................................................................................. 28
4.2.5 Unit Root Test .............................................................................................................. 29
4.2.6 Test for Random and Fixed Effects ............................................................................. 34
4.3 Inferential Statistics ............................................................................................................ 35
4.3.1 Correlation Analysis .................................................................................................... 36
4.3.2 Multiple Linear Regression.......................................................................................... 36
4.4 Interpretation and Discussion of Findings .......................................................................... 38
CHAPTER FIVE: SUMMARY, CONCLUSIONS, AND RECOMMENDATIONS ........... 49
5.1 Introduction ......................................................................................................................... 49
5.2 Summary of Findings .......................................................................................................... 49
5.3 Conclusion .......................................................................................................................... 50
5.4 Recommendations ............................................................................................................... 51
5.5 Recommendations for Further Study .................................................................................. 52
5.6 Limitations of the Study...................................................................................................... 53
REFERENCES ..................................................................................................................... 54

viii
APPENDICES ............................................................................................................................. 57
Appendix 1: Companies Listed at the Nairobi Securities Exchange ........................................ 57
Appendix II: Data Collection Sheet .......................................................................................... 62
Appendix III: Research Data ................................................................................................ 63

ix
LIST OF TABLES
Table 3.1: Operationalization of Study Variables ......................................................................... 23
Table 4.1: Shapiro-Francia Test for Normality............................................................................. 27
Table 4.2: Breusch-Pagan/Cook-Weisberg Test for Homoscedacity ........................................... 27
Table 4.3: VIF Multicollinearity Statistics ................................................................................... 28
Table 4.4: Unit Root Test for Firm Value..................................................................................... 29
Table 4.5: Unit Root Test for Inventory Conversion Period ........................................................ 30
Table 4.6: Unit Root Test for Average Collection Period ............................................................ 30
Table 4.7: Unit Root Test for Average Payment Period ............................................................... 31
Table 4.8: Unit Root Test for Cash Conversion Cycle ................................................................. 32
Table 4.9: Unit Root Test for Firm Size ....................................................................................... 33
Table 4.10: Unit Root Test for Leaverage .................................................................................... 33
Table 4.11: Unit Root Test for Sales Growth ............................................................................... 34
Table 4.12: Hausman Test of Specification .................................................................................. 35
Table 4.13: Correlation Analysis .................................................................................................. 36
Table 4.14: Fixed Effects Panel Multiple Linear Regression ....................................................... 37

x
LIST OF FIGURES
Figure 2.1: Conceptual Framework .............................................................................................. 19

xi
ABBREVIATIONS
ACP Average Collection Period
APP Average payment period
ARP Account Receivable Period
CA Current Asset
CL Current Liabilities
CMA Capital Market Authority
DIO Days inventory outstanding
DPO Day’s payable outstanding
DSO Days sales outstanding
ICP Inventory collection period
KCB Kenya Commercials Bank
KNBS Kenya National Bureau of Statistics
MPS Market price per share
NSE Nairobi Securities Exchange
NTC Net trade cycle
SMEs Small and Medium Enterprises
TA Total Asset
WC Working Capital
WCM Working Capital Management

xii
ABSTRACT
Proper managing of working capital enhances the value of the shareholders. Indeed, the key cause
for the failure of most firms, partnerships and small firms is poor working capital management,
which entails inventory, receivables, and payables management. The objective of this research is
to establish the effect of working capital management on firm value of firms listed at the Nairobi
Securities Exchange, Kenya. It also aimed at reviewing the increasing body of theoretical and
empirical studies that have endeavored to examine the range of magnitude and effects of the
working capital management on corporate value. The target population was all the listed firms at
the Nairobi Securities Exchange. Secondary sources of data were employed. Panel data was
utilized, data was collected for several units of analysis over a varying time periods. The research
employed inferential statistics, which included correlation analysis and panel multiple linear
regression equation with the technique of estimation being Ordinary Least Squares (OLS) and so
as to establish the relationship of the working capital management and corporate value while
incorporating the control effect of firm size, leverage, and sales growth. The study findings were
that average collection period, average payment period, firm size, and leverage are negatively
significantly associated with firm value. Additionally study findings revealed that the various
working capital management practices, firm size, leverage, and sales significantly influenced firm
value and they can be utilized to significantly predict firm value. The final study finding was that
only firm size had a significant relationship with firm value, t has a significant negative influence
on firm value. Policy recommendations were made to the CMA and NSE, and by extension, the
National Treasury, to formulate and enforce rules and regulations on working capital management
since it has been established that it influences the value of quoted firms. Further recommendations
were made to firm management and consultants to implement working capital management in
order to boost firm value. Additional recommendations were made to other capital markets’
stakeholders like investment banks, equity analysts, and individual investors to search for firms
with good working capital management to invest or recommend to invest. Final recommendations
were made to firm management and consultants not to concentrate on any one WCM component
in isolation but to employ wholesomely good working capital management practices.

1
CHAPTER ONE: INTRODUCTION
1.1 Background of the Study
The working capital management performs a critical part for the success and failure of the firm
since it controls the profitability and liquidity position of the firms. Proper managing of working
capital constituents enhances the value of the shareholders. Indeed, the key cause for the failure of
most firms, partnerships and small firms is poor working capital management including inventory,
receivables and payables management. In order to avoid liquidity risk, it is vital for a firm to have
efficient mechanisms of managing the constituents of working capital (Mweta 2018). Rendering
to the Kenya National Bureau of Statistics (KNBS), the recent failure of companies such as
Nakumatt supermarkets, tuskys supermarkets and Athi river mining has been traced to how
liquidity occasioned by poor Working Capital Management(WCM). Insufficient WCM leads to
the firm’s cash flow being poor causing the company to inability to meet day to day activities
(Kiganda, 2016). The value of the firm determines the overall equity and debt position of the
enterprise based on the market indicators. The value of the firm incorporate the equity and the
liability portion of the balance sheet of the firm as determined by the market forces (Tauringana
& AdjapongAfrifa, 2013).
The liquidity preference theory provides the rationale as to why people should have cash at their
disposal. Some of the reasons why people hold cash are to act as a precaution against future price
increase and to meet the current expenditures. In essence, holding on cash would create liquidity
which is key component of working capital management. In fact, cash itself is a component of
WCM (Keynes, 1936). The conservative theory of WCM on the hand argue that firm leverage on
long term sources of funds to finance its permanent assets (Weston & Eugene, 1975). Conversely,
the aggressive theory of working capital provides the explanation as to why firms anticipate

2
investing in high risk with high use of short term funding in finance of fixed and current assets
(Belt, 1979). Thus, a conservative WCM policy focuses on reduction of return and possible risk
while the essence of the aggressive policy is to generate more returns to the shareholders and
greater risk.
The stock and financial market play a crucial role in the economic growth of the country. The most
important function of financial sector is to promote economic development. It is clear that a well-
functioning capital and stock market enhance economic efficiency, investment and growth
(Olweny, 2014). This means the performance of listed firms at Nairobi security exchange (NSE)
is important to the economic growth of country. Working capital presents a big opportunity for
listed companies at NSE to release cash from their balance sheet and operate more effectively.
Actually well-managed working capital elements provide firms with growth without need for
additional funding (Olweny, 2014).
1.1.1 Working Capital Management
Working capital management is a strategic decision that relates with the assets and liabilities that
extent for a short period of less than a year. This is a significant decision because it effects extends
to the liquidity, solvency and profitability position of the firm (Oluoch, 2017). Working capital
management relates with the decisions concerning how the firm optimally balances amongst the
current assets and the current liabilities which are the obligations arising in the course of the
business. This is a significant decision, because it influences the company's view of liquidity risk.
Apart from the current assets and liabilities, the cash conversion cycle is another important
component of WCM (Nzioki, Kimeli, Abudho & Nthiwa, 2013). Net trade cycle is another proxy
that can be used to measure WCM and this is as same as the CCC (Shin & Soenen, 1998). In NTC,

3
the three building blocks of WCM (account payable, receivables and inventories) are expressed in
proportion to turnover in percentage form (Shin & Soenen, 1998). Thus, WCM management must
also recognize the difference between the liquidity and the need to create value for shareholders
that is a delicate deliberation (Makori & Jagongo, 2013).
Current assets include inventories, trade receivables, prepaid expenses, cash and the bank balances
and the associated equivalents. Holding too much cash would limit the investment prospects of the
firm and this would affect its value (Gorondutse, Ali, Abubakar & Naalah, 2017). On the other
hand, if an organization maintains a lot of cash into the inventories, it may increase the built up
capital which represents an opportunity costs as such funds would have been utilized to finance
investment prospects of the firm. On the other hand, firms that have limited level of current assets
for instance inventories would face a challenge of meeting unexpected changes in demand as well
as other unforeseen risks (Kaur & Sing, 2013).
Current liabilities include the trade payables, accruals and short term loan facilities that mature in
less than a year like the bank overdraft. They represent the short term sources of finances for the
firm (Majeed, Makki, Salem & Aziz, 2013). A firm should be able to pay off these current
liabilities on a timely basis. Sound management of the current liabilities aims to ensure that the
cash outflow from the firm does not adversely affect its liquidity position. The CCC is a time frame
from the point the outputs are purchased and when cash is collected from the sale (Arunkumar &
Ramanan, 2013). Longer CCC requires an organization to invest a huge amount of WC and they
can maximize the sales generated by the firm hence the value. The components of CCC include
days inventory outstanding (DIO), the days sales outstanding (DSO), and the days payable
outstanding (DPO) (Enqvist, Graham & Nikkinen, 2014).

4
Thus, Working capital management strives to establish a balance amongst current assets and
current liabilities as the key components. WCM require an organization to put in place a plan and
control for both current assets and liabilities (Naser, Nuseith & Al-hadeya, 2013). This should be
done effectively to limit the possibility of failure to meet the obligations on time. However, finance
managers can negotiate with the trade payables to extent repayment period while collecting
account receivable at a faster pace. According to Arbidane & Ignatjeva, 2013), the best way of
gauging the level of efficiency of WCM is through use of ratio analysis including quick ratio and
current ratio. Thus, this study will adopt ratios in operationalizing WCM and these will include
the current ratio, liquidity ratio and asset tangibility.
1.1.2 Value of the Firm
The firm value is market based measures that determine how much a business would fetch if its
assets were to be disposed. It is the sum total of all the equities and debts in the firm including the
preferential shares. The value of the firm is closely related with the concept of shareholder wealth
maximization. Being a market based indicator, firm of the firm is the most objective gauge of the
wealth of the shareholders of an entity (Ogundipe et al., 2012).
The main goal of managing organizational funds is accomplishing the objective of shareholder
wealth maximization. Shareholders wealth, which is synonymous with firm value, it factors in all
the benefits that a firm derives in the future be it short-term or long-term. Market value can be
used to measure the performance of publicly listed firms since it requires information on the
current stock prices. This gets rid of the challenge of approximating the time lag between
implementation and increased productivity or profitability. Other accounting ratios like the price
to earnings ratio (P/E) ratio and market-to-book value ratio suffer from a number of flaws in that

5
accounting rules change, shifted reported earnings without any real change in the underlying
business. Further, numerous loopholes in accounting ease the ability of executives to misinform
investors (Cheng, Liu & Tzeng, 2011; Boyd, 2010; Chowdhury & Chowdhury, 2010; McConnel
& Servaes, 1990).
Different measures have been adopted in measuring the value of the firm. These include the use
of Tobin’s Q (Arachchi, Perera&Vijayakumaran, 2017 & Vijayakumaran, 2019) and market
capitalization. Nyoro (2013) operationalized the value of shareholders in terms of market price per
share (MPS). Previous research (Florackis, Kostakis & Ozkan, 2009; Agrawal & Knoeber, 1996;
Thomsen, Pedersen & Kvist, 2006 & Himmelberg, Hubbard & Palia, 1999) concur that the value
of the firm is represented by the ratio of market based value of equity and debts expressed in the
book value which is divided by the book value of the total assets in place. This study will measure
firm value using Tobin’s Q as adopted from past related studies.
1.1.3 Working Capital Management and the Value of the Firm
Theoretically, the conservative WC theory favors the firm to adopt a longer CCC unlike the
aggressive WC theory that advocates for a shorter CCC. However, there exists mixed empirical
evidence on short and longer CCC and their influence on the value of the firm. Arachchi, Perera
and Vijayakumaran (2017) focused on the frontier market to bring out the link amongst WCM and
the firm value. The study operationalized WCM into CCC and its associated components whereas
firm value was measured using Tobin’s Q. The control variables that were adopted in this inquiry
included growth in sales, leverage and the size of the firm. An inverse link was established between
CCC and Tobin Q.

6
While focusing on Indonesian listed entities, Sianipar and Prijadi (2018) explored the link between
WC and the firm value. The study noted that the net trade cycle (NTC) and the firm value are
negatively and significantly related with each other. In Egypt, Moussa (2018) was interested in
bringing out the link between WCM and on the ability of the firm to perform and its overall value.
The study noted that CCC as a dimension of WCM and the firm value are positively and
significantly related with each other. A study conducted among the listed Chinese firms by
Vijayakumaran (2019) focused on the efficiency of WCM and the firm’s value. NTC was used as
a proxy of WCM while Tobin Q was used in place of firm value. A negative link was noted
between NTC and the firm’s value.
1.1.4 Firms Listed at the Nairobi Securities Exchange
In the year 1954, the Nairobi Securities Exchange (NSE) was founded by stockbrokers as a
voluntary association and was given the responsibilities to regulate the trading activities and also
develop the securities market. It has developed to be one of the leading African Exchanges and
more even it acts as an iconic trading facility not only to local investors but also international
investors who aims of gaining entrance to the economic growth of Kenya and Africa at large. It
deals with both variable and fixed income securities and has 64 listed companies, an Income Real
Estate Investment Trust (I-REIT), an Exchange Traded Fund (ETF) and a futures derivatives
market (CMA, 2016).
The exchange performs a vital part in the Kenyan economy through promoting savings and
investments and also assisting both local and foreign companies obtain cost effective capital.
Capital Markets Authority of Kenya (CMA) is the regulator of NSE. NSE is also an associate of
World Federation of Exchange and it is the founding partner of both the East African Securities

7
Exchanges (EASEA) and the African Securities Exchange Association (ASEA). In addition it an
associate of the Association of Futures Market and is a partner exchange in the United Nation-led
sustainable stock exchanges (SSE) initiative (Mutai, 2014). From 1950s when the NSE started
operation of organized stock markets there has been a tremendous growth in the stock market over
the years both in terms of the services and product offered and the number of listed firms in the
exchange with the current number of listed firms being over sixty firms (CMA, 2016).
The stock and financial market play a crucial role in the economic growth of the country. The most
important function of financial sector is to promote economic development. It is clear that a well-
functioning capital and stock market enhance economic efficiency, investment and growth
(Olweny, 2014). This means the performance of listed firms at Nairobi security exchange (NSE)
is important to the economic growth of country. Working capital presents a big opportunity for
listed companies at NSE to release cash from their balance sheet and operate more effectively.
Actually well managed working capital elements provide firms with growth without need for
additional funding (Olweny, 2014).
1.2 Research Problem
Working capital management represents an internal and short term source of financing which can
enhance the value of the firm if well utilized. Working capital management is a delicate decision
to make since it has an effect on liquidity risk of the firm (Gorondutse, 2017). It requires an
organization to maintain a balance amongst the current assets and liabilities that would maximize
the value of the firm. Working capital management and its associated components like CCC and
NTC as well as the current assets and liabilities should be well planned and managed for the firm
to maximize its value (Nzioki et al., 2013).

8
The working capital management performs a critical part for the success and failure of the firm
since it controls the profitability and liquidity position of the firms. Proper managing of working
capital constituents enhances the value of the shareholders (Mweta, 2018). In Kenya, a concern
has been raised about the listed firms pertaining their working capital components as these firms
have been put under statutory management of working capital, bailouts by government or
subsidizing on collapsing firms such as Uchumi supermarkets, Nakumatt supermarkets, tuskys
supermarkets and Athi river mining.This circumstance has resulted to loss of both the confidence
and wealth of investors in the stock market (KNBS, 2017).
Studies conducted on WCM include Arachchi et al. (2017) who focused on the frontier market to
bring out the link between WCM and the firm value. An inverse link was established between
CCC and Tobin Q ratio while focusing on Indonesian listed entities, Sianipar and Prijadi (2018)
explored the link between WC and the firm value and noted that CCC as a dimension of WCM
and the firm value are positively and significantly related with each other. A study conducted
among the listed Chinese firms by Vijayakumaran (2019) focused on the effectiveness of WCM
and the firm’s value and a negative link was noted between NTC and the firm’s value.
Locally in Kenya, Mwangi and Obwogi (2018) focused on Kenyan listed manufacturing firms to
bring out the link between WCM and their profitability. The study noted mixed results between
the components of WCM represented by CCC and the ability of the firms to perform. Kiptoo
(2017) focused on firms that engage in processing of tea to bring out the link between WCM and
their financial performance. A significant link was registered between WCM and the ability of the
firm to perform in financial terms.

9
As indicated by the studies reviewed, it is shown that some of them were conducted in different
countries and contexts like Indonesia and not in Kenya. Other studies were done focusing on WCM
and performance or financial performance of the firm and not firm value. This create contextual
and conceptual gap, which the present study seeks to fill through responding to the following
research question: what is the effect of Working capital management on firm value of firms listed
at the Nairobi security exchange, Kenya?
1.3 Research Objective
To establish the effect of working capital management on firm value of firms listed at the Nairobi
security exchange, Kenya.
1.4 Value of the Study
This study will be advantageous to many stakeholders ranging from scholars, researchers,
government and its agencies, manager of listed firms, lawmakers, stock market official and many
others. Additionally, this study will contribute much to the current knowledge body and aid in
predicting firm value basing on working capital management. More so, other scholar may use this
study in future to reference their work. The study will also contribute in enlarging the breadth as
well as quality of the research works and publications. Findings from the study will be of assistance
in furtherance of the knowledge base on the study parameters
The policy makers including the Capital Market Authority (CMA) will be able to formulate sound
policies that will enhance and support maximization of the value of the listed firms. Practitioners
in the field of corporate finance including the finance managers will be able to have an
understanding of the role played by WCM with respect to the value of the firm. Scholars and
researcher will be able to review material of this study in future.

10
CHAPTER TWO: LITERATURE REVIEW
2.1 Introduction
The theories guiding the study will be reviewed in this chapter. The chapter will look at the
determinants of the working capital and the past related studies with the gaps being indicated. The
conceptual framework will be presented with the variables and how they are interlinked with each
other.
2.2 Theoretical Review
The section looks the theories that will inform the present study.
2.2.1 Keynesian Liquidity Preference Theory
The theory was formulated by Keynes (1936) and it indicate that it is good for the firm to
effectively manage its cash reserve. The theory raises three reasons why it is of essence for the
firm to management its cash; transaction, precautionary and speculative motives. The safety supply
of the reserves and cash in the firm inform the precautionary motive. The desires for the firm to
participate in the opportunities of investment inform the precautionary motive of requiring cash.
For transaction motive, the firm is required to maintain cash so as meet the bills including the need
to pay for wages and salaries, dividends to owners, trade payables and the taxes.
According to Pandey (2010), a firm cannot ignore a need for cash to ensure that the day to day
operations are maintained for smoothness. Thus, it is important that organizations invest a
reasonable amount of cash into their current assets. In essence, the management of cash is a
component of WCM, which cannot be ignored by the firm. Therefore, the theory provides the need
for firms to operationalize their WCM through sound management of their cash.

11
2.2.2 The Conservative Theory of Working Capital
The origin of this theory can be linked to Weston and Eugene (1975). The theory argues that a firm
leverages on long term sources of funds to finance its fixed assets with some portion of the current
assets. This is a WCM approach that is characterized by lower levels of productivity and risk. With
the level of risk being low, it follows that the level of return from this aggressive WCM dimension
would be low. WCM aims at realizing two key objectives in the firm, profitability and the
solvency.
Solvency requires a firm to have some level of liquidity (Pandey, 2006). The theory argues that
firms should hold a huge buildup of inventories and cash so as to meet the obligations as they arise.
This is too risky because they increase the opportunity cost of tied up capital that would have
otherwise been utilized ion financing investment projects which can maximize the value of the
firm. The theory will be used to underpin the need for the firm to embrace WCM so as to enhance
the value of the shareholders. The theory incorporates an element of risk and return in the WCM,
which determine the firm value. Based on this theory, a negative association is predicted amongst
WCM and the value of the firm.
2.2.3 Aggressive Theory of Working Capital
Attributed to Belt (1979), this theory argues that a firm leverages on short term sources of funds
to finance the current as well as the fixed assets in place. The theory is ideal to the firms that are
characterized by high risk which automatically translate into greater returns. Since the funds are
borrowed on a short period, the interest rates on these funds in the aggressive theory are very low.
However, there are higher risks linked with such short term debt facilities in the aggressive WCM
perspective.

12
The aggressive theory of WCM is more ideal to those firms operating in an economy that is
characterized by a greater degree of stability with certainty of the future cash flows. The aggressive
WCM theory advocates the firm should offer shorter credit periods to trade receivables, with
minimal amount of inventories held in stock and a relatively smaller quantity of cash held at hand.
There are higher risks of default on the company on account of inadequate funds to meet the
obligations. However, these higher risks are associated with greater returns to the firm. On the
basis of this theory, a positive association is anticipated amongst WCM and the value of the firm.
2.3 Determinants of the working capital
This section will bring out the key factors that shape the value of the listed firms in Kenya.
2.3.1 Working capital management
WCM has different associated components like the current assets, current liabilities and the cash
conversion cycle as well as the net trade cycle. Proper management of these components is a key
driver of profitability and ultimate value creation to the firm. In fact, one of the basic functions of
the finance managers of the corporation is to enhance the working capital of the firm. WCM has
both desirable and undesirable influence on profitability position of the firm and ultimately on its
value (Makori & Jagongo, 2013).
Excellent WCM is critical for profitability of the firm which maximizes the wealth of the firm. A
firm that has good WCM practices will have limited chances of external borrowing which
maximizes the overall firm value. Furthermore, good WCM practices require the firm to prudently
utilize the borrowed funds to avoid liquidity and cash flow challenges which may hurt the overall
position of the firm (Kaur & Sing, 2013). In essence, WCM aims at ensuring that there are
adequate cash flows in the firm so as to meet the obligations arising in the course of the operations

13
2.3.2 Nature of business
Nature of business is a very significant aspect as long as establishing the required WC is concerned
for different kind of companies. Mostly, huge amount of working capital will be needed by
manufacturing or trading firms as a result of fixed investment in raw materials, work in progress
inventory and finished products. Therefore, nature of business is one of the key factors. Normally,
working capital requirements in trade firms are greater since many investments are centered in
inventory or stock in order to satisfy production needs, manufacturing firms do require a great
amount of work capital. While, companies that offer services and not products need less working
capital in cash, since they do not have to maintain large inventories (Elbadry, 2018).
In other companies with large fixed investment for instance large companies and public utilities,
they normally require very minimal current assets partially due to cash, partially due to fact that
they deal with services as opposed to products and also due to the nature of business. Equally, the
fundamental and mail industries or manufacturers of goods are typically less involved in working
capital than those of the consumer goods manufacturing industries (Alehegne, 2019).
2.3.3 Firm Size
Firm size is a multidimensional concept that has traditionally been operationalized as a logarithm
of the total assets of the firm, the overall staff, the sales revenues and the number of branches of
the firm. Smaller firms have limited assets to be pledged as securities in case they aspire to have
access to long term sources of funds. This is as opposed to larger firms that are deemed to have
excellent relationship with capital markets and can access funds (both equities and debts) at the
market rates more easily. These two items are the basic components of the value of the firm (Naser,
Nuseith & Al-hadeya, 2013).

14
According to Whited (1992), and Petersen and Fazzari (1993) the relatively smaller entities are
associated with more financial related challenges. Ideally, smaller firms may have low amount of
capital invested in their current assets. This may be an explanation as to why such smaller firms
are characterized by low levels of inventories and receivables. At the same time, the operations of
smaller firms are largely supported by short term credit obtained from the trade payables.
Therefore, the size of the firm will have an influence on the value of the firm. The study will
operationalize firm size as a natural logarithm of the overall value of assets in the firm.
2.2.4 Terms of credit
Credit terms is another determining factors of working capital. Credit terms allow the company
to decide the amount and length of credit earned by its suppliers. Where suppliers of raw materials
offer long-term credit, the company can afford less working capital, while suppliers only offer a
short-term loan, the company needs additional working capital to pay the creditors (Nuryana,
2017). According to Nuryana (2017) more working capital will be needed by companies that
normally buys its raw materials for cash and sells its products on credit. On the contrast, less
working capital will be required for companies that normally sell for cash and purchase on credit.
The duration of the credit affects working capital directly.
Credit policy denotes the average time that it takes to collect cash of the sales made on credit.
There are a number of factors, which determine the credit policy comprising of clients credit rating,
industry practices among others. The requirements for working capital will certainly be higher
when longer credit period and extended to all customers regardless of the reliability of the
customers. It is because the debtors' balance would be higher, and therefore a comparatively longer
duration, which would naturally take more capital (Holmstrom & Tirole, 2000)

15
2.2.5 Seasonal requirements
The requirement for working capital is constant for companies that sell products during the entire
season, however for companies that sell seasonal goods, a higher amount is needed in the peak
season a there is more demand, more stock needs to be maintained and a quick supply needs to be
provided, whereas the demand is extremely small during off-season or slack season, and less
capital is needed (Leeson, 2016).
According to Leeson (2016) there are raw materials which are found only during particular season
though they are needed all year round. Therefore, an organization is required to purchase and store
raw material in bulk for use during the year. In this scenario, more working capital will be needed.
Also there are products which are highly marketed during a certain season, in this case, more
working capital during the season and less working capital during the off season is required.
2.4 Empirical Literature Review
Borrowing evidence from the context of Turkey, Şamiloğlu and Akgün (2016) sought to bring out
the link between WCM and the ability of firms to remain profitable. The measures of WCM
included the ARP, APP and CCC and the specific focus of the inquiry was on listed firms. A ten
year time horizon was taken covering 2003 all through to 2012. The returns generated on the values
of the assets and the equities of the entities were used as proxies of financial performance. An
inverse but significant link was noted between WCM and the ability of the firms to perform. A
related inquiry in Turky by Samet and Nazan (2017) focused on WCM and the ability of the firms
to remain profitable. A total of 41 entities were covered with the time horizon covering 2005 all
through to 2016. The study noted existence of an inverse link between WCM and the profitable
prospects of an entity. A study conducted among the listed Chinese firms by Vijayakumaran

16
(2019) focused on the efficiency of WCM and the firm’s value. In effort to operationalize WCM,
the inquiry used NTC which was found to have an inverse link with the Tobin’s Q of the entity.
While focusing on Indonesian listed entities, Sianipar and Prijadi (2018) explored the link between
WC and the firm value. The focus of the study was on the non-monetary but listed entities where
a total of 167 of them were covered. With adoption of the panel data methodologies, the period of
consideration of the inquiry was from 2006 all through to 2016. The inquiry noted that WCM and
the firm value are inversely but significantly linked with other. Another investigation among non-
money entities listed in Pakistan was done by Hassan, Imran, Amjad and Hussain (2014) with a
focus on WCM and its link with the ability of the firm to perform. The period of consideration of
the inquiry was from 2007 all through to 2010 with information sought from auxiliary sources.
The inquiry documented a direct and significant link between the ability of the firm to manage
receivables and performance. As control indicators, the size of the entity was seen to have a direct
interaction with the ability of the firm to perform.
Sudiyatno, Puspitasari and Sudarsi (2017) focused on Indonesian entities to bring out the link
between WC and the ability of the entity to perform with some elements of its value. The period
covered by this inquiry was 2010 all through 2013. Ratios were used as proxies of WC which
included current assets against the overall assets and current liabilities to overall assets. The capital
structure was taken as a control indicator in the inquiry. The firm’s value was measured using
Tobin’s Q. While CA/TA resulted into a direct link with ability of the firm to perform, CA/TA had
an inverse link.Arachchi, Perera and Vijayakumaran (2017) focused on the frontier market to bring
out the link between WCM and the firm value. The specific focus of the inquiry was on listed
entities on Colombo Security market. The period of consideration was from 2011 all through to
2015. WCM and its efficiency were examined using CCC while Tobin’s Q was applied to gauge

17
firm value. The size of the entity, the growth in turnover and the leverage were taken as control
indicators. An inverse link was noted between CCC and the firm value.
Akoto, Awunyo and Angmor (2013) looked at WCM and the ability of Ghanaian entities to remain
profitable. A total of 13 listed manufacturing entities were covered with the time frame ranging
from 2005 all through to 2009. By leveraging ion panel data methodologies, it was shown that
ARD and the level of firm performance are inversely linked. On the other hand, CCC and
performance had a direct and significant link with each other. An inquiry into WCM and the ability
of the firm to create wealth was reviewed by Oseifuah and Gyekye (2017) with reference to the
South African context. The adopted methodologies were panel data and the time frame was from
2003 all through to 2012. The results of the inquiry were mixed based on the individual
components of WCM. The conversion period of inventories and the receivables were directly and
significantly linked with the value of the entity. CCC and the firm value had a direct but
insignificant link with each other. In Egypt, Moussa (2018) was interested in bringing out the link
between WCM and on the ability of the firm to perform and its overall value. The adopted
methodologies of the inquiries were panel data with the time horizon taken as 2000 all through to
2010. A direct and significant link was noted between CCC and the value of the firm.
Mwangi and Obwogi (2018) focused on Kenyan listed manufacturing firms to bring out the link
between WCM and their performance. The adopted design was quantitative that entailed gathering
of information from auxiliary sources. The period of consideration of the inquiry was ten year
frame covering 2007 all through to 2016. The ability of the entity to perform financial was
analyzed with the aid of ROE and Tobin’s Q. It was shown that while CCC and the ability of the
firm to perform in financial terms are inversely but significantly linked with each other, the link
with Tobin’s Q was direct but not significant. Kiptoo (2017) focused on firms that engage in

18
processing of tea to bring out the link between WCM and their financial performance. The adopted
design was cross sectional descriptive with 54 respondents being the target. Information was
gathered from first hand data sources. A significant link was documented between WCM and the
ability of the entity to perform.
Likalama (2016) did an assessment of WCM and its role as much as the profitability of the entity
is concerned. The specific focus of the inquiry was on agro- firms with their operations with
Eldoret. Gathering the views from first hand sources, it was shown that WCM and the profitable
ability of the firm are significantly linked with each other. Nyoro (2013) looked at WCM and its
link with the ability of the entity to create the value for its shareholders. CA and CL were the
specific indicators used to gauge WCM while value creation was operationalized as MPS. Mixed
results were obtained by this inquiry.
Mwirigi, Wambugu and Maina (2018) focused on the small and medium enterprises (SMEs) to
bring out the interaction between WCM and their ability to perform. The adopted designs were
cross sectional and correlational in nature. The information for the inquiry was obtained from
questionnaire. Mixed results were obtained between the WCM components and the ability of the
firm to perform. Mwangi, Makau and Kosimbei (2014) focused on the non-monetary listed entities
in Kenyan context to bring out the link between WCM and their ability to perform. A total of 42
entities were covered with the time frame covering 2006 all through to 2012. The adopted
methodologies were panel data. A direct and significant link was noted between aggressive,
conservative policy of financing and the ability of the firm to perform financially.

19
2.6 Conceptual Framework
Independent Variables
Figure 2.1: Conceptual Framework
2.5 Summary of Literature and Research Gaps
Generally, from almost all surveys reviewed in the literature, it is clear that working capital
management is a key aspect in optimizing the profits of a firm. In summary, all through the
literature a most researchers have concluded that the working capital management is related with
reduction in cash conversion cycle that affects firm value.
In terms of gaps, several gaps were unearthed, which warranted this study. There was a conceptual
gap in the studies conducted by Mwangi and Obwogi (2018), Samet and Nazan (2017), Kiptoo
(2017) because they focused on financial performance and profitability not firm value.
Average receivable period
Value of the Firm
Tobin’s Q
Cash Conversion Cycle
Inventory conversion period
Dependent Variable
Average payable period
Control variables
Firm size
Leverage
Sales growth
Sales growth

20
There is also a conceptual gap in the study conducted by Şamiloğlu and Akgün (2016) because it
utilized financial performance as dependent variable but the current study will look firm value.
Finally, the study conducted by Mwangi et al (2014) presents a contextual gap because not all
firms listed at the NSE were used as the population in the study and thus the findings can vary if
the excluded sectors are included.
There is a contextual gap in the studies conducted by Vijayakumaran (2019), and Sianipar and
Prijadi (2018), because they were not conducted in the Kenyan context. There is a methodological
gap in the study conducted by Mwirigi et al. (2018), because it employed primary data, which was
cross-sectional, the current study will utilize secondary panel data.

21
CHAPTER THREE: RESEARCH METHODOLOGY
3.1 Introduction
The design that will be adopted and the targeted population in the study are detailed in this chapter.
The means gathering information and how the processing will be done are also detailed in this
chapter. All these contents are aligned with the overall topic of the inquiry.
3.2 Research Design
The study embraced a descriptive correlational design. It aided in summarizing the WCM and firm
value of firms quoted at the NSE, Kenya. On the other hand, the correlational design was used to
support regression analysis in establishing the cause effect relationship between WCM and firm
value (Kothari, 2012).
3.3 Target Population
Grabich (2012) posits that a set of people, events or elements that are studied with an aim of
providing answers to the research questions is referred to as a study population. All the 67 listed
firms at the NSE, whose list is provided in Appendix I, formed the population in this study. The
study is a census because the entire population was examined.
3.4 Data Collection
The study collected five years secondary data for the time frame 2015 to 2019. Data on firm market
value, liabilities total assets, cash-flows from operations, market value of equity, accounts
receivable, inventory, accounts payable, tax payable, and other assets, was collected for the period.
This data was collected from publications by the NSE, CMA and respective financial statements

22
of the listed firms. The data was gathered on the annual basis. A data collection sheet was applied
in collecting of the secondary data in this study.
3.5 Data Analysis
Data collected was organized, tabulated and simplified so as to make it easier to analyze, interpret
and understand. Because panel data was employed for the study, STATA version 13 was the
statistical analysis program utilized for the study because it is able to perform panel multiple linear
regression. Inferential statistics covering correlation and regression analysis were used to test the
effect of WCM on firm value.
3.5.1 Model Specification
The regression model to be adopted by the study took the following form:
Where:
Y = Tobin Q ratio
β0 = constant
β0, β1, β2, β3, β4, β5, β6, β7= beta coefficients
X2 = Average payment period
X3 = Inventory conversion period
X4 = Cash Conversion Cycle
X5= Firm size
X6= Leverage
X7= Sales growth
ε = Error term

23
The results were presented using tables and graphs for trend analysis on the variables.
3.5.2 Operationalization of Variables
Table 3.1 shows how the variables of the study were operationalized
Table 3.1: Operationalization of Study Variables
Variables Measurement
Dependent variable
Tobin’s Q ratio (Total Market Value + Liabilities)/(Total Book
Value + Liabilities) (Tobin, 1969)
Independent variables
Inventory conversion period Inventory/cost of goods sold* 365
Average collection period Account receivable / net sales*365
Average payment period Account payable/ purchases*365
Cash conversion cycle ACP + ICP – APP
Control variables
Firm size Natural logarithm of total assets
Leverage Total debt/ total equity
Sales growth Current period sales – prior period sales/ prior
period sales*100
3.5.3 Test of Significance
The p-values aided in determining the overall significance of the study variables. To interpret p-
values, the threshold was 0.05 or 5%. In this regard, the p-values less than 0.05 denoted that the
link between the study variable is significant.

24
3.5.4 Diagnostic Tests
For the validity of regression analysis, a number of assumptions are done in conducting linear
regression models. These are; no multi-collinearity, observations are sampled randomly,
conditional mean ought to be zero, linear regression model is “linear in parameters”, spherical
errors: there is homoscedasticity and no auto-correlation, and the optional assumption: error terms
ought to be distributed normally. According to the Gauss-Markov Theorem, the first 5
assumptions of the linear regression model, the regression OLS estimators, are the Best Linear
Unbiased Estimators (Grewal et al., 2004).
The aforementioned assumptions are of great importance since when any of them is violated would
mean the regression estimates will be incorrect and unreliable. Particularly, a violation would bring
about incorrect signs of the regression estimates or the difference of the estimates would not be
reliable, resulting to confidence intervals that are either too narrow or very wide (Gall et al., 2006).
The diagnostic tests are conducted so as to guarantee that the assumptions are met to attain the
Best Linear Unbiased Estimators. Regression diagnostics assess the model assumptions and probe
if there are interpretations with a great, unwarranted effect on the examination or not. Diagnostic
examinations on normality, linearity, multicollinearity, and autocorrelation were done on the
collected data to establish its suitability in the formulation of linear regression model. Normality
was tested by the Shapiro-Francia test, which is suitable for testing distributions of Gaussian nature
which have specific mean and variance. Linearity indicates a direct proportionate association
amongst dependent and independent variable such that variation in independent variable is
followed by a correspondent variation in dependent variable (Gall et al., 2006). Linearity was
tested by determining homoscedasticy, which was determined by the Breusch-Pagan Cook-
Weisberg Test for Homoscedacity.

25
Tests for multicollinearity of data was carried out using variance inflation factors (VIF) to
determine whether the predictor variables considered in the research are significantly correlated
with each other. According to Grewal et al. (2004) the main sources of multicollinearity are small
sample sizes, low explained variable and low measure reliability in the independent variables.
Auto-correlation test was carried out through the Durbin-Watson Statistic.
Additionally, to avoid spurious regression results unit root test was carried out on the panel data.
The aim of conducting unit root test is to check whether the macroeconomic variables under study
are integrated of order on (1, 1) or not before estimation procedure can be proceeded into. Unit
root test was conducted through the Fisher-type unit root test. The study also utilized the Hausman
specification test to ascertain if the variables used in the study possess fixed influence overtime or
if they have varying and random influence over time. The null hypothesis is that that the variables
have a random effect and the alternate hypothesis is that the variables have a fixed effect. If the
significance value is less than α (0.05), the null hypothesis will consequently rejected and if the
significance value is greater than α (0.05), the null hypothesis will not be rejected.

26
CHAPTER FOUR: DATA ANALYSIS, RESULTS, AND FINDINGS
4.1 Introduction
This chapter entails of the data analysis, interpretation and the discussions of the outcomes. The
section hence is fragmented to three sub sections, which entail; diagnostic tests, inferential
statistics, and the interpretation and the discussion of findings. Precisely this chapter summarizes
the platform for data presentations, analysis, interpretations, and discussions.
4.2 Diagnostic Tests
Diagnostic tests that are a precursor to conducting linear regression were conducted. Diagnostic
tests done in this study included; normality tests, homoscedacity tests, multicollinearity tests and
autocorrelation tests. Normality test was carried out using the the Shapiro-Francia test and the
homoscedacity test was conducted through the Breusch-Pagan Cook-Weisberg Test for
Homoscedacity. Test on Multicolinearity of data was carried out using Variance Inflation Factors
(VIF) while the autocorrelation test was done through the Durbin-Watson statistic. Unit root test
was conducted through the Fisher-type unit root test. Additionally, the Hausman test was
conducted to determine whether fixed or variable effects panel regression should be conducted.
4.2.1 Normality Test
The normality tests for all the variables employed in the study are highlighted in Table 4.1.

27
Table 4.1: Shapiro-Francia Test for Normality
Variable Obs W' V' z Prob>z
TobinQRatio 277 0.15569 181.865 10.988 0.00001
Inventoryc~d 277 0.82181 38.382 7.703 0.00001
Averagecol~d 274 0.96748 6.94 4.088 0.00002
Averagepay~d 274 0.97483 5.371 3.548 0.00019
Cashconver~e 274 0.79132 44.528 8.011 0.00001
FirmSize 277 0.97645 5.074 3.43 0.0003
Levearage 277 0.37537 134.546 10.352 0.00001
Salesgrowth 277 0.12609 188.242 11.061 0.00001
In the test, the null hypothesis holds that the data has a normal distribution. The level of
significance adopted in the study is 5%. Since the significance values in tests for all the variables
are less than α (0.05), the null hypothesis is rejected. Hence, the data series of the variables
employed in the study are not normally distributed.
4.2.2 Homoscedacity Test
The homoscedacity tests for all the predictor variables employed in the study are enlisted in Table
4.2.
Table 4.2: Breusch-Pagan/Cook-Weisberg Test for Homoscedacity
Breusch-Pagan / Cook-Weisberg test for heteroskedasticity
Ho: Constant variance
Variables: fitted values of TobinQRatio
chi2(1) = 967.74
Prob > chi2 = 0.0000
The null hypothesis is that there is homoscedacity. The level of significance adopted in the study
is 5%. Since the significance value is less than α (0.05), the null hypothesis is rejected. Hence, the
data series of all the predictor variables are heteroscedastic.

28
4.2.3 Test for Multicollinearity
Results on Test for Multicolinearity of data carried out using Variance Inflation Factors (VIF) are
displayed in Table 4.3.
Table 4.3: VIF Multicollinearity Statistics
Variable VIF 1/VIF
Cashconver~e 72.22 0.013847
Inventoryc~d 70.95 0.014095
Averagepay~d 5.91 0.169138
FirmSize 5.75 0.174057
Levearage 1.2 0.830493
Salesgrowth 1.01 0.990525
Mean VIF 26.17
The common rule in statistics is that the VIF values should be less than 10 and greater than 1. The
findings indicate that the VIF of cash conversion cycle and inventory conversion period fall out of
the range of 1 to 10. Thus, the variables exhibit multicollinearity. The findings also indicate that
the VIF values of average collection period, firm size, leverage, and sales growth fall below 10
and are greater than 1. Hence, there is no presence of multicollinearity amongst those predictor
variables.
4.2.4 Tests for Autocorrelation
Test for Autocorrelation of data was carried out using the Durbin Watson statistic. The findings
displayed that Durbin-Watson d-statistic (7, 274) = 1.6599943. The Durbin-Watson statistic ranges
from point 0 and point 4. If there exist no correlation between variables, a value of 2 is shown. If
the values fall under point 0 up to a point less than 2, this is an indication of an autocorrelation and
on the contrast a negative autocorrelation exist if the value falls under point more than 2 up to 4.
As a common rule in statistics, value falling under the range 1.5 to 2.5 is considered relatively

29
normal whereas values that fall out of the range raise a concern (Shenoy & Sharma, 2015). Field
(2009) however, opines that values above 3 and less than 1 are a sure reason for concern. Therefore,
the data used in this panel is not serially autocorrelated since it meets this threshold.
4.2.5 Unit Root Test
The results for the unit root test conducted for the data series firm value is displayed in Table 4.4.
Table 4.4: Unit Root Test for Firm Value
The null hypothesis is that firm value has a unit root and the alternate hypothesis is that the variable
is stationery. Since the significance values for the P, Z, L* and Pm tests are all less than the critical
value (α) at the 5% confidence level, then the null hypothesis is rejected. Thus, the panel data
series is stationery.
The results for the unit root test conducted for the data series inventory conversion period are
displayed in Table 4.5.

30
Table 4.5: Unit Root Test for Inventory Conversion Period
The null hypothesis is that inventory conversion period has a unit root and the alternate hypothesis
is that the variable is stationery. Since the significance values for the P, Z, L* and Pm tests are all
less than the critical value (α) at the 5% confidence level, then the null hypothesis is rejected. Thus,
the panel data series is stationery.
The results for the unit root test conducted for the data series average collection period are
displayed in Table 4.6.
Table 4.6: Unit Root Test for Average Collection Period

31
The null hypothesis is that average collection period has a unit root and the alternate hypothesis is
that the variable is stationery. Since the significance values for the P, Z, L* and Pm tests are all
less than the critical value (α) at the 5% confidence level, then the null hypothesis is rejected. Thus,
the panel data series is stationery.
The results for the unit root test conducted for the data series average payment period are displayed
in Table 4.7.
Table 4.7: Unit Root Test for Average Payment Period
The null hypothesis is that average payment period has a unit root and the alternate hypothesis is
that the variable is stationery. The significance values for the P and Pm tests are less than the
critical value (α) at the 5% confidence level while the significance values of the Z and L* are more
than the critical value (α) at the 5% confidence level. In case of any conflict in the tests, the inverse
chi-squared and modified inv. chi-squared tests take precedence. Thus, the null hypothesis is
rejected. Thus, the panel data series is stationery.
The results for the unit root test conducted for the data series cash conversion cycle are displayed
in Table 4.8.

32
Table 4.8: Unit Root Test for Cash Conversion Cycle
The null hypothesis is that cash conversion cycle has a unit root and the alternate hypothesis is that
the variable is stationery. Since the significance values for the P, Z, L* and Pm tests are all less
than the critical value (α) at the 5% confidence level, then the null hypothesis is rejected. Thus, the
panel data series is stationery.
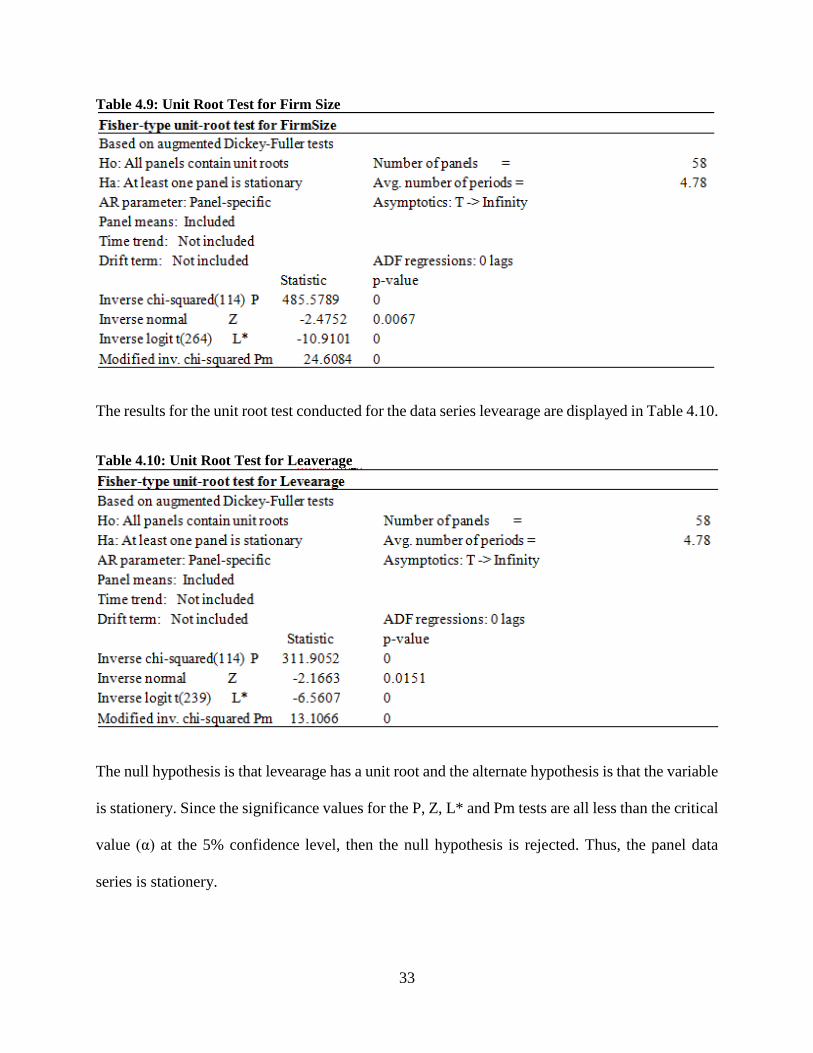
The results for the unit root test conducted for the data series firm size are displayed in Table 4.9.
The null hypothesis is that firm size has a unit root and the alternate hypothesis is that the variable
is stationery. Since the significance values for the P, Z, L* and Pm tests are all less than the critical
value (α) at the 5% confidence level, then the null hypothesis is rejected. Thus, the panel data
series is stationery.
33
Table 4.9: Unit Root Test for Firm Size
The results for the unit root test conducted for the data series levearage are displayed in Table 4.10.
Table 4.10: Unit Root Test for Leaverage
The null hypothesis is that levearage has a unit root and the alternate hypothesis is that the variable
is stationery. Since the significance values for the P, Z, L* and Pm tests are all less than the critical
value (α) at the 5% confidence level, then the null hypothesis is rejected. Thus, the panel data
series is stationery.

34
The results for the unit root test conducted for the data series sales growth are displayed in Table
4.11.
Table 4.11: Unit Root Test for Sales Growth
4.2.6 Test for Random and Fixed Effects
The study carried out the Hausman test to determine if the variables have fixed influence overtime
or if the variables have varying and random influence over time. Before the Hausman test was
conducted, the variables had to be transformed because they did not meet the conditions of
normality, homoscedacity. Thus, a logarithmic function was introduced to all the variables to
transform them. Since you cannot transform a negative value with a logarithmic function, negative
values were considered as missing values. The variables cash conversion cycle and inventory
conversion period exhibited multicollinearity, thus, they were dropped from the analysis. The
finding on the Hausman test of specification is presented in Table 4.12.

35
Table 4.12: Hausman Test of Specification
The null hypothesis assumed that variables have a random effect and alternate hypothesis was that
the variables have a fixed effect. If the p value is less than 0.05 then the null hypothesis will be
rejected and if greater than 0.05 then the null hypothesis will not be rejected. When the Hausman
chi-square test statistic is negative, the alternate hypothesis is adopted because asymptotically, the
p value is equal to 1. The significance value obtained in the hausman test conducted (0.0006) is
less than 0.05. Thus, the variables have a fixed effect and a fixed effect panel model was utilized.
4.3 Inferential Statistics
Inferential statistics were used in determining the direction, relationship, and strength of the
association between the predictor variables and the response variable. The section entails the
inferential statistics employed in the study, which included correlation and fixed effects panel
multiple linear regression analysis.

36
4.3.1 Correlation Analysis
Correlation analysis establishes whether there exists an association among two variables. The
association falls between a perfect positive and a strong negative correlation. The study used
Pearson Correlation. This study employed a Confidence Interval of 95% and a two-tail test. The
correlation test was done to ascertain the association between financial risk and financial
performance.
Table 4.13: Correlation Analysis
Table 4.13 displays that average collection period, average payment period, firm size, and leverage
are significantly correlated at the 5% significance level to firm value. They all have a negative
significant association with firm value. Sales growth however, does not have a significant
association with firm value at the 5% significance level.
4.3.2 Multiple Linear Regression
The fixed effects panel regression model assessed the effect of WCM and firm size on firm value.
The regression analysis was established at the 5% significance level. The significance critical value
0.0809 0.9103 0.8440 0.8708 0.7644
LogSalesgr~h -0.1051 -0.0068 -0.0119 0.0098 0.0181 1.0000
0.0034 0.0000 0.0000 0.0000
LogLevearage -0.1753* 0.3616* 0.3513* 0.2949* 1.0000
0.0000 0.0000 0.0000
LogFirmSize -0.4041* 0.8586* 0.8959* 1.0000
0.0000 0.0000
LogA~tperiod -0.3028* 0.9424* 1.0000
0.0000
LogA~nperiod -0.2447* 1.0000
LogTobinQR~o 1.0000
LogTob~o L~coll~d L~paym~d LogFir~e LogLev~e LogSal~h

37
exhibited from the Analysis of Variance and Model Coefficients were compared with the values
obtained in the analysis. The findings are displayed in Table 4.14.
Table 4.14: Fixed Effects Panel Multiple Linear Regression
The overall R2 indicates deviations in response variable as a consequence of differences in
predictor variables. The overall R2 value is 0.1661, a discovery that 16.61% of the deviations in
firm value are caused by the various working capital management practices, firm size, leaverage,
and sales growth. Other factors not incorporated in the model justify for 83.39% of the variations
in firm value.
The null hypothesis is that the various working capital management practices, firm size, leaverage,
and sales growth do not significantly influence firm value. The significance value obtained in the
study (Prob>F=0.0000) is less than the critical value of 0.05. Consequently, the null hypothesis is

38
rejected. Thus, the various working capital management practices, firm size, leaverage, and sales
growth do influence firm value. Thus, they can be utilized to significantly predict firm value.
The null hypothesis was that there was no significant relationship between each aspect of working
capital management employed in the study, firm size, leverage, and sales growth with firm value.
The study findings exhibited that only firm size had a significant relationship with firm value. This
is because its significance value is less than the critical significance value (α) of 0.05 and thus the
null hypothesis is rejected. It has a significant negative influence on firm value. Average collection
period, average payment period, leverage, and sales growth however do not have significant effects
on firm value. This is because their significance values are greater than the critical significance
value (α) of 0.05. The following model was thus developed;
Y = 10.86074 - 8.891879X1
Where;
Y = Firm Value
X1 = Firm Size
This implies that when firm size is equal to zero, the firm value is 10.86074. Subsequently, when
firm size increases by one unit, there is a decrease in firm value by 8.891879 units.
4.4 Interpretation and Discussion of Findings
The study endeavored to establish the effect of working capital management on firm value of firms
listed at the Nairobi security exchange, Kenya, with firm size, leverage, and sales growth acting
as the control variables. The variables had to be transformed because they did not meet the
conditions of normality, homoscedasticity. Thus, a logarithmic function was introduced to all the

39
variables to transform them. The variables cash conversion cycle and inventory conversion period
exhibited multicollinearity, thus, they were dropped from the analysis.
The study findings established that average collection period, average payment period, firm size,
and leverage are significantly correlated at the 5% significance level to firm value. They all have
a negative significant association with firm value. Sales growth however, does not have a
significant association with firm value at the 5% significance level. Additionally, the study
findings revealed that the various working capital management practices, firm size, leaverage, and
sales growth do influence firm value. Thus, they can be utilized to significantly predict firm value.
The study findings also exhibited that that only firm size had a significant relationship with firm
value. It has a significant negative influence on firm value. Average collection period, average
payment period, leverage, and sales growth however do not have significant effects on firm value.
The current study finding that the average collection period and average payment period
components of WCM are significantly negatively associated with firm value and the additional
finding that the various working capital management practices, firm size, leaverage, and sales
growth do influence firm value concurs with the Conservative Theory of Working Capital
proposed by Weston and Eugene (1975). The theory incorporates an element of risk and return in
the WCM which determine the firm value. Based on this theory, a negative association is predicted
amongst WCM and the value of the firm. with the study findings. However, the current study also
established that none of the working capital component individually significantly affected firm
value.
The current study finding that the average collection period and average payment period
components of WCM are significantly negatively associated with firm value and the additional

40
finding that the various working capital management practices, firm size, leaverage, and sales
growth do influence firm value concurs with the Aggressive Theory of Working Capital attributed
to Belt (1979). According to the theory, there are higher risks of default on the company on account
of inadequate funds to meet the obligations. However, these higher risks are associated with greater
returns to the firm. Based on this theory, a positive association is anticipated amongst WCM and
the value of the firm. However, the current study also established that none of the working capital
component individually significantly affected firm value.
The current study finding that the average collection period and average payment period
components of WCM are significantly negatively associated with firm value and the additional
finding that the various working capital management practices, firm size, leaverage, and sales
growth do influence firm value concurs with the study findings of the study conducted by (Mweta,
2018). The study established that proper managing of working capital constituents enhances the
value of the shareholders. Indeed, the key cause for the failure of most firms, partnerships and
small firms is poor working capital management including inventory, receivables and payables
management. In order to avoid liquidity risk, it is vital for a firm to have efficient mechanisms of
managing the constituents of working capital.
While focusing on Indonesian listed entities, Sianipar and Prijadi (2018) explored the link between
WC and the firm value. The study noted that the net trade cycle (NTC) and the firm value are
negatively and significantly related with each other. In Egypt, Moussa (2018) was interested in
bringing out the link between WCM and on the ability of the firm to perform and its overall value.
The study noted that CCC as a dimension of WCM and the firm value are positively and
significantly related with each other. The current study finding that the average collection period
and average payment period components of WCM are significantly negatively associated with

41
firm value and the additional finding that the various working capital management practices, firm
size, leaverage, and sales growth do influence firm value concurs with the study findings.
However, the current study also established that none of the working capital component
individually significantly affected firm value.
A study conducted among the listed Chinese firms by Vijayakumaran (2019) focused on the
efficiency of WCM and the firm’s value. NTC was used as a proxy of WCM while Tobin Q was
used in place of firm value. A negative link was noted between NTC and the firm’s value. The
current study finding that the average collection period and average payment period components
of WCM are significantly negatively associated with firm value and the additional finding that the
various working capital management practices, firm size, leaverage, and sales growth do influence
firm value concurs with the study findings. However, the current study also established that none
of the working capital component individually significantly affected firm value.
Arachchi et al. (2017) focused on the frontier market to bring out the link between WCM and the
firm value. An inverse link was established between CCC and Tobin Q ratio while focusing on
Indonesian listed entities, Sianipar and Prijadi (2018) explored the link between WC and the firm
value and noted that CCC as a dimension of WCM and the firm value are positively and
significantly related with each other. The current study finding that the average collection period
and average payment period components of WCM are significantly negatively associated with
firm value and the additional finding that the various working capital management practices, firm
size, leaverage, and sales growth do influence firm value concurs with the study findings.
However, the current study also established that none of the working capital component
individually significantly affected firm value.

42
Locally in Kenya, Mwangi and Obwogi (2018) focused on Kenyan listed manufacturing firms to
bring out the link between WCM and their profitability. The study noted mixed results between
the components of WCM represented by CCC and the ability of the firms to perform. The current
study finding that the average collection period and average payment period components of WCM
are significantly negatively associated with firm value and the additional finding that the various
working capital management practices, firm size, leaverage, and sales growth do influence firm
value concurs with the study findings. However, the current study also established that none of the
working capital component individually significantly affected firm value.
Kiptoo (2017) focused on firms that engage in processing of tea to bring out the link between
WCM and their financial performance. A significant link was registered between WCM and the
ability of the firm to perform in financial terms. The current study finding that the average
collection period and average payment period components of WCM are significantly negatively
associated with firm value and the additional finding that the various working capital management
practices, firm size, leaverage, and sales growth do influence firm value concurs with the study
findings. However, the current study also established that none of the working capital component
individually significantly affected firm value.
Excellent WCM is critical for profitability of the firm which maximizes the wealth of the firm. A
firm that has good WCM practices will have limited chances of external borrowing which
maximizes the overall firm value. Furthermore, good WCM practices require the firm to prudently
utilize the borrowed funds to avoid liquidity and cash flow challenges which may hurt the overall
position of the firm (Kaur & Sing, 2013). The current study finding that the average collection
period and average payment period components of WCM are significantly negatively associated
with firm value and the additional finding that the various working capital management practices,

43
firm size, leaverage, and sales growth do influence firm value concurs with the study findings.
However, the current study also established that none of the working capital component
individually significantly affected firm value.
According to Whited (1992), and Petersen and Fazzari (1993) the relatively smaller entities are
associated with more financial related challenges. Ideally, smaller firms may have low amount of
capital invested in their current assets. This may be an explanation as to why such smaller firms
are characterized by low levels of inventories and receivables. This is in contrast to the current
study finding that firm size has a statistically significant negative relationship with firm value.
Şamiloğlu and Akgün (2016) sought to bring out the link between WCM and the ability of firms
to remain profitable. The measures of WCM included the ARP, APP and CCC and the specific
focus of the inquiry was on listed firms. A ten year time horizon was taken covering 2003 all
through to 2012. The returns generated on the values of the assets and the equities of the entities
were used as proxies of financial performance. An inverse but significant link was noted between
WCM and the ability of the firms to perform. The current study finding that the average collection
period and average payment period components of WCM are significantly negatively associated
with firm value and the additional finding that the various working capital management practices,
firm size, leaverage, and sales growth do influence firm value concurs with the study findings.
However, the current study also established that none of the working capital component
individually significantly affected firm value.
A related inquiry in Turkey by Samet and Nazan (2017) focused on WCM and the ability of the
firms to remain profitable. A total of 41 entities were covered with the time horizon covering 2005
all through to 2016. The study noted existence of an inverse link between WCM and the profitable

44
prospects of an entity. A study conducted among the listed Chinese firms by Vijayakumaran
(2019) focused on the efficiency of WCM and the firm’s value. In effort to operationalize WCM,
the inquiry used NTC which was found to have an inverse link with the Tobin’s Q of the entity.
The current study finding that the average collection period and average payment period
components of WCM are significantly negatively associated with firm value and the additional
finding that the various working capital management practices, firm size, leaverage, and sales
growth do influence firm value concurs with the study findings. However, the current study also
established that none of the working capital component individually significantly affected firm
value.
Another investigation among non-money entities listed in Pakistan was done by Hassan, Imran,
Amjad and Hussain (2014) with a focus on WCM and its link with the ability of the firm to
perform. The period of consideration of the inquiry was from 2007 all through to 2010 with
information sought from auxiliary sources. The inquiry documented a direct and significant link
between the ability of the firm to manage receivables and performance. The current study finding
that the average collection period and average payment period components of WCM are
significantly negatively associated with firm value and the additional finding that the various
working capital management practices, firm size, leaverage, and sales growth do influence firm
value concurs with the study findings. However, the current study also established that none of the
working capital component individually significantly affected firm value. As control indicators,
the size of the entity was seen to have a direct interaction with the ability of the firm to perform.
This is in agreement to the current study finding that firm size has a statistically significant
relationship with firm value.

45
Sudiyatno, Puspitasari and Sudarsi (2017) focused on Indonesian entities to bring out the link
between WC and the ability of the entity to perform with some elements of its value. The period
covered by this inquiry was 2010 all through 2013. Ratios were used as proxies of WC which
included current assets against the overall assets and current liabilities to overall assets. The capital
structure was taken as a control indicator in the inquiry. The firm’s value was measured using
Tobin’s Q. While CA/TA resulted into a direct link with ability of the firm to perform, CA/TA had
an inverse link. The current study finding that the average collection period and average payment
period components of WCM are significantly negatively associated with firm value and the
additional finding that the various working capital management practices, firm size, leaverage, and
sales growth do influence firm value concurs with the study findings. However, the current study
also established that none of the working capital component individually significantly affected
firm value.
Arachchi, Perera and Vijayakumaran (2017) focused on the frontier market to bring out the link
between WCM and the firm value. The specific focus of the inquiry was on listed entities on
Colombo Security market. The period of consideration was from 2011 all through to 2015. WCM
and its efficiency were examined using CCC while Tobin’s Q was applied to gauge firm value.
The size of the entity, the growth in turnover and the leverage were taken as control indicators. An
inverse link was noted between CCC and the firm value. The current study finding that the average
collection period and average payment period components of WCM are significantly negatively
associated with firm value and the additional finding that the various working capital management
practices, firm size, leaverage, and sales growth do influence firm value concurs with the study
findings. However, the current study also established that none of the working capital component
individually significantly affected firm value.

46
Akoto, Awunyo and Angmor (2013) looked at WCM and the ability of Ghanaian entities to remain
profitable. A total of 13 listed manufacturing entities were covered with the time frame ranging
from 2005 all through to 2009. By leveraging ion panel data methodologies, it was shown that
ARD and the level of firm performance are inversely linked. On the other hand, CCC and
performance had a direct and significant link with each other. The current study finding that the
average collection period and average payment period components of WCM are significantly
negatively associated with firm value and the additional finding that the various working capital
management practices, firm size, leaverage, and sales growth do influence firm value concurs with
the study findings. However, the current study also established that none of the working capital
component individually significantly affected firm value.
An inquiry into WCM and the ability of the firm to create wealth was reviewed by Oseifuah and
Gyekye (2017) with reference to the South African context. The adopted methodologies were
panel data and the time frame was from 2003 all through to 2012. The results of the inquiry were
mixed based on the individual components of WCM. The conversion period of inventories and the
receivables were directly and significantly linked with the value of the entity. CCC and the firm
value had a direct but insignificant link with each other. The current study finding that the average
collection period and average payment period components of WCM are significantly negatively
associated with firm value and the additional finding that the various working capital management
practices, firm size, leaverage, and sales growth do influence firm value concurs with the study
findings. However, the current study also established that none of the working capital component
individually significantly affected firm value.
In Egypt, Moussa (2018) was interested in bringing out the link between WCM and on the ability
of the firm to perform and its overall value. The adopted methodologies of the inquiries were

47
panel data with the time horizon taken as 2000 all through to 2010. A direct and significant link
was noted between CCC and the value of the firm. The current study finding that the average
collection period and average payment period components of WCM are significantly negatively
associated with firm value and the additional finding that the various working capital management
practices, firm size, leaverage, and sales growth do influence firm value concurs with the study
findings. However, the current study also established that none of the working capital component
individually significantly affected firm value.
Mwangi and Obwogi (2018) focused on Kenyan listed manufacturing firms to bring out the link
between WCM and their performance. The adopted design was quantitative that entailed gathering
of information from auxiliary sources. The period of consideration of the inquiry was ten year
frame covering 2007 all through to 2016. It was shown that while CCC and the ability of the firm
to perform in financial terms are inversely but significantly linked with each other, the link with
Tobin’s Q was direct but not significant. The current study finding that none of the working capital
component individually significantly affected firm value is in agreement with the study findings.
Kiptoo (2017) focused on firms that engage in processing of tea to bring out the link between
WCM and their financial performance. Information was gathered from first hand data sources. A
significant link was documented between WCM and the ability of the entity to perform. The
current study finding that the average collection period and average payment period components
of WCM are significantly negatively associated with firm value and the additional finding that the
various working capital management practices, firm size, leaverage, and sales growth do influence
firm value concurs with the study findings. However, the current study also established that none
of the working capital component individually significantly affected firm value.

48
Likalama (2016) did an assessment of WCM and its role as much as the profitability of the entity
is concerned. The specific focus of the inquiry was on agro- firms with their operations with
Eldoret. Gathering the views from first hand sources, it was shown that WCM and the profitable
ability of the firm are significantly linked with each other. The current study finding that the
average collection period and average payment period components of WCM are significantly
negatively associated with firm value and the additional finding that the various working capital
management practices, firm size, leaverage, and sales growth do influence firm value concurs with
the study findings. However, the current study also established that none of the working capital
component individually significantly affected firm value.
Mwangi, Makau and Kosimbei (2014) focused on the non-monetary listed entities in Kenyan
context to bring out the link between WCM and their ability to perform. A total of 42 entities were
covered with the time frame covering 2006 all through to 2012. The adopted methodologies were
panel data. A direct and significant link was noted between aggressive, conservative policy of
financing and the ability of the firm to perform financially. The current study finding that the
average collection period and average payment period components of WCM are significantly
negatively associated with firm value and the additional finding that the various working capital
management practices, firm size, leaverage, and sales growth do influence firm value concurs with
the study findings. However, the current study also established that none of the working capital
component individually significantly affected firm value.

49
CHAPTER FIVE: SUMMARY, CONCLUSIONS, AND
RECOMMENDATIONS
5.1 Introduction
This section shows the study findings summary, offered conclusions, and recommendations on the
effect of working capital management on firm value of firms listed at the Nairobi Security
Exchange. Additionally, the research limitations and further research suggestions are also outlined.
5.2 Summary of Findings
The study endeavored to assess the effect of the effect of working capital management on firm
value of firms listed at the Nairobi Security Exchange, with firm size, leverage, and sales growth
acting as the control variables. The study employed the use of correlation and regression analyses.
The correlation analysis employed in the study established that average collection period, average
payment period, firm size, and leverage are significantly correlated at the 5% significance level to
the value of firms listed at the NSE. They all have a negative significant association with firm
value. Sales growth however, does not have a significant association with the value of firms listed
at the NSE at the 5% significance level.
The fixed effects of panel multiple linear regression revealed that the various working capital
management practices, firm size, leaverage, and sales growth do influence the value of firms listed
at the NSE. Thus, they can be utilized to significantly predict firm value. The analysis also revealed
that only firm size had a significant relationship with the value of firms listed at the NSE. It had a
significant negative influence on firm value. Average collection period, average payment period,
leverage, and sales growth however do not have significant effects on the value of firms quoted at
the NSE.

50
5.3 Conclusion
In this section, the conclusion of the study is given; the conclusion is affiliated to the study
objective, which was to establish the effect of working capital management on firm value of firms
listed at the Nairobi Security Exchange. The study concluded that working capital management
with the control factors entailing firm size, leaverage, and sales growth do influence the value of
listed firms. The study also concluded that the WCM aspects of average collection period and
average payment were significantly negatively associated with the value of listed firms. The study
concluded that however none of the components of WCM had an individual significant effect on
firm value.
The current study conclusion that the average collection period and average payment period
components of WCM are significantly negatively associated with firm value and the additional
finding that the various working capital management practices, firm size, leaverage, and sales
growth do influence firm value concurs with the Conservative Theory of Working Capital
proposed by Weston and Eugene (1975). The theory incorporates an element of risk and return in
the WCM which determine the firm value. Based on this theory, a negative association is predicted
amongst WCM and the value of the firm. with the study findings. However, the current study also
established that none of the working capital component individually significantly affected firm
value.
The conclusion also concurs with the Aggressive Theory of Working Capital attributed to Belt
(1979). According to the theory, there are higher risks of default on the company on account of
inadequate funds to meet the obligations. However, these higher risks are associated with greater
returns to the firm. Based on this theory, a positive association is anticipated amongst WCM and
51
the value of the firm. However, the current study also established that none of the working capital
component individually significantly affected firm value.
Similarly, the conclusion concurs with the study conclusions of the study conducted by (Mweta,
2018). The study established that proper managing of working capital constituents enhances the
value of the shareholders. Indeed, the key cause for the failure of most firms, partnerships and
small firms is poor working capital management including inventory, receivables and payables
management. In order to avoid liquidity risk, it is vital for a firm to have efficient mechanisms of
managing the constituents of working capital.
The current study conclusion that none of the working capital component individually significantly
affected firm value is in agreement with the study conclusion by Mwangi and Obwogi (2018) on
a study focusing on Kenyan listed manufacturing firms to bring out the link between WCM and
their performance. The adopted design was quantitative that entailed gathering of information from
auxiliary sources. The period of consideration of the inquiry was ten year frame covering 2007 all
through to 2016. It was shown that while CCC and the ability of the firm to perform in financial
terms are inversely but significantly linked with each other, the link with Tobin’s Q was direct but
not significant.
5.4 Recommendations
The study findings will aid in further researches to be conducted on the field of working capital
management and its impact on corporate value. Later scholars keen in research on working capital
management and its impact on corporate value will use the study findings as referral. Policy
recommendations are made to the CMA and NSE, and by extension, the National Treasury, to
formulate and enforce rules and regulations on working capital management since it has been

52
established that it influences the value of quoted firms. The recommendation will guide
government regulators in making policies and practices to boost the capital markets and in
extension, the financial system, to mitigate collapse of listed companies and ensure lack of stability
in value of financial securities issued in the capital markets.
The finding that the average collection period and average payment period components of WCM
are significantly negatively associated with firm value and the additional finding that the various
working capital management practices, firm size, leverage, and sales growth do influence firm
value generates conclusions to firm management and consultants to implement accrual quality in
order to boost firm value. Other stakeholders like investment banks, equity analysts, and individual
investors should search for firms with good working capital management to invest or recommend
to invest. This is because there is a significant link between the ability of the firm to manage
working capital and performance (Amjad & Hussain, 2014). The finding that none of the
components of WCM had an individual significant effect on firm value calls for recommendations
to firm management and consultants not to concentrate on any one WCM component in isolation
but to employ wholesomely good working capital management practices.
5.5 Recommendations for Further Study
Exploring the influence of working capital management on corporate value is of great importance
the policy makers in the National Treasury, CMA, and NSE, practitioners in the capital markets,
and consultants. However, the current study was carried out in the capital markets context, the
same study could be carried out across other firms like Small and Medium-Sized Enterprises
(SMEs) establish if the study findings would hold. The study was only carried out in the Kenyan
context, further studies can be conducted out of Kenyan context, they can be conducted in the
African or global jurisdictions to establish whether the study findings would hold.
53
The study only considered firm size, leverage, and sales growth as the only factors moderating the
relationship between working capital management and corporate value. A study can be conducted
to ascertain there are factors that moderate on the relationship between WCM and corporate value.
This study used secondary data, a subsequent research should be undertaken applying primary data
to ascertain if the study findings would hold and either complement or criticize the finding of this
study. Multiple linear regression and correlation analysis were applied in the study; Other analysis
technique for example cluster analysis, discriminant analysis, granger causality and factors should
be incorporated in the subsequent research.
5.6 Limitations of the Study
The study was conducted only in the capital markets context, due to time and cost and also
availability of data constraints, which does not give clear indication of findings if firms in other
sectors like Over the Counter (OTC) markets and SMEs or all the firms in the economy were also
incorporated in the study. More uncertainties would occur if similar studies were replicated in
firms outside the realm of capital markets. Although the research engaged secondary sources of
data, there were some major challenges like some of the data being not readily available; especially
data on the accruals quality and it took great lengths and costs to obtain it. The data was not utilized
in their raw form and further calculations and manipulations of the data were required. Impending
delays were experienced due to data processing and further editing before the compilation by the
researcher.

54
REFERENCES
Agrawal, A., & Knoeber, C. R. (1996). Firm Performance and Mechanisms to Control Agency
Problems between Managers and Shareholders. The Journal of Financial and Quantitative
Analysis, 31(3), 377-397 https://doi.org/10.2307/2331397
Akoto, K. (2013). Working capital management and profitability: Evidence from Ghanaian listed
manufacturing firms. Journal of Economics and International Finance, 5(9), 373–379.
https://doi.org/10.5897/jeif2013.0539
Alehegne, Damot. “Determinants of Working Capital Requirement on Manufacturing Firms.”
European Business & Management, vol. 5, no. 1, 2019, p. 1, 10.11648/j.ebm.20190501.11.
Arachchi, A. N. H., Perera, W., & Vijayakumaran, R. (2018). The Impact of Working Capital
Management on Firm Value: Evidence from a Frontier Market. Asian Journal of Finance
& Accounting, 9(2), 399. https://doi.org/10.5296/ajfa.v9i2.12449
Arbidane, I, & Ignatjeva, S. (2013). The Relationship between working capital management and
profitability: a Latvian Case. Global Review of Accounting and Finance 4(1), 148-158.
Arunkumar, O. N, & Ramanan, T. R. (2013). Working capital management and profitability: a
sensitivity analysis. International Journal of Research and Development 2(1), 51-58.
Cheng, Y., Liu, Y. &Tzeng, C. (2011).Capital structure and firm value in china: A panel threshold
regression analysis. African Journal of Business Management, 4(12), 2500-2507.
Elbadry, Ahmed. “The Determinants of Working Capital Management in the Egyptian SMEs.”
Accounting and Finance Research, vol. 7, no. 2, 14 Mar. 2018, p. 155,
www.sciedu.ca/journal/index.php/afr/article/download/13052/8150,
10.5430/afr.v7n2p155. Accessed 8 May 2019.
Enqvist, J., Graham, M., & Nikkinen, J. (2014). The impact of working capital management on
firm profitability in different business cycles: Evidence from Finland. Research in
International Business and Finance, 32, 36–49. https://doi.org/10.1016/j.ribaf.2014.03.005
Florackis, C., Kostakis, A., & Ozkan, A. (2009). Managerial ownership and performance,”
Journal of Business Research, 62 (4), 1350-1357
Gorondutse, A. H., Abubakar, A., Ali, R. A., & Naalah, M. N. I. (2017). THE EFFECT OF
WORKING CAPITAL MANAGEMENT ON SMEs PROFITABILITY IN MALAYSIA.
Polish Journal of Management Studies, 16(2), 99–109.
https://doi.org/10.17512/pjms.2017.16.2.09
Hassan, N. U., Imran, M. M., Amjad, M., & Hussain, M. (2014). Effects of Working Capital
Management on Firm Performance: An Empirical Study of Non-financial listed Firms in
Pakistan. International Journal of Academic Research in Business and Social Sciences,
4(6), 114–132. https://doi.org/10.6007/ijarbss/v4-i6/931
Himmelberg, C. P., Hubbard, R. G., & Palia, D. (1999). Understanding the determinants of
managerial ownership and the link between ownership and performance. Journal of
Financial Economics, 53(3), 353–384. https://doi.org/10.1016/s0304-405x(99)00025-2

55
Holmstrom, Bengt, and Jean Tirole. “Liquidity and Risk Management.” Journal of Money, Credit
and Banking, vol. 32, no. 3, Aug. 2000, p. 295, 10.2307/2601167.
Kaur, H. V, & Sing S. (2013). Managing efficiency and profitability through working capital: An
empirical analysis of BSE 200 companies. Asian Journal of Business Management 5 (2),
197-207.
Kiganda, A. (2016, 10 19). Kenya’s Construction Industry and its Challenges. Retrieved from
construction review online: https://constructionreviewonline.com/2016/09/kenyas-
construction-industry-and-its-challenges/
Kiptoo, I. K. (2017). Working capital management practices and financial performance of tea
processing firms in Kenya. Unpublished MBA Project-University of Embu
Kothari C. R. (2012). Research Methodology, 2nd Ed. New Delhi: New Age International
Publishers
Leeson, J. (2016). CONCEPT OF WORKING CAPITAL management. International Journal of
Commerce, Business and Management, 5, 372-377.
Likalama, A. A. (2016). Assessing working capital management as a determinant of profitability
of agro- firms in Eldoret business center, Kenya. Unpublished MBA Project-Kisii
University Repository
Majeed, S, Makki M, Salem, S, & Aziz, T. (2013). The relationship of cash conversion cycle and
profitability of firms: An empirical investigation of Pakistani Firms. Journal of Emerging
Issues in Economics, Finance and Banking 1, 35-51.
Makori, D. M., & Jagongo, A., (2013). Working Capital Management and Firm Profitability:
Empirical Evidence from Manufacturing and Construction Firms Listed on Nairobi
Securities Exchange, Kenya. International Journal of Accounting and Taxation, 1 (1).
Moussa, A. A. (2018). "The impact of working capital management on firms’ performance and
value: evidence from Egypt," Journal of Asset Management, Palgrave Macmillan, 19(4),
pages 259-273
Mwangi , J. G., & Obwogi, J. (2018). Effect of working capital management on the performance
of listed manufacturing firms in Kenya. The International Journal of Business and
Management. 6(9),
Mwangi, L. W., Makau, M. S., & Kosimbei, G. (2014). Effects of working capital management on
performance of nonfinancial companies listed in NSE, Kenya. European Journal of
Business and Management 6(11), 195-2015\
Mweta, T. M. (2018). Effect of Working Capital Management on the Financial Performance:
Evidence of Construction and Allied Sector Firms Listed at Nairobi Securities Exchange.
Research Journal of Finance and Accounting, 9, 38-49.

56
Mwirigi, D., Wambugu, H. W., & Maina, M. (2018). The effect of working capital management
on performance of small enterprises in Kenya. International Journal of Managerial Studies
and Research 6(12), PP 1-9
Naser K, Nuseith R, Al-hadeya A (2013). Factors influencing corporate working capital
management: Evidence from an emerging economy. Journal of Contemporary Issues in
Business Research 2(1), 11-30.
Nuryana, Ida. “Analysis Credit Risk Management Minimizing Performing Loans to Credit
Business People.” Management and Business Review, vol. 1, no. 1, 12 June 2017, p. 38,
10.21067/mbr.v1i1.2126.
Nzioki, P. M., Kimeli, S. K., Abudho, M. R., & Nthiwa, J. M. (2013). Management of working
capital and its effect on profitability of manufacturing companies listed on Nairobi
securities exchange (NSE), Kenya. International Journal of Business and Finance
Management Research. 1(3), 35-42
Ogundipe, S. E., Idowu, A. & Ogundipe, L. O. (2012). Working Capital Management, Firms’
Performance and Market Valuation in Nigeria. International Journal of Social and Human
Sciences, 6, 143-147.
Oseifuah, E. K., & Gyekye, A. (2017). Working capital management and shareholders' wealth
creation: evidence from non-financial firms listed on the Johannesburg Stock Exchange.
Investment Management and Financial Innovations, 14(1), 80-88.
Şamiloğlu, F., & Akgün, A. L. (2016). The relationship between working capital management and
profitability: Evidence from Turkey. Business and Economics Research Journal 7(2), 1-14
Shin, H.H., & Soenen, L (1998). Efficiency of Working Capital and Corporate Profitability,
Financial Practice and Education 8 (2), 37-45.
Sianipar, A., & Prijadi, R. (2018). Effect of working capital and financial aspects to firm Value:
an empirical study on Indonesian listed firms. Advances in Economics, Business and
Management Research 89(2), 388-393
Sudiyatno, B., Puspitasari, E., & Sudarsi, S. (2017). Working capital, firm performance, and firm
value: An empirical study in manufacturing industry on Indonesia Stock Exchange.
Economics World, 5(5), 444-450
Tauringana, V., & AdjapongAfrifa, G. (2013). The relative importance of working capital
management and its components to Small Enterprises' profitability. Journal of Small
Business and Enterprise Development, 20(3), 453-469.
Thomsen, S., Pedersen, T., & Kvist, H. (2006). Block holder ownership: Effects on firm value
in market and control based governance systems,” Journal of Corporate Finance, 12(3),
246-269
Vijayakumaran, R. (2019).Efficiency of working capital management and firm value: Evidence
from Chinese listed firms. International Journal of Financial Research 10(6), 30-47

57
APPENDICES
Appendix 1: Companies Listed at the Nairobi Securities Exchange

58
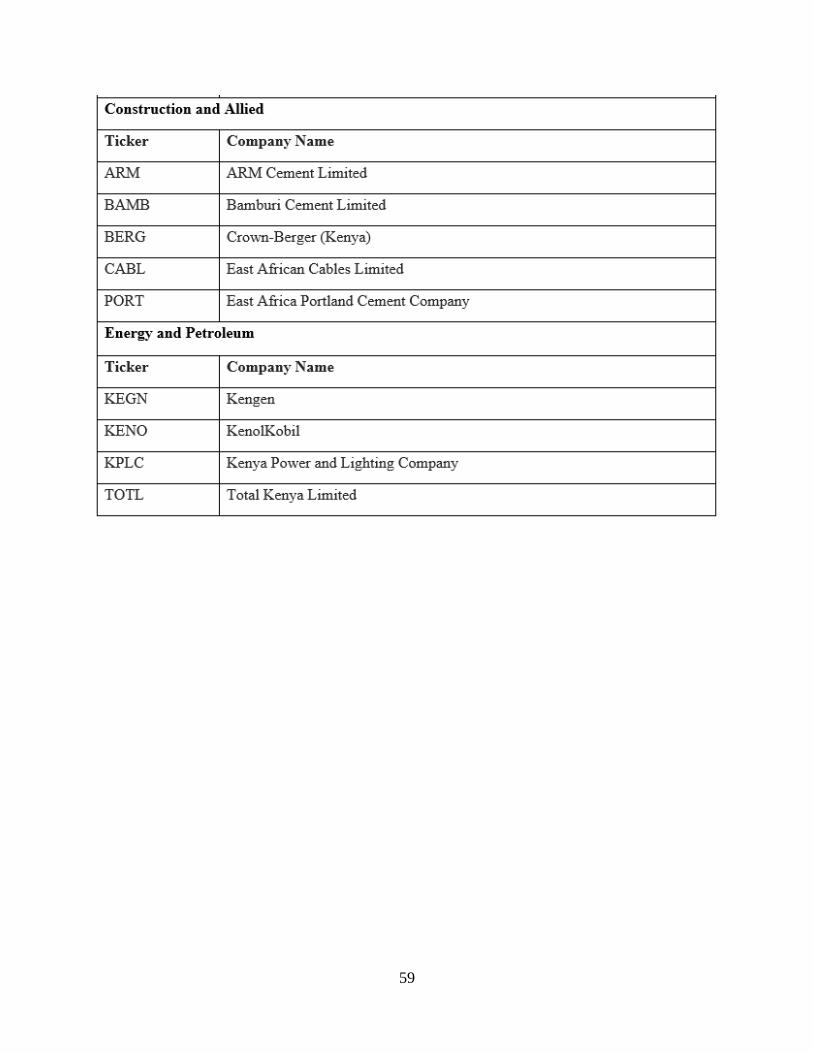
59

60

61
Source: Nairobi Securities Exchange Website (2020)

62
Appendix II: Data Collection Sheet
Name of
Company
Sector
Data 2015 2016 2017 2018 2019
Total Market
Value
Total Book
Value
Liabilities
Tobin’s Q
Ratio
Net Income
Cash flows from
operations
Conservative
Accounting
Accounts
Receivables
Inventory
Accounts
Payable
Tax Payable

63
Other Current
Assets
Appendix III: Research Data
Num
ber Year Tobin Q
Ratio
Average
collection
period Average payment
period Firm
Size Levear
age Sales
growth
1 2017 0.532075 14.64973 15.20284 17.569
69 0.3757
44 -0.52486
1 2016 0.604281 15.34577 15.46973 17.748
49 0.4205
59 -0.12935
1 2015 0.640816 15.0784 15.36669 17.765
54 0.7172
93 0.373451
2 2019 0.696413 14.73778 15.71088 17.709
06 0.2814
37 0.012364
2 2018 0.966313 14.7912 15.87156 17.734
65 0.1549
73 0.011894
2 2017 1.296207 15.34048 15.62314 17.669
97 0.0898
48 0.09897
2 2016 1.333233 15.52552 15.74457 17.524
46 0.0679
48 0.061078
2 2015 1.395332 14.89562 15.73287 17.553
89 0.0729
09 0.066721
3 2019 0.460549 14.26871 14.47038 16.256
44 1.4526
33 0.242449
3 2018 0.443872 14.34423 14.415 16.135
3 1.7292
3 0.313401
3 2017 0.438984 14.18912 14.3559 16.042
03 1.4325
75 0.14162
3 2016 0.466826 14.41983 14.62442 16.088
17 0.7669
42 0.200802
3 2015 0.504916 14.49287 14.73486 16.011
41 0.6130
65 0.134322
4 2019 0.623718 12.07106 11.57347 15.069
27 0.1015
29 0.133257
4 2018 1.153631 11.8955 11.34582 15.030
79 0.0543
27 0.07407
4 2017 1.388878 11.9028 11.73177 15.011
54 0.0494
95 0.06991
4 2016 2.36821 12.09079 11.88986 14.941
01 0.0305
42 0.047807
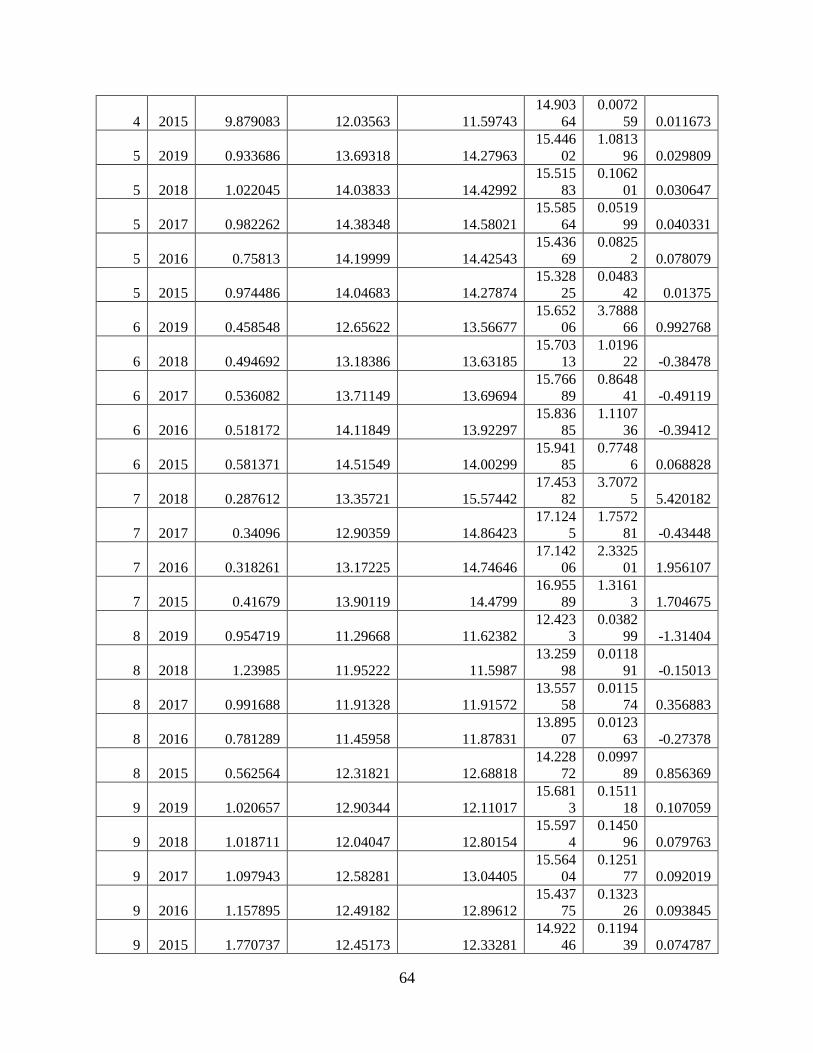
64
4 2015 9.879083 12.03563 11.59743 14.903
64 0.0072
59 0.011673
5 2019 0.933686 13.69318 14.27963 15.446
02 1.0813
96 0.029809
5 2018 1.022045 14.03833 14.42992 15.515
83 0.1062
01 0.030647
5 2017 0.982262 14.38348 14.58021 15.585
64 0.0519
99 0.040331
5 2016 0.75813 14.19999 14.42543 15.436
69 0.0825
2 0.078079
5 2015 0.974486 14.04683 14.27874 15.328
25 0.0483
42 0.01375
6 2019 0.458548 12.65622 13.56677 15.652
06 3.7888
66 0.992768
6 2018 0.494692 13.18386 13.63185 15.703
13 1.0196
22 -0.38478
6 2017 0.536082 13.71149 13.69694 15.766
89 0.8648
41 -0.49119
6 2016 0.518172 14.11849 13.92297 15.836
85 1.1107
36 -0.39412
6 2015 0.581371 14.51549 14.00299 15.941
85 0.7748
6 0.068828
7 2018 0.287612 13.35721 15.57442 17.453
82 3.7072
5 5.420182
7 2017 0.34096 12.90359 14.86423 17.124
5 1.7572
81 -0.43448
7 2016 0.318261 13.17225 14.74646 17.142
06 2.3325
01 1.956107
7 2015 0.41679 13.90119 14.4799 16.955
89 1.3161
3 1.704675
8 2019 0.954719 11.29668 11.62382 12.423
3 0.0382
99 -1.31404
8 2018 1.23985 11.95222 11.5987 13.259
98 0.0118
91 -0.15013
8 2017 0.991688 11.91328 11.91572 13.557
58 0.0115
74 0.356883
8 2016 0.781289 11.45958 11.87831 13.895
07 0.0123
63 -0.27378
8 2015 0.562564 12.31821 12.68818 14.228
72 0.0997
89 0.856369
9 2019 1.020657 12.90344 12.11017 15.681
3 0.1511
18 0.107059
9 2018 1.018711 12.04047 12.80154 15.597
4 0.1450
96 0.079763
9 2017 1.097943 12.58281 13.04405 15.564
04 0.1251
77 0.092019
9 2016 1.157895 12.49182 12.89612 15.437
75 0.1323
26 0.093845
9 2015 1.770737 12.45173 12.33281 14.922
46 0.1194
39 0.074787

65
10 2019 0.392505 17.22999 #NUM! 19.760
92 4.8969
53 0.165172
10 2018 0.414017 16.90123 14.27689 19.753
98 3.6473
97 0.15744
10 2017 0.438603 16.57247 15.16608 19.747
04 3.0824
89 0.150359
10 2016 0.410927 16.05061 16.1121 19.720
16 4.8644
35 0.178029
10 2015 0.376584 15.98075 15.88525 19.651
84 10.211
66 4.213366
11 2017 0.904817 15.82841 15.1644 16.997
68 0 0.110045
11 2016 0.940552 15.5535 15.19479 17.001
93 0 0.142614
11 2015 0.875011 15.52602 14.79997 16.670
66 0 0.127045
12 2018 0.460333 17.49449 18.08169 19.634
57 20.924
22 0.297349
12 2017 0.476786 17.75279 17.80402 19.618
34 10.647
05 0.452487
12 2016 0.473479 17.29881 17.37934 19.483
95 11.323
32 0.288515
12 2015 0.465837 17.06679 17.08616 19.434
07 5.8942
68 -1.09029
13 2019 0.551038 16.42903 17.23928 19.091
96 12.208
22 -0.14582
13 2018 0.692478 16.4853 17.21797 18.732
82 0.1854
23 -0.36034
13 2017 0.639902 16.4095 17.01296 18.810
17 4.6663 -3.39306
13 2016 0.576614 16.52915 16.99523 18.863
35 13.525
86 -4.66295
13 2015 0.528904 16.51142 16.6564 19.019
86 14.603
9 0.049515
14 2019 5.445398 16.71286 17.17255 19.075
48 0.0014
82 0.062161
14 2018 4.422449 16.57912 17.09141 18.936
13 0 0.045201
14 2017 5.215441 16.69659 17.41466 18.901
17 0 0.049663
14 2016 4.015833 16.84192 17.50611 18.885
56 0 0.048803
14 2015 3.366494 16.14781 17.53937 18.871
49 0.0007
51 -0.73658
15 2019 0.80469 12.83297 13.28206 14.241
33 0.4865
79 -1.34351
15 2018 0.487678 13.28915 13.07725 14.766
33 0.0381
58 0.103114
15 2017 0.465975 13.59296 13.19005 14.904
03 0.0451
14 -0.51892

66
15 2016 0.470876 13.48208 13.34307 15.006
66 0.0084
44 -0.00417
15 2015 0.459593 13.4473 13.14606 15.137
59 0.0043
81 0.482635
16 2019 0.342782 13.01836 12.60084 16.501
61 0.3491
59 0.066539
16 2018 0.423037 13.50124 12.9278 16.377
48 0.2596
82 0.046538
16 2017 0.570953 13.81273 13.21311 16.395
43 0.1748
32 0.176428
16 2016 0.329861 13.03042 13.09611 16.637
99 0.2681
66 0.218631
16 2015 0.337779 13.14237 12.96954 16.590
88 0.2205
91 -0.21498
17 2019 0.721084 13.87445 14.28606 15.249
63 0.2016
58 0.108368
17 2018 0.693828 14.29058 14.03138 15.357
98 0.2231
92 -0.06972
17 2017 0.796519 14.22748 14.017 15.310
58 0.1263
36 0.147208
17 2016 0.546115 14.41013 13.64763 15.298
24 0.4574
71 -0.12655
17 2015 0.697508 14.2226 13.42626 15.286
98 0.3018
57 0.1464
18 2019 0.600918 16.24268 15.75881 17.441
58 0.1227
73 0.133579
18 2018 0.607058 15.98638 15.91073 17.485
69 0.0686
62 0.185087
18 2017 0.574819 16.0937 15.90949 17.453
42 0.0905
22 0.208769
18 2016 0.51938 15.98045 15.87014 17.404
17 0.1332
84 0.140568
18 2015 0.552886 16.05817 15.92519 17.348
47 0.1083
31 -2.40159
19 2019 0.355725 16.13588 15.98024 17.292
77 17.502
15 -2.68121
19 2018 0.575302 14.53365 15.80013 16.629
01 5.1045
64 -1.73667
19 2017 0.561372 15.0269 15.72815 16.746
22 2.0060
12 -0.44858
19 2016 0.499964 15.13315 15.40493 16.755
28 1.9436
69 -1.08501
19 2015 0.55359 15.67052 15.26799 16.755
28 1.9188
88 -3.46202
20 2016 0.705777 12.31462 15.3598 15.425
39 0.4629
75 -0.98356
20 2015 0.800053 13.73539 15.166 15.673
84 0.1235
38 0.211652
21 2019 0.47023 14.9198 14.95078 16.180
7 0.4572
65 0.30048

67
21 2018 0.486109 14.84992 14.77542 16.111
34 0.4772
94 -0.0022
21 2017 0.560497 14.7078 15.1524 16.062
09 0.2528
78 0.214278
21 2016 0.495808 14.54423 14.6416 15.937
96 0.4089
89 0.513486
21 2015 0.377666 14.52275 14.51242 15.975
59 0.8375
62 0.115825
22 2019 0.716436 15.10281 14.88229 16.308
44 0.0974
16 0.081819
22 2018 1.118274 14.96497 14.81963 16.231
25 0.0023
23 0.061767
22 2017 1.729293 14.63194 14.78746 16.242
11 0.0011
84 0.093228
22 2016 1.342616 14.72405 14.76105 16.314
82 0.0008
67 0.057512
22 2015 2.418206 14.89341 15.00524 16.356
85 0.0042
18 0.01892
23 2019 0.662137 12.83297 13.20969 14.504
97 0.0057
89 0.017798
23 2018 0.882105 12.63209 13.27415 14.577
13 0 0.009371
23 2017 1.085523 12.46691 13.29389 14.616
92 0 0.027074
23 2016 1.223845 12.67696 13.17278 14.614
75 9.33E-
05 0.030892
23 2015 0.964078 12.79275 13.31604 14.657
49 0 0.093946
24 2019 1.22475 15.92244 17.14285 18.282
17 0.3039
2 0.02971
24 2018 2.099421 15.88824 17.01945 18.081
66 0.1571
9 0.032832
24 2017 2.389841 16.11087 16.85114 18.015
22 0.1389
38 0.045209
24 2016 2.394013 16.26411 16.89961 17.938
56 0.1197
25 0.031626
24 2015 2.53938 16.0253 16.46467 18.019
31 0.1138
14 0.008149
25 2019 0.404943 9.206031 9.23171 13.756
1 0.2307
21 -0.13409
25 2018 0.558493 9.267571 9.07738 13.716
68 0.1633
56 2.018756
25 2017 0.810203 9.329111 8.92305 13.735
17 0.1153
46 0.050439
25 2016 0.964874 9.390651 8.76872 13.542
61 0.0807
15 0.001072
25 2015 1.852875 9.452191 8.61439 12.971
39 0.0867
73 -0.07055
26 2019 0.430017 12.81159 13.31713 15.928
38 0.5153
03 0.191393

68
26 2018 0.43449 14.55432 13.78111 16.067
34 0.5454
19 -0.09395
26 2017 0.475303 14.12858 13.54781 15.939
46 0.5275
13 0.154863
26 2016 0.47848 14.06826 13.20457 16.005
08 0.5135
01 -0.1354
26 2015 0.347134 13.94877 12.49055 15.962
44 1.0105
97 -0.20077
27 2019 0.458464 11.84044 11.93373 14.525
11 0.5945
33 0.28358
27 2018 0.42469 13.55086 12.50892 14.727
41 0.7529
4 -0.10102
27 2017 0.426174 12.96527 12.27842 14.523
7 0.7552
43 0.374364
27 2016 0.452724 13.04819 11.93987 14.578
46 0.6711
3 -0.02912
27 2015 0.527005 12.8926 11.54847 14.500
24 0.5637
99 0.001759
28 2019 4.044671 11.74006 9.721426 12.370
19 0.0231
23 0.002123
28 2018 3.71342 11.8327 10.72657 12.499
69 0.0246
49 -0.01845
28 2017 3.789647 11.67645 10.58251 12.476
13 0.0289
93 -0.015
28 2016 3.759629 11.70243 10.2371 12.550
35 0.0381
77 0.001532
28 2015 5.540048 11.94842 9.8816 12.656
41 0.0262
9 -0.09565
29 2019 0.748756 9.557399 10.41021 13.064
18 1.6158
65 -0.42817
29 2018 0.815185 9.469854 10.75419 12.679
02 1.8971
81 -0.68052
29 2017 0.69797 9.993055 11.38589 12.834
77 1.9962
12 -0.77025
29 2016 0.655024 10.06358 10.60105 12.846
81 1.9227
55 -0.37657
29 2015 0.629973 10.89217 10.0436 12.998
83 1.4135
56 0.056846
30 2019 0.447577 13.94626 14.4711 16.705
13 1.8445
91 0.042722
30 2018 0.485464 14.05273 14.40651 16.683
3 0.8557
22 0.020178
30 2017 0.551856 14.1025 14.40123 16.676
96 0.9912
43 0.03463
30 2016 0.45704 13.96285 14.24391 16.647
73 1.4371
33 -0.06161
30 2015 0.486862 13.97304 14.30127 16.576
52 0.8554
72 0.066111
31 2019 0.670823 15.10167 14.9279 16.365
2 0.0343
7 0.085136

69
31 2018 0.588674 15.5449 15.3571 16.484
49 0.0834
82 0.071131
31 2017 0.646386 15.68748 15.28794 16.437
2 0.0008
17 0.05973
31 2016 0.636097 15.66025 15.26728 16.417
19 0.0006
78 0.024222
31 2015 0.932496 15.51473 15.0851 16.338
71 0.0163
43 0.15794
32 2019 0.54432 14.44399 14.92663 18.683
64 0 -0.62482
32 2018 0.577944 14.14929 14.74753 18.553
18 0.0251
65 0.013273
32 2017 0.628811 13.89307 14.50639 18.469
16 0.0181
26 0.017673
32 2016 0.616693 14.03148 14.463 18.321
61 0 0.003166
32 2015 0.630207 13.85048 14.64281 18.226
83 0 1.130116
33 2019 0.528569 14.04493 14.37498 17.183
93 0 0.180546
33 2018 0.54194 14.07263 14.14724 17.186
3 0 0.13915
33 2017 0.535458 14.06392 14.2084 17.210
4 0 0.178901
33 2016 0.538334 13.59086 13.08433 17.163
4 0 0.157208
33 2015 0.633666 12.31144 13.53544 17.115
39 0 0.133535
34 2019 0.298554 13.19636 13.46732 17.734
77 0 0.079519
34 2018 0.426726 12.32299 13.52231 17.607
91 0 0.103215
34 2017 0.483978 12.42371 13.37449 17.570
47 0 0.089123
34 2016 0.569666 12.1338 13.10968 17.466
02 0 0.07046
34 2015 0.574687 11.63325 13.10968 17.397
75 0 0.155985
35 2019 0.522338 14.11099 14.62055 17.458
92 0 -0.08759
35 2018 0.547316 14.04887 14.64682 17.414
99 0 0.01827
35 2017 0.543293 13.57159 14.11434 17.429
63 0 0.12795
35 2016 0.558606 12.7136 13.62667 17.368
58 0 -0.04006
35 2015 0.616652 12.98438 13.66915 17.357
45 0 0.064895
36 2019 0.536285 14.30051 14.87544 18.645
77 0 0.080972

70
36 2018 0.572301 14.48057 14.81869 18.456
59 0 0.024105
36 2017 0.599987 14.31322 15.08298 18.410
88 0 -0.00416
36 2016 0.569912 14.41058 14.70897 18.242
06 0 0.04823
36 2015 0.61892 14.31799 14.7529 18.167
49 0 0.07143
37 2019 0.549129 12.7362 14.00494 17.379
49 0 -0.04152
37 2018 0.595055 12.34013 13.83015 17.313
42 0.0228
45 0.277486
37 2017 0.70288 12.42782 13.76397 17.233
41 0 0.130123
37 2016 0.63426 12.406 13.38546 17.104
91 0 -0.15391
37 2015 0.792814 12.82635 13.57085 17.031
19 0 0.20989
38 2019 0.214972 11.72173 11.78981 14.302 1.6976 0.143438
38 2018 0.219097 12.03066 12.03359 14.321
66 1.4994
64 0.285449
38 2017 0.249173 11.76943 11.80376 14.309
47 1.0343
36 0.404025
38 2016 0.259074 12.11488 11.90528 14.239
16 1.7931
14 0.256679
38 2015 0.292912 11.99075 12.10492 14.241
7 0.4626
98 -3.65534
39 2019 0.459478 15.75015 15.48338 18.438
16 2.5566
22 -1.22041
39 2018 0.457761 15.58661 15.42488 18.382
86 2.3320
24 -0.31979
39 2017 0.534376 15.31645 15.50868 18.297
22 1.3365
61 -0.3464
39 2016 0.526515 14.46366 15.02073 18.172
91 1.4132
16 -0.37022
39 2015 0.609924 14.42527 14.93968 18.096
89 1.0918
71 0.0194
40 2019 0.614108 12.91907 14.30419 15.285
18 0 0.049623
40 2018 0.580525 11.15635 14.1807 15.320
13
-
0.0022
9 0.042801
40 2017 0.581645 11.28283 13.89018 15.314
65 0.0826
24 0.048335
40 2016 0.573281 11.08445 13.38165 15.184
15 0.3846
81 0.084616
40 2015 0.638356 11.34025 13.29928 15.166
78 5.34E-
07 0.078119
41 2019 1.417476 11.11935 11.36031 14.623
06 0.0114
31 -2.12498

71
41 2018 1.665241 11.29634 11.44967 14.612
29 0.0007
18 0.367507
41 2017 2.362609 11.4333 11.11154 14.561
35 0.0014
33 -0.72043
41 2016 1.826089 11.16932 11.68871 14.515
51 0.0033
94 0.096384
41 2015 1.821649 11.24548 11.65677 14.466
92 0.0032
17 0.137996
42 2019 1.821595 15.10297 15.87926 16.903
66 0.0374
13 0.080633
42 2018 3.341582 14.85381 15.50946 16.724
5 0.0392
74 0.133967
42 2017 2.827525 14.84622 15.37532 16.695
02 0.1142
32 0.144589
42 2016 2.555516 14.74843 15.32844 16.733
27 0.1304
89 -45.9473
42 2015 2.328434 14.73137 15.29355 16.743
03 0.0456
04 -1.94845
43 2018 0.515811 11.58839 16.40094 16.571
44
-
4.4787
1 0.081802
43 2017 0.414993 13.99283 16.22915 16.997
35
-
1.6879
7 0.065267
43 2016 0.369338 13.86335 15.89861 17.103
95
-
0.3832
3 0.022012
43 2015 0.476723 14.24331 15.84766 16.832
66
-
1.1440
2 0.019978
44 2019 0.859789 13.73218 13.61015 14.667
47 0 0.078203
44 2018 0.694258 13.5844 13.58938 14.694
11 0 0.089878
44 2017 0.860176 13.57321 13.22347 14.435
41 0 0.007497
44 2016 0.600022 13.37666 12.96168 14.439
81 0 0.007052
44 2015 0.746357 12.63043 12.44947 13.443
46 0 0.000657
45 2017 0.549921 11.84436 13.26151 14.255
59 0 0.102827
45 2016 0.506507 12.36214 13.34707 14.640
42 0 0.12469
45 2015 0.590558 13.18399 12.67294 14.726
21 0 0.132828
46 2019 0.545626 13.37214 13.20085 14.640
2 0.4848
98 0.149696
46 2018 0.893763 13.50873 13.29841 14.424
88 0.0230
21 0.113729

72
46 2017 1.117539 13.57259 13.17102 14.334
76 0.0325
62 0.149187
46 2016 1.143203 13.57697 13.03753 14.235
01 0.0307
06 0.135633
46 2015 1.320295 13.55578 13.14709 14.098
08 0.0515
65 0.147263
47 2019 5.131419 11.17662 10.6654 11.820
44 0.0500
19 0.163676
47 2018 6.590566 10.93296 10.21984 11.648
9 0.0446
6 0.110838
47 2017 43.8636 10.99475 10.3505 11.592
46 0.0064
46 0.23853
47 2016 51.13795 10.72424 9.946693 11.399
1 0.0065
82 0.161848
47 2015 58.72219 10.37866 9.687202 11.273
8 0.0063
8 0.128997
48 2019 0.571028 19.08797 19.12679 19.739
72 4.5343
79 0.234235
48 2018 0.561285 18.99366 19.1502 19.600
3 4.7184
74 0.126226
48 2017 0.602972 18.94183 19.04113 19.419
74 5.3911
05 0.12069
48 2016 0.568361 18.94251 18.9983 19.375
11 4.6022
24 0.150738
48 2015 0.622186 18.79801 18.92196 19.299
8 2.7232
17 0.126117
49 2019 0.566888 19.40168 19.60897 19.940
21 3.9266
74 0.146652
49 2018 0.577317 19.31844 19.53948 19.840
58 3.6528
99 0.114789
49 2017 0.559206 19.47629 19.46998 19.773
57 4.0683
79 -0.04432
49 2016 0.5728 19.37678 19.37416 19.678
65 3.7503
27 -0.28075
49 2015 0.627353 19.15579 19.39674 19.651
78 2.7762
4 0.034726
50 2019 0.497484 19.10926 19.52099 19.771
94 10.556
11 0.185009
50 2018 0.520514 19.07859 19.46046 19.749
66 7.2851
11 0.153837
50 2017 0.539932 19.09387 19.39993 19.710
75 5.7686
8 0.200298
50 2016 0.516478 19.04289 19.28822 19.608
66 8.5523
42 0.093241
50 2015 0.565621 18.99473 19.08364 19.419
87 4.4620
92 0.06918
51 2019 0.551361 19.71935 19.98715 20.328
27 1.8719
07 0.104285
51 2018 0.554113 19.51001 19.86231 20.167
07 3.1754
45 0.086409

73
51 2017 0.608217 19.44705 19.73747 20.077
89 2.8754
18 0.151993
51 2016 0.58345 19.39926 19.63618 19.976
11 3.4602
61 0.208972
51 2015 0.646531 19.41354 19.5265 19.874
78 2.3579
54 0.150336
52 2019 0.47432 17.46752 17.30621 17.848
95 18.599
6 0.223739
52 2018 0.472596 17.58688 17.36285 17.918
97 23.567
62 0.146288
52 2017 0.483094 17.7203 17.41949 18.028
25 15.432
65 -0.64123
52 2016 0.494354 17.81315 17.47153 18.091
21 12.385
45 -0.0471
52 2015 0.51861 17.7862 17.54517 18.087
44 7.8445
95 0.247833
53 2019 0.565944 18.87028 19.40784 19.428
74 5.6985
81 0.029087
53 2018 0.63322 18.81018 19.17746 19.331
51 3.3814
98 -0.21616
53 2017 0.688126 18.84607 18.94708 19.296
61 1.8389
13 0.166306
53 2016 0.643247 18.71838 18.80263 19.165
2 2.2984
7 0.216069
53 2015 0.688147 18.66616 18.70571 19.071
57 1.9101
83 0.191899
54 2019 0.564591 20.09847 20.17551 20.616
32 4.7407
37 0.260222
54 2018 0.544103 19.93774 20.10236 20.386
83 5.2310
63 0.162041
54 2017 0.565768 19.86214 20.02922 20.287
35 4.1251
67 0.143001
54 2016 0.536444 19.77069 19.92069 20.204
47 5.6571
51 0.173577
54 2015 0.590357 19.66186 19.86617 20.140
04 3.5547
86 0.134583
55 2019 0.509191 17.64136 18.45681 18.534
27 81.226
49 0.158542
55 2018 0.492439 17.68209 18.40927 18.559
13 59.850
92 0.150418
55 2017 0.497886 17.77367 18.36173 18.514
84 32.401 0.118411
55 2016 0.492911 17.8232 18.35742 18.534
78 42.692
2 0.121222
55 2015 0.499205 18.03213 18.52163 18.647
34 21.436
4 0.096768
56 2018 0.504401 18.57643 18.7888 19.155
01 8.8209
69 0.094685
56 2017 0.511225 18.601 18.74938 19.144
22 7.9389
33 0.110838

74
56 2016 0.504759 18.55579 18.53244 18.948
12 8.3596
18 0.23853
56 2015 0.547524 18.55746 18.53726 18.926
22 5.0378
44 0.161848
57 2019 0.544092 18.84473 19.28494 19.494
68 5.8947
99 0.128997
57 2018 0.535235 18.80325 19.07084 19.453
7 6.8671
58 0.234235
57 2017 0.523797 18.68716 18.85674 19.331
91 6.4444
07 0.126226
57 2016 0.520039 18.56554 18.59739 19.184
67 6.2626
75 0.12069
57 2015 0.535483 18.43632 18.48127 19.155
22 5.2151
5 0.150738
58 2019 0.582082 18.67292 19.27841 19.526
4 3.6568
97 0.126117
58 2018 0.582975 18.5917 19.22843 19.469
42 3.5736
26 0.146652
58 2017 0.592467 18.65413 19.17844 19.470
54 3.3598
09 0.114789
58 2016 0.593394 18.62534 19.04447 19.338
9 3.1710
86 -0.04432
58 2015 0.60865 18.56153 18.96321 19.270
68 2.8769
91 0.094685