
Work Package 7 - Soclimpact
998
-
Upload
khangminh22 -
Category
Documents
-
view
0 -
download
0
Transcript of Work Package 7 - Soclimpact


Work Package 7:
Ranking and Mapping transition pathways in islands and enabling networking and
information system for regional and EU policy design
Deliverable 7.2. Draft Island Reports for stakeholder engagement
Coordinated by Ramboll/ULPGC with the participation of all IFPs and reviewed by Christos
Giannakopoulos (NOA) and Mark Meyer (GWS), according to the quality review internal process.
Final version – 4/11/2020

ABSTRACT
The draft island report (Task 7.2- D7.2) forms the core material for user engagement at island level.
It will be used to disseminate project research outcomes to regional stakeholders, aiming to raise
social awareness among policy-makers and practitioners about CC consequences at regional level,
and provide knowledge based information for the upcoming co-definition of optimal adaptation
pathways for EU islands (Tasks 7.3 and 7.4).
This background report is a single and easy-to-understand document that presents existing
knowledge and Soclimpact´s findings regarding Climate Change´s socio-economic impacts on 12
EU islands. This synthetic presentation includes a broad overview of the current situation of the
island (geography, socio-economic context, current climate and risks) and economic projections.
Further sections are dedicated to climate change outlook and expected risks for the four blue
economy sectors (tourism, aquaculture, energy and maritime transport), operationalized Impact
Chains, socio-economic impacts of climate change, and current climate policy status for each island.
Each draft report is jointly developed by Ramboll/ULPGC and the Island Focal Point partners
and Work Package leaders.

STRUCTURE OF THE ISLANDS´ REPORTS AND CONTENT
DESCRIPTION
The reports´ structure was designed and validated by all partners during the last SOCLIMPACT
General Assembly (November 2019) in Sicily, Italy. The next tables briefly describe the general
structure for each island report, the chosen approach for data inventory, collection and
presentation. The structure is coherent with the logical workflow of the project on one hand, and
a comprehensive overview of the project results by island´s case study.
The twelve appendices present the material collected so far in the form of texts and graphs for
each island but also data and visualization tables. In spite of the significant work accomplished so
far in terms of collecting and presenting existing knowledge and new results, this information
should still be considered as raw material at this stage. More work is required to synthetize the
information, to homogenize the presentations across islands, and to provide user-friendly
visualization in interaction with WP8. Finally, it is important to point out that the content of the
report could differ from one island to another, given that the available information and sources for
data production are different, thus leading to well personalized research outcomes at regional level
(i.e. not all impact chains will be operationalized in all islands, and also climatic projections will not
cover all impacts for each island), although the valuable work provided by the Island Focal Points
partners.
Table 1 : Draft Island Report: table of contents
1. Current situation and recent trends 1.1. Current geopolitical context 1.2 Current climate and risks 1.3. Macroeconomic status 1.4. Recent evolution of the blue economy sectors
2. Economic projections 2.1. Macroeconomic projections 2.2. Sectoral projections
3. Climate Change outlook 3.1. Tourism 3.2. Aquaculture 3.3 Energy 3.4 Maritime Transport
4. Climate change risks 4.1. Tourism 4.2. Aquaculture 4.3. Energy 4.4. Maritime Transport
5. Socio-economic impacts of climate change 5.1 Market and non-market effects of CC: tourism, aquaculture, energy, maritime transport 5.2 Macro-economicprojections
6. Towards climate resiliency 6.1 Current situation: general commitment, specific limits and obstacle 6.2 Building resiliency: adaptation pathways
7. References

Table 2 : Draft Island Report: description of content and source of information
Sections Description Source: project deliverable*
Introduction Brief presentation and storylines for the blue economy sectors Deliverable 3.4
1. Current situation and recent trends
1.1 Current geopolitical context
Geography, political status, population dynamics, labor force Deliverable 6.2
1.2 Current climate and risks Climate means and extremes (temperature, precipitation, wind), main climate risks and significant past events
Deliverable 6.2 & 7.1
1.3 Macroeconomic status Country GDP profile and income sources. Deliverable 6.2
1.4 Recent evolution of the blue economy sectors
Recent trends observed with regards to tourism, aquaculture, maritime transport and energy Deliverable 6.2
2. Economic projections
2.1 Macroeconomic projections
Changes in GDP components Deliverable 6.2
2.2. Sectoral projections Changes in sectoral value added Deliverable 6.2
3. Climate Change outlook: Hazard indicators outlook: projected changes for the mid-century and end-century considering RCP 2.6 and RCP 8.5 and multi-model approach
3.1 Tourism
Sea-grass evolution
Fire weather index
Beach flooding
Humidity Index
Percentage of days when T > 98th percentile
Length of the window of opportunity for vector-borne diseases
Deliverables 4.3, 4.4

3.2 Aquaculture
Fish Species Thermal Stress Indicator 56
Annual Mean Significant Wave Height (AMSH) 63
Extreme Wave Return Time
Deliverables 4.3, 4.4
3.3 Energy
Indicators of change in renewable energy productivity
Extreme wind NWiX98
Extreme temperature
Cooling Degree Days
Available water: Total Precipitation, Total Runoff and Standardized
Deliverables 4.3, 4.4
3.4 Maritime Transport
Mean Sea Level Rise
Storm surge Extremes
Frequency of extreme high winds
Wave extremes
Deliverables 4.3, 4.4
Climate change risks: Risk assessment based on Impact Chain modelling approach
4.1. Tourism
Changes in environmental attributes ICs available: Impact of forest fire - Loss of tourist attractiveness due to marine habitat degradation
Changes in human being comfort ICs available: Impact of heatwaves on thermal comfort
Deliverable 4.5
4.2. Aquaculture
Changes in sales and profit as a result of climate change ICs available: economic losses
Effects of extreme weather events
Repair/replacement and upgrade costs for infrastructure
Farming of non-native species and invasions ICs available: temperature
Deliverable 4.5

4.3. Energy
Risk of changes in energy demand due to changes in precipitations and temperatures ICs available: Increased energy demand due to increased cooling demand - Energy demand desalinsation
Risk of changes in power generation due to LT climate change and variability
Risk of damages to transmission grids due to extreme events
Deliverable 4.5
4.4. Maritime Transport
Damages to ports infrastructures and equipments due to floods and waves
Damages to ships on route due to extreme weather events
Risk of isolation due to transport disruption ICs available: Risk of transport disruption
Deliverable 4.5
5. Socio-economic impacts of climate change: Empirical evidence of the CC socio- economic effects on the supply and the demand side of the 4 blue economy sectors, for different RCP scenarios and risks. Different techniques/experiments are employed for each sector which fed the macroeconomic projections.
5.1. Market and non-
market effects of CC
Tourism sector: Changes in tourism arrivals and expenditure for different CC risks and adaptation measures
Maritime transport: change in operation costs
Energy: change in cooling and desalination energy demand
Big data analysis-tourism: change in hotels prices
Aquaculture: changes in productivity
Deliverable 5.2, 5.3 5.5 and 5.6
5.2 Macro economic projections
Multisectoral Scenarios Simulation results thanks to the integration of GEM-E3 and GINFORS models.
Deliverable 6.3
6. Towards climate resiliency
6.1 Current situation: Current climate policies status: general commitment, specific limits and obstacles Deliverable 7.1
6.2 Building resiliency: Ranking of adaptation pathways: results of regional workshops for each island Deliverable 7.3
*Availability of the source at 30/04/2020: (Green for yes / Red for no)

METHODOLOGICAL APPROACH
An iterative process has been implemented with constant interaction with WP Leaders, so as to
ensure an effective integration of data when it becomes available. In parallel, regular meetings with
the IFPs are organised to provide those updates. The material provided to IFPs so far encompasses:
- the Report’structure and related template;
- a knowledge table mapping data availability for each island.and updates.
Further material to be provided includes:
- text with accompanying vizualizations for critical parts of the report to ensure homogeneity
and consistency across the reports.
Collecting selected contents
Various types of content are collected:
- text and graphs from existing reports (e.g. from deliverable 6.2 to feed parts 1 and 2 of the
Island report); They are integrated directly into the draft report;
- raw data from climate modeling (from deliverable 4.3 for instance) and maps. This
information is collected in a dedicated table.
- existing visualization and data from external sources (Meteo Blue and World Bank data).
This information is stored in a dedicated table.
Translating scientific content into accessible information
Collected data is to be prepared before final integration:
- Text and graphs will be homogenized and synthetized across the islands;
- Raw data from climate modeling is being adapted and transformed into nice visualizations.
This requires substantial work on appropriate wording across the indicators. For instance,
we selected “reference period” wording to name the period 1986-2005. This period was
named in various ways across the reports (historical, reference, etc.). Similar work is
conducted to name the indicators, the models, the scenarios, the values in a consistent way
across the sectoral indicators.
- In interaction with WP8 infographic-type illustrations should be produced to feed the
reports. Below is an indicative example of illustrations to be produced.
Inventory of data availability and Impact Chains
At this stage, it is possible to present an inventory of data availability and Impact Chains by island,
information that will define the final structure of each island report. Tables from 3 to 5 provides
a global picture of data availability for each island and allows for the identification of gaps. In the
table 3 the N/A boxes is the information that has not been provided by any deliverable of the
project. In these cases further effort is required in order to provide similar information as per the
rest of the islands.

Data gaps can be divided into two types:
- Gaps common to all islands: for instance, ‘current climate and related risks’ (section1.2) is
not well covered by existing project data. For this purpose, external data and visualizations
have been collected for each island (see appendix 13) and will be formatted to fit the
reports.
- Individual data gaps: whereas certain islands are well covered by project output data (e.g.
Malta, Cyprus), certain islands suffer from a lack of data availability. This is largely due to
a lack of input data at island level. But when it is possible, additional literature review can
be compiled to feed certain parts of the report (e.g. current context).

Table 3 : Data inventory per island (knowledge table)
Report outlines 4. Climate change risks
Where to find relevant
info
D4.5 (Results partially available for 11
Impact Chains-IC)
Azores D6.2 - Ch 3.6.1 D6.2 - Ch 3.6.2D4,3 + Appendix 1 -
D4.4a,b 2 IC- Tourism D5.2-D5.3-D5.5-D5.6 D6.3
D7.1_R – Chapter: SOCLIMPACT
ISLANDS CONTEXT +staring in page 59
Balearic Islands D6.2 - Ch 3.6.1 D6.2 - Ch 3.6.2 D4,3 + Appendix 2 -
D4.4a,b,d,e
3 IC - Tourism
1 IC- Maritime TRansportD5.2-D5.3-D5.5-D5.6 D6.3
D7.1_R – Chapter: SOCLIMPACT
ISLANDS CONTEXT +staring in page 59
Baltic Islands N/A N/A D4,3 + Appendix 3-
D4.4a,b,e2 IC- Tourism D5.2-D5.3-D5.5-D5.6 D6.3
D7.1_R – Chapter: SOCLIMPACT
ISLANDS CONTEXT +staring in page 59
Canary Islands D6.2 - Ch 3.7.1 D6.2 - Ch 3.7.2D4,3 + Appendix 4 -
D4.4a,b,e
2 IC - Tourism
1 IC- Maritime Transport
2 IC - Energy
D5.2-D5.3-D5.5-D5.6 D6.3D7.1_R – Chapter: SOCLIMPACT
ISLANDS CONTEXT +staring in page 59
Corsica N/A N/AD4,3 + Appendix 5-
D4.4a,b,c,e
3 IC - Tourism
2 IC- Aquaculture
1 IC - Maritime TRansport
D5.2-D5.3-D5.5-D5.6 D6.3D7.1_R – Chapter: SOCLIMPACT
ISLANDS CONTEXT +staring in page 59
Crete D6.2 - Ch 3.3.1 D6.2 - Ch 3.3.2D4,3 + Appendix 6-
D4.4a,b,c,e
3 IC - Tourism
1 IC - Maritime TRansportD5.2-D5.3-D5.5-D5.6 D6.3
D7.1_R – Chapter: SOCLIMPACT
ISLANDS CONTEXT +staring in page 59
Cyprus D6.2 - Ch 3.1.1 D6.2 - Ch 3.1.2D4,3 + Appendix 7-
D4.4a,b,e
3 IC - Tourism
2 IC- Aquaculture
2 IC- Energy
1 IC - Maritime transport
D5.2-D5.3-D5.5-D5.6 D6.3D7.1_R – Chapter: SOCLIMPACT
ISLANDS CONTEXT +staring in page 59
French West Indies N/A N/A D4,3 + Appendix 12 2 IC- Tourism D5.2-D5.3-D5.5-D5.6 D6.3D7.1_R – Chapter: SOCLIMPACT
ISLANDS CONTEXT +staring in page 59
Madeira D6.2 - Ch 3.9.1 D6.2 - Ch 3.9.2D4,3 + Appendix 8-
D4.4a,b,e
2 IC - Tourism
2 IC- Aquaculture D5.2-D5.3-D5.5-D5.6 D6.3
D7.1_R – Chapter: SOCLIMPACT
ISLANDS CONTEXT +staring in page 59
Malta D6.2 - Ch 3.2.1 D6.2 - Ch 3.2.2D4,3 + Appendix 9-
D4.4a,b,e
3 IC - Tourism
2 IC- Aquaculture
2 IC- Energy
1 IC - Maritime transport
D5.2-D5.3-D5.5-D5.6 D6.3D7.1_R – Chapter: SOCLIMPACT
ISLANDS CONTEXT +staring in page 59
Sardegna D6.2 - Ch 3.5.1 D6.2 - Ch 3.5.2D4,3 + Appendix 10-
D4.4a,b,c,e
3 IC - Tourism
2 IC- Aquaculture D5.2-D5.3-D5.5-D5.6 D6.3
D7.1_R – Chapter: SOCLIMPACT
ISLANDS CONTEXT +staring in page 59
Sicily D6.2 - Ch 3.4.1 D6.2 - Ch 3.4.2D4,3 + Appendix 11-
D4.4a,b,e
3 IC - Tourism
2 IC- Aquaculture D5.2-D5.3-D5.5-D5.6 D6.3
D7.1_R – Chapter: SOCLIMPACT
ISLANDS CONTEXT +staring in page 59
D4.1 to 4.4 D5.2-D5.3-D5.5-D5.6 D6.3 D7.1_RD6.2 + KO meeting
presentationsD.6.2
1. 1.Current situation
and recent trends
2. 2.Economic
projections
3. Climate Change
outlook5. Socio economic impacts 6. Main ongoing adaptation policies

Table 4: Check list Impact Chain operationalization per island
*Energy: There are islands for which the operationalization was not possible, but the normalization and analysis of hazards is provided
in this section (section 4. Climate risks of the islands report).
Sector Impact Chain Azores Baleari Baltic Canary Corsica Crete Cyprus Madeira Malta Sardegna Sicilia West Tourism IC Thermal Comfort Exposure data
missing
AHP Exposure
data
AHP Exposure
data
Exposure
data
AHP Exposure
data
AHP AHP Exposure
data
All data
missingTourism IC Forest Fires GIZ GIZ Expos./vul
n. data
GIZ GIZ GIZ GIZ GIZ GIZ GIZ GIZ All data
missingTourism IC Marine Habitat Degradation Expos./vuln.
data missing
AHP Expos./vul
n. data
AHP Expos./vul
n. data
Expos./vul
n. data
AHP Expos./vuln
. data
AHP Expos./vuln.
data missing
AHP All data
missingAquaculture IC Economic lossses Exposure data
missing
Exposure
data
Exposure
data
Exposure
data
AHP&GIZ Exposure
data
AHP&GIZ AHP AHP&GIZ AHP&GIZ AHP&GIZ All data
missingAquaculture IC temperature Exposure data
missing
Exposure
data
Exposure
data
Exposure
data
GIZ Exposure
data
GIZ GIZ GIZ GIZ GIZ All data
missingEnergy Energy demand - Desalination Hazard data
missing
Expos./vul
n. data
Expos./vul
n. data
GIZ Expos./vul
n. data
Expos./vul
n. data
GIZ Hazard data
resolution
GIZ Expos./vuln.
data missing
Expos./vul
n. data
All data
missingEnergy Energy demand - Cooling Hazard data
missing
Expos./vul
n. data
Expos./vul
n. data
GIZ Expos./vul
n. data
Expos./vul
n. data
GIZ Hazard data
resolution
GIZ Expos./vuln.
data missing
Expos./vul
n. data
All data
missingMaritime Transport Transport Disruption adaptation
capacity data
GIZ Expos./vul
n. data
GIZ GIZ GIZ GIZ Expos./vuln
. data
GIZ Expos./vuln.
data missing
Expos./vul
n. data
All data
missing
Colour code
Finalized
Not available hazard data missing
Not available vulnerability data missing
Not available adaptation capacity data missing
All data

Balearic Canary Crete Madeira Sardinia West Azores Fehmarn Corsica Cyprus Malta Sicily
Mean Sea Level Rise ok ok ok ok ok ok ok ok ok ok ok ok
Storm surge Extremes ok ok ok ok ok ok ok
Frequency of extreme high winds ok ok ok ok ok ok ok ok ok ok ok
Wave extremes ok ok ok ok ok ok ok ok ok ok ok
Sea-grass evolution ok ok ok ok ok ok ok ok
Fire weather index ok ok ok ok ok ok ok ok ok ok
Humidity Index – Humidex percentage of days when T <35oC ok ok ok ok ok ok ok ok ok ok ok
Length of the window of opportunity for vector-borne diseases ok ok ok ok ok ok ok ok
Beach reduction ok ok ok ok ok ok ok ok ok ok
Wind energy productivity (onshore/offshore) ok ok ok ok ok ok ok ok ok ok
Solar PV energy productivity (onshore/offshore) ok ok ok ok ok ok ok ok ok ok
Wind energy drought frequency ok ok ok ok ok ok ok ok ok ok
Solar PV energy drought frequency ok ok ok ok ok ok ok ok ok ok
Combined (wind/PV) energy drought frequency ok ok ok ok ok ok ok ok ok ok
Extreme wind NWiX98 ok ok ok ok ok ok ok ok ok ok
Extreme temperature T>98th percentile ok ok ok ok ok ok ok ok ok ok
Cooling Degree Days ok ok ok ok ok ok ok ok ok ok
Standardized precipitation-evapotranspiration index ok ok ok ok ok ok ok ok ok ok
Available water: Total Precipitation, Total Runoff ok ok ok ok ok ok ok ok
Annual Mean Significant Wave Height (AMSH) 63 ok ok ok ok ok ok ok
Extreme Wave Return Time ok ok ok ok ok ok ok
No. of day exceeding the threshold of 24 oC of fish thermal stress ok ok ok ok ok ok ok ok
Lack of data/Resolution is very coarse and results are not fully reliable due to model limitations
Island did not show interest in the sector, hazard data can be derived from EU sources and literature
Exteme storm surges were not modelled (only atmospheric pressure), although overall mean coastal surge levels can be
calculated considering sea level rise
Island did not show interest in the sector, data might possibly be available from dedicated regional programmes (e.g. BALTEX
- https://www.baltex-research.eu )
Not only resolution is very coarse as data come from GCMs, but precipitation is totally unrealistic as island orography is
completely or largely missing in the global model and runoff cannot even be defined in the absence of land
Though the indicators have been calculated, the climate model data are inadequate (SRES emissions scenario instead of
RCP emissions scenario, projections only until 2050) and unreliable (Azores lies very near to a corner of the model domain,
which is a source of biases in the results)
Inadequate and unreliable data + the precipitation data are also unrealistic as the island orography is not adequately captured
due to the limited resolution of the model
Not considered a hazard for the area
Maritime transport (MT)
Tourism (T)
Energy (E)
Aquaculture (A)
Not enough information available/regional level,some simulations were run but with coarse resoluton (thus not included)
Table 5: Check list availability
of hazard indicators projections per island

APPENDIXES

APPENDIX 1

1
TABLE OF CONTENT
INTRODUCTION ............................................................................................................................................... 2
1 CURRENT SITUATION AND RECENT TRENDS .................................................................................................. 3
1.1 CURRENT GEOPOLITICAL CONTEXT ......................................................................................................................... 3 1.2 CURRENT CLIMATE AND RISKS............................................................................................................................... 4 1.3 MACROECONOMIC STATUS .................................................................................................................................. 5 1.4 RECENT EVOLUTION OF THE BLUE ECONOMY SECTORS ............................................................................................... 7
2 ECONOMIC PROJECTIONS ........................................................................................................................... 10
2.1 THE MACROECONOMIC PROJECTIONS .................................................................................................................. 10 2.2 THE SECTORAL PROJECTIONS .............................................................................................................................. 11 2.3 EMPLOYMENT ................................................................................................................................................. 12
3 CLIMATE CHANGE OUTLOOK ....................................................................................................................... 13
3.1 TOURISM ....................................................................................................................................................... 14 3.2 AQUACULTURE ................................................................................................................................................ 18 3.3 ENERGY ......................................................................................................................................................... 20 3.4 MARITIME TRANSPORT ..................................................................................................................................... 27
4 CLIMATE CHANGE RISKS .............................................................................................................................. 30
4.1 TOURISM ....................................................................................................................................................... 30 4.2 AQUACULTURE ................................................................................................................................................ 37 4.3 ENERGY ......................................................................................................................................................... 47 4.4 MARITIME TRANSPORT ..................................................................................................................................... 48
5 SOCIO ECONOMIC IMPACTS OF CLIMATE CHANGE ..................................................................................... 49
5.1 MARKET AND NON-MARKET EFFECTS OF CC .......................................................................................................... 49 5.2 MACROECONOMIC PROJECTIONS ........................................................................................................................ 54
6 TOWARDS CLIMATE RESILIENCY .................................................................................................................. 58
6.1 CURRENT SITUATION: GENERAL COMMITMENT, SPECIFIC LIMITS AND OBSTACLES .......................................................... 58
7 REFERENCES ................................................................................................................................................ 61

2
Introduction This report is the background material for stakeholders in the upcoming adaptation pathways
workshop in the Azores Islands. First, a presentation that includes the geography and socio-
economic context for the Island, and the socioeconomic trends without climate change (WP6),
which range from the present to the end-of the century. Regarding Climate Change, the expected
climate risks and vulnerabilities for the blue economy are presented and ran (WP3), joint to the
expected trends of physical risks, booth current and future (WP4). Finally, specific economic
impacts are estimated, considering the evolution of some physical risks (WP5 and WP6). The
current climate policy and resilience of the Island is also presented (WP7). Finally, a link to the
projects original work is made in the references section.
The Azores at a glance
The nine islands of the Archipelago of the Azores are all of volcanic origin and are located in the
middle of the North Atlantic, dispersed along a 600 km long stretch from Santa Maria to Corvo
and approximately between 37° and 40° north latitude and 25° and 31° west longitude. Some
246,772 people live (data from 2011) in this island territory of 2,325 km2, which is at a distance
of 1,600 km from the European continent and 2,454 km from the North American continent
(Canada). The population distribution is around half for the main island São Miguel, one quarter
to Terceira island and the remaining islands account for another one quarter.
The Blue Economy sectors
Tourism
The coastal recreational and leisure activities are one of the main tourist attractions in the region.
These include activities such as recreational boating, and maritime-tourist activities (e.g. cruise
tourism, diving, whale, and dolphin watching, swimming with dolphins, sport fishing) and nature
tourism (e.g. hiking and sightseeing). A growing activity is also tourist real estate, especially on
the coast, which results in the construction of various support infrastructures along the coast.
Energy
In 2019 the annual consumption was around 743 GWh. Production was 38.3% from renewables
and local resources, but all islands have different energy mixes. They are all non-connected and
depend on fossil thermal generation to ensure energy quality and face a challenge to add more
renewable energy. Islands have well established geothermal energy running (São Miguel and
Terceira). They all face and cope with harsh climatic conditions and are challenged with high
winds (i.e., 213 km/h; Flores, 2014), heavy precipitation with the risk of floods and landslides.
Climate change will aggravate these risks and create new ones, challenging the region.
Aquaculture
The aquaculture sector in the Azores aims to contribute to the creation of business niches
associated with aquaculture products, providing opportunities for social development and
employment and, at the same time, increasing regional productivity without increasing the
extractive pressure on fishery resources. The sector is still developing in the Region, and
conditions are still being defined for the exercise of the activity on an experimental or scientific
basis.

3
Maritime Transport
The maritime-port sector is responsible for around 70% of international trade and plays a
fundamental role in the development of the Region. The importance of maritime transport,
namely cargo, led to the development of port infrastructures, which assume on all islands a
fundamental role in the flow of goods in and out. This is the main means of transporting goods,
both for connections abroad, namely to Madeira and the Portuguese mainland, as well as inter-
island connections. Passenger shipping works all year round in the central group and service is
extended in the summer months to all other islands.
1 Current situation and recent trends
1.1 Current geopolitical context
The Azores archipelago is an autonomous region of Portugal located in the North Atlantic,
approximately 1,500 km from the European mainland. The Island group comprises 9 islands and
several islets belonging to three groups: 1) the Western Group (with two islands: Flores and
Corvo); 2) the Central Group (with five islands: Faial, Pico, São Jorge, Graciosa and Terceira);
and 3) the Eastern Group (with two islands: São Miguel and Santa Maria).
The Azores have a moderate climate, influenced by the surrounding Atlantic. The marine surface
area of the Azores is 954,496 km2, yielding one of the largest exclusive economic zones (EEZs)
in the European Union. The Azores have been autonomous since 1976 and have self-governing
institutions. They can levy own taxes and participate in international negotiations for treaties and
agreements which concern their region.
Population dynamics of the island
Today, total population on the Azores equals 243,862 residents, of which 51% are female. 13.5%
are younger than 15 years and 16% are older than 65. The share of under 15-year-olds is similar
to mainland Portugal, while the share of 65+ is significantly lower. The structure compares to
the age structure in Italy, Germany or Malta. The total population figures remained relatively
stable between 2000 and 2018 on the Azores. The higher education rate of population between
30 and 34 years old is shown in Table 1.
Table 1: Higher education rate of population aged 30 - 34 years old (3 year moving average).
Education level 30 y.o. 31 y.o. 32 y.o. 33 y.o. 34 y.o.
Basic education
All 58% 58% 59% 60% 60%
Male 62% 63% 62% 62% 63%
Female 55% 54% 56% 57% 57%
Secondary education
All 15% 15% 16% 16% 16%
Male 14% 13% 14% 15% 14%
Female 17% 17% 17% 16% 17%
Tertiary education
All 11% 11% 10% 9% 9%
Male 8% 8% 7% 7% 7%
Female 13% 14% 12% 11% 11% Source: INE, Labour Force Survey.

4
Harmonised medium-term population outlooks for European regions are available from the Europop2013 population projections. The respective main scenario results for the Azores show a slightly declining population figures until 2050.
Figure 1: Baseline population projection for Azores (2015-2050). Source: Eurostat proj_13rpms3 database, own representation.
1.2 Current climate and risks
The Azores islands have an autonomous adaptive capacity that was driven by centuries of
exposure to harsh conditions presented by the North Atlantic sea. All aspects of life and
infrastructure are designed to withstand stresses that are not applicable to the mainland. For
instance, storm Hercules brought high winds with gusts reaching 213 km/h on the Flores island
in February 2014, resulting in some damages to the energy grid.
The same event would most likely cause havoc in Portuguese mainland, as it was the case of
storm Leslie, where wind gusts of 176 km/h were recorded but where 200 high and medium
voltage transmission towers were downed. Therefore, not neglecting existing vulnerabilities, the
same events may have less impact in the Azores Islands than expected, especially when
comparing with Portuguese main land infrastructure. Also, there are significant differences
regarding systems’ resilience inside the region and in different Island. For example, the
occidental island can resist to extreme wind that would be problematic in the central islands.
0
50.000
100.000
150.000
200.000
250.000
300.000
2015 2020 2025 2030 2035 2040 2045 2050

5
Figure 2: Climate factsheet. Source: Own elaboration with data from GFDRR ThinkHazard!; D7.1 Conceptual Framework and Meteoblue; Meteoblue global NEMS (NOAA Environmental
Modeling System)
1.3 Macroeconomic status
The Azores have received EU funding since 1986: they face challenges regarding supply (e.g. of
energy) due to its difficult topography and its small size. However, GDP growth rates exceed
those of the Portuguese mainland in quite some years since then. In particular, in the years
before 2009, the Azores exhibited strong growth of up to 10% (in 1999 and 2001). The economy
took a dive in 2011 and 2012, in the wake of the EURO crisis post 2009. The Azores’ economy
dived a little less, but growth rates have not exceeded the mainland’s ever since.

6
Figure 3: GDP Growth rates, Azores and mainland Portugal. Source: SOCLIMPACT Deliverable Report - D6.2 Macroeconomic outlook of the islands’ economic systems and pre-testing simulations - Statistics of the Azores
(SREA), own graph.
Between 2000 and 2017, nominal GDP increased by slightly more than 68%. However, on a per
capita basis, this economic growth lagged behind average economic developments in the
European Union. The Azores’ GDP shrank to a larger extent in 2012 and did not come back
more strongly than the Portuguese mainland. Both have recently been growing much stronger
than the EU in total. Other regions, too, came better through the financial crisis, but are lagging
currently compared to EU average, such as Germany or UK.
The Azores do not own fossil fuel resources; all fuels are imported as are all other raw materials.
Official trade statistics can be highly misleading as they do only pertain to direct trade with
foreign countries. This is a very small percentage of all trade of the Azores with other regions.
Most of the trade is done with Lisbon and Porto. A lot of Azorean exports to third countries is
done through Lisbon. It is very difficult to track these exports.
The Azores economic structure is essentially characterized by the development of service
activities. The public sector contributes 29% to gross value added, followed by 25% from the
trade, accommodation and food services sector, which comprises most of the touristic activities.
Real estate contributes 13%, agriculture and fishery contribute 9%. All other sectors together
contribute the last quarter to total value added.

7
Figure 4: Gross value added by sector in Azores, 2017. Source: SOCLIMPACT Deliverable Report - D6.2 Macroeconomic outlook of the islands’ economic systems and pre-testing simulations; own elaboration
1.4 Recent evolution of the blue economy sectors
Tourism
More than one 800,000 tourists came in 2017 to the Azores. By far the largest part of this tourist
flux comes from the Portuguese mainland, almost 50% in 2018. The second largest group comes
from Germany, followed by Spain, France and UK
The expenditure structure can be taken from the Azorean tourism satellite accounts.
Table gives an overview. Tourists spend the largest amount on food and drinks, followed by
accommodation, and then air transport. Activities, such as car rentals, cultural events,

8
recreational activities comprise roughly 30 million Euro, travel agencies and guides more than 10
million Euro.
Figure 5: Development of tourists’ arrivals in Azores. Source: SREA.
Table 2: Tourists’ expenditures in Azores 2015, in 1000 Euro
Products Excursionists
(1) Tourists
(2) All visitors
(3=1+2)
A. Characteristic products 4,343 317,163 321,506
1. Accommodation 0 86,683 86,683
2. Catering and Beverages 2850 100,644 103,494
3. Passenger Transport 1446 105,249 106,695
3.1 Interurban road transport 1337 4,712 6,048
3.2 Water transport 0 635 635
3.3 Air transport 0 82,604 82,604
3.4 Services incidental to transportation and Maintenance and repair services of transport equipment
0 507 507
3.5 Hire transport equipment 109 16,791 16,901
4. Travel Agencies. Tour Operators and Tour Guides 3 10,644 10,647
5. Cultural Recreation and Leisure Services and Other Tourism Services
44 13,943 13,987
B. Non-Characteristic Products 3047 55,880 58,927
Total Tourism Money Consumption (net) 7390 373,042 380,433 Source: TSA of the Azores, SREA.
Maritime transport
Maritime transport developed steadily over time regarding freight transport. Unloaded
merchandise follows the economic business cycle and the oil price, freight cargo follows a very

9
steady path and reflects the exports of food, wine and other goods. Passengers increased since
2012 to slightly below 600,000; not including cruise ships.
Figure 6: Azores Maritime transport of goods in tons. Source: SREA, own graph.
Aquaculture
The Blue Economy sector aquaculture is always rather dwarfed. On the Azores, no economic
significant contribution exists from aquaculture. A pilot project is currently pursued, but no
expansion planned.
Energy
Electricity generation still relies heavily on imported fuel and Diesel, but uses the Island’s natural
source, i.e. geothermal energy and hydro energy. Wind energy and solar PV are marginal as of
yet. EDA - Eletricidade dos Açores is the national company for energy production and
distribution.
Table 3: Contribution of renewable resources to the electricity production (Normalized Data %) by Geographic localization in Azores islands (NUTS - 2013); 2017, in %.
Zone Share in %
Portugal PT
Mainland 1 47.11
Azores 2 39.16
Madeira 3 26.60 Source: DGEC, Statistics on coal, oil, electric power and natural gas.

10
Figure 7: Electricity generation on the Azores (in kWh). Source: https://www.eda.pt/Mediateca/Publicacoes/Producao/Paginas/default.aspx .
2 Economic projections
2.1 The macroeconomic projections
According to our reference projections, the Azores continue to grow on average with a 1.5%
yearly rate throughout the 2015-2100 period. The main driver of growth is private consumption
with an average yearly growth rate of 1.8% over the whole projection period (Table). While the
respective GDP- shares of trade and investments remain relatively stable over the projections
period, the GDP-shares of public consumption are projected to decrease over time.
Table 4: Azores GDP and GDP components yearly growth rates in 2020-2100.
2020 2025 2030 2035 2040 2045 2050 2060 2070 2100
GDP 2.9% 1.4% 1.3% 1.2% 1.1% 1.0% 1.0% 1.6% 1.6% 1.6%
Private consumption 4.5% 1.8% 1.7% 1.5% 1.4% 1.3% 1.2% 1.7% 1.7% 1.7%
Public consumption -0.1% 0.0% 0.0% -0.1% -0.2% -0.3% -0.4% 1.7% 1.7% 1.7%
Investments 2.8% 1.8% 1.6% 1.5% 1.4% 1.3% 1.2% 1.0% 1.0% 1.0%
Trade 2.8% 1.8% 1.6% 1.5% 1.4% 1.3% 1.2% 1.5% 1.5% 1.4% Source: SOCLIMPACT Deliverable Report - D6.2 Macroeconomic outlook of the islands’ economic systems and pre-testing simulations.

11
Figure 8: Macroeconomic components as a % share of GDP for Azores in 2015-2100. Source: SOCLIMPACT Deliverable Report - D6.2 Macroeconomic outlook of the islands’ economic systems and pre-testing simulations.
2.2 The sectoral projections
The economy of the Azores remains a service-led economy throughout the 2015-2100 period
with an increasing contribution of other market services, other transport services, electricity,
water and accommodation and food services.
The aggregated gross value-added shares of agriculture, fishery, manufacturing and consumer
goods sectors is projected to decline slightly from above 15% in 2015 to about 13% until 2100.
The respective shares of electricity and water services are projected to increase only slightly until
2100. Construction activities contribute between 7% and 8% to total gross value added
throughout the projection period.
Total tourism activities are projected to increase their respective gross value-added shares.
Starting from more than 8% in 2015, this share is projected to increase to 9.3% until 21001.
1 The share of tourism in GDP is calculated via the tourism satellite account (TSA) matrices of 2015, assuming that the same shares that indicate the contribution of tourism to the productions of tourism-related sectors (such as the accommodation and food services, transport services, travel agency and related activities, cultural and recreational activities) remain throughout the 2015-2100 period. Please see Appendix B for the complete database of the estimated TSAs.

12
Figure 9: Sectoral value added as a % share to total GVA for Azores in 2015, 2050 and 2100. Source: SOCLIMPACT Deliverable Report - D6.2 Macroeconomic outlook of the islands’ economic systems and pre-testing simulations.
Table 5: Sectoral contribution as a % share of total gross value added for Azores in 2015-2100.
GVA % shares 2015 2020 2025 2030 2035 2040 2045 2050 2060 2070 2100
Agriculture 7.5% 6.6% 6.3% 6.1% 6.0% 5.8% 5.7% 5.6% 5.4% 5.2% 4.7%
Fishery 1.7% 1.5% 1.5% 1.4% 1.4% 1.4% 1.3% 1.3% 1.3% 1.2% 1.1%
Manufacturing 2.6% 2.6% 2.7% 2.7% 2.7% 2.8% 2.8% 2.8% 2.8% 2.9% 3.0%
Consumer goods 3.8% 3.9% 3.9% 4.0% 4.0% 4.1% 4.1% 4.1% 4.2% 4.2% 4.4%
Electricity 2.0% 2.1% 2.1% 2.2% 2.2% 2.2% 2.2% 2.2% 2.3% 2.3% 2.4%
Water 0.5% 0.5% 0.5% 0.5% 0.5% 0.6% 0.6% 0.6% 0.6% 0.6% 0.6%
Construction 7.9% 7.6% 7.5% 7.5% 7.5% 7.5% 7.5% 7.6% 7.6% 7.6% 7.3%
Water transport 1.2% 1.2% 1.2% 1.2% 1.3% 1.3% 1.3% 1.3% 1.3% 1.3% 1.4%
Other transport 9.7% 9.8% 9.9% 10.1% 10.2% 10.2% 10.3% 10.3% 10.5% 10.6% 10.9%
Accommodation and food services
1.6% 1.6% 1.7% 1.7% 1.7% 1.8% 1.8% 1.8% 1.8% 1.9% 2.0%
Travel agency and related activities
0.1% 0.1% 0.1% 0.1% 0.1% 0.1% 0.1% 0.1% 0.0% 0.0% 0.0%
Recreational services 0.0% 0.0% 0.0% 0.0% 0.0% 0.0% 0.0% 0.0% 0.0% 0.0% 0.0%
Other market services
23.8% 24.8% 24.9% 24.9% 24.9% 24.9% 24.9% 24.9% 24.9% 25.0% 25.0%
Non-market services 37.5% 37.6% 37.5% 37.5% 37.5% 37.4% 37.4% 37.3% 37.3% 37.2% 37.1% Source: SOCLIMPACT Deliverable Report - D6.2 Macroeconomic outlook of the islands’ economic systems and pre-testing simulations.
2.3 Employment
The service-led economic growth brings positive effects to the labour market with
unemployment projected to more or less clear out in the long run. The contribution of each
sector to total employment depends on the labour intensity of the sector. The biggest employing

13
sectors are non-market and other market services. Construction as well as the consumer goods
industries, other transport and accommodation and food services do also still provide significant
employment contributions in 2100.
Tourism is largest employer of the Blue growth sectors under analysis, particularly due to the
high labour intensity of accommodation and food services. The fisheries sector is projected to
undergo a slight decline in economy-wide employment shares from around 2% to 1.5% in 2100.
Electricity and water transport services feature more or less stable aggregated employment shares
throughout the projection period. However, none of these sectors is projected to contribute
more than 1% to total employment in 2100.
Table 2: Sectoral contribution as a % share of total gross value added for Azores in 2015-2100.
2015 2020 2025 2030 2035 2040 2045 2050 2060 2070 2100
Unemployment rate
12.8% 11.3% 10.1% 9.1% 8.2% 8.0% 7.7% 7.3% 6.7% 6.2% 5.6%
Source: SOCLIMPACT Deliverable Report - D6.2 Macroeconomic outlook of the islands’ economic systems and pre-testing simulations.
Figure 10: Sectoral employment as a % share of total for Azores in 2015, 2050, 2100. Source: SOCLIMPACT Deliverable Report - D6.2 Macroeconomic outlook of the islands’ economic systems and pre-testing simulations.
3 Climate change outlook
Climate hazards indicators represent the entry point to understand the climate change exposure
of the blue economy sectors. The indicators have generally been computed for two scenario

14
RCP2.6 (ambitious mitigation scenario) and RCP8.5 (business as usual) and for different horizon
times namely: a reference period (1965-2005), mid-century (2046-2065) and end of century
(2081-2100). Main source of climate projections (future climate) for the Azores Islands is
MENA-CORDEX ensemble even if other model sources were applied when required,
depending of available scales. Results are presented in form of maps, tables or graphs and only
when the information shows an interesting outcome.
As to its reliability, it is important to note that Atlantic islands (Azores, Madeira, Canaries and
West Indies) lie in very critical areas where global models might be inaccurate in predicting the
large scale patterns (regional models are not available), and resolution is so coarse that in fact
many islands don't even exist in model orography. This acknowledged, this is the only
information we can provide, and at least future tendencies can be inferred. The new CMIP6
simulations might shed more light on this issues, but we can only suggest that results should be
updated as they become available.
The same partly holds for the wave simulations: local resolution has been significantly increased
in the dedicated new simulations of this project, performed by the partner ENEA (up to 0.05°),
but the forcing wind field is still derived from the coarse global models.
Stakeholders should be made aware that uncertainty is an inherent characteristic of climate data,
and that any future planning must cope with it. Climatologists can only high light POTENTIAL
threats and constraints, they cannot predict the future and pave the way to solutions. Conveying
this piece of information is one of the most critical points of climate-change-related information.
All the graphics presented below can be found in high resolution in the Soclimpact
Project official website HERE.
3.1 Tourism
Beach flooding and related losses
One of the consequences of an increase in the mean sea level will be the flooding of coastal areas. This includes sand beaches, which are the main asset for tourism activities in most of the European islands. Therefore, estimating the potential risk of beach loss due to climate change is of paramount importance for the economy of those islands. The 95th percentile of the flood level averaged was selected as an indicator of interest. The values are presented as anomalies with respect to the present mean sea level at beach location (i.e. including the median contribution of run-up). In all cases an increase is expected being larger at the end of the century under scenario RCP8.5. The larger values are found for the Atlantic islands, where slightly larger sea level rise is combined with the effect of much larger wind waves. The values in that scenario is 170 cm in the Azores. Under RCP2.6 scenarios the values are less than half, suggesting that a mitigation scenario could largely minimize the negative impact of climate change on beach flooding.

15
Figure 11: Projected extreme flood level (in the vertical, in cml) at beach locations with respect to the present (1986-2005) mean sea level values averaged for the islands under scenario RCP2.6 (left) and RCP8.5 (right).
Ensemble of models using Global simulations produced by Hemer et al. (2013). Source: Soclimpact Project deliverable D4.4d Report on the evolution of beaches
Under mean conditions, we find that, at end of century, the total beach surface loss range from
~85% under scenario RCP2.6 to ~99% under scenario RCP8.5. The beach could disappear in
the Azores islands.
Figure 12: Beach reduction % (scaling approximation). Source: Soclimpact Project deliverable D4.4d Report on the evolution of beaches

16
Humidity Index
For the assessment of climate hazard on heat related impacts of climate change on human health, the humidity index (Humidex) (Masterton and Richardson, 1979) has been used. Humidex value is an equivalent temperature, which express the temperature perceived by people (the one that the human body would feel), given the actual air temperature and relative humidity. As a more representative indicator for the assessment of inhabitants’ and tourists’ thermal comfort, the Number of Days with Humidex greater than 35°C was selected. From the above classification, a day with Humidex above 35°C describes conditions from discomfort to imminent danger for humans. For the Azores, which are not included or are included marginally in the EURO and MENA-CORDEX domains, the ESCENA Project model runs (Jiménez-Guerrero et al. 2013) were employed that have been produced under the AR4 IPCC scenarios with 25 km spatial resolution. Here, SRES B1 and A1B scenarios are selected, considered to be closer to RCP2.6 and RCP8.5, respectively. The historical period is 1981-2000 and the near future period is 2031-2050.
Figure 13: Humidex in number of days (ESCENA)
Source: Soclimpact project deliverable D4.3_Atlases of newly developed indexes and indicator
Percentage of days when T > 98th percentile - T98p
The T98p is defined as the percentage of time where the mean daily temperature T is above the 98th percentile of mean daily temperature calculated for the reference period 1986-2005.For the archipelago of Azores, two sets of ensembles are presented due to the different runs available for each scenario, in order to have inter-comparable results; i.e. ECHAM5_r2/PROMES and ARPEGE/PROMES have been used for both A1B and B1 ensembles, while all 4 GCM/RCM pairs have been used for an A1B ensemble. The two land grid points correspond to Sao Miguel and Terceira islands. The T98p will increase in the future from 4% (B1- equivalent RCP2.6.) for both islands to almost 7% (A1B – equivalent RCP8.5), 4 models).

17
Figure 14: Percentage of days when T > 98th percentile (ESCENA)
Source: Soclimpact project deliverable D4.3_Atlases of newly developed indexes and indicator

18
Fire weather index (FWI)
The FWI system provides numerical non-dimensional ratings of relative fire potential for a generalized fuel type (mature pine stands) based solely on weather observations. FWI is part of the Canadian Forest Fire Danger Rating System established in Canada since 1971 (van Wagner 1987). Furthermore, since 2007, FWI has been adopted at the EU level and used in a harmonized way throughout Europe by the European Forest Fire Information System (EFFIS) of the Copernicus Emergency Management Service (since 2015). The index was calculated for the fire season (defined from May to October) for all models, scenarios and periods. For the Azores islands, under the scenario (B1), the class of hazard changes from low to high. It is important to note that when using normalized data, in order to compare different time periods and scenarios, only the lowest and the highest grid point values are considered. Additionally, FWI results include temperature, precipitation, relative humidity and wind. It is not only a matter of temperature (wh ich is in fact higher under A1B). This is, during the days with high temperatures and high relative humidity (as Azores are in the middle of the ocean), the index values are expected to decrease, which seems to be the scenario A1B.
Figure 15: Fire Weather Index (ESCENA) with the color associated to the class of hazard Source: D4.4c Report on potential fire behaviour and exposure
3.2 Aquaculture
The predicted impacts of climate change on the oceans and seas of the planet is expected to have direct impacts on marine based aquaculture systems. Basic effects are the following (Soto and Brugere, 2008): Change in biophysical characteristics of coastal areas.
Increased invasions from alien species.
Increased spread of diseases.
Changes in the physiology of the cultivated species by changing temperature, salinity, oxygen availability and other important physical water parameters.
Changes in the differences between sea and air temperature which will alter the seasonality, frequency and severity of storms, cyclones and other extreme events, affect the stability of the coastal resources and potentially increase the damages in infrastructure.

19
Sea level rise, acidification, changes in precipitation and other effects will also add to the changes in coastal ecosystems and environment, thus affecting production and infrastructure (=investments).
Annual Mean Significant Wave Height (AMSH) Annual Mean Significant Wave Height was selected as a relevant indicator of the average For the Atlantic as a whole, no major changes in wave height mean values are observed, but a northward shift of the zonal belt where the meridional gradient of the field is strongest. For the Atlantic as a whole, no major changes in wave height mean values are observed, but a northward shift of the zonal belt where the meridional gradient of the field is strongest. Concerning the Azores, the AMSH could be decreased under RCP8.5 (far future).
Figure 16: Significant wave height (m) under present climate and under RCP8.5 (far future)
Source: Soclimpact Project deliverable D4.3 Atlases of newly developed hazard indexes and indicators
Extreme Wave Return Time Return times for a threshold of 7 m significant wave height (hs) were computed, this significant height having been identified by stakeholders as the critical limit for severe damages to assets at sea, for both the near (2046-2065) and the far (2080-2100) time horizons. Return times can be related to the payback times of investments and help assess potential economic losses and economic sustainability. The hazard for Azores remains virtually unchanged.

20
Figure 17: Extreme wave return under present climate and under RCP8.5 (far future) Source: Soclimpact Project deliverable D4.3 Atlases of newly developed hazard indexes and indicators
3.3 Energy
A series of indicators related to renewable energy productivity is presented. The selected indicators are extreme temperatures, wind and photovoltaic (PV) energy productivity, as well as the frequency and duration of low-productivity periods, termed energy droughts (Raynaud et al., 2018), as a measure of the variability of these sources. The productivity and variability of these renewable energy sources will depend on climate. The possibility of reduced productivity due to climate change poses a risk to the energy generation, if it is based on these renewable energy sources. Also, a possible increase in the frequency and duration of solar and wind energy droughts will require an increase in storage and backup sources. Among the different renewable energy sources, solar PV and wind energy have been selected, as they are (and very likely will be) the main renewable energy sources, due to their degree of technological development and their comparatively low cost. In order to consider a marine energy source, offshore wind energy is included, in addition to onshore wind energy.
Extreme temperatures
The T98p is defined as the percentage of time where the mean daily temperature T is above the 98th percentile of mean daily temperature calculated for the reference period. For the archipelago of Azores, two sets of ensembles are presented due to the different runs available for each scenario. The T98p will increase in the future from 4% (B1- equivalent RCP2.6) to 6% (A1B – equivalent RCP8.5.), showing that, daily temperatures will be above T98p for24 days per year approximately.

21
Figure 18: Percentage of days per year when T > 98th percentile - T98p Source: Soclimpact Project deliverable D4.3 Atlases of newly developed hazard indexes and indicators
Wind and photovoltaic (PV energy) productivity
Wind energy productivity
It can be observed that the ensemble-mean projects an increase of Wprod for A1B emissions scenario for the period 2031-2050. This increase is highest for the islands located more to the southeast, while no changes or slight decreases to the northwest of the area are expected. In B1 scenario, a similar pattern of changes as in A1B is seen, but decreases are more extended than increases, so that the spatially averaged changes (map) show a slight decrease in this case. The spatially averaged changes are rather small ensemble mean changes are around 1%, which is partly due to a high model spread, as different models show changes of opposite sign and similar magnitude.

22
Figure 19: Wind energy productivity. Models of ESCENA project. Ensemble mean values of annual wind productivity indicators (kWh/kW) in the control period (1981-2000) and ensemble mean changes in the future period (2031-2050) for the B1 and A1B scenarios. Ensemble minimum and maximum values are shown in
brackets. In the simulations corresponding to the Azores region, land areas are too small, and averages are computed over the whole domain, which is mainly sea. Source: Soclimpact Project deliverable- D4.4a Report on solar and wind energy
Figure 20: Panel A: Yearly mean wind energy productivity [10^3 kWh/kW] for the control time period (1981- 2000). Panel B: Changes in yearly mean wind energy productivity in the B1 scenario for the 2031-2050 period
with respect to the control. Panel C: As for panel B, but for the A1B scenario. Source: Soclimpact Project deliverable- D4.4a Report on solar and wind energy

23
PV productivity
Annual photovoltaic productivity over the Azores Islands shows mean values between 650 to
750 kWh/kW. These values are below the ones expected with simulated and observed solar
radiation found in the literature (Magarreiro, 2016). However, this negative bias is likely due to
the fact that the region is very close to the model boundaries. For changes in both scenarios,
A1B and B1 for the future period 2031-2050, a slight increase can be observed in both cases,
with higher values in the eastern islands in the B1 scenario. The spatially averaged changes are
small (around 1% with respect to the control period) for both scenarios.
.
Figure 21: Photovoltaic (PV) productivity. Models of ESCENA project. Ensemble mean values of annual solar productivity indicators (kWh/kW) in the control period (1981-2000) and ensemble mean changes in the
future period (2031-2050) for the B1 and A1B scenarios. Ensemble minimum and maximum values are shown in brackets. In the simulations corresponding to the Azores region, land areas are too small, and averages are
computed over the whole domain, which is mainly sea. Source: Soclimpact Project deliverable- D4.4a Report on solar and wind energy

24
Figure 22: Panel A: Yearly mean photovoltaic productivity [kWh/kW] for the control time period (1981-2000). Panel B: Changes in yearly mean photovoltaic productivity in the A1B scenario for the 2031-2050 period
with respect to the control. Panel C: As for panel B, but for the B1 scenario. Source: Soclimpact Project deliverable- D4.4a Report on solar and wind energy
Frequency and duration of low-productivity periods (energy droughts) as a measure of
the variability of these sources
Moderate and severe wind droughts tend to experience a subtle increase in frequency, especially in the B1 scenario. In the A1B scenario, the frequency of wind droughts tends to decrease. Results obtained for the different scenarios are in line with wind productivity changes. Severe PV droughts, in contrast, experience a little increase in the B1 scenario and a subtle decrease in the A1B case. In most of the cases, there is uncertainty in the sign of change.

25
Figure 23: Ensemble mean frequency of severe productivity drought days (%) in the reference period, as well as the ensemble mean changes in the frequency of drought days (%) in the different time periods considered.
Source: Soclimpact Project deliverable D4.4a Report on solar and wind energy
Figure 24: Ensemble mean frequency of severe productivity drought days (%) in the reference period, as well as the ensemble mean changes in the frequency of drought days (%) in the different time periods considered.
Source: Soclimpact Project deliverable D4.4a Report on solar and wind energy

26
Cooling Degree Days
Climate change may impose welfare reductions to the European islands’ societies by affecting thermal comfort. Cooling Degree Days (CDD) are a measure of how much (in degrees), and for how long (in days), outdoor air temperature is higher than 18°C or 65° Farenheit. It is found that the CDD values triple according to the A1B scenario, while are more than double for the B1.
Figure 25: Cooling Degree Days Source: Soclimpact Project deliverable D4.3 Atlases of newly developed hazard indexes and indicators
In the map, the two land grid points correspond to Sao Miguel and Terceira islands. It is found that for both analyses (for 2 and 4 models, respectively), the CDD values triple according to the A1B scenario, while are more than double for the B1.

27
Figure 26: Cooling Degree Days (4 models’ simulations). Source: Soclimpact Project deliverable D4.3 Atlases of newly developed hazard indexes and indicators
3.4 Maritime Transport
Sea level rise
Sea level rise (SLR) is one of the major threats linked to climate change. It would induce permanent flooding of coastal areas with a profound impact on society, economy and environment. Moreover, an increase in the mean sea level would result in a larger impact of coastal storms with the consequent increase of risk. The results are presented in terms of mean sea level rise. For Azores Islands, the SLR ranges from 24, 44 cm (RCP2.6) to 68, 69 cm (RCP8.5) at the end of the century.

28
Figure 27: Mean sea level rise (in cm) with respect to the reference period (1986-2005). Ensemble mean of CMIP 5 simulations and scaling approximation for RCP2.6
Source: D4.4b Report on storm surge levels
Wind extremes The wind extremity index NWIX98 is defined as the number of days per year exceeding the 98th
percentile of mean daily wind speed. This number decreases in the far future under RCP8.5 (- 24 %). Like the NWIX98, the 98th percentile of daily wind speed, WIX98, decreases under RCP8.5.
Figure 28: Wind Extremity Index (NWIX98). Ensemble mean of the MENA-CORDEX simulations. Source: D4.3_Atlases of newly developed indexes and indicator.

29
Wave extremes (99th percentile of significant wave height averaged)
Marine storms can have a negative impact on maritime transport, coastal-based tourism and aquaculture, among other activities. To illustrate this impact, the 99th percentile of significant wave height averaged has been chosen. A decrease in the extreme wave height is found being larger under scenario RCP8.5 as illustrated in the following map. In relative terms, the averaged changes are lower than 10% even under theRCP8.5.
Figure 29: the 99th percentile of significant wave height averaged for the reference period and the relative change for
the RCP8.5. Global simulations produced by Hemer et al. (2013). Source: D4.4b Report on storm surge levels
Figure 30: the 99th percentile of significant wave height averaged for the reference period and the relative change for the RCP8.5 and RCP2.6. Global simulations produced by Hemer et al. (2013).
Source: D4.4b Report on storm surge levels

30
4 Climate change risks
4.1 Tourism
For the tourism sector, three impact chains (IC) were operationalized: i) Loss of attractiveness of a destination due to the loss of services from marine ecosystems, ii) Loss of comfort due to increase of thermal stress iii) Risk of forest fires and loss of attractiveness
For the first two, the AHP method was employed. This methodology is ideal to respond to the hierarchical nature of the impact chain and, secondly, for using expert judgements to assess the comparative risk for the islands over a large number of indicators. By the side of shadows, this method requires quite specific data that wasn’t able to collect for some islands. The AHP method also requires “values” for experts to compare. More specifically, for the first IC the data is needed for “Tourist Arrivals” and “Vulnerable Groups” indicators, which is regards the Exposure of people to heatwaves for the hottest period, such as:
- Number of tourist arrivals per month for the past 5 years. - Number of tourists per month aged 14 and under for the past 5 years - Number of tourists per month aged 65 and over for the past 5 years - Percentage of tourist activities that are sensitive to heatwaves (such as hiking, etc.). - Number of beds available in medical facilities per 100,000 inhabitants.
If, for example, an island gets a lot of tourists, but most of them just spend their time by the beach, then the island is not so much at risk of losing tourists because when they visit they’ll be by the beach and able to cool down. On the other hand, if almost all the tourists visit the island for hiking, but it gets too hot, then the island could be at risk since some may change their minds and visit somewhere else with a moderate climate and do their hiking there. Additionally, it is necessary to investigate how well an island is equipped with dealing with patients who suffer from a heatwave-related episode. For the second IC, the data collected was:
- Surface of marine Phanerogams & Phanerogams' reduction due to heat: Surface, in km2; and expected % of surface loss for RCP8.5 distant future.
- Number of divers: Number of tourists practising Diving at the destination. - Products substitution capacity: capacity to derive tourist demand to non-marine habitat-
based activities. - Seagrass removal: capacity to remove dead seagrass lying on beaches. - Sea water pollution: quality of management of inshore and offshore sewages.
If one information is missing, it is not possible to conduct the risk assessment analysis, as it is a comparative analysis between European islands. Finally, the third IC Provided some results for the case of Azores, which are summarized in this section.

31
Risk of forest fires and loss of attractiveness Forest fires are considered an important parameter for the attractiveness of tourist destinations,
especially in the Mediterranean area. Severe episodes were met in Algarve (Portugal) and Greece
(Athens area) in the recent period, threatening the tourist season. The concept of Impact Chain
(Fritzsche et al. 2014) is applied as a climate risk assessment method, and is considered an ideal
tool to communicate to stakeholders the complex relations between climate hazards and socio
economic effects on sectorial activities (Schneiderbauer et al. 2013).
The Impact Chains propose diagrams articulating the causal links between the different
components of climate risks (according to AR5 concepts: hazards, exposure, vulnerability, risks).
For each of these components, several indicators are selected and collected. Data are then
normalised to be able to be aggregated with different weights. The final objective is to achieve a
standardised risk score that, according to the spatial scale of the analysis can allow comparison
and decision making on adaptation, including hierarchization of resource allocation or
identification of adaptation options to mitigate climate risk.
In the framework of SOCLIMPACT project, the following steps have been developed:
- The selection of “priority impacts” with the sector teams;
- The identification of risks with the sector teams and Islands Focal Points (IFPs) and the construction of theoretical impact chains, filling the components and identifying the factors inside the different risk components, with the sector teams for the generic IC and with the IFPs for the specific IC;
- The identification and selection of the indicators for each factor of risk in the various impact chains, according to a number of characteristics and criteria, with the help of the sector leaders and the IFPs to replace theoretical component of the risk with indicators commonly used in the scientific publications or projects on climate change.

32
Figure 31: Theoretical IC - Loss of attractiveness due to increased danger of forest fire in touristic areas Source: Soclimpact deliverable D3.2
After defining the theoretical design, the identification and selection of suitable indicators were
associated to each factor of the impact chain and a new diagram tool has been proposed.

33
Figure 32: Loss of attractiveness due to increased danger of forest fire in touristic areas Source: Soclimpact deliverable D3.3
For the operationalization, we assessed whether selected indicators are sufficiently explicit or
not. Indeed, many indicators were formulated in a very broad way, causing a few problems in
identifying suitable data sets. Furthermore, the data were checked for explicit spatial coverage,
resolution, temporal coverage and time frame. Finally, we evaluated possible substitutes or
alternatives for those indicators with no suitable data to substantiate them.

34
Figure 33: Final Impact Chain Model Source: Soclimpact deliverable D4.5
For the Azores islands, which are not included or are included marginally in the EURO and
MENA-CORDEX domains, the ESCENA Project model runs (Jiménez-Guerrero et al. 2013)
were employed. They have been produced under the AR4 IPCC scenarios with 25 km spatial
resolution. Here, SRES B1 and A1B scenarios are selected, considered to be closer to RCP2.6
and RCP8.5, respectively.
The historical period (reference) is 1981-2000 and the near future period is 2031-2050. The
selected RCM/GCM pairs that were available are presented in the following table:

35
Table 7: Climatic input variables and data sources for hazard component calculation for Azores
GCM/RCM pairs Experiments
ECHAM5 r2/PROMES Historical SRES A1B SRES B1
ARPEGE (version 3)/ PROMES Historical SRES A1B SRES B1
Source: Soclimpact deliverable D4.5
In order to normalize the index, the min-max method was applied. Min-max normalizes
indicators to have an identical range [0, 1] by subtracting the minimum value and dividing by the
range of the indicator values (OECD 2008). Afterwards, the normalized index was categorized
into five equal interval classes representing values from “Very low" to "Very high”. With respect
to Azores, as the models emission scenarios and future periods differ, the results are not
comparable with the rest of the islands.
Considering the weighing, an assessment of GIZ methodology has been developed for this
impact chain including interviews with various types of stakeholders (cf dedicated 4.5 to forest
fires). Then, the risk score was calculated for the Azores separately from the other 9 islands as
future data is not the same (for Azores, to compute the part of hazard (FWI), the scenario B1
and A1B have been used and for other islands RCP 2.6 and RCP 8.5). Finally, in the calculation
of risk, the exposure is the major component with 57% of the final score.
Figure 34: Risk score and components of the risk for the reference period
Source: SOCLIMPACT Deliverable Report – D4.5Comperhensive approach for policy makers

36
Figure 35: Risk score for scenarios for SRES B1 and A1B (near future) Source: SOCLIMPACT Deliverable Report – D4.5Comperhensive approach for policy makers
The score of risk is low for Azores during the current period and for the near future under the scenario B1. Under the scenario B1, the risk will be medium. Concerning the component of exposure in the calculation of the risk, the nature of exposure explains the majority of component with 75% and within the nature of exposure, the indicator “cultivated area” (%) is the most important in the sub-component.
Figure 36: Details and scores of the two subcomponents of exposure (nature and level of exposure) Source: SOCLIMPACT Deliverable Report – D4.5Comperhensive approach for policy makers

37
Concerning the vulnerability component, there is no current sensitivity with the flammability index and the component is only composed of adaptative capacity. The indicator about GDP is the most significant in the calculation of adaptative capacity.
Figure 37: Details and scores of the two subcomponents of vulnerability (adaptative capacity and sensitivity) Source: SOCLIMPACT Deliverable Report – D4.5Comperhensive approach for policy makers
4.2 Aquaculture
In the Soclimpact project, aquaculture includes only marine-based operations where off-shore
and coastal aquaculture are included, and freshwater and land-based aquaculture are excluded.
Examples of climate change hazards that can impact aquaculture are changes in ocean warming
and acidification, as well as oceoanographic changes in currents, waves, and wind speed. Sudden
impacts such as an increase in the frequency and intensity of storms and heat waves are also
impacting aquaculture. Other effects of climate change on aquaculture activities are increased
invasions from alien species, increased spread of diseases and changes in the physiology of the
cultivated species by changing temperature, oxygen availability and other important physical
water parameters. An important indirect impact to aquaculture is the change in fisheries
production due to climate change. Aquaculture of finfish is highly dependent on fisheries for
feed ingredients. This already a current problem with many fisheries overexploited and will only
intensify in the future. Climate change is also predicted to impact food safety, where temperature
changes modify food safety risks associated with food production, storage, and distribution.
Socio-economic impacts on aquaculture are hard to assess due to the uncertainty of the changes
in hazards and the limited knowledge these impacts have on the biophysical system of
aquaculture species (Handisyde et al. 2014). In the framework of Soclimpact, the following risks
were studied:

38
1) Risk of Fish species thermal stress due to increased sea surface temperature
Changes in water temperature can directly affect the growth rate and Food Conversion Ratio of
the fish. Temperature also affects the oxygen levels and can cause harmful algae blooms, reduce
water quality and an increase in occurrence of diseases and parasites which can than affect the
fish or other culture species. A change in temperature can ultimately change the ranges of
suitable species for a certain area but can also have positive impacts such as increased growth
(mainly in tropical and sub-tropical regions) and a longer growing season. Primary productivity
can also increase with increasing temperature, which may be beneficial for filter feeders such as
mussels.
2) Risk of increased fragility of the aquaculture activity due to an increase of extreme
weather.
Increased frequency and intensity of extreme weather events result in higher waves and storm
surges and changes in salinity. These events result in loss of stock and damages to infrastructure
and require adaptation in species selection, site selection and technologies.
Indeed, the objective of the risk assessment is to obtain final risk scores according to a gradient
(very low to high) and to be able to compare the European islands with each other.
As mentioned in the part dedicated to the forest fire impact chain, the concept of Impact Chain
(Schneiderbauer et al. 2013; Fritzsche et al. 2014) is also applied as a climate risk assessment
method (with 7 steps for aquaculture, present risk and future risk are calculated separatly) for
research of decision making. The goal of this method is to use collected data for certain
indicators of the impact chains for different islands to assess the risks of each island’s
aquaculture sector to be affected by the hazard displayed in the impact chain. Therefore, data for
all indicators were collected from all islands. After reviewing the data, selecting indicators and
islands, the indicators were normalized, and different risk components were weighted. Using
these values, the risks for present and future conditions under different Representative
Concentration Pathway (RCP) scenarios were calculated for the different island and compared
between each other. For the aquaculture impact chains, RCP 4.5 and 8.5 were compared since
for the hazard models RCP 2.6 was not always available.
These steps will be described in detail in the following sections.
Step 1: Data collection by Island Focal Points
To be able to apply the GIZ risk assessment method, a solid data basis is crucial. Therefore, data
was collected by the Island Focal Points (IFPs) of the SOCLIMPACT project. The questionnaire
requested datasets for 16 indicators and topics with several subcategories on exposure and
vulnerability. The IFPs reached out to local stakeholders and authorities to collect the requested
data which was then resubmitted to the Sectoral Modelling Team (SMT) Aquaculture.
Step 2: Data review and island selection
Data were submitted by most of the islands to the SMT Aquaculture. Most datasets were
incomplete with major data missing regarding important information for the successful
operationalization of the impact chains. Therefore, and for the fact that some islands do
currently not have any active marine aquaculture operations running, some islands were excluded

39
from the operationalization. Out of the 12 islands assessed in the SOCLIMPACT project, six
were included in the operationalization of the impact chains using the risk assessment method
from GIZ: Corsica, Cyprus, Madeira, Malta, Sardinia and Sicily. The other six islands (Azores,
Balearic Islands, Baltic Island, Canary Islands, Crete and French West Indies) do currently not
have active marine cage aquaculture operations or show insufficient data availability. Data on
hazards was provided by the models developed in work package 4. Eventually, Madeira was
excluded for the impact chain on extreme weather events due to lack of reliable hazard data. A
qualitative analysis will be provided in the result section.
Step 3: Review and selection of indicators
The data collection and review revealed that not all indicators of the impact chains could be used
for the operationalization process. Therefore, these indicators were reviewed carefully and the
ones which were not represented by sufficient data were excluded. The revised impact chain was
developed depending on the indicators selected.
Figure 38: Impact chain on Increased fragility of the aquaculture activity due to an increase of extreme weather adjusted depending on data availability and used for the operationalisation.
Source: Soclimpact project deliverable 3.2
Impact chain: extreme weather events
Hazard
For the component hazard both indicators were used for the operationalisation. The wave
amplitude was shown as significant wave height (SWH) in m and the return time number of
years between extreme events quantified with a threshold of >7m. The data was derived from
the climate models of Deliverable 4.4 at the exact locations where the fish farms are located and
then averaged for all locations on one island. This allows a more accurate assessment than taking
the average values for the entire island.

40
Exposure
Four indicators were selected to be operationalized. The number of aquaculture operators was
provided by the IFPs and additional literature. There was no data available on the actual size of
stock, therefore the yearly production of aquaculture products (fish and shellfish) in tons was
used as a proxy indicator. The location of farms was rated by using two different proxy
indicators: the location of the farms in relation to the prevailing wind direction and the average
distance of the farms to shore. To be able to rate the location in relation to the wind direction,
the values were estimated (with 0 being completely sheltered and 1 being exposed to wind and
possible storms). After normalizing the distance from shore (measured by using GIS software
and the exact coordinates of the fish farms), both values were averaged and represent the
exposure of the location of farms.
Sensitivity (vulnerability)
Two indicators were applied to calculate the score of factors of sensitivity. The sensitivity of
species was estimated by reviewing literature and interviewing experts regarding the vulnerability
of species to extreme weather events. After receiving these data, average values were calculated
of all values for the present species on each island.
Table 8: Estimated vulnerability factors for the sensitivity of species to wave stress. 1= very vulnerable to stress: 0=very resilient to stress.
Sensitivity of species for wave stress threshold
Species Sea bream Sea bass Tuna Mussels & Clams
Estimated vulnerability
factor 0.55 0.65 0.3 0.9
Source: Soclimpact project deliverable 4.5
The same approach was implemented to calculate the vulnerability of the infrastructure types
used on each island based on the type of species farmed.
Table 9: Estimated vulnerability values for the vulnerability of infrastructure in case of an extreme weather event.
1= very vulnerable to stress: 0=very resilient to stress.
Vulnerability of aquaculture infrastructure in case of an extreme weather event
Infrastructure for species Sea bream & Sea bass Tuna Mussels & Clams
Estimated vulnerability
factor 0.4 0.3 0.6
Source: Soclimpact project deliverable 4.5

41
Adaptive capacity (vulnerability)
The indicators distance to harbor and the presence of warning systems were used to describe the
adaptive capacity. As there is a weather forecast available for all islands, the values for the
presence of warning systems are all the same and represent low values. The distance to harbors
was moved to the subcomponent adaptive capacity and measured using GIS software and the
exact locations of the farms which were provided by the IFPs and literature data. It represents
the average distance of all farms to their closest harbor for each island and is shown in meters.
The indicator stocking density and engineering of structures were excluded from the
operationalisation. For the stocking density there were no data available from all islands and in
any case, it was estimated to be similar for all islands. The engineering of structures was already
covered with the type of infrastructures in the sensitivity subcomponent.
Impact chain: sea surface temperature
Hazard
Changes in surface water temperature was chosen to be the indicator representing the
component hazard. The temperature data for this indicator was obtained from the location of
each farm from the climate models of Deliverable 4.4 and averaged per island. To calculate the
hazard for each island and each RCP, the species’ temperature thresholds were taken into
account. According to a literature review (see Annex) the temperature thresholds for farmed
species is the following:
Table 10:Temperature threshold per species.
Temperature thresholds for different species
Species Sea bream Sea bass Tuna Mussels & Clams
Threshold (°C) 24 25 24 20.5
Source: Soclimpact project deliverable 4.5
It must be noted that the threshold for Tuna was set to 24°C since in the project only Tuna
fattening is done (in Malta) and for adult fish the threshold is 24°C while in the review the whole
life cycle as well as prey species was taken into account which is not relevant for this exercise.
Based on these thresholds, the duration of the longest event per year (in days) was calculated for
the temperatures 20 °C, 24 °C and 25 °C for RCP 4.5 and 8.5 from the models developed in
WP4. After normalizing these values (which is described in detail in Step 4), the values for each
temperature and therefore each species threshold were averaged using the sum product of the
normalized values and the species’ proportion on the total production of the island. The final
values represent the score of the hazard. The indicator changes in seawater characteristics was
not included in the operationalization as there is no additional data related to this indicator which
is not covered by the surface water temperature indicator.
Exposure
Two indicators were used for the component exposure: the number of aquaculture operators
and the yearly production (in tons) as a proxy indicator for the size of stock.

42
Sensitivity (vulnerability)
The subcomponent sensitivity includes two indicators which were combined to one indicator for
the operationalization. The sensitivity of species directly correlates with suitable temperature for
species and therefore it is summarized as temperature sensitivity of species. It was calculated by
using temperature threshold values for each species obtained from a literature review and expert
opinion. These values were averaged depending on which species and in which quantities they
are farmed on the islands.
Table 11: Estimated vulnerability factors for the sensitivity of species to temperature stress.
1= very vulnerable to stress: 0=very resilient to stress.
Sensitivity of species for temperature stress threshold
Species Sea bream Sea bass Tuna Mussels & Clams
Estimated vulnerability
factor 0.6 0.6 0.3 1
Source: Soclimpact project deliverable 4.5
Adaptive capacity (vulnerability)
Two out of four indicators from the impact chain were utilized for the operationalization. The
monitoring early warning systems were included and show all the same values for all islands as
there is a sea surface temperature forecast available for each island. The capacity to change
species was included with all the islands displaying the same value as well. The risk value is high
in this case, as it would be quite difficult to change species farmed on the islands in general as
this would result in high economic expenditures. For the indicator of the impact chain know-
how of recognizing and treating diseases/parasites there is no data available for any island. As
this could vary a lot between the islands, the indicator was removed instead of making
assumptions, to not negatively influence the risk values. A similar case arises from the indicator
availability of alternative place for farming. There is no data available to make correct
assumptions regarding the occurrence of alternative areas on the islands and therefore the
indicator was not used for the operationalization.
Step 4: Normalization of indicator data for all islands
In order to come up with one final risk value per island and to be able to compare these values
between islands, the indicator values were transferred into unit-less values on a common scale.
The normalized values range between 0 and 1 with 0 being low risk and 1 being very high risk.
There are two different ways of normalizing the indicator values:
- Minimum/maximum normalization;
- Expert judgement.
Fraction of maximum normalization
This normalization method was used for indicators which were expressed by real data and not by
expert judgement. The value for each island was calculated as a fraction of the maximum value in

43
de data set. Meaning the island with the maximum value was given 1 and the rest as a fraction
thereof.
The following indicators were normalized using this method:
Extreme weather events:
- yearly production/ number of aquaculture operators
- average distance from shore (location of farms)
- average distance to harbour
Sea surface temperature: - yearly production/ number of aquaculture operators
Minimum/maximum normalization
This normalization method was used for indicators which were expressed by real data and not by
expert judgement. The minimum and the maximum value of that indicator of all islands was
calculated and the following formula was applied to normalize all indicator values to the scale
between 0 and 1:
For both impact chains, the hazard values were normalised using the min and max method.
However, in these cases the minimum and maximum values were not automatically the
minimum and maximum values of the entire dataset but rather treated differently for every
hazard indicator. This handling of the normalisation of the hazard indicators arose from the
different nature of the indicator itself and the fact that data were available for different RCPs and
periods of time. Therefore, the hazard indicators were normalised as following:
The sea surface temperature values were normalised separately for each temperature data set.
This means that all values for all RCPs and time periods of one “longest event over a certain
temperature” were taken into account when determining the minimum and maximum values.
For Madeira, RCP 4.5 data was not available, therefore RCP 2.6 data was used and doubled.
Wave amplitude (significant wave height)

44
Figure 39: Modelling indicators for sea-state hazards, return time and significant wave height starting with 4
Global Circulation-Regional Circulation Model chains, which a fed into the WAM regional wave model. Results
are then normalized. Source: Soclimpact project deliverable 4.5
The return time was normalised as following; all values equal or greater that 10 are set to 0, all
values between 0 and 10 are linearly mapped to the interval 1-0, so that 0 gives risk 1, 10 gives
risk 0. It was assumed that a time period of 10 or more years allowed to repay investments is a
reasonable threshold.
Since, as described in D4.4 of Soclimpact, that the probability of having at least one event
exceeding the return level associated with a N-year return period during a N-year time window
(highlighted in red in Table 12) is anyway greater than that of its complement (no events
exceeding the limit in the N-year time window), and that the return level cannot be considered a
“no-risk” safety level in evaluating the survivability and sustainability of structures or plants.
Table 12: Probability of occurrence of at least one event exceeding the return level associated with a given return
period (blue) in a given time window (green), according to the formula.
RL,T=1-(1-1/T)**L, where L=length of time window, T=Return Period.
Return Period [years]
Probability of occurrence
1 years 2 years 5 years 10 years 20 years
5 20% 36% 67% 89% 99%
10 10% 19% 41% 65% 88%
20 5% 10% 23% 40% 64% Source: Soclimpact project deliverable 4.5
Therefore, using a combination of the normalized values and the probability of occurrence,
experts transformed these values into risk classes such all "low", "moderate", "medium", "high",
"very high", or the like, on a qualitative basis.

45
Expert judgement
For some indicators from both impact chains there was no data available which is the reason
why expert judgement and estimations were applied. The following indicators were expressed
using expert’s estimations:
Extreme weather events: - farm locations (in relation to main wind direction)
- sensitivity of species
- vulnerability of type of infrastructure
- presence of warning system
Sea surface temperature: - estimated temperature sensitivity of species
- capacity to change species
- monitoring early warning systems
In all cases the normalization scale of 0 to 1 was applied with 0 being low risk and 1 being very
high risk.
Step 5: Weighting of different risk components
In this step, the different risk components hazard, exposure and vulnerability (including the sub-
components sensitivity and adaptive capacity) were rated. The total of the values sums up to 1.
The weights were estimated by aquaculture experts and the basis of the estimations were
subjective estimations, similar to the ones used in the AHP method. However, in this method
the data availability was additionally taken into account. Components for which the available data
was scarce, outdated or more unreliable the weights were set lower on purpose, while
components with accurate datasets were given a higher weight as following:
Table 13: Components and their weights.
(Sub)Component Weight
Sea surface temperature Extreme events
Hazard 0.3 0.6 wave height 0.2 return time 0.8
Exposure 0.4 0.2
Vulnerability 0.3 0.2
Sensitivity 0.75 0.75
Adaptive Capacity 0.25 0.25 Source: Soclimpact project deliverable 4.5
Step 6: Calculations of risk for present conditions
Before being able to calculate the risk values, the scores for each component/ subcomponent
had to be calculated by taking the average of the corresponding indicators:

46
s – score
comp – component or subcomponent
ind – indicator
n – number of indicators
The final risk value was calculated by summing up the scores of the components multiplied
individually with the corresponding risk component weightings:
s – score
w – weight
haz – hazard
exp – exposure
vul – vulnerability
sen – sensitivity
ac – adaptive capacity
These risk values were calculated for each island individually and range between 0 and 1. After
completing these calculations, it was possible to compare the islands between each other.
Step 7: Calculations of risk for future conditions (different RCPs)
To be able to project the risk values to future conditions, the operationalization was adjusted to
the different Representative Concentration Pathways (RCPs). Therefore, the whole
operationalization was duplicated and different values for the hazard indicators per island were
inserted. These values were taken directly from the climate models provided in work package 4
for the different RCP scenarios (RCP 4.5 and 8.5). The resulting values can be compared
between the islands as well as between the different RCP scenarios.
Results
Impact chain: extreme weather events
Exposure and vulnerability indicators
Atlantic islands
Table 14: Risk results for impact chain Extreme weather events for the Atlantic Islands
Hadley centre ACCESS
Risk Historic RCP 8.5 Mid century
RCP 8.5 End-century
Historic RCP 8.5 Mid century
RCP 8.5 End-century

47
Azores 0.83 0.76 0.79 0.15 0.41 0.67
Madeira 0.20 0 0.01 0 0 0
Source: Soclimpact project deliverable 4.5
For the Atlantic islands, 2 models are available (Hadley Centre and ACCESS) for data on return
time. As can be seen in table, the results of these models are highly variable. For the Azores even
the change of the risk is different, where the Hadley riley model shows a decrease in risk while
ACCESS shows a significant increase in risk. Therefore, no conclusion can be made. For
Madeira, the risk in the future will be nihil. Not considering probability, it could be concluded
that climate change has no or a positive effect on the occurrence on extreme events in Madeira.
However, since this data is not accurate, more work needs to be done.
4.3 Energy
There are more than 2200 inhabited islands in the EU. Lately, they have come into the focus of
the EU, which addresses energy questions as part of the 'Clean energy for all Europeans'
package. The Clean energy for EU islands initiative provides a long-term framework to help
islands generate their own sustainable, low-cost energy. This is particularly interesting, because
many islands have vast amounts of renewable energy sources but rely on fossil fuel imports yet.
These are relevant challenges regarding the energy transition in the EU, whose aim of net zero
greenhouse gas emissions in 2050 should determine the future energy plans of the islands.
Islands could provide showcases for successful 100% renewable energy supply.
Most Renewable Energy Systems (RES) depend on the climate, and therefore climate change can
have an impact of the resource amount. Additionally, wind and solar PV energy are not
dispatchable, and its variability represents a challenge for its integration in the power system.
This is a challenge that can be addressed through storage or backup plants (which can be itself
renewable energy plants), through demand management, but also taking advantage of
complementarity of PV and wind energy and its very different variability characteristics.
There are also challenges for the demand and transmission components of the energy systems of
the islands due to climate change: changes in temperature leading to changing energy demand,
changes in precipitation and evaporation creating risks for desalination, and extreme weather
events (particularly extreme winds) challenging the distribution infrastructure. After intensive
desk research, the latter was ruled out, due to the low number of past incidents found in the
literature or news media and the future projections showing a reduction in wind extremes for
most islands.
Thus, for the energy sector three general impact chains (IC) have been developed in the
SOCLIMPACT project:

48
i) risk of changes in power generation due to long term climate change and variability,
ii) risk of changes in energy demand due to changes in precipitation and temperatures,
iii) risk of damages to transmission grids due to extreme events.
Only the second IC was selected for operationalization. Data availability constraints for all
islands have been a basic reason for this selection. For this IC, two different analysis were carried
out:
- the increased energy demand due to increased cooling demand,
- the increased energy demand due to increased desalination needs.
Both risks depend on the temperature increase, which is a very certain effect of climate change.
The criteria for the selection of the islands have been: (a) availability of data for the computation
of the exposure and vulnerability indicators of the demand-side ICs, (b) modelling constraints of
the hazard component.
Specifically, there are important limitations regarding the resolution of the climate data for the
small Atlantic islands. The available simulations covering the Atlantic Ocean have a significantly
lower spatial resolution than the simulations for the Mediterranean Sea. Thus, the demand-side
ICs have not been operationalized for smaller islands such as Azores.
4.4 Maritime Transport
For the Maritime Transport sector, three main climate change risks have been identified. These are: i) risk of damages to ports’ infrastructures and equipment due to floods and waves, ii) risk of damages to ships on route (open water and near coast) due to extreme weather events and iii) risk of isolation due to transport disruption. The operationalization was applied to the third one (risk of isolation due to transport disruption) which in terms of hazards and impacts can be considered as a combination of the other two. The selection of islands to be included in the analysis was based on the importance and dependency on the Maritime Transport sector and on data availability. Although this sector is of great importance for Azores, the lack of reliable and consistent data limited the analysis, especially in regard:
- Value of transported goods expressed in freight (VGTStot) - Number of renovated infrastructure (NAgePo). - Percentage of renewables (PEnRR), - Early warning systems (NOcSta) and harbour alternatives (NApt).
Nevertheless, this information is also useful at the moment of evaluating and ranking adaptation measures for the islands.

49
5 Socio economic impacts of climate change
5.1 Market and non-market effects of CC
Tourism
In order to analyse the reactions of tourists to the impacts of climate change and the preferences
for adaptation policies, several hypothetical situations were posed to 300 tourists visiting Azores
whereby possible CC impacts were outlined for the island (i.e., beach erosion, infectious diseases,
forest fires, marine biodiversity loss, heat waves, etc.).
Figure 40: Socio-economic characteristics and travel description: Tourists visiting Azores Source: SOCLIMPACT Deliverable Report - D5.5 Report on market and non-market costs of Climate Change and benefits of climate actions for Europe
Firstly, tourists had to indicate whether they would keep their plans to stay at the island or find
an alternate destination if the impact had occurred, which allows predictions of the effects on
tourism arrivals to be made for each island. Secondly, tourists were asked to choose between
various policy measures funded through an additional payment per day of stay – the tourists’
choices being an expression of their preferences for attributes/policies. To estimate the results,
the conditional logit model was run by using the Stata software.
In general, data confirms that tourists are highly averse to marine wildlife disappearing to a large
extent (75.30% of tourists would change destination). Moreover, they are not willing to visit the
islands when there is risk of infectious diseases becoming more widespread (72.70%) or when
water is scarce for leisure activities (57.70%). In addition, policies related to marine habitats
restoration (10€/day), water supply reinforcement (8.4€/day) and cultural heritage protection
(6.3€/day) are the most valued, on average, by tourists visiting these islands.

50
Although climate change impacts are outside the control of tourism practitioners and policy-
makers, they can nevertheless utilise this knowledge to improve the predictability of the effect
that certain adaptation policies and risk management strategies, and develop their plans
accordingly.
Figure 41: Tourists’ response to climate change impacts and related policies: Tourists visiting Azores Source: SOCLIMPACT Deliverable Report - D5.5 Report on market and non-market costs of Climate Change and benefits of climate actions for Europe
SEE VIDEO SUMMARY OF RESULTS HERE
The infographic can be found in high resolution in the Soclimpact Project official
website HERE.
The impact of increased temperatures and heat waves on human thermal comfort
In order to assess how the variation in temperature impacts on the tourism sector through
changes in tourism demand our research question was: “How do increasing temperatures (and
heat waves) impact prices and, more in general, expenditure of tourists?” Arguably, when
temperatures grow, tourists adjust their behaviour: they might switch destination, or they might
stay longer or shorter depending on their attitudes and preferences. In turn, all these changes
modify the market equilibrium, pushing tourism companies to adjust their prices to re-establish
the equilibrium between demand and supply. The change in demand and the change in price

51
determine the change in tourism expenditure which is, from the destination’s perspective,
tourism revenue.
We monitored current weather conditions posted on several weather forecast providers and daily
prices posted on Booking.com by hotels. We then estimated the link between daily temperature
and daily price, controlling for all the other factors affecting prices. We finally applied these
estimates to the increase in the number of days with excessive temperature projected for the
future in two scenarios (RCP2.6 and RCP8.5) and in two time horizons (near future, about 2050;
distant future, about 2100).
Among the different indicators linked to thermal stress, Soclimpact is focusing on two: the
number of days in which the temperature is above the 98th percentile and the number of days in
which the perceived temperature is above 35 degrees. Although in D5.6 the impact for both
indices were computed, in this document we only report the second one (named HUMIDEX)
because it is the most intuitive and because human thermal stress is more related to the absolute
value of the temperature than its deviation from some pre-determined distribution. In line with
the project, we assumed that thermal stress appears when the perceived temperature grows
above 35 Celsius degrees.
As thermal stress is delimited in the summer months, and this is when the great majority of
tourists arrive in these islands, the whole analysis has been carried out in six months only: from
May to October included. In other words, we assume that there is no thermal stress (and hence
no impact on tourism) in the rest of the year.
Initially, three islands were investigated: Corsica, Sardinia, and Sicily, given the massive amount
of potential data. Other estimations were provided for Azores using the Index of Distance in
Destination Image to position each island in a range that goes from Sardinia / Corsica on one
side and Sicily on the other side. Without entering the details of the extrapolation method (which
are explained in D5.6 appendixes) a summary of results is reported here:
Table 15: Estimation of increase in average price and revenues for Azores
Actual share of days in which humidex > 35 degrees
Future scenario considered
Days in the corresponding scenario in which humidex > 35 degrees
Increase in the average price
Increase in the tourism overnight stays
Increase in tourism revenues
8.93%
rcp26near 14.88% 2.4% 0.5% 2.9%
rcp85near 18.38% 3.8% 0.8% 4.5% Source : Soclimpact project deliverable D5.3
According to these findings, the average increase in temperature, which is correlated to a
growing thermal stress for tourists, brings an economic advantage to tourism destinations. This
is only an apparent contradiction with previous findings. This study does not neglect the fact that
if islands are too hot, tourists will choose to move to other (cooler) destinations, that in principle
exist. Then, the increase in tourism (and tourism revenues) stem from the fact that, when the
temperature is too hot, people would prefer to move to coastal areas (where the climatic
conditions are more bearable) than staying inland or in cities. Future trends will also facilitate this

52
pressure of tourism demand (think about the spreading of smart working activities where, in
principle, the worker can relocate wherever he/she wants).
Aquaculture
The economic impacts on aquaculture production was not analysed for Azores for two reasons:
- The sector is still under development for the region, and the production levels of the
four main species analysed (seabream, seabass, Medmussels, and Bluefin Tuna) are very
low.
- The hazards indicators that are expected to affect the aquaculture production and
infrastructures do not show significant changes in the region.
Energy
Climate change may impose welfare reductions to the European islands’ societies by affecting
thermal comfort. Cooling Degree Days (CDD) are a measure of how much (in degrees), and for
how long (in days), outdoor air temperature is higher than 18°C or 65° Farenheit. The CDD is
used as a measure of the energy needed to cool buildings. The increase in CDD and the energy
demand (GWh/year) for cooling are estimated for the islands, under different scenarios of global
climate change.
Under the high emissions scenario, it is expected that the CDD increase to 91 CDD2
approximately. This value could be, for example, a combination of 50 days with temperatures of
19°C (50CDD) and other 20 days with temperatures of 20°C (400CDD). Under this situation,
the increase in cooling energy demand is expected to be 936%.
The infographics presented below can be found in high resolution in the Soclimpact
Project official website HERE.
2 The indicator is computed by multiplying the number of days exceeding the threshold by the difference in
temperatures. For example the CDD for 100 days at 20 °C is computed as 100*(20-18) = 200CDD

53
Figure 42: Estimations of increased energy demand for cooling in Azores under different scenarios of climate
change until 2100 Source: SOCLIMPACT Deliverable Report - D5.6. Integration and coordination of non-market and big data analysis of economic values resulting from Climate Change
impacts to GEM-E3-ISL and GINFORS models.
Maritime transport
For maritime transport, it has been estimated the impact of Sea Level Rise on ports' economy of
the island. The costs have been calculated with reference to1meter; this is, the investment needed
to increase the infrastructures' height by 1 meter. There is not necessarily a strict correspondence
between the SLR and the required elevation of port infrastructures, which also depend on the
coastal hydrodynamic and the shape of dikes of each port. By experts’ recommendation, we have
assumed that 1 m increase in port height is required to cope with the SLR under RCP 8.5
scenario of emissions. Extrapolation for other RCP scenarios is then conducted based on
proportionality.
The starting point was the identification of the principal ports in each island (economic
relevance). Second, the analysis of the different port areas (exterior, ramps, oil, etc.), and their
uses. Third, the elevation costs were estimated per each area and port separately (considering 1
meter elevation). Thus, the costs of 1-meter elevation presented are the sum of all areas and
ports analysed, and including the rest of the ports of the island (if applicable) based on
proportionality. Estimations consider that all ports areas of the entire area should be elevated at
the same time. In other words, the economic values can be interpreted as the depreciation
(amortization) costs of the investment needed to increase all porsts’ infrastructures' in the island
for 125 years time horizon. No discount rate has been applied.
As expected, the rising of sea levels will affect the sector, as new investments will be needed to
keep ports’ operability. Under the high emissions scenario, it is expected that these costs could
increase 357,000.00 euros per year until the end of the century.

54
The infographic presented below can be found in high resolution in the Soclimpact
Project official website HERE.
Figure 43: Increased costs for maintaining ports’ operability in Azores under different scenarios of SLR caused by climate change until 2100
Source: SOCLIMPACT Deliverable Report - D5.6. Integration and coordination of non-market and big data analysis of economic values resulting from Climate Change impacts to GEM-E3-ISL and GINFORS models.
5.2 Macroeconomic projections
The aim of our study is to assess the socioeconomic impacts of biophysical changes for the
Azores. For this purpose we have used the GEM-E3-ISL model; a single-region, multi-sectoral
general equilibrium model based on the principles of neo-classical theory, and GINFORS; a
macro-econometric model based on the principles of post-Keynesian theory.
Both models include 14 sectors of economic activity, with an emphasis on services and
specifically on those composing the tourism industry. The GEM-E3-ISL model also include:
endogenous representation of labor market and trade flows etc.
Changes in the mean temperature, sea level and precipitation rates are expected to affect energy
consumption, tourism flows and infrastructure developments. These impact-chains have been
examined and quantified under two emission pathways: RCP2.6 which is compatible with a
MEAN SEA LEVEL RISE SLR

55
temperature increase well below 2C by the end of the century and RCP8.5 which is a high-
emission scenario. The impact on these three (3) factors has been quantified in D5.6 and is used
as input in the economic models, which then assess the effects on GDP, consumption,
investments, employment etc.
In total 14 scenarios have been quantified for Azores. The scenarios can be classified in the
following categories:
1. Tourism scenarios: these scenarios examine the reduction in tourism revenues due to
changes in human comfort as captured by the hum-index, the degradation of marine
environment, increased risk of forest fires and beach reduction
2. Energy scenarios: these scenarios examine the impacts of increased electricity
consumption for cooling purposes and for water desalination
3. Infrastructure scenarios: these scenarios examine the impacts of port infrastructure
damages
4. Aggregate scenarios: these scenarios examine the total impact of the previous-described
changes in the economy
In this scenario we examine the impacts of a simultaneous change in electricity consumption,
tourism revenues and infrastructure damages. The scenario specifications for the two climatic
variants are presented below:
Table 16: Aggregate scenario –results
Tourism revenues (% change from reference levels)
Electricity consumption (% change from reference
levels)
Infrastructure damages
(% of GDP)
RCP2.6 (2045-2060) -20.62
0 -0.04
RCP2.6 (2080-2100) -25.40
18.24 -0.04
RCP8.5 (2045-2060) -33.03
0 -0.10
RCP8.5 (2080-2100) -40.56
33.1 -0.12
Source: GEM-E3-ISL
The theoretical and structural differences of the two models mean that this study produces is a
reasonable range of impacts, given the uncertainty embodied in economic analysis and especially
in the long-term.
In GEM-E3-ISL, the economy is in equilibrium at each point in time. Prices adjust to ensure
that supply equals demand (market clearing), capital is fully used; however, the allows for
equilibrium unemployment. The impacts are driven mainly by the supply side through changes in
relative prices that determines competitiveness change, substitution effects etc. The GEM-E3-
ISL model assesses the impacts on the economy up to 2100.
The macro-econometric type of models, such as GINFORS, do not require that all markets are
in equilibrium; idle capital and involuntary unemployment are some other features of this type of

56
models where the results are driven mainly by adjustments in the demand side of the economy.
The GINFORS assesses the impacts on the economy up to 2050.
With respect to GDP the estimated change compared to the reference case is between -0.3% and
-3.1% in the RCP2.6 in 2050 and between -0.8% and -4% in the RCP8.5. The cumulative change
over the period 2040-2100 is estimated (by GEM-E3-ISL) to be equal to -2.8% in the RCP2.6
and -6.5% in the RCP8.5.
Figure 44: Percentage Change in GDP. Source: GWS, own calculation
With respect to sectorial impacts both models show a significant decrease in the activity of tourism related sectors and an increase in the activity of the primary and secondary sectors.

57
Figure 45: Production percentage change from reference. Source: GWS, own calculation
Overall employment falls in the economy and especially in tourism related sectors following the
slowdown in domestic activity. In GEM-E3-ISL increases in employment in non-tourism related
activities are related to labor costs reductions (as wages fall and their competitiveness increases)
and a consequent substitution of capital with labor in other sectors. Employment falls on average
by 0.2% in the RCP2.6 and by 0.3% in the RCP8.5.

58
Figure 46: Employment percentage change from reference. Source: GWS, own calculation
6 Towards climate resiliency
6.1 Current situation: general commitment, specific limits and obstacles
The Azores approved its Regional Strategy on Climate Change (ERAC) in 2011 (Resolution
123/2011). The ERAC is to be put into action through the Regional Program for Climate
Change (PRAC) approved by Resolution of the Council of the Government 93/2014. The
PRAC is focused in mitigation and adaptation to climate change to major economic sectors and
natural assets, and its interaction with the climate.
Since its conclusion (PRAC, 2016) and public presentation in November 2017 no action plan has
been put in force although the PRAC was proposed for approval in July 2018 by the regional
autonomous government. Despite this, the SRIERPA (Sistema Regional de Inventário de

59
Emissões por Fontes de Remoção por Sumidouros de Poluentes Atmosférico), a regional system
of inventory and monioring of carbon sinks and emissions, that feeds the IRERPA (Inventário
de Emissões por Fontes de Remoção por Sumidouros de Poluentes Atmosféricos, was created
within the scope of PRAC and seems to be still active (Despacho n.º 84/2018). This inventory
produces results that comply with IPCC methods and that can be fully integrated with the
national inventory system INERPA (Inventário Nacional de Emissões Atmosféricas), using the
CRF (Common Reporting Format) and producing the NIR (National Inventory Report).
The autonomous regional government continues to announce its commitment on renewable
energy and future investments. Also, it must be noted that harsh consequences on fossil fuel-
based energy have not been put in force, both in energy sector and the transport sector. Both
sectors benefit from tax relieves given for the purchase of fuel-oil and diesel fuel that may come
to end if the commitment to climate change reaches its full potential.
The expansion of renewable energy sources in the electric sector continued, for instance in 2017,
the geothermal electricity plant started operation of 4 MW of stable production. The project
started in the year 2000, first drills where made in 2007 and in 2015 the installation of a
(predicted) 3.5 MW went underway. This facility will provide for 10% of the electricity and
intentions exist to increase the available power. There has been also the announcement of an
energy plan with the 2030 horizon (Estratégia Açoriana para a Energia 2030) and a plan for the
electrification of mobility (Estratégia para a Implementação da Mobilidade Elétrica nos Açores)
which aims for having 2000 electric vehicles in the islands by 2030 as well. Both for the
adaptation and mitigation part the PRAC contain recommendations regarding electric mobility
that may shape its’ future course.
To sum-up the regions commitment to fight climate change and deal with risks is:
Risk:
Improve the research capacity: a. Climate; b. Monitorization c. Vulnerability assessment);
Mitigation: (1) Promote low carbon economy; (2) GEE emission sustainable reduction; (3) Integrate the mitigation objectives in the sectors;
Adaptation: (1) Build resilience for the territory; (2) Promote adaptative capacity on key sectors; (3) integrate the mitigation objectives in the sectors.

60
Table 17: Specific limits and obstacle and relevant documents
Specific limits and obstacles
The major constrain in this territory is the fact that this is an outermost Regions, some 1600 kms away from main land Portugal (locally referred as the continent). The dimension of some islands leads to a lack of critical mass to achieve economies of scale, making them economically depend from the outside. This reality is aggravated by the fact that this archipelago very spread out, stretching 600 kms from its further corners, grouped in three clusters, very much dependent on air and sea transport. The sea ports and airports tend to be oversized to ensure (whenever possible) regular direct connections to the main land (where feasible), even in through rough conditions, as those found in north Atlantic (frequent) storms.
Each island has an isolated electrical grid as the connection between different islands has not been possible to attain. A connection between Faial and Pico islands has been tried but failed due to technical and endurance difficulties. The advent of a sustainable energy grid linking some of the five islands of the central group could reshape their energy system, reducing context costs, increasing quality, reliability of service and ensuring the feasibility of further development of renewable energy.
Relevant documents
- ERAC (Climate Change Regional Strategy)
- PRAC (Climate Change Regional Program) as it was on the public discussion phase;
- IRERPA
- INERPA Source: SOCLIMPACT Deliverable Report – D7.1 Conceptual framework

61
7 References
Fritzsche et al. (2014). The Vulnerability Sourcebook: Concept and guidelines for standardized vulnerability assessments.
Handisyde, N., Lacalle, D. S., Arranz, S., & Ross, L. G. (2014). Modelling the flood cycle, aquaculture development potential and risk using MODIS data: A case study for the floodplain of the Rio Paraná, Argentina. Aquaculture, 422, 18-24.
Jiménez-Guerrero, P., Montávez, J. P., Domínguez, M., Romera, R., Fita, L., Fernández, J., ... & Gaertner, M. A. (2013). Mean fields and interannual variability in RCM simulations over Spain: the ESCENA project. Climate Research, 57(3), 201-220.
Magarreiro, C. (2016). Solar Energy Potential in a Changing Climate: Iberia and Azores Assessment Combining Dynamical and Statistical Downscaling Methods. PhD Thesis, Faculdade de Ciências, Universidade de Lisboa.
Masterton JM., RichardsonF.A. (1979). Humidex, a method of quantifying humandiscomfort due to excessive heat and humidity, CLI 1–79, Environment Canada.Atmospheric Environment Service, Downsview, Ontario.
Raynaud, D., Hingray, B., François, B., & Creutin, J.D. (2018). Energy droughts from variable renewable energy sources in European climates. Renewable Energy, 125, 578-589.
Schneiderbauer, S., Pedoth, L., Zhang, D., & Zebisch, M. (2013). Assessing adaptive capacity within regional climate change vulnerability studies—an Alpine example. Natural hazards, 67(3), 1059-1073.
Soto, D., & Brugere, C. (2008). The challenges of climate change for aquaculture. FAO aquaculture newsletter, (40).
Van Wagner, C. E.,1987: Development and structure of a Canadian forest fire weather index system, Forestry Tech. Rep. 35, Canadian Forestry Service, Ottawa.

APPENDIX 2

1
TABLE OF CONTENT
INTRODUCTION ................................................................................................................................................ 2
1 CURRENT SITUATION AND RECENT TRENDS .................................................................................................. 3
1.1 CURRENT GEOPOLITICAL CONTEXT ......................................................................................................................... 3 1.2 CURRENT CLIMATE AND RISKS ............................................................................................................................... 5 1.3 MACROECONOMIC STATUS .................................................................................................................................. 6 1.4 RECENT EVOLUTION OF THE BLUE ECONOMY SECTORS ............................................................................................... 8
2 ECONOMIC PROJECTIONS ............................................................................................................................ 12
2.1 THE MACROECONOMIC PROJECTIONS ................................................................................................................... 12 2.2 THE SECTORAL PROJECTIONS .............................................................................................................................. 12 2.3 EMPLOYMENT ................................................................................................................................................. 14
3 CLIMATE CHANGE OUTLOOK ....................................................................................................................... 15
3.1 TOURISM ....................................................................................................................................................... 15 3.2 AQUACULTURE ................................................................................................................................................ 18 3.3 ENERGY ......................................................................................................................................................... 20 3.4 MARITIME TRANSPORT ..................................................................................................................................... 26
4 CLIMATE CHANGE RISKS .............................................................................................................................. 29
4.1 TOURISM ....................................................................................................................................................... 29 4.2 AQUACULTURE ................................................................................................................................................ 59 4.3 ENERGY ......................................................................................................................................................... 60 4.4 MARITIME TRANSPORT ..................................................................................................................................... 68
5 SOCIO ECONOMIC IMPACTS OF CLIMATE CHANGE ...................................................................................... 71
5.1 MARKET AND NON-MARKET EFFECTS OF CC .......................................................................................................... 71 5.2 MACROECONOMIC PROJECTIONS ........................................................................................................................ 78
6 TOWARDS CLIMATE RESILIENCY .................................................................................................................. 81
6.1 CURRENT SITUATION: GENERAL COMMITMENT, SPECIFIC LIMITS AND OBSTACLE ............................................................ 81
7 REFERENCES ................................................................................................................................................ 83

2
Introduction
This report is the background material for stakeholders in the upcoming adaptation pathways
workshop in the Balearic Islands. First, a presentation that includes the geography and socio-
economic context for the Island, and the socioeconomic trends without climate change (WP6),
which range from the present to the end-of the century. Regarding Climate Change, the expected
climate risks and vulnerabilities for the blue economy are presented and ran (WP3), joint to the
expected trends of physical risks, booth current and future (WP4). Finally, specific economic
impacts are estimated, considering the evolution of some physical risks (WP5 and WP6). The
current climate policy and resilience of the Island is also presented (WP7). Finally, a link to the
projects original work is made in the references section.
The Balearic Islands at a glance
The Balearic Islands constitute the westernmost Spanish archipelago in the Mediterranean. With
a total area of 4,984 km2 and a population of 1,150,962 inhabitants (Eurostat, 2018). The co-
official languages are Catalan and Spanish. Regarding to the geographical characteristics, the
highest mountain is located in Mallorca (Puig Major in the Serra the Tramuntana) has an altitude
of 1,432 m. The minimum distance separating Mallorca from Menorca is 35 km, and Ibiza is 75
km far from Valencia. The islands enjoy a mild climate with an annual average of 2,850 hours of
sunshine and an average annual temperature of 18ºC. The main international airports are on
Mallorca, Menorca and Ibiza. Access to the island of Formentera is only possible by ferry boat.
There are seven ports with regular sea lines that host around 98,000 passengers. The islands can
be reached via ferry and airplane.
The Blue Economy sectors
Aquaculture
Production in the Blue Economy sector aquaculture is increasing, but at very low speed, and has
very low importance in terms of economic weight in this region
Maritime Transport
The passenger’s ships with positive growth rates and positively growing revenues in the islands
are cruise ships, a holiday activity with a rapidly growing market. However, the freight maritime
transport is even more important. They provide paramount sources such as fuels, food, building
material, consumer goods such as cars etc mostly arriving from the Peninsula. The maritime
transport is principally operated by the 5 most important ports of the Islands (Alcúdia, Eivissa,
Maó, Palma and La Savina) which are managed by Puertos del Estado.
Energy
Regarding energy supply and electricity generation, the Spanish grid operator Red Electrica de
España provides electricity to the islands. Moreover, two electricity subsystems of the Balearic
Islands were connected in 2016 by the Majorca-Ibiza double electricity link with a submarine
cable resting on the seafloor at depths of up to 800 metres. There are other interconnection
projects between islands that will interconnect the islands. In 2019 the Government of the

3
Balearic Islands has decided to meet the energy demands with 10% renewables by 2020, 35% by
2030 and 100% by 2050. Currently, 80 MW PV are installed.
Tourism
Tourism is the island’s most important source of income, contributing to approximately 35% of
the GDP, and closing 2019 with 16.45 million tourists. Even though arrivals have decreased
0.6%, tourist spending increased 1.4% last year to 16.51 billion euros, the highest historical value.
The average stay is 6 days and the most popular time of the year is June to September. Most of
the tourists come from the UK and Germany. The management of the increase in tourist arrivals
along with the climate-related hazards (heat waves, flooding) are the main concerns to be
addressed by the stakeholders.
1 Current situation and recent trends
1.1 Current geopolitical context
The Balearic Islands (regional capital: Palma de Mallorca) constitute the westernmost Spanish
archipelago in the Mediterranean. With their weather, they attract tourism. The European
Regional Innovation Monitor describes the archipelago with “a total area of 4,984 km2, and its
population, with 1,150,962 inhabitants, represents 2.5% of the state (Eurostat, 2018). The co-
official languages are Catalan and Spanish. The Balearic Islands’ industry has undergone an
important process of modernisation and has backed the promotion of a strategy based on quality
and design.”1
The Balearic Islands Regional Context Survey2 describes the geographical outlay of the islands as
follows: The highest mountain is located in Mallorca. With 1,432 m altitude, Puig Majorin the
Serra de Tramuntana, is a protected natural area that in 2011 was declared UNESCO World
Heritage. The minimum distance separating Mallorca from Menorca is 35 km, and Ibiza is 75 km
far from Valencia by sea. The islands enjoy a mild climate with an annual average of 2,850 hours
of sunshine and an average annual temperature of 18ºC. There are 3 UNESCO declarations, one
on each island related to natural biodiversity and culture: Serra de Tramuntana in Mallorca,
Menorca Biosphere Reserve and Ibiza World Heritage Site. Population in 2016was of
1,107,220people, and the main cities are: Palma de Mallorca (the capital), Calvià, Ibiza, Manacor,
Santa Eulària, Marratxí, Llucmajor and Inca.
Main international airports are on Mallorca, Menorca and Ibiza. Access to the island of
Formentera is only possible by ferry boat. Approximately 75% of the air traffic is concentrated in
Palma airport, followed by Ibiza. There are seven ports with regular sea lines that hosted around
97,773 passengers.
Each Island has a regional government. The data situation for the Baleares is less detailed than for other Spanish regions, for instance for the Canaries (see report on Canary Islands).
1 https://ec.europa.eu/growth/tools-databases/regional-innovation-monitor/base-profile/balearic-islands
2 https://www.interregeurope.eu/fileadmin/user_upload/tx_tevprojects/library/file_1508251726.pdf

4
Population dynamics of the island Between 2000 and 2018, total population figures rose from 0.8 million to almost 1.2 million
inhabitants. This implies a marked average annual growth rate of almost 2%. However, growth
rates dampened from 2010 afterwards.
Population density on the Balearic Islands (Baleares) is high and growing. More than twice as
many people live on the Baleares per square kilometer compared to the mainland. The most
densely populated Baleares is Formentera, which also exhibits the largest growth rate. Mallorca
comes second and Menorca third. The latter have much lower growth rates.
The population on the Balearic Islands is younger on average than the mainland population, with
the mean age being 45 as opposed to 48 on mainland Spain (Eurostat, demo_r_d2jan). Regarding
the education levels, the share of persons with tertiary education, or employed in science or both
lies significantly lower than in mainland Spain. Also, the time trend differs: while the respective
shares in Spain constantly rise over time, they reached a peak in 2017 on the Baleares and fell
since.
Table 1: Shares of persons with higher education in the workforce (percent).
Region
Persons with tertiary
education (ISCED)
Persons employed in science and technology
Persons with tertiary
education (ISCED) and employed in science and technology
Scientists and engineers
2014 Spain 37.2 21.6 17.9 5.5
Illes Balears 29.3 17.9 13.4 2.9
2015 Spain 37.6 22.2 18.4 5.6
Illes Balears 28.9 17.8 13.3 3.9
2016 Spain 38.3 23.3 19.3 5.9
Illes Balears 30.2 18.7 14.7 4.6
2017 Spain 39.0 24.1 19.9 6.1
Illes Balears 32.0 20.0 15.8 4.6
2018 Spain 39.9 24.7 20.5 6.3
Illes Balears 30.7 18.3 13.9 4.1
Source: Eurostat, HRST by category and NUTS 2 regions.
Unemployment typically is lower than on the Spanish mainland. During the crisis, the Baleares
exhibit the same unemployment rate for all labor force, and almost the same for young workers
until 24 years (even slightly higher than Spain in the year 2010. After 2012, the Baleares recovered
more rapidly and to a lower level. The relation between youth unemployment and full
unemployment rates is about the same as on mainland Spain, but both on a lower level.
However, youth unemployment is very high and well above the EU average.
Harmonised medium term population outlooks for European regions are available from the
Europop2013 population projections. Figure 1 shows the respective main scenario results for the
Balearic Islands.

5
Figure 1: Baseline population projection for Balearic Islands (2020-2050). Source: Eurostat proj_13rpms3 database, own representation.
As shown, the Balearic Islands are expected to experience lasting population growth until 2050.
The projected population growth from slightly more than 1.1 million inhabitants in 2015 to less
than 1.4 million inhabitants in 2050 corresponds to an average annual growth of slightly less than
0.6%.
1.2 Current climate and risks
In the Balearic Islands, the Mediterranean maritime climate predominates. Annual rainfall ranges from 350 mm to 650 mm. Usually, autumn records the highest rainfall. Temperatures are mild throughout the year, without extremes, with soft, wet winters and dry, hot summers. The winds are predominantly from the north and in winter from the south.
In Mallorca, the annual precipitation varies from one part of the island to another, between 350 mm in the south and 1,500 mm in the high mountain areas of the Tramuntana Mountains.In Minorca, the average annual rainfall is 650 mm. This figure varies depending on the year and the region of the island.
Ibiza and Formentera have a climate with high average temperatures. Rainfall is irregular and scarce, a total of 380 mm on Ibiza and 350 mm on Formentera. The predominant winds are from the west-southwest in winter and from the east in summer.

6
Figure 2: Climate factsheet Source: Own elaboration with data from GFDRR ThinkHazard!; D7.1 Conceptual Framework and Meteoblue; Meteoblue global NEMS (NOAA Environmental
Modeling System)
1.3 Macroeconomic status
The Balearic Islands have a higher GDP per capita than the Spanish mainland. Until the crisis,
the per capita GDP was higher than EU28 average, too. Like Spanish mainland, the recovery
went less quickly than for EU28. Figure 3 shows the respective developments for the Islands,
Spain, EU28 and Germany for comparison. While Spain and the Islands seem to have managed
the turn around and positive, increasing growth rates, the EU28 slackens over the last two years
in the data set. Germany left the crisis very fast and shows no slowing in the data set. However,
the data set ends with the year 2017.

7
Figure 3: Development of GDP per capita for the Baleares, Spain, Germany and the EU28 (current Euro).
Source: Eurostat.
Figure 4 shows the distribution of gross value added by sector for the Balearic Islands (inner ring)
and Spain (outer ring). The largest value-added contribution stems from tourism, with 38% in the
sector wholesale and retail trade, transport, accommodation and food activities. This share is
much larger than the respective share in Spain (24%). The largest difference in relevance can be
found in the industrial sector. While it contributes more than 18% to the Spanish economy, the
share of industry on the Balearics is 7%. Real estate on the Balearic Islands outranks Spain with
15% compared to 11%.
Figure 4: Gross value added by sector – comparison Spain with Balearic Islands. Source: Eurostat nama_10r_3gva.

8
The development of the contributions to gross value added by sector shows that tourism related
value increased more rapidly than other sectors (Figure 5). Financial and insurance activities lost
in relevance, as well as the construction sector. The latter did not recover from the real estate
crisis in Spain. Real estate activities, however, recovered in full and gained strongly in importance.
Industry, information and agriculture stayed stable at low levels.
Figure 5: Gross value added by sector in 1000 Euro. Source: Eurostat, nama_10r_3gva, own graph.
1.4 Recent evolution of the blue economy sectors
Tourism
Tourism is still increasing on the Balearic Islands. Lately, there has been a public discussion about
overtourism, mainly in cities but on Islands as well. The online travel magazine mypics states:
“Resources are scarce on islands. The ecological balance in nature is even more sensitive than in
the city. In several years it has been reported (…) that drinking water has become scarce. The
sewage and garbage disposal for the many people on the islands is a problem. They are inhabited
only by relatively few natives. The sewage and garbage disposal are adjusted to them and of
course also to tourists. However, when seven to thirty times the amount of waste and sewage is
produced in the season, it is no longer manageable. Waste water is discharged untreated into the
sea.” Adding climate change to this scenario makes the islands even more vulnerable.

9
Figure 6: Tourism on the Balearics: absolute numbers and growth rates. Source: Eurostat, tour_occ_arn2, own graph.
Tourist number mainly know one direction of development: upwards. The Balearics benefit from
the global trend as well as from shift in tourism in the Mediterranean Sed. During the crisis,
global tourism took a dent, only to recover at full speed very early on. Growth then stagnated and
tourist number stayed at a very high level until they were boosted again in 2016, mainly benefiting
from the shift in tourism away from Turkey and, to some extent, Egypt.
Total number now are well exceeding 10 million tourists per year. The main reasons for tourism
on the Baleares are the natural beauty, landscapes and beaches (Table 2).
Table 2: Main motifs of German tourists to travel to Mallorca. Motif Percent
Natur and Landscape 70%
Beach 62%
Culture 58%
Cuisine 57%
Nightlive/Ballermann/ElArenal 12%
Source: Statista.
Maritime transport
While global maritime transport of goods grows steadily with global trade, the transport of
people by ship has been replaced by airplanes if it comes to going from one place to another. The
only passenger ships with positive growth rates and positively growing revenues are cruise ships,
a holiday activity with a rapidly growing market.

10
Islands participate in the latter, but have more reasons for the freight maritime transport: they
rely on resources such as fuels, food, building material, consumer goods such as cars etc. are
brought to the island by ship.
Figure 7 shows the development of freight and passenger maritime transport for the Baleares.
While passenger transport is increasing lately, freight transport decreased by more than 50% since
2006. The reasons will be researched further during the scenario building and modelling analysis.
Figure 7: Freight and Passenger Transport on the Balearics Source: SOCLIMPACT Deliverable Report - D6.2 Macroeconomic outlook of the islands’ economic systems and pre-testing simulations
Aquaculture
Production in the Blue Economy sector aquaculture is increasing, but at very low speed.
Table 3: Production value of Balearic Aquaculture 2018.
Species 2015 2016 2017 2018
Sea bass or sea bass 5,891,119 9,938,250 8,171,690 12,267,879
Dorade 4,123,899 6,293,130 1,241,546 783,395
Gold or red carp - - 750 -
Cyprinids nep 3,000 - 3,000 -
Common carp - - 3,000 -
Total 10,018,017 16,231,380 9,419,987 13,051,275
Source: Spanish Ministry for Agriculture, Food and Fishery:
Electricity
Regarding energy supply and electricity generation, the Spanish grid operator RED Electrica de
Espagna describes the challenges as follows: “Until the electricity interconnection between the
Spanish peninsula and the Balearic Islands was put into service, the Balearic Islands electricity
system was comprised of two smaller-sized subsystems which were electrically isolated, Majorca-
Menorca and Ibiza-Formentera, which made it difficult to achieve similar stability and service
quality indexes as those systems which are larger and interconnected.

11
For this reason, Red Eléctrica undertook this electricity interconnection project to provide a link
with the transmission grid on the Spanish peninsula. This interconnection, in addition to
representing a complementary option to the construction of new power stations on the Balearic
Islands, will also allow competition in the Islands’ generation market to be increased, with the
consequent improvement in energy efficiency and sustainability of the Balearic Islands’ electricity
system.
In 2016 the two electricity subsystems of the Balearic Islands are finally connected by the
Majorca-Ibiza double electricity link. At the time of its commissioning, this interconnection link
is the longest and deepest submarine link in alternating current of its kind in the world, as the
submarine cable rests on the seafloor at depths of up to 800 meters. The Majorca-Ibiza
submarine interconnection also provides advantages of an environmental nature and also cost
savings for the electricity system as a whole. Although this is the major development project in
the Balearic Islands, there are other interconnection projects between islands that will connect
Majorca to Menorca and Ibiza to Formentera.” Therefore, the Balearic Islands are less inclined
for own solutions, compared to more isolated Islands. However, only this year, 2019, the
Government of the Balearic Islands has decided to meet the energy demands on Mallorca,
Menorca, Ibiza and Formentera with 10% renewables by 2020, 35% by 2030 and 100% by 2050
(PV Magazine, 2019)3. Currently, 80MW PV are installed, thus the plan can be called rather
ambitious. To support PV development, existing car parks will be required to install PV as well as
every new building. Estimates exist which foresee 230 MW of PV being currently in the pipeline,
which will bring RE shares in the Baleares to 10%.
Infrastructure, R&D and planned projects
The main infrastructure plans at the regional level are the Industrial Plan Illes Balears 2018-2025
which will support diversification and modernization with the following expenditure plan:4
• Technological acceleration and innovation (€25m) • Financing and improvement of the institutional environment (€15m) • Capacity building for human capital and quality employment (€30m) • Internationalization of companies (€13m) • Promotion of industrial clusters (€5m) • Industrial land, logistics and energetic resources (€7m) • Monitoring and analysis (€7m) This strategy is expected to create 3,000 new jobs, increase the occupation in manufacturing and
increase Gross Value Added by 9%. The strategic relevant sectors comprise: nautic, aeronautic,
fashion, habitat, food and cultural and technological industries.
The European Regional Development Fund program has very similar targets and expects similar
results. Both programs do not go beyond 2025.
3 https://www.pv-magazine.com/2018/02/15/spains-balearic-islands-propose-ambitious-100-renewable-
energy-law/ 4 https://ec.europa.eu/growth/tools-databases/regional-innovation-monitor/policy-document/industrial-plan-
illes-balears-2018-2025.

12
2 Economic projections
2.1 The macroeconomic projections
According to our reference projections, Balearic Islands continues to grow with a 1.6% yearly
rate throughout the 2015-2100 period. A main driver of growth is investments with an average
yearly growth rate of 1.8% over the whole projection period (Table 4). While growth rates of
private and public consumption are projected to decrease over time, a long-term reduction of the
trade deficit also plays a key role for the sustained economic growth. This indicates a transition
towards a more sustainable economy that reduces its reliance on imported consumption and
increases its productive capacity through investment activity.
Table 4: Balearic Islands GDP and GDP components yearly growth rates in 2020-2100. 2020 2025 2030 2035 2040 2045 2050 2060 2070 2100
GDP 3.1% 2.0% 1.9% 1.7% 1.6% 1.5% 1.4% 1.6% 1.6% 1.2%
Private consumption 2.3% 0.8% 0.8% 0.8% 0.7% 0.7% 0.7% 0.9% 1.1% 0.9%
Public consumption 2.8% 1.2% 1.1% 1.1% 1.0% 0.9% 0.9% 0.8% 1.0% 0.8%
Investments 3.8% 2.0% 1.8% 1.6% 1.5% 1.3% 1.2% 1.8% 1.8% 1.8%
Trade 1.4% -1.5% -1.7% -1.9% -2.1% -2.4% -2.9% -3.7% -5.2% -5.7% Source: SOCLIMPACT Deliverable Report - D6.2 Macroeconomic outlook of the islands’ economic systems and pre-testing simulations
The high growth contribution of investments in the period up to 2050 is due to a high paced
growth towards 2020 which counterbalances a lack of investments during the economic crisis.
Throughout the 2025-2050 period, investments growth rates do not exceed overall GDP growth
rates. Private consumption is projected to represent also in 2100 the largest demand component
of GDP, followed by investments and public consumption.
Figure 8: Macroeconomic components as a % share of GDP for Balearic Islands in 2015-2100. Source: SOCLIMPACT Deliverable Report - D6.2 Macroeconomic outlook of the islands’ economic systems and pre-testing simulations
2.2 The sectoral projections
The Balearic Islands economy remains a service-led economy throughout the 2015-2100 period
with an increasing contribution of other market services, construction services and other

13
transport services. Whereas declining shares in overall gross value added are projected for
accommodation and food services as well as non-market services, both sectors are still projected
to provide significant contributions (more than 27%) to total gross value added in 2100.
The aggregated gross value added share of agriculture, fishery, manufacturing and consumer
goods is projected to decline from almost 3% in 2015 to less than 2% until 2100. This
observation is mainly driven by respective decreases in the gross value added shares for the
consumer goods industry.
Electricity and water services are projected to contribute between 2 and 3% to total gross value
added throughout the projection period.
Total tourism activities are projected to provide rather stable contributions to total gross value
added throughout the projection period. Starting from more than 18% in 2015, the respective
shares decline slightly to less than 17% in 21005.
Figure 9: Sectoral value added as a % share to total GVA for Balearic Islands in 2015, 2050 and 2100. Source: SOCLIMPACT Deliverable Report - D6.2 Macroeconomic outlook of the islands’ economic systems and pre-testing simulations.
5 The share of tourism in GDP is calculated via the tourism satellite account (TSA) matrices of 2015, assuming that the same shares that indicate the contribution of tourism to the productions of tourism-related sectors (such as the accommodation and food services, transport services, travel agency and related activities, cultural and recreational activities) remain throughout the 2015-2100 period. Please see Appendix B of SOCLIMPACT Deliverable Report D6.2 for the complete database of the estimated TSAs.

14
Table 5: Sectoral contribution as a % share of total gross value added for Balearic Islands in 2015-2100. GVA % shares 2015 2020 2025 2030 2035 2040 2045 2050 2060 2070 2100
Agriculture 1.1% 1.0% 1.0% 1.0% 0.9% 0.9% 0.9% 0.9% 0.8% 0.8% 0.7%
Fishery 0.1% 0.1% 0.1% 0.1% 0.1% 0.1% 0.1% 0.1% 0.0% 0.0% 0.0%
Manufacturing 0.2% 0.2% 0.2% 0.2% 0.1% 0.1% 0.1% 0.1% 0.1% 0.1% 0.1%
Consumer goods 1.6% 1.3% 1.2% 1.2% 1.1% 1.1% 1.1% 1.1% 1.0% 0.9% 0.8%
Electricity 2.2% 2.1% 2.1% 2.0% 2.0% 2.0% 1.9% 1.9% 1.8% 1.7% 1.6%
Water 0.7% 0.7% 0.7% 0.6% 0.6% 0.6% 0.6% 0.6% 0.5% 0.5% 0.5%
Construction 8.6% 9.5% 9.6% 9.7% 9.8% 9.9% 10.0% 10.1% 10.3% 10.5% 14.7%
Water transport 1.6% 1.5% 1.5% 1.5% 1.4% 1.4% 1.4% 1.3% 1.3% 1.2% 1.1%
Other transport 4.5% 4.5% 4.6% 4.7% 4.8% 4.9% 5.0% 5.2% 5.5% 5.8% 5.9%
Accommodation & food services
18.1% 17.6% 17.5% 17.4% 17.3% 17.2% 17.2% 17.1% 16.9% 16.7% 15.8%
Travel agency & related activities
1.5% 1.4% 1.3% 1.3% 1.2% 1.2% 1.2% 1.2% 1.1% 1.0% 0.9%
Recreational services 0.6% 0.6% 0.6% 0.5% 0.5% 0.5% 0.5% 0.5% 0.4% 0.4% 0.4%
Other market services 45.4% 45.8% 46.1% 46.3% 46.5% 46.7% 46.8% 46.9% 47.2% 47.4% 45.5%
Non-market services 13.9% 13.7% 13.6% 13.5% 13.4% 13.4% 13.3% 13.2% 13.0% 12.8% 12.1%
Source: SOCLIMPACT Deliverable Report - D6.2 Macroeconomic outlook of the islands’ economic systems and pre-testing simulations.
2.3 Employment
The service-led economic growth brings positive effects to the labour market with
unemployment projected to fall from almost 14% in 2015 to slightly less than 7% in 2100. The
contribution of each sector to total employment depends on the labor intensity of the sector. The
biggest employing sectors are non-market and other market services as well as accommodation
and food services. Recreational services and construction services also feature significant
employment shares throughout the 2015-2100 period.
Tourism is largest employer of the Blue growth sectors under analysis, particularly due to the
high labor intensity of accommodation and food services. The lowest contribution to overall
employment among Blue growth sectors is attributed to the fisheries sector.
Table 6: Sectoral contribution as a % share of total gross value added for Balearic Islands in 2015-2100.
2015 2020 2025 2030 2035 2040 2045 2050 2060 2070 2100
Unemployment rate
13.8% 10.4% 9.0% 8.1% 7.7% 7.6% 8.0% 7.9% 7.3% 6.3% 6.9%
Source: SOCLIMPACT Deliverable Report - D6.2 Macroeconomic outlook of the islands’ economic systems and pre-testing simulations.

15
Figure 10: Sectoral employment as a % share of total for Balearic Islands in 2015, 2050, 2100. Source: SOCLIMPACT Deliverable Report - D6.2 Macroeconomic outlook of the islands’ economic systems and pre-testing simulations
3 Climate change outlook
Climate hazards indicators represent the entry point to understand the climate change exposure
of the blue economy sectors. The indicators have been computed for two scenario RCP2.6 (low
emission scenario) and RCP8.5 (high emission scenario) and for different horizon times namely: a
reference period (1965-2005), mid-century (2046-2065) and end of century (2081-2100). Main
source of climate projections (future climate) for the Balearic Islands is MED-CORDEX
ensemble (regional scale of Mediterranean area) and CMIP5 Ensemble (global scale) even if other
model sources were applied when required, depending of available scales. Results are presented in
form of maps, tables or graphs and only when the information shows an interesting outcome.
All the graphics presented below can be found in high resolution in the Soclimpact
Project official website HERE.
3.1 Tourism
Seagrass evolution
Posidonia Oceanica and Zostera are foundation species in Mediterranean waters. Foundation species have a large contribution towards creating and maintaining habitats that support other species. First, they are numerically abundant and account for most of the biomass in an ecosystem. Second, they are at or near the base of the directional interaction networks that characterize ecosystems. Third, their abundant connections to other species in an ecological

16
network mostly reflect non-trophic or mutualistic interactions, including providing structural support for other species, significantly altering ecosystem properties to [dis]favor other species, altering metabolic rates of associated species, and modulating fluxes of energy and nutrient flow through the system. Seagrasses are the main habitat for coastal marine ecosystems. They provide different services like sediment retention (and thus clearer waters), coastal protection (in front of marine storms), shelter for marine organisms, etc. Therefore, the state of seagrasses is a convenient proxy for the state of coastal environment. 3 species are located in the coasts of Balearic Islands: Cymodocea, Zostera and Posidonia, which is the most represented species. The results of RCP8.5 projections indicate a complete disappearance of Zostera from mid-century and for Posidonia, a loss of 35% could be observed at end of century. Beach flooding and related losses
One of the consequences of an increase in the mean sea level will be the flooding of coastal areas. This includes sand beaches, which are the main asset for tourism activities in most of the European islands. Therefore, estimating the potential risk of beach loss due to climate change is of paramount importance for the economy of those islands.
Extreme flood level (95th percentile of flood level averaged) The 95th percentile of the flood level averaged was selected as an indicator of interest. The values are presented as anomalies with respect to the present mean sea level at beach location (i.e. including the median contribution of runup). An increase is expected being larger at the end of the century under scenario RCP8.5.
. Figure 11: Projected extreme flood level (in the vertical, in cm) at beach locations with respect to the present (1986-2005) mean sea level values averaged for the islands under scenario RCP2.6 (left) and RCP8.5 (right). Ensemble
of models using Global simulations produced by Hemer et al. (2013). Source: D4.4d Report on the evolution of beaches

17
Under mean conditions, we find that, at end of century, the total beach surface loss range from
~45% under scenario RCP2.6 to ~70% under scenario RCP8.5.
Figure 12: Beach reduction % (scaling approximation). Source: SOCLIMPACT Deliverable Report - D4.4d Report on the evolution of beaches.
Fire weather Index
The FWI system provides numerical non-dimensional ratings of relative fire potential for a generalized fuel type (mature pine stands) based solely on weather observations. FWI is part of the Canadian Forest Fire Danger Rating System established in Canada since 1971 (van Wagner 1987). Furthermore, since 2007, FWI has been adopted at the EU level and used in a harmonized way throughout Europe by the European Forest Fire Information System (EFFIS) of the Copernicus Emergency Management Service (since 2015). It is selected for exploring the mechanisms of fire danger change for the islands of interest in the framework of SOCLIMPACT Project, as it has been proved to adequately perform for several locations, including the Mediterranean basin. The index was calculated for the fire season (defined from May to October) over the Mediterranean for all models, scenarios and periods. For the archipelago of Baleares, N=49 grid cells were retained from the model’s domain. In the following figure the ensemble means, and the uncertainty is presented for all periods and RPCs. It seems that under RCP2.6, the index slightly increases at the middle of the century, while it returns to present levels towards the end of the century. On the other hand, under RCP8.5 there is an increased fire danger that exceeds 30% at the end of the century. In any case, the fire danger for Baleares is among the lowest of the Mediterranean islands with a normalized FWI in the low category for fire danger and only the central areas of Mallorca reach medium fire danger by the end of the century.

18
Figure 13: Fire Weather Index (EURO-CORDEX) with the color associated to the class of hazard Source: SOCLIMPACT Deliverable Report - D4.4c Report on potential fire behaviour and exposure
Humidex
For the assessment of climate hazard on heat related impacts of climate change on human health, the humidity index (Humidex) (Masterton and Richardson, 1979) has been used. Humidex value is an equivalent temperature, which express the temperature perceived by people (the one that the human body would feel), given the actual air temperature and relative humidity. As a more representative indicator for the assessment of inhabitants’ and tourists’ hazard on heat related climate change impacts, the Number of Days with Humidex greater than 35°C was selected. From the above classification, a day with Humidex above 35°C describes conditions from discomfort to imminent danger for humans. For the archipelago of Baleares, N=49 grid cells were retained from the models domain. In the following figure the ensemble mean and the uncertainty is presented for all periods and RPCs. It is found that the number of days above discomfort threshold with be double under RCP8.5 by the end of the century.
Figure 14: Humidex in number of days (EURO-CORDEX) Source: D4.3_Atlases of newly developed indexes and indicator
3.2 Aquaculture
Extreme Wave Return Time

19
Changes in currents and waves cause decreased flushing rates (shellfish) and salinity changes,
leading to accumulation of waste under cages, stock loss, and damage to facility/structure. Under
this scenario, there is a need to invest in stronger constructions and higher insurance costs. In
order to analyse these changes, return times for a threshold of 7 m significant wave height (hs)
were computed. This significant height has been identified by stakeholders as the critical limit for
severe damages to assets at sea. Return times can be related to the payback times of investments
and help assess potential economic losses and economic sustainability. In the future, under
RCP8.5. (far future), the extreme wave return time will increase all around the islands.
Figure 15: Extreme wave return under present climate and under RCP8.5 (far future) Source: D4.3 Atlases of newly developed hazard indexes and indicators with Appendixes
Annual Mean Significant Wave Height (AMSH) The Annual Mean Significant Wave Height was selected as a relevant indicator of the average stress for aquaculture infrastructures. For Balearic Islands, a decrease of annual mean significant wave height could be observed under RCP8.5 at the end of century.

20
Figure 16: AMSH Source: D4.3 Atlases of newly developed hazard indexes and indicators with Appendixes
3.3 Energy
Renewable energy productivity indexes
A series of indicators related to renewable energy productivity is presented. The selected indicators are wind and photovoltaic (PV) energy productivity, as well as the frequency and duration of low-productivity periods, termed energy droughts (Raynaud et al., 2018), as a measure of the variability of these sources. The productivity and variability of these renewable energy sources will depend on climate. The possibility of reduced productivity due to climate change poses a risk to the energy generation, if it is based on these renewable energy sources. Also, a possible increase in the frequency and duration of solar and wind energy droughts will require an increase in storage and backup sources. Among the different renewable energy sources, solar PV and wind energy have been selected, as they are (and very likely will be) the main renewable energy sources, due to their degree of technological development and their comparatively low cost. In order to consider a marine energy source, offshore wind energy is included, in addition to onshore wind energy.
Wind and photovoltaic (PV energy) productivity
A general decrease can be observed for every scenario and period, being the 2081-2100 period in
RCP8.5 the one with the highest decrease. A noticeable maximum decrease is observed between
Mallorca and Ibiza in this latter case, while over land the decrease is maller in absolute terms, but
higher in relative terms as Wprod is systematically loer.

21
Figure 17: E2: Panel A: Yearly mean wind energy productivity [10^3 kWh/kW] for the control time period (1986-2005). Panels B - C: Changes in yearly mean wind energy productivity in the RCP2.6 scenario for periods
2046 - 2065 and 2081 - 2100 with respect to the control. Panels D - E: As for panels B - C, but for the RCP8.5 scenario.
Source: Soclimpact Project deliverable- D4.4a Report on solar and wind energy
Wprod is systematically much higher over the sea, due to the fact that there is less friction than
over land. This occurs in all areas of the domain. The future decrease in Wprod is found for both
land and maritime regions and both emissions scenarios, although with differences in the
magnitude. RCP8.5 is clearly the scenario where a higher decrease in productivity is expected. It
is worth noting that RCP2.6 seems to recover from the decrease by the end of the 21st century, in
contrast to RCP8.5. The decreases are higher in relative terms over land (up to 13%).
With respect to the wind energy productivity and PV production a clear decrease is found in the Balearic Islands in the RCP8.5 scenario at the end of the XXI century.

22
Figure 18: Wind energy productivity. Source: D4.4a Report on solar and wind energy
Figure 19: Wind energy productivity. Source: D4.4a Report on solar and wind energy
There is a general decrease in photovoltaic productivity for the Balearic Islands with respect to the control period (1986-2005). The most negative changes can be found in RCP8.5 scenario at the end of the century (2081-2100). The photovoltaic productivity decrease is larger over the sea than over land. Uncertainty in the sign of the projected changes in future scenarios is low, with a general agreement except for RCP2.6 over land, where one of the models project a positive change. Changes are rather small in scenario RCP2.6 (around 1%), while in scenario RCP8.5 a decrease of 2% (land) and 5% (sea) is projected at the end of the century. These results agree with previous references that project a slight decrease of PV production over the south of Europe (Jerez et al., 2015).

23
Figure 20: Photovoltaic (PV) productivity(sea). Ensemble of models using. Source: D4.4a Report on solar and wind energy
Figure 21: Photovoltaic (PV) productivity(land). Ensemble of models using. Source: D4.4a Report on solar and wind energy
Frequency and duration of low-productivity periods (energy droughts) as a measure of
the variability of these sources
Wind energy productivity droughts are generally much more frequent than photovoltaic productivity droughts. Also, the duration of wind energy drought episodes (measured by the maximum consecutive energy drought days) is greater than that of photovoltaic droughts. This highlights the steadiness of photovoltaic production in the analyzed island.

24
Projected changes in the % of days of drought are generally not larger than 5%. For instance, in line with what is found for wind energy productivity, in the Balearic Islands we observe an increase in the occurrence of wind energy droughts in the RCP8.5 scenario, especially in the second half of the XXI century. For moderate wind and severe droughts, a generalized increase in the occurrence is observed for the both scenarios. Regarding moderate and severe PV droughts, their frequency in the reference period and their changes are very small in both scenarios. Wind droughts experience a generalized increase in frequency in all scenarios and time periods considered. The increase in the occurrence of wind droughts is especially remarkable in the second half of the 21st century, in the RCP8.5 scenario, where moderate droughts occur on average for 17 days more per year and severe droughts for 13 days more per year.
Figure 22: Ensemble mean frequency of moderate and severe WIND productivity drought days (%) in the reference period, as well as the ensemble mean changes in the frequency of drought days (%) in the different time
periods considered. Averages are computed over land. Source: D4.4a Report on solar and wind energy

25
Figure 23: Ensemble mean frequency of moderate and severe PV productivity drought days (%) in the reference period, as well as the ensemble mean changes in the frequency of drought days (%) in the different time periods
considered. Averages are computed over land. Source: D4.4a Report on solar and wind energy
Figure 24: Ensemble mean frequency of moderate and severe productivity drought days (COMBINED) in the reference period, as well as the ensemble mean changes in the frequency of drought days (%) in the different time
periods considered. Averages are computed over land. Source: D4.4a Report on solar and wind energy

26
3.4 Maritime Transport
Sea level rise
Sea level rise (SLR) is one of the major threats linked to climate change. It would induce permanent flooding of coastal areas with a profound impact on society, economy and environment. Moreover, an increase in the mean sea level would result in a larger impact of coastal storms with the consequent increase of risk. The results are presented in terms of mean sea level rise. For Balearic Islands, the SLR ranges from 24, 92 cm (RCP2.6) to 65,86 cm (RCP8.5) at the end of the century.
Figure 25: Mean sea level rise (in cm) with respect to the reference period (1986-2005). Ensemble mean of CMIP 5 simulations and scaling approximation for RCP2.6
Source: Deliverable D4.4b Report on storm surge levels
Storm surge extremes
Storm surge events, characterized by positive extreme sea levels and mechanically forced by atmospheric pressure and wind are the main responsible for coastal flooding, especially when combined with high tides. To present, the only ensemble populated with enough number of members to compute meaningful statistics on climate projections is the one produced for the Mediterranean by Lionello et al. (2016). This ensemble consists on 6 simulations run with the HYPSE model at 1/4º of spatial resolution and forced by the high-resolution wind fields from the MedCORDEX ensemble which in turn is nested into CMIP5 global simulations. The simulations are run for the period 1950-2100 thus covering the historical period as well as the whole 21st century. Complementary, the ensemble includes three hindcast simulations that are used to establish present reference levels. Storm surge could decrease amount 10% under RCP8.5 (far future).

27
Figure 26: 99th percentile of atmospherically forced sea level (in cm) averaged for the hindcast period, the near future (2046-2065) and the far future (2081-2100) under scenarios RCP2.6 (with scaling approximation) and
RCP8.5, relative change in brackets. Source: SOCLIMPACT Deliverable Report - D4.4b Report on storm surge levels
Frequency of extreme high winds (Wind Extremity Index – NWIX98)
The wind extremity index NWIX98 is defined as the number of days per year exceeding the 98th
percentile of mean daily wind speed. This number decreases in the far future with a strongest value under RCP8.5 (- 27 %).
Figure 27: Wind Extremity Index (NWIX98). Ensemble mean of EURO-CORDEX simulations.
Source: D4.3_Atlases of newly developed indexes and indicator

28
Wave extremes (99th percentile of significant wave height averaged)
Marine storms can have a negative impact on maritime transport, coastal-based tourism and aquaculture, among other activities. To illustrate this impact, the 99th percentile of significant wave height averaged has been chosen. A decrease in the extreme wave height is found being larger under scenario RCP8.5 as illustrated in the following map.
Figure 28: the 99th percentile of significant wave height averaged for the reference period and the relative change for the RCP8.5. MED-CORDEX and Global simulations produced by Hemer et al. (2013).
Source: Deliverable D4.4b Report on storm surge levels
Figure 29: the 99th percentile of significant wave height averaged for the reference period and the relative change for the RCP8.5 and RCP2.6. MED-CORDEX and Global simulations produced by Hemer et al. (2013).
Source: Deliverable D4.4b Report on storm surge levels

29
4 Climate change risks
4.1 Tourism
For the tourism sector, three impact chains (IC) were operationalized: i) Loss of attractiveness due to marine habitats degradation ii) Loss of comfort due to a decrease in thermal comfort iii) Loss of attractiveness due to increased danger of forest fires in touristic areas
For the first two, the AHP method was employed. This methodology is ideal to respond to the hierarchical nature of the impact chain and, secondly, for using expert judgements to assess the comparative risk for the islands over a large number of indicators. By the side of shadows, this method requires quite specific data that wasn’t able to collect for some islands. Loss of attractiveness due to marine habitats degradation Climate change is expected to impact tourism activities through direct impacts on comfort and
health of tourists, on the infrastructures and facilities that provide basic services to visitors and
on the natural ecosystems that hold a big part of the attractions of the coastal and marine tourism
destinations. The analysis of those impacts was decomposed into a single impact chain.
Specifically, it presents a conceptual model on the effect that Climate Change would have on
conditions that make marine environments attractive for tourists visiting coastal destinations.
More in detail, climate hazards like the increase of mean and variability of seawater temperature
and the increase of oceans acidification, mainly, are affecting marine habitats with touristic
relevance through diminishing bio-productivity and attracting exotic species, some of them toxic,
and because of that, reducing the attractiveness of marine landscapes and the presence of flagship
species; increasing turbidity in bathing and diving sea waters affecting the quality of bathing,
diving, snorkelling and bottom-glass boating experiences, at least; and increased frequency and
intensity of episodes of seagrasses massive death that arrive to the beaches affecting the
experience of lying and staying there.
The next figure shows the theoretical impact chain. As can be seen in the figure, the impact of
Climate Change on the touristic attractiveness of an island depends on a set of multi-dimensional
factors, including:
1. Increase in the mean and variability of seawater temperature is the main driver of marine habitat degradation; also seawater acidification impacts marine life although it substantially varies depending of the marine organisms;
2. The risk of those marine habitat transformations for tourism critically depends on the nature exposed to it, the amount and proportion of tourists that feel marine habitat is a relevant motivation to visit the destination, and the resilience of the exposed natural assets and tourists to those changes in the marine environmental conditions;
3. Finally, the preparedness to cope with the deterioration of its marine environment by developing substitutive attractions, is also a key aspect to assess the effective risk that those hazards pose on the tourism industry at the destination.

30
The complex relationship between climate change, marine habitats and tourism still exhibits
important gaps of knowledge. For example, there is no evidence on the impact that the
abovementioned hazards may have on the communities of cetaceans that live or pass through
near the coasts of the islands under study. In some cases, this is a very important economic
chapter within the tourism industry in the islands. Whether climate change is going to diminish or
not the abundance, or affect the distance of those cetacean communities from the island requires
further research.
Figure 30: Loss of destination attractiveness due to marine environment degradation as a result of climate change hazards.
Source: SOCLIMPACT Deliverable Report – D3.2. Definition of complex impact chains and input-output matrix for each islands and sectors

31
Selection of operationalization method
The Analytical Hierarchy Process (AHP) method, introduced by Saaty (1980), was selected as the
technique to operationalize the impact chain since it is a well-grounded tool that allows for the
prioritization/ranking of alternatives using a weighting scheme that is established by expert
judgement. Hence, for the purposes of the project, it was considered suitable as it would be able
to reconcile the contribution of each risk factor (hazards, exposure, and vulnerability, which
includes sensitivity and adaptive capacity) towards the risk based on expert opinion and,
subsequently, order the islands in terms of which one is most at risk of losing attractiveness due
to the degradation of the marine environment.
Application of the AHP methodology
The problem to be solved along through the expert decision process was comparing the risk of
the European islands of losing tourist attractiveness due to the deterioration of their marine
habitats as consequence of climate change. The hierarchy tree for this decision problem was built
underpinning on the impact chain elements, together with the variables that express the tourism-
related environmental and social systems’ exposure to those hazards, the sensitivity of the
exposed systems to the referenced hazards and the social capacities to cope with the potential
impacts of climate change by protecting nature and the society and/or making them more
resilient.
Some modifications of the original impact chain were undertaken for the sake of feasibility,
although experts were encouraged to have in mind all the factors they know can affect the impact
of climate change
on the marine habitat services for tourism. It means that the hierarchy tree is a simplified
structure of the main factors explaining the complex relationship between climate change and the
ecosystem services that support tourist use of marine environments, but other factors also known
by experts must be taken into account at the time of comparing the components of the risk
between islands. This is one of the most interesting strengths of the decision processes based on
expert participation and, particularly, of the multicriteria analysis used in this case. The next figure
shows the basic structure, or hierarchy tree, of the decision making process that was presented to
the experts.

32
Figure 31: Hierarchy tree for marine habitats impact chain. Source: SOCLIMPACT Deliverable Report – D4.5. Design of a comprehensive approach to climate and climate-related risk information to policy makers and the general
public
Hazards are the climate events that instigate the climate-associated risk. In our context, seawater
heating was considered as the most relevant variable to assess changes in the conservation status
of the marine habitats that provide services for coastal tourism activities. Other hazards initially
considered, like acidification and storms, were finally discarded. The first one because its effects
on living marine organism are still under study and the evidence is dispersed and not conclusive.
The second one because in the Mediterranean Sea and the Atlantic Ocean that surrounds the
islands under study, storms are considered not so frequent and intense to not giving time to
marine ecosystems to recover their previous conservation status.
Regarding indicators, published research shows 25 and 26 Celsius degrees as the threshold
temperatures over which seagrass meadows, the foundation species that mainly structure
ecosystems in the marine habitats of reference, start to decline. The indicators used were the
number of days per year with seawater temperature over 25 and 26 Celsius degrees. Sources of
information and data were provided by the Soclimpact modellers.
Exposure denotes the range of ecological and social systems susceptible to be damaged by
hazards. This criterion, the natural and social systems potentially damaged by the selected climate
hazards, was decomposed into three sub-criteria, one referred to the marine environment, and
the other two related to the use that tourists make of the services provided for the marine
environments at the destination. These three sub-criteria were expressed through three respective
indicators. One, referred to the surface of marine phanerogams that suffer from the climate
stressors. Phanerogams, specially Posidonia in the Mediterranean and Cymodosea in the Atlantic,
are the very foundation species organizing most of the coastal ecosystems. They provide food
and shelter to many different species and keep seawater clear by absorbing sediments.
Additionally, when become damaged, seagrasses meadows deliver dead individuals that go to lay
on the beaches used by tourists.

33
The second sub-criterion is one about the different types of direct uses that tourists make of the
ecosystem services. Diving was selected to represent theses uses and the selected indicator was
the number of divers per year. It was assumed that other sea watching activities like snorkelling
and bottom-glass boating evolve similarly than diving. Experts were also invited to consider other
sea environment users potentially affected by the lack of water transparency and dead seagrass
suspended in seawater like surfers, windsurfers and other active users of the marine environment.
The third sub-criterion was related to the impact on most of tourists as bathers. Turbid water
affects the quality of the bathing experience, which is an activity that most tourists do.
Sensitivity concerns the susceptibility of natural, cultural, and built resources to harm that is a
direct or indirect result of Climate Change hazards. For the operationalization of this impact
chain, sensitivity relates to the susceptibility of the phanerogam meadows to changes in seawater
temperature and to the extent to which the impoverishing of seawater conditions and marine
ecosystems may affect tourists’ welfare.
Regarding the effects of episodes of seawater heating on the integrity of seagrasses meadows, the
variable selected was periods of overheating and the indicators were the number of days per year
with seawater temperature over 25 and 26 Celsius degrees. As explained above, experts were
invited to take into account their experience and their knowledge about the differences between
the way seagrasses behave in the real world and in the laboratory when studying the impact of
water heating.
With respect to the impact of the marine environmental degradation on the welfare of tourists,
the indicator selected was the tourists’ willingness to pay for the preservation of marine
ecosystems6. Thus, ecosystems’ and social’s susceptibility are both taken into account when
comparing risks of marine environment degradation due to climate change between islands.
Adaptive capacity reveals the potential to face the hazards by reducing the level of exposure
and/or increasing the resilience of the tourism system. This criterion was split into three sub-
criteria, one referred to the substitution of marine-based activities by lesser marine habitats
dependent ones, and two concerning actions to heal the marine environment like removing dead
seagrasses or reducing non-treated sewage discharges (and consequently, seawater pollution). In
this case, island experts were consulted about the capacity of their reference destination to
address these adaptation actions using a 1-4 scale, where 1 represented a very poor management
capacity and 4 expressed a full capacity to deal with it.
Results and islands’ ranking
The table below shows the final results of the operationalization process. In particular, it
summarizes the global weights of the sub-criteria and the criteria and the global score of the risk
6 This information was delivered by Soclimpact researchers who are in charge of the work package WP5. More
information at: SOCLIMPACT Deliverable Report – D5.5. Report on market and non-market economic values for environmental services of marine and coastal ecosystems related to the activities of the blue economy.

34
for each island; thus islands can be compared not just globally but also across the set of the sub-
criteria and the criteria being considered to estimate the aggregated risk.
Table 7: Final scores and islands’ ranking (under RCP8.5 distant future).
Criteria Sub-criteria Balearic Canary Cyprus Malta Sicily
Hazards Seawater heating RCP8.5 (2081-2100)
0.018 (8.0%)
0.004 (2.2%)
0.054 (23.6%)
0.025 (12.7%)
0.025 (14.7%)
Exposure
Surface of marine phanerogams
0.034 0.002 0.004 0.009 0.022
Number of divers 0.009 0.005 0.001 0.002 0.002
Tourists’ arrivals 0.013 0.013 0.002 0.001 0.006
Total 0.056
(25.0%) 0.020
(11.0%) 0.007 (3.1%)
0.012 (6.1%)
0.029 (17.1%)
Sensitivity
Phanerogams’ susceptibility to heat
0.072 0.072 0.008 0.024 0.024
Economic valuation
0.003 0.027 0.004 0.006 0.010
Total 0.075
(33.5%) 0.099
(54.7%) 0.012 (5.2%)
0.030 (15.2%)
0.034 (20.0%)
Adaptive capacity
Products substitution
0.034 0.034 0.086 0.060 0.016
Seagrass removal 0.020 0.002 0.007 0.007 0.003
Sea water pollution
0.021 0.021 0.063 0.063 0.063
Total 0.079
(35.3%) 0.058
(32.0%) 0.155
(67.7%) 0.130
(66.0%) 0.082
(48.2%)
Total 0.224 0.181 0.229 0.197 0.170
Rank 2 4 1 3 5
Note: Total contribution of the criterion to the final score of the island in parenthesis.
Source: SOCLIMPACT Deliverable Report – D4.5. Design of a comprehensive approach to climate and climate-related risk information to policy makers and the general
public
The risk: from Eastern to Western and viceversa
The relative risk for marine habitat-based tourism demand due to the heating of seawaters
surrounding the European islands is determined by the combination of three different factors
already reflected in the marine habitat impact chain: the intensity and lasting of periods of
seawater heating, the susceptibility of the marine habitats and tourism activities based on it to the
heating process and the changes in the habitat, respectively; and the capacities of the respective
islands’ societies to reinforce natural and social systems’ resilience to seawater heating and its
ecosystem impacts.

35
Based on the available indicators and on their own knowledge, the experts’ evaluation of the
complex relationships between seawater heating, habitats transformation and the response of the
tourism system, depicts a big picture featured by the following results:
- From the perspective of the intensity of the hazard, threats diminish from Eastern to
Western. Effectively, episodes of water heating threating the integrity of marine
ecosystems will we much more relevant throughout the Eastern Mediterranean and will
become softer as moving Western.
- From the perspective of the susceptibility of the marine foundation species to seawater
heating, western Mediterranean hosts the most vulnerable phanerogam communities as
genetically they are not ready to face increasing water temperature variability at the
rhythm climate change is powering. As a result, this risk factor decays from Western to
Eastern.
- Other relevant factors determining the relative risk faced by each island are related to the
management capacity of other hazards, different than seawater heating, also degrading
marine habitats (i.e. the current relevance of marine habitat-based tourism and the
capacity of the local tourism system to provide competitive alternatives giving value to
other, not marine-based natural and cultural tourist attractions). Those capacities are
unevenly distributed across the islands, basically depending on the level of development
of their respective environment management and tourism management subsystems.
Some characteristics of the risk ranking provided by experts, and consequently, the final scores,
are:
- Cyprus leads the rank of risk due to, in addition to the greater seawater heating, its
experiencing ecological disruptive processes related to its closeness to the Red Sea;
strongly attracting exotic species with high capacity to destabilise the marine ecosystems.
- On the other extreme, Sicily is the island exhibiting a lesser risk mainly due to it holds a
more balanced distribution of the indicators expressive of the range of factors
determining the risk.
- The Canary Islands hold a relatively low risk mainly due to their expected low level of
seawater heating; their higher weakness consists of the magnitude of the tourism system
exposed to the potential risk.
- The Balearic Islands are the most exposed islands. In addition, RCP8.5 distant future
shows a progress in heating relatively higher than other islands, meaning a strong threat
for their relatively susceptible Posidonia meadows.
- Malta holds a relative low risk mainly due to its low exposition to the risk and the
potential of alternative, non-marine-habitat-based, tourist products.
Below are presented some paragraphs devoted to go deeper into the complexity of the ecosystem
dynamics that influence the holistic effect of climate change on the European islands’ marine
habitats; before presenting some lines highlighting the specificities of this impact chain for each
island.
In the Eastern Mediterranean, the impact of seawater heating on the seagrass meadows (and on
the marine habitat as a whole) not only depends on the physiological response of the plants

36
concerned to heating, but also on the response of the system as a whole. On the Eastern shore of
the Mediterranean, a strong increase in herbivorous species from the Red Sea has been observed
that cross the Suez Canal and have settled near the continental and insular coastal areas.
Posidonia meadows have been found to be part of their diet.
The heating exacerbates the metabolic needs of these herbivorous species (Siganus Luridus and
others) increasing their voracity and, consequently, leading to greater pressure on the
phanerogams. Given that, on the other hand, the surface of these meadows in the environment
of Cyprus is small, predation by these herbivores may threaten Posidonia with extinction,
disappearing with it the conservation functions of the ecosystem that it currently carries out as
protection against erosion, containment of water turbidity (assimilation of organic residues),
shelter and food for fingerlings of fish and other marine organisms, etc.
Other factors such as the sewage treatment or the sedimentation of waste from coastal
constructions interact with the seawater heating, exacerbating the degradation of marine habitats.
Together, factors of global change other than seawater heating are expected to act more intensely
in Cyprus, increasing the vulnerability of this island's marine habitat to climate change.
Analysis of Balearic Islands
Balearic’s risk regarding seawater heating rests on the high natural exposure represented by the
surface of their Posidonia meadows and the size of their marine habitat-based tourist activity,
representing the 25% of the risk. Of course, as Posidonia surface must be preserved, and the
flow of tourists maintained, resilience against this risk should be achieved through strengthening
mainly the potential to successfully substitute marine based demand for demand for other tourist
products, that need to be properly developed and commercialised. The Archipelago has a wide
range of other natural and cultural resources and technical and financial capabilities to go forward
this way and is already working on it. The eradication of other pressures on Posidonia meadows,
as sewage and coastal infrastructures, is capital for keeping this risk under control, as it has been
outlined by recent research.
The mentioned advantages and disadvantages of the Balearic Islands are depicted in the next
figures. The further the criteria or sub-criteria is located from the centre of the graph, the more it
affects the risk.

37
Figure 32: Global weights of each criteria and sub-criteria in the final score. Source: SOCLIMPACT Deliverable Report – D4.5. Design of a comprehensive approach to climate and climate-related risk information to policy makers and the
general public
Figure 33: Global weights of each criteria and sub-criteria in the final score. Source: SOCLIMPACT Deliverable Report – D4.5. Design of a comprehensive approach to climate and climate-related risk information to policy makers and the general
public

38
The operationalization of the impact chain for the “Loss of attractiveness of a destination due to the loss
of services from marine ecosystems” was conducted using the AHP method. The method proved to be
appropriate, firstly, for dealing with the hierarchical nature of the impact chain and, secondly, for
using expert judgements to assess the comparative risk for the islands over a large number of
indicators (sub-criteria). Because the AHP method determines a ranking of the islands, it can
provide decision-makers with relative values but not with absolute values. Such values will be
delivered by the modelling activities of other work packages and will give stakeholders a more
complete picture of this specific risk in terms of social, economic, and environmental impacts.
Loss of comfort due to a decrease in thermal comfort This section describes the work carried out for the operationalization of the impact chain “Loss of
competitiveness of destinations due to a decrease in thermal comfort”7. It provides details on the method
applied for the operationalization, the island data used, and the results obtained. As can be seen
in the figure, the impact of Climate Change on the touristic attractiveness of an island depends
on a set of multi-dimensional factors, including:
1. the frequency, intensity, and duration of heatwaves, 2. to what extent and how tourist activities and tourists become exposed to heatwaves, and
how sensitive different segments of tourists are to extreme heat, and 3. the preparedness of the destination to cope with thermal discomfort episodes through
information, technology, alternative activities, and medical attention.
Figure 34: Loss of competitiveness of destinations due to a decrease in thermal comfort Source: SOCLIMPACT Deliverable Report – D3.2. Definition of complex impact chains and input-output matrix for each islands and sectors
7 Detailed information about the methodology used and the results obtained is available at: SOCLIMPACT Deliverable
Report – D4.5. Design of a comprehensive approach to climate and climate-related risk information to policy makers and the general public.

39
For the purposes of the operationalization it was decided by the team to retitle the risk as “Loss of
attractiveness of a destination due to a decrease in thermal comfort”. This was done in order for the risk to
more accurately reflect the effects of the hazards, exposure and vulnerability on an island rather
than an on an individual tourist.
The selection of islands to be compared was based on the availability of island data provided by
the IFPs. The five islands selected for comparison were the Balearic Islands, the Canary Islands,
Cyprus, Malta, and Sardinia.
Selection of operationalization method
The Analytical Hierarchy Process (AHP) method was selected as the technique to operationalize
the impact chain since it is a well-grounded tool that allows for the prioritization/ranking of
alternatives using a weighting scheme that is established by expert judgement. Hence, for the
purposes of the project, it was considered suitable as it would be able to reconcile the
contribution of each risk factor (hazards, exposure, and vulnerability) towards the risk based on
expert opinion and, subsequently, order the islands in terms of which one is most at risk of losing
attractiveness due to a decrease in thermal comfort.
Application of the AHP methodology
The problem to be solved along through the expert decision process was comparing the risk of
the European islands of losing tourist attractiveness due to a decrease in thermal comfort as
consequence of climate change. The hierarchy tree for this decision problem was built
underpinning on the impact chain elements. Some refinements were necessary regarding the
indicators (at sub-criteria level) that were to be used for comparing the islands.

40
Figure 35: Hierarchy tree for thermal comfort impact chain. Source: SOCLIMPACT Deliverable Report – D4.5. Design of a comprehensive approach to climate and climate-related risk information to policy makers and the general
public
Hazards are the climate events that instigate the climate-associated risk. For the AHP method,
thermal sensation was considered as the most relevant indicator to assess changes in the thermal
comfort of tourists while staying at their destination as it is a concept that combines temperature
and humidity. Thus, it is the only sub-criterion of the Hazard criterion. Moreover, the humidity
index (humidex) (Masterton and Richardson, 1979) was selected as the most appropriate metric
for thermal sensation. The metric is an equivalent temperature that express the temperature
perceived by people (i.e., the temperature that the human body would feel), given the actual air
temperature and relative humidity.
Exposure denotes the range of ecological and social systems susceptible to be damaged by
hazards. This criterion was decomposed into sub-criteria relating to three indicators. The first
indicator relates to the exposure of tourists to heatwaves. The measure of the indicator combines
the percentage of an island prone to heatwaves and the percentage of the tourist
accommodations and facilities located in those areas prone to heatwaves. It is necessary to factor
in both these aspects of exposure in order to allow for a better comparison of islands. For
example, if an island has a small area that is prone to heatwaves with the majority of tourists
frequenting in that small area, then the combination of the two factors will play a role when
comparing, for instance, an island that has large areas prone to heatwaves, but with tourists
frequenting in places outside these areas, since the overall exposure will be different. Specifically,
it was decided to assign a weight of 75% to percentage of an island prone to heatwaves and the
remaining 25% to the percentage of tourist accommodations and facilities located in heatwave-
prone areas. The second indicator deals with the number of tourist arrivals during the hottest

41
months. The indicator is represented by the percentage of tourists that visit an island between the
months of May and September averaged over the last five years. Finally, the third indicator
concerns vulnerable groups of tourists who have the highest risk of being affected by heatwaves.
Literature confirms that under-6s and over-65s are the most vulnerable age groups, however, the
statistical services of the islands homogeneously provide data for the under-14 and over-65 age
groups. For this indicator, two values were computed:
1. the number of tourists visiting an island that were under 14 years of age during the months of May and September over the total number of tourists visiting during the same period, averaged over the last five years, and
2. the number of tourists visiting an island that were over 65 years of age during the months of May and September over the total number of tourists visiting during the same period, averaged over the last five years.
For purpose of combining the two values and adjusting the change to age groups, it was decided to apply a ratio of 15:85 in order to emphasize the proportion of over-65s (85%) to the proportion of under-14s (15%).
Sensitivity concerns the susceptibility of natural, cultural, and built resources to harm that is a
direct or indirect result of Climate Change hazards. For the operationalization of this impact
chain, sensitivity relates to the susceptibility of tourists and is broken down into sub-criteria
pertaining to two indicators. The first indicator involves tourist activities. The effect of heatwaves
on tourist activities varies greatly. For example, a tourist sunbathing at a beach will not feel the
effects of a heatwave to the same degree as a tourist that is trekking. Different destinations have
different rates of tourists practicing activities incompatible with heatwaves events. So, this
indicator aims at catching these differences. More specifically, this indicator is a measure of the
percentage of visitors who state that they practice activities not compatible with heatwave events.
The second indicator concerns the economic valuation of heatwaves from the perspective of
tourists. In the case of a heatwave event, all tourists will suffer from thermal discomfort to a
certain degree. Hence, the indicator represents their willingness to avoid this discomfort as
expressed in monetary terms. Therefore, it is measured by much money tourists are willing to pay
to avoid a heatwave during their vacation time8.
Adaptive capacity reveals the potential to face the hazards by reducing the level of exposure
and/or increasing the resilience of the tourism system through providing information, adopting
proper technology, supplying alternative activities, and improving medical attention. This
criterion is split into sub-criteria concerning three indicators. The first indicator has deals with
early warning systems. Setting up a proper early warning system can help tourists and service
providers to plan effective responses to heatwaves, making them less distressing and reducing the
destination’s vulnerability. Hence, this indicator is measured with a score representing the quality
of early warning systems in place and advisement of options for tourists. The second indicator
involves air conditioning. Air conditioning is the most effective technology used to combat
extreme heat. Therefore, the indicator uses the percentage of hotel accommodations and tourist
8 Further information available at: SOCLIMPACT Deliverable Report – D5.5. Report on market and non-market economic
values for environmental services of marine and coastal ecosystems related to the activities of the blue economy.

42
facilities offering air conditioning systems as a measure of the capacity of the destination to cope
with this hazard. The final indicator concerns the care and medical attention (such as in the case
of heatstroke or similar) available on an island that may be necessary to help reduce pain or avoid
casualties due to diseases related to heatwaves. Therefore, the number of hospital beds available
on an island per 100,000 potential users, both residents and tourists, is taken as the measure of
this indicator.
Results and islands’ ranking
The table below shows the final results of the operationalization process. In particular, it
summarizes the global weights of the sub-criteria and the criteria and the global score of the risk
for each island; thus islands can be compared not just globally but also across the set of the sub-
criteria and the criteria being considered to estimate the aggregated risk.
Table 8: Final scores and islands’ ranking (under RCP8.5 distant future).
Criteria Sub-criteria Balearic Canary Cyprus Malta Sardinia
Hazards Humidex RCP8.5 (2081-2100)
0.024 (12.1%)
0.008 (4.6%)
0.088 (34.6%)
0.023 (11.7%)
0.023 (13.1%)
Exposure
Exposed areas 0.007 0.002 0.007 0.007 0.007
Vulnerable groups 0.007 0.017 0.016 0.017 0.038
Tourists’ arrivals 0.050 0.008 0.029 0.018 0.065
Total 0.064
(32.2%) 0.027
(15.5%) 0.053
(20.9%) 0.042
(21.3%) 0.110
(62.9%)
Sensitivity
Heat-sensitive activities
0.074 0.073 0.074 0.074 0.012
Economic valuation 0.004 0.004 0.015 0.028 0.010
Total 0.079
(39.7%) 0.078
(44.8%) 0.089
(35.0%) 0.103
(52.3%) 0.021
(12.0%)
Adaptive capacity
Early-warning systems
0.007 0.007 0.007 0.007 0.003
Air conditioning 0.011 0.048 0.011 0.021 0.012
Medical attention 0.014 0.006 0.005 0.002 0.005
Total 0.032
(16.1%)
0.061 (35.1%)
0.024 (9.4%)
0.030 (15.2%)
0.020 (11.4%)
Total 0.199 0.174 0.254 0.197 0.175
Rank 2 5 1 3 4
Note: Total contribution of the criterion to the final score of the island in parenthesis. Source: SOCLIMPACT Deliverable Report – D4.5. Design of a comprehensive approach to climate and climate-related risk information to policy makers and the general
public

43
Cyprus is at most risk of loss of competitiveness due to a decrease in thermal comfort in all four
scenarios as it is ranked the highest in all cases. This is mainly attributed to the fact that the
number of days with a heatwave is predicted to increase greatly both in the near and distant
future. In addition, the island’s tourist accommodations and facilities are located in areas most
prone to heatwaves, and these are visited by many tourists during the months of May to
September. Cyprus also scores the highest in Sensitivity and average in Adaptive capacity.
The Balearic Islands and Malta are ranked second and third, respectively, with regards to the
risk of loss of competitiveness. However, their overall scores are very close: 0.199 for the Balearic
Islands and 0.1970 for Malta in the RCP8.5 distant future scenario. They score relatively high in
Exposure and Sensitivity (the most important criteria for the risk) and average in Hazard and
Adaptive capacity.
Sardinia and the Canary Islands are the lowest at risk of loss of competitiveness. Even though
Sardinia scores the highest for Exposure, it has a low score for Sensitivity (which contributes
most to the risk) and average scores for Hazard and Adaptive capacity. On the other hand, the
Canary Islands has a low score for Hazard and Exposure, but relatively high for Sensitivity and
Adaptive capacity.
Analysis of Balearic Islands
The islands show some disadvantage in the criterion Sensitivity and Exposure, which contribute
39.7% and 32.2%, respectively, to the total risk. In the former stands out the importance of the
heat-sensitive activities, while the latter can be explained by the high amount of tourists that
arrives to the islands each year.
The mentioned advantages and disadvantages of Balearic Islands are depicted in the next figure.
The further the criteria or sub-criteria is located from the centre of the graph, the more it affects
the risk.
Figure 36: Global weights of each criteria and sub-criteria in the final score. Source: SOCLIMPACT Deliverable Report – D4.5. Design of a comprehensive approach to climate and climate-related risk information to policy makers and the general
public

44
Figure 37: Global weights of each criteria and sub-criteria in the final score. Source: SOCLIMPACT Deliverable Report – D4.5. Design of a comprehensive approach to climate and climate-related risk information to policy makers and the general
public
The operationalization of the impact chain for the “Loss of attractiveness of a destination due to a
decrease in thermal comfort” was conducted using the AHP method. The method proved to be
appropriate, firstly, for dealing with the hierarchical nature of the impact chain and, secondly, for
using expert judgements to assess the comparative risk for the islands over a large number of
indicators (sub-criteria). Because the AHP method determines a ranking of the islands, it can
provide decision-makers with relative values but not with absolute values. Such values will be
delivered by the modelling activities of other work packages and will give stakeholders a more
complete picture of this specific risk in terms of social, economic, and environmental impacts.
Loss of attractiveness due to increased danger of forest fires in touristic areas
Forest fires are considered as an important parameter for the attractiveness of tourist
destinations, especially in the Mediterranean area. Severe episodes were met in Algarve (Portugal)
and Greece (Athens area) in the recent period, threatening the tourist season.
This study focuses on the implementation and analysis of the selected Impact Chain “Risk of
forest fires and consequences on tourism attractiveness of a destination”. Out of the 12
islands assessed in the SOCLIMPACT project, nine were included in the operationalization: the
three Atlantic Islands (Azores, Canary Islands and Madeira) and the Mediterranean ones (Balearic
Islands, Crete, Corsica, Cyprus, Malta, Sardinia and Sicily).

45
The concept of Impact Chain (Schneiderbauer et al. 2013; Fritzsche et al. 2014) is applied as a
climate risk assessment method (with 6 steps) for research of decision making. Impact Chains
propose diagrams articulating the causal links between the different components of climate risks
(according to AR5 concepts: hazards, exposure, vulnerability, risks, step 1)). For each of these
components of the theoretical IC (figure, step 2), several indicators are selected and collected
(step 3). Data are then normalised to be able to be aggregated (steps 4 and 5) with different
weights. The final objective (step 6) is to achieve a standardised risk score that, according to the
spatial scale of the analysis can allow comparison and decision making on adaptation, including
hierarchization of resource allocation or identification of adaptation options to mitigate climate
risk.
Figure 38: Loss of attractiveness due to increased danger of forest fire in touristic areas. Source : SOCLIMPACT Deliverable Report – D3.2. Definition of complex impact chains and input-output matrix for each islands and sectors

46
Figure 39: Loss of attractiveness due to increased danger of forest fire in touristic areas.
Source : SOCLIMPACT Deliverable Report – D3.3. Definition of complex impact chains and input-output matrix for each islands and sectors
Many indicators were formulated in a very broad way, causing a few problems in identifying
suitable data sets. Furthermore, the data were checked for explicit spatial coverage, resolution,
temporal coverage and time frame. Finally, we evaluated possible substitutes or alternatives for
those indicators with no suitable data to substantiate them.

47
Figure 40: Final Impact Chain Model. Source: SOCLIMPACT Deliverable Report – D3.2. Definition of complex impact chains and input-output matrix for each islands and sectors
In order to normalize the index, the min-max method was applied. Min-max normalizes
indicators to have an identical range [0, 1] by subtracting the minimum value and dividing by the
range of the indicator values (OECD 2008). The mathematical formula and more information on
min-max normalization method are presented in the following section. Afterwards, the
normalized index was categorized into five equal interval classes representing values from “Very
low" to "Very high”. Considering the weighing, an assessment of GIZ methodology has been
developed for this impact chain including interviews with various types of stakeholders (cf.
dedicated 4.5 to forest fires).

48
The indicators previously normalized have been aggregated to elaborate three sub-component
indices (hazard, exposure, vulnerability) and the final risk index. The result is included in a
comparison for the 9 other islands studied for the risk linked to forest fires.
Comparative study
Hazard
The main findings are:
Scores for fire danger increase as we move from West to East and from North to South, with the exception of Malta, which is much smaller and the selected grid cells are mostly influenced by maritime conditions.
Under RCP2.6, it seems that the fire danger returns to the present conditions towards the end of the century apart from Crete which score will increase from medium to high, even under this RCP.
Under RCP8.5, the increase is much more prominent, ranging from 22% to 46%, with the highest values for Corsica, Sardinia and Sicily, which implies that under this scenario at the end of the Century, the western and central Mediterranean will be more affected.
Figure 41: Hazard score (Fire Weather Index) per island for the reference period (1986-2005). Source: SOCLIMPACT Deliverable Report – D4.5Comperhensive approach for policy makers

49
Figure 42: Hazard score (Fire Weather Index) per island at the end of the century (2081-2100) under RCP2.6 (Ambitious Mitigation Policies).
Source: SOCLIMPACT Deliverable Report – D4.5Comperhensive approach for policy makers
Figure 43: Hazard score (Fire Weather Index) at the end of the century (2081-2100) under RCP8.5 (Business
as usual). Source: SOCLIMPACT Deliverable Report – D4.5Comperhensive approach for policy makers

50
Exposure
The results show that:
Atlantic Islands (Madeira and Canary Islands) are more exposed (high score) than Mediterranean Islands (from low to medium score). We can see an increase as we move from North to South in the Mediterranean area.
Atlantics Islands higher scores are mainly explained by the level of exposure rather than the nature of exposure, which is quite similar across islands, except for Malta which rate is very low.
The nature of exposure varies across EU Islands despite of their homogeneous score: Corsica has the highest score for forest areas followed by Madeira, Canary Islands. These two last ones have the highest score of forest belonging to protected areas. We can find a significant proportion of cultivated areas in other Islands namely: Sicily, Sardinia, Balearic Islands, Crete and Cyprus.
The level of exposure for Canary Islands and Madeira is particularly important because of the high scores for each of the 4 considered indicators: population density, population over 65 years, population under 9 years and tourist density
Figure 44: Exposure score (current period) per island. Source: SOCLIMPACT Deliverable Report – D4.5Comperhensive approach for policy makers

51
Figure 45: Subcomponents of exposure and related score (current period) per island. Source: SOCLIMPACT Deliverable Report – D4.5Comperhensive approach for policy makers
Figure 46: Breakdown by exposure subcomponent. Source: SOCLIMPACT Deliverable Report – D4.5Comperhensive approach for policy makers

52
Vulnerability
The main findings are:
Results show large disparity across EU Islands in terms of vulnerability. The vulnerability score for Corsica is very high followed by Sardinia (high), Madeira, Balearic Islands and Cyprus. Malta, Canary Islands and Crete scores are low and Sicilia very low.
Breakdown by component highlights a quite homogeneous score for adaptative capacity whereas sensitivity score (Flammability Index) is very different from an island to another.
Not surprisingly for the flammability index, Corsica and Sardinia have the highest score, Malta, Sicilia and Canary Islands, the lowest one.
Looking at the adaptative capacity subcomponent, despite of the quite homogeneous scores, factors of influence are quite different among the islands:
o high score for employees in the primary sector, apart from Sardinia and Sicily; o scores for density of firefighters and volunteers are important for all the islands
except for Cyprus; o GDP per capita and level of education are the most heterogeneous factors of
influence; o GDP per capita score is very high for Crete, very low for Corsica, Malta and
Balearic Islands. o Scores for education level is important for Cyprus and low for Madeira, Malta and
Corsica.
Figure 47: Vulnerability score per island. Source: SOCLIMPACT Deliverable Report – D4.5Comperhensive approach for policy makers

53
Figure 48: Subcomponents of vulnerability and related score (current period) per island. Source: SOCLIMPACT Deliverable Report – D4.5Comperhensive approach for policy makers
Figure 49: Details and scores of the two subcomponents (adaptive capacity and sensitivity) per island. Source: SOCLIMPACT Deliverable Report – D4.5Comperhensive approach for policy makers

54
Risk
- For the reference period, the overall risk Figure is medium for Atlantic Islands (Madeira and Canary Islands) and Eastern Mediterranean Islands (Crete and Cyprus). Risk for other islands is low and very low for Malta.
- Looking at the breakdown of the risk, the structure is quite similar for 3 groups: o Madeira, Canary Islands, Sicilia and Balearic Islands: Predominance of exposure
component (around 50% of the score); o Crete and Cyprus: Predominance of the hazard component (around 40% of the
score); o Corsica and Sardinia: Predominance of the vulnerability component (around 60-
70%); o Only Malta has a quite balanced distribution across the components.
- In this exercise, only the hazard component is changing in the future. In the near future whatever the considered RCP, the risk increases only for Cyprus from medium to high. While the risk remains stable with the RCP2.6 in the distant future for all islands apart from Cyprus, there is an increase from very low to low for Malta and from low to medium for Balearic Islands, Corsica and Sardinia with RCP8.5 (distant future). Even under this RCP8.5 risk remains constant for Canary Islands and Madeira (Medium) and Sicily (Low).
Figure 50: Risk score per island for the reference period (1986-2005). Source: SOCLIMPACT Deliverable Report – D4.5Comperhensive approach for policy makers

55
Figure 51: Risk breakdown by island for the reference period (1986-2005). Source: SOCLIMPACT Deliverable Report – D4.5Comperhensive approach for policy makers
Figure 52: Risk score per island in the near future (2046-2065) under RCP2.6 (Ambitious Mitigation Policies) and RCP8.5 (Business as usual).
Source: SOCLIMPACT Deliverable Report – D4.5Comperhensive approach for policy makers

56
Figure 53: Risk score per island at the end in the distant future (2081-2100) under RCP2.6 (Ambitious Mitigation Policies) and RCP8.5 (Business as usual).
Source: SOCLIMPACT Deliverable Report – D4.5Comperhensive approach for policy makers
Figure 54: Score per component and per island in the near (2046-2065) and the distant future (2081-2100) under RCP2.6 (Ambitious Mitigation Policies) and RCP8.5 (Business as usual).
Source: SOCLIMPACT Deliverable Report – D4.5Comperhensive approach for policy makers

57
Balearic Islands results
The risk is low under the reference period and futures scenarios.
Figure 55: Risk score and components of the risk for the reference period. Source: SOCLIMPACT Deliverable Report – D4.5Comperhensive approach for policy makers
Figure 56: Risk score at the end in the distant future (2081-2100) under RCP2.6 (Ambitious Mitigation
Policies) and RCP8.5 (Business as usual) Source: SOCLIMPACT Deliverable Report – D4.5Comperhensive approach for policy makers

58
Considering the component of exposure, the nature of exposure is the most represented sub-
component (54%) and cultivated areas is the most significant indicator in the calculation.
Figure 57: Details and scores of the two subcomponents of exposure (nature and level of exposure). Source: SOCLIMPACT Deliverable Report – D4.5Comperhensive approach for policy makers
Considering the vulnerability component, both sub-components have almost the same
importance (around 50%).
Figure 58: Details and scores of the two subcomponents of vulnerability (adaptative capacity and sensitivity).
Source: SOCLIMPACT Deliverable Report – D4.5Comperhensive approach for policy makers

59
4.2 Aquaculture
In the Soclimpact project, aquaculture includes only marine-based operations where off-shore
and coastal aquaculture are included, and freshwater and land-based aquaculture are excluded.
Examples of climate change hazards that can impact aquaculture are changes in ocean warming
and acidification, as well as oceoanographic changes in currents, waves, and wind speed. Sudden
impacts such as an increase in the frequency and intensity of storms and heat waves are also
impacting aquaculture. Other effects of climate change on aquaculture activities are increased
invasions from alien species, increased spread of diseases and changes in the physiology of the
cultivated species by changing temperature, oxygen availability and other important physical
water parameters. An important indirect impact to aquaculture is the change in fisheries
production due to climate change. Aquaculture of finfish is highly dependent on fisheries for feed
ingredients. This already a current problem with many fisheries overexploited and will only
intensify in the future. Climate change is also predicted to impact food safety, where temperature
changes modify food safety risks associated with food production, storage, and distribution.
Socio-economic impacts on aquaculture are hard to assess due to the uncertainty of the changes
in hazards and the limited knowledge these impacts have on the biophysical system of
aquaculture species (Handisyde et al. 2014). In the framework of Soclimpact, the following risks
were studied:
1) Risk of Fish species thermal stress due to increased sea surface temperature
Changes in water temperature can directly affect the growth rate and Food Conversion Ratio of
the fish. Temperature also affects the oxygen levels and can cause harmful algae blooms, reduce
water quality and an increase in occurrence of diseases and parasites which can than affect the
fish or other culture species. A change in temperature can ultimately change the ranges of suitable
species for a certain area but can also have positive impacts such as increased growth (mainly in
tropical and sub-tropical regions) and a longer growing season. Primary productivity can also
increase with increasing temperature, which may be beneficial for filter feeders such as mussels.
2) Risk of increased fragility of the aquaculture activity due to an increase of extreme
weather.
Increased frequency and intensity of extreme weather events result in higher waves and storm
surges and changes in salinity. These events result in loss of stock and damages to infrastructure
and require adaptation in species selection, site selection and technologies.
Indeed, the objective of the risk assessment is to obtain final risk scores according to a gradient
(very low to high) and to be able to compare the European islands with each other. For the
Balearic Islands, it was difficult to obtain the adequate data to make these comparisons. The type
of data that was necessary to compile was:
- Farm area (km2)
- Value of stocks
- Quick support intervention plans
- Early warning system
- Sensivity of species

60
4.3 Energy
There are more than 2200 inhabited islands in the EU. Lately, they have come into the focus of
the EU, which addresses energy questions as part of the 'Clean energy for all Europeans' package.
The Clean energy for EU islands initiative provides a long-term framework to help islands
generate their own sustainable, low-cost energy. This is particularly interesting, because many
islands have vast amounts of renewable energy sources but rely on fossil fuel imports yet. These
are relevant challenges regarding the energy transition in the EU, whose aim of net zero
greenhouse gas emissions in 2050 should determine the future energy plans of the islands. Islands
could provide showcases for successful 100% renewable energy supply.
The National Hydropower Association (NHA) defines marine energy as electricity generation
from marine kinetic energy, such as waves, tidal and ocean currents. Pisacane et al. (2018) add
other marine energy sources like ocean thermal energy conversion (exploiting temperature
differences between deep and surface ocean waters) and salinity gradient energy (harnessing the
energy potential of differences in salt concentration in ocean and river waters). All these
technologies are still in a development phase, and even if they reach the commercial phase in the
future, it is not likely that they will generate a large share of the power. Therefore, the analysis in
SOCLIMPACT focuses on the main renewable energy sources (RES), wind energy and solar
photovoltaic (PV) energy, which are presently, and very likely in future, the backbone of the
deployment of renewable energies, due to their technological maturity and low cost.
Nevertheless, we take into account not only onshore but also offshore wind energy, as a
specifically marine energy source which has distinct advantages like much higher productivity and
less time variability than onshore wind energy, and does not require land space which is limited
and costly in the islands. There are relevant obstacles for its deployment, like the deep
bathymetry surrounding most of the islands, and the lower wind speeds over the Mediterranean
in comparison to areas like the North Sea where offshore wind energy is being deployed rapidly.
Additionally, we consider also offshore PV energy. Despite some disadvantages that have to be
overcome (corrosion problems due to salty water or the impact of waves), this application is
receiving growing interest, as it offers an option for renewable energy development in countries
and islands with limited space for the installation of solar panels, and can show increased
performance due to the cooling effect of water and wind on PV cells.
Most RES (renewable energy sources) depend on the climate, and therefore climate change can
have an impact of the resource amount. Additionally, wind and solar PV energy are not
dispatchable, and its variability represents a challenge for its integration in the power system. This
is a challenge that can be addressed through storage or backup plants (which can be itself
renewable energy plants), through demand management, but also taking advantage of
complementarity of PV and wind energy and its very different variability characteristics. This
approach is gaining attention from stakeholders in the islands, as demonstrated by the report by
Monitor Deloitte and Endesa (2020), in which one of the key recommendations for achieving an
accelerated zero carbon target in Balearic and Canary Islands by 2040 is the combination of solar
PV and wind energy, with clearly higher shares of PV than of wind energy. Such a mix would
reduce strongly the need for storage, due to the stability of solar PV production.

61
There are also challenges for the demand and transmission components of the energy systems of
the islands due to climate change: changes in temperature leading to changing energy demand,
changes in precipitation and evaporation creating risks for desalination.
For the energy sector, three theoretical impact chains (IC) have been proposed in the
SOCLIMPACT project:
i) risk of changes in power generation due to long term climate change and variability, ii) risk of changes in energy demand due to changes in precipitation and temperatures, iii) risk of damages to transmission grids due to extreme events.
Only the second IC, i.e., the one related to changes in energy demand was selected to be
operationalized, mainly due to data availability constraints. The quality of IC operationalization
depends strongly on data availability over long periods. Data for cooling energy demand are still
scarce and difficult to obtain, despite the requirements of the European Commission for
information regarding the national energy efficiency targets. The availability and quality of
cooling demand data should improve in the future due to the need for tracking the advances
towards energy efficiency targets. Desalination demand data should also improve strongly,
including data about the energy efficiency of the desalination processes used.
This demand-side IC has been deployed into two individual ICs, namely, the increased energy
demand due to increased cooling demand and the increased energy demand due to increased
desalination needs. Both risks depend on the temperature increase, which is a very certain effect
of climate change. The risk assessment was carried through and expert assisted process.
The diagrams of the two operationalized impact chains are presented below
Figure 59: Conceptualization framework for the operationalization of the energy impact chain: Risk of increased
energy demand due to increased cooling demand. Source: Soclimpact project Deliverable 4.5-Comprenhensive approach for policy makers

62
Figure 60: Conceptualization framework for the operationalization of the energy impact chain: Risk of increased
energy demand due to increased desalination demand Source: Soclimpact project Deliverable 4.5-Comprenhensive approach for policy makers
Hazard scores for energy demand (Cooling Degree Days -CDD, Standardized Precipitation-
Evapotranspiration Index - SPEI), and supply indicators (wind energy, solar PV and combined
productivity and droughts) were analysed. The aim is to jointly consider future increases in energy
demand due to temperature and precipitation changes and the potential for covering it with
renewable energy sources in the future.
Regarding the normalization of these hazards, we use an approach based on their future change.
The available literature indicates that the future projected changes of renewable energy
productivity frequently do not exceed a level of 10% relative to present values. Changes of about
10% would not modify clearly a normalized score like the one use for present climate (leading to
a very limited variation range of the score), but they represent a significant impact on the
productivity and profitability of the energy plants. Therefore, the future change of renewable
energy productivity is compared to a 10% threshold, both on the negative (normalized values
above 0.5) and the positive side (normalized values below 0.5). The normalization also includes a
minor contribution of a comparison of the changes relative to other islands.
CDD and SPEI scores are normalized with respect to a maximum projected value previously
identified. Renewable energy productivity indicators in present climate are normalized using
global thresholds (5th and 95th percentiles of the respective technologies). The same
normalization method is used for projected changes of renewable energy droughts. Thus,
energy drought indicators are normalized comparing them to a maximum upper limit, taken
among all the islands and renewable energy technologies.
A fundamental aspect of the method is that we apply an objective procedure for obtaining the
weights of the risk components (hazard, exposure and vulnerability) based on time-series

63
correlations of observed data for energy demand and for the different indicators involved in the
impact chains. This allows to detect which factors have a larger impact on the energy demand.
This method, based on correlations between observed energy demand and observed data for the
indicators, points out that several exposure and vulnerability factors have a stronger weight than
the climate hazards on short time-scales (interannual variations for periods of about 10 years).
This is consistent with the drivers considered in the national forecasts, for periods of 10 years,
performed as part of the EU Energy Efficiency Directive. A consequence of this is the relatively
low weights assigned to the climate hazards in the operationalization.
For the operationalization of the full impact chains, the exposure and vulnerability indicators
were also weighted utilizing different criteria. The mathematical procedure developed proposes
the definition of weights per group of variables (hazard, vulnerability and exposure) that allow
identifying the relationship between each of the components and the dependent variable (in this
case, energy demand due to desalination or energy demand due to cooling). The detailed weight
calculation for the risk components (hazards, exposure and vulnerability) can be found in the
Soclimpact Project deliverables 4.5.
It was not possible to conduct a full operationalization of the IC for the case of Balearics. The
criteria for the selection of the islands have been: (a) availability of data for the computation of
the exposure and vulnerability indicators of the demand-side ICs, (b) modeling constraints of the
hazard component. In the next tables we present the normalized hazard scores for the island.
Table 9: Energy demand and supply hazard scores for Balearics
Histori-cal ref.(1986-2005)
Demand Supply: Productivity Land Sea
Droughts
CDD 0.16 Wind 0.99 0.25 0.95
SPEI 0.00 Solar PV 0.22 0.25 0.13
Combined 0.23
RCP2.6 (2046-2065)
Demand Supply: Productivity change
Droughts change
CDD 0.26 Wind 0.7 0.6 0.7
SPEI 0.32 Solar PV 0.5 0.6 0.1
Combined 0.5
RCP8.5 (2046-2065)
Demand Supply: Productivity change
Droughts change
CDD 0.36 Wind 0.9 0.8 0.8
SPEI 0.60 Solar PV 0.6 0.7 0.6
Combined 0.8

64
RCP2.6 (2081-2100)
Demand Supply: Productivity change
Droughts change
CDD 0.24 Wind 0.7 0.6 0.7
SPEI 0.24 Solar PV 0.5 0.6 0.2
Combined 0.6
RCP8.5 (2081-2100)
Demand Supply: Productivity change
Droughts change
CDD 0.60 Wind 1 0.9 1.0
SPEI 0.92 Solar PV 0.6 0.8 0.4
Combined 0.9
Categorization:
0.00 – 0.20 Very low
0.20 – 0.40 Low
0.40 – 0.60 Medium
0.60 – 0.80 High
0.80 – 1.00 Very high
Source: Soclimpact project Deliverable 4.5-Comprenhensive approach for policy makers
The increase in cooling energy demand should be relatively moderate under the low-emissions
scenario, reaching high values only at the end of the century under the high-emissions scenario.
In contrast, drought conditions will be much worse under RCP8.5 scenario, which could threaten
the availability of groundwater and reservoir water and induce a large increase in desalination
demand. The contribution of desalinated water is already substantial, though the introduction of
new surface and groundwater sources in Mallorca by 2009-2010, among other factors, reduced
for a few years the high percentage of desalinated water. This percentage has increased again in
the last years.
The present good solar PV resources will not change substantially under RCP2.6 scenario, while a
slight reduction is expected under the high-emissions scenario. PV is already a stable resource, as
shown by present climate PV droughts, and this stability will even improve under RCP2.6. Wind
resources are rather limited and highly-variable over land, and will even decrease in the future,
but offshore wind energy could play a significant role in the decarbonization process.
The large variability of wind energy could be compensated to a high degree through a
combination with PV energy, which should limit the need for storage or backup power for the
high RE shares planned by the regional government. The availability of a power interconnection
to mainland is also helpful for the decarbonization of energy supply in the Balearic Islands. The
potential coverage through RES of future cooling and desalination energy demand increases
seems much easier under the mitigation scenario than under RCP8.6.

65
* Islands’ comparison and future challenges
- The frame for energy supply in the islands are the binding targets established in the 2030
climate and energy EU framework and the long term horizon of a decarbonized energy system by
2050.
- The future change of wind energy and PV productivity should be rather small in general:
around 5% or less with respect to the reference period in many cases, with maximum changes of
about 10% for some islands at the end of the century under RCP8.5 scenario (particularly for
wind energy productivity over land). A 10% productivity change could have a significant impact
on a planned or existing plant if it occurs over the lifetime of the power plant, but in this case
such a change would extend over many decades, which will facilitate adaptation and efficiency
measures.
- Projected PV productivity changes are generally smaller than wind energy changes. In most
cases PV productivity remains constant or decreases slightly. The main exception is Fehmarn,
which shows a clear decreasing tendency in PV productivity under RCP8.5 scenario, reaching a
10% decrease by end of the century.
- There is a specific uncertainty source in the photovoltaic projections. Most regional climate
model simulations, including the ones used here, do not include a projected evolution of aerosols
in future climate runs. The missed effect of the likely evolution of aerosols would likely increase
to some degree the future surface solar radiation and PV productivity over most of the islands
(Gutiérrez et al., 2020).
- Renewable energy productivity droughts are a measure of the variability of the resource. Wind
droughts are much more frequent (around 50% of the days for most islands) than PV droughts
(10% or less of the days). This agrees with results from the study of Raynaud et al. (2018), and
highlights the stable character of the solar productivity in comparison to wind productivity over
time.
- Wind energy droughts are more frequent in the Mediterranean islands than in the Atlantic
islands or Fehmarn. The best quality resources in terms of stability are found for Canary Islands,
which show the minimum values of both wind energy and PV droughts among all islands.
Fehmarn shows by far the worse PV drought score, corresponding a drought frequency of 23%
of the days.
- Projected changes in the frequency of droughts are small, with future variations that generally
do not attain a magnitude greater than 5% of the days. This indicates that the time-variability
characteristics of wind and PV energy are a robust feature, which is relevant for planning the
amount of storage or backup needed.
- The combination of PV and wind energy has generally a very positive impact on the frequency
of droughts as a result of the complementarity of both sources. This impact also exists but is less
clear for islands with substantial summer wind energy resources (Canary Islands, Madeira and
Crete).
- As part of the pathway towards very high or 100% RES shares, offshore wind energy should
play a very relevant role. Solutions to overcome the obstacle posed by the deep bathymetry

66
surrounding most of the islands are beginning to near commercial deployment, so that floating
offshore wind plants are already planned near Gran Canaria and Sicily.
- Offshore PV could be an interesting option for some islands, particularly when land surface
limitations are large. There is growing interest in this option, as shown by the test plants being
installed and the references made to this technology in the Roadmap for the Offshore Renewable
Energy Strategy of the European Commission or in the report of Monitor Deloitte and Endesa
(2020) about the accelerated decarbonization of Canary and Balearic Islands.
- The combination of different types of offshore renewable energy sources in the same platform
is also attracting interest, as the different sources can exhibit complementarity in time and the
combined output can thus be more stable and reliable. The different RES can also share part of
the installations, like the connection to land, reducing their cost (Pisacane et al., 2018;
MarineEnergy, 2019a). The European Union is trying to promote such combinations, through
projects like MUSICA (Multiple Use of Space for Island Clean Autonomy) which will design and
test a floating offshore platform integrating wind, PV and wave energy for use on islands
(MarineEnergy, 2019b), and plans to develop roadmaps for its deployment in three case study
islands, among them Malta and the Canaries (MaREI, 2020).
- New financing possibilities linked to the recently approved EU COVID-19 recovery fund, and
over a longer term associated to the European Green Deal, should facilitate the deployment of
renewables in the islands, as the energy transition is a key target.
- Interconnections to mainland are very important for supply safety. Excessive dependency on
interconnections to mainland should be nevertheless avoided, due to risk of blackouts, as the
failure of a single element (one transmission line) can knock out instantaneously a large
proportion of the power of an island and even cause an island-wide blackout, as has occurred
several times in Malta in the last years.
Read more: Hazard indicator computation and normalization
Cooling degree days (CDD) are used to give an indication of the effect of outside air
temperature on building energy consumption during a specified period of time. The Cooling
Degree Days (CDD) index gives the number of degrees and number of days that the outside
air temperature at a specific location is higher than a specified base temperature. For the indicator
weight calculation, the observed values of CDD (EUROSTAT) have been used, and compare to
the hazard of the island. With respect to the normalization of the indicator, we have used a fixed
lower threshold and a relative maximum as upper threshold. The minimum CDD value has been
taken as 0, while the maximum CDD value has been taken as the maximum over all islands,
emissions scenarios and time periods (CDD=1183.49 ºC· days/year, corresponding to Cyprus
for RCP8.5 scenario, end of century period).
Standardised Precipitation-Evapotranspiration Index (SPEI) is a drought index that takes
into account not only the effect of precipitation variations, but also the effect of temperature
variations on evapotranspiration. The calculation is based on the monthly difference between
precipitation and potential evapotranspiration, which represents the monthly water surplus or

67
deficit. The indicator weight calculation was done using data from ECA&D (European Climate
Assessment & Dataset). The normalization of the indicator has taken into account the fact that
by definition, present conditions correspond to reference conditions (SPEI=0), and that all future
changes are towards negative SPEI values, that is towards drier conditions. Therefore, the best
score value (0) has been assigned to SPEI=0, while the worst score value (1) has been assigned to
the largest negative value found for all islands, emissions scenarios and time periods (SPEI=-2.5,
obtained for several islands under RCP8.5 emissions scenario by the end of century).
The indicator Wind energy productivity (kWh/kW) is defined as the energy produced in a
period of time divided by the power installed, which is considered as unitary. The indicator is
calculated separately for land and sea. Offshore wind energy is the most developed ocean energy,
and it is likely to be an important future energy source for the analysed islands. Its characteristics
are typically very different to onshore wind energy, due to the large differences in surface friction.
The energy productivity values are averaged respectively over the island land points and over the
sea points in a domain that reaches a maximum distance of one degree latitude and longitude
respectively to the maximum and minimum longitude/latitude land points of the islands.
The normalization is performed using absolute thresholds, that represent high or low global
values of productivity. These thresholds have been obtained from a global renewable power
report (IRENA, 2019). The maximum annual productivity would be 8760 kWh/kW,
corresponding to a 100% capacity factor. The obtained CF thresholds for onshore wind energy
are 20% (corresponding to a normalized score of 1) and 45% (normalized score of 0), while for
offshore energy they are 30% and 50%.
Photovoltaic productivity (kWh/kW) is defined as the energy produced in a period of time
divided by the power capacity installed. In order to obtain photovoltaic productivity, daily surface
solar radiation (SSR) and ambient temperature from the climate simulations are used as input
variables for a parametric PV model. The normalization is performed using absolute thresholds,
that represent high or low global values of productivity, taken from the same report as for wind
energy. In this case, the maximum threshold is adapted taking into account that the calculations
performed here assume fixed panels, while IRENA global report does not differentiate between
fixed and sun-tracking panels. Therefore, we estimate an upper CF threshold (normalized score
of 0) of 20% for fixed panels, from the 25% value deduced from IRENA global report.
Renewable energy productivity droughts indicators are a way of quantifying the time-
variability of renewable energies that depend on meteorological conditions. Low values of energy
droughts correspond to a stable output, while high values correspond to a highly variable output.
The combined renewable energy droughts represent the complementarity between wind and PV
energy. A high complementarity of both sources reduces the need for energy storage or backup
sources.
Two different thresholds are calculated to determine moderate (50% of mean daily productivity)
and severe (20% of mean daily productivity) energy productivity droughts, respectively. For the
normalization of these energy drought indicators, we have used a combination of an absolute

68
threshold (a value of 0% of drought days) corresponding to a score of 0 and a relative maximum
upper limit, taken among all the islands and renewable energy technologies (55% of days with
moderate droughts, obtained for wind energy in Corsica) corresponding to a score of 1. The
same normalization limits are applied for wind, PV and combined productivity droughts.
4.4 Maritime Transport
Maritime transport is defined as the carriage of goods and passengers by sea-going vessels, on
voyages undertaken wholly or partly at sea. It is often considered as the backbone of the world
economy, with 80% of the global trade volume passing through ports (Asariotis & Benamara,
2012). For islands, the transport of goods and passengers by ship is even more essential. At the
same time, Maritime Transport contributes to climate change through its carbon emissions which
are found to be near 3% of the global CO2 equivalent emissions (Smith et al. 2015). Compared to
land and air transport, it is the (economically and ecologically) most effective way of distributing
goods globally. A changing climate will challenge Maritime Transport to adapt to future risks and
lower its emissions.
The whole range of potential impacts of climate change on ports operations and throughput is
still under study and it remains a high degree of uncertainty about it. Various climate change
stressors can affect both harbour infrastructure and ships on route. For example, ports are
vulnerable nodes of Maritime Transport as they are strongly affected by rising sea-levels, which in
turn affect port facilities and increase the risk of flooding. Sea-level rise has accelerated in the last
century and will rise by 0.43 to 0.84 m until 2100, depending on the emission scenario (Pörtner et
al., 2019). Due to ocean dynamics and the Earth’s gravity field, there will also be regional
differences in sea-level rise in the order of 0.1 m (Asariotis & Benamara, 2012). The causes of
sea-level rise are the thermal expansion of water and the melting of glaciers due to the increase in
global mean temperature (Vermeer & Rahmstorf, 2009).
Maritime transport can also be affected by climate change through the increase in the intensity of
extreme weather events including tropical-like cyclones. According to climate projections,
tropical cyclones are not expected to change significantly in frequency but in intensity due to
rising sea-surface temperatures (Pörtner et al., 2019). The resulting extreme winds and waves can
harm ships, but also cause damage and flooding of ports, especially in combination with sea-level
rise (Hanson & Nicholls, 2012).
For the Maritime Transport sector, three main climate change risks have been identified for the
SOCLIMPACT project. These are:
(a) risk of damages to ports’ infrastructures and equipment due to floods and waves,
(b) risk of damages to ships on route (open water and near coast) due to extreme weather events,
(c) risk of isolation due to transport disruption.
We selected to operationalize the third one which in terms of hazards and impacts can be
considered as a combination of the other two. The hazard risk component indicators considered
for the operationalization were: extreme waves (SWHX98), extreme wind (WiX98) and mean sea

69
level rise (MSLAVE). The exposure indicators are: number of passengers (NPax), islands’ total
population (NTotP), value of transported goods expressed in freight (VGTStot) and number of
ports per island or archipelago (NPo), while the sensitivity indicators include: the number of
isolation days (NIID) and renovated infrastructure (NAgePo). Finally, for the component of
adaptive capacity the proposed indicators are: percentage of renewables (PEnRR), number of
courses/trainings (NTrCoRM), early warning systems (NOcSta) and harbour alternatives (NApt).
Unfortunately, due to the lack of reliable and consistent data we had to exclude the “number of
isolation days” and “number of courses/trainings” indicators. The conceptualization framework
of the operationalization is summarized in the next Figure.
Figure 61: Conceptualization framework for the operationalization of the Maritime Transport Impact Chain:
Risk of Transport Disruption. Source: Soclimpac project deliverable 4.5

70
For assessing future risk, we considered projections or estimations for the indicators when these
were available. This was mainly the case for the components of hazard (mean sea level rise,
extreme waves and wind), exposure (population, number of passengers, value of goods), and the
contribution of renewables. Two Representative Concentration Pathways (RCPs) were
considered for meteorological hazards. One “high-emission” or “business-as-usual” pathway
(RCP8.5) and a more optimistic one (RCP2.6) that is closer to the main targets of the Paris
Accord tο keep global warming to lower levels than 2 °C since pre-industrial times.
Besides the historical reference period, we consider two 20-year future periods of analysis. One
over the middle of the 21st century (2046-2065) and one covering the end of the 21st century
(2081-2100). The normalization of indicators was performed across the different islands in order
to facilitate and inter-island comparison and prioritize the islands of higher risk.
Regarding the weighting of the different risk components, we have tested several weights,
however, according to expert judgement and discussion with specialists on the Maritime sector,
we have found more appropriate to assign equal weights to all main components of risk (i.e. 0.33
for Hazard, 0.33 for Exposure and 0.33 for Vulnerability). For the sub-components of Exposure,
we have assigned a weight of 0.33 for Nature of Exposure and a weight of 0.66 for Level of
Exposure since the latter one is believed to be of greatest importance. Similarly, for the
vulnerability sub-components, we have assigned a weight of 0.25 for the Factors of Sensitivity
and a weight of 0.75 for the Factors of Adaptive Capacity.
The weighting and categorization of risk is a subjective decision, nevertheless we consider our
selection to be quite conservative and therefore we believe that a slightly different choice would
not significantly affect the main conclusions drawn. For the recent past/present conditions, the
operationalization of the Maritime Transport Impact Chain indicates low risk for all investigated
islands. In general, the Maritime Transport sector of the larger islands (e.g. Corsica, Cyprus and
Crete) is found to be more resilient to the impacts of climate change. Up to a point, this is related
to the large number of harbour alternatives in comparison with smaller islands.
Our results for the future highlight the importance of adopting a low-emission pathway since this
will keep the risk for Maritime Transport disruption in similar as present conditions while for
some islands the risk is expected to slightly decline. In terms of island inter-comparison, Malta’s
maritime sector is found to be most vulnerable, nevertheless, future risk even under RCP8.5 is
not expected to exceed medium risk values. On the contrary, Corsica is the island less susceptible
to climate change impacts. Detailed results for each investigated SOCLIMPACT island are
presented in the following sub-sections.

71
Table 10: Summary of present and future risk of isolation due to Maritime Transport disruption for each island
and scenario based on the Impact Chain operationalization.
Categorization:
Source: Soclimpact project deliverable 4.5
The Balearic Islands in the western part of the Mediterranean is the last archipelago that was
investigated for the impact of climate change in the Maritime Transport sector. For the historical
reference period, the impact change operationalization resulted in a risk value of 0.326 (low risk).
The greatest contribution to the overall risk comes from the low adaptive capacity because of the
small number of harbour alternatives and low percentage of renewables in the island. Since the
contribution of renewables is expected to increase under RCP2.6 while the contribution of
exposure and hazard indicators is more or less the same, for the middle of the current century the
risk under this scenario is expected to decrease to a value of 0.281. By the end of the century, the
risk for Maritime Transport disruption for the Balearics is expected to further decrease (0.264).
For the “business-as-usual” RCP8.5, the risk is expected to slightly increase (values of 0.331-
0.344), as a result of the meteorological hazards (mainly extreme winds and mean sea level rise)
and smaller contribution of renewable energy.
READ MORE about the risk indicator computation: normalization of sub-component
indicators on Deliverable 4.5 Soclimpact project HERE
5 Socio economic impacts of climate change
5.1 Market and non-market effects of CC
Tourism
In order to analyse the reactions of tourists to the impacts of climate change and the preferences
for adaptation policies, several hypothetical situations were posed to 253 tourists visiting Balearic
Islands whereby possible CC impacts were outlined for the island (i.e., beach erosion, infectious
diseases, forest fires, marine biodiversity loss, heat waves, etc.).
RISK VALUE PER
ISLAND
Historical
Reference RCP2.6 MID RCP2.6 END RCP8.5 MID RCP8.5 END
CYPRUS 0.241 0.210 0.218 0.258 0.292
CRETE 0.229 0.208 0.201 0.257 0.282
MALTA 0.376 0.347 0.335 0.395 0.414
CORSICA 0.220 0.194 0.194 0.243 0.273
CANARY ISLANDS 0.336 0.292 0.250 0.346 0.341
BALEARIC ISLANDS 0.326 0.281 0.264 0.331 0.344
0.00 – 0.20 Very low
0.20 – 0.40 Low
0.40 – 0.60 Medium
0.60 – 0.80 High
0.80 – 1.00 Very high

72
Figure 62: Socio-economic characteristics and travel description: Tourists visiting Balearic Islands Source: Deliverable Report D5.5 Market and non-market analysis
Firstly, tourists had to indicate whether they would keep their plans to stay at the island or find an
alternate destination if the impact had occurred, which allows predictions of the effects on
tourism arrivals to be made for each island. Secondly, tourists were asked to choose between
various policy measures funded through an additional payment per day of stay – the tourists’
choices being an expression of their preferences for attributes/policies. To estimate the results,
the conditional logit model was run by using the Stata software.
In general, data confirms that tourists are highly averse to risks of infectious diseases becoming
more widespread (98.40% of tourists would change destination). Moreover, they are not willing
to visit the islands is beaches largely disappear (91.30%) or if the temperature becomes
uncomfortably hot to them (87.40%). On the other hand, policies related to coastal
infrastructures protection (1.2€/day), infectious diseases prevention (1€/day), water supply
reinforcement (1€/day), and heat waves protection (1€/day) are the most valued, on average, by
tourists visiting these islands.
Although climate change impacts are outside the control of tourism practitioners and policy-
makers, they can nevertheless utilise this knowledge to improve the predictability of the effect
that certain adaptation policies and risk management strategies, and develop their plans
accordingly.

73
Figure 63: Choice experiments results: Tourists visiting Balearic Islands Source: Deliverable Report D5.5 Market and non-market analysis
The infographic can be found in high resolution in the Soclimpact Project official website
HERE.
The impact of increased temperatures and heat waves on human thermal comfort
In order to assess how the variation in temperature impacts on the tourism sector through
changes in tourism demand our research question was: “How do increasing temperatures (and
heat waves) impact prices and, more in general, expenditure of tourists?” Arguably, when
temperatures grow, tourists adjust their behaviour: they might switch destination, or they might
stay longer or shorter depending on their attitudes and preferences. In turn, all these changes
modify the market equilibrium, pushing tourism companies to adjust their prices to re-establish
the equilibrium between demand and supply. The change in demand and the change in price
determine the change in tourism expenditure which is, from the destination’s perspective,
tourism revenue.
We monitored current weather conditions posted on several weather forecast providers and daily
prices posted on Booking.com by hotels. We then estimated the link between daily temperature
and daily price, controlling for all the other factors affecting prices. We finally applied these
estimates to the increase in the number of days with excessive temperature projected for the
future in two scenarios (RCP2.6 and RCP8.5) and in two time horizons (near future, about 2050;
distant future, about 2100).

74
Among the different indicators linked to thermal stress, Soclimpact is focusing on two: the
number of days in which the temperature is above the 98th percentile and the number of days in
which the perceived temperature is above 35 degrees. Although in D5.6 the impact for both
indices were computed, in this document we only report the second one (named HUMIDEX)
because it is the most intuitive and because human thermal stress is more related to the absolute
value of the temperature than its deviation from some pre-determined distribution. In line with
the project, we assumed that thermal stress appears when the perceived temperature grows above
35 Celsius degrees.
As thermal stress is delimited in the summer months, and this is when the great majority of
tourists arrive in these islands, the whole analysis has been carried out in six months only: from
May to October included. In other words, we assume that there is no thermal stress (and hence
no impact on tourism) in the rest of the year.
Initially, three islands were investigated: Corsica, Sardinia, and Sicily, given the massive amount of
potential data. Other estimations were provided for Balearic Islands using the Index of Distance
in Destination Image to position each island in a range that goes from Sardinia / Corsica on one
side and Sicily on the other side. Without entering the details of the extrapolation method (which
are explained in D5.6 appendixes) a summary of results is reported here:
Table 11: Estimation of increase in average price and revenues for Balearic Islands
Actual share of days in
which humidex > 35
degrees
Future scenario
considered
Days in the corresponding
scenario in which humidex > 35
degrees
Increase in the
average price
Increase in the
tourism overnight
stays
Increase in
tourism revenues
28.99%
rcp26near 37.10% 3.0% 0.6% 3.6%
rcp26far 36.22% 2.7% 0.5% 3.2%
rcp85near 38.30% 3.4% 0.7% 4.1%
rcp85far 62.85% 12.5% 2.5% 15.3% Source : Soclimpact project deliverable D5.3
According to these findings, the average increase in temperature, which is correlated to a growing
thermal stress for tourists, brings an economic advantage to tourism destinations. This is only an
apparent contradiction with previous findings. This study does not neglect the fact that if islands
are too hot, tourists will choose to move to other (cooler) destinations, that in principle exist.
Then, the increase in tourism (and tourism revenues) stem from the fact that, when the
temperature is too hot, people would prefer to move to coastal areas (where the climatic
conditions are more bearable) than staying inland or in cities. Future trends will also facilitate this
pressure of tourism demand (think about the spreading of smart working activities where, in
principle, the worker can relocate wherever he/she wants).
Aquaculture
The effects of increased sea surface temperatures on aquaculture production were calculated
using a lethal temperature threshold, and considering the production share of the region. Four
different future scenarios shown by IPCC estimations (RCP2.6 and RCP8.5 near and distant)

75
were analysed, which correspond to four water temperature increases in the region (mean values),
with respect to the reference period.
To do this, we assume one main specie cultured in this region: Mussels, and a model of
production function, calculating the monthly biomass production which depends on the monthly
water temperature. Results are presented on yearly base (mean values). In order to facilitate the
interpretation of the results, we present the value of production of the last year available, for
which we calculate the new values under the different CC scenarios. As expected, the production
levels (tons) will decrease for both, low and high emissions scenarios.
Figure 64: Estimations of changes in aquaculture production (tons), due to increased sea surface temperature Source: Deliverable Report D5.6
The infographic can be found in high resolution in the Soclimpact Project official website
HERE.
Energy
Climate change may impose welfare reductions to the European islands’ societies by affecting
thermal comfort. Cooling Degree Days (CDD) are a measure of how much (in degrees), and for
how long (in days), outdoor air temperature is higher than 18°C or 65° Farenheit. The CDD is
used as a measure of the energy needed to cool buildings. The increase in CDD and the energy
demand (GWh/year) for cooling are estimated for the islands, under different scenarios of
global climate change.
Under the high emissions scenario, it is expected that the CDD increase to 712 CDD9
approximately. This value could be, for example, a combination of 100 days with temperatures of
24°C (600CDD) and other 56 days with temperatures of 20°C (112CDD). Under this situation,
the increase in cooling energy demand is expected to be 277%.
The infographics presented below can be found in high resolution in the Soclimpact
Project official website HERE.
9 The indicator is computed by multiplying the number of days exceeding the threshold by the difference in
temperatures. For example, the CDD for 100 days at 20 °C is computed as 100*(20-18) = 200CDD

76
Figure 65: Estimations of increased energy demand for cooling in Balearic Islands under different scenarios of
climate change until 2100 Source: Deliverable Report D5.6
The Standardized Precipitation Evapotranspiration Index (SPEI) is analysed as a representative
indicator for increases in water demand for islands’ residents, tourists and agriculture, while it
also provides an indication on the available water stored in dams or underground resources. To
estimate the increase of energy demand due to the increase in water demand, it was assumed that
most of the islands will have to produce desalinated seawater (or groundwater) to meet further
increases of demand. Thus, the estimation of the increase in energy demand (GWh/year) to
produce more drinking water has been done based on the energy consumption required to
desalinate seawater.
Under the high emissions scenario (RCP8.5), the situation could critical as the indicator reach the
highest levels, which could lead to an increase of 153% in desalination energy demand.
Figure 66: Estimations of increased energy demand for desalination in Balearic Islands under different scenarios of
climate change until 2100 Source: Deliverable Report D5.6

77
Maritime Transport
For maritime transport, it has been estimated the impact of Sea Level Rise on ports' operability
costs of the islands. The costs have been calculated with reference to1meter; this is, the
investment needed to increase the infrastructures' height by 1 meter. There is not necessarily a
strict correspondence between the SLR and the required elevation of port infrastructures, which
also depend on the coastal hydrodynamic and the shape of dikes of each port. By experts’
recommendation, we have assumed that 1 m increase in port height is required to cope with the
SLR under RCP 8.5 scenario of emissions. Extrapolation for other RCP scenarios is then
conducted based on proportionality.
The starting point was the identification of the principal ports in each island (economic
relevance). Second, the analysis of the different port areas (exterior, ramps, oil, etc.), and their
uses. Third, the elevation costs were estimated per each area and port separately (considering 1
meter elevation). Thus, the costs of 1-meter elevation presented are the sum of all areas and ports
analysed, and including the rest of the ports of the island (if applicable) based on proportionality.
Estimations consider that all ports areas of the entire area should be elevated at the same time. In
other words, the economic values can be interpreted as the depreciation (amortization) costs of
the investment needed to increase all porsts’ infrastructures' in the island for 125 years time
horizon. No discount rate has been applied.
As expected, the rising of sea levels will affect the sector, as new investments will be needed to
keep ports’ operability. Under the high emissions scenario, it is expected that these costs could
increase up to 5.5 million euros per year until the end of the century.
The infographic presented below can be found in high resolution in the Soclimpact
Project official website HERE.
Figure 67: Increased costs for maintaining ports’ operability in Balearic Islands under different scenarios of SLR caused by climate change until 2100
Source: Deliverable Report D5.6
MEAN SEA LEVEL RISE SLR

78
5.2 Macroeconomic projections
The aim of our study is to assess the socioeconomic impacts of biophysical changes for Balearic
Islands. For this purpose we have used the GEM-E3-ISL model; a single-region, multi-sectoral
general equilibrium model based on the principles of neo-classical theory, and GINFORS; a
macro-econometric model based on the principles of post-Keynesian theory.
Both models include 14 sectors of economic activity, with an emphasis on services and
specifically on those composing the tourism industry. The GEM-E3-ISL model also include:
endogenous representation of labor market and trade flows etc.
Changes in the mean temperature, sea level and precipitation rates are expected to affect energy
consumption, tourism flows and infrastructure developments. These impact-chains have been
examined and quantified under two emission pathways: RCP2.6 which is compatible with a
temperature increase well below 2C by the end of the century and RCP8.5 which is a high-
emission scenario. The impact on these three (3) factors has been quantified in D5.6 and is used
as input in the economic models, which then assess the effects on GDP, consumption,
investments, employment etc.
In total 16 scenarios have been quantified for Balearic Islands. The scenarios can be classified in
the following categories:
1. Tourism scenarios: these scenarios examine the reduction in tourism revenues due to
changes in human comfort as captured by the hum-index, the degradation of marine
environment, increased risk of forest fires and beach reduction
2. Energy scenarios: these scenarios examine the impacts of increased electricity
consumption for cooling purposes and for water desalination
3. Infrastructure scenarios: these scenarios examine the impacts of port infrastructure
damages
4. Aggregate scenarios: these scenarios examine the total impact of the previous-described
changes in the economy.
In this scenario we examine the impacts of a simultaneous change in electricity consumption,
tourism revenues and infrastructure damages. The scenario specifications for the two climatic
variants are presented below:
Table 12: Aggregate scenario –results
Tourism revenues (% change from reference levels)
Electricity consumption (% change from reference
levels)
Infrastructure damages
(% of GDP)
RCP2.6 (2045-2060) -8.14 10.8 -0.01
RCP2.6 (2080-2100) -10.71 4.4 -0.01
RCP8.5 (2045-2060) -11.36 25.2 -0.01
RCP8.5 (2080-2100) -34.08 51.2 -0.03
Source: GEM-E3-ISL

79
The theoretical and structural differences of the two models mean that this study produces is a
reasonable range of impacts, given the uncertainty embodied in economic analysis and especially
in the long-term.
In GEM-E3-ISL, the economy is in equilibrium at each point in time. Prices adjust to ensure that
supply equals demand (market clearing), capital is fully used; however, the allows for equilibrium
unemployment. The impacts are driven mainly by the supply side through changes in relative
prices that determines competitiveness change, substitution effects etc. The GEM-E3-ISL model
assesses the impacts on the economy up to 2100,
The macro-econometric type of models, such as GINFORS, do not require that all markets are
in equilibrium; idle capital and involuntary unemployment are some other features of this type of
models where the results are driven mainly by adjustments in the demand side of the economy.
The GINFORS assesses the impacts on the economy up to 2050.
With respect to GDP the estimated change compared to the reference case is between -2.2% and -3.4% in the RCP2.6 in 2050 and between -3.3% and -4.5% in the RCP8.5. The cumulative CHANGE over the period 2040-2100 is estimated (by GEM-E3-ISL) to be equal to -2.8% in the RCP2.6 and -6.5% in the RCP8.5.
Figure 68: Percentage Change in GDP. Source: GWS, own calculation

80
With respect to sectorial impacts both models show a significant decrease in the activity of tourism related sectors and an increase in the activity of the primary and secondary sectors. Construction services also increase driven by the expansion of power generation facilities.
Figure 69: Production percentage change from reference. Source: GWS, own calculation
Overall employment falls in the economy and especially in tourism related sectors following the
slowdown in domestic activity. In GEM-E3-ISL increases in employment in non-tourism related
activities are related to labor costs reductions (as wages fall and their competitiveness increases)
and a consequent substitution of capital with labor in other sectors. Employment falls on average
by 1.6% in the RCP2.6 and by 2.9% in the RCP8.5.

81
Figure 70: Employment percentage change from reference. Source: GWS, own calculation
6 Towards climate resiliency
6.1 Current situation: general commitment, specific limits and obstacle
The region should follow the commitments at European and Spanish level with a limited capacity
of action as the responsibilities on energy or coastal infrastructures, for instance, are not all held
at regional level.
In the case of the Balearic Region, and while the Spanish government is finalizing yet his Law on
Climate Change, the Governing Council approved in February 2019, the Climate Change and
Transition Law Energy of the Balearic Islands. This law is in line with the global targets of
reduction of the EU by 2030 and 2050 and therefore obliges the Balearic Islands to be
responsible in the reduction of emissions and the penetration of the renewable energies.
In the particular case of the Menorca island, there are several initiatives even more ambitious and
the islands is being considered as a pilot case at EU level for the transition to decarbonized
islands.
The present regional government is committed with the actions on climate change and
adaptation, but there will be elections in a couple of months and is unknown what will be the

82
position of the new government. This is a major concern as far as involvement on actions on
climate change strongly depends on the color of the party.
Also, some strategies can be designed at regional level, but their effective implementation will
depend on the regulations and strategies at National Level. Furthermore, actions at local level can
face the opposition of some economic sectors (basically linked to tourism activities) which are
strong and usually reluctant to changes.
Relevant documents
- Regional department on climate change:
http://www.caib.es/govern/organigrama/area.do?coduo=2679877&lang=es
- Regional roadmap for adaptation to climate change:
http://www.caib.es/govern/sac/fitxa.do?codi=3098540&coduo=2679877&lang=es
- Summary of the Regional Law on Climate Change and Energy Transition:
http://www.caib.es/pidip2front/jsp/es/ficha-convocatoria/9199460
- Assessment of vulnerability of the Balearic Islands:
http://www.caib.es/govern/sac/fitxa.do?codi=3098540&coduo=2390767&lang=es

83
7 References
Asariotis, R. & Benamara, H. (Eds.). (2012). Maritime transport and the climate change challenge.
Routledge.
Fritzsche et al. (2014). The Vulnerability Sourcebook: Concept and guidelines for standardised
vulnerability assessments.
GIZ (2017). The Vulnerability Sourcebook: Concept and guidelines for standardised vulnerability
assessments. Deutsche Gesellschaft für Internationale Zusammenarbeit (GIZ).
Gutiérrez, C., Somot, S., Nabat, P., Mallet, M., Corre, L., van Meijgaard, E., Perpiñán, 0. &
Gaertner, M. Á. (2020). Future evolution of surface solar radiation and photovoltaic potential in
Europe: investigating the role of aerosols. Environmental Research Letters, 15(3), 034035.
Handisyde, N., Ross, L., Badjeck, M.C., & Allison, E. (2014). The Effects of Climate Change on
World Aquaculture: A Global Perspective.
Hanson, S. & Nicholls, R. J. (2012). Extreme flood events and port cities through the twenty-first
century. Maritime Transport and the Climate Change Challenge, 243.
Hernandez, Y., Guimarães Pereira, Â., Barbosa, P. (2018): Resilient futures of a small island: A
participatory approach in Tenerife (Canary Islands) to address climate change, Environmental
Science & Policy, 80, 28-37.
IRENA (2019). Renewable Power Generation Costs in 2018, International Renewable Energy.
Agency, Abu Dhabi.
Jerez, S., Thais, F., Tobin, I., Wild, M., Colette, A., Yiou, P., & Vautard, R. (2015). The CLIMIX
model: a tool to create and evaluate spatially-resolved scenarios of photovoltaic and wind power
development. Renewable and sustainable energy reviews, 42, 1-15.
Lahtinen, H., Viljamaa, K., Buligescu, B., Wintjes, R (2013): Summary Assessment of the Canary
Islands. Report prepared for the European Service Innovation Centre (ESIC).
MaREI (2020). MaREI to lead €9m project to build floating offhsore platform. Retrieved from:
https://www.marei.ie/marei-to-lead-e9m-project-to-build-floating-offshore-platform/
MarineEnergy (2019a). WavEC: Combined Wind, Wave and Solar to Transform Marine Energy.
Retrieved from https://marineenergy.biz/2019/12/16/wavec-combined-wind-wave-and-solar-
to-transform-marine-energy/
MarineEnergy (2019b). SINN Power Supports MUSICA Project. Retrieved from
https://marineenergy.biz/2019/10/22/sinn-power-supports-musica-project/
Masterton JM., RichardsonF.A. (1979). Humidex, a method of quantifying humandiscomfort due
to excessive heat and humidity, CLI 1–79, Environment Canada.Atmospheric Environment
Service, Downsview, Ontario.
Monitor Deloitte and Endesa (2020). Los Territorios No Peninsulares 100% descarbonizados en
2040: la vanguardia de la transición energética en España.

84
OECD (2008). Handbook on Constructing Composite Indicators: Methodology and User Guide.
Organisation for Economic Co-operation and Development (OECD).
Pisacane, G., Sannino, G., Carillo, A., Struglia, M. V., & Bastianoni, S. (2018). Marine energy
exploitation in the Mediterranean region: steps forward and challenges. Frontiers in Energy Research,
6, 109.
Pörtner, H. O., Roberts, D., Masson-Delmotte, V., Zhai, P., Tignor, M., Poloczanska, E., ... &
Petzold, J. (2019). IPCC Special Report on the Ocean and Cryosphere in a Changing Climate.
IPCC Intergovernmental Panel on Climate Change: Geneva, Switzerland.
Raynaud, D., Hingray, B., François, B., & Creutin, J.D. (2018). Energy droughts from variable
renewable energy sources in European climates. Renewable Energy, 125, 578-589.
Saaty, T.L. (1980). The Analytic Hierarchy Process.McGraw-Hill, New York.
Schneiderbauer, S., Zebisch, M., Kass, S., & Pedoth, L. (2013). Assessment of vulnerability to
natural hazards and climate change in mountain environments – examples from the Alps. In:
Birkmann J (ed) Measuring vulnerability to natural hazards: towards disaster resilient societies.
United Nations University Press, Tokyo, 349-380.
Smith, T. W. P., Jalkanen, J. P., Anderson, B. A., Corbett, J. J., Faber, J., Hanayama, S., O’Keeffe,
E., Parker, S., Johansson, L., Aldous, L., Raucci, C., Traut, M., Ettinger, S., Nelissen, D., Lee, D.
S., Ng, S., Agrawal, A., Winebrake, J. J., Hoen, M., ... Pandey, A. (2015). Third IMO Greenhouse
Gas Study 2014. International Maritime Organization.
Soto, D. and Brugere, C. (2008) The challenges of climate change for aquaculture. FAO
Aquaculture Newsletter, No. 40, pp. 30–32. FAO, Rome.
Uche-Soria, M.; Rodríguez-Monroy, C. Special Regulation of Isolated Power Systems: The
Canary Islands, Spain. Sustainability 2018, 10, 2572.
Van Wagner, C. E.,1987: Development and structure of a Canadian forest fire weather index
system, Forestry Tech. Rep. 35, Canadian Forestry Service, Ottawa.
Vermeer, M. & Rahmstorf, S. (2009). Global sea level linked to global temperature. Proceedings
of the national academy of sciences, 106(51), 21527-21532.
SOCLIMPACT Deliverable Reports
SOCLIMPACT Deliverable Report – D3.2. Definition of complex impact chains and input-output matrix for
each islands and sectors.
SOCLIMPACT Deliverable Report – D3.3. Definition of complex impact chains and input-output matrix for
each islands and sectors.
SOCLIMPACT Deliverable Report – D4.3. Atlases of newly developed hazard indexes and indicators with
Appendixes.
SOCLIMPACT Deliverable Report – D4.4a Report on solar and wind energy.
SOCLIMPACT Deliverable Report – D4.4b Report on storm surge levels.
SOCLIMPACT Deliverable Report – D4.4c Report on potential fire behaviour and exposure.

85
SOCLIMPACT Deliverable Report – D4.4e Report on estimated seagrass density.
SOCLIMPACT Deliverable Report – D4.4d Report on the evolution of beaches.
SOCLIMPACT Deliverable Report – D4.5. Design of a comprehensive approach to climate and climate-related
risk information to policy makers and the general public.
SOCLIMPACT Deliverable Report – D5.5. Report on market and non-market economic values for
environmental services of marine and coastal ecosystems related to the activities of the blue economy.
SOCLIMPACT Deliverable Report – D5.6. Integration and coordination of non-market and big data analysis
of economic values resulting from Climate Change impacts to GEM-E3-ISL and GINFORS models.
SOCLIMPACT Deliverable Report – D6.2. Macroeconomic outlook of the islands’ economic systems and pre-
testing simulations.
SOCLIMPACT Deliverable Report – D7.1. Conceptual framework.

APPENDIX 3

1
TABLE OF CONTENT
INTRODUCTION ................................................................................................................................................ 2
1 CURRENT SITUATION AND RECENT TRENDS .................................................................................................. 4
1.1 CURRENT GEOPOLITICAL CONTEXT ......................................................................................................................... 4 1.2 CURRENT CLIMATE AND RISKS ............................................................................................................................... 6 1.3 MACROECONOMIC STATUS .................................................................................................................................. 8 1.4 RECENT EVOLUTION OF THE BLUE ECONOMY SECTORS ............................................................................................. 10
2 ECONOMIC PROJECTIONS ............................................................................................................................ 13
2.1 THE MACROECONOMIC PROJECTIONS ................................................................................................................... 13 2.2 THE SECTORAL PROJECTIONS .............................................................................................................................. 14 2.3 EMPLOYMENT ................................................................................................................................................. 16
3 CLIMATE CHANGE OUTLOOK ....................................................................................................................... 16
3.1 TOURISM ....................................................................................................................................................... 17 3.2 AQUACULTURE ................................................................................................................................................ 20 3.3 ENERGY ......................................................................................................................................................... 22 3.4 MARITIME TRANSPORT ..................................................................................................................................... 33
4 CLIMATE CHANGE RISKS .............................................................................................................................. 36
4.1 TOURISM ....................................................................................................................................................... 36 4.2 AQUACULTURE ................................................................................................................................................ 65 4.3 ENERGY ......................................................................................................................................................... 66 4.4 MARITIME TRANSPORT ..................................................................................................................................... 74
5 SOCIO ECONOMIC IMPACTS OF CLIMATE CHANGE ...................................................................................... 77
5.1 MARKET AND NON-MARKET EFFECTS OF CC .......................................................................................................... 77 5.2 MACROECONOMIC PROJECTIONS ........................................................................................................................ 86
6 TOWARDS CLIMATE RESILIENCY .................................................................................................................. 90
6.1 CURRENT SITUATION: GENERAL COMMITMENT, SPECIFIC LIMITS AND OBSTACLE ............................................................ 90
7 REFERENCES ................................................................................................................................................ 93

2
Introduction
This report is the background material for stakeholders in the upcoming adaptation pathways
workshop in the Canary Islands. First, a presentation that includes the geography and socio-
economic context for the Island, and the socioeconomic trends without climate change (WP6),
which range from the present to the end-of the century. Regarding Climate Change, the expected
climate risks and vulnerabilities for the blue economy are presented and ran (WP3), joint to the
expected trends of physical risks, booth current and future (WP4). Finally, specific economic
impacts are estimated, considering the evolution of some physical risks (WP5 and WP6). The
current climate policy and resilience of the Island is also presented (WP7). Finally, a link to the
projects original work is made in the references section.
The Canary Islands at a glance
The Canary Islands are a Spanish archipelago (the southernmost autonomous community)
located in the Atlantic Ocean. Actually, the islands are geographically located in the African
Tectonic Plate (at 100km. away from Morocco), even though the archipelago is economically and
politically European.
The seven main islands are (from largest to smallest in area) Tenerife, Fuerteventura, Gran
Canaria, Lanzarote, La Palma, La Gomera, El Hierro1; but the archipelago also includes some
more smaller islands and islets.
The Canary Islands were formed by volcanic eruptions millions of years ago. They have a total
extension of 7493km2, a population of 2,153,389 inhabitants and a density of 287.39 inhabitants
per km2. The population of the archipelago is mostly concentrated in the two capital islands:
around 43% on the island of Tenerife and 40% on the island of Gran Canaria.
The Blue Economy sectors
Aquaculture
In the Canary Islands there are mainly fish farms (seabass, Senegalese sole and seabream). The
most important species in the Canary Islands are seabream and European seabass, which
represent more than 95% of the aquaculture production in the islands and 22% of the total
production of these species in Spain. In 2017 were obtained in Gran Canaria the first productions
of penaeid shrimps, but due to the needed land, their development will not be highlighted in our
region.
The total production of fisheries and aquaculture registered in Canarian first-sale ports reached
7810 tons of fish in 2017, with a total value of 43 million EUR. The former represents 36.09% of
the fresh fisheries production in the islands, while 63.91% of the production corresponds to
fishing. However, aquaculture products represent most of the total production value (58.10%).
Maritime Transport
The Canary Islands are not self-sustaining, so they depend on maritime transport. This sector
plays a significant role in the archipelago’s economy, not only because of the islands’ dependence
on the outside in terms of goods’ imports and their condition of outermost region, which drives
1 The island of La Graciosa is the eighth island, but it is not included in our analysis.

3
costs up, but also because of the strategic location of the islands, which are located in the middle
of the transatlantic routes.
In the year 2019, the passenger traffic amounted to almost 7 million people, while total freight
traffic (including goods loaded, unloaded and transshipped) reached 39,667,153 tons. The Port of
Las Palmas de Gran Canaria is among the most important national maritime ports, along with the
Port of Algeciras, the Port of Barcelona and the Port of Valencia. It has occupied the 100th-
120th position with respect to container traffic worldwide in several occasion.
Energy
The archipelago has seven main islands, with seven independent electrical isolated electrical
systems. Only Fuerteventura and Lanzarote and interconnected trough a submarine cable. The
small and weak island grids pose a big challenge towards maximizing penetration of variable and
intermittent RES generation, without jeopardizing grid stability, and quality and guarantee of
power supply.
At the moment, the Renewable Energy covers in the Canary Islands 13% of electricity demand;
but regarding the primary energy balance, it only covers 2% (Canary Islands still depend on oil
derivatives around 98%. In the smaller island, El Hierro, the hydroelectric power plant was
launched in 2014, with a penetration of 20% in electricity balance (but not of the total primary
energy of the island). In 2016, it attained almost 40% (again, only on electricity balance); and
almost 50% in 2017 (of annual electricity balance). In the first months of 2018, the plant
managed to cover 60% of electricity demand, thanks to the improvements made by the
technicians of ITC.
Tourism
The economy of Canary Islands relies in the service sector, which accounts for 84.9% of the
gross value added (GVA). Activities related to tourism have an especial importance (Instituto
Canario de Estadística – ISTAC, 2019).
The archipelago's beaches, climate and important natural attractions, especially Maspalomas in
Gran Canaria and Teide National Park and Mount Teide (a World Heritage Site) in Tenerife
(rising to 3,718 metres, the highest point on Spanish soil and the third tallest volcano in the world
measured from its base on the ocean floor), make it a major tourist destination with over 12
million visitors per year, especially Tenerife, Gran Canaria, Fuerteventura and Lanzarote.

4
1 Current situation and recent trends
1.1 Current geopolitical context
The Canary Islands are located in the Atlantic Ocean, nearby the South coast of Morocco
(between about 27° 38' and 29° 30' north latitude and 13° 22' and 18° 11' west longitude). The
Canary Islands therefore represent one of the outermost regions in Europe. The autonomous
Spanish archipelago group is formed by seven main islands and a few smaller islands. The main
islands are Tenerife, Gran Canaria, Fuerteventura, Lanzarote, La Palma, La Gomera and El
Hierro. The overall territory has an extension of 7,447 km² and is inhabited by 2,154,978 people
(2017), accounting for 4.6% of the total population in Spain. Besides already being one of the
regions with the highest density of population, it is also among those that have been consistently
gaining population over time2.
Trade winds and the cool waters of the subtropical North Atlantic prevent the Canary Islands to
suffer from the extreme weather conditions of the nearby Sahara Desert3. According to the
national meteorological service for the UK, “the Canary Islands experience a Mediterranean
climate typified by extremely dry summer months with warm temperatures and mild winters with
more rainfall, particularly to the north of the region. In terms of temperature alone, the Canary
Islands experience a subtropical climate which means that temperatures [are] mild and stable
throughout the year within the range 18 - 24 °C. Summer in the Canary Islands sees consistently
high temperatures in the high 20's with only traces of rainfall on any of the islands. Despite their
southerly location, temperatures do not become unbearably high due to the cooling influence of
the surrounding waters of the Atlantic Ocean. The hottest days occur when easterly winds cause
hot dry air from the Sahara Desert to sweep across the islands, often laden with dust. Winters in
the Canaries are mild, Tenerife for example still sees average maximum temperatures of 21 °C in
January despite being the coldest month. In winter Atlantic depressions can cause infrequent
stormy periods with disturbed weather and higher rainfall. Winter rainfall varies between islands
and is higher in the northern parts of the archipelago which are more exposed to the northeast
trade winds. Las Palmas de Gran Canaria on the exposed northern side of Gran Canaria sees 46
mm rainfall during February while the sheltered Arrecife on Lanzarote sees just 14 mm4.”
In a summary assessment for the European Service Innovation Centre, Lahtinen et al. (2013)
summarized detailed information on territorial structures and administrative hierarchies as
follows: “The islands are divided into two provinces: Santa Cruz de Tenerife and Las Palmas.
The former covers the islands of Tenerife, La Gomera, La Palma and El Hierro, while the latter
contains the islands of Gran Canaria, Fuerteventura and Lanzarote. Instead of having a single
regional capital, there are two: the cities of Santa Cruz de Tenerife and Las Palmas de Gran
Canaria. There are four layers of administration on the islands:
1. The Government of Spain;
2. The Government of the Canary Islands – a joint administration of the seven islands;
2 European Commission. https://ec.europa.eu/growth/tools-databases/regional-innovation-monitor/base-profile/canary-islands.
3 Hernandez, Y., Guimarães Pereira, Â., Barbosa, P. (2018): Resilient futures of a small island: A participatory approach in Tenerife (Canary Islands) to address climate change, Environmental Science & Policy, 80, 28-37.
4 https://www.metoffice.gov.uk/weather/travel-and-events/holiday-weather/europe/canary-islands.

5
3. The administration of each island (isle council); and
4. The administration of each municipality.5
According to the European Commission, the “Canary Islands present a wide range of possibilities
in terms of technological innovation due to its strategic geographical location, its special fiscal
status and the high quality of human capital it holds. On the other hand, this region also suffers
from clear weaknesses caused mainly by the fragile innovative and environmental systems of the
islands. The business ecosystem of the Canary Islands relies heavily on the geographical location
and the particular characteristics of the archipelago. However as expected; it is mainly devoted to
the service sector, with special emphasis in tourism”.6
Population dynamics of the island
In terms of total population, the Canary Islands rank eighth in Spain. The average population
density of the Canary Islands already amounts to more than twice the Spanish average. Total
population figures still exhibit a clear trend towards growth. Figure 1 illustrates the development
of total population figures since the year 2000. The majority of the overall population lives on the
two main islands Gran Canaria and Tenerife. The European Job Mobility Portal (EURES)
reports that foreign population residing in the Canary Islands accounts for 12.22 % of the total.
“The most numerous in rank order are Italians, Germans, British, Moroccans, Venezuelans and
Cubans”7.
As a reference to latest available harmonized regional population projections, Figure 2 shows main
scenario results for the Canary Islands from the Europop2013 population projections. According
to this projection, the Canary Islands will continue to experience population growth until 2050.
However, with only moderate growth rates: the projected population growth from more than 2.1
million inhabitants in 2015 to nearly 2.5 million inhabitants in 2050 corresponds to an average
annual growth of (slightly more than) 0.4%.
5 Lahtinen, H., Viljamaa, K., Buligescu, B., Wintjes, R (2013): Summary Assessment of the Canary Islands. Report prepared for the European Service Innovation Centre (ESIC).
6 https://ec.europa.eu/growth/tools-databases/regional-innovation-monitor/base-profile/canary-islands.
7https://ec.europa.eu/eures/main.jsp?countryId=ES&acro=lmi&showRegion=true&lang=en&mode=text®ionId=ES5&nuts2Code=ES53&nuts3Code=null&catId=441.

6
Figure 1: Population development in the Canary Islands region 2000 – 2018. Source: Eurostat demo_r_gind3 database, own representation.
Figure 2: Baseline population projection for Canary Islands (2015-2050).
Source: Eurostat proj_13rpms3 database, own representation.
1.2 Current climate and risks
The climate in the Canary Islands is subtropical and arid. The temperature fluctuations are not big. It is characterized by deficient and irregular rainfall, especially in the lower areas (less than 300mm) due to the predominance of the Azores Anticyclone. In the midland’s areas exposed to the trade winds, rainfall can reach 800-1000 mm.
Rainfall is more intense in late autumn, especially in winter, while summer is the driest season of the year. Tenerife, La Palma and Gran Canaria are the islands where it rains most.
In the area of summits, on the higher islands, the trade winds cease to affect, lowering precipitation compared to average, around 400 mm, which in some cases may be in the form of snow.

7
The temperatures are mild all year round. The south of all the islands registers the warmest temperatures with an annual average above 20oC. Lanzarote and Fuerteventura are the aridest islands, so this average is generalized. On the other islands, as we go up in altitude, the average annual temperature drops, to 14oC for example on the peaks of Gran Canaria, to 13oC on El
Hierro and La Gomera, in the higher areas of La Palma it reaches 9oC or in the Can adas del Teide (Tenerife) up to 5oC.
Figure 3: Climate factsheet Source: Own elaboration with data from GFDRR ThinkHazard!; D7.1 Conceptual Framework and Meteoblue; Meteoblue global NEMS (NOAA Environmental
Modeling System)

8
1.3 Macroeconomic status
Between 2000 and 2017, nominal GDP increased by slightly more than 71% in the Canary
Islands region. However, on a per capita basis, this economic growth lagged behind average
economic developments in the European Union.
Table 1: Real variation rate of gross domestic product. 2006-2017
Year 06-07 07-08 08-09 09-10 10-11 11-12 12-13 13-14 14-15 15-16 16-17
Canary Islands 3.2 0.1 -4.4 1.0 -1.0 -2.5 -1.3 0.8 2.4 3.0 2.9
Spain 3.8 1.1 -3.6 0.0 -1.0 -2.9 -1.7 1.4 3.4 3.3 3.1
Germany 3.3 1.1 -5.6 4.1 3.7 0.5 0.5 1.9 1.7 1.9 2.2
United Kingdom
2.4 -0.5 -4.2 1.7 1.5 1.5 2.1 3.1 2.3 1.9 1.8
Euro Area 3.0 0.4 -4.5 2.1 1.6 -0.9 -0.2 1.3 2.1 1.8 2.4
EU 3.0 0.4 -4.3 2.1 1.7 -0.4 0.3 1.8 2.3 2.0 2.4
Source: National Statistics Institute; EUROSTAT, Compiled by: CCE
Whereas regional per capita GDP equaled about 78% of average European per capita GDP in
the year 2000, this benchmark figure decreased to less than 70% by 2017. In 2017, several sectors
grew faster than in mainland Spain (Table 2), such as agriculture and fishing, construction, trade,
transport and hotels and real estate activities. Overall GDP grew less than mainland Spain, due to
less growth in manufacturing and in energy industries. The latter sectors should be strengthened
and are the targets of economic diversification and development strategies (see below).
Table 2: Sectoral development of the Canary Islands 2011-2017, and Spain 2017, annual growth rates.
Canaries Spain 2011 2012 2013 2014 2015 2016 2017 2017
GDP -1.0 -2.5 -1.3 0.8 2.4 3.0 2.9 3.1
Agriculture, fishing -17.0 -0.7 1.2 -6.9 -8.4 6.2 4.1 3.7
Industry and energy -7.1 -5.9 -12.7 0.5 -0.8 2.3 2.2 3.7
Manufacturing industry -11.1 -6.8 -7.9 -4.0 9.8 -0.3 3.0 3.8
Construction -15.3 -7.9 -6.9 -2.0 2.9 2.0 8.9 4.9
Services 1.9 -1.7 0.5 0.9 2.3 3.0 2.5 2.6
Trade, transport, hotel 4.0 -1.7 -0.6 1.3 2.9 3.7 3.5 3.2
Information and communications -1.1 0.3 7.3 9.3 3.5 5.6 5.1 5.1
Financial, insurance -4.2 -5.4 -6.4 -5.7 -5.0 -0.6 -0.9 -1.5
Real estate activities 4.2 2.7 2.0 0.4 0.4 1.8 1.9 1.3
Service activities -2.0 -7.1 0.1 2.2 10.7 7.1 3.5 6.2
Public administration 0.5 -2.4 1.6 -0.5 0.4 1.6 0.5 1.4
Other services 0.7 -1.2 -1.2 1.8 3.7 1.6 3.7 1.7
Gross Value Added -0.6 -2.4 -1.1 0.5 1.9 2.9 2.8 2.9
Source: National Statistics Institute, Compiled by: CCE
Figure 4 illustrates the development of gross value added in selected key sectors of the Canary
Islands economy. The graphs of the time series depict an economic structure that is essentially
characterized by the development of service activities. As can be inferred from the solid dark line,
aggregated “wholesale and retail trade, transport, accommodation and food service activities”
provide predominant contributions to total regional income generation. With aggregated gross
value-added figures levelling around 14 billion Euros in 2017, the economic significance of this

9
sector also clearly exceeds the economic significance of “public administration, defense, education,
human health and social work activities”.
The Canaries have no own fossil fuel resources; all fuels are imported. Also, the Canaries exhibit
a lack of all other raw materials. Agricultural areas and natural resources such as beaches, water
and scenery, however, are abundant and contribute predominantly to regional export flows.
The regional economy runs a serious trade deficit which increased considerably in the past. As
reported by the Canarias’ Statistical Office (Instituto Canario de Estadística, ISTAC), this deficit
rose from almost 8.5 billion euros in 2000 to more than 13 billion euros in 2017. Table 3
reproduces a most recent overview on aggregated import and export data. The development of
imports is essentially driven by imports of mineral fuels, mineral oils and other refined products
(more than 2.8 billion euros in 2017), motor vehicles, other land transportation vehicles and parts
thereof (more than 2.4 billion euros in 2017) as well machinery and mechanical appliances and
parts thereof (almost 1 billion euros in 2017).
Figure 4: Development of gross value added in selected key sectors.
Source: Eurostat TGS00010 database, own representation.
Table 3: Summary of foreign trade flows for the Canary Islands 2017.
Total value (in thousands of euros)
Difference Year-to-Year Variation (%)
2007 2016 2017 16-17 07-17 16-17 07-17
TOTAL 3,223,403 3,055,300 3,523,337 468,037 299,934 15.3 9.3
Oil products (chapter 27*)
1,266,958 269,117 483,254 214,136 -783,704 79.6 -61.9
Total (excluding chapter 27*)
1,956,445 2,786,183 3,040,083 253,901 1,083,638 9.1 55.4
Source: Canary Islands Economy Annual Report 2017

10
0
2000000
4000000
6000000
8000000
10000000
12000000
14000000
16000000
18000000
2005 2006 2007 2008 2009 2010 2011 2012 2013 2014 2015 2016 2017 2018 2019
It is interesting to note that the above-mentioned major import categories do also represent
major export categories. However, the reported export volumes are considerably lower than the
import values mentioned above (around 483 million euros for mineral fuels, mineral oils and
other refined products, 187 million euros for motor vehicles, other land transportation vehicles
and parts thereof and 178 million euros for machinery and mechanical appliances and parts
thereof). Whereas individual products of the most important export category “special encodings”
can hardly be named in more detail, fruits and nuts, tobacco and tobacco products as well as fish
and other aquatic products represent relevant domestic contributions to the reported export
flows.
1.4 Recent evolution of the blue economy sectors
Tourism
Tourism is still increasing on the Canaries. Lately, there has been a public discussion about
overtourism, mainly in cities but on islands as well. The online travel magazine Mypics states:
“Resources are scarce on islands. The ecological balance in nature is even more sensitive than in
the city. In several years it has been reported that drinking water has become scarce. The sewage
and garbage disposal for the many people on the islands is a problem. They are inhabited only by
relatively few natives. The sewage and garbage disposal are adjusted to them and of course also to
tourists. However, when seven to thirty times the amount of waste and sewage is produced in the
season, it is no longer manageable. Waste water is discharged untreated into the sea.” Adding
climate change to this scenario makes the islands even more vulnerable. Figure 5 and table 4
show an overview of the development of the main tourist indicators for the Canary Islands.
Almost 14 million visitors spent close to 17 billion Euro in 2017 and employed close to 60
thousand people in the accommodation sector alone.
Figure 5: Development of tourist arrivals in Canary Islands. Source: Promotur
The expenditures are distributed to accommodation (31%), transport (except flights) (10%), food
and drink (20%), souvenirs 7%), and leisure (tours, sports, cultural events) (32%) (Tourist profile.

11
Canary Islands, 2017).
Apparently, the choice of this destination by tourists is predominantly influenced by prevailing
climate conditions. Other relevant impact factors of respective traveler decisions are given by
available regional possibilities to relax, the availability and quality of beaches and individual
landscapes features. In general, the two big islands (Tenerife and Gran Canaria) offer both beach
and nature activities. Fuerteventura is famous for beaches, the dunes, and sea sports. La Palma
and La Gomera are well-known for their nature and forests. Lanzarote is famous for its cultural
heritage (gastronomy: vineyard) and its exacerbated volcanic landscapes. The later attribute is also
predominant in El Hierro.
Table 4: Main tourist indicators from Canary Island for 2016 and 2017.
2016 2017 Var. abs. 16-17
Var. (%)
16-17
Average stay (days) 7.7 7.5 -0.2 -
Employed personnel tourist accommodation
Hotels 45,695 47,264 1,569 3.4
Apartments 11,425 11,635 210 1.8
Bed places
Hotels 214,852 215,836 984 0.5
Apartments 212,502 218,252 5,750 2.7
Employed personnel per each bed places
Hotels 18.9 19.4 0.5 -
Apartments 7.2 7.4 0.3 -
Total establishments 14.3 14.7 0.5 -
Tourist Expenditure Survey
Total tourists’ expenditure 15,070 16,780 1,710 11.3
Average expenditure per person 1,137 1,181 44 3.9
Average daily expenditure per person 130 138 8 6.2
Source: FRONTUR-Canarias (ISTAC); AENA; Establishments occupancy survey (INE); EGATUR (INE); ISTAC.
Maritime transport
While global maritime transport of goods grows steadily with global trade, the transport of
people by ship has been replaced by airplanes if it comes to going from one place to another. The
only passenger ships with positive growth rates and positively growing revenues are cruise ships,
a holiday activity with a rapidly growing market.
Table 5: Maritime transport activities.
2012 2013 2014 2015 2016
Passengers (in 1000) 3,356 4,035 3,801 3,658 4,652
Freight (in 1000 tons) 29,816 25,707 24,409 25,570 25,020
Source: Eurostat
Islands, and such the Canaries participate in the latter, but have more reasons for the freight
maritime transport: they rely on resources (such as fuels, food, building material, consumer goods
such as cars etc.) which are brought to the island by ship. Both activities have been relatively

12
stable over the last five years. Nevertheless, the Canarian Port Authorities plan several additional
ports in the near future.
Aquaculture
The Blue Economy sector aquaculture is always rather dwarfed. On the Canaries, it only has a
share of 0.2% of total value-added. The aquaculture in the Canary Islands stands out because at
present the range of temperature between summer and winter is not very pronounced, which
causes an advantage in production, in time and a specific commercial size.
The main fishing activities of the Canary Islands are coastal artisanal fishing (for small pelagic
species, demersals and tuna), cephalopod fishing off the coast of Africa by a fleet of freezer
trawlers, and high seas tuna fishing. All the catches are landed in ports authorised as first-sale
markets. Currently, there are 31 entities authorised as first-sale points for fresh fisheries products,
and 17 for frozen fisheries products. More than half of the total fresh fisheries production is
landed in Tenerife, particularly as regards pelagic fish and crustaceans. Gran Canaria is very
significant for landings of demersal fish and molluscs. In Lanzarote pelagic landings are
dominant, whereas La Palma and El Hierro have important parts of the crustacean landings.
Table 6: Economic contribution of aquaculture.
2015 2016 2017 2018
NACE 03 Fishing and Aquaculture
Output 149,537 199,067 226,722 185,849
GVA 28,811 42,899 11,177 31,999
Aquaculture
Output 130,864 178,474 201,747 163,756
GVA 18,596 31,265 -2,072 19,533
GVA of Aquaculture to GVA of total economy
0.22% 0.34% -0.02% 0.18%
GVA of Aquaculture to GVA of NACE 03 64.54% 72.88% -18.54% 61.04%
Output of Aquaculture to output of NACE 03 87.51% 89.66% 88.98% 88.11%
Full time equivalent employees 159 161 178 223 Source: SOCLIMPACT Deliverable Report - D6.2 Macroeconomic outlook of the islands’ economic systems and pre-testing simulations
Electricity
The Greenpeace Energy Revolution Scenario describes the challenges of electricity generation
and energy supply on the Canaries as follows8: The structure of energy demand in the Canary
Islands shows relevant differences with respect to the Peninsula or European Union countries,
and it is particularly defined by the mild climate, yielding lower needs regarding heating, the
demand from tourists, the transport sector, because the Canary Islands have a vehicle per capita
8
https://www.dlr.de/dlr/Portaldata/1/Resources/documents/2015/Energy_R_evolution_
CanaryIslands_Execu- tiveSummary_EN.pdf

13
ratio 20% over the national average, and an ageing fleet. The need for drinking water production,
through sea water desalination puts additional pressure on electricity generation. Energy demand
in the residential sector is inferior to the national average, not only due to the mild climate, but
also to the inadequate coverage of heating and cooling needs. In fact, only 30% have air
conditioning systems, and out of household energy demand only 3% corresponds to climate
control (heating/cooling). This 3% would rise to 10% with a desirable incorporation level. High
cost of electricity generation due to the high dependence on fossil fuels are a key issue. The costs
of electricity generation in the Canary Islands, 237 € / MWh (according to latest data from the
National Commission of markets and competition, CNMC) are among the highest in the
European electricity markets. To prevent the Canarian electric bill to be higher than the rest of
the state, these extra costs are shared on the bill of all customers in the country, in other words:
subsidized.
Figure 6: Power generation technologies currently applied in the Canary Islands. Source: Uche-Soria & Rodríguez-Monroy (2018)9
2 Economic projections
2.1 The macroeconomic projections
According to our reference projections, Canary Islands continue to grow with a 1.6% yearly rate
throughout the 2015-2100 period. Main drivers of growth are investments and public
consumption with an average yearly growth rate of 1.5% over the whole projection period. (Table
7). While growth rates of private consumption are projected to range around 1%, a long-term
9 Uche-Soria, M.; Rodríguez-Monroy, C. Special Regulation of Isolated Power Systems: The
Canary Islands, Spain. Sustainability 2018, 10, 2572.

14
reduction of the trade deficit also plays a key role for the sustained economic growth (Figure 7)
This indicates a transition towards a more sustainable economy that reduces its reliance on
imported consumption and increases its productive capacity through investment activity.
Table 7: Canary Islands’ GDP and GDP components yearly growth rates in 2020-2100.
2020 2025 2030 2035 2040 2045 2050 2060 2070 2100
GDP 3.0% 1.7% 1.6% 1.5% 1.4% 1.3% 1.2% 1.6% 1.5% 1.4% Private consumption
1.3% 0.9% 0.9% 0.8% 0.8% 0.8% 0.7% 1.0% 1.3% 1.1%
Public consumption 2.9% 2.3% 2.1% 1.9% 1.7% 1.6% 1.5% 1.3% 1.1% 1.1% Investments 4.0% 0.6% 0.5% 0.5% 0.5% 0.5% 0.5% 2.0% 1.8% 1.8%
Trade -
0.7% -0.9%
-1.0%
-1.0%
-1.1%
-1.1%
-1.2%
-1.2%
-1.2%
-3.9%
Source: SOCLIMPACT Deliverable Report - D6.2 Macroeconomic outlook of the islands’ economic systems and pre-testing simulations
Figure 7: Macroeconomic components as a % share of GDP for Canary Islands in 2015-2100. Source: SOCLIMPACT Deliverable Report - D6.2 Macroeconomic outlook of the islands’ economic systems and pre-testing simulations
The high growth contribution of investments in the period up to 2050 is primarily due to a high
paced growth towards 2020 which counterbalances a lack of investments during the economic
crisis. Throughout the 2025-2050 period, investments growth rates do not exceed overall GDP
growth rates. Private consumption is projected to represent also in 2100 the largest demand
component of GDP, followed by public consumption and investments.
2.2 The sectoral projections
The Canary Islands’ economy remains a service-led economy throughout the 2015-2100 period
with an increasing contribution of non-market and other market services. The aggregated gross
value added share of agriculture, fishery, manufacturing and consumer goods sectors is projected
to diminish by roughly 1.5% until 2100. The aggregated share of electricity services, water
services and construction services remains relatively stable close to 13% until 2100.

15
The aggregated gross value added share of total tourism activities is projected to range around 13%
throughout the projection period.
Figure 8: Sectoral value added as a % share to total GVA for Canary Islands in 2015, 2050 and 2100. Source: SOCLIMPACT Deliverable Report - D6.2 Macroeconomic outlook of the islands’ economic systems and pre-testing simulations
Table 8: Sectoral contribution as a % share of total gross value added for Canary Islands in 2015-2100. GVA % shares 2015 2020 2025 2030 2035 2040 2045 2050 2060 2070 2100
Agriculture 1.2% 1.1% 1.1% 1.1% 1.0% 1.0% 1.0% 1.0% 0.9% 0.9% 0.8%
Fishery 0.0% 0.0% 0.0% 0.0% 0.0% 0.0% 0.0% 0.0% 0.0% 0.0% 0.0%
Manufacturing 2.5% 2.4% 2.4% 2.4% 2.3% 2.3% 2.3% 2.2% 2.2% 2.1% 1.9%
Consumer goods 1.3% 1.2% 1.2% 1.2% 1.2% 1.1% 1.1% 1.1% 1.1% 1.0% 0.9%
Electricity 4.7% 4.6% 4.5% 4.5% 4.5% 4.4% 4.4% 4.4% 4.3% 4.2% 3.9%
Water 2.9% 2.9% 2.9% 2.9% 2.8% 2.8% 2.8% 2.8% 2.7% 2.6% 2.5%
Construction 5.2% 5.5% 5.3% 5.2% 5.0% 4.9% 4.8% 4.7% 5.1% 5.4% 6.3%
Water transport 0.7% 0.7% 0.7% 0.6% 0.6% 0.6% 0.6% 0.6% 0.6% 0.5% 0.5%
Other transport 4.3% 4.3% 4.4% 4.4% 4.5% 4.6% 4.6% 4.7% 4.8% 4.9% 5.3%
Accommodation and food services
9.8% 9.6% 9.5% 9.5% 9.4% 9.3% 9.3% 9.2% 9.1% 9.0% 8.5%
Travel agency and related activities
0.5% 0.4% 0.4% 0.4% 0.4% 0.4% 0.4% 0.4% 0.4% 0.3% 0.3%
Recreational services 2.4% 2.3% 2.3% 2.2% 2.2% 2.2% 2.1% 2.1% 2.0% 2.0% 1.8%
Other market services 49.3% 49.9% 50.4% 50.8% 51.2% 51.5% 51.8% 52.0% 52.2% 52.5% 53.2%
Non-market services 15.1% 14.9% 14.9% 14.9% 14.8% 14.8% 14.8% 14.7% 14.6% 14.4% 14.0% Source: SOCLIMPACT Deliverable Report - D6.2 Macroeconomic outlook of the islands’ economic systems and pre-testing simulations

16
2.3 Employment
The service-led economic growth brings positive effects to the labour market with
unemployment projected to fall from more than 15% in 2015 to less than 7% until 2100. The
contribution of each sector to total employment depends on the labor intensity of the sector. The
biggest employing sectors are the non-market and market services as well as accommodation and
food services. Accommodation and food services together with recreational services can
therefore also be identified some most significant employers amongst the Blue growth sectors
under analysis. The lowest contributions to overall employment among Blue growth sectors can
be observed for the Fishery sector.
Table 9: Sectoral contribution as a % share of total gross value added for Canary Islands in 2020-2100
2015 2020 2025 2030 2035 2040 2045 2050 2060 2070 2100
Unemployment rate
15.5% 12.1% 10.8% 10.0% 9.5% 9.2% 8.9% 8.7% 8.5% 7.7% 6.5%
Source: SOCLIMPACT Deliverable Report - D6.2 Macroeconomic outlook of the islands’ economic systems and pre-testing simulations
Figure 9: Sectoral employment as a % share of total for Canary Islands in 2015, 2050, 2100 Source: SOCLIMPACT Deliverable Report - D6.2 Macroeconomic outlook of the islands’ economic systems and pre-testing simulations
3 Climate change outlook
Climate hazards indicators represent the entry point to understand the climate change exposure
of the blue economy sectors. The indicators have been computed for two scenarios, RCP2.6 (low
emission scenario) and RCP8.5 (high emission scenario), and for different horizon times namely:
a reference period (1965-2005), mid-century (2046-2065) and end of century (2081-2100). The
main source of climate projections for the Canary Islands is MENA-CORDEX, even if other

17
model sources were applied when required. Results are presented in the form of maps, tables or
graphs and only when the information shows an interesting outcome.
As to its reliability, it is important to note that Atlantic islands (Azores, Madeira, Canaries and West Indies) lie in very critical areas where global models might be inaccurate in predicting the large scale patterns (regional models are not available), and resolution is so coarse that in fact many islands don't even exist in model orography. This acknowledged, this is the only information we can provide, and at least future tendencies can be inferred. The new CMIP6 simulations might shed more light on this issues, but we can only suggest that results should be updated as they become available. The same partly holds for the wave simulations: local resolution has been significantly increased in the dedicated new simulations of this project, performed by the partner ENEA (up to 0.05°), but the forcing wind field is still derived from the coarse global models. Stakeholders should be made aware that uncertainty is an inherent characteristic of climate data, and that any future planning must cope with it. Climatologists can only highlight POTENTIAL threats and constraints, they cannot predict the future and pave the way to solutions. Conveying this piece of information is one of the most critical points ofclimate-change-related information. All the graphics presented below can be found in high resolution in the Soclimpact
Project official website HERE.
3.1 Tourism
Tourist [thermal] discomfort (Humidity Index)
As a representative indicator for the assessment of inhabitants’ and tourists’ hazard on heat
related climate change impacts, the Number of Days with Humidity Index (Humidex) greater
than 35°C was selected. From a predefined classification, a day with Humidex above 35°C
describes conditions from discomfort to imminent danger for humans. For Canary Islands, under
RCP8.5 (far future), the number increases.
Figure 10: Humidex. Ensemble mean of MENA-CORDEX simulations. Source: SOCLIMPACT Deliverable Report - D4.3 Atlases of newly developed indexes and indicator

18
Seagrass evolution
Seagrasses are the main habitat for coastal marine ecosystems. They provide different services
like sediment retention (and thus clearer waters), coastal protection (in front of marine storms),
shelter for marine organisms, etc. Therefore, the state of seagrasses is a convenient proxy for the
state of coastal environment. Our results suggest that no seagrass losses are expected for the
three following species located in the coasts of Canary Islands: Cymodocea, Zostera and
Halophila.
Figure 11: Seagrass evolution (covered area in km2). Source: SOCLIMPACT Deliverable Report - D4.4e Report on estimated seagrass density
Beach flooding and related losses
One of the consequences of an increase in the mean sea level will be the flooding of coastal
areas. This includes sand beaches, which are the main asset for tourism activities in most of the
European islands. Therefore, estimating the potential risk of beach loss due to climate change is
of paramount importance for the economy of those islands.
The 95th percentile of the flood level averaged was selected as an indicator of interest. The larger
projected values are found for the Atlantic islands in SOCLIMPACT, where slightly larger sea
level rise is combined with the effect of much larger wind waves. The values range from 59.92
cm for RCP2.6 to 137.8 cm for RCP8.5 in the far future. Under the RCP 2.6, the values are less
than half, suggesting that a mitigation scenario could largely minimize the negative impact of
climate change on beach flooding.

19
Figure 12: Projected extreme flood level (in the vertical) at beach locations with respect to the present (1986-2005) mean sea level values averaged for the island (far future only). Ensemble of models using Global simulations
produced by Hemer et al. (2013). Source: SOCLIMPACT Deliverable Report - D4.4d Report on the evolution of beaches
Under mean conditions we find that, at end of century, the total beach surface loss ranges from
~48% under scenario RCP2.6 to ~80% under scenario RCP8.5.
Figure 13: Beach reduction % (scaling approximation). Source: SOCLIMPACT Deliverable Report - D4.4d Report on the evolution of beaches.
Fire Weather Index
The FWI system provides numerical non-dimensional ratings of relative fire potential for a generalized fuel type (mature pine stands) based solely on weather observations. FWI is part of the Canadian Forest Fire Danger Rating System established in Canada since 1971 (van Wagner 1987). Furthermore, since 2007, FWI has been adopted at the EU level and used in a harmonized way throughout Europe by the European Forest Fire Information System (EFFIS) of the Copernicus Emergency Management Service (since 2015).

20
It is selected for exploring the mechanisms of fire danger change for the islands of interest in the framework of SOCLIMPACT Project, as it has been proved to adequately perform for several locations, including the Mediterranean basin. The index was calculated for the fire season (defined from May to October) for all models, scenarios and periods. For the Canary Islands, the ensemble means, and the uncertainty is presented for all periods and RPCs. Under RCP8.5 there is an increased fire danger: the hazard class changes from medium (reference period) to high.
Figure 14: Fire Weather Index (EURO-CORDEX) with the color associated to the class of hazard Source: SOCLIMPACT Deliverable Report - D4.4c Report on potential fire behaviour and exposure
3.2 Aquaculture
The predicted impacts of climate change on the oceans and seas of the planet is expected to have
direct impacts on marine based aquaculture systems. Basic effects are the following (Soto and
Brugere, 2008).
Change in biophysical characteristics of coastal areas:
Increased invasions from alien species.
Increased spread of diseases.
Changes in the physiology of the cultivated species by changing temperature, salinity,
oxygen availability and other important physical water parameters.

21
Changes in the differences between sea and air temperature which will alter the
seasonality, frequency and severity of storms, cyclones and other extreme events, affect
the stability of the coastal resources and potentially increase the damages in infrastructure.
Sea level rise, acidification, changes in precipitation and other effects will also add to the
changes in coastal ecosystems and environment, thus affecting production and
infrastructure (=investments).
Annual Mean Significant Wave Height (AMSH)
Annual Mean Significant Wave Height was selected as a relevant indicator of the average stress
aquaculture infrastructures are subject to. For the Atlantic as a whole, no major changes in wave
height mean values are observed, but a northward shift of the zonal belt where the meridional
gradient of the field is strongest. The seasonal means for the reference period are presented
hereafter.
Figure 15: AMSH (seasonal; DJF=Winter, MAM=Spring, JJA=Summer, SON=Autumn).
Source: SOCLIMPACT Deliverable Report - D4.3 Atlases of newly developed hazard indexes and indicators with Appendixes

22
Extreme Wave Return Time
Return times for a threshold of 7 m significant wave height (hs) were computed, this significant
height having been identified by stakeholders as the critical limit for severe damages to assets at
sea. Return times can be related to the payback times of investments and help assess potential
economic losses and economic sustainability.
The Atlantic islands under observation in SOCLIMPACT deserve special treatment, due to their
location in an area that is particularly sensitive to climate-change induced changes in the global
circulation.
A uniform increase in return times is observed, as the meridional gradient in extreme event
frequency experiences a northward shift and is confined within a thinner zonal belt. In the far
future and under the RCP8.5 scenario, the Canaries appear to be less exposed to the extreme
events potentially harmful to aquaculture infrastructures.
The evident limitation of such conclusions is their being based on a single driving model
experiment, which is clearly insufficient to investigate the natural variability of the position and
intensity of the observed meridional gradient.
Figure 16: Extreme Wave Return Time. Source: SOCLIMPACT Deliverable Report - D4.3 Atlases of newly developed hazard indexes and indicators with Appendixes
3.3 Energy
Renewable energy productivity indexes
A series of indicators related to renewable energy productivity is presented. The selected
indicators are wind and photovoltaic (PV) energy productivity, as well as the frequency and
duration of low-productivity periods, termed energy droughts (Raynaud et al., 2018), as a measure
of the variability of these sources. The productivity and variability of these renewable energy

23
sources will depend on climate. The possibility of reduced productivity due to climate change
poses a risk to the energy generation, if it is based on these renewable energy sources. Also, a
possible increase in the frequency and duration of solar and wind energy droughts will require an
increase in storage and backup sources.
Among the different renewable energy sources, solar PV and wind energy have been selected, as
they are (and very likely will be) the main renewable energy sources, due to their degree of
technological development and their comparatively low cost. In order to consider a marine
energy source, offshore wind energy is included, in addition to onshore wind energy.
Wind and photovoltaic (PV) energy productivity
Yearly photovoltaic productivity shows generally small changes over the island (with respect to
the yearly productivity of the reference period), with some increases mostly over the
mountainous areas of the islands, while coastal areas show mostly decreases. Larger changes are
found for RCP8.5, but even for this emissions scenario they remain below 5% over land,
pointing towards a stable energy resource.
In general, eastern islands have higher productivity values, while lower values are seen on the
north-west side of the domain. With respect to the wind energy productivity a clear increase is
found in the Canary Islands in the RCP8.5 scenario at the end of the XXI century (nearly 5%).
Figure 17: Wind energy productivity (land). Ensemble of models using MENA-CORDEX. Source: SOCLIMPACT Deliverable Report - D4.4a Report on solar and wind energy

24
Figure 18: Wind energy productivity (sea). Ensemble of models using MENA-CORDEX.
Source: SOCLIMPACT Deliverable Report - D4.4a Report on solar and wind energy
Figure 19: Photovoltaic (PV) productivity (land). Ensemble of models using MENA-CORDEX. Source: SOCLIMPACT Deliverable Report - D4.4a Report on solar and wind energy.

25
Figure 20: Photovoltaic (PV) productivity (sea). Ensemble of models using MENA-CORDEX. Source: SOCLIMPACT Deliverable Report - D4.4a Report on solar and wind energy
Time series of PV productivity show the expected seasonal pattern with higher values in central
months of the year. In general, a substantial relative interannual variability of PV productivity
over the Canary Islands is found, except for summer months. Future negative changes can be
appreciated easily for summer in RCP8.5 and RCP2.6, particularly in RCP8.5 at the end of the
century. PV productivity tends to decrease also in spring and autumn in RCP8.5. These changes
are responsible of the annual mean changes in PV productivity projected over the domain. In
other seasons changes are less clear due to the higher interannual variability.
Figure 21: Annual and seasonal variability of PV productivity (kWh/kW, in monthly average for each season) for the Canary Islands domain for selected periods for (A) RCP2.6 and (B) RCP8.5. Note that only complete
winters (DJF) have been taken into account to construct the time series. Source: SOCLIMPACT Deliverable Report - D4.4a Report on solar and wind energy

26
The annual and seasonal variability analysis for wind energy shows that this region has a weak
seasonal cycle. The maximum occurs in summer, the minimum occurs in autumn, although it is
very close to winter values. However, models project seasonal changes so that the future seasonal
cycle should be even weaker. The increase found in RCP8.5, especially by end of century, is
mainly related to the winter, also with a slight increase in autumn. A decrease in summer occurs
in both periods.
Figure 22: Annual and seasonal variability of Wprod (kWh/kW, in monthly average for each season) for the Canary Islands domain for selected periods for RCP2.6 (upper panel) and RCP8.5 (lower panel). Note that only
complete winters (DJF) have been taken into account to construct the time series. Source: SOCLIMPACT Deliverable Report - D4.4a Report on solar and wind energy
Frequency and duration of low-productivity periods (energy droughts) as a measure of
the variability of these sources
Wind energy productivity droughts are generally much more frequent than photovoltaic
productivity droughts. Also, the duration of wind energy drought episodes (measured by the
maximum consecutive energy drought days) is greater than that of photovoltaic droughts. This
highlights the steadiness of photovoltaic production in the analyzed island.
Projected changes in the % of days of drought are generally not larger than 5%. For instance, in
line with what is found for wind energy productivity, in the Canary Islands we observe a
pronounced decrease in the occurrence of wind energy droughts in the RCP8.5 scenario,
especially in the second half of the XXI century. Results indicate also that in general, offshore
wind energy is less variable than onshore wind energy, as wind energy droughts over the sea are
less frequent and last less than over land.
As for moderate wind droughts, changes in the frequency of moderate PV droughts show great
spatial variability in the RCP2.6 case, while a generalised decrease in the occurrence of moderate

27
PV droughts is found for the RCP8.5 scenario. Regarding severe PV droughts, their frequency in
the reference period and their changes are very small in both scenarios.
Figure 23: Ensemble mean frequency of moderate and severe productivity drought days (%) in the reference period, as well as the ensemble mean changes in the frequency of drought days (%) in the different time periods considered.
Averages are computed over land. Source: SOCLIMPACT Deliverable Report - D4.4a Report on solar and wind energy
Figure 24: Ensemble mean frequency of moderate and severe productivity drought days (%) in the reference period, as well as the ensemble mean changes in the frequency of drought days (%) in the different time periods considered.
Averages are computed over land. Source: SOCLIMPACT Deliverable Report - D4.4a Report on solar and wind energy

28
The Figure expands the results presented and provides a good overview regarding the ensemble
mean frequency (%) and maximum number of consecutive energy drought days for the different
time periods and scenarios considered. We observe that wind drought episodes are much more
frequent and of a longer duration than PV events. Both the frequency and the maximum
duration of combined PV and wind energy droughts tend to take intermediate values between
both. Wind, PV and combined energy productivity droughts, respectively, experience a decrease
in frequency and maximum duration in the RCP8.5 scenario (compare red dots in Figure below).
Changes in the frequency and maximum duration of drought episodes in the RCP2.6 scenario are
not homogeneous (compare orange dots).
Figure 25: Ensemble mean frequency (%) and maximum number of consecutive energy drought days (cedd) for wind (A), photovoltaic (PV; B) and combined PV and wind (C) moderate droughts in the Canary Islands (note that means have been exclusively computed over land). Orange dots (not annotated) are computed for the control time period (1986-2005) taking into account the model available for the RCP2.6 scenario, whilst red dots (not annotated) are calculated for the control time period considering the models available for the RCP8.5. Annotated orange and red circles are calculated for the RCP2.6 and RCP8.5 scenarios, respectively, for P1 (2046-2065)
and P2 (2081-2100). Source: SOCLIMPACT Deliverable Report - D4.4a Report on solar and wind energy
Regarding wind productivity droughts, we observe that these are more frequent in winter and
autumn and take the minimum values in summer. This result is consistent with the seasonal cycle
of the wind productivity, with maximum values in spring/summer, when wind trades intensify. In
both scenarios interannual variability is larger in the RCP2.6 case, given that this scenario
accounts for just one model. In the RCP8.5 scenario, a decrease in the number of wind drought
days can be observed in winter and autumn in both time periods. The decreased number of wind
drought days found in RCP8.5 scenario can be therefore mainly attributed to the wind
productivity increase that occurs in winter and autumn.

29
Figure 26: Annual and seasonal number of moderate wind drought days for the Canary Islands domain for the
selected periods for (A) RCP2.6 and (B) RCP8.5 scenarios. Note that only complete winters (DJF) have been
taken into account to construct the time series. Source: SOCLIMPACT Deliverable Report - D4.4a Report on solar and wind energy
Focusing on PV droughts we note that, in line with what has been found for the wind
productivity, droughts are more frequent in winter in autumn.
Figure 27: Annual and seasonal number of moderate combined PV and wind drought days for the Canary
Islands domain for the selected periods for (A) RCP2.6 and (B) RCP8.5 scenarios. Note that only complete
winters (DJF) have been taken into account to construct the time series. Source: SOCLIMPACT Deliverable Report - D4.4a Report on solar and wind energy

30
Whilst wind droughts are less prone to occur in spring and summer in both cases, PV droughts
are now almost absent in these two seasons. This is consistent with prevailingly anticyclonic
conditions in spring and summer and higher atmospheric instability associated with the arrival of
Atlantic fronts in winter and autumn. Therefore, annual mean changes in the frequency of PV
droughts are largely set by insolation changes in the winter season.
Interannual variations are largest in winter. In the RCP8.5 scenario, PV droughts experience a
remarkable drop in frequency in winter, especially at the end of the 21st century. This is again
consistent with the subtle increase of the PV productivity observed in this season. In both
RCP2.6 and RCP8.5 scenarios PV productivity experiences a decrease in summer in the two
considered time periods. Interestingly, this is not linked to a noticeable increase in the frequency
of PV droughts in summer, which suggests that the productivity decrease is mostly evenly
distributed among most summer days and is not mainly due to larger daily variability in surface
solar radiation.
Regarding the seasonal cycle of combined PV and wind droughts, we note that this is in all time
periods and scenarios qualitatively similar to that found for wind droughts. However, now the
frequency of droughts has a smaller magnitude than in the case of wind droughts, as expected
from the combination with a low variability energy source like PV. Wind productivity, which has
a greater magnitude and a larger variability in time than PV productivity, seems to control the
seasonal cycle to a larger extent. In this case, as for wind droughts, a decrease in the frequency of
combined droughts occurs in winter and autumn in both periods of the RCP8.5 scenario.
Cooling Degree Days
The Cooling degree days (CDD) index gives the number of degrees and number of days that the
outside air temperature at a specific location is higher than a specified base temperature,
providing the severity of the heat in a specific time period taking into consideration outdoor
temperature and average room. For RCP2.6 (one model analysis), we found that for near future
the increase is almost 60% while at the end of the century this increase will be above 80%. On
the other hand, the analysis of the RCP8.5 with 4 models provides a more devastating picture as
the number of CDD will be almost 3 times larger than the reference period.

31
Figure 28: Cooling Degree Days. Ensemble mean of MENA-CORDEX simulations. Source: SOCLIMPACT Deliverable Report - D4.3 Atlases of newly developed hazard indexes and indicators with Appendixes
Extreme temperature (Percentage of days when T>98th percentile – T98p)
For the assessment of climate hazard on temperature related impacts of climate change on the
energy sector, the percentage of days when T > 98th percentile (T98p) has been used. For
RCP2.6, the indicator will reach 7% by the end of the century. On the other hand, the RCP8.5
future projections show that, while in mid-century about 7% of the days will be above T98p
threshold, at the end of the century, daily temperatures will be above T98p for almost 25% (~90
days per year) of time.
Figure 29: Percentage of days when T>98th percentile. Ensemble mean of MENA-CORDEX simulations. Source: SOCLIMPACT Deliverable Report - D4.3 Atlases of newly developed hazard indexes and indicators with Appendixes

32
Available water: Standardized Precipitation-Evapotranspiration Index
This index is used as an indication of water availability. The Canary Islands are located in a
geographical zone that is expected to be greatly affected by climate change. Although there are
much less available simulations for Macaronesia, it is the only case of the investigated
SOCLIMPACT islands where a clear transition to drier conditions is evident even under the
ambitious pathway.
In particular, Gran Canaria, Fuerteventura and parts of Tenerife are projected to experience
moderate to extreme dry conditions under RCP2.6. For all islands, the extreme dry thresholds are
also expected to be exceeded by the middle of the current century under RCP8.5.
Figure 30: Ensemble mean values of the Standardized Precipitation-Evaporation Index (SPEI) averaged.
Source: SOCLIMPACT Deliverable Report - D4.3 Atlases of newly developed hazard indexes and indicators with Appendixes

33
Figure 31: Standardized Precipitation Evaporation Index (SPEI) time-series for the RCP2.6 (top) and RCP8.5 (bottom).
Source: SOCLIMPACT Deliverable Report - D4.3 Atlases of newly developed hazard indexes and indicators with Appendixes
3.4 Maritime Transport
Sea level rise
Sea level rise (SLR) is one of the major threats linked to climate change. It would induce
permanent flooding of coastal areas with a profound impact on the society, on the economy on
the and environment. Moreover, an increase in the mean sea level would result in a larger impact
of coastal storms with the consequent increase of risk. The results are presented in terms of
averaged sea level rise. For Canary, the SLR ranges from 27cm (RCP2.6) to 74 cm (RCP8.5) at
the end of the century.

34
Figure 32: Mean sea level rise (in cm) with respect to the reference period (1986-2005). Ensemble mean of CMIP 5 simulations and scaling approximation for RCP2.6. Source: SOCLIMPACT Deliverable Report - D4.4b Report on storm surge levels
Wind extremes
The wind extremity index NWIX98 is defined as the number of days per year exceeding the 98th
percentile of mean daily wind speed. This number decreases in the far future with a strongest
value under RCP2.6 (-10%) than under RCP8.5 (-2.1%).
Figure 33: Wind Extremity Index (NWIX98). Ensemble mean of MENA-CORDEX simulations. Source: SOCLIMPACT Deliverable Report - D4.3Atlases of newly developed indexes and indicator

35
Like the NWIX98, the 98th percentile of daily wind speed, WIX98, decreases but with a smaller
magnitude for RCP 2.6. It remains constant for RCP8.5.
Wave extremes (99th percentile of significant wave height averaged)
Marine storms can have a negative impact on maritime transport, coastal-based tourism and
aquaculture, among other activities. To illustrate this impact, the 99th percentile of significant
wave height averaged has been chosen. A decrease in the extreme wave height is found being
larger under scenario RCP8.5, as illustrated in the following map. In relative terms the averaged
changes are lower than 10% even under this stronger scenario.
Figure 34: the 99th percentile of significant wave height averaged for the reference period and the relative change for the RCP8.5. Global simulations produced by Hemer et al. (2013).
Source: SOCLIMPACT Deliverable Report - D4.4b Report on storm surge levels.
Figure 35: The 99th percentile of significant wave height averaged for the reference period and extreme wave height for RCP2.6 and RCP8.5. Global simulations produced by Hemer et al. (2013).
Source: SOCLIMPACT Deliverable Report - D4.4b Report on storm surge levels

36
4 Climate change risks
4.1 Tourism
For the tourism sector, three impact chains (IC) were operationalized: i) Loss of attractiveness of a destination due to the loss of services from marine ecosystems, ii) Loss of comfort due to increase of thermal stress iii) Loss of attractiveness due to increased danger of forest fires
Loss of attractiveness due to marine habitats degradation
Climate change is expected to impact tourism activities through direct impacts on comfort and
health of tourists, on the infrastructures and facilities that provide basic services to visitors and
on the natural ecosystems that hold a big part of the attractions of the coastal and marine tourism
destinations. The analysis of those impacts was decomposed into a single impact chain.
Specifically, it presents a conceptual model on the effect that Climate Change would have on
conditions that make marine environments attractive for tourists visiting coastal destinations.
More in detail, climate hazards like the increase of mean and variability of seawater temperature
and the increase of oceans acidification, mainly, are affecting marine habitats with touristic
relevance through diminishing bio-productivity and attracting exotic species, some of them toxic,
and because of that, reducing the attractiveness of marine landscapes and the presence of flagship
species; increasing turbidity in bathing and diving sea waters affecting the quality of bathing,
diving, snorkelling and bottom-glass boating experiences, at least; and increased frequency and
intensity of episodes of seagrasses massive death that arrive to the beaches affecting the
experience of lying and staying there.
The next figure shows the theoretical impact chain. As can be seen in the figure, the impact of
Climate Change on the touristic attractiveness of an island depends on a set of multi-dimensional
factors, including:
1. Increase in the mean and variability of seawater temperature is the main driver of marine habitat degradation; also seawater acidification impacts marine life although it substantially varies depending of the marine organisms;
2. The risk of those marine habitat transformations for tourism critically depends on the nature exposed to it, the amount and proportion of tourists that feel marine habitat is a relevant motivation to visit the destination, and the resilience of the exposed natural assets and tourists to those changes in the marine environmental conditions;
3. Finally, the preparedness to cope with the deterioration of its marine environment by developing substitutive attractions, is also a key aspect to assess the effective risk that those hazards pose on the tourism industry at the destination.
The complex relationship between climate change, marine habitats and tourism still exhibits
important gaps of knowledge. For example, there is no evidence on the impact that the
abovementioned hazards may have on the communities of cetaceans that live or pass through
near the coasts of the islands under study. In some cases, this is a very important economic
chapter within the tourism industry in the islands. Whether climate change is going to diminish or

37
not the abundance, or affect the distance of those cetacean communities from the island requires
further research.
Figure 36: Loss of destination attractiveness due to marine environment degradation as a result of climate change hazards.
Source: SOCLIMPACT Deliverable Report – D3.2. Definition of complex impact chains and input-output matrix for each islands and sectors
Selection of operationalization method
The Analytical Hierarchy Process (AHP), introduced by Saaty (1980), method was selected as the
technique to operationalize the impact chain since it is a well-grounded tool that allows for the
prioritization/ranking of alternatives using a weighting scheme that is established by expert
judgement. Hence, for the purposes of the project, it was considered suitable as it would be able
to reconcile the contribution of each risk factor (hazards, exposure, and vulnerability, which
includes sensitivity and adaptive capacity) towards the risk based on expert opinion and,
subsequently, order the islands in terms of which one is most at risk of losing attractiveness due
to the degradation of the marine environment.
Application of the AHP methodology
The problem to be solved along through the expert decision process was comparing the risk of
the European islands of losing tourist attractiveness due to the deterioration of their marine
habitats as consequence of climate change. The hierarchy tree for this decision problem was built
underpinning on the impact chain elements, together with the variables that express the tourism-
related environmental and social systems’ exposure to those hazards, the sensitivity of the
exposed systems to the referenced hazards and the social capacities to cope with the potential

38
impacts of climate change by protecting nature and the society and/or making them more
resilient.
Some modifications of the original impact chain were undertaken for the sake of feasibility,
although experts were encouraged to have in mind all the factors they know can affect the impact
of climate change on the marine habitat services for tourism. It means that the hierarchy tree is a
simplified structure of the main factors explaining the complex relationship between climate
change and the ecosystem services that support tourist use of marine environments, but other
factors also known by experts must be taken into account at the time of comparing the
components of the risk between islands. This is one of the most interesting strengths of the
decision processes based on expert participation and, particularly, of the multicriteria analysis
used in this case. The next figure shows the basic structure, or hierarchy tree, of the decision
making process that was presented to the experts.
Figure 37: Hierarchy tree for marine habitats impact chain.
Source: SOCLIMPACT Deliverable Report – D4.5. Design of a comprehensive approach to climate and climate-related risk information to policy makers and the general public
Hazards are the climate events that instigate the climate-associated risk. In our context, seawater
heating was considered as the most relevant variable to assess changes in the conservation status
of the marine habitats that provide services for coastal tourism activities. Other hazards initially
considered, like acidification and storms, were finally discarded. The first one because its effects
on living marine organism are still under study and the evidence is dispersed and not conclusive.
The second one because in the Mediterranean Sea and the Atlantic Ocean that surrounds the
islands under study, storms are considered not so frequent and intense to not giving time to
marine ecosystems to recover their previous conservation status.
Regarding indicators, published research shows 25 and 26 Celsius degrees as the threshold
temperatures over which seagrass meadows, the foundation species that mainly structure
ecosystems in the marine habitats of reference, start to decline. The indicators used were the
number of days per year with seawater temperature over 25 and 26 Celsius degrees. Sources of
information and data were provided by the Soclimpact modellers.

39
Exposure denotes the range of ecological and social systems susceptible to be damaged by
hazards. This criterion, the natural and social systems potentially damaged by the selected climate
hazards, was decomposed into three sub-criteria, one referred to the marine environment, and
the other two related to the use that tourists make of the services provided for the marine
environments at the destination. These three sub-criteria were expressed through three respective
indicators. One, referred to the surface of marine phanerogams that suffer from the climate
stressors. Phanerogams, specially Posidonia in the Mediterranean and Cymodosea in the Atlantic,
are the very foundation species organizing most of the coastal ecosystems. They provide food
and shelter to many different species and keep seawater clear by absorbing sediments.
Additionally, when become damaged, seagrasses meadows deliver dead individuals that go to lay
on the beaches used by tourists.
The second sub-criterion is one about the different types of direct uses that tourists make of the
ecosystem services. Diving was selected to represent theses uses and the selected indicator was
the number of divers per year. It was assumed that other sea watching activities like snorkelling
and bottom-glass boating evolve similarly than diving. Experts were also invited to consider other
sea environment users potentially affected by the lack of water transparency and dead seagrass
suspended in seawater like surfers, windsurfers and other active users of the marine environment.
The third sub-criterion was related to the impact on most of tourists as bathers. Turbid water
affects the quality of the bathing experience, which is an activity that most tourists do.
Sensitivity concerns the susceptibility of natural, cultural, and built resources to harm that is a
direct or indirect result of Climate Change hazards. For the operationalization of this impact
chain, sensitivity relates to the susceptibility of the phanerogam meadows to changes in seawater
temperature and to the extent to which the impoverishing of seawater conditions and marine
ecosystems may affect tourists’ welfare.
Regarding the effects of episodes of seawater heating on the integrity of seagrasses meadows, the
variable selected was periods of overheating and the indicators were the number of days per year
with seawater temperature over 25 and 26 Celsius degrees. As explained above, experts were
invited to take into account their experience and their knowledge about the differences between
the way seagrasses behave in the real world and in the laboratory when studying the impact of
water heating.
With respect to the impact of the marine environmental degradation on the welfare of tourists,
the indicator selected was the tourists’ willingness to pay for the preservation of marine
ecosystems10. Thus, ecosystems’ and social’s susceptibility are both taken into account when
comparing risks of marine environment degradation due to climate change between islands.
Adaptive capacity reveals the potential to face the hazards by reducing the level of exposure
and/or increasing the resilience of the tourism system. This criterion was split into three sub-
criteria, one referred to the substitution of marine-based activities by lesser marine habitats
10
This information was delivered by Soclimpact researchers who are in charge of the work package WP5. More information at: SOCLIMPACT Deliverable Report – D5.5. Report on market and non-market economic values for environmental services of marine and coastal ecosystems related to the activities of the blue economy.

40
dependent ones, and two concerning actions to heal the marine environment like removing dead
seagrasses or reducing non-treated sewage discharges (and consequently, seawater pollution). In
this case, island experts were consulted about the capacity of their reference destination to
address these adaptation actions using a 1-4 scale, where 1 represented a very poor management
capacity and 4 expressed a full capacity to deal with it.
Results and islands’ ranking
The table below shows the final results of the operationalization process. In particular, it
summarizes the global weights of the sub-criteria and the criteria and the global score of the risk
for each island; thus islands can be compared not just globally but also across the set of the sub-
criteria and the criteria being considered to estimate the aggregated risk.
Table 10: Final scores and islands’ ranking (under RCP8.5 distant future).
Criteria Sub-criteria Balearic Canary Cyprus Malta Sicily
Hazards Seawater heating RCP8.5 (2081-2100)
0.018 (8.0%)
0.004 (2.2%)
0.054 (23.6%)
0.025 (12.7%)
0.025 (14.7%)
Exposure
Surface of marine phanerogams
0.034 0.002 0.004 0.009 0.022
Number of divers 0.009 0.005 0.001 0.002 0.002
Tourists’ arrivals 0.013 0.013 0.002 0.001 0.006
Total 0.056
(25.0%)
0.020 (11.0%)
0.007 (3.1%)
0.012 (6.1%)
0.029 (17.1%)
Sensitivity
Phanerogams’ susceptibility to heat
0.072 0.072 0.008 0.024 0.024
Economic valuation 0.003 0.027 0.004 0.006 0.010
Total 0.075
(33.5%) 0.099
(54.7%) 0.012 (5.2%)
0.030 (15.2%)
0.034 (20.0%)
Adaptive capacity
Products substitution 0.034 0.034 0.086 0.060 0.016
Seagrass removal 0.020 0.002 0.007 0.007 0.003
Sea water pollution 0.021 0.021 0.063 0.063 0.063
Total 0.079
(35.3%) 0.058
(32.0%) 0.155
(67.7%) 0.130
(66.0%) 0.082
(48.2%)
Total 0.224 0.181 0.229 0.197 0.170
Rank 2 4 1 3 5
Note: Total contribution of the criterion to the final score of the island in parenthesis.
Source: SOCLIMPACT Deliverable Report – D4.5. Design of a comprehensive approach to climate and climate-related risk information to policy makers and the general
public

41
The risk: from Eastern to Western and viceversa
The relative risk for marine habitat-based tourism demand due to the heating of seawaters
surrounding the European islands is determined by the combination of three different factors
already reflected in the marine habitat impact chain: the intensity and lasting of periods of
seawater heating, the susceptibility of the marine habitats and tourism activities based on it to the
heating process and the changes in the habitat, respectively; and the capacities of the respective
islands’ societies to reinforce natural and social systems’ resilience to seawater heating and its
ecosystem impacts.
Based on the available indicators and on their own knowledge, the experts’ evaluation of the
complex relationships between seawater heating, habitats transformation and the response of the
tourism system, depicts a big picture featured by the following results:
- From the perspective of the intensity of the hazard, threats diminish from Eastern to
Western. Effectively, episodes of water heating threating the integrity of marine
ecosystems will we much more relevant throughout the Eastern Mediterranean and will
become softer as moving Western.
- From the perspective of the susceptibility of the marine foundation species to seawater
heating, western Mediterranean hosts the most vulnerable phanerogam communities as
genetically they are not ready to face increasing water temperature variability at the
rhythm climate change is powering. As a result, this risk factor decays from Western to
Eastern.
- Other relevant factors determining the relative risk faced by each island are related to the
management capacity of other hazards, different than seawater heating, also degrading
marine habitats (i.e. the current relevance of marine habitat-based tourism and the
capacity of the local tourism system to provide competitive alternatives giving value to
other, not marine-based natural and cultural tourist attractions). Those capacities are
unevenly distributed across the islands, basically depending on the level of development
of their respective environment management and tourism management subsystems.
Some characteristics of the risk ranking provided by experts, and consequently, the final scores,
are:
- Cyprus leads the rank of risk due to, in addition to the greater seawater heating, its
experiencing ecological disruptive processes related to its closeness to the Red Sea;
strongly attracting exotic species with high capacity to destabilise the marine ecosystems.
- On the other extreme, Sicily is the island exhibiting a lesser risk mainly due to it holds a
more balanced distribution of the indicators expressive of the range of factors
determining the risk.
- The Canary Islands hold a relatively low risk mainly due to their expected low level of
seawater heating; their higher weakness consists of the magnitude of the tourism system
exposed to the potential risk.
- The Balearic Islands are the most exposed islands. In addition, RCP8.5 distant future
shows a progress in heating relatively higher than other islands, meaning a strong threat
for their relatively susceptible Posidonia meadows.
- Malta holds a relative low risk mainly due to its low exposition to the risk and the
potential of alternative, non-marine-habitat-based, tourist products.

42
Below are presented some paragraphs devoted to go deeper into the complexity of the ecosystem
dynamics that influence the holistic effect of climate change on the European islands’ marine
habitats; before presenting some lines highlighting the specificities of this impact chain for each
island.
In the Eastern Mediterranean, the impact of seawater heating on the seagrass meadows (and on
the marine habitat as a whole) not only depends on the physiological response of the plants
concerned to heating, but also on the response of the system as a whole. On the Eastern shore of
the Mediterranean, a strong increase in herbivorous species from the Red Sea has been observed
that cross the Suez Canal and have settled near the continental and insular coastal areas.
Posidonia meadows have been found to be part of their diet.
The heating exacerbates the metabolic needs of these herbivorous species (Siganus Luridus and
others) increasing their voracity and, consequently, leading to greater pressure on the
phanerogams. Given that, on the other hand, the surface of these meadows in the environment
of Cyprus is small, predation by these herbivores may threaten Posidonia with extinction,
disappearing with it the conservation functions of the ecosystem that it currently carries out as
protection against erosion, containment of water turbidity (assimilation of organic residues),
shelter and food for fingerlings of fish and other marine organisms, etc.
Other factors such as the sewage treatment or the sedimentation of waste from coastal
constructions interact with the seawater heating, exacerbating the degradation of marine habitats.
Together, factors of global change other than seawater heating are expected to act more intensely
in Cyprus, increasing the vulnerability of this island's marine habitat to climate change.
Analysis of Canary Islands
The Canary Islands hold the best natural conditions to face this risk as all consulted climatic
models predict a very low probability of seawater heating to increase over the critical thresholds
for the Cymodocea meadows surrounding their seawaters. This and the tourists’ perception of
the marine attributes sensitivities explains more than 54.7% of the total risk that the Archipelago
exhibits at this regard. This vulnerability is partially compensated by the fact that a great part of
its marine biodiversity-based tourist activity depend on ecological processes different than those
supported by seagrasses meadows, like cetaceans watching, but still showing high uncertainty
about its relationship with this and other climate hazards. Like in the case of the Balearic, the
Canary need to develop capacities for tourist diversification bringing other resources to the
tourist value generation process. Fortunately, seawater mobility around the islands allow to hide
the deficits of an insufficient and inefficiently managed sewage treatment system. The mentioned
advantages and disadvantages of the Canary Islands are depicted in the next figures. The further
the criteria or sub-criteria is located from the centre of the graph, the more it affects the risk.

43
Figure 38: Global weights of each criteria and sub-criteria in the final score. Source: SOCLIMPACT Deliverable Report – D4.5. Design of a comprehensive approach to climate and climate-related risk information to policy makers and the general
public
Figure 39: Global weights of each criteria and sub-criteria in the final score. Source: SOCLIMPACT Deliverable Report – D4.5. Design of a comprehensive approach to climate and climate-related risk information to policy makers and the general
public

44
The operationalization of the impact chain for the “Loss of attractiveness of a destination due to the loss
of services from marine ecosystems” was conducted using the AHP method. The method proved to be
appropriate, firstly, for dealing with the hierarchical nature of the impact chain and, secondly, for
using expert judgements to assess the comparative risk for the islands over a large number of
indicators (sub-criteria). Because the AHP method determines a ranking of the islands, it can
provide decision-makers with relative values but not with absolute values. Such values will be
delivered by the modelling activities of other work packages and will give stakeholders a more
complete picture of this specific risk in terms of social, economic, and environmental impacts.
Loss of comfort due to increase of thermal stress
This section describes the work carried out for the operationalization of the impact chain “Loss of
competitiveness of destinations due to a decrease in thermal comfort”11. It provides details on the method
applied for the operationalization, the island data used, and the results obtained. As can be seen
in the figure, the impact of Climate Change on the touristic attractiveness of an island depends
on a set of multi-dimensional factors, including:
4. the frequency, intensity, and duration of heatwaves, 5. to what extent and how tourist activities and tourists become exposed to heatwaves, and
how sensitive different segments of tourists are to extreme heat, and 6. the preparedness of the destination to cope with thermal discomfort episodes through
information, technology, alternative activities, and medical attention.
Figure 40: Loss of competitiveness of destinations due to a decrease in thermal comfort Source: SOCLIMPACT Deliverable Report – D3.2. Definition of complex impact chains and input-output matrix for each islands and sectors
11
Detailed information about the methodology used and the results obtained is available at: SOCLIMPACT Deliverable Report – D4.5. Design of a comprehensive approach to climate and climate-related risk information to policy makers and the general public.

45
For the purposes of the operationalization it was decided by the team to retitle the risk as “Loss of
attractiveness of a destination due to a decrease in thermal comfort”. This was done in order for the risk to
more accurately reflect the effects of the hazards, exposure and vulnerability on an island rather
than an on an individual tourist.
The selection of islands to be compared was based on the availability of island data provided by
the IFPs. The five islands selected for comparison were the Balearic Islands, the Canary Islands,
Cyprus, Malta, and Sardinia.
Selection of operationalization method
The Analytical Hierarchy Process (AHP) method, introduced by Saaty (1980), was selected as the
technique to operationalize the impact chain since it is a well-grounded tool that allows for the
prioritization/ranking of alternatives using a weighting scheme that is established by expert
judgement. Hence, for the purposes of the project, it was considered suitable as it would be able
to reconcile the contribution of each risk factor (hazards, exposure, and vulnerability) towards the
risk based on expert opinion and, subsequently, order the islands in terms of which one is most
at risk of losing attractiveness due to a decrease in thermal comfort.
Application of the AHP methodology
The problem to be solved along through the expert decision process was comparing the risk of
the European islands of losing tourist attractiveness due to a decrease in thermal comfort as
consequence of climate change. The hierarchy tree for this decision problem was built
underpinning on the impact chain elements. Some refinements were necessary regarding the
indicators (at sub-criteria level) that were to be used for comparing the islands.
Figure 41: Hierarchy tree for thermal comfort impact chain. Source: SOCLIMPACT Deliverable Report – D4.5. Design of a comprehensive approach to climate and climate-related risk information to policy makers and the general
public

46
Hazards are the climate events that instigate the climate-associated risk. For the AHP method,
thermal sensation was considered as the most relevant indicator to assess changes in the thermal
comfort of tourists while staying at their destination as it is a concept that combines temperature
and humidity. Thus, it is the only sub-criterion of the Hazard criterion. Moreover, the humidity
index (humidex) (Masterton and Richardson, 1979) was selected as the most appropriate metric
for thermal sensation. The metric is an equivalent temperature that express the temperature
perceived by people (i.e., the temperature that the human body would feel), given the actual air
temperature and relative humidity.
Exposure denotes the range of ecological and social systems susceptible to be damaged by
hazards. This criterion was decomposed into sub-criteria relating to three indicators. The first
indicator relates to the exposure of tourists to heatwaves. The measure of the indicator combines
the percentage of an island prone to heatwaves and the percentage of the tourist
accommodations and facilities located in those areas prone to heatwaves. It is necessary to factor
in both these aspects of exposure in order to allow for a better comparison of islands. For
example, if an island has a small area that is prone to heatwaves with the majority of tourists
frequenting in that small area, then the combination of the two factors will play a role when
comparing, for instance, an island that has large areas prone to heatwaves, but with tourists
frequenting in places outside these areas, since the overall exposure will be different. Specifically,
it was decided to assign a weight of 75% to percentage of an island prone to heatwaves and the
remaining 25% to the percentage of tourist accommodations and facilities located in heatwave-
prone areas. The second indicator deals with the number of tourist arrivals during the hottest
months. The indicator is represented by the percentage of tourists that visit an island between the
months of May and September averaged over the last five years. Finally, the third indicator
concerns vulnerable groups of tourists who have the highest risk of being affected by heatwaves.
Literature confirms that under-6s and over-65s are the most vulnerable age groups, however, the
statistical services of the islands homogeneously provide data for the under-14 and over-65 age
groups. For this indicator, two values were computed:
1. the number of tourists visiting an island that were under 14 years of age during the months of May and September over the total number of tourists visiting during the same period, averaged over the last five years, and
2. the number of tourists visiting an island that were over 65 years of age during the months of May and September over the total number of tourists visiting during the same period, averaged over the last five years.
For purpose of combining the two values and adjusting the change to age groups, it was decided
to apply a ratio of 15:85 in order to emphasize the proportion of over-65s (85%) to the
proportion of under-14s (15%).
Sensitivity concerns the susceptibility of natural, cultural, and built resources to harm that is a
direct or indirect result of Climate Change hazards. For the operationalization of this impact
chain, sensitivity relates to the susceptibility of tourists and is broken down into sub-criteria
pertaining to two indicators. The first indicator involves tourist activities. The effect of heatwaves
on tourist activities varies greatly. For example, a tourist sunbathing at a beach will not feel the

47
effects of a heatwave to the same degree as a tourist that is trekking. Different destinations have
different rates of tourists practicing activities incompatible with heatwaves events. So, this
indicator aims at catching these differences. More specifically, this indicator is a measure of the
percentage of visitors who state that they practice activities not compatible with heatwave events.
The second indicator concerns the economic valuation of heatwaves from the perspective of
tourists. In the case of a heatwave event, all tourists will suffer from thermal discomfort to a
certain degree. Hence, the indicator represents their willingness to avoid this discomfort as
expressed in monetary terms. Therefore, it is measured by much money tourists are willing to pay
to avoid a heatwave during their vacation time12.
Adaptive capacity reveals the potential to face the hazards by reducing the level of exposure
and/or increasing the resilience of the tourism system through providing information, adopting
proper technology, supplying alternative activities, and improving medical attention. This
criterion is split into sub-criteria concerning three indicators. The first indicator has deals with
early warning systems. Setting up a proper early warning system can help tourists and service
providers to plan effective responses to heatwaves, making them less distressing and reducing the
destination’s vulnerability. Hence, this indicator is measured with a score representing the quality
of early warning systems in place and advisement of options for tourists. The second indicator
involves air conditioning. Air conditioning is the most effective technology used to combat
extreme heat. Therefore, the indicator uses the percentage of hotel accommodations and tourist
facilities offering air conditioning systems as a measure of the capacity of the destination to cope
with this hazard. The final indicator concerns the care and medical attention (such as in the case
of heatstroke or similar) available on an island that may be necessary to help reduce pain or avoid
casualties due to diseases related to heatwaves. Therefore, the number of hospital beds available
on an island per 100,000 potential users, both residents and tourists, is taken as the measure of
this indicator.
Results and islands’ ranking
The table below shows the final results of the operationalization process. In particular, it
summarizes the global weights of the sub-criteria and the criteria and the global score of the risk
for each island; thus islands can be compared not just globally but also across the set of the sub-
criteria and the criteria being considered to estimate the aggregated risk.
12
Further information available at: SOCLIMPACT Deliverable Report – D5.5. Report on market and non-market economic values for environmental services of marine and coastal ecosystems related to the activities of the blue economy.

48
Table 11: Final scores and islands’ ranking (under RCP8.5 distant future).
Criteria Sub-criteria Balearic Canary Cyprus Malta Sardinia
Hazards Humidex RCP8.5 (2081-2100)
0.024 (12.1%)
0.008 (4.6%)
0.088 (34.6%)
0.023 (11.7%)
0.023 (13.1%)
Exposure
Exposed areas 0.007 0.002 0.007 0.007 0.007
Vulnerable groups 0.007 0.017 0.016 0.017 0.038
Tourists’ arrivals 0.050 0.008 0.029 0.018 0.065
Total 0.064
(32.2%)
0.027 (15.5%)
0.053 (20.9%)
0.042 (21.3%)
0.110 (62.9%)
Sensitivity
Heat-sensitive activities
0.074 0.073 0.074 0.074 0.012
Economic valuation 0.004 0.004 0.015 0.028 0.010
Total 0.079
(39.7%) 0.078
(44.8%) 0.089
(35.0%) 0.103
(52.3%) 0.021
(12.0%)
Adaptive capacity
Early-warning systems
0.007 0.007 0.007 0.007 0.003
Air conditioning 0.011 0.048 0.011 0.021 0.012
Medical attention 0.014 0.006 0.005 0.002 0.005
Total 0.032
(16.1%)
0.061 (35.1%)
0.024 (9.4%)
0.030 (15.2%)
0.020 (11.4%)
Total 0.199 0.174 0.254 0.197 0.175
Rank 2 5 1 3 4
Note: Total contribution of the criterion to the final score of the island in parenthesis. Source: SOCLIMPACT Deliverable Report – D4.5. Design of a comprehensive approach to climate and climate-related risk information to policy makers and the general
public
Cyprus is at most risk of loss of competitiveness due to a decrease in thermal comfort in all four
scenarios as it is ranked the highest in all cases. This is mainly attributed to the fact that the
number of days with a heatwave is predicted to increase greatly both in the near and distant
future. In addition, the island’s tourist accommodations and facilities are located in areas most
prone to heatwaves, and these are visited by many tourists during the months of May to
September. Cyprus also scores the highest in Sensitivity and average in Adaptive capacity.
The Balearic Islands and Malta are ranked second and third, respectively, with regards to the risk
of loss of competitiveness. However, their overall scores are very close: 0.199 for the Balearic
Islands and 0.1970 for Malta in the RCP8.5 distant future scenario. They score relatively high in
Exposure and Sensitivity (the most important criteria for the risk) and average in Hazard and
Adaptive capacity.
Sardinia and the Canary Islands are the lowest at risk of loss of competitiveness. Even though
Sardinia scores the highest for Exposure, it has a low score for Sensitivity (which contributes
most to the risk) and average scores for Hazard and Adaptive capacity. On the other hand, the

49
Canary Islands has a low score for Hazard and Exposure, but relatively high for Sensitivity and
Adaptive capacity.
While the Canary Islands are the lowest at risk of loss of competitiveness due to thermal
discomfort, they perform badly at Adaptive Capacity. Moreover, Exposure represents the most
important criterion for the islands, especially due to the heat-sensitive activities.
The mentioned advantages and disadvantages of Canary Islands are depicted in the next figure.
The further the criteria or sub-criteria is located from the centre of the graph, the more it affects
the risk.
Figure 42: Global weights of each criteria and sub-criteria in the final score. Source: SOCLIMPACT Deliverable Report – D4.5. Design of a comprehensive approach to climate and climate-related risk information to policy makers and the general
public

50
Figure 43: Global weights of each criteria and sub-criteria in the final score. Source: SOCLIMPACT Deliverable Report – D4.5. Design of a comprehensive approach to climate and climate-related risk information to policy makers and the general
public
The operationalization of the impact chain for the “Loss of attractiveness of a destination due to a
decrease in thermal comfort” was conducted using the AHP method. The method proved to be
appropriate, firstly, for dealing with the hierarchical nature of the impact chain and, secondly, for
using expert judgements to assess the comparative risk for the islands over a large number of
indicators (sub-criteria). Because the AHP method determines a ranking of the islands, it can
provide decision-makers with relative values but not with absolute values. Such values will be
delivered by the modelling activities of other work packages and will give stakeholders a more
complete picture of this specific risk in terms of social, economic, and environmental impacts.
Loss of attractiveness due to increased danger of forest fires Forest fires are considered as an important parameter for the attractiveness of tourist
destinations, especially in the Mediterranean area. Severe episodes were met in Algarve (Portugal)
and Greece (Athens area) in the recent period, threatening the tourist season.
This study focuses on the implementation and analysis of the selected Impact Chain “Risk of
forest fires and consequences on tourism attractiveness of a destination”. Out of the 12
islands assessed in the SOCLIMPACT project, nine were included in the operationalization: the
three Atlantic Islands (Azores, Canary Islands and Madeira) and the Mediterranean ones (Balearic
Islands, Crete, Corsica, Cyprus, Malta, Sardinia and Sicily).
The concept of Impact Chain (Schneiderbauer et al. 2013; Fritzsche et al. 2014) is applied as a
climate risk assessment method (with 6 steps) for research of decision making. Impact Chains

51
propose diagrams articulating the causal links between the different components of climate risks
(according to AR5 concepts: hazards, exposure, vulnerability, risks, step 1)). For each of these
components of the theoretical IC, several indicators are selected and collected. Data are then
normalised to be able to be aggregated (steps 4 and 5) with different weights. The final objective
(step 6) is to achieve a standardised risk score that, according to the spatial scale of the analysis
can allow comparison and decision making on adaptation, including hierarchization of resource
allocation or identification of adaptation options to mitigate climate risk.
Figure 44: Loss of attractiveness due to increased danger of forest fire in touristic areas. Source: SOCLIMPACT Deliverable Report – D3.2. Definition of complex impact chains and input-output matrix for each islands and sectors

52
Figure 45: Loss of attractiveness due to increased danger of forest fire in touristic areas.
Source: SOCLIMPACT Deliverable Report – D3.3. Definition of complex impact chains and input-output matrix for each islands and sectors
Many indicators were formulated in a very broad way, causing a few problems in identifying
suitable data sets. Furthermore, the data were checked for explicit spatial coverage, resolution,
temporal coverage and time frame. Finally, we evaluated possible substitutes or alternatives for
those indicators with no suitable data to substantiate them.

53
Figure 46: Final Impact Chain Model Source: SOCLIMPACT Deliverable Report – D3.2. Definition of complex impact chains and input-output matrix for each islands and sectors
In order to normalize the index, the min-max method was applied. Min-max normalizes
indicators to have an identical range [0, 1] by subtracting the minimum value and dividing by the
range of the indicator values (OECD 2008). The mathematical formula and more information on
min-max normalization method are presented in the following section. Afterwards, the
normalized index was categorized into five equal interval classes representing values from “Very
low" to "Very high”. Considering the weighing, an assessment of GIZ methodology has been
developed for this impact chain including interviews with various types of stakeholders (cf.
dedicated 4.5 to forest fires).

54
The indicators previously normalized have been aggregated to elaborate three sub-component
indices (hazard, exposure, vulnerability) and the final risk index. The result is included in a
comparison for the 9 other islands studied for the risk linked to forest fires.
Comparative study
Hazard
The main findings are:
Scores for fire danger increase as we move from West to East and from North to South, with the exception of Malta, which is much smaller and the selected grid cells are mostly influenced by maritime conditions.
Under RCP2.6, it seems that the fire danger returns to the present conditions towards the end of the century apart from Crete which score will increase from medium to high, even under this RCP.
Under RCP8.5, the increase is much more prominent, ranging from 22% to 46%, with the highest values for Corsica, Sardinia and Sicily, which implies that under this scenario at the end of the Century, the western and central Mediterranean will be more affected.
Figure 47: Hazard score (Fire Weather Index) per island for the reference period (1986-2005) Source: SOCLIMPACT Deliverable Report – D4.5Comperhensive approach for policy makers

55
Figure 48: Hazard score (Fire Weather Index) per island at the end of the century (2081-2100) under RCP2.6 (Ambitious Mitigation Policies).
Source: SOCLIMPACT Deliverable Report – D4.5Comperhensive approach for policy makers
Figure 49: Hazard score (Fire Weather Index) at the end of the century (2081-2100) under RCP8.5 (Business as usual).
Source: SOCLIMPACT Deliverable Report – D4.5Comperhensive approach for policy makers

56
Exposure
The results show that:
Atlantic Islands (Madeira and Canary Islands) are more exposed than Mediterranean Islands (from low to medium score). We can see an increase as we move from North to South in the Mediterranean area.
Atlantics Islands higher scores are mainly explained by the level of exposure rather than the nature of exposure, which is quite similar across islands, except for Malta which rate is very low.
The nature of exposure varies across EU Islands despite of their homogeneous score: Corsica has the highest score for forest areas followed by Madeira, Canary Islands. These two last ones have the highest score of forest belonging to protected areas. We can find a significant proportion of cultivated areas in other Islands namely: Sicily, Sardinia, Balearic Islands, Crete and Cyprus.
The level of exposure for Canary Islands and Madeira is particularly important because of the high scores for each of the 4 considered indicators: population density, population over 65 years, population under 9 years and tourist density.
Figure 50: Exposure score (current period) per island Source: SOCLIMPACT Deliverable Report – D4.5Comperhensive approach for policy makers

57
Figure 51: Subcomponents of exposure and related score (current period) per island. Source: SOCLIMPACT Deliverable Report – D4.5Comperhensive approach for policy makers
Figure 52: Breakdown by exposure subcomponent. Source: SOCLIMPACT Deliverable Report – D4.5Comperhensive approach for policy makers

58
Vulnerability
The main findings are:
Results show large disparity across EU Islands in terms of vulnerability. The vulnerability score for Corsica is very high followed by Sardinia (high), Madeira, Balearic Islands and Cyprus. Malta, Canary Islands and Crete scores are low and Sicilia very low.
Breakdown by component highlights a quite homogeneous score for adaptative capacity whereas sensitivity score (Flammability Index) is very different from an island to another.
Not surprisingly for the flammability index , Corsica and Sardinia have the highest score, Malta, Sicilia and Canary Islands, the lowest one.
Looking at the adaptative capacity subcomponent, despite of the quite homogeneous scores, factors of influence are quite different among the islands:
o high score for employees in the primary sector, apart from Sardinia and Sicily; o scores for density of firefighters and volunteers are important for all the islands
except for Cyprus; o GDP per capita and level of education are the most heterogeneous factors of
influence; o GDP per capita score is very high for Crete, very low for Corsica, Malta and
Balearic Islands. o Scores for education level is important for Cyprus and low for Madeira, Malta and
Corsica.
Figure 53: Vulnerability score per island Source: SOCLIMPACT Deliverable Report – D4.5Comperhensive approach for policy makers

59
Figure 54: Subcomponents of vulnerability and related score (current period) per island. Source: SOCLIMPACT Deliverable Report – D4.5Comperhensive approach for policy makers
Figure 55: Details and scores of the two subcomponents (adaptive capacity and sensitivity) per island. Source: SOCLIMPACT Deliverable Report – D4.5Comperhensive approach for policy makers

60
Risk
- For the reference period, the overall risk is medium for Atlantic Islands (Madeira and Canary Islands) and Eastern Mediterranean Islands (Crete and Cyprus). Risk for other islands is low and very low for Malta.
- Looking at the breakdown of the risk, the structure is quite similar for 3 groups: o Madeira, Canary Islands, Sicilia and Balearic Islands: Predominance of exposure
component (around 50% of the score); o Crete and Cyprus: Predominance of the hazard component (around 40% of the
score); o Corsica and Sardinia: Predominance of the vulnerability component (around 60-
70%); o Only Malta has a quite balanced distribution across the components.
- In this exercise, only the hazard component is changing in the future. In the near future whatever the considered RCP, the risk increases only for Cyprus from medium to high. While the risk remains stable with the RCP2.6 in the distant future for all islands apart from Cyprus, there is an increase from very low to low for Malta and from low to medium for Balearic Islands, Corsica and Sardinia with RCP8.5. Even under this RCP8.5 risk remains constant for Canary Islands and Madeira (Medium) and Sicily (Low).
Figure 56: Risk score per island for the reference period (1986-2005). Source: SOCLIMPACT Deliverable Report – D4.5Comperhensive approach for policy makers

61
Figure 57: Risk breakdown by island for the reference period (1986-2005). Source: SOCLIMPACT Deliverable Report – D4.5Comperhensive approach for policy makers
Figure 58: Risk score per island in the near future (2046-2065) under RCP2.6 (Ambitious Mitigation Policies) and RCP8.5 (Business as usual).
Source: SOCLIMPACT Deliverable Report – D4.5Comperhensive approach for policy makers

62
Figure 59: Risk score per island at the end in the distant future (2081-2100) under RCP2.6 (Ambitious Mitigation Policies) and RCP8.5 (Business as usual).
Source: SOCLIMPACT Deliverable Report – D4.5Comperhensive approach for policy makers
Figure 60: Score per component and per island in the near (2046-2065) and the distant future (2081-2100) under RCP2.6 (Ambitious Mitigation Policies) and RCP8.5 (Business as usual).
Source: SOCLIMPACT Deliverable Report – D4.5Comperhensive approach for policy makers

63
Canary island results
The risk is medium under the reference period and under both future scenarios at the end of
century. The component of hazard is the most important in the calculation of the risk score
(45%).
Figure 61: Risk score and components of the risk for the reference period. Source: SOCLIMPACT Deliverable Report – D4.5Comperhensive approach for policy makers
Figure 62: Risk score at the end in the distant future (2081-2100) under RCP2.6 (Ambitious Mitigation
Policies) and RCP8.5 (Business as usual). Source: SOCLIMPACT Deliverable Report – D4.5Comperhensive approach for policy makers

64
Concerning the component of exposure, the level of exposure is the most represented sub-
component (59 %).
Figure 63: Details and scores of the two subcomponents of exposure (nature and level of exposure) per island. Source: SOCLIMPACT Deliverable Report – D4.5Comperhensive approach for policy makers
Concerning the vulnerability component, the adaptative capacity is the most represented
subcomponent (76%).
Figure 64: Details and scores of the two subcomponents of vulnerability (adaptative capacity and sensitivity). Source: SOCLIMPACT Deliverable Report – D4.5Comperhensive approach for policy makers

65
4.2 Aquaculture
In the Soclimpact project, aquaculture includes only marine-based operations where off-shore
and coastal aquaculture are included, and freshwater and land-based aquaculture are excluded.
Examples of climate change hazards that can impact aquaculture are changes in ocean warming
and acidification, as well as oceoanographic changes in currents, waves, and wind speed. Sudden
impacts such as an increase in the frequency and intensity of storms and heat waves are also
impacting aquaculture. Other effects of climate change on aquaculture activities are increased
invasions from alien species, increased spread of diseases and changes in the physiology of the
cultivated species by changing temperature, oxygen availability and other important physical
water parameters. An important indirect impact to aquaculture is the change in fisheries
production due to climate change. Aquaculture of finfish is highly dependent on fisheries for feed
ingredients. This already a current problem with many fisheries overexploited and will only
intensify in the future. Climate change is also predicted to impact food safety, where temperature
changes modify food safety risks associated with food production, storage, and distribution.
Socio-economic impacts on aquaculture are hard to assess due to the uncertainty of the changes
in hazards and the limited knowledge these impacts have on the biophysical system of
aquaculture species (Handisyde et al. 2014). In the framework of Soclimpact, the following risks
were studied:
1) Risk of Fish species thermal stress due to increased sea surface temperature
Changes in water temperature can directly affect the growth rate and Food Conversion Ratio of
the fish. Temperature also affects the oxygen levels and can cause harmful algae blooms, reduce
water quality and an increase in occurrence of diseases and parasites which can than affect the
fish or other culture species. A change in temperature can ultimately change the ranges of suitable
species for a certain area but can also have positive impacts such as increased growth (mainly in
tropical and sub-tropical regions) and a longer growing season. Primary productivity can also
increase with increasing temperature, which may be beneficial for filter feeders such as mussels.
2) Risk of increased fragility of the aquaculture activity due to an increase of extreme
weather.
Increased frequency and intensity of extreme weather events result in higher waves and storm
surges and changes in salinity. These events result in loss of stock and damages to infrastructure
and require adaptation in species selection, site selection and technologies.
Indeed, the objective of the risk assessment is to obtain final risk scores according to a gradient
(very low to high) and to be able to compare the European islands with each other. For the
Canary Islands, it was difficult to obtain the adequate data to make these comparisons. The type
of data that was necessary to compile was:
- Farm area (km2)
- Value of stocks
- Quick support intervention plans
- Early warning system
- Sensivity of species

66
4.3 Energy
There are more than 2200 inhabited islands in the EU. Lately, they have come into the focus of
the EU, which addresses energy questions as part of the 'Clean energy for all Europeans' package.
The Clean energy for EU islands initiative provides a long-term framework to help islands
generate their own sustainable, low-cost energy. This is particularly interesting, because many
islands have vast amounts of renewable energy sources but rely on fossil fuel imports yet. These
are relevant challenges regarding the energy transition in the EU, whose aim of net zero
greenhouse gas emissions in 2050 should determine the future energy plans of the islands. Islands
could provide showcases for successful 100% renewable energy supply.
The National Hydropower Association (NHA) defines marine energy as electricity generation
from marine kinetic energy, such as waves, tidal and ocean currents. Pisacane et al. (2018) add
other marine energy sources like ocean thermal energy conversion (exploiting temperature
differences between deep and surface ocean waters) and salinity gradient energy (harnessing the
energy potential of differences in salt concentration in ocean and river waters). All these
technologies are still in a development phase, and even if they reach the commercial phase in the
future, it is not likely that they will generate a large share of the power. Therefore, the analysis in
SOCLIMPACT focuses on the main renewable energy sources (RES), wind energy and solar
photovoltaic (PV) energy, which are presently, and very likely in future, the backbone of the
deployment of renewable energies, due to their technological maturity and low cost.
Nevertheless, we take into account not only onshore but also offshore wind energy, as a
specifically marine energy source which has distinct advantages like much higher productivity and
less time variability than onshore wind energy, and does not require land space which is limited
and costly in the islands. There are relevant obstacles for its deployment, like the deep
bathymetry surrounding most of the islands, and the lower wind speeds over the Mediterranean
in comparison to areas like the North Sea where offshore wind energy is being deployed rapidly.
Additionally, we consider also offshore PV energy. Despite some disadvantages that have to be
overcome (corrosion problems due to salty water or the impact of waves), this application is
receiving growing interest, as it offers an option for renewable energy development in countries
and islands with limited space for the installation of solar panels, and can show increased
performance due to the cooling effect of water and wind on PV cells.
Most RES (renewable energy sources) depend on the climate, and therefore climate change can
have an impact of the resource amount. Additionally, wind and solar PV energy are not
dispatchable, and its variability represents a challenge for its integration in the power system. This
is a challenge that can be addressed through storage or backup plants (which can be itself
renewable energy plants), through demand management, but also taking advantage of
complementarity of PV and wind energy and its very different variability characteristics. This
approach is gaining attention from stakeholders in the islands, as demonstrated by the report by
Monitor Deloitte and Endesa (2020), in which one of the key recommendations for achieving an
accelerated zero carbon target in Balearic and Canary Islands by 2040 is the combination of solar
PV and wind energy, with clearly higher shares of PV than of wind energy. Such a mix would
reduce strongly the need for storage, due to the stability of solar PV production.

67
There are also challenges for the demand and transmission components of the energy systems of
the islands due to climate change: changes in temperature leading to changing energy demand,
changes in precipitation and evaporation creating risks for desalination.
For the energy sector, three theoretical impact chains (IC) have been proposed in the
SOCLIMPACT project:
i) risk of changes in power generation due to long term climate change and variability, ii) risk of changes in energy demand due to changes in precipitation and temperatures, iii) risk of damages to transmission grids due to extreme events.
Only the second IC, i.e., the one related to changes in energy demand was selected to be
operationalized, mainly due to data availability constraints. The quality of IC operationalization
depends strongly on data availability over long periods. Data for cooling energy demand are still
scarce and difficult to obtain, despite the requirements of the European Commission for
information regarding the national energy efficiency targets. The availability and quality of
cooling demand data should improve in the future due to the need for tracking the advances
towards energy efficiency targets. Desalination demand data should also improve strongly,
including data about the energy efficiency of the desalination processes used.
This demand-side IC has been deployed into two individual ICs, namely, the increased energy
demand due to increased cooling demand and the increased energy demand due to increased
desalination needs. Both risks depend on the temperature increase, which is a very certain effect
of climate change. The risk assessment was carried through and expert assisted process. The
diagrams of the two operationalized impact chains are presented below
Figure 65: Conceptualization framework for the operationalization of the energy impact chain: Risk of increased energy demand due to increased cooling demand.
Source: Soclimpact project Deliverable 4.5-Comprenhensive approach for policy makers

68
Figure 66: Conceptualization framework for the operationalization of the energy impact chain: Risk of increased energy demand due to increased desalination demand
Source: Soclimpact project Deliverable 4.5-Comprenhensive approach for policy makers
Hazard scores for energy demand (Cooling Degree Days -CDD, Standardized Precipitation-
Evapotranspiration Index - SPEI), and supply indicators (wind energy, solar PV and combined
productivity and droughts) were analysed. The aim is to jointly consider future increases in energy
demand due to temperature and precipitation changes and the potential for covering it with
renewable energy sources in the future.
Regarding the normalization of these hazards, we use an approach based on their future change.
The available literature indicates that the future projected changes of renewable energy
productivity frequently do not exceed a level of 10% relative to present values. Changes of about
10% would not modify clearly a normalized score like the one use for present climate (leading to
a very limited variation range of the score), but they represent a significant impact on the
productivity and profitability of the energy plants. Therefore, the future change of renewable
energy productivity is compared to a 10% threshold, both on the negative (normalized values
above 0.5) and the positive side (normalized values below 0.5). The normalization also includes a
minor contribution of a comparison of the changes relative to other islands.
CDD and SPEI scores are normalized with respect to a maximum projected value previously
identified. Renewable energy productivity indicators in present climate are normalized using
global thresholds (5th and 95th percentiles of the respective technologies). The same
normalization method is used for projected changes of renewable energy droughts. Thus,

69
energy drought indicators are normalized comparing them to a maximum upper limit, taken
among all the islands and renewable energy technologies.
A fundamental aspect of the method is that we apply an objective procedure for obtaining the
weights of the risk components (hazard, exposure and vulnerability) based on time-series
correlations of observed data for energy demand and for the different indicators involved in the
impact chains. This allows to detect which factors have a larger impact on the energy demand.
This method, based on correlations between observed energy demand and observed data for the
indicators, points out that several exposure and vulnerability factors have a stronger weight than
the climate hazards on short time-scales (interannual variations for periods of about 10 years).
This is consistent with the drivers considered in the national forecasts, for periods of 10 years,
performed as part of the EU Energy Efficiency Directive. A consequence of this is the relatively
low weights assigned to the climate hazards in the operationalization.
For the operationalization of the full impact chains, the exposure and vulnerability indicators
were also weighted utilizing different criteria. The mathematical procedure developed proposes
the definition of weights per group of variables (hazard, vulnerability and exposure) that allow
identifying the relationship between each of the components and the dependent variable (in this
case, energy demand due to desalination or energy demand due to cooling). The detailed weight
calculation for the risk components (hazards, exposure and vulnerability) can be found in the
Soclimpact Project deliverables 4.5.
Hereafter we only present the results of the operationalization of the IC, this is, the final risk
scores for increased cooling and desalination energy demand, joint to a general conclusion:
Table 12: Final risk scores for Canary Islands: cooling and desalination energy demand, for the historical and
future periods.
Hist. ref. RCP2.6
RCP2.6 (2046-2065)
RCP2.6 (2081-2100)
Hist. ref. RCP8.5
RCP8.5 (2046-2065)
RCP8.5 (2081-2100)
Cooling 0.30 0.31 0.32 0.33 0.38 0.45
Desalin. 0.29 0.46 0.47 0.29 0.54 0.58
Categorization:
0.00 – 0.20 Very low
0.20 – 0.40 Low
0.40 – 0.60 Medium
0.60 – 0.80 High
0.80 – 1.00 Very high
Source: Soclimpact project Deliverable 4.5-Comprenhensive approach for policy makers
The risk associated to cooling energy demand shows low present values, that almost do not
increase in the case of RCP2.6 scenario, while it increases to a medium value at the end of the
century for RCP8.5 as a consequence of the temperature increase. The weights of the different
components, obtained through an objective correlation method, indicate a higher importance for
vulnerability indicators than for hazard and exposure indicators. Specifically, energy intensity and

70
per capita energy demand (vulnerability indicators) show very high correlation with cooling
energy demand. The ratio of the yearly number of tourists to population is very high, but it
shows a low correlation with cooling energy demand. A possible explanation for this is the very
low tourism seasonality in Gran Canaria, as a high number of tourists well distributed over the
year seems to have a low impact on cooling energy demand. In contrast, population density
shows a high correlation to cooling energy demand, while CDD correlates moderately with this
demand.
The low present risk score for desalination energy demand increases clearly even in the mitigation
scenario, and doubles toward the end of the century for RCP8.5 as result of the very strong
increase of SPEI score. In this case, a higher correlation between the number of tourists and
desalination energy demand is found, which increases the weight of the exposure component in
such a way that the three risk components have nearly the same weight. The percentage of
desalinated water with respect to total water (rising from 20% in 1990 to more than 50% in the
last years) shows the highest correlation with desalination energy demand. This indicates that
other sources of water are already stressed, and this stress will only increase due to SPEI
decreases. But as the percentage of desalinated water has a higher impact on energy demand than
SPEI, once the percentage is near 100%, the increases of desalination energy demand might slow
down.
* Energy demand:
- Certain data illustrate the strong impact that demand-side management options can have on
energy demand. In the case of Malta, water losses in the distribution network were tackled
through a leak management strategy during several years in such a way that the water losses were
nearly halved from 2004 to 2009. This factor has been decisive in the evolution of the
desalination energy demand, which has decreased 20% from 2004 to 2018 at the same time that
GDP has grown 80%, the number of tourists has doubled and drought conditions have
worsened.
- A clear demand management option for reducing cooling demand is the improvement of the
energy efficiency of buildings. The energy efficiency directive of the EU sets binding targets for
all European countries, but the data about the efficiency classes of buildings are rather limited
and difficult to access. The scarce data available indicate that there is much room for
improvement in this respect. A consequent implementation of energy efficiency measures in
buildings could reduce clearly the effect of increasing temperatures on energy demand.
- Digitalisation is key in EU strategies. In this respect, demand side management options for
adaptation to generation peaks and troughs should be developed as much as possible through
digitalisation, prioritising automatic instead of manual adaptation.
* Energy supply:
- The frame for energy supply in the islands are the binding targets established in the 2030
climate and energy EU framework and the long term horizon of a decarbonized energy system by
2050.

71
- The future change of wind energy and PV productivity should be rather small in general:
around 5% or less with respect to the reference period in many cases, with maximum changes of
about 10% for some islands at the end of the century under RCP8.5 scenario (particularly for
wind energy productivity over land). A 10% productivity change could have a significant impact
on a planned or existing plant if it occurs over the lifetime of the power plant, but in this case
such a change would extend over many decades, which will facilitate adaptation and efficiency
measures.
- In general, projections show a decreasing tendency of wind energy productivity over the
Mediterranean region, with a more important decrease for the RCP8.5 scenario. The main
exception is Crete, which shows a consistent increasing tendency.
- Projected PV productivity changes are generally smaller than wind energy changes. In most
cases PV productivity remains constant or decreases slightly. The main exception is Fehmarn,
which shows a clear decreasing tendency in PV productivity under RCP8.5 scenario, reaching a
10% decrease by end of the century.
- There is a specific uncertainty source in the photovoltaic projections. Most regional climate
model simulations, including the ones used here, do not include a projected evolution of aerosols
in future climate runs. The missed effect of the likely evolution of aerosols would likely increase
to some degree the future surface solar radiation and PV productivity over most of the islands
(Gutiérrez et al., 2020).
- Renewable energy productivity droughts are a measure of the variability of the resource. Wind
droughts are much more frequent (around 50% of the days for most islands) than PV droughts
(10% or less of the days). This agrees with results from the study of Raynaud et al. (2018), and
highlights the stable character of the solar productivity in comparison to wind productivity over
time.
- Wind energy droughts are more frequent in the Mediterranean islands than in the Atlantic
islands or Fehmarn. The best quality resources in terms of stability are found for Canary Islands,
which show the minimum values of both wind energy and PV droughts among all islands.
Fehmarn shows by far the worse PV drought score, corresponding a drought frequency of 23%
of the days.
- Projected changes in the frequency of droughts are small, with future variations that generally
do not attain a magnitude greater than 5% of the days. This indicates that the time-variability
characteristics of wind and PV energy are a robust feature, which is relevant for planning the
amount of storage or backup needed.
- The combination of PV and wind energy has generally a very positive impact on the frequency
of droughts as a result of the complementarity of both sources. This impact also exists but is less
clear for islands with substantial summer wind energy resources (Canary Islands, Madeira and
Crete).
- As part of the pathway towards very high or 100% RES shares, offshore wind energy should
play a very relevant role. Solutions to overcome the obstacle posed by the deep bathymetry
surrounding most of the islands are beginning to near commercial deployment, so that floating
offshore wind plants are already planned near Gran Canaria and Sicily.

72
- Offshore PV could be an interesting option for some islands, particularly when land surface
limitations are large. There is growing interest in this option, as shown by the test plants being
installed and the references made to this technology in the Roadmap for the Offshore Renewable
Energy Strategy of the European Commission or in the report of Monitor Deloitte and Endesa
(2020) about the accelerated decarbonization of Canary and Balearic Islands.
- The combination of different types of offshore renewable energy sources in the same platform
is also attracting interest, as the different sources can exhibit complementarity in time and the
combined output can thus be more stable and reliable. The different RES can also share part of
the installations, like the connection to land, reducing their cost (Pisacane et al., 2018;
MarineEnergy, 2019a). The European Union is trying to promote such combinations, through
projects like MUSICA (Multiple Use of Space for Island Clean Autonomy) which will design and
test a floating offshore platform integrating wind, PV and wave energy for use on islands
(MarineEnergy, 2019b), and plans to develop roadmaps for its deployment in three case study
islands, among them Malta and the Canaries (MaREI, 2020).
- New financing possibilities linked to the recently approved EU COVID-19 recovery fund, and
over a longer term associated to the European Green Deal, should facilitate the deployment of
renewables in the islands, as the energy transition is a key target.
- Interconnections to mainland are very important for supply safety. Excessive dependency on
interconnections to mainland should be nevertheless avoided, due to risk of blackouts, as the
failure of a single element (one transmission line) can knock out instantaneously a large
proportion of the power of an island and even cause an island-wide blackout, as has occurred
several times in Malta in the last years.
Hazard indicator computation and normalization
Cooling degree days (CDD) are used to give an indication of the effect of outside air
temperature on building energy consumption during a specified period of time. The Cooling
Degree Days (CDD) index gives the number of degrees and number of days that the outside
air temperature at a specific location is higher than a specified base temperature.
For the indicator weight calculation, the observed values of CDD (EUROSTAT) have been used,
and compare to this hazard of the island. With respect to the normalization of the indicator, we
have used a fixed lower threshold and a relative maximum as upper threshold. The minimum
CDD value has been taken as 0, while the maximum CDD value has been taken as the maximum
over all islands, emissions scenarios and time periods (CDD=1183.49 ºC· days/year,
corresponding to Cyprus for RCP8.5 scenario, end of century period).
Standardised Precipitation-Evapotranspiration Index (SPEI) is a drought index that takes
into account not only the effect of precipitation variations, but also the effect of temperature
variations on evapotranspiration. The calculation is based on the monthly difference between
precipitation and potential evapotranspiration, which represents the monthly water surplus or
deficit. The monthly differences can be aggregated at different time-scales, depending on the type
of drought to be monitored.

73
Temperature and precipitation data for SPEI calculation have been taken from the selected
regional climate model simulations. Regarding the indicator weight calculation, the ECA&D
(European Climate Assessment & Dataset) data have been used for Malta and Cyprus, while for
Gran Canaria local data have been applied (Plan Hidrológico de Gran Canaria, 2019).
The normalization of the indicator has taken into account the fact that by definition, present
conditions correspond to reference conditions (SPEI=0), and that all future changes are towards
negative SPEI values, that is towards drier conditions. Therefore, the best score value (0) has
been assigned to SPEI=0, while the worst score value (1) has been assigned to the largest
negative value found for all islands, emissions scenarios and time periods (SPEI=-2.5, obtained
for several islands under RCP8.5 emissions scenario by the end of century).
The indicator Wind energy productivity (kWh/kW) is defined as the energy produced in a period
of time divided by the power installed, which is considered as unitary. The indicator is calculated
separately for land and sea. Offshore wind energy is the most developed ocean energy, and it is
likely to be an important future energy source for the analysed islands. Its characteristics are
typically very different to onshore wind energy, due to the large differences in surface friction.
The energy productivity values are averaged respectively over the island land points and over the
sea points in a domain that reaches a maximum distance of one degree latitude and longitude
respectively to the maximum and minimum longitude/latitude land points of the islands.
The normalization is performed using absolute thresholds, that represent high or low global
values of productivity. These thresholds have been obtained from a global renewable power
report (IRENA, 2019). The maximum annual productivity would be 8760 kWh/kW,
corresponding to a 100% capacity factor. The obtained CF thresholds for onshore wind energy
are 20% (corresponding to a normalized score of 1) and 45% (normalized score of 0), while for
offshore energy they are 30% and 50%.
Photovoltaic productivity (kWh/kW) is defined as the energy produced in a period of time
divided by the power capacity installed. In order to obtain photovoltaic productivity, daily surface
solar radiation (SSR) and ambient temperature from the climate simulations are used as input
variables for a parametric PV model. The normalization is performed using absolute thresholds,
that represent high or low global values of productivity, taken from the same report as for wind
energy. In this case, the maximum threshold is adapted taking into account that the calculations
performed here assume fixed panels, while IRENA global report does not differentiate between
fixed and sun-tracking panels. Therefore, we estimate an upper CF threshold (normalized score
of 0) of 20% for fixed panels, from the 25% value deduced from IRENA global report.
Renewable energy productivity droughts indicators are a way of quantifying the time-
variability of renewable energies that depend on meteorological conditions. Low values of energy
droughts correspond to a stable output, while high values correspond to a highly variable output.
The combined renewable energy droughts represent the complementarity between wind and PV
energy. A high complementarity of both sources reduces the need for energy storage or backup
sources.

74
Two different thresholds are calculated to determine moderate (50% of mean daily productivity)
and severe (20% of mean daily productivity) energy productivity droughts, respectively. For the
normalization of these energy drought indicators, we have used a combination of an absolute
threshold (a value of 0% of drought days) corresponding to a score of 0 and a relative maximum
upper limit, taken among all the islands and renewable energy technologies (55% of days with
moderate droughts, obtained for wind energy in Corsica) corresponding to a score of 1. The
same normalization limits are applied for wind, PV and combined productivity droughts.
4.4 Maritime Transport
Maritime transport is defined as the carriage of goods and passengers by sea-going vessels, on
voyages undertaken wholly or partly at sea. It is often considered as the backbone of the world
economy, with 80% of the global trade volume passing through ports (Asariotis & Benamara,
2012). For islands, the transport of goods and passengers by ship is even more essential. At the
same time, Maritime Transport contributes to climate change through its carbon emissions which
are found to be near 3% of the global CO2 equivalent emissions (Smith et al. 2015). Compared to
land and air transport, it is the (economically and ecologically) most effective way of distributing
goods globally. A changing climate will challenge Maritime Transport to adapt to future risks and
lower its emissions.
The whole range of potential impacts of climate change on ports operations and throughput is
still under study and it remains a high degree of uncertainty about it. Various climate change
stressors can affect both harbour infrastructure and ships on route. For example, ports are
vulnerable nodes of Maritime Transport as they are strongly affected by rising sea-levels, which in
turn affect port facilities and increase the risk of flooding. Sea-level rise has accelerated in the last
century and will rise by 0.43 to 0.84 m until 2100, depending on the emission scenario (Pörtner et
al., 2019). Due to ocean dynamics and the Earth’s gravity field, there will also be regional
differences in sea-level rise in the order of 0.1 m (Asariotis & Benamara, 2012). The causes of
sea-level rise are the thermal expansion of water and the melting of glaciers due to the increase in
global mean temperature (Vermeer & Rahmstorf, 2009).
Maritime transport can also be affected by climate change through the increase in the intensity of
extreme weather events including tropical-like cyclones. According to climate projections,
tropical cyclones are not expected to change significantly in frequency but in intensity due to
rising sea-surface temperatures (Pörtner et al., 2019). The resulting extreme winds and waves can
harm ships, but also cause damage and flooding of ports, especially in combination with sea-level
rise (Hanson & Nicholls, 2012).
For the Maritime Transport sector, three main climate change risks have been identified for the
SOCLIMPACT project. These are:
(a) risk of damages to ports’ infrastructures and equipment due to floods and waves,
(b) risk of damages to ships on route (open water and near coast) due to extreme weather events,
(c) risk of isolation due to transport disruption.

75
We selected to operationalize the third one which in terms of hazards and impacts can be
considered as a combination of the other two. The hazard risk component indicators considered
for the operationalization were: extreme waves (SWHX98), extreme wind (WiX98) and mean sea
level rise (MSLAVE). The exposure indicators are: number of passengers (NPax), islands’ total
population (NTotP), value of transported goods expressed in freight (VGTStot) and number of
ports per island or archipelago (NPo), while the sensitivity indicators include: the number of
isolation days (NIID) and renovated infrastructure (NAgePo). Finally, for the component of
adaptive capacity the proposed indicators are: percentage of renewables (PEnRR), number of
courses/trainings (NTrCoRM), early warning systems (NOcSta) and harbour alternatives (NApt).
Unfortunately, due to the lack of reliable and consistent data we had to exclude the “number of
isolation days” and “number of courses/trainings” indicators. The conceptualization framework
of the operationalization is summarized in the next Figure.
Figure 67: Conceptualization framework for the operationalization of the Maritime Transport Impact Chain:
Risk of Transport Disruption. Source: Soclimpac project deliverable 4.5 Design of a comprehensive approach to climate and climate-related risk information to policy makers and the general public

76
For assessing future risk, we considered projections or estimations for the indicators when these
were available. This was mainly the case for the components of hazard (mean sea level rise,
extreme waves and wind), exposure (population, number of passengers, value of goods), and the
contribution of renewables. Two Representative Concentration Pathways (RCPs) were
considered for meteorological hazards. One “high-emission” or “business-as-usual” pathway
(RCP8.5) and a more optimistic one (RCP2.6) that is closer to the main targets of the Paris
Accord tο keep global warming to lower levels than 2 °C since pre-industrial times.
Besides the historical reference period, we consider two 20-year future periods of analysis. One
over the middle of the 21st century (2046-2065) and one covering the end of the 21st century
(2081-2100). The normalization of indicators was performed across the different islands in order
to facilitate and inter-island comparison and prioritize the islands of higher risk.
Regarding the weighting of the different risk components, we have tested several weights,
however, according to expert judgement and discussion with specialists on the Maritime sector,
we have found more appropriate to assign equal weights to all main components of risk (i.e. 0.33
for Hazard, 0.33 for Exposure and 0.33 for Vulnerability). For the sub-components of Exposure,
we have assigned a weight of 0.33 for Nature of Exposure and a weight of 0.66 for Level of
Exposure since the latter one is believed to be of greatest importance. Similarly, for the
vulnerability sub-components, we have assigned a weight of 0.25 for the Factors of Sensitivity
and a weight of 0.75 for the Factors of Adaptive Capacity.
The weighting and categorization of risk is a subjective decision, nevertheless we consider our
selection to be quite conservative and therefore we believe that a slightly different choice would
not significantly affect the main conclusions drawn. For the recent past/present conditions, the
operationalization of the Maritime Transport Impact Chain indicates low risk for all investigated
islands. In general, the Maritime Transport sector of the larger islands (e.g. Corsica, Cyprus and
Crete) is found to be more resilient to the impacts of climate change. Up to a point, this is related
to the large number of harbour alternatives in comparison with smaller islands.
Our results for the future highlight the importance of adopting a low-emission pathway since this
will keep the risk for Maritime Transport disruption in similar as present conditions while for
some islands the risk is expected to slightly decline. In terms of island inter-comparison, Malta’s
maritime sector is found to be most vulnerable, nevertheless, future risk even under RCP8.5 is
not expected to exceed medium risk values. On the contrary, Corsica is the island less susceptible
to climate change impacts. Detailed results for each investigated SOCLIMPACT island are
presented in the following sub-sections.

77
Table 13: Summary of present and future risk of isolation due to Maritime Transport disruption for each island
and scenario based on the Impact Chain operationalization.
Categorization:
Source: Soclimpact project deliverable 4.5 Design of a comprehensive approach to climate and climate-related risk information to policy makers and the general public
Canary Islands is our only case study archipelago outside the Mediterranean. For the reference
period, our analysis indicates low risk values of 0.336. It is therefore the second largest risk value
after Malta. This result is clearly due to the contribution of exposure indicators. In particular, the
total population, number of passengers and value of goods are the highest among all investigated
islands. Under an RCP2.6 pathway, risk value is expected to decrease (risk values of 0.250-0.292).
This is mainly due to the combination of decreased contribution form adaptive capacity and
exposure indicators since the population of the archipelago was assumed to be reduced following
the mainland Spain trends. Under pathway RCP8.5. this reduction of the exposure and adaptive
capacity indicators is counterbalanced with a significant increased contribution of meteorological
hazards due to climate change. As the Canaries are located in the Atlantic Ocean, the projected
mean sea level rise (0.74 cm) is the highest amongst all islands or archipelagos. As a result, the end
of the century risk values (0.341) are not expected to exceed the low level class.
READ MORE about the risk indicator computation: normalization of sub-component indicators on
Deliverable 4.5 Soclimpact project HERE
5 Socio economic impacts of climate change
5.1 Market and non-market effects of CC
Tourism
In order to analyse the reactions of tourists to the impacts of climate change and the preferences
for adaptation policies, several hypothetical situations were posed to 300 tourists visiting Canary
Islands whereby possible CC impacts were outlined for the island (i.e., beach erosion, infectious
diseases, forest fires, marine biodiversity loss, heat waves, etc.).
RISK VALUE PER
ISLAND
Historical
Reference RCP2.6 MID RCP2.6 END RCP8.5 MID RCP8.5 END
CYPRUS 0.241 0.210 0.218 0.258 0.292
CRETE 0.229 0.208 0.201 0.257 0.282
MALTA 0.376 0.347 0.335 0.395 0.414
CORSICA 0.220 0.194 0.194 0.243 0.273
CANARY ISLANDS 0.336 0.292 0.250 0.346 0.341
BALEARIC ISLANDS 0.326 0.281 0.264 0.331 0.344
0.00 – 0.20 Very low
0.20 – 0.40 Low
0.40 – 0.60 Medium
0.60 – 0.80 High
0.80 – 1.00 Very high

78
Figure 68: Socio-economic characteristics and travel description: Tourists visiting Canary Islands. Source: SOCLIMPACT Deliverable Report - D5.5 Report on market and non-market costs of Climate Change and benefits of climate actions for Europe
Firstly, tourists had to indicate whether they would keep their plans to stay at the island or find an
alternate destination if the impact had occurred, which allows predictions of the effects on
tourism arrivals to be made for each island. Secondly, tourists were asked to choose between
various policy measures funded through an additional payment per day of stay – the tourists’
choices being an expression of their preferences for attributes/policies. To estimate the results,
the conditional logit model was run by using the Stata software.
In general, data confirms that tourists are highly averse to risks of infectious diseases becoming
more widespread (82.30% of tourists would change destination). Moreover, they are not willing
to visit islands where marine wildlife has disappeared to a large extent (71.30%) or where
wildfires occur more often (69%). On the other hand, policies related to marine habitat
restoration (12.75€/day), water supply reinforcement (11.5€/day), and cultural heritage
protection (8.1€/day) are the most valued, on average, by tourists visiting these islands.
Although climate change impacts are outside the control of tourism practitioners and policy-
makers, they can nevertheless utilise this knowledge to improve the predictability of the effect
that certain adaptation policies and risk management strategies would have, and develop their
plans accordingly.

79
Figure 69: Tourists’ response to climate change impacts and related policies: Tourists visiting Canary Islands Source: SOCLIMPACT Deliverable Report - D5.5 Report on market and non-market costs of Climate Change and benefits of climate actions for Europe
SEE VIDEO SUMMARY OF RESULTS HERE
The infographic can be found in high resolution in the Soclimpact Project official website
HERE.
How tourists perceive the island destination: A comparative approach through the analysis of
social media
While historically destination image is projected by DMOs and tourists’ offices, the advent of
social media allow the construction of an image which is also a projection of tourists. The
content of their communication online shows the image they perceive. In this section we analyse
how tourists “talk” about the different islands on social media, in order to understand what the
perceived image is.
We use a specific tool (Google Cloud Vision) to scan the content of images posted by tourists on
Instagram (the market leader in visual social media) while they are on holiday in selected islands.
The content is translated in up to ten labels attached to each picture. For each island we aggregate
and rank the different labels to find out the most important characteristics tourists associate to

80
the island (assuming that they are correlated with the most frequent labels attached to the
pictures).
We analyse eight islands representative of the Atlantic Ocean (four islands of the Canary
Archipelago: Fuerteventura, Gran Canaria, Lanzarote, Tenerife) and of the Mediterranean Sea
(Crete, Cyprus, Malta, Sicily). We scan posts geotagged in these islands by tourists (identified by a
travel-related hashtag such as #visit #holiday #travel, etc) in summer 2019 (June to September),
returning a total number of 745,235 pictures considered in the analysis. The breakdown is in the
table below.
Table 14: Characteristics of the sample of pictures under analysis
Island
Indicator Tenerife
Gran Canaria
Fuerteventura Lanzarote Cyprus Crete Malta Sicily
Num. of posts (total)
49,234 33,145 38,452 25,471 63,561 93,752 74,925 119,896
Avg. num. of pictures per post
1.77 1.67 1.56 1.8 1.76 1.74 1.81 1.68
Share of geotagged posts
67% 67% 67% 65% 70% 74% 76% 73%
Number of scanned pictures
74,537 48,337 52,577 39,381 95,808 141,538 117,576 175,481
Source: Soclimpact project deliverable D5.3
After aggregating similar words, top labels for each island were obtained. The following pools
were created utilizing a frequency analysis, which is the total number of times the label occurs in
each island. A first glance at the word clouds shows that all destinations look extremely similar
which, perhaps, is of little surprise given that they all are European sea & sun destinations: hence,
labels like Sky, Sea, Vacation, Tree, Beach are among the most frequent for all islands.
Nonetheless, some differences can be spotted: Mountain appears relatively more frequently in
Tenerife than in other islands’; Sea and Ocean have relatively more weight in Fuerteventura;
Architecture and Building are of more importance in Cyprus, Crete, Malta and Sicily than in the
Canary Islands, something that is clearly linked to the density of cultural heritage in the
Mediterranean islands: in fact, all the labels representing architectural, religious and historical sites
(History, Historic, Ruins, Site, Ancient, Building, Dome, Mosque, Holy, Medieval, etc.) have
higher ranks in these islands than in the Canaries. The islands of this archipelago have more
similar images, but also reveal distinct features: for example Gran Canaria appears the most
urban, Tenerife is characterized by a higher frequency of labels related to partying and nightlife
but also for wildlife spotting, Lanzarote stands out for its arid landscapes and Fuerteventura for
the vast sandy seashores and turquoise waters as the frequencies of labels such Beach, Shore,
Sand, Coast, Turquoise, Ocean show.

81
Gran Canaria Tenerife Fuerteventura
Lanzarote Crete Cyprus
Malta Sicily

82
The impact of increased temperatures and heat waves on human thermal comfort
In order to assess how the variation in temperature impacts on the tourism sector through
changes in tourism demand our research question was: “How do increasing temperatures (and
heat waves) impact prices and, more in general, expenditure of tourists?” Arguably, when
temperatures grow, tourists adjust their behaviour: they might switch destination, or they might
stay longer or shorter depending on their attitudes and preferences. In turn, all these changes
modify the market equilibrium, pushing tourism companies to adjust their prices to re-establish
the equilibrium between demand and supply. The change in demand and the change in price
determine the change in tourism expenditure which is, from the destination’s perspective,
tourism revenue.
We monitored current weather conditions posted on several weather forecast providers and daily
prices posted on Booking.com by hotels. We then estimated the link between daily temperature
and daily price, controlling for all the other factors affecting prices. We finally applied these
estimates to the increase in the number of days with excessive temperature projected for the
future in two scenarios (RCP2.6 and RCP8.5) and in two time horizons (near future, about 2050;
distant future, about 2100).
Among the different indicators linked to thermal stress, Soclimpact is focusing on two: the
number of days in which the temperature is above the 98th percentile and the number of days in
which the perceived temperature is above 35 degrees. Although in D5.6 the impact for both
indices were computed, in this document we only report the second one (named HUMIDEX)
because it is the most intuitive and because human thermal stress is more related to the absolute
value of the temperature than its deviation from some pre-determined distribution. In line with
the project, we assumed that thermal stress appears when the perceived temperature grows above
35 Celsius degrees. As thermal stress is delimited in the summer months, and this is when the
great majority of tourists arrive in these islands, the whole analysis has been carried out in six
months only: from May to October included. In other words, we assume that there is no thermal
stress (and hence no impact on tourism) in the rest of the year.
Initially, three islands were investigated: Corsica, Sardinia, and Sicily, given the massive amount of
potential data. Other estimations were provided for Canary Islands using the Index of Distance
in Destination Image to position each island in a range that goes from Sardinia / Corsica on one
side and Sicily on the other side. Without entering the details of the extrapolation method (which
are explained in D5.6 appendixes) a summary of results is reported here:
Table 15: Estimation of increase in average price and revenues for Canary Islands
Actual share of days in
which humidex > 35
degrees
Future scenario
considered
Days in the corresponding
scenario in which humidex > 35
degrees
Increase in the
average price
Increase in the
tourism overnight
stays
Increase in
tourism revenues
3.51%
rcp26near 6.30% 1.1% 0.2% 1.4%
rcp26far 6.96% 1.4% 0.3% 1.7%
rcp85near 14.90% 4.4% 0.9% 5.3%
rcp85far 41.37% 15.2% 3.0% 18.6% Source : Soclimpact project deliverable D5.3

83
According to these findings, the average increase in temperature, which is correlated to a growing
thermal stress for tourists, brings an economic advantage to tourism destinations. This is only an
apparent contradiction with previous findings. This study does not neglect the fact that if islands
are too hot, tourists will choose to move to other (cooler) destinations, that in principle exist.
Then, the increase in tourism (and tourism revenues) stem from the fact that, when the
temperature is too hot, people would prefer to move to coastal areas (where the climatic
conditions are more bearable) than staying inland or in cities. Future trends will also facilitate this
pressure of tourism demand (think about the spreading of smart working activities where, in
principle, the worker can relocate wherever he/she wants).
Aquaculture
The effects of increased sea surface temperatures on aquaculture production were calculated
using a lethal temperature threshold by specie, and considering the production share of the
region. Four different future scenarios shown by IPCC estimations (RCP2.6 and RCP8.5 near
and distant) were analysed, which correspond to four water temperature increases
To do this, we assume two main species cultured in this region: Seabream and Seabass, and a
model of production function, calculating the monthly biomass production which depends on
the monthly water temperature. Results are presented on yearly base (mean values). In order to
facilitate the interpretation of the results, we present the value of production of the last year
available, for which we calculate the new values under the different CC scenarios.
In both scenarios, the production function will not be negatively affected by the increased sea
temperature, as the projected values are under the lethal thershold of the fish species.
Figure 70: Estimations of changes in aquaculture production (tons), due to increased sea surface temperature Source: Deliverable Report D5.6 Integration and coordination of non-market and big data analysis of economic values resulting from Climate Change impacts to GEM-
E3-ISL and GINFORS models.
The infographic can be found in high resolution in the Soclimpact Project official website
HERE.

84
Energy
Climate change may impose welfare reductions to the European islands’ societies by affecting
thermal comfort. Cooling Degree Days (CDD) are a measure of how much (in degrees), and for
how long (in days), outdoor air temperature is higher than 18°C or 65° Farenheit. The CDD is
used as a measure of the energy needed to cool buildings. The increase in CDD and the energy
demand (GWh/year) for cooling are estimated for the islands, under different scenarios of
global climate change.
Under the high emissions scenario, it is expected that the CDD increase to 665 CDD13
approximately. This value could be, for example, a combination of 100 days with temperatures of
24°C (400CDD) and other 132 days with temperatures of 20°C (265CDD). Under this situation,
the increase in cooling energy demand is expected to be 265%.
The infographics presented below can be found in high resolution in the Soclimpact
Project official website HERE.
Figure 71: Estimations of increased energy demand for cooling in Canary Islands under different scenarios of
climate change until 2100. Source: SOCLIMPACT Deliverable Report - D5.6. Integration and coordination of non-market and big data analysis of economic values resulting from Climate Change
impacts to GEM-E3-ISL and GINFORS models.
The Standardized Precipitation Evapotranspiration Index (SPEI) is analysed as a representative
indicator for increases in water demand for islands’ residents, tourists and agriculture, while it
also provides an indication on the available water stored in dams or underground resources. To
estimate the increase of energy demand due to the increase in water demand, it was assumed that
most of the islands will have to produce desalinated seawater (or groundwater) to meet further
increases of demand. Thus, the estimation of the increase in energy demand (GWh/year) to
13
The indicator is computed by multiplying the number of days exceeding the threshold by the difference in
temperatures. For example, the CDD for 100 days at 20 °C is computed as 100*(20-18) = 200CDD

85
produce more drinking water has been done based on the energy consumption required to
desalinate seawater.
Under the high emissions scenario (RCP8.5), the situation could be critical as the indicator reach
the highest levels, which could lead to an increase of 206% in desalination energy demand.
Figure72: Estimations of increased energy demand for desalination in Canary Islands under different scenarios of
climate change until 2100. Source: SOCLIMPACT Deliverable Report - D5.6. Integration and coordination of non-market and big data analysis of economic values resulting from Climate
Change4impacts to GEM-E3-ISL and GINFORS models.
Maritime Transport
For maritime transport, it has been estimated the impact of Sea Level Rise on ports' operability
costs of the islands. The costs have been calculated with reference to 1meter; this is, the
investment needed to increase the infrastructures' height by 1 meter. There is not necessarily a
strict correspondence between the SLR and the required elevation of port infrastructures, which
also depend on the coastal hydrodynamic and the shape of dikes of each port. By experts’
recommendation, we have assumed that 1 m increase in port height is required to cope with the
SLR under RCP8.5 scenario of emissions. Extrapolation for other RCP scenarios is then
conducted based on proportionality.
The starting point was the identification of the principal ports in each island (economic
relevance). Second, the analysis of the different port areas (exterior, ramps, oil, etc.), and their
uses. Third, the elevation costs were estimated per each area and port separately (considering 1
meter elevation). Thus, the costs of 1-meter elevation presented are the sum of all areas and ports
analysed, and including the rest of the ports of the island (if applicable) based on proportionality.
Estimations consider that all ports areas of the entire area should be elevated at the same time. In
other words, the economic values can be interpreted as the depreciation (amortization) costs of
the investment needed to increase all ports’ infrastructures' in the island for 125 years time
horizon. No discount rate has been applied.
As expected, the rising of sea levels will affect the sector, as new investments will be needed to
keep ports’ operability. Under the high emissions scenario, it is expected that these costs could
increase 16 million euros per year until the end of the century.

86
The infographic presented below can be found in high resolution in the Soclimpact
Project official website HERE.
Figure 73: Increased costs for maintaining ports’ operability in Canary Islands under different scenarios of SLR caused by climate change until 2100.
Source: SOCLIMPACT Deliverable Report - D5.6. Integration and coordination of non-market and big data analysis of economic values resulting from Climate Change impacts to GEM-E3-ISL and GINFORS models.
5.2 Macroeconomic projections
The aim of our study is to assess the socioeconomic impacts of biophysical changes for Canary
Islands. For this purpose we have used the GEM-E3-ISL model; a single-region, multi-sectoral
general equilibrium model based on the principles of neo-classical theory, and GINFORS; a
macro-econometric model based on the principles of post-Keynesian theory.
Both models include 14 sectors of economic activity, with an emphasis on services and
specifically on those composing the tourism industry. The GEM-E3-ISL model also include:
endogenous representation of labor market and trade flows etc.
Changes in the mean temperature, sea level and precipitation rates are expected to affect energy
consumption, tourism flows and infrastructure developments. These impact-chains have been
examined and quantified under two emission pathways: RCP2.6 which is compatible with a
temperature increase well below 2C by the end of the century and RCP8.5 which is a high-
emission scenario. The impact on these three (3) factors has been quantified in D5.6 and is used
as input in the economic models, which then assess the effects on GDP, consumption,
investments, employment etc.
In total 18 scenarios have been quantified for Canary Islands. The scenarios can be classified in
the following categories:
MEAN SEA LEVEL RISE SLR

87
1. Tourism scenarios: these scenarios examine the reduction in tourism revenues due to
changes in human comfort as captured by the hum-index, the degradation of marine
environment, increased risk of forest fires and beach reduction
2. Energy scenarios: these scenarios examine the impacts of increased electricity
consumption for cooling purposes and for water desalination
3. Infrastructure scenarios: these scenarios examine the impacts of port infrastructure
damages
4. Aggregate scenarios: these scenarios examine the total impact of the previous-described
changes in the economy.
In this scenario we examine the impacts of a simultaneous change in electricity consumption,
tourism revenues and infrastructure damages. The scenario specifications for the two climatic
variants are presented below:
Table 16: Aggregate scenario –results
Tourism revenues (% change from reference
levels)
Electricity consumption (% change from reference
levels)
Infrastructure damages
(% of GDP)
RCP2.6 (2045-2060)
-10.01 6.0 -0.39
RCP2.6 (2080-2100)
-12.81 13.6 -0.43
RCP8.5 (2045-2060)
-12.64 9.0 -1.03
RCP8.5 (2080-2100)
-18.47 34.2 -1.17
Source: GEM-E3-ISL
The theoretical and structural differences of the two models mean that this study produces is a
reasonable range of impacts, given the uncertainty embodied in economic analysis and especially
in the long-term.
In GEM-E3-ISL, the economy is in equilibrium at each point in time. Prices adjust to ensure that
supply equals demand (market clearing), capital is fully used; however, the allows for equilibrium
unemployment. The impacts are driven mainly by the supply side through changes in relative
prices that determines competitiveness change, substitution effects etc. The GEM-E3-ISL model
assesses the impacts on the economy up to 2100.
The macro-econometric type of models, such as GINFORS, do not require that all markets are
in equilibrium; idle capital and involuntary unemployment are some other features of this type of
models where the results are driven mainly by adjustments in the demand side of the economy.
The GINFORS assesses the impacts on the economy up to 2050.
With respect to GDP the estimated change compared to the reference case is between -2.6% and
-3.8% in the RCP2.6 in 2050 and between -5.7% and -6.2% in the RCP8.5. The cumulative
change over the period 2040-2100 is estimated (by GEM-E3-ISL) to be equal to -4.2% in the
RCP2.6 and -9.7% in the RCP8.5.

88
Figure 74: Percentage Change in GDP. Source: GWS, own calculation
With respect to sectorial impacts both models show a significant decrease in the activity of
tourism related sectors and an increase in the activity of the manufacturing sector, consumer
goods industries and agriculture.

89
Figure 75: Production percentage change from reference. Source: GWS, own calculation
Overall employment falls in the economy and especially in tourism related sectors following the
slowdown in domestic activity. In GEM-E3-ISL increases in employment in non-tourism related
activities are related to labor costs reductions (as wages fall and their competitiveness increases)
and a consequent substitution of capital with labor in other sectors. Employment falls on average
by 5.0% in the RCP2.6 and by 8.7% in the RCP8.5.

90
Figure 76: Employment percentage change from reference. Source: GWS, own calculation
6 Towards climate resiliency
6.1 Current situation: general commitment, specific limits and obstacle
There exists a document called “Canary Islands Strategy to Fight Against Climate Change
(Estrategia canaria de lucha contra el cambio climático)”, applicable to the Canary Islands, which was
elaborated by the Canary Agency for Sustainable Development and Climate Change (Agencia
Canaria de Desarrollo Sostenible y Cambio Climático). This agency was active between 2009 and 2012,
when it was extinguished by decree. Since then, there is no institution in the Canary Government
focused on addressing climate change issues; and the mentioned strategy plan hasn’t been
reactivated nor updated. According to this document, presented at the UN Climate Change
Conference 2017, even if Canary Islands tried to pass an adaptation plan which includes advice
for adaptation and mitigation policies, there is no policy implemented in Canary Islands in this
respect.
There exists a Committee of Experts advising the Regional Government (belonging to the
executive power) which has at its disposal technical sub-committees in charge of these specific

91
issues, but the information related to its activity should be provided by the Regional
Government.
Between 2015 and 2018, the Executive Regional Government power announced the setting up of
the Canary Islands Observatory of Climate Change (Observatorio Canario de Cambio Climático), an
organism which creation was proposed in 2015 by the Cabildo de [Island Authority hall of]
Lanzarote. However, the regulation of this institution hasn’t been provided yet, and it does not
dispose of specific personnel yet. Also, in 2018 it was announced the creation of a Climate
Change Commission, associated to the Presidency of the Canary Government, and also the
presentation of a draft bill for Climate Change in Canary Islands, but these initiatives haven’t
been materialized yet.
In conclusion, the Canary Islands have not updated the strategic plan that considers adaptation
and mitigation policies for the islands, being this a priority objective for the society, its territory
and its productive sectors.
The islands of La Gomera, Gran Canaria and Lanzarote have at their disposal recent Strategies
and Actions Action Plans regarding Climate Change, thanks to their Island Authorities hall
(Cabildo). However, only the island of Gran Canaria has activated the passing and
implementation in the Governing Council of its Action Plan, whose horizons and objectives are
set for 2030-2050. In addition, Gran Canaria has developed and executed numerous initiatives in
the last three years. It has promoted several projects with the Spanish Government (OECC –
Oficina Española de Cambio Climático), the Fundación Biodiversidad, the convention of United Nations
for Climate Chante (UNFCC), the European Commission (Joint Research Centre), and
numerous collectives and social agents of the island.
The Cabildo Island Authority of Gran Canaria has promoted with support of The Canary Islands
Institute of Technology, in parallel, in the previous two years (2017-2018), the adherence of the
island’s municipalities to the EC initiative of The Covenant of Mayors, and development
developed of the Strategic Energy and Climate Action Plans (SECAPs) and Plans for Climate and
Sustainable Energy (Planes de Acción por el Clima y la Energía Sostenible, PACES). 10 of all the 21
municipalities of the island have their own action plans (SCEAPs), and their inventory of
greenhouse gas emission inventory to work on its the progressive reduction of CO2 emission in
the coming years. The other 11 municipalities are in the process of elaborating their SECAPs.
Finally, the Island Authority of (Cabildo de) Gran Canaria has worked since 2017 together with the
Agencia Estatal de Meteorología (AEMET) to sign a specific agreement about Adverse
Meteorological Events (Fenómenos Meteorológicos Adversos, FMA) in Gran Canaria. On the other
hand, in the framework of the INTERREG MAC programme a project was elaborated and
presented by the Island Authority of (Cabildo de) Gran Canaria in 2018 to work in the
Macaronesian area on Climate Change (other participants: AEMET, OECC, Governments of
Senegal, Mauritania and Cabo Verde, ULPGC, Cabildo de El Hierro, Lanzarote and Tenerife).
Table 17: Specific limits and obstacle and relevant documents
Specific limits and obstacle
There is the need for more multilevel governance, and the strongest main limitation faced is the lack of
commitment of the regional government regarding this issue. A group of experts (Grupo de Acción Climática
de Gran Canaria) wrote a roadmap, which was not implemented afterwards (reference 1).
Moreover, the strategies are carried out at island level, meaning that in many cases there is no consensus or

92
homogenization of the topic in the different islands. For instance, the Island Authority of (Cabildo de) Gran
Canaria cooperates with the Canary Islands Institute of Technology in the elaboration of the SECAPs for
its municipalities, and collaborate with the national agency of meteorology (AEMET), while other islands
are not addressing the problem (here).
According to an expert in this issue: “the most important and severe limitation is the lack of political
willingness to design and address a strategic plan that allows to have:
a) An updated strategy regarding the impacts in all productive sectors to promote adaptation policies.
b) An updated strategy regarding emissions in all sectors to promote mitigation policies about
Greenhouse Gas Emissions, with the aim of working on the EU and IPCC proposals (reduce
emissions about 45% in 2030 based on 2010’s registration, and by 100% in 2050).”
Other entities of the Canary Islands, such as the Canary Islands Institute of Technology (ITC),
Universidad de La Laguna, Universidad de Las Palmas de Gran Canaria, WWF, ITC, PLOCAN, Centro
UNESCO Gran Canaria, Asociación Domitila, Ben Magec-Ecologistas en Acción, Muévete por el Clima,
Fundación Orotava de la Ciencia, among others, promote the research and dissemination of climate
change impacts, but better coordination among them is needed, and they are not coordinated with the
Regional Government, the 7 Island Authorities and the 88 municipalities, which may not ensure the
efficient implementation in the islands of all the plans addressing climate change.
Relevant documents
- Climate Change Adaptation Plan for Canary Islands (2011)
- Provide public information regarding the adaptation plan
- Climate Change Adaptation Plan (2014-2018), follow-up (National level)
- AdapteCCa
- Measures against Climate Change
- Applicable regulation (come from National level):
- Strategies for Canary Islands to fight against climate change (includes a mitigation plan)
Source: SOCLIMPACT Deliverable Report - D7.1. Conceptual framework

93
7 References
Asariotis, R. & Benamara, H. (Eds.). (2012). Maritime transport and the climate change challenge.
Routledge.
Fritzsche et al. (2014). The Vulnerability Sourcebook: Concept and guidelines for standardised
vulnerability assessments.
GIZ (2017). The Vulnerability Sourcebook: Concept and guidelines for standardised vulnerability
assessments. Deutsche Gesellschaft für Internationale Zusammenarbeit (GIZ).
Gutiérrez, C., Somot, S., Nabat, P., Mallet, M., Corre, L., van Meijgaard, E., Perpiñán, 0. & Gaertner, M.
Á. (2020). Future evolution of surface solar radiation and photovoltaic potential in Europe: investigating
the role of aerosols. Environmental Research Letters, 15(3), 034035.
Handisyde, N., Ross, L., Badjeck, M.C., & Allison, E. (2014). The Effects of Climate Change on World
Aquaculture: A Global Perspective.
Hanson, S. & Nicholls, R. J. (2012). Extreme flood events and port cities through the twenty-first century.
Maritime Transport and the Climate Change Challenge, 243.
Hernandez, Y., Guimarães Pereira, Â., Barbosa, P. (2018): Resilient futures of a small island: A
participatory approach in Tenerife (Canary Islands) to address climate change, Environmental Science &
Policy, 80, 28-37.
Lahtinen, H., Viljamaa, K., Buligescu, B., Wintjes, R (2013): Summary Assessment of the Canary Islands.
Report prepared for the European Service Innovation Centre (ESIC).
MarineEnergy (2019a). WavEC: Combined Wind, Wave and Solar to Transform Marine Energy.
Retrieved from https://marineenergy.biz/2019/12/16/wavec-combined-wind-wave-and-solar-to-
transform-marine-energy/
MarineEnergy (2019b). SINN Power Supports MUSICA Project. Retrieved from
https://marineenergy.biz/2019/10/22/sinn-power-supports-musica-project/
MaREI (2020). MaREI to lead €9m project to build floating offhsore platform. Retrieved from:
https://www.marei.ie/marei-to-lead-e9m-project-to-build-floating-offshore-platform/
Monitor Deloitte and Endesa (2020). Los Territorios No Peninsulares 100% descarbonizados en 2040: la
vanguardia de la transición energética en España.
OECD (2008). Handbook on Constructing Composite Indicators: Methodology and User Guide.
Organisation for Economic Co-operation and Development (OECD).
Pisacane, G., Sannino, G., Carillo, A., Struglia, M. V., & Bastianoni, S. (2018). Marine energy exploitation
in the Mediterranean region: steps forward and challenges. Frontiers in Energy Research, 6, 109.
Plan Hidrológico de Gran Canaria (2019). Ciclo de Planificación Hidrológica 2015-2021. Consejo Insular
de Aguas de Gran Canaria.
Pörtner, H. O., Roberts, D., Masson-Delmotte, V., Zhai, P., Tignor, M., Poloczanska, E., ... & Petzold, J.
(2019). IPCC Special Report on the Ocean and Cryosphere in a Changing Climate. IPCC
Intergovernmental Panel on Climate Change: Geneva, Switzerland.

94
Raynaud, D., Hingray, B., François, B., & Creutin, J.D. (2018). Energy droughts from variable renewable
energy sources in European climates. Renewable Energy, 125, 578-589.
Saaty, T.L. (1980). The Analytic Hierarchy Process.McGraw-Hill, New York.
Schneiderbauer, S., Zebisch, M., Kass, S., & Pedoth, L. (2013). Assessment of vulnerability to natural
hazards and climate change in mountain environments – examples from the Alps. In: Birkmann J (ed)
Measuring vulnerability to natural hazards: towards disaster resilient societies. United Nations University
Press, Tokyo, 349-380.
Smith, T. W. P., Jalkanen, J. P., Anderson, B. A., Corbett, J. J., Faber, J., Hanayama, S., O’Keeffe, E.,
Parker, S., Johansson, L., Aldous, L., Raucci, C., Traut, M., Ettinger, S., Nelissen, D., Lee, D. S., Ng, S.,
Agrawal, A., Winebrake, J. J., Hoen, M., ... Pandey, A. (2015). Third IMO Greenhouse Gas Study 2014.
International Maritime Organization.
Soto, D. and Brugere, C. (2008) The challenges of climate change for aquaculture. FAO Aquaculture
Newsletter, No. 40, pp. 30–32. FAO, Rome.
Turismo de Islas Canarias y Gobierno de Canarias (2017). Tourist profile Canary Islands 2017.
Uche-Soria, M.; Rodríguez-Monroy, C. Special Regulation of Isolated Power Systems: The Canary Islands,
Spain. Sustainability 2018, 10, 2572.
Vermeer, M. & Rahmstorf, S. (2009). Global sea level linked to global temperature. Proceedings of the
national academy of sciences, 106(51), 21527-21532.
SOCLIMPACT Deliverable Reports
SOCLIMPACT Deliverable Report – D3.2. Definition of complex impact chains and input-output matrix for each
islands and sectors.
SOCLIMPACT Deliverable Report – D3.3. Definition of complex impact chains and input-output matrix for each
islands and sectors.
SOCLIMPACT Deliverable Report - D4.3. Atlases of newly developed hazard indexes and indicators with Appendixes.
SOCLIMPACT Deliverable Report - D4.4a Report on solar and wind energy.
SOCLIMPACT Deliverable Report - D4.4b Report on storm surge levels.
SOCLIMPACT Deliverable Report - D4.4c Report on potential fire behaviour and exposure.
SOCLIMPACT Deliverable Report - D4.4e Report on estimated seagrass density.
SOCLIMPACT Deliverable Report - D4.4d Report on the evolution of beaches.
SOCLIMPACT Deliverable Report – D4.5. Design of a comprehensive approach to climate and climate-related risk
information to policy makers and the general public.
SOCLIMPACT Deliverable Report – D5.5. Report on market and non-market economic values for environmental
services of marine and coastal ecosystems related to the activities of the blue economy.
SOCLIMPACT Deliverable Report - D5.6. Integration and coordination of non-market and big data analysis of economic
values resulting from Climate Change impacts to GEM-E3-ISL and GINFORS models.
SOCLIMPACT Deliverable Report - D6.2. Macroeconomic outlook of the islands’ economic systems and pre-testing
simulations.
SOCLIMPACT Deliverable Report - D7.1. Conceptual framework.

APPENDIX 4

1
TABLE OF CONTENT
INTRODUCTION .............................................................................................................................. 2
1 CURRENT SITUATION AND RECENT TRENDS ................................................................................. 3
1.1 CURRENT GEOPOLITICAL CONTEXT ........................................................................................................... 3 1.2 CURRENT CLIMATE AND RISKS ................................................................................................................ 4 1.3 MACROECONOMIC STATUS .................................................................................................................... 5 1.4 RECENT EVOLUTION OF THE BLUE ECONOMY SECTORS ................................................................................. 6
2 ECONOMIC PROJECTIONS ........................................................................................................... 11
2.1 THE MACROECONOMIC PROJECTIONS .................................................................................................... 11
3 CLIMATE CHANGE OUTLOOK ....................................................................................................... 11
3.1 TOURISM ......................................................................................................................................... 12 3.2 AQUACULTURE ................................................................................................................................. 16 3.3 ENERGY ........................................................................................................................................... 17 3.4 MARITIME TRANSPORT ....................................................................................................................... 23
4 CLIMATE CHANGE RISKS ............................................................................................................. 27
4.1 TOURISM ......................................................................................................................................... 27 4.2 AQUACULTURE ................................................................................................................................. 42 4.3 ENERGY ........................................................................................................................................... 61 4.4 MARITIME TRANSPORT ....................................................................................................................... 70
5 SOCIO ECONOMIC IMPACTS OF CLIMATE CHANGE ...................................................................... 74
5.1 MARKET AND NON-MARKET EFFECTS OF CC ............................................................................................ 74
6 TOWARDS CLIMATE RESILIENCY .................................................................................................. 82
6.1 CURRENT SITUATION: GENERAL COMMITMENT, SPECIFIC LIMITS AND OBSTACLE ............................................. 82
7 REFERENCES ............................................................................................................................... 84

2
Introduction
This report is the background material for stakeholders in the upcoming adaptation
pathways workshop in the Corsica Island. First, a presentation that includes the
geography and socio-economic context for the Island, and the socioeconomic trends
without climate change (WP6), which range from the present to the end-of the century.
Regarding Climate Change, the expected climate risks and vulnerabilities for the blue
economy are presented and ran (WP3), joint to the expected trends of physical risks,
booth current and future (WP4). Finally, specific economic impacts are estimated,
considering the evolution of some physical risks (WP5 and WP6). The current climate
policy and resilience of the Island is also presented (WP7). Finally, a link to the projects
original work is made in the references section.
Corsica at a glance
Corsica is an island located in the Mediterranean Sea and a French territorial collectivity.
It is the fourth largest island in the Mediterranean, with a surface area of 8,680 km² and a
population of 325,000 residents. The island is mainly composed of forests (46% of the
island) and counts several landscapes and local or endemic specificities. Corsica has
experienced the strongest regional growth in France for 20 years (+2.3% average annual
GDP growth). The economy’s island heavily depends on tourism but is trying to
diversify itself (renewable energies, education and sciences, digital startups).
The Blue Economy sectors
Aquaculture
Marine aquaculture in Corsica is an interesting sector driven by a dynamic synergy
between university (Universita Corsica) and leading regional businesses such as the
Gloria Maris group. This sector continues to expand and counts nearly 11 companies
making 11 million euros a year, employing 120 people in Corsica. Aquaculture is
developed in the eastern plain of the island. In the past three year, the shellfish
production has grown by 20%.
Maritime Transport
The maritime transport is an important and developed sector which ensures "territorial
continuity" and allows Corsica to open to international markets. Nearly 26,000
commercial rotations are carried out on the island each year by 2 main companies:
Corsica Linea and Corsica Ferries. However, the cruise sector remains the most emitting
sector. In 2016, 400 000 tourists arrived in Ajaccio by cruise ships and 40 000 pleasure
boats were declared in Corsica.
Energy
Fossil energy accounts for 40% of Corsica’s energy mix. But this mix depends mainly on
imports from Italy, Sardinia (30%) and uses 20% of hydraulic energy. In order to counter

3
this dependence on fossil fuels and imports, Corsica is one of the first territories to have
developed a "Renewable Energy Development Program".
Tourism
Tourism is the most important sector in Corsica. In 2015, 10,6% of the Island’s
employment and 11% of the GDP were generated by tourist’s spending’s. In addition,
the population increases sharply in the summer: 430,000 non-residents in the high season
(mid-August) for a population of 320,000 inhabitants. For example, in 2016 Corsica has
welcomed over 8.9 million passengers. But the tourism industry is also a major problem
on the island, resulting in a high cost of living, long-term rental difficulties due to
seasonal offers, high real estate prices and very poorly paid seasonal jobs.
1 Current situation and recent trends
1.1 Current geopolitical context
Corsica is a French administrative authority. It is the fourth largest and the most
mountainous of the Mediterranean islands, located 220 km from the French mainland.
As the northernmost Mediterranean island, with ten peaks rising over 2,000m, Corsica
has distinctive climate characteristics. Its varied topography harbours different strata of
vegetation, ranging from Mediterranean to Alpine. Around 40% of the surface area (out
of 8 680km2) is protected by a Natural Park status.
In terms of climate, hot and dry summers are followed by cold winters. Annual
precipitation varies from 600 mm on the coast to 2,000 mm in the mountainous regions.
Rainfall is concentrated in the spring and autumn, occasionally bringing heavy and
destructive flooding. (Mouillot et al., 2008; Kołodziejski, 2013).
The capital of Corsica and largest city is Ajaccio, home to 70 000. Corsica’s total
population is 336 459 (Eurostat, 2019), making it the French region with the lowest
number of inhabitants. Corsica also has low population density: 38.76 (compared to a
French average of 119 people per km2). However, demographic trends are dynamic, with
growth rates of 3.8% per year from 2014 to 2018 (Regional Innovation Monitor, 2018).
With mortality and birth rates cancelling out, this increase is attributed entirely to
migration inflows. A comparison of population makeup by age group shows that
population trends are positive for age groups above 45, while the percentage of people
between the ages of 15 and 44 is declining (observations between 2011 and 2016). This
indicates that migration to Corsica is fuelled by retirees. Indeed, retirees accounted for
30% of households in 2016 (INSEE, 2020). Other specificities in the demographic
structure include the high proportion of single-parent families (11,4%) and the number
of people above 15 years of age without a degree (35%, as opposed to 30% on the
mainland).

4
Table 1: Evolution of population by age groups.
Age groups 2016 % 2011 %
Total 330 455 100 314 486 100
0 - 14 50 826 15.4 48 293 15.4
15 - 29 51 568 15.6 51 968 16.5
30 - 44 62 924 19 63 000 20
45 - 59 69 259 21 65 590 20.9
60 - 74 59 770 18.1 53 697 17.1
75 and over 36 108 10.9 31 937 10.2 Source Soclimpact project deliverable D6.2
As a semi-autonomous region of France (Collectivité Territoriale Corse - CTC), Corsica
possesses a unique governance structure. A directly elected council, the General
Assembly, in turns elects a separate council with executive powers, which is in charge of
managing the region. The economic, social and cultural council (Comité Economique
Social et Culturel – CESC) has consultative status. Compared to other French regions,
the regional government has additional competences in the domains of culture,
education, environment, spatial planning, tourism, transport, vocational training and
energy. There are seven public establishments tasked with implementing regional
policies. These regionally specific frameworks complement state-level policies (Regional
Innovation Monitor, 2018).
Corsica has been a French territory since 1768, when ceded by Genoa. In the 1800s,
technical progress as well as economic development helped temper some of the island’s
internal divisions and banditry. In the early XXth century, traditional activities (olive oil
production, oak cork, chesnut production) began to suffer from competition with other
Mediterranean islands and the economic fabric began to wear thin. During the latter half
of the XXth century, relations with the mainland became strained with the rise of
independentist sentiments and assassinations campaigns1. Nowadays, Corsica’s economy
is based on the tertiary sector- closely tied in with tourism. Industrial activities account
for only 6% of added value, while the construction sector represents 11%. In terms of
infrastructure, Corsica boasts four international airports and seven major ports, as well as
232 km of railroads connecting the cities of Bastia, Ajaccio and Calvi (Kołodziejski,
2013).
1.2 Current climate and risks
The climate of Corsica is generally described as Mediterranean, characterised by hot, dry summers and mild, wet winters. However, there are large temperature variations depending on altitude differences and winds. In fact, Corsica is divided into four climatic
1 https://www.routard.com/guide/corse/1046/histoire.htm

5
zones: Mediterranean climate (up to 200 m of altitude); Transition zone (from 200 to 1000 m altitude); Moderate climate (from 1000 to 1500 m altitude); Alpine climate (at more than 1500 m altitude).
From 1000 m, the average temperature is below 0°C. Also, average rainfall is less than 500 mm per year on the coast, can reach 1500 mm at an altitude of 1000 m and 2000 mm in the high mountains.
In summer, the coast is very dry. Thunderstorms are rare, but violent. The average maximum temperatures generally reach 30°C. In winter, the average minimum temperatures are between 5 and 7°C, due to the immediate proximity of the Mediterranean. Between October and February, snow falls and often covers the summits until summer.
Figure 1: Climate factsheet
Source: Own elaboration with data from GFDRR ThinkHazard!; D7.1 Conceptual Framework and Meteoblue; Meteoblue global NEMS (NOAA Environmental Modeling System)
1.3 Macroeconomic status
In 2018, Corsica’s GDP amounted to € 9 642 million, equivalent to 0.40% of total
French GDP. In fact, Corsica chronically placed among the poorest French metropolitan
regions by GDP per capita until the first decade of the XXIst century. Partly due to the

6
concurrent demographic increase, GDP per capita grew at a much faster rate than the
French average and suffered less from the 2008 crisis. Between 2015 and 2017, the
average growth rate of the region was 2.64% per year (EUROSTAT, 2019). However,
the GDP per capita, reaching €24 600 in 2017, remained significantly below the national
average of €30 600.
Corsica’s economy is driven by tourism and as a result, relies heavily on the services
sector. Trade services are the dominant sector, while non-trade services and construction
industries are over-represented. Overall, employment in services represents 80% of jobs,
compared to 18 % for industry. Agriculture employs fewer workers than national
average and covers smaller surfaces. Across sectors; small companies predominate, with
96% employing less than 10 people; the proportion of self-employed workers is also
higher than national average (one in six as opposed to one in ten people). This reflects a
productive apparatus composed of SMEs dealing in commerce or craftsmanship (Institut
Montaigne, 2015). Corsica’s unemployment rate is aligned with national average (9.4% in
2018, compared to 9.1% national average). The most affected populations are the
youngest and those over 50(INSEE, 2018).
Corsica holds a commercial deficit of € 378 million in 2018. Main exports include agro-
food products (25%), followed by mechanical, electronic, and tech equipments. Imports
are linked to transportation material, agricultural products, and oil products. Its principal
trade partners are EU countries, often accessed through Italy. (Serdjanian, 2018.)
Table 2: Export and import balances with EU and other countries. Export Import Solde
Union européenne 28 138 379 052 -350 914
dont Zone euro 26 624 343 554 -316 931
Pays tiers 75 308 419 606 -344 299
Europe hors UE 7 942 5 979 +1 963
Afrique 11 028 7 365 +3 663
Amérique 11 618 12 563 -945
Proche et Moyen Orient 10 631 912 +9 719
Asie 6 588 42 525 -35 936
Drivers 877 6 708 -5 831
Ensemble CAF/FAB hors matériel militaire
78 822 455 105 -378 283
Source: Serdjanian, 2018.
Overall, Corsica is by far the French region with least exports in terms of value; one
explanation is that insularity renders the costs of exporting goods prohibitive.
1.4 Recent evolution of the blue economy sectors
Tourism

7
The tourism industry is a mainstay of the Corsican economy. The island’s varied
geographic features and ideal weather conditions make it an attractive destination. In
2012, 31 % of GDP came from tourism: € 2.5 billion were spent overall, of which €590
million in transportation and €410 million for commercial accommodations. Seasonal
employment in tourism also generates around 20 000 jobs each summer (Observatoire
du Tourisme de la Corse, 2018)
In 2018, 35 million overnight stays were registered (based on air and maritime arrivals).
Only 28% of overnight stays are purchased in commercial/collective accommodations
(hotels, campgrounds); the remaining 72% are in private accommodations (Observatoire
du Tourisme de la Corse, 2018). This is due partly to tourists gravitating towards peer-to-
peer sites, but also to the large proportion of secondary homes in Corsica. These account
for over a third of total housing on the island, compared to a national average of 10%.
(INSEE, 2018).
Most overnight stays happen during the summer months, with August the peak month.
Figure 2: Daily variation of island population by month(air and sea). Source: Author, data from Observatoire Régional des Transports de la Corse.
The majority of tourists counted by overnight stays in commercial accommodations are
of French nationality (78%); Germans and Italians constitute the bulk of foreign tourists.
Most passengers also arrive directly from French ports or airports (85% of arrivals are
from France). Cruise ships also bring in a significant number of passengers, 930 000 in
2017, although traffic is on the decline (- 19.6%) due to a slowdown in activity in
Ajaccio’s port. This is compensated by an increase in air travel, driven by offering from
low cost companies (Tirroloni, 2018). Overall,t he number of tourist arrivals are steadily
increasing from year to year, as shown in Figure 3.
-50000
0
50000
100000
150000
200000
250000
300000
350000
400000
450000

8
3600000
3700000
3800000
3900000
4000000
4100000
4200000
4300000
2008 2010 2012 2014 2016 2018 2020
Figure 3: Evolution of total yearly passenger entries (air and sea) Source Soclimpact project deliverable D6.2
Aquaculture
Aquaculture activity in Corsica falls into one of two categories:
Shellfish farming: production of mussels and oysters, most of which takes place
on the Eastern coast, in the Diane and Urbino coastal pools.
Fish farming: sea bass, gilt head bream, and meagre (or salmon bass) are the
species farmed, mostly on pockets along the Western coast. The largest open-sea
site (2nd largest in France) is installed in the bay of Ajaccio (SRDAM, 2015).
Aquaculture is the agricultural activity with the highest export volume after winemaking;
nearly 80%2 of production by volume is exported to mainland France or to the rest of
Europe (including 95% of fish, 30% for shellfish). Export value was around €13 million
in 2016 (ODDC, 2016), of which €9.5 million for fish. Despite its strong economic
value, the activity generates few (but highly specialized and skilled) jobs: 125 in 2012,
down to 90 jobs in 2016.
The sector is fairly concentrated (only 7 active companies) and well-structured thanks to
the Syndicate of Corsican Fish Farmers (Syndicat des Aquaculteurs Corses, Mare è Stagni
Corsi). A single entity, Gloria Maris, is responsible for 90% of exports, including 150
shipped beyond Europe.
2 http://paris-sur-la-corse.com/les-aquaculteurs-corses-misent-sur-la-qualite/

9
Table 3: Evolution of aquaculture sector from 2012 to 2016.
Shellfish Fish
2012 2016 2012 2016
Number of companies 4 3 7 4
Tonnage produced 950 1100 1200 1200 Source of data: ODDC, 2016.
As evidenced by
Table , while the number of companies involved in aquaculture activities has diminished
since 2012, total production has increased. The syndicate has pushed for the island’s
production to earn Geographical Indication status, enshrining the strong focus on quality
in recent years. Specific actions include environmental monitoring of open sea farms,
constant veterinary surveillance, low density of fish in cages, and obtaining the ‘Label
Rouge’ quality label for all three fish species.
The objective of further developing the sector is also supported at the regional level, with
a planning document for the development of Marine Aquaculture released in 2015
(Schéma régional de développement de l’aquaculture marine, SRDAM). It stakes out 17
sites for potential exploitation (incl. 14 for fish farming and 3 for shellfish), with due
consideration for sustainability issues and environmental regulations.
Energy
The fact of its insularity added to the lack of local energy sources means Corsica is highly
dependent in terms of total energy supply. Total energy consumption encompasses
vehicle fuel, liquefied petroleum gas for heating, combustibles used to produce electricity,
etc. It also includes the importation of electricity from Sardinia and mainland Italy,
through two interconnectors (ODDC, 2019). The island’s oil supply is exclusively
brought in by ships, spiking costs and making energy costs weigh more in the local
economy than for other French regions. The island is dependent on outside supply for
nearly 87% of its total primary energy consumption, which totaled 654 ktoe3 in 2014 (see
Figure 4).
Figure 4: Share of primary energy consumption by resource in 2014.
Source: ODDC, 2019.
3 Toe stands for Tonne of oil equivalent (around 42 Gigajoules)
79%
8%
9% 4%
Oil Electric linkages Electric (renewable) Thermal (renewable)

10
By contrast, the share of renewable energies within the electricity mix is particularly high
nearly 40% in terms of production capacity4. As shown, hydroelectricity represents the
largest share of renewables, although solar energy has been on the rise in recent years.
There are four hydroelectric dams operating in Corsica. In a given year, the share of
renewable energies within the electricity mix depends strongly on the water intake
contributing to hydroelectric power generation. There are three existing wind farms in
Corsica: Calenzana (10 turbines), Ersa and Rogliano (combined 21 turbines), which
produce a total of 21 MW, up from 18 in 2014. A regional ‘wind turbine plan’ was
established in 2007 to minimize impacts of new installations on biodiversity. Due to
Corsica’s sunny climate and monetary incentives, many solar panel projects were initiated
up to 2010. Public support consists of a guarantee to buy electricity produced at set rates
for installations producing less than 100kWc, with a specific tender mechanism when
power provided is above 100kWc (ODDC, 2019).
In terms of total energy consumption, three trends emerge from the past 10 years:
An increase in electricity imports from Sardinia
Significant fluctuations in terms of local renewable energy production, due to
yearly variations of water intake for hydroelectricity
Persistent decrease in LPG imports
On December 18th, 2015, Corsica voted a Pluriannual Energy Programme (PPE, 2015).
It aims to bring the share of renewable energies up to 22% of total energy consumption
by 2023, and up to 40% of electricity production. This will be done by relying on
increased energy efficiency, lower overall consumption, and higher installed power
capacity for renewables.
Maritime Transport
Corsica is connected to the mainland and the rest of Europe through 6 commercial ports
(Calvi’s port is a marina) and 3 airports. There are 29 regular lines, piloted by 6
companies. Corsica Ferries dominates the passenger market, while Corsica Linea and La
Meridionale share market access for freight transport. Ajaccio is the principal cruise ship
port, while Bastia receives the bigger share of traffic from operators of regular lines. In
2017, regular lines ferried 4 million passengers to and from Corsica, including 2.7 million
from France. Cruise ships brought and additional 0.9 million passengers. Although
maritime passage has historically been prevalent, in recent years air traffic has caught up,
surpassing maritime passages for the first time in 2018 (ORTC, 2018). The number of
overall passengers has steadily risen.
4 In terms of net electricity production delivered to the grid in 2014 (corresponding to 2127 GWh), renewable energies account for a bit less, around 32% (PPE, 2015).

11
For Bastia and other Corsican ports, imports constitute about ¾ of total freight transit
(excluding cement and oil products), a commercial deficit which has been stable in recent
years5. As evidenced by this import/export ratio, freight transport is used to fulfill
domestic needs rather than operating as a hub for international routes. The total tonnage
transiting through Corsican ports in 2017 was 2.2 million (INSEE, 2018)– compared to
60 million tons for Sardinian ports (Martinetti, 2012).
Unlike for passenger traffic, the vast majority of roll traffic is connected to French ports
-about 87% in 2016- and specifically to Marseille, which accounts for 78% of traffic with
mainland France6. Indeed, most Corsican companies and commerce have developed
supply chains with providers from mainland France. Again, Bastia is the leading port in
terms of linear meters of freight exchanged, followed by Ajaccio then Porto Vecchio far
behind. The Collectivité Territoriale de Corse has an obligation to ensure a minimal
service to French ports, which it delegates to one of the regular lines through a
competitive procedure.
2 Economic projections
2.1 The macroeconomic projections
The Corsican GDP is projected to display a growth rate of 2.1%, or 1.6% per inhabitant. This make it sit far above the French average, and the fastest progressing region in Metropolitan France by GDP. This growth is likely fuelled by the tourist industry and expanding tertiary sector which accompanies an increase in the number of stays. These projections were carried out by the French COR and represent the reference scenario for the respective evolutions in GDP of French regions from 1990 to 20507.
3 Climate change outlook
Climate hazards indicators represent the entry point to understand the climate change
exposure of the blue economy sectors. The indicators have been computed for two
scenario RCP2.6 (low emission scenario) and RCP8.5 (high emission scenario) and for
different horizon times namely: a reference period (1965-2005), mid-century (2046-2065)
and end of century (2081-2100). Main source of climate projections (future climate) for
Corsica is EURO-CORDEX ensemble even if other model sources were applied when
required, depending of available scales. Results are presented in form of maps, tables or
graphs and only when the information shows an interesting outcome.
5 http://mapage.noos.fr/croussel/div/bilan_bastia.html 6 https://www.isula.corsica/attachment/994918/ 7 https://www.ecologique-solidaire.gouv.fr/sites/default/files/II%20-%20Sc%C3%A9nario%20de%20r%C3%A9f%C3%A9rence.pdf

12
All the graphics presented below can be found in high resolution in the
Soclimpact Project official website HERE.
3.1 Tourism
Beach flooding and related losses
One of the consequences of an increase in the mean sea level will be the flooding of coastal areas. This includes sand beaches, which are the main asset for tourism activities in most of the European islands. Therefore, estimating the potential risk of beach loss due to climate change is of paramount importance for the economy of those islands. The 95th percentile of the flood level averaged was selected as an indicator of interest. The values are presented as anomalies with respect to the present mean sea level at beach location (i.e. including the median contribution of runup). In all cases an increase is expected being larger at the end of the century under scenario RCP8.5. The values in that scenario is 992.48 cm in Corsica.
Figure 5: Projected extreme flood level (in the vertical, in cml) at beach locations with respect to the
present (1986-2005) mean sea level values averaged for the islands under scenario RCP2.6 (left) and RCP8.5 (right). Ensemble of models using Global simulations produced by Hemer et al. (2013).
Source: SOCLIMPACT Deliverable Report - D4.4d Report on the evolution of beaches
Under mean conditions, we find that, at end of century, the total beach surface loss range
from ~38% under scenario RCP2.6 to ~54% under scenario RCP8.5.

13
Figure 6: Beach reduction % (scaling approximation).
Source: SOCLIMPACT Deliverable Report - D4.4d Report on the evolution of beaches.
Seagrass evolution
Seagrasses are the main habitat for coastal marine ecosystems. They provide different
services like sediment retention (and thus clearer waters), coastal protection (in front of
marine storms), shelter for marine organisms, etc. Therefore, the state of the seagrasses is
a convenient proxy for the state of coastal environment. That is, large well-preserved
extensions of seagrasses lead to a better coastal marine environment which in turn is
more resilient in front of hazards.
Our results suggest that no seagrass losses are expected for the Posidonia located in the coasts of Corsica island.
Figure 7: Seagrass evolution
Source: SOCLIMPACT Deliverable Report - D4.4e Report on estimated seagrass density

14
Length of the window of opportunity for vector-borne diseases Vector Suitability Index for Aedes Albopictus (Asian Tiger Mosquito) Climate change can influence the transmission of vector-borne diseases (VBDs) through altering the habitat suitability of insect vectors. This is mainly controlled by increases of ambient air temperature and changes in the hydrological cycle. In the framework of SOCLIMPACT we explore if potential changes to meteorological conditions can affect the distribution of the Asian tiger mosquito (Aedes albopictus). Asian tiger mosquito is native to the tropical and subtropical areas of Southeast Asia; however, in the past few decades, this species has spread to many countries through the international transport of goods and increased travel (Scholte and Schaffner 2007). It is of great epidemiological importance since it can transmit viral pathogens and infectious agents that cause chikungunya, dengue fever, yellow fever and various encephalitides (Proestos et al. 2015). The multi-criteria decision support vector distribution model of Proestos et al. (2015) has been employed to estimate the regional habitat suitability maps. This is based on extending previous work on the environmental/climatic factors affecting the life cycle of the Asian tiger mosquito (Waldock et al. 2013; Proestos et al., 2015). The mosquito habitat suitability model combines seven meteorological indices based on field observations, extensive literature review and expert knowledge. Corsica is another example of suitable habitat for the Asian tiger mosquito. According to the European Centre of Disease Prevention and Control populations of the mosquito have already been reported. The ensemble mean of EURO-CORDEX simulations suggest slight increases of the suitability for both 21st century time slices under scenario RCP2.6 and for the mid-century under scenario RCP8.5.
Figure 8: Habitat Suitability Index (HSI) values averaged over eight SOCLIMPACT islands and for each sub-period of analysis. Red colors indicate increases while blue colors indicate decreases in the future. [80-100: High Suitability; 60-80: Medium Suitability; 40-60: Low Suitability; <40 No Suitability].
Source: Soclimpact project deliverable 4.3

15
Forest Weather Index (FWI)
Fire weather Index
The FWI system provides numerical non-dimensional ratings of relative fire potential for a generalized fuel type (mature pine stands) based solely on weather observations. FWI is part of the Canadian Forest Fire Danger Rating System established in Canada since 1971 (van Wagner 1987). Furthermore, since 2007, FWI has been adopted at the EU level and used in a harmonized way throughout Europe by the European Forest Fire Information System (EFFIS) of the Copernicus Emergency Management Service (since 2015). It is selected for exploring the mechanisms of fire danger change for the islands of interest in the framework of SOCLIMPACT Project, as it has been proved to adequately perform for several locations, including the Mediterranean basin. The index was calculated for the fire season (defined from May to October) over the Mediterranean for all models, scenarios and periods. For Corsica, N=75 grid cells were retained from the models domain. In the following figure the ensemble mean and the uncertainty is presented for all periods and RPCs. It seems that under RCP2.6, the index slightly increases at the middle of the century, while it returns to present levels towards the end of the century. On the other hand, under RCP8.5 there is an increased fire danger that exceeds 30% at the end of the century. The fire danger for Corse is quite low and the majority of the island is characterized by very low and low fire danger, with few areas exhibiting medium danger. Though by the end of the areas with medium fire danger increase substantially. Regarding uncertainty, the coastal areas of the islands present higher values of standard deviation, indicating that there are larger differences among models are at the areas of the island with higher maritime influence (see respective maps).
Figure 9: Fire Weather Index (EURO-CORDEX) with the color associated to the class of risk
(Mediterranean study). Source: SOCLIMPACT Deliverable Report - D4.4c Report on potential fire behaviour and exposure

16
Humidex
For the assessment of climate hazard on heat related impacts of climate change on human health, the humidity index (Humidex) (Masterton and Richardson, 1979) has been used. Humidex value is an equivalent temperature, which express the temperature perceived by people (the one that the human body would feel), given the actual air temperature and relative humidity. As a more representative indicator for the assessment of inhabitants’ and tourists’ hazard on heat related climate change impacts, the Number of Days with Humidex greater than 35°C was selected. From the above classification, a day with Humidex above 35°C describes conditions from discomfort to imminent danger for humans. For Corsica, N=75 grid cells were retained from the models domain. In the following figure the ensemble mean and the uncertainty is presented for all periods and RPCs.
Figure 10: Humidex. Ensemble mean of EURO-CORDEX simulations. Source: SOCLIMPACT Deliverable Report - D4.3 Atlases of newly developed indexes and indicator
3.2 Aquaculture
Temperature changes in seawater trigger physical impacts; increased harmful algal
blooms, decreased oxygen level, increase in diseases and parasites, changes in ranges of
suitable species, increased growth rate, increased food conversion ratio and more
extended growing season. Furthermore, all these impacts lead to socio-economic
implications among them; changes in production levels and an increase in fouling and
pests. The objective of the current analysis is to identify and quantify the variations
(future climate scenarios with respect to present climate) in the number and in the
duration of events characterized by a Sea Surface Temperature (SST) exceeding a given
threshold. The SST thresholds have been identified according to the farming and feeding

17
necessities of several marine species, particularly relevant for the aquaculture sector in
the Mediterranean Sea (MS).
Figure 11: Number of days per year exceeding a given threshold. Source: Soclimpact project deliverable 4.5
3.3 Energy
Percentage of days when T > 98th percentile - T98p
The T98p is defined as the percentage of time where the mean daily temperature T is above the 98th percentile of mean daily temperature calculated for the reference period 1986-2005. For Corse, N=75 grid cells were retained from the models domain. In the following figure the ensemble mean and the uncertainty is presented for all periods and RCPs. It is found that T98p is about 5% during RCP2.6 towards mid-century and slightly decreases at the end of the century, while for RCP8.5 almost 20% of the year will exhibit temperatures above the 98th percentile. The coastal grid cells are more affected by the temperatures increase compared to the inland grid cells.
Figure 12: Percentage of days when T>98th percentile. Ensemble mean of EURO-CORDEX
simulations Source: SOCLIMPACT Deliverable Report - D4.4a Report on solar and wind energy

18
Renewable energy productivity indexes
A series of indicators related to renewable energy productivity is presented. The selected
indicators are wind and photovoltaic (PV) energy productivity, as well as the frequency
and duration of low-productivity periods, termed energy droughts (Raynaud et al., 2018),
as a measure of the variability of these sources. The productivity and variability of these
renewable energy sources will depend on climate. The possibility of reduced productivity
due to climate change poses a risk to the energy generation, if it is based on these
renewable energy sources. Also, a possible increase in the frequency and duration of solar
and wind energy droughts will require an increase in storage and backup sources.
Among the different renewable energy sources, solar PV and wind energy have been selected, as they are (and very likely will be) the main renewable energy sources, due to their degree of technological development and their comparatively low cost. In order to consider a marine energy source, offshore wind energy is included, in addition to onshore wind energy.
Photovoltaic energy productivity
A decrease is projected for Corsica in both scenarios and each period, but its magnitude
is generally small, below or about 2% in all cases except in scenario RCP8.5 at the end of
the century where the projected decrease reaches 4% over the sea. Differences between
land and sea are not very high, although spatially averaged values of changes over the sea
are more negative.
Figure 13: Photovoltaic (PV) productivity (land). Ensemble of models using MENA-CORDEX. Source: SOCLIMPACT Deliverable Report - D4.4a Report on solar and wind energy.

19
Figure 14: Photovoltaic (PV) productivity (land). Ensemble of models using MENA-CORDEX. Source: SOCLIMPACT Deliverable Report - D4.4a Report on solar and wind energy.
Wind energy productivity
An important decrease of Wprod is obtained in RCP8.5 at the end of this century,
specially over the sea, where it reaches 5% in spatial average. In RCP2.6 changes are
small. These general trends are affected by regional differences, probably related to
orography-wind interaction. The decrease in RCP8.5 is robustly supported by the
uncertainty analysis, except for those regions where the decrease is weaker. Tobin et al.
(2015, 2016) also show a general decrease with noticeable regional differences. Model
spread is relatively high, with differences in the sign of changes in several cases.
Figure 15: Wind energy productivity (land). Ensemble of models using MENA-CORDEX. Source: SOCLIMPACT Deliverable Report - D4.4a Report on solar and wind energy

20
Figure 16: Wind energy productivity (sea). Ensemble of models using MENA-CORDEX. Source: SOCLIMPACT Deliverable Report - D4.4a Report on solar and wind energy
Frequency and duration of low-productivity periods (energy droughts) as a
measure of the variability of these sources
Energy productivity droughts
In the control time period, moderate and severe wind droughts are more prone to occur than in most of the other islands, especially over land, where moderate droughts develop about 55% of the days. This indicates that wind is highly variable, with extended periods of low wind. In the RCP2.6 scenario, wind droughts mostly decrease in frequency, but changes are small, whilst in the RCP8.5 scenario the droughts become more frequent. The increase in the percentage of wind droughts is particularly remarkable over land, in the second half of the 21st century, in the RCP8.5 scenario. The increase in the frequency of wind droughts observed in the RCP8.5 scenario in the 2081-2100 time period is well supported by most of the models that conform the ensemble, as well as by changes in the wind productivity.

21
Figure 17: Ensemble mean frequency of moderate and severe productivity drought days (%) in the reference period, as well as the ensemble mean changes in the frequency of drought days (%) in the
different time periods considered. Averages are computed over land. Source: SOCLIMPACT Deliverable Report - D4.4a Report on solar and wind energy
Figure 18: Ensemble mean frequency of moderate and severe productivity drought days (%) in the reference period, as well as the ensemble mean changes in the frequency of drought days (%) in the
different time periods considered. Averages are computed over land. Source: SOCLIMPACT Deliverable Report - D4.4a Report on solar and wind energy

22
Figure 19: Wind energy and Photovoltaic (PV) productivity-COMBINED EFFECT. Ensemble
mean frequency of severe productivity drought days (%) in the control time period, as well as the ensemble mean changes in the frequency of drought days (%) in the different time periods considered for the
RCP2.6 and RCP8.5 scenarios. Averages are computed over land. Source: SOCLIMPACT Deliverable Report - D4.4a Report on solar and wind energy
Cooling Degree Days
The Cooling degree days (CDD) index gives the number of degrees and number of days that the outside air temperature at a specific location is higher than a specified base temperature, providing provides the severity of the heat in a specific time period taking into consideration outdoor temperature and average room.
Figure 20: Cooling Degree Days. Ensemble mean of EURO-CORDEX simulations. Source: SOCLIMPACT Deliverable Report - D4.3 Atlases of newly developed hazard indexes and indicators with Appendixes

23
Available water: Standardized Precipitation Index This index is used as an indication of water availability. Mild changes are projected under
RCP2.6, while under the business-as-usual scenario the whole island is expected to be
severely affected by meteorological droughts.
Figure 21: Ensemble mean values of the Standardized Precipitation Evaporation Index (SPEI)
averaged. Source: SOCLIMPACT Deliverable Report - D4.3 Atlases of newly developed hazard indexes and indicators with Appendixes
3.4 Maritime Transport
Sea level rise (SLR) is one of the major threats linked to climate change. It would induce permanent flooding of coastal areas with a profound impact on society, economy and environment. Moreover, an increase in the mean sea level would result in a larger impact of coastal storms with the consequent increase of risk. The results are presented in terms of mean sea level rise. For Corsica, the SLR ranges from 21.31 cm (RCP2.6) to 58.41 cm (RCP8.5) at the end of the century.

24
Figure 22: Mean sea level rise (in cm) with respect to the reference period (1986-2005). Ensemble mean of CMIP 5 simulations and scaling approximation for RCP2.6
Source: SOCLIMPACT Deliverable Report - D4.4b Report on storm surge levels
Storm surge extremes
Storm surge events, characterized by positive extreme sea levels and mechanically forced by atmospheric pressure and wind are the main responsible for coastal flooding, especially when combined with high tides. To present, the only ensemble populated with enough number of members to compute meaningful statistics on climate projections is the one produced for the Mediterranean by Lionello et al. (2016). This ensemble consists on 6 simulations run with the HYPSE model at 1/4º of spatial resolution and forced by the high-resolution wind fields from the MedCORDEX ensemble which in turn is nested into CMIP5 global simulations. The simulations are run for the period 1950-2100 thus covering the historical period as well as the whole 21st century. Complementary, the ensemble includes three hindcast simulations that are used to establish present reference levels. For Corsica, the results show a very low or even non-existent decrease except for RCP8.5 at the end of the century (-9%).

25
Figure 23: 99th percentile of atmospherically forced sea level (in cm) averaged for the hindcast period, the near future (2046-2065) and the far future (2081-2100) under scenarios RCP2.6 (with scaling
approximation) and RCP8.5 and (relative change in %). Source: SOCLIMPACT Deliverable Report - D4.4b Report on storm surge levels
Wind extremes
The wind extremity index NWIX98 is defined as the number of days per year exceeding the 98th percentile of mean daily wind speed. This number decreases in the far future under RCP8.5 (- 10.8 %). .
Figure 24: Wind Extremity Index (NWIX98). Ensemble mean of the EURO-CORDEX simulations.
Source: SOCLIMPACT Deliverable Report - D4.3Atlases of newly developed indexes and indicator

26
The 98th percentile of daily wind speed, WIX98, decreases under RCP2.6. and RCP 8.5. with a more significant magnitude for RCP 2.6.
Wave extremes (99th percentile of significant wave height averaged)
Marine storms can have a negative impact on maritime transport, coastal-based tourism and aquaculture, among other activities. To illustrate this impact, the 99th percentile of significant wave height averaged has been chosen. A decrease in the extreme wave height is found being larger under scenario RCP8.5 as illustrated in the following map and figure in far future (-3%).
Figure 25: the 99th percentile of significant wave height averaged for the reference period and the relative change for the RCP8.5. Global simulations produced by Hemer et al. (2013).
Source: SOCLIMPACT Deliverable Report - D4.4b Report on storm surge levels.
Figure 26: the 99th percentile of significant wave height averaged for the reference period and the relative change for the RCP8.5 and RCP2.6. Global simulations produced by Hemer et al. (2013).
Source: SOCLIMPACT Deliverable Report - D4.4b Report on storm surge levels

27
4 Climate change risks
4.1 Tourism
For the tourism sector, three impact chains (IC) were operationalized: i) Loss of attractiveness of a destination due to the loss of services from marine ecosystems, ii) Loss of comfort due to increase of thermal stress iii) Loss of attractiveness due to increased danger of forest fires in touristic areas
For the first two, the AHP method was employed. This methodology is ideal to respond to the hierarchical nature of the impact chain and, secondly, for using expert judgements to assess the comparative risk for the islands over a large number of indicators. By the side of shadows, this method requires quite specific data that wasn’t able to collect for some islands. The AHP method also requires “values” for experts to compare. More specifically, for the first IC the data is needed for “Tourist Arrivals” and “Vulnerable Groups” indicators, which is regards the Exposure of people to heatwaves for the hottest period, such as:
- Number of tourist arrivals per month for the past 5 years. - Number of tourists per month aged 14 and under for the past 5 years - Number of tourists per month aged 65 and over for the past 5 years - Percentage of tourist activities that are sensitive to heatwaves (such as hiking,
etc.). - Number of beds available in medical facilities per 100,000 inhabitants.
If, for example, an island gets a lot of tourists, but most of them just spend their time by the beach, then the island is not so much at risk of losing tourists because when they visit they’ll be by the beach and able to cool down. On the other hand, if almost all the tourists visit the island for hiking, but it gets too hot, then the island could be at risk since some may change their minds and visit somewhere else with a moderate climate and do their hiking there. Additionally, it is necessary to investigate how well an island is equipped with dealing with patients who suffer from a heatwave-related episode. For the second IC, the data collected was:
- Surface of marine Phanerogams & Phanerogams' reduction due to heat: Surface, in km2; and expected % of surface loss for RCP8.5 distant future.
- Number of divers: Number of tourists practising Diving at the destination. - Products substitution capacity: capacity to derive tourist demand to non-marine
habitat-based activities. - Seagrass removal: capacity to remove dead seagrass lying on beaches. - Sea water pollution: quality of management of inshore and offshore sewages.
If one information is missing, it is not possible to conduct the risk assessment analysis, as it is a comparative analysis between European islands. Finally, the third IC provided results for the case of Corsica, which are summarized in the next section.

28
Loss of attractiveness due to increased danger of forest fires in touristic areas Forest fires are considered as an important parameter for the attractiveness of tourist
destinations, especially in the Mediterranean area. Severe episodes were met in Algarve
(Portugal) and Greece (Athens area) in the recent period, threatening the tourist season.
This study focuses on the implementation and analysis of the selected Impact Chain
“Risk of forest fires and consequences on tourism attractiveness of a destination”.
Out of the 12 islands assessed in the SOCLIMPACT project, nine were included in the
operationalization: the three Atlantic Islands (Azores, Canary Islands and Madeira) and
the Mediterranean ones (Balearic Islands, Crete, Corsica, Cyprus, Malta, Sardinia and
Sicily).
The concept of Impact Chain (Schneiderbauer et al. 2013; Fritzsche et al. 2014) is applied
as a climate risk assessment method (with 6 steps) for research of decision making.
Impact Chains propose diagrams articulating the causal links between the different
components of climate risks (according to AR5 concepts: hazards, exposure,
vulnerability, risks, step 1)). For each of these components of the theoretical IC, several
indicators are selected and collected (step 3). Data are then normalised to be able to be
aggregated (steps 4 and 5) with different weights. The final objective (step 6) is to achieve
a standardised risk score that, according to the spatial scale of the analysis can allow
comparison and decision making on adaptation, including hierarchization of resource
allocation or identification of adaptation options to mitigate climate risk.
Figure 27: Loss of attractiveness due to increased danger of forest fire in touristic areas. Source: SOCLIMPACT Deliverable Report – D3.2. Definition of complex impact chains and input-output matrix for each islands and sectors

29
Figure 28: Loss of attractiveness due to increased danger of forest fire in touristic areas. Source: SOCLIMPACT Deliverable Report – D3.3. Definition of complex impact chains and input-output matrix for each islands and sectors
Many indicators were formulated in a very broad way, causing a few problems in
identifying suitable data sets. Furthermore, the data were checked for explicit spatial
coverage, resolution, temporal coverage and time frame. Finally, we evaluated possible
substitutes or alternatives for those indicators with no suitable data to substantiate them.

30
Figure 29: Final Impact Chain Model Source: SOCLIMPACT Deliverable Report – D3.2. Definition of complex impact chains and input-output matrix for each islands and sectors
In order to normalize the index, the min-max method was applied. Min-max normalizes
indicators to have an identical range [0, 1] by subtracting the minimum value and
dividing by the range of the indicator values (OECD 2008). The mathematical formula
and more information on min-max normalization method are presented in the following
section. Afterwards, the normalized index was categorized into five equal interval classes
representing values from “Very low" to "Very high”. Considering the weighing, an
assessment of GIZ methodology has been developed for this impact chain including
interviews with various types of stakeholders (cf. dedicated 4.5 to forest fires).

31
The indicators previously normalized have been aggregated to elaborate three sub-
component indices (hazard, exposure, vulnerability) and the final risk index. The result is
included in a comparison for the 9 other islands studied for the risk linked to forest fires.
Comparative study
Hazard
The main findings are:
Scores for fire danger increase as we move from West to East and from North to South, with the exception of Malta, which is much smaller and the selected grid cells are mostly influenced by maritime conditions.
Under RCP2.6, it seems that the fire danger returns to the present conditions towards the end of the century part from Crete which score will increase from medium to high, even under this RCP.
Under RCP8.5, the increase is much more prominent, ranging from 22% to 46%, with the highest values for Corsica, Sardinia and Sicily, which implies that under this scenario at the end of the Century, the western and central Mediterranean will be more affected (Figure).
Figure 30: Hazard score (Fire Weather Index) per island for the reference period (1986-2005). Source: SOCLIMPACT Deliverable Report – D4.5Comperhensive approach for policy makers

32
Figure 31: Hazard score (Fire Weather Index) per island at the end of the century (2081-2100) under RCP2.6 (Ambitious Mitigation Policies).
Source: SOCLIMPACT Deliverable Report – D4.5Comperhensive approach for policy makers
Figure 32: Hazard score (Fire Weather Index) at the end of the century (2081-2100) under RCP8.5 (Business as usual).
Source: SOCLIMPACT Deliverable Report – D4.5Comperhensive approach for policy makers

33
Exposure
The results show that:
Atlantic Islands (Madeira and Canary Islands) are more exposed (high score, Figure) than Mediterranean Islands (from low to medium score). We can see an increase as we move from North to South in the Mediterranean area.
Atlantics Islands higher scores are mainly explained by the level of exposure rather than the nature of exposure, which is quite similar across islands, except for Malta which rate is very low.
The nature of exposure varies across EU Islands despite of their homogeneous score: Corsica has the highest score for forest areas followed by Madeira, Canary Islands. These two last ones have the highest score of forest belonging to protected areas. We can find a significant proportion of cultivated areas in other Islands namely: Sicily, Sardinia, Balearic Islands, Crete and Cyprus.
The level of exposure for Canary Islands and Madeira is particularly important because of the high scores for each of the 4 considered indicators: population density, population over 65 years, population under 9 years and tourist density.
Figure 33: Exposure score (current period) per island. Source: SOCLIMPACT Deliverable Report – D4.5Comperhensive approach for policy makers

34
Figure 34: Subcomponents of exposure and related score (current period) per island. Source: SOCLIMPACT Deliverable Report – D4.5Comperhensive approach for policy makers
Figure 35: Breakdown by exposure subcomponent. Source: SOCLIMPACT Deliverable Report – D4.5Comperhensive approach for policy makers

35
Vulnerability
The main findings are:
Results show large disparity across EU Islands in terms of vulnerability. The vulnerability score for Corsica is very high followed by Sardinia (high), Madeira, Balearic Islands and Cyprus. Malta, Canary Islands and Crete scores are low and Sicilia very low.
Breakdown by component highlights a quite homogeneous score for adaptative capacity whereas sensitivity score (Flammability Index) is very different from an island to another.
Not surprisingly for the flammability index, Corsica and Sardinia have the highest score, Malta, Sicilia and Canary Islands, the lowest one.
Looking at the adaptative capacity subcomponent, despite of the quite homogeneous scores, factors of influence are quite different among the islands:
o high score for employees in the primary sector, apart from Sardinia and Sicily;
o scores for density of firefighters and volunteers are important for all the islands except for Cyprus;
o GDP per capita and level of education are the most heterogeneous factors of influence;
o GDP per capita score is very high for Crete, very low for Corsica, Malta and Balearic Islands.
o Scores for education level is important for Cyprus and low for Madeira, Malta and Corsica.
Figure 36: Vulnerability score per island. Source: SOCLIMPACT Deliverable Report – D4.5Comperhensive approach for policy makers

36
Figure 37: Subcomponents of vulnerability and related score (current period) per island. Source: SOCLIMPACT Deliverable Report – D4.5Comperhensive approach for policy makers
Figure 38: Details and scores of the two subcomponents (adaptive capacity and sensitivity) per island. Source: SOCLIMPACT Deliverable Report – D4.5Comperhensive approach for policy makers

37
Risk
- For the reference period, the overall risk is medium for Atlantic Islands (Madeira and Canary Islands) and Eastern Mediterranean Islands (Crete and Cyprus). Risk for other islands is low and very low for Malta.
- Looking at the breakdown of the risk, the structure is quite similar for 3 groups: o Madeira, Canary Islands, Sicilia and Balearic Islands: Predominance of
exposure component (around 50% of the score); o Crete and Cyprus: Predominance of the hazard component (around 40%
of the score); o Corsica and Sardinia: Predominance of the vulnerability component
(around 60-70%); o Only Malta has a quite balanced distribution across the components.
- In this exercise, only the hazard component is changing in the future. In the near future whatever the considered RCP, the risk increases only for Cyprus from medium to high. While the risk remains stable with the RCP2.6 in the distant future for all islands apart from Cyprus, there is an increase from very low to low for Malta and from low to medium for Balearic Islands, Corsica and Sardinia with RCP8.5 (distant future). Even under this RCP8.5 risk remains constant for Canary Islands and Madeira (Medium) and Sicily (Low).
Figure 39: Risk score per island for the reference period (1986-2005). Source: SOCLIMPACT Deliverable Report – D4.5Comperhensive approach for policy makers

38
Figure 40: Risk breakdown by island for the reference period (1986-2005). Source: SOCLIMPACT Deliverable Report – D4.5Comperhensive approach for policy makers
Figure 41: Risk score per island in the near future (2046-2065) under RCP2.6 (Ambitious Mitigation Policies) and RCP8.5 (Business as usual).
Source: SOCLIMPACT Deliverable Report – D4.5Comperhensive approach for policy makers

39
Figure 42: Risk score per island at the end in the distant future (2081-2100) under RCP2.6 (Ambitious Mitigation Policies) and RCP8.5 (Business as usual). Source: SOCLIMPACT Deliverable Report – D4.5Comperhensive approach for policy makers
Figure 43: Score per component and per island in the near (2046-2065) and the distant future (2081-2100) under RCP2.6 (Ambitious Mitigation Policies) and RCP8.5 (Business as usual).
Source: SOCLIMPACT Deliverable Report – D4.5Comperhensive approach for policy makers

40
Corsica island results
For Corsica, the risk is low under the reference period and RCP 2.6. (distant) and the risk
is medium under RCP 8.5. (distant).
Figure 44: Risk score and components of the risk for the reference period. Source: SOCLIMPACT Deliverable Report – D4.5Comperhensive approach for policy makers
Figure 45: Risk score at the end in the distant future (2081-2100) under RCP2.6 (Ambitious Mitigation Policies) and RCP8.5 (Business as usual).
Source: SOCLIMPACT Deliverable Report – D4.5Comperhensive approach for policy makers

41
Considering the component of exposure, the nature of exposure is the most represented
sub-component (96 %). The indicator “forest areas” is the most important.
Figure 46: Details and scores of the two subcomponents of exposure (nature and level of exposure) per island.
Source: SOCLIMPACT Deliverable Report – D4.5Comperhensive approach for policy makers
Considering the component of vulnerability, the sub-component of sensitivity is the
most represented (68%).

42
Figure 47: Details and scores of the two subcomponents of vulnerability (adaptative capacity and sensitivity).
Source: SOCLIMPACT Deliverable Report – D4.5Comperhensive approach for policy makers
4.2 Aquaculture
In the framework of Soclimpact, the following impacts were more closely studied:
1) Increased fragility of the aquaculture activity due to an increase of extreme
weather.
Increased frequency and intensity of extreme weather events result in higher waves and
storm surges and changes in salinity. These events result in loss of stock and damages to
infrastructure and require adaptation in species selection, site selection and technologies.
2) Decrease in production due to an increase in surface water temperature
Changes in water temperature can directly affect the growth rate and Food Conversion
Ratio of the fish. Temperature also affects the oxygen levels and can cause harmful algae
blooms, reduce water quality and an increase in occurrence of diseases and parasites
which can than affect the fish or other culture species. A change in temperature can
ultimately change the ranges of suitable species for a certain area but can also have
positive impacts such as increased growth (mainly in tropical and sub-tropical regions)
and a longer growing season. Primary productivity can also increase with increasing
temperature, which may be beneficial for filter feeders such as mussels.
The risk assessment followed 7 steps process, present risk and future risk, which are
calculated separatly) for research of decision making. The goal of this method is to use

43
collected data for certain indicators of the impact chains for different islands to assess
the risks of each island’s aquaculture sector to be affected by the hazard displayed in the
impact chain. Therefore, data for all indicators were collected from all islands. After
reviewing the data, selecting indicators and islands, the indicators were normalized, and
different risk components were weighted. Using these values, the risks for present and
future conditions under different Representative Concentration Pathway (RCP) scenarios
were calculated for the different island and compared between each other. For the
aquaculture impact chains, RCP 4.5 and 8.5 were compared since for the hazard models
RCP 2.6 was not always available.
These steps will be described in detail in the following sections.
Step 1: Data collection by Island Focal Points
To be able to apply the GIZ risk assessment method, a solid data basis is crucial.
Therefore, data was collected by the Island Focal Points (IFPs) of the SOCLIMPACT
project. The questionnaire requested datasets for 16 indicators and topics with several
subcategories on exposure and vulnerability. The IFPs reached out to local stakeholders
and authorities to collect the requested data which was then resubmitted to the Sectoral
Modelling Team (SMT) Aquaculture.
Step 2: Data review and island selection
Data were submitted by most of the islands to the SMT Aquaculture. Most datasets were
incomplete with major data missing regarding important information for the successful
operationalization of the impact chains. Therefore, and for the fact that some islands do
currently not have any active marine aquaculture operations running, some islands were
excluded from the operationalization. Out of the 12 islands assessed in the
SOCLIMPACT project, six were included in the operationalization of the impact chains
using the risk assessment method from GIZ: Corsica, Cyprus, Madeira, Malta, Sardinia
and Sicily. The other six islands (Azores, Balearic Islands, Baltic Island, Canary Islands,
Crete and French West Indies) do currently not have active marine cage aquaculture
operations or show insufficient data availability. Data on hazards was provided by the
models developed in work package 4. Eventually, Madeira was excluded for the impact
chain on extreme weather events due to lack of reliable hazard data. A qualitative analysis
will be provided in the result section.
Step 3: Review and selection of indicators
The data collection and review revealed that not all indicators of the impact chains could
be used for the operationalization process. Therefore, these indicators were reviewed
carefully and the ones which were not represented by sufficient data were excluded. The
revised impact chain was developed depending on the indicators selected.

44
Figure 48: Impact chain on Increased fragility of the aquaculture activity due to an increase of extreme weather adjusted depending on data availability and used for the operationalisation.
Source: Soclimpact project deliverable 3.2
Production data of farmed species per island
Some indicators require data on the proportions of species farmed on a specific island.
Therefore, a table with % of each species farmed on each island was prepared. This data
was obtained directly from the IFPs or from the FAO or national statistics offices.
Table 4: Proportions of aquaculture species farmed per island. Proportion of species production
Species Mussels &
clams Tuna Sea bream Sea bass
Corsica 0.43
0.265 0.265
Cyprus
0.84 0.16
Madeira
1.0
Malta
0.94 0.048 0.012
Sardinia 0.84
0.08 0.08
Sicily 0.44
0.3 0.26 Source: Soclimpact project deliverable 4.5

45
Impact chain: extreme weather events
Hazard
For the component hazard both indicators were used for the operationalisation. The
wave amplitude was shown as significant wave height (SWH) in m and the return time
number of years between extreme events quantified with a threshold of >7m. The data
was derived from the climate models of Deliverable 4.4 at the exact locations where the
fish farms are located and then averaged for all locations on one island. This allows a
more accurate assessment than taking the average values for the entire island.
Exposure
Four indicators were selected to be operationalized. The number of aquaculture
operators was provided by the IFPs and additional literature. There was no data available
on the actual size of stock, therefore the yearly production of aquaculture products (fish
and shellfish) in tons was used as a proxy indicator. The location of farms was rated by
using two different proxy indicators: the location of the farms in relation to the
prevailing wind direction and the average distance of the farms to shore. To be able to
rate the location in relation to the wind direction, the values were estimated (with 0 being
completely sheltered and 1 being exposed to wind and possible storms). After
normalizing the distance from shore (measured by using GIS software and the exact
coordinates of the fish farms), both values were averaged and represent the exposure of
the location of farms.
Sensitivity (vulnerability)
Two indicators were applied to calculate the score of factors of sensitivity. The sensitivity
of species was estimated by reviewing literature and interviewing experts regarding the
vulnerability of species to extreme weather events. After receiving these data, average
values were calculated of all values for the present species on each island.
Table 5: Estimated vulnerability factors for the sensitivity of species to wave stress. 1= very vulnerable to stress: 0=very resilient to stress.
Source: Soclimpact project deliverable 4.5
Sensitivity of species for wave stress threshold
Species Sea bream Sea bass Tuna Mussels & Clams
Estimated vulnerability
factor 0.55 0.65 0.3 0.9

46
The same approach was implemented to calculate the vulnerability of the infrastructure
types used on each island based on the type of species farmed.
Table 6: Estimated vulnerability values for the vulnerability of infrastructure in case of an extreme weather event.
1= very vulnerable to stress: 0=very resilient to stress.
Source: Soclimpact project deliverable 4.5
Adaptive capacity (vulnerability)
The indicators distance to harbor and the presence of warning systems were used to
describe the adaptive capacity. As there is a weather forecast available for all islands, the
values for the presence of warning systems are all the same and represent low values. The
distance to harbors was moved to the subcomponent adaptive capacity and measured
using GIS software and the exact locations of the farms which were provided by the
IFPs and literature data. It represents the average distance of all farms to their closest
harbor for each island and is shown in meters. The indicator stocking density and
engineering of structures were excluded from the operationalisation. For the stocking
density there were no data available from all islands and in any case, it was estimated to
be similar for all islands. The engineering of structures was already covered with the type
of infrastructures in the sensitivity subcomponent.
Impact chain: Increased sea surface temperature
Hazard
Changes in surface water temperature was chosen to be the indicator representing the
component hazard. The temperature data for this indicator was obtained from the
location of each farm from the climate models of Deliverable 4.4 and averaged per
island. To calculate the hazard for each island and each RCP, the species’ temperature
thresholds were taken into account. According to a literature review (see Annex) the
temperature thresholds for farmed species is the following:
Vulnerability of aquaculture infrastructure in case of an extreme weather event
Infrastructure for species Sea bream & Sea bass Tuna Mussels & Clams
Estimated vulnerability factor 0.4 0.3 0.6

47
Table 7: Temperature threshold per species.
Temperature thresholds for different species
Species Sea bream Sea bass Tuna Mussels & Clams
Threshold (°C) 24 25 24 20.5
Source: Soclimpact project deliverable 4.5
It must be noted that the threshold for Tuna was set to 24°C since in the project only
Tuna fattening is done (in Malta) and for adult fish the threshold is 24°C while in the
review the whole life cycle as well as prey species was taken into account which is not
relevant for this exercise. Based on these thresholds, the duration of the longest event
per year (in days) was calculated for the temperatures 20 °C, 24 °C and 25 °C for RCP
4.5 and 8.5 from the models developed in WP4. After normalizing these values (which is
described in detail in Step 4), the values for each temperature and therefore each species
threshold were averaged using the sum product of the normalized values and the species’
proportion on the total production of the island. The final values represent the score of
the hazard. The indicator changes in seawater characteristics was not included in the
operationalization as there is no additional data related to this indicator which is not
covered by the surface water temperature indicator.
Exposure
Two indicators were used for the component exposure: the number of aquaculture
operators and the yearly production (in tons) as a proxy indicator for the size of stock.
Sensitivity (vulnerability)
The subcomponent sensitivity includes two indicators which were combined to one
indicator for the operationalization. The sensitivity of species directly correlates with
suitable temperature for species and therefore it is summarized as temperature sensitivity
of species. It was calculated by using temperature threshold values for each species
obtained from a literature review and expert opinion. These values were averaged
depending on which species and in which quantities they are farmed on the islands.
Table 8: Estimated vulnerability factors for the sensitivity of species to temperature stress.
1= very vulnerable to stress: 0=very resilient to stress.
Source: Soclimpact project deliverable 4.5
Sensitivity of species for temperature stress threshold
Species Sea bream Sea bass Tuna Mussels & Clams
Estimated vulnerability
factor 0.6 0.6 0.3 1

48
Adaptive capacity (vulnerability)
Two out of four indicators from the impact chain were utilized for the
operationalization. The monitoring early warning systems were included and show all the
same values for all islands as there is a sea surface temperature forecast available for each
island. The capacity to change species was included with all the islands displaying the
same value as well. The risk value is high in this case, as it would be quite difficult to
change species farmed on the islands in general as this would result in high economic
expenditures. For the indicator of the impact chain know-how of recognizing and
treating diseases/parasites there is no data available for any island. As this could vary a
lot between the islands, the indicator was removed instead of making assumptions, to not
negatively influence the risk values. A similar case arises from the indicator availability of
alternative place for farming. There is no data available to make correct assumptions
regarding the occurrence of alternative areas on the islands and therefore the indicator
was not used for the operationalization.
Step 4: Normalization of indicator data for all islands
In order to come up with one final risk value per island and to be able to compare these
values between islands, the indicator values were transferred into unit-less values on a
common scale. The normalized values range between 0 and 1 with 0 being low risk and 1
being very high risk.
There are two different ways of normalizing the indicator values:
- Minimum/maximum normalization;
- Expert judgement.
Fraction of maximum normalization
This normalization method was used for indicators which were expressed by real data
and not by expert judgement. The value for each island was calculated as a fraction of the
maximum value in de data set. Meaning the island with the maximum value was given 1
and the rest as a fraction thereof.
The following indicators were normalized using this method:
Extreme weather events:
- yearly production/ number of aquaculture operators
- average distance from shore (location of farms)
- average distance to harbour
Sea surface temperature:
- yearly production/ number of aquaculture operators
Minimum/maximum normalization
This normalization method was used for indicators which were expressed by real data
and not by expert judgement. The minimum and the maximum value of that indicator of

49
all islands was calculated and the following formula was applied to normalize all indicator
values to the scale between 0 and 1:
𝑥𝑛𝑜𝑟𝑚𝑎𝑙𝑖𝑧𝑒𝑑 = (𝑥 − 𝑥𝑚𝑖𝑛)
(𝑥𝑚𝑎𝑥 − 𝑥𝑚𝑖𝑛)
For both impact chains, the hazard values were normalised using the min and max
method. However, in these cases the minimum and maximum values were not
automatically the minimum and maximum values of the entire dataset but rather treated
differently for every hazard indicator. This handling of the normalisation of the hazard
indicators arose from the different nature of the indicator itself and the fact that data
were available for different RCPs and periods of time. Therefore, the hazard indicators
were normalised as following:
The sea surface temperature values were normalised separately for each temperature data
set. This means that all values for all RCPs and time periods of one “longest event over a
certain temperature” were taken into account when determining the minimum and
maximum values. For Madeira, RCP 4.5 data was not available, therefore RCP 2.6 data
was used and doubled.
Wave amplitude (significant wave height)
Figure 49: Modelling indicators for sea-state hazards, return time and significant wave height starting with 4 Global Circulation-Regional Circulation Model chains, which a fed into the WAM regional
wave model. Results are then normalized. Source: Soclimpact project deliverable 4.5
The return time was normalised as following; all values equal or greater that 10 are set to
0, all values between 0 and 10 are linearly mapped to the interval 1-0, so that 0 gives risk

50
1, 10 gives risk 0. It was assumed that a time period of 10 or more years allowed to repay
investments is a reasonable threshold.
Since, as described in D4.4 of Soclimpact, that the probability of having at least one
event exceeding the return level associated with a N-year return period during a N-year
time window is anyway greater than that of its complement (no events exceeding the
limit in the N-year time window), and that the return level cannot be considered a “no-
risk” safety level in evaluating the survivability and sustainability of structures or plants.
Table 9: Probability of occurrence of at least one event exceeding the return level associated with a given return period (blue) in a given time window (green), according to the formula. RL,T=1-(1-1/T)**L, where L=length of time window, T=Return Period.
Return Period [years]
Probability of occurrence
1 years 2 years 5 years 10 years 20 years
5 20% 36% 67% 89% 99%
10 10% 19% 41% 65% 88%
20 5% 10% 23% 40% 64% Source: Soclimpact project deliverable 4.5
Therefore, using a combination of the normalised values and the probability of
occurance, experts transformed these values into risk classes such all "low", "moderate",
"medium", "high", "very high", or the like, on a qualitative basis.
Expert judgement
For some indicators from both impact chains there was no data available which is the
reason why expert judgement and estimations were applied. The following indicators
were expressed using expert’s estimations:
Extreme weather events: - farm locations (in relation to main wind direction) - sensitivity of species - vulnerability of type of infrastructure - presence of warning system
Sea surface temperature: - estimated temperature sensitivity of species - capacity to change species
- monitoring early warning systems
In all cases the normalization scale of 0 to 1 was applied with 0 being low risk and 1
being very high risk.

51
Step 5: Weighting of different risk components
In this step, the different risk components hazard, exposure and vulnerability (including
the sub-components sensitivity and adaptive capacity) were rated. The total of the values
sums up to 1. The weights were estimated by aquaculture experts and the basis of the
estimations were subjective estimations, similar to the ones used in the AHP method.
However, in this method the data availability was additionally taken into account.
Components for which the available data was scarce, outdated or more unreliable the
weights were set lower on purpose, while components with accurate datasets were given
a higher weight as following:
Table 10: Components and their weights. (Sub)Component Weight
Sea surface temperature Extreme events
Hazard 0.3 0.6 wave height 0.2 return time 0.8
Exposure 0.4 0.2
Vulnerability 0.3 0.2
Sensitivity 0.75 0.75
Adaptive Capacity 0.25 0.25 Source: Soclimpact project deliverable 4.5
Step 6: Calculations of risk for present conditions
Before being able to calculate the risk values, the scores for each component/
subcomponent had to be calculated by taking the average of the corresponding
indicators:
𝑠𝑐𝑜𝑚𝑝 =(𝑖𝑛𝑑1 + 𝑖𝑛𝑑2 + ⋯ + 𝑖𝑛𝑑𝑛)
𝑛
s – score
comp – component or subcomponent
ind – indicator
n – number of indicators
The final risk value was calculated by summing up the scores of the components
multiplied individually with the corresponding risk component weightings:
𝑅𝑖𝑠𝑘 = 𝑠ℎ𝑎𝑧 ∗ 𝑤ℎ𝑎𝑧 + 𝑠𝑒𝑥𝑝 ∗ 𝑤𝑒𝑥𝑝 + 𝑤𝑣𝑢𝑙 ∗ (𝑠𝑠𝑒𝑛 ∗ 𝑤𝑠𝑒𝑛 + 𝑠𝑎𝑐 ∗ 𝑤𝑎𝑐)
s – score w – weight haz – hazard exp – exposure vul – vulnerability

52
sen – sensitivity ac – adaptive capacity
These risk values were calculated for each island individually and range between 0 and 1.
After completing these calculations, it was possible to compare the islands between each
other.
Step 7: Calculations of risk for future conditions (different RCPs)
To be able to project the risk values to future conditions, the operationalization was
adjusted to the different Representative Concentration Pathways (RCPs). Therefore, the
whole operationalization was duplicated and different values for the hazard indicators
per island were inserted. These values were taken directly from the climate models
provided in work package 4 for the different RCP scenarios (RCP 4.5 and 8.5). The
resulting values can be compared between the islands as well as between the different
RCP scenarios.
Results
Impact chain: extreme weather event

53
Table 11: Exposure and vulnerability indicators each island
Component Exposure Vulnerability
Component Weight 0.2 0.2
Sub-component Factor of sensitivity Factors of adaptive capacity
Sub-component weight 0.75 0.25
Indicator Average Size of
producers Location of farms
Score for
level of
exposure
Sensitivity of
species (stress)
Type of
infrastructures
(material and
strength)
Score of
factor of
sensitivity
Distance to
harbour (vessel
capacity in
extreme weather
conditions)
[average & m]
Absence of
warning system
Score of
factor of
adaptive
capacity
Proxy indicator Yearly production
/Number of operators
Farms
sheltered
from wind
direction
Average distance
from shore (m) Average of
normalised
indicators
Estimated
sensitivity of
species
Type of infrastructure
(based on species)
Average of
indicators
Average distance to
harbour (m)
Presence of
warning system Average of
normalised
indicators
Data Normalised Normalised Data Normalised Normalised Normalised Data Normalised Normalised
Corsica 328.6 0.12 0.4 644 0.16 0.20 0.7 0.5 0.59 4789 0.96 0 0.48
Cyprus 811.4 0.29 0.5 3923 1.00 0.53 0.6 0.4 0.48 4616 0.92 0 0.46
Malta 2,755.9 1.00 0.5 1731 0.44 0.74 0.3 0.3 0.31 4165 0.83 0 0.42
Sardinia 537.2 0.19 0.4 1193 0.30 0.27 0.9 0.6 0.71 2183 0.44 0 0.22
Sicily 399.6 0.14 0.5 1000 0.25 0.27 0.7 0.5 0.61 5000 1.00 0 0.50
Source: Soclimpact project deliverable 4.5

54
Mediterranean islands
Hazards
Statistics of extreme events can significantly differ across the four model realizations
The hazard data for return time was derived from 3 different models; CMCC, CNRM and GUF.
Since the data varies highly between models a best- and worst case scenario was executed where
in the best-case scenario the lowest value (showing the lowest risk) between the models was used
and in the worst case scenario the highest value was used. Distance between the best and the
worst projection, give an estimate of uncertainty
Model projections for Average Significant Wave Height are in good agreement as to both pattern
and values. Hazard was evaluated from ensemble mean, uncertainty from ensemble STD (not
exceeding 15% - highest disagreement for highest values).
Figure 50: Results for return time in best- and worst-case scenarios for Mediterranean islands for reference period
(red line), RCP 4.5 (dotted line) and RCP 8.5 (black line). Source: Soclimpact project deliverable 4.5

55
"Worst" and "best" cases respectively refer to the least and most favorable projection in the set of models. For example return time, you will find that there is at least one model predicting no hazard for all islands except Sardinia with no significant variations across scenarios. In fact, all circles cluster and overlap at the centre, while those that represent Sardinia all lie very close to the limit between the two lower hazard classes. On the other hand, at least one other model predicts appreciable yet low hazard for Corsica, Sicily and Sardinia, and hazard going from moderate (reference period, red) to medium (RCP8.5, solid black), to high (RCP4.5, dotted black) for Malta, while for Cyprus the hazard is irrelevant even for the most negative projection. This means that a) the result for Sardinia and Cyprus is stable across models, b) models slightly disagree for Sicily and Corsica, but generally predict low hazard, c) the projection for Malta is affected by greater uncertainty for all scenarios. This is due to the fact that Malta is located in the Sicily Channel, where the dynamics exhibit significant gradients in the direction perpendicular to the channel axis, which are differently represented by different models. The worst and best cases do not necessarily come from the same model for all islands, that is, one model can predict the lowest hazard for Sicily and another one for Sardinia, and each of these projections is represented in the plot for the corresponding island.
Risk- Best-case scenario
Table: 12: Risk results for best-case scenario for impact chain Extreme weather events
Reference period
Mid century End century
Risk Hist. RCP 4.5 RCP 8.5 RCP 4.5 RCP 8.5
Corsica 0.19 0.19 0.19 0.20 0.21
Cyprus 0.23 0.23 0.23 0.23 0.22
Malta 0.26 0.26 0.26 0.26 0.26
Sardinia 0.30 0.32 0.32 0.28 0.31
Sicily 0.20 0.20 0.20 0.20 0.20 Source: Soclimpact project deliverable 4.5

56
Figure 51: Risk results for best-case scenario for impact chain Extreme weather events under RCP 4.5 Source: Soclimpact project deliverable 4.5
Figure 52: Risk results for best-case scenario for impact chain Extreme weather events under RCP 8.5 Source: Soclimpact project deliverable 4.5
0,00
0,05
0,10
0,15
0,20
0,25
0,30
0,35
Historic mid century end century
RCP 4.5
Corsica Cyprus Malta Sardinia Sicily
0,00
0,05
0,10
0,15
0,20
0,25
0,30
0,35
Historic mid century end century
RCP 8.5
Corsica Cyprus Malta Sardinia Sicily

57
Risk- Worst-case scenario
Table 13: Risk results for worst-case scenario for impact chain Extreme weather events
Reference period
Mid century End century
Risk Hist. RCP 4.5 RCP 8.5 RCP 4.5 RCP 8.5
Corsica 0.25 0.25 0.26 0.28 0.26
Cyprus 0.23 0.23 0.23 0.23 0.22
Malta 0.42 0.45 0.56 0.45 0.36
Sardinia 0.33 0.33 0.34 0.33 0.33
Sicily 0.30 0.34 0.33 0.33 0.26 Source: Soclimpact project deliverable 4.5
Figure 53: Risk results for worst-case scenario for impact chain Extreme weather events under RCP 4.5 Source: Soclimpact project deliverable 4.5
0,00
0,05
0,10
0,15
0,20
0,25
0,30
0,35
0,40
0,45
0,50
begin century mid century end century
RCP 4.5
Corsica Cyprus Malta Sardinia Sicily

58
Figure 54: Risk results for worst-case scenario for impact chain Extreme weather events under RCP 8. Source: Soclimpact project deliverable 4.5
Bigger islands were separated in areas since conditions can vary greatly in different parts of the island. Table 14: Risk results for impact chain Extreme weather events for the Mediterranean islands with large islands
analysed on a local level using the worst-case scenario.
Worst case Historic RCP 4.5 RCP 8.5
mid century end century mid century end century
Malta 0.37 0.45 0.45 0.56 0.36
Sicily North 0.34 0.39 0.39 0.36 0.30
Sicily East 0.17 0.20 0.20 0.20 0.20
Sicily South 0.41 0.42 0.40 0.42 0.30
Corsica West 0.37 0.32 0.37 0.34 0.34
Corsica East 0.18 0.18 0.18 0.18 0.19
Sardinia West 0.40 0.46 0.47 0.47 0.44
Sardinia East 0.39 0.20 0.20 0.20 0.18
Cyprus 0.23 0.23 0.23 0.23 0.22
Source: Soclimpact project deliverable 4.5
For all islands and all RCPs, it can be concluded that there is no significant change in risk, even in the worst-case scenario, between the reference period, middle and end of the century. Malta, Sicily south and Sardinia west are found to be the most vulnerable with risk exceeding 0.45 due
0,00
0,10
0,20
0,30
0,40
0,50
0,60
begin century mid century end century
RCP 8.5
Corsica Cyprus Malta Sardinia Sicily
0.00 – 0.20
Very low
0.20 – 0.40
Low
0.40 – 0.60
Medium
0.60 – 0.80
High
0.80 – 1.00
Very high

59
to a higher hazard risk. Malta also has the highest exposure of all islands. Malta has an increased risk mid-century in the worst case scenario, due to an increase in hazard. Impact chain: sea surface temperature
Hazard
Model projections are in good agreement with previous lower resolution ensemble estimates but
offering greater detail along island shorelines. Uncertainty to be rigorously estimated from
ensemble STD when new simulations of comparable resolution become available, but overall
tendency regarded as robust.
Exposure and vulnerability indicators
Table 15: Expose and vulnerability indicators, the data for each island and the normalized values.
Component Exposure Vulnerability
Component weight 0.4 0.3
Sub-component Factor of sensitivity Factors of adaptive capacity
Sub-component weight 0.75 0.25
Indicator Average Size of
producers
Score for
level of
exposure
Sensitivity
of species
(stress)
Score of
factor of
sensitivity
Monitoring
early
warning
systems
Capacity
to change
species
Score of
factor of
adaptive
capacity
Proxy indicator
Yearly production
/Number of operators Average of
normalised
indicators
Temperature
sensitivity of
species
(expert
guess) Indicator
Monitoring
early
warning
systems
Capacity to
change
species Average
of
indicator
Data Normalised Normalised Normalised Normalised
Corsica 328.6 0.12 0.12 0.7 0.7 0 1 0.5
Cyprus 811.4 0.29 0.29 0.6 0.6 0 1 0.5
Madeira 125.3 0.05 0.05 0.6 0.6 0 1 0.5
Malta 2,755.9 1.00 1.00 0.6 0.6 0 1 0.5
Sardinia 537.2 0.19 0.19 0.9 0.9 0 1 0.5
Sicily 399.6 0.14 0.14 0.8 0.8 0 1 0.5
Source: Soclimpact project deliverable 4.5
Risk
The values in this analysis is not an estimate of the risk but rather a ranking between islands since a lot of the data was normalised based on a min-max or fraction of the maximum of the islands. A proper risk assessment would need additional data from farmers and a detailed model of

60
farming results as a function of temperature. Malta has a much higher risk than the other islands due to the high exposure, Malta’s farm produce on average 3.5 to 22 times more than the farms on other islands.
Table 16: Risk results for impact chain Sea Surface temperature
Historic Mid century End century
Risk Hist. RCP 4.5 RCP 8.5 RCP 4.5 RCP 8.5
Corsica 0.30 0.34 0.41 0.38 0.42
Cyprus 0.40 0.48 0.48 0.50 0.59
Malta 0.68 0.73 0.74 0.75 0.80
Madeira 0.19 0.26 0.23 0.24 0.35
Sardinia 0.37 0.42 0.43 0.44 0.49
Sicily 0.38 0.43 0.43 0.45 0.48
Source: Soclimpact project deliverable 4.5
Figure 55: Risk results for impact chain Sea Surface temperature under RCP 4.5 Source: Soclimpact project deliverable 4.5
0,00
0,10
0,20
0,30
0,40
0,50
0,60
0,70
0,80
historic mid century end century
RCP 4.5
Corsica Cyprus Malta Madeira Sardinia Sicily

61
Figure 56: Risk results for impact chain Sea Surface temperature under RCP 8.5 Source: Soclimpact project deliverable 4.5
4.3 Energy
There are more than 2200 inhabited islands in the EU. Lately, they have come into the focus of
the EU, which addresses energy questions as part of the 'Clean energy for all Europeans'
package. The Clean energy for EU islands initiative provides a long-term framework to help
islands generate their own sustainable, low-cost energy. This is particularly interesting, because
many islands have vast amounts of renewable energy sources but rely on fossil fuel imports yet.
These are relevant challenges regarding the energy transition in the EU, whose aim of net zero
greenhouse gas emissions in 2050 should determine the future energy plans of the islands.
Islands could provide showcases for successful 100% renewable energy supply.
The National Hydropower Association (NHA) defines marine energy as electricity generation
from marine kinetic energy, such as waves, tidal and ocean currents. Pisacane et al. (2018) add
other marine energy sources like ocean thermal energy conversion (exploiting temperature
differences between deep and surface ocean waters) and salinity gradient energy (harnessing the
energy potential of differences in salt concentration in ocean and river waters). All these
technologies are still in a development phase, and even if they reach the commercial phase in the
future, it is not likely that they will generate a large share of the power. Therefore, the analysis in
SOCLIMPACT focuses on the main renewable energy sources (RES), wind energy and solar
photovoltaic (PV) energy, which are presently, and very likely in future, the backbone of the
deployment of renewable energies, due to their technological maturity and low cost.
0,00
0,10
0,20
0,30
0,40
0,50
0,60
0,70
0,80
0,90
historic mid century end century
RCP 8.5
Corsica Cyprus Malta Madeira Sardinia Sicily

62
Nevertheless, we take into account not only onshore but also offshore wind energy, as a
specifically marine energy source which has distinct advantages like much higher productivity
and less time variability than onshore wind energy, and does not require land space which is
limited and costly in the islands. There are relevant obstacles for its deployment, like the deep
bathymetry surrounding most of the islands, and the lower wind speeds over the Mediterranean
in comparison to areas like the North Sea where offshore wind energy is being deployed rapidly.
Additionally, we consider also offshore PV energy. Despite some disadvantages that have to be
overcome (corrosion problems due to salty water or the impact of waves), this application is
receiving growing interest, as it offers an option for renewable energy development in countries
and islands with limited space for the installation of solar panels, and can show increased
performance due to the cooling effect of water and wind on PV cells.
Most RES (renewable energy sources) depend on the climate, and therefore climate change can
have an impact of the resource amount. Additionally, wind and solar PV energy are not
dispatchable, and its variability represents a challenge for its integration in the power system.
This is a challenge that can be addressed through storage or backup plants (which can be itself
renewable energy plants), through demand management, but also taking advantage of
complementarity of PV and wind energy and its very different variability characteristics. This
approach is gaining attention from stakeholders in the islands, as demonstrated by the report by
Monitor Deloitte and Endesa (2020), in which one of the key recommendations for achieving an
accelerated zero carbon target in Balearic and Canary Islands by 2040 is the combination of solar
PV and wind energy, with clearly higher shares of PV than of wind energy. Such a mix would
reduce strongly the need for storage, due to the stability of solar PV production.
There are also challenges for the demand and transmission components of the energy systems of
the islands due to climate change: changes in temperature leading to changing energy demand,
changes in precipitation and evaporation creating risks for desalination.
For the energy sector, three theoretical impact chains (IC) have been proposed in the
SOCLIMPACT project:
i) risk of changes in power generation due to long term climate change and variability, ii) risk of changes in energy demand due to changes in precipitation and temperatures, iii) risk of damages to transmission grids due to extreme events.
Only the second IC, i.e., the one related to changes in energy demand was selected to be
operationalized, mainly due to data availability constraints. The quality of IC operationalization
depends strongly on data availability over long periods. Data for cooling energy demand are still
scarce and difficult to obtain, despite the requirements of the European Commission for
information regarding the national energy efficiency targets. The availability and quality of
cooling demand data should improve in the future due to the need for tracking the advances
towards energy efficiency targets. Desalination demand data should also improve strongly,
including data about the energy efficiency of the desalination processes used.

63
This demand-side IC has been deployed into two individual ICs, namely, the increased energy
demand due to increased cooling demand and the increased energy demand due to increased
desalination needs. Both risks depend on the temperature increase, which is a very certain effect
of climate change. The risk assessment was carried through and expert assisted process.
The diagrams of the two operationalized impact chains are presented below
Figure 57: Conceptualization framework for the operationalization of the energy impact chain: Risk of increased
energy demand due to increased cooling demand. Source: Soclimpact project Deliverable 4.5-Comprenhensive approach for policy makers

64
Figure 58: Conceptualization framework for the operationalization of the energy impact chain: Risk of increased
energy demand due to increased desalination demand Source: Soclimpact project Deliverable 4.5-Comprenhensive approach for policy makers
Hazard scores for energy demand (Cooling Degree Days -CDD, Standardized Precipitation-
Evapotranspiration Index - SPEI), and supply indicators (wind energy, solar PV and
combined productivity and droughts) were analysed. The aim is to jointly consider future
increases in energy demand due to temperature and precipitation changes and the potential for
covering it with renewable energy sources in the future.
Regarding the normalization of these hazards, we use an approach based on their future change.
The available literature indicates that the future projected changes of renewable energy
productivity frequently do not exceed a level of 10% relative to present values. Changes of about
10% would not modify clearly a normalized score like the one use for present climate (leading to
a very limited variation range of the score), but they represent a significant impact on the
productivity and profitability of the energy plants. Therefore, the future change of renewable
energy productivity is compared to a 10% threshold, both on the negative (normalized values
above 0.5) and the positive side (normalized values below 0.5). The normalization also includes a
minor contribution of a comparison of the changes relative to other islands.

65
CDD and SPEI scores are normalized with respect to a maximum projected value previously
identified. Renewable energy productivity indicators in present climate are normalized using
global thresholds (5th and 95th percentiles of the respective technologies). The same
normalization method is used for projected changes of renewable energy droughts. Thus,
energy drought indicators are normalized comparing them to a maximum upper limit, taken
among all the islands and renewable energy technologies.
A fundamental aspect of the method is that we apply an objective procedure for obtaining the
weights of the risk components (hazard, exposure and vulnerability) based on time-series
correlations of observed data for energy demand and for the different indicators involved in the
impact chains. This allows to detect which factors have a larger impact on the energy demand.
This method, based on correlations between observed energy demand and observed data for the
indicators, points out that several exposure and vulnerability factors have a stronger weight than
the climate hazards on short time-scales (interannual variations for periods of about 10 years).
This is consistent with the drivers considered in the national forecasts, for periods of 10 years,
performed as part of the EU Energy Efficiency Directive. A consequence of this is the relatively
low weights assigned to the climate hazards in the operationalization.
For the operationalization of the full impact chains, the exposure and vulnerability indicators
were also weighted utilizing different criteria. The mathematical procedure developed proposes
the definition of weights per group of variables (hazard, vulnerability and exposure) that allow
identifying the relationship between each of the components and the dependent variable (in this
case, energy demand due to desalination or energy demand due to cooling). The detailed weight
calculation for the risk components (hazards, exposure and vulnerability) can be found in the
Soclimpact Project deliverables 4.5.
It was not possible to conduct a full operationalization of the IC for the case of Corsica.. The
criteria for the selection of the islands have been: (a) availability of data for the computation of
the exposure and vulnerability indicators of the demand-side ICs, (b) modeling constraints of the
hazard component. In the next tables we present the normalized hazard scores for the island and
the interpretation.
Table 17: Energy demand and supply hazard scores for Corsica
Histori-cal ref.(1986-2005)
Demand Supply: Productivity Land Sea
Droughts
CDD 0.08 Wind 0.78 0.24 1.00
SPEI 0.00 Solar PV 0.26 0.28 0.19
Combined 0.38

66
RCP2.6 (2046-2065)
Demand Supply: Productivity change
Droughts change
CDD 0.14 Wind 0.3 0.4 0.4
SPEI 0.12 Solar PV 0.6 0.7 0.8
Combined 0.5
RCP8.5 (2046-2065)
Demand Supply: Productivity change
Droughts change
CDD 0.20 Wind 0.5 0.6 0.6
SPEI 0.40 Solar PV 0.6 0.7 0.6
Combined 0.8
RCP2.6 (2081-2100)
Demand Supply: Productivity change
Droughts change
CDD 0.13 Wind 0.3 0.3 0.4
SPEI 0.04 Solar PV 0.7 0.6 0.7
Combined 0.7
RCP8.5 (2081-2100)
Demand Supply: Productivity change
Droughts change
CDD 0.39 Wind 0.6 0.8 0.7
SPEI 0.80 Solar PV 0.6 0.7 0.3
Combined 0.9
Categorization:
0.00 – 0.20 Very low
0.20 – 0.40 Low
0.40 – 0.60 Medium
0.60 – 0.80 High
0.80 – 1.00 Very high
Source: Soclimpact project Deliverable 4.5-Comprenhensive approach for policy makers
The power demand in Corsica is still characterised by a clear winter maximum, in contrast to
other islands. The peak power demand in summer is 20-30% lower than the peak demand in
winter (data corresponding to the period 2012-2016). The very low present CDD score reflects
this fact well. The CDD score should remain very low for RCP2.6 scenario. For RCP8.5
scenario, CDD score would increase more, but it would not reach high values anyway. As the
peak demand occurs presently in winter, some increase in summer cooling demand could be

67
covered by present power generation capacity, but the interconnection to Sardinia is not secured
in summer. A fact that could boost the cooling energy demand if temperature rises much is the
very high tourism seasonality.
Regarding the hydrological drought indicator, a very strong contrast is found between both
emissions scenarios, with small changes for RCP2.6 and a strong increase for the high-emissions
scenario (reaching very high values by the end of the century). In the latter scenario, the
substantial contribution of hydropower (20-30% in 2016-2018) to power generation could be
strongly affected, and the presently negligible desalination demand could be progressively more
important.
In Corsica, presently the most important renewable energy source is hydropower, followed by
solar PV energy (with a share of about 8%). Wind energy is marginal today. Solar PV resources
are good, and the PV droughts score indicates a fairly high stability. The opposite is found for
wind energy, which shows a very high variability (the maximum among all considered islands).
Wind energy shows modest potential over land, but high potential over sea. Small decreases in
PV and wind energy potential are projected, except for wind energy in RCP2.6 scenario, where
an increase in wind energy potential is projected. The “Regional air climate and energy scheme”
has a target of 100% renewable energy coverage for 2050. Floating offshore wind energy could
play a relevant factor for this objective if the technology can be successfully adapted to the deep
bathymetry, as rather high capacity factors could be obtained at the northern coast and especially
east of the Strait of Bonifacio.
* Islands’ comparison and future challenges
- The frame for energy supply in the islands are the binding targets established in the 2030
climate and energy EU framework and the long term horizon of a decarbonized energy system
by 2050.
- The future change of wind energy and PV productivity should be rather small in general:
around 5% or less with respect to the reference period in many cases, with maximum changes of
about 10% for some islands at the end of the century under RCP8.5 scenario (particularly for
wind energy productivity over land). A 10% productivity change could have a significant impact
on a planned or existing plant if it occurs over the lifetime of the power plant, but in this case
such a change would extend over many decades, which will facilitate adaptation and efficiency
measures.
- Projected PV productivity changes are generally smaller than wind energy changes. In most
cases PV productivity remains constant or decreases slightly. The main exception is Fehmarn,
which shows a clear decreasing tendency in PV productivity under RCP8.5 scenario, reaching a
10% decrease by end of the century.
- There is a specific uncertainty source in the photovoltaic projections. Most regional climate
model simulations, including the ones used here, do not include a projected evolution of aerosols
in future climate runs. The missed effect of the likely evolution of aerosols would likely increase
to some degree the future surface solar radiation and PV productivity over most of the islands
(Gutiérrez et al., 2020).

68
- Renewable energy productivity droughts are a measure of the variability of the resource. Wind
droughts are much more frequent (around 50% of the days for most islands) than PV droughts
(10% or less of the days). This agrees with results from the study of Raynaud et al. (2018), and
highlights the stable character of the solar productivity in comparison to wind productivity over
time.
- Wind energy droughts are more frequent in the Mediterranean islands than in the Atlantic
islands or Fehmarn. The best quality resources in terms of stability are found for Canary Islands,
which show the minimum values of both wind energy and PV droughts among all islands.
Fehmarn shows by far the worse PV drought score, corresponding a drought frequency of 23%
of the days.
- Projected changes in the frequency of droughts are small, with future variations that generally
do not attain a magnitude greater than 5% of the days. This indicates that the time-variability
characteristics of wind and PV energy are a robust feature, which is relevant for planning the
amount of storage or backup needed.
- The combination of PV and wind energy has generally a very positive impact on the frequency
of droughts as a result of the complementarity of both sources. This impact also exists but is less
clear for islands with substantial summer wind energy resources (Canary Islands, Madeira and
Crete).
- As part of the pathway towards very high or 100% RES shares, offshore wind energy should
play a very relevant role. Solutions to overcome the obstacle posed by the deep bathymetry
surrounding most of the islands are beginning to near commercial deployment, so that floating
offshore wind plants are already planned near Gran Canaria and Sicily.
- Offshore PV could be an interesting option for some islands, particularly when land surface
limitations are large. There is growing interest in this option, as shown by the test plants being
installed and the references made to this technology in the Roadmap for the Offshore
Renewable Energy Strategy of the European Commission or in the report of Monitor Deloitte
and Endesa (2020) about the accelerated decarbonization of Canary and Balearic Islands.
- The combination of different types of offshore renewable energy sources in the same platform
is also attracting interest, as the different sources can exhibit complementarity in time and the
combined output can thus be more stable and reliable. The different RES can also share part of
the installations, like the connection to land, reducing their cost (Pisacane et al., 2018;
MarineEnergy, 2019a). The European Union is trying to promote such combinations, through
projects like MUSICA (Multiple Use of Space for Island Clean Autonomy) which will design and
test a floating offshore platform integrating wind, PV and wave energy for use on islands
(MarineEnergy, 2019b), and plans to develop roadmaps for its deployment in three case study
islands, among them Malta and the Canaries (MaREI, 2020).

69
- New financing possibilities linked to the recently approved EU COVID-19 recovery fund, and
over a longer term associated to the European Green Deal, should facilitate the deployment of
renewables in the islands, as the energy transition is a key target.
- Interconnections to mainland are very important for supply safety. Excessive dependency on
interconnections to mainland should be nevertheless avoided, due to risk of blackouts, as the
failure of a single element (one transmission line) can knock out instantaneously a large
proportion of the power of an island and even cause an island-wide blackout, as has occurred
several times in Malta in the last years.
Read more: Hazard indicator computation and normalization
Cooling degree days (CDD) are used to give an indication of the effect of outside air
temperature on building energy consumption during a specified period of time. The Cooling
Degree Days (CDD) index gives the number of degrees and number of days that the outside
air temperature at a specific location is higher than a specified base temperature. For the
indicator weight calculation, the observed values of CDD (EUROSTAT) have been used, and
compare to the hazard of the island. With respect to the normalization of the indicator, we have
used a fixed lower threshold and a relative maximum as upper threshold. The minimum CDD
value has been taken as 0, while the maximum CDD value has been taken as the maximum over
all islands, emissions scenarios and time periods (CDD=1183.49 ºC· days/year, corresponding to
Cyprus for RCP8.5 scenario, end of century period).
Standardised Precipitation-Evapotranspiration Index (SPEI) is a drought index that takes
into account not only the effect of precipitation variations, but also the effect of temperature
variations on evapotranspiration. The calculation is based on the monthly difference between
precipitation and potential evapotranspiration, which represents the monthly water surplus or
deficit. The indicator weight calculation was done using data from ECA&D (European Climate
Assessment & Dataset). The normalization of the indicator has taken into account the fact that
by definition, present conditions correspond to reference conditions (SPEI=0), and that all
future changes are towards negative SPEI values, that is towards drier conditions. Therefore, the
best score value (0) has been assigned to SPEI=0, while the worst score value (1) has been
assigned to the largest negative value found for all islands, emissions scenarios and time periods
(SPEI=-2.5, obtained for several islands under RCP8.5 emissions scenario by the end of
century).
The indicator Wind energy productivity (kWh/kW) is defined as the energy produced in a
period of time divided by the power installed, which is considered as unitary. The indicator is
calculated separately for land and sea. Offshore wind energy is the most developed ocean energy,
and it is likely to be an important future energy source for the analysed islands. Its characteristics
are typically very different to onshore wind energy, due to the large differences in surface
friction. The energy productivity values are averaged respectively over the island land points and
over the sea points in a domain that reaches a maximum distance of one degree latitude and
longitude respectively to the maximum and minimum longitude/latitude land points of the
islands.

70
The normalization is performed using absolute thresholds, that represent high or low global
values of productivity. These thresholds have been obtained from a global renewable power
report (IRENA, 2019). The maximum annual productivity would be 8760 kWh/kW,
corresponding to a 100% capacity factor. The obtained CF thresholds for onshore wind energy
are 20% (corresponding to a normalized score of 1) and 45% (normalized score of 0), while for
offshore energy they are 30% and 50%.
Photovoltaic productivity (kWh/kW) is defined as the energy produced in a period of time
divided by the power capacity installed. In order to obtain photovoltaic productivity, daily
surface solar radiation (SSR) and ambient temperature from the climate simulations are used as
input variables for a parametric PV model. The normalization is performed using absolute
thresholds, that represent high or low global values of productivity, taken from the same report
as for wind energy. In this case, the maximum threshold is adapted taking into account that the
calculations performed here assume fixed panels, while IRENA global report does not
differentiate between fixed and sun-tracking panels. Therefore, we estimate an upper CF
threshold (normalized score of 0) of 20% for fixed panels, from the 25% value deduced from
IRENA global report.
Renewable energy productivity droughts indicators are a way of quantifying the time-
variability of renewable energies that depend on meteorological conditions. Low values of energy
droughts correspond to a stable output, while high values correspond to a highly variable output.
The combined renewable energy droughts represent the complementarity between wind and PV
energy. A high complementarity of both sources reduces the need for energy storage or backup
sources.
Two different thresholds are calculated to determine moderate (50% of mean daily productivity)
and severe (20% of mean daily productivity) energy productivity droughts, respectively. For the
normalization of these energy drought indicators, we have used a combination of an absolute
threshold (a value of 0% of drought days) corresponding to a score of 0 and a relative maximum
upper limit, taken among all the islands and renewable energy technologies (55% of days with
moderate droughts, obtained for wind energy in Corsica) corresponding to a score of 1. The
same normalization limits are applied for wind, PV and combined productivity droughts.
4.4 Maritime Transport
Maritime transport is defined as the carriage of goods and passengers by sea-going vessels, on
voyages undertaken wholly or partly at sea. It is often considered as the backbone of the world
economy, with 80% of the global trade volume passing through ports (Asariotis & Benamara,
2012). For islands, the transport of goods and passengers by ship is even more essential. At the
same time, Maritime Transport contributes to climate change through its carbon emissions
which are found to be near 3% of the global CO2 equivalent emissions (Smith et al. 2015).
Compared to land and air transport, it is the (economically and ecologically) most effective way

71
of distributing goods globally. A changing climate will challenge Maritime Transport to adapt to
future risks and lower its emissions.
The whole range of potential impacts of climate change on ports operations and throughput is
still under study and it remains a high degree of uncertainty about it. Various climate change
stressors can affect both harbour infrastructure and ships on route. For example, ports are
vulnerable nodes of Maritime Transport as they are strongly affected by rising sea-levels, which
in turn affect port facilities and increase the risk of flooding. Sea-level rise has accelerated in the
last century and will rise by 0.43 to 0.84 m until 2100, depending on the emission scenario
(Pörtner et al., 2019). Due to ocean dynamics and the Earth’s gravity field, there will also be
regional differences in sea-level rise in the order of 0.1 m (Asariotis & Benamara, 2012). The
causes of sea-level rise are the thermal expansion of water and the melting of glaciers due to the
increase in global mean temperature (Vermeer & Rahmstorf, 2009).
Maritime transport can also be affected by climate change through the increase in the intensity of
extreme weather events including tropical-like cyclones. According to climate projections,
tropical cyclones are not expected to change significantly in frequency but in intensity due to
rising sea-surface temperatures (Pörtner et al., 2019). The resulting extreme winds and waves can
harm ships, but also cause damage and flooding of ports, especially in combination with sea-level
rise (Hanson & Nicholls, 2012).
For the Maritime Transport sector, three main climate change risks have been identified for the
SOCLIMPACT project. These are:
(a) risk of damages to ports’ infrastructures and equipment due to floods and waves,
(b) risk of damages to ships on route (open water and near coast) due to extreme weather
events,
(c) risk of isolation due to transport disruption.
We selected to operationalize the third one which in terms of hazards and impacts can be
considered as a combination of the other two. The hazard risk component indicators considered
for the operationalization were: extreme waves (SWHX98), extreme wind (WiX98) and mean sea
level rise (MSLAVE). The exposure indicators are: number of passengers (NPax), islands’ total
population (NTotP), value of transported goods expressed in freight (VGTStot) and number of
ports per island or archipelago (NPo), while the sensitivity indicators include: the number of
isolation days (NIID) and renovated infrastructure (NAgePo). Finally, for the component of
adaptive capacity the proposed indicators are: percentage of renewables (PEnRR), number of
courses/trainings (NTrCoRM), early warning systems (NOcSta) and harbour alternatives
(NApt). Unfortunately, due to the lack of reliable and consistent data we had to exclude the
“number of isolation days” and “number of courses/trainings” indicators. The conceptualization
framework of the operationalization is summarized in the next Figure.

72
Figure 59: Conceptualization framework for the operationalization of the Maritime Transport Impact Chain:
Risk of Transport Disruption. Source: Soclimpac project deliverable 4.5
For assessing future risk, we considered projections or estimations for the indicators when these
were available. This was mainly the case for the components of hazard (mean sea level rise,
extreme waves and wind), exposure (population, number of passengers, value of goods), and the
contribution of renewables. Two Representative Concentration Pathways (RCPs) were
considered for meteorological hazards. One “high-emission” or “business-as-usual” pathway
(RCP8.5) and a more optimistic one (RCP2.6) that is closer to the main targets of the Paris
Accord tο keep global warming to lower levels than 2 °C since pre-industrial times.

73
Besides the historical reference period, we consider two 20-year future periods of analysis. One
over the middle of the 21st century (2046-2065) and one covering the end of the 21st century
(2081-2100). The normalization of indicators was performed across the different islands in order
to facilitate and inter-island comparison and prioritize the islands of higher risk.
Regarding the weighting of the different risk components, we have tested several weights,
however, according to expert judgement and discussion with specialists on the Maritime sector,
we have found more appropriate to assign equal weights to all main components of risk (i.e. 0.33
for Hazard, 0.33 for Exposure and 0.33 for Vulnerability). For the sub-components of Exposure,
we have assigned a weight of 0.33 for Nature of Exposure and a weight of 0.66 for Level of
Exposure since the latter one is believed to be of greatest importance. Similarly, for the
vulnerability sub-components, we have assigned a weight of 0.25 for the Factors of Sensitivity
and a weight of 0.75 for the Factors of Adaptive Capacity.
The weighting and categorization of risk is a subjective decision, nevertheless we consider our
selection to be quite conservative and therefore we believe that a slightly different choice would
not significantly affect the main conclusions drawn. For the recent past/present conditions, the
operationalization of the Maritime Transport Impact Chain indicates low risk for all investigated
islands. In general, the Maritime Transport sector of the larger islands (e.g. Corsica, Cyprus and
Crete) is found to be more resilient to the impacts of climate change. Up to a point, this is
related to the large number of harbour alternatives in comparison with smaller islands.
Our results for the future highlight the importance of adopting a low-emission pathway since
this will keep the risk for Maritime Transport disruption in similar as present conditions while
for some islands the risk is expected to slightly decline. In terms of island inter-comparison,
Malta’s maritime sector is found to be most vulnerable, nevertheless, future risk even under
RCP8.5 is not expected to exceed medium risk values. On the contrary, Corsica is the island less
susceptible to climate change impacts. Detailed results for each investigated SOCLIMPACT
island are presented in the following sub-sections.
Table 18: Summary of present and future risk of isolation due to Maritime Transport disruption for each island
and scenario based on the Impact Chain operationalization.
Categorization
Source: Soclimpact project deliverable 4.5
RISK VALUE PER
ISLAND
Historical
Reference RCP2.6 MID RCP2.6 END RCP8.5 MID RCP8.5 END
CYPRUS 0.241 0.210 0.218 0.258 0.292
CRETE 0.229 0.208 0.201 0.257 0.282
MALTA 0.376 0.347 0.335 0.395 0.414
CORSICA 0.220 0.194 0.194 0.243 0.273
CANARY ISLANDS 0.336 0.292 0.250 0.346 0.341
BALEARIC ISLANDS 0.326 0.281 0.264 0.331 0.344
0.00 – 0.20 Very low
0.20 – 0.40 Low
0.40 – 0.60 Medium
0.60 – 0.80 High
0.80 – 1.00 Very high

74
The Maritime Transport sector in the island of Corsica is found to be less susceptible to climate
change as our Impact Chain operationalization indicates the lowest risk values among all
investigated islands (risk value of 0.22 for present conditions). This is related mostly to low
exposure indicators. Under pathway RCP2.6, this value will be slightly reduced because the
negative effect of increasing meteorological hazards is counterbalanced by an increase in the
adaptive capacity as the percentage of renewables is expected to increase in this low-emission
pathway. Under scenario RCP8.5, the risk is expected to slightly increase by mid-21st century and
reach a value of 0.273 by 2100.
READ MORE about the risk indicator computation: normalization of sub-component
indicators on Deliverable 4.5 Soclimpact project HERE
5 Socio economic impacts of climate change
5.1 Market and non-market effects of CC
Tourism In order to understand the effect of climate change on tourists’ behavior, a representative sample of 2538 European citizens have been interviewed in their countries of origins. Through online surveys, tourists were asked how climate change impacts can affect their travelling decisions and the islands’ destination choice.
Figure 60: Socio-demographic profile of respondents Source: Deliverable Report D5.5

75
The technique of discrete choice experiments (DCEs) was implemented. This technique has
been widely applied to the evaluation of tourists' preferences both in natural areas and other
tourism contexts (e.g.,Morley, 1994; Eymann and Ronning, 1997; Huybers, 2003). It involves
asking tourists to choose between alternative profiles or sets of attributes of the tourist
destinations. The principal advantage of this method is that it allows researchers to investigate
the preferences of various attributes of the tourist product simultaneously.
DCEs consist of several choice sets, each containing a set of mutually exclusive hypothetical
alternatives between which respondents are asked to choose their preferred one. Alternatives are
defined by a set of attributes, each attribute taking one or more levels. Individuals' choices imply
implicit trade-offs between the levels of the attributes in the different alternatives included in a
choice set. In particular, he will pick the one providing the highest utility, which depends on the
attribute levels of the alternatives. Socio-economic characteristics of the individual may influence
this decision. The resulting choices are finally analyzed to estimate the contribution that each
attribute and level add to the overall utility of individuals. Moreover, when the cost or price is
included as an attribute, marginal utility estimates can easily be converted into willingness-to-pay
(WTP) estimates for changes in the attribute levels and, by combining different attribute
changes, welfare measures may be obtained.
As a result of data analysis, a ranking of islands image was obtained, according to the opinion
and the image that tourists have of each island under analysis. Besides, the percentage of tourists
that would not visit any European island posed to CC impacts was obtained, which alert on the
potential decrease in tourism arrivals for these islands. Finally, the choice model allows to
measure the changes in the willingness to pay of tourists for visiting these EU islands, which
alert on how these impacts would affect tourism expenditure in the EU islands posed to CC. The
results are useful to evaluate the priorities in terms of risks management and responsiveness,
from the tourism management perspective.

76
Figure 61: Tourists’ preferences for islands destinations and tourists’ behavioural response to CC risks Source: Deliverable Report D5.5
The infographic can be found in high resolution in the Soclimpact Project official
website HERE.
The impact of increased temperatures and heat waves on human thermal comfort
In order to assess how the variation in temperature impacts on the tourism sector through
changes in tourism demand our research question was: “How do increasing temperatures (and
heat waves) impact prices and, more in general, expenditure of tourists?” Arguably, when
temperatures grow, tourists adjust their behaviour: they might switch destination, or they might

77
stay longer or shorter depending on their attitudes and preferences. In turn, all these changes
modify the market equilibrium, pushing tourism companies to adjust their prices to re-establish
the equilibrium between demand and supply. The change in demand and the change in price
determine the change in tourism expenditure which is, from the destination’s perspective,
tourism revenue.
We monitored current weather conditions posted on several weather forecast providers and daily
prices posted on Booking.com by hotels. We then estimated the link between daily temperature
and daily price, controlling for all the other factors affecting prices. We finally applied these
estimates to the increase in the number of days with excessive temperature projected for the
future in two scenarios (RCP2.6 and RCP8.5) and in two time horizons (near future, about 2050;
distant future, about 2100).
Among the different indicators linked to thermal stress, Soclimpact is focusing on two: the
number of days in which the temperature is above the 98th percentile and the number of days in
which the perceived temperature is above 35 degrees. Although in D5.6 the impact for both
indices were computed, in this document we only report the second one (named HUMIDEX)
because it is the most intuitive and because human thermal stress is more related to the absolute
value of the temperature than its deviation from some pre-determined distribution. In line with
the project, we assumed that thermal stress appears when the perceived temperature grows
above 35 Celsius degrees.
As thermal stress is delimited in the summer months, and this is when the great majority of
tourists arrive in these islands, the whole analysis has been carried out in six months only: from
May to October included. In other words, we assume that there is no thermal stress (and hence
no impact on tourism) in the rest of the year.
Initially, three islands were investigated: Corsica, Sardinia, and Sicily, given the massive amount
of potential data. We focused the analysis in three specific areas, represented in the map below:
the south-east area of Corsica (between Porto Vecchio and Boniface); the North-East area of
Sardinia (Costa Smeralda) and the South-East area of Sicily (the coastal area of Catania and
Siracusa provinces). Arguably, these are among the most important coastal tourism areas of these
islands. Overall, 60 hotels (for a total of about 240,000 observations) were monitored in Corsica;
150 hotels (for a total of about 620,000 observations) were monitored in Sardinia; 129 hotels
were monitored in Sicily (for a total of about 726,000 observations) over the period 1 May 2019
– 31 October 2019.

78
Figure 62: Map of the region Source : Soclimpact project deliverable D5.3
At present, 7.89% (column 1 of the table below) of “summer” days (days in the period between
1 May and 31 October) have a HUMIDEX higher than 35 Celsius degrees in the area under
investigation (Bonifacio and Porto Vecchio). In absolute terms, this is about 14 days.
In the future, this share (column 3) will almost double to 14.85% in rcp2.6, double (to 15.84%)
in rcp8.5 near, and increase of four-fold (to 39.51%, about 71 days!) in rcp8.5, distant.
Consequently, demand for holidays in Corsica will increase and the new equilibrium shows an
increase in the average price posted by hotels in the destination (column 4) and an increase in
overnight stays (column 5, this is estimated using the past correlation between average prices and
occupancy rates in hotels, data provided by STR). The joint impact of price and demand will lead
to an increase in hotels revenues (last column of the table) and, assuming that the change in
revenues spreads to the other tourism products in a similar way, an increase in tourism revenues
for the whole destination will be recorded. Hence, the estimation reported in the last column of
the table below can be interpreted as the percentage increase in tourism revenues for the island.
Table 19: Estimation of increase in average price and revenues for Corsica
Actual share of days in
which humidex > 35
degrees
Future scenario
considered
Days in the corresponding
scenario in which humidex > 35
degrees
Increase in the
average price
Increase in the
tourism overnight
stays
Increase in
tourism revenues
7.89%
rcp26near 14.85% 2.6% 0.5% 3.2%
rcp26far 14.85% 2.6% 0.5% 3.2%
rcp85near 15.84% 3.0% 0.6% 3.6%
rcp85far 39.51% 12.0% 2.4% 14.7% Source : Soclimpact project deliverable D5.3

79
According to these findings, the average increase in temperature, which is correlated to a
growing thermal stress for tourists, brings an economic advantage to tourism destinations. This
is only an apparent contradiction with previous findings. This study does not neglect the fact that
if islands are too hot, tourists will choose to move to other (cooler) destinations, that in principle
exist. In this study the underlying assumption is instead that growing temperatures are a global
issue, thereby not modifying the relative position of a destination. Then, the increase in tourism
(and tourism revenues) stem from the fact that, when the temperature is too hot, people would
prefer to move to coastal areas (where the climatic conditions are more bearable) than staying
inland or in cities. Future trends will also facilitate this pressure of tourism demand (think about
the spreading of smart working activities where, in principle, the worker can relocate wherever
he/she wants).
Aquaculture
The effects of increased sea surface temperature on aquaculture production were calculated using
a lethal temperature threshold by specie, and considering the production share of the region.
Four different future scenarios shown by IPCC estimations (RCP2.6 and RCP8.5 near and
distant) were analysed, which correspond to four water temperature increases in the region with
respect to the reference period.
To do this, we assume three main species cultured in this region: seabream, seabass and mussels
and a model of production function, calculating the monthly biomass production which depends
on the monthly water temperature. Results are presented on yearly base (mean values). In order
to facilitate the interpretation of the results, we present the value of production of the last year
available, for which we calculate the new values under the different CC scenarios.
The production levels (tons) will decrease only if surface temperature increase more than 1oC
above the reference value. In both cases, the average annual increase is in levels below 21oC, the
threshold of thermal stress for mussels, the most sensitive species.
Figure 63: Estimations of changes in aquaculture production (tons), due to increased sea surface temperature Source: Deliverable Report D5.6
The infographic can be found in high resolution in the Soclimpact Project official
website HERE.

80
Energy
Climate change may impose welfare reductions to the European islands’ societies by affecting
thermal comfort. Cooling Degree Days (CDD) are a measure of how much (in degrees), and for
how long (in days), outdoor air temperature is higher than 18°C or 65° Farenheit. The CDD is
used as a measure of the energy needed to cool buildings. The increase in CDD and the energy
demand (GWh/year) for cooling are estimated for the islands, under different scenarios of
global climate change.
Under the high emissions scenario, it is expected that the CDD increase to 457 CDD8. This
value could be, for example, a combination of 228 days with temperatures of 20°C (456CDD
aprox). Under this situation, the increase in cooling energy demand is expected to be 753%.
The infographics presented below can be found in high resolution in the Soclimpact
Project official website HERE.
Figure 64: Estimations of increased energy demand for cooling in Corsica under different scenarios of climate
change until 2100 Source: Deliverable Report D5.6
8 The indicator is computed by multiplying the number of days exceeding the threshold by the difference in
temperatures. For example the CDD for 100 days at 20 °C is computed as 100*(20-18)= 200CDD

81
Maritime Transport For maritime transport, it has been estimated the impact of Sea Level Rise on ports' operability
costs of the island. The costs have been calculated with reference to1meter; this is, the
investment needed to increase the infrastructures' height by 1 meter. There is not necessarily a
strict correspondence between the SLR and the required elevation of port infrastructures, which
also depend on the coastal hydrodynamic and the shape of dikes of each port. By experts’
recommendation, we have assumed that 1 m increase in port height is required to cope with the
SLR under RCP 8.5 scenario of emissions. Extrapolation for other RCP scenarios is then
conducted based on proportionality.
The starting point was the identification of the principal ports in the island (economic relevance).
Second, the analysis of the different port areas (exterior, ramps, oil, etc.), and their uses. Third,
the elevation costs were estimated per each area and port separately (considering 1 meter
elevation). Thus, the costs of 1-meter elevation presented are the sum of all areas and ports
analysed. Estimations consider that all ports areas of the entire area should be elevated at the
same time. In other words, the economic values can be interpreted as the depreciation
(amortization) costs of the investment needed to increase all porsts’ infrastructures' in the island
for 125 years time horizon. No discount rate has been applied.
As expected, the rising of sea levels will affect the sector, as new investment will be needed to
keep ports’ operability. Under the high emissions scenario, it is expected that these costs could
increase 1.14 million of euros per year until the end of the century.
The infographic presented below can be found in high resolution in the Soclimpact
Project official website HERE.
Figure 65: Increased costs for maintaining ports’ operability in Corsica under different scenarios of SLR caused by
climate change until 2100 Source: Deliverable Report D5.6
MEAN SEA LEVEL RISE SLR

82
6 Towards climate resiliency
6.1 Current situation: general commitment, specific limits and obstacle
With regards to its policies, the Corsica government has drafted the following plans and
strategies.
National scale
Climate-Impact Knowledge GICC 1999.
National Strategy 2007.
National consultation.
PNACC (National Plan for Adaptation to Climate Change) 2011-2015.
2015 PNACC Assessment.
Proposal Development 2016-2017.
2019 PNACC (second).
Island scale
Climate Change Adaptation Plan - Corsica Basin.
The Plan for Development and Sustainable Development of Corsica (PADDUC).
The Regional Plan of Climate of Air and Energy (SRCAE).
Multiannual Energy Program (PPE).
MedCOP.
Territorial Climate-Air-Energy Plans (PCAET).
The Regional Plan for Air Quality.
National Strategy for Integrated Coastline Management.
Table 20: Specific limits and obstacle and relevant documents
Specific limits and obstacle
- Key land use, spatial planning, urban planning and maritime spatial planning policies do not consider the impacts of climate change
- Initiatives disconnected from the metropolitan territory sometimes
Relevant documents
- Collectivité Territoriale de Corse (2014). Adoption du Schéma Climat, Air, Energie
de la Corse (SRCAE) et son annexe, le Schéma Régional Eolien (SRE). Assemblée de
Corse.
- Collectivité Territoriale de Corse (2013). SRCAE Assemblée de Corse.
- Collectivité Territoriale de Corse (2010). Le Plan Régional pour la Qualité de l'Air.

83
Assemblée de Corse.
- Universitá di Corsica Pasquale Paoli (2018). Changement climatique et milieu marin
en Corse. Price Albert II of Monaco Foundation.
- Agence de l'eau Rhône Méditerranée Corse (2018). Plan de Bassin D´adaptation au
Changement Climatique dans le domaine de L´eau. Ministère de la Transition
Écologique.
- Direction de l’Environnement et de l’Energie (2012). Plan climat énergie territorial.
Ministère de la Transition Écologique.
- Les services de l'État en Haute-Corse (2020). Plans de prévention du risque
Inondation. Préfet de la Haute-Corse.
- Les services de l'État en Haute-Corse (2018). Le risque inondation. Préfet de la
Haute-Corse.
- Les services de l'État en Haute-Corse (2019). Plans de prévention du risque incendie
de forê. Préfet de la Haute-Corse.
- Interreg Maritime (2019). MAREGOT: MAnagement des Risques de l`Erosion
cotière et actions de Gouvernance Transfrontalière. Union Européenne.
- Réseau d’Observation du Littoral de Corse (2018). ADAPTO. Rol Corse.
Source: Deliverable 7.1 Conceptual framework

84
7 References
Asariotis, R. & Benamara, H. (Eds.). (2012). Maritime transport and the climate change
challenge. Routledge.
Fritzsche et al. (2014). The Vulnerability Sourcebook: Concept and guidelines for standardized
vulnerability assessments
GIZ (2017) The Vulnerability Sourcebook: Concept and guidelines for standardised vulnerability
assessments. Deutsche Gesellschaft für Internationale Zusammenarbeit (GIZ)
Gutiérrez, C., Somot, S., Nabat, P., Mallet, M., Corre, L., van Meijgaard, E., Perpiñán, 0. &
Gaertner, M. Á. (2020). Future evolution of surface solar radiation and photovoltaic potential in
Europe: investigating the role of aerosols. Environmental Research Letters, 15(3), 034035.
Hanson, S. & Nicholls, R. J. (2012). Extreme flood events and port cities through the twenty-
first century. Maritime Transport and the Climate Change Challenge, 243.
MaREI (2020). MaREI to lead €9m project to build floating offhsore platform. Retrieved from:
https://www.marei.ie/marei-to-lead-e9m-project-to-build-floating-offshore-platform/
MarineEnergy (2019a). WavEC: Combined Wind, Wave and Solar to Transform Marine Energy.
Retrieved from https://marineenergy.biz/2019/12/16/wavec-combined-wind-wave-and-solar-
totransform-marine-energy/
Masterton JM., RichardsonF.A. (1979). Humidex, a method of quantifying humandiscomfort due
to excessive heat and humidity, CLI 1–79, Environment Canada.Atmospheric Environment
Service, Downsview, Ontario.
Mouillot, D. (2008). NEW MULTIDIMENSIONAL FUNCTIONAL DIVERSITY INDICES
FOR A MULTIFACETED FRAMEWORK IN FUNCTIONAL ECOLOGY. Volume89,
Issue8, August 2008, Pages 2290-2301.
Pisacane, G., Sannino, G., Carillo, A., Struglia, M. V., & Bastianoni, S. (2018). Marine energy
exploitation in the Mediterranean region: steps forward and challenges. Frontiers in Energy
Research, 6, 109.
Pörtner, H. O. and Peck, M. A. (2011). Effects of Climate Change: In: Farrell, A. P. (ed.)
Encyclopedia of Fish Physiology: From Genome to Environment, San Diego: Academic Press
Proestos Y, Christophides GK, Ergüler K, et al (2015) Present and future projections of habitat
suitability of the Asian tiger mosquito, a vector of viral pathogens, from global climate
simulation. Philos Trans R Soc B Biol Sci 370:1–16. doi: 10.1098/rstb.2013.0554.
Raynaud, D., Hingray, B., François, B., & Creutin, J.D. (2018). Energy droughts from variable
renewable energy sources in European climates. Renewable Energy, 125, 578-589.

85
Schneiderbauer, S., Pedoth, L., Zhang, D., & Zebisch, M. (2013). Assessing adaptive capacity
within regional climate change vulnerability studies—an Alpine example. Natural hazards, 67(3),
1059-1073.
Scholte JE, Schaffner F (2007). "Waiting for the tiger: establishment and spread of the Aedes
albopictus mosquito in Europe". In Takken, W.; Knols, B. G. J. (eds.). Emerging pests and
vector-borne diseases in Europe. 1. Wageningen Academic. Publishers. ISBN 978-90-8686-053-
1.
Serdjanian, L. (2018). Amélioration progressive sur le front de l'emploi. Retrieved from
http://www.epsilon.insee.fr/jspui/bitstream/1/48293/1/IC_CO_12.pdf
Smith, T. W. P., Jalkanen, J. P., Anderson, B. A., Corbett, J. J., Faber, J., Hanayama, S., O’Keeffe,
E., Parker, S., Johansson, L., Aldous, L., Raucci, C., Traut, M., Ettinger, S., Nelissen, D., Lee, D.
S., Ng, S., Agrawal, A., Winebrake, J. J., Hoen, M., ... Pandey, A. (2015). Third IMO Greenhouse
Gas Study 2014. International Maritime Organization.
Van Wagner, C. E.,1987: Development and structure of a Canadian forest fire weather index
system, Forestry Tech. Rep. 35, Canadian Forestry Service, Ottawa.
Vermeer, M. & Rahmstorf, S. (2009). Global sea level linked to global temperature. Proceedings
of the national academy of sciences, 106(51), 21527-21532.
Waldock J, Chandra NL, Lelieveld J, et al (2013) The role of environmental variables on Aedes
albopictus biology and chikungunya epidemiology. Pathog Glob Health 107:224–241. doi:
10.1179/2047773213Y.0000000100.

APPENDIX 5

1
TABLE OF CONTENT
INTRODUCTION............................................................................................................................................ 2
1 CURRENT SITUATION AND RECENT TRENDS ............................................................................................... 3
1.1 CURRENT GEOPOLITICAL CONTEXT ......................................................................................................................... 3 1.2 CURRENT CLIMATE AND RISKS ............................................................................................................................... 6 1.3 MACROECONOMIC STATUS .................................................................................................................................. 7 1.4 RECENT EVOLUTION OF THE BLUE ECONOMY SECTORS ............................................................................................... 8
2 ECONOMIC PROJECTIONS ........................................................................................................................ 12
2.1 THE MACROECONOMIC PROJECTIONS .................................................................................................................. 12 2.2 THE SECTORAL PROJECTIONS .............................................................................................................................. 13 2.3 EMPLOYMENT ................................................................................................................................................. 15
3 CLIMATE CHANGE OUTLOOK ................................................................................................................... 16
3.1 TOURISM ....................................................................................................................................................... 17 3.2 AQUACULTURE ................................................................................................................................................ 21 3.3 ENERGY ......................................................................................................................................................... 21 3.4 MARITIME TRANSPORT ..................................................................................................................................... 28
4 CLIMATE CHANGE RISKS .......................................................................................................................... 32
4.1 TOURISM ....................................................................................................................................................... 32 4.2 AQUACULTURE ................................................................................................................................................ 48 4.3 ENERGY ......................................................................................................................................................... 49 4.4 MARITIME TRANSPORT ..................................................................................................................................... 57
5 SOCIO ECONOMIC IMPACTS OF CLIMATE CHANGE ................................................................................... 61
5.1 MARKET AND NON-MARKET EFFECTS OF CC .......................................................................................................... 61 5.2 MACROECONOMIC PROJECTIONS ........................................................................................................................ 69
6 TOWARDS CLIMATE RESILIENCY .............................................................................................................. 73
6.1 CURRENT SITUATION: GENERAL COMMITMENT, SPECIFIC LIMITS AND OBSTACLE ............................................................ 73
7 REFERENCES ............................................................................................................................................ 76

2
Introduction
This report is the background material for stakeholders in the upcoming adaptation pathways
workshop in the Crete. First, a presentation that includes the geography and socio-economic
context for the Island, and the socioeconomic trends without climate change (WP6), which range
from the present to the end-of the century. Regarding Climate Change, the expected climate risks
and vulnerabilities for the blue economy are presented and ran (WP3), joint to the expected
trends of physical risks, booth current and future (WP4). Finally, specific economic impacts are
estimated, considering the evolution of some physical risks (WP5 and WP6). The current climate
policy and resilience of the Island is also presented (WP7). Finally, a link to the projects original
work is made in the references section.
Crete at a glance
Crete is the 5th largest island in the Mediterranean and the largest and most populous of Greek
islands. The island's population was estimated to 635.000 in 2019. The total area of Crete is 8.336
sq.Km. (6,3% of the total area of the Greek territory). It has a remarkable coastline of more than
1000 Km.
The island is extremely mountainous with three main mountain ranges, Psiloritis (Idi) (2456m.),
Lefka Ori (2454 m.) and Dikti (Lassithi Mountains) (2148 m), which cross it from the west to
east.
Crete is one of the most popular holiday destinations in Greece, accounting for 24% of Greek
tourism receipts. Although Crete is producing a wide range of high-quality agricultural products,
being one of the most self-sufficient regions of Greece, its main income comes from tourism
and services. Crete is the 5th largest island in the Mediterranean and the largest and most
populous of Greek islands.
The Blue Economy sectors
Aquaculture
The fisheries sector along with aquaculture, is considered important for the economy of Crete,
despite its small contribution to GDP, as it contributes to maintaining the economic and social
cohesion of large areas of the island. The main type of aquaculture that is carried out in Crete is
marine aquaculture and a few small freshwater farms in the inland. There is also a freshwater
aquaculture unit of spiroulina production farm. The main marine species commercially cultured
is the gilthead seabream (Sparus aurata) and European seabass (Dicentrachus labrax).
Maritime Transport
In Crete, due to the large coastline, the port system is very extensive, consisting of a large
number of ports and port facilities of different sizes, while its contribution to the economy of
the island is particularly important. Maritime transport is key for the region's development but is
also part of the growing economic activities in Crete. In Crete there are a number of port
facilities , which mainly concern 2 ports of international importance (Port of Heraklion and port
of Souda), 1 of national importance (port of Rethymno) and 2 of major importance (port of

3
Agios Nikolaos and port of Sitia), along with a large number (about 60) fishing shelters and
marinas.
Energy
The energy industry in the Region of Crete has as its main pillars the three steam power stations
(HPP): Chania, Linoperama and Atherinolakkos, while the Local Production Station (GSP) of
Gavdos is in operation, with an installed nominal power of 430kW. Electricity is produced
mainly by imported fuel oil (78%), while renewable sources hold a moderate share in total power
generation. The share of renewable sources in total electricity production reaches 22% in 2018
(solar and wind), with the largest part being attributed to solar power generation. The electrical
interconnection of Crete with Attica and the Peloponnese, via a submarine cable is in the process
of implementation.
Tourism
Crete is an island with incomprehensible diversity and contrasts that attracts many tourists every
year. Tourism is the most dynamically developing sector and the demand gave incentives for
important investments in hotel units, resulting in the qualitative and quantitative upgrading of
hotel infrastructures. An important competitive advantage of the tourist branch is the high
percentage of high standard hotel infrastructures. Crete has 30,31% of the total of 5-star beds in
Greece and 24,57% of 4-star beds respectively. welcomes approximately 15% of all international
tourism to Greece. Tourism-related revenues account for almost 35% of the regional GDP.
1 Current situation and recent trends
1.1 Current geopolitical context
Crete is the largest and most populated Greek island and also the 5th largest in the
Mediterranean covering an area of 8,336 km2. It has a population of 633,506 people and it is
located in the South-East Meditteranean sea (35°12.6′N 24°54.6′E). Crete is sub-divided into
four sub-regional units: Heraklion, Chania, Rethymnon and Lasithi. The capital of Crete is
Heraklion. Southernmost point of European Union, Gavdos island, is part of Crete.
The climate of Crete is mild Mediterranean, with hot summers and mild winters. Nevertheless,
the temperature varies between coastal and non-coastal areas due to the island’s natural
landscape. In the inner island there are three mountainous ranges that cross the island from the
east to the west, namely Dikti (2,148m.), Lefka Ori (2,454m.) and Psiloreitis (2,456m.) making
the climate around them colder during the winter months and cooler during the summer period.
To the east and the south-east lowlands are the hottest areas in the island, with their climate
resembling more to the climate of northern African countries. The coastline of the island is
approximately 1,046km long.
Crete hosted the first known European civilization, the Minoan civilization which played a
significant role in the development of the Greek civilization and has been also part of the
Romanian and Byzantine empire. During the medieval times Crete was part of Venice, which

4
allowed the island to benefit from the Renaissance period and has finally passed to the Turks in
1669. After a long period of political and civil upset, Crete earned its autonomy in 1896 and has
re-united with Greece in 1913.
The long history of the island and its cultural heritage as well as its natural landscape, with both
large sandy beaches and countless canyons (with most know being the canyon of Samaria),
makes Crete one of the most attractive tourist destinations in Europe as it offers a lot of
alternative activities to its prospective visitors by combining nature and culture.
Population dynamics of the island
Population dynamics are in line with their national counterpart. The population of Greece is
shrinking and is projected to fall even more in the future. With respect to its population
structure, Crete is characterized by an increasing share ageing population, yet with a smaller rate
than the rest of the country, as it is the case for most of the EU28 regions (see Table 1).
Table 1: Population distribution by age group in Crete (2008-2017).
POPULATION DISTRIBUTION BY AGE GROUP, 2008-2017
2008 2009 2010 2011 2012 2013 2014 2015 2016 2017
0-14 (%) 16.7 16.7 16.7 16.7 16.7 16.8 16.7 16.6 16.5 16.4
15-64 (%) 65.9 66.1 66.1 66.0 65.9 65.6 65.3 65.1 64.9 64.7
65+ (%) 17.4 17.2 17.2 17.3 17.4 17.6 18 18.3 18.6 18.9
Sources: Eurostat
Figure 1: Population dynamics by age group
Sources: Eurostat
13,0%
13,5%
14,0%
14,5%
15,0%
15,5%
16,0%
16,5%
17,0%
20
08
20
09
20
10
20
11
20
12
20
13
20
14
20
15
20
16
20
17
20
18
Population share 0-14
Greece Kriti
62,0%
62,5%
63,0%
63,5%
64,0%
64,5%
65,0%
65,5%
66,0%
66,5%
67,0%
20
08
20
09
20
10
20
11
20
12
20
13
20
14
20
15
20
16
20
17
20
18
Population share 15-64
Greece Kriti
0,0%
5,0%
10,0%
15,0%
20,0%
25,0%
20
08
20
09
20
10
20
11
20
12
20
13
20
14
20
15
20
16
20
17
20
18
Population share 65+
Greece Kriti

5
The population projections were combined with the Eurostat’s 2019 population projections at
the national level to obtain a consistent projection of Crete’s population up to 2100. The
reference projection of population in Crete is displayed, which marks the population for the
period 2015-2100.
Figure 2: Baseline population projection for Crete (2015-2100).
Source: Eurostat.
The Labour Force
The Labour Force (i.e., the employed and the unemployed persons) amounted to 258,300
persons in 2018, of which 157,800 were males and 127,500were females. The Labour Force
participation rate for the age group 15-64 was 68.7% of the total population of this age group or
280,500 persons. The respective percentage for males was 77.0% or 154,600 persons, and for
females 60.6% or 207,644 persons. The figure illustrates the changes in labour force,
employment and rate of unemployment from 2005 to 2018
Figure 3: Labour force change in Crete (2005-2018). Source: Eurostat
0,0
100,0
200,0
300,0
400,0
500,0
600,0
700,0
2015 2020 2025 2030 2035 2040 2045 2050 2060 2070 2100
'00
0 p
erso
ns

6
1.2 Current climate and risks
The climate of Crete is generally described as mild Mediterranean. The atmosphere can be quite humid, depending on the proximity to the sea, while winter is fairly mild. The precipitation in Crete is characterized by spatial and temporal variation increasing towards the western and north parts of the island. Western Crete (Chania province) receives more rain compared to the Eastern part of Crete. The island is mountainous with mean elevation of 482 m ranging from sea level to 2450m ( Psiloritis, Lefka Ori). Snowfall is common on the mountains between November and May, but rare in the low-lying areas.
During the Cretan summer, average temperatures reach the high 20s-low 30s Celsius with maxima touching the upper 30s-mid 40s.More sunny days and higher temperatures prevail across the south coast, including the Messara valley and Asterousia mountains, driven mainly by the prevailing North African climatic zone. In general, a basic characteristic of the local climate are large deviations from place to place.
Extreme events, such as meteorological droughts, hydrological droughts, extreme flow and
extreme precipitation events are becoming more intense and frequent due to climate change. In
recent years, major weather events have become more common in Crete.
In 29/5/2013 multiple Wildfires in Regional Unit of Chania caused estimated disaster cost
1.915.545€. Strong southerly winds blowing in the area were hampering fire-fighting efforts,
while the entire fire brigade of the Region has been mobilised in response to multiple fires that
broke out in the region .
Crete has experienced torrential rainfall and flooding for two times during February 2019. Hit
by two storms, Crete has seen extreme levels of heavy rain during February. Some areas recorded
around 400mm of rain between 12 and 17 February. Floods of 12-13/2/2019 & 24-25/2/2019
costs 4 deaths and one person missing. First estimation of disaster cost was 100.000.000 € for
R.U. of Chania and in total 263.000.000 € for the Island.

7
Figure 4: Climate factsheet Source: Own elaboration with data from GFDRR ThinkHazard!; D7.1 Conceptual Framework and Meteoblue; Meteoblue global NEMS (NOAA Environmental
Modeling System)
1.3 Macroeconomic status
Crete is a service-led economy, with the tourism-related sectors serving as the driving force of
regional growth. Produces almost 5% of Greek GDP. In 2016, the main sources of income in
Crete derived from tertiary activities, which comprised 79.2% of the regional GDP, while
secondary activities (mainly construction and manufacturing) accounted for 13.9% of the GDP,

8
and finally primary activities (agriculture, forestry and fishing) made up the remaining 6.9% of
the GDP.
Figure 5: International exports of goods by broad category. Sources: SEK, Association of Cretan Exporters.
The international exports of goods (manufactured and agricultural produces excluding petroleum
products) in 2016 accounted for 5.3% of the regional GDP with food and drink products being
the largest category, led by the olive oil exports. The main international trading partners of Crete
are Italy, with a share of 30%, followed by Germany (16%). Nevertheless, Cretan exports are
slowing down according to more recent statistics having recorded losses for the past 2 years
(Table 2).
Table 2: International exports of Crete.
2012 2013 2014 2015 2016 2017 2018
Inter-national exports (in mn. €) 265 363 294 285.4 464 444.1 435
Main trading partners (%)
Italy - - - - 30 20 18.7
Germany - - - - 16 20 18.5
France - - - - 4 5 5.7 Sources: SEK, Association of Cretan Exporters
1.4 Recent evolution of the blue economy sectors
Tourism
The tourism industry is fundamental for the Cretan economy. Recent statistics show an
increasing trend in the number of persons visiting the island, and consequently to the number of
overnight stays; nevertheless, the average length of trips remains almost stable with 8.5 nights
per visitor. The majority of foreign tourists originates from Germany (28.7%) followed by
France (11.8%) and United Kingdom (10%). Furthermore, according to accommodation
statistics the share of domestic (intra-national) tourists is diminishing over the past decade
highlighting the significance of international tourists for the local economy and underlining its
exposure to international competition (Figure 6). The occupancy rate of hotels reached 65% in
Food and drinks Chemical products Textiles and clothing
Machinery and Equipment Other goods
20182017
2016

9
2018 which implies that existing accommodation facilities can support even higher flows of
inbound visitors in the future.
Figure 6: Number of tourists and overnight stays in Crete (2016-2018). Sources: INSETE.
Figure 7: Intra-national tourism statistics in Crete (2010-2018). Sources: INSETE.
Tourism-related revenues account for almost 35% of the regional GDP, reaching €3,095million
and €3,133.9 million in 2016 implying a decreasing trend in the average tourist expenditure. The
importance of tourism for the regional economy is also depicted in the employment statistics
where we can note a significant increase in relative share of tourism-related employment in the
overall employment of the island.
37000
38000
39000
40000
41000
42000
43000
44000
45000
4000
4200
4400
4600
4800
5000
5200
5400
2016 2017 2018
'00
0 n
igh
ts
'00
0 p
erso
ns
Tourists Overnight stays
0,00%
5,00%
10,00%
15,00%
20,00%
25,00%
30,00%
2 0 1 0 2 0 1 1 2 0 1 2 2 0 1 3 2 0 1 4 2 0 1 5 2 0 1 6 2 0 1 7 2 0 1 8
Domestic arrivals Domestic overnight stays

10
Maritime transport
The island has a long tradition in maritime transport and some of the most important Greek
shipowners originate from Crete. Two of the largest Greek passenger maritime companies
headquartered in Crete, namely ANEK and Minoan Lines, with the latter being bought by an
Italian company in 2008. Data on passenger transport and cruises over the last five years reveal
an upward trend in the number of people using maritime transport services as ports movement
reached 2.93 million people in 2018; while the number of cruise passenger disembarking in the
island the 453 thousand passengers (Table 3).
Table 3: Maritime passenger transport by ship type in Crete (2013-2018).
2013 2014 2015 2016 2017
Ferries 2,446,140 2,685,989 2,268,104 2,430,335 2,805,390
Cruises 440,288 329,709 355,699 413,655 340,033
Sources: INSETE
As the maritime sector is important in scale and complexity, it is highlighted that for the research
interests of SOCLIMPACT project, namely the estimation of climate impacts on the Blue
Economy sectors, not all components of the sector are relevant. In particular, only maritime
transportation strictly related to the transportation of passengers and goods to and from the
island is relevant to this analysis, while other major components such as ship-management, naval
engineering and shipbuilding are not part of this analysis. To this end, the projections presented
below refer to Water transport as in the Eurostat classification, thus to the more narrow
estimation of transportation of passengers and goods that includes sea and coastal passenger and
freight transport as well as inland passenger and freight transport.
Aquaculture
The aquaculture sector is of minor importance for the regional economy. According to the
Region of Crete data the fishing sector (which includes aquaculture activities) employed about
10001 persons and recorded revenues of approximately €5 million in 2016. At the moment there
are not aquaculture companies operate in the island (with the exception of the HCMR’s
experimental Facilities).
Electricity
Electricity is produced mainly by imported fuel oil (78%), while renewable sources hold a
moderate share in total power generation. The Figure indicates that the share of renewable
1 Data from Department of Fisheries Region of Crete.

11
0
500
1000
1500
2000
2500
3000
3500
2014 2015 2016 2017 2018
GW
h
Oil Solar Wind
sources in total electricity production reaches 22% in 2018, with the largest part being attributed
to solar power generation. The island’s electricity system is planned to connect to the national
grid by 2021 via a submarine cable. The interconnection with the mainland will transform the
power supply system of Crete. The region of Crete and the Transmission System Operator of
Greece have both identified that Crete can become a hub of renewable energy, while natural gas
power plants may also be constructed in the near future.
Figure 8: Electricity generation by source in Crete in the period 2014-2017. Source: DEDDHE.
Infrastructure, R&D and planned projects
There are three airports in the island and four major passenger ports.
There are two major infrastructure projects planned and expected to be carried out within the
next decade in Crete Both are expected to significantly improve the quality of the existing
infrastructure:
The first one is the Crete Northern Highway (BOAK), a national highway that will
connect the eastern to the western part of the island. The highway will provide access to
all major ports and airports of the island. The total cost is estimated to € 1.3-1.7 billions,
The second one is construction of a modern international airport in Kastelli, near
Heraklion. The new airport will replace the existing airport of Heraklion. The estimated
cost is €500 million and it is expected create 1,500 additional jobs during its construction
phase and around 7,500 full-time jobs during its operation phase.
With respect to R&D, Crete scores very high compared to other Greek regions. Specifically, the
island had the highest share of R&D expenditures to GDP (1.53%) in 2016, nationwide, which
translates to approximately €134.7 million. Research is carried out mainly by the public and the
higher-education sector.

12
2 Economic projections
2.1 The macroeconomic projections
Based on the projections, Crete grows with an average annual rate of 1.6% throughout the 2015-
2100 period and with 2.1% throughout the 2015-20150 period. In the short-run, the main driver
of growth is investments while in the long-run it is the increase in private consumption
expenditures are that supports growth (Table 4). Trade surpluses, the largest part of which is
attributed to intra-national trade, are expected to diminish over time and to follow a more
balanced path. Still, Crete remains a net exporter in 2100. In the short term, investments grow
with a high pace, counterbalancing the lack of investments during the economic crisis, while
presenting a stable growth rate throughout the 2025-2050. We assume that the share of public
consumption slightly decreases until 2100; nevertheless, per capita public consumption
expenditures increase over the time period under consideration.
Table 4: CreteGDP and GDP components yearly growth rates in 2020-2100.
2020 2025 2030 2035 2040 2045 2050 2060 2070 2100
GDP 2.3% 2.6% 2.3% 2.1% 2.1% 1.9% 1.7% 1.6% 1.5% 1.0%
Private consumption 1.8% 1.6% 2.0% 2.6% 2.9% 2.8% 2.7% 2.1% 2.1% 1.4%
Public consumption 1.9% 2.2% 1.9% 1.7% 1.7% 1.5% 1.3% 1.4% 1.3% 1.0%
Investments 5.3% 5.7% 3.6% 2.5% 1.6% 1.2% 0.7% 1.3% 1.0% 0.9%
Exports 1.7% 2.0% 2.0% 2.2% 2.1% 1.8% 1.7% 1.8% 1.7% 1.3%
Imports 1.8% 2.0% 2.1% 2.5% 2.3% 2.0% 2.0% 2.1% 1.9% 1.6%
Source : Deliverable Report D6.2 Modelling socioeconomic impacts for EU islands.

13
Figure 9: Macroeconomic components as a % share of GDP for Crete in 2015-2100. Source: Deliverable Report D6.2 Modelling socioeconomic impacts for EU islands.
2.2 The sectoral projections
The Cretan economy remains a service-led economy throughout the 2015-2100 period with an
increasing contribution of market, accommodation and food services. In 2015, non-market
services are the second largest sector in the economy but in 2100 it is projected that
accommodation and food services will take their place mainly to the tourism led growth
projected.
Blue growth sectors increase in importance throughout the 2015-2100 period. In particular,
tourism grows from 22.9% as a share of GDP in 2015 to 26.1% in 21002. While the water
transport sector grows steadily, travel agency and related activities register a declining share in
total value added as they grow with a lower rate than that of GDP.
2 The share of tourism in GDP is calculated via the tourism satellite account (TSA) matrices of 2015, assuming that the same shares that indicate the contribution of tourism to the productions of tourism-related sectors (such as the accommodation and food services, transport services, travel agency and related activities, cultural and recreational activities) remain throughout the 2015-2100 period. Please see Appendix B for the complete database of the estimated TSAs.
0,0%
10,0%
20,0%
30,0%
40,0%
50,0%
60,0%
70,0%
80,0%
90,0%
100,0%
2020 2025 2030 2035 2040 2045 2050 2060 2070 2100
Private Consumption Public Consumption Investment Trade

14
Figure 10: Sectoral value added as a % share to total GVA for Crete in 2015, 2050 and 2100. Source: Deliverable Report D6.2 Modelling socioeconomic impacts for EU islands.
The most important Blue growth industry in Crete is tourism; tourism related expenditures are
calculated to 22.9% of the regional GDP in 2015. This share is expected to reach 26.1% in the
end of the projection period. Total employment of sectors associated with tourism increases by
18.1% over the projection period and increase should be largely attributed to tourism as most of
their demand is non-domestic. For the rest of the Blue growth sectors, their contribution to
GDP is expected to remain stable over the projection period: namely the share of aquaculture
will continue to be around 0.1% and that of water transport services around 0.2%.
Table 5: Sectoral contribution as a % share of total gross value added for Crete in 2015-2100.
GVA % shares 2015 2020 2025 2030 2035 2040 2045 2050 2060 2070 2100
Agriculture 5.6% 5.2% 4.9% 4.9% 4.9% 5.0% 5.0% 5.1% 5.3% 5.7% 5.4%
Fishery 0.1% 0.1% 0.1% 0.1% 0.1% 0.1% 0.1% 0.1% 0.1% 0.1% 0.1%
Manufacturing 2.9% 2.8% 2.9% 2.9% 2.8% 2.8% 2.8% 2.7% 2.6% 2.6% 2.3%
Consumer goods 3.1% 3.0% 2.9% 2.9% 2.9% 2.9% 2.9% 2.9% 2.9% 3.0% 2.9%
Electricity 1.9% 1.8% 1.8% 1.8% 1.8% 1.8% 1.8% 1.9% 1.9% 2.0% 2.1%
Water 0.6% 0.5% 0.5% 0.5% 0.5% 0.5% 0.5% 0.5% 0.5% 0.5% 0.4%
Agriculture
Fishery
Manufacturing
Consumer goods
Electricity
Water
Construction
Water transport
Other transport
Accommodation and foodservicesTravel agency and relatedactivities
2100
2050
2015

15
Construction 4.0% 4.5% 5.3% 5.6% 5.8% 5.7% 5.6% 5.3% 5.2% 5.1% 4.7%
Water transport 0.2% 0.2% 0.2% 0.2% 0.2% 0.2% 0.2% 0.2% 0.2% 0.2% 0.2%
Other transport 1.6% 1.6% 1.5% 1.5% 1.5% 1.5% 1.5% 1.5% 1.5% 1.5% 1.4%
Accommodation and
food services 17.3% 17.6% 17.7% 17.8% 18.0% 18.2% 18.3% 18.5% 19.0% 19.2% 22.5%
Travel agency and
related activities 0.5% 0.5% 0.5% 0.4% 0.4% 0.4% 0.4% 0.4% 0.4% 0.4% 0.4%
Recreational services 1.8% 1.8% 1.7% 1.7% 1.6% 1.6% 1.6% 1.6% 1.5% 1.5% 1.3%
Other market services 39.7% 39.9% 39.9% 40.1% 40.5% 40.9% 41.2% 41.5% 42.1% 42.6% 43.2%
Non-market services 20.7% 20.5% 20.1% 19.6% 19.0% 18.5% 18.2% 17.8% 16.8% 15.8% 13.4%
Source: Deliverable Report D6.2 Modelling socioeconomic impacts for EU islands.
The largest share of exports is attributed to exports of services rather than goods. With respect
to trade in goods, agricultural products are significant for the region’s trade position, their
exports account for 9.3% of total regional exports, as well as the exports of consumer good’s
industries (mainly of food and beverages) which account for 7.7% of total Cretan exports.
Nevertheless, their shares are expected to diminish over the projection period for two reasons:
the first one being the small income elasticity for these product categories and the second one is
that a largest part of the output of the industry will serve to satisfy domestic demand. With
respect to the Blue growth sectors, accommodation services record the most significant increase
as their export share is expected to reach approximately 37% of total regional exports (from
around 30% in 2015).
Table 6: The tourism industry as % of GDP in Crete in 2020-2100.
2020 2025 2030 2035 2040 2045 2050 2060 2070 2100
Tourism 22.9% 22.7% 22.6% 22.4% 22.6% 22.7% 22.7% 22.8% 23.2% 23.5%
Source: Deliverable Report D6.2 Modelling socioeconomic impacts for EU islands.
2.3 Employment
The service-led economic growth brings positive effects to the labor market with unemployment
projected to fall from 24.3% in 2015 to more sustainable levels until 2050. The contribution of
each sector to total employment depends on the labor intensity of the sector. The biggest
employing sectors are the market, non-market services, accommodation and food services as
well as agriculture. Employment in agriculture is expected to decrease over the period examined
mainly due to the adoption of more efficient cultivation methods and the automation of
agricultural production. The construction sector records significant increase until the mid-
century due to the foreseen investment projects and the higher investments associated with the
tourism industry. Tourism is largest employer of the Blue growth sectors under analysis,

16
particularly due to the high labor intensity of accommodation and food services. Water transport
employs a only small share of total and thus has the lowest contribution among the Blue growth
sectors.
Table 7: Sectoral contribution as a % share of total gross value added for Crete in 2020-2100.
2015 2020 2025 2030 2035 2040 2045 2050 2060 2070 2100
Unemployment
rate 24.3% 20.1% 18.7% 17.1% 16.5% 14.3% 11.6% 9.9% 8.6% 8.6% 8.6%
Source: Own calculations.
Figure 11: Sectoral employment as a % share of total for Crete in 2015, 2050, 2100. Source: Deliverable Report D6.2 Modelling socioeconomic impacts for EU islands.
3 Climate change outlook
Climate hazards indicators represent the entry point to understand the climate change exposure
of the blue economy sectors. The indicators have been computed for two scenario RCP2.6 (low
emission scenario) and RCP8.5 (high emission scenario) and for different horizon times namely:
a reference period (1965-2005), mid-century (2046-2065) and end of century (2081-2100). Main
source of climate projections (future climate) for Crete is EURO-CORDEX ensemble even if
other model sources were applied when required, depending of available scales. Results are
presented in form of maps, tables or graphs and only when the information shows an interesting
outcome.

17
All the graphics presented below can be found in high resolution in the Soclimpact
Project official website HERE.
3.1 Tourism
Beach flooding and related losses
One of the consequences of an increase in the mean sea level will be the flooding of coastal areas. This includes sand beaches, which are the main asset for tourism activities in most of the European islands. Therefore, estimating the potential risk of beach loss due to climate change is of paramount importance for the economy of those islands.
Extreme flood level (95th percentile of flood level averaged) The 95th percentile of the flood level averaged was selected as an indicator of interest. The values are presented as anomalies with respect to the present mean sea level at beach location (i.e. including the median contribution of runup). In all cases an increase is expected being larger at the end of the century under scenario RCP8.5. The values in that scenario is 116.54 cm in Crete.
Figure 12: Projected extreme flood level (in the vertical, in cml) at beach locations with respect to the present
(1986-2005) mean sea level values averaged for the islands under scenario RCP2.6 (left) and RCP8.5 (right).
Ensemble of models using Global simulations produced by Hemer et al. (2013). Source: D4.4d Report on the evolution of beaches
Under mean conditions, we find that, at end of century, the total beach surface loss range from
~38% under scenario RCP2.6 to ~68% under scenario RCP8.5.

18
Figure 13: Beach reduction % (scaling approximation). Source: SOCLIMPACT Deliverable Report - D4.4d Report on the evolution of beaches.
Seagrass evolution
Seagrasses are the main habitat for coastal marine ecosystems. They provide different services
like sediment retention (and thus clearer waters), coastal protection (in front of marine storms),
shelter for marine organisms, etc. Therefore, the state of the seagrasses is a convenient proxy for
the state of coastal environment. That is, large well-preserved extensions of seagrasses lead to a
better coastal marine environment which in turn is more resilient in front of hazards.
Our results suggest that no seagrass losses are expected for the Posidonia located in the coasts of Crete island.
Figure 14: Seagrass evolution. Source: SOCLIMPACT Deliverable Report - D4.4e Report on estimated seagrass density

19
Length of the window of opportunity for vector-borne diseases Vector Suitability Index for Aedes Albopictus (Asian Tiger Mosquito) Climate change can influence the transmission of vector-borne diseases (VBDs) through altering the habitat suitability of insect vectors. This is mainly controlled by increases of ambient air temperature and changes in the hydrological cycle. In the framework of SOCLIMPACT we explore if potential changes to meteorological conditions can affect the distribution of the Asian tiger mosquito (Aedes albopictus). Asian tiger mosquito is native to the tropical and subtropical areas of Southeast Asia; however, in the past few decades, this species has spread to many countries through the international transport of goods and increased travel (Scholte and Schaffner 2007). It is of great epidemiological importance since it can transmit viral pathogens and infectious agents that cause chikungunya, dengue fever, yellow fever and various encephalitides (Proestos et al. 2015). The multi-criteria decision support vector distribution model of Proestos et al. (2015) has been employed to estimate the regional habitat suitability maps. This is based on extending previous work on the environmental/climatic factors affecting the life cycle of the Asian tiger mosquito (Waldock et al. 2013; Proestos et al., 2015). The mosquito habitat suitability model combines seven meteorological indices based on field observations, extensive literature review and expert knowledge. For the Greek island of Crete, the environmental conditions are also favorable for the establishment of Aedes Albopictus. Future regional simulations under RCP2.6 suggest a small increase in the values of HSI. In agreement with the future trends for Cyprus, pathway RCP8.5 implies a decrease in the habitat suitability. This is more evident in the central inland regions and in the southwest parts of the island.
Figure 15: Habitat Suitability Index (HSI) values averaged over eight SOCLIMPACT islands and for each sub-period of analysis. Red colors indicate increases while blue colors indicate decreases in the future. [80-100:
High Suitability; 60-80: Medium Suitability; 40-60: Low Suitability; <40 No Suitability]. Source: Soclimpact project deliverable 4.3

20
Forest Weather Index (FWI)
The FWI system provides numerical non-dimensional ratings of relative fire potential for a generalized fuel type (mature pine stands) based solely on weather observations. FWI is part of the Canadian Forest Fire Danger Rating System established in Canada since 1971 (van Wagner 1987). Furthermore, since 2007, FWI has been adopted at the EU level and used in a harmonized way throughout Europe by the European Forest Fire Information System (EFFIS) of the Copernicus Emergency Management Service (since 2015). It is selected for exploring the mechanisms of fire danger change for the islands of interest in the framework of SOCLIMPACT Project, as it has been proved to adequately perform for several locations, including the Mediterranean basin. The index was calculated for the fire season (defined from May to October) over the Mediterranean for all models, scenarios and periods. For Crete, N=78 grid cells were retained from the models domain. In the following figure the ensemble mean and the uncertainty is presented for all periods and RPCs. The fire danger in Crete is among the highest in the Mediterranean. For the present climate, the most areas of the island pertain to the medium fire danger classification. It seems that under RCP2.6, the index increases by almost 10% at the middle of the century, while this increase is halted towards the end of the century. On the other hand, under RCP8.5 the fire danger increases substantially, reaching a 30% increase at the end of the century, while there are areas in the central and southern parts of the island that cross over into very high fire danger. Regarding uncertainty, we find that under RCP2.6 the standard deviation decreased in most areas towards the end of the century, indicating the model projections for the FWI meet for this scenario, while the opposite is found for RCP8.5, where the uncertainty is higher at the end of the century.
Figure 16: Fire Weather Index (EURO-CORDEX) with the color associated to the class of risk
(Mediterranean study) Source: SOCLIMPACT Deliverable Report - D4.4c Report on potential fire behaviour and exposure

21
Humidex
For the assessment of climate hazard on heat related impacts of climate change on human health, the humidity index (Humidex) (Masterton and Richardson, 1979) has been used. Humidex value is an equivalent temperature, which express the temperature perceived by people (the one that the human body would feel), given the actual air temperature and relative humidity. As a more representative indicator for the assessment of inhabitants’ and tourists’ hazard on heat related climate change impacts, the Number of Days with Humidex greater than 35°C was selected. From the above classification, a day with Humidex above 35°C describes conditions from discomfort to imminent danger for humans. For Crete, N=78 grid cells were retained from the models domain. In the following figure the ensemble mean and the uncertainty is presented for all periods and RPCs. From one month in the present climate and 1.5 month in the mid-century for both scenarios, Crete will have 3,5 months with discomfort conditions by the end of the century under RCP8.5.
Figure 17: Humidex. Ensemble mean of EURO-CORDEX simulations. Source: SOCLIMPACT Deliverable Report - D4.3 Atlases of newly developed indexes and indicator
3.2 Aquaculture
No information was provided by climate models, given the lack of uncertainty of data at regional level 3.3 Energy
Percentage of days when T > 98th percentile - T98p
The T98p is defined as the percentage of time where the mean daily temperature T is above the 98th percentile of mean daily temperature calculated for the reference period 1986-2005. For Crete, N=78 grid cells were retained from the models domain. The ensemble mean and the uncertainty is presented for all periods and RCPs. It is found that T98p is about 7% during RCP2.6 towards mid-century and slightly decreases at the end of the century, while for RCP8.5

22
more than one fifth of the year will exhibit temperatures above the 98th percentile by the end of the century. The coastal grid cells, mainly in the north, are more affected by the temperatures increase compared to the inland grid cells.
Figure 18: Percentage of days when T>98th percentile. Ensemble mean of EURO-CORDEX simulations. Source: SOCLIMPACT Deliverable Report - D4.4a Report on solar and wind energy
Renewable energy productivity indexes
A series of indicators related to renewable energy productivity is presented. The selected
indicators are wind and photovoltaic (PV) energy productivity, as well as the frequency and
duration of low-productivity periods, termed energy droughts (Raynaud et al., 2018), as a measure
of the variability of these sources. The productivity and variability of these renewable energy
sources will depend on climate. The possibility of reduced productivity due to climate change
poses a risk to the energy generation, if it is based on these renewable energy sources. Also, a
possible increase in the frequency and duration of solar and wind energy droughts will require an
increase in storage and backup sources.
Among the different renewable energy sources, solar PV and wind energy have been selected, as they are (and very likely will be) the main renewable energy sources, due to their degree of technological development and their comparatively low cost. In order to consider a marine energy source, offshore wind energy is included, in addition to onshore wind energy. Photovoltaic energy productivity
The ensemble mean value in photovoltaic productivity show spatial differences mostly over the Crete Island, which probably is due to its complex orography. That can be also appreciated in mean changes maps, where the sign of changes in some regions over land are positive, in contrast with the mean value of the whole domain (not shown). For the RCP8.5 scenario, changes are bigger, with the same pattern: more negative on average over sea than over land but still under 5% with respect to the control period.

23
The small magnitude of the projected changes is in line with the study of Panagea et al. (2014), in
which where a small increase in simulated photovoltaic production was projected over Crete in
simulations for SRES A1B emissions scenario. In that study, the increase in surface solar
radiation was partly compensated by the increase in projected temperature.
Figure 19: Photovoltaic (PV) productivity (land). Ensemble of models using MENA-CORDEX. Source: SOCLIMPACT Deliverable Report - D4.4a Report on solar and wind energy.
Figure 20: Photovoltaic (PV) productivity (sea). Ensemble of models using MENA-CORDEX. Source: SOCLIMPACT Deliverable Report - D4.4a Report on solar and wind energy.
Wind energy productivity
Important regional differences can be observed, which could be related to the complex
orography of Crete. Within this complex context, increases of Wprod tend to prevail in the

24
2046-2065 period for both RCP2.6 and RCP8.5. On the contrary, Wprod decreases tend are
spatially more extended in the 2081-2100 period. RCP8.5 scenario shows a complex pattern of
maxima and minima, with decreases prevailing to the south and northwest of the island, and
maxima located inland. The maximum relative change is about 6% in spatial average over land
for mid-century period in RCP2.6.
Figure 21: Wind energy productivity (land). Ensemble of models using MENA-CORDEX. Source: SOCLIMPACT Deliverable Report - D4.4a Report on solar and wind energy
Figure 22: Wind energy productivity (sea). Ensemble of models using MENA-CORDEX. Source: SOCLIMPACT Deliverable Report - D4.4a Report on solar and wind energy

25
Frequency and duration of low-productivity periods (energy droughts) as a measure of
the variability of these sources
Changes in wind productivity are generally consistent with projected changes in wind productivity for the different scenarios and time periods. Addressing PV droughts, both their frequency in the control period and their future changes are smaller than for wind droughts. We observe that in the control period, the northwest of the island is more prone to experience PV droughts (not shown). Projected changes in the frequency of severe PV droughts are almost zero. The impact of combining PV and wind energy is really positive for severe droughts, as their frequency is much smaller than for wind energy alone.
Figure 23: Wind energy productivity. Ensemble mean frequency of severe productivity drought days (%) in the control time period, as well as the ensemble mean changes in the frequency of drought days (%) in the different time periods considered for the RCP2.6 and RCP8.5 scenarios. Ensemble minimum and maximum values are given
in brackets. Averages are computed over land. Source: SOCLIMPACT Deliverable Report - D4.4a Report on solar and wind energy

26
Figure 24: Photovoltaic (PV) productivity. Ensemble mean frequency of severe productivity drought days (%) in the control time period, as well as the ensemble mean changes in the frequency of drought days (%) in the different time periods considered for the RCP2.6 and RCP8.5 scenarios. Ensemble minimum and maximum values are
given in brackets. Averages are computed over land. Source: SOCLIMPACT Deliverable Report - D4.4a Report on solar and wind energy
Figure 25: Wind and Photovoltaic (PV) productivity-COMBINED . Ensemble mean frequency of severe productivity drought days (%) in the control time period, as well as the ensemble mean changes in the frequency of
drought days (%) in the different time periods considered for the RCP2.6 and RCP8.5 scenarios. Ensemble minimum and maximum values are given in brackets. Averages are computed over land.
Source: SOCLIMPACT Deliverable Report - D4.4a Report on solar and wind energy

27
Cooling Degree Days
The Cooling degree days (CDD) index gives the number of degrees and number of days that the outside air temperature at a specific location is higher than a specified base temperature, providing s the severity of the heat in a specific time period taking into consideration outdoor temperature and average room.
Figure 26: Cooling Degree Days. Ensemble mean of EURO-CORDEX simulations. Source: SOCLIMPACT Deliverable Report - D4.3 Atlases of newly developed hazard indexes and indicators with Appendixes
Available water: Standardized Precipitation Index This index is used as an indication of water availability.
For Crete, only some regions of the north-east of the island are expected to be affected under
RCP2.6 and exceed the “dry” conditions threshold. Under the business-as-usual RCP8.5 forcing,
parts of the island are expected to experience extreme dry conditions that will be evident even
from the mid-21st century. Mild changes are projected under RCP2.6, while under the business-
as-usual scenario the whole island is expected to be severely affected by meteorological droughts.

28
Figure 27: Ensemble mean values of the Standardized Precipitation Evaporation Index (SPEI) averaged. Source: SOCLIMPACT Deliverable Report - D4.3 Atlases of newly developed hazard indexes and indicators with Appendixes
3.4 Maritime Transport
Sea level rise
Sea level rise (SLR) is one of the major threats linked to climate change. It would induce permanent flooding of coastal areas with a profound impact on society, economy and environment. Moreover, an increase in the mean sea level would result in a larger impact of coastal storms with the consequent increase of risk. The results are presented in terms of mean sea level rise. For Crete, the SLR ranges from 28, 90 cm (RCP2.6) to 57.81 cm (RCP8.5) at the end of the century.

29
Figure 28: Mean sea level rise (in cm) with respect to the reference period (1986-2005). Ensemble mean of CMIP 5 simulations and scaling approximation for RCP2.6
Source: SOCLIMPACT Deliverable Report - D4.4b Report on storm surge levels
Storm surge extremes
Storm surge events, characterized by positive extreme sea levels and mechanically forced by atmospheric pressure and wind are the main responsible for coastal flooding, especially when combined with high tides. To present, the only ensemble populated with enough number of members to compute meaningful statistics on climate projections is the one produced for the Mediterranean by Lionello et al. (2016). This ensemble consists on 6 simulations run with the HYPSE model at 1/4º of spatial resolution and forced by the high-resolution wind fields from the MedCORDEX ensemble which in turn is nested into CMIP5 global simulations. The simulations are run for the period 1950-2100 thus covering the historical period as well as the whole 21st century. Complementary, the ensemble includes three hindcast simulations that are used to establish present reference levels. For Crete, the results show a very low or even non-existent decrease except for RCP8.5 at the end of the century (-13%).

30
Figure 29: 99th percentile of atmospherically forced sea level (in cm) averaged for the hindcast period, the near future (2046-2065) and the far future (2081-2100) under scenarios RCP2.6 (with scaling approximation) and
RCP8.5 and (relative change in %). Source: SOCLIMPACT Deliverable Report - D4.4b Report on storm surge levels
Frequency of extreme high winds (Wind Extremity Index – NWIX98)
The wind extremity index NWIX98 is defined as the number of days per year exceeding the 98th
percentile of mean daily wind speed. This number increases for both scenarios in both horizons. Like the NWIX98, the 98th percentile of daily wind speed, WIX98, decreases under RCP8.5. with a more significant magnitude for RCP 8.5.
Figure 30: Wind Extremity Index (NWIX98). Ensemble mean of the EURO-CORDEX simulations.
Source: SOCLIMPACT Deliverable Report - D4.3Atlases of newly developed indexes and indicator

31
Wave extremes (99th percentile of significant wave height averaged)
Marine storms can have a negative impact on maritime transport, coastal-based tourism and aquaculture, among other activities. To illustrate this impact, the 99th percentile of significant wave height averaged has been chosen. A decrease in the extreme wave height is found being larger under scenario RCP8.5 as illustrated in the following map along the south coast and an increase along the north coast.
Figure 31: the 99th percentile of significant wave height averaged for the reference period and the relative change for the RCP8.5. Global simulations produced by Hemer et al. (2013).
Source: SOCLIMPACT Deliverable Report - D4.4b Report on storm surge levels
Figure 32: the 99th percentile of significant wave height averaged for the reference period and the relative change for the RCP8.5 and RCP2.6. Global simulations produced by Hemer et al. (2013).
Source: SOCLIMPACT Deliverable Report - D4.4b Report on storm surge levels

32
4 Climate change risks
4.1 Tourism
For the tourism sector, three impact chains (IC) were operationalized: i) Loss of attractiveness of a destination due to the loss of services from marine ecosystems, ii) Loss of comfort due to increase of thermal stress iii) Loss of attractiveness due to increased danger of forest fires in touristic areas
For the first two, the AHP method was employed. This methodology is ideal to respond to the hierarchical nature of the impact chain and, secondly, for using expert judgements to assess the comparative risk for the islands over a large number of indicators. By the side of shadows, this method requires quite specific data that wasn’t able to collect for some islands. The AHP method also requires “values” for experts to compare. More specifically, for the first IC the data is needed for “Tourist Arrivals” and “Vulnerable Groups” indicators, which is regards the Exposure of people to heatwaves for the hottest period, such as:
- Number of tourist arrivals per month for the past 5 years. - Number of tourists per month aged 14 and under for the past 5 years - Number of tourists per month aged 65 and over for the past 5 years - Percentage of tourist activities that are sensitive to heatwaves (such as hiking, etc.). - Number of beds available in medical facilities per 100,000 inhabitants.
If, for example, an island gets a lot of tourists, but most of them just spend their time by the beach, then the island is not so much at risk of losing tourists because when they visit they’ll be by the beach and able to cool down. On the other hand, if almost all the tourists visit the island for hiking, but it gets too hot, then the island could be at risk since some may change their minds and visit somewhere else with a moderate climate and do their hiking there. Additionally, it is necessary to investigate how well an island is equipped with dealing with patients who suffer from a heatwave-related episode. For the second IC, the data collected was:
- Surface of marine Phanerogams & Phanerogams' reduction due to heat: Surface, in km2; and expected % of surface loss for RCP8.5 distant future.
- Number of divers: Number of tourists practising Diving at the destination. - Products substitution capacity: capacity to derive tourist demand to non-marine habitat-
based activities. - Seagrass removal: capacity to remove dead seagrass lying on beaches. - Sea water pollution: quality of management of inshore and offshore sewages.
If one information is missing, it is not possible to conduct the risk assessment analysis, as it is a comparative analysis between European islands. Finally, the third IC Provided some results for the case of Crete which are summarized hereafter. Loss of attractiveness due to increased danger of forest fires in touristic areas

33
Forest fires are considered as an important parameter for the attractiveness of tourist
destinations, especially in the Mediterranean area. Severe episodes were met in Algarve (Portugal)
and Greece (Athens area) in the recent period, threatening the tourist season.
This study focuses on the implementation and analysis of the selected Impact Chain “Risk of
forest fires and consequences on tourism attractiveness of a destination”. Out of the 12
islands assessed in the SOCLIMPACT project, nine were included in the operationalization: the
three Atlantic Islands (Azores, Canary Islands and Madeira) and the Mediterranean ones
(Balearic Islands, Crete, Corsica, Cyprus, Malta, Sardinia and Sicily).
The concept of Impact Chain (Schneiderbauer et al. 2013; Fritzsche et al. 2014) is applied as a
climate risk assessment method (with 6 steps) for research of decision making. Impact Chains
propose diagrams articulating the causal links between the different components of climate risks
(according to AR5 concepts: hazards, exposure, vulnerability, risks, step 1)). For each of these
components of the theoretical IC (figure, step 2), several indicators are selected and collected
(step 3). Data are then normalised to be able to be aggregated (steps 4 and 5) with different
weights. The final objective (step 6) is to achieve a standardised risk score that, according to the
spatial scale of the analysis can allow comparison and decision making on adaptation, including
hierarchization of resource allocation or identification of adaptation options to mitigate climate
risk.

34
Figure 33: Loss of attractiveness due to increased danger of forest fire in touristic areas. Source: SOCLIMPACT Deliverable Report – D3.2. Definition of complex impact chains and input-output matrix for each islands and sectors

35
Figure 34: Loss of attractiveness due to increased danger of forest fire in touristic areas Source: SOCLIMPACT Deliverable Report – D3.3. Definition of complex impact chains and input-output matrix for each islands and sectors
Many indicators were formulated in a very broad way, causing a few problems in identifying
suitable data sets. Furthermore, the data were checked for explicit spatial coverage, resolution,
temporal coverage and time frame. Finally, we evaluated possible substitutes or alternatives for
those indicators with no suitable data to substantiate them.

36
Figure 35: Final Impact Chain Model
Source: SOCLIMPACT Deliverable Report – D3.2. Definition of complex impact chains and input-output matrix for each islands and sectors
In order to normalize the index, the min-max method was applied. Min-max normalizes
indicators to have an identical range [0, 1] by subtracting the minimum value and dividing by the
range of the indicator values (OECD 2008). The mathematical formula and more information on
min-max normalization method are presented in the following section. Afterwards, the
normalized index was categorized into five equal interval classes representing values from “Very
low" to "Very high”. Considering the weighing, an assessment of GIZ methodology has been
developed for this impact chain including interviews with various types of stakeholders (cf.
dedicated 4.5 to forest fires).

37
The indicators previously normalized have been aggregated to elaborate three sub-component
indices (hazard, exposure, vulnerability) and the final risk index. The result is included in a
comparison for the 9 other islands studied for the risk linked to forest fires.
Comparative study
Hazard
The main findings are:
Scores for fire danger increase as we move from West to East and from North to South, with the exception of Malta, which is much smaller and the selected grid cells are mostly influenced by maritime conditions.
Under RCP2.6, it seems that the fire danger returns to the present conditions towards the end of the century apart from Crete which score will increase from medium to high, even under this RCP.
Under RCP8.5, the increase is much more prominent, ranging from 22% to 46%, with the highest values for Corsica, Sardinia and Sicily, which implies that under this scenario at the end of the Century, the western and central Mediterranean will be more affected.
Figure 36: Hazard score (Fire Weather Index) per island for the reference period (1986-2005).
Source: SOCLIMPACT Deliverable Report – D4.5Comperhensive approach for policy makers

38
Figure 37: Hazard score (Fire Weather Index) per island at the end of the century (2081-2100) under RCP2.6
(Ambitious Mitigation Policies). Source: SOCLIMPACT Deliverable Report – D4.5Comperhensive approach for policy makers
Figure 38: Hazard score (Fire Weather Index) at the end of the century (2081-2100) under RCP8.5 (Business as usual).
Source: SOCLIMPACT Deliverable Report – D4.5Comperhensive approach for policy makers

39
Exposure
The results show that:
Atlantic Islands (Madeira and Canary Islands) are more exposed (high score, Figure) than Mediterranean Islands (from low to medium score). We can see an increase as we move from North to South in the Mediterranean area.
Atlantics Islands higher scores are mainly explained by the level of exposure rather than the nature of exposure, which is quite similar across islands, except for Malta which rate is very low.
The nature of exposure varies across EU Islands despite of their homogeneous score: Corsica has the highest score for forest areas followed by Madeira, Canary Islands. These two last ones have the highest score of forest belonging to protected areas. We can find a significant proportion of cultivated areas in other Islands namely: Sicily, Sardinia, Balearic Islands, Crete and Cyprus.
The level of exposure for Canary Islands and Madeira is particularly important because of the high scores for each of the 4 considered indicators: population density, population over 65 years, population under 9 years and tourist density.
Figure 39: Exposure score (current period) per island. Source: SOCLIMPACT Deliverable Report – D4.5Comperhensive approach for policy makers

40
Figure 40: Subcomponents of exposure and related score (current period) per island. Source: SOCLIMPACT Deliverable Report – D4.5Comperhensive approach for policy makers
Figure 41: Breakdown by exposure subcomponent. Source: SOCLIMPACT Deliverable Report – D4.5Comperhensive approach for policy makers

41
Vulnerability
The main findings are:
Results show large disparity across EU Islands in terms of vulnerability. The vulnerability score for Corsica is very high followed by Sardinia (high), Madeira, Balearic Islands and Cyprus. Malta, Canary Islands and Crete scores are low and Sicilia very low.
Breakdown by component highlights a quite homogeneous score for adaptative capacity whereas sensitivity score (Flammability Index) is very different from an island to another.
Not surprisingly for the flammability index, Corsica and Sardinia have the highest score, Malta, Sicilia and Canary Islands, the lowest one.
Looking at the adaptative capacity subcomponent, despite of the quite homogeneous scores, factors of influence are quite different among the islands:
o high score for employees in the primary sector, apart from Sardinia and Sicily; o scores for density of firefighters and volunteers are important for all the islands
except for Cyprus; o GDP per capita and level of education are the most heterogeneous factors of
influence; o GDP per capita score is very high for Crete, very low for Corsica, Malta and
Balearic Islands. o Scores for education level is important for Cyprus and low for Madeira, Malta
and Corsica.
Figure 42: Vulnerability score per island. Source: SOCLIMPACT Deliverable Report – D4.5Comperhensive approach for policy makers

42
Figure 43: Subcomponents of vulnerability and related score (current period) per island. Source: SOCLIMPACT Deliverable Report – D4.5Comperhensive approach for policy makers
Figure 44: Details and scores of the two subcomponents (adaptive capacity and sensitivity) per island. Source: SOCLIMPACT Deliverable Report – D4.5Comperhensive approach for policy makers

43
Risk
- For the reference period, the overall risk is medium for Atlantic Islands (Madeira and Canary Islands) and Eastern Mediterranean Islands (Crete and Cyprus). Risk for other islands is low and very low for Malta.
- Looking at the breakdown of the risk, the structure is quite similar for 3 groups: o Madeira, Canary Islands, Sicilia and Balearic Islands: Predominance of exposure
component (around 50% of the score); o Crete and Cyprus: Predominance of the hazard component (around 40% of the
score); o Corsica and Sardinia: Predominance of the vulnerability component (around 60-
70%); o Only Malta has a quite balanced distribution across the components.
- In this exercise, only the hazard component is changing in the future. In the near future whatever the considered RCP, the risk increases only for Cyprus from medium to high. While the risk remains stable with the RCP2.6 in the distant future for all islands apart from Cyprus, there is an increase from very low to low for Malta and from low to medium for Balearic Islands, Corsica and Sardinia with RCP8.5 (distant future). Even under this RCP8.5 risk remains constant for Canary Islands and Madeira (Medium) and Sicily (Low).
Figure 45: Risk score per island for the reference period (1986-2005). Source: SOCLIMPACT Deliverable Report – D4.5Comperhensive approach for policy makers

44
Figure 46: Risk breakdown by island for the reference period (1986-2005). Source: SOCLIMPACT Deliverable Report – D4.5Comperhensive approach for policy makers
Figure 47: Risk score per island in the near future (2046-2065) under RCP2.6 (Ambitious Mitigation Policies) and RCP8.5 (Business as usual),
Source: SOCLIMPACT Deliverable Report – D4.5Comperhensive approach for policy makers

45
Figure 48: Risk score per island at the end in the distant future (2081-2100) under RCP2.6 (Ambitious Mitigation Policies) and RCP8.5 (Business as usual).
Source: SOCLIMPACT Deliverable Report – D4.5Comperhensive approach for policy makers
Figure 49: Score per component and per island in the near (2046-2065) and the distant future (2081-2100) under RCP2.6 (Ambitious Mitigation Policies) and RCP8.5 (Business as usual).
Source: SOCLIMPACT Deliverable Report – D4.5Comperhensive approach for policy makers

46
Crete island results
The component of hazard is predominant (50%) and the risk is medium under reference period
and under RCP 2.6. (end of century). The risk is high under RCP 8.5. (end of century).
Figure 50: Risk score and components of the risk for the reference period. Source: SOCLIMPACT Deliverable Report – D4.5Comperhensive approach for policy makers
Figure 51: Risk score at the end in the distant future (2081-2100) under RCP2.6 (Ambitious Mitigation Policies) and RCP8.5 (Business as usual).
Source: SOCLIMPACT Deliverable Report – D4.5Comperhensive approach for policy makers

47
The component of exposure is represented in majority by the nature of exposure (80%).
Figure 52: Details and scores of the two subcomponents of exposure (nature and level of exposure). Source: SOCLIMPACT Deliverable Report – D4.5Comperhensive approach for policy makers
Considering the vulnerability component, the sub-component of adaptative capacity is the most
represented (66%).
Figure 53: Details and scores of the two subcomponents of vulnerability (adaptative capacity and sensitivity). Source: SOCLIMPACT Deliverable Report – D4.5Comperhensive approach for policy makers

48
4.2 Aquaculture
In the Soclimpact project, aquaculture includes only marine-based operations where off-shore
and coastal aquaculture are included, and freshwater and land-based aquaculture are excluded.
Examples of climate change hazards that can impact aquaculture are changes in ocean warming
and acidification, as well as oceoanographic changes in currents, waves, and wind speed. Sudden
impacts such as an increase in the frequency and intensity of storms and heat waves are also
impacting aquaculture. Other effects of climate change on aquaculture activities are increased
invasions from alien species, increased spread of diseases and changes in the physiology of the
cultivated species by changing temperature, oxygen availability and other important physical
water parameters. An important indirect impact to aquaculture is the change in fisheries
production due to climate change. Aquaculture of finfish is highly dependent on fisheries for
feed ingredients. This already a current problem with many fisheries overexploited and will only
intensify in the future. Climate change is also predicted to impact food safety, where temperature
changes modify food safety risks associated with food production, storage, and distribution.
Socio-economic impacts on aquaculture are hard to assess due to the uncertainty of the changes
in hazards and the limited knowledge these impacts have on the biophysical system of
aquaculture species (Handisyde et al. 2014). In the framework of Soclimpact, the following risks
were studied:
1) Risk of Fish species thermal stress due to increased sea surface temperature
Changes in water temperature can directly affect the growth rate and Food Conversion Ratio of
the fish. Temperature also affects the oxygen levels and can cause harmful algae blooms, reduce
water quality and an increase in occurrence of diseases and parasites which can than affect the
fish or other culture species. A change in temperature can ultimately change the ranges of
suitable species for a certain area but can also have positive impacts such as increased growth
(mainly in tropical and sub-tropical regions) and a longer growing season. Primary productivity
can also increase with increasing temperature, which may be beneficial for filter feeders such as
mussels.
2) Risk of increased fragility of the aquaculture activity due to an increase of extreme
weather.
Increased frequency and intensity of extreme weather events result in higher waves and storm
surges and changes in salinity. These events result in loss of stock and damages to infrastructure
and require adaptation in species selection, site selection and technologies. Indeed, the objective
of the risk assessment is to obtain final risk scores according to a gradient (very low to high) and
to be able to compare the European islands with each other. For Crete, it was difficult to obtain
the adequate data to make these comparisons. The type of data that was necessary to compile
was:
- Farm area (km2)
- Value of stocks
- Quick support intervention plans
- Early warning system

49
- Sensivity of species
4.3 Energy
There are more than 2200 inhabited islands in the EU. Lately, they have come into the focus of
the EU, which addresses energy questions as part of the 'Clean energy for all Europeans'
package. The Clean energy for EU islands initiative provides a long-term framework to help
islands generate their own sustainable, low-cost energy. This is particularly interesting, because
many islands have vast amounts of renewable energy sources but rely on fossil fuel imports yet.
These are relevant challenges regarding the energy transition in the EU, whose aim of net zero
greenhouse gas emissions in 2050 should determine the future energy plans of the islands.
Islands could provide showcases for successful 100% renewable energy supply.
The National Hydropower Association (NHA) defines marine energy as electricity generation
from marine kinetic energy, such as waves, tidal and ocean currents. Pisacane et al. (2018) add
other marine energy sources like ocean thermal energy conversion (exploiting temperature
differences between deep and surface ocean waters) and salinity gradient energy (harnessing the
energy potential of differences in salt concentration in ocean and river waters). All these
technologies are still in a development phase, and even if they reach the commercial phase in the
future, it is not likely that they will generate a large share of the power. Therefore, the analysis in
SOCLIMPACT focuses on the main renewable energy sources (RES), wind energy and solar
photovoltaic (PV) energy, which are presently, and very likely in future, the backbone of the
deployment of renewable energies, due to their technological maturity and low cost.
Nevertheless, we take into account not only onshore but also offshore wind energy, as a
specifically marine energy source which has distinct advantages like much higher productivity
and less time variability than onshore wind energy, and does not require land space which is
limited and costly in the islands. There are relevant obstacles for its deployment, like the deep
bathymetry surrounding most of the islands, and the lower wind speeds over the Mediterranean
in comparison to areas like the North Sea where offshore wind energy is being deployed rapidly.
Additionally, we consider also offshore PV energy. Despite some disadvantages that have to be
overcome (corrosion problems due to salty water or the impact of waves), this application is
receiving growing interest, as it offers an option for renewable energy development in countries
and islands with limited space for the installation of solar panels, and can show increased
performance due to the cooling effect of water and wind on PV cells.
Most RES (renewable energy sources) depend on the climate, and therefore climate change can
have an impact of the resource amount. Additionally, wind and solar PV energy are not
dispatchable, and its variability represents a challenge for its integration in the power system.
This is a challenge that can be addressed through storage or backup plants (which can be itself
renewable energy plants), through demand management, but also taking advantage of
complementarity of PV and wind energy and its very different variability characteristics. This
approach is gaining attention from stakeholders in the islands, as demonstrated by the report by
Monitor Deloitte and Endesa (2020), in which one of the key recommendations for achieving an
accelerated zero carbon target in Balearic and Canary Islands by 2040 is the combination of solar

50
PV and wind energy, with clearly higher shares of PV than of wind energy. Such a mix would
reduce strongly the need for storage, due to the stability of solar PV production.
There are also challenges for the demand and transmission components of the energy systems of
the islands due to climate change: changes in temperature leading to changing energy demand,
changes in precipitation and evaporation creating risks for desalination.
For the energy sector, three theoretical impact chains (IC) have been proposed in the
SOCLIMPACT project:
i) risk of changes in power generation due to long term climate change and variability, ii) risk of changes in energy demand due to changes in precipitation and temperatures, iii) risk of damages to transmission grids due to extreme events.
Only the second IC, i.e., the one related to changes in energy demand was selected to be
operationalized, mainly due to data availability constraints. The quality of IC operationalization
depends strongly on data availability over long periods. Data for cooling energy demand are still
scarce and difficult to obtain, despite the requirements of the European Commission for
information regarding the national energy efficiency targets. The availability and quality of
cooling demand data should improve in the future due to the need for tracking the advances
towards energy efficiency targets. Desalination demand data should also improve strongly,
including data about the energy efficiency of the desalination processes used.
This demand-side IC has been deployed into two individual ICs, namely, the increased energy
demand due to increased cooling demand and the increased energy demand due to increased
desalination needs. Both risks depend on the temperature increase, which is a very certain effect
of climate change. The risk assessment was carried through and expert assisted process.
The diagrams of the two operationalized impact chains are presented below

51
Figure 54: Conceptualization framework for the operationalization of the energy impact chain: Risk of increased
energy demand due to increased cooling demand Source: Soclimpact project Deliverable 4.5-Comprenhensive approach for policy makers
Figure 55: Conceptualization framework for the operationalization of the energy impact chain: Risk of increased
energy demand due to increased desalination demand Source: Soclimpact project Deliverable 4.5-Comprenhensive approach for policy makers

52
Hazard scores for energy demand (Cooling Degree Days -CDD, Standardized Precipitation-
Evapotranspiration Index - SPEI), and supply indicators (wind energy, solar PV and
combined productivity and droughts) were analysed. The aim is to jointly consider future
increases in energy demand due to temperature and precipitation changes and the potential for
covering it with renewable energy sources in the future.
Regarding the normalization of these hazards, we use an approach based on their future change.
The available literature indicates that the future projected changes of renewable energy
productivity frequently do not exceed a level of 10% relative to present values. Changes of about
10% would not modify clearly a normalized score like the one use for present climate (leading to
a very limited variation range of the score), but they represent a significant impact on the
productivity and profitability of the energy plants. Therefore, the future change of renewable
energy productivity is compared to a 10% threshold, both on the negative (normalized values
above 0.5) and the positive side (normalized values below 0.5). The normalization also includes a
minor contribution of a comparison of the changes relative to other islands.
CDD and SPEI scores are normalized with respect to a maximum projected value previously
identified. Renewable energy productivity indicators in present climate are normalized using
global thresholds (5th and 95th percentiles of the respective technologies). The same
normalization method is used for projected changes of renewable energy droughts. Thus,
energy drought indicators are normalized comparing them to a maximum upper limit, taken
among all the islands and renewable energy technologies.
A fundamental aspect of the method is that we apply an objective procedure for obtaining the
weights of the risk components (hazard, exposure and vulnerability) based on time-series
correlations of observed data for energy demand and for the different indicators involved in the
impact chains. This allows to detect which factors have a larger impact on the energy demand.
This method, based on correlations between observed energy demand and observed data for the
indicators, points out that several exposure and vulnerability factors have a stronger weight than
the climate hazards on short time-scales (interannual variations for periods of about 10 years).
This is consistent with the drivers considered in the national forecasts, for periods of 10 years,
performed as part of the EU Energy Efficiency Directive. A consequence of this is the relatively
low weights assigned to the climate hazards in the operationalization.
For the operationalization of the full impact chains, the exposure and vulnerability indicators
were also weighted utilizing different criteria. The mathematical procedure developed proposes
the definition of weights per group of variables (hazard, vulnerability and exposure) that allow
identifying the relationship between each of the components and the dependent variable (in this
case, energy demand due to desalination or energy demand due to cooling). The detailed weight
calculation for the risk components (hazards, exposure and vulnerability) can be found in the
Soclimpact Project deliverables 4.5.
It was not possible to conduct a full operationalization of the IC for the case of Crete.. The
criteria for the selection of the islands have been: (a) availability of data for the computation of

53
the exposure and vulnerability indicators of the demand-side ICs, (b) modeling constraints of the
hazard component. In the next tables we present the normalized hazard scores for the island.
Table 8: Energy demand and supply hazard scores for Crete
Histori-cal ref.(1986-2005)
Demand Supply: Productivity Land Sea
Droughts
CDD 0.20 Wind 0.63 0.00 0.84
SPEI 0.00 Solar PV 0.19 0.21 0.16
Combined 0.41
RCP2.6 (2046-2065)
Demand Supply: Productivity change
Droughts change
CDD 0.29 Wind 0.1 0.3 0.2
SPEI 0.32 Solar PV 0.4 0.6 0.1
Combined 0.3
RCP8.5 (2046-2065)
Demand Supply: Productivity change
Droughts change
CDD 0.42 Wind 0.2 0.3 0.3
SPEI 0.68 Solar PV 0.6 0.7 0.4
Combined 0.5
RCP2.6 (2081-2100)
Demand Supply: Productivity change
Droughts change
CDD 0.28 Wind 0.3 0.3 0.3
SPEI 0.32 Solar PV 0.5 0.6 0.3
Combined 0.5
RCP8.5 (2081-2100)
Demand Supply: Productivity change
Droughts change
CDD 0.66 Wind 0.2 0.5 0.4
SPEI 0.96 Solar PV 0.6 0.7 0.1
Combined 0.7
Categorization:
0.00 – 0.20
Very low
0.20 – 0.40
Low
0.40 – 0.60
Medium
0.60 – 0.80
High
0.80 – 1.00
Very high
Source: Soclimpact project Deliverable 4.5-Comprenhensive approach for policy makers
The low present CDD score would not increase much under RCP2.6 scenario, pointing to a
limited cooling energy demand in this case. The increase of Etesian winds in summer would help
to moderate this demand. In contrast, under RCP8.5 this score would reach high values by the

54
end of the century. Regarding the hydrological drought conditions, some increase during the first
half of the century is expected under RCP2.6. Under RCP8.5, a strong and sustained worsening
is projected, which would imply a high pressure on desalination energy demand. The possibility
of using large quantities of brackish water instead of seawater can lower the cost of desalination
(Zotalis et al., 2014).
In 2017, the shares of wind energy and solar PV were respectively 17,0% and 4,6%. The
relatively negative score of wind energy productivity over land is a spatial average, and in a
mountainous island like Crete large spatial differences in wind energy potential are observed, and
therefore the potential contribution of onshore wind is higher than what the 0.63 score could
imply. Offshore wind energy resources are excellent, but the obstacles of deep bathymetry have
to be overcome. Future projections show even an improvement of the wind energy potential,
particularly over land. This highlights the importance of local factors in the future evolution of
climate variables, as the opposite tendency predominates for other islands. Solar PV productivity
has very good scores, and in the future it will change only slightly.
Present variability is high for onshore wind, whereas solar PV is characterised by low frequencies
of energy droughts. The complementarity of PV and wind energy is less marked than for other
islands, as the high summer wind potential coincides with the PV maximum. Variability will
decrease in the future both for wind and PV energy.
* Islands’ comparison and future challenges
- The frame for energy supply in the islands are the binding targets established in the 2030
climate and energy EU framework and the long term horizon of a decarbonized energy system
by 2050.
- The future change of wind energy and PV productivity should be rather small in general:
around 5% or less with respect to the reference period in many cases, with maximum changes of
about 10% for some islands at the end of the century under RCP8.5 scenario (particularly for
wind energy productivity over land). A 10% productivity change could have a significant impact
on a planned or existing plant if it occurs over the lifetime of the power plant, but in this case
such a change would extend over many decades, which will facilitate adaptation and efficiency
measures.
- Projected PV productivity changes are generally smaller than wind energy changes. In most
cases PV productivity remains constant or decreases slightly. The main exception is Fehmarn,
which shows a clear decreasing tendency in PV productivity under RCP8.5 scenario, reaching a
10% decrease by end of the century.
- There is a specific uncertainty source in the photovoltaic projections. Most regional climate
model simulations, including the ones used here, do not include a projected evolution of aerosols
in future climate runs. The missed effect of the likely evolution of aerosols would likely increase
to some degree the future surface solar radiation and PV productivity over most of the islands
(Gutiérrez et al., 2020).

55
- Renewable energy productivity droughts are a measure of the variability of the resource. Wind
droughts are much more frequent (around 50% of the days for most islands) than PV droughts
(10% or less of the days). This agrees with results from the study of Raynaud et al. (2018), and
highlights the stable character of the solar productivity in comparison to wind productivity over
time.
- Wind energy droughts are more frequent in the Mediterranean islands than in the Atlantic
islands or Fehmarn. The best quality resources in terms of stability are found for Canary Islands,
which show the minimum values of both wind energy and PV droughts among all islands.
Fehmarn shows by far the worse PV drought score, corresponding a drought frequency of 23%
of the days.
- Projected changes in the frequency of droughts are small, with future variations that generally
do not attain a magnitude greater than 5% of the days. This indicates that the time-variability
characteristics of wind and PV energy are a robust feature, which is relevant for planning the
amount of storage or backup needed.
- The combination of PV and wind energy has generally a very positive impact on the frequency
of droughts as a result of the complementarity of both sources. This impact also exists but is less
clear for islands with substantial summer wind energy resources (Canary Islands, Madeira and
Crete).
- As part of the pathway towards very high or 100% RES shares, offshore wind energy should
play a very relevant role. Solutions to overcome the obstacle posed by the deep bathymetry
surrounding most of the islands are beginning to near commercial deployment, so that floating
offshore wind plants are already planned near Gran Canaria and Sicily.
- Offshore PV could be an interesting option for some islands, particularly when land surface
limitations are large. There is growing interest in this option, as shown by the test plants being
installed and the references made to this technology in the Roadmap for the Offshore
Renewable Energy Strategy of the European Commission or in the report of Monitor Deloitte
and Endesa (2020) about the accelerated decarbonization of Canary and Balearic Islands.
- The combination of different types of offshore renewable energy sources in the same platform
is also attracting interest, as the different sources can exhibit complementarity in time and the
combined output can thus be more stable and reliable. The different RES can also share part of
the installations, like the connection to land, reducing their cost (Pisacane et al., 2018;
MarineEnergy, 2019a). The European Union is trying to promote such combinations, through
projects like MUSICA (Multiple Use of Space for Island Clean Autonomy) which will design and
test a floating offshore platform integrating wind, PV and wave energy for use on islands
(MarineEnergy, 2019b), and plans to develop roadmaps for its deployment in three case study
islands, among them Malta and the Canaries (MaREI, 2020).
- New financing possibilities linked to the recently approved EU COVID-19 recovery fund, and
over a longer term associated to the European Green Deal, should facilitate the deployment of
renewables in the islands, as the energy transition is a key target.

56
- Interconnections to mainland are very important for supply safety. Excessive dependency on
interconnections to mainland should be nevertheless avoided, due to risk of blackouts, as the
failure of a single element (one transmission line) can knock out instantaneously a large
proportion of the power of an island and even cause an island-wide blackout, as has occurred
several times in Malta in the last years.
Read more: Hazard indicator computation and normalization
Cooling degree days (CDD) are used to give an indication of the effect of outside air
temperature on building energy consumption during a specified period of time. The Cooling
Degree Days (CDD) index gives the number of degrees and number of days that the outside
air temperature at a specific location is higher than a specified base temperature. For the
indicator weight calculation, the observed values of CDD (EUROSTAT) have been used, and
compare to the hazard of the island. With respect to the normalization of the indicator, we have
used a fixed lower threshold and a relative maximum as upper threshold. The minimum CDD
value has been taken as 0, while the maximum CDD value has been taken as the maximum over
all islands, emissions scenarios and time periods (CDD=1183.49 ºC· days/year, corresponding to
Cyprus for RCP8.5 scenario, end of century period).
Standardised Precipitation-Evapotranspiration Index (SPEI) is a drought index that takes
into account not only the effect of precipitation variations, but also the effect of temperature
variations on evapotranspiration. The calculation is based on the monthly difference between
precipitation and potential evapotranspiration, which represents the monthly water surplus or
deficit. The indicator weight calculation was done using data from ECA&D (European Climate
Assessment & Dataset). The normalization of the indicator has taken into account the fact that
by definition, present conditions correspond to reference conditions (SPEI=0), and that all
future changes are towards negative SPEI values, that is towards drier conditions. Therefore, the
best score value (0) has been assigned to SPEI=0, while the worst score value (1) has been
assigned to the largest negative value found for all islands, emissions scenarios and time periods
(SPEI=-2.5, obtained for several islands under RCP8.5 emissions scenario by the end of
century).
The indicator Wind energy productivity (kWh/kW) is defined as the energy produced in a
period of time divided by the power installed, which is considered as unitary. The indicator is
calculated separately for land and sea. Offshore wind energy is the most developed ocean energy,
and it is likely to be an important future energy source for the analysed islands. Its characteristics
are typically very different to onshore wind energy, due to the large differences in surface
friction. The energy productivity values are averaged respectively over the island land points and
over the sea points in a domain that reaches a maximum distance of one degree latitude and
longitude respectively to the maximum and minimum longitude/latitude land points of the
islands.
The normalization is performed using absolute thresholds, that represent high or low global
values of productivity. These thresholds have been obtained from a global renewable power

57
report (IRENA, 2019). The maximum annual productivity would be 8760 kWh/kW,
corresponding to a 100% capacity factor. The obtained CF thresholds for onshore wind energy
are 20% (corresponding to a normalized score of 1) and 45% (normalized score of 0), while for
offshore energy they are 30% and 50%.
Photovoltaic productivity (kWh/kW) is defined as the energy produced in a period of time
divided by the power capacity installed. In order to obtain photovoltaic productivity, daily
surface solar radiation (SSR) and ambient temperature from the climate simulations are used as
input variables for a parametric PV model. The normalization is performed using absolute
thresholds, that represent high or low global values of productivity, taken from the same report
as for wind energy. In this case, the maximum threshold is adapted taking into account that the
calculations performed here assume fixed panels, while IRENA global report does not
differentiate between fixed and sun-tracking panels. Therefore, we estimate an upper CF
threshold (normalized score of 0) of 20% for fixed panels, from the 25% value deduced from
IRENA global report.
Renewable energy productivity droughts indicators are a way of quantifying the time-
variability of renewable energies that depend on meteorological conditions. Low values of energy
droughts correspond to a stable output, while high values correspond to a highly variable output.
The combined renewable energy droughts represent the complementarity between wind and PV
energy. A high complementarity of both sources reduces the need for energy storage or backup
sources.
Two different thresholds are calculated to determine moderate (50% of mean daily productivity)
and severe (20% of mean daily productivity) energy productivity droughts, respectively. For the
normalization of these energy drought indicators, we have used a combination of an absolute
threshold (a value of 0% of drought days) corresponding to a score of 0 and a relative maximum
upper limit, taken among all the islands and renewable energy technologies (55% of days with
moderate droughts, obtained for wind energy in Corsica) corresponding to a score of 1. The
same normalization limits are applied for wind, PV and combined productivity droughts.
4.4 Maritime Transport
Maritime transport is defined as the carriage of goods and passengers by sea-going vessels, on
voyages undertaken wholly or partly at sea. It is often considered as the backbone of the world
economy, with 80% of the global trade volume passing through ports (Asariotis & Benamara,
2012). For islands, the transport of goods and passengers by ship is even more essential. At the
same time, Maritime Transport contributes to climate change through its carbon emissions
which are found to be near 3% of the global CO2 equivalent emissions (Smith et al. 2015).
Compared to land and air transport, it is the (economically and ecologically) most effective way
of distributing goods globally. A changing climate will challenge Maritime Transport to adapt to
future risks and lower its emissions.

58
The whole range of potential impacts of climate change on ports operations and throughput is
still under study and it remains a high degree of uncertainty about it. Various climate change
stressors can affect both harbour infrastructure and ships on route. For example, ports are
vulnerable nodes of Maritime Transport as they are strongly affected by rising sea-levels, which
in turn affect port facilities and increase the risk of flooding. Sea-level rise has accelerated in the
last century and will rise by 0.43 to 0.84 m until 2100, depending on the emission scenario
(Pörtner et al., 2019). Due to ocean dynamics and the Earth’s gravity field, there will also be
regional differences in sea-level rise in the order of 0.1 m (Asariotis & Benamara, 2012). The
causes of sea-level rise are the thermal expansion of water and the melting of glaciers due to the
increase in global mean temperature (Vermeer & Rahmstorf, 2009).
Maritime transport can also be affected by climate change through the increase in the intensity of
extreme weather events including tropical-like cyclones. According to climate projections,
tropical cyclones are not expected to change significantly in frequency but in intensity due to
rising sea-surface temperatures (Pörtner et al., 2019). The resulting extreme winds and waves can
harm ships, but also cause damage and flooding of ports, especially in combination with sea-level
rise (Hanson & Nicholls, 2012).
For the Maritime Transport sector, three main climate change risks have been identified for the
SOCLIMPACT project. These are:
(a) risk of damages to ports’ infrastructures and equipment due to floods and waves,
(b) risk of damages to ships on route (open water and near coast) due to extreme weather
events,
(c) risk of isolation due to transport disruption.
We selected to operationalize the third one which in terms of hazards and impacts can be
considered as a combination of the other two. The hazard risk component indicators considered
for the operationalization were: extreme waves (SWHX98), extreme wind (WiX98) and mean sea
level rise (MSLAVE). The exposure indicators are: number of passengers (NPax), islands’ total
population (NTotP), value of transported goods expressed in freight (VGTStot) and number of
ports per island or archipelago (NPo), while the sensitivity indicators include: the number of
isolation days (NIID) and renovated infrastructure (NAgePo). Finally, for the component of
adaptive capacity the proposed indicators are: percentage of renewables (PEnRR), number of
courses/trainings (NTrCoRM), early warning systems (NOcSta) and harbour alternatives
(NApt). Unfortunately, due to the lack of reliable and consistent data we had to exclude the
“number of isolation days” and “number of courses/trainings” indicators. The conceptualization
framework of the operationalization is summarized in the next Figure.
For assessing future risk, we considered projections or estimations for the indicators when these
were available. This was mainly the case for the components of hazard (mean sea level rise,
extreme waves and wind), exposure (population, number of passengers, value of goods), and the
contribution of renewables. Two Representative Concentration Pathways (RCPs) were
considered for meteorological hazards. One “high-emission” or “business-as-usual” pathway
(RCP8.5) and a more optimistic one (RCP2.6) that is closer to the main targets of the Paris
Accord tο keep global warming to lower levels than 2 °C since pre-industrial times.

59
Figure 56: Conceptualization framework for the operationalization of the Maritime Transport Impact Chain:
Risk of Transport Disruption. Source: Soclimpac project deliverable 4.5
Besides the historical reference period, we consider two 20-year future periods of analysis. One
over the middle of the 21st century (2046-2065) and one covering the end of the 21st century
(2081-2100). The normalization of indicators was performed across the different islands in order
to facilitate and inter-island comparison and prioritize the islands of higher risk.
Regarding the weighting of the different risk components, we have tested several weights,
however, according to expert judgement and discussion with specialists on the Maritime sector,
we have found more appropriate to assign equal weights to all main components of risk (i.e. 0.33

60
for Hazard, 0.33 for Exposure and 0.33 for Vulnerability). For the sub-components of Exposure,
we have assigned a weight of 0.33 for Nature of Exposure and a weight of 0.66 for Level of
Exposure since the latter one is believed to be of greatest importance. Similarly, for the
vulnerability sub-components, we have assigned a weight of 0.25 for the Factors of Sensitivity
and a weight of 0.75 for the Factors of Adaptive Capacity.
The weighting and categorization of risk is a subjective decision, nevertheless we consider our
selection to be quite conservative and therefore we believe that a slightly different choice would
not significantly affect the main conclusions drawn. For the recent past/present conditions, the
operationalization of the Maritime Transport Impact Chain indicates low risk for all investigated
islands. In general, the Maritime Transport sector of the larger islands (e.g. Corsica, Cyprus and
Crete) is found to be more resilient to the impacts of climate change. Up to a point, this is
related to the large number of harbour alternatives in comparison with smaller islands.
Our results for the future highlight the importance of adopting a low-emission pathway since
this will keep the risk for Maritime Transport disruption in similar as present conditions while
for some islands the risk is expected to slightly decline. In terms of island inter-comparison,
Malta’s maritime sector is found to be most vulnerable, nevertheless, future risk even under
RCP8.5 is not expected to exceed medium risk values. On the contrary, Corsica is the island less
susceptible to climate change impacts. Detailed results for each investigated SOCLIMPACT
island are presented in the following sub-sections.
Table 9: Summary of present and future risk of isolation due to Maritime Transport disruption for each island
and scenario based on the Impact Chain operationalization.
Categorization:
Source: Soclimpact project deliverable 4.5
RISK VALUE PER
ISLAND
Historical
Reference RCP2.6 MID RCP2.6 END RCP8.5 MID RCP8.5 END
CYPRUS 0.241 0.210 0.218 0.258 0.292
CRETE 0.229 0.208 0.201 0.257 0.282
MALTA 0.376 0.347 0.335 0.395 0.414
CORSICA 0.220 0.194 0.194 0.243 0.273
CANARY ISLANDS 0.336 0.292 0.250 0.346 0.341
BALEARIC ISLANDS 0.326 0.281 0.264 0.331 0.344
0.00 – 0.20
Very low
0.20 – 0.40
Low
0.40 – 0.60
Medium
0.60 – 0.80
High
0.80 – 1.00
Very high

61
For the largest Greek island during the historical reference period the Impact Chain
operationalization indicates similar conclusions as the case of Cyprus. The risk value is
characterised as low (0.229) with more important contribution arriving from the factors of
adaptive capacity. This is due to the low contribution of renewables and the relatively low
number of harbour alternatives (e.g. airports) in the particular island. For RCP2.6 the risk of
transport disruption is projected to slightly decrease for the middle and remain stable for the end
of the 21st century. This mainly due to a higher contribution of renewable energy. This higher
contribution makes the island less dependent on the imported fossil fuel for energy production
and therefore increases its capacity to adapt and be self-sustained. For the business-as-usual
RCP8.5 our analysis indicates an increase for the end of the current century (risk value of 0.28).
This increase can be attributed to the projected augmentation of meteorological hazards (mainly
extreme winds and mean sea level rise). The fact that Crete is one of the islands where the level
of exposure indicators (population, number of passengers and value of goods) is expected to
strongly decrease, keeps future risk for transport disruption in relatively low levels.
READ MORE about the risk indicator computation: normalization of sub-component indicators on
Deliverable 4.5 Soclimpact project HERE
5 Socio economic impacts of climate change
5.1 Market and non-market effects of CC
Tourism
In order to analyse the reactions of tourists to the impacts of climate change and the preferences
for adaptation policies, several hypothetical situations were posed to 224 tourists visiting Crete
whereby possible CC impacts were outlined for the island (i.e., beach erosion, infectious diseases,
forest fires, marine biodiversity loss, heat waves, etc.).
Figure 57: Socio-economic characteristics and travel description: Tourists visiting Crete Source: Deliverable Report D5.5 Market and non-market analysis

62
Firstly, tourists had to indicate whether they would keep their plans to stay at the island or find
an alternate destination if the impact had occurred, which allows predictions of the effects on
tourism arrivals to be made for each island. Secondly, tourists were asked to choose between
various policy measures funded through an additional payment per day of stay – the tourists’
choices being an expression of their preferences for attributes/policies. To estimate the results,
the conditional logit model was run by using the Stata software.
In general, data confirms that tourists are highly averse to the risk of wildfires occurring more
often (26.80% of tourists would change destination). Moreover, they are not willing to visit
islands where infectious diseases become more widespread (23.20%) or the cultural heritage is
damaged due to weather conditions (17.40%). On the other hand, policies related to land habitat
restoration (2.4€/day), the prevention of infectious diseases (2€/day), and coastal infrastructures
protection (1.8€/day) are the most valued, on average, by tourists visiting this island.
Although climate change impacts are outside the control of tourism practitioners and policy-
makers, they can nevertheless utilise this knowledge to improve the predictability of the effect
that certain adaptation policies and risk management strategies, and develop their plans
accordingly.
Figure 58: Choice experiments results for the tourism sector: Tourists visiting Crete. Source: Deliverable Report D5.5 Market and non-market analysis
The infographic can be found in high resolution in the Soclimpact Project official
website HERE.

63
How tourists perceive the island destination: A comparative approach through the analysis of
social media
While historically destination image is projected by DMOs and tourists’ offices, the advent of
social media allow the construction of an image which is also a projection of tourists. The
content of their communication online shows the image they perceive. In this section we analyse
how tourists “talk” about the different islands on social media, in order to understand what the
perceived image is.
We use a specific tool (Google Cloud Vision) to scan the content of images posted by tourists on
Instagram (the market leader in visual social media) while they are on holiday in selected islands.
The content is translated in up to ten labels attached to each picture. For each island we
aggregate and rank the different labels to find out the most important characteristics tourists
associate to the island (assuming that they are correlated with the most frequent labels attached
to the pictures).
We analyse eight islands representative of the Atlantic Ocean (four islands of the Canary
Archipelago: Fuerteventura, Gran Canaria, Lanzarote, Tenerife) and of the Mediterranean Sea
(Crete, Cyprus, Malta, Sicily). We scan posts geotagged in these islands by tourists (identified by a
travel-related hashtag such as #visit #holiday #travel, etc) in summer 2019 (June to September),
returning a total number of 745,235 pictures considered in the analysis. The breakdown is in the
table below.
Table 10: Characteristics of the sample of pictures under analysis
Island
Indicator Tenerife
Gran Canaria
Fuerteventura Lanzarote Cyprus Crete Malta Sicily
Num. of posts (total)
49,234 33,145 38,452 25,471 63,561 93,752 74,925 119,896
Avg. num. of pictures per post
1.77 1.67 1.56 1.8 1.76 1.74 1.81 1.68
Share of geotagged posts
67% 67% 67% 65% 70% 74% 76% 73%
Number of scanned pictures
74,537 48,337 52,577 39,381 95,808 141,538 117,576 175,481
Source: Soclimpact project deliverable D5.3
After aggregating similar words, top labels for each island were obtained. The following pools
were created utilizing a frequency analysis, which is the total number of times the label occurs in
each island. A first glance at the word clouds shows that all destinations look extremely similar
which, perhaps, is of little surprise given that they all are European sea & sun destinations:
hence, labels like Sky, Sea, Vacation, Tree, Beach are among the most frequent for all islands.

64
Nonetheless, some differences can be spotted: Mountain appears relatively more frequently in
Tenerife than in other islands’; Sea and Ocean have relatively more weight in Fuerteventura;
Architecture and Building are of more importance in Cyprus, Crete, Malta and Sicily than in the
Canary Islands, something that is clearly linked to the density of cultural heritage in the
Mediterranean islands: in fact, all the labels representing architectural, religious and historical
sites (History, Historic, Ruins, Site, Ancient, Building, Dome, Mosque, Holy, Medieval, etc.) have
higher ranks in these islands than in the Canaries. The islands of this archipelago have more
similar images, but also reveal distinct features: for example Gran Canaria appears the most
urban, Tenerife is characterized by a higher frequency of labels related to partying and nightlife
but also for wildlife spotting, Lanzarote stands out for its arid landscapes and Fuerteventura for
the vast sandy seashores and turquoise waters as the frequencies of labels such Beach, Shore,
Sand, Coast, Turquoise, Ocean show.
Gran Canaria Tenerife Fuerteventura
Lanzarote Crete Cyprus
Malta Sicily

65
The impact of increased temperatures and heat waves on human thermal comfort
In order to assess how the variation in temperature impacts on the tourism sector through
changes in tourism demand our research question was: “How do increasing temperatures (and
heat waves) impact prices and, more in general, expenditure of tourists?” Arguably, when
temperatures grow, tourists adjust their behaviour: they might switch destination, or they might
stay longer or shorter depending on their attitudes and preferences. In turn, all these changes
modify the market equilibrium, pushing tourism companies to adjust their prices to re-establish
the equilibrium between demand and supply. The change in demand and the change in price
determine the change in tourism expenditure which is, from the destination’s perspective,
tourism revenue.
We monitored current weather conditions posted on several weather forecast providers and daily
prices posted on Booking.com by hotels. We then estimated the link between daily temperature
and daily price, controlling for all the other factors affecting prices. We finally applied these
estimates to the increase in the number of days with excessive temperature projected for the
future in two scenarios (RCP2.6 and RCP8.5) and in two time horizons (near future, about 2050;
distant future, about 2100).
Among the different indicators linked to thermal stress, Soclimpact is focusing on two: the
number of days in which the temperature is above the 98th percentile and the number of days in
which the perceived temperature is above 35 degrees. Although in D5.6 the impact for both
indices were computed, in this document we only report the second one (named HUMIDEX)
because it is the most intuitive and because human thermal stress is more related to the absolute
value of the temperature than its deviation from some pre-determined distribution. In line with
the project, we assumed that thermal stress appears when the perceived temperature grows
above 35 Celsius degrees.
As thermal stress is delimited in the summer months, and this is when the great majority of
tourists arrive in these islands, the whole analysis has been carried out in six months only: from
May to October included. In other words, we assume that there is no thermal stress (and hence
no impact on tourism) in the rest of the year.
Initially, three islands were investigated: Corsica, Sardinia, and Sicily, given the massive amount
of potential data. Other estimations were provided for Crete using the Index of Distance in
Destination Image to position each island in a range that goes from Sardinia / Corsica on one
side and Sicily on the other side. Without entering the details of the extrapolation method (which
are explained in D5.6 appendixes) a summary of results is reported here:

66
Table 11: Estimation of increase in average price and revenues for Crete
Actual share of days in
which humidex > 35
degrees
Future scenario
considered
Days in the corresponding
scenario in which humidex > 35
degrees
Increase in the
average price
Increase in the
tourism overnight
stays
Increase in
tourism revenues
17.15%%
rcp26near 26.52% 2.2% 0.4% 2.7%
rcp26far 27.95% 2.6% 0.5% 3.1%
rcp85near 30.52% 3.2% 0.6% 3.9%
rcp85far 56.44% 9.4% 1.9% 11.5% Source : Soclimpact project deliverable D5.3
According to these findings, the average increase in temperature, which is correlated to a
growing thermal stress for tourists, brings an economic advantage to tourism destinations. This
is only an apparent contradiction with previous findings. This study does not neglect the fact that
if islands are too hot, tourists will choose to move to other (cooler) destinations, that in principle
exist. Then, the increase in tourism (and tourism revenues) stem from the fact that, when the
temperature is too hot, people would prefer to move to coastal areas (where the climatic
conditions are more bearable) than staying inland or in cities. Future trends will also facilitate this
pressure of tourism demand (think about the spreading of smart working activities where, in
principle, the worker can relocate wherever he/she wants).
Energy
Climate change may impose welfare reductions to the European islands’ societies by affecting
thermal comfort. Cooling Degree Days (CDD) are a measure of how much (in degrees), and for
how long (in days), outdoor air temperature is higher than 18°C or 65° Farenheit. The CDD is
used as a measure of the energy needed to cool buildings. The increase in CDD and the energy
demand (GWh/year) for cooling are estimated for the islands, under different scenarios of
global climate change.
Under the high emissions scenario, it is expected that the CDD increase to 586 CDD3. This
value could be, for example, a combination of 243 days with temperatures of 20°C (586CDD).
Under this situation, the increase in cooling energy demand is expected to be 216%.
The infographics presented below can be found in high resolution in the Soclimpact
Project official website HERE.
3 The indicator is computed by multiplying the number of days exceeding the threshold by the difference in
temperatures. For example the CDD for 100 days at 20 °C is computed as 100*(20-18)= 200CDD

67
Figure 59: Estimations of increased energy demand for cooling in Crete under different scenarios of climate change
until 2100 Source: Deliverable Report D5.6
The Standardized Precipitation Evapotranspiration Index (SPEI) is analysed as a representative
indicator for increases in water demand for islands’ residents, tourists and agriculture, while it
also provides an indication on the available water stored in dams or underground resources. To
estimate the increase of energy demand due to the increase in water demand, it was assumed that
most of the islands will have to produce desalinated seawater (or groundwater) to meet further
increases of demand. Thus, the estimation of the increase in energy demand (GWh/year) to
produce more drinking water has been done based on the energy consumption required to
desalinate seawater.
Under the low emissions scenario (RCP2.6), there are not significant changes in the SPEI
indicator, that will remain in its ¨normal¨ level, as it is nowadays. Nevertheless, an increase of
32% in desalination energy demand is expected. Under RCP8.5 the scenario alerts on a severe
aridity leading to an increase of 159% of the energy demand.

68
Figure 60: Estimations of increased energy demand for desalination in Crete under different scenarios of climate
change until 2100 Source: Deliverable Report D5.6
Maritime Transport
For maritime transport, it has been estimated the impact of Sea Level Rise on ports' operability
costs of the island. The costs have been calculated with reference to1meter; this is, the
investment needed to increase the infrastructures' height by 1 meter. There is not necessarily a
strict correspondence between the SLR and the required elevation of port infrastructures, which
also depend on the coastal hydrodynamic and the shape of dikes of each port. By experts’
recommendation, we have assumed that 1 m increase in port height is required to cope with the
SLR under RCP 8.5 scenario of emissions. Extrapolation for other RCP scenarios is then
conducted based on proportionality.
The starting point was the identification of the principal ports in each island (economic
relevance). Second, the analysis of the different port areas (exterior, ramps, oil, etc.), and their
uses. Third, the elevation costs were estimated per each area and port separately (considering 1
meter elevation). Thus, the costs of 1-meter elevation presented are the sum of all areas and
ports analysed, and including the rest of the ports of the island (if applicable) based on
proportionality. Estimations consider that all ports areas of the entire area should be elevated at
the same time. In other words, the economic values can be interpreted as the depreciation
(amortization) costs of the investment needed to increase all ports’ infrastructures' in the island
for 125 years time horizon. No discount rate has been applied.
As expected, the rising of sea levels will affect the sector, as new investment will be needed to
keep ports’ operability. Under the high emissions scenario, it is expected that these costs could
increase 1.26 million of euros per year until the end of the century.
The infographic presented below can be found in high resolution in the Soclimpact
Project official website HERE.

69
Figure 61: Increased costs for maintaining ports’ operability in Crete under different scenarios of SLR caused by climate change until 2100
Source: Deliverable Report D5.6
5.2 Macroeconomic projections
The aim of our study is to assess the socioeconomic impacts of biophysical changes for the
island of Kriti. For this purpose we have used the GEM-E3-ISL model; a single-region, multi-
sectoral general equilibrium model based on the principles of neo-classical theory, and
GINFORS; a macro-econometric model based on the principles of post-Keynesian theory.
Both models include 14 sectors of economic activity, with an emphasis on services and
specifically on those composing the tourism industry. The GEM-E3-ISL model also include:
endogenous representation of labor market and trade flows etc.
Changes in the mean temperature, sea level and precipitation rates are expected to affect energy
consumption, tourism flows and infrastructure developments. These impact-chains have been
examined and quantified under two emission pathways: RCP2.6 which is compatible with a
temperature increase well below 2C by the end of the century and RCP8.5 which is a high-
emission scenario. The impact on these three (3) factors has been quantified in D5.6 and is used
as input in the economic models, which then assess the effects on GDP, consumption,
investments, employment etc.
MEAN SEA LEVEL RISE SLR

70
In total 17 scenarios have been quantified for Kriti. The scenarios can be classified in the
following categories:
1. Tourism scenarios: these scenarios examine the reduction in tourism revenues due to
changes in human comfort as captured by the hum-index, the degradation of marine
environment, increased risk of forest fires and beach reduction
2. Energy scenarios: these scenarios examine the impacts of increased electricity
consumption for cooling purposes and for water desalination
3. Infrastructure scenarios: these scenarios examine the impacts of port infrastructure
damages
4. Aggregate scenarios: these scenarios examine the total impact of the previous-described
changes in the economy.
In this scenario we examine the impacts of a simultaneous change in electricity consumption,
tourism revenues and infrastructure damages. The scenario specifications for the two climatic
variants are presented below:
Table 12: Aggregate scenario –results
Tourism revenues (% change from reference levels)
Electricity consumption (% change from reference
levels)
Infrastructure damages
(% of GDP)
RCP2.6 (2045-2060)
-11.21 3.8 -0.26
RCP2.6 (2080-2100)
-15.54 0.7 -0.25
RCP8.5 (2045-2060)
-39.19 10.3 -0.69
RCP8.5 (2080-2100)
-44.82 15.4 -0.68
Source: GEM-E3-ISL
The theoretical and structural differences of the two models mean that this study produces is a
reasonable range of impacts, given the uncertainty embodied in economic analysis and especially
in the long-term.
In GEM-E3-ISL, the economy is in equilibrium at each point in time. Prices adjust to ensure
that supply equals demand (market clearing), capital is fully used; however, the allows for
equilibrium unemployment. The impacts are driven mainly by the supply side through changes in
relative prices that determines competitiveness change, substitution effects etc. The GEM-E3-
ISL model assesses the impacts on the economy up to 2100.
The macro-econometric type of models, such as GINFORS, do not require that all markets are
in equilibrium; idle capital and involuntary unemployment are some other features of this type of

71
models where the results are driven mainly by adjustments in the demand side of the economy.
The GINFORS assesses the impacts on the economy up to 2050.
With respect to GDP the estimated change compared to the reference case is between -1.1% and
-1.3% in the RCP2.6 in 2050 and between -3.8% and -6.0% in the RCP8.5. The cumulative
reduction over the period 2040-2100 is estimated (by GEM-E3-ISL) to be equal to 2.1% in the
RCP2.6 and 7.9% in the RCP8.5.
Figure 62: Percentage Change in GDP. Source: GWS, own calculation
With respect to sectorial impacts both models show a significant decrease in the activity of
tourism related sectors and an increase in the activity of the manufacturing sector, highlighting
the opportunities for the development of domestic manufactured products.

72
Figure 63: Production percentage change from reference. Source: GWS, own calculation
Overall employment falls in the economy and especially in tourism related sectors following the
slowdown in domestic activity. In GEM-E3-ISL increases in employment in non-tourism related
activities are related to labor costs reductions (as wages fall and their competitiveness increases)
and a consequent substitution of capital with labor in other sectors. Employment falls on average
by 0.75% in the RCP2.6 and by 2.5% in the RCP8.5.

73
Figure 64: Employment percentage change from reference. Source: GWS, own calculation
6 Towards climate resiliency
6.1 Current situation: general commitment, specific limits and obstacle
The development of a strategy for adapting to climate change is National and Regional
obligation arising from the Framework Convention on Climate Change, commitments to the EU
and the Paris Agreement on Climate Change.
The implementation of the National Program for the reduction of greenhouse gas emissions for
the period 2000-2010, was approved by the Council of Ministers with the act of 5 / 27.2.2003
(Government Gazette 58A / 5.3.03). In April 2016, the Ministry of Environment and Energy
completed the National Strategy for Climate Change Adaptation (ESPKA). The country ratified
the Agreement on 06.10.2016 Paris (with Law 4426/2016, Government Gazette A'87) and
submitted ratification documents on 14.10.2016.
According to article 43 of Law 4414/2016, the regions have the obligation to prepare Regional
Plan for Adaptation to Climate Change (PESPKA). PESPKA is one integrated plan that
identifies and prioritizes the necessary measures and actions of adaptation and in accordance
with Regulation 1303/2013 / EU constitutes in advance a validity for implementation NSRF

74
programs. The basic structure of PESPKA is defined in HA 11258 "Specialization content of
Regional Plans for Adaptation to Climate Change (PESPKA), according to Article 43 of Law
4414/2016 (Α΄149) "(Government Gazette 873B / 2017).
The Region of Crete is in the process of submitting a proposal for the Regional Adaptation
Strategy for Climate Change. The objective of the Region of Crete is to draw up a plan that will
provide answers around the actions that will have to be implemented against climate change,
which affects everyday life, local economy, agriculture, livestock farming, fisheries, tourism and
more.
According to the decision of the Regional Council 28/2015, the (RIS3CRETE) Smart
Specialization Strategy of Crete was approved. This official text mentions how the Region of
Crete will deal with climate change and how the policies of the region are generally integrated
and interact.
In particular, the Smart Specialisation Strategy of the Region of Crete aims at using the potential
of innovation and scientific knowledge in order to:
(a) revitalise the agro-alimentary complex so as to adapt to climate change, strengthening of
export branches and promotion of the value of Cretan nutrition which is Crete’s intangible
cultural heritage.
(b) achieve the consolidation in the international market of a competitive cultural - tourism
complex, with unique and original features
(c) reduce Crete’s dependence on conventional forms of energy
(d) shift towards the sustainable use of the island’s natural resources
(e) make the best of the sea’s possibilities
(f) develop world-class educational and training activities for its human capital which will rely on
Crete’s educational web
(g) develop production activities of high added value in emerging sectors which will rely on
Crete’s educational web
Reducing dependence on conventional energy sources through energy saving in buildings,
lighting and infrastructures (wastewater and water management) and the full exploitation of the
potential of renewable energy in the context of the particularities of Crete, in terms of
sustainability. Region of Crete is taking action by guidelines and proposed measures for water
management in crops, as well as specific measures for adapting olive cultivation to climate
change. And is in process to involve stakeholders in the preparation of adaptation policies
mainly trough EU projects.

75
Table 13: Specific limits and obstacle and relevant documents
Specific limits and obstacle
- Until nowadays, spatial planning, urban planning and maritime spatial planning policies do not consider the impacts of climate change.
- Regional Policies depend on National Policies and National Legislation to be followed. The main obstacles are slow procedures due to bureaucracy and funding constraints.
Relevant documents
- National Strategy for Climate Change - The no. 11258 / 6-3-2017 (Government Gazette 873 / Β '/ 16-3-2017) on "Specialization of
Regional Content Climate Change Adaptation Plans in accordance with Article 43 of Law 4414/2016 (A149): link
Source: Deliverable 7.1 Conceptual framework

76
7 References
Asariotis, R. & Benamara, H. (Eds.). (2012). Maritime transport and the climate change
challenge. Routledge.
Fritzsche et al. (2014). The Vulnerability Sourcebook: Concept and guidelines for standardized
vulnerability assessments
GIZ (2017) The Vulnerability Sourcebook: Concept and guidelines for standardised vulnerability
assessments. Deutsche Gesellschaft für Internationale Zusammenarbeit (GIZ)
Gutiérrez, C., Somot, S., Nabat, P., Mallet, M., Corre, L., van Meijgaard, E., Perpiñán, 0. &
Gaertner, M. Á. (2020). Future evolution of surface solar radiation and photovoltaic potential in
Europe: investigating the role of aerosols. Environmental Research Letters, 15(3), 034035.
Handisyde, N., Lacalle, D. S., Arranz, S., & Ross, L. G. (2014). Modelling the flood cycle,
aquaculture development potential and risk using MODIS data: A case study for the floodplain
of the Rio Paraná, Argentina. Aquaculture, 422, 18-24.
Hanson, S. & Nicholls, R. J. (2012). Extreme flood events and port cities through the twenty-
first century. Maritime Transport and the Climate Change Challenge, 243.
IRENA (2019). Renewable Power Generation Costs in 2018, International Renewable Energy.
Agency, Abu Dhabi.
MaREI to lead €9m project to build floating offhsore platform. Retrieved from:
https://www.marei.ie/marei-to-lead-e9m-project-to-build-floating-offshore-platform/
MarineEnergy (2019a). WavEC: Combined Wind, Wave and Solar to Transform Marine Energy.
Retrieved from https://marineenergy.biz/2019/12/16/wavec-combined-wind-wave-and-solar-
totransform-marine-energy/
Masterton JM., RichardsonF.A. (1979). Humidex, a method of quantifying humandiscomfort due
to excessive heat and humidity, CLI 1–79, Environment Canada.Atmospheric Environment
Service, Downsview, Ontario.
Pisacane, G., Sannino, G., Carillo, A., Struglia, M. V., & Bastianoni, S. (2018). Marine energy
exploitation in the Mediterranean region: steps forward and challenges. Frontiers in Energy
Research, 6, 109.
Pörtner, H. O. and Peck, M. A. (2011). Effects of Climate Change: In: Farrell, A. P. (ed.)
Encyclopedia of Fish Physiology: From Genome to Environment, San Diego: Academic Press
Proestos Y, Christophides GK, Ergüler K, et al (2015) Present and future projections of habitat
suitability of the Asian tiger mosquito, a vector of viral pathogens, from global climate
simulation. Philos Trans R Soc B Biol Sci 370:1–16. doi: 10.1098/rstb.2013.0554.
Raynaud, D., Hingray, B., François, B., & Creutin, J.D. (2018). Energy droughts from variable
renewable energy sources in European climates. Renewable Energy, 125, 578-589.

77
Schneiderbauer, S., Pedoth, L., Zhang, D., & Zebisch, M. (2013). Assessing adaptive capacity
within regional climate change vulnerability studies—an Alpine example. Natural hazards, 67(3),
1059-1073.
Scholte JE, Schaffner F (2007). "Waiting for the tiger: establishment and spread of the Aedes
albopictus mosquito in Europe". In Takken, W.; Knols, B. G. J. (eds.). Emerging pests and
vector-borne diseases in Europe. 1. Wageningen Academic. Publishers. ISBN 978-90-8686-053-
1.
Smith, T. W. P., Jalkanen, J. P., Anderson, B. A., Corbett, J. J., Faber, J., Hanayama, S., O’Keeffe,
E., Parker, S., Johansson, L., Aldous, L., Raucci, C., Traut, M., Ettinger, S., Nelissen, D., Lee, D.
S., Ng, S., Agrawal, A., Winebrake, J. J., Hoen, M., ... Pandey, A. (2015). Third IMO Greenhouse
Gas Study 2014. International Maritime Organization.
Vermeer, M. & Rahmstorf, S. (2009). Global sea level linked to global temperature. Proceedings
of the national academy of sciences, 106(51), 21527-21532.
Waldock J, Chandra NL, Lelieveld J, et al (2013) The role of environmental variables on Aedes
albopictus biology and chikungunya epidemiology. Pathog Glob Health 107:224–241. doi:
10.1179/2047773213Y.0000000100.
Zotalis, K., Dialynas, E. G., Mamassis, N., & Angelakis, A. N. (2014). Desalination technologies:
Hellenic experience. Water, 6(5), 1134-1150.

APPENDIX 6

1
TABLE OF CONTENT
INTRODUCTION .............................................................................................................................. 2
1 CURRENT SITUATION AND RECENT TRENDS ................................................................................. 4
1.1 CURRENT GEOPOLITICAL CONTEXT ........................................................................................................... 4 1.2 CURRENT CLIMATE AND RISKS ................................................................................................................ 6 1.3 MACROECONOMIC STATUS .................................................................................................................... 8 1.4 RECENT EVOLUTION OF THE BLUE ECONOMY SECTORS ................................................................................ 8
2 ECONOMIC PROJECTIONS ........................................................................................................... 13
2.1 THE MACROECONOMIC PROJECTIONS .................................................................................................... 13 2.2 THE SECTORAL PROJECTIONS ................................................................................................................ 14 2.3 EMPLOYMENT ................................................................................................................................... 15
3 CLIMATE CHANGE OUTLOOK ....................................................................................................... 17
3.1 TOURISM ......................................................................................................................................... 17 3.2 AQUACULTURE ................................................................................................................................. 22 3.3 ENERGY ........................................................................................................................................... 23 3.4 MARITIME TRANSPORT ....................................................................................................................... 32
4 CLIMATE CHANGE RISKS ............................................................................................................. 37
4.1 TOURISM ......................................................................................................................................... 37 4.2 AQUACULTURE ................................................................................................................................. 67 4.3 ENERGY ........................................................................................................................................... 86 4.4 MARITIME TRANSPORT ....................................................................................................................... 96
5 SOCIO ECONOMIC IMPACTS OF CLIMATE CHANGE .................................................................... 101
5.1 MARKET AND NON-MARKET EFFECTS OF CC .......................................................................................... 101 5.2 MACROECONOMIC PROJECTIONS ........................................................................................................ 110
6 TOWARDS CLIMATE RESILIENCY ................................................................................................ 114
6.1 CURRENT SITUATION: GENERAL COMMITMENT, SPECIFIC LIMITS AND OBSTACLES .......................................... 114
7 REFERENCES ............................................................................................................................. 118

2
Introduction
This report provides the background material for stakeholders in the upcoming
adaptation pathways workshop in Cyprus. First, a presentation that includes the
geography and socio-economic context for the Island, and the socioeconomic trends
without Climate Change (WP6), which range from the present to the end of the century.
Regarding Climate Change, the expected climate risks and vulnerabilities for the blue
economy are presented (WP3), joint to the expected trends of physical risks, both current
and future (WP4). Finally, specific economic impacts are estimated, considering the
evolution of some physical risks (WP5 and WP6). The current climate policy and
resilience of the island is also presented (WP7). Finally, a link to the project’s original
work is made in the references section.
Cyprus at-a-glance
Cyprus is an island situated at the north-eastern end of the Mediterranean basin. It
covers an area of 9,251 sq. km and stands at the crossroads of Europe, Africa, and Asia.
It is the third largest island in the Mediterranean, smaller than Sicily and Sardinia, but
larger than Corsica and Crete. It has a population of about 870,000, with the capital
Lefkosia situated in the heart of the island. The island can be reached by air and sea
transport, and the main means of transport on the island are cars, bicycles, and buses.
The main economic sectors estimated in 2018 are agriculture (2.3% of GDP), industry
(14.1% of GDP) and services (83.6% of GDP). Tourism is the largest economy of the
services sector, with a total contribution of 21.9% towards the total GDP in 2018.
According to Eurostat, the share of energy from RES amounted to 13.88% in 2018.
The Blue Economy sectors
Aquaculture
Aquaculture in Cyprus constitutes an important component of its primary agricultural
production, showing impressive growth rates and high-quality export products. As the
global production of the capture fisheries sector decreases in the last twenty years and
the demand for fishery products continues to grow, the contribution of aquaculture to
the fishery products consumed worldwide each year has increased from about 10% in the
‘70s to around 50% in 2016.
Maritime Transport
Cyprus has over the years become one of the largest and widely known shipping centres
in the world, comprising both ship owning and ship management companies. It is the
largest third-party ship management centre in Europe and amongst the top three
worldwide. Several of the ship management companies that operate on the island rank
among the largest of their kind in the world and it is estimated that they manage about
20% of the world’s third-party managed fleet.

3
Energy
Cyprus is an island with no exploited indigenous hydrocarbon energy sources. This
means that its power generation system operates in isolation and totally relies on
imported fuels for electricity generation. Currently, the primary imported fuel used in
electricity generation is heavy fuel oil and gasoil. Cyprus’ power generation system
consists of three thermal power stations with a total installed capacity of 1480 MWe.
Tourism
The travel and tourism industry is the largest commercial sector of Cyprus, contributing
21.9% of the country’s GDP in 2018. The number of tourist arrivals in 2017 reached
3,652,073 – corresponding to an increase of 14.6% from 2016. Europe is the traditional
tourist market for Cyprus, with visitors from European countries constituting 87.5% of
the total tourist arrivals in 2017, while visitors from European Union countries making
up 59.7%. The United Kingdom is the most important source of tourism to the island
and its share was 34.3% of the total tourist traffic in 2017, followed by Russia with
22.6%, Israel with 7.1%, Germany with 5.2%, and Greece with 4.6%. The total revenue
from tourism during this period was estimated at €2,639.1 million compared to €2,363.4
million in 2016, recording an increase of 11.7%. The majority of tourists stated to have
stayed in coastal areas of the island, such as Pafos and Polis, Ayia Napa, Paralimni,
Larnaka, and Lemesos.

4
1 Current situation and recent trends
1.1 Current geopolitical context
Cyprus is a small island of 9.253 sq. km (3.572 sq. miles), extending 240 km (149 miles)
from east to west and 100 km (62 miles) from north to south. It is strategically situated in
the far eastern end of the Mediterranean (33° E, 35° N), at the crossroads of Europe,
Africa and Asia, and in close proximity to the busy trade routes linking Europe with the
Middle East, Russia, Central Asia and the Far East.
Cyprus has a Mediterranean climate: hot dry summers from June to September and mild,
wet winters from November to March, which are separated by short Autumn and Spring
seasons of rapid change in weather patterns in October, April and May. Sunshine is
abundant during the whole year, particularly from April to September when the daily
average exceeds eleven hours. There are two mountain ranges on the island: the
Pentadaktylos range which runs along almost the entire northern coast, and the Troodos
massif in the central and south-western parts of the island which culminates in the peak
of Mount Olympus, 1.953 m above sea level. Cyprus’ 648 m coastal line is indented and
rocky in the north with long sandy beaches in the south. Between the two ranges lies the
fertile plain of Mesaoria. Cyprus became politically independent from British rule in
1960. The Turkish invasion, launched on 20 July 1974, resulted in the occupation of
35,2% of the island’s territory and about 200.000 Greek Cypriots were displaced.
On 1 May 2004 the Republic of Cyprus became a full member of the EU and in January
2008 Cyprus joined the Eurozone. Accession to the EU was a natural choice for Cyprus,
dictated by its culture, civilization, history, its European outlook and adherence to the
ideals of democracy, freedom and justice. Since its accession to the EU, Cyprus has
undergone significant structural reforms that have transformed its economic landscape.
Trade and interest rates have been liberalized, while price controls and investment
restrictions have been lifted. Private financing has been introduced for the construction
and operation of major infrastructure projects and monopolies have been abolished.
The new political context created by the accession to the EU is also expected to impact
positively on the efforts to reach a comprehensive settlement to the division of Cyprus
that will reunite its people and reintegrate its economy.
Population dynamics of the island
Cyprus is also characterized by an increasing aging population (Table 1), as most EU27
Member States (CyStat, 2019a; 2019b).

5
Table 1: Population distribution by age group (2009-2018).
Age range 2009 2010 2011 2012 2013 2014 2105 2016 2017 2018
0-14 (%) 17.2 16.8 16.5 16.4 16.3 16.4 16.4 16.3 16.2 16.1
15-44 (%) 45.9 46.1 46.3 45.9 45.1 44.5 44.1 43.9 43.8 43.7
45-64 (%) 24.4 24.4 24.4 24.5 24.7 24.5 24.4 24.2 24.1 24.1
65+ (%) 12.5 12.7 12.8 13.2 13.9 14.6 15.1 15.6 15.9 16.1 Sources: Cyprus Statistical Service (Cyprus in Figures 2018 Edition; Demographic Statistics 2018).
The reference projection of population in Cyprus is displayed in Figure 1, which marks
the population for the period 2018-2100 (Eurostat, 2018a).
Figure 1: Baseline population projection for Cyprus (2015-2100). Sources: Eurostat.
Labour force
The labour force (i.e., the employed and the unemployed persons) amounted to 437,495
persons in 2018, of which 228,509 were males and 208,985 females. The labour force
participation rate for the age group 15-64 was 75% of the total population of this age
group or 426,159 persons. The respective percentage for males was 79.9% or 219,657
persons, and for females 70.4% or 206,503 persons. Figure 2 illustrates the changes in
labour force, employment and rate of unemployment from 2005 to 2018 (Eurostat,
2018b).

6
Figure 2: Labour force change in Cyprus (2005-2018). Sources: Eurostat.
1.2 Current climate and risks
The main features of the Mediterranean climate of Cyprus are marked by the hot and dry summers from mid-May to mid-September, the rainy but mild winters from mid-November to mid-March, and two short autumn and spring transitional seasons of rapid change in weather conditions.
During the summer, Cyprus is influenced by a shallow trough of low pressure, which has its centre in southwest Asia, resulting in high temperatures and clear skies. Rainfall is very low with an average value under 5% of the average total rainfall of the whole year. In winter, Cyprus is affected by the frequent passage of small depressions and fronts moving in the Mediterranean from west to east. These weather disturbances can last up to three days at a time and give the greatest amounts of precipitation. The total average rainfall during December-February corresponds to approximately 60% of the total rainfall of the year.

7
Figure 3: Climate factsheet Source: Own elaboration with data from GFDRR ThinkHazard!; D7.1 Conceptual Framework and Meteoblue; Meteoblue global NEMS (NOAA
Environmental Modeling System)
The central Troodos massif (at 1,951 metres) and, to a lesser extent, the Pentadaktylos mountain range (at roughly 1,000 metres) play an important role in shaping the meteorological conditions in the various regions of Cyprus and in creating local phenomena. The presence of the sea surrounding the island is also a cause of local phenomena in the coastal areas. This, together with high sunshine and mostly clear skies bring significant seasonal and daily variations in temperatures between the coastal regions and the inland areas of the island.

8
1.3 Macroeconomic status
Cyprus is a service-led economy. In 2018, the main sources of income in Cyprus derived
from tertiary activities, which comprised 84% of the country’s GDP. In particular,
wholesale and retail trade, real estate activities and financial and insurance activities
provided the highest income in the last year. Secondary activities (mainly construction
and manufacturing) accounted for 14% of the GDP, and finally primary activities
(agriculture, forestry and fishing) made up the remaining 2% of the GDP.
A summary of the exports/dispatched from Cyprus for 2018 are provided in Table 2
(CyStat, 2019c). The main agricultural products domestically produced that were
exported in 2018 consist of potatoes (2.71%), fish (1.99%) and citrus fruit (0.82%).
Bentonite was the most exported domestic mineral product, contributing to 0.27% of
Cyprus’ exports. Regarding industrial products of agricultural origin, the top domestically
produced items exported were halloumi and other cheeses (12.88%), and also fruit and
vegetable juices (2.21%). Mineral fuels and oils were the main exported industrial
products of mineral origin produced domestically, which accounted for 41.02% of all
exported goods. Finally, for industrial products of manufacturing origin, the leading
exported products comprised pharmaceutical products (17.32%) and waste and scrap of
paper, glass and metal (2.60%).
Table 2: Cyprus exports/dispatches for 2018.
EXPORTS & DISPATCHES, 2018 2018 (Euro mn)
Total exports/dispatches 4,263.6
Exports/dispatches of:
foreign produced goods 2,691.2
domestically produced goods 1,572.3
Domestic exports/dispatches, excluding stores and provisions 1,561.7
by Category (%)
Agricultural products 5.90
Minerals 0.40
Industrial products of:
agricultural origin 16.97
mineral origin 44.44
manufacturing origin 31.41
Unclassified 0.88 Sources: Cyprus Statistical Service (Intra-Extra EU Trade Statistics January-December 2018, Foreign Trade Statistics Series III Report No. 153).
1.4 Recent evolution of the Blue Economy sectors
This subsection provides an overview of recent trends observed in Cyprus with regards
to tourism, maritime transport, aquaculture, and energy.

9
Tourism
The movement of travellers to and from Cyprus in 2018 recorded an increase in arrivals
and departures compared to 2017. Total arrivals of travellers reached 5,535,797 recording
an increase of 6.1% and departures totalled 5,521,515 recording an increase of 6.2%
compared to 2017. International visitors arriving in Cyprus reached 4,024,119 in 2018,
compared to 3,750,074 in 2017 (Figure 4).
The number of same-day visitors who did not stay overnight in the country, reached
85,494 in 2018 compared to 98,001 in 2017. Same-day visitors from ports accounted for
72.2% and same-day visitors from airports for 27.8% of total same-day visitors. The
majority of same-day visitors from airports were British (50.2%), Israelis (18.4%) and
Greeks (8.6%).
Europe has as usual been the traditional tourist market for Cyprus. In 2018, European
countries provided the island with 88.2% of the total tourist arrivals and the European
Union countries with 62.3%. The United Kingdom is the most important source of
tourism to the island and its share was 33.7% of the total tourist traffic, followed by
Russia with 19.9%, Israel with 5.9%, Germany with 4.8% and Greece with 4.7%.
Figure 4: Development of tourist arrivals in Cyprus Source: The World Bank.
In 2018, the total revenue from tourism was estimated at €2,710.6 million compared to
€2,639.1 million in 2017 recording an increase of 2.7%. Tourism Satellite Accounts
(TSA) provides data of inbound tourism expenditure, domestic expenditure and other
tourism consumption. In some regions, this information is not computed on a regular
basis, hence it is necessary for information to be extracted from local tourism
departments. For the case of Cyprus, national TSA data is quite outdated (relating to
2007).

10
Maritime Transport
The maritime and shipping sector in Cyprus is of global importance as the country has
the 11th largest sovereign flag in terms of tonnage in the world and among the top five
ship-management services in the world. Due to its position, Cyprus is a major shipping
centre within the EU registering the 3rd largest tonnage in the Union. The maritime
cluster of Cyprus is highly diverse in its composition, while ship-management companies
from all over the world consist a large part of it. The development of the sectors is
enhanced by the stable and strong state support through the tax regime and innovation
policies. In the last years the sector has seen a noticeable boost due to the dedicated
support policies and geopolitical developments (e.g., Brexit, reconstruction of
neighbouring countries).
As the maritime sector is important in scale and complexity, it is highlighted that for the
research interests of SOCLIMPACT project, namely the estimation of climate impacts
on the Blue Economy sectors, not all components of the sector are relevant. Specifically,
only maritime transportation strictly related to the transportation of passengers and
goods to and from the island is relevant to this analysis, while other major components
such as ship-management, naval engineering and shipbuilding are not part of this
analysis. To this end, the projections presented below refer to water transport as in the
Eurostat classification, thus to the narrower estimation of transportation of passengers
and goods that includes sea and coastal passenger and freight transport, as well as inland
passenger and freight transport.
Aquaculture
Aquaculture in Cyprus is an important component in primary agricultural production,
showing impressive growth rates and high-quality export products. Currently, nine (9)
marine open sea cage farms operate in Cyprus, with a total value of production equal to
45.4 million euros in 2018 (Table 3). Cyprus also operates to aquaculture research
stations, the Cyprus Marine Aquaculture Research Centre and the Freshwater
Aquaculture Research Station. According to the Department of Fisheries and Marine
Research of the Ministry of Agriculture in Cyprus1, the direct employment of the
aquaculture sector is currently around 340 persons.
1 http://www.moa.gov.cy/moa/dfmr/dfmr.nsf/All/CF42DB069283278342257E960035E13B?OpenDocument

11
Table 3: Aquaculture production for Cyprus in 2017.
FATTENING FARMS (TABLE-SIZE)
SPECIES
LOCAL MARKET EXPORTS TOTAL
QUANTITY (tonnes)
VALUE (€)
QUANTITY (tonnes)
VALUE (€)
QUANTITY (tonnes)
VALUE (€)
Seabream 1,619.00 8,740,616 3,261.00 14,437,284 4,880.00 23,177,900
Seabass 815.00 5,754,904 1,650.00 10,130,660 2,465.00 15,885,564
Meagre 0.28 1,485 0.00 0 0.28 1,485
Red Seabream
0.00 0 0.00 0 0.00 0
Shrimp 28.00 300,000 0.00 0 28.00 300,000
Rainbow Trout
43.60 335,500 0.00 0 43.60 335,500
Sturgeon 1.50 37,500 0.00 0 1.50 37,500
TOTAL 2,507.38 15,170,005 4,911.00 24,567,944 7,418.38 39,737,949
HATCHERIES (FRY)
SPECIES
LOCAL MARKET EXPORTS TOTAL
QUANTITY (number)
VALUE (€)
QUANTITY (number)
VALUE (€)
QUANTITY (number)
VALUE (€)
Seabream 11,397,954 1,677,424 8,435,723 1,994,911 19,833,677 3,672,335
Seabass 7,017,729 1,018,684 3,657,565 958,458 10,675,294 1,977,142
Shrimp 1,100,000 11,000 0 0 1,100,000 11,000
Spinefoot 10,000 2,000 0 0 0 0
Rainbow Trout
93,600 2,773 0 0 93,600 2,773
Sturgeon 0 0 0 0 0 0
TOTAL 19,619,283 2,711,881 12,093,288 2,953,369 31,702,571 5,663,250 Source: SOCLIMPACT Deliverable D6.2.
Energy
Electricity generation is dominated by imported fuel oil, while renewable sources are
gradually gaining importance. Figure 5 indicates that the share of renewable sources in
total electricity production reaches 9% in 2017. However, as indicated in the National
Energy and Climate Plan (DoE, 2020) submitted by Cyprus to the EC in January 2020
(Figure 5), production of electricity by fuel oil is almost entirely substituted by natural gas
while renewable penetration reaches 25% towards 2030.

12
Figure 5: Electricity generation by source in Cyprus in the period 1990-2017.
Sources: IEA.
Figure 6: Projected generation mix till 2030 – PPM scenario, with all available Technologies contribution.
Sources: Cyprus’ Integrated National Energy and Climate Plan.
0
1000
2000
3000
4000
5000
6000
1990 1995 2000 2005 2010 2015 2017
Gen
erat
ion
(G
Wh
)
Oil Solar PV Biofuels Wind

13
2 Economic projections
2.1 The macroeconomic projections
According to the projections, Cyprus continues to grow with a 1.8% yearly rate
throughout the 2015-2100 period and 2.3% for the 2015-2050 period. The main driver of
growth during the short-term period is investments while private consumption continues
to play a key role (Table 4).
Table 4: Cyprus GDP and GDP components yearly growth rates in 2020-2100. GROWTH RATES OF GDP COMPONENTS, 2020-2100
2020 2025 2030 2035 2040 2045 2050 2060 2070 2100
Growth rates (%)
GDP 2.5 2.1 1.7 2.5 2.8 2.4 2.3 1.1 1.5 1.6
Private consumption
1.6 1.9 1.6 2.0 2.7 2.1 1.8 1.2 1.2 1.6
Public consumption
-0.8 2.1 1.7 2.5 2.8 2.4 2.3 1.1 1.5 1.6
Investments 9.9 1.0 1.2 2.5 2.3 3.5 2.7 0.6 2.5 1.1
Trade 2.7 -1.4 0.3 -2.8 1.1 1.3 -3.5 -0.6 0.9 -4.6 Source: SOCLIMPACT Deliverable D6.2.
Nevertheless, the contribution of private consumption to GDP is diminishing towards
2100, compensated by the growth of investments and an improved net trade position
(Figure 7). This indicates a transition towards a more sustainable economy that reduces
its reliance on imported consumption and increases its productive capacity through
investment activity. Investments grow with a high pace towards 2020, counterbalancing
the lack of investments during the economic crisis, while presenting a stable growth rate
throughout the 2025-2050 period which is higher than that of GDP. We assume that the
GDP-share of public consumption remains the same throughout the 2015-2100 period
as Cyprus has already a privatized economy.
Figure 7: Macroeconomic components as a percentage share of GDP for Cyprus in 2015-2100. Source: SOCLIMPACT Deliverable D6.2 - own calculations.

14
2.2 The sectoral projections
The Cyprus economy remains a service-led economy throughout the 2015-2100 period
(Table 5), with an increasing contribution of market, accommodation and food services.
Moving towards the end of the century, the share of primary and secondary sectors in
gross value added (GVA) falls further to the benefit of sectors with higher value added.
Demand for construction services increases in line with investment demand but with a
lower growth rate, while transport services increase with a rate higher than GDP in order
to enable the growing economic linkages of the island with the rest of the world.
Blue growth sectors increase in importance throughout the 2015-2100 period. In
particular, the contribution of tourism in total value added grows from 20% in 2015 to
28% in 21002. While the water transport sector grows steadily, travel agency and related
activities register a declining share in total value added as they grow with a lower rate
than that of GDP. Table 5 illustrates the changes to the sectorial decomposition of GVA
for Cyprus from 2015 until the near future (2050) and the distant future (2100).
Table 5: Sectoral contribution as a percentage share of total GVA for Cyprus in 2015-2100.
SECTORIAL CONTRIBUTION, 2020-2100
2015 2020 2025 2030 2035 2040 2045 2050 2060 2070 2100
GVA share (%)
Agriculture 1.9 1.5 1.5 1.5 1.5 1.5 1.5 1.6 1.6 1.5 1.5
Fishery 0.2 0.2 0.2 0.2 0.2 0.2 0.2 0.2 0.2 0.2 0.2
Manufacturing 3.3 4.2 4.3 4.4 4.1 4.2 4.4 4.0 3.5 3.5 3.6
Consumer goods 1.7 1.4 1.4 1.4 1.4 1.4 1.3 1.5 1.6 1.4 1.4
Electricity 1.7 1.6 1.6 1.6 1.6 1.6 1.6 1.5 1.5 1.5 1.5
Water 0.2 0.2 0.2 0.2 0.2 0.2 0.2 0.2 0.2 0.2 0.2
Construction 3.2 4.0 3.9 3.9 4.5 4.5 4.8 4.8 4.8 5.3 5.2
Water transport 3.2 3.8 4.0 4.2 4.4 4.6 4.9 4.3 3.9 3.9 4.3
Other transport 3.8 4.0 4.1 4.0 3.4 3.4 3.4 3.7 3.4 3.2 3.1
Accommodation and food services
6.4 6.5 6.6 6.7 6.4 6.4 6.2 5.7 6.0 5.9 6.2
Travel agency and related activities
1.1 0.9 0.9 0.9 0.8 0.7 0.6 0.7 0.7 0.6 0.5
Recreational 0.3 0.4 0.4 0.4 0.4 0.4 0.5 0.4 0.4 0.4 0.4
2 The share of tourism in GDP is calculated via the tourism satellite account (TSA) matrices of 2015, assuming that the same shares that indicate the contribution of tourism to the productions of tourism-related sectors (such as the accommodation and food services, transport services, travel agency and related activities, cultural and recreational activities) remain throughout the 2015-2100 period.

15
services
Other market services
52.3 53.0 52.6 52.1 52.9 53.0 52.8 53.8 55.6 56.6 56.1
Non-market services
20.7 18.3 18.4 18.5 18.2 17.8 17.5 17.7 16.7 16.0 15.8
Source: SOCLIMPACT Deliverable D6.2 - own calculations.
Figure 8: Sectoral contribution as a percentage share of total GVA for Cyprus (2015, 2050, 2100). Source: SOCLIMPACT Deliverable D6.2 - own calculations.
2.3 Employment
The service-led economic growth brings positive effects to the labour market with
unemployment projected to fall from 15% in 2015 to more sustainable levels within a 20-
year period. The contribution of each sector to total employment depends on the labour
intensity of the sector. The biggest employing sectors are the market and non-market
services as well as construction. Manufacturing and other transport sectors also retain
their shares throughout the 2015-2100 period. Tourism is largest employer of the Blue
growth sectors under analysis, particularly due to the high labour intensity of
accommodation and food services. Water transport employs an only small share of total
and thus has the lowest contribution among the Blue growth sectors.
Table 6: Sectoral contribution as a % share of total gross value added for Cyprus in 2020-2100. 2015 2020 2025 2030 2035 2040 2045 2050 2060 2070 2100
Unemployment rate 15.0% 11.1% 9.8% 6.1% 5.9% 5.9% 5.9% 5.9% 5.7% 5.6% 5.8%
Source: SOCLIMPACT Deliverable D6.2 - own calculations.

16
Figure 9: Sectoral employment as a % share of total for Cyprus (2015, 2050, 2100). Source: SOCLIMPACT Deliverable D6.2 - own calculations.

17
3 Climate Change outlook
Climate hazards indicators represent the entry point to understand the climate change
exposure of the blue economy sectors. The indicators have been computed for two
scenario RCP2.6 (low emission scenario) and RCP8.5 (high emission scenario) and for
different horizon times namely: a reference period (1965-2005), mid-century (2046-2065)
and end of century (2081-2100). Main source of climate projections (future climate) for
Cyprus is EURO-CORDEX ensemble even if other model sources were applied when
required, depending on available scales. Results are presented in form of maps, tables or
graphs and only when the information shows an interesting outcome.
All the graphics presented below can be found in high resolution at the
SOCLIMPACT Project official website here.
3.1 Tourism
One of the consequences of an increase in the mean sea level will be the flooding of
coastal areas. This includes sand beaches, which are the main asset for tourism activities
in most of the European islands. Therefore, estimating the potential risk of beach loss
due to climate change is of paramount importance for the economy of those islands.
Extreme flood level (95th percentile of flood level averaged)
The 95th percentile of the flood level averaged was selected as an indicator of interest.
The values are presented as anomalies with respect to the present mean sea level at beach
location (i.e., including the median contribution of runup).
Figure: 10: Projected extreme flood level (in the vertical, in cml) at beach locations with respect to the present (1986-2005) mean sea level values averaged for the island under scenario RCP2.6 (left) and RCP8.5 (right). Ensemble of models using Global simulations produced by Hemer et al. (2013).
Source: SOCLIMPACT Deliverable D4.4d.

18
In all cases an increase is expected being larger at the end of the century under scenario
RCP8.5. The values in that scenario is 92.47 cm in Cyprus. Under RCP2.6 scenario the
values are less than half, suggesting that a mitigation scenario could largely minimize the
negative impact of climate change on beach flooding.
Beach reduction
Under mean conditions, we find that, at end of century, the total beach surface loss range
from ~30% under scenario RCP2.6 to ~54% under scenario RCP8.5.
Figure 11: Beach reduction % (scaling approximation). Source: SOCLIMPACT Deliverable D4.4d.
Seagrass evolution
Seagrasses are the main habitat for coastal marine ecosystems. They provide different
services like sediment retention (and thus clearer waters), coastal protection (in front of
marine storms), shelter for marine organisms, etc. Therefore, the state of the seagrasses is
a convenient proxy for the state of coastal environment. That is, large well-preserved
extensions of seagrasses lead to a better coastal marine environment which in turn is
more resilient in front of hazards.
Our results suggest that no seagrass losses are expected for the Posidonia located in the
coasts of the island.

19
Figure 12: Projection of seagrass coverage Source: SOCLIMPACT Deliverable D4.4e.
Length of the window of opportunity for vector-borne diseases - Vector suitability
index for Aedes Albopictus (Asian Tiger Mosquito)
Climate change can influence the transmission of vector-borne diseases (VBDs) through
altering the habitat suitability of insect vectors. This is mainly controlled by increases of
ambient air temperature and changes in the hydrological cycle. In the framework of
SOCLIMPACT we explore if potential changes to meteorological conditions can affect
the distribution of the Asian tiger mosquito (Aedes albopictus). Asian tiger mosquito is
native to the tropical and subtropical areas of Southeast Asia; however, in the past few
decades, this species has spread to many countries through the international transport of
goods and increased travel (Scholte and Schaffner, 2007). It is of great epidemiological
importance since it can transmit viral pathogens and infectious agents that cause
chikungunya, dengue fever, yellow fever and various encephalitides (Proestos et al.,
2015).
The multi-criteria decision support vector distribution model of Proestos et al. (2015) has
been employed to estimate the regional habitat suitability maps. This is based on
extending previous work on the environmental/climatic factors affecting the life cycle of
the Asian tiger mosquito (Waldock et al., 2013; Proestos et al., 2015). The mosquito
habitat suitability model combines seven meteorological indices based on field
observations, extensive literature review and expert knowledge.
According to figure, for the island of Cyprus located in the eastern Mediterranean, for
the historical period the simulated climate conditions indicate a medium suitability

20
according to our definition (HSI values of 68.7). This is expected to slightly increase in a
future of strong climate change mitigation (pathway RCP2.6). On the contrary under
business-as-usual RCP8.5 the suitability is expected to decrease. For a large part of the
island (mainly inland) the future climatic conditions will likely be unfavourable for the
Asian tiger mosquito, while high suitability is mostly simulated over the mountainous
areas of Troodos where summer temperatures are not expected to exceed the 40°C
threshold.
Figure 13: Habitat Suitability Index (HSI) values averaged over eight SOCLIMPACT islands and for each sub-period of analysis. Red colours indicate increases while blue colours indicate decreases in the
future. [80-100: High Suitability; 60-80: Medium Suitability; 40-60: Low Suitability; <40 No Suitability].
Source: SOCLIMPACT Deliverable D4.3.
Forest weather index (FWI)
The FWI system provides numerical non-dimensional ratings of relative fire potential for
a generalized fuel type (mature pine stands) based solely on weather observations. FWI is
part of the Canadian Forest Fire Danger Rating System established in Canada since 1971
(van Wagner, 1987). Furthermore, since 2007, FWI has been adopted at the EU level and
used in a harmonized way throughout Europe by the European Forest Fire Information
System (EFFIS) of the Copernicus Emergency Management Service (since 2015).
It is selected for exploring the mechanisms of fire danger change for the islands of
interest in the framework of SOCLIMPACT Project, as it has been proved to adequately
perform for several locations, including the Mediterranean basin. The index was
calculated for the fire season (defined from May to October) over the Mediterranean for
all models, scenarios and periods.
For Cyprus, N=77 grid cells were retained from the model’s domain. In the following
figure the ensemble means, and the uncertainty is presented for all periods and RPCs.
The fire danger for this island is the highest among the Mediterranean islands.

21
According to the model simulations, there are areas that already belong to very high fire
danger class. It seems that under RCP2.6, the index slightly increases by 5%. On the
other hand, under RCP8.5 the increase in fire danger exceeds 20% by the end of the
century. Even this increase is lower than in other islands, the majority of the island will
be under high and very high fire danger.
Figure 14: Fire Weather Index (EURO-CORDEX) with the colour associated to the level of risk Source: SOCLIMPACT Deliverable D4.4c.
Humidex
For the assessment of climate hazard on heat related impacts of climate change on
human health, the humidity index (Humidex) (Masterton and Richardson, 1979) has
been used. Humidex value is an equivalent temperature, which express the temperature
perceived by people (the one that the human body would feel), given the actual air
temperature and relative humidity. As a more representative indicator for the assessment
of inhabitants’ and tourists’ hazard on heat related climate change impacts, the Number
of Days with Humidex greater than 35°C was selected. From the above classification, a
day with Humidex above 35°C describes conditions from discomfort to imminent
danger for humans.
For Cyprus, N=77 grid cells were retained from the model’s domain. In the present
climate, the days with discomfort cover almost 3 months, with a small increase at the
mid-century and for the RCP2.6, while respective number of days at the end of the
century will correspond to more than 5 months.

22
Figure 15: Humidex. Ensemble mean of EURO-CORDEX simulations Source: SOCLIMPACT Deliverable D4.3.
3.2 Aquaculture
The predicted impacts of climate change on the oceans and seas of the planet is expected
to have direct impacts on marine based aquaculture systems. Basic effects are the
following (Soto and Brugere, 2008):
Change in biophysical characteristics of coastal areas.
Increased invasions from alien species.
Increased spread of diseases.
Changes in the physiology of the cultivated species by changing temperature, salinity,
oxygen availability and other important physical water parameters.
Changes in the differences between sea and air temperature, which will alter the
seasonality, frequency and severity of storms, cyclones and other extreme events,
affect the stability of the coastal resources, and potentially increase the damages in
infrastructure.
Sea level rise, acidification, changes in precipitation and other effects will also add to the
changes in coastal ecosystems and environment, thus affecting production and
infrastructure (=investments).
Temperature changes in seawater trigger physical impacts; increased harmful algal
blooms, decreased oxygen level, increase in diseases and parasites, changes in ranges of
suitable species, increased growth rate, increased food conversion ratio and more
extended growing season. Furthermore, all these impacts lead to socio-economic
implications among them; changes in production levels and an increase in fouling and
pests. The objective of the current analysis is to identify and quantify the variations
(future climate scenarios with respect to present climate) in the number and in the
duration of events characterized by a Sea Surface Temperature (SST) exceeding a given

23
threshold. The SST thresholds have been identified according to the farming and feeding
necessities of several marine species, particularly relevant for the aquaculture sector in
the Mediterranean Sea (MS).
Figure 16: Number of days per year Sea Surface Temperature (SST) exceeds a given threshold.
Source: SOCLIMPACT Deliverable D4.5.
3.3 Energy
Percentage of days when T > 98th percentile - T98p
The T98p is defined as the percentage of time where the mean daily temperature T is
above the 98th percentile of mean daily temperature calculated for the reference period
1986-2005. For Cyprus, N=77 grid cells were retained from the model’s domain. In the
following figure the ensemble mean and the uncertainty is presented for all periods and
RCPs.
It is found that T98p is about 7% during RCP2.6 towards mid-century and slightly
decreases at the end of the century, while for RCP8.5 more than 20% of the year will
exhibit temperatures above the 98th percentile.

24
Figure 17: Percentage of days when T>98th percentile. Ensemble mean of EURO-CORDEX simulations
Source: SOCLIMPACT Deliverable D4.3.
Renewable energy productivity indexes
A series of indicators related to renewable energy productivity is presented. The selected
indicators are wind and photovoltaic (PV) energy productivity, as well as the frequency
and duration of low-productivity periods, termed energy droughts (Raynaud et al., 2018),
as a measure of the variability of these sources. The productivity and variability of these
renewable energy sources will depend on climate. The possibility of reduced productivity
due to climate change poses a risk to the energy generation, if it is based on these
renewable energy sources. Also, a possible increase in the frequency and duration of solar
and wind energy droughts will require an increase in storage and backup sources.
Among the different renewable energy sources, solar PV and wind energy have been
selected, as they are (and very likely will be) the main renewable energy sources, due to
their degree of technological development and their comparatively low cost. In order to
consider a marine energy source, offshore wind energy is included, in addition to
onshore wind energy.
Photovoltaic energy productivity
Spatial differences between areas of the Cyprus Island can be appreciated, with minimum
values in mountain regions. Changes in future periods are also different for that areas in
comparison with the maritime area, where a generalized decrease is projected. Although
some positive changes are seen over land in some areas, especially for the RCP8.5
scenario at the end of the century, spatially averaged changes over land are negative,
although they are very small (less than 2%). The higher decrease is projected also for the

25
RCP8.5 scenario at the end of the century over the sea. In spatial average, it represents a
4% of negative change.
Figure 18: Panel A: Yearly mean photovoltaic productivity [kWh/kW] for the control time period (1986-2005). Panel B: Changes in yearly mean photovoltaic productivity in the RCP2.6 scenario for
the 2046-2065 period with respect to the control. Panel C: As for panel B but for the RCP8.5 scenario. Panel D: Changes in yearly mean photovoltaic productivity in the RCP2.6 scenario for the 2081-2100
period with respect to the control. Panel E: As for panel D but for the RCP8.5 scenario. Source: SOCLIMPACT Deliverable D4.4a.

26
Figure 19: PV energy productivity. Ensemble of models –land Source: SOCLIMPACT Deliverable D4.4a.
Figure 20: PV energy productivity. Ensemble of models –sea Source: SOCLIMPACT Deliverable D4.4a.

27
Wind energy productivity
No important changes are obtained for both RCP2.6 and RCP8.5 scenarios in the 2046-
2065 period, except for a certain decrease over the sea in RCP8.5 of 3% in spatial
average. However, at the end of the century, both RCP2.6 and RCP8.5 indicate a
decrease in Wprod, which is more pronounced in the RCP8.5 scenario, specially over the
sea (nearly 9% in spatial average). Model spread is high, with one model projecting a
spatially averaged decrease of 13% over sea and nearly 18% over land in RCP8.5 at the
end of the century. Other studies seem to also show a general decrease in this region
(Tobin et al., 2015; 2016).
Figure 21: Wind energy productivity. Ensemble of models –land Source: SOCLIMPACT Deliverable D4.4a.

28
Figure 22: Wind energy productivity. Ensemble of models –sea Source: SOCLIMPACT Deliverable D4.4a.
Frequency and duration of low-productivity periods (energy droughts) as a
measure of the variability of these sources
Wind productivity droughts in the control period are quite frequent, especially to the
west of the island. In the RCP2.6 scenario, changes in the frequency of wind droughts
show great spatial variability over the considered domain. In the RCP8.5 case, there is a
sharp increase in the number of drought days in all regions except for the marine areas
immediately to the north and to the south of the island. The increase observed in the
RCP8.5 scenario in the 2081-2100 time period is greater than 4% of all days (about 16
days more per year) for moderate droughts over land. Changes in the occurrence of wind
droughts are roughly consistent with changes observed in wind productivity.

29
Figure 23: Ensemble mean frequency of severe productivity drought days-WIND (%) in the reference period, as well as the ensemble mean changes in the frequency of drought days (%) in the different time
periods considered. Averages are computed over land. Source: SOCLIMPACT Deliverable D4.4a.
PV droughts are much less frequent than wind droughts in the control period. They are
also more prone to develop over the west of the island (not showed). Interestingly, a
general decrease in the frequency of moderate PV droughts is projected in both
scenarios. Severe PV droughts are already very infrequent in the control period (about 3
days per year) and tend to experience very little changes with a minor decrease over
localised areas. The combination of PV and wind energy has large positive effects on the
drought frequency: The combined severe drought frequency is practically zero, pointing
to a high complementarity of wind and solar energy.

30
Figure 24: Ensemble mean frequency of severe productivity drought days-PV (%) in the reference period, as well as the ensemble mean changes in the frequency of drought days (%) in the different time periods
considered. Averages are computed over land. Source: SOCLIMPACT Deliverable D4.4a.
Figure 25: Ensemble mean frequency of severe productivity drought days-COMBINED (%) in the reference period, as well as the ensemble mean changes in the frequency of drought days (%) in the
different time periods considered. Averages are computed over land. Source: SOCLIMPACT Deliverable D4.4a.

31
Cooling Degree Days
The Cooling degree days (CDD) index gives the number of degrees and number of days
that the outside air temperature at a specific location is higher than a specified base
temperature, providing provides the severity of the heat in a specific time period taking
into consideration outdoor temperature and average room.
For Cyprus, at the end of century, under RCP8.5., the increase of number of days is
almost 150%, that else the triple of the hindcast.
Figure 26: Cooling Degree Days. Ensemble mean of EURO-CORDEX simulations
Source: SOCLIMPACT Deliverable D4.3.
Available water: Standardized precipitation index
This index is used as an indication of water availability. For Cyprus only some regions of
the north-east of the island are expected to be affected under RCP2.6 and exceed the
“dry” conditions threshold. Under the business-as-usual RCP8.5 forcing, parts of the
island are expected to experience extreme dry conditions that will be evident even from
the mid-21st century. Mild changes are projected under RCP2.6, while under the
business-as-usual scenario the whole island is expected to be severely affected by
meteorological droughts.

32
Figure 27: Ensemble mean, maximum and minimum values of the Standardized Precipitation
Evaporation Index (SPEI) averaged over each SOCLIMPACT island and for each sub-period of
analysis (EURO-CORDEX). Source: SOCLIMPACT Deliverable D4.3.
3.4 Maritime transport
Mean seal level rise
Sea level rise (SLR) is one of the major threats linked to climate change. It would induce
permanent flooding of coastal areas with a profound impact on society, economy and
environment. Moreover, an increase in the mean sea level would result in a larger impact
of coastal storms with the consequent increase of risk.
Several factors affect the evolution of mean sea level. At global scale, first, mass
variations linked to the addition/removal of water from the ocean can be induced by
land-based ice melting or by changes in the groundwater due to, basically, human
activities. Second, thermal expansion due to ocean warming would also induce a rice of
global mean sea level. Furthermore, regional changes are also expected and could induce
a major contribution to total sea level rise at coastal scale. These are linked to the
gravitational fingerprint of changes in the ocean mass, to changes in the circulation
patterns (which in turn are related to the steric/density variations), to mass redistribution
by atmospheric pressure and wind, and to land motion. All these factors cannot be
modelled at the same time as they involve very different processes, so the typical
approach is to use different models to cope with the different contributions.
For Cyprus, the SLR ranges from 28.90 cm to 57.81 cm (RCP8.5) at the end of the
century.

33
Figure 28: Mean sea level rise (in cm) with respect to the reference period (1986-2005). Ensemble mean
of CMIP 5 simulations and scaling approximation for RCP2.6 Source: SOCLIMPACT Deliverable D4.4b.
Storm surge extremes
Storm surge events, characterized by positive extreme sea levels and mechanically forced
by atmospheric pressure and wind are the main responsible for coastal flooding,
especially when combined with high tides. Different diagnostics can be used to
characterize the storm surge events in terms of intensity, length or frequency and each
option is suitable for different applications (i.e. infrastructure design would typically rely
on return levels, while beach morphodynamics relies on percentiles). Nevertheless,
previous studies have shown that the qualitative conclusions are equivalent and as far as
no clear thresholds have been defined for the impact chains the simplest approach has
been followed using the 95th percentile to define extreme sea level events.
To characterize storm surge high frequency (sub-daily) sea level data is required, which
unfortunately is scarce. Most climate models provide only daily to monthly outputs so
they cannot be used for this task. To present, the only ensemble populated with enough
number of members to compute meaningful statistics on climate projections is the one
produced for the Mediterranean by Lionello et al. (2016). This ensemble consists of 6
simulations run with the HYPSE model at 1/4º of spatial resolution and forced by the
high-resolution wind fields from the MedCORDEX ensemble which in turn is nested
into CMIP5 global simulations. The simulations are run for the period 1950-2100 thus
covering the historical period as well as the whole 21st century. Complementary, the
ensemble includes three hindcast simulations that are used to establish present reference
levels.
To present, the only ensemble populated with enough number of members to compute
meaningful statistics on climate projections is the one produced for the Mediterranean by

34
Lionello et al. (2016). This ensemble consists of 6 simulations run with the HYPSE
model at 1/4º of spatial resolution and forced by the high-resolution wind fields from
the MedCORDEX ensemble which in turn is nested into CMIP5 global simulations. The
simulations are run for the period 1950-2100 thus covering the historical period as well
as the whole 21st century. Complementary, the ensemble includes three hindcast
simulations that are used to establish present reference levels.
The results show a very low or even non-existent decrease except for RCP8.5 at the end
of the century. Cyprus is the island where the value is the highest over the hindcast in the
Mediterranean area but also the one with the lowest decrease in the far future.
Figure 29: 99th percentile of atmospherically forced sea level (in cm) averaged for the hindcast period, the near future (2046-2065) and the far future (2081-2100) under scenarios RCP2.6 (with scaling
approximation) and RCP8.5 and (relative change in %). Source: SOCLIMPACT Deliverable D4.4b.
Frequency of extreme high winds
This hazard indicator makes use of two indices:
The wind extremity index (NWIX98), which is defined as the number of days per
year exceeding the 98th percentile of mean daily wind speed (of the reference period
1986-2005), and
The 98th percentile of daily wind speed (WIX98) around the islands, which is
calculated for the same periods and scenarios as the NWIX98 indicator.
The indices were calculated for each island, model, scenario and period. The mean
NWIX98 for each island is calculated for an area within about 50 km around the

35
coastline of each island (approximated as a rectangle). The land covered grid points of
the islands themselves are not taken into consideration.
The calculation was performed for all available combinations of global (GCM) and
regional (RCM) models. Their ensemble mean and uncertainty (described by the
ensemble minimum and maximum) are provided for the reference period (1986-2005), as
well as the two future periods of interest (mid-century: 2046-2065 and end-century:
2081-2100) for EURO and MENA–CORDEX simulations and for the reference period
(1981-2000), as well as the selected future period (2031-2050) for ESCENA simulations.
The wind extremity index NWIX98 is defined as the number of days per year exceeding
the 98th percentile of mean daily wind speed. This number decreases in the far future
under RCP8.5 (- 22 %).
Figure 30: Wind Extremity Index (NWIX98). Ensemble mean of the EURO-CORDEX simulations.
Source: SOCLIMPACT Deliverable D4.3.
Like the NWIX98, the 98th percentile of daily wind speed, WIX98, decreases for all
islands except Crete and Fehmarn. However, the magnitude of the relative change is
much smaller than for the NWIX98. The maximum magnitude of relative change in
WIX98 is -3.8% for the island of Madeira at the end of the century under RCP8.5
compared to a change in NWIX98 of -32.3% for the same island, period and emission
scenario.
Wave extremes (99th percentile of significant wave height averaged)
Marine storms can have a negative impact on maritime transport, coastal-based tourism
and aquaculture, among other activities. To illustrate this impact, the 99th percentile of

36
significant wave height averaged has been chosen. A decrease in the extreme wave height
is found being larger under scenario RCP8.5 as illustrated in the following map.
In relative terms, the averaged changes are lower than 10% even under the stronger
scenario. The more significant change is observed under RCP8.5. at the end of century
with -7%.
Figure 31: the 99th percentile of significant wave height averaged for the reference period and the relative
change for the RCP8.5. Global simulations produced by Hemer et al. (2013). Source: SOCLIMPACT Deliverable D4.4b.
Figure 32: the 99th percentile of significant wave height averaged for the reference period and the relative change for the RCP8.5 and RCP2.6. Global simulations produced by Hemer et al. (2013).
Source: SOCLIMPACT Deliverable D4.4b.

37
4 Climate change risks
4.1 Tourism
In this section of tourism, we present the results of operationalization if three impact
chains.
1. Loss of attractiveness due to increased danger of forest fires in touristic areas
2. Loss of attractiveness due to marine habitats degradation
3. Loss of competitiveness of destinations due to a decrease in thermal comfort
Loss of attractiveness due to increased danger of forest fires in touristic areas
Forest fires are considered as an important parameter for the attractiveness of tourist
destinations, especially in the Mediterranean area. Severe episodes were met in Algarve
(Portugal) and Greece (Athens area) in the recent period, threatening the tourist season.
This study focuses on the implementation and analysis of the selected Impact Chain
“Risk of forest fires and consequences on tourism attractiveness of a destination”.
Out of the 12 islands assessed in the SOCLIMPACT project, nine were included in the
operationalization: the three Atlantic Islands (Azores, Canary Islands and Madeira) and
the Mediterranean ones (Balearic Islands, Crete, Corsica, Cyprus, Malta, Sardinia and
Sicily).
The concept of Impact Chain (Schneiderbauer et al. 2013; Fritzsche et al. 2014) is applied
as a climate risk assessment method (with 6 steps) for research of decision making.
Impact Chains propose diagrams articulating the causal links between the different
components of climate risks (according to AR5 concepts: hazards, exposure,
vulnerability, risks, step 1). For each of these components of the theoretical IC (step 2),
several indicators are selected and collected (step 3). Data are then normalized to be able
to be aggregated (steps 4 and 5) with different weights. The final objective (step 6) is to
achieve a standardized risk score that, according to the spatial scale of the analysis can
allow comparison and decision making on adaptation, including hierarchization of
resource allocation or identification of adaptation options to mitigate climate risk.

38
Figure 33: Loss of attractiveness due to increased danger of forest fire in touristic areas.
Source: SOCLIMPACT Deliverable D3.2.

39
Figure 34: Loss of attractiveness due to increased danger of forest fire in touristic areas. Source: SOCLIMPACT Deliverable D3.2.
Many indicators were formulated in a very broad way, causing a few problems in
identifying suitable data sets. Furthermore, the data were checked for explicit spatial
coverage, resolution, temporal coverage and time frame. Finally, we evaluated possible
substitutes or alternatives for those indicators with no suitable data to substantiate them.

40
Figure 35: Final Impact Chain Model Source: SOCLIMPACT Deliverable D4.5.
In order to normalize the index, the min-max method was applied. Min-max normalizes
indicators to have an identical range [0, 1] by subtracting the minimum value and
dividing by the range of the indicator values (OECD 2008). The mathematical formula
and more information on min-max normalization method are presented in the following
section. Afterwards, the normalized index was categorized into five equal interval classes
representing values from “Very low" to "Very high”. Considering the weighing, an
assessment of GIZ methodology has been developed for this impact chain including
interviews with various types of stakeholders (cf. dedicated 4.5 to forest fires).

41
The indicators previously normalized have been aggregated to elaborate three sub-
component indices (hazard, exposure, vulnerability) and the final risk index. The result is
included in a comparison for the 9 other islands studied for the risk linked to forest fires.
Comparative study
Hazard
The main findings are:
Scores for fire danger increase as we move from West to East and from North to South, with the exception of Malta, which is much smaller and the selected grid cells are mostly influenced by maritime conditions.
Under RCP2.6, it seems that the fire danger returns to the present conditions towards the end of the century apart from Crete which score will increase from medium to high, even under this RCP.
Under RCP8.5, the increase is much more prominent, ranging from 22% to 46%, with the highest values for Corsica, Sardinia and Sicily, which implies that under this scenario at the end of the Century, the western and central Mediterranean will be more affected.
Figure 36: Hazard score (Fire Weather Index) per island for the reference period (1986-2005). Source: SOCLIMPACT Deliverable D4.5.

42
Figure 37: Hazard score (Fire Weather Index) per island at the end of the century (2081-2100) under RCP2.6 (Ambitious Mitigation Policies).
Source: SOCLIMPACT Deliverable D4.5.
Figure 38: Hazard score (Fire Weather Index) at the end of the century (2081-2100) under RCP8.5 (Business as usual).
Source: SOCLIMPACT Deliverable D4.5.

43
Exposure
The results show that:
Atlantic Islands (Madeira and Canary Islands) are more exposedFigure than Mediterranean Islands (from low to medium score). We can see an increase as we move from North to South in the Mediterranean area.
Atlantics Islands higher scores are mainly explained by the level of exposure rather than the nature of exposure, which is quite similar across islands, except for Malta which rate is very low.
The nature of exposure varies across EU Islands despite of their homogeneous score: Corsica has the highest score for forest areas followed by Madeira, Canary Islands. These two last ones have the highest score of forest belonging to protected areas. We can find a significant proportion of cultivated areas in other Islands namely: Sicily, Sardinia, Balearic Islands, Crete and Cyprus.
The level of exposure for Canary Islands and Madeira is particularly important because of the high scores for each of the 4 considered indicators: population density, population over 65 years, population under 9 years and tourist density.
Figure 39: Exposure score (current period) per island. Source: SOCLIMPACT Deliverable D4.5.

44
Figure 40: Subcomponents of exposure and related score (current period) per island. Source: SOCLIMPACT Deliverable D4.5.
Figure 41: Breakdown by exposure subcomponent. Source: SOCLIMPACT Deliverable D4.5.

45
Vulnerability
The main findings are:
Results show large disparity across EU Islands in terms of vulnerability. The vulnerability score for Corsica is very high followed by Sardinia (high), Madeira, Balearic Islands and Cyprus. Malta, Canary Islands and Crete scores are low and Sicilia very low.
Breakdown by component highlights a quite homogeneous score for adaptative capacity whereas sensitivity score (Flammability Index) is very different from an island to another.
Not surprisingly for the flammability index, Corsica and Sardinia have the highest score, Malta, Sicilia and Canary Islands, the lowest one.
Looking at the adaptative capacity subcomponent, despite of the quite homogeneous scores, factors of influence are quite different among the islands:
o high score for employees in the primary sector, apart from Sardinia and Sicily;
o scores for density of firefighters and volunteers are important for all the islands except for Cyprus;
o GDP per capita and level of education are the most heterogeneous factors of influence;
o GDP per capita score is very high for Crete, very low for Corsica, Malta and Balearic Islands.
o Scores for education level is important for Cyprus and low for Madeira, Malta and Corsica.
Figure 42: Vulnerability score per island. Source: SOCLIMPACT Deliverable D4.5.

46
Figure 43: Subcomponents of vulnerability and related score (current period) per island. Source: SOCLIMPACT Deliverable D4.5.
Figure 44: Details and scores of the two subcomponents (adaptive capacity and sensitivity) per island. Source: SOCLIMPACT Deliverable D4.5.

47
Risk
- For the reference period, the overall risk is medium for Atlantic Islands (Madeira and Canary Islands) and Eastern Mediterranean Islands (Crete and Cyprus). Risk for other islands is low and very low for Malta.
- Looking at the breakdown of the risk, the structure is quite similar for 3 groups: o Madeira, Canary Islands, Sicilia and Balearic Islands: Predominance of
exposure component (around 50% of the score); o Crete and Cyprus: Predominance of the hazard component (around 40%
of the score); o Corsica and Sardinia: Predominance of the vulnerability component
(around 60-70%); o Only Malta has a quite balanced distribution across the components.
- In this exercise, only the hazard component is changing in the future. In the near future whatever the considered RCP, the risk increases only for Cyprus from medium to high. While the risk remains stable with the RCP2.6 in the distant future for all islands apart from Cyprus, there is an increase from very low to low for Malta and from low to medium for Balearic Islands, Corsica and Sardinia with RCP8.5 (distant future). Even under this RCP8.5 risk remains constant for Canary Islands and Madeira (Medium) and Sicily (Low).
Figure 45 Risk score per island for the reference period (1986-2005). Source: SOCLIMPACT Deliverable D4.5.

48
Figure 46: Risk breakdown by island for the reference period (1986-2005). Source: SOCLIMPACT Deliverable D4.5.
Figure 47: Risk score per island in the near future (2046-2065) under RCP2.6 (Ambitious Mitigation Policies) and RCP8.5 (Business as usual).
Source: SOCLIMPACT Deliverable D4.5.

49
Figure 48: Risk score per island at the end in the distant future (2081-2100) under RCP2.6 (Ambitious Mitigation Policies) and RCP8.5 (Business as usual).
Source: SOCLIMPACT Deliverable D4.5.
Figure 49: Score per component and per island in the near (2046-2065) and the distant future (2081-2100) under RCP2.6 (Ambitious Mitigation Policies) and RCP8.5 (Business as usual).
Source: SOCLIMPACT Deliverable D4.5.

50
Cyprus island results
The risk is medium under the reference period and high under both scenarios at the end
of the century.
Figure 50: Risk score and components of the risk for the reference period. Source: SOCLIMPACT Deliverable D4.5.
Figure 51: Risk score at the end in the distant future (2081-2100) under RCP2.6 (Ambitious Mitigation Policies) and RCP8.5 (Business as usual).
Source: SOCLIMPACT Deliverable D4.5.

51
Considering the component of exposure, the sub-component of nature of expose is the
most represented (59%).
Figure 52: Details and scores of the two subcomponents of exposure (nature and level of exposure). Source: SOCLIMPACT Deliverable D4.5.
Considering the component of vulnerability, both sub-components have the same
significance.
Figure 53: Details and scores of the two subcomponents of vulnerability (adaptative capacity and sensitivity).
Source: SOCLIMPACT Deliverable D4.5.

52
Loss of attractiveness due to marine habitats degradation
Climate change is expected to impact tourism activities through direct impacts on
comfort and health of tourists, on the infrastructures and facilities that provide basic
services to visitors and on the natural ecosystems that hold a big part of the attractions of
the coastal and marine tourism destinations. The analysis of those impacts was
decomposed into a single impact chain.
Specifically, it presents a conceptual model on the effect that Climate Change would have
on conditions that make marine environments attractive for tourists visiting coastal
destinations. More in detail, climate hazards like the increase of mean and variability of
seawater temperature and the increase of oceans acidification, mainly, are affecting
marine habitats with touristic relevance through diminishing bio-productivity and
attracting exotic species, some of them toxic, and because of that, reducing the
attractiveness of marine landscapes and the presence of flagship species; increasing
turbidity in bathing and diving sea waters affecting the quality of bathing, diving,
snorkelling and bottom-glass boating experiences, at least; and increased frequency and
intensity of episodes of seagrasses massive death that arrive to the beaches affecting the
experience of lying and staying there.
The next figure shows the theoretical impact chain. As can be seen in the figure, the
impact of Climate Change on the touristic attractiveness of an island depends on a set of
multi-dimensional factors, including:
1. Increase in the mean and variability of seawater temperature is the main driver of marine habitat degradation; also seawater acidification impacts marine life although it substantially varies depending of the marine organisms;
2. The risk of those marine habitat transformations for tourism critically depends on the nature exposed to it, the amount and proportion of tourists that feel marine habitat is a relevant motivation to visit the destination, and the resilience of the exposed natural assets and tourists to those changes in the marine environmental conditions;
3. Finally, the preparedness to cope with the deterioration of its marine environment by developing substitutive attractions, is also a key aspect to assess the effective risk that those hazards pose on the tourism industry at the destination.
The complex relationship between climate change, marine habitats and tourism still
exhibits important gaps of knowledge. For example, there is no evidence on the impact
that the abovementioned hazards may have on the communities of cetaceans that live or
pass through near the coasts of the islands under study. In some cases, this is a very
important economic chapter within the tourism industry in the islands. Whether climate
change is going to diminish or not the abundance or affect the distance of those cetacean
communities from the island requires further research.

53
Figure 54: Loss of destination attractiveness due to marine environment degradation as a result of climate change hazards.
Source: SOCLIMPACT Deliverable D3.2.
Selection of operationalization method
The Analytical Hierarchy Process (AHP) method was selected as the technique to
operationalize the impact chain since it is a well-grounded tool that allows for the
prioritization/ranking of alternatives using a weighting scheme that is established by
expert judgement. Hence, for the purposes of the project, it was considered suitable as it
would be able to reconcile the contribution of each risk factor (hazards, exposure, and
vulnerability, which includes sensitivity and adaptive capacity) towards the risk based on
expert opinion and, subsequently, order the islands in terms of which one is most at risk
of losing attractiveness due to the degradation of the marine environment.
Application of the AHP methodology
The problem to be solved along through the expert decision process was comparing the
risk of the European islands of losing tourist attractiveness due to the deterioration of
their marine habitats as consequence of climate change. The hierarchy tree for this
decision problem was built underpinning on the impact chain elements, together with the
variables that express the tourism-related environmental and social systems’ exposure to

54
those hazards, the sensitivity of the exposed systems to the referenced hazards and the
social capacities to cope with the potential impacts of climate change by protecting
nature and the society and/or making them more resilient.
Some modifications of the original impact chain were undertaken for the sake of
feasibility, although experts were encouraged to have in mind all factors they know can
affect the impact of climate change
on the marine habitat services for tourism. It means that the hierarchy tree is a simplified
structure of the main factors explaining the complex relationship between climate change
and the ecosystem services that support tourist use of marine environments, but other
factors also known by experts must be taken into account at the time of comparing the
components of the risk between islands. This is one of the most interesting strengths of
the decision processes based on expert participation and, particularly, of the multicriteria
analysis used in this case. The next figure shows the basic structure, or hierarchy tree, of
the decision-making process that was presented to the experts.
Figure 55: Hierarchy tree for marine habitats impact chain. Source: SOCLIMPACT Deliverable D4.5.
Hazards are the climate events that instigate the climate-associated risk. In our context,
seawater heating was considered as the most relevant variable to assess changes in the
conservation status of the marine habitats that provide services for coastal tourism
activities. Other hazards initially considered, like acidification and storms, were finally
discarded. The first one because its effects on living marine organism are still under study
and the evidence is dispersed and not conclusive. The second one because in the
Mediterranean Sea and the Atlantic Ocean that surrounds the islands under study, storms

55
are considered not so frequent and intense to not giving time to marine ecosystems to
recover their previous conservation status.
Regarding indicators, published research shows 25 and 26 Celsius degrees as the
threshold temperatures over which seagrass meadows, the foundation species that mainly
structure ecosystems in the marine habitats of reference, start to decline. The indicators
used were the number of days per year with seawater temperature over 25 and 26 Celsius
degrees. Sources of information and data were provided by the SOCLIMPACT
modellers.
Exposure denotes the range of ecological and social systems susceptible to be damaged
by hazards. This criterion, the natural and social systems potentially damaged by the
selected climate hazards, was decomposed into three sub-criteria, one referred to the
marine environment, and the other two related to the use that tourists make of the
services provided for the marine environments at the destination. These three sub-
criteria were expressed through three respective indicators. One, referred to the surface
of marine phanerogams that suffer from the climate stressors. Phanerogams, specially
Posidonia in the Mediterranean and Cymodosea in the Atlantic, are the very foundation
species organizing most of the coastal ecosystems. They provide food and shelter to
many different species and keep seawater clear by absorbing sediments. Additionally,
when become damaged, seagrasses meadows deliver dead individuals that go to lay on
the beaches used by tourists.
The second sub-criterion is one about the different types of direct uses that tourists
make of the ecosystem services. Diving was selected to represent theses uses and the
selected indicator was the number of divers per year. It was assumed that other sea
watching activities like snorkelling and bottom-glass boating evolve similarly than diving.
Experts were also invited to consider other sea environment users potentially affected by
the lack of water transparency and dead seagrass suspended in seawater like surfers,
windsurfers and other active users of the marine environment.
The third sub-criterion was related to the impact on most of tourists as bathers. Turbid
water affects the quality of the bathing experience, which is an activity that most tourists
do.
Sensitivity concerns the susceptibility of natural, cultural, and built resources to harm
that is a direct or indirect result of Climate Change hazards. For the operationalization of
this impact chain, sensitivity relates to the susceptibility of the phanerogam meadows to
changes in seawater temperature and to the extent to which the impoverishing of
seawater conditions and marine ecosystems may affect tourists’ welfare.
Regarding the effects of episodes of seawater heating on the integrity of seagrasses
meadows, the variable selected was periods of overheating and the indicators were the
number of days per year with seawater temperature over 25 and 26 Celsius degrees. As
explained above, experts were invited to take into account their experience and their

56
knowledge about the differences between the way seagrasses behave in the real world
and in the laboratory when studying the impact of water heating.
With respect to the impact of the marine environmental degradation on the welfare of
tourists, the indicator selected was the tourists’ willingness to pay for the preservation of
marine ecosystems3. Thus, ecosystems’ and social’s susceptibility are both taken into
account when comparing risks of marine environment degradation due to climate change
between islands.
Adaptive capacity reveals the potential to face the hazards by reducing the level of
exposure and/or increasing the resilience of the tourism system. This criterion was split
into three sub-criteria, one referred to the substitution of marine-based activities by lesser
marine habitats dependent ones, and two concerning actions to heal the marine
environment like removing dead seagrasses or reducing non-treated sewage discharges
(and consequently, seawater pollution). In this case, island experts were consulted about
the capacity of their reference destination to address these adaptation actions using a 1-4
scale, where 1 represented a very poor management capacity and 4 expressed a full
capacity to deal with it.
Results and islands’ ranking
The table below shows the final results of the operationalization process. In particular, it
summarizes the global weights of the sub-criteria and the criteria and the global score of
the risk for each island; thus islands can be compared not just globally but also across the
set of the sub-criteria and the criteria being considered to estimate the aggregated risk.
Table 7: Final scores and islands’ ranking (under RCP8.5 distant future).
Criteria Sub-criteria Balearic Canary Cyprus Malta Sicily
Hazards Seawater heating RCP8.5 (2081-2100)
0.018 (8.0%)
0.004 (2.2%)
0.054 (23.6%)
0.025 (12.7%)
0.025 (14.7%)
Exposure
Surface of marine phanerogams
0.034 0.002 0.004 0.009 0.022
Number of divers 0.009 0.005 0.001 0.002 0.002
Tourists’ arrivals 0.013 0.013 0.002 0.001 0.006
Total 0.056
(25.0%) 0.020
(11.0%) 0.007 (3.1%)
0.012 (6.1%)
0.029 (17.1%)
Sensitivity Phanerogams’ susceptibility to
0.072 0.072 0.008 0.024 0.024
3 This information was delivered by SOCLIMPACT researchers who are in charge of the work package WP5. More information at: SOCLIMPACT Deliverable D5.5.

57
heat
Economic valuation
0.003 0.027 0.004 0.006 0.010
Total 0.075
(33.5%) 0.099
(54.7%) 0.012 (5.2%)
0.030 (15.2%)
0.034 (20.0%)
Adaptive capacity
Products substitution
0.034 0.034 0.086 0.060 0.016
Seagrass removal 0.020 0.002 0.007 0.007 0.003
Sea water pollution
0.021 0.021 0.063 0.063 0.063
Total 0.079
(35.3%) 0.058
(32.0%) 0.155
(67.7%) 0.130
(66.0%) 0.082
(48.2%)
Total 0.224 0.181 0.229 0.197 0.170
Rank 2 4 1 3 5
Note: Total contribution of the criterion to the final score of the island in parenthesis.
Source: SOCLIMPACT Deliverable D4.5 .
The risk: from Eastern to Western and vice-versa
The relative risk for marine habitat-based tourism demand due to the heating of
seawaters surrounding the European islands is determined by the combination of three
different factors already reflected in the marine habitat impact chain: the intensity and
lasting of periods of seawater heating, the susceptibility of the marine habitats and
tourism activities based on it to the heating process and the changes in the habitat,
respectively; and the capacities of the respective islands’ societies to reinforce natural and
social systems’ resilience to seawater heating and its ecosystem impacts.
Based on the available indicators and on their own knowledge, the experts’ evaluation of
the complex relationships between seawater heating, habitats transformation and the
response of the tourism system, depicts a big picture featured by the following results:
- From the perspective of the intensity of the hazard, threats diminish from
Eastern to Western. Effectively, episodes of water heating threating the integrity
of marine ecosystems will we much more relevant throughout the Eastern
Mediterranean and will become softer as moving Western.
- From the perspective of the susceptibility of the marine foundation species to
seawater heating, western Mediterranean hosts the most vulnerable phanerogam
communities as genetically they are not ready to face increasing water
temperature variability at the rhythm climate change is powering. As a result, this
risk factor decays from Western to Eastern.
- Other relevant factors determining the relative risk faced by each island are
related to the management capacity of other hazards, different than seawater
heating, also degrading marine habitats (i.e. the current relevance of marine

58
habitat-based tourism and the capacity of the local tourism system to provide
competitive alternatives giving value to other, not marine-based natural and
cultural tourist attractions). Those capacities are unevenly distributed across the
islands, basically depending on the level of development of their respective
environment management and tourism management subsystems.
Some characteristics of the risk ranking provided by experts, and consequently, the final
scores, are:
- Cyprus leads the rank of risk due to, in addition to the greater seawater heating,
its experiencing ecological disruptive processes related to its closeness to the Red
Sea; strongly attracting exotic species with high capacity to destabilise the marine
ecosystems.
- On the other extreme, Sicily is the island exhibiting a lesser risk mainly due to it
holds a more balanced distribution of the indicators expressive of the range of
factors determining the risk.
- The Canary Islands hold a relatively low risk mainly due to their expected low
level of seawater heating; their higher weakness consists of the magnitude of the
tourism system exposed to the potential risk.
- The Balearic Islands are the most exposed islands. In addition, RCP8.5 distant
future shows a progress in heating relatively higher than other islands, meaning a
strong threat for their relatively susceptible Posidonia meadows.
- Malta holds a relative low risk mainly due to its low exposition to the risk and the
potential of alternative, non-marine-habitat-based, tourist products.
Below are presented some paragraphs devoted to go deeper into the complexity of the
ecosystem dynamics that influence the holistic effect of climate change on the European
islands’ marine habitats; before presenting some lines highlighting the specificities of this
impact chain for each island.
In the Eastern Mediterranean, the impact of seawater heating on the seagrass meadows
(and on the marine habitat as a whole) not only depends on the physiological response of
the plants concerned to heating, but also on the response of the system as a whole. On
the Eastern shore of the Mediterranean, a strong increase in herbivorous species from
the Red Sea has been observed that cross the Suez Canal and have settled near the
continental and insular coastal areas. Posidonia meadows have been found to be part of
their diet.
The heating exacerbates the metabolic needs of these herbivorous species (Siganus
Luridus and others) increasing their voracity and, consequently, leading to greater
pressure on the phanerogams. Given that, on the other hand, the surface of these
meadows in the environment of Cyprus is small, predation by these herbivores may
threaten Posidonia with extinction, disappearing with it the conservation functions of the
ecosystem that it currently carries out as protection against erosion, containment of water
turbidity (assimilation of organic residues), shelter and food for fingerlings of fish and
other marine organisms, etc.

59
Other factors such as the sewage treatment or the sedimentation of waste from coastal
constructions interact with the seawater heating, exacerbating the degradation of marine
habitats. Together, factors of global change other than seawater heating are expected to
act more intensely in Cyprus, increasing the vulnerability of this island's marine habitat
to climate change.
Analysis of Cyprus
The position of Cyprus leading the ranking of the risk of its tourism industry to be
negatively affected by seawater heating powered by climate change rests mostly on the
two extremes of the impact chain under study. While the hazard explains the 23.6% of
the risk the deficits of the adaptive capacity explain another 67.7%, both giving account
for more than the 91.3% of the risk. Although the island holds many cultural resources
to decouple the generating of tourist value added from the marine environment
conditions, some technical, institutional and, even, historical factors prevent from going
further this way so far. Reviewed information shows some projects and policies that have
been undertaken to explore pathways for successful diversification, but it seems that the
translation of the potentialities into effective policies has failed due to obstacles related to
governance.
The mentioned advantages and disadvantages of Cyprus are depicted in the next figures.
The further the criteria or sub-criteria is located from the centre of the graph, the more it
affects the risk.
Figure 56: Global weights of each criteria and sub-criteria in the final score.
Source: SOCLIMPACT Deliverable D4.5.

60
Figure 57: Global weights of each criteria and sub-criteria in the final score. Source: SOCLIMPACT Deliverable D4.5.
The operationalization of the impact chain for the “Loss of attractiveness of a destination due to
the loss of services from marine ecosystems” was conducted using the AHP method. The method
proved to be appropriate, firstly, for dealing with the hierarchical nature of the impact
chain and, secondly, for using expert judgements to assess the comparative risk for the
islands over a large number of indicators (sub-criteria). Because the AHP method
determines a ranking of the islands, it can provide decision-makers with relative values
but not with absolute values. Such values will be delivered by the modelling activities of
other work packages and will give stakeholders a more complete picture of this specific
risk in terms of social, economic, and environmental impacts.
Loss of competitiveness of destinations due to a decrease in thermal comfort
This section describes the work carried out for the operationalization of the impact chain
“Loss of competitiveness of destinations due to a decrease in thermal comfort”4. It provides details on
the method applied for the operationalization, the island data used, and the results
obtained. As can be seen in the figure, the impact of Climate Change on the touristic
attractiveness of an island depends on a set of multi-dimensional factors, including:
4 Detailed information about the methodology used and the results obtained is available at: SOCLIMPACT Deliverable Report – D4.5. Design of a comprehensive approach to climate and climate-related risk information to policy makers and the general public.

61
4. the frequency, intensity, and duration of heatwaves, 5. to what extent and how tourist activities and tourists become exposed to
heatwaves, and how sensitive different segments of tourists are to extreme heat, and
6. the preparedness of the destination to cope with thermal discomfort episodes through information, technology, alternative activities, and medical attention.
Figure 58: Loss of competitiveness of destinations due to a decrease in thermal comfort Source: SOCLIMPACT Deliverable D3.2.
For the purposes of the operationalization it was decided by the team to retitle the risk as
“Loss of attractiveness of a destination due to a decrease in thermal comfort”. This was done in order
for the risk to more accurately reflect the effects of the hazards, exposure and
vulnerability on an island rather than an on an individual tourist.
The selection of islands to be compared was based on the availability of island data
provided by the IFPs. The five islands selected for comparison were the Balearic Islands,
the Canary Islands, Cyprus, Malta, and Sardinia.
Selection of operationalization method

62
The Analytical Hierarchy Process (AHP) method was selected as the technique to
operationalize the impact chain since it is a well-grounded tool that allows for the
prioritization/ranking of alternatives using a weighting scheme that is established by
expert judgement. Hence, for the purposes of the project, it was considered suitable as it
would be able to reconcile the contribution of each risk factor (hazards, exposure, and
vulnerability) towards the risk based on expert opinion and, subsequently, order the
islands in terms of which one is most at risk of losing attractiveness due to a decrease in
thermal comfort.
Application of the AHP methodology
The problem to be solved along through the expert decision process was comparing the
risk of the European islands of losing tourist attractiveness due to a decrease in thermal
comfort as consequence of climate change. The hierarchy tree for this decision problem
was built underpinning on the impact chain elements. Some refinements were necessary
regarding the indicators (at sub-criteria level) that were to be used for comparing the
islands.
Figure 59: Hierarchy tree for thermal comfort impact chain. Source: SOCLIMPACT Deliverable D4.5.
Hazards are the climate events that instigate the climate-associated risk. For the AHP
method, thermal sensation was considered as the most relevant indicator to assess

63
changes in the thermal comfort of tourists while staying at their destination as it is a
concept that combines temperature and humidity. Thus, it is the only sub-criterion of the
Hazard criterion. Moreover, the humidity index (humidex) (Masterton and Richardson,
1979) was selected as the most appropriate metric for thermal sensation. The metric is an
equivalent temperature that express the temperature perceived by people (i.e., the
temperature that the human body would feel), given the actual air temperature and
relative humidity.
Exposure denotes the range of ecological and social systems susceptible to be damaged
by hazards. This criterion was decomposed into sub-criteria relating to three indicators.
The first indicator relates to the exposure of tourists to heatwaves. The measure of the
indicator combines the percentage of an island prone to heatwaves and the percentage of
the tourist accommodations and facilities located in those areas prone to heatwaves. It is
necessary to factor in both these aspects of exposure in order to allow for a better
comparison of islands. For example, if an island has a small area that is prone to
heatwaves with the majority of tourists frequenting in that small area, then the
combination of the two factors will play a role when comparing, for instance, an island
that has large areas prone to heatwaves, but with tourists frequenting in places outside
these areas, since the overall exposure will be different. Specifically, it was decided to
assign a weight of 75% to percentage of an island prone to heatwaves and the remaining
25% to the percentage of tourist accommodations and facilities located in heatwave-
prone areas. The second indicator deals with the number of tourist arrivals during the
hottest months. The indicator is represented by the percentage of tourists that visit an
island between the months of May and September averaged over the last five years.
Finally, the third indicator concerns vulnerable groups of tourists who have the highest
risk of being affected by heatwaves. Literature confirms that under-6s and over-65s are
the most vulnerable age groups, however, the statistical services of the islands
homogeneously provide data for the under-14 and over-65 age groups. For this indicator,
two values were computed:
1. the number of tourists visiting an island that were under 14 years of age during the months of May and September over the total number of tourists visiting during the same period, averaged over the last five years, and
2. the number of tourists visiting an island that were over 65 years of age during the months of May and September over the total number of tourists visiting during the same period, averaged over the last five years.
For purpose of combining the two values and adjusting the change to age groups, it was
decided to apply a ratio of 15:85 in order to emphasize the proportion of over-65s (85%)
to the proportion of under-14s (15%).
Sensitivity concerns the susceptibility of natural, cultural, and built resources to harm
that is a direct or indirect result of Climate Change hazards. For the operationalization of
this impact chain, sensitivity relates to the susceptibility of tourists and is broken down
into sub-criteria pertaining to two indicators. The first indicator involves tourist activities.

64
The effect of heatwaves on tourist activities varies greatly. For example, a tourist
sunbathing at a beach will not feel the effects of a heatwave to the same degree as a
tourist that is trekking. Different destinations have different rates of tourists practicing
activities incompatible with heatwaves events. So, this indicator aims at catching these
differences. More specifically, this indicator is a measure of the percentage of visitors
who state that they practice activities not compatible with heatwave events. The second
indicator concerns the economic valuation of heatwaves from the perspective of tourists.
In the case of a heatwave event, all tourists will suffer from thermal discomfort to a
certain degree. Hence, the indicator represents their willingness to avoid this discomfort
as expressed in monetary terms. Therefore, it is measured by much money tourists are
willing to pay to avoid a heatwave during their vacation time5.
Adaptive capacity reveals the potential to face the hazards by reducing the level of
exposure and/or increasing the resilience of the tourism system through providing
information, adopting proper technology, supplying alternative activities, and improving
medical attention. This criterion is split into sub-criteria concerning three indicators. The
first indicator has deals with early warning systems. Setting up a proper early warning
system can help tourists and service providers to plan effective responses to heatwaves,
making them less distressing and reducing the destination’s vulnerability. Hence, this
indicator is measured with a score representing the quality of early warning systems in
place and advisement of options for tourists. The second indicator involves air
conditioning. Air conditioning is the most effective technology used to combat extreme
heat. Therefore, the indicator uses the percentage of hotel accommodations and tourist
facilities offering air conditioning systems as a measure of the capacity of the destination
to cope with this hazard. The final indicator concerns the care and medical attention
(such as in the case of heatstroke or similar) available on an island that may be necessary
to help reduce pain or avoid casualties due to diseases related to heatwaves. Therefore,
the number of hospital beds available on an island per 100,000 potential users, both
residents and tourists, is taken as the measure of this indicator.
Results and Island´s ranking
The table below shows the final results of the operationalization process. In particular, it
summarizes the global weights of the sub-criteria and the criteria and the global score of
the risk for each island; thus islands can be compared not just globally but also across the
set of the sub-criteria and the criteria being considered to estimate the aggregated risk.
5 Further information available at: SOCLIMPACT Deliverable D5.5.

65
Table 8: Final scores and islands’ ranking (under RCP8.5 distant future).
Criteria Sub-criteria Balearic Canary Cyprus Malta Sardinia
Hazards Humidex RCP8.5 (2081-2100)
0.024 (12.1%)
0.008 (4.6%)
0.088 (34.6%)
0.023 (11.7%)
0.023 (13.1%)
Exposure
Exposed areas 0.007 0.002 0.007 0.007 0.007
Vulnerable groups 0.007 0.017 0.016 0.017 0.038
Tourists’ arrivals 0.050 0.008 0.029 0.018 0.065
Total 0.064
(32.2%) 0.027
(15.5%) 0.053
(20.9%) 0.042
(21.3%) 0.110
(62.9%)
Sensitivity
Heat-sensitive activities
0.074 0.073 0.074 0.074 0.012
Economic valuation
0.004 0.004 0.015 0.028 0.010
Total 0.079
(39.7%) 0.078
(44.8%) 0.089
(35.0%) 0.103
(52.3%) 0.021
(12.0%)
Adaptive capacity
Early-warning systems
0.007 0.007 0.007 0.007 0.003
Air conditioning 0.011 0.048 0.011 0.021 0.012
Medical attention 0.014 0.006 0.005 0.002 0.005
Total 0.032
(16.1%) 0.061
(35.1%) 0.024 (9.4%)
0.030 (15.2%)
0.020 (11.4%)
Total 0.199 0.174 0.254 0.197 0.175
Rank 2 5 1 3 4
Note: Total contribution of the criterion to the final score of the island in parenthesis.
Source: SOCLIMPACT Deliverable D4.5.
Cyprus is at most risk of loss of competitiveness due to a decrease in thermal comfort in
all four scenarios as it is ranked the highest in all cases. This is mainly attributed to the
fact that the number of days with a heatwave is predicted to increase greatly both in the
near and distant future. In addition, the island’s tourist accommodations and facilities are
located in areas most prone to heatwaves, and these are visited by many tourists during
the months of May to September. Cyprus also scores the highest in Sensitivity and
average in Adaptive capacity.
The Balearic Islands and Malta are ranked second and third, respectively, with regards to
the risk of loss of competitiveness. However, their overall scores are very close: 0.199 for
the Balearic Islands and 0.1970 for Malta in the RCP8.5 distant future scenario. They

66
score relatively high in Exposure and Sensitivity (the most important criteria for the risk)
and average in Hazard and Adaptive capacity.
Sardinia and the Canary Islands are the lowest at risk of loss of competitiveness. Even
though Sardinia scores the highest for Exposure, it has a low score for Sensitivity (which
contributes most to the risk) and average scores for Hazard and Adaptive capacity. On
the other hand, the Canary Islands has a low score for Hazard and Exposure, but
relatively high for Sensitivity and Adaptive capacity.
Analysis of Cyprus
Cyprus is at most risk of loss of competitiveness due to a decrease in thermal comfort in
all four scenarios as it is ranked the highest in all cases. This is mainly attributed to the
fact that the number of days with a heatwave is predicted to increase greatly both in the
near and distant future. In addition, the island’s tourist accommodations and facilities are
located in areas most prone to heatwaves, and these are visited by many tourists during
the months of May to September. Cyprus also scores the highest in Sensitivity and
average in Adaptive capacity.
The mentioned advantages and disadvantages of Cyprus are depicted in the next figure.
The further the criteria or sub-criteria is located from the centre of the graph, the more it
affects the risk.
Figure 60: Global weights of each criteria and sub-criteria in the final score. Source: SOCLIMPACT Deliverable D4.5.

67
Figure 61: Global weights of each criteria and sub-criteria in the final score. Source: SOCLIMPACT Deliverable D4.5.
The operationalization of the impact chain for the “Loss of attractiveness of a destination due to
a decrease in thermal comfort” was conducted using the AHP method. The method proved to
be appropriate, firstly, for dealing with the hierarchical nature of the impact chain and,
secondly, for using expert judgements to assess the comparative risk for the islands over
a large number of indicators (sub-criteria). Because the AHP method determines a
ranking of the islands, it can provide decision-makers with relative values but not with
absolute values. Such values will be delivered by the modelling activities of other work
packages and will give stakeholders a more complete picture of this specific risk in terms
of social, economic, and environmental impacts.
4.2 Aquaculture
In the framework of SOCLIMPACT, the following impacts were more closely studied:
1) Increased fragility of the aquaculture activity due to an increase of extreme
weather.
Increased frequency and intensity of extreme weather events result in higher waves and
storm surges and changes in salinity. These events result in loss of stock and damages to
infrastructure and require adaptation in species selection, site selection and technologies.
2) Decrease in production due to an increase in surface water temperature

68
Changes in water temperature can directly affect the growth rate and Food Conversion
Ratio of the fish. Temperature also affects the oxygen levels and can cause harmful algae
blooms, reduce water quality and an increase in occurrence of diseases and parasites
which can than affect the fish or other culture species. A change in temperature can
ultimately change the ranges of suitable species for a certain area but can also have
positive impacts such as increased growth (mainly in tropical and sub-tropical regions)
and a longer growing season. Primary productivity can also increase with increasing
temperature, which may be beneficial for filter feeders such as mussels.
The concept of Impact Chain (Schneiderbauer et al. 2013; Fritzsche et al. 2014) is also
applied as a climate risk assessment method (with 7 steps for aquaculture, present risk
and future risk are calculated separately) for research of decision making. The goal of
this method is to use collected data for certain indicators of the impact chains for
different islands to assess the risks of each island’s aquaculture sector to be affected by
the hazard displayed in the impact chain. Therefore, data for all indicators were collected
from all islands. After reviewing the data, selecting indicators and islands, the indicators
were normalized, and different risk components were weighted. Using these values, the
risks for present and future conditions under different Representative Concentration
Pathway (RCP) scenarios were calculated for the different island and compared between
each other. For the aquaculture impact chains, RCP 4.5 and 8.5 were compared since for
the hazard models RCP 2.6 was not always available.
Step 1: Data collection by Island Focal Points
To be able to apply the GIZ risk assessment method, a solid data basis is crucial.
Therefore, data was collected by the Island Focal Points (IFPs) of the SOCLIMPACT
project. The questionnaire requested datasets for 16 indicators and topics with several
subcategories on exposure and vulnerability. The IFPs reached out to local stakeholders
and authorities to collect the requested data which was then resubmitted to the Sectoral
Modelling Team (SMT) Aquaculture.
Step 2: Data review and island selection
Data were submitted by most of the islands to the SMT Aquaculture. Most datasets were
incomplete with major data missing regarding important information for the successful
operationalization of the impact chains. Therefore, and for the fact that some islands do
currently not have any active marine aquaculture operations running, some islands were
excluded from the operationalization. Out of the 12 islands assessed in the
SOCLIMPACT project, six were included in the operationalization of the impact chains
using the risk assessment method from GIZ: Corsica, Cyprus, Madeira, Malta, Sardinia
and Sicily. The other six islands (Azores, Balearic Islands, Baltic Island, Canary Islands,
Crete and French West Indies) do currently not have active marine cage aquaculture
operations or show insufficient data availability. Data on hazards was provided by the
models developed in work package 4. Eventually, Madeira was excluded for the impact
chain on extreme weather events due to lack of reliable hazard data. A qualitative analysis
will be provided in the result section.

69
Step 3: Review and selection of indicators
The data collection and review revealed that not all indicators of the impact chains could
be used for the operationalization process. Therefore, these indicators were reviewed
carefully and the ones which were not represented by sufficient data were excluded. The
revised impact chain was developed depending on the indicators selected.
Figure 62: Impact chain on Increased fragility of the aquaculture activity due to an increase of extreme weather adjusted depending on data availability and used for the operationalisation.
Source: SOCLIMPACT Deliverable D3.2.
Some indicators require data on the proportions of species farmed on a specific island.
Therefore, a table with % of each species farmed on each island was prepared. This data
was obtained directly from the IFPs or from the FAO or national statistics offices.
Table: 9: Proportions of aquaculture species farmed per island. Proportion of species production
Species Mussels &
clams Tuna Sea bream Sea bass
Corsica 0.43
0.265 0.265
Cyprus
0.84 0.16
Madeira
1.0
Malta
0.94 0.048 0.012
Sardinia 0.84
0.08 0.08
Sicily 0.44
0.3 0.26 Source: SOCLIMPACT Deliverable D4.5.

70
Impact chain: extreme weather events
Hazard
For the component hazard both indicators were used for the operationalisation. The
wave amplitude was shown as significant wave height (SWH) in m and the return time
number of years between extreme events quantified with a threshold of >7m. The data
was derived from the climate models of Deliverable D4.4 at the exact locations where
the fish farms are located and then averaged for all locations on one island. This allows a
more accurate assessment than taking the average values for the entire island.
Exposure
Four indicators were selected to be operationalized. The number of aquaculture
operators was provided by the IFPs and additional literature. There was no data available
on the actual size of stock, therefore the yearly production of aquaculture products (fish
and shellfish) in tons was used as a proxy indicator. The location of farms was rated by
using two different proxy indicators: the location of the farms in relation to the
prevailing wind direction and the average distance of the farms to shore. To be able to
rate the location in relation to the wind direction, the values were estimated (with 0 being
completely sheltered and 1 being exposed to wind and possible storms). After
normalizing the distance from shore (measured by using GIS software and the exact
coordinates of the fish farms), both values were averaged and represent the exposure of
the location of farms.
Sensitivity (vulnerability)
Two indicators were applied to calculate the score of factors of sensitivity. The sensitivity
of species was estimated by reviewing literature and interviewing experts regarding the
vulnerability of species to extreme weather events. After receiving these data, average
values were calculated of all values for the present species on each island.
Table 10: Estimated vulnerability factors for the sensitivity of species to wave stress. 1= very vulnerable to stress: 0=very resilient to stress.
Sensitivity of species for wave stress threshold
Species Sea bream Sea bass Tuna Mussels & Clams
Estimated vulnerability factor
0.55 0.65 0.30 0.90
Source: SOCLIMPACT Deliverable D4.5. The same approach was implemented to calculate the vulnerability of the infrastructure types used on each island based on the type of species farmed.

71
Table 11: Estimated vulnerability values for the vulnerability of infrastructure in case of an extreme weather event.
1= very vulnerable to stress: 0=very resilient to stress.
Vulnerability of aquaculture infrastructure in case of an extreme weather event
Infrastructure for species Sea bream & Sea bass Tuna Mussels & Clams
Estimated vulnerability factor 0.4 0.3 0.6
Source: SOCLIMPACT Deliverable D4.5.
Adaptive capacity (vulnerability)
The indicators distance to harbor and the presence of warning systems were used to
describe the adaptive capacity. As there is a weather forecast available for all islands, the
values for the presence of warning systems are all the same and represent low values. The
distance to harbors was moved to the subcomponent adaptive capacity and measured
using GIS software and the exact locations of the farms which were provided by the
IFPs and literature data. It represents the average distance of all farms to their closest
harbor for each island and is shown in meters. The indicator stocking density and
engineering of structures were excluded from the operationalisation. For the stocking
density there were no data available from all islands and in any case, it was estimated to
be similar for all islands. The engineering of structures was already covered with the type
of infrastructures in the sensitivity subcomponent.
Impact chain: Increased sea surface temperature
Hazard
Changes in surface water temperature was chosen to be the indicator representing the
component hazard. The temperature data for this indicator was obtained from the
location of each farm from the climate models of Deliverable D4.4 and averaged per
island. To calculate the hazard for each island and each RCP, the species’ temperature
thresholds were taken into account. According to a literature review (see Annex) the
temperature thresholds for farmed species is the following:
Table 12: Temperature threshold per species.
Temperature thresholds for different species
Species Sea bream Sea bass Tuna Mussels & Clams
Threshold (°C) 24 25 24 20.5
Source: SOCLIMPACT Deliverable D4.5.

72
It must be noted that the threshold for Tuna was set to 24°C since in the project only
Tuna fattening is done (in Malta) and for adult fish the threshold is 24°C while in the
review the whole life cycle as well as prey species was taken into account which is not
relevant for this exercise. Based on these thresholds, the duration of the longest event
per year (in days) was calculated for the temperatures 20 °C, 24 °C and 25 °C for RCP
4.5 and 8.5 from the models developed in WP4. After normalizing these values (which is
described in detail in Step 4), the values for each temperature and therefore each species
threshold were averaged using the sum product of the normalized values and the species’
proportion on the total production of the island. The final values represent the score of
the hazard. The indicator changes in seawater characteristics was not included in the
operationalization as there is no additional data related to this indicator which is not
covered by the surface water temperature indicator.
Exposure
Two indicators were used for the component exposure: the number of aquaculture
operators and the yearly production (in tons) as a proxy indicator for the size of stock.
Sensitivity (vulnerability)
The subcomponent sensitivity includes two indicators which were combined to one
indicator for the operationalization. The sensitivity of species directly correlates with
suitable temperature for species and therefore it is summarized as temperature sensitivity
of species. It was calculated by using temperature threshold values for each species
obtained from a literature review and expert opinion. These values were averaged
depending on which species and in which quantities they are farmed on the islands.
Table 13: Estimated vulnerability factors for the sensitivity of species to temperature stress.
1= very vulnerable to stress: 0=very resilient to stress.
Source: SOCLIMPACT Deliverable D4.5.
Adaptive capacity (vulnerability)
Two out of four indicators from the impact chain were utilized for the
operationalization. The monitoring early warning systems were included and show all the
same values for all islands as there is a sea surface temperature forecast available for each
island. The capacity to change species was included with all the islands displaying the
same value as well. The risk value is high in this case, as it would be quite difficult to
change species farmed on the islands in general as this would result in high economic
expenditures. For the indicator of the impact chain know-how of recognizing and
treating diseases/parasites there is no data available for any island. As this could vary a
Sensitivity of species for temperature stress threshold
Species Sea bream Sea bass Tuna Mussels & Clams
Estimated vulnerability
factor 0.6 0.6 0.3 1

73
lot between the islands, the indicator was removed instead of making assumptions, to not
negatively influence the risk values. A similar case arises from the indicator availability of
alternative place for farming. There is no data available to make correct assumptions
regarding the occurrence of alternative areas on the islands and therefore the indicator
was not used for the operationalization.
Step 4: Normalization of indicator data for all islands
In order to come up with one final risk value per island and to be able to compare these
values between islands, the indicator values were transferred into unit-less values on a
common scale. The normalized values range between 0 and 1 with 0 being low risk and 1
being very high risk.
There are two different ways of normalizing the indicator values:
- Minimum/maximum normalization;
- Expert judgement.
Fraction of maximum normalization
This normalization method was used for indicators which were expressed by real data
and not by expert judgement. The value for each island was calculated as a fraction of the
maximum value in de data set. Meaning the island with the maximum value was given 1
and the rest as a fraction thereof.
The following indicators were normalized using this method:
Extreme weather events:
- yearly production/ number of aquaculture operators
- average distance from shore (location of farms)
- average distance to harbour
Sea surface temperature:
- yearly production/ number of aquaculture operators
Minimum/maximum normalization
This normalization method was used for indicators which were expressed by real data
and not by expert judgement. The minimum and the maximum value of that indicator of
all islands was calculated and the following formula was applied to normalize all indicator
values to the scale between 0 and 1:
𝑥𝑛𝑜𝑟𝑚𝑎𝑙𝑖𝑧𝑒𝑑 = (𝑥 − 𝑥𝑚𝑖𝑛)
(𝑥𝑚𝑎𝑥 − 𝑥𝑚𝑖𝑛)
For both impact chains, the hazard values were normalised using the min and max
method. However, in these cases the minimum and maximum values were not
automatically the minimum and maximum values of the entire dataset but rather treated
differently for every hazard indicator. This handling of the normalisation of the hazard

74
indicators arose from the different nature of the indicator itself and the fact that data
were available for different RCPs and periods of time. Therefore, the hazard indicators
were normalised as following:
The sea surface temperature values were normalised separately for each temperature data
set. This means that all values for all RCPs and time periods of one “longest event over a
certain temperature” were taken into account when determining the minimum and
maximum values. For Madeira, RCP 4.5 data was not available, therefore RCP 2.6 data
was used and doubled.
Wave amplitude (significant wave height)
Figure 63: Modelling indicators for sea-state hazards, return time and significant wave height starting with 4 Global Circulation-Regional Circulation Model chains, which a fed into the WAM regional
wave model. Results are then normalized. Source: SOCLIMPACT Deliverable D4.5.
The return time was normalised as following; all values equal or greater that 10 are set to
0, all values between 0 and 10 are linearly mapped to the interval 1-0, so that 0 gives risk
1, 10 gives risk 0. It was assumed that a time period of 10 or more years allowed to repay
investments is a reasonable threshold.
Since, as described in Deliverable D4.4 of SOCLIMPACT, that the probability of having
at least one event exceeding the return level associated with a N-year return period
during a N-year time window (highlighted in red) is anyway greater than that of its
complement (no events exceeding the limit in the N-year time window), and that the
return level cannot be considered a “no-risk” safety level in evaluating the survivability
and sustainability of structures or plants.

75
Table 14: Probability of occurrence of at least one event exceeding the return level associated with a given return period (blue) in a given time window (green), according to the formula RL,T=1-(1-1/T)**L, where L=length of time window, T=Return Period.
Return Period [years]
Probability of occurrence
1 years 2 years 5 years 10 years 20 years
5 20% 36% 67% 89% 99%
10 10% 19% 41% 65% 88%
20 5% 10% 23% 40% 64% Source: SOCLIMPACT Deliverable D4.5.
Therefore, using a combination of the normalised values and the probability of
occurrence, experts transformed these values into risk classes such all "low", "moderate",
"medium", "high", "very high", or the like, on a qualitative basis.
Expert judgement
For some indicators from both impact chains there was no data available which is the
reason why expert judgement and estimations were applied. The following indicators
were expressed using expert’s estimations:
Extreme weather events: - farm locations (in relation to main wind direction) - sensitivity of species - vulnerability of type of infrastructure - presence of warning system
Sea surface temperature: - estimated temperature sensitivity of species - capacity to change species
- monitoring early warning systems
In all cases the normalization scale of 0 to 1 was applied with 0 being low risk and 1
being very high risk.
Step 5: Weighting of different risk components
In this step, the different risk components hazard, exposure and vulnerability (including
the sub-components sensitivity and adaptive capacity) were rated. The total of the values
sums up to 1. The weights were estimated by aquaculture experts and the basis of the
estimations were subjective estimations, similar to the ones used in the AHP method.
However, in this method the data availability was additionally taken into account.
Components for which the available data was scarce, outdated or more unreliable the
weights were set lower on purpose, while components with accurate datasets were given
a higher weight as following:

76
Table 15: Components and their weights. (Sub)Component Weight
Sea surface temperature Extreme events
Hazard 0.3 0.6 wave height 0.2 return time 0.8
Exposure 0.4 0.2
Vulnerability 0.3 0.2
Sensitivity 0.75 0.75
Adaptive Capacity 0.25 0.25 Source: SOCLIMPACT Deliverable D4.5.
Step 6: Calculations of risk for present conditions
Before being able to calculate the risk values, the scores for each component/
subcomponent had to be calculated by taking the average of the corresponding
indicators:
𝑠𝑐𝑜𝑚𝑝 =(𝑖𝑛𝑑1 + 𝑖𝑛𝑑2 + ⋯ + 𝑖𝑛𝑑𝑛)
𝑛
s – score
comp – component or subcomponent
ind – indicator
n – number of indicators
The final risk value was calculated by summing up the scores of the components
multiplied individually with the corresponding risk component weightings:
𝑅𝑖𝑠𝑘 = 𝑠ℎ𝑎𝑧 ∗ 𝑤ℎ𝑎𝑧 + 𝑠𝑒𝑥𝑝 ∗ 𝑤𝑒𝑥𝑝 + 𝑤𝑣𝑢𝑙 ∗ (𝑠𝑠𝑒𝑛 ∗ 𝑤𝑠𝑒𝑛 + 𝑠𝑎𝑐 ∗ 𝑤𝑎𝑐)
s – score w – weight haz – hazard exp – exposure vul – vulnerability sen – sensitivity ac – adaptive capacity
These risk values were calculated for each island individually and range between 0 and 1.
After completing these calculations, it was possible to compare the islands between each
other.
Step 7: Calculations of risk for future conditions (different RCPs)
To be able to project the risk values to future conditions, the operationalization was
adjusted to the different Representative Concentration Pathways (RCPs). Therefore, the

77
whole operationalization was duplicated and different values for the hazard indicators
per island were inserted. These values were taken directly from the climate models
provided in work package 4 for the different RCP scenarios (RCP 4.5 and 8.5). The
resulting values can be compared between the islands as well as between the different
RCP scenarios.
Results
Impact chain: extreme weather events

78
Table 16: Exposure and vulnerability indicators each island
Component Exposure Vulnerability
Component Weight 0.2 0.2
Sub-component Factor of sensitivity Factors of adaptive capacity
Sub-component weight 0.75 0.25
Indicator Average Size of
producers Location of farms
Score for
level of
exposure
Sensitivity
of species
(stress)
Type of
infrastructures
(material and
strength)
Score of
factor of
sensitivity
Distance to
harbour (vessel
capacity in extreme
weather
conditions)
[average & m]
Absence of
warning
system
Score of
factor of
adaptive
capacity
Proxy indicator
Yearly production
/Number of
operators
Farms
sheltered
from wind
direction
Average distance
from shore (m) Average of
normalised
indicators
Estimated
sensitivity
of species
Type of
infrastructure
(based on
species) Average
of
indicators
Average distance
to harbour (m)
Presence of
warning
system Average of
normalised
indicators
Data Normalised Normalised Data Normalised Normalised Normalised Data Normalised Normalised
Corsica 328.6 0.12 0.4 644 0.16 0.20 0.7 0.5 0.59 4789 0.96 0 0.48
Cyprus 811.4 0.29 0.5 3923 1.00 0.53 0.6 0.4 0.48 4616 0.92 0 0.46
Malta 2,755.9 1.00 0.5 1731 0.44 0.74 0.3 0.3 0.31 4165 0.83 0 0.42
Sardinia 537.2 0.19 0.4 1193 0.30 0.27 0.9 0.6 0.71 2183 0.44 0 0.22
Sicily 399.6 0.14 0.5 1000 0.25 0.27 0.7 0.5 0.61 5000 1.00 0 0.50
Source: SOCLIMPACT Deliverable D4.5.

79
Mediterranean islands
Hazards
Statistics of extreme events can significantly differ across the four model realizations
The hazard data for return time was derived from 3 different models; CMCC, CNRM and GUF.
Since the data varies highly between models a best- and worst case scenario was executed where in
the best-case scenario the lowest value (showing the lowest risk) between the models was used and
in the worst case scenario the highest value was used. Distance between the best and the worst
projection, give an estimate of uncertainty
Model projections for Average Significant Wave Height are in good agreement as to both pattern
and values. Hazard was evaluated from ensemble mean, uncertainty from ensemble STD (not
exceeding 15% - highest disagreement for highest values).
Figure 64: Results for return time in best- and worst-case scenarios for Mediterranean islands for reference period
(red line), RCP 4.5 (dotted line) and RCP 8.5 (black line). Source: SOCLIMPACT Deliverable D4.5.

80
"Worst" and "best" cases respectively refer to the least and most favourable projection in the set of models. For example, return time, you will find that there is at least one model predicting no hazard for all islands except Sardinia with no significant variations across scenarios. In fact, all circles cluster and overlap at the centre, while those that represent Sardinia all lie very close to the limit between the two lower hazard classes. On the other hand, at least one other model predicts appreciable yet low hazard for Corsica, Sicily and Sardinia, and hazard going from moderate (reference period, red) to medium (RCP8.5, solid black), to high (RCP4.5, dotted black) for Malta, while for Cyprus the hazard is irrelevant even for the most negative projection. This means that a) the result for Sardinia and Cyprus is stable across models, b) models slightly disagree for Sicily and Corsica, but generally predict low hazard, c) the projection for Malta is affected by greater uncertainty for all scenarios. This is due to the fact that Malta is located in the Sicily Channel, where the dynamics exhibit significant gradients in the direction perpendicular to the channel axis, which are differently represented by different models. The worst and best cases do not necessarily come from the same model for all islands, that is, one model can predict the lowest hazard for Sicily and another one for Sardinia, and each of these projections is represented in the plot for the corresponding island.
Risk- Best-case scenario
Table 17: Risk results for best-case scenario for impact chain Extreme weather events
Reference period
Mid century End century
Risk Hist. RCP 4.5 RCP 8.5 RCP 4.5 RCP 8.5
Corsica 0.19 0.19 0.19 0.20 0.21
Cyprus 0.23 0.23 0.23 0.23 0.22
Malta 0.26 0.26 0.26 0.26 0.26
Sardinia 0.30 0.32 0.32 0.28 0.31
Sicily 0.20 0.20 0.20 0.20 0.20
Source: SOCLIMPACT Deliverable D4.5.

81
Figure 65: Risk results for best-case scenario for impact chain Extreme weather events under RCP 4.5 Source: SOCLIMPACT Deliverable D4.5.
Figure 66: Risk results for best-case scenario for impact chain Extreme weather events under RCP 8.5. Source: SOCLIMPACT Deliverable D4.5.
0,00
0,05
0,10
0,15
0,20
0,25
0,30
0,35
Historic mid century end century
RCP 4.5
Corsica Cyprus Malta Sardinia Sicily
0,00
0,05
0,10
0,15
0,20
0,25
0,30
0,35
Historic mid century end century
RCP 8.5
Corsica Cyprus Malta Sardinia Sicily

82
Risk- Worst-case scenario
Table 18: Risk results for worst-case scenario for impact chain Extreme weather events.
Reference period
Mid century End century
Risk Hist. RCP 4.5 RCP 8.5 RCP 4.5 RCP 8.5
Corsica 0.25 0.25 0.26 0.28 0.26
Cyprus 0.23 0.23 0.23 0.23 0.22
Malta 0.42 0.45 0.56 0.45 0.36
Sardinia 0.33 0.33 0.34 0.33 0.33
Sicily 0.30 0.34 0.33 0.33 0.26 Source: SOCLIMPACT Deliverable D4.5.
Figure 67: Risk results for worst-case scenario for impact chain Extreme weather events under RCP 4.5. Source: SOCLIMPACT Deliverable D4.5.
0,00
0,05
0,10
0,15
0,20
0,25
0,30
0,35
0,40
0,45
0,50
begin century mid century end century
RCP 4.5
Corsica Cyprus Malta Sardinia Sicily

83
Figure 68: Risk results for worst-case scenario for impact chain Extreme weather events under RCP 8.5. Source: SOCLIMPACT Deliverable D4.5.
Bigger islands were separated in areas since conditions can vary greatly in different parts of the island.
Table 19: Risk results for impact chain Extreme weather events for the Mediterranean islands with large islands analysed on a local level using the worst-case scenario.
Worst case Historic RCP 4.5 RCP 8.5
mid century end century mid century end century
Malta 0.37 0.45 0.45 0.56 0.36
Sicily North 0.34 0.39 0.39 0.36 0.30
Sicily East 0.17 0.20 0.20 0.20 0.20
Sicily South 0.41 0.42 0.40 0.42 0.30
Corsica West 0.37 0.32 0.37 0.34 0.34
Corsica East 0.18 0.18 0.18 0.18 0.19
Sardinia West 0.40 0.46 0.47 0.47 0.44
Sardinia East 0.39 0.20 0.20 0.20 0.18
Cyprus 0.23 0.23 0.23 0.23 0.22
Source: SOCLIMPACT Deliverable D4.5.
For all islands and all RCPs, it can be concluded that there is no significant change in risk, even in the worst-case scenario, between the reference period, middle and end of the century. Malta, Sicily south and Sardinia west are found to be the most vulnerable with risk exceeding 0.45 due to a
0,00
0,10
0,20
0,30
0,40
0,50
0,60
begin century mid century end century
RCP 8.5
Corsica Cyprus Malta Sardinia Sicily
0.00 – 0.20
Very low
0.20 – 0.40
Low
0.40 – 0.60
Medium
0.60 – 0.80
High
0.80 – 1.00
Very high

84
higher hazard risk. Malta also has the highest exposure of all islands. Malta has an increased risk mid-century in the worst-case scenario, due to an increase in hazard. Impact chain: sea surface temperature
Hazard
Model projections are in good agreement with previous lower resolution ensemble estimates but
offering greater detail along island shorelines. Uncertainty to be rigorously estimated from
ensemble STD when new simulations of comparable resolution become available, but overall
tendency regarded as robust.
Exposure and vulnerability indicators
Table 20: Expose and vulnerability indicators, the data for each island and the normalized values.
Component Exposure Vulnerability
Component
weight 0.4 0.3
Sub-component Factor of sensitivity Factors of adaptive capacity
Sub-component
weight 0.75 0.25
Indicator Average Size of
producers
Score for
level of
exposure
Sensitivity
of species
(stress)
Score of
factor of
sensitivity
Monitoring
early
warning
systems
Capacity
to change
species
Score of
factor of
adaptive
capacity
Proxy indicator
Yearly production
/Number of
operators
Average of
normalised
indicators
Temperature
sensitivity of
species
(expert
guess)
Indicator
Monitoring
early
warning
systems
Capacity to
change
species
Average
of
indicator
Data Norm
alised Normalised Normalised Normalised
Corsica 328.6 0.12 0.12 0.7 0.7 0 1 0.5
Cyprus 811.4 0.29 0.29 0.6 0.6 0 1 0.5
Madeira 125.3 0.05 0.05 0.6 0.6 0 1 0.5
Malta 2,755.9 1.00 1.00 0.6 0.6 0 1 0.5
Sardinia 537.2 0.19 0.19 0.9 0.9 0 1 0.5
Sicily 399.6 0.14 0.14 0.8 0.8 0 1 0.5
Source: SOCLIMPACT Deliverable D4.5.
Risk
The values in this analysis is not an estimate of the risk but rather a ranking between islands since a lot of the data was normalised based on a min-max or fraction of the maximum of the islands. A proper risk assessment would need additional data from farmers and a detailed model of farming results as a function of temperature. Malta has a much higher risk than the other islands due to the high exposure, Malta’s farm produce on average 3.5 to 22 times more than the farms on other islands.

85
Table 21: Risk results for impact chain Sea Surface temperature.
Historic Mid century End century
Risk Hist. RCP 4.5 RCP 8.5 RCP 4.5 RCP 8.5
Corsica 0.30 0.34 0.41 0.38 0.42
Cyprus 0.40 0.48 0.48 0.50 0.59
Malta 0.68 0.73 0.74 0.75 0.80
Madeira 0.19 0.26 0.23 0.24 0.35
Sardinia 0.37 0.42 0.43 0.44 0.49
Sicily 0.38 0.43 0.43 0.45 0.48
Source: SOCLIMPACT Deliverable D4.5.
Figure 69: Risk results for impact chain Sea Surface temperature under RCP 4.5. Source: SOCLIMPACT Deliverable D4.5.
0,00
0,10
0,20
0,30
0,40
0,50
0,60
0,70
0,80
historic mid century end century
RCP 4.5
Corsica Cyprus Malta Madeira Sardinia Sicily

86
Figure 70: Risk results for impact chain Sea Surface temperature under RCP 8.5. Source: SOCLIMPACT Deliverable D4.5.
4.3 Energy
There are more than 2200 inhabited islands in the EU. Lately, they have come into the focus of the
EU, which addresses energy questions as part of the 'Clean energy for all Europeans' package. The
Clean energy for EU islands initiative provides a long-term framework to help islands generate
their own sustainable, low-cost energy. This is particularly interesting, because many islands have
vast amounts of renewable energy sources but rely on fossil fuel imports yet. These are relevant
challenges regarding the energy transition in the EU, whose aim of net zero greenhouse gas
emissions in 2050 should determine the future energy plans of the islands. Islands could provide
showcases for successful 100% renewable energy supply.
The National Hydropower Association (NHA) defines marine energy as electricity generation from
marine kinetic energy, such as waves, tidal and ocean currents. Pisacane et al. (2018) add other
marine energy sources like ocean thermal energy conversion (exploiting temperature differences
between deep and surface ocean waters) and salinity gradient energy (harnessing the energy
potential of differences in salt concentration in ocean and river waters). All these technologies are
still in a development phase, and even if they reach the commercial phase in the future, it is not
likely that they will generate a large share of the power. Therefore, the analysis in SOCLIMPACT
focuses on the main renewable energy sources (RES), wind energy and solar photovoltaic (PV)
energy, which are presently, and very likely in future, the backbone of the deployment of renewable
energies, due to their technological maturity and low cost.
0,00
0,10
0,20
0,30
0,40
0,50
0,60
0,70
0,80
0,90
historic mid century end century
RCP 8.5
Corsica Cyprus Malta Madeira Sardinia Sicily

87
Nevertheless, we take into account not only onshore but also offshore wind energy, as a specifically
marine energy source which has distinct advantages like much higher productivity and less time
variability than onshore wind energy, and does not require land space which is limited and costly in
the islands. There are relevant obstacles for its deployment, like the deep bathymetry surrounding
most of the islands, and the lower wind speeds over the Mediterranean in comparison to areas like
the North Sea where offshore wind energy is being deployed rapidly.
Additionally, we consider also offshore PV energy. Despite some disadvantages that have to be
overcome (corrosion problems due to salty water or the impact of waves), this application is
receiving growing interest, as it offers an option for renewable energy development in countries
and islands with limited space for the installation of solar panels, and can show increased
performance due to the cooling effect of water and wind on PV cells.
Most RES (renewable energy sources) depend on the climate, and therefore climate change can
have an impact of the resource amount. Additionally, wind and solar PV energy are not
dispatchable, and its variability represents a challenge for its integration in the power system. This
is a challenge that can be addressed through storage or backup plants (which can be itself
renewable energy plants), through demand management, but also taking advantage of
complementarity of PV and wind energy and its very different variability characteristics. This
approach is gaining attention from stakeholders in the islands, as demonstrated by the report by
Monitor Deloitte and Endesa (2020), in which one of the key recommendations for achieving an
accelerated zero carbon target in Balearic and Canary Islands by 2040 is the combination of solar
PV and wind energy, with clearly higher shares of PV than of wind energy. Such a mix would
strongly reduce the need for storage, due to the stability of solar PV production.
There are also challenges for the demand and transmission components of the energy systems of
the islands due to climate change: changes in temperature leading to changing energy demand,
changes in precipitation and evaporation creating risks for desalination.
For the energy sector, three theoretical impact chains (IC) have been proposed in the
SOCLIMPACT project:
i) risk of changes in power generation due to long term climate change and variability, ii) risk of changes in energy demand due to changes in precipitation and temperatures, iii) risk of damages to transmission grids due to extreme events.
Only the second IC, i.e., the one related to changes in energy demand was selected to be
operationalized, mainly due to data availability constraints. The quality of IC operationalization
depends strongly on data availability over long periods. Data for cooling energy demand are still
scarce and difficult to obtain, despite the requirements of the European Commission for
information regarding the national energy efficiency targets. The availability and quality of cooling
demand data should improve in the future due to the need for tracking the advances towards
energy efficiency targets. Desalination demand data should also improve strongly, including data
about the energy efficiency of the desalination processes used.

88
This demand-side IC has been deployed into two individual ICs, namely, the increased energy
demand due to increased cooling demand and the increased energy demand due to increased
desalination needs. Both risks depend on the temperature increase, which is a very certain effect of
climate change. The risk assessment was carried through and expert assisted process.
The diagrams of the two operationalized impact chains are presented below
Figure 71: Conceptualization framework for the operationalization of the energy impact chain: Risk of increased
energy demand due to increased cooling demand Source: SOCLIMPACT Deliverable D4.5.

89
Figure 72: Conceptualization framework for the operationalization of the energy impact chain: Risk of increased
energy demand due to increased desalination demand. Source: SOCLIMPACT Deliverable D4.5.
Hazard scores for energy demand (Cooling Degree Days -CDD, Standardized Precipitation-
Evapotranspiration Index - SPEI), and supply indicators (wind energy, solar PV and combined
productivity and droughts) were analysed. The aim is to jointly consider future increases in energy
demand due to temperature and precipitation changes and the potential for covering it with
renewable energy sources in the future.
Regarding the normalization of these hazards, we use an approach based on their future change.
The available literature indicates that the future projected changes of renewable energy productivity
frequently do not exceed a level of 10% relative to present values. Changes of about 10% would
not modify clearly a normalized score like the one use for present climate (leading to a very limited
variation range of the score), but they represent a significant impact on the productivity and
profitability of the energy plants. Therefore, the future change of renewable energy productivity is
compared to a 10% threshold, both on the negative (normalized values above 0.5) and the positive
side (normalized values below 0.5). The normalization also includes a minor contribution of a
comparison of the changes relative to other islands.
CDD and SPEI scores are normalized with respect to a maximum projected value previously
identified. Renewable energy productivity indicators in present climate are normalized using global
thresholds (5th and 95th percentiles of the respective technologies). The same normalization
method is used for projected changes of renewable energy droughts. Thus, energy drought

90
indicators are normalized comparing them to a maximum upper limit, taken among all the islands
and renewable energy technologies.
A fundamental aspect of the method is that we apply an objective procedure for obtaining the
weights of the risk components (hazard, exposure and vulnerability) based on time-series
correlations of observed data for energy demand and for the different indicators involved in the
impact chains. This allows to detect which factors have a larger impact on the energy demand.
This method, based on correlations between observed energy demand and observed data for the
indicators, points out that several exposure and vulnerability factors have a stronger weight than
the climate hazards on short time-scales (interannual variations for periods of about 10 years). This
is consistent with the drivers considered in the national forecasts, for periods of 10 years,
performed as part of the EU Energy Efficiency Directive. A consequence of this is the relatively
low weights assigned to the climate hazards in the operationalization.
For the operationalization of the full impact chains, the exposure and vulnerability indicators were
also weighted utilizing different criteria. The mathematical procedure developed proposes the
definition of weights per group of variables (hazard, vulnerability and exposure) that allow
identifying the relationship between each of the components and the dependent variable (in this
case, energy demand due to desalination or energy demand due to cooling). The detailed weight
calculation for the risk components (hazards, exposure and vulnerability) can be found in the
SOCLIMPACT deliverables D4.5.
Hereafter the results of the hazard assessment and operationalization of the ICs are presented.
Table 22: Energy demand and supply hazard scores for Cyprus
Histori-cal ref.(1986-2005)
Demand Supply: Productivity Land Sea
Droughts
CDD 0.39 Wind 1.00 0.65 0.93
SPEI 0.00 Solar PV 0.16 0.22 0.12
Combined 0.14
RCP2.6 (2046-2065)
Demand Supply: Productivity change
Droughts change
CDD 0.55 Wind 0.4 0.5 0.5
SPEI 0.32 Solar PV 0.5 0.6 0.1
Combined 0.3
RCP8.5 (2046-2065)
Demand Supply: Productivity change
Droughts change
CDD 0.71 Wind 0.7 0.7 0.7
SPEI 0.76 Solar PV 0.5 0.7 0.1

91
Combined 0.5
RCP2.6 (2081-2100)
Demand Supply: Productivity change
Droughts change
CDD 0.54 Wind 0.6 0.5 0.6
SPEI 0.32 Solar PV 0.5 0.6 0.1
Combined 0.6
RCP8.5 (2081-2100)
Demand Supply: Productivity change
Droughts change
CDD 1.00 Wind 0.9 0.9 0.9
SPEI 0.96 Solar PV 0.6 0.7 0.0
Combined 0.7
Categorization:
0.00 – 0.20 Very low
0.20 – 0.40 Low
0.40 – 0.60 Medium
0.60 – 0.80 High
0.80 – 1.00 Very high
Source: SOCLIMPACT Deliverable D4.5.
Cyprus shows many differences compared to Crete, despite their relative proximity. The CDD
score in Cyprus is nearly two time the score in Crete, for present climate and for RCP2.6 scenario,
while for RCP8.5 it increases very strongly reaching the maximum value among all islands. For this
high-emissions scenario, Cyprus would be the only island in which the threshold obtained by
Jakubcionis et al. (2018) for full penetration of air conditioning equipment is exceeded by the end
of the century (on average for the whole island). This highlights the strong increase in cooling
energy demand expected under the high-emissions scenario.
SPEI scores would increase moderately under RCP2.6, with no change during the second half of
the century, while a strong increase is expected under RCP8.5. In the latter case, the present
percentage of desalinated water (between 4 and 31% from 2010-2017) would increase strongly.
Wind energy potential is much smaller than for Crete. Taken together with the very high score for
wind energy droughts, wind energy could be considered as a rather low-quality energy resource.
But the scores are calculated from spatial and temporal averages of wind energy productivity, and
some specific areas and seasons can show good wind energy potential. Koroneos et al. (2005)
indicate that the southern coastal zone and certain exposed areas of the mountains are very
promising for wind energy. Also, offshore wind energy near the southern coast of Cyprus is
substantial in summer and shows a daily cycle with an afternoon/evening maximum (Tyrlis and
Lelieveld, 2013) that, combined with PV, could match rather well the daily demand curve. This is
important as maximum power demand occurs in summer.

92
Solar PV potential is high, and the productivity is very stable. In this case, a combination of PV and
wind would be very beneficial in terms of stability of output, as the combined energy droughts
(50/50 PV/wind energy) are at the very low level of solar PV.
Wind energy productivity projections show mostly some tendency of reduction, with relatively
large reductions under RCP8.5 by the end of the century. Solar PV projections show either no
change or small reductions in productivity.
Table 23: Risk scores for Cyprus: cooling and desalination energy demand, for the historical and future periods.
Hist. ref. RCP2.6 (2046-2065)
RCP2.6 (2081-2100)
RCP8.5 (2046-2065)
RCP8.5 (2081-2100)
Cooling 0.46 0.48 0.48 0.51 0.55
Desalination 0.40 0.41 0.41 0.43 0.44
Categorization:
0.00 – 0.20 Very low
0.20 – 0.40 Low
0.40 – 0.60 Medium
0.60 – 0.80 High
0.80 – 1.00 Very high
Source: SOCLIMPACT Deliverable D4.5.
The risk associated to cooling energy demand shows presently a medium score, which does not
increase much for RCP2.6 scenario. The increase for RCP8.5 scenario is much clearer. The weights
of the different components indicate a higher importance for exposure indicators, followed by
vulnerability and finally hazard indicators. The indicator showing the largest correlation is the ratio
of the number of tourists to population, in stark contrast to Gran Canaria. Though the tourism
seasonality is high, its influence on cooling energy demand is low, at least for the period
considered. It should be taken into account that the available cooling energy demand data cover
only a 9-years period (2010-2018), which is a source of uncertainty as impacts over longer time
periods will not be captured. Likely as a result of this short period, the correlation of CDD with
cooling demand is low, and the correlation of cooling demand to energy intensity is negative. It
seems that the very strong increase in the number of tourists (nearly doubling from 2010 to 2018)
has been enough to hide the influence of other factors. There is also little room for an increase of
cooling demand linked to more air conditioning equipment, as the cooling penetration rate is
already very high (80%).
The risk linked to desalination energy demand also presents now a medium score, and in these
cases projected increases are very limited. This is due to the very low weight of the hazard
component (SPEI) obtained through the correlation method, as the available desalination energy
demand data cover only a limited period (2010-2017), in which the largest correlations are found
for the percentage of desalinated water over total water, the GDP per capita and the number of
tourists. SPEI may have a stronger impact over longer time-periods, as a sustained increase of
temperatures and evaporation could show cumulative effects on desalination demand that outstrip
other factors.

93
As a sensitivity calculation, we have obtained the desalination risk scores using equal weights for
hazard, exposure and vulnerability. The risk score increases in this case by approximately 50% for
RCP2.6, and more than doubles for RCP8.5 by the end of the century. This shows the strong
dependency of risk scores on the applied weights.
* Energy demand:
- In general, the future risk or hazard scores for desalination demand show worse values than the
risk or hazard scores for cooling demand. The combined impact of decreasing precipitation and
increasing temperatures is projected to generate strong drought conditions both in the
Mediterranean and Atlantic islands, under the high-emissions scenario (RCP8.5).
- The contrast between the mitigation scenario (RCP2.6) and the high-emissions scenario is drastic.
Not only are the hazard scores much lower for RCP2.6, but they even tend to decrease slightly
during the second half of the century, while for RCP8.5 the hazard scores tend to rise in a
sustained way.
- A clear demand management option for reducing cooling demand is the improvement of the
energy efficiency of buildings. The energy efficiency directive of the EU sets binding targets for all
European countries, but the data about the efficiency classes of buildings are rather limited and
difficult to access. The scarce data available indicate that there is much room for improvement in
this respect. A consequent implementation of energy efficiency measures in buildings could reduce
clearly the effect of increasing temperatures on energy demand.
- Digitalisation is key in EU strategies. In this respect, demand side management options for
adaptation to generation peaks and troughs should be developed as much as possible through
digitalisation, prioritising automatic instead of manual adaptation.
* Energy supply:
- The frame for energy supply in the islands is the binding targets established in the 2030 climate
and energy EU framework and the long-term horizon of a decarbonized energy system by 2050.
- The future change of wind energy and PV productivity should be rather small in general: around
5% or less with respect to the reference period in many cases, with maximum changes of about
10% for some islands at the end of the century under RCP8.5 scenario (particularly for wind energy
productivity over land). A 10% productivity change could have a significant impact on a planned or
existing plant if it occurs over the lifetime of the power plant, but in this case such a change would
extend over many decades, which will facilitate adaptation and efficiency measures.
- In general, projections show a decreasing tendency of wind energy productivity over the
Mediterranean region, with a more important decrease for the RCP8.5 scenario. The main
exception is Crete, which shows a consistent increasing tendency.

94
- There is a specific uncertainty source in the photovoltaic projections. Most regional climate
model simulations, including the ones used here, do not include a projected evolution of aerosols
in future climate runs. The missed effect of the likely evolution of aerosols would likely increase to
some degree the future surface solar radiation and PV productivity over most of the islands
(Gutiérrez et al., 2020).
- Renewable energy productivity droughts are a measure of the variability of the resource. Wind
droughts are much more frequent (around 50% of the days for most islands) than PV droughts
(10% or less of the days). This agrees with results from the study of Raynaud et al. (2018), and
highlights the stable character of the solar productivity in comparison to wind productivity over
time.
- Projected changes in the frequency of droughts are small, with future variations that generally do
not attain a magnitude greater than 5% of the days. This indicates that the time-variability
characteristics of wind and PV energy are a robust feature, which is relevant for planning the
amount of storage or backup needed.
- As part of the pathway towards very high or 100% RES shares, offshore wind energy should play
a very relevant role. Solutions to overcome the obstacle posed by the deep bathymetry surrounding
most of the islands are beginning to near commercial deployment, so that floating offshore wind
plants are already planned near Gran Canaria and Sicily.
- Offshore PV could be an interesting option for some islands, particularly when land surface
limitations are large. There is growing interest in this option, as shown by the test plants being
installed and the references made to this technology in the Roadmap for the Offshore Renewable
Energy Strategy of the European Commission or in the report of Monitor Deloitte and Endesa
(2020) about the accelerated decarbonization of Canary and Balearic Islands.
- The combination of different types of offshore renewable energy sources in the same platform is
also attracting interest, as the different sources can exhibit complementarity in time and the
combined output can thus be more stable and reliable. The different RES can also share part of the
installations, like the connection to land, reducing their cost (Pisacane et al., 2018; MarineEnergy,
2019a). The European Union is trying to promote such combinations, through projects like
MUSICA (Multiple Use of Space for Island Clean Autonomy) which will design and test a floating
offshore platform integrating wind, PV and wave energy for use on islands (MarineEnergy, 2019b),
and plans to develop roadmaps for its deployment in three case study islands, among them Malta
and the Canaries (MaREI, 2020).
- New financing possibilities linked to the recently approved EU COVID-19 recovery fund, and
over a longer term associated to the European Green Deal, should facilitate the deployment of
renewables in the islands, as the energy transition is a key target.
- Interconnections to mainland are very important for supply safety. Excessive dependency on
interconnections to mainland should be nevertheless avoided, due to risk of blackouts, as the
failure of a single element (one transmission line) can knock out instantaneously a large proportion
of the power of an island and even cause an island-wide blackout, as has occurred several times in
Malta in the last years.

95
Read more: Hazard indicator computation and normalization
Cooling degree days (CDD) are used to give an indication of the effect of outside air
temperature on building energy consumption during a specified period of time. The Cooling
Degree Days (CDD) index gives the number of degrees and number of days that the outside air
temperature at a specific location is higher than a specified base temperature. For the indicator
weight calculation, the observed values of CDD (EUROSTAT) have been used, and compared to
the hazard of the island. With respect to the normalization of the indicator, we have used a fixed
lower threshold and a relative maximum as upper threshold. The minimum CDD value has been
taken as 0, while the maximum CDD value has been taken as the maximum over all islands,
emissions scenarios and time periods (CDD=1183.49 ºC· days/year, corresponding to Cyprus for
RCP8.5 scenario, end of century period).
Standardised Precipitation-Evapotranspiration Index (SPEI) is a drought index that takes
into account not only the effect of precipitation variations, but also the effect of temperature
variations on evapotranspiration. The calculation is based on the monthly difference between
precipitation and potential evapotranspiration, which represents the monthly water surplus or
deficit. The indicator weight calculation was done using data from ECA&D (European Climate
Assessment & Dataset). The normalization of the indicator has taken into account the fact that by
definition, present conditions correspond to reference conditions (SPEI=0), and that all future
changes are towards negative SPEI values, that is towards drier conditions. Therefore, the best
score value (0) has been assigned to SPEI=0, while the worst score value (1) has been assigned to
the largest negative value found for all islands, emissions scenarios and time periods (SPEI=-2.5,
obtained for several islands under RCP8.5 emissions scenario by the end of century).
The indicator Wind energy productivity (kWh/kW) is defined as the energy produced in a period
of time divided by the power installed, which is considered as unitary. The indicator is calculated
separately for land and sea. Offshore wind energy is the most developed ocean energy, and it is
likely to be an important future energy source for the analysed islands. Its characteristics are
typically very different to onshore wind energy, due to the large differences in surface friction. The
energy productivity values are averaged respectively over the island land points and over the sea
points in a domain that reaches a maximum distance of one degree latitude and longitude
respectively to the maximum and minimum longitude/latitude land points of the islands.
The normalization is performed using absolute thresholds, that represent high or low global values
of productivity. These thresholds have been obtained from a global renewable power report
(IRENA, 2019). The maximum annual productivity would be 8760 kWh/kW, corresponding to a
100% capacity factor. The obtained CF thresholds for onshore wind energy are 20%
(corresponding to a normalized score of 1) and 45% (normalized score of 0), while for offshore
energy they are 30% and 50%.
Photovoltaic productivity (kWh/kW) is defined as the energy produced in a period of time
divided by the power capacity installed. In order to obtain photovoltaic productivity, daily surface

96
solar radiation (SSR) and ambient temperature from the climate simulations are used as input
variables for a parametric PV model. The normalization is performed using absolute thresholds,
that represent high or low global values of productivity, taken from the same report as for wind
energy. In this case, the maximum threshold is adapted taking into account that the calculations
performed here assume fixed panels, while IRENA global report does not differentiate between
fixed and sun-tracking panels. Therefore, we estimate an upper CF threshold (normalized score of
0) of 20% for fixed panels, from the 25% value deduced from IRENA global report.
Renewable energy productivity droughts indicators are a way of quantifying the time-variability
of renewable energies that depend on meteorological conditions. Low values of energy droughts
correspond to a stable output, while high values correspond to a highly variable output. The
combined renewable energy droughts represent the complementarity between wind and PV energy.
A high complementarity of both sources reduces the need for energy storage or backup sources.
Two different thresholds are calculated to determine moderate (50% of mean daily productivity)
and severe (20% of mean daily productivity) energy productivity droughts, respectively. For the
normalization of these energy drought indicators, we have used a combination of an absolute
threshold (a value of 0% of drought days) corresponding to a score of 0 and a relative maximum
upper limit, taken among all the islands and renewable energy technologies (55% of days with
moderate droughts, obtained for wind energy in Corsica) corresponding to a score of 1. The same
normalization limits are applied for wind, PV and combined productivity droughts.
4.4 Maritime Transport
Maritime transport is defined as the carriage of goods and passengers by sea-going vessels, on
voyages undertaken wholly or partly at sea. It is often considered as the backbone of the world
economy, with 80% of the global trade volume passing through ports (Asariotis & Benamara,
2012). For islands, the transport of goods and passengers by ship is even more essential. At the
same time, Maritime Transport contributes to climate change through its carbon emissions which
are found to be near 3% of the global CO2 equivalent emissions (Smith et al., 2015). Compared to
land and air transport, it is the (economically and ecologically) most effective way of distributing
goods globally. A changing climate will challenge Maritime Transport to adapt to future risks and
lower its emissions.
The whole range of potential impacts of climate change on ports operations and throughput is still
under study and it remains a high degree of uncertainty about it. Various climate change stressors
can affect both harbour infrastructure and ships on route. For example, ports are vulnerable nodes
of Maritime Transport as they are strongly affected by rising sea-levels, which in turn affect port
facilities and increase the risk of flooding. Sea-level rise has accelerated in the last century and will
rise by 0.43 to 0.84 m until 2100, depending on the emission scenario (Pörtner et al., 2019). Due to
ocean dynamics and the Earth’s gravity field, there will also be regional differences in sea-level rise
in the order of 0.1 m (Asariotis & Benamara, 2012). The causes of sea-level rise are the thermal

97
expansion of water and the melting of glaciers due to the increase in global mean temperature
(Vermeer & Rahmstorf, 2009).
Maritime transport can also be affected by climate change through the increase in the intensity of
extreme weather events including tropical-like cyclones. According to climate projections, tropical
cyclones are not expected to change significantly in frequency but in intensity due to rising sea-
surface temperatures (Pörtner et al., 2019). The resulting extreme winds and waves can harm ships,
but also cause damage and flooding of ports, especially in combination with sea-level rise (Hanson
and Nicholls, 2012).
For the Maritime Transport sector, three main climate change risks have been identified for the
SOCLIMPACT project. These are:
(a) risk of damages to ports’ infrastructures and equipment due to floods and waves,
(b) risk of damages to ships on route (open water and near coast) due to extreme weather events,
(c) risk of isolation due to transport disruption.
We selected to operationalize the third one which in terms of hazards and impacts can be
considered as a combination of the other two. The hazard risk component indicators considered
for the operationalization were: extreme waves (SWHX98), extreme wind (WiX98) and mean sea
level rise (MSLAVE). The exposure indicators are: number of passengers (NPax), islands’ total
population (NTotP), value of transported goods expressed in freight (VGTStot) and number of
ports per island or archipelago (NPo), while the sensitivity indicators include: the number of
isolation days (NIID) and renovated infrastructure (NAgePo). Finally, for the component of
adaptive capacity the proposed indicators are: percentage of renewables (PEnRR), number of
courses/trainings (NTrCoRM), early warning systems (NOcSta) and harbour alternatives (NApt).
Unfortunately, due to the lack of reliable and consistent data we had to exclude the “number of
isolation days” and “number of courses/trainings” indicators. The conceptualization framework of
the operationalization is summarized in the next Figure.

98
Figure 73: Conceptualization framework for the operationalization of the Maritime Transport Impact Chain: Risk
of Transport Disruption. Source: SOCLIMPACT Deliverable D4.5.
For assessing future risk, we considered projections or estimations for the indicators when these
were available. This was mainly the case for the components of hazard (mean sea level rise,
extreme waves and wind), exposure (population, number of passengers, value of goods), and the
contribution of renewables. Two Representative Concentration Pathways (RCPs) were considered
for meteorological hazards. One “high-emission” or “business-as-usual” pathway (RCP8.5) and a
more optimistic one (RCP2.6) that is closer to the main targets of the Paris Accord tο keep global
warming to lower levels than 2 °C since pre-industrial times.

99
Besides the historical reference period, we consider two 20-year future periods of analysis. One
over the middle of the 21st century (2046-2065) and one covering the end of the 21st century (2081-
2100). The normalization of indicators was performed across the different islands in order to
facilitate and inter-island comparison and prioritize the islands of higher risk.
Regarding the weighting of the different risk components, we have tested several weights, however,
according to expert judgement and discussion with specialists on the Maritime sector, we have
found more appropriate to assign equal weights to all main components of risk (i.e. 0.33 for
Hazard, 0.33 for Exposure and 0.33 for Vulnerability). For the sub-components of Exposure, we
have assigned a weight of 0.33 for Nature of Exposure and a weight of 0.66 for Level of Exposure
since the latter one is believed to be of greatest importance. Similarly, for the vulnerability sub-
components, we have assigned a weight of 0.25 for the Factors of Sensitivity and a weight of 0.75
for the Factors of Adaptive Capacity.
The weighting and categorization of risk is a subjective decision, nevertheless we consider our
selection to be quite conservative and therefore we believe that a slightly different choice would
not significantly affect the main conclusions drawn. For the recent past/present conditions, the
operationalization of the Maritime Transport Impact Chain indicates low risk for all investigated
islands. In general, the Maritime Transport sector of the larger islands (e.g. Corsica, Cyprus and
Crete) is found to be more resilient to the impacts of climate change. Up to a point, this is related
to the large number of harbour alternatives in comparison with smaller islands.
Our results for the future highlight the importance of adopting a low-emission pathway since this
will keep the risk for Maritime Transport disruption in similar as present conditions while for some
islands the risk is expected to slightly decline. In terms of island inter-comparison, Malta’s maritime
sector is found to be most vulnerable, nevertheless, future risk even under RCP8.5 is not expected
to exceed medium risk values. On the contrary, Corsica is the island less susceptible to climate
change impacts. Detailed results for each investigated SOCLIMPACT island are presented in the
following sub-sections.

100
Table 24: Summary of present and future risk of isolation due to Maritime Transport disruption for each island and
scenario based on the Impact Chain operationalization.
Categorization:
Source: SOCLIMPACT Deliverable D4.5 Design of a comprehensive approach to climate and climate-related risk information to policy makers and the general public.
For the eastern Mediterranean island of Cyprus and the risk of isolation due to Maritime Transport
disruption, our analysis indicated low risk values (0.241) during the historical reference period.
Greatest is the contribution that comes from the factors of adaptive capacity and nature of
exposure. On the contrary, the hazard indicators related to the meteorological hazards had a much
smaller contribution. For the mid of the 21st century the risk for transport disruption remains low
for both RCP2.6 and RCP8.5 (values of 0.21 and 0.258 respectively). The contribution of hazard
indicators is becoming more significant, since mean sea level rise is increased compared to the
default zero value of the historical reference period. Since the exposure indicators have the same
values for both pathways, the differences in the risk values are for this period mainly driven by the
factors of adaptive capacity and mainly the contribution of renewables. This contribution is
expected to be more important in an RCP2.6 future, therefore the risk values are somehow lower.
For the end of the 21st century, the risk values do not change much for the optimistic RCP2.6. On
the contrary, for RCP8.5 our analysis indicates an increase in the risk value (0.292), however this is
still categorised in the low class.
READ MORE about the risk indicator computation: normalization of sub-component
indicators in SOCLIMPACT Deliverable D4.5 here.
RISK VALUE PER
ISLAND
Historical
Reference RCP2.6 MID RCP2.6 END RCP8.5 MID RCP8.5 END
CYPRUS 0.241 0.210 0.218 0.258 0.292
CRETE 0.229 0.208 0.201 0.257 0.282
MALTA 0.376 0.347 0.335 0.395 0.414
CORSICA 0.220 0.194 0.194 0.243 0.273
CANARY ISLANDS 0.336 0.292 0.250 0.346 0.341
BALEARIC ISLANDS 0.326 0.281 0.264 0.331 0.344
0.00 – 0.20 Very low
0.20 – 0.40 Low
0.40 – 0.60 Medium
0.60 – 0.80 High
0.80 – 1.00 Very high

101
5 Socio economic impacts of climate change
5.1 Market and non-market effects of CC
Tourism
In order to analyse the reactions of tourists to the impacts of climate change and the preferences
for adaptation policies, several hypothetical situations were posed to 258 tourists visiting Cyprus
whereby possible CC impacts were outlined for the island (i.e., beach erosion, infectious diseases,
forest fires, marine biodiversity loss, heat waves, etc.).
Figure 74: Socio-economic characteristics and travel description: Tourists visiting Cyprus Source: Deliverable Report D5.5.
Firstly, tourists had to indicate whether they would keep their plans to stay at the island or find an
alternate destination if the impact had occurred, which allows predictions of the effects on tourism
arrivals to be made for each island. Secondly, tourists were asked to choose between various policy
measures funded through an additional payment per day of stay – the tourists’ choices being an
expression of their preferences for attributes/policies. To estimate the results, the conditional
model was run by using the Stata software.
In general, data confirms that tourists are highly averse to risks of infectious diseases becoming
more widespread (97.70% of tourists would change destination). Moreover, they are not willing to
visit islands where beaches largely disappear (84.50%) or where temperature becomes
uncomfortably hot (72.50%). Consequently, policies related to beaches protection (11€/day), heat
waves amelioration (8.7€/day), and the prevention of infectious diseases (6.9€/day) are the most
valued, on average, by tourists visiting this island.

102
Although climate change impacts are outside the control of tourism practitioners and policymakers,
they can nevertheless utilise this knowledge to improve the predictability of the effect that certain
adaptation policies and risk management strategies, and develop their plans accordingly.
Figure 75: Choice experiments results for the tourism sector: Tourists visiting Cyprus Source: Deliverable Report D5.5.
The infographic can be found in high resolution in the SOCLIMPACT Project official
website here.
How tourists perceive the island destination: A comparative approach through the analysis of social
media
While historically destination image is projected by DMOs and tourists’ offices, the advent of social
media allow the construction of an image which is also a projection of tourists. The content of
their communication online shows the image they perceive. In this section we analyse how tourists
“talk” about the different islands on social media, in order to understand what the perceived image
is.
We use a specific tool (Google Cloud Vision) to scan the content of images posted by tourists on
Instagram (the market leader in visual social media) while they are on holiday in selected islands.
The content is translated in up to ten labels attached to each picture. For each island we aggregate

103
and rank the different labels to find out the most important characteristics tourists associate to the
island (assuming that they are correlated with the most frequent labels attached to the pictures).
We analyse eight islands representative of the Atlantic Ocean (four islands of the Canary
Archipelago: Fuerteventura, Gran Canaria, Lanzarote, Tenerife) and of the Mediterranean Sea
(Crete, Cyprus, Malta, Sicily). We scan posts geotagged in these islands by tourists (identified by a
travel-related hashtag such as #visit #holiday #travel, etc) in summer 2019 (June to September),
returning a total number of 745,235 pictures considered in the analysis. The breakdown is in the
table below.
Table 25: Characteristics of the sample of pictures under analysis
Island
Indicator Tenerife
Gran Canaria
Fuerteventura Lanzarote Cyprus Crete Malta Sicily
Num. of posts (total)
49,234 33,145 38,452 25,471 63,561 93,752 74,925 119,896
Avg. num. of pictures per post
1.77 1.67 1.56 1.8 1.76 1.74 1.81 1.68
Share of geotagged posts
67% 67% 67% 65% 70% 74% 76% 73%
Number of scanned pictures
74,537 48,337 52,577 39,381 95,808 141,538 117,576 175,481
Source: Soclimpact project deliverable D5.3
After aggregating similar words, top labels for each island were obtained. The following pools were
created utilizing a frequency analysis, which is the total number of times the label occurs in each
island. A first glance at the word clouds shows that all destinations look extremely similar which,
perhaps, is of little surprise given that they all are European sea & sun destinations: hence, labels
like Sky, Sea, Vacation, Tree, Beach are among the most frequent for all islands. Nonetheless, some
differences can be spotted: Mountain appears relatively more frequently in Tenerife than in other
islands’; Sea and Ocean have relatively more weight in Fuerteventura; Architecture and Building are
of more importance in Cyprus, Crete, Malta and Sicily than in the Canary Islands, something that is
clearly linked to the density of cultural heritage in the Mediterranean islands: in fact, all the labels
representing architectural, religious and historical sites (History, Historic, Ruins, Site, Ancient,
Building, Dome, Mosque, Holy, Medieval, etc.) have higher ranks in these islands than in the
Canaries. The islands of this archipelago have more similar images, but also reveal distinct features:
for example Gran Canaria appears the most urban, Tenerife is characterized by a higher frequency
of labels related to partying and nightlife but also for wildlife spotting, Lanzarote stands out for its
arid landscapes and Fuerteventura for the vast sandy seashores and turquoise waters as the
frequencies of labels such Beach, Shore, Sand, Coast, Turquoise, Ocean show.

104
Gran Canaria Tenerife Fuerteventura
Lanzarote Crete Cyprus
Malta Sicily

105
The impact of increased temperatures and heat waves on human thermal comfort
In order to assess how the variation in temperature impacts on the tourism sector through changes
in tourism demand our research question was: “How do increasing temperatures (and heat waves)
impact prices and, more in general, expenditure of tourists?” Arguably, when temperatures grow,
tourists adjust their behaviour: they might switch destination, or they might stay longer or shorter
depending on their attitudes and preferences. In turn, all these changes modify the market
equilibrium, pushing tourism companies to adjust their prices to re-establish the equilibrium
between demand and supply. The change in demand and the change in price determine the change
in tourism expenditure which is, from the destination’s perspective, tourism revenue.
We monitored current weather conditions posted on several weather forecast providers and daily
prices posted on Booking.com by hotels. We then estimated the link between daily temperature
and daily price, controlling for all the other factors affecting prices. We finally applied these
estimates to the increase in the number of days with excessive temperature projected for the future
in two scenarios (RCP2.6 and RCP8.5) and in two time horizons (near future, about 2050; distant
future, about 2100).
Among the different indicators linked to thermal stress, Soclimpact is focusing on two: the number
of days in which the temperature is above the 98th percentile and the number of days in which the
perceived temperature is above 35 degrees. Although in D5.6 the impact for both indices were
computed, in this document we only report the second one (named HUMIDEX) because it is the
most intuitive and because human thermal stress is more related to the absolute value of the
temperature than its deviation from some pre-determined distribution. In line with the project, we
assumed that thermal stress appears when the perceived temperature grows above 35 Celsius
degrees.
As thermal stress is delimited in the summer months, and this is when the great majority of tourists
arrive in these islands, the whole analysis has been carried out in six months only: from May to
October included. In other words, we assume that there is no thermal stress (and hence no impact
on tourism) in the rest of the year.
Initially, three islands were investigated: Corsica, Sardinia, and Sicily, given the massive amount of
potential data. Other estimations were provided for Cyprus using the Index of Distance in
Destination Image to position each island in a range that goes from Sardinia / Corsica on one side
and Sicily on the other side. Without entering the details of the extrapolation method (which are
explained in D5.6 appendixes) a summary of results is reported here:

106
Table 26: Estimation of increase in average price and revenues for Cyprus
Actual share of days in
which humidex > 35
degrees
Future scenario
considered
Days in the corresponding
scenario in which humidex > 35
degrees
Increase in the
average price
Increase in the
tourism overnight
stays
Increase in
tourism revenues
50.47%
rcp26near 61.59% 2.6% 0.5% 3.1%
rcp26far 62.47% 2.8% 0.6% 3.4%
rcp85near 64.88% 3.4% 0.7% 4.1%
rcp85far 88.60% 8.9% 1.8% 10.9% Source : Soclimpact project deliverable D5.3
According to these findings, the average increase in temperature, which is correlated to a growing
thermal stress for tourists, brings an economic advantage to tourism destinations. This is only an
apparent contradiction with previous findings. This study does not neglect the fact that if islands
are too hot, tourists will choose to move to other (cooler) destinations, that in principle exist.
Then, the increase in tourism (and tourism revenues) stem from the fact that, when the
temperature is too hot, people would prefer to move to coastal areas (where the climatic conditions
are more bearable) than staying inland or in cities. Future trends will also facilitate this pressure of
tourism demand (think about the spreading of smart working activities where, in principle, the
worker can relocate wherever he/she wants).
Aquaculture
To do this, we assume two main species cultured in this region: Seabream (SB) and Tuna (T), and a
model of production function, calculating the monthly biomass production which depends on the
monthly water temperature. Results are presented on yearly base (mean values). In order to
facilitate the interpretation of the results, we present the value of production of the last year
available, for which we calculate the new values under the different CC scenarios. As expected, the
production levels (tons) will decrease for both, low and high emissions scenarios.

107
7,303.00 *4,659.31(-36.2%)
0(-100%)
20.9 22.40 23.90
7,303.00 *5.922,73(-18.9%)
5.732,86(-21.5%)
20.9 21.8 21.9
*Source: data provided by regional stakeholders to the Soclimpact project
SEA SU
RFA
CE TEM
EPR
ATU
RE
(MEA
N)
AQ
UA
CU
LTU
RE
PR
OD
UC
TIO
N
SEA SU
RFA
CE TEM
EPR
ATU
RE
(MEA
N)
AQ
UA
CU
LTU
RE
PR
OD
UC
TIO
N
*Source: data provided by regional stakeholders to the Soclimpact project
20,25
20,50
20,75
21,00
21,25
21,50
21,75
22,00
0,00
1.500,00
3.000,00
4.500,00
6.000,00
7.500,00
9.000,00
Reference period1986-2005
Mid century2046-2065
End century2081 - 2100
ºCt LOW EMISSIONS SCENARIO RCP2.6
19,00
20,00
21,00
22,00
23,00
24,00
25,00
0,00
1.500,00
3.000,00
4.500,00
6.000,00
7.500,00
9.000,00
Reference period1986-2005
Mid century2046-2065
End century2081 - 2100
ºCt HIGH EMISSION SCENARIO RCP8.5
Figure 76: Estimations of changes in aquaculture production (tons), due to increased sea surface temperature
Source: SOCLIMPACT Deliverable D5.6.
The infographic can be found in high resolution in the SOCLIMPACT Project official
website here.
Energy
Climate change may impose welfare reductions to the European islands’ societies by affecting
thermal comfort. Cooling Degree Days (CDD) are a measure of how much (in degrees), and for
how long (in days), outdoor air temperature is higher than 18°C or 65° Farenheit. The CDD is
used as a measure of the energy needed to cool buildings. The increase in CDD and the energy
demand (GWh/year) for cooling are estimated for the islands, under different scenarios of global
climate change.
Under the high emissions scenario, it is expected that the CDD increase to 1183 CDD6 aprox in
2100. This value could be, for example, a combination of 107 days with temperatures of 29°C.
Under this situation, the increase in cooling energy demand is expected to be 252%.
The infographics presented below can be found in high resolution in the SOCLIMPACT
Project official website here.
6 The indicator is computed by multiplying the number of days exceeding the threshold by the difference in
temperatures. For example the CDD for 100 days at 20 °C is computed as 100*(20-18)= 200CDD

108
Figure 77: Estimations of increased energy demand for cooling in Cyprus under different scenarios of climate change
until 2100 Source: SOCLIMPACT Deliverable D5.6.
The Standardized Precipitation Evapotranspiration Index (SPEI) is analysed as a representative
indicator for increases in water demand for islands’ residents, tourists and agriculture, while it also
provides an indication on the available water stored in dams or underground resources. To estimate
the increase of energy demand due to the increase in water demand, it was assumed that most of
the islands will have to produce desalinated seawater (or groundwater) to meet further increases of
demand. Thus, the estimation of the increase in energy demand (GWh/year) to produce more
drinking water has been done based on the energy consumption required to desalinate seawater.
Under the low emissions scenario (RCP2.6), there are not significant changes in the SPEI indicator,
that will remain in its ¨normal¨ level, as it is nowadays. Nevertheless, an increase of 36% in
desalination energy demand is expected. Under RCP8.2 the scenario alerts on a severe aridity
leading to an increase of 159% of the energy demand.

109
Figure 78: Estimations of increased energy demand for desalination in Cyprus under different scenarios of climate
change until 2100 Source: SOCLIMPACT Deliverable D5.6.
Maritime Transport
For maritime transport, it has been estimated the impact of Sea Level Rise on ports' operability
costs of the island. The costs have been calculated with reference to1meter; this is, the investment
needed to increase the infrastructures' height by 1 meter. There is not necessarily a strict
correspondence between the SLR and the required elevation of port infrastructures, which also
depend on the coastal hydrodynamic and the shape of dikes of each port. By experts’
recommendation, we have assumed that 1 m increase in port height is required to cope with the
SLR under RCP 8.5 scenario of emissions. Extrapolation for other RCP scenarios is then
conducted based on proportionality.
The starting point was the identification of the principal ports in each island (economic relevance).
Second, the analysis of the different port areas (exterior, ramps, oil, etc.), and their uses. Third, the
elevation costs were estimated per each area and port separately (considering 1-metre elevation).
Thus, the costs of 1-meter elevation presented are the sum of all areas and ports analysed and
including the rest of the ports of the island (if applicable) based on proportionality. Estimations
consider that all ports areas of the entire area should be elevated at the same time. In other words,
the economic values can be interpreted as the depreciation (amortization) costs of the investment
needed to increase all port infrastructures on the island within the next 125 years. No discount rate
has been applied.
As expected, the rising of sea levels will affect the sector, as new investment will be needed to keep
ports’ operability. Under the high emissions scenario, it is expected that these costs could increase
4.3 million euros per year until the end of the century.
The infographic presented below can be found in high resolution in the SOCLIMPACT
Project official website here.

110
Figure 79: Increased costs for maintaining ports’ operability in Cyprus under different scenarios of SLR caused by
climate change until 2100 Source: SOCLIMPACT Deliverable D5.6.
5.2 Macroeconomic projections
The aim of our study is to assess the socioeconomic impacts of biophysical changes for the island
of Cyprus. For this purpose we have used the GEM-E3-ISL model; a single-region, multi-sectoral
general equilibrium model based on the principles of neo-classical theory, and GINFORS; a
macro-econometric model based on the principles of post-Keynesian theory.
Both models include 14 sectors of economic activity, with an emphasis on services and specifically
on those composing the tourism industry. The GEM-E3-ISL model also include: endogenous
representation of labor market and trade flows etc.
Changes in the mean temperature, sea level and precipitation rates are expected to affect energy
consumption, tourism flows and infrastructure developments. These impact-chains have been
examined and quantified under two emission pathways: RCP2.6 which is compatible with a
temperature increase well below 2C by the end of the century and RCP8.5 which is a high-emission
scenario. The impact on these three (3) factors has been quantified in D5.6 and is used as input in
MEAN SEA LEVEL RISE SLR

111
the economic models, which then assess the effects on GDP, consumption, investments,
employment etc.
In total 17 scenarios have been quantified for Cyprus. The scenarios can be classified in the
following categories:
1. Tourism scenarios: these scenarios examine the reduction in tourism revenues due to
changes in human comfort as captured by the hum-index, the degradation of marine
environment, increased risk of forest fires and beach reduction
2. Energy scenarios: these scenarios examine the impacts of increased electricity consumption
for cooling purposes and for water desalination
3. Infrastructure scenarios: these scenarios examine the impacts of port infrastructure
damages
4. Aggregate scenarios: these scenarios examine the total impact of the previous-described
changes in the economy.
In this scenario we examine the impacts of a simultaneous change in electricity consumption,
tourism revenues and infrastructure damages. The scenario specifications for the two climatic
variants are presented below:
Table 27: Aggregate scenario –results
Tourism revenues (% change from reference levels)
Electricity consumption (% change from reference
levels)
Infrastructure damages
(% of GDP)
RCP2.6 (2045-2060) -10.88 19.3 -0.02
RCP2.6 (2080-2100) -14.83 16.6 -0.02
RCP8.5 (2045-2060) -41.33 37.0 -0.06
RCP8.5 (2080-2100) -49.24 68.6 -0.07 Source: GEM-E3-ISL
The theoretical and structural differences of the two models mean that this study produces is a
reasonable range of impacts, given the uncertainty embodied in economic analysis and especially in
the long-term.
In GEM-E3-ISL, the economy is in equilibrium at each point in time. Prices adjust to ensure that
supply equals demand (market clearing), capital is fully used; however, the allows for equilibrium
unemployment. The impacts are driven mainly by the supply side through changes in relative prices
that determines competitiveness change, substitution effects etc. The GEM-E3-ISL model assesses
the impacts on the economy up to 2100.
The macro-econometric type of models, such as GINFORS, do not require that all markets are in
equilibrium; idle capital and involuntary unemployment are some other features of this type of
models where the results are driven mainly by adjustments in the demand side of the economy.
The GINFORS assesses the impacts on the economy up to 2050.

112
With respect to GDP the estimated change compared to the reference case is between -0.95% and
-2.2% in the RCP2.6 in 2050 and between -3.0% and -8.0% in the RCP8.5. The cumulative change
over the period 2040-2100 is estimated (by GEM-E3-ISL) to be equal to -1% in the RCP2.6 and -
4% in the RCP8.5.
Figure 80: Percentage Change in GDP. Source: GWS, own calculation
With respect to sectorial impacts both models show a significant decrease in the activity of tourism
related sectors and an increase in the activity of the manufacturing sector and to a lesser extent in
the consumer goods industries sector. In the GEM-E3-ISL model the reduction in wages in
response to the increasing unemployment in the tourism industries implies competitiveness gains
for other market services (e.g. business sector, trade etc.).

113
Figure 81: Production percentage change from reference. Source: GWS, own calculation
Overall employment falls in the economy and especially in tourism related sectors following the
slowdown in domestic activity. In GEM-E3-ISL increases in employment in non-tourism related
activities are related to labor costs reductions (as wages fall and their competitiveness increases)
and a consequent substitution of capital with labor in other sectors. Employment falls on average
by 0.3% in the RCP2.6 and by 0.9% in the RCP8.5.

114
Figure 82: Employment percentage change from reference. Source: GWS, own calculation
6 Towards climate resiliency
6.1 Current situation: general commitment, specific limits and obstacles
The island has adopted a number of Climate Change actions at both national and European level.
The following lists the most important actions:
1992 Adoption of the United Nations Convention on Climate Change (UNFCCC) to
stabilize concentrations of greenhouse gases in the atmosphere at levels that prevent
dangerous impacts on the climate from human activities.
1994 UNFCCC entered into force.
1997 Cyprus ratified the UNFCCC as a non-Annex I Party.
1998 Adoption of the Kyoto Protocol to limit greenhouse gas emissions for the periods
2008-2012 and 2013-2020.
2003 Cyprus ratified the Kyoto Protocol.
2008 Start of the Kyoto Protocol’s First Commitment period.
2009 EU’s Climate and Energy Package for 2020 agreed.
2011 Cyprus changed its UNFCCC status to Annex I party.
2011 EU’s 2050 Roadmap agreed.

115
2012 End of the Kyoto Protocol’s First Commitment period.
2012 Doha amendment to the Kyoto Protocol for 2013-2020.
2015 Adoption of the Paris Agreement to reduce greenhouse gas emissions.
2016 Paris Agreement entered into force.
2017 Cyprus ratified the Paris Agreement.
With regards to its policies, the Cyprus government has drafted several plans and strategies
concerning water, energy and waste into various directives.
The River Basin Management Plan and Water Policy drafted in the framework of the Water
Framework Directive.
The Flood Risk Management Plan drafted in the of the Floods Directive.
The National energy efficiency action plan of Cyprus drafted in the framework of the
Energy Efficiency Directive.
The National Renewable Energy Action Plan drafted in the framework of the 2009/28/EC
Directive.
The Nearly Zero Energy Buildings Action Plan drafted in the framework of the Energy
Performance of Building Directive.
The European Common Agriculture Policy.
The National Biodiversity Strategy. Cyprus has formulated the National Biodiversity
Strategy (NBS) during 2013, as a reference document in order to fulfil the commitments
accepted with the ratification of the Convention on Biological Diversity.
The Strategy for the Management of waste.
The low-carbon development strategy of Cyprus to 2050.
The Multiannual national plan for the development of sustainable aquaculture.
The Ministry of Agriculture, Rural Development and Environment compiled a strategic plan of
objectives and actions for the purpose of promoting a green economy, sustainable agriculture and
fisheries growth and efficient use of natural resources. Table 28 provides a list of these goals that
are related to the SOCLIMPACT project.
Table 28: Cyprus strategic goals and objectives.
STRATEGIC PLAN OBJECTIVES & ACTIONS
Climate Change mitigation and adaptation (Department of Environment)
1. Reduction in greenhouse gas emissions and adaptation to climate change. 2. Implementation of international and EU commitments on climate change, protection
of the ozone layer and regulation and monitoring of fluorinated greenhouse gases. 3. Coordination of climate change policy issues.
Environmental protection (Department of Environment)
1. Protection of the environment from the activities of industrial and livestock installations, waste management operators and waste producers.
2. Managing species and habitats with the objective of halting the degradation of the conservation status.

116
3. Assessment of the impacts on the environment from plans/programmes/projects and other actions.
Efficient protection of forests against fires and other agents (Department of Forests)
1. Protection of forests against forest fires. 2. Protection of forests against other agents.
Protection of biodiversity and other ecosystem services (Department of Forests)
1. Protection of biodiversity and other ecosystem services. 2. Adaptation of forests to climate change and contribution of forests to mitigating
climate change.
Safeguard the quality and protect the water resources and aquatic environment (Water Development Department)
1. Implementation of the Floods Directive 2007/60/EC.
Protection and conservation of the marine environment (Department of Fisheries and Marine Research)
1. Studies and monitoring of the marine waters up to the EEZ, under the relevant European legislation and International Conventions.
2. Management and Monitoring of Marine Protected Areas. 3. Inspection and combat of oil pollution (combat teams).
Source: SOCLIMPACT Deliverable D7.1.
The following table presents some of the most significant limits and obstacles facing the island
with regards the adoption and implementation of various actions, strategies and policies aimed to
combat Climate Change:
Table 29: Specific limits and obstacle and relevant documents
Specific limits and obstacle
A dedicated process is in place to facilitate stakeholders' involvement in the preparation of
adaptation policies. However, there is little (mainly sectoral) evidence of transboundary
cooperation to address common challenges with relevant neighbouring countries
(cooperation between Mediterranean countries).
There are a few organizations that are responsible for observing the impacts of climate
change in various sectors (and monitoring of environmental variables).
Climate risks/vulnerability assessments do not take transboundary risks into account, when
relevant. It is unclear how Cyprus will address climate risks transcending the country's
frontiers (e.g., risks coming from warmer countries, changes in the Mediterranean, etc.)
It is unclear how knowledge gaps are used to prioritize funding in the field of adaptation
research. Some research into the assessment of existing and future impacts on vulnerable
economic sectors is being financed and carried out through one-off projects. It has been
decided to assess all knowledge gaps related to climate change impacts and adaptation and
identify possible sources of funding for their research.
Education materials or specific training activities to build adaptation capacity or to help
stakeholders to adapt to climate change are not yet available.

117
There are no updated sources of information available on climate change data and
adaptation policy developments. Cyprus developed a CYPADAPT portal to support the
dissemination of information on climate change adaptation. The platform was expected to
provide access and share information and views on many different issues concerning
adaptation options, climate impacts, vulnerability, case studies, research activities,
legislation, financing opportunities, tools for adaptation planning and useful links, but has
not been updated since 2014.
Very few mechanisms are in place to coordinate disaster risk management and climate
change adaptation. Disaster risk reduction plans do not factor in projected climate extremes
that may occur in the future, while the national adaptation strategy does not mention
specific disaster preparedness plans or how these account for climate change adaptation.
Funding is available to increase climate resilience in vulnerable sectors and for cross-cutting
adaptation action, but other elements, such as coordination, governance, capacity building,
indicators and projections do not have specific allocation of resources. Also, costs of
climate change impacts and costs/benefits of adaptation in general have yet to be
identified.
The Cypriot authorities just started harmonizing national legislation and mainstream
adaptation to reflect the Environmental Impact Assessment (EIA) Directive.
Key land use, spatial planning, urban planning and maritime spatial planning policies do not
consider the impacts of climate change.
Relevant documents
- Department of Environment (2016). Εθνική Στρατηγική για την Προσαρμογή στην Κλιματική Αλλαγή (National Strategy for the Adaptation to Climate Change). Nicosia: Ministry of Agriculture, Rural Development and Environment.
- Department of Environment (2015). Strategic Plan for Environment and Natural Resources. Nicosia: Ministry of Agriculture, Rural Development and Environment.
- Department of Environment (2016). The Cyprus Climate Change Risk Assessment Evidence Report. Nicosia: Ministry of Agriculture, Rural Development and Environment.
- Zachariadis, T. (2016). Climate Change in Cyprus: Review of the Impacts and Outline of an Adaptation Strategy. Cham: Springer International Publishing.
- Audit Office (2012). Adapting to Climate Change – Facing Today the Challenges of the Future. Nicosia: Audit Office.
- Department of Environment (2018). Seventh National Communication & Third Biennial
Report - under the United Nations Framework Convention on Climate Change. Nicosia:
Ministry of Agriculture, Rural Development and Environment.
Source: SOCLIMPACT Deliverable D7.1.

118
7 References
Asariotis R, Benamara H (Eds) (2012). Maritime transport and the climate change challenge.
Routledge.
CyStat (2019a). Cyprus in figures, 2018 edition. Cyprus Statistical Service. Lefkosia, Cyprus.
CyStat (2019b). Demographic statistics 2018. Cyprus Statistical Service. Lefkosia, Cyprus.
CyStat (2019c). Intra - Extra EU trade statistics, foreign trade statistics, Series III Report No. 153.
Cyprus Statistical Service. Lefkosia, Cyprus.
DoE (2020). Cyprus' Integrated National Energy and Climate Plan 2021-2030. Department of
Environment. Lefkosia, Cyprus.
Eurostat (2018a). Baseline population projection for Cyprus 2015-2100. Eurostat website.
https://appsso.eurostat.ec.europa.eu/nui/show.do?dataset=proj_19np&lang=en.
Eurostat (2018b). Labour force survey (labour force, employment and rate of unemployment)
2005-2018. Eurostat website. https://ec.europa.eu/eurostat/web/lfs/data/database.
Fritzsche et al. (2014). The Vulnerability Sourcebook: Concept and guidelines for standardised
vulnerability assessments.
GIZ (2017) The Vulnerability Sourcebook: Concept and guidelines for standardised vulnerability
assessments. Deutsche Gesellschaft für Internationale Zusammenarbeit (GIZ)
Gutiérrez C, Somot S, Nabat P, Mallet M, Corre L, van Meijgaard E, Perpiñán O, Gaertner MÁ
(2020). Future evolution of surface solar radiation and photovoltaic potential in Europe:
investigating the role of aerosols. Environmental Research Letters, 15(3), 034035.
Hanson S, Nicholls RJ (2012). Extreme flood events and port cities through the twenty-first
century. Maritime Transport and the Climate Change Challenge, 243.
Hemer MA, Fan Y, Mori N, Semedo A, Wang XL (2013) Projected changes in wave climate from a
multi-model ensemble. Nature Climate Change, 3, pp. 471-476, doi: 10.1038/NCLIMATE1791.
IRENA (2019). Renewable power generation costs in 2018, International Renewable Energy.
Agency, Abu Dhabi.
Jakubcionis M, Moles C, Kavvadias K, Santamaria M, Carlsson J (2018). Synthesis report on the
evaluation of national notifications related to Article 14 of the Energy Efficiency Directive, EUR
29286 EN, Publication Office of the European Union, Luxembourg.
Koroneos C, Fokaidis P, Moussiopoulos N (2005). Cyprus energy system and the use of renewable
energy sources. Energy, 30(10), 1889-1901.
MaREI (2020). MaREI to lead €9m project to build floating offshore platform. Retrieved from:
https://www.marei.ie/marei-to-lead-e9m-project-to-build-floating-offshore-platform/

119
MarineEnergy (2019a). WavEC: combined wind, wave and solar to transform marine energy.
Retrieved from https://marineenergy.biz/2019/12/16/wavec-combined-wind-wave-and-
solar-to-transform-marine-energy/
MarineEnergy (2019b). SINN Power Supports MUSICA Project. Retrieved from
https://marineenergy.biz/2019/10/22/sinn-power-supports-musica-project/
Masterton JM, Richardson FA (1979). Humidex: a method of quantifying human discomfort due to
excessive heat and humidity, CLI 1-79, Environment Canada, Atmospheric Environment,
Downsview, Ontario.
OECD (2008). Handbook on constructing composite indicators: methodology and user guide.
Organisation for Economic Co-operation and Development (OECD).
Pisacane G, Sannino G, Carillo A, Struglia MV, Bastianoni S (2018). Marine energy exploitation in
the Mediterranean region: steps forward and challenges. Frontiers in Energy Research, 6(109).
Pörtner H-O, Roberts DC, Masson-Delmotte V, Zhai P, Tignor M, Poloczanska E, Petzold J
(2019). IPCC Special report on the ocean and cryosphere in a changing climate. IPCC
Intergovernmental Panel on Climate Change: Geneva, Switzerland.
Proestos Y, Christophides GK, Ergüler K, Tanarhte M, Waldock J, Lelieveld J. (2015) Present and
future projections of habitat suitability of the Asian tiger mosquito, a vector of viral pathogens,
from global climate simulation. Philosophical Transactions of the Royal Society of London Series
B Biological Sciences, 370:1–16. doi: 10.1098/rstb.2013.0554.
Raynaud D, Hingray B, François B, Creutin, JD (2018). Energy droughts from variable renewable
energy sources in European climates. Renewable Energy, 125, 578-589.
Schneiderbauer S, Zebisch M, Kass S, Pedoth L (2013). Assessment of vulnerability to natural
hazards and climate change in mountain environments – examples from the Alps. In: Birkmann J
(ed) Measuring vulnerability to natural hazards: towards disaster resilient societies. United Nations
University Press, Tokyo, 349-380.
Scholte JE, Schaffner F (2007). “Waiting for the tiger: establishment and spread of the Aedes
albopictus mosquito in Europe”. In Takken, W.; Knols, B. G. J. (eds.). Emerging pests and vector-
borne diseases in Europe. 1. Wageningen Academic Publishers. ISBN 978-90-8686-053-1.
Smith TWP, Jalkanen JP, Anderson BA, Corbett JJ, Faber J, Hanayama S, O’Keeffe E, Parker S,
Johansson L, Aldous L, Raucci C, Traut M, Ettinger S, Nelissen D, Lee DS, Ng S, Agrawal A,
Winebrake JJ, Hoen, M, Pandey A (2015). Third IMO Greenhouse Gas Study 2014. International
Maritime Organization.
Soto D, Brugere C (2008). The challenges of climate change for aquaculture. FAO Aquaculture
Newsletter, No. 40, pp. 30–32. FAO, Rome.
Tobin I, Vautard R, Balog I, Bréon FM, Jerez S, Ruti PM, Thais F, Vrac M, Yiou P. (2015).
Assessing climate change impacts on European wind energy from ENSEMBLES high-resolution
climate projections. Climatic Change, 128(1-2), 99-112.

120
Tobin I, Jerez S, Vautard R, Thais F, van Meijgaard E, Prein AF, Déqué M, Kotlarski S, Fox Maule
C, Nikulin G, Noël, T, Teichmann C (2016). Climate change impacts on the power generation
potential of a European mid-century wind farms scenario. Environmental Research Letters, 11(3),
034013.
Tyrlis E, Lelieveld J (2013). Climatology and dynamics of the summer Etesian winds over the
eastern Mediterranean. Journal of the Atmospheric Sciences, 70(11), 3374-3396.
van Wagner CE (1987). Development and structure of the Canadian forest fire weather index
system. Ottawa: Canadian Forestry Service, Petawawa National Forestry Institute. Report No.:
Forestry Technical Report 35.
Vermeer M, Rahmstorf S (2009). Global sea level linked to global temperature. Proceedings of the
national academy of sciences, 106(51), 21527-21532.
Waldock J, Chandra NL, Lelieveld J, Proestos Y, Michael E (2013). The role of environmental
variables on Aedes albopictus biology and chikungunya epidemiology. Pathogens and Global
Health, 107:224–241. doi: 10.1179/2047773213Y.0000000100.
SOCLIMPACT Deliverable Reports
SOCLIMPACT Deliverable D3.2. Definition of complex impact chains and input-output matrix
for each islands and sectors.
SOCLIMPACT Deliverable D4.1 Report on climatic databases to be used to quantify indicators in
the impact chains
SOCLIMPACT Deliverable D4.3. Atlases of newly developed hazard indexes and indicators with
Appendixes.
SOCLIMPACT Deliverable D4.4a Report on solar and wind energy.
SOCLIMPACT Deliverable D4.4b Report on storm surge levels.
SOCLIMPACT Deliverable D4.4c Report on potential fire behaviour and exposure.
SOCLIMPACT Deliverable D4.4d Report on the evolution of beaches.
SOCLIMPACT Deliverable D4.4e Report on estimated seagrass density.
SOCLIMPACT Deliverable D4.5. Design of a comprehensive approach to climate and climate-
related risk information to policy makers and the general public.
SOCLIMPACT Deliverable D5.5. Report on market and non-market economic values for
environmental services of marine and coastal ecosystems related to the activities of the blue
economy.

121
SOCLIMPACT Deliverable D5.6. Integration and coordination of non-market and big data
analysis of economic values resulting from Climate Change impacts to GEM-E3-ISL and
GINFORS models.
SOCLIMPACT Deliverable D6.2. Macroeconomic outlook of the islands’ economic systems and
pre-testing simulations.
SOCLIMPACT Deliverable D7.1. Conceptual framework.

1
APPENDIX 7

2
TABLE OF CONTENT
INTRODUCTION............................................................................................................................................... 3
1 CURRENT SITUATION AND RECENT TRENDS .................................................................................................. 4
1.1 CURRENT GEOPOLITICAL CONTEXT ............................................................................................................................ 4 1.2 CURRENT CLIMATE AND RISKS .................................................................................................................................. 6 1.3 MACROECONOMIC STATUS ..................................................................................................................................... 8 1.4 RECENT EVOLUTION OF THE BLUE ECONOMY SECTORS .................................................................................................. 8
2. CLIMATE CHANGE OUTLOOK ..................................................................................................................... 11
2.1 TOURISM .......................................................................................................................................................... 12 2.2 ENERGY ............................................................................................................................................................ 14 2.3 MARITIME TRANSPORT ........................................................................................................................................ 22
3 CLIMATE CHANGE RISKS ............................................................................................................................. 24
3.1 ENERGY ............................................................................................................................................................ 24 3.1.1 Island comparisons and future challenges for PV and wind energy .......................................................................... 30
3.2 MARITIME TRANSPORT ........................................................................................................................................ 31
4 SOCIO-ECONOMIC IMPACTS OF CLIMATE CHANGE ...................................................................................... 32
4.1 MARKET AND NON-MARKET EFFECTS OF CC ............................................................................................................. 32
5 TOWARDS CLIMATE RESILIENCY ................................................................................................................. 35
5.1 CURRENT SITUATION: GENERAL COMMITMENT, SPECIFIC LIMITS AND OBSTACLE ............................................................... 35
6. REFERENCES .............................................................................................................................................. 36

3
Introduction
This report contains the background material, climate hazard predictions and socio-economic
assessment of Fehmarn within the SOCLIMPACT project context. The report starts by describing
the geography and socio-economic context of the island, as well as the socioeconomic trends
without climate change (WP6), which range from the present to the end of the 21st century.
Regarding climate change, the expected climate risks and vulnerabilities for the blue economy are
presented and modelled (WP3). These projections are joined with the expected trends of physical
risks, both current and future (WP4). Based on this analysis, specific economic impacts are
estimated, considering the evolution of some physical risks (WP5 and WP6). The current climate
policy and climate change resilience of the island are also presented (WP7). Finally, a link to the
project’s original work is made in the reference section and when relevant data is presented.
Fehmarn at a glance
Fehmarn is the third largest German Baltic Sea island with an area of 85.5 km2 and a population of
12.500. It is located between the Bay of Kiel in the West, and the Bay of Mecklenburg in the East.
The island can be reached via a bridge that connects it to the German mainland (train, car,
walking), and by boat. There is a ferry port on the island’s North side, with regular connections to
Denmark several times per day. The island is mostly flat (highest elevation 27.2 m) and has a
partially undulating land mass; low dunes, beach lakes, and sand pits at the north coast; and a
cliffed coast in the east. With many sandy beaches, it is vulnerable to erosion caused by storm
surges. A large fraction of the land is used for intensive agriculture, mostly producing rape seed
and cereals.
The Blue Economy sectors
Tourism
Tourism is the island’s most important Source: of income. Approximately 300,000 overnight
guests stay on Fehmarn every year, with the vast majority being German (~99%). Many tourists
stay on one of the huge campsites that are situated at different locations along the coastline. A lot
of people use the same caravan pitch for many years or even decades and visit regularly during
holidays and on weekends throughout the season. For people from northern German
municipalities, Fehmarn is also a popular day trip destination as the connecting mainland bridge
makes the island easily accessible by car.
Energy
Fehmarn’s electricity grid, as well as the water supply, are connected to the German mainland.
Economically relevant are the island’s wind parks. The wind turbines produce 443,160 MWh/year,
which is approximately equal to 464% of the island’s energy demand. Being one of the sunniest
regions in Germany, PV plants are also widely used. Together with energy produced via the
burning of agricultural biomass, Fehmarn produces and exports far more electrical energy to the
mainland than it requires for its own consumption.

4
Maritime Transport
Maritime transport does not play an island-typical role as most cars and trains arrive via the
Fehmarn Sound Bridge from the German mainland. Most maritime transport is happening at
Puttgarden harbour, where the ferry connection to Denmark operates. It forms part of the
shortest route between Hamburg and Copenhagen and has been heavily used for centuries. Apart
from Puttgarden, maritime traffic in Fehmarn is rather small scale with no remarkable international
ship traffic going on. Burgstaaken, the second largest port, serves as the home port for local
fishing boats, and for shipping agricultural products to the German mainland. It also has touristic
infrastructure with a submarine museum, a marina, and gastronomy.
1 Current situation and recent trends
1.1 Current geopolitical context
The island of Fehmarn has 85.5 km² of terrestrial area and is located in the Baltic Sea in northern
Germany. As of December 2018, 12,592 people lived permanently on Fehmarn1. Since the middle
of the 20th century, the population development showed little fluctuation, with the number of
inhabitants remaining between 12,000 and 13,000 (Fig. 1). From 1713 until 1864 Fehmarn was
under Danish control. Afterwards, the island became part of Prussia. Now Fehmarn is part of the
Kreis Ostholstein, a district that is part of the German federal state Schleswig-Holstein.
Figure 1: Inhabitants of Fehmarn 1730-2016. Note that the x-
axis scale is not linear but displays distinctive years for which a
population census was available. Source: https://de.wikipedia.org/wiki/Fehmarn
1 http://region.statistik-nord.de/detail/0110001100110101111/1/348/786/

5
The population of Fehmarn is on average 48.9 years old2, which is older than the German average age of 44.4 years3. The unemployment rate of Fehmarn is similar to that of the rest of Germany4 5. The municipality is currently governed by mayor Jörg Weber, who is a member of the Social Democratic Party of Germany (SPD). At the last election in 2018, the SPD received 28 %, and the Christian Democratic Union (CDU) received 27.8% of votes. The remaining votes went to the Voters Union of Fehmarn (15.5%), the Community of Fehmarn’s citizens called “Wir unternehmen was” (“We do something”) (12.,9%), and the Green Party (10.2%).
According to the Statistikamt Nord, the statistical service for northern Germany, 85% of the
islands’ surface are green space6 and the population density is only 69 inhabitants per km² 7. The
islands interior is characterized by intensive agriculture and thus covered with fields where mostly
cereals and rapeseed are grown. Next to the agricultural sector, the blue economy sectors are
crucial to Fehmarn’s economy, with tourism being the most important one.
The island has four nature reserves with a total area of 1577 ha8, located mostly along the 78-km-
long coastline. The North coast, located between Markelsdorfer Huk and Puttgarden, is a dune
landscape with beach lakes, while the East coast is a stony shore and has cliffs. In the South and
the West of the island, mostly white sandy beaches can be found as a flat coastal strip. The coasts
of Fehmarn frequently suffer from erosion. The island’s interior is protected against floods with a
system of dykes. Coastal protection and dyke maintenance are under responsibility of the federal
state government of Schleswig-Holstein in Kiel. This is important because most of the area of
Fehmarn is barely higher than the sea level, with the highest point being at 27.2 meters above sea
level (Hinrichsberg). Coastal protection and dyke building are adaptation measures that have been
executed at the German coastlines for hundreds of years and are therefore managed with huge
experience.
The town hall of Fehmarn is in Burg, the most central district of Fehmarn, which serves as the central point of administration. It is the formal capital of Fehmarn and has approximately 6,000 inhabitants.
Burg is connected to the German mainland by train, but the connections are not very frequent, with trains going to Lübeck approximately every two hours during operating times. During summer weekends, a train connects Fehmarn to Cologne and two trains run directly from Fehmarn to Hamburg. There are also busses that connect Fehmarn and the German mainland, but
2 http://region.statistik-nord.de/detail/0110001100110101111/1/348/786 3 https://www.bib.bund.de/DE/Fakten/Fakt/B19-Durchschnittsalter-Bevoelkerung-ab-1871.html 4 https://hartz4widerspruch.de/jobcenter-ostholstein-geschaeftsstelle-fehmarn-alle-infos/ 5 https://www.bpb.de/nachschlagen/zahlen-und-fakten/soziale-situation-in-deutschland/61718/arbeitslose-und-arbeitslosenquote 6 http://region.statistik-nord.de/detail/0110001100110101111/1/348/786/ 7 http://region.statistik-nord.de/detail/0110001100110101111/1/348/786/ 8 https://wallnau.nabu.de/projekte/nsgbetreuung/index.html

6
the vast majority of people coming to the island reach Fehmarn and Burg by private car. Across the entire island, cars are the most used mode of transport.
1.2 Current climate and risks
At the German Baltic coast, the climate is central European with relatively cool summers and humid winters. Even though the number of sunny days at the coast is higher than further inland and Fehmarn is considered to be the sunniest German island, precipitation is common in all seasons. Westerly winds are predominant and there is no influence of the Gulf Stream on the climate of the Baltic region. As the water exchange between the North Sea and Baltic Sea is small, the salinity of the Baltic Sea is extremely low. As a result of these brackish conditions, large areas of the Baltic Sea can get frozen during some winters.
The cool water of the Baltic Sea is also responsible for relatively low maximum air temperatures along coastal areas in the summer (on average not much higher than 20°C). During winter on the other hand, the temperature buffering capacity of the Baltic Sea causes relatively mild average temperatures (rarely dropping below 0°C) (Figs. 2.1 – 2.4). In comparison, air temperatures in areas further inland can get much colder.
Figure 2.1: Average temperature and precipitation on Fehmarn (figure is part of the Climate factsheet for
Fehmarn). Source: Own elaboration with data from GFDRR ThinkHazard!; D7.1 Conceptual Framework and Meteoblue; Meteoblue global NEMS (NOAA Environmental
Modeling System)

7
Figure 2.2: Average weather patterns on Fehmarn (figure is part of the Climate factsheet for Fehmarn). Source: Own elaboration with data from GFDRR ThinkHazard!; D7.1 Conceptual Framework and Meteoblue; Meteoblue global NEMS (NOAA Environmental
Modeling System)
Figure 2.3: Average wind speeds on Fehmarn (figure is part of the Climate factsheet for Fehmarn).
Source: Own elaboration with data from GFDRR ThinkHazard!; D7.1 Conceptual Framework and Meteoblue; Meteoblue global NEMS (NOAA Environmental Modeling System)

8
Figure 2.4: Average wind directions and speeds on Fehmarn (figure is part of the Climate factsheet for Fehmarn).
Source: Own elaboration with data from GFDRR ThinkHazard!; D7.1 Conceptual Framework and Meteoblue; Meteoblue global NEMS (NOAA Environmental Modeling System)
1.3 Macroeconomic status
Data on the macroeconomic status of Fehmarn is not readily available, as it is a small municipality
within the German federal structure. Information is only available for higher levels (whole district,
federal state), from which it is not possible to derive Fehmarn-specific information on economic
outputs. The tourism industry is by far the most important economical factor on the island and is
therefore responsible for majority of income and employment. Further detailed information on the
structure of this sector can be found in the next section 1.4.
1.4 Recent evolution of the blue economy sectors
Tourism
Fehmarn is an attractive tourism spot, as it has a high percentage of sunny hours when compared
to other German regions. Approximately 300,000 guests, not including people that come for a day

9
trip, stay on Fehmarn each year9. The main tourism season is the summer, mainly between July and
August when many Germans have summer holidays (Fig. 3). Between 2017 and 2019, about
148,000 to 167,000 tourists visited Fehmarn during these two months alone10. The huge number of
visitors make the tourism sector a main source of jobs for the citizens of Fehmarn and roughly
90% of the island’s population are directly or indirectly dependent on the tourism industry11. Many
inhabitants rent out parts of their own house, or own holiday homes and apartments on the island.
Tourism on Fehmarn is basically domestic. A huge majority of guests come from Germany, some
from Denmark and very few from other European countries. Fehmarn is a popular target for short
and daytrips for people living in Hamburg, Lübeck, or other municipalities in northern Germany,
as connection of the island to the mainland via the bridge makes it easily accessible by car and no
ferry booking is required.
Another characteristic of tourism on Fehmarn is the popularity of caravan camping. Roughly half
of all tourists stay on one of the huge camping sites that are situated at different spots along the
island’s coastline. It is common to use the same caravan pitch for many years or even decades and
to visit the island regularly for holidays and on weekends throughout the season.
Figure 3: Monthly number of tourists on Fehmarn in 2019.
Source: Tourism Service Fehmarn
Maritime Transport
Maritime transport has been of little relevance for the overall functioning of the island since the
Fehmarn Sound Bridge (Fehmarnsundbrücke) was built in 1963. The bridge is being used by cars
and trains, and it connects Fehmarn to the German mainland. As a result of this connection, the
9 https://de.wikipedia.org/wiki/Fehmarn 10 https://www.fehmarn.de/ 11 https://www.ikzm-d.de/inhalt.php?page=21,595
0
10.000
20.000
30.000
40.000
50.000
60.000
70.000
80.000
90.000
MO
NTH
LY A
MO
UN
T O
F TO
UR
ISTS
MONTH

10
blue economy sector “maritime transport” does not play an island-typical role as most transport
arrives via the bridge from the German mainland. If their destination is not Fehmarn, they cross
the island and take the ferry from Puttgarden harbour in the north of Fehmarn to Rødby in
Denmark. The route across Fehmarn is the shortest link between Hamburg and Copenhagen (and
from there to Sweden) and has been heavily used for centuries.
Currently there is a restructuring of this important traffic artery going on. A tunnel with roads and
rails is planned to be built between Fehmarn and Denmark. A gigantic traffic project that is very
controversially discussed in the whole region. This “Fehmarn Belt Fixed Link” is planned to be
18 km long and is projected to be finished in 2028. The construction has started, and necessary
sites are currently being built on the Danish coast. The new tunnel will be the longest rail tunnel in
the world 12 and should replace the currently used ferry service, which is privately run by the ferry-
company Scandlines. The tunnel project faces repeated delays because of ongoing lawsuits and
unclarities in the financial planning, as well as expected negative environmental impacts. The
island’s south coast is also affected by this project and there is a plan in place to construct a tunnel
for car traffic and trains by 2028, with the current bridge remaining in use for pedestrians and
cyclists only.
Apart from the ferry to Denmark, the maritime traffic in Fehmarn is rather small scale with no
remarkable international ship traffic going on. Burgstaaken, the second largest port, serves as the
home port for local fishing boats, and for shipping agricultural products to the German mainland.
It also has touristic infrastructure with a submarine museum, a marina, and gastronomy.
Energy
Due its geographical location, Fehmarn is a large producer of renewable energy. The island’s wind
parks are economically relevant and used to be in the Guinness Book of Records as Germany's
largest wind farm. Even though Fehmarn’s inhabitants initially had doubts concerning the wind
parks and their effect on their lives, most of them now have a positive attitude towards them.
According to data from 2015, the wind turbines produced approximately 443,160 MWh/Year,
which was around 464% of the island’s energy demand13. As there are also an above-average
number of solar installations per capita as well as energy generation from biomass, Fehmarn’s
energy production from renewable energy sources surpasses its electricity consumption by far (Fig.
4), and Fehmarn is producing almost 5 times the island’s energy demand solemnly from renewable
sources13. Fehmarn’s electricity grid, as well as the water supply, are connected to the German
mainland and most of this energy is being exported to the German mainland.
12 https://www.railway-technology.com/features/fehmarnbelt-tunnel-european-link 13 http://www.energymap.info/energieregionen/DE/105/119/480/16452.html

11
Figure 4: Renewable Energy produced on Fehmarn MWh (2015) Source: http://www.energymap.info/energieregionen/DE/105/119/480/16452.html
Aquaculture
There are no commercial aquaculture farms on or around Fehmarn island.
2. Climate Change outlook
Climate hazard indicators represent the entry point to understand the climate change exposure of
blue economy sectors. The indicators have been computed for two scenarios from the IPCC
Assessment Report, RCP2.6 (low emission scenario) and RCP8.5 (high emission scenario). In
addition, they were calculated for different time horizons within those scenarios, namely: a
reference period (1965-2005), mid-century (2046-2065) and end of century (2081-2100). The main
source of climate projections for Fehmarn is the EURO-CORDEX ensemble, but other model
sources were applied when required, depending on available scales. Results are presented in form
of graphs or tables.
All the graphics presented below can be found in higher resolution on the official
SOCLIMPACT Project website HERE.

12
2.1 Tourism
Length of the window of opportunity for vector-borne diseases Vector Suitability Index for Aedes Albopictus (Asian Tiger Mosquito) Climate change can influence the transmission of vector-borne diseases (VBDs) through altering the habitat suitability of insect vectors. This is mainly controlled by increases of ambient air temperature and changes in the hydrological cycle. Within the SOCLIMPACT framework, we explore if potential changes to meteorological conditions can affect the distribution of the Asian tiger mosquito (Aedes albopictus). The Asian tiger mosquito is native to the tropical and subtropical areas of Southeast Asia. In the past few decades however, this species has spread to many countries through the international transport of goods and increased travel (Scholte and Schaffner 2007). It is of great epidemiological importance since it can transmit viral pathogens and infectious agents that can cause chikungunya, dengue fever, yellow fever and various forms of encephalitis (Proestos et al. 2015). The multi-criteria decision support vector distribution model of Proestos et al. (2015) has been employed to estimate regional habitat suitability maps (not shown), based on previous work on the environmental/climatic factors affecting the life cycle of the Asian tiger mosquito (Waldock et al. 2013; Proestos et al., 2015). The mosquito habitat suitability model combines seven meteorological indices based on field observations, extensive literature review and expert knowledge. For Fehmarn and its relatively northern latitudinal location, climate change is expected to affect the habitat suitability of A. albopictus. Precipitation and relative humidity are expected to increase under future conditions, while the temperature range in a future climate is expected to provide a more optimal environment for the establishment and spread of specific mosquito populations. This would change the habitat suitability from currently moderate levels to high suitability (Fig. 5).

13
Figure 5: Habitat Suitability Index (HSI) values averaged over eight SOCLIMPACT islands and for each sub-period of analysis. Red colors indicate increases while blue colors indicate decreases in the future. [80-100: High Suitability; 60-80: Medium Suitability; 40-60: Low Suitability; <40 No Suitability]
Source: SOCLIMPACT project deliverable 4.3.
Humidity Index
For the assessment of heat-related impacts of climate change on human health, the humidity index (Humidex) (Masterton and Richardson, 1979) has been used. The Humidex value expresses the temperature perceived by people (the one that the human body would feel), given the actual air temperature and relative humidity. As a representative indicator for the assessment of inhabitants’ and tourists’ hazard on heat related climate change impacts, the number of days with Humidex values greater than 35°C were selected. From the above classification, a day with Humidex above 35°C describes conditions ranging from discomfort to imminent danger for humans. For Fehmarn, N=2 grid cells were retained from the model’s domain. In Fig. 6, the ensemble mean is presented for all periods and RPCs. It is found that for the present climate and the near future, the days with discomfort are very scarce (1-2 days per year), but a larger number of discomfort days could prevail under the RCP8.5 scenario at the end of the century (6 days) (Fig. 6).

14
Figure 6: Humidex ensemble mean of EURO-CORDEX simulations.
Source: SOCLIMPACT project deliverable 4.3
2.2 Energy
Extreme Temperatures
Extreme temperatures are predicted to increase with climate change. The T98p value is used as a proxy to define extreme heat events and defined as the percentage of time where the mean daily temperature T is above the 98th percentile of mean daily temperature calculated for the reference period 1986-2005. For Fehmarn, N=2 grid cells were retained from the models domain. In Fig. 7, the ensemble mean is presented for all periods and RCPs. It is found that about 5% of days will be above T98p during RCP2.6 towards the middle and end of the century, while for RCP8.5 almost 18% of the year will exhibit temperatures above the 98th percentile.

15
Figure: 7: Percentage of days when T>98th percentile. Ensemble mean of EURO-CORDEX simulations
Source: SOCLIMPACT project deliverable 4.3
Photovoltaic (PV energy) productivity
A general decrease in photovoltaic energy productivity is projected over Fehmarn for each period
in both scenarios (RCP2.6 and RCP8.5) (Fig. 8 for land-based productivity and Fig. 9 for sea-based
productivity). In the RCP8.5 scenario, the decrease is largest for the period at the end of the
century (2081-2100), with a reduction by around 10% of the control period’s productivity.
The projected decrease in the RCP2.6 land-based scenario is clearly smaller, with a reduction of
around 2% in the 2046-2065 period, and around 1% in 2081-2100. The differences between sea
and land mean values are small. However, in the RCP2.6 scenario, the productivity on land is
predicted to slightly recover towards the end of the century, whereas on sea, it is predicted to
continuously fall.
Modelled changes in the RCP8.5 scenario for Fehmarn are more noticeable than changes found
for other Mediterranean Islands of the project consortium (please refer to the other island reports).
The SOCLIMPACT model predictions confirm previous studies which also predicted a decrease
in projected PV power productivity and surface solar radiation, and associated these declines to
more intense, frequent, or persistent positive North Atlantic Oscillation phases (Jerez et al., 2015,
Bartok et al., 2017).

16
Figure: 8: Ensemble mean values of annual PV productivity indicators – land (kWh/kW) in the control period
(1986-2005) and ensemble mean changes in future periods (2046-2065, 2081-2100) for the RCP2.6 and RCP8.5 scenarios. Spatial averages are computed for land and sea separately.
Source: SOCLIMPACT project deliverable 4.4a.
Figure 9: Ensemble mean values of annual PV productivity indicators-sea (kWh/kW) in the control period (1986-2005) and ensemble mean changes in future periods (2046-2065, 2081-2100) for the RCP2.6 and
RCP8.5 scenarios. Spatial averages are computed for land and sea separately. Source: SOCLIMPACT project deliverable 4.4a.

17
Wind productivity
Clear differences in predicted wind productivity (Wprod) over land and sea can be observed
between scenarios (Figs. 10 & 11). Whereas the RCP2.6 scenario predicts a general decrease in
both periods across both systems, RCP8.5 predicts continues increases in wind productivity as the
century progresses. The fact that this region has no clear signal in predicted changes (as opposed
to the Mediterranean regions), and predictions may vary with the RCP scenario under observation,
is consistent with previous studies (Tobin et al., 2015, 2016).
Wprod averaged over the region is consistent with the previous analysis, with the signal of the
RCP8.5 modelling being different from RCP2.6. The RCP8.5 results show small increases in
Wprod, both over land and sea (less than 2% of the respective productivity in the control period).
Although the agreement between models is low, the decrease for RCP2.6 is consistent among
models and reaches 5% over land at the end of the century.
Figure 10: Ensemble mean values of annual wind productivity indicators -land (kWh/kW) in the control period
(1986-2005) and ensemble mean changes in future periods (2046-2065, 2081-2100) for the RCP2.6 and
RCP8.5 scenarios. Spatial averages are computed for land and sea separately. Source: SOCLIMPACT project deliverable 4.4a.

18
Figure 11: Ensemble mean values of annual wind productivity indicators –sea (kWh/kW) in the control period
(1986-2005) and ensemble mean changes in future periods (2046-2065, 2081-2100) for the RCP2.6 and
RCP8.5 scenarios. Spatial averages are computed for land and sea separately. Source: SOCLIMPACT project deliverable 4.4a.
Frequency and duration of low-productivity periods (energy droughts) as a measure of the
variability of these sources
In the control time period, wind droughts are much more likely to occur over land than over the
sea (not shown). The frequency of days in which wind drought conditions develop increases
slightly in the RCP2.6 scenario, by 0.2%, while the frequency of wind droughts remains virtually
the same in the RCP8.5 scenario (Fig. 12). Only severe wind droughts show an increase in the
southwest of the region, in the RCP8.5 scenario at the end of the 21st century (not shown). The
increase in the percentage of days with wind drought conditions in the RCP2.6 scenario is
supported by most of the models considered in the ensemble.
PV droughts are more frequent than in most of the other studied regions, with values for
moderate droughts over land close to 23% (not shown). The frequency of severe PV droughts are
predicted to increase only marginally, with no increase in the RCP2.6 scenario, and an increase of
0.2% by the end of the century in the RCP 8.5 scenario. Moderate droughts are however expected
to occur more frequently, where increases of 18 days per year are expected.

19
The result of the varying trends in wind and PV droughts means that across both scenarios, the
combined amount of total days during which an energy drought can be expected, remains almost
unchanged until the end of the century, rising only by 0.1% in both scenarios (Fig. 14).
Figure: 12: Modelled % days with wind energy droughts. Ensemble mean frequency of severe productivity drought days (%) in the control time period, as well as the ensemble mean changes in the frequency of drought days (%) in the
different time periods considered for the RCP2.6 and RCP8.5 scenarios. Averages are computed over land. Source: SOCLIMPACT project deliverable 4.4a.

20
Figure: 13: Modelled photovoltaic (PV) productivity droughts. Ensemble mean frequency of severe productivity drought days (%) in the control time period, as well as the ensemble mean changes in the frequency of drought days
(%) in the different time periods considered for the RCP2.6 and RCP8.5 scenarios. Source: SOCLIMPACT project deliverable 4.4a.
Figure 14: Expected combined effects of wind energy and Photovoltaic (PV) productivity droughts. Ensemble mean frequency of severe productivity drought days (%) in the control time period, as well as the ensemble mean changes in the frequency of drought days (%) in the different time periods considered for the RCP2.6 and RCP8.5 scenarios.
Source: SOCLIMPACT project deliverable 4.4a.

21
Cooling Degree Days
The Cooling Degree Days (CDD) index gives the number of degrees and number of days for which the outside air temperature at a specific location is higher than a specified base temperature. Therefore, it provides a measure for the severity of the heat during a specific period, taking into consideration outdoor temperature and average room temperature. The CDD index quantifies days during which active cooling of buildings becomes necessary. For Fehmarn, N=2 grid cells were retained from the model domains. In Fig. 15, the ensemble mean is presented for all periods and RPCs. It is found that until the middle of the century in both scenarios, the increases in CDD index values are almost negligible, while towards the end of the century this number would be 15 times greater under RCP 8.5, but not under RCP 2.6. In consequence, even though there is currently no need for additional cooling on Fehmarn, the need will emerge in the future.
Figure 15: Cooling Degree Days. Ensemble mean of EURO-CORDEX simulations Source: SOCLIMPACT project deliverable 4.3

22
Available water: Standardized Precipitation Evaporation Index The Standardized Precipitation Evaporation Index (SPEI) is used as an indication for water
availability. Fehmarn island is the only case where the regional simulations suggest no significant
changes in the occurrence of multiannual droughts. The precipitation increases projected for
northern Europe are likely counterbalanced by the increases in temperature. Therefore, no
significant SPEI changes are expected for this region and the SPEI values are expected to remain
in the “Normal” range (Fig. 16).
Figure 16: Ensemble mean values of the Standardized Precipitation Evaporation Index (SPEI)
Source: SOCLIMPACT project deliverable 4.3
2.3 Maritime transport
Sea level rise
Sea level rise (SLR) is one of the major threats linked to climate change. It could induce permanent flooding of coastal areas with a profound impact on society, economy, and environment. Moreover, an increase in the mean sea level would result in a larger impact of coastal storms with the consequent increase of risk. The results are presented in terms of expected mean SLR. For Fehmarn, the SLR predictions range from 20 cm (RCP2.6) to 57 cm (RCP8.5) at the end of the century (Fig. 17).

23
Figure 17: Mean sea level rise (in cm) with respect to the reference period (1986-2005). Ensemble mean of CMIP 5 simulations and scaling approximation for RCP2.6.
Source: SOCLIMPACT project deliverable 4.3.
Wind extremes
The wind extremity index NWIX98 is defined as the number of days per year that exceed the 98th
percentile of mean daily wind speed. This number is predicted to increase from currently 7.3 days to 9.5 days at end of the century under the RCP8.5scenario, an increase by 30.6%. In the low emissions scenario RCP2.6, the number of days is predicted to decrease from 7.3 to 6.1 days per year (Fig. 18).
Figure: 18: Wind Extremity Index (NWIX98). Ensemble mean of the EURO-CORDEX simulations Source: SOCLIMPACT project deliverable 4.3.

24
3 Climate change risks
3.1 Energy
There are more than 2200 inhabited islands in the EU. Lately, they have come into the focus as the
EU set out to addresses energy questions as part of the “Clean energy for all Europeans” package.
The “Clean energy for EU islands initiative” provides a long-term framework to help islands
generate their own sustainable, low-cost energy. This is particularly interesting because many
islands still rely on fossil fuel imports although they have vast amounts of renewable energy
resources available. This energy transition is a relevant challenge in the EU, whose aim of net zero
greenhouse gas emissions in 2050 should determine the future energy plans of islands. Islands
could provide showcases for successful 100% renewable energy supply.
The US National Hydropower Association (NHA) defines marine energy as “electricity generation
from marine kinetic energy, such as waves, tidal and ocean currents”. Pisacane et al. (2018) added
other marine energy sources like ocean thermal energy conversion (exploiting temperature
differences between deep and surface ocean waters) and salinity gradient energy (harnessing the
energy potential of differences in salt concentration between ocean and river waters). All these
technologies are still in a development phase, and even if they reach the commercial phase in the
future, it is not likely that they will generate a large share of the power. Therefore, the analysis in
SOCLIMPACT focused on the main renewable energy sources (RES), wind energy and solar
photovoltaic (PV) energy, which are presently, and very likely also in the future, the backbone of
the deployment of renewable energies, due to their technological maturity and low cost.
For wind energy, we did not only take into account onshore but also offshore wind energy. It is a
specifically marine energy source which has distinct advantages over onshore wind energy like
higher productivity and less time variability, and it does not require land space which is limited and
costly on islands. There are relevant obstacles for its deployment, like the deep bathymetry
surrounding most of the project islands, and the lower wind speeds over the Mediterranean in
comparison to areas like the North Sea where offshore wind energy is being deployed rapidly.
Additionally, we also considered offshore PV energy. Despite some disadvantages that have to be
overcome (corrosion problems due to salty water or the impact of waves), this application is
receiving growing interest, as it offers an option for renewable energy development in countries
and islands with limited space for the installation of solar panels, and can show increased
performance due to the cooling effect of water and wind on PV cells.
Most RES depend on climate, and therefore climate change can have an impact on the resource
availability. In addition, wind and solar PV energy are not dispatchable, and their production
variability represents a challenge for their integration into the power system. This is a challenge
that can be addressed through storage or backup plants (which themselves can be renewable
energy plants), through demand management, but also taking advantage of complementarity
between PV and wind energy and its very different variability characteristics. This approach is
gaining attention from stakeholders on the islands, as demonstrated in reports by Monitor Deloitte

25
and Endesa (2020), in which one of the key recommendations for achieving an accelerated zero
carbon target on the Balearic and Canary Islands by 2040 is the combination of solar PV and wind
energy (whereby PV would have a clearly higher share than wind energy). Such a mix would
strongly reduce the need for storage, due to the stability of PV energy production.
There are also challenges for the demand and transmission components of the islands’ energy
systems due to climate change: Changes in temperature leading to changing energy demand, as well
as changes in precipitation and evaporation creating risks for desalination.
For the energy sector, three theoretical impact chains (IC) have been proposed in the
SOCLIMPACT project:
i) risk of changes in power generation due to long term climate change and variability, ii) risk of changes in energy demand due to changes in precipitation and temperatures, iii) risk of damages to transmission grids due to extreme events.
Only the second IC was selected to be operationalized, mainly due to data availability constraints.
The quality of IC operationalization depends strongly on data availability over long periods. Data
for cooling energy demand are still scarce and difficult to obtain, despite the requirements of the
European Commission to provide information regarding the national energy efficiency targets.
The availability and quality of cooling demand data should improve in the future due to the need
for tracking the advances towards energy efficiency targets. Desalination demand data should also
improve strongly, including data about the energy efficiency of the desalination processes used.
This demand-side IC has been deployed into two individual ICs, namely, the increased energy
demand due to increased cooling demand, and the increased energy demand due to increased
desalination needs. Both risks depend on the temperature increase, which is a very certain
consequence of climate change. The risk assessment was carried out through an expert assisted
process.
The diagrams of the two operationalized impact chains are presented below in Figs. 19 and 20:

26
Figure 19: Conceptualization framework for the operationalization of the energy impact chain: Risk of increased
energy demand due to increased cooling demand. Source: SOCLIMPACT project Deliverable 4.5-Comprenhensive approach for policy makers
Figure 20: Conceptualization framework for the operationalization of the energy impact chain: Risk of increased
energy demand due to increased desalination demand. Source: SOCLIMPACT project Deliverable 4.5-Comprenhensive approach for policy makers

27
Hazard scores for energy demand (Standardized Precipitation-Evapotranspiration Index – SPEI,
Cooling Degree Days - CDD), and supply indicators (wind energy, solar PV and combined
productivity and droughts) were analysed. The aim was to jointly consider future increases in
energy demand due to temperature and precipitation changes and the potential for replacing it
with renewable energy sources in the future.
Regarding the normalization of these hazards, we used an approach based on their future change.
The available literature indicates that the future projected changes of renewable energy
productivity frequently do not exceed a level of 10% relative to present values. Changes of about
10% would not modify a normalized score like the one used for present climate simulations
(leading to a very limited variation range of the score). Such relatively small changes do however
still represent a significant impact on the productivity and profitability of power plants. Therefore,
the future change of renewable energy productivity is compared to a 10% threshold, both on the
negative (normalized values above 0.5) and the positive side (normalized values below 0.5). The
normalization also includes a minor contribution of a comparison of the changes relative to other
islands.
CDD and SPEI scores are normalized with respect to a previously identified maximum projected
value. Renewable energy productivity indicators of the present climate are normalized using global
thresholds (5th and 95th percentiles of the respective technologies). The same normalization
method is used for projected changes of renewable energy droughts. Thus, energy drought
indicators are normalized, comparing them to a maximum upper limit, taken among all the islands
and renewable energy technologies.
A fundamental aspect of the method is that we applied an objective procedure for obtaining the
weights of the risk components (hazard, exposure and vulnerability) based on time-series
correlations of observed data for energy demand and for the different indicators involved in the
impact chains. This allowed to detect which factors have a larger impact on the energy demand.
This method is based on correlations between observed energy demand and observed data for the
indicators, and points out that on short time-scales, several exposure and vulnerability factors have
a stronger weight than the climate hazards (within interannual variations for periods of about 10
years). This is consistent with the drivers considered in the national forecasts (for periods of 10
years), performed as part of the EU Energy Efficiency Directive. A consequence of this is the
relatively low weights assigned to the climate hazards in the operationalization.
For the operationalization of the full impact chains, the exposure and vulnerability indicators were
also weighted utilizing different criteria. The mathematical procedure developed proposes the
definition of weights per group of variables (hazard, vulnerability and exposure) that allowed to
identify the relationship between each of the components and the dependent variable (in this case,
energy demand due to desalination or energy demand due to cooling). The detailed weight
calculation for the risk components (hazards, exposure and vulnerability) can be found in the
SOCLIMPACT Project deliverable 4.5.

28
It was however not possible to conduct a full operationalization of the IC for the case of Fehmarn.
The criteria for the selection of the islands were: (a) availability of data for the computation of the
exposure and vulnerability indicators of the demand-side ICs, and (b) modeling constraints of the
hazard components. In Table 1, we present the normalized hazard scores for Fehmarn across the
RCP 2.6 and 8.5 scenarios from the historical reference period until the end of the 21st century.
Table 1: Energy demand and supply hazard scores for Fehmarn
Historical reference period
Historical ref.(1986-2005)
Demand Supply: Productivity Land Sea
Droughts
CDD 0.00 Wind 0.55 0.00 0.79
SPEI 0.00 Solar PV 0.69 0.67 0.43
Combined 0.40
Middle of the century
RCP2.6 (2046-2065)
Demand Supply: Productivity change
Droughts change
CDD 0.00 Wind 0.7 0.7 0.6
SPEI 0.20 Solar PV 0.7 0.7 0.7
Combined 0.9
RCP8.5 (2046-2065)
Demand Supply: Productivity change
Droughts change
CDD 0.01 Wind 0.5 0.3 0.4
SPEI 0.28 Solar PV 0.8 0.8 1.0
Combined 0.8

29
End of century
RCP2.6 (2081-2100)
Demand Supply: Productivity change
Droughts change
CDD 0.00 Wind 0.8 0.8 0.8
SPEI 0.12 Solar PV 0.6 0.6 0.7
Combined 1.0
RCP8.5 (2081-2100)
Demand Supply: Productivity change
Droughts change
CDD 0.03 Wind 0.4 0.4 0.5
SPEI 0.36 Solar PV 1.0 1.0 1.0
Combined 0.9
Legend:
0.00 – 0.20 Very low
0.20 – 0.40 Low
0.40 – 0.60 Medium
0.60 – 0.80 High
0.80 – 1.00 Very high
Source: SOCLIMPACT project Deliverable 4.5-Comprenhensive approach for policy makers.
As could be expected due to its high latitude, hazard scores for Fehmarn are very different to most
other islands. CDD is zero for present conditions and under the RCP2.6 scenario, and it increases
very little under RCP8.5. Cooling energy demand will not be a problem here. SPEI shows some
tendency to increase, particularly under RCP8.5, but it should be taken into account that this score
is relative to the present climate SPEI which defines the minimum threshold, and the climate in
the area is relatively wet. Therefore, no significant problems should be expected regarding water
availability.
Future productivity is projected to decrease, particularly solar PV in the RCP8.5 scenario. The
exception is wind energy, which would improve slightly in the RCP8.5 scenario. There is also a
tendency for higher variability, especially in the case of PV for the mitigation scenario RCP2.6.
Combining wind and PV productivity, the renewable energies potential has a different profile than
on other SOCLIMPACT islands, with an excellent offshore wind energy potential and a clearly
lower PV potential. Compared to other islands, wind energy is less variable and PV energy is more
variable. As a consequence, a combined use of wind energy and PV could have a smaller and
reduced energy supply variability than either wind or PV energy separately, which is also a feature
not found on other islands.

30
3.1.1 Island comparisons and future challenges for PV and wind energy
- Across all SOCLIMPACT islands, the framework governing energy supply are the binding
targets established in the 2030 climate and energy EU framework, and the long-term horizon of a
decarbonized energy system by 2050.
- In general, the future change of wind energy and PV productivity should be rather small: In
many cases it is predicted to be around 5% or less with respect to the reference period, with
maximum changes of about 10% for some islands at the end of the century under the RCP8.5
scenario (particularly for wind energy productivity over land). A 10% productivity change could
have a significant impact on a planned or existing plant if it occurs over the lifetime of the power
plant, but in this case such a change would extend over many decades, which will facilitate
adaptation and efficiency measures.
- Projected PV productivity changes are generally smaller than wind energy changes. In most cases
PV productivity remains constant or decreases slightly. The main exception is Fehmarn, which
shows a clear decreasing tendency in PV productivity under RCP8.5 scenario, potentially reaching
a 10% decrease by the end of the century.
- There is a specific source of uncertainty in the photovoltaic projections. Most regional climate
model simulations, including the ones used here, do not include a projected evolution of aerosols
in future climate runs. The missed effect of the evolution of aerosols would likely increase to some
degree the future surface solar radiation and PV productivity over most of the islands (Gutiérrez et
al., 2020).
- Renewable energy productivity droughts are a measure of the variability of the resource. Wind
droughts are much more frequent (around 50% of the days for most islands) than PV droughts
(10% or less of the days). This agrees with results from the study of Raynaud et al. (2018), and
highlights the stable character of the solar productivity in comparison to wind productivity over
time.
- Wind energy droughts are more frequent on the Mediterranean islands than on the Atlantic
islands or Fehmarn. The best quality resources in terms of stability are found on the Canary
Islands, which show the smallest values of both, wind energy and PV droughts, among all islands.
Fehmarn shows by far the worse predicted PV drought score, corresponding to a drought
frequency of 23% of the days.
- Projected changes in the frequency of droughts are small, with future variations generally staying
below 5% of the days. This indicates that the time-variability characteristics of wind and PV energy
are a robust feature, which is relevant for planning the amount of storage or backup needed.
- The combination of PV and wind energy has generally a very positive impact on the frequency of
droughts as a result of the complementarity of both sources. This is also the case, but is less clear,
for islands with substantial summer wind energy resources (Canary Islands, Madeira and Crete).

31
- As part of the pathway towards very high or 100% RES shares, offshore wind energy should play
a very relevant role. Solutions to overcome the obstacle posed by the deep bathymetry
surrounding most of the islands are beginning to near commercial deployment. For instance,
floating offshore wind plants are already planned near Gran Canaria and Sicily.
- Offshore PV could be an interesting option for some islands, particularly when land surface
limitations are large. There is growing interest in this option, as shown by the test plants being
installed and the references made to this technology in the “Roadmap for the Offshore Renewable
Energy Strategy of the European Commission”, or in the report of Monitor Deloitte and Endesa
(2020) about the accelerated decarbonization of the Canary and Balearic Islands.
- The combination of different types of offshore renewable energy sources on the same platform
is also attracting interest, as the different sources can exhibit complementarity in time and the
combined output can thus be more stable and reliable. The different RES can also share part of
the installations, like the connection to land, reducing their cost (Pisacane et al., 2018;
MarineEnergy, 2019a). The European Union is trying to promote such combinations, through
projects like MUSICA (Multiple Use of Space for Island Clean Autonomy) which will design and
test a floating offshore platform integrating wind, PV and wave energy for use on islands
(MarineEnergy, 2019b), and plans to develop roadmaps for its deployment across three case study
islands, among them Malta and the Canaries (MaREI, 2020).
- New financing possibilities linked to the recently approved EU COVID-19 recovery fund, and
over a longer term associated to the European Green Deal, should facilitate the deployment of
renewables on the islands, as the energy transition is a key target.
- Interconnections with the mainland are very important for supply safety. Excessive dependency
on such interconnections should nevertheless be avoided, due to risk of blackouts, as the failure of
a single element (one transmission line) could instantaneously knock out a large proportion of the
power of an island and even cause an island-wide blackout, as has occurred several times in Malta
in the last years.
Read more: Description of Hazard indicators and their computation and normalization on SOCLIMPACT
project Deliverable 4.5-Comprenhensive approach for policy makers
3.2 Maritime Transport
Although all necessary data was available to operationalise an impact chain for Fehmarn’s maritime transport, the operationalisation was not performed. As Fehmarn island is connected to the mainland via a bridge, it did not make sense to assess the risk for maritime transport disruptions.

32
4 Socio-economic impacts of climate change
4.1 Market and non-market effects of CC
Tourism
In order to analyse the attitudes of tourists towards the impacts of climate change and the
preferences for adaptation policies, several hypothetical situations were posed to them via
questionnaires, whereby possible climate change impacts were outlined for the island (i.e., beach
erosion, infectious diseases, forest fires, marine biodiversity loss, heat waves, etc.).
Firstly, tourists had to indicate whether they would keep their plans to come to the island or
whether they would rather find an alternative destination if the impact were to occur. This
knowledge can inform predictions on future tourist arrivals for each island. Secondly, tourists were
asked to choose between various policy measures funded through an additional payment per day
of stay – the tourists’ choices being an expression of their preferences for attributes/policies.
Using the Stata software, the ASC-Logit model was run to assess the results.
On Fehmarn, 196 tourists visiting the island were surveyed. The results are presented in
Figs. 21 & 22. In general, data confirmed that tourists are highly averse to the risk of marine
wildlife disappearing to a large extent (83% of tourists would change destination). Moreover, they
would not be willing to visit the island if beaches largely disappeared (78.4%) or if infectious
diseases became more widespread (73%). Consequently, policies related to water supply
reinforcement (10.4€/day), marine habitat restoration (9.3€/day), and beaches protection (7€/day)
are on average the most valued adaptation measures among Fehmarn tourists.
Figure 21: Socio-economic characteristics and travel description: Tourists visiting Fehmarn Source: Deliverable Report D5.5 Market and non-market analysis. The infographic can be found in high resolution on the SOCLIMPACT Project official website HERE.

33
Although climate change impacts are outside the control of tourism practitioners and policy-
makers, they can nevertheless utilise this knowledge to improve the predictability of the effect that
certain adaptation policies and risk management strategies could have on tourism flows, and
develop their plans accordingly.
Figure 22: Choice experiments results for the tourism sector: Tourists visiting Fehmarn Source: Deliverable Report D5.5 Market and non-market analysis. The infographic can be found in high resolution on the SOCLIMPACT Project official
website HERE.
Maritime Transport For maritime transport, the impact of SLR on each island’s port operability costs was estimated.
The costs have been calculated with reference to a 1-meter-SLR, i.e. the investment needed to
increase the infrastructures' height by 1 meter. There is not necessarily a strict correspondence
between the SLR and the required elevation of port infrastructures, which also depend on the
coastal hydrodynamic and the shape of dikes of each port. With the help of experts’

34
recommendations, we assumed that a 1-m-increase in port height is required to cope with most
predicted SLR under the RCP 8.5 scenario. Extrapolation for other RCP scenarios was then
conducted based on proportionality.
The starting point was the identification of the economic relevance of principal ports on each
island. Second, the different port areas (exterior, ramps, oil, etc.), and their uses were analysed.
Third, the elevation costs were estimated per each area and port separately (considering an
elevation of 1 meter). Thus, the costs for a 1-meter-elevation are presented as the sum of all areas
and ports analysed, proportionally including other ports on the island (if applicable). Estimates
consider that all port areas of the entire area should be elevated at the same time. In other words,
the economic values can be interpreted as the depreciation (amortization) costs of the investment
needed to increase all port infrastructures on an island for the 125-year-modelling time horizon.
No discount rate was applied.
As expected, SLR is predicted to affect the maritime transport sector, and new investment will be
needed to keep ports operational. Under the high emissions scenario, it is expected that these costs
will range from 0.488 million (mid-century) to 0.994 million Euros per year by the end of the
century (Fig. 23).
Figure 23: Increased costs for maintaining ports’ operability in Fehmarn under different scenarios of SLR caused by climate change until 2100.
Source: Deliverable Report D5.6, The infographic presented below can be found in high resolution in the SOCLIMPACT Project official website HERE.
MEAN SEA LEVEL RISE SLR

35
5 Towards climate resiliency
5.1 Current situation: general commitment, specific limits and obstacle
For Fehmarn, climate politics are applied on different, partially independent, political levels.
Mitigation concepts do exist on several levels of governance (national, federal state of Schleswig-
Holstein, Region of Ostholstein, City of Fehmarn).
The picture looks different when considering adaptation policies. While there is a strategy for
climate adaptation on national and federal state levels, such strategies are still missing on a regional
or island-wide level. An exception are coastal protection and dyke building plans that always
existed for coastal regions in Germany. On the island level, Fehmarn stakeholders are open to
develop strategic answers to climate change, taking the findings of the SOCLIMPACT project as a
starting point. Specific limits to adaptation policies can be found in Table 2.
Table 2: Specific climate adaptation limits and obstacles for Fehmarn, and relevant documents
Specific limits and obstacles
The commitment for climate adaptation in the region is limited. Most municipalities have not yet discussed adaptation measures apart from the traditional coastal protection and dyke building plans. However, signs of change are slowly starting to emerge. The very hot summers of 2018 and 2019 have shown the need for action, and the national government is beginning to finance scientific research and projects that develop good practice implementation principles. Nevertheless personal capacities for climate adaptation in the administrations of regions/municipalities are still not existent (if they are, only on a project-funded basis), so that budgets are not coherent and are distributed over several already existing sectors, such as firefighting, building, health, port administration, and beach management.
Relevant documents (connected as hyperlinks)
Mitigation Climate Mitigation in the Region Ostholstein Adaptation German Adaptation Strategy (DAS) Adaptation Strategy of the Federal State of Schleswig-Holstein Project Radost - Climate Adaptation at German Baltic Coasts Project Radost Website: https://klimzug-radost.de/
Source: Conceptual framework from Deliverable 7.1

36
6. References
Bartók, B., Wild, M., Folini, D., Lüthi, D., Kotlarski, S., Schär, C., Vautard, R., Jerez, S., Imecs, Z.
(2017). Projected changes in surface solar radiation in CMIP5 global climate models and in
EURO-CORDEX regional climate models for Europe. Climate Dynamics, 49(7–8), pp.2665–2683.
http://link.springer.com/10.1007/s00382-016-3471-2 .
Gutiérrez, C., Somot, S., Nabat, P., Mallet, M., Corre, L., van Meijgaard, E., Perpiñán, 0. &
Gaertner, M. Á. (2020). Future evolution of surface solar radiation and photovoltaic potential in
Europe: investigating the role of aerosols. Environmental Research Letters, 15(3), 034035.
Handisyde, N., Lacalle, D. S., Arranz, S., & Ross, L. G. (2014). Modelling the flood cycle,
aquaculture development potential and risk using MODIS data: A case study for the floodplain of
the Rio Paraná, Argentina. Aquaculture, 422, 18-24.
IRENA (2019). Renewable Power Generation Costs in 2018, International Renewable Energy.
Agency, Abu Dhabi.
Jerez, S., Thais, F., Tobin, I., Wild, M., Colette, A., Yiou, P., & Vautard, R. (2015). The CLIMIX
model: a tool to create and evaluate spatially-resolved scenarios of photovoltaic and wind power
development. Renewable and sustainable energy reviews, 42, 1-15.
MaREI to lead €9m project to build floating offhsore platform. Retrieved from:
https://www.marei.ie/marei-to-lead-e9m-project-to-build-floating-offshore-platform/
MarineEnergy (2019a). WavEC: Combined Wind, Wave and Solar to Transform Marine Energy.
Retrieved from https://marineenergy.biz/2019/12/16/wavec-combined-wind-wave-and-solar-
totransform-marine-energy/
Masterton JM., RichardsonF.A. (1979). Humidex, a method of quantifying humandiscomfort due
to excessive heat and humidity, CLI 1–79, Environment Canada.Atmospheric Environment
Service, Downsview, Ontario.
Pisacane, G., Sannino, G., Carillo, A., Struglia, M. V., & Bastianoni, S. (2018). Marine energy
exploitation in the Mediterranean region: steps forward and challenges. Frontiers in Energy
Research, 6, 109.
Proestos Y, Christophides GK, Ergüler K, et al (2015) Present and future projections of habitat
suitability of the Asian tiger mosquito, a vector of viral pathogens, from global climate simulation.
Philos Trans R Soc B Biol Sci 370:1–16. doi: 10.1098/rstb.2013.0554.
Scholte JE, Schaffner F (2007). "Waiting for the tiger: establishment and spread of the Aedes
albopictus mosquito in Europe". In Takken, W.; Knols, B. G. J. (eds.). Emerging pests and vector-
borne diseases in Europe. 1. Wageningen Academic. Publishers. ISBN 978-90-8686-053-1.

37
Tobin, I., Jerez, S., Vautard, R., Thais, F., Van Meijgaard, E., Prein, A., ... & Noël, T. (2016).
Climate change impacts on the power generation potential of a European mid-century wind farms
scenario. Environmental Research Letters, 11(3), 034013.
Tobin, I., Vautard, R., Balog, I., Bréon, F. M., Jerez, S., Ruti, P. M., ... & Yiou, P. (2015). Assessing
climate change impacts on European wind energy from ENSEMBLES high-resolution climate
projections. Climatic Change, 128(1-2), 99-112.
Waldock J, Chandra NL, Lelieveld J, et al (2013) The role of environmental variables on Aedes
albopictus biology and chikungunya epidemiology. Pathog Glob Health 107:224–241. doi:
10.1179/2047773213Y.0000000100.
Websites and online references for Fehmarn background information and blue economy
sections at beginning of the document:
http://region.statistik-nord.de/detail/0110001100110101111/1/348/786/
https://www.bib.bund.de/DE/Fakten/Fakt/B19-Durchschnittsalter-Bevoelkerung-ab-1871.html https://hartz4widerspruch.de/jobcenter-ostholstein-geschaeftsstelle-fehmarn-alle-infos/ https://www.bpb.de/nachschlagen/zahlen-und-fakten/soziale-situation-in-deutschland/61718/arbeitslose-und-arbeitslosenquote https://wallnau.nabu.de/projekte/nsgbetreuung/index.html https://de.wikipedia.org/wiki/Fehmarn https://www.fehmarn.de/ https://www.ikzm-d.de/inhalt.php?page=21,595 https://www.railway-technology.com/features/fehmarnbelt-tunnel-european-link http://www.energymap.info/energieregionen/DE/105/119/480/16452.html

APPENDIX 8

1
TABLE OF CONTENT
INTRODUCTION .............................................................................................................................. 2
1 CURRENT SITUATION AND RECENT TRENDS ................................................................................. 4
1.1 CURRENT GEOPOLITICAL CONTEXT ........................................................................................................... 4 1.2 CURRENT CLIMATE AND RISKS ................................................................................................................ 6 1.3 MACROECONOMIC STATUS .................................................................................................................... 8 1.4 RECENT EVOLUTION OF THE BLUE ECONOMY SECTORS ............................................................................... 10
2 ECONOMIC PROJECTIONS ........................................................................................................... 14
2.1 THE MACROECONOMIC PROJECTIONS .................................................................................................... 14 2.2 THE SECTORAL PROJECTIONS ................................................................................................................ 15 2.3 EMPLOYMENT ................................................................................................................................... 16
3 CLIMATE CHANGE OUTLOOK ....................................................................................................... 17
3.1 TOURISM ......................................................................................................................................... 18 3.2 AQUACULTURE ................................................................................................................................. 20 3.3 ENERGY ........................................................................................................................................... 22 3.4 MARITIME TRANSPORT ....................................................................................................................... 29
4 CLIMATE CHANGE RISKS ............................................................................................................. 31
4.1 TOURISM ......................................................................................................................................... 31 4.2 AQUACULTURE ................................................................................................................................. 47 4.3 ENERGY ........................................................................................................................................... 66 4.4 MARITIME TRANSPORT ....................................................................................................................... 75
5 SOCIO ECONOMIC IMPACTS OF CLIMATE CHANGE ...................................................................... 76
5.1 MARKET AND NON-MARKET EFFECTS OF CC ............................................................................................ 76 5.2 MACROECONOMIC PROJECTIONS .......................................................................................................... 81
6 TOWARDS CLIMATE RESILIENCY .................................................................................................. 85
6.1 CURRENT SITUATION, LIMITS AND RELEVANT DOCUMENTS ......................................................................... 85
7 REFERENCES ............................................................................................................................... 91

2
Introduction
This report is the background material for stakeholders in the upcoming adaptation
pathways workshop in Madeira. First, a presentation that includes the geography and
socio-economic context for the Island, and the socioeconomic trends without climate
change (WP6), which range from the present to the end-of the century. Regarding
Climate Change, the expected climate risks and vulnerabilities for the blue economy are
presented and ran (WP3), joint to the expected trends of physical risks, booth current
and future (WP4). Finally, specific economic impacts are estimated, considering the
evolution of some physical risks (WP5 and WP6). The current climate policy and
resilience of the Island is also presented (WP7). Finally, a link to the projects original
work is made in the references section.
Madeira at a glance
Madeira archipelago, discovered in 1419, is a Portuguese autonomous region located in
Atlantic Ocean (978 km southeast Lisbon and 700 km west Africa). Madeira, with 741
km2 and 249 052 residents, and Porto Santo, with 42 km2 and 5 2020 residents, are the
inhabitant islands. Funchal, in Madeira, is the capital city.
Until 17th century, sugarcane was the economy driver of Madeira island, followed by
“Madeira wine” production. Currently, tourism is the main economic activity, being the
luxurious vegetation and the landscape the greatest attractions. The nature reserve covers
two thirds of the territory, being Laurissilva forest the only UNESCO Natural World
Heritage Site in Portugal.
In Porto Santo, seasonal tourism during summer is the main economic activity, being the
9 km golden sand beach, the turquoise sea, the geologic heritage and the peaceful
environment the main attractions.
Desertas and Selvagens islands are biodiversity conservation territories, with special
protection status.
The Blue Economy sectors
Aquaculture
In Madeira archipelago, the economic significance of aquiculture is small, being the
production in open sea restricted to south coast of Madeira island, where two companies
produce seabream. After an initial experience, the activity restarted in 2005.
The production oscillated between 169 tonnes in 2011, and 570 tonnes in 2013. The
regional market consumes an average of 150 tonnes, per year, of local aquiculture
production.

3
Since 2001, "Centro de Maricultura da Calheta”, a research centre, produces juvenile fish
for aquiculture, provides training and technical support to private fish farming
companies, and develops research, namely on the production of local species.
Maritime Transport
Madeira archipelago is highly dependent on freight maritime transport. Cruise activity is
important to the tourism sector in Madeira. The maritime transport is strategic to
connect the inhabited islands.
Madeira has two ports in the south coast. The Caniçal port is for freight traffic and
Funchal port for touristic purposes, being also used by the ferry that connects the
islands. Small boat marinas and ports exist around Madeira for recreational and fishing
activities. The north coast sea makes difficult the operation of larger port facilities. Porto
Santo has a port facility for freight and passenger transport, being strategic for tourism.
Energy
The Madeira archipelago is highly dependent on fossil fuels (79% primary energy, 2018).
The electricity generation from renewables is limited by the small and isolated electricity
systems, which demands significative investments in energy storage and smart grids, to
guaranty the quality and security of supply.
The dependence on maritime and air transports, and land mobility limited on road
transports, make challenging the energy mix diversification for transports (50% final
energy, 2018).
The islands isolation, fragmentation and small size entails high investments in
redundancy infrastructures, namely for electricity generation and energy storage, and
increases the energy system vulnerability to climate change.
Tourism
Tourism is the main economic activity in Madeira archipelago and does not have mass
tourism characteristics.
In Madeira island the activity is not seasonal. The mild climate, nature, landscape and
special events are main attractions. Sea and mountains are geographically close providing
a wide range of experiences. Hiking in Laurissilva forest and alongside water channels,
and sea activities are particularly appreciated. Since 2014, more than one million tourists
arrive each year to Madeira.
Porto Santo Island has seasonal tourism, being its sandy beach the main attraction.
Peaceful environment, geologic heritage, special events and sports are being explored to
decrease seasonality.

4
1 Current situation and recent trends
1.1 Current geopolitical context
Madeira is an archipelago located in the North Atlantic Ocean, being one of the two
autonomous regions of Portugal. Madeira and Porto Santo are the inhabited islands of
the archipelago. Total population of both inhabited islands was 253 945 people1 (2.5% of
the Portuguese population) in 2018. This leads to a rather high population density (318
inh/km2)2.
The EC’s Regional Innovation Monitor (RIM plus), describes the Autonomous Region
of Madeira’s governance structure as follows. “Contrarily to what happens to the
Portuguese mainland regions, Autonomous Region of Madeira (RAM) has political and
administrative autonomy with its own government bodies such as the Regional
Government and the Legislative Assembly (Parliament). The government is composed
by the Presidency, a Vice-Presidency (includes Parliamentary Affairs, External Relations
and Coordination, and Finances) and the following 9 Regional Departments 3:
Economy;
Education, Science and Technology
Health and Civil Protection;
Tourism and Culture;
Social Inclusion and Citizenship
Environment, Natural Resources and Climate Change;
Sea and Fisheries;
Agriculture and Rural Development;
Equipment and Infrastructures”.
The total population remained relatively stable between 2000 and 2018. In 2018, the total population of RAM equals 253 945 residents, of which 53% are female. 13,5% are younger than 15 years and 16,7% are older than 65. The share of under 15-year-olds is similar to mainland Portugal, the share of 65+ is significantly lower.
Table 1 represents the regional rate of employment by gender and level of education, per
year. The rate of employment is directly proportional to the education level rate in all
represented years.
1 https://estatistica.madeira.gov.pt/en/download-now-3/social-gb/popcondsoc-gb/demografia-gb/demografia-serie-gb/demografia-long-series-gb.html 2 https://ec.europa.eu/growth/tools-databases/regional-innovation-monitor/base-profile/madeira-region 3https://www.madeira.gov.pt/Governo-Regional-Madeira/Governo/OGoverno/Secretarias

5
Table 1: Employment rate according to gender and highest completed level of education.
Employment rate by year (2013-2018)
Highest completed level of education
Gender 2013 2014 2015 2016 2017 2018
Basic education - 3rd cycle or less Total 43 44.4 44.4 45.1 46.8 47.1
M 50.3 51.8 51.4 53.1 56.5 56.5
F 36.2 37.6 37.9 37.6 37.8 38.3
Secondary and post-secondary education
Total 56 56.4 60.4 61.2 63.5 66.8
M 55.7 55.8 59.6 61 64.5 67.9
F 56.2 56.9 61 61.3 62.6 65.9
Higher education Total 77.3 75.7 73.5 77 77.2 81.6
M 76.4 75 76.5 77.8 80.2 80.8
F 77.8 76.1 71.9 76.6 75.6 82.1 Source: DREM Excel sheet A5, own representation.
The population projection scenarios of the statistic services of Madeira foresee a
decrease of population (Figure 1). In the low scenario, population falls by half in 2080. In
the high scenario, the population increases until 2040 and then, gradually, decreases until
2080.
Figure 1: Population projections, three different scenarios. Source: DREM Excel sheet T4, own representation.

6
1.2 Current climate and risks
Madeira Island has a very mild climate. Its geographical location and orography defines avariety of microcli- mates with dense vegetation (Laurissilva forest), particularly on north side.The Funchal average temperature is 23oC in summer and 18oC in winter.
The annual average temperature is 19oC in south coast, 16oC in north, and 8oC in highest peaks (1800 meters).- The sea temperature is very mild, with an average temperature of 23oC in summer and 18oC in winter.
The rains are more frequent between October and May. Given the orography and the prevailing north-easterly winds, the rains are more regular and abundant in north-facing slopes. In summer, rainfall is less frequent and abundant, especially in south side and coastalareas.
Porto Santo island has an average temperature of 22o C in summer and 17o C in winter. These temperatures are similar to Madeira’s. Rainfall is less abundant in this island, defining a drier landscape.

7
Figure 2: Climate factsheet Source: Own elaboration with data from GFDRR ThinkHazard!; D7.1 Conceptual Framework and Meteoblue; Meteoblue global NEMS (NOAA
Environmental Modeling System)

8
1.3 Macroeconomic status
Figure 3 represents the GDP Growth Rates for RAM and Portugal Mainland, between
1996 and 2017. Madeira’s economy was hit hard by the 2008 crisis, with negative impacts
in 2009, 2011 and 2012. In 2012, GDP shrank by almost 10% but came back stronger
than mainland GDP in the following year.
Figure 3: GDP Growth Rates, RAM and mainland Portugal. Source: DREM Excel sheet D.1.3, own representation.
In 2018. the GDP in purchasing power standard per inhabitant was 23 1004 PPS in
RAM. staying below the Portuguese average (23 300)5 and far below the EU-28 average
(30 400)5.
Table 2 illustrates the development of gross value added in key sectors of the RAM
economy. It reveals an economic structure that is essentially characterized by the
development of service activities. Driving contributors to growth are professional.
scientific technical and similar activities; administrative and support service activities as
well as wholesale trade.
Table 2 represents the trade balance of RAM. The autonomous region runs a major trade
deficit with the EU. With the rest of the world. RAM runs. from 2009. a trade surplus.
In 2017 RAM imported mostly from the EU and mainly agricultural products (28%) and
food (14%). followed by machinery equipment (13%) and chemicals (9%). From outside
the EU.
4 https://ec.europa.eu/eurostat/databrowser/view/tgs00005/default/table?lang=en
5 https://ec.europa.eu/eurostat/web/products-datasets/-/sdg_10_10
-10,0
-5,0
0,0
5,0
10,0
15,0
GDP Growth Rate RAM GDP Growth Rate Mainland

9
Table 2: Sectoral annual growth rates development of RAM 2011-2017 and Mainland Portugal
2017.
Source: DREM Excel sheet D.1.12. own representation.
2011
2012
2013
2014
2015
2016
2017
Main
lan
d
GDP -2% -
10%
2% 2% 2% 4% 4% 4
%
Agriculture. livestock production.
hunting. forestry and fishing
-9% 5% 3% -
7%
7% -1% 2% 5
%
Mining and quarrying; manufacturing;
electricity. gas. steam and air
conditioning supply; water abstraction.
purification and supply; sewerage.
waste management and remediation
activities
-5% -9% 8% -
2%
7% 4% 5% 3
%
Construction -
10%
-
15%
-
18%
-
1%
-
3%
3% 6% 7
%
Wholesale and retail trade; repair of
motor vehicles and motorcycles;
transportation and storages;
accommodation and food service
activities
-1% -
12%
4% 5% 3% 6% 6% 5
%
Information and communication
activities
1% -
20%
-6% -
2%
3% 1% 3% 3
%
Financial and insurance activities 10% -
19%
-
12%
1% 0% -
15%
0% 0
%
Real estate activities -1% 4% 6% 2% 2% 2% 2% 3
%
Professional. scientific technical and
similar activities; administrative and
support service activities
-2% -
14%
-2% 8% 5% 12% 12
%
7
%
Public administration and defence;
compulsory social security; education;
human health and social work
activities
-2% -
13%
4% 0% 2% 2% 2% 3
%
Arts. entertainment and recreation.
repair of household goods and other
services
1% -3% 1% 3% -
6%
6% 5% 4
%

10
1.4 Recent evolution of the blue economy sectors
Tourism
As showed in Table 3 since 2014. more than one million tourists arrive each year to
Madeira. Most arriving tourists stay in hotels. From 2014 to 2018. the rural tourism and
local lodging had a significant increase of tourist arrivals.
Table 3: Development of tourist arrivals by type of accommodation.
Tourists arrivals by type of
establishment
Years
2014 2015 2016 2017 2018
Total 1 022 997 1 103 916 1 276 549 1 395 981 1 395 023
Hotel establishments
893 826 960 292 1 088 764 1 165 678 1 143 849
Hotels 610 972 656 070 759 205 826 556 816 736
Apartment hotels
238 632 248 979 266 845 265 845 256 266
Tourist apartments
10 306 16 038 19 995 22 499 21 263
Tourist villages 6 959 7 994 8 515 9 276 8 346
"Pousadas" 2 057 2 268 2 425 3 027 2 216
"Quintas da Madeira"
24 900 28 943 31 779 38 475 39 022
Rural tourism 14 534 16 930 20 860 30 782 34 273
Local lodging 114 637 126 694 166 925 199 521 216 901
Source: DREM Excel sheet I.9. own representation.
Table 4 shows an overview of the evolution. between 2017 and 2018. of the main tourist
indicators for Madeira. Almost 1.4 million visitors spent 426 751 thousand Euros in 2018
and the accommodation sector employed 7 thousand people.

11
Table 4: Main tourist indicators from Madeira. 2018 and percentage change compared to 2017.
2018 Cumulative Year-On-Year Change Rate (%)
Guest arrivals (No.) (source DREM. Excel sheet I.5) 1 395 023 -0.1
Residents in Portugal 286 761 0.8
Residents in foreign countries 1 108 262 -0.3
Guests lodged (No.) (Excel sheet I.6) 1 607 899 -0.8
Residents in Portugal 311 279 0.8
Residents in foreign countries 1 296 620 -1.2
Nights spent (No.) (Excel sheet I.7) 8 360 844 -0.3
Residents in Portugal 938 269 1.2
Residents in foreign countries 7 422 575 -0.4
Average stay (No. of nights) (Excel sheet I.8) 5.20 0
Establishments in activity (No.) (Excel sheet I.39) 358 10.6
Lodging capacity (No. of beds) (Excel sheet I.43) 34 399 3.5
Net bed occupancy rate (%) (Excel sheet I.18) 62.4 -3.7 p.p.
Net room occupancy rate (%) (Excel sheet I.21) 68.4 -3.7 p.p.
Total revenue (thousand €) (Excel sheet I.24) 426 751 1.7
Revenue from accommodation (thousand €) (Excel sheet I.27)
279 187 1.9
RevPAR (€)(Excel sheet I.33) 47.47 -1.4
ADR (€)(Excel sheet I.36) 69.38 3.9
Employed personnel in tourism accommodation (No.) (Excel sheet I.45)
7 127 3.4
Source: DREM. own representation.
The arrivals of residents in foreign countries decreased 0.3% and the arrivals of residents
in Portugal has increased 0.8%. While total arrivals have slightly decreased from 2018 to
2017 (-0.1%). total revenues have increased (1.7%). This is mainly due to the average
daily rate per tourist (ADR) that has increased 3.9%.
One of the main touristic activity is hiking in the mountains. which can be affected by
climate change namely the increase of forest fire risk. The physical outdoor activities can
also be limited by heat waves.
Maritime transport
While freight maritime transport grows with global trade. the maritime transport of
people has been replaced by commercial flights. The exception is. at a global level. the
Cruise ships had a rapid growing market. In the RAM. between 2004 and 2018. with an
average of 573 per year. the cruise ships have an important contribution for the tourism
sector. particularly for the local commerce and touristic services in Funchal.

12
In insular regions. the maritime transport of passengers remains an important option to
transport resident population and tourism between islands. Figure 4 shows that the
maritime daily connection of passenger ships (excluding cruise ships) that transport
residents and tourists between Madeira and Porto Santo islands represents the major
vessel movements in the RAM ports. This connection is very important to the touristic
activity in Porto Santo island. namely in the summer season. and to supply the island
with fresh products.
Islands. such as Madeira. are highly dependent on freight maritime transport. They rely
on imported resources such as fuels. food. building materials. consumer goods such as
cars etc.. which are brought to the island by ship.
Figure 4: Number of commercial vessels in the ports of the RAM. Source: DREM Excel sheet III.10. own representation. (*)Mainly the daily connections between Madeira and Porto Santo Island.
Aquaculture
The economic significance of aquiculture is particularly small in RAM. The 2008
Handbook on Fishery in Madeira (Iborra Martín, 2008) claims: “Aquaculture has scarcely
been developed in Madeira. In the 1990s business was brisk. but production ceased in
2000. In 2005 commercial production restarted. which produced 400 tonnes in 2006.
with a value of € 2.1 million.”
In 2001 the ‘Centro de Maricultura da Calheta’ was created in Madeira island with
funding from the POSEI Programme. This centre supports the development of
aquiculture activity in Madeira Island and promotes research namely on the production
of local species in captivity.
0
200
400
600
800
1 000
1 200
1 400
1 600
1 800
2004 2005 2006 2007 2008 2009 2010 2011 2012 2013 2014 2015 2016 2017 2018
Year
Passenger ships* (excluding cruise ships) Freight transport Cruise ships

13
Figure 5 presents the annual aquaculture production in Madeira island between 2006 and
2018. The productivity oscillates throughout the years with the minimum value of 169
tonnes in 2011 and the maximum value of 570 tonnes in 2013. The regional market
consumes an average of 150 tonnes per year of local aquaculture production.
Figure 5: Annual production. in tonnes. since 2006 until 2018 in Madeira island. Source INE. own representation. (*) Data gather from local companies. (**) Data gather from Regional Fisheries Secretariat.
Energy
According to the Regional Agency for Energy and Environment of the Autonomous
Region of Madeira. in 2017. wind. solar. hydro. biomass. urban waste and biofuel
contributed to around 11% to the total primary energy demand. The demand for
electricity generation is about 44% of total primary energy. Electricity is generated from
gas. fueloil and renewables.
For final energy consumption. the demand for transport is about 51%. households 20%.
services 22%. industry 7%. agriculture. forestry and fishing 0.3%. Solar. biomass. biofuels
contribute about 6% to final energy consumption.
400
550
455 448 437*
169
316
570
194
429386 376
590**
2006 2007 2008 2009 2010 2011 2012 2013 2014 2015 2016 2017 2018
Year

14
2 Economic projections
2.1 The macroeconomic projections
According to Soclimpact reference projections. Madeira’s GDP continues to grow
throughout the 2015-2100 period. The main drivers of growth are private consumption
and investments over the whole projection period (Table 5).
Respective GDP-shares of private consumption and investments remain relatively stable
over the projections period (Figure 6). Investments grow at a high pace in 2020.
However. these growth rates decline steadily afterwards. The trade deficit is assumed to
be reduced in the long run.
Table 5: Madeira GDP and GDP components yearly growth rates in 2020-2100.
2020 2025 2030 2035 2040 2045 2050 2060 2070 2100
GDP 2.5 1.3 1.3 1.2 1.1 1.0 0.9 1.2 1.0 1.4
Private consumption 3.4 1.8 1.7 1.5 1.4 1.3 1.2 1.1 0.8 1.0
Public consumption -0.3 -0.2 -0.2 -0.3 -0.4 -0.6 -0.7 1.1 0.8 1.0
Investments 3.1 1.7 1.5 1.4 1.3 1.3 1.2 1.0 1.0 1.0
Trade 3.1 1.7 1.5 1.4 1.3 1.3 1.2 0.9 0.6 -0.5 Source: Deliverable 6.2: Macroeconomic outlook for the islands.
Figure 6: Macroeconomic components as a % share of GDP for Madeira in 2015-2100. Source: Deliverable 6.2: Macroeconomic outlook for the islands.

15
2.2 The sectoral projections
According to Soclimpact projections. RAM’s economy remains a service-led economy
throughout the 2015-2100 period. with significant contributions to total gross value
added from construction. non-market services. accommodation and food services. and
other market services (Figure 7).
Agriculture. fishery. manufacturing and consumer goods sectors are projected to
contribute. in total. less than 6% to the economy-wide gross value added. in 2100.
Total tourism activities are projected to experience a long run increase of their respective
gross value-added shares. Starting from more than 11% in 2015. this share is projected to
increase steadily to more than 14% until 21006.
Figure 7: Sectoral value added as a % share to total GVA for Madeira in 2015, 2050 and 2100. Source: Deliverable 6.2: Macroeconomic outlook of the islands.
6 The share of tourism in GDP is calculated via the tourism satellite account (TSA) matrices of 2015, assuming that the same shares that indicate the contribution of tourism to the productions of tourism-related sectors (such as the accommodation and food services, transport services, travel agency and related activities, cultural and recreational activities) remain throughout the 2015-2100 period. Please see Appendix B of the D.6.2: Macroeconomic outlook for the islands for the complete database of the estimated TSAs.

16
Table 6: Sectoral contribution as a % share of total gross value added for Madeira in 2015-2100. GVA % shares 2015 2020 2025 2030 2035 2040 2045 2050 2060 2070 2100
Agriculture 1.9 1.7 1.6 1.6 1.5 1.5 1.4 1.4 1.3 1.3 1.1
Fishery 0.7 0.7 0.6 0.6 0.6 0.6 0.5 0.5 0.5 0.5 0.4
Manufacturing 1.9 1.8 1.7 1.7 1.7 1.7 1.6 1.6 1.6 1.5 1.4
Consumer goods 3.8 3.6 3.5 3.4 3.4 3.3 3.3 3.2 3.2 3.1 2.9
Electricity 1.3 1.2 1.2 1.2 1.1 1.1 1.1 1.1 1.1 1.1 1.0
Water 0.3 0.3 0.3 0.3 0.3 0.3 0.3 0.3 0.3 0.3 0.2
Construction 12.7 11.9 11.8 11.7 11.7 11.7 11.7 11.8 11.8 11.8 11.4
Water transport 1.1 1.1 1.1 1.2 1.2 1.2 1.2 1.2 1.2 1.3 1.3
Other transport 4.1 4.2 4.3 4.4 4.4 4.5 4.5 4.5 4.6 4.7 4.9
Accommodation and food services
8.5 8.4 8.8 9.1 9.3 9.5 9.6 9.8 10.1 10.3 11.3
Travel agency and related activities
0.0 0.0 0.0 0.0 0.0 0.0 0.0 0.0 0.0 0.0 0.0
Recreational services
1.3 1.5 1.4 1.2 1.1 1.0 1.0 0.9 0.8 0.7 0.4
Other market services
37.4 37.5 37.3 37.1 37.0 36.8 36.7 36.6 36.4 36.2 35.6
Non-market services
25.0 26.0 26.3 26.5 26.7 26.8 26.9 27.0 27.2 27.4 28.0
Source: Deliverable 6.2: Macroeconomic outlook of the islands.
2.3 Employment
The service-led economic growth brings positive effects to the labour market with
unemployment rates being continuously reduced throughout the projection period. The
contribution of each sector to total employment depends on the labor intensity of the
sector. The biggest employing sectors are the non-market and other market services as
well as accommodation and food services. Construction services do also still provide
significant employment contributions in 2100.
Tourism is the largest employer of the Blue growth sectors under analysis, particularly
due to the high labor intensity of accommodation and food services. Electricity, water
transport and fisheries feature rather stable employment shares throughout the
projection period. However, none of these sectors contributes individually more than 1%
to total employment.
Table 1: Sectoral contribution as a % share of total gross value added for Madeira in 2015-2100 2015 2020 2025 2030 203
5 204
0 204
5 205
0 206
0 207
0 210
0
Unemployment rate
14.7%
11.7%
10.9%
10.3%
9.7%
9.0%
8.2%
7.4%
7.5%
7.5%
7.2%
Source: Deliverable 6.2: Macroeconomic outlook of the islands.

17
Figure 1: Sectoral employment as a % share of total for Madeira in 2015, 2050, 2100 Source: Deliverable 6.2: Macroeconomic outlook of the islands.
3 Climate Change outlook
Climate hazards indicators represent the entry point to understand the climate change
exposure of the blue economy sectors. The indicators have been computed for two
scenario RCP2.6 (ambitious mitigation scenario) and RCP8.5 (business as usual) and for
different horizon times namely: a reference period (1965-2005), mid-century (2046-2065)
and end of century (2081-2100). Main source of climate projections (future climate) for
Madeira is MENA-CORDEX ensemble even if other model sources were applied when
required, depending of available scales. Results are presented in form of maps, tables or
graphs and only when the information shows an interesting outcome.
As to its reliability, it is important to note that Atlantic islands (Azores, Madeira, Canaries and West Indies) lie in very critical areas where global models might be inaccurate in predicting the large scale patterns (regional models are not available), and resolution is so coarse that in fact many islands don't even exist in model orography. This acknowledged, this is the only information we can provide, and at least future tendencies can be inferred. The new CMIP6 simulations might shed more light on this issues, but we can only suggest that results should be updated as they become available.

18
The same partly holds for the wave simulations: local resolution has been significantly increased in the dedicated new simulations of this project, performed by the partner ENEA (up to 0.05°), but the forcing wind field is still derived from the coarse global models. Stakeholders should be made aware that uncertainty is an inherent characteristic of climate data, and that any future planning must cope with it. Climatologists can only highlight POTENTIAL threats and constraints, they cannot predict the future and pave the way to solutions. Conveying this piece of information is one of the most critical points of climate-change-related information. All the graphics presented below can be found in high resolution in the
Soclimpact Project official website HERE.
3.1 Tourism
Beach flooding and related losses
One of the consequences of an increase in the mean sea level will be the flooding of coastal areas. This includes sand beaches, which are the main asset for tourism activities in most of the European islands. Therefore, estimating the potential risk of beach loss due to climate change is of paramount importance for the economy of those islands. The 95th percentile of the flood level averaged was selected as an indicator of interest. The values are presented as anomalies with respect to the present mean sea level at beach location (i.e. including the median contribution of runup). In all cases an increase is expected being larger at the end of the century under scenario RCP8.5. The larger values are found for the Atlantic islands, where slightly larger sea level rise is combined with the effect of much larger wind waves. The values in that scenario is 163 cm in Madeira. Under RCP2.6 scenario the values are less than half, suggesting that a mitigation scenario could largely minimize the negative impact of climate change on beach flooding.

19
.
Figure 9: Projected extreme flood level (in the vertical, in cml) at beach locations with respect to the present (1986-2005) mean sea level values averaged for the islands under scenario RCP2.6 (left) and
RCP8.5 (right). Ensemble of models using Global simulations produced by Hemer et al. (2013). Source: SOCLIMPACT Deliverable Report - D4.4d Report on the evolution of beaches
Under mean conditions, we find that, at end of century, the total beach surface loss range
from ~57% under scenario RCP2.6 to ~95% under scenario RCP8.5.
Figure 10: Beach reduction % (scaling approximation). Source: Soclimpact project deliverable D4.4d Report on the evolution of beaches

20
Humidex
For the assessment of heat related impacts of climate change on human health, the humidity index (Humidex) (Masterton and Richardson, 1979) has been used. Humidex value is an equivalent temperature, which express the temperature perceived by people (the one that the human body would feel), given the actual air temperature and relative humidity. As a more representative indicator for the assessment of inhabitants’ and tourists’ hazard on heat related climate change impacts, the Number of Days with Humidex greater than 35°C was selected. From the above classification, a day with Humidex above 35°C describes conditions from discomfort to imminent danger for humans. For Madeira, two separate analysis were conducted, as RCP2.6 was available for only one
model, while for RCP8.5 we used four GCM/RCM pairs. We find that for RCP2.6, the
days with discomfort are negligible, though, the analysis of the RCP8.5 future projections
shows that from less than 1 day in the present climate, the number increases to 30 days
per year at the end of the century.
Figure 11: Humidex. Ensemble mean of MENA-CORDEX simulations Source: Soclimpact project deliverable D4.3_Atlases of newly developed indexes and indicator
3.2 Aquaculture
The predicted impacts of climate change on the oceans and seas of the planet is expected to have direct impacts on marine based aquaculture systems. Basic effects are the following (Soto and Brugere, 2008): Change in biophysical characteristics of coastal areas.
Increased invasions from alien species.
Increased spread of diseases.

21
Changes in the physiology of the cultivated species by changing temperature, salinity, oxygen availability and other important physical water parameters.
Changes in the differences between sea and air temperature which will alter the seasonality, frequency and severity of storms, cyclones and other extreme events, affect the stability of the coastal resources and potentially increase the damages in infrastructure.
Sea level rise, acidification, changes in precipitation and other effects will also add to the changes in coastal ecosystems and environment, thus affecting production and infrastructure (=investments).
Fish Thermal Stress Temperature changes in seawater trigger physical impacts; increased harmful algal blooms, decreased oxygen level, increase in diseases and parasites, changes in ranges of suitable species, increased growth rate, increased food conversion ratio and more extended growing season. Furthermore, all these impacts lead to socio-economic implications among them; changes in production levels and an increase in fouling and pests. The objective of the current analysis is to identify and quantify the variations (future climate scenarios with respect to present climate) in the number and in the duration of events characterized by a Sea Surface Temperature (SST) exceeding a given threshold. The SST thresholds have been identified according to the farming and feeding necessities of several marine species, particularly relevant for the aquaculture sector in the Mediterranean Sea (MS). For Madeira, the increase in sea surface temperature is expected to be critical for mussels and clams, with 200 days per year exceeding the threshold. For the case of seabass , the risk would increase 50 times.
Figure 12: Number of days exceeding the fish thermal threshold Source: Soclimpact project deliverable D4.3_Atlases of newly developed indexes and indicator

22
3.3 Energy
Percentage of days when T > 98th percentile - T98p
The T98p is defined as the percentage of time where the mean daily temperature T is above the 98th percentile of mean daily temperature calculated for the reference period 1986-2005. For Madeira, we have conducted two separate analyses, as RCP2.6 was available for only one model, while for RCP8.5 we used four GCM/RCM pairs. Thus, for one-model analysis, we find that for RCP2.6, the number of days with temperatures above the reference 98th percentile will exceed 10% by the end of the century. On the other hand, the RCP8.5 future projections with four models shows that, while in mid-century about 8% of the days with be above T98p threshold, at the end of the century, daily temperatures will be above T98p for almost 25% (~90 days per year) of time.
Figure 13: Percentage of days when T>98th percentile. Ensemble mean of MENA-CORDEX simulations
Source: Soclimpact project deliverable D4.3_Atlases of newly developed indexes and indicator
Renewable energy productivity indexes
A series of indicators related to renewable energy productivity is presented. The selected indicators are wind and photovoltaic (PV) energy productivity, as well as the frequency and duration of low-productivity periods, termed energy droughts (Raynaud et al., 2018), as a measure of the variability of these sources. The productivity and variability of these renewable energy sources will depend on climate. The possibility of reduced productivity due to climate change poses a risk to the energy generation, if it is based on these

23
renewable energy sources. Also, a possible increase in the frequency and duration of solar and wind energy droughts will require an increase in storage and backup sources. Among the different renewable energy sources, solar PV and wind energy have been selected, as they are (and very likely will be) the main renewable energy sources, due to their degree of technological development and their comparatively low cost. In order to consider a marine energy source, offshore wind energy is included, in addition to onshore wind energy. Photovoltaic energy productivity
The annual mean value of photovoltaic productivity over Madeira in the control period (1986-2005) is lower than for the rest of Islands analyzed in this project (except for the Azores, which presents values that should be taken with caution due to likely biases caused by their proximity to climate model boundaries). Solar irradiation values from EUMETSAT satellite over the Madeira Islands presents similar values than those for the north-western side of the Iberian Peninsula. Our computations over Madeira show values of PV productivity similar to those found in (Šúri et al., 2007) for their European solar potential publication. Changes in photovoltaic productivity projected for this region are mostly negative but
also rather small (less than 3% of the control period values), and lower than the changes
projected for other regions. An increase in photovoltaic productivity is projected over
land for RCP8.5 scenario, although that increase represents just around 1% of the annual
mean value. However, it is important to notice the coarse resolution of the model in
comparison to the island area.
Figure 14: Ensemble mean values of annual solar productivity indicators –land (kWh/kW) in the
control period (1986-2005) and ensemble mean changes in future periods (2046-2065, 2081-2100) for
the RCP2.6 and RCP8.5 scenarios. Spatial averages are computed for land and sea separately. Source: Soclimpact project deliverable D4.3_Atlases of newly developed indexes and indicator

24
Figure 15: Ensemble mean values of annual solar productivity indicators –sea(kWh/kW) in the control
period (1986-2005) and ensemble mean changes in future periods (2046-2065, 2081-2100) for the
RCP2.6 and RCP8.5 scenarios. Spatial averages are computed for land and sea separately. Source: Soclimpact project deliverable D4.3_Atlases of newly developed indexes and indicator
Wind energy productivity
Control period values are very high both over land and sea, in comparison to the other
islands of the study (Wprod is only higher in the Canary Islands). A general trend to
decreasing Wprod is obtained for almost all the cases, which is more important in RCP2.6
for 2081-2100 period. The projected changes in RCP8.5 are uncertain in sign.

25
Figure 16: Ensemble mean values of annual wind productivity indicators-land (kWh/kW) in the control period (1986-2005) and ensemble mean changes in future periods (2046-2065, 2081-2100) for
the RCP2.6 and RCP8.5 scenarios. Spatial averages are computed for land and sea separately. Source: Soclimpact project deliverable D4.3_Atlases of newly developed indexes and indicator
Figure 17: Ensemble mean values of annual wind productivity indicators – sea (kWh/kW) in the control period (1986-2005) and ensemble mean changes in future periods (2046-2065, 2081-2100) for
the RCP2.6 and RCP8.5 scenarios. Spatial averages are computed for land and sea separately. Source: Soclimpact project deliverable D4.3_Atlases of newly developed indexes and indicator

26
Frequency and duration of low-productivity periods (energy droughts) as a
measure of the variability of these sources
In the control time period, wind productivity droughts are more prone to develop over
land than over the sea (not showed). Over the studied domain, the frequency of wind
droughts tends to increase in the RCP2.6 scenario, while these present a subtle increase
(decrease) to the north (south) of the domain in the RCP8.5 case. In the RCP8.5
scenario, models show agreement regarding the increase in the frequency of droughts.
Figure 18: Wind energy productivity. Ensemble mean frequency of severe productivity drought days
(%) in the control time period, as well as the ensemble mean changes in the frequency of drought days
(%) in the different time periods considered for the RCP2.6 and RCP8.5 scenarios. Ensemble minimum
and maximum values are given in brackets. Averages are computed over land. Source: Soclimpact project deliverable D4.4a Report on solar and wind energy
In the case of PV droughts, we observe that moderate PV droughts tend to increase in
frequency in the RCP2.6 scenario, but they decrease in the RCP8.5 case. Severe PV
droughts are very infrequent in the control period, and their projected changes are very
small.

27
Figure 19: Photovoltaic (PV) productivity. Ensemble mean frequency of severe productivity drought days (%) in the control time period, as well as the ensemble mean changes in the frequency of drought days (%) in the different time periods considered for the RCP2.6 and RCP8.5 scenarios. Ensemble minimum and
maximum values are given in brackets. Averages are computed over land. Source: Soclimpact project deliverable D4.4a Report on solar and wind energy
The drought frequency for the combination of PV and wind energy is again very small
for current and future periods.
Figure 20: Combination Wind and Photovoltaic (PV) productivity. Ensemble mean frequency of severe productivity drought days (%) in the control time period, as well as the ensemble mean changes in the frequency of drought days (%) in the different time periods considered for the RCP2.6 and RCP8.5
scenarios. Ensemble minimum and maximum values are given in brackets. Averages are computed over land.
Source: Soclimpact project deliverable D4.4a Report on solar and wind energy

28
Cooling Degree Days
The Cooling degree days (CDD) index gives the number of degrees and number of days that the outside air temperature at a specific location is higher than a specified base temperature, providing provides the severity of the heat in a specific time period taking into consideration outdoor temperature and average room. For Madeira, we have conducted two separate analyses, as RCP2.6 was available for only one model. Thus, for one-model analysis, we find that for near future, CDD will be 3 times larger at the end of the century. On the other hand, the analysis of the RCP8.5 future projections with four models, provide a more devastating picture as the number of CDD will be almost 6 times larger than the reference period.
Figure 21: Cooling Degree Days. Ensemble mean of MENA-CORDEX simulations. Source: Soclimpact project deliverable D4.3_Atlases of newly developed indexes and indicator
Standardized precipitation evapotranspiration index
The Standardized Precipitation- Evapotranspiration Index - SPEI is used as an indicator of water availability. In particular, this hazard index can serve as a representative indicator for increases in water demand for islands’ residents, tourists and agriculture, while it also provides an indication on the available water stored in dams or underground resources. In a drier future, which is the likely case for most SOCLIMPACT islands, this will lead in additional increases in desalination and water pumping needs, a scenario which will substantially increase the cost for adaptation.

29
Figure 22: Standardized precipitation evapotranspiration index Source: Soclimpact project deliverable D4.3_Atlases of newly developed indexes and indicator
3.4 Maritime transport
Sea level rise
Sea level rise (SLR) is one of the major threats linked to climate change. It would induce permanent flooding of coastal areas with a profound impact on society, economy and environment. Moreover, an increase in the mean sea level would result in a larger impact of coastal storms with the consequent increase of risk. The results are presented in terms of mean sea level rise. For Madeira, the SLR ranges from 27, 27 cm (RCP2.6) to 74,72 cm (RCP8.5) at the end of the century.
Figure 23: Mean sea level rise (in cm) with respect to the reference period (1986-2005). Ensemble mean of CMIP 5 simulations and scaling approximation for RCP2.6
Source: Soclimpact project deliverable D4.4b Report on storm surge levels.

30
Wind extremes The wind extremity index NWIX98 is defined as the number of days per year exceeding the 98th percentile of mean daily wind speed. This number decreases in the far future under RCP8.5 (- 32 %).
Figure 24: Wind Extremity Index (NWIX98). Ensemble mean of the MENA-CORDEX
simulations. Source: Soclimpact project deliverable D4.3_Atlases of newly developed indexes and indicator
Like the NWIX98, the 98th percentile of daily wind speed, WIX98, decreases under RCP8.5. with a more significant magnitude for RCP 8.5.
Wave extremes (99th percentile of significant wave height averaged)
Marine storms can have a negative impact on maritime transport, coastal-based tourism and aquaculture, among other activities. To illustrate this impact, the 99th percentile of significant wave height averaged has been chosen. A decrease in the extreme wave height is found being larger under scenario RCP8.5 as illustrated in the following map. The more significant change is observed under RCP8.5. at the end of century with -5%.

31
Figure 25: the 99th percentile of significant wave height averaged for the reference period and the relative change for the RCP8.5. Global simulations produced by Hemer et al. (2013).
Source: Soclimpact project deliverable D4.4b Report on storm surge levels
Figure 26: the 99th percentile of significant wave height averaged for the reference period and the relative change for the RCP8.5 and RCP2.6. Global simulations produced by Hemer et al. (2013).
Source: Soclimpact project deliverable D4.4b Report on storm surge levels
4 Climate change risks
4.1 Tourism
For the tourism sector, three impact chains (IC) were operationalized: i) Loss of attractiveness of a destination due to the loss of services from marine ecosystems, ii) Loss of comfort due to increase of thermal stress iii) Los of attractiveness due to increased danger of forest fires in touristic areas

32
For the first two, the AHP method was employed. This methodology is ideal to respond to the hierarchical nature of the impact chain and, secondly, for using expert judgements to assess the comparative risk for the islands over a large number of indicators. By the side of shadows, this method requires quite specific data that wasn’t able to collect for some islands. The AHP method also requires “values” for experts to compare. More specifically, for the first IC the data is needed for “Tourist Arrivals” and “Vulnerable Groups” indicators, which is regards the Exposure of people to heatwaves for the hottest period, such as:
- Number of tourist arrivals per month for the past 5 years. - Number of tourists per month aged 14 and under for the past 5 years - Number of tourists per month aged 65 and over for the past 5 years - Percentage of tourist activities that are sensitive to heatwaves (such as hiking,
etc.). - Number of beds available in medical facilities per 100,000 inhabitants.
If, for example, an island gets a lot of tourists, but most of them just spend their time by the beach, then the island is not so much at risk of losing tourists because when they visit they’ll be by the beach and able to cool down. On the other hand, if almost all the tourists visit the island for hiking, but it gets too hot, then the island could be at risk since some may change their minds and visit somewhere else with a moderate climate and do their hiking there. Additionally, it is necessary to investigate how well an island is equipped with dealing with patients who suffer from a heatwave-related episode. For the second IC, the data collected was:
- Surface of marine Phanerogams & Phanerogams' reduction due to heat: Surface, in km2; and expected % of surface loss for RCP8.5 distant future.
- Number of divers: Number of tourists practising Diving at the destination. - Products substitution capacity: capacity to derive tourist demand to non-marine
habitat-based activities. - Seagrass removal: capacity to remove dead seagrass lying on beaches. - Sea water pollution: quality of management of inshore and offshore sewages.
If one information is missing, it is not possible to conduct the risk assessment analysis, as it is a comparative analysis between European islands. Finally, the third IC provided some results for the case of Madeira, as presented below: Los of attractiveness due to increased danger of forest fires in touristic areas
Forest fires are considered as an important parameter for the attractiveness of tourist
destinations, especially in the Mediterranean area. Severe episodes were met in Algarve
(Portugal) and Greece (Athens area) in the recent period, threatening the tourist season.

33
The concept of Impact Chain (Schneiderbauer et al. 2013; Fritzsche et al. 2014) is applied
as a climate risk assessment method (with 6 steps) for research of decision making.
Impact Chains propose diagrams articulating the causal links between the different
components of climate risks (according to AR5 concepts: hazards, exposure,
vulnerability, risks, step 1). For each of these components of the theoretical IC , several
indicators are selected and collected (step 3). Data are then normalized to be able to be
aggregated (steps 4 and 5) with different weights. The final objective (step 6) is to achieve
a standardized risk score that, according to the spatial scale of the analysis can allow
comparison and decision making on adaptation, including hierarchization of resource
allocation or identification of adaptation options to mitigate climate risk.
Figure 27: Loss of attractiveness due to increased danger of forest fire in touristic areas Source: Soclimpact deliverable D3.2

34
Figure 28: Loss of attractiveness due to increased danger of forest fire in touristic areas Source: Soclimpact deliverable D3.3
Many indicators were formulated in a very broad way, causing a few problems in
identifying suitable data sets. Furthermore, the data were checked for explicit spatial
coverage, resolution, temporal coverage and time frame. Finally, we evaluated possible
substitutes or alternatives for those indicators with no suitable data to substantiate them.

35
Figure 29: Final Impact Chain Model Source: Soclimpact deliverable D4.5
In order to normalize the index, the min-max method was applied. Min-max normalizes
indicators to have an identical range [0, 1] by subtracting the minimum value and
dividing by the range of the indicator values (OECD 2008). The mathematical formula
and more information on min-max normalization method are presented in the following
section. Afterwards, the normalized index was categorized into five equal interval classes
representing values from “Very low" to "Very high”. Considering the weighing, an

36
assessment of GIZ methodology has been developed for this impact chain including
interviews with various types of stakeholders (cf. dedicated 4.5 to forest fires).
The indicators previously normalized have been aggregated to elaborate three sub-
component indices (hazard, exposure, vulnerability) and the final risk index. The result is
included in a comparison for the 9 other islands studied for the risk linked to forest fires.
Hazard scores
The main findings are:
Scores for fire danger increase as we move from West to East and from North to South, with the exception of Malta, which is much smaller and the selected grid cells are mostly influenced by maritime conditions.
Under RCP2.6, it seems that the fire danger returns to the present conditions towards the end of the century apart from Crete which score will increase from medium to high, even under this RCP.
Under RCP8.5, the increase is much more prominent, ranging from 22% to 46%, with the highest values for Corsica, Sardinia and Sicily, which implies that under this scenario at the end of the Century, the western and central Mediterranean will be more affected
Figure 30: Hazard score (Fire Weather Index) per island for the reference period (1986-2005) Source: Soclimpact deliverable D4.5

37
Figure 31: Hazard score (Fire Weather Index) per island at the end of the century (2081-2100) under
RCP2.6 (Ambitious Mitigation Policies) Source: Soclimpact deliverable D4.5
Figure 32: Hazard score (Fire Weather Index) at the end of the century (2081-2100) under RCP8.5
(Business as usual) Source: Soclimpact deliverable D4.5

38
Exposure
The results show that:
Atlantic Islands (Madeira and Canary Islands) are more exposed than Mediterranean Islands (from low to medium score). We can see an increase as we move from North to South in the Mediterranean area.
Atlantics Islands higher scores are mainly explained by the level of exposure rather than the nature of exposure, which is quite similar across islands, except for Malta which rate is very low.
The nature of exposure varies across EU Islands despite of their homogeneous score: Corsica has the highest score for forest areas followed by Madeira, Canary Islands. These two last ones have the highest score of forest belonging to protected areas. We can find a significant proportion of cultivated areas in other Islands namely: Sicily, Sardinia, Balearic Islands, Crete and Cyprus.
The level of exposure for Canary Islands and Madeira is particularly important because of the high scores for each of the 4 considered indicators: population density, population over 65 years, population under 9 years and tourist density.
Figure 33: Exposure score (current period) per island Source: Soclimpact deliverable D4.5

39
Figure 34: Subcomponents of exposure and related score (current period) per island Source: Soclimpact deliverable D4.5
Figure 35: Breakdown by exposure subcomponent Source: Soclimpact deliverable D4.5

40
Vulnerability
The main findings are:
Results show large disparity across EU Islands in terms of vulnerability. The vulnerability score for Corsica is very high followed by Sardinia (high), Madeira, Balearic Islands and Cyprus. Malta, Canary Islands and Crete scores are low and Sicilia very low.
Breakdown by component highlights a quite homogeneous score for adaptative capacity whereas sensitivity score (Flammability Index) is very different from an island to another.
Not surprisingly for the flammability index, Corsica and Sardinia have the highest score, Malta, Sicilia and Canary Islands, the lowest one.
Looking at the adaptative capacity subcomponent, despite of the quite homogeneous scores, factors of influence are quite different among the islands:
o high score for employees in the primary sector, apart from Sardinia and Sicily;
o scores for density of firefighters and volunteers are important for all the islands except for Cyprus;
o GDP per capita and level of education are the most heterogeneous factors of influence;
o GDP per capita score is very high for Crete, very low for Corsica, Malta and Balearic Islands.
o Scores for education level is important for Cyprus and low for Madeira, Malta and Corsica.
Figure 36: Vulnerability score per island Source: Soclimpact deliverable D4.5

41
Figure 37: Subcomponents of vulnerability and related score (current period) per island Source: Soclimpact deliverable D4.5
Figure 38: Details and scores of the two subcomponents (adaptive capacity and sensitivity) per island Source: Soclimpact deliverable D4.5

42
Risk
- For the reference period, the overall risk is medium for Atlantic Islands (Madeira and Canary Islands) and Eastern Mediterranean Islands (Crete and Cyprus). Risk for other islands is low and very low for Malta.
- Looking at the breakdown of the risk, the structure is quite similar for 3 groups: o Madeira, Canary Islands, Sicilia and Balearic Islands: Predominance of
exposure component (around 50% of the score); o Crete and Cyprus: Predominance of the hazard component (around 40%
of the score); o Corsica and Sardinia: Predominance of the vulnerability component
(around 60-70%); o Only Malta has a quite balanced distribution across the components.
- In this exercise, only the hazard component is changing in the future. In the near future whatever the considered RCP, the risk increases only for Cyprus from medium to high. While the risk remains stable with the RCP2.6 in the distant future for all islands apart from Cyprus, there is an increase from very low to low for Malta and from low to medium for Balearic Islands, Corsica and Sardinia with RCP8.5 (distant future). Even under this RCP8.5 risk remains constant for Canary Islands and Madeira (Medium) and Sicily (Low).
Figure 39: Risk score per island for the reference period (1986-2005) Source: Soclimpact deliverable D4.5

43
Figure 40: Risk breakdown by island for the reference period (1986-2005) Source: Soclimpact deliverable D4.5
Figure 41: Risk score per island in the near future (2046-2065) under RCP2.6 (Ambitious
Mitigation Policies) and RCP8.5 (Business as usual) Source: Soclimpact deliverable D4.5

44
Figure 42: Risk score per island at the end in the distant future (2081-2100) under RCP2.6
(Ambitious Mitigation Policies) and RCP8.5 (Business as usual) Source: Soclimpact deliverable D4.5
Figure 43: Score per component and per island in the near (2046-2065) and the distant future (2081-
2100) under RCP2.6 (Ambitious Mitigation Policies) and RCP8.5 (Business as usual) Source: Soclimpact deliverable D4.5

45
Madeira island results
Considering, the reference period, the risk is medium and the component of exposure is
the most represented. There is no change in the future for the category of risk.
Figure 44: Risk score and components of the risk for the reference period Source: Soclimpact deliverable D4.5
Figure 45: Risk score at the end in the distant future (2081-2100) under RCP2.6 (Ambitious
Mitigation Policies) and RCP8.5 (Business as usual) Source: Soclimpact deliverable D4.5

46
Considering the exposure component, the level of exposure is the most represented in
the calculation of the final risk scores.
Figure 46: Details and scores of the two subcomponents of exposure (nature and level of exposure) per
island Source: Soclimpact deliverable D4.5
Considering the vulnerability component, the sensitivity is the most represented.
Figure 47: Details and scores of the two subcomponents of vulnerability (adaptative capacity and
sensitivity) Source: Soclimpact deliverable D4.5

47
4.2 Aquaculture
In the framework of Soclimpact, the following impacts were more closely studied:
1) Increased fragility of the aquaculture activity due to an increase of extreme
weather.
Increased frequency and intensity of extreme weather events result in higher waves and
storm surges and changes in salinity. These events result in loss of stock and damages to
infrastructure and require adaptation in species selection, site selection and technologies.
2) Decrease in production due to an increase in surface water temperature
Changes in water temperature can directly affect the growth rate and Food Conversion
Ratio of the fish. Temperature also affects the oxygen levels and can cause harmful algae
blooms, reduce water quality and an increase in occurrence of diseases and parasites
which can than affect the fish or other culture species. A change in temperature can
ultimately change the ranges of suitable species for a certain area but can also have
positive impacts such as increased growth (mainly in tropical and sub-tropical regions)
and a longer growing season. Primary productivity can also increase with increasing
temperature, which may be beneficial for filter feeders such as mussels.
The concept of Impact Chain (Schneiderbauer et al. 2013; Fritzsche et al. 2014) is also
applied as a climate risk assessment method (with 7 steps for aquaculture, present risk
and future risk are calculated separately) for research of decision making. The goal of
this method is to use collected data for certain indicators of the impact chains for
different islands to assess the risks of each island’s aquaculture sector to be affected by
the hazard displayed in the impact chain. Therefore, data for all indicators were collected
from all islands. After reviewing the data, selecting indicators and islands, the indicators
were normalized, and different risk components were weighted. Using these values, the
risks for present and future conditions under different Representative Concentration
Pathway (RCP) scenarios were calculated for the different island and compared between
each other. For the aquaculture impact chains, RCP 4.5 and 8.5 were compared since for
the hazard models RCP 2.6 was not always available.
Step 1: Data collection by Island Focal Points
To be able to apply the GIZ risk assessment method, a solid data basis is crucial.
Therefore, data was collected by the Island Focal Points (IFPs) of the SOCLIMPACT
project. The questionnaire requested datasets for 16 indicators and topics with several
subcategories on exposure and vulnerability. The IFPs reached out to local stakeholders
and authorities to collect the requested data which was then resubmitted to the Sectoral
Modelling Team (SMT) Aquaculture.
Step 2: Data review and island selection
Data were submitted by most of the islands to the SMT Aquaculture. Most datasets were
incomplete with major data missing regarding important information for the successful

48
operationalization of the impact chains. Therefore, and for the fact that some islands do
currently not have any active marine aquaculture operations running, some islands were
excluded from the operationalization. Out of the 12 islands assessed in the
SOCLIMPACT project, six were included in the operationalization of the impact chains
using the risk assessment method from GIZ: Corsica, Cyprus, Madeira, Malta, Sardinia
and Sicily. The other six islands (Azores, Balearic Islands, Baltic Island, Canary Islands,
Crete and French West Indies) do currently not have active marine cage aquaculture
operations or show insufficient data availability. Data on hazards was provided by the
models developed in work package 4. Eventually, Madeira was excluded for the impact
chain on extreme weather events due to lack of reliable hazard data. A qualitative analysis
will be provided in the result section.
Step 3: Review and selection of indicators
The data collection and review revealed that not all indicators of the impact chains could
be used for the operationalization process. Therefore, these indicators were reviewed
carefully and the ones which were not represented by sufficient data were excluded. The
revised impact chain was developed depending on the indicators selected.
Figure 48: Impact chain on Increased fragility of the aquaculture activity due to an increase of extreme weather adjusted depending on data availability and used for the operationalisation.
Source: Soclimpact project deliverable 3.2

49
Some indicators require data on the proportions of species farmed on a specific island.
Therefore, a table with % of each species farmed on each island was prepared. This data
was obtained directly from the IFPs or from the FAO or national statistics offices.
Table 8: Proportions of aquaculture species farmed per island. Proportion of species production
Species Mussels &
clams Tuna Sea bream Sea bass
Corsica 0.43
0.265 0.265
Cyprus
0.84 0.16
Madeira
1.0
Malta
0.94 0.048 0.012
Sardinia 0.84
0.08 0.08
Sicily 0.44
0.3 0.26 Source: Soclimpact project deliverable 4.5
Impact chain: extreme weather events
Hazard
For the component hazard both indicators were used for the operationalisation. The
wave amplitude was shown as significant wave height (SWH) in m and the return time
number of years between extreme events quantified with a threshold of >7m. The data
was derived from the climate models of Deliverable 4.4 at the exact locations where the
fish farms are located and then averaged for all locations on one island. This allows a
more accurate assessment than taking the average values for the entire island.
Exposure
Four indicators were selected to be operationalized. The number of aquaculture
operators was provided by the IFPs and additional literature. There was no data available
on the actual size of stock, therefore the yearly production of aquaculture products (fish
and shellfish) in tons was used as a proxy indicator. The location of farms was rated by
using two different proxy indicators: the location of the farms in relation to the
prevailing wind direction and the average distance of the farms to shore. To be able to
rate the location in relation to the wind direction, the values were estimated (with 0 being
completely sheltered and 1 being exposed to wind and possible storms). After
normalizing the distance from shore (measured by using GIS software and the exact
coordinates of the fish farms), both values were averaged and represent the exposure of
the location of farms.
Sensitivity (vulnerability)
Two indicators were applied to calculate the score of factors of sensitivity. The sensitivity
of species was estimated by reviewing literature and interviewing experts regarding the

50
vulnerability of species to extreme weather events. After receiving these data, average
values were calculated of all values for the present species on each island.
Table 9: Estimated vulnerability factors for the sensitivity of species to wave stress. 1= very vulnerable to stress: 0=very resilient to stress.
Source: Soclimpact project deliverable 4.5
The same approach was implemented to calculate the vulnerability of the infrastructure
types used on each island based on the type of species farmed.
Table 10: Estimated vulnerability values for the vulnerability of infrastructure in case of an extreme weather event.
1= very vulnerable to stress: 0=very resilient to stress.
Source: Soclimpact project deliverable 4.5
Adaptive capacity (vulnerability)
The indicators distance to harbor and the presence of warning systems were used to
describe the adaptive capacity. As there is a weather forecast available for all islands, the
values for the presence of warning systems are all the same and represent low values. The
distance to harbors was moved to the subcomponent adaptive capacity and measured
using GIS software and the exact locations of the farms which were provided by the
IFPs and literature data. It represents the average distance of all farms to their closest
harbor for each island and is shown in meters. The indicator stocking density and
engineering of structures were excluded from the operationalisation. For the stocking
density there were no data available from all islands and in any case, it was estimated to
be similar for all islands. The engineering of structures was already covered with the type
of infrastructures in the sensitivity subcomponent.
Impact chain: Increased sea surface temperature
Hazard
Sensitivity of species for wave stress threshold
Species Sea bream Sea bass Tuna Mussels & Clams
Estimated vulnerability
factor 0.55 0.65 0.3 0.9
Vulnerability of aquaculture infrastructure in case of an extreme weather event
Infrastructure for species Sea bream & Sea bass Tuna Mussels & Clams
Estimated vulnerability factor 0.4 0.3 0.6

51
Changes in surface water temperature was chosen to be the indicator representing the
component hazard. The temperature data for this indicator was obtained from the
location of each farm from the climate models of Deliverable 4.4 and averaged per
island. To calculate the hazard for each island and each RCP, the species’ temperature
thresholds were taken into account. According to a literature review (see Annex) the
temperature thresholds for farmed species is the following:
Table 11: Temperature threshold per species.
Temperature thresholds for different species
Species Sea bream Sea bass Tuna Mussels & Clams
Threshold (°C) 24 25 24 20.5
Source: Soclimpact project deliverable 4.5
It must be noted that the threshold for Tuna was set to 24°C since in the project only
Tuna fattening is done (in Malta) and for adult fish the threshold is 24°C while in the
review the whole life cycle as well as prey species was taken into account which is not
relevant for this exercise. Based on these thresholds, the duration of the longest event
per year (in days) was calculated for the temperatures 20 °C, 24 °C and 25 °C for RCP
4.5 and 8.5 from the models developed in WP4. After normalizing these values (which is
described in detail in Step 4), the values for each temperature and therefore each species
threshold were averaged using the sum product of the normalized values and the species’
proportion on the total production of the island. The final values represent the score of
the hazard. The indicator changes in seawater characteristics was not included in the
operationalization as there is no additional data related to this indicator which is not
covered by the surface water temperature indicator.
Exposure
Two indicators were used for the component exposure: the number of aquaculture
operators and the yearly production (in tons) as a proxy indicator for the size of stock.
Sensitivity (vulnerability)
The subcomponent sensitivity includes two indicators which were combined to one
indicator for the operationalization. The sensitivity of species directly correlates with
suitable temperature for species and therefore it is summarized as temperature sensitivity
of species. It was calculated by using temperature threshold values for each species
obtained from a literature review and expert opinion. These values were averaged
depending on which species and in which quantities they are farmed on the islands.

52
Table 12: Estimated vulnerability factors for the sensitivity of species to temperature stress.
1= very vulnerable to stress: 0=very resilient to stress.
Source: Soclimpact project deliverable 4.5
Adaptive capacity (vulnerability)
Two out of four indicators from the impact chain were utilized for the
operationalization. The monitoring early warning systems were included and show all the
same values for all islands as there is a sea surface temperature forecast available for each
island. The capacity to change species was included with all the islands displaying the
same value as well. The risk value is high in this case, as it would be quite difficult to
change species farmed on the islands in general as this would result in high economic
expenditures. For the indicator of the impact chain know-how of recognizing and
treating diseases/parasites there is no data available for any island. As this could vary a
lot between the islands, the indicator was removed instead of making assumptions, to not
negatively influence the risk values. A similar case arises from the indicator availability of
alternative place for farming. There is no data available to make correct assumptions
regarding the occurrence of alternative areas on the islands and therefore the indicator
was not used for the operationalization.
Step 4: Normalization of indicator data for all islands
In order to come up with one final risk value per island and to be able to compare these
values between islands, the indicator values were transferred into unit-less values on a
common scale. The normalized values range between 0 and 1 with 0 being low risk and 1
being very high risk.
There are two different ways of normalizing the indicator values:
- Minimum/maximum normalization;
- Expert judgement.
Fraction of maximum normalization
This normalization method was used for indicators which were expressed by real data
and not by expert judgement. The value for each island was calculated as a fraction of the
maximum value in de data set. Meaning the island with the maximum value was given 1
and the rest as a fraction thereof.
Sensitivity of species for temperature stress threshold
Species Sea bream Sea bass Tuna Mussels & Clams
Estimated vulnerability
factor 0.6 0.6 0.3 1

53
The following indicators were normalized using this method:
Extreme weather events:
- yearly production/ number of aquaculture operators
- average distance from shore (location of farms)
- average distance to harbour
Sea surface temperature:
- yearly production/ number of aquaculture operators
Minimum/maximum normalization
This normalization method was used for indicators which were expressed by real data
and not by expert judgement. The minimum and the maximum value of that indicator of
all islands was calculated and the following formula was applied to normalize all indicator
values to the scale between 0 and 1:
𝑥𝑛𝑜𝑟𝑚𝑎𝑙𝑖𝑧𝑒𝑑 = (𝑥 − 𝑥𝑚𝑖𝑛)
(𝑥𝑚𝑎𝑥 − 𝑥𝑚𝑖𝑛)
For both impact chains, the hazard values were normalised using the min and max
method. However, in these cases the minimum and maximum values were not
automatically the minimum and maximum values of the entire dataset but rather treated
differently for every hazard indicator. This handling of the normalisation of the hazard
indicators arose from the different nature of the indicator itself and the fact that data
were available for different RCPs and periods of time. Therefore, the hazard indicators
were normalised as following:
The sea surface temperature values were normalised separately for each temperature data
set. This means that all values for all RCPs and time periods of one “longest event over a
certain temperature” were taken into account when determining the minimum and
maximum values. For Madeira, RCP 4.5 data was not available, therefore RCP 2.6 data
was used and doubled.
Wave amplitude (significant wave height)

54
Figure 49: Modelling indicators for sea-state hazards, return time and significant wave height starting with 4 Global Circulation-Regional Circulation Model chains, which a fed into the WAM regional
wave model. Results are then normalized. Source: Soclimpact project deliverable 4.5
The return time was normalised as following; all values equal or greater that 10 are set to
0, all values between 0 and 10 are linearly mapped to the interval 1-0, so that 0 gives risk
1, 10 gives risk 0. It was assumed that a time period of 10 or more years allowed to repay
investments is a reasonable threshold.
Since, as described in D4.4 of Soclimpact, that the probability of having at least one
event exceeding the return level associated with a N-year return period during a N-year
time window is anyway greater than that of its complement (no events exceeding the
limit in the N-year time window), and that the return level cannot be considered a “no-
risk” safety level in evaluating the survivability and sustainability of structures or plants.
Table 13: Probability of occurrence of at least one event exceeding the return level associated with a given return period (blue) in a given time window (green), according to the formula. RL,T=1-(1-1/T)**L, where L=length of time window, T=Return Period.
Return Period [years]
Probability of occurrence
1 years 2 years 5 years 10 years 20 years
5 20% 36% 67% 89% 99%
10 10% 19% 41% 65% 88%
20 5% 10% 23% 40% 64% Source: Soclimpact project deliverable 4.5

55
Therefore, using a combination of the normalised values and the probability of
occurance, experts transformed these values into risk classes such all "low", "moderate",
"medium", "high", "very high", or the like, on a qualitative basis.
Expert judgement
For some indicators from both impact chains there was no data available which is the
reason why expert judgement and estimations were applied. The following indicators
were expressed using expert’s estimations:
Extreme weather events: - farm locations (in relation to main wind direction) - sensitivity of species - vulnerability of type of infrastructure - presence of warning system
Sea surface temperature: - estimated temperature sensitivity of species - capacity to change species
- monitoring early warning systems
In all cases the normalization scale of 0 to 1 was applied with 0 being low risk and 1
being very high risk.
Step 5: Weighting of different risk components
In this step, the different risk components hazard, exposure and vulnerability (including
the sub-components sensitivity and adaptive capacity) were rated. The total of the values
sums up to 1. The weights were estimated by aquaculture experts and the basis of the
estimations were subjective estimations, similar to the ones used in the AHP method.
However, in this method the data availability was additionally taken into account.
Components for which the available data was scarce, outdated or more unreliable the
weights were set lower on purpose, while components with accurate datasets were given
a higher weight as following:
Table 14: Components and their weights. (Sub)Component Weight
Sea surface temperature Extreme events
Hazard 0.3 0.6 wave height 0.2 return time 0.8
Exposure 0.4 0.2
Vulnerability 0.3 0.2
Sensitivity 0.75 0.75
Adaptive Capacity 0.25 0.25 Source: Soclimpact project deliverable 4.5

56
Step 6: Calculations of risk for present conditions
Before being able to calculate the risk values, the scores for each component/
subcomponent had to be calculated by taking the average of the corresponding
indicators:
𝑠𝑐𝑜𝑚𝑝 =(𝑖𝑛𝑑1 + 𝑖𝑛𝑑2 + ⋯ + 𝑖𝑛𝑑𝑛)
𝑛
s – score
comp – component or subcomponent
ind – indicator
n – number of indicators
The final risk value was calculated by summing up the scores of the components
multiplied individually with the corresponding risk component weightings:
𝑅𝑖𝑠𝑘 = 𝑠ℎ𝑎𝑧 ∗ 𝑤ℎ𝑎𝑧 + 𝑠𝑒𝑥𝑝 ∗ 𝑤𝑒𝑥𝑝 + 𝑤𝑣𝑢𝑙 ∗ (𝑠𝑠𝑒𝑛 ∗ 𝑤𝑠𝑒𝑛 + 𝑠𝑎𝑐 ∗ 𝑤𝑎𝑐)
s – score w – weight haz – hazard exp – exposure vul – vulnerability sen – sensitivity ac – adaptive capacity
These risk values were calculated for each island individually and range between 0 and 1.
After completing these calculations, it was possible to compare the islands between each
other.
Step 7: Calculations of risk for future conditions (different RCPs)
To be able to project the risk values to future conditions, the operationalization was
adjusted to the different Representative Concentration Pathways (RCPs). Therefore, the
whole operationalization was duplicated and different values for the hazard indicators
per island were inserted. These values were taken directly from the climate models
provided in work package 4 for the different RCP scenarios (RCP 4.5 and 8.5). The
resulting values can be compared between the islands as well as between the different
RCP scenarios.
Results
Impact chain: extreme weather events

57
Table 15: Exposure and vulnerability indicators each island
Component Exposure Vulnerability
Component Weight 0.2 0.2
Sub-component Factor of sensitivity Factors of adaptive capacity
Sub-component weight 0.75 0.25
Indicator Average Size of
producers Location of farms
Score for
level of
exposure
Sensitivity of
species (stress)
Type of
infrastructures
(material and
strength)
Score of
factor of
sensitivity
Distance to
harbour (vessel
capacity in extreme
weather
conditions)
[average & m]
Absence of
warning system
Score of
factor of
adaptive
capacity
Proxy indicator
Yearly production
/Number of
operators
Farms
sheltered
from wind
direction
Average distance
from shore (m) Average of
normalised
indicators
Estimated
sensitivity of
species
Type of
infrastructure (based
on species) Average of
indicators
Average distance to
harbour (m)
Presence of
warning system Average of
normalised
indicators
Data Normalised Normalised Data Normalised Normalised Normalised Data Normalised Normalised
Corsica 328.6 0.12 0.4 644 0.16 0.20 0.7 0.5 0.59 4789 0.96 0 0.48
Cyprus 811.4 0.29 0.5 3923 1.00 0.53 0.6 0.4 0.48 4616 0.92 0 0.46
Malta 2,755.9 1.00 0.5 1731 0.44 0.74 0.3 0.3 0.31 4165 0.83 0 0.42
Sardinia 537.2 0.19 0.4 1193 0.30 0.27 0.9 0.6 0.71 2183 0.44 0 0.22
Sicily 399.6 0.14 0.5 1000 0.25 0.27 0.7 0.5 0.61 5000 1.00 0 0.50
Source: Soclimpact project deliverable 4.5

58
Mediterranean islands
Hazards
Statistics of extreme events can significantly differ across the four model realizations
The hazard data for return time was derived from 3 different models; CMCC, CNRM and GUF.
Since the data varies highly between models a best- and worst case scenario was executed where
in the best-case scenario the lowest value (showing the lowest risk) between the models was used
and in the worst case scenario the highest value was used. Distance between the best and the
worst projection, give an estimate of uncertainty
Model projections for Average Significant Wave Height are in good agreement as to both pattern
and values. Hazard was evaluated from ensemble mean, uncertainty from ensemble STD (not
exceeding 15% - highest disagreement for highest values).
Figure 50: Results for return time in best- and worst-case scenarios for Mediterranean islands for reference period
(red line), RCP 4.5 (dotted line) and RCP 8.5 (black line). Source: Soclimpact project deliverable 4.5
"Worst" and "best" cases respectively refer to the least and most favorable projection in the set of models. For example return time, you will find that there is at least one model predicting no

59
hazard for all islands except Sardinia with no significant variations across scenarios. In fact, all circles cluster and overlap at the centre, while those that represent Sardinia all lie very close to the limit between the two lower hazard classes. On the other hand, at least one other model predicts appreciable yet low hazard for Corsica, Sicily and Sardinia, and hazard going from moderate (reference period, red) to medium (RCP8.5, solid black), to high (RCP4.5, dotted black) for Malta, while for Cyprus the hazard is irrelevant even for the most negative projection. This means that a) the result for Sardinia and Cyprus is stable across models, b) models slightly disagree for Sicily and Corsica, but generally predict low hazard, c) the projection for Malta is affected by greater uncertainty for all scenarios. This is due to the fact that Malta is located in the Sicily Channel, where the dynamics exhibit significant gradients in the direction perpendicular to the channel axis, which are differently represented by different models. The worst and best cases do not necessarily come from the same model for all islands, that is, one model can predict the lowest hazard for Sicily and another one for Sardinia, and each of these projections is represented in the plot for the corresponding island.
Risk- Best-case scenario
Table 16: Risk results for best-case scenario for impact chain Extreme weather events
Reference period
Mid century End century
Risk Hist. RCP 4.5 RCP 8.5 RCP 4.5 RCP 8.5
Corsica 0.19 0.19 0.19 0.20 0.21
Cyprus 0.23 0.23 0.23 0.23 0.22
Malta 0.26 0.26 0.26 0.26 0.26
Sardinia 0.30 0.32 0.32 0.28 0.31
Sicily 0.20 0.20 0.20 0.20 0.20
Source: Soclimpact project deliverable 4.5

60
Figure 51: Risk results for best-case scenario for impact chain Extreme weather events under RCP 4.5 Source: Soclimpact project deliverable 4.5
Figure 52: Risk results for best-case scenario for impact chain Extreme weather events under RCP 8.5 Source: Soclimpact project deliverable 4.5
0,00
0,05
0,10
0,15
0,20
0,25
0,30
0,35
Historic mid century end century
RCP 4.5
Corsica Cyprus Malta Sardinia Sicily
0,00
0,05
0,10
0,15
0,20
0,25
0,30
0,35
Historic mid century end century
RCP 8.5
Corsica Cyprus Malta Sardinia Sicily

61
Risk- Worst-case scenario
Table 17: Risk results for worst-case scenario for impact chain Extreme weather events
Reference period
Mid century End century
Risk Hist. RCP 4.5 RCP 8.5 RCP 4.5 RCP 8.5
Corsica 0.25 0.25 0.26 0.28 0.26
Cyprus 0.23 0.23 0.23 0.23 0.22
Malta 0.42 0.45 0.56 0.45 0.36
Sardinia 0.33 0.33 0.34 0.33 0.33
Sicily 0.30 0.34 0.33 0.33 0.26 Source: Soclimpact project deliverable 4.5
Figure 53: Risk results for worst-case scenario for impact chain Extreme weather events under RCP 4.5 Source: Soclimpact project deliverable 4.5
0,00
0,05
0,10
0,15
0,20
0,25
0,30
0,35
0,40
0,45
0,50
begin century mid century end century
RCP 4.5
Corsica Cyprus Malta Sardinia Sicily

62
Figure 54: Risk results for worst-case scenario for impact chain Extreme weather events under RCP 8. Source: Soclimpact project deliverable 4.5
Bigger islands were separated in areas since conditions can vary greatly in different parts of the island. Table 18: Risk results for impact chain Extreme weather events for the Mediterranean islands with large islands
analysed on a local level using the worst-case scenario.
Worst case Historic RCP 4.5 RCP 8.5
mid century end century mid century end century
Malta 0.37 0.45 0.45 0.56 0.36
Sicily North 0.34 0.39 0.39 0.36 0.30
Sicily East 0.17 0.20 0.20 0.20 0.20
Sicily South 0.41 0.42 0.40 0.42 0.30
Corsica West 0.37 0.32 0.37 0.34 0.34
Corsica East 0.18 0.18 0.18 0.18 0.19
Sardinia West 0.40 0.46 0.47 0.47 0.44
Sardinia East 0.39 0.20 0.20 0.20 0.18
Cyprus 0.23 0.23 0.23 0.23 0.22
Source: Soclimpact project deliverable 4.5
For all islands and all RCPs, it can be concluded that there is no significant change in risk, even in the worst-case scenario, between the reference period, middle and end of the century. Malta, Sicily south and Sardinia west are found to be the most vulnerable with risk exceeding 0.45 due to a higher hazard risk. Malta also has the highest exposure of all islands. Malta has an increased risk mid-century in the worst case scenario, due to an increase in hazard.
0,00
0,10
0,20
0,30
0,40
0,50
0,60
begin century mid century end century
RCP 8.5
Corsica Cyprus Malta Sardinia Sicily
0.00 – 0.20
Very low
0.20 – 0.40
Low
0.40 – 0.60
Medium
0.60 – 0.80
High
0.80 – 1.00
Very high

63
Atlantic islands
Table 19: Risk results for impact chain Extreme weather events for the Atlantic Islands
Hadley centre ACCESS
Risk Historic RCP 8.5 Mid century
RCP 8.5 End-century
Historic RCP 8.5 Mid century
RCP 8.5 End-century
Azores 0.83 0.76 0.79 0.15 0.41 0.67
Madeira 0.20 0 0.01 0 0 0
Source: Soclimpact project deliverable 4.5
For the Atlantic islands, 2 models are available (Hadley Centre and ACCESS) for data on return
time. The results of these models are highly variable. For the Azores even the change of the risk
is different, where the Hadley riley model shows a decrease in risk while ACCESS shows a
significant increase in risk. Therefore, no conclusion can be made. For Madeira, the risk in the
future will be nihil. Not considering probability, it could be concluded that climate change has no
or a positive effect on the occurrence on extreme events in Madeira. However, since this data is
not accurate, more work needs to be done.
Impact chain: sea surface temperature
Hazard
Model projections are in good agreement with previous lower resolution ensemble estimates but
offering greater detail along island shorelines. Uncertainty to be rigorously estimated from
ensemble STD when new simulations of comparable resolution become available, but overall
tendency regarded as robust.
Exposure and vulnerability indicators
Table 20: Expose and vulnerability indicators, the data for each island and the normalized values. Component Exposure Vulnerability
Component
weight 0.4 0.3
Sub-component Factor of sensitivity Factors of adaptive capacity
Sub-component
weight 0.75 0.25
Indicator Average Size of
producers
Score for
level of
exposure
Sensitivity
of species
(stress)
Score of
factor of
sensitivity
Monitoring
early
warning
systems
Capacity to
change
species
Score of
factor of
adaptive
capacity
Proxy indicator Yearly production
/Number of operators
Average of
normalised
indicators
Temperature
sensitivity of
species
(expert
Indicator
Monitoring
early
warning
systems
Capacity to
change
species
Average
of
indicator

64
guess)
Data Normalised Normalised Normalised Normalised
Corsica 328.6 0.12 0.12 0.7 0.7 0 1 0.5
Cyprus 811.4 0.29 0.29 0.6 0.6 0 1 0.5
Madeira 125.3 0.05 0.05 0.6 0.6 0 1 0.5
Malta 2,755.9 1.00 1.00 0.6 0.6 0 1 0.5
Sardinia 537.2 0.19 0.19 0.9 0.9 0 1 0.5
Sicily 399.6 0.14 0.14 0.8 0.8 0 1 0.5
Source: Soclimpact project deliverable 4.5
Risk
The values in this analysis is not an estimate of the risk but rather a ranking between islands since a lot of the data was normalised based on a min-max or fraction of the maximum of the islands. A proper risk assessment would need additional data from farmers and a detailed model of farming results as a function of temperature. Malta has a much higher risk than the other islands due to the high exposure, Malta’s farm produce on average 3.5 to 22 times more than the farms on other islands.
Table 21: Risk results for impact chain Sea Surface temperature
Historic Mid century End century
Risk Hist. RCP 4.5 RCP 8.5 RCP 4.5 RCP 8.5
Corsica 0.30 0.34 0.41 0.38 0.42
Cyprus 0.40 0.48 0.48 0.50 0.59
Malta 0.68 0.73 0.74 0.75 0.80
Madeira 0.19 0.26 0.23 0.24 0.35
Sardinia 0.37 0.42 0.43 0.44 0.49
Sicily 0.38 0.43 0.43 0.45 0.48
Source: Soclimpact project deliverable 4.5

65
Figure 55: Risk results for impact chain Sea Surface temperature under RCP 4.5 Source: Soclimpact project deliverable 4.5
Figure 56: Risk results for impact chain Sea Surface temperature under RCP 8.5 Source: Soclimpact project deliverable 4.5
0,00
0,10
0,20
0,30
0,40
0,50
0,60
0,70
0,80
historic mid century end century
RCP 4.5
Corsica Cyprus Malta Madeira Sardinia Sicily
0,00
0,10
0,20
0,30
0,40
0,50
0,60
0,70
0,80
0,90
historic mid century end century
RCP 8.5
Corsica Cyprus Malta Madeira Sardinia Sicily

66
4.3 Energy
There are more than 2200 inhabited islands in the EU. Lately, they have come into the focus of
the EU, which addresses energy questions as part of the 'Clean energy for all Europeans'
package. The Clean energy for EU islands initiative provides a long-term framework to help
islands generate their own sustainable, low-cost energy. This is particularly interesting, because
many islands have vast amounts of renewable energy sources but rely on fossil fuel imports yet.
These are relevant challenges regarding the energy transition in the EU, whose aim of net zero
greenhouse gas emissions in 2050 should determine the future energy plans of the islands.
Islands could provide showcases for successful 100% renewable energy supply.
The National Hydropower Association (NHA) defines marine energy as electricity generation
from marine kinetic energy, such as waves, tidal and ocean currents. Pisacane et al. (2018) add
other marine energy sources like ocean thermal energy conversion (exploiting temperature
differences between deep and surface ocean waters) and salinity gradient energy (harnessing the
energy potential of differences in salt concentration in ocean and river waters). All these
technologies are still in a development phase, and even if they reach the commercial phase in the
future, it is not likely that they will generate a large share of the power. Therefore, the analysis in
SOCLIMPACT focuses on the main renewable energy sources (RES), wind energy and solar
photovoltaic (PV) energy, which are presently, and very likely in future, the backbone of the
deployment of renewable energies, due to their technological maturity and low cost.
Nevertheless, we take into account not only onshore but also offshore wind energy, as a
specifically marine energy source which has distinct advantages like much higher productivity
and less time variability than onshore wind energy, and does not require land space which is
limited and costly in the islands. There are relevant obstacles for its deployment, like the deep
bathymetry surrounding most of the islands, and the lower wind speeds over the Mediterranean
in comparison to areas like the North Sea where offshore wind energy is being deployed rapidly.
Additionally, we consider also offshore PV energy. Despite some disadvantages that have to be
overcome (corrosion problems due to salty water or the impact of waves), this application is
receiving growing interest, as it offers an option for renewable energy development in countries
and islands with limited space for the installation of solar panels, and can show increased
performance due to the cooling effect of water and wind on PV cells.
Most RES (renewable energy sources) depend on the climate, and therefore climate change can
have an impact of the resource amount. Additionally, wind and solar PV energy are not
dispatchable, and its variability represents a challenge for its integration in the power system.
This is a challenge that can be addressed through storage or backup plants (which can be itself
renewable energy plants), through demand management, but also taking advantage of
complementarity of PV and wind energy and its very different variability characteristics. This
approach is gaining attention from stakeholders in the islands, as demonstrated by the report by
Monitor Deloitte and Endesa (2020), in which one of the key recommendations for achieving an
accelerated zero carbon target in Balearic and Canary Islands by 2040 is the combination of solar
PV and wind energy, with clearly higher shares of PV than of wind energy. Such a mix would
reduce strongly the need for storage, due to the stability of solar PV production.

67
There are also challenges for the demand and transmission components of the energy systems of
the islands due to climate change: changes in temperature leading to changing energy demand,
changes in precipitation and evaporation creating risks for desalination.
For the energy sector, three theoretical impact chains (IC) have been proposed in the
SOCLIMPACT project:
i) risk of changes in power generation due to long term climate change and variability, ii) risk of changes in energy demand due to changes in precipitation and temperatures, iii) risk of damages to transmission grids due to extreme events.
Only the second IC, i.e., the one related to changes in energy demand was selected to be
operationalized, mainly due to data availability constraints. The quality of IC operationalization
depends strongly on data availability over long periods. Data for cooling energy demand are still
scarce and difficult to obtain, despite the requirements of the European Commission for
information regarding the national energy efficiency targets. The availability and quality of
cooling demand data should improve in the future due to the need for tracking the advances
towards energy efficiency targets. Desalination demand data should also improve strongly,
including data about the energy efficiency of the desalination processes used.
This demand-side IC has been deployed into two individual ICs, namely, the increased energy
demand due to increased cooling demand and the increased energy demand due to increased
desalination needs. Both risks depend on the temperature increase, which is a very certain effect
of climate change. The risk assessment was carried through and expert assisted process.
The diagrams of the two operationalized impact chains are presented below
Figure 57: Conceptualization framework for the operationalization of the energy impact chain: Risk of increased
energy demand due to increased cooling demand Source: Soclimpact project Deliverable 4.5-Comprenhensive approach for policy makers

68
Figure 58: Conceptualization framework for the operationalization of the energy impact chain: Risk of increased
energy demand due to increased desalination demand Source: Soclimpact project Deliverable 4.5-Comprenhensive approach for policy makers
Hazard scores for energy demand (Cooling Degree Days -CDD, Standardized Precipitation-
Evapotranspiration Index - SPEI), and supply indicators (wind energy, solar PV and
combined productivity and droughts) were analysed. The aim is to jointly consider future
increases in energy demand due to temperature and precipitation changes and the potential for
covering it with renewable energy sources in the future.
Regarding the normalization of these hazards, we use an approach based on their future change.
The available literature indicates that the future projected changes of renewable energy
productivity frequently do not exceed a level of 10% relative to present values. Changes of about
10% would not modify clearly a normalized score like the one use for present climate (leading to
a very limited variation range of the score), but they represent a significant impact on the
productivity and profitability of the energy plants. Therefore, the future change of renewable
energy productivity is compared to a 10% threshold, both on the negative (normalized values
above 0.5) and the positive side (normalized values below 0.5). The normalization also includes a
minor contribution of a comparison of the changes relative to other islands.
CDD and SPEI scores are normalized with respect to a maximum projected value previously
identified. Renewable energy productivity indicators in present climate are normalized using
global thresholds (5th and 95th percentiles of the respective technologies). The same
normalization method is used for projected changes of renewable energy droughts. Thus,
energy drought indicators are normalized comparing them to a maximum upper limit, taken
among all the islands and renewable energy technologies.

69
A fundamental aspect of the method is that we apply an objective procedure for obtaining the
weights of the risk components (hazard, exposure and vulnerability) based on time-series
correlations of observed data for energy demand and for the different indicators involved in the
impact chains. This allows to detect which factors have a larger impact on the energy demand..
This method, based on correlations between observed energy demand and observed data for the
indicators, points out that several exposure and vulnerability factors have a stronger weight than
the climate hazards on short time-scales (interannual variations for periods of about 10 years).
This is consistent with the drivers considered in the national forecasts, for periods of 10 years,
performed as part of the EU Energy Efficiency Directive. A consequence of this is the relatively
low weights assigned to the climate hazards in the operationalization.
For the operationalization of the full impact chains, the exposure and vulnerability indicators
were also weighted utilizing different criteria. The mathematical procedure developed proposes
the definition of weights per group of variables (hazard, vulnerability and exposure) that allow
identifying the relationship between each of the components and the dependent variable (in this
case, energy demand due to desalination or energy demand due to cooling). The detailed weight
calculation for the risk components (hazards, exposure and vulnerability) can be found in the
Soclimpact Project deliverables 4.5.
It was not possible to conduct a full operationalization of the IC for the case of Madeira. The
criteria for the exclusion of the island was: (a) availability of data for the computation of the
exposure and vulnerability indicators of the demand-side ICs, (b) modeling constraints of the
hazard component. In the next tables we present the normalized hazard scores for the island. In
this regard, the assessment was carried out on the normalized hazard indicators
Table 22: Energy demand and supply hazard scores for Madeira
Histori-cal ref.(1986-2005)
Demand Supply: Productivity Land Sea
Droughts
CDD 0.01 (2.6) 0.06 (8.5)
Wind 0.20 0.00 0.67
SPEI 0.00 Solar PV 0.54 0.52 0.20
Combined 0.47
RCP2.6 (2046-2065)
Demand Supply: Productivity change
Droughts change
CDD 0.04 Wind 0.7 0.7 0.8
SPEI 0.32 Solar PV 0.6 0.6 0.9
Combined 1.0

70
RCP8.5 (2046-2065)
Demand Supply: Productivity change
Droughts change
CDD 0.18 Wind 0.6 0.5 0.5
SPEI 0.60 Solar PV 0.4 0.6 0.1
Combined 0.6
RCP2.6 (2081-2100)
Demand Supply: Productivity change
Droughts change
CDD 0.04 Wind 0.8 0.7 0.8
SPEI 0.28 Solar PV 0.7 0.7 0.9
Combined 1.0
RCP8.5 (2081-2100)
Demand Supply: Productivity change
Droughts change
CDD 0.35 Wind 0.6 0.5 0.5
SPEI 0.96 Solar PV 0.3 0.6 0.0
Combined 0.5
Categorization:
0.00 – 0.20 Very low
0.20 – 0.40 Low
0.40 – 0.60 Medium
0.60 – 0.80 High
0.80 – 1.00 Very high
Source: Soclimpact project Deliverable 4.5-Comprenhensive approach for policy makers
For Madeira, CDD scores are presently very low, and should remain in this category except
under RCP8.5 scenario by the end of the century. This implies only limited increases in cooling
energy demand at least until mid-century. The projected evolution of SPEI scores is clearly
worse. Under RCP2.6, this score increases to 0.32 by mid-century, stabilising thereafter. Under
the high-emissions scenario, SPEI increase is already strong by mid-century, reaching almost the
maximum score by the end of the century. This could imply a substantial pressure on water
resources. Presently, there is only a desalination plant in the smallest island, Porto Santo. The
observed time-series from this desalination plant show nevertheless the positive impact of
efficiency measures, as the specific consumption has decreased from 5.5 kWh/m3 in 2006 to 4
kWh/m3, and the yearly maximum desalination consumption has also decreased from the highest
value attained in August 2007 (807 MWh) to a clearly lower value of 626 MWh in August 2017
(this is the highest value in the last decade).
Regarding the potential of renewable energies, wind energy resources are really high. Wind
energy is already a relevant energy source in Madeira, with a share of 12.6% in 2018. Wind
variability is lower than for the other islands, except Canary Islands. PV energy had a share of
3.5% in 2018 (Electricidade da Madeira, 2019). Present PV productivity scores from the climate

71
models show only medium scores, but these values should be taken with caution in this case, as
they are average values over the island. The spatial resolution of the available models is limited
(50 km) and is not able to capture in detail the distribution of surface solar radiation, which
shows strong contrasts in Madeira due to the combined effect of the frequent NE trade winds
and the mountain range that is oriented perpendicularly to it.
Future projections of renewable energy indicators show a marked contrast between RCP2.6 and
RCP8.5. The productivity of both RES would decrease somewhat under RCP2.6, while it would
remain roughly constant under RCP8.5. It should be taken into account that RCP2.6 data are
more uncertain, as only one climate model simulation was available.
There is a comparatively strong improvement in PV stability under RCP8.5 scenario, coincident
with the large increase in SPEI score. The droughts scores for both RES would be worse under
RCP2.6, but there is more uncertainty in the results for this scenario as explained before.
The share of renewables is already fairly high in Madeira (about 30%), which is a remarkable
value for an island without interconnections to mainland. In the ongoing process of increasing
the share of RES, the issue of storage is receiving much attention (Miguel et al., 2017), and
pumped storage is already part of the system in Madeira. The large and more stable offshore
wind resources could play an important role in an electrical system with higher RES shares. In
this respect, the special characteristics of the wind field, heavily influenced by the trade winds in
the summer months, could be taken advantage of. The configuration of the mountains,
perpendicular to the trade winds, generates strong and rather persistent winds near to the
western and eastern extremes of the island as the flow is forced to go around the island. This
could be a source of large wind energy resources, complementary to hydroelectric power that
diminishes strongly in summer (Electricidade da Madeira, 2019). Solar PV participation should
also be increased strongly due to its overall stability characteristics and also due to its summer
maximum. Measures along these lines could limit the need for storage.
* Islands’ comparison and challenges
- The contrast between the mitigation scenario (RCP2.6) and the high-emissions scenario is
drastic. Not only are the hazard scores much lower for RCP2.6, but they even tend to decrease
slightly during the second half of the century, while for RCP8.5 the hazard scores tend to rise in
a sustained way.
- The Atlantic islands show a more contained increase of CDD than the Mediterranean islands,
while the SPEI decrease is similar in both basins. One reason for this different behaviour can be
the higher sea surface temperatures of the Mediterranean Sea in summer. Another factor may be
the different wind regimes in summer, as trade winds are strong and persistent over Canary
Islands and Madeira, contributing to moderate temperatures, while over the Mediterranean Sea
winds are generally low in summer.
- A clear demand management option for reducing cooling demand is the improvement of the
energy efficiency of buildings. The energy efficiency directive of the EU sets binding targets for
all European countries, but the data about the efficiency classes of buildings are rather limited
and difficult to access. The scarce data available indicate that there is much room for

72
improvement in this respect. A consequent implementation of energy efficiency measures in
buildings could reduce clearly the effect of increasing temperatures on energy demand.
- Digitalisation is key in EU strategies. In this respect, demand side management options for
adaptation to generation peaks and troughs should be developed as much as possible through
digitalisation, prioritising automatic instead of manual adaptation.
- The frame for energy supply in the islands are the binding targets established in the 2030
climate and energy EU framework and the long term horizon of a decarbonized energy system
by 2050.
- The future change of wind energy and PV productivity should be rather small in general:
around 5% or less with respect to the reference period in many cases, with maximum changes of
about 10% for some islands at the end of the century under RCP8.5 scenario (particularly for
wind energy productivity over land). A 10% productivity change could have a significant impact
on a planned or existing plant if it occurs over the lifetime of the power plant, but in this case
such a change would extend over many decades, which will facilitate adaptation and efficiency
measures.
- In general, projections show a decreasing tendency of wind energy productivity over the
Mediterranean region, with a more important decrease for the RCP8.5 scenario. The main
exception is Crete, which shows a consistent increasing tendency.
- Projected PV productivity changes are generally smaller than wind energy changes. In most
cases PV productivity remains constant or decreases slightly. The main exception is Fehmarn,
which shows a clear decreasing tendency in PV productivity under RCP8.5 scenario, reaching a
10% decrease by end of the century.
- There is a specific uncertainty source in the photovoltaic projections. Most regional climate
model simulations, including the ones used here, do not include a projected evolution of aerosols
in future climate runs. The missed effect of the likely evolution of aerosols would likely increase
to some degree the future surface solar radiation and PV productivity over most of the islands
(Gutiérrez et al., 2020).
- Renewable energy productivity droughts are a measure of the variability of the resource. Wind
droughts are much more frequent (around 50% of the days for most islands) than PV droughts
(10% or less of the days). This agrees with results from the study of Raynaud et al. (2018), and
highlights the stable character of the solar productivity in comparison to wind productivity over
time.
- Wind energy droughts are more frequent in the Mediterranean islands than in the Atlantic
islands or Fehmarn. The best quality resources in terms of stability are found for Canary Islands,
which show the minimum values of both wind energy and PV droughts among all islands.
Fehmarn shows by far the worse PV drought score, corresponding a drought frequency of 23%
of the days.
- Projected changes in the frequency of droughts are small, with future variations that generally
do not attain a magnitude greater than 5% of the days. This indicates that the time-variability
characteristics of wind and PV energy are a robust feature, which is relevant for planning the
amount of storage or backup needed.

73
- The combination of PV and wind energy has generally a very positive impact on the frequency
of droughts as a result of the complementarity of both sources. This impact also exists but is less
clear for islands with substantial summer wind energy resources (Canary Islands, Madeira and
Crete).
- As part of the pathway towards very high or 100% RES shares, offshore wind energy should
play a very relevant role. Solutions to overcome the obstacle posed by the deep bathymetry
surrounding most of the islands are beginning to near commercial deployment, so that floating
offshore wind plants are already planned near Gran Canaria and Sicily.
- Offshore PV could be an interesting option for some islands, particularly when land surface
limitations are large. There is growing interest in this option, as shown by the test plants being
installed and the references made to this technology in the Roadmap for the Offshore
Renewable Energy Strategy of the European Commission or in the report of Monitor Deloitte
and Endesa (2020) about the accelerated decarbonization of Canary and Balearic Islands.
- The combination of different types of offshore renewable energy sources in the same platform
is also attracting interest, as the different sources can exhibit complementarity in time and the
combined output can thus be more stable and reliable. The different RES can also share part of
the installations, like the connection to land, reducing their cost (Pisacane et al., 2018;
MarineEnergy, 2019a). The European Union is trying to promote such combinations, through
projects like MUSICA (Multiple Use of Space for Island Clean Autonomy) which will design and
test a floating offshore platform integrating wind, PV and wave energy for use on islands
(MarineEnergy, 2019b), and plans to develop roadmaps for its deployment in three case study
islands, among them Malta and the Canaries (MaREI, 2020).
- New financing possibilities linked to the recently approved EU COVID-19 recovery fund, and
over a longer term associated to the European Green Deal, should facilitate the deployment of
renewables in the islands, as the energy transition is a key target.
- Interconnections to mainland are very important for supply safety. Excessive dependency on
interconnections to mainland should be nevertheless avoided, due to risk of blackouts, as the
failure of a single element (one transmission line) can knock out instantaneously a large
proportion of the power of an island and even cause an island-wide blackout, as has occurred
several times in Malta in the last years.
Read more: Hazard indicator computation and normalization
Cooling degree days (CDD) are used to give an indication of the effect of outside air
temperature on building energy consumption during a specified period of time. The Cooling
Degree Days (CDD) index gives the number of degrees and number of days that the outside
air temperature at a specific location is higher than a specified base temperature. For the
indicator weight calculation, the observed values of CDD (EUROSTAT) have been used, and
compare to the hazard of the island. With respect to the normalization of the indicator, we have
used a fixed lower threshold and a relative maximum as upper threshold. The minimum CDD
value has been taken as 0, while the maximum CDD value has been taken as the maximum over

74
all islands, emissions scenarios and time periods (CDD=1183.49 ºC· days/year, corresponding to
Cyprus for RCP8.5 scenario, end of century period).
Standardised Precipitation-Evapotranspiration Index (SPEI) is a drought index that takes
into account not only the effect of precipitation variations, but also the effect of temperature
variations on evapotranspiration. The calculation is based on the monthly difference between
precipitation and potential evapotranspiration, which represents the monthly water surplus or
deficit. The indicator weight calculation was done using data from ECA&D (European Climate
Assessment & Dataset). The normalization of the indicator has taken into account the fact that
by definition, present conditions correspond to reference conditions (SPEI=0), and that all
future changes are towards negative SPEI values, that is towards drier conditions. Therefore, the
best score value (0) has been assigned to SPEI=0, while the worst score value (1) has been
assigned to the largest negative value found for all islands, emissions scenarios and time periods
(SPEI=-2.5, obtained for several islands under RCP8.5 emissions scenario by the end of
century).
The indicator Wind energy productivity (kWh/kW) is defined as the energy produced in a
period of time divided by the power installed, which is considered as unitary. The indicator is
calculated separately for land and sea. Offshore wind energy is the most developed ocean energy,
and it is likely to be an important future energy source for the analysed islands. Its characteristics
are typically very different to onshore wind energy, due to the large differences in surface
friction. The energy productivity values are averaged respectively over the island land points and
over the sea points in a domain that reaches a maximum distance of one degree latitude and
longitude respectively to the maximum and minimum longitude/latitude land points of the
islands.
The normalization is performed using absolute thresholds, that represent high or low global
values of productivity. These thresholds have been obtained from a global renewable power
report (IRENA, 2019). The maximum annual productivity would be 8760 kWh/kW,
corresponding to a 100% capacity factor. The obtained CF thresholds for onshore wind energy
are 20% (corresponding to a normalized score of 1) and 45% (normalized score of 0), while for
offshore energy they are 30% and 50%.
Photovoltaic productivity (kWh/kW) is defined as the energy produced in a period of time
divided by the power capacity installed. In order to obtain photovoltaic productivity, daily
surface solar radiation (SSR) and ambient temperature from the climate simulations are used as
input variables for a parametric PV model. The normalization is performed using absolute
thresholds, that represent high or low global values of productivity, taken from the same report
as for wind energy. In this case, the maximum threshold is adapted taking into account that the
calculations performed here assume fixed panels, while IRENA global report does not
differentiate between fixed and sun-tracking panels. Therefore, we estimate an upper CF
threshold (normalized score of 0) of 20% for fixed panels, from the 25% value deduced from
IRENA global report.

75
Renewable energy productivity droughts indicators are a way of quantifying the time-
variability of renewable energies that depend on meteorological conditions. Low values of energy
droughts correspond to a stable output, while high values correspond to a highly variable output.
The combined renewable energy droughts represent the complementarity between wind and PV
energy. A high complementarity of both sources reduces the need for energy storage or backup
sources.
Two different thresholds are calculated to determine moderate (50% of mean daily productivity)
and severe (20% of mean daily productivity) energy productivity droughts, respectively. For the
normalization of these energy drought indicators, we have used a combination of an absolute
threshold (a value of 0% of drought days) corresponding to a score of 0 and a relative maximum
upper limit, taken among all the islands and renewable energy technologies (55% of days with
moderate droughts, obtained for wind energy in Corsica) corresponding to a score of 1. The
same normalization limits are applied for wind, PV and combined productivity droughts.
4.4 Maritime Transport
For the Maritime Transport sector, three main climate change risks have been identified. These are: i) risk of damages to ports’ infrastructures and equipment due to floods and waves, ii) risk of damages to ships on route (open water and near coast) due to extreme weather events and iii) risk of isolation due to transport disruption. The operationalization was applied to the third one (risk of isolation due to transport disruption) which in terms of hazards and impacts can be considered as a combination of the other two. The selection of islands to be included in the analysis was based on the importance and dependency on the Maritime Transport sector and on data availability. Although Madeira is highly dependent of this sector, the lack of reliable and consistent data limited the analysis, especially in regard:
- Value of transported goods expressed in freight (VGTStot) - Number of renovated infrastructure (NAgePo). - Percentage of renewables (PEnRR), - Early warning systems (NOcSta) and harbour alternatives (NApt).
Nevertheless, this information is also useful at the moment of evaluating and ranking adaptation measures for the islands.

76
5 Socio economic impacts of climate change
5.1 Market and non-market effects of CC
Tourism
In order to analyse the reactions of tourists to the impacts of climate change and the preferences
for adaptation policies, several hypothetical situations were posed to 252 tourists visiting Madeira
whereby possible CC impacts were outlined for the island (i.e., beach erosion, infectious diseases,
forest fires, marine biodiversity loss, heat waves, etc.).
Figure 59: Socio-economic characteristics and travel description: Tourists visiting Madeira Source: Deliverable Report D5.5 Market and non-market analysis
Firstly, tourists had to indicate whether they would keep their plans to stay at the island or find
an alternate destination if the impact had occurred, which allows predictions of the effects on
tourism arrivals to be made for each island. Secondly, tourists were asked to choose between
various policy measures funded through an additional payment per day of stay – the tourists’
choices being an expression of their preferences for attributes/policies. To estimate the results,
the conditional logit model was run by using the Stata software.
In general, data confirms that tourists are highly averse to risks of infectious disease (84.90% of
tourists would change destination). Moreover, they are not willing to visit islands where marine
wildlife has disappeared to a large extent (80.2%) or where temperature becomes uncomfortably
hot (69.8%). Consequently, policies related to marine habitat restoration (10.3€/day), water
supply reinforcement (8.2€/day), and the prevention of infectious diseases (5.4€/day) are the
most valued, on average, by tourists visiting this island.
Although climate change impacts are outside the control of tourism practitioners and policy-
makers, they can nevertheless utilise this knowledge to improve the predictability of the effect
that certain adaptation policies and risk management strategies, and develop their plans
accordingly.

77
Figure 60: Choice experiments results for the tourism sector: Tourists visiting Madeira Source: Deliverable Report D5.5 Market and non-market analysis
The infographic can be found in high resolution in the Soclimpact Project official
website HERE.
Aquaculture
The effects of increased sea surface temperatures on aquaculture production were calculated
using a lethal temperature threshold by specie, and considering the production share of the
region. Four different future scenarios shown by IPCC estimations (RCP2.6 and RCP8.5 near
and distant) were analysed, which correspond to four water temperature increases in the region
(mean values), with respect to the reference period.
To do this, we assume that the total production of the region is Seabream (SB). A model of
production function is calculated using the monthly biomass production which depends on the
monthly water temperature. Results are presented on yearly base (mean values). In order to
facilitate the interpretation of the results, we present the value of production of the last year
available, for which we calculate the new values under the different CC scenarios.
In both scenarios, the production function will not be negatively affected by the increased sea
temperature, as the projected values are under the lethal threshold of the fish specie (24ºC).
There is only an apparent contradiction with the analysis provided in the previous section (risk
assessment). While the risk analysis considered many other aspects of vulnerability and exposure,
the analysis here only includes temperature and production, assuming that the rest of variables
will not intervene.

78
Figure 61: Estimations of changes in aquaculture production (tons), due to increased sea surface temperature Source: Deliverable Report D5.6
The infographic can be found in high resolution in the Soclimpact Project official
website HERE.
Energy
Climate change may impose welfare reductions to the European islands’ societies by affecting
thermal comfort. Cooling Degree Days (CDD) are a measure of how much (in degrees), and for
how long (in days), outdoor air temperature is higher than 18°C or 65° Farenheit. The CDD is
used as a measure of the energy needed to cool buildings. The increase in CDD and the energy
demand (GWh/year) for cooling are estimated for the islands, under different scenarios of global
climate change.
Under the high emissions scenario, it is expected that the CDD increase to almost 411 CDD7.
This value could be, for example, a combination of 100 days with temperatures of 20°C
(200CDD) and other 70 days with temperatures of 21°C (211CDD). Under this situation, the
increase in cooling energy demand is expected to be about 600%.
The infographics presented below can be found in high resolution in the Soclimpact
Project official website HERE.
7 The indicator is computed by multiplying the number of days exceeding the threshold by the difference in
temperatures. For example the CDD for 100 days at 20 °C is computed as 100*(20-18)= 200CDD

79
Figure 62: Estimations of increased energy demand for cooling in Madeira under different scenarios of climate
change until 2100 Source: Deliverable Report D5.6
The Standardized Precipitation Evapotranspiration Index (SPEI) is analysed as a representative
indicator for increases in water demand for islands’ residents, tourists and agriculture, while it
also provides an indication on the available water stored in dams or underground resources. To
estimate the increase of energy demand due to the increase in water demand, it was assumed that
most of the islands will have to produce desalinated seawater (or groundwater) to meet further
increases of demand. Thus, the estimation of the increase in energy demand (GWh/year) to
produce more drinking water has been done based on the energy consumption required to
desalinate seawater.
Under the low emissions scenario (RCP2.6), there are not significant changes in the SPEI
indicator, that will remain in its ¨normal¨ level, as it is nowadays. Under RCP8.5 the scenario
alerts on a severe aridity leading to an increase of 159% of the energy demand.

80
Figure 63: Estimations of increased energy demand for desalination in Madeira under different scenarios of
climate change until 2100 Source: Deliverable Report D5.6
Maritime Transport
For maritime transport, it has been estimated the impact of Sea Level Rise on ports' operability
costs of the island. The costs have been calculated with reference to1meter; this is, the
investment needed to increase the infrastructures' height by 1 meter. There is not necessarily a
strict correspondence between the SLR and the required elevation of port infrastructures, which
also depend on the coastal hydrodynamic and the shape of dikes of each port. By experts’
recommendation, we have assumed that 1 m increase in port height is required to cope with the
SLR under RCP 8.5 scenario of emissions. Extrapolation for other RCP scenarios is then
conducted based on proportionality.
The starting point was the identification of the principal ports in each island (economic
relevance). Second, the analysis of the different port areas (exterior, ramps, oil, etc.), and their
uses. Third, the elevation costs were estimated per each area and port separately (considering 1
meter elevation). Thus, the costs of 1-meter elevation presented are the sum of all areas and
ports analysed, and including the rest of the ports of the island (if applicable) based on
proportionality. Estimations consider that all ports areas of the entire area should be elevated at
the same time. In other words, the economic values can be interpreted as the depreciation
(amortization) costs of the investment needed to increase all porsts’ infrastructures' in the island
for 125 years time horizon. No discount rate has been applied.
As expected, the rising of sea levels will affect the sector, as new investment will be needed to
keep ports’ operability. Under the high emissions scenario, it is expected that these costs could
increase until 0.98 million euros per year until the end of the century.
The infographic presented below can be found in high resolution in the Soclimpact
Project official website HERE.

81
Figure 64: Increased costs for maintaining ports’ operability in Madeira under different scenarios of SLR caused by climate change until 2100
Source: Deliverable Report D5.6
5.2 Macroeconomic projections
The aim of our study is to assess the socioeconomic impacts of biophysical changes for the
island of Madeira. For this purpose we have used the GEM-E3-ISL model; a single-region,
multi-sectoral general equilibrium model based on the principles of neo-classical theory, and
GINFORS; a macro-econometric model based on the principles of post-Keynesian theory.
Both models include 14 sectors of economic activity, with an emphasis on services and
specifically on those composing the tourism industry. The GEM-E3-ISL model also include:
endogenous representation of labor market and trade flows etc.
Changes in the mean temperature, sea level and precipitation rates are expected to affect energy
consumption, tourism flows and infrastructure developments. These impact-chains have been
examined and quantified under two emission pathways: RCP2.6 which is compatible with a
temperature increase well below 2C by the end of the century and RCP8.5 which is a high-
emission scenario. The impact on these three (3) factors has been quantified in D5.6 and is used
as input in the economic models, which then assess the effects on GDP, consumption,
investments, employment etc.
In total 15 scenarios have been quantified for Madeira. The scenarios can be classified in the
following categories:
MEAN SEA LEVEL RISE SLR

82
1. Tourism scenarios: these scenarios examine the reduction in tourism revenues due to
changes in human comfort as captured by the hum-index, the degradation of marine
environment, increased risk of forest fires and beach reduction
2. Energy scenarios: these scenarios examine the impacts of increased electricity
consumption for cooling purposes and for water desalination
3. Infrastructure scenarios: these scenarios examine the impacts of port infrastructure
damages
4. Aggregate scenarios: these scenarios examine the total impact of the previous-described
changes in the economy.
In this scenario we examine the impacts of a simultaneous change in electricity consumption,
tourism revenues and infrastructure damages. The scenario specifications for the two climatic
variants are presented below:
Table 23: Aggregate scenario –results
Tourism revenues (% change from reference levels)
Electricity consumption (% change from reference
levels)
Infrastructure damages
(% of GDP)
RCP2.6 (2045-2060) -14.35 1.7 -0.20
RCP2.6 (2080-2100) -17.02 41.1 -0.25
RCP8.5 (2045-2060) -23.25 3.2 -0.54
RCP8.5 (2080-2100) -27.37 8.4 -0.69 Source: GEM-E3-ISL
The theoretical and structural differences of the two models mean that this study produces is a
reasonable range of impacts, given the uncertainty embodied in economic analysis and especially
in the long-term.
In GEM-E3-ISL, the economy is in equilibrium at each point in time. Prices adjust to ensure
that supply equals demand (market clearing), capital is fully used; however, the allows for
equilibrium unemployment. The impacts are driven mainly by the supply side through changes in
relative prices that determines competitiveness change, substitution effects etc. The GEM-E3-
ISL model assesses the impacts on the economy up to 2100.
The macro-econometric type of models, such as GINFORS, do not require that all markets are
in equilibrium; idle capital and involuntary unemployment are some other features of this type of
models where the results are driven mainly by adjustments in the demand side of the economy.
The GINFORS assesses the impacts on the economy up to 2050.
With respect to GDP the estimated change compared to the reference case is between -1.2% and
-3.5% in the RCP2.6 in 2050 and between -2% and -4.0% in the RCP8.5. The cumulative change
over the period 2040-2100 is estimated (by GEM-E3-ISL) to be equal to -3.4% in the RCP2.6
and -3.7% in the RCP8.5.

83
Figure 65: Percentage Change in GDP. Source: GWS, own calculation
With respect to sectorial impacts both models show a significant decrease in the activity of
tourism related sectors and an increase in the activity of the manufacturing sector in both
models. The GINFORS also foresees increased activity in the primary production sectors and
consumer goods while in the GEM-E3-ISL primary production increases only in the RCP2.6
while in the RCP8.5 the magnitude of changes leads to a decrease in their activity levels.

84
Figure 66: Production percentage change from reference. Source: GWS, own calculation
Overall employment falls in the economy and especially in tourism related sectors following the
slowdown in domestic activity. In GEM-E3-ISL increases in employment in non-tourism related
activities are related to labor costs reductions (as wages fall and their competitiveness increases)
and a consequent substitution of capital with labor in other sectors. Employment falls on average
by 0.2% in the RCP2.6 and by 0.6% in the RCP8.5.

85
Figure 67: Employment percentage change from reference.
Source: GWS, own calculation
6 Towards climate resiliency
6.1 Current situation, limits and relevant documents
The Autonomous Region of Madeira is a signatory to three commitments in the scope of
Climate Change mitigation. the Under2 Memorandum of Understanding at a regional level. the
Pact of Islands at an island level and the Covenant of Mayors. at a local level.
The Under2 Memorandum of Understanding (MOU) is a climate agreement for subnational governments. By signing the agreement on October 2017. the Autonomous Region of Madeira commits to achieve a 90% reduction in CO2 emissions until 2050. in comparison to 1990 – the level of emission reduction necessary to limit global warming to under 2°C by the end of this century. Governments who sign or ratify the Under2 MOU become part of the Under2 Coalition. that is a global community of state and regional governments committed to ambitious climate action in line with the Paris Agreement.
The Pact of Islands signed by the Regional Government on April 2011 is an instrument where
the island’s authorities commit to go beyond the objectives set by the EU for 2020. reducing the
CO2 emissions in their respective territories by at least 20%. contributing to the achievement of
the sustainable goals of the European Union for the year 2020.

86
The mitigation actions to achieve the Pact of Islands commitment are stated in the Sustainable
Energy Action Plans (SEAPs). that were developed by AREAM for Madeira and Porto Santo
Islands under the ISLEPACT project. co-financed by DG TREN and Empresa de Electricidade da
Madeira (EEM).
According to these plans. the future policies for energy will be oriented to ensure the security of
energy supply. economic and environmental sustainability of the sector and quality of energy
services. and to contribute to job creation. regional added value and competitiveness of the
regional economy.
At a local level. SEAPs with local mitigation measures were also developed by AREAM for 9
municipalities under the project PACTO DE AUTARCAS. financed by the European Regional
Development Fund (ERDF) and the Municipalities of Machico. Santana. São Vicente. Porto
Moniz. Calheta. Ponta do Sol. Ribeira Brava. Câmara de Lobos and Porto Santo.
For 2030 and 2050. at regional and local levels. Sustainable Energy and Climate Action Plans
(SECAPs) are being developed by AREAM for the Autonomous Region of Madeira and 7
municipalities. under Horizon 2020. in the scope of the C-TRACK 50 project. that will present
mitigation and adaptation measures at regional and local levels. Concerning mitigation. the
objective is. in relation with 1990. to reduce at least 40% of emissions by 2030 and reach carbon
neutrality in 2050. by reducing at least 85% of emissions at local level combined with carbon
sequestration.
The MADEIRA 2020 Regional Smart Specialization Strategy (RIS3) is also an important
instrument that identifies the strategic areas for the Autonomous Region of Madeira. addressing
different interactions with climate change mitigation and adaptation:
- Tourism;
- Sea Resources and Technologies;
- Health and wellness;
- Agri-Food Quality;
- Sustainability. maintenance and infrastructure management;
- Energy. Mobility and Climate Change;
- Information and Communication Technologies.
Specifically concerning Adaptation. in September 2015. Madeira approved the Strategy CLIMA-
Madeira - Climate Change Adaptation Strategy of the Autonomous Region of Madeira. This
strategy aims to:
- Enhance the knowledge about the relationship between the climatic system and the natural and human systems;
- Reduce the vulnerability for the impacts of climate change;
- Explore the opportunities created by climate change;
- Promote adaptation measures based on evidences from scientific studies and good practices;
- Integrate the adaptation measures in the current governmental instruments;
- Promote the involvement and synergies among the stakeholders in the process of adaptation.

87
Several instruments are being developed to increase the adaptation capacity namely to reduce the
risk of flash floods and forest fires. It should be noted that. in the last decade. several extreme
climatic events have caused floods and forest fires with high gravity. namely:
- Flash flood on 20th February 2010: a heavy rain in the high peaks of Madeira caused a
massive flash flood in Funchal and Ribeira Brava causing 47 victims. 250 wounded. 600
displaced persons. and 217 million € in damages. affecting the commerce. public utility
services (electric grid. water supply). infrastructures (roads and ports) and the tourism
activity.
- Flash flood in Porto da Cruz on 28th and 29th November 2013: a heavy rain on the
north coast of Madeira caused massive landslides that destroyed houses and roads in the
town of Porto da Cruz.
- Fires on 18th July 2012: This fire burned several houses and forest area. displacing about
100 persons.
- Fires 8-9th August 2016: This fire started in the forest area and reached the Funchal city
centre causing 3 victims and 61 million € of damages in the city infrastructures with more
than 300 buildings affected. displacing about 1000 persons.
After the Flash flood of 20th February 2010. the Madeira Alluvial Risk Assessment Study
(EARAM1)8 was developed that allowed to assess and characterize the risks associated with this
type of flood (alluvial). establishes the principles that should guide interventions against its
effects and provides elements to justify the investments in the recovery and protection of
populations and infrastructures. EARAM1 proposes a set of guiding principles for protection
measures. grouped and characterized in six types of actions:
- Retention of solid material;
- Control solid material transport;
- Vulnerability mitigation of exposed areas;
- Control of risk exposure;
- Forecast and warning - Structured forecast system;
- Training and information to the public.
In 2017. the Plan for the risk of flood management of the Autonomous Region of Madeira
(PGRI-RAM 2016-2021). was developed with the following strategic objectives:
- Increase the perception of the risk of flooding and of the strategies of action in the population and social and economic agents;
- Improve the knowledge and the forecasting capacity to adequate the flood risk management;
- Improve spatial planning and exposure management in flooded areas;
- Improve resilience and decrease the vulnerability of elements located in the areas of possible flooding;
- Contribute to improving or maintaining the good condition of water bodies.
8 https://poseur.portugal2020.pt/media/41664/sistema-de-alerta-de-aluvi%C3%B5es-na-ram_srei.pdf

88
Madeira already has an early warning system of flash floods. It can predict a flash flood six hours
in advance. The system’s name is Flash Flood Alert Systems (SAARAM) and was developed by
LREC – Laboratório Regional de Engenharia Civil.
Madeira is also developing the Regional Strategy Against Forest Fires (PRDFCI) that will be
concluded by August 2020.
Concerning the financial resources to implement mitigation and adaptation measures stated in
the existing planning instruments and studies. in addition to national. regional and local financial
resources. the structural funds are a key resource.
The Regional Strategic Orientation Document Compromisso Madeira@2020 established the
framework for the implementation of the structural funds during the 2014-2020 programming
period. The document states that it is important to develop an upstream work to reinforce the
knowledge about future and current events related to climate change. integrating international
networks of research and sharing the knowledge and the good practices of intervention. In
parallel. Compromisso Madeira 2020 underlines the need to develop approaches of interaction
among different regional authorities (public health. tourism and leisure. water resources. coastal
areas. agriculture. forests. etc.) to identify intervention measures that assure (Compromisso
Madeira@2020 - Page 42 and 43):
- Implementation of preventive measures in the field of Civil Protection that contribute to the improvement of the population's quality of life. to its safety and assets;
- Dissemination of scientific knowledge and good practices of adaptation;
- Formulation of anticipatory measures to mitigate vulnerabilities and climate change effects;
- Elaboration of strategic and operational orientations for adaptation to climate change. on global and sectorial terms;
- Creation of an integrated information system that allows the development of databases and the indicators generation for the identification and prospective management of the main health risks related to climate change. e.g. floods (at coastal level and water courses). extreme temperatures. air and ozone pollution and vector-borne diseases.
In the current framework programme several measures of mitigation and adaptation were
implemented with structural funds. namely in the field of data collection. planning. risk
assessment and management instruments. warning systems. and water and energy storage.
As part of the preparation for the next framework programme. the Madeira 2030 Strategic
Orientation Document (version of October 2019) was prepared. in which. with a direct link
to climate change. two of the region's strategic challenges stand out:
- Consolidation of regional value chains (Tourism / Leisure; Blue Economy; Knowledge
Services; and Energy and Sustainable Mobility)
- Fostering innovative experiences in adapting to Climate Change and Energy Transition
in crucial areas of water. soil. biodiversity and energy sources management. focusing on
critical territories and valuing the creation of innovation and experimentation
relationships with the priorities in regional smart specialization.

89
Within the scope of this Challenge. the Autonomous Region of Madeira is equipped with
recent sectoral planning instruments and others in the final phase (Integrated Strategic
Transport Plan. Sustainable Urban Mobility Plan. Regional Agenda for the Circular
Economy. CLIMA-Madeira Strategy. Sustainable Energy . Waste Management Plan. PROT
RAM - 1st phase.…) that identify specific priorities and action measures that should inspire
public guidelines for strategic and operational management and allocation of public. national
and regional public funding resources.
Table 24: Specific limits and obstacle and relevant documents
Specific limits and obstacle
Limitation faced by Madeira are: - The absence of equipment’s to systematically collect representative climatic data for
Madeira Island namely sea temperature, wave characteristics, currents; - The small and isolated electricity grid limits the penetration of intermittent renewable
energies; - The financing limitations to invest in adaptation measures such as: water collection and
storage solutions and reforestation.
Relevant documents
- Sustainable Energy Action Plans (SEAP) in the scope of Pact of Islands
- SEAP for Madeira Island
- SEAP for Porto Santo Island
- Sustainable Energy Action Plans (SEAP) in the scope of Covenant of mayors for climate and energy:
Climate change adaptation documents: Strategy CLIMA-Madeira, strategy for adaptation to climate change of the Autonomous Region of Madeira. This strategic document aims to:
- Enhance the knowledge about the relation between the climatic system and the natural and human systems;
- Reduce the vulnerability for the impacts of climate change; - Explore the opportunities created by climate change; - Promote adaptation measures based on evidences from scientific studies and good
practices; - Integrate the adaptations measures in the current governmental instruments; - Promote the involvement and the synergies among the interested parts in the process of
adaptation. Link: http://clima-madeira.pt/uploads/public/estr_clima_web.pdf Plan for the risk of flood management of the Autonomous Region of Madeira (PGRI-RAM 2016-2021) – in the Link below it can be find the Google Drive folder with the documents regarding the studies of Flooding Risk. Link: Assessing the flood risk in Madeira Island – this article contains a set of measures and instruments, namely structural measures that aim the mitigation of the damages caused by the

90
heavy rains. Hydrogeomorphological risks – In the page 77 it can be find the measures proposed to reinforce the adaptation capacity of Madeira island regarding the risk of floods Link: http://clima-madeira.pt/uploads/public/rel_hidrogeo.pdf Heavy Rainfall Events and Mass Movements in the Funchal Area (Madeira. Portugal): Spatial Analysis and Susceptibility Assessment (Sérgio Lopes. Marcelo Fragoso and António Lopes). published on 15th January 2020. presents new information on the spatial distribution of intense rainfall and a new map of susceptibility to the formation of mass movements in the mountainous streams of the municipality of Funchal. the capital of the Autonomous Region of Madeira. an archipelago of Portugal.
Source: Deliverable 7.1 Conceptual framework

91
7 References
Electricidade da Madeira (2019). Caracterizaçao da rede de transporte e distribuiçao em AT e
MT – 2018.
Fritzsche et al. (2014). The Vulnerability Sourcebook: Concept and guidelines for standardized
vulnerability assessments.
Gutiérrez, C., Somot, S., Nabat, P., Mallet, M., Corre, L., van Meijgaard, E., Perpiñán, 0. &
Gaertner, M. Á. (2020). Future evolution of surface solar radiation and photovoltaic potential in
Europe: investigating the role of aerosols. Environmental Research Letters, 15(3), 034035.
Iborra Martín, J. (2008). Fisheries in Madeira. Available at https://orfish.eu/library/fisheries-in-
madeira
IRENA (2019). Renewable Power Generation Costs in 2018, International Renewable Energy.
Agency, Abu Dhabi.
MaREI to lead €9m project to build floating offhsore platform. Retrieved from:
https://www.marei.ie/marei-to-lead-e9m-project-to-build-floating-offshore-platform/
MarineEnergy (2019a). WavEC: Combined Wind, Wave and Solar to Transform Marine Energy.
Retrieved from https://marineenergy.biz/2019/12/16/wavec-combined-wind-wave-and-solar-
totransform-marine-energy/
Masterton JM., RichardsonF.A. (1979). Humidex, a method of quantifying humandiscomfort due
to excessive heat and humidity, CLI 1–79, Environment Canada.Atmospheric Environment
Service, Downsview, Ontario.
Miguel, M., Nogueira, T., & Martins, F. (2017). Energy storage for renewable energy integration:
the case of Madeira Island, Portugal. Energy Procedia, 136, 251-257.
Pisacane, G., Sannino, G., Carillo, A., Struglia, M. V., & Bastianoni, S. (2018). Marine energy
exploitation in the Mediterranean region: steps forward and challenges. Frontiers in Energy
Research, 6, 109.
Raynaud, D., Hingray, B., François, B., & Creutin, J.D. (2018). Energy droughts from variable
renewable energy sources in European climates. Renewable Energy, 125, 578-589.
Schneiderbauer, S., Pedoth, L., Zhang, D., & Zebisch, M. (2013). Assessing adaptive capacity
within regional climate change vulnerability studies—an Alpine example. Natural hazards, 67(3),
1059-1073.
Soto, D., & Brugere, C. (2008). The challenges of climate change for aquaculture. FAO
aquaculture newsletter, (40).
Šúri, M., Huld, T.A., Dunlop, E.D., Ossenbrink, H.A. (2007). Potential of solar electricity
generation in the European Union member states and candidate countries. Solar Energy, 81,
1295–1305.
Van Wagner, C. E.,1987: Development and structure of a Canadian forest fire weather index
system, Forestry Tech. Rep. 35, Canadian Forestry Service, Ottawa.

APPENDIX 9

1
TABLE OF CONTENT
INTRODUCTION .............................................................................................................................. 2
1 CURRENT SITUATION AND RECENT TRENDS ................................................................................. 3
1.1 CURRENT GEOPOLITICAL CONTEXT ........................................................................................................... 3 1.2 CURRENT CLIMATE AND RISKS ................................................................................................................ 5 1.3 MACROECONOMIC STATUS .................................................................................................................... 6 1.4 RECENT EVOLUTION OF THE BLUE ECONOMY SECTORS ................................................................................. 7
2 ECONOMIC PROJECTIONS ........................................................................................................... 11
2.1 THE MACROECONOMIC PROJECTIONS .................................................................................................... 11 2.2 THE SECTORAL PROJECTIONS ................................................................................................................ 12 2.3 EMPLOYMENT ................................................................................................................................... 14
3 CLIMATE CHANGE OUTLOOK ....................................................................................................... 14
3.1 TOURISM ......................................................................................................................................... 15 3.2 AQUACULTURE ................................................................................................................................. 20 3.3 ENERGY ........................................................................................................................................... 23 3.4 MARITIME TRANSPORT ....................................................................................................................... 30
4 CLIMATE CHANGE RISKS ON BLUE ECONOMY .............................................................................. 34
4.1 TOURISM ......................................................................................................................................... 34 4.2 AQUACULTURE ................................................................................................................................. 64 4.3 ENERGY ........................................................................................................................................... 84 4.4 MARITIME TRANSPORT ....................................................................................................................... 92
5 SOCIO-ECONOMIC IMPACTS OF CLIMATE CHANGE ...................................................................... 96
5.1 MARKET AND NON-MARKET EFFECTS OF CLIMATE CHANGE ......................................................................... 96 5.2 MACROECONOMIC PROJECTIONS ........................................................................................................ 105
6 TOWARDS CLIMATE RESILIENCY ................................................................................................ 109
6.1 CURRENT SITUATION: GENERAL COMMITMENT, SPECIFIC LIMITS AND OBSTACLES .......................................... 109
7 REFERENCES ............................................................................................................................. 112

2
Introduction
This report is the background material for stakeholders participating in the upcoming
adaptation pathways workshop in the Maltese Islands. It sums up results of the project
that come from other Work Package Deliverables. First, a presentation that includes the
geography and socio-economic context for the Island, and the socioeconomic trends
without climate change (WP6), which range from the present to the end-of the century.
Regarding Climate Change, the expected climate risks and vulnerabilities for the blue
economy are presented and ran (WP3), joint to the expected trends of physical risks,
booth current and future (WP4). Finally, specific economic impacts are estimated,
considering the evolution of some physical risks (WP5 and WP6). The current climate
policy and resilience of the Island is also presented (WP7). Finally, a link to the projects
original work is made in the references section.
Malta at a glance
The country of Malta refers to a group of islands in the Mediterranean Sea, with a total
surface of 316 km2 (Zammit, 1986). The three largest islands, Malta, Gozo and Comino,
host all 515,000 residents (NSO, 2020). The low, rocky islands can be identified by their
coralline limestone and steep coastal cliffs. Sandy beaches cover small parts of the
coastline. The highest point of the islands is Ta’ Dmejrek on Malta Island, with an
altitude of 253 m. The Maltese Islands do not have any permanent surface water and
some rivers only spring during extreme rainfall. The islands have to deal with a shortage
of fresh water and depend on desalination (FAO, 2006).
The Blue Economy sectors
Aquaculture
Aquaculture is defined as “Farming finfish, shellfish and aquatic plants” (EC, 2020). It is
one of the world's fastest growing food sectors and provides the planet with about half
of all the fish we eat. The world’s population is expected to rise to 9 billion by 2050,
creating a considerable demand for food and sources of protein (World Bank, 2013).
Aquaculture can contribute to assure food security, meet nutrition needs, as well as social
and economic inclusion, employment and lessen the need for fish imports in some
countries. Sustainable aquaculture is also needed because fisheries alone will not meet the
growing demand for seafood (EC, 2015). In the context of islands, the aquaculture sector
needs attention as it represents an important sector for many islands. In the Soclimpact
project, aquaculture includes only marine-based operations where off-shore and coastal
aquaculture are included, and freshwater and land-based aquaculture are excluded.
Malta has 7 marine aquaculture operators, of which most are focused on tuna fattening
and one operates a closed-cycle seabream farm. The farms are spread over 9 different
sites. The annual production in 2018 was over 19,000 T, of which 90% was tuna (NSO,
2019a). Effects of increasing sea temperature and shifts in currents and nutrient flow
may have an impact on the aquaculture sector. Especially since Malta's aquaculture sector

3
is highly dependent on wild caught Tuna fisheries, an endangered species vulnerable to
the effects of climate change.
Maritime Transport
Maritime transport has been a catalyst of economic development and prosperity
throughout the history of the country. Malta has two mayor ports, the Malta Freeport in
the Bay of Marsaxlokk, and the Port of Valletta. More than 90% of all goods entering
and leaving Malta go through these ports (Malta Marittima, 2020). The port of
Marsaxlokk is the base of 70% of the county’s fishing fleet and is handling about 2.7
million Twenty-Foot Equivalent (Malta Freeport, 2020; TM, 2020). The Port of Valletta
is a multi-purpose port equipped for a large number of maritime services such as cruise
liner and cargo berths, bunkering facilities, ship building yards and storage facilities
(Malta Marittima, 2020).
Energy
Malta uses a total of 180,000 Tons of fossil fuel per year and produces 133,419 MWh of
renewable energy of which 58 MWh is wind energy, 125,054 MWh solar energy and
8,307 MWh produced using biogas (NSO, 2017). For a large part of its fossil fuel it is
dependent on Sicily. The Government strongly considers the exploration of blue
renewable energy opportunities. The four main blue energy areas that are being focused
upon for further study are: offshore wind farms, floating photovoltaic islands, tidal wave
energy conversion and blue geothermal renewable energy.
Tourism
Tourism is one of the most important sectors for the Maltese economy contributing to
approximately 27% of the GDP (World Travel and Tourism Council, 2018). Tourists are
visiting Malta for the island’s rich history and culture as well as aquatic activities. Lately,
medical tourism has also become popular in Malta. In 2019, Malta had 2,753,239 visitors,
an increase of 5.9% compared to 2018. Malta can accommodate 55,597 tourists at any
given time with an occupancy rate of around 80% in summer and 47% in the winter
months (MTA, 2019). The average stay is 7 nights, and the most popular time of the year
is June to September. Most tourists are from the United Kingdom, followed by Italy,
France, and Germany. Malta also has a significant number of visits from Cruise liners
(over 300 cruise liners/year) (MTA, 2019).
1 Current situation and recent trends
1.1 Current geopolitical context
Malta is an independent country in southern Europe, which constitutes of the three
Maltese Islands: Malta, Gozo, and Comino. The islands are located approximately 80 km
south of Sicily. It is the smallest member state of the European Union in terms of
terrestrial area (316 km2) and population (515.000 inhabitants), but it has the highest
population density (1.400 inhabitants/km2) (NSO, 2020).

4
The highest point of the islands is Ta’ Dmejrek on Malta Island, with an altitude of 253
m. About a third of the islands is used for agriculture and less than 1% of the island’s
surface is covered by forest. 13.1% (~41 km2) of land area forms part of the EU Natura
2000 Network of protected areas and 35.5% of Maltese Waters (4.138 km2) have been
designated as marine protected areas, as reported by the Environment & Resources
Authority. The Maltese Islands have very little permanent surface water which results in
freshwater shortages and therefore are dependent on desalination of sea water.
Its capital is Valletta, which is the smallest national capital in the European Union by area
at 0.8 km². The official languages are Maltese and English. However, Maltese, the only
Semitic language in the European Union, is officially recognised as the national language.
The Maltese civilization dates back thousands of years and Malta hosts some of the
oldest malithic sites in the world. Malta features a key geopolitical position and was a
British colony since 1814. In 1964 Malta gained its independence and declare itself a
republic ten years later. Malta became an EU member in May 2004 and began using the
Euro as currency in 2008. Currently, Malta is the smallest member of the European
Union in terms of Gross Domestic Product.
Population dynamics of the island
During the period 2011 and 2017, the population of Malta increased with an overall
growth of 56,835 inhabitants. In particular, the Northern Harbour District registered the
highest population growth of 26.0%, followed by the Northern district registering a
growth of 23.1% while the least growth was recorded in the Southern Harbour District,
registering a growth of 2.7%. Population increase in the last years has been largely due to
net migration. Overall, unemployment levels in Malta have decreased considerably in the
period 2013-2018, being one of the lowest in the EU (NSO, 2019b).
Figure 1: Total Population of Malta 2006-2019. Source: National Statistics office of Malta

5
1.2 Current climate and risks
Malta has a typical Mediterranean climate with mild rainy winter and dry hot summers.
The mean temperature for the summer months is 35 °C while the lowest average
monthly temperature is 11 °C in winter. The presence of the surrounding water mass
shapes the climate of the Maltese islands significantly. The general weather is often
cooler and more humid (75% average) compared to larger inland areas.
The high thermal capacity of the sea provides a more stable ambient temperature on the
islands. However, when colder air comes from the north at the end of summer,
combined with the warmer waters, this creates weather instability causing heavy thunder
storms and intense rainfall. One of the highest in Europe, Malta has an average of 3,000
hours of sun per year. The average sea water temperature is 20 °C. In the current
government, climate change policy falls under the portfolio of the Minister for
Sustainable Development. Environment and Climate Change (MSDEC).

6
Figure 2: Climate factsheet Source: Own elaboration with data from GFDRR ThinkHazard!; D7.1 Conceptual Framework and Meteoblue; Meteoblue global NEMS (NOAA
Environmental Modeling System)
1.3 Macroeconomic status
Due to its geographic location in the centre of the Mediterranean Sea and its limitation of
natural resources, Malta’s economy is driven by the service sector (Eurostat, 2019). In
particular, services related to professional, scientific and technical activities have
developed substantially towards 2018 to the detriment of manufacturing, while trade and
tourism-related services show a stable contribution to total GVA. In 2018, the economy
expanded 6.2%. Malta’s growth outpaced the growth registered at EU level which stood
at 2.2% and the Euro Area 19 at 2.0%, a pattern observed since 2012. The contribution

7
of net exports to growth is almost stable throughout the 2010-2017 period (EC, 2019).
Tourism is one of the main pillars of the Maltese economy while emerging sectors such
as gaming, online gambling and real estate provide further growth potentials to the island
and have largely contributed to the high GDP growth rates registered recently. Gross
value added from financial and insurance activities grew by more than 10% over the
same period of 2017. Malta is growing into an international services centre, as financial,
insurance operators and remote gaming companies serve almost exclusively foreign
customers, thus explaining the growth through exports (EC, 2019).
Table 1: Gross Value Added by aggregate NACE sector, Malta 2010, 2015 and 2018
NACE_R2/TIME 2010 2015 2018
Total - all NACE activities 5,790.8 8,550.0 10,854.8
Agriculture, forestry and fishing 96.1 104.3 108.2
Industry (except construction) 893.6 862.9 1,089.9
Manufacturing 749.7 723.2 892.8
Construction 270.3 327.5 395.7
Wholesale and retail trade, transport, accommodation and food service activities 1,236.9 1,948.0 2,309.5
Information and communication 319.7 559.7 703.4
Financial and insurance activities 452.0 552.7 652.6
Real estate activities 347.1 442.2 531.7
Professional, scientific and technical activities; administrative and support service activities 536.5 1,080.7 1,616.4
Public administration, defence, education, human health and social work activities 1,061.7 1,461.2 1,820.7
Arts, entertainment and recreation; other service activities; activities of household and extra-territorial organizations and bodies 576.7 1,211.0 1,626.7
Source : D6.2- Eurostat
1.4 Recent evolution of the blue economy sectors
Tourism
Tourism is contributing significantly to the GDP of Malta, with a total contribution close
to 30% of GDP, thus placing Malta first to the ranking among the Mediterranean
countries that feature a strong economic dependence on tourism (World Travel and
Tourism Council, 2018). According to the NSO, 2.75 million inbound tourists visiting
Malta were registered in 2019, 5.9% higher than in 2018 (NSO, 2019c). Malta is the
member state of the EU with the highest tourism intensity with 21 guest nights per
inhabitant (Eurostat, 2017).

8
Inbound tourists are more likely to stay in collective accommodation establishments
(69.4%) and on average stayed 7 nights. Similarly, in 2017, total domestic trips between
Malta, Gozo and Comino amounted to 260,763, 10.3% more than 2016. Overall,
inbound tourism shows rapid growth throughout the last decades. The origin of visitors
has changed through time, moving away from visitors from the UK and Italy (Common-
wealth and neighbouring country respectively) towards other countries. Most tourists
choose Malta due to the cultural heritage and the weather conditions, while an increasing
number of tourists is moving away from collective accommodation towards private
accommodation. Furthermore, the average length of stay is steadily declining while
expenditure per night is increasing (Attard, 2018).
Tourism Satellite Accounts (TSA) provides data of inbound tourism expenditure,
domestic expenditure, and other tourism consumption. In some regions, this information
is not computed on a regular basis, hence information has to be extracted local tourism
departments. For the case of Malta, national TSA data is quite outdated (relating to 2010
for Malta).
Aquaculture
The farming of closed cycle species such as Gilthead seabream and European seabass
takes place in marine floating cages of diameters up to 25 m. These cages are located in
shallow coastal waters close to shore. Capture-based aquaculture in Malta consists of
Figure 3: Inbound tourism development per month for the years 2014-2018. Source: NSO (2019a).
0
50.000
100.000
150.000
200.000
250.000
300.000
350.000
400.000
Jan Feb Mar Apr May Jun Jul Aug Sep Oct Nov Dec
Tou
rism
arr
ival
s
2014 2015 2016 2017 2018 2019

9
fattening of wild catch bluefin tuna in circular marine floating cages of diameters up to
100 m.
According to the Aquaculture Directorate of the Maltese government, the aquaculture
industry has 4 tuna ranches that produce over 80% of Malta’s aquaculture production
through capture-based aquaculture, and 2 closed cycle species farms that produce sea
bream, sea bass and meagre.
According to the National Statistics Office (NSO), in 2018 the industry produced a
combined output generated by closed cycle species and tuna farming of a total of 19,300
tons of fish. This amounted to a total value of €239.2 million, which is a 18.9% increase
compared to 2017 (NSO, 2019a). More than 95% of this value was generated by blue-fin
tuna farming and the remaining amount was closed cycle species such as sea bass. sea
bream and other species.
The aquaculture sector generates a total of 964 full-time equivalent jobs (FTE), including
197 FTE employed in the aquaculture sector itself and an additional 767 FTE jobs
generated by way of indirect and induced economic impacts (FAO, 2020). These jobs
were mainly concentrated in the whole-sale and retail trade, transport and
communication, financial intermediation and manufacturing sectors.
Figure 4: Fish farming sales by species and year in Malta. Source: (NSO. 2019b).
Energy
In 2018, the total electricity supply in Malta was 2,532,606 MWh. The electricity system
in Malta experienced important updates with the inauguration of the Malta-Italy
interconnector in 2015 and the switching off of all heavy fuel oil power plants in 2017.
The latest available data indicates that electricity imports via the interconnector reached
0
5.000
10.000
15.000
20.000
25.000
2012 2013 2014 2015 2016 2017 2018
Ton
nes
of
fish
Tuna Sea Bream Sea Bass Other

10
65% in 2016 which gave the impression that domestic production was continuously
diminishing. but in the following two years it dropped down. reaching 25% in 2018
(NSO, 2019d).
Renewables are gradually starting to penetrate the domestic supply system, most notably
with the installation of new Photovoltaic panels in 2016 and 2017. In 2018, the
renewable energy generation was less than 198,587 MWh of which more than 95% are
generated by PV installations, many of which are domestic stand-alone systems which are
not connected to the grid (NSO, 2019c).
Figure 5: Electricity generation by source in Malta in the period 1990-2017. Source: IEA website.
The electricity demand is projected to rise to 3,200,000 MWh by 2025 (from: Malta’s
Report to the European Commission on the Implementation of Directive 2009/72/EC,
Directive 2009/73/EC and Directive 2005/89/EC).
Maritime Transport
Beside the international airport in Luqa, Malta is well connected to the surrounding
countries and worldwide via its shipping routes. Maritime transport is important for the
movement of goods and passengers in Malta. The islands have two main ports for large
cargo and passenger vessels: The Grand Harbour in Valletta and the Freeport in
Marsaxlokk. Approximately 97% of the cargo throughput is handled at the Freeport
(TM, 2015). In 2018, more than 2,200 vessels and 3.41 million TEUs with a gross
tonnage of 295 million were handled which is almost twice as much as in 2007. In total
330 cruise ships with 722,926 passengers arrived in Malta and 304,804 passengers used
the ferry services in Malta in 2018 (TM, 2018).

11
Maritime freight transport is largely used for domestic needs and does not serve as an
international port hub. In terms of weight of seaborne freight handled in Maltese ports,
Malta registers 8.8 tonnes per inhabitant compared to an EU average of 7.7 tonnes
(Eurostat, 2019).
Figure 6: Gross Tonnage of Vessels in Malta for the years 2007-2018. Source: (TM. 2019).
2 Economic projections
2.1 The macroeconomic projections
Malta registers a 1.7% annual GDP growth rate throughout the 2015-2100 period and a
1.8% rate in the 2015-2050 period. The main driver of growth during the short-term
period is private consumption, which includes tourism demand. As seen in Figure 7 the
contribution of private consumption in GDP increases throughout time to the detriment
of investments and trade. Private consumption growth rates surpass that of GDP
throughout the period, indicating that the Maltese economy is achieving growth through
high value-added sectors like services and tourism but without investing further on
productive capacity and adequate infrastructure.

12
Figure 7: Macroeconomic components as a % share of GDP for Malta in 2015-2100.
Source: own calculations.
In parallel, trade balance remains positive yet gradually becomes neutral. Tourism
maintains a stable share in GDP throughout the period, which as discussed above is one
of the highest in the Mediterranean. This also justifies the increasing share of private
consumption in GDP. It is assumed that the GDP share of public consumption remains
roughly the same throughout the 2015-2100 period as Malta has already a privatized
economy.
2.2 The sectoral projections
The Maltese economy remains a service-led economy throughout the 2015-2100 period
with an increasing contribution of recreational, accommodation and other market
services. Moving towards the end of the century, the share of primary and secondary
sectors in gross value-added falls significantly to the benefit of sectors with higher value
added, as observed in recent years. Blue growth sectors increase in importance
throughout the 2015-2100 period. Tourism sustains or slightly increases its share in GDP
throughout the period1. Similarly, water transport maintains its share (0.5% of GDP)
while fisheries (which includes aquaculture) and electricity gradually see a lower
contribution to gross value added.
1 The share of tourism in GDP is calculated via the tourism satellite account (TSA) matrices of 2015, assuming that
the same shares that indicate the contribution of tourism to the productions of tourism-related sectors (such as the accommodation and food services, transport services, travel agency and related activities, cultural and recreational activities) remain throughout the 2015-2100 period. Please see Appendix B for the complete data-base of the estimated TSAs.

13
Figure 8: Sectoral value added as a % share to total GVA for Malta in 2015, 2050 and 2100.
Source: Own calculations D6.2
Table 2: Sectoral contribution as a % share of total gross value added for Malta in 2020-2100.
GVA % shares 2015 2020 2025 2030 2035 2040 2045 2050 2060 2070 2100
Agriculture 1.8% 1.9% 1.8% 1.7% 1.6% 1.7% 1.7% 1.7% 1.8% 1.8% 1.7%
Fishery 0.4% 0.4% 0.4% 0.4% 0.4% 0.4% 0.4% 0.4% 0.4% 0.4% 0.4%
Manufacturing 10.8
% 9.8% 9.7% 9.6% 9.7% 10.1
% 10.1
% 10.1
% 10.6
% 10.6
% 10.8
%
Consumer goods 2.1% 2.1% 2.0% 2.0% 2.1% 2.1% 2.1% 2.1% 2.2% 2.3% 2.4%
Electricity 1.0% 0.9% 0.9% 0.9% 1.0% 1.0% 1.0% 1.0% 1.1% 1.1% 1.3%
Water 1.1% 0.9% 0.9% 0.9% 1.0% 1.0% 1.0% 1.0% 1.1% 1.1% 1.2%
Construction 4.7% 4.2% 4.3% 4.3% 4.3% 4.5% 4.5% 4.5% 4.5% 4.4% 4.1%
Water transport 0.5% 0.5% 0.5% 0.5% 0.5% 0.5% 0.5% 0.5% 0.5% 0.5% 0.5%
Other transport 5.8% 6.1% 6.2% 6.2% 6.1% 5.9% 5.9% 5.9% 5.6% 5.5% 5.0%
Accommodation and food services 4.6% 4.5% 4.4% 4.3% 4.7% 4.8% 4.9% 4.9% 5.6% 5.9% 6.8%
Travel agency and related activities 0.8% 0.8% 0.8% 0.8% 0.8% 0.8% 0.8% 0.8% 0.8% 0.8% 0.8%
Recreational services 8.7% 7.2% 7.0% 6.8% 8.2% 7.8% 7.9% 8.0% 9.3% 9.7% 11.4
%
Other market services 40.0
% 41.9
% 42.3
% 42.6
% 41.7
% 41.6
% 41.7
% 41.7
% 40.7
% 40.8
% 41.1
%
Non-market services 17.8
% 18.8
% 18.9
% 19.0
% 18.0
% 18.0
% 17.7
% 17.4
% 15.9
% 15.2
% 12.5
% Source: Own calculations D6.2

14
2.3 Employment
Malta already registers sustainable unemployment levels and the continuous growth of
the service sectors leads to even lower unemployment rates towards the end of the
century. The non-market services is a labour-intensive sector thus contributing with a
higher proportion to total employment than the respective share in total value added.
Tourism-related and other market services are also large employers, while manufacturing
and other transport sectors retain their shares throughout the 2015-2100 period. Tourism
is the largest employer of the Blue growth sectors under analysis, particularly due to the
high labour intensity of accommodation and food services, while water transport,
fisheries and electricity all contribute with shares less than 0.5%.
Table 3: Unemployment rate in Malta in 2020-2100: Own calculations
2015 2020 2025 2030 2035 2040 2045 2050 2060 2070 2100
Unemployment rate 5.4% 4.2% 4.2% 4.1% 4.1% 4.0% 4.0% 4.0% 3.9% 3.9% 3.8% Source: Own calculations D6.2
Figure 9: Sectoral employment as a % share of total for Malta in 2015, 2050, 2100 Source: Own calculations D6.2
3 Climate Change outlook
Climate hazards indicators represent the entry point to understand the climate change
exposure of the blue economy sectors. The indicators have been computed for two
scenario RCP2.6 (low emission scenario) and RCP8.5 (high emission scenario) and for
different horizon times namely: a reference period (1965-2005), mid-century (2046-2065)
and end of century (2081-2100). Main source of climate projections (future climate) for

15
the Malta is MED-CORDEX ensemble (regional scale of Mediterranean area) and
CMIP5 Ensemble (global scale) even if other model sources were applied when required,
depending on available scales. Results are presented in form of maps, tables or graphs
and only when the information shows an interesting outcome.
All the graphics presented below can be found in high resolution in the
Soclimpact Project official website HERE.
3.1 Tourism
Seagrass evolution
Posidonia Oceanica is a foundation species in Mediterranean waters. Foundation species have a large contribution towards creating and maintaining habitats that support other species. First, they are numerically abundant and account for most of the biomass in an ecosystem. Second, they are at or near the base of the directional interaction networks that characterize ecosystems. Third, their abundant connections to other species in an ecological network mostly reflect non-trophic or mutualistic interactions, including providing structural support for other species, significantly altering ecosystem properties to [dis]favor other species, altering metabolic rates of associated species, and modulating fluxes of energy and nutrient flow through the system. Seagrasses are the main habitat for coastal marine ecosystems. They provide different services like sediment retention (and thus clearer waters), coastal protection (in front of marine storms), shelter for marine organisms, etc. Therefore, the state of seagrasses is a convenient proxy for the state of coastal environment. In Malta, the results of RCP8.5 projections indicate a decrease of 20% of coverage area of Posidonia for the end-century. Although the projected reduction may seem moderate, it has to be kept in mind that the losses will be localized in the nearshore areas, so it is expected a large impact on water transparency in beach areas. Ecosystem services will be probably be less affected.
Figure 10: Seagrass evolution. Present coverage and projected changes (km2) of the main species Source: Soclimpact project deliverable D4.4e Report on estimated seagrass density

16
Fire weather Index (FWI)
The FWI system provides numerical non-dimensional ratings of relative fire potential for a generalized fuel type (mature pine stands) based solely on weather observations. FWI is part of the Canadian Forest Fire Danger Rating System established in Canada since 1971 (van Wagner 1987). Furthermore, since 2007, FWI has been adopted at the EU level and used in a harmonized way throughout Europe by the European Forest Fire Information System (EFFIS) of the Copernicus Emergency Management Service (since 2015). It is selected for exploring the mechanisms of fire danger change for the islands of interest in the framework of SOCLIMPACT Project, as it has been proved to adequately perform for several locations, including the Mediterranean basin. The index was calculated for the fire season (defined from May to October) over the Mediterranean for all models, scenarios and periods. For Malta, N=5 grid cells were retained from the model’s domain. The ensemble mean and the uncertainty is presented for all periods and RPCs. As this island has small acreage, the grid cells present low land fraction and are influenced by the sea. It seems that under RCP2.6, the index slightly increases at the middle of the century, while it halts towards the end of the century. On the other hand, under RCP8.5 there is an increased fire danger of about 20% at the end of the century. It should be noted that the fire danger values for all points are classified as low, thus, for all scenarios/periods all areas belong to the same class, exhibiting also low uncertainty.
Figure 11: (Normalized) Fire Weather Index (EURO-CORDEX) with the color associated to the class of hazard
Source: Soclimpact project deliverable D4.4c Report on potential fire behaviour and exposure

17
Beach flooding and related losses
One of the consequences of an increase in the mean sea level will be the flooding of coastal areas. This includes sand beaches, which are the main asset for tourism activities in most of the European islands. Therefore, estimating the potential risk of beach loss due to climate change is of paramount importance for the economy of those islands. The 95th percentile of the flood level averaged was selected as an indicator of interest. The values are presented as anomalies with respect to the present mean sea level at beach location (i.e. including the median contribution of runup). An increase is expected being larger at the end of the century under scenario RCP8.5.
.
Figure 12: Projected extreme flood level (in the vertical, in cm) at beach locations with respect to the present (1986-2005) mean sea level values averaged for the islands under scenario RCP2.6 (left) and
RCP8.5 (right). Ensemble of models using Global simulations produced by Hemer et al. (2013). Source: Soclimpact project deliverable D4.4d Report on the evolution of beaches
Under mean conditions, we find that, at end of century, the total beach surface loss range
from ~40% under scenario RCP2.6 to ~70% under scenario RCP8.5.

18
Figure 13: Beach reduction % (scaling approximation). Source: Soclimpact project deliverable D4.4d Report on the evolution of beaches
Humidex
Humidex value is an equivalent temperature, which express the temperature perceived by people (the one that the human body would feel), given the actual air temperature and relative humidity. The Number of Days with Humidex greater than 35°C was selected. as the more representative indicator for the assessment of inhabitants’ and tourists’ hazard on heat related climate change impacts. A day with Humidex above 35°C describes conditions from discomfort to imminent danger for humans. For Malta, N=5 grid cells were retained from the models domain. In the following figure the ensemble mean and the uncertainty is presented for all periods and RPCs. From 1.5 month in the present climate and above 2 months in the mid-century for both scenarios, Malta will have almost 4 months with discomfort conditions by the end of the century under RCP8.5.

19
Figure 14: Humidex in number of days (EURO-CORDEX) Source: Soclimpact project deliverable D4.3_Atlases of newly developed indexes and indicator
Length of the window of opportunity for vector-borne diseases Vector Suitability Index for Aedes Albopictus (Asian Tiger Mosquito) Climate change can influence the transmission of vector-borne diseases (VBDs) through altering the habitat suitability of insect vectors. This is mainly controlled by increases of ambient air temperature and changes in the hydrological cycle. In the framework of SOCLIMPACT we explore if potential changes to meteorological conditions can affect the distribution of the Asian tiger mosquito (Aedes albopictus). Asian tiger mosquito is native to the tropical and subtropical areas of Southeast Asia; however, in the past few decades, this species has spread to many countries through the international transport of goods and increased travel (Scholte and Schaffner 2007). It is of great epidemiological importance since it can transmit viral pathogens and infectious agents that cause chikungunya, dengue fever, yellow fever and various encephalitides (Proestos et al. 2015). The multi-criteria decision support vector distribution model of Proestos et al. (2015) has been employed to estimate the regional habitat suitability maps. This is based on extending previous work on the environmental/climatic factors affecting the life cycle of the Asian tiger mosquito (Waldock et al. 2013; Proestos et al., 2015). The mosquito habitat suitability model combines seven meteorological indices based on field observations, extensive literature review and expert knowledge. Malta is also a SOCLIMPACT case where presence of the Asian tiger mosquito has been reported. In terms of climate projections for the future, Malta and Gonzo are a similar example to the Balearic Islands. Regional climate simulations suggest a transition from medium to low habitat suitability under a strong emission scenario (pathway RCP8.5). Milder changes and an average increase in the suitability is projected for simulations forced under pathway RCP2.6.

20
Figure 15: Habitat Suitability Index (HSI) values averaged over eight SOCLIMPACT islands and for each sub-period of analysis. Red colors indicate increases while blue colors indicate decreases in the future. [80-100: High Suitability; 60-80: Medium Suitability; 40-60: Low Suitability; <40 No
Suitability]. Source: Soclimpact project deliverable D4.3_Atlases of newly developed indexes and indicator
3.2 Aquaculture
The predicted impacts of climate change on the oceans and seas of the planet is expected to have direct impacts on marine based aquaculture systems. Basic effects are the following (Soto and Brugere, 2008): Change in biophysical characteristics of coastal areas.
Increased invasions from alien species.
Increased spread of diseases.
Changes in the physiology of the cultivated species by changing temperature, salinity, oxygen availability and other important physical water parameters.
Changes in the differences between sea and air temperature which will alter the seasonality, frequency and severity of storms, cyclones and other extreme events, affect the stability of the coastal resources and potentially increase the damages in infrastructure.
Sea level rise, acidification, changes in precipitation and other effects will also add to the changes in coastal ecosystems and environment, thus affecting production and infrastructure (=investments).
It has been recognized that climate change impacts on aquaculture will be highly
unpredictable and extremely localized. Examples of climate change hazards that can
impact aquaculture are changes in ocean warming and acidification, as well as
oceanographic changes in currents, waves, and wind speed. Sudden impacts such as an

21
increase in the frequency and intensity of storms and heat waves are also impacting
aquaculture. Other effects of climate change on aquaculture activities are increased
invasions from alien species, increased spread of diseases and changes in the physiology
of the cultivated species by changing temperature, oxygen availability and other
important physical water parameters. An important indirect impact to aquaculture is the
change in fisheries production due to climate change. Aquaculture of finfish is highly
dependent on fisheries for feed ingredients. This is already a current problem with many
fisheries overexploited and will only be intensified in the future.
Eventually, impacts caused by climate change can lead to loss of production and
infrastructure. Climate change is also predicted to impact food safety, where temperature
changes modify food safety risks associated with food production, storage, and
distribution.
Socio-economic impacts on aquaculture are hard to assess due to the uncertainty of the
changes in hazards and the limited knowledge these impacts have on the biophysical
system of aquaculture species.
In the framework of Soclimpact, the following impacts were more closely studied:
i) Changes in water temperature can directly affect the growth rate and Food
Conversion Ratio of the fish. Temperature also affects the oxygen levels and can
cause harmful algae blooms, reduce water quality and an increase in occurrence of
diseases and parasites which can than affect the fish or other culture species. A
change in temperature can ultimately change the ranges of suitable species for a
certain area but can also have positive impacts such as increased growth (mainly in
tropical and sub-tropical regions) and a longer growing season. Primary productivity
can also increase with increasing temperature, which may be beneficial for filter
feeders such as mussels.
ii) Increased frequency and intensity of extreme weather events result in higher waves
and storm surges and changes in salinity. These events result in loss of stock and
damages to infrastructure and require adaptation in species selection, site selection
and technologies.
Fish species thermal stress indicators
The objective of the current analysis is to identify and quantify the variations (future climate scenarios with respect to present climate) in the number and in the duration of events characterized by a Sea Surface Temperature (SST) exceeding a given threshold. The SST thresholds have been identified according to the farming and feeding necessities of several marine species, particularly relevant for the aquaculture sector in the Mediterranean Sea (MS). Under scenario 8.5 at end of the century, the sea surface temperature could reach the thresholds adopted with important consequence a change in the species distribution.

22
Figure 16: Non-normalized hazard from rising SST- From left to right: RCP2.6, RCP4.5, RCP8.5;
from top to bottom: reference period, near future, far future Source: Soclimpact project deliverable D4.5
Figure 17: Number of days exceeding the threshold of sea surface temperature Source: Soclimpact project deliverable D4.5
Extreme Wave Return Time Return times for a threshold of 7 m significant wave height (hs) were computed, this significant height having been identified by stakeholders as the critical limit for severe damages to assets at sea. Return times can be related to the payback times of investments and help assess potential economic losses and economic sustainability. In the future, under RCP8.5. (far future), the extreme wave return time will decrease depending on the model’s outputs: for example, with the GUF model, the hazard class changes from high to low. With the models of CNRM and LMD, there is not significant change

23
Figure 18: RCP8.5 - Normalized hazard from extreme waves - top left: CMCC; top right: CNRM;
bottom left: GUF; bottom right: LMD Source: Soclimpact project deliverable D4.5
3.3 Energy
Standardized Precipitation Evaporation Index (SPEI) The Standardized Precipitation- Evapotranspiration Index - SPEI is used as an indicator of water availability. In particular, this hazard index can serve as a representative indicator for increases in water demand for islands’ residents, tourists and agriculture, while it also provides an indication on the available water stored in dams or underground resources.

24
In EURO-CORDEX 12-km simulations Malta and Gonzo are represented by a very small number of grid points. Nevertheless, climate projections corroborate similar results with the rest of the Mediterranean islands. There are strong indications towards moderate and extreme drier conditions under RCP8.5 and negative but near-normal SPEI values under RCP2.6. This will lead in additional increases in desalination and water pumping needs, a scenario which will substantially increase the cost for adaptation.
Figure 19: Ensemble mean, maximum and minimum values of the Standardized Precipitation Evaporation Index (SPEI) averaged over each SOCLIMPACT island and for each sub-period of
analysis (EURO-CORDEX). Source: Soclimpact project deliverable D4.3_Atlases of newly developed indexes and indicator
Percentage of days when T > 98th percentile - T98p
The T98p is defined as the percentage of time where the mean daily temperature T is above the 98th percentile of mean daily temperature calculated for the reference period 1986-2005. For RCP2.6, the indicator will reach 10% by the end of the century. On the other hand, the RCP8.5 future projections show that, daily temperatures will be above T98p for 26% on average (~94 days per year) of time.

25
Figure 20: Percentage of days when T > 98th percentile (EURO-CORDEX) Source: Soclimpact project deliverable D4.3_Atlases of newly developed indexes and indicator
Renewable energy productivity indexes
A series of indicators related to renewable energy productivity is presented. The selected indicators are wind and photovoltaic (PV) energy productivity, as well as the frequency and duration of low-productivity periods, termed energy droughts (Raynaud et al., 2018), as a measure of the variability of these sources. The productivity and variability of these renewable energy sources will depend on climate. The possibility of reduced productivity due to climate change poses a risk to the energy generation, if it is based on these renewable energy sources. Also, a possible increase in the frequency and duration of solar and wind energy droughts will require an increase in storage and backup sources. Among the different renewable energy sources, solar PV and wind energy have been selected, as they are (and very likely will be) the main renewable energy sources, due to their degree of technological development and their comparatively low cost. In order to consider a marine energy source, offshore wind energy is included, in addition to onshore wind energy.
Wind energy productivity:
All the scenarios in both 2046-2065 and 2081-2100 periods show a tendency to
decreasing Wprod. However, the magnitude of the decreases varies. As occurs in other
regions, RCP8.5 in the 2081-2100 period shows the most important decrease.

26
Figure 21: Wind energy productivity (land). Ensemble of models using. Source: Soclimpact project deliverable D4.4a Report on solar and wind energy
Figure 22: Wind energy productivity (sea). Ensemble of models using. Source: Soclimpact project deliverable D4.4a Report on solar and wind energy
Photovoltaic energy productivity:
The spatial pattern of photovoltaic productivity changes is represented (Deliverable 4.3,
not showed), showing an extended decrease for both scenarios and both periods. The
2081-2100 period for RCP8.5 presents the largest negative changes. Malta the decrease

27
reaches 3% in the RCP8.5 scenario at the end of the century. The decreases are larger
over the sea, particularly over the southern part of the domain. Productivity decreases are
rather small for RCP 2.6.
Figure 23: Photovoltaic (PV) productivity (land). Ensemble of models using. Source: Soclimpact project deliverable D4.4a Report on solar and wind energy
Figure 24: Photovoltaic (PV) productivity (sea). Ensemble of models using.
Source: Soclimpact project deliverable D4.4a Report on solar and wind energy
Frequency and duration of low-productivity periods (energy droughts) as a
measure of the variability of these sources

28
Wind droughts are remarkably more frequent over land than over the sea in the control
period. Overall, severe wind productivity droughts tend to experience an increase in
occurrence in both scenarios. This increase is particularly important in the 2081-2100
period of the RCP8.5 scenario.
Figure 25: Ensemble mean frequency of severe WIND productivity drought days (%) in the reference period, as well as the ensemble mean changes in the frequency of drought days (%) in the different time
periods considered. Averages are computed over land. Source: Soclimpact project deliverable D4.4a Report on solar and wind energy
Projected changes in the frequency of severe PV droughts are small. Severe PV droughts
are very infrequent and practically no change is projected in the future.

29
Figure 26: Ensemble mean frequency of severe PV productivity drought days (%) in the reference period, as well as the ensemble mean changes in the frequency of drought days (%) in the different time periods
considered. Averages are computed over land. Source: Soclimpact project deliverable D4.4a Report on solar and wind energy
Finally, the combined effect (wind and PV) does not show significant changes in the future.
Figure 27: Ensemble mean frequency of severe productivity drought days (%) in the reference period, as well as the ensemble mean changes in the frequency of drought days (%) in the different time periods
considered (combined effect) Source: Soclimpact project deliverable D4.4a Report on solar and wind energy

30
Cooling Degree Days
The Cooling degree days (CDD) index gives the number of degrees and number of days that the outside air temperature at a specific location is higher than a specified base temperature, providing provides the severity of the heat in a specific time period taking into consideration outdoor temperature and average room. For RCP2.6, we found that, for near future and far future, the increase is about 50%. On the other hand, the analysis of the RCP8.5 provides a more devastating picture as the number of CDD will be around four times larger than the reference period.
Figure 28: Cooling Degree Days. Ensemble mean of EURO-CORDEX simulations, relative change (%)
Source: Soclimpact project deliverable D4.3 Atlases of newly developed hazard indexes and indicators with Appendixes
3.4 Maritime transport
Sea level rise
Sea level rise (SLR) is one of the major threats linked to climate change. It would induce permanent flooding of coastal areas with a profound impact on society, economy and environment. Moreover, an increase in the mean sea level would result in a larger impact of coastal storms with the consequent increase of risk. The results are presented in terms of mean sea level rise. For Malta, the SLR ranges from 24, 10 cm (RCP2.6) to 64,99 cm (RCP8.5) at the end of the century.

31
Figure 29: Mean sea level rise (in cm) with respect to the reference period (1986-2005). Ensemble mean of CMIP 5 simulations and scaling approximation for RCP2.6
Source: Soclimpact project deliverable 4.4b Report on storm surge levels
Storm surge extremes
Storm surge events, characterized by positive extreme sea levels and mechanically forced by atmospheric pressure and wind are the main responsible for coastal flooding, especially when combined with high tides. To present, the only ensemble populated with enough number of members to compute meaningful statistics on climate projections is the one produced for the Mediterranean by Lionello et al. (2016). This ensemble consists on 6 simulations run with the HYPSE model at 1/4º of spatial resolution and forced by the high-resolution wind fields from the MedCORDEX ensemble which in turn is nested into CMIP5 global simulations. The simulations are run for the period 1950-2100 thus covering the historical period as well as the whole 21st century. Complementary, the ensemble includes three hindcast simulations that are used to establish present reference levels. Storm surge could decrease amount 20% under RCP8.5 (far future). Nevertheless it is worth noting that the Mean Sea Level Rise is expected to be critically larger in this same period and scenario.

32
Figure 30: 99th percentile of atmospherically forced sea level (in cm) averaged for the hindcast period, the near future (2046-2065) and the far future (2081-2100) under scenarios RCP2.6 (with scaling
approximation) and RCP8.5, relative change in brackets. Source: Soclimpact project deliverable 4.4b Report on storm surge levels
Wind extremes
The wind extremity index NWIX98 is defined as the number of days per year exceeding the 98th percentile of mean daily wind speed. This number decreases in the far future with a strongest value under RCP8.5 (- 22.9 %). Like the NWIX98, the 98th percentile of daily wind speed, WIX98, decreases but with a more significant magnitude for RCP 8.5.
Figure 31: Wind Extremity Index (NWIX98). Ensemble mean of EURO-CORDEX simulations. Source: Soclimpact project deliverable D4.3_Atlases of newly developed indexes and indicator

33
Wave extremes (99th percentile of significant wave height averaged)
Marine storms can have a negative impact on maritime transport, coastal-based tourism and aquaculture, among other activities. To illustrate this impact, the 99th percentile of significant wave height averaged has been chosen. A decrease in the extreme wave height is found being larger under scenario RCP8.5 as illustrated in the following maps.
Figure 32: the 99th percentile of significant wave height averaged for the reference period and the relative change for the RCP8.5. MED-CORDEX and Global simulations produced by Hemer et al. (2013).
Source: Soclimpact project deliverable 4.4b Report on storm surge levels
Figure 33: the 99th percentile of significant wave height averaged for the reference period and the relative change for the RCP8.5 and RCP2.6. MED-CORDEX and Global simulations produced by Hemer
et al. (2013). Source: Soclimpact project deliverable 4.4b Report on storm surge levels

34
4 Climate change risks on blue economy
4.1 Tourism
In this section of tourism, we present the results of operationalization if three impact
chains.
Loss of attractiveness due to increased danger of forest fires in touristic areas
Forest fires are considered as an important parameter for the attractiveness of tourist
destinations, especially in the Mediterranean area. Severe episodes were met in Algarve
(Portugal) and Greece (Athens area) in the recent period, threatening the tourist season.
This study focuses on the implementation and analysis of the selected Impact Chain
“Risk of forest fires and consequences on tourism attractiveness of a destination”. Out
of the 12 islands assessed in the SOCLIMPACT project, nine were included in the
operationalization: the three Atlantic Islands (Azores, Canary Islands and Madeira) and
the Mediterranean ones (Balearic Islands, Crete, Corsica, Cyprus, Malta, Sardinia and
Sicily).
The concept of Impact Chain (Schneiderbauer et al. 2013; Fritzsche et al. 2014) is applied
as a climate risk assessment method (with 6 steps) for research of decision making.
Impact Chains propose diagrams articulating the causal links between the different
components of climate risks (according to AR5 concepts: hazards, exposure,
vulnerability, risks, step 1). For each of these components of the theoretical IC (step 2),
several indicators are selected and collected (step 3). Data are then normalised to be able
to be aggregated (steps 4 and 5) with different weights. The final objective (step 6) is to
achieve a standardised risk score that, according to the spatial scale of the analysis can
allow comparison and decision making on adaptation, including hierarchization of
resource allocation or identification of adaptation options to mitigate climate risk.

35
Figure 34: Loss of attractiveness due to increased danger of forest fire in touristic areas Source: Soclimpact deliverable D3.2

36
Figure 35: Loss of attractiveness due to increased danger of forest fire in touristic areas Source: Soclimpact deliverable D3.3
Many indicators were formulated in a very broad way, causing a few problems in
identifying suitable data sets. Furthermore, the data were checked for explicit spatial
coverage, resolution, temporal coverage and time frame. Finally, we evaluated possible
substitutes or alternatives for those indicators with no suitable data to substantiate them.

37
Figure 36: Final Impact Chain Model Source: Soclimpact deliverable D4.5
In order to normalize the index, the min-max method was applied. Min-max normalizes
indicators to have an identical range [0, 1] by subtracting the minimum value and
dividing by the range of the indicator values (OECD 2008). The mathematical formula
and more information on min-max normalization method are presented in the following
section. Afterwards, the normalized index was categorized into five equal interval classes
representing values from “Very low" to "Very high”. Considering the weighing, an
assessment of GIZ methodology has been developed for this impact chain including
interviews with various types of stakeholders (cf. dedicated 4.5 to forest fires).

38
The indicators previously normalized have been aggregated to elaborate three sub-
component indices (hazard, exposure, vulnerability) and the final risk index. The result is
included in a comparison for the 9 other islands studied for the risk linked to forest fires.
Hazard scores
The main findings are:
Scores for fire danger increase as we move from West to East and from North to South, with the exception of Malta, which is much smaller and the selected grid cells are mostly influenced by maritime conditions.
Under RCP2.6, it seems that the fire danger returns to the present conditions towards the end of the century apart from Crete which score will increase from medium to high, even under this RCP.
Under RCP8.5, the increase is much more prominent, ranging from 22% to 46%, with the highest values for Corsica, Sardinia and Sicily, which implies that under this scenario at the end of the Century, the western and central Mediterranean will be more affected
Figure 37: Hazard score (Fire Weather Index) per island for the reference period (1986-2005) Source: Soclimpact deliverable D4.5

39
Figure 38: Hazard score (Fire Weather Index) per island at the end of the century (2081-2100) under
RCP2.6 (Ambitious Mitigation Policies) Source: Soclimpact deliverable D4.5
Figure 29: Hazard score (Fire Weather Index) at the end of the century (2081-2100) under RCP8.5
(Business as usual) Source: Soclimpact deliverable D4.5

40
Exposure
The results show that:
Atlantic Islands (Madeira and Canary Islands) are more exposed than Mediterranean Islands (from low to medium score). We can see an increase as we move from North to South in the Mediterranean area.
Atlantics Islands higher scores are mainly explained by the level of exposure rather than the nature of exposure, which is quite similar across islands, except for Malta which rate is very low.
The nature of exposure varies across EU Islands despite of their homogeneous score: Corsica has the highest score for forest areas followed by Madeira, Canary Islands. These two last ones have the highest score of forest belonging to protected areas. We can find a significant proportion of cultivated areas in other Islands namely: Sicily, Sardinia, Balearic Islands, Crete and Cyprus.
The level of exposure for Canary Islands and Madeira is particularly important because of the high scores for each of the 4 considered indicators: population density, population over 65 years, population under 9 years and tourist density.
Figure 40: Exposure score (current period) per island Source: Soclimpact deliverable D4.5

41
Figure 41: Subcomponents of exposure and related score (current period) per island Source: Soclimpact deliverable D4.5
Figure 42: Breakdown by exposure subcomponent Source: Soclimpact deliverable D4.5

42
Vulnerability
The main findings are:
Results show large disparity across EU Islands in terms of vulnerability. The vulnerability score for Corsica is very high followed by Sardinia (high), Madeira, Balearic Islands and Cyprus. Malta, Canary Islands and Crete scores are low and Sicilia very low.
Breakdown by component highlights a quite homogeneous score for adaptative capacity whereas sensitivity score (Flammability Index) is very different from an island to another.
Not surprisingly for the flammability index, Corsica and Sardinia have the highest score, Malta, Sicilia and Canary Islands, the lowest one.
Looking at the adaptative capacity subcomponent, despite of the quite homogeneous scores, factors of influence are quite different among the islands:
o high score for employees in the primary sector, apart from Sardinia and Sicily;
o scores for density of firefighters and volunteers are important for all the islands except for Cyprus;
o GDP per capita and level of education are the most heterogeneous factors of influence;
o GDP per capita score is very high for Crete, very low for Corsica, Malta and Balearic Islands.
o Scores for education level is important for Cyprus and low for Madeira, Malta and Corsica.
Figure 43: Vulnerability score per island Source: Soclimpact deliverable D4.5

43
Figure 44: Subcomponents of vulnerability and related score (current period) per island Source: Soclimpact deliverable D4.5
Figure 45: Details and scores of the two subcomponents (adaptive capacity and sensitivity) per island Source: Soclimpact deliverable D4.5

44
Risk
- For the reference period, the overall risk Figureis medium for Atlantic Islands (Madeira and Canary Islands) and Eastern Mediterranean Islands (Crete and Cyprus). Risk for other islands is low and very low for Malta.
- Looking at the breakdown of the risk, the structure is quite similar for 3 groups: o Madeira, Canary Islands, Sicilia and Balearic Islands: Predominance of
exposure component (around 50% of the score); o Crete and Cyprus: Predominance of the hazard component (around 40%
of the score); o Corsica and Sardinia: Predominance of the vulnerability component
(around 60-70%); o Only Malta has a quite balanced distribution across the components.
- In this exercise, only the hazard component is changing in the future. In the near future whatever the considered RCP, the risk increases only for Cyprus from medium to high. While the risk remains stable with the RCP2.6 in the distant future for all islands apart from Cyprus, there is an increase from very low to low for Malta and from low to medium for Balearic Islands, Corsica and Sardinia with RCP8.5. Even under this RCP8.5 risk remains constant for Canary Islands and Madeira (Medium) and Sicily (Low).
Figure 46: Risk score per island for the reference period (1986-2005) Source: Soclimpact deliverable D4.5

45
Figure 47: Risk breakdown by island for the reference period (1986-2005)
Source: Soclimpact deliverable D4.5
Figure 48: Risk score per island in the near future (2046-2065) under RCP2.6 (Ambitious
Mitigation Policies) and RCP8.5 (Business as usual) Source: Soclimpact deliverable D4.5

46
Figure 49: Risk score per island at the end in the distant future (2081-2100) under RCP2.6
(Ambitious Mitigation Policies) and RCP8.5 (Business as usual) Source: Soclimpact deliverable D4.5
Figure 50: Score per component and per island in the near (2046-2065) and the distant future (2081-
2100) under RCP2.6 (Ambitious Mitigation Policies) and RCP8.5 (Business as usual) Source: Soclimpact deliverable D4.5

47
Malta island results
Considering, the reference period, the risk for Malta is very low and the three
components are balanced. The future risk will change from very low to low under RCP
8.5 at the end of century.
Figure 51: Risk score and components of the risk for the reference period Source: Soclimpact deliverable D4.5
Figure 52: Risk score at the end in the distant future (2081-2100) under RCP2.6 (Ambitious
Mitigation Policies) and RCP8.5 (Business as usual) Source: Soclimpact deliverable D4.5

48
Considering the exposure component, only the level of exposure is represented in the
calculation of the final risk scores.
Figure 53: Details and scores of the two subcomponents of exposure (nature and level of exposure) Source: Soclimpact deliverable D4.5
Considering the vulnerability component, only the adaptive capacity is represented:
indeed, the flammability index as indicator of the sub-component of sensitivity is almost
0. The indicators of numbers of firefighters (+volunteers) and the occupation rate (%)
are the most representative within the adaptive capacity sub-component.

49
Figure 54: Details and scores of the two subcomponents of vulnerability (adaptative capacity and
sensitivity) Source: Soclimpact deliverable D4.5
Loss of attractiveness due to marine habitats degradation
Climate change is expected to impact tourism activities through direct impacts on
comfort and health of tourists, on the infrastructures and facilities that provide basic
services to visitors and on the natural ecosystems that hold a big part of the attractions of
the coastal and marine tourism destinations. The analysis of those impacts was
decomposed into a single impact chain.
Specifically, it presents a conceptual model on the effect that Climate Change would have
on conditions that make marine environments attractive for tourists visiting coastal
destinations. More in detail, climate hazards like the increase of mean and variability of
seawater temperature and the increase of oceans acidification, mainly, are affecting
marine habitats with touristic relevance through diminishing bio-productivity and
attracting exotic species, some of them toxic, and because of that, reducing the
attractiveness of marine landscapes and the presence of flagship species; increasing
turbidity in bathing and diving sea waters affecting the quality of bathing, diving,
snorkelling and bottom-glass boating experiences, at least; and increased frequency and
intensity of episodes of seagrasses massive death that arrive to the beaches affecting the
experience of lying and staying there.

50
The next figure shows the theoretical impact chain. As can be seen in the figure, the
impact of Climate Change on the touristic attractiveness of an island depends on a set of
multi-dimensional factors, including:
1. Increase in the mean and variability of seawater temperature is the main driver of marine habitat degradation; also seawater acidification impacts marine life although it substantially varies depending of the marine organisms;
2. The risk of those marine habitat transformations for tourism critically depends on the nature exposed to it, the amount and proportion of tourists that feel marine habitat is a relevant motivation to visit the destination, and the resilience of the exposed natural assets and tourists to those changes in the marine environmental conditions,
3. Finally, the preparedness to cope with the deterioration of its marine environment by developing substitutive attractions, is also a key aspect to assess the effective risk that those hazards pose on the tourism industry at the destination.
The complex relationship between climate change, marine habitats and tourism still
exhibits important gaps of knowledge. For example, there is no evidence on the impact
that the abovementioned hazards may have on the communities of cetaceans that live or
pass through near the coasts of the islands under study. In some cases, this is a very
important economic chapter within the tourism industry in the islands. Whether climate
change is going to diminish or not the abundance or affect the distance of those cetacean
communities from the island requires further research.
Figure 55: Loss of destination attractiveness due to marine environment degradation as a result of climate change hazards.
Source: SOCLIMPACT Deliverable Report – D3.2. Definition of complex impact chains and input-output matrix for each islands and sectors
Sen
siti
vity
Ad
ap
tive
ca
pa
city
Ocean acidification
Seawage reduction
EXPOSURE
Length of beaches
VULNERABILITY
HAZARD
RISKSurface of marine
phanerograms
Economic evaluation
Loss of attractiveness due to marine habitat degradation
Increased coral bleaching with degradation of
biodiversity and sea landscapes
INTERMEDIATE IMPACTS
Arrival of exotic species and
impoverishing of local biodiversity
Changes in species
distribution, abundance
and/or diversity
Potential for substitution
Costs of technological measures in tourism companies to improve marine-
based tourism experience
Deterioration of the destination imageLess will ingness to pay for marine activities
DEMAND-SIDE SUPPLY-SIDE
Sea water heating
Number of divers
Less tourism arrivals and receipts
Tourists arrivals
Socio-economic impacts
More extreme events
Phanerograms reduction due to
heat
Dead Seagrass removal

51
Selection of operationalization method
The Analytical Hierarchy Process (AHP) method was selected as the technique to
operationalize the impact chain since it is a well-grounded tool that allows for the
prioritization/ranking of alternatives using a weighting scheme that is established by
expert judgement. Hence, for the purposes of the project, it was considered suitable as it
would be able to reconcile the contribution of each risk factor (hazards, exposure, and
vulnerability, which includes sensitivity and adaptive capacity) towards the risk based on
expert opinion and, subsequently, order the islands in terms of which one is most at risk
of losing attractiveness due to the degradation of the marine environment.
Application of the AHP methodology
The problem to be solved along through the expert decision process was comparing the
risk of the European islands of losing tourist attractiveness due to the deterioration of
their marine habitats as consequence of climate change. The hierarchy tree for this
decision problem was built underpinning on the impact chain elements, together with the
variables that express the tourism-related environmental and social systems’ exposure to
those hazards, the sensitivity of the exposed systems to the referenced hazards and the
social capacities to cope with the potential impacts of climate change by protecting
nature and the society and/or making them more resilient.
Some modifications of the original impact chain were undertaken for the sake of
feasibility, although experts were encouraged to have in mind all the factors they know
can affect the impact of climate change on the marine habitat services for tourism. It
means that the hierarchy tree is a simplified structure of the main factors explaining the
complex relationship between climate change and the ecosystem services that support
tourist use of marine environments, but other factors also known by experts must be
taken into account at the time of comparing the components of the risk between islands.
This is one of the most interesting strengths of the decision processes based on expert
participation and, particularly, of the multicriteria analysis used in this case. The next
figure shows the basic structure, or hierarchy tree, of the decision making process that
was presented to the experts.

52
Figure 56: Hierarchy tree for marine habitats impact chain. Source: SOCLIMPACT Deliverable Report – D4.5. Design of a comprehensive approach to climate and climate-related risk information to policy makers
and the general public
Hazards are the climate events that instigate the climate-associated risk. In our context,
seawater heating was considered as the most relevant variable to assess changes in the
conservation status of the marine habitats that provide services for coastal tourism
activities. Other hazards initially considered, like acidification and storms, were finally
discarded. The first one because its effects on living marine organism are still under study
and the evidence is dispersed and not conclusive. The second one because in the
Mediterranean Sea and the Atlantic Ocean that surrounds the islands under study, storms
are considered not so frequent and intense to not giving time to marine ecosystems to
recover their previous conservation status.
Regarding indicators, published research shows 25 and 26 Celsius degrees as the
threshold temperatures over which seagrass meadows, the foundation species that mainly
structure ecosystems in the marine habitats of reference, start to decline. The indicators
used were the number of days per year with seawater temperature over 25 and 26 Celsius
degrees. Sources of information were data provided by the Soclimpact modellers.
Exposure denotes the range of ecological and social systems susceptible to be damaged
by hazards. This criterion, the natural and social systems potentially damaged by the
selected climate hazards, was decomposed into three sub-criteria, one referred to the
marine environment, and the other two related to the use that tourists make of the
services provided for the marine environments at the destination. These three sub-
criteria were expressed through three respective indicators. One, referred to the surface
of marine phanerogams that suffer from the climate stressors. Phanerogams, specially

53
Posidonia in the Mediterranean and Cymodosea in the Atlantic, are the very foundation
species organizing most of the coastal ecosystems. They provide food and shelter to
many different species and keep seawater clear by absorbing sediments. Additionally,
when become damaged, seagrasses meadows deliver dead individuals that go to lay on
the beaches used by tourists.
The second sub-criterion is one about the different types of direct uses that tourists
make of the ecosystem services. Diving was selected to represent theses uses and the
selected indicator was the number of divers per year. It was assumed that other sea
watching activities like snorkelling and bottom-glass boating evolves similarly than
diving. Experts were also invited to consider other sea environment users potentially
affected by the lack of water transparency and dead seagrass suspended in seawater like
surfers, windsurfers and other active users of the marine environment.
The third sub-criterion was related to the impact on most of tourists as bathers. Turbid
water affects the quality of bathing experience, which is an activity that most tourists do.
Sensitivity concerns the susceptibility of natural, cultural, and built resources to harm
that is a direct or indirect result of Climate Change hazards. For the operationalization of
this impact chain, sensitivity relates to the susceptibility of the phanerogam meadows to
changes in seawater temperature and to the extent to which the impoverishing of
seawater conditions and marine ecosystems may affect the welfare of tourists.
Regarding the effects of episodes of seawater heating on the integrity of seagrasses
meadows, the variable selected was periods of overheating and the indicators were the
number of days per year with seawater temperature over 25 and 26 Celsius degrees. As
explained above, experts were invited to take into account their experience and their
knowledge about the differences between the way seagrasses behave in the real world
and in the laboratory when studding the impact of water heating.
With respect to the impact of the marine environmental degradation on the welfare of
tourists, the indicator selected was the tourists’ willingness to pay for the preservation of
marine ecosystems2. Thus, ecosystem and social susceptibility are both taken into
account when comparing risks of marine environment degradation due to climate change
between islands.
Adaptive capacity reveals the potential to face the hazards by reducing the level of
exposure and/or increasing the resilience of the tourism system. This criterion was split
into three sub-criteria, one referred to the substitution of marine-based activities by lesser
marine habitats dependent ones, and two concerning with actions to heal the marine
2 This information was delivered by Soclimpact researchers who are in charge of the work package number 5. More information at: SOCLIMPACT Deliverable Report – D5.5. Report on market and non-market economic values for environmental services of marine and coastal ecosystems related to the activities of the blue economy.

54
environment like removing dead seagrasses or reducing non-treated sewage discharges.
In this case, island experts were consulted about the capacity of their reference
destination to address these adaptation actions using a 1-4 scale, where 1 represented a
very poor management capacity and 4 expressed a full capacity to deal with it.
Results and islands’ ranking
The table below shows the final results of the operationalization process. In particular, it
summarizes the global weights of the sub-criteria and the criteria and the global score of
the risk for each island; thus islands can be compared not just globally but also across the
set of the sub-criteria and the criteria being considered to estimate the aggregated risk.
Table 4: Final scores and islands’ ranking (under RCP8.5 distant future).
Criteria Sub-criteria Balearic Canary Cyprus Malta Sicily
Hazards Seawater heating RCP8.5 (2081-2100)
0.032 (15.9%)
0.007 (3.9%)
0.096 (35.3%)
0.044 (25.3%)
0.044 (25.5%)
Exposure
Surface of marine phanerogams
0.029 0.002 0.004 0.008 0.020
Number of divers 0.008 0.004 0.001 0.001 0.001
Tourists’ arrivals 0.012 0.012 0.002 0.001 0.005
Total 0.049
(24.6%) 0.018 (9.9%)
0.007 (2.5%)
0.011 (6.1%)
0.026 (15.4%)
Sensitivity
Phanerogams’ susceptibility to heat
0.048 0.082 0.011 0.020 0.017
Economic valuation
0.002 0.024 0.004 0.006 0.009
Total 0.050
(25.1%) 0.106
(57.7%) 0.014 (5.3%)
0.025 (14.6%)
0.026 (15.3%)
Adaptive capacity
Products substitution
0.032 0.032 0.093 0.032 0.017
Seagrass removal 0.018 0.002 0.006 0.006 0.003
Sea water pollution
0.019 0.019 0.056 0.056 0.056
Total 0.069
(34.4%) 0.053
(28.5%) 0.154
(56.9%) 0.094
(54.0%) 0.075
(43.8%)
Total 0.199 0.184 0.271 0.174 0.172
Rank 2 3 1 4 5
Note: Total contribution of the criterion to the final score of the island in parenthesis. Source: SOCLIMPACT Deliverable Report – D4.5. Design of a comprehensive approach to climate and climate-related risk information to policy makers
and the general public

55
Globally, the ranking obtained from the experts’ opinions assigns Cyprus the higher
score of the risk of its tourism sector to be affected by climate shock considered, the
heating of seawater, through its impact on the marine habitat services underpinning
tourist activity in the islands. This is mainly due to its high scores in the expected
evolution of the hazard and its low adaptive capacity, especially in the aspects of product
substitution and seawater pollution. Cyprus outstands in this position in all emissions
scenarios and time horizons, so for the experts there is no doubt this island will face the
higher risk at this respect.
Sicily and Malta show, in this order, the most advantageous position related to this risk
of their tourism activity to be affected by seawater heating, but due to different reasons.
While they are equal in hazard and sensitivity, the differ in exposition, where Malta get
advantage on Sicily due to the size of seagrass meadows exposed; and in adaptive
capacity, where Sicily performs better than Malta, especially in its potential to substitute
marine environment based products by other types of products.
In the middle, the Canary Islands follow Sicily and Malta in the ranking of the best
positioned to face this risk, and then the Balearic Islands. Yet, it is in the RCP8.5 distant
future scenario, because the susceptibility of the Posidonia meadows to the scenario in
which the episodes of seawater temperature higher than 26 increase notably. In the other
scenarios, even if the position of these Archipelagos is the same, the score of both
islands is very close, and their position in the ranking could result exchanged between
them.
Regarding the factors explaining their position in the ranking, the Balearic and the
Canary Islands show again differences. Balearic Islands perform worse in the hazard,
especially in the scenario RCP8.5 distant future, and in the exposure, mainly due to the
high differences in the surface of their phanerogam meadows. However, they advantage
the Canary Islands in sensitivity, mainly due to the extreme differences in the value that
tourists visiting both archipelagos give to the deterioration of the marine environments
measured through the tourists’ willingness to pay for actions to preserve them. Regarding
the adaptive capacity, their scores are similar, just separated for the better performance of
the Canary Islands when dealing with dead seagrass removal, mainly due to the much
higher amount of seagrass arriving to the beaches.
Summarizing, Cyprus faces the most critical position due to the intensity of the hazard
and the low capacity to cope with it; Sicily and Malta show the best score regarding this
risk due to their balanced distribution of risk components, not having strong weakness in
any of them. Meanwhile, the Balearic Islands show weakness in the size of the sub-
systems exposed and the Canary Islands in the sensitivity of the visitors to the worsening
of the marine environments and their Cymodocea meadows to seawater heating.
Regarding the last aspect, although all models consulted agreed in considering very low
the probability of seawater temperature going to levels of thermal stress for those
phanerogams, their position at this regards could be very sensitive to small seawater
heating predictions of the referred models.

56
Results displayed above emphasise comparisons between islands as this is the main
purpose of this analysis. However, results also allow to analyse the internal components
of the risk exhibited by each island. It comes simply from analysing with some more
detail the percentages regarding the total score for the risk of the criteria and sub-criteria
considered to obtain it.
Analysis of Malta
The island shows starting surrounding conditions favourable to face the risk of seawater
heating. Although the island scores the second worst in adaptive capacities to cope with
the main vectors of the problem, there are two particular aspects that compensate that
disadvantage. Firstly, the island does not hold attributes to attract classical massive
tourism to its coasts, as large beaches and exuberant marine ecosystems. Conversely,
Maltese tourism is attracted by its cultural attributes and business. Secondly, its marine
tourism industry heavily rests on activities that are not sensitive to the quality of the
marine environment, as the motorised ones. Because of it, even if Malta shares with
Sicily the lowest risk related to seawater heating, this island shows lesser uncertainties
than those showed by the Italian island.
The mentioned advantages and disadvantages of Malta are depicted in the next figures.
The further the criteria or sub-criteria is located from the centre of the graph, the more it
affects the risk.
Figure 57: Global weights of each criteria and sub-criteria in the final score. Source: SOCLIMPACT Deliverable Report – D4.5. Design of a comprehensive approach to climate and climate-related risk information to policy makers
and the general public

57
Figure 58: Global weights of each criteria and sub-criteria in the final score. Source: SOCLIMPACT Deliverable Report – D4.5. Design of a comprehensive approach to climate and climate-related risk information to policy makers
and the general public
The operationalization of the impact chain for the “Loss of attractiveness of a destination due to
the loss of services from marine ecosystems” was conducted using the AHP method. The method
proved to be appropriate, firstly, for dealing with the hierarchical nature of the impact
chain and, secondly, for using expert judgements to assess the comparative risk for the
islands over a large number of indicators (sub-criteria). Because the AHP method
determines a ranking of the islands, it can provide decision-makers with relative values
but not with absolute values. Such values will be delivered by the modelling activities of
other work packages and will give stakeholders a more complete picture of this specific
risk in terms of social, economic, and environmental impacts.
Loss of competitiveness of destinations due to a decrease in thermal comfort
This section describes the work carried out for the operationalization of the impact chain
“Loss of competitiveness of destinations due to a decrease in thermal comfort”3. It provides details on
the method applied for the operationalization, the island data used, and the results
obtained. As can be seen in the figure, the impact of Climate Change on the touristic
attractiveness of an island depends on a set of multi-dimensional factors, including:
3 Detailed information about the methodology used and the results obtained is available at: SOCLIMPACT Deliverable Report – D4.5. Design of a comprehensive approach to climate and climate-related risk information to policy makers and the general public.

58
1. the frequency, intensity, and duration of heatwaves, 2. to what extent and how tourist activities and tourists become exposed to
heatwaves, and how sensitive different segments of tourists are to extreme heat, and
3. the preparedness of the destination to cope with thermal discomfort episodes through information, technology, alternative activities, and medical attention.
Figure 59: Loss of competitiveness of destinations due to a decrease in themal comfort Source: SOCLIMPACT Deliverable Report – D3.2. Definition of complex impact chains and input-output matrix for each islands and sectors
For the purposes of the operationalization it was decided by the team to retitle the risk as
“Loss of attractiveness of a destination due to a decrease in thermal comfort”. This was done in order
for the risk to more accurately reflect the effects of the hazards, exposure and
vulnerability on an island rather than an on an individual tourist.
The selection of islands to be compared was based on the availability of island data
provided by the IFPs. The five islands selected for comparison were the Balearic Islands,
the Canary Islands, Cyprus, Malta, and Sardinia.
HAZARD
Humidity Index: Days with discomfort level greater than
35°C
Loss of competitiveness of destination due to a
decrease in thermal comfort
Increase in heat waves
Early warning system and management plans
Heat-affected
activities
Exposed areas Vulnerable groups
EXPOSURE
RISK
Increase of tropical nights
Medical attention
Increase in costs related to energy consumption (air conditioning)Increase in costs associated to health issues
Increase in water demandIncrease in health issues
Excess demand of health servicesChange in tourist seasons
DEMAND-SIDE SUPPLY-SIDE
INTERMEDIATE IMPACTS
Less tourism arrivals and receipts
Changes in seasonalregimes
New niches for disease
vectors
Tourist arrivals
Economic valuation
Air conditioning
VULNERABILITY
Se
ns
itiv
ity
Ad
ap
tiv
e c
ap
ac
ity
Socio-economic impacts

59
Selection of operationalization method
The Analytical Hierarchy Process (AHP) method was selected as the technique to
operationalize the impact chain since it is a well-grounded tool that allows for the
prioritization/ranking of alternatives using a weighting scheme that is established by
expert judgement. Hence, for the purposes of the project, it was considered suitable as it
would be able to reconcile the contribution of each risk factor (hazards, exposure, and
vulnerability) towards the risk based on expert opinion and, subsequently, order the
islands in terms of which one is most at risk of losing attractiveness due to a decrease in
thermal comfort.
Application of the AHP methodology
The problem to be solved along through the expert decision process was comparing the
risk of the European islands of losing tourist attractiveness due to a decrease in thermal
comfort as consequence of climate change. The hierarchy tree for this decision problem
was built underpinning on the impact chain elements. Some refinements were necessary
regarding the indicators (at sub-criteria level) that were to be used for comparing the
islands.
Figure 60: Hierarchy tree for thermal comfort impact chain. Source: SOCLIMPACT Deliverable Report – D4.5. Design of a comprehensive approach to climate and climate-related risk information to policy makers
and the general public
Hazards are the climate events that instigate the climate-associated risk. For the AHP
method, thermal sensation was considered as the most relevant indicator to assess

60
changes in the thermal comfort of tourists while staying at their destination as it is a
concept that combines temperature and humidity. Thus, it is the only sub-criterion of the
Hazard criterion. Moreover, the humidity index (humidex) (Masterton and Richardson,
1979) was selected as the most appropriate metric for thermal sensation. The metric is an
equivalent temperature that express the temperature perceived by people (i.e., the
temperature that the human body would feel), given the actual air temperature and
relative humidity.
Exposure denotes the range of ecological and social systems susceptible to be damaged
by hazards. This criterion was decomposed into sub-criteria relating to three indicators.
The first indicator relates to the exposure of tourists to heatwaves. The measure of the
indicator combines the percentage of an island prone to heatwaves and the percentage of
the tourist accommodations and facilities located in those areas prone to heatwaves. It is
necessary to factor in both these aspects of exposure in order to allow for a better
comparison of islands. For example, if an island has a small area that is prone to
heatwaves with the majority of tourists frequenting in that small area, then the
combination of the two factors will play a role when comparing, for instance, an island
that has large areas prone to heatwaves, but with tourists frequenting in places outside
these areas, since the overall exposure will be different. Specifically, it was decided to
assign a weight of 75% to percentage of an island prone to heatwaves and the remaining
25% to the percentage of tourist accommodations and facilities located in heatwave-
prone areas. The second indicator deals with the number of tourist arrivals during the
hottest months. The indicator is represented by the percentage of tourists that visit an
island between the months of May and September averaged over the last five years.
Finally, the third indicator concerns vulnerable groups of tourists who have the highest
risk of being affected by heatwaves. Literature confirms that under-6s and over-65s are
the most vulnerable age groups, however, the statistical services of the islands
homogeneously provide data for the under-14 and over-65 age groups. For this indicator,
two values were computed:
1. the number of tourists visiting an island that were under 14 years of age during the months of May and September over the total number of tourists visiting during the same period, averaged over the last five years, and
2. the number of tourists visiting an island that were over 65 years of age during the months of May and September over the total number of tourists visiting during the same period, averaged over the last five years.
For purpose of combining the two values and adjusting the change to age groups, it was
decided to apply a ratio of 15:85 in order to emphasize the proportion of over-65s (85%)
to the proportion of under-14s (15%).
Sensitivity concerns the susceptibility of natural, cultural, and built resources to harm
that is a direct or indirect result of Climate Change hazards. For the operationalization of
this impact chain, sensitivity relates to the susceptibility of tourists and is broken down
into sub-criteria pertaining to two indicators. The first indicator involves tourist activities.

61
The effect of heatwaves on tourist activities varies greatly. For example, a tourist
sunbathing at a beach will not feel the effects of a heatwave to the same degree as a
tourist that is trekking. Different destinations have different rates of tourists practicing
activities incompatible with heatwaves events. So, this indicator aims at catching these
differences. More specifically, this indicator is a measure of the percentage of visitors
who state that they practice activities not compatible with heatwave events. The second
indicator concerns the economic valuation of heatwaves from the perspective of tourists.
In the case of a heatwave event, all tourists will suffer from thermal discomfort to a
certain degree. Hence, the indicator represents their willingness to avoid this discomfort
as expressed in monetary terms. Therefore, it is measured by much money tourists are
willing to pay to avoid a heatwave during their vacation time4.
Adaptive capacity reveals the potential to face the hazards by reducing the level of
exposure and/or increasing the resilience of the tourism system through providing
information, adopting proper technology, supplying alternative activities, and improving
medical attention. This criterion is split into sub-criteria concerning three indicators. The
first indicator has deals with early warning systems. Setting up a proper early warning
system can help tourists and service providers to plan effective responses to heatwaves,
making them less distressing and reducing the destination’s vulnerability. Hence, this
indicator is measured with a score representing the quality of early warning systems in
place and advisement of options for tourists. The second indicator involves air
conditioning. Air conditioning is the most effective technology used to combat extreme
heat. Therefore, the indicator uses the percentage of hotel accommodations and tourist
facilities offering air conditioning systems as a measure of the capacity of the destination
to cope with this hazard. The final indicator concerns the care and medical attention
(such as in the case of heatstroke or similar) available on an island that may be necessary
to help reduce pain or avoid casualties due to diseases related to heatwaves. Therefore,
the number of hospital beds available on an island per 100,000 potential users, both
residents and tourists, is taken as the measure of this indicator.
Results and islands’ ranking
The table below shows the final results of the operationalization process. In particular, it
summarizes the global weights of the sub-criteria and the criteria and the global score of
the risk for each island; thus islands can be compared not just globally but also across the
set of the sub-criteria and the criteria being considered to estimate the aggregated risk.
4 Further information available at: SOCLIMPACT Deliverable Report – D5.5. Report on market and non-market economic values for environmental services of marine and coastal ecosystems related to the activities of the blue economy.

62
Table 5: Final scores and islands’ ranking (under RCP8.5 distant future).
Criteria Sub-criteria Balearic Canary Cyprus Malta Sardinia
Hazards Humidex RCP8.5 (2081-2100)
0.024 (12.1%)
0.008 (4.6%)
0.088 (34.6%)
0.023 (11.7%)
0.023 (13.1%)
Exposure
Exposed areas 0.007 0.002 0.007 0.007 0.007
Vulnerable groups 0.007 0.017 0.016 0.017 0.038
Tourists’ arrivals 0.050 0.008 0.029 0.018 0.065
Total 0.064
(32.2%)
0.027 (15.5%)
0.053 (20.9%)
0.042 (21.3%)
0.110 (62.9%)
Sensitivity
Heat-sensitive activities
0.074 0.073 0.074 0.074 0.012
Economic valuation 0.004 0.004 0.015 0.028 0.010
Total 0.079
(39.7%)
0.078 (44.8%)
0.089 (35.0%)
0.103 (52.3%)
0.021 (12.0%)
Adaptive capacity
Early-warning systems
0.007 0.007 0.007 0.007 0.003
Air conditioning 0.011 0.048 0.011 0.021 0.012
Medical attention 0.014 0.006 0.005 0.002 0.005
Total 0.032
(16.1%)
0.061 (35.1%)
0.024 (9.4%)
0.030 (15.2%)
0.020 (11.4%)
Total 0.199 0.174 0.254 0.197 0.175
Rank 2 5 1 3 4
Note: Total contribution of the criterion to the final score of the island in parenthesis. Source: SOCLIMPACT Deliverable Report – D4.5. Design of a comprehensive approach to climate and climate-related risk information to policy makers
and the general public
Cyprus is at most risk of loss of competitiveness due to a decrease in thermal comfort in
all four scenarios as it is ranked the highest in all cases. This is mainly attributed to the
fact that the number of days with a heatwave is predicted to increase greatly both in the
near and distant future. In addition, the island’s tourist accommodations and facilities are
located in areas most prone to heatwaves, and these are visited by many tourists during
the months of May to September. Cyprus also scores the highest in Sensitivity and
average in Adaptive capacity.
The Balearic Islands and Malta are ranked second and third, respectively, with regards to
the risk of loss of competitiveness. However, their overall scores are very close: 0.199 for
the Balearic Islands and 0.1970 for Malta in the RCP8.5 distant future scenario. They
score relatively high in Exposure and Sensitivity (the most important criteria for the risk)
and average in Hazard and Adaptive capacity.
Sardinia and the Canary Islands are the lowest at risk of loss of competitiveness. Even
though Sardinia scores the highest for Exposure, it has a low score for Sensitivity (which

63
contributes most to the risk) and average scores for Hazard and Adaptive capacity. On
the other hand, the Canary Islands has a low score for Hazard and Exposure, but
relatively high for Sensitivity and Adaptive capacity.
Analysis of Malta
The island shows some disadvantage in the criterion Sensitivity, contributing 52.3% to
the final score. In particular, it is due to the heat-sensitive activities that tourists carry out
when visiting the destination, given that Maltese tourism is attracted by its cultural
attributes. On the other hand, Malta scores average in the Hazard, in Exposure and in
Adaptive Capacity, being especially favourable the medical attention in the latter case.
The mentioned advantages and disadvantages of Malta are depicted in the next figure.
The further the criteria or sub-criteria is located from the centre of the graph, the more it
affects the risk.
Figure 61: Global weights of each criteria and sub-criteria in the final score. Source: SOCLIMPACT Deliverable Report – D4.5. Design of a comprehensive approach to climate and climate-related risk information to policy makers
and the general public

64
Figure 62: Global weights of each criteria and sub-criteria in the final score. Source: SOCLIMPACT Deliverable Report – D4.5. Design of a comprehensive approach to climate and climate-related risk information to policy makers
and the general public
The operationalization of the impact chain for the “Loss of attractiveness of a destination due to
a decrease in thermal comfort” was conducted using the AHP method. The method proved to
be appropriate, firstly, for dealing with the hierarchical nature of the impact chain and,
secondly, for using expert judgements to assess the comparative risk for the islands over
a large number of indicators (sub-criteria). Because the AHP method determines a
ranking of the islands, it can provide decision-makers with relative values but not with
absolute values. Such values will be delivered by the modelling activities of other work
packages and will give stakeholders a more complete picture of this specific risk in terms
of social, economic, and environmental impacts.
4.2 Aquaculture
In the framework of Soclimpact, the following impacts were more closely studied:
1) Increased fragility of the aquaculture activity due to an increase of extreme
weather.
Increased frequency and intensity of extreme weather events result in higher waves and
storm surges and changes in salinity. These events result in loss of stock and damages to
infrastructure and require adaptation in species selection, site selection and technologies.
2) Decrease in production due to an increase in surface water temperature
Changes in water temperature can directly affect the growth rate and Food Conversion
Ratio of the fish. Temperature also affects the oxygen levels and can cause harmful algae

65
blooms, reduce water quality and an increase in occurrence of diseases and parasites
which can than affect the fish or other culture species. A change in temperature can
ultimately change the ranges of suitable species for a certain area but can also have
positive impacts such as increased growth (mainly in tropical and sub-tropical regions)
and a longer growing season. Primary productivity can also increase with increasing
temperature, which may be beneficial for filter feeders such as mussels.
The concept of Impact Chain (Schneiderbauer et al. 2013; Fritzsche et al. 2014) is also
applied as a climate risk assessment method (with 7 steps for aquaculture, present risk
and future risk are calculated separately) for research of decision making. The goal of
this method is to use collected data for certain indicators of the impact chains for
different islands to assess the risks of each island’s aquaculture sector to be affected by
the hazard displayed in the impact chain. Therefore, data for all indicators were collected
from all islands. After reviewing the data, selecting indicators and islands, the indicators
were normalized, and different risk components were weighted. Using these values, the
risks for present and future conditions under different Representative Concentration
Pathway (RCP) scenarios were calculated for the different island and compared between
each other. For the aquaculture impact chains, RCP 4.5 and 8.5 were compared since for
the hazard models RCP 2.6 was not always available.
Step 1: Data collection by Island Focal Points
To be able to apply the GIZ risk assessment method, a solid data basis is crucial.
Therefore, data was collected by the Island Focal Points (IFPs) of the SOCLIMPACT
project. The questionnaire requested datasets for 16 indicators and topics with several
subcategories on exposure and vulnerability. The IFPs reached out to local stakeholders
and authorities to collect the requested data which was then resubmitted to the Sectoral
Modelling Team (SMT) Aquaculture.
Step 2: Data review and island selection
Data were submitted by most of the islands to the SMT Aquaculture. Most datasets were
incomplete with major data missing regarding important information for the successful
operationalization of the impact chains. Therefore, and for the fact that some islands do
currently not have any active marine aquaculture operations running, some islands were
excluded from the operationalization. Out of the 12 islands assessed in the
SOCLIMPACT project, six were included in the operationalization of the impact chains
using the risk assessment method from GIZ: Corsica, Cyprus, Madeira, Malta, Sardinia
and Sicily. The other six islands (Azores, Balearic Islands, Baltic Island, Canary Islands,
Crete and French West Indies) do currently not have active marine cage aquaculture
operations or show insufficient data availability. Data on hazards was provided by the
models developed in work package 4. Eventually, Madeira was excluded for the impact
chain on extreme weather events due to lack of reliable hazard data. A qualitative analysis
will be provided in the result section.

66
Step 3: Review and selection of indicators
The data collection and review revealed that not all indicators of the impact chains could
be used for the operationalization process. Therefore, these indicators were reviewed
carefully and the ones which were not represented by sufficient data were excluded. The
revised impact chain was developed depending on the indicators selected.
Figure 63: Impact chain on Increased fragility of the aquaculture activity due to an increase of extreme
weather adjusted depending on data availability and used for the operationalisation. Source: Soclimpact project deliverable 3.2
Some indicators require data on the proportions of species farmed on a specific island.
Therefore, a table with % of each species farmed on each island was prepared. This data
was obtained directly from the IFPs or from the FAO or national statistics offices.
Table 6: Proportions of aquaculture species farmed per island. Proportion of species production
Species Mussels &
clams Tuna Sea bream Sea bass
Corsica 0.43
0.265 0.265
Cyprus
0.84 0.16
Madeira
1.0
Malta
0.94 0.048 0.012
Sardinia 0.84
0.08 0.08
Sicily 0.44
0.3 0.26 Source: Soclimpact project deliverable 4.5

67
Impact chain: extreme weather events
Hazard
For the component hazard both indicators were used for the operationalisation. The
wave amplitude was shown as significant wave height (SWH) in m and the return time
number of years between extreme events quantified with a threshold of >7m. The data
was derived from the climate models of Deliverable 4.4 at the exact locations where the
fish farms are located and then averaged for all locations on one island. This allows a
more accurate assessment than taking the average values for the entire island.
Exposure
Four indicators were selected to be operationalized. The number of aquaculture
operators was provided by the IFPs and additional literature. There was no data available
on the actual size of stock, therefore the yearly production of aquaculture products (fish
and shellfish) in tons was used as a proxy indicator. The location of farms was rated by
using two different proxy indicators: the location of the farms in relation to the
prevailing wind direction and the average distance of the farms to shore. To be able to
rate the location in relation to the wind direction, the values were estimated (with 0 being
completely sheltered and 1 being exposed to wind and possible storms). After
normalizing the distance from shore (measured by using GIS software and the exact
coordinates of the fish farms), both values were averaged and represent the exposure of
the location of farms.
Sensitivity (vulnerability)
Two indicators were applied to calculate the score of factors of sensitivity. The sensitivity
of species was estimated by reviewing literature and interviewing experts regarding the
vulnerability of species to extreme weather events. After receiving these data, average
values were calculated of all values for the present species on each island.
Table 7: Estimated vulnerability factors for the sensitivity of species to wave stress. 1= very vulnerable to stress: 0=very resilient to stress.
Source: Soclimpact project deliverable 4.5
The same approach was implemented to calculate the vulnerability of the infrastructure
types used on each island based on the type of species farmed.
Sensitivity of species for wave stress threshold
Species Sea bream Sea bass Tuna Mussels & Clams
Estimated vulnerability
factor 0.55 0.65 0.3 0.9

68
Table 8: Estimated vulnerability values for the vulnerability of infrastructure in case of an extreme weather event.
1= very vulnerable to stress: 0=very resilient to stress.
Source: Soclimpact project deliverable 4.5
Adaptive capacity (vulnerability)
The indicators distance to harbor and the presence of warning systems were used to
describe the adaptive capacity. As there is a weather forecast available for all islands, the
values for the presence of warning systems are all the same and represent low values. The
distance to harbors was moved to the subcomponent adaptive capacity and measured
using GIS software and the exact locations of the farms which were provided by the
IFPs and literature data. It represents the average distance of all farms to their closest
harbor for each island and is shown in meters. The indicator stocking density and
engineering of structures were excluded from the operationalisation. For the stocking
density there were no data available from all islands and in any case, it was estimated to
be similar for all islands. The engineering of structures was already covered with the type
of infrastructures in the sensitivity subcomponent.
Impact chain: Increased sea surface temperature
Hazard
Changes in surface water temperature was chosen to be the indicator representing the
component hazard. The temperature data for this indicator was obtained from the
location of each farm from the climate models of Deliverable 4.4 and averaged per
island. To calculate the hazard for each island and each RCP, the species’ temperature
thresholds were taken into account. According to a literature review (see Annex) the
temperature thresholds for farmed species is the following:
Table 9: Temperature threshold per species.
Temperature thresholds for different species
Species Sea bream Sea bass Tuna Mussels & Clams
Threshold (°C) 24 25 24 20.5
Source: Soclimpact project deliverable 4.5
Vulnerability of aquaculture infrastructure in case of an extreme weather event
Infrastructure for species Sea bream & Sea bass Tuna Mussels & Clams
Estimated vulnerability factor 0.4 0.3 0.6

69
It must be noted that the threshold for Tuna was set to 24°C since in the project only
Tuna fattening is done (in Malta) and for adult fish the threshold is 24°C while in the
review the whole life cycle as well as prey species was taken into account which is not
relevant for this exercise. Based on these thresholds, the duration of the longest event
per year (in days) was calculated for the temperatures 20 °C, 24 °C and 25 °C for RCP
4.5 and 8.5 from the models developed in WP4. After normalizing these values (which is
described in detail in Step 4), the values for each temperature and therefore each species
threshold were averaged using the sum product of the normalized values and the species’
proportion on the total production of the island. The final values represent the score of
the hazard. The indicator changes in seawater characteristics was not included in the
operationalization as there is no additional data related to this indicator which is not
covered by the surface water temperature indicator.
Exposure
Two indicators were used for the component exposure: the number of aquaculture
operators and the yearly production (in tons) as a proxy indicator for the size of stock.
Sensitivity (vulnerability)
The subcomponent sensitivity includes two indicators which were combined to one
indicator for the operationalization. The sensitivity of species directly correlates with
suitable temperature for species and therefore it is summarized as temperature sensitivity
of species. It was calculated by using temperature threshold values for each species
obtained from a literature review and expert opinion. These values were averaged
depending on which species and in which quantities they are farmed on the islands.
Table 10: Estimated vulnerability factors for the sensitivity of species to temperature stress.
1= very vulnerable to stress: 0=very resilient to stress.
Source: Soclimpact project deliverable 4.5
Adaptive capacity (vulnerability)
Two out of four indicators from the impact chain were utilized for the
operationalization. The monitoring early warning systems were included and show all the
same values for all islands as there is a sea surface temperature forecast available for each
island. The capacity to change species was included with all the islands displaying the
same value as well. The risk value is high in this case, as it would be quite difficult to
Sensitivity of species for temperature stress threshold
Species Sea bream Sea bass Tuna Mussels & Clams
Estimated vulnerability
factor 0.6 0.6 0.3 1

70
change species farmed on the islands in general as this would result in high economic
expenditures. For the indicator of the impact chain know-how of recognizing and
treating diseases/parasites there is no data available for any island. As this could vary a
lot between the islands, the indicator was removed instead of making assumptions, to not
negatively influence the risk values. A similar case arises from the indicator availability of
alternative place for farming. There is no data available to make correct assumptions
regarding the occurrence of alternative areas on the islands and therefore the indicator
was not used for the operationalization.
Step 4: Normalization of indicator data for all islands
In order to come up with one final risk value per island and to be able to compare these
values between islands, the indicator values were transferred into unit-less values on a
common scale. The normalized values range between 0 and 1 with 0 being low risk and 1
being very high risk.
There are two different ways of normalizing the indicator values:
- Minimum/maximum normalization;
- Expert judgement.
Fraction of maximum normalization
This normalization method was used for indicators which were expressed by real data
and not by expert judgement. The value for each island was calculated as a fraction of the
maximum value in de data set. Meaning the island with the maximum value was given 1
and the rest as a fraction thereof.
The following indicators were normalized using this method:
Extreme weather events:
- yearly production/ number of aquaculture operators
- average distance from shore (location of farms)
- average distance to harbour
Sea surface temperature:
- yearly production/ number of aquaculture operators
Minimum/maximum normalization
This normalization method was used for indicators which were expressed by real data
and not by expert judgement. The minimum and the maximum value of that indicator of
all islands was calculated and the following formula was applied to normalize all indicator
values to the scale between 0 and 1:
𝑥𝑛𝑜𝑟𝑚𝑎𝑙𝑖𝑧𝑒𝑑 = (𝑥 − 𝑥𝑚𝑖𝑛)
(𝑥𝑚𝑎𝑥 − 𝑥𝑚𝑖𝑛)

71
For both impact chains, the hazard values were normalised using the min and max
method. However, in these cases the minimum and maximum values were not
automatically the minimum and maximum values of the entire dataset but rather treated
differently for every hazard indicator. This handling of the normalisation of the hazard
indicators arose from the different nature of the indicator itself and the fact that data
were available for different RCPs and periods of time. Therefore, the hazard indicators
were normalised as following:
The sea surface temperature values were normalised separately for each temperature data
set. This means that all values for all RCPs and time periods of one “longest event over a
certain temperature” were taken into account when determining the minimum and
maximum values. For Madeira, RCP 4.5 data was not available, therefore RCP 2.6 data
was used and doubled.
Wave amplitude (significant wave height)
Figure 64: Modelling indicators for sea-state hazards, return time and significant wave height starting with 4 Global Circulation-Regional Circulation Model chains, which a fed into the WAM regional
wave model. Results are then normalized. Source: Soclimpact project deliverable 4.5
The return time was normalised as following; all values equal or greater that 10 are set to
0, all values between 0 and 10 are linearly mapped to the interval 1-0, so that 0 gives risk
1, 10 gives risk 0. It was assumed that a time period of 10 or more years allowed to repay
investments is a reasonable threshold.

72
Since, as described in D4.4 of Soclimpact, that the probability of having at least one
event exceeding the return level associated with a N-year return period during a N-year
time window is anyway greater than that of its complement (no events exceeding the
limit in the N-year time window), and that the return level cannot be considered a “no-
risk” safety level in evaluating the survivability and sustainability of structures or plants.
Table 11: Probability of occurrence of at least one event exceeding the return level associated with a given return period (blue) in a given time window (green), according to the formula. RL,T=1-(1-1/T)**L, where L=length of time window, T=Return Period.
Return Period [years]
Probability of occurrence
1 years 2 years 5 years 10 years 20 years
5 20% 36% 67% 89% 99%
10 10% 19% 41% 65% 88%
20 5% 10% 23% 40% 64% Source: Soclimpact project deliverable 4.5
Therefore, using a combination of the normalised values and the probability of
occurance, experts transformed these values into risk classes such all "low", "moderate",
"medium", "high", "very high", or the like, on a qualitative basis.
Expert judgement
For some indicators from both impact chains there was no data available which is the
reason why expert judgement and estimations were applied. The following indicators
were expressed using expert’s estimations:
Extreme weather events: - farm locations (in relation to main wind direction) - sensitivity of species - vulnerability of type of infrastructure - presence of warning system
Sea surface temperature: - estimated temperature sensitivity of species - capacity to change species
- monitoring early warning systems
In all cases the normalization scale of 0 to 1 was applied with 0 being low risk and 1
being very high risk.
Step 5: Weighting of different risk components
In this step, the different risk components hazard, exposure and vulnerability (including
the sub-components sensitivity and adaptive capacity) were rated. The total of the values
sums up to 1. The weights were estimated by aquaculture experts and the basis of the
estimations were subjective estimations, similar to the ones used in the AHP method.
However, in this method the data availability was additionally taken into account.

73
Components for which the available data was scarce, outdated or more unreliable the
weights were set lower on purpose, while components with accurate datasets were given
a higher weight as following:
Table 12: Components and their weights. (Sub)Component Weight
Sea surface temperature Extreme events
Hazard 0.3 0.6 wave height 0.2 return time 0.8
Exposure 0.4 0.2
Vulnerability 0.3 0.2
Sensitivity 0.75 0.75
Adaptive Capacity 0.25 0.25 Source: Soclimpact project deliverable 4.5
Step 6: Calculations of risk for present conditions
Before being able to calculate the risk values, the scores for each component/
subcomponent had to be calculated by taking the average of the corresponding
indicators:
𝑠𝑐𝑜𝑚𝑝 =(𝑖𝑛𝑑1 + 𝑖𝑛𝑑2 + ⋯ + 𝑖𝑛𝑑𝑛)
𝑛
s – score
comp – component or subcomponent
ind – indicator
n – number of indicators
The final risk value was calculated by summing up the scores of the components
multiplied individually with the corresponding risk component weightings:
𝑅𝑖𝑠𝑘 = 𝑠ℎ𝑎𝑧 ∗ 𝑤ℎ𝑎𝑧 + 𝑠𝑒𝑥𝑝 ∗ 𝑤𝑒𝑥𝑝 + 𝑤𝑣𝑢𝑙 ∗ (𝑠𝑠𝑒𝑛 ∗ 𝑤𝑠𝑒𝑛 + 𝑠𝑎𝑐 ∗ 𝑤𝑎𝑐)
s – score w – weight haz – hazard exp – exposure vul – vulnerability sen – sensitivity ac – adaptive capacity

74
These risk values were calculated for each island individually and range between 0 and 1.
After completing these calculations, it was possible to compare the islands between each
other.
Step 7: Calculations of risk for future conditions (different RCPs)
To be able to project the risk values to future conditions, the operationalization was
adjusted to the different Representative Concentration Pathways (RCPs). Therefore, the
whole operationalization was duplicated and different values for the hazard indicators
per island were inserted. These values were taken directly from the climate models
provided in work package 4 for the different RCP scenarios (RCP 4.5 and 8.5). The
resulting values can be compared between the islands as well as between the different
RCP scenarios.

75
Results
Impact chain: extreme weather events
Table 13: Exposure and vulnerability indicators each island Component Exposure Vulnerability
Component Weight 0.2 0.2
Sub-component Factor of sensitivity Factors of adaptive capacity
Sub-component weight 0.75 0.25
Indicator Average Size of
producers Location of farms
Score for
level of
exposure
Sensitivity of
species (stress)
Type of
infrastructures
(material and
strength)
Score of
factor of
sensitivity
Distance to
harbour (vessel
capacity in extreme
weather
conditions)
[average & m]
Absence of
warning
system
Score of
factor of
adaptive
capacity
Proxy indicator
Yearly production
/Number of
operators
Farms
sheltered
from wind
direction
Average distance
from shore (m) Average of
normalised
indicators
Estimated
sensitivity of
species
Type of
infrastructure
(based on species) Average of
indicators
Average distance to
harbour (m)
Presence of
warning
system Average of
normalised
indicators
Data Normalised Normalised Data Normalised Normalised Normalised Data Normalised Normalised
Corsica 328.6 0.12 0.4 644 0.16 0.20 0.7 0.5 0.59 4789 0.96 0 0.48
Cyprus 811.4 0.29 0.5 3923 1.00 0.53 0.6 0.4 0.48 4616 0.92 0 0.46
Malta 2,755.9 1.00 0.5 1731 0.44 0.74 0.3 0.3 0.31 4165 0.83 0 0.42
Sardinia 537.2 0.19 0.4 1193 0.30 0.27 0.9 0.6 0.71 2183 0.44 0 0.22
Sicily 399.6 0.14 0.5 1000 0.25 0.27 0.7 0.5 0.61 5000 1.00 0 0.50
Source: Soclimpact project deliverable 4.5

77
Mediterranean islands
Hazards
Statistics of extreme events can significantly differ across the four model realizations
The hazard data for return time was derived from 3 different models; CMCC, CNRM and GUF.
Since the data varies highly between models a best- and worst case scenario was executed where
in the best-case scenario the lowest value (showing the lowest risk) between the models was used
and in the worst case scenario the highest value was used. Distance between the best and the
worst projection, give an estimate of uncertainty
Model projections for Average Significant Wave Height are in good agreement as to both pattern
and values. Hazard was evaluated from ensemble mean, uncertainty from ensemble STD (not
exceeding 15% - highest disagreement for highest values).
Figure 65: Results for return time in best- and worst-case scenarios for Mediterranean islands for reference period
(red line), RCP 4.5 (dotted line) and RCP 8.5 (black line). Source: Soclimpact project deliverable 4.5
"Worst" and "best" cases respectively refer to the least and most favorable projection in the set of models. For example return time, you will find that there is at least one model predicting no

78
hazard for all islands except Sardinia with no significant variations across scenarios. In fact, all circles cluster and overlap at the centre, while those that represent Sardinia all lie very close to the limit between the two lower hazard classes. On the other hand, at least one other model predicts appreciable yet low hazard for Corsica, Sicily and Sardinia, and hazard going from moderate (reference period, red) to medium (RCP8.5, solid black), to high (RCP4.5, dotted black) for Malta, while for Cyprus the hazard is irrelevant even for the most negative projection. This means that a) the result for Sardinia and Cyprus is stable across models, b) models slightly disagree for Sicily and Corsica, but generally predict low hazard, c) the projection for Malta is affected by greater uncertainty for all scenarios. This is due to the fact that Malta is located in the Sicily Channel, where the dynamics exhibit significant gradients in the direction perpendicular to the channel axis, which are differently represented by different models. The worst and best cases do not necessarily come from the same model for all islands, that is, one model can predict the lowest hazard for Sicily and another one for Sardinia, and each of these projections is represented in the plot for the corresponding island.
Risk- Best-case scenario
Table 14: Risk results for best-case scenario for impact chain Extreme weather events
Reference period
Mid century End century
Risk Hist. RCP 4.5 RCP 8.5 RCP 4.5 RCP 8.5
Corsica 0.19 0.19 0.19 0.20 0.21
Cyprus 0.23 0.23 0.23 0.23 0.22
Malta 0.26 0.26 0.26 0.26 0.26
Sardinia 0.30 0.32 0.32 0.28 0.31
Sicily 0.20 0.20 0.20 0.20 0.20
Source: Soclimpact project deliverable 4.5

79
Figure 66: Risk results for best-case scenario for impact chain Extreme weather events under RCP 4.5 Source: Soclimpact project deliverable 4.5
Figure 67: Risk results for best-case scenario for impact chain Extreme weather events under RCP 8.5 Source: Soclimpact project deliverable 4.5
0,00
0,05
0,10
0,15
0,20
0,25
0,30
0,35
Historic mid century end century
RCP 4.5
Corsica Cyprus Malta Sardinia Sicily
0,00
0,05
0,10
0,15
0,20
0,25
0,30
0,35
Historic mid century end century
RCP 8.5
Corsica Cyprus Malta Sardinia Sicily

80
Risk- Worst-case scenario
Table 15: Risk results for worst-case scenario for impact chain Extreme weather events
Reference period
Mid century End century
Risk Hist. RCP 4.5 RCP 8.5 RCP 4.5 RCP 8.5
Corsica 0.25 0.25 0.26 0.28 0.26
Cyprus 0.23 0.23 0.23 0.23 0.22
Malta 0.42 0.45 0.56 0.45 0.36
Sardinia 0.33 0.33 0.34 0.33 0.33
Sicily 0.30 0.34 0.33 0.33 0.26 Source: Soclimpact project deliverable 4.5
Figure 68: Risk results for worst-case scenario for impact chain Extreme weather events under RCP 4.5 Source: Soclimpact project deliverable 4.5
0,00
0,05
0,10
0,15
0,20
0,25
0,30
0,35
0,40
0,45
0,50
begin century mid century end century
RCP 4.5
Corsica Cyprus Malta Sardinia Sicily

81
Figure 69: Risk results for worst-case scenario for impact chain Extreme weather events under RCP 8. Source: Soclimpact project deliverable 4.5
Bigger islands were separated in areas since conditions can vary greatly in different parts of the island. Table 16: Risk results for impact chain Extreme weather events for the Mediterranean islands with large islands
analysed on a local level using the worst-case scenario.
Worst case Historic RCP 4.5 RCP 8.5
mid century end century mid century end century
Malta 0.37 0.45 0.45 0.56 0.36
Sicily North 0.34 0.39 0.39 0.36 0.30
Sicily East 0.17 0.20 0.20 0.20 0.20
Sicily South 0.41 0.42 0.40 0.42 0.30
Corsica West 0.37 0.32 0.37 0.34 0.34
Corsica East 0.18 0.18 0.18 0.18 0.19
Sardinia West 0.40 0.46 0.47 0.47 0.44
Sardinia East 0.39 0.20 0.20 0.20 0.18
Cyprus 0.23 0.23 0.23 0.23 0.22
Source: Soclimpact project deliverable 4.5
For all islands and all RCPs, it can be concluded that there is no significant change in risk, even in the worst-case scenario, between the reference period, middle and end of the century. Malta, Sicily south and Sardinia west are found to be the most vulnerable with risk exceeding 0.45 due to a higher hazard risk. Malta also has the highest exposure of all islands. Malta has an increased risk mid-century in the worst case scenario, due to an increase in hazard.
0,00
0,10
0,20
0,30
0,40
0,50
0,60
begin century mid century end century
RCP 8.5
Corsica Cyprus Malta Sardinia Sicily
0.00 – 0.20
Very low
0.20 – 0.40
Low
0.40 – 0.60
Medium
0.60 – 0.80
High
0.80 – 1.00
Very high

82
Impact chain: sea surface temperature
Hazard
Model projections are in good agreement with previous lower resolution ensemble estimates but
offering greater detail along island shorelines. Uncertainty to be rigorously estimated from
ensemble STD when new simulations of comparable resolution become available, but overall
tendency regarded as robust.
Exposure and vulnerability indicators
Table 17: Expose and vulnerability indicators, the data for each island and the normalized values.
Component
Exposur
e Vulnerability
Component
weight 0.4 0.3
Sub-component Factor of sensitivity Factors of adaptive capacity
Sub-component
weight 0.75 0.25
Indicator Average Size of
producers
Score for
level of
exposure
Sensitivity
of species
(stress)
Score of
factor of
sensitivit
y
Monitorin
g early
warning
systems
Capacity
to change
species
Score
of factor
of
adaptiv
e
capacity
Proxy indicator
Yearly production
/Number of operators
Average
of
normalise
d
indicators
Temperatur
e sensitivity
of species
(expert
guess)
Indicator
Monitoring
early
warning
systems
Capacity
to change
species
Average
of
indicato
r
Data Normalise
d Normalised
Normalise
d
Normalise
d
Corsica 328.6 0.12 0.12 0.7 0.7 0 1 0.5
Cyprus 811.4 0.29 0.29 0.6 0.6 0 1 0.5
Madeira 125.3 0.05 0.05 0.6 0.6 0 1 0.5
Malta 2,755.9 1.00 1.00 0.6 0.6 0 1 0.5
Sardinia 537.2 0.19 0.19 0.9 0.9 0 1 0.5
Sicily 399.6 0.14 0.14 0.8 0.8 0 1 0.5
Source: Soclimpact project deliverable 4.5
Risk
The values in this analysis is not an estimate of the risk but rather a ranking between islands since a lot of the data was normalised based on a min-max or fraction of the maximum of the islands. A proper risk assessment would need additional data from farmers and a detailed model of farming results as a function of temperature. Malta has a much higher risk than the other islands due to the high exposure, Malta’s farm produce on average 3.5 to 22 times more than the farms on other islands.

83
Table 18: Risk results for impact chain Sea Surface temperature
Historic Mid century End century
Risk Hist. RCP 4.5 RCP 8.5 RCP 4.5 RCP 8.5
Corsica 0.30 0.34 0.41 0.38 0.42
Cyprus 0.40 0.48 0.48 0.50 0.59
Malta 0.68 0.73 0.74 0.75 0.80
Madeira 0.19 0.26 0.23 0.24 0.35
Sardinia 0.37 0.42 0.43 0.44 0.49
Sicily 0.38 0.43 0.43 0.45 0.48
Source: Soclimpact project deliverable 4.5
Figure 70: Risk results for impact chain Sea Surface temperature under RCP 4.5 Source: Soclimpact project deliverable 4.5
0,00
0,10
0,20
0,30
0,40
0,50
0,60
0,70
0,80
historic mid century end century
RCP 4.5
Corsica Cyprus Malta Madeira Sardinia Sicily

84
Figure 71: Risk results for impact chain Sea Surface temperature under RCP 8.5 Source: Soclimpact project deliverable 4.5
4.3 Energy
There are more than 2200 inhabited islands in the EU. Lately, they have come into the focus of
the EU, which addresses energy questions as part of the 'Clean energy for all Europeans'
package. The Clean energy for EU islands initiative provides a long-term framework to help
islands generate their own sustainable, low-cost energy. This is particularly interesting, because
many islands have vast amounts of renewable energy sources but rely on fossil fuel imports yet.
These are relevant challenges regarding the energy transition in the EU, whose aim of net zero
greenhouse gas emissions in 2050 should determine the future energy plans of the islands.
Islands could provide showcases for successful 100% renewable energy supply.
The National Hydropower Association (NHA) defines marine energy as electricity generation
from marine kinetic energy, such as waves, tidal and ocean currents. Pisacane et al. (2018) add
other marine energy sources like ocean thermal energy conversion (exploiting temperature
differences between deep and surface ocean waters) and salinity gradient energy (harnessing the
energy potential of differences in salt concentration in ocean and river waters). All these
technologies are still in a development phase, and even if they reach the commercial phase in the
future, it is not likely that they will generate a large share of the power. Therefore, the analysis in
SOCLIMPACT focuses on the main renewable energy sources (RES), wind energy and solar
photovoltaic (PV) energy, which are presently, and very likely in future, the backbone of the
deployment of renewable energies, due to their technological maturity and low cost.
0,00
0,10
0,20
0,30
0,40
0,50
0,60
0,70
0,80
0,90
historic mid century end century
RCP 8.5
Corsica Cyprus Malta Madeira Sardinia Sicily

85
Nevertheless, we take into account not only onshore but also offshore wind energy, as a
specifically marine energy source which has distinct advantages like much higher productivity
and less time variability than onshore wind energy, and does not require land space which is
limited and costly in the islands. There are relevant obstacles for its deployment, like the deep
bathymetry surrounding most of the islands, and the lower wind speeds over the Mediterranean
in comparison to areas like the North Sea where offshore wind energy is being deployed rapidly.
Additionally, we consider also offshore PV energy. Despite some disadvantages that have to be
overcome (corrosion problems due to salty water or the impact of waves), this application is
receiving growing interest, as it offers an option for renewable energy development in countries
and islands with limited space for the installation of solar panels, and can show increased
performance due to the cooling effect of water and wind on PV cells.
Most RES (renewable energy sources) depend on the climate, and therefore climate change can
have an impact of the resource amount. Additionally, wind and solar PV energy are not
dispatchable, and its variability represents a challenge for its integration in the power system.
This is a challenge that can be addressed through storage or backup plants (which can be itself
renewable energy plants), through demand management, but also taking advantage of
complementarity of PV and wind energy and its very different variability characteristics. This
approach is gaining attention from stakeholders in the islands, as demonstrated by the report by
Monitor Deloitte and Endesa (2020), in which one of the key recommendations for achieving an
accelerated zero carbon target in Balearic and Canary Islands by 2040 is the combination of solar
PV and wind energy, with clearly higher shares of PV than of wind energy. Such a mix would
reduce strongly the need for storage, due to the stability of solar PV production.
There are also challenges for the demand and transmission components of the energy systems of
the islands due to climate change: changes in temperature leading to changing energy demand,
changes in precipitation and evaporation creating risks for desalination.
For the energy sector, three theoretical impact chains (IC) have been proposed in the
SOCLIMPACT project:
i) risk of changes in power generation due to long term climate change and variability, ii) risk of changes in energy demand due to changes in precipitation and temperatures, iii) risk of damages to transmission grids due to extreme events.
Only the second IC, i.e., the one related to changes in energy demand was selected to be
operationalized, mainly due to data availability constraints. The quality of IC operationalization
depends strongly on data availability over long periods. Data for cooling energy demand are still
scarce and difficult to obtain, despite the requirements of the European Commission for
information regarding the national energy efficiency targets. The availability and quality of
cooling demand data should improve in the future due to the need for tracking the advances
towards energy efficiency targets. Desalination demand data should also improve strongly,
including data about the energy efficiency of the desalination processes used.
This demand-side IC has been deployed into two individual ICs, namely, the increased energy
demand due to increased cooling demand and the increased energy demand due to increased

86
desalination needs. Both risks depend on the temperature increase, which is a very certain effect
of climate change. The risk assessment was carried through and expert assisted process.
The diagrams of the two operationalized impact chains are presented below
Figure 72: Conceptualization framework for the operationalization of the energy impact chain: Risk of increased energy demand due to increased cooling demand
Source: Soclimpact project Deliverable 4.5-Comprenhensive approach for policy makers
Figure 73: Conceptualization framework for the operationalization of the energy impact chain: Risk of increased energy demand due to increased desalination demand
Source: Soclimpact project Deliverable 4.5-Comprenhensive approach for policy makers

87
Hazard scores for energy demand (Cooling Degree Days -CDD, Standardized Precipitation-
Evapotranspiration Index - SPEI), and supply indicators (wind energy, solar PV and
combined productivity and droughts) were analysed. The aim is to jointly consider future
increases in energy demand due to temperature and precipitation changes and the potential for
covering it with renewable energy sources in the future.
Regarding the normalization of these hazards, we use an approach based on their future change.
The available literature indicates that the future projected changes of renewable energy
productivity frequently do not exceed a level of 10% relative to present values. Changes of about
10% would not modify clearly a normalized score like the one use for present climate (leading to
a very limited variation range of the score), but they represent a significant impact on the
productivity and profitability of the energy plants. Therefore, the future change of renewable
energy productivity is compared to a 10% threshold, both on the negative (normalized values
above 0.5) and the positive side (normalized values below 0.5). The normalization also includes a
minor contribution of a comparison of the changes relative to other islands.
CDD and SPEI scores are normalized with respect to a maximum projected value previously
identified. Renewable energy productivity indicators in present climate are normalized using
global thresholds (5th and 95th percentiles of the respective technologies). The same
normalization method is used for projected changes of renewable energy droughts. Thus,
energy drought indicators are normalized comparing them to a maximum upper limit, taken
among all the islands and renewable energy technologies.
A fundamental aspect of the method is that we apply an objective procedure for obtaining the
weights of the risk components (hazard, exposure and vulnerability) based on time-series
correlations of observed data for energy demand and for the different indicators involved in the
impact chains. This allows to detect which factors have a larger impact on the energy demand.
This method, based on correlations between observed energy demand and observed data for the
indicators, points out that several exposure and vulnerability factors have a stronger weight than
the climate hazards on short time-scales (interannual variations for periods of about 10 years).
This is consistent with the drivers considered in the national forecasts, for periods of 10 years,
performed as part of the EU Energy Efficiency Directive. A consequence of this is the relatively
low weights assigned to the climate hazards in the operationalization.
For the operationalization of the full impact chains, the exposure and vulnerability indicators
were also weighted utilizing different criteria. The mathematical procedure developed proposes
the definition of weights per group of variables (hazard, vulnerability and exposure) that allow
identifying the relationship between each of the components and the dependent variable (in this
case, energy demand due to desalination or energy demand due to cooling). The detailed weight
calculation for the risk components (hazards, exposure and vulnerability) can be found in the
Soclimpact Project deliverables 4.5.
Hereafter we only present the results of the operationalization of the IC, this is, the final risk
scores for increased cooling and desalination energy demand, joint to a general conclusion:
.

88
Table 19: Final risk scores for Malta: cooling and desalination energy demand, for the historical and future
periods.
Risk scores Hist. ref. RCP2.6 (2046-2065)
RCP2.6 (2081-2100)
RCP8.5 (2046-2065)
RCP8.5 (2081-2100)
Cooling 0.49 0.51 0.51 0.53 0.57
Desalination 0.47 0.54 0.55 0.61 0.67
Categorization:
0.00 – 0.20 Very low
0.20 – 0.40 Low
0.40 – 0.60 Medium
0.60 – 0.80 High
0.80 – 1.00 Very high
Source: Soclimpact project Deliverable 4.5-Comprenhensive approach for policy makers
According to the risk analysis, it is expected a large cooling energy demand increase. Besides,
desalination demand, which is already high, should also increase for both emissions scenarios,
but much more under RCP8.5.
Malta is an island with large constraints on land-based RES, due to its small size and large
population density. Additionally, present onshore wind energy resources are limited. PV energy
potential is good, and the energy droughts indicator shows a high stability. PV energy can be
integrated in buildings and has therefore a higher potential, though its installation in apartment
blocks faces uncertainties like the possibility of redevelopment of existing buildings based on an
increase in the number of storeys. As a consequence, the NECP (2019) only projects a very
limited increase of RES share from a present value of 9% to 11.5% in 2030. Such a low share
moves Malta away from the EU targets. Offshore PV might be the main renewable energy
technology with substantial potential, particularly if the capacity of the interconnector with Sicily
could be increased or battery storage could be installed in sufficient quantities for grid stability
reasons. In this respect, one of the first tests in the world with offshore PV was performed in
Malta (Grech et al., 2016).
The scores for the expected change of renewable energy productivity point to a small decrease,
except under RCP8.5 by end of the century, when a relatively large decrease is projected,
particularly for wind energy. The stability characteristics would show limited changes under
RCP2.6, and would worsen clearly under RCP8.5 for wind energy.
The risk associated to cooling energy demand shows presently a medium value, which would
remain almost constant under RCP2.6 and would nearly reach a high value under RCP8.5 by the
end of the century. The projected increase of the risk score is relatively small despite the large
increase in CDD under RCP8.5 (CDD score increases twofold by mid of century and threefold
by end of century), due to the low weight assigned to the hazard. In this case, the availability of
observed cooling energy demand data was very low (only 4 years), which is insufficient for
calculating meaningful weights through correlation with the different indicators.
A medium score is also obtained for the risk linked to desalination energy demand, for present
climate conditions. The projected increase of the risk is higher than for cooling energy demand,
reaching high scores under RCP8.5. In this case, the weights offer a very interesting information
about the impact of adaptation options. In this case, we have a rather long desalination energy

89
demand series (2004-2018). If we take the whole series, there is a strong decreasing trend in
demand until 2009. If we take the whole time-series for the correlations, these show
counterintuitive values, while if we take the series from 2009-2018, the correlation is -40%,
which is a result that lies within the expectations (drier conditions are associated to more
desalination). Another example of this unexpected behaviour is the correlation between
desalination demand and population or number of tourists: it is negative if the whole series
(2004-2018) is used (implying less desalination demand for higher population or number of
tourists), but it is strongly positive if the period 2009-2018 is taken.
A report from the Water Services Corporation of Malta (2018) offers a very likely reason for this
behaviour: there was a strong reduction in water leakages from 2004 to 2009, while water losses
have not varied much between 2009 and 2018. Therefore, the strong reduction in desalination
energy demand from 2004 to 2009 is clearly driven by the infrastructure improvement,
overriding the impact of the factors included quantitatively in the impact chain calculations. The
reduction of water leakages is a demand side management option, and its impact over the short
term shows the potential importance of these kind of measures.
We have opted therefore to calculate all correlations and weights using the desalination demand
series from 2009-2018. As a result, the climate hazard receives a weight of 0.2, while the
exposure and vulnerability components have a weight of 0.38 and 0.42, respectively. Most
individual indicators for the exposure and vulnerability components show a high correlation with
the observed desalination demand. It is noticeable that tourism seasonality has been decreasing
through the selected period, and shows a large, but negative, correlation with desalination
demand.
* Energy demand:
- Certain data illustrate the strong impact that demand-side management options can have on energy demand. In the case of Malta, water losses in the distribution network were tackled through a leak management strategy during several years in such a way that the water losses were nearly halved from 2004 to 2009. This factor has been decisive in the evolution of the desalination energy demand, which has decreased 20% from 2004 to 2018 at the same time that GDP has grown 80%, the number of tourists has doubled and drought conditions have worsened.
- A clear demand management option for reducing cooling demand is the improvement of the energy efficiency of buildings. The energy efficiency directive of the EU sets binding targets for all European countries, but the data about the efficiency classes of buildings are rather limited and difficult to access. The scarce data available indicate that there is much room for improvement in this respect. A consequent implementation of energy efficiency measures in buildings could reduce clearly the effect of increasing temperatures on energy demand.
- Digitalisation is key in EU strategies. In this respect, demand side management options for adaptation to generation peaks and troughs should be developed as much as possible through digitalisation, prioritising automatic instead of manual adaptation.

90
* Energy supply:
- The frame for energy supply in the islands are the binding targets established in the 2030 climate and energy EU framework and the long term horizon of a decarbonized energy system by 2050.
- The combination of different types of offshore renewable energy sources in the same platform is also attracting interest, as the different sources can exhibit complementarity in time and the combined output can thus be more stable and reliable. The different RES can also share part of the installations, like the connection to land, reducing their cost (Pisacane et al., 2018; MarineEnergy, 2019a). The European Union is trying to promote such combinations, through projects like MUSICA (Multiple Use of Space for Island Clean Autonomy) which will design and test a floating offshore platform integrating wind, PV and wave energy for use on islands (MarineEnergy, 2019b), and plans to develop roadmaps for its deployment in three case study islands, among them Malta and the Canaries (MaREI, 2020).
- New financing possibilities linked to the recently approved EU COVID-19 recovery fund, and over a longer term associated to the European Green Deal, should facilitate the deployment of renewables in the islands, as the energy transition is a key target.
- Interconnections to mainland are very important for supply safety. Excessive dependency on interconnections to mainland should be nevertheless avoided, due to risk of blackouts, as the failure of a single element (one transmission line) can knock out instantaneously a large proportion of the power of an island and even cause an island-wide blackout, as has occurred several times in Malta in the last years.
Read more: Hazard indicator computation and normalization
Cooling degree days (CDD) are used to give an indication of the effect of outside air temperature on building energy consumption during a specified period of time. The Cooling Degree Days (CDD) index gives the number of degrees and number of days that the outside air temperature at a specific location is higher than a specified base temperature. For the indicator weight calculation, the observed values of CDD (EUROSTAT) have been used, and compare to the hazard of the island. With respect to the normalization of the indicator, we have used a fixed lower threshold and a relative maximum as upper threshold. The minimum CDD value has been taken as 0, while the maximum CDD value has been taken as the maximum over all islands, emissions scenarios and time periods (CDD=1183.49 ºC· days/year, corresponding to Cyprus for RCP8.5 scenario, end of century period). Standardised Precipitation-Evapotranspiration Index (SPEI) is a drought index that takes into account not only the effect of precipitation variations, but also the effect of temperature variations on evapotranspiration. The calculation is based on the monthly difference between precipitation and potential evapotranspiration, which represents the monthly water surplus or deficit. The indicator weight calculation was done using data from ECA&D (European Climate Assessment & Dataset). The normalization of the indicator has taken into account the fact that by definition, present conditions correspond to reference conditions (SPEI=0), and that all future changes are towards negative SPEI values, that is towards drier conditions. Therefore, the best score value (0) has been assigned to SPEI=0, while the worst score value (1) has been assigned to the largest negative value found for all islands, emissions scenarios and time periods

91
(SPEI=-2.5, obtained for several islands under RCP8.5 emissions scenario by the end of century). The indicator Wind energy productivity (kWh/kW) is defined as the energy produced in a period of time divided by the power installed, which is considered as unitary. The indicator is calculated separately for land and sea. Offshore wind energy is the most developed ocean energy, and it is likely to be an important future energy source for the analysed islands. Its characteristics are typically very different to onshore wind energy, due to the large differences in surface friction. The energy productivity values are averaged respectively over the island land points and over the sea points in a domain that reaches a maximum distance of one degree latitude and longitude respectively to the maximum and minimum longitude/latitude land points of the islands. The normalization is performed using absolute thresholds, that represent high or low global values of productivity. These thresholds have been obtained from a global renewable power report (IRENA, 2019). The maximum annual productivity would be 8760 kWh/kW, corresponding to a 100% capacity factor. The obtained CF thresholds for onshore wind energy are 20% (corresponding to a normalized score of 1) and 45% (normalized score of 0), while for offshore energy they are 30% and 50%. Photovoltaic productivity (kWh/kW) is defined as the energy produced in a period of time divided by the power capacity installed. In order to obtain photovoltaic productivity, daily surface solar radiation (SSR) and ambient temperature from the climate simulations are used as input variables for a parametric PV model. The normalization is performed using absolute thresholds, that represent high or low global values of productivity, taken from the same report as for wind energy. In this case, the maximum threshold is adapted taking into account that the calculations performed here assume fixed panels, while IRENA global report does not differentiate between fixed and sun-tracking panels. Therefore, we estimate an upper CF threshold (normalized score of 0) of 20% for fixed panels, from the 25% value deduced from IRENA global report. Renewable energy productivity droughts indicators are a way of quantifying the time-variability of renewable energies that depend on meteorological conditions. Low values of energy droughts correspond to a stable output, while high values correspond to a highly variable output. The combined renewable energy droughts represent the complementarity between wind and PV energy. A high complementarity of both sources reduces the need for energy storage or backup sources. Two different thresholds are calculated to determine moderate (50% of mean daily productivity) and severe (20% of mean daily productivity) energy productivity droughts, respectively. For the normalization of these energy drought indicators, we have used a combination of an absolute threshold (a value of 0% of drought days) corresponding to a score of 0 and a relative maximum upper limit, taken among all the islands and renewable energy technologies (55% of days with moderate droughts, obtained for wind energy in Corsica) corresponding to a score of 1. The same normalization limits are applied for wind, PV and combined productivity droughts.

92
4.4 Maritime Transport
Maritime transport is defined as the carriage of goods and passengers by sea-going vessels, on
voyages undertaken wholly or partly at sea. It is often considered as the backbone of the world
economy, with 80% of the global trade volume passing through ports (Asariotis & Benamara,
2012). For islands, the transport of goods and passengers by ship is even more essential. At the
same time, Maritime Transport contributes to climate change through its carbon emissions
which are found to be near 3% of the global CO2 equivalent emissions (Smith et al. 2015).
Compared to land and air transport, it is the (economically and ecologically) most effective way
of distributing goods globally. A changing climate will challenge Maritime Transport to adapt to
future risks and lower its emissions.
The whole range of potential impacts of climate change on ports operations and throughput is
still under study and it remains a high degree of uncertainty about it. Various climate change
stressors can affect both harbour infrastructure and ships on route. For example, ports are
vulnerable nodes of Maritime Transport as they are strongly affected by rising sea-levels, which
in turn affect port facilities and increase the risk of flooding. Sea-level rise has accelerated in the
last century and will rise by 0.43 to 0.84 m until 2100, depending on the emission scenario
(Pörtner et al., 2019). Due to ocean dynamics and the Earth’s gravity field, there will also be
regional differences in sea-level rise in the order of 0.1 m (Asariotis & Benamara, 2012). The
causes of sea-level rise are the thermal expansion of water and the melting of glaciers due to the
increase in global mean temperature (Vermeer & Rahmstorf, 2009).
Maritime transport can also be affected by climate change through the increase in the intensity of
extreme weather events including tropical-like cyclones. According to climate projections,
tropical cyclones are not expected to change significantly in frequency but in intensity due to
rising sea-surface temperatures (Pörtner et al., 2019). The resulting extreme winds and waves can
harm ships, but also cause damage and flooding of ports, especially in combination with sea-level
rise (Hanson & Nicholls, 2012).
For the Maritime Transport sector, three main climate change risks have been identified for the
SOCLIMPACT project. These are:
(a) risk of damages to ports’ infrastructures and equipment due to floods and waves,
(b) risk of damages to ships on route (open water and near coast) due to extreme weather events,
(c) risk of isolation due to transport disruption.
We selected to operationalize the third one which in terms of hazards and impacts can be
considered as a combination of the other two. The hazard risk component indicators considered
for the operationalization were: extreme waves (SWHX98), extreme wind (WiX98) and mean sea
level rise (MSLAVE). The exposure indicators are: number of passengers (NPax), islands’ total
population (NTotP), value of transported goods expressed in freight (VGTStot) and number of
ports per island or archipelago (NPo), while the sensitivity indicators include: the number of
isolation days (NIID) and renovated infrastructure (NAgePo). Finally, for the component of
adaptive capacity the proposed indicators are: percentage of renewables (PEnRR), number of
courses/trainings (NTrCoRM), early warning systems (NOcSta) and harbour alternatives
(NApt). Unfortunately, due to the lack of reliable and consistent data we had to exclude the

93
“number of isolation days” and “number of courses/trainings” indicators. The conceptualization
framework of the operationalization is summarized in the next Figure.
Figure 74: Conceptualization framework for the operationalization of the Maritime Transport Impact Chain:
Risk of Transport Disruption. Source: Soclimpac project deliverable 4.5
For assessing future risk, we considered projections or estimations for the indicators when these
were available. This was mainly the case for the components of hazard (mean sea level rise,
extreme waves and wind), exposure (population, number of passengers, value of goods), and the
contribution of renewables. Two Representative Concentration Pathways (RCPs) were

94
considered for meteorological hazards. One “high-emission” or “business-as-usual” pathway
(RCP8.5) and a more optimistic one (RCP2.6) that is closer to the main targets of the Paris
Accord tο keep global warming to lower levels than 2 °C since pre-industrial times.
Besides the historical reference period, we consider two 20-year future periods of analysis. One
over the middle of the 21st century (2046-2065) and one covering the end of the 21st century
(2081-2100). The normalization of indicators was performed across the different islands in order
to facilitate and inter-island comparison and prioritize the islands of higher risk.
Regarding the weighting of the different risk components, we have tested several weights,
however, according to expert judgement and discussion with specialists on the Maritime sector,
we have found more appropriate to assign equal weights to all main components of risk (i.e. 0.33
for Hazard, 0.33 for Exposure and 0.33 for Vulnerability). For the sub-components of Exposure,
we have assigned a weight of 0.33 for Nature of Exposure and a weight of 0.66 for Level of
Exposure since the latter one is believed to be of greatest importance. Similarly, for the
vulnerability sub-components, we have assigned a weight of 0.25 for the Factors of Sensitivity
and a weight of 0.75 for the Factors of Adaptive Capacity.
The weighting and categorization of risk is a subjective decision, nevertheless we consider our
selection to be quite conservative and therefore we believe that a slightly different choice would
not significantly affect the main conclusions drawn. For the recent past/present conditions, the
operationalization of the Maritime Transport Impact Chain indicates low risk for all investigated
islands. In general, the Maritime Transport sector of the larger islands (e.g. Corsica, Cyprus and
Crete) is found to be more resilient to the impacts of climate change. Up to a point, this is
related to the large number of harbour alternatives in comparison with smaller islands.
Our results for the future highlight the importance of adopting a low-emission pathway since
this will keep the risk for Maritime Transport disruption in similar as present conditions while
for some islands the risk is expected to slightly decline. In terms of island inter-comparison,
Malta’s maritime sector is found to be most vulnerable, nevertheless, future risk even under
RCP8.5 is not expected to exceed medium risk values. On the contrary, Corsica is the island less
susceptible to climate change impacts. Detailed results for each investigated SOCLIMPACT
island are presented in the following sub-sections.
Table 20: Summary of present and future risk of isolation due to Maritime Transport disruption for each island
and scenario based on the Impact Chain operationalization.
RISK VALUE PER
ISLAND
Historical
Reference RCP2.6 MID RCP2.6 END RCP8.5 MID RCP8.5 END
CYPRUS 0.241 0.210 0.218 0.258 0.292
CRETE 0.229 0.208 0.201 0.257 0.282
MALTA 0.376 0.347 0.335 0.395 0.414
CORSICA 0.220 0.194 0.194 0.243 0.273
CANARY ISLANDS 0.336 0.292 0.250 0.346 0.341
BALEARIC ISLANDS 0.326 0.281 0.264 0.331 0.344

95
Categorization:
Source: Soclimpact project deliverable 4.5
The Impact Chain operationalization for Malta highpoints a higher present relative risk for
isolation due to Maritime Transport disruption compared to Cyprus and Crete (Risk value of
0.376). This is mostly related to the high values of nature and level of exposure indicators due to
the combination of small number of ports and high value of goods. Two other contributors to
the relatively higher risk value, related to increased vulnerability, is the small number of harbour
alternatives (e.g. airports) and the small percentage of renewables in the total energy mix. For
RCP2.6, the risk is expected to slightly decrease, mainly due to an expected increase of the
renewable energy contribution, nevertheless Malta will be still classified as a low risk region. On
the contrary, under the RCP8.5 pathway the risk for transport disruption in the Maltese islands is
projected to increase and marginally classified as low for the middle of the 21st century (risk value
of 0.395). For the end of the current century the risk is projected to increase into medium values
(0.414). This is due to the lower contribution of renewables in this high-emission scenario and
the increase of the hazard indicators (mainly extreme winds and mean sea level rise). The mean
sea level in particular is expected to rise by 65 cm posing an additional threat to harbour
infrastructure.
READ MORE about the risk indicator computation: normalization of sub-component indicators on
Deliverable 4.5 Soclimpact project HERE
0.00 – 0.20 Very low
0.20 – 0.40 Low
0.40 – 0.60 Medium
0.60 – 0.80 High
0.80 – 1.00 Very high

96
5 Socio-economic impacts of climate change
5.1 Market and non-market effects of climate change
Tourism
In order to analyze the reactions of tourists to the impacts of climate change and the preferences
for adaptation policies, several hypothetical situations were posed to 255 tourists visiting Malta
whereby possible climate change impacts were outlined for the island (e.g., beach erosion,
infectious diseases, forest fires, marine biodiversity loss, heat waves, etc.).
Figure 75: Socio-economic characteristics and travel description: Tourists visiting Malta Source: Deliverable Report D5.5 Market and non-market analysis
Firstly, tourists had to indicate whether they would keep their plans to stay at the island or find
an alternate destination if the impact had occurred, which allows predictions of the effects on
tourism arrivals to be made for each island. Secondly, tourists were asked to choose between
various policy measures funded through an additional payment per day of stay – the tourists’
choices being an expression of their preferences for attributes/policies. To estimate the results,
the conditional logit model was run by using the Stata software.
In general, data confirms that tourists are highly averse to risks of infectious diseases becoming
more widespread (75.30% of tourists would change destination). Moreover, they are not willing
to visit islands where water is scarce for leisure activities (67.20%) or where marine wildlife has
disappeared to a large extent (62.10%). On the other hand, policies related to the prevention
of infectious diseases (9.2€/day), water supply reinforcement (8.2€/day), and marine habitats
protection (5.7€/day) are the most valued, on average, by tourists visiting this island.
Although climate change impacts are outside the control of tourism practitioners and policy
makers, they can nevertheless utilise this knowledge to improve the predictability of the effect
that certain adaptation policies and risk management strategies, and develop their plans
accordingly.

97
Figure 76: Choice experiments results for the tourism sector: Tourists visiting Malta Source: Deliverable Report D5.5 Market and non-market analysis
The infographic can be found in high resolution in the Soclimpact Project official
website HERE.
How tourists perceive the island destination: A comparative approach through the analysis of
social media
While historically destination image is projected by DMOs and tourists’ offices, the advent of
social media allow the construction of an image which is also a projection of tourists. The
content of their communication online shows the image they perceive. In this section we analyse
how tourists “talk” about the different islands on social media, in order to understand what the
perceived image is.
We use a specific tool (Google Cloud Vision) to scan the content of images posted by tourists on
Instagram (the market leader in visual social media) while they are on holiday in selected islands.
The content is translated in up to ten labels attached to each picture. For each island we
aggregate and rank the different labels to find out the most important characteristics tourists
associate to the island (assuming that they are correlated with the most frequent labels attached
to the pictures).

98
We analyse eight islands representative of the Atlantic Ocean (four islands of the Canary
Archipelago: Fuerteventura, Gran Canaria, Lanzarote, Tenerife) and of the Mediterranean Sea
(Crete, Cyprus, Malta, Sicily). We scan posts geotagged in these islands by tourists (identified by a
travel-related hashtag such as #visit #holiday #travel, etc) in summer 2019 (June to September),
returning a total number of 745,235 pictures considered in the analysis. The breakdown is in the
table below.
Table 21: Characteristics of the sample of pictures under analysis
Island
Indicator Tenerife
Gran Canaria
Fuerteventura Lanzarote Cyprus Crete Malta Sicily
Num. of posts (total)
49,234 33,145 38,452 25,471 63,561 93,752 74,925 119,896
Avg. num. of pictures per post
1.77 1.67 1.56 1.8 1.76 1.74 1.81 1.68
Share of geotagged posts
67% 67% 67% 65% 70% 74% 76% 73%
Number of scanned pictures
74,537 48,337 52,577 39,381 95,808 141,538 117,576 175,481
Source: Soclimpact project deliverable D5.3
After aggregating similar words, top labels for each island were obtained. The following pools
were created utilizing a frequency analysis, which is the total number of times the label occurs in
each island. A first glance at the word clouds shows that all destinations look extremely similar
which, perhaps, is of little surprise given that they all are European sea & sun destinations:
hence, labels like Sky, Sea, Vacation, Tree, Beach are among the most frequent for all islands.
Nonetheless, some differences can be spotted: Mountain appears relatively more frequently in
Tenerife than in other islands’; Sea and Ocean have relatively more weight in Fuerteventura;
Architecture and Building are of more importance in Cyprus, Crete, Malta and Sicily than in the
Canary Islands, something that is clearly linked to the density of cultural heritage in the
Mediterranean islands: in fact, all the labels representing architectural, religious and historical
sites (History, Historic, Ruins, Site, Ancient, Building, Dome, Mosque, Holy, Medieval, etc.) have
higher ranks in these islands than in the Canaries. The islands of this archipelago have more
similar images, but also reveal distinct features: for example Gran Canaria appears the most
urban, Tenerife is characterized by a higher frequency of labels related to partying and nightlife
but also for wildlife spotting, Lanzarote stands out for its arid landscapes and Fuerteventura for
the vast sandy seashores and turquoise waters as the frequencies of labels such Beach, Shore,
Sand, Coast, Turquoise, Ocean show.

99
Gran Canaria Tenerife Fuerteventura
Lanzarote Crete Cyprus
Malta Sicily

100
The impact of increased temperatures and heat waves on human thermal comfort
In order to assess how the variation in temperature impacts on the tourism sector through
changes in tourism demand our research question was: “How do increasing temperatures (and
heat waves) impact prices and, more in general, expenditure of tourists?” Arguably, when
temperatures grow, tourists adjust their behaviour: they might switch destination, or they might
stay longer or shorter depending on their attitudes and preferences. In turn, all these changes
modify the market equilibrium, pushing tourism companies to adjust their prices to re-establish
the equilibrium between demand and supply. The change in demand and the change in price
determine the change in tourism expenditure which is, from the destination’s perspective,
tourism revenue.
We monitored current weather conditions posted on several weather forecast providers and daily
prices posted on Booking.com by hotels. We then estimated the link between daily temperature
and daily price, controlling for all the other factors affecting prices. We finally applied these
estimates to the increase in the number of days with excessive temperature projected for the
future in two scenarios (RCP2.6 and RCP8.5) and in two time horizons (near future, about 2050;
distant future, about 2100).
Among the different indicators linked to thermal stress, Soclimpact is focusing on two: the
number of days in which the temperature is above the 98th percentile and the number of days in
which the perceived temperature is above 35 degrees. Although in D5.6 the impact for both
indices were computed, in this document we only report the second one (named HUMIDEX)
because it is the most intuitive and because human thermal stress is more related to the absolute
value of the temperature than its deviation from some pre-determined distribution. In line with
the project, we assumed that thermal stress appears when the perceived temperature grows
above 35 Celsius degrees.
As thermal stress is delimited in the summer months, and this is when the great majority of
tourists arrive in these islands, the whole analysis has been carried out in six months only: from
May to October included. In other words, we assume that there is no thermal stress (and hence
no impact on tourism) in the rest of the year.
Initially, three islands were investigated: Corsica, Sardinia, and Sicily, given the massive amount
of potential data. Other estimations were provided for Malta using the Index of Distance in
Destination Image to position each island in a range that goes from Sardinia / Corsica on one
side and Sicily on the other side. Without entering the details of the extrapolation method (which
are explained in D5.6 appendixes) a summary of results is reported here:

101
Table 22: Estimation of increase in average price and revenues for Malta
Actual share of days in
which humidex > 35
degrees
Future scenario
considered
Days in the corresponding
scenario in which humidex > 35
degrees
Increase in the
average price
Increase in the
tourism overnight
stays
Increase in
tourism revenues
26.36%
rcp26near 36.55% 1.5% 0.3% 1.8%
rcp26far 37.10% 1.5% 0.3% 1.9%
rcp85near 39.01% 1.8% 0.4% 2.2%
rcp85far 64.77% 5.5% 1.1% 6.7% Source : Soclimpact project deliverable D5.3
According to these findings, the average increase in temperature, which is correlated to a
growing thermal stress for tourists, brings an economic advantage to tourism destinations. This
is only an apparent contradiction with previous findings. This study does not neglect the fact that
if islands are too hot, tourists will choose to move to other (cooler) destinations, that in principle
exist. Then, the increase in tourism (and tourism revenues) stem from the fact that, when the
temperature is too hot, people would prefer to move to coastal areas (where the climatic
conditions are more bearable) than staying inland or in cities. Future trends will also facilitate this
pressure of tourism demand (think about the spreading of smart working activities where, in
principle, the worker can relocate wherever he/she wants).
Aquaculture
The effects of increased sea surface temperatures on aquaculture production were calculated
using a lethal temperature threshold by specie and considering the production share of the
region. Four different future scenarios shown by IPCC estimations (RCP2.6 and RCP8.5 near
and distant) were analysed, which correspond to four water temperature increases in the region
(mean values), with respect to the reference period.
To do this, we assume two main species cultured in this region: Seabream (SB) and Tuna (T),
and a model of production function, calculating the monthly biomass production which depends
on the monthly water temperature. Results are presented on yearly base (mean values). In order
to facilitate the interpretation of the results, we present the value of production of the last year
available, for which we calculate the new values under the different CC scenarios.
As expected, the production levels (tons) will decrease for both, low and high emissions
scenarios. In both cases, the average annual temperatures are projected in levels below 23oC and
24oC, which are the thresholds of thermal stress for Bluefin tuna and Seabream species.

102
18,75
19,00
19,25
19,50
19,75
20,00
20,25
15.500,0016.000,0016.500,0017.000,0017.500,0018.000,0018.500,0019.000,0019.500,00
Reference period1986-2005
Mid century2046-2065
End century2081 - 2100
ºCt LOW EMISSIONS SCENARIO RCP2.6
*Source: NSO 2019 Aquaculture Stat
SEA SU
RFA
CE TEM
EPR
ATU
RE
(MEA
N)
AQ
UA
CU
LTU
RE
PR
OD
UC
TIO
N
19,291.00 *16,918 .21
(-12.3%)17,285.74
(-10.4%)
19.3 20.1 20.0
18,018,519,019,520,020,521,021,522,0
0,00
5.000,00
10.000,00
15.000,00
20.000,00
25.000,00
Reference period1986-2005
Mid century2046-2065
End century2081 - 2100
ºCt HIGH EMISSIONS SCENARIO RCP8.5
SEA SU
RFA
CE TEM
EPR
ATU
RE
(MEA
N)
AQ
UA
CU
LTU
RE
PR
OD
UC
TIO
N
*Source: NSO 2019 Aquaculture Stat
19,291.00 *14,834.78(-23.1%)
7.465,62(-61.3%)
19.3 20.6 21.8
20.25
20.00
19.75
19.50
19.25
19.00
18.75
22.00
21.50
21.00
20.50
19.50
19.00
18.50
18.00
Figure 77: Estimations of changes in aquaculture production (tons), due to increased sea surface temperature Source: Deliverable Report D5.6
The infographic can be found in high resolution in the Soclimpact Project official
website HERE.
Energy
Climate change may impose welfare reductions to the European islands’ societies by affecting
thermal comfort. Cooling Degree Days (CDD) are a measure of how much (in degrees), and for
how long (in days), outdoor air temperature is higher than 18 °C or 65 °F. The CDD is used as a
measure of the energy needed to cool buildings. The increase in CDD and the energy demand
(GWh/year) for cooling are estimated for the islands, under different scenarios of global climate
change. Under the high emissions scenario, it is expected that the CDD increase to 887 CDD5.
This value could be, for example, a combination of 100 days with temperatures of 24°C
(600CDD) and other 143 days with temperatures of 20°C (200CDD). Under this situation, the
increase in cooling energy demand is expected to be 240%.
The infographics presented below can be found in high resolution in the Soclimpact
Project official website HERE.
5 The indicator is computed by multiplying the number of days exceeding the threshold by the difference in
temperatures. For example the CDD for 100 days at 20 °C is computed as 100*(20-18)= 200CDD
PRODUCTION SHARE %
SEABREAM 10
BLUEFIN TUNA 90

103
Figure 78: Estimations of increased energy demand for cooling in Malta under different scenarios of climate change
until 2100 Source: Deliverable Report D5.6
The Standardized Precipitation Evapotranspiration Index (SPEI) is analysed as a representative
indicator for increases in water demand for islands’ residents, tourists and agriculture, while it
also provides an indication on the available water stored in dams or underground resources. To
estimate the increase of energy demand due to the increase in water demand, it was assumed that
most of the islands will have to produce desalinated seawater (or groundwater) to meet further
increases of demand. Thus, the estimation of the increase in energy demand (GWh/year) to
produce more drinking water has been done based on the energy consumption required to
desalinate seawater.
Under the low emissions scenario (RCP2.6), there are not significant changes in the SPEI
indicator, that will remain in its ¨normal¨ level, as it is nowadays. Nevertheless, an increase of
36% in desalination energy demand is expected. Under RCP8.2 the scenario alerts on a severe
aridity leading to an increase of 159% of the energy demand.
Figure 79: Estimations of increased energy demand for desalination in Malta under different scenarios of climate
change until 2100 Source: Deliverable Report D5.6

104
Maritime Transport
For maritime transport, the impact of Sea Level Rise (SLR) on ports' operability costs of the
island were calculated with reference to 1 m; which is defined as the investment needed to
increase the infrastructures' height by 1 m. There is not necessarily a strict correspondence
between the SLR and the required elevation of port infrastructures, as it also depends on the
coastal hydrodynamic and the shape of dikes of each port. By experts’ recommendation, it was
assumed that 1 m increase in port height is required to cope with the SLR under RCP 8.5
scenario of emissions. Extrapolation for other RCP scenarios was then conducted based on
proportionality.
The starting point was the identification of the principal ports in each island (economic
relevance). Second, the analysis of the different port areas (exterior, ramps, oil, etc.), and their
uses. Third, the elevation costs were estimated per each area and port separately (considering 1
meter elevation). Thus, the costs of 1-meter elevation presented are the sum of all areas and
ports analysed, and including the rest of the ports of the island (if applicable) based on
proportionality. Estimations consider that all ports areas of the entire area should be elevated at
the same time. In other words, the economic values can be interpreted as the depreciation
(amortization) costs of the investment needed to increase all porsts’ infrastructures' in the island
for 125 years time horizon. No discount rate has been applied.
As expected, the rising of sea levels will affect the sector, as new investment will be needed to
keep ports’ operability. Under the high emissions scenario, it is expected that these costs could
increase 2.8 million of euros per year until the end of the century.
The infographic presented below can be found in high resolution in the Soclimpact
Project official website HERE.

105
Figure 80: Increased costs for maintaining ports’ operability in Malta under different scenarios of SLR caused by climate change until 2100
Source: Deliverable Report D5.6
5.2 Macroeconomic projections
The aim of our study is to assess the socioeconomic impacts of biophysical changes for the
island of Malta. For this purpose we have used the GEM-E3-ISL model; a single-region, multi-
sectoral general equilibrium model based on the principles of neo-classical theory, and
GINFORS; a macro-econometric model based on the principles of post-Keynesian theory.
Both models include 14 sectors of economic activity, with an emphasis on services and
specifically on those composing the tourism industry. The GEM-E3-ISL model also include:
endogenous representation of labor market and trade flows etc.
Changes in the mean temperature, sea level and precipitation rates are expected to affect energy
consumption, tourism flows and infrastructure developments. These impact-chains have been
examined and quantified under two emission pathways: RCP2.6 which is compatible with a
temperature increase well below 2C by the end of the century and RCP8.5 which is a high-
emission scenario. The impact on these three (3) factors has been quantified in D5.6 and is used
as input in the economic models, which then assess the effects on GDP, consumption,
investments, employment etc.
MEAN SEA LEVEL RISE SLR

106
In total 17 scenarios have been quantified for Malta. The scenarios can be classified in the
following categories:
1. Tourism scenarios: these scenarios examine the reduction in tourism revenues due to
changes in human comfort as captured by the hum-index, the degradation of marine
environment, increased risk of forest fires and beach reduction
2. Energy scenarios: these scenarios examine the impacts of increased electricity
consumption for cooling purposes and for water desalination
3. Infrastructure scenarios: these scenarios examine the impacts of port infrastructure
damages
4. Aggregate scenarios: these scenarios examine the total impact of the previous-described
changes in the economy.
In this scenario we examine the impacts of a simultaneous change in electricity consumption,
tourism revenues and infrastructure damages. The scenario specifications for the two climatic
variants are presented below:
Table 23: Aggregate scenario –results
Tourism revenues (% change from reference levels)
Electricity consumption (% change from reference
levels)
Infrastructure damages
(% of GDP)
RCP2.6 (2045-2060)
-10.31 6.9 -0.26
RCP2.6 (2080-2100)
-14.19 4.2 -0.29
RCP8.5 (2045-2060)
-20.03 14.0 -0.69
RCP8.5 (2080-2100)
-33.42 25.7 -0.77
Source: GEM-E3-ISL
The theoretical and structural differences of the two models mean that this study produces is a
reasonable range of impacts, given the uncertainty embodied in economic analysis and especially
in the long-term.
In GEM-E3-ISL, the economy is in equilibrium at each point in time. Prices adjust to ensure
that supply equals demand (market clearing), capital is fully used; however, the allows for
equilibrium unemployment. The impacts are driven mainly by the supply side through changes in
relative prices that determines competitiveness change, substitution effects etc. The GEM-E3-
ISL model assesses the impacts on the economy up to 2100.
The macro-econometric type of models, such as GINFORS, do not require that all markets are
in equilibrium; idle capital and involuntary unemployment are some other features of this type of

107
models where the results are driven mainly by adjustments in the demand side of the economy.
The GINFORS assesses the impacts on the economy up to 2050.
With respect to GDP the estimated change compared to the reference case is between -0.15%
and -1.8% in the RCP2.6 in 2050 and between -0.55% and -4.0% in the RCP8.5. The cumulative
change over the period 2040-2100 is estimated (by GEM-E3-ISL) to be equal to -0.2% in the
RCP2.6 and -0.9% in the RCP8.5.
Figure 81: Percentage Change in GDP.
Source: GWS, own calculation
With respect to sectorial impacts both models show a significant decrease in the activity of
tourism related sectors and an increase in the activity of the manufacturing sector and to a lesser
extent in the activity of the primary sectors of production.

108
Figure 82: Production percentage change from reference.
Source: GWS, own calculation
Overall employment falls in the economy and especially in tourism related sectors following the
slowdown in domestic activity. In GEM-E3-ISL increases in employment in non-tourism related
activities are related to labor costs reductions (as wages fall and their competitiveness increases)
and a consequent substitution of capital with labor in other sectors. Employment falls on average
by 0.02% in both climatic variants.

109
Figure 83: Employment percentage change from reference.
Source: GWS, own calculation
6 Towards climate resiliency
6.1 Current situation: general commitment, specific limits and obstacles
“Malta ratified the UNFCCC in 1994 and the Kyoto Protocol in 2001. Malta did not immediately
take on any quantified emission limitation or reduction obligations under these international
instruments; thus. it did not have a quantified target for the limitation or reduction of
greenhouse gas emissions for the first Kyoto Protocol Commitment Period (CP1; 2008-2012).”
(MRA, 2017). However, in 2010 Malta became an Annex I party to the UNFCCC which
signified the intention of Malta to step up against climate change (MRA, 2017).
Malta also reports an annual national GHG inventory and other information at national and
Union level relevant to climate change in line with the Monitoring Mechanism set out in EU
Regulation No 525/2013 and needs to adhere to EU Emission Trading Scheme (EU Directive
2003/87/EC).
“Malta is committed to remain in line with the Effort Sharing Decision (Decision No.
406/2009/EC of 23 April 2009) thereby conforming to a reduction of its GHG emission growth
by no more than 5% on 2005 levels by 2020” (Ministry for Sustainable Development, the
Environment and Climate Change, 2017).

110
Relevant National Documents
Climate Action Act
This Act, adopted in 2015, provides for action in order to contribute to the mitigation of climate
change by limiting anthropogenic emissions of greenhouse gases and protecting and enhancing
greenhouse gas sinks and reservoirs. It also contributes to the prevention, avoidance and
reduction of the adverse impacts of climate change and the reduction of vulnerability,
enhancement of resilience, and adaptation to the adverse effects of climate change. It requires
the ministry to review and update the national adaptation strategy every four years.
Malta’s National Strategy for Policy and Abatement Measures relating to the Reduction
of Greenhouse Gas Emissions (MRRA, 2009)
This strategy, adopted in 2009, includes 96 actions for the period 2009-2020 to be adopted to
reduce greenhouse gas emissions. Abatement measures are divided in four groups: energy, waste
and agriculture, water and transport.
National Climate Change Adaption Strategy (MRRA, 2012)
This strategy, adopted in 2012, recommends the necessary adaptation measures deemed relevant
to sectors that are vulnerable to a changing climate through a set of 72 actions which addresses
the following areas: agriculture, biodiversity, freshwater resources and coastal zones, land
degradation, fisheries and migration. It also addresses issues related to financial impacts and
sustainability.” Six actions on tourism are included which focus mainly on research and one
action to draw up a Tourism Action and Contingency plan. Adaption action plans were not
developed due to the small size of the state. Malta is currently revising this strategy with the aim
of including relevant adaptation policies. The new strategy is called the Low Carbon
Development Strategy which is based on UN Framework Convention on Climate Change, Paris
Agreement and Regulation (EU) N0 525/2013 of the European Parliament.
The following sector documents do consider adaptation issues (EC Country fiche for Malta);
The 2nd Water Catchment Management Plan for the Maltese Islands (2016)
The Malta National Biodiversity Strategy and Action Plan 2012-2020
The National Energy Efficiency Action Plan
The Malta’s National Transport Master Plan 20259. adopted in 2016
The National Agricultural Policy for the Maltese Islands 2016-2025.
Table 24: Specific limits and obstacle and relevant documents
Specific limits and obstacles
Since the implementation of the Climate Adaption Strategy, adaption action has not been a primary focus of Malta’s authorities. One reason for that can be the small size of the country which limits the range of issues that authorities can address (see here). Additionally, Malta’s number of inhabitants and cars on the island is increasing which results in the need to widen existing roads and to build new ones. Little is done to curtail emissions from transport, which is one of the main contributors of GHG. This seems to jar with Malta’s

111
commitment to reduce greenhouse gas emissions and will make it difficult for the country to meet its emission targets (see here). The rapidly increasing number of inhabitants on the island also triggers the boom of construction, which converses more and more green areas into building sites which further limits the ability to absorb Carbon dioxide from the atmosphere. There is an overall lack of subject-specific studies to estimate the impact and its costs of climate change and the required adaption(see here).
Effects of climate change on aquaculture activities include biological. environmental and socio-economic impacts and can be short- or long-term caused by f.e. changing temperature. oxygen availability and increased extreme weather events. Eventually these impacts can lead to loss of production and infrastructure (Bueno and Soro 2017). A strong focus should therefore be placed on building general adaptive capacity that supports the sector.
Relevant documents
- Malta's Low Carbon Development Strategy
(https://meae.gov.mt/en/Public_Consultations/MSDEC/Documents/MSDEC%20LC
DS%20Vision.PDF )
- Climate Action Act
- Malta’s’ National Strategy for Policy and Abatement Measures relating to the Reduction of Greenhouse Gas Emissions (https://environment.gov.mt/en/Documents/Downloads/maltaClimateChangeAdaptationStrategy/nationalClimateChangeMitigationStrategy.pdf)
- National Climate Change Adaption Strategy (https://parlament.mt/media/67383/5790.pdf )
Source: Deliverable Report D7.1

112
7 References
Asariotis, R. and Benamara, H. (Eds.), 2012. Maritime transport and the climate change
challenge. Routledge.
Attard, S., 2018. The evolution of Malta’s tourism product over recent years. (2018) Quarterly
review 2018 pp41-55 of Central Bank of Malta.
EC (European Commission), 2009. DECISION No 406/2009/EC OF THE EUROPEAN
PARLIAMENT AND OF THE COUNCIL of 23 April 2009 on the effort of Member States
to reduce their greenhouse gas emissions to meet the Community’s greenhouse gas emission
reduction commitments up to 2020. Official Journal of the European Union. https://eur-
lex.europa.eu/legal-content/EN/TXT/PDF/?uri=CELEX:32009D0406&from=EN
EC (European Commission), 2015. Future Brief: Sustainable Aquaculture, Science for
Environment Policy.
https://ec.europa.eu/environment/integration/research/newsalert/pdf/sustainable_aquacultur
e_FB11_en.pdf.
EC (European Commission), 2019. COMMISSION STAFF WORKING DOCUMENT
Country Report Malta 2019 Assessment of progress on structural reforms, prevention and
correction of macroeconomic imbalances, and results of in-depth reviews under Regulation
(EU) No 1176/2011, 27.02.2019.
EC (European Commission), 2020. Aquaculture.
https://ec.europa.eu/fisheries/cfp/aquaculture_en.
EU Directive 2003/87/EC on establishing a scheme for greenhouse gas emission allowance
trading within the Community and amending Council Directive 96/61/EC. https://eur-
lex.europa.eu/legal-content/EN/TXT/PDF/?uri=CELEX:32003L0087&from=EN
European Climate Assessment & Dataset, https://www.ecad.eu.
Eurostat, 2017. Eurostat celebrates Malta. https://ec.europa.eu/eurostat/en/web/products-
eurostat-news/-/EDN-20170921-1
Eurostat, 2019. Seaborne transport of freight between main ports in the reporting country and
their partner ports grouped by main geographical areas, 2016-2017.
https://ec.europa.eu/eurostat/statistics-
explained/index.php?title=File:Seaborne_transport_of_freight_between_main_ports_in_the_re
porting_country_and_their_partner_ports_grouped_by_main_geographical_areas,_2016-
2017.png.
FAO (Food and Agriculture Organization), 2006. Malta water resources review.
http://www.fao.org/3/a-a0994e.pdf.
FAO (Food and Agriculture Organization), 2020. National Aquaculture Sector Overview Malta
http://www.fao.org/fishery/countrysector/naso_malta/en.
Fritzsche, K., Schneiderbauer, S., Bubeck, P., Kienberger, S., Buth, M., Zebisch, M., and
Kahlenborn, W., 2014. The Vulnerability Sourcebook: Concept and guidelines for standardised
vulnerability assessments.

113
GIZ (2017) The Vulnerability Sourcebook: Concept and guidelines for standardised
vulnerability assessments. Deutsche Gesellschaft für Internationale Zusammenarbeit (GIZ)
Grech, M., Mule Stagno, L., Aquilina, M., Cadamuro, M., and Witzke, U., 2016.
Floatingphotovoltaic installation in Maltese sea, in: OSES-2016, Malta.
Hanson, S. & Nicholls, R. J., 2012. Extreme flood events and port cities through the twenty-first
century. Maritime Transport and the Climate Change Challenge, 243.
Hemer, M., Fan, Y., Mori, N., Semedo, A., Wang, X., 2013. Projected changes wave climate
from a multi-model ensemble. Nature Climate Change. 10.1038/NCLIMATE1791.
IRENA, 2019. Renewable Power Generation Costs in 2018, International Renewable Energy
Agency, Abu Dhabi.
Lionello, P. & Özsoy, Emin & Planton, Serge & Zanchetta, G., 2017. Climate Variability and
Change in the Mediterranean Region. Global and Planetary Change. 151. 1-3.
10.1016/j.gloplacha.2017.04.005.
Malta Freeport, 2020. Traffic Volumes, TEUs Handled. https://maltafreeport.com.mt/about-
us/accomplishments-2/traffic-volumes/.
Malta Marittima, 2020. Logistics. https://www.maltamarittima.org.mt/index.php/what-is-
clustering/policy-areas/logistics.
MaREI, 2020. MaREI to lead €9m project to build floating offhsore platform. Retrieved from:
https://www.marei.ie/marei-to-lead-e9m-project-to-build-floating-offshore-platform/
MarineEnergy, 2019a. WavEC: Combined Wind, Wave and Solar to Transform Marine
Energy. Retrieved from https://marineenergy.biz/2019/12/16/wavec-combined-wind-wave-
and-solar-to-transform-marine-energy/
MarineEnergy, 2019b. SINN Power Supports MUSICA Project. Retrieved from
https://marineenergy.biz/2019/10/22/sinn-power-supports-musica-project/
Masterton, J.M. and Richardson, F.A., 1979. Humidex: A Method of Quantifying Human
Discomfort Due to Excessive Heat and HumidityService de l'environnement atmospherique. 45
pages.
Monitor Deloitte and Endesa, 2020. Los Territorios No Peninsulares 100% descarbonizados en
2040: la vanguardia de la transición energética en España,.
MRA (Malta Resources Authority), 2017. The Seventh National Communication of Malta to
the United National Framework Convention on Climate Change. Institute for Climate Change
and Sustainable Development, University of Malta Climate. Change Unit, Malta Resources
Authority.
https://unfccc.int/files/national_reports/annex_i_natcom/submitted_natcom/application/pdf
/42967815_malta-nc7-1-nc7_malta_2017_final.pdf
MRRA (Ministry for Resources and Rural Affairs), 2009. Malta’s National Strategy for Policy
and Abatement Measures relating to the Reduction of Greenhouse Gas Emissions.

114
MRRA (Ministry for Resources and Rural Affairs), 2012. National Climate Change Adaptation
Strategy.
MTA (Malta Tourism Authority), 2019. Tourism in Malta, Facts & Figures 2019.
https://www.mta.com.mt/en/file.aspx?f=32328.
Ministry for Sustainable Development, the Environment and Climate Change, 2017. Malta’s
Low Carbon Development Strategy – Our vision.
https://meae.gov.mt/en/Public_Consultations/MSDEC/Documents/MSDEC%20LCDS%20
Vision.PDF.
NSO (National Statistics Office Malta), 2017. Electricity Generation: 2007-2016, News Release
163/2017.
https://nso.gov.mt/en/News_Releases/View_by_Unit/Unit_B3/Environment_Energy_Trans
port_and_Agriculture_Statistics/Documents/2017/News2017_163.pdf.
NSO (National Statistics Office Malta), 2019a. News Release 187/2019. Aquaculture 2018.
https://nso.gov.mt/en/News_Releases/View_by_Unit/Unit_B3/Environment_Energy_Trans
port_and_Agriculture_Statistics/Documents/2019/News2019_187.pdf.
NSO(National Statistics Office Malta), 2019b. Regional Statistics Malta, 2019 Edition.
https://nso.gov.mt/en/publicatons/Publications_by_Unit/Documents/02_Regional_Statistics
_(Gozo_Office)/Regional%20Statistics%20MALTA%202019%20Edition.pdf.
NSO (National Statistics Office Malta), 2019c. Inbound tourism reports.
https://nso.gov.mt/en/News_Releases/View_by_Unit/Unit_C3/Tourism_Statistics/Pages/In
bound-Tourism.aspx.
NSO (National Statistics Office Malta), 2019d. Electricity Supply: 2014-2018 News Release
163/2019 from 08 October 2019.
https://nso.gov.mt/en/News_Releases/View_by_Unit/Unit_02/Regional_and_Geospatial_Sta
tistics/Documents/2019/News2019_163.pdf.
NSO (National Statistics Office Malta), 2020. News Release 114/2020.
https://nso.gov.mt/en/News_Releases/Documents/2020/07/News2020_114.pdf.
Pisacane, G., Sannino, G., Carillo, A., Struglia, M. V., and Bastianoni, S., 2018. Marine energy
exploitation in the Mediterranean region: steps forward and challenges. Frontiers in Energy
Research, 6, 109.
Pörtner, H. O., Roberts, D., Masson-Delmotte, V., Zhai, P., Tignor, M., Poloczanska, E., and
Petzold, J., 2019. IPCC Special Report on the Ocean and Cryosphere in a Changing Climate.
IPCC Intergovernmental Panel on Climate Change: Geneva, Switzerland.
Proestos, Y., Christophides, G. K., Ergüler, K., Tanarhte, M., Waldock, J., & Lelieveld, J., 2015.
Present and future projections of habitat suitability of the Asian tiger mosquito, a vector of viral
pathogens, from global climate simulation. Philosophical transactions of the Royal Society of
London. Series B, Biological sciences, 370(1665), 20130554.
https://doi.org/10.1098/rstb.2013.0554.

115
Raynaud, D., Hingray, B., François, B., & Creutin, J.D. (2018). Energy droughts from variable
renewable energy sources in European climates. Renewable Energy, 125, 578-589.
Schneiderbauer, S., Zebisch, M., Kass, S., and Pedoth, L., 2013. Assessment of vulnerability to
natural hazards and climate change in mountain environments – examples from the Alps.
Scholte JE, Schaffner F (2007). "Waiting for the tiger: establishment and spread of the Aedes
albopictus mosquito in Europe". In Takken, W.; Knols, B. G. J. (eds.). Emerging pests and
vector-borne diseases in Europe. 1. Wageningen Academic. Publishers. ISBN 978-90-8686-053-
1.
Smith, T. W. P., Jalkanen, J. P., Anderson, B. A., Corbett, J. J., Faber, J., Hanayama, S.,
O’Keeffe, E., Parker, S., Johansson, L., Aldous, L., Raucci, C., Traut, M., Ettinger, S., Nelissen,
D., Lee, D. S., Ng, S., Agrawal, A., Winebrake, J. J., Hoen, M., ... Pandey, A. (2015). Third IMO
Greenhouse Gas Study 2014. International Maritime Organization.
Soto, D. and Brugere, C., 2008 The challenges of climate change for aquaculture. FAO
Aquaculture Newsletter, No. 40, pp. 30–32. FAO, Rome.
TM (Transport Malta), 2015. Maritime Statistics, Cargo Throughput, Number of Trailers 2003-
2015. https://www.transport.gov.mt/Sea-Ports-in-Malta-Maritime-Statistics-Cargo-
Throughput-amp-Number-of-Trailers-2003-2015.pdf-f129.
TM, 2018. Transport Malta, Annual Report 2018. https://www.transport.gov.mt/Transport-
Malta-Annual-Report-2018_web.pdf-f4606.
TM, 2020. Port of Marsaxlokk. https://www.transport.gov.mt/maritime/local-waters/ports-in-
malta/port-of-marsaxlokk-114.
Van Wagner, C. E.,1987: Development and structure of a Canadian forest fire weather index
system, Forestry Tech. Rep. 35, Canadian Forestry Service, Ottawa.
Vermeer, M. and Rahmstorf, S., 2009. Global sea level linked to global temperature.
Proceedings of the national academy of sciences, 106(51), 21527-21532
Waldock, J., Chandra, N.L., Lelieveld, J., Proestos, Y., Michael, E., Christophides, G., Parham,
P.E,. 2013. The role of environmental variables on Aedes albopictus biology and chikungunya
epidemiology. Pathog Glob Health. 107(5):224-41. doi: 10.1179/2047773213Y.0000000100.
PMID: 23916332; PMCID: PMC4001452.
Water Services Company, 2018, Annual Reoprt. Malta.
World Bank, 2013. FISH TO 2030 Prospects for Fisheries and Aquaculture.
http://www.fao.org/3/i3640e/i3640e.pdf.
World Travel and Tourism Council, 2018. Travel and Tourism Economic impact 2018.
Zammit, A., 1986. Valletta and the system of human settlements in the Maltese Islands".
Ekistics. 53 (316/317): 89–95.

APPENDIX 10

1
Tabla de contenido
INTRODUCTION .................................................................................................................................. 2
1 CURRENT SITUATION AND RECENT TRENDS ..................................................................................... 3
1.1 CURRENT GEOPOLITICAL CONTEXT ............................................................................................................... 3 1.2 CURRENT CLIMATE AND RISKS .................................................................................................................... 5 1.3 MACROECONOMIC STATUS ........................................................................................................................ 7 1.4 RECENT EVOLUTION OF THE BLUE ECONOMY SECTORS ..................................................................................... 7
2 ECONOMIC PROJECTIONS .............................................................................................................. 10
2.1 THE MACROECONOMIC PROJECTIONS ........................................................................................................ 10 2.2 THE SECTORAL PROJECTIONS .................................................................................................................... 11 2.3 EMPLOYMENT....................................................................................................................................... 12
3 CLIMATE CHANGE OUTLOOK ......................................................................................................... 13
3.1 TOURISM ............................................................................................................................................. 13 3.2 AQUACULTURE ..................................................................................................................................... 18 3.3 ENERGY ............................................................................................................................................... 19 3.4 MARITIME TRANSPORT ........................................................................................................................... 26
4 CLIMATE CHANGE RISKS ................................................................................................................ 29
4.1 TOURISM ............................................................................................................................................. 29 4.2 AQUACULTURE ..................................................................................................................................... 51 4.3 ENERGY ............................................................................................................................................... 70 4.4 MARITIME TRANSPORT ........................................................................................................................... 78
5 SOCIO ECONOMIC IMPACTS OF CLIMATE CHANGE ......................................................................... 78
5.1 MARKET AND NON-MARKET EFFECTS OF CC ................................................................................................ 78 5.2 MACROECONOMIC PROJECTIONS .............................................................................................................. 86
6 TOWARDS CLIMATE RESILIENCY ..................................................................................................... 90
6.1 CURRENT SITUATION: GENERAL COMMITMENT, SPECIFIC LIMITS AND OBSTACLE ................................................. 90
7 REFERENCES .................................................................................................................................. 92

2
Introduction
This report is the background material for stakeholders in the upcoming adaptation
pathways workshop in Sardinia. First, a presentation that includes the geography and socio-
economic context for the Island, and the socioeconomic trends without climate change
(WP6), which range from the present to the end-of the century. Regarding Climate Change,
the expected climate risks and vulnerabilities for the blue economy are presented and ran
(WP3), joint to the expected trends of physical risks, booth current and future (WP4).
Finally, specific economic impacts are estimated, considering the evolution of some
physical risks (WP5 and WP6). The current climate policy and resilience of the Island is
also presented (WP7). Finally, a link to the projects original work is made in the references
section.
Sardinia at a glance
Sardinia is the second largest island in the Mediterranean after Sicily covering an area of 29.949 km2 and is located in the western part of Italy in the Tyrrhenian sea just to the south of the French island of Corsica (40°4′N 9°17′E). With a population 1.648 million people Sardinia is one of the least populated regions of Italy. Sardinia enjoys a certain autonomy compared to other regions and for that reason, on the Italian constitution, it is granted Autonomous status. It is organised in Provinces. Municipalities and Metropolitan Cities and the largest part of its population (around 50%) is concentrated in two major urban areas: Cagliari (capital of the island) with 560,000 inhabitants and Sassari with 331,000 inhabitants.
The Blue Economy sectors
Aquaculture
As far as semi-intensive aquaculture is concerned, Sardinian companies are currently represented by facilities/plants for the breeding of valuable fish species both of salt and fresh water and of molluscs. Sardinia is still one of the leading Italian regions in marine fish production, with the greatest development potential both for quantitative as well as qualitative production. Despite the great availability of suitable sites to undertake the activity, fish farming in Sardinia has played a marginal role in the economy of the region until the late 1990s. The most recent farms are those set up at sea (offshore) in the 90s, adopting appropriate plant technologies that allow good integration with the surrounding environment. Among the fish, sea bream and sea bass are the two most important marine species bred.
Maritime Transport
Sardinian ports are responsible for 10% of the national cargo movement and 12% of total passenger movement while activities tied to the maritime transport sector generate income equal to 5.3% of the regional gross value added (Banca Intesa and SRM. 2019).

3
The port of Cagliari, which has the longest berths on the island, is the ‘core’ harbour of Sardinia in terms of infrastructure, equipment for loading and unloading of containers. Second for the available length of berths comes Porto Torres (North-West). The blue economy employs 42,300 people in Sardinia and 611 companies are active in the maritime cluster. To date, the greatest weakness of the Sardinian port system is represented by the excessive dependence on the oil sector. In 2018, the Management Committee of the Port System Authority of the Sardinian Sea unanimously approved the release of a 50-year state-owned maritime concession in favour of Edison Spa for the construction of a terminal for liquefied natural gas in the industrial port of Oristano.
Energy
Sardinia is interconnected to the Italian electricity grid. Electricity production reached 13
GWh in 2015 with the majority of the production facilities in the island being fossil-fuel
powered (ap-proximately 74%). which consisted of coal power plants (49%) and oil plants
(51%). while a moderate share of electricity production comes from renewable sources
(approximately 26%). The main source of renewable electricity is solar power (69%) as the
island has an installed capacity of 732MW, followed by wind (26%) with an installed
capacity of 1.028MW, biofuels (3.3%) and hydro power (1%).
Tourism
The tourism industry contributes approximately 7% of the regional value added. The
attraction of tourists is growing at a relatively steady pace over the past twenty years.
Sardinia records the second highest increase in tourism arrivals since 2000 among
Mediterranean islands after Crete, along with the nights spent in the island.
The main touristic attractions of the island, according to recent studies, are beaches (53%)
followed by cultural sightings (19%) and tradition-related attractions (12%). The promotion
of tourism is one of the main priorities of the regional authorities and the short-term
actions for this target are described in the “Piano Strategico di Sviluppo e Marketing
TuristicodellaSardegna” (2018).
1 Current situation and recent trends
1.1 Current geopolitical context
Sardinia is the second largest island in the Mediterranean after Sicily covering an area of
29.949 km2 and is located in the western part of Italy. in the Tyrrhenian sea. just to the
south of the French island of Corsica (40°4′N 9°17′E). With a population 1.648 thousand
people Sardinia is one of the least populated regions of Italy. Sardinia enjoys a certain
autonomy compared to other regions and for that reason it is named as Autonomous
Region of Sardinia. It is organised in Provinces. Municipalities and Metropolitan Cities and
the largest part of its population. around 50%. is concentrated in two major urban areas:

4
Cagliari (capital of the island) with 560 thousand inhabitants and Sassari with 331 thousand
inhabitants.
The climate of Sardinia is mild Mediterranean. with hot summers and mild winters.
Neverthe-less. the temperature varies between coastal (9-11oC in the winter and 9-11oC in
the summer) and non-coastal areas as the inner part of the island is mountainous (-2-4oC
in the winter and 16-20oC in the summer). The island’s highest elevation point is the Punta
La Marmora (1.834 meters). followed by Punta Sa Berritta (1.362 meters) and sa Punta
Manna (1.259 meters). After an ambitious reforestation program Sardinia is now Italy’s
most forested regions. as forests cover 50% of the island and host a wide variety of
endemic mammal sub-species. rare amphibians and birds. The island has 3 national parks
and ten regional ones. The island has approximately 100 beaches offering a wide variety in
terms of beaches geology ranging from sandy beaches to cliffs and caves
The population of Sardinia has reached its 30 years peak in 2014 with 1.663 million people
and is slowly decreasing for the past years. Population growth falls short compared to the
average population growth in Italy. as fertility rates are almost 20% lower than the national
average with slightly lower mortality rates and a relatively small outflow of population
towards the Italian Peninsula. Sardinia is characterized by an increasing share ageing
population (ap-proximately 4% in the past decade).
Figure 1: Population growth in Italy and in Sardinia (2008-2017). Source: Soclimpact project deliverable 6.1

5
Figure 2: Baseline population projection for Sardinia (2020-2100). Source: Eurostat & Own calculations.
1.2 Current climate and risks
The climate of Sardinia is typically Mediterranean with mild temperatures throughout the year and short-li- ved winters. Sardinia is a windy island, especially from October to April when the mistral blows from North-West (France) whereas in spring and summer the prevailing winds blow from Africa, bringing warm and dry weather.
Rainfall is not abundant, in fact it ranges from 400 to 550 millimetres per year on the coast, and follow the Mediterranean pattern, since it is more common in autumn and winter, it decreases gradually in spring and reaches its lowest in summer, when it almost never rains.
The island is sheltered from cold waves; along the coasts and in the plains, snowfall is quite rate, but it can occur in the coldest winters, more frequently in the north of the region. When it comes to the effects of climate change on Sardinia, since the early ‘80s data reveal a warming trend confirmed by temperature extremes with an increase in the extremes of heat and a reduction of extremes of cold. The number of tropical nights per year has also been increasing.
The expected climate change signal is less clear for rain than for temperature. In fact, precipitation indices do not highlight an unequivocal change in the frequency and intensity of precipitation. However, a tendency.

6
Figure 3: Climate factsheet Source: Own elaboration with data from GFDRR ThinkHazard!; D7.1 Conceptual Framework and Meteoblue; Meteoblue global NEMS (NOAA
Environmental Modeling System)

7
1.3 Macroeconomic status
Sardinia is a service led economy with services contributing consistently more than 70% of
the regional gross value added (GVA) over the past 20 years. During this period the
servicification of the Sardinian economy has intensified. The share of services in total
GVA. according to the most recent ISTAT statistics. has grown from 72.4% in 1995 to
82.2% in 2016 and the respec-tive Industry (excl. construction and utilities) share has
dropped from 9.4% to 5.3% during the same period. The contribution of agriculture to the
regional economy has been almost constant and around 9%. with small variations. for the
whole 20-year period. The inter-national exports of goods (manufactured and agricultural
products) in 2016 accounted for €4.2 billion. almost exclusively attributed to industrial
products while imports accounted for €5.2 billion consisting of industrial products (97%)
and agriculture and fishing products.
1.4 Recent evolution of the blue economy sectors
Tourism
The tourism industry contributes approximately 7% of the regional value added. The
attraction of tourists is growing at a relatively steady pace over the past twenty years.
Sardinia records the second highest increase in tourism arrivals since 2000 among
Mediterranean islands after Crete. along with the nights spent in the island. On average
there is a slight decrease in the average length of stay in the island (4.6 nights per visitor in
2018 compared to 5.4 in 19950). The promotion of tourism is one of the main priorities of
the regional authorities and the short-term actions for this target are described in the
“Piano Strategico di Sviluppo e Marketing Turistico della Sardegna” (2018). The main
touristic attractions of the island. according to recent studies. are beaches (53%) followed
by cultural sightings (19%) and tradition-related attractions (12%).
Figure 4: Nights spend in Sardinia 1995-2018. Source: Eurostat.

8
0
2.000
4.000
6.000
8.000
10.000
12.000
14.000
16.000
'00
0 p
asse
nge
rs
Passengers embarked Passengers disembarked
Total (embarked+disembarked)
Figure 5: Tourist arrivals in Sardinia 1995-2018. Source: Eurostat.
Maritime transport
Sardinian ports are responsible for 10% of the national cargo movement and 12% of total
passenger movement while activities tied to the maritime transport sector generate income
equal to 5.3% of the regional gross value added (Banca Intesa and SRM. 2019). Eurostat
statistics over the period 1995-2017 reveal a two-phase trend for the island’s maritime
transport sector: i) during the first period. and before the global financial crisis of 2008
both passengers and freight movement were recording an increase of 17.6% and 14.3%
relative to 1997 while ii) after the financial crisis there was a sharp decrease in maritime
transport activities (-14% compared to 1997 and -24% compared to 2008 for cargo
movement and -24% compared to 1997 and -365 compared to 2008 for passenger
movement).
Figure 6: Maritime passenger transport 1997-2017.
Source: Eurostat.

9
0
10.000
20.000
30.000
40.000
50.000
60.000
70.000
'00
0 t
on
es
Freight loaded Freight unloaded Total (loaded + unloaded)
Figure 7: Maritime transport movements from/to Sardinian ports 1997-2017.
Source: Eurostat.
As the maritime sector is important in scale and complexity. it is highlighted that for the
research interests of SOCLIMPACT project. namely the estimation of climate impacts on
the Blue Economy sectors. not all components of the sector are relevant. In particular. only
maritime transportation strictly related to the transportation of passengers and goods to
and from the island is relevant to this analysis. while other major components such as ship-
management. naval engineering and shipbuilding are not part of this analysis. To this end.
the projections presented below refer to Water transport as in the Eurostat classification.
thus to the more narrow estimation of transportation of passengers and goods that
includes sea and coastal passenger and freight transport as well as inland passenger and
freight transport.
Aquaculture
The aquaculture sector is of minor importance for the regional economy contributing
approximately 0.25% of the regional value added in 2015 and employing around 5.900
people.
Electricity
Sardinia is interconnected to the Italian electricity grid. Electricity production reached 13
GWh in 2015 with the majority of the production facilities in the island being fossil-fuel
powered (ap-proximately 74%). which consisted of coal power plants (49%) and oil plants
(51%). while a moderate share of electricity production comes from renewable sources
(approximately 26%). The main source of renewable electricity is solar power (69%) as the

10
island has an installed capacity of 732MW. followed by wind (26%)1 with an installed
capacity of 1.028MW. biofuels (3.3%) and hydro power (1%).
Infrastructure. R&D and planned projects
In the islands there are three passenger airports in operation: in Cagliari. Olbia and
Alghero; the road network extends to over 12.946 kilometres and the rail network extends
to over 429 kilometres. There are 4 major ports in the island: the Port of Arbatax – Tortolì.
the Port of Cagliari. the Port of Golfo Aranci. the Port of Olbia and the Port of Porto
Torres. and 9 minor ports. With respect to R&D the amount of funds directed towards
new technology account for 0.77% of the regional GDP in 2017 or €261 million with the
largest part being performed by higher education institutions (61%) and only a small part
being performed by the private sector (13%).
2 Economic projections
2.1 The macroeconomic projections
Based on the projections. Sardinia grows with an average annual rate of 0.9% throughout
the 2015-2100 period and with 0.6% throughout the 2015-2100 period. The main driver of
growth throughout the period is the improvement of the island’s competitiveness which is
supported by increased investments (Table 1) that lead to a decrease of the regional trade
deficit. Trade deficits are projected to decrease to around 9.5% of the regional GDP
compared to the trade deficits of 2015 of 17.9% of the Sardinian GDP. Still. Sardinia
remains a net importer in 2100. Investments grow with a high pace over the whole
projected period. reflecting the increased funding requirements of the economy. We
assume that the share of public consumption slightly decreases until 2100; nevertheless. per
capita public consumption expenditures increase over the time period under consideration.
Table 1: Sardinia GDP and GDP components yearly growth rates in 2020-2100.
2020 2025 2030 2035 2040 2045 2050 2060 2070 2100
GDP 0.0% 0.5% 0.4% 0.6% 0.6% 1.0% 1.1% 1.5% 1.4% 0.9%
Private consumption 0.2% 0.5% 0.3% 0.4% 0.5% 0.8% 0.9% 1.3% 1.1% 0.8%
Public consumption 0.4% 0.1% 0.0% 0.2% 0.2% 0.6% 0.7% 1.3% 1.3% 0.9%
Investments 1.1% 0.7% 0.6% 1.1% 1.1% 1.2% 1.3% 1.6% 1.4% 0.9%
Exports 0.0% 1.2% 0.3% 0.6% -0.1% 1.9% -0.3% -0.2% -0.6% 0.9%
Imports 0.4% 1.0% 0.2% 0.4% -0.1% 1.5% -0.3% -0.2% -0.6% 0.8%
Source: Own calculations.
1 http://www.regione.sardegna.it/documenti/1_231_20181221121007.pdf

11
Figure 8: Macroeconomic components as a % share of GDP for Sardinia in 2015-2100. Source: Own calculations.
2.2 The sectoral projections
The Sardinian economy remains a service-led economy throughout the 2015-2100 period.
Market and non-market services remain the largest activities in the Sardinian economy but
during this period there is a clear reorientation from traditional public related activities.
towards market-oriented activities. Other sectors that are expected to record higher relative
growth are the construction sector (+1.4% relative to 2015). which benefits more from the
increased investment expenditures. the consumer goods industries (+1.3%) to a lesser
extent the accommodation and food services sector (+0.3%).
Figure 9: Sectoral value added as a % share to total GVA for Sardinia in 2015, 2050 and 2100. Source: Own Calculations.

12
The accommodation and food service sector are projected to slightly increase its
contribution to the regional economy reflecting the moderate increasing pace of tourist
arrivals in the island and the same trend is projected for the consumer goods industry
which is mainly made up of food products and is linked to tourism activity through the
wholesale trade and restaurants activities. For the maritime sector the relatively small
projected growth rates are associated mainly to the decrease of freight transport activity
with the reduction on imports and the diversification of the economy.
Table 2: Sectoral contribution as a % share of total gross value added for Sardinia in 2015-2100.
Source: D6.2- Own calculations.
2.3 Employment
Economic growth brings positive effects to the labor market with unemployment projected
to fall from 17.4% in 2015 to more sustainable levels until 2050 (8.2%). The contribution
of each sector to total employment depends on the labor intensity of the sector. The
biggest employing sectors are the market. non-market services and manufacturing
employing 66.3% of the total working population in 2015. while the share of labor
employed in agriculture is 6.1%. The latter is expected to decrease over the period
examined mainly due to the adoption of more efficient cultivation methods and the
automation of agricultural production. The employment in the construction sector is
projected to increase from 6.5% to 7.7% due to the increased investment levels foreseen
over the whole projection period for the modernization of the production facilities.
Service-related employment increases from 53.4% in 2015 to 60.7% in 2100.
Table 3: Sectoral contribution as a % share of total gross value added for Cyprus in 2020-2100
2015 2020 2025 2030 2035 2040 2045
2050
2060
2070
2100
Unemployment rate
17.4%
15.0%
13.5%
12.1%
11.6%
10.2% 9.4% 9.5% 9.2% 8.3% 8.2%
Source: D6.2- Own calculations.
GVA % shares 2015 2020 2025 2030 2035 2040 2045 2050 2060 2070 2100
Agriculture 5.3% 5.3% 5.3% 5.3% 5.6% 5.5% 5.6% 5.6% 5.5% 5.4% 5.1%
Fishery 0.2% 0.2% 0.2% 0.2% 0.2% 0.2% 0.2% 0.2% 0.2% 0.2% 0.2%
Manufacturing 4.6% 3.8% 3.7% 3.5% 3.6% 3.3% 3.3% 3.2% 3.0% 3.1% 3.4%
Consumer goods 1.5% 1.9% 1.8% 1.8% 1.9% 2.0% 2.0% 2.2% 2.4% 2.7% 2.8%
Electricity 2.2% 2.2% 2.2% 2.2% 2.3% 2.2% 2.3% 2.2% 2.2% 2.1% 2.2%
Water 1.4% 1.2% 1.2% 1.1% 1.1% 1.0% 1.0% 0.9% 0.8% 0.8% 0.7%
Construction 5.6% 5.3% 5.3% 5.3% 5.5% 5.6% 5.6% 5.8% 6.4% 7.1% 7.1%
Water transport 0.9% 0.8% 0.7% 0.7% 0.7% 0.6% 0.5% 0.5% 0.4% 0.3% 0.3%
Other transport 4.2% 4.2% 4.2% 4.1% 4.2% 4.0% 4.0% 3.9% 3.7% 3.5% 3.4%
Accommodation and food services 3.5% 3.7% 3.8% 3.8% 3.8% 3.9% 3.9% 3.9% 3.8% 3.7% 3.9%
Travel agency and related activities 0.1% 0.1% 0.1% 0.1% 0.1% 0.1% 0.1% 0.1% 0.1% 0.1% 0.1%
Recreational services 4.8% 5.0% 4.9% 4.8% 4.8% 4.7% 4.7% 4.6% 4.5% 4.4% 4.2%
Other market services 36.6% 38.1% 39.4% 40.3% 40.1% 41.2% 41.7% 42.1% 41.9% 40.9% 41.5%
Non-market services 28.9% 27.9% 27.2% 26.6% 26.2% 25.6% 25.0% 24.8% 25.1% 25.6% 25.2%

13
Figure 10: Sectoral employment as a % share of total for Sardinia in 2015, 2050, 2100 Source: D6.2- Own calculations.
3 Climate Change outlook
Climate hazards indicators represent the entry point to understand the climate change
exposure of the blue economy sectors. The indicators have been computed for two
scenario RCP2.6 (low emission scenario) and RCP8.5 (high emission scenario) and for
different horizon times namely: a reference period (1965-2005), mid-century (2046-2065)
and end of century (2081-2100). Main source of climate projections (future climate) for
Sardinia is EURO-CORDEX ensemble even if other model sources were applied when
required, depending of available scales. Results are presented in form of maps, tables or
graphs and only when the information shows an interesting outcome.
All the graphics presented below can be found in high resolution in the Soclimpact
Project official website HERE.
3.1 Tourism
Beach flooding and related losses
One of the consequences of an increase in the mean sea level will be the flooding of coastal areas. This includes sand beaches, which are the main asset for tourism activities in most of

14
the European islands. Therefore, estimating the potential risk of beach loss due to climate change is of paramount importance for the economy of those islands. The 95th percentile of the flood level averaged was selected as an indicator of interest. The values are presented as anomalies with respect to the present mean sea level at beach location (i.e. including the median contribution of runup). In all cases an increase is expected being larger at the end of the century under scenario RCP8.5. The values of extreme flood levels in that scenario is 92.47 cm in Sardinia.
Figure 11: Projected extreme flood level (in the vertical, in cml) at beach locations with respect to the present (1986-2005) mean sea level values averaged for the islands under scenario RCP2.6 (left) and RCP8.5
(right). Ensemble of models using Global simulations produced by Hemer et al. (2013). Source: SOCLIMPACT Deliverable Report - D4.4d Report on the evolution of beaches
Under mean conditions, we find that, at end of century, the total beach surface loss range
from ~46% under scenario RCP2.6 to ~77% under scenario RCP8.5.

15
Figure 12: Beach reduction (%). Source: Soclimpact project deliverable D4.4d Report on the evolution of beaches
Seagrass evolution
Seagrasses are the main habitat for coastal marine ecosystems. They provide different
services like sediment retention (and thus clearer waters), coastal protection (in front of
marine storms), shelter for marine organisms, etc. Therefore, the state of the seagrasses is a
convenient proxy for the state of coastal environment. That is, large well-preserved
extensions of seagrasses lead to a better coastal marine environment which in turn is more
resilient in front of hazards.
Our results suggest that no seagrass losses are expected for the Posidonia located in the
coasts of Sardinia island, except under the scenario 8.5 at the end of century (loss of
14,4%).
Figure 13: Seagrass evolution.

16
Source: SOCLIMPACT Deliverable Report - D4.4e Report on estimated seagrass density
Length of the window of opportunity for vector-borne diseases Vector Suitability Index for Aedes Albopictus (Asian Tiger Mosquito) Climate change can influence the transmission of vector-borne diseases (VBDs) through altering the habitat suitability of insect vectors. This is mainly controlled by increases of ambient air temperature and changes in the hydrological cycle. In the framework of SOCLIMPACT we explore if potential changes to meteorological conditions can affect the distribution of the Asian tiger mosquito (Aedes albopictus). Asian tiger mosquito is native to the tropical and subtropical areas of Southeast Asia; however, in the past few decades, this species has spread to many countries through the international transport of goods and increased travel (Scholte and Schaffner 2007). It is of great epidemiological importance since it can transmit viral pathogens and infectious agents that cause chikungunya, dengue fever, yellow fever and various encephalitides (Proestos et al. 2015). The multi-criteria decision support vector distribution model of Proestos et al. (2015) has been employed to estimate the regional habitat suitability maps. This is based on extending previous work on the environmental/climatic factors affecting the life cycle of the Asian tiger mosquito (Waldock et al. 2013; Proestos et al., 2015). The mosquito habitat suitability model combines seven meteorological indices based on field observations, extensive literature review and expert knowledge. Sardinia is found to have high habitat suitability index values for the simulations of the present climate. This is also verified by the fact that populations of Aedes Albopictus have already been reported in this island. Slight increases and decreases of the HSI values are projected for simulations under RCP2.6 and RCP8.5 respectively. The decreases are mainly found to be in the interior of the island (not showed) where the higher increases of temperature are expected to occur in a warmer future.
Figure 14: Habitat Suitability Index (HSI) values averaged over eight SOCLIMPACT islands and for each sub-period of analysis. Red colors indicate increases while blue colors indicate decreases in the future. [80-100: High Suitability; 60-80: Medium Suitability; 40-60: Low Suitability; <40 No Suitability].
Source: Soclimpact project deliverable 4.3

17
Fire weather Index (FWI)
The FWI system provides numerical non-dimensional ratings of relative fire potential for a generalized fuel type (mature pine stands) based solely on weather observations. FWI is part of the Canadian Forest Fire Danger Rating System established in Canada since 1971 (van Wagner 1987). Furthermore, since 2007, FWI has been adopted at the EU level and used in a harmonized way throughout Europe by the European Forest Fire Information System (EFFIS) of the Copernicus Emergency Management Service (since 2015). It is selected for exploring the mechanisms of fire danger change for the islands of interest in the framework of SOCLIMPACT Project, as it has been proved to adequately perform for several locations, including the Mediterranean basin.The index was calculated for the fire season (defined from May to October) over the Mediterranean for all models, scenarios and periods. For Sardinia, N=185 grid cells were retained from the models domain. In the following figure the ensemble mean and the uncertainty is presented for all periods and RPCs. While the most areas exhibit very and low fire danger in the present climate and under RCP2.6 for the near and the distant future as well, it seems that under RCP8.5, many areas cross over into medium fire danger, while increases towards the end of the century there are areas mainly inland that exhibit high fire danger. The overall increase exceeds 40%. For RCP2.6, we find the highest uncertainty for the near future period, which decreases substantially at the end of the century, indicating that the projections become more robust.
Figure 15: Fire Weather Index (EURO-CORDEX) with the color associated to the nivel of risk.
Source: SOCLIMPACT Deliverable Report - D4.3
Humidex
For the assessment of climate hazard on heat related impacts of climate change on human health, the humidity index (Humidex) (Masterton and Richardson, 1979) has been used. Humidex value is an equivalent temperature, which express the temperature perceived by

18
people (the one that the human body would feel), given the actual air temperature and relative humidity. As a more representative indicator for the assessment of inhabitants’ and tourists’ hazard on heat related climate change impacts, the Number of Days with Humidex greater than 35°C was selected. From the above classification, a day with Humidex above 35°C describes conditions from discomfort to imminent danger for humans. For Sardinia, N=185 grid cells were retained from the models domain. In the following figure the ensemble mean and the uncertainty is presented for all periods and RPCs. From less than 2 months in the present climate and quite above 2 months in the mid-century for both scenarios, Sardinia will have almost 4 months with discomfort conditions by the end of the century under RCP8.5.
Figure 16: Humidex. Ensemble mean of EURO-CORDEX simulations. Source: SOCLIMPACT Deliverable Report - D4.3 Atlases of newly developed indexes and indicator
3.2 Aquaculture
The predicted impacts of climate change on the oceans and seas of the planet is expected to have direct impacts on marine based aquaculture systems. Basic effects are the following (Soto and Brugere, 2008):
Increased invasions from alien species.
Increased spread of diseases.
Changes in the physiology of the cultivated species by changing temperature, salinity, oxygen availability and other important physical water parameters.
Changes in the differences between sea and air temperature which will alter the seasonality, frequency and severity of storms, cyclones and other extreme events, affect the stability of the coastal resources and potentially increase the damages in infrastructure.

19
Sea level rise, acidification, changes in precipitation and other effects will also add to the changes in coastal ecosystems and environment, thus affecting production and infrastructure (=investments).
Temperature changes in seawater trigger physical impacts; increased harmful algal blooms, decreased oxygen level, increase in diseases and parasites, changes in ranges of suitable species, increased growth rate, increased food conversion ratio and more extended growing season. Furthermore, all these impacts lead to socio-economic implications among them; changes in production levels and an increase in fouling and pests. The objective of the current analysis is to identify and quantify the variations (future climate scenarios with respect to present climate) in the number and in the duration of events characterized by a Sea Surface Temperature (SST) exceeding a given threshold. The SST thresholds have been identified according to the farming and feeding necessities of several marine species, particularly relevant for the aquaculture sector in the Mediterranean Sea (MS).
Figure 17: Number of day per year exceeding a given threshold. Source: Soclimpact project deliverable 4.5
3.3 Energy
Percentage of days when T > 98th percentile - T98p
The T98p is defined as the percentage of time where the mean daily temperature T is above the 98th percentile of mean daily temperature calculated for the reference period 1986-2005. For Sardinia, N=185 grid cells were retained from the models domain. In the following figure the ensemble mean and the uncertainty is presented for all periods and RCPs. It is found that T98p is about 5% during RCP2.6 towards mid-century and slightly decreases at the end of the century, while for RCP8.5, 18% of the year will exhibit temperatures above the 98th percentile by the end of the century. The coastal grid cells are more affected by the temperatures increase compared to inland grid cells (not showed).

20
Figure 18: Percentage of days when T>98th percentile. Ensemble mean of EURO-CORDEX simulations.
Source: SOCLIMPACT Deliverable Report - D4.4a Report on solar and wind energy. Renewable energy productivity indexes
Photovoltaic energy productivity
The “noisy” spatial pattern can be also seen in the projected changes, mostly for the period
2081-2100 in the RCP8.5 scenario. Despite of the local increase, in spatial average a
decrease over land and on maritime areas is projected, as in all the other cases. However,
the projected decrease is mostly small, with values that does not reach 1% of change over
land, and changes over the sea with a maximum average that represents less than 5% of the
annual mean productivity in the control period.
Figure 19: Ensemble mean values of annual solar productivity indicators (kWh/kW) in the control period
(1986-2005) and ensemble mean changes in future periods (2046-2065, 2081-2100) for the RCP2.6
and RCP8.5 scenarios. Source: SOCLIMPACT Deliverable Report - D4.4a Report on solar and wind energy.

21
Figure 20: Ensemble mean values of annual solar productivity indicators (kWh/kW) in the control period
(1986-2005) and ensemble mean changes in future periods (2046-2065, 2081-2100) for the RCP2.6
and RCP8.5 scenarios. Source: SOCLIMPACT Deliverable Report - D4.4a Report on solar and wind energy.
Wind energy productivity
Slight changes are obtained for RCP2.6 scenario and RCP8.5 by the middle of this century.
However, changes over the sea are larger in the RCP8.5 scenario by the end of the century,
with a spatially averaged decrease of about 5%.
Figure 21: Ensemble mean values of annual wind and solar productivity indicators (kWh/kW) in the
control period (1986-2005) and ensemble mean changes in future periods (2046-2065, 2081-2100) for
the RCP2.6 and RCP8.5 scenarios. Source: SOCLIMPACT Deliverable Report - D4.4a Report on solar and wind energy

22
Figure 22: Ensemble mean values of annual wind and solar productivity indicators (kWh/kW) in the
control period (1986-2005) and ensemble mean changes in future periods (2046-2065, 2081-2100) for
the RCP2.6 and RCP8.5 scenarios. Source: SOCLIMPACT Deliverable Report - D4.4a Report on solar and wind energy
Frequency and duration of low-productivity periods (energy droughts) as a measure
of the variability of these sources
In this region, in the control period, wind droughts are more frequent over land than over
the sea, especially in the central and eastern portions of the island. Changes in the
frequency of wind droughts are rather small in the RCP2.6 scenario. In the RCP8.5 case, an
increase in the occurrence of wind droughts is projected, reaching 7 days more per year for
moderate droughts at the end of the century.
It is also remarkable that the greatest increase in the percentage of days in which drought
conditions develop occurs in the center-east of the island, where droughts in the control
time period are more likely to happen. Changes in the frequency of wind droughts are in
line with changes in wind productivity.
Changes in the frequency of severe PV droughts in the considered scenarios are very small.
The combination of PV and wind energy is highly positive, as moderate droughts in the
control period occur with a frequency almost as low as for PV droughts alone, and the
frequency of severe droughts is almost negligible, even below the already very low value for
PV energy.

23
Figure 23: Photovoltaic (PV) productivity. Ensemble mean frequency of moderate and severe productivity drought days (%) in the control time period, as well as the ensemble mean changes in the frequency of drought days (%) in the different time periods considered for the RCP2.6 and RCP8.5 scenarios.
Source: SOCLIMPACT Deliverable Report - D4.4a Report on solar and wind energy
Figure 24: Wind energy productivity. Ensemble mean frequency of moderate and severe productivity drought days (%) in the control time period, as well as the ensemble mean changes in the frequency of drought days (%) in the different time periods considered for the RCP2.6 and RCP8.5 scenarios.
Ensemble minimum and maximum values are given in brackets. Averages are computed over land. Source: SOCLIMPACT Deliverable Report - D4.4a Report on solar and wind energy

24
Figure 25: COMBINED energy productivity. Ensemble mean frequency of moderate and severe productivity drought days (%) in the control time period, as well as the ensemble mean changes in the frequency of drought days (%) in the different time periods considered for the RCP2.6 and RCP8.5
scenarios. Ensemble minimum and maximum values are given in brackets. Averages are computed over land.
Source: SOCLIMPACT Deliverable Report - D4.4a Report on solar and wind energy
Cooling Degree Days
The Cooling degree days (CDD) index gives the number of degrees and number of days that the outside air temperature at a specific location is higher than a specified base temperature, providing provides the severity of the heat in a specific time period taking into consideration outdoor temperature and average room. For Sardinia, at the end of century, under RCP8.5., the increase of number of days is amount the triple of the hindcast.

25
Figure 26: Cooling Degree Days. Ensemble mean of EURO-CORDEX simulations. Source: SOCLIMPACT Deliverable Report - D4.3 Atlases of newly developed hazard indexes and indicators with Appendixes
Available water: Standardized Precipitation Index This index is used as an indication of water availability. For Sardinia only some regions of
the north-east of the island are expected to be affected under RCP2.6 and exceed the “dry”
conditions threshold. Under the business-as-usual RCP8.5 forcing, parts of the island are
expected to experience extreme dry conditions that will be evident even from the mid 21st
century. Mild changes are projected under RCP2.6, while under the business-as-usual
scenario the whole island is expected to be severely affected by meteorological droughts.
Figure 27: Ensemble mean values of the Standardized Precipitation Evaporation Index (SPEI) averaged. Source: SOCLIMPACT Deliverable Report - D4.3 Atlases of newly developed hazard indexes and indicators with Appendixes

26
3.4 Maritime transport
Sea level rise
Sea level rise (SLR) is one of the major threats linked to climate change. It would induce permanent flooding of coastal areas with a profound impact on society, economy and environment. Moreover, an increase in the mean sea level would result in a larger impact of coastal storms with the consequent increase of risk. The results are presented in terms of mean sea level rise. For Sardinia, the SLR ranges from 22.19 cm (RCP2.6) to 60.46 cm (RCP8.5) at the end of the century.
Figure 28: Mean sea level rise (in cm) with respect to the reference period (1986-2005). Ensemble mean of CMIP 5 simulations and scaling approximation for RCP2.6.
Source: SOCLIMPACT Deliverable Report - D4.4b Report on storm surge levels
Storm surge extremes
Storm surge events, characterized by positive extreme sea levels and mechanically forced by atmospheric pressure and wind are the main responsible for coastal flooding, especially when combined with high tides. To present, the only ensemble populated with enough number of members to compute meaningful statistics on climate projections is the one produced for the Mediterranean by Lionello et al. (2016). This ensemble consists on 6 simulations run with the HYPSE model at 1/4º of spatial resolution and forced by the high-resolution wind fields from the MedCORDEX ensemble which in turn is nested into CMIP5 global simulations. The simulations are run for the period 1950-2100 thus covering the historical period as well as the whole 21st century. Complementary, the ensemble includes three hindcast simulations that are used to establish present reference levels. The results show a low decrease except for RCP8.5 at the end of the century.

27
Figure 29: 99th percentile of atmospherically forced sea level (in cm) averaged for the hindcast period, the near future (2046-2065) and the far future (2081-2100) under scenarios RCP2.6 (with scaling
approximation) and RCP8.5 and (relative change in %). Source: SOCLIMPACT Deliverable Report - D4.4b Report on storm surge levels
Wind extremes
The wind extremity index NWIX98 is defined as the number of days per year exceeding the 98th percentile of mean daily wind speed. This number decreases in the far future under RCP8.5 (- 15.9%).
Figure 30: Wind Extremity Index (NWIX98). Ensemble mean of the EURO-CORDEX simulations. Source: SOCLIMPACT Deliverable Report - D4.3Atlases of newly developed indexes and indicator

28
Wave extremes (99th percentile of significant wave height averaged)
Marine storms can have a negative impact on maritime transport, coastal-based tourism and aquaculture, among other activities. To illustrate this impact, the 99th percentile of significant wave height averaged has been chosen. A decrease in the extreme wave height is found being larger under scenario RCP8.5 as illustrated in the following map, more significantly in the West coast of the island. The more significant change is observed under RCP8.5. at the end of century with -3%.
Figure 31: the 99th percentile of significant wave height averaged for the reference period and the relative change for the RCP8.5. Global simulations produced by Hemer et al. (2013).
Source: SOCLIMPACT Deliverable Report - D4.4b Report on storm surge levels.
Figure 32: the 99th percentile of significant wave height averaged for the reference period and the relative change for the RCP8.5 and RCP2.6. Global simulations produced by Hemer et al. (2013).
Source: SOCLIMPACT Deliverable Report - D4.4b Report on storm surge levels

29
4 Climate change risks
4.1 Tourism
For the tourism sector, three impact chains (IC) were operationalized: i) Loss of attractiveness of a destination due to the loss of services from marine ecosystems, ii) Loss of comfort due to increase of thermal stress iii) Risk of forest fires and loss of attractiveness
Sardinia was not included in the analysis of the first IC. The main reason is the insufficient data availability, for “Tourist Arrivals” and “Vulnerable Groups” indicators, which is regards the Exposure of people to heatwaves for the hottest period, such as:
- Number of tourist arrivals per month for the past 5 years. - Number of tourists per month aged 14 and under for the past 5 years - Number of tourists per month aged 65 and over for the past 5 years - Percentage of tourist activities that are sensitive to heatwaves (such as hiking, etc.). - Number of beds available in medical facilities per 100,000 inhabitants.
If one information is missing, it is not possible to conduct the risk assessment analysis, as it is a comparative analysis between European islands. The other two IC provided some results for the case of Sardinia, joitn to other,,,,islands, which are summarized in the next section. Loss of comfort due to increase of thermal stress This section describes the work carried out for the operationalization of the impact chain
“Loss of competitiveness of destinations due to a decrease in thermal comfort”2. It provides details on
the method applied for the operationalization, the island data used, and the results
obtained. As can be seen in the next figure, the impact of Climate Change on the touristic
attractiveness of an island depends on a set of multi-dimensional factors, including:
1. the frequency, intensity, and duration of heatwaves, 2. to what extent and how tourist activities and tourists become exposed to
heatwaves, and how sensitive different segments of tourists are to extreme heat, and
3. the preparedness of the destination to cope with thermal discomfort episodes through information, technology, alternative activities, and medical attention.
2 Detailed information about the methodology used and the results obtained is available at: SOCLIMPACT Deliverable Report – D4.5. Design of a comprehensive approach to climate and climate-related risk information to policy makers and the general public.

30
Figure 33: Loss of competitiveness of destinations due to a decrease in thermal comfort Source: SOCLIMPACT Deliverable Report – D3.2. Definition of complex impact chains and input-output matrix for each islands and sectors
For the purposes of the operationalization it was decided by the team to retitle the risk as
“Loss of attractiveness of a destination due to a decrease in thermal comfort”. This was done in order
for the risk to more accurately reflect the effects of the hazards, exposure and vulnerability
on an island rather than an on an individual tourist.
The selection of islands to be compared was based on the availability of island data
provided by the IFPs. The five islands selected for comparison were the Balearic Islands,
the Canary Islands, Cyprus, Malta, and Sardinia.
Selection of operationalization method
The Analytical Hierarchy Process (AHP) method was selected as the technique to
operationalize the impact chain since it is a well-grounded tool that allows for the
prioritization/ranking of alternatives using a weighting scheme that is established by expert
judgement. Hence, for the purposes of the project, it was considered suitable as it would be
able to reconcile the contribution of each risk factor (hazards, exposure, and vulnerability)
towards the risk based on expert opinion and, subsequently, order the islands in terms of
which one is most at risk of losing attractiveness due to a decrease in thermal comfort.
Application of the AHP methodology
The problem to be solved along through the expert decision process was comparing the
risk of the European islands of losing tourist attractiveness due to a decrease in thermal
comfort as consequence of climate change. The hierarchy tree for this decision problem
was built underpinning on the impact chain elements. Some refinements were necessary

31
regarding the indicators (at sub-criteria level) that were to be used for comparing the
islands.
Figure 34: Hierarchy tree for thermal comfort impact chain. Source: SOCLIMPACT Deliverable Report – D4.5. Design of a comprehensive approach to climate and climate-related risk information to policy makers and
the general public
Hazards are the climate events that instigate the climate-associated risk. For the AHP
method, thermal sensation was considered as the most relevant indicator to assess changes
in the thermal comfort of tourists while staying at their destination as it is a concept that
combines temperature and humidity. Thus, it is the only sub-criterion of the Hazard
criterion. Moreover, the humidity index (humidex) (Masterton and Richardson, 1979) was
selected as the most appropriate metric for thermal sensation. The metric is an equivalent
temperature that express the temperature perceived by people (i.e., the temperature that the
human body would feel), given the actual air temperature and relative humidity.
Exposure denotes the range of ecological and social systems susceptible to be damaged by
hazards. This criterion was decomposed into sub-criteria relating to three indicators. The
first indicator relates to the exposure of tourists to heatwaves. The measure of the indicator
combines the percentage of an island prone to heatwaves and the percentage of the tourist
accommodations and facilities located in those areas prone to heatwaves. It is necessary to
factor in both these aspects of exposure in order to allow for a better comparison of
islands. For example, if an island has a small area that is prone to heatwaves with the
majority of tourists frequenting in that small area, then the combination of the two factors
will play a role when comparing, for instance, an island that has large areas prone to
heatwaves, but with tourists frequenting in places outside these areas, since the overall

32
exposure will be different. Specifically, it was decided to assign a weight of 75% to
percentage of an island prone to heatwaves and the remaining 25% to the percentage of
tourist accommodations and facilities located in heatwave-prone areas. The second
indicator deals with the number of tourist arrivals during the hottest months. The indicator
is represented by the percentage of tourists that visit an island between the months of May
and September averaged over the last five years. Finally, the third indicator concerns
vulnerable groups of tourists who have the highest risk of being affected by heatwaves.
Literature confirms that under-6s and over-65s are the most vulnerable age groups,
however, the statistical services of the islands homogeneously provide data for the under-
14 and over-65 age groups. For this indicator, two values were computed:
1. the number of tourists visiting an island that were under 14 years of age during the months of May and September over the total number of tourists visiting during the same period, averaged over the last five years, and
2. the number of tourists visiting an island that were over 65 years of age during the months of May and September over the total number of tourists visiting during the same period, averaged over the last five years.
For purpose of combining the two values and adjusting the change to age groups, it was
decided to apply a ratio of 15:85 in order to emphasize the proportion of over-65s (85%)
to the proportion of under-14s (15%).
Sensitivity concerns the susceptibility of natural, cultural, and built resources to harm that
is a direct or indirect result of Climate Change hazards. For the operationalization of this
impact chain, sensitivity relates to the susceptibility of tourists and is broken down into
sub-criteria pertaining to two indicators. The first indicator involves tourist activities. The
effect of heatwaves on tourist activities varies greatly. For example, a tourist sunbathing at
a beach will not feel the effects of a heatwave to the same degree as a tourist that is
trekking. Different destinations have different rates of tourists practicing activities
incompatible with heatwaves events. So, this indicator aims at catching these differences.
More specifically, this indicator is a measure of the percentage of visitors who state that
they practice activities not compatible with heatwave events. The second indicator
concerns the economic valuation of heatwaves from the perspective of tourists. In the case
of a heatwave event, all tourists will suffer from thermal discomfort to a certain degree.
Hence, the indicator represents their willingness to avoid this discomfort as expressed in
monetary terms. Therefore, it is measured by much money tourists are willing to pay to
avoid a heatwave during their vacation time3.
Adaptive capacity reveals the potential to face the hazards by reducing the level of
exposure and/or increasing the resilience of the tourism system through providing
information, adopting proper technology, supplying alternative activities, and improving
medical attention. This criterion is split into sub-criteria concerning three indicators. The
first indicator has deals with early warning systems. Setting up a proper early warning
3 Further information available at: SOCLIMPACT Deliverable Report – D5.5. Report on market and non-market economic values for environmental services of marine and coastal ecosystems related to the activities of the blue economy.

33
system can help tourists and service providers to plan effective responses to heatwaves,
making them less distressing and reducing the destination’s vulnerability. Hence, this
indicator is measured with a score representing the quality of early warning systems in place
and advisement of options for tourists. The second indicator involves air conditioning. Air
conditioning is the most effective technology used to combat extreme heat. Therefore, the
indicator uses the percentage of hotel accommodations and tourist facilities offering air
conditioning systems as a measure of the capacity of the destination to cope with this
hazard. The final indicator concerns the care and medical attention (such as in the case of
heatstroke or similar) available on an island that may be necessary to help reduce pain or
avoid casualties due to diseases related to heatwaves. Therefore, the number of hospital
beds available on an island per 100,000 potential users, both residents and tourists, is taken
as the measure of this indicator.
Results and island´s ranking
The table below shows the final results of the operationalization process. In particular, it
summarizes the global weights of the sub-criteria and the criteria and the global score of
the risk for each island; thus islands can be compared not just globally but also across the
set of the sub-criteria and the criteria being considered to estimate the aggregated risk.
Table 4: Final scores and islands’ ranking (under RCP8.5 distant future).
Criteria Sub-criteria Balearic Canary Cyprus Malta Sardinia
Hazards Humidex RCP8.5 (2081-2100)
0.024 (12.1%)
0.008 (4.6%)
0.088 (34.6%)
0.023 (11.7%)
0.023 (13.1%)
Exposure
Exposed areas 0.007 0.002 0.007 0.007 0.007
Vulnerable groups 0.007 0.017 0.016 0.017 0.038
Tourists’ arrivals 0.050 0.008 0.029 0.018 0.065
Total 0.064
(32.2%) 0.027
(15.5%) 0.053
(20.9%) 0.042
(21.3%) 0.110
(62.9%)
Sensitivity
Heat-sensitive activities
0.074 0.073 0.074 0.074 0.012
Economic valuation
0.004 0.004 0.015 0.028 0.010
Total 0.079
(39.7%) 0.078
(44.8%) 0.089
(35.0%) 0.103
(52.3%) 0.021
(12.0%)
Adaptive capacity
Early-warning systems
0.007 0.007 0.007 0.007 0.003
Air conditioning 0.011 0.048 0.011 0.021 0.012

34
Medical attention 0.014 0.006 0.005 0.002 0.005
Total 0.032
(16.1%) 0.061
(35.1%) 0.024 (9.4%)
0.030 (15.2%)
0.020 (11.4%)
Total 0.199 0.174 0.254 0.197 0.175
Rank 2 5 1 3 4
Note: Total contribution of the criterion to the final score of the island in parenthesis.
Source: SOCLIMPACT Deliverable Report – D4.5. Design of a comprehensive approach to climate and climate-related risk information to policy makers and
the general public
Cyprus is at most risk of loss of competitiveness due to a decrease in thermal comfort in all
four scenarios as it is ranked the highest in all cases. This is mainly attributed to the fact
that the number of days with a heatwave is predicted to increase greatly both in the near
and distant future. In addition, the island’s tourist accommodations and facilities are
located in areas most prone to heatwaves, and these are visited by many tourists during the
months of May to September. Cyprus also scores the highest in Sensitivity and average in
Adaptive capacity.
The Balearic Islands and Malta are ranked second and third, respectively, with regards to
the risk of loss of competitiveness. However, their overall scores are very close: 0.199 for
the Balearic Islands and 0.1970 for Malta in the RCP8.5 distant future scenario. They score
relatively high in Exposure and Sensitivity (the most important criteria for the risk) and
average in Hazard and Adaptive capacity.
Sardinia and the Canary Islands are the lowest at risk of loss of competitiveness. Even
though Sardinia scores the highest for Exposure, it has a low score for Sensitivity (which
contributes most to the risk) and average scores for Hazard and Adaptive capacity. On the
other hand, the Canary Islands has a low score for Hazard and Exposure, but relatively
high for Sensitivity and Adaptive capacity.
Analysis of Sardinia
As explained above, Sardinia scores the highest for Exposure among all the analysed
islands, contributing this criterion 62.9% to the total score. This is due to both tourists’
arrivals and vulnerable groups. On the other hand, it is one of the islands at the lowest risk
of loss of competitiveness due to thermal discomfort because of its exposure and adaptive
capacity.
The mentioned advantages and disadvantages of Sardinia are depicted in the next figure.
The further the criteria or sub-criteria is located from the centre of the graph, the more it
affects the risk.

Figure 35: Global weights of each criteria and sub-criteria in the final score. Source: SOCLIMPACT Deliverable Report – D4.5. Design of a comprehensive approach to climate and climate-related risk information to policy makers
and the general public
Figure 36: Global weights of each criteria and sub-criteria in the final score. Source: SOCLIMPACT Deliverable Report – D4.5. Design of a comprehensive approach to climate and climate-related risk information to policy makers
and the general public

36
The operationalization of the impact chain for the “Loss of attractiveness of a destination due to
a decrease in thermal comfort” was conducted using the AHP method. The method proved to
be appropriate, firstly, for dealing with the hierarchical nature of the impact chain and,
secondly, for using expert judgements to assess the comparative risk for the islands over
a large number of indicators (sub-criteria). Because the AHP method determines a
ranking of the islands, it can provide decision-makers with relative values but not with
absolute values. Such values will be delivered by the modelling activities of other work
packages and will give stakeholders a more complete picture of this specific risk in terms
of social, economic, and environmental impacts.
Loss of attractiveness due to increased danger of forest fires in touristic areas Forest fires are considered as an important parameter for the attractiveness of tourist
destinations, especially in the Mediterranean area. Severe episodes were met in Algarve
(Portugal) and Greece (Athens area) in the recent period, threatening the tourist season.
This study focuses on the implementation and analysis of the selected Impact Chain
“Risk of forest fires and consequences on tourism attractiveness of a destination”.
Out of the 12 islands assessed in the SOCLIMPACT project, nine were included in the
operationalization: the three Atlantic Islands (Azores, Canary Islands and Madeira) and
the Mediterranean ones (Balearic Islands, Crete, Corsica, Cyprus, Malta, Sardinia and
Sicily).
The concept of Impact Chain (Schneiderbauer et al. 2013; Fritzsche et al. 2014) is applied
as a climate risk assessment method (with 6 steps) for research of decision making.
Impact Chains propose diagrams articulating the causal links between the different
components of climate risks (according to AR5 concepts: hazards, exposure,
vulnerability, risks, step 1)). For each of these components of the theoretical IC (step 2),
several indicators are selected and collected (step 3). Data are then normalised to be able
to be aggregated (steps 4 and 5) with different weights. The final objective (step 6) is to
achieve a standardised risk score that, according to the spatial scale of the analysis can
allow comparison and decision making on adaptation, including hierarchization of
resource allocation or identification of adaptation options to mitigate climate risk.

37
Figure 37: Loss of attractiveness due to increased danger of forest fire in touristic areas. Source: SOCLIMPACT Deliverable Report – D3.2. Definition of complex impact chains and input-output matrix for each islands and sectors

38
Figure 38: Loss of attractiveness due to increased danger of forest fire in touristic areas, from D3.3. Source: SOCLIMPACT Deliverable Report – D3.3. Definition of complex impact chains and input-output matrix for each islands and sectors
Many indicators were formulated in a very broad way, causing a few problems in
identifying suitable data sets. Furthermore, the data were checked for explicit spatial
coverage, resolution, temporal coverage and time frame. Finally, we evaluated possible
substitutes or alternatives for those indicators with no suitable data to substantiate them.

39
Figure 39: Final Impact Chain Model Source: SOCLIMPACT Deliverable Report – D3.2. Definition of complex impact chains and input-output matrix for each islands and sectors
In order to normalize the index, the min-max method was applied. Min-max normalizes
indicators to have an identical range [0, 1] by subtracting the minimum value and
dividing by the range of the indicator values (OECD 2008). The mathematical formula
and more information on min-max normalization method are presented in the following
section. Afterwards, the normalized index was categorized into five equal interval classes
representing values from “Very low" to "Very high”. Considering the weighing, an

40
assessment of GIZ methodology has been developed for this impact chain including
interviews with various types of stakeholders (cf. dedicated 4.5 to forest fires).
The indicators previously normalized have been aggregated to elaborate three sub-
component indices (hazard, exposure, vulnerability) and the final risk index. The result is
included in a comparison for the 9 other islands studied for the risk linked to forest fires.
Comparative study
Hazard
The main findings are:
Scores for fire danger increase as we move from West to East and from North to South, with the exception of Malta, which is much smaller and the selected grid cells are mostly influenced by maritime conditions.
Under RCP2.6, it seems that the fire danger returns to the present conditions towards the end of the century.
Apart from Crete which score will increase from medium to high, even under this RCP.
Under RCP8.5, the increase is much more prominent, ranging from 22% to 46%, with the highest values for Corsica, Sardinia and Sicily, which implies that under this scenario at the end of the Century, the western and central Mediterranean will be more affected.
Figure 40: Hazard score (Fire Weather Index) per island for the reference period (1986-2005). Source: SOCLIMPACT Deliverable Report – D4.5Comperhensive approach for policy makers

41
Figure 41: Hazard score (Fire Weather Index) per island at the end of the century (2081-2100) under
RCP2.6 (Ambitious Mitigation Policies). Source: SOCLIMPACT Deliverable Report – D4.5Comperhensive approach for policy makers
Figure 42: Hazard score (Fire Weather Index) at the end of the century (2081-2100) under RCP8.5 (Business as usual).
Source: SOCLIMPACT Deliverable Report – D4.5Comperhensive approach for policy makers

42
Exposure
The results show that:
Atlantic Islands (Madeira and Canary Islands) are more exposed (high score), than Mediterranean Islands (from low to medium score). We can see an increase as we move from North to South in the Mediterranean area.
Atlantics Islands higher scores are mainly explained by the level of exposure rather than the nature of exposure, which is quite similar across islands, except for Malta which rate is very low.
The nature of exposure varies across EU Islands despite of their homogeneous score: Corsica has the highest score for forest areas followed by Madeira, Canary Islands. These two last ones have the highest score of forest belonging to protected areas. We can find a significant proportion of cultivated areas in other Islands namely: Sicily, Sardinia, Balearic Islands, Crete and Cyprus.
The level of exposure for Canary Islands and Madeira is particularly important because of the high scores for each of the 4 considered indicators: population density, population over 65 years, population under 9 years and tourist density.
Figure 43: Exposure score (current period) per island. Source: SOCLIMPACT Deliverable Report – D4.5Comperhensive approach for policy makers

43
Figure 44: Subcomponents of exposure and related score (current period) per island. Source: SOCLIMPACT Deliverable Report – D4.5Comperhensive approach for policy makers
Figure 45: Breakdown by exposure subcomponent. Source: SOCLIMPACT Deliverable Report – D4.5Comperhensive approach for policy makers

44
Vulnerability
The main findings are:
Results show large disparity across EU Islands in terms of vulnerability. The vulnerability score for Corsica is very high followed by Sardinia (high), Madeira, Balearic Islands and Cyprus. Malta, Canary Islands and Crete scores are low and Sicilia very low.
Breakdown by component highlights a quite homogeneous score for adaptative capacity whereas sensitivity score (Flammability Index) is very different from an island to another.
Not surprisingly for the flammability index, Corsica and Sardinia have the highest score, Malta, Sicilia and Canary Islands, the lowest one.
Looking at the adaptative capacity subcomponent, despite of the quite homogeneous scores, factors of influence are quite different among the islands:
o high score for employees in the primary sector, apart from Sardinia and Sicily;
o scores for density of firefighters and volunteers are important for all the islands except for Cyprus;
o GDP per capita and level of education are the most heterogeneous factors of influence;
o GDP per capita score is very high for Crete, very low for Corsica, Malta and Balearic Islands.
o Scores for education level is important for Cyprus and low for Madeira, Malta and Corsica.
Figure 46: Vulnerability score per island. Source: SOCLIMPACT Deliverable Report – D4.5Comperhensive approach for policy makers

45
Figure 47: Subcomponents of vulnerability and related score (current period) per island. Source: SOCLIMPACT Deliverable Report – D4.5Comperhensive approach for policy makers
Figure 48: Details and scores of the two subcomponents (adaptive capacity and sensitivity) per island. Source: SOCLIMPACT Deliverable Report – D4.5Comperhensive approach for policy makers

46
Risk
- For the reference period, the overall risk is medium for Atlantic Islands (Madeira and Canary Islands) and Eastern Mediterranean Islands (Crete and Cyprus). Risk for other islands is low and very low for Malta.
- Looking at the breakdown of the risk, the structure is quite similar for 3 groups: o Madeira, Canary Islands, Sicilia and Balearic Islands: Predominance of
exposure component (around 50% of the score); o Crete and Cyprus: Predominance of the hazard component (around 40%
of the score); o Corsica and Sardinia: Predominance of the vulnerability component
(around 60-70%); o Only Malta has a quite balanced distribution across the components.
- In this exercise, only the hazard component is changing in the future. In the near future whatever the considered RCP, the risk increases only for Cyprus from medium to high. While the risk remains stable with the RCP2.6 in the distant future for all islands apart from Cyprus, there is an increase from very low to low for Malta and from low to medium for Balearic Islands, Corsica and Sardinia with RCP8.5 (distant future). Even under this RCP8.5 risk remains constant for Canary Islands and Madeira (Medium) and Sicily (Low).
Figure 49: Risk score per island for the reference period (1986-2005). Source: SOCLIMPACT Deliverable Report – D4.5Comperhensive approach for policy makers

47
Figure 50: Risk breakdown by island for the reference period (1986-2005). Source: SOCLIMPACT Deliverable Report – D4.5Comperhensive approach for policy makers
Figure 51: Risk score per island in the near future (2046-2065) under RCP2.6 (Ambitious Mitigation Policies) and RCP8.5 (Business as usual).
Source: SOCLIMPACT Deliverable Report – D4.5Comperhensive approach for policy makers

48
Figure 52: Risk score per island at the end in the distant future (2081-2100) under RCP2.6 (Ambitious Mitigation Policies) and RCP8.5 (Business as usual). Source: SOCLIMPACT Deliverable Report – D4.5Comperhensive approach for policy makers
Figure 53: Score per component and per island in the near (2046-2065) and the distant future (2081-2100) under RCP2.6 (Ambitious Mitigation Policies) and RCP8.5 (Business as usual).
Source: SOCLIMPACT Deliverable Report – D4.5Comperhensive approach for policy makers

49
Sardinia island results
The risk is low for Sardinia under the reference period and RCP 2.6. (distant) while the
risk is medium under RCP 8.5 at the end of century.
Figure 54: Risk score and components of the risk for the reference period. Source: SOCLIMPACT Deliverable Report – D4.5Comperhensive approach for policy makers
Figure 55: Risk score at the end in the distant future (2081-2100) under RCP2.6 (Ambitious Mitigation Policies) and RCP8.5 (Business as usual).
Source: SOCLIMPACT Deliverable Report – D4.5Comperhensive approach for policy makers

50
Concerning the component of exposure, the nature of exposure is the most represented
sub-component (84%) with the cultivated areas as the main indicator.
Concerning the component of vulnerability, the sub-component of sensitivity is the most
represented (61%).
Figure 56: Details and scores of the two subcomponents of exposure (nature and level of exposure) per island.
Source: SOCLIMPACT Deliverable Report – D4.5Comperhensive approach for policy makers
Figure 57: Details and scores of the two subcomponents of vulnerability (adaptative capacity and sensitivity.
Source: SOCLIMPACT Deliverable Report – D4.5Comperhensive approach for policy makers

51
4.2 Aquaculture
In the framework of Soclimpact, the following impacts were more closely studied:
1) Increased fragility of the aquaculture activity due to an increase of extreme
weather.
Increased frequency and intensity of extreme weather events result in higher waves and
storm surges and changes in salinity. These events result in loss of stock and damages to
infrastructure and require adaptation in species selection, site selection and technologies.
2) Decrease in production due to an increase in surface water temperature
Changes in water temperature can directly affect the growth rate and Food Conversion
Ratio of the fish. Temperature also affects the oxygen levels and can cause harmful algae
blooms, reduce water quality and an increase in occurrence of diseases and parasites
which can than affect the fish or other culture species. A change in temperature can
ultimately change the ranges of suitable species for a certain area but can also have
positive impacts such as increased growth (mainly in tropical and sub-tropical regions)
and a longer growing season. Primary productivity can also increase with increasing
temperature, which may be beneficial for filter feeders such as mussels.
The concept of Impact Chain (Schneiderbauer et al. 2013; Fritzsche et al. 2014) is also
applied as a climate risk assessment method (with 7 steps for aquaculture, present risk
and future risk are calculated separately) for research of decision making. The goal of
this method is to use collected data for certain indicators of the impact chains for
different islands to assess the risks of each island’s aquaculture sector to be affected by
the hazard displayed in the impact chain. Therefore, data for all indicators were collected
from all islands. After reviewing the data, selecting indicators and islands, the indicators
were normalized, and different risk components were weighted. Using these values, the
risks for present and future conditions under different Representative Concentration
Pathway (RCP) scenarios were calculated for the different island and compared between
each other. For the aquaculture impact chains, RCP 4.5 and 8.5 were compared since for
the hazard models RCP 2.6 was not always available.
Step 1: Data collection by Island Focal Points
To be able to apply the GIZ risk assessment method, a solid data basis is crucial.
Therefore, data was collected by the Island Focal Points (IFPs) of the SOCLIMPACT
project. The questionnaire requested datasets for 16 indicators and topics with several
subcategories on exposure and vulnerability. The IFPs reached out to local stakeholders
and authorities to collect the requested data which was then resubmitted to the Sectoral
Modelling Team (SMT) Aquaculture.
Step 2: Data review and island selection
Data were submitted by most of the islands to the SMT Aquaculture. Most datasets were
incomplete with major data missing regarding important information for the successful

52
operationalization of the impact chains. Therefore, and for the fact that some islands do
currently not have any active marine aquaculture operations running, some islands were
excluded from the operationalization. Out of the 12 islands assessed in the
SOCLIMPACT project, six were included in the operationalization of the impact chains
using the risk assessment method from GIZ: Corsica, Cyprus, Madeira, Malta, Sardinia
and Sicily. The other six islands (Azores, Balearic Islands, Baltic Island, Canary Islands,
Crete and French West Indies) do currently not have active marine cage aquaculture
operations or show insufficient data availability. Data on hazards was provided by the
models developed in work package 4. Eventually, Madeira was excluded for the impact
chain on extreme weather events due to lack of reliable hazard data. A qualitative analysis
will be provided in the result section.
Step 3: Review and selection of indicators
The data collection and review revealed that not all indicators of the impact chains could
be used for the operationalization process. Therefore, these indicators were reviewed
carefully and the ones which were not represented by sufficient data were excluded. The
revised impact chain was developed depending on the indicators selected.
Figure 58: Impact chain on Increased fragility of the aquaculture activity due to an increase of extreme weather adjusted depending on data availability and used for the operationalisation.
Source: Soclimpact project deliverable 3.2
Some indicators require data on the proportions of species farmed on a specific island.
Therefore, a table with % of each species farmed on each island was prepared. This data
was obtained directly from the IFPs or from the FAO or national statistics offices.

53
Table 5: Proportions of aquaculture species farmed per island. Proportion of species production
Species Mussels &
clams Tuna Sea bream Sea bass
Corsica 0.43
0.265 0.265
Cyprus
0.84 0.16
Madeira
1.0
Malta
0.94 0.048 0.012
Sardinia 0.84
0.08 0.08
Sicily 0.44
0.3 0.26 Source: Soclimpact project deliverable 4.5
Impact chain: extreme weather events
Hazard
For the component hazard both indicators were used for the operationalisation. The
wave amplitude was shown as significant wave height (SWH) in m and the return time
number of years between extreme events quantified with a threshold of >7m. The data
was derived from the climate models of Deliverable 4.4 at the exact locations where the
fish farms are located and then averaged for all locations on one island. This allows a
more accurate assessment than taking the average values for the entire island.
Exposure
Four indicators were selected to be operationalized. The number of aquaculture
operators was provided by the IFPs and additional literature. There was no data available
on the actual size of stock, therefore the yearly production of aquaculture products (fish
and shellfish) in tons was used as a proxy indicator. The location of farms was rated by
using two different proxy indicators: the location of the farms in relation to the
prevailing wind direction and the average distance of the farms to shore. To be able to
rate the location in relation to the wind direction, the values were estimated (with 0 being
completely sheltered and 1 being exposed to wind and possible storms). After
normalizing the distance from shore (measured by using GIS software and the exact
coordinates of the fish farms), both values were averaged and represent the exposure of
the location of farms.
Sensitivity (vulnerability)
Two indicators were applied to calculate the score of factors of sensitivity. The sensitivity
of species was estimated by reviewing literature and interviewing experts regarding the
vulnerability of species to extreme weather events. After receiving these data, average
values were calculated of all values for the present species on each island.

54
Table: 6: Estimated vulnerability factors for the sensitivity of species to wave stress. 1= very vulnerable to stress: 0=very resilient to stress.
Source: Soclimpact project deliverable 4.5
The same approach was implemented to calculate the vulnerability of the infrastructure
types used on each island based on the type of species farmed.
Table 7: Estimated vulnerability values for the vulnerability of infrastructure in case of an extreme weather event.
1= very vulnerable to stress: 0=very resilient to stress.
Source: Soclimpact project deliverable 4.5
Adaptive capacity (vulnerability)
The indicators distance to harbor and the presence of warning systems were used to
describe the adaptive capacity. As there is a weather forecast available for all islands, the
values for the presence of warning systems are all the same and represent low values. The
distance to harbors was moved to the subcomponent adaptive capacity and measured
using GIS software and the exact locations of the farms which were provided by the
IFPs and literature data. It represents the average distance of all farms to their closest
harbor for each island and is shown in meters. The indicator stocking density and
engineering of structures were excluded from the operationalisation. For the stocking
density there were no data available from all islands and in any case, it was estimated to
be similar for all islands. The engineering of structures was already covered with the type
of infrastructures in the sensitivity subcomponent.
Impact chain: Increased sea surface temperature
Hazard
Sensitivity of species for wave stress threshold
Species Sea bream Sea bass Tuna Mussels & Clams
Estimated vulnerability
factor 0.55 0.65 0.3 0.9
Vulnerability of aquaculture infrastructure in case of an extreme weather event
Infrastructure for species Sea bream & Sea bass Tuna Mussels & Clams
Estimated vulnerability factor 0.4 0.3 0.6

55
Changes in surface water temperature was chosen to be the indicator representing the
component hazard. The temperature data for this indicator was obtained from the
location of each farm from the climate models of Deliverable 4.4 and averaged per
island. To calculate the hazard for each island and each RCP, the species’ temperature
thresholds were taken into account. According to a literature review (see Annex) the
temperature thresholds for farmed species is the following:
Table 8: Temperature threshold per species.
Temperature thresholds for different species
Species Sea bream Sea bass Tuna Mussels & Clams
Threshold (°C) 24 25 24 20.5
Source: Soclimpact project deliverable 4.5
It must be noted that the threshold for Tuna was set to 24°C since in the project only
Tuna fattening is done (in Malta) and for adult fish the threshold is 24°C while in the
review the whole life cycle as well as prey species was taken into account which is not
relevant for this exercise. Based on these thresholds, the duration of the longest event
per year (in days) was calculated for the temperatures 20 °C, 24 °C and 25 °C for RCP
4.5 and 8.5 from the models developed in WP4. After normalizing these values (which is
described in detail in Step 4), the values for each temperature and therefore each species
threshold were averaged using the sum product of the normalized values and the species’
proportion on the total production of the island. The final values represent the score of
the hazard. The indicator changes in seawater characteristics was not included in the
operationalization as there is no additional data related to this indicator which is not
covered by the surface water temperature indicator.
Exposure
Two indicators were used for the component exposure: the number of aquaculture
operators and the yearly production (in tons) as a proxy indicator for the size of stock.
Sensitivity (vulnerability)
The subcomponent sensitivity includes two indicators which were combined to one
indicator for the operationalization. The sensitivity of species directly correlates with
suitable temperature for species and therefore it is summarized as temperature sensitivity
of species. It was calculated by using temperature threshold values for each species
obtained from a literature review and expert opinion. These values were averaged
depending on which species and in which quantities they are farmed on the islands.

56
Table 9: Estimated vulnerability factors for the sensitivity of species to temperature stress.
1= very vulnerable to stress: 0=very resilient to stress.
Source: Soclimpact project deliverable 4.5
Adaptive capacity (vulnerability)
Two out of four indicators from the impact chain were utilized for the
operationalization. The monitoring early warning systems were included and show all the
same values for all islands as there is a sea surface temperature forecast available for each
island. The capacity to change species was included with all the islands displaying the
same value as well. The risk value is high in this case, as it would be quite difficult to
change species farmed on the islands in general as this would result in high economic
expenditures. For the indicator of the impact chain know-how of recognizing and
treating diseases/parasites there is no data available for any island. As this could vary a
lot between the islands, the indicator was removed instead of making assumptions, to not
negatively influence the risk values. A similar case arises from the indicator availability of
alternative place for farming. There is no data available to make correct assumptions
regarding the occurrence of alternative areas on the islands and therefore the indicator
was not used for the operationalization.
Step 4: Normalization of indicator data for all islands
In order to come up with one final risk value per island and to be able to compare these
values between islands, the indicator values were transferred into unit-less values on a
common scale. The normalized values range between 0 and 1 with 0 being low risk and 1
being very high risk.
There are two different ways of normalizing the indicator values:
- Minimum/maximum normalization;
- Expert judgement.
Fraction of maximum normalization
This normalization method was used for indicators which were expressed by real data
and not by expert judgement. The value for each island was calculated as a fraction of the
maximum value in de data set. Meaning the island with the maximum value was given 1
and the rest as a fraction thereof.
The following indicators were normalized using this method:
Extreme weather events:
Sensitivity of species for temperature stress threshold
Species Sea bream Sea bass Tuna Mussels & Clams
Estimated vulnerability
factor 0.6 0.6 0.3 1

57
- yearly production/ number of aquaculture operators
- average distance from shore (location of farms)
- average distance to harbour
Sea surface temperature:
- yearly production/ number of aquaculture operators
Minimum/maximum normalization
This normalization method was used for indicators which were expressed by real data
and not by expert judgement. The minimum and the maximum value of that indicator of
all islands was calculated and the following formula was applied to normalize all indicator
values to the scale between 0 and 1:
𝑥𝑛𝑜𝑟𝑚𝑎𝑙𝑖𝑧𝑒𝑑 = (𝑥 − 𝑥𝑚𝑖𝑛)
(𝑥𝑚𝑎𝑥 − 𝑥𝑚𝑖𝑛)
For both impact chains, the hazard values were normalised using the min and max
method. However, in these cases the minimum and maximum values were not
automatically the minimum and maximum values of the entire dataset but rather treated
differently for every hazard indicator. This handling of the normalisation of the hazard
indicators arose from the different nature of the indicator itself and the fact that data
were available for different RCPs and periods of time. Therefore, the hazard indicators
were normalised as following:
The sea surface temperature values were normalised separately for each temperature data
set. This means that all values for all RCPs and time periods of one “longest event over a
certain temperature” were taken into account when determining the minimum and
maximum values. For Madeira, RCP 4.5 data was not available, therefore RCP 2.6 data
was used and doubled.
Wave amplitude (significant wave height)

58
Figure 59: Modelling indicators for sea-state hazards, return time and significant wave height starting with 4 Global Circulation-Regional Circulation Model chains, which a fed into the WAM regional
wave model. Results are then normalized. Source: Soclimpact project deliverable 4.5
The return time was normalised as following; all values equal or greater that 10 are set to
0, all values between 0 and 10 are linearly mapped to the interval 1-0, so that 0 gives risk
1, 10 gives risk 0. It was assumed that a time period of 10 or more years allowed to repay
investments is a reasonable threshold.
Since, as described in D4.4 of Soclimpact, that the probability of having at least one
event exceeding the return level associated with a N-year return period during a N-year
time window is anyway greater than that of its complement (no events exceeding the
limit in the N-year time window), and that the return level cannot be considered a “no-
risk” safety level in evaluating the survivability and sustainability of structures or plants.
Table 10: Probability of occurrence of at least one event exceeding the return level associated with a given return period (blue) in a given time window (green), according to the formula. RL,T=1-(1-1/T)**L, where L=length of time window, T=Return Period.
Return Period [years]
Probability of occurrence
1 years 2 years 5 years 10 years 20 years
5 20% 36% 67% 89% 99%
10 10% 19% 41% 65% 88%
20 5% 10% 23% 40% 64% Source: Soclimpact project deliverable 4.5

59
Therefore, using a combination of the normalised values and the probability of
occurance, experts transformed these values into risk classes such all "low", "moderate",
"medium", "high", "very high", or the like, on a qualitative basis.
Expert judgement
For some indicators from both impact chains there was no data available which is the
reason why expert judgement and estimations were applied. The following indicators
were expressed using expert’s estimations:
Extreme weather events: - farm locations (in relation to main wind direction) - sensitivity of species - vulnerability of type of infrastructure - presence of warning system
Sea surface temperature: - estimated temperature sensitivity of species - capacity to change species
- monitoring early warning systems
In all cases the normalization scale of 0 to 1 was applied with 0 being low risk and 1
being very high risk.
Step 5: Weighting of different risk components
In this step, the different risk components hazard, exposure and vulnerability (including
the sub-components sensitivity and adaptive capacity) were rated. The total of the values
sums up to 1. The weights were estimated by aquaculture experts and the basis of the
estimations were subjective estimations, similar to the ones used in the AHP method.
However, in this method the data availability was additionally taken into account.
Components for which the available data was scarce, outdated or more unreliable the
weights were set lower on purpose, while components with accurate datasets were given
a higher weight as following:
Table 11: Components and their weights. (Sub)Component Weight
Sea surface temperature Extreme events
Hazard 0.3 0.6 wave height 0.2 return time 0.8
Exposure 0.4 0.2
Vulnerability 0.3 0.2
Sensitivity 0.75 0.75
Adaptive Capacity 0.25 0.25 Source: Soclimpact project deliverable 4.5

60
Step 6: Calculations of risk for present conditions
Before being able to calculate the risk values, the scores for each component/
subcomponent had to be calculated by taking the average of the corresponding
indicators:
𝑠𝑐𝑜𝑚𝑝 =(𝑖𝑛𝑑1 + 𝑖𝑛𝑑2 + ⋯ + 𝑖𝑛𝑑𝑛)
𝑛
s – score
comp – component or subcomponent
ind – indicator
n – number of indicators
The final risk value was calculated by summing up the scores of the components
multiplied individually with the corresponding risk component weightings:
𝑅𝑖𝑠𝑘 = 𝑠ℎ𝑎𝑧 ∗ 𝑤ℎ𝑎𝑧 + 𝑠𝑒𝑥𝑝 ∗ 𝑤𝑒𝑥𝑝 + 𝑤𝑣𝑢𝑙 ∗ (𝑠𝑠𝑒𝑛 ∗ 𝑤𝑠𝑒𝑛 + 𝑠𝑎𝑐 ∗ 𝑤𝑎𝑐)
s – score w – weight haz – hazard exp – exposure vul – vulnerability sen – sensitivity ac – adaptive capacity
These risk values were calculated for each island individually and range between 0 and 1.
After completing these calculations, it was possible to compare the islands between each
other.
Step 7: Calculations of risk for future conditions (different RCPs)
To be able to project the risk values to future conditions, the operationalization was
adjusted to the different Representative Concentration Pathways (RCPs). Therefore, the
whole operationalization was duplicated and different values for the hazard indicators
per island were inserted. These values were taken directly from the climate models
provided in work package 4 for the different RCP scenarios (RCP 4.5 and 8.5). The
resulting values can be compared between the islands as well as between the different
RCP scenarios.
Results
Impact chain: extreme weather events

61
Table 12: Exposure and vulnerability indicators each island
Component Exposure Vulnerability
Component Weight 0.2 0.2
Sub-component Factor of sensitivity Factors of adaptive capacity
Sub-component weight 0.75 0.25
Indicator Average Size of
producers Location of farms
Score for
level of
exposure
Sensitivity of
species (stress)
Type of
infrastructures
(material and
strength)
Score of
factor of
sensitivity
Distance to
harbour (vessel
capacity in extreme
weather
conditions)
[average & m]
Absence of
warning system
Score of
factor of
adaptive
capacity
Proxy indicator
Yearly production
/Number of
operators
Farms
sheltered
from wind
direction
Average distance
from shore (m) Average of
normalised
indicators
Estimated
sensitivity of
species
Type of
infrastructure (based
on species) Average of
indicators
Average distance to
harbour (m)
Presence of
warning system Average of
normalised
indicators
Data Normalised Normalised Data Normalised Normalised Normalised Data Normalised Normalised
Corsica 328.6 0.12 0.4 644 0.16 0.20 0.7 0.5 0.59 4789 0.96 0 0.48
Cyprus 811.4 0.29 0.5 3923 1.00 0.53 0.6 0.4 0.48 4616 0.92 0 0.46
Malta 2,755.9 1.00 0.5 1731 0.44 0.74 0.3 0.3 0.31 4165 0.83 0 0.42
Sardinia 537.2 0.19 0.4 1193 0.30 0.27 0.9 0.6 0.71 2183 0.44 0 0.22
Sicily 399.6 0.14 0.5 1000 0.25 0.27 0.7 0.5 0.61 5000 1.00 0 0.50
Source: Soclimpact project deliverable 4.5

62
Mediterranean islands
Hazards
Statistics of extreme events can significantly differ across the four model realizations
The hazard data for return time was derived from 3 different models; CMCC, CNRM and GUF.
Since the data varies highly between models a best- and worst case scenario was executed where in
the best-case scenario the lowest value (showing the lowest risk) between the models was used and
in the worst case scenario the highest value was used. Distance between the best and the worst
projection, give an estimate of uncertainty
Model projections for Average Significant Wave Height are in good agreement as to both pattern
and values. Hazard was evaluated from ensemble mean, uncertainty from ensemble STD (not
exceeding 15% - highest disagreement for highest values).
Figure 60: Results for return time in best- and worst-case scenarios for Mediterranean islands for reference period
(red line), RCP 4.5 (dotted line) and RCP 8.5 (black line). Source: Soclimpact project deliverable 4.5

63
"Worst" and "best" cases respectively refer to the least and most favorable projection in the set of models. For example return time, you will find that there is at least one model predicting no hazard for all islands except Sardinia with no significant variations across scenarios. In fact, all circles cluster and overlap at the centre, while those that represent Sardinia all lie very close to the limit between the two lower hazard classes. On the other hand, at least one other model predicts appreciable yet low hazard for Corsica, Sicily and Sardinia, and hazard going from moderate (reference period, red) to medium (RCP8.5, solid black), to high (RCP4.5, dotted black) for Malta, while for Cyprus the hazard is irrelevant even for the most negative projection. This means that a) the result for Sardinia and Cyprus is stable across models, b) models slightly disagree for Sicily and Corsica, but generally predict low hazard, c) the projection for Malta is affected by greater uncertainty for all scenarios. This is due to the fact that Malta is located in the Sicily Channel, where the dynamics exhibit significant gradients in the direction perpendicular to the channel axis, which are differently represented by different models. The worst and best cases do not necessarily come from the same model for all islands, that is, one model can predict the lowest hazard for Sicily and another one for Sardinia, and each of these projections is represented in the plot for the corresponding island.
Risk- Best-case scenario
Table 13: Risk results for best-case scenario for impact chain Extreme weather events
Reference period
Mid century End century
Risk Hist. RCP 4.5 RCP 8.5 RCP 4.5 RCP 8.5
Corsica 0.19 0.19 0.19 0.20 0.21
Cyprus 0.23 0.23 0.23 0.23 0.22
Malta 0.26 0.26 0.26 0.26 0.26
Sardinia 0.30 0.32 0.32 0.28 0.31
Sicily 0.20 0.20 0.20 0.20 0.20
Source: Soclimpact project deliverable 4.5

64
Figure 61: Risk results for best-case scenario for impact chain Extreme weather events under RCP 4.5 Source: Soclimpact project deliverable 4.5
Figure 62: Risk results for best-case scenario for impact chain Extreme weather events under RCP 8.5 Source: Soclimpact project deliverable 4.5
0,00
0,05
0,10
0,15
0,20
0,25
0,30
0,35
Historic mid century end century
RCP 4.5
Corsica Cyprus Malta Sardinia Sicily
0,00
0,05
0,10
0,15
0,20
0,25
0,30
0,35
Historic mid century end century
RCP 8.5
Corsica Cyprus Malta Sardinia Sicily

65
Risk- Worst-case scenario
Table: 14: Risk results for worst-case scenario for impact chain Extreme weather events
Reference period
Mid century End century
Risk Hist. RCP 4.5 RCP 8.5 RCP 4.5 RCP 8.5
Corsica 0.25 0.25 0.26 0.28 0.26
Cyprus 0.23 0.23 0.23 0.23 0.22
Malta 0.42 0.45 0.56 0.45 0.36
Sardinia 0.33 0.33 0.34 0.33 0.33
Sicily 0.30 0.34 0.33 0.33 0.26 Source: Soclimpact project deliverable 4.5
Figure 63: Risk results for worst-case scenario for impact chain Extreme weather events under RCP 4.5 Source: Soclimpact project deliverable 4.5
0,00
0,05
0,10
0,15
0,20
0,25
0,30
0,35
0,40
0,45
0,50
begin century mid century end century
RCP 4.5
Corsica Cyprus Malta Sardinia Sicily

66
Figure 64: Risk results for worst-case scenario for impact chain Extreme weather events under RCP 8. Source: Soclimpact project deliverable 4.5
Bigger islands were separated in areas since conditions can vary greatly in different parts of the island.
Table 15: Risk results for impact chain Extreme weather events for the Mediterranean islands with large islands analysed on a local level using the worst-case scenario.
Worst case Historic RCP 4.5 RCP 8.5
mid century end century mid century end century
Malta 0.37 0.45 0.45 0.56 0.36
Sicily North 0.34 0.39 0.39 0.36 0.30
Sicily East 0.17 0.20 0.20 0.20 0.20
Sicily South 0.41 0.42 0.40 0.42 0.30
Corsica West 0.37 0.32 0.37 0.34 0.34
Corsica East 0.18 0.18 0.18 0.18 0.19
Sardinia West 0.40 0.46 0.47 0.47 0.44
Sardinia East 0.39 0.20 0.20 0.20 0.18
Cyprus 0.23 0.23 0.23 0.23 0.22
Source: Soclimpact project deliverable 4.5
For all islands and all RCPs, it can be concluded that there is no significant change in risk, even in the worst-case scenario, between the reference period, middle and end of the century. Malta, Sicily south and Sardinia west are found to be the most vulnerable with risk exceeding 0.45 due to a
0,00
0,10
0,20
0,30
0,40
0,50
0,60
begin century mid century end century
RCP 8.5
Corsica Cyprus Malta Sardinia Sicily
0.00 – 0.20
Very low
0.20 – 0.40
Low
0.40 – 0.60
Medium
0.60 – 0.80
High
0.80 – 1.00
Very high

67
higher hazard risk. Malta also has the highest exposure of all islands. Malta has an increased risk mid-century in the worst case scenario, due to an increase in hazard. Atlantic islands
Table 16: Risk results for impact chain Extreme weather events for the Atlantic Islands
Hadley centre ACCESS
Risk Historic RCP 8.5 Mid century
RCP 8.5 End-century
Historic RCP 8.5 Mid century
RCP 8.5 End-century
Azores 0.83 0.76 0.79 0.15 0.41 0.67
Madeira 0.20 0 0.01 0 0 0
Source: Soclimpact project deliverable 4.5
For the Atlantic islands, 2 models are available (Hadley Centre and ACCESS) for data on return
time. As can be seen the results of these models are highly variable. For the Azores even the
change of the risk is different, where the Hadley riley model shows a decrease in risk while
ACCESS shows a significant increase in risk. Therefore, no conclusion can be made. For Madeira,
the risk in the future will be nihil. Not considering probability, it could be concluded that climate
change has no or a positive effect on the occurrence on extreme events in Madeira. However,
since this data is not accurate, more work needs to be done.
Impact chain: sea surface temperature
Hazard
Model projections are in good agreement with previous lower resolution ensemble estimates but
offering greater detail along island shorelines. Uncertainty to be rigorously estimated from
ensemble STD when new simulations of comparable resolution become available, but overall
tendency regarded as robust.
Exposure and vulnerability indicators
Table 17: Expose and vulnerability indicators, the data for each island and the normalized values.
Component Exposure Vulnerability
Component weight 0.4 0.3
Sub-component Factor of sensitivity Factors of adaptive capacity
Sub-component weight 0.75 0.25
Indicator Average Size of
producers
Score for
level of
exposure
Sensitivity
of species
(stress)
Score of
factor of
sensitivity
Monitoring
early
warning
systems
Capacity
to change
species
Score of
factor of
adaptive
capacity

68
Proxy indicator
Yearly production
/Number of operators Average of
normalised
indicators
Temperature
sensitivity of
species
(expert
guess) Indicator
Monitoring
early
warning
systems
Capacity to
change
species Average
of
indicator
Data Normalised Normalised Normalised Normalised
Corsica 328.6 0.12 0.12 0.7 0.7 0 1 0.5
Cyprus 811.4 0.29 0.29 0.6 0.6 0 1 0.5
Madeira 125.3 0.05 0.05 0.6 0.6 0 1 0.5
Malta 2,755.9 1.00 1.00 0.6 0.6 0 1 0.5
Sardinia 537.2 0.19 0.19 0.9 0.9 0 1 0.5
Sicily 399.6 0.14 0.14 0.8 0.8 0 1 0.5
Source: Soclimpact project deliverable 4.5
Risk
The values in this analysis is not an estimate of the risk but rather a ranking between islands since a lot of the data was normalised based on a min-max or fraction of the maximum of the islands. A proper risk assessment would need additional data from farmers and a detailed model of farming results as a function of temperature. Malta has a much higher risk than the other islands due to the high exposure, Malta’s farm produce on average 3.5 to 22 times more than the farms on other islands.
Table 18: Risk results for impact chain Sea Surface temperature
Historic Mid century End century
Risk Hist. RCP 4.5 RCP 8.5 RCP 4.5 RCP 8.5
Corsica 0.30 0.34 0.41 0.38 0.42
Cyprus 0.40 0.48 0.48 0.50 0.59
Malta 0.68 0.73 0.74 0.75 0.80
Madeira 0.19 0.26 0.23 0.24 0.35
Sardinia 0.37 0.42 0.43 0.44 0.49
Sicily 0.38 0.43 0.43 0.45 0.48
Source: Soclimpact project deliverable 4.5

69
Figure 65: Risk results for impact chain Sea Surface temperature under RCP 4.5 Source: Soclimpact project deliverable 4.5
Figure 66: Risk results for impact chain Sea Surface temperature under RCP 8.5 Source: Soclimpact project deliverable 4.5
0,00
0,10
0,20
0,30
0,40
0,50
0,60
0,70
0,80
historic mid century end century
RCP 4.5
Corsica Cyprus Malta Madeira Sardinia Sicily
0,00
0,10
0,20
0,30
0,40
0,50
0,60
0,70
0,80
0,90
historic mid century end century
RCP 8.5
Corsica Cyprus Malta Madeira Sardinia Sicily

70
4.3 Energy
There are more than 2200 inhabited islands in the EU. Lately, they have come into the focus of
the EU, which addresses energy questions as part of the 'Clean energy for all Europeans' package.
The Clean energy for EU islands initiative provides a long-term framework to help islands
generate their own sustainable, low-cost energy. This is particularly interesting, because many
islands have vast amounts of renewable energy sources but rely on fossil fuel imports yet. These
are relevant challenges regarding the energy transition in the EU, whose aim of net zero
greenhouse gas emissions in 2050 should determine the future energy plans of the islands. Islands
could provide showcases for successful 100% renewable energy supply.
The National Hydropower Association (NHA) defines marine energy as electricity generation
from marine kinetic energy, such as waves, tidal and ocean currents. Pisacane et al. (2018) add
other marine energy sources like ocean thermal energy conversion (exploiting temperature
differences between deep and surface ocean waters) and salinity gradient energy (harnessing the
energy potential of differences in salt concentration in ocean and river waters). All these
technologies are still in a development phase, and even if they reach the commercial phase in the
future, it is not likely that they will generate a large share of the power. Therefore, the analysis in
SOCLIMPACT focuses on the main renewable energy sources (RES), wind energy and solar
photovoltaic (PV) energy, which are presently, and very likely in future, the backbone of the
deployment of renewable energies, due to their technological maturity and low cost.
Nevertheless, we take into account not only onshore but also offshore wind energy, as a
specifically marine energy source which has distinct advantages like much higher productivity and
less time variability than onshore wind energy, and does not require land space which is limited
and costly in the islands. There are relevant obstacles for its deployment, like the deep bathymetry
surrounding most of the islands, and the lower wind speeds over the Mediterranean in comparison
to areas like the North Sea where offshore wind energy is being deployed rapidly.
Additionally, we consider also offshore PV energy. Despite some disadvantages that have to be
overcome (corrosion problems due to salty water or the impact of waves), this application is
receiving growing interest, as it offers an option for renewable energy development in countries
and islands with limited space for the installation of solar panels, and can show increased
performance due to the cooling effect of water and wind on PV cells.
Most RES (renewable energy sources) depend on the climate, and therefore climate change can
have an impact of the resource amount. Additionally, wind and solar PV energy are not
dispatchable, and its variability represents a challenge for its integration in the power system. This
is a challenge that can be addressed through storage or backup plants (which can be itself
renewable energy plants), through demand management, but also taking advantage of
complementarity of PV and wind energy and its very different variability characteristics. This
approach is gaining attention from stakeholders in the islands, as demonstrated by the report by
Monitor Deloitte and Endesa (2020), in which one of the key recommendations for achieving an
accelerated zero carbon target in Balearic and Canary Islands by 2040 is the combination of solar
PV and wind energy, with clearly higher shares of PV than of wind energy. Such a mix would
reduce strongly the need for storage, due to the stability of solar PV production.

71
There are also challenges for the demand and transmission components of the energy systems of
the islands due to climate change: changes in temperature leading to changing energy demand,
changes in precipitation and evaporation creating risks for desalination.
For the energy sector, three theoretical impact chains (IC) have been proposed in the
SOCLIMPACT project:
i) risk of changes in power generation due to long term climate change and variability, ii) risk of changes in energy demand due to changes in precipitation and temperatures, iii) risk of damages to transmission grids due to extreme events.
Only the second IC, i.e., the one related to changes in energy demand was selected to be
operationalized, mainly due to data availability constraints. The quality of IC operationalization
depends strongly on data availability over long periods. Data for cooling energy demand are still
scarce and difficult to obtain, despite the requirements of the European Commission for
information regarding the national energy efficiency targets. The availability and quality of cooling
demand data should improve in the future due to the need for tracking the advances towards
energy efficiency targets. Desalination demand data should also improve strongly, including data
about the energy efficiency of the desalination processes used.
This demand-side IC has been deployed into two individual ICs, namely, the increased energy
demand due to increased cooling demand and the increased energy demand due to increased
desalination needs. Both risks depend on the temperature increase, which is a very certain effect of
climate change. The risk assessment was carried through and expert assisted process.
The diagrams of the two operationalized impact chains are presented below
Figure 67: Conceptualization framework for the operationalization of the energy impact chain: Risk of increased
energy demand due to increased cooling demand Source: Soclimpact project Deliverable 4.5-Comprenhensive approach for policy makers

72
Figure 68: Conceptualization framework for the operationalization of the energy impact chain: Risk of increased
energy demand due to increased desalination demand Source: Soclimpact project Deliverable 4.5-Comprenhensive approach for policy makers
Hazard scores for energy demand (Cooling Degree Days -CDD, Standardized Precipitation-
Evapotranspiration Index - SPEI), and supply indicators (wind energy, solar PV and combined
productivity and droughts) were analysed. The aim is to jointly consider future increases in energy
demand due to temperature and precipitation changes and the potential for covering it with
renewable energy sources in the future.
Regarding the normalization of these hazards, we use an approach based on their future change.
The available literature indicates that the future projected changes of renewable energy
productivity frequently do not exceed a level of 10% relative to present values. Changes of about
10% would not modify clearly a normalized score like the one use for present climate (leading to a
very limited variation range of the score), but they represent a significant impact on the
productivity and profitability of the energy plants. Therefore, the future change of renewable
energy productivity is compared to a 10% threshold, both on the negative (normalized values
above 0.5) and the positive side (normalized values below 0.5). The normalization also includes a
minor contribution of a comparison of the changes relative to other islands.
CDD and SPEI scores are normalized with respect to a maximum projected value previously
identified. Renewable energy productivity indicators in present climate are normalized using global
thresholds (5th and 95th percentiles of the respective technologies). The same normalization
method is used for projected changes of renewable energy droughts. Thus, energy drought

73
indicators are normalized comparing them to a maximum upper limit, taken among all the islands
and renewable energy technologies.
A fundamental aspect of the method is that we apply an objective procedure for obtaining the
weights of the risk components (hazard, exposure and vulnerability) based on time-series
correlations of observed data for energy demand and for the different indicators involved in the
impact chains. This allows to detect which factors have a larger impact on the energy demand.
This method, based on correlations between observed energy demand and observed data for the
indicators, points out that several exposure and vulnerability factors have a stronger weight than
the climate hazards on short time-scales (interannual variations for periods of about 10 years). This
is consistent with the drivers considered in the national forecasts, for periods of 10 years,
performed as part of the EU Energy Efficiency Directive. A consequence of this is the relatively
low weights assigned to the climate hazards in the operationalization.
For the operationalization of the full impact chains, the exposure and vulnerability indicators were
also weighted utilizing different criteria. The mathematical procedure developed proposes the
definition of weights per group of variables (hazard, vulnerability and exposure) that allow
identifying the relationship between each of the components and the dependent variable (in this
case, energy demand due to desalination or energy demand due to cooling). The detailed weight
calculation for the risk components (hazards, exposure and vulnerability) can be found in the
Soclimpact Project deliverables 4.5.
It was not possible to conduct a full operationalization of the IC for the case of Sardinia.. The
criteria for the selection of the islands have been: (a) availability of data for the computation of the
exposure and vulnerability indicators of the demand-side ICs, (b) modeling constraints of the
hazard component. In the next tables we present the normalized hazard scores for the island and
the interpretation.
Table 19: Energy demand and supply hazard scores for Sardinia
Hazard assessment:
Histori-cal ref.(1986-2005)
Demand Supply: Productivity Land Sea
Droughts
CDD 0.14 Wind 0.90 0.24 0.94
SPEI 0.00 Solar PV 0.25 0.28 0.18
Combined 0.24
RCP2.6 (2046-2065)
Demand Supply: Productivity change
Droughts change
CDD 0.23 Wind 0.4 0.4 0.5
SPEI 0.16 Solar PV 0.6 0.7 0.7
Combined 0.4

74
RCP8.5 (2046-2065)
Demand Supply: Productivity change
Droughts change
CDD 0.32 Wind 0.5 0.6 0.6
SPEI 0.48 Solar PV 0.5 0.7 0.4
Combined 0.6
RCP2.6 (2081-2100)
Demand Supply: Productivity change
Droughts change
CDD 0.22 Wind 0.4 0.3 0.5
SPEI 0.08 Solar PV 0.6 0.6 0.5
Combined 0.6
RCP8.5 (2081-2100)
Demand Supply: Productivity change
Droughts change
CDD 0.55 Wind 0.6 0.8 0.7
SPEI 0.84 Solar PV 0.5 0.7 0.1
Combined 0.9
Categorization:
0.00 – 0.20 Very low
0.20 – 0.40 Low
0.40 – 0.60 Medium
0.60 – 0.80 High
0.80 – 1.00 Very high
Source: Soclimpact project Deliverable 4.5-Comprenhensive approach for policy makers
The CDD score for present climate is in the “very low” range, though the cooling penetration rate
is substantial (47.5% in 2014, the highest for Italy) following an ISTAT survey. The results of this
survey for Italy show a likely reason for this apparent lack of relationship between CDD and
cooling demand: several northern regions show high cooling penetration rates (Veneto, Emilia-
Romagna are the second and third regions with highest cooling penetration rate), while some
southern regions with higher temperatures like Calabria have a clearly lower cooling penetration
rate. This suggests that purchasing power has a stronger impact on cooling demand than CDD.
CDD score is projected to increase in a limited way under RCP2.6 scenario, pointing to a
comparatively low cooling energy demand increase in Sardinia due to this factor. The projected
increases under the high-emissions scenario are much higher, with the score reaching a medium
value by end of the century. The contrast is much stronger for the SPEI score, which rises only
slightly under RCP2.6, but strongly under RCP8.5. Desalinated water is already used in Sardinia.
Its demand should increase strongly under RCP8.5 scenario.
Renewable energies play already a relevant role in the power supply. In 2017, the wind energy
share was 12.4%, while the PV share was 7.6%. Additionally, there is a significant amount of
hydropower capacity (466 MW). The important share of wind energy seems contradictory with the
low wind energy productivity obtained for present climate over land, but this may be associated to
the fact that the score is a spatial average and the score is a relative value with respect to global

75
values. Also, large contrasts in wind energy resources are found in a mountainous island like
Sardinia. Wind energy resources over land are also highly variable in time. PV resources are good
and much more stable. The combination of PV and wind energy has very positive impact on the
power generation stability, reflecting a high complementarity of both sources.
Wind energy productivity is projected to increase slightly under RCP2.6 scenario, while PV
productivity will decrease slightly. Small productivity changes are obtained over land under
RCP8.5, but a substantial decrease of offshore wind energy productivity is projected by end of the
century for this scenario. Energy drought scores do not change much in most cases, except under
RCP8.5 by end of the century, with a strong improvement of PV stability which coincides with the
very high SPEI score in this case.
* Islands’ comparison and future challenges
- The frame for energy supply in the islands are the binding targets established in the 2030 climate
and energy EU framework and the long term horizon of a decarbonized energy system by 2050.
- The future change of wind energy and PV productivity should be rather small in general: around
5% or less with respect to the reference period in many cases, with maximum changes of about
10% for some islands at the end of the century under RCP8.5 scenario (particularly for wind
energy productivity over land). A 10% productivity change could have a significant impact on a
planned or existing plant if it occurs over the lifetime of the power plant, but in this case such a
change would extend over many decades, which will facilitate adaptation and efficiency measures.
- Projected PV productivity changes are generally smaller than wind energy changes. In most cases
PV productivity remains constant or decreases slightly. The main exception is Fehmarn, which
shows a clear decreasing tendency in PV productivity under RCP8.5 scenario, reaching a 10%
decrease by end of the century.
- There is a specific uncertainty source in the photovoltaic projections. Most regional climate
model simulations, including the ones used here, do not include a projected evolution of aerosols
in future climate runs. The missed effect of the likely evolution of aerosols would likely increase to
some degree the future surface solar radiation and PV productivity over most of the islands
(Gutiérrez et al., 2020).
- Renewable energy productivity droughts are a measure of the variability of the resource. Wind
droughts are much more frequent (around 50% of the days for most islands) than PV droughts
(10% or less of the days). This agrees with results from the study of Raynaud et al. (2018), and
highlights the stable character of the solar productivity in comparison to wind productivity over
time.
- Wind energy droughts are more frequent in the Mediterranean islands than in the Atlantic islands
or Fehmarn. The best quality resources in terms of stability are found for Canary Islands, which
show the minimum values of both wind energy and PV droughts among all islands. Fehmarn
shows by far the worse PV drought score, corresponding a drought frequency of 23% of the days.
- Projected changes in the frequency of droughts are small, with future variations that generally do
not attain a magnitude greater than 5% of the days. This indicates that the time-variability

76
characteristics of wind and PV energy are a robust feature, which is relevant for planning the
amount of storage or backup needed.
- The combination of PV and wind energy has generally a very positive impact on the frequency of
droughts as a result of the complementarity of both sources. This impact also exists but is less
clear for islands with substantial summer wind energy resources (Canary Islands, Madeira and
Crete).
- As part of the pathway towards very high or 100% RES shares, offshore wind energy should play
a very relevant role. Solutions to overcome the obstacle posed by the deep bathymetry
surrounding most of the islands are beginning to near commercial deployment, so that floating
offshore wind plants are already planned near Gran Canaria and Sicily.
- Offshore PV could be an interesting option for some islands, particularly when land surface
limitations are large. There is growing interest in this option, as shown by the test plants being
installed and the references made to this technology in the Roadmap for the Offshore Renewable
Energy Strategy of the European Commission or in the report of Monitor Deloitte and Endesa
(2020) about the accelerated decarbonization of Canary and Balearic Islands.
- The combination of different types of offshore renewable energy sources in the same platform is
also attracting interest, as the different sources can exhibit complementarity in time and the
combined output can thus be more stable and reliable. The different RES can also share part of
the installations, like the connection to land, reducing their cost (Pisacane et al., 2018;
MarineEnergy, 2019a). The European Union is trying to promote such combinations, through
projects like MUSICA (Multiple Use of Space for Island Clean Autonomy) which will design and
test a floating offshore platform integrating wind, PV and wave energy for use on islands
(MarineEnergy, 2019b), and plans to develop roadmaps for its deployment in three case study
islands, among them Malta and the Canaries (MaREI, 2020).
- New financing possibilities linked to the recently approved EU COVID-19 recovery fund, and
over a longer term associated to the European Green Deal, should facilitate the deployment of
renewables in the islands, as the energy transition is a key target.
- Interconnections to mainland are very important for supply safety. Excessive dependency on
interconnections to mainland should be nevertheless avoided, due to risk of blackouts, as the
failure of a single element (one transmission line) can knock out instantaneously a large proportion
of the power of an island and even cause an island-wide blackout, as has occurred several times in
Malta in the last years.
Read more: Hazard indicator computation and normalization
Cooling degree days (CDD) are used to give an indication of the effect of outside air
temperature on building energy consumption during a specified period of time. The Cooling
Degree Days (CDD) index gives the number of degrees and number of days that the outside air
temperature at a specific location is higher than a specified base temperature. For the indicator
weight calculation, the observed values of CDD (EUROSTAT) have been used, and compare to
the hazard of the island. With respect to the normalization of the indicator, we have used a fixed
lower threshold and a relative maximum as upper threshold. The minimum CDD value has been

77
taken as 0, while the maximum CDD value has been taken as the maximum over all islands,
emissions scenarios and time periods (CDD=1183.49 ºC· days/year, corresponding to Cyprus for
RCP8.5 scenario, end of century period).
Standardised Precipitation-Evapotranspiration Index (SPEI) is a drought index that takes
into account not only the effect of precipitation variations, but also the effect of temperature
variations on evapotranspiration. The calculation is based on the monthly difference between
precipitation and potential evapotranspiration, which represents the monthly water surplus or
deficit. The indicator weight calculation was done using data from ECA&D (European Climate
Assessment & Dataset). The normalization of the indicator has taken into account the fact that by
definition, present conditions correspond to reference conditions (SPEI=0), and that all future
changes are towards negative SPEI values, that is towards drier conditions. Therefore, the best
score value (0) has been assigned to SPEI=0, while the worst score value (1) has been assigned to
the largest negative value found for all islands, emissions scenarios and time periods (SPEI=-2.5,
obtained for several islands under RCP8.5 emissions scenario by the end of century).
The indicator Wind energy productivity (kWh/kW) is defined as the energy produced in a
period of time divided by the power installed, which is considered as unitary. The indicator is
calculated separately for land and sea. Offshore wind energy is the most developed ocean energy,
and it is likely to be an important future energy source for the analysed islands. Its characteristics
are typically very different to onshore wind energy, due to the large differences in surface friction.
The energy productivity values are averaged respectively over the island land points and over the
sea points in a domain that reaches a maximum distance of one degree latitude and longitude
respectively to the maximum and minimum longitude/latitude land points of the islands.
The normalization is performed using absolute thresholds, that represent high or low global values
of productivity. These thresholds have been obtained from a global renewable power report
(IRENA, 2019). The maximum annual productivity would be 8760 kWh/kW, corresponding to a
100% capacity factor. The obtained CF thresholds for onshore wind energy are 20%
(corresponding to a normalized score of 1) and 45% (normalized score of 0), while for offshore
energy they are 30% and 50%.
Photovoltaic productivity (kWh/kW) is defined as the energy produced in a period of time
divided by the power capacity installed. In order to obtain photovoltaic productivity, daily surface
solar radiation (SSR) and ambient temperature from the climate simulations are used as input
variables for a parametric PV model. The normalization is performed using absolute thresholds,
that represent high or low global values of productivity, taken from the same report as for wind
energy. In this case, the maximum threshold is adapted taking into account that the calculations
performed here assume fixed panels, while IRENA global report does not differentiate between
fixed and sun-tracking panels. Therefore, we estimate an upper CF threshold (normalized score of
0) of 20% for fixed panels, from the 25% value deduced from IRENA global report.
Renewable energy productivity droughts indicators are a way of quantifying the time-variability
of renewable energies that depend on meteorological conditions. Low values of energy droughts
correspond to a stable output, while high values correspond to a highly variable output. The
combined renewable energy droughts represent the complementarity between wind and PV

78
energy. A high complementarity of both sources reduces the need for energy storage or backup
sources.
Two different thresholds are calculated to determine moderate (50% of mean daily productivity)
and severe (20% of mean daily productivity) energy productivity droughts, respectively. For the
normalization of these energy drought indicators, we have used a combination of an absolute
threshold (a value of 0% of drought days) corresponding to a score of 0 and a relative maximum
upper limit, taken among all the islands and renewable energy technologies (55% of days with
moderate droughts, obtained for wind energy in Corsica) corresponding to a score of 1. The same
normalization limits are applied for wind, PV and combined productivity drought.
4.4 Maritime Transport
For the Maritime Transport sector, three main climate change risks have been identified. These are: i) risk of damages to ports’ infrastructures and equipment due to floods and waves, ii) risk of damages to ships on route (open water and near coast) due to extreme weather events and iii) risk of isolation due to transport disruption. The operationalization was applied to the third one (risk of isolation due to transport disruption) which in terms of hazards and impacts can be considered as a combination of the other two. The selection of islands to be included in the analysis was based on the importance and dependency on the Maritime Transport sector and on data availability. The lack of reliable and consistent data limited the analysis for Sardinia. More specifically, this data was:
- Value of transported goods expressed in freight (VGTStot) - Number of renovated infrastructure (NAgePo). - Percentage of renewables (PEnRR), - Early warning systems (NOcSta) and harbour alternatives (NApt).
This information is also useful at the moment of evaluating and ranking adaptation measures for the islands.
5 Socio economic impacts of climate change
5.1 Market and non-market effects of CC
Tourism In order to understand the effect of climate change on tourists behavior, an representative sample of 2538 European citizens have been interviewed in their countries of origins. Through online surveys, tourists were asked how climate change impacts can affect their travelling decisions and the islands’ destination choice.

79
Figure 69: Socio-demographic profile of respondents Source: Deliverable Report D5.5
The technique of discrete choice experiments (DCEs) was implemented. This technique has been
widely applied to the evaluation of tourists' preferences both in natural areas and other tourism
contexts (e.g.,Morley, 1994; Eymann and Ronning, 1997; Huybers, 2003). It involves asking
tourists to choose between alternative profiles or sets of attributes of the tourist destinations. The
principal advantage of this method is that it allows researchers to investigate the preferences of
various attributes of the tourist product simultaneously.
DCEs consist of several choice sets, each containing a set of mutually exclusive hypothetical
alternatives between which respondents are asked to choose their preferred one. Alternatives are
defined by a set of attributes, each attribute taking one or more levels. Individuals' choices imply
implicit trade-offs between the levels of the attributes in the different alternatives included in a
choice set. In particular, he will pick the one providing the highest utility, which depends on the
attribute levels of the alternatives. Socio-economic characteristics of the individual may influence
this decision. The resulting choices are finally analyzed to estimate the contribution that each
attribute and level add to the overall utility of individuals. Moreover, when the cost or price is
included as an attribute, marginal utility estimates can easily be converted into willingness-to-pay
(WTP) estimates for changes in the attribute levels and, by combining different attribute changes,
welfare measures may be obtained.
As a result of data analysis, a ranking of islands image was obtained, according to the opinion and
the image that tourists have of each island under analysis. Besides, the percentage of tourists that
would not visit any European island posed to CC impacts was obtained, which alert on the
potential decrease in tourism arrivals for these islands. Finally, the choice model allows to measure
the changes in the willingness to pay of tourists for visiting these EU islands, which alert on how
these impacts would affect tourism expenditure in the EU islands posed to CC. The results are
useful to evaluate the priorities in terms of risks management and responsiveness, from the
tourism management perspective.

80
Figure 70: Tourists’ preferences for islands destinations and behavioural response to CC risks. Source: Deliverable Report D5.5
The infographic can be found in high resolution in the Soclimpact Project official website
HERE.
The impact of increased temperatures and heat waves on human thermal comfort
In order to assess how the variation in temperature impacts on the tourism sector through changes
in tourism demand our research question was: “How do increasing temperatures (and heat waves)
impact prices and, more in general, expenditure of tourists?” Arguably, when temperatures grow,
tourists adjust their behaviour: they might switch destination, or they might stay longer or shorter
depending on their attitudes and preferences. In turn, all these changes modify the market
equilibrium, pushing tourism companies to adjust their prices to re-establish the equilibrium
between demand and supply. The change in demand and the change in price determine the change
in tourism expenditure which is, from the destination’s perspective, tourism revenue.
We monitored current weather conditions posted on several weather forecast providers and daily
prices posted on Booking.com by hotels. We then estimated the link between daily temperature

81
and daily price, controlling for all the other factors affecting prices. We finally applied these
estimates to the increase in the number of days with excessive temperature projected for the future
in two scenarios (RCP2.6 and RCP8.5) and in two time horizons (near future, about 2050; distant
future, about 2100).
Among the different indicators linked to thermal stress, Soclimpact is focusing on two: the
number of days in which the temperature is above the 98th percentile and the number of days in
which the perceived temperature is above 35 degrees. Although in D5.6 the impact for both
indices were computed, in this document we only report the second one (named HUMIDEX)
because it is the most intuitive and because human thermal stress is more related to the absolute
value of the temperature than its deviation from some pre-determined distribution. In line with the
project, we assumed that thermal stress appears when the perceived temperature grows above 35
Celsius degrees.
As thermal stress is delimited in the summer months, and this is when the great majority of
tourists arrive in these islands, the whole analysis has been carried out in six months only: from
May to October included. In other words, we assume that there is no thermal stress (and hence no
impact on tourism) in the rest of the year.
Initially, three islands were investigated: Corsica, Sardinia, and Sicily, given the massive amount of
potential data. We focused the analysis in three specific areas, represented in the map below: the
south-east area of Corsica (between Porto Vecchio and Boniface); the North-East area of Sardinia
(Costa Smeralda) and the South-East area of Sicily (the coastal area of Catania and Siracusa
provinces). Arguably, these are among the most important coastal tourism areas of these islands.
Overall, 60 hotels (for a total of about 240,000 observations) were monitored in Corsica; 150
hotels (for a total of about 620,000 observations) were monitored in Sardinia; 129 hotels were
monitored in Sicily (for a total of about 726,000 observations) over the period 1 May 2019 – 31
October 2019.
Figure 71: Map of the region Source : Soclimpact project deliverable D5.3

82
At present, 27.23% (column 1 of the table below) of “summer” days (days in the period between 1
May and 31 October) have a HUMIDEX higher than 35 Celsius degrees in the area under
investigation (Costa Smeralda).
In the future, this share (column 3) will increase to about 35-36% in rcp2.6, to 37.59% in rcp8.5
near, and to 61.48% in rcp8.5, distant. Consequently, demand for holidays in Sardinia will increase
and the new equilibrium shows an increase in the average price posted by hotels in the destination
(column 4) and an increase in overnight stays (column 5, this is estimated using the past
correlation between average prices and occupancy rates in hotels, data provided by STR). The joint
impact of price and demand will lead to an increase in hotels revenues (last column of the table)
and, assuming that the change in revenues spreads to the other tourism products in a similar way,
an increase in tourism revenues for the whole destination will be recorded. Hence, the estimation
reported in the last column of the table below can be interpreted as the percentage increase in
tourism revenues for the island.
Table 20: Estimation of increase in average price and revenues for Sardinia
Actual share of days in
which humidex > 35
degrees
Future scenario
considered
Days in the corresponding
scenario in which humidex > 35
degrees
Increase in the
average price
Increase in the
tourism overnight
stays
Increase in
tourism revenues
27.23%
rcp26near 35.78% 3.3% 0.7% 4.0%
rcp26far 35.07% 3.0% 0.6% 3.7%
rcp85near 37.59% 4.0% 0.8% 4.9%
rcp85far 61.48% 13.3% 2.7% 16.3% Source : Soclimpact project deliverable D5.3
According to these findings, the average increase in temperature, which is correlated to a growing
thermal stress for tourists, brings an economic advantage to tourism destinations. This is only an
apparent contradiction with previous findings. This study does not neglect the fact that if islands
are too hot, tourists will choose to move to other (cooler) destinations, that in principle exist. In
this study the underlying assumption is instead that growing temperatures are a global issue,
thereby not modifying the relative position of a destination. Then, the increase in tourism (and
tourism revenues) stem from the fact that, when the temperature is too hot, people would prefer
to move to coastal areas (where the climatic conditions are more bearable) than staying inland or
in cities. Future trends will also facilitate this pressure of tourism demand (think about the
spreading of smart working activities where, in principle, the worker can relocate wherever he/she
wants).
Aquaculture
The effects of increased sea surface temperatures on aquaculture production were calculated using
a lethal temperature threshold by specie, and considering the production share of the region. Four
different future scenarios shown by IPCC estimations (RCP2.6 and RCP8.5 near and distant) were

83
analysed, which correspond to four water temperature increases in the region (mean values), with
respect to the reference period.
To do this, we assume three main species cultured in this region: Seabream, seabass and mussels,
and a model of production function, calculating the monthly biomass production which depends
on the monthly water temperature. Results are presented on yearly base (mean values). In order to
facilitate the interpretation of the results, we present the value of production of the last year
available, for which we calculate the new values under the different CC scenarios.
As expected, the production levels (tons) will decrease for both, low and high emissions scenarios.
In both cases, the average annual temperatures are projected in levels below 21oC, which is the
thresholds of thermal stress for mussels, the most sensitive specie of the three analysed.
Figure 72: Estimations of changes in aquaculture production (tons), due to increased sea surface temperature Source: Deliverable Report D5.6
The infographic can be found in high resolution in the Soclimpact Project official website
HERE.
Energy
Climate change may impose welfare reductions to the European islands’ societies by affecting
thermal comfort. Cooling Degree Days (CDD) are a measure of how much (in degrees), and for
how long (in days), outdoor air temperature is higher than 18°C or 65° Farenheit. The CDD is
used as a measure of the energy needed to cool buildings. The increase in CDD and the energy
demand (GWh/year) for cooling are estimated for the islands, under different scenarios of global
climate change.
Under the high emissions scenario, it is expected that the CDD increase to 656 CDD4. This value
could be, for example, a combination of 100 days with temperatures of 21°C (400CDD) and other
128 days with temperatures of 20°C (256CDD). Under this situation, the increase in cooling
energy demand is expected to be 281%.
4 The indicator is computed by multiplying the number of days exceeding the threshold by the difference in
temperatures. For example the CDD for 100 days at 20 °C is computed as 100*(20-18)= 200CDD

84
The infographics presented below can be found in high resolution in the Soclimpact
Project official website HERE.
Figure 73: Estimations of increased energy demand for cooling in Sardinia under different scenarios of climate
change until 2100 Source: Deliverable Report D5.6
The Standardized Precipitation Evapotranspiration Index (SPEI) is analysed as a representative
indicator for increases in water demand for islands’ residents, tourists and agriculture, while it also
provides an indication on the available water stored in dams or underground resources. To
estimate the increase of energy demand due to the increase in water demand, it was assumed that
most of the islands will have to produce desalinated seawater (or groundwater) to meet further
increases of demand. Thus, the estimation of the increase in energy demand (GWh/year) to
produce more drinking water has been done based on the energy consumption required to
desalinate seawater.
Under the low emissions scenario (RCP2.6), there are not significant changes in the SPEI
indicator, that will remain in its ¨normal¨ level, as it is nowadays. An increase of 113% in
desalination energy demand is expected under RCP8.5, a scenario with severe aridity for the island.

85
Figure 74: Estimations of increased energy demand for desalination in Sardinia under different scenarios of climate
change until 2100 Source: Deliverable Report D5.6
Maritime Transport
For maritime transport, it has been estimated the impact of Sea Level Rise on ports' operability
costs of the island. The costs have been calculated with reference to1meter; this is, the investment
needed to increase the infrastructures' height by 1 meter. There is not necessarily a strict
correspondence between the SLR and the required elevation of port infrastructures, which also
depend on the coastal hydrodynamic and the shape of dikes of each port. By experts’
recommendation, we have assumed that 1 m increase in port height is required to cope with the
SLR under RCP 8.5 scenario of emissions. Extrapolation for other RCP scenarios is then
conducted based on proportionality.
The starting point was the identification of the principal ports in each island (economic relevance).
Second, the analysis of the different port areas (exterior, ramps, oil, etc.), and their uses. Third, the
elevation costs were estimated per each area and port separately (considering 1 meter elevation).
Thus, the costs of 1-meter elevation presented are the sum of all areas and ports analysed, and
including the rest of the ports of the island (if applicable) based on proportionality. Estimations
consider that all ports areas of the entire area should be elevated at the same time. In other words,
the economic values can be interpreted as the depreciation (amortization) costs of the investment
needed to increase all porsts’ infrastructures' in the island for 125 years time horizon. No discount
rate has been applied.
As expected, the rising of sea levels will affect the sector, as new investment will be needed to keep
ports’ operability. Under the high emissions scenario, it is expected that these costs could increase
by 1.9 million of euros per year until the end of the century.
The infographic presented below can be found in high resolution in the Soclimpact
Project official website HERE.

86
Figure 75: Increased costs for maintaining ports’ operability in Sardinia under different scenarios of SLR caused by climate change until 2100
Source: Deliverable Report D5.6
5.2 Macroeconomic projections
The aim of our study is to assess the socioeconomic impacts of biophysical changes for the island of Sardinia. For this purpose we have used the GEM-E3-ISL model; a single-region, multi-sectoral general equilibrium model based on the principles of neo-classical theory, and GINFORS; a macro-econometric model based on the principles of post-Keynesian theory. Both models include 14 sectors of economic activity, with an emphasis on services and specifically on those composing the tourism industry. The GEM-E3-ISL model also include: endogenous representation of labor market and trade flows etc. Changes in the mean temperature, sea level and precipitation rates are expected to affect energy consumption, tourism flows and infrastructure developments. These impact-chains have been examined and quantified under two emission pathways: RCP2.6 which is compatible with a temperature increase well below 2C by the end of the century and RCP8.5 which is a high-emission scenario. The impact on these three (3) factors has been quantified in D5.6 and is used as input in the economic models, which then assess the effects on GDP, consumption, investments, employment etc. In total 18 scenarios have been quantified for Sardinia. The scenarios can be classified in the following categories:
1. Tourism scenarios: these scenarios examine the reduction in tourism revenues due to changes in human comfort as captured by the hum-index, the degradation of marine environment, increased risk of forest fires and beach reduction
MEAN SEA LEVEL RISE SLR

87
2. Energy scenarios: these scenarios examine the impacts of increased electricity consumption for cooling purposes and for water desalination
3. Infrastructure scenarios: these scenarios examine the impacts of port infrastructure damages
4. Aggregate scenarios: these scenarios examine the total impact of the previous-described changes in the economy
The aim of the aggregate scenario is to examine the impacts on the economy of a simultaneous change in electricity consumption, tourism revenues and infrastructure damages. The scenario specifications for the two climatic variants are presented below:
Table 21: Aggregate scenario –results
Tourism revenues (% change from reference levels)
Electricity consumption
(% change from reference levels)
Infrastructure damages (% of GDP)
RCP2.6 (2045-2060) -11.17 4.5 -0.07
RCP2.6 (2080-2100) -15.64 0.9 -0.09
RCP8.5 (2045-2060) -39.17 10.9 -0.19
RCP8.5 (2080-2100) -58.68 19.5 -0.25 Source: GEM-E3-ISL
The theoretical and structural differences of the two models mean that this study produces is a reasonable range of impacts, given the uncertainty embodied in economic analysis and especially in the long-term. In GEM-E3-ISL, the economy is in equilibrium at each point in time. Prices adjust to ensure that supply equals demand (market clearing), capital is fully used; however, the allows for equilibrium unemployment. The impacts are driven mainly by the supply side through changes in relative prices that determines competitiveness change, substitution effects etc. The GEM-E3-ISL model assesses the impacts on the economy up to 2100. The macro-econometric type of models, such as GINFORS, do not require that all markets are in equilibrium; idle capital and involuntary unemployment are some other features of this type of models where the results are driven mainly by adjustments in the demand side of the economy. The GINFORS assesses the impacts on the economy up to 2050. With respect to GDP the estimated reduction compared to the reference case is between 0.7% and 3% in the RCP2.6 in 2050 and between 2.5% and 8% in the RCP8.5. The cumulative reduction over the period 2040-2100 is estimated (by GEM-E3-ISL) to be equal to 1.1% in the RCP2.6 and 3.6% in the RCP8.5.

88
Figure 76: Percentage Change in GDP.
Source: GWS, own calculation
With respect to sectorial impacts both models show a significant decrease in the activity of tourism related sectors and an increase in the activity of the manufacturing industries, highlighting the opportunities for secondary sectors, in the context of economy’s adaptation process. The increase of transport activity in the GEM-E3-ISL model is related to the increase in exports.

89
Figure 77: Production percentage change from reference.
Source: GWS, own calculation
Overall employment falls in the economy and especially in tourism related sectors. In GEM-E3-ISL increases in employment in non-tourism related activities are related to labor costs reductions (as wages fall) and a consequent substitution of capital with labor. Employment falls on average by 0.3% in the RCP2.6 and by 1.1% in the RCP8.5

90
Figure 78: Employment percentage change from reference. Source: GWS, own calculation
6 Towards climate resiliency
6.1 Current situation: general commitment, specific limits and obstacle
According to the Regional Adaptation Strategy, the general commitments of the region are:
o create a context of suitable conditions for adaptation, acting on the level of rules and process management;
o create and support the ability to adapt, through knowledge and skills and their circulation, also providing the potential tools for the implementation of adaptation;
o indicate effective paths of adaptation, integrating techniques, technologies and methodologies, giving priority to ecological, social and economic sustainability.
Furthermore, the general objectives contained in the Regional strategy are: 1) minimize the risks arising from climate change; 2) protect the health, well-being and assets of the population; 3) preserving the natural heritage; 4) maintain or improve the resilience and adaptability of natural, social and economic systems; 5) take advantage of any opportunities that might arise with the new weather conditions

91
Table 22: Specific limits and obstacle and relevant documents
Specific limits and obstacle
Until now days, spatial planning, urban planning and maritime spatial planning policies do not take into account the impacts of climate change. Regional Policies depend on National Policies and National Legislation to be followed. The main obstacles are slow procedures due to bureaucracy and funding constraints. A limit is represented by the lower awareness of Local Authorities, the Sardinia Region aims to increase the awareness of the problem to stimulate a dialogue between all stakeholders and actors in order to facilitate the promotion and implementation of effective actions.
Relevant documents
National Climate Change Adaptation Strategy (SNAC) Regional Climate Change Adaptation Strategy (SRACC) http://delibere.regione.sardegna.it/protected/45116/0/def/ref/DBR45071/ Strategic plan for aquaculture in Italy 2014-2020 Regional strategic plan of tourism development 2018/2021 of the Sardinia region Plan for the Hydrogeological Asset of the Sardinia Region Map of Environmentally Sensitive Areas To Desertification, ESAS Regional plan for programming the activities of prevision, prevention and active fight for the defense of vegetation against fire (year of revision 2018) Protection plan of waters – Sardinia region MasterAdapt project Clisel project Maregot project
Source: Deliverable 7.1 Conceptual framework

92
7 References
A Eymann, G Ronning - Regional Science and Urban Economics, 1997 - Elsevier
Fritzsche et al. (2014). The Vulnerability Sourcebook: Concept and guidelines for standardized
vulnerability assessments
Gutiérrez, C., Somot, S., Nabat, P., Mallet, M., Corre, L., van Meijgaard, E., Perpiñán, 0. &
Gaertner, M. Á. (2020). Future evolution of surface solar radiation and photovoltaic potential in
Europe: investigating the role of aerosols. Environmental Research Letters, 15(3), 034035.
Huybers T, Bennett J. 2000. Impact of the environment on holiday destination choices of
prospective UK tourists: implications for tropical North Queensland. Tourism
Economics 6(1): 21–46
IRENA (2019). Renewable Power Generation Costs in 2018, International Renewable Energy.
Agency, Abu Dhabi.
MaREI to lead €9m project to build floating offhsore platform. Retrieved from:
https://www.marei.ie/marei-to-lead-e9m-project-to-build-floating-offshore-platform/
MarineEnergy (2019a). WavEC: Combined Wind, Wave and Solar to Transform Marine Energy.
Retrieved from https://marineenergy.biz/2019/12/16/wavec-combined-wind-wave-and-solar-
totransform-marine-energy/
Masterton JM., RichardsonF.A. (1979). Humidex, a method of quantifying humandiscomfort due
to excessive heat and humidity, CLI 1–79, Environment Canada.Atmospheric Environment
Service, Downsview, Ontario.
Pisacane, G., Sannino, G., Carillo, A., Struglia, M. V., & Bastianoni, S. (2018). Marine energy
exploitation in the Mediterranean region: steps forward and challenges. Frontiers in Energy
Research, 6, 109.
Proestos Y, Christophides GK, Ergüler K, et al (2015) Present and future projections of habitat
suitability of the Asian tiger mosquito, a vector of viral pathogens, from global climate simulation.
Philos Trans R Soc B Biol Sci 370:1–16. doi: 10.1098/rstb.2013.0554.
Schneiderbauer, S., Pedoth, L., Zhang, D., & Zebisch, M. (2013). Assessing adaptive capacity
within regional climate change vulnerability studies—an Alpine example. Natural hazards, 67(3),
1059-1073.
Scholte JE, Schaffner F (2007). "Waiting for the tiger: establishment and spread of the Aedes
albopictus mosquito in Europe". In Takken, W.; Knols, B. G. J. (eds.). Emerging pests and vector-
borne diseases in Europe. 1. Wageningen Academic. Publishers. ISBN 978-90-8686-053-1.
Soto, D., & Brugere, C. (2008). The challenges of climate change for aquaculture. FAO
aquaculture newsletter, (40).
Van Wagner, C. E.,1987: Development and structure of a Canadian forest fire weather index
system, Forestry Tech. Rep. 35, Canadian Forestry Service, Ottawa.

93
Waldock J, Chandra NL, Lelieveld J, et al (2013) The role of environmental variables on Aedes
albopictus biology and chikungunya epidemiology. Pathog Glob Health 107:224–241. doi:
10.1179/2047773213Y.0000000100.

APPENDIX 11

1
TABLE OF CONTENT
INTRODUCTION .................................................................................................................................. 2
1 CURRENT SITUATION AND RECENT TRENDS .................................................................................... 3
1.1 CURRENT GEOPOLITICAL CONTEXT ........................................................................................................... 3 1.2 CURRENT CLIMATE AND RISKS ................................................................................................................ 5 1.3 MACROECONOMIC STATUS .................................................................................................................... 6 1.4 RECENT EVOLUTION OF THE BLUE ECONOMY SECTORS ................................................................................. 8
2 ECONOMIC PROJECTIONS ............................................................................................................. 11
2.1 MACROECONOMIC PROJECTIONS .......................................................................................................... 11 2.2 SECTORAL PROJECTIONS ...................................................................................................................... 12 2.3 EMPLOYMENT ................................................................................................................................... 13
3 CLIMATE CHANGE OUTLOOK ......................................................................................................... 14
3.1 TOURISM ......................................................................................................................................... 14 3.2 AQUACULTURE ................................................................................................................................. 19 3.3 ENERGY ........................................................................................................................................... 20 3.4 MARITIME TRANSPORT ....................................................................................................................... 27
4 CLIMATE CHANGE RISKS ................................................................................................................ 30
4.1 TOURISM ......................................................................................................................................... 30 4.2 AQUACULTURE ................................................................................................................................. 54 4.3 ENERGY ........................................................................................................................................... 72 4.4 MARITIME TRANSPORT ....................................................................................................................... 80
5 SOCIO ECONOMIC IMPACTS OF CLIMATE CHANGE ........................................................................ 81
5.1 MARKET AND NON-MARKET EFFECTS OF CC ............................................................................................ 81 5.2 MACROECONOMIC PROJECTIONS .......................................................................................................... 91
6 TOWARDS CLIMATE RESILIENCY .................................................................................................... 95
6.1 CURRENT SITUATION: GENERAL COMMITMENT, SPECIFIC LIMITS AND OBSTACLES ............................................ 95
7 REFERENCES .................................................................................................................................. 97

2
Introduction
This report is the background material for stakeholders in the upcoming adaptation
pathways workshop in Sicily. First, a presentation that includes the geography and socio-
economic context for the Island, and the socioeconomic trends without climate change
(WP6), which range from the present to the end-of the century. Regarding Climate
Change, the expected climate risks and vulnerabilities for the blue economy are presented
and ran (WP3), joint to the expected trends of physical risks, booth current and future
(WP4). Finally, specific economic impacts are estimated, considering the evolution of
some physical risks (WP5 and WP6). The current climate policy and resilience of the
Island is also presented (WP7). Finally, a link to the projects original work is made in the
references section.
Sicily at a glance
Sicily, in the south of Italy, is the largest and one of the most densely populated islands in
the Mediterranean Sea. Together with its surrounding islands, Sicily forms an
autonomous region of Italy. The island is mostly mountainous with a seismic and
volcanic activity quite intense. Here there is the Europe’s highest active volcano, Mount
Etna (3.350 meters). The only wide valley is the fertile Plain of Catania in the east. The
climate is subtropical and Mediterranean. Underground water and springs are plentiful.
The natural vegetation of Sicily has been greatly reduced by human influence, and forests
occupy only 4 percent of the territory.
The Blue Economy sectors
Aquaculture
Aquaculture in Sicily is mainly based on seabass and seabream production, with an
average ratio of 54 to 46%. Small and variable quantity of other marine species are
produced, such as: sharpsnout seabream, red porgy, common dentex, amberjack, meagre,
Mediterranean bluefin tuna. Commercial shellfish culture is limited to small mussel farms
in the Provinces of Palermo, Messina and Syracuse. The Regional Pilot Centre for
Aquaculture of Assessorato Agricoltura e Foreste of the Sicilian Region coordinates
research, development and pilot scale production in fresh water aquaculture. This sector
is expected to grow rapidly in the next few years.
Maritime Transport
Palermo is considered one of the Italian strategic ports for the Motorways of the Sea
system by the Ministry of Transport. The Sicilian ports in which today Ro-Ro cabotage
services are operated for the combined road-sea are: Palermo, Termini Imerese, Catania,
Trapani. Considering the port facilities, Sicily exceeds the national average. Due to its
geographical conformation, the region has in fact a large number of ports, but the type
and quality of services offered is inadequate in relation to the structure of the production
system and the demand for passenger and freight transport.

3
Energy
Renewable sources are hydroelectric, photovoltaics, from biomass. No renewable
sources: Power stations with steam turbines powered by poly-fuel. Semi-thick dense oils
and natural gas are used, creating a mix that has led to a certain control of emissions in
compliance with environmental legislation. In the Aeolian Islands it has been planned a
"Plan for recovery and increase of installed capacity end adaptation of auxiliary systems"
including the installation of 10 new electro diesel production groups. The end uses
concern the equivalent consumption of primary energy sources in the four census macro-
sectors: Primary, Civil, Industry and Transportation.
Tourism
Sicily's sunny, dry climate, scenery, cuisine, history and architecture attract many tourists
from mainland Italy and abroad. The tourist season peaks in the summer months,
although people visit the island all year round. Tourism is one of the most important
sectors for the island economy. In 2018, Sicily had 15.1 million presences, with an
increase of 4.9% respect the 2017, and almost 5 million of arrivals (+4.8% in respect of
2017). The average stay is 3 nights with a bed occupancy rate of about 20%, then very
low. The most popular time of the year is from May to September.
1 Current situation and recent trends
1.1 Current geopolitical context
Sicily is the largest island in the Mediterranean Sea and one of the 20 regions of Italy. It
is one of the five Italian autonomous regions in Southern Italy along with surrounding
minor islands, officially referred to as Regione Siciliana. Its most prominent landmark
is Mount Etna, the tallest active volcano in Europe and one of the most active in the
world. Sicily was inhabited 10.000 years ago. The earliest archaeological evidence of
human activity on the island dates from as early as 12.000 BC.
Sicily has a rich and unique culture, especially regarding arts, music, literature, cuisine
and architecture. The natural vegetation of Sicily has been greatly reduced by human
influence and forests occupy only 4 percent of the territory. In terms of geography, 61
% of Sicily's territory consists of hills, 25 % of mountains and 14 % of plains. The
northern part of Sicily is mountainous while the southern part has lower hills and
plains.
The Sicilian population has been stable since 1990, close to 5 million which is
equivalent to 4% of the Italian population. In 2013, 25 % of the population of the
island lived in the province of Palermo, 21.9 % in Catania, 12.7 % in Messina, 5.4 % in

4
Caltanissetta and 3.4 % in Enna1. The active population holds a stable share in total
population, equal to 34% throughout the 2007-2018 period (Figure 1).
Unemployment levels in Sicily register an increase in the recent years and are among
the highest in Italy and Europe. while youth unemployment levels reached 44% in
2018. Combating the growing youth and total unemployment levels is critical in order
to enhance social coherence in Sicily.
Figure 1: Total and active population of Sicily 2007-2018.
Source: Eurostat.
The reference projection of population in Sicily is displayed in Figure 2, which marks
the population for the period 2015-2100. Sicily is facing an ageing population, similarly
to the rest of Italy which is comparable to the levels of demographic crisis registered in
Japan. This, along with the growing gathering urbanization, leads to a strong decline of
the Sicilian population posing further challenges for growth.
1 Economic, Social and Territorial situation of Sicily 2015 accessed in:
http://www.europarl.europa.eu/cmsdata/120267/pe540372_en.pdf

5
Figure 2: Baseline population projection for Sicily (2015-2100). Source: Eurostat.
1.2 Current climate and risks
The climate in Sicily is Mediterranean on the coast as well as in the little islands and archipelagos of the region, with a mild and rainy winter season and warm and sunny summers. The mid-seasons are quite mutable. On the coastline, specially on the south-west, the influence of the winds coming from Africa makes the climate torrid. In the inland, prevainly mountainous, the climate is almost continental on the hills, with winters moderately cold and summers quite torrid, and colder on the mountains.
In general, the rainfall is quite poor, specially at low altitude and on the coast, where the landscape is semi-arid. Over the 1,000 mt of altitude, snowfall can be abundant and frequent. For example, on the Etna Volcano, often snows also in the summer due to the Atlantic currents which affect the climate especially between the end of July and the beginning of August.

6
Figure 3: Climate factsheet Source: Own elaboration with data from GFDRR ThinkHazard!; D7.1 Conceptual Framework and Meteoblue; Meteoblue global NEMS (NOAA
Environmental Modeling System)
1.3 Macroeconomic status
Sicily lags behind the national and European economy in terms of economic
development. GDP PPS per capita was on average just €17.500 in 2016, among the
second lowest in the country and corresponding to 62% of the national GDP PPS per
capita (€28.200) and 60% of GDP average in the European Union (€29.200)2. As
shown in Figure 4, the GDP of Sicily registered a continuous decline over the period
2009-2014, with a rate of decrease which was higher than the national average.
Nevertheless, since 2014 the economic performance has been improving, with GDP in
2017 getting close to 2009 levels.
2 https://ec.europa.eu/growth/tools-databases/regional-innovation-monitor/base-profile/sicily

7
Figure 4: GDP and Disposable income by households for Malta. Source: Eurostat.
Figure 5: GVA by activity in 2007-2015 in Sicily. Source: National Statistics Office.

8
1.4 Recent evolution of the blue economy sectors
Tourism
Tourism is an important economic activity in Sicily, but represents only a small share
of regional GDP, lower than the national average contribution3. Overall arrivals at
tourist accommodations in Sicily are only 5% of total arrivals in Italy (Figure 6).
Figure 6: Arrivals at tourist accommodation establishments as reported by the Reporting country, Italy and Sicily 2007-2018.
Source: Eurostat.
Maritime Transport
Maritime transport is important for Sicily, particularly for the connection of the island
to the mainland, while other smaller routes serve for connection with small
surrounding islands. Sicily is also connected via Palermo and Trapani to Tunisia, while
daily connections with Malta have also been established. The port of Augusta is the
fifth-largest cargo port in Italy and handles tones of goods. Figure 7 shows that the
seaborne transportation of freight in Sicily steadily covers 20% of total transport of
freight in Italy for the 2007-2018 period.
3 Economic, Social and Territorial situation of Sicily 2015 accessed in: http://www.europarl.europa.eu/cmsdata/120267/pe540372_en.pdf

9
Figure 7: Maritime transport of freight, Italy and Sicily 2002-2017. Source: Eurostat.
Aquaculture
According to a 2010 report by the European Parliament’s Committee on Fisheries4,
fisheries and aquaculture represent 0.58% of the total economy. In terms of
processing. Sicily has the largest number of companies dealing with fish conservation
in Italy (32%). More importantly, Sicily is one of the few regions in Italy where the
fisheries sector has a positive trade balance, with most exports going to Japan but also
Spain, Greece and France. In 2010 the Sicilian fishing fleet comprised of 3323 vessels,
representing the largest regional fleet in Italy. This number is significantly falling in
recent years due to scrapping policies. Aquaculture in Sicily is largely dominated by
seabass and sea bream production and represents around 20% of total Italian
production. Twelve aquaculture farms were active in 2008, using different types of
floating cages. Sicily is considered a Convergence Region by the European Union
Cohesion Policy and is legible for special funding also regarding the development of
fisheries and aquaculture.
Electricity
Sicily is interconnected through high voltage connections with the Italian mainland and
Malta. The latter meets an important share of its total electricity demand via imports
from Sicily. In particular, in 2017 68% of electricity demand was met through the high
voltage interconnector that was established in 2015. The Sicilian power supply system
4 http://www.europarl.europa.eu/RegData/etudes/note/join/2010/431596/IPOL-
PECH_NT(2010)431596_EN.pdf

10
features traditional thermal plants, hydro plants, biomass plants, solar PV plants and
some wind plants. Sicily has a large solar potential with high levels of horizontal
irradiation. According to Pagliaro et al 20155, in 2014 the installed capacity of solar PV
plants was equal to 1400 MW. Italy featured a successful feed in tariff system, while PV
owners can benefit from net metering systems. Expansions of the interconnection
capacity have enabled exports from the island to the mainland and have contributed to
the fall of electricity prices in both regions (Meneguzzo et al 20166).
Figure 8: Electricity generation by PV, wind and hydro plants in Sicily. Source: TERNA and Meneguzzo et al 2016.
Infrastructure. R&D and planned projects
The transport system in Sicily is in similar condition to that of the rest of Southern
Italy. Investments in upgrading and maintenance of infrastructure are crucial for the
improvement of macroeconomic indicators, as the current state hinders the efficient
movement of people and goods. Sicily, as a “Convergence” region, has been receiving
EU funding with the aim to improve mobility, focusing on railways and ports but also
on interconnecting regions through the highway or road networks. Key projects
include the railway in Palermo urban and metropolitan areas and the expansion of the
Catania metropolitan line. Sicily has several airports, with Catania airport receiving the
5 Pagliaro, M., R. Ciriminna, F. Meneguzzo, and L. Albanese. 2015. Sicily's solar report 2015, Simplicissimus Book Farm, Catania, Italy. ISBN 9788869094231 6 Meneguzzo, F., Ciriminna, R., Albanese, L. and Pagliaro, M. (2016), The remarkable impact of renewable energy generation in Sicily onto electricity price formation in Italy. Energy Sci Eng, 4: 194-204. doi:10.1002/ese3.119

11
most passengers, followed by Palermo-Punta Raisi airport and Trapani-Birgi airport,
while Comiso, Lambendusa and Pantellaria airports have lower capacities. Similarly,
Sicily features several ports, such as Messina, Trapani, Palermo, Catania and Augusta
which is a large commercial port. Recently, it was announced7 that three major Sicilian
ports, Palermo, Termini Imerese and Trapani will be upgraded through the Italian
infrastructure planning program.
Regarding ICT infrastructure, In 2017, 74% of households had access to the Internet
in 2017, one of the lowest percentage in Italy (the national equivalent was 79%).
Nevertheless, this share has increased significantly in the last few years, from 62% in
2014. Regarding R&D, in 2015, domestic expenditure on R&D was ca. €863m in Sicily,
mainly due to regional universities (54%), businesses (28%), public authorities and
non-profit institutions (18%)8. According to data elaborated by Eurostat. In 2017, the
number of employees in high-tech sectors amounted to 28.500, representing 2.1% of
of the employed population, far below the Italian and the European average (3.4% and
4% respectively).
2 Economic projections
2.1 Macroeconomic projections
In terms of GDP growth, Sicily registers a 1.3% yearly rate throughout the 2015-2100
period and a 1.1% rate in the 2015-2050 period. The main driver of growth during the
entire period is investments, particularly in the short term, and a sustained private
consumption throughout the period (Table 1). As seen in Figure 9 the economy of
Sicily is projected to become more sustainable, as the trade deficit gradually diminishes
and the contribution of investments to GDP increases. The above imply a reduction of
private and public consumption when ex- pressed as a share of GDP. In particular, the
share of public consumption in GDP, which was the highest among all islands in 2015,
drops to levels similar to those of the rest of the islands.
Table 1: GDP projections 2100. 2020 2025 2030 2035 2040 2045 2050 2060 2070 2100
GDP 1.3% 0.8% 0.5% 0.9% 0.9% 1.6% 1.6% 1.6% 1.5% 1.3%
Private
consumption 1.7% 0.3% -0.4% 0.2% 0.6% 1.3% 1.4% 1.4% 1.2% 1.1%
Public
consumption 1.0% 0.4% 0.1% 0.6% 0.6% 1.2% 1.2% 1.3% 1.2% 0.8%
Investments 1.2% 2.7% 2.4% 2.9% 1.1% 1.9% 1.8% 1.7% 1.6% 1.3%
Trade 2.1% 0.0% -1.4% -0.2% -0.7% -0.1% 0.2% 0.4% -0.2% -1.8% Source: Soclimpact project deliverable 6.2
7 https://www.portseurope.com/sicily-port-projects-enter-italys-infrastructure-planning-programme/ 8 https://ec.europa.eu/growth/tools-databases/regional-innovation-monitor/base-profile/sicily

12
Figure 9: Macroeconomic components as a % share of GDP for Sicily in 2015-2100. Source: Own calculations.
2.2 Sectoral projections
The economy of Sicily remains a service-led economy throughout the 2015-2100
period. However, a transition from non-market towards market services is projected.
Construction registers an increasing share in total value added, following the trajectory
of investments. The share of Blue economy sectors in total value-added falls slightly in
the 2015-2100 period, as tourism falls slightly below 10% of GDP.
Figure 10: Sectoral value added as a % share to total GVA for Sicily in 2015, 2050 and 2100. Own calculations.

13
Table 2: GVA shares by sector 2100. GVA % shares
2015 2020 2025 2030 2035 2040 2045 2050 2060 2070 2100
Agriculture 4.2% 4.0% 4.0% 4.0% 3.9% 3.9% 3.8% 3.7% 3.6% 3.5% 3.6% Fishery 0.3% 0.3% 0.3% 0.3% 0.3% 0.3% 0.3% 0.2% 0.2% 0.2% 0.2% Manufacturing
4.1% 3.7% 3.5% 3.5% 3.4% 3.2% 2.9% 2.6% 2.2% 2.0% 1.8%
Consumer goods
1.3% 1.3% 1.3% 1.3% 1.3% 1.4% 1.4% 1.5% 1.8% 2.0% 2.2%
Electricity 1.3% 1.2% 1.2% 1.2% 1.2% 1.1% 1.1% 1.0% 0.9% 0.8% 0.8% Water 1.4% 1.4% 1.4% 1.3% 1.3% 1.3% 1.2% 1.2% 1.1% 1.1% 1.0% Construction 4.9% 5.1% 5.6% 6.1% 6.7% 6.9% 7.3% 7.7% 8.5% 9.1% 10.8% Water transport
0.7% 0.7% 0.6% 0.6% 0.6% 0.6% 0.5% 0.5% 0.4% 0.3% 0.2%
Other transport
4.5% 4.4% 4.4% 4.4% 4.4% 4.4% 4.3% 4.2% 4.1% 4.0% 3.9%
Accommodation and food services
2.9% 3.0% 3.0% 3.1% 3.1% 3.1% 3.2% 3.3% 3.4% 3.4% 3.6%
Travel agency and related activities
0.1% 0.1% 0.1% 0.1% 0.1% 0.1% 0.1% 0.1% 0.1% 0.1% 0.1%
Recreational services
4.8% 4.8% 4.8% 4.7% 4.6% 4.5% 4.5% 4.5% 4.4% 4.3% 3.9%
Other market services
37.% 38.% 38.% 38.% 39.% 40.% 40.% 41.% 43.% 44.% 46.0%
Non-market services
32.% 31.% 31.% 30.% 30.% 29.% 28.% 27.% 26.% 25.% 21.9%
Source: Soclimpact project deliverable 6.2
2.3 Employment
Sicily registers high unemployment levels, particularly among young people, which poses
a challenge for future economic policies. Our reference projections assume a declining
unemployment rate that falls by 13 p.p. in the 2015-2100 period (Table 3). This positive
evolution, However, is not the result of economic transformation and job creation, but
rather the effect of the declining population. The only sector that shows higher
employment numbers is construction. The next Figure describes the share of each
sector in total employment, indicating that almost half of the Sicilian jobs are in the
market services, while almost 10% of total employment is related to tourism.
Table 3: Unemployment rate in Sicily in 2015-2100. 2015 2020 2025 2030 2035 2040 2045 2050 2060 2070 2100 Unemployme
nt rate 21.4% 20.4% 18.3% 16.2
% 12.3% 11.0% 9.4% 8.5% 8.4% 8.2% 8.2%
Source: Own calculations.

14
Figure 11: Sectoral employment as a % share of total for Sicily in 2015, 2050, 2100. Source: Soclimpact project deliverable 6.2
3 Climate Change outlook
Climate hazards indicators represent the entry point to understand the climate change
exposure of the blue economy sectors. The indicators have been computed for two
scenario RCP2.6 (low emission scenario) and RCP8.5 (high emission scenario) and for
different horizon times namely: a reference period (1965-2005), mid-century (2046-2065)
and end of century (2081-2100). Main source of climate projections (future climate) for
the Sicily is MED-CORDEX ensemble (regional scale of Mediterranean area) and
CMIP5 Ensemble (global scale) even if other model sources were applied when required,
depending of available scales. Results are presented in form of maps, tables or graphs
and only when the information shows an interesting outcome.
All the graphics presented below can be found in high resolution in the
Soclimpact Project official website HERE.
3.1 Tourism
Seagrass evolution
Posidonia Oceanica is a foundation specie in Mediterranean waters. Foundation species have a large contribution towards creating and maintaining habitats that support other species. First, they are numerically abundant and account for most of the biomass in an ecosystem. Second, they are at or near the base of the directional interaction networks that characterize ecosystems. Third, their abundant connections to other species in an ecological network mostly reflect non-trophic or mutualistic interactions, including providing structural support for other species, significantly altering ecosystem properties

15
to [dis]favor other species, altering metabolic rates of associated species, and modulating fluxes of energy and nutrient flow through the system. Seagrasses are the main habitat for coastal marine ecosystems. They provide different services like sediment retention (and thus clearer waters), coastal protection (in front of marine storms), shelter for marine organisms, etc. Therefore, the state of seagrasses is a convenient proxy for the state of coastal environment. 1 specie is located in the coasts of Sicily: Posidonia. The results of RCP8.5 projections indicate a loss of 28,3% at end of century.
Figure 12: Projection of seagrass coverage
Source: Soclimpact project deliverable D4.4e Report on estimated seagrass density
Beach flooding and related losses
One of the consequences of an increase in the mean sea level will be the flooding of coastal areas. This includes sand beaches, which are the main asset for tourism activities in most of the European islands. Therefore, estimating the potential risk of beach loss due to climate change is of paramount importance for the economy of those islands. The 95th percentile of the flood level averaged was selected as an indicator of interest. The values are presented as anomalies with respect to the present mean sea level at beach location (i.e. including the median contribution of runup). An increase is expected being larger at the end of the century under scenario RCP8.5.
.

16
Figure 13: Projected extreme flood level (in the vertical, in cml) at beach locations with respect to the present (1986-2005) mean sea level values averaged for the islands under scenario RCP2.6 (left) and
RCP8.5 (right). Ensemble of models using Global simulations produced by Hemer et al. (2013). Source: SOCLIMPACT Deliverable Report - D4.4d Report on the evolution of beaches
Under mean conditions, we find that, at end of century, the total beach surface loss range
from ~34% under scenario RCP2.6 to ~61% under scenario RCP8.5.
Figure 14: Beach reduction % (scaling approximation).
Source: Soclimpact project deliverable D4.4d Report on the evolution of beaches

17
Fire weather Index
The FWI system provides numerical non-dimensional ratings of relative fire potential for a generalized fuel type (mature pine stands) based solely on weather observations. FWI is part of the Canadian Forest Fire Danger Rating System established in Canada since 1971 (van Wagner 1987). Furthermore, since 2007, FWI has been adopted at the EU level and used in a harmonized way throughout Europe by the European Forest Fire Information System (EFFIS) of the Copernicus Emergency Management Service (since 2015). It is selected for exploring the mechanisms of fire danger change for the islands of interest in the framework of SOCLIMPACT Project, as it has been proved to adequately perform for several locations, including the Mediterranean basin. The index was calculated for the fire season (defined from May to October) over the Mediterranean for all models, scenarios and periods. For Sicily, N=195 grid cells were retained from the models domain. In the following figure the ensemble mean and the uncertainty is presented for all periods and RPCs. While the most areas exhibit very low, low and medium fire danger in the present climate and under RCP2.6 for the near and the distant future as well, it seems that under RCP8.5, more areas exhibit medium danger at mid-century, while towards the end of the century a major part of the island will be under medium and high fire danger. The overall increase of the risk score for the island exceeds 30%.
Figure 15: Fire Weather Index (EURO-CORDEX) with the color associated to the nivel of risk Source: Soclimpact project deliverable D4.4c Report on potential fire behaviour and exposure
Humidex
For the assessment of climate hazard on heat related impacts of climate change on human health, the humidity index (Humidex) (Masterton and Richardson, 1979) has been used. Humidex value is an equivalent temperature, which express the temperature perceived by people (the one that the human body would feel), given the actual air temperature and relative humidity. As a more representative indicator for the assessment

18
of inhabitants’ and tourists’ hazard on heat related climate change impacts, the Number of Days with Humidex greater than 35°C was selected. From the above classification, a day with Humidex above 35°C describes conditions from discomfort to imminent danger for humans. For Sicily, N=195 grid cells were retained from the models domain. In the following figure the ensemble mean and the uncertainty is presented for all periods and RPCs. From less than 2 months in the present climate and quite above 2 months in the mid-century for both scenarios, Sicily will have almost 4 months with discomfort conditions by the end of the century under RCP8.5.
Figure 16: Humidex in number of days (EURO-CORDEX) Source: Soclimpact project deliverable D4.3_Atlases of newly developed indexes and indicator
Length of the window of opportunity for vector-borne diseases Vector Suitability Index for Aedes Albopictus (Asian Tiger Mosquito) Climate change can influence the transmission of vector-borne diseases (VBDs) through altering the habitat suitability of insect vectors. This is mainly controlled by increases of ambient air temperature and changes in the hydrological cycle. In the framework of SOCLIMPACT we explore if potential changes to meteorological conditions can affect the distribution of the Asian tiger mosquito (Aedes albopictus). Asian tiger mosquito is native to the tropical and subtropical areas of Southeast Asia; however, in the past few decades, this species has spread to many countries through the international transport of goods and increased travel (Scholte and Schaffner 2007). It is of great epidemiological importance since it can transmit viral pathogens and infectious agents that cause chikungunya, dengue fever, yellow fever and various encephalitides (Proestos et al. 2015). The multi-criteria decision support vector distribution model of Proestos et al. (2015) has been employed to estimate the regional habitat suitability maps. This is based on

19
extending previous work on the environmental/climatic factors affecting the life cycle of the Asian tiger mosquito (Waldock et al. 2013; Proestos et al., 2015). The mosquito habitat suitability model combines seven meteorological indices based on field observations, extensive literature review and expert knowledge. The projection for the island indicates that the current situation will not be worsened. However, actual suitability index should be taken into account in climate policy design.
Figure 17: Habitat Suitability Index (HSI) values averaged over eight SOCLIMPACT islands and for each sub-period of analysis. Red colors indicate increases while blue colors indicate decreases in the future. [80-100: High Suitability; 60-80: Medium Suitability; 40-60: Low Suitability; <40 No
Suitability]. Source: Soclimpact project deliverable D4.3_Atlases of newly developed indexes and indicator
Water from natural sources In general, changes appear to be within natural variability and relatively small for RCP2.6, while for the 8.5 scenario a significant decrease in precipitation is observed, especially in the far future. The same considerations hold for total runoff, although the statistically significant areas are somewhat smaller. 3.2 Aquaculture
Temperature changes in seawater trigger physical impacts; increased harmful algal blooms, decreased oxygen level, increase in diseases and parasites, changes in ranges of suitable species, increased growth rate, increased food conversion ratio and more extended growing season. Furthermore, all these impacts lead to socio-economic implications among them; changes in production levels and an increase in fouling and pests. The objective of the current analysis is to identify and quantify the variations (future climate scenarios with respect to present climate) in the number and in the duration of events characterized by a Sea Surface Temperature (SST) exceeding a given

20
threshold. The SST thresholds have been identified according to the farming and feeding necessities of several marine species, particularly relevant for the aquaculture sector in the Mediterranean Sea (MS).
Figure 18: Fish thermal thershold Source: Soclimpact project deliverable D4.5
More information can be found in the next section dedicated to risk assessment 3.3 Energy
Standardized Precipitation Evaporation Index (SPEI) As expected from the definition of SPEI, for our historical reference period, normal conditions are simulated for all islands. On average, simulations under pathway RCP2.6 indicate small changes in the SPEI values and for most islands near-normal conditions are expected throughout the 21st century as a result of the smaller changes in the precipitation regimes, combined with mild increases in near-surface temperature. Under the high emission RCP8.5 pathway all European Islands are expected to face much drier conditions. The signal becomes stronger towards the end of the 21st century.

21
Figure 19: Ensemble mean, maximum and minimum values of the Standardized Precipitation
Evaporation Index (SPEI) averaged over each SOCLIMPACT island and for each sub-period of
analysis (EURO-CORDEX). Source: Soclimpact project deliverable D4.3_Atlases of newly developed indexes and indicator
Percentage of days when T > 98th percentile - T98p
The T98p is defined as the percentage of time where the mean daily temperature T is above the 98th percentile of mean daily temperature calculated for the reference period 1986-2005. For Sicily, N=195 grid cells were retained from the models domain. In the following figure the ensemble mean and the uncertainty is presented for all periods and RCPs. It is found that T98p is about 5% during RCP2.6 towards mid-century and slightly decreases at the end of the century, while for RCP8.5 almost one fifth of the year will exhibit temperatures above the 98th percentile. The coastal grid cells are more affected by the temperatures increase compared to the inland grid cells.
Figure 20: Percentage of days when T > 98th percentile (EURO-CORDEX) Source: Soclimpact project deliverable D4.3_Atlases of newly developed indexes and indicator

22
Renewable energy productivity indexes
A series of indicators related to renewable energy productivity is presented. The selected indicators are wind and photovoltaic (PV) energy productivity, as well as the frequency and duration of low-productivity periods, termed energy droughts (Raynaud et al., 2018), as a measure of the variability of these sources. The productivity and variability of these renewable energy sources will depend on climate. The possibility of reduced productivity due to climate change poses a risk to the energy generation, if it is based on these renewable energy sources. Also, a possible increase in the frequency and duration of solar and wind energy droughts will require an increase in storage and backup sources. Among the different renewable energy sources, solar PV and wind energy have been selected, as they are (and very likely will be) the main renewable energy sources, due to their degree of technological development and their comparatively low cost. In order to consider a marine energy source, offshore wind energy is included, in addition to onshore wind energy.
Wind energy productivity
All the scenarios in both 2046-2065 and 2081-2100 periods show a tendency to decreasing Wprod. However, the magnitude of the decreases varies. As occurs in other regions, RCP8.5 in the 2081-2100 period shows the most important decrease, specially over the sea to the north and to the south of Sicily. The southern minimum of Sicily encompasses Malta, where a rather large reduction of 10% with respect to the control value is projected in this scenario and period over land. The reduction over land in Sicily is smaller in absolute terms, but reaches a value of 9% with respect to the control value which is also clearly lower than in Malta.
Figure 21: Wind energy productivity. Ensemble of models –land Source: Socimpact project deliverable d4.4a report on solar and wind energy

23
Figure 22: Wind energy productivity. Ensemble of models –sea Source: Socimpact project deliverable d4.4a report on solar and wind energy
PV energy productivity
The 2081-2100 period for RCP8.5 presents the largest negative changes. Over land, the
decreases are lower than 2% of the control productivity in spatial average over Sicily,
while over Malta the decrease reaches 3% in the RCP8.5 scenario at the end of the
century. The decreases are larger over the sea, particularly over the southern part of the
domain. Productivity decreases are rather small for RCP2.6.
Figure 23: PV energy productivity. Ensemble of models –land Source: Socimpact project deliverable d4.4a report on solar and wind energy

24
Figure 24: PV energy productivity. Ensemble of models –sea Source: Socimpact project deliverable d4.4a report on solar and wind energy
Frequency and duration of low-productivity periods (energy droughts) as a
measure of the variability of these sources
Wind droughts are remarkably more frequent over land than over the sea in the control
period. Overall, wind productivity droughts tend to experience an increase in occurrence
in both scenarios. Changes in the frequency of wind droughts in this island are consistent
with the observed changes in wind productivity. Projected changes in the frequency of
moderate PV droughts are small both in Malta and in Sicily. Severe PV droughts are very
infrequent in both islands small, and practically no change is projected in the future. The
combination of PV and wind energy is very positive in Sicily both for moderate and
severe droughts in the control period.

25
Figure 25: Ensemble mean frequency of severe productivity drought days-WIND (%) in the reference period, as well as the ensemble mean changes in the frequency of drought days (%) in the different time
periods considered. Averages are computed over land. Source: Socimpact project deliverable d4.4a report on solar and wind energy
Figure 26: Ensemble mean frequency of severe productivity drought days-PV (%) in the reference period, as well as the ensemble mean changes in the frequency of drought days (%) in the different time periods
considered. Averages are computed over land. Source: Socimpact project deliverable d4.4a report on solar and wind energy

26
Figure 27: Ensemble mean frequency of severe productivity drought days-COMBINED (%) in the reference period, as well as the ensemble mean changes in the frequency of drought days (%) in the
different time periods considered. Averages are computed over land. Source: Socimpact project deliverable d4.4a report on solar and wind energy
Cooling Degree Days
The Cooling degree days (CDD) index gives the number of degrees and number of days that the outside air temperature at a specific location is higher than a specified base temperature, providing provides the severity of the heat in a specific time period taking into consideration outdoor temperature and average room. .
Figure 28: Cooling Degree Days. Ensemble mean of EURO-CORDEX simulations Source: Soclimpact project deliverable D4.3_Atlases of newly developed indexes and indicator

27
3.4 Maritime transport
Sea level rise
Sea level rise (SLR) is one of the major threats linked to climate change. It would induce permanent flooding of coastal areas with a profound impact on society, economy and environment. Moreover, an increase in the mean sea level would result in a larger impact of coastal storms with the consequent increase of risk. The results are presented in terms of mean sea level rise. For Sicily, the SLR ranges from 22.96 cm (RCP2.6) to 62.5 cm (RCP8.5) at the end of the century .
Figure 29: Mean sea level rise (in cm) with respect to the reference period (1986-2005). Ensemble mean of CMIP 5 simulations and scaling approximation for RCP2.6
Source: Soclimpact project deliverable D4.4b Report on storm surge levels
Storm surge extremes
Storm surge events, characterized by positive extreme sea levels and mechanically forced by atmospheric pressure and wind are the main responsible for coastal flooding, especially when combined with high tides. To present, the only ensemble populated with enough number of members to compute meaningful statistics on climate projections is the one produced for the Mediterranean by Lionello et al. (2016). This ensemble consists on 6 simulations run with the HYPSE model at 1/4º of spatial resolution and forced by the high-resolution wind fields from the MedCORDEX ensemble which in turn is nested into CMIP5 global simulations. The simulations are run for the period 1950-2100 thus covering the historical period as well as the whole 21st century. Complementary, the ensemble includes three hindcast simulations that are used to establish present reference levels. Storm surge could decrease amount 20% under RCP8.5 (far future).

28
Figure 30: 99th percentile of atmospherically forced sea level (in cm) averaged for the hindcast period, the near future (2046-2065) and the far future (2081-2100) under scenarios RCP2.6 (with scaling
approximation) and RCP8.5, relative change in brackets. Source: Soclimpact project deliverable D4.4b Report on storm surge levels
Wind extremes
The wind extremity index NWIX98 is defined as the number of days per year exceeding the 98th percentile of mean daily wind speed. This number decreases in the far future with a strongest value under RCP8.5 (- 16 %). Like the NWIX98, the 98th percentile of daily wind speed, WIX98, decreases but with a more significant magnitude for RCP 8.5.
Figure 31: Wind Extremity Index (NWIX98). Ensemble mean of EURO-CORDEX simulations.
Source: Soclimpact project deliverable D4.3_Atlases of newly developed indexes and indicator.

29
Wave extremes (99th percentile of significant wave height averaged)
Marine storms can have a negative impact on maritime transport, coastal-based tourism and aquaculture, among other activities. To illustrate this impact, the 99th percentile of significant wave height averaged has been chosen. A decrease in the extreme wave height is found being larger under scenario RCP8.5.
Figure 32: the 99th percentile of significant wave height averaged for the reference period and the relative change for the RCP8.5. MED-CORDEX and Global simulations produced by Hemer et al. (2013).
Source: Soclimpact project deliverable D4.4b Report on storm surge levels
Figure 33: the 99th percentile of significant wave height averaged for the reference period and the relative
change for the RCP8.5 and RCP2.6. Global simulations produced by Hemer et al. (2013). Source: SOCLIMPACT Deliverable Report - D4.4b Report on storm surge levels

30
4 Climate change risks
4.1 Tourism
For the tourism sector, three impact chains (IC) were operationalized: i) Loss of comfort due to increase of thermal stress ii) Loss of attractiveness due to marine habitat degradation iii) Loss of attractiveness due to increased danger of forest fires
For the first IC the data collected was:
- Surface of marine Phanerogams & Phanerogams' reduction due to heat: Surface, in km2; and expected % of surface loss for RCP8.5 distant future.
- Number of divers: Number of tourists practising Diving at the destination. - Products substitution capacity: capacity to derive tourist demand to non-marine
habitat-based activities. - Seagrass removal: capacity to remove dead seagrass lying on beaches. - Sea water pollution: quality of management of inshore and offshore sewages.
If one information is missing, it is not possible to conduct the risk assessment analysis, as it is a comparative analysis between European islands. Sicily island shows a lack of data availability that limited the analysis. The other two IC provided some results for Sicily, which are summarized hereafter. Loss of attractiveness due to marine habitat degradation Climate hazards like the increase of mean and variability of seawater temperature and the
increase of oceans acidification, mainly, are affecting marine habitats with touristic
relevance through diminishing bio-productivity and attracting exotic species, some of
them toxic, and because of that, reducing the attractiveness of marine landscapes and the
presence of flagship species; increasing turbidity in bathing and diving sea waters
affecting the quality of bathing, diving, snorkelling and bottom-glass boating experiences,
at least; and increased frequency and intensity of episodes of seagrasses massive death
that arrive to the beaches affecting the experience of lying and staying there.
The next figure shows the theoretical impact chain. As can be seen in the figure, the
impact of Climate Change on the touristic attractiveness of an island depends on a set of
multi-dimensional factors, including:
1. Increase in the mean and variability of seawater temperature is the main driver of marine habitat degradation; also seawater acidification impacts marine life although it substantially varies depending of the marine organisms;
2. The risk of those marine habitat transformations for tourism critically depends on the nature exposed to it, the amount and proportion of tourists that feel marine habitat is a relevant motivation to visit the destination, and the resilience of the exposed natural assets and tourists to those changes in the marine environmental conditions;

31
3. Finally, the preparedness to cope with the deterioration of its marine environment by developing substitutive attractions, is also a key aspect to assess the effective risk that those hazards pose on the tourism industry at the destination.
The complex relationship between climate change, marine habitats and tourism still
exhibits important gaps of knowledge. For example, there is no evidence on the impact
that the abovementioned hazards may have on the communities of cetaceans that live or
pass through near the coasts of the islands under study. In some cases, this is a very
important economic chapter within the tourism industry in the islands. Whether climate
change is going to diminish or not the abundance, or affect the distance of those
cetacean communities from the island requires further research.
The Analytical Hierarchy Process (AHP) method was selected as the technique to
operationalize the impact chain since it is a well-grounded tool that allows for the
prioritization/ranking of alternatives using a weighting scheme that is established by
expert judgement. Hence, for the purposes of the project, it was considered suitable as it
would be able to reconcile the contribution of each risk factor (hazards, exposure, and
vulnerability, which includes sensitivity and adaptive capacity) towards the risk based on
expert opinion and, subsequently, order the islands in terms of which one is most at risk
of losing attractiveness due to the degradation of the marine environment.
Figure 34: Loss of destination attractiveness due to marine environment degradation as a result of climate change hazards.
Source: SOCLIMPACT Deliverable Report – D3.2. Definition of complex impact chains and input-output matrix for each islands and sectors

32
Application of the AHP methodology
The problem to be solved along through the expert decision process was comparing the
risk of the European islands of losing tourist attractiveness due to the deterioration of
their marine habitats as consequence of climate change. The hierarchy tree for this
decision problem was built underpinning on the impact chain elements, together with the
variables that express the tourism-related environmental and social systems’ exposure to
those hazards, the sensitivity of the exposed systems to the referenced hazards and the
social capacities to cope with the potential impacts of climate change by protecting
nature and the society and/or making them more resilient.
Some modifications of the original impact chain were undertaken for the sake of
feasibility, although experts were encouraged to have in mind all the factors they know
can affect the impact of climate change on the marine habitat services for tourism. It
means that the hierarchy tree is a simplified structure of the main factors explaining the
complex relationship between climate change and the ecosystem services that support
tourist use of marine environments, but other factors also known by experts must be
taken into account at the time of comparing the components of the risk between islands.
This is one of the most interesting strengths of the decision processes based on expert
participation and, particularly, of the multicriteria analysis used in this case. The next
figure shows the basic structure, or hierarchy tree, of the decision making process that
was presented to the experts.
Figure 35: Hierarchy tree for marine habitats impact chain. Source: SOCLIMPACT Deliverable Report – D4.5. Design of a comprehensive approach to climate and climate-related risk information to policy makers
and the general public
Hazards are the climate events that instigate the climate-associated risk. In our context,
seawater heating was considered as the most relevant variable to assess changes in the

33
conservation status of the marine habitats that provide services for coastal tourism
activities. Other hazards initially considered, like acidification and storms, were finally
discarded. The first one because its effects on living marine organism are still under study
and the evidence is dispersed and not conclusive. The second one because in the
Mediterranean Sea and the Atlantic Ocean that surrounds the islands under study, storms
are considered not so frequent and intense to not giving time to marine ecosystems to
recover their previous conservation status.
Regarding indicators, published research shows 25 and 26 Celsius degrees as the
threshold temperatures over which seagrass meadows, the foundation species that mainly
structure ecosystems in the marine habitats of reference, start to decline. The indicators
used were the number of days per year with seawater temperature over 25 and 26 Celsius
degrees. Sources of information and data were provided by the Soclimpact modellers.
Exposure denotes the range of ecological and social systems susceptible to be damaged
by hazards. This criterion, the natural and social systems potentially damaged by the
selected climate hazards, was decomposed into three sub-criteria, one referred to the
marine environment, and the other two related to the use that tourists make of the
services provided for the marine environments at the destination. These three sub-
criteria were expressed through three respective indicators. One, referred to the surface
of marine phanerogams that suffer from the climate stressors. Phanerogams, specially
Posidonia in the Mediterranean and Cymodosea in the Atlantic, are the very foundation
species organizing most of the coastal ecosystems. They provide food and shelter to
many different species and keep seawater clear by absorbing sediments. Additionally,
when become damaged, seagrasses meadows deliver dead individuals that go to lay on
the beaches used by tourists.
The second sub-criterion is one about the different types of direct uses that tourists make
of the ecosystem services. Diving was selected to represent theses uses and the selected
indicator was the number of divers per year. It was assumed that other sea watching
activities like snorkelling and bottom-glass boating evolve similarly than diving. Experts
were also invited to consider other sea environment users potentially affected by the lack
of water transparency and dead seagrass suspended in seawater like surfers, windsurfers
and other active users of the marine environment.
The third sub-criterion was related to the impact on most of tourists as bathers. Turbid
water affects the quality of the bathing experience, which is an activity that most tourists
do.
Sensitivity concerns the susceptibility of natural, cultural, and built resources to harm
that is a direct or indirect result of Climate Change hazards. For the operationalization of
this impact chain, sensitivity relates to the susceptibility of the phanerogam meadows to
changes in seawater temperature and to the extent to which the impoverishing of
seawater conditions and marine ecosystems may affect tourists’ welfare.
Regarding the effects of episodes of seawater heating on the integrity of seagrasses
meadows, the variable selected was periods of overheating and the indicators were the

34
number of days per year with seawater temperature over 25 and 26 Celsius degrees. As
explained above, experts were invited to take into account their experience and their
knowledge about the differences between the way seagrasses behave in the real world
and in the laboratory when studying the impact of water heating.
With respect to the impact of the marine environmental degradation on the welfare of
tourists, the indicator selected was the tourists’ willingness to pay for the preservation of
marine ecosystems9. Thus, ecosystems’ and social’s susceptibility are both taken into
account when comparing risks of marine environment degradation due to climate change
between islands.
Adaptive capacity reveals the potential to face the hazards by reducing the level of
exposure and/or increasing the resilience of the tourism system. This criterion was split
into three sub-criteria, one referred to the substitution of marine-based activities by lesser
marine habitats dependent ones, and two concerning actions to heal the marine
environment like removing dead seagrasses or reducing non-treated sewage discharges
(and consequently, seawater pollution). In this case, island experts were consulted about
the capacity of their reference destination to address these adaptation actions using a 1-4
scale, where 1 represented a very poor management capacity and 4 expressed a full
capacity to deal with it.
Results and islands’ ranking
The table below shows the final results of the operationalization process. In particular, it
summarizes the global weights of the sub-criteria and the criteria and the global score of
the risk for each island; thus islands can be compared not just globally but also across the
set of the sub-criteria and the criteria being considered to estimate the aggregated risk.
Table 4: Final scores and islands’ ranking (under RCP8.5 distant future).
Criteria Sub-criteria Balearic Canary Cyprus Malta Sicily
Hazards Seawater heating RCP8.5 (2081-2100)
0.018 (8.0%)
0.004 (2.2%)
0.054 (23.6%)
0.025 (12.7%)
0.025 (14.7%)
Exposure
Surface of marine phanerogams
0.034 0.002 0.004 0.009 0.022
Number of divers 0.009 0.005 0.001 0.002 0.002
Tourists’ arrivals 0.013 0.013 0.002 0.001 0.006
Total 0.056
(25.0%) 0.020
(11.0%) 0.007 (3.1%)
0.012 (6.1%)
0.029 (17.1%)
9 This information was delivered by Soclimpact researchers who are in charge of the work package WP5. More information at: SOCLIMPACT Deliverable Report – D5.5. Report on market and non-market economic values for environmental services of marine and coastal ecosystems related to the activities of the blue economy.

35
Sensitivity
Phanerogams’ susceptibility to heat
0.072 0.072 0.008 0.024 0.024
Economic valuation
0.003 0.027 0.004 0.006 0.010
Total 0.075
(33.5%) 0.099
(54.7%) 0.012 (5.2%)
0.030 (15.2%)
0.034 (20.0%)
Adaptive capacity
Products substitution
0.034 0.034 0.086 0.060 0.016
Seagrass removal 0.020 0.002 0.007 0.007 0.003
Sea water pollution
0.021 0.021 0.063 0.063 0.063
Total 0.079
(35.3%) 0.058
(32.0%) 0.155
(67.7%) 0.130
(66.0%) 0.082
(48.2%)
Total 0.224 0.181 0.229 0.197 0.170
Rank 2 4 1 3 5
Note: Total contribution of the criterion to the final score of the island in parenthesis.
Source: SOCLIMPACT Deliverable Report – D4.5. Design of a comprehensive approach to climate and climate-related risk information to policy makers
and the general public
The risk: from Eastern to Western and viceversa
The relative risk for marine habitat-based tourism demand due to the heating of
seawaters surrounding the European islands is determined by the combination of three
different factors already reflected in the marine habitat impact chain: the intensity and
lasting of periods of seawater heating, the susceptibility of the marine habitats and
tourism activities based on it to the heating process and the changes in the habitat,
respectively; and the capacities of the respective islands’ societies to reinforce natural and
social systems’ resilience to seawater heating and its ecosystem impacts.
Based on the available indicators and on their own knowledge, the experts’ evaluation of
the complex relationships between seawater heating, habitats transformation and the
response of the tourism system, depicts a big picture featured by the following results:
- From the perspective of the intensity of the hazard, threats diminish from
Eastern to Western. Effectively, episodes of water heating threating the integrity
of marine ecosystems will we much more relevant throughout the Eastern
Mediterranean and will become softer as moving Western.
- From the perspective of the susceptibility of the marine foundation species to
seawater heating, western Mediterranean hosts the most vulnerable phanerogam
communities as genetically they are not ready to face increasing water
temperature variability at the rhythm climate change is powering. As a result, this
risk factor decays from Western to Eastern.

36
- Other relevant factors determining the relative risk faced by each island are
related to the management capacity of other hazards, different than seawater
heating, also degrading marine habitats (i.e. the current relevance of marine
habitat-based tourism and the capacity of the local tourism system to provide
competitive alternatives giving value to other, not marine-based natural and
cultural tourist attractions). Those capacities are unevenly distributed across the
islands, basically depending on the level of development of their respective
environment management and tourism management subsystems.
Some characteristics of the risk ranking provided by experts, and consequently, the final
scores, are:
- Cyprus leads the rank of risk due to, in addition to the greater seawater heating,
its experiencing ecological disruptive processes related to its closeness to the Red
Sea; strongly attracting exotic species with high capacity to destabilise the marine
ecosystems.
- On the other extreme, Sicily is the island exhibiting a lesser risk mainly due to it
holds a more balanced distribution of the indicators expressive of the range of
factors determining the risk.
- The Canary Islands hold a relatively low risk mainly due to their expected low
level of seawater heating; their higher weakness consists of the magnitude of the
tourism system exposed to the potential risk.
- The Balearic Islands are the most exposed islands. In addition, RCP8.5 distant
future shows a progress in heating relatively higher than other islands, meaning a
strong threat for their relatively susceptible Posidonia meadows.
- Malta holds a relative low risk mainly due to its low exposition to the risk and the
potential of alternative, non-marine-habitat-based, tourist products.
Below are presented some paragraphs devoted to go deeper into the complexity of the
ecosystem dynamics that influence the holistic effect of climate change on the European
islands’ marine habitats; before presenting some lines highlighting the specificities of this
impact chain for each island.
In the Eastern Mediterranean, the impact of seawater heating on the seagrass meadows
(and on the marine habitat as a whole) not only depends on the physiological response of
the plants concerned to heating, but also on the response of the system as a whole. On
the Eastern shore of the Mediterranean, a strong increase in herbivorous species from
the Red Sea has been observed that cross the Suez Canal and have settled near the
continental and insular coastal areas. Posidonia meadows have been found to be part of
their diet.
The heating exacerbates the metabolic needs of these herbivorous species (Siganus
Luridus and others) increasing their voracity and, consequently, leading to greater
pressure on the phanerogams. Given that, on the other hand, the surface of these
meadows in the environment of Cyprus is small, predation by these herbivores may
threaten Posidonia with extinction, disappearing with it the conservation functions of the
ecosystem that it currently carries out as protection against erosion, containment of water

37
turbidity (assimilation of organic residues), shelter and food for fingerlings of fish and
other marine organisms, etc.
Other factors such as the sewage treatment or the sedimentation of waste from coastal
constructions interact with the seawater heating, exacerbating the degradation of marine
habitats. Together, factors of global change other than seawater heating are expected to
act more intensely in Cyprus, increasing the vulnerability of this island's marine habitat to
climate change.
Analysis of Sicily
Sicily ranks the best position regarding the climate change risk under analysis. The island
does not outstand in any component of the risk but neither shows critical pitfalls
regarding it. With respect to the foundation specie, the island holds the second largest
surface, but lesser susceptible to sweater heating. This island also presents the most
balanced tourist demand, as it treasures a wide range of cultural, social, landscape,
gastronomic and historic resources to underpin a tourism industry not very dependent
on the marine environment. All these factors together, but none of them particularly,
make Sicily the most resilient island to the risk of its tourism industry being affected by
seawater heating. The most salient weakness at this respect seems to be the seawater
pollution due to a deficient capacity to treat sewage. Related investments should be a
priority for this island.
The mentioned advantages and disadvantages of Sicily are depicted in the next figures.
The further the criteria or sub-criteria is located from the centre of the graph, the more it
affects the risk.

38
Figure 36: Global weights of each criteria and sub-criteria in the final score. Source: SOCLIMPACT Deliverable Report – D4.5. Design of a comprehensive approach to climate and climate-related risk information to policy makers
and the general public
Figure 37: Global weights of each criteria and sub-criteria in the final score. Source: SOCLIMPACT Deliverable Report – D4.5. Design of a comprehensive approach to climate and climate-related risk information to policy makers
and the general public

39
The operationalization of the impact chain for the “Loss of attractiveness of a destination due to
the loss of services from marine ecosystems” was conducted using the AHP method. The method
proved to be appropriate, firstly, for dealing with the hierarchical nature of the impact
chain and, secondly, for using expert judgements to assess the comparative risk for the
islands over a large number of indicators (sub-criteria). Because the AHP method
determines a ranking of the islands, it can provide decision-makers with relative values
but not with absolute values. Such values will be delivered by the modelling activities of
other work packages and will give stakeholders a more complete picture of this specific
risk in terms of social, economic, and environmental impacts.
Loss of attractiveness due to increased danger of forest fires in touristic areas Forest fires are considered as an important parameter for the attractiveness of tourist
destinations, especially in the Mediterranean area. Severe episodes were met in Algarve
(Portugal) and Greece (Athens area) in the recent period, threatening the tourist season.
This study focuses on the implementation and analysis of the selected Impact Chain
“Risk of forest fires and consequences on tourism attractiveness of a destination”. Out
of the 12 islands assessed in the SOCLIMPACT project, nine were included in the
operationalization: the three Atlantic Islands (Azores, Canary Islands and Madeira) and
the Mediterranean ones (Balearic Islands, Crete, Corsica, Cyprus, Malta, Sardinia and
Sicily).
The concept of Impact Chain (Schneiderbauer et al. 2013; Fritzsche et al. 2014) is applied
as a climate risk assessment method (with 6 steps) for research of decision making.
Impact Chains propose diagrams articulating the causal links between the different
components of climate risks (according to AR5 concepts: hazards, exposure,
vulnerability, risks, step 1). For each of these components of the theoretical IC, several
indicators are selected and collected (step 3). Data are then normalised to be able to be
aggregated (steps 4 and 5) with different weights. The final objective (step 6) is to achieve
a standardised risk score that, according to the spatial scale of the analysis can allow
comparison and decision making on adaptation, including hierarchization of resource
allocation or identification of adaptation options to mitigate climate risk.

40
Figure 38: Loss of attractiveness due to increased danger of forest fire in touristic areas
Source:: Soclimpact project D3.2

41
Figure 39: Loss of attractiveness due to increased danger of forest fire in touristic areas. Source:: Soclimpact project D3.3
Many indicators were formulated in a very broad way, causing a few problems in
identifying suitable data sets. Furthermore, the data were checked for explicit spatial
coverage, resolution, temporal coverage and time frame. Finally, we evaluated possible
substitutes or alternatives for those indicators with no suitable data to substantiate them.

42
Figure 40: Final Impact Chain Model Source:: Soclimpact project D4.5
In order to normalize the index, the min-max method was applied. Min-max normalizes
indicators to have an identical range [0, 1] by subtracting the minimum value and dividing
by the range of the indicator values (OECD 2008). The mathematical formula and more
information on min-max normalization method are presented in the following section.
Afterwards, the normalized index was categorized into five equal interval classes
representing values from “Very low" to "Very high”. Considering the weighing, an
assessment of GIZ methodology has been developed for this impact chain including
interviews with various types of stakeholders (cf. dedicated 4.5 to forest fires).

43
The indicators previously normalized have been aggregated to elaborate three sub-
component indices (hazard, exposure, vulnerability) and the final risk index. The result is
included in a comparison for the 9 other islands studied for the risk linked to forest fires.
Comparative study
Hazard
The main findings are:
Scores for fire danger increase as we move from West to East and from North to South, with the exception of Malta, which is much smaller and the selected grid cells are mostly influenced by maritime conditions.
Under RCP2.6, it seems that the fire danger returns to the present conditions towards the end of the century apart from Crete which score will increase from medium to high, even under this RCP.
Under RCP8.5, the increase is much more prominent, ranging from 22% to 46%, with the highest values for Corsica, Sardinia and Sicily, which implies that under this scenario at the end of the Century, the western and central Mediterranean will be more affected.
Figure 41: Hazard score (Fire Weather Index) per island for the reference period (1986-2005) Source:: Soclimpact project D4.5

44
Figure 42: Hazard score (Fire Weather Index) per island at the end of the century (2081-2100) under RCP2.6 (Ambitious Mitigation Policies)
Source:: Soclimpact project D4.5
Figure 43: Hazard score (Fire Weather Index) at the end of the century (2081-2100) under RCP8.5 (Business as usual)
Source:: Soclimpact project D4.5

45
Exposure
The results show that:
Atlantic Islands (Madeira and Canary Islands) are more exposed than Mediterranean Islands (from low to medium score). We can see an increase as we move from North to South in the Mediterranean area.
Atlantics Islands higher scores are mainly explained by the level of exposure rather than the nature of exposure, which is quite similar across islands, except for Malta which rate is very low.
The nature of exposure varies across EU Islands despite of their homogeneous score: Corsica has the highest score for forest areas followed by Madeira, Canary Islands. These two last ones have the highest score of forest belonging to protected areas. We can find a significant proportion of cultivated areas in other Islands namely: Sicily, Sardinia, Balearic Islands, Crete and Cyprus.
The level of exposure for Canary Islands and Madeira is particularly important because of the high scores for each of the 4 considered indicators: population density, population over 65 years, population under 9 years and tourist density.
Figure 44: Exposure score (current period) per island Source:: Soclimpact project D4.5

46
Figure 45: Subcomponents of exposure and related score (current period) per island Source:: Soclimpact project D4.5
Figure 46: Breakdown by exposure subcomponent Source:: Soclimpact project D4.5

47
Vulnerability
The main findings are:
Results show large disparity across EU Islands in terms of vulnerability. The vulnerability score for Corsica is very high followed by Sardinia (high), Madeira, Balearic Islands and Cyprus. Malta, Canary Islands and Crete scores are low and Sicilia very low.
Breakdown by component highlights a quite homogeneous score for adaptative capacity whereas sensitivity score (Flammability Index) is very different from an island to another.
Not surprisingly for the flammability index, Corsica and Sardinia have the highest score, Malta, Sicily and Canary Islands, the lowest one.
Looking at the adaptative capacity subcomponent, despite of the quite homogeneous scores, factors of influence are quite different among the islands:
o high score for employees in the primary sector, apart from Sardinia and Sicily;
o scores for density of firefighters and volunteers are important for all the islands except for Cyprus;
o GDP per capita and level of education are the most heterogeneous factors of influence;
o GDP per capita score is very high for Crete, very low for Corsica, Malta and Balearic Islands.
o Scores for education level is important for Cyprus and low for Madeira, Malta and Corsica.
Figure 47: Vulnerability score per island Source:: Soclimpact project D4.5

48
Figure 48: Subcomponents of vulnerability and related score (current period) per island Source:: Soclimpact project D4.5
Figure 49: Details and scores of the two subcomponents (adaptive capacity and sensitivity) per island Source:: Soclimpact project D4.5

49
Risk
- For the reference period, the overall risk is medium for Atlantic Islands (Madeira and Canary Islands) and Eastern Mediterranean Islands (Crete and Cyprus). Risk for other islands is low and very low for Malta.
- Looking at the breakdown of the risk, the structure is quite similar for 3 groups: o Madeira, Canary Islands, Sicily and Balearic Islands: Predominance of
exposure component (around 50% of the score); o Crete and Cyprus: Predominance of the hazard component (around 40%
of the score); o Corsica and Sardinia: Predominance of the vulnerability component
(around 60-70%); o Only Malta has a quite balanced distribution across the components.
- In this exercise, only the hazard component is changing in the future. In the near future whatever the considered RCP, the risk increases only for Cyprus from medium to high. While the risk remains stable with the RCP2.6 in the distant future for all islands apart from Cyprus, there is an increase from very low to low for Malta and from low to medium for Balearic Islands, Corsica and Sardinia with RCP8.5. Even under this RCP8.5 risk remains constant for Canary Islands and Madeira (Medium) and Sicily (Low).
Figure 50: Risk score per island for the reference period (1986-2005) Source:: Soclimpact project D4.5

50
Figure 51: Risk breakdown by island for the reference period (1986-2005) Source:: Soclimpact project D4.5
Figure 52: Risk score per island in the near future (2046-2065) under RCP2.6 (Ambitious Mitigation Policies) and RCP8.5 (Business as usual)
Source:: Soclimpact project D4.5

51
Figure 53: Risk score per island at the end in the distant future (2081-2100) under RCP2.6 (Ambitious Mitigation Policies) and RCP8.5 (Business as usual)
Source:: Soclimpact project D4.5
Figure 54: Score per component and per island in the near (2046-2065) and the distant future (2081-
2100) under RCP2.6 (Ambitious Mitigation Policies) and RCP8.5 (Business as usual) Source:: Soclimpact project D4.5
Sicily island results

52
Under RCP8.5, the risk category will change from low to medium under RCP 8.5 at the
end of the century. The component of exposure is the most represented.
Figure 55: Risk score and components of the risk for the reference period
Source:: Soclimpact project D4.5
Figure 56: Risk score at the end in the distant future (2081-2100) under RCP2.6 (Ambitious Mitigation Policies) and RCP8.5 (Business as usual)
Source:: Soclimpact project D4.5
Concerning the exposure component, the both sub-components are equivalent. For the
level of exposure, the age of population is very important and for the nature of exposure,
the % of cultivated area is the more significant indicator.

53
Figure 57: Details and scores of the two subcomponents of exposure (nature and level of exposure) Source:: Soclimpact project D4.5
Concerning the vulnerability component, the adaptive capacity is more significant than
the sensitivity.
Figure 58: Details and scores of the two subcomponents of vulnerability (adaptative capacity and sensitivity
Source: Soclimpact project D4.5

54
4.2 Aquaculture
In the framework of Soclimpact, the following impacts were more closely studied:
1) Increased fragility of the aquaculture activity due to an increase of extreme
weather.
Increased frequency and intensity of extreme weather events result in higher waves and
storm surges and changes in salinity. These events result in loss of stock and damages to
infrastructure and require adaptation in species selection, site selection and technologies.
2) Decrease in production due to an increase in surface water temperature
Changes in water temperature can directly affect the growth rate and Food Conversion
Ratio of the fish. Temperature also affects the oxygen levels and can cause harmful algae
blooms, reduce water quality and an increase in occurance of diseases and parasites
which can than affect the fish or other culture species. A change in temperature can
ultimately change the ranges of suitable species for a certain area but can also have
positive impacts such as increased growth (mainly in tropical and sub-tropical regions)
and a longer growing season. Primary productivity can also increase with increasing
temperature, which may be benificial for filter feeders such as mussels.
The concept of Impact Chain (Schneiderbauer et al. 2013; Fritzsche et al. 2014) is also
applied as a climate risk assessment method (with 7 steps for aquaculture, present risk
and future risk are calculated separately) for research of decision making. The goal of
this method is to use collected data for certain indicators of the impact chains for
different islands to assess the risks of each island’s aquaculture sector to be affected by
the hazard displayed in the impact chain. Therefore, data for all indicators were collected
from all islands. After reviewing the data, selecting indicators and islands, the indicators
were normalized, and different risk components were weighted. Using these values, the
risks for present and future conditions under different Representative Concentration
Pathway (RCP) scenarios were calculated for the different island and compared between
each other. For the aquaculture impact chains, RCP 4.5 and 8.5 were compared since for
the hazard models RCP 2.6 was not always available.
Step 1: Data collection by Island Focal Points
To be able to apply the GIZ risk assessment method, a solid data basis is crucial.
Therefore, data was collected by the Island Focal Points (IFPs) of the SOCLIMPACT
project. The questionnaire requested datasets for 16 indicators and topics with several
subcategories on exposure and vulnerability. The IFPs reached out to local stakeholders
and authorities to collect the requested data which was then resubmitted to the Sectoral
Modelling Team (SMT) Aquaculture.
Step 2: Data review and island selection
Data were submitted by most of the islands to the SMT Aquaculture. Most datasets were
incomplete with major data missing regarding important information for the successful
operationalization of the impact chains. Therefore, and for the fact that some islands do

55
currently not have any active marine aquaculture operations running, some islands were
excluded from the operationalization. Out of the 12 islands assessed in the
SOCLIMPACT project, six were included in the operationalization of the impact chains
using the risk assessment method from GIZ: Corsica, Cyprus, Madeira, Malta, Sardinia
and Sicily. The other six islands (Azores, Balearic Islands, Baltic Island, Canary Islands,
Crete and French West Indies) do currently not have active marine cage aquaculture
operations or show insufficient data availability. Data on hazards was provided by the
models developed in work package 4. Eventually, Madeira was excluded for the impact
chain on extreme weather events due to lack of reliable hazard data. A qualitative analysis
will be provided in the result section.
Step 3: Review and selection of indicators
The data collection and review revealed that not all indicators of the impact chains could
be used for the operationalization process. Therefore, these indicators were reviewed
carefully and the ones which were not represented by sufficient data were excluded. The
revised impact chain was developed depending on the indicators selected.
Figure 59: Impact chain on Increased fragility of the aquaculture activity due to an increase of extreme weather adjusted depending on data availability and used for the operationalisation.
Source: Soclimpact project deliverable 3.2
Some indicators require data on the proportions of species farmed on a specific island.
Therefore, a table with % of each species farmed on each island was prepared. This data
was obtained directly from the IFPs or from the FAO or national statistics offices.

56
Table 5: Proportions of aquaculture species farmed per island.
Proportion of species production
Species Mussels &
clams Tuna Sea bream Sea bass
Corsica 0.43
0.265 0.265
Cyprus 0.84 0.16 Madeira 1.0
Malta 0.94 0.048 0.012 Sardinia 0.84 0.08 0.08
Sicily 0.44 0.3 0.26 Source: Soclimpact project deliverable 4.5
Impact chain: extreme weather events
Hazard
For the component hazard both indicators were used for the operationalisation. The
wave amplitude was shown as significant wave height (SWH) in m and the return time
number of years between extreme events quantified with a threshold of >7m. The data
was derived from the climate models of Deliverable 4.4 at the exact locations where the
fish farms are located and then averaged for all locations on one island. This allows a
more accurate assessment than taking the average values for the entire island.
Exposure
Four indicators were selected to be operationalized. The number of aquaculture
operators was provided by the IFPs and additional literature. There was no data available
on the actual size of stock, therefore the yearly production of aquaculture products (fish
and shellfish) in tons was used as a proxy indicator. The location of farms was rated by
using two different proxy indicators: the location of the farms in relation to the
prevailing wind direction and the average distance of the farms to shore. To be able to
rate the location in relation to the wind direction, the values were estimated (with 0 being
completely sheltered and 1 being exposed to wind and possible storms). After
normalizing the distance from shore (measured by using GIS software and the exact
coordinates of the fish farms), both values were averaged and represent the exposure of
the location of farms.
Sensitivity (vulnerability)
Two indicators were applied to calculate the score of factors of sensitivity. The sensitivity
of species was estimated by reviewing literature and interviewing experts regarding the
vulnerability of species to extreme weather events. After receiving these data, average
values were calculated of all values for the present species on each island.

57
Table: 6: Estimated vulnerability factors for the sensitivity of species to wave stress. 1= very vulnerable to stress: 0=very resilient to stress.
Sensitivity of species for wave stress threshold
Species Sea bream Sea bass Tuna Mussels & Clams
Estimated vulnerability
factor 0.55 0.65 0.3 0.9
Source: Soclimpact project deliverable 4.5
The same approach was implemented to calculate the vulnerability of the infrastructure
types used on each island based on the type of species farmed.
Table 7: Estimated vulnerability values for the vulnerability of infrastructure in case of an extreme weather event.
Vulnerability of aquaculture infrastructure in case of an extreme weather event
Infrastructure for species Sea bream & Sea bass Tuna Mussels & Clams
Estimated vulnerability
factor 0.4 0.3 0.6
1= very vulnerable to stress: 0=very resilient to stress. Source: Soclimpact project deliverable 4.5
Adaptive capacity (vulnerability)
The indicators distance to harbor and the presence of warning systems were used to
describe the adaptive capacity. As there is a weather forecast available for all islands, the
values for the presence of warning systems are all the same and represent low values. The
distance to harbors was moved to the subcomponent adaptive capacity and measured
using GIS software and the exact locations of the farms which were provided by the
IFPs and literature data. It represents the average distance of all farms to their closest
harbor for each island and is shown in meters. The indicator stocking density and
engineering of structures were excluded from the operationalisation. For the stocking
density there were no data available from all islands and in any case, it was estimated to
be similar for all islands. The engineering of structures was already covered with the type
of infrastructures in the sensitivity subcomponent.
Impact chain: Increased sea surface temperature
Hazard
Changes in surface water temperature was chosen to be the indicator representing the
component hazard. The temperature data for this indicator was obtained from the

58
location of each farm from the climate models of Deliverable 4.4 and averaged per
island. To calculate the hazard for each island and each RCP, the species’ temperature
thresholds were taken into account. According to a literature review (see Annex) the
temperature thresholds for farmed species is the following:
Table 8: Temperature threshold per species.
Temperature thresholds for different species
Species Sea bream Sea bass Tuna Mussels & Clams
Threshold (°C) 24 25 24 20.5
Source: Soclimpact project deliverable 4.5
It must be noted that the threshold for Tuna was set to 24°C since in the project only
Tuna fattening is done (in Malta) and for adult fish the threshold is 24°C while in the
review the whole life cycle as well as prey species was taken into account which is not
relevant for this exercise. Based on these thresholds, the duration of the longest event
per year (in days) was calculated for the temperatures 20 °C, 24 °C and 25 °C for RCP
4.5 and 8.5 from the models developed in WP4. After normalizing these values (which is
described in detail in Step 4), the values for each temperature and therefore each species
threshold were averaged using the sum product of the normalized values and the species’
proportion on the total production of the island. The final values represent the score of
the hazard. The indicator changes in seawater characteristics was not included in the
operationalization as there is no additional data related to this indicator which is not
covered by the surface water temperature indicator.
Exposure
Two indicators were used for the component exposure: the number of aquaculture
operators and the yearly production (in tons) as a proxy indicator for the size of stock.
Sensitivity (vulnerability)
The subcomponent sensitivity includes two indicators which were combined to one
indicator for the operationalization. The sensitivity of species directly correlates with
suitable temperature for species and therefore it is summarized as temperature sensitivity
of species. It was calculated by using temperature threshold values for each species
obtained from a literature review and expert opinion. These values were averaged
depending on which species and in which quantities they are farmed on the islands.

59
Table 9: Estimated vulnerability factors for the sensitivity of species to temperature stress.
1= very vulnerable to stress: 0=very resilient to stress.
Source: Soclimpact project deliverable 4.5
Adaptive capacity (vulnerability)
Two out of four indicators from the impact chain were utilized for the
operationalization. The monitoring early warning systems were included and show all the
same values for all islands as there is a sea surface temperature forecast available for each
island. The capacity to change species was included with all the islands displaying the
same value as well. The risk value is high in this case, as it would be quite difficult to
change species farmed on the islands in general as this would result in high economic
expenditures. For the indicator of the impact chain know-how of recognizing and
treating diseases/parasites there is no data available for any island. As this could vary a
lot between the islands, the indicator was removed instead of making assumptions, to not
negatively influence the risk values. A similar case arises from the indicator availability of
alternative place for farming. There is no data available to make correct assumptions
regarding the occurrence of alternative areas on the islands and therefore the indicator
was not used for the operationalization.
Step 4: Normalization of indicator data for all islands
In order to come up with one final risk value per island and to be able to compare these
values between islands, the indicator values were transferred into unit-less values on a
common scale. The normalized values range between 0 and 1 with 0 being low risk and 1
being very high risk.
There are two different ways of normalizing the indicator values:
- Minimum/maximum normalization; - Expert judgement.
Fraction of maximum normalization
This normalization method was used for indicators which were expressed by real data
and not by expert judgement. The value for each island was calculated as a fraction of the
maximum value in de data set. Meaning the island with the maximum value was given 1
and the rest as a fraction thereof.
The following indicators were normalized using this method:
Extreme weather events:
- yearly production/ number of aquaculture operators
Sensitivity of species for temperature stress threshold
Species Sea bream Sea bass Tuna Mussels & Clams
Estimated
vulnerability factor 0.6 0.6 0.3 1

60
- average distance from shore (location of farms)
- average distance to harbour
Sea surface temperature:
- yearly production/ number of aquaculture operators
Minimum/maximum normalization
This normalization method was used for indicators which were expressed by real data
and not by expert judgement. The minimum and the maximum value of that indicator of
all islands was calculated and the following formula was applied to normalize all indicator
values to the scale between 0 and 1:
xnormalized=(x− xmin)
(xmax− xmin)
For both impact chains, the hazard values were normalised using the min and max
method. However, in these cases the minimum and maximum values were not
automatically the minimum and maximum values of the entire dataset but rather treated
differently for every hazard indicator. This handling of the normalisation of the hazard
indicators arose from the different nature of the indicator itself and the fact that data
were available for different RCPs and periods of time. Therefore, the hazard indicators
were normalised as following:
The sea surface temperature values were normalised separately for each temperature data
set. This means that all values for all RCPs and time periods of one “longest event over a
certain temperature” were taken into account when determining the minimum and
maximum values. For Madeira, RCP 4.5 data was not available, therefore RCP 2.6 data
was used and doubled.
Wave amplitude (significant wave height)

61
Figure 60: Modelling indicators for sea-state hazards, return time and significant wave height starting with 4 Global Circulation-Regional Circulation Model chains, which a fed into the WAM regional
wave model. Results are then normalized. Source: Soclimpact project deliverable 4.5
The return time was normalised as following; all values equal or greater that 10 are set to
0, all values between 0 and 10 are linearly mapped to the interval 1-0, so that 0 gives risk
1, 10 gives risk 0. It was assumed that a time period of 10 or more years allowed to repay
investments is a reasonable threshold.
Since, as described in D4.4 of Soclimpact, that the probability of having at least one
event exceeding the return level associated with a N-year return period during a N-year
time window is anyway greater than that of its complement (no events exceeding the
limit in the N-year time window), and that the return level cannot be considered a “no-
risk” safety level in evaluating the survivability and sustainability of structures or plants.
Table 10: Probability of occurrence of at least one event exceeding the return level associated with a given return period (blue) in a given time window (green), according to the formula. RL,T=1-(1-1/T)**L, where L=length of time window, T=Return Period.
Return Period [years]
Probability of occurrence 1 years 2 years 5 years 10 years 20 years
5 20% 36% 67% 89% 99% 10 10% 19% 41% 65% 88% 20 5% 10% 23% 40% 64%
Source: Soclimpact project deliverable 4.5
Therefore, using a combination of the normalised values and the probability of
occurance, experts transformed these values into risk classes such all "low", "moderate",
"medium", "high", "very high", or the like, on a qualitative basis.

62
Expert judgement
For some indicators from both impact chains there was no data available which is the
reason why expert judgement and estimations were applied. The following indicators
were expressed using expert’s estimations:
Extreme weather events: - farm locations (in relation to main wind direction) - sensitivity of species - vulnerability of type of infrastructure - presence of warning system
Sea surface temperature: - estimated temperature sensitivity of species - capacity to change species
- monitoring early warning systems
In all cases the normalization scale of 0 to 1 was applied with 0 being low risk and 1
being very high risk.
Step 5: Weighting of different risk components
In this step, the different risk components hazard, exposure and vulnerability (including
the sub-components sensitivity and adaptive capacity) were rated. The total of the values
sums up to 1. The weights were estimated by aquaculture experts and the basis of the
estimations were subjective estimations, similar to the ones used in the AHP method.
However, in this method the data availability was additionally taken into account.
Components for which the available data was scarce, outdated or more unreliable the
weights were set lower on purpose, while components with accurate datasets were given
a higher weight as following:
Table 11: Components and their weights. (Sub)Component Weight
Sea surface temperature Extreme events Hazard 0.3 0.6
wave height 0.2 return time 0.8
Exposure 0.4 0.2 Vulnerability 0.3 0.2 Sensitivity 0.75 0.75 Adaptive Capacity 0.25 0.25
Source: Soclimpact project deliverable 4.5
Step 6: Calculations of risk for present conditions
Before being able to calculate the risk values, the scores for each component/
subcomponent had to be calculated by taking the average of the corresponding
indicators:

63
scomp=(ind|1+ind2+…+indn)
n
s – score
comp – component or subcomponent
ind – indicator
n – number of indicators
The final risk value was calculated by summing up the scores of the components
multiplied individually with the corresponding risk component weightings:
Risk= shaz∗ whaz+sexp∗ wexp+wvul ∗ (ssen∗ wsen+sac∗ wac)
s – score w – weight haz – hazard exp – exposure vul – vulnerability sen – sensitivity ac – adaptive capacity
These risk values were calculated for each island individually and range between 0 and 1.
After completing these calculations, it was possible to compare the islands between each
other.
Step 7: Calculations of risk for future conditions (different RCPs)
To be able to project the risk values to future conditions, the operationalization was
adjusted to the different Representative Concentration Pathways (RCPs). Therefore, the
whole operationalization was duplicated and different values for the hazard indicators
per island were inserted. These values were taken directly from the climate models
provided in work package 4 for the different RCP scenarios (RCP 4.5 and 8.5). The
resulting values can be compared between the islands as well as between the different
RCP scenarios.
Results
Impact chain: extreme weather events

64
Table 12: Exposure and vulnerability indicators each island
Component Exposure Vulnerability Component Weight
0.2 0.2
Sub-component Factor of sensitivity Factors of adaptive capacity Sub-component weight
0.75 0.25
Indicator Average Size of
producers Location of farms
Score for level of
exposure
Sensitivity of species
(stress)
Type of infrastructures (material and
strength)
Score of factor of sensitivity
Distance to harbour (vessel
capacity in extreme weather
conditions) [average & m]
Absence of warning system
Score of factor of adaptive capacity
Proxy indicator Yearly production
/Number of operators
Farms sheltered
from wind direction
Average distance from shore (m)
Average of
normalised
indicators
Estimated sensitivity of species
Type of infrastructure
(based on species)
Average of
indicators
Average distance to harbour (m)
Presence of warning system
Average of
normalised
indicators Data Normalised
Normalised
Data
Normalised
Normalised Normalised Data
Normalised
Normalised
Corsica 328.6 0.12 0.4 644 0.16 0.20 0.7 0.5 0.59
4789
0.96 0 0.48
Cyprus 811.4 0.29 0.5
3923
1.00 0.53 0.6 0.4 0.48 4616
0.92 0 0.46
Malta 2,755.9 1.00 0.5
1731
0.44 0.74 0.3 0.3 0.31 4165
0.83 0 0.42
Sardinia 537.2 0.19 0.4
1193
0.30 0.27 0.9 0.6 0.71 2183
0.44 0 0.22
Sicily 399.6 0.14 0.5
1000
0.25 0.27 0.7 0.5 0.61 5000
1.00 0 0.50
Source: Soclimpact project deliverable 4.5

65
Mediterranean islands
Hazards
Statistics of extreme events can significantly differ across the four model realizations
The hazard data for return time was derived from 3 different models; CMCC, CNRM and GUF.
Since the data varies highly between models a best- and worst case scenario was executed where
in the best-case scenario the lowest value (showing the lowest risk) between the models was used
and in the worst case scenario the highest value was used. Distance between the best and the
worst projection, give an estimate of uncertainty
Model projections for Average Significant Wave Height are in good agreement as to both pattern
and values. Hazard was evaluated from ensemble mean, uncertainty from ensemble STD (not
exceeding 15% - highest disagreement for highest values).
Figure 61: Results for return time in best- and worst-case scenarios for Mediterranean islands for reference period
(red line), RCP 4.5 (dotted line) and RCP 8.5 (black line). Source: Soclimpact project deliverable 4.5
Return time

66
"Worst" and "best" cases respectively refer to the least and most favorable projection in the set of models. For example return time, you will find that there is at least one model predicting no hazard for all islands except Sardinia with no significant variations across scenarios. In fact, all circles cluster and overlap at the centre, while those that represent Sardinia all lie very close to the limit between the two lower hazard classes. On the other hand, at least one other model predicts appreciable yet low hazard for Corsica, Sicily and Sardinia, and hazard going from moderate (reference period, red) to medium (RCP8.5, solid black), to high (RCP4.5, dotted black) for Malta, while for Cyprus the hazard is irrelevant even for the most negative projection. This means that a) the result for Sardinia and Cyprus is stable across models, b) models slightly disagree for Sicily and Corsica, but generally predict low hazard, c) the projection for Malta is affected by greater uncertainty for all scenarios. This is due to the fact that Malta is located in the Sicily Channel, where the dynamics exhibit significant gradients in the direction perpendicular to the channel axis, which are differently represented by different models. The worst and best cases do not necessarily come from the same model for all islands, that is, one model can predict the lowest hazard for Sicily and another one for Sardinia, and each of these projections is represented in the plot for the corresponding island.
Risk- Best-case scenario
Table 13: Risk results for best-case scenario for impact chain Extreme weather events
Reference period
Mid century End century
Risk Hist. RCP 4.5 RCP 8.5 RCP 4.5 RCP 8.5
Corsica 0.19 0.19 0.19 0.20 0.21
Cyprus 0.23 0.23 0.23 0.23 0.22
Malta 0.26 0.26 0.26 0.26 0.26
Sardinia 0.30 0.32 0.32 0.28 0.31
Sicily 0.20 0.20 0.20 0.20 0.20
Source: Soclimpact project deliverable 4.5

67
Historic mid century end century0,00
0,05
0,10
0,15
0,20
0,25
0,30
0,35
RCP 4.5
Corsica Cyprus Malta Sardinia Sicily
Figure 62: Risk results for best-case scenario for impact chain Extreme weather events under RCP 4.5 Source: Soclimpact project deliverable 4.5
Historic mid century end century0,00
0,05
0,10
0,15
0,20
0,25
0,30
0,35
RCP 8.5
Corsica Cyprus Malta Sardinia Sicily
Figure 63: Risk results for best-case scenario for impact chain Extreme weather events under RCP 8.5 Source: Soclimpact project deliverable 4.5

68
Risk- Worst-case scenario
Table 14: Risk results for worst-case scenario for impact chain Extreme weather events
Reference period
Mid century End century
Risk Hist. RCP 4.5 RCP 8.5 RCP 4.5 RCP 8.5
Corsica 0.25 0.25 0.26 0.28 0.26
Cyprus 0.23 0.23 0.23 0.23 0.22
Malta 0.42 0.45 0.56 0.45 0.36
Sardinia 0.33 0.33 0.34 0.33 0.33
Sicily 0.30 0.34 0.33 0.33 0.26 Source: Soclimpact project deliverable 4.5
begin century mid century end century0,00
0,05
0,10
0,15
0,20
0,25
0,30
0,35
0,40
0,45
0,50
RCP 4.5
Corsica Cyprus Malta Sardinia Sicily
Figure 64: Risk results for worst-case scenario for impact chain Extreme weather events under RCP 4.5 Source: Soclimpact project deliverable 4.5

69
begin century mid century end century0,00
0,10
0,20
0,30
0,40
0,50
0,60
RCP 8.5
Corsica Cyprus Malta Sardinia Sicily
Figure 65: Risk results for worst-case scenario for impact chain Extreme weather events under RCP 8. Source: Soclimpact project deliverable 4.5
Bigger islands were separated in areas since conditions can vary greatly in different parts of the island. Table 15: Risk results for impact chain Extreme weather events for the Mediterranean islands with large islands
analysed on a local level using the worst-case scenario.
Worst case Historic RCP 4.5 RCP 8.5
mid century end century mid century end century
Malta 0.37 0.45 0.45 0.56 0.36
Sicily North 0.34 0.39 0.39 0.36 0.30
Sicily East 0.17 0.20 0.20 0.20 0.20
Sicily South 0.41 0.42 0.40 0.42 0.30
Corsica West 0.37 0.32 0.37 0.34 0.34
Corsica East 0.18 0.18 0.18 0.18 0.19
Sardinia West 0.40 0.46 0.47 0.47 0.44
Sardinia East 0.39 0.20 0.20 0.20 0.18
Cyprus 0.23 0.23 0.23 0.23 0.22
0.00 – 0.20
Very low
0.20 – 0.40
Low
0.40 – 0.60
Medium
0.60 – 0.80
High
0.80 – 1.00
Very high
Source: Soclimpact project deliverable 4.5
For all islands and all RCPs, it can be concluded that there is no significant change in risk, even in the worst-case scenario, between the reference period, middle and end of the century. Malta, Sicily south and Sardinia west are found to be the most vulnerable with risk exceeding 0.45 due to a higher hazard risk. Malta also has the highest exposure of all islands. Malta has an increased risk mid-century in the worst case scenario, due to an increase in hazard.

70
Impact chain: sea surface temperature
Hazard
Model projections are in good agreement with previous lower resolution ensemble estimates but
offering greater detail along island shorelines. Uncertainty to be rigorously estimated from
ensemble STD when new simulations of comparable resolution become available, but overall
tendency regarded as robust.
Exposure and vulnerability indicators
Table 16: Expose and vulnerability indicators, the data for each island and the normalized values.
Component Exposure Vulnerability Component
weight 0.4 0.3 Sub-component Factor of sensitivity Factors of adaptive capacity Sub-component
weight 0.75 0.25
Indicator Average Size of
producers
Score for
level of
exposure
Sensitivity
of species
(stress)
Score of
factor of
sensitivity
Monitoring
early
warning
systems
Capacity
to change
species
Score of
factor of
adaptive
capacity
Proxy indicator
Yearly production
/Number of operators
Average of
normalise
d
indicators
Temperature
sensitivity of
species
(expert
guess)
Indicator
Monitoring
early
warning
systems
Capacity to
change
species
Average
of
indicato
r Data Normalised Normalised Normalised Normalised
Corsica 328.6 0.12 0.12 0.7 0.7 0 1 0.5
Cyprus 811.4 0.29 0.29 0.6 0.6 0 1 0.5
Madeira 125.3 0.05 0.05 0.6 0.6 0 1 0.5
Malta 2,755.9 1.00 1.00 0.6 0.6 0 1 0.5
Sardinia 537.2 0.19 0.19 0.9 0.9 0 1 0.5
Sicily 399.6 0.14 0.14 0.8 0.8 0 1 0.5 Source: Soclimpact project deliverable 4.5
Risk
The values in this analysis is not an estimate of the risk but rather a ranking between islands since a lot of the data was normalised based on a min-max or fraction of the maximum of the islands. A proper risk assessment would need additional data from farmers and a detailed model of farming results as a function of temperature. Malta has a much higher risk than the other islands due to the high exposure, Malta’s farm produce on average 3.5 to 22 times more than the farms on other islands.

71
Table 17: Risk results for impact chain Sea Surface temperature.
Historic Mid century End century
Risk Hist. RCP 4.5 RCP 8.5 RCP 4.5 RCP 8.5
Corsica 0.30 0.34 0.41 0.38 0.42
Cyprus 0.40 0.48 0.48 0.50 0.59
Malta 0.68 0.73 0.74 0.75 0.80
Madeira 0.19 0.26 0.23 0.24 0.35
Sardinia 0.37 0.42 0.43 0.44 0.49
Sicily 0.38 0.43 0.43 0.45 0.48
Source: Soclimpact project deliverable 4.5
historic mid century end century0,00
0,10
0,20
0,30
0,40
0,50
0,60
0,70
0,80
RCP 4.5
Corsica Cyprus Malta Madeira Sardinia Sicily
Figure 66: Risk results for impact chain Sea Surface temperature under RCP 4.5 Source: Soclimpact project deliverable 4.5

72
historic mid century end century0,00
0,10
0,20
0,30
0,40
0,50
0,60
0,70
0,80
0,90
RCP 8.5
Corsica Cyprus Malta Madeira Sardinia Sicily
Figure 67: Risk results for impact chain Sea Surface temperature under RCP 8.5 Source: Soclimpact project deliverable 4.5
4.3 Energy
There are more than 2200 inhabited islands in the EU. Lately, they have come into the focus of
the EU, which addresses energy questions as part of the 'Clean energy for all Europeans'
package. The Clean energy for EU islands initiative provides a long-term framework to help
islands generate their own sustainable, low-cost energy. This is particularly interesting, because
many islands have vast amounts of renewable energy sources but rely on fossil fuel imports yet.
These are relevant challenges regarding the energy transition in the EU, whose aim of net zero
greenhouse gas emissions in 2050 should determine the future energy plans of the islands.
Islands could provide showcases for successful 100% renewable energy supply.
The National Hydropower Association (NHA) defines marine energy as electricity generation
from marine kinetic energy, such as waves, tidal and ocean currents. Pisacane et al. (2018) add
other marine energy sources like ocean thermal energy conversion (exploiting temperature
differences between deep and surface ocean waters) and salinity gradient energy (harnessing the
energy potential of differences in salt concentration in ocean and river waters). All these
technologies are still in a development phase, and even if they reach the commercial phase in the
future, it is not likely that they will generate a large share of the power. Therefore, the analysis in
SOCLIMPACT focuses on the main renewable energy sources (RES), wind energy and solar
photovoltaic (PV) energy, which are presently, and very likely in future, the backbone of the
deployment of renewable energies, due to their technological maturity and low cost.
Nevertheless, we take into account not only onshore but also offshore wind energy, as a
specifically marine energy source which has distinct advantages like much higher productivity

73
and less time variability than onshore wind energy, and does not require land space which is
limited and costly in the islands. There are relevant obstacles for its deployment, like the deep
bathymetry surrounding most of the islands, and the lower wind speeds over the Mediterranean
in comparison to areas like the North Sea where offshore wind energy is being deployed rapidly.
Additionally, we consider also offshore PV energy. Despite some disadvantages that have to be
overcome (corrosion problems due to salty water or the impact of waves), this application is
receiving growing interest, as it offers an option for renewable energy development in countries
and islands with limited space for the installation of solar panels, and can show increased
performance due to the cooling effect of water and wind on PV cells.
Most RES (renewable energy sources) depend on the climate, and therefore climate change can
have an impact of the resource amount. Additionally, wind and solar PV energy are not
dispatchable, and its variability represents a challenge for its integration in the power system.
This is a challenge that can be addressed through storage or backup plants (which can be itself
renewable energy plants), through demand management, but also taking advantage of
complementarity of PV and wind energy and its very different variability characteristics. This
approach is gaining attention from stakeholders in the islands, as demonstrated by the report by
Monitor Deloitte and Endesa (2020), in which one of the key recommendations for achieving an
accelerated zero carbon target in Balearic and Canary Islands by 2040 is the combination of solar
PV and wind energy, with clearly higher shares of PV than of wind energy. Such a mix would
reduce strongly the need for storage, due to the stability of solar PV production.
There are also challenges for the demand and transmission components of the energy systems of
the islands due to climate change: changes in temperature leading to changing energy demand,
changes in precipitation and evaporation creating risks for desalination.
For the energy sector, three theoretical impact chains (IC) have been proposed in the
SOCLIMPACT project:
i) risk of changes in power generation due to long term climate change and variability, ii) risk of changes in energy demand due to changes in precipitation and temperatures, iii) risk of damages to transmission grids due to extreme events.
Only the second IC, i.e., the one related to changes in energy demand was selected to be
operationalized, mainly due to data availability constraints. The quality of IC operationalization
depends strongly on data availability over long periods. Data for cooling energy demand are still
scarce and difficult to obtain, despite the requirements of the European Commission for
information regarding the national energy efficiency targets. The availability and quality of
cooling demand data should improve in the future due to the need for tracking the advances
towards energy efficiency targets. Desalination demand data should also improve strongly,
including data about the energy efficiency of the desalination processes used.
This demand-side IC has been deployed into two individual ICs, namely, the increased energy
demand due to increased cooling demand and the increased energy demand due to increased
desalination needs. Both risks depend on the temperature increase, which is a very certain effect
of climate change. The risk assessment was carried through and expert assisted process.

74
The diagrams of the two operationalized impact chains are presented below
Figure 68: Conceptualization framework for the operationalization of the energy impact chain: Risk of increased
energy demand due to increased cooling demand Source: Soclimpact project Deliverable 4.5-Comprenhensive approach for policy makers
Figure 69: Conceptualization framework for the operationalization of the energy impact chain: Risk of increased
energy demand due to increased desalination demand Source: Soclimpact project Deliverable 4.5-Comprenhensive approach for policy makers

75
Hazard scores for energy demand (Cooling Degree Days -CDD, Standardized Precipitation-
Evapotranspiration Index - SPEI), and supply indicators (wind energy, solar PV and
combined productivity and droughts) were analysed. The aim is to jointly consider future
increases in energy demand due to temperature and precipitation changes and the potential for
covering it with renewable energy sources in the future.
Regarding the normalization of these hazards, we use an approach based on their future change.
The available literature indicates that the future projected changes of renewable energy
productivity frequently do not exceed a level of 10% relative to present values. Changes of about
10% would not modify clearly a normalized score like the one use for present climate (leading to
a very limited variation range of the score), but they represent a significant impact on the
productivity and profitability of the energy plants. Therefore, the future change of renewable
energy productivity is compared to a 10% threshold, both on the negative (normalized values
above 0.5) and the positive side (normalized values below 0.5). The normalization also includes a
minor contribution of a comparison of the changes relative to other islands.
CDD and SPEI scores are normalized with respect to a maximum projected value previously
identified. Renewable energy productivity indicators in present climate are normalized using
global thresholds (5th and 95th percentiles of the respective technologies). The same
normalization method is used for projected changes of renewable energy droughts. Thus,
energy drought indicators are normalized comparing them to a maximum upper limit, taken
among all the islands and renewable energy technologies.
A fundamental aspect of the method is that we apply an objective procedure for obtaining the
weights of the risk components (hazard, exposure and vulnerability) based on time-series
correlations of observed data for energy demand and for the different indicators involved in the
impact chains. This allows to detect which factors have a larger impact on the energy demand.
This method, based on correlations between observed energy demand and observed data for the
indicators, points out that several exposure and vulnerability factors have a stronger weight than
the climate hazards on short time-scales (interannual variations for periods of about 10 years).
This is consistent with the drivers considered in the national forecasts, for periods of 10 years,
performed as part of the EU Energy Efficiency Directive. A consequence of this is the relatively
low weights assigned to the climate hazards in the operationalization.
For the operationalization of the full impact chains, the exposure and vulnerability indicators
were also weighted utilizing different criteria. The mathematical procedure developed proposes
the definition of weights per group of variables (hazard, vulnerability and exposure) that allow
identifying the relationship between each of the components and the dependent variable (in this
case, energy demand due to desalination or energy demand due to cooling). The detailed weight
calculation for the risk components (hazards, exposure and vulnerability) can be found in the
Soclimpact Project deliverables 4.5.
It was not possible to conduct a full operationalization of the IC for the case of Sicily.. The
criteria for the selection of the islands have been: (a) availability of data for the computation of
the exposure and vulnerability indicators of the demand-side ICs, (b) modeling constraints of the

76
hazard component. In the next tables we present the normalized hazard scores for the island and
the interpretation.
Table 18: Energy demand and supply hazard scores for Sicily
Histori-cal ref.(1986-2005)
Demand Supply: Productivity Land Sea
Droughts
CDD 0.18 Wind 1.00 0.31 0.95
SPEI 0.00 Solar PV 0.21 0.26 0.15
Combined 0.20
RCP2.6 (2046-2065)
Demand Supply: Productivity change
Droughts change
CDD 0.28 Wind 0.5 0.6 0.6
SPEI 0.24 Solar PV 0.5 0.6 0.4
Combined 0.5
RCP8.5 (2046-2065)
Demand Supply: Productivity change
Droughts change
CDD 0.38 Wind 0.7 0.7 0.7
SPEI 0.56 Solar PV 0.6 0.7 0.4
Combined 0.8
RCP2.6 (2081-2100)
Demand Supply: Productivity change
Droughts change
CDD 0.27 Wind 0.6 0.5 0.6
SPEI 0.24 Solar PV 0.5 0.6 0.3
Combined 0.5
RCP8.5 (2081-2100)
Demand Supply: Productivity change
Droughts change
CDD 0.63 Wind 0.9 0.9 0.9
SPEI 0.92 Solar PV 0.6 0.8 0.1
Combined 0.9
Categorization:
0.00 – 0.20 Very low
0.20 – 0.40 Low
0.40 – 0.60 Medium
0.60 – 0.80 High
0.80 – 1.00 Very high
Source: Soclimpact project Deliverable 4.5-Comprenhensive approach for policy makers

77
CDD and SPEI scores in Sicily are similar to Sardinia, but somewhat higher. This reflects higher
temperatures in Sicily, and a slightly worse future evolution regarding hydrological drought
conditions. Cooling penetration rate in Sicily (37.6% in 2014) is lower than in Sardinia, indicating
again that other factors like purchasing power have more impact on this rate than CDD alone.
The importance of the economic factors is confirmed by the evolution of sales air conditioning
equipment in Italy in the years before and after the crisis of 2008 (Marvuglia and Messineo,
2012).
The bad wind energy productivity score over land should be adequately interpreted, as it is a
spatial average over a very mountainous and large island, where certain areas show good
potential. This reflects in the importance that onshore wind energy has already now, as it is the
renewable source contributing most to power generation, followed by PV and hydropower. RES
share was nearly 25% in 2013 (Meneguzzo et al., 2016). The offshore wind energy productivity
score is good, with important spatial differences. The sea area to the west-southwest of Sicily
shows the best potential for offshore wind installations. Precisely in this area, a floating wind
farm of 250 MW is projected near Marsala (Renewables Now, 2020). If the project is successful,
it will be a large boost to the RES share of the island, and should also reduce the need for
storage and backup due to the better variability characteristics of offshore wind energy in
comparison to onshore wind energy.
Solar PV resources are good, and the low PV drought score indicates low variability. The
combination of wind and PV energy is particularly positive in Sicily, as the combined drought
score is almost as low as the PV drought score. The projected changes of wind and PV energy
productivity and droughts are small under RCP2.6, while wind energy productivity could
decrease significantly under RCP8.5 by end of the century. In contrast, in the high-emissions
scenario, solar PV would increase its stability clearly.
* Islands’ comparison and future challenges
- The frame for energy supply in the islands are the binding targets established in the 2030
climate and energy EU framework and the long term horizon of a decarbonized energy system
by 2050.
- The future change of wind energy and PV productivity should be rather small in general:
around 5% or less with respect to the reference period in many cases, with maximum changes of
about 10% for some islands at the end of the century under RCP8.5 scenario (particularly for
wind energy productivity over land). A 10% productivity change could have a significant impact
on a planned or existing plant if it occurs over the lifetime of the power plant, but in this case
such a change would extend over many decades, which will facilitate adaptation and efficiency
measures.
- Projected PV productivity changes are generally smaller than wind energy changes. In most
cases PV productivity remains constant or decreases slightly. The main exception is Fehmarn,
which shows a clear decreasing tendency in PV productivity under RCP8.5 scenario, reaching a
10% decrease by end of the century.
- There is a specific uncertainty source in the photovoltaic projections. Most regional climate
model simulations, including the ones used here, do not include a projected evolution of aerosols

78
in future climate runs. The missed effect of the likely evolution of aerosols would likely increase
to some degree the future surface solar radiation and PV productivity over most of the islands
(Gutiérrez et al., 2020).
- Renewable energy productivity droughts are a measure of the variability of the resource. Wind
droughts are much more frequent (around 50% of the days for most islands) than PV droughts
(10% or less of the days). This agrees with results from the study of Raynaud et al. (2018), and
highlights the stable character of the solar productivity in comparison to wind productivity over
time.
- Wind energy droughts are more frequent in the Mediterranean islands than in the Atlantic
islands or Fehmarn. The best quality resources in terms of stability are found for Canary Islands,
which show the minimum values of both wind energy and PV droughts among all islands.
Fehmarn shows by far the worse PV drought score, corresponding a drought frequency of 23%
of the days.
- Projected changes in the frequency of droughts are small, with future variations that generally
do not attain a magnitude greater than 5% of the days. This indicates that the time-variability
characteristics of wind and PV energy are a robust feature, which is relevant for planning the
amount of storage or backup needed.
- The combination of PV and wind energy has generally a very positive impact on the frequency
of droughts as a result of the complementarity of both sources. This impact also exists but is less
clear for islands with substantial summer wind energy resources (Canary Islands, Madeira and
Crete).
- As part of the pathway towards very high or 100% RES shares, offshore wind energy should
play a very relevant role. Solutions to overcome the obstacle posed by the deep bathymetry
surrounding most of the islands are beginning to near commercial deployment, so that floating
offshore wind plants are already planned near Gran Canaria and Sicily.
- Offshore PV could be an interesting option for some islands, particularly when land surface
limitations are large. There is growing interest in this option, as shown by the test plants being
installed and the references made to this technology in the Roadmap for the Offshore
Renewable Energy Strategy of the European Commission or in the report of Monitor Deloitte
and Endesa (2020) about the accelerated decarbonization of Canary and Balearic Islands.
- The combination of different types of offshore renewable energy sources in the same platform
is also attracting interest, as the different sources can exhibit complementarity in time and the
combined output can thus be more stable and reliable. The different RES can also share part of
the installations, like the connection to land, reducing their cost (Pisacane et al., 2018;
MarineEnergy, 2019a). The European Union is trying to promote such combinations, through
projects like MUSICA (Multiple Use of Space for Island Clean Autonomy) which will design and
test a floating offshore platform integrating wind, PV and wave energy for use on islands
(MarineEnergy, 2019b), and plans to develop roadmaps for its deployment in three case study
islands, among them Malta and the Canaries (MaREI, 2020).
- New financing possibilities linked to the recently approved EU COVID-19 recovery fund, and
over a longer term associated to the European Green Deal, should facilitate the deployment of
renewables in the islands, as the energy transition is a key target.

79
- Interconnections to mainland are very important for supply safety. Excessive dependency on
interconnections to mainland should be nevertheless avoided, due to risk of blackouts, as the
failure of a single element (one transmission line) can knock out instantaneously a large
proportion of the power of an island and even cause an island-wide blackout, as has occurred
several times in Malta in the last years.
Read more: Hazard indicator computation and normalization
Cooling degree days (CDD) are used to give an indication of the effect of outside air
temperature on building energy consumption during a specified period of time. The Cooling
Degree Days (CDD) index gives the number of degrees and number of days that the outside
air temperature at a specific location is higher than a specified base temperature. For the
indicator weight calculation, the observed values of CDD (EUROSTAT) have been used, and
compare to the hazard of the island. With respect to the normalization of the indicator, we have
used a fixed lower threshold and a relative maximum as upper threshold. The minimum CDD
value has been taken as 0, while the maximum CDD value has been taken as the maximum over
all islands, emissions scenarios and time periods (CDD=1183.49 ºC· days/year, corresponding to
Cyprus for RCP8.5 scenario, end of century period).
Standardised Precipitation-Evapotranspiration Index (SPEI) is a drought index that takes
into account not only the effect of precipitation variations, but also the effect of temperature
variations on evapotranspiration. The calculation is based on the monthly difference between
precipitation and potential evapotranspiration, which represents the monthly water surplus or
deficit. The indicator weight calculation was done using data from ECA&D (European Climate
Assessment & Dataset). The normalization of the indicator has taken into account the fact that
by definition, present conditions correspond to reference conditions (SPEI=0), and that all
future changes are towards negative SPEI values, that is towards drier conditions. Therefore, the
best score value (0) has been assigned to SPEI=0, while the worst score value (1) has been
assigned to the largest negative value found for all islands, emissions scenarios and time periods
(SPEI=-2.5, obtained for several islands under RCP8.5 emissions scenario by the end of
century).
The indicator Wind energy productivity (kWh/kW) is defined as the energy produced in a
period of time divided by the power installed, which is considered as unitary. The indicator is
calculated separately for land and sea. Offshore wind energy is the most developed ocean energy,
and it is likely to be an important future energy source for the analysed islands. Its characteristics
are typically very different to onshore wind energy, due to the large differences in surface
friction. The energy productivity values are averaged respectively over the island land points and
over the sea points in a domain that reaches a maximum distance of one degree latitude and
longitude respectively to the maximum and minimum longitude/latitude land points of the
islands.
The normalization is performed using absolute thresholds, that represent high or low global
values of productivity. These thresholds have been obtained from a global renewable power
report (IRENA, 2019). The maximum annual productivity would be 8760 kWh/kW,
corresponding to a 100% capacity factor. The obtained CF thresholds for onshore wind energy
are 20% (corresponding to a normalized score of 1) and 45% (normalized score of 0), while for
offshore energy they are 30% and 50%.

80
Photovoltaic productivity (kWh/kW) is defined as the energy produced in a period of time
divided by the power capacity installed. In order to obtain photovoltaic productivity, daily
surface solar radiation (SSR) and ambient temperature from the climate simulations are used as
input variables for a parametric PV model. The normalization is performed using absolute
thresholds, that represent high or low global values of productivity, taken from the same report
as for wind energy. In this case, the maximum threshold is adapted taking into account that the
calculations performed here assume fixed panels, while IRENA global report does not
differentiate between fixed and sun-tracking panels. Therefore, we estimate an upper CF
threshold (normalized score of 0) of 20% for fixed panels, from the 25% value deduced from
IRENA global report.
Renewable energy productivity droughts indicators are a way of quantifying the time-
variability of renewable energies that depend on meteorological conditions. Low values of energy
droughts correspond to a stable output, while high values correspond to a highly variable output.
The combined renewable energy droughts represent the complementarity between wind and PV
energy. A high complementarity of both sources reduces the need for energy storage or backup
sources.
Two different thresholds are calculated to determine moderate (50% of mean daily productivity)
and severe (20% of mean daily productivity) energy productivity droughts, respectively. For the
normalization of these energy drought indicators, we have used a combination of an absolute
threshold (a value of 0% of drought days) corresponding to a score of 0 and a relative maximum
upper limit, taken among all the islands and renewable energy technologies (55% of days with
moderate droughts, obtained for wind energy in Corsica) corresponding to a score of 1. The
same normalization limits are applied for wind, PV and combined productivity droughts.
4.4 Maritime Transport
For the Maritime Transport sector, three main climate change risks have been identified. These are: i) risk of damages to ports’ infrastructures and equipment due to floods and waves, ii) risk of damages to ships on route (open water and near coast) due to extreme weather events and iii) risk of isolation due to transport disruption. The operationalization was applied to the third one (risk of isolation due to transport disruption) which in terms of hazards and impacts can be considered as a combination of the other two. The selection of islands to be included in the analysis was based on the importance and dependency on the Maritime Transport sector and on data availability. Although this sector is of great importance for Sicily, the lack of reliable and consistent data limited the analysis, especially in regard:
- Value of transported goods expressed in freight (VGTStot) - Number of renovated infrastructure (NAgePo). - Percentage of renewables (PEnRR), - Early warning systems (NOcSta) and harbour alternatives (NApt).

81
Nevertheless, this information is also useful at the moment of evaluating and ranking adaptation measures for the islands.
5 Socio economic impacts of climate change
5.1 Market and non-market effects of CC
Tourism
In order to analyse the reactions of tourists to the impacts of climate change and the preferences
for adaptation policies, several hypothetical situations were posed to 290 tourists visiting Sicily
whereby possible CC impacts were outlined for the island (i.e., beach erosion, infectious diseases,
forest fires, marine biodiversity loss, heat waves, etc.).
Figure 70: Socio-economic characteristics and travel description: Tourists visiting Sicily
Source: Deliverable Report D5.5 Market and non-market analysis
Firstly, tourists had to indicate whether they would keep their plans to stay at the island or find
an alternate destination if the impact had occurred, which allows predictions of the effects on
tourism arrivals to be made for each island. Secondly, tourists were asked to choose between
various policy measures funded through an additional payment per day of stay – the tourists’
choices being an expression of their preferences for attributes/policies. To estimate the results,
the conditional logit model was run by using the Stata software.
In general, data confirms that tourists are highly averse to risks of infectious diseases becoming
more widespread (75.30% of tourists would change destination). Moreover, they are not willing
to visit islands where the cultural heritage is damaged due to weather conditions (52.40%), where
wildfires occure more often (52.10%) or where water is scarce for leisure activities (52.10%).
Consequently, policies related to the prevention of infectious diseases (3.5€/day), the protection
of the cultural heritage (3.5€/day), and the marine habitats restoration (3.2€/day) are the most
valued, on average, by tourists visiting this island.

82
Although climate change impacts are outside the control of tourism practitioners and policy-
makers, they can nevertheless utilise this knowledge to improve the predictability of the effect
that certain adaptation policies and risk management strategies, and develop their plans
accordingly.
Figure 71: Choice experiments results for the tourism sector: Tourists visiting Sicily Source: Deliverable Report D5.5 Market and non-market analysis
The infographic can be found in high resolution in the Soclimpact Project official
website HERE.
How tourists perceive the island destination: A comparative approach through the analysis of
social media
While historically destination image is projected by DMOs and tourists’ offices, the advent of
social media allow the construction of an image which is also a projection of tourists. The
content of their communication online shows the image they perceive. In this section we analyse
how tourists “talk” about the different islands on social media, in order to understand what the
perceived image is.
We use a specific tool (Google Cloud Vision) to scan the content of images posted by tourists on
Instagram (the market leader in visual social media) while they are on holiday in selected islands.
The content is translated in up to ten labels attached to each picture. For each island we
aggregate and rank the different labels to find out the most important characteristics tourists

83
associate to the island (assuming that they are correlated with the most frequent labels attached
to the pictures).
We analyse eight islands representative of the Atlantic Ocean (four islands of the Canary
Archipelago: Fuerteventura, Gran Canaria, Lanzarote, Tenerife) and of the Mediterranean Sea
(Crete, Cyprus, Malta, Sicily). We scan posts geotagged in these islands by tourists (identified by a
travel-related hashtag such as #visit #holiday #travel, etc) in summer 2019 (June to September),
returning a total number of 745,235 pictures considered in the analysis. The breakdown is in the
table below.
Table 19: Characteristics of the sample of pictures under analysis
Island
Indicator Tenerife
Gran Canaria
Fuerteventura Lanzarote Cyprus Crete Malta Sicily
Num. of posts (total)
49,234 33,145 38,452 25,471 63,561 93,752 74,925 119,896
Avg. num. of pictures per post
1.77 1.67 1.56 1.8 1.76 1.74 1.81 1.68
Share of geotagged posts
67% 67% 67% 65% 70% 74% 76% 73%
Number of scanned pictures
74,537 48,337 52,577 39,381 95,808 141,538 117,576 175,481
Source: Soclimpact project deliverable D5.3
After aggregating similar words, top labels for each island were obtained. The following pools
were created utilizing a frequency analysis, which is the total number of times the label occurs in
each island. A first glance at the word clouds shows that all destinations look extremely similar
which, perhaps, is of little surprise given that they all are European sea & sun destinations:
hence, labels like Sky, Sea, Vacation, Tree, Beach are among the most frequent for all islands.
Nonetheless, some differences can be spotted: Mountain appears relatively more frequently in
Tenerife than in other islands’; Sea and Ocean have relatively more weight in Fuerteventura;
Architecture and Building are of more importance in Cyprus, Crete, Malta and Sicily than in the
Canary Islands, something that is clearly linked to the density of cultural heritage in the
Mediterranean islands: in fact, all the labels representing architectural, religious and historical
sites (History, Historic, Ruins, Site, Ancient, Building, Dome, Mosque, Holy, Medieval, etc.) have
higher ranks in these islands than in the Canaries. The islands of this archipelago have more
similar images, but also reveal distinct features: for example Gran Canaria appears the most
urban, Tenerife is characterized by a higher frequency of labels related to partying and nightlife
but also for wildlife spotting, Lanzarote stands out for its arid landscapes and Fuerteventura for
the vast sandy seashores and turquoise waters as the frequencies of labels such Beach, Shore,
Sand, Coast, Turquoise, Ocean show.

84
Gran Canaria Tenerife Fuerteventura
Lanzarote Crete Cyprus
Malta Sicily

85
The impact of increased temperatures and heat waves on human thermal comfort
In order to assess how the variation in temperature impacts on the tourism sector through
changes in tourism demand our research question was: “How do increasing temperatures (and
heat waves) impact prices and, more in general, expenditure of tourists?” Arguably, when
temperatures grow, tourists adjust their behaviour: they might switch destination, or they might
stay longer or shorter depending on their attitudes and preferences. In turn, all these changes
modify the market equilibrium, pushing tourism companies to adjust their prices to re-establish
the equilibrium between demand and supply. The change in demand and the change in price
determine the change in tourism expenditure which is, from the destination’s perspective,
tourism revenue.
We monitored current weather conditions posted on several weather forecast providers and daily
prices posted on Booking.com by hotels. We then estimated the link between daily temperature
and daily price, controlling for all the other factors affecting prices. We finally applied these
estimates to the increase in the number of days with excessive temperature projected for the
future in two scenarios (RCP2.6 and RCP8.5) and in two time horizons (near future, about 2050;
distant future, about 2100).
Among the different indicators linked to thermal stress, Soclimpact is focusing on two: the
number of days in which the temperature is above the 98th percentile and the number of days in
which the perceived temperature is above 35 degrees. Although in D5.6 the impact for both
indices were computed, in this document we only report the second one (named HUMIDEX)
because it is the most intuitive and because human thermal stress is more related to the absolute
value of the temperature than its deviation from some pre-determined distribution. In line with
the project, we assumed that thermal stress appears when the perceived temperature grows
above 35 Celsius degrees.
As thermal stress is delimited in the summer months, and this is when the great majority of
tourists arrive in these islands, the whole analysis has been carried out in six months only: from
May to October included. In other words, we assume that there is no thermal stress (and hence
no impact on tourism) in the rest of the year.
Initially, three islands were investigated: Corsica, Sardinia, and Sicily, given the massive amount
of potential data. We focused the analysis in three specific areas, represented in the map below:
the south-east area of Corsica (between Porto Vecchio and Boniface); the North-East area of
Sardinia (Costa Smeralda) and the South-East area of Sicily (the coastal area of Catania and
Siracusa provinces). Arguably, these are among the most important coastal tourism areas of these
islands. Overall, 60 hotels (for a total of about 240,000 observations) were monitored in Corsica;
150 hotels (for a total of about 620,000 observations) were monitored in Sardinia; 129 hotels
were monitored in Sicily (for a total of about 726,000 observations) over the period 1 May 2019
– 31 October 2019.

86
Figure 72: Map of the region Source : Soclimpact project deliverable D5.3
At present, 28.49% (column 1 of the table below) of “summer” days (days in the period between
1 May and 31 October) have a HUMIDEX higher than 35 Celsius degrees in the area under
investigation (Coastal area of Catania and Siracusa).
In the future, this share (column 3) will increase to about 37-38% in rcp2.6, to 40.60% in rcp8.5
near, and to 65.04% in rcp8.5, distant. Consequently, demand for holidays in Sicily will increase
and the new equilibrium shows an increase in the average price posted by hotels in the
destination (column 4) and an increase in overnight stays (column 5, this is estimated using the
past correlation between average prices and occupancy rates in hotels, data provided by STR).
The joint impact of price and demand will lead to an increase in hotels revenues (last column of
the table) and, assuming that the change in revenues spreads to the other tourism products in a
similar way, an increase in tourism revenues for the whole destination will be recorded. Hence,
the estimation reported in the last column of the table below can be interpreted as the
percentage increase in tourism revenues for the island.

87
Table 20: Estimation of increase in average price and revenues for Sicily
Actual share of days in
which humidex > 35 degrees
Future scenario
considered
Days in the corresponding
scenario in which humidex > 35
degrees
Increase in the
average price
Increase in the
tourism overnight
stays
Increase in
tourism revenues
28.49%
rcp26near 37.53% 0.4% 0.1% 0.5%
rcp26far 38.41% 0.5% 0.1% 0.6%
rcp85near 40.60% 0.6% 0.1% 0.7%
rcp85far 65.04% 1.7% 0.3% 2.1% Source : Soclimpact project deliverable D5.3
According to these findings, the average increase in temperature, which is correlated to a
growing thermal stress for tourists, brings an economic advantage to tourism destinations. This
is only an apparent contradiction with previous findings. This study does not neglect the fact that
if islands are too hot, tourists will choose to move to other (cooler) destinations, that in principle
exist. In this study the underlying assumption is instead that growing temperatures are a global
issue, thereby not modifying the relative position of a destination. Then, the increase in tourism
(and tourism revenues) stem from the fact that, when the temperature is too hot, people would
prefer to move to coastal areas (where the climatic conditions are more bearable) than staying
inland or in cities. Future trends will also facilitate this pressure of tourism demand (think about
the spreading of smart working activities where, in principle, the worker can relocate wherever
he/she wants).
Aquaculture
The effects of increased sea surface temperatures on aquaculture production were calculated
using a lethal temperature threshold by specie, and considering the production share of the
region. Four different future scenarios shown by IPCC estimations (RCP2.6 and RCP8.5 near
and distant) were analysed, which correspond to four water temperature increases in the region
(mean values), with respect to the reference period.
To do this, we assume two main species cultured in this region: Seabream (SB) and Tuna (T),
and a model of production function, calculating the monthly biomass production which depends
on the monthly water temperature. Results are presented on yearly base (mean values). In order
to facilitate the interpretation of the results, we present the value of production of the last year
available, for which we calculate the new values under the different CC scenarios.
As expected, the production levels (tons) will decrease for both, low and high emissions
scenarios. In both cases, the average annual temperatures are projected in levels below 23oC and
24oC, which are the thresholds of thermal stress for Bluefin tuna and Seabream species.

88
Figure 73: Estimations of changes in aquaculture production (tons), due to increased sea surface temperature Source: Deliverable Report D5.6
The infographic can be found in high resolution in the Soclimpact Project official
website HERE.
Energy
Climate change may impose welfare reductions to the European islands’ societies by affecting
thermal comfort. Cooling Degree Days (CDD) are a measure of how much (in degrees), and for
how long (in days), outdoor air temperature is higher than 18°C or 65° Farenheit. The CDD is
used as a measure of the energy needed to cool buildings. The increase in CDD and the energy
demand (GWh/year) for cooling are estimated for the islands, under different scenarios of
global climate change.
Under the high emissions scenario, it is expected that the CDD increase to 5112 CDD10. This
value represents, for example, 365 days with temperatures of 32°C (5110CDD). Under this
situation, the increase in cooling energy demand is expected to be 235%.
The infographics presented below can be found in high resolution in the Soclimpact
Project official website HERE.
10 The indicator is computed by multiplying the number of days exceeding the threshold by the difference in
temperatures. For example the CDD for 100 days at 20 °C is computed as 100*(20-18)= 200CDD

89
Figure 74: Estimations of increased energy demand for cooling in Sicily under different scenarios of climate change
until 2100 Source: Deliverable Report D5.6
The Standardized Precipitation Evapotranspiration Index (SPEI) is analysed as a representative
indicator for increases in water demand for islands’ residents, tourists and agriculture, while it
also provides an indication on the available water stored in dams or underground resources. To
estimate the increase of energy demand due to the increase in water demand, it was assumed that
most of the islands will have to produce desalinated seawater (or groundwater) to meet further
increases of demand. Thus, the estimation of the increase in energy demand (GWh/year) to
produce more drinking water has been done based on the energy consumption required to
desalinate seawater.
Under the low emissions scenario (RCP2.6), there are not significant changes in the SPEI
indicator, that will remain in its ¨normal¨ level, as it is nowadays. Nevertheless, an increase of
24% in desalination energy demand is expected. Under RCP8.5 the scenario alerts on a severe
aridity leading to an increase of 138% of the energy demand.
Figure 75: Estimations of increased energy demand for desalination in Sicily under different scenarios of climate
change until 2100 Source: Deliverable Report D5.6

90
Maritime Transport
For maritime transport, it has been estimated the impact of Sea Level Rise on ports' operability
costs of the island. The costs have been calculated with reference to1meter; this is, the
investment needed to increase the infrastructures' height by 1 meter. There is not necessarily a
strict correspondence between the SLR and the required elevation of port infrastructures, which
also depend on the coastal hydrodynamic and the shape of dikes of each port. By experts’
recommendation, we have assumed that 1 m increase in port height is required to cope with the
SLR under RCP 8.5 scenario of emissions. Extrapolation for other RCP scenarios is then
conducted based on proportionality.
The starting point was the identification of the principal ports in each island (economic
relevance). Second, the analysis of the different port areas (exterior, ramps, oil, etc.), and their
uses. Third, the elevation costs were estimated per each area and port separately (considering 1
meter elevation). Thus, the costs of 1-meter elevation presented are the sum of all areas and
ports analysed, and including the rest of the ports of the island (if applicable) based on
proportionality. Estimations consider that all ports areas of the entire area should be elevated at
the same time. In other words, the economic values can be interpreted as the depreciation
(amortization) costs of the investment needed to increase all ports’ infrastructures' in the island
for 125 years time horizon. No discount rate has been applied.
As expected, the rising of sea levels will affect the sector, as new investment will be needed to
keep ports’ operability. Under the high emissions scenario, it is expected that these costs could
increase 3.6 million of euros per year until the end of the century.
The infographic presented below can be found in high resolution in the Soclimpact
Project official website HERE.

91
Figure 76: Increased costs for maintaining ports’ operability in Sicily under different scenarios of SLR caused by climate change until 2100
Source: Deliverable Report D5.6
5.2 Macroeconomic projections
The aim of our study is to assess the socioeconomic impacts of biophysical changes for the
island of Sardinia. For this purpose we have used the GEM-E3-ISL model; a single-region,
multi-sectoral general equilibrium model based on the principles of neo-classical theory, and
GINFORS; a macro-econometric model based on the principles of post-Keynesian theory.
Both models include 14 sectors of economic activity, with an emphasis on services and
specifically on those composing the tourism industry. The GEM-E3-ISL model also include:
endogenous representation of labor market and trade flows etc.
Changes in the mean temperature, sea level and precipitation rates are expected to affect energy
consumption, tourism flows and infrastructure developments. These impact-chains have been
examined and quantified under two emission pathways: RCP2.6 which is compatible with a
temperature increase well below 2C by the end of the century and RCP8.5 which is a high-
emission scenario. The impact on these three (3) factors has been quantified in D5.6 and is used
as input in the economic models, which then assess the effects on GDP, consumption,
investments, employment etc.
MEAN SEA LEVEL RISE SLR

92
In total 18 scenarios have been quantified for Sicily. The scenarios can be classified in the
following categories:
1. Tourism scenarios: these scenarios examine the reduction in tourism revenues due to
changes in human comfort as captured by the hum-index, the degradation of marine
environment, increased risk of forest fires and beach reduction
2. Energy scenarios: these scenarios examine the impacts of increased electricity
consumption for cooling purposes and for water desalination
3. Infrastructure scenarios: these scenarios examine the impacts of port infrastructure
damages
4. Aggregate scenarios: these scenarios examine the total impact of the previous-described
changes in the economy.
In this scenario we examine the impacts of a simultaneous change in electricity consumption,
tourism revenues and infrastructure damages. The scenario specifications for the two climatic
variants are presented below:
Table 21: Aggregate scenario –results
Tourism revenues (% change from reference levels)
Electricity consumption
(% change from reference levels)
Infrastructure damages
(% of GDP)
RCP2.6 (2045-2060) -7.24 10.5 -0.04
RCP2.6 (2080-2100) -10.06 3.1 -0.04
RCP8.5 (2045-2060) -13.76 25.3 -0.10
RCP8.5 (2080-2100) -38.44 43.5 -0.12 Source: GEM-E3-ISL
The theoretical and structural differences of the two models mean that this study produces is a
reasonable range of impacts, given the uncertainty embodied in economic analysis and especially
in the long-term.
In GEM-E3-ISL, the economy is in equilibrium at each point in time. Prices adjust to ensure
that supply equals demand (market clearing), capital is fully used; however, the allows for
equilibrium unemployment. The impacts are driven mainly by the supply side through changes in
relative prices that determines competitiveness change, substitution effects etc. The GEM-E3-
ISL model assesses the impacts on the economy up to 2100.
The macro-econometric type of models, such as GINFORS, do not require that all markets are
in equilibrium; idle capital and involuntary unemployment are some other features of this type of
models where the results are driven mainly by adjustments in the demand side of the economy.
The GINFORS assesses the impacts on the economy up to 2050.
With respect to GDP the estimated change compared to the reference case is between 0.05% and -0.5% in the RCP2.6 in 2050 and between -1.1% and 1.6% in the RCP8.5. The cumulative reduction over the period 2040-2100 is estimated (by GEM-E3-ISL) to be equal to 0.54% in the RCP2.6 and 2.6% in the RCP8.5. IN GINFORS increased investments are the driver of GDP

93
increases in the RCP2.6 while in the GEM-E3-IS model increased investments in electricity crowds-out other productive investments and drive capital prices higher resulting in competitiveness losses; hence these two effects cancel out the positive impact of increased investments.
Figure 77: Percentage Change in GDP. Source: GWS, own calculation
With respect to sectorial impacts both models show a significant decrease in the activity of
tourism related sectors and an increase in the activity of the non-service sectors, highlighting the
opportunities for the development of other activities secondary sectors.

94
Figure 78: Production percentage change from reference. Source: GWS, own calculation
Overall employment falls in the economy and especially in tourism related sectors. In GEM-E3-
ISL increases in employment in non-tourism related activities are related to labor costs
reductions (as wages fall and their competitiveness increases) and a consequent substitution of
capital with labor. Employment falls on average by 0.1% in the RCP2.6 in the RCP8.5

95
Figure 79: Employment percentage change from reference. Source: GWS, own calculation
6 Towards climate resiliency
6.1 Current situation: general commitment, specific limits and obstacles
Proposal of an integrated national plan for energy and climate (31/12/2018): To support
and provide a robust analytical basis for the National Integrated Energy and Climate Plan
(PNEC), the following were implemented:
- a BASE scenario that describes an evolution of the energy system with current policies and
measures;
- a PNEC scenario that quantifies the strategic objectives of the plan.
The PNEC tables illustrate the main objectives of the 2030 plan on renewables, energy efficiency
and greenhouse gas emissions and the main measures envisaged to achieve the objectives of the
Plan.
National Plan of Adaptation to Climate Change (July 2017): this plan identifies and
discusses the main objectives to be pursued and the necessary steps, for each one of the socio-
economic and environmental sectors of interest, based on the climatic and impact analyzes to
face the impacts of the expected climate changes. From the sector analysis, over 350 actions

96
emerged that were collected in a single Database that contains detailed analytical information for
each individual action and different selection keys for the actions to allow easy search and
consultation of the same.
There are 13 cross-cutting actions that are common to all the sectors analyzed and which have a
national value, together with more specific actions for each sector.. The actions identified for
each sector are associated with the impacts identified in the previous analyzes, the adaptation
targets to be pursued and the homogeneous climatic areas of implementation, suggested on the
basis of the RCP 4.5 climate scenario identified as the reference scenario.
Table 22: Specific limits and obstacle and relevant documents
Specific limits and obstacle
Different kind of limits and barriers, respectively experienced by individuals, organizations and local governments, exist. From the point of view of individuals, a general low personal understanding of climate change and its impacts exists. Considering organizations (both private and public) we can highlight different barriers: - inadequate funds for adaptation, especially the financial ones - uncertainty around the scale of the climate changes and the concrete risks - lack of locally relevant and practical information about potential climate impacts - limited financial resources both for medium sized organizations and local governments - culture of the organization Specifically, for local governments, there is a difficult in planning
Relevant documents
Proposal of an integrated national plan for energy and climate (31/12/2018) National Plan of Adaptation to Climate Change (July 2017)
Sicily has not launched specific initiatives for the preparation of Strategies and/or Plans but has ongoing activities preliminary to these paths. The process began with the drafting of the ERDF OP 2014-2020 - Objective 5 where climate adaptation is considered unifying and transversal for the reduction of exposure to natural risk.
Strategic plan for aquaculture in Italy 2014-2020
Regional Plan of Transport and Mobility (Sicily Region)
Regional strategic plan of tourism development 2019/2023 -three-year program of tourism development 2019/2021 of the Sicilian region
Plan for the Hydrogeological Asset of the Sicilian Region
Map of vulnerable areas at desertification risk of in Sicily
Regional plan for programming the activities of prevision, prevention and active fight for the defense of vegetation against the fire (year of revision 2018)
Source: Deliverable 7.1 Conceptual framework/

97
7 References
Fritzsche et al. (2014). The Vulnerability Sourcebook: Concept and guidelines for standardized
vulnerability assessments
Gutiérrez, C., Somot, S., Nabat, P., Mallet, M., Corre, L., van Meijgaard, E., Perpiñán, 0. &
Gaertner, M. Á. (2020). Future evolution of surface solar radiation and photovoltaic potential in
Europe: investigating the role of aerosols. Environmental Research Letters, 15(3), 034035.
IRENA (2019). Renewable Power Generation Costs in 2018, International Renewable Energy.
Agency, Abu Dhabi.
MaREI to lead €9m project to build floating offhsore platform. Retrieved from:
https://www.marei.ie/marei-to-lead-e9m-project-to-build-floating-offshore-platform/
MarineEnergy (2019a). WavEC: Combined Wind, Wave and Solar to Transform Marine Energy.
Retrieved from https://marineenergy.biz/2019/12/16/wavec-combined-wind-wave-and-solar-
totransform-marine-energy/
Marvuglia, A., & Messineo, A. (2012). Using recurrent artificial neural networks to forecast
household electricity consumption. Energy Procedia, 14, 45-55.
Masterton JM., RichardsonF.A. (1979). Humidex, a method of quantifying humandiscomfort due
to excessive heat and humidity, CLI 1–79, Environment Canada.Atmospheric Environment
Service, Downsview, Ontario.
Meneguzzo, F., Ciriminna, R., Albanese, L., & Pagliaro, M. (2016). The remarkable impact of
renewable energy generation in Sicily onto electricity price formation in Italy. Energy Science &
Engineering, 4(3), 194-204.
Pagliaro, M., R. Ciriminna, F. Meneguzzo, and L. Albanese. 2015. Sicily's solar report 2015, Simplicissimus Book Farm, Catania, Italy. ISBN 9788869094231
Pisacane, G., Sannino, G., Carillo, A., Struglia, M. V., & Bastianoni, S. (2018). Marine energy
exploitation in the Mediterranean region: steps forward and challenges. Frontiers in Energy
Research, 6, 109.
Proestos Y, Christophides GK, Ergüler K, et al (2015) Present and future projections of habitat
suitability of the Asian tiger mosquito, a vector of viral pathogens, from global climate
simulation. Philos Trans R Soc B Biol Sci 370:1–16. doi: 10.1098/rstb.2013.0554.
Raynaud, D., Hingray, B., François, B., & Creutin, J.D. (2018). Energy droughts from variable
renewable energy sources in European climates. Renewable Energy, 125, 578-589.
Renewables Now, “Floating wind farm of 250 MW to be built off Sicily – report”, 22 June 2020,
https://renewablesnow.com/news/floating-wind-farm-of-250-mw-to-be-built-off-sicily-report-
703459/
Schneiderbauer, S., Pedoth, L., Zhang, D., & Zebisch, M. (2013). Assessing adaptive capacity
within regional climate change vulnerability studies—an Alpine example. Natural hazards, 67(3),
1059-1073.

98
Scholte JE, Schaffner F (2007). "Waiting for the tiger: establishment and spread of the Aedes
albopictus mosquito in Europe". In Takken, W.; Knols, B. G. J. (eds.). Emerging pests and
vector-borne diseases in Europe. 1. Wageningen Academic. Publishers. ISBN 978-90-8686-053-
1.
Van Wagner, C. E.,1987: Development and structure of a Canadian forest fire weather index
system, Forestry Tech. Rep. 35, Canadian Forestry Service, Ottawa.
Waldock J, Chandra NL, Lelieveld J, et al (2013) The role of environmental variables on Aedes
albopictus biology and chikungunya epidemiology. Pathog Glob Health 107:224–241. doi:
10.1179/2047773213Y.0000000100.

APPENDIX 12

1
TABLE OF CONTENT
INTRODUCTION ............................................................................................................................................... 2
1 CURRENT SITUATION AND RECENT TRENDS .................................................................................................. 3
1.1 CURRENT GEOPOLITICAL CONTEXT ......................................................................................................................... 3 1.2 CURRENT CLIMATE AND RISKS............................................................................................................................... 4 1.3 RECENT EVOLUTION OF THE BLUE ECONOMY SECTORS ............................................................................................... 5
2 CLIMATE CHANGE OUTLOOK ......................................................................................................................... 7
2.1 TOURISM ......................................................................................................................................................... 8 2.2 MARITIME TRANSPORT ..................................................................................................................................... 10
3 CLIMATE CHANGE RISKS .............................................................................................................................. 11
3.1 TOURISM ....................................................................................................................................................... 11 3.2 AQUACULTURE ................................................................................................................................................ 12 3.3 ENERGY ......................................................................................................................................................... 13 3.4 MARITIME TRANSPORT ..................................................................................................................................... 14
4 SOCIO ECONOMIC IMPACTS OF CLIMATE CHANGE ..................................................................................... 15
4.1 MARKET AND NON-MARKET EFFECTS OF CC .......................................................................................................... 15
5 REFERENCES ................................................................................................................................................ 17

2
Introduction
This report is the background material for stakeholders in the upcoming adaptation pathways
workshop in West Indies. It sums up results of the project that come from other Work Package
Deliverables (with the exception of D7.1R from WP7). A presentation that includes the
geography and socio-economic context for the hole of the nine Islands. The socioeconomic
trends without climate change are presented (WP6), which range from the present to the end-of
the century. The same is made regarding Climate Change trends and expected physical risks1,
booth current and future (WP4). The expected climate risks and vulnerabilities for the blue
economy are presented firstly with Impact chains developed (WP3) and ran (WP4) by the
project1, and secondly providing the primary economic effects and focusing in tourism related
impacts (WP5)1. The macroeconomic impacts of climate change are also presented (WP6)1. The
current climate policy and resilience of the Island is also presented (WP7)2. Finally, a link to the
projects original work is made in the references section.
French West Indies at a glance
The French West Indies refers to the Overseas department and the archipelago of Guadeloupe
and the territorial collectivity of Martinique, both located in the Lesser Antilles. Guadeloupe has
a total surface area of 1,628 km² and a population of 395,000. Martinique has a surface area of
1128 km² and a population of 375,000. The economy of both islands heavily depends on tourism
and agriculture export as source of foreign exchange. They are reliant upon mainland France for
product import.
The Blue Economy sectors
Aquaculture
Marine aquaculture in Guadeloupe and Martinique has 2 companies that breed only the
Caribbean Wolf (Sciaenops ocellata). Production is low (35 tonnes in 2019 in Martinique),
because the operators are small family units. This sector of activity faces several economic
difficulties (competition with imports, food prices), health (pollution, viruses) and technical
(sargassum, cyclone). To revitalize the sector, research is currently underway to identify a new
species adapted to farming conditions with good growth potential.
Maritime Transport
The large seaport of Guadeloupe brings together several activities ranging from the traffic of
goods to that of passengers. 90% of the goods go through the Jarry site. Like Guadeloupe,
Martinique's large seaport, located in the bay of Fort-de-France brings together several
specialized sites. It concentrates 98% of merchandise traffic and allows the transport of
passengers and cruise passengers.
Energy
Fossil energy accounts for 76.5% of Martinique's energy mix. The share of renewable energy is
steadily increasing and is currently made up of photovoltaic (13.3%), biomass (6.7%) and wind
power (2.4%). Overall consumption amounts to 1526 GWh. In Guadeloupe, electricity
1 Still to be included in the report
2 Still to be concluded in the report

3
consumption amounts to 1465 GWh. 21.4% concerns renewable energies, mainly geothermal
energy, followed by photovoltaic, biomass, wind and hydraulic power. The two islands appear far
from the goals set by the government for 2030. But have some potential to develop new sources
of renewable energy.
Tourism
In 2019, tourism accounted for 9.5 per cent of Guadeloupe's GDP. The high season for both
islands runs from November to April. In recent years, strong growth has been observed in the
sector thanks to cruise. It is mainly the landscape and beaches that attract tourists in Martinique
and Guadeloupe. The majority come from mainland France, other European countries, but also
from the United States.
1 Current situation and recent trends
1.1 Current geopolitical context
The French Antilles includes Guadeloupe (16 ° N - 62 ° W) and Martinique (14 ° 40'N - 61 ° W).
two tropical islands located 7000 km from mainland France in the archipelago of the Lesser
Antilles between the Atlantic Ocean at the east and the Caribbean Sea at the west.
Martinique is located between the island of Dominica to the north (40 km) and that of St. Lucia
to the south (30 km). Measuring 64 km long and 24 km wide. Martinique occupies an area of
1100 km². The south of the island is fairly dry and offers many peaks and gentle slopes on which
the vegetation is not too large. This is where we find the white sand beaches unlike those of the
North whose sand come from volcano. The north of the island has much more mountainous
relief. high enough to catch the clouds. The volcano of Mount Pelée (1397 m) is surrounded by
humid tropical forest. The temperature is relatively uniform throughout the year with differences
up to 3 to 4 degrees are observed between February and September. for an annual average of
about 27 °C in the Lamentin. In the dry season the average temperature is 25 °C. and 28 °C in
the wet season. In 2018. the Martinican population was estimated at 368.640 inhabitants (-1.1%
over one year). It has been declining continuously since 2007. due to a negative migratory
balance whose deficit is accelerating. and a slowdown in natural increase. As a result of a
declining birth rate. an increasing life expectancy. and the departure of young people of
reproductive age. the Martinican population is aging. Nearly 28% of the population is over 60
years old.
Guadeloupe is located 120 km north of Martinique. between the island of Montserrat in the
north (53 km) and that of Dominica in the south (23 km). The Guadeloupe archipelago consists
of two main islands. separated by a narrow stretch of sea: Grande-Terre (588 km²). where the
agglomeration of Pointe-à-Pitre is located. the economic center of the department. and the
Basse-Terre (848 km²). where the city of Basse-Terre is located. administrative capital of the
department. Basse-Terre is the result of the formation of a recent volcanic chain which
culminates in Soufriere (1.467 meters). while the other islands of the archipelago are of coral
origin. Guadeloupe benefits from a tropical climate tempered by the winds oriented towards the
East due to the Azores High. As in Martinique. there are two seasons whose transitions are more

4
or less marked: - a dry season called Lent from December to May (25 °C on average). and a
wetter season called wintering. from July to October (26 °C on average). during which tropical
depressions and cyclonic phenomena occur. As of January 1. 2016. Guadeloupe had 394.110
inhabitants. Between 2011 and 2016. it lost 10.525 individuals due to the widening of the
migration deficit which is no longer offset by natural increase. The latest estimates show the
continuation of this trend (390.704 inhabitants on January 1. 2018 and 382.704 on January 1.
2019). More and more young people aged 18-25 are leaving the territory. The aging of the
population is amplified by the fall in the birth rate.
1.2 Current climate and risks
There are two main seasons in the French West Indies. Average temperatures vary little during the year between 2 and 4 degrees, but much more depending on the time of day and location.
The average rainfall is mainly related to the relief. The dry season, also called "Care me", lasts from February to April and is characterised by temperatures that can reach between 28 and 30 degrees during the day. It is also the sunniest period of the year. The other season, wet season, lasts from June to October and is very hot and humid. The Intertropical Convergence Zone is getting closer to the West Indies. The rains are more numerous and intense. Maximum temperatures can reach between 32 degrees Celsius. This season is also associated with cyclones. The wind called trade winds blows almost permanently from East to North-East between 30 and 50 km/h but is weaker and irregular during this season.
Figure 1: Climate factsheets of Martinique Source: Own elaboration with data from GFDRR ThinkHazard!; D7.1 Conceptual Framework and Meteoblue; Meteoblue global NEMS (NOAA Environmental
Modeling System)

5
Figure 2: Climate factsheets of Guadeloupe Source: Own elaboration with data from GFDRR ThinkHazard!; D7.1 Conceptual Framework and Meteoblue; Meteoblue global NEMS (NOAA Environmental
Modeling System)
1.3 Recent evolution of the blue economy sectors
Guadeloupe and Martinique have the characteristics of a tertiary economy. In 2017. Guadeloupe companies generated added value of 2.7 billion euros. The added value of businesses covers 41% of the total wealth produced in Guadeloupe. i.e. a higher contribution to administrations (33%) and households (20%). Trade largely contributes to this result. with almost a third of the wealth created (31%). followed by scientific and technical activities. administrative services and business support (18%). For Martinique. also in 2017. companies generated added value of 3.3 billion euros. The added value of businesses covers 43% of the total wealth produced in Martinique. i.e. a higher contribution to administrations (31%) and households (19%).

6
Tourism
A study by the World Travel and Tourism Council measures the economic impact of the tourism
sector in Guadeloupe. It assesses the overall contribution of tourism to Guadeloupe GDP in
2017 at 10.9% 1. and its direct contribution at 2.4% (i.e. € 918.4 million and € 201.6 million
respectively).
In Martinique. In 2018. tourist attendance reached a new record in Martinique. with 1.046.735
tourists (+ 0.5% compared to 2017). According to the National Institute of Statistics and
Economic Studies (Insee). all visitors (tourists and excursionists) spent directly 451.5 million
euros. an increase of 6.3% compared to 2017.
Figure 3: Night spend in Martinique. Guadeloupe. Guyane. France 2010-2018. Source : Insee.
Maritime transport
The offer of the large seaport of Guadeloupe (GPMG) - Guadeloupe Port Caraïbes - is spread
over 5 specialized sites contributing to regional planning. Jarry is the main port which
concentrates 90% of the goods traffic of the archipelago and constitutes an excellent logistics
platform. entirely dedicated to freight. The activity of the port is mainly oriented towards the
domestic market. Imports thus represent 74.5% of merchandise traffic while merchandise
exports remain limited and dependent on local production (bananas and sugar). In Martinique
98% of the goods pass by the “Grand port maritime de Martinqiue”. In 2018. goods traffic
amounted to 3.060.716 tonnes (44% loose. 55% goods).

7
Figure 4: Trafic de marchandises entre 2009 et 2018 (en millier de tonnes). Source: Grand Port Maritime de Guadeloupe.
2 Climate Change outlook
Climate hazards indicators represent the entry point to understand the climate change exposure
of the blue economy sectors. The indicators have been computed for two scenario RCP2.6 (low
emission scenario) and RCP8.5 (high emission scenario) and for different horizon times namely:
a reference period (1965-2005), mid-century (2046-2065) and end of century (2081-2100).
As to its reliability, it is important to note that Atlantic islands (Azores, Madeira, Canaries and West Indies) lie in very critical areas where global models might be inaccurate in predicting the large scale patterns (regional models are not available), and resolution is so coarse that in fact many islands don't even exist in model orography. This acknowledged, this is the only information we can provide, and at least future tendencies can be inferred. The new CMIP6 simulations might shed more light on this issues, but we can only suggest that results should be updated as they become available. The same partly holds for the wave simulations: local resolution has been significantly increased in the dedicated new simulations of this project, performed by the partner ENEA (up to 0.05°), but the forcing wind field is still derived from the coarse global models. Stakeholders should be made aware that uncertainty is an inherent characteristic of climate data, and that any future planning must cope with it. Climatologists can only highlight POTENTIAL threats and constraints, they cannot predict the future and pave the way to solutions. Conveying this piece of information is one of the most critical points of climate-change-related information.

8
2.1 Tourism
Beach flooding and related losses
One of the consequences of an increase in the mean sea level will be the flooding of coastal areas. This includes sand beaches, which are the main asset for tourism activities in most of the European islands. Therefore, estimating the potential risk of beach loss due to climate change is of paramount importance for the economy of those islands. The 95th percentile of the flood level averaged was selected as an indicator of interest. The values are presented as anomalies with respect to the present mean sea level at beach location (i.e. including the median contribution of runup). In all cases an increase is expected being larger at the end of the century under scenario RCP8.5. The values in that scenario is 131.37 cm in West Indies.
Figure 5: Projected extreme flood level (in the vertical, in cml) at beach locations with respect to the present (1986-
2005) mean sea level values averaged for the islands under scenario RCP2.6 (left) and RCP8.5 (right). Ensemble of models using Global simulations produced by Hemer et al. (2013).
Source: SOCLIMPACT Deliverable Report - D4.4d Report on the evolution of beaches

9
Table 1: Projected extreme flood level (in the vertical) at beach locations with respect to the present (1986-2005) mean sea level values averaged for the island. Ensemble of models using Global simulations produced by Hemer et
al. (2013).
Low emission
scenario (RCP 2.6)
Low emission
scenario (RCP 2.6)
High emission scenario (RCP8.5)
High emission scenario (RCP8.5)
Mid-Century (2046-2065)
End of Century (2081-2100)
Mid-Century (2046-2065)
End of Century (2081-2100)
Absolute value Absolute value Absolute value Absolute value
45.11 cm 57.35 cm 87.61 cm 131.37 cm Source: SOCLIMPACT Deliverable Report - D4.4d Report on the evolution of beaches
Under mean conditions, we find that, at end of century, the total beach surface loss range from
~46% under scenario RCP2.6 to ~77% under scenario RCP8.5.
Figure 6: Beach reduction % (scaling approximation).
Source: SOCLIMPACT Deliverable Report - D4.4d Report on the evolution of beaches.

10
2.2 Maritime transport
Sea level rise
Sea level rise (SLR) is one of the major threats linked to climate change. It would induce permanent flooding of coastal areas with a profound impact on society, economy and environment. Moreover, an increase in the mean sea level would result in a larger impact of coastal storms with the consequent increase of risk. The results are presented in terms of mean sea level rise. For West Indies, the SLR ranges from 26.91 cm (RCP2.6) to 70.27 cm (RCP8.5) at the end of the century.
Figure 7: Mean sea level rise (in cm) with respect to the reference period (1986-2005). Ensemble mean of CMIP 5 simulations and scaling approximation for RCP2.6
Source: SOCLIMPACT Deliverable Report - D4.4b Report on storm surge levels
Wave extremes (99th percentile of significant wave height averaged)
Marine storms can have a negative impact on maritime transport, coastal-based tourism and aquaculture, among other activities. To illustrate this impact, the 99th percentile of significant wave height averaged has been chosen. A decrease in the extreme wave height is found being larger under scenario RCP8.5 as illustrated in the following map and table in far future (-5%).
Figure 8: the 99th percentile of significant wave height averaged for the reference period and the relative change for the RCP8.5. Global simulations produced by Hemer et al. (2013).
Source: SOCLIMPACT Deliverable Report - D4.4b Report on storm surge levels.

11
Figure 9: the 99th percentile of significant wave height averaged for the reference period and the relative change for
the RCP8.5 and RCP2.6. Global simulations produced by Hemer et al. (2013). Source: SOCLIMPACT Deliverable Report - D4.4b Report on storm surge levels
3 Climate change risks
All the graphics presented below can be found in high resolution in the Soclimpact
Project official website HERE.
3.1 Tourism
For the tourism sector, three impact chains (IC) were operationalized: i) Loss of attractiveness of a destination due to the loss of services from marine ecosystems, ii) Loss of comfort due to increase of thermal stress iii) Risk of forest fires and loss of attractiveness
For the first two, the AHP method was employed. This methodology is ideal to respond to the hierarchical nature of the impact chain and, secondly, for using expert judgements to assess the comparative risk for the islands over a large number of indicators. By the side of shadows, this method requires quite specific data that wasn’t able to collect for some islands. The AHP method also requires “values” for experts to compare. More specifically, for the first IC the data is needed for “Tourist Arrivals” and “Vulnerable Groups” indicators, which is regards the Exposure of people to heatwaves for the hottest period, such as:
- Number of tourist arrivals per month for the past 5 years. - Number of tourists per month aged 14 and under for the past 5 years - Number of tourists per month aged 65 and over for the past 5 years - Percentage of tourist activities that are sensitive to heatwaves (such as hiking, etc.).

12
- Number of beds available in medical facilities per 100,000 inhabitants. If, for example, an island gets a lot of tourists, but most of them just spend their time by the beach, then the island is not so much at risk of losing tourists because when they visit they’ll be by the beach and able to cool down. On the other hand, if almost all the tourists visit the island for hiking, but it gets too hot, then the island could be at risk since some may change their minds and visit somewhere else with a moderate climate and do their hiking there. Additionally, it is necessary to investigate how well an island is equipped with dealing with patients who suffer from a heatwave-related episode. For the second IC, the data collected was:
- Surface of marine Phanerogams & Phanerogams' reduction due to heat: Surface, in km2; and expected % of surface loss for RCP8.5 distant future.
- Number of divers: Number of tourists practising Diving at the destination. - Products substitution capacity: capacity to derive tourist demand to non-marine habitat-
based activities. - Seagrass removal: capacity to remove dead seagrass lying on beaches. - Sea water pollution: quality of management of inshore and offshore sewages.
If one information is missing, it is not possible to conduct the risk assessment analysis, as it is a comparative analysis between European islands. Finally, the GIZ method utilized for the operationalization of the third IC did not require experts evaluation, although the type of data utilized was also quite specific, regarding environmental, socio-economic, and spatial planning data (e.g. land use and cover). In some cases, local stakeholders and authorities were reached by the partners of the project. In other cases partners provided an additional effort in looking at and collecting data for the successful operationalization of the impact chains. Finally, the data were checked in order to verify similar coverage and timeframes. The West Indies show insufficient data availability. The data with more difficulties to be collected was:
- Cultivated area (Pcrops) - Forest in a protected area - Tourist density - Flammability Index - Density of firefighters and voluntary - Fires Risk Plan
3.2 Aquaculture
In the Soclimpact project, aquaculture includes only marine-based operations where off-shore
and coastal aquaculture are included, and freshwater and land-based aquaculture are excluded.
Examples of climate change hazards that can impact aquaculture are changes in ocean warming
and acidification, as well as oceoanographic changes in currents, waves, and wind speed. Sudden
impacts such as an increase in the frequency and intensity of storms and heat waves are also
impacting aquaculture. Other effects of climate change on aquaculture activities are increased
invasions from alien species, increased spread of diseases and changes in the physiology of the
cultivated species by changing temperature, oxygen availability and other important physical

13
water parameters. An important indirect impact to aquaculture is the change in fisheries
production due to climate change. Aquaculture of finfish is highly dependent on fisheries for
feed ingredients. This already a current problem with many fisheries overexploited and will only
intensify in the future. Climate change is also predicted to impact food safety, where temperature
changes modify food safety risks associated with food production, storage, and distribution.
Socio-economic impacts on aquaculture are hard to assess due to the uncertainty of the changes
in hazards and the limited knowledge these impacts have on the biophysical system of
aquaculture species (Handisyde et al. 2014). In the framework of Soclimpact, the following risks
were studied:
1) Risk of Fish species thermal stress due to increased sea surface temperature
Changes in water temperature can directly affect the growth rate and Food Conversion Ratio of
the fish. Temperature also affects the oxygen levels and can cause harmful algae blooms, reduce
water quality and an increase in occurrence of diseases and parasites which can than affect the
fish or other culture species. A change in temperature can ultimately change the ranges of
suitable species for a certain area but can also have positive impacts such as increased growth
(mainly in tropical and sub-tropical regions) and a longer growing season. Primary productivity
can also increase with increasing temperature, which may be beneficial for filter feeders such as
mussels.
2) Risk of increased fragility of the aquaculture activity due to an increase of extreme
weather.
Increased frequency and intensity of extreme weather events result in higher waves and storm
surges and changes in salinity. These events result in loss of stock and damages to infrastructure
and require adaptation in species selection, site selection and technologies.
Indeed, the objective of the risk assessment is to obtain final risk scores according to a gradient
(very low to high) and to be able to compare the European islands with each other. For West
Indies, it was difficult to obtain the adequate data to make these comparisons. The type of data
that was necessary to compile was:
- Farm area (km2)
- Value of stocks
- Quick support intervention plans
- Early warning system
- Sensivity of species
3.3 Energy
There are more than 2200 inhabited islands in the EU. Lately, they have come into the focus of
the EU, which addresses energy questions as part of the 'Clean energy for all Europeans'
package. The Clean energy for EU islands initiative provides a long-term framework to help
islands generate their own sustainable, low-cost energy. This is particularly interesting, because
many islands have vast amounts of renewable energy sources but rely on fossil fuel imports yet.

14
These are relevant challenges regarding the energy transition in the EU, whose aim of net zero
greenhouse gas emissions in 2050 should determine the future energy plans of the islands.
Islands could provide showcases for successful 100% renewable energy supply.
Most Renewable Energy Systems (RES) depend on the climate, and therefore climate change can
have an impact of the resource amount. Additionally, wind and solar PV energy are not
dispatchable, and its variability represents a challenge for its integration in the power system.
This is a challenge that can be addressed through storage or backup plants (which can be itself
renewable energy plants), through demand management, but also taking advantage of
complementarity of PV and wind energy and its very different variability characteristics.
There are also challenges for the demand and transmission components of the energy systems of
the islands due to climate change: changes in temperature leading to changing energy demand,
changes in precipitation and evaporation creating risks for desalination, and extreme weather
events (particularly extreme winds) challenging the distribution infrastructure. After intensive
desk research, the latter was ruled out, due to the low number of past incidents found in the
literature or news media and the future projections showing a reduction in wind extremes for
most islands.
Thus, for the energy sector three general impact chains (IC) have been developed in the
SOCLIMPACT project:
i) risk of changes in power generation due to long term climate change and variability,
ii) risk of changes in energy demand due to changes in precipitation and temperatures,
iii) risk of damages to transmission grids due to extreme events.
Only the second IC was selected for operationalization. Data availability constraints for all
islands have been a basic reason for this selection. For this IC, two different analysis were carried
out:
- the increased energy demand due to increased cooling demand,
- the increased energy demand due to increased desalination needs.
Both risks depend on the temperature increase, which is a very certain effect of climate change.
The criteria for the selection of the islands have been: (a) availability of data for the computation
of the exposure and vulnerability indicators of the demand-side ICs, (b) modeling constraints of
the hazard component. In both cases, West Indies show a lack of reliable and updated data.
3.4 Maritime Transport
For the Maritime Transport sector, three main climate change risks have been identified. These are: i) risk of damages to ports’ infrastructures and equipment due to floods and waves, ii) risk of damages to ships on route (open water and near coast) due to extreme weather events and iii) risk of isolation due to transport disruption.

15
The operationalization was applied to the third one (risk of isolation due to transport disruption) which in terms of hazards and impacts can be considered as a combination of the other two. The selection of islands to be included in the analysis was based on the importance and dependency on the Maritime Transport sector and on data availability. Although this sector is of great importance for the economy of West Indies, the lack of reliable and consistent data limited the analysis, especially in regard:
- Value of transported goods expressed in freight (VGTStot) - Number of renovated infrastructure (NAgePo). - Percentage of renewables (PEnRR), - Early warning systems (NOcSta) and harbour alternatives (NApt).
Nevertheless, this information is also useful at the moment of evaluating and ranking adaptation measures for the islands.
4 Socio economic impacts of climate change
4.1 Market and non-market effects of CC
Tourism
In order to analyse the reactions of tourists to the impacts of climate change and the preferences
for adaptation policies, several hypothetical situations were posed to 200 tourists visiting the
West Indies whereby possible CC impacts were outlined for the island (i.e., beach erosion,
infectious diseases, forest fires, marine biodiversity loss, heat waves, etc.).
Figure 10: Socio-economic characteristics and travel description: Tourists visiting West Indies Source: Deliverable Report D5.5 Market and non-market analysis

16
Firstly, tourists had to indicate whether they would keep their plans to stay at the island or find
an alternate destination if the impact had occurred, which allows predictions of the effects on
tourism arrivals to be made for each island. Secondly, tourists were asked to choose between
various policy measures funded through an additional payment per day of stay – the tourists’
choices being an expression of their preferences for attributes/policies. To estimate the results,
the conditional logit model was run by using the Stata software.
In general, data confirms that tourists are highly averse to risks of infectious diseases becoming
more widespread (55.50% of tourists would change destination). Moreover, they are not willing
to visit islands where beaches largely disappear (38%) or where water is scarce for leisure
activities (34.50%). In addition, policies related to beaches protection (9.2€/day), land habitats
restoration (19.1€/day), and the prevention of infectious diseases (7.9€/day) are the most valued,
on average, by tourists visiting these islands.
Although climate change impacts are outside the control of tourism practitioners and policy-
makers, they can nevertheless utilise this knowledge to improve the predictability of the effect
that certain adaptation policies and risk management strategies, and develop their plans
accordingly.
Figure 11: Choice experiments results for the tourism sector: Tourists visiting West Indies Source: Deliverable Report D5.5 Market and non-market analysis

17
The infographic can be found in high resolution in the Soclimpact Project official
website HERE.
For the rest of the sectors there was not available information to conduct an economic
evaluation of climate change impacts.
5 References
Handisyde et al. 2014 (s4) Handisyde, N., Lacalle, D. S., Arranz, S., & Ross, L. G. (2014).
Modelling the flood cycle, aquaculture development potential and risk using MODIS data: A
case study for the floodplain of the Rio Paraná, Argentina. Aquaculture, 422, 18-24.


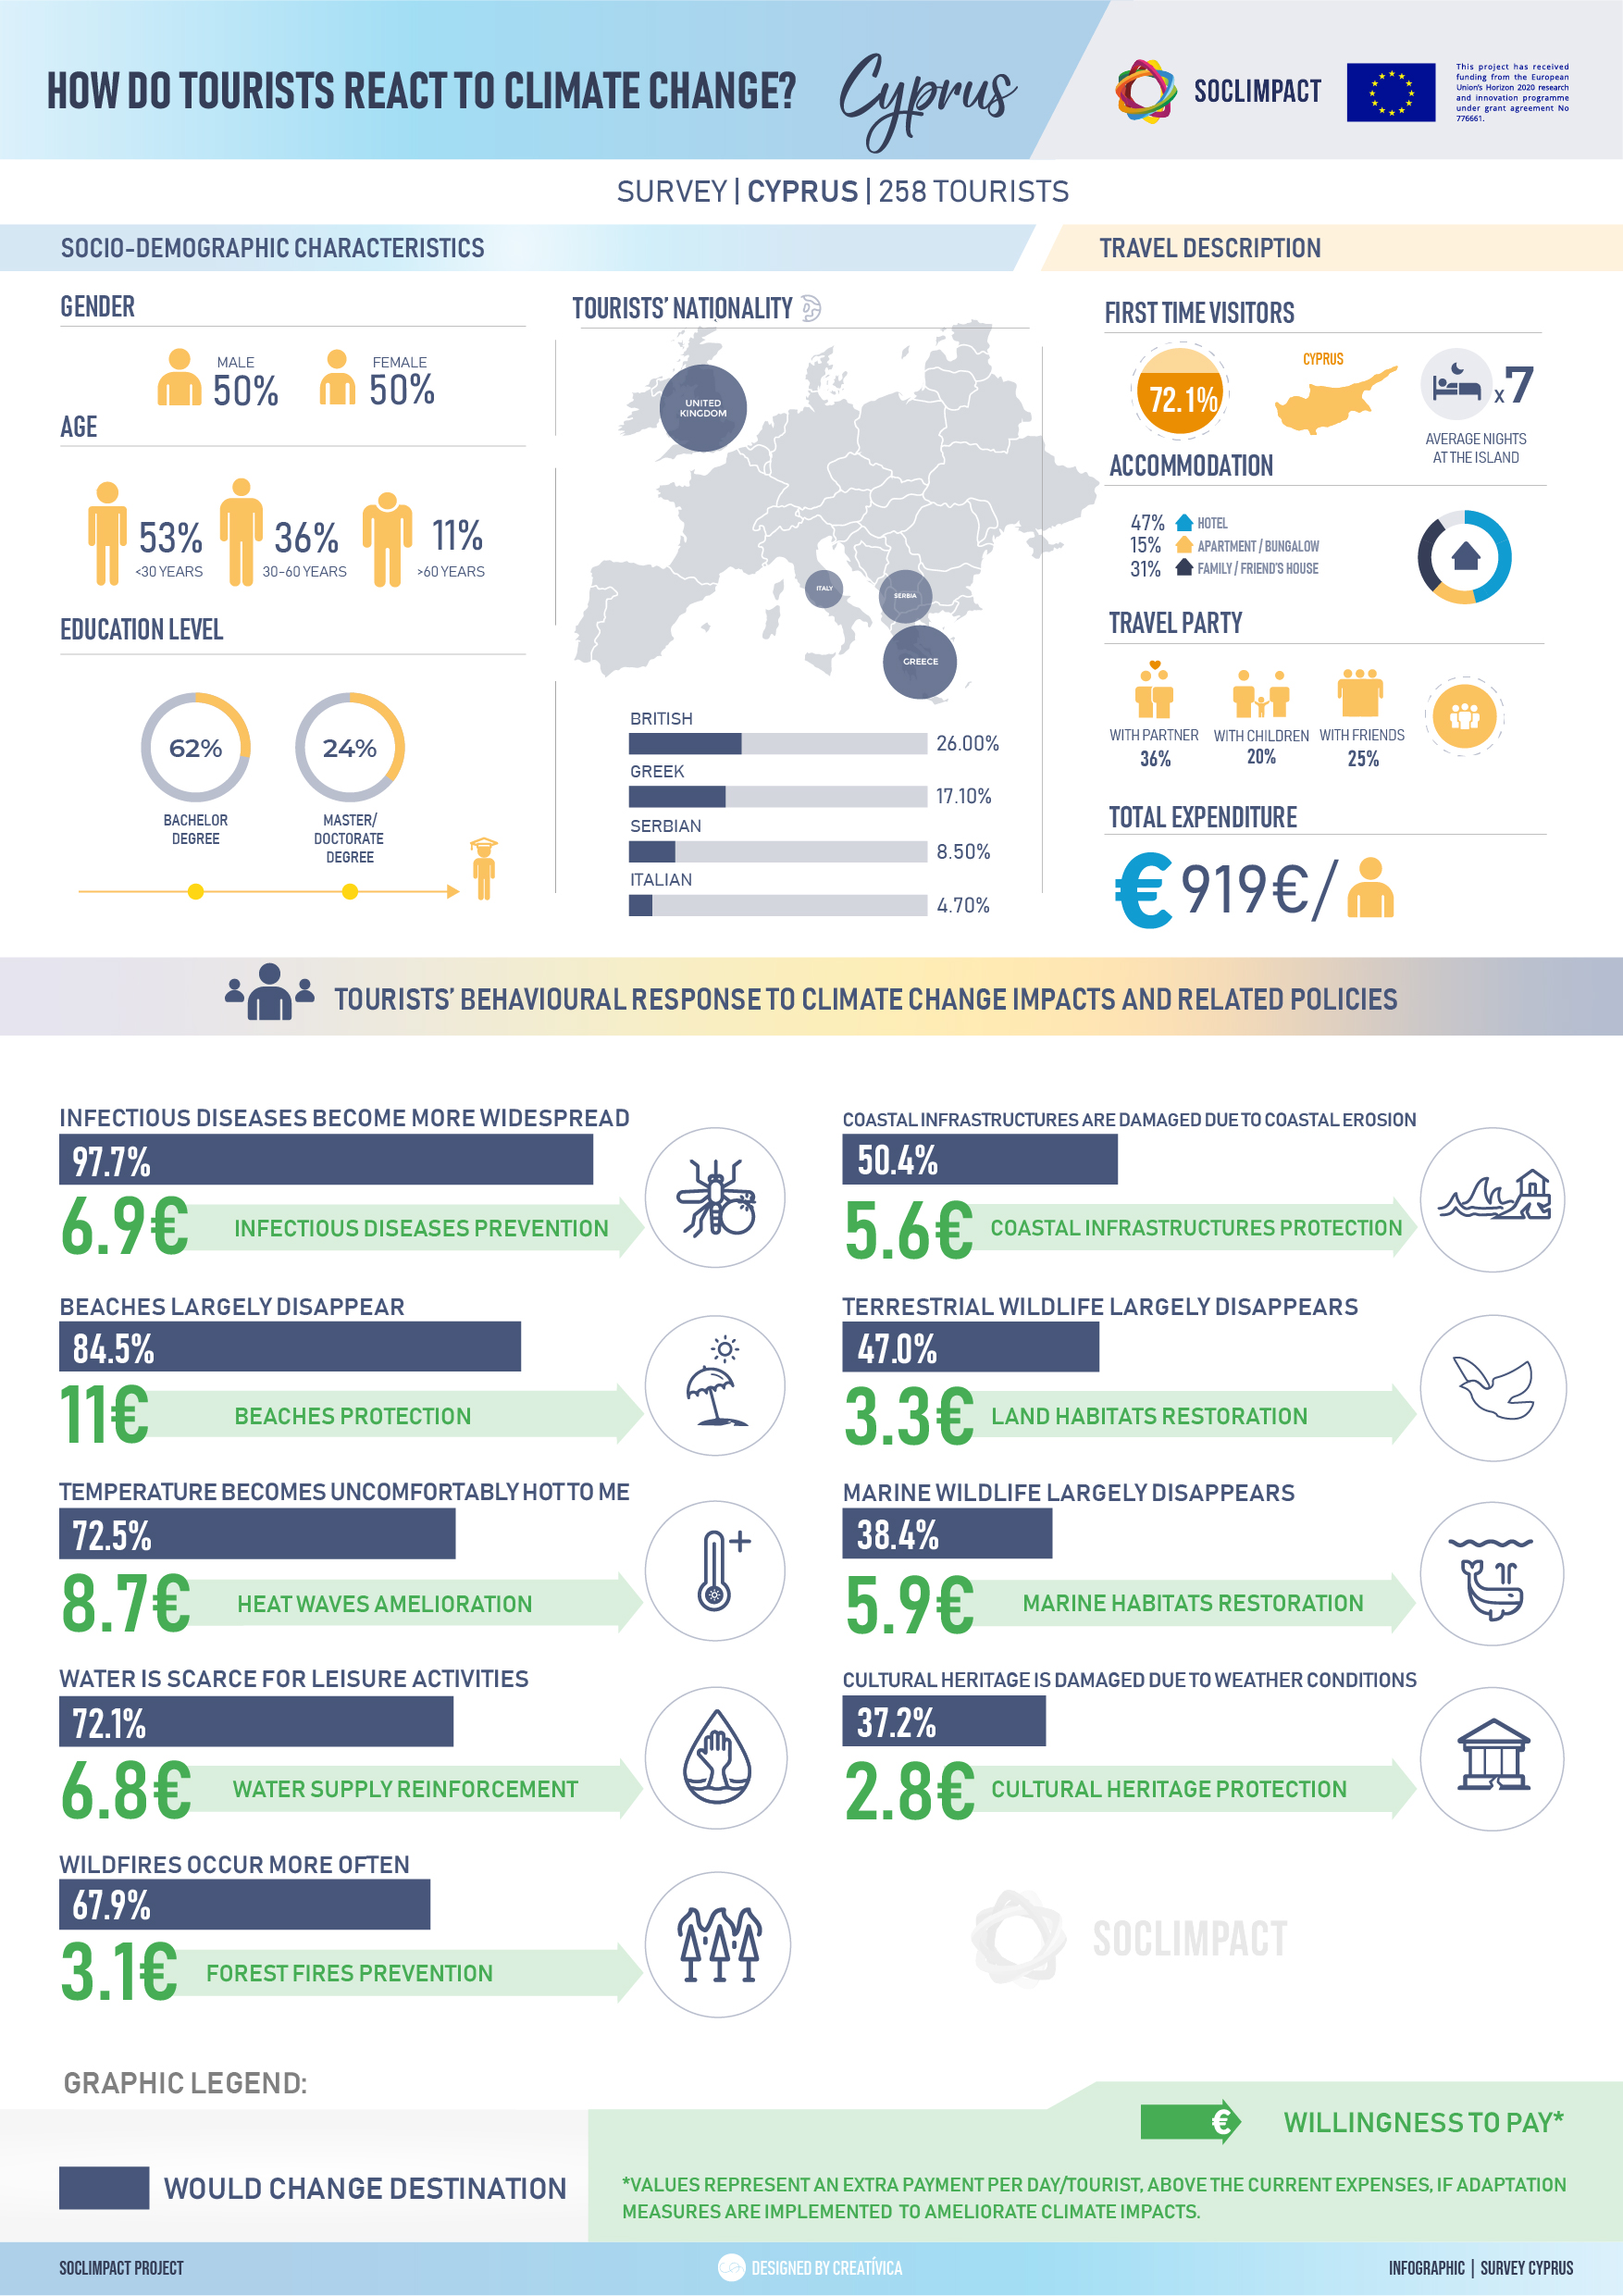
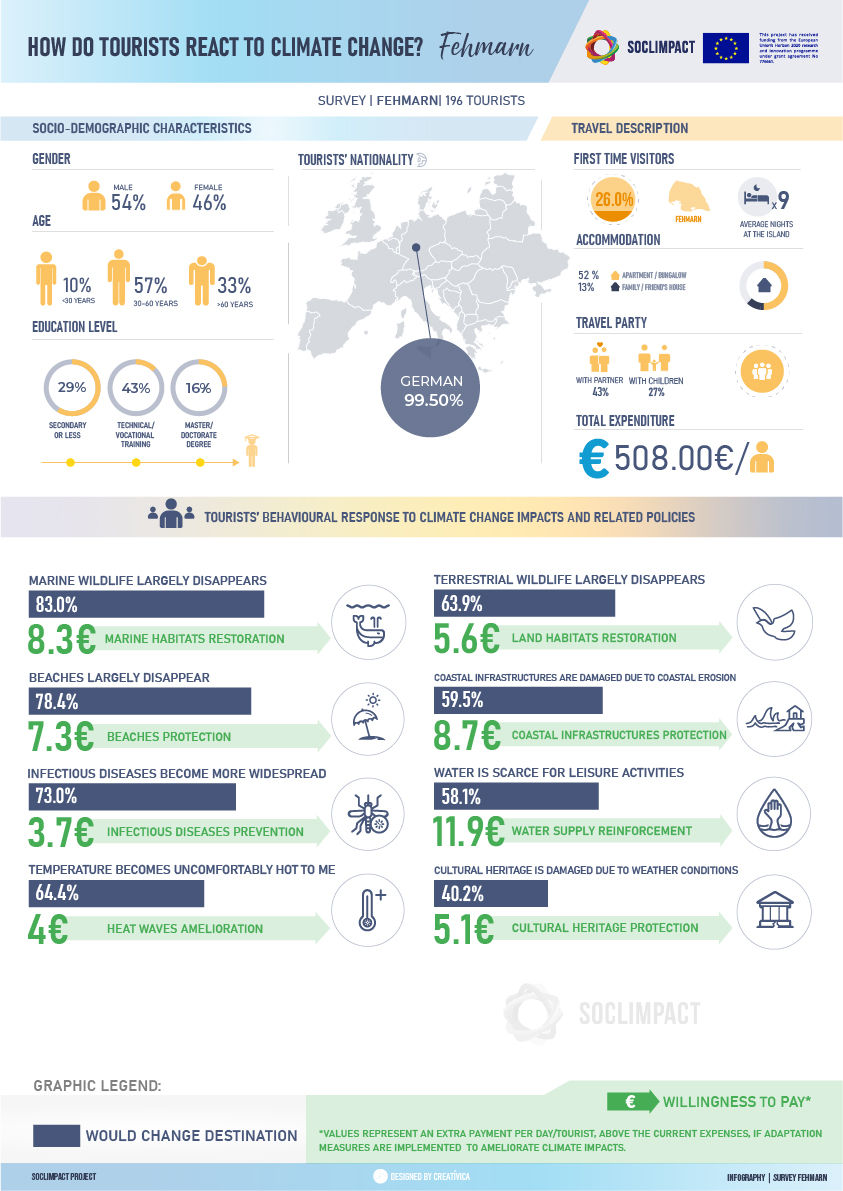
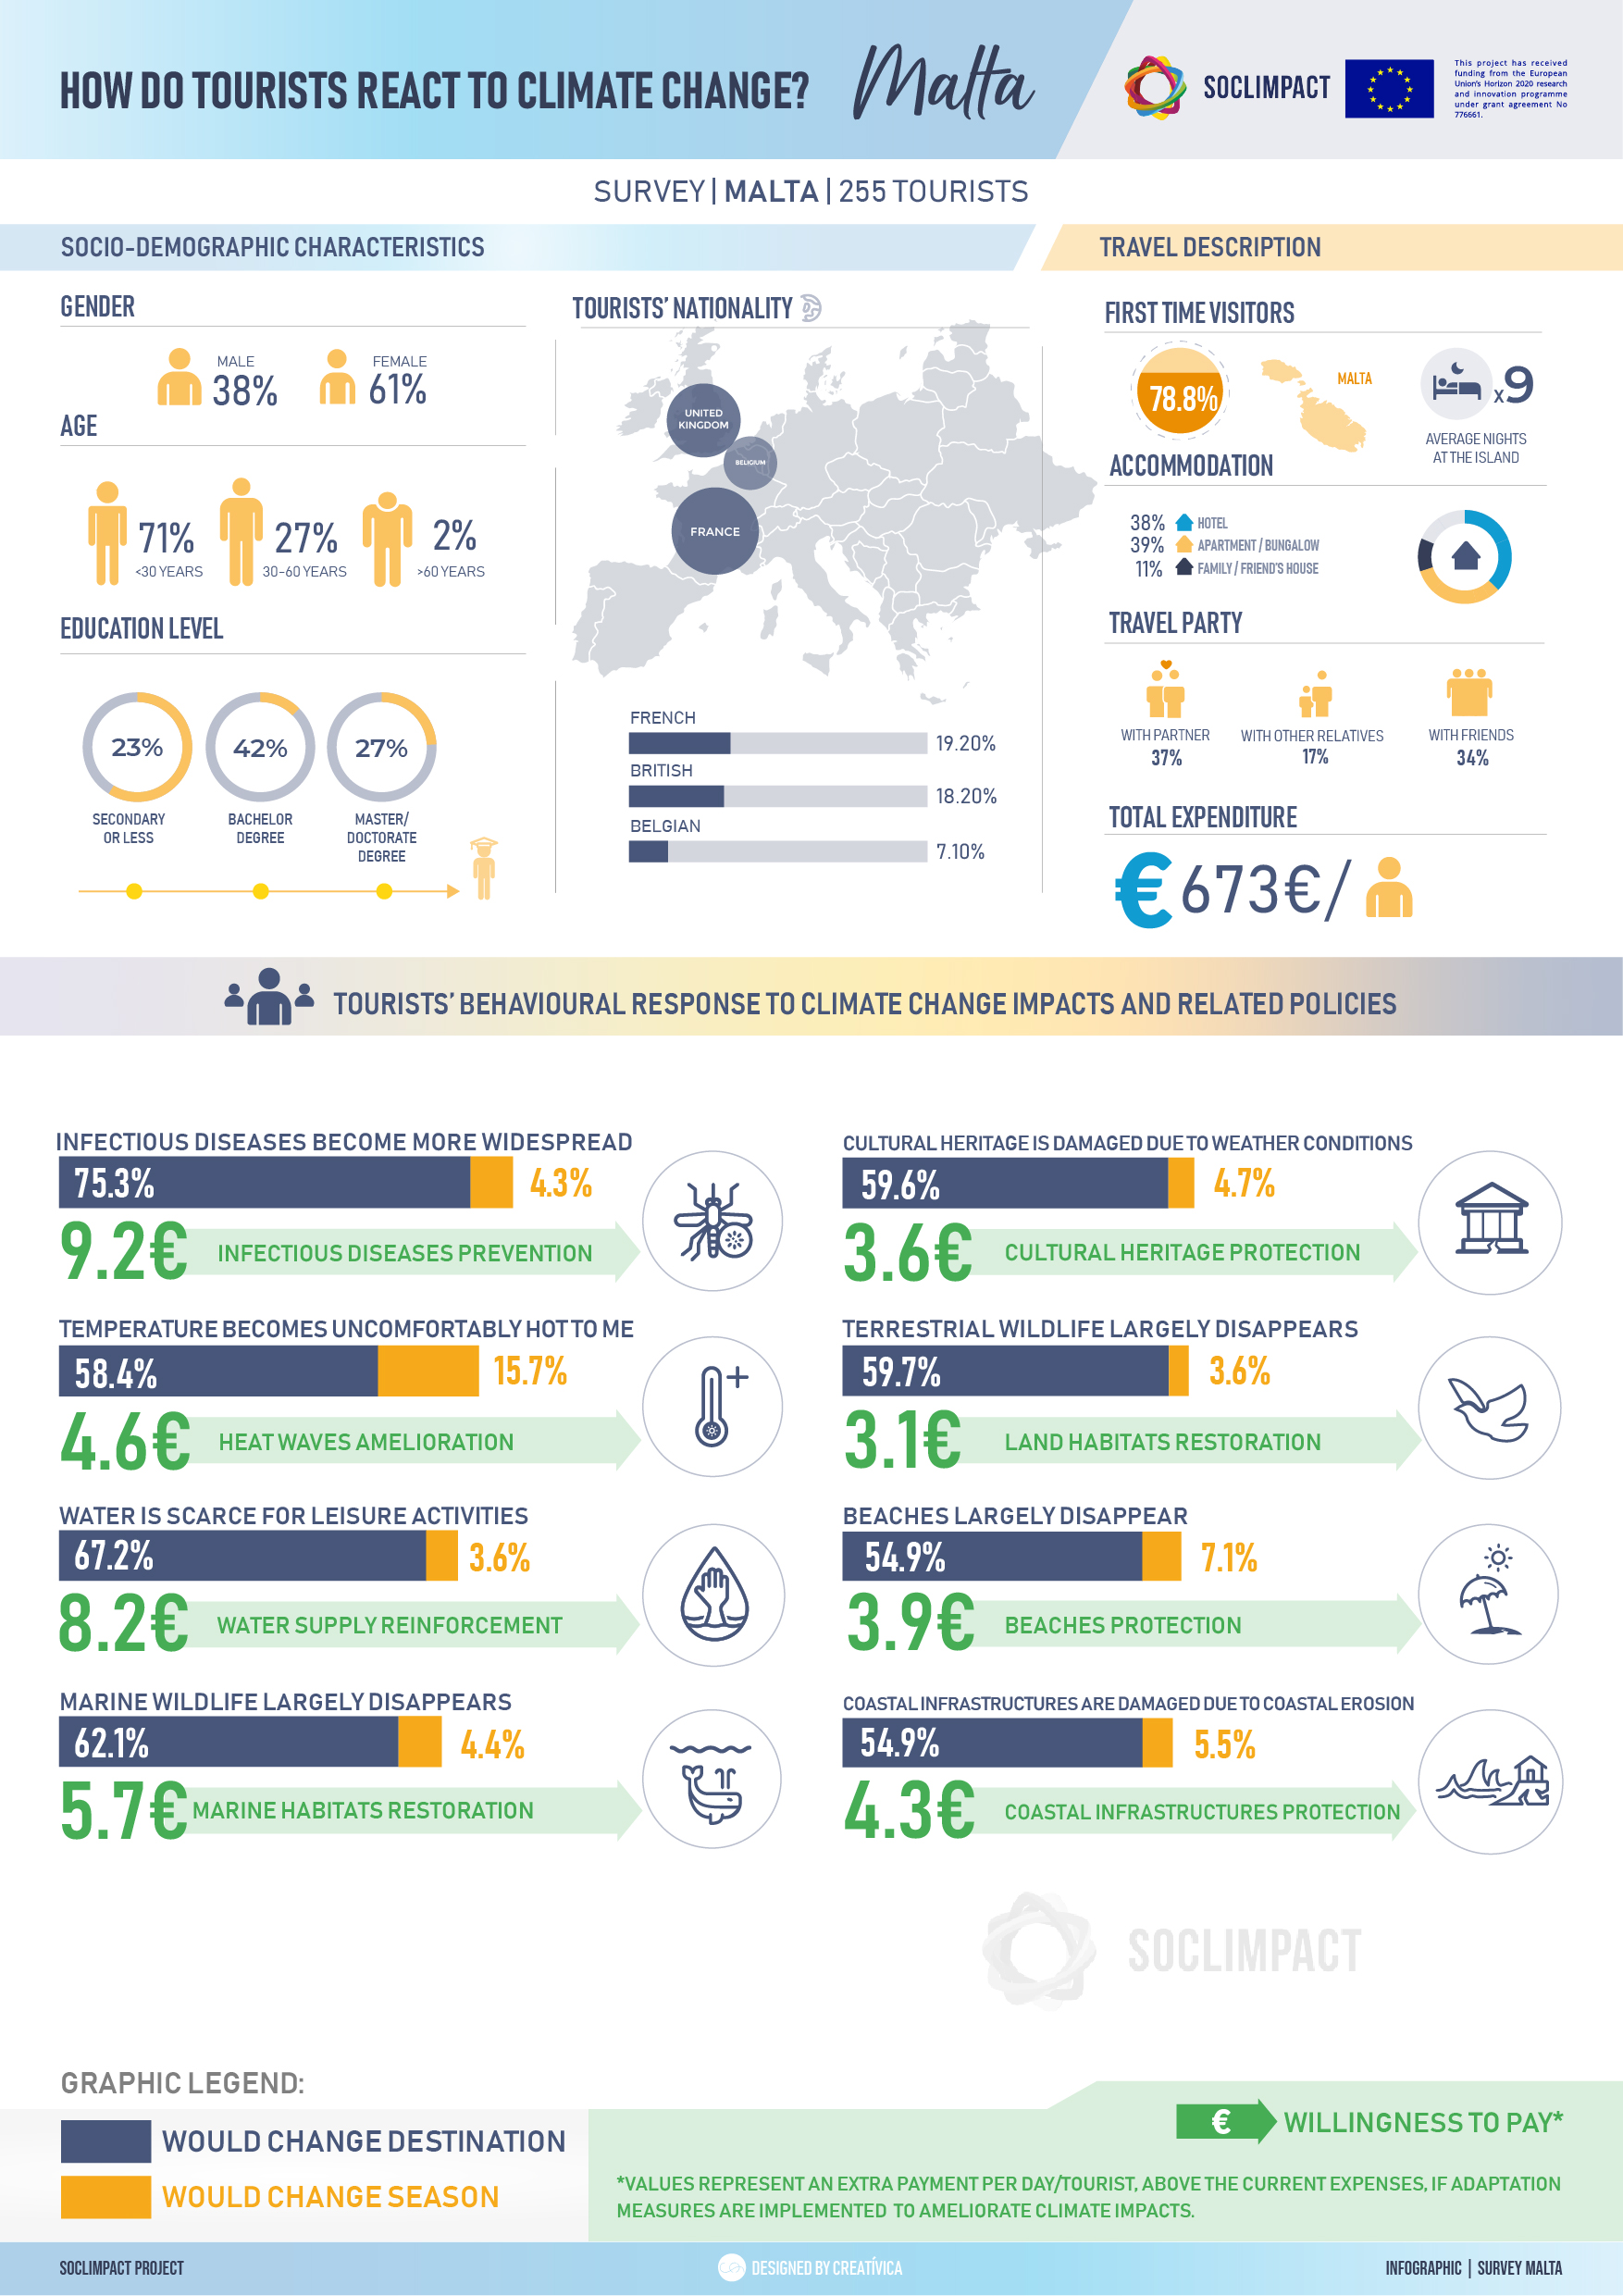
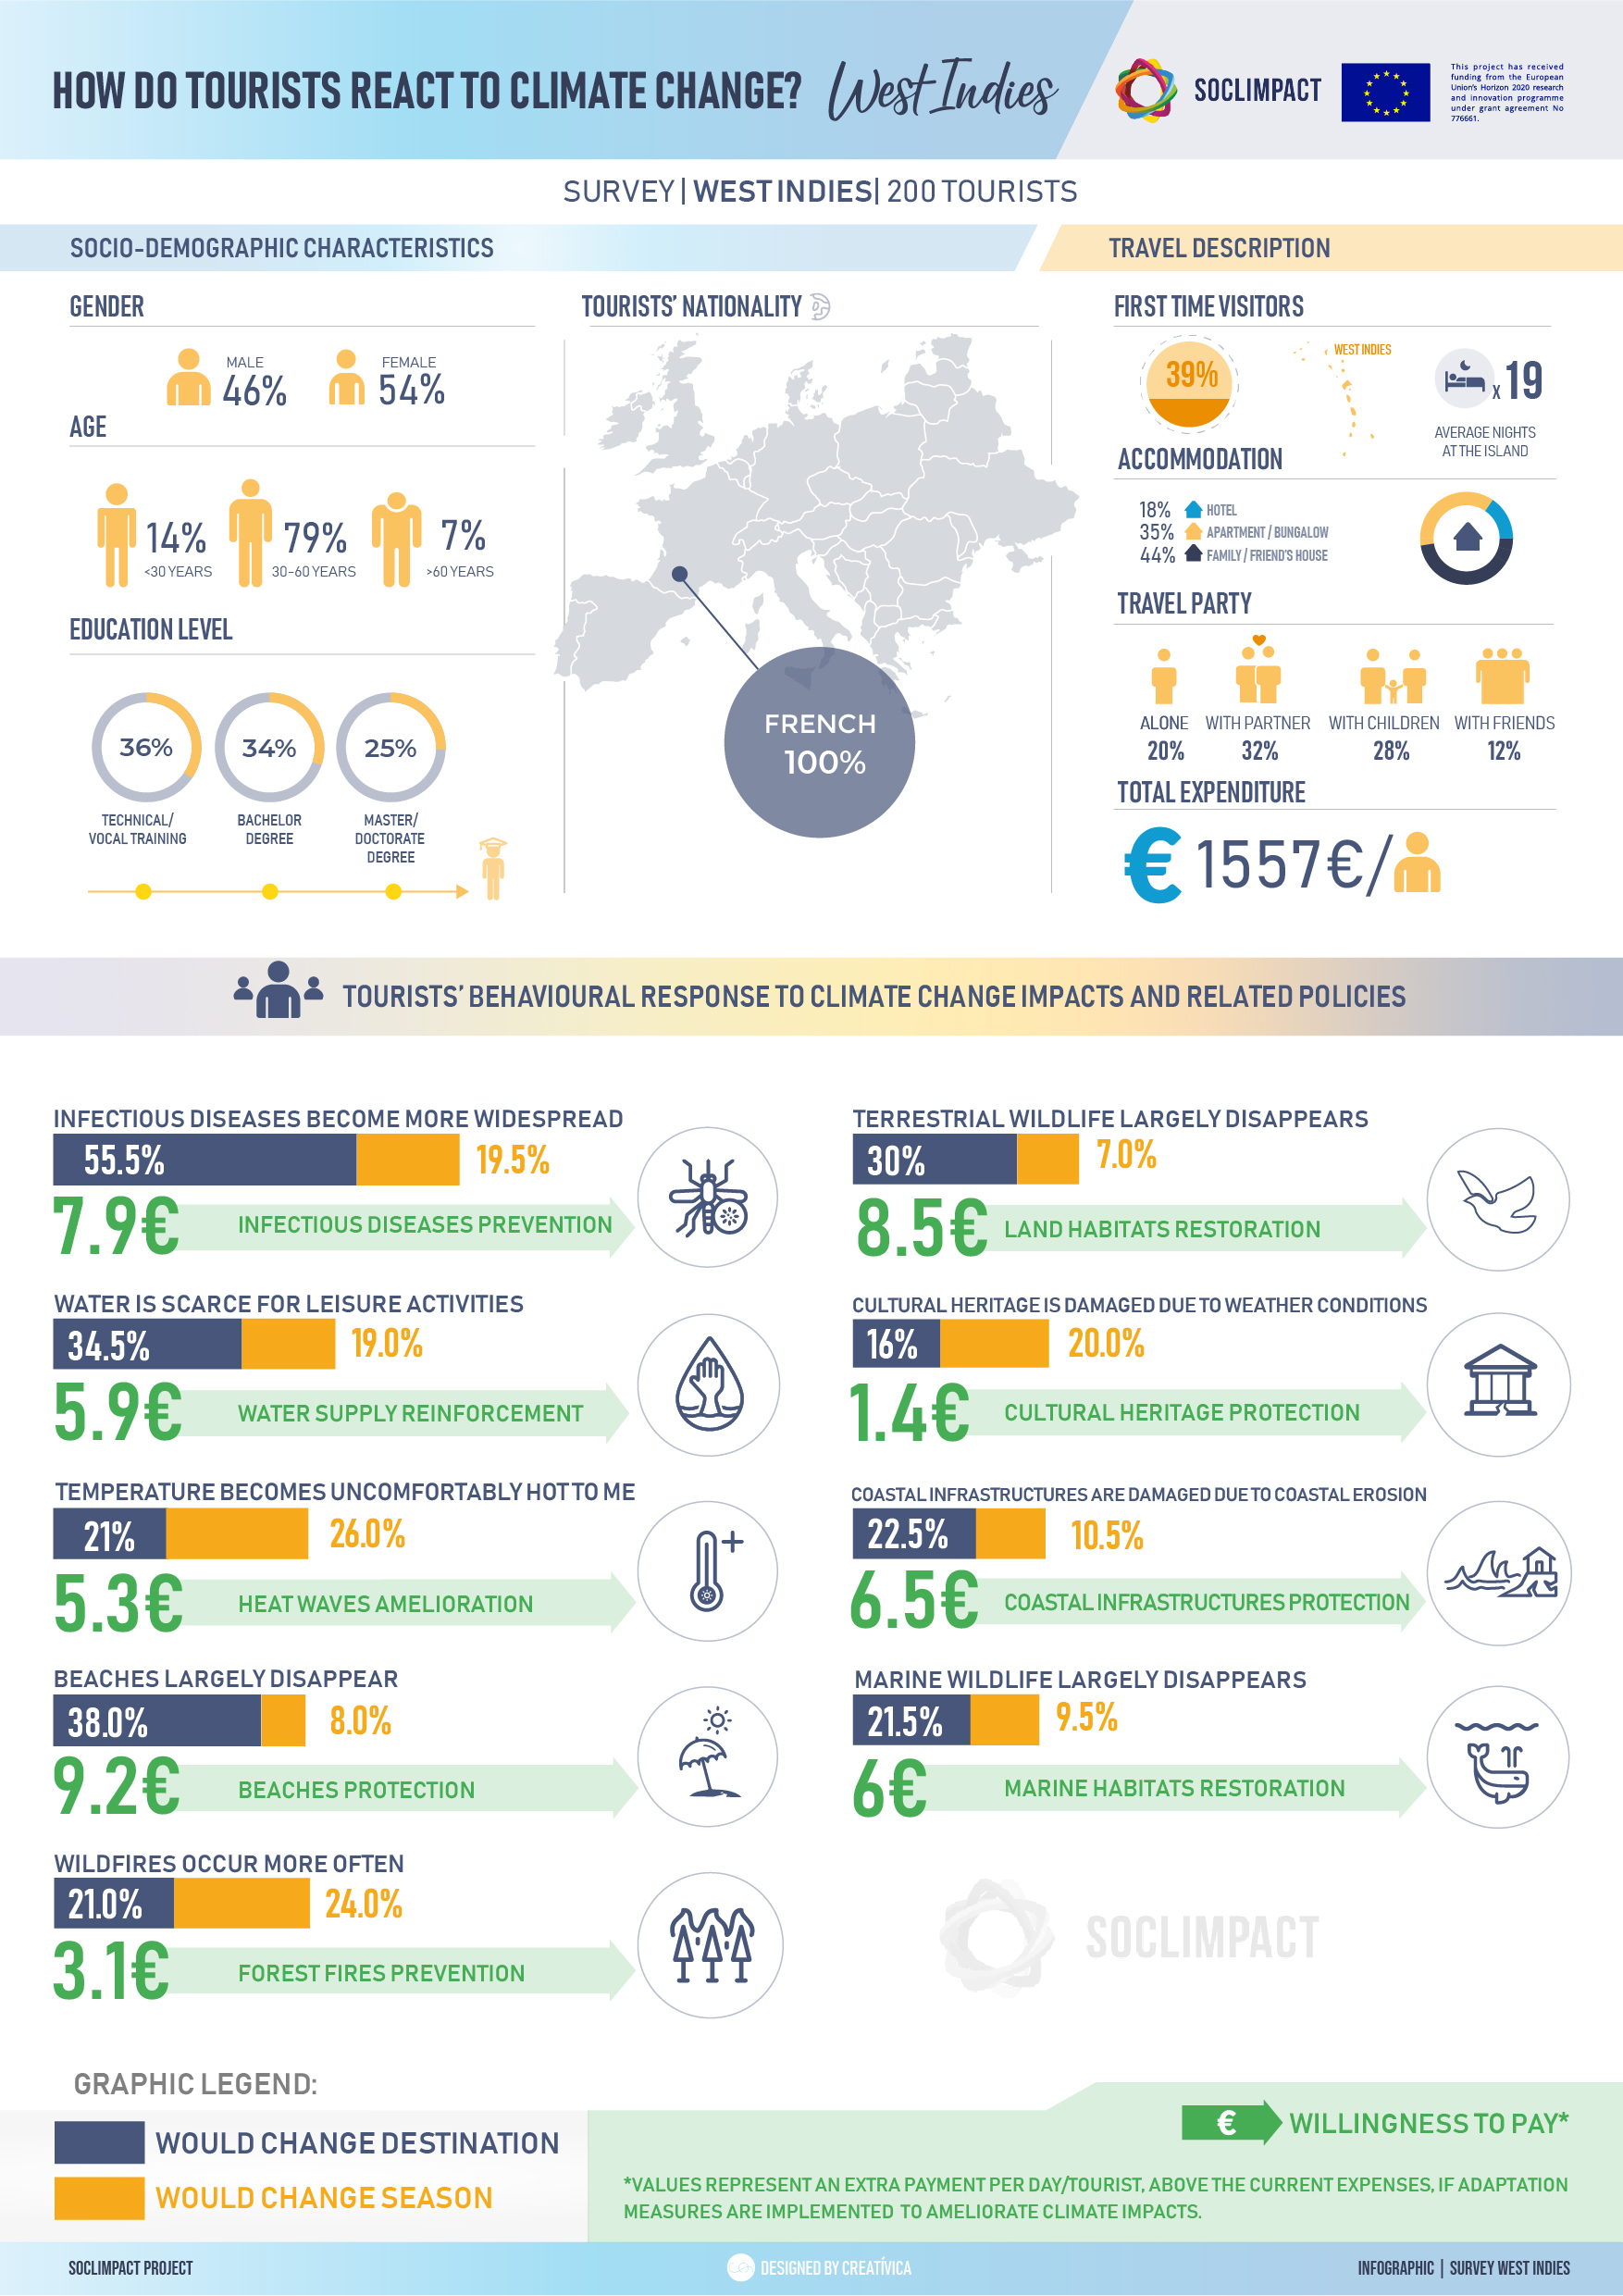