WOOD BIO-PLASTIC COMPOSITES By MENG-HSIN TSAI A ...
224
INVESTIGATION OF A SUSTAINABLE ALTERNATIVE - WOOD BIO-PLASTIC COMPOSITES By MENG-HSIN TSAI A dissertation submitted in partial fulfillment of the requirements for the degree of DOCTOR OF PHILOSOPHY WASHINGTON STATE UNIVERSITY Materials Science and Engineering Program December 2011
-
Upload
khangminh22 -
Category
Documents
-
view
0 -
download
0
Transcript of WOOD BIO-PLASTIC COMPOSITES By MENG-HSIN TSAI A ...

INVESTIGATION OF A SUSTAINABLE ALTERNATIVE -
WOOD BIO-PLASTIC COMPOSITES
By
MENG-HSIN TSAI
A dissertation submitted in partial fulfillment of the requirements for the degree of
DOCTOR OF PHILOSOPHY
WASHINGTON STATE UNIVERSITY
Materials Science and Engineering Program
December 2011

ii
To the Faculty of Washington State University
The members of the Committee appointed to examine the dissertation of MENG-HSIN TSAI find it satisfactory and recommend that it be accepted.
____________________________________
Michael P. Wolcott, Ph.D., Chair
____________________________________
Jinwen Zhang, Ph.D
____________________________________
Karl Englund, Ph.D
____________________________________
Long Jiang, Ph.D
____________________________________
Vikram Yadama, Ph.D

iii
ACNOWLEDGMENT
I would like to appreciate the faculties and staffs of Department of Civil
Engineering, Materials Science and Engineering Program, and Composite Materials
and Engineering Center (CMEC) for your assistance and support throughout the years.
Special thanks to my advisor Dr. Michael P. Wolcott and my committee Dr. Karl
Englund, Dr. Vikram Yadama, Dr. Jinwen Zhang, and Dr. Long Jiang for their
valuable guidance and support on my research. A special thanks to Bob Duncan, Scott
Lewis and Dr. Brent Olson for their assistance and dedication. I would not have been
able to complete this research without their help. Additionally, I would like to thank
the financial support from Department of Energy. My thanks also go to my colleagues
in the CMEC for their help and emotional support. Finally, I also appreciate my wife,
Lee-Wen Chen, my son, Eric Tsai, and all my family for their love and support.

iv
INVESTIGATION OF A SUSTAINABLE ALTERNATIVE –
WOOD BIO-PLASTIC COMPSOITES
Abstract
by Meng-Hsin Tsai, PhD. Washington State University
December 2011
Chair: Michael P. Wolcott
Bio-polymers have become a focus for developing wood bio-plastic composites
since they can be sustainably renewed from agricultural resources. One of the
bio-polymers, poly-3-hydroxybutyrate (PHB), has been widely studied for its
performance enhancement by blending with wood flour and coupling agents. One
riddle of the influence from coupling agents on PHB/wood flour (WF) composites
was discussed in this study. A lab-scale composting evaluation test was developed
based on ASTM standards in order to understand the compostability of PHB/WF
composites. During the compostability evaluation, multiple phases of biodegradation
such as lag, biodegradation, and slow down phases were observed. Theoretically,
microcracks occurred during the lag phase, which is a combination of physical
(microcracks) and chemical (decomposition) degradation. The following phase of
biodegradation occurs when the organic matter of PHB/WF composites rapidly

v
converts to carbon dioxide, known as mineralization behavior in its biological
definition.
In addition, this carbon conversion process is involved in a carbon cycling
ecosystem. Mineralization results indicated that PHB was consumed faster than wood
flour. Wood flour was then believed to challenge the compostability of the PHB/WF
composite. It was also observed that hypha could not reach the PHB located in the
core of the composite. This phase is the slow down phase. Without coupling agents,
an in accordance with ASTM standards and the results found this study, the PHB/WF
composite is certified as a compostable polymeric material. Furthermore, purification
of producing neat PHB has been reported as consuming more energy than producing
polyolefin. By eliminating the purification step of PHB production, energy
consumption could be limited and seen to reduce. In this study, the PHB/wood
flour/cell debris (PWC) composites were successfully developed and produced
through injection molding and extrusion processes. The mechanical performance and
moisture diffusion behaviors of the PWC composites were comparable with a
commercial wood plastic composite. Therefore, a sustainable alternative - wood
bioplastic composite was developed by maintaining biodegradability and its carbon
footprint was effectively controlled, both of which are sustainable requirements.

vi
TABLE OF CONTENTS
Page
ACKNOWLEDGEMENT ….…………………………………………………….. iii
ABSTRACT …....……………………………...……………………………………. iv
LIST OF FIGURES ...……………………………………………………………... xiii
LIST OF TABLES ………………………………………………………………… xvi
CHAPTER 1 - PROJECT INTRODUCTION
1.1 Introduction ..……………………………………………………………. 1
1.2 Background ..……………………………………………………………. 3
1.2.1 Poly-hydroxyalkanoates (PHAs) ..………………………………… 3
1.2.2 Definition of “Biodegradable plastic” and “Compostable plastic” .. 5
1.2.3 Composting mechanism and carbon cycling ecosystem ...………... 6
1.2.4 Mechanics of enzymatic degradation .…………………………… 10
1.3 Researches and Developments (Biocomposites) ...……………………… 15
1.4 Objectives …....………………………………………………………….. 18
1.5 References ………………………………………………………………. 21
CHAPTER 2 - COMPOSTABILITY AND MINERALIZATION BEHAVIORS OF
A POLY-3-HYDROXYBUTYRATE/WOOD FLOUR COMPOSITE
2.1 Introduction ……………………………………………………………... 27
2.2 Materials and Methods ..………………………………………………… 31
vii
2.2.1 Materials ..………………………………………………………. 31
2.2.2 Testing specimen preparation …………………………………... 32
2.2.3 Composting apparatus and procedure …………………………... 34
2.2.4 Thermal analysis ………………………………………………... 39
2.2.5 Fickian diffusion coefficients …………………………………... 40
2.2.6 Enzymatic kinetic ………………………………………………. 41
2.2.7 Morphology …………………………………………………….. 43
2.3 Results and Discussion …………………………………………………. 43
2.3.1 Thermal degradation ……………………………………………. 43
2.3.2 CO2 evolution and mineralization .……………………………… 44
2.3.3 Thermal analysis ………………………………………………... 50
2.3.4 Fickian diffusion coefficient ……………………………………. 52
2.3.5 Enzymatic kinetic ……………………………………………….. 53
2.3.6 Morphology ……………………………………………………... 54
2.4 Conclusion ………………………………………………………………. 56
2.5 Acknowledgements ……………………………………………………... 58
2.6 References ………………………………………………………………. 59
CHAPTER 3 - A NOVEL INVESTIGATION OF HYGROTHERMAL EFFECTS
ON PROPERTIES DEGRADATION AND PROPAGATION OF PHB/WF

viii
COMPOSITES BY USING THE CONTINUOUS DAMAGE MECHANISM
3.1 Introduction ……………………………………………………………... 65
3.2 Materials and Methods ………………………………………………….. 68
3.2.1 Materials ………………………………………………………... 68
3.2.2 Methods ………………………………………………………… 69
3.2.2.1 Composite extrusion preparation ……………………….. 69
3.2.2.1.1 Melt compounding …………………………… 69
3.2.2.1.2 Sheet extrusion ……………………………….. 70
3.2.2.2 Testing specimen preparation and hygro- / hydro- thermal
conditioning ...…………………………………………... 71
3.2.2.3 Mechanical properties and density evaluation ……......... 72
3.3 Results and Discussion ………………………………………………….. 73
3.3.1 Moisture absorption …………………………………………….. 73
3.3.2 Moisture effects on specific tensile properties …………………. 74
3.3.3 Hygrothermal effects (Moisture and mechanical degradation) … 79
3.3.4 Microcracking evaluation by the Continuous Damage
Mechanism …...…………………………………………………. 83
3.3.5 Proposed microcracking mechanism under hygrothermal
conditions …………………………………………………….… 86

ix
3.4 Conclusion ………………………………………………………………. 87
3.5 References ……….……………………………………………………… 89
CHAPTER 4 - INVESTIGATION OF EFFECTS OF COUPLING AGNETS ON
COMPOSTABILITY AND MINERALIZATION BEHAVIORS OF
POLY-3-HYDROXYBUTYRATE/WOOD FLOUR COMPOSITES
4.1 Introduction ……………………………………………………………... 94
4.2 Materials and Methods ………………………………………………….. 98
4.2.1 Materials ………………………………………………………... 98
4.2.2 Testing specimen preparation …………………………………... 99
4.2.3 Composting apparatus and procedure …………………………. 101
4.2.4 Fickian diffusion coefficient …………………………………... 106
4.2.5 Enzymatic kinetic ……………………………………………... 106
4.2.6 Morphology …………………………………………………… 108
4.3 Results and Discussion ………………………………………………... 109
4.3.1 CO2 evolution and mineralization results ……………………... 109
4.3.2 Fickian diffusion coefficient …………………………………... 114
4.3.3 Enzymatic kinetic ……………………………………………... 116
4.3.4 Morphology …………………………………………………… 118
4.3.5 Enzymatic surface erosion mechanism ……………………….. 121

x
4.4 Conclusion …………………………………………………………….. 123
4.5 Acknowledgments …………………………………………………….. 125
4.6 References …………………………………………………………….. 126
CHAPTER 5 - DEVELOPING ENERGY EFFICIENT AND COST EFFECTIVE
POLY-3-HYDROXYBUTYRATE /WOOD FLOUR COMPOSITES: EXTRUSION
5.1 Introduction ……………………………………………………………. 132
5.2 Materials and Methods ………………………………………………… 136
5.2.1 Materials ………………………………………………………. 136
5.2.2 Methods ……………………………………………………….. 137
5.2.2.1 Particle size distribution analysis of ground cell debris .. 137
5.2.2.2 Torque rheometry ……………………………………… 137
5.2.2.3 Preparation of composites ……………………………... 138
5.2.2.4 Preparation of testing specimens ………………………. 141
5.2.2.5 Morphology ……………………………………………. 141
5.2.2.6 Mechanical properties and sample density …………….. 142
5.2.2.7 Moisture resistance …………………………………….. 142
5.3 Results and Discussion …………...……………………………… 143
5.3.1 Torque rheometry ………………………………………... 143
5.3.2 Morphology ……………………………………………… 148

xi
5.3.3 Density and mechanical properties ………………………. 150
5.3.4 Moisture behavior ………………………………………... 154
5.4 Conclusions ……………………………………………………... 160
5.5 Acknowledgements ……………………………………………... 161
5.6 References ………………………………………………………. 162
CHAPTER 6 - DEVELOPING ENERGY EFFICIENT AND COST EFFECTIVE
PHB/WF COMPOSITES: INJECTION MOLDING
6.1 Introduction ……………………………………………………………. 166
6.2 Materials and Methods ………………………………………………… 170
6.2.1 Materials ……………………………………………………….. 170
6.2.2 Methods ………………………………………………………... 171
6.2.2.1 Preparation of composites ……………………………... 171
6.2.2.2 Injection molded testing specimens …………………… 173
6.2.2.3 Thermal degradation analysis of raw materials ……….. 174
6.2.2.4 Mechanical properties and sample densities …………... 174
6.2.2.5 Morphology ……………………………………………. 175
6.2.2.6 Moisture behavior and diffusion ………………………. 176
6.3 Results and Discussion ………………………………………………... 177
6.3.1 Thermal degradation …………………………………………... 177

xii
6.3.2 Material density and mechanical properties …………………... 178
6.3.3 Morphology …………………………………………………… 182
6.3.4 Moisture diffusion behavior …………………………………... 186
6.4 Conclusion …………………………………………………………….. 192
6.5 Acknowledgement …………………………………………………….. 193
6.6 References ……………………………………………………………... 194
CHAPTER 7 – CONCLUSION
APPENDIX A – MALEATION OF POLY-3-HYDROXYBUTYRATE BY
REACTIVE EXTRUSION
A.1 Introduction …………………………………………………………… 201
A.2 Materials and Methods ………………………………………………... 202
A.2.1 Materials ………………………………………………………. 202
A.2.2 Methods ……………………………………………………...... 202
A.2.2.1 Reaction Extrusion of MA-grafting on PHB …………. 202
A.2.2.2 Evaluation of MA-grafting Ratio …………………….. 203
A.3 Results and Discussion ………………………………………………... 205
A.4 Conclusion …………………………………………………………….. 206
A.5 References ……………………………………………………………... 207

xiii
LIST OF FIGURES Page
Figure 1.1 Biological enzyme, substrate, enzyme- substrate complex, and products concentration change with time …………………………………………………….. 13 Figure 1.2 Plot of Michaelis-Menten equation with determination of Michaelis constant, Km ………………………………………………………………………… 14 Figure 1.3 Lineweaver-Burk Plot of reciprocal Michaelis- Menten equation for determining Km/Vmax, and 1/Vmax …………………………………………………... 15 Figure 2.1 Schematic of the lab-scale material compostability evaluation set-up system ………………………………………………………………………………. 38 Figure 2.2 Weight loss and derivative thermogravimetry of PHB, WF, and PHB/WF composite …………………………………………………………………………... 44 Figure 2.3 The accumulative CO2 evolving production of CP, PHB, PHB/WF composite, and control compost material ………………………………………….. 48 Figure 2.4 The accumulative mineralization of CP, PHB, and PHB/WF composite. 49 Figure 2.5 Lineweaver-Burk plot of rate of mineralization and substrate content … 54 Figure 2.6 Comparison of initial samples (CP, PHB, and PHB/WF composite) and after 90days composted sample debris ……………………………………………... 55 Figure 2.7 SEM Morphology of different sample (CP, PHB, PHB/WF composite) surfaces on day 1 (a) and after 90 days (b) ……………………………………........ 56 Figure 3.1 Relative water absorption behaviors of three different PHB/WF composites …………………………………………………………………………. .74 Figure 3.2 Plot of relation of moisture content and specific tensile strength of three different PHB/WF composites ……………………………………………………... 76 Figure 3.3 Plot of relation of relative moisture content and specific tensile modulus of three different PHB/WF composites ……………………………………………….. 76 Figure 3.4 Plot of relation of relative moisture content and strain at break of three different PHB/WF composites ………………………………………………………77 Figure 3.5 Plot of relation of relative moisture content and strength adjusting factor of three different PHB/WF composites with regression curves ………………………..78 Figure 3.6 Plot of relation of relative moisture content and modulus adjusting factor of three different PHB/WF composites with regression curves ………………...…….. 79 Figure 3.7 Plot of relation of specific tensile strength against conditioning time .…. 82 Figure 3.8 Plot of relation of specific tensile modulus against conditioning time .… 82 Figure 3.9 Plot of relation of relative moisture absorption against hygro-thermal conditioning time …………………………………………………………………… 83 Figure 3.10 Plot of relation of theoretical calculated damage parameter (ω) in percentage against conditioning time ………………………………………………. 86

xiv
Figure 4.1 Schematic of lab-scale material compostability evaluation set-up system ……………………………………………………………………………... 105 Figure 4.2 Plot of accumulative CO2 evolving production against square root of time in hours of polymeric composites and materials ………………………………….. 114 Figure 4.3 Plot of accumulative mineralization against square root of time in hours of polymeric composites and materials ……………………………………………… 115 Figure 4.4 Lineweaver-Burk plot of rate of mineralization and substrate content ... 118 Figure 4.5 Morphology of PHB (A) and eroded and/or biodegradated surface of PHB (B – F) …………………………………………………………………………….. 120 Figure 4.6 Morphology of a PHB/WF composite (A) and eroded and/or biodegradated surfaces of PHB/WF composites (B – F) …………………………………………. 121 Figure 4.7 Morphology of crystal region of PHB (A) and evidence of hypha (B and C) on the surface of PHB/WF composite …………………………………………….. 122 Figure 5.1 Torque rheometry behavior at different temperatures on the control formulation (PW) …………………………………………………………………. 146 Figure 5.2 Torque rheometry behavior of the six formulations of PWCCs at 165
oC ………………………………………………………………………………….. 147 Figure 5.3 Torque rheometry behavior of six different formulations of PWCCs with processing temperature of 160 and 165 oC …………………………………………147 Figure 5.4 SEM micrographs of cell debris (left) and pine wood flour (right) …… 150 Figure 5.5 Interfacial bonding of wood flour (a) and cell debris (b) with PHB matrix on microtomed surface of PWCC ………………………………………………… 150 Figure 5.6 Plot of the relation of cell debris content and specific MOR of the PWCCs ……………………………………………………………………………. 153 Figure 5.7 Plot of the relation of cell debris content and specific MOE of the PWCCs …………………………………………………………………………..... 153 Figure 5.8 Plot of the relation of cell debris content and specific impact strength of the PWCCs …………………………………………………………………………..... 154 Figure 5.9 Plot of moisture absorption versus square root of time of seven composites ………………………………………………………………………… 156 Figure 5.10 Plot of thickness change versus square root of time of seven composites ………………………………………………………………………… 156 Figure 5.11 Plot of true moisture diffusion constant versus cell debris content ….. 160 Figure 6.1 Functional group reactions between isocyanate chemicals and wood/moisture …………………………………………………………………….. 169 Figure 6.2 Ground cell debris particle size distributions ………………………….. 171 Figure 6.3 Plot of the thermogravimetric curves of pine wood flour, cell debris, and neat PHB ………………………………………………………………………….. 178

xv
Figure 6.4 Plot of the relation of tensile properties and cell debris contents ……... 180 Figure 6.5 Plot of the relation of flexural properties and cell debris contents ……. 181 Figure 6.6 Plot of the relation of impact strength and cell debris contents ………. .181 Figure 6.7 SEM micrographs of cell debris (a) and pine wood flour (b) …………. 184 Figure 6.8 Fracture surfaces of neat PHB (a), PHB/wood flour composite (b), and PHB/wood flour/cell debris composite (c). Magnification: X80 …………………. 184 Figure 6.9 Fracture surfaces of neat PHB (a), PHB/wood flour composite (b), and PHB/wood flour/cell debris composite (c). Magnification: X500 ………………... 185 Figure 6.10 Sectioned surface of PHB/wood flour/cell debris composites ………. 185 Figure 6.11 Wood lumens filled with polymer …………………………………… 185 Figure 6.12 Plot of moisture absorption against square root of time in seconds …. 187 Figure 6.13 Plot of thickness swelling against square root of time in seconds …… 188 Figure 6.14 Plot of true moisture diffusion constant versus cell debris content ….. 192

xvi
LIST OF TABLES Page
Table 2.1 The proportion of compost feedstocks …………………………………... 31 Table 2.2 The chemical characteristics of the materials ………………………….... 38 Table 2.3 The rates of CO2 evolution and mineralization of each sample in different phases of biodegradation ………………………………………………………….... 46 Table 2.4 The average moisture content and pH value of control, CP, PHB, and PHB/WF composite ……………………………………………………………….... 49 Table 2.5 Thermal properties of PHB and PHB/WF in different sampling times ..... 51 Table 2.6 Enzyme kinetic constants of different materials ………………………… 54 Table 4.1 Proportion of compost feedstocks ……………………………………… 100 Table 4.2 Chemical characteristics of materials …………………………………... 106 Table 4.3 Rates of CO2 evolution and mineralization of each sample in different phases of biodegradation ………………………………………………………….. 111 Table 4.4 Mineralization diffusion coefficient of different polymeric material and composites ………………………………………………………………………… 117 Table 4.5 Enzyme kinetic constants of different materials ……………………….. 118 Table 5.1 Particle size distribution of cell debris after hammer milling ………….. 138 Table 5.2 Formulations of PHB/WF control and PHB/WF/Cell debris mixtures for torque rheometry study ……………………………………………………………. 139 Table 5.3 Formulations of HDPE/WF, PHB/WF control, and PHB/WF/cell debris composites ………………………………………………………………………… 141 Table 5.4 Temperature profiles used for extrusion of the seven formulations ……. 141 Table 5.5 Densities of HDPE/wood flour, PHB/WF control and PHB/wood flour/cell debris composites …………………………………………………………………. 151 Table 5.6 Actual output date of extrusion processing of the different composites .. 151 Table 5.7 Comparison of moisture diffusion parameters of extruded PHB composites and commercial HDPE composite ………………………………………………... 159 Table 6.1 Formulations of two controls of PHB/WF (PW) and PHB/cell debris (PC) and PHB/WF/cell debris (PWC) composites ……………………………………... 173 Table 6.2 Densities and mechanical properties with standard deviation of four formulations ………………………………………………………………………. 180 Table 6.3 Apparent (DA) and true (D) diffusion constants for the six formulations ………………………………………………………………………. 190

xvii
DEDICATION
This dissertation is dedicated to my wife Lee-Wen Chen, my son Eric (Eitzer) Tsai and all my family members who have provided their emotional supports throughout
these years.

1
Chapter 1 Project Introduction
1.1 Introduction
Development of fossil fuel derived polymers has facilitated the convenience of
our life style since the early 20th century. Durability is the biggest advantage of these
polymers. Polyolefin is one broad example. Using fillers to reinforce polymers and
form polymeric composites has been seen as a solution to expand the performance
envelope, such as improving stiffness, tensile strength, impact, dimensional stability,
and also to reduce cost. The two main categories of these fillers are: 1) inorganic
fillers, such as talc, mica, calcium carbonate, glass fiber, etc.; and 2) organic/natural
fibers, such as wood flour/fiber, cellulose, rice hull, wheat straw, etc. Nowadays,
“green” aspects and lightweight have become another focus for maintaining
sustainable requirements, e.g. less carbon dioxide emission during transportation and
reduction of the carbon footprint of products. Natural fibers such as wood flour/fiber
demonstrate most of these sustainable advantages. Wood polymer composites (WPCs)
have been successfully developed in recent decades. WPCs play a major role in the
replacement of polymeric materials in building and construction, such as decking,
siding, fencing, etc. [1][2][3]. Now, the application is moving into the field of
injection molding, such as for automotive parts, containers, and consumer goods, due

2
to its low cost and lightweight (0.8 g/cm3 of average wood density vs. 2.8 g/cm3 of
talc). Unfortunately, the advantage of durability of polymers is now seen as
problematic in some product applications, e.g. consumer goods, because these
polymers may require hundreds of years to degrade after the products are disposed.
According to the US Environmental Protection Agency (EPA), one statistical
report [4] indicates that in 2009 only approximately 9% of non-durable plastic goods
were recovered in the US. To be specific, about 17.3 million tons of plastic waste was
land-filled in 2009. This statistical report indicates that recycling is still a challenge in
the US. Fortunately, biologically derived polymers (bio-polymers) have been
discovered and developed by engineers and scientists. These bio-polymers can be
derived not only from natural resources, but can also be biodegraded under enzymatic
conditions [5][6][7][8]. The most commonly studied examples of bio-based polymers
are poly-lactic acid (PLA) and poly-hydroxyalkanoates (PHAs). Utilization of these
bio-polymers is now seen as a solution for achieving the reduction of petroleum
dependence. The reason behind this idea is that bio-polymers, for example PHAs, can
be sustainably synthesized and fermented from natural carbohydrate resources via
biological processes [9]. Furthermore, the utilization of a sustainable material (wood
flour) as a reinforcement in bio-polymers to form wood bio-polymer composite is

3
now creating more attention as a solution to achieve sustainability while maintaining
performance requirements.
1.2 Background
1.2.1 Poly-hydroxyalkanoates (PHAs)
One family of microbial polyesters, PHAs, is biologically synthesized by
bacteria with carbohydrate feedstock and reserved as an energy source for bacteria.
PHAs have widely different properties, from stiff to rubbery (thermoplastic to
elastomer), which are associated with different species of bacteria and feed sources
[9][10][11][12]. Because of that, PHAs have been viewed as an alternative to lessen
dependence on crude oil. Many previous studies [9][10][11][12] have indicated that
the first PHA was discovered in 1925 and known as polyhydroxybutyrate (PHB)
French scientist Maurice Lemoigne found that PHB was an energy reserve made up of
many different bacteria with carbohydrate substrate feeding. PHB is a highly
crystalline substance with a melting point of about 175oC [10]. PHB possesses a
similar processability to many commodity polymers with no issue in using
conventional polymer processing techniques and equipment [13]. Moreover, PHB is
biodegradable and compostable [14][15], which means that it can be mineralized by

4
biologically converting organic carbon to CO2 as a metabolism of microorganisms
[16][17].
However, the cost of PHAs is much higher than that of polyolefin.
Conventionally, PHAs is converted from starch through biological synthesis; 1 kg of
PHAs requires about 3.3 kg of starch for conversion [18]. Additionally, further
procedures of sterilization and purification are required to obtain purified PHAs
polymer. These processes not only consume food resources such as starch, but also
require more energy input [18][19]. After this cradle-to-grave analysis [18], it appears
that producing 1kg of PHA from corn would require 65% more fossil fuel to generate
the same quantity of petroleum-based polystyrene.
The addition of natural organic fillers to reinforce the PHAs can maintain
biodegradability and expand the performance envelope with cost reductions. Starch,
soy protein, wood flour (WF), and other natural fibers are not frequently used. The
performance of natural fibers has often been studied in engineering biocomposites
through integration with PHB due to the low cost and high strength/stiffness from
natural fibers [20][21][22]. However, the discrepancy of surface tensions of
hydrophobic bio-polymer and hydrophilic organic fillers causes incompatibility in the
blend system. In morphology, it has been observed that the interfacial gap between
the fiber and the matrix causes stress concentration while applying a load [22][23][24],

5
which then induces low performance of the biocomposites. The reason for this result
is that applied loads cannot be transferred properly between fiber and matrix. Hence,
it is desirable to modify the surface adhesion between two materials by adding
chemicals such as a compatibilizer, which is also known as a coupling agent or
interfacial modifier. The performance of the biocomposites can therefore be regarded
as being improved. Research results have indicated that enhanced mechanical
properties and reduction of moisture absorption were observed by adding
compatibilizers to wood-plastics composites (WPCs) [23][24][25][26].
1.2.2 Definition of “Biodegradable” and “Compostable”
As mentioned earlier, PHB has been proven and classified as a biodegradable
and compostable bio-polymer [14][15]. However, these two terminologies are
commonly misstated or addressed. According to ASTM D 6400, the definitions of
biodegradable and compostable are: “Biodegradable plastic (polymer) is defined as a
polymer in which the degradation results from the action of naturally occurring
microorganisms such as bacteria, fungi, and algae”; “Compostable plastic (polymer)
is defined as a polymer that undergoes degradation by biological processes during
composting to yield CO2, water, inorganic compounds, and biomass at a rate
consistent with other known compostable materials and leaves no visible,

6
distinguishable or toxic residue.” Notably, the testing period for this research will be
conducted for a period of 180 days. For plastic products consisting of a single
polymer, 60% of the organic carbon of the polymer must be converted to CO2 within
the 180 day testing period. The compostability of biopolymers or biocomposites will
be carried out by a laboratory scale evaluation in accordance with ASTM D5338.
1.2.3 Composting Mechanism and Carbon Cycling Ecosystem
In municipal waste management (MSW), one method of reducing municipal
waste is to decompose all compostable products, e.g. kitchen wastes, by a composting
technique. During the composting process, the organic carbon of these compostable
products can be converted to carbon dioxide (CO2) by aerobic enzymatic
bioactivation/bioreactions [16][17]. By composting the compostable plastic products,
a reduction of the annual landfill capacity can therefore be expected. In the
mechanisms of composting, organic matter is decomposed by the metabolism of
aerobic microorganisms under a condition of high humidity and high temperature.
Under such conditions, a hygrothermal condition will first influence the substrate
materials, e.g. dimensional swelling (escalation of microcracking occurs [27]) and
deterioration of properties. In this stage, moisture will penetrate into the substrates
potentially by diffusion and capillary movements. Following hydrolysis, in which

7
only the polymer chain is broken down to small chain length, could possibly occur
before biodegradation [6]. Biological degradation next occurs and produces
by-products such as CO2, water, heat energy, and composted soil. The composting
degradation mechanism can be schematically seen in Scheme 1.1). In accordance with
the eco-system of carbon cycling, plants can further photosynthesize the released
carbon from organic matter, and the carbon can also be sequestered as feedstock. For
example, vascular plants can store carbon and produce food sources, e.g.
polysaccharides or carbohydrates, as well as structural components, such as starch and
cellulose. These two components can further be harvested and utilized to produce
PHAs by utilizing biological synthesizing processes. Therefore, a carbon cycling
ecosystem can be expected to develop (See Scheme 1.2).

8
Scheme 1.1 The mechanism of composting degradation
Scheme 1.2 The carbon cycling ecosystem
Complex carbohydrates (Starch/Cellulose)
Packaging products Bio-composites
PHB
Fermentation
Polymerization
PLA
CO2, H2O, Compost soil, Energy
Biodegradation Photooxidation
Recycling
Agricultural feedstocks
Photosynthesis
Thermal p
roces
sing
Composting
Food sources
Solar energy
O
O
C
=CH3
CHn
nO
OC
=CH3CH CH2
Extra
ctio
n Waste, Debris, etc.
Complex carbohydrates (Starch/Cellulose)
Packaging products Bio-composites
PHB
Fermentation
Polymerization
PLA
CO2, H2O, Compost soil, Energy
Biodegradation Photooxidation
Recycling
Agricultural feedstocks
Photosynthesis
Thermal p
roces
sing
Composting
Food sources
Solar energy
O
O
C
=CH3
CHn
O
O
C
=CH3
CHn
nO
OC
=CH3CH CH2 n
OOC
=CH3CH CH2O
OC
=CH3CH CH2
Extra
ctio
n Waste, Debris, etc.

9
Theoretically, the bio-degradation reaction involves three phases: lag phase,
biodegradation phase, and plateau phase [14][28]. The lag phase is a period of
adjustment to microorganisms after the introduction of a new substrate into the culture
mixture. In the first step of this phase, material consequently uptakes moisture and
results in dimensional swelling. This change happens because moisture penetrates into
the material and fills the spaces between polymer chains of the material. Over time,
the polymeric material experiences creep damage because of its nature of
viscoelasticity properties due to internal stress generated by the swollen dimension
after moisture absorption. Previous studies indicated that internal microcracks
occurred after polymeric materials absorbed moisture [29][30]. This result is
recognized as hygrothermal condition effects, and further caused nonlinear Fickian
moisture diffusion due to escalated moisture of microcracks [27][31]. Possibly,
polymer chains, especially polyester, could break down to scissions known as
hydrolysis, but may not exhibit molecular weight loss [6].
In the second step, enzymes or depolymerases from microorganisms begin to
attach or bind with the substrate materials and begin to operate the
biodegradation/catalyzing reaction while moisture and oxygen are provided
uninterruptedly. The decomposed materials further supply nutrients to the
microorganisms [16][17]. Hydrolysis and biodegradation might simultaneously occur

10
during this period, but it is believed that in this case there is more biodegrading
decomposition than hydrolysis. In the last step of lag phase, by-products such as CO2
are generated by enzymatic catalysis bio-reaction, which is related to the metabolism
of microorganisms.
The following example of the biodegradation phase can be observed during a
rapidly CO2 generation rate. In this period, the exponentially grown enzymes react
with the substrate material. After most of the substrate material is consumed, the
plateau phase occurs with stable or close-to-no bio-reaction. Hence, the
biodegradation ends. The simplified mechanism of compost is that organic matter
converts to carbon dioxide (mineralization) by enzyme reactions from
microorganisms. As the organic matter can be released back to the atmosphere via
composting techniques, the capacity of waste landfill is then to be seen as a reduction,
if all compostable materials are indeed composted. In sustainable views assessing the
environment impact of products, the results of the accumulation of CO2 evolution and
mineralization could estimate the required time period to convert polymeric products
back to nature, which is also been considered as life-cycle assessment [19].

11
1.2.4 Mechanics of Enzymatic Degradation
As mentioned earlier, the rate of enzyme bioreaction can be understood by
reflecting on the results of CO2 evolution during composting evaluation. The higher
the rate of CO2 evolves, the more rapidly enzyme bioreaction occurs. Enzyme kinetics
has often been studied to understand enzyme-substrates bioreactions. Enzyme kinetics
is also broadly applied in the areas of biology, bio-engineering, food science,
agriculture, environmental/soil science, etc. Also, enzyme kinetics can be recognized
as a rate/velocity of enzyme bio-reaction [32]. As bioreactions of composting
processes are mainly operated and dependent on enzymes, enzyme kinetics can be
theoretically applied to evaluate the enzyme kinetic during composting. The concepts
of enzyme kinetics were empirically and theoretically developed on composting
[33][34]. Further, enzyme kinetic results will specifically utilize exploration and
numerical quantification of the behavior of the biodegradation process during
composting. In enzyme mechanisms and kinetics, under single-substrate mechanisms,
Brown concluded the first biological and mathematical fundamental concept of
enzyme kinetics, which was presented as follows as a stoichiometric scheme model
[32][35][36] in 1902:
E+ S ±!! ES
!! E+ P (1)

12
Where E is free enzymes, S is substrate, ES is complex of activated enzyme
attached on substrate surface or substrate binds with enzyme, + k1 is the reaction rate
constant of enzyme adsorb to the S, - k1 is reaction rate constant of ES desorbing E, P
is by/end-products irreversibly produced from ES, and k2 is the reaction rate constant
of enzyme producing P.
Later, as summarized by Briggs and Haldane [37], in 1913, Michaelis and
Menten concluded the concept to a theoretical model. The concept equations have
been proved successfully in empirical cases of enzyme actions in 1924 by Kuhn.
Therefore, by the law of mass action with two crucial assumptions that are 1) under a
quasi-steady state, concentration of ES changes much slower than those of P and S,
and 2) total enzyme does not change over time, the Michaelis-Menten equations
expressed by following:
d[ES]/dt = k1 [E][S] – (-k1+ k2)[ES] (2)
In the assumption of the quasi-equilibrium/steady state (see Fig. 1.1 [36]), which
is d[ES]/dt = 0, after an initial burst phase on ES:
k1[E][S] = (-k1+k2)[ES] (3)

13
Figure 1.1. Biological enzyme, substrate, enzyme- substrate complex, and products concentration change with time
As it is understood that the concentration of free enzyme [E] is equal to the
concentration of total enzyme [ET] minus [ES], the equation (3) turns to:
k1([ET] - [ES])[S] = (-k1+k2)[ES] (4)
To solve equation (4) to get [ES]
[ES] = [ET] [S] /{[S] + (-k1+k2)/ k1} (5)
where (-k1+k2)/ k1 = Km is the Michaelis constant, then it turns to :
ES = [!!][!]! !!!
ES = !! !! !!!
(6)
The production rate, d[P]/dt, is equivalent with consumption rate of [ES] and
expressed as v, then :

14
v = d[P]/dt = k2[ES] (7)
Since a theoretical maximum reaction velocity, Vmax, can be observed when [ES]
equal [ET]. When all concentration of enzymes are saturated with substrate, this can
be expressed as:
Vmax = k2 [ET] (8)
Further, substituting (5) into (6) with concept of (7):
v = !!"#[!]! ! !!
(9)
The equation (9) is called the Michaelis-Menten equation and is used to predict
the velocity of enzyme reaction as a function of substrate concentration. Also, the
equation was been empirically proved by Monod [38]. In this equation, the Vmax and
Km are the kinetic parameters to the enzyme reaction. Figure 1.2 is the plot of the
Michaelis-Menten equation.
Figure 1.2. Plot of Michaelis-Menten equation with determination of Michaelis constant, Km

15
In order to extrapolate and determine the kinetic parameters, the
Michaelis-Menten equation is reciprocated as follows:
!!= !!
!!"#∙ ![!]+ !
!!"# (10)
Further the Lineweaver-Burk plot (Fig. 1.3) is used for determining the slope,
Km/Vmax, and intercept, 1/Vmax, of a plot of equation which incorporates 1/v and 1/[S].
The lower the value of Km, the higher the affinity of enzyme that occurs for the
substrate catalyst (k1) and/or less efficient of product production rates (k2). The higher
the value of Vmax, the faster the rate of reaction occurs during substrate catalyst
[33][34][39].
Figure 1.3. Lineweaver-Burk Plot of reciprocal Michaelis- Menten equation for determining Km/Vmax, and 1/Vmax

16
1.2 Research and Development (biocompositses)
As WPC has been developed for decades, researchers have found that the key
enhancement of mechanical and physical (moisture) properties is to modify the
interface between wood and plastic. Thus, the compatibilizer effects of WPCs have
then been widely studied. The conclusion of most of research studies has been that
maleic anhydride (MA) grafted on polyethylene and polypropylene (MA-PE / MA-PP)
are the common potential compatibilizers for WPCs [23][24][40][41]. In these studies,
approximately 20 to 30 percent improvement was observed on mechanical properties.
Water absorption also received considerable attention, resulting in about
50-percentage reduction [24]. With the performance requirements of wood
biopolymer composites, such as PHB/wood flour (WF) composites, adding
compatibilizers is now seen as one promising solution to solve the disparity of
hydrophobic-hydrophilic (PHB/wood flour) [22]. Better filler dispersion and/or
chemical interaction between filler and matrix are expected to occur. With improved
interfacial adhesion between wood and PHB, applied loads could be properly
transferred between filler and matrix without stress concentration, which is believed
to cause failure. Moreover, with the improved interfacial bonding (less gap), the rate
of moisture diffusion will decrease. Anderson [22] concluded that MA grafted on
PHB (PHB-g-MA) is a suitable compatibilizer for enhancing PHB/WF composites. In

17
his thesis, about 10 to 30 percent difference in strength was observed with different
processes because of side group of PHB-g-MA, succinic moieties, can possibly
provide hydrogen and/or chemical bonding with the hydroxyl group (-OH) of wood
fiber [23][40][41][42]. Moreover, the isocyanate group (-NCO) of isocyanate
adhesives is expected to bond chemically on the hydroxyl-rich functional group of
wood and partially with a polymer matrix [24][43][44]. A polymeric diphenylmethane
diisocyanate (pMDI) can be used as a compatibilzer for the WPCs. Anderson [22]
indicated that approximately 20~50 percent variation of mechanical properties and
water uptakes were found in the pMDI added PHB/WF composites. Also, the pMDI
had a more significant improvement than the other compatibilizers. This could be due
to the fact that the functional groups of isocyanates highly reacts between wood and
PHB. In conclusion, the PHB-g-MA and pMDI can provide an interfacial modifying
option and create physical and/or chemical bonding between wood and PHB.
Unfortunately, there is a lack of focus on compatibilizer effects of the
compostability of biocomposites. Adding compatibilizers provides an enhancement of
interfacial bonding between matrix and fillers, but the compostability of
biocomposites could also be influenced. It can be concluded that the possible reasons
are: 1) Reduction rate of moisture diffusion was observed and it retards bioreaction
from enzymes with substrates. This is because the enzymes are generated from living

18
microorganisms, which require water and oxygen to subsist; and 2) Less surface area
and internal microcracks were observed in the geometrically highly-packed (improved
interfacial bonding) of the biocomposite. For these reasons, internal defects such as
gaps and microcracks can provide capillary motion and trapping moisture, and will
not be seen to benefit enzyme molecular diffusion on the compatibilizer added
PHB/WF composites.
1.3 Objectives
As many of the above motivations described, this study will extend and contribute
to the fundamental and relevant knowledge of mechanisms of composting on
PHB/WF composites by crossing science from biological and agriculture science to
engineering bio-composites. For instance, initially (lag phase), escalation of
microcracking in the composites should be observed due to hygrothermal
conditioning effects. The concept of continuous damage mechanics (CDM) will be
applied to assist numerical evaluation of the growth of microcracking. The details of
the CDM will be further discussed in the Chapter 3. In the biodegradation phase,
enzymes highly active and mineralize the substrates (biocomposites). Recognizing the
theoretical enzyme reaction and kinetics can be conducted by applying the
Michealis-Menton concept with the results of substrate concentration changes and

19
mineralization rate. In addition, the scenario of microcracks explains the behavior of
non-linear moisture (non-Fickian) diffusion. Additionally, with sustainability
requirements, eliminating one energy consumption step of PHB purification can be
seen as one solution to achieve this goal, by blending wood flour and PHB-laden cell
debris to produce WPC. This process is essential to assist in the reduction of energy
consumption from production of PHB while maintaining its performance. Therefore,
this innovative study will be expected to provide knowledge and understanding of a
sustainable alternative PHB/WF composite.
The main objectives to be accomplished in this research study are :
a. To investigate the compostability and mineralization behavior of PHB/WF composites under a lab-scale composting evaluation
b. To understand hygrothermal effects of compatibilizers added PHB/WF composites by using continuous damage mechanisms to determine microcracking accumulation
c. To investigate the compatibilizers’ effects on compostability and enzymatic degradation mechanism of PHB/WF composites
d. To investigate processability and performance of extrusion grade of PHB/WF/Cell debris composites
e. To investigate the performance of injection molding grade PHB/WF/Cell debris composites

20
The expected outcomes and contributions of this innovative research are 1)
facilitating fundamental knowledge based of the hygrothermal and compatibilizer
effects on compostability of biocomposites; 2) providing estimation of carbon
footprint and life-cycle assessment of a compostable biocomposites through the
results of mineralization; and 3) developing using unpurified PHB for extrusion and
injection molding graded of PHB/WF composites.
In future studies, the assistances from this study will serve as an example of
evaluating and certifying compostable biocomposites and understanding
compatibilizer effects on biocomposites. Moreover, the innovated method of crossing
the science of enzymatic degradation kinetics with diffusion assumption can help to
recognize mineralization behavior and biodegradation mechanism of compostable
biocomposites. Finally, it can further provide information to support estimation of
carbon footprint (emission) and product life-cycle assessment by noteworthy
exploration of mineralization during composting.

21
1.4 References
[1] C. Clemons. 2002. Wood-Plastic Composites in the United States The Interfacing of Two Industries. Forest Products Journal. 52(6): 10 - 18
[2] P. M. Smith and M. P. Wolcott. 2006. Opportunities for Wood/Natural Fiber-Plastic Composites in Residential and Industrial Applications. Forest Products Journal. 56(3):4-11
[3] 「Wood-Plastic Composite Lumber vs. Wood Decking | Dovetail Partners INC.」 [Online]. Available: http://www.dovetailinc.org/reportsview/2010/responsible-materials/pdr-jim-bowyerp/wood-plastic-composite-lumber-vs-wood-decking. [Accessed: 22-Feb-2011].
[4] 「Municipal Solid Waste in the United States: Facts and Figures | Municipal Solid Waste | Wastes | US EPA」. [Online]. Available: http://www.epa.gov/epawaste/nonhaz/municipal/msw99.htm. [Accessed: 06-July-2011].
[5] R. Chandra and R. Rustgi. 1998. Biodegradable polymers. Progress in Polymer Science. 23(7): 1273-1335
[6] M. Vert, J. Feijen, A. Albertsson, G. Scott, and E. Chiellini. 1992. Biodegradable polymers and plastics. Cambridge [England]: Royal Society of Chemistry
[7] M. Flieger, M. Kantorová, A. Prell, T. Řezanka, and J. Votruba. 2003. Biodegradable plastics from renewable sources. Folia Microbiologica. 48(1):27-44
[8] Y. Doi and A Steinbüchel. 2001. Biopolymers - Polyesters III Applications and Commercial Products. 4(10). Weinheim ;Chichester: Wiley-VCH
[9] C. S. K. Reddy, R. Ghai, Rashmi, and V. C. Kalia. 2003. Polyhydroxyalkanoates: an overview. Bioresource Technology. 87(2): 137-146
[10] P. A. Holmes. 1985. Applications of PHB - a microbially produced biodegradable thermoplastic. Physics in Technology. 16(1):32-36
[11] S. Y. Lee. 1996. Bacterial polyhydroxyalkanoates. Biotechnology and Bioengineering. 49(1): 1-14
[12] R. A. J. Verlinden, D. J. Hill, M. A. Kenward, C. D. Williams, and I. Radecka, 2007. Bacterial synthesis of biodegradable polyhydroxyalkanoates. Journal of Applied Microbiology. 102(6): 1437-1449
[13] J. Zhang, S. McCarthy , and R. Whitehouse. 2004. Reverse temperature injection molding of BiopolTM and effect on its properties. Journal of Applied Polymer Science. 94(2): 483-491

22
[14] U. Pagga, D. B. Beimborn, J. Boelens, and B. De Wilde. 1995. Determination of the aerobic biodegradability of polymeric material in a laboratory controlled composting test. Chemosphere. 31(11-12):4475-4487
[15] D. S. Rosa, R. P. Filho, Q. S. H. Chui, M. R. Calil, and C. G. F. Guedes. 2003. The biodegradation of poly-β-(hydroxybutyrate), poly-β-(hydroxybutyrate-co-β-valerate) and poly(ε-caprolactone) in compost derived from municipal solid waste. European Polymer Journal. 39(2):233-237
[16] N. Trautmann. 1998. Composting in the classroom : scientific inquiry for high school students. Dubuque, Iowa: Kendall/Hunt Pub
[17] The BioCycle Guide to the Art & Science of Composting. Emmaus, Pa: JG Press, 1991.
[18] T. U. Gerngross. 1999. Can biotechnology move us toward a sustainable society?. Nat. Biotech. 17(6):541-544
[19] R. Narayan. 2004. Drivers And Rationale For Use Of BiobasedMaterials Based On Life Cycle Assessment (LCA). Global Plastics Environmental Conference, Atlanta, GA
[20] L. Jiang, J. Huang, J. Qian, F. Chen, J. Zhang, M. Wolcott, and Y. Zhu. 2008. Study of Poly(3-hydroxybutyrate- co-3-hydroxyvalerate) (PHBV)/Bamboo Pulp Fiber Composites: Effects of Nucleation Agent and Compatibilizer. Journal of Polymers and the Environment. 16(2): 83-93
[21] A. Gregorova, R. Wimmer, M. Hrabalova, M. Koller, T. Ters, and N. Mundigler. 2009. Effect of surface modification of beech wood flour on mechanical and thermal properties of poly (3-hydroxybutyrate)/wood flour composites. Holzforschung. 63(5): 565-570
[22] Scott P. Anderson. 2007. Wood Fiber Reinforced Bacterial Biocomposites: Effects of Interfacial Modifiers and Processing on Mechanical and Physical Properties. Master thesis, Washington State University
[23] D. Harper and M. Wolcott. 2004. Interaction between coupling agent and lubricants in wood-polypropylene composites. Composites Part A: Applied Science and Manufacturing. 35(3): 385-394
[24] M. J. A. Chowdhury, and M. P. Wolcott. 2007. Compatibilizer selection to improve mechanical and moisture properties of extruded wood-HDPE composites. Forest Products Journal. 57(9): 46-53
[25] K. Oksman Niska, M. Sain, Institute of Materials, Minerals, and Mining. 2008. Wood-polymer composites. Cambridge [England]: CRC Press ;Woodhead Pub.
[26] A. Klesov. 2007. Wood-plastic composites. Hoboken N.J.: Wiley-Interscience

23
[27] J. Zhou and J. P. Lucas. 1995. The effects of a water environment on anomalous absorption behavior in graphite/epoxy composites. Composites Science and Technology. 53(1): 57-64
[28] R. M. Maier, I. L. Pepper, and C. P. Gerba. 2009. Environmental microbiology, Second Edition. Academic Press
[29] E. G. Wolff. 1980. Microcracking in Graphite-Epoxy Composites. The Airspace Corporation. Report: SD-TR-80435.
[30] Y. J. Weitsman. 1991. Moisture in Composites: Sorption and Damage, in Composite Materials Series 4 - Fatigue of composite materials, K. L. Reifsnider, Eddit. Amsterdam ;New York: Elsevier. pp.385-429.
[31] L.-W. Cai and Y. Weitsman. 1994. Non-Fickian Moisture Diffusion in Polymeric Composites. Journal of Composite Materials. 28(2):130 -154
[32] R. T. Haug. 1993. The practical handbook of compost engineering. CRC Press [33] P. Agamuthu, L. C. Choong, S. Hasan, and V. V. Praven. 2000. Kinetic
Evaluation of Composting of Agricultural Wastes. Environmental Technology. 21(2): 185-192
[34] D. S. Whang and G. F. Meenaghan. 1980. Kinetic Model of Composting process. Compost Science and Utilization. 21(3):44 - 46
[35] A. J. Brown. 1902. Enzyme Action. Journal of the Chemical Society . 81:373-388 [36] H. Bisswanger. 2002. Enzyme kinetics : principles and methods. Weinheim
(Federal Republic of Germany): WILEY-VCH [37] G. E. Briggs and J. B. S. Haldane. 1925. A Note on the Kinetics of Enzyme
Action. Biochemical Journal. 19(2):338-339 [38] J. Monod. 1949. The Growth of Bacterial Cultures. Annual Review of
Microbiology. 3(1): 371-394 [39] H. D. Belitz, W. Grosch, and P. Schieberle. 2009. Food Chemistry. Fourth
Edditon. Springer [40] H. Dalväg, C. Klason, and H.-E. Strömvall. 1985. The Efficiency of Cellulosic
Fillers in Common Thermoplastics. Part II. Filling with Processing Aids and Coupling Agents. International Journal of Polymeric Materials. 11(1): 9-38
[41] R. Gauthier, C. Joly, A. C. Coupas, H. Gauthier, and M. Escoubes1998. Interfaces in polyolefin/cellulosic fiber composites: Chemical coupling, morphology, correlation with adhesion and aging in moisture. Polymer Composites. 19(3):287-300
[42] A. K. Bledzki, S. Reihmane, and J. Gassan. 1996. Properties and modification methods for vegetable fibers for natural fiber composites. Journal of Applied Polymer Science. 59(8):1329-1336
24
[43] E. Petinakis, L. Yu, G. Edward, K. Dean, H. Liu, and A. Scully. 2009. Effect of Matrix–Particle Interfacial Adhesion on the Mechanical Properties of Poly(lactic acid)/Wood-Flour Micro-Composites. Journal of Polymers and the Environment. 17(2):83-94
[44] A. Karmarkar, S. S. Chauhan, J. M. Modak, and M. Chanda. 2007. Mechanical properties of wood-fiber reinforced polypropylene composites: Effect of a novel compatibilizer with isocyanate functional group. Composites Part A: Applied Science and Manufacturing. 38(2):227-233

25
Chapter 2 Compostability and Mineralization Behaviors of a
Poly-3-hydroxybutyrate/Wood Flour Composite
Abstract
243 million tons of municipal solid waste was generated with a limited recovery
rate in 2009. One solution for this issue is to compost compostable materials, which is
the conversion of organic carbon to carbon dioxide (CO2) by metabolism of
organisms. Assessing the compostability and biodegradability of any compostable
materials can be achieved in accordance with ASTM standard D6400 and D5338.
Poly-3-hydroxybutyrate (PHB) is a biodegradable plastic produced by fermenting
natural carbon sources. With physical and mechanical properties similar to
polypropylene, PHB is being targeted to replace petroleum plastics in many
applications. Our hypothesis is that natural fibers such as wood flour (WF) can be
used as a reinforcement to expand the performance envelope while maintaining the
biodegradable properties of the polymer. A composting test was established in
accordance with ASTM D 5338 to evaluate the compostability of PHB and the
PHB/WF composite. The result showed that the PHB/WF composite reached over
60% mineralization after 117 days, which means that it can be classified as a
compostable material in accordance with ASTM D6400. The PHB/WF composite

26
resulted in a lower rate of CO2 and mineralization (34.2mg/g/hr0.5 and 17.5%/hr0.5)
than both the neat PHB and the positive control (cellulose paper). It is believed that
this result is because the complex structure and chemicals of wood influenced the rate
of mineralization in the composite. The composite formulation may be used to tailor
degradation rates. Notably, after being composted, the crystallinity of PHB resulted in
a 17% improvement. Additionally, the concept of diffusion is that small molecules,
such as moisture and enzymes, diffuse into a substrate over time. For this reason,
enzyme diffusion behavior can be recognized and numerically presented, while CO2 is
simultaneously generated as the end-product of bioreaction. After application of the
Fickian diffusion equation on the biodegradation phases, the mineralization Fickian
diffusion coefficient of PHB was about twice higher than that of the PHB/WF
composite (7.72 vs. 3.69 x 10⁻⁵ mm2/hr0.5), which could imply that the enzymes
showed a slower diffusion in the PHB/WF composite than in PHB. Additionally, after
applying the Michaelis-Menten equation to determine enzyme kinetics, the results
indicated that enzymes had a higher bioreaction rate with PHB than with the PHB/WF
composite.
Key words: Poly-3-hydroxybutyrate, Compostability, Mineralization, Degradation,
Fickian Diffusion

27
2.1 Introduction
Durability, a benefit of most plastics, is now viewed as problematic with some
products because it may require more than 100 years to degrade after the product is
disposed of. According to the US Environmental Protection Agency (EPA), 243
million tons of municipal solid waste was generated in 2009 and only ca. 2 million
tons out of 30 million tons of disposed plastic were recovered in the US during 2009
[1]. These plastic wastes contained ca.19 million tons of non-durable plastic goods
including disposable products, containers, and packaging plastics, and only ca. 9% of
those materials were recycled. Interpretation of these statistics indicates that about
17.3 million tons of plastic wastes were land-filled in 2009[1]. This statistical result
indicates that recycling is still a challenge in the US. Another solution in waste
management is to utilize biodegradable biopolymers that are now emerging as a
biodegradable option to reduce petroleum dependent and natural organic fillers, such
as natural fibers and starch; such reinforcement may provide additional benefits to
expand the performance envelope while maintaining biodegradability. Typically,
organic materials (wood, paper, etc.) and food wastes are used as carbon sources for
the composting process. With respect to the carbon cycling ecosystem, this process
converts organic carbon to carbon dioxide (CO2), while the remaining organic
material can be used as a soil amendments that provides nutrient retention and reduces

28
environmental impact by using chemical nutrients and also reduces the cost of
landscaping. Several studies [2][3][4] have indicated that organic matter is carried out
from the compost mixture and then used as an energy source for microorganisms
during composting. Moreover, because biopolymers are mainly comprised of carbon,
hydrogen and oxygen, they may also be converted to soil amendments in this process.
To evaluate the compostability or biodegradability of an organic material under
aerobic conditions, a test was developed to understand biodegradability and
specification of compostable polymeric materials in accordance with ASTM D 5338
and D 6400. This test can estimate and monitor the rate of CO2 evolution and
mineralization on the compostable materials for further analysis.
Currently, biopolymers are commercially produced by fermentation of sugars and
other natural carbon sources. Two such bio-polymers, polylactic acid (PLA) and
poly-3-hydroxybutyrate (PHB), one of most common used biopolymer in a family of
Polyhydroxyalkanoates (PHAs), have been studied for their biodegradability.
Commercial PLA bottles [5] have been evaluated for compostability and
biodegradation using both full and laboratory scaled tests in accordance with ASTM
D 5338. Moreover, PHAs and PHAs/natural filler composites have been studied, and
it has been concluded that these materials can be biodegraded under different
environments, such as compost [6][7][8][9], seawater [10] , enzymatic condition

29
[11][12][13][14][15][16], and sewage sludge [17]. However, biodegradability varies
based on the type of PHAs. After a certain period of biodegradation, PHAs test
specimens become undetectable, causing difficulty in collecting tested samples for
further evaluation, such as morphology and thermal properties. Also, after a
significant weight loss of the PHAs natural fillers-reinforced composites, the
mechanical properties become undetectable because the samples disintegrate during
recovery or dimensional reduction made it unable to carry the load [6]. In this case,
the dimensional reduction behavior of specimens can be used as a mechanical safety
factor.
After introducing a biodegradable material into a composting environment, the
moisture first penetrates into the material, and then the microorganisms react.
Furthermore, during the composting, moisture plays a limiting factor in the operation
and degradation of organic matter in microorganisms. The rate of moisture
penetration (moisture diffusion behaviors), which has been studied on natural
filler-reinforced composites [18][19][20], takes on the role of operating
biodegradation. If mineralization vs. time can fit the Fickian diffusion equation, it can
indicate the limiting steps and also explain the mineralization diffusion behavior of
materials. Therefore, by understanding the rates of CO2 evolution and mineralization
diffusion behavior of the products, the carbon cycle period and amounts need to be

30
estimated. In addition, in biological study most bioreactions have three different
phases: lag, bioreaction (biodegradation), and decreased/plateau phase [8][21]. During
the lag phase, the enzyme starts reacting with the substrate followed by a rapid
reaction which is seen as the bioreaction phase. To fundamentally understand the
enzymatic reactions during composting, many studies [22][23][24] have indicated that
by using enzyme kinetic equations, i.e. the Michaelis-Menten equation, the reaction
can be numerically compared.
The goal of this study was to demonstrate that PHB/Wood Flour (WF) composite
can be classified as a compostable material by testing under laboratory scale
conditions in accordance with ASTM D5338 and that output data can be further
applied based on Fickian diffusion equation to understand mineralization behavior.
The specific objectives were to: 1) identify the compostability of PHB/WF composite
by using a lab-scale apparatus; 2) evaluate the mineralization, properties, and
morphology change of PHB/WF composite during composting; 3) apply the Fickian
diffusion equation and Michealis-Menten equation to understand mineralization
diffusion behavior and enzyme reaction kinetics.

31
2.2. Materials and methods
2.2.1 Materials
Purified PHB powder was provided by Ningbo Tianan Biologic Material Co.,
Ltd., Ningbo, China. 60-mesh wood flour (Pinus) was provided by American Wood
Fibers, Schofield, WI. Chromatograph paper (CP; Fisherbrand® CHR200) made from
cotton cellulose with a 3.3mm thickness was provided from Fisher Scientific, Inc.
The compost inoculums were about four-month-matured and provided by the
Washington State University compost facility. The compost was sieved through a
sieve screen with openings of 10 mm diameter. Proportions of the compost feedstock
[25] are shown in Table 2.1. Moisture content of the compost was adjusted to ca.
50%.
Table 2.1 The proportion of compost feedstocks
Manure Ash Compost Food Waste Yard Waste Dirt Wood Chips*
78% 10% 10% 1% 0.5% 0.5% 5%*
* added during the wet season to provide porosity

32
2.2.2 Testing sample preparation
In accordance with ASTM D 5338, analytical-grade cellulose was used as the
positive control for comparison with other plastic materials. In order to reduce error of
surface area, the control and different testing materials were made into a flake shape
with particle diameter of ca. 10mm and thickness of ca. 0.5mm).
The wood flour was dried in a rotary steam tube drier and its moisture content was
ca. 3.0%. PHB and dried wood flour were placed into a plastic bag with a ratio of
50/50 dried wt% and manually mixed by vigorous shaking and tumbling for ca. 5
minutes. The PHB/WF mixture was then compounded by a co-rotating twin screw
extruder (Leistriz ZSE-18) with a screw diameter of 18 mm and length/diameter (L/D)
ratio of 40 equipped with a volumetric feeder. To improve melt strength and reduce
thermal degradation, a declining temperature profile of the extruder was applied
during the extrusion process. The extrusion temperature profile was set at
170/175/170/165/164 /163/162/160oC, from the feeding throat to the die adapter. The
screw speed was maintained at 125 rpm. Under this speed, the residence time of the
materials in the barrel was estimated to be about 1.5 minutes. The extrudate was air
cooled and pelletized.
To maintain a highly polymer penetration into the wood lumens, the composite
pellets were injection molded by an injection molding machine (Sumitomo SE 50D).

33
Injection temperature profile was controlled at 175/180/175/170oC from the feeding
zone to the nozzle. Mold temperature was 60oC. The filling pressure was set at 1700
kgf/cm2 and the packing pressures were 1250 kgf/cm2 and 1360 kgf/cm2 for the first
and second stage, respectively. The injection molding cycling time was about 75
seconds. The molded specimens were then hot-pressed into 0.5 mm thickness
composite film with a multi-step press method until reaching 15MPa for 15 minutes at
170oC. The composite film was followed by air cooling and chopped to a flake shape
(a particle diameter of ca. 12 mm). Tensile properties and density of the injection
molded specimen were evaluated in accordance with ASTM D 638. The composite
had a density of 1.31, tensile strength of 23.3 ± 0.94 MPa, tensile modulus of 9.7 ±
0.28 GPa, and 0.4% strain at break.
PHB flake was prepared by hot-pressing PHB powder at 170oC and chopped to a
flake shape (a particle diameter of ca. 15 mm and thickness of ca. 0.7 mm).
Chromatograph paper was also chopped into flake shape with a particle diameter of ca.
12 mm.

34
2.2.3 Composting apparatus and procedure
In this study, the procedures outlined in ASTM D 5338 were used to assess
biodegradation of plastics in a laboratory scale-compost experiment, and the
apparatus set-up was also built in accordance with ASTM D 5338 (see Fig. 2.1). The
system consisted of determining the degree and rate of mineralization of plastic
materials from organic carbon to evolved carbon dioxide. A series of bioreactors
(each in triplicate) containing blank (compost only), cellulose flake (positive control +
compost), PHB flake (polymer reference + compost), and PHB/WF composite flake
(sample + compost) were tested via this system. The ratio of inoculums mixture was
6:1 (compost:flake samples) in dry mass. The biodegradation test was carried out
under a laboratory-controlled condition: CO2-free and humidified inlet air had a
constant flow of ca. 90 ml/min., outlet air after reactors was trapped by 12 CO2
trappers, and 12 bioreactors were placed in a 58 ± 2oC a water bath throughout the
entire experimenting period.
The CO2-free and humidified inlet air was generated by compressing air through a
sodium hydroxide (NaOH) solution to remove CO2 and then passed through deionized
(DI) water to humidify the inlet air. To maintain a consistent condition, the
moisturized and CO2-free air was divided and adjusted by flow meters, and further
input to the bottom of each bioreactor. The bioreactor was built using a glass jar of

35
internal volume 2 L with a screen placed at the bottom of jar to avoid channeling and
provide equally distributed inlet air in the compost. Each mixture of inoculums was
mixed and placed into jars with about 20 mm space from the lid for outlet air
distributed to CO2 trappers. All mixtures of inoculums were stirred weekly to avoid
channeling and to provide proper aeration and contact between sample and compost.
A set of condensed water collectors was placed before each CO2 trapper. The 200 ml
CO2 trappers contained 2.5 M NaOH solution to collect the amount of CO2 produced
by each bioreactor. The following CO2 trapping reaction was discussed as in ASTM D
5338:
NaOH + CO2 → NaHCO3 --------------------------------------------------- (1)
then
NaHCO3 + NaOH → Na2CO3 + H2O ----------------------------------------- (2)
5 ml aliquots were removed from each trapper and then titrated with 0.5M
hydrochloric acid (HCl) solution 3 times a week, and the CO2 traps were changed
weekly. During the titration, CO2 was chemically reacted and removed as follows:
NaCO3 + HCl → NaHCO3 + NaCl ------------------------------------ (3)
then
NaHCO3 + HCl → NaCl + H2O + CO2 ------------------------------------ (4)

36
Initially, 5 drops of phenolphthalein indicator (pink color) were added to the 5 ml
aliquots and further titrated until the end-point, as indicated when the color turned to
colorless (as in titration formula 3). In addition, 5 drops of methyl orange indicator
were then added, and then titrated until the color turned from orange to red (as in
titration formula 4). The amounts of HCl consumed during the second titration
(formula 4) were used to calculate and obtain the evolving CO2 in accordance with the
following equation [4]:
CO2 (g) = VHCl (ml) x CHCl (molar) x 44 /1000 ---------------------------- (5)
where VHCl is the volume of HCl consumed in the second titration; CHCl is the
concentration of HCl solution; and 44 is the molar mass of CO2.
Further, the percentage of mineralization can be calculated in accordance with
ASTM D 5338:
Mineralization (%) = [(CO2)sample –(CO2)blank]/ ThCO2 (eq. 2.1)
where (CO2)sample is the cumulative amount of CO2 obtained from the titration
result of each sample mixture inoculums with the time; (CO2)blank is the cumulative
amount of CO2 obtained from the titration result of each blank inoculums (compost
only) with the time; and ThCO2 is the theoretical quantity of each sample CO2
evolution, which can be calculated based on the following equation:

37
ThCO2 = Msample x TOCsample x 44 /12 (eq. 2.2)
where Msample is the total dried mass of the sample material which was introduced
to the compost inoculums; TOCsample is the proportion of total organic carbon (TOC)
in the dried sample material; 44 is molar mass of CO2; and 12 is the atomic mass of
carbon.
Because all of the sample materials used in this study were assumed to be
compostable material, the following test was based on an evaluation method on TOC
of compost and/or municipal solid waste (MSW). In compost materials, TOC can be
estimated via a formula of reduction from total organic matter (TOM) on a prediction
equation of MSWs (waste paper based) and city refuse compost experimental results
[26]:
TOC = 1.703 + 0.520 * TOM (eq. 2.3)
According to APHA 2540 D and E, TOM content determines ignition loss of oven
dried samples by using a muffle furnace at 550oC for 30 minutes, and then being
weighed after cooling in a desiccator. The chemical characteristics of each sample
material are shown in Table 2.2.
After the composting test ended, which was the day the PHB/WF composite
reached 60% of mineralization in this study, the mixture inoculums were taken out of

38
the bioreactors and moisture content and pH value of the inoculums were tested. A pH
meter was used to measure the pH values. Each sample was diluted in a 5:1 w/w ratio
of DI water to each dried mixture inoculums. The pH value of each sample was
recorded after each sample was placed in a 25± 1oC water bath for 30 minutes.
Table 2.2 The chemical characteristics of the materials
Compost CP PHB PHB/WF
Composite WF
TOM (%) 81.1 99.4 99.7 99.4 99.2
Ash (%) 18.9 0.6 0.3 0.6 0.8
TOC (%) 43.9 53.4 53.5 53.4 53.3
ThCO2 402.2 81.2 81.5 81.2 81.1
Figure 2.1 Schematic of the lab-scale material compostability evaluation set-up system

39
2.2.4 Thermal analysis
To evaluate thermal degradation, thermal stability and weight loss, the sample
materials were first oven dried at 103 ± 2oC until weights were stabilized. About 5 to
10 mg of each dried sample was placed in an aluminum crucible and then placed in
thermo-gravimetric analysis (TA-TGA) with a heating rate of 20oC/min from room
temperature (RT) to 550 oC and air flow rate of 100 ml/min. of inlet inert gas, nitrogen
(N2), which prevents specimen oxidation during the heating process.
Thermal properties were determined and evaluated at day 1, 90, and 117
(incubation time) by using a TA Instrument DSC 2920 calorimeter. Testing samples
were removed from each bioreactor and as much compost or remaining material as
possible was washed out on the surface of the samples with DI water. After being
oven dried (ca. 80oC) and placed in a desiccator until cooled to RT, about 5-10 mg of
flake samples were placed into an aluminum crucible, and further, the sample pan was
put in the differential scanning calorimeter (DSC) at a heating rate of 10oC/min from
30 to 200oC in a N2 atmosphere with a air flow rate of 60 ml/min. The first scan was
used to evaluate the melting temperature (Tm) which was present in the endothermic
transition after material biodegraded, and then integrated to obtain the entropy of the
samples to compare the biodegradation effects on the crystallinity of the sample
materials. Crystallinity was calculated by the following equation:

40
Crystallinity (%) = (Δ Hmelt x 100) / (Δ Href x msample) (eq. 2.3)
Where ΔHmelt is the measured energy on melting sample; Δ Href is the reference
energy required to melt the sample (PHB :146J/g [27]); and msample is the sample mass
placed in the aluminum crucible.
2.2.5 Fickian Diffusion Coefficients
During the composting test, the moisture was first penetrated into sample
materials followed by biodegradation reaction. Moisture penetration behavior can be
discussed and studied by using the Fickian diffusion equation. Considering geometry
effects, a geometric edge correction factor was also calculated to obtain the true
diffusion constant (D). Furthermore, moisture diffusion behavior is an important role
of operating biodegradation. If the evolved CO2 vs. time can fit the Fickian diffusion
equation with a geometric edge correction, it will indicate the limiting steps and also
explain the mineralization diffusion behavior of the materials. The Fickian diffusion
equation [18] [19] is shown below:
!! = π !!!!"#
! !!!! !
! (eq. 2.4) and ! = !!
!!! !!! !
! (eq. 2.5)
where DA is the apparent diffusion constant; Msat is the maximum mineralization
percentage at the end of the test period; dMt/d√t is the slope of mineralization over

41
square root of time relation; and h, L, and W are the height, length, and width of
sample.
2.2.6 Enzymatic Kinetic
The enzyme kinetic is known as an accurate and reliable way to determine
enzymatic reaction. It can also provide numerical elementary mechanisms of the
reactions. The concept of the Michaelis-Menten kinetic [22][23][28] is widely used in
compost and agriculture science. Since mineralization is driven by bioreaction (faster
bioreaction occurs at a higher rate of mineralization), the results of mineralization
may be used to obtain the kinetic constants from the Michaelis-Menten equation
[22][23][28]. This will further facilitate understanding of enzyme bioreaction
behavior on PHB/WF composites, and possibly provide knowledge concerning the
composting behavior on the composite for future research studies. The equation can
be presented as:
v = !!"#[!]! ! !!
(eq. 2.6) or !!= !!
!!"#∙ ![!]+ !
!!"# (eq. 2.7)
where Km is Michealis constant, v is production rate (rate of mineralization, %/day),
Vmax is theoretical maximum reaction velocity, and [S] is the substrate (ratio of
converted carbon/ash, g/g).

42
Further, the Lineweaver-Burk plotting method can be used to determine the slope,
Km/Vmax, and intercept, 1/Vmax of a plot of equation which incorporates 1/v and 1/[S].
The lower the value of Km, the higher the affinity of enzyme occurs for the substrate
catalyst and/or less efficient of products production rate (CO2 in this case). The higher
the value of Vmax, the faster the rate of reaction occurs during substrate catalyst
[22][23][28].
2.2.7 Morphology
The surface morphology of sample materials (initial and 90 days) was observed by
using a scanning electron microscope (FEI SEM, FEI 200F). The tested samples,
removed from mixture inoculums at day 90, were washed with DI water to remove
the compost debris and then dried at 80oC. The control samples were also oven dried
to remove moisture, which could influence the quality of coating. All the prepared
samples were mounted on aluminum stubs and gold-coated by a sputter coater.

43
2.3. Results and discussion
2.3.1 Thermal degradation
Studies have shown that the degree of crystallinity on PHB can be increased by
reinforcement with natural fibers [29][30]. It is believed that when polymer chains are
highly packed (i.e., they have a high degree of crystallinity) in the same free volume,
the polymer chains require more input energy to mobilize. Thermal degradation
continues to occur with further heating. TGA results (Fig. 2.2) indicated that wood
flour enhanced the thermal stability of PHB/WF composite compared to neat PHB,
wood flour, and the PHB/WF composite. The weight loss of the PHB/WF composite
started decreasing at ca. 10oC higher than neat PHB. In addition, the peaks of thermal
degradation (Td) for the PHB and PHB/WF composite had 10oC difference (273oC vs.
283oC) from the derivative thermogravimetry (DTG) curves.

44
Figure 2.2 Weight loss and derivative thermogravimetry of PHB, WF, and PHB/WF composite
2.3.2 CO2 evolution and mineralization results
In composting chemistry, organic matter chemical breakdown is mainly reacted
by enzymes that are produced from microorganisms. In this system, complex organic
matters of mixture inoculums are depolymerized by the enzymes, and then the
microorganisms absorb the breakdowns as energy sources into their cells and are
further metabolized [3][4]. Enzymes, in the case of aerobic microorganisms, can
convert organic matter to CO2 and remaining water, energy, and residuals. This
45
conversion is known as a mineralization process. Therefore, the rate of enzyme
reaction and rate of mineralization have a positive relation.
In this study, as observed for the three different materials (CP, PHB, and
PHB/WF composite), a lag phase of biodegradation occurred during the first week of
compost experimentation. In this lag phase, because the testing materials had just
been introduced into the mixture inoculums, the microorganisms did not fully attach
with the test samples, and/or the low moisture content (MC) of the samples did not
benefit the bioreaction from the enzymes. This resulted in a lower rate of CO2 gas
evolution than that in the biodegradation phase (Table 2.3). After the MC of the
samples equilibrated, the high bioreaction occurred within the biodegradation phases,
which followed after the lag phases. However, under high humidity and temperature
conditions, hydrolytic cleavage on the polyester [13] [31], PHB (in this case), can
occur. The PHB polymer chain may have fractured and reduced to shorter polymer
chains, but no CO2 or weight loss occurred [32] [33]. Moreover, the polymer chains of
hydrolyzed cleavage possibly provided more contact surface which could have
advanced the bioreactions. The biodegradation phase was followed after the lag phase
with a high rate of CO2 evolution appeared until day 47. An alleviated biodegradation
phase occurred beginning on day 49. Due to the similar amount of total theoretical
CO2 evolution of the different materials, the mineralization of each material had the
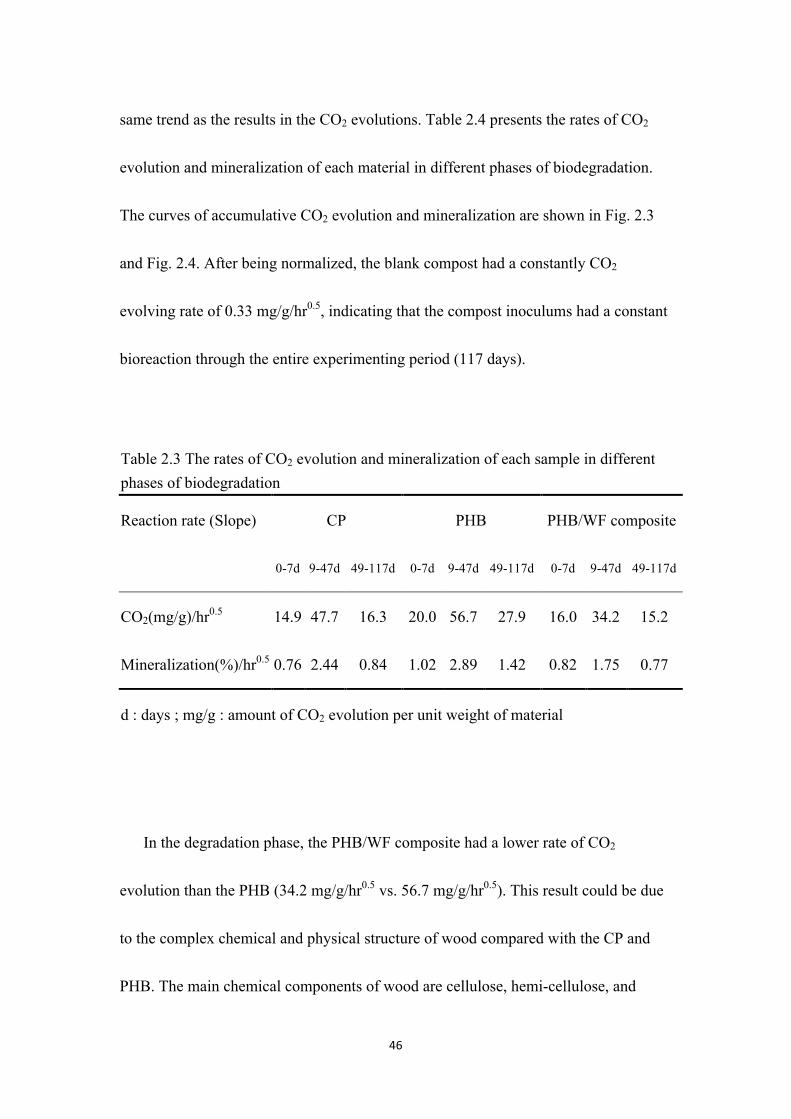
46
same trend as the results in the CO2 evolutions. Table 2.4 presents the rates of CO2
evolution and mineralization of each material in different phases of biodegradation.
The curves of accumulative CO2 evolution and mineralization are shown in Fig. 2.3
and Fig. 2.4. After being normalized, the blank compost had a constantly CO2
evolving rate of 0.33 mg/g/hr0.5, indicating that the compost inoculums had a constant
bioreaction through the entire experimenting period (117 days).
Table 2.3 The rates of CO2 evolution and mineralization of each sample in different phases of biodegradation
Reaction rate (Slope) CP PHB PHB/WF composite
0-7d 9-47d 49-117d 0-7d 9-47d 49-117d 0-7d 9-47d 49-117d
CO2(mg/g)/hr0.5 14.9 47.7 16.3 20.0 56.7 27.9 16.0 34.2 15.2
Mineralization(%)/hr0.5 0.76 2.44 0.84 1.02 2.89 1.42 0.82 1.75 0.77
d : days ; mg/g : amount of CO2 evolution per unit weight of material
In the degradation phase, the PHB/WF composite had a lower rate of CO2
evolution than the PHB (34.2 mg/g/hr0.5 vs. 56.7 mg/g/hr0.5). This result could be due
to the complex chemical and physical structure of wood compared with the CP and
PHB. The main chemical components of wood are cellulose, hemi-cellulose, and

47
lignin. Each of these chemicals require certain conditions (enzymes, humidity, and
temperature) and time (in the scale of years) to achieve depolymerization or decay
[34][35]. For example, lignin, which ties cellulose microfibers together and forms the
structure of wood and functions as rigid polymers, has complex chemical structures
and anti-enzyme property [4]. Moreover, strong mechanical interlocking occurs when
polymer penetrates into porous wood by high pressure from the injection molding
process [36]. The PHB-rich skin of the composite was caused by the heating
processes. Morphologically, during biodegradation, the PHB located at the surface
was first biodegraded, and then wood flour was exposed to the enzymatic
environment. Another possibility is that in the high humidity condition, after the wood
absorbed moisture, the swelling of the wood flour created gaps between the wood
flour and polymer, which created a gap for moisture and/or for enzyme penetration.
Furthermore, enzymes can depolymerize PHB which is located in wood lumens. A
retarded rate of CO2 evolution and mineralization (Figs. 2.3 and 2.4) was observed
after day 47. The reasons for this retardation may be because the enzymes have
difficultly reacting with PHB that is located in the inmost depth of wood lumens while
simultaneously degrading some wood chemicals. Moreover, after the test ended, some
of the mixture inoculums had a loss of moisture less than 50% (Table 2.4). Since
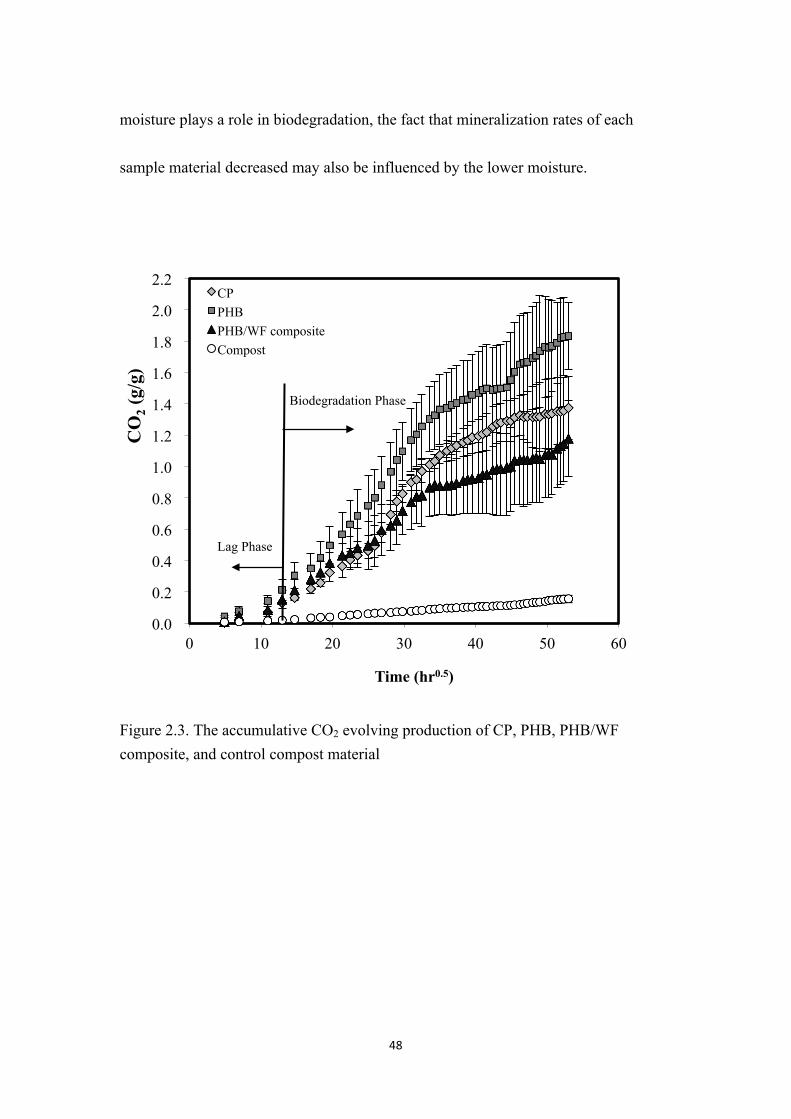
48
moisture plays a role in biodegradation, the fact that mineralization rates of each
sample material decreased may also be influenced by the lower moisture.
Figure 2.3. The accumulative CO2 evolving production of CP, PHB, PHB/WF composite, and control compost material
0.0
0.2
0.4
0.6
0.8
1.0
1.2
1.4
1.6
1.8
2.0
2.2
0 10 20 30 40 50 60
CO
2 (g/
g)
Time (hr0.5)
CP PHB PHB/WF composite Compost
Lag Phase
Biodegradation Phase

49
Figure 2.4. The accumulative mineralization of CP, PHB, and PHB/WF composite
Table 2.4 The average moisture content and pH value of control, CP, PHB, and PHB/WF composite
Control CP PHB PHB/WF composite
MC(%) 28.8 (16.0)* 28.8 (9.5) 52.9 (22.0) 41.4 (34.6)
pH value (at 25oC) 8.3 (0.1) 8.7 (0.7) 8.5 (0.1) 8.6 (0.4)
*: standard deviation
As in the discussion of the thermal degradation results, an increased degree of
crystallinity in PHB was indicated by reinforcement with natural fibers, which
function as nucleating points [30][37] for polymer crystallization. With a higher
0%
10%
20%
30%
40%
50%
60%
70%
80%
90%
100%
0 10 20 30 40 50 60
Min
eral
izat
ion
Time (hr0.5)
CP PHB PHB/WF Composite

50
degree of crystallinity on PHB/WF composite, a lower rate of depolymerization was
expected. However, in the literature [13][15] it has been noted that if the mixture
inoculums (natural compost) are not isolated on a specific enzymatic condition,
biodegradation could occur simultaneously in the amorphous and crystalline regions.
In accordance with ASTM D 5338 and D 6400, in a natural compost condition, a
polymeric material mineralized over 60% within 180 days can be classified as a
biodegradable material. In this study, ca. 60.2% of the PHB/WF composite was
mineralized after 117 days. Therefore, the PHB/WF composite can be classified as a
biodegradable material.
2.3.3 Thermal analysis
The degree of crystallinity changed on PHB samples by sampling on days 1, 90,
and 117 (shown in Table 2.5) during the composting test. The melting point shifted
down about 3oC from 168.3oC (initial), compared with the PHB collected on days 1
and 117. The enthalpy of melting (ΔHm) and degree of crystallinity increased with
increasing composting time (ca. 17% increase in both enthalpy of melting and degree
of crystallinity). This result could possibly be explained that the amorphous region of
PHB had first biodegraded, followed by the crystalline region. On the PHB/WF
composites, upon day 90 sample collection, most of sample flakes were broken apart

51
or difficult to distinguish from the natural compost. After a certain amount of PHB
degraded, the declined mechanical properties of the composite were expected because
wood flour had less adhesion for sticking tighter to form a composite. Furthermore,
the flake shape samples could have been broken into smaller particles during the
mechanical weekly stirring (one requirement in ASTM D 5338 to maintain aeration).
Therefore, the degree of crystallinity on the PHB/WF composite became challenge to
detect after a certain period of testing (90 days in this case).
Table 2.5 Thermal properties of PHB and PHB/WF in different sampling times
Day 1 Day 90 Day 117
PHB
Tm 168.3(0.7) 167.0(2.0) 165.4(0.9)
ΔHm (J/g) 78.7(1.4) 87.6(4.5) 92.1 (1.1)
Crystallinity (%) 53.9(0.9) 60.0(3.1) 63.1(0.8)
PHB/WF composite
Tm 168.0(0.5) - -
ΔHm (J/g) 88.5(0.6) - -
Crystallinity (%) 60.6(0.4) - -

52
2.3.4 Fickian diffusion coefficient
As moisture is a key of limitation for operating bioreactions by enzymes that are
produced from microorganisms, moisture penetration is a major influencing factor on
the rate of mineralization. The behavior of small molecules (liquid or gas) transported
throughout solid materials can be numerically presented by the Fickian diffusion.
However, some non-Fickian behavior could be found during the lag phase and also
may show in the alleviated biodegradation phase. The maximum percentages of
mineralization (Msat) were taken at the end of the experiment (day 117), and the
slopes of mineralization over square root of time were taken during the
biodegradation phase (days 9-47). The plot of percentage of mineralization of each
sample material in contrast with the square root of time is shown in Fig. 2.4. The
results of different rates of mineralization in each sample with different periods are
shown in Table 2.3. The PHB/WF composite had a lower Fickian coefficient of
3.69E-5 mm2/hr0.5 compared with PHB (7.72E-5 mm2/hr0.5). The reason for the
PHB/WF composite had a low Fickian coefficient could be discussed by the complex
chemicals of wood and the increased degree of crystallinity induced challenges to
enzyme to degrade the composite.

53
2.3.5 Enzymatic Kinetic
The enzymatic kinetic constant, Michaelis constant, Km, and theoretical maximum
reaction velocity, Vmax, were obtained after applying the Lineweaver-Burk plotting
method (Fig. 2.5) with the calculated results from mineralization. The results shown
in Table 2.6 indicate that the PHB had a highest value of Km and Vmax, which
indicates that PHB that had the lowest rate of enzyme binding with PHB, but the
highest enzyme reaction, and produced more CO2 than CP and the PHB/WF
composite. In other words, the enzyme reacted more efficiently on PHB than CP and
the PHB/WF composite. This result also corresponds with the results found in the
mineralization Fickian diffusion. Application of the Michaelis-Menten equation to
analyze the enzyme reaction kinetic during the composting process and can help to
understand the process of composting compostable biocomposites.

54
Figure 2.5 Lineweaver-Burk plot of rate of mineralization and substrate content
Table 2.6 Enzyme kinetic constants of different materials
Km Vmax (1/day)
Cellulose paper 562.2 0.291
PHB 776.7 0.494
PHB/WF composite 526.7 0.325
2.3.6 Morphology
The comparison of initial sample and the sample debris after being composted is
shown in Figure 2.6. White rot fungi could be also observed on the composted sample
of cellulose paper and PHB/WF composite. The surface erosion of the tested samples
were observed and studied by SEM. As shown in Fig. 2.7, the marked areas were
y = 163.52x + 3.4382
y = 383.37x + 2.0259
y = 171.28x + 3.0727
-4
0
4
8
12
16
20
24
28
32
-0.04 0 0.04 0.08 0.12 0.16 0.2
1/(m
iner
aliz
atio
n/da
y)
1/(carbon/ash)
CP PHB PHB/WF Composite

55
perceived as surface erosion by enzymes and/or microorganisms, in comparison with
the first test and testing after 90 days. On the edge side of the PHB/WF composite,
less evidence was found on the wood flour surface, which confirms our earlier
statement: Wood required more time or was too difficult to biodegrade. Additionally,
the PHB/WF composite samples swelled and the structure loosened under the
hygrothermal conditions and also showed enzyme erosion. The cross section of
PHB/WF composite samples were not able to be prepared by microtone, but ideally,
the longitudinal lumen and the transversal opening (pits) of the wood may possibly
provide a path for enzymes to penetrate into the lumen. However, there is not
sufficient evidence to prove this hypothesis by using SEM technology.
Figure 2.6 Comparison of initial samples (CP, PHB, and PHB/WF composite) and after 90days composted sample debris

56
Figure 2.7 SEM Morphology of different sample (CP, PHB, PHB/WF composite) surfaces on day 1 (a) and after 90 days (b)
2.4. Conclusion
A similar amount of theoretical CO2 of CP, PHB, and PHB/WF composite
resulted because the constituted chemical components of these materials are carbon,
oxygen, and hydrogen. The CO2 evolution results showed that the PHB/WF
composite reached over 60% mineralization after 117 days, while the CP and PHB
had reached ca. 70% and 90% mineralization. According to ASTM D 5338, PHB/WF
composite can be classified as a biodegradable and compostable material. During the
biodegradation phase (days 9-47), rates of CO2 evolution in PHB/WF composite and

57
PHB were 34.2 mg/g/hr0.5 and 56.7 mg/g/hr0.5. This indicates that more rapid
bioreaction occurred in PHB than in the PHB/WF composite. After mathematically
calculating the percentage of mineralization of each material, the PHB/WF composite
had a lower mineralization rate (ca. 1.75%/hr0.5) than neat PHB or the positive control,
CP (ca. 2.89 and 2.44%/hr0.5, respectively). The complex structure and chemical
structure of wood is believed to have caused the lower mineralization of the PHB/WF
composite than that of the neat PHB. The DSC results indicate that the crystallinity of
the PHB in the composite increased (ca. 10% higher than neat PHB) by adding wood
flour, and further slightly enhanced thermal stability. Under natural compost
conditions, i.e., a condition of unisolated enzymes, the crystalline and amorphous
region of PHB was expected to change by biodegradation, e.g. increased 17% of
crystallinity of PHB. During composting, one limiting factor for microorganisms
operating the biodegradation process is moisture, which becomes a key of operating
biodegradation. After mineralization vs. time fit in the Fickian diffusion equation, the
mineralization diffusion behaviors of the three materials were numerically quantified.
The results of mineralization of Fickian diffusion on PHB and PHB/WF composite
were 7.72 and 3.69 x 10⁻⁵ mm2/hr0.5, respectively. By applying the Michaelis-Menten
equation to determine the fundamental enzyme kinetic and understanding, the results
successfully indicated the same results in the mineralization Fickian diffusion: a

58
higher enzyme reaction occurred in PHB than for the PHB/WF composite. SEM
morphology showed evidence of erosion on the surface of both the PHB and PHB/WF
composite, but there was less evidence on the wood flour. This result indicates that
wood flour requires more time to fully degrade. To summarize, according to ASTM
D6400, the PHB/WF composites could still be classified as a compostable and
biodegradable material based on the results in this study. The concepts of the Fickian
diffusion and enzyme reaction kinetic, Michaelis-Menten equation were successfully
applied in order to understand fundamental enzyme reactions during composting.
2.5. Acknowledgements
The authors acknowledge to the U.S Department of Energy for supporting this
study by contract NO. DE-AC07-051D14517, and also thank the composting facility
at Washington State University which provided compost materials.

59
2.6. References
[1] 「Municipal Solid Waste in the United States: Facts and Figures | Municipal Solid Waste | Wastes | US EPA」. [Online]. Available: http://www.epa.gov/epawaste/nonhaz/municipal/msw99.htm. [Accessed: 06-July-2011].
[2] The BioCycle Guide to the Art & Science of Composting. 1991. Emmaus, Pa: JG Press.
[3] Z.-S. Chen. 2005. Compost production : a manual for Asian farmers. Taipei Taiwan: Food and Fertilizer Technology Center for the Asian and Pacific Region.
[4] N. Trautmann. 1998. Composting in the classroom : scientific inquiry for high school students. Dubuque Iowa: Kendall/Hunt Pub.
[5] G. Kale, R. Auras, S. P. Singh, and R. Narayan. 2007. Biodegradability of polylactide bottles in real and simulated composting conditions. Polymer Testing. 26(8):1049-1061
[6] S. H. Imam, L. Chen, S. H. Gordon, R. L. Shogren, D. Weisleder, and R. V. Greene. 1998. Biodegradation of Injection Molded Starch-Poly (3-hydroxybutyrate-co-3-hydroxyvalerate) Blends in a Natural Compost Environment. Journal of Polymers and the Environment. 6(2): 91-98
[7] S. Luo and A. N. Netravali. 2003.A study of physical and mechanical properties of poly(hydroxybutyrate-co-hydroxyvalerate) during composting」, Polymer Degradation and Stability. 80(1): 59-66
[8] U. Pagga, D. B. Beimborn, J. Boelens, and B. De Wilde. 1995. Determination of the aerobic biodegradability of polymeric material in a laboratory controlled composting test. Chemosphere. 31(11-12): 4475-4487
[9] D. S. Rosa, R. P. Filho, Q. S. H. Chui, M. R. Calil, and C. G. F. Guedes. 2003. The biodegradation of poly-β-(hydroxybutyrate), poly-β-(hydroxybutyrate-co-β-valerate) and poly(ε-caprolactone) in compost derived from municipal solid waste. European Polymer Journal, 39(2):233-237.
[10] H. Tsuji and K. Suzuyoshi. 2002. Environmental degradation of biodegradable polyesters 1. Poly(ε-caprolactone), poly[(R)-3-hydroxybutyrate], and poly(L-lactide) films in controlled static seawater . Polymer Degradation and Stability, 75(2):347-355,
[11] W.-K. Lee, J.-H. Ryou, and C.-S. Ha. 2003. Retardation of enzymatic degradation of microbial polyesters using surface chemistry: effect of addition of non-degradable polymers. Surface Science. 542(3): 235-243

60
[12] B. A. Ramsay, V. Langlade, P. J. Carreau, andJ . A. Ramsay. 1993. Biodegradability and mechanical properties of poly-(β-hydroxybutyrate-co-β-hydroxyvalerate)-starch blends. Appl. Environ. Microbiol. 59(4): 1242-1246
[13] M. Scandola, et al. 1997. Polymer Blends of Natural Poly(3-hydroxybutyrate-co-3-hydroxyvalerate) and a Synthetic Atactic Poly(3-hydroxybutyrate). Characterization and Biodegradation Studies. Macromolecules. 30(9): 2568-2574
[14] F. Su, T. Iwata, F. Tanaka, and Y. Doi. 2003. Crystal Structure and Enzymatic Degradation of Poly(4-hydroxybutyrate). Macromolecules. 36(17): 6401-6409
[15] M. R. Timmins, R. W. Lenz, P. J. Hocking, R. H. Marchessault, and R. C. Fuller. 1996. Effect of tacticity on enzymatic degradability of poly(β-hydroxybutyrate). Macromolecular Chemistry and Physics. 197(4): 1193-1215
[16] C.-S. Wu, et al. 2006. Assessing biodegradability and mechanical, thermal, and morphological properties of an acrylic acid-modified poly(3-hydroxybutyric acid)/wood flours biocomposite. Journal of Applied Polymer Science. 102(4): 3565-3574
[17] B. H. Briese, D. Jendrossek, and H. G. Schlegel. 1994. Degradation of poly(3-hydroxybutyrate-co-3-hydroxyvalerate) by aerobic sewage sludge. FEMS Microbiology Letters. 117(1). 107-111
[18] M. J. A. Chowdhury and M. P. Wolcott. 2007. Compatibilizer selection to improve mechanical and moisture properties of extruded wood-HDPE composites.」, Forest Products Journal. 57(9): 46-53
[19] S. V. Rangaraj and L. V. Smith. 2000. Effects of Moisture on the Durability of a Wood/Thermoplastic Composite. Journal of Thermoplastic Composite Materials. 13(2):140-161
[20] G. H. Yew, A. M. Mohd Yusof, Z. A. Mohd Ishak, and U. S. Ishiaku. 2005. Water absorption and enzymatic degradation of poly(lactic acid)/rice starch composites. Polymer Degradation and Stability. 90(3):488-500
[21] R. M. Maier, I. L. Pepper, and C. P. Gerba. 2009. Environmental microbiology, Second Edition. Academic Press
[22] D. S. Whang and G. F. Meenaghan. 1980. Kinetic Model of Composting process. Compost Science and Utilization. 21(3):44-46,
[23] P. Agamuthu, L. C. Choong, S. Hasan, and V. V. Praven. 2000. Kinetic Evaluation of Composting of Agricultural Wastes. Environmental Technology. 21(2):185-192

61
[24] S. Kumar, A. Sakhale, and S. Mukherjee. 2009. Simplified Kinetic Analysis for Composting of Municipal Solid Waste. Practice Periodical of Hazardous, Tocix, and Radioactive Waste Management. 13(3):179-186,
[25] 「WSU compost facility - feedstock/recipe」. [Online]. Available: http://facops.wsu.edu/Compost/compost_production_fr.asp. [Accessed: 27-April-2010].
[26] E. Iglesias Jiménez and V. Pérez García. 1992. Relationships between organic carbon and total organic matter in municipal solid wastes and city refuse composts, Bioresource Technology. 41(3): 265-272,
[27] P. J. Barham, A. Keller, E. L. Otun, and P. A. Holmes. 1984. Crystallization and morphology of a bacterial thermoplastic: poly-3-hydroxybutyrate. Journal of Materials Science. 19(9): 2781-2794
[28] G. E. Briggs and J. B. S. Haldane. 1925. A Note on the Kinetics of Enzyme Action」, Biochemical Journal. 19(2):338-339
[29] R. Krishnaprasad, N. Veena, H. Maria, R. Rajan, M. Skrifvars, and K. Joseph. 2009. Mechanical and Thermal Properties of Bamboo Microfibril Reinforced Polyhydroxybutyrate Biocomposites. Journal of Polymers and the Environment. 17(2):109-114
[30] V. E. Reinsch and S. S. Kelley. 1997. Crystallization of poly(hydroxybutrate-co-hydroxyvalerate) in wood fiber-reinforced composites. Journal of Applied Polymer Science. 64(9):1785-1796
[31] E. Renard, M. Walls, P. Guérin, and V. Langlois. 2004. Hydrolytic degradation of blends of polyhydroxyalkanoates and functionalized polyhydroxyalkanoates. Polymer Degradation and Stability. 85(2):779-787
[32] A. Göpferich. 1996. Mechanisms of polymer degradation and erosion. Biomaterials. 17(2):103-114
[33] M. Vert. 1992. International Scientific Workshop on Biodegradable Polymers and Plastics, Montpellier. Biodegradable polymers and plastics. Cambridge [England]: Royal Society of Chemistry
[34] J. L. Bowyer, R. Shmulsky, and J. G. Haygreen. 2003. Forest products and wood science. Wiley-Blackwell
[35] Forest Products Laboratory (U.S.). Wood handbook : wood as an engineering material, Rev. 1987. [Madison WI] ;Washington D.C.
[36] Scott P. Anderson. 2007. Wood Fiber Reinforced Bacterial Biocomposites: Effects of Interfacial Modifiers and Processing on Mechanical and Physical Properties. Master thesis. Washington State University.

62
[37] L. Jiang, et al. 2008. Study of Poly(3-hydroxybutyrate- co-3-hydroxyvalerate) (PHBV)/Bamboo Pulp Fiber Composites: Effects of Nucleation Agent and Compatibilizer. Journal of Polymers and the Environment. 16(2):83-93.

63
Chapter 3 A Novel Investigation of Hygrothermal Effects on Properties
Degradation and Propagation of PHB/WF Composites by Using the Continuous
Damage Mechanism
Abstract
Wood plastic composites (WPCs) have been developed successfully for use in
outdoor applications due to advantages of low maintenance, durability, and low cost.
However, moisture is one factor that can deteriorate properties of many composite
materials; this situation is known as mechanical properties degradation, especially
under hygro-/hydrothermal conditions. For these reasons, the hygro-/hydrothermal
effects of WPCs need to be investigated. In this study, by using
poly-3-hydroxybutyrate (PHB) to produce PHB/wood flour (WF) composites with
coupling agents included to enhance interfacial bonding, water/moisture resistance
and tensile properties were improved at different levels of moisture content. After
analyzing the results, mechanical degradation of the PHB/WF composites was
observed with changing moisture content. Furthermore, moisture-swollen wood flour
created internal stress and caused damage, such as microcracks, on the PHB matrix.
This result is perceived as damages from creep, which is a viscoelastic behavior of
polymeric material. It is obvious that tensile properties deteriorated with increased

64
hygrothermal condition time. However, it is challenging to use a microscope to
observe and quantify the moisture-induced damage. Fortunately, the damage can be
numerically presented by utilizing the fundamental concept of continuous damage
mechanism (CDM), in order to understand the propagation of microcracking. The
results indicated that microcracking was rapidly increased in the initial 10 days, but
slowed after that time. Lastly, by using the results in this investigation, a theoretical
propagation of microcracking is presented in a schematic sketch.
Key Words: WPC, PHB, hygro-/hydrothermal, degradation, microcracks,
propagation, continuous damage mechanism

65
3.1 Introduction
Moisture is an environmental effect that changes the physical and mechanical
behavior of fiber reinforced composites. These effects are due to the fact that moisture
consists of small molecules, which can penetrate and diffuse into composite materials
over time based on the theory of diffusion, and further deteriorates properties of the
materials [1]. It is crucial to understand these moisture effects for future design and
selection of structural materials. In residential buildings, a “green” fiber reinforced
composite, i.e. wood plastic composite (WPC), has been introduced into the market in
the last decade due to its low maintenance, low cost, high performance, and high
durability [2][3]. However, the drawback of using wood flour as a reinforcement is
moisture absorption, which is a common characteristic of wood. Furthermore, since
the exterior application means that WPC is highly exposed in an outdoor environment,
behavior of moisture absorption becomes an enormous focus. Many previous
researchers [4][5][6][7][8] have indicated that even when wood flour is embedded in
hydrophobic plastics, moisture can still diffuse and be absorbed over time, and then
cause the properties deterioration. Additionally, such deterioration has been
previously investigated and it was discovered that after moisture was absorbed by
wood four, the dimension became unstable and then swelled. This moisture-induced
swelling of wood flour causes an internal stress to plastic as tensile and/or shear

66
stresses and to the wood itself in the form of compressive stress, and also breaks down
interfacial bonding between wood and plastic [5] [7] [9] [10]. Such stress on the
matrix further leads to the formation of defects such as microcracking and interfacial
debonding. The deterioration of mechanical properties, i.e. strength and modulus, can
be seen after the defects have occurred. Both types of defects are widely found in
many cases of synthetic composites, but there are limited studies on WPCs [1]
[5][10][11][12] [13]. These investigators also pointed out that non-Fickian moisture
diffusion (also known as non-linear behavior) resulted due to such defects. The reason
for the phenomenon of anomalous absorption was due to capillary force, which
collected the moisture in the cracks or gaps (microvoids) and/or by the cavitation
mechanism [11] [14].
Given these conclusions, it is now desirable to determine the escalation of
micricracking. Use of a microscope and morphology is the common methodology to
determine the microcracks and microvoids inside of composites. However, one
concern is that during the sample preparation of morphology observation, additional
damage could possibly be generated, resulting in a challenge to detect the true damage
morphology by microtoming the composite samples. Fortunately, utilizing the
concept of continuous damage mechanism (CDM), the propagation of microcracking
growth can be numerically and fundamentally understood [15]. However, as

67
mentioned previously, more understanding of the physical and mechanical
degradation of WPC from hygrothermal effects needs to be investigated, because
WPC is targeted to be utilized in variable applications under hygro-/hydrothermal
conditions.
Because sustainability has been a major focus since the early 21st century,
non-petroleum derived bio-polymers are now being used to produce WPC [3][8] to
meet sustainability requirements. Natural fibers have often been studied for
performance effects of biocomposites by blending with one biopolymer,
poly-3-hydroxybutyrate (PHB), due to its low cost and high strength/stiffness of
natural fibers [8][16][17]. However, the discrepancy of surface tension of
hydrophobic bio-plastic and hydrophilic natural fibers causes incompatibility in the
blend system. It has been observed that an interfacial gap between fiber and matrix
causes stress concentration while applying a load [8][18]. After applying loads, the
stresses cannot be transferred properly between fiber and matrix, and then induce low
performance of the biocomposites and WPCs. Hence, it is desirable to modify the
surface adhesion between the two materials, which can be achieved by adding
chemicals such as a compatibilizer, known as a coupling agent and/or interfacial
modifier. The performance of biocomposites can therefore be improved. Research
results indicated that enhanced mechanical properties and reduction of moisture

68
absorption were observed by adding compatibilizers to WPCs [4][8][16][17][19][20].
This study is therefore aimed at controlling interfacial bonding by adding
coupling agents to produce PHB/wood flour (WF) composites. The objectives are to:
1) discover the relation of tensile properties and moisture content; 2) find the
hygro-/hydrothermal condition effects on the performance of PHB/wood flour
composites; and 3) apply the concept of CDM to determine the propagation of
microcracking during hygrothermal conditioning by eliminating the preparation error.
3.2 Materials and Methods
3.2.1 Materials
Purified PHB powder was provided by Ningbo Tianan Biologic Material Co.,
Ltd., Ningbo, China. 60-mesh wood flour (Pinus) was provided by American Wood
Fibers, Schofield, WI. Flake form of diphenylmethane Diisocyanate (MDI, Mondur
M) was supplied by Bayer MaterialScience LLC and PHB-g-MA (for preparation and
details, see Appendix A) were functioned as the coupling agent between hydrophobic
PHB and hydrophilic wood flour.

69
3.2.2 Methods
3.2.2.1 Composite Extrusion Preparation
3.2.2.1.1 Melt Compounding
The wood flour was first dried in a conventional oven at 103±2oC for 24 hours.
The moisture content was further detected and obtained ca. 1.7%. In this study, 2 wt.
% of two coupling agents, MDI and PHB-g-MA, were placed into plastic bags with a
constant ratio of PHB/wood flour (70/30 at dried wt%). Each of the mixtures in
plastic bags was manually mixed by vigorous shaking and tumbling for 5 minutes.
After being mixed, a co-rotating twin screw extruder (Leistriz ZSE-18) with a screw
diameter of 18 mm and length/diameter (L/D) ratio of 40 equipped with a volumetric
feeder for constant feeding was used to melt and compound the mixture in order to
improve the dispersion and provide energy for the coupling agent to react between the
wood flour and PHB. A declining temperature profile of the extruder was applied
during the extrusion process. The extrusion temperature profile was set at 165, 165,
160, 155, 150, 145, 140, and 135oC, respectively, from the feeding throat to the die
adapter. The screw speed of extruder and feeder was maintained at 150 and 250 rpm.
Under these speeds, the residence time of the materials in the barrel was measured to
be ca. 2 to 2.8 minutes with output rates of 14 to 16.5 grams per minute. The

70
extrudate was cooled in a water bath and then pelletized. The different formulations of
pellets were oven dried at 80oC for 24 hours and stored in zip-lock bags.
3.2.2.1.2 Sheet Extrusion
Three different dried PHB/WF composite pellets were extruded by using the same
extruder with a slit die into a sheet with a cross section of 2mm x 40mm, and then
passed through a set of calendaring rolls. The temperature profile was set the same as
that for the melt compounding process, and the attached slit die was heated up to 135
oC. The screw speeds of the extruder and feeder were maintained at 100 and 85 rpm,
respectively. Under these speeds, the output rate was measured to obtain ca. 26 to 35
grams per minute. The gap between the two compressing rollers was set at ca. 1 mm
and the temperature of the rollers was controlled at 60oC. The exit extruded and
cooled sheets of PHB/WF composites were cut into length of ca. 300 cm for storage.
The three PHB/WF composites were coded as control, MA2 (added 2 wt.% of
MA-g-PHB), and ISO2 (added 2 wt.% of MDI) as shown through this entire paper.

71
3.2.2.2 Testing Specimen Preparation and Hygro-/Hydro-thermal Conditioning
Sheets of PHB/WF composites were prepared into a dog-bone shape for further
tensile testing in accordance with ASTM D 638 Type I. All of these specimens were
placed in a condition room at 21oC with 50% of relative humidity for a week in order
to release the internal stress during preparation.
To evaluate water absorption behavior and moisture content effects on
mechanical properties of the PHB/WF composites, a series of tensile specimens were
immersed in distilled water, and sampled at 12, 24, 48, and 96 hours to evaluate the
relation between moisture content and properties and rate of water absorption. The
water absorption test was performed by removing specimens from the water and
wiping out the residual water on the surface of specimens, and then recording the
weight change. Furthermore, in order to understand the moisture content effects of
mechanical properties, tensile properties of the PHB/WF composites were detected
after the measurement of weight change. This examination was conducted by six
replicates of each formulation to reduce experimental error.
The other series of specimens was placed in a condition chamber with 58 oC and
95% of relative humidity and conditioned for 45 days. The sampling days were the 1st,
3rd, 6th, 10th, 15th, 21th, 30th, 36th, and 45th day. In order to reduce the moisture effects
and error on further tensile testing and evaluations, six replicates of each formulation

72
were sampled out from the conditioning chamber and then replaced into a control
condition room at 21oC and 50% of relative humidity for one week. The moisture
absorption under this hygrothermal condition was carried out by monitoring five
rectangular shaped specimens of each formulation while sampling the tensile testing
specimens. The thickness and weight change were measured at the sampling period.
3.2.2.3 Mechanical Properties and Density Evaluation
A screw driven Instron 4466 equipped with a 10-KN load cell and a pair of
mechanical grips was used for tensile tests. The tensile tests were conducted at a
crosshead speed of 5 mm per minute. The tensile strain was recorded and measured
by an extensometer (MTS model # 634.12E-24). These setups of tensile tests were
conducted in accordance with ASTM standard D638. Six replicates were tested for
each formulation to obtain a statistical mean value and standard deviation. Sample
density was calculated by dividing sample mass by sample volume. All of the samples
(for both mechanical and density testing) were conditioned at 21oC and 50% of
relative humidity for 7 days prior to the tests.

73
3.3 Results and Discussion
3.3.1 Moisture Absorption
Water absorption behavior has long been considered as a drawback to reduce
performance of WPCs and limit their application [3][6][10][18]. This finding was also
believed to deteriorate the performance of PHB/WF composites. However, by adding
coupling agents, water resistance can be improved due to controlling the
hydrophilicity of wood flour by coupling the hydroxyl group of wood with PHB [8].
As shown in the results presented in Fig. 3.1, after adding two different coupling
agents, MA-g-PHB and MDI (shown as MA2 and ISO2, respectively, in Figure 3.1), a
reduction of water absorption was observed in two different PHB/WF composites.
After 96 hours immersion, the control PHB/WF composite, PHB/WF composites with
2% of MA-g-PHB, and PHB/WF composites with 2% of MDI resulted in a mean
value of moisture content of 9.33%, 7.41%, and 5.67%, respectively. This indicated
that moisture resistance was improved with 20 to 40% water absorption reduction by
the coupling agents. Notably, the isocyanate coupling agent of MDI had a more
significant function in controlling the water absorption of the PHB/WF composite
than that of MA-g-PHB.

74
Figure 3.1 Relative water absorption behaviors of three different PHB/WF composites
3.3.2 Moisture Effects on Specific Tensile Properties
Given that WPC has been pointed out as having mechanical properties that
declined with increasing moisture content [5][7][10], moisture content plays an
important role in properties of polymeric composite materials. The relation between
moisture content and mechanical properties of the PHB/WF composites needs to be
addressed, since both wood and biopolymers are sensitive to moisture. As shown in
Figure 3.2 and Figure 3.3, it is clear that with increasing moisture content, three of the
PHB/WF composites had different decreased rates of specific strength and modulus.
Furthermore, the two coupling agents improved ca. 35 to 65% in both specific
strength and modulus in comparison with the control PHB/WF composite with
0.0%
2.0%
4.0%
6.0%
8.0%
10.0%
0 20 40 60 80 100
Rel
ativ
e w
ater
abs
orpt
ion
Immersion time (hours)
Control MA2 ISO2

75
different moisture content. The isocyanate coupling agent, MDI, resulted in
outstanding performance of PHB/WF composites [8]. This result is believed to be due
to the fact that the interfacial bonding between wood and PHB was improved, with
the result being that applied loads could be transferred properly without stress
concentration, and also because of the change of hydrophilicity of wood in the
composites [4][9][21][22]. The relation of moisture content and specific properties
can be numerically interpreted using statistical regression analysis (see Figures 3.2
and 3.3). As exhibited in Figure 3.4, it is obvious that the higher the moisture content
obtained, the larger the strain at break. This evidence indicates that moisture can be
recognized as a plasticizer to the PHB/WF composites. On the other hand, the results
of normalized specific tensile modulus (see Fig. 3.3) shows that the two composites
with the addition of 2% of coupling agents had higher sensitivity (higher slope) in
changing moisture content than that of the control PHB/WF composites, but a higher
rate of water absorption than the other two (see Fig 3.1).

76
Figure 3.2 Plot of relation of relative moisture content and specific tensile strength of three different PHB/WF composites
Figure 3.3 Plot of relation of relative moisture content and specific tensile modulus of three different PHB/WF composites
y = -59.4x + 18.6 R² = 0.91
y = -70.4x + 23.5 R² = 0.93
y = -71.7x + 26.4 R² = 0.85 0
10
20
30
0.0% 2.0% 4.0% 6.0% 8.0% 10.0%
Spec
ific
Tehn
sile
Str
engt
h (M
Pa)
Relative moisture content (%)
Control
MA2
ISO2
y = -25.2x + 4.44 R² = 0.90
y = -28.9x + 5.12 R² = 0.94
y = -32.9x + 5.15 R² = 0.98
0.0
1.0
2.0
3.0
4.0
5.0
6.0
0.0% 2.0% 4.0% 6.0% 8.0% 10.0%
Spec
ific
Tens
ile M
odul
us (G
Pa)
Relative moisture content (%)
Control
MA2
ISO2

77
Figure 3.4 Plot of relation of moisture content and strain at break of three different PHB/WF composites
To normalize overall moisture influences on different PHB/WF composites, the
relation can be theoretically described by using an equation with a moisture corrected
factor [23]:
K(σ !" !)′ = C(σ !" !) ∙ K(σ !" !) (equ. 3.1)
and
C(σ !" !) = 1− α(σ !" !) ∙ MC (equ. 3.2)
where K is the specific tensile strength (Kσ) and modulus (KE), C(α or E) is the moisture
content adjusting factor to the specific strength and modulus, α(α or E) is the slope of the
normalized linear curve, and MC is the moisture content. This model was further used
to evaluate and correct tensile properties with a linear function of normalization with
y = 0.07x + 0.01 R² = 0.87
y = 0.06x + 0.01 R² = 0.66
y = 0.10x + 0.01 R² = 0.95 0.00%
0.50%
1.00%
1.50%
2.00%
0.0% 2.0% 4.0% 6.0% 8.0% 10.0%
Stra
in a
t bre
ak (m
m/m
m)
Relative moistutr content (%)
Control
MA2
ISO2

78
the initial of MC of each PHB/WF composite at immersion time of zero. The
calculated results are shown in Figures 3.5 and 3.6 with linear regression curves. The
slope of the normalized linear curve (α) was expressed, showing that by comparing
with three composites the coupling agents had no significant effects on the normalized
specific tensile strength, but that of moisture content did. Thus, it can be concluded
that moisture content is one sensitive function of the tensile properties of PHB/WF
composites.
Figure 3.5 Plot of relation of relative moisture content and strength adjusting factor of three different PHB/WF composites with regression curves
y = -2.47x + 0.94
y = -2.40x + 0.94
y = -2.22x + 0.97
0.2
0.3
0.4
0.5
0.6
0.7
0.8
0.9
1
0.0% 2.0% 4.0% 6.0% 8.0% 10.0%
Str
engt
h a
djus
ting
fact
or
Relative moisture content (%)
Control
MA2
ISO2

79
Figure 3.6 Plot of relation of relative moisture content and modulus adjusting factor of three different PHB/WF composites with regression curves
3.3.3 Hygrothermal Effects (moisture and mechanical degradation)
Moisture plays a key role in properties deterioration of composites, especially on
WPCs, due to the hydrophilicity of wood flour. After moisture is absorbed from wood
flour, WPCs become dimensionally unstable, which is known as swelling.
Furthermore, the moisture-induced swelling of composites caused a certain degree of
internal stress on either the wood flour and/or polymer matrix. Fatigue and creep
damage of the composites therefore resulted after stresses accumulated [5][10]. This
phenomenon can be understood as viscoelastic behavior of polymeric material, which
is commonly found not only in the synthetic composites, but also significantly in the
WPCs. In the theory of moisture diffusion, known as Fickian diffusion, moisture
y = -3.32x + 0.80
y = -4.69x + 0.92
y = -5.62x + 0.95 0.2
0.3
0.4
0.5
0.6
0.7
0.8
0.9
1
0.0% 2.0% 4.0% 6.0% 8.0% 10.0%
Mod
ulus
adj
sutin
g fa
ctor
Relative moisture content (%)
Control
MA2
ISO2

80
diffuses slowly from the surface to the core of the composites [1][24]. It has been
found that shear stress is evident at the interface of the wood particle and polymer
matrix [5]. Notably, under hygrothermal conditions, it appears that moisture and
temperature have a coupling effect on moisture diffusion behavior, as proven in
experimental results and by using the Arrhenius equation to describe this effect
[5][25]; the higher the temperature, the faster the moisture penetration occurs. To
understand the hygrothermal effects on PHB/WF composites, a severe condition,
58oC and 95% relative humidity, was set as a condition to accelerate mechanical
degradation. The results, shown in Figures 3.7 and 3.8, show that specific tensile
strength and modulus reduced with conditioning time. The changes of moisture
absorption with time of three different PHB/WF composites are shown in Figure 3.9.
The control PHB/WF composite exhibited higher moisture absorption than those of
the other two composites in a comparison of ca. 5.0% and ca. 3.2% at day 10. This
result indicates that the coupling agents reduced moisture absorption in the PHB/WF
composites. It is interesting that one transition of the strength reduction (ca. 20%)
exhibited after 10 to 15 days of conditioning. After 21 days of conditioning, the three
composites showed ca. 40% properties reduction, and after 30 days of conditioning, it
was a challenge to detect the properties of the specimens by the universal testing
machine. Moreover, different results were exhibited in the specific tensile modulus

81
(see Figure 3.8) compared with that of strength. The modulus of three PHB/WF
composites appeared as a 13 to 24% of reduction before 3 days of conditioning, and
after 6 days, it remained in a stable stage without greater deterioration. However,
higher initial specific tensile properties were found in the composite added with MDI
as a coupling agent compared with the control PHB/WF composites (ca. 41% higher
in specific tensile strength and ca. 14% in that of the modulus), but there was higher
deterioration after hygrothermal conditioning. Possibly, with the high temperature
environment and moisture diffusion, the interfacial bonding was weakened by
moisture and debonding, as the time-temperature dependent of creep damages
occurred and remained a gap at the interface between wood and PHB matrix [5]
and/or created microcracks on the matrix [10]. Both debonding and microcracking, as
defects, are a cause of the reduction of the tensile properties. Studies have pointed out
that micro-cracks and/or micro-voids induced a non-Fickian moisture diffusion or
anomalous moisture absorption behaviors [11][14][24][26][27].

82
Figure 3.7 Plot of relation of specific tensile strength against conditioning time
Figure 3.8 Plot of relation of specific tensile modulus against conditioning time
0
5
10
15
20
25
30
0 500 1000 1500 2000
Spec
ific
Tens
ile S
tren
gth
(MPa
)
Conditioning time (sec0.5)
Control MA2 ISO2
0.0
1.0
2.0
3.0
4.0
5.0
6.0
0 500 1000 1500 2000
Spec
ific
Tens
ile M
odul
us (G
Pa)
Conditioning time (sec0.5)
Control MA2 ISO2

83
Figure 3.9 Plot of relation of relative moisture absorption against hygrothermal conditioning time
3.3.4 Microcracking Evaluation by Continuous Damage Mechanism
Since microcracks potentially occur and are distributed across an entire
cross-section by hygrothermal effects, it is a conundrum to quantify the cracking area
due to extra damage that may be produced during the preparation of microscope
observation. Fortunately, it is possible to apply the theory of continuous damage
mechanism (CDM) to obtain the damage, microcracks and/or gap (debond), inside the
PHB/WF composites. One remarkable effect is more obviously on the reduction of
modulus (stiffness) of the composites, which can be further used to define the
accumulated damage [15]. One-dimensional CDM is the simplest concept, but can
only be applied with certain requirements, such as single stress and damage
0.0%
1.0%
2.0%
3.0%
4.0%
5.0%
6.0%
7.0%
0 200 400 600 800 1000 1200 1400 1600 1800
Rel
ativ
e m
oist
ure
abso
rptio
n (%
)
Hygrothemal conditioning time (sec0.5)
Control
MA2
ISO2

84
accumulated in a uni-axial direction. Uni-axial tensile testing is therefore proposed to
be used to determine the damage. The determination of the damage involves
theoretical calculation from the CDM. Consider that a damage-free (microcrack-free)
composite rod bar has a nominal cross-section area (A0). When the rod bar is under a
certain level of stress or load, damages (microcracks) will appear in the rod. In CDM,
this damage can be detected by the loss of modulus of the rod and is represented by
damage parameter, ω, as in the following equation:
ω= 1- E/ E0 or E = (1- ω)*E0 (equ 3.3a, b)
where E0 and E are the initial modulus (at the time of zero) and modulus after damage.
To prove this equation conceptually, microcracks result in the same effect as actual
damage, and the damage can be seen as a reduction of area:
ω= 1- A/A0 or A = (1- ω) A0 (equ 3.4a,b)
where A is the remaining normal area.
By hygrothermal conditioning, the composites are damaged (ω is from 0 to 1), and
effective stress, σ, can be expressed as
σ = P/ A = P/ A * A0/A0 = σ0 * A/ A0 = σ0 * (1- ω) (equ 3.5)
when ω =0, the effective stress will be equal to a normal stress. Based on Hooke’s law
(σ = E*ε), the same strain occurs under a tensile stress, and equ 3.3b can be proved by
deriving equation of 3.5 over the strain. Therefore, the relation of the microcrack area

85
under a hygrothermal condition could be investigated on the basis of the reduction of
the tensile modulus.
After using the mean value of the results presented in section 3.3.3 to calculate
area of microcracks (damage) via the theoretical concept of one dimension of CDM,
the relation of conditioning time and proportion of damage is obtained, as shown in
Figure 3.10. There is assuming that the perfect bonding condition is occurred at the
ISO2 because of isocyanate coupling agent can significantly improve the interfacial
bonding between wood and PHB [8]. As control formulation was expected to almost
no interfacial bonding, evidence of gaps was discovered by previous study [8].
Furthermore, the evidence was implied by the results of water and moisture
absorption (Figure 3.1 and 3.9), showing that the control formulation absorbed more
water and/or moisture than the other two PHB/WF composites. Therefore, the damage
propagation of different PHB/WF composites was obtained by using initial specific
tensile modulus of ISO as the E0. Notably, after approximately 10 days of
conditioning, the area of microcracks on each formulation was stabilized. Possibly, in
the two PHB/WF composites with coupling agents added, the interfacial bonding was
believe to be weakened under the hygrothermal condition and further debonded by
shear force from swollen fiber [5]. Gaps therefore remained. These observations
proved that the PHB/WF composites damaged area, which consisted of gaps

86
(interfacial debonding) and micro-cracks (creep damage in the PHB matrix). It is also
possible that thermal shock (temperature range from 58 down to 21oC) might mildly
accelerate the microcracking. As proposed, the propagation of damage could be used
to illustrate the microcracking behavior of the PHB/WF composites during
hygrothermal conditioning (see Figure 3.10). Therefore, as the calculated resulted
indicated that the coupling agents were successfully improved the hygrothermal
damage resistance by comparing with the control formulation.
Figure 3.10 Plot of relation of theoretical calculated damage parameter (ω) in percentage against conditioning time
0.0%
10.0%
20.0%
30.0%
40.0%
50.0%
60.0%
0 500 1000 1500
Dam
age
para
met
er
Conditioning time (sec0.5)
Control
MA2
ISO2

87
3.3.5 Proposed microcracking mechanism under hygrothermal conditions
To conclude what was investigated above, the presumed microcracking
mechanism is shown in Scheme 3.1. This scenario occurs after the PHB/WF
composite has absorbed moisture to its saturation point, an internal stress was created
by swollen wood flour (diameter increased), followed by the induced creep damage
on PHB matrix with time. As the creep damage propagated, the damage extended
from an initial microcrack to a microvoid and/or debonding at the interface of wood
and PHB (see Scheme 3.1). After the PHB/WF composite cooled and slowly
dehydrated, the composite shrank dimensionally and gaps/voids remained from wood
flour and matrix PHB interfacial debonding and/or microcracks from creep damages
in the matrix. Possibly, the thermal and moisture shock induced some extra damage in
the matrix.
Scheme 3.1 Proposed relation of microcracking by internal stress corresponding with changing moisture content

88
3.4 Conclusion
Density is one factor that influences the mechanical performance of a composite,
but by comparing with specific mechanical properties of PHB/WF composites, the
error from the density can be eliminated. According to the results shown in this study,
use of a coupling agent can improve mechanical performance and reduce moisture
and water absorption under a hygro-/hydrothermal condition. As expected, the
coupling agent of MDI resulted in ca. 40~55% less water absorption and ca. 40%
improvement in tensile stress. Overall, moisture content influenced tensile properties
with a negative linear relation. It appeared that moisture reacted as a plasticizer to the
PHB/WF composites; the higher the moisture content, the larger the elongation at the
failure (strain at break) occurred. After theoretically normalizing the moisture effects
on the PHB/WF composites, it is clear that moisture influenced the mechanical
properties, especially in the tensile modulus. As temperature and moisture are coupled
to influence the deterioration of tensile properties of PHB/WF composites, it is
necessary to discuss the hygrothermal effects. As a result, it appeared that the tensile
properties declined after a certain period of time of conditioning at 58oC and 95% RH.
The cause of the properties deterioration was believed to have been caused by
interfacial debonding and creep-induced microcracking, both of which are caused by
swollen wood flour. Moreover, theoretical determination of microcracking can be

89
achieved by using the continuous damage mechanism (CDM). Reduction of tensile
modulus was successfully used to obtain the proportion of damages during the
hygrothermal conditioning, without physically sectioning the composite materials for
microscope observation. Crossing the investigated results in this study with the
fundamental understanding by using the CDM, it can be concluded that the interfacial
debonding and damages on matrix could be the main reasons for microvoids (i.e.
microcracks and gaps, respectively). These microviods can induce cavitations and
capillary force to absorb more moisture/water in the PHB/WF composites. By using
the investigated results, a proposed moisture-induced microcracking and debonding
can be illustrated by using a schematic sketch. In conclusion, the hygro-/hydrothermal
effects of the PHB/WF composites were successfully investigated with a fundamental
understanding propagation of microcracking by applying the concept of CDM.

90
3.5 References
[1] Y. J. Weitsman. 1991. Moisture in Composites: Sorption and Damage in Composite Materials Series 4 - Fatigue of composite materials, K. L. Reifsnider editted, Amsterdam ;New York: Elsevier. pp. 385-429.
[2] C. Clemons. 2002. Wood-Plastic Composites in the United States The Interfacing of Two Industries. Forest Products Journal. 52(6):10-18
[3] P. M. Smith and M. P. Wolcott. 2006. Opportunities for Wood/Natural Fiber-Plastic Composites in Residential and Industrial Applications. Forest Products Journal. 56(3):4-11
[4] J.-W. Kim, D. Harper, and A. Taylor. 2008. Effect of Wood Species on Water Sorption and Durability of Wood-Plastic Composites. Wood and Fiber Science. 40(4):519-531
[5] S. V. Rangaraj and L. V. Smith. 2000. Effects of Moisture on the Durability of a Wood/Thermoplastic Composite. Journal of Thermoplastic Composite Materials. 13(2):140-161
[6] A. Schirp and M. Wolcott. 2005. Influence of Fungal Decay and Moisture Absorption on Mechanical Properties of Extruded Wood-Plastic Composites. Wood and Fiber Science. 37(4):643-652
[7] N. Stark. 2001. Influence of Moisture Absorption on Mechanical Properties of Wood Flour-Polypropylene Composites. Journal of Thermoplastic Composite Materials. 14(5):421 -432
[8] Scott P. Anderson. 2007. Wood Fiber Reinforced Bacterial Biocomposites: Effects of Interfacial Modifiers and Processing on Mechanical and Physical Properties. Master thesis, Washington State University
[9] K. Joseph, S. Thomas, and C. Pavithran. 1995. Effect of ageing on the physical and mechanical properties of sisal-fiber-reinforced polyethylene composites. Composites Science and Technology. 53(1):99-110
[10] Stark, N. M. and Gardner, D. J. 2008. Outdoor durability of wood-polymer composites in Wood-polymer composites. Cambridge, England : Woodhead Publishing, Ltd. ; Boca Raton, FL : CRC Press. Woodhead Publishing in materials. pp. 142-165.
[11] J. Zhou and J. P. Lucas. 1995. The effects of a water environment on anomalous absorption behavior in graphite/epoxy composites. Composites Science and Technology. 53(1):57-64
[12] L. J. Burcham, M. R. Vanlandingham, R. F. Eduljee, and J. W. Gillespie. 1996. Moisture effects on the behavior of graphite/polyimide composites. Polymer Composites. 17(5):682-690

91
[13] H. T. Hahn. 1987. Hygrothermal Damage in Graphite/Epoxy Laminates. Journal of Engineering Materials and Technology. 109(1):3-11
[14] C. Shirrell. 1978. Diffusion of Water Vapor in Graphite/Epoxy Composites」, in Advanced Composite Materials—Environmental Effects, J. Vinson edited. 100 Barr Harbor Drive, PO Box C700, West Conshohocken, PA 19428-2959: ASTM International, 1978. pp. 21-41.
[15] E. J. Barbero. 2007. Damage Mechanics in Finite element analysis of composite materials, CRC Press. pp. 191 - 206.
[16] L. Jiang et al. 2008. Study of Poly(3-hydroxybutyrate- co -3-hydroxyvalerate) (PHBV)/Bamboo Pulp Fiber Composites: Effects of Nucleation Agent and Compatibilizer. Journal of Polymers and the Environment. 16(2):83-93
[17] A. Gregorova, R. Wimmer, M. Hrabalova, M. Koller, T. Ters, and N. Mundigler. 2009. Effect of surface modification of beech wood flour on mechanical and thermal properties of poly (3-hydroxybutyrate)/wood flour composites. Holzforschung. 63(5):565-570
[18] M. J. A. Chowdhury and M. P. Wolcott. 2007. Compatibilizer selection to improve mechanical and moisture properties of extruded wood-HDPE composites. Forest Products Journal. 57(9):46-53.
[19] H. Dalväg, C. Klason, and H.-E. Strömvall. 1985. The Efficiency of Cellulosic Fillers in Common Thermoplastics. Part II. Filling with Processing Aids and Coupling Agents. International Journal of Polymeric Materials. 11(1):9-38
[20] R. Gauthier, C. Joly, A. C. Coupas, H. Gauthier, and M. Escoubes. 1998. Interfaces in polyolefin/cellulosic fiber composites: Chemical coupling, morphology, correlation with adhesion and aging in moisture. Polymer Composites. 19(3):287-300
[21] E. Petinakis, L. Yu, G. Edward, K. Dean, H. Liu, and A. Scully. 2009. Effect of Matrix–Particle Interfacial Adhesion on the Mechanical Properties of Poly(lactic acid)/Wood-Flour Micro-Composites. Journal of Polymers and the Environment. 17(2):83-94
[22] A. Karmarkar, S. S. Chauhan, J. M. Modak, and M. Chanda. 2007. Mechanical properties of wood-fiber reinforced polypropylene composites: Effect of a novel compatibilizer with isocyanate functional group. Composites Part A: Applied Science and Manufacturing. 38(2):227-233
[23] M. C. Hatch. 2008. Processing, Mechanical, and Environmental Performance of Engineering Polymer Wood-Plastic Composites. Master thesis, Washington State University
[24] L.-W. Cai and Y. Weitsman. 1994. Non-Fickian Moisture Diffusion in Polymeric Composites. Journal of Composite Materials. 28(2):130 -154

92
[25] J. P. Komorowski. 1983. Hygrothermal Effects in Continuous Fibre Reinforced Composites. Part I. Thermal and Moisture Diffusion in Composite Materials. Aeronautical note. National Aeroautical Establishment. National Research Council. Ottawa, Ontario, Canada. pp. 1-51
[26] Y. J. Weitsman. 2006. Anomalous fluid sorption in polymeric composites and its relation to fluid-induced damage. Composites Part A: Applied Science and Manufacturing. 37(4):617-623
[27] L. J. Burcham, M. R. Vanlandingham, R. F. Eduljee, and J. W. Gillespie. 1996. Moisture effects on the behavior of graphite/polyimide composites. Polymer Composites. 17(5):682-690

93
Chapter 4 Investigation of Effects of Coupling Agents on Compostability and
Mineralization Behaviors of Poly-3-hydroxybutyrate/Wood Flour Composites
Abstract
Durability of petroleum-derived plastics is now seen as a drawback to the
environment as indicated in statistical research of municipal solid plastic waste in
accordance with the US Environmental Protection Agency (EPA). One solution is the
use of biodegradable biopolymer, e.g. Poly-3-hydroxybutyrate (PHB), reinforced with
wood flour (WF) to expand its performance and maintain biodegradability. With this
composting technique, which converts solid organic matter to carbon dioxide, one
biocomposite of the PHB/WF composite is seen as an alternative to reduce
environmental impacts. However, other studies have focused on coupling agents that
enhance the performance and water resistance of PHB/WF composites; currently, the
compostability of biodegradable PHB/WF composites remains a deficiency. The
current study focused on coupling agent effects on the compostability and
mineralization of PHB/WF composites. The coupling agents used in this study were
maleic anhydride grafted PHB (PHB-g-MA) and diphenylmethane diisocyanate
(MDI). The results indicated that MDI significantly reduced the compostability of the
PHB/WF composite. An approximately 12% reduction of rate of CO2 evolution and

94
mineralization was found and about 35% less material was mineralized at the end of
the test (day 54) compared with the PHB/WF control composite. It was believed that
MDI efficiently coupled and bonded wood flour and PHB and further reduced rate of
mineralization. Notably, wood has a much lower rate of mineralization
(approximately five fold) than PHB. Additionally, the Michaelis-Menten kinetic was
successfully utilized to determine the theoretical enzyme kinetic during the lag phase,
and Fickian diffusion was effectively applied to understand the mineralization
diffusion behavior during the biodegradation phase. It was concluded that by
controlling the interfacial bonding between wood and PHB, compostability of the
PHB/WF composites could also be engineered. Enzymatic surface erosion was
observed by using microscopy. A novel investigated mechanism of enzymatic surface
erosion on the PHB/WF composites was schematically sketched out and the results
corresponded with three phases of biodegradation.
Key words: poly-3-hydroxybutyrate, coupling agent, compostability, mineralization,
Fickian diffusion, enzyme kinetic

95
4.1. Introduction
According to the US Environmental Protection Agency (EPA), 243 million tons of
municipal solid waste was generated in 2009 and only about 2 million tons out of 30
million tons of disposed plastic were recovered in the US during 2009[1]. This
statistical result indicates that municipal plastic waste is still a challenge in the US.
Additionally, these plastic wastes contained approximately19 million tons of
non-durable plastic goods including disposable products, containers, and packaging
plastics, and only about 9% of those materials were recycled. Interpretation of these
statistics indicates that about 17.3 million tons of plastic wastes were land-filled in
2009[1]. Utilizing biodegradable biologically derived polymers (biopolymer) that are
now emerging as a biodegradable option to reduce the environmental challenge and
reduce petroleum dependent, biodegradation can be achieved under anaerobic (e.g.
landfill) and aerobic (e.g. composting) conditions. Under anaerobic conditions,
landfill, methane and carbon dioxide (green house gases) are generated as by-products.
Methane can be utilized as an energy source for power and heat. However, if methane
is not been collected properly, it can cause a certain degree of environmental impacts
[2]. Carbon dioxide (CO2), on the other hand, can be absorbed by natural plants and
produce more carbon feedstocks, such as wood and starch. Therefore, to prevent
potential issues from methane, the composting process can aerobically convert the

96
organic matter in biodegradable polymeric materials into carbon dioxide efficiently.
With respect to the carbon cycling ecosystem, this process converts organic carbon to
CO2, while remaining organic material as a soil amendment that provides natural
nutrient retention and further reduces the cost of landscaping. Several studies [3][4][5]
have indicated that organic matter can be carried out from the compost mixture and
then used as an energy source for microorganisms during composting. Moreover,
because biopolymers are mainly comprised of carbon, hydrogen and oxygen, they
may also be converted to soil amendments in this process. To evaluate the
compostability or biodegradability of an organic material under aerobic conditions
thus became our focus for further study in order to understand its mineralization
behavior, which can further be used to estimate the amount and rate of CO2 evolution.
One biopolymer, Poly-3-hydroxybutyrate (PHB) has been studied for its
biodegradability under different environments, such as compost [6][7][8][9], seawater
[10], enzymatic conditions [11][12][13][14][15][16], and sewage sludge [17].
However, due to its performance limitation, natural fillers such as wood fiber/flour
(WF) and starch are mainly used to reinforce the biopolymers while maintaining
biodegradability and extend its performance envelope. Unfortunately, the discrepancy
of surface tension leads to the result that in the wood flour and polymer, PHB in this
case, are not compatible, which reduces performance enhancement [18][19]. The

97
solution that was investigated in this study is to add a compatibilizer, also referred to
as a coupling agent. A compatibilizer is a solution added to maintain the performance
envelope of the biocomposite. Better filler dispersion and/or chemically interaction
between the filler and the matrix may occur after a compatibilizer is added. Since
wood plastic composites (WPCs) have been developed for decades, researchers have
found that the key to mechanical and physical (moisture) property enhancement is to
modify the interface between wood and plastic. To encourage this performance
enhancement, the compatibilizer effects of WPCs were then studied. Most research
studies have concluded that maleric anhydride (MA) grafted on polyethylene and
polypropylene (MA-PE/MA-PP) are the common potential compatibilizers for the
WPCs [20][21][22]. In these studies, approximately 20 to 30% improvement was
observed on mechanical properties. Water uptakes also received considerable
attention, resulting in about 50% reduction [22]. In biopolymer applications, studies
[18][23] concluded that MA grafted on PHB (MA-PHB) is a suitable compatibilizer
for enhancing natural fiber reinforced PHB composites and about 10 to 30%
difference in strength were observed by different processes. This result is because the
side group of MA-PHB, succinic moieties, can possibly provide hydrogen and/or
chemical bonding with the hydroxyl group (-OH) of wood fiber [20][21][24][25].
Moreover, the isocyanate group (-NCO) of isocyanate adhesives is expected to bond

98
chemically on the hydroxyl-rich functional group of wood and partially on PHB
[22][26][27]. A polymeric diphenylmethane diisocyanate (pMDI) can be used as a
compatibilzer to the WPCs. Anderson [18] indicated that about 20~50% variation of
mechanical properties and water uptakes were found on the pMDI added PHB/WF
composites. Also, the pMDI had showed significant improvement compared to the
other compatibilizers. This result could be due to the fact that the functional groups of
isocyanates are highly reacts between wood and PHB. In conclusion, the MA-PHB
and pMDI can provide an interfacial modifying option and create physical and/or
chemical bonding between wood and PHB. However, there is a deficiency of research
of coupling agent effects on biodegradability of PHB/WF composites, as most
previous studies were focused on performance enhancement.
The goal of this study was to demonstrate that the coupling agent affects the
compostability of biodegradable PHB/wood flour (WF) composite by evaluation
under laboratory scale conditions in accordance with ASTM D5338 and that output
data can be further applied based on the Fickian diffusion equation to understand
mineralization behavior. The specific objectives were to: 1) identify the
compostability of PHB/WF composites with coupling agents added by using a
lab-scale apparatus; 2) evaluate the mineralization and morphology change of
PHB/WF composites during composting; and 3) apply the Fickian diffusion equation

99
and Michealis-Menten equation to understand mineralization diffusion behavior and
enzyme reaction kinetics.
4.2. Materials and methods
4.2.1 Materials
Purified PHB powder was provided by Ningbo Tianan Biologic Material Co.,
Ltd., Ningbo, China. Wood flour (Pinus, 60-mesh) was provided by American Wood
Fibers, Schofield, WI. Maleic anhydride grafted PHB (PHB-g-MA) was prepared by
reaction extrusion process and 0.43% of grafting ratio was detected (for preparation
and details, see Appendix A). Flake form of diphenylmethane diisocyanate (MDI,
Mondur M) was supplied by Bayer MaterialScience LLC. The PHB-g-MA and MDI
functioned as the coupling agent between hydrophobic PHB and hydrophilic wood
flour.
Approximately four-month-matured compost inoculums were provided by the
Washington State University compost facility. The compost was sieved through a
sieve screen with openings of 10 mm diameter during nursing. Proportions of the
compost feedstock [28] are shown in Table 4.1. Moisture content of the compost was
adjusted to approximately 50%.

100
Table 4.1 Proportion of compost feedstocks
Manure Ash Compost Food Waste Yard Waste Dirt Wood Chips*
78% 10% 10% 1% 0.5% 0.5% 5%*
* added during the wet season to provide porosity
4.2.2 Testing specimen preparation
The wood flour was first dried in a conventional oven at 103±2oC for 24 hours.
The moisture content was further detected to be about 1.7%. Three formulations of
PHB/WF composites of PHB (70 wt.%), i.e. dried wood flour (30 wt.%), and 2 wt. %
of two coupling agents, MDI and PHB-g-MA, were placed into plastic bags with a
constant ratio of PHB/wood flour (70/30 at dried wt.%). The three PHB/WF
composites were coded as control, MA2 (added 2 wt.% of MA-g-PHB), and ISO2
(added 2 wt.% of MDI), as indicated through this chapter. Each of the mixtures in
plastic bags was manually mixed by vigorous shaking and tumbling for 5 minutes.
After being mixed, a co-rotating twin screw extruder (Leistriz ZSE-18) with a screw
diameter of 18 mm and length/diameter (L/D) ratio of 40 equipped with a volumetric
feeder for constant feeding was used to melt and compound the mixture in order to
improve dispersion and provide energy for the coupling agent to react between the
wood flour and PHB. A declining temperature profile of the extruder was applied

101
during the extrusion process. The extrusion temperature profile was set at 165, 165,
160, 155, 150, 145, 140, and 135oC, respectively, from the feeding throat to the die
adapter. Screw speed of the extruder and the feeder was maintained at 150 and 250
rpm. Under these speeds, the residence time of the materials in the barrel was
measured at approximately 2 to 2.8 minutes with output rates of 14 to 16.5 grams per
minute. The extrudate was cooled in a water bath and then pelletized. The different
formulations of pellets were oven dried at 80oC for 24 hours and stored in zip-lock
bags.
Three different dried PHB/WF composite pellets were extruded by using the same
extruder with a slit die in a sheet with a cross section of 2mm x 40mm, and then
passed through a set of calendaring rolls. The temperature profile was set to be the
same as that for the melt compounding process, and the attached slit die was heated
up to 135 oC. The screw speeds of the extruder and feeder were maintained at 100 and
85 rpm, respectively. Under these speeds, the output rate was measured to obtain
approximately 26 to 35 grams per minute. The gap between the two compressing
rollers was set at approximately1 mm; the temperature of the rollers was controlled at
60oC. The exit extruded and cooled sheets of PHB/WF composites were chopped into
flake form using a granulator (Nelmor®) with a screen of diameter of approximately
15 mm. This process simulated preparation during composting.

102
4.2.3 Composting apparatus and procedure
In this study, the procedures outlined in ASTM D 5338 were used to assess
biodegradation of plastics in a laboratory scale-compost experiment, and the
apparatus set-up was also built in accordance with ASTM D 5338 (see Fig. 4.1). The
system consisted of determining the degree and rate of mineralization of plastic
materials from organic carbon to evolved carbon dioxide. A series of 18 bioreactors
(each in triplicate) containing blank (compost only), PHB flake (sample of PHB
polymer + compost), wood flour (sample of 60 mesh pine wood flour + compost),
PHB/WF composite flake (sample of the control composite + compost),
PHB/WF/MA2 composite flake (sample of the composite with 2% coupling agent of
PHB-g-MA+ compost), and PHB/WF/MDI2 composite flake (sample of the
composite with 2% coupling agent of MDI + compost) were tested via this system.
The ratio of inoculums mixture was controlled at 6:1 (compost:flake samples) in dry
mass. The biodegradation test was carried out under a laboratory-controlled condition:
CO2-free and humidified inlet air with a constant flow of approximately 90 ml/min.,
outlet air after reactors was trapped by 18 CO2 trappers, and 18 bioreactors were
placed in a 58 ± 2oC a water bath throughout the entire experimenting period.
The CO2-free and humidified inlet air was generated by compressing air through a
sodium hydroxide (NaOH) solution to remove CO2 and then passed through deionized

103
(DI) water to generate humidify air. To maintain a consistent condition, the
moisturized and CO2-free air was diverted and adjusted by flow meters and further
input to the bottom of each bioreactor. The bioreactor was built using a glass jar of
approximately internal volume 2 L with a screen placed at the bottom of jar to avoid
channeling and provide equally distributed inlet air in the compost. Each mixture of
inoculums was mixed and placed into jars with about 20 mm space from the lid for
outlet air distributed to CO2 trappers. All mixtures of inoculums were stirred weekly
to avoid channeling and to provide proper aeration and contact between sample and
compost. A set of condensed water collectors was placed before each CO2 trapper.
The 400 ml CO2 trappers contained 2.5 M NaOH solution to collect the amount of
CO2 produced by each bioreactor. The following CO2 trapping reaction was discussed,
as stated in ASTM D 5338:
NaOH + CO2 → NaHCO3 --------------------------------------------------- (1)
then
NaHCO3 + NaOH → Na2CO3 + H2O ----------------------------------------- (2)
5 ml aliquots were removed from each trapper and then titrated with 0.5M
hydrochloric acid (HCl) solution 3 times a week, and the CO2 traps were changed
weekly. During titration, CO2 was chemically reacted and removed as follows:
104
NaCO3 + HCl → NaHCO3 + NaCl -------------------------------------- (3)
then
NaHCO3 + HCl → NaCl + H2O + CO2 --------------------------------------- (4)
Initially, 5 drops of phenolphthalein indicator (pink color) were added to the 5 ml
aliquots and further titrated until the end-point, as indicated when the color turned to
colorless (as in titration formula 3). In addition, 5 drops of methyl orange indicator
were then added, and then titrated until the color turned from orange to red (as in
titration formula 4). The amounts of HCl consumed during the second titration
(formula 4) were used to calculate and obtain the evolving CO2 in accordance with the
following equation [5]:
CO2 (g) = VHCl (ml) x CHCl (molar) x 44 /1000 ----------------------------- (5)
where VHCl is the volume of HCl consumed in the second titration; CHCl is the
concentration of HCl solution; and 44 is the molar mass of CO2.
Further, the percentage of mineralization can be calculated in accordance with
ASTM D 5338:
Mineralization (%) = [(CO2)sample –(CO2)blank]/ ThCO2 (eq. 4.1)
where (CO2)sample is the cumulative amount of CO2 obtained from the titration result of
each sample mixture inoculum with the time; (CO2)blank is the cumulative amount of

105
CO2 obtained from the titration result of each blank inoculum (compost only) with the
time; and ThCO2 is the theoretical quantity of each sample CO2 evolution, which can
be calculated based on the following equation:
ThCO2 = Msample x TOCsample x 44 /12 (eq. 4.2)
where Msample is the total dried mass of the sample material which was introduced to
the compost inoculums; TOCsample is the proportion of total organic carbon (TOC) in
the dried sample material; 44 is molar mass of CO2; and 12 is the atomic mass of
carbon.
Because all of the sample materials used in this study were assumed to be
compostable, the following test was based on an evaluation method on TOC of
compost and/or municipal solid waste (MSW). In compost materials, TOC can be
estimated via a formula of reduction from total organic matter (TOM) on a prediction
equation of MSWs (waste paper based) and city refuse compost experimental results
[29]:
TOC = 1.703 + 0.520 * TOM (eq. 4.3)
According to APHA 2540 D and E, TOM content determines ignition loss of oven
dried samples by using a muffle furnace at 550oC for 30 minutes, and then being

106
weighed after cooling in a desiccator. The chemical characteristics of each sample
material are shown in Table 4.2.
Table 4.2 Chemical characteristics of materials
Compost WF PHB Control MA2 ISO2
TOM (%) 65.4 99.5 99.1 99.4 99.4 99.4
Ash (%) 34.6 0.5 0.9 0.6 0.6 0.6
TOC (%) 35.7 53.4 53.2 53.4 53.4 53.4
ThCO2 284.2 74.4 74.2 74.4 74.4 74.4
Figure 4.1 Schematic of lab-scale material compostability evaluation set-up system

107
4.2.4 Fickian diffusion coefficients
During the composting test, moisture was first penetrated into sample materials,
followed by biodegradation reaction. Moisture diffusion behavior plays an important
role in the operation of biodegradation. Moreover, the moisture penetration behavior
of a WPC can be discussed and studied by using the Fickian diffusion equation
[22][30]. If the evolved CO2 vs. time can fit the Fickian diffusion equation, it will
indicate the limiting steps and also explain the mineralization diffusion behavior of
the materials. The Fickian diffusion equation is shown below:
!! = π !!!!"#
! !!!! !
! (eq. 4.4)
where DA is the apparent diffusion constant; Msat is the maximum mineralization
percentage at the end of the test period; dMt/d√t is the slope of mineralization over
square root of time relation; and h is the thickness of the composite flake sample.
4.2.5 Enzymatic kinetic
In composting chemistry, organic matter chemical breakdown is mainly reacted
by enzymes that are produced from microorganisms. Enzymes, in the case of aerobic
microorganisms, can convert organic matter to CO2 and remaining water, energy, and
residuals. In this system, complex organic matters of mixture inoculums are

108
depolymerized by the enzymes, and then the microorganisms absorb the breakdowns
as energy sources into their cells and further produce CO2 [3] [4] [5][31]. This
conversion is known as the mineralization process. It can therefore be expected that
the rate of enzyme reaction and rate of mineralization have a positive relation.
The enzyme kinetic is recognized as an accurate and reliable way to determine
enzymatic reaction. It can also provide numerical elementary mechanisms of the
reactions. The concept of the Michaelis-Menten kinetic [32][33][34][35] is widely
used in compost and agriculture science. Since mineralization is driven by bioreaction
(faster bioreaction occurs at a higher rate of mineralization), the results of
mineralization may be used to obtain the kinetic constants from the Michaelis-Menten
equation [33][34][35][36]. This will further facilitate understanding of enzyme
bioreaction behavior on PHB/WF composites, and possibly provide knowledge
concerning the composting behavior on the composite for future research studies. The
equation can be presented as:
v = !!"#[!]! ! !!
(eq. 4.5) or !!= !!
!!"#∙ ![!]+ !
!!"# (eq. 4.6)
where Km is Michealis constant, v is production rate (rate of mineralization, %/day),
Vmax is theoretical maximum reaction velocity, and [S] is the substrate (ratio of
converted carbon/ash, g/g).
109
Further, the Lineweaver-Burk plotting method can be used to determine the slope,
Km/Vmax, and intercept, 1/Vmax of a plot of equation which incorporates 1/v and 1/[S].
The lower the value of Km, the higher the affinity of enzyme occurs for the substrate
catalyst and/or less efficient of products production rate (CO2 in this case). The higher
the value of Vmax, the faster the rate of reaction occurs during substrate catalyst
[33][34][35].
4.2.6 Morphology
The surface morphology of sample materials was observed by using a scanning
electron microscope (FEI SEM, FEI 200F). The tested samples, removed from
mixture inoculums at day 90, were washed with DI water to remove compost debris
and then dried at 80oC. The control samples were also oven dried to remove moisture,
which could influence the quality of coating. All of the prepared samples were
mounted on aluminum stubs and gold-coated by a sputter coater.

110
4.3. Results and discussion
4.3.1 CO2 evolution and mineralization results
In this study, as the observation of the different polymeric materials (i.e . PHB,
PHB/WF composite, PHB/WF/MA2 composite, and PHB/WF/ISO2 composite), a lag
phase of biodegradation occurred during the first week (day 0 to day 5) of compost
experimentation. In this lag phase, theoretically, microorganisms in the compost
inoculums did not fully migrate and react with the test samples. Moreover, low
moisture content (MC) of the samples did not benefit the bioreaction from the
enzymes produced from the microorganisms. Because of these possible reasons, it
resulted in a lower rate of CO2 gas evolution than that in the biodegradation phase
(Table 4.3). After the MC of the samples equilibrated, a rapid bioreaction occurred
within the biodegradation phases, which followed after the lag phases. However,
under high humidity and temperature conditions, hydrolytic cleavage on the polyester
[13][37], PHB (in this case), could possible occur. The PHB polymer chain may have
fractured and reduced to shorter polymer chains, but no CO2 or weight loss occurred
[37][38]. Moreover, the polymer chains of hydrolyzed cleavage possibly provided
more contact surface which could have advanced the bioreactions. Following the lag
phase, a high rate of CO2 evolution appeared until day 21, which was believed to
mark the biodegradation phase. An alleviated biodegradation phase occurred

111
beginning on day 24. Due to the similar amount of total theoretical CO2 evolution of
the different materials, the mineralization of each material had the same trend as the
results in the CO2 evolutions. The results shown in Table 4.3 present the rates of CO2
evolution and mineralization of each material in different phases of biodegradation.
Notably, the rate of CO2 evolution (mg/g/hr0.5) had been normalized with the mass of
each sample, which can be further used for product end life cycle. In the other words,
the higher the rate of CO2 evolution, the shorter product end life cycle required. The
curves of accumulative CO2 evolution and mineralization are shown in Fig. 4.2 and
Fig. 4.3. The blank compost had a constant rate of CO2 evolution and mineralization,
which indicates that the compost inoculums had a constant bioreaction throughout the
entire experimenting period.
Table 4.3 Rates of CO2 evolution and mineralization of each sample in different phases of biodegradation
Day Reaction Rate Compost WF PHB Control MA2 ISO2
0-5 CO2* 1.3 7.3 14.2 15.9 13.4 7.6
Mineralization** 0.10% 0.37% 0.73% 0.81% 0.69% 0.39%
7-21 CO2 2.2 6.7 34.8 29.2 28.8 25.8
Mineralization 0.17% 0.34% 1.78% 1.49% 1.47% 1.32%
24-54 CO2 4.7 11.6 14.1 15.2 13.7 11.0
Mineralization 0.36% 0.59% 0.72% 0.78% 0.70% 0.56% * CO2 is amount of CO2 evolution per unit weight of material over square root of hours (mg/g/hr0.5); ** Mineralization is percentage of mineralization over square root of hours (%/hr0.5).
112
In the degradation phase (day 7 to 21), in the comparison with PHB, WF and the
PHB/WF (control) composite, wood flour had the lowest rate (6.7 mg/g/hr0.5) of CO2
evolution. Complex chemical compounds, e.g. lignin, are believed to have caused the
difficulty of bioreactions from enzymes with wood [5]. The main chemical
components of wood are cellulose, hemi-cellulose, and lignin. Each of these
chemicals require certain conditions (enzymes, humidity, and temperature) and time
(in the scale of years) to achieve depolymerization or decay [39][40]. For example,
lignin, which ties cellulose microfibers together and forms the structure of wood and
functions as a rigid polymer, has complex chemical structures and anti-enzyme
property [5], which was believed to cause the difficulty of degradation. On the other
hand, the two PHB/WF composites with coupling agents added, MA2 and ISO2, had
lower rate of CO2 evolution than the control (28.8 and 25.8 mg/g/hr0.5 vs. 29.2
mg/g/hr0.5). Studies [18][23] have indicated that coupling agents improved the
interfacial bonding between wood and PHB by changing the wettability (surface
tension) of wood and coupling the functional groups, e.g. hydroxyl group, in wood
with PHB. In this research, the coupled PHB with wood flour can be seen as one
binding component, which resulted the difficulty of bioreaction with enzymes due to
the lignin effects and possible the molecular weight effects. The larger the molecular
weight, the longer the time it takes to degrade. However, when looking at the

113
difference between the two coupling agents, there was not enough evidence to
conclude that the PHB/WF composite with PHB-g-MA added had less biodegradation
resistance than MDI because of grafting ratio was only 0.43% compared with the
higher functionality two of MDI.
Morphologically, during biodegradation, the PHB-rich skin of the composites was
first biodegraded, and then wood flour was exposed to the enzymatic environment.
Another possibility is that in the high humidity condition, moisture-induced swelling
of wood flour created defects between the wood flour and polymer as interfacial
debonding and microcracks on surface and inner of the PHB/WF composites.
Furthermore, enzymes can rapidly depolymerize PHB due to the expansion surface
area. A retarded rate of CO2 evolution and mineralization (Figs. 4.2 and 4.3) was
observed after day 21. The reasons for this retardation may be because the enzymes
have difficultly reacting with PHB, which is located in the innermost depth of wood
lumens and/or blocked by the wood flour while simultaneously degrading some wood
chemicals. Further morphology studies are encouraged to focus on this question in
order to understand the composting biodegradation mechanisms and surface erosion
process.
Notably, on the last day (day 54) of this experiment, the mineralization levels of
different polymeric composites and materials were 16.6%, 40.4%, 39.8%, 36.3%, and

114
25.7% (WF, PHB, Control, MA2, and ISO2, respectively). The PHB/WF composite
of ISO2 resulted in an approximately 35% and 29%, respectively, less mineralization
than that of the PHB/WF composites of the control and MA2. Only about 9%
difference appeared between the control and MA2. This indicates that using MDI as a
coupling agent can significantly reduce the rate of mineralization during composting.
Figure 4.2 Plot of accumulative CO2 evolving production against square root of time in hours of polymeric composites and materials
0
100
200
300
400
500
600
700
800
900
CO
2 Evo
lutio
n (m
g/g)
Time (hr0.5)
Compost WF PHB Control MA2 ISO2

115
Figure 4.3 Plot of accumulative mineralization against square root of time in hours of polymeric composites and materials
4.3.2 Fickian diffusion coefficient
As moisture is a key of limitation for operating bioreactions by enzymes that are
produced from microorganisms, moisture penetration is a major influencing factor on
the rate of mineralization. The behavior of small molecules (liquid or gas) transported
throughout solid materials can be numerically presented by the Fickian diffusion.
Enzymes produced from microorganisms are small molecules and display diffusion
behavior in solid materials [41]. Theoretically, after an enzyme is diffused into a solid
material, the enzyme will react with the substrate and then be consumed by the
microorganism to produce carbon dioxide as its metabolism. For this reason, by
0.0%
5.0%
10.0%
15.0%
20.0%
25.0%
30.0%
35.0%
40.0%
0 5 10 15 20 25 30 35 40
Min
eral
izat
ion
(%)
Time (hr0.5)
Compost WF PHB Control MA2 ISO2

116
applying the Fickian diffusion onto mineralization, the mineralization diffusion
process can further be recognized and presented by its diffusion coefficient. However,
non-Fickian behavior, i.e., non-linear relation, could be found during the lag phase
and may also show in the alleviated biodegradation phase. By excluding the lag phase
in this study to understand the enzymatic diffusion behavior, the maximum
percentages of mineralization (Msat) were taken at the end of the experiment (day 54),
and the slopes of mineralization over square root of time were taken during the
biodegradation phase (days 7-21). The results are shown in Table 4.4; the PHB/WF
composite with MDI added had the lowest diffusion coefficient of 4.83E-5 mm2/hr0.5
overall. The diffusion coefficient is approximately 17% and 30% less than that of
MA2 and control PHB/WF composites, respectively. The reason for this difference
could be because the interfacial bonding was improved by the coupling agents and
thus resulted in the difficulty of the enzyme reaction with the PHB-coupled-WF.
Moreover, as mentioned previously, the 0.43% of grafting degree of PHB-g-MA had
limited function on coupling between the functional groups in wood and PHB.
Therefore, the MDI resulted in a significantly reduction of mineralization diffusion.

117
Table 4.4 Mineralization diffusion coefficients of different polymeric material and composites
PHB Control MA2 ISO2
Mineralization diffusion
Da (mm2/hr0.5)
5.17E-05 6.94E-05 5.80E-05 4.83E-05
4.3.3 Enzymatic kinetic
To determine the enzymatic kinetic, calculation of the data of mineralization from
the lag phase was used. In biology, an organism starts to expand its population during
the lag phase, and then followed an exponential growth. However, the growth will
meet a population limitation due to limited food sources as a close-to-no or plateau
growing. After it meets the plateau growing state, ideally, the rapidly constant
bioreaction (linear slope) occurs. The enzymatic kinetic of mineralization in this study
was calculated by using the Michaelis-Menten equation, applying the
Lineweaver-Burk plotting method to determine kinetic constants. The enzymatic
kinetic constant, Michaelis constant, Km, and theoretical maximum reaction velocity,
Vmax, were obtained after applying the Lineweaver-Burk plotting method (see in Fig.
4.4) with the calculated results from mineralization. The results shown in Table 4.5
indicate that the PHB/WF composite with MDI added had the lowest value of Km and
Vmax, which indicates that the composite had the lowest enzyme reaction and lowest
rate of CO2 production than the others. In other words, the enzyme reacted more
efficiently on PHB, control and MA2 composites than ISO2 composites by

118
comparison with the maximum reaction velocities. This result also corresponds with
the results found in the mineralization Fickian diffusion. Therefore, applying the
Michaelis-Menten equation to analyze the enzyme reaction kinetic during the
composting process can definitely help to fundamentally understand the process of
composting compostable biocomposites.
Figure 4.4 Lineweaver-Burk plot of rate of mineralization and substrate content
Table 4.5 Enzyme kinetic constants of different materials
Km Vmax (1/day)
Wood Flour 0.76 0.023
PHB 25.1 0.24
Control 31.4 0.22
MA2 35.7 0.24
ISO2 21.4 0.13
y = 32.806x + 43.162 y = 103.48x + 4.123 y = 143.48x + 4.5722 y = 150.54x + 4.2133 y = 166.73x + 7.7774
0
10
20
30
40
50
60
70
80
90
0 0.1 0.2 0.3 0.4 0.5 0.6 0.7
1/(m
iner
aliz
atio
n/da
y)
1/(carbon/ash)
WF PHB Control MA2 ISO2

119
4.3.4 Morphology
Studies indicated that the biodegradation process of biodegradable polymers is a
surface erosion process. By geometrically understand that the surface of the
biocomposites was first exposed with the enzyme and/or microorganisms, and further
result as a consumption process by the bioreactions. This surface erosion is seen as
layer-by-layer erosion process from surface to the core of the biocomposites.
Morphology is one way to determine and understand the surface erosion process by
enzymes on the PHB/WF composites. The results shown in Figures 4.5-A and -B
demonstrate that by comparing before and after composting on PHB samples,
evidence of the eroded surface was found on PHB after being composted. By
increasing magnitude, it appeared that the evidence of the partially eroded sphere of
PHB crystal remained on the sample surface (Figures 4.5-C and -D). This result
shows that the amorphous region of PHB was believed first biodegradated and eroded
by enzymes with our previous results - the degree of crystallinity of PHB was
increased after certain period of time composted. Possibly, a higher density of the
crystal region requires more time to biodegrade. The snow-flake like crystal PHB was
also observed on the sample surface (Figure 4.5-E). Upon observation of cross-section
of PHB (Figure 4.5-F), it is clear that erosion appears on the surface, but not on the

120
inner part of the PHB sample. This evidence further to ensures that the enzymatic
biodegradation reacts as a surface erosion process.
Figure 4.5 Morphology of PHB (A) and eroded and/or biodegradated surface of PHB (B – F)
With the observation of PHB/WF composites, evidence of surface erosion is
obviously seen (shown in Figure 4.6). Interestingly, microorganism hypha was also
clear as seen during the morphology observation. Moreover, wood flour was exposed
after the surface of PHB was biodegraded and eroded (arrowed in Figure 4.6-C, -D,
and -E). The surface eroded PHB was also found next to and/or behind wood flour.
The wood flour had no significant biodegradation and/or surface erosion, but it
appeared that wood flour was broken down to finer particles (as seen in Figure 4.6-E

121
and -F). This result confirms our earlier statement: wood required more time or was
more difficult to fully biodegrade. Furthermore, after increasing the magnitude in
microscope observation (the results shown in Figures 4.6 and 4.7), evidence of hypha
of microorganism and partially eroded (biodegraded) surface of PHB appears, which
is located underneath of hypha and wood flour (see Figures 4.7-B and -C).
Additionally, it appears that wood flour, here, as an obstacle, detracts hypha from
reaching the inner PHB for further degradation. By connecting this observation and
the results of mineralization, a slow-down phase after biodegradation can be
explained. To conclude this morphology evidence, a surface erosion mechanism can
be sketched out and will be discussed in the next section.
Figure 4.6 Morphology of a PHB/WF composite (A) and eroded and/or biodegradated surfaces of PHB/WF composites (B – F)

122
Figure 4.7 Morphology of crystal region of PHB (A) and evidence of hypha (B and C) on the surface of PHB/WF composite
4.3.5 Enzymatic surface erosion mechanism
By combining the results of mineralization and discovery of morphology, the lag,
biodegradation, and slow-down phases can be explained by fundamentally and
theoretically understanding. The proposed schematic sketch of the relation of erosion
mechanism and mineralization is presented in Scheme 4.1 (lag, biodegradation, and
slow-down phase). This presentation is during the lag phase, and the microorganisms
have not been attached or are only partially attached on the surface of the PHB/WF
composite, and in this phase, only some bioreactions occurred. In the biodegradation
phase, the microorganisms are exponentially grown, resulting in rapid bioreactions
and constantly producing carbon dioxide. As to the morphology, the PHB-rich skin
was consumed and the hypha of the microorganisms reached the entire surface and/or
eroded surface (inner) of the composites. At the transition between the biodegradation
phase and a consequent slow-down phase, most of the PHB on the surface was

123
consumed and the hypha reached partially decomposed (or broke down) the wood
flour. The wood flour became an obstacle to hypha reaching the PHB inside of wood
lumen or below wood flour. Therefore, a slow-down phase was observed.
Scheme 4.1 Proposed mineralization process and surface erosion mechanism on
PHB/WF composites

124
4.4. Conclusion
In this study, three different biodegradation phases during composting were
observed from the results of theoretically calculated carbon dioxide evolution and
mineralization. The phases are lag (day 0 to 5), biodegradation (day 7 to 21), and
slow-down phase (day 21 to 54). The lag phase can also be seen as an adjusting phase
for microorganisms in the compost inoculums. The biodegradation phase is seen as
rapidly bioreaction phased, and the slow-down phase follows after the biodegradation
phase. In comparison with coupling agent effects, MDI resulted in an outstanding
anti-enzymatic reaction, which is implied from lowest rate of carbon dioxide
evolution and lowest rate of mineralization (ca. 12% less rate of CO2 evolution and
rate of mineralization than the PHB/WF composite). In the end of the experiment, the
PHB/WF composite with MDI added resulted in that approximately 35% less material
was mineralized than in the control PHB/WF composites. Moreover, using the
coupling agent of PHB-g-MA resulted in some level of influence on compostability of
the PHB/WF composite, but it was not as significant as MDI. It is believed that the
low grafting ratio of MA was the limitation. During composting, one limiting factor
for microorganisms operating the biodegradation process is moisture, which becomes
a key of operating biodegradation. After fitting the results of mineralization vs. time
in the Fickian diffusion equation, the mineralization diffusion behaviors of the

125
PHB/WF composites were numerically quantified. The results of mineralization of
Fickian diffusion on the PHB/WF composites of the control, MA2 and ISO2 were
6.94, 5.80, and 4.83 x 10⁻⁵ mm2/hr0.5, respectively. The PHB/WF composite with MDI
added resulted approximately 17% and 30% less than that of MA2 and control
PHB/WF composites, respectively. By applying the Michaelis-Menten equation to
determine the fundamental enzyme kinetic and understanding, the results correspond
with the results found in the mineralization Fickian diffusion: the lowest enzyme
reaction occurred in the PHB/WF composite, with MDI added as compared with the
control and MA2. In the morphology studies, evidence of surface erosion of the PHB
and the PHB/WF composites was found. The sphere crystal structure remained on the
surface of the PHB as well as on some the PHB/WF composites. Additionally, the
hypha of microorganisms and broken wood flour remained on the surface of the
composites. This result indicates and proves that wood flour requires more time to
degrade. Notably, the wood flour was believed to block hypha from reaching the inner
PHB and caused the retardant of biodegradation, which shows in the slow-down
phase. To summarize and reinforce the investigated results in this study, not only
were the Fickian diffusion and the Michealis-Menten kinetic successfully applied to
fundamental understand biodegradation during composting, but also the relation of
surface erosion and mineralization was pointed out by using a schematic sketch which

126
provides a state-of-the-art view of mineralization mechanism on the PHB/WF
composites. Lastly, this mechanism could potentially provide valuable information on
the biodegradation of different natural fiber reinforced biocomposites.
4.5. Acknowledgements
The authors acknowledge to the U.S Department of Energy for supporting this
study by contract NO. DE-AC07-051D14517, and also thank the composting facility
at Washington State University which provided compost materials.

127
4.6. References
[1] "Municipal Solid Waste in the United States: Facts and Figures | Municipal Solid Waste | Wastes | US EPA". [Online]. Available: http://www.epa.gov/epawaste/nonhaz/municipal/msw99.htm. Accessed: 06-July-2011
[2] J. W. Levis and M. A. Barlaz. 2011. Is Biodegradability a Desirable Attribute for Discarded Solid Waste? Perspectives from a National Landfill Greenhouse Gas Inventory Model. Environmental Science & Technology. 45(13):5470-5476
[3] The BioCycle Guide to the Art & Science of Composting. Emmaus, Pa: JG Press, 1991.
[4] Z.-S. Chen. 2005. Compost production : a manual for Asian farmers. Taipei Taiwan: Food and Fertilizer Technology Center for the Asian and Pacific Region
[5] N. Trautmann. 1998. Composting in the classroom : scientific inquiry for high school students. Dubuque Iowa: Kendall/Hunt Pub.
[6] S. H. Imam, L. Chen, S. H. Gordon, R. L. Shogren, D. Weisleder, and R. V. Greene. 1998. Biodegradation of Injection Molded Starch-Poly (3-hydroxybutyrate-co-3-hydroxyvalerate) Blends in a Natural Compost Environment. Journal of Polymers and the Environment. 6(2):91-98
[7] S. Luo and A. N. Netravali. 2003. A study of physical and mechanical properties of poly(hydroxybutyrate-co-hydroxyvalerate) during composting. Polymer Degradation and Stability. 80(1):59-66
[8] U. Pagga, D. B. Beimborn, J. Boelens, and B. De Wilde. 1995. Determination of the aerobic biodegradability of polymeric material in a laboratory controlled composting test」, Chemosphere. 31(11-12):4475-4487
[9] D. S. Rosa, R. P. Filho, Q. S. H. Chui, M. R. Calil, and C. G. F. Guedes. 2003. The biodegradation of poly-β-(hydroxybutyrate), poly-β-(hydroxybutyrate-co-β-valerate) and poly(ε-caprolactone) in compost derived from municipal solid waste. European Polymer Journal. 39(2):233-237
[10] H. Tsuji and K. Suzuyoshi. 2002. Environmental degradation of biodegradable polyesters 1. Poly(ε-caprolactone), poly[β-3-hydroxybutyrate], and poly(L-lactide) films in controlled static seawater. Polymer Degradation and Stability. 75(2):347-355
[11] W.-K. Lee, J.-H. Ryou, and C.-S. Ha. 2003. Retardation of enzymatic degradation of microbial polyesters using surface chemistry: effect of addition of non-degradable polymers. Surface Science. 542(3):235-243, 2003.
[12] B. A. Ramsay, V. Langlade, P. J. Carreau, and J. A. Ramsay. 1993. Biodegradability and mechanical properties of

128
poly-(β-hydroxybutyrate-co-β-hydroxyvalerate)-starch blends. Appl. Environ. Microbiol. 59(4):1242-1246
[13] M. Scandola, et al. 1997. Polymer Blends of Natural Poly(3-hydroxybutyrate-co-3-hydroxyvalerate) and a Synthetic Atactic Poly(3-hydroxybutyrate). Characterization and Biodegradation Studies. Macromolecules. 30(9):2568-2574
[14] F. Su, T. Iwata, F. Tanaka, and Y. Doi. Crystal Structure and Enzymatic Degradation of Poly(4-hydroxybutyrate). Macromolecules. 36(17):6401-6409
[15] M. R. Timmins, R. W. Lenz, P. J. Hocking, R. H. Marchessault, and R. C. Fuller. 1996.Effect of tacticity on enzymatic degradability of poly(β-hydroxybutyrate). Macromolecular Chemistry and Physics. 197(4):1193-1215
[16] C.-S. Wu. 2006. Assessing biodegradability and mechanical, thermal, and morphological properties of an acrylic acid-modified poly(3-hydroxybutyric acid)/wood flours biocomposite. Journal of Applied Polymer Science. 102(4):3565-3574
[17] B. H. Briese, D. Jendrossek, and H. G. Schlegel. 1994. Degradation of poly(3-hydroxybutyrate-co-3-hydroxyvalerate) by aerobic sewage sludge. FEMS Microbiology Letters. 117(1):107-111
[18] Scott P. Anderson. 2007. Wood Fiber Reinforced Bacterial Biocomposites: Effects of Interfacial Modifiers and Processing on Mechanical and Physical Properties. Master thesis, Washington State University
[19] D. Harper and M. Wolcott. 2004. Interaction between coupling agent and lubricants in wood-polypropylene composites. Composites Part A: Applied Science and Manufacturing. 35(3):385-394
[20] H. Dalväg, C. Klason, and H.-E. Strömvall. 1985. The Efficiency of Cellulosic Fillers in Common Thermoplastics. Part II. Filling with Processing Aids and Coupling Agents」, International Journal of Polymeric Materials. 11(1):9-38
[21] R. Gauthier, C. Joly, A. C. Coupas, H. Gauthier, and M. Escoubes. 1998. Interfaces in polyolefin/cellulosic fiber composites: Chemical coupling, morphology, correlation with adhesion and aging in moisture. Polymer Composites. 19(3):287-300
[22] M. J. A. Chowdhury and M. P. Wolcott. 2007. Compatibilizer selection to improve mechanical and moisture properties of extruded wood-HDPE composites. Forest Products Journal. 57(9):46-53
[23] L. Jiang, et al. 2008. Study of Poly(3-hydroxybutyrate- co -3-hydroxyvalerate) (PHBV)/Bamboo Pulp Fiber Composites: Effects of Nucleation Agent and Compatibilizer」, Journal of Polymers and the Environment. 16(2):83-93

129
[24] David P. Harper. 2003. A Thermodynamic, Spectroscopic, and Mechanical Characterization of the Wood-Polypropylene Interphase. Master Thesis, Washington State University
[25] A. K. Bledzki, S. Reihmane, and J. Gassan. 1996. Properties and modification methods for vegetable fibers for natural fiber composites. Journal of Applied Polymer Science. 59(8):1329-1336
[26] E. Petinakis, L. Yu, G. Edward, K. Dean, H. Liu, and A. Scully. 2009. Effect of Matrix–Particle Interfacial Adhesion on the Mechanical Properties of Poly(lactic acid)/Wood-Flour Micro-Composites. Journal of Polymers and the Environment. 17(2):83-94
[27] A. Karmarkar, S. S. Chauhan, J. M. Modak, and M. Chanda. 2007. Mechanical properties of wood-fiber reinforced polypropylene composites: Effect of a novel compatibilizer with isocyanate functional group. Composites Part A: Applied Science and Manufacturing. 38(2):227-233
[28] "WSU compost facility - feedstock/recipe". [Online]. Available: http://facops.wsu.edu/Compost/compost_production_fr.asp. Accessed: 27-April-2010.
[29] E. Iglesias Jiménez and V. Pérez García. 1992. Relationships between organic carbon and total organic matter in municipal solid wastes and city refuse composts」, Bioresource Technology. 41(3):265-272
[30] S. V. Rangaraj and L. V. Smith. 2000. Effects of Moisture on the Durability of a Wood/Thermoplastic Composite. Journal of Thermoplastic Composite Materials. 13(2):140-161
[31] R. T. Haug. 1993. The practical handbook of compost engineering. CRC Press. [32] G. E. Briggs and J. B. S. Haldane. 1925. A Note on the Kinetics of Enzyme
Action」, Biochemical Journal. 19(2):338-339 [33] D. S. Whang and G. F. Meenaghan. 1980. Kinetic Model of Composting
process」, Compost Science and Utilization. 21(3):44 - 46 [34] S. Kumar, A. Sakhale and S. Mukherjee. 2009. Simplified Kinetic Analysis for
Composting of Municipal Solid Waste. Practice Periodical of Hazardous, Tocix, and Radioactive Waste Management. 13(3):179-186
[35] P. Agamuthu, L. C. Choong, S. Hasan, and V. V. Praven. 2000. Kinetic Evaluation of Composting of Agricultural Wastes. Environmental Technology. 21(2):185
[36] J. Monod. 1949. The Growth of Bacterial Cultures. Annual Review of Microbiology. 3(1):371-394
130
[37] M. Vert, International Scientific Workshop on Biodegradable Polymers and Plastics, Montpellier. 1992. Biodegradable polymers and plastics. Cambridge [England]: Royal Society of Chemistry
[38] A. Göpferich. 1996. Mechanisms of polymer degradation and erosion. Biomaterials. 17(2):103-114
[39] N. M. Stark and D. J. Gardner. 2008. Outdoor durability of wood-polymercomposites」, in Wood-Polymer Composites, Cambridge, England: CRC Press ;Woodhead Pub. pp.142 - 165.
[40] C. G. Carll and T. L. Highley. 1999. Decay of Wood and Wood-Based Products above Ground in Buildings. Journal of Testing and Evaluation. 27(2):150-158
[41] J. P. Kernevez. 1980. Enzyme mathematics. Elsevier

131
Chapter 5 Developing PHB/WF/Cell debris Composites: Extrusion
Abstract
Wood plastic composite (WPC) has been promoted as a good example of
engineerable and sustainable materials. To move toward a sustainable society, it is
necessary to use bio-based polymer, i.e. poly-3-hydroxybutyrate (PHB), to produce
WPCs. Production of pure PHB from PHB-laden sterilized bacteria cells requires
solvent-based extraction and purification, both of which have raised concerns of
substantial environmental impacts and energy consumption. One solution for reducing
these impacts is to directly process PHB-laden cells as components in a polymeric
composite. This study investigated using cell debris as a reinforcement to replace
wood flour in order to produce a wood bio-plastic composite. Purified PHB and
PHB-free cell debris were used to simulate PHB-laden microbes in extruding
PHB/wood flour (WF)/cell debris ternary composites (PWCCs) with various wood
flour/cell debris ratios. Torque rheometry was studied to understand the temperature
and viscosity relation, and the results provided information to design temperature
profiles for the extrusion process of different formulations. A commercial formulation
of WPC, high density polyethylene (HDPE)/WF composite, was also extruded as a
comparison. Polymeric methylene-diphnenyl-diisocynate (pMDI) was used as a

132
coupling agent to increase the interfacial bonding between the PHB matrix and the
hydrophilic fillers. Mechanical properties and water adsorption of the composites
were investigated in accordance with ASTM standards. The mechanical properties
and moisture resistance of the PWCCs were decreased with the increasing content of
the cell debris. As shown in a morphology study, the low aspect ratio of cell debris
and poor interfacial bonding with PHB were possible reasons causing the
deterioration of performance of PWCCs. However, the performance of the PWCC
formulation of cell debris/wood flour ratio of 3:2 showed that mechanical properties
and water resistance were comparable to a commercial WPC. Moisture diffusion and
activation energy were also evaluated. As a result of this investigation, PWCCs could
potentially replace some of the petroleum derived WPCs in current markets.
Key Words: sustainability, poly-3-hydroxybutyrate (PHB), wood plastic composite
(WPC), torque rheometry, moisture diffusion, flexure properties.

133
5.1 Introduction
In recent years, there has been a movement toward the use of sustainable
materials and reducing environmental impacts. Natural resources such as natural fiber
and wood flour are the most common candidates for use as reinforcements to form
polymeric composites because of their low cost coupled with higher specific
performance. For that reason, wood plastic composite (WPC) has been promoted as a
good example of durable, engineerable, and sustainable materials [1]. However, to
lessen dependence on crude oil, WPCs have been investigated by using bio-based
polymers as a matrix. One family group of bio-based polymer, polyhydroxyalkanoates
(PHAs), has been viewed as an alternative to achieve this goal because it has widely
different properties, from stiff to rubbery, or from thermoplastic to elastomer [2] [3].
Many previous studies [4][3][5][6] indicated that in the polymer first discovered in
1925, polyhydroxybutyrate (PHB), French scientist Maurice Lemoigne found that
PHB was an energy reserve and is made up of many different bacteria with
carbohydrate substrate feeding. PHB is a highly crystalline substance with a melting
point of ca. 175oC; its mechanical properties are comparable to those of
polypropylene [4][6]. PHB possesses a similar processability to many commodity
polymers with no issue in using conventional polymer processing techniques and

134
equipment. Moreover, PHB [3][5][6][7] is biodegradable and compostable, which
means it can be mineralized to form CO2 with the assistance of microorganisms.
However, the major hurdle preventing PHB use in WPCs is the cost; the cost of
PHB is much higher than that of commodity plastics. A cradle-to-grave analysis [8]
showed that to produce 1kg of PHB from corn would require 65% more fossil fuel to
generate the same quantity of petroleum-based polystyrene. This result indicates that
the methodology of conventional PHA production exhibits a high demand for crude
oil required, along with generating more carbon emissions. On the other hand, if one
considers the costs and procedures from the process of recycling petrochemical
plastics, the overall life cycle costs of PHAs could be more comparable with those of
petrochemical plastics. To solve the energy consumption, one way is to find an
alternative carbohydrate source to produce PHAs because converting from corn to
glucose requires 8129 KJ per kg, and ca. 3.3 kg of glucose is needed to generate 1kg
of PHAs during bacterial fermentation [8]. Moreover, to obtain high purification of
PHAs, the processes of extraction and purification, which are organic solvent and
energy intensive, are needed [3][6]. With the environmental impact of using
crop-based feedstock and the purification process, it is challenging for PHAs to be
represented as a sustainable commodity.

135
Recent research [9] has indicated successful utilization of a waste stream that
contained a certain amount of carbohydrate sources from municipal waste water to
generate PHAs. It can be imagined that waste water from forestry, food, and
agriculture industries could be utilized as potential sources. This strategy of utilizing
low cost feed sources from waste water is further seen as a solution to sustainably
produce PHAs while reducing waste water impacts. Furthermore, PHA-based WPCs
would be more economic if the PHA-laden bacterial cells are used directly to produce
the WPCs [10]. With this innovative production process, the PHA extraction and
purification steps are eliminated. To summarize, using municipal wastewater as
feedstock to generate PHAs and directly processing PHA-laden bacterial cells to form
WPCs would bring about significant energy and environmental benefits with ca.
30~40% reduction of total product costs [10].
Although the previous studies [9][10] demonstrated that a PHB-rich cell mass
could be directly used to prepare composites by melt blending and pressure molding,
the study lacks investigation into the microstructure and interface of the composites,
which often critically determines composite properties. The impact of cell mass
content on mechanical properties and water resistance of the composites and the
reasons behind the impact are also not fully identified. Water resistance is an
important property for WPCs due to the environment, to which most WPCs are

136
exposed in applications. Current WPC markets are primarily comprised of extruded
WPC products such as deck floors, sidings, railings, etc. The packing pressure
provided by a typical extrusion process is much lower than that in an injection
molding process. Torque rheometry is further needed to study the relation between
temperature and viscosity, which could help to design a suitable process temperature
to increase packing pressure during extrusion processes. In a previous study,
Anderson [11] investigated a coupling agent, polymeric methylene diphenyl
diisocyanates (pMDI), which has shown outstanding performance in enhancing the
interfacial bonding between hydrophobic PHB and hydrophilic wood flour. Bacterial
cell debris has also been classified as a hydrophilic material. By adding the coupling
agent, the performance of WPC, which is mainly integrated with PHA-laden cell
debris and wood flour, can be expected to be improved.
The specific objectives of this study are: 1) to investigate the extrusion
processability of PHB/wood/cell debris composites (PWCCs) by using torque
rheometry; 2) to investigate the cell debris content effect on mechanical properties
and moisture resistance with a comparison of a commercial WPC; and 3) to study the
morphology of microstructure and interface of the PWCCs.

137
5.2 Materials & Methods
5.2.1 Materials
Purified PHB powder (Tianan Biologic Material Co., Ltd, Ningbo, China), waste
effluents cell debris (provided by UC-Davis; ca. 88% of particle dimension were less
than 250µm), and wood flour (Pinus, 60-mesh, American Wood Fibers, Schofield, WI)
were the three main components of the PWCCS. Boron nitride (BN) (Carbotherm
PCTF5, Saint Gobain Advanced Ceramics Co., Amherst, NY) was used as a
crystallization agent to promote PHB crystallization. Glycolube WP2200 (Lonza Inc.,
Allendale, NJ) was included as a lubricant to improve processability. Talc (Nicron
403) was provided by Riotinto of Centennial and used for processability and water
resistance improvements. Liquid-form pMDI (Mondur 541, Bayer MaterialScience,
Pittsburgh, PA) contained 31.5 mass % NCO and functioned as the coupling agent
between hydrophobic PHB and hydrophilic wood flour and cell debris. In addition, a
commercial WPC was used as a comparison. The raw materials of the commercial
WPC were high density polyethylene (HDPE, Petrothene® LB010000 from Equistar),
zinc stearate (DLG20, Chemical Distributors, Inc.), and ethylene bis straramide (EBS)
wax (General Electric Specialty Chemicals)

138
5.2.2 Methods
5.2.2.1 Particle size distribution analysis of ground cell debris
A hummer mill with a screen size of 0.0312 inches was used to grind the dried
cell debris. The cell debris was ground with the condition of as-received. Particle size
distribution analysis of the ground cell debris was conducted by using a Ro-Tap sieve
analyzer with a series of stacked screens, with the screen size ranging from 20 to
120-mesh (top to bottom). The instrument was allowed to run for about 10 minutes to
separate the cell debris. The particle size distribution of the ground cell debris is
shown in Table 5.1. About 88 wt. % of the cell debris particles were less than
diameter of 250 µm (60-mesh).
Table 5.1 Particle size distribution of cell debris after hammer milling
5.2.2.2 Torque rheometry
Mixing torque rheometry of different formulations was evaluated using a Haake
Rheomix 600p equipped with a 69 ml mixing chamber. 70 vol% of the chamber was
filled with each formulation. The materials were then mixed by a pair of roller blades
Particle
size (µm) <125µm
125~150
µm
150~177
µm
177~250
µm
250~420
µm
420~833
µm
> 833
µm
Weight
percentage
(%)
59.1% 9.3% 7.7% 11.7% 8.9% 2.8% 0.4%

139
at 20 rpm under different temperatures for 10 minutes. The torque was continuously
monitored during the mixing process. The torque values obtained under different
mixing conditions were used to optimize the conditions of the extrusion process. The
formulations used for torque rheometry are listed in Table 5.2 without contents of
lubricants, talc, and nucleation agent, since the contents of these chemicals did not
markedly alter the viscosity of the formulations.
Table 5.2 Formulations of PHB/WF control and PHB/WF/Cell debris mixtures for torque rheometry study
Formulation
Components
PHB/WF
(PW)
PHB/WF/
20%
Cell debris
(PWC20)
PHB/WF/
40%
Cell debris
(PWC40)
PHB/WF/
60%
Cell debris
(PWC60)
PHB/WF/
80%
Cell debris
(PWC80)
PHB/Cell
debris
(PC)
Cell debris* 0 11.4 22.8 34.2 45.6 57
WF (pine)* 57 45.6 34.2 22.8 11.4 0
PHB 35 35 35 35 35 35
pMDI 4 4 4 4 4 4
*: 60-mesh particle size. WF: Wood flour. All units are in parts.
5.2.2.3 Preparation of composites
60-mech of pine wood flour was dried by a rotary steam tube drier to a moisture
content of about 3%. Ground cell debris powder was dried at 100oC in a convection
oven for 24 hours. Purified PHB, BN, WP2200, and talc were used as-received. PMDI

140
was first well dispersed in PHB powder (manually mixed until not a viable
agglomerate), and then blended with all the other components in a drum blender for 5
minutes. Six formulations of PWCCs and one commercial WPC were prepared with
the formulation shown in Table 5.3. Melt compounding was accomplished using a
conical co-rotating twin screw extruder (Cinicinnati Milicron CM 35) with a screw
diameter of 35 mm and a length/diameter (L/D) ratio of 22. To improve melt strength
and reduce material thermal degradation, a declining temperature profile of the
extruder was applied during the extrusion process [12]. The temperature profiles for
all formulations, which had been optimized based on the torque data of torque
rheometry, are shown in Table 5.4. The screw speed was maintained at 20 rpm.
Extrusion residence time was ca. 1 minute. Each formulation was extruded through a
slit die (cross-section 38 X 9.8 mm) and annealed with spray water upon exiting.
Melting pressure was monitored as an indicator of the melt viscosity of the
composites before the materials entered the first die zone.

141
Table 5.3 Formulations of HDPE/WF, PHB/WF control, and PHB/WF/cell debris composites
Formulation
Components
HDPE/
WF
(HW)
PHB/
WF
(PW)
PHB/WF/
20%
Cell debris
(PWC 20)
PHB/WF/
40%
Cell debris
(PWC 40)
PHB/WF/
60%
Cell debris
(PWC 60)
PHB/WF/
80%
Cell debris
(PWC 80)
PHB/
Cell debris
(PC)
Cell debris* 0 0 11.4 22.8 34.2 45.6 57 WF (pine)* 58 57 45.6 34.2 22.8 11.4 0 Polymer 32 35 35 35 35 35 35 Talc 7 8 8 8 8 8 8 pMDI 0 4 4 4 4 4 4 Lubricant 2 3 3 3 3 3 3 Wax (EBS) 1 0 0 0 0 0 0 Nucleating agent
(Boron nitride) 0 0.2 0.2 0.2 0.2 0.2 0.2
*: 60 mesh particle size. WF: Wood Flour. Lubricant: Zinc stearate for HW; WP2200 for all others. All units are in parts.
Table 5.4 Temperature profiles used for extrusion of the seven formulations
oC BZ1 BZ2 BZ3 Screw DZ1 DZ2 HW 163 163 163 163 170 170 PW 170 175 165 163 163 160 PWC 20 170 175 165 163 163 160 PWC 40 170 170 165 160 160 160 PWC 60 165 170 165 155 155 155 PWC 80 160 165 160 150 150 150 PC 160 160 155 150 150 150
BZ: barrel zone DZ: die zone

142
5.2.2.4 Preparation of testing specimens
The extrudates were cut into 205mm long sections for flexural testing. The
length was 20 times of the sample thickness (9.8 mm) in accordance with ASTM
Standard D 790 requirements. Impact test specimens were prepared following ASTM
Standard D256. The dimensions of the specimens were 12 X 9.8 X 60 mm and the
specimens were notched by a XQZ-I specimen Notch Cutter. Specimens for water
absorption were surfaced by a planer and machined into 11 X 8 X 100 mm.
5.2.2.5 Morphology
Morphology of wood flour and cell debris particles was individually employed
by using scanning electronic microscope (SEM), and as well as interfacial bonding of
particle-polymer. The extruded composite samples were first cut into a small
specimen, and further cryo-microtomed to obtain a non-plastic deformation on the
sectioned surface. The samples were oven dried at 100oC for 24 hours to remove
moisture, which may influence the quality of gold coating. After being cooled down
in a dessicator at room temperature at least 2 hours, all of the dried samples were
mounted on aluminum stubs and gold-coated by a sputter coater. The coated samples
are further observed by using SEM (FEI 200F).

143
5.2.2.6 Mechanical properties and sample density
A screw driven Instron 4466 equipped with a 10-KN load cell and a three point
bending test fixture was used for flexural tests. The flexural tests were performed with
a crosshead speed of 3.80 mm/min. Modulus of rupture and modulus of elasticity
were calculated in accordance with ASTM D790. Impact tests were conducted using a
Dynisco BPI tester. ASTM Standards D256 (mode A) and D790 were followed in the
impact and flexural tests, respectively. Statistically, five replicates were tested for
each formulation to obtain a mean value with a standard deviation. Sample density
was calculated by dividing sample mass by sample volume. All of the samples (for
both mechanical and density testing) were conditioned at 21oC and 50% relative
humidity (RH) for 7 days prior to the tests.
5.2.2.7 Moisture resistance
Water absorption of the composites was performed following ASTM D 570.
Samples were immersed in distilled water at room temperature (controlled at 21oC).
The weight and thickness of the samples were measured after different periods of
immersion time. Moisture content (MC) and thickness swelling (TS) were calculated
by the following equations:
MC % = !!!!! ×!""!!
(eq. 5.1)

144
TS % = !!!!! ×!""!!
(eq. 5.2)
where Mt is the mass of the specimens at time t, and M0 is the initial mass of the
specimens; Tt is the thickness of the specimens at time t, and T0 is the initial thickness
of the specimens.
5.3 Results and Discussion
5.3.1 Torque rheometry
In polymer physics, temperature and viscosity of polymer melt are strongly
related, which means that, generally, higher temperature results in a lower viscosity of
polymer melt, non-Newtonian fluid [13]. This can be explained by using the Power
Law model.
η γ = !γ!!! (eq. 5.3)
where η is viscosity, m is a sensitive function of temperature, n is a parameter, γ is
shear rate.
Torque rheometry was used to optimize extrusion temperature profiles of
different formulations. In a study of microscope morphology (see Figures 5.4 and 5.5),
as shown, cell debris had a low aspect ratio (ca. 1.0) and poor interaction with the
PHB matrix. This result could be because the ground cell debris particle had a low
aspect ratio, which did not support an increase in the viscosity of molten mixture, like

145
fiber does [14]. It was therefore expected that a decreased viscosity of the PHB/wood
flour/cell debris (PWC) melt could be observed with increasing content of cell debris.
This result led to a lack of high die pressure, which was essential for the packing of
the extrudates during extrusion processes. Insufficient packing of the extrudates
resulted in void-laden low-density products.
In this study, the control formulation (PW) was first melt mixed in the torque
rheometer at different temperatures (160, 165, 170, 175, and 180oC) with a constant
rotation rate of 20 rpm. After 8 minutes of mixing in the rheometer, the control
formulation showed similar torque value of ca. 2.5 Nm when the temperature was set
at 170, 175, and 180 oC (Figure 5.1). At 160 oC, PHB did not melt at all after 8
minutes of mixing because the melting point of the PHB is ca. 165 oC. The mixture
was still in dry powder form with a low torque value. The set of the roller in the
torque rheometer did not create a high shear, but in a twin screw extrusion process,
extra heat can be generated by sharing, and further benefit the melting. At 165 oC, the
molten mixture of polymer and wood flour was found after mixing. Under this
condition, the result showed that it had torque value of about 3.5 Nm after an 8 minute
mix. This result can indicate that the viscosity was slightly higher at a temperature of
165 oC than at 170, 175, and 180oC.

146
Figure 5.1 Torque rheometry behavior at different temperatures on the control formulation (PW)
Next, all six formulations were examined to determine their viscosities at 165 oC
by using a torque rheometer. PHB in all of the formulations was well molten and
wood flour was completely wetted with the molten polymer after six minutes of
mixing at this temperature. However, as shown in Figure 5.2, at the 8th minute, the
formulations with high cell debris contents (e.g., PWC60, PWC80, and PC) exhibited
a lower torque (ca. 2 Nm) than the other three formulations (ca. 3.5Nm). This result
was believed to be due to the fact that the low aspect ratio of the cell debris and poor
interaction with the polymer matrix did not contributed to increased viscosity of the
melt mixture. The materials after the mixing also appeared loose for formulations
0
5
10
15
20
25
30
0 1 2 3 4 5 6 7 8
Torq
ue(N
m)
Time(min)
160C 165C 170C 175C 180C

147
PWC80 and PC. To increase the torques for the three low-torque formulations, the
mixing temperature was further decreased and set at 160 oC.
Figure 5.2 Torque rheometry behavior of the six formulations of PWCCs at 165 oC
Figure 5.3 Torque rheometry behavior of six different formulations of PWCCs with processing temperature of 160 and 165 oC
0
5
10
15
20
25
30
0 1 2 3 4 5 6 7 8
Torq
ue(N
m)
Time(min)
PW
PWC20 PWC40 PWC60
0
5
10
15
20
25
0 1 2 3 4 5 6 7 8
Torq
ue(N
m)
Time(min)
165C PW 165C PWC20 165C PWC40 160C PWC60 160C PWC80 160C PC

148
By using this strategy of reducing the mixing temperature, the formulation of
PWC60, PWC80, and PC resulted in an increased torque value of ca. 3.0 Nm at the 6th
minute by comparing with those of the other three formulations (PW, PWC20, and
PWC40) at 165 oC (Figure 5.3). Notably, the formulation of PC exhibited a decreased
torque after 6.5 minutes mixing; this result could possibly be due to the thermal
degradation on cell debris. Moreover, the mixtures after the mixing were as dense as
the other formulations at 165 oC. Therefore, this result could still be due to using 160
oC as the extrusion temperature for the three high cell debris content formulations
(PWC60, PWC80, and PC), and 165 oC for the other three formulations with low cell
debris content. The extrusion temperature profiles for all of the formulations were
further designed based on this investigation and are shown in Table 5.4.
5.3.2 Morphology
As shown in the depiction of microstructure in Figure 5.4, cell debris had an
aspect ratio of ca. 1 with irregular shape; 60-mesh pine wood flour had a fiber shape
to bundle (aspect ratio of ca. 5). The cell debris displayed wide particle size
distribution with a small amount of large particles measuring ca. 300 microns (Table
5.1). Possibly, by intensive shear during extrusion, some wood fiber bundles may be
broken, and further increase the L/D ratios and enhance their reinforcing effect. In

149
observation of the microtomed surface of PWCC, the cell debris had a poor interfacial
bonding, which evidenced a gap between cell debris and PHB matrix (Figure 5.5).
Cell debris is a complicated system, comprising mainly protein, polysaccharides,
triglycerides, and inorganic impurities. Pretreatment of cell debris during its
production, impurities of the cell debris, and degradation of cell debris during thermal
processing might be related to limitation of the access of pMDI to the reactive sites of
the cell debris. This finding therefore reduced compatibilization effects and eventually
resulted in poor interfacial bonding between the cell debris and the PHB matrix.
Remarkably, PHB polymer penetrated into wood lumen (Figure 5.5), creating a
mechanical interlock. This result is believed to cause by the high packing pressure
which benefited from the way in which polymer melt combined into the wood lumen.
The high interfacial adhesion between the PHB matrix and wood fiber had been
studied and it was found that the coupling agent, pMDI, is highly reactive with both
hydroxyl and carboxyl groups, and is able to chemically link the two phases [11]. This
result assumes that the high content of cell debris in the PWCCs had declined
mechanical properties caused by the poor interfacial bonding between cell debris and
PHB.

150
Figure 5.4. SEM micrographs of cell debris (left) and pine wood flour (right)
Figure 5.5 Interfacial bonding of wood flour (a) and cell debris (b) with PHB matrix on microtomed surface of PWCC
5.3.3 Density and mechanical properties
The densities of the six extruded PHB formulations and one HDPE/WD
composite are shown in Table 5.5. The values ranged from 1.27 to 1.35 g/cm3, which
reflect that by increasing die pressure for high cell debris content formulations (see in
Table 5.6), the composites were more densely packed and their densities were similar
to the formulations containing less cell debris. The commercial formulation (HW) had

151
the lowest density among all the samples. This was because the density of HDPE (ca.
0.9 g/cm3) was substantially lower than the density of PHB (ca. 1.2 g/cm3).
Table 5.5 Densities of HDPE/wood flour, PHB/WF control and PHB/wood flour/cell debris composites HW PW PWC20 PWC40 PWC60 PWC80 PC Density (g/cm3)
1.18 1.31 1.33 1.32 1.27 1.34 1.35
*: standard deviation less than 0.01 Table 5.6 Actual output date of extrusion processing of the different composites Formulations Die Temperature (oC) Die Pressure (psi) Ampere (A)
HW 170 536 5 PW 163 910 7
PWC 20 166 842 6 PWC 40 164 618 5 PWC 60 160 530 5 PWC 80 156 850 5
PC 153 921 5
Coats [10] pointed out that after being statistical analyzed, one-way analysis of
variance (ANOVA), the mechanical properties of PHB-rich biomass composites
significantly corresponded with density, especially on MOE. In order to
independently consider the effects of cell debris content by using specific MOE,
MOR, and impact strength for the comparison, the error could be limited and a proper
comparison on cell debris effect on mechanical properties could be obtained. After
plotting the cell debris content against mechanical properties, as shown in Figures 5.6,

152
5.7, and 5.8, the higher content of cell debris, the lower the specific flexural properties
(moduli) and specific impact strength of the PWCCs. The properties reductions could
be caused by the low aspect ratio of the cell debris particles [10] and the fact that its
poor interfacial bonding (see Figure 5.5) with the PHB matrix were attributed to this
property deterioration. By plotting with a regression curve on each result (Figure 5.6,
5.7, and 5.8), the relation of the cell debris with each mechanical property can be
displaced by an equation. These equations can further provide for designing product
performance. In the comparison with HW formulation, a commercial WPC
formulation, the ternary PHB composites of containing high cell debris contents
(PWC60 and PWC80) exhibited comparable flexure properties with those of HW
(specific MOR: 21.93±0.71 MPa and specific MOE: 3.22±0.11 GPa). However, the
specific impact strengths of all PWCCs are lower than that of HW (2.17±0.18 KJ/m2).
Considering the PHB yielding rate to integrating PHB-rich biomass to produce
PWCCs, the PHB concentration of the cell debris needs to be contained more than
50% (e.g. PWC60; Table 5.3) to obtain comparable flexure properties (specific MOR:
18.97±0.54 MPa and specific MOE: 3.18±0.09 GPa) with HW. On the other hand, the
more PHB yield in the cell, the better the performance obtained. This result was also
addressed in a previous investigative research [10].

153
Figure 5.6 Plot of the relation of cell debris content and specific MOR of the PWCCs
Figure 5.7 Plot of the relation of cell debris content and specific MOE of the PWCCs
y = 155.83x2 - 154.36x + 52.612 R² = 0.97497
0.0
10.0
20.0
30.0
40.0
50.0
60.0
0% 10% 20% 30% 40% 50% 60%
Spec
ific
MO
R (M
Pa)
Cell debris content
y = 5.4155x2 - 7.1511x + 5.1717 R² = 0.96065
0.00
1.00
2.00
3.00
4.00
5.00
6.00
0% 10% 20% 30% 40% 50% 60%
Spec
ific
MO
E (G
Pa)
Cell debris content

154
Figure 5.8 Plot of the relation of cell debris content and specific impact strength of the PWCCs
5.3.4 Moisture behavior
Moisture has been seen as a key of deterioration or degradation on properties of
waterfront facilities, which is becoming an enormously increasing expense for
maintenance and materials [15]. To understand the moisture diffusion of WPCs, it is
necessary to understand material development. The seven formulation composites
were immersed for an 8-week period of time; the result of water absorption and
thickness swelling is shown in Figures 5.9 and 5.10. The commercial formulation HW
showed the highest moisture saturation content (Msat, ca. 22%) after 8 weeks
y = 5.4029x2 - 5.8133x + 2.459 R² = 0.95842
0.0
0.5
1.0
1.5
2.0
2.5
3.0
0% 10% 20% 30% 40% 50% 60%
Spci
fic im
pact
sten
gth
(KJ/
m2 )
Cell debris content

155
immersion, but it did not exhibit the highest thickness change. The PHB composites
with a high content of cell debris, i.e. PC and PWC 80, showed a larger thickness
change. A very slow rate of moisture absorption occurred on the PW and PWC20
composites. These results indicated that with pMDI to improve interfacial bonding
and suppress the hydrophilicity of wood flour and cell debris, the maximum moisture
absorption at a time of 8 weeks for all of the PHB composites was lower than for the
commercial WPC. For the PC and PWC80 composites, it exhibited a non-Fickian
behavior after ca. 1000 hours of immersion. This result could possibly be explained
by the fact that water soluble material was partially discharged from the material
during the long term immersion [15]. In the dimensional stability, the larger thickness
change of the composites of PC and PWC 80 might be due to the large expansion of
the cell debris or poor interfacial bonding between cell debris and PHB matrix.
Overall, the composite of PWC60 exhibited better moisture resistances than that of
HW composite.

156
Figure 5.9 Plot of moisture absorption versus square root of time of seven composites
Figure 5.10 Plot of thickness change versus square root of time of seven composites
0.0
5.0
10.0
15.0
20.0
25.0
0 200 400 600 800 1000 1200 1400
Moi
stur
e ab
sorp
tion
(%)
Time (S0.5)
PW PWC20 PWC40 PWC60 PWC80 PC HW
0.0
5.0
10.0
15.0
20.0
25.0
0 200 400 600 800 1000 1200 1400
Thi
ckne
ss C
hang
e (%
)
Time (S0.5)
PW PWC20 PWC40 PWC60 PWC80 PC HW

157
Liquid or gas transportation through a solid material, i.e. WPCs, is often modeled
by Fickian diffusion equation [15][16]. In Fickian diffusion, plotting the amount of
uptakes (moisture in this case) at a given time period against the square root of the
time period produces a linear region followed by a non-linear approach to Msat. The
apparent diffusion constant (DA) can be calculated by:
!! = ! !!!!"#
! !!!! !
! (eq. 5.4)
where h is the thickness of the specimens and dMt/d√t is the slope of the weight gain
versus square root of time. Considering a three-dimensional diffusion, a geometric
edge correction factor can be used to calculate the true diffusion constant (D) [15]:
! = !!!!! !!
! !! (eq. 5.5)
where l and w are the length and width of the specimens, respectively. The higher true
diffusion constant, the faster moisture, could penetrate through the thickness.
The degree of sample swelling was defined by a swelling coefficient (β) [15],
β = !"!"#!"!"#
(eq. 5.6)
where TSmax and MCmax are represented as maximum thickness swelling and
maximum moisture absorption, respectively.
As shown in Table 5.7, formulation of PC had the highest true diffusion constant
(1.04E-05 mm2/sec) among the seven formulations, indicating that this composite had

158
the highest moisture penetrating rate or the poorest water resistance. To explain this
result geometrically, the gap between cell debris and PHB matrix led to the moisture
penetrated by capillarity into the composites, which increased the rate of diffusion.
Moreover, it was found that the higher content of cell debris resulted in a higher
swelling coefficient of the composites. The internal structure of the composites is also
the main factor affecting the degree of swelling. Chowdhury and Wolcott [17]
indicated that by using a coupling agent, the TSmax and MCmax could be limited
because the strong internal bonding improved dimensional stability. Since the fixed
amount of coupling agent was used on the PWCCs with the result shown in Table 5.7,
the more cell debris that were added, the more moisture was absorbed. This is
believed to be due to the high hydrophilicity (the PC had ca. 7 times faster diffusion
constant than that of the PW) and larger amount of moisture absorption of the cell
debris than wood flour, in the comparison of maximum moisture uptakes of PW and
PC (15.7% vs. 17.9%). Based on the equation of the swelling coefficient, it also
proved that the dimension of high concentration of cell debris was due to the fact that
an unstable or weak interfacial bonding led to the large amount of thickness swelling.

159
Table 5.7 Comparison of moisture diffusion parameters of extruded PHB composites and commercial HDPE composite
HW PW PWC20 PWC40 PWC60 PWC80 PC slope* 1.49E-04 6.63E-05 7.21E-05 1.04E-04 1.49E-04 1.63E-04 2.16E-04 MCmax 22.0% 15.7% 15.1% 15.1% 16.3% 15.9% 17.9% TSmax 11.9% 7.9% 9.5% 10.0 % 9.3% 14.8% 23.6% D (mm2/s) 2.16E-06 1.25E-06 1.34E-06 3.34E-06 5.32E-06 8.25E-06 1.04E-05 β 0.541 0.502 0.632 0.660 0.572 0.929 1.316
*: dM!/d t, indication of water absorption rate.
It is possible to express the relation between content of cell debris and true
diffusion constant by an Arrhenius-like relation:
D! = D ∙ exp!!!!∙! (eq. 5.7)
where D is the true diffusion constant of the PW composite, D’ is the true diffusion of
different cell debris content of PWCCs, R is the universal gas constant (8.314
J/K/mol.), T is the temperature of 294oK , Ea is the activation energy (J/mol.). To
obtain the Ea, the equation of 5.7 can also be presented as:
lnD! = !!!!∙ !!+ lnD (eq. 5.8)
The relation could be obtained by plotting cell debris against true diffusion constant,
resulting in Figure 5.11. By using the regression curve, the activation energy of
moisture diffusion on increasing cell debris content in the PWCCs can be calculated
and obtained as the value of -0.0489 J/mol, which means that by increasing cell debris
content, less energy is required for moisture penetration.

160
Figure 5.11 Plot of true moisture diffusion constant versus cell debris content
5.4 Conclusions
The results in this study investigated and demonstrated that using cell debris and
purified PHB to simulate and extrude PHB/wood flour/cell debris products can be
utilized. The results of torque rheometry showed not only an understanding of the
relation of temperature and viscosity, but notably, that it can be successfully used to
design extrusion temperature profiles for formulations with different cell debris
contents. A suitable temperature profile was set for each formulation. A consistent
packing pressure in the die zone occurred in different PWCCs. All of the sample
products extruded at high die pressure were without defects, even at high cell debris
contents. The properties resulted in increasing cell debris content with decreased
y = 2E-05x + 8E-08 R² = 0.95559
0.00E+00
2.00E-06
4.00E-06
6.00E-06
8.00E-06
1.00E-05
1.20E-05
0 0.1 0.2 0.3 0.4 0.5 0.6
True
diff
usio
n co
nsta
nt (m
m2 /s
ec)
Cell debris content (%)

161
properties of the composites, i.e. the mechanical properties and water resistance. The
PHB/wood flour/cell debris composites with a cell debris/wood flour ratio of 3:2
showed mechanical properties and water resistance similar to commercial HDPE
WPC. This result indicates that the more PHB yielded in bacteria cell, the better
performance on the PWCCs with a low wood flour content. In the results of moisture
Fickian diffusion, it appeared that the cell debris was believed to cause the
deterioration of moisture resistance. In conclusion, the cell debris laden biodegradable
PHB/wood flour composites were successfully developed and investigated. In some
of investigated formulations, further potential to replace some of current fossil oil
derived WPCs could be seen.
5.5 Acknowledgements
The authors gratefully acknowledge the financial support provided by the U.S.
Department of Energy, under the grant of Development of Renewable Microbial
Polyesters for Cost Effective and Energy-Efficient Wood-Plastic Composites.

162
5.6 References
[1] P. M. Smith and M. P. Wolcott. 2006. Opportunities for Wood/Natural Fiber-Plastic Composites in Residential and Industrial Applications. Forest Products Journal. 56(3): 4-11
[2] M. Flieger, M. Kantorová, A. Prell, T. Řezank, and J. Votruba. 2003. Biodegradable plastics from renewable sources. Folia Microbiologica. 48(1):27-44
[3] S. Y. Lee. 1996. Bacterial polyhydroxyalkanoates. Biotechnology and Bioengineering. 49(1):1-14
[4] P. A. Holmes. 1985. Applications of PHB - a microbially produced biodegradable thermoplastic. Physics in Technology. 16(1):32-36
[5] C. S. K. Reddy, R. Ghai, Rashmi, and V. C. Kalia. 2003. Polyhydroxyalkanoates: an overview. Bioresource Technology. 87(2):137-146
[6] R. A. J. Verlinden, D. J. Hill, M. A. Kenward, C. D. Williams, and I. Radecka. 2007. Bacterial synthesis of biodegradable polyhydroxyalkanoates. Journal of Applied Microbiology. 102(6):1437-1449
[7] U. Pagga, D. B. Beimborn, J. Boelens, and B. De Wilde. 1995. Determination of the aerobic biodegradability of polymeric material in a laboratory controlled composting test. Chemosphere. 31(11-12):4475-4487
[8] T. U. Gerngross. 1999. Can biotechnology move us toward a sustainable society?. Nature Biotechnology. 17(6):541-544
[9] E. R. Coats, F. J. Loge, M. P. Wolcott, K. Englund, and A. G. McDonald. 2007. Synthesis of Polyhydroxyalkanoates in Municipal Wastewater Treatment. Water Environment Research. 79: 2396-2403
[10] E. R. Coats, F. J. Loge, M. P. Wolcott, K. Englund, and A. G. McDonald. 2008. Production of natural fiber reinforced thermoplastic composites through the use of polyhydroxybutyrate-rich biomass. Bioresource Technology. 99(7):2680-2686
[11] Scott P. Anderson. 2007. Wood Fiber Reinforced Bacterial Biocomposites: Effects of Interfacial Modifiers and Processing on Mechanical and Physical Properties. Master thesis, Washington State University
[12] J. Zhang, S. McCarthy, and R. Whitehouse. 2004. Reverse temperature injection molding of BiopolTM and effect on its properties. Journal of Applied Polymer Science. 94(2):483-491
[13] Z. Tadmor and C. G. Gogos. 2006. Principles of polymer processing. John Wiley and Sons.

163
[14] S. Migneault, et. al. 2008. Effect of fiber length on processing and properties of extruded wood�fiber/HDPE composites. Journal of Applied Polymer Science. 110(2):1085-1092
[15] S. V. Rangaraj and L. V. Smith. 2000. Effects of Moisture on the Durability of a Wood/Thermoplastic Composite. Journal of Thermoplastic Composite Materials. 13(2):140-161
[16] J.-W. Kim, D. Harper, and A. Taylor. 2008. Effect of Wood Species on Water Sorption and Durability of Wood-Plastic Composites. Wood and Fiber Science. 40(4):519-531
[17] M. J. A. Chowdhury and M. P. Wolcott. 2007. Compatibilizer selection to improve mechanical and moisture properties of extruded wood-HDPE composites. Forest Products Journal. 57(9):46-53

164
Chapter 6 Developing PHB/WF/Cell debris Composites: Injection Molding
Abstract
Wood plastic composites (WPCs) have been mainly targeted in the market of
decking or construction materials produced by extrusion techniques. Recently, the
WPC market has been diverted to injection molding applications. Conventionally,
WPCs highly depend on and are made from petroleum-based thermoplastics. Utilizing
biobased thermoplastics for WPCs has been considered as a solution to reduce overall
energy consumption and to lessen the dependence of crude oil with consideration of
sustainability. Poly-3-hydroxybutyrate (PHB) is a biodegradable microbial polyester,
which is biosynthesized by the bioactivities of microbes in carbohydrate-rich waste
effluents. To eliminate the costly step of PHB purification from microbe cells, directly
utilization of unpurified PHB (i.e. PHB-laden microbe cells) to produce WPCs is then
seen to effectively reduce expense and energy consumption. In this study, purified
PHB and PHB-free cell debris were used to simulate PHB laden microbes in
producing PHB/wood flour/cell debris ternary composites (PWCCs) with various
wood flour/cell debris ratios. The PWCCs were prepared by twin screw compounding
followed by injection molding. Polymeric methylene-diphenyl-diisocynate (pMDI)
was used as a coupling agent to increase the interfacial bonding between the PHB
matrix and wood four/cell debris. Morphology, mechanical properties (i.e. tensile,

165
flexural, and impact strength), and moisture behavior of the composites were
investigated. The results of the morphology study indicated that PHB penetrated into
wood lumens, where stronger interlocking and interfacial bonding were created with
the PHB matrix than that of cell debris. Through this observation, decreased
mechanical properties and moisture resistance of the composites could be described as
being caused by the weak interfacial bonding between cell debris and PHB while
increasing cell debris content. In comparison with a conventional
polypropylene-wood flour composite, at the replacement ratio of 3:2 (cell
debris:wood flour), the ternary composites exhibited slightly higher mechanical
properties than that of the conventional WPC. After investigating moisture Fickian
diffusion behavior, it was concluded that the cell debris increased moisture absorption.
During the immersion, cracking and dissolving of the composites appeared a
non-Fickain diffusion behavior. Based on what was discovered in morphology studies,
improving the interfacial bonding between cell debris and PHB may provide a better
performance of the ternary composites. In conclusion, to reach sustainability, with the
consideration of energy efficiency and cost effectiveness, the PWCCs were
successfully applied in the injection molding process and their performance was
similar to that of conventional WPC.

166
Key words: poly-3-hydroxybutyrate (PHB), wood plastic composite (WPC),
polymeric methylene-diphenyl-diisocynate (pMDI), sustainability, moisture behavior,
waste effluents
6.1 Introduction
Wood plastic composites (WPCs) have shown a rapidly growing rate since
1997[1]. According to a forecasting report from Freedonia Group, Inc. in 2010, WPCs
are expected to reach a market value of ca. 2.3 million dollars in 2013[2]. Recently,
with their high performance in environmental contributions of WPC [1], the market
has been expanded to the use of injection molding applications, such as automotive
parts, toys, consumer goods, etc. in both American and Europe [2]. WPCs are
traditionally highly dependent on polyolefin, e.g. polyethylene (PE), polypropylene
(PP), etc., which is derived from crude oil. In consideration of energy consumption,
the overall energy costs (including recycling, transportation, etc.) of WPCs are much
higher than that of traditional engineered wood products. Utilizing biobased
thermoplastics for WPCs is now seen as a solution to decrease the overall energy
costs and to lessen the dependence of crude oil in a sustainable society.
Unfortunately, renewable microbial polyesters, e.g. polyhydroxyalkanoates
(PHAs), are not currently used in WPCs, primarily because production costs are

167
higher than for conventional petrochemical-derived plastics. During extraction and
purification of poly-3-hydroxybutyrate (PHB), one of most common used in the
family of PHAs, more fossil fuel is actually consumed, generating more carbon
dioxide than a polyolefin [3]. Thus, considering the costs and procedures of recycling
the polyolefin, the overall life-cycle costs of the renewable microbial polyesters will
be more comparable. Typically, crop-based carbohydrate feedstock is utilized to
produce PHB, but conversion processes to obtain carbohydrate from corn consumes
energy (8129 KJ per kg) [3]. In this point, Coats et al [4] have successfully
investigated the use of municipal waste effluents that contain a certain level of
carbohydrate to feed microbes and produce PHB. This is seen as the first step to
reduce energy consumption from the purification of PHB and to achieve production of
PHB from waste effluents of municipal, agricultural, and forest products sectors.
Furthermore, it is possible to economically produce WPCs by directly utilizing
unpurified PHB (i.e. PHB-laden microbe cells) to accomplish reduction or elimination
of the most costly step in microbial plastic production - purification of the polymer
from the cell debris [5]. Using unpurified PHB (i.e. sterilized PHB- laden microbe
cells) to produce WPCs can therefore be seen as a significant reduction in raw
material cost and energy consumption.

168
Using this strategy, the cost of producing and utilizing these renewable plastics
in WPCs can be greatly reduced. Significant environmental benefits will also be
realized by the wastewater treatment industry in municipal, industrial (pulp mill), and
agricultural sectors through incorporation of waste biosolids (i.e. cell debris, etc.) into
composites. Improved economic competitiveness of the domestic forest products
industry is expected, as the plastic in WPCs comprises on average 52% of formulation
costs and 30% of total product costs [5].
Previous studies [6][7][8] indicated that isocyanate-based adhesives can react
with hydroxyl groups in wood to create a covalent bond (See Figure 6.1), but the
reaction could be influenced by moisture in the wood. Anderson [9] pointed out that
using polymeric diphenylmethane diisocyanate (pMDI) as a coupling agent could
significantly increase the mechanical properties and water resistance of PHB/wood
flour composites in a comparison of four different types of coupling agents. This
result was attributed to the reactions of pMDI with both hydrophilic wood flour and a
hydrophobic PHB matrix, which substantially improves the interfacial bonding
between the two phases. Notably, bacterial cell debris is also categorized as a
hydrophilic material. Therefore, to maintain the sustainability to produce WPCs, by
adding pMDI, performances of a ternary WPC, which integrates with PHB-laden cell
debris (PHB and cell debris) and wood flour, can be expected to be improved.

169
Figure 6.1 Functional group reactions between isocyanate chemicals and
wood/moisture
In this investigative study, a purified microbial polyester, PHB, and PHB-free
cell debris were used to simulate sterilized PHB-laden cell debris to produce
PHB/wood flour/cell debris ternary composites (PWCCs) with variant ratios of wood
flour replacement by cell debris via extrusion compounding, followed by injection
molding processes. Phase morphology, mechanical properties, and moisture behaviors
of the ternary composites were evaluated to understand the relation with the content
of cell debris.

170
6.2 Materials and Methods
6.2.1 Materials
The purified PHB powder (provided by Tianan Biologic Material Co., Ltd.,
Ningbo, China), sterilized cell debris harvested from municipal waste effluents
(provided by UC-Davids and ground into 60-mesh particle; see Figure 6.2 for particle
distribution), and wood flour (Pinus, 60-mesh, American Wood Fibers, Schofield, WI)
were the three main components of the PWC composites. As shown in Figure 6.2, the
particle size of cell debris is well distributed from 833 µm to 125 µm, and ca. 38% of
particle smaller than the diameter of 125µm. Boron nitride (BN) (Carbotherm PCTF5,
Saint Gobain Advanced Ceramics Co., Amherst, NY) was used as a crystallization
agent to promote PHB crystallization. Glycolube WP2200 (Lonza Inc., Allendale, NJ)
was included as a lubricant to improve processability. Talc (Nicron 403) was provided
by Riotinto of Centennial and was used for processability and water resistance
improvements. Liquid-form pMDI (Mondur 541, Bayer MaterialScience, Pittsburgh,
PA) contained 31.5 mass % NCO and functioned as the coupling agent between
hydrophobic PHB and hydrophilic wood flour and cell debris.

171
Figure 6.2 Ground cell debris particle size distributions
6.2.2 Methods
6.2.2.1 Preparation of composites
60-mech pine wood flour was dried by a rotary steam tube drier. The moisture
content was further detected and obtained ca. 3%. Ground cell debris powder was
dried at 100oC for 24 hours in a convection oven to remove possible moisture and
volatile solids. PHB, BN, WP2200, and talc were used as received. A coupling agent,
pMDI, was first introduced and well dispersed in PHB powder (manually mixed until
not a viable agglomerate). The PHB/pMDI mixture, together with the other
components, were put into a plastic bag and manually mixed by vigorous shaking and
tumbling for 5 minutes. All four formulations of PWCCs and two controls of
0.0%
5.0%
10.0%
15.0%
20.0%
25.0%
30.0%
35.0%
40.0%
45.0%
>0.833 0.42 0.25 0.177 0.15 0.125 <0.125
Freq
uenc
y
Particle size (mm)

172
PHB/WF (PW) and PHB/cell debris (PC) are detailed in Table 6.1. In these ternary
composites, a portion of the WF content (20, 40, 60, and 80%, respectively) was
replaced with the same amount of cell debris to produce four different ternary
composite formulations. PW and PC binary composites were also prepared as control
formulations. Each of dried mixed mixtures were following melt compounded by
using a co-rotating twin screw extruder (Leistriz ZSE-18) with a screw diameter of 18
mm and length/diameter (L/D) ratio of 40 equipped with a volumetric feeder. To
improve melt strength and reduce thermal degradation, a declining temperature profile
of the extruder was applied during the extrusion process [10]. The temperatures of the
barrel were set at 170, 175, 170, 165, 164, 163, 162, and 160oC, respectively, from the
feeding throat to the die adapter. The screw speed was maintained at 125 rpm. Under
this speed, the measured residence time of the molten materials in the barrel was ca.
1.5 minutes. The extrudates exiting the die were air cooled and pelletized for injection
molding.

173
Table 6.1 Formulations of two controls of PHB/WF (PW) and PHB/cell debris (PC) and PHB/WF/cell debris (PWC) composites
Formulation Components
PW PWC20 PWC40 PWC60 PWC80 PC
Cell debris* 0 11.4 22.8 34.2 45.6 57 Wood flour (pine)* 57 45.6 34.2 22.8 11.4 0 PHB 35 35 35 35 35 35 Talc-Nicron 403 8 8 8 8 8 8 pMDI 4 4 4 4 4 4 Lubricant (WP2200) 3 3 3 3 3 3 Nucleating agent (Boron Nitride) 0.2 0.2 0.2 0.2 0.2 0.2 *: 60 mesh particle size. WF: Wood Flour. All units are in parts.
6.2.2.2 Injection molded testing specimens
Flexural test specimens (12 X 3 X 127 mm) and tensile specimens (ASTM
standard D638 type III) were injection molded by an injection molding machine
(Sumitomo SE 50D). Injection temperatures were controlled at 175, 180, 175, and
170oC from the feeding zone to the nozzle. Mold temperature was set at 60oC. The
filling pressure was set at 1700 kgf/cm2 and the packing pressures were 1250 kgf/cm2
and 1360 kgf/cm2 for the first and second stage, respectively. The true cycling time of
the injection molding process was ca. 75 seconds. Impact test specimens (12 X 3 X 60
mm) were prepared following ASTM D256. All of the impact testing specimens were
notched by a XQZ-I specimen Notch Cutter. The specimens for the water absorption
test were prepared by a milling machine to the size of 11X 2.5 X 125 mm.

174
6.2.2.3 Thermal degradation analysis of raw materials
The neat PHB, 60-mesh pine wood flour, ground cell debris was analyzed for
thermal degradation behavior with a thermal gravimetric analysis (TGA), Rheometric
Scientific STA. Thermal degradation (i.e. weight loss) and thermal stability of the raw
materials were performed. Sample size of 8 to 10 mg of each of the raw materials was
placed in an aluminum crucible and exposed to a heating rate of 10oC per minute from
room temperature to 600oC under an air flow rate of 60 ml/min. of inlet inert gas,
nitrogen (N2), which prevents specimen oxidation during the heating process. Sample
weight was monitored continuously during the process.
6.2.2.4 Mechanical properties and sample densities
A screw driven Instron 4466 equipped with a 10-KN load cell and a pair of
mechanical grips was used for tensile tests, and a pair of flexural fixtures was used for
three point bending tests. The tensile tests were conducted at a crosshead speed of 5
mm per minute. The tensile strain was recorded and measured by an extensometer
(MTS model # 634.12E-24). The flexural tests (three point bending) were performed
with a crosshead speed of 1.40 mm per minute. Impact tests were conducted using a
Dynisco Basic Pendulum Impact tester. These setups of tensile, impact, and flexural
tests were conducted in accordance with ASTM standard D638, D256 (mode A), and

175
D790, respectively. Five replicates were tested for each formulation to obtain a
statistical mean value and standard deviation. Sample density was calculated by
dividing sample mass by sample volume. All of the samples (for both mechanical and
density testing) were conditioned at 21oC and 50% relative humidity (RH) for 7 days
prior to the tests.
6.2.2.5 Morphology
To investigate wood flour and cell debris distribution in the PHB matrix and
particle-polymer interfacial interaction, tensile fracture surfaces of the composites
were sputter coated with gold and observed by using a Hitachi S-570 scanning
electronic microscope (SEM) with different magnitudes. The morphologies of the
ground cell debris and pine wood flour were also employed by SEM. To understand
the polymer penetration, the injection molded samples were cut into a small specimen,
and followed cryo-microtomed to obtain a non-plastic deformation on the sectioned
surface. All the microtomed specimens were mounted on aluminum stubs and
gold-coated by a sputter coater.

176
6.2.2.6 Moisture behavior and diffusion
Composite moisture behaviors were performed in accordance with ASTM D 570
and the immersion period was targeted for twenty weeks. To reduce experience error,
four replicates of each sample composite were carried out. First, because of during the
injection molding process, the higher contain of plastic was found in the skin layer of
the molded specimen, in order to understand the true moisture behavior of the
composites, the plastic-rich skin of specimens was removed from each specimen, and
then immersed in distilled water at room temperature (controlled at 21oC). The weight
and thickness of each specimen was measured at different periods of immersion.
Moisture content (MC) and thickness swelling (TS) were calculated by the following
equations:
MC % = !!!!! ×!""!!
(eq. 6.1)
TS % = !!!!! ×!""!!
(eq. 6.2)
where Mt is the mass of the specimens at time t, and M0 is the initial mass of the
specimens; Tt is the thickness of the specimens at time t, and T0 is the initial thickness
of the specimens.

177
6.3 Results and Discussion
6.3.1 Thermal degradation
TGA was continuously monitoring the weight change of each specimen during
the heating procedure in a furnace at a constant ramp rate of 10oC per minute.
Thermal degradation temperature of each component in the sample can be obtained
from the plot of weight loss (in percentage) versus temperature (Figure 6.3) for neat
wood flour, ground cell debris, and neat PHB powder. It is clear from this figure that
PHB rapidly broke down within a short temperature range (between 250 and 280oC).
The wood flour started to decompose at ca. 200oC, and degradation occurred within a
broader temperature range (lower thermal degradation rate) than in the other two
materials, through a two step degradation process. The cell debris thermal degradation
started at ca. 100oC, but at the lowest degradation rate. About 40% of residue,
possible most are inorganic composition, of cell debris left at the end of the test (600
oC). The low degradation rate and high content of sample residue of the cell debris
was believed to be due to its complex constituents, primarily including various types
of proteins, polysaccharides, triglycerides, and inorganic residue.

178
Figure 6.3 Plot of the thermogravimetric curves of pine wood flour, cell debris, and
neat PHB
6.3.2 Material density and mechanical properties
Commonly, in WPCs the density has been considered as a correlation with
mechanical properties [9][11], which means the higher density, the better the
mechanical performance that can be achieved. The densities of composites made by
six different formulations are shown in Table 6.2. Density did not show a significant
change (less than 2.3%) with various cell debris/wood flour ratios. In comparing PW
and PC, the results indicated that the cell debris and wood flour had similar densities.
Possibly, the high pressure applied during the injection molding process benefited
0
10
20
30
40
50
60
70
80
90
100
0 100 200 300 400 500
Wei
ght l
oss(
%)
Temperature (oC)
PHB Pine Cell debris

179
PHB melt penetration into the wood cell lumen or crushed the cellular structure of
wood flour, also known as densifying wood by the high pressure of molding process.
The results in Table 6.2 list the tensile and flexural strength and modulus of the
six composites for later comparison. The relations of mechanical properties, i.e.
tensile and flexural, and cell debris content are further plotted in Figures 6.4 and 6.5,
respectively. With increasing the content of the cell debris, both of tensile strength
and modulus had a negative result. At the cell debris/wood flour ratio of 3:2
formulation of PWC60, the composites exhibited flexural properties of MOR of
42.8MPa and MOE of 5.88GPa, which were comparable with that of PP/wood flour
composites (MOR of 44MPa; MOE of 3.1GPa [5]). Notably, the properties were
about 55 to 65% of the tensile and flexural properties of the control sample PW (39.7
MPa and 10.2 GPa in tensile strength and modulus; 69.4 MPa and 7.43 GPa in MOR
and MOE). Impact strength of the composites also showed a declining trend; the
higher the cell debris content, the lower the impact strength (Figure 6.6). The reason
for this tread was believed to be poor interfacial bonding between the cell debris and
PHB (discussed later in phase morphology) and degradation (starting at 100oC) of the
cell debris during processing. The degradation of the cell debris produced a gaseous
substance which could cause voids and other sample defects in the composites.
Moreover, the cell debris had a cubic shape or low aspect ratio, which was

180
unfavorable to the mechanical properties of the composites compared to the fiber
shape of the wood flour.
Table 6.2 Densities and mechanical properties with standard deviation of four formulations
Formulation Density* Tensile Properties Flexural Properties
Strength (MPa)
Modulus (GPa) MOR (MPa) MOE (GPa)
PW 1.396 39.7(0.94) 10.2(0.30) 69.4(1.25) 9.18(0.06) PWC20 1.388 31.0(0.54) 8.76(0.18) 53.9(1.07) 7.80(0.07) PWC40 1.388 26.4(0.36) 7.83(0.13) 45.2(0.85) 6.66(0.07) PWC60 1.390 23.4(0.51) 6.74(0.17) 42.8(1.73) 5.88(0.09) PWC80 1.368 19.7(0.99) 7.40(0.22) 34.6(1.83) 5.85(0.21) PC 1.365 14.4(0.86) 6.43(0.15) 26.5(2.68) 4.92(0.22)
*Standard deviation is less than 0.01 ( ) Standard deviation
Figure 6.4 Plot of the relation of tensile properties and cell debris contents
y = -40.952x + 37.438 y = 11.968x2 - 12.842x + 10.128
0
2
4
6
8
10
12
14
0
5
10
15
20
25
30
35
40
45
0.0% 10.0% 20.0% 30.0% 40.0% 50.0% 60.0%
Mod
ulus
(GPa
)
Stre
ngth
(M
Pa)
Cell debris content
Strength Modulus strength Modulus

181
Figure 6.5 Plot of the relation of flexural properties and cell debris contents
Figure 6.6 Plot of the relation of impact strength and cell debris contents
y = -68.872x + 65.029 y = 9.1924x2 - 12.24x + 9.1082
0
2
4
6
8
10
12
0
10
20
30
40
50
60
70
80
0.0% 10.0% 20.0% 30.0% 40.0% 50.0% 60.0%
Mod
ulus
(GPa
)
Stre
ngth
(M
Pa)
Cell debris content
MOR MOE strength Modulus
y = 4.768x2 - 4.8055x + 2.6132
0.0
0.5
1.0
1.5
2.0
2.5
3.0
0.0% 10.0% 20.0% 30.0% 40.0% 50.0% 60.0%
Impa
ct S
tren
gth
(KJ/
m2 )
Cell debris content

182
6.3.3 Morphology
The microstructures of cell debris and wood flour are expressed in Figure 6.7.
The cell debris displayed wide particle size distribution with large particles measuring
ca. 300 microns (Figure 6.7a). Cell debris particles exhibited irregular shapes with
low aspect ratio, known as length/diameter (L/D) ratio, or cubic-like shape. On the
other hand, wood flour particles are composed of bundles of wood fibers (Figure
6.7b). During the process of extrusion compounding, intensive shear generated from
two screws could break some of these bundles and increase their aspect ratios, which
could further enhance their reinforcing effect. On the fracture surface (see in Figure
6.8b) of the PHB/wood flour composite, limited interfacial debonding between wood
fiber and PHB matrix was observed, which indicated strong interaction between the
two phases. Because of this strong interaction, many craters were formed by fiber
pulled-out with matrix (see Figure 6.9b) on the fracture surface. In contrast, weak
interaction between the cell debris and PHB could be observed by debonding or
gapping at their interfaces (indicated by the arrows in Figures 6.8c and 6.9c). The cell
debris particles (arrowed) and wood flour (cratered) were found to be homogenously
distributed in the polymer matrix (Figure 6.8c). The difference of the interfacial
properties was distinguished more easily under higher magnification (Figure 6.9). The
high interfacial adhesion between PHB matrix and wood fiber, indicated by the

183
arrows in Figure 6.9b, is possibly contributed by the coupling agent, pMDI, which is
highly reactive with both hydroxyl and carboxyl groups [6][7][8], and is able to
chemically link with the two phases. The cell debris is a complicated system,
comprising mainly protein, polysaccharides, triglycerides, and inorganic impurities.
The cell debris pre-treatment during its production, impurities of the cell debris, and
the cell debris degradation during processing might limit the access of pMDI to the
reactive sites of the cell debris and therefore reduce its compatibilization effects,
which could eventually result in weak interfacial bonding between cell debris and
PHB matrix (Figure 6.9c).
In Figure 6.10, the sectioned surfaces of PHB/wood flour/cell debris composites
are displayed. Due to the high pressure from the injection molding process, many
wood cells were crushed or severely deformed (Figure 6.10, deformation indicated by
arrows). The high pressure also forced molten PHB flew into some of the cells. It was
clear that the PHB melt was forced and penetrated into cells through longitudinal and
transverse lumens (Fig. 6.11). This penetration further provided more contact area and
created a strong mechanical interlocking between polymer and wood fiber, which
substantially improved stress transfer between the two phases. In contrast, cell debris
was seemingly not deformed by the high pressure of injection molding process nor

184
any PHB penetration observed (Figure 6.10). As a result, they formed a weak
interfacial bond with PHB, resulting in deteriorated properties.
Figure 6.7 SEM micrographs of cell debris (a) and pine wood flour (b)
Figure 6.8. Fracture surfaces of neat PHB (a), PHB/wood flour composite (b), and PHB/wood flour/cell debris composite (c). Magnification: X80
a b
a b c

185
Figure 6.9. Fracture surfaces of neat PHB (a), PHB/wood flour composite (b), and PHB/wood flour/cell debris composite (c). Magnification: X500
Figure 6.10 Sectioned surface of PHB/wood flour/cell debris composites
Figure 6.11. Wood lumens filled with polymer
a b c
Cell debris
Wood flour
wood cell
PHB
PHB
wood cell transverse lumen
longitudinal lumen

186
6.3.4 Moisture diffusion behavior
As shown in Figure 6.12, moisture absorption increased with increasing cell
debris concentration. Moisture absorption rate (initial slope of the curve) also
increased with increasing cell debris concentration. The samples with higher cell
debris concentrations required less time to reach their saturation point. However, it
had been observed that the mass of the specimens were decreased after they reached
their saturation points. For example, the sample of PC reached moisture saturation
content (Msat, ca. 28%) in three days, but a mass reduction occurred after 4 weeks
immersion. This result may be explained by the possibility that water soluble material
was dissolved [12], or perhaps some loosened material on the surface of the immersed
sample fell into the water. In comparison, the control sample (PW) reached its
saturation point of ca. 17% in six weeks. Thickness of six composite samples
increased to a larger extent at a high rate at high content of cell debris (Figure 6.13).
Therefore, it can be concluded that the addition of cell debris increased water
absorption and thickness swelling of the composites. This finding was most probably
due to high hydrophility and dimension instability after absorbed moisture of cell
debris, which could be proved by comparing the saturation point and maximum
thickness swelling of the PC and PW composites (ca. 29.0% vs. ca. 17.7% and ca.
30.2% vs. ca.12.9%) compared to the PW composites. Additionally, cracks and weak

187
interfacial bonding between cell debris and PHB allowed faster moisture penetration,
known as capillary absorption.
Figure 6.12 Plot of moisture absorption against square root of time in seconds
0.0%
5.0%
10.0%
15.0%
20.0%
25.0%
30.0%
35.0%
0 500 1000 1500 2000 2500 3000 3500
Moi
stur
e ab
sorp
tion
Time (s0.5)
PW PW20C PW40C PW60C PW80C

188
Figure 6.13 Plot of thickness swelling against square root of time in seconds
Wood flour and cell debris are known as hydrophilic materials. In composites,
the hydrophobic PHB did not absorb moisture, but mainly absorbed by wood and cell
debris. After wood flour absorbed moisture, the dimension of wood flour became
unstable or swelled, which caused internal stress. Based on the viscoelastic behavior
of polymer under a load/stress, continuous damage can occur, which is known as
creep, and create micro-cracks or viable cracks with time goes by. In many studies
[13][14][15][16] it has been indicated that cracks can be found in a composite after a
certain period of time being immersed in water or salt water. In this study, due to a
large dimensional swelling during the immersion, cracks were formed on the surface
of different composite samples. Surface cracks appeared on the third, second, and first
0.0%
5.0%
10.0%
15.0%
20.0%
25.0%
30.0%
35.0%
0 500 1000 1500 2000 2500 3000 3500
Thi
ckne
ss sw
ellin
g
Time (S0.5)
PW PWC20 PWC40 PWC60 PWC80

189
day of immersion on the PWC60, PWC80, and PC composites, respectively. Samples
with a lower concentration of cell debris showed cracks after 4 weeks of immersion.
Liquid or gas transportation through a solid material is often modeled by
Fickian diffusion equation. In Fickian diffusion, plotting the amount of uptake
(moisture in this case) at a given time period against the square root of the time period
produces a linear region followed by a non-linear approach to Msat. The apparent
diffusion constant (DA) [14][17][18] can be calculated by:
!! = ! !!!!"#
! !!!! !
! (eq. 6.3)
where h is the thickness of the specimens and dMt/d√t is the slope of the weight gain
versus square root of time.
In considering 3-dimensional diffusion, a geometric edge correction factor can
be used to calculate the true diffusion constant (D) [19]:
! = !!!!! !!
! !! (eq. 6.4)
where L and W are the length and width of the specimens, respectively.
As shown in Table 6.3, the composite of PC had the highest true diffusion
coefficient (4.09E-6 mm2/sec) among the six formulations, which indicates that the
composite had the highest rate of moisture diffusion or the lowest water resistance.
Moreover, plotting the relation of true diffusion constant versus content of cell debris
in Figure 6.14, the higher the cell debris content, the faster the moisture diffusion

190
occurred. This can explain that cell debris is a highly hydrophilic material with a poor
interfacial bonding with a PHB matrix, which provided capillary penetration. Because
cracking and material dissolution occurred, most of the moisture absorption curves
exhibited a non-Fickian diffusion behavior after a certain period of immersion time
[20], after which they reached their own saturated points.
Understanding of the relation of sample swelling and moisture absorption can be
achieved by calculating a swelling coefficient (β) [17],
β = !"!"#!"!"#
(eq. 6.5)
where TSmax and MCmax represent maximum thickness swelling and maximum of
moisture absorption, respectively. The results (Table 6.3) indicated that the higher the
cell debris content, the higher the swelling coefficient of the composites (ranging
from 0.731 to 1.012). Based on equation 6.5, it could be explained that low
dimensional stability (large amount of dimensional swelling) of the composites
caused the high value of swelling coefficient (β).
Table 6.3 Apparent (DA) and true (D) diffusion constants for the six formulations
PW PWC20 PWC40 PWC60 PWC80 PC Slope* 1.08E-04 1.45E-04 2.03E-04 2.27E-04 4.06E-04 5.77E-04 TSmax 12.93 % 13.66 % 15.43 % 20.12 % 21.45 % 30.25 % MCmax 17.75 % 19.09 % 20.39 % 22.16 % 20.97 % 29.05 % DA 7.66E-07 1.35E-06 2.55E-06 2.62E-06 6.11E-06 6.73E-06 D 4.69E-07 8.27E-07 1.56E-06 1.60E-06 3.72E-06 4.09E-06 β 0.731 0.716 0.759 0.908 0.993 1. 012
*: dMt/d√t

191
Possibly, the relation between content of cell debris and true diffusion constant
can be expressed by an Arrhenius-like relation:
D! = D ∙ exp!!!!∙! (eq. 6.6)
where D is the true diffusion constant of the PW composite, D’ is the true diffusion of
different cell debris content of PWCCs, R is the universal gas constant (8.314
J/K/mol.), T is the temperature of 294oK , and Ea is the activation energy (J/mol.). To
obtain Ea, the equation of 6.6 can also be presented as:
lnD! = !!!!∙ !!+ lnD (eq. 6.7)
The relation could be obtained by plotting cell debris against the true diffusion
constant and result in Figure 6.14. By using the regression curve, the activation
energy of moisture diffusion on increasing cell debris content in the PWCCs can be
calculated and obtained as the value of -0.0171 J/mol, which means that by increasing
cell debris content, less energy is required to have moisture penetrated at the same
temperature condition. However, since it was found that the PWC60, PWC80, and PC
had viable cracks occurring in the early step (after less than a week) of immersion, the
moisture diffusion may be influenced because of the cracks are seeing to accelerate
the moisture penetration via capillary force. If only the composites of PW, PWC20,
and PWC40 (observed cracks after 4 weeks immersion) are considered, the activation
energy of moisture diffusion will be -0.0122J/mol.

192
Figure 6.14 Plot of true moisture diffusion constant versus cell debris content
6.4 Conclusion
The results of this study investigated and demonstrated that using purified PHB
and PHB-free cell debris were successfully compounded with wood flour by twin
screw extrusion and molded into test samples by injection molding. The
disadvantages of using cell debris, e.g. large and irregular shape, poor interfacial
bonding, and thermal degradation, were believed to contribute to the decline of
performance and moisture resistance of the composites. These properties decreased
with increasing cell debris content. In addition, the formulation of PWC60, the cell
ratio of debris:wood flour is 3:2 showed a comparable mechanical performance with a
HDPE/WF composite. Moisture behavior was investigated using Fickian diffusion
y = 7E-06x + 1E-07
y = 5E-06x + 4E-07
0.00E+00
5.00E-07
1.00E-06
1.50E-06
2.00E-06
2.50E-06
3.00E-06
3.50E-06
4.00E-06
4.50E-06
0.0% 10.0% 20.0% 30.0% 40.0% 50.0% 60.0%
True
diff
usio
n co
nsta
nt (m
m2 /s
ec)
Cell debris content

193
theory. However, cracking and dissolved materials resulted in composites with a
non-Fickain diffusion behavior after they reached their saturation points. With
evidence from SEM morphology study, improvement of the interfacial bonding
between PHB and cell debris is expected to improve performance of the composite.
Lastly, based on the results from the simulated composites, the PHB laden cell
debris/wood flour composites could possibly be investigated by using extrusion
compounding process followed by injection molding. Other investigated formulations
were further seen as potential replacements for current WPCs, where polymers are
derived from crude oil, or to be utilized in an application with requirements of
biodegradable and “green” aspects.
6.5 Acknowledgement
The authors gratefully acknowledge the financial support provided by the U.S.
Department of Energy, under the grant of Development of Renewable Microbial
Polyesters for Cost Effective and Energy-Efficient Wood-Plastic Composites.

194
6.6 References
[1] P. M. Smith and M. P. Wolcott. 2006. Opportunities for Wood/Natural Fiber-Plastic Composites in Residential and Industrial Applications. Forest Products Journal. 56(3):4-11
[2] J. Bowyer. 2010. WOOD-PLASTIC COMPOSITE LUMBER V S. WOOD DECKING : A COMPARI SON OF PERFORMANCE CHARACTERISTICS AND ENVIRONMENTAL ATTRIBUTES. Minneapolis, MN: Dovetail Partners, Inc., pp. 1-13
[3] T. U. Gerngross. 1999. Can biotechnology move us toward a sustainable society? Nat Biotech. 17(6):541-544
[4] E. R. Coats, F. J. Loge, M. P. Wolcott, K. Englund, and A. G. McDonald. 2007. Synthesis of Polyhydroxyalkanoates in Municipal Wastewater Treatment. Water Environment Research. 79:2396-2403
[5] E. R. Coats, F. J. Loge, M. P. Wolcott, K. Englund, and A. G. McDonald. 2008. Production of natural fiber reinforced thermoplastic composites through the use of polyhydroxybutyrate-rich biomass. Bioresource Technology. 99(7):2680-2686
[6] X. Zhou and C. E. Frazier. 2001. Double labeled isocyanate resins for the solid-state NMR detection of urethane linkages to wood. International Journal of Adhesion and Adhesives. 21(3):259-264
[7] S. Das, M. J. Malmberg, and C. E. Frazier. 2007. Cure chemistry of wood/polymeric isocyanate (PMDI) bonds: Effect of wood species. International Journal of Adhesion and Adhesives. 27(3):250-257
[8] S. L. Wendler and C. E. Frazier. 1996. Effect of moisture content on the isocyanate/wood adhesive bondline by 15N CP/MAS NMR. Journal of Applied Polymer Scienc. 61(5):775-782
[9] Scott P. Anderson. 2007. Wood Fiber Reinforced Bacterial Biocomposites: Effects of Interfacial Modifiers and Processing on Mechanical and Physical Properties. Master thesis, Washington State University
[10] J. Zhang, S. McCarthy, and R. Whitehouse. 2004. Reverse temperature injection molding of BiopolTM and effect on its properties. Journal of Applied Polymer Science. 94(2):483-491
[11] A. Klesov. 2007. Wood-plastic composites. Hoboken N.J.: Wiley-Interscience [12] Y. J. Weitsman. 1995. Effects of Fluids on Polymeric Composites - A Review [13] L. V. Smith and Y. J. Weitsman. 1990. The immersed fatigue response of
polymer composites. International Journal of Fracture. 82(1):31-42

195
[14] S. V. Rangaraj and L. V. Smith. 2000. Effects of Moisture on the Durability of a Wood/Thermoplastic Composite. Journal of Thermoplastic Composite Materials. 13(2):140-161
[15] Y. J. Weitsman. 1991. "Moisture in Composites: Sorption and Damage" in Composite Materials Series 4 - Fatigue of composite materials. K. L. Reifsnider editted. Amsterdam ;New York: Elsevier. pp. 385-429.
[16] A. C. Loos and G. S. Springer. 1979. Moisture Absorption of Graphite-Epoxy Composites Immersed in Liquids and in Humid Air. Journal of Composite Materials. 13(2):131 -147
[17] M. J. A. Chowdhury and M. P. Wolcott. 2007. Compatibilizer selection to improve mechanical and moisture properties of extruded wood-HDPE composites. Forest Products Journal. 57(9):46-53
[18] J.-W. Kim, D. Harper, and A. Taylor. 2008. Effect of Wood Species on Water Sorption and Durability of Wood-Plastic Composites. Wood and Fiber Science. 40(4):519-531
[19] R. M. V. G. K. Rao, N. Balasubramanian, and M. Chanda. 1984. Factors Affecting Moisture Absorption in Polymer Composites Part I: Influence of Internal Factors. Journal of Reinforced Plastics and Composites. 3(3):232 -245
[20] J. Zhou and J. P. Luca. 1995. The effects of a water environment on anomalous absorption behavior in graphite/epoxy composites. Composites Science and Technology. 53(1):57-64

196
Chapter 7 Conclusion
Due to the increasing lack of fossil fuel resources, it is an urgent to move toward
to a more sustainable source of energy. Utilizing natural renewable materials such as
wood and biopolymer products, is now becoming an enormous focus in order to
decouple the dependence on fossil fuel and to maintain sustainable requirements. Both
wood and biopolymers, (specifically referred to as PHB in this study), can be renewed
via biological production processes. Blending these two components in order to form
wood biopolymer composites is seen as an alternative solution. Notably, PHB is a
biodegradable and compostable biopolymer, which indicates that PHB can be
biologically converted back to nature. Additionally, wood plastic composite (WPC)
has been developed for decades to satisfy the demands of performance, cost reduction,
and “green” aspects in variable applications, such as extruded and injection-molded
goods. Traditionally, WPC is made with wood flour/fiber (WF) and petroleum-based
polymer, e.g. polyolefin and polyvinyl chlorate. With the sustainable benefit from
wood and biopolymer, PHB, wood bio-polymer composites are seen as a key toward
to sustainability. However, the energy required to purify PHB is a large drawback to
maintaining the sustainable image of biopolymer. Additionally, addition of a coupling
agent to improve the performance of wood biopolymer composites may influence the
compostability of the composite. Therefore, the major objectives of this research are:

197
1) evaluating compostability and biodegradation behavior of wood-PHB composites
in lab scale testing; 2) understanding the mechanisms of biodegradation and physical
degradation; and 3) utilizing PHB-laden cell debris to produce wood-PHB composites
through extrusion and injection molding processes.
The results indicated that PHB and PHB/WF composites (50:50 wt%) can be
classified as compostable polymeric materials in accordance with ASTM D5338 and
D6400 via a lab-scale test. The PHB/WF composite had 60% mineralization after 120
days of composting. Different degradation phases were explored, such as lag,
degradation, and slow-down. In accordance with previous studies and results
discussed in this research, the crystallinity of PHB was increased after a certain period
of composting time. This result is explained by the fact that the microorganism
consumes the amorphous region of PHB first, and then the crystalline region. Also, as
small molecular of enzyme, which is produced from microorganisms, it is possible to
penetrate through the PHB/WF composites. After applying the Fickian diffusion
concept on the results of mineralization, the mineralization (biodegradation) behavior
of PHB/WF composite was numerically presented. During composting of
compostable materials, lag phase of the biodegradation was very critical since that is
how the enzymatic bioreaction starts. Microcracking is believed to occur due to the
fact that the viscoelastic behavior of filler reinforced polymeric material under the

198
hygrothermal conditions. Under this condition, soften polymer and dimensional
swelled composite is exhibited. After PHB/WF composites with PHB-g-MA and MDI
as coupling agents were placed in a hygrothermal condition chamber, physical
damage and mechanical degradation were observed by using continuous damage
mechanics to theoretically obtain the percentage of crack damage. Using MDI as a
coupling agent in PHB/WF composites resulted outstanding hygrothermal resistance
because of a better interfacial bonding than the control and PHB-g-MA added
formulation. Comparison with mathematically normalized results and moisture effects
on tensile properties proved this statement. After recognized the lag phase, by using a
lab-scale composting setup, the biodegradation of different PHB/WF composites were
performed. The results showed that by improving interfacial bonding, a lower rate of
mineralization was observed on the MDI added PHB/WF composite compared with
PHB-g-MA added and control. Additionally, application of a well-known
Michaelis-Menten enzymatic kinetic concept, enzymatic behavior during the lag
phase can be numerically presented and may provide more fundamental
understanding. Surface morphology observation showed evidence of surface erosion
during the biodegradation. Microscope evidence of hypha and wood flour that
remained on the surface of the PHB/WF composites could represent the slow-down
phase. It could be expected that the microbial resistance from lignin of wood was a

199
drawback in influencing the compostability of the PHB/WF composites. Combining
the results of composting and hygrothermal effects, a state-of-the-art view of the
biodegradation mechanism could be schematically sketched to fundamentally
understand the lag, biodegradation, and slow-down phases.
Energy consumption during PHB production and purification are seen as
drawbacks for utilizing PHB. Fortunately, previous research has indicated that PHB
could be generated from waste water treatment plants, which could assist reduction of
energy consumption and demands for raw agricultural materials. Eliminating the
purification step of PHB and directly blending PHB-laden cell debris with wood flour
to produce PHB/WF composites is a possible method to reduce energy consumption.
The results of this study showed that it is possible to use PHB-laden cell debris
to produce PHB/WF composites. The mechanical performance of the composite with
a 3:2 ratio of cell debris and wood flour was comparable with one commercial WPC.
However, the highly hydrophilicity of cell debris deteriorates the moisture resistance
of the PHB/WF composites, even with MDI added as coupling agent.
In conclusion, this innovative research provides much fundamental knowledge
and leads to an understanding of the process of composting biodegradation. Many
theoretically methodologies were successfully applied in order to investigate and
numerically explain the results. From the point of view of sustainability, the PHB/WF

200
composite is a suitable candidate to assist the global movement toward a more
sustainable society. This aim could be achieved by estimating the individual and local
product carbon footprint (carbon cycling ecosystem), which may be estimated by
using the mineralization results and reduction of energy consumption from PHB
purification proposed in this research.

201
Appendix A Maleation of Poly-3-hydroxybutyrate by Reactive Extrusion
A.1 Introduction
Bio-based polymers have been a focus as an alternative of petroleum derived
polymer, such as polyolefin. Forming a bio-composite, natural organic materials (e.g.
wood flour and starch) are commonly added as reinforcement to these bio-polymers to
expend the performance envelope and cost reduction. However, the discrepancy of
hydrophobic polymer and hydrophilic reinforcements causes a drawback on the
bio-composites. One way to improve the interfacial adhesion is to use functionized
bio-polymers. The functionization can be achieved by using multiple methods that are
mainly to introduce functional groups onto the polymer chain and form internal force
to each other and/or to the functional groups (most are hydroxyl and carboxyl groups)
on the reinforcements. Moad [1] indicated that the most widespread method of
grafting functionality onto polymer chains is by free radical-induced reactive
extrusion. Peroxide is the common use to provide the free radical to initiate reactions
and result a monomer or macro-monomer grafted on the polymer chain. This entire
reaction process is conveyed through an extruder. Maleic anhydride (MA) has widely
been used to graft onto polyolefin and bio-polymers and used as a compatibilizer to
enhance the interfacial adhesion in a biocomposite, such as wood plastic composites
[2][3][4]. Poly-3-hydroxybutyrate (PHB), one of biopolymer, has been introduced to

202
produce MA grafted PHB (PHB-g-MA) by reactive extrusion [5], but the degree of
grafting did not be pointed out. Therefore, this following research is using reactive
extrusion to produce PHB-g-MA and identify the degree of grafting and thermal
properties.
A.2 Materials and Methods
A.2.1 Materials
Purified PHB powder was provided by Ningbo Tianan Biologic Material Co.,
Ltd., Ningbo, China. Wood flour (Ponderosa pine, 60-mesh) was provided by
American Wood Fibers, Schofield, WI. Powder form of maleic anhydride (95% of
purity), MA, and liquid form of initiator, 2,5-Dimethyl-2, 5-di-(tert-butylperoxy)
hexane (Luperox® 101) was supplied from Sigma-Aldrich Co. LLC.
A.2.2 Methods
A.2.2.1 Reaction Extrusion of MA-grafting on PHB
Reaction extrusion process has been widely utilized to polymerize or graft
functional groups and/or monomers onto polymers [1][6]. During the reaction process
of extrusion, an initiator is needed to provide a free radical, which is seeing as a
reacting point, onto polymer chain. In this study, the mixture of PHB and additional

203
MA (2 parts) and initiator (0.2 parts) was first mixed by manually vigorous shaking
and tumbling for 5 minutes in a plastic bag. The mixture was later thermally reacted
using a co-rotating twin screw extruder (Leistriz ZSE-18) with a screw diameter of 18
mm and length/diameter (L/D) ratio of 40 equipped with a volumetric feeder for a
constant feeding. To improve melt strength and reduce thermal degradation, a
declining temperature profile of the extruder was applied during the extrusion process.
The extrusion temperature profile was set at 165, 175, 170, 165, 160, 155, 150, and
145oC, from the feeding throat to the die adapter. The screw speed of extruder and
feeder was maintained at 55 and 400 rpm. The temperature and pressure of PHB melt
flow before existing die were detected at ca. 131oC and ca. 2.48MPa. Under these
speed, the residence time of the materials in the barrel was measured to be ca. 4
minutes. The extrudate was air cooled and following pelletized into a pellet form. The
pellet of PHB-g-MA was stored in a zip-lock bag.
A.2.2.2 Evaluation of MA-grafting Ratio
Titration was used to determine the degree of maleation for the sample of
PHB-g-MA. The procedure of the titration [6][7] was modified to determine
accurately degree of maleation. The non-reacted MA monomer was evaporated by
heating the PHB-g-MA pellets at ca. 85oC under a conventional oven with a vacuum

204
to evolve and discharge air for 24 hours. 4 gram of the pellets were further removed
and dissolved in 75 ml of chloroform, and 20 drops of 1M of hydrochloric solution
was added to hydrolyze anhydride into carboxylic acid at room temperature. The
solution was vigorously stirred for 30 minutes and then purified, known as
precipitation, by dripping into 300ml of acetone in order to remove any residual
homo-/co-polymer of MA. This solution was stored into a refrigerator at ca. 4oC for
24 hours in order to prevent any possible entrapping of homo-/co-polymer of MA and
reduce the settling time. The precipitates were filtered and washed by acetone and
distilled water several times before replace in a conventional oven and venting out
any remaining solvent on the precipitated polymer, PHB-g-MA, at 85oC for 24 hours.
To determine the grafting degree, ca. 0.4 gram of the purified precipitated PHB
polymer was sampled and dissolved in 20 ml of chloroform. The solution was added 5
drops of phenolphthalein as a color indicator, and then titrated using 0.04 M of
potassium hydroxide (KOH) in methanol. The degree of MA grafting was calculated
based on the following equation:
Degree of MA grafting (%) = N!"# ∙ V!"#2W!"#$%&
×98.06×100
where NKOH and VKOH are the volume and normality, moles per equivalent, of the
KOH solution; Wsample is the sample weight of PHB-g-MA in grams.

205
A.3 Results and Discussion
Reaction extrusion and MA grafting ratio
During the titration process, precipitation, which could result in an experience
error, did not appeare in this study. After titration of the PHB-chloroform solution, the
degree of MA grating on PHB was determined and obtained an average of degree of
0.427% with coefficient of variance (COV) of 5.4%. Notably, the grafting degree is
similar with that of another bio-polymer, polylactide (PLA), which had a degree MA
grafting of ca. 0.45% [6]. PHB is frequently comparing with PLA due to both of them
have ester group in their polymer main chain. This result indicated the MA monomer
was successfully grafted onto the PHB polymer chain. The chemical structure of
PHB-g-MA could be concluded and the proposed mechanism of maleation reaction [6]
is shown in Scheme A.1. The functional group of the grafted MA was believed to
improve the interaction with hydroxyl group of wood flour by ring-opening [2][3][5].

206
Scheme A.1 Proposed mechanism of maleation reaction onto a polyester chain
A.4 Conclusion
It can be concluded that by using reactive extrusion can achieve the maleation of
PHB. The titration result indicated that the functional group of MA was successfully
grafted onto the polymer chain of PHB with a mean grafting ratio of 0.43%. As the
maleatic anhydrate is highly reactive with hydroxyl group on wood, this PHB-g-MA
can be further used as a coupling agent to solve the discrepancy of PHB and wood
flour, and further enhance the performance of the PHB/WF composites.

207
A.5 References
[1] G. Moad. 1999. The synthesis of polyolefin graft copolymers by reactive extrusion. Progress in Polymer Science. 24(1):81-142
[2] M. J. A. Chowdhury and M. P. Wolcott. 2007. Compatibilizer selection to improve mechanical and moisture properties of extruded wood-HDPE composites. Forest Products Journal. 57(9):46-53
[3] David P. Harper. 2003. A Thermodynamic, Spectroscopic, and Mechanical Characterization of the Wood-Polypropylene Interphase. Master Thesis, Washington State University
[4] R. Gauthier, C. Joly, A. C. Coupas, H. Gauthier, and M. Escoubes. 1998. Interfaces in polyolefin/cellulosic fiber composites: Chemical coupling, morphology, correlation with adhesion and aging in moisture. Polymer Composites. 19(3):287-300
[5] Scott P. Anderson. 2007. Wood Fiber Reinforced Bacterial Biocomposites: Effects of Interfacial Modifiers and Processing on Mechanical and Physical Properties. Master thesis, Washington State University
[6] D. Carlson, L. Nie, R. Narayan, and P. Dubois. 1999. Maleation of polylactide (PLA) by reactive extrusion. Journal of Applied Polymer Science. 72(4):477-485
[7] Y. Nabar, J. M. Raquez, P. Dubois, and R. Narayan. 2005. Production of Starch Foams by Twin-Screw Extrusion: Effect of Maleated Poly(butylene adipate-co-terephthalate) as a Compatibilizer. Biomacromolecules. 6(2):807-817