Women’s Political Empowerment and Investments in Primary Schooling in India
41
1 23 Social Indicators Research An International and Interdisciplinary Journal for Quality-of-Life Measurement ISSN 0303-8300 Soc Indic Res DOI 10.1007/s11205-015-0870-4 Women’s Political Empowerment and Investments in Primary Schooling in India Nafisa Halim, Kathryn M. Yount, Solveig A. Cunningham & Rohini P. Pande
-
Upload
independent -
Category
Documents
-
view
1 -
download
0
Transcript of Women’s Political Empowerment and Investments in Primary Schooling in India

1 23
Social Indicators ResearchAn International and InterdisciplinaryJournal for Quality-of-Life Measurement ISSN 0303-8300 Soc Indic ResDOI 10.1007/s11205-015-0870-4
Women’s Political Empowerment andInvestments in Primary Schooling in India
Nafisa Halim, Kathryn M. Yount,Solveig A. Cunningham & RohiniP. Pande
1 23
Your article is protected by copyright and all
rights are held exclusively by Springer Science
+Business Media Dordrecht. This e-offprint
is for personal use only and shall not be self-
archived in electronic repositories. If you wish
to self-archive your article, please use the
accepted manuscript version for posting on
your own website. You may further deposit
the accepted manuscript version in any
repository, provided it is only made publicly
available 12 months after official publication
or later and provided acknowledgement is
given to the original source of publication
and a link is inserted to the published article
on Springer's website. The link must be
accompanied by the following text: "The final
publication is available at link.springer.com”.
Women’s Political Empowerment and Investmentsin Primary Schooling in India
Nafisa Halim • Kathryn M. Yount •
Solveig A. Cunningham • Rohini P. Pande
Accepted: 11 January 2015� Springer Science+Business Media Dordrecht 2015
Abstract Using a national district-level dataset of India composed of information on
investments in primary schooling [data from the District Information Survey for Education
(DISE, 2007/8)] and information on demographic characteristics of elected officials [data
from the Election Commission of India (ECI, 2000/04)], we examined the relationship
between women’s representation in State Legislative Assembly (SLA) seats and district-
level investments in primary schooling. We used OLS regressions adjusting for con-
founders and spatial autocorrelation, and estimated separate models for North and South
India. Women’s representation in general SLA seats typically was negatively associated
with investments in primary-school amenities and teachers; women’s representation in
SLA seats reserved for under-represented minorities, i.e., scheduled castes and scheduled
tribes, typically was positively associated with investments in primary schooling, espe-
cially in areas addressing the basic needs of poor children. Women legislators’ gender and
caste identities may shape their decisions about redistributive educational policies.
Keywords Gender � India � Intersectionality � Political representation �Primary schooling � Redistributive policies
N. Halim (&)Center for Global Health and Development, Department of Global Health, School of Public Health,Boston University, 801 Massachusetts Ave, Crosstown Center, 3rd Floor, Boston, MA 02118, USAe-mail: [email protected]
K. M. Yount � S. A. CunninghamHubert Department of Global Health, Rollins School of Public Health, Emory University, 1518 CliftonRd. NE, Atlanta, GA 30322, USAe-mail: [email protected]
K. M. Yount � S. A. CunninghamDepartment of Sociology, Emory University, 1555 Dickey Drive, Atlanta, GA 30322, USA
R. P. Pande7118 Willow Avenue, Takoma Park, MD 20912, USA
123
Soc Indic ResDOI 10.1007/s11205-015-0870-4
Author's personal copy
1 Introduction
At independence, India made a pledge to legislate redistributive policies1 to improve the
wellbeing of its disadvantaged groups, including scheduled castes and scheduled tribe (SC/
ST) members and women (Besley and Coate 1997; Pande 2003; Chattopadhyay and Duflo
2004). Constitutional mandates ensure that women and SC/ST members are present in the
legislature to help shape policies representing the interests of these groups. India reserved
up to one-fourth of the seats in the national and state legislatures for SC/ST members, and
one-third of all positions of chief in village councils for women (Pande 2003; Chatto-
padhyay and Duflo 2004). Moreover, in 1996, Indian legislators proposed the Women’s
Reservation Bill, a constitutional amendment to reserve one-third of the seats in the
national and state legislatures for women (Sanyal 2008). The amendment has since been
under political deliberation in the Lower House of India’s bipartite parliament; in 2010, it
was approved by the Upper House (Clots-Figueras 2011; The Hindu 2014).
Constitutional mandates to increase the representation of women and SC/ST individuals in
the legislatures are predicated on the idea that legislators seek to improve the wellbeing of the
groups with which they identify. Legislators’ identities, defined as their ‘‘internalized posi-
tional designation’’ with respect to gender, religion, caste, class, race, ethnicity, sexuality, or
other designation (Stryker 1980: 60) are expected to matter for their political priorities and
decisions (e.g., Phillips 1995, 1998). Thus, legislators’ identities should lead them to promote
redistributing resources to the social groups with which they identify (Pande 2003; Chatto-
padhyay and Duflo 2004; Clots-Figueras 2011). Further, systematic differences between men
and women have been noted in the literature in spending on child-related issues (e.g., Lott and
Kenny 1999; Edlund and Pande 2001; Edlund et al. 2005), indicating that women may
legislate more for redistributive policies, including those to improve and expand primary
schooling (Lundberg et al. 1997; Thomas 1990, 1997; Duflo 2003; Rubalcava et al. 2009).
At the same time, legislators, like other people have multiple intersecting identities
(e.g., Frederick 2010; Hill Collins 2000; Phillips 1995, 1998), and legislators’ intersec-
tional political consciousness can entail ‘‘simultaneous expression of solidarity with
women, racial and ethnic minorities, and poor and working-class voters as well as concern
for the socio-political status of these groups’’ (Frederick 2010: 478). Therefore, in com-
parative research on gender and redistributive policy, questions persist about ‘‘which
identity matters? and how?’’ (Clots-Figueras 2011; Garcia et al. 2005; Delaney and
O’Toole 2008; Moghadam 1991; Saidel and Loscocco 2005; Zhou et al. 1998).
In this study, we use theories of intersectionality (Frederick 2010; Hancock 2007;
McCall 2005) to examine the relationship between legislators’ intersecting gender and
caste identities and redistributive education policies in India. India is an important case
study for testing this relationship, being a country where women with diverse backgrounds
are securing an increasing number of political offices in the country (Mohanty 1995;
Randall 2006). Important to know is to what extent gender and caste/tribe identities tend to
inform women legislators, as they make redistributive policy decisions (Crenshaw 1991;
Sen 2005; Dreze and Sen 1995, 2002; Frederick 2010). India’s gender and caste systems2
dominate the country’s social stratification, ascribing to all a position in rigid social
1 Redistributive policy refers to measures paid by one group to grant goods and services to other, relativelydisadvantaged groups.2 The Indian government recognizes scheduled tribes, scheduled castes (Shudras), other ‘‘backward’’(occupational) castes and ‘‘general’’ castes (Brahaman, Kshatriya, Vaishayas). The first three groups aredefined as socially and economically disadvantaged and deserving of special protections.
N. Halim et al.
123
Author's personal copy

hierarchies by birth, and, thereby, limiting for women (Miller 1989; Murthi et al. 1995;
Jeffrey and Basu 1996) and SC/ST members (Beteille 1969; Furer-Haimendorf 1982;
Galanter 1984; Omvedt 1993) opportunities for social mobility. Both groups also have a
long history of grassroots activism to redress oppression directed at them based on their
gender and caste identities. In the 19th century, non-Brahmin castes agitated for reforms to
remove the monopoly of the higher castes (Srinivas 1957), while women’s participation in
the nationalist struggle for independence helped to expand women’s roles and opportu-
nities (Anandhi 1991; Thapar 1993).
Of course, women are not a homogenous group. Holding divergent positions in India’s
caste-based hierarchies, high- and low-caste women tend to experience divergent privi-
leges or wants (Crenshaw 1991; Frederick 2010; Hill Collins 2000; Phillips 1998). This
may divide SC/ST members and women rather than uniting them in a common struggle
(Jenkins 1999). Indeed, Indian scholars have argued that low-caste women experience
disadvantages, including lack of opportunities for schooling, health care, economic
mobility and political participation, arising from simultaneous gender and caste oppression
(Deshpande 2007; Mehrotra 2006).
Using rich district-level data, comprehensive district-level data on investments in pri-
mary schooling available for the 2007/8 school year and on state legislators’ gender and
caste from years immediately prior (2000–2004) SLA elections from all but one state, we
assess to what extent women’s representation in State Legislative Assembly (SLA) seats,
reserved and not reserved for SC/ST, is associated with investments in primary school
amenities and teachers, two domains of educational policy associated with children’s
primary schooling in India (Greenwald et al. 1996; Hannaway and Woodroffe 2003).
Investments in primary school amenities and teachers are redistributive, since, unlike the
non-poor, who tend to turn to the private sector for primary education, the poor rely on
government-run primary-schools (Bardhan 1996). We explore whether the magnitude by
which women’s SLA representation is associated with primary-school investments vary
between North India—known for patriarchy and caste rigidity—and South India—known
for gender equity and caste activism. Differences in gender norms and caste activism
between North and South India may limit or expand the ability of women, as legislators, to
influence redistributive education policies.
2 Gender, Identity Politics, and Redistributive Policy
Despite dramatic global change in women’s political representation (Paxton et al. 2006,
2007), gender gaps, especially at higher levels of government, persist (Coffe and Bol-
zendahl 2010; Kenworthy and Malami 1999; Kunovich and Paxton 2005; Paxton and
Kunovich 2003). Debate also persists about the extent to which women politicians can and
do promote redistributive policies favoring women’s and children’s interests (Malhotra and
Schuler 2005; Wangnerud 2002).
2.1 Theories of Gender and Redistributive Policy
Feminist theorists have argued that liberal democracies have privileged the representation
of ideas over the identities of representatives (Phillips 1998). Given the different values,
life experiences, and expertise that women bring to politics, they may distinctly favor
redistributive measures aimed at women and children. In the household, income or assets
Women in Politics and Schooling Investments
123
Author's personal copy

controlled by women have raised household spending on human capital across diverse
contexts (Lundberg et al. 1997; Thomas 1990, 1997; Duflo 2003; Rubalcava et al. 2009). In
the U.S. and Western Europe, women have been more likely than men to support public
spending on childcare and child-related issues (Lott and Kenny 1999; Edlund and Pande
2001; Edlund et al. 2005; Miller 2008; Svaleryd 2009). In the U.S., women’s represen-
tation in 12 state legislatures has been positively associated with the sponsorship and
passage of bills concerning women, children and families (Thomas 1991, 1994; Thomas
and Welch 1991). In Norway, women’s representation in municipal government has been
positively associated with the provision of public childcare (Bratton and Ray 2002). In the
Mexican congress, women’s representation of as little as 13 %, combined with other
facilitating conditions, has enabled legislation against sex crimes and for affirmative action
(Stevenson 1999). Finally, cross-nationally in the 1980s and 1990s, the percentage of
women in national legislatures has been positively associated with social welfare spending,
especially on the family (Bolzendahl 2011).
Likewise, in India, the policy interests of men and women state legislators vary across
the 16 largest states (Clots-Figueras 2011), with women politicians more likely than men to
promote education in their constituencies. In Uttar Pradesh, the most populous state in
India and home to the largest number and fourth largest share of SC people (Census of
India 2011), most women legislators during 1952–1996 opened schools in their areas, and
some engaged in programs to improve education (Pundir and Singh 2002).
2.2 Intersectionality, Identity Politics, and Redistributive Policy
Women politicians may not be a homogenous group, and may hold differing positions in
social hierarchies, entailing differing experiences and allegiances (Crenshaw 1991; Fred-
erick 2010; Hill Collins 2000; Phillips 1998). Some women politicians, who may be
proxies for their husbands or their elite families (Baviskar 2005), may be no more likely
than their male colleagues to support women’s interests (Franceschet and Piscopo 2008;
Gotell and Brodie 1996; Schwindt-Bayer 2011). Conversely, members of historically
marginalized groups may promote more strongly the interests of these groups (Pande 2003;
Besley et al. 2004); and women from these groups may do the same. In the U.S., black
women legislators aligned with non-black women to support pro-women policies, with
black men to support pro-minority policies, and with fellow black women legislators on the
policies that most affected them, including on education, health care, employment, and
economic growth (Barrett 1995).
3 Indian Context
Three aspects of the Indian context are relevant to this discussion: trends in primary
schooling, the political system and women’s representation in it, and legislative and pro-
grammatic efforts to enhance schooling.
3.1 Trends in Primary Schooling
Primary education in India is intended to give students 6–11 years a foundation in reading,
writing, mathematics, and social studies. Primary programs generally require no prior
schooling, although children increasingly attend pre-primary programs. Gains in primary
schooling in India have been marked. In the 1990s, the percentage of children 6–14 years
N. Halim et al.
123
Author's personal copy
who were attending school increased from 68 to 79 % (International Institute for Popu-
lation Sciences (IIPS) 1995; IIPS and Macro International 2000). Still, in 1998–1999, only
83 % of boys and 74 % of girls 6–14 years were attending school, a minority of boys
(41 %) and girls (36 %) finished primary school by age 14, and the median completed
grades of schooling was 5.5 for boys and 1.6 for girls (Wu et al. 2007; IIPS and ORC
Macro 2000). Six states accounted for three-fourths of the 40 million children 6–11 years
who were out of school (Mehrotra 2006). During the 1990s and early 2000s, gains in
schooling were faster for girls than for boys, such that from 1999 to 2006, attendance for
boys 6–10 years stabilized at 85 %, while that for girls rose from 78 to 81 % (IIPS and
Macro International 2000, 2007). By 2005/6, the period for this analysis, in every state
except Bihar, more than three-fifths of children 6–17 years were attending school, with
Kerala (90 %) and Himachal Pradesh (89 %) having the highest percentages (IIPS and
Macro International 2007).
3.2 Political System and Political Reservations for Women and Scheduled Castes/
Scheduled Tribes
India’s political system is a federalist one, and the constitution gives much political control
to the 28 states and 7 Union Territories (UTs). The State Legislative Assemblies (SLAs)
are directly elected bodies that perform the administrative functions of state governments.
Administratively, states are divided into districts, which are subdivided into tehsils or
talukas. Politically, states and UTs are divided into single-member constituencies in which
SLA contestants are elected in first-past-the-post elections. Geographic boundaries are
drawn to ensure an equal number of inhabitants per constituency. For elections before
2008, delimitation rules enacted in 1985 assigned these constituencies to parent districts.
The median number of constituencies per district is nine.
India’s constitution directs the government to establish district infrastructures for local
governance, called Panchayat. These Panchayats comprise elected village, block, and
district councils that administer local public goods, albeit with mixed success (Bonu et al.
2011; Meenakshisundaram 2005). The SLAs devolve development (including educational)
programming to the Panchayat and decide the budget for such programs. SLA legislators
may direct funds to district educational offices.
For decades, attempts to secure adequate political representation for non-Brahmin castes
failed (Srinivas 1957). At independence, the Indian constitution provided political reserva-
tion for SC/ST, who are *25 % of the population, often geographically concentrated, and
socio-economically disadvantaged (Census of India 2011). In 1950, India reserved up to one-
fourth of the seats in the national and state legislatures for SC/ST members (Pande 2003).
Constitutionally, jurisdictions in national and state legislatures are reserved for these groups
before national and state elections (Constitution of India 1949; Library of Congress and
Federal Research Division 2004), proportional to groups’ shares in the national and state
populations, according to the most recent census preceding the election.
Debates over political reservations for women have occurred since British rule. In the
1920s and 1930s, the British placed a lower priority on reservations for women than on
reservations for particular religious and caste groups (Jenkins 1999). In 1935, seats were
reserved for women in provincial legislatures, but the Indian government removed these
reservations at Independence (Jenkins 1999). After decades of debate, the 73rd amendment
to India’s constitution established in 1992 that one-third of seats in the Panchayat and one-
third of Head-of-Panchayat positions would be reserved for women (Baviskar 2005; Ban
and Rao 2008). In 1996, a parliamentary bill was proposed to reserve one-third of seats for
Women in Politics and Schooling Investments
123
Author's personal copy

women in the SLAs and the lower house of the federal Parliament. This bill was debated in
several parliamentary sessions but not ratified (Sanyal 2008).
Partly as a result of these efforts, at the national parliamentary level, women with more
diverse backgrounds are entering politics. However, most women (and men) politicians
still originate from elite families (Randall 2006; Richter 1990). After the Indian govern-
ment mandated a 30 % reservation for women in the Panchayat, many newly elected
women were from elite castes (Mohanty 1995). Over time, poorer and less politically
connected women have held office at this level (Ban and Rao 2008; Baviskar 2005). On the
whole, however, women’s political representation at the state and national levels remains
low. During 1967–2001, women won at most 14 % of the general SLA seats and 24 % of
SC/ST seats in India’s 16 largest states (Clots-Figueras 2007).
3.3 Legislative Efforts to Expand and Improve Schooling
Several constitutional amendments deal directly with education, but the SLAs play the
major role in educational policy and expenditures, especially at the primary and secondary
levels (Mehrotra 2006). State governments have Departments of Education, which control
and implement these activities. States and four UTs have passed acts making primary
education compulsory,3 with compulsion referring to the government’s provision of
schooling, not families’ duties to send children to school.
The government has aimed to enhance educational infrastructure over time. Under the
1986 National Policy on Education, the Central Government established Operation
Blackboard, under which every primary school was to have at least two teachers, two
classrooms, and the equipment and aids needed to teach at the primary level. National
Norms established that a primary school be provided within 1 km of habitations with
200–300 persons. In 2001, Education for All was initiated as the main governmental
program to achieve universal primary education of satisfactory quality by 2010. The
program comprises 15 interventions, including the provision of free textbooks, grants to
schools, grants to teachers, and teacher training. In 2009, the Right of Children to Free and
Compulsory Education Act was passed to provide universal (except Jammu and Kashmir)
free and compulsory education to all children 6–14 years (or until completing primary
school). The Act required that private schools reserve 25 % of admissions for poor chil-
dren, mandated improvements to school infrastructure, teacher training, and pupil-to-tea-
cher ratios, and provided models to plan and monitor progress toward these goals (India
Development Gateway 2009).
3.4 Intersectionality in Indian Politics and Redistributive Education Policies
In India, legislators’ gender and caste identities have been associated with redistributive-
policies. In district-level data from 16 states, the policy interests of men and women state
legislators differed markedly overall (Clots-Figueras 2011); yet, general women legislators,
who hold seats not reserved for SC/ST and who often come from elite families of privileged
castes, have not supported policies representing women’s interests (Clots-Figueras 2011).
They have not promoted laws to equalize women’s and men’s rights to inheritance, have
favored pro-rich expenditures, have opposed redistributive land reforms, have invested in
3 The States are Assam, Andhra Pradesh, Bihar, Gujarat, Haryana, Jammu and Kashmir, Karnataka,Madhya Pradesh, Maharashtra, Punjab, Rajasthan, Tamil Nadu, Kerala, and West Bengal. The UTs areChandigarh, Delhi, Pondicherry and Andaman and Nicobar Islands.
N. Halim et al.
123
Author's personal copy
higher (rather than lower) tiers of education, and have reduced social expenditures (Clots-
Figueras 2011). In contrast, SC/ST women state legislators have favored redistributive
policies, such as capital investments in irrigation, have supported revenue expenditures on
water supply, some aspects of lower-level schooling,4 and laws to equalize women’s and
men’s inheritance rights (Clots-Figueras 2011).
Other studies show different results. In village-level experiments in West Bengal and
Rajasthan, women Panchayat heads, SC/ST and non-SC/ST alike, invested more in
drinking water and roads—public goods linked to women’s concerns at the local level
(Chattopadhyay and Duflo 2004). Proceedings from 155 rural village-assembly meetings in
Rajasthan have shown a relative neglect of health, education, and gender issues; yet, SC/ST
chairpersons of both genders have been more likely than their higher-caste counterparts to
raise SC/ST-related issues (Bonu et al. 2011). In four Southern states, women Panchayat
heads have resembled their male counterparts in willingness to provide public goods (Ban
and Rao 2008).
The range of findings with respect to intersectionality of gender and caste in policy-
making suggests that this relationship is still unresolved and needs further study. In
addition, the variation across states suggests that the context may matter for this rela-
tionship, an issue we start to address with our analysis by North and South regions of India,
as described below.
3.5 Women’s Intersectional Political Interests in Social Context
The nature and magnitude of gender and caste gaps in redistributive investments may
depend on the broader social context (Ban and Rao 2008; McCall 2005). Variations in
gender norms and caste activism across the Northern and Southern states offer an inter-
esting example. Southern Indian states have been characterized as less patriarchal than
Northern states, with more egalitarian norms about gender (Dyson and Moore 1983). While
Southern states such as Tamil Nadu and Kerala historically have had more rigid caste
hierarchies and lower-caste discrimination than some Northern states, many Southern
states also have had a long history of relatively successful activist social and political
movements against caste discrimination (Anandhi 1991; Franke and Chasin 1994; Jadhav
1986; Ratnam 2008). In some Southern states, such as Tamil Nadu, women’s and lower-
caste’s movements were allied (Anandhi 1991). Thus, in the Southern states, where people
are currently more attuned to lower-caste needs, lower-caste women may be more effective
in furthering redistributive policies. In the North, higher-caste women may be more
effective in maintaining an elitist status quo.
3.6 Implications and Hypotheses
To date, studies of women in formal politics have focused on western nations (Kenworthy and
Malami 1999; Paxton et al. 2007). Also, studies often have compared the political influence of
women and men, ignoring potential distinctions among women (Paxton et al. 2007; Hughes
and Paxton 2008). Less is known about how women’s intersecting identities shape their
political interests, influence, and decisions (Crenshaw 1991; Frederick 2010). Moreover,
studies of women’s political influence (Ban and Rao 2008; Clots-Figueras 2007, 2011) have
considered relatively few indicators of investments in schooling. This district-level analysis
4 Clots-Figueras (2011) finds that, in India, SC/ST women legislators have a strong effect on primaryschools and general women legislators have a strong effect on middle schools.
Women in Politics and Schooling Investments
123
Author's personal copy
extends others in India focused on the reservation of local seats for women (Chattopadhyay
and Duflo 2004) as well as state and local seats for SC/ST legislators (Chin and Prakash 2011;
Munshi and Rosenzweig 2008; Pande 2003).5 This analysis helps to shed some light on the
reasons for inequities in the distribution of a mandated public good in a setting where
inequities in human resources can exceed those across the world’s nations.
Two hypotheses follow. First, the political representation of women in seats reserved for
SC/ST in India’s SLA will be positively associated with investments in primary schooling,
especially in the historically less patriarchal South, where low-caste activism has been
more prominent. Second, the political representation of women in non-reserved or general
SLA seats will be negatively associated with investments in primary schooling, especially
in the historically more patriarchal North, where low-caste activism has been less
prominent.
4 Data and Methods
4.1 Sample Construction and Data Sources
The district was our unit of analysis, as it permitted estimation of associations between
women’s political representation in the smallest possible geographic area in which elec-
toral constituencies are located. The district also is a germane operational level at which to
study investments in schooling. Although the central and state governments in India
control educational funding (Mehrotra 2006), its uses are determined partly at the district
and lower administrative and political levels by decisions that constituent state represen-
tatives may influence.
The analysis was based on data from the District Information Survey for Education
(DISE) and the Election Commission of India (ECI). The DISE provides state- and district-
level data on schools and their pupils. The DISE does not cover Education Guarantee
Schools, alternative learning centers, or unregistered schools; private-school coverage is
increasing.6 The DISE operates through State Education Departments. Officials at the
taluka/tehsil level maintain lists of all schools; they send forms and instructions annually
for each school to complete, review and compile the data, and pass it to the district, State
headquarters, and State Education Department. In 2008, the DISE covers all 624 districts in
all States and UTs, and all public schools in those districts participated in the DISE survey.
Data quality is monitored, and the data are generally high quality and complete (United
Nations Children’s Fund 2011). The data relevant for this analysis include indicators of: (1)
primary-school amenities, including school availability and school quality; and (2) pri-
mary-school teachers, including counts per school and per student population, qualifica-
tions, gender, and caste affiliation.7
5 For SC/ST officials, investment in the number of primary schools has been positive where the SC/STpopulation has been concentrated Crost and Kambhampati (2010). Also, the effects of political reservationfor SC have differed from those for ST, with the latter more aligned with concerns of the poor (Chin andPrakash 2011; Pande 2003).6 EGS are established in habitations where no formal school exists within 1 km and at least 15–25 children6–14 years are out of school. Alternative learning centers serve deprived (e.g., street, migrating) children(National Portal Content Management Team 2009).7 The DISE also collects data on grants to schools, incentives per 100 enrolled pupils, and pupils, includingenrollment, exam results, and grade-specific promotion, repetition, and drop-out.
N. Halim et al.
123
Author's personal copy

Since 1951, the ECI has produced public reports on the results of all elections to the
lower house of the national Parliament and SLAs. The reports include data for all
electoral constituencies on counts of all electors and voters, overall and by gender, as
well as attributes of the contestants (gender, political party, performance in elections,
including absolute and relative number of votes won for seats indicated as reserved or
not-reserved for SC/ST). To link and aggregate constituency-level data from the ECI to
districts, we followed published guidelines listing all constituencies by their assigned
district based on delimitation rules set in 1985, which held for the election years relevant
for this study (2000–2004) (Bose and Singh Bose and Singh 1988a, b, c, Bose and Singh
2000a, b).
For each data source, we created a dataset of the districts comprising India in 1981,
the census year reflecting the district boundaries that existed when the 1985 delimitation
rules linked electoral constituencies to districts. We grouped districts into three sets: (1)
those with unchanged boundaries for the period between 1981 and 2008, (2) those that
were cleanly partitioned during the period, and (3) adjacent districts with more complex
boundary changes. Of the 624 districts in 2008, 171 (27 %) had unchanged boundaries,
165 (24 %) were cleanly partitioned, and 288 (46 %) were adjacent districts that
underwent complex boundary changes. Following procedures for weighting from Kumar
and Somanathan (2009), we created a DISE dataset of matched districts or district
composites that were unchanged since 1981. These procedures yielded a dataset of 328
districts and district composites (hereafter called district composites), accounting for all
624 districts of India in 2008. Of the 328 district composites, two with missing data in
the DISE were dropped. We merged the remaining 326 district composites with ECI data
for elections in the closest year (2000–2004) preceding the 2007/8 academic year, and
316 of these district composites matched. The ECI’s exclusion of UTs accounted for 7 of
the 10 non-matching district composites. The three other non-matching district com-
posites also were absent from the ECI. These 316 district composites have 1–104
electoral constituencies.
4.2 Outcomes
Twenty interval- or ratio-level outcomes captured district-level investments to (1) school
amenities and (2) teacher quantity and quality. Unless stated, all measures refer to pri-
mary-only schools, which do not have upper-primary and secondary sections and represent
75 % of schools with a primary section in the average district. Using indicators in each
domain (noted in Table 1), we conducted principal components analysis (PCA) to generate
scores from the first component to reflect the overall level of investment in each domain.
The Chronbach’s alphas and Kaiser–Meyer–Olkin (KMO) measures of sampling adequacy
for each of these scores were, respectively: 0.74 and 0.78 for school amenities and 0.21 and
0.52 for teacher quantity and quality.
In the average district in 2007/8 (Table 1), 11 % of government schools were estab-
lished since 2003, suggesting rapid expansion in school infrastructures. Most schools
(94 %) had a school building, two-thirds had a pucca or cement building (reflecting higher-
quality construction), and two-thirds had classrooms that were in good condition or not
needing repair. Most (84 %) schools had a drinking fountain, 59 % had common toilets
and 42 % had girls’ toilets, 31 % had a kitchen, and 31 % had a pre-primary program for
children 3–5 years. The prevalence of schools with each of these amenities varied across
districts, from nearly 0 % to nearly 100 % for most amenities. The ratio of classrooms per
Women in Politics and Schooling Investments
123
Author's personal copy
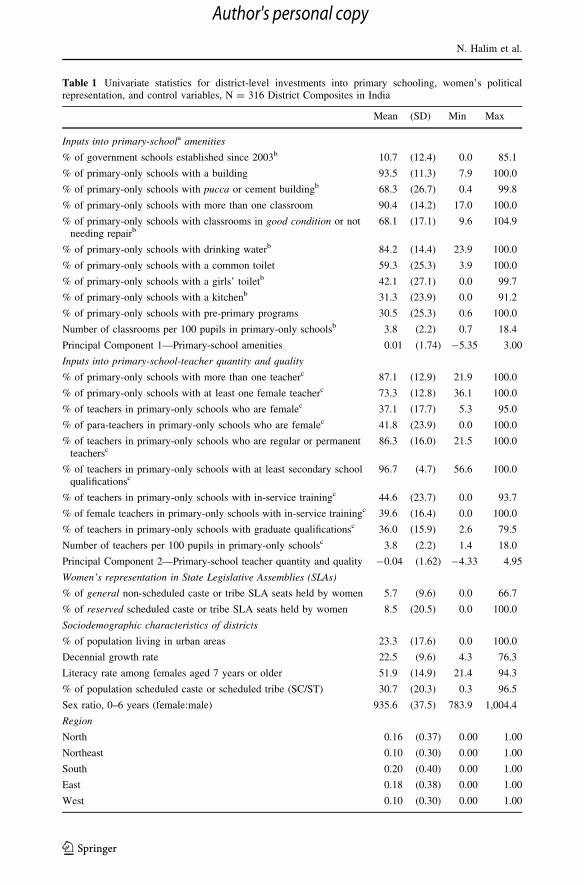
Table 1 Univariate statistics for district-level investments into primary schooling, women’s politicalrepresentation, and control variables, N = 316 District Composites in India
Mean (SD) Min Max
Inputs into primary-schoola amenities
% of government schools established since 2003b 10.7 (12.4) 0.0 85.1
% of primary-only schools with a building 93.5 (11.3) 7.9 100.0
% of primary-only schools with pucca or cement buildingb 68.3 (26.7) 0.4 99.8
% of primary-only schools with more than one classroom 90.4 (14.2) 17.0 100.0
% of primary-only schools with classrooms in good condition or notneeding repairb
68.1 (17.1) 9.6 104.9
% of primary-only schools with drinking waterb 84.2 (14.4) 23.9 100.0
% of primary-only schools with a common toilet 59.3 (25.3) 3.9 100.0
% of primary-only schools with a girls’ toiletb 42.1 (27.1) 0.0 99.7
% of primary-only schools with a kitchenb 31.3 (23.9) 0.0 91.2
% of primary-only schools with pre-primary programs 30.5 (25.3) 0.6 100.0
Number of classrooms per 100 pupils in primary-only schoolsb 3.8 (2.2) 0.7 18.4
Principal Component 1—Primary-school amenities 0.01 (1.74) -5.35 3.00
Inputs into primary-school-teacher quantity and quality
% of primary-only schools with more than one teacherc 87.1 (12.9) 21.9 100.0
% of primary-only schools with at least one female teacherc 73.3 (12.8) 36.1 100.0
% of teachers in primary-only schools who are femalec 37.1 (17.7) 5.3 95.0
% of para-teachers in primary-only schools who are femalec 41.8 (23.9) 0.0 100.0
% of teachers in primary-only schools who are regular or permanentteachersc
86.3 (16.0) 21.5 100.0
% of teachers in primary-only schools with at least secondary schoolqualificationsc
96.7 (4.7) 56.6 100.0
% of teachers in primary-only schools with in-service trainingc 44.6 (23.7) 0.0 93.7
% of female teachers in primary-only schools with in-service trainingc 39.6 (16.4) 0.0 100.0
% of teachers in primary-only schools with graduate qualificationsc 36.0 (15.9) 2.6 79.5
Number of teachers per 100 pupils in primary-only schoolsc 3.8 (2.2) 1.4 18.0
Principal Component 2—Primary-school teacher quantity and quality -0.04 (1.62) -4.33 4.95
Women’s representation in State Legislative Assemblies (SLAs)
% of general non-scheduled caste or tribe SLA seats held by women 5.7 (9.6) 0.0 66.7
% of reserved scheduled caste or tribe SLA seats held by women 8.5 (20.5) 0.0 100.0
Sociodemographic characteristics of districts
% of population living in urban areas 23.3 (17.6) 0.0 100.0
Decennial growth rate 22.5 (9.6) 4.3 76.3
Literacy rate among females aged 7 years or older 51.9 (14.9) 21.4 94.3
% of population scheduled caste or scheduled tribe (SC/ST) 30.7 (20.3) 0.3 96.5
Sex ratio, 0–6 years (female:male) 935.6 (37.5) 783.9 1,004.4
Region
North 0.16 (0.37) 0.00 1.00
Northeast 0.10 (0.30) 0.00 1.00
South 0.20 (0.40) 0.00 1.00
East 0.18 (0.38) 0.00 1.00
West 0.10 (0.30) 0.00 1.00
N. Halim et al.
123
Author's personal copy

100 pupils in the average district was 3.8 (about 26 pupils per classroom) but ranged from
0.7 to 18.4 across districts.
Average investments in the quantity and quality of teachers in primary-only schools
were high but also varied across districts (Table 1). In the average district, most schools
had more than one teacher (87 %) and almost three-fourths (73 %) had at least one woman
teacher. More than one-third of all teachers (37 %) and para-teachers8 (42 %) were
women. Most teachers (86 %) were regular or permanent employees and had at least
secondary-school training (97 %), but fewer teachers had in-service training (45 %) or
graduate qualifications (36 %).
4.3 Explanatory Variables
Four district-level variables captured legislators’ intersectional gender and caste identities.
These variables measured (1) the percentage of general SLA seats (not reserved for SC/ST)
in the district held by women, (2) this percentage squared, (3) the percentage of SLA seats
reserved for SC/ST held by women9 and (4) this percentage squared. Women legislators
holding general SLA seats are likely to belong to non-SC/ST castes, and women legislators
holding SLA seats reserved for SC/ST are members of SC/ST castes.10
Inclusion of the quadratic terms permitted non-linear relationships between women’s
political representation in specified seats and various investments in primary schooling
without specifying threshold levels for the relationship between women’s representation
8 Para-teachers are full-time employees but need not be professionally qualified as teachers and are paid at alower rate than full-time teachers.9 In India, scheduled caste is further subdivided into many sub groups. Since the ECI collects data onmembership in the scheduled caste, as opposed to a specific denomination within scheduled caste, we treatall scheduled caste women as one.10 According to the Handbook for Candidates, an online publication by the Election Commission of India(ECI), both general and SC/ST women are eligible to compete from a general seat. The Handbook forCandidates says, ‘‘if you are a candidate for a general seat, that is to say, for a seat not reserved for theScheduled Castes or Scheduled Tribes as mentioned in the preceding sub-clauses, then you must be anelector for any parliamentary constituency (vide section 4 of the Representation of the People Act, 1951)’’(page 10). However, ECI reports on election results do not provide information on caste membership ofthose who have won general SLA seats (reports provide data on gender, political party, and performance inelections, including absolute and relative number of votes won for seats indicated as reserved or not-reserved for SC/ST). Therefore, in the current analysis, we assumed that women who won general seats inthe SLAs during the years for which we have data in this analysis were not SC/ST women. Our assumption
Table 1 continued
Mean (SD) Min Max
Central 0.27 (0.44) 0.00 1.00
a For most variables, as indicated, data pertain to primary-only schools, that is, schools that do not includeupper primary and secondary sections 75 % of schools that include a primary section are primary-onlyschoolsb Indicators included in Principal Component 1c Indicators included in Principal Component 2d # Districts report more classrooms in good condition than the total number of classrooms
Women in Politics and Schooling Investments
123
Author's personal copy

and investments in schools (Bratton and Ray 2002). We derived four measures from SLA
elections that had occurred in 2000–2004, a mean of 5 years before the 2007–2008 aca-
demic year for which school measures were taken, assuming that 5 years is a suitable time
for newly elected (or reelected) politicians to make policy decisions and for these decisions
to manifest in schools (Bratton and Ray 2002). During these years, women’s political
representation in India’s SLAs was low, with 6 % of general seats and 9 % of reserved
seats held by women (Table 1). These percentages, however, varied across the districts,
from zero to two-thirds of general seats and from zero to all reserved seats.
4.4 Control Variables
We included five control variables from the 2001 Census projected in the DISE dataset to
2007/8 to capture district-level attributes that may confound the relationship between
women’s political representation and investments in primary schooling. These were the
percentage of the population that was urban to capture the overall level of industrialization
(Meyer et al. 1979), decennial population growth rate to capture the rate of change in
population size (Clots-Figueras 2011; McLendon et al. 2005; Pal and Ghosh 2008), rate of
literacy for women 7 years and older to capture pre-existing levels of education (Dye 1966,
1969), percentage of the population that was from SC/STs (Pal and Ghosh, 2008), and ratio
of girls to boys 0–6 years in the population to capture gender discrimination (Echavarri and
Ezcurra 2010). In sensitivity analyses (see ‘‘Analysis’’), we added a sixth control variable
of region to adjust for fixed, unmeasured regional attributes (like religious composition,
culture, language, or economic infrastructure) that may be related to the explanatory
variables and outcomes (Meyer et al. 1979; Renzulli and Roscigno 2005; Roy et al. 2000).
In the average district, 23 % of the population lived in urban areas, the decennial growth
rate was 23, 52 % of women 7 years or older were literate, one-third (31 %) of the
population was SC/ST, and the sex ratio of girls to boys aged 0–6 years was below parity
(936 girls per 1,000 boys). Districts varied on all of these attributes (Table 1). Districts
were distributed across regions as follows: 16 % in the North, 10 % in the Northeast, 20 %
in the South, 18 % in the East, 10 % in the West, and 27 % in the Central Region.
4.5 Analysis
We conducted univariate explorations to assess the completeness and distributions of all
variables (Table 1). We estimated Pearson pairwise correlations to explore unadjusted
associations of the explanatory variables and outcomes as well as potential collinearities
among the explanatory variables and covariates (Tables 2 and 3). We used multivariate
ordinary least squares (OLS) regression with spatially-corrected standard errors to estimate
Eqs. 1 and 2 below, measuring the relationship of women’s representation in general and
reserved SLA seats with each of the 22 school investment indicators described in the
preceding section, pertaining to school amenities and teacher quantity and quality
(Table 4). We analyzed each outcome separately as well as in two overall measures. Let i
denote district, Yi a vector of continuous variables reflecting district-level inputs to primary
Footnote 10 continuedis likely to reflect the reality given that, for general SLA seats, non SC/ST candidates are likely to secureparty nominations and, ultimately, win elections since the constituencies of the general SLA seats arepredominantly non SC/ST. To the best of our knowledge, all prior research on general and SC/ST womenlegislators made the same assumption (Clots-Figueras 2011; Bhalotraa et al. 2014).
N. Halim et al.
123
Author's personal copy

schooling, GWi the percentage of general SLA seats in the district held by women and
GWi2 this percentage squared, RWi the percentage of reserved SLA seats in the district held
by women and RWi2 this percentage squared,11,12 and Xi a vector of district-level controls.
We estimated two models for each outcome. The first model included only the controls,
and the second model also included the measures for women’s representation in general
and reserved SLA seats, as follows:
Yi ¼ bo þ b1�5Xi þ ei ð1Þ
Yi ¼ b0 þ b1�5Xi þ b6Wi þ b7GW2i þ bRWi þ b9RW2
i þ ei ð2Þ
We used the R2 values from the restricted model (1) and full model (2) to compute the
percentage of the explained variance in each outcome accounted for by measures of women’s
political representation. To explore whether SC/ST and non-SC/ST women’s political rep-
resentation operated differently in regions characterized broadly by less (North) and more
(South) activism and social reform with respect to women and disadvantaged groups, we re-
estimated the models stratifying the sample into Northern and Southern districts.
In all models, we used spatially-corrected standard errors to account for any cross-
sectional data dependencies among clustered districts. All districts in India likely have
some inter-dependence because all operate within the national political commitment to
compulsory primary schooling; yet, measures of interest may co-vary more closely across
adjacent than non-adjacent districts because (1) districts in the same state are subject to the
same state-legislative processes and outcomes, (2) residents of adjacent districts may be
part of shared social units that traverse state or other political boundaries, and (3) districts
that had landlord-based systems to collect land revenue under colonialism now invest less
in health and education than districts that had cultivator-based systems (Anselin 1988;
Banerjee and Iyer 2005; Banerjee et al. 2007). With these possibilities in mind, we created
as large a sample of districts as possible to mitigate the fact that spatially dependent
observations contain less information than do independent observations (Anselin 1988).
We also used the Cluster Covariance Estimator (CCE) to estimate spatially-corrected OLS
models following Eqs. (1) and (2) (Bester et al. 2011; Conley 1996, 1999). The CCE allays
the dual threats of autocorrelation and heteroskedasticity in cross-sectional data (Bester
et al. 2011; Conley 1996, 1999) and provides more robust spatially-corrected standard
errors than would standard OLS techniques or alternative methods for spatial analysis
(Anselin 1988; Bester et al. 2011; Loftin and Ward 1983). The CCE approach tracks the
source of dependence across observations to the cluster to which subsets of observations
mainly belong (Bester et al. 2011), assuming that clusters are approximately independent
(e.g., there are relatively few clusters that, on average, are normally distributed by con-
taining many observations). We treated the following six regions as clusters: North (50
districts), Northeast (31), South (63), East (56), West (32), and Central (84). With rela-
tively few regions and a large number of districts per region (52.7, on average), our test
statistics using CCE are robust to spatial dependence. We calculated t-statistics with the
STATA 11.0 cluster command (Bester et al. 2011).
Our discussion stresses associations that are significant at p value B 0.05 and mar-
ginally significant results (p B 0.10).
11 Replacing the squared term with a variable for whether thresholds were reached (12.5, 16.0 %) forwomen’s district-level representation in SLA seats yielded similar results (available on request).12 Pairwise correlations among the explanatory variables were -0.03 to 0.93. Estimated variance inflationfactors for these variables were 4.42–7.56, mitigating concerns of collinearity.
Women in Politics and Schooling Investments
123
Author's personal copy
Multicollinearity in the control variables was not a concern, as the highest correlation
among these variables (0.51) was that between the percentage of the population urban and
the rate of literacy among women (Tables 2 and 3).
Our dependent variables represent a period of time 5 years after the estimates we use for
explanatory variables. While establishing such appropriate temporality between the
explanatory variables and outcomes and controlling for pre-existing confounders of this
relationship did not permit us to make claims of causality, these steps did permit us to
present the direction and magnitude of association with more confidence.
Finally, we conducted sensitivity analyses to assess the robustness of our findings
(available upon request). First, we added design variables for region to account for fixed,
unobserved regional attributes that may be associated with women’s political representa-
tion and inputs to primary schooling. These controls did not markedly alter either the
patterns of association or the inferences for our explanatory variables, so the more par-
simonious models are presented. Second, we conducted outlier analyses and re-estimated
all of the full multivariate regression models excluding districts with high influence on the
regression coefficients (sample sizes of 290–304). In general, the magnitudes of and
inferences for the coefficients for women’s political representation were robust to the
removal of outlying districts.
After estimating all multivariate models, we used those to generate predicted scores for
the two principle components for school amenities and teacher quality and quantity. We
generated these scores setting all covariates to their means and varying the values of
women’s political representation in general seats and in reserved seats between 0 and
35 %, within which most of the district observations fall. These predictions illustrate the
patterns of association of women’s representation in general and reserved SLA seats with
redistributive investments in primary schooling, broadly speaking. We conducted all
analyses using STATA 11.0 and SAS 9.2 (SAS Institute, Cary, NC, USA).
5 Results
5.1 Bivariate Results
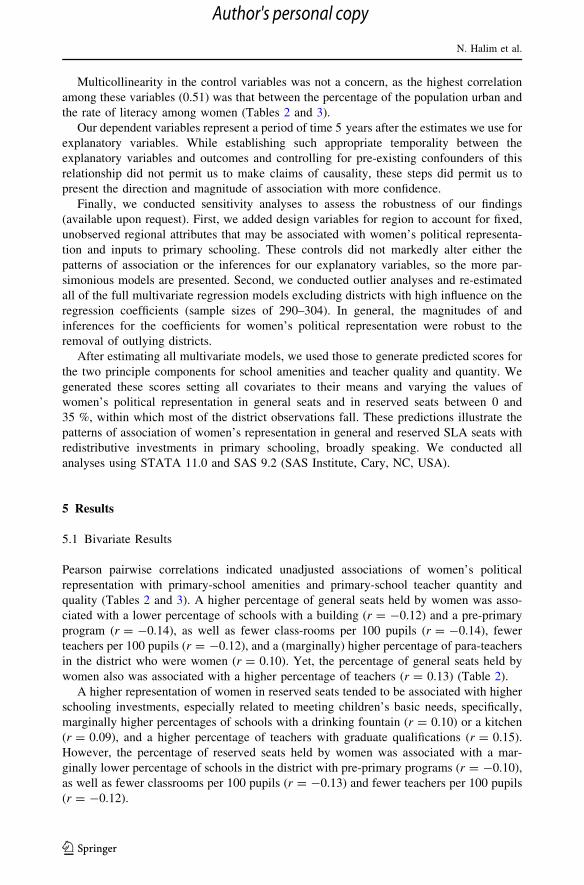
Pearson pairwise correlations indicated unadjusted associations of women’s political
representation with primary-school amenities and primary-school teacher quantity and
quality (Tables 2 and 3). A higher percentage of general seats held by women was asso-
ciated with a lower percentage of schools with a building (r = -0.12) and a pre-primary
program (r = -0.14), as well as fewer class-rooms per 100 pupils (r = -0.14), fewer
teachers per 100 pupils (r = -0.12), and a (marginally) higher percentage of para-teachers
in the district who were women (r = 0.10). Yet, the percentage of general seats held by
women also was associated with a higher percentage of teachers (r = 0.13) (Table 2).
A higher representation of women in reserved seats tended to be associated with higher
schooling investments, especially related to meeting children’s basic needs, specifically,
marginally higher percentages of schools with a drinking fountain (r = 0.10) or a kitchen
(r = 0.09), and a higher percentage of teachers with graduate qualifications (r = 0.15).
However, the percentage of reserved seats held by women was associated with a mar-
ginally lower percentage of schools in the district with pre-primary programs (r = -0.10),
as well as fewer classrooms per 100 pupils (r = -0.13) and fewer teachers per 100 pupils
(r = -0.12).
N. Halim et al.
123
Author's personal copy

Ta
ble
2P
ears
on
corr
elat
ion
coef
fici
ents
for
dis
tric
t-le
vel
mea
sure
so
fin
ves
tmen
tsin
pri
mar
ysc
ho
oli
ng
,w
om
en’s
po
liti
cal
repre
sen
tati
on
,an
dco
ntr
ol
var
iab
les,
N=
31
6D
istr
ict
Co
mp
osi
tes
inIn
dia
Wn
’sp
ol.
rep
.P
rim
ary
-sch
ool
amen
itie
saS
oci
odem
og
rap
hic
con
tro
ls
(1)
(2)
(3)
(4)
(5)
(6)
(7)
(8)
(9)
(10
)(1
1)
(12
)(1
3)
(14
)(1
5)
(16
)(1
7)
(18
)(1
9)
(1)
1.0
0
(2)
-0.0
31.0
0
(3)
-0.0
6-
0.0
41.0
0
(4)
-0.1
2*
-0.0
4-
0.3
5**
1.0
0
(5)
0.0
0-
0.0
1-
0.2
3**
0.3
2**
1.0
0
(6)
-0.0
40.0
1-
0.3
1**
0.0
80.4
1**
1.0
0
(7)
-0.0
40.0
1-
0.2
3**
0.1
5**
0.6
3**
0.2
7**
1.0
0
(8)
-0.0
70.1
0�
-0.4
3**
0.2
5**
0.3
9**
0.4
2**
0.4
6**
1.0
0
(9)
0.0
0-
0.0
2-
0.4
4**
0.3
0**
0.3
3**
0.3
7**
0.4
1**
0.5
9**
1.0
0
(10)
-0.0
40.0
4-
0.3
3**
0.3
1**
0.5
8**
0.3
7**
0.5
4**
0.6
0**
0.5
9**
1.0
0
(11)
-0.0
60.0
9�
-0.2
5**
0.2
2**
0.2
0**
0.1
8**
0.1
9**
0.3
4**
0.3
0**
0.2
7**
1.0
0
(12)
-0.1
4*
-0.1
0�
0.0
70.3
0**
-0.0
9-
0.1
1�
-0.1
0�
-0.1
4*
0.1
7**
-0.0
5-
0.0
51.0
0
(13)
-0.1
4*
-0.1
3*
-0.0
50.3
4**
-0.2
3**
-0.0
9�
-0.2
2**
-0.1
1�
-0.0
6-
0.1
5**
-0.2
2**
0.3
5**
1.0
0
(14)
-0.0
20.0
7-
0.5
2**
0.3
2**
0.7
6**
0.4
7**
0.7
6**
0.7
7**
0.6
2**
0.8
2**
0.4
8**
-0.1
5**
-0.3
2**
1.0
0
(15)
0.0
30.0
3-
0.1
5**
0.1
8**
0.1
4*
0.0
90.3
5**
0.2
0**
0.2
2**
0.2
9**
0.0
30.1
3�
0.0
00.2
81.0
0
(16)
-0.0
6-
0.0
70.2
0**
-0.0
6-
0.0
20.1
6**
-0.2
0**
-0.1
9**
-0.0
4-
0.0
5-
0.0
80.3
5**
-0.0
2-
0.1
60.0
01.0
0
Women in Politics and Schooling Investments
123
Author's personal copy

Ta
ble
2co
nti
nued
Wn
’sp
ol.
rep
.P
rim
ary
-sch
ool
amen
itie
saS
oci
odem
og
rap
hic
con
tro
ls
(1)
(2)
(3)
(4)
(5)
(6)
(7)
(8)
(9)
(10
)(1
1)
(12
)(1
3)
(14
)(1
5)
(16
)(1
7)
(18
)(1
9)
(17)
0.0
2-
0.0
6-
0.4
2**
0.3
4**
-0.0
70.0
50.0
50.1
7**
0.2
7**
0.1
2*
-0.0
60.1
7**
0.3
5**
0.1
00.5
1**
-0.2
7**
1.0
0
(18)
-0.1
6**
-0.0
8-
0.0
40.1
0�
-0.4
0**
-0.0
7-
0.4
5**
-0.2
7**
-0.1
9**
-0.3
2**
0.0
70.2
4**
0.3
7**
-0.3
9-
0.2
7**
0.2
9**
-0.0
61.0
0
(19)
-0.1
1*
0.0
00.1
0�
-0.1
6**
-0.4
6**
-0.2
6**
-0.3
9**
-0.2
5**
-0.1
7**
-0.3
9**
0.1
2*
0.0
40.1
0�
-0.3
9-
0.1
8**
-0.1
0�
-0.0
90.3
2**
1.0
0
(1)
Wo
men
’sre
pre
sen
tati
on
ing
ener
al(n
on
-sch
edu
led
cast
eo
rtr
ibe)
SL
Ase
ats
(2)
wo
men
’sre
pre
sen
tati
on
inre
serv
ed(s
ched
ule
d-c
aste
or
trib
e)S
LA
seat
s(3
)%
of
go
ver
nm
ent
sch
oo
lses
tab
lish
edsi
nce
20
03
,(4
)%
of
pri
mar
y-o
nly
sch
oo
lsw
ith
ab
uil
din
g,(5
)%
of
pri
mar
y-o
nly
sch
ools
wit
hp
ucc
ao
rce
men
tb
uil
din
g,(6
)%
of
pri
mar
y-
only
schools
wit
hm
ore
than
one
clas
sroom
,(7
)%
of
pri
mar
y-o
nly
schools
wit
hcl
assr
oom
sin
go
od
con
dit
ion
or
no
tn
eed
ing
repai
r,(8
)%
of
pri
mar
y-o
nly
sch
ools
wit
hd
rin
kin
gw
ater
,(9
)%
of
pri
mar
y-o
nly
sch
oo
lsw
ith
aco
mm
on
toil
et,(1
0)
%o
fp
rim
ary
-on
lysc
ho
ols
wit
ha
gir
ls’
toil
et,(1
1)
%o
fp
rim
ary
-on
lysc
ho
ols
wit
ha
kit
chen
,(1
2)
%o
fp
rim
ary
-only
sch
ools
wit
hp
re-p
rim
ary
pro
gra
ms,
(13
)N
um
ber
of
clas
sro
om
sp
er1
00
pu
pil
sin
pri
mar
y-o
nly
sch
oo
ls,(1
4)
Pri
nci
pal
Co
mpo
nen
t1
,(1
5)
%o
fp
op
ula
tio
nli
vin
gin
urb
anar
eas,
(16)
Dec
ennia
lgro
wth
rate
,(1
7)
Lit
erac
yra
team
ong
fem
ales
aged
7yea
rsor
old
er,
(18)
%o
fpopula
tion
sched
ule
dca
ste
or
sched
ule
dtr
ibe
(SC
/ST
),(1
9)
Sex
rati
o,
0–6
yea
rs(f
emal
e:m
ale)
�p
B.1
0;
*p
B.0
5;
**
pB
.01
;*
**
pB
.00
1a
See
foo
no
teb
of
Tab
le1
for
the
sub
set
of
ind
icat
ors
incl
ud
edin
Pri
nci
pal
Co
mpo
nen
t1
N. Halim et al.
123
Author's personal copy

Ta
ble
3P
ears
on
corr
elat
ion
coef
fici
ents
for
dis
tric
t-le
vel
mea
sure
so
fin
ves
tmen
tsin
pri
mar
ysc
ho
oli
ng
,w
om
en’s
po
liti
cal
rep
rese
nta
tion
,an
dco
ntr
ol
var
iab
les,
N=
31
6d
istr
ict
com
po
site
sin
Ind
ia
Wm
’spol.
rep.
Pri
mar
y-s
chool
teac
her
quan
tity
and
qual
ity
aS
oci
odem
og
rap
hic
con
tro
ls
(1)
(2)
(3)
(4)
(5)
(6)
(7)
(8)
(9)
(10
)(1
1)
(12
)(1
3)
(14
)(1
5)
(16
)(1
7)
(18
)
(1)
1.0
0
(2)
-0.0
31.0
0
(3)
0.0
70.0
31.0
0
(4)
-0.0
20.0
30.1
5**
1.0
0
(5)
0.0
4-
0.0
10.2
4**
0.6
1**
1.0
0
(6)
0.1
0�
0.0
30.4
0**
0.5
0**
0.3
6**
1.0
0
(7)
0.1
3*
0.0
40.0
60.0
50.5
9**
-0.0
21.0
0
(8)
-0.0
30.0
80.0
6-
0.0
4-
0.0
3-
0.1
5**
-0.0
91.0
0
(9)
0.0
80.0
1-
0.0
5-
0.1
1�
0.1
5**
-0.0
30.1
7**
0.1
3*
1.0
0
(10)
-0.0
40.0
10.3
1**
0.7
3**
0.7
6**
0.4
9**
0.1
3*
0.0
30.0
81.0
0
(11)
0.0
30.1
5**
-0.0
60.0
50.0
9�
0.0
00.1
3*
0.3
7**
0.1
8**
0.0
91.0
0
(12)
-0.1
2*
-0.1
2*
-0.0
60.1
2*
0.2
5**
0.0
80.0
9-
0.3
1**
-0.1
1�
0.0
4-
0.2
5**
1.0
0
(13)
0.0
40.0
20.3
8**
0.7
0**
0.9
3**
0.5
7**
0.5
2**
-0.0
80.1
6**
0.7
7**
0.0
80.2
6**
1.0
0
(14)
0.0
30.0
30.1
6**
0.3
2**
0.5
5**
0.2
4**
0.2
3**
0.0
1-
0.0
80.4
9**
0.2
1**
-0.0
30.5
0**
1.0
0
(15)
-0.0
6-
0.0
7-
0.0
90.0
0-
0.2
4**
-0.0
5-
0.1
1*
-0.2
8**
-0.3
4**
-0.2
4**
-0.0
90.0
1-
0.1
8**
0.0
01.0
0
(16)
0.0
2-
0.0
60.2
4**
0.3
0**
0.6
6**
0.2
9**
0.4
3**
-0.1
2*
0.1
0�
0.4
9**
-0.0
40.3
0**
0.6
3**
0.5
1**
-0.2
7**
1.0
0
Women in Politics and Schooling Investments
123
Author's personal copy

Tab
le3
con
tin
ued
Wm
’spol.
rep.
Pri
mar
y-s
chool
teac
her
quan
tity
and
qual
ity
aS
oci
od
emo
gra
ph
icco
ntr
ols
(1)
(2)
(3)
(4)
(5)
(6)
(7)
(8)
(9)
(10
)(1
1)
(12
)(1
3)
(14
)(1
5)
(16
)(1
7)
(18
)
(17)
-0.1
6**
-0.0
8-
0.2
4**
-0.2
0**
-0.2
0**
-0.1
1*
-0.0
1-
0.4
4**
-0.0
6-
0.2
1**
-0.2
8**
0.3
5**
-0.2
0**
-0.2
7**
0.2
9**
-0.0
61.0
0
(18)
-0.1
1*
0.0
0-
0.0
7-
0.0
5-
0.0
5-
0.0
6-
0.0
1-
0.0
20.0
3-
0.1
2*
-0.2
2**
0.1
8**
-0.0
3-
0.1
8**
-0.1
0�
-0.0
90.3
2**
1.0
0
(1)
Wo
men
’sre
pre
sen
tati
on
ing
ener
alo
rn
on
-sch
edu
led
cast
eo
rtr
ibe
SL
Ase
ats
(2)
wo
men
’sre
pre
sen
tati
on
inre
serv
edo
rsc
hed
ule
d-c
aste
or
trib
ese
ats
(3)
%o
fp
rim
ary
-o
nly
sch
ools
wit
hm
ore
than
on
ete
ach
er,(4
)%
of
pri
mar
y-o
nly
sch
oo
lsw
ith
atle
ast
on
efe
mal
ete
ach
er(5
)%
of
teac
her
sin
pri
mar
y-o
nly
sch
ools
wh
oar
efe
mal
e,(6
)%
of
par
a-te
ach
ers
inp
rim
ary
-on
lysc
ho
ols
wh
oar
efe
mal
e,(7
)%
of
teac
her
sin
pri
mar
y-o
nly
sch
ools
wh
oar
ere
gu
lar
or
per
man
ent
teac
her
s,(8
)%
of
teac
her
sin
pri
mar
y-o
nly
sch
ools
wit
hat
leas
tse
con
dar
ysc
ho
ol
qu
alifi
cati
on
s,(9
)%
of
teac
her
sin
pri
mar
y-o
nly
sch
oo
lsw
ith
in-s
erv
ice
trai
nin
g,
(10
)%
of
fem
ale
teac
her
sin
pri
mar
y-o
nly
sch
ools
wit
hin
-ser
vic
etr
ain
ing
,(1
1)
%o
fte
ach
ers
inp
rim
ary
-only
sch
ools
wit
hg
rad
uat
eq
ual
ifica
tio
ns,
(12
)N
um
ber
of
teac
her
sp
er1
00
pu
pil
sin
pri
mar
y-o
nly
sch
ools
,(1
3)
Pri
nci
pal
Com
ponen
t2,(1
4)
%o
fpopula
tion
livin
gin
urb
anar
eas,
(15)
Dec
ennia
lgro
wth
rate
,(1
6)
Lit
erac
yra
team
ong
fem
ales
aged
7yea
rsor
old
er,(1
7)
%o
fp
op
ula
tio
nsc
hed
ule
dca
ste/
sched
ule
dtr
ibe
(SC
/ST
),(1
8)
Sex
rati
o,
0–6
yea
rs(f
emal
e:m
ale)
�p
B0
.10;
*p
B.0
5;
**
pB
.01
;*
**
pB
.00
1a
See
foo
note
co
fT
able
1fo
rth
esu
bse
to
fin
dic
ato
rsin
clu
ded
inP
rin
cipal
Co
mpo
nen
t2
N. Halim et al.
123
Author's personal copy

5.2 Multivariate Results for Women’s Political Representation
Table 4 presents multivariate results. Each row represents a regression model that includes all
explanatory variables and district-level controls. The first two sets of columns show the
estimated coefficients (bs) and standard errors (SE) from these full models for the four terms
capturing women’s political representation. The third column shows the R2 values for these
models (estimated coefficients for the control variables are available upon request). For
comparison, the fourth column shows the R2 values for the ‘‘restricted’’ models that included
only the control variables (estimated coefficients for these models also are available upon
request). The last column provides the percentages of the explained variances in the outcomes
accounted for by the four measures of women’s political representation.
The percentage of general seats held by women was negatively associated with several
measures of school amenities and teacher quantity and quality. An increase of one per-
centage point in the representation of women in general seats was associated with lower
percentages of schools in the district with a pucca or cement building, a pre-primary
program, and at least one woman teacher, as well as a lower percentage of women teachers
in the district with in-service training. For three of these investments (schools with a pre-
primary program, schools with at least one woman teacher, and women teachers with in-
service training), the negative associations diminished at higher levels of women’s rep-
resentation in general seats, as reflected by the significant, positive quadratic terms
(Table 4). For several other investments in primary schooling, the negative coefficients for
the linear terms and the positive coefficients for the quadratic terms for women’s repre-
sentation in general seats were jointly significant, as reflected by the p values for F-tests of
joint significance in Table 4. These investments included the percentage of schools with:
pucca or cement buildings, with classrooms in good condition, and with pre-primary
programs; the PC score for primary-school amenities; and the number of teachers per 100
pupils. Thus, for all these investments, the estimated relationship with women’s repre-
sentation in general seats was, again, a diminishing negative one.
Complementing the above patterns, several inputs to primary schooling were at least
marginally (p B 0.10) negatively associated with women’s representation in general SLA
seats. These included the percentage of primary-only schools with a building and a girls’
toilet and the percentage of teachers with at least secondary-school qualifications. Only the
percentage of teachers in primary-only schools who were regular or permanent teachers
had a marginally positive joint association with women’s representation in general seats.
Thus, we find that women’s representation in general SLA seats had significant asso-
ciations at p B 0.10 with 11 of 22 measures of primary-school amenities and teacher
quantity/quality; out of these 11 associations, 10 were negative, with negative relationships
being somewhat smaller at higher levels of women’s representation in these seats.
The percentage of women in SLA seats reserved for scheduled caste and scheduled tribe
representatives was positively associated with several measures of school amenities and
teacher quantity and quality (Table 4). An increase in the percentage of reserved seats held
by women was associated with higher percentages of schools having a drinking fountain, a
higher percentage of para-teachers who were women, and a higher percentage of women
teachers with in-service training. All of these positive associations tended to be smaller at
higher levels of women’s representation in reserved seats, as reflected by the negative
coefficients for the quadratic terms for women’s representation in these seats (Table 4).
For nine other investments in primary schooling, the coefficients for women’s repre-
sentation in reserved seats were at least marginally (jointly or independently) significant,
showing positive (linear term) but in most cases diminishing (quadratic term) relationships,
Women in Politics and Schooling Investments
123
Author's personal copy

Ta
ble
4E
stim
ates
for
adju
sted
spat
ial
regre
ssio
ns
of
dis
tric
t-le
vel
inves
tmen
tsin
topri
mar
ysc
hooli
ng
on
wom
en’s
poli
tica
lre
pre
senta
tion
(WP
R),
N=
31
6d
istr
ict
com
po
site
sin
Ind
ia
%gen
eral
(no
n-S
C/S
T)
SL
Ase
ats
hel
db
yw
om
en%
rese
rved
(SC
/ST
)S
LA
seat
sh
eld
by
wo
men
RF2
(full
)3R
R2
(res
tric
t)4
%o
fR
F2
acco
un
ted
for
by
WP
RL
inea
rQ
uad
rati
cL
inea
rQ
uad
rati
c
b(S
E)
pb
(SE
)p
p[
Fb
(SE
)p
b(S
E)
pp[
F
Inputs
into
pri
mary
-sch
ool
am
enit
ies
%of
gover
nm
ent
schools
esta
bli
shed
since
2003
-0.0
08
(0.1
87)
-0.0
02
(0.0
05)
-0.1
02
(0.0
57)
0.0
01
(0.0
01)
�0.2
10.2
04.2
5
%of
pri
mar
y-o
nly
schools
wit
ha
buil
din
g-
0.2
51
(0.1
26)
�0.0
03
(0.0
03)
0.0
17
(0.0
44)
-0.0
00
(0.0
01)
0.1
80.1
79.3
3
%of
pri
mar
y-o
nly
schools
wit
hpucc
aor
cem
ent
buil
din
g
-0.7
11
(0.2
60)
*0.0
14
(0.0
07)
**
-0.2
16
(0.2
33)
0.0
02
(0.0
02)
0.3
20.3
06.3
8
%of
pri
mar
y-o
nly
schools
wit
hm
ore
than
one
clas
sroom
-0.1
30
(0.1
15)
0.0
01
(0.0
02)
-0.0
98
(0.0
87)
0.0
01
(0.0
01)
0.1
00.0
98.6
0
%of
pri
mar
y-o
nly
schools
wit
hcl
assr
oom
sin
good
condit
ion
or
not
nee
din
gre
pai
r
-0.4
12
(0.2
76)
0.0
05
(0.0
07)
**
-0.0
70
(0.0
87)
0.0
00
(0.0
01)
0.3
90.3
75.4
6
%of
pri
mar
y-o
nly
schools
wit
hdri
nkin
gw
ater
-0.2
89
(0.1
82)
0.0
03
(0.0
04)
0.2
29
(0.0
88)
*-
0.0
02
(0.0
01)
*0.1
80.1
418.3
7
%of
pri
mar
y-o
nly
schools
wit
ha
com
mon
toil
et
-0.3
30
(0.2
17)
0.0
06
(0.0
03)
0.2
63
(0.1
64)
-0.0
04
(0.0
02)
�0.1
30.1
28.9
6
%of
pri
mar
y-o
nly
schools
wit
ha
gir
ls’
toil
et-
0.5
43
(0.2
77)
0.0
07
(0.0
05)
�0.2
07
(0.2
20)
-0.0
03
(0.0
03)
0.2
50.2
37.0
0
%of
pri
mar
y-o
nly
schools
wit
ha
kit
chen
-0.0
65
(0.3
22)
-0.0
01
(0.0
06)
0.3
91
(0.1
80)
�-
0.0
04
(0.0
02)
�0.0
60.0
429.6
8
%of
pri
mar
y-o
nly
schools
wit
hpre
-pri
mar
y
pro
gra
ms
-0.8
05
(0.1
45)
**
0.0
16
(0.0
01)
***
***
0.0
10
(0.1
82)
-0.0
01
(0.0
02)
0.2
50.2
29.8
4
Num
ber
of
clas
sroom
sper
100
pupil
sin
pri
mar
y-o
nly
schools
-0.0
31
(0.0
17)
0.0
00
(0.0
00)
-0.0
25
(0.0
14)
0.0
00
(0.0
00)
*0.3
10.2
95.9
9
Pri
nci
pal
Com
ponen
t1—
Pri
mar
y-s
chool
amen
itie
sa-
0.0
38
(0.0
25)
0.0
01
(0.0
01)
**
0.0
14
(0.0
07)
�-
0.0
00
(0.0
00)
0.3
00.2
85.8
8
N. Halim et al.
123
Author's personal copy

Ta
ble
4co
nti
nued
%gen
eral
(no
n-S
C/S
T)
SL
Ase
ats
hel
db
yw
om
en%
rese
rved
(SC
/ST
)S
LA
seat
sh
eld
by
wo
men
RF2
(fu
ll)3
RR2
(res
tric
t)4
%o
fR
F2
acco
un
ted
for
by
WP
RL
inea
rQ
uad
rati
cL
inea
rQ
uad
rati
c
b(S
E)
pb
(SE
)p
p[
Fb
(SE
)p
b(S
E)
pp[
F
Inputs
into
pri
mary
-sch
ool-
teach
erquanti
tyand
quali
ty
%of
pri
mar
y-o
nly
schools
wit
hm
ore
than
one
teac
her
0.1
31
(0.0
90)
-0.0
03
(0.0
03)
0.1
44
(0.0
82)
-0.0
02
(0.0
01)
�0.1
20.1
18.9
1
%of
pri
mar
y-o
nly
schools
wit
hat
leas
tone
fem
ale
teac
her
-0.2
81
(0.0
89)
*0.0
06
(0.0
02)
*�
0.1
17
(0.0
51)
�-
0.0
01
(0.0
01)
0.1
70.1
67.9
9
%of
par
a-te
acher
sin
pri
mar
y-o
nly
schools
who
are
fem
ale
0.3
72
(0.3
60)
-0.0
05
(0.0
11)
0.4
50
(0.0
84)
***
-0.0
05
(0.0
01)
***
**
0.1
30.1
021.3
6
%of
teac
her
sin
pri
mar
y-o
nly
schools
who
are
regula
ror
per
man
ent
teac
her
s
0.3
25
(0.2
14)
-0.0
03
(0.0
04)
�-
0.0
51
(0.0
69)
0.0
01
(0.0
01)
0.2
10.1
812.4
3
%of
teac
her
sin
pri
mar
y-o
nly
schools
wit
hat
leas
tse
condar
ysc
hool
qual
ifica
tions
-0.0
18
(0.0
50)
-0.0
01
(0.0
01)
�0.0
19
(0.0
16)
-0.0
00
(0.0
00)
�0.2
80.2
73.9
5
%of
teac
her
sin
pri
mar
y-o
nly
schools
wit
hin
-
serv
ice
trai
nin
g
0.3
28
(0.3
72)
-0.0
05
(0.0
09)
0.2
56
(0.2
61)
-0.0
03
(0.0
03)
0.1
40.1
39.7
1
%of
fem
ale
teac
her
sin
pri
mar
y-o
nly
schools
wit
hin
-ser
vic
etr
ainin
g
-0.3
87
(0.1
19)
*0.0
07
(0.0
03)
*�
0.1
92
(0.0
76)
*-
0.0
03
(0.0
01)
�0.3
60.3
45.6
5
%of
teac
her
sin
pri
mar
y-o
nly
schools
wit
h
gra
duat
equal
ifica
tions
-0.0
90
(0.1
70)
0.0
02
(0.0
04)
0.1
20
(0.1
30)
-0.0
00
(0.0
01)
�0.1
60.1
57.7
2
Num
ber
of
teac
her
sper
100
pupil
sin
pri
mar
y-
only
schools
-0.0
19
(0.0
25)
0.0
00
(0.0
00)
***
-0.0
24
(0.0
09)
*0.0
00
(0.0
00)
�0.2
60.2
54.7
9
Women in Politics and Schooling Investments
123
Author's personal copy

Ta
ble
4co
nti
nu
ed
%gen
eral
(no
n-S
C/S
T)
SL
Ase
ats
hel
db
yw
om
en%
rese
rved
(SC
/ST
)S
LA
seat
sh
eld
by
wo
men
RF2
(fu
ll)3
RR2
(res
tric
t)4
%o
fR
F2
acco
un
ted
for
by
WP
RL
inea
rQ
uad
rati
cL
inea
rQ
uad
rati
c
b(S
E)
pb
(SE
)p
p[
Fb
(SE
)p
b(S
E)
pp[
F
Pri
nci
pal
Com
ponen
t2—
Tea
cher
quan
tity
and
qual
ity
inpri
mar
y-o
nly
schools
b0.0
02
(0.0
18)
0.0
00
(0.0
00)
0.0
15
(0.0
07)
�-
0.0
00
(0.0
00)
0.4
60.4
60.0
0
Robust
stan
dar
der
rors
,ad
just
ing
for
regio
nal
clust
erin
g,
are
inpar
enth
eses
.S
CS
TS
ched
ule
dC
aste
/Sch
edu
led
Tri
be,
SL
AS
tate
Leg
isla
tive
Ass
embly
.A
lles
tim
ates
from
the
full
(adju
sted
)m
od
els
incl
ud
eco
ntr
ols
for
the
per
cen
tag
eo
fth
ed
istr
ict’
s:p
op
ula
tio
nli
vin
gin
urb
anar
eas,
dec
enn
ial
gro
wth
rate
,ra
teo
fli
tera
cyam
on
gfe
mal
esag
ed7
yea
rsor
old
er,
per
centa
ge
of
the
popula
tion
Sch
edu
led
Cas
teo
rS
ched
ule
dT
rib
e(S
C/S
T),
and
fem
ale-
to-m
ale
rati
oo
fch
ild
ren
0–
6y
ears
.A
lles
tim
ates
inre
stri
cted
mo
del
sin
clu
de
on
lyth
eco
ntr
ol
var
iab
les
infu
llm
od
els
�p
B0
.10,
*p
B0
.05,
**
pB
0.0
1,
**
*p
B0
.00
1a
See
foo
note
2o
fT
able
1fo
rth
esu
bse
to
fin
dic
ato
rsin
clu
ded
inP
rin
cip
alC
om
po
nen
t1
bS
eefo
on
ote
3o
fT
able
1fo
rth
esu
bse
to
fin
dic
ato
rsin
clu
ded
inP
rin
cipal
Co
mpo
nen
t2
cF
ull
mo
del
:B
oth
WP
Ran
dco
ntr
ol
var
iab
les
dR
estr
icte
dm
od
el:
On
lyco
ntr
ol
var
iab
les
N. Halim et al.
123
Author's personal copy
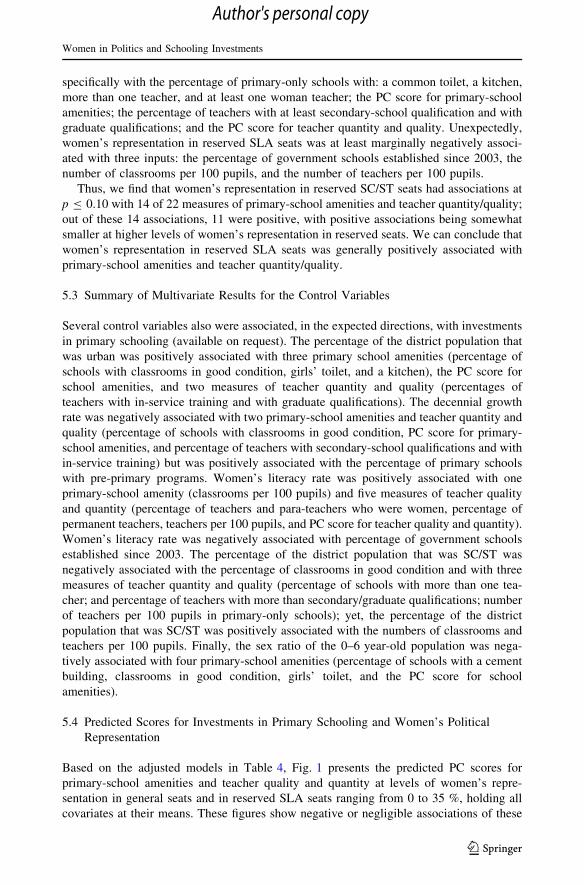
specifically with the percentage of primary-only schools with: a common toilet, a kitchen,
more than one teacher, and at least one woman teacher; the PC score for primary-school
amenities; the percentage of teachers with at least secondary-school qualification and with
graduate qualifications; and the PC score for teacher quantity and quality. Unexpectedly,
women’s representation in reserved SLA seats was at least marginally negatively associ-
ated with three inputs: the percentage of government schools established since 2003, the
number of classrooms per 100 pupils, and the number of teachers per 100 pupils.
Thus, we find that women’s representation in reserved SC/ST seats had associations at
p B 0.10 with 14 of 22 measures of primary-school amenities and teacher quantity/quality;
out of these 14 associations, 11 were positive, with positive associations being somewhat
smaller at higher levels of women’s representation in reserved seats. We can conclude that
women’s representation in reserved SLA seats was generally positively associated with
primary-school amenities and teacher quantity/quality.
5.3 Summary of Multivariate Results for the Control Variables
Several control variables also were associated, in the expected directions, with investments
in primary schooling (available on request). The percentage of the district population that
was urban was positively associated with three primary school amenities (percentage of
schools with classrooms in good condition, girls’ toilet, and a kitchen), the PC score for
school amenities, and two measures of teacher quantity and quality (percentages of
teachers with in-service training and with graduate qualifications). The decennial growth
rate was negatively associated with two primary-school amenities and teacher quantity and
quality (percentage of schools with classrooms in good condition, PC score for primary-
school amenities, and percentage of teachers with secondary-school qualifications and with
in-service training) but was positively associated with the percentage of primary schools
with pre-primary programs. Women’s literacy rate was positively associated with one
primary-school amenity (classrooms per 100 pupils) and five measures of teacher quality
and quantity (percentage of teachers and para-teachers who were women, percentage of
permanent teachers, teachers per 100 pupils, and PC score for teacher quality and quantity).
Women’s literacy rate was negatively associated with percentage of government schools
established since 2003. The percentage of the district population that was SC/ST was
negatively associated with the percentage of classrooms in good condition and with three
measures of teacher quantity and quality (percentage of schools with more than one tea-
cher; and percentage of teachers with more than secondary/graduate qualifications; number
of teachers per 100 pupils in primary-only schools); yet, the percentage of the district
population that was SC/ST was positively associated with the numbers of classrooms and
teachers per 100 pupils. Finally, the sex ratio of the 0–6 year-old population was nega-
tively associated with four primary-school amenities (percentage of schools with a cement
building, classrooms in good condition, girls’ toilet, and the PC score for school
amenities).
5.4 Predicted Scores for Investments in Primary Schooling and Women’s Political
Representation
Based on the adjusted models in Table 4, Fig. 1 presents the predicted PC scores for
primary-school amenities and teacher quality and quantity at levels of women’s repre-
sentation in general seats and in reserved SLA seats ranging from 0 to 35 %, holding all
covariates at their means. These figures show negative or negligible associations of these
Women in Politics and Schooling Investments
123
Author's personal copy
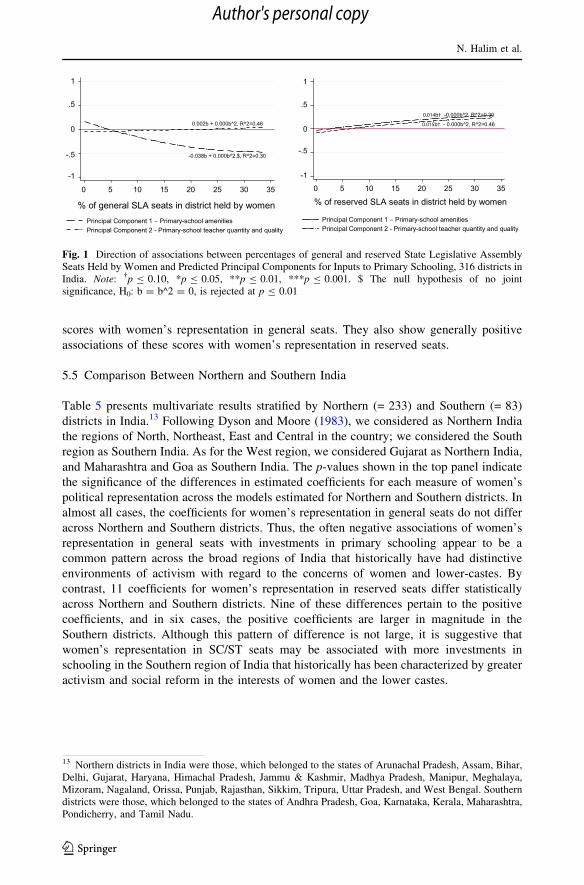
scores with women’s representation in general seats. They also show generally positive
associations of these scores with women’s representation in reserved seats.
5.5 Comparison Between Northern and Southern India
Table 5 presents multivariate results stratified by Northern (= 233) and Southern (= 83)
districts in India.13 Following Dyson and Moore (1983), we considered as Northern India
the regions of North, Northeast, East and Central in the country; we considered the South
region as Southern India. As for the West region, we considered Gujarat as Northern India,
and Maharashtra and Goa as Southern India. The p-values shown in the top panel indicate
the significance of the differences in estimated coefficients for each measure of women’s
political representation across the models estimated for Northern and Southern districts. In
almost all cases, the coefficients for women’s representation in general seats do not differ
across Northern and Southern districts. Thus, the often negative associations of women’s
representation in general seats with investments in primary schooling appear to be a
common pattern across the broad regions of India that historically have had distinctive
environments of activism with regard to the concerns of women and lower-castes. By
contrast, 11 coefficients for women’s representation in reserved seats differ statistically
across Northern and Southern districts. Nine of these differences pertain to the positive
coefficients, and in six cases, the positive coefficients are larger in magnitude in the
Southern districts. Although this pattern of difference is not large, it is suggestive that
women’s representation in SC/ST seats may be associated with more investments in
schooling in the Southern region of India that historically has been characterized by greater
activism and social reform in the interests of women and the lower castes.
0.014b† -0.000b^2, R^2=0.30
0.015b† - 0.000b^2, R^2=0.46
-1
-.5
0
.5
1
0 5 10 15 20 25 30 35
% of reserved SLA seats in district held by women
Principal Component 1 – Primary-school amenitiesPrincipal Component 2 - Primary-school teacher quantity and quality
-0.038b + 0.000b^2,$, R^2=0.30
0.002b + 0.000b^2, R^2=0.46
-1
-.5
0
.5
1
0 5 10 15 20 25 30 35
% of general SLA seats in district held by womenPrincipal Component 1 – Primary-school amenitiesPrincipal Component 2 - Primary-school teacher quantity and quality
Fig. 1 Direction of associations between percentages of general and reserved State Legislative AssemblySeats Held by Women and Predicted Principal Components for Inputs to Primary Schooling, 316 districts inIndia. Note: �p B 0.10, *p B 0.05, **p B 0.01, ***p B 0.001. $ The null hypothesis of no jointsignificance, H0: b = b^2 = 0, is rejected at p B 0.01
13 Northern districts in India were those, which belonged to the states of Arunachal Pradesh, Assam, Bihar,Delhi, Gujarat, Haryana, Himachal Pradesh, Jammu & Kashmir, Madhya Pradesh, Manipur, Meghalaya,Mizoram, Nagaland, Orissa, Punjab, Rajasthan, Sikkim, Tripura, Uttar Pradesh, and West Bengal. Southerndistricts were those, which belonged to the states of Andhra Pradesh, Goa, Karnataka, Kerala, Maharashtra,Pondicherry, and Tamil Nadu.
N. Halim et al.
123
Author's personal copy
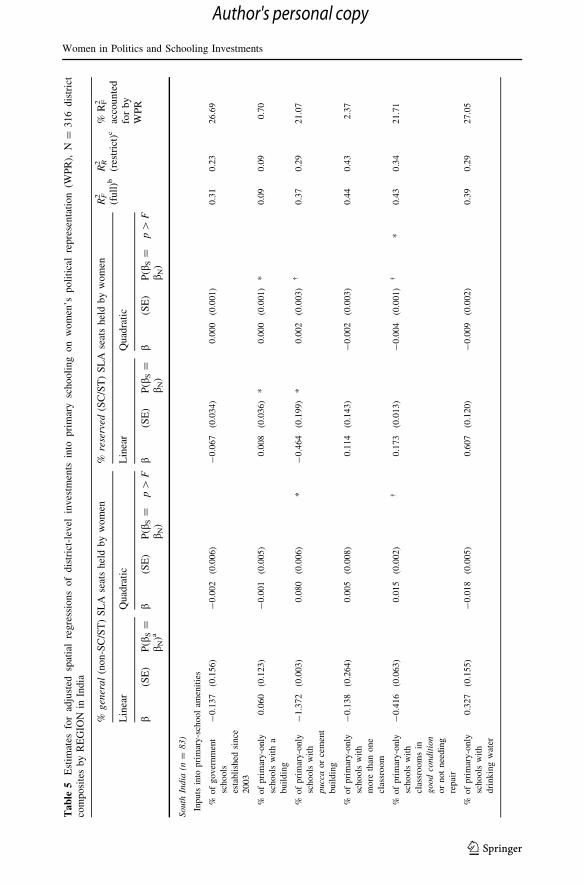
Ta
ble
5E
stim
ates
for
adju
sted
spat
ial
regre
ssio
ns
of
dis
tric
t-le
vel
inves
tmen
tsin
topri
mar
ysc
hooli
ng
on
wom
en’s
poli
tica
lre
pre
senta
tion
(WP
R),
N=
31
6d
istr
ict
com
po
site
sb
yR
EG
ION
inIn
dia
%gen
eral
(no
n-S
C/S
T)
SL
Ase
ats
hel
db
yw
om
en%
rese
rved
(SC
/ST
)S
LA
seat
sh
eld
by
wo
men
RF2
(fu
ll)b
RR2
(res
tric
t)c
%R
F2
acco
un
ted
for
by
WP
R
Lin
ear
Qu
adra
tic
Lin
ear
Qu
adra
tic
b(S
E)
P(b
S=
b N)a
b(S
E)
P(b
S=
b N)
p[
Fb
(SE
)P
(bS
=b N
)b
(SE
)P
(bS
=b N
)p[
F
South
India
(n=
83)
Inputs
into
pri
mar
y-s
chool
amen
itie
s
%of
gover
nm
ent
schools
esta
bli
shed
since
2003
-0.1
37
(0.1
56)
-0.0
02
(0.0
06)
-0.0
67
(0.0
34)
0.0
00
(0.0
01)
0.3
10.2
326.6
9
%of
pri
mar
y-o
nly
schools
wit
ha
buil
din
g
0.0
60
(0.1
23)
-0.0
01
(0.0
05)
0.0
08
(0.0
36)
*0.0
00
(0.0
01)
*0.0
90.0
90.7
0
%of
pri
mar
y-o
nly
schools
wit
h
pucc
aor
cem
ent
buil
din
g
-1.3
72
(0.0
03)
0.0
80
(0.0
06)
*-
0.4
64
(0.1
99)
*0.0
02
(0.0
03)
�0.3
70.2
921.0
7
%of
pri
mar
y-o
nly
schools
wit
h
more
than
one
clas
sroom
-0.1
38
(0.2
64)
0.0
05
(0.0
08)
0.1
14
(0.1
43)
-0.0
02
(0.0
03)
0.4
40.4
32.3
7
%of
pri
mar
y-o
nly
schools
wit
h
clas
sroom
sin
good
condit
ion
or
not
nee
din
g
repai
r
-0.4
16
(0.0
63)
0.0
15
(0.0
02)
�0.1
73
(0.0
13)
-0.0
04
(0.0
01)
�*
0.4
30.3
421.7
1
%of
pri
mar
y-o
nly
schools
wit
h
dri
nkin
gw
ater
0.3
27
(0.1
55)
-0.0
18
(0.0
05)
0.6
07
(0.1
20)
-0.0
09
(0.0
02)
0.3
90.2
927.0
5
Women in Politics and Schooling Investments
123
Author's personal copy
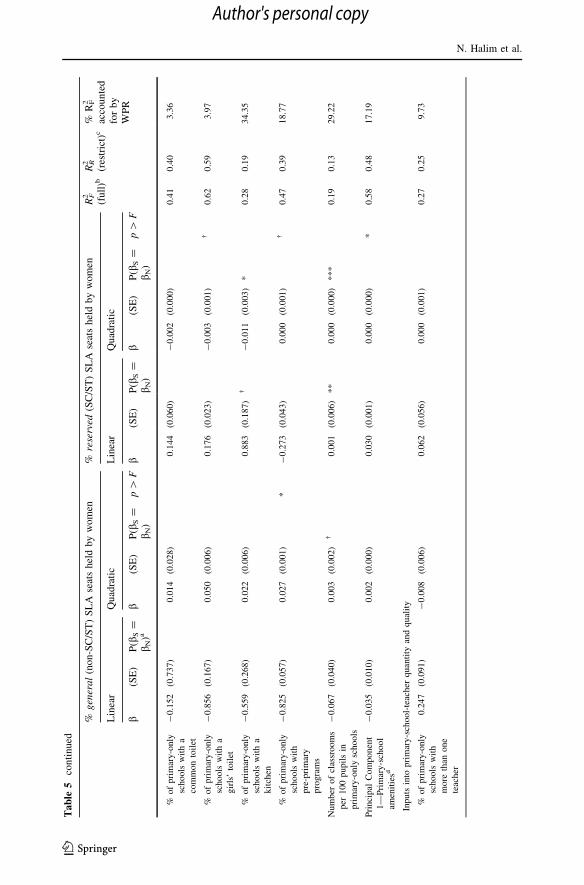
Ta
ble
5co
nti
nued
%gen
eral
(no
n-S
C/S
T)
SL
Ase
ats
hel
db
yw
om
en%
rese
rved
(SC
/ST
)S
LA
seat
sh
eld
by
wo
men
RF2
(fu
ll)b
RR2
(res
tric
t)c
%R
F2
acco
un
ted
for
by
WP
R
Lin
ear
Qu
adra
tic
Lin
ear
Qu
adra
tic
b(S
E)
P(b
S=
b N)a
b(S
E)
P(b
S=
b N)
p[
Fb
(SE
)P
(bS
=b N
)b
(SE
)P
(bS
=b N
)p[
F
%of
pri
mar
y-o
nly
schools
wit
ha
com
mon
toil
et
-0.1
52
(0.7
37)
0.0
14
(0.0
28)
0.1
44
(0.0
60)
-0.0
02
(0.0
00)
0.4
10.4
03.3
6
%of
pri
mar
y-o
nly
schools
wit
ha
gir
ls’
toil
et
-0.8
56
(0.1
67)
0.0
50
(0.0
06)
0.1
76
(0.0
23)
-0.0
03
(0.0
01)
�0.6
20.5
93.9
7
%of
pri
mar
y-o
nly
schools
wit
ha
kit
chen
-0.5
59
(0.2
68)
0.0
22
(0.0
06)
0.8
83
(0.1
87)
�-
0.0
11
(0.0
03)
*0.2
80.1
934.3
5
%of
pri
mar
y-o
nly
schools
wit
h
pre
-pri
mar
y
pro
gra
ms
-0.8
25
(0.0
57)
0.0
27
(0.0
01)
*-
0.2
73
(0.0
43)
0.0
00
(0.0
01)
�0.4
70.3
918.7
7
Num
ber
of
clas
sroom
s
per
100
pupil
sin
pri
mar
y-o
nly
schools
-0.0
67
(0.0
40)
0.0
03
(0.0
02)
�0.0
01
(0.0
06)
**
0.0
00
(0.0
00)
***
0.1
90.1
329.2
2
Pri
nci
pal
Com
ponen
t
1—
Pri
mar
y-s
choo
l
amen
itie
sd
-0.0
35
(0.0
10)
0.0
02
(0.0
00)
0.0
30
(0.0
01)
0.0
00
(0.0
00)
*0.5
80.4
817.1
9
Inputs
into
pri
mar
y-s
chool-
teac
her
quan
tity
and
qual
ity
%of
pri
mar
y-o
nly
schools
wit
h
more
than
one
teac
her
0.2
47
(0.0
91)
-0.0
08
(0.0
06)
0.0
62
(0.0
56)
0.0
00
(0.0
01)
0.2
70.2
59.7
3
N. Halim et al.
123
Author's personal copy
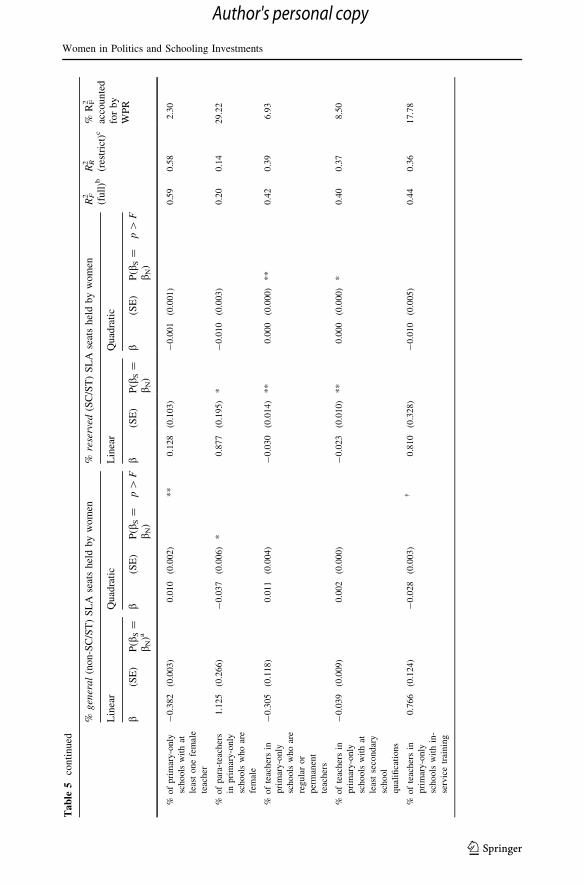
Ta
ble
5co
nti
nued
%gen
eral
(no
n-S
C/S
T)
SL
Ase
ats
hel
db
yw
om
en%
rese
rved
(SC
/ST
)S
LA
seat
sh
eld
by
wo
men
RF2
(fu
ll)b
RR2
(res
tric
t)c
%R
F2
acco
un
ted
for
by
WP
R
Lin
ear
Qu
adra
tic
Lin
ear
Qu
adra
tic
b(S
E)
P(b
S=
b N)a
b(S
E)
P(b
S=
b N)
p[
Fb
(SE
)P
(bS
=b N
)b
(SE
)P
(bS
=b N
)p[
F
%of
pri
mar
y-o
nly
schools
wit
hat
leas
tone
fem
ale
teac
her
-0.3
82
(0.0
03)
0.0
10
(0.0
02)
**
0.1
28
(0.1
03)
-0.0
01
(0.0
01)
0.5
90.5
82.3
0
%of
par
a-te
acher
s
inpri
mar
y-o
nly
schools
who
are
fem
ale
1.1
25
(0.2
66)
-0.0
37
(0.0
06)
*0.8
77
(0.1
95)
*-
0.0
10
(0.0
03)
0.2
00.1
429.2
2
%of
teac
her
sin
pri
mar
y-o
nly
schools
who
are
regula
ror
per
man
ent
teac
her
s
-0.3
05
(0.1
18)
0.0
11
(0.0
04)
-0.0
30
(0.0
14)
**
0.0
00
(0.0
00)
**
0.4
20.3
96.9
3
%of
teac
her
sin
pri
mar
y-o
nly
schools
wit
hat
leas
tse
condar
y
school
qual
ifica
tions
-0.0
39
(0.0
09)
0.0
02
(0.0
00)
-0.0
23
(0.0
10)
**
0.0
00
(0.0
00)
*0.4
00.3
78.5
0
%of
teac
her
sin
pri
mar
y-o
nly
schools
wit
hin
-
serv
ice
trai
nin
g
0.7
66
(0.1
24)
-0.0
28
(0.0
03)
�0.8
10
(0.3
28)
-0.0
10
(0.0
05)
0.4
40.3
617.7
8
Women in Politics and Schooling Investments
123
Author's personal copy

Ta
ble
5co
nti
nued
%gen
eral
(no
n-S
C/S
T)
SL
Ase
ats
hel
db
yw
om
en%
rese
rved
(SC
/ST
)S
LA
seat
sh
eld
by
wo
men
RF2
(fu
ll)b
RR2
(res
tric
t)c
%R
F2
acco
un
ted
for
by
WP
R
Lin
ear
Qu
adra
tic
Lin
ear
Qu
adra
tic
b(S
E)
P(b
S=
b N)a
b(S
E)
P(b
S=
b N)
p[
Fb
(SE
)P
(bS
=b N
)b
(SE
)P
(bS
=b N
)p[
F
%of
fem
ale
teac
her
sin
pri
mar
y-o
nly
schools
wit
hin
-
serv
ice
trai
nin
g
-0.3
68
(0.0
81)
0.0
10
(0.0
06)
0.4
86
(0.1
61)
*-
0.0
07
(0.0
02)
*0.6
40.6
05.6
9
%of
teac
her
sin
pri
mar
y-o
nly
schools
wit
h
gra
duat
e
qual
ifica
tions
0.9
18
(0.0
18)
-0.0
43
(0.0
02)
*0.4
02
(0.1
72)
*-
0.0
04
(0.0
03)
*0.3
20.2
715.7
3
Num
ber
of
teac
her
sper
100
pupil
sin
pri
mar
y-o
nly
schools
-0.0
53
(0.0
22)
0.0
03
(0.0
01)
-0.0
09
(0.0
04)
*0.0
00
(0.0
00)
�0.2
20.1
915.7
9
Pri
nci
pal
Com
ponen
t
2—
Tea
cher
quan
tity
and
qual
ity
in
pri
mar
y-o
nly
schools
e
-0.0
04
(0.0
09)
0.0
00
(0.0
00)
0.0
43
(0.0
14)
***
-0.0
01
(0.0
00)
***
0.5
60.5
35.4
3
Nort
hIn
dia
(n=
233)
Inputs
into
pri
mar
y-s
chool
amen
itie
s
%of
gover
nm
ent
schools
esta
bli
shed
since
2003
0.0
20
(0.2
67)
-0.0
03
(0.0
06)
-0.1
02
(0.0
77)
0.0
01
(0.0
01)
0.1
70.1
65.1
1
%of
pri
mar
y-o
nly
schools
wit
ha
buil
din
g
-0.3
75
(0.0
99)
0.0
06
(0.0
02)
*0.0
24
(0.0
53)
*0.0
00
(0.0
01)
*0.2
40.2
014.8
4
N. Halim et al.
123
Author's personal copy
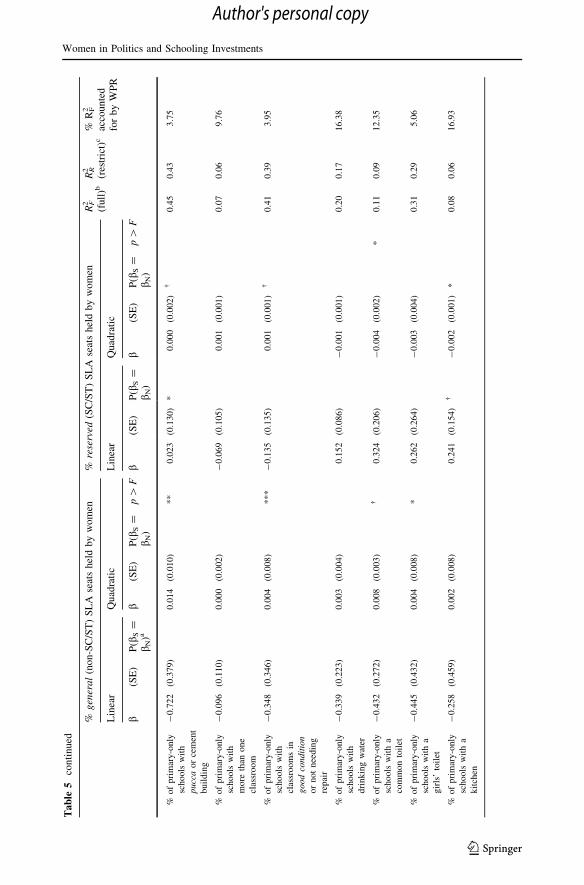
Ta
ble
5co
nti
nued
%gen
eral
(no
n-S
C/S
T)
SL
Ase
ats
hel
db
yw
om
en%
rese
rved
(SC
/ST
)S
LA
seat
sh
eld
by
wo
men
RF2
(full
)bR
R2
(res
tric
t)c
%R
F2
acco
un
ted
for
by
WP
RL
inea
rQ
uad
rati
cL
inea
rQ
uad
rati
c
b(S
E)
P(b
S=
b N)a
b(S
E)
P(b
S=
b N)
p[
Fb
(SE
)P
(bS
=b N
)b
(SE
)P
(bS
=b
N)
p[
F
%of
pri
mar
y-o
nly
schools
wit
h
pucc
aor
cem
ent
buil
din
g
-0.7
22
(0.3
79)
0.0
14
(0.0
10)
**
0.0
23
(0.1
30)
*0.0
00
(0.0
02)
�0.4
50.4
33.7
5
%of
pri
mar
y-o
nly
schools
wit
h
more
than
one
clas
sroom
-0.0
96
(0.1
10)
0.0
00
(0.0
02)
-0.0
69
(0.1
05)
0.0
01
(0.0
01)
0.0
70.0
69.7
6
%of
pri
mar
y-o
nly
schools
wit
h
clas
sroom
sin
good
condit
ion
or
not
nee
din
g
repai
r
-0.3
48
(0.3
46)
0.0
04
(0.0
08)
***
-0.1
35
(0.1
35)
0.0
01
(0.0
01)
�0.4
10.3
93.9
5
%of
pri
mar
y-o
nly
schools
wit
h
dri
nkin
gw
ater
-0.3
39
(0.2
23)
0.0
03
(0.0
04)
0.1
52
(0.0
86)
-0.0
01
(0.0
01)
0.2
00.1
716.3
8
%of
pri
mar
y-o
nly
schools
wit
ha
com
mon
toil
et
-0.4
32
(0.2
72)
0.0
08
(0.0
03)
�0.3
24
(0.2
06)
-0.0
04
(0.0
02)
*0.1
10.0
912.3
5
%of
pri
mar
y-o
nly
schools
wit
ha
gir
ls’
toil
et
-0.4
45
(0.4
32)
0.0
04
(0.0
08)
*0.2
62
(0.2
64)
-0.0
03
(0.0
04)
0.3
10.2
95.0
6
%of
pri
mar
y-o
nly
schools
wit
ha
kit
chen
-0.2
58
(0.4
59)
0.0
02
(0.0
08)
0.2
41
(0.1
54)
�-
0.0
02
(0.0
01)
*0.0
80.0
616.9
3
Women in Politics and Schooling Investments
123
Author's personal copy

Ta
ble
5co
nti
nued
%gen
eral
(no
n-S
C/S
T)
SL
Ase
ats
hel
db
yw
om
en%
rese
rved
(SC
/ST
)S
LA
seat
sh
eld
by
wo
men
RF2
(fu
ll)b
RR2
(res
tric
t)c
%R
F2
acco
un
ted
for
by
WP
R
Lin
ear
Qu
adra
tic
Lin
ear
Qu
adra
tic
b(S
E)
P(b
S=
b N)a
b(S
E)
P(b
S=
b N)
p[
Fb
(SE
)P
(bS
=b N
)b
(SE
)P
(bS
=b N
)p[
F
%of
pri
mar
y-o
nly
schools
wit
h
pre
-pri
mar
y
pro
gra
ms
-0.8
56
(0.1
75)
0.0
17
(0.0
02)
***
0.2
08
(0.1
94)
-0.0
03
(0.0
02)
0.2
20.2
011.2
5
Num
ber
of
clas
sroom
s
per
100
pupil
sin
pri
mar
y-o
nly
schools
-0.0
44
(0.0
27)
0.0
00
(0.0
00)
�-
0.0
38
(0.0
19)
**
0.0
00
(0.0
00)
***
0.3
50.3
37.8
3
Pri
nci
pal
Com
ponen
t
1—
Pri
mar
y-s
choo
l
amen
itie
sd
-0.0
38
(0.0
39)
0.0
01
(0.0
01)
0.0
15
(0.0
09)
0.0
00
(0.0
00)
0.3
20.3
04.9
9
Inputs
into
pri
mar
y-s
chool-
teac
her
quan
tity
and
qual
ity
%of
pri
mar
y-o
nly
schools
wit
h
more
than
one
teac
her
0.0
93
(0.1
08)
-0.0
02
(0.0
03)
0.1
89
(0.0
83)
-0.0
02
(0.0
01)
*0.1
00.0
911.8
0
%of
pri
mar
y-o
nly
schools
wit
hat
leas
tone
fem
ale
teac
her
-0.1
56
(0.0
89)
0.0
04
(0.0
03)
0.1
07
(0.0
56)
-0.0
02
(0.0
01)
0.1
40.1
37.6
6
%of
par
a-te
acher
s
inpri
mar
y-o
nly
schools
who
are
fem
ale
0.3
33
(0.4
10)
-0.0
04
(0.0
13)
*0.3
53
(0.0
61)
*-
0.0
04
(0.0
01)
*0.1
00.0
728.4
4
%of
teac
her
sin
pri
mar
y-o
nly
schools
who
are
regula
ror
per
man
ent
teac
her
s
0.5
87
(0.3
29)
-0.0
07
(0.0
06)
*-
0.0
15
(0.1
09)
**
0.0
01
(0.0
01)
**
*0.1
70.1
233.4
9
N. Halim et al.
123
Author's personal copy
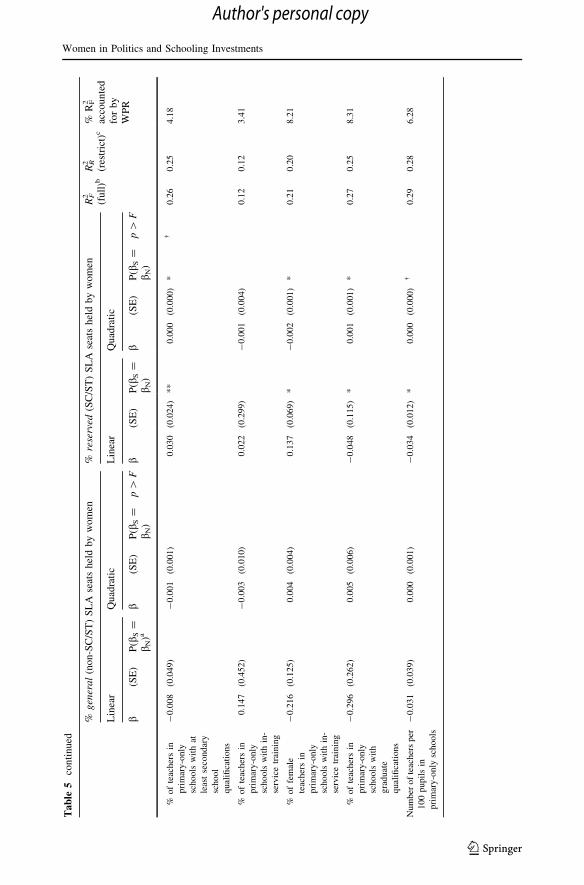
Ta
ble
5co
nti
nued
%gen
eral
(no
n-S
C/S
T)
SL
Ase
ats
hel
db
yw
om
en%
rese
rved
(SC
/ST
)S
LA
seat
sh
eld
by
wo
men
RF2
(fu
ll)b
RR2
(res
tric
t)c
%R
F2
acco
un
ted
for
by
WP
R
Lin
ear
Qu
adra
tic
Lin
ear
Qu
adra
tic
b(S
E)
P(b
S=
b N)a
b(S
E)
P(b
S=
b N)
p[
Fb
(SE
)P
(bS
=b N
)b
(SE
)P
(bS
=b N
)p[
F
%of
teac
her
sin
pri
mar
y-o
nly
schools
wit
hat
leas
tse
condar
y
school
qual
ifica
tions
-0.0
08
(0.0
49)
-0.0
01
(0.0
01)
0.0
30
(0.0
24)
**
0.0
00
(0.0
00)
*�
0.2
60.2
54.1
8
%of
teac
her
sin
pri
mar
y-o
nly
schools
wit
hin
-
serv
ice
trai
nin
g
0.1
47
(0.4
52)
-0.0
03
(0.0
10)
0.0
22
(0.2
99)
-0.0
01
(0.0
04)
0.1
20.1
23.4
1
%of
fem
ale
teac
her
sin
pri
mar
y-o
nly
schools
wit
hin
-
serv
ice
trai
nin
g
-0.2
16
(0.1
25)
0.0
04
(0.0
04)
0.1
37
(0.0
69)
*-
0.0
02
(0.0
01)
*0.2
10.2
08.2
1
%of
teac
her
sin
pri
mar
y-o
nly
schools
wit
h
gra
duat
e
qual
ifica
tions
-0.2
96
(0.2
62)
0.0
05
(0.0
06)
-0.0
48
(0.1
15)
*0.0
01
(0.0
01)
*0.2
70.2
58.3
1
Num
ber
of
teac
her
sper
100
pupil
sin
pri
mar
y-o
nly
schools
-0.0
31
(0.0
39)
0.0
00
(0.0
01)
-0.0
34
(0.0
12)
*0.0
00
(0.0
00)
�0.2
90.2
86.2
8
Women in Politics and Schooling Investments
123
Author's personal copy
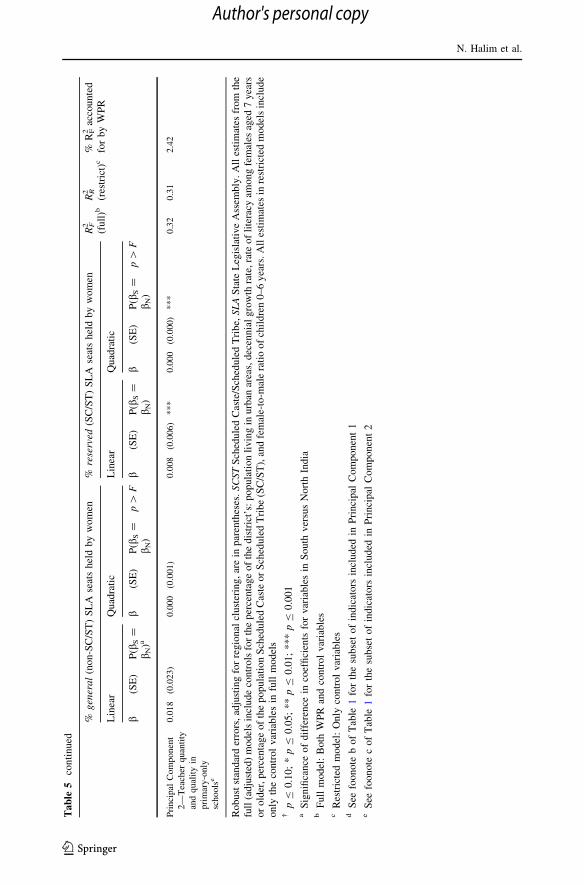
Ta
ble
5co
nti
nued
%gen
eral
(no
n-S
C/S
T)
SL
Ase
ats
hel
db
yw
om
en%
rese
rved
(SC
/ST
)S
LA
seat
sh
eld
by
wo
men
RF2
(fu
ll)b
RR2
(res
tric
t)c
%R
F2ac
cou
nte
dfo
rb
yW
PR
Lin
ear
Qu
adra
tic
Lin
ear
Qu
adra
tic
b(S
E)
P(b
S=
b N)a
b(S
E)
P(b
S=
bN
)p[
Fb
(SE
)P
(bS
=b
N)
b(S
E)
P(b
S=
b N)
p[
F
Pri
nci
pal
Com
ponen
t
2—
Tea
cher
quan
tity
and
qual
ity
in
pri
mar
y-o
nly
schools
e
0.0
18
(0.0
23)
0.0
00
(0.0
01)
0.0
08
(0.0
06)
***
0.0
00
(0.0
00)
***
0.3
20.3
12.4
2
Robust
stan
dar
der
rors
,ad
just
ing
for
regio
nal
clust
erin
g,
are
inpar
enth
eses
.S
CS
TS
ched
ule
dC
aste
/Sch
edu
led
Tri
be,
SL
AS
tate
Leg
isla
tive
Ass
emb
ly.
All
esti
mat
esfr
om
the
full
(adju
sted
)m
od
els
incl
ud
eco
ntr
ols
for
the
per
cen
tag
eo
fth
ed
istr
ict’
s:p
op
ula
tio
nli
vin
gin
urb
anar
eas,
dec
enn
ial
gro
wth
rate
,ra
teo
fli
tera
cyam
on
gfe
mal
esag
ed7
yea
rso
ro
lder
,p
erce
nta
ge
of
the
po
pu
lati
on
Sch
edu
led
Cas
teo
rS
ched
ule
dT
ribe
(SC
/ST
),an
dfe
mal
e-to
-mal
era
tio
of
chil
dre
n0
–6
yea
rs.
All
esti
mat
esin
rest
rict
edm
od
els
incl
ud
eo
nly
the
con
trol
var
iab
les
infu
llm
od
els
�p
B0
.10
;*
pB
0.0
5;
**
pB
0.0
1;
**
*p
B0
.00
1a
Sig
nifi
can
ceo
fd
iffe
ren
cein
coef
fici
ents
for
var
iab
les
inS
ou
thv
ersu
sN
ort
hIn
dia
bF
ull
mo
del
:B
oth
WP
Ran
dco
ntr
ol
var
iab
les
cR
estr
icte
dm
od
el:
On
lyco
ntr
ol
var
iab
les
dS
eefo
on
ote
bo
fT
able
1fo
rth
esu
bse
to
fin
dic
ato
rsin
clu
ded
inP
rin
cip
alC
om
po
nen
t1
eS
eefo
on
ote
co
fT
able
1fo
rth
esu
bse
to
fin
dic
ato
rsin
clu
ded
inP
rin
cip
alC
om
po
nen
t2
N. Halim et al.
123
Author's personal copy

6 Discussion and Conclusion
In this analysis, we have assessed whether and how women’s district-level representation
in SLAs is associated with investments in primary schooling in India. This work makes
several contributions. First, we address a gap in the international literature on women’s
political representation (Paxton et al. 2007). Second, we address persistent questions in
feminist theory about the influences of intersecting gender and caste identities on redis-
tributive policies aimed at aiding children (Frederick 2010; Paxton et al. 2007). The
‘‘double’’ burden of disadvantage among low-caste women in India (Deshpande 2007) and
the implications of this experience for their interests in redistributive policy have not been
extensively studied (see also Hancock 2007). Third, this work fills gaps in the literature on
women’s empowerment and child well-being in South Asia, which either has focused on
women’s micro-level social and economic empowerment or has shown mixed results with
respect to women’s representation and redistributive policies in India (Chattopadhyay and
Duflo 2004; Clots-Figueras 2007, 2011; Pal and Ghosh 2008). Fourth, our use of com-
prehensive district-level data on inputs to primary schooling available for the 2007/8
school year and on prior (2000–2004) SLA elections from all but one state in India extends
prior analyses, which have focused on women’s representation in SLAs in selected states
and on selected investments in schooling (Clots-Figueras 2007, 2011). Lastly, this research
is timely, given extended and recent debates in India’s parliament about the reservation of
seats for women in central and state governments (see Clots-Figueras 2011).
In line with our hypotheses, the representation of women in SLA seats reserved for
scheduled caste and schedule tribe representatives was significantly and positively asso-
ciated with several investments in primary schooling amenities and teacher quantity and
quality. Of these positive associations, two notable ones were those between women’s
representation in reserved seats and school amenities that help to meet poor children’s
basic needs–drinking fountains and kitchens. These findings corroborate and extend
findings from selected regions of India, which have shown that SC/ST state legislators have
favored capital investments in basic aspects of lower-level schooling as well as increased
revenue expenditures on water supply (Clots-Figueras 2007).
The general pattern of positive associations between SC/ST women’s representation and
redistributive, pro-woman-and-child policies may have other, competing explanations.
Namely, the political resources that translate interests into action may be unequally dis-
tributed among politicians, relegating SC/ST women to so-called feminine issues (Dia-
mond 1977). Inequality regime describes the practices and processes that maintain race,
ethnic, class, caste, and gender disparities in power and control over goals, resources, and
outcomes among participants within organizations (Acker 2006). The gendered distribu-
tions of political resources in Argentinean, Colombian, and Costa Rican legislatures have
demonstrated this point (Schwindt-Bayer 2006). On the one hand, women legislators in
these countries have prioritized and initiated more bills concerning women, children, and
families than concerning agriculture. On the other hand, gender gaps are small in legis-
lators’ attitudes on education, health, and the economy, but men legislators more often
initiate bills in these areas. Schwindt-Bayer (2006) attributes this discrepancy to gender
gaps in committee membership. Thus, SC/ST women’s apparent ‘‘success’’ in champi-
oning investments in primary schooling may reflect their marginalization in other legis-
lative arenas, precluding them from translating all of their interests into action. Qualitative
research with SC/ST and non-SC/ST men and women legislators could help to unpack the
existence, nature, and extent of inequity in the distribution of political resources among
them and the influences of these inequities on the policies they can affect.
Women in Politics and Schooling Investments
123
Author's personal copy

Several negative coefficients for the quadratic term for women’s representation in
reserved seats suggest that the interpretations require nuance. Namely, the positive rela-
tionship of women’s representation in reserved seats with (selected) schooling inputs is
somewhat lower at higher levels of their representation. As SC/ST women legislators gain
representation, their growing presence may threaten the gender-caste status quo in SLAs,
causing a backlash that inhibits the pursuit of their political priorities. Alternatively, as SC/
ST women gain representation (at these lower levels), they may begin to think and act
more like their other colleagues. Longitudinal follow-up of SC/ST men and women leg-
islators would help to discern the merits of these explanations.
Finally, there is modest evidence of positive associations of women’s representation in
reserved seats with selected schooling inputs in South India. These findings provide some
support for the idea that low-caste women politicians have more capacity to enact redis-
tributive educational policies in the regions with a stronger and longer-standing political
culture of activism and social reform to redress historical disadvantages of women and
lower-castes. Thus, a broader culture favoring redistribution may enable low-caste women
politicians to implement their political interests.
As expected, women’s representation in general SLA seats is negatively associated with
several investments in primary-school amenities and teacher quality and quantity. Yet, at
higher levels of women’s representation in these seats, this negative association is smaller,
as reflected in several positive coefficients for the quadratic term for women’s represen-
tation in general seats. One reading of this pattern is that, at the lowest levels of repre-
sentation in general seats (e.g., from 0 to 35 %, as in Fig. 1), women align to their
privileged caste interests and so invest even less in public primary schooling; yet, as
women’s representation in general seats increases, their interests may shift to align more
with women and children, and they become more willing (or less unwilling) to invest in
public primary schooling. The absence of significant differences in these patterns across
North and South India suggests that the broader culture of social activism may not
influence the political interests and decisions of elite women politicians. Longitudinal
follow-up of non-SC/ST men and women representatives would help to assess the merits of
this explanation.
Together, our findings suggest, at a minimum, that the dynamics and implications for
redistributive educational policies may differ for high- and low-caste women legislators in
India. This difference may adhere despite the fact that high- and low-caste women’s
representation in India’s SLAs was low, on average, with 6 % of general seats and 9 % of
reserved seats held by women. Despite low representation, women legislators, of general
and SC/ST backgrounds alike, can convince their male colleagues to introduce in the SLAs
proposals on redistributive policies to be voted on by the legislatures or to vote affirma-
tively on the ones introduced by women legislators. For instance, in the Orissa Legislative
Assembly, women legislators convinced their men counterparts of their ideas as well as
introduced proposals to be voted on in the legislature (Mishra 2000).
Still, women’s representation beyond 35 percent remains rare, especially for general
seats in the SLAs in India. An important area for future research is to explore the impli-
cations for redistributive, pro-woman-and-child policies of ‘‘critical mass’’ of SC/ST and
non-SC/ST women legislators on redistributive, pro-woman-and-child policies. When
women politicians are a small minority, they may lack the collective power to pursue their
political interests; yet, when women comprise a critical mass, of say 15–30 %, they may be
able to translate their interests into policy (Paxton et al. 2007). Findings from the Indian
states of West Bengal and Rajasthan corroborate a critical mass theory of women’s
political representation. Namely, Village Councils in which 30 % of seats were randomly
N. Halim et al.
123
Author's personal copy
reserved for women showed differences in the policy interests of men and women members
and a greater tendency for women to implement their preference to invest in drinking water
(Chattopadhyay and Duflo 2004). Yet, collectively, the evidence is thin that reaching a
critical mass matters, and in some wealthier settings, women’s increasing representation
has provoked hostility and discriminatory backlash (Paxton et al. 2007). Currently,
women’s low average numeric representation in Indian districts precludes a thorough
analysis of critical mass theory. As women’s political representation increases, this theory
should be fully explored.
Future research also might explore other identities among women state legislators to
further differentiate political support for redistributive policies. Our focus on the gender
and caste identities of state legislators stemmed from assertions by Indian scholars that
low-caste women have experienced unique forms of oppression (Deshpande 2007; Me-
hrotra 2006), and so their political empowerment may give voice to distinct political
interests that align with redistributive investments in education better than do the interests
of higher-caste women. To undertake a more refined inter-categorical, comparative ana-
lysis (McCall 2005), we would need more detailed information on group identity. For
instance, the ECI does not contain information on the candidate’s religion. Religion might
be inferred from a candidate’s family name, but this method of assignment would produce
errors, and so other data sources would be required. Finally, an Indian politician’s party
affiliation may be correlated with his or her caste identity. Research on the influence of
other identities would enhance our understanding of the heterogeneity of women’s political
interests.
This analysis is cross-sectional, but does take advantage of appropriate temporality
between covariates and outcomes. This paper lays the foundation for future research and
contributes evidence to debates about the role of reservations for disadvantaged groups. At
least at the lower levels of representation, SC/ST women may foster investments in the
amenities of schools that address the basic needs especially of poor children. Yet, the
benefits of reservations may differ between policies, with the representation of SC/ST
women potentially investing only in some domains. Such variation is likely for other
redistributive policies and it will be important to understand the outcomes and contexts in
which gender-by-caste reservations are ‘‘net’’ welfare enhancing for women, children, and
girls.
Acknowledgments We appreciate the assistance of Ms. Rudina Sobvokiak in data preparation and of Ms.Teresa Parker and Ms. Francine Pope in manuscript preparation. We also thank Professor Nancy Folbre, thediscussant for Session 167 ‘‘Gender in Developing Countries’’ of the 2010 meeting of the PopulationAssociation of America, for comments on a previous version of this manuscript. Any remaining errors arethe responsibility of the authors. This analysis was supported by research grant 1R03HD051822-01A2 fromthe National Institute of Child Health and Development.
References
Acker, J. (2006). Inequality regimes gender, class, and race in organizations. Gender and Society, 20(4),441–464.
Anandhi, S. (1991). Women’s question in the Dravidian Movement c. 1925–1948. Social Scientist, 19(5/6),24–41.
Anselin, L. (1988). Spatial econometrics: Methods and models. Boston, M.A.: Kluwer Academic.Ban, R., & Rao, V. (2008). Tokenism or agency? The impact of women’s reservations on village democ-
racies in south India. Economic Development and Cultural Change, 56(3), 501–530.
Women in Politics and Schooling Investments
123
Author's personal copy

Banerjee, A., & Iyer, L. (2005). History, institutions, and economic performance: The legacy of colonialland tenure systems in India. American Economic Review, 95(4), 1190–1213.
Banerjee, A., Somanathan, R., & Pande, R. (2007). The political economy of public goods: Some evidencefrom India. Journal of Development Economics, 82, 287–314.
Bardhan, P. (1996). Efficiency, equity and poverty alleviation: Policy issues in less developed countries. TheEconomic Journal, 106(438), 1344–1356.
Barrett, E. J. (1995). The policy priorities of African American women in state legislatures. LegislativeStudies Quarterly, 20(2), 223–247.
Baviskar, B. S. (2005). Impact of women’s participation in local governance in rural India. In L. C. Jain(Ed.), Decentralization and local governance (pp. 329–342). New Delhi: Longman.
Besley, T., & Coate, S. (1997). An economic model of representative democracy. Quarterly Journal ofEconomics, 112(11), 85–114.
Besley, T., Pande, R., & Rao, V. (2004). The politics of public good provision: Evidence from Indian localgovernments. Journal of the European Economics Association Papers and Proceedings, 2(2–3),416–426.
Bester, A. C., Conley, T. G., & Hansen, C. B. (2011). Inference with dependent data using cluster covarianceestimators. Journal of Econometrics, 165(2), 137–151.
Bhalotra, S., Clots-Figueras, I., Cassan, G., & Iyer, L. (2014). Religion, politician identity and developmentoutcomes: Evidence from India. Journal of Public Economics, 104, 4–17.
Beteille, A. (1969). Social inequality. Harmondsworth: Penguin.Bolzendahl, C. (2011). Beyond the big picture: gender influences on disaggregated and domain-specific
measures of social spending, 1980–1999. Politics and Gender, 7, 35–70.Bonu, S., Rani, M., Peters, D. H., & Baker, T. D. (2011). Empowering the socially excluded in rural local
governments: An exploratory study from a State in India. Journal of International Development, 23,42–62.
Bose, S. B., & Singh, V. B. (1988a). State elections in India: Data handbook on Vidhan Sabha elections1952-85: The East and Northeast. London: Sage.
Bose, S. B., & Singh, V. B. (1988b). State elections in India: Data handbook on Vidhan Sabha Elections1952-85: The North Part II. London: Sage.
Bose, S. B., & Singh, V. B. (1988c). State elections in India: Data handbook on Vidhan Sabha elections1952-85: The South. London: Sage.
Bose, S. B., & Singh, V. B. (2000a). State elections in India: Data handbook on Vidhan Sabha Elections1952-85: The North Part I. London: Sage.
Bose, S. B., & Singh, V. B. (2000b). State elections in India: Data handbook on Vidhan Sabha elections1952-85: The West. London: Sage.
Bratton, K. A., & Ray, L. P. (2002). Descriptive Representation, policy outcomes, and municipal day-carecoverage in Norway. American Journal of Political Science, 46(2), 428–437.
Census of India. 2011. www.censusindia.netChattopadhyay, R., & Duflo, E. (2004). Women as policy makers: Evidence from a Randomized Policy
Experiment in India. Econometrica, 72(5), 1409–1443.Chin, A., & Prakash, N. (2011). The redistributive effects of political reservation for minorities: Evidence
from India. Journal of Development Economics, 96, 265–277.Clots-Figueras, I. (2007). Are Female Leaders Good for Education? Evidence from India. Working Paper
07-73 Economics Series 42, Universidad Carlos III de Madrid.Clots-Figueras, I. (2011). Women in Politics: Evidence from the Indian states. Journal of Public Economics,
95, 664–690.Coffe, H., & Bolzendahl, C. (2010). Same game, different rules? Gender differences in political partici-
pation. Sex Roles, 62(5–6), 318–333.Conley, T. (1996). Econometric Modeling of Cross-Sectional Dependence. Dissertation, University of
Chicago.Conley, T. (1999). GMM estimation with cross-sectional dependence. Journal of Econometrics, 92, 1–45.Constitution of India. (1949). Parts V and VI. http://india.gov.in/govt/constitutions_of_india.phpCrenshaw, K. (1991). Mapping the Margins: Intersectionality, identity politics, and violence against women
of color. Stanford Law Review, 43, 1241–1299.Crost, B., & Kambhampati, U. S. (2010). Political market characteristics and the provision of educational
infrastructure in North India. World Development, 38(2), 195–204.Delaney, L., & O’Toole, F. (2008). Individual, household and gender preferences for social transfers.
Journal of Economic Psychology, 29(3), 348–359.Deshpande, A. (2007). Overlapping identities under liberalization: Gender and caste in India. Economic
Development and Cultural Change, 55(4), 735–760.
N. Halim et al.
123
Author's personal copy

Diamond, I. (1977). Sex roles in the State House. New Haven: Yale University Press.Dreze, J., & Sen, A. (1995). India economic development and social opportunity. Delhi: Oxford University
Press.Dreze, J., & Sen, A. (2002). India: Development and participation (2nd ed.). New York: Oxford University
Press.Duflo, E. (2003). Grandmothers and Granddaughters: Old age pension and intrahousehold allocation in
South Africa. World Bank Economic Review, 17(1), 1–25.Dye, T. R. (1966). Politics, economics and the public: Policy outcomes in the American States. Chicago:
Rand McNally.Dye, T. R. (1969). Income inequality and American state politics. The American Political Science Review,
63(1), 157–162.Dyson, T., & Moore, M. (1983). On Kinship structure, female autonomy, and demographic behavior in
India. Population and Development Review, 9(1), 35–60.Echavarri, R. A., & Ezcurra, R. (2010). Education and gender bias in the sex ratio at birth: Evidence from
India. Demography, 47(1), 249–268.Edlund, L., Haider, L., & Pande, R. (2005). Unmarried parenthood and redistributive politics. Journal of
European Economic Association, 3(1), 95–119.Edlund, L., & Pande, R. (2001). Why Have women become left-wing? The political gender gap and the
decline in marriage. Quarterly Journal of Economics, 117, 917–961.Franceschet, S., & Piscopo, J. M. (2008). Gender quotas and women’s substantive representation: Lessons
from Argentina. Politics and Gender, 4, 393–425.Franke, R. W., & Chasin, B. H. (1994). Kerala: Radical reform as development in an Indian State. Oregon,
USA: Food First Books.Frederick, A. H. (2010). Practicing electoral politics in the cracks: Intersectional consciousness in a Latina
Candidate’s City Council Campaign. Gender and Society, 24, 475–498.Furer-Haimendorf, C. V. (1982). Tribes of India: The struggle for survival. Delhi: Oxford University Press.Galanter, M. (1984). Competing equalities. Law and the backward classes in India. Berkley: University of
California Press.Garcia, D. M., Desmarais, S., Branscombe, N. R., & Gee, S. S. (2005). Opposition to redistributive
employment policies for women: The role of policy experience and group interest. British Journal ofSocial Psychology, 44, 583–602.
Gotell, L., & Brodie, J. (1996). Women and the parties in the 1990s: Less than ever an issue of numbers. InH. G. Thornburn (Ed.), Party politics in Canada (7th ed., pp. 54–71). Scarborough: Prentice Hall.
Greenwald, R., Hedges, L. V., & Laine, R. D. (1996). The effect of school resources on student achieve-ment. Review of Educational Research, 66(3), 361–396.
Hancock, A. M. (2007). When multiplication doesn’t equal quick addition: Examining intersectionality as aresearch paradigm. Perspectives on Politics, 5(1), 63–79.
Hannaway, J., & Woodroffe, N. (2003). Policy instruments in education. Review of Research in Education,27, 1–24.
Hill Collins, P. (2000). It’s all in the family: Intersections of gender, race, and nation. In U. Narayan & S.Harding (Eds.), Decentering the Center: Philosophy for a multicultural, postcolonial, and feministWorld (pp. 156–176). Bloomington: Indiana University Press.
Hughes, M. M., & Paxton, P. (2008). Continuous change, episodes, and critical periods: A framework forunderstanding women’s political representation over Time. Politics and Gender, 4, 233–264.
International Institute for Population Sciences (IIPS). (1995). National Family Health Survey (MCH andFamily Planning), India 1992–93. Bombay: IIPS.
International Institute for Population Sciences (IIPS) and Macro International. (2000). National FamilyHealth Survey (NFHS-2), 1998-99: India. Mumbai: IIPS.
International Institute for Population Sciences (IIPS) and Macro International. (2007). National FamilyHealth Survey (NFHS-3) 2005-06: India. Mumbai: IIPS.
India Development Gateway. (2009). Primary Education. Right to Education. http://www.indg.in/primary-education/policiesandschemes/right-to-education-bill
Jadhav, M. H. (1986). Anti-caste movement in Maharashtra. Economic and Political Weekly, 21, 740–742.Jeffrey, R., & Basu, A. M. (1996). Girls’ schooling, women’s autonomy and fertility change in South Asia.
New Delhi: Sage Publications.Jenkins, L. D. (1999). Competing inequalities: The Struggle over reserved legislative seats for women in
India. International Review of Social History, 44(Supplement), 53–75.Kenworthy, L., & Malami, M. (1999). Gender inequality in political representation: A worldwide com-
parative analysis. Social Forces, 78(1), 235–268.
Women in Politics and Schooling Investments
123
Author's personal copy

Kumar, H., & Somanathan, R. (2009). Mapping Indian Districts Across Census Year, 1971-2001. WorkingPaper No. 176. Centre for Development Economics Department of Economics, Delhi School ofEconomics.
Kunovich, S., & Paxton, P. (2005). Pathways to power: The role of political parties in women’s nationalPolitical representation. American Journal of Sociology, 111(2), 505–552.
Library of Congress, Federal Research Division. (2004) Country Profile: India. http://lcweb2.loc.gov/frd/cs/profiles/India.pdf
Loftin, C., & Ward, S. (1983). A spatial autocorrelation model of the effects of population density onfertility. American Sociological Review, 48(1), 121–128.
Lott, J. R., & Kenny, L. W. (1999). Did women’s suffrage change the size and scope of government?Journal of Political Economy, 107, 77–95.
Lundberg, S., Pollak, R. A., & Wales, T. J. (1997). Do husbands and wives pool their resources?: Evidencefrom the United Kingdom Child Benefit. Journal of Human Resources, 32(3), 463–480.
Malhotra, A., & Schuler, S. R. (2005). Women’s empowerment as a variable in international development.In D. Narayan (Ed.), Measuring empowerment: Cross-disciplinary perspectives (pp. 71–88). Wash-ington, D.C.: The World Bank.
McCall, L. (2005). The complexity of intersectionality. Signs, 30(3), 1771–1800.McLendon, M. K., Heller, D. E., & Young, S. P. (2005). State postsecondary policy innovation: Politics,
competition, and the interstate migration of policy ideas. The Journal of Higher Education, 76(4),363–400.
Meenakshisundaram, S. S. (2005). Rural development for Panchayati Raj. In L. C. Jain (Ed.), Decentrali-sation and local governance (pp. 417–433). New Delhi: Longman.
Mehrotra, S. K. (2006). Reforming elementary education in India: A menu of options. International Journalof Educational Development, 26(3), 261–277.
Meyer, J. W., Tyack, D., Nagel, J., & Gordon, A. (1979). Public Education as Nation-building in America:Enrollments and bureaucratization in the American States, 1870–1930. The American Journal ofSociology, 85(3), 591–613.
Miller, B. D. (1989). Changing patterns of juvenile sex rations in rural India, 1961 to 1971. Economic andPolitical Weekly, 24(22), 1229–1236.
Miller, G. (2008). Women’s suffrage, political responsiveness, and child survival in American history.Quarterly Journal of Economics, 123(3), 1287–1327.
Mishra, R. C. (2000). Role of women in legislatures in India: A Study. New Delhi: Anmol Publications.Moghadam, V. M. (1991). The reproduction of gender inequality In Muslim societies—A case-study Of Iran
in the 1980s. World Development, 19(10), 1335–1349.Mohanty, B. (1995). Panchayati Raj, 73rd Constitutional Amendment and Women. Economic and Political
Weekly, 30(52), 3346–3350.Munshi, K., & Rosenzweig, M. (2008). The efficacy of parochial politics: caste, commitment, and com-
petence in Indian local governments. Working Paper No. 14335. National Bureau of EconomicResearch.
Murthi, M., Guio, A. C., & Dreze, J. (1995). Mortality, Fertility, and Gender Bias in India: A District-LevelAnalysis. Population and Development Review, 21(4), 745–782.
National Portal Content Management Team. (2009). Education Guarantee Scheme and Alternative andInnovative Education. http://india.gov.in/sectors/education/education_guarantee.php
Omvedt, G. (1993). Dalits and the democratic revolution: Dr Ambedkar and the dalit movement in ColonialIndia. New Delhi: Sage Publishers.
Pal, S., & Ghosh, S. (2008). The Elite and the Marginalised: An Analysis of Public Spending on MassEducation in the Indian States, IZA Discussion Paper No. 3707, Bonn, Institute for the Study of Labor.
Pande, R. (2003). Can mandated political representation increase policy influence for disadvantagedminorities? American Economic Review, 93(4), 1132–1151.
Paxton, P., Hughes, M. M., & Green, J. L. (2006). The international women’s movement and women’spolitical representation, 1893–2003. American Sociological Review, 71(6), 898–920.
Paxton, P., & Kunovich, S. (2003). Women’s political representation: The importance of ideology. SocialForces, 82(1), 87–113.
Paxton, P., Kunovich, S., & Hughes, M. M. (2007). Gender in Politics. Annual Review of Sociology, 33,263–284.
Phillips, A. (1998). The Politics of Presence. Oxford: Clarendon Press.Pundir, J. K., & Singh, P. (2002). Women legislators in UP: Background, emergence and role. Economic and
Political Weekly, 37(1), 923–928.Randall, V. (2006). Legislative gender quotas and Indian exceptionalism: The travails of the women’s
reservation bill. Comparative Politics, 39(1), 63–82.
N. Halim et al.
123
Author's personal copy

Ratnam, K. Y. (2008). The Dalit Movement and Democratization in Andhra Pradesh. Working Paper 13.East-West Center Washington.
Renzulli, L. A., & Roscigno, V. J. (2005). Charter school policy, implementation, and diffusion across theUnited States. Sociology of Education, 78, 344–366.
Richter, L. K. (1990). Exploring theories of female leadership in South and Southeast Asia. Pacific Affairs,63(4), 524–540.
Roy, A., Kamaiah, B., & Rao, M. G. (2000). Educational expenditure of large states—A normative view.Economic and Political Weekly, 35(17), 1465–1469.
Rubalcava, L., Teruel, G., & Thomas, D. (2009). Investments, time preferences, and public transfers paid towomen. Economic Development and Cultural Change, 57(3), 507–538.
Saidel, J. R., & Loscocco, K. (2005). Agency leaders, gendered institutions, and representative bureaucracy.Public Administration Review, 65(2), 158–170.
Sanyal, K. (2008). Legislative brief: The Constitution (One Hundred and Eighth Amendment) Bill, 2008.PRS Legislative Brief.
Schwindt-Bayer, L. A. (2006). Still Supermadres? Gender and the policy priorities of Latin AmericanLegislators. American Journal of Political Science, 50(3), 570–585.
Schwindt-Bayer, L. A. (2011). Women who win: Social backgrounds, paths to power, and political ambitionin Latin American legislatures. Politics & Gender, 7(1), 1–33.
Sen, A. (2005). The argumentative Indian: Writings on Indian history, culture and identity. New York:Picador.
Srinivas, M. N. (1957). Caste in Modern India. The Journal of Asian Studies, 16(4), 529–548.Stevenson, L. S. (1999). Gender politics in the Mexican Democratization process: Electing women and
legislating sex crimes and affirmative Action, 1988–97. In J. Domınguez & A. Poire (Eds.), TowardsMexico’s democratization: Parties, campaigns, elections and public opinion (pp. 57–87). New York:Routledge Press.
Stryker, S. 1980. Symbolic Interactionism: A Social Structural Version. Menlo Park, CA: BenjaminCummings.
Svaleryd, H. (2009). Women’s representation and public spending. European Journal of Political Economy,25(2), 186–198.
Thapar, S. (1993). Women as activists; women as symbols: A Study of the Indian Nationalist Movement.Feminist Review, 44, 81–96.
The Hindu. (2014). Women’s bill: An idea whose time is yet to come in LS. http://www.thehindu.com/news/national/womens-bill-an-idea-whose-time-is-yet-to-come-in-ls/article5713978.ece. Retrieved onNovember 01, 2014.
Thomas, D. (1990). Intra-household resource allocation: an inferential approach. Journal of HumanResources, 25(4), 635–664.
Thomas, S. (1991). The impact of women on state legislative policies. Journal of Politics, 53, 958–976.Thomas, S. (1994). How women legislate. New York: Oxford University Press.Thomas, D. (1997). Incomes, expenditures and health outcomes: Evidence on intrahousehold resource
allocation. In L. Haddad, J. Hoddinott, & H. Alderman (Eds.), Intrahousehold resource allocation indeveloping countries: Models, methods, and policy (pp. 142–164). Baltimore: Johns Hopkins Press.
Thomas, S., & Welch, S. (1991). The Impact of gender on activities and priorities of State Legislators. TheWestern Political Quarterly, 44(2), 445–456.
United Nations Children’s Fund [UNICEF]. (2011). Using the district information system for education topromote equity in education. Briefing Paper Series: Innovations, lessons, and good practices. NewDelhi: UNICEF.
Wangnerud, L. (2002). Testing the politics of presence: Women’s representation in the Swedish Riksdag.Scandanavian Political Studies, 23(1), 67–91.
Wu, K. B., Goldschmidt, P., Boscardin, C. K., & Azam, M. (2007). Girls in India: Poverty, location, andsocial disparities. In M. Lewis & M. Lockheed (Eds.), Exclusion, gender and education: Case studiesfrom the Developing World (pp. 119–143). Washington, D.C.: Center for Global Development.
Zhou, X. G., Moen, P., & Tuma, N. B. (1998). Educational stratification in urban China: 1949-94. Sociologyof Education, 71(3), 199–222.
Women in Politics and Schooling Investments
123
Author's personal copy