Women’s Employment after Childbirth
31
Women’s Employment after Childbirth Marcela C. Perticara Claudia Sanhueza Universidad Alberto Hurtado / Ilades-Georgetown Master in Economics Program Version: Junio 2010 Abstract This paper explores the dynamics of female employment decisions around childbearing using longitudinal data from the 2002-2006 Chilean Social Protection Survey (Encuesta de Protección Social, EPS). The study evaluates how the birth of a child can affect the woman’s decision to work. The results indicate that the hazard of leaving employment is high for women during the first year of their newborn child. The mother of a newborn child could be 3 times more likely to leave employment. Even after exhausting maternity leave (12 weeks), women still face a high risk of leaving employment. When the child is three month old women still face a 40-50% higher risk of leaving employment, but the risk tends to disappear after the child is more than one year old. These results could be interpreted as maternal leave laws are delaying the decision of some women of quitting their employment after giving birth. Moreover, these effects get magnified for women who are entitled to maternity benefits. For women without maternity benefits the risk of leaving employment is high right after the birth, but this effects disappears quickly. For women with maternity benefits we find de opposite. The risk of leaving employment remains pretty high (70-80%) during the first and second year of the child. The introduction of individual effects and employment history variables reveal the persistence of two contrasting labor force patterns among women. As the actual labor experience increases, the probability of entering an inactivity period decreases. Additionally, the greater the number of years a woman remained inactive in the past, the greater the probability of re-entering an inactivity period. In the voluntary transitions model, past inactivity periods have a smaller effect on the probability of leaving employment. We interpret this results as a possible indication of an important penalization by the labor market, in terms of employment opportunities after prolonged periods of inactivity. Keywords: Fertility; Childcare; Motherhood; Mothers; Participation; Women. Jel-codes: J13, J62, J63 Special thanks to Secretaría de Previsión Social (Chile) for their collaboration in allowing the use of the 2002- 2006 Social Protection Survey for the preparation of this study. Claudio Agostini, Dante Contreras, Osvaldo Larrañaga made very enlightening comments to an earlier version of this paper. Contact information: Marcela Perticará ([email protected]) or Claudia Sanhueza ([email protected]), Erasmo Escala 1835, Ph: (56-2) 889-7356 Fax: (56-2) 692-0303.
-
Upload
independent -
Category
Documents
-
view
2 -
download
0
Transcript of Women’s Employment after Childbirth

Women’s Employment after Childbirth
Marcela C. Perticara
Claudia Sanhueza
Universidad Alberto Hurtado / Ilades-Georgetown Master in Economics Program
Version: Junio 2010
Abstract
This paper explores the dynamics of female employment decisions around childbearing using
longitudinal data from the 2002-2006 Chilean Social Protection Survey (Encuesta de Protección
Social, EPS). The study evaluates how the birth of a child can affect the woman’s decision to work.
The results indicate that the hazard of leaving employment is high for women during the first year of
their newborn child. The mother of a newborn child could be 3 times more likely to leave
employment. Even after exhausting maternity leave (12 weeks), women still face a high risk of
leaving employment. When the child is three month old women still face a 40-50% higher risk of
leaving employment, but the risk tends to disappear after the child is more than one year old. These
results could be interpreted as maternal leave laws are delaying the decision of some women of
quitting their employment after giving birth. Moreover, these effects get magnified for women who
are entitled to maternity benefits. For women without maternity benefits the risk of leaving
employment is high right after the birth, but this effects disappears quickly. For women with
maternity benefits we find de opposite. The risk of leaving employment remains pretty high (70-80%)
during the first and second year of the child. The introduction of individual effects and employment
history variables reveal the persistence of two contrasting labor force patterns among women. As the
actual labor experience increases, the probability of entering an inactivity period decreases.
Additionally, the greater the number of years a woman remained inactive in the past, the greater the
probability of re-entering an inactivity period. In the voluntary transitions model, past inactivity
periods have a smaller effect on the probability of leaving employment. We interpret this results as a
possible indication of an important penalization by the labor market, in terms of employment
opportunities after prolonged periods of inactivity.
Keywords: Fertility; Childcare; Motherhood; Mothers; Participation; Women.
Jel-codes: J13, J62, J63
Special thanks to Secretaría de Previsión Social (Chile) for their collaboration in allowing the use of the 2002-
2006 Social Protection Survey for the preparation of this study. Claudio Agostini, Dante Contreras, Osvaldo
Larrañaga made very enlightening comments to an earlier version of this paper. Contact information: Marcela Perticará ([email protected]) or Claudia Sanhueza
([email protected]), Erasmo Escala 1835, Ph: (56-2) 889-7356 Fax: (56-2) 692-0303.

2
1. Introduction
The relationship between female labor market participation and fertility has received massive
attention in the economic literature. Most of fertility research focused on the study of
differences on labor market participation of women with and without children or with total
number of children. Some recent developments use instrumental variables for total number
of children to identify the causal effect of family size on women labor market participation.
Instead, in this paper we study the dynamic effect of a birth event on female labor market
employment.
Using a monthly longitudinal dataset of more than 5,000 women we study the labor market
participation of women before and after the birth of a child. The primary objective is to
evaluate how the birth of a child can affect the woman’s decision to work, controlling for
women attachment to the labor market. To capture the effects of individual preferences
playing a role on the woman’s attachment to the labor market and the effect of other non-
varying omitted variables, the model developed includes a time-invariant individual effect.
Furthermore, pre-labor experience variables control for the effect of the individual’s intrinsic
(time varying) attachment to the labor market and ensure the consistent estimation of the
effect of the family structure variables on the current employment status. We observe women
that have been in the labor market for one month up to 26 years. In addition, we compare the
dynamic effect of fertility on employment dynamics comparing women that are entitled to
receive maternal benefits with those that are not entitled.

3
Chile exhibits a participation rate significantly lower than the regional average. Countries
such as Argentina, Colombia, Uruguay and Bolivia have achieved a greater insertion of
women in the labor market. Despite this fact, during the period of 1990–2006, the female
labor force participation increased in Chile from 34.8% to 46.3%1. In particular, the labor
force participation rate has gown from 23% to 37.4% among women with small children
(less than one year-old, and 43.8% to 61.8% among women without children. These changes,
however, have not been strong enough for the country’s participation rate to be at par with
those of the developed economies, and inclusively with those of many Latin American
countries.
Individual preferences can certainly play a fundamental role when explaining the scarce
labor force attachment of the woman in Chile. Contreras and Plaza (2004) find that male
chauvinistic behavior has a negative and significant effect on the decision of participating in
the labor market. Even more, the negative effect of such variables more than double the
positive effect of the human capital variables. The empirical evidence, found in this paper, is
consistent with the theoretical papers of Vendrik (2003) and Neubourg and Vendrik (1994)
and with the empirical results found by Fernández et al. (2004), Antecol (2003), Antecol and
Bedard (2002) and Chuang and Lee (2003). The cultural perception of the woman’s role in
the family is clearly related to her fertility rate, which in turn affects her decision to
participate in the labor market. Additionally, the labor supply of low-income females might
be particularly affected by maternity benefits and the limited supply of (formal) childcare
along with an excessive compression in the wage structure.
1 National Employment Survey, INE.

4
For example, some papers find a positive relationship between labor force participation and
maternity leave duration (M. Baker y K. Milligan, 2005, S. Burgess et al., 2008, C. R.
Winegarden y P. M. Bracy, 1995). Baker and Millingan (2005) exploiting an the expansion
of job-protected maternity leave in Canada, find that maternity leave reduces the proportion
of women quitting their jobs and increase the probability of returning to their pre-births
employers. Burgess et al. (2008) using UK data find that women who are entitle to maternity
rights are more likely to return to their pre-birth job before seven months. Low skill workers
tend to exhaust their paid maternity leave, while managerial and professional women tend
extend their leave until the expiration of their unpaid leave. Abe et. al (1998) and Ronsen and
Sundstrom (1996) find qualitatively similar results for United States, Japan and UK.
In Chile, various studies find that there is a decreasing relationship between labor force
participation and the number of children in the family, both the total number of children as
well as those under the age of 5 years (D. Contreras et al., 1999, A. Mizala et al., 1999)2.
However, the results found do not necessarily indicate that the number of children negatively
affects the female labor supply in Chile. The number of children in the family can also be
associated with the family model adopted. Additionally, the models may contain omitted
variables, which affect the decisions of fertility, as well as those of labor supply. Due to the
correlation between the family structure variables and the error term in the participation
equation, not only are the estimated coefficients of these variables biased, but also the
estimates of the labor supply parameters. By studying the same women before and after the
birth we can face the problems in the ongoing literature.

5
The following section presents the empirical model to be estimated. Section 3 describes the
data and examines the mobility patterns between the different employment statuses for both
men and women. In particular, the labor force participation and the employment patterns for
women are compared using data from the 2006 EPS and the 2006 CASEN Survey. Section 4
analyzes the main results of the estimation and finally section 5 concludes.
2. Data and models to be estimated
The purpose of this paper is to examine the determinants of the woman’s decision to enter an
inactivity period. In particular, we study the determinant of the transition from employment
to out of the employment, from employment to inactivity and from employment to voluntary
inactivity. The woman’s decision to quit working is modeled as a function of human capital
variables (schooling), employment history variables, such as actual labor experience, years
of employment at job, and history of unemployment and inactivity periods, and family
structure variables, such as the number and age of the children and marital status.
To undertake the analysis, we use the 2002-2006 Social Protection Survey. This survey
contains information on complete and incomplete periods of employment, inactivity and
unemployment for each individual interviewed. In 2002, individuals were questioned on all
periods of unemployment, inactivity and employment held from 1980 onwards. In 2004,
individuals were questioned on all periods of unemployment, inactivity and employment
held from 2002 to 2004 and the survey included new individuals who were asked their
2 According to the data from the 2006 CASEN Survey the labor participation rate of a woman, with no children
is 61.8%, while that of a woman, with a child younger than 12 months, is 37.4%.

6
individual labor market history from 1980 onwards. In 2006, all individuals were asked
about their labor market history from 2004 to 2006. Since we do not observe labor history of
women before 1980 we restrict our sample to women who were under 50 years old in 2006
who were aged over 24 in 1980. The final sample contains information on 22,256
employment events for 5,513 women.
The information on complete and incomplete periods of labor activity and on the type of
labor market transition experienced by the individual allow us to study the entry to inactivity
periods in a continuous event-history framework. The hazard function ))(;( tZth ii for worker i
at time t will be assumed to take the proportional hazard form:
(1) ))(exp()())(;( 0 tZttZth iiii
where
h i takes the value 1 if the individual stops working and enters an inactivity period,
and assumes the value 0 if the individual continues employed,
0(t) is the baseline hazard
function, )(tZi is a vector of variables that can or cannot vary in time for worker i at time t,
and is a vector of parameters to be estimated. Additionally, we consider a second model
in which
h i takes the value 1 if she enters voluntarily an inactivity period, 0 if she continues
employed . In the latter model, the decision of leaving the job is not influenced by a layoff or
by reasons unknown to the worker. Antel (1986, 1988), Moore et al. (1998) and McLaughlin
(1990, 1991), among others, find that it pays off to distinguish between voluntary and
involuntary labor market movements, even when this information is self-reported.

7
The model assumes that the probability of entering an inactivity period is a function of the
continuous employment time t (that measures the attachment to the labor market and/or the
acquisition of current labor experience), but it is also a function of the individual’s
characteristics, and the employment and family histories included in Z.
The likelihood function to be maximized depends on the assumptions made on the baseline
function )(0 t . The baseline function can be assigned a parametric form or it can be left
unspecified (non-parametric estimation). In our case we choose to model the baseline
function following a Weibull distribution,
(2) 1
0 )( pptt
If the parameter p is less than one, the hazard of entering an inactivity period is decreasing in
the continuous employment time; while if it is greater than one, the hazard of entering an
inactivity period is increasing in employment time.
When individuals have more than one event, the likelihood function of the complete
employment history would consist of the sum of the likelihood functions of each event.
Additionally, the model assumes an individual effect i , which captures the particular tastes
of an individual with respect to employment. An individual, with less attachment to the labor
market than the average worker, would have i greater than one, while an individual, with
greater attachment to the labor market, would have i less than one. In order to check for
8
robustness, this random effect is parameterized as both following a Gamma and an inverse
Gaussian distribution.
The variables of interest in this model are those related to family structure. The set of family
structure variables essentially consists of the history of childbirths. We also include monthly
dummies to highlight the characteristics of maternal benefits in Chile. Maternal benefits in
Chile entitled paid leave for 18 weeks (6 weeks before birth and 12 weeks after it) and paid
leave if the child is sick until he is one year old. Additionally, women have the right to two
half-hours a day for breastfeeding. Companies with 19 or more female workers have to
provide free daycare to women until their child turns two years old. In particular, we are
interested in analyzing whether these maternity benefits might delay women’s exit of
employment.
For this reason, we construct the following dummy variables. The variable “month of births”
equals one for the month a women experience a birth, zero otherwise. The variable “month
2-3” equals one while the child is two to three months old (until the worker exhaust his
maternity leave), zero otherwise. We also have dummy variables for months 4-12 (paid leave
for a sick child) and for months 13 to 24 (some women are entitled to free day care). Finally
we add a continuous variable that counts months after maternity benefits are exhausted. We
interact these variables with a dummy variable that equals to one whenever a women is
entitled to receive maternity benefits3.
3 In Chile women are entitled to maternity benefits if: (a) they are salaried workers and they have been affiliated
to the pension system for at least six months; (b) they are independent workers and they have been affiliated to
the pension system for 12 months. The company provided free-day care is only for women working in firms
with more than 19 female workers. We do no have controls for this eligibility.
9
Other control variables to be included in the model are: years of schooling, age and
employment history variables, such as years of actual pre-labor experience, years of
inactivity and of unemployment since 1980, dummies for the presence of other small
children in the household and dummies for different economic sectors.
Two conditions adopted in the model will adequately identify the childbirth effect. One is the
inclusion of a individual effect, which potentially captures the effects of the cultural factors
playing a role on the woman’s attachment to the labor market and the effect of other non-
varying omitted variables. The other is the inclusion of employment history variables (pre-
labor experience). As reported by Duleep and Sanders (1994), Dex et al. (1998) and
Nakamura and Nakamura (1996, 1994), the use of pre-labor experience variables makes it
possible to control for the individual’s intrinsic (time varying) attachment to the labor market
and to consistently estimate the effect of the family structure variables on the current
employment status. Furthermore, it is not necessary to have a long employment history.
Having information on relatively recent labor experience is sufficient to consistently estimate
the parameters of the dynamic labor supply model (Nakamura, 1994; 1996).
The employment history of the individual is reflected in the model by means of the time
variable in equation (1), as well as through the variables that record the individual’s
employment history prior to the beginning of each employment period. The employment
history is characterized by years of experience and years of inactivity. All models are
estimated with and without year effects, in order to control for labor market conditions.

10
One drawback of this dataset is that variables related to the spouses’ presence are not well
defined in this dataset. In the first two waves of EPS individuals were asked to report
information on the year of marriage (or the year the couple began living together) and
whether the individual ended the relationship (EPS 2002) or became widowed or divorced
(EPS 2004), but these surveys didn’t include information about the date of separation or the
date of death of the partner. It wasn’t until EPS 2006 when they began asking in which year
the relationship ended. Therefore we only will observe complete marital histories for three
specific groups: (i) women who have been continuously single; (ii) women who only have
had one couple and they are still together in 2006; (iii) more recent couples, whose
information is reported in 2006.
In order to deal with this problem, we could explore different options. We could estimate the
model with an imputed marital status variable, assuming that a relationship does not end until
the next relationship starts or until the individual reports its end. In this base model (Model I)
we include a fuzzy dummy variable that flags the existence of a partner or and spouse
present. In Model II, we only include women with complete marital status histories, that is,
women identified in the different groups specified in the previous paragraph.
Self-reported employment histories go back only to the beginning of 1980. For this reason,
all the estimates are presented for men and women who were under 50 in 2006. This decision
is justified by the consideration that respondents over 50 (in 2006) were aged over 24 in
1980, the assumption accordingly being that their work histories are underreported.

11
3. Data. Patterns of Female Labor Market Mobility
The 2006 Social Protection Survey reports information on about 16,000 individuals, of
which half of them are women. As we explained in the previous section, we only consider
women under 50 in 2006, so we end up with a sample of 5,513 individuals. Preliminary
studies conducted by the Superintendencia de Administradoras de Fondos de Pensiones4
reveal that the density of the contributions reported by the EPS are similar to those obtained
from their administrative records5. Hence, this database seems to be reliable for studying
continuous employment periods.
Table 1 reports basic descriptive statistics of the final sample used in this study.
INSERT TABLE 1
Graph 1 shows the proportion of women that are inactive in year t, conditional that they were
employed in year t-1, compared to men in the same condition.
INSERT GRAPH 1
Table 2 reports statistics on the duration of employment, unemployment and inactivity
periods for both men and women considered in the sample. In general, it is observed that
women have shorter median duration of employment periods (with the same employer) than
men.
4 This agency regulates the Administrators of Pension Funds.
5 The SAPF has a data set with the provisional history of a sample of individuals affiliated to the system.
12
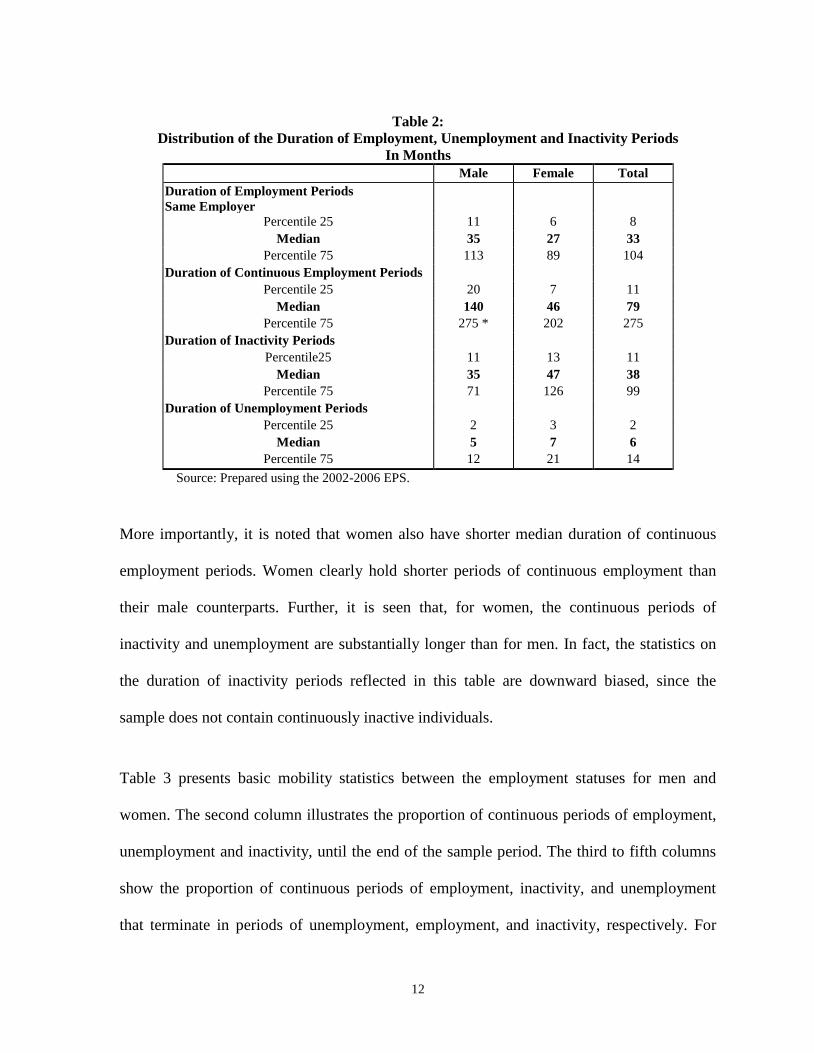
Table 2:
Distribution of the Duration of Employment, Unemployment and Inactivity Periods
In Months
Male Female Total
Duration of Employment Periods
Same Employer
Percentile 25 11 6 8
Median 35 27 33
Percentile 75 113 89 104
Duration of Continuous Employment Periods
Percentile 25 20 7 11
Median 140 46 79
Percentile 75 275 * 202 275
Duration of Inactivity Periods
Percentile25 11 13 11
Median 35 47 38
Percentile 75 71 126 99
Duration of Unemployment Periods
Percentile 25 2 3 2
Median 5 7 6
Percentile 75 12 21 14
Source: Prepared using the 2002-2006 EPS.
More importantly, it is noted that women also have shorter median duration of continuous
employment periods. Women clearly hold shorter periods of continuous employment than
their male counterparts. Further, it is seen that, for women, the continuous periods of
inactivity and unemployment are substantially longer than for men. In fact, the statistics on
the duration of inactivity periods reflected in this table are downward biased, since the
sample does not contain continuously inactive individuals.
Table 3 presents basic mobility statistics between the employment statuses for men and
women. The second column illustrates the proportion of continuous periods of employment,
unemployment and inactivity, until the end of the sample period. The third to fifth columns
show the proportion of continuous periods of employment, inactivity, and unemployment
that terminate in periods of unemployment, employment, and inactivity, respectively. For

13
women, it is observed that 55% of the continuous employment events end in inactivity
periods, while 92% of the inactivity periods end in employment periods. The table further
indicates that women are more inclined to retire from the labor market than their male
colleagues. There is a greater probability for the employment periods held by men to
terminate in unemployment periods.
Table 3:
Persistence in the Employment Status by Sex
Type of Event % Events
Continuing in 2006
% Events Terminate in Periods of
Unemployment Employment Inactivity
Men
Unemployment 15.0 98.1 1.8
Employment 53.6 77.6 22.4
Inactivity 17.7 12.2 87.8
Women
Unemployment 18.9 96.1 3.8
Employment 37.9 44.7 55.3
Inactivity 27.1 7.3 92.7
Source: Prepared using the 2002- 2006 EPS.
4. Results
Tables A-1 to A-6 present the estimation of the different models presented in section 2. As it
was explained, we present models with and without random effects and different sets of
dummy variables in order to control for births and other time variables related to maternal
benefits. In all the models, the variables included are those of employment history, years of
schooling, and family structure. In all the tables, a negative (positive) coefficient will
indicate that this variable reduces (increases) the risk of leaving employment and falling into

14
inactivity. Positive coefficients lead to a hazard ratio greater than one, while negative
coefficients lead to a hazard ratio less than one.
From these tables it can be seen that women who experience a birth have a high risk of
leaving employment. This risk is very high during the first month of the child, and then
decreases but remains positive until the child reaches 12 months. The results are qualitatively
robust across different specifications, although the estimated effects are bigger in the model
of voluntarily transitions.
Table 4 presents a summary of the hazard ratios of entering an inactivity period for the
model that does not control for entitlement to maternity benefits. We only present them for
for the random effect model with inverse gaussian frailty, but the results are very similar
across the different model. In Graph 2 we only present the hazard rates for Model (d) to
illustrate the gradient of the birth effect.
During the first year of the baby the risk of falling into inactivity remains high, but decreases
as the baby ages. Women face a high risk of leaving employment after they exhaust their
maternal leave, but the risk seems to disappear after the child is more than one year old.

15
Table 4:
The Effect of the Birth of a Child on the Probability of Entering an Inactivity Period
- All women – random effect inverse gaussian-
Modelo I Modelo II
(a) (b) (c) (d)
All transitions
Pre-birth 3-month period 2.62 *** 2.63 *** 2.84 *** 2.83 ***
Month Birth 3.19 *** 3.11 *** 2.78 *** 2.72 ***
Month 2-3 1.14 1.13 1.01 1.01
Month 4-12 1.45 *** 1.43 *** 1.33 ** 1.33 **
Month 13-24 1.12 1.11 1.02 1.01
Voluntary transitions
Pre-birth 3-month period 2.48 *** 2.49 *** 2.68 *** 2.68 ***
Month Birth 3.60 *** 3.44 *** 3.68 *** 3.52 ***
Month 2-3 1.52 * 1.50 * 1.32 1.31
Month 4-12 1.87 *** 1.82 *** 1.86 *** 1.82 ***
Month 13-24 1.17 1.13 1.12 1.10
Source: Prepared using the 2002-2006 EPS. Notes: * p<0.05; ** p<0.01;*** p<0.001.
Graph 2:
Relative Hazard after childbirth
0.00 0.50 1.00 1.50 2.00 2.50 3.00 3.50 4.00
Pre-birth 3-month period
Month Birth
Month 2-3
Month 4-12
Month 13-24
Hazard
rate
All transitions Voluntary transitions
Source: Prepared using the 2002-2006 EPS.

16
These results could be consistent with maternal leave laws delaying the decision of some
women of quitting their employment. However this evidence is weak than we expected,
provided that the gradient tends to disappear before women exhaust their benefits. In this
model, however we haven’t controlled for the fact that some women might not quality to
maternity benefits. Table 5 reports these same estimates in the model in which we control for
maternity benefits eligibility, while Graph 3 presents only the results for Model (d). Once we
account for the fact that some women might not qualify for maternity benefits, we still do
find that the risk of leaving employment increases when the child is born or even in the
previous months. But all the other effects disappear for the group of women that might not
be entitled to maternity benefits. Women who are entitled to maternity benefits experience a
higher risk of leaving employment (falling into inactivity) during the first year and second
year of the child. All the hazard ratios in Table 5 are presented relative to the base category
(women that do not experience a birth), but the differences between women with and without
benefits are always statistically significant.
These results could be suggesting that maternity laws are delaying the decision of some women of
quitting their employment after giving birth. But after women exhaust both their maternal paid leave
and sick-child leave, the risk of leaving employment remains high, meaning that women will exit
employment in any case.

17
Table 5:
The Effect of the Birth of a Child on the Probability of Entering an Inactivity Period
- Women with and without benefits – random effect inverse gaussian-
Modelo I Modelo II
(a) (b) (c) (d)
All transitions
Pre-birth 3-month period 2.41 *** 2.45 *** 2.79 *** 2.81 ***
Pre-birth 3-month period for women with MB 2.76 2.74 2.84 2.81
Month Birth 2.45 *** 2.45 *** 2.06 ** 2.05 **
Month birth for women with MB 3.92 3.76 3.57 3.45
Month 2-3 0.69 0.70 0.59 ** 0.60 *
Month 2-3 for women with MB 1.54 *** 1.51 ** 1.43 *** 1.41 **
Month 4-12 1.08 1.09 0.96 0.97
Month 4-12 for women with MB 1.86 *** 1.81 *** 1.79 *** 1.76 ***
Month 13-24 0.81 0.81 * 0.75 * 0.75 *
Month 13-24 for women with MB 1.47 *** 1.44 *** 1.33 *** 1.31 ***
Voluntary transitions
Pre-birth 3-month period 2.35 ** 2.38 ** 2.81 *** 2.84 ***
Pre-birth 3-month period for women with MB 2.55 2.55 2.58 2.57
Month Birth 2.33 * 2.29 * 2.34 * 2.28 *
Month birth for women with MB 4.56 4.31 4.78 4.53
Month 2-3 0.83 0.83 0.69 0.70
Month 2-3 for women with MB 2.08 * 2.02 * 1.90 * 1.86 *
Month 4-12 1.16 1.15 1.10 1.09
Month 4-12 for women with MB 2.52 *** 2.42 *** 2.60 *** 2.54 **
Month 13-24 0.84 0.82 0.79 0.78
Month 13-24 for women with MB 1.48 ** 1.42 * 1.46 * 1.41 *
Source: Prepared using the 2002-2006 EPS. Notes: * p<0.05; ** p<0.01;*** p<0.001.
MB: Maternity benefits.

18
Graph 3:
Relative Hazard after childbirth for women with and without maternal benefits
A- All transitions
0.00 0.50 1.00 1.50 2.00 2.50 3.00 3.50 4.00
Pre-birth 3-month period
Month Birth
Month 2-3
Month 4-12
Month 13-24
Hazard
rate
No Benefits With benefits
B- Voluntary transitions
0.00 0.50 1.00 1.50 2.00 2.50 3.00 3.50 4.00
Pre-birth 3-month period
Month Birth
Month 2-3
Month 4-12
Month 13-24
Hazard
rate
No Benefits With benefits
Source: Prepared using the 2002-2006 EPS.
19
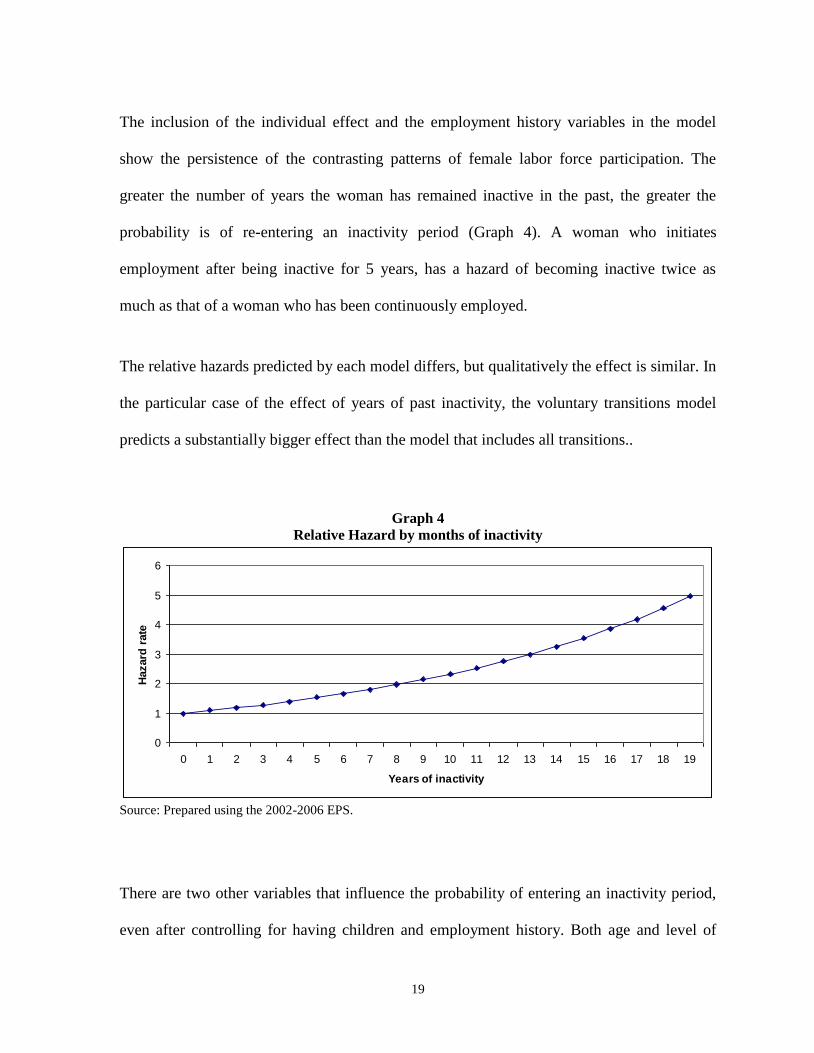
The inclusion of the individual effect and the employment history variables in the model
show the persistence of the contrasting patterns of female labor force participation. The
greater the number of years the woman has remained inactive in the past, the greater the
probability is of re-entering an inactivity period (Graph 4). A woman who initiates
employment after being inactive for 5 years, has a hazard of becoming inactive twice as
much as that of a woman who has been continuously employed.
The relative hazards predicted by each model differs, but qualitatively the effect is similar. In
the particular case of the effect of years of past inactivity, the voluntary transitions model
predicts a substantially bigger effect than the model that includes all transitions..
Graph 4
Relative Hazard by months of inactivity
0
1
2
3
4
5
6
0 1 2 3 4 5 6 7 8 9 10 11 12 13 14 15 16 17 18 19
Years of inactivity
Hazard
rate
Source: Prepared using the 2002-2006 EPS.
There are two other variables that influence the probability of entering an inactivity period,
even after controlling for having children and employment history. Both age and level of

20
education, significantly influence the probability of retiring from the labor market6. The base
category is defined as the 15-year old individuals. There are no fertile cycle effects, since
there are controls for the presence of children in the household and for employment history
variables. The hazard of entering an inactivity period decreases monotonically with age.
Graph 5:
Relative Hazard by Age
0
0.2
0.4
0.6
0.8
1
1.2
20 21 22 23 24 25 26 27 28 29 30 31 32 33 34 35 36 37 38 39 40 41 42 43 44 45 46 47 48 49 50
Age
Hazard
rate
Source: Prepared using the 2002-2006 EPS.
6 At some point we included quadratic terms for preexperience and education. The results were robust to these
changes. We only left the quadratic term for age.

21
The human capital variables also reveal a strong trend to remain in the labor market, as is
predicted by the dynamic theories of labor supply. A woman holding a university education
will enter an inactivity period with a substantially lower probability than a woman holding an
incomplete primary education (Figure 4).
Figure 4:
Relative Hazard by Years of Schooling
0
0.2
0.4
0.6
0.8
1
1.2
0 1 2 3 4 5 6 7 8 9 10 11 12 13 14 15 16 17
Schooling
Hazard
rate
Source: Prepared using the 2002 EPS.

22
5. Conclusions
There are studies that estimate the effect of the family structure on the female labor supply in
Chile. The estimation of standard labor supply models utilizing cross-sectional databases
have suggested that the presence of children in the household has negative effects on female
labor force participation, while it only marginally affects male labor force participation. In
particular, these studies report that greater effects are produced at the level of participation
rather than at.... A crucial problem encountered when evaluating these results is that family
structure variables depend on the family model adopted or individual preferences, which in
turn also conditions female labor force participation. Considering these issues, the family
structure variables are potentially endogenous.
This paper explores the dynamics of female labor force participation in Chile using
longitudinal data to evaluate how the birth of a child can affect the woman’s decision to
work. It is expected that an individual effect, which does not vary in time, will capture the
effects of individual preferences on the woman’s attachment to the labor market and the
effect of other non-varying omitted variables. Furthermore, pre-labor experience variables
control for the effect of the individual’s intrinsic (time varying) attachment to the labor
market and ensure the consistent estimation of the effect of the family structure variables on
the current employment status.
We find that women face a high risk of leaving employment during the first month following
the birth of their child. For all women we notice that women face a high risk of leaving

23
employment after they exhaust their maternal leave (12 weeks), but the risk seems to
disappear after the child is more than one year old. These results could be seen as maternal
leave laws delaying the decision of some women of quitting their employment. Moreover,
when we make an effort to identify eligibility for maternal women, we find that these effects
only matter for women that are entitled to maternal benefits. For women without maternity
benefits the risk of leaving employment is high right after the birth, but this effects
disappears quickly. For women with maternity benefits we find de opposite. The risk of
leaving employment remains high (70-80%) during the first and second year of the child.
The persistence of the contrasting labor force patterns among women are confirmed when
the individual effect and the employment history variables are considered in the model. As
the actual labor experience increases, the probability of entering an inactivity period
decreases. Additionally, the greater the number of years a woman remained inactive in the
past, the greater the probability is of re-entering an inactivity period. In the voluntary
transitions model, the presence of inactivity periods in the past is less frequent than in the
model that includes all transitions. This can be seen as a possible indication of an important
penalization by the labor market, in terms of employment opportunities.
24
References
Abe, M., et al. "Maternity Leave Policies and Womens Employment after Childbirth:
Evidence from the United States, Britain and Japan." Centre for Analysis of Social
Exclusion, LSE, CASE Papers, 1998.
Antecol, H. "Why is there Cross-Country Variation in Female Labor Force Participation
Rates?. The Role of Male Attitudes Toward Family and Sex Roles," Claremont Colleges
Working Papers, 2003.
Antecol, H. y Bedard, K. "The Decision to Work by Married Immigrant Women: The Role
of Extended Family Households," Claremont College, Working Papers, 2002.
Antel, J. J. "Human Capital Investment Specialization and the Wage Effects of Voluntary
Labor Mobility." Review of Economics and Statistics, 1986, 68(3), pp. 477-83.
____. "Interrelated Quits: An Empirical Analysis of the Utility Maximizing Mobility
Hypothesis." Review of Economics and Statistics, 1988, 70(1), pp. 17-22.
Baker, M. y Milligan, K. "How does job-proetected maternity leave affect mother´s
employment and infant health?," Cambridge: National Bureau of Economic Research
Working Paper, 2005, 59.
Burgess, S., et al. "Maternity Rights and Mothers' Return to Work." Labour Economics,
2008, 15(2), pp. 168-201.
Chuang, H. L. y Lee, H. y. "The Return on Women's Human Capital and the Role of Male
Attitudes toward Working Wives: Gender Roles, Work Interruption, and Women's Earnings
in Taiwan." American Journal of Economics and Sociology, 2003, 62(2), pp. 435-59.
Contreras, D., et al. "Tasa de Participación Femenina: 1957-1997. Un Análisis de Cohortes
Sintéticos," Universidad de Chile, Working Papers, 1999.
Contreras, D. y Plaza, G. "Participación Femenina en el Mercado Laboral Chileno. ¿Cuánto
importan los Factores Culturales?," Encuentro 2004 de la Sociedad de Economía de Chile.
Villa Alemana, Chile, 2004.
de Neubourg, C. y Vendrik, M. "An Extended Rationality Model of Social Norms in
Labour Supply." Journal of Economic Psychology, 1994, 15(1), pp. 93-126.

25
Dex, S. y et al. "Women's Employment Transitions around Child Bearing." Oxford Bulletin
of Economics and Statistics, 1998, 60(1), pp. 79-98.
Duleep, H. O. y Sanders, S. "Empirical Regularities across Cultures: The Effect of Children
on Woman's Work." Journal of Human Resources, 1994, 29(2), pp. 328-47.
Fernandez, R., et al. "Preference Formation and the Rise of Women's Labor Force
Participation: Evidence from WWII," National Bureau of Economic Research Working
Papers, 2004.
McLaughlin, K. J. "General Productivity Growth in a Theory of Quits and Layoffs."
Journal of Labor Economics, 1990, 8(1), pp. 75-98.
____. "A Theory of Quits and Layoffs with Efficient Turnover." Journal of Political
Economy, 1991, 99(1), pp. 1-29.
Mizala, A., et al. "Female Labor Supply in Chile," Documentos de trabajo CEA, 1999.
Moore, M. J., et al. "The Anatomy of Jumps and Falls in Wages," S. W. Polachek, Research
in Labor Economics. London: JAI Press Inc., 1998, 201-32.
Nakamura, A. y Nakamura, M. "An Event Analysis of Female Labor Supply," S. W.
Polachek, Research in Labor Economics. Binghamton: Elsevier, 1996, 353-78.
____. "Predicting Female Labor Supply: Effects of Children and Recent Work Experience."
Journal of Human Resources, 1994, 29(2), pp. 302-27.
Vendrik, M. C. M. "Dynamics of a Household Norm in Female Labour Supply." Journal of
Economic Dynamics and Control, 2003, 27(5), pp. 823-41.
Winegarden, C. R. y Bracy, P. M. "Demographic Consequences of Maternal-Leave
Programs in Industrial Countries: Evidence from Fixed-Effects Models." Southern Economic
Journal, 1995, 61(4), pp. 1020-35.

Table A-1
Estimated Results. Model without random effect and without entitlement to maternity leave variable
All transitions into inactivity Only voluntary transitions into inactivity
Model I Model I Model II Model II Model I Model I Model II Model II
No Pre-experience -0.7034 *** -0.6255 *** -0.7411 *** -0.6728 *** -0.3432 *** -0.2421 *** -0.4053 *** -0.3115 ***
Years of pre-experience -0.0014 -0.0043 -0.0065 -0.0079 0.0046 0.0006 -0.0019 -0.0037
Schooling -0.0647 *** -0.0691 *** -0.0630 *** -0.0673 *** -0.0103 -0.0149 * -0.0107 -0.0159
Pre-birth 3-month period 0.9623 *** 0.9595 *** 1.0512 *** 1.0438 *** 0.9225 *** 0.9190 *** 1.0092 *** 1.0025 ***
Month Birth 0.9874 *** 0.9815 *** 0.8881 *** 0.8797 *** 1.0905 *** 1.0659 *** 1.1432 *** 1.1172 ***
Month 2-3 -0.0376 -0.0331 -0.1488 -0.1426 0.2350 0.2302 0.1013 0.1017
Month 4-12 0.1859 ** 0.1843 ** 0.1486 0.1503 0.3747 *** 0.3609 *** 0.3919 *** 0.3873 ***
Month 13-24 0.0052 -0.0068 -0.0614 -0.0708 0.0022 -0.0256 -0.0278 -0.0533
Total months since birth -0.0017 *** -0.0018 *** -0.0023 *** -0.0023 *** -0.0024 ** -0.0026 *** -0.0026 ** -0.0027 **
Has partner 0.5358 *** 0.5207 *** 0.6157 *** 0.6065 *** 0.6569 *** 0.6502 *** 0.7315 *** 0.7145 ***
Age -0.2526 *** -0.2849 *** -0.2551 *** -0.2899 *** -0.2888 *** -0.3241 *** -0.2913 *** -0.3303 ***
Age sq. 0.0030 *** 0.0035 *** 0.0030 *** 0.0036 *** 0.0036 *** 0.0041 *** 0.0036 *** 0.0042 ***
Years of inactivity 0.0741 *** 0.0648 *** 0.0698 *** 0.0619 *** 0.0712 *** 0.0575 *** 0.0680 *** 0.0557 ***
Entitled to maternity leave = 1 -0.3410 *** -0.3265 *** -0.3631 *** -0.3487 *** -0.5040 *** -0.4799 *** -0.5531 *** -0.5320 ***
Total kids -0.0230 -0.0084 0.0192 0.0297 -0.0653 ** -0.0366 -0.0442 -0.0173
Year effects Yes Yes Yes Yes
Constant 3.2267 *** 2.6980 *** 3.3099 *** 2.9416 *** 1.8382 *** 1.4437 *** 1.9816 *** 1.7756 ***
ln p -0.2017 *** -0.2164 *** -0.2075 *** -0.2180 *** -0.0214 -0.0388 -0.0238 -0.0349
P 0.8173 0.8054 0.8126 0.8042 0.9788 0.9619 0.9765 0.9657
Source: Prepared using the 2002-2006 EPS.
Notes: * p<0.05; ** p<0.01;*** p<0.001; Model I, with fuzzy control for presence of partner; Model II, only women with known marital history.
Other controls introduced in some of the models but not reported here: year effects; economic sector dummies (agricultural, industrial, etc.); presence of
other small children, by age.
27
Table A-2
Estimated Results. Model with random effect (gamma distribution) and without entitlement to maternity leave
variable
All transitions into inactivity Only voluntary transitions into inactivity
Model I Model I Model II Model II Model I Model I Model II Model II
No Pre-experience -1.1002 *** -1.0231 *** -1.1345 *** -1.0850 *** -0.4232 *** -0.2900 *** -0.4875 *** -0.3824 ***
Years of pre-experience -0.0442 *** -0.0529 *** -0.0477 *** -0.0546 *** -0.0126 -0.0251 -0.0186 -0.0265
Schooling -0.0859 *** -0.1012 *** -0.0793 *** -0.0923 *** -0.0036 -0.0075 -0.0041 -0.0093
Pre-birth 3-month period 0.9334 *** 0.9313 *** 1.0190 *** 1.0112 *** 0.9123 *** 0.9052 *** 0.9946 *** 0.9806 ***
Month Birth 1.0668 *** 1.0600 *** 0.9462 *** 0.9325 *** 1.1262 *** 1.1136 *** 1.1608 *** 1.1394 ***
Month 2-3 0.0760 0.0945 -0.0490 -0.0327 0.2823 0.3048 0.1389 0.1597
Month 4-12 0.2915 *** 0.3063 *** 0.2166 * 0.2279 ** 0.4367 *** 0.4576 *** 0.4377 *** 0.4530 ***
Month 13-24 0.0761 0.0713 -0.0192 -0.0241 0.0451 0.0381 0.0042 -0.0040
Total months since birth -0.0022 *** -0.0024 *** -0.0028 *** -0.0029 *** -0.0027 ** -0.0031 *** -0.0028 ** -0.0030 **
Has partner 0.7344 *** 0.7471 *** 0.8203 *** 0.8367 *** 0.7724 *** 0.8215 *** 0.8507 *** 0.8755 ***
Age -0.3042 *** -0.3777 *** -0.3091 *** -0.3784 *** -0.3016 *** -0.3570 *** -0.3034 *** -0.3562 ***
Age sq. 0.0039 *** 0.0048 *** 0.0039 *** 0.0048 *** 0.0039 *** 0.0045 *** 0.0038 *** 0.0045 ***
Years of inactivity 0.0737 *** 0.0624 *** 0.0722 *** 0.0630 *** 0.0649 *** 0.0454 *** 0.0635 *** 0.0483 ***
Entitled to maternity leave = 1 -0.5575 *** -0.5538 *** -0.5527 *** -0.5469 *** -0.6583 *** -0.6891 *** -0.6930 *** -0.7120 ***
Total kids -0.0034 0.0426 0.0477 * 0.0821 *** -0.0524 * 0.0058 -0.0304 0.0157
Year effects Yes Yes Yes Yes
Constant 4.6727 *** 4.8998 *** 4.7264 *** 4.9831 *** 2.0834 *** 1.9660 *** 2.2214 *** 2.2266 ***
ln p 0.0860 *** 0.1438 ** 0.0571 * 0.1029 ** 0.0893 ** 0.1377 *** 0.0725 * 0.1073 **
p 1.0898 1.1546 1.0588 1.1084 1.0935 1.14766 1.0752 1.11327
Ln theta 0.4766 *** 0.7652 *** 0.3405 ** 0.5823 *** 0.2992 0.8682 *** 0.1280 0.5960 *
Source: Prepared using the 2002-2006 EPS.
Notes: * p<0.05; ** p<0.01;*** p<0.001; Model I, with fuzzy control for presence of partner; Model II, only women with known marital history.
Other controls introduced in some of the models but not reported here: year effects; economic sector dummies (agricultural, industrial, etc.); presence of
other small children, by age.

28
Table A-3
Estimated Results. Model with random effect (inverse Gaussian distribution) and without entitlement to maternity
leave variable
All transitions into inactivity Only voluntary transitions into inactivity
Model I Model I Model II Model II Model I Model I Model II Model II
No Pre-experience -1.1501 *** -1.0134 *** -1.1995 *** -1.0935 *** -0.5835 *** -0.3630 ** -0.6969 *** -0.4988 ***
Years of pre-experience -0.0343 *** -0.0297 ** -0.0407 *** -0.0359 ** -0.0254 -0.0198 -0.0385 -0.0301
Schooling -0.1014 *** -0.1122 *** -0.0955 *** -0.1070 *** -0.0111 -0.0212 -0.0112 -0.0233
Pre-birth 3-month period 0.9648 *** 0.9677 *** 1.0426 *** 1.0405 *** 0.9097 *** 0.9129 *** 0.9846 *** 0.9860 ***
Month Birth 1.1604 *** 1.1357 *** 1.0242 *** 1.0002 *** 1.2796 *** 1.2353 *** 1.3021 *** 1.2595 ***
Month 2-3 0.1303 0.1240 0.0061 0.0051 0.4208 * 0.4064 * 0.2772 0.2695
Month 4-12 0.3692 *** 0.3570 *** 0.2860 ** 0.2817 ** 0.6270 *** 0.5962 *** 0.6222 *** 0.6007 ***
Month 13-24 0.1165 0.0999 0.0180 0.0107 0.1549 0.1191 0.1173 0.0927
Total months since birth -0.0022 *** -0.0024 *** -0.0030 *** -0.0030 *** -0.0030 ** -0.0033 ** -0.0032 * -0.0035 **
Has partner 0.8312 *** 0.8051 *** 0.9297 *** 0.9163 *** 1.0660 *** 1.0362 *** 1.1829 *** 1.1369 ***
Age -0.3719 *** -0.4434 *** -0.3729 *** -0.4455 *** -0.4488 *** -0.5144 *** -0.4417 *** -0.5139 ***
Age sq. 0.0045 *** 0.0054 *** 0.0045 *** 0.0055 *** 0.0056 *** 0.0063 *** 0.0055 *** 0.0063 ***
Years of inactivity 0.0938 *** 0.0857 *** 0.0885 *** 0.0823 *** 0.0956 *** 0.0787 *** 0.0903 *** 0.0767 ***
Entitled to maternity leave = 1 -0.4873 *** -0.4522 *** -0.5062 *** -0.4732 *** -0.8243 *** -0.7726 *** -0.8836 *** -0.8362 ***
Total kids -0.0125 0.0248 0.0458 0.0741 ** -0.0565 0.0064 -0.0328 0.0243
Year effects Yes Yes Yes Yes
Constant 4.6727 *** 4.8998 *** 4.7264 *** 4.9831 *** 2.0834 *** 1.9660 *** 2.2214 *** 2.2266 ***
ln p 0.0860 *** 0.1438 ** 0.0571 * 0.1029 ** 0.0893 ** 0.1377 *** 0.0725 * 0.1073 **
p 1.0898 1.1546 1.0588 1.1084 1.0935 1.14766 1.0752 1.11327
Ln theta 0.4766 *** 0.7652 *** 0.3405 ** 0.5823 *** 0.2992 0.8682 *** 0.1280 0.5960 *
Source: Prepared using the 2002-2006 EPS.
Notes: * p<0.05; ** p<0.01;*** p<0.001; Model I, with fuzzy control for presence of partner; Model II, only women with known marital history.
Other controls introduced in some of the models but not reported here: year effects; economic sector dummies (agricultural, industrial, etc.); presence of
other small children, by age.

29
Table A-4: Estimated Results. Model without random effect and with entitlement to maternity leave variable
All transitions into inactivity Only voluntary transitions into inactivity
Model I Model I Model II Model II Model I Model I Model II Model II
No Pre-experience -0.7034 *** -0.6255 *** -0.7411 *** -0.6728 *** -0.3432 *** -0.2421 *** -0.4053 *** -0.3115 ***
Years of pre-experience -0.0014 -0.0043 -0.0065 -0.0079 0.0046 0.0006 -0.0019 -0.0037
Schooling -0.0647 *** -0.0691 *** -0.0630 *** -0.0673 *** -0.0103 -0.0149 * -0.0107 -0.0159
Pre-birth 3-month period 0.9623 *** 0.9595 *** 1.0512 *** 1.0438 *** 0.9225 *** 0.9190 *** 1.0092 *** 1.0025 ***
Pre-birth 3-month period * entitled to mat.ty
leave
Month Birth 0.9874 *** 0.9815 *** 0.8881 *** 0.8797 *** 1.0905 *** 1.0659 *** 1.1432 *** 1.1172 ***
Month birth * entitled to maternity leave
Month 2-3 -0.0376 -0.0331 -0.1488 -0.1426 0.2350 0.2302 0.1013 0.1017
Month 2-3 * entitled to maternity leave
Month 4-12 0.1859 ** 0.1843 ** 0.1486 0.1503 0.3747 *** 0.3609 *** 0.3919 *** 0.3873 ***
Month 4-12 * entitled to maternity leave
Month 13-24 0.0052 -0.0068 -0.0614 -0.0708 0.0022 -0.0256 -0.0278 -0.0533
Month 13-24 * entitled to maternity leave
Total months since birth -0.0017 *** -0.0018 *** -0.0023 *** -0.0023 *** -0.0024 ** -0.0026 *** -0.0026 ** -0.0027 **
Total months since birth * Entitled
Has partner 0.5358 *** 0.5207 *** 0.6157 *** 0.6065 *** 0.6569 *** 0.6502 *** 0.7315 *** 0.7145 ***
Age -0.2526 *** -0.2849 *** -0.2551 *** -0.2899 *** -0.2888 *** -0.3241 *** -0.2913 *** -0.3303 ***
Age sq. 0.0030 *** 0.0035 *** 0.0030 *** 0.0036 *** 0.0036 *** 0.0041 *** 0.0036 *** 0.0042 ***
Years of inactivity 0.0741 *** 0.0648 *** 0.0698 *** 0.0619 *** 0.0712 *** 0.0575 *** 0.0680 *** 0.0557 ***
Entitled to maternity leave = 1 -0.3410 *** -0.3265 *** -0.3631 *** -0.3487 *** -0.5040 *** -0.4799 *** -0.5531 *** -0.5320 ***
Total kids -0.0230 -0.0084 0.0192 0.0297 -0.0653 ** -0.0366 -0.0442 -0.0173
Year effects Yes Yes Yes Yes
Constant 3.2267 *** 2.6980 *** 3.3099 *** 2.9416 *** 1.8382 *** 1.4437 *** 1.9816 *** 1.7756 ***
ln p -0.2017 *** -0.2164 *** -0.2075 *** -0.2180 *** -0.0214 -0.0388 -0.0238 -0.0349
p 0.8173 0.8054 0.8126 0.8042 0.9788 0.9619 0.9765 0.9657
Source: Prepared using the 2002-2006 EPS.
Notes: * p<0.05; ** p<0.01;*** p<0.001; Model I, with fuzzy control for presence of partner; Model II, only women with known marital history.
Other controls introduced in some of the models but not reported here: year effects; economic sector dummies (agricultural, industrial, etc.); presence of
other small children, by age.

30
Table A-5: Estimated Results. Model with random effect (gamma) and with entitlement to maternity leave variable
All transitions into inactivity Only voluntary transitions into inactivity
Model I Model I Model II Model II Model I Model I Model II Model II
No Pre-experience -1.0929 *** -1.0148 *** -1.1388 *** -1.0879 *** -0.4133 *** -0.2893 *** -0.4806 *** -0.3818 ***
Years of pre-experience -0.0427 *** -0.0505 ** -0.0477 *** -0.0538 *** -0.0093 -0.0216 -0.0160 -0.0238
Schooling -0.0879 *** -0.1031 *** -0.0819 *** -0.0951 *** -0.0063 -0.0100 -0.0065 -0.0115
Pre-birth 3-month period 0.8230 *** 0.8303 *** 0.9760 *** 0.9770 *** 0.8367 *** 0.8463 *** 1.0039 *** 1.0056 ***
Pre-birth 3-month period * entitled to maternity
leave 0.2008 0.1761 0.0751 0.0536 0.1429 0.1118 -0.0017 -0.0285
Month Birth 0.7997 *** 0.8137 *** 0.6539 ** 0.6489 ** 0.6819 * 0.7017 * 0.6994 0.6960
Month birth * entitled to maternity leave 0.5265 * 0.4851 0.5895 0.5714 0.7486 0.6891 0.7825 0.7460
Month 2-3 -0.3862 * -0.3556 -0.5446 ** -0.5218 ** -0.2894 -0.2489 -0.4487 -0.4177
Month 2-3 * entitled to maternity leave 0.7789 *** 0.7513 ** 0.8672 *** 0.8485 ** 0.8948 ** 0.8564 * 0.9583 * 0.9307 *
Month 4-12 0.0281 0.0529 -0.0700 -0.0577 0.0401 0.0644 0.0144 0.0238
Month 4-12 * entitled to maternity leave 0.5558 *** 0.5285 *** 0.6207 *** 0.6131 *** 0.7082 *** 0.6953 *** 0.7639 *** 0.7699 ***
Month 13-24 -0.2040 * -0.2211 * -0.2778 * -0.2972 ** -0.2053 -0.2259 -0.2570 -0.2770
Month 13-24 * entitled to maternity leave 0.5710 *** 0.5917 *** 0.5437 *** 0.5710 *** 0.4642 * 0.4931 * 0.4965 * 0.5198 *
Total months since birth -0.0034 *** -0.0037 *** -0.0043 *** -0.0045 *** -0.0031 *** -0.0034 *** -0.0031 ** -0.0033 **
Total months since birth * Entitled 0.0027 *** 0.0028 *** 0.0034 *** 0.0036 *** 0.0009 0.0008 0.0007 0.0007
Has partner 0.7310 *** 0.7448 *** 0.8197 *** 0.8390 *** 0.7496 *** 0.8024 *** 0.8276 *** 0.8569 ***
Age -0.3025 *** -0.3746 *** -0.3075 *** -0.3766 *** -0.2983 *** -0.3529 *** -0.2984 *** -0.3511 ***
Age sq. 0.0038 *** 0.0047 *** 0.0038 *** 0.0048 *** 0.0038 *** 0.0045 *** 0.0037 *** 0.0044 ***
Years of inactivity 0.0759 *** 0.0654 *** 0.0752 *** 0.0669 *** 0.0660 *** 0.0470 *** 0.0640 *** 0.0491 ***
Entitled to maternity leave = 1 -0.7877 *** -0.7807 *** -0.7881 *** -0.7849 *** -0.8207 *** -0.8413 *** -0.8385 *** -0.8509 ***
Total kids -0.0088 0.0345 0.0407 0.0727 ** -0.0539 * -0.0003 -0.0316 0.0109
Year effects Yes Yes Yes Yes
Constant 4.7687 *** 4.9725 *** 4.8417 *** 5.0926 *** 2.1468 *** 2.0219 *** 2.2468 *** 2.2499 ***
ln p 0.0871 *** 0.1430 ** 0.0650 ** 0.1104 *** 0.0739 * 0.1213 ** 0.0602 0.0938 **
p 1.091 1.1537 1.0672 1.1168 1.0767 1.12892 1.0621 1.09838
Ln theta 0.4798 *** 0.7587 *** 0.3811 ** 0.6134 *** 0.1205 0.7503 ** -0.0244 0.4873
Source: Prepared using the 2002-2006 EPS.
Notes: * p<0.05; ** p<0.01;*** p<0.001; Model I, with fuzzy control for presence of partner; Model II, only women with known marital history
Other controls introduced in some of the models but not reported here: year effects; economic sector dummies (agricultural, industrial, etc.); presence of
other small children, by age.

31
Table A-6: Estimated Results. Model with RE (inv. gaussian) and with entitlement to maternity leave variable
All transitions into inactivity Only voluntary transitions into inactivity
Model I Model I Model II Model II Model I Model I Model II Model II
No Pre-experience -1.1272 *** -0.9988 *** -1.1741 *** -1.0772 *** -0.5800 *** -0.3623 ** -0.6894 *** -0.4969 ***
Years of pre-experience -0.0321 ** -0.0278 ** -0.0383 *** -0.0337 ** -0.0260 -0.0203 -0.0391 -0.0304
Schooling -0.1020 *** -0.1127 *** -0.0960 *** -0.1074 *** -0.0120 -0.0217 -0.0117 -0.0237
Pre-birth 3-month period 0.8781 *** 0.8942 *** 1.0245 *** 1.0332 *** 0.8561 ** 0.8678 ** 1.0320 *** 1.0446 ***
Pre-birth 3-month period * entitled to maternity
leave 0.1381 0.1150 0.0189 -0.0011 0.0783 0.0677 -0.0851 -0.0997
Month Birth 0.8957 *** 0.8977 *** 0.7240 ** 0.7163 ** 0.8458 * 0.8270 * 0.8506 * 0.8229 *
Month birth * entitled to maternity leave 0.4692 0.4263 0.5489 0.5207 0.6720 0.6330 0.7132 0.6886
Month 2-3 -0.3641 -0.3543 -0.5262 ** -0.5142 * -0.1914 -0.1807 -0.3643 -0.3522
Month 2-3 * entitled to maternity leave 0.7955 *** 0.7692 ** 0.8835 *** 0.8607 ** 0.9231 * 0.8841 * 1.0064 * 0.9733 *
Month 4-12 0.0766 0.0882 -0.0368 -0.0254 0.1465 0.1385 0.0998 0.0876
Month 4-12 * entitled to maternity leave 0.5457 *** 0.5034 *** 0.6193 *** 0.5890 *** 0.7775 *** 0.7452 *** 0.8567 *** 0.8449 **
Month 13-24 -0.2064 -0.2134 * -0.2829 * -0.2835 * -0.1766 -0.2009 -0.2311 -0.2449
Month 13-24 * entitled to maternity leave 0.5935 *** 0.5776 *** 0.5688 *** 0.5552 *** 0.5675 ** 0.5520 * 0.6079 * 0.5919 *
Total months since birth -0.0034 *** -0.0035 *** -0.0045 *** -0.0045 *** -0.0031 * -0.0035 ** -0.0034 * -0.0037 **
Total months since birth * Entitled 0.0025 *** 0.0023 *** 0.0032 *** 0.0031 *** 0.0004 0.0003 0.0005 0.0004
Has partner 0.8164 *** 0.7935 *** 0.9104 *** 0.9025 *** 1.0585 *** 1.0282 *** 1.1732 *** 1.1289 ***
Age -0.3644 *** -0.4360 *** -0.3625 *** -0.4352 *** -0.4421 *** -0.5070 *** -0.4314 *** -0.5040 ***
Age sq. 0.0044 *** 0.0053 *** 0.0044 *** 0.0053 *** 0.0055 *** 0.0062 *** 0.0054 *** 0.0062 ***
Years of inactivity 0.0943 *** 0.0866 *** 0.0900 *** 0.0842 *** 0.0932 *** 0.0766 *** 0.0876 *** 0.0747 ***
Entitled to maternity leave = 1 -0.7257 *** -0.6767 *** -0.7476 *** -0.7059 *** -1.0040 *** -0.9391 *** -1.0538 *** -0.9957 ***
Total kids -0.0168 0.0190 0.0387 0.0653 ** -0.0556 0.0070 -0.0333 0.0231
Year effects Yes Yes Yes Yes
Constant 6.6038 *** 6.4040 *** 6.4984 *** 6.5416 *** 6.0393 *** 5.3315 *** 5.8930 *** 5.6033 ***
ln p 0.2888 *** 0.2734 *** 0.2476 *** 0.2467 *** 0.5619 *** 0.5036 *** 0.5300 *** 0.4869 ***
p 1.3348 1.3145 1.2809 1.2798 1.754 1.65463 1.6989 1.62724
Ln theta 2.5575 *** 2.5283 *** 2.2641 *** 2.3169 *** 4.5733 *** 4.1627 *** 4.2652 *** 3.9790 ***
Source: Prepared using the 2002-2006 EPS.
Notes: * p<0.05; ** p<0.01;*** p<0.001; Model I, with fuzzy control for presence of partner; Model II, only women with known marital history.
Other controls introduced in some of the models but not reported here: year effects; economic sector dummies (agricultural, industrial, etc.); presence of
other small children, by age.