Childbirth Series Section Four: Understanding Cesarean Birth ...
Upload
khangminh22Category
view
1download
0
Health Aspectsof Pregnancyand ChildbirthUnited States, 1982
Statistics collected in 1982 are presented on
the timing of the first prenatal visit, the
source of prenatal care, smoking and
alcohol use during pregnancy, low birth
weight, and how delivery was paid for. The
data are shown by characteristics of the
mother and the pregnancy.
Data From the National Survey ofFamily GrowthSeries 23, No. 16
DHHS Publication No. (PHS) 89-1992
U.S. Department of Health and Human
Services
Public Health Service
Centers for Disease Control
National Center for Health Statistics
Hyattsville, Md.
December 1988

Copyright Information
All material appearing In this report IS in the public domain and may bereproduced or copied wl!hout permission; c!tatlon as to source, however, IS
appreciated.
Suggested Citation
National Center for Health Statistics, E. R. Pamuk and W. D. Mosher. 1988.
Health aspects of pregnancy and childbirth: United States, 1982. Vita/ and/-fea/#r Statisf/cs. Series 23, No. 16. DHHS Pub. No. (PHS) 8%1992. Public
Health Serw$e, Washington: U.S. Government Printing Office.
Library of Congress Cataloging-in-Publication Data
Pamuk, Elsie.Health aspects of pregnancy and chlldb!rth, United States, 1982. p. cm. —
(Series 23, Data from the national survey of femdy growth ; no. 16) (DHHSpublication : no. (PHS) 89-1992)
Bibhography: p.ISBN O&8406-0398-71. Prenatal car+United States—Stat!stlcs. 2. Pregnant women—Unled
Slates—Drug use-Statistics. 3. Bwth weight, Low—United States—Statistics.4. Chlldblrlh-Economic aspects—United States—Statistics. 5. Health
survey e-United States—StatWcs. 6. Statistics, MedicaW_lnited States. 1.Mosher, William D. Il. National Center for Health Statstics (U. S.) Ill. Nahonal
Survey of Family Growth (U.S.) IV. Title. V. Series. VI, Series: Vital and health
statistics. Series 23, Data from the national survey of family growth ; no. 16.[DNLM: 1. Labor—United States—statistics. 2. Pregnancy—United States—
statistics. 3. Prenatal Car&Unlted States—statistics. W2 A N148VW no. 16]RG960.P36 1988 362.1 ‘982’00973-dcl 9DNLM/DLCfor Library of Congress 88–1 6406
CIP
—

National Center for Health Statistics
Manning Feinlcib, M.D., Dr. P.H., Director
Robert A. Israel, Deputy Director
Jacob J. Feldman, Ph.D., Associute Director for Analysisand EI]idemiologs
Gail F. Fisher, Ph.D., Associate Directorfor Pkmning and.Extmnural Programs
Pet er L. Hur]ey, Associate Director for Wal and HealthStf7tistics $wtenzs
Stephen E. Nieberding, Associate Director for Management
George A. Schnack, Associate Direclor for Data Processingand Sen’ices
Monroe G. Sirken, Ph.D., Associate Director for Researchand Methodology
Sandra S. Smith, Information Officer
Division of Vital Statistics
John E. Patterson, Director
James A. Weed, Ph. D., Deputy Director
William F. Pratt, Ph. D., Chiej Family Growth SurveyBranch
Joseph D. Farrell, Chiej Systems and ProgrammingBranch
Mabel G. Smith, Chie$ Statistical Resources Branch
Coopexmkg Agexcks
Cycle 111of the National Survey of Family Growt~ 19S3 was supported inpmt by the Nntiorml Institute of Child Health mrd Hummr Development, NatiorrdImtitutes of Health, and the Office of Population Affoirs, Office of the AssistnntSecrekuy of Health. Both of these ngencies afso participated in the questionnaireand sumey design.

Contents
Introduction . . . . . . . . . . . . . . . . . . . . . . . . . . . . . . . . . . . . . . . . . . . . . . . . . . . . . . . . . . . . . . . . . . . . . . . . . . . . . . . . . . . . . . . . . .
Summary ofprincipal findings.. . . . . . . . . . . . . . . . . . . . . . . . . . . . . . . . . . . . . . . . . . . . . . . . . . . . . . . . . . . . . . . . . . . . . . . . . .
Source and limitations ofthe data. . . . . . . . . . . . . . . . . . . . . . . . . . . . . . . . . . . . . . . . . . . . . . . . . . . . . . . . . . . . . . . . . . . . . . . .
Comparisonswith other data.... . . . . . . . . . . . . . . . . . . . . . . . . . . . . . . . . . . . . . . . . . . . . . . . . . . . . . . . . . . . . . . . . . . . . . . . .
Findings . . . . . . . . . . . . . . . . . . . . . . . . . . . . . . . . . . . . . . . . . . . . . . . . . . . . . . . . . . . . . . . . . . . . . . . . . . . . . . . . . . . . . . . . . . . . . .Timing ofthefirst prenatal visit . . . . . . . . . . . . . . . . . . . . . . . . . . . . . . . . . . . . . . . . . . . . . . . . . . . . . . . . . . . . . . . . . . . . . . .First source ofprenatal care. . . . . . . . . . . . . . . . . . . . . . . . . . . . . . . . . . . . . . . . . . . . . . . . . . . . . . . . . . . . . . . . . . . . . . . . . .Cigarette smoking duringmost recent pregnancy . . . . . . . . . . . . . . . . . . . . . . . . . . . . . . . . . . . . . . . . . . . . . . . . . . . . . . . . .Alcohol consumption duringrnost recent pregnancy . . . . . . . . . . . . . . . . . . . . . . . . . . . . . . . . . . . . . . . . . . . . . . . . . . . . . .Low birth weight . . . . . . . . . . . . . . . . . . . . . . . . . . . . . . . . . . . . . . . . . . . . . . . . . . . . . . . . . . . . . . . . . . . . . . . . . . . . . . . . . . . .Source ofpayment fordelivery. . . . . . . . . . . . . . . . . . . . . . . . . . . . . . . . . . . . . . . . . . . . . . . . . . . . . . . . . . . . . . . . . . . . . . . .Trends in sourceof payment fordelivcry 1973-82 . . . . . . . . . . . . . . . . . . . . . . . . . . . . . . . . . . . . . . . . . . . . . . . . . . . . . . .
References . . . . . . . . . . . . . . . . . . . . . . . . . . . . . . . . . . . . . . . . . . . . . . . . . . . . . . . . . . . . . . . . . . . . . . . . . . . . . . . . . . . . . . . . . . .
List ofdetailed tables . . . . . . . . . . . . . . . . . . . . . . . . . . . . . . . . . . . . . . . . . . . . . . . . . . . . . . . . . . . . . . . . . . . . . . . . . . . . . . . . . .
Appendixes
I. Technical notch . . . . . . . . . . . . . . . . . . . . . . . . . . . . . . . . . . . . . . . . . . . . . . . . . . . . . . . . . . . . . . . . . . . . . . . . . . . . . . . . . . .11. Definitions oftcrms . . . . . . . . . . . . . . . . . . . . . . . . . . . . . . . . . . . . . . . . . . . . . . . . . . . . . . . . . . . . . . . . . . . . . . . . . . . . . . .III. Itcmson thc1982Nationa lSurvey of Family Growth questionnaire rclatcd to health aspects ofpregnancy and
childbirth . . . . . . . . . . . . . . . . . . . . . . . . . . . . . . . . . . . . . . . . . . . . . . . . . . . . . . . . . . . . . . . . . . . . . . . . . . . . . . . . . . . . . . . .
List oftext figures
1.
2.
3.
4.
5.
6.
7.
8.
Pcrccnt of mothers receiving prenatal care in the first trimester, by race and marital status: United States,197!)-82 . . . . . . . . . . . . . . . . . . . . . . . . . . . . . . . . . . . . . . . . . . . . . . . . . . . . . . . . . . . . . . . . . . . . . . . . . . . . . . . . . . . . . . . . .Percent ofwomenwhorcceived prenatal care for a pregnancy endingin 1979-82 whoscfirst prenatal care wasfrom a private physician, by race and mari(al status of mother at outcome: United States, 1982 . . . . . . . . . . . . . .Percent ofever married women whosrnokcd 150r more cigarettes pcr day during their most rccentprcgnancy,by race ancleducation: United States, 1982. . . . . . . . . . . . . . . . . . . . . . . . . . . . . . . . . . . . . . . . . . . . . . . . . . . . . . . . . . .Percent ofever pregnant women who drank alcoholic beverages oncc aweek or more during their most rcccntpregnancy, byrace and education: United States, 19S2 . . . . . . . . . . . . . . . . . . . . . . . . . . . . . . . . . . . . . . . . . . . . . . . . .Percent ofsingle Iivebirths towomen 15–44yearsofage that wcrelowbirth weight, byraccaml marital statusofmothcra ttimeofbirth :United States, 1982 . . . . . . . . . . . . . . . . . . . . . . . . . . . . . . . . . . . . . . . . . . . . . . . . . . . . . . . . . .Pcrccnt ofmost recent live births toevcrprcgnant w’omcn15+lycars ofagelhatwerc lowbirthwcight, hyraceof mothcrand numberofcigarettcs srnokedpc rdayduri ngpregnancy:United S(atcs, 1982 . . . . . . . . . . . . . . . . .Percent of live births in 1979–82 that were paid for, in whole or in part, from specified sources, by race of mother:United States, 19S2 . . . . . . . . . . . . . . . . . . . . . . . . . . . . . . . . . . . . . . . . . . . . . . . . . . . . . . . . . . . . . . . . . . . . . . . . . . . . . . .Percent distribution of most rccen( live births bysourcc ofpayrnen tfordclivery: women 15+lyears ofage whoever had alive birth: Unitul States, 1973 and 1982..... . . . . . . . . . . . . . . . . . . . . . . . . . . . . . . . . . . . . . . . . ... . . . . .
List oftext tables
A. Number ofpregnancics ending in alivcbirth in January 1979 orlatcrtowomcn 15A4ycars ofagcanclpcrccntdistribution by months pregnant when prenatal cwtbcgan,according to race, origin, and age aml marital statusat birth: Unitccl States, 1982.. . . . . .. . . . . . . . . . . . . . . . . . . . . . . . . . . . . . . . . . . . . . . . . . . . . . . . . . . . . . . . . . . . . . . . . .
1
3
8
9
11111516192122
25
26
28
6?
67
71
3
3
4
5
5
5
6
6
12
...Ill

B. Number of pregnancies ending in live births or spontaneous loss in January 1979 or later to women 15-44 yearsof age, percent receiving prenatal care, and percent distribution of pregnancies receiving care by source of care atfirst visit, according to race, origin, and age and marital status at pregnancy outcome United States, 1982 . . . . . 1.4
c. Percent of women 15–44 years of age whose most recent pregnancy ended in live birth or spontaneous loss notsmoking cigarettes and not consuming any alcoholic beverages during the most recent pregnanq, by race, origin,and selected characteristics: United States, 1982 . . . . . . . . . . . . . . . . . . . . . . . . . . . . . . . . . . . . . . . . . . . . . . . . . . . . . . . 18
D. Number of women 15–44 years of age whose most recent pregnanq ended in live birth or spontaneous loss andpercent distribution by average number of cigarettes smoked per day during the pregnancy, according to race ofwoman andyear ofoutcome: United States, 1982 . . . . . . . . . . . . . . . . . . . . . . . . . . . . . . . . . . . . . . . . . . . . . . . . . . . . . 18
E. Number of women 15–44 years of age whose most recent pregnancy ended in live birth or spontaneous loss andpercent distribution by average frequency of alcoholic beverage consumption during the pregnancy, according torace ofwoman andyear of outcome: United States, 1982 . . . . . . . . . . . . . . . . . . . . . . . . . . . . . . . . . . . . . . . . . . . . . . . 21
F. Percent of single live births that were low birth weight, by race, origin, and marital status of mother at time ofbirth:Unite dStates ,1982 . . . . . . . . . . . . . . . . . . . . . . . . . . . . . . . . . . . . . . . . . . . . . . . . . . . . . . . . . . . . . . . . . . . . . . . . . 22
G. Number of live births in January 1979 or later to women 15-44 years of age and percent paid for from specifiedsources, by race, origin, and selected characteristics: United States, 1982 . . . . . . . . . . . . . . . . . . . . . . . . . . . . . . . . . . 24
Symbols
--- Data not available
. . . Categow not applicable
Quantity zero
0.0 Quantity more than zero but less than0.05
z Quantity more than zero but less than500 where numbers are rounded tothousands
* Figure does not meet standards ofreliability or precision (see Technicalnotes)
iv

Health Aspects ofPregnancy andChildbirthby Elsie R. Pamuk, M.A. and William D.Mosher, Ph. D., Division of Vital Statistics
Introduction
In 1900, the infant mortality rate in the Uniter-1Stateswas about 100 infant cleat11sper 1,000 live births (Shapiro,Schlesinger, and Ncsbitt, 1968). At that time, more thanhalf of infant deaths were postneonatal (after the first 27days of life) and were due primarily to the infant’s environm-ent, especially infections causing diarrhea and respiratoryillnesses (McCormick, 1985; NCHS, 1986a; Shapiro, Schle-singer, and Ncsbitt, 1968). Between 1900 and 1950, infantmortality rates declinccl by about 70 percent, to 29 per1,000 births. In 1950, about two-thirds of infant deathswere neonatal (during the first 27 days of life) (NCHS,1986a). Between 1950 and 1982, the infant mortality ratefell from 29 to 11.5 per 1,000 live births, but neonataldeaths still made up two-thirds of infant deaths. The majorcauses of neonatal death stcm from conditions that developduring pregnancy (Brown, 1985; McCormick, 1985;Shapiro, Schlesinger, and Ncsbitt, 1968). Low birth weightwas a factor in two-thirds of neonatal deaths in 1982, just asin 1950 (Brown, 1985; McCormick, 19S5; Shapiro,Schlcsingcr, and Ncsbitt, 1968; Shapiro ct al., 19S0).
Infant mortality for births to white women has beensubstantially lower than for births to women of other racesin the 20th century (NCHS, 1986a; Shapiro, Schlesinger,and Ncsbit t, 1968). Further, the 1982 rate was higher in theUnited Sta(cs than in a number of other industrializedcountries (Shapiro ct al., 1980). Progress in reducing infantmortality probably will depend on reducing neonatal mor-tality and the conditions in pregnancy that cause it(Behrman, 1985; Brown, 1985; Institute of Medicine, 1985;McCormick, 1985; NCHS, 19S1a; Shapiro et al., 19S0).Accordingly, this report presents the first eomprchcnsiveanalysis of the data from the National Survey of FamilyGrowth on health aspects of pregnancy and childbirth.These measures of health may bc useful in assessing therisk of infant mortality among various groups in the UnitedStates.
The National Survey of Family Growth (NSFG), aperiodic survey conducted by the National Center forHcahh Statistics, is designed to provide information onfertility, family planning, and aspects of maternal and infanthealth that are closely related to chiklbcaring. This reportpresents a wide range of data from the survey on healthaspects of pregnancy and childbirth, including
●
●
●
●
●
●
●
The number of months women had been pregnantwhen they began receiving prenatal care for that preg-nancy (tables 1–6).Whether they rcceivcd their prenatal care for thatpregnancy from a private doctor, a hospital clinic, oranother kind of clinic (tables 7–12).Whether women smoked during their most recentpregnancy, and if so, how much they smoked (tables13-18).Whether women drank alcoholic beverages duringtheir most recent pregnancy, and if so, how often(tables 19-24).The proportion of babies weighing 5% pounds or lCSSatbirth (tables 25 and 26).How deliveries were paid for (sources of payment,tables 27–32).Trends in sources of payment for delivery of live birthsin 1973 and 19S2 (table 33).
Note that the measures of health in this report arcarranged in temporal orclcr-that is, the order in whichthey usuaIIy occur: from first prenataI visit (tables 1–12) tosmoking and drinking during pregnancy (tables 13–24) tobirth weight (ttibles 25 and 26) to sources of payment forthe birth (tabIcs 27–33). These data arc shown separatelyfor pregnancies of women of all races, of white women, andof black women, in rcIation to
● The mother’s age and marital status when the preg-nancy ended.
. Birth order or pregnancy order.
. Whether the pregnancy had been wanted by the mo[hcrat the time of conception.
The data arc also shown by selcctccl characteristics ofthe woman at the date of interview, including geographicregion, education, most recent occupation, income (as apercent of poverty level), whether shc had rcccivcd Medic-aid, and rcsidcncc (mctropoli[an or nonmctropolitan). Thesample size was not large enou@ to study pregnancies ofHispanic women in the same amount of detail as for whiteand for black women, but data arc shown for Hispanicwomen in the text tables.
1

In tables 1–12 and 25–33 of this report, data arepresented on prenatal care, low birth weight, and howdelivery was paid for. In these tables, the unit of analysis isthe pregnancy or birth. Women who had more than onepregnancy arc included once for each pregnaney, andwomen who had never been pregnant are excluded entirely.For example, a woman who had her first birth in 1979 atagc 19 and her second birth in 1981 at age 21 would bccountccl twice in tables 1–12 and 25-33. For convenience inwriting, the word “women “ is sometimes used in the textwhen discussing data in tables 1–12 and 25–33, but thereader should note that these tables refer to pregnancies orbirths.
The range and richness of the data shown here are notmatchccl in any other source of national information. Forexample, this report contains data on miscarriages and
stillbirths as well’ as live births. This report also containsinformation on income, occupation, and receipt of Medic-aid, which is not available in other published reports basedon national data sources.
The data shown here may be useful for measuring theadequacy of medical care during pregnaney, the sourceswomen use to obtain and pay for prenatal and obstetricservices, certain health practices during pregnaney, andbirth weight, one important measure of pregnaney out-come.
Certain other measures related to pregnancy outcomewere analyzed in a previous report (NCHS, 1987a); thosemeasures included infertility, surgical sterilization, pelvicin flammato~ disease, spontaneous prcgnaney loss, andcesarean section.

Summary of principalfindings
There are large differences by race and Hispanic originin many aspects of the health of women during pregnancyand in the health of their infants. This is why data arepresented separately for pregnancies of white, black, andHispanic women. One major finding of this report is thatthe large race differences observed in timing of the firstprenatal visit, in rates of low birth weight, and in sources ofpayment for delivery were limited primarily to ever marriedwomen.
Timing of the first prenatal visit-BIack women wereless likely to receive early prenatal care than white women.Nearly 70 percent of white women began prenatal care inthe first trimester of pregnancy, compared with only 53pcrccnt of black women (figure 1). However, the percentsreceiving early prenatal care were similar by race in thehighest cat egories of education, income, and occupationalstatus.
For both white and black births, prenatal care was lesslikely to begin in the first trimester if the mother was a
‘w
All women
u
72
82 r
Never married Ever married
Marital status of mother at lime of birth
Figure 1. Percent of mothers receiving prfmabd care frr the fkst trfrnester,by race and marital status United Stateq 1979-82
teenager, had never married, had not finished high school,had never worked, had a low income, was receiving Medic-aid, or if her pregnancy was unwanted at conception(figure 1).
Births to Hispanic women were more likely to havereceived prenatal care only after the fifth month of preg-nancy, or not at all, than were those to non-Hispanic whitewomen. About 7 percent of all pregnancies received noprenatal care at all, but fewer than 2 percent of pregnanciesending in live birth received no care at all.
First source of prenatal care-For about 80 percent ofpregnancies of white women, first prenatal care was byprivate doctors, compared with only 48 percent of pregnan-cies of black women (figure 2). Among both black andwhite women, pregnancies to teenagers and never marriedwomen were less likely to receive prenatal care from
90-
ao-
70-
60-
so- 48gel? do
,,’:, :.,20-
.,:
.,.,,,, .,’... ,
lo- : :,’:;:.,,,:,.,,:
~:,:,.,:0
80
—All pregnancies
53
i
37
,.-.,., :,,’.,:
,:. :,.
,.,:.:, ,
,,,,.: .”..,,
Never married
Mari!al status at outcome
❑ Back
H Wh,te
84
60
,,.,,,.,
,,
‘::. ,,,, .
.,.
,,,’
,.
:,
‘,.
Ever marriet
Fgure 2. Percent of women who received prenatal care for a fxegnancyending m 197W2 whose first prenatal care was from a private physicia~by race and marital status of mother at outcome United Stateq 1982
.

private physicians than pregnancies to older women andever married women.
For a given pregnancy, women who received early andcontinuous prenatal care (that is, who began care in thefirst trimester and had a visit at least once a month there-after) were less likely to have attended a clinic for their firstvisit than women who received later or discontinuous care.
Smoking during pregnanq—About 69 percent ofwomen did not smoke at all during their most recentpregnancy. The proportion of women not smoking at allwas similar for white and black women. However, whitewomen were more likely to have smoked 15 or morecigarettes per day lhan were black women (16 percentversus 10 percent), especially younger, less-educated, andnever married women (figure 3).
White women with less than 12 years of education werealmost three times as likely to have smoked 15 or morecigarettes per day during their most recent pregnancy thanwere college-educated women (26 percent versus 9 percent,figure 3). Heavy smoking declined as education increasedamong black women, as well, although not as sharply.
For both white and black women, those whose preg-nancies ended in spontaneous loss were more likely to havesmoked than were women whose pregnancies ended in livebirth.
Dlinking during pregnancy-About 12 percent ofwomen drank alcoholic beverages at least once a week dur-ing their most recent pregnancy, and the proportions weresimilar for black and white women. For both races, alcoholconsumption increased with the age of the pregnant
Women whose most recent pregnancy ended in spon-taneous 10SSwere almost twice as likely to have ccmsumedalcohol once a week or more (19 percent) as were womenwhose pregnancy ended in live birth (11 percent). Thisdifference was found for both white and black women.
In contrast to cigarette smoking, alcohol consumptionduring pregnancy was more common among white womenwith some college education than among those with lesseducation (figures 3 and 4). The proportion of whitewomen who drank alcohol once a week or more duringtheir most recent pregnancies was more than twice as largefor women with some college education (17 percent) as forthose having less than 12 years of schooling (8 percent), butfor black women the reverse was true (8 percent versus 17percent, figure 4).
Hispanic women were more likely to have abstainedfrom smoking than non-Hispanic white women (83 percentversus 67 percent), and more likely to have abstained fromdrinking alcohol during their most recent pregnancy thannon-Hispanic white women (69 percent versus 50 percent).
Low bi)fh weight—The proportion of babies who werelow birth weight was twice as high for black as whitemothers (12 percent versus 6 percent). For never marriedmothers, however, there was no significant difference byrace in the percent of low birth weight (figure 5).
Babies born to mothers who had smoked 15 or morecigarettes a day during pregnancy had about three times theincidence of low birth weight (13 percent) seen for babiesborn to molhers who had not smoked at all (4 percent). Anincreased risk of low birth weight was found for both white
woman. and black women who smoke~ (figure 6).
30
1 26
0-11years 12 years 13 years 0-11 years 12 years 13 yearsor more or more
White women Black women
Education
Fgure 3. Percent of ever married women who smoked 15 or more cigarettes par day during their most recent pregnancy, by race and education:United States, 1982
4

20
15
10
5
0
12
9
8
17
CM 1 years 12 yeara
11
17
8
13 yearsor more
Total
Education
0-11 years 12 years
Black women
8
13 yearsor more
Figure 4. Percent of ever pregnant women who drank akoholic beverages once a week or more during their mosl recent pregnancy, by race andeducatbn: United Stateq 1982
15 7
❑ Black
❑ White
10
5
0
All births Never married Ever married
Marital status at time of birth
Figure 5. Percent of single live births to women 1544 years of age thstwere bw bhlh weigh~ by race and marital status of mother at t-me ofbirth United States, 1982
20 7 18,6
None Less 150r None Leas 150rthan 15 more than 15 more
Whtie women Black women
Number of cigarettes smoked per day during pregnancy
F~re 6. Percent of most recent Eve births to ever pregnant wornenIW years of sge that ware Iew birth wei~h by race of mother andnumber of cigarettes smoked per day during pregnancyUnited States 1982

Sources of pqment for deIivery-About 68 percent of black women were paid for by Medicaid about four times asdeliveries to white women used private medical insurance often as were births to white women (30 percent versus 7as a source of payment for delivery, compared with only 38 percent, figure 7). Black births were also nearly twice aspercent of deliveries to black women (figure 7). Births to likely as white births (15 percent versus 8 percent) to be
80?
70-
60-
50-
;
Q 40-
2
30-24
44
—
Self, family,or friends
68
38 rPrivate medical
insurance
@ Bla.k
❑ White
Medicaid Other government All other
Source of payment for delivery
F~ure 7. Percent of live births in 1972-62 that were paid for, in whole or in pa~ from specified sourceq by race of mother: United States 19!32
40-
35-
30-
25-
Eg
20-5n
i 5-
10-
5-
o—
22
1973
10
1
1982
28
Own incomeonly
38
1973 1982
Privafe medicalinsurance only
32
1973
25
109
78
65
i 982 1973 1982 1973 1982 1973 1982
Own income Medicaid Other government All otherand insurance
Source of payment for delivery
Figure 8. Percent distribution of most recent live births by source of payment for delive~ women 1544 yeare of age who ever had a live birthUnited States+ 1973 and 1982
6

paid for by other government sources. Race differences in private medical insurance, declined (figure 8). The propor-source of payment for delivery were not significant for tion of births paid for by Medicaid or other governmentnever married women. sources did not change significantly overall, but the propor-
Between 1973 and 1982, the proportion of live births tion paid for using government funds other than Medicaidpaid for entirely by private medical insurance increased. increased for black women, women who had not finishedThe proportion paid for out of pocket, with or without high school, and women with low incomes.
7

Source and limitationsof the data
Cycle III of the National Survey of Family Growth(NSFG) was based on personal interviews with a multistagearea probability sample of 7,969 women 15-44 years of agein the civilian noninstitutionalized population of the conter-minous United States. For the first time, women wereeligible for interview regardless of their marital status.
Between August of 1982 and February of 1983, 4,577white women, 3,201 black women, and 191 women of otherraces were interviewed. Black women and women 15–19years of age were sampled at higher rates than others, toincrease the reliability of statistics from these groups. Eachinterview was conducted in person and focused on therespondent’s marital and pregnancy history, her use ofcontraception, whether each pregnancy had been plannedat the time of conception, her use of family planning andinfertility services, her physical ability to bear children, anda wide range of social and economic characteristics. Ques-tions were also asked about prenatal care, the weight ofeach child at birth, smoking and drinking during the lastpregnancy, and sources of payment for delivery of livebirths. Interviews were conducted by trained female inter-viewers and lasted an average of 1 hour.
Characteristics such as race, origin, parity, education,and geographic region refer to the woman who wasinterviewed. For convenience in writing, in this report,expressions such as “black births” refer to births to blackwomen, regardless of the race of the father. Similarly,women living in families with incomes below 150 percent ofthe poverty level are referred to as low-income women, andwomen living in families with higher incomes are referredto as high-income women.
The statistics cited are estimates for the national pop-ulation from which the sample was drawn. Because theestimates are based on a sample, they are subject tosampling variability. Further, nonsampling errors may havebeen introduced during interviewing, data processing, andanalysis, although quality control measures were used ateach stage to minimize error. Further discussion of thesurvey design, definition of terms, and sampling variabilitycan be found both in the appendixes and in a detailedreport (NCHS, 1985a) on the design of the survey.
In this report, the term “similar” means that anyobserved difference between two estimates being comparedis not statistically significant; terms such as “greater,”“less,” “larger,” and “smaller” indicate that the observeddifferences are statistically significant at the 5-percent levelusing a two-tailed t-test with 39 degrees of freedom. State-ments about differences that are qualified in some way (forexample, “the data suggest”) indicate that the difference issignificant at the 10-percent but not at the 5-percent level.
The following sections include comparisons with otherdata and detailed descriptions of survey findings on whenprenatal care began, the source of prenatal care, smokingand alcohol use during pregnancy, birth weight, and sourcesof payment for delivery of live births. Appendix I containstechnical notes on how the survey was designed and con-ducted; appendix II, definitions of technical terms used inthe report; and appendix III, the survey questions on thetopics covered in this report.

Comparisons withother data
The data in this report are from the 19S2 NationalSurvey of Family Growth. The NSFG is the only source ofreliable national data on the source of prenatal care (pri-vate doctor, hospital clinic, or other clinic—tables 7–12)and on the sources of payment for delivery of live births(insurance, Medicaid, and so forth-tables 27-33).
LOWbhfh w@hf-Data on birth weight are publishedeach year from the birth registration system for the UnitedStates and for each State, by such characteristics as race,age and education of the mother, birth order, and month ofthe pregnancy for which prenatal care began. It is impor-tant to emphasize that the birth registration data are basedon com,plcte counts of all births and refer only to births in aparticular calendar year, but the data in this report arebased on a sample of births and refer to births in severalcalendar years up to 1982. In addition, the data on low birthweight-5 pounds S ounces (2,500 grams) or less—in thisreport refer only to single live births, not all births. Thefollowing table shows a sample comparison–the percent ofsingle live births that were low birth weight by race, fromthe 1982 NSFG and the 1981 data on registered births(NCHS, 1985b):
NSFG RegisteredRace (*2 standartierrors) birihs,1961
All races . . . . . . . . . . . . . . 6.6 (* 1.0) 5.9
white . . . . . . . .. ~...... 5.6 (3 1.0) 4.8Black . . . . . . . . . . . . . . . . 12.2 (*1.7) 11.3
The numbers in parentheses after the NSFG figuresshow two standard errors around the NSFG estimate. Ineach case, the NSFG data and the data from the registeredbirths are within two standard errors of each other; that is,the NSFG estimates do not differ significantly from thebirth registration data.
Another source of data on low birth weight is the 1980National Natality Survey (NNS), which was based on asample of about 10,000 births in 1980. Questionnaires weresent by mail to mothers and health care providers to obtainadditional information about the births (Placck, 1984).
Timing of the jkrt prenafal \’isit—In the NSFG, themother was asked the following question for each birth thatoccurrecl in 1979-S2: “During this pregnancy, did you evervisit a doctor or clinic for prenatal care?” If the motheranswered “yes,” shc was asked: “How many months preg-nant were you when you first visited a doctor or clinic forprenatal care?”
On the birth registration certificate, the entry reads“month of pregnancy prenatal care began” (first, second,etc.). This was obtained either from the mother herself orfrom physician records.
Differences between the wording of these questionsand those asked on the certificate of live birth and the NNS,as well as differences in methods of data collection, thetime refere~ce of the questions, and sampling error, ac-count for variation among the three data sources in theobserved percents of women who began care within aspecified period.
In general, a smaller proportion of respondents to the1982 NSFG than of mothers in the NNS or of those in thevital records reported beginning care in the first trimester;76.3 percent of 19S0 birth certificates reported care in thefirst trimester of pregnancy (Forrest and Singh, 1987), butNSFG data show 65.9 percent of live births occurringbetween 1979 and the date of interview as receiving tirst-trimcster care (table 1). These differences are important,because they give different estimates of the amount ofprogress that has been made toward the goal of timelyprenatal care for all mothers and babies. It is not clearwhich source—the birth certificates, the NNS, or theNSFG—gives lhe most accurate estimate of the true Ievelof first trimester prenatal care, and further methodologicalresearch is ncccssary to answer this question (Forrest andSingh, 1987). However, all three sources– the NSFG, the1980 NNS, and the vital statistics—show that black, unmar-ried, teenage, and less educated women get first-trimesterprenatal care less often than do others (Forrest and Singh,19S7; Ingram, Makuc, and Kleinman, 1986; NCHS, 1978a).This strengthens confidence in the NSFG findings for vari-ables not contained in the NNS or vital statistics.
Smoking and alcohol consump~ion duringpwgnancy-These data are not available from the birth registrationsystem. They me available for married mothers from the19S0 NNS (Prager et al., 1984). Thus the NSFG data onsmoking and alcohol use during pregnancy for never mar-ried and formerly married mothers are not available fromany other reliable national source.
Other dijf2wnccs—The NSFG contains a number ofvariables that were not collected in the birth registrationstatistics in the early 1980’s. These include the following:
● Income.. Current receipt of Medicaid.. Most recent occupation.

● Wontedness of the pregnancy. edness, and smoking and alcohol use. Therefore, the data● Sources of payment for births. for unmarried mothers by income, occupation, and wanted-. Smoking and alcohol use during pregnancy. ness and the data on smoking and drinking during preg-. Type of provider of prenatal care. nancy for unmarried mothers are not avaiIabIe from any
Of these, the following were collected in the 1980 NNS,other national source.
but only from married mothers: income, occupation, want-
10

Timing of the first prenatal visit
In numerous studies, mothers receiving prenatal carehave been shown to have better birth outcomes than havemothers receiving no care. In these studies, prenatal carehas been associated with a lower incidence of low birthweight, lower neonatal mortality, less need for neonatalintensive care, and lower hospital costs (Moore et al., 1986;Kotelcheck et al., 19S4; Heins et al., 1983; Leveno et al.,1985). Further, most studies show that the impact of pre-natal care is greatest for adolescent, unmarried, Hispanic,black, and other high-risk women (Kotelcheck et al., 1984;Greenberg, 1983; Peoples and Siegel, 1983).
Prenatal care is important because most interventionsto improve pregnancy outcome must occur in the context ofprenatal care (Institute of Medicine, 1985; NCHS, 1981a).Prenatal care makes it possible to offer counseling onnutrition, smoking, and alcohol and drug consumptionduring pregnancy; to identifj medical conditions such ashigh blood pressure and diabetes; to assess the risk ofproblems such as preterm cielivcry, premature rupture ofmembranes, and low birth weight; and to manage theseproblems appropriately (Brown, 19S5; Institute of Mccli-cine, 1985; NCHS, 1981a; Bchrman, 19S5; Moore et al.,1986; Heins et al., 1983; Leveno et al., 19S5).
The timing of the beginning of prenatal care is widelyused as a convenient, if imperfect, indicator of the adequacyof care. Recognizing its importance, the Surgeon Generalof the United States in 19S0 set a goal that by 1990, at least90 percent of women in all counties and of every racial andethnic group would bc obtaining prenatal care during thefirst trimester (Koontz, 1984). The data in this section willhelp to reveal the status of prenatal care in various socialgroups in the United States near the beginning of the1980’s.
Data on the timing of the first prenatal visit are shownfor live births in tables 1-6 in order to compare pregnanciesof approximately equal length. For example, most preg-nancy losses occur early (LericJon, 1977); thus ~vhen olderwomen (who have more prcgmmcy Iosscs) arc comparedwith younger women (who have fewer losses), more olclcrthan younger women would be cxpcctcd to have receif’edno care, because more of their pregnancies did not last 9months. In fact, as shown in table 7, women who hodpregnancy losses arc much more likely than mothers of livebirths to rcccive no prenatai care at all, apparently because
many women do not know they are pregnant until a miscar-riage occurs or miscarry shortly after they find out. Thus, awoman who has a miscarriage in the first trimester, beforebeginning prenatal care, would be classified as receiving nocare, largely because the pregnancy ended before she had achance to seek prenatal care. To avoid this problem, mis-carriages are excluded from tables 1–6. Stillbirths are ex-cluded because there were too few in the survey to studyseparately and because limiting the data to live birthsmakes the data more comparable to the other data on livebirths in this report and to those in the tables based on thebirth registration system.
Characte)isfics of the pregnarrq~-Data from the NSFGshow that the timing— and by implication the adequacy—ofprenatal care varies considerably by age (table 1). Less thanhalf (46 pcrccnt) of births to teenaged mothers receivcclearly care, compared with three-quarters of births towomen aged 25-29 years. About 17 percent of births toadolescent mothers received care only after the fiflh fullmonth of pregnancy or not at all, three times the proportionamong births to mothers aged 25–29. Second births weresorncwhat more likely to receive care in the first trimester(73 pcrccnt) than were first births or third or higher-orderbirths (63 and 60 percent, respectively). These findings byage and birth order arc consistent wi[h those reported byIngram et al. (19S6) and by Taffel (NCHS, 1978a), basedon vital statistics data.
Births to never married women were much lCSSlikelyto have rcccivcd care early in the pregnancy than werebirths to ever married women (table 1). Only 44 percent ofbir[hs to never married mothers had care initititccl in thefirst trimester, compared with 71 pcrccnt of births to evermarried women. Births to never married women weremuch more likely to get late prenatal care or no care thanbirths to ever married women. These findings arc consistentwith those from other national data sources (Forrest andSingh, 1987; Ingram, Makuc, and Kleinman, 19S6; NCHS,1978a). Similarly, only half (50 percent) of all unwantedbirths and only 56 percent of mislimcd births rcccivedfirst-trimester care, compared with 73 pcrccnt of births thatwere wanted at the time they were conceived (’\vanlcclthen” in table 1).
Comparing tables 2 and 3 reveals large diffcrcnccs inthe timing of prcnat al care by race. White molhcrs reportedthat prenatal care began in the first 3 months of pregnancyfor 69 pcrccnt of their births between 1979 and the date of
11

interview; this compares with only 53 percent of those ofblack women (figure 1). Much of this difference was madeup in the fourth or fifth month of pregnancy-37 percent ofblack births had had prenatal care beginning in the fourthor fifth month, compared with 24 percent of white births.The percents in the last timing category are similar by race(tables 2 and 3).
The pattern of variation in the timing of the firstprenatal visit by age, birth order, marital status, and wont-edness status for both white and black births is generallyconsistent with the pattern just described for all racescombined. For example, the difference in the percent ofbirths receiving prenatal care in the first trimester betweenthose with mothers aged 25–29 and those with teenagedmothers was approximately 26 percentage points for bothwhite and black women; and births to never marriedwomen were much less likely to get early care in each racialgroup (figure 1). The data suggest, however, that thedifference in the timing of prenatal care between unwantedbirths and those that were appropriately timed was largerfor black (28 percentage points) than for white women (19percentage points).
Hispanic o]ig”n —The timing of prenatal care for birthsto Hispanic women is shown in table A according to age
and marital status. These data are compared with those fornon-Hispanic white and non-Hispanic black births sepa-rately, because the differences between white and blacknon-Hispanic births are so large that using an overall“non-Hispanic” category for comparison would be mislead-ing (Ingram, Makuc, and Kleinman, 1986; Felice et al.,1986; Chavez et al., 1986; Williams et al., 1986).
The data in table A suggest that age and marital statusdifferences in the timing of prenatal care for Hispanicbirths are considerably different from the general pattern(NCHS, 1978a). For example births to Hispanic teenagerswere more likely to have received first-trimester care thanbirths to non-Hispanic white teenagers (64 percenl versus45 percent). In contrast, births to Hispanic women aged 20years and older were much less likely to receive first-trimester care than births to non-Hispanic white women(46 percent versus 66 percent at 20-24 years of age).
Another contrast between Hispanic and other births isshown in the data by marital status in table A. Births tonever married non-Hispanic white women were much lesslikely to receive early prenatal care than births to evermarried non-Hispanic white women (39 percent versus 74percent). The same was true for non-Hispanic black women(43 percent versus 63 percent). However, among Hispanic
Table A. Number of pregnancies ending in a live birth in January 1979 or later to women 15-44 years of age and percent distribution bymonths pregnant when prenatal care began, according to race, origin, and age and marital status at birth: United States, 1982
[Statistics are based on a sample of the household population of the conterminous United Stales. See appendixes I and II for discussion of the sample design,sampling variability, and definitions of temrsi
Monfhs pregnant when prenatal care began
Number in Less than 3or4 5 months orCharacteristic thousands Total 3 months months more or 170care
Hispanic . . . . . . . . . . . . . . . . . . . . . . . . . . . . . . . . .
Mother’s age at lime of birlh:Under 20years . . . . . . . . . . . . . . . . . . . . . . . . . . .20-24 years . . . . . . . . . . . . . . . . . . . . . . . . . . . . .25-44 years . . . . . . . . . . . . . . . . . . . . . . . . . . . . .
Mother’s marilal status at lime of birth:Never married . . . . . . . . . . . . . . . . . . . . . . . . . . . .Evermarried, . . . . . . . . . . . . . . . . . . . . . . . . . . . .
Non-Hispanic while . . . . . . . . . . . . . . . . . . . . . . . . . .
Mother’s age at IIme of birfh:tJnder20 years . . . . . . . . . . . . . . . . . . . . . . . . . . .20-24 years . . . . . . . . . . . . . . . . . . . . . . . . . . . . .25-44 years . . . . . . . . . . . . . . . . . . . . . . . . . . . . .
Mother’s marital status at time of birlh:Never married . . . . . . . . . . . . . . . . . . . . . . . . . . . .Evermarried . . . . . . . . . . . . . . . . . . . . . . . . . . . . .
Non-H6panic black . . . . . . . . . . . . . . . . . . . . . . . . .
Mother’s age at time of birth:Under 20years . . . . . . . . . . . . . . . . . . . . . . . . . . .20-24 years . . . . . . . . . . . . . . . . . . . . . . . . . . . . .25-44 years . . . . . . . . . . . . . . . . . . . . . . . . . . . .
Mother’s marital status at hme of birth:Never married . . . . . . . . . . . . . . . . . . . . . . . . . . . .Evermarried . . . . . . . . . . . . . . . . . . . . . . . . . . . . .
11,704
380527796
4601,222
i 10,246
1,0163,3695,842
9139,311
12,020
512755752
1,021995
Percent distribution
100.0 56.1 25.6 16.1
100.0 64.0 ‘20.0 *16.O100.0 46.2 35.9 *17.9100.0 63.1 *2 I .9 *15.O
100.0 56.5 *19.6 *21.7100.0 56.0 28.0 *14.O
100.0 70.4 23.2 6.4
100.0 45.0 40.0 *15.O100.0 66.1 26.7 *7.3100.0 77.4 16.2 *4.4
100.0 39.1 43,8 *17.1100.0 73.6 21.1 5.4
100.0 52.7 36.9 10.4
100.0 37.9 43.8 18.3100.0 53.7 36.3 ‘6.0100.0 62,0 30.7 *7.2
100.0 43.2 41.6 15.2100.0 62.5 32.1 *5.3
1Includes births for which mothets marital status at birth was unknown and other races, not slvxm separately.
12

births there was almost no difference by marital status inthe proportion receiving early prenatal care (59 percentversus 5S percent, table A).
Showing Hispanic births separately appears to affectwhite-black comparisons of the timing of prenatal care. Forexample, comparison of data for white and black women intables 2 and 3 and in table A shows that excluding Hispanicbirths from the comparisons for teenage births cuts the racedifference in half, making it nonsignificant:
Percent receiving carein first 3 months
TablesTeenage mothers 2 and 3 Table A
Vie... . . . . . . . . . . . . . 50.9 45.0Black . . . . . . . . . . . . . . . . 37.0 37.9
Difference . . . . . . . . . . . . . 13.9 7.1
The slightly greater proportion of births to never mar-ried non-Hispanic black mothers receiving care in the firsttrimester (43 percent) compared with the proportion fornever married non-Hispanic white mothers (39 percent,table A) is not statistically significant, but it is consistentwith findings from vital statistics and the 19S0 NNS(Forrest and Singh, 1987; NCHS, 1978a).
These differences suggest that the pattern of the timeof first prenatal care by age and marital status differs byHispanic origin, with teenage and never married Hispanicwomen resembling non-Hispanic white women, and olderand ever married Hispanic women resemblingnon-Hispanic black women. An overall Hispanic versusnon-Hispanic comparison would obscure these two distinctpatterns of prenatal care. Further, differences by Hispanicorigin sometimes affect comparisons of white and blackwomen as shown above. The sample sizes for Hispanicpregnancies are too small to investigate these hypotheses ingreater detail in this report, but these findings suggest thatit will be most useful to show Hispanic pregnancies by ageand marital status and contrast them with pregnancies ofnon-Hispanic white and non-Hispanic black women sepa-rately.
Charatkvistics of the mofher-The timing of first pre-natal care for all live births since January 1979 by selectedcharacteristics of the mother at the date of the NSFGinterview is shown in table 4.
The timing of prenatal care differed sharply with thesocioeconomic characteristics of the mother. Fewer thanhalf of births to mothers with less than 12 years of schoolingreceived prenatal care in the first trimester (4S percent),compared with more than three-fourths of infants born tomothers wiih some colIcge (77 percent). About 18 pcrccntof births to the least educated women rcceivcd care onlyafter the fifth month of pregnancy or not at all, comparedwith only 3 percent of births to college-educated women.
The largest differences in the timing of prenatal careare in the mother’s most recent occupation. Prenatal carebegan in the first trimester for 82 percent of births toprofessionals or managers; this proportion declined to lessthan 50 percent for births to women working in craft,
operative, or farm occupations, and for women who neverworked. Similarly, the proportion who began care at thesixth month or later or who never received care rangedfrom 3 percent for births to professionals and managers to21 percent for births to women who had never worked.
Only half of births to low-income women (149 percentof poverty level or less) began to receive prenatal care inthe first trimester, compared with three of four births tohigher-income women. Similarly, only 46 percent of birthsto women receiving Medicaid at the time of the interviewhad prenatal care beginning in the tlrst trimester, comparedwith 69 percent for those not receiving Medicaid. This doesnot necessarily mean that these mothers were Medicaidrecipients at the time they became pregnant; it is possiblethat being pregnant, needing care, and having no othersource of care was the reason they became Medicaidrecipients.
The distribution of births by mother’s region, educa-tion, occupation, income, and Medicaid status varies byrace; thus the timing of prenatal care for these characteris-tics is given separately for white and black women in tables5 and 6. Births to white women living in the Northeast weremore likely to rcccive first-trimester care than births towomen in the South (78 percent versus 65 percent, table 5).This was also true for black women (63 percent versus 49percent, table 6). The proportion of births to black womenwho received early care differed more sharply by mother’seducational lCVC1than did births to white women. For whitemothers, the proportions beginning prenatal care in thefirst trimester were 52 percent in the lowest educationgroup and 79 pcrccnt in the highest, a range of 27 percent-age points, but for black mothers this proportion rangedfrom 35 percent in the lowest education group to 71percent in the highest, a range of 36 percentage points.Thus, births to white mothers with less than a high schooleducation were more likely to receive care in the firsttrimester (52 percent) than were births to black motherswith this amount of schooling (35 percent), but amongbirths to mothers with at Icast some college, the propor-tions receiving early care were simik.lr.
There were large race differences in the timing ofprenatal care for sales and clerical and for service workers.However, the proportions of births receiving first-trimestercare did not differ significantly by race among professionalsand managers or among craft workers, operatives, or farmworkers. In addition, the data also suggest that infants bornto white mothers were more likcly to have rcccived first-trimcstcr care than infants born to black mothers regard-lCSSof whether income at survey date was lCSSthan 150pcrccnt of the poverty level or more. However, for infantsborn to mothers with incomes of 3tltl pcrccnt of the povertylevel or more, the percents receiving early care were similarby race—79 percent for white and 78 percent for blackwomen. There also was no significant race difference in thetiming of prenatal care among births to mothers receivingMedicaid at the interview date.
In summary, there was no significant difference by racein the proportion receiving first-trimester prenatal care
13

among relatively homogeneous groups: those with incomesof 300 percent of poverty level or more; craft workers,operatives, and farm workers; or women receiving Medic-aid. Race differences are largest within relatively large anddiverse groups, such as women not receiving Medicaid andhigh school graduates. In other words, the very large racedifference in receipt of first trimester prenatal care is notsignificant when socioeconomic stahu differences betweenwhite and black women are well conholledfor. This suggeststhat socioeconomic status, not race itself, is the mostimportant determinant of early prenatal care.
Receipt of any prenatal care–About 93 percent of allwomen who had pregnancies ending in a live birih orspontaneous fetal loss in 1979–82 received some prenatalcare (table 7). This percent varied from approximately 90percent among pregnancies of never married and teenagemothers to 96 percent of pregnancies of women aged 25 to29 years. The proportion receiving prenatal care was even
higher for pregnancies ending in a live birth—98 percent–with very little variation by age, marilal status, or wonted-ness status at conception. The proportions receiving prena-tal care were similar for white and black women andvirtually identical when limited to live births (tables 8and 9).
The percent of women receiving prenatal care and thesource of care at first visit are shown by race and Hispanicorigin in table B. The data suggest that both overall and atthe older ages, pregnancies to Hispanic women were lesslikely to receive any prenatal care (87 percent overall)compared with pregnancies to non-Hispanic white women(95 percent overall). However, the data also suggest thatHispanic teenagers were somewhat more likely than non-Hispanic white teenagers to receive any care at all (98percent versus 87 percent).
Table 10 also shows that pregnancies to women whohad not graduated from high school were less likely to
Table B. Number of pregnancies ending in live births or spontaneous loss in January 1979 or later to women 1544 years of age,percent receiving prenatal care, and percent distribution of pregnancies receiving care by source of care at first visit, according to race,origin, and age and marital status at pregnancy outcome: United States, 1982
[Statistics are based on a sample of the housetsold population of the conterminous United States. See appendixes I and II for discussion of the sample design,sampling variability, and definition of terms]
Source of prenatal careal fhw vkit
NumDer in Percent receiving Privale Hospital OtherCharacteristic thousands prenatal care Total doctor clinic clinic
All pregnancies
Hispanic . . . . . . . . . . . . . . . . . . . . . . . . . . . . . . . . .
Mother’s age at pregnancy outcome:Under 20 years . . . . . . . . . . . . . . . . . . . . . . . . . . .20-24 years....<,.......<.. . . . . . . . . . . . . .25-44 years . . . . . . . . . . . . . . . . . . . . . . . . . . . . .
Mother’s marital status at pregnancy outcome:Never married . . . . . . . . . . . . . . . . . . . . . . . . . . . .Evermarried . . . . . . . . . . . . . . . . . . . . . . . . . . . . .
Non-Hlspanlc white . . . . . . . . . . . . . . . . . . . . . . . . . .
Mother’s age at pregnancy outcome:Under 20 years . . . . . . . . . . . . . . . . . . . . . . . . . . .20-24 years . . . . . . . . . . . . . . . . . . . . . . . . . . . .25-44 years . . . . . . . . . . . . . . . . . . . . . . . . . . .
Mother’s marifal status at pregnancy outcome:Never married . . . . . . . . . . . . . . . .. . . . . . . . . . . . .Evermarried . . . . . . . . . . . . . . . . . . . . . . . . . . . . .
Non-Hispanic black . . . . . . . . . . . . . . . . . . . . . . . . . .
Mother’s age at pregnancy outcome:Under 20years . . . . . . . . . . . . . . . . . . . . . . . . . . .20-24 years . . . . . . . . . . . . . . . . . . . . . . . . . .25-44 years.............,.. . . . . . . . . . . . . .
Mother’s marital status at pregnancy outcome:Never married . . . . . . . . . . . . . . . . . . . . . . . . . . . .Ever married . . . . . . . . . . . . . . . . . . . . . . . . . . . . .
Ltve births
Hispanic . . . . . . . . . . . . . . . . . . . . . . . . . . . .Non-Hispanic whiff ..,...... . . . . . . . . . . . . . . . . .Non-Hispanic black . . . . . . . . . . . . . . . . . . . . . . . . . .
Percenl distribution
I 1.993 86.6 100.0 61.8 16.0 22.2
406570
1,018
98.380.385.4
100.0100.0100.0
66,645.887,9
*15.5*24.9●11.6
*17.9*29.3‘20.5
5221,470
88.686.6
100.0100.0
62.565.2
‘29.0●11.4
*18.523,4
112.340 94.6 100.0 82.9 6.1 11.1
1,3553,86278104
87.195.295.7
100.0100.0100.0
66.075.090.2
*1 6.57.5
*3.4”
*17.517.5
6.4
1,23011,086
12,489
91.494.9
100.0100,0
52.286.1
47.6
●18.54.7
~7.8
29.39.2
34.790.8 100,0
631884975
90.892.089.7
100.0100.0100.0
31.942.662.8
18.219.415.9
49.937.921.2
1,2691,213
90.291.4
100.0100.0
37.258.6
16.716.5
44.024.9
1,70410,2462,020
93.299.298,3
100.0100.0100.0
61.582.647.7
16.66.1
17.8
21.911.334.5
1Inctides pregnarwies for which mother’s marital status al cutcome was unknown d other races, not shown separately.
14

receive prenatal care at all (88 percent) than were pregnan-cies to women with more education (95 percent). This wastrue for pregnancies ending in live birth as well, althoughthe difference was not as large.
First source of prenatal care
Although many studies of prenatal care have beenpublished, statistics like those in tables 7-12 do not appearto be available from any other national source. Firstsources of prenatal care are categorized in tables 7-12 as‘{private doctor~’ “hospital clinicfl and “other (nonhospital)clinic.”
Women interviewed in (hc 1982 NSFG were asked tospecify the type of prenatal care provider they used on theirfirst visit for each pregnancy ending on or after January 1,1979. These are listed in tables 7–12 for all pregnanciesexcept those ending in induced abortion; pregnancies end-ing in live birth are shown separately. If a woman reportedthat her first prenatal care for a particular pregnancy wasby a private doctor, private group practice, co-op, or privateclinic, the care was classified in tables 7–12 as by a privatedoctor. Care at a hospital clinic is shown separately intables 7–12. Care at a community health center clinic,public health department clinic, family planning or abortionclinic, student health service, or military health serviceclinic is classified as “other clinics” in tables 7–12 andsometimes referred to as “nonhospital” clinics in the text.
Chcvactenktics of the pregnmcy-In 75 percent of allprcgnancics, the first prenatal visit was to a private doctor;in 9 percent, to a clinic in a hospital; and in 16 percent, tosome other type of clinic. These same percents charactcr-fizcd all pregnancies ending in a live birih. There were,however, large differences in the first source of prenatalcare, depending on the age of the pregnant woman, hermarital status, and lhe wantcdness status of the pregnancy.
The proportion of women receiving care from clinicsdccrcascd as the age of the pregnant woman increased.Teenagers were four times as likely to use a hospital clinicor other clinic for the first prenatal visit as women 30-44years of age (-M pcrccnt, compared with only 11 pcrccnt ).
A majority of pregnancies to never married women (55pcrccnt) rcccivcd prenatal care scrviccs from hospital clin-ics or other clinics. This compares with only 18 percent forpregnancies to ever married women. Furthcrrnorc, plannedpregnancies were associated with privately financed care,but differences in source of care behvccn mistimccl andunwanted pregnancies were not significant, All of thesegeneral observations held for live births as WCH.
Data m-eshown separately for pregnancies ofwhitc andof black women in tables 8 and 9. First sources of carediffcrccl substantially by race; four of five prcgrmncics ofwhite women rcceivcd care from a private doctor, com-pared with fewer than half of pregnancies to black women(figure 2). Black women were more than twice as likely aswhite women to have made their first prcrmtal visit to ahospital clinic (18 percent versus 7 percent) or other clinic(34 percent versus 13 percent).
For both races, the proportion rccciving first prenatalcare from a nonhospital clinic declined as age of the womanincreased, but the decline was much steeper for blackwomen. (The only increase, for white women aged 20-24years, was not significant.) For about 50 percent of preg-nancies to black teenagers receiving care, the first visit wasto a nonhospital clinic. This proportion decreased sharplyas age increased, to 17 percent of pregnancies to blackwomen 30J14 years of age. Among white women, 17percent of pregnancies to teenagers first received care fromnonhospita] clinics, declining to 6 percent at age 30-44.Thus, the proportion of pregnancies receiving care at non-hospital clinics was higher for black than for white womenin each age group, but the difference was greatest at theyoungest ages.
In contrast, the proportion of teenage pregnanciesreceiving prenatal services from hospilal clinics was similarfor white and black women (16 percent versus 18 percent).But among pregnancies to white women, the percent re-ceiving their first prenatal care from a hospital clinic de-clined sharply with age, from 16 percent to 3 percent, whileamong pregnancies to black women, the observed declinefrom 18 percent to 14 percent was not large and notstatistically significant.
There was no significant variation in lhe first source ofcare by pregnancy order for white women, but first preg-nancies of black women were more likely to receive prena-tal services from nonhospit al clinics (41 percent versus 14percent, tables 8 and 9), perhaps because of the higherproportion of first pregnancies at younger ages for blackwomen.
For both races, pregnancies of newer married womenwere less likely to rcccivc care from private doctors andmore likely to obtain scrviccs from nonhospital clinics thanpregnancies to ever marriul women (figure 2). Prcgnancicsto never married while women were almost four times aslikely to receive their first prenutal care from hospitalclinics (22 pcrccnt) than were pregnancies occurring to evermarried white women (6 pcrccnt ). In contrast, the pcrccntof black pregnancies first rccciving prenatal semices from ahospital clinic did not vary significantly by marital stu[us.Thus, similar proportions of prcgmmcics to white and blacknever marriw! women rcccivecl prcnutal cmc at a hospitalclinic (22 and 19 pcrccnt), but a larger proportion ofpregnancies to never marriccl black women reccivcr,l theirfirst prenatal care at a nonhospital clinic (44 and 26 per-cent).
These patterns of variation in source of prenatal careaccording to race, age, and marital status apply equally tothe subset of pregnancies cncling in live birih. Thus, it is notsurprising that births rccciving late or noncontinuous pre-natol care were more likely [o htivc rcccivecl their firstscrviccs from a clinic—younger, never murricd women andwomen whose pregnancy was unwanted at conception wereboth more Iikcly to initiate care after (hc first trimester andto have altcnded a clinic for their first prenatal visit. Asseen in the last line of table 7, 39 pcrccnt of womenrccciving late or discontinuous prenatal care rcccivcd their
15

first services from a clinic, but the proportion varied from33 percent for white births to 63 percent for black births(tables 8 and 9).
Among pregnancies receiving care, those to Hispanicwomen were less likely than those to non-Hispanic whitewomen to obtain it from private physicians (62 percentversus 83 percent, table B). However, this difference waslimited to pregnancies of women aged 20 years or older andmarried women. Pregnancies of Hispanic teenagers werevery similar to those of non-Hispanic white [ecnagers insource of prenatal services, but pregnancies of Hispanicwomen 20 and older were more similar to those of non-Hispanic black women 20 and older. Vital statistics datasuggest that Hispanic teenage mothers were most oftenU.S.-born and older Hispanic women foreign-born;foreign-born women are probably more likely than U.S.-born women to use clinics (Ventura and Taffel, 1985).
Characteristics of the woman —The percent of pregnan-cies receiving any prenatal care and the source of care atfirst visit are shown in table 10 and separately for white andblack women in tables 11 and 12 by selected characteristicsof the woman on the date she was interviewed.
Overall, pregnancies to women living in the Midwestwere more likely to have received their first prenatal ser-vices from private physicians than were those to women inthe Northeast or South (83 percent versus 71 percent).Pregnancies to women in the Northeast were more thantwice as likely to have obtained prenatal care at a hospitalclinic than were those in any other region (17 percentversus 7 to 8 percent). A larger proportion of pregnanciesto women living in the South received care from “other”clinics (23 percent), compared wiih those in the Northeastor Midwest (9 to 12 percent).
The proportion of pregnant women receiving care fromprivate physicians differed sharply with the level of educa-tion—from 56 percent for pregnancies to women with lessthan 12 years of schooling to 86 percent for women whohad attended college. Pregnancies to women with less thana high school education were four times as likely to havereceived service from a hospital clinic (16 percent versus 4percent) and over two and a half times as likely to havereceived services from ot hcr clinics (28 percent versus 10percent) as pregnancies to college-educated women.
Differences by education in the proportion of pregnan-cies receiving care from clinics were larger for white thanfor black women. Pregnancies to white women with lessthan 12 years of schooling were at least twice as likely tohave first received services at either a hospital clinic orother clinic than were those to high school graduates (39percent versus 17 percent). Among pregnancies to blackwomen, this difference by education was smaller (64 per-cent versus 56 percent) and not significant. The racialdifference in the proportion of pregnancies to women withless than a high school education that received care athospital clinics was not significant (16 percent versus 19percent).
Differences according to most recent occupation weremarked. The proportion of pregnancies receiving care from
private sources differed sharply, from 88 percent of profes-sionals and managers to 53 percent of women who hadnever worked (table 10). The decline was steeper for blackwomen, from 78 percent to 30 percent (table 12).
Pregnancies to white women were more likely thanpregnancies to black women to receive their first prenatalcare from private doctors in every occupational groupexcept professionals and managers, for whom the differ-ence was not significant (tables 11 and 12). Similarly, withthe exception of professionals and managers, the percentreceiving care at nonhospital clinics was two or three timesas large for black as for white women in each occupationalcat egory.
Overall, pregnancies to low-income women were morethan twice as likely to have received care from a hospitalclinic (14 percent versus 6 percent) and almost three timesas Iikcly to have received care at a nonhospi[al clinic (28percent versus 10 percent) than prcgancies to women withhigher incomes (table 10).
In each income catego~, pregnancies to black womenwere less likely than pregnancies to white women to,receivecare from private physicians and substantially more likely toget it from nonhospital clinics. Indeed, most of these differ-ences were significant at the 0.001 level. The proportion ofblack women receiving services at hospital clinics did notdiffer significantly by income, but the proportion obtainingcare at nonhospita] clinics was sharply higher for low-income black women (43 percent) than for high-incomeblack women (24 percent).
Fewer than half (42 percent) of women receiving Med-icaid at the survey date had obtained prenatal care from aprivate doctor. About 20 percent received care at a clinic ina hospital, and 38 percent received care at a community-basecl clinic. There was no observed difference betweenwhite and black Medicaid recipients in the proportionreceiving hospital clinic services, and the observed differ-ences in the proportions receiving private physician servicesand care at “nonhospital” clinics were not large enough tobe significant, given the relatively small number of womenin the sample who were receiving Medicaid.
These generalizations regarding the source of prenatalcare are also true when only pregnancies ending in livebirth are examined.
Cigarette smoking during mostrecent pregnancy
Smoking during pregnancy has been shown 10 increasethe risk of adverse pregnancy outcomes, including low birthweight, prcterm birth, miscarriage, premature rupture ofmembranes, infant death, low Apgar scores, and illnessduring childhood (Harlap, 1987; Keppel and Taffel, 1987;Hogue and Sappenfield, 1987; Moss et al., 1987; Sachs,1987; Stein and Kline, 1983; Anderson et al., 1984; Doug-herty and Jones, 1982; Rantakallio, 1983). These effectsworsen when smoking is heavier (Moss et al., 1987: Sachs,1987; Anderson et al., 1984; Dougherty and Jones, 1982).Recent studies attribute 21–39 percent of cases of low birth
16

weight, 1l–14 percent of cases of preterm births, and about4,600 infant deaths in the United States each year tomaternal smoking (Behrman, 19S5; Hogue and Sappen-fielcl, 1987; Sachs, 1%S7).
Most well-controllccl studies show that, independentlyof other factors, smoking reduces birth weight by 150-300grams, and doubles the risk of low birth weight (Hogue andSappcnficld, 1987; Stein and Kline, 19S3; Anderson et al.,19s4).
The effects of maternal smoking on postnatal childhealth arc more difficult to study, but two recent reportssuggest that maternal smoking during pregnancy has long-h.lsting adverse effects. Moss et al. (19S7) found that chil-dren under the age of 3 years whose mothers smokedduring pregnancy were more likely to bc in poor health, tohave a chronic condition, to be hospitalized at least once,and to have more days of bed rest because of illness thanwas true for children of mothers who did not smoke duringpregnancy. These relationships were stronger for childrenof mothers who smoked more, and they held when control-ling for the mother’s age, parity, and education and thechild’s birth weight. Investigators in Finland who followedchildren to the age of 14 (Rantakallio, 19S3) found thatchildren of mothers who smoked during pregnancy hadmore respiratory diseases, were shorter, and had loweraverage achievement in school than other study children,after controlling for oiher variables.
Chamctcvistics of the pregnancy-The National Surveyof Family Growth data in tables 13–18 show patterns ofsmoking during pregnancy for both married and unmarriedwomen and include other characteristics not found in anyother national source. Women who had ever been pregnantwere asked, “On the average, during your last pregnancy,how many cigarettes per day did you usually smoke, ifany?”
The answer categories were:
●
●
●
●
●
●
●
●
About one a clay or less.Just a fcw (PI).About half a pack .(5–14).About a pack (15-24).About 1% packs (25-34).About 2 packs (35-44).More than 2 packs (45+).Didn’t smoke during last pregnancy.
Women who reported smoking about half a pack (5-14cigarettes) or less per day are shown in tables 13-15 ashaving smoked fewer than 15 pcr day. These women aresometimes referred to as light smokers in the text. Thosewho reported smoking about a pack (15–24) or more perday are shown in tables 13-15 as having smoked 15 or moreper day and arc called heavy smokers in the text.
Overall, nearly 7 out of 10 women did not smoke at alIduring their most recent pregnancy (69 percent, table 13).Those who did smoke were divided almost equaIIy betweenthose smoking fewer than 15 cigarettes per day (16 percent)and those smoking 15 or more per day (15 percent). The
proportion who did not smoke at all was similar for whiteand black women (69 and 71 percent), but black womenwere less likely to have smoked 15 or more cigarettes perday (10 percent versus 16 percent, tables 14 and 15).
For white women, the proportion of nonsmokers in-creased with age at pregnancy outcome from 58 percent ofteenagers to 73 percent of women aged 25–44 years (table14). This pattern was not observed for black women (table15). The highest proportion of bIack women who did notsmoke at all was at ages 20-24 (75 percent) and the lowest(66 percent) at ages 30-44 years. The proportion of blackwomen smoking 15 or more cigarettes per day increasedfrom 6 percent of teenagers to 16 percent of the oldest agegroup, but for white women there was a nonsignificantdecIinc with age in the proportion who smoked heavily.
White ever married women were more likely not tohave smoked during their most recent pregnancies thanwhite never married women (70 percent versus 54 percent,table 14). However, this difference by marital status wassmalIer and not significant for black women. About 25percent of never married white women smoked 15 or morecigarettes pcr day, compared with 15 percent of ever mar-ried white women; for black women, the proportions whosmoked heavily were similar by marital status.
Refraining from smoking was more common amongwomen whose last pregnancy had been wanted at the timeof conception, but for black women, these percents did notdiffer significantly.
Of the women whose most recent pregnancy ended in alive birth, 71 pcrccnt dicl not smoke at all while they werepregnant, compared with only 59 percent of women whosemost recent prcgnaney ended in a miscarriage or stillbirth.The difference between the proportions of nonsmokersaccording to pregnancy outcome was somewhat larger forblack (17 percentage points) than for white women (12percentage points). The data suggest, however, that forboth races, the proportion of women smoking 15 or morecigarettes per day was about 8 percentage points higher forthose whose most rcccnt pregnancy ended in miscarriage orstillbirth than for those whose pregnancy ended in a livebirth.
For women whose most recent prcgnaney ended inJanuary 1979 or later, 77 percent who rcceivcd adequateprenatal care did not smoke at all, compared with only 65percent of women who did not receive adequate care. Thedata suggest that the proportions of women who smokedwere higher for women receiving late or discontinuous carethan for oihers. These findings su~est either that adequatecare discourages some women from smoking during preg-nancy or that women with good health habits (such as notsmoking) use prenatal health services more than do womenwith worse hcal[h habits.
In general, the Iargest race differences were observedin the proportion of women smoking 15 or more cigarettespcr day during tbcir last pregnancy, with a higher percent ofwhite than of black women smoking heavily. Race differ-ences in t!le percent smoking heavily were greatest for
17

Table C. Percent of women 1544 years of age whose most recent pregnancy ended in live birth or spontaneous loss not smokingcigarettes and not consuming any alcoholic beverages during the most recent pregnancy, by race, origin, and selected characteristics:United States, 1982
[Statistics are based on a sample of the household population of the contermlnous United States. See appendixes I and II for discussion of the sample design,sampling varlablllfy, and definition of terms]
Percent not smoking Percent nof drinkingcigarettes at all alcofrol at all
Non-Hispanic Non-Hispanic Non-Hispanic Non-Hispanic
Characfer/sfiC Hispanic whale black Hispanic white black
Total . . . . . . . . . . . . . . . . . . . . . . . . . . . . . . . . . . 82.8 67.2 70.8 69.3 49.8 87.0
Age at pregnancy outcome
Under 20years . . . . . . . . . . . . . . . . . . . . . . . . . . . . . 77.720-24 yeare . . . . . . . . . . . . . . . . . . . . . . . . . . . . . . 81.725-44 years . . . . . . . . . . . . . . . . . . . . . . . . . . . . . . . 84.8
54.862.071.5
72.575.066.7
77.076.382.2
66.653.645.5
77.070.460.0
Martial status at pregnancy outcome
Nevermarrled . . . . . . . . . . . . . . . . . . . . . . . . . . . . . . 77.8Evermarrled . . . . . . . . . . . . . . . . . . . . . . . . . . . . . 85.1
45.568.4
67.172.7
71,568,0
47.949.9
68.565.7
Pregnancy outcome
Llvebkth. . . . . . . . . . . . . . . . . . . . . . . . . . . . . . . . . 83.1Spontaneouspregnancyloss... . . . . . . . . . . . . . . . . . 80.4
68.455.6
73.254.7
70.954.5
50.047.1
66.854.9
1Data for all racesati origins are shown In tables 13 aml 16. Races other than white or black are not shown Separately.
women who had never married orwere in their teens atthe
outcome of their most recent pregnancy. The race differ-enceinheavy smoking diminished as age increased.
Thepercentsof women nonsmoking during their mostrecent pregnancies are given in table C by race and His-panic origin. The proportion whodid not smoke at all was83 percent for Hispanic women—higher than for non-Hisptmicwhite (67 percent) and black (71 percent) women.Thepercentwhodid not smoke atall increased significantlywith age for non-Hispanic white women (from 55 to 72percent), but this increase was smaller and not significantfor Hispanic women (from 78 to 85 percent).
Ever married non-Hispanic white women were one anda half times as likely to have abstained from smoking during
their most recent pregnancy (68 percent) than were nevermarried women (46 percent). In contrast, abstention fromsmoking did not differ significantly by marital status amongHispanic or non-Hispanic black women. Thus, the propor-tion abstaining from smoking was lowest for never marriednon-Hispanic white women: Only 46 percent abstainedduring their most recent pregnancy, compared with 78percent of never married Hispanic women and 67 percentof never married non-Hispanic black women.
To account for differences in time between a woman’smost recent pregnancy and the date of interview, table Ddetails smoking behavior by year of outcome. Perhapsbecause of increasing awareness of the dangers of smokingduring pregnancy, the proportion smoking heavily (15 or
Table D. Number of women 15-44 years of age whose most recent pregnancy ended in live birth or spontaneous loss and percentdistribution by average number of cigarettes smoked per day during the pregnancy, according to race of woman and year of outcome:United States, 1982
[Statisticsare based on a sample of the household population of the coniermlnous United States. See appendixes I and II for discussion of the sample design,samplmg variability, and definition of terms]
Average number of cigarettes smokedper day during pregnancy
NumberRace of woman of women Fewer 15 or
and vear of outcome /n thousands Total None than 15 more
Percent distribution
Allwomenl . . . . . . . . . . . . . . . . . . . . . . . . . . . . . . . 29,345
9,8907,974
11,481
100.0 69,4 15.7 14.9
198C-82 . . . . . . . . . . . . . . . . . . . . . . . . . . . . . . . . .1975-79 . . . . . . . . . . . . . . . . . . . . . . . . . . . . . . . . .Before 1975 . . . . . . . . . . . . . . . . . . . . . . . . . . . . . . .
100.0 72.2 16.1 11.6100.0 69.1 15,2 15.6100.0 67.3 15.7 17.0
White women . . . . . . . . . . . . . . . . . . . . . . . . . . . . . . 24,174 100.0 66.7 15.2 16.1
1960-62 . . . . . . . . . . . . . . . . . . . . . . . . . . . . . . . . .197s79, . . . . . . . . . . . . . . . . . . . . . . . . . . . . . . . .Before 1975 . . . . . . . . . . . . . . . . . . . . . . . . . . . . .
8,1096,2999,765
100.0 71.8 15.4 12.9100.0 66.7 14.7 16.6100.0 66.2 15.4 18.4
4,222
1,412
1,398
1,412
100.0 70.9 19.6 9.5
100.0 70.6 22.6 6.8100.0 71.6 17.3 10.9100.0 70.4 18.9 10.7
Black women . . . . . . . . . . . . . . . . . . . . . . . . . . .
1980-82 . . . . . . . . . . . . . . . . . . . . . . . . . . . . . . . . .1975-79 . . . . . . . . . . . . . . . . . . . . . . . . . . . . .Before 1975 . . . . . . . . . . . . . . . . . . . . . . . . . . . .
i Incbdes white, black, and otkr races.
18
more cigarettes per clay) was smaller for women whose lastpregnancy ended in 1980-82 than for those whose pregn-ancy ended before 1975 (12 percent versus 17 percent).For black women, the observed percent decrease betsveen1975–79 and 1980-82 was smaller than for white womenand not significant. In short, in 1980-82 white women werestill more likely to smoke 15 or more cigarettes per dayduring pregnancy than were black women, but the differ-ence was a little less than before 1975.
Characteristics of the woman —Smoking behavior dur-ing the most recent pregnancy is shown according to se-lected characteristics of the woman at the time of theinterview in tables 16-18.
Proportions of women not smoking at all were similarfor all four geographic regions (table 16). White women inthe Midwest and South were more likely to have smoked“heavily” during their most recent pregnancy than wereblack women living in the same regions (tables 17 and 18).
The percent of women who refrained from smokingduring their most recent pregnancy rose substantially withtheir years of schooling: 79 percent of women with somecollege education did not smoke at all, compared with only56 percent of women with less than a high school educa-tion—a difference of 23 percentage points. Overall, differ-ences by education made a larger difference in theproportion smoking heavily than in the proportion smokinglightly women with less than a high school education weremore than twice as likely as college-educated women tohave smoked at least a pack a day during their most recentpregnancy (24 percent versus 9 percent). It is worth noting,however, that this difference by education was much largerfor white women (26 percent versus 9 percent) than forblack women (13 percent versus 6 percent, I@re 3).
Given their obscrwcd differences by education, it is notsurprising that a larger percent of women employed asprofessionals or managers (78 percent) than of womenworking in service occupations (62 percent) or in craft orfarm occupations or as operatives (63 pcrccnt) did notsmoke at all during their most recent pregnancy.
Low-income white women were more likely to havesmoked during their last pregnancy than were higllcr-income white women, but this cfiffcrcncc was smaller forblack women and not significant. Similarly, white womenrccciving Medicaid were much less Iikcly to abstain fromsmoking (50 percent, table 17) than were women notreceiving Medicaid (70 percent). Further, for white women,almost twice as many of those receiving Medicaid as ofthose not rccciving Medicaid smoked 15 or more cigarettesper day (29 percent versus 15 percent). In contrast, therewas no significant cliffcrence by Medicaid status for blackwomen, either in Ihc proportion who had abstained or inthe proportion who had smoked heavily.
Thus, white women with lCSSthan a high school educa-tion, those most rcccntly employed as craft or farm workersor as opera~ivcs, and those receiving Medicaid at the dateof interview were more li!icly than their black countcrpurtsto have smohxl heavily during their most recent pregnancy(tables 17 and 1S and figure 3).
Alcohol consumption during mostrecent pregnancy
Mothers who drink heavily during pregnancy haveincreased risks of spontaneous pregnancy loss, and theirbabies have increased risks of low birth weight, pre- andpostnatal growth retardation, mental retardation, learningdisorders, hyperactivity, and perinatal mortality (AmericanMedical Association, 1993; Kruse, 1984; Mills et al., 1984;Abel, 1982). Babies of alcoholic mothers are often bornwith several of these symptoms, called fetal alcohol syn-drome (Abel, 1982; AMA, 1983; Kruse, 1984; Mills et al.,19s4).
After reviewing a number of epidemiologic studies, theAmerican Medical Association (1983) concluded that analcohol intake of 1 ounce (one drink) per day or morereduces birth weight, and that the risk of spontaneouspregnancy loss is increased when the intake is 1 ounce perweek or more. One ounce or more pcr week corresponds tothe “more frequen~” drinking category in tables 19–24. Theeffects of the amounts in the “less frequent” category intables 19–24 are not known (AMA, 1983; Mills ct al.,19s4).
In a large recent study, alcohol consumption was asso-ciated with reduced birth weight after controlling for smok-ing and other variables (Mills et al., 1984). The studyshowed that increased risks of low birth weight occurredamong newborns of women who consumed onc drink a dayor more (Mills ct al., 1984). However, that is more alcoholconsumption than in the “more frequent” drinking categoryin tubles 19-24. Several issues need to be rcsolvcci byfurther research, including the health effects of binge drink-ing and other drinking patterns; the month of pregnancy inwhich drinking occurs; and whether the health effects ofbeer, wine, and iiquor differ (AMA, 1983; Krusc, 1984;Stein and Kline, 19S3).
The AMA conclucfcd that the amount of alcohol aprcgmmt woman can consume without adversely affectinghcr baby is still unknown, and that, until a safe amount isdctcrmimxf, prcgm.mt women should no( usc alcohol a[ all(ANIA, 19S3). Similarly, in July 1981, the Surgeon Gcncmlof the Unitccl Slates advisccl physicians that “ciIch patientSI1OUICIbc told about the risk of alcohol consumption duringpregnancy and advised not to drink alcoholic bcvcragcs”(Surgeon General of the Unitccl States, 19S1).
Chcwac[e)istics of [he pregnancy— In the 19S2 NatiormlSurvey of Family Growth, ever pregnant women wereasked, “During your last prcgnanq, how often did youusually drink alcoholic beverages, that is, beer, wine, orliquor?”
Women who rcportecl drinking ICSSthan once a weekarc sometimes rcfcrrccl to as “infrequent drinkers” in thisreport, and \vomcn w’ho reported drinking at least once aweek arc sometimes refcrrcci to as “rcgular” or “frequent”drinkers. The frequency with which women drank alcoholicbeverages during their most rcccnt pregnancy ending in livebirth, miscarriage, or sti]lbir[h is given in tahlcs 19-21.Ovcral], about 55 percent rcportcrl not drinking at all; 34
19

percent, less than once a week; and 12 percent, once a weekor more (table 19). Black women were more likely to haverefrained from drinking altogether than were white women(67 percent versus 52 percent, tables 21 and 20 respec-tively), but this difference was due almost entirely to thediffering proportions of women drinking less than once aweek; the percents drinking once a week or more weresimilar by race (11–12 percent).
The percent who reported consuming no alcohol at allduring their most recent pregnancy decreased from 71percent for teenagers to 48 percent for those aged 25–29years. Women aged 25-44 were at least twice as likely asteenagers to have consumed alcohol at least once a weekduring their most recent pregnancy. Unlike smoking behav-ior, the same general age-related pattern of alcohol con-sumption was observed for both white and black women(tables 20 and 21).
Considering all races combined, never married womenwere more likely to have abstained from drinking alcoholduring pregnancy than were ever married women (62 per-cent versus 54 percent, table 19). However, this differencewas due to the fact that never married women were dispro-portionately black, and that black women were more likelyto abstain from drinking than white women (tables 20 and21), because differences in the frequency of alcohol con-sumption by marital status within the two race groups werenot significant. This similarity by marital status is in sharpcontrast to the pattern for smoking behavior, for whichlarge differences by marital status were observed, bothoverall and for white women in particular (tables 13 and14). Differences in drinking behavior during pregnancy bywontedness status at conception were relatively small andnot significant.
Women whose most recent pregnancy ended in miscar-riage or stillbirth were almost twice as likely to have beenfrequent drinkers (once a week or more) than were thosewhose most recent pregnancy resulted in a live birth; 19percent of women whose pregnancy ended in a pregnancyloss drank once a week or more, compared with 11 percentof women whose pregnancy ended in a live birth.
This finding was also observed for white and blackwomen separately. Black women who last had a live birthwere more likely than black women who last had a preg-nancy loss to have abstained from alcohol use (69 percentversus 55 percent), but the proportions abstaining weresimilar by pregnancy oulcome for white women. Unlikesmoking, however, frequency of alcohol consumption didnot differ significantly between women who had receivedfrequent prenatal care and those who had not.
Overall, differences in frequency of alcohol consump-tion between black and white women are apparent only inthe percents of those who did not drink at all and of thosewho drank less often than once a week. Proportions ofthose who drank once a week or more were similar forblack and white women in all categories of the characteris-tics examined. This is in sharp contrast to smoking behav-ior, for which the largest race differences were observed in
the proportions of those smoking 15 or more cigarettes perday.
As seen in table C, 69 percent of Hispanic women didnot drink alcoholic beverages at all during their most recentpregnancy, compared with 67 percent of non-Hispanicblack women and only 50 percent of non-Hispanic whitewomen. ln general, for the categories of age, marital status,and pregnancy outcome given in table C, the proportionsnot drinking at all among Hispanic women did not differsignificantly from those for non-Hispanic black women andwere higher than those for non-Hispzmic white women.
The pattern of alcohol consumption during thle mostrecent pregnancy by the year in which the pregnancy endedis outlined in table E. White women whose most recentpregnancy ended in 1980-82 were less likely to have con-sumed alcohol once a week or more than women whose lastpregnancy ended before 1975 (9 percent versus :15 per-cent). For bJack women, there was no significant trend.
Charactoistics of the woman —Alcohol consumptionduring the most recent pregnanq is shown by selectedcharacteristics of the woman at the time of interview intables 22–24. Both white and black women living in theSouth were more likely to have abstained from alcohol thanwere women living in any other region. This regionaldifferential was particularly large among white wornen (66percent in the South, versus 44-47 percent in the otherregions).
For white women, alcohol consumption during preg-nancy increased with education level (table 23). Only about33 percent of white women with less than a high schooleducation drank during pregnancy, compared with 59 per-cent of college-educated women. Similarly, about 8 percentof white women with less than a high school educationdrank once a week or more, compared with 17 percent ofcollege-educated women (figure 4). For black women, lessfrequent drinking increased with education level, and morefrequent drinking decreased as education increased (figure4).
Differences in alcohol consumption by occupation werelargely limited to white women. The proportion of whitewomen not drinking at all during their most recent preg-nancy ranged from 37 percent of women employed asprofessionals or managers to 74 percent of white womenwho had never been employed. White professionals andmanagers were more likely to drink once a week or morethan any other occupational group. In contrast, there werefew significant variations in level of drinking by occultationamong black women.
Abstinence from alcohol was more common amonglow-income white women than among higher-income whitewomen (66 percent versus 48 percent) and more commonamong white women receiving Medicaid at the date ofinterview than among white women not receiving Medicaid(73 percent versus 51 percent). For black women, on theother hand, the proportions not drinking at all were similarby income and Medicaid status. For both races, the propor-tion not drinking at all was highest for women resicling in
20

Table E. Number of women 15-44 years of age whose most recent pregnancy ended in five birth or spontaneous loss and percentdistribution by average frequency of alcoholic beverage consumption during the pregnancy, according to race of woman and year ofoutcome: United Sates, 1982
[Statistics are based on a sample of the household population of the conterminous United States. See appendixes I and II for discussion of the sample design,sampllng variability, and definition of termsl
Average frequency of afcoholbbeverage consumption during pregnancy
Number Lees fhan Once a
Race of woman of women once a weekand year of oukome in thousands Total Never week or more
Percent dktrlbufiin
Allwomenl . . . . . . . . . . . . . . . . . . . . . . . . . . . . . . . 29,345 10CI.O 54.5 33.7 11.8
1980-62 . . . . . . . . . . . . . . . . . . . . . . . . . . . . . . . . . 9,890 100.0 55.4 35.61975-79 . . . . . . . . . . . . . . . . . . . . . . . . . . . . . . . . .
9.07,974 100.0 56.4 32.2
Before 1975 . . . . . . . . . . . . . . . . . . . . . . . . . . . . . . .11.4
11,481 100.0 52.5 33.1 14.4
Whitewomen. . . . . . . . . . . . . . . . . . . . . . . . . . . . . . 24,174 100.0 51.8 36.3 11.9
1980-62 . . . . . . . . . . . . . . . . . . . . . . . . . . . . . . . . . 8,108 100.0 53.2 38.21975-79 . . . . . . . . . . . . . . . . . . . . . . . . . . . . . . . . .
8.66,299 100.0 53.3 35.5
Before1975 . . . . . . . . . . . . . . . . . . . . . . . . . . . . . . .11,2
9,765 100.0 49.6 35.2 15.1
Black Women . . . . . . . . . . . . . . . . . . . . . . . . . . . . . . 4,222 100.0 67.1 22.1 10.8
1980-62 . . . . . . . . . . . . . . . . . . . . . . . . . . . . . . . . . 1,412 100.0 67.4 23.5197579 . . . . . . . . . . . . . . . . . . . . . . . . . . . . . . . . .
9.11,398 100.0 67.6 20.2
Before 1975 . . . . . . . . . . . . . . . . . . . . . . . . . . . . . . .12.2
1,412 100.0 66.3 225 11.2
i lnchdes white, Hack, and otterraces.
nonmetropolitan areas, but this difference was smaller forblackwomen.
For white women, more frequent drinking (once aweckormore) duringpregnancy wasmorecommon amongthose who were college educated (17 percent), who wereemployed as professionals or managers (19 percent), orwhohadincornes at least three times the poverty level (16percent) than among others. In contrast, more frequentdrinkingwas more prevalent among black women whohadnot finished high school (17 percent) and those receivingMedicaid at the survey date (16 percent).
Low birth weight
A baby weighing 5fipounds (2,500 grams) or lessatbirth is classified as low birth weight (Institute of Medicine,1985). In the first 28 days after birth, low-birth-weightbabies have nearly 40 times the mortality of other babies,and they account for two-thirds of neonatal deaths in theUnited States (McCormick, 1985; Brown, 1985; Shapiroctal., 1980; Institute of Medicine, 1985). Low-birth-weightbabies are also five times more likely to die between 28days and 1 year after birth and are more likely to developneurodevelopmental handicaps, including cerebral palsyand seizure disorders, congenital anomalies, significant ill-nesses, learning disorders, and behavioral problems (Mc-Cormick, 1985; Brown, 1985; Shapiro et al., 1980; Instituteof Medicine, 1985; NCHS, 1981a; Bchrman, 1985; Siegel,1985). In addition, neonatal intensive care of low-birth-weight babies is expensive-in 1981, $1.5 billion was spenton neonatal intensive care in the United States, most of iton low-birth-weight babies (American Public Health Asso-ciation, 1986; Phibbs, Williams, and Phibbs, 1981),
The biological causes of low birth weight are not wellunderstood. There is, however, a large lit crat ure on risk
factors–that is, characteristics that make low birth weightmore likely. The list of these characteristics is long; theyinclude age (under 18 and over 34 years), black race, loweducation, having had a previous low-birth-weight baby,lack of prenatal care, previous muItiple pregnancy losses,smoking, drinking, short interval since the most recentpregnancy, low socioeconomic status, and being unmarried(McCormick, 1985; Brown, 1985; Institute of Medicine,1985; Behrman, 1985). These characteristics are importantin screening and risk assessment, because they can beidentified before delivery (McCormick, 1985; Brown, 1985;Institute of Medicine, 1985; Bchrman, 1985). Of these,smoking may be the most important preventable risk factor,because 21-39 percent of low-birth-weight infants in theUnited States have been attributed to maternal smoking(Behrman, 1985; Hogue and Sappenfield, 1!-)87; Sachs,1987). Another very important risk factor for low birthweight is being of black race after controlling for maternalage, education, parity, smoking, height, weight, weight gainduring pregnancy, previous low-birth weight deliveries, andthe timing of prenatal care, the percent of black babies whowere low birth weight is still higher than that for whitebabies (Brown, 1985).
Chmockristics of the pregnancy-Table 25 shows theproportion of single live births that were low birth weight byrace of the mother and selected characteristics of thepregnancy. Variation in the percent low birth weight issmall relative to variations observed in the health-relatedbehavior during pregnancy reported in the preceding tables.But because low birth weight often results in long-termillness or infant death (Institute of Medicine, 1985), evensmall variations have important consequences for the pop-ulations involved.
Data from Cycle 111of the National Survey of FamilyGrowth reveal that 6.6 percent of all babies born to women
21
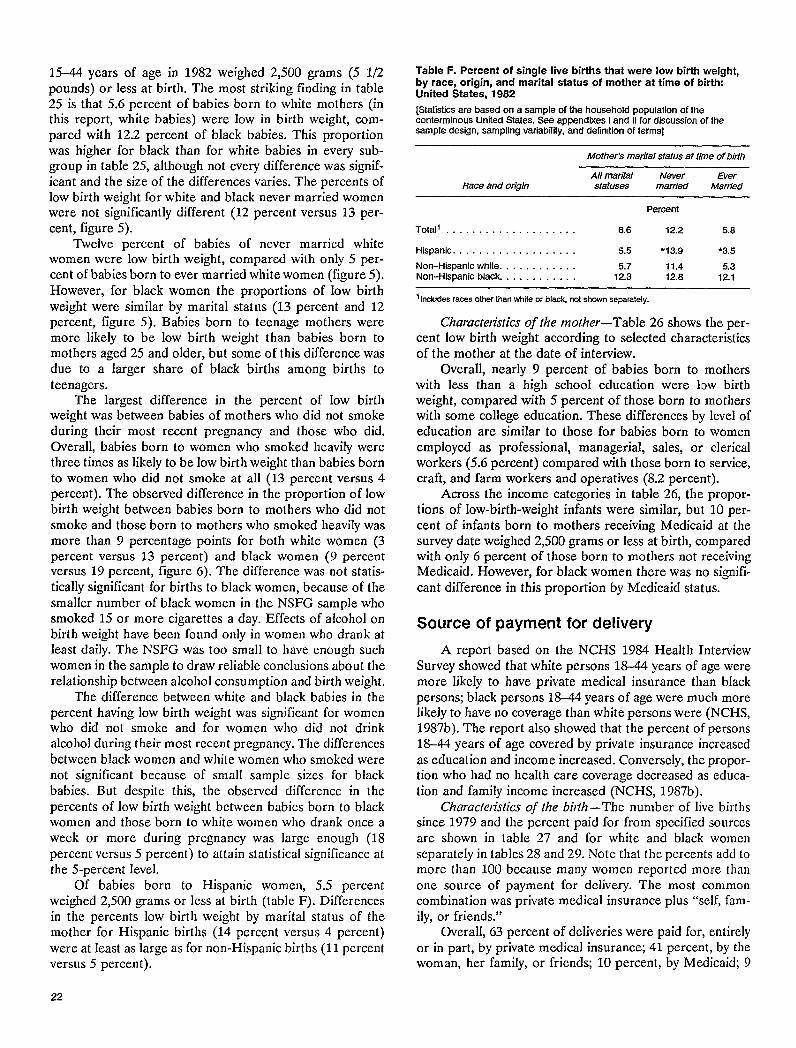
15-44 years of age in 1982 weighed 2,500 grams (5 1/2pounds) or less at birth. The most striking finding in table25 is that 5.6 percent of babies born to white mothers (inthis report, white babies) were low in birth weight, com-pared with 12.2 percent of black babies. This proportionwas higher for black than for white babies in every sub-group in table 25, although not every difference was signif-icant and the size of the differences varies. The percents oflow birth weight for white and blaclc never married womenwere not significantly different (12 percent versus 13 per-cent, figure 5).
Twelve percent of babies of never married whitewomen were low birth weight, compared with only 5 per-cent of babies born to ever married white women (figure 5).However, for black women the proportions of low birthweight were similar by marital status (13 percent and 12percent, figure 5). Babies born to teenage mothers weremore likely to be low birth weight than babies born tomothers aged 25 and older, but some of this difference wasdue to a larger share of black births among births toteenagers.
The largest difference in the percent of low birthweight was between babies of mothers who did not smokeduring their most recent pregnancy and those who did.Overall, babies born to women who smoked heavily werethree times as likely to be low birth weight than babies bornto women who did not smoke at all (I3 percent versus 4percent). The observed difference in the proportion of lowbirth weight between babies born to mothers who did notsmoke and those born to mothers who smoked heavily wasmore than 9 percentage points for both white women (3percent versus 13 percent) and black women (9 percentversus 19 percent, fi~wre 6). The difference was not statis-tically significant for births to black women, because of thesmaller number of black women in the NSFG sample whosmoked 15 or more cigarettes a day. Effects of alcohol onbirth weight have been found only in women who drank atleast daily. The NSFG was too small to have enough suchwomen in the sample to draw reliable conclusions about therelationship between alcohol consumption and birth weight.
The difference between white and black babies in thepercent having low birth weight was significant for womenwho did not smoke and for women who did not drinkalcohol during their most recent pregnancy. The differencesbetween black women and while women who smoked werenot significant because of small sample sizes for blackbabies. But despite this, the observed difference in thepercents of low birth weight between babies born to blackwomen and those born to white women who drank once aweek or more during pregnancy was large enough (18percent versus 5 percent) to attain statistical significance atthe 5-percent Ievel.
Of babies born to Hispanic women, 5.5 percentweighed 2,500 grams or ICSSat birth (table F). Differencesin the percents low birth weight by marital status of themother for Hispanic births (14 percent versus 4 percent)were at least as large as for non-Hispanic births (11 pcrccntversus 5 percent).
Table F. Percent of single live births that were low birth weight,by race, origin, and marital status of mother at time of birth:United States, 1982
[Statistics are based on a sample of the household population of theconlerminous United States. See appendixes I and II for discussion of thesample design, sampling variability, and defkution of terms]
Mother% maritti status at time of bkth
All nrarilal Never EverRace and orlgln stafuses married Married
Total . . . . . . . . . . . . . . . . . . . . 6.6 12.2 5.8
Hispanic . . . . . . . . . . . . . . . . . . . 5.5 *13.9 *3.5
Non-Hispanic white. . . . . . . . . . . . 5.7 11.4 5.3Non-Hiapanlc black. . . . . . . . . . . . 12.3 12.8 12.1
i Mudes races other than white or black, m! shown separately.
Charactenktics of the mother-Table 26 shows the per-cent low birth weight according to selected characteristicsof the mother at the date of interview.
Overall, nearly 9 percent of babies born to motherswith less than a high school education were 1(OWbirthweight, compared with 5 percent of those born to motherswith some college education. These differences by level ofeducation arc simikm to those for babies born to womenemployed as professional, managerial, sales, or clericalworkers (5.6 percent) compared with those born to service,craft, and farm workers and operatives (8.2 percent).
Across the income categories in table 26, the propor-tions of low-birth-weight infants were similar, but 10 per-cent of infants born to mothers receiving Medicaid at thesurvey date weighed 2,500 grams or less at birth, comparedwith only 6 percent of those born to mothers not receivingMedicaid. However, for black women there was no signifi-cant difference in this proportion by Medicaid status.
Source of payment for delivery
A report based on the NCHS 1984 Health InterviewSurvey showed that white persons 18-44 years of age weremore likely to have private medical insurance than blackpersons; black persons 18-44 years of age were much morelikely to have no coverage than white persons were (NCHS,1987b). The report also showed that the percent of persons18-44 years of age covered by private insurance increasedas education and income increased. Conversely, the propor-tion who had no health care coverage decreased as educa-tion and family income increased (NCHS, 1987b).
Chmxk/istics of the bit~h–The number of live birthssince 1979 and the pcrccnt paid for from spccificd sourcesare shown in table 27 and for white and black womenseparately in tables 28 and 29. Note that the percents add tomore than 100 because many women reported more thanone source of payment for delivery. The most commoncombination was private medical insurance plus “sc]f, fam-ily, or friends.”
Overall, 63 percent of deliveries were paid for, entirelyor in part, by private medical insurance; 41 percent, by thewoman, her family, or friends; 10 percent, by Medicaid; 9
22

percent, by State anrllor local government; and 6 percent, inother ways. The difference in source of payment by racewas very Iargcx 68 percent of white births were covered byprivate medical insurance (table 28), compared with only38 percent of black births (table 29 and figure 7). Becauseprivate medical insurance often covers most but not all ofmedical expenses, and because white women were morelikely to use insurance than black women, white womenwould be expected to use their own income more often thanblack women—and this was the case: 44 percent of deliver-ies to white women were at least partly paid for usingout-of-pocket funds, compared with 24 percent for births toblack women (figure 7).
Even more strikingly, although only 7 percent of allwhite women used Medicaid as a source of payment for livebirth, 30 percent of black women did so. About 8 percent ofdeliveries to white women were paid for by other govern-ment sources, compared with 15 percent of deliveries toblack women. The figure for all other sources was smalland similar for both races (figure 7).
The percent of deliveries paid for through privatemcclical insurance increased dramatically with age of themother, from 27 percent for teenage mothers to 80 percentfor women 30-44 years old. This increase with age wassimilar for both black and white women—an increase ofapproximateely 50 percentage points over the entire agerange, with the largest difference for adjacent age groupsseen between teenage women and women aged 20-24.Thus, a larger percent of white births than of black birthswere paid for from private medical insurance in every agegroup.
On the other hand, nearly half–47 percent—of birthsto black teenagers were paid for by Medicaid, comparedwith only 20 percent of births to white teenagers. Forwomen aged 30-44 at delivery, the proportion pair-l for byMedicaid was 2 percent for white and 18 percent for blackwomen.
Overall, a higher proportion of births to teenagers werepaid for through non-Federal governmental sources (24percent) than was true for other age groups (4-9 pcrccnt).The proportions of births paid for through these sourceswere similar for white and black tccnagcrs and for whiteand black women aged 3044, but a higher proportion ofblack than of white births were paid for by State and/orlocal government sources for women 20-29 years of age.
Method of payment differed dramatically by maritalstatus of the mother at birth. For all races combined, 72percent of births to ever married mothers were paid forwith private medical insurance, compared with only 18pcrccnt of births to never married rnothcrs. The proportionpaid for out of pocket (“self, family, or friends”) was almosttwice as great for deliveries to ever married women (45percent) as for those to never married women (23 pcrccnt).Ordy 4 percent of births to ever married women were paidfor by Medicaid, compared with 40 percent of births tonever married women.
Differences by race in the source of payment for birthsto never married women were not significant. Significant
race differences were found, however, for births to evermarried women (and, therefore, for all births).
For both black and white births, those that werewanted at the time of conception were much more likely tobe paid for from private medical insurance than were birthsthat were either mistimed or unwanted, and less likely to bepaid for from Medicaid.
Sources of payment for birth differed substantiallybetween women receiving early and continuous prenatalcare and those receiving later or discontinuous care. Birthswith early and continuous care were more likely to be paidfor with private medical insurance (73 percent versus 45percent) and less likely to be paid for by Medicaid (6percent versus 18 percent) and non-Federal governmentsources (5 percent versus 16 percent) than were birthsreceiving late or discontinuous care (table 27). About 12percent of white deliveries and 41 percent of black deliver-ies following late or discontinuous prenatal care were paidfor through Medicaid.
In assessing these figures, it should be noted that poorwomen may not have been receiving Medicaid when theybecame pregnant or sought prenatal care. Some may havebeen determined eligible for Medicaid ordy ajler they be-came pregnant. Births to white mothers receiving early andcontinuous prenatal care were less likely to be paid forfrom non-Federal government sources than were thosereceiving late or discontinuous care, but for black womenthe proportions paid for from these sources did not differsignificantly by timing and continuity of prenatal care.Differences in the proportions paid for out of pocket andfrom all other sources were not significant, either overall orfor eilhcr race group (tables 27-29).
As expected, sources of payment for delivery differedsharply by whether prenatal care was reccivecl at a clinic orfrom a private doctor. Births to those rccciving care at aclinic were much lCSSlikely than births rccciving care at aprivate doctor to be paid for out of pocket (28 percentversus 45 pcrccnt ) or by private medical insurance (27pcrccnt versus 76 pcrccnt ). Births rccciving prenatal carefrom clinics were also much more Iikcly than those caredfor by private doctors to be paid for by Medicaid (27pcrccnt versus 5 percent ), by State and/or local government(18 percent versus 6 pcrccnt), and by other sources (15pcrccnt versus 3 pcrccnt ). About 1 in 7 births to womenrccciving care from clinics was paid for from “all other”sources. The largest part of the “all other” category is themili[ary. It is Iik+ that many of these births rcccivedprcnatzd care at chmcs in military hospitals.
The pattern of source of payment for delivery accord-ing to prenatal ctirc provider for white births closely rcscm-blcd the paitern for all races, but for black birlhs [hepcrccnts of dc]ivcric!s paid for out of pocket and from othergovernment sources did not cliffcr significantly by type ofprenatal care provider.
Sources of payment for delivery by origin and race areseen in table G. About 40 pcrccnt of births to Hispanicwomen were paid for (entirely or in part) out of pocket(“self, family, or friends”); 42 pcrccnt were paid with private
23

Table G. Number of live births in January 1979 or later to women 15-44 years of age and percent paid for from specified sources, byrace, origin, and selected characteristics: United States, 1982
[Statistics are heed on a sample of Ihe household population of the Conterminous Untied States. See appendixes I and II for discussion of the sample design,sampling variability, and defuwtion of termsJ
Source of payment
Number Sel( Privateof births h family, or medics/ Other All
CharacterWc thousands friends insurance Medicaid government other
Percentl
Hispanic . . . . . . . . . . . . . . . . . . . . . . . . . . . . . . . 21,704 40,1 41.9 19.6 14.5 ●4.5
Mother’s age at time of birth:Under 20 yeare . . . . . . . . . . . . . . . . . . . . . . . . . . .20-24 years . . . . . . . . . . . . . . . . . . . . . . . . . .25-44 yeafs . . . . . . . . . . . . . . . . . . . . . . . . .
380527796
*35.339.243.0
*23.6*28.759.4
%28.0*26.8*10.6
*25.3*13.1*10.3
*0.5*8.2*4. 1
Mother’s marital status at time of birth:Nevermarried . . . . . . . . . . . . . . . . . . . . . . . . . . .Evermarried . . . . . . . . . . . . . . . . . . . . . . . . . .
4601,222
*28. O44.9
44.4
*17.351.5
44.6*9.7
5.0
*15.3*14.2
6.8
*2.7*5.3
6,0Non-Hispanicwhife . . . . . . . . . . . . . . . . . . . . . . . . . .
Mother’sageattime ofbirth:Under20years . . . . . . . . . . . . . . . . . . . . . . . . . . .20-24yeare . . . . . . . . . . . . . . . . . . . . . . . . . . . . .25-44years . . . . . . . . . . . . . . . . . . . . . . . . . . . . .
210,248 71.6
1,0163,3895.842
37.639.748.4
34.765.082.1
*1 7.9+7.0*1.5
23.9*7.2*3,5
*5.O8.6
*4.7
Mother’s marital status at time of birth:Nevermarrled . . . . . . . . . . . . . . . . . . . . . . . . . . . .Evermarried . . . . . . . . . . . . . . . . . . . . . . . .
9139,311
25.546.2
+18.676.7
32.2*2.4
30.5
30.54.5
15.2
*3.96.2
6.6Non-Hispanic black . . . . . . . . . . . . . . . . . . . . . . . . . .
Mother’s age at time of birth:Under20yeare . . . . . . . . . . . . . . . . . . . . . . . . . . .20-24years . . . . . . . . . . . . . . . . . . . . . . . . . . . . .2W4years . . . . . . . . . . . . . . . . . . . . . . . . . . . . .
2,020 24.0 37.3
512755752
21.425.024.6
*13.534.156.8
46.030.620.0
20.615.711.0
●6.7*7.7*5.4
Molher’s marital status atfimeofbklh:Nevermarried . . . . . . . . . . . . . . . . . . . . . . . . . . . .Evermarried . . . . . . . . . . . . . . . . . . . . . . . . . . . . .
1.021 17.630.5
16.458.6
46.514.3
22.9*7.2
*4.38.9’995
~Tl?esumofthe percents exceeds 100.Obecausesome women reported morethanonesource ofpayment.‘Includes births fcf which moths% marital status at time of birth wes unknown.
medical insurance; 20 percent, with Medicaid; 14 percentfrom other government sources; and 5 percent, from othersources. Thus, births to Hispanic women were much lesslike]ythan birthsto non-Hispanic white women to bepaidfor by private medical insurance (42 percent versus 72percent), andmore likely to bepaidfor by Medicaid (20perccnt versus 5 percent) and other government sources(15percent versus 7 percent). Comparing bir[hsto His-panic women with births to non-Hispanic black women(table G), births to Hispanic women were more likely to bepaid forout ofpocket (40 percent versus 24percent) andless likely to be paid for by Medicaid (20 percent versus 31percent) than births to non-Hispanic black women. Asobserved for both white and black non-Hispanic births,deliveries to never marriccl Hispanic women were muchmore likely to be paid for through Medicaid (45 percentversus 10 percent) and less likely to be paid for throughinsurance (17 percent versus 52pcrccni) than was true fordeliveries to ever married Hispanic women.
Charackvistics of the mother-Tables 30, 31, and 32show the percents of births paid for from various sourcesaccording to characteristics of the mother at the date ofinterview (not necessarily at the date of the birth).
For both white and black births, the proportion paid forby private insurance increased with the rising education of
24
the mother-from 40 to 84 percent for births to whitewomen and from 16 to 58 percent for births to blackwomen. The proportions paid by Medicaid declined sharplyas the mother’s education increased, for both white andblack births, and the race difference in the use of Medicaidwas very large for all three categories of education. Forexample, at the lowest educational level, 49 percent of blackbirths and only 20 percent of white births were paid forusing Medicaid.
Source of payment for delivery differed considerablyaccording to the most recent occupation of the mother. Forall races combined, 84 percent of births to women em-ployed asprofessionals or managers used private medicalinsurance and54pcrcent used income from self, family, orfriends, but only 2 percent used funds from Medicaid orother government sources. In contrast, only27 percent ofbirths to women who had never worked used private med-ical insurance to pay for delivery, 38 percent used out-of-pockct resources, but 32 percent used Medicaid and 14percent used State or local government sources .Thepro-portion of births toprofessionals andmana.gerswl]o usedtheir own income as a source of payment was higher forwhite than for black women (56 percent versus 23 percent).However, theother four sources ofpayrnent for birthstoprofessional and managerial women were similar by race.

On the other hand, there were large race differences inpayment for births to women in the other occupationalgroups. More than half of births to never employed blackwomen were paid for using Medicaid, compared wit$ 26percent for never employed white women.
Births to low-income women were more likely to havebeen paid for using Medicaid (24 percent versus 2 percent)or by other government sources (19 percent versus 2-4percent) than were births to higher-income women, butthere were significant differences by race within this incomecatego~. Birlhs to low-income black women were morelikely to have been paid for by Medicaid than were births tolow-income white women (41 percent versus 18 pcrccnt).
Fewer than half (47 percent) of current Medicaidrecipients reported Medicaid as a source of payment forclclivcry. In addition, 30 percent of births to current Med-icaid recipients were paid for through other governmentsources. Taken together, these findings suggest that inmany cases either the woman was eligible for Medicaidduring her pregnancy but unable to complete the applica-tion process before delivery; or, after delivery (or as a resultof the birth), she lost support from her parents or thebaby’s father, or her income decreased, and she thus be-came eligible for Medicaid.
Trends in source of payment fordelivery: 1973-82
The percent distributions of source of payment fordelivery for the most recent birth to women interviewed in1973 and for the most recent birth since January 1979 towomen interviewed in 1982 are given in table 33 and figure8. Over this 9-year period, the percent of women who paid
for their most recent delivery entirely from their own ortheir family’s own income declined from 22 percent to 10percent (figure 8). The decline was apparent at all ages, atall levels of education and income examined, in everyregion, and for both white and black women. However, thedecline was largest among births to teenagers (from 38percent to 9 percent). The declines were generally similaracross cat egories of all variables except age.
The percent of women who paid for their most recentbirth entirely through private medical insurance increasedby approximately 10 percentage points, from 28 percent in1973 to 38 percent in 1982 (figure 8). In contrast to thetrend in self-payment, however, this increase was smallerand not significant among teenagers, black and Hispanicwomen, women with a high school education or less, low-income women, and those living in the Midwest. Theproportion of women who used a combination of privatemedical insurance and their own income to pay for theirmost recent delivery declined from 32 to 25 percent (figure8).
These data suggest that there has been a slight increasein the proportion of women paying for delive~ from Med-icaid between the two survey dates, but the rise from 7 to 10percent was not large enough to be significant at the 5percent level. Overall, a similar lhree-point increase wassuggested in the proportion of most recent deliveries paidfor from other government sources (from 6 to 9 percent),but larger, significant increases were found among births toteenagers, black women, women with Icss than 12 years ofeducation, and low-income women. The data also suggestthat a Iargcr proportion of Hispanic women interviewed in1982 than of those interviewed in 1973 used other govern-ment sources to pay for their most rcccnt deliveries.
25

References
Abel, E. 1982. Consumption of alcohol during pregnancy: Areview of effects on growth and development of offspring. Hum.
Biol. 54(3):421-53.
American Medical Association, Council on Scientific Affairs.1983. Fetal effects of maternal alcohol use. .L4&L4249(18):2517-21.
American Public Heahh Association. 1986. Preventing low birth-weight. Am. J. Public Health 76(3):343-47.
Andccson, G. D., I. N. Blidner, S. McClemont, and J. C. Sinclair.1984. Determinants of size at birth in a Canadian population. Am.
J. Obstet. Gynecol 150(3):236-44.
Behrman, R. E. 1985. Preventing low birthweight: a pediatricperspective. J. Pediatz 107(6):842-54.
Brown, S. S. 1985. Can low birthweight be prevented? Fatn.
Plann. Perspect. 17(3): 112–18.
Chavez, L. R., W. A. Cornelius, and O. W. Jones. 1986. Utiliza-tion of health services by Mexican immigrant women in SanDiego. Women and Health 11(2):3-20.
Dougherty, C. R. S., and A. D. Jones. 1982. The determinants ofbirthweight. Am. J. Obstet. Gynecoi. 144(2):190-200.
Felice, M. E., P. Shragg, M. James, and D. R. Hollingsworth.1986. Clinical obsemations of Mexican-American, Caucasian, andblack pregnant teenagem. J, Adolesc. Health Care 7(5):305-10.
Forrest, J. D., and S. Singh. 1987. Timing of prenatal care in theUnited States: How accurate are our measurements? Healfh Serv.
Res. 22(2):235–53.
Greenberg, R. S. 1983. The impact of prenatal care in differentsocial groups. Ant. J. Obstet. Gynecol. 145(7):797–801.
Harlap, S. 1987. Smoking and spontaneous abortion. In M. J.Rosenberg, Smoking and Reproductive Health. Littleton, Mass.:PSG Publishing Co.
Heins, H. C., J. M. Miller, A. Sear, et al. 1983. Benefits of astatewide high-risk perinatal program. Obsfet. GynecoL6~(3):094_96.
Hogue, C. J. R., and W. Sappenfield. 1987. Smoking and lowbirthweight: current concepts. In M. J. Rosenberg, Smoking and
Repro(iuctive Hea[th. Littleton, Mass.: PSG Publishing Co.
Ingram, D. D., D. Malmc, and J.C. Kleinman. 1986. National andState trends in use of prenatal care, 1970-1983. Am. J. Pub/it
Health 76(4):4 15-23.
Institute of Medicine. 1985. Preventing low birtbweight. Washing-ton: National Academy Press.
Keppel, K.G., and S. M. Taffel. 1987. Maternal smoking andweight gain in relation to birthweight and the risk of fetal
and infant death. In M. J. Rosenberg, Smoking and ReprodzLctive
Healt/z. Littleton, Mass.: PSG Publishing Co.
Koontz, A. M. 1984. Pregnancy and infant health: progress towardthe 1990 objectives. Public Health Rep. 99(2):184-92.
Kotelcheck, M., J. B. Schwartz, M. T. Anderka, and K. S. Finison.1984. WIC participation and pregnancy outcomes: Massachusettsstatewide evaluation project. Am J. Public Health 74(10):1086-92.
Kruse, J. 1984. Alcohol use during pregnancy. Am Fare. Physician
29(4): 199–203.
Leridon, H., translated by Judith F. Helzner. 1977. Human Fertil-
ity: The Basic Components. Chicago: University of Chicago Press.chap. 4.
Leveno, K. J., F. G. Cunningham, M. L. Roark, et al. 1985.Prenatal care and the low birthweight infant. Obstet. GynecoI.
66(5):599-605.
McCormick, M. C. 1985. The contribution of low birthweight toinfant mortality and childhood morbidity. N. Engl. J. Med.
312:82-90.
Milk, J. L., B. I. Graubard, E. E. Harley, et al. 1984. Maternalalcohol consumption and birthweight: How much drinking duringpregnancy is safe? JAW 252(14):1875-79.
Moore, T. R., W. Origel, T. C. Key, and R. Resnik. 1986. Theperinatal and economic impact of prenatal care in a low socioeco-nomic population. Am. J. Obstet. Gyn.ccol. 154(1):29-33.
Mosher, W. D., and M. C. Horn. 1986. Source of service and visitrate for family planning services: United States, 1982. Public
HeaIth Rep. 101(4):405-16.
Moss, A. J., M. D. OverPeck, G. E. Hendemhot, et al. 1987.Prenatal smoking and childhood morbidity. In M. J. Rosenberg,Smoking and Reproductive HeaIth. Littleton, Mass.: PSG Publish-ing Co.
National Center for Health Statistics, S. Taffel. 1978a. Prenatalcare: United States, 1969–75. Htaland Health Statistics. Series 21,
No. 33. DHEW Pub. No. (PHS) 78-1911. Public Health Semite.Washington: U.S. Government Printing Office.
National Center for Health Statistics, D. K. French. 1978b.National SuIVcy of Family Growth, Cycle I: Sample design,estimation procedures, and variance estimation. Vital and Health
Statistics. Series 2, No. 76. DHEW Pub. No. (PHS) 78-1350.Public Health Se~ice. Washington: U.S. Government PrintingOffice.
National Center for Health Statistics, J. C. Kleinman. 1981a.Trends and variations in low birthweight. Health, United States,
1981. DHHS Pub. No. (PHS) 82-1232. Public Health Service.Washington: U.S. Government Printing Office.
26

National Center for Health Statistics, W. R. Grady. 1981b. Na-tional Sumey of Family Growth, Cycle II: Sample design, estima-tion procedures, and variance estimation. Wtal and HealthStadsdcs. Series 2, No. 87. DHEW Pub. No. (PHS) 81-1361.Public Health Service. Washington: U.S. Government PrintingOffice.
Na[ional Center for Health Statistics, C. A. Bachrach, M. C. Horn,W. D. Mosher, and I. Shimizu. 1985a. National Survey of FamilyGrowth, Cycle III: Sample design, weighting, and variance estima-tion. Wal and Health Sfadsdcs. Series 2, No. 98. DHHS Pub. No.(PHS) 85-1372. Public Health Service. Washington: U.S. Govcm-ment Printing Office.
National Center for Health Statistics. 1985b. Wul Statistics o~fheUnifcd Sfates, 1981. Vol. I, Natality. DHHS Pub. No. (PHS)85-1113. Public Health Service. Washington: U.S. GovernmentPrinting Office. table 141.
National Center for Health Statistics, W. F. Pratt and M. C. Horn.1985c. Wanted and unwanted childbearing, United States,1973-82. Advance Dafa j70nt V?tai and HcaIth Statistics. No. 108.DHHS Pub. No. (PHS) 85-1250. Public Health Sctvicc. Hyatts-ville, Md.
National center for Health Stat istics. 19S6a. Wul Srafistics of tJzeUni(ecJ States, 1982. Vol. II, Mortality, Part A. DHHS Pub. No.(PHS) 86-1122. Public Health Scrvicc. Washington: U.S. Govern-ment Printing Office. tables 2-1 and 2!-6.
National Center for Health Statistics, M. C. Horn and W. D.Moshcr. 1986b. Use of setvices for family planning and infertility,United States, 1982. Htal and ZZealfh S~a/istics. Series 23, No, 13.DHHS Pub. No. (PHS) 87-1989. Public Hcalt h %rvice. Washing-ton: U.S. Government Printing Office.
National center for Health Statistics, W. Mosher and W. Pratt.1987a. Fecundity, infertility, and reproductive health in theUnited States, 1982. V7taland HcaltJ1 Sfafis/ics. Series 23, No. 14.DHHS Pub. No. (PHS) 87-1990. Public Health Smvice. Washing-ton: U.S. Government Printing Office.
National Center for Health Statistics, P. Rics. 19S7b. Health carecovcmge by sociodcmographic and health chamctcristics: UnitedStates, 1984. MM mtci IIeaItIz S/atisfics. Series 10, No. 162. DHHSPub. No. (PHS) 87-1590. Public Health Scrvicc. Washington: U.S.Gowxnmcnt Printing Office.
birthweight: the value of re-fined analyses. Med. Care21(6):58&608.
Phibbs, C. S., R. L. Williams, and R. H. Phibbs. 1981. Newbornrisk factors and costs of neonatal intensive care. Pediatrics6S(3):313-21.
Placek, P. J. 1984. The 1980 National Natality Survey and Na-tional Fetal Mortality Survey-methods used and PHS agencyparticipation. pubiic Healflz Rep. 99(2):11 1-16.
Prager, K., H. Malin, D. Spiegler, et al. 1984. Smoking anddrinking behavior before and during pregnarq of married moth-ers of live-born infants and stillborn infants. Prtbiic Health Rep.99(2): 117-27.
Rantakallio, P. 1983. A follow-up study up to the age of 14 ofchildren whose mothers smoked during pregnancy. Acfa Paediatr,Scattd. 72747-53.
Sachs, B. P. 1987. Sharing the cigarette: The effects of smoking inpregnancy. In M. J. Rosenberg, Smoking and Reproductive Heu/th.Littleton, Mass.: PSG Publishing Co.
Shapiro, S., M. C. McCormick, B. H. Starficld, et al. 1980.Relevance of correlates of infant deaths for significant morbidityat 1 year of age. Am. J. Obstet. Gyecoi. 136(3):363-73.
Shapiro, S., E. R. Schlcsingcr, and R. E. L. Ncsbitt, Jr. 1968.Iujant, Pe~itlataJ, MatenlaJ, and ChiJcfJlood MolfaJity in the UnitedStates. Cambridge, Mass.: Harvard University Press.
Siegel, E. 1985. Low birthweight and prctcrm birth: the emergingimportance of prevention. S0:. Praeven/ilwefJ. 30(3):11 S-24.
Stein, Z., and J. Kline. 1983. Smoking, alcohol, and reproduction.Am. J. PubJic Health 73(10):1154-56.
Surgeon General of the United States. 1981. Surgeon General’sadvisory on alcohol and prcgnarq. FDA Dntg BLiJ1. 11:1-2.(Quoted in American Medical Association, 1983.)
Ventura, S., and S. Taffcl. 1985. Childbearing characteristics ofU.S.- and tkwign-bom Hispanic mothers. Public lkcdtJl Rrp.100(6):647-52.
Williams, R. L., N. J. 13inkin, and E. J. Clingman. 1986. Pregnancyoutcomes among Spanish-surname women in California. Am. .I.PubJic IIealtll 76(4):387-91.
Pcopks, M. D., and E. Siegel. 1983. Measuring the impact ofprograms for mothers and infants on prenatal care and low
27

List of detailed tables
1. Number of pregnancies ending in a live birth in January1979 or later to women 15-44 years of age and percentdistribution by months pregnant when prenatal carebegan, according to selected characteristics of the birth:United States, 1982...,, . .. . . . . . . . . . . . . . . . . . . . . . . . . . . . . . . . . . . . . .
2. Number of pregnancies ending in a live birth in January1979 or later to white women 15-44 years of age andpercent distribution by months pregnant when prenatalcare began, according to selected characteristics of thebirth: United States, 1982 ... . . . . . . . . . . . . . . . . . . . . . . . . . . . . . . . . . .
3. Number of pregnancies ending in a live birth in January1979 or later to black women 15-44 years of age andpercent distribution by months pregnant when prenatalcare began, according to selected characteristics of thebirth: United States, 1982 .. . . . . . . . . . . . . . . . . . . . . . . . . . . . . . . . . . . .
4. Number of pregnancies ending in a live birth in January1979 or later to women 15-44 years of age and percentdistribution by months pregnant when prenatal carebegan, according to selected characterisitcs of themother United States, 1982 ... . . . . . . . . . . . . . . . . . . . . . . . . .. . . . . .
5. Number of pregnancies ending in a live birth in January1979 or later to white women 1544 years of age andpercent distribution by months pregnant when prenatalcare began, according to selected characteristics of themother United States, 1982 . .. . . . . . . . . . . . . . . . . . . . . . . . . . . . . . . .
6. Number of pregnrmcies ending in a live birth in Janua~1979 or later to black women 15-44 years of age andpercent distribution by months pregnant when prenatalcare began, according to selected characteristics of themother: United States, 1982 . .. . . . .. . . . . . . . . . . . . . . . . . . . . . . . . . .
7. Number of pregnancies ending in a live birth or spon-taneous loss in January 1979 or later to women 15-44years of age, percent receiving prenatal care, and per-cent distribution of pregnancies receiving care bysource of care at first visit, according to selected char-acteristics of the pregnancy United States, 1982 . .. . . . . .
8. Number of pregnancies ending in a live birth or spon-taneous loss in January 1979 or later to white women15-44 years of age, percent receiving prenatal care, andpercent distribution of pregnancies receiving care bysource of care at first visit, according to selected char-acteristics of the pregnancy United States 1982 .. . . . . . . .
9. Number of pregnancies ending in a live birth or spon-taneous loss in January 1979 or later to black women15-44 years of age, percent receiving prenatal care, andpercent distribution of pregnancies receiving care bysource of care at first visit, according to selected char-acteristics of the pregnancy: United States, 1982 . .. . . . . .
10. Number of pregnancies ending in a live birth or spon-taneous loss in January 1979 or later to women 15-44years of age, percent receiving prenatal care, and per-cent distribution of pregnancies receiving care by
30 source of care at first visit, according to selected char-acteristics of the woman: United States, 1982 . .. .. . . . . . . .
11. Number of pregnancies ending in a live birth or spon-taneous loss in January 1979 or later to white women15-44 years of age, percent receiving prenatal care, and
30 percent distribution of pregnancies receiving care bysource of care at first visit, according to selected char-acteristics of the woman: United States, 1982 . .. . . . . . . . . .
12. Number of pregnancies ending in a live birth or spon-taneous loss in January 1979 or later to black women
31 15-44 years of age, percent receiving prenatal care, andpercent distribution of pregnancies receiving care bysource of care at first visit, according to selected char-acteristics of the woman: United States, 1982 .. . . . . . . . . . .
13. Number of women 15-44 years of age whose most31 recent pregnancy ended in a live birth or spontaneous
loss and percent distribution by average number ofcigarettes smoked per day during the pregnancy, ac-cording to selected characteristics of the pregnancyUnited States. 1982 . .. . . .. . . . . . . . . . . .. . . . . . . . . . . . . .. . . . .. . . . . . . .
32 14. Number of white women 15-44 years of age whosemost recent pregnancy ended in a live birth or sponta-neous loss and percent distribution by average numberof cigarettes smoked per day during the pregnancy,according to selected characteristics of the pregnancy:
33 United States, 1982 ... . . . . . . . . . . . . . . . . . . . . . . . . . . . . . . . . . .. . . . . . . .
15. Number of black women 15-44 years of age whosemost recent pregnancy ended in a live birth or sponta-neous loss and percent distribution by average numbe,rof cigarettes smoked per day during the pregnancy,according to selected characteristics of the pregnancy
34 United States, 1982 ... . . . . . . . . . . . . . . . . . . . . . . . . . . . . . . . . . . . . . . . . . .
16. Number of women 15-44 years of age whose mostrecent pregnancy ended in a live birth or spontaneousloss and percent distribution by average number ofcigarettes smoked per day during the pre=mancy, ac-cording to selected characteristics of the woman:
35 United States. 1982 .. . . . . . . . . . . . . . . . . . . . . . . . . . . . . . . . . . . . . . . . . . . .
17. Number of white women 15-44 years of age whosemost recent pregnancy ended in a live birth or sponta-neous loss and percent distribution by average numberof cigarettes smoked per day during the pregnancy,according to selected characteristics of the woman:
36 United States, 1982 .. . . . . . . . . . . . . . . . . . . . . . . . . . . . . . . . . . . . . .. . . . . .
37
38
39
40
41
42
43
44
28

18. Number of black women 15-44 years of age whosemost recent pregnancy ended in a live birth or sponta-neous loss and percent distribution by average numberof cigarettes smoked per day during the pregnancy,according to selected characteristics of the woman:United States, 1982 ... . . . . . . . . . . . . . . . . . . . .. . . . . . . . . . . . . . . . . . . . . .
19. Number of women 15-44 years of age whose mostrecent pregnancy ended in a live birth or spontaneousloss and percent distribution by average frequency ofalcoholic beverage consumption during the pregnancy,according to selected characteristics of the pregnancy:United States, 19S2 ... . . . . . . . . . . . . . . . . . . . . . . . . . . . . . . . . . . . . . . . . . .
20. Number of white women 1544 yearn of age whosemost recent pregnancy ended in a Iive birth or sponta-neous loss and percent distribution by average fre-quency of alcoholic beverage consumption during thepregnancy, according to selected characteristics of thepregnancy: United States, 1982 .. . . . . . . . . . . . . . . . . . . . . . . . . . . . .
2.1. Number of black women 15+44 years of age whosemost recent pregnancy ended in a live birth or sponta-neous loss and percent distribution by average fre-quency of alcoholic beverage consumption during thepregnancy, according to selected characteristics of thepregnancy: United States, 1982 .. . . . . . . . . . . . . . . . . . . . .. . . . . . . .
zz Number of women 15–44 years of age whose mostrecent pregnancy ended in a live birth or spontaneousloss and percent distribution by average frequency ofalcoholic beverage consumption during the pregnancy,according to selected characteristics of the woman:United States, 1989. .. . . . . . . . . . . . . . . . . . . . . . . . . .. . . . . . . . . . . . . . . . . .
23. Number of white women 15-44 years of agewhosemost recent pregnancy ended in a live birth or sponta-neous loss and percent distribution by average fre-quency of alcoholic beverage consumption during thepregnancy, according to selected characteristics of thewoman: United States, 1982 . .. . . . . . . . . . . . . . . . . . . . . . . . . . . . . . . .
24. Number of black women 15-44 years of age whosemost recent pregnancy ended in a live birth or sponta-neous loss and percent distribution by average fre-
quency of alcoholic beverage consumption during thepregnancy, according to selected characteristics of thewoman: United States, 1982 . .. . . . . . . . . . . . . . . . . . . . . . . . . . . . . . . .
25. Number of single live births to women 15-44 years ofage and percent low birth weight, by race and selected
45 characteristics of the birth: United States, 1982 . .. . .. . . . .
26. Number of single live births to women 15-44 years ofage and percent low birth weight, by race and selectedcharacteristics of the mothe~ United States, 1982... .. . .
27. Number of live births in January 1979 or later to
46 women 15-44 years of age and percent paid for fromspecified sources, by selected characteristics of thebirth: United States, 198? .. . . .. . . . . . . . . . . . . . . . . . . . . . . . . . . . . . . .
28. Number of live births in January 1979 or later to whitewomen 15-44 years of age and percent paid for fromspecified sources, by selected characteristics of the
47 birth: United States, 1982 .. . . . . . . . . . . . . . . . . . . . . . . . . . . . . . . . . . ..
~g. Number of live births in January 1979 or later to blackwomen 1544 years of age and percent paid for fromspecified sources, by selected characteristics of thebirth: United States, 1982 .. . . . . . . . . . . . . . . . . . . . . . . . . . . . . . . . .. . .
30. Number of live births in January 1979 or later to48 women 15-44 years of age and percent paid for from
specified sources, by selected characteristics of themothe~ United States, 1982 . .. . . . . . . . . .. . . . . . . . . . . . . . . . . . . . . .
31. Number of live births in January 1979 or later to whitewomen 1544 years of age and percent paid for fromspecified sources, by selected characteristics of the
49 mothen United States, 1982 . .. . . . . . . . . . . . . . . . . . . . . . . . . . . . . . ..
32. Number of live births in January 1979 or later to blackwomen 15+1 years of age and percent paid for fromspecified sources, by selected characteristics of themothen United States, 1982 . .. . . . . . . . . . . . . . . . . . . . . . . . . . . . . . . .
33. Number of women 15-44 years of age who have ever50 had a live birth and percent distribution by source of
payment of the hospital bill for the most recent birth,according to selected characteristics: United States,1973 and 1982.. . . . . . . . . . . . . . . . . . . . . . . . . . . . . . . . . . . . . . . . . . . . . . . .. . .
51
52
53
54
55
56
57
58
59
60
29

Table 1. Number of pregnancies ending in a live birth in January 1979 or later to women 15-44 years of age and percent distribution bymonths pregnant when prenatal care began, according to selected characteristics of the birth: United States, 1982
[Statistics are based on a sample of the household population of the Conterminous Unlfed States. See appendixes i and II for discussion of the sample design,sampling variability, and definition of terms]
Months pregnant when prenatal care began
Number in Less than 3or4Characteristic
5 months orthousands Tots/ 3 months months more or no care
Percent dlstr~bufion
All pregnancies ending in a We btrth . . . . . ., 114,372 100.0 65.9 25.6 8.5
Mother’s age at time of birth:Under 20 years . . . . . . . . . . . . . . . . . . . . . . . . . . . 1,972 100.0 45.7 37.5 16.820-24 years . . . . . . . . . . . . . . . . . . . . . . . . . . . 4,764 100.0 61.4 30.1 B.525-29 years . . . . . . . . . . . . . . . . . . . . . . . . . . . 4,863 100.0 75.1 19.5 *5.430-44 years, . . . . . . . . . . . . . . . . . . . . . . . . . . . 2,773 100.0 72.1 19.9 *8.O
Birth orde~First . . . . . . . . . . . . . . . . . . . . . . . . . . . . . . . . . . 6,001 100.0 63,4 28.1Second . . . . . . . . . . . . . . . . . . . . . . . . . . . . . . . .
&44,900 100.0 72.9 20.7 6.3
Third orhigher . . . . . . . . . . . . . . . . . . . . . . . . . . . . 3,471 100.0 60.2 28.2 1“1.7
Mother’s marital status al time of birllrNever married . . . . . . . . . . . . . . . . . . . . . . . . . . . . 2,471 100.0 43.8 39.1 17.2Evermarried . . . . . . . . . . . . . . . . . . . . . . . . . . . . . 11,872 100.0 70.6 22.7 fL7
Wontedness status at conception:Wanledthen . . . . . . . . . . . . . . . . . . . . . . . . . . . . .Mistimed . . . . . . . . . . . . . . . . . . . . . . . . . . . . . . .
9,127 100.0 72.6 20.9 6.63,823 100.0 56.0 33.5 10.5
Unwanted . . . . . . . . . . . . . . . . . . . . . . . . . . . . . . . 1,422 100.0 49.6 34.9 *15.5
1Includes births fw which mother’s marital status at birth or wontedness status at mnceptlon was unknown.
Table 2. Number of pregnancies ending in alive birth ln January 19790rlater towhite women 15-44 years ofage and percentdistribution by months pregnant when prenatal care began, according to selected characteristics of the birth: United States, 1982
[Statistics are based on a sample of the household population of the contermlnous United States. See appendixes I and II for discussion of the sample design,sampling variability, and definition of terms]
Monlhs pregnant when prenatal care began
Number In Less than 3or4 5monthsorC/raracteristlc thousands Total 3 months months more or no care
PercenI distribution
Allpregnancies ending in alive birth . . . . . . . . . 111,836 100.0 68.7 23.6 7,7
Mother’s age at time of birth:Under 20years . . . . . . . . . . . . . . . . . . . . . . . . . . 1,364 100.0 50.9 34.7 *14,320-24years . . . . . . . . . . . . . . . . . . . . . . . . . . . . . 3,890 100.0 63.3 28.0 8,725-29years . . . . . . . . . . . . . . . . . . . . . . . . . . . . . 4,200 100.0 77.0 18.8 *4.230-44years . . . . . . . . . . . . . . . . . . . . . . . . . . . . . 2,381 100.0 73.3 18.2 *8. 5
Birth orderFirst, . . . . . . . . . . . . . . . . . . . . . . . . . . . . . . . 4,902 100.0 66.0 26.3 7.7Second . . . . . . . . . . . . . . . . . . .:.......,.,.. 4,142 100.0 76.2 18.7 *5. 1Third orhigher. . .,, ...,... . . . . . . . . . . . . . . . . 2,792 100.0 62.3 26.1 11.7
Mother’s marital status attimeofblrth:Nevermarried . . . . . . . . . . . . . . . . . . . . . . . . . . 1,350 100.0 46.6 35.7 17.7Evermarried . . . . . . . . . . . . . . . . . . . . . . . . . . . . . 10,460 100.0 71.6 21.9 6.4
Wontedness status at conception:Wanted lien . . . . . . . . . . . . . . . . . . . . . . . . . . . . . 7,912 100.0 74.1 19.3 6.5Mistimed . . . . . . . . . . . . . . . . . . . . . . . . . . . 2,980 100.0 58.5 33.0 *6.5Unwanted . . . . . . . . . . . . . . . . . . . . . . . . . . . . . . . 944 100.0 55.1 29.6 *15.1
1Includes bhths for which mother’s marital status at birth or wontedness status at mnception was unknown.
30

Table 3. Number of pregnancies ending in a live birth in January 1979 or later to black women 15=%4 years of age and percentdistribution by months pregnant when prenatal care began, according to selected characteristics of the birth: United States, 1982
[Statistics are based on a sample of the household population of the ccntermlnous United States. See appendixes I and II for discussion of the sample design,sampling variability, and definition of terms]
Months pregnant when prenatal care began
Number in Less than 3or4 5 months orCharacferMb thousands Total 3 months months more or no care
Percent distribution
Ali pregnancies ending in a live birth . . . . . . . . . . . . . . . 12,095 100.0 53.0 36.6 10.4
Mother’s age at time of birth:Under 20years . . . . . . . . . . . . . . . . . . . . . . . . . . . 528 100.0 37.0 44.320-24 years . . . . . . . . . . . . . . . . . . . . . . . . . . . . .
16.7774 100.0 53.9 37.9
25-29 years . . . . . . . . . . . . . . . . . . . . . . . . . . . . .*8.2
505 1Oil.o 64.3 26.130-44 years . . . . . . . . . . . . . . . . . . . . . . . . . . . . .
*9.7286 i 00.0 50.9 37.2 *2.O
Birth ordecFirst . . . . . . . . . . . . . . . . . . . . . . . . . . . . . . . . . . 657 100.0 49.2 38.4Second . . . . . . . . . . . . . . . . . . . . . . . . . . . . . . . .
12.4603 100.0 61.1 31.5 *7.5
Third orhigher . . . . . . . . . . . . . . . . . . . . . . . . . . . . 635 100.0 50.4 39.2 *10.5
Mother’s marital status at time of birth:Never married . . . . . . . . . . . . . . . . . . . . . . . . . . . . 1,049 100.0 42.7 41.7Evermarried . . . . . . . . . . . . . . . . . . . . . . . . . . . . .
15.71,042 100.0 63.4 31.5 *5. 1
Wontedness status at conception:Wantedihen . . . . . . . . . . . . . . . . . . . . . . . . . . . . . 935 100.0Mistimed . . . . . . . . . . . . . . . . . . . . . . . . . . . . . . .
63.4 32.0 ●4.5709 100.0 50.2 35.6
Unwanted . . . . . . . . . . . . . . . . . . . . . . . . . . . . . . .14.3
450 100.0 35.9 47.9 16.2
1Includesbirihsforwhich mother’s marital status at birth or wantedm?ss status at mnception wss unknown.
Table 4. Number of pregnancies ending inalive birthin January 19790r Iatertowomenl 544years ofage and percent distribution bymonths pregnant when prenatal care began, according toseIected characteristics of the mother: United States, 1982
[Statisticsare based on a sample of the household population of the conterm[nous United Stales, See appendixes I and II for discussion of the sample design,sampling variability, and definition of terms]
Months pregnant when prenatal care began
Number in Less fhan 3or4 5monfhsorCtraracteristk thousands Total 3 months months more or no care
Percent distnbuhon
Allpregnancles endmginalivebkth . . . . . . . . . . . . . . 114,372 100,0 65,9 25.6 8,5
Region:Northeast . . . . . . . . . . . . . . . . . . . . . . . . . . . . . . . 2,653 100.0 75.0 19.3Midwest . . . . . . . . . . . . . . . . . . . . . . . . . . . . . . . .
*5.83,839 100.0 65,7 29.0
South, . . . . . . . . . . . . . . . . . . . . . . . . . . . . . . . .‘5.3
4,719 100.0 60.6 28,8West . . . . . . . . . . . . . . . . . . . . . . . . . . . . . . . . . . 3,161
10.5100.0 66,4 22.1 11.5
Education:Lessthan 12years ..,...... . . . . . . . . . . . . . . . . 3,516 100.0 46.2 33.412years . . . . . . . . . . . . . . . . . . . . . . . . . . . . . . . .
16,45,669 100.0 66.7 25.9
13yearsormore . . . . . . . . . . . . . . . . . . . . . . . . . .7.4
5,187 100.0 ?7.1 20,0 ●2.9
Most recent occupation:Professionalormanageriel . . . . . . . . . . . . . . . . . . . . 2,222 1Cx3,0 81.9 15.5Salesorcierical . . . . . . . . . . . . . . . . . . . . . . . . . . .
*2.65,502 100.0 72.8 220
Service . . . . . . . . . . . . . . . . . . . . . . . . . . . . . . . .5.2
2,575 100.0 65,7 25.4Craftorfarm workeroroperalive . . . . . . . . . . . . .
*8,91,851 100.0 46.6 42,9
Neverworked . . . . . . . . . . . . . . . . . . . . . . . . . . . .●10.3
2,142 100.0 48,3 309 20.7
Poverty level income:149percentorless . . . . . . . . . . . . . . . . . . . . . . . . . 5,113 100.0 501 341150percentormore . . . . . . . . . . . . . . . . . . . . . . . . 9,260
15.8100.0 74.7 20.9
300percentormore . . . . . . . . . . . . . . . . . . . . . . .4,4
4,663 100.0 78.7 18.4 ●3.o
Medlcaldslatus:RecewesMedicald . . . . . . . . . . . . . . . . . . . . . . . . . 2,059 100.0 45.9 37.5DoesnotreceiveMedicaid . . . . . . . . . . . . . . . . . . . .
16.612,269 100.0 69.2 23.6 7.1
f Irdudes births for which last occupation or Medicaid status was unkmwn.
31

Table 5. Number of pregnancies ending in a live birth in January 1979 or later to white women 1S-44 years of age and percentdistribution by months pregnant when prenatal care began, according to selected characteristics of the mother: United States, 1982
[Statistics are based on a sample of the household population of the contermlnous United Slates. See appendkes I and II for discussion of the sample design,sampling variability, and definition of terms]
Months pregnant when prenatal cara began
Number in Less Vran 3or4 5 months orCharacteristic thousands Total 3 months months more or no care
Percent distribution
All pregnancies ending in a We birlh . . . . . 111,836 100.0 68.7 23.6 7.7
Region:Northeast . . . . . . . . . . . . . . . . . . . . . . . . . . . . . 2,183 100.0 77.6 16.7Midwest . . . . . . . . . . . . . . . . . . . . . . . . . . . . . . . 3,449 100.0 67.4 28.2South . . . . . . . . . . . . . . . . . . . . . . . . . . . . . . . . . 3,458 100.0 64.8 25.8West . . . . . . . . . . . . . . . . . . . . . . . . . . . . . . . . . . 2,746 100.0 68.1 20.5
*5.7*4. 49.4
11.4
Education:Lessthan 12yeare . . . . . . . . . . . . . . . . . . . . . . . . . 2,794 100.0 51.8 30.7 17.512years . . . . . . . . . . . . . . . . . . . . . . . . . . . . . . . 4,693 100.0 69.1 23.9 7.013yearsormore . . . . . . . . . . . . . . . . . . . . . . . . . . 4,438 100.0 79.2 18.7 *2. 1
Most recent occupation:Professional ormanagerial . . . . . . . . . . . . . . . . . . . . 1,998 100.0 81.9 16.1Salesorclerlcal . . . . . . . . . . . . . . . . . . . . . . . . . . .
*2.14,619 100.0 75.7 19.7
Service . . . . . . . . . . . . . . . . . . . . . . . . . . . . . . . .*4.6
2,116 100.0 68.0 23.0Craftorfarm workeroroperative . . . . . . . . . . .
+’9.01,532 100.0 47.7 41.7 *1O.6
Neverworked . . . . . . . . . . . . . . . . . . . . . . . . . . . . 1,542 100.0 52.0 28.1 19.9
Poveriylevel income:149percentorless . . . . . . . . . . . . . . . . . . . . . . . . . 3,774 100.0 53.3 31.2 15.5150percentormore . . . . . . . . . . . . . . . . . . . . . . . . 8,062 100.0 76.0 20.0 4.0
300percentormore. ,....., . . . . . . . . . . . . . . . 4,095 100.0 78.9 18.6 *2.5
Medicaid status:RecewesMedlcaid . . . . . . . . . . . . . . . . . . . . . . . . . 1,222 100.0 47.4 35.3 *17.3DcxasnotrecelveMedicaid . . . . . . . . . . . . . . . . . . . . 10,599 100.0 71.2 22.2 6.6
1lnc~de~ Mfih5 for which Imt occupation or Medicaid Stsh Wss unk~wn.
32

Table 6. Number of pregnancies ending in a live birth in January 1979 or later to black women 15-44 years of age and percentdistribution by months pregnant when prenatal care began, according to selected characteristics of the mother: United States, 1982
[Statisfka are baaed on a sample of the household population of the contermlnous United States. See appandkes 1and II for discussion of the sample design,sampling variability, and definition of terms]
Months pregnant when prenatal care began
Number in Less than 3or4 5 months orCharacferktlc thousands Total 3 months months more or no care
Percent distribution
All pregnancies ending in a live birth . . . . . . . . . . . . . . . 12,095 100.0 53.0 36.6 10.4
Region:Northeast . . . . . . . . . . . . . . . . . . . . . . . . . . . . . . . 389 100.0 62.7 33.0 *4.3Midwest . . . . . . . . . . . . . . . . . . . . . . . . . . . . . . . . 320 100.0 53.4 39.1 ●7.6South . . . . . . . . . . . . . . . . . . . . . . . . . . . . . . . . . 1,141 100.0 48.9 38,8 12.3West . . . . . . . . . . . . . . . . . . . . . . . . . . . . . . . . . . 244 100.0 56.4 28.9 *1 4.7
Education:Lessthan 12years . . . . . . . . . . . . . . . . . . . . . . . . . 652 100.0 35.2 46.5 18.312years . . . . . . . . . . . . . . . . . . . . . . . . . . . . . . . . 867 100.0 54.7 36.2 9.213yearsormore . . . . . . . . . . . . . . . . . . . . . . . . . . 576 100.0 70.7 26.1 *3.2
Most recent occupation:Professional ormanagerial . . . . . . . . . . . . . . . . . . . . 151 100.0 90.8 *7.6Salesorclerical . . . . . . . . . . . . . . . . . . . . . . . . . . .
*1.7682
servic e . . . . . . . . . . . . . . . . . . . . . . . . . . . . . . .100.0 58.5 36.2 *5.3
433 100.0 52.3 38.6Craflorfarmworkeroroperafiie . . . . . . . . . . . . . . . .
●9. 1274 100.0 47.3 45.9 *6.8
Neverworked . . . . . . . . . . . . . . . . . . . . . . . . . . . . 532 100.0 38.9 40.3 20.6
Poverty level income149percentorless . . . . . . . . . . . . . . . . . . . . . . . . . 1,185 100.0 42.6 42.4 i 4.9150 percentormore . . . . . . . . . . . . . . . . . . . . . . . . 910 100.0 66.6 2?3.0 *4.4
300percentormore . . . . . . . . . . . . . . . . . . . . . . . 369 100.0 78.3 19.3 *2.3
Medicaid slatus:Receives Medicaid . . . . . . . . . . . . . . . . . . . . . . . . . 786 100.0 44.3 41.8DoesnotreceiveMedicaid . . . . . . . . . . . . . . . . . . . .
13.91,290 100.0 58.2 33.5 8.3
i Includes births for which last occupation or Medicaid stalus was unkmwn.
33

Table 7. Number of pregnancies ending in a live birth or spontaneous loss in January 1979 or later to women 15-44 years of age,percent receiving prenatal care, and percent distribution of pregnancies receiving care by source of care at first visit, according toselected characteristics of the pregnancy: United States, 1982
[Statistics are based on a sample of the household population of the conterminous Umted States. See appendixes I and II for discussion of the sample design,samplmg variability, and definition of terms]
Source of prenatal care at first visit
Number In Percent receiving Private Hospital Other
Characteristic thousands prenatal care Total doctor clinic clink
Percent distribution
Allpregnanciesl . . . . . . . . . . . . . . . . . . . . . . . . . . .
Mother’s age at pregnancy oulcome:Under 20years . . . . . . . . . . . . . . . . . . . . . . . .20-24 years . . . . . . . . . . . . . . . . . . . . . . . . . . . .25-29 years............,.. . . . . . . . . . . . . . .30-44yeara . . . . . . . . . . . . . . . . . . . . . . . . . . .
Pregnancy ordecFirstpregnancy . . . . . . . . . . . . . . . . . . . . . . . . . .Secondpregnancy, . . . . . . . . . . . . . . . . . . . . . . . .Third pregnancyorhlgher . . . . . . . . . . . . . . . . . . . .
Mother’s marital status at pregnancy outcome:Nevermarrled . . . . . . . . . . . . . . . . . . . . . . . . . . . .Evermarried . . . . . . . . . . . . . . . . . . . . . . . . . . . . .
Wontedness status at conception:Wantedtben . . . . . . . . . . . . . . . . . . . . . . . . . . . . .Mistimed . . . . . . . . . . . . . . . . . . . . . . . . . . . . . . .Unwanted . . . . . . . . . . . . . . . . . . . . . . . . . . . . . . .
Lwebirths . . . . . . . . . . . . . . . . . . . . . . . . . . . . . . . .
Mother’s age at birth:Under20years . . . . . . . . . . . . . . . . . . . . . . . . . . .20-24years . . . . . . . . . . . . . . . . . . . . . . . . . . . . .25-29yeare . . . . . . . . . . . . . . . . . . . . . . . . . . . . .30-44years . . . . . . . . . . . . . . . . . . . . . . . . . . . . .
Mother’s mariial status at pregnancy outcome:Nevermarried . . . . . . . . . . . . . . . . . . . . . . . . . . . .Evermarried . . . . . . . . . . . . . . . . . . . . . . . . . . . . .
Wontedness status at conception:Wantedthen . . . . . . . . . . . . . . . . . . . . . . . . . . . .Mistimed . . . . . . . . . . . . . . . . . . . . . . . . . . . . . . .Unwanted . . . . . . . . . . . . . . . . . . . . . . . . . . . . . . .
Prenatal care:Earlyand continuous . . . . . . . . . . . . . . . . . . . . . . .Lateordiscontinuous ..,.... . . . . . . . . . . . . . .
%7,397 93.1 100.0 75.3 8.8 15.8
2,4745,4505,6373,636
89.693.096.091.0
100,0100.0100.0100.0
55.667.082.769.3
16.211.16.7
*3.8
26.121.910.6*6.9
5,526
5,6046,267
94.093.092.4
100.0100.0100.0
71.478.176.5
9.68.08.6
18.713.914.9
3,09314,272
89.893.8
100.0100.0
45.381.6
19.9
6.534.811.9
10,6974,7101,991
95.490.986.0
100.0100.0100.0
80.069.162.6
7.6
9.5*14.5
12.4
21.322,9
‘14.372 98.4 100.0 74.9 9.0 16.1
1,9724,7644,6632,773
98.197.4
99.798.0
100.0100.0100.0100.0
55.166.8
82.988.7
16.311.4
6.6‘4.2
28.721.8
10.5*7. 1
2,47111,872
97.19&7
100.0100.0
43.481.3
20.86.6
35.812.0
79.668.860.4
7.59.9
*16.6
9,1273,623
1,422
98.697.7
99.3
100.0100.0100.0
12.821.323.0
9,1245,052
100.095.5
100.0100.0
62.260.9
7.012.9
10.826.2
l..Allpre9nancies,, referSto liWbjflk, misardages, andstillMdhS. Itiuced abortimsareexcluded.21c.Ades pregnancies for which data were missing on mother% marital status at outcome or on prens.tal care.
34

Table 8. Number of pregnancies ending in a live birth or spontaneous loss in January 1979 or later to white women 15-44 years of age,percent receiving prenatal care, and percent distribution of pregnancies receiving care by source of care at first visit according toselected characteristics of the pregnancy United States, 1982
[Statktks are based on a sample of the household population of the conterminous United States. See append~es I and II for discussion of the sample design,sampling variability, and definition of terms]
Source of prenatal care at first visif
Number in Percent receiving PrivateCharacteristic
Hosptfal Otherthousands prenatal mre Total doctor clink clinic
Percent distribution
Atlpregnanclesl . . . . . . . . . . . . . . . . . . . . . . . . . . . . 214,148 93.6 100.0 60.2 7.3 12.5
Mother’s age at pregnancy outcome:Under 20years . . . . . . . . . . . . . . . . . . . . . . . . . . .20-24 years . . . . . . . . . . . . . . . . . . . . . . . . . . . . .25-29 years . . . . . . . . . . . . . . . . . . . . . . . . . . . . .30-44 years . . . . . . . . . . . . . . . . . . . . . . . . . . . . .
Pregnancy ordecFirst pregnancy . . . . . . . . . . . . . . . . . . . . . . . . . . .%condpregnancy . . . . . . . . . . . . . . . . . . . . . . . . .Third pregnancy orhigher . . . . . . . . . . . . . . . . . . . .
Mother’s mardal status at pregnancy outcomeNever married . . . . . . . . . . . . . . . . . . . . . . . . . . . .Evermarried . . . . . . . . . . . . . . . . . . . . . . . . . . . . .
Wontedness status at conception:Wantadthen . . . . . . . . . . . . . . . . . . . . . . . . . . . . .Mistimed . . . . . . . . . . . . . . . . . . . . . . . . . . . . . . .Unwanted . . . . . . . . . . . . . . . . . . . . . . . . . . . . . . .
1,7284,4254,9953,000
89.593.296.991.3
94.592.993.5
eo.594.1
95.491.587.0
100.0Icno100.0100.0
66.671.985.691.2
16.39.5
*5,2*2.8
17.116.6
9.2●6.O
4,4984,6435,007
100.0ICKI.O100.0
77.681.881.1
8.07.38.8
14.410.812.2
1,69512,427
100.0100.0
52.283.8
21.75.5
26.010.7
9,1633,6951.269
100.0 83.774.071.3
6.3‘7,5
*14.8
10.018.5
●13.8100.0100.0
100.0
100.0100.0IQ3.O100.0
211,636Liveblrths . . . . . . . . . . . . . . . . . . . . . . . . . . . . . . . .
Mother’s age at birth:Under20years . . . . . . . . . . . . . . . . . . . . . . . . . . .2C-24years . . . . . . . . . . . . . . . . . . . . . . . . . . . . .25-29years . . . . . . . . . . . . . . . . . . . . . . . . . . . . .30-44years . . . . . . . . . . . . . . . . . . . . . . . . . . . . .
Molher’s mariialstatus atbirth:Nevermarried . . . . . . . . . . . . . . . . . . . . . . . . . . . .Evermarried . . . . . . . . . . . . . . . . . . . . . . . . . . . . .
Wontedness stalus at cone.eplion:Wantedthen . . . . . . . . . . . . . . . . . . . . . . . . . . . . .Mistimed . . . . . . . . . . . . . . . . . . . . . . . . . . . . . . .Unwanted . . . . . . . . . . . . . . . . . . . . . . . . . . . . . . .
Prenatal care:Earlyandconlinuous . . . . . . . . . . . . . . . . . . . . . . . .Lateordiscontinuous . . . . . . . . . . . . . . . . . . . . . . .
98.3 79.9 7.5 12.7
1,3643,6904,2002,361
98.497.299.897.7
96.596.6
96.497.6
100.0
100.094.9
65.471.786.190.6
*16.39.8
●4.9●3.2
18.318.6
9.0*6.2
1,35010,460
100.0 48.663.8
23.65.5
27.810.7100.0
7,9122,980
e44
100.0100.0100.0
83,573,569.1
6.2●7. 9
*17.3
10.318.8
●13.7
7,6563,636
100.0100.0
85.667.3
5.611.1
8.621.5
1-AII prWnancie~,, ,erem to live births, miscarriages, and sldlblrlhs. Inducedabort’kmsare exdwd.‘Inchdes pregnamies for which data were rrissirg on mdher’s marital status at wtmrne or on prenatal care.
35

Table 9. Number of pregnancies ending In a live birth or spontaneous loss in January 1979 or later to black women 15-44 years of age,percent receiving prenatal care, and percent distribution of pregnancies receiving care by source of care at first visit, according toselected characteristicsof the pregnancy United States, 1982
[Statistlsearebasedon a sample of the household population of me contefmlnous Untted states.Seeappendixes I and II for dtssusslon of the sample design,sampling verte.bllity, and detinltton of terms]
Source of prenatal care at fkit visil
Number In Percent receiving Private HosPllal OtherCharactwlstb thousands prenatal care Total dmfor clink clinic
Percent dlstributkm
100.0 48.3 17.5 34.2Allpregnanciesl . . . . . . . . . . . . . . . . . . . . . . . . . . . .
Mother’s age at pregnancy outcome:Under 20yeare . . . . . . . . . . . . . . . . . . . . . . . . . . .2@24yeafs . . . . . . . . . . . . . . . . . . . . . . . . . . . . .26-29 years . . . . . . . . . . . . . . . . . . . . . . . . . . . . .SO-44 years . . . . . . . . . . . . . . . . . . . . . . . . . . . . .
Pregnancy ordecFifefpregnancy . . . . . . . . . . . . . . . . . . . . . . . . . . .Second pregnancy . . . . . . . . . . . . . . . . . . . . . . . . .Thlrdpregnancy orhlgher . . . . . . . . . . . . . . . . . . . .
Molher’s marital status at pregnancy outcomeNever mafrlad . . . . . . . . . . . . . . . . . . . . . . . . . . . .Evermafrled . . . . . . . . . . . . . . . . . . . . . . . . . . . . .
Wontedness status at conception:Wantedthen . . . . . . . . . . . . . . . . . . . . . . . . . . . . .Mistimed . . . . . . . . . . . . . . . . . . . . . . . . . . . . . . .Unwanted . . . . . . . . . . . . . . . . . . . . . . . . . . . . . . .
Livebirlhs . . . . . . . . . . . . . . . . . . . . . . . . . . . . . . . .
Mother’s age at Wfh:Under20yeare . . . . . . . . . . . . . . . . . . . . . . . . . . .20-24yaars . . . . . . . . . . . . . . . . . . . . . . . . . . . . .25-29yaars . . . . . . . . . . . . . . . . . . . . . . . . . . . . .30-14years . . . . . . . . . . . . . . . . . . . . . . . . . . . . .
Mother’s marilal status at blrlt?:Nevermarrled . . . . . . . . . . . . . . . . . . . . . . . . . . . .Evermarrled . . . . . . . . . . . . . . . . . . . . . . . . . . . . .
Wontedness status at conception:Wanledthen . . . . . . . . . . . . . . . . . . . . . . . . . . . . .Mistimed . . . . . . . . . . . . . . . . . . . . . . . . . . . . . . .Unwanted . . . . . . . . . . . . . . . . . . . . . . . . . . . . . . .
Prenatalcsre:Esriyendcontinuous . . . . . . . . . . . . . . . . . . . . . . .Lateordtscontinuous . . . . . . . . . . . . . . . . . . . . . . .
22,574 91.0
6469026164(N
91.092.289.690.3
100.0 31.5 18.3 50.2100.0 43.1 19.1 37.8100.0 60.3 16.9 22.6100.0 69.4 *13.9 ●16,7
806685
1,062
93.292.566.4
100.0 42.3 16.9 40.8100.0 48.6 15.9 35.5100.0 52.8 19.2 28.0
1,2671,271
90.491.6
10Q.O 37.1 18.7 44.2100.0 59.8 16.2 24.0
1,116850
95,689.464.8
100.0 52.6 16.6 30.9100.0 47.5 20.0 32.5100.0 40.5 15.9 43.6
22,065 9&4 100.0 48.3 17.6 34.1
526774505266
97.098.698.7
100.0
100.0100,0
33.242.561.069.7
18.619.116.6
*13.1
48.238,322.4
*17.2100.0100.0
1,0491,042
97.699.2
100,0 37.659.1
18.716.4
43.724.5100.0
935709460
99.597.497.7
100.0100+0100,0
52.248.839.4
16.320.016.4
31.531.244.2
1,0401,001
100.096.7
100.0100.0
57.937.3
14.421.2
27.741.5
f4cAllpreg~les,} referstollwblflh, mlscardages,arxt stillbirths.lmluced abortbnssreexckled.zl~~d~p~~ies forwhi~dtiawm rdsslngonmcthets msritelsts.tusatcutcome oronprenatslcare.
36

Table 10. Number of pregnancies ending in a live birth or spontaneous loss in January 1979 or iater to women 15-44 years of age,percent receiving prenatsi care, and percent distribution of pregnancies receiving care by source of care at first visi$ according toseiected characteristics of the woman: United States, 1982
IStatiitiis are based on a sample of the household population of the conterminous United States. See appendxes I and II for discussion of the sample design,sampling varlabilii, and definition of terms]
source of prenatal ewe at tirst visil
Number in Percent recatving Private Hosplfal OtherCtraracterbtk thousands prenatal care Total doctor Clwc cllnk
Percent diitributbn
Allpregnancissl . . . . . . . . . . . . . . . . . . . . . . . . . . . . %7,397 93.1 100.0 75.3 8.8 15.8
11.99.4
22.816.5
27.714.210.4
●8.611.616.120.631.9
28.29.67.5
37.712.4
16.1
12.29.8
22.617.3
26.014.79.9
*9.211.615.521.132.0
28.39.57.4
37.8~24
Reg”bm:Northeast . . . . . . . . . . . . . . . . . . . . . . . . . . . . . . .Midwest . . . . . . . . . . . . . . . . . . . . . . . . . . . . . . . .South . . . . . . . . . . . . . . . . . . . . . . . . . . . . . . . . .West . . . . . . . . . . . . . . . . . . . . . . . . . . . . . . . . . .
Education:Lessthan 12years . . . . . . . . . . . . . . . . . . . . . . . . .12years . . . . . . . . . . . . . . . . . . . . . . . . . . . . . . . .13yearsormore . . . . . . . . . . . . . . . . . . . . . . . . . .
Most recent occupation:Profasslonalormanagerial . . . . . . . . . . . . . . . . . . . .Salesorclericai . . . . . . . . . . . . . . . . . . . . . . . . . . .Service . . . . . . . . . . . . . . . . . . . . . . . . . . . . . . . .Craftorfarmwori(eroroperathre . . . . . . . . . . . . . . . .Neverworkad . . . . . . . . . . . . . . . . . . . . . . . . . . . .
Poverty level Incomw149 percentorless . . . . . . . . . . . . . . . . . . . . . . . . .150percentormore . . . . . . . . . . . . . . . . . . . . . . . .
300parcentormore. ,, . . . . . . . . . . . . . . . . . . . .Madicaidstatus
RecetvesMedfcaid . . . . . . . . . . . . . . . . . . . . . . . . .DoesnolreceiveMedlcaid ..,. . . . . . . . . . . . . . . . .
3,2444,5015,6723,980
94.393.793.391.2
87.694.894.7
93.294.593.494.987.9
100.0 71.383.170.576.8
68.276.585.6
87.982.071.469.652.9
16.87.56.7
*6.7
16.19.3
*4.O
100.0IOQ.O100.0
100.0100.0100.0
100.0100.010Q.O100.0100.0
lW.O100.0100.0
100.0100.0
1CQ.o
100.0100.0100.0100.0
100.0100.0100.0
100.0100.0100,0Iwo100.0
IWI.O103.0100.0
100.0100.0
4,1566,7466,495
2,7386,7493,2632,0742,458
●3.56.4
12.5*9.915.2
5,91011,4876,025
91.793.894.2
57.684.487.1
14.36.15.3
19.97.1
2,S6714,963
91.493.4
42.380.5
LMebirths . . . . . . . . . . . . . . . . . . . . . . . . . . . . . . . . ‘14,372 96.4 74.9 9.0
RagIon:Northeast . . . . . . . . . . . . . . . . . . . . . . . . . . . . . . .Midwest . . . . . . . . . . . . . . . . . . . . . . . . . . . . . . . .Sough . . . . . . . . . . . . . . . . . . . . . . . . . . . . . . . . .West . . . . . . . . . . . . . . . . . . . . . . . . . . . . . . . . . .
Education:Lessthan 12yeare . . . . . . . . . . . . . . . . . . . . . . . . .12yeare . . . . . . . . . . . . . . . . . . . . . . . . . . . . . . . .13yearsormore . . . . . . . . . . . . . . . . . . . . . . . . . .
Most recent occupation:Professbnalormanagerial . . . . . . . . . . . . . . . . . . . .Salesorclerical . . . . . . . . . . . . . . . . . . . . . . . . . . .Service . . . . . . . . . . . . . . . . . . . . . . . . . . . . . . . .Craftorfarmworl(eroroparalNe . . . . . . . . . . . . . . . .Neverworked . . . . . .. ~..... . . . . . . . . . . . . . . .
Poverfylevellncome:149percentorlass . . . . . . . . . . . . . . . . . . . . . . . . .150percantormore . . . . . . . . . . . . . . . . . . . . . . . .
300percentormore . . . . . . . . . . . . . . . . . . . . . . .Medicaldslalus
ReceivesMadlcaid . . . . . . . . . . . . . . . . . . . . . . . . .DoesnotreceNe Medicaid . . . . . . . . . . . . . . . . . . . .
2,6533,6394,7193,161
99.596.997.897.9
69.583.670.675.2
18.3*6.66.7
●7.6
3,5165,6895,187
95.599.299,5
55.276.685.7
87.582.071.768.952.2
16.98.6
*4.4
2,2225,5022,5751,8512,142
5,1139,2604,663
00.999.396.797.994.7
97.099.2
100.0
*3.36.5
12.6*9.915.9
57.064.566.8
14.76.0
*5.8
2,05912,269
97.706.5
42.280.4
2007.2
1-AII pregtiies,) refers to live blr(hs, miscarriages, and stlllbklhs. khad tirtbm am exckfed.‘Inchdes pregnawies for which rnotkr’s last occupation or nmlhet’s Medicaid stalus was unkno,vn.
37

Table ll. Number ofpregnancies ending Inalive bitihor spontaneous loss in January 19790r Iaterto white women 15-44 years of age,percent receiving prenatal care, and percent distribution of pregnancies receiving care by source of care at first visitj according toselected characteristics of the woman: United States, 1982
[Statisticsare based on a sampleof the householdpopulationof the conlermlnousUnited States. See appendixes I and II for discussion of the sample design,sempllrrg variability, and definifiin of terms]
Source of prenatal care at fimt visit
Number In Percent receiving Private Hospital OtherCharacterLstk thousands prenatal care Total doctor clirrlo cllnic
Percent distribution
100.0
100.0100.0100.0100.0
100.0100,0100.0
100.0100.0100.0100.0100.0
100.0100.0103.0
100.0100.0
100.0
100.0100.0100.0100.0
100.0100.0100.0
100.0100.0100.0100.0100.0
100.0100.0
60.2
76.186.078.478.8
60.9
7.3
14.1*6,3*5.2*5.8
15.77.5
*2.5
*3. 1*4.710.9
*10.6*12,6
13.54.7
*4.4
20.06.0
7.5
15,6*5.3*5.2*6.6
16.76.8
*2.6
*3.O*4.6
●11.0*I 0.7*13.4
14.24.4
*4.7
19.56.1
12.5
*9.87.7
16.415.4
23.59.59.3
*8.99.0
12.616.625.3
23.67.66.6
33.910.3
12.7
●9.68.1
16.615.8
23.910.18.4
*9.48.9
*11.617.526.0
23.77.66.6
34.010.2
Allpregnanclesl . . . . . . . . . . . . . . . . . . . . . . . . . . . . 214,148 93.6
Region:NcrttIeset . . . . . . . . . . . . . . . . . . . . . . . . . . . . . . .Midwest . . . . . . . . . . . . . . . . . . . . . . . . . . . . . . . .South . . . . . . . . . . . . . . . . . . . . . . . . . . . . . . . . .West . . . . . . . . . . . . . . . . . . . . . . . . . . . . . . . . . .
Education:Lessthan 12years, . . . . . . . . . . . . . . . . . . . . . . . .12years . . . . . . . . . . . . . . . . . . . . . . . . . . . . . . . .13yearsormore . . . . . . . . . . . . . . . . . . . . . . . . . .
Most recent occupation:Professionalormanageriel . . . . . . . . . . . . . . . . . . . .Salesorclerltal . . . . . . . . . . . . . . . . . . . . . . . . . . .Serve . . . . . . . . . . . . . . . . . . . . . . . . . . . . . . . .Craftorfarm workeroroperative . . . . . . . . . . . . . . . .Neverworked . . . . . . . . . . . . . . . . . . . . . . . . . . . .
Poverty level income:149percenlorless . . . . . . . . . . . . . . . . . . . . . . . . .150percentormore . . . . . . . . . . . . . . . . . . . . . . . .
WOpercentcrmore . . . . . . . . . . . . . . . . . . . . . . .Medicaid status:
RecetvesMadicald . . . . . . . . . . . . . . . . . . . . . . . . .DoesnctreceNeMedicaid . . . . . . . . . . . . . . . . . . .
2,6223,9894,1973,340
95.394.693.191.6
3,2515,5215,375
88.495.395.1
93.295.693.395.967.1
63.088.2
88.086.376.572,762.1
62.987.7
2,4305,5652,6381,6701,759
4,2649,6635,182
92.694.194.7 69.0
1,35412,757
92.293.8
46.163.7
79.9
74.686.678.277.6
59.463.188.9
67.686.577.471.860.6
62.168.066.7
46.583.6
Livebiflhs . . . . . . . . . . . . . . . . . . . . . . . . . . . . . . . . 211,636 98.3
Region:Northeast . . . . . . . . . . . . . . . . . . . . . . . . . . . . . . .Midwest . . . . . . . . . . . . . . . . . . . . . . . . . . . . . . . .south . . . . . . . . . . . . . . . . . . . . . . . . . . . . . . . . .West . . . . . . . . . . . . . . . . . . . . . . . . . . . . . . . . . .
Education:Lessthan 12yeare, . . . . . . . . . . . . . . . . . . . . . . . .12years, . . . . . . . . . . . . . . . . . . . . . . . . . . . . . . .13yearsormore . . . . . . . . . . . . . . . . . . . . . . . . . .
Most recent occupafiin:Professtonalormanagerkd . . . . . . . . . . . . . . . . . . . .SaIesorclerical . . . . . . . . . . . . . . . . . . . . . . . . . . .Service . . . . . . . . . . . . . . . . . . . . . . . . . . . . . . . .Cr6ftorfarmworkeroroperatNe . . . . . . . . . . . . . . . .Never Worked . . . . . . . . . . . . . . . . . . . . . . . . . . . .
Poverty level Income:149percentorlees. .,...... . . . . . . . . . . . . . . . .WOpercentormore. . . . . . . . . . . . . . . . . . . . . . . .
300percenlormcre . . . . . . . . . . . . . . . . . . . . . . .Medkakistatus
Receives Medicaid......,.. . . . . . . . . . . . . . . . .DoesnotreceiveMedicatd ...,. . . . . . . . . . . . . . . .
2,1833,4493,4562,746
99.598,997.697.7
2,7944,6934,346
94.999.399.5
1,9984,6192,1161,5021,542
100.099.398.697.793.5
3,7748$624,095
96.699.1
100.0 100.0
1,2221o,5e9
97.598.4
100.0100.0
1,.AII pregMWIeS,, refem to IIW births, mlxe,rriages, ad stillbirths. Irduced abortiins we excluded.2j~~d@ ~regmIeS fo, whlti mothets k+t occupation or mothefs Medkeid $tams w= unk~n.
38
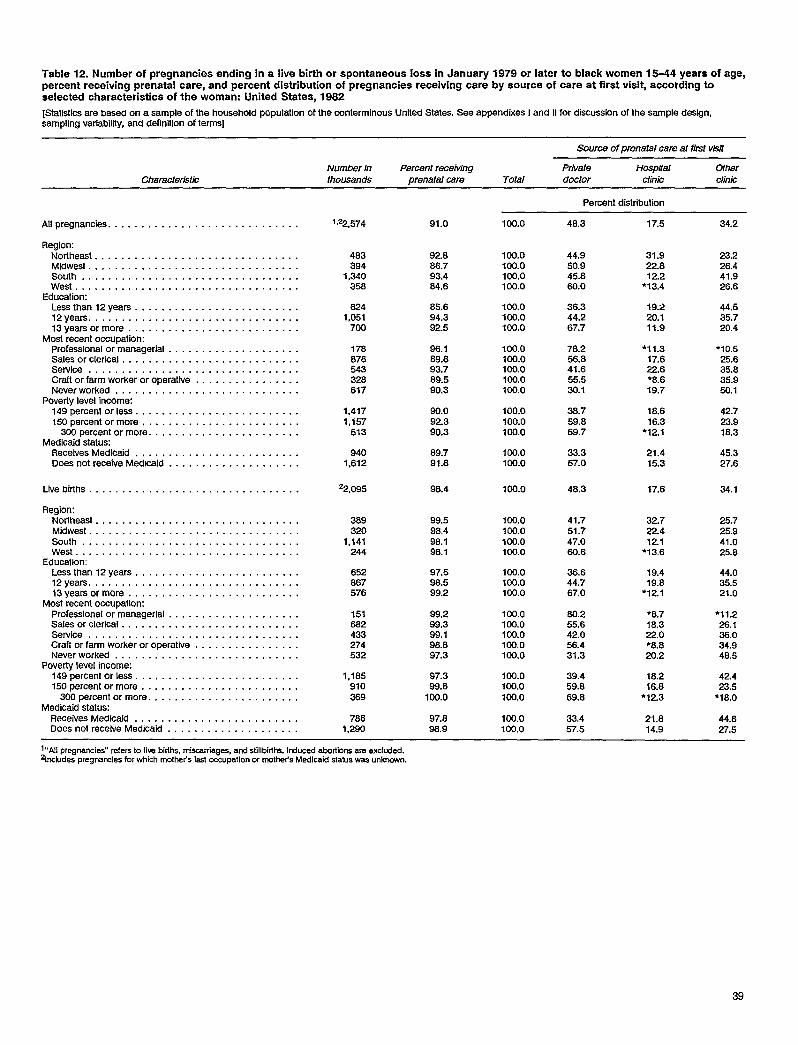
Table 12. Number of pregnancies ending in a live birth or spontaneous loss in January 1979 or later to black women 15-%4 years of age,percent receiving prenatal care, and percent distribution of pregnancies receiving care by source of care at first visit, according toselected characteristics of the woman: United States, 1982
[Statistics are based on a sample of the household pOpUkitlOn of the contermlnous United States. See appendixes I and II fOr discussion of the sample design,sampllng varfabilify, and definition of terms]
Source of prenatal care at fkst vlsfl
Number in Percent raceivlng Private Hospital OtherCharacteristic thousands prenatal mre Total doctor Clkrk clink
Percent distribution
All pregnancies . . . . . . . . . . . . . . . . . . . . . . . . . . . . . i,22,574 91.0 100.0 48.3 17.5 34.2
23.226.441.926.6
44.535.720.4
*1O.525.635.835.950.1
42.723.918.3
45.327.6
34.1
25.725.941.025.8
44.035.521.0
*11.226.136.034.946.5
42.423.5
*18.O
44.827.5
Region:Notiheast . . . . . . . . . . . . . . . . . . . . . . . . . . . . . . .Midwest . . . . . . . . . . . . . . . . . . . . . . . . . . . . . . . .South . . . . . . . . . . . . . . . . . . . . . . . . . . . . . . . . .West . . . . . . . . . . . . . . . . . . . . . . . . . . . . . . . . . .
Education:Lessthan 12years . . . . . . . . . . . . . . . . . . . . . . . . .12years . . . . . . . . . . . . . . . . . . . . . . . . . . . . . . . .13yearsormore . . . . . . . . . . . . . . . . . . . . . . . . . .
Most recent occupation:Professional ormanagerlal . . . . . . . . . . . . . . . . . . . .Salesorclerical . . . . . . . . . . . . . . . . . . . . . . . . . . .Service . . . . . . . . . . . . . . . . . . . . . . . . . . . . . . . .CraflorfarmworKeroroperath4e . . . . . . . . . . . . . . . .Neverworked . . . . . . . . . . . . . . . . . . . . . . . . . . . .
Poverty level income149percentorless . . . . . . . . . . . . . . . . . . . . . . . . .150percentormore . . . . . . . . . . . . . . . . . . . . . . . .
300 percentormore . . . . . . . . . . . . . . . . . . . . . . .Medicaid status:
Receives Medicaid . . . . . . . . . . . . . . . . . . . . . . . . .DoesnotreceiveMedtcald . . . . . . . . . . . . . . . . . . . .
483394
1,340356
8241,051
700
178876543328617
1,4171,157
513
9401,612
92.686.793.464.6
100.0100.0100.0lcslo
100.0100.0100.0
100.0100.0100.0100.0Im.o
100.0100.0100.0
100.01M.o
100.0
44.950.945.8W.o
36.344.267.7
76.256.841.655.530.1
36.759.669.7
33.357.0
46.3
31.922612.2
*13.4
19:220.111.9
●11 .317.6226●6.619.7
16.616.3
*12.1
21.415.3
17.6
85.694.392.5
96.189.893.769.5eo.3
90.092.390.3
89.791.6
Ltvebirths . . . . . . . . . . . . . . . . . . . . . . . . . . . . . . . . 22,095 96.4
Region:Northeast . . . . . . . . . . . . . . . . . . . . . . . . . . . . . . .Midwest . . . . . . . . . . . . . . . . . . . . . . . . . . . . . . . .South . . . . . . . . . . . . . . . . . . . . . . . . . . . . . . . . .West . . . . . . . . . . . . . . . . . . . . . . . . . . . . . . . . . .
Education:Lessthan 12years . . . . . . . . . . . . . . . . . . . . . . . . .12yeara . . . . . . . . . . . . . . . . . . . . . . . . . . . . . . . .13yearsormore . . . . . . . . . . . . . . . . . . . . . . . . . .
Most recent occupation:Professlonalormanagerlal . . . . . . . . . . . . . . . . . . . .Salesorclerical . . . . . . . . . . . . . . . . . . . . . . . . . . .Service . . . . . . . . . . . . . . . . . . . . . . . . . . . . . . . .Craftorfarmworkeroroperative . . . . . . . . . . . . . . . .Neverworked . . . . . . . . . . . . . . . . . . . . . . . . . . . .
Poverty level income:149percentorless . . . . . . . . . . . . . . . . . . . . . . . . .150percenIormore . . . . . . . . . . . . . . . . . . . . . . . .
300percentormore . . . . . . . . . . . . . . . . . . . . . . .Medica!d status:
Receives Medicaid . . . . . . . . . . . . . . . . . . . . . . . . .DoesnotrecefveMedicaid . . . . . . . . . . . . . . . . . . . .
369 99.598.498.198.1
100.0100.0
100.0100.0
100.0
100.0
100.0
100.0
100.0
100.0
100.0
100.0
100.0
100.0
100,0
100,0
too.o
41.751.747.060.6
36.644.767.0
60.255.642.056.431.3
39.459.869.8
33,457.5
32.722.412.1
*13.6
19.419.6
*12.1
●6.716.322.0●8.620.2
16.216.6
*12.3
21.814.9
3201,141
244
652667576
97.598.599.2
99.29%3w. 198.697.3
151682433274532
1,185910369
97.399.8
lfx).o
7861,290
97.896.9
1,,AII pregmxies$) ~efem to IIW bkths, miscarriages, and stillbirths. Induced s.bortkkm are EXCk%d.
%chtdes pregnsnsies for which mother% last occupation or mothats Madicaid status was unkwn.
39

Table 13. Number of women 15-44 years of age whose most recent pregnancy ended in a five birth or spontaneous loss and percentdistribution by average number of cigarettes smoked per day during the pregnancy, according to selected characteristics of thepregnancy: United States, 1982
[Statistics are based on a sample of the household population of the contermlnous United Stake. See appendixes I end II for discussion of the sample design,sampling variability, and definition of terms]
Average number of cigarettes smoked
Number ofw day during pregnancy
women In Fewer 15 orCheracterLstJ$ thousands Total None fhan 15 more
Percent dislribufiin
All Women . . . . . . . . . . . . . . . . . . . . . . . . . . . . . . . . i 29,357 100.0 69.4 15.7 14.9
Age at pregnancy outcome:Under 20years . . . . . . . . . . . . . . . . . . . . . . . . . . . 2,933 100.0 61.6 22,320-24yeare . . . . . . . . . . . . . . . . . . . . . . . . . . . . .
16.19,511 100.0 88.4 17.2
25-29yeare . . . . . . . . . . . . . . . . . . . . . . . . . . . . .16.4
10,784 100.0 72.4 13.930-44yeare . . . . . . . . . . . . . . . . . . . . . . . . . . . . .
13.76,149 100.0 72.5 13.3 14.2
Pregnancy order:Firstpregnancy . . . . . . . . . . . . . . . . . . . . . . . . . . . 6,436 100.0 68.2 19.8Secondpregnency . . . . . . . . . . . . . . . . . . . . . . . . .
12.09,562 100.0 72.4 14.2
Thirdpregnancyorhigher . . . . . . . . . . . . . . . . . . . .13.4
13,339 100.0 67.9 14.8 17.4
Marital status at pregnancy outcome:Nevermarriad . . . . . . . . . . . . . . . . . . . . . . . . . . . . 3,252 100.0 59.9 22.6Evermarried . . . . . . . . . . . . . . . . . . . . . . . . . . . . .
17.525,899 100.0 70.7 14.7 14.5
Wontedness status at conception:Wanledthen . . . . . . . . . . . . . . . . . . . . . . . . . . . . . 18,130 100.0 72.4 13.8Mistimed . . . . . . . . . . . . . . . . . . . . . . . . . . . . . . .
13.87,024 100.0 65.5 18.2
Unwanted . . . . . . . . . . . . . . . . . . . . . . . . . . . . . . .16.3
4,202 100.0 63.2 19.5 17.3
Pregnancy outcomeLtveblrfh, . . . . . . . . . . . . . . . . . . . . . . . . . . . . . . 26,224 100.0 70.7 15.2Spontaneouspregnancyloss. . . . . . . . . . . , . . . . . .
14.13,133 100.0 59.0 19.7 21.4
Prenatalcsra2Eartyandcontlnuous . . . . . . . . . . . . . . . . . . . . . . . . 7,308 100.0 76.9 12.7Lateordlecontinuous . . . . . . . . . . . . . . . . . . . . . . .
10.44,548 100.0 64.8 19.2 16.0
ll~hdeswomn forwbmdtdstatus aicutcomeatitimlng andcmtidtyofprenetal carewereunkrwm fOrtbMdrOCent Pre9m~Y.2PragnarClesendingon or afterJaruary 1, 1979.
6
40

Table 14. Number of white women 15-44 years of age whose most recent pregnancy ended in a live birth or spontaneous ioss andpercent distribution by average number of cigarettes smoked per day during the pregnancy, according to selected characteristics of thepregnancy United States, 1982
[Statistics are based on a sample of the household population of the conterminous Untted States. See eppendLxes I and IIfor dlscueeion of the sample design,sampling variability, and definttlon of terms]
Average number of c@areftes smoked
Number ofpef day durtng pregnancy
wom~ in Fewer 15 orCharacfe&tic thousands Total None then 15 more
Percent distribution
All women . . . . . . . . . . . . . . . . . . . . . . . . . . . . . . . . 124,174 100.0 68.7 15.2 16.1
Age at pregnancy outcomeUnder 20years . . . . . . . . . . . . . . . . . . . . . . . . . . . 2,034 100.0 57.9 22.0 20.120-24 yeare . . . . . . . . . . . . . . . . . . . . . . . . . . . . . 7,776 100.0 64.3 17.326-29 years . . . . . . . . . . . . . . . . . . . . . . . . . . . . .
18.49,320 100.0 72.5 13.3
3044yeare . . . . . . . . . . . . . . . . . . . . . . . . . . . . .14.2
5,043 100.0 73.0 12.8 14.3
Pregnancy ordecFirst pregnancy . . . . . . . . . . . . . . . . . . . . . . . . . . . 5,173 100.0 66.9 19.7Second pregnancy . . . . . . . . . . . . . . . . . . . . . . . . .
13.48,118 100.0 71.5 14.1
Third pregnancy orhigher . . . . . . . . . . . . . . . . . . . .14.4
10,663 lW.O 67.5 13.9 18.6
Marifet status at pregnancy outcomeNever married . . . . . . . . . . . . . . . . . . . . . . . . . . . . 1,608 100.0 54.1 21.1Evermarried . . . . . . . . . . . . . . . . . . . . . . . . . . . . .
24.822,509 100.0 69.9 14.7 15.4
Wontedness status at conception:Wanted then . . . . . . . . . . . . . . . . . . . . . . . . . . . . . 15,686 100.0Mistimed . . . . . . . . . . . . . . . . . . . . . . . . . . . . . . .
71.9 13.4 14.65,568 100.0 64.0 17.6
Unwanted . . . . . . . . . . . . . . . . . . . . . . . . . . . . . . .18.4
2,920 100.0 60.4 2a3 19.3
Pregnancy outcomeLivebirth . . . . . . . . . . . . . . . . . . . . . . . . . . . . . . . 21,602 1rxt.o 69.9 14.8Spontaneous pregnancy loss.. . . . . . . . . . . . . . . . . .
15.32,372 100.0 57.7 19.0 23.3
Prenatal care:zEarlyandcontinuous . . . . . . . . . . . . . . . . . . . . . . . . 6,209 1Cw.o 76.6 12.2Lateordiscontinuous . . . . . . . . . . . . . . . . . . . . . . .
11.33,433 1Cn3.o 64.3 ?8.4 17.3
1Imbdes Wmn forwhom mantelstatusat wtcome, and timinge.rd continuityor prenaralcare were unknownforthe K@@r-m Pq~W.‘Pregnancieserding on or afterJanua~ 1, 1979.
41

Table 15. Number of black women 15-44 years of age whose most recent pregnancy ended in a live birth or spontaneous loss andpercent distribution by average number of cigarettes smoked per day during the pregnancy, according to selected characteristics of thepregnancy United states, 1982
[Statistics are based on a sample of the household population of the contermlnous UnifedSlates. See appendxes I and II for discussion of the sample design,sampling variability, and defimtlon of terms]
Average number of cigarettes smolred
Number ofper day during pregnancy
womam In Fewer 15 orCharacteristk thousands Total None than 15 more
Percent distribution
Allwomen . . . . . . . . . . . . . . . . . . . . . . . . . . . . . . . . 14,234 100.0 71.0 19.5 9.5
Age al pregnancy outcome:Under 20years . . . . . . . . . . . . . . . . . . . . . . . . . . . 822 100.0 72.6 21.720-24 years . . . . . . . . . . . . . . . . . . . . . . . . . . . . .
*5.81,479 100,0 75.3 18.1
25-29years . . . . . . . . . . . . . . . . . . . . . . . . . . . . .6.5
1,146 100.0 66.0 20.530-44years . . . . . . . . . . . . . . . . . . . . . . . . . . . . .
11.5786 100.0 65.5 18.6 15.8
Pregnancy orde~Fkstpregnsncy . . . . . . . . . . . . . . . . . . . . . . . . . . . 1,092 100.0 74.9 1S.9.%condpregnancy. ..,..... . . . . . . . . . . . . . . . .
6.11,099 100,0 73.2 17.7
Thirdpregnancyorhlgher . . . . . . . . . . . . . . . . . .9.1
2,043 100.0 67.7 20.9 11.5
Mafifal statusatpreg nancyoulcomeNevermarried . . . . . . . . . . . . . . . . . . . . . . . . . . . . 1,646 100.0 67.3 23.3Evermarried . . . . . . . . . . . . . . . . . . . . . . . . . . . . .
9.42,537 100.0 73.0 17.4 9.6
Wontedness status at conception:Wanledthen . . . . . . . . . . . . . . . . . . . . . . . . . . . . . 1,872 100.0 73.0 18.4Mistimed . . . . . . . . . . . . . . . . . . . . . . . . . . . . . . .
8.51,232 100.0 71.5 22.0
Unwanted . . . . . . . . . . . . . . . . . . . . . . . . . . . . . . .6.5
1,129 100.0 67.0 18.8 14.3
Pregnancy outcomeLtvebirth . . . . . . . . . . . . . . . . . . . . . . . . . . . . . . . 3,668 100.0 73.3 78.4Spontaneouspregnancyloss. . . . . . . . . . . . . . . . . .
8.3566 100.0 56.2 26.9 16.8
Prenataf care?EartyandconWruous.., . . . . . . . . . . . . . . . . . . . . . 674 100.0 76.6 17.7Lateordiscontinuous . . . . . . . . . . . . . . . . . . . . . . .
*5.7S71 100.0 64.3 24.6 11.0
1lmbdes women for whom marttal status at oufcorr-e, ard timing and continuity of prenatal care were unknown for the most recent pregnancy.ZPregWcIeS e“di”g on or after Jarwary 1, 1979.
42

Table 16. Number of women 15-44 years of age whose most recent pregnancy ended in a five birth or spontaneous loss and percentdistribution by average number of cigarettes smoked per day during the pregnancy, according to selected characteristics of the woman:United States, 1982
[Stalietlcs are based on a sample of the household population of the conterminous United States. See appendixes I and Hfor dscussion of the sample design,sampling variability, and defintlion of terms]
Average number of clgaretfes smoked
Number ofper day durtng pregnancy
womei-r in Fewer 15 orCheracteristb thousands Total A42ne than 75 more
Percent dlstrlbutlon
Allwomen . . . . . . . . . . . . . . . . . . . . . . . . . . . . . . . . i29,357 100.0 69.4 15.7 14.9
Region:Northeast . . . . . . . . . . . . . . . . . . . . . . . . . . . . . . . 5,764 100.0 69.3 19.4Midwest . . . . . . . . . . . . . . . . . . . . . . . . . . . . . . . .
11.37,736 100.0 66.2 17.1
South . . . . . . . . . . . . . . . . . . . . . . . . . . . . . . . . .16.7
10,139 100.0 70.9 13.7West . . . . . . . . . . . . . . . . . . . . . . . . . . . . . . . . . .
15.45,699 100.0 71.4 13.5 15.2
Education:Lessthan 12years . . . . . . . . . . . . . . . . . . . . . . . . . 6,360 Iwo 55.7 20.7 23.612years . . . . . . . . . . . . . . . . . . . . . . . . . . . . . . . . 12,652 100.0 68.3 16.1 15.613yearsormore . . . . . . . . . . . . . . . . . . . . . . . . . . 10,345 100.0 79.2 12.1 6.7
Most recent occupation:Professionalormmagerlai . . . . . . . . . . . . . . . . . . . . 4,362 100.0 77.5 11.4Salesorclerical . . . . . . . . . . . . . . . . . . . . . . . . . . .
11.212,630 100.0 72.3 14.1
Service . . . . . . . . . . . . . . . . . . . . . . . . . . . . . . . .13.6
5,662 100.0 61.9 20.5Craftorfarmworkeroroparatiie.. . . . . . . . . . . . . . .
17.64,075 100.0 63.1 16.6
Neverworked . . . . . . . . . . . . . . . . . . . . . . . . . . . .20.3
2,442 100.0 69.2 17.6 13.0
Povertylevel income:149percentorlees . . . . . . . . . . . . . . . . . . . . . . . . . 7,553 100.0 63.3 19.8150parcentormore . . . . . . . . . . . . . . . . . . . . . . . .
16.921,604 100.0 71.6 14.2
300percentormore . . . . . . . . . . . . . . . . . . . . . . .14.2
12,316 100.0 72.2 13.9 13.9
Medicaid statusReceivesMadicaki . . . . . . . . . . . . . . . . . . . . . . . . . 2,620 100.0 57.5 21.2Does notreceNeMediceid . . . . . . . . . . . . . . . . . . . .
21.326,556 100.0 70.7 15.1 14.2
ResidenceMetropolitan . . . . . . . . . . . . . . . . . . . . . . . . . . . . . 22,637 1Oa.o 69.0 18.0Nonmetropoliten . . . . . . . . . . . . . . . . . . . . . . . . . . .
15.06,720 1CO.o 71.0 14.5 14.5
i Inck.ides women whose lest occupation or Medicaid status wes unkmwm.
43

Table 17. Number of white women 16-44 yeara of age whose most recent pregnancy ended in a live birth or spontaneous loss andpercent distribution by average number of cigarettes smoked per day during the pregnancy, according to selected characteristic of thewoman: United States, 1982
[Statistlca are based on a sample of the household population of the contenrrinous United States. See appendixes I and II for discussion of the sample desfgn,sampllng variability, and definition of terms]
Average number of clgareties smoked
Number ofper day during pregnancy
womea In Fewer 15 orCtraracterMc thousands Total None than 15 more
Percent distribution
All women . . . . . . . . . . . . . . . . . . . . . . . . . . . . . . . . 124,174 100.0 64?.7 15.2 16.1
Region:Northeast . . . . . . . . . . . . . . . . . . . . . . . . . . . . . . .Midwest . . . . . . . . . . . . . . . . . . . . . . . . . . . . . . . .
4,880 100.0 66.3 19.9 11.86,730 100.0 65.7 16.7 17.6
South, . . . . . . . . . . . . . . . . . . . . . . . . . . . . . . . . 7,672 100.0 70.2 12.5West . . . . . . . . . . . . . . . . . . . . . . . . . . . . . . . . . .
17.34,682 100.0 70.8 12.8 16.4
Education:Lessthan 12years . . . . . . . . . . . . . . . . . . . . . . . . . 4,804 100.0 53.2 20.412years . . . . . . . . . . . . . . . . . . . . . . . . . . . . . . . .
26,410,S67 100.0 67.6 15.6
13yeatsormore . . . . . . . . . . . . . . . . . . . . . . . . . .16.8
8,703 100.0 78.8 11.8 9.4
Most recent occupation:Professionalormanagerlal . . . . . . . . . . . . . . . . . . . . 3,827 100.0 77.0 11.1SaIesorclerkal . . . . . . . . . . . . . . . . . . . . . . . . . . .
11.910,741 100,0 71.6 13.8
&N& . . . . . . . . . . . . . . . . . . . . . . . . . . . . . . . .14.6
4,466 100.0 60.9 20.1Craftorfarrnworkeroroperative . . . . . . . . . . . . . . . .
19.03,226 100.0 61.2 15.9
Neverworked . . . . . . . . . . . . . . . . . . . . . . . . . . . .22.9
1,789 100.0 68.5 17.0 14.6
Poveriy level income:149percentorless . . . . . . . . . . . . . . . . . . . . . . . . . 5,263 100.0 60.9 19.5150percentormore . . . . . . . . . . . . . . . . . . . . . . . .
19.618,912 100.0 70.9 14.0
300percenlormore . . . . . . . . . . . . . . . . . . . . . . .15.1
10,825 100.0 71.3 14.0 14.7
Medicaldslatus:Receives Medicaid . . . . . . . . . . . . . . . . . . . . . . . . . 1,480 100.0 50.4 20.2DoesnotreceiveMedlcaid . . . . . . . . . . . . . . . . . . . .
29.422,569 100.0 70.1 14.9 15.1
Residence:Metropolita n . . . . . . . . . . . . . . . . . . . . . . . . . . . . 16,3541 100.0 6s.3 15.4Nonmetropolftan . . . . . . . . . . . . . . . . . . . . . . . . . . .
16.35,824 100.0 70.0 14.5 15.5
!Imhdeswomn vimaalastoccupatlon orh%dicaidstatw wmunkmwn.
44

Table 18. Number of black women 15-44 years of age whose most recent pregnancy ended in a live birth or spontaneous loss andpercent distribution by average number of cigarettes smoked per day during the pregnancy, according to selected characteristics of thewoman: United States, 1982
[Slatlstks are based on a sample of the household population of the contermlnous United Sta!as. See appendixes I and II for discussion of the sample design,sampling variability, and defintlkm of termsl
Number ofpar day during pregnancy
women h Fewer 15 orCharacteristk thousands Total None than 15 more
Percent diitributlon
Allwomen . . . . . . . . . . . . . . . . . . . . . . . . . . . . . . . . 14,234 1CN3.o 71.0 19.5 9.5
Region:Northeast . . . . . . . . . . . . . . . . . . . . . . . . . . . . . . . 700 100.0 71.3 19.6Midw@X . . . . . . . . . . . . . . . . . . . . . . . . . . . . . . . .
+9.0847 100.0 67.5
south. . . . . . . . . . . . . . . . . . . . . . . . . . . . . . . . .23.0 9.4
2,202 100.0 73.2 17.4West . . . . . . . . . . . . . . . . . . . . . . . . . . . . . . . . . .
9.4485 100.0 66.8 22.8 ●1O.4
Eduoalbn:Lessthan 12years . . . . . . . . . . . . . . . . . . . . . . . . . 1,269 100.0 63.3 24.012years . . . . . . . . . . . . . . . . . . . . . . . . . . . . . . . . 1,736
12.7100.0 71.8
13yearsormore . . . . . . . . . . . . . . . . . . . . . . . . . .18.6 9.6
1,229 100.0 77.7 16.3 6.0
Most recent occupation:Professkmalormanagerial . . . . . . . . . . . . . . . . . . . . 354 100.0 S0.8Salesorclerical . . . . . . . . . . . . . . . . . . . . . . . . . . .
*13.9 *5.31,464 100.0 73.6
.%wloe . . . . . . . . . . . . . . . . . . . . . . . . . . . . . . . .17.7
1,1058.7
100.0 64.0Craftorfarmworkeroroperative . . . . . . . . . . . . . . . .
23.8718
12.2100,0 73.1
Naverworlred . . . . . . . . . . . . . . . . . . . . . . . . . . . .17.7
5439.2
100.0 69.5 22.2 *8.4
PoverlyleveIlncome149percentorless . . . . . . . . . . . . . . . . . . . . . . . . . 2,063 1CH3.O 68.6 22.2l~percentormore . . . . . . . . . . . . . . . . . . . . . . . .
9.32,151 100.0 73.3
300percentormore . . . . . . . . . . . . . . . . . . . . . . .17.0
9549.7
100.0 71.4 17.5 11,1
MedioaidstatusReceWsMedk8id . . . . . . . . . . . . . . . . . . . . . . . . . 1,078 10Q.O *.4 22.7DoesnotreceiveMedkaid . . . . . . . . . . . . . . . . . . . . 3,112
10.9100.0 725 18.4 9.1
Residence:Metropolllan . . . . . . . . . . . . . . . . . . . . . . . . . . . . . 3,454 10C%O 69.8Nonmetropollten. . . . . . . . . . . . . . . . . . . . . . . . . . .
20.3760
9.9100.0 76.3 16.2 *7. 5
tlmhd~~~n Wk=l~~@on orkfedlcddstatus wasunhown.
45

Table 19. Number of women 15-44 years of age whose most recent pregnancy ended in a iive birth or spontaneous ioss and percentdistribution by average frequency of aicoholic beverage consumption during the pregnancy, according to seiected characteristics of thepregnancy United States, 1982
[Statistics are based on a sample of the household population of the contermlnous United States. See append~es I and II for discussion of the sample design,sampling variability, and definition of terms]
Average frequency of alcoholic beverageconsumptkm durrhg pregnancy
Number ofwomen In Less than Once a
Characte&tic thousands To:& Never once a wedr week or more
Percent distribution
Allwomen . . . . . . . . . . . . . . . . . . . . . . . . . . . . . . . . 129,357 100.0 54.5 33.7 11.8
Age at pregnancy outcomeUnder 20years . . . . . . . . . . . . . . . . . . . . . . . . . . . 2,933 100.0 70.9 22.720-24 years . . . . . . . . . . . . . . . . . . . . . . . . . . . . .
*8.49,511 100.0 59.2 31.8
25-29 yeare . . . . . . . . . . . . . . . . . . . . . . . . . . . . .9.0
10,764 100.0 48.0 38.5 13.530-44ye8fs . . . . . . . . . . . . . . . . . . . . . . . . . . . . . 6,149 100.0 51.0 33.4 15.5
Pregnancy ordenFirstpregnancy . . . . . . . . . . . . . . . . . . . . . . . . . . . 6,436 100.0 80.6 30.8Second pregnancy . . . . . . . . . . . . . . . . . . . . . . . . .
8.69,582 100.0 51.3 37.0
Third pregnancyorh!gher ..., . . . . . . . . . . . . . . . .11.7
13,339 100.0 54.0 32.7 13.3
Marital statusatpregnancy outcome:Nevermarriad . . . . . . . . . . . . . . . . . . . . . . . . . . . . 3,252 100.0 62.0 25.5 12.5Evermarriad . . . . . . . . . . . . . . . . . . . . . . . . . . . . . 25,899 100.0 53.5 34.9 11.6
Wontedness status at conception:Wantedthen . . . . . . . . . . . . . . . . . . . . . . . . . . . . . 18,130 100.0 53.7 34.7 11.6 ‘Mistimed . . . . . . . . . . . . . . . . . . . . . . . . . . . . . . . 7,024 100.0 53.3 35.1Unwalled . . . . . . . . . . . . . . . . . . . . . . . . . . . . . . .
11.74,202 100.0 60.4 27.0 12.6
Pregnancy outcomeUvebkth. . . . . . . . . . . . . . . . . . . . . . . . . . . . . . . 26,224 100.0 55.0 34.1Spontaneouspregnancyloes . . . . . . . . . . . . . . . . . . .
10.93,133 100.0 50.4 20.3 19.3
Prenatal carixzEarlyandcontinuous . . . . . . . . . . . . . . . . . . . . . . . . 7,306 100.0 54.8 37.4Lateordkcontinuous . . . . . . . . . . . . . . . . . . . . . . .
7.84,548 100.0 57.7 30.9 11.4
I Inchdes women for whom marital status at outcome and timing and mntlr-dtyof prenetal care were unknown for the rrwst recent pregmrwy.Zpmgmmim ending on or after Jaw.Jary 1, 1979.
46

Table 20. Number of white women 15-44 years of age whose most recent pregnancy ended in a live birth or spontaneous loss andpercent distribution by average frequency of alcoholic beverage consumption during the pregnancy, according to selectedcharacteristics of the pregnancy: United States, 1982
[Statistics are based on a sample of the household population of the contermlnous UnttedStates.Sw appendixes I and Ii for discussion of the sample design,sampling variability, and definition of terms]
Average frequency of alcofrok beverage
Number ofcorsumptkwr during pregnancy
women In Less man Once aChamcferktic thousands Totst Never orrce a WS9K week or more
Allwomen . . . . . . . . . . . . . . . . . . . . . . . . . . . . . . . . ‘24,174 100.0 51.8 36.3 11.9
Age at pregnancy outcomeUnder 20years . . . . . . . . . . . . . . . . . . . . . . . . . . . 2,034 100.0 66.0 25.7 *6.320-24 years . . . . . . . . . . . . . . . . . . . . . . . . . . . . . 7,778 100.0 56.3 34.425-29 years . . . . . . . . . . . . . . . . . . . . . . . . . . . . .
9.29,320 100.0 46.1 40.5 13.3
30-44 years . . . . . . . . . . . . . . . . . . . . . . . . . . . . . 5,043 100.0 46.7 35.6 15.6
Pregnancy orderFirstpregnancy . . . . . . . . . . . . . . . . . . . . . . . . . . . 5,173 100.0 56.6Secondpregnancy . . . . . . . . . . . . . . . . . . . . . . . . . 8,118 Iwo 48.3Third pregnancyorhlgher . . . . . . . . . . . . . . . . . . . . 10,663 lW.O 52.1
34.439.434.9
8.812.313.0
Marftal statusatpregnan cyoutcomeNevermarried . . . . . . . . . . . . . . . . . . . . . . . . . . . . 1,506 100.0 55.0 32.5 *12.4Evermarriad . . . . . . . . . . . . . . . . . . . . . . . . . . . . . 22,509 100.0 51.5 36.7 11.8
Wontedness status at conception:Wantedthen . . . . . . . . . . . . . . . . . . . . . . . . . . . . . 15,666Mistimed . . . . . . . . . . . . . . . . . . . . . . . . . . . . . . .
100.0 51.8 36.5 11.65,566 1W1.o 49.0 36.5 12.5
Unwanted . . . . . . . . . . . . . . . . . . . . . . . . . . . . . . . 2,920 1M.o %.9 30.8 12.3
Pregnancy outcome:Ltiebirth . . . . . . . . . . . . . . . . . . . . . . . . . . . . . . . 21,602 100.0 52.2 36.6 11.0Spxrtaneous pragnancyloss. . . . . . . . . . . . . . . . . . . 2,372 100,0 4a. 1 32.0 20.0
Prenatal car.xzEarlyandcontinuous . . . . . . . . . . . . . . . . . . . . . . . . 6,209 i 00.0 53.4 39.3Lateordiscontlnuous . . . . . . . . . . . . . . . . . . . . . . .
7.33,433 100.0 54.5 34.3 11.3
1lnckjes womemforwhomrnerftalstatusat cutcorneand limingand continuityof venntd care ware unk- ~r i~ * r~~ P%I~.‘Pregnanciesendingon or aftw January 1, 1979.
47

Table 21. Number of black women 15-44 years of age whose most recent pregnancy ended in a live birth or spontaneous loss andpercent distribution by average frequency of alcoholic beverage consumption during the pregnancy, according to selectedcharacteristics of the pregnancy United States, 1982
[Statistics are based on a sample of the household population of the contermlnous United States. See appendixes I and II for discussion of the sample design,sampling variability, and definitkx of terms]
Average frequency otaicoholic beveni’ge
Number ofcorrsumptkm during pregnancy
women In Less than Once aCharacteristic thousends Total Never once a w&?k week or more
Percent dlstributiin
Allwomen . . . . . . . . . . . . . . . . . . . . . . . . . . . . . . . . 14,234 Irxr.o 67.1 22.0 10.9
Age at pregnancy outcome:Under 20years . . . . . . . . . . . . . . . . . . . . . . . . . . . 822 100.0 77.0 15.920-24 yesrs . . . . . . . . . . . . . . . . . . . . . . . . . . . . .
●7.21,479 100.0 70.4 20.3
25-29 years . . . . . . . . . . . . . . . . . . . . . . . . . . . . .9.3
1,146 100.0 61.1 26.63C44yeers . . . . . . . . . . . . . . . . . . . . . . . . . . . . .
12.4786 100.0 59.6 24.9 15.5
Pregnancy orderFirstpregnancy . . . . . . . . . . . . . . . . . . . . . . . . . . . 1,092 100.0 75.9 17.3.%condpregnancy . . . . . . . . . . . . . . . . . . . . . . . . .
6.81,099 100.0 67.1 25.0
Thlrdpregnancyorhigher . . . . . . . . . . . . . . . . . . . .7.9
2,043 100.0 62.5 22.9 14.6
Mariial status at pregnancy outcome:Nevermarried . . . . . . . . . . . . . . . . . . . . . . . . . . . . 1,648 100.0 68.6 19.8Evermarriad . . . . . . . . . . . . . . . . . . . . . . . . . . . . .
11.62,537 100.0 65.9 23.6 10.5
Wontedness status at conception:Wantedthen . . . . . . . . . . . . . . . . . . . . . . . . . . . . . 1,872 i 00.0 65.1 24.7Mistimed . . . . . . . . . . . . . . . . . . . . . . . . . . . . . . .
10.21,232 100.0 71.7 20.4
Unwanted . . . . . . . . . . . . . . . . . . . . . . . . . . . . . . .7.9
l,12a 100.0 65.5 19.3 15.3
Pregnancy outcome:Liveblrth . . . . . . . . . . . . . . . . . . . . . . . . . . . . . . . 3,666 100.0 69.0 21.3Spontaneouspregnancyloss. . . . . . . . . . . . . . . . . . .
9.7100.0 55.1 26.3 18.6
Prenatal carwzEarlyandcontlnuous, . . . . . . . . . . . . . . . . . . . . . . . 874 100.0 66.8 26.4Lateordiacontlnuous . . . . . . . . . . . . . . . . . . . . . . .
*6.8871 100.0 67.9 19.9 12.2
1l~~,j~$ ~omn for ~~m mafital status at WtCOM and timing and mntinully of prenatalcare were unk- for t~ M* rece~ P~9~ncy.‘Pregnanoles ending on or aflar January 1, 1979.
48

Table 22. Number of women 1s44 years of age whose moat recent pregnancy ended in a live birth or spontaneous loss and percentdistribution by average frequency of alcoholic beverage consumption during the pregnancy, according to selected characteristicsof thewoman: United States, 1982
I.Statistics are based on a sample of the household population of the conterrnlnous Unled States. See appendkes I and II for dkcusskm of the sample design,sampling variabilhy, and definition of terrnsi
Awarage frequency ofalcdrolh? beverage
Number ofconsurnptbr during pregnancy
women In Less than Once aCharacterktk thousands Total Never once a weefr week or mom
Percent distribution
Allwomen . . . . . . . . . . . . . . . . . . . . . . . . . . . . . . . . %,357 100.0 54.5 33.7 11.8
Region:Northeast . . . . . . . . . . . . . . . . . . . . . . . . . . . . . . . 5,764 100.0 46.4 37.3Midwest . . . . . . . . . . . . . . . . . . . . . . . . . . . . . . . . 7,736 Im.o 49.1 39.2South . . . . . . . . . . . . . . . . . . . . . . . . . . . . . . . . . 10,139 100.0 67.9 23.8West . . . . . . . . . . . . . . . . . . . . . . . . . . . . . . . . . . 5,6S9 100.0 46.6 40.1
Educat!on:Lessthan 12years . . . . . . . . . . . . . . . . . . . . . . . . . 6,36JJ 100.0 67.112years . . . . . . . . . . . . . . . . . . . . . . . . . . . . . . . . 12,652 100.0 55.813yearsormore . . . . . . . . . . . . . . . . . . . . . . . . . . 10,345 100.0 45,4
23.435.036.4
16.311.08.3
13.3
9.59.3
16.2
Most recent occupation:Professionalormanagerlal . . . . . . . . . . . . . . . . . . . . 4,362 100.0 39.5 42.2 16.3Salesorclerlcal . . . . . . . . . . . . . . . . . . . . . . . . . . . 12,630 100.0 52.6 35.6 11.8SONkO . . . . . . . . . . . . . . . . . . . . . . . . . . . . . . . . 5,662 100.0 55.8 35.6 8.5Craftorfarmworkeroroperative . . . . . . . . . . . . . . . . 4,075 100.0 63.3 25.9 10.7Neverworlred . . . . . . . . . . . . . . . . . . . . . . . . . . . . 2,442 100.0 73.2 17.7 9.1
Poverty level Income149percentorless . . . . . . . . . . . . . . . . . . . . . . . . . 7,553 100.0 66.4 25.3 8.4150percenIormore . . . . . . . . . . . . . . . . . . . . . . . . 21,LW4 100.0 50.4 36.6 12.9
300percentormore . . . . . . . . . . . . . . . . . . . . . . . 12,316 100.0 46.8 37.3 16.0
Medlcakfstalus:RecetvasMedicaid . . . . . . . . . . . . . . . . . . . . . . . . . 2,620 100.0 70.1DoesnotraceiveMadkaid . . . . . . . . . . . . . . . . . . . . 26,556 100.0 53.0
ResidenceMetropol~an . . . . . . . . . . . . . . . . . . . . . . . . . . . . . 22,637 100.0 50.5Nonmetropolllan . . . . . . . . . . . . . . . . . . . . . . . . . . . 6,72U 100.0 66.3
19.335.1
36.025.9
10.611.9
13.55.9
llnchdeswomen forwhomlsstexupstlon orMedicaidstatus wasunlamvm
49

Table 23. Number of white women 15-44 years of age whose most recent pregnancy ended in a five birth or spontaneous loss andpercent distribution by average frequency of alcohoiic beverage consumption during the pregnancy, according to selectedcharacteristics of the woman: United States, 1982
[Statistics are based on a sample of the household populatkm of the contermlnous United States. Sss appendixes I end II for discussion of the sample design,sampling variebilii, and definition of terms]
Average frequency of alcoholic beverage
Number ofconsumption during pregnancy
women In Less then Once aCharecferistk thousands Total Never once a weak week or more
Percent distribution
Allwomen . . . . . . . . . . . . . . . . . . . . . . . . . . . . . . . . ‘24,174 100.0 51.8 36.3 11.9
Region:Northeast . . . . . . . . . . . . . . . . . . . . . . . . . . . . . . . 4,880 100.0 43.5 39.0Midwest . . . . . . . . . . . . . . . . . . . . . . . . . . . . . . . . 6,730 100.0 47.0 41.5South . . . . . . . . . . . . . . . . . . . . . . . . . . . . . . . . . 7,672 100.0 66.3 25.6West . . . . . . . . . . . . . . . . . . . . . . . . . . . . . . . . . . 4,692 100.0 44.0 43.3
17.511.5
8.112.8
Education:Lessthan 12years . . . . . . . . . . . . . . . . . . . . . . . . . 4,904 100.0 67.3 24.812yeers . . . . . . . . . . . . . . . . . . . . . . . . . . . . . . . .
7.910,567 100,0 53.1 37.6
13yearsormore . . . . . . . . . . . . . . . . . . . . . . . . . .9.3
6,703 100.0 41.5 41.2 17.3
Mostrecentoocupatio n:Professionatormanagerial . . . . . . . . . . . . . . . . . . . . 3,827 100.0 38.8 43.9Salesorclerical . . . . . . . . . . . . . . . . . . . . . . . . . . .
19.310,741 100.0 50.5 37.6
Service . . . . . . . . . . . . . . . . . . . . . . . . . . . . . . . .11.9
4,466 100.0 52.5 40.4Craftorfarmworkeroroperative . . . . . . . . . . . . . . . . 3,226 100.0 60.4 28.6 inNeverworked . . . . . . . . . . . . . . . . . . . . . . . . . . . . 1,789 100.0 73.5 17.0 *9.5
Poverfylevel income:149percentorless . . . . . . . . . . . . . . . . . . . . . . . . . 5,263 100.0 65.6 27.4150percentormore . . . . . . . . . . . . . . . . . . . . . . . .
7.118,912 100.0 48.0 38.8
300percentormore . . . . . . . . . . . . . . . . . . . . . . .13.2
10,825 100.0 44.4 39.2 16.4
Med!eaktstatusReoeivesMedicaid . . . . . . . . . . . . . . . . . . . . . . . . . 1,490 100.0 72.6 20.4 *7.ODoesnotreceNeMedicsld . . . . . . . . . . . . . . . . . . . . 22,569 100.0 50.5 37.3 12.2
ResldervxxMetropolitan . . . . . . . . . . . . . . . . . . . . . . . . . . . . . 16,350 100.0 47.0 39.2Nonmetropol~an, . . . . . . . . . . . . . . . . . . . . . . . . . .
13.95,824 100.0 67.1 27.2 5.7
f Imhdes womenforwtmmlestocwpatlon .x Medicaidstatuswes unknown.
50
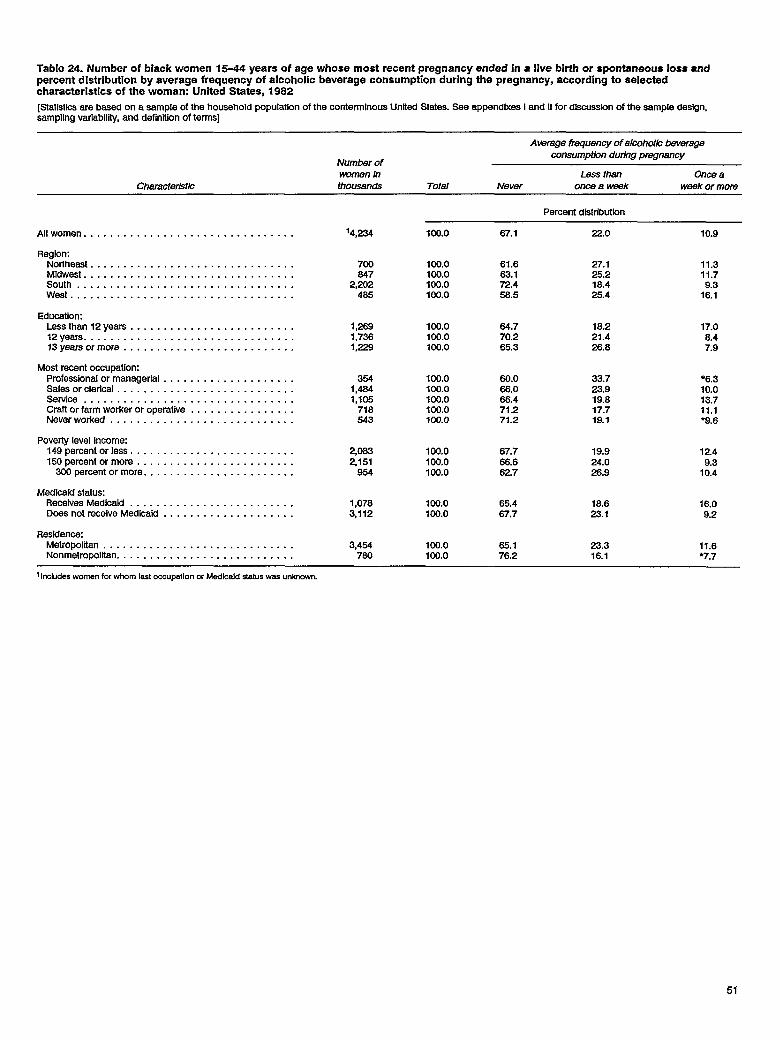
Table 24. Number of black women 15-44 years of age whose most recent pregnancy ended in a live birth or spontaneous loss andpercent distribution by average frequency of alcoholic beverage consumption during the pregnancy, according to selectedcharacteristics of the woman: United States, 1982
[Statistics are based on a sample of the household population of the conterminous United Slates. See appendixes I end II for d-sskx of the sample design,sampling varlabllity, and definltkm of terms]
Aberage rk?quency of alcotrok beverage
Number ofconsumption durkrg fnwgrrancy
wcvnen h Less then Once aCharscieristls thousands Total Never onceaweelr weak or more
Percent disfribufion
Allwomen . . . . . . . . . . . . . . . . . . . . . . . . . . . . . . . . %4,234 100.0 67.1 22.0 10.9
RegionNortheast . . . . . . . . . . . . . . . . . . . . . . . . . . . . . . .Mtiwest . . . . . . . . . . . . . . . . . . . . . . . . . . . . . . . .
70+3 100.0 61.6 27.1 11.3647 100.0 63.1 25.2
South . . . . . . . . . . . . . . . . . . . . . . . . . . . . . . . . .11.7
2,202 lm.o 724 18.4West . . . . . . . . . . . . . . . . . . . . . . . . . . . . . . . . . .
9.3485 lW.O 56.5 25.4 16.1
Education:Lessthan 12years . . . . . . . . . . . . . . . . . . . . . . . . . 1,269 100.0 64.712years . . . . . . . . . . . . . . . . . . . . . . . . . . . . . . . . 1,736 100.0 70.213yearsormore . . . . . . . . . . . . . . . . . . . . . . . . . . 1,228 1W.o 65.3
18.221.426.6
17.08.47.9
Most recent occupation:Professionalormanagerial . . . . . . . . . . . . . . . . . . . . 354 100.0 60.0 33.7Salesorclerical . . . . . . . . . . . . . . . . . . . . . . . . . . .
*6.31,464 100.0 66.0 23.9
Service . . . . . . . . . . . . . . . . . . . . . . . . . . . . . . . .10.0
1,105 100.0 66.4 19.8Crafforfarmworkeroroperative . . . . . . . . . . . . . . . .
13.7718 100.0 71.2 17.7
Neverworked, . . . . . . . . . . . . . . . . . . . . . . . . . . .11.1
543 100.0 71.2 WI ●9. 6
Povertylevel income:149percentorlessc . . . . . . . . . . . . . . . . . . . . . . . . 2,(X33 100.0 67.7 19.9150percentormore . . . . . . . . . . . . . . . . . . . . . . . .
12.42,151 100.0 66.6 24.0
3@) percen!ormore . . . . . . . . . . . . . . . . . . . . . . .9.3
954 100.0 62.7 26.9 10.4
Medicaid status:RecetvesMedicald . . . . . . . . . . . . . . . . . . . . . . . . . 1,078 I&J.o 65.4 18.6DoesnolreceiveMedk.aid . . . . . . . . . . . . . . . . . . . .
16.03,112 100.0 67.7 23.1 9.2
Res!dencsMetropoltlan . . . . . . . . . . . . . . . . . . . . . . . . . . . . . 3,454 100.0 65.1 23.3Nonmelropditan. . . . . . . . . . . . . . . . . . . . . . . . . . .
11.6760 100.0 76.2 16.1 *7.7
flndudeswmrwn forwhomlastoccupation cfMediw”dstetus was unknown.
51

Table 25. Number of single live births to women 15-44 years of age and percent low birth weight by race and selected characteristicsofthe birth: United States, 1982
[Statistics are based on a sample of Ihe household population of Ihe conlermlnous United States. See appendixes I and II for discussion of the sample design,sampling variabifii, and definition cf terms]
All races White Black
Number of Percent Number of Percent Number of Percentbirths In low births in low births in low
Characteristic thousands birth weight thousands bhih we/ght fhousands birlh weight
Allllve bkths. . . . . . . . . . . . . . . . . . . . . . . . . . . . . . .
Mother’s age at birth:Under 20yeara . . . . . . . . . . . . . . . . . . . . . . . . . . .20-24 yeare . . . . . . . . . . . . . . . . . . . . . . . . . . . . .25-44 years . . . . . . . . . . . . . . . . . . . . . . . . . . . . .
Bklh ordecFlret birth . . . . . . . . . . . . . . . . . . . . . . . . . . . . . . .Second birth . . . . . . . . . . . . . . . . . . . . . . . . . . . . .Third birth orhigher . . . . . . . . . . . . . . . . . . . . . . . .
Mother’s marital status at birth:Nevermarried . . . . . . . . . . . . . . . . . . . . . . . . . . . .Evermarried . . . . . . . . . . . . . . . . . . . . . . . . . . . . .
Wontedness status al conceptkm:Wsntedthen . . . . . . . . . . . . . . . . . . . . . . . . . . . . .Mistlmedorunwanted . . . . . . . . . . . . . . . . . . . . . . .
Amount smoked during pregnancy (most recent bhm):Didnotsmoke . . . . . . . . . . . . . . . . . . . . . . . . . . . .Fewerthan 15perday . . . . . . . . . . . . . . . . . . . . . . .150rmoreperday . . . . . . . . . . . . . . . . . . . . . . . . .
Frequency of alcohol consumption during pregnancy (most
recent birth):Didnotdrink . . . . . . . . . . . . . . . . . . . . . . . . . . . . .Lessthanonceaweek . . . . . . . . . . . . . . . . . . . . . .Onceaweekormore . . . . . . . . . . . . . . . . . . . . . . .
lm,511 6.6 156,602 5.6 110,907 12.2
14,80329,01325,634
&76.75.3
10,60123,66822,060
7.35.64.7
3,8114,3642,704
13.212.410.5
30,66221,66616,940
7.26.45.8
25.417 6.2
z
4,5033,0123,392
13.210.912.013;139
8,30460,603
12.35.6
3,82152,339
12.05.1
4,3406,405
12.712.0
41,97027,540
5.87.9
36,11220,490
5.36.2
4,58f6,328
10.213.6
18,2653,6663,637
4.210.012.9
15,0723,1613,282
3.39.1
12.6
2,639657295
9.015.4
*18.6
14,2228,7942,361
6.26.5
●6.2
11,2447,6652,401
5.26.4
*4.7
2,4697732-52
10.9*8,0
+47.7
llnchdes birthsforwhichn-nlhar’sage at blrt~ dherk maritalstatusat birth,wantadnessstatusat conception,emountsnmkadduringPre9rMIwY, or frequencyof aicohd consWIPtion dwha
pregnancywas unkrown.
52

Table 26. Number of single live births to women 15-44 years of age and percent low birth weigh$ by race and selected characteristicsofthe mother: United States, 1982
[Stal(stim are based on a sample of the household population of the conterminous United Statas. See appendixes I and II for d-sslon of the sample design,sampling variabilii, and definition of terms]
All races White Black
Number of Percent Number of Percent Number of Percentbirths in low births h tow births kr tow
Charecteristlc thousands birth we~ht thousands birth we&ht thousands birth we@ht
Alllive births. . . . . . . . . . . . . . . . . . . . . . . . . . . . . . . 159,511 6.6 158,802 5.6 i 10,907 12.2
Region:Notiheast . . . . . . . . . . . . . . . . . . . . . . . . . . . . . . . 13,475Midwest . . . . . . . . . . . . . . . . . . . . . . . . . . . . . . . .
6.5 11,133 5.9 1,899 10.618,750 7.5 16,275 6.3 2,225
South . . . . . . . . . . . . . . . . . . . . . . . . . . . . . . . . .14.9
23,669 7.2 17,457 5.7 5,581West . . . . . . . . . . . . . . . . . . . . . . . . . . . . . . . . . .
12.113,617 4.5 11,738 4.1 1,202 10.2
Education:Lessthan 12yeare . . . . . . . . . . . . . . . . . . . . . . . . . 18,247 8.9 13,!3)5 7.5 4,19812years . . . . . . . . . . . . . . . . . . . . . . . . . . . . . . . .
13.929,285 6.2 24,628 5.3 3,970
130rmoreyear3 . . . . . . . . . . . . . . . . . . . . . . . . . . 21,97811.2
5.3 18,488 4.6 2,741 11.0
Most recent occupation:Professional, managerlel, eales, and clerical workers. . . . 37,724 5.6 32,275 5.0 4,220Service, craft, and farm worl(er eandoparetb’es . . . . . . .
11.324,920 8.2 19,207 7.0 5,247
Neverworked . . . . . . . . . . . . . . . . . . . . . . . . . . . .13.3
6,418 6.6 4,765 *5.O 1,379 10.5
Poverty level income149percentorless . . . . . . . . . . . . . . . . . . . . . . . . . 20,286 7.7 13,893 5.6 5,932150percentormore . . . . . . . . . . . . . . . . . . . . . . . .
12949,225 42,709 5.6 4,975
300percentormore . . . . . . . . . . . . . . . . . . . . . . .11.4
26,223 % 23,239 5.6 1,395 11.0
Medicalds!attxRacelvesMadicaid . . . . . . . . . . . . . . . . . . . . . . . . . 7,278 10,2 4,088 8.7 3,096DoesnotreceiveMedicaid . . . . . . . . . . . . . . . . . . . .
12.061,770 6.2 52,178 5.4 7.724 12.3
ReskfancwMetropolita n . . . . . . . . . . . . . . . . . . . . . . . . . . . . 53,331 7.1 42,708 6.1 8,976Nonmetropdtan. . . . . . . . . . . . . . . . . . . . . . . . . . .
12.116,184) 5.1 13,895 4.2 1,932 12.4
1l~~d~~ b]fl~ fm ~hl~h ~t~ts l~t ocm@i~” or ~~<~ M~~d ~t~~ ~~ ““k-~,
53

Table 27. Number of live births in January 1979 or later to women 15-44 years of age and percent paid for from specified sources, byselected characteristics of the birth: United States, 1982
[Skdlsiics are based on a sample of the household population of the conterminous United Skdes. See appendixes I and II for discussion of the sample design,sampling variability, and definition of terms]
Source of payment
Number of Seit Privatebirths In fami~, or medical Other All
Character&t/c thousands kiends insurance Medicaid government other
Percenti
214,372
1,9724,7644,6632,773
6,0014,9003,471
2,47111,672
9,1273,8231,422
9,1245,052
10,4663,514
60213,451
1,06213,046
Alllive birlhs. . . . . . . . . . . . . . . . . . . . . . . . . . . . . . .
Mothar’s age at time of birth:Under 20yeafs . . . . . . . . . . . . . . . . . . . . . . . . . . .20-24 yesra . . . . . . . . . . . . . . . . . . . . . . . . . . . . .25-29 years . . . . . . . . . . . . . . . . . . . . . . . . . . . . .30-44yaars . . . . . . . . . . . . . . . . . . . . . . . . . . . . .
BirthordeKFirst.. . . . . . . . . . . . . . . . . . . . . . . . . . . . . . . . .Second . . . . . . . . . . . . . . . . . . . . . . . . . . . . . . . .Thlrdorhigher . . . . . . . . . . . . . . . . . . . . . . . . . . . .
Mothef’s martIalslalus attlmeofblrth:Nevermarriad . . . . . . . . . . . . . . . . . . . . . . . . . . . .Evermarried . . . . . . . . . . . . . . . . . . . . . . . . . . . . .
Wantednasa status at concepllon:
40.7 63.1 10,4 9.1 5.9
32.237.346.542.6
27.355.975.060.3
26,913.4*4. 7*3.6
23.79.1
*4. 1*7.4
*4.78.2
*5.2*3.9
40.838.344.2
68.268.663.6
11.78.5
11.1
10.27.39.6
6.26.5
●4.5
22.544.5
18.372.3
39.94.4
24.65.9
*3.66.3
6.216.521.5
Wanted then. . . . .Mistime d........Unwanted. . . . . .
Prenatal care:Early and continuous.Late or discontinuous
Prenatal care providec
. . . . . . . . . . . . . . . . . . . . . . . 40,841.737.6
72.648.641.2
6.811.317.6
5.37.1
*6.3. . . . . . . . . . . . . . . . . . . . . .. . . . . . . . . . . . . . . . . . . . . . .
42.138.6
73.144.7
6.417.9
5.415.8
5.76.5
. . . . . . . . . . . . . . . . . . . . . . .
. . . . . . . . . . . . . . . . . . . . . . .
44.827.9
75.927.0
4.827.1
6.217.9
2.714.9
Privatedodor . . . . . . . . . . . . . . . . . . . . . . . . . . . .Hosphalorothercllnk . . . . . . . . . . . . . . . . . . . . . . .
Birth weight:51Apoundsorless ..,...... . . . . . . . . . . . . . . . .Morethan51Apounds . . . . . . . . . . . . . . . . . . . . . . .
Whather Infanl came home from hospital wilh mother:Dldnotcomehome . . . . . . . . . . . . . . . . . . . . . . .Camehome . . . . . . . . . . . . . . . . . . . . . . . . . . . . .
40.740.8
54.163.6
‘18.010.0
●6.38.9
●8.55.7
36.340.7
55.564.2
*1 6.310.0
*13.48.8
*4.95.7
17hewmofthepments exceeds 100.0beceuse somewomenreportedn-orethanorwsource cfpayment.‘Inchdes Mths for wkkh mother’smaritalstatusat birih,timingand contlruityof prenatalcare, prenatalcare provider,birth we~hi, or whether the infant cams homefrom hospital with tha motherwesurkrrawnor notappficsble.
54

Table 28. Number of live births in January 1979 or later to white women 15-44 years of age and percent paid for from specified sources,by selected characteristics of the birth: United States, 1982
[Statistics are based on a sample of the household population of the contermlnous United States. See appendkes I and II for discussion of the sample destgn,sampling variability, and definition of terms]
Source of payment
Number of Seit Privatebirihs in fami~, or medical Other
CharacteristicAll
thousands f?iends Insurance Medhxid government other
Percentl
Allliie bifths. . . . . . . . . . . . . . . . . . . . . . . . . . . . . . .
Mother’s age at time of birth:Under 20years . . . . . . . . . . . . . . . . . . . . . . . . . . .20-24 yeare . . . . . . . . . . . . . . . . . . . . . . . . . . . . .26-29 years . . . . . . . . . . . . . . . . . . . . . . . . . . . . .30-44 years . . . . . . . . . . . . . . . . . . . . . . . . . . . . .
Birth orde~FirstSeco;tillII:IIInII:nJI:II: :::::::::::::Third orhlgher . . . . . . . . . . . . . . . . . . . . . . . . . . . .
Mother’s martial status al time of birth:Nevermarried . . . . . . . . . . . . . . . . . . . . . . . . . . . .Evermarried . . . . . . . . . . . . . . . . . . . . . . . . . . . . .
Wontedness status at conception:Wantedthen . . . . . . . . . . . . . . . . . . . . . . . . . . . . .Mistimed . . . . . . . . . . . . . . . . . . . . . . . . . . . . . . .Unwanted. . . . . . . . . . . . . . . . . . . . . . . . . . . . . . .
Prenatal care:Earlyandcontinuous . . . . . . . . . . . . . . . . . . . . . . . .Lateordlscontlnuous . . . . . . . . . . . . . . . . . . . . . . .
Prenatal care provldecPrNatedcetor . . . . . . . . . . . . . . . . . . . . . . . . . . . .Hospltalorothercllnic . . . . . . . . . . . . . . . . . . . . . . .
Birth weight:5,Apoundsor[ess . . . . . . . . . . . . . . . . . . . . . . . . .Morethan 5!4pounds . . . . . . . . . . . . . . . . . . . . . . .
Whether infant came home from hospital with mothenDidnotcomehome . . . . . . . . . . . . . . . . . . . . . . . . .Camehome . . . . . . . . . . . . . . . . . . . . . . . . . . . . .
%1,636
1,3643,8904,2002,381
4,9024,1422,792
1,35010,46JJ
7,9122,980
944
7,6563,838
9,1912,319
58a11,138
7e810,808
43.8 67.5 7.0 7.8 5.8
37.139.649.145.4
32.080.278.181.5
20.29.6
*3.1*2O
23.78.0
●2.6*7.4
●3.98.6
*5.1*3.8
43.540.946.9
82.572588.9
8.4*5.6●6.7
8.8*6.5‘8.0
6.0*6.4●4.7
26.846.0
18.773.7
36.43.3
24.35.7
*3.66.2
43.245.045.6
75.153.847.2
4.412.4
●11.7
6.09.7
●16.6
5.0●7.1‘8.9
44.542.5
76.349.2
4.612.1
4.212.1
5.3*7. 1
46.631.6
78.028.4
3.321.7
5.317.9
●2.617.7
45.943.8
81.3Oa.o
●1O.86.9
*5.97.6
*9.55.7
40.643.8
62.588.5
*8.37.0
*14.67.4
*4.75.6
‘The.sumorthepercents exceeds100.0because sonwwamenreported morethanonescur~ ofpaymmt.‘Irc!udestirths forwtichnwttwfs msritalstatusat bklh,timingand contiruityofprenatal Csre,prer?atalcare provider, bhthweigtt, cfwkiherltmltiti camehomefrom Imspltdwilhtka rrw+twrwas udamwn or rnt applicable.
55

Table 29. Number of live births in January 1979 or later to black women 15-44 years of age and percent paid for from specified sources,by selected characteristics of the birth: United States, 1982
[Statistics are based on a sample of the household population of the contermlnous United States. See appendixes I and II for discussion of the sample design,sampling variability, and definition of terms]
Source of payment
Number of S%ft Privatebirths in faml~, or medical Other All
Characterk’tk thousands friends insurance Medicakl government other
Alllive birIhs. . . . . . . . . . . . . . . . . . . . . . . . . . . . . . .
Mother’s age at time of birth:Under 20years . . . . . . . . . . . . . . . . . . . . . . . . . . .2C-24years . . . . . . . . . . . . . . . . . . . . . . . . . . . . .26-29 yeara . . . . . . . . . . . . . . . . . . . . . . . . . . . . .30-14 years . . . . . . . . . . . . . . . . . . . . . . . . . . . . .
Birth ordar:First . . . . . . . . . . . . . . . . . . . . . . . . . . . . . . . . . .Second . . . . . . . . . . . . . . . . . . . . . . . . . . . . . . . .Ttrirdorh[gher . . . . . . . . . . . . . . . . . . . . . . . . . . . .
Mother’s marital status attimeofblrm:Navermarried . . . . . . . . . . . . . . . . . . . . . . . . . . . .Evarmarried . . . . . . . . . . . . . . . . . . . . . . . . . . . . .
Wontedness status at conception:Wantedthen . . . . . . . . . . . . . . . . . . . . . . . . . . . . .Mistimed . . . . . . . . . . . . . . . . . . . . . . . . . . . . . . .Unwanted . . . . . . . . . . . . . . . . . . . . . . . . . . . . . . .
Prenatal careEarlyandcontlnuous . . . . . . . . . . . . . . . . . . . . . . . .Lsteordlacontinuous . . . . . . . . . . . . . . . . . . . . . . .
Prenafsl care provkfer:Prlvatedoctor . . . . . . . . . . . . . . . . . . . . . . . . . . . .Hospifalorotherclinic . . . . . . . . . . . . . . . . . . . . . . .
Bltth weight:5!Apoundsorless . . . . . . . . . . . . . . . . . . . . . . . . .Morethan5!Apounds . . . . . . . . . . . . . . . . . . . . . . .
Whether infant came home from hospital with motherDidnotcomehome . . . . . . . . . . . . . . . . . . . . . . . . .Camehome . . . . . . . . . . . . . . . . . . . . . . . . . . . . .
22,095
528774505266
857603635
1,0491,042
93570945a
1,0401,002
9811,048
2031,876
2391,824
24.1 37.7 30.3 15.1 6.4
21.625.326.7
*2I .3
*13.133.953.664.8
47.030.519.7
*17.6
20.615.9*11.3
*9.7
*6.5*7.6*5.5*4.4
26.122.420.5
31.145.439.2
33.125.631.0
16.1*11.4
17.3
*6.9*7.8*4.2
17.630.6
16,059.3
46.913.7
23.3*6.9
*4.28.5
25.126.019.3
49.330.524.9
21.833.943.2
12.814.420.8
8,0*7,4*1,3
25.623.1
47.926.0
20.441.1
14.116,1
7.6*5.3
26.522.1
56.019.3
17.0421
12.6i 7.4
*3.89.1
*24.324.1
32.938.1
41.329.2
*1 0.215.7
*7.36.3
*24.424.1
26.739.3
45.128.2
*11.215.8
*5.96.5
%eeumofthepmerrts exceedslCO.Obeceuse sorrwwmrenreporled morethanonescurce ofpayrment.‘lnchdes b!rk for wtich mother’s marital status at birth, timing ard continuity of prenatal care, prenatal sere provider, birth weight, or whether the lnfent came hem frcin Imspltal with the motherwas unknown or not applicable.
56

Table 30. Number of live births in January 1979 or later to women 1S-44 years of age and percent paid for from specified sources, byselected characteristics of the mothe~ United States, 1982
[Statistics are based on a sample of the household population of the contemninous Unfled States. Sea appendixes I and II for discussion of the sample design,sampling varlablltty, and definition of terms]
Number of sax Privatebirths h? fami~, or madhxt Other All
Characteristic thousands fiierrds insurance Madkakt aovarnmerrt other
AlllNebiflhs . . . . . . . . . . . . . . . . . . . . . . . . . . . . . . . 214,372 40.7 83.1 10.4 9.1 5.9
Region:Northeast . . . . . . . . . . . . . . . . . . . . . . . . . . . . . . . 2,653 32.8 71.1 16.0 *4.7Midwest . . . . . . . . . . . . . . . . . . . . . . . . . . . . . . . .
%?.63,839 37.7 75.7 ‘6.8 7.3
Sough . . . . . . . . . . . . . . . . . . . . . . . . . . . . . . . . .*3.O
4,719 44.7 53.7 10.7 10.6West . . . . . . . . . . . . . . . . . . . . . . . . . . . . . . . . . .
6.93,161 45.2 55.1 9.9 12.7 *7.6
Education:Lessthan 12years . . . . . . . . . . . . . . . . . . . . . . . . . 3,516 33.4 35.3 25.0 17.0 *6.512years . . . . . . . . . . . . . . . . . . . . . . . . . . . . . . . . 5,869 42.2 64.0 7.8 9.213yearsormore . . . . . . . . . . . . . . . . . . . . . . . . . .
6.55,187 .44.0 80.8 *3. 6 *3.6 ●4.8
Mosl recent occupation:Professkmalormanagerial . . . . . . . . . . . . . . . . . . . . 53.9 63.9 ●0.9 *1.2Salesorclerlcal . . . . . . . . . . . . . . . . . . . . . . . . . . .
*6.2%% 39.8 71.9 5.5 6.2 6.1
Service . . . . . . . . . . . . . . . . . . . . . . . . . . . . . . . . 2,575 34.9 68.7 11.0 15.5Crafforfarmworkeroroperetiie . . . . . . . . . . . . . . . .
*5.61,851 39.7 621 ●10.9 *12.7
NeverWorked . . . . . . . . . . . . . . . . . . . . . . . . . . . .*3.2
2,142 37.5 26.7 31.9 14.0 ●7.6
Povertylevei income:149percentorless . . . . . . . . . . . . . . . . . . . . . . . . . 5,113 32.8 35.6 23.6 19.1150percentormore . . . . . . . . . . . . . . . . . . . . . . . .
8.59,260 45.1 78.3 3.2
300percentormore . . . . . . . . . . . . . . . . . . . . . . .4.4
4,863 43.9 83.0 *25 ?2 *4.2
Medicaid status:ReceivesMedicald . . . . . . . . . . . . . . . . . . . . . . . . . 2,059 14.2 14.0 47.3 30.4Doasnot receiveMedlcaid . . . . . . . . . . . . . . . . . . . .
●3.212,269 45.2 71.3 4.3 5.6 6.3
‘Timsumofths pmcents exceeds lm.obecause Somewomsnrepxted morelhanonesource dpsyrnwi‘Icchdes births fm which rrmlhefs last occupation or mdker’s MedirAd SISAJS was unknown.
.57

Table 31. Number of live births in January 1979 or later to white women 16-44 yeara of age and percent paid for from specified sources,by selected characteristicsof the mother: United States, 1982
[Sfallstics are based on a sample of the household population of the conterminous United States. See append~es I and II for discussion of the sample design,sampllng varlabiliry, and definition of terms]
Source of payment
Number of Sex Privatebirths In faml~, or medical Other All
Characteristic thousands Mends insurance Medicaid government other
Percentf
Allllve Mrths. . . . . . . . . . . . . . . . . . . . . . . . . . . . . . . 211,836 43.8 67.5 7.0 7.8 5.8
Region:Northeast . . . . . . . . . . . . . . . . . . . . . . . . . . . . . . . 2,183 35.7 77.0 13.2 *2.3 *2.3Midwest . . . . . . . . . . . . . . . . . . . . . . . . . . . . . . . . 3,449 39.0 79.5 *3.9 *6.4South . . . . . . . . . . . . . . . . . . . . . . . . . . . . . . . . .
*3. 13,458 50.1 58.7 *4.4 9.6
West . . . . . . . . . . . . . . . . . . . . . . . . . . . . . . . . . .9.9
2,746 48.4 55.9 9e.3 11.6 *7.O
Education:Lessthan 12yeare . . . . . . . . . . . . . . . . . . . . . . . . . 2,794 37.8 39.7 19.6 14.9 *7.612yeare . . . . . . . . . . . . . . . . . . . . . . . . . . . . . . . . 4,693 45.0 66,9 *4.2 8.213yearsormore . . . . . . . . . . . . . . . . . . . . . . . . . .
6.04,348 46.5 83,8 *1.9 *2.8 *4.5
Most recent occupation:Professional ormanagerial . . . . . . . . . . . . . . . . . . . . 1,998 56.4 85.3 *0.6Salesorclerlcal . . . . . . . . . . . . . . . . . . . . . . . . . . .
*6. 14,619 41.8 74.8 *3. 1 *5.8 *5.9
Service . . . . . . . . . . . . . . . . . . . . . . . . . . . . . . . . 2,118 36.3 61.1 *7.7 14.1 *5. 1Craft orfarmworkeroroperatlve . . . . . . . . . . . . . . . . 1,502 40.2 65.0 *8.6 *1 1.9 *3.7NeverWorked . . . . . . . . . . . . . . . . . . . . . . . . . . . . 1,542 44.6 32.4 25.8 *10.7 *8.8
Poverty level Income:149percentorless . . . . . . . . . . ) . . . . . . . . . . . . . . 3,774 36.7 39.7 18.3 18.4 9.5150percentormore . . . . . . . . . . . . . . . . . . . . . . . . 8,062 47.2 60.5 *1.7 *2.8 4.2
300percentormore . . . . . . . . . . . . . . . . . . . . . . . 4,095 45.2 64.3 ‘1.8 *2.4 *3.8
Medicaid status:RecelvesMedlcaid . . . . . . . . . . . . . . . . . . . . . . . . . 1,222 *16.1 +37.4 41.8 33,0DoesnotreceiveMedicaid . . . . . . . . . . . . . . . . . . . .
*3.910,599 47.0 73.2 3.0 4.9 6.1
lT~sufrrofthe percetis exceads [email protected] somewmnenreported rrsxethsnonescurce Ciwmefi.‘Inchdea births for which rrottwr% last occupation or mother’s Medicaid slatus was unknown.
58

Table 32. Number of live births in January 1979 or later to black women 15-44 years of age and percent paid for from specified sources,by selected characteristics of the mother: United States, 1982
[StatMics are based on a sample of me household population of the conterminous UnitedStates. See appendixes I and II for discussion of the sample design,sampling variability, and defmltlon of terms]
Source of payment
Number of Self Privatebirths m fami/y, or medtcal Ofher All
Characterislk thousands friends insurance Medicaid government other
Percenll
Allhve births. . . . . . . . . . . . . . . . . . . . . . . . . . . . . . . 22,095 24.1 37.7 30.3 15.1 6.4
Region:Northeast . . . . . . . . . . . . . . . . . . . . . . . . . . . . . . . 389 19.9 40.1 34.2 *11.4Midwest . . . . . . . . . . . . . . . . . . . . . . . . . . . . . . . .
*5.O320 *13.5 38.9 39.7 *15.O
south. . . . . . . . . . . . . . . . . . . . . . . . . . . . . . . . .*2.6
1,141 28.5 36.7 29.2 13.6West, . . . . . . . . . . . . . . . . . . . . . . . . . . . . . . . . .
*6.3244 *24.2 36.6 *16.7 27.9 *13.7
Education:Lessthan 12years . . . . . . . . . . . . . . . . . . . . . . . . .12years. . . . . . . . . . . . . . . . . . . . . . . . . . . . . . . .13yearsormore . . . . . . . . . . . . . . . . . . . . . . . . . .
652667576
15.629.525.7
16.040.357.9
46.625.117.4
24.113.6*7.3
*2.2*7.9*6.6
Most recent occupation:Professional ormanagerial . . . . . . . . . . . . . . . . . . . . 151 *22.5 63,8 *4.3 *1.5Salesorclencal . . . . . . . . . . . . . . . . . . . . . . . . . . .
*9.6662 27.7 48.9 21.2 *10.3
Service . . . . . . . . . . . . . . . . . . . . . . . . . . . . . . . .●8.9
433 20.0 35.3 27.5 20.6Crafforfarm workeroroperalive . . . . . . . . . . . . . . . .
*6.7274 33.1 47.3 26.7 *10.O
Neverworlred . . . . . . . . . . . . . . . . . . . . . . . . . . . .*1.O
532 19.2 *7.8 52.3 23.2 *2.6
Poverty level income:149percentorless . . . . . . . . . . . . . . . . . . . . . . . . . 1,165 21.2 22.4 40.5 19.8150percentormore . . . . . . . . . . . . . . . . . . . . . . . .
*6.2910 28.0 57.6 16.9 9.0
300percentormore. . . . . . . . . . . . . . . . . . . . . .*6.6
369 29.1 64.0 *12.2 *1.3 *10.I
Medicaid status:ReceMes Medlcald . . . . . . . . . . . . . . . . . . . . . . . . . 786DoesnotreceiveMedicaid . . . . . . . . . . . . . . . . . . . . 1,290
10.8 ●7.832.5 55.8
57.613.4
25.3 *1.98.9 9.2
lTksumofthe percenkexceeds lW.Obecausesome vmmenreport.% moreihanocesource @payment.‘Ir’chdes births ior which molfwr’s last occupation or mdher’s Medicaid status was unkrmwn.
59

0)
O Table 33. Number of women 1s-44 years of age who have ever had a live biti and Peroent distribution by source of payment of the hospital bill for the most recent birth, according toselected characteristics United States, 1973 and 1982
[Statlst!cs are bawd on a sample of the household population of the CCMteMIinfJUSUnited states. sea aPPandtxas I and II for dtxusskm of the sample deelgn, sampling variability, end deflnitbn of terms]
Source of payment
Uwn incomeOwn hrcome Insurance and Ottrer
WomenAll
on~ only Insurance Medica+d government other
Charactertstlc 19s2~ 1973 Totat 199.2 1973 198.2 1973 1962 1973 1962 1973 1982 1973 1982 1973
Numtw In thousands Percent distribution
Allwomen . . . . . . . . . . . . . 212,060 Z25,~3 100.0 10.0 22.2 37.5 27.9 25.1 32.2 10.1 7,1 9.1 6.0 6.3 4.6
Age at time of birth:Under 20years . . . . . . . . 1,473 2,788 IWO *9. 1 36.1 16.4 ●10.5 ●6. 1 *14.520-24 years . . . . . . . . . . 3,647 8,619
25.1 17.3 28.3 ●6.7100.0 11.8
14.9 *1 2.926.2 36.8 26.6 18.1 27.5 13.8
25-44 yeare . . . . . . . . . .7.9
6,7609.0 7.6
13,915 100.0 9.110.5 ●4.3
16.8 42.5 32.0 33.3 38.5 4.6 4.6 4.9 4.9 5.5 ‘3.2
Race:White . . . . . . . . . . . . . . 9,946 22,182 100.0 10.6 22.3 39.1 28.8 28.0Black . . . . . . . . . . . . . .
35.2 6.61,752
4.63,359 IrM.o 6.8 21.6 28.3
7.9 5.921.9
7.88.6
3.213.2 30.0 23.9 15.0 5.4 11.3 14.1
Educat!on:Lees.than 12yeam. . . . . . 2,669 8,319 ILX3.O 12.5 28.2 23.9 22.7 11.9 21.6 23.912yeare . . . . . . . . . . . . . 4,771
14.6 17.4 *4.312,161 100.0 11.1 19.6 36.1
10.431.7 24.6
6.734.8 8.1
13years ormore . . . . . . . 4,419 5,323 100.0 7.1 19.04.2 9.2 7.0 8.9 *2.7
45.7 27.2 34.2 42.7 *3.3 ●2. 1 ●3.6 ●6.3 6.2 *2.7
Poverty level income149 percent or lees. . . . . . 3,869 5,818 100.0 12.3 25.2 19.4 17.2 12.5 18.9 24.6150 percent or more. . . . . 8,110 19,9s5
21.7 19.8 ●6.7100.0 8.8 2?.4 46.4 31.0 31.3
11.4 10.336.0 3.0
3(XI percent or more. . . . 4,0e72.9
10,212 100.0 6.4 20,5 49.03.8 5.8 6.7
31.7 33.23.0
3e.7 *2.2 *0.9 ●2.5 5.0 6.7 ●2.2
Ftagton:Notlheast . . . . . . . . . . . . 2,201 5,406 100.0 *5,0 14.0 48.3 35.0 21.5 33.4 14.6Midwest . . . . . . . . . . . . . 3,228
10.7 ●5.46,757
*3.O100.0
*5.3*6.6 16.3
*3.647,2 4f.8 26.4 29.7
Saute . . . . . . . . . . . . . .7.0 *5.7
4,0e3 8,Li308.1 *3.2
100.0*4.5
13.1*3.3
26.8 28.4 19.3 24.6 33.2 10.5West . . . . . . . . . . . . . . .
*5.22,562 5,138 100.0 13.3 31.2 28.9
10.116.2
6.4 12.227.4
7.032.3 9.4 *8.4 11.8 *8.7 9.2 *3,2
lWOmn ~~ mostrecentrm birthoccurredon or aftcxJarwary 1, 1979.‘Inchdes white,black,end othsrrasesandwomenforwiwm age at Eat birthwasunkrmvn.

Appendixes
I.
II.
HI.
Technical notes . . . . . . . . . . . . . . . . . . . . . . . . . . . . . . . . . . . . . . . . . . . . . . . . . . . . . . . . . . . . . . . . . . . . . . . . . . . . . . . . . . .Background. . . . . . . . . . . . . . . . . . . . . . . . . . . . . . . . . . . . . . . . . . . . . . . . . . . . . . . . . . . . . . . . . . . . . . . . . . . . . . . . . . . .Statistical design. . . . . . . . . . . . . . . . . . . . . . . . . . . . . . . . . . . . . . . . . . . . . . . . . . . . . . . . . . . . . . . . . . . . . . . . . . . . . . . .Measurement pro$ess . . . . . . . . . . . . . . . . . . . . . . . . . . . . . . . . . . . . . . . . . . . . . . . . . . . . . . . . . . . . . . . . . . . . . . . . . . .Data reduction . . . . . . . . . . . . . . . . . . . . . . . . . . . . . . . . . . . . . . . . . . . . . . . . . . . . . . . . . . . . . . . . . . . . . . . . . . . . . . . . .Reliability ofestimates . . . . . . . . . . . . . . . . . . . . . . . . . . . . . . . . . . . . . . . . . . . #. . . . . . . . . . . . . . . . . . . . . . . . . . . . . .Estimation ofstandard errors... . . . . . . . . . . . . . . . . . . . . . . . . . . . . . . . . . . . . . . . . . . . . . . . . . . . . . . . . . . . . . . . . . .Testing differences . . . . . . . . . . . . . . . . . . . . . . . . . . . . . . . . . . . . . . . . . . . . . . . , . . . . . . . . . . . . . . . . . . . . . . . . . . . . . .Nonsampling error . . . . . . . . . . . . . . . . . . . . . . . . . . . . . . . . . . . . . . . . . . . . . . . . . . . . . . . . . . . . . . . . . . . . . . . . . . . . . .Interview nonresponse . . . . . . . . . . . . . . . . . . . . . . . . . . . . . . . . . . . . . . . . . . . . . . . . . . . . . . . . . . . . . . . . . . . . . . . . . . .Item nonresponse. . . . . . . . . . . . . . . . . . . . . . . . . . . . . . . . . . . . . . . . . . . . . . . . . . . . . . . . . . . . . . . . . . . . . . . . . . . . . . .
Definitions ofterms . . . . . . . . . . . . . . . . . . . . . . . . . . . . . . . . . . . . . . . . . . . . . . . . . . . . . . . . . . . . . . . . . . . . . . . . . . . . . . .Dependent variables . . . . . . . . . . . . . . . . . . . . . . . . . . . . . . . . . . . . . . . . . . . . . . . . . . . . . . . . . . . . . . . . . . . . . . . . . . . .Characteristics ofpregnancies.. . . . . . . . . . . . . . . . . . . . . . . . . . . . . . . . . . . . . . . . . . . . . . . . . . . . . . . . . . . . . . . . . . .Demographic terms . . . . . , . . . . . . . . . . . . . . . . . . . . . . . . . . . . . . . . . . . . . . . . . . . . . . . . . . . . . . . . . . . . . . . . . . . . . . .
Items onthe 1982 National Surveyof Family Growth questionnaire related to health aspects ofpregnancy andchildbirth . . . . . . . . . . . . . . . . . . . . . . . . . . . . . . . . . . . . . . . . . . . . . . . . . . . . . . . . . . . . . . . . . . . . . . . . . . . . . . . . . . . . . . . .
List of appendix tables
I. Estimates ofparameters A and Bforrelative standmd error cuwes, byage, m~itals tatus,andr ace . . . . . . . . . .II. Approximate relative standmd errors mdstmdard errors forestimated number ofpre@ancies ofwomen of all
races 1982 National Survey of Family Growth . . . . . . . . . . . . . . . . . . . . . . . . . . . . . . . . . . . . . . . . . . . . . . . . . . . . . . . .III. Approximate standard errors for estimated percents expressed in percentage pints, for pregnancies to women of
all races: 1982 National Survey of Family Growth . . . . . . . . . . . . . . . . . . . . . . . . . . . . . . . . . . . . . . . . . . . . . . . . . . . . .
6262626363636364656566
67676869
71
64
64
65
61

Appendix ITechnical notes
Background Statistical design
This report is one of a series based on the NationalSurvey of Family Growth (NSFG), conducted by the Na-tional Center for Health Statistics (NCHS). The NSFG wasdesigned to provide data on fertility, family planning, andaspects of maternal and child health that are closely relatedto childbearing.
The NSFG is a periodic survey based on personalinterviews with a nationwide sample of women. The NSFGhas been conducted three times–in 1973, 1976, and 1982.The present report is based on Qcle III of the NSFG. Adetailed report on Cycle III is contained in “NationalSurvey of Family Growth, Cycle III: Sample Design,Weighting, and Variance Estimation,” Series 2, No. 98,Vital and Health Statistics (NCHS, 1985a). A detaileddescription of the methods and procedures used in Cycle Ican be found in “National Survey of Family Growth, CycleI: Sample Design, Estimation Procedures, and VarianceEstimation,” Series 2, No. 76, of VW and Health Statistics(NCHS, 1978b), and for Cycle II, in “National Survey ofFaniily Growth, Cycle II: Sample Design, Estimation Pro-cedures, and Variance Estimation,” Series 2, No. 87, ofVital and Health Statistics (NCHS, 1981b). This appendixpresents a summary of the more important technical as-pects of the 1982 NSFG.
Fieldwork for Cycle III was carried out under a con-tract with NCHS by Westat, Inc., between August of 1982and February of 1983. For the first time, the samplerepresented all women 15-44 years of age, regardless ofmarital status, in the civilian noninstitutionalized popula-tion of the conterminous United States. Women living ingroup quarters, such as college dormitories, were includedin Cycle III. Interviews were conducted with 7,969 women;3,201 were black, 4,577 were white, and 191 were of otherraces.
Interviews were conducted by trained female interview-ers in respondents’ homes and lasted an average of 1 hour.The interview focused on pregnancy history, use of contra-ceptives in each pregnanq interval, physical ability to bearchildren, expectations of bearing children in the future, useof family planning and infertility services, marital history,labor force participation, and a wide range of social, eco-nomic, and demographic characteristics.
NOTE A list of references follows the text.
The NSFG is based on a multistage area probabilitysample. Black households and households with residentteenage women were sampled at higher rates than wereother households so that reliable estimates of statisticscould be presented separately for black and teenagewomen. In addition, the sample was designed to providetabulations for each of the four major geographic regions ofthe United States.
The first stage of the sample design consisted of draw-ing a sample of primary sampling units (PSU’S). A PSUconsisted of a county, a small group of contiguous counties,or a standard metropolitan statistical area, as defined by theU.S. Bureau of the Census in 1970. The second and thirdstages of sampling were used to select several segments(clusters of 15 to about 60 dwelling units) within each PSU.A systematic sample of dwelling units was then selectedfrom each segment. Each sample dwelling unit was visitedby an interviewer, who listed all household members. Theinterviewer then consulted a computer-generated samplingtable to determine which woman, if any, should be inter-viewed.
The statistics in this report are estimates for the na-tional population and were computed by multiplying eachsample case by the number of women she represented inthe population. The multipliers, or final weights, rangedfrom less than 500 to more than 50,000 and average~dabout7,000. They were derived by using three basic steps:
. Infldion by the reciprocalOf the probability of selec-tion-The probability of selection is the product of theprobabilities of selection of the PSU, segment, house-hold, and sample person within the household.
● Nonresponseadjustment-The weighted estimates wereratio adjusted for nonresponse by a multiplication oftwo factors. The first factor adjusted for nonresponseto the screening questionnaire by imputing the (charac-teristics of women in responding households to womenin nonresponding households in the same PSU andstratum. The second factor adjusted for nonresponse tothe interview by imputing the characteristics of re-sponding women to nonresponding women in the sameage, race, and marital status category and PSU. Re-sponse to the screener was 95.1 percent and responseto the interview was 83.5 percent, yielding a combinedresponse rate of 79.4 percent.
62

● Postsiratijication by man”tid status, age, and race—Theestimates were ratio adjusted within each of 24 age,race, and marital status categories to independent esti-mates of the population of women aged 1544. Theindependent estimates were derived from the CurrentPopulation Surveys of the U.S. Bureau of the Census.
The effect of the ratio estimating process was to makethe sample more closely representative of the noninstitution-alized population of women 1544 years of age in the eon-terminous United States. The final poststratification re-duced the sample variances of the estimates for moststatistics.
All figures were individually rounded; aggregate fig-ures (numbers) were rounded to the nearest thousand.Aggregate numbers and percents may not add to the totalbecause of this rounding.
Measurement process
Field operations for Cycle III were carried out byWestat, Inc., under contract with NCHS; these operationsincluded pretesting the interview schedule, selecting thesample, interviewing respondents, and performing specifiedquality control cheeks. Interviewers, all of whom werefemale, were trained for 1 week prior to field work. Thefirst five interview schedules done by each interviewer werereviewed; after a high level of quality was achieved by aninterviewer, this review was reduced to a sample of ques-tionnaires, unless an unacceptable level of error was found.A 10-percent sample of respondents were recontacted bytelephone to verify that the interview had taken place andthat certain key items had been accurately recorded.
A portion of the interview schedule applicable to thisreport is reproduced in appendix 111. Two forms of thequestionnaire were used, one for women 15-24 years of ageand one for women 2544 years of age. The questionnairefor women aged 15–24 included a few additional items thatreferred to early experiences that women over 25 could notbe expected to remember accurately.
Data reduction
The responses of each woman to the interview ques-tions were translated into predetermined numerical codes,and these code numbers were recorded on computer tapes.The first few questionnaires eodcd by each coder werechecked completely, after an acceptable level of quality wasreached, verification of coding was performed on a system-atic sample of each coder’s questionnaires. The data wereedited by computer to identify inconsistencies betweenresponses as well as code numbers not allowed in thecoding scheme; these errors were corrected.
Missing data on all variables used in this report wereimputed to provide consistent national estimates. (To speedrelease of the public use computer tape, however, not allvariables on the computer tape were imputed.) If the levelof missing data is relatively high (more than 5 percent), this
fact is noted in appendix II. Only two items are so affected:poverty level income and age (or date) at first intercourse.
Reliability of estimates
Beeause the statistics presented in this report are basedon a sample, they may differ somewhat from the figuresthat would have been obtained had a complete census beentaken using the same questionnaires, instructions, inter-viewing personnel, and field procedures. This chance differ-ence between sample results and a complete count isreferred to as sampling error.
Sampling error is measured by a statistic called thestandard error of estimate. The chances are about 68 in 100that an estimate from the sample will differ from a com-plete count by less than the standard error. The chances areabout 95 in 100 that the difference between the sampleestimate and a complete count will be less than twice thestandard error. The relative standard error of an estimate isobtained by dividing the standard error of the estimate bythe estimate itself and is expressed as a percent of theestimate. Numbers and percents that have a relative stan-dard error of more than 30 percent are considered unreli-able. These figures are marked with an asterisk to cautionthe user, but they may be combined to make other types ofcomparisons of greater reliability.
Estimation of standard errors
Because of the complex multistage design of the NSFGsample, conventional formulas for calculating sampling er-rors are inapplicable. Standard errors were, therefore, esti-mated empirically by using a technique known as balancedhalf-sample replication. This technique produces highlyreliable, unbiased estimates of sampling errors. Its applica-tion to the NSFG has been described elsewhere (NCHS,1978b, 1981b, 1985a).
Because it would be prohibitively expensive to estimateand cumbersome to publish a standard error for eachpercent or other statistic by this technique, standard errorswere computed for selected statistics and population sub-groups that were chosen to represent a wide variety ofdemographic characteristics and a wide variation in the sizeof the estimates themselves. Curves were then fitted to therelative standard error estimates (ratio of the standarderror to the estimate itself) for numbers of women accord-ing to the model
RSE (N’)=(A +B/N’)%
where N’ is the number of women and A and B are theparameters whose estimates determine the shape of thecurve. Separate curves were fitted for women of all racescombined and white women, and for black women,because a different sampling rate was used for blackwomen.
NOTE A list of references fdo~s the text.
63

Table L Estimates of parameter A and B for relative standarderror curves, by age, marital status, and race
Age, mariai status, WIY race Parameter A Parameter B
Pregnancies of women 1544 yearsof age bv marital status and race
All pre~nancles:lAllraces andwhte . . . . . . . . . . .Black . . . . . . . . . . . . . . . .
Pregnancies of ever married Women:iAllraces and white . . . . . . . . . . .Black . . . . . . . . . . . . . . . . . . .
Pregnancies of never married womenandofleenagers 15-19 years ofageiAll races
Nevermarried . . . . . . . . . . . . .Teenagers . . . . . . . . . . . . . . . .
White:Nevermarrled . . . . . . . . . . . . . .Teenagers . . . . . . . . . . . . . . . .
Black:Never married and teenagers . . .
-0.0000013532830.0001091980
0.003120391-0.0001123101
0.013887280.005951224
0.070965950.01024644
25567.4423707143,225243
43592.72540015676.710304
6660.9619877802.208396
13265.3231139664.917046
0.004546507 3430.760245
1 Parameters for pregnancies we also used when computing standard errors for numbers andpercents of births ard living children.
Separate curves were fitted for teenagers, for the samereason. The estimates of A and B are shown in table I.
To calculate the estimated standard error or relativestandard error of an aggregate or percent, the appropriateestimates of A and B are used in the equations:
RSE. ,= (A +B/N’)”
SEN,= (A +B/iV’)w (N’)
RSEP, = (B/P’”(100– P’)/X’)”
SEP,= (BP@O- P’)/X’)x
Table IL Approximate relative standard errors and standarderrors for estimated number of pregnancies of women of allraces: 1982 National Survey of Family Growth
Relative standardSize of est/mate standard error error
100,000 . . . . . . . . . . . . . . . . . . .500,000 . . . . . . . . . . . . . . . . . . .1,000,000 . . . . . . . . . . . . . . . . . .5,000,000 . . . . . . . . . . . . . . . . . .10,000,000 . . . . . . . . . . . . . . . . .15,000,000 . . . . . . . . . . . .. . . . .30,000,000 . . . . . . . . . . . . . . . . .50,000,000 . . . . . . . . . . . . . . . . .
50.622.616.0
7.15.14.12.92.3
50,600113,000180,000360,0CKI510,000619,000875,000
1,129,000
where
N’= number of pregnancies,P’= percent,X’= number of pregnancies in the denominator
of the percent,SE= standard error, and
RSE= relative standard error.
Tables II and 111show some illustrative standard errorsof aggregates and percents of pregnancies of women of allraces from Cycle 111of the NSFG.
Testing differences
The standard error of a difference between two com-parative statistics, such as the proportion of babies born towhite mothers that were low birth weight compared withthat of babies born to black mothers, is approximately thesquare root of the sum of the squares of the standard errorsof the statistics considered separately, or calculated by thisformula: If
d=P’l –P’2
then
Sd= (P’ J2(RSEPJ2+ (P’2)2(RSEPJ2
where P’l is the estimated percent for one group and P’2is the estimated percent for the other group, and RSEP,Iand RSEP,2 are the relative standard errors of P’, and P’2.This formula will represent the actual standard errorquite accurately for the difference befsveen separate anduncorrelated characteristics, although it is only a roughapproximation in most other cases.
A difference among comparable proportions or otherstatistics from two or more subgroups is considered to bestatistically significant when a difference of that size orlarger would be expected by chance in fewer than 5 percentof repeated samples of the same size and type, if no truedifference existed in the populations sampled. Such a dif-ference would be statistically significant at the 0.05 level. Bythis criterion, if the observed difference or a larger onecould be expected by chance in more than 5 percent of
Table Ill. Approximate standard errors for estimated percents expressed in percentage points, for pregnancies to women of all races:1982 National Survey of Family Growth
Estimated percent
2 or 5 or 10 or .20 or 30 or 40 orBase of percent 98 95 90 80 70 80 50
100,000 . . . . . . . . . . . . . . . . . . . . . . . 7.1 11.0 15.2 20.2 23.2 24.8 25.3500,000 . . . . . . . . . . . . . . . . . . . . . . . 3.2 4.9 6.8 9.0 10.4 11.1 11.31,000,000 . . . . . . . . . . . . . . . . . . . . . 2.2 3.5 4.6 6.4 7.3 7.8 6.05,000,000 . . . . . . . . . . . . . . . . . . . . . 1.0 1.6 2.1 2.9 3,3 3.5 3.610,000,000 . . . . . . . . . . . . . . . . . . . . . . 0.7 1.1 1.5 2.0 2.3 2.5 2.520,000,000 . . . . . . . . . . . . . . . . . . . . . . 0.5 0.8 1.1 1.4 1.6 1.8 1.830,000,000 . . . . . . . . . . . . . . . . . . . . . 0.4 0.6 0.9 1.2 1.3 1.4 1.550,000,000 . . . . . . . . . . . . . . . . . . . . . . 0.3 0.5 0.7 0.9 1.0 1.1 1.1
&le of use of table Ill: If 30 percent of pregnancies In a specific catagoy received their firet prenatal care In the third or fourth month of pregnancy and the base of that percent was 10,OOO,OCO,thtin the 30-percent column ard the 10,000,000 row indicate that one standard error is 2.3 percentage points end two standard errors are twice that, cr 4.8 percentage points Therefore, the chanceis 95 [n 100 th~ the tme peme”t i“ the pop”latio” Wm ktween 25.4 and S4.e (30.0 percent plus or minus 4.S percent). This is celled a 95-p8rcent confidence interval. h addition, the retstk
standard error of that 30-percent estimate IS 2.3 perceni dhdded by 30 @rcent, or 7.7 percent.
64

repeated samples, then one cannot be sufficiently confidentto conclude that a real difference exists betsveen the popu-lations. When an observed difference is large enough to bestatistically significant, the true difference in the populationis estimated to lie between the observed difference plus orminus two standard errors of that difference in 95 of 100samples.
Although the 5-percent criterion is conventionally ap-plied, it is in a sense arbitrary; depending on the purpose ofthe particular comparison, a different level of significancemay be more useful. For greater confidence, one would testfor significance at the 0.01 (l-percent) level, but if one canaccept a 10-percent chance of concluding a difference existswhen there actually is none in the population, a test ofsignificance at the 10-percent level would be appropriate.
The term “similar” means that any observed differencebetween hvo estimates being compared is not statisticallysignificant, but terms such as “greater,” “less,” “larger,”and “smaller” indicate that the observed differences arestatistically significant at the 0.05 level using a txvo-tailedt-test with 39 degrees of freedom. Statements about differ-ences that are qualified in some way (as by the phrases “thedata suggest” and “some evidence”) indicate that the dif-ference is significant at the 0.10 level but not at the 0.05level.
When a substantial observed difference is found not tobe statistically significant, one should not conclude that nodifference exists but simply that such a difference cannot beestablished with 95-percent confidence from this sample.This is especially important in Cycle III, because the num-ber of ever married women in the sample is 4,651, com-pared with 7,970 in Cycle II—a reduction of 42 percent.This means that the standard errors in Cycle III are largerthan those in Cycle H, so it is harder to establish significantdifferences in Cycle III than in Cycle II. Lack of commentin the text about any two statistics does not mean that thedifference was tested and found not to be significant.
The number of replicates in the balanced half-samplereplication design minus one (39 in Cycle 111) can reason-ably be used as an estimate of the number of degrees offreedom, although the exact value of the degrees of free-dom is unknown. Therefore, in this report, differencesbetsveen sample statistics are compared using a two-tailedt-test with 39 degrees of freedom.
For example, in the years up to and including 1982,12,2 percent of the 10,907,000 births to black women and5.6 percent of the 56,602,000 births to white women werelow birth weight. To test this racial difference at the 0.05level of significance, compute
12.2–5.6t=
V(12.2)2RSE2[1U) +(5.6)2RSE’(5,,
Relative standard errors are computed using theappropriate values for B from table 1:
‘SE(l’2AA!ZZE=0.0686
and
RSEc~dl=
W
(25567.442370)(100-5.6)
(5.6)(56,602,000)
=0.0873thus
12.2–5.6t=
=6.81
The two-tailed 0.95 critical value (1-a) for a t statistic with39 degrees of freedom is 2.02. Therefore, the difference issignificant at the 5-percent level.
Nonsampling error
Although sampling error affects the reliability of surveyestimates, nonsampling error may introduce bias. The re-sults of any survey are subject to at least four types ofnonsampling error, including interview nonresponse; non-response to individual questions or items within the inter-view; inconsistency of responses to questions; and errors ofrecording, coding, and keying by survey personnel.
To minimize nonsampling error, stringent quality con-trol procedures were introduced at every stage of thesurvey, including a check on completeness of the householdlisting extensive training and practice of interviewers; fieldediting of questionnaires; short verification interviews witha subsample of respondents; verification of coding andediting, independent recode of a sample of questionnairesby NCHS; keypunch verification; and an extensive com-puter “cleaning” to check for inconsistent responses, miss-ing data, and invalid codes. A detailed description of someof these procedures follows; others were discussed above.
Interview nonresponse
Interview nonresponse means that no part of an inter-view was obtained. It resulted from failure at any of threeprincipal steps: (1) failure to list all households in samplesegments, (2) failure to screen all listed households, and (3)failure to interview an eligible woman in each screenedhousehold. A discussion of these steps follows.
The completeness of a list cannot be tested directly,because this requires an independent, accurate enumera-tion of the households that should have been listed. In theNSFG, the completeness and accuracy of lists were testedby the missed dwelling unit (DU) procedure at the time of
65

screening: Where the first structure in a segment wasincluded in the sample, the whole segment was checked tosee whether any structures had been missed in the listingprocess; where the first structure was a multiple-DU struc-ture and the first-listed unit in the building was included inthe sample, the entire structure was checked for missedDU’S.
Of the original sample of 34,641 DU’S screened, 3,614were found to be vacant or not to be DU’S. Of the 31,027occupied DU’S, 4.9 percent were not screened successfully.Screening was completed in 29,511 households; 9,964 ofthese contained eligible respondents who were selected forinterview. Interviews were not completed in 16.5 percent ofthese cases, because of refusals by respondents (8.3 per-cent) and by the parents of respondents under 18 years ofage (1.5 percent), no contact after repeated calls (2.8percent), or other problems (4.0 percent).
The adjustment for interview nonresponse describedabove imputes to nonresponding women the characteristicsof responding women of the same age group, race, maritalstatus, and geographic area.
Item nonresponse
answer to a question, when the question was erroneously-not asked or the answer was not recorded by the inter-viewer, or when the answer could not be coded. The rate ofnonresponse to individual questions was very low in Cycle111, as it was in Cycle II. Some examples of item nonre-sponse from among a total of 7,969 respondents are asfollows: religion of respondent, 11 cases and respondent’soccupation, 37 cases. The item with the most nonresponsewas family income (from which poverty-level income wasderived), with 1,767 cases. All missing data were imputed inthis report. For those few items for which the proportion ofcases imputed was high, this fact is noted in the appropriatesection of the definitions.
As with all survey data, responses to the NSFG weresubject to deliberate misreporting by the respondent. Suchmisreporting cannot be detected directly, but it can bedetected indirectly by the extensive computer “cleaning”and editing procedures used in the NSFG.
Item nonresponse may have occurred when a respon-dent refused to answer a question or did not know the
66

Appendix IIDefinitions of terms
Dependent variablesMonths pregnant when prenatal care begam—For preg-
nancies ending in January 1979 or later, women in the 1982survey were asked, “During this pregnancy, did you evervisit a doctor or clinic for prenatal care?” Women whoanswered “yes” were then asked, “How many monthspregnant were you when you first visited a doctor or clinicfor prenatal care?” Women who answered that they wereless than a month, 1 month, or 2 months pregnant wereclassified as beginning prenatal care in the first trimester,or at “less than 3 months.” Those who said they were 3 or 4months pregnant were classified as “3 or 4 months preg-nant” in the tables. Women who said they had been preg-nant at least 5 months when they began prenatal care andthose who received no prenatal care at all are combined, inthe category”5 months or more or no care,” in tables 1–6.
Research on the proportion of births receiving firsttrimester prenatal care has used 3 national data sourcesbirth certificates (Forrest and Sin@, 1987; Ingram, Makuc,and Kleinman, 1986; NCHS, 1978a), the 1980 NationalNatality Survey (NNS) (Prager et al., 1984), and the Na-tional Survey of Family Growth (NSFG) (Forrest andSingh, 1987). Because the questions are worded and admin-istered differently in these 3 sources, the proportions re-porting first-trimester care differ (Forrest and .Singh, 1987).However, in one recent study the largest differences areseen in the first 1 or 2 months of pregnancy, which su~eststhat (1) the timing of the beginning of pregnancy differsamong sources of data; (2) some women may be countingpregnancy tests as first prenatal visits; and (3) mothersreport, but physicians may sometimes be unaware of, earlyvisits to other providers of prenatal care (Forrest and Singh,1987). One additional difference is that some data sourcesuse “current month” of pregnancy, while others use “com-pleted month.” For example, a woman who was 7 weekspregnant at her first visit may report that she is currently inher second month of pregnancy, or that she had completedone month of pregnancy at her first visit. Such a womanwould be classified in this report as getting care after 1completed month of pregnancy. In Cycle IV of the NSFG,additional questions on the timing of the first visit will beasked to address these issues, which should help to deter-mine which source is providing the most accurate estimateof the extent of first-trimester care.
NOTE A list of references follows the text.
First source of prenatal care-Women who reportedthat they visited a doctor or clinic for prenatal care (forpregnancies ending in January 1979 or later) were asked,“To which of the places on the card did you go for your firstvisit?” They were then shown a card listing the followingtypes of medical facilities
A.B.c.D.E.F.G.H.J.
K
Community health center clinic. . . . . . .Public health department clinic. . . . . . .Family planning clinic. . . . . . . . . . . . . . .Abortion clinic . . . . . . . . . . . . . . . . . . . . .Student health service clinic. . . . . . . . . .Military health service clinic . . . . . . . . .Hospital clinic . . . . . . . . . . . . . . . . . . . . .Private doctor . . . . . . . . . . . . . . . . . . . . .Private group practice, co-op, or privateclinic . . . . . . . . . . . . . . . . . . . . . . . . . . . . .Other (specify) . . . . . . . . . . . . . . . . . . . . .
0102030405060708
0910
In this report, women who answered H or J wereclassified as receiving care from a “private doctor or clinic”;women who answered G, as using a “hospital clinic”; andthose who answered A–F or K, as using “other clinic.” Inprevious NSFG reports on use of family planning services(NCHS, 1986b; Mosher and Horn, 1986), the categories“other clinic” and “hospital clinic” were combined into anoverall “clinic” category. With respect to prenatal care,sample sizes are not large enough to allow separate analy-ses of use of the seven different types of clinics.
Smoking during pregnancy– Women in the NSFG whohad ever been pregnant were asked, “On the averageduring your (last) pregnancy, how many cigarettes per daydid you smoke, if any?”
The responses were coded in the following categories
About one a day or less . . . . . . . . . . . . . . . . . 01Just afew(2+) . . . . . . . . . . . . . . . . . . . . . . . . . 02About halfapack (5-14) . . . . . . . . . . . . . . . . . 03About apack (15-24) . . . . . . . . . . . . . . . . . . . 04About lYzpacks (25-34) . . . . . . . . . . . . . . . . . 05About 2packs (35-44) . . . . . . . . . . . . . . . . . . . 06More than 2packs (45+) . . . . . . . . . . . . . . . . 07Didn’t smoke during (last) pregnancy . . . . . . 96
In this report, women in categories 01,02, and 03 wereclassified as having smoked fewer than 15 cigarettes perday. Those in categories 04,05,06, and 07 were classified ashaving smoked 15 or more per day. Women in category 96were labeled as “did not smoke at all.”
67

Women who were currently pregnant were excludedfrom the statistics on smoking and drinking during the mostrecent pregnancy. In contrast, in a previous report (NCHS,1987a), currently pregnant women were included in thetables showing smoking and drinking during pregnancy, butexcluded from the statistics by age at pregnancy outcome(NCHS, 1987a). In this report, they were excluded entirelyso that the totals would be more consistent throughout thetables and so that the data would refer only to completedpregnancies.
Alcohol consumption dunngpregnancy-Women in theNSFG who had ever been pregnant were also asked,“During your (last) pregnancy, how often (did) you usuallydrink alcoholic beverages, that is, beer, wine, or liquor?Was it
Every day . . . . . . . . . . . . . . . . . . . . . . . . . . . . . . 1Afewdays a week . . . . . . . . . . . . . . . . . . . . . . 2Once a week . . . . . . . . . . . . . . . . . . . . . . . . . . . 3Once a month . . . . . . . . . . . . . . . . . . . . . . . . . . 4Less than once a month . . . . . . . . . . . . . . . . . . 5Or never?” . . . . . . . . . . . . . . . . . . . . . . . . . . . . . 6
In this report, women in category 6 “did not drink atall”; women in categories 4 and 5 drank “less than once aweek”; and those in categories 1, 2, and 3 drank “once aweek or more.”
Low birth weight—A “low-birth-weight” baby is onewho weighs 5 pounds 8 ounces or less at birth. Statistics onbirth weight in this report are shown only for single livebirths, because multiple births often have lower birthweights. For all births in the NSFG, women were asked,“How much did (child’s name) weigh at birth?” Womenwho could not remember were then asked, “Did (child’sname) weigh more than 5]%pounds, or less?”
As noted in the text, births in this report occurredduring a period of several years up to and including 1982and are based on a sample, but births in the vital statisticssystem occurred during a specified calendar year and arebased on birth certificates. (In most states, statistics onbirth weight were based on all birth certificates; in selectedstates, data on birth weight were based on a 50 percentsample of birth certificates.)
Source of pqvnent for delivey–Women who had hadone or more live births were asked the following questionfor each live birth in January 1979 or later: “This card listssome of the ways in which medical bills can be paid. When(child) was born, in which of these ways was the bill paid?”
The woman was then handed a card containing thefollowing categories
A. Your (or your husband’s) own income. 01B. Partner, boyfriend, or his family . . . . . . 02C. Insurance (which you carry or is carried
for you) . . . . . . . . . . . . . . . . . . . . . . . . . . . 03D. No charge—paid by Medicaid . . . . . . . . 04
NOTE A lk.t of references follows the text.
68
E. Government assistance other thanMedicaid (State or local) . . . . . . . . . . . . 05
F. Military . . . . . . . . . . . . . . . . . . . . . . . . . . . 06G. Parents or other relatives. . . . . . . . . . . . 07H. Some other Way (ripeci&). . . . . . . . . . . . 08
Up to three answers were coded for each birth, so thepercents in these tables add to more than 100. Responses tocategories A, B, and G were combined to form the category“self, family, or friends”; category C is labeled “privatemedical insurance” in the tables; catego~ D is labeled“Medicaid”; and category E is labeled “other government.”Responses in categories F and H were combined to formthe “all other” category in the tables.
Characteristics of pregnancies
Prenatal care—In this report, prenatal care was classi-fied as “early and continuous” if it began in the firsttrimester and if the woman made at least one prenatal visitper month. Prenatal care was classified as “late or discon-tinuous” if care did not begin in the first trimester or if thevisits were made less often than once a month. It should bestressed that this variable reflects only the timing andfrequency of prenatal visits; it does not measure the lengthof the visits, what the doctor and patient talked about, thequalifications and experience of the doctor or other pro-vider, or the woman’s level of satisfaction with the care.
Age at birth or pregnancy outcome —13ach woman wasasked the month, day, and year each pregnancy ended. Herdate of birth was subtracted from the date the pregnancyended to compute her age in completed years when thechild was born or the pregnancy otherwise ended.
Birth order or pregnancy order–Births are classified bybirth order. Where the birth order is “first;’ the birth wasthe woman’s first birth; where it is “second;’ the birth wasthe woman’s second birth. Similarly, where the pregnancyorder is “first,” it was the woman’s first pregnancy where itis “second,” it was the woman’s second pregnancy, and soon.
Mm”taI status at birth and atpregnancy outcome—Theseare classified as “never married” or “ever married.” If thedate of the baby’s birth was before the date of the woman’sfirst formal marriage, the woman was classified as “nevermarried at birth”; if the date of the baby’s birth was afterthe date of her first formal marriage, she was classified as“ever married at birth.” The same procedure was used forother pregnancy outcomes.
Wontedness status at conception –Pregnancies wereclassifed as “wanted thenj’ “mistimed,” “unwanted;’ or“undetermined’ according to the mother’s report of herattitude toward the pregnancy at the time she becamepregnant. There were very few “undetermined” pregnan-cies, so they are included in the totals but not shownseparately in this report. The wontedness of each pregnancywas determined from a series of questions that askedwhether the woman had wanted to become pregnant at thetime of conception. It is important to emphasize that an

“unwanted pregnancy” does not necessarily mean “un-wanted child”; many children who were not wanted atconception nonetheless become cherished members oftheir families.
Wanted then –A pregnancy was classified as “wantedthen” if the woman had stopped usin~ or was not using,contraception at about the time she became pregnant,because she wanted to become pregnant, or if she said thatshe became pregnant later than she had wanted to or at theright time.
Mistimed-Women whose pregnancies were classifiedas wanted were asked, “Did you become pregnant soonerthan you wanted, later than you wanted, or at about theright time?” If the mother said that the pregnancy occurredsooner than she wanted, the pregnancy was classified as“mistimed.”
Unwanted–A pregnancy was classified as unwanted ifthe woman, at the time the pregnancy occurred, did notwant to have a(nother) baby, ever.
For further details on how pregnancies are classified bywontedness status, see ‘Wanted and Unwanted Childbear-ing: United States, 1973–82; Advance Data No. 108, May9, 1985 (NCHS, 1985c).
Demographic terms
Characteristics of women
Race—Race refers to the race of the woman inter-viewed and is reported as black, white, or other. In CycleIII, race was classified according to the woman’s choice ofwhich race best described her. In Cycles I and II, race wasclassified by the observation of the interviewer. Compari-sons of the results of Cycle III using both definitionsindicate that results of both methods of classification arevery similar.
Hispanic origin—A respondent was classified as beingof Hispanic origin if she reported that her only or principalnational origin was Puerto Rican, Cuban, Mexican Ameri-can, Central or South American, or other Spanish. In tablespresenting data for women by race, women of Hispanicorigin are included in the statistics for white and blackwomen who were classified as such by race.
Region of residence— Data are classified by region ofresidence into the four major census regions: Northeast,Midwest, South, and West. The sample size greatly restrictsthe possibility of meaningful analyses by social characteris-tics among smaller geographic divisions. The areas consti-tuting these four major geographic regions are as folfowx
Geographic regionand division States included
NortheastNew England . . . . . . . . . . Maine, New Hampshire,
Vermont, Massachusetts,Rhode Island, Connecticut
NOTE A list of references follows the text.
Middle Atlantic . . . . . . . .
MidwestEast North Central . . . . .
West North Central . . . . .
SouthSouth Atlantic.. . . . . . . . .
East South Central. . . . . .
West South Central . . . . .
WestMountain . . . . . . . . . . . . . .
Pacific . . . . . . . . . . . . . . . .
New York, New Jersey,Pennsylvania
Ohio, Indiana, Illinois,Michigan, Wisconsin
Minnesota, Iowa, Missouri,North Dakota, SouthDakota, Nebraska, Kansas
Delaware, Maryland,District of Columbia,Virginia, West Virginia,North Carolina, SouthCarolina, Gecmgia, Florida
Kentucky, Tennessee,Alabama, Mississippi
Arkansas, Louisiana,Oklahoma, Texas
Montan~ Idaho, Wyoming,Colorado, New Mexico,Arizona, Utah, Nevada
Washington, Oregon,California
Pkzce of Resz21ence-Data are classitied by place ofresidence into two categories, metropolitan and nonmetro-politan, using 1980 census population counts. A respon-dent’s place of residence is metropolitan if the census gavethe area as part of a standard metropolitan statistical area(SMSA), as established by the U.S. Office of Managementand Budget, and nonmetropolitan if it is not in an SMSA.Nonmetropcditan areas may include both rural and urbanplaces.
Education–Education was classified according to thehighest grade or year of regular school or college com-pleted. Determination of the highest year completed wasbased on responses to a series of questions concerning thelast grade or year of school attended and whether thatgrade or year was completed.
Poveq level income-The poverty index ratio was cal-culated by dividing the total family income by the weightedaverage threshold income of families whose head of house-hold was under 65 years of age, based on the poverty levelsshown in table A-3 in the U.S. Bureau of the CensusCuwent Population Repotis, Series P-60, No. 140, “MoneyIncome and Poverty Status of Families and Persons in theU.S., 1982.” This definition takes into account the sex of thefamily head and the number of persons in the family. Totalfamily income includes income from all sources for allmembers of the respondent’s family. For a substantialnumber of respondents (22 percent), total family incomewas not ascertained. These missing values were imputedusing a known value of another similar, randomly selectedrespondent. Because of these high levels of missing data,
69

small differences by poverty level income should beinterpreted with caution.Most recent occup&”on —Women who were working at
the date of interview were asked:
● What is your occupation? That is, what is your jobcalled?
. What are your most important activities or duties?● What kind of business or industry do you work for?
That is, what do they make or do?
Women who had worked in the past but were notcurrently working were asked:
. What was your last occupation? That is, what was yourjob called?
. What were your most recent activities or duties?● What kind of business or industry did you work for?
That is, what did they make or do?
The answers to these questions were recorded verba-tim and used by specially trained occupation coders infinding the most appropriate standard job title in the 1980U.S. Census classification. Where more than one occupationwas given, the primary or first-mentioned occupation wascoded. Occupations were coded using the 3-digit codesused by the U.S. Bureau of the Census; for this report,however, they have been grouped into major categories,according to Bureau practice.
Medicaid status-Women were asked, “Are you your-self now covered by Medicaid (STATE NAME FORMEDICAID), or do you have a card that looks like this?”The respondent was then shown a Medicaid card for herState. In this report, women who said that they werecovered by Medicaid or had a Medicaid card at the date ofinterview were classified as “receives Medicaid.” All otherwomen were classified as “does not receive Medicaid.”
70

Appendix !11Items on the 1982National Survey ofFamily Growthquestionnaire relatedto health aspects ofpregnancy andchildbirth
ALL PREGNANCIES
B-19.
rHAWI
CARD
7
Thinking about your (1 st/2nd/etc. ) pregnant y,in which of the ways shown cm this card didthe pregnsncy end? (CIRCLE CODE HERE AfKI—W B&P RECORD. )
A. Still birth . . . . . . . . . . . .B. Miscarriage . . . . . . . . . . . .C. Abortion . . . . . . . . . . . . .
D. Birth by Cesarean section. . . . .E. BirLh by normal (vaginal) delivery
IF MIH. TIPLE OUTCONE, CIRCLE FIRST OUTCOtf
AGOVE AtWI ENTER LET IER FOR OTHER OUTCOF!L(S)ON LINE . . . . . . . . . . . . . . . . . . . .
B-20. Was the baby a boy or a girl?
Boy . . . . . . . . . . . . . . . . .Girl . . . . . . . . . . . . . . . . .Twins, both bode . . . . . . . . . . .Twins, tdhgirls . . . . . . . . . .Twins, one boy, one girl. . . . . . .
0-21. hhat did you name (her/him)? (ENTER MRE
AhO ON B&P RECORD. )—
&22. O) what dmke (was [CHILD] born/did that preg-nancy end)? (ENTER lfRE fig ON B&P RECORD. )
FIRST
PREGNANCY
. . . ...* 1 (B-22)
. . . . . . . 2 (B-22)
. . . . . . . 3 (B-22)
. . . . . . . 4 (G-20)
. . . . . . . 5 (0-20)
. . . . . . . 1
. . . . . . . 2
. . . . . . . 3
. . . . . . . 4
. . . . . . . 5
NAHE
I I—T)43 YR
SECONDPREGNANCY
. . . . . . . 7 (B-22)
. . . . . . . 2 (o-22)
. . . . . . . 3 ( B-22)
. . . . . . . 4 (520)
. . . . . . . 5 (13-20)
. . . . . . . 1
. . . . . . . 2
. . . . . . . 3
. . . . . . . 4
. . . . . . . 5
NANE
N4NE
I I—Tm YR
BOX 7. IF PREGNANCY ENDED BEFORE JANUARY 1979, SKIP TO BOX 8.
lF PREGNANCY ENOED JANUARY 1979 OR LATER, CONTINUE.
&23. During this pregnancy, did you ever visita doctor or clinic for prenatal care?
Yes . . . . . . . . . . . . . . 1 (B-24) . . . . . . . 1 (B-24)
. . . . . . . . . . . ...0. 2 (60x a) . . . . . ..2(BOXB)
B-24 . HOW many muntha pregnant were you tin youfirst vibfted a doctor or clinic for prenatalcare? KINTHS M3NTHS
71

B-25. TO which of the places on the card did yougo for your first visit?
ElHAND
CARD
3
A.B.
c.
D.
E.
F.
G.
H.
J.
K.
Community health center clinic . .Public health department clinic. .Family planning clinic . . . . . .Abortion clinic. . . . . . . . . .Student health service clinic. . .
Military health service clinic . .Hospital clinic. . . . . . . . . .Private doctor . . . . . . . . . .
Private group practice, co-op,or private clinic. . . . . . . . .Other (spECIFY). . . . . . . . . .
B-26. Between your first visit and the end of the
pregnancy, how often did you visit a doctoror clinic for prenatal care? Was it once
a month or more, or less often than that?
Once a month or more. . . . . .
Less often than once a month. .
Pregnancy ended within month of
first visit . . . . . . . . .
. . .
. . .
. . .
B-27. During your pregnancy, did a doctor evertell you to remain in bed for one or moreweeks because of some problem related toyour pregnancy?
Ye9. . . . . . .No. . . . . . . .
FIRSTPREGNANCY
. . . . . . . 01
. . . . . . . 02
. . . . . . . 03
. . . . . . . 04
. . . . . . . 05
. . . . . . . 06
. . . . . . . 07
. . . . . . . 08
. . . . . . . 09
. . . . . . . 10
. . . . . . . 1
. . . . . . . 2
. . . . . . . 3
. . . . . . . 1
. . . . . . . 2
SECONDPREGNANCY
● ✎ ✎ ✎ ✎ ✎ ✎ 01. . . . . . . 02
. . . . . . . 03
. . . . . . . 04
. . . . . . . 05
. . . . . . . 06
. . . . . . . 07
. . . . . . . 08
. . . . . . . 09
. . . . . . . 10
. ..*... 1
. . . . . . . 2
. . . . . . . 3
. . . . . . . ?
. . . . . . . 2
BOX 8. IF PREGNANCY ENDED IN:
LIVE BIRTH, GO TO B-2B, PAGE 12.
ABORTION, GO TO B-39, PAGE 18.
MISCARRIAGE OR STILLBIRTH, GO TO B-47, PAGE 22.
72

LIY
CHILD’s NANE
B-28. tbw much did (CHILD) weigh at birth?
B-29. Did (s/he) weigh more than 5 7/2 pounds orless?
More. . . . . . .5 1/2 or less . .
BIRTHSPregnancy No. ] I I Pregnancy No. I I 1—— ——
FIRST BIRTH I SECOW BIRTH
I (Box 9) I (BOX 9)LB.5. OZ. -iiEn — Oz.
OK. . . . . . 9898 (B-29) IOK.. . . . . 9898 (B-29) I
. . . . . . . 1
. . . . . . . 2. . . . . . . 1
. . . . . . . 2
●
BOX 9. IF CHILD BORN BEFORE JANUARY 1979, SKIP TO BOX 10.
IF CHILD BORN JANUARY 1979 OR LATER, CONTINUE.
B-30. This card Iists some of the waya in which
medical bills can be paid. Wan (CHILD)
was born, in which of these ways was thebill paid? (CIRCLE ALL THAT APPLY AND
PROBE : Mat other ways?)
AHANDA.
CARD
BB.
c.
D.E.
F.
G.
H.
Your (or your husband’a) on
income. . . . . . . . . . . . . .Partner/boyfriend or his family. .Insurance (which you carry or
is carried for you). . . . . . . .No charge -- pRid by Medicaid. . .Government assistance otherthan Medicaid (state or local) . .Military . . . . . . . . . . . . .Parents or other relatives . . . .
Some other way (SPECIFY) . . . . .
B-31 . Did (CHILD) come home from the hospitaI at the
same time you did, or did s/he have to staylongsr for medical reasons?
Came home with mother . . . . . . . .Stayed longer . . . . . . . . . . . .Child given up for adoption . . . . .
Not born in hospital. . . . . . . . .Child died at hospital. . . . . . . .
B-32. In the first six months of (her/his) life, did
you ever take (CHILD) to the doctor or clinicfor a well-baby or routine checkup?
Yes . . . . . . .No. . . . . . . .
. . . . . . . 07
. . . . . . . 02
..,.*** 03
. . . . . . . 04
. . . . . . . 05
. . . . . . . 06
. . . . . . . 07
. ..*.. . OB
I
. . . . . . . 1 (8-32)
● . ...0. 2 (B-32)
. . . . . . . 3 (Box 12,
PAGE 16)
. . . . . . . 4 (B-32)
. . . . . . . 5 (8-36)
. . . . . . . 1
. . . . . . . 2
. . . . . . . 01
. . . . . . . 02
. . . . . . . 03
. . . . . . . 04
. . . . . . . 05
. . . . . . ● 06
. . . . . . . 07
. . . . . . ● 08
. . . . . . . 1 (B-32)
. . . . . . . 2 {B-32)
. . . . . . . 3 (Box 12,
PAGE 16)
. . . . . . . 4 (B-32)
. . . . . . . 5 (B-36)
. . . . . . . 1
. . . . . . . 2
73

Box 33. ● IF R NEVER PREGNANT, GO TO BOX 34.
m IF R EVER PREGNANT, CONTINUE.
*
C-63 . There has recently been a great deal of discussion about cigarette smoking end women’s health. On the aver-
age, during your (last) pregnancy, how many cigarette par day (did/have) you smoke(d), if any?
Nxmtoneadey orless. . . . . . . . ...01
Just afew(2-4) . . . . . . . . . . . ...02
tiouthalf apack (5-14)... . . . . ...03
Pboutapeck (15-24) . . . . . . . . . . ..o4
About 1 1/2 packa (25-34). . . . . . . . . . 05
Mout2packs (35-44). . . . . . . . . ...06
Mcrethan 2packs (45+).... . . . . ...07
Didn’t amoka during (laet/currant)
pregnancy . . . . . . . . . . . . . . ...96
66-67
C-64. During your (last) pregnancy,
wine, or liquor? (Waa/Is) it
u
HAND
CARD
17
how often (did/do) you usually drink alcoholic beverages, that ia, beer,
. . .
A. Every day, . . . . . . , . . . . . . ...1
B. Afewdays s week, . . . . . . . . . ...2
C.. ilnceaneek, . . . . . . . . . . . . ...3
D. Once a month, . . . . . . . . . . . ...468
E. Less thanonce a month, . . . . . . ...5
F. Or never? . . . . . . . . . . . . . ...6
74 t+u. S.GOVERNMENT PRINTING OFFICE: 19 BS-241-259t S1001

.——.
AuaiZableOnlyfiomtheGovemmentl%ting O~e...
CertifiedLtielhbles
The NATIONAL CENTER FK)R HEALTHSTATISTICS has just released for sale the1985 life expectancy tables. The life tables,certified as official documents, are utilized bylawyers as legal evidence, insurance analysts,actuaries, pension planners, demographers, andother researched. The publication includes
-aalst8tiatkoftheInitedStataa, 1985 mlfa Tat.lahN, s-6
,,.......! !,., ., . . . . . . . . .. . .,.,,.,,. . . . . . . . . . . . . . . . . .
_iFCt CK)l CS--1, —-- -,r –--— ~...m, -11
current and trend data by age, sex, and racefrom 1900 to 1985, survivors to specified ages,and median length of life. The koklet is -available only hm the GwernmentPrinting Office at a cost of $1.50per copy. Use the handy order fbrmbeluw to puldlase your copy today. 1111
-——— ———— ———— ———— ———— ———— ———— _____ _—_— ———. ———. —.
Publication Order Form Mail to: Suprwntendent of Documents
Order processing code: * 6247Government Pnntmg CYhceWashmgfon, DC 20402
❑ YM, please send me copies of Health, united &iStK, 1887
GPO Stock Number-017-022-01 IJ32-1
The total cost of my order is $ Foreign orders pleaseac!dan additional 25?&
Prices irclude reg.dar cbrrestic postagearid handling and are god through December,1988. After that date, pleasecall Order and Information Desk at
(~) 7833238 to ~Jerifyprices.
Please ~pe or PrintPlamechoose method of payment:❑ Check payablelotheS.wr,n!en@nt of Dcc.rnen&
(Company or personal name)❑ GPO DeposI r%CO””( CIIUII1-u
(Add[honal addressJattentlon Ihne) ❑ WA MasterCard or Cfmcekcou.t
(Street address)
(City, State, ZIP Code) [S!gnature)
()
(Daylme phone mcludmg area code) (Credit card expiration date)
Thank pu for your order! Thank you for your orderl Thank you for your orderl Thank you for your order! Thank you for your orded

The annual nationalreport on health...
Health,United States,1987
The National Center for Health Statistics The 1987 edition covers current healthhas just released for sale the 1987 annual topics including AIDS, smoking, nursingreport to Congress on the Nation’s health. homes, hospital use, trends in lifeUtilized by analysts, educators, and expectancy and mortality, andresearchers, this comprehensive report many other facets of America’s
~~
presents easy-to-read and up-to-date facts health. Don’t miss the opportunityand statistics in one convenient volume. to order your COPYtoday. Mm
..— — ———— —————— —— _______ ____ ____ _______ ____ ____ ___
Publication Order Form Mail to: Superintendent of DocumentsGovernment Printing Office
orderPr=SSiwc@= * 6383 Washington, D.C. 20402-9325
❑ YES. please send r-w copies of Health, United States, 1987
GPO St~k Number-017-022-01032- 1 Price $13.00
The total cost of my order is $ Foreign orders please add an additional 25%
Prices include r~l ar domestic postege and handling and are good thrwgh Decemtw 1988. After that date, please call Order and Inforrnation Desk at
(202) 7833238 to verify prices.
Please Type or Print
(Company or personal name)
(AddMonaladdrewattenllon Ihne)
(Streetaddress)
Please choose method of payment:❑ Check payable totheSupenntendent of Dcwments
❑ GPO Deposit Account UIIIII1-cl
❑ VISA, MasterCard or CholcePccounl
(CIIy,State,ZIP Code) (Signature) Apr\l 1988
()(Daylme phone ,ncludlngarea code) (Credit card exprahon date)
Thank you for your order{ Thank you for your order] Thank you for your orderl Thank you for your orded Thank you for your orded

Vital and Health Statisticsseries descriptions
SERIES 1.
SERIES 2.
SERIES 3.
SERIES 4
SERIES 5.
SERIES 10.
SERIES 11.
SERIES 12.
SERIES 13.
Programs and Collection Procedure* Reports descrlbmg the
general programs of the National Center for Health Stalisttcs
and its offices and d!wslons and the data collection methods
used They also include def!nlflons and other material necessary
for understanding the data.
Data Evaluation and Methoda ResearckStudles of new statis-
tical methodology tncludmg experimental tests of new survey
methods, studies of vital statmtics collection methods, new analyf -
cal techniques, ob]ectwe evaluations of rehablhty of collected
data, and contributions to statlst!cal theory. Studies also include
comparison of U.S. methodology with those of other countnes.
Analytical snd Epidemiologicel Stude*Reports presenting
analyftcal or interpretive studies based on vital and health statls-
tlcs, carrying the analysis further than the expository types of
reports m the other series.
Documents and Committee Reports-Fmal reports of major
committees concerned with vital and health statistics and docu-
ments such as recommended model wtal regwtration laws and
revised birth and death certlftcates.
Comparative International Vial and Health Statistics Re-
ports-Analyflcal and descnptwe reports comparing U.S. wtal
and health statistics with those of other countries.
Data From the National Health Interview Survey-Stat@lcs
on illness, accidental injuries, dlsabtlity, use of hospital. medical,
dental, and other services, and other health-related top!cs, all
based on data collected m the contmumg national household
interwew survey.
Date From the National Heatth Examination Survey and the
National Health and Nutrition Examination Survey-Data from
direct examination, testing, and measurement of national samples
of the civihan nonmstitutlonalized population provide the basis
for (1) estimates of the medically defined prevalence of speclflc
diseases m the United States and the distributions of the population
w!th respect to phystcal, physiological, and psychologlcal charac-
teristics and (2) analysis of relationships among the various meas-
urements without reference to an explicit finite umverse of persons.
Date From the Inatitutionaliied Population Surveye-Dlscon-
tmued m 1975. Reports from these surveys are included m Series
13.
Data on Health Resources Ufilition-Statistics on the utd!za-
tion of health manpower and facdties prowdmg long-term care,
ambulatory care, hospital care, and family planning services.
SERIES 14.
SERIES 15.
SERIES 20.
SERIES 21.
SERIES 22.
SERIES 23.
Data on Health Resources: Manpower and Facitiiie*Stats-
tics on the numbers, geographic distribution, and characteristics
of health resources mcludmg physlclans, denksts, nurses, other
health occupations, hospitals, nursing homes, and outpatient facd-
ties.
Data From Special Suweye-Statistics on health and health-
related topics collected m spec!al surveys that are not a parl
of the contmumg data systems of the National Center for Health
Stat@lcs.
Data on Morialiiy-Various statistics on mortahty other than
as included m regular annual or monthly reports. Special analyses
by cause of death, age, and other demographic variables; geo-
graphic and time series analyses; and statistics on characteristics
of deaths not avadable from the wtal records based on sample
surveys of those records.
Data on Natetii, Marriage, and Divor~Vanous statistics
on natahty, marriage, and d!vorce other than as included m regular
annual or monthly reports. Spec(al analyses by demographic
variables; geographic and time series analyses; studies of fertility;
and statistics on characteristics of births not avadable from the
wtal records based on sample surveys of those records.
Data From the National Mo~ality and Natality Surveye-Dis-
contmued in 1975. Reports from these sample surveys based
on vital records are included in Series 20 and 21, respectwely.
Data From the National Suwey of Famiiv Growth-Statistics
on fertillty, famdy formation and dissolution, family planning, and
related maternal and infant health topics derived from a periodtc
survey of a nationwide probablhty sample of women 15-44 years
of age.
For answers to questions about this report or tor a list of titles of reports
publlshed m these series, contact:
Sclentlfic and Technical Information Branch
National Center for Health Stat@cs
Centers for D!sease Control
Pubhc Health Service
Hyattsville, Md. 20782
301-436-8500

US DEPARTMENT OF HEALTH ANDHUMAN SERVICES
Pubhc Health SerwceCenters for Dsease ControlNational Cenfer for Health Statjstlcs3700 East-West HighwayHyatfswlle, Mayland 20782
OFFICIAL BUSINESSPENALTY FOR PRIVATE USE. $300
BULK RATEPOSTAGE & FEES PAID
PHS/NCHSPERMIT NO. G–281
DHHSPubilcation No. (PHS)8%1992, Sertes 23, No. 16
Copyright © 2022 FDOKUMEN