with the directions of The Hon'ble National Green Tribunal ...
360
-
Upload
khangminh22 -
Category
Documents
-
view
1 -
download
0
Transcript of with the directions of The Hon'ble National Green Tribunal ...
Modified Quarterly Progress Report on the Compliance by the State of Kerala
with the directions of The Hon’ble National Green Tribunal, Principal Bench, New Delhi
as per the
Orders dated 16.01.2019, 25.04.2019, 12.09.2019 &
07.01.2020 in O.A. No.606/2018
Order dated 17.07.2019 in O.A.No.519/2019
Order dated 24.01.2020 in O.A No 514/2019
Order dated 26-9-2019 in O.A. No. 360/2018
Order Dated 19.02.2019 in O.A. No. 593/2017
Order dated 17-9-2019 in O.A. No. 829/2019
Orders dated 20-9-2018 and 8-4- 2019 in O.A.No.673/2018
Order dated 10-5-2019 in O.A. No. 325/2015
Order dated 05-11-2019 in O.A. No. 639/2018
Order dated 13-12-2018 in O.A.No.1038/2018
Order dated 8-10-2018 in OA No.681/2018
Orders dated 12.04.2019 and 26.08.2019 in O.A no. 804/2017
Order dated 15-7-2019 in O.A. No. 710/2017, 711/2017, 712/2017 and 713/2017
Submitted by
The Chief Secretary, Government of Kerala
2nd July, 2020
2
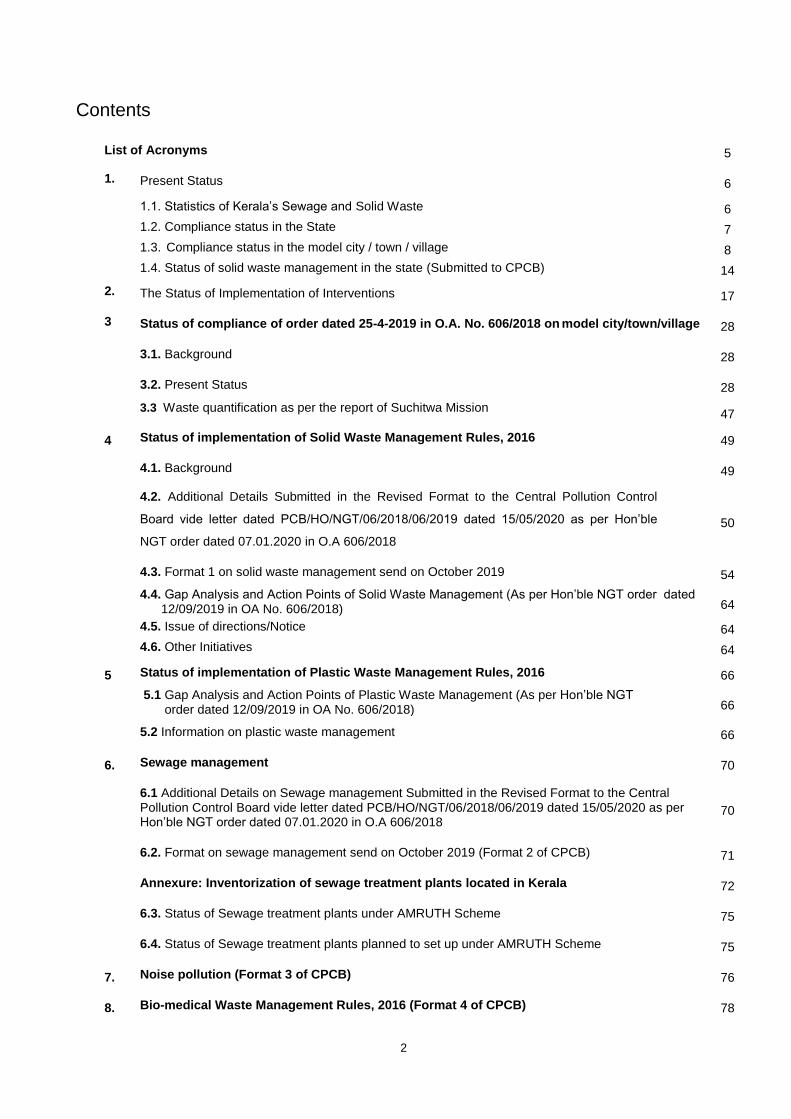
Contents
List of Acronyms 5
1. Present Status 6
1.1. Statistics of Kerala’s Sewage and Solid Waste 6
1.2. Compliance status in the State 7
1.3. Compliance status in the model city / town / village 8
1.4. Status of solid waste management in the state (Submitted to CPCB) 14
2. The Status of Implementation of Interventions 17
3 Status of compliance of order dated 25-4-2019 in O.A. No. 606/2018 on model city/town/village 28
3.1. Background 28
3.2. Present Status 28
3.3 Waste quantification as per the report of Suchitwa Mission 47
4 Status of implementation of Solid Waste Management Rules, 2016 49
4.1. Background 49
4.2. Additional Details Submitted in the Revised Format to the Central Pollution Control
Board vide letter dated PCB/HO/NGT/06/2018/06/2019 dated 15/05/2020 as per Hon’ble
NGT order dated 07.01.2020 in O.A 606/2018
50
4.3. Format 1 on solid waste management send on October 2019 54
4.4. Gap Analysis and Action Points of Solid Waste Management (As per Hon’ble NGT order dated 12/09/2019 in OA No. 606/2018) 64
4.5. Issue of directions/Notice 64
4.6. Other Initiatives 64
5 Status of implementation of Plastic Waste Management Rules, 2016 66
5.1 Gap Analysis and Action Points of Plastic Waste Management (As per Hon’ble NGT order dated 12/09/2019 in OA No. 606/2018) 66
5.2 Information on plastic waste management 66
6. Sewage management 70
6.1 Additional Details on Sewage management Submitted in the Revised Format to the Central Pollution Control Board vide letter dated PCB/HO/NGT/06/2018/06/2019 dated 15/05/2020 as per Hon’ble NGT order dated 07.01.2020 in O.A 606/2018
70
6.2. Format on sewage management send on October 2019 (Format 2 of CPCB) 71
Annexure: Inventorization of sewage treatment plants located in Kerala 72
6.3. Status of Sewage treatment plants under AMRUTH Scheme 75
6.4. Status of Sewage treatment plants planned to set up under AMRUTH Scheme 75
7. Noise pollution (Format 3 of CPCB) 76
8. Bio-medical Waste Management Rules, 2016 (Format 4 of CPCB) 78
3
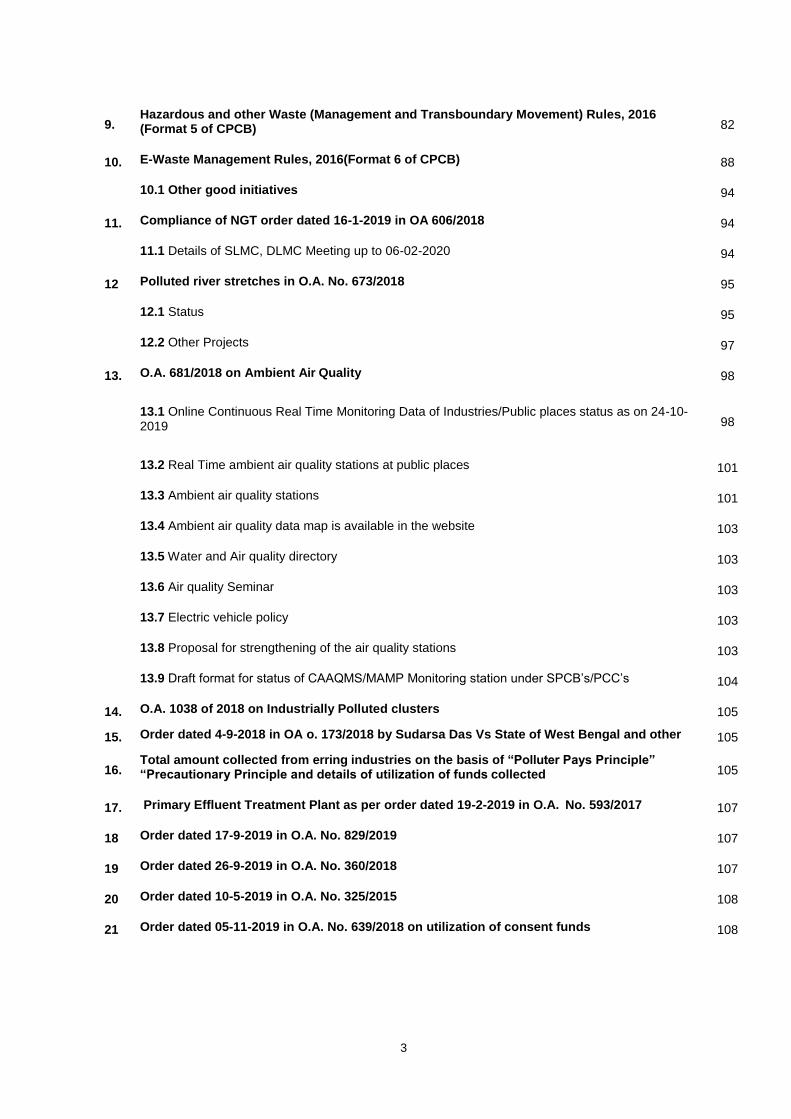
9. Hazardous and other Waste (Management and Transboundary Movement) Rules, 2016 (Format 5 of CPCB) 82
10. E-Waste Management Rules, 2016(Format 6 of CPCB) 88
10.1 Other good initiatives 94
11. Compliance of NGT order dated 16-1-2019 in OA 606/2018 94
11.1 Details of SLMC, DLMC Meeting up to 06-02-2020 94
12 Polluted river stretches in O.A. No. 673/2018 95
12.1 Status 95
12.2 Other Projects 97
13. O.A. 681/2018 on Ambient Air Quality 98
13.1 Online Continuous Real Time Monitoring Data of Industries/Public places status as on 24-10-2019 98
13.2 Real Time ambient air quality stations at public places 101
13.3 Ambient air quality stations 101
13.4 Ambient air quality data map is available in the website 103
13.5 Water and Air quality directory 103
13.6 Air quality Seminar 103
13.7 Electric vehicle policy 103
13.8 Proposal for strengthening of the air quality stations 103
13.9 Draft format for status of CAAQMS/MAMP Monitoring station under SPCB’s/PCC’s 104
14. O.A. 1038 of 2018 on Industrially Polluted clusters 105
15. Order dated 4-9-2018 in OA o. 173/2018 by Sudarsa Das Vs State of West Bengal and other 105
16. Total amount collected from erring industries on the basis of “Polluter Pays Principle” “Precautionary Principle and details of utilization of funds collected 105
17. Primary Effluent Treatment Plant as per order dated 19-2-2019 in O.A. No. 593/2017 107
18 Order dated 17-9-2019 in O.A. No. 829/2019 107
19 Order dated 26-9-2019 in O.A. No. 360/2018 107
20 Order dated 10-5-2019 in O.A. No. 325/2015 108
21 Order dated 05-11-2019 in O.A. No. 639/2018 on utilization of consent funds 108
4
Annexure
Annexure 1 Status Report on solid waste management
Annexure 2 Notice issued to Thiruvananthapuram Corporation
Annexure 3 Reply received from Thiruvananthapuram Corporation
Annexure 4 Hon’ble High Court judgment dated 04-12-2019 in WP (c) No. 32870 of 2019
Annexure 5 Direction issued to Thrissur Corporation
Annexure 6 Hon’ble High Court judgment dated 26-11-2019 in WP (c) No. 30789 of 2019
Annexure 7 Writ Appeal submitted by Thrissur Corporation
Annexure 8 Notice issued to Kochi Corporation
Annexure 9 Notice issued to Kalamassery Municipality
Annexure 10 G.O.(Rt) No. 128/2019/ENVT dated 31-12-2019 Annexure 11 Alternative materials that can be used as a substitute for the banned single use plastic
G.O. (Rt.) No.02/2020/Envt. dated 27-01-2020
Annexure 12 EPR Proposal
Annexure 13 Details of Sewage treatment plants under AMRUTH Scheme
5
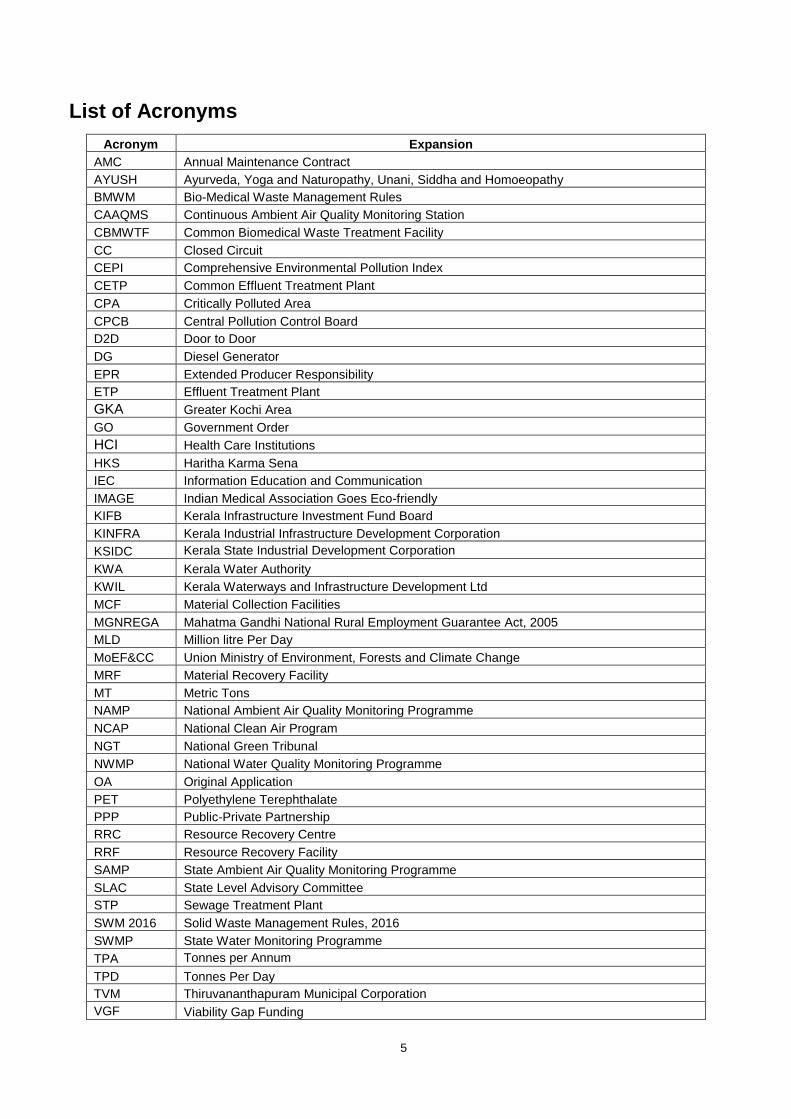
List of Acronyms
Acronym Expansion
AMC Annual Maintenance Contract
AYUSH Ayurveda, Yoga and Naturopathy, Unani, Siddha and Homoeopathy
BMWM Bio-Medical Waste Management Rules
CAAQMS Continuous Ambient Air Quality Monitoring Station
CBMWTF Common Biomedical Waste Treatment Facility
CC Closed Circuit
CEPI Comprehensive Environmental Pollution Index
CETP Common Effluent Treatment Plant
CPA Critically Polluted Area
CPCB Central Pollution Control Board
D2D Door to Door
DG Diesel Generator
EPR Extended Producer Responsibility
ETP Effluent Treatment Plant
GKA Greater Kochi Area
GO Government Order
HCI Health Care Institutions
HKS Haritha Karma Sena
IEC Information Education and Communication
IMAGE Indian Medical Association Goes Eco-friendly
KIFB Kerala Infrastructure Investment Fund Board
KINFRA Kerala Industrial Infrastructure Development Corporation
KSIDC Kerala State Industrial Development Corporation
KWA Kerala Water Authority
KWIL Kerala Waterways and Infrastructure Development Ltd
MCF Material Collection Facilities
MGNREGA Mahatma Gandhi National Rural Employment Guarantee Act, 2005
MLD Million litre Per Day
MoEF&CC Union Ministry of Environment, Forests and Climate Change
MRF Material Recovery Facility
MT Metric Tons
NAMP National Ambient Air Quality Monitoring Programme
NCAP National Clean Air Program
NGT National Green Tribunal
NWMP National Water Quality Monitoring Programme
OA Original Application
PET Polyethylene Terephthalate
PPP Public-Private Partnership
RRC Resource Recovery Centre
RRF Resource Recovery Facility
SAMP State Ambient Air Quality Monitoring Programme
SLAC State Level Advisory Committee
STP Sewage Treatment Plant
SWM 2016 Solid Waste Management Rules, 2016
SWMP State Water Monitoring Programme
TPA Tonnes per Annum
TPD Tonnes Per Day
TVM Thiruvananthapuram Municipal Corporation
VGF Viability Gap Funding
6
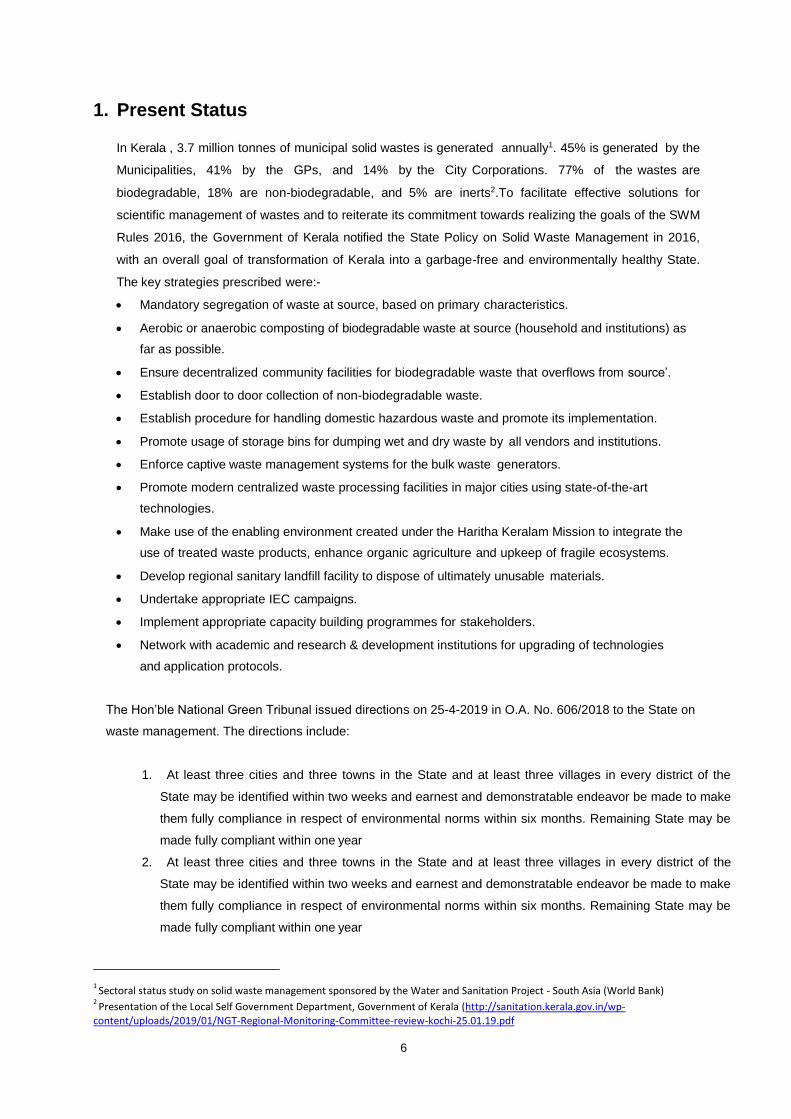
1. Present Status
In Kerala , 3.7 million tonnes of municipal solid wastes is generated annually1. 45% is generated by the
Municipalities, 41% by the GPs, and 14% by the City Corporations. 77% of the wastes are
biodegradable, 18% are non-biodegradable, and 5% are inerts2.To facilitate effective solutions for
scientific management of wastes and to reiterate its commitment towards realizing the goals of the SWM
Rules 2016, the Government of Kerala notified the State Policy on Solid Waste Management in 2016,
with an overall goal of transformation of Kerala into a garbage-free and environmentally healthy State.
The key strategies prescribed were:-
Mandatory segregation of waste at source, based on primary characteristics.
Aerobic or anaerobic composting of biodegradable waste at source (household and institutions) as
far as possible.
Ensure decentralized community facilities for biodegradable waste that overflows from source’.
Establish door to door collection of non-biodegradable waste.
Establish procedure for handling domestic hazardous waste and promote its implementation.
Promote usage of storage bins for dumping wet and dry waste by all vendors and institutions.
Enforce captive waste management systems for the bulk waste generators.
Promote modern centralized waste processing facilities in major cities using state-of-the-art
technologies.
Make use of the enabling environment created under the Haritha Keralam Mission to integrate the
use of treated waste products, enhance organic agriculture and upkeep of fragile ecosystems.
Develop regional sanitary landfill facility to dispose of ultimately unusable materials.
Undertake appropriate IEC campaigns.
Implement appropriate capacity building programmes for stakeholders.
Network with academic and research & development institutions for upgrading of technologies
and application protocols.
The Hon’ble National Green Tribunal issued directions on 25-4-2019 in O.A. No. 606/2018 to the State on
waste management. The directions include:
1. At least three cities and three towns in the State and at least three villages in every district of the
State may be identified within two weeks and earnest and demonstratable endeavor be made to make
them fully compliance in respect of environmental norms within six months. Remaining State may be
made fully compliant within one year
2. At least three cities and three towns in the State and at least three villages in every district of the
State may be identified within two weeks and earnest and demonstratable endeavor be made to make
them fully compliance in respect of environmental norms within six months. Remaining State may be
made fully compliant within one year
1 Sectoral status study on solid waste management sponsored by the Water and Sanitation Project - South Asia (World Bank)
2 Presentation of the Local Self Government Department, Government of Kerala (http://sanitation.kerala.gov.in/wp-
content/uploads/2019/01/NGT-Regional-Monitoring-Committee-review-kochi-25.01.19.pdf
7
3. The District Magistrates may monitor the status of compliance of environmental norms, at least once
in two weeks.
The first quarterly report was submitted before the Hon’ble NGT on 15-7-2019. The second quarterly
report was submitted on 31-10-2019. The third quarterly report was submitted on 19-2-2020. The
present report summarizes the actions taken by the Government of Kerala to abide by the Order dated
16-1-2019 in O.A. 606/2018 (para.40); order in O.A. 593/2017 dated 19-2-2019; orders dated 25-4-
2019 and 12-9-2019 in O.A. 606/2018;order dated 17-9-2019 in O.A. No. 829/2019; order dated 10-5-
2019 in O. A. 325/15; and order dated 26-9-2019 in O.A. No. 360/2018. It outlines the status of different
interventions, the timelines set for meeting the targets, and the estimated budget.
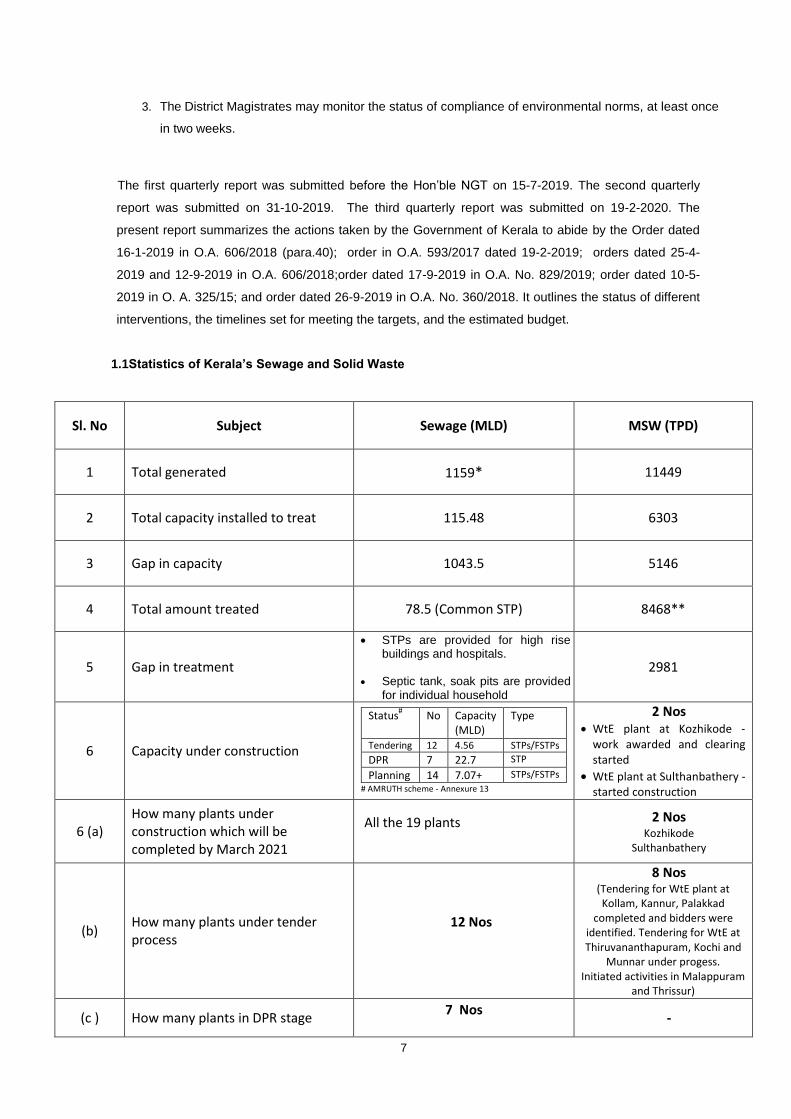
1.1Statistics of Kerala’s Sewage and Solid Waste
Sl. No Subject Sewage (MLD) MSW (TPD)
1 Total generated 1159* 11449
2 Total capacity installed to treat 115.48 6303
3 Gap in capacity 1043.5 5146
4 Total amount treated 78.5 (Common STP) 8468**
5 Gap in treatment
STPs are provided for high rise buildings and hospitals.
Septic tank, soak pits are provided for individual household
2981
6 Capacity under construction
Status# No Capacity
(MLD) Type
Tendering 12 4.56 STPs/FSTPs
DPR 7 22.7 STP
Planning 14 7.07+ STPs/FSTPs
# AMRUTH scheme - Annexure 13
2 Nos WtE plant at Kozhikode -
work awarded and clearing started
WtE plant at Sulthanbathery -started construction
6 (a) How many plants under construction which will be completed by March 2021
All the 19 plants
2 Nos Kozhikode
Sulthanbathery
(b) How many plants under tender process
12 Nos
8 Nos (Tendering for WtE plant at Kollam, Kannur, Palakkad
completed and bidders were identified. Tendering for WtE at Thiruvananthapuram, Kochi and
Munnar under progess. Initiated activities in Malappuram
and Thrissur)
(c ) How many plants in DPR stage 7 Nos
-
8
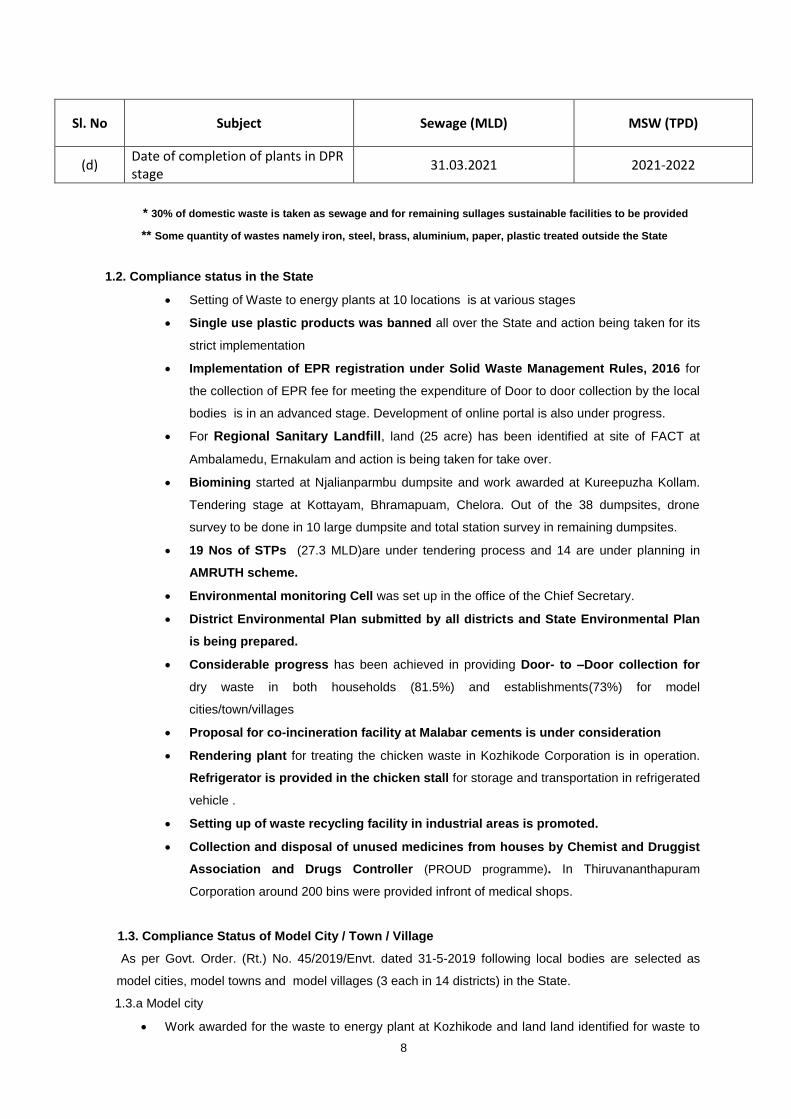
Sl. No Subject Sewage (MLD) MSW (TPD)
(d) Date of completion of plants in DPR stage
31.03.2021 2021-2022
* 30% of domestic waste is taken as sewage and for remaining sullages sustainable facilities to be provided
** Some quantity of wastes namely iron, steel, brass, aluminium, paper, plastic treated outside the State
1.2. Compliance status in the State
Setting of Waste to energy plants at 10 locations is at various stages
Single use plastic products was banned all over the State and action being taken for its
strict implementation
Implementation of EPR registration under Solid Waste Management Rules, 2016 for
the collection of EPR fee for meeting the expenditure of Door to door collection by the local
bodies is in an advanced stage. Development of online portal is also under progress.
For Regional Sanitary Landfill, land (25 acre) has been identified at site of FACT at
Ambalamedu, Ernakulam and action is being taken for take over.
Biomining started at Njalianparmbu dumpsite and work awarded at Kureepuzha Kollam.
Tendering stage at Kottayam, Bhramapuam, Chelora. Out of the 38 dumpsites, drone
survey to be done in 10 large dumpsite and total station survey in remaining dumpsites.
19 Nos of STPs (27.3 MLD)are under tendering process and 14 are under planning in
AMRUTH scheme.
Environmental monitoring Cell was set up in the office of the Chief Secretary.
District Environmental Plan submitted by all districts and State Environmental Plan
is being prepared.
Considerable progress has been achieved in providing Door- to –Door collection for
dry waste in both households (81.5%) and establishments(73%) for model
cities/town/villages
Proposal for co-incineration facility at Malabar cements is under consideration
Rendering plant for treating the chicken waste in Kozhikode Corporation is in operation.
Refrigerator is provided in the chicken stall for storage and transportation in refrigerated
vehicle .
Setting up of waste recycling facility in industrial areas is promoted.
Collection and disposal of unused medicines from houses by Chemist and Druggist
Association and Drugs Controller (PROUD programme). In Thiruvananthapuram
Corporation around 200 bins were provided infront of medical shops.
1.3. Compliance Status of Model City / Town / Village
As per Govt. Order. (Rt.) No. 45/2019/Envt. dated 31-5-2019 following local bodies are selected as
model cities, model towns and model villages (3 each in 14 districts) in the State.
1.3.a Model city
Work awarded for the waste to energy plant at Kozhikode and land land identified for waste to
9
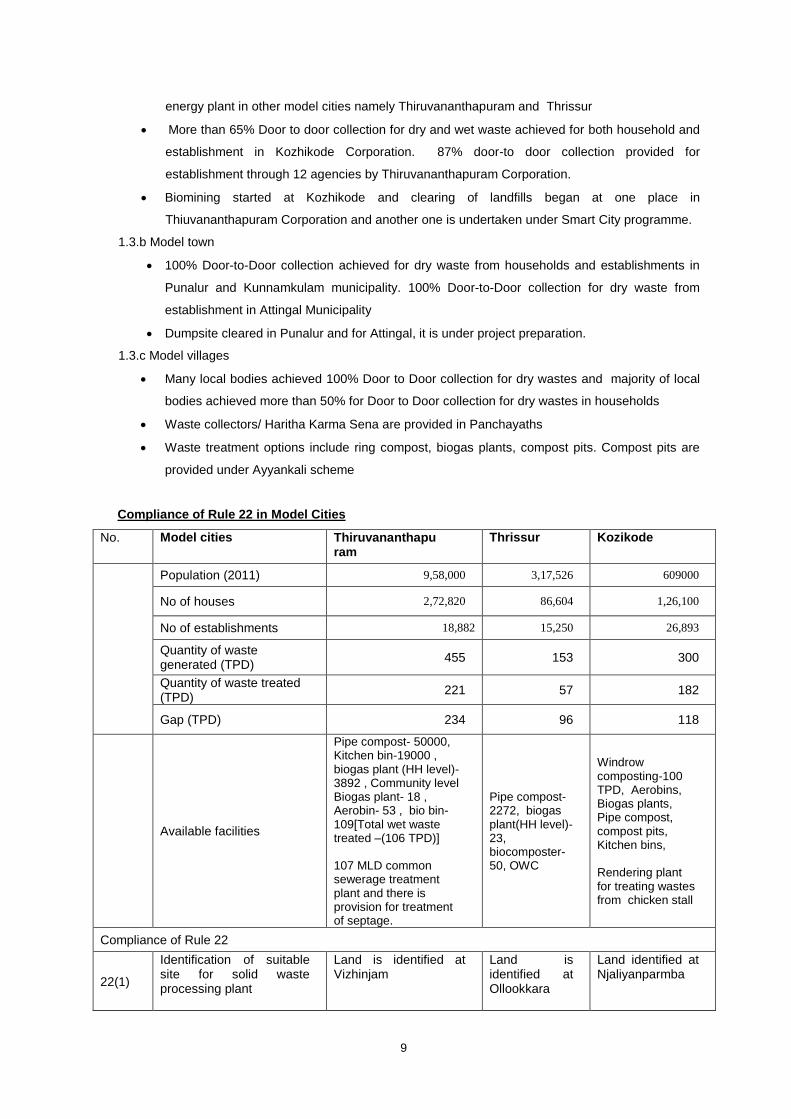
energy plant in other model cities namely Thiruvananthapuram and Thrissur
More than 65% Door to door collection for dry and wet waste achieved for both household and
establishment in Kozhikode Corporation. 87% door-to door collection provided for
establishment through 12 agencies by Thiruvananthapuram Corporation.
Biomining started at Kozhikode and clearing of landfills began at one place in
Thiuvananthapuram Corporation and another one is undertaken under Smart City programme.
1.3.b Model town
100% Door-to-Door collection achieved for dry waste from households and establishments in
Punalur and Kunnamkulam municipality. 100% Door-to-Door collection for dry waste from
establishment in Attingal Municipality
Dumpsite cleared in Punalur and for Attingal, it is under project preparation.
1.3.c Model villages
Many local bodies achieved 100% Door to Door collection for dry wastes and majority of local
bodies achieved more than 50% for Door to Door collection for dry wastes in households
Waste collectors/ Haritha Karma Sena are provided in Panchayaths
Waste treatment options include ring compost, biogas plants, compost pits. Compost pits are
provided under Ayyankali scheme
Compliance of Rule 22 in Model Cities
No. Model cities Thiruvananthapuram
Thrissur Kozikode
Population (2011) 9,58,000 3,17,526 609000
No of houses 2,72,820 86,604 1,26,100
No of establishments 18,882 15,250 26,893
Quantity of waste generated (TPD)
455 153 300
Quantity of waste treated (TPD)
221 57 182
Gap (TPD) 234 96 118
Available facilities
Pipe compost- 50000, Kitchen bin-19000 , biogas plant (HH level)-3892 , Community level Biogas plant- 18 , Aerobin- 53 , bio bin-109[Total wet waste treated –(106 TPD)] 107 MLD common sewerage treatment plant and there is provision for treatment of septage.
Pipe compost-2272, biogas plant(HH level)-23, biocomposter-50, OWC
Windrow composting-100 TPD, Aerobins, Biogas plants, Pipe compost, compost pits, Kitchen bins, Rendering plant for treating wastes from chicken stall
Compliance of Rule 22
22(1)
Identification of suitable site for solid waste processing plant
Land is identified at Vizhinjam
Land is identified at Ollookkara
Land identified at Njaliyanparmba
10
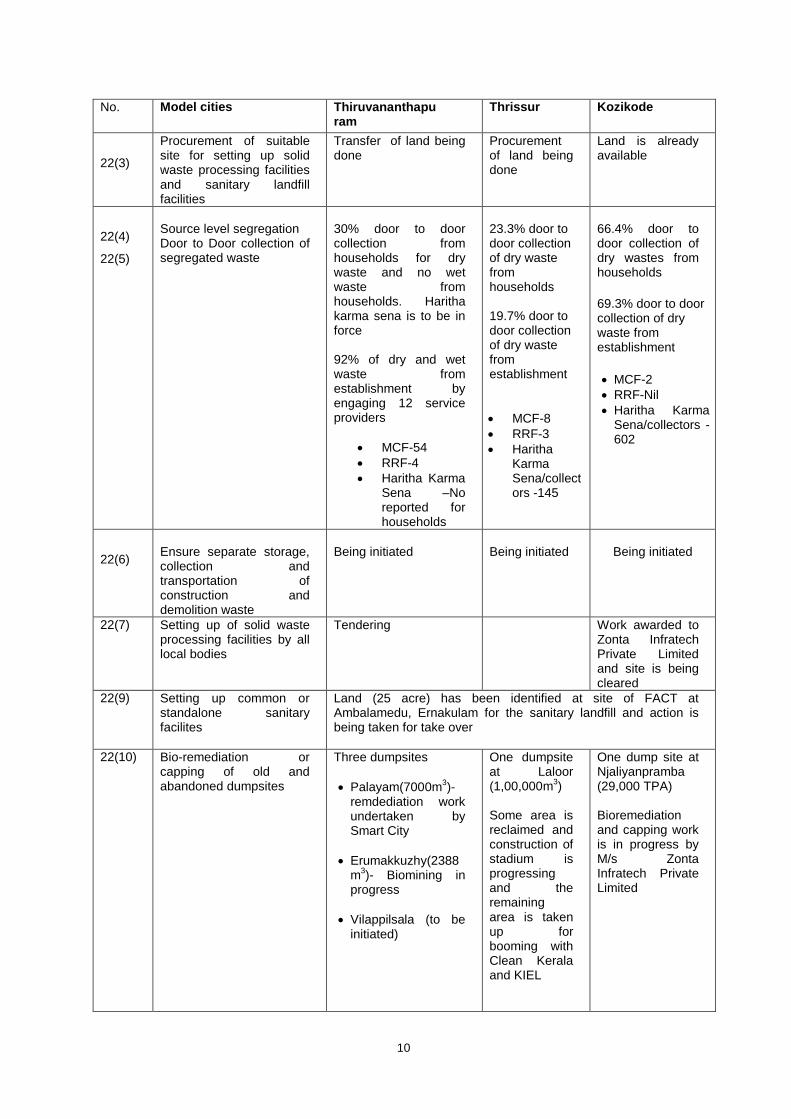
No. Model cities Thiruvananthapuram
Thrissur Kozikode
22(3)
Procurement of suitable site for setting up solid waste processing facilities and sanitary landfill facilities
Transfer of land being done
Procurement of land being done
Land is already available
22(4)
22(5)
Source level segregation Door to Door collection of segregated waste
30% door to door collection from households for dry waste and no wet waste from households. Haritha karma sena is to be in force 92% of dry and wet waste from establishment by engaging 12 service providers
MCF-54
RRF-4
Haritha Karma Sena –No reported for households
23.3% door to door collection of dry waste from households 19.7% door to door collection of dry waste from establishment
MCF-8
RRF-3
Haritha Karma Sena/collectors -145
66.4% door to door collection of dry wastes from households
69.3% door to door collection of dry waste from establishment MCF-2
RRF-Nil
Haritha Karma Sena/collectors - 602
22(6)
Ensure separate storage, collection and transportation of construction and demolition waste
Being initiated
Being initiated
Being initiated
22(7) Setting up of solid waste processing facilities by all local bodies
Tendering Work awarded to Zonta Infratech Private Limited and site is being cleared
22(9) Setting up common or standalone sanitary facilites
Land (25 acre) has been identified at site of FACT at Ambalamedu, Ernakulam for the sanitary landfill and action is being taken for take over
22(10) Bio-remediation or capping of old and abandoned dumpsites
Three dumpsites
Palayam(7000m3)-
remdediation work undertaken by Smart City
Erumakkuzhy(2388m
3)- Biomining in
progress
Vilappilsala (to be initiated)
One dumpsite at Laloor (1,00,000m
3)
Some area is reclaimed and construction of stadium is progressing and the remaining area is taken up for booming with Clean Kerala and KIEL
One dump site at Njaliyanpramba (29,000 TPA) Bioremediation and capping work is in progress by M/s Zonta Infratech Private Limited
11
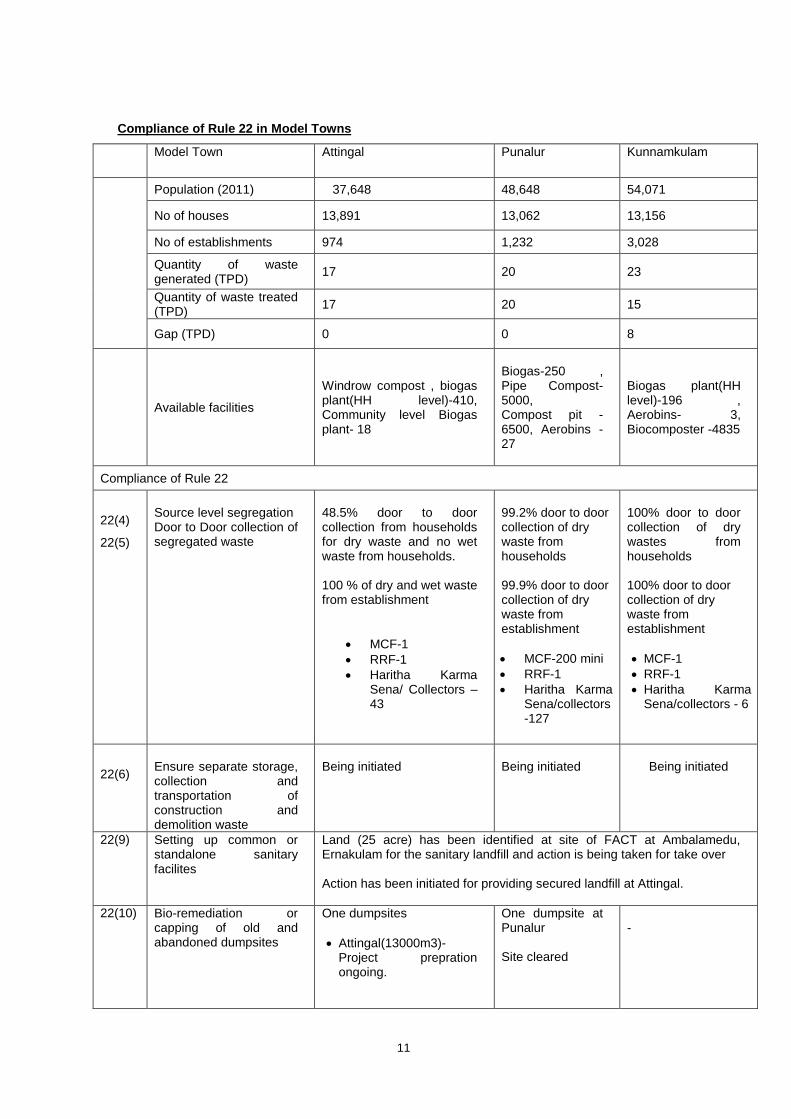
Compliance of Rule 22 in Model Towns
Model Town Attingal Punalur Kunnamkulam
Population (2011) 37,648 48,648 54,071
No of houses 13,891 13,062 13,156
No of establishments 974 1,232 3,028
Quantity of waste generated (TPD)
17 20 23
Quantity of waste treated (TPD)
17 20 15
Gap (TPD) 0 0 8
Available facilities
Windrow compost , biogas plant(HH level)-410, Community level Biogas plant- 18
Biogas-250 , Pipe Compost- 5000, Compost pit - 6500, Aerobins -27
Biogas plant(HH level)-196 , Aerobins- 3, Biocomposter -4835
Compliance of Rule 22
22(4)
22(5)
Source level segregation Door to Door collection of segregated waste
48.5% door to door collection from households for dry waste and no wet waste from households. 100 % of dry and wet waste from establishment
MCF-1
RRF-1
Haritha Karma Sena/ Collectors –43
99.2% door to door collection of dry waste from households 99.9% door to door collection of dry waste from establishment
MCF-200 mini
RRF-1
Haritha Karma Sena/collectors -127
100% door to door collection of dry wastes from households 100% door to door collection of dry waste from establishment
MCF-1
RRF-1
Haritha Karma Sena/collectors - 6
22(6)
Ensure separate storage, collection and transportation of construction and demolition waste
Being initiated
Being initiated
Being initiated
22(9) Setting up common or standalone sanitary facilites
Land (25 acre) has been identified at site of FACT at Ambalamedu, Ernakulam for the sanitary landfill and action is being taken for take over Action has been initiated for providing secured landfill at Attingal.
22(10) Bio-remediation or capping of old and abandoned dumpsites
One dumpsites
Attingal(13000m3)- Project prepration ongoing.
One dumpsite at Punalur Site cleared
-
12
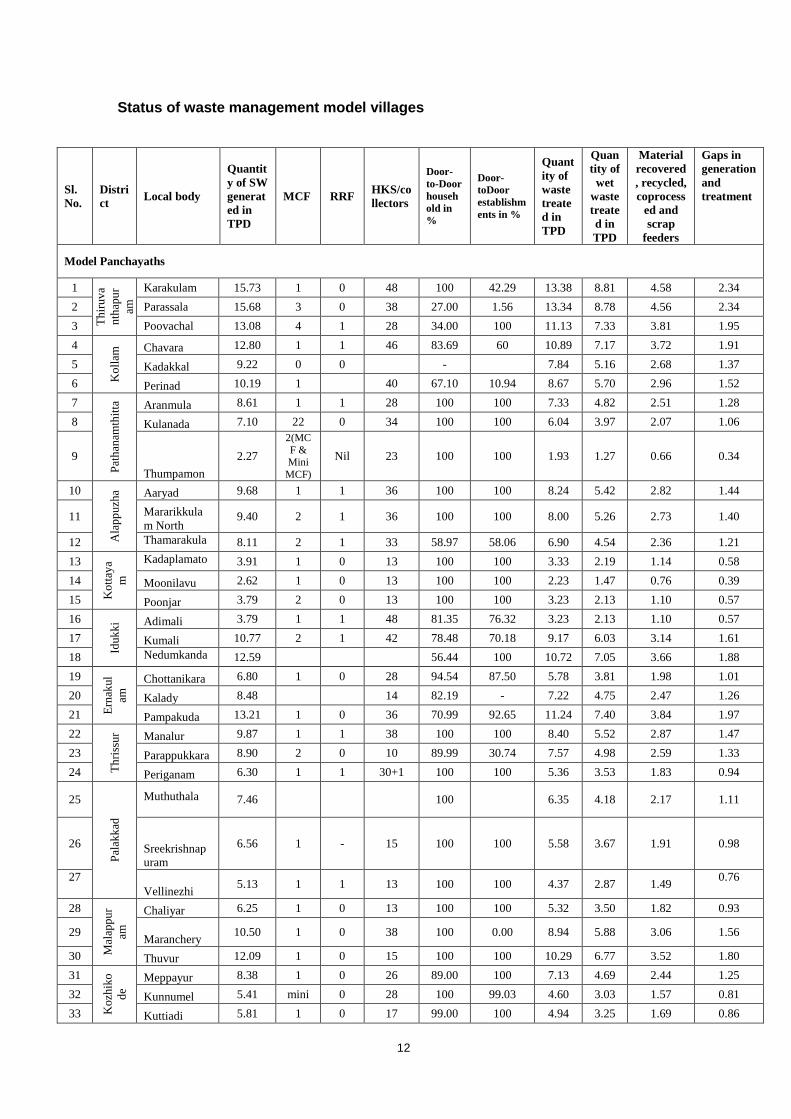
Status of waste management model villages
Sl.
No.
Distri
ct Local body
Quantit
y of SW
generat
ed in
TPD
MCF RRF HKS/co
llectors
Door-
to-Door
househ
old in
%
Door-
toDoor
establishm
ents in %
Quant
ity of
waste
treate
d in
TPD
Quan
tity of
wet
waste
treate
d in
TPD
Material
recovered
, recycled,
coprocess
ed and
scrap
feeders
Gaps in
generation
and
treatment
Model Panchayaths
1
Th
iruv
a
nth
apu
r
am
Karakulam 15.73 1 0 48 100 42.29 13.38 8.81 4.58 2.34
2 Parassala 15.68 3 0 38 27.00 1.56 13.34 8.78 4.56 2.34
3 Poovachal 13.08 4 1 28 34.00 100 11.13 7.33 3.81 1.95
4
Ko
llam
Chavara 12.80 1 1 46 83.69 60 10.89 7.17 3.72 1.91
5 Kadakkal 9.22 0 0 - 7.84 5.16 2.68 1.37
6 Perinad 10.19 1 40 67.10 10.94 8.67 5.70 2.96 1.52
7
Pat
han
amth
itta
Aranmula 8.61 1 1 28 100 100 7.33 4.82 2.51 1.28
8 Kulanada 7.10 22 0 34 100 100 6.04 3.97 2.07 1.06
9
Thumpamon
2.27
2(MC
F & Mini
MCF)
Nil 23 100 100 1.93 1.27 0.66 0.34
10
Ala
pp
uzh
a Aaryad 9.68 1 1 36 100 100 8.24 5.42 2.82 1.44
11 Mararikkula
m North 9.40 2 1 36 100 100 8.00 5.26 2.73 1.40
12 Thamarakula
m 8.11 2 1 33 58.97 58.06 6.90 4.54 2.36 1.21
13
Ko
ttay
a
m
Kadaplamato
m 3.91 1 0 13 100 100 3.33 2.19 1.14 0.58
14 Moonilavu 2.62 1 0 13 100 100 2.23 1.47 0.76 0.39
15 Poonjar 3.79 2 0 13 100 100 3.23 2.13 1.10 0.57
16
Iduk
ki Adimali 3.79 1 1 48 81.35 76.32 3.23 2.13 1.10 0.57
17 Kumali 10.77 2 1 42 78.48 70.18 9.17 6.03 3.14 1.61
18 Nedumkanda
m 12.59 56.44 100 10.72 7.05 3.66 1.88
19
Ern
akul
am Chottanikara 6.80 1 0 28 94.54 87.50 5.78 3.81 1.98 1.01
20 Kalady 8.48 14 82.19 - 7.22 4.75 2.47 1.26
21 Pampakuda 13.21 1 0 36 70.99 92.65 11.24 7.40 3.84 1.97
22
Th
riss
ur Manalur 9.87 1 1 38 100 100 8.40 5.52 2.87 1.47
23 Parappukkara 8.90 2 0 10 89.99 30.74 7.57 4.98 2.59 1.33
24 Periganam 6.30 1 1 30+1 100 100 5.36 3.53 1.83 0.94
25
Pal
akk
ad
Muthuthala
7.46 100 6.35 4.18 2.17 1.11
26 Sreekrishnap
uram
6.56 1 - 15 100 100 5.58 3.67 1.91 0.98
27
Vellinezhi
5.13 1 1 13 100 100 4.37 2.87 1.49 0.76
28
Mal
app
ur
am
Chaliyar 6.25 1 0 13 100 100 5.32 3.50 1.82 0.93
29 Maranchery
10.50 1 0 38 100 0.00 8.94 5.88 3.06 1.56
30 Thuvur 12.09 1 0 15 100 100 10.29 6.77 3.52 1.80
31
Ko
zhik
o
de
Meppayur 8.38 1 0 26 89.00 100 7.13 4.69 2.44 1.25
32 Kunnumel 5.41 mini 0 28 100 99.03 4.60 3.03 1.57 0.81
33 Kuttiadi 5.81 1 0 17 99.00 100 4.94 3.25 1.69 0.86
13
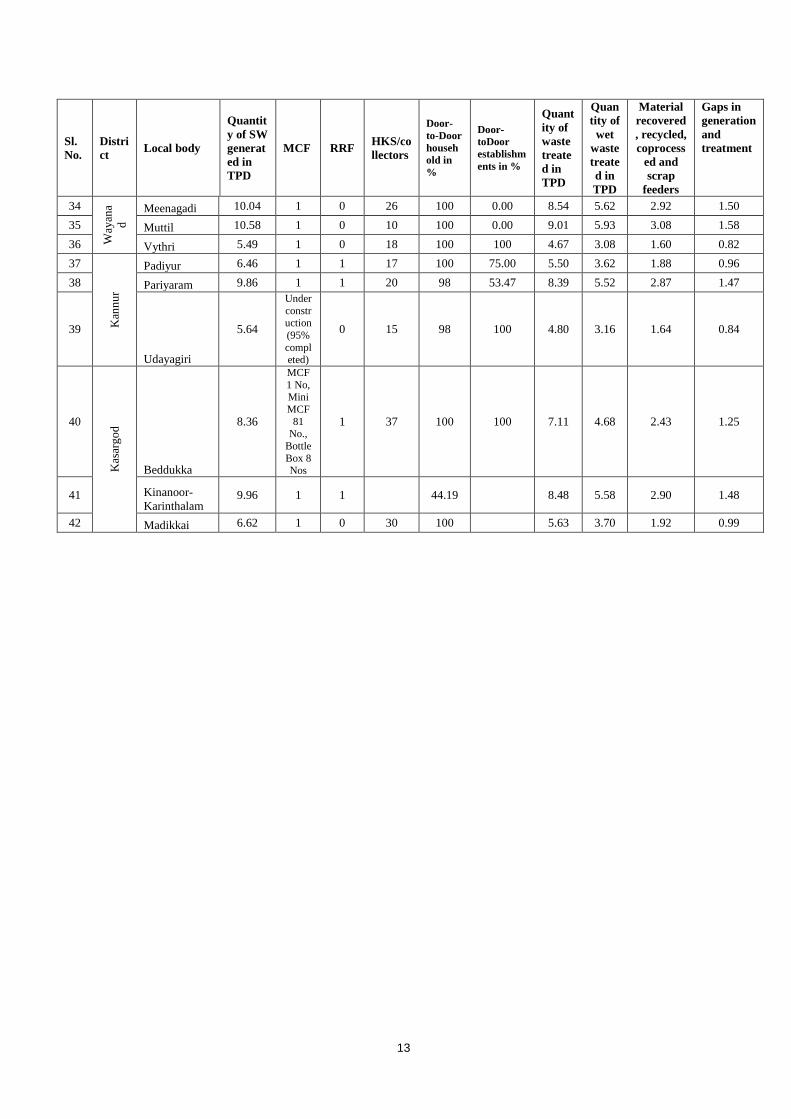
Sl.
No.
Distri
ct Local body
Quantit
y of SW
generat
ed in
TPD
MCF RRF HKS/co
llectors
Door-
to-Door
househ
old in
%
Door-
toDoor
establishm
ents in %
Quant
ity of
waste
treate
d in
TPD
Quan
tity of
wet
waste
treate
d in
TPD
Material
recovered
, recycled,
coprocess
ed and
scrap
feeders
Gaps in
generation
and
treatment
34
Way
ana
d
Meenagadi 10.04 1 0 26 100 0.00 8.54 5.62 2.92 1.50
35 Muttil 10.58 1 0 10 100 0.00 9.01 5.93 3.08 1.58
36 Vythri 5.49 1 0 18 100 100 4.67 3.08 1.60 0.82
37
Kan
nu
r
Padiyur 6.46 1 1 17 100 75.00 5.50 3.62 1.88 0.96
38 Pariyaram 9.86 1 1 20 98 53.47 8.39 5.52 2.87 1.47
39
Udayagiri
5.64
Under
construction
(95%
completed)
0 15 98 100 4.80 3.16 1.64 0.84
40
Kas
arg
od
Beddukka
8.36
MCF
1 No, Mini
MCF
81 No.,
Bottle
Box 8 Nos
1 37 100 100 7.11 4.68 2.43 1.25
41 Kinanoor-
Karinthalam 9.96 1 1 44.19
8.48 5.58 2.90 1.48
42 Madikkai 6.62 1 0 30 100
5.63 3.70 1.92 0.99
14
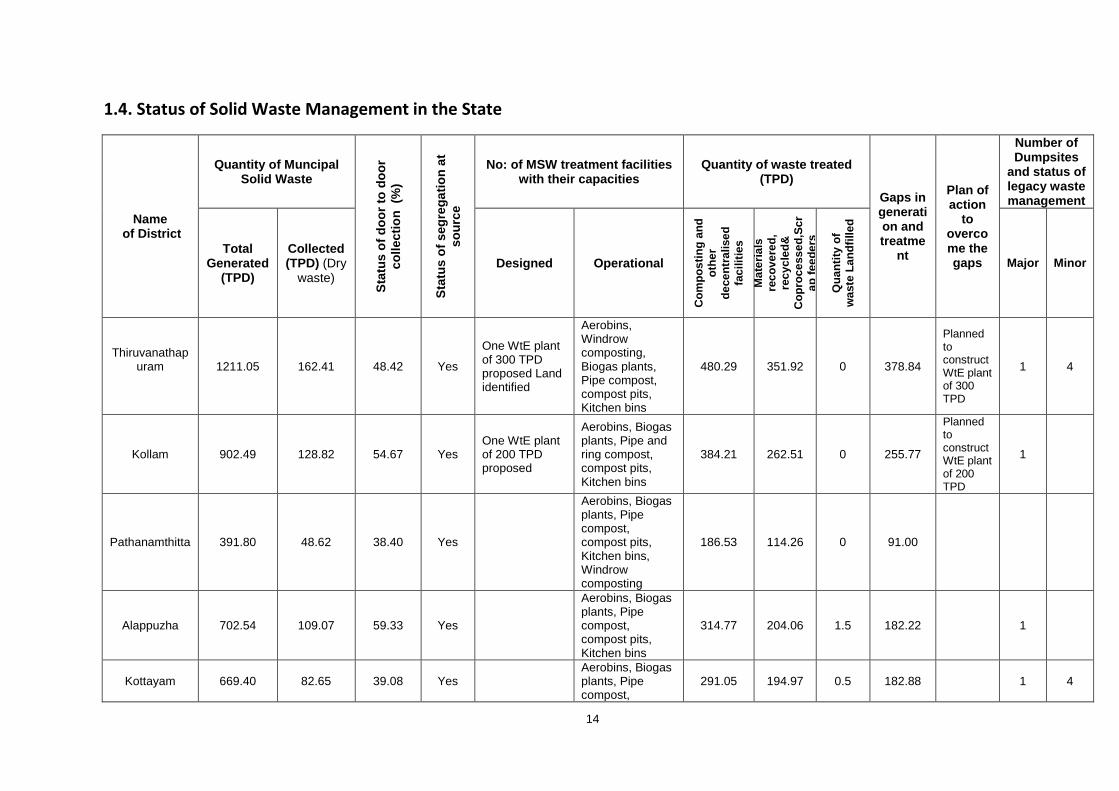
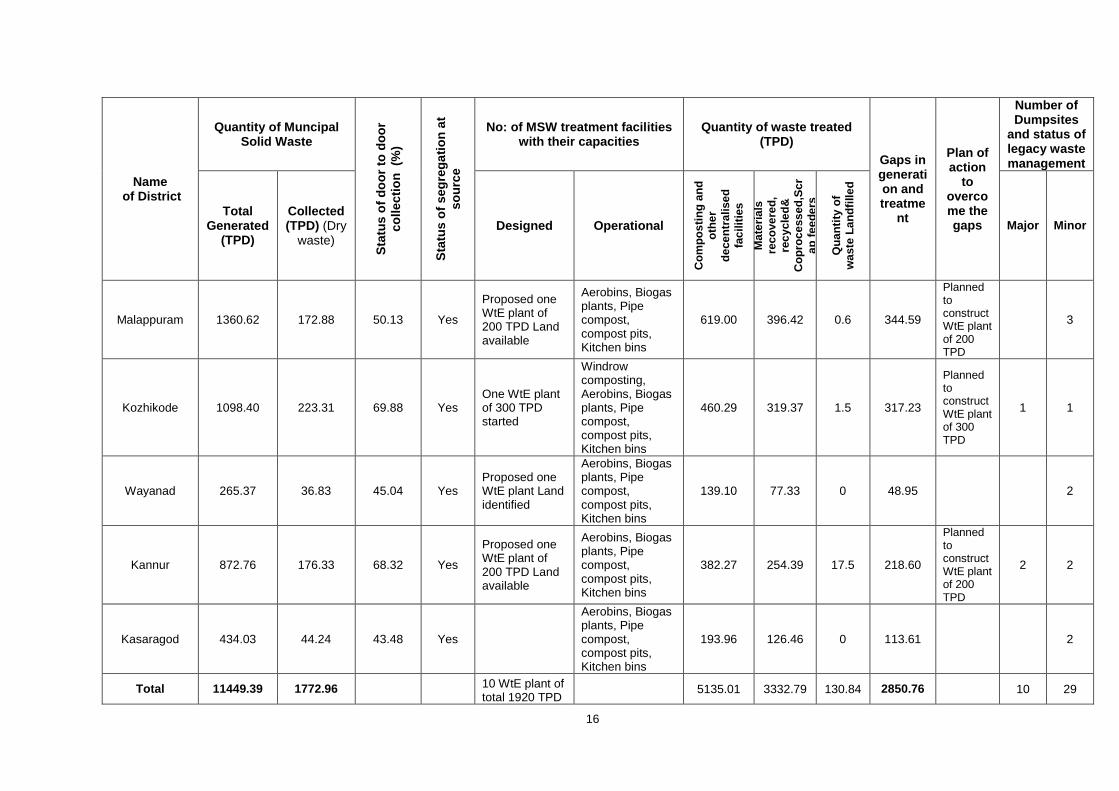
1.4. Status of Solid Waste Management in the State
Name of District
Quantity of Muncipal Solid Waste
Sta
tus o
f d
oo
r to
do
or
co
llecti
on
(%
)
Sta
tus o
f seg
reg
ati
on
at
so
urc
e
No: of MSW treatment facilities with their capacities
Quantity of waste treated (TPD)
Gaps in generation and treatme
nt
Plan of action
to overcome the gaps
Number of Dumpsites
and status of legacy waste management
Total Generated
(TPD)
Collected (TPD) (Dry
waste) Designed Operational
Co
mp
os
tin
g a
nd
o
the
r
de
ce
ntr
alise
d
fac
ilit
ies
Ma
teri
als
rec
ove
red
, re
cyc
led
&
Co
pro
ce
ss
ed
,Sc
r
ap
fe
ed
ers
Qu
an
tity
of
wa
ste
La
nd
fille
d
Major Minor
Thiruvanathapuram
1211.05 162.41 48.42 Yes
One WtE plant of 300 TPD proposed Land identified
Aerobins, Windrow composting, Biogas plants, Pipe compost, compost pits, Kitchen bins
480.29 351.92 0 378.84
Planned to construct WtE plant of 300 TPD
1 4
Kollam 902.49 128.82 54.67 Yes One WtE plant of 200 TPD proposed
Aerobins, Biogas plants, Pipe and ring compost, compost pits, Kitchen bins
384.21 262.51 0 255.77
Planned to construct WtE plant of 200 TPD
1
Pathanamthitta 391.80 48.62 38.40 Yes
Aerobins, Biogas plants, Pipe compost, compost pits, Kitchen bins, Windrow composting
186.53 114.26 0 91.00
Alappuzha 702.54 109.07 59.33 Yes
Aerobins, Biogas plants, Pipe compost, compost pits, Kitchen bins
314.77 204.06 1.5 182.22 1
Kottayam 669.40 82.65 39.08 Yes Aerobins, Biogas plants, Pipe compost,
291.05 194.97 0.5 182.88 1 4
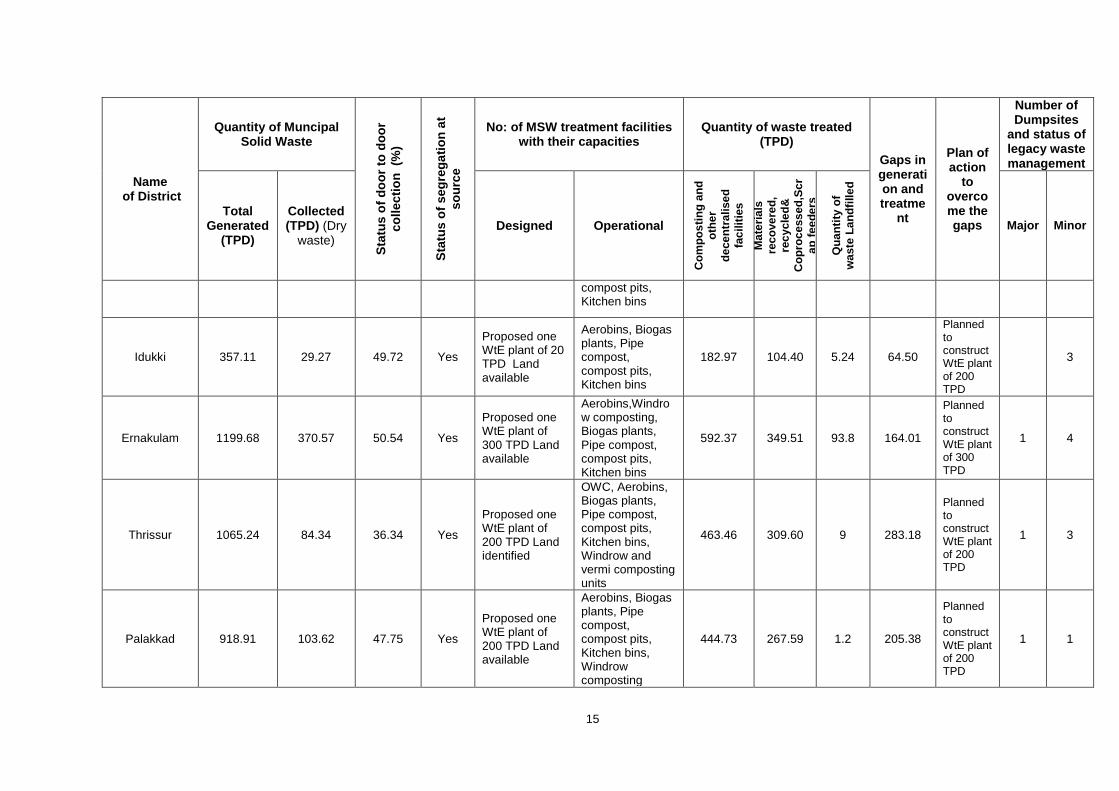
15
Name of District
Quantity of Muncipal Solid Waste
Sta
tus o
f d
oo
r to
do
or
co
llecti
on
(%
)
Sta
tus o
f seg
reg
ati
on
at
so
urc
e
No: of MSW treatment facilities with their capacities
Quantity of waste treated (TPD)
Gaps in generation and treatme
nt
Plan of action
to overcome the gaps
Number of Dumpsites
and status of legacy waste management
Total Generated
(TPD)
Collected (TPD) (Dry
waste) Designed Operational
Co
mp
os
tin
g a
nd
o
the
r
de
ce
ntr
alise
d
fac
ilit
ies
Ma
teri
als
rec
ove
red
, re
cyc
led
&
Co
pro
ce
ss
ed
,Sc
r
ap
fe
ed
ers
Qu
an
tity
of
wa
ste
La
nd
fille
d
Major Minor
compost pits, Kitchen bins
Idukki 357.11 29.27 49.72 Yes
Proposed one WtE plant of 20 TPD Land available
Aerobins, Biogas plants, Pipe compost, compost pits, Kitchen bins
182.97 104.40 5.24 64.50
Planned to construct WtE plant of 200 TPD
3
Ernakulam 1199.68 370.57 50.54 Yes
Proposed one WtE plant of 300 TPD Land available
Aerobins,Windrow composting, Biogas plants, Pipe compost, compost pits, Kitchen bins
592.37 349.51 93.8 164.01
Planned to construct WtE plant of 300 TPD
1 4
Thrissur 1065.24 84.34 36.34 Yes
Proposed one WtE plant of 200 TPD Land identified
OWC, Aerobins, Biogas plants, Pipe compost, compost pits, Kitchen bins, Windrow and vermi composting units
463.46 309.60 9 283.18
Planned to construct WtE plant of 200 TPD
1 3
Palakkad 918.91 103.62 47.75 Yes
Proposed one WtE plant of 200 TPD Land available
Aerobins, Biogas plants, Pipe compost, compost pits, Kitchen bins, Windrow composting
444.73 267.59 1.2 205.38
Planned to construct WtE plant of 200 TPD
1 1
16
Name of District
Quantity of Muncipal Solid Waste
Sta
tus o
f d
oo
r to
do
or
co
llecti
on
(%
)
Sta
tus o
f seg
reg
ati
on
at
so
urc
e
No: of MSW treatment facilities with their capacities
Quantity of waste treated (TPD)
Gaps in generation and treatme
nt
Plan of action
to overcome the gaps
Number of Dumpsites
and status of legacy waste management
Total Generated
(TPD)
Collected (TPD) (Dry
waste) Designed Operational
Co
mp
os
tin
g a
nd
o
the
r
de
ce
ntr
alise
d
fac
ilit
ies
Ma
teri
als
rec
ove
red
, re
cyc
led
&
Co
pro
ce
ss
ed
,Sc
r
ap
fe
ed
ers
Qu
an
tity
of
wa
ste
La
nd
fille
d
Major Minor
Malappuram 1360.62 172.88 50.13 Yes
Proposed one WtE plant of 200 TPD Land available
Aerobins, Biogas plants, Pipe compost, compost pits, Kitchen bins
619.00 396.42 0.6 344.59
Planned to construct WtE plant of 200 TPD
3
Kozhikode 1098.40 223.31 69.88 Yes One WtE plant of 300 TPD started
Windrow composting, Aerobins, Biogas plants, Pipe compost, compost pits, Kitchen bins
460.29 319.37 1.5 317.23
Planned to construct WtE plant of 300 TPD
1 1
Wayanad 265.37 36.83 45.04 Yes Proposed one WtE plant Land identified
Aerobins, Biogas plants, Pipe compost, compost pits, Kitchen bins
139.10 77.33 0 48.95 2
Kannur 872.76 176.33 68.32 Yes
Proposed one WtE plant of 200 TPD Land available
Aerobins, Biogas plants, Pipe compost, compost pits, Kitchen bins
382.27 254.39 17.5 218.60
Planned to construct WtE plant of 200 TPD
2 2
Kasaragod 434.03 44.24 43.48 Yes
Aerobins, Biogas plants, Pipe compost, compost pits, Kitchen bins
193.96 126.46 0 113.61 2
Total 11449.39 1772.96
10 WtE plant of total 1920 TPD
5135.01 3332.79 130.84 2850.76
10 29
17
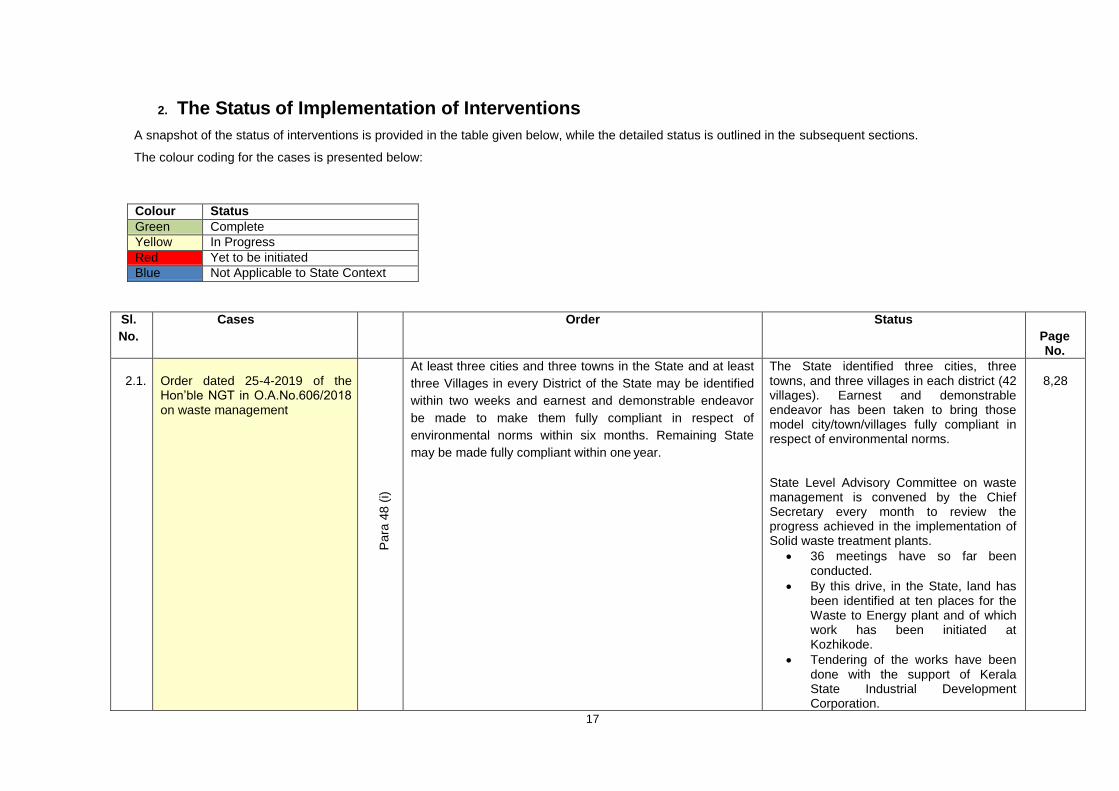
2. The Status of Implementation of Interventions
A snapshot of the status of interventions is provided in the table given below, while the detailed status is outlined in the subsequent sections.
The colour coding for the cases is presented below:
Colour Status
Green Complete
Yellow In Progress
Red Yet to be initiated
Blue Not Applicable to State Context
Sl.
No.
Cases
Order Status Page No.
2.1.
Order dated 25-4-2019 of the Hon’ble NGT in O.A.No.606/2018 on waste management
Para
48 (
i)
At least three cities and three towns in the State and at least
three Villages in every District of the State may be identified
within two weeks and earnest and demonstrable endeavor
be made to make them fully compliant in respect of
environmental norms within six months. Remaining State
may be made fully compliant within one year.
The State identified three cities, three towns, and three villages in each district (42 villages). Earnest and demonstrable endeavor has been taken to bring those model city/town/villages fully compliant in respect of environmental norms. State Level Advisory Committee on waste management is convened by the Chief Secretary every month to review the progress achieved in the implementation of Solid waste treatment plants.
36 meetings have so far been conducted.
By this drive, in the State, land has been identified at ten places for the Waste to Energy plant and of which work has been initiated at Kozhikode.
Tendering of the works have been done with the support of Kerala State Industrial Development Corporation.
8,28
18
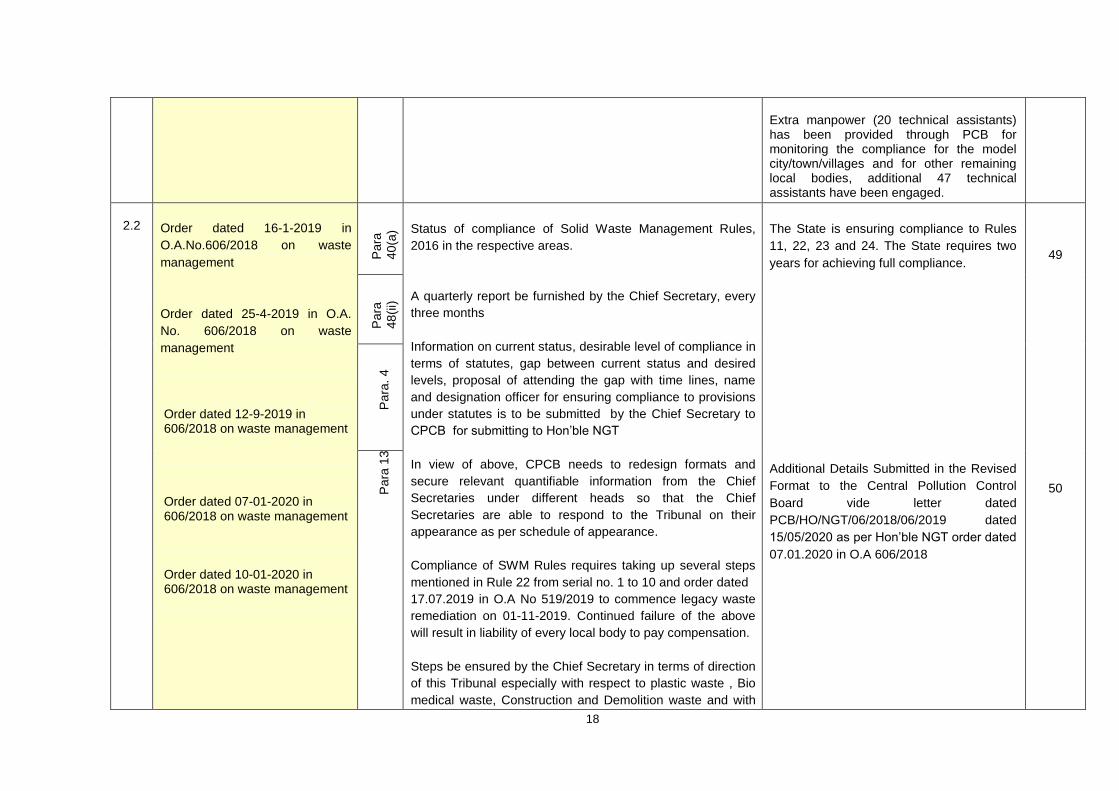
Extra manpower (20 technical assistants) has been provided through PCB for monitoring the compliance for the model city/town/villages and for other remaining local bodies, additional 47 technical assistants have been engaged.
2.2
Order dated 16-1-2019 in
O.A.No.606/2018 on waste
management
Order dated 25-4-2019 in O.A.
No. 606/2018 on waste
management
Order dated 12-9-2019 in 606/2018 on waste management Order dated 07-01-2020 in 606/2018 on waste management Order dated 10-01-2020 in 606/2018 on waste management
Para
40(a
)
Status of compliance of Solid Waste Management Rules,
2016 in the respective areas.
A quarterly report be furnished by the Chief Secretary, every
three months
Information on current status, desirable level of compliance in
terms of statutes, gap between current status and desired
levels, proposal of attending the gap with time lines, name
and designation officer for ensuring compliance to provisions
under statutes is to be submitted by the Chief Secretary to
CPCB for submitting to Hon’ble NGT
In view of above, CPCB needs to redesign formats and
secure relevant quantifiable information from the Chief
Secretaries under different heads so that the Chief
Secretaries are able to respond to the Tribunal on their
appearance as per schedule of appearance.
Compliance of SWM Rules requires taking up several steps
mentioned in Rule 22 from serial no. 1 to 10 and order dated
17.07.2019 in O.A No 519/2019 to commence legacy waste
remediation on 01-11-2019. Continued failure of the above
will result in liability of every local body to pay compensation.
Steps be ensured by the Chief Secretary in terms of direction
of this Tribunal especially with respect to plastic waste , Bio
medical waste, Construction and Demolition waste and with
The State is ensuring compliance to Rules
11, 22, 23 and 24. The State requires two
years for achieving full compliance.
Additional Details Submitted in the Revised
Format to the Central Pollution Control
Board vide letter dated
PCB/HO/NGT/06/2018/06/2019 dated
15/05/2020 as per Hon’ble NGT order dated
07.01.2020 in O.A 606/2018
49
50
Para
48(i
i)
Para
. 4
P
ara
13
19
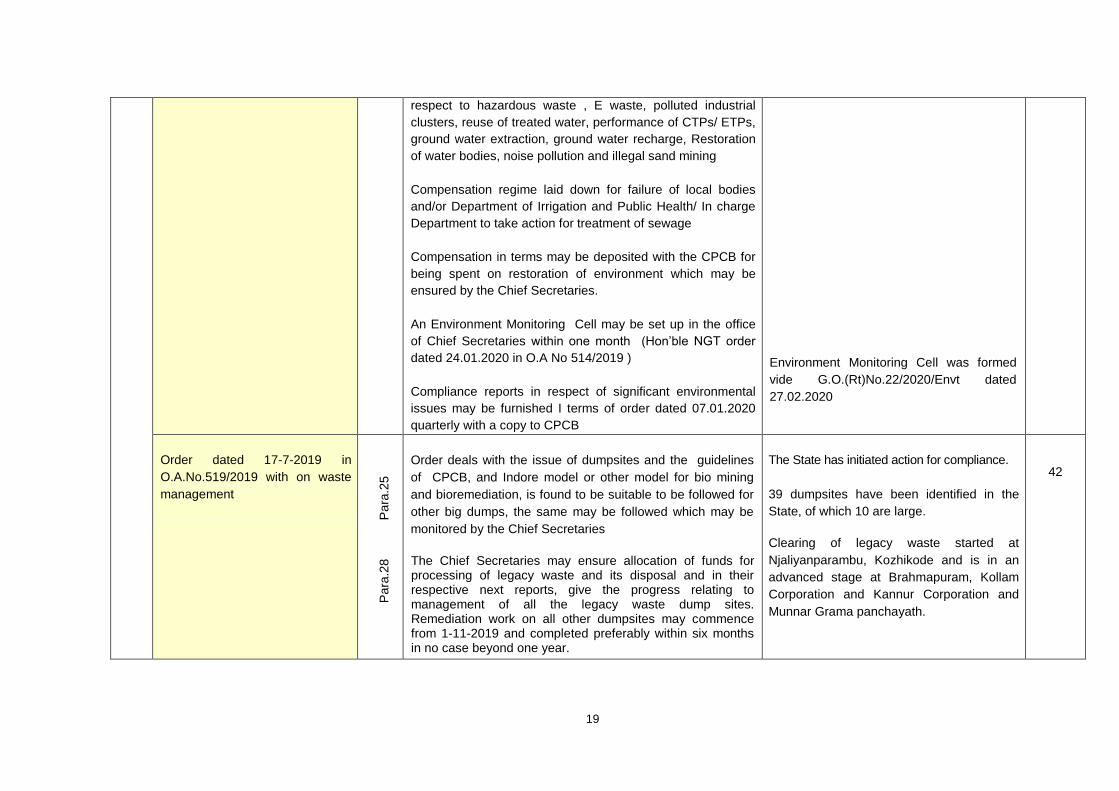
respect to hazardous waste , E waste, polluted industrial
clusters, reuse of treated water, performance of CTPs/ ETPs,
ground water extraction, ground water recharge, Restoration
of water bodies, noise pollution and illegal sand mining
Compensation regime laid down for failure of local bodies
and/or Department of Irrigation and Public Health/ In charge
Department to take action for treatment of sewage
Compensation in terms may be deposited with the CPCB for
being spent on restoration of environment which may be
ensured by the Chief Secretaries.
An Environment Monitoring Cell may be set up in the office
of Chief Secretaries within one month (Hon’ble NGT order
dated 24.01.2020 in O.A No 514/2019 )
Compliance reports in respect of significant environmental
issues may be furnished I terms of order dated 07.01.2020
quarterly with a copy to CPCB
Environment Monitoring Cell was formed
vide G.O.(Rt)No.22/2020/Envt dated
27.02.2020
Order dated 17-7-2019 in
O.A.No.519/2019 with on waste
management
Para
.28
P
ara
.25
Order deals with the issue of dumpsites and the guidelines
of CPCB, and Indore model or other model for bio mining
and bioremediation, is found to be suitable to be followed for
other big dumps, the same may be followed which may be
monitored by the Chief Secretaries
The Chief Secretaries may ensure allocation of funds for processing of legacy waste and its disposal and in their respective next reports, give the progress relating to management of all the legacy waste dump sites. Remediation work on all other dumpsites may commence from 1-11-2019 and completed preferably within six months in no case beyond one year.
The State has initiated action for compliance.
39 dumpsites have been identified in the
State, of which 10 are large.
Clearing of legacy waste started at
Njaliyanparambu, Kozhikode and is in an
advanced stage at Brahmapuram, Kollam
Corporation and Kannur Corporation and
Munnar Grama panchayath.
42
20
2.3
Order dated 16-1-2019 in
O.A.No.606/2018 on waste
management
Para
40(a
)
Status of compliance of Plastic Waste Management Rules,
2016 in the respective areas.
Government have imposed a complete ban on the manufacture, storage, transport, and sale of single use plastic items in the State with effect from 1-1-2020 vide G.O.(Rt) No. 128/2019/ENVT dated 31-12-2019. For the implementation of the producer responsibility as per Solid Waste Management Rules, 2016 and Plastic Waste Management Rules, 2016, Kerala State convened National level seminar on 12-6-2019. A hearing of brand owners was conducted on 7-12-2019 and evolved proposal for the implementation of EPR and is under the consideration of the Government. The State has ensured compliance to Rules 16 on constitution of State Level Advisory Committee and Rule 17 on annual report. The State requires one year for achieving full compliance.
66
2.4
Order dated 16-1-2019 in
O.A.No.606/2018 on waste
management
Status of compliance of Bio-Medical Waste Management
The State has complied with Rule 13 on annual report. The State requires two years to complete 2 numbers of common Biomedical Waste Treatment Plants. Presently, Common Biomedical waste treatment facility is in operation in Palakkad. For CBWTF at Ambalamedu by IMA, the Kochi Corporation earmarked 3 acre land to IMAGE for the project. has been instructed to earmark the area Work for CBWTF in Ambalamedu by Kerala Enviro Infrastructure Limited will commence soon.
78
21
Clean Kerala Company submitted proposal for setting up landfill at the site of KINFRA at Ambalamedu and is under the consideration of the Government.
Order dated 15-7-2019 in O.A.
No. 710/2017, 711/2017,
712/2017 and 713/2017
Para
. 8
The State may furnish complete inventory of HCFs and BMW
generation within two months and where the inventories are
in complete, the same may be completed. The order is to
ensure authorization by all HCFs, setting up common
treatment and disposal facility, furnish information on the
barcode system, and for satisfactory action plans. Chief
Secretaries may personally monitor compliance of
environmental norms including BMW Rules with the District
Magistrate once every month. The District Magistrate may
conduct such monitoring twice every month.
District Environmental Plan is to be prepared by District
Committee chaired and monitored by District Magistrate.
Such District Envrionment Plan and constitution of District
committee may be placed in the website of district. Monthly
report to be filed by District Magistrate to the Chief Secretary
and this may be placed on the website of district for a period
of one year. This may be operative from 1-8-2019.
Inventory has been submitted to the Central Pollution Control Board.
District Level Monitoring Committee (DLMC) constituted under the Chairmanship of District Collector, has informed to submit the District Environmental Plan. All District have submitted District Envrionmental Plan.
2.5
Order dated 25-4-2019 of the Hon’ble NGT in O.A.No.606/2018 on waste management
Para
48(a
)
Status of compliance of E-Waste Management Rules, 2016
in the respective areas
The State initiated action for the compliance
of EPR. The State has complied with Rule
18 on submission of annual report, and I in
the process of setting up a waste
processing unit which will become
operational in 2020 and land has been
allotted to Clean Kerala Company Limited.
Action is being taken for the implementation
88
22
of EPR in the State.
2.6
Order dated 25-4-2019 of the Hon’ble NGT in O.A.No.606/2018 on waste management Orders dated 12.04.2019 and 26.08.2019 in O.A no. 804/2017 in the matter of Rajiv Narayan & Anr. Vs. Union of India & Ors.
Para
48(a
) Status of compliance of Hazardous Management Rules,
2016 in the respective areas
The Chief Secretaries may look into the issue of capacity
building of the SPCB/PCCs to deal with the issue of
compliance of the rules.
All the Chief Secretary of the all States/UTs have to provide
compliance status report on implementation of
recommendation made by Monitoring Committee in its interim
report as well as final report to monitor of provisions of
Hazardous & Other Waste (Management and Transboundary
Movement) Rules 2016.
The State has complied with Rule 20(3).
82
Para
10
2.7
Order dated 25-4-2019 of the
Hon’ble NGT in O.A.No.606/2018
on waste management Para
48(a
) Status of Batteries Waste Management and Handling Rules,
2001
The State has complied with Rule.
2.8
Order dated 16-1-2019 in
O.A.No.606/2018 on waste
management Para
40 (
b)
Status of functioning of Committees constituted by this
order.
The State has complied with the order, and
formed a State Level Monitoring Committee
and District Level Monitoring Committee.
Field visits have been undertaken.
94
2.9.
Order dated 16-1-2019 in
O.A.No.606/2018
Order dated 20-9-2018 and 8-4-
Item (c) of para 40 of the order dated 16-1-2019 in O.A.No.606/2018 on polluted stretches.
As per order dated 20-9-2018 in O.A.No.673/2018 action plan is to be submitted for 21 polluted stretches
The implementation of Karamana river action plan has been reviewed by RRC.
Action plans for 20 Priority IV & V Polluted stretches were submitted in December 2018. Macroplans for 13 stretches were submitted
95
23
2019 in O.A.No.673/2018 on
polluted stretches.
Order dated 25-1-2019 in
O.A.No.581/2018 on river
Karamana.
Order dated 25-1-2019 in
O.A.No.582/2018 on river Tirur-
Ponnani.
Order dated 17-9-2019 in
O.A.No.829/2019
As per order dated 25-1-2019 in O.A.No.581/2018 directing the State to take remedial action on action plan. As per order dated 8-4-2019 in O.A. No. 673/2018 Karamana action plan was approved. As per order dated 25-1-2019 in O.A.No.582/2018 directing the State to prepare the action plan of Tirur-Ponnani within one month. The Tribunal is also considering the issue of remedying 351 identified polluted stretches.
in June 2019. Though the remaining exempted category is in an advanced state, as instructed by the Central Pollution Control Board, action plans were submitted for the remaining seven polluted stretches on 30-7-2019.The progress on the implementation of action plan is reviewed regularly.
The State requires three years for compliance.
Action Plan for Tirur – Ponnani submitted to
CPCB and Hon’ble NGT.
Action plan for priority river IV revised
submitted and approved.
2.10.
Order dated 16-1-2019 in
O.A.No.606/2018 P
ara
40 (
d)
Non attainment city on air quality
None of the cities in Kerala is included in the
Non-attainment cities. However, the action
plan to expand the ambient air-quality
monitoring network was submitted to CPCB.
Continuous Real-Time Monitoring is being
done in 8 locations.
101
Order dated 8-10-2018-Non-
attainment cities (OA
No.681/2018)
Para
15 (
i)
All the states with non-attainment cities must prepare
appropriate action plans within 2 months aimed at bringing
the standards of air quality within the prescribed norms within
6 months from the date of finalization of action plans.
24
2.11.
Order dated 16-1-2019 in
O.A.No.606/2018
Order dated 13-12-2018 in
O.A.No.1038/2018
Para
40 (
e)
As per order dated 13-12-2018 in O.A.No.1038/2018 SPCB is to finalize the time bound action plan with regard to identification of industrial clusters in accordance with the revised norms laid down by the CPCB. To restore environmental qualities within norms.
Greater Kochi was identified as critically polluted in 2009. The score was again calculated in 2011 and the Moratorium imposed on developmental activities in the Greater Kochi Area as CPA was lifted vide office memorandum No. J-11013/5/2010-1A II (I) dated 23.05.2011 by Ministry of Environment and Forest. Now the score has been reduced and now this area is identified as “Other Pollutant Stretches” only. However preparation of Action Plan for monitoring the Air Quality within the limit has been initiated.
105
2.12.
Order dated 16-1-2019 in
O.A.No.606/2018
Order dated 4-9-2018 in
O.A.No.173/2018 by Sudarsan
Das Vs. State of West Bengal and
others
Para
40 (
f)
Item (f) of para 40 of order dated 16-1-2019 in O.A.
No.606/2018
Not Applicable
105
2.13.
Order dated 16-1-2019 in
O.A.No.606/2018
Para
40 (
g)
Total amount collected from erring industries on the basis of
“Polluter Pays Principle” “Precautionary Principle and details
of utilization of funds collected.
15 Industries have been fined, INR 7.25 Crores have been collected. Direction issued to Thrissur Corporation for environmental compensation of Rs. 4.5 Crore. Land has been identified by the Corporation for the centralized plant. Notice issued to Thiruvananthapuram Corporation for giving environmental compensation of 14.59 crore. Land has been identified for the centralized plant at Vizhinjam. Tendering is being done.
105
25
Notice was also issued to Kochi Corporation, Municipalities namely Thrippunithura, Aluva, Angamaly, and Kalamassery and Maradu panchayath for taking steps to provide biomethanation plant for the food wastes generated. Direction issued to the three hospitals and to DMO and Urban Directorate and Panchayath in Idukki in OA 585/2018. Meeting conducted with DMO, Urban and Panchayath Directorate in May, 2020 and action is being taken for the implementation of the decisions.
Order dated 23-09-2019 in O.A.No. 585/2018
Para
14
As per order dated 23-09-2019 in O.A.No. 585/2018, directed the Chief Secretary, State of Kerala to look into matter along with Director of Urban Directorate and Panchayat Director and the respective Principal Secretaries at the State Level and take appropriate against those erring officers who are standing against of the Rules and delaying the implementation of rules so far.
2.14.
Order dated 16-1-2019 in
O.A.No.606/2018
Para
40 (
h)
Identification and development of Model Cities and Towns in
the State in the first phase which can be replicated late for
other cities and towns of the State
As in Sl. No. 2.1 above
8,28
2.15.
Order dated 16-1-2019 in
O.A.No.606/2018
Order dated 19-2-2019 in
O.A.No.593/2017
As per order dated 19-2-2019 in O.A.No.593/2017, Chief Secretaries may specially look into the subject of setting up and proper functioning of STPs/CETPs/ETPs in their respective jurisdiction. All the local bodies and or the concerned departments of the state government have to ensure 100% treatment of the
Non-functioning ETPs have been identified and further action has been initiated. The reports for the term up to November 2019 have been submitted. The Urban Directorate has been informed.
107
26
Order dated 28-8-2019 in
O.A.No.593/2017
generated sewage and in default to pay compensation which is to be recovered by the State/UTs, with effect from 01.04.2020. The Chief Secretaries of all the State/UTs may furnish their respective compliance report on this subject also in O.A.No.606/2018
2.16
Order dated 17-9-2019 in
O.A.No.829/2019
Order dated 29-11-2019 in
O.A.No.829/2019
The Tribunal has directed that no untreated sewage/industrial effluent be discharged into any water bodies (which include coastal waters). Any violation is to result in compensation starting from 01.02.2020 District Environment Plans to be prepared on coastal and marine pollution Direction to all SPCB of Costal state to give relevant information to CPCB within 1 month
Informed Urban Directorate
107
2.17
Order dated 26-9-2019 in OA.No. 360/2018
Par
a. 1
2
The Department of Environment of all States may collect such District Environment Plans of their respective states and finalize the State Environment Plan covering the specific thematic area in Para. 7 including the information as contained in Para-8 and template of model by CPCB, The action for preparation of State’s Environment Plan shall be
monitored by the respective Chief Secretaries of the State.
District Environmental Plan was submitted
by all districts. Action is being taken to
prepare State Environment Plan.
107
2.18 Order dated 10-5-2019 in OA No 325/2015
Par
a 1
3
All the States are directed to review the existing framework of restoration of all the water bodies by preparing an appropriate action plan. Such action plan may be submitted within three months and a report funished to the CPCB. The Chief Secretaries of all the State in the course of undertaking monitoring exercise in pursuance of order in OA 606/2018
1
st phase report submitted. Action initiated
for 2nd
phase including field monitoring.
108
27
Order dated 25-02-2020 in OA No 325/2015
Par
a .5
may also include restoration of water bodies. Information is to be provided by 31-03-2020 failing which compensation is to be paid. The Action plan should provide for commencement from 01.04.2020 and conclusion 31-03-2021
2.19
Order dated 05-11-2019 in O.A. No. 639/2018
The Hon’ble National Green Tribunal vide Order dated 05-11-2019 in O.A. No. 639/2018 directed that State Pollution Control Board may undertake capacity enhancement out of consent fund by procuring requisite equipments, setting up of modern labs and recruiting/engaging staff and experts. It is also directed that all vacancies must be filled up as already directed by NGT vide order dated 28-08-2019 I O.A. No. 95/2018 which may be ensured by the Chief Secretary.
The Board is working with 433 employees including 93 permanent employees. An amount of Rs.2.9 crore is incurred monthly towards salary and other expenses which are met from the consent fund. For permanent appointment, notification was issued on 26-12-2015 for appointment by Public Service Commission and rules notified on 14-11-2019. After getting sanction for the renewal of Kerala State Pollution Control Board Subordinate Service Rules, 1999, Government can make permanent appointment to the Board.
108
28
3. Status of compliance of order dated 25-4-2019 of the Hon’ble NGT in O.A.No. 606/2018 on model city/town/village
3.1 Background
The Government of Kerala vide G.O. (Rt.) No. 45/2019/Envt. dated 31-5-2019 selected three model cities,
three model towns and 42 model villages (3 each in 14 districts) in the State. The model cities are
Thiruvananthapuram, Thrissur and Kozhikode and three model towns are Attingal, Punalur and
Kunnamkulam. Workshops were convened to make them fully complied with environmental norms.
3.2 Present status
3.2.1. Constitution of Environment Monitoring Cell
Environment Monitoring Cell was formed vide G.O.(Rt)No.22/2020/Envt dated 27.02.2020.
3.2.2 Activities under Rule 22 of the Solid Waste Management Rules, 2016
(a) Rule 22(1) - Identification of suitable sites for setting up solid waste processing facilities (b) Rule 22(3)- Procurement of suitable sites for setting up solid waste processing facility and
sanitary landfill facilities
(c) Rule 22(7)- Setting up solid waste processing facilities by all local bodies having one lakh population or more population
(d) Rule 22(8)- Setting up solid waste processing facilities by local bodies and census town below 1 lakh population
Action taken -
Proposal for Co-incineration submitted by Malabar Cements, Palakkad
o Entrusted National Council for Cement and Building Materials (NCBM) to study and
prepare a technical proposal considering the various technical aspects with regards
to AFR/co-processing.
o NCBM submitted the proposal with multi-channel burner system which is not
presently practiced/established in the country and may affect the productivity and
smooth operations of the plant at increased thermal substitution rates
o The facilities for using liquid hazardous waste like used/spent oil on marginal scale
can also integrate after conforming the suitability
o The investment required for the same as per the Techno Economical Feasibility
Study (TEFS) for Co-processing of Alternate Fuel is around Rs. 44.62 Crore.
o Finance Department was asked to review the proposal from Malabar Cements
Limited in detail and to explore the possibility of allocating funds under MIDP scheme
to Malabar Cements Limited for modernizing the plant.
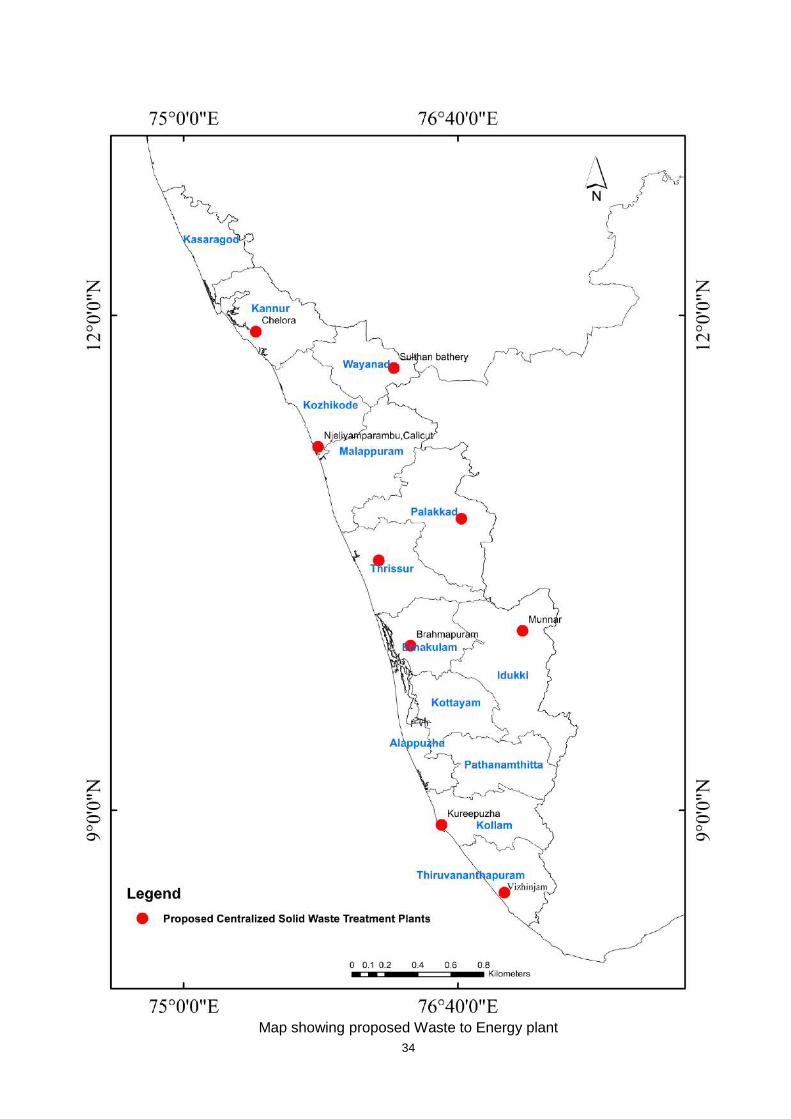
Sites for Waste to Energy plant identified are Kannur, Kozhikode, Palakkad, Thrissur,
Kochi, Kollam, Thiruvananthapuram, Malappuram, Munnar and Sulthan Bathery. Work
awarded for the plant at Kozhikode. The progress is given below:
29
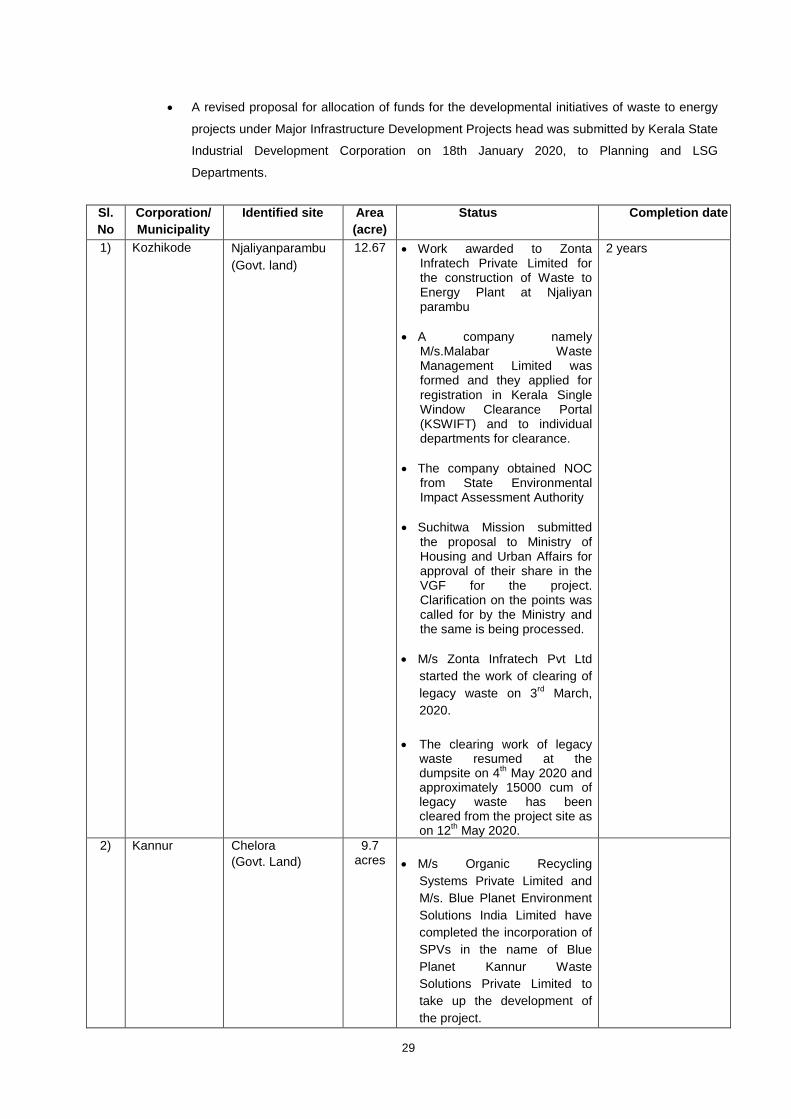
A revised proposal for allocation of funds for the developmental initiatives of waste to energy
projects under Major Infrastructure Development Projects head was submitted by Kerala State
Industrial Development Corporation on 18th January 2020, to Planning and LSG
Departments.
Sl.
No
Corporation/
Municipality
Identified site Area
(acre)
Status Completion date
1) Kozhikode Njaliyanparambu
(Govt. land)
12.67 Work awarded to Zonta Infratech Private Limited for the construction of Waste to Energy Plant at Njaliyan parambu
A company namely M/s.Malabar Waste Management Limited was formed and they applied for registration in Kerala Single Window Clearance Portal (KSWIFT) and to individual departments for clearance.
The company obtained NOC from State Environmental Impact Assessment Authority
Suchitwa Mission submitted the proposal to Ministry of Housing and Urban Affairs for approval of their share in the VGF for the project. Clarification on the points was called for by the Ministry and the same is being processed.
M/s Zonta Infratech Pvt Ltd
started the work of clearing of
legacy waste on 3rd
March,
2020.
The clearing work of legacy waste resumed at the dumpsite on 4
th May 2020 and
approximately 15000 cum of legacy waste has been cleared from the project site as on 12
th May 2020.
2 years
2) Kannur Chelora
(Govt. Land)
9.7 acres
M/s Organic Recycling
Systems Private Limited and
M/s. Blue Planet Environment
Solutions India Limited have
completed the incorporation of
SPVs in the name of Blue
Planet Kannur Waste
Solutions Private Limited to
take up the development of
the project.
30
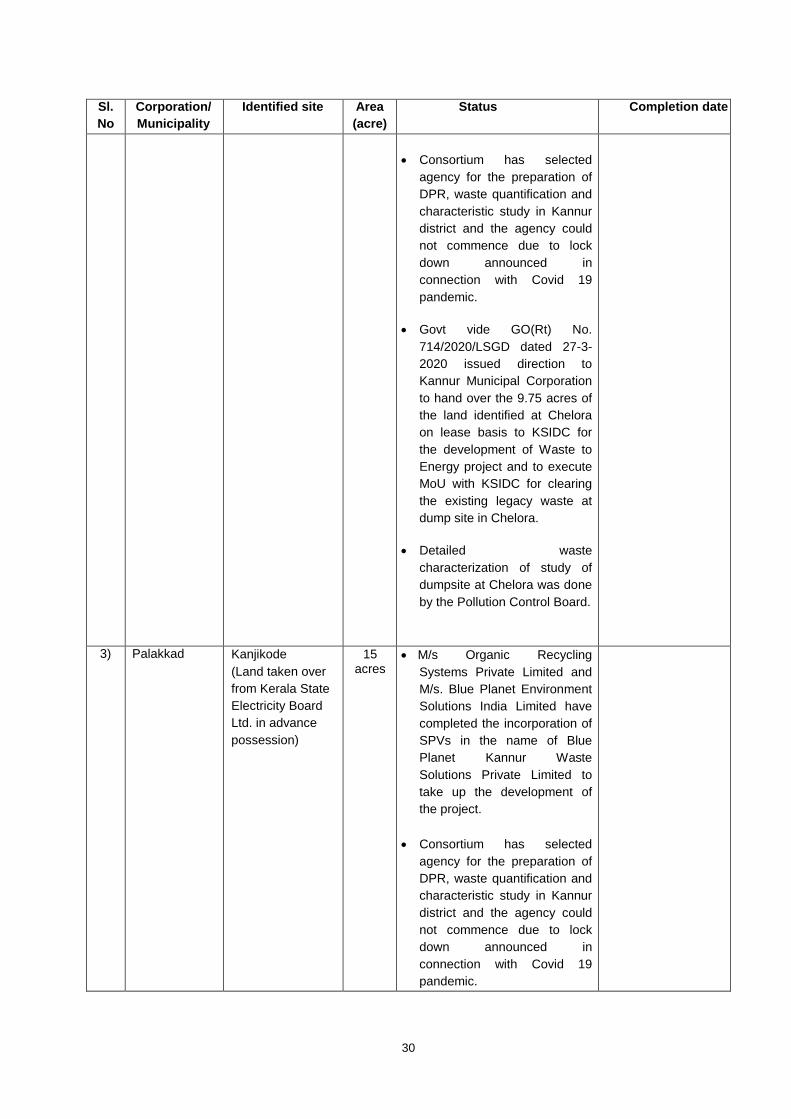
Sl.
No
Corporation/
Municipality
Identified site Area
(acre)
Status Completion date
Consortium has selected
agency for the preparation of
DPR, waste quantification and
characteristic study in Kannur
district and the agency could
not commence due to lock
down announced in
connection with Covid 19
pandemic.
Govt vide GO(Rt) No.
714/2020/LSGD dated 27-3-
2020 issued direction to
Kannur Municipal Corporation
to hand over the 9.75 acres of
the land identified at Chelora
on lease basis to KSIDC for
the development of Waste to
Energy project and to execute
MoU with KSIDC for clearing
the existing legacy waste at
dump site in Chelora.
Detailed waste
characterization of study of
dumpsite at Chelora was done
by the Pollution Control Board.
3) Palakkad Kanjikode
(Land taken over
from Kerala State
Electricity Board
Ltd. in advance
possession)
15 acres
M/s Organic Recycling
Systems Private Limited and
M/s. Blue Planet Environment
Solutions India Limited have
completed the incorporation of
SPVs in the name of Blue
Planet Kannur Waste
Solutions Private Limited to
take up the development of
the project.
Consortium has selected
agency for the preparation of
DPR, waste quantification and
characteristic study in Kannur
district and the agency could
not commence due to lock
down announced in
connection with Covid 19
pandemic.
31
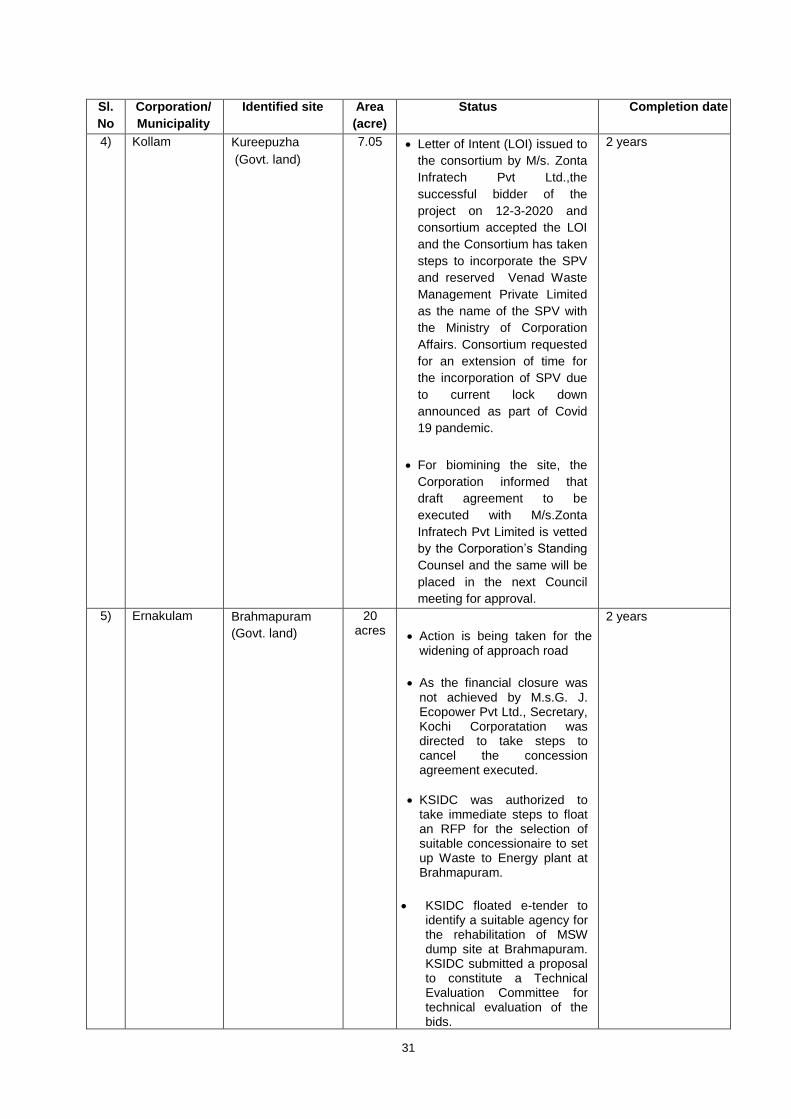
Sl.
No
Corporation/
Municipality
Identified site Area
(acre)
Status Completion date
4) Kollam Kureepuzha
(Govt. land)
7.05 Letter of Intent (LOI) issued to
the consortium by M/s. Zonta
Infratech Pvt Ltd.,the
successful bidder of the
project on 12-3-2020 and
consortium accepted the LOI
and the Consortium has taken
steps to incorporate the SPV
and reserved Venad Waste
Management Private Limited
as the name of the SPV with
the Ministry of Corporation
Affairs. Consortium requested
for an extension of time for
the incorporation of SPV due
to current lock down
announced as part of Covid
19 pandemic.
For biomining the site, the
Corporation informed that
draft agreement to be
executed with M/s.Zonta
Infratech Pvt Limited is vetted
by the Corporation’s Standing
Counsel and the same will be
placed in the next Council
meeting for approval.
2 years
5) Ernakulam Brahmapuram
(Govt. land)
20 acres
Action is being taken for the widening of approach road
As the financial closure was not achieved by M.s.G. J. Ecopower Pvt Ltd., Secretary, Kochi Corporatation was directed to take steps to cancel the concession agreement executed.
KSIDC was authorized to take immediate steps to float an RFP for the selection of suitable concessionaire to set up Waste to Energy plant at Brahmapuram.
KSIDC floated e-tender to
identify a suitable agency for the rehabilitation of MSW dump site at Brahmapuram. KSIDC submitted a proposal to constitute a Technical Evaluation Committee for technical evaluation of the bids.
2 years
32
Sl.
No
Corporation/
Municipality
Identified site Area
(acre)
Status Completion date
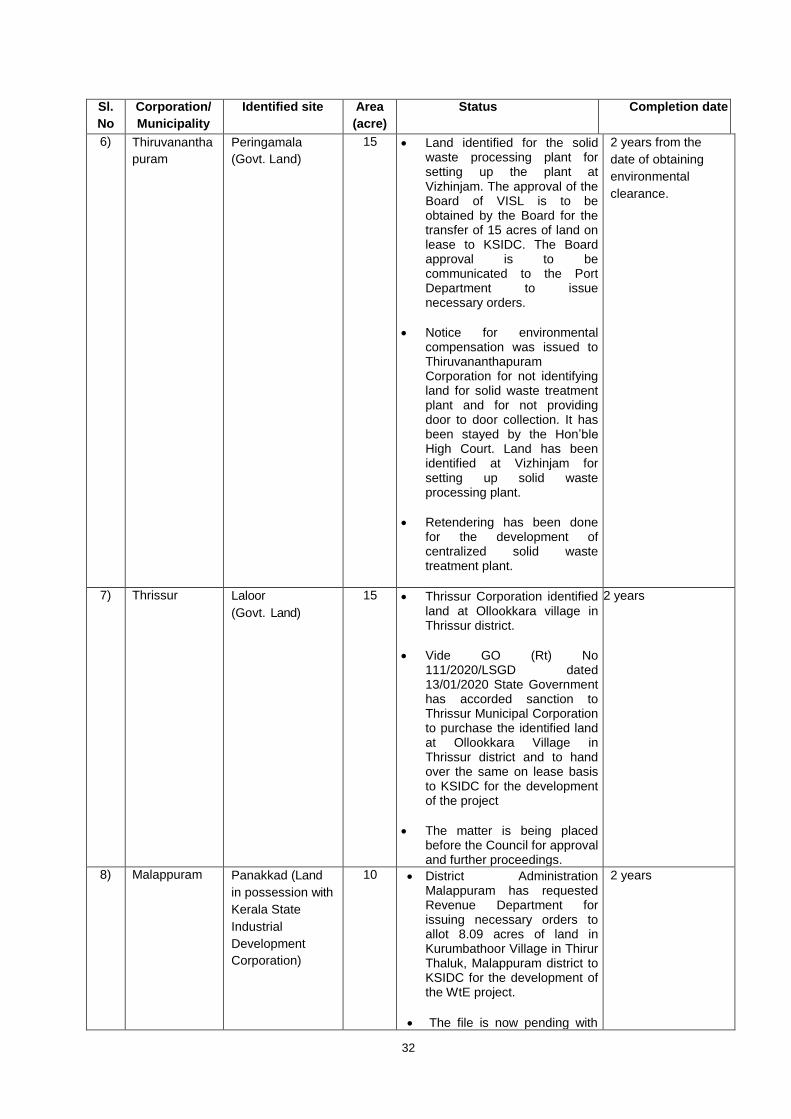
6) Thiruvanantha
puram
Peringamala
(Govt. Land)
15 Land identified for the solid waste processing plant for setting up the plant at Vizhinjam. The approval of the Board of VISL is to be obtained by the Board for the transfer of 15 acres of land on lease to KSIDC. The Board approval is to be communicated to the Port Department to issue necessary orders.
Notice for environmental compensation was issued to Thiruvananthapuram Corporation for not identifying land for solid waste treatment plant and for not providing door to door collection. It has been stayed by the Hon’ble High Court. Land has been identified at Vizhinjam for setting up solid waste processing plant.
Retendering has been done for the development of centralized solid waste treatment plant.
2 years from the
date of obtaining
environmental
clearance.
7) Thrissur Laloor
(Govt. Land)
15 Thrissur Corporation identified land at Ollookkara village in Thrissur district.
Vide GO (Rt) No 111/2020/LSGD dated 13/01/2020 State Government has accorded sanction to Thrissur Municipal Corporation to purchase the identified land at Ollookkara Village in Thrissur district and to hand over the same on lease basis to KSIDC for the development of the project
The matter is being placed before the Council for approval and further proceedings.
2 years
8) Malappuram Panakkad (Land
in possession with
Kerala State
Industrial
Development
Corporation)
10 District Administration Malappuram has requested Revenue Department for issuing necessary orders to allot 8.09 acres of land in Kurumbathoor Village in Thirur Thaluk, Malappuram district to KSIDC for the development of the WtE project.
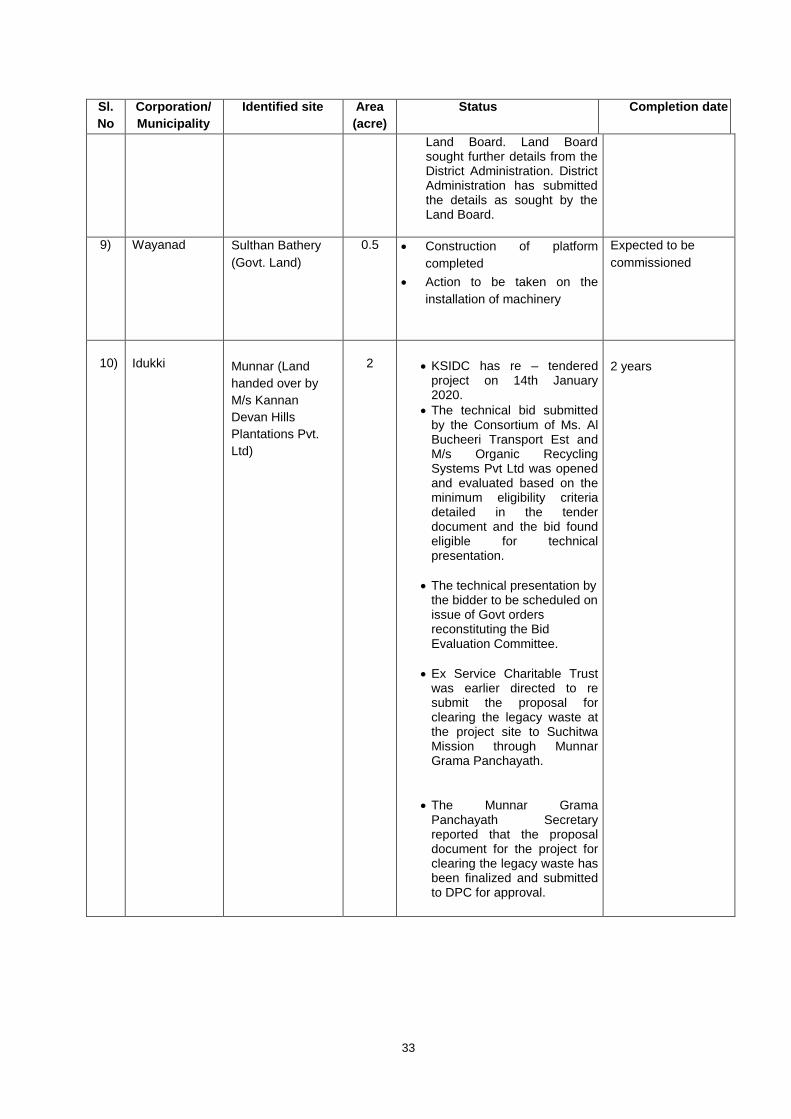
The file is now pending with
2 years
33
Sl.
No
Corporation/
Municipality
Identified site Area
(acre)
Status Completion date
Land Board. Land Board sought further details from the District Administration. District Administration has submitted the details as sought by the Land Board.
9) Wayanad Sulthan Bathery
(Govt. Land)
0.5 Construction of platform
completed
Action to be taken on the
installation of machinery
Expected to be
commissioned
10)
Idukki
Munnar (Land
handed over by
M/s Kannan
Devan Hills
Plantations Pvt.
Ltd)
2
KSIDC has re – tendered project on 14th January 2020.
The technical bid submitted by the Consortium of Ms. Al Bucheeri Transport Est and M/s Organic Recycling Systems Pvt Ltd was opened and evaluated based on the minimum eligibility criteria detailed in the tender document and the bid found eligible for technical presentation.
The technical presentation by the bidder to be scheduled on issue of Govt orders reconstituting the Bid Evaluation Committee.
Ex Service Charitable Trust was earlier directed to re submit the proposal for clearing the legacy waste at the project site to Suchitwa Mission through Munnar Grama Panchayath.
The Munnar Grama Panchayath Secretary reported that the proposal document for the project for clearing the legacy waste has been finalized and submitted to DPC for approval.
2 years
34
Map showing proposed Waste to Energy plant
35
e) Rule 22(2)- Identification of suitable sites for setting up common regional sanitary landfill facilities for suitable clusters of local authorities under 0.5 million population and for setting up common regional sanitary landfill facilities or stand alone sanitary landfill facilities by all local authorities having a population of 0.5 million or more
(f) Rule 22(3)- Procurement of suitable sites for setting up solid waste processing facility and
sanitary landfill facilities
Action is being taken for the procurement of suitable site at Thrissur and Thiruvananthapuram Corporation for setting up solid waste processing faciliities
Action is also being taken for the procurement of land of KINFRA at Ambalamedu, Ernakulam for the providing of landfill.
(g) Rule 22(9)-Setting up common or stand alone sanitary landfills by or for all local bodies having 5 lakh or more population for the disposal of only such residual wastes from the processing facilities as well s untreatable inert wastes as permitted under rules
Land has been identified at the site of FACT at Ambalamedu, Ernakulam for the sanitary landfill and action is being taken at the Government level for the takeover of the same.
(h) Rule 22(10)Setting up common or regional landfills by all localbodies and census town under 5 lakh for the disposal of permitted waste under the rules
Action has been initiated for providing secured landfill at Attingal.
(i) Rule 22(5) -Ensure Door to Door collection of segregated waste and its transportation in covered vehicles to processing or disposal facilities
(j) Rule 22(4) – Enforcing waste generators to practice segregation of biodegradable, recyclable,
combustible, sanitary waste, domestic hazardous and inert solid waste at source
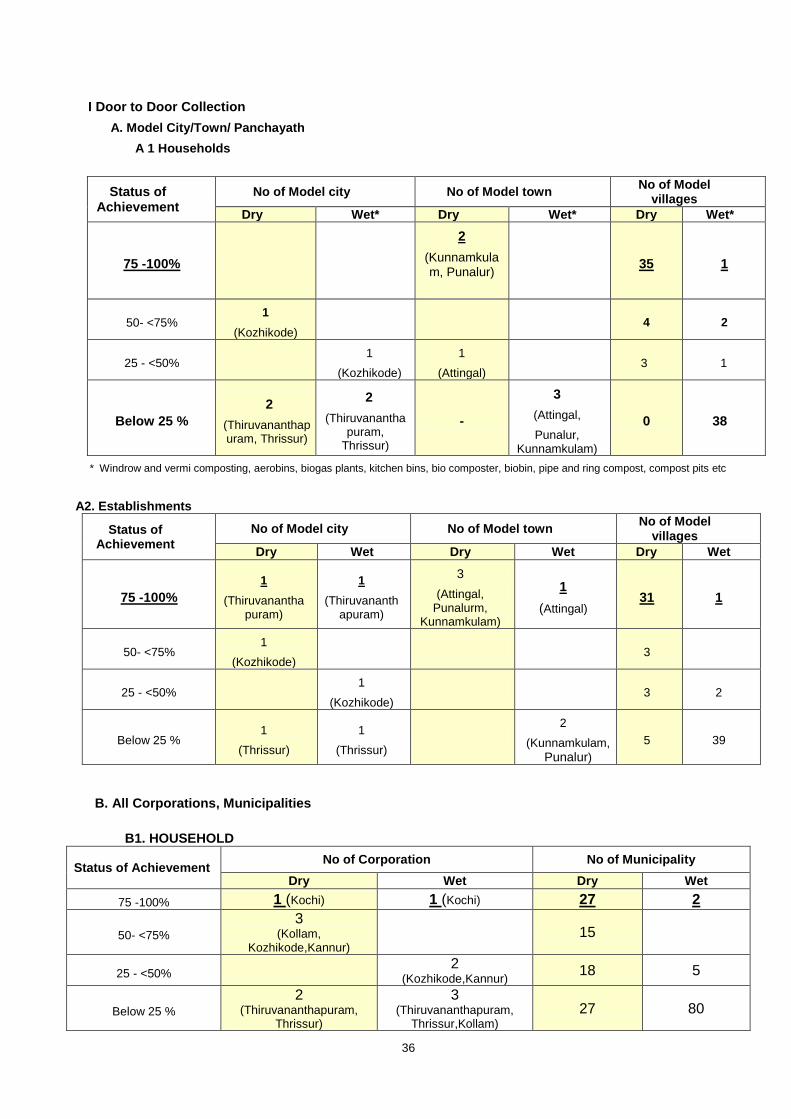
For the model city/town/villages, considerable progress has been achieved in providing door to
door facility for dry wastes in both households (81.5%) and establishments (73%). Detailed report is
submitted within Annexure 1.
Show cause notice for not levying Environmental Compensation of Rs. 14. 59 crore was issued to
the model city, Thiruvananthapuram Corporation having no considerable progress in the identification of
land and on door to door collection . A copy of show cause notice issued and its reply are submitted as
Annexure 2 and 3. However the Corporation approached the Hon’ble High Court and has been stayed
(Annexure 4). The case is pending with the Hon’ble High Court.The land has been identified for
centralized system at Vizhinjam, Thiruvananthapuram.
Direction was issued to Thrissur Corporation for remitting environmental compensation
(Annexure.5) and they also approached Hon’ble High Court and the Court in judgment dated 26-11-
2019 in WP (c) No. 30789 of 2019, directed to approach Hon’ble NGT within the stipulated time or to
implede in the case in NGT or both (Annexure 6). Then they submitted appeal before the High Court
(Annexure 7) and the Court stayed the notice and directed to have bond with Pollution Control Board
that arrears will be given as per the final order of the Court. However they identified land at Thrissur for
solid waste treatment plant and action is taken to procure land. Notice for not levying Environmental
Compensation of Rs. 1.12 Crore was issued to Kochi Corporation (Annexure 8).Notice for not levying
Environmental Compensation of Rs. 2.47 Crore issued to Kalamassery Municipality (Annexure 9).Land
has been identified for centralized system at Ollukkara, Thrissur.
36
I Door to Door Collection
A. Model City/Town/ Panchayath
A 1 Households
Status of Achievement
No of Model city No of Model town No of Model
villages
Dry Wet* Dry Wet* Dry Wet*
75 -100%
2
(Kunnamkulam, Punalur)
35 1
50- <75% 1
(Kozhikode) 4 2
25 - <50% 1
(Kozhikode)
1
(Attingal) 3 1
Below 25 %
2
(Thiruvananthapuram, Thrissur)
2
(Thiruvananthapuram,
Thrissur)
-
3
(Attingal,
Punalur, Kunnamkulam)
0 38
* Windrow and vermi composting, aerobins, biogas plants, kitchen bins, bio composter, biobin, pipe and ring compost, compost pits etc
A2. Establishments
Status of Achievement
No of Model city No of Model town No of Model
villages
Dry Wet Dry Wet Dry Wet
75 -100%
1
(Thiruvananthapuram)
1
(Thiruvananthapuram)
3
(Attingal, Punalurm,
Kunnamkulam)
1
(Attingal) 31 1
50- <75% 1
(Kozhikode) 3
25 - <50% 1
(Kozhikode) 3 2
Below 25 % 1
(Thrissur)
1
(Thrissur)
2
(Kunnamkulam,
Punalur)
5 39
B. All Corporations, Municipalities
B1. HOUSEHOLD
Status of Achievement No of Corporation No of Municipality
Dry Wet Dry Wet
75 -100% 1 (Kochi) 1 (Kochi) 27 2
50- <75%
3 (Kollam,
Kozhikode,Kannur)
15
25 - <50% 2 (Kozhikode,Kannur)
18 5
Below 25 %
2 (Thiruvananthapuram,
Thrissur)
3 (Thiruvananthapuram,
Thrissur,Kollam)
27 80
37
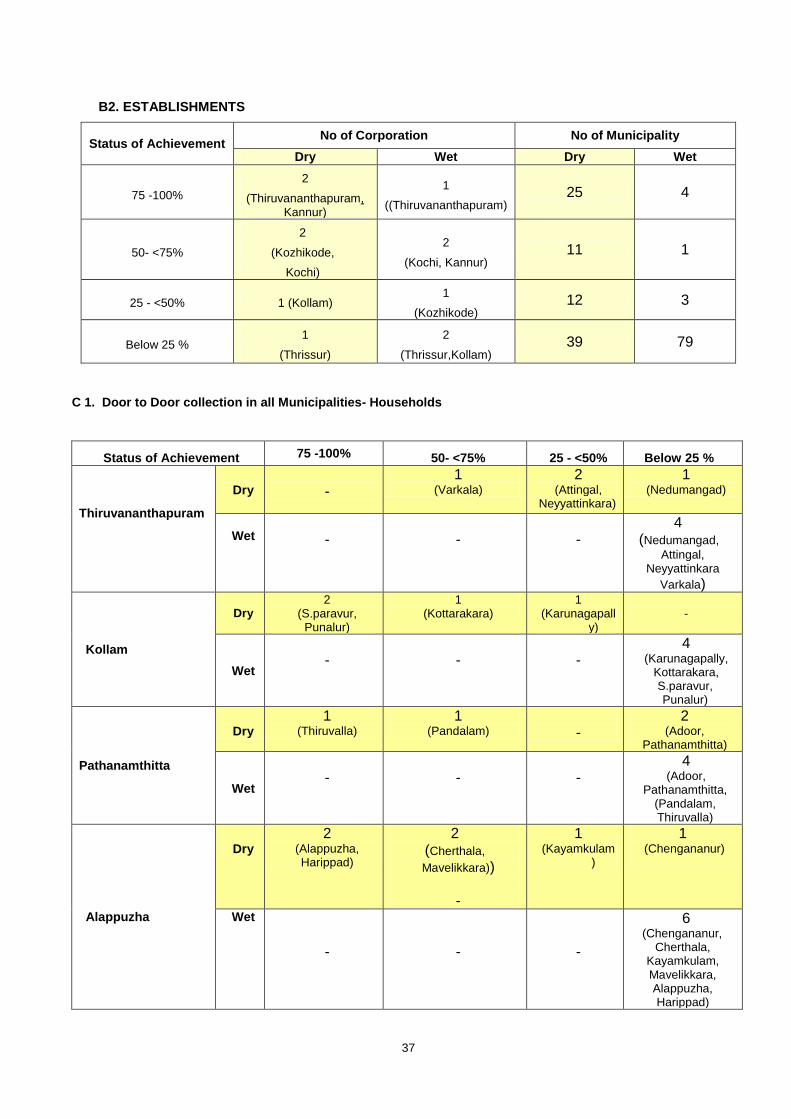
B2. ESTABLISHMENTS
Status of Achievement No of Corporation No of Municipality
Dry Wet Dry Wet
75 -100%
2
(Thiruvananthapuram, Kannur)
1
((Thiruvananthapuram) 25 4
50- <75%
2
(Kozhikode,
Kochi)
2
(Kochi, Kannur) 11 1
25 - <50% 1 (Kollam) 1
(Kozhikode) 12 3
Below 25 % 1
(Thrissur)
2
(Thrissur,Kollam) 39 79
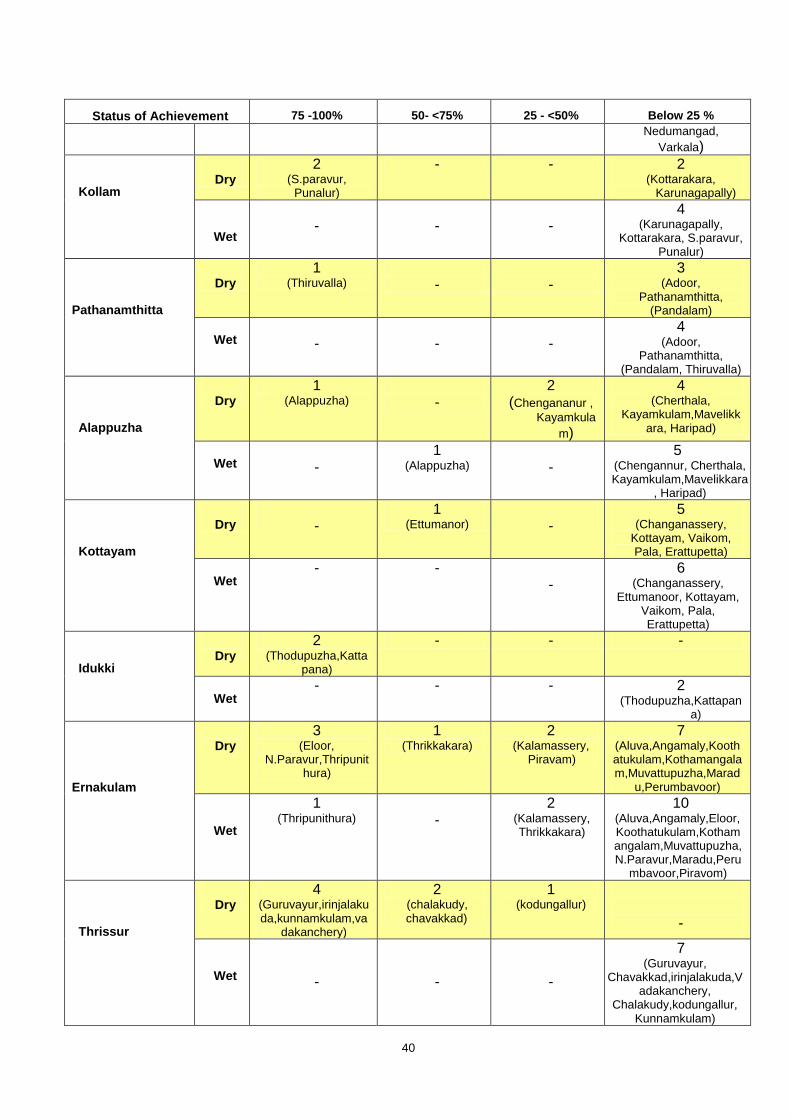
C 1. Door to Door collection in all Municipalities- Households
Status of Achievement 75 -100% 50- <75% 25 - <50% Below 25 %
Thiruvananthapuram
Dry
-
1 (Varkala)
2 (Attingal,
Neyyattinkara)
1 (Nedumangad)
Wet
-
-
-
4 (Nedumangad,
Attingal, Neyyattinkara
Varkala)
Kollam
Dry
2 (S.paravur,
Punalur)
1 (Kottarakara)
1 (Karunagapall
y)
-
Wet
-
-
-
4 (Karunagapally,
Kottarakara, S.paravur, Punalur)
Pathanamthitta
Dry
1 (Thiruvalla)
1 (Pandalam)
-
2 (Adoor,
Pathanamthitta)
Wet
-
-
-
4 (Adoor,
Pathanamthitta, (Pandalam, Thiruvalla)
Alappuzha
Dry
2 (Alappuzha, Harippad)
2 (Cherthala,
Mavelikkara)) -
1 (Kayamkulam
)
1 (Chengananur)
Wet -
-
-
6 (Chengananur,
Cherthala, Kayamkulam, Mavelikkara, Alappuzha, Harippad)
38
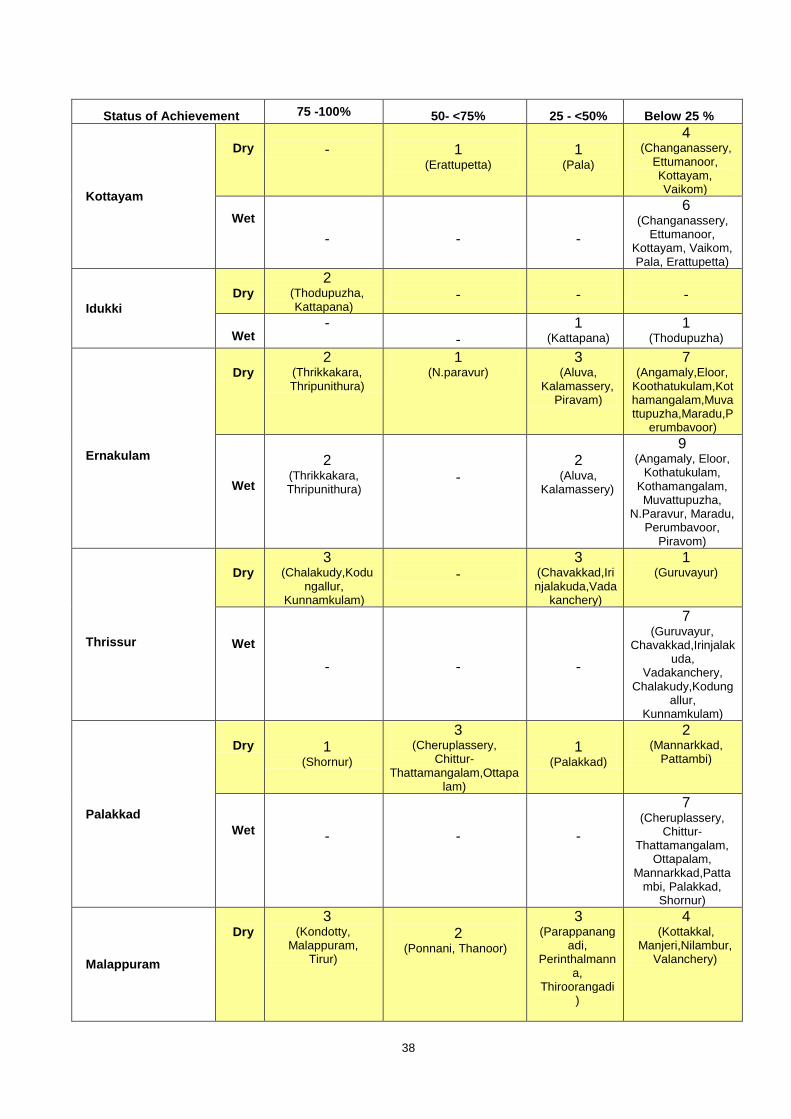
Status of Achievement 75 -100% 50- <75% 25 - <50% Below 25 %
Kottayam
Dry
-
1
(Erattupetta)
1
(Pala)
4 (Changanassery,
Ettumanoor, Kottayam, Vaikom)
Wet
-
-
-
6 (Changanassery,
Ettumanoor, Kottayam, Vaikom, Pala, Erattupetta)
Idukki
Dry
2 (Thodupuzha, Kattapana)
-
-
-
Wet
- -
1 (Kattapana)
1 (Thodupuzha)
Ernakulam
Dry
2 (Thrikkakara, Thripunithura)
1 (N.paravur)
3 (Aluva,
Kalamassery, Piravam)
7 (Angamaly,Eloor,
Koothatukulam,Kothamangalam,Muvattupuzha,Maradu,P
erumbavoor)
Wet
2
(Thrikkakara, Thripunithura)
-
2
(Aluva, Kalamassery)
9 (Angamaly, Eloor,
Kothatukulam, Kothamangalam, Muvattupuzha,
N.Paravur, Maradu, Perumbavoor,
Piravom)
Thrissur
Dry
3 (Chalakudy,Kodu
ngallur, Kunnamkulam)
-
3 (Chavakkad,Irinjalakuda,Vada
kanchery)
1 (Guruvayur)
Wet
-
-
-
7 (Guruvayur,
Chavakkad,Irinjalakuda,
Vadakanchery, Chalakudy,Kodung
allur, Kunnamkulam)
Palakkad
Dry
1
(Shornur)
3 (Cheruplassery,
Chittur-Thattamangalam,Ottapa
lam)
1
(Palakkad)
2 (Mannarkkad,
Pattambi)
Wet
-
-
-
7 (Cheruplassery,
Chittur-Thattamangalam,
Ottapalam, Mannarkkad,Patta
mbi, Palakkad, Shornur)
Malappuram
Dry
3 (Kondotty,
Malappuram, Tirur)
2
(Ponnani, Thanoor)
3 (Parappanang
adi, Perinthalmann
a, Thiroorangadi
)
4 (Kottakkal,
Manjeri,Nilambur,Valanchery)
39
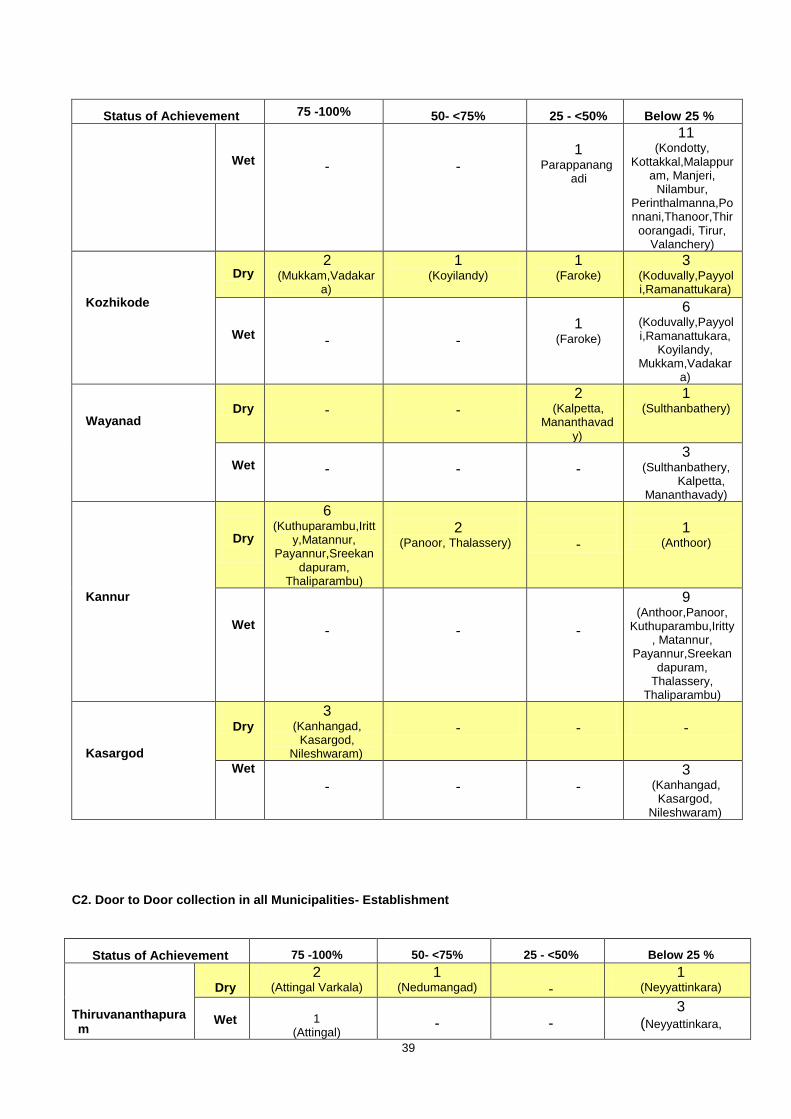
Status of Achievement 75 -100% 50- <75% 25 - <50% Below 25 %
Wet
-
-
1
Parappanangadi
11 (Kondotty,
Kottakkal,Malappuram, Manjeri,
Nilambur, Perinthalmanna,Ponnani,Thanoor,Thiroorangadi, Tirur,
Valanchery)
Kozhikode
Dry
2 (Mukkam,Vadakar
a)
1 (Koyilandy)
1 (Faroke)
3 (Koduvally,Payyoli,Ramanattukara)
Wet
-
-
1
(Faroke)
6 (Koduvally,Payyoli,Ramanattukara,
Koyilandy, Mukkam,Vadakar
a)
Wayanad
Dry
-
-
2 (Kalpetta,
Mananthavady)
1 (Sulthanbathery)
Wet
-
-
-
3 (Sulthanbathery,
Kalpetta, Mananthavady)
Kannur
Dry
6 (Kuthuparambu,Iritt
y,Matannur, Payannur,Sreekan
dapuram, Thaliparambu)
2
(Panoor, Thalassery)
-
1
(Anthoor)
Wet
-
-
-
9 (Anthoor,Panoor,
Kuthuparambu,Iritty, Matannur,
Payannur,Sreekandapuram,
Thalassery, Thaliparambu)
Kasargod
Dry
3 (Kanhangad,
Kasargod, Nileshwaram)
-
-
-
Wet -
-
-
3 (Kanhangad, Kasargod,
Nileshwaram)
C2. Door to Door collection in all Municipalities- Establishment
Status of Achievement 75 -100% 50- <75% 25 - <50% Below 25 %
Thiruvananthapuram
Dry
2 (Attingal Varkala)
1 (Nedumangad)
-
1 (Neyyattinkara)
Wet
1
(Attingal)
-
-
3 (Neyyattinkara,
40
Status of Achievement 75 -100% 50- <75% 25 - <50% Below 25 % Nedumangad,
Varkala) Kollam
Dry
2 (S.paravur,
Punalur)
- - 2 (Kottarakara,
Karunagapally)
Wet
-
-
-
4 (Karunagapally,
Kottarakara, S.paravur, Punalur)
Pathanamthitta
Dry
1 (Thiruvalla)
-
-
3 (Adoor,
Pathanamthitta, (Pandalam)
Wet
-
-
-
4 (Adoor,
Pathanamthitta, (Pandalam, Thiruvalla)
Alappuzha
Dry
1 (Alappuzha)
-
2 (Chengananur ,
Kayamkula
m)
4 (Cherthala,
Kayamkulam,Mavelikkara, Haripad)
Wet
-
1 (Alappuzha)
-
5 (Chengannur, Cherthala, Kayamkulam,Mavelikkara
, Haripad)
Kottayam
Dry
-
1 (Ettumanor)
-
5 (Changanassery,
Kottayam, Vaikom, Pala, Erattupetta)
Wet
- - -
6 (Changanassery,
Ettumanoor, Kottayam, Vaikom, Pala, Erattupetta)
Idukki
Dry
2 (Thodupuzha,Katta
pana)
- - -
Wet
- - - 2 (Thodupuzha,Kattapan
a)
Ernakulam
Dry
3 (Eloor,
N.Paravur,Thripunithura)
1 (Thrikkakara)
2 (Kalamassery,
Piravam)
7 (Aluva,Angamaly,Koothatukulam,Kothamangalam,Muvattupuzha,Marad
u,Perumbavoor)
Wet
1 (Thripunithura)
-
2 (Kalamassery, Thrikkakara)
10 (Aluva,Angamaly,Eloor,Koothatukulam,Kothamangalam,Muvattupuzha,N.Paravur,Maradu,Peru
mbavoor,Piravom)
Thrissur
Dry
4 (Guruvayur,irinjalakuda,kunnamkulam,va
dakanchery)
2 (chalakudy, chavakkad)
1 (kodungallur)
-
Wet
-
-
-
7 (Guruvayur,
Chavakkad,irinjalakuda,Vadakanchery,
Chalakudy,kodungallur, Kunnamkulam)
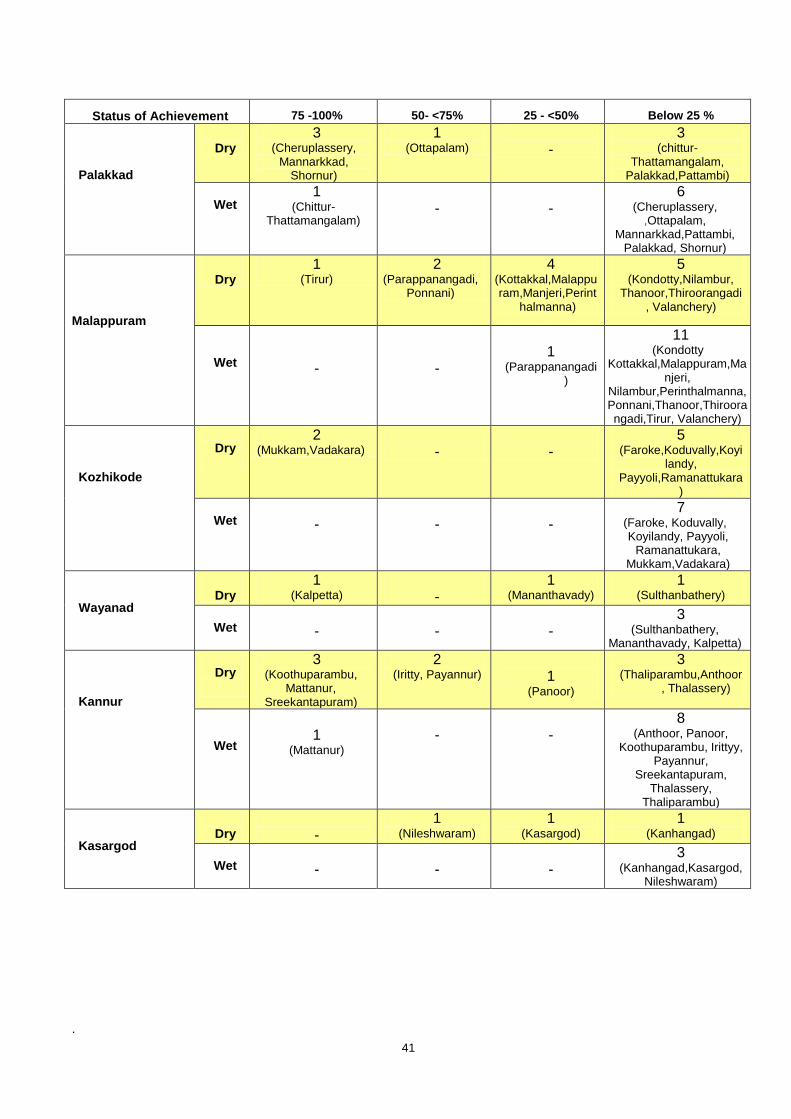
41
Status of Achievement 75 -100% 50- <75% 25 - <50% Below 25 % Palakkad
Dry
3 (Cheruplassery,
Mannarkkad, Shornur)
1 (Ottapalam)
-
3 (chittur-
Thattamangalam, Palakkad,Pattambi)
Wet
1 (Chittur-
Thattamangalam)
-
-
6 (Cheruplassery,
,Ottapalam, Mannarkkad,Pattambi,
Palakkad, Shornur)
Malappuram
Dry
1 (Tirur)
2 (Parappanangadi,
Ponnani)
4 (Kottakkal,Malappuram,Manjeri,Perint
halmanna)
5 (Kondotty,Nilambur,
Thanoor,Thiroorangadi, Valanchery)
Wet
-
-
1
(Parappanangadi)
11 (Kondotty
Kottakkal,Malappuram,Manjeri,
Nilambur,Perinthalmanna, Ponnani,Thanoor,Thiroorangadi,Tirur, Valanchery)
Kozhikode
Dry
2 (Mukkam,Vadakara)
-
-
5 (Faroke,Koduvally,Koyi
landy, Payyoli,Ramanattukara
)
Wet
-
-
-
7 (Faroke, Koduvally, Koyilandy, Payyoli,
Ramanattukara, Mukkam,Vadakara)
Wayanad
Dry
1 (Kalpetta)
-
1 (Mananthavady)
1 (Sulthanbathery)
Wet
-
-
-
3 (Sulthanbathery,
Mananthavady, Kalpetta)
Kannur
Dry
3 (Koothuparambu,
Mattanur, Sreekantapuram)
2 (Iritty, Payannur)
1
(Panoor)
3 (Thaliparambu,Anthoor
, Thalassery)
Wet
1
(Mattanur)
-
-
8 (Anthoor, Panoor,
Koothuparambu, Irittyy, Payannur,
Sreekantapuram, Thalassery,
Thaliparambu)
Kasargod
Dry
-
1 (Nileshwaram)
1 (Kasargod)
1 (Kanhangad)
Wet
-
-
-
3 (Kanhangad,Kasargod,
Nileshwaram)
.
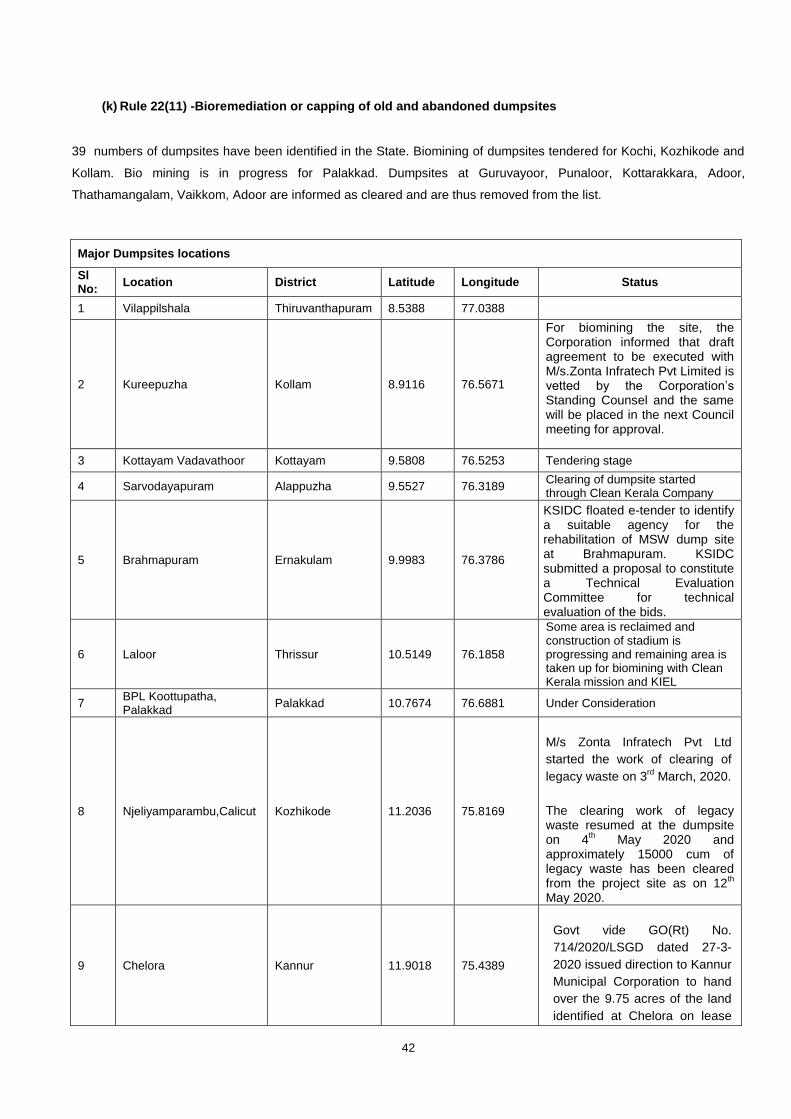
42
(k) Rule 22(11) -Bioremediation or capping of old and abandoned dumpsites
39 numbers of dumpsites have been identified in the State. Biomining of dumpsites tendered for Kochi, Kozhikode and
Kollam. Bio mining is in progress for Palakkad. Dumpsites at Guruvayoor, Punaloor, Kottarakkara, Adoor,
Thathamangalam, Vaikkom, Adoor are informed as cleared and are thus removed from the list.
Major Dumpsites locations
Sl No:
Location District Latitude Longitude Status
1 Vilappilshala Thiruvanthapuram 8.5388 77.0388
2 Kureepuzha Kollam 8.9116 76.5671
For biomining the site, the Corporation informed that draft agreement to be executed with M/s.Zonta Infratech Pvt Limited is vetted by the Corporation’s Standing Counsel and the same will be placed in the next Council meeting for approval.
3 Kottayam Vadavathoor Kottayam 9.5808 76.5253 Tendering stage
4 Sarvodayapuram Alappuzha 9.5527 76.3189 Clearing of dumpsite started through Clean Kerala Company
5 Brahmapuram Ernakulam 9.9983 76.3786
KSIDC floated e-tender to identify a suitable agency for the rehabilitation of MSW dump site at Brahmapuram. KSIDC submitted a proposal to constitute a Technical Evaluation Committee for technical evaluation of the bids.
6 Laloor Thrissur 10.5149 76.1858
Some area is reclaimed and construction of stadium is progressing and remaining area is taken up for biomining with Clean Kerala mission and KIEL
7 BPL Koottupatha, Palakkad
Palakkad 10.7674 76.6881 Under Consideration
8 Njeliyamparambu,Calicut Kozhikode 11.2036 75.8169
M/s Zonta Infratech Pvt Ltd
started the work of clearing of
legacy waste on 3rd
March, 2020.
The clearing work of legacy waste resumed at the dumpsite on 4
th May 2020 and
approximately 15000 cum of legacy waste has been cleared from the project site as on 12
th
May 2020.
9 Chelora Kannur 11.9018 75.4389
Govt vide GO(Rt) No.
714/2020/LSGD dated 27-3-
2020 issued direction to Kannur
Municipal Corporation to hand
over the 9.75 acres of the land
identified at Chelora on lease
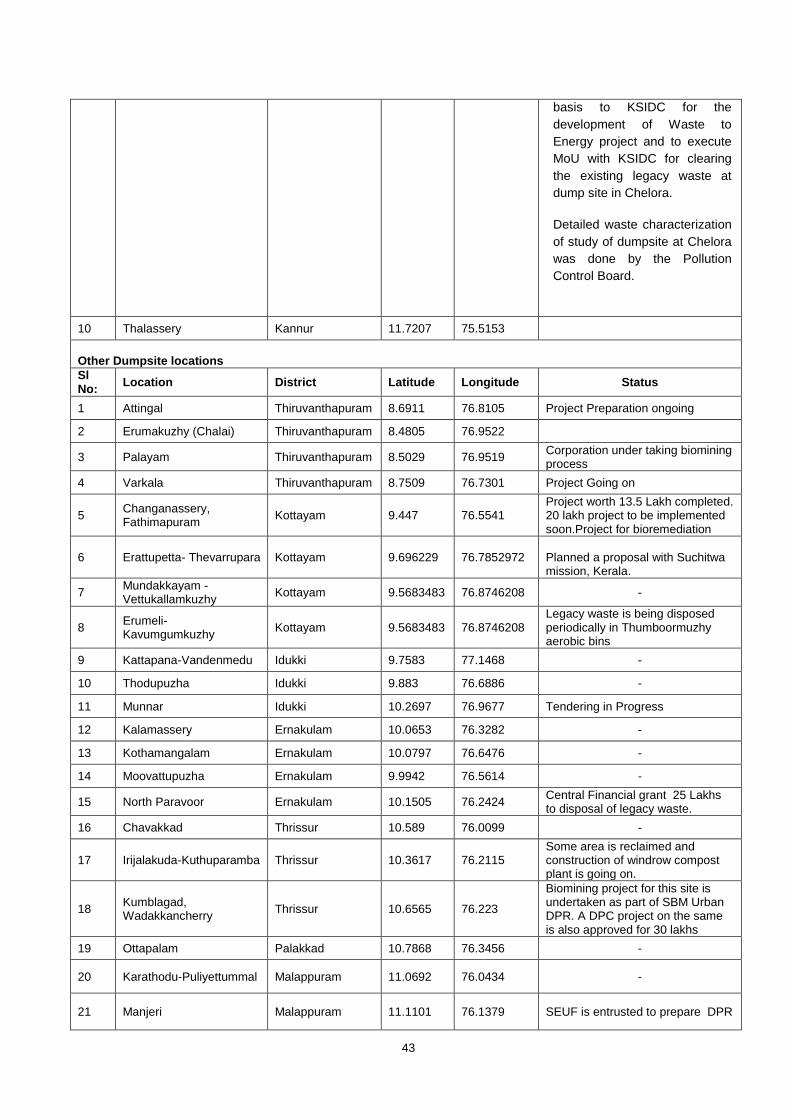
43
basis to KSIDC for the
development of Waste to
Energy project and to execute
MoU with KSIDC for clearing
the existing legacy waste at
dump site in Chelora.
Detailed waste characterization
of study of dumpsite at Chelora
was done by the Pollution
Control Board.
10 Thalassery Kannur 11.7207 75.5153
Other Dumpsite locations
Sl No:
Location District Latitude Longitude Status
1 Attingal Thiruvanthapuram 8.6911 76.8105 Project Preparation ongoing
2 Erumakuzhy (Chalai) Thiruvanthapuram 8.4805 76.9522
3 Palayam Thiruvanthapuram 8.5029 76.9519 Corporation under taking biomining process
4 Varkala Thiruvanthapuram 8.7509 76.7301 Project Going on
5 Changanassery, Fathimapuram
Kottayam 9.447 76.5541 Project worth 13.5 Lakh completed. 20 lakh project to be implemented soon.Project for bioremediation
6 Erattupetta- Thevarrupara Kottayam 9.696229 76.7852972 Planned a proposal with Suchitwa mission, Kerala.
7 Mundakkayam -Vettukallamkuzhy
Kottayam 9.5683483 76.8746208 -
8 Erumeli- Kavumgumkuzhy
Kottayam 9.5683483 76.8746208 Legacy waste is being disposed periodically in Thumboormuzhy aerobic bins
9 Kattapana-Vandenmedu Idukki 9.7583 77.1468 -
10 Thodupuzha Idukki 9.883 76.6886 -
11 Munnar Idukki 10.2697 76.9677 Tendering in Progress
12 Kalamassery Ernakulam 10.0653 76.3282 -
13 Kothamangalam Ernakulam 10.0797 76.6476 -
14 Moovattupuzha Ernakulam 9.9942 76.5614 -
15 North Paravoor Ernakulam 10.1505 76.2424 Central Financial grant 25 Lakhs to disposal of legacy waste.
16 Chavakkad Thrissur 10.589 76.0099 -
17 Irijalakuda-Kuthuparamba Thrissur 10.3617 76.2115 Some area is reclaimed and construction of windrow compost plant is going on.
18 Kumblagad, Wadakkancherry
Thrissur 10.6565 76.223
Biomining project for this site is undertaken as part of SBM Urban DPR. A DPC project on the same is also approved for 30 lakhs
19 Ottapalam Palakkad 10.7868 76.3456 -
20 Karathodu-Puliyettummal Malappuram 11.0692 76.0434 -
21 Manjeri Malappuram 11.1101 76.1379 SEUF is entrusted to prepare DPR
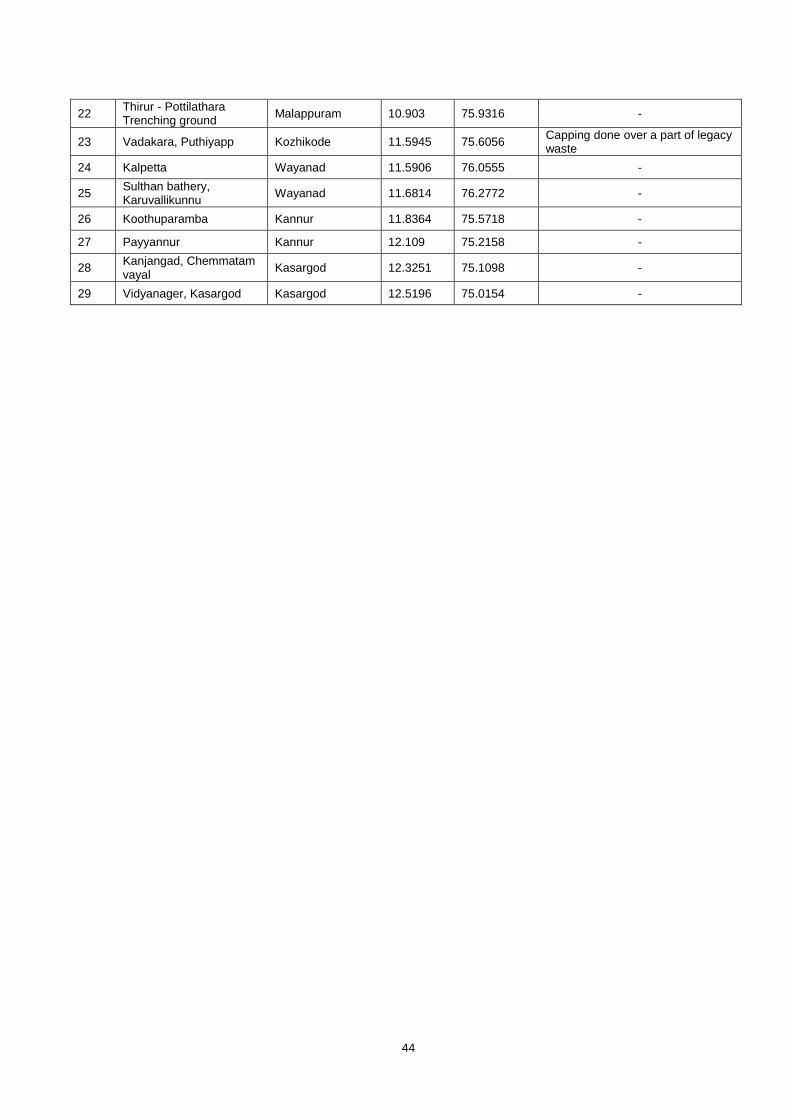
44
22 Thirur - Pottilathara Trenching ground
Malappuram 10.903 75.9316 -
23 Vadakara, Puthiyapp Kozhikode 11.5945 75.6056 Capping done over a part of legacy waste
24 Kalpetta Wayanad 11.5906 76.0555 -
25 Sulthan bathery, Karuvallikunnu
Wayanad 11.6814 76.2772 -
26 Koothuparamba Kannur 11.8364 75.5718 -
27 Payyannur Kannur 12.109 75.2158 -
28 Kanjangad, Chemmatam vayal
Kasargod 12.3251 75.1098 -
29 Vidyanager, Kasargod Kasargod 12.5196 75.0154 -
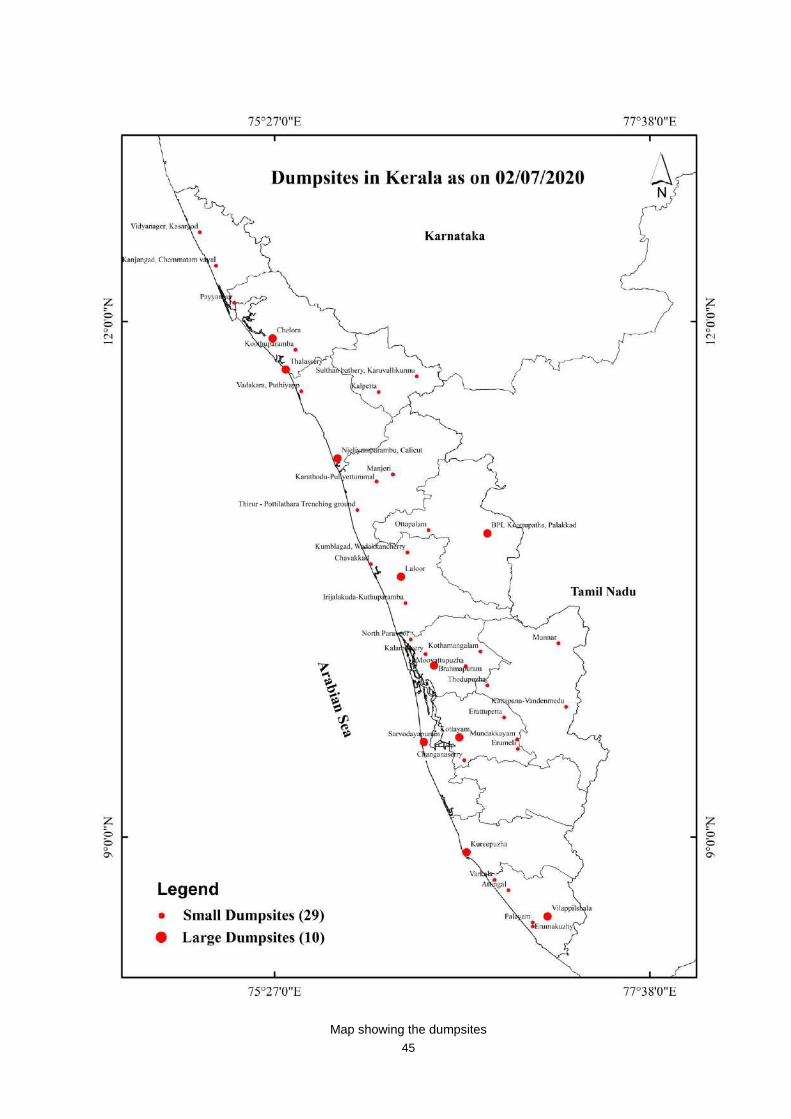
45
Map showing the dumpsites
46
3.2.2 Ban on single use plastic
Government have imposed a complete ban on the manufacture, storage, transport, and sale of single use
plastic items in the State with effect from 1-1-2020 vide G.O.(Rt) No. 128/2019/ENVT dated 31-12-2019
(Annexure10).
Alternative materials that can be used as a substitute for the banned single use plastic has been issued vide
G.O. (Rt.) No.02/2020/Envt. dated 27-01-2020 (Annexure11)
Surprise checking has been conducted by the officials of Pollution Control Board, Local bodies and District
Collectorate and action taken against/charged fine 36 numbers of violators.
Workshop was conducted on 13-02-2020 for the awareness of “Identification of Single Use Plastics
Products by Simple Methods, Alternatives & Compostable Products” by Kerala State Pollution Control
Board, CIPET and NIIST to the stakeholders. The programme is also arranged on 24-02-2020 and 26-02-
2020 at Ernakulum and Kozhikode.
3.2.3 Extended Producer Responsibility under Solid Waste Management Rules
For the implementation of the producer responsibility as per Solid Waste Management Rules, 2016 and Plastic Waste
Management Rules, 2016, Kerala State convened National level seminar on 12-6-2019. A hearing of brand owners was
conducted on 07-12-2019 and evolved proposal for the implementation of EPR and is under the consideration of the
Government. The financial assistance by brand owners/producers/manufacturers/importers can be remitted in the EPR
fund and this fund can be utilized for meeting to the extent possible cost of door-to-door collection. A copy of the proposal
is submitted herewith as Annexure12.
3.2.4 Other good initiatives
Rendering plant for the wastes from chicken stalls is functioning in Kozhikode. The main
feature of this facility is the storage of chicken wastes in refrigerators in chicken stall and transportation in
refrigerated vehicle and thereby preventing the emanation of bad odour during transportation. Chicken stall
having agreement with the rendering plant shall only be issued consent from the Board. It is reported that Rs.
50,000 has been given by the company to the local body.
Collection and disposal of unused medicines from houses were initiated by Chemists and Druggist
Association and Drugs Controller (PROUD programme) in Thiruvananthapuram Corporation. Around 200 bins
were provided in front of medical shops in Thiruvananthapuram Corporation. The first load of collected waste of
5T has been flagged off from Thiruvananthapuram to biomedical waste treatment facility on 1-10-2019. Action is
being taken to have this collection programme in other parts of the State. The scope for getting fund from
manufacturers, producers and brand owners as per EPR is also looked into.
47
3.3 Waste quantification as per the report of Suchitwa Mission
Kerala generates about 10,044TPD of municipal solid wastes; 14% by 6 city Corporations, 45% by Municipalities
and 41% generated by 941 Grama Panchayaths, 49% of the waste is generated in households; 36% in institutions and
15% in way sides and public places. 7734 TPD of waste is putrescible in nature, 1808 TPD is non-biodegradable and
502TPD is inert. Non biodegradables wastes include 603TPD of paper, 402TPD of plastic, 100TPD of metals, 100TPD of
glass, 200 TPD of rubber and leather and 40TPD of domestic hazardous waste. Currently 3494 TPD, out of total
7734TPD (45%) of biodegradable waste is treated in households, institutions and community level. This works out to be
45% of the biodegradable waste generated in the State. Projects for installation of 13,09,478 household level composting
or bio-methanation units will increase the waste treatment capacity to 71%(i.e. 5491 TPD). The non-biodegradable waste
is collected from sources and temporarily stored in material collection facility (MCF). There are 658 operational MCF in
Grama panchayaths and 179 operational MCFs in ULBs.
Segregation of waste is practiced in 75% urban local bodies and 66% Grama panchayths. 87 ULBs out
of total 93 ULBs and 620 GPs, out of 941 GPs are practicing segregation at source. The segregation is
ensured as the Local Governments are engaging Haritha Karma Sena (HKSs) for Door-to-Door
collection of segregated non-biodegradable waste. HKS is a micro-enterprise group formed and trained
by the State Poverty Eradication Mission namely Kudumbasree, which collects the segregated waste by
charging a user fee. In the initial stages of operation, the HKS is given validity Gap Fund for one year as
per the rate fixed by the State Government.
About 150 schools in Thiruvananthapuram district have installed sanitary napkin incinerator by the
Hindustan Life care Systems. 18 ULBs have proposed to install 420 sanitary napkin incinerators at a
total cost of Rs. 1.34 Crore.
Government proposes to establish C&D waste management facility for which fund is earmarked under
the budget provision for 2-19-20. It is proposed to establish the facility in collaboration with major
stakeholders for management of construction and demolition waste, such as building materials, debris,
rubbles resulting from construction, re-modelling, repair and demolition of any civil structure. Preliminary
discussions have been held with Swatch Bharath Mission (Urban) in the Ministry of Housing and Urban
Affairs, Government of India for technical support.
Government through the Suchitwa Mission has initiated enlistment and registration of all types of scrap
dealers in the state to promote recycling. Around 2000 scrap dealers and rag pickers have been
registered so far in district wise and their address and contact details are uploaded in the website of
Suchitwa Mission. It is estimated that about 50% of recyclable materials are handled by the scrap
dealers in the State.
Government has enlisted 3 accredited agencies and 64 service providers for providing technical
services for installation of various tools.
Government have constituted Haritha Kerala Mission to enable the local authorities to pursue integrated
action for environmental degradation of the State linking with waste management, compost generation,
organic cultivation, water conservation etc.
Government have made it mandatory to provision 10% and 15% of the plan fund received respectively
by rural and urban local government for waste management.
Government is also providing additional fund required for improving infrastructure for waste
management as well as awareness and capacity builing.
In 2019-2020, the Urban Local Government earmarked Rs. 178.48 Crore and Rural Local Government
earmarked Rs.316.44 Crore for sanitation and waste management. In addition Rs. 75 Crore had been
48
provided under State scheme and Rs. 182.93 Crore had been provided under Centre-State Scheme
namely Swachh Bharath Mission.
Government have constituted Clean Kerala Company to provide waste management services,
especially in the management of plastic and other recyclables, e-waste and operation and maintenance
of resource recovery facilities established by the Urban Local Government and Block panchayaths.
Site available for recovery and recycling facility have been notified by Kerala State Industrial
Development Corporation and Kerala Industrial Infrastructure development Corporation. Vide G. O.
(M.S) No. 6/2019/Envt dated 27-11-2010 has issued direction to earmark 5% area for recycling and
recovery in industrial parks.
Capacity building programs are organized through Kerala Institute of Local Administration to give
training to stake holders.
Aerobic composting and bio-methanation plants are established and operated at 410 tons
biodegradable waste per day. Centralized composting plants are operational in 14 locations which also
treat market waste on day to day basis.
Aerobic composting or biomethanation facility is installed in about 4.64 lakh houses, 31075 institutions
and 2151 community places. In addition about 30 lakh households are composting their waste in
composting pits. Sanction has been given for installation of 13,09, 478 household level composting
facilities. In addition 23 ULBs have set up centralized composting plants among which the plants include
Brahmapuram plant of capacity 220 TPD at Kochi and at Kozhikode of capacity 100TPD. The rest of the
plants have capacity varying from 1 to 10 TPD and of which only 10 are functional. 4090 TPD out of
total 7762 TPDof biodegradable waste is treated at households, institutions and community level. This
works out to be 53% of the biodegradable waste generated in the State.
There are 658 operational MCFs in Grama Panchayaths and 179 operational MCFs in ULBs. The non
biodegradable waste stored in MCF are transferred to Resource Recovery facility(RRF) for final
segreagation and recycling.it is proposed to establish 263 RRFs all over the Sate by providing at least
one RRF in each block panchayath and Municipality and for each in each city Corporation. All RRFs
are provided with plastic shredding units and bailing units. Some of the RRFs are also equipped to
recycle plastic materials.
The Clean Kerala Company Limited is entrusted to collect the non-biodegradable waste from MCF and
operate the RRF. From 2016 onwards. the Clean Kerala Company have supplied 665 T of shredded
plastic for mixing with bitumen. 360 T of shredded plastics are consumed for road making in Local Self
Government Institutions and 315 T by the PWD.
49
4. Status of implementation of Solid Waste Management Rules, 2016 4.1 Background
The Government of Kerala has taken efforts to implement the Solid Waste Management Rules, 2016 in the State.
There are 6 Corporations, 87 Municipalities and 941 GPs in the State. The Kerala State Pollution Control Board
(KPSCB) issued repeated directions to all local bodies to ensure compliance of the Solid Waste Management
Rules, 2016. 3831.6 TPD of solid waste is generated from the cities and towns. The Government of Kerala
constituted a State Level Advisory Committee on Waste Management chaired by the Chief Secretary; this
Committee has conducted 36 meetings, till date, for monitoring solid waste management on monthly basis.
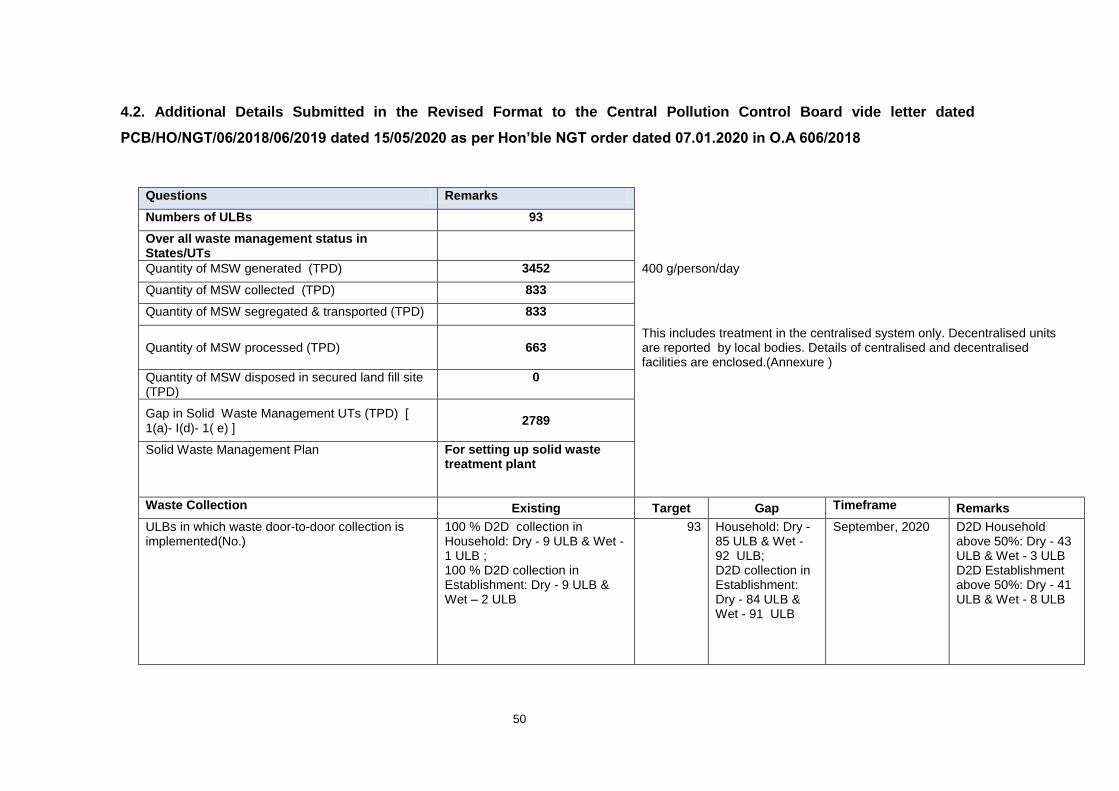
50
4.2. Additional Details Submitted in the Revised Format to the Central Pollution Control Board vide letter dated
PCB/HO/NGT/06/2018/06/2019 dated 15/05/2020 as per Hon’ble NGT order dated 07.01.2020 in O.A 606/2018
Questions Remarks
Numbers of ULBs 93
Over all waste management status in States/UTs
Quantity of MSW generated (TPD) 3452 400 g/person/day
Quantity of MSW collected (TPD) 833
Quantity of MSW segregated & transported (TPD) 833
Quantity of MSW processed (TPD) 663 This includes treatment in the centralised system only. Decentralised units are reported by local bodies. Details of centralised and decentralised facilities are enclosed.(Annexure )
Quantity of MSW disposed in secured land fill site (TPD)
0
Gap in Solid Waste Management UTs (TPD) [ 1(a)- I(d)- 1( e) ]
2789
Solid Waste Management Plan For setting up solid waste treatment plant
Waste Collection Existing Target Gap Timeframe Remarks
ULBs in which waste door-to-door collection is implemented(No.)
100 % D2D collection in Household: Dry - 9 ULB & Wet - 1 ULB ; 100 % D2D collection in Establishment: Dry - 9 ULB & Wet – 2 ULB
93 Household: Dry - 85 ULB & Wet - 92 ULB; D2D collection in Establishment: Dry - 84 ULB & Wet - 91 ULB
September, 2020 D2D Household above 50%: Dry - 43 ULB & Wet - 3 ULB D2D Establishment above 50%: Dry - 41 ULB & Wet - 8 ULB

51
ULBs in which segregation of waste is implemented (No.)
100 % D2D collection in Household: Dry - 8 ULB & Wet - 1 ; 100 % D2D collection in Establishment: Dry - 9 ULB & Wet - 2
93 Household: Dry - 85 ULB & Wet - 92 ULB; D2D collection in Establishment: Dry - 84 ULB & Wet - 91 ULB
September, 2020
ULBs in which transportation of segregeted waste is implemented (No.)
12 93 81
Waste Processing
Material Recovery facilities
Total Capacity (TPD) 2700 September, 2020
Number 151 264 113 September, 2020 Details from Suchitwa Mission as on Feb 2020
Number of ULBs covered 56 93 37 September, 2020
Recycling
Total Capacity (TPD) List enclosed Annexure.3 0 0
Number 214 0 0
Number of ULBs covered List enclosed Annexure.3 0 0
Composting
Total Capacity (TPD) 420.59 September, 2020
Number 47 93 46 September, 2020
Number of ULBs covered 47 93 46 September, 2020
Biomethanation
Total Capacity (TPD) 103.15 September, 2020
Number 12 September, 2020
Number of ULBs covered 12 0 September, 2020
RDF
Total Capacity (TPD) 9 9 2 Years
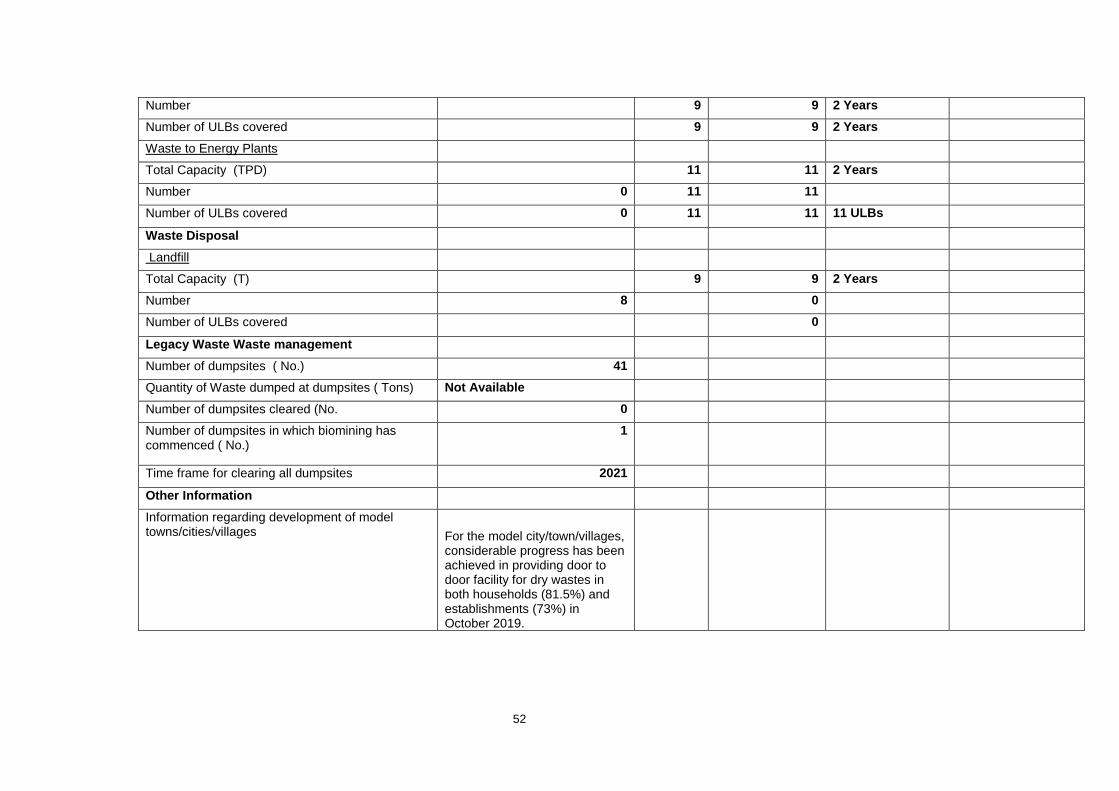
52
Number 9 9 2 Years
Number of ULBs covered 9 9 2 Years
Waste to Energy Plants
Total Capacity (TPD) 11 11 2 Years
Number 0 11 11
Number of ULBs covered 0 11 11 11 ULBs
Waste Disposal
Landfill
Total Capacity (T) 9 9 2 Years
Number 8 0
Number of ULBs covered 0
Legacy Waste Waste management
Number of dumpsites ( No.) 41
Quantity of Waste dumped at dumpsites ( Tons) Not Available
Number of dumpsites cleared (No. 0
Number of dumpsites in which biomining has commenced ( No.)
1
Time frame for clearing all dumpsites 2021
Other Information
Information regarding development of model towns/cities/villages For the model city/town/villages,
considerable progress has been achieved in providing door to door facility for dry wastes in both households (81.5%) and establishments (73%) in October 2019.

53
Creation of Environmental cell The Chief Secretary convenes the meeting of State Level Advisoy Committee (SLAC) on Solid waste management monthly. The progress in waste to energy plant is reviewed during the meeting. 36 nos of meeting had been conducted so far.The District Collector, Secretaries of local bodies, Pollution Control Board, Kerala State Industrial Development Corporation are the participants for the meeting.
Standardization of rates for procurement of services/equipment (to do away with the tendering process) required for solid waste management
Kerala State Industrial Development Corporation is dealing with the teneing for installation of waste management system in the State and is monthly reviewed by the Chief Secretary
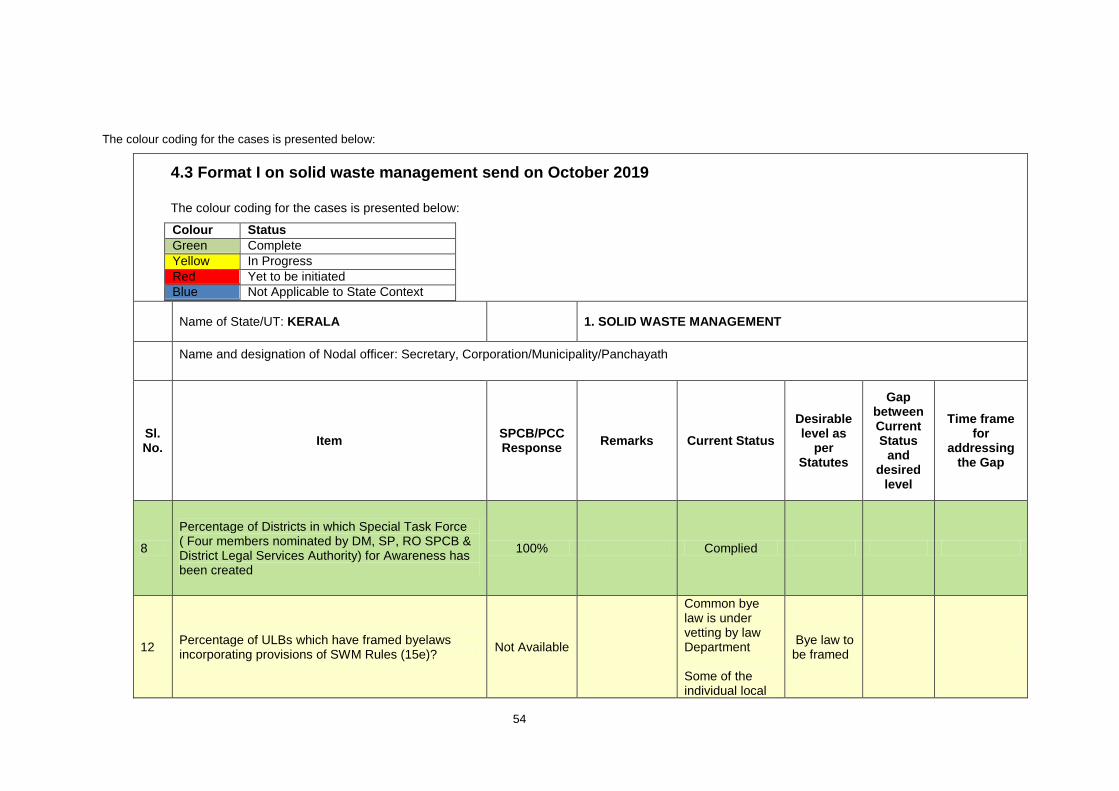
54
The colour coding for the cases is presented below:
4.3 Format I on solid waste management send on October 2019
The colour coding for the cases is presented below:
Colour Status
Green Complete
Yellow In Progress
Red Yet to be initiated
Blue Not Applicable to State Context
Name of State/UT: KERALA 1. SOLID WASTE MANAGEMENT
Name and designation of Nodal officer: Secretary, Corporation/Municipality/Panchayath
Sl. No.
Item SPCB/PCC Response
Remarks Current Status
Desirable level as
per Statutes
Gap between Current Status
and desired
level
Time frame for
addressing the Gap
8
Percentage of Districts in which Special Task Force ( Four members nominated by DM, SP, RO SPCB & District Legal Services Authority) for Awareness has been created
100% Complied
12 Percentage of ULBs which have framed byelaws incorporating provisions of SWM Rules (15e)?
Not Available
Common bye law is under vetting by law Department Some of the individual local
Bye law to be framed
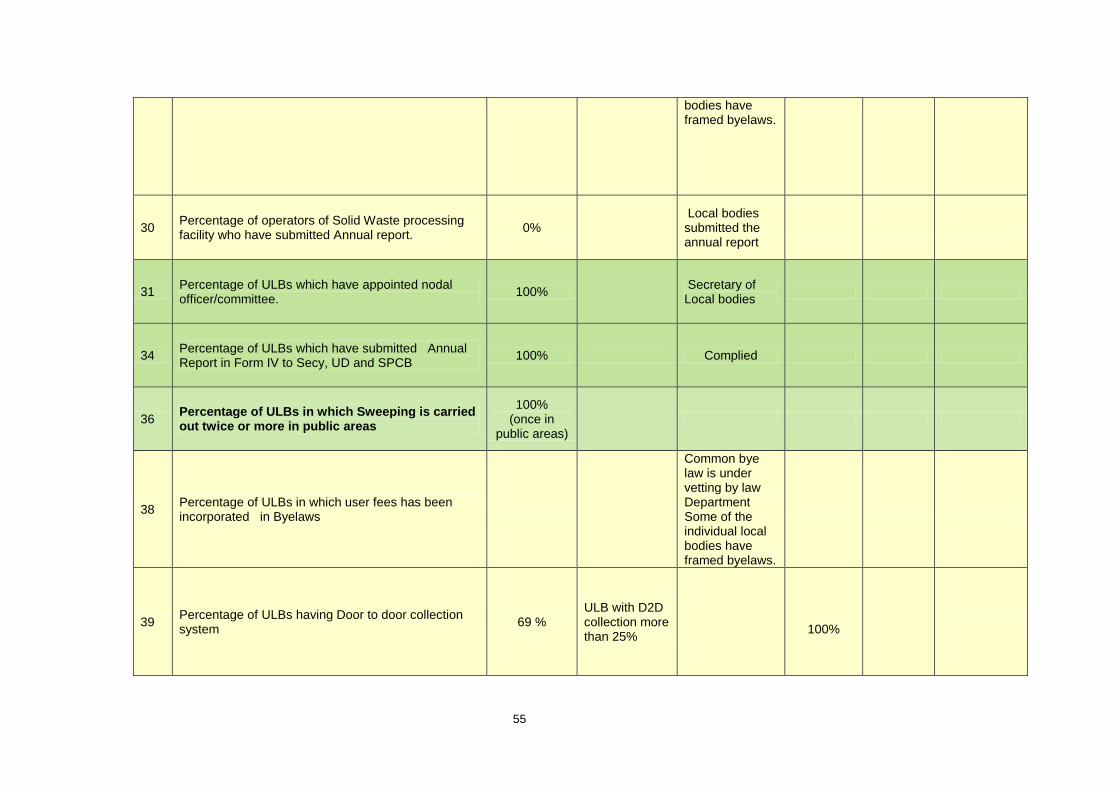
55
bodies have framed byelaws.
30 Percentage of operators of Solid Waste processing facility who have submitted Annual report.
0%
Local bodies submitted the annual report
31 Percentage of ULBs which have appointed nodal officer/committee.
100%
Secretary of Local bodies
34 Percentage of ULBs which have submitted Annual Report in Form IV to Secy, UD and SPCB
100% Complied
36 Percentage of ULBs in which Sweeping is carried out twice or more in public areas
100% (once in
public areas)
38 Percentage of ULBs in which user fees has been incorporated in Byelaws
Common bye law is under vetting by law Department Some of the individual local bodies have framed byelaws.
39 Percentage of ULBs having Door to door collection system
69 % ULB with D2D collection more than 25%
100%
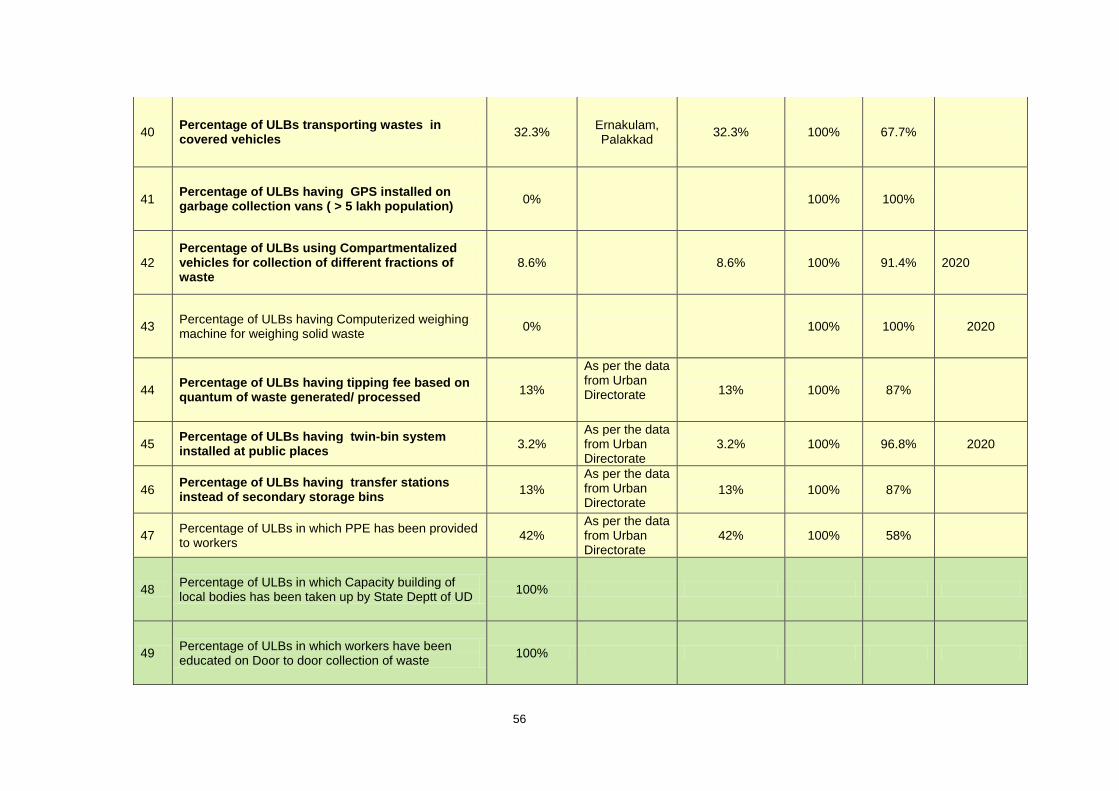
56
40 Percentage of ULBs transporting wastes in covered vehicles
32.3% Ernakulam, Palakkad
32.3% 100% 67.7%
41 Percentage of ULBs having GPS installed on garbage collection vans ( > 5 lakh population)
0%
100% 100%
42 Percentage of ULBs using Compartmentalized vehicles for collection of different fractions of waste
8.6%
8.6% 100% 91.4% 2020
43 Percentage of ULBs having Computerized weighing machine for weighing solid waste
0%
100% 100% 2020
44 Percentage of ULBs having tipping fee based on quantum of waste generated/ processed
13%
As per the data from Urban Directorate 13% 100% 87%
45 Percentage of ULBs having twin-bin system installed at public places
3.2% As per the data from Urban Directorate
3.2% 100% 96.8% 2020
46 Percentage of ULBs having transfer stations instead of secondary storage bins
13%
As per the data from Urban Directorate
13% 100% 87%
47 Percentage of ULBs in which PPE has been provided to workers
42% As per the data from Urban Directorate
42% 100% 58%
48 Percentage of ULBs in which Capacity building of local bodies has been taken up by State Deptt of UD
100%
49 Percentage of ULBs in which workers have been educated on Door to door collection of waste
100%
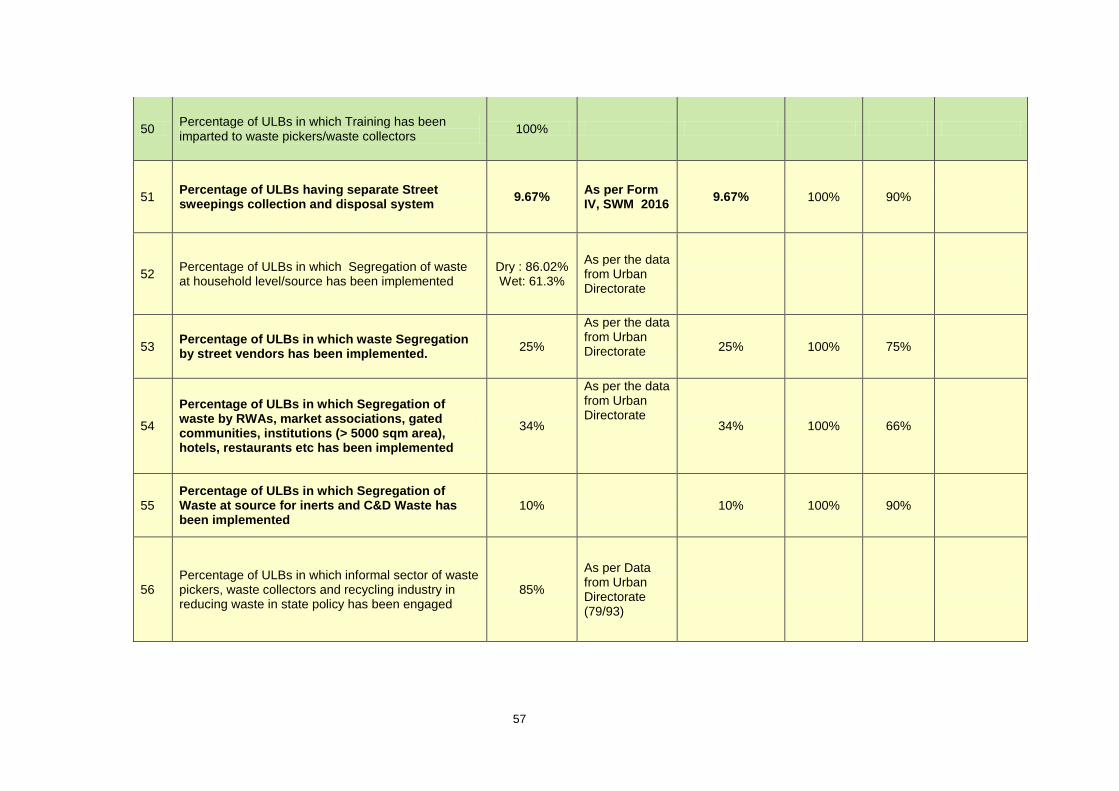
57
50 Percentage of ULBs in which Training has been imparted to waste pickers/waste collectors
100%
51 Percentage of ULBs having separate Street sweepings collection and disposal system
9.67% As per Form IV, SWM 2016
9.67% 100% 90%
52 Percentage of ULBs in which Segregation of waste at household level/source has been implemented
Dry : 86.02% Wet: 61.3%
As per the data from Urban Directorate
53 Percentage of ULBs in which waste Segregation by street vendors has been implemented.
25%
As per the data from Urban Directorate 25% 100% 75%
54
Percentage of ULBs in which Segregation of waste by RWAs, market associations, gated communities, institutions (> 5000 sqm area), hotels, restaurants etc has been implemented
34%
As per the data from Urban Directorate
34% 100% 66%
55 Percentage of ULBs in which Segregation of Waste at source for inerts and C&D Waste has been implemented
10% 10% 100% 90%
56 Percentage of ULBs in which informal sector of waste pickers, waste collectors and recycling industry in reducing waste in state policy has been engaged
85%
As per Data from Urban Directorate (79/93)
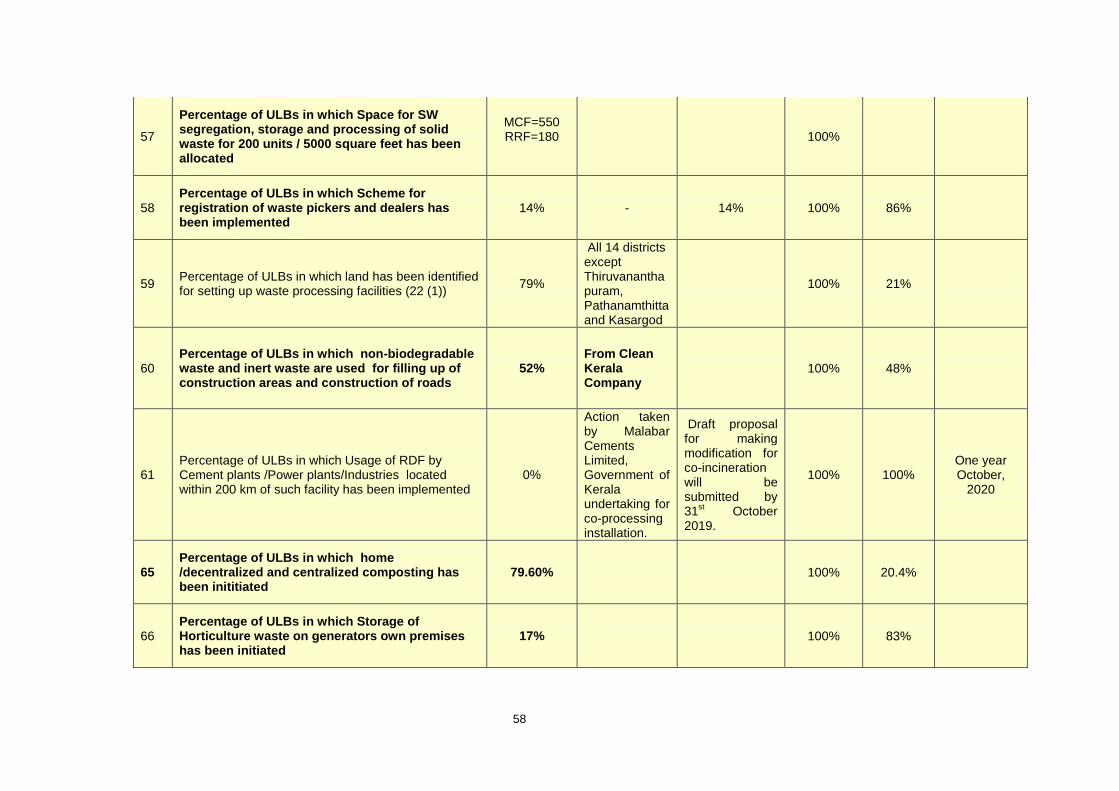
58
57
Percentage of ULBs in which Space for SW segregation, storage and processing of solid waste for 200 units / 5000 square feet has been allocated
MCF=550 RRF=180
100%
58 Percentage of ULBs in which Scheme for registration of waste pickers and dealers has been implemented
14% - 14% 100% 86%
59 Percentage of ULBs in which land has been identified for setting up waste processing facilities (22 (1))
79%
All 14 districts except Thiruvananthapuram, Pathanamthitta and Kasargod
100% 21%
60 Percentage of ULBs in which non-biodegradable waste and inert waste are used for filling up of construction areas and construction of roads
52% From Clean Kerala Company
100% 48%
61 Percentage of ULBs in which Usage of RDF by Cement plants /Power plants/Industries located within 200 km of such facility has been implemented
0%
Action taken by Malabar Cements Limited, Government of Kerala undertaking for co-processing installation.
Draft proposal for making modification for co-incineration will be submitted by 31
st October
2019.
100% 100% One year October,
2020
65 Percentage of ULBs in which home /decentralized and centralized composting has been inititiated
79.60% 100% 20.4%
66 Percentage of ULBs in which Storage of Horticulture waste on generators own premises has been initiated
17% 100% 83%
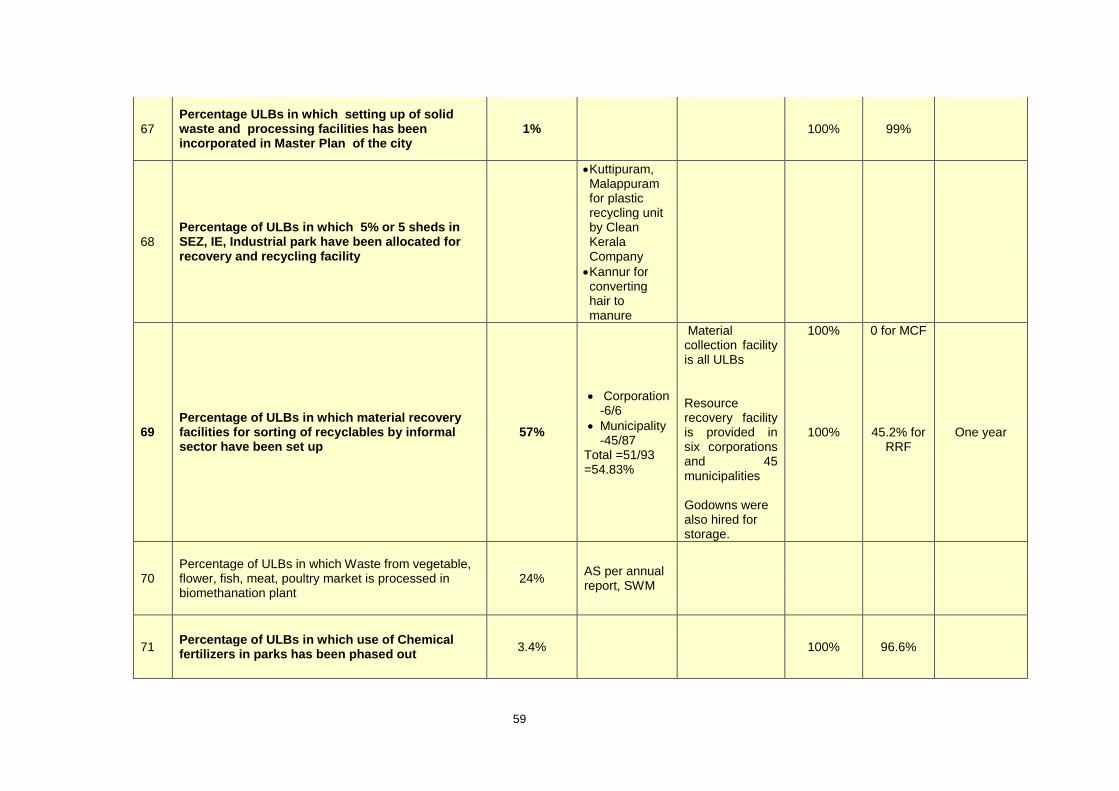
59
67 Percentage ULBs in which setting up of solid waste and processing facilities has been incorporated in Master Plan of the city
1%
100% 99%
68 Percentage of ULBs in which 5% or 5 sheds in SEZ, IE, Industrial park have been allocated for recovery and recycling facility
Kuttipuram, Malappuram for plastic recycling unit by Clean Kerala Company
Kannur for converting hair to manure
69 Percentage of ULBs in which material recovery facilities for sorting of recyclables by informal sector have been set up
57%
Corporation-6/6
Municipality-45/87
Total =51/93 =54.83%
Material collection facility is all ULBs Resource recovery facility is provided in six corporations and 45 municipalities Godowns were also hired for storage.
100%
100%
0 for MCF
45.2% for RRF
One year
70 Percentage of ULBs in which Waste from vegetable, flower, fish, meat, poultry market is processed in biomethanation plant
24% AS per annual report, SWM
71 Percentage of ULBs in which use of Chemical fertilizers in parks has been phased out
3.4% 100% 96.6%

60
72 Percentage /Number of Waste processing based on Waste to Energy/RDF
Seven 77%
Land identified at seven places. Land to be identified in Thiruvananthapuram and Thrissur
Brahmapuram, Ernakulam and work will be started
Kozhikode, DPR submitted by the company.
Palakkad and Kannur –bidding
Kollam, Munnar-retendering
Sulthan bathery, Wayanad- installation of machinery to be done
100% 23% 2020
73 Percentage of Waste processing units based on Composting/Biomethanation
28%
100% 72%
77 Percentage of ULBs in which Biodegradable waste is sent to compost/biomethanation plant
79.50%
Brahmapuram, Attingal, North Paravur, Kumaly, Kattappana
79.50% 100% 20.5%

61
78 Percentage of ULBs in which non-biodegradable wastes is sent to MRF/ Secondary storage facility
100%
54.8%
Corporation-6/6
Municipality-45/87
Total =51/93 =54.83%
Material collection facility is all ULBs Resource recovery facility is provided in six corporations and 45 municipalities Godowns were also hired for storage.
100% 100%
0 for MCF
45.2% for RRF
79 Percentage of W to E plants having Facilities for segregation of waste prior to processing of waste in W to E Plants
0%
Land for WtE plant is identified at 7 places.
Brahmapuram, Ernakulam and work will be started
Kozhikode, DPR submitted by the company.
Palakkad and Kannur –bidding
Kollam, Munnar-retendering
100% 100% Two years
80 Percentage increase in number of Authorizations granted
80%
1 No in 2017-2018, 5 Nos in 2018-2019
81 Percentage of ULBs displaying data related to functioning of plant and its adherence to prescribed parameters displayed on ULB's website
0% - - 100% 100%
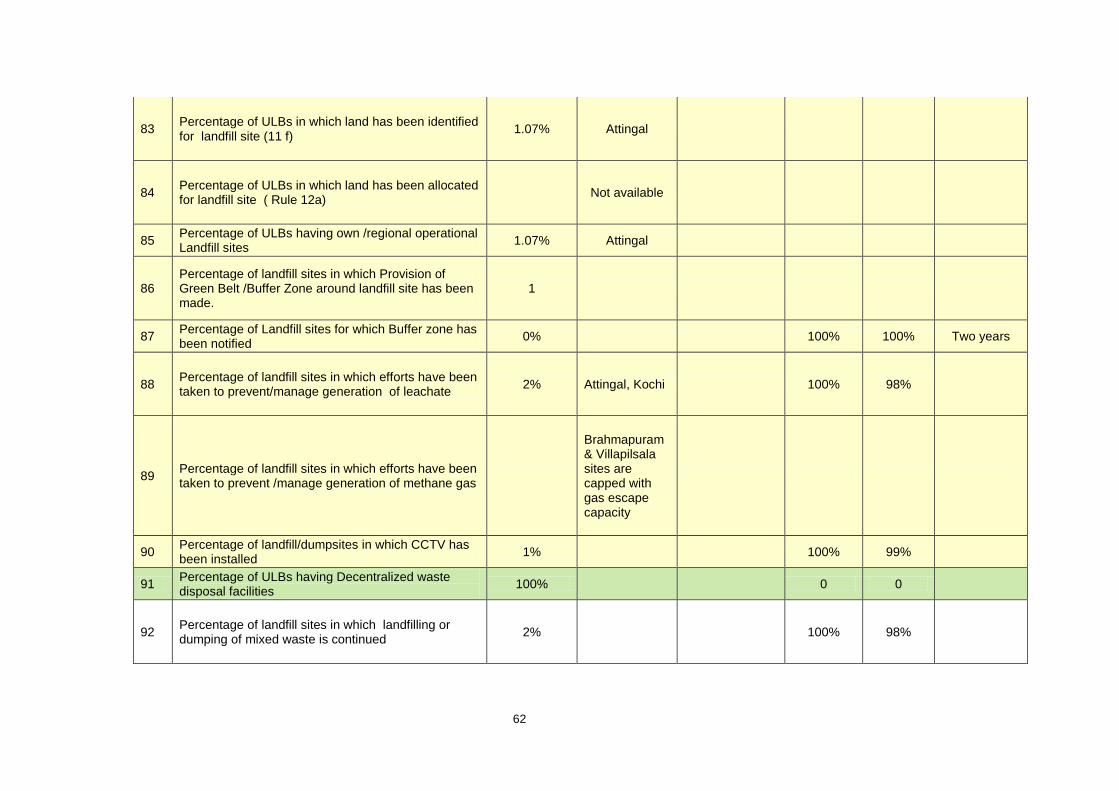
62
83 Percentage of ULBs in which land has been identified for landfill site (11 f)
1.07% Attingal
84 Percentage of ULBs in which land has been allocated for landfill site ( Rule 12a)
Not available
85 Percentage of ULBs having own /regional operational Landfill sites
1.07% Attingal
86 Percentage of landfill sites in which Provision of Green Belt /Buffer Zone around landfill site has been made.
1
87 Percentage of Landfill sites for which Buffer zone has been notified
0% 100% 100% Two years
88 Percentage of landfill sites in which efforts have been taken to prevent/manage generation of leachate
2% Attingal, Kochi 100% 98%
89 Percentage of landfill sites in which efforts have been taken to prevent /manage generation of methane gas
Brahmapuram & Villapilsala sites are capped with gas escape capacity
90 Percentage of landfill/dumpsites in which CCTV has been installed
1%
100% 99%
91 Percentage of ULBs having Decentralized waste disposal facilities
100%
0 0
92 Percentage of landfill sites in which landfilling or dumping of mixed waste is continued
2%
100% 98%
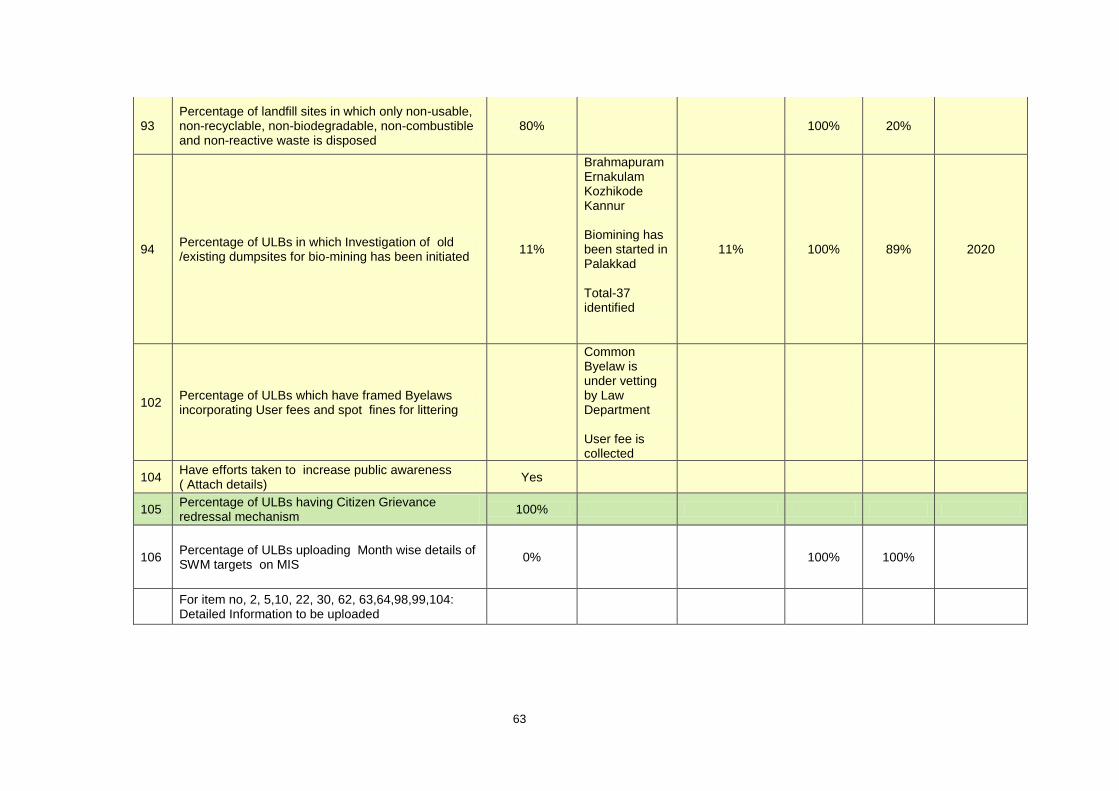
63
93 Percentage of landfill sites in which only non-usable, non-recyclable, non-biodegradable, non-combustible and non-reactive waste is disposed
80%
100% 20%
94 Percentage of ULBs in which Investigation of old /existing dumpsites for bio-mining has been initiated
11%
Brahmapuram Ernakulam Kozhikode Kannur Biomining has been started in Palakkad Total-37 identified
11% 100% 89% 2020
102 Percentage of ULBs which have framed Byelaws incorporating User fees and spot fines for littering
Common Byelaw is under vetting by Law Department User fee is collected
104 Have efforts taken to increase public awareness ( Attach details)
Yes
105 Percentage of ULBs having Citizen Grievance redressal mechanism
100%
106 Percentage of ULBs uploading Month wise details of SWM targets on MIS
0% 100% 100%
For item no, 2, 5,10, 22, 30, 62, 63,64,98,99,104: Detailed Information to be uploaded
64
4.4 Gap Analysis and Action Points of Solid Waste Management (As per Hon’ble NGT order dated 12/09/2019 in OA No. 606/2018) in ULBs
i. Quantity of Waste generated / collected /treated: 3452 * / 833 / 663 # TPD {*waste generated 400 g /person
per day; # This includes treatment in the centralised system. Decentralised units are reported at household
level. Details of centralised and decentralised facilities are enclosed as Annexure.1. }
ii. Quantity of Waste processed in Composting Sites/ Bio-methanation/ waste to energy plants/ Landfill: 663 TPD
iii. Existing capacity of Waste Processing/ Disposal Facilities: 663 TPD
iv. Planned capacity of Waste Processing/ Disposal Facilities: 1800 TPD
v. Timeframe for installation of planned capacity of Waste Processing/ Disposal Facilities: ……24 months
vi. Percentage of Urban Local Bodies (ULBs)/ Village Panchayats (VPs) Covered and timeframe for covering all
the ULBs/VPs: 78% , .24 months
vii. Number of Legacy waste dumpsites in the State/UTs and plan for their Remediation: 40 nos.
4.5. Issue of directions/notice
Notice has been issued to seven Corporation/Municipalities/panchayaths for non compliance of SWM Rules.
Direction has been issued to Thrissur Corproration.
As per order in 585/2018 of the Hon’ble NGT, notice issued to Urban Directorate and Panchayat Directorate
regarding 54 localbodies in Idukki district. A meeting was conducted through video confrerencing with the Urban
and Panchaayth Directorate and to District Medical Officer. Action is being taken to implement the decisions taken
in the meeting.
Notice was also issued to Southern Railway, Thiruvananthapuram and Palakkad divisions. Reply from Southern
Railway has been received on 8-10-2019 and they have also submitted the details namely item name, code,
quantity and registered recycler and the same is under scrutiny. The major findings in the reply are as follows:
1) In Thiruvananthapuram division, segregation of solid waste is done. Aerobin is provided for biodegradable
wastes and non-biodegradable waste are cleared of dust, shredded and disposed through Clean Kerala
Company.
2) Two bottle crusher units are installed in Thiruvananthapuram for the scientific way of treatment of plastic
bottles generated from coaches and stations
3) Construction of waste water recycling plant at Thiruvananthapuram. Kochuveli, Nagercoil and Ernakulam is
under final stage.
4) Effluent treatment plant is under construction at Irumpananm, Ernakulam.
5) A pilot project for the waste disposal at both Poojappura Railway station and one way station-VAK is under
progress.
4.6. Other initiatives
4.6.1 Proposed Kerala Waste Management Authority
The Government of Kerala has amended the Panchayath Raj Act to take over the powers of local
bodies in waste disposal and is working on the proposal to set up Kerala Waste Management
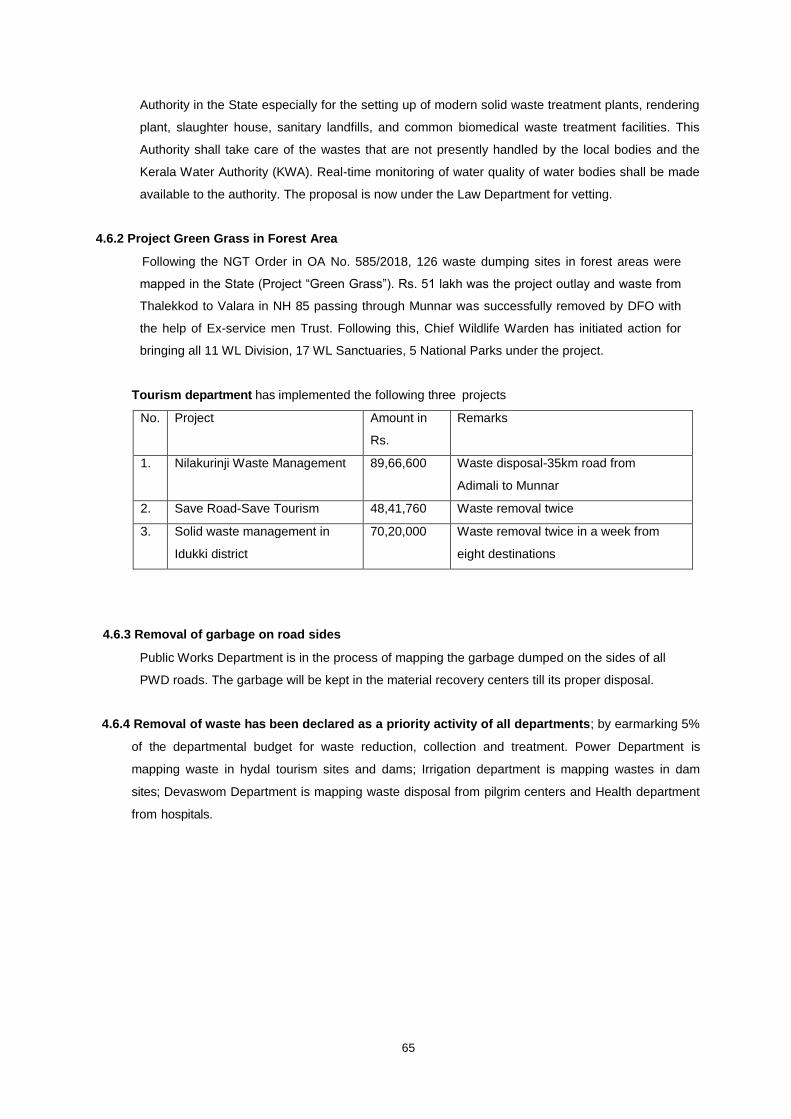
65
Authority in the State especially for the setting up of modern solid waste treatment plants, rendering
plant, slaughter house, sanitary landfills, and common biomedical waste treatment facilities. This
Authority shall take care of the wastes that are not presently handled by the local bodies and the
Kerala Water Authority (KWA). Real-time monitoring of water quality of water bodies shall be made
available to the authority. The proposal is now under the Law Department for vetting.
4.6.2 Project Green Grass in Forest Area
Following the NGT Order in OA No. 585/2018, 126 waste dumping sites in forest areas were
mapped in the State (Project “Green Grass”). Rs. 51 lakh was the project outlay and waste from
Thalekkod to Valara in NH 85 passing through Munnar was successfully removed by DFO with
the help of Ex-service men Trust. Following this, Chief Wildlife Warden has initiated action for
bringing all 11 WL Division, 17 WL Sanctuaries, 5 National Parks under the project.
Tourism department has implemented the following three projects
No. Project Amount in
Rs.
Remarks
1. Nilakurinji Waste Management 89,66,600 Waste disposal-35km road from
Adimali to Munnar
2. Save Road-Save Tourism 48,41,760 Waste removal twice
3. Solid waste management in
Idukki district
70,20,000 Waste removal twice in a week from
eight destinations
4.6.3 Removal of garbage on road sides
Public Works Department is in the process of mapping the garbage dumped on the sides of all
PWD roads. The garbage will be kept in the material recovery centers till its proper disposal.
4.6.4 Removal of waste has been declared as a priority activity of all departments; by earmarking 5%
of the departmental budget for waste reduction, collection and treatment. Power Department is
mapping waste in hydal tourism sites and dams; Irrigation department is mapping wastes in dam
sites; Devaswom Department is mapping waste disposal from pilgrim centers and Health department
from hospitals.
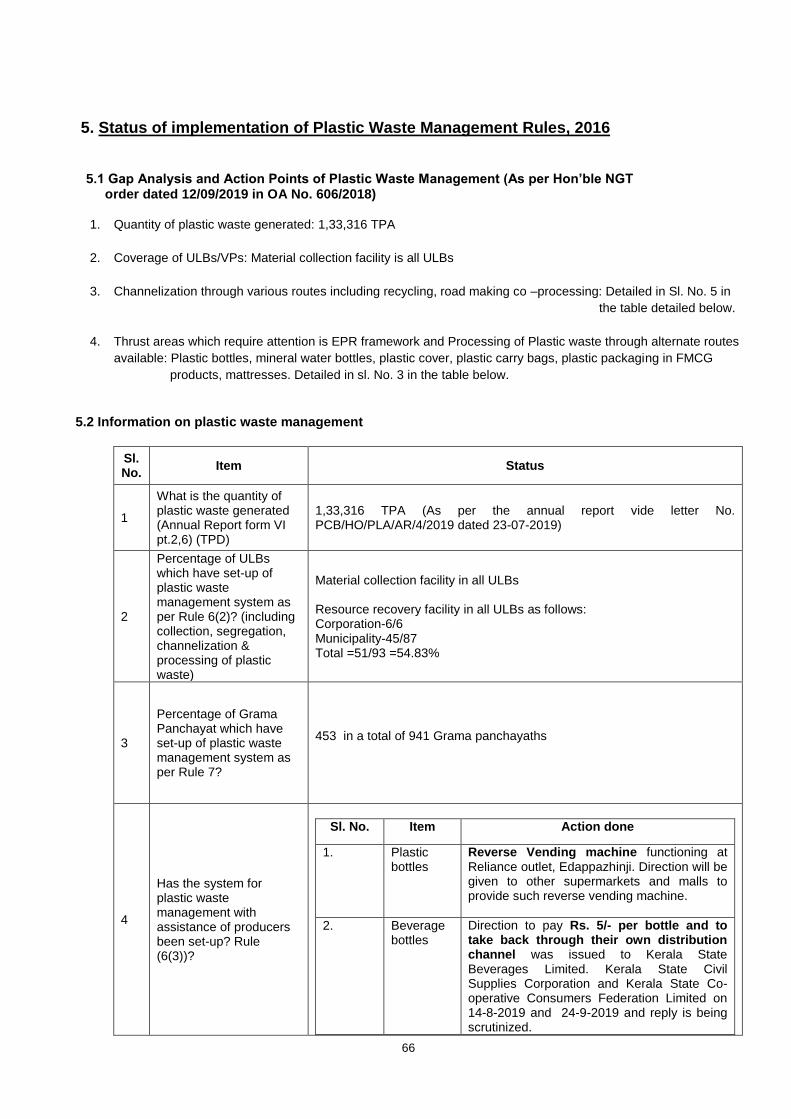
66
5. Status of implementation of Plastic Waste Management Rules, 2016
5.1 Gap Analysis and Action Points of Plastic Waste Management (As per Hon’ble NGT order dated 12/09/2019 in OA No. 606/2018)
1. Quantity of plastic waste generated: 1,33,316 TPA
2. Coverage of ULBs/VPs: Material collection facility is all ULBs
3. Channelization through various routes including recycling, road making co –processing: Detailed in Sl. No. 5 in
the table detailed below.
4. Thrust areas which require attention is EPR framework and Processing of Plastic waste through alternate routes
available: Plastic bottles, mineral water bottles, plastic cover, plastic carry bags, plastic packaging in FMCG
products, mattresses. Detailed in sl. No. 3 in the table below.
5.2 Information on plastic waste management
Sl. No.
Item Status
1
What is the quantity of plastic waste generated (Annual Report form VI pt.2,6) (TPD)
1,33,316 TPA (As per the annual report vide letter No. PCB/HO/PLA/AR/4/2019 dated 23-07-2019)
2
Percentage of ULBs which have set-up of plastic waste management system as per Rule 6(2)? (including collection, segregation, channelization & processing of plastic waste)
Material collection facility in all ULBs Resource recovery facility in all ULBs as follows: Corporation-6/6 Municipality-45/87 Total =51/93 =54.83%
3
Percentage of Grama Panchayat which have set-up of plastic waste management system as per Rule 7?
453 in a total of 941 Grama panchayaths
4
Has the system for plastic waste management with assistance of producers been set-up? Rule (6(3))?
Sl. No. Item Action done
1. Plastic bottles
Reverse Vending machine functioning at Reliance outlet, Edappazhinji. Direction will be given to other supermarkets and malls to provide such reverse vending machine.
2. Beverage bottles
Direction to pay Rs. 5/- per bottle and to take back through their own distribution channel was issued to Kerala State Beverages Limited. Kerala State Civil Supplies Corporation and Kerala State Co-operative Consumers Federation Limited on 14-8-2019 and 24-9-2019 and reply is being scrutinized.
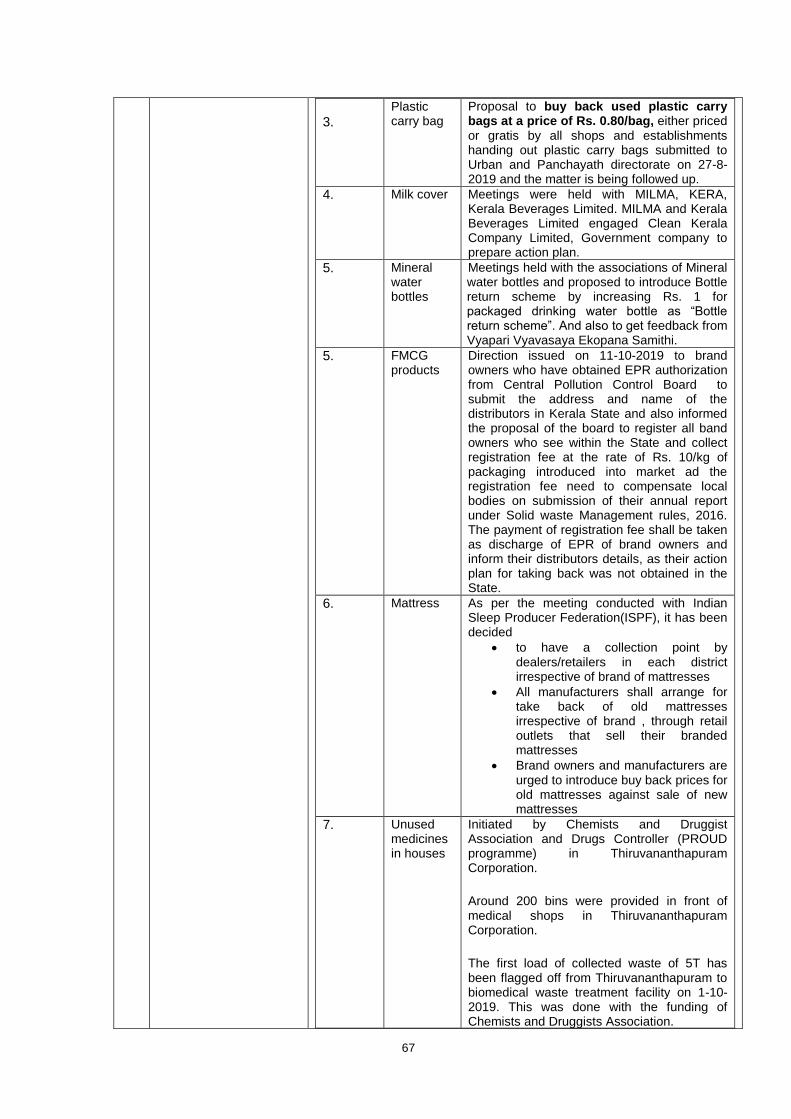
67
3.
Plastic carry bag
Proposal to buy back used plastic carry bags at a price of Rs. 0.80/bag, either priced or gratis by all shops and establishments handing out plastic carry bags submitted to Urban and Panchayath directorate on 27-8-2019 and the matter is being followed up.
4. Milk cover Meetings were held with MILMA, KERA, Kerala Beverages Limited. MILMA and Kerala Beverages Limited engaged Clean Kerala Company Limited, Government company to prepare action plan.
5. Mineral water bottles
Meetings held with the associations of Mineral water bottles and proposed to introduce Bottle return scheme by increasing Rs. 1 for packaged drinking water bottle as “Bottle return scheme”. And also to get feedback from Vyapari Vyavasaya Ekopana Samithi.
5. FMCG products
Direction issued on 11-10-2019 to brand owners who have obtained EPR authorization from Central Pollution Control Board to submit the address and name of the distributors in Kerala State and also informed the proposal of the board to register all band owners who see within the State and collect registration fee at the rate of Rs. 10/kg of packaging introduced into market ad the registration fee need to compensate local bodies on submission of their annual report under Solid waste Management rules, 2016. The payment of registration fee shall be taken as discharge of EPR of brand owners and inform their distributors details, as their action plan for taking back was not obtained in the State.
6. Mattress As per the meeting conducted with Indian Sleep Producer Federation(ISPF), it has been decided
to have a collection point by dealers/retailers in each district irrespective of brand of mattresses
All manufacturers shall arrange for take back of old mattresses irrespective of brand , through retail outlets that sell their branded mattresses
Brand owners and manufacturers are urged to introduce buy back prices for old mattresses against sale of new mattresses
7. Unused medicines in houses
Initiated by Chemists and Druggist Association and Drugs Controller (PROUD programme) in Thiruvananthapuram Corporation.
Around 200 bins were provided in front of medical shops in Thiruvananthapuram Corporation.
The first load of collected waste of 5T has been flagged off from Thiruvananthapuram to biomedical waste treatment facility on 1-10-2019. This was done with the funding of Chemists and Druggists Association.

68
Action is being taken to have this collection programme in other parts of the State.
Action is taken to get fund from manufacturers, producers and brand owners as per EPR.
8. End of life vehicle
As per the meeting 24-05-2019, it has been decided to take steps to control the unauthorized dismantling centers; to arrange meeting with KINFRA, SIDCO, KSIDC for setting up dismantling units and to have own authorized dismantling centers for KSRTC.
5 Status of Utilization of plastic waste (Annual Report form VI pt.4)
a In Recycling Clean Kerala Company-100T by Clean Kerala Company
b Road Construction Clean Kerala Company collected 845.5 T of plastic waste and
583.4T (69%) has been used for road construction by Clean Kerala Company Limited.
c Waste to oil Nil
d Co-processing of Plastic Waste in Cement kilns
Nil
e RDF Nil
f Footpath /Tiles Nil
g Others -
6 Whether local bodies have framed bye-laws [Rule 6(4)]?
Common byelaw
7
Whether plastic carry bags & plastic sheet of thickness < 50 micron banned or not [Rule 4(c)]?
Banned
8
Has complete ban on plastic carry bags been imposed? (Annual Report format pt.3)
Plastic ban in and around Nilackal, Sabarimala, Pamba, Pilgrim area vide notification dated 08-11-2018.
Plastic ban in Erumeli by District collector vide order No. Dated 02-11-2015.
Plastic ban in tourist spots as per order no. PCB/T4/115/97 dated 14-6-2018.
9
Status of action taken on noncompliance of PWM Rules (Annual Report format pt.9)
Fine collected for illegal sale of plastic carry bag (<50 micron) by Mannarkad Municipality –Rs. 1,05,500 Fine collected for illegal sale of plastic carry bag (<50 micron) by Nedumagad Municipality –Rs. 85,500 from 19-2-2018 -19-8-2019 and 96.318 kg of plastic confisticated.
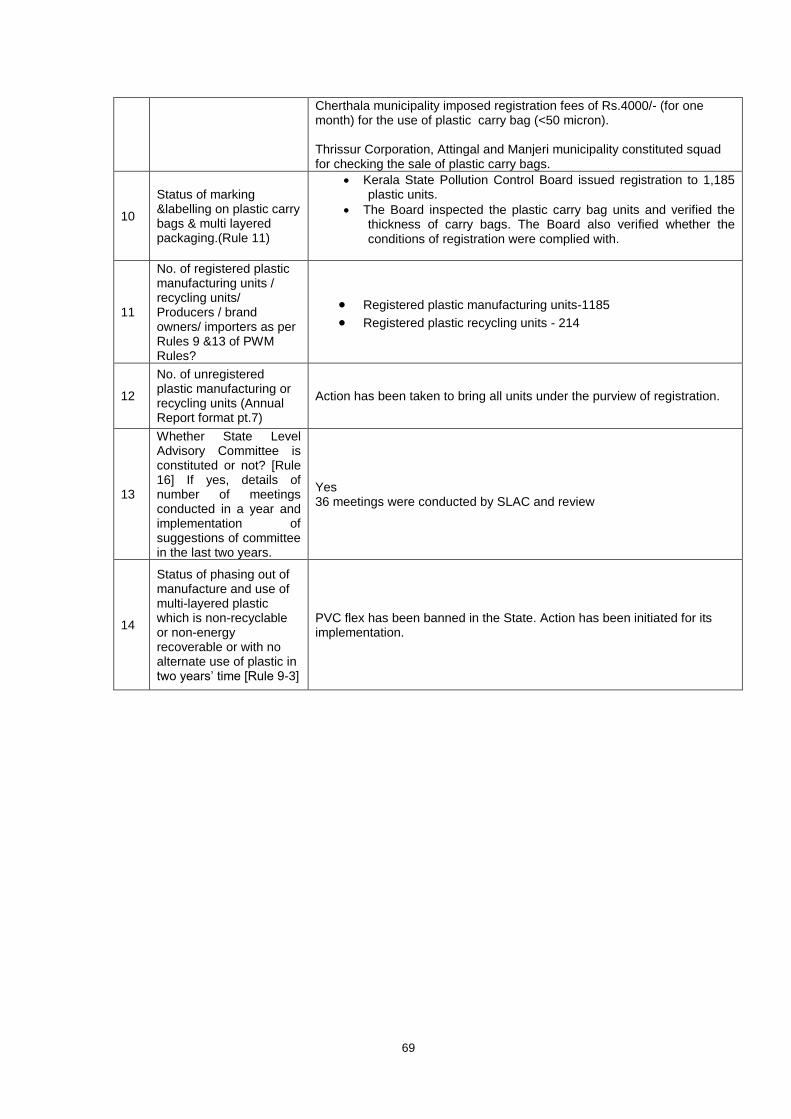
69
Cherthala municipality imposed registration fees of Rs.4000/- (for one month) for the use of plastic carry bag (<50 micron). Thrissur Corporation, Attingal and Manjeri municipality constituted squad for checking the sale of plastic carry bags.
10
Status of marking &labelling on plastic carry bags & multi layered packaging.(Rule 11)
Kerala State Pollution Control Board issued registration to 1,185 plastic units.
The Board inspected the plastic carry bag units and verified the thickness of carry bags. The Board also verified whether the conditions of registration were complied with.
11
No. of registered plastic manufacturing units / recycling units/ Producers / brand owners/ importers as per Rules 9 &13 of PWM Rules?
Registered plastic manufacturing units-1185
Registered plastic recycling units - 214
12
No. of unregistered plastic manufacturing or recycling units (Annual Report format pt.7)
Action has been taken to bring all units under the purview of registration.
13
Whether State Level Advisory Committee is constituted or not? [Rule 16] If yes, details of number of meetings conducted in a year and implementation of suggestions of committee in the last two years.
Yes 36 meetings were conducted by SLAC and review
14
Status of phasing out of manufacture and use of multi-layered plastic which is non-recyclable or non-energy recoverable or with no alternate use of plastic in two years’ time [Rule 9-3]
PVC flex has been banned in the State. Action has been initiated for its implementation.
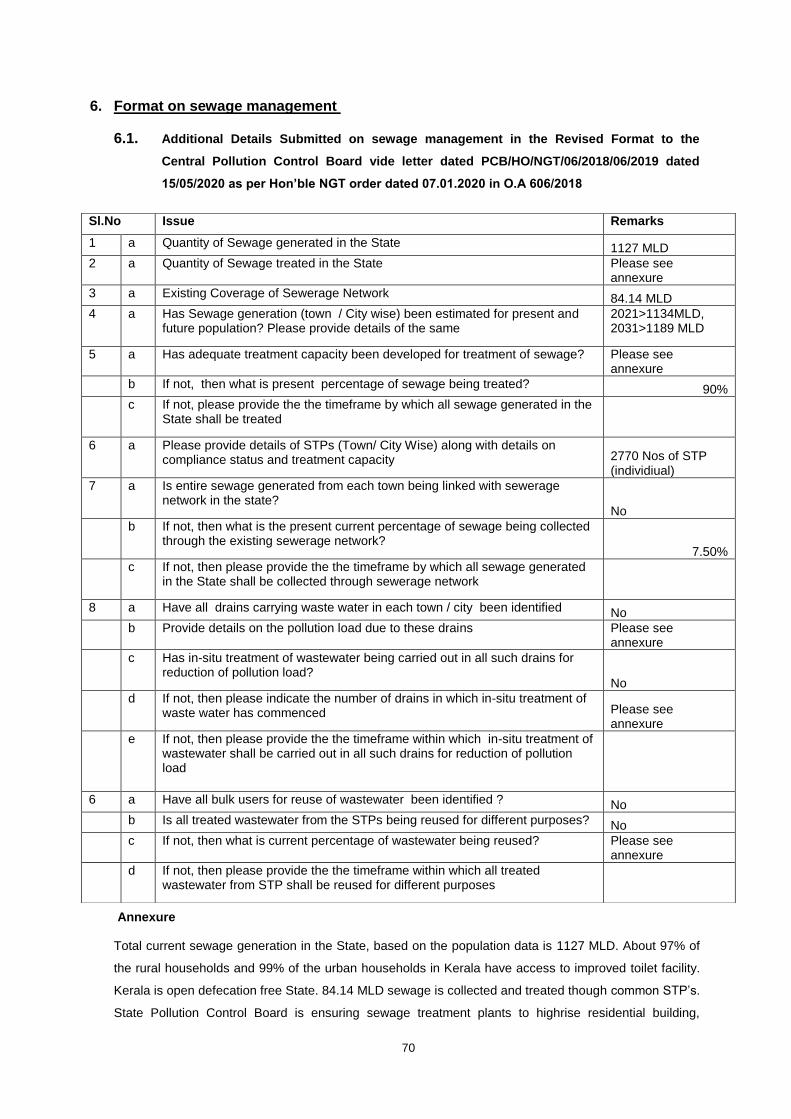
70
6. Format on sewage management
6.1. Additional Details Submitted on sewage management in the Revised Format to the
Central Pollution Control Board vide letter dated PCB/HO/NGT/06/2018/06/2019 dated
15/05/2020 as per Hon’ble NGT order dated 07.01.2020 in O.A 606/2018
Annexure
Total current sewage generation in the State, based on the population data is 1127 MLD. About 97% of
the rural households and 99% of the urban households in Kerala have access to improved toilet facility.
Kerala is open defecation free State. 84.14 MLD sewage is collected and treated though common STP’s.
State Pollution Control Board is ensuring sewage treatment plants to highrise residential building,
Sl.No Issue Remarks
1 a Quantity of Sewage generated in the State 1127 MLD
2 a Quantity of Sewage treated in the State Please see annexure
3 a Existing Coverage of Sewerage Network 84.14 MLD
4 a Has Sewage generation (town / City wise) been estimated for present and future population? Please provide details of the same
2021>1134MLD, 2031>1189 MLD
5 a Has adequate treatment capacity been developed for treatment of sewage? Please see annexure
b If not, then what is present percentage of sewage being treated? 90%
c If not, please provide the the timeframe by which all sewage generated in the State shall be treated
6 a Please provide details of STPs (Town/ City Wise) along with details on compliance status and treatment capacity 2770 Nos of STP
(individiual)
7 a Is entire sewage generated from each town being linked with sewerage network in the state?
No
b If not, then what is the present current percentage of sewage being collected through the existing sewerage network?
7.50%
c If not, then please provide the the timeframe by which all sewage generated in the State shall be collected through sewerage network
8 a Have all drains carrying waste water in each town / city been identified No
b Provide details on the pollution load due to these drains Please see annexure
c Has in-situ treatment of wastewater being carried out in all such drains for reduction of pollution load?
No
d If not, then please indicate the number of drains in which in-situ treatment of waste water has commenced Please see
annexure
e If not, then please provide the the timeframe within which in-situ treatment of wastewater shall be carried out in all such drains for reduction of pollution load
6 a Have all bulk users for reuse of wastewater been identified ? No
b Is all treated wastewater from the STPs being reused for different purposes? No
c If not, then what is current percentage of wastewater being reused? Please see annexure
d If not, then please provide the the timeframe within which all treated wastewater from STP shall be reused for different purposes
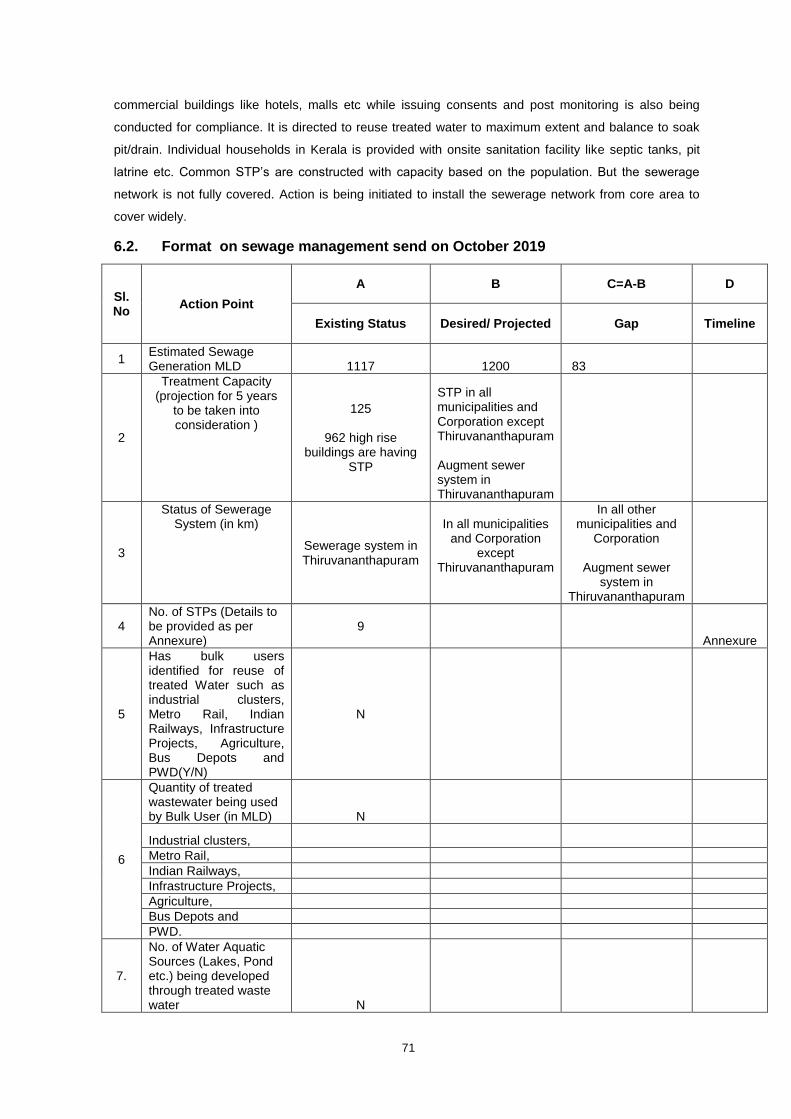
71
commercial buildings like hotels, malls etc while issuing consents and post monitoring is also being
conducted for compliance. It is directed to reuse treated water to maximum extent and balance to soak
pit/drain. Individual households in Kerala is provided with onsite sanitation facility like septic tanks, pit
latrine etc. Common STP’s are constructed with capacity based on the population. But the sewerage
network is not fully covered. Action is being initiated to install the sewerage network from core area to
cover widely.
6.2. Format on sewage management send on October 2019
Sl. No
Action Point
A B C=A-B D
Existing Status Desired/ Projected Gap Timeline
1 Estimated Sewage Generation MLD 1117 1200 83
2
Treatment Capacity (projection for 5 years
to be taken into consideration )
125
962 high rise buildings are having
STP
STP in all municipalities and Corporation except Thiruvananthapuram Augment sewer system in Thiruvananthapuram
3
Status of Sewerage System (in km)
Sewerage system in Thiruvananthapuram
In all municipalities and Corporation
except Thiruvananthapuram
In all other municipalities and
Corporation
Augment sewer system in
Thiruvananthapuram
4 No. of STPs (Details to be provided as per Annexure)
9 Annexure
5
Has bulk users identified for reuse of treated Water such as industrial clusters, Metro Rail, Indian Railways, Infrastructure Projects, Agriculture, Bus Depots and PWD(Y/N)
N
6
Quantity of treated wastewater being used by Bulk User (in MLD) N
Industrial clusters,
Metro Rail,
Indian Railways,
Infrastructure Projects,
Agriculture,
Bus Depots and
PWD.
7.
No. of Water Aquatic Sources (Lakes, Pond etc.) being developed through treated waste water N
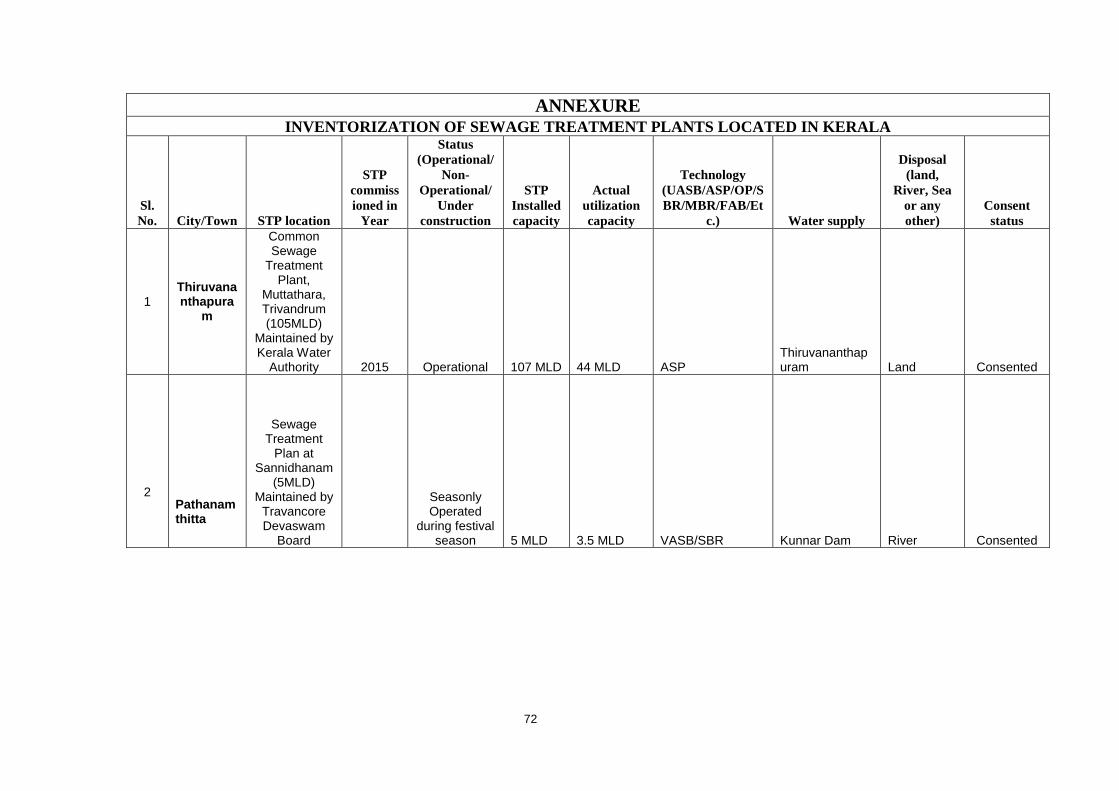
72
ANNEXURE INVENTORIZATION OF SEWAGE TREATMENT PLANTS LOCATED IN KERALA
Sl.
No. City/Town STP location
STP
commiss
ioned in
Year
Status
(Operational/
Non-
Operational/
Under
construction
STP
Installed
capacity
Actual
utilization
capacity
Technology
(UASB/ASP/OP/S
BR/MBR/FAB/Et
c.) Water supply
Disposal
(land,
River, Sea
or any
other)
Consent
status
1 Thiruvananthapura
m
Common Sewage
Treatment Plant,
Muttathara, Trivandrum (105MLD)
Maintained by Kerala Water
Authority 2015 Operational 107 MLD 44 MLD ASP Thiruvananthapuram Land Consented
2
Pathanamthitta
Sewage Treatment
Plan at Sannidhanam
(5MLD) Maintained by
Travancore Devaswam
Board
Seasonly Operated
during festival season 5 MLD 3.5 MLD VASB/SBR Kunnar Dam River Consented
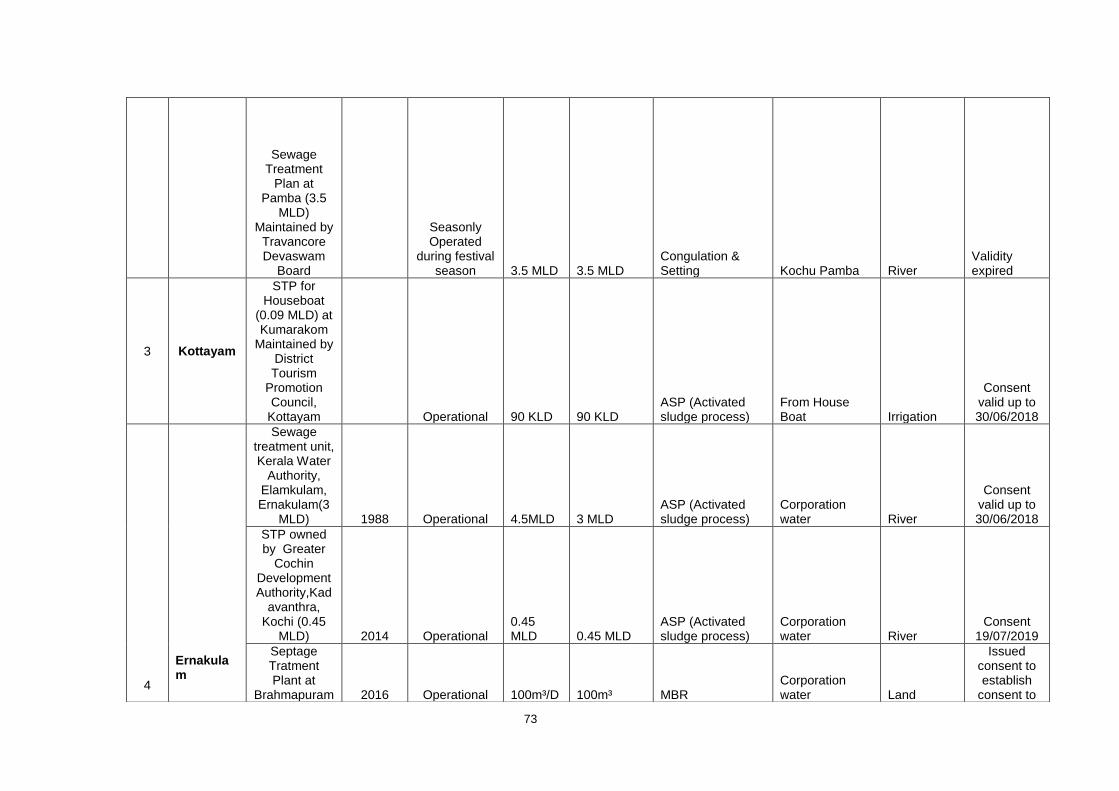
73
Sewage Treatment
Plan at Pamba (3.5
MLD) Maintained by
Travancore Devaswam
Board
Seasonly Operated
during festival season 3.5 MLD 3.5 MLD
Congulation & Setting Kochu Pamba River
Validity expired
3 Kottayam
STP for Houseboat
(0.09 MLD) at Kumarakom
Maintained by District Tourism
Promotion Council,
Kottayam Operational 90 KLD 90 KLD ASP (Activated sludge process)
From House Boat Irrigation
Consent valid up to 30/06/2018
4
Ernakulam
Sewage treatment unit, Kerala Water
Authority, Elamkulam, Ernakulam(3
MLD) 1988 Operational 4.5MLD 3 MLD ASP (Activated sludge process)
Corporation water River
Consent valid up to 30/06/2018
STP owned by Greater
Cochin Development Authority,Kad
avanthra, Kochi (0.45
MLD) 2014 Operational 0.45 MLD 0.45 MLD
ASP (Activated sludge process)
Corporation water River
Consent 19/07/2019
Septage Tratment Plant at
Brahmapuram 2016 Operational 100m³/D 100m³ MBR Corporation water Land
Issued consent to establish
consent to

74
(0.1 MLD) Kochi
Corporation, Ernakulam
operate under
process
Sewage Treatment
Plant, DO - 1, Aluva
Municipality
5 Kannur
Sewage treatment Plant at
Taliparambu (0.5MLD)
Taliparambu Municipality,
Kannur 2012 Operational 0.5MLD 0.5MLD ASP with MBBR
Waste water from Thaliparambu municipal area
Storm water drain leading to Kuppam river
applied for consent to operate -
under processing
6 Thrissur
Sewage treatment Plant at
Guruvayur in Thrissur District
Not yet commissioned 3 MLD 3 MLD ASP
Guruvayur Municipal area
applied for consent to operate -
under processing

75
6.3. Status of Sewage treatment plants under AMRUTH Scheme
It is noted that under the Amruth Project, 112 projects including 24 main projects at a cost of Rs. 159.81
Crore are included. Of which they have completed 38 works for an amount of Rs. 25 crore.
a) In Kollam Corporation, five projects including three projects at a total cost of Rs. 87.74 Crore. Technical
Sanction has been issued for an amount of Rs. 39.67 Crore and it is in the stage of tendering.
b) In Alappuzha municipality, four projects are at a cost of 10.09 Crore. Of which technical sanction
issued to two projects at a cost of Rs. 3.05 Crore and it is in the tendering stage.
c) In the case of Kochi Corporation, there are four projects at a cost of Rs. 103.34 Crore. Of which,
technical sanction issued to three projects at a cost of Rs 56.644 Crore and it is in tendering stage.
d) For Thrissur, there are three projects at a cost of Rs. 103.34 Crore and of which technical sanction is
given for three projects at a cost of Rs. 52.92 crore and is in a tendering stage.
e) In Guruvayoor, there is one project at a cost of Rs. 4.5 Crore. Technical sanction is issued for Rs. 3.9
Crore and is in the tendering stage.
f) For Kozhikode Corporation, there are three projects at a cost of Rs. 120.81 Crore. Technical sanction
was issued for three projects at a cost of Rs. 130.6 Crore. Work awarded to one project at a cost of Rs.
14.1 Crore. The actionplan for Kallayi river included in Polluted stretch includes proposal for sewage
treatment plant.
g) For Kannur, there are two projects at a cost of Rs. 50.23 crore and of which technical sanction issued
to one project at a cost of Rs. 2.36 crore and is in tendering stage.
6.4. Status of sewage treatment plant planned to set up under AMRUTH scheme
The details of Sewage Treatment Plant which is planned to set up in 14 districts under the AMRUT
scheme obtained from Suchitwa Mission are enclosed as Annexure 13.

76
7. Format on Noise pollution
Sl. No
Content Current Status Desirable Gap
Time Line
1. No. of stations for Ambient Noise Monitoring
Nil Proposed 4 Nos. of Stations
Setting up of Ambient monitoring
station
2019-2020
2. No. of stations in Industrial Zone
Nil Setting up of Ambient monitoring station
-
3. No. of stations in commercial Zone
Nil Setting up of Ambient monitoring station
2019-2020
4. No. of stations in Residential Zone
Nil Setting up of Ambient monitoring station
-
5. No. of stations in Silence Zone
Nil Setting up of Ambient monitoring station
2019-2020
6. Compliance of Ambient Standards ( No. of Stations) Industrial Zone Commercial Zone Residential Zone Silence Zone
Noise mapping was done and it was
observed that junctions are non complying
Setting up of Ambient
monitoring station
Setting up of Ambient monitoring station
2019-2020-
7. Identification of Hot Spots Yes in Thiruvananthapuram, noise mapping was
done and it was observed that junctions
are non complying
Noise mapping in other cities
Noise mapping in other cities
2020
8. Designated Authorities defined as per Noise Rules (Y/N) Details to be provide)
Yes
District Magistrate,
Commissioners of
Police /
Superintendents of
Police and Deputy
Superintendents of
Police (Sub Divisional
Officers) were
designated as per G.O
No. 111/2002 the
Home (F) Department
9. Has Methodology been prepared for granting permission for installation of Public Address System ( Y/N) ( Details to be provide)
Yes Police department is granting the
permission for public address system
-
10. Has Methodology been prepared for redressal of complaint on noise pollution ? ( Y/N) ( Details to be provided)
Yes Pollution Control
Board for noise
due to various
activities such as
operation of
-
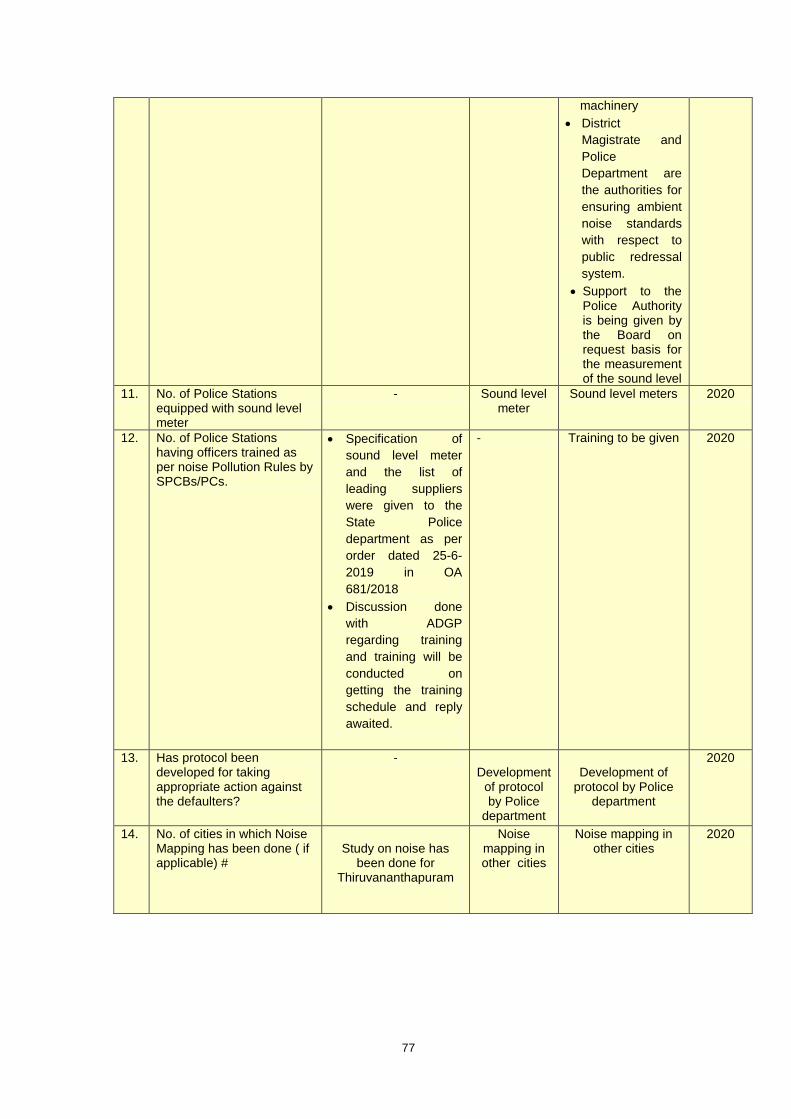
77
machinery
District
Magistrate and
Police
Department are
the authorities for
ensuring ambient
noise standards
with respect to
public redressal
system.
Support to the Police Authority is being given by the Board on request basis for the measurement of the sound level
11. No. of Police Stations equipped with sound level meter
- Sound level meter
Sound level meters 2020
12. No. of Police Stations having officers trained as per noise Pollution Rules by SPCBs/PCs.
Specification of
sound level meter
and the list of
leading suppliers
were given to the
State Police
department as per
order dated 25-6-
2019 in OA
681/2018
Discussion done
with ADGP
regarding training
and training will be
conducted on
getting the training
schedule and reply
awaited.
- Training to be given 2020
13. Has protocol been developed for taking appropriate action against the defaulters?
- Development
of protocol by Police
department
Development of
protocol by Police department
2020
14. No. of cities in which Noise Mapping has been done ( if applicable) #
Study on noise has
been done for Thiruvananthapuram
Noise mapping in other cities
Noise mapping in other cities
2020
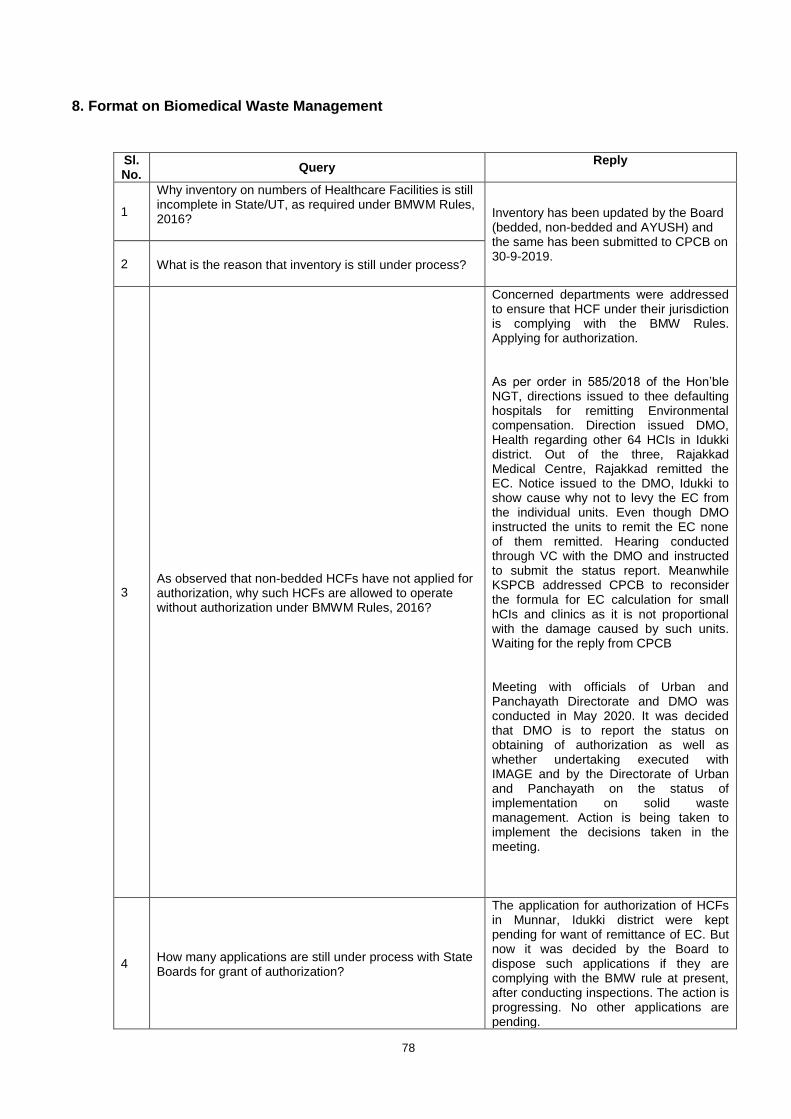
78
8. Format on Biomedical Waste Management
Sl. No.
Query Reply
1
Why inventory on numbers of Healthcare Facilities is still incomplete in State/UT, as required under BMWM Rules, 2016?
Inventory has been updated by the Board (bedded, non-bedded and AYUSH) and the same has been submitted to CPCB on 30-9-2019.
2 What is the reason that inventory is still under process?
3 As observed that non-bedded HCFs have not applied for authorization, why such HCFs are allowed to operate without authorization under BMWM Rules, 2016?
Concerned departments were addressed to ensure that HCF under their jurisdiction is complying with the BMW Rules. Applying for authorization. As per order in 585/2018 of the Hon’ble NGT, directions issued to thee defaulting hospitals for remitting Environmental compensation. Direction issued DMO, Health regarding other 64 HCIs in Idukki district. Out of the three, Rajakkad Medical Centre, Rajakkad remitted the EC. Notice issued to the DMO, Idukki to show cause why not to levy the EC from the individual units. Even though DMO instructed the units to remit the EC none of them remitted. Hearing conducted through VC with the DMO and instructed to submit the status report. Meanwhile KSPCB addressed CPCB to reconsider the formula for EC calculation for small hCIs and clinics as it is not proportional with the damage caused by such units. Waiting for the reply from CPCB Meeting with officials of Urban and Panchayath Directorate and DMO was conducted in May 2020. It was decided that DMO is to report the status on obtaining of authorization as well as whether undertaking executed with IMAGE and by the Directorate of Urban and Panchayath on the status of implementation on solid waste management. Action is being taken to implement the decisions taken in the meeting.
4 How many applications are still under process with State Boards for grant of authorization?
The application for authorization of HCFs in Munnar, Idukki district were kept pending for want of remittance of EC. But now it was decided by the Board to dispose such applications if they are complying with the BMW rule at present, after conducting inspections. The action is progressing. No other applications are pending.
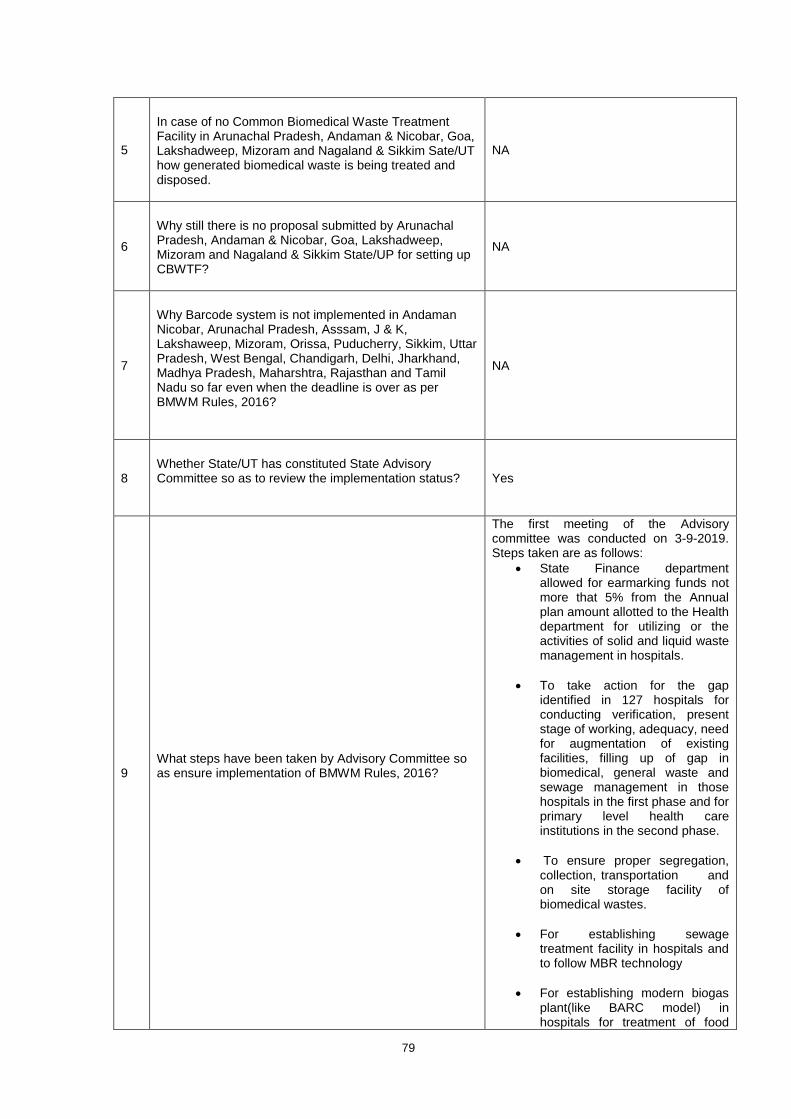
79
5
In case of no Common Biomedical Waste Treatment Facility in Arunachal Pradesh, Andaman & Nicobar, Goa, Lakshadweep, Mizoram and Nagaland & Sikkim Sate/UT how generated biomedical waste is being treated and disposed.
NA
6
Why still there is no proposal submitted by Arunachal Pradesh, Andaman & Nicobar, Goa, Lakshadweep, Mizoram and Nagaland & Sikkim State/UP for setting up CBWTF?
NA
7
Why Barcode system is not implemented in Andaman Nicobar, Arunachal Pradesh, Asssam, J & K, Lakshaweep, Mizoram, Orissa, Puducherry, Sikkim, Uttar Pradesh, West Bengal, Chandigarh, Delhi, Jharkhand, Madhya Pradesh, Maharshtra, Rajasthan and Tamil Nadu so far even when the deadline is over as per BMWM Rules, 2016?
NA
8 Whether State/UT has constituted State Advisory Committee so as to review the implementation status?
Yes
9 What steps have been taken by Advisory Committee so as ensure implementation of BMWM Rules, 2016?
The first meeting of the Advisory committee was conducted on 3-9-2019. Steps taken are as follows:
State Finance department allowed for earmarking funds not more that 5% from the Annual plan amount allotted to the Health department for utilizing or the activities of solid and liquid waste management in hospitals.
To take action for the gap identified in 127 hospitals for conducting verification, present stage of working, adequacy, need for augmentation of existing facilities, filling up of gap in biomedical, general waste and sewage management in those hospitals in the first phase and for primary level health care institutions in the second phase.
To ensure proper segregation, collection, transportation and on site storage facility of biomedical wastes.
For establishing sewage treatment facility in hospitals and to follow MBR technology
For establishing modern biogas plant(like BARC model) in hospitals for treatment of food

80
and vegetable waste; source segregation of general wastes other than biomedical wastes; establishing MCF and RRF
For giving proper IEC activities for reduction of waste
To promote common treatment and disposal facility in Medical colleges where there is sufficient lad available for catering the need of the hospital and other small hospitals in the district
Monitoring by District Level Monitoring committee chaired by District Collectors
10
How many HCFs other than hospitals, nursing homes etc. such as veterinary hospitals, animal houses, and AYUSH hospitals have been monitored?
257 veterinary institutions, two animal houses and 256 AYUSH units have been identified. Notice was issued to the concerned departments for bringing all such HCFs under authorization. The status is being updated through the annual reports being collected from the HCFs and from the District offices
11
What is the frequency for conducting training or capacity building programmes for State Board officials and for staff of HCFs?
Board in association with National Safety Council is conducting training to the staff of HCF and CBMWTF once in a year. The CBMWTF, (IMAGE) conducts training to
newly affiliated HCF;
newly appointed staff if any on need basis;
Whenever notices improper segregation/handling of BMW, in any HCF;
CBMWTF conducts routine training also with not less than twice a year.
12
What is the status of installation of Continuous Online Emission Monitoring System with CBWTF and why it has not been implemented by all CBWTFs? What follow-up action has been taken by State Boards?
Online emission monitoring system installed in CBMTWT and is connected to Board’s server. The parameters namely CO, CO2 and primary and secondary temperatures are continuously monitored and the other parameters namely PM, HCl, NOx and VOC are monitored by CBMTW on monthly basis.
13 How OCEMS data received by state Boards is being validated?
The values of CO, CO2, and primary and secondary temperature are connected to Board’s server and exceedances if any are noticed.

81
14
What is the status of compliance to BMWM Rules, 2016 by CBWFFs? What action has been taken against defaulting facilities?
Common Biomedical waste treatment facility is in operation in Palakkad. For another CBWTF at Ambalamedu by IMA, the Kochi Corporation has been instructed to earmark the area of five acre for the project. The District Collector issued order on 06.02.20 to hand over 3 acre of land at Brahmapuram. The surveying work is progressing by the Taluk Surveyors. Work for CBWTF in Ambalamedu by Kerala Enviro Infrastructure Limited will commence soon.
15 What is the frequency of monitoring of Healthcare Facilities for verification of compliance to BMWM Rules?
Health care institutions having more than 100KL generation of effluent falls under Red category and for such category, time frame fixed for inspection and collection of sample is once in a month. The other HCIs fall under orange category For such units, frequency of inspection is once in three for large scale, once in six months for medium and once in a year for small scale.
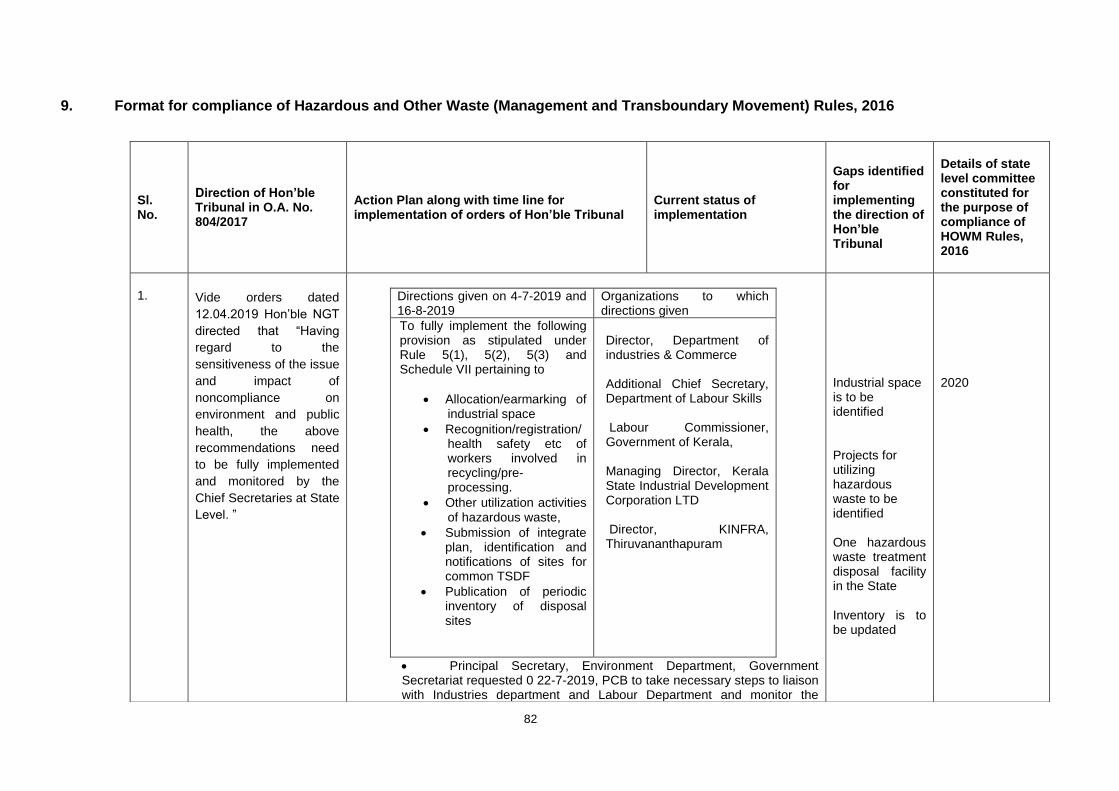
82
9. Format for compliance of Hazardous and Other Waste (Management and Transboundary Movement) Rules, 2016
Sl. No.
Direction of Hon’ble Tribunal in O.A. No. 804/2017
Action Plan along with time line for implementation of orders of Hon’ble Tribunal
Current status of implementation
Gaps identified for implementing the direction of Hon’ble Tribunal
Details of state level committee constituted for the purpose of compliance of HOWM Rules, 2016
1.
Vide orders dated
12.04.2019 Hon’ble NGT
directed that “Having
regard to the
sensitiveness of the issue
and impact of
noncompliance on
environment and public
health, the above
recommendations need
to be fully implemented
and monitored by the
Chief Secretaries at State
Level. ”
Directions given on 4-7-2019 and 16-8-2019
Organizations to which directions given
To fully implement the following provision as stipulated under Rule 5(1), 5(2), 5(3) and Schedule VII pertaining to
Allocation/earmarking of industrial space
Recognition/registration/health safety etc of workers involved in recycling/pre-processing.
Other utilization activities of hazardous waste,
Submission of integrate plan, identification and notifications of sites for common TSDF
Publication of periodic inventory of disposal sites
Director, Department of industries & Commerce Additional Chief Secretary, Department of Labour Skills Labour Commissioner, Government of Kerala, Managing Director, Kerala State Industrial Development Corporation LTD Director, KINFRA, Thiruvananthapuram
Principal Secretary, Environment Department, Government Secretariat requested 0 22-7-2019, PCB to take necessary steps to liaison with Industries department and Labour Department and monitor the
Industrial space is to be identified Projects for utilizing hazardous waste to be identified
One hazardous waste treatment disposal facility in the State
Inventory is to be updated
2020
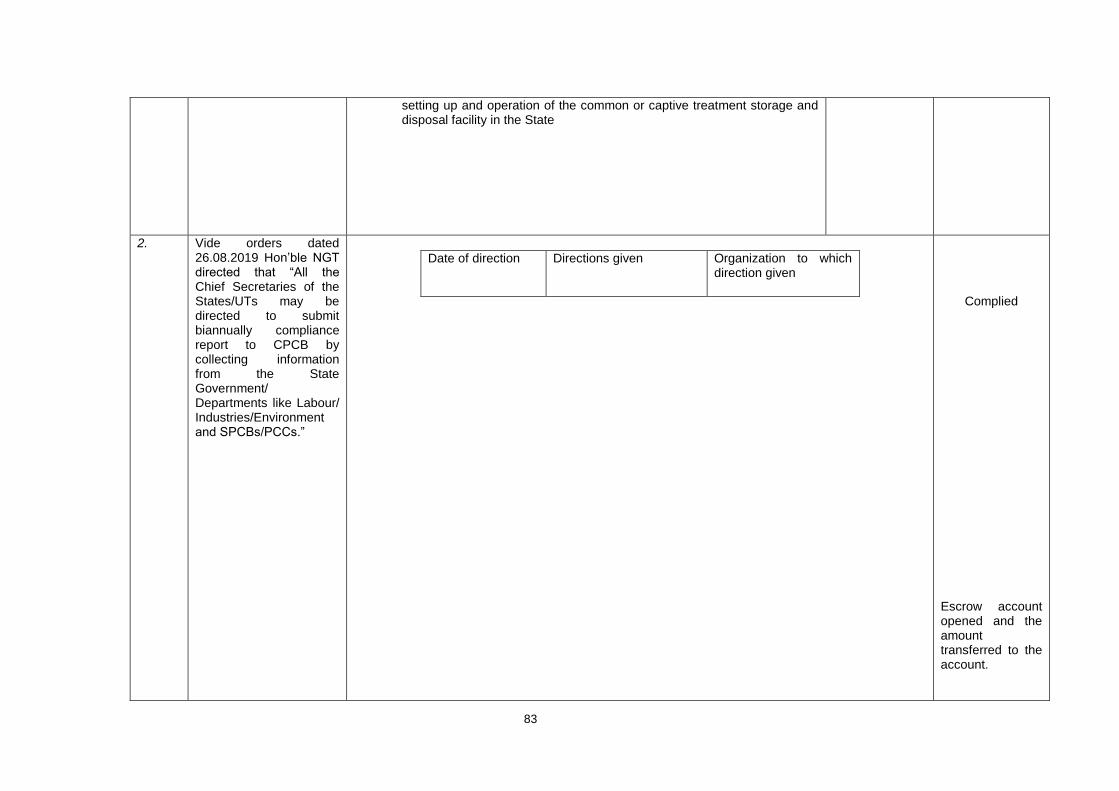
83
setting up and operation of the common or captive treatment storage and disposal facility in the State
2. Vide orders dated 26.08.2019 Hon’ble NGT directed that “All the Chief Secretaries of the States/UTs may be directed to submit biannually compliance report to CPCB by collecting information from the State Government/ Departments like Labour/ Industries/Environment and SPCBs/PCCs.”
Date of direction Directions given Organization to which direction given
Complied Escrow account opened and the amount transferred to the account.
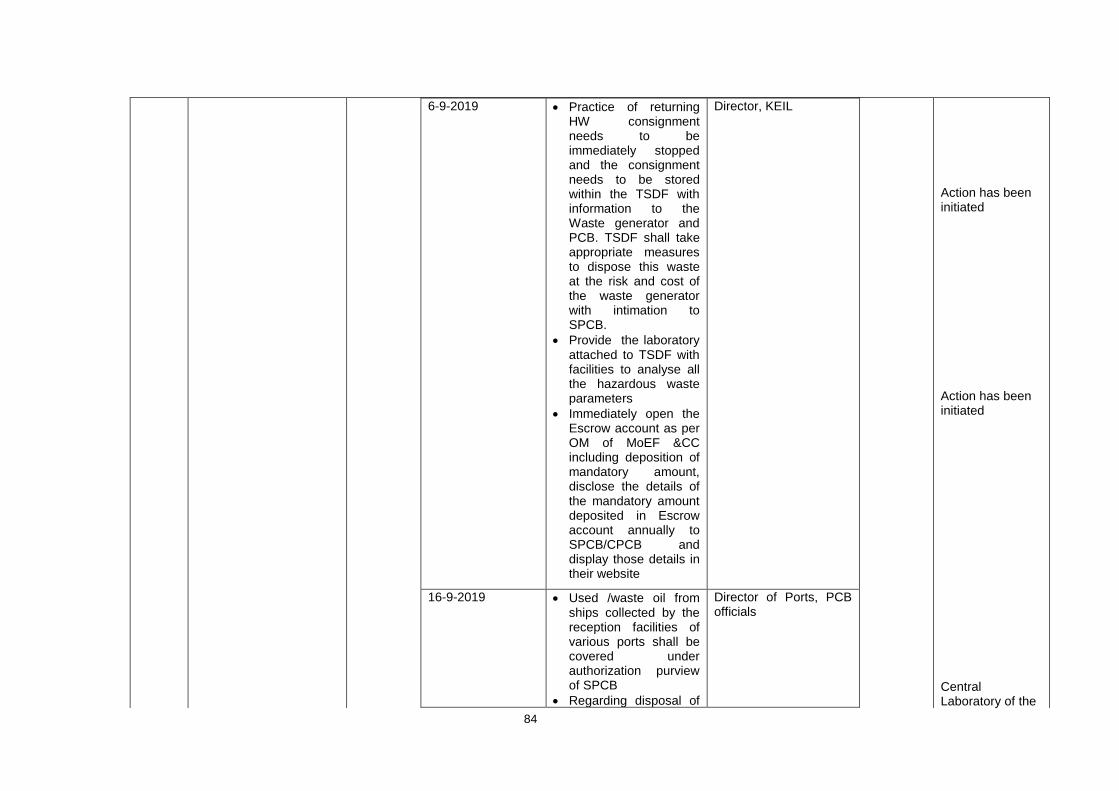
84
6-9-2019 Practice of returning HW consignment needs to be immediately stopped and the consignment needs to be stored within the TSDF with information to the Waste generator and PCB. TSDF shall take appropriate measures to dispose this waste at the risk and cost of the waste generator with intimation to SPCB.
Provide the laboratory attached to TSDF with facilities to analyse all the hazardous waste parameters
Immediately open the Escrow account as per OM of MoEF &CC including deposition of mandatory amount, disclose the details of the mandatory amount deposited in Escrow account annually to SPCB/CPCB and display those details in their website
Director, KEIL
16-9-2019 Used /waste oil from ships collected by the reception facilities of various ports shall be covered under authorization purview of SPCB
Regarding disposal of
Director of Ports, PCB officials
Action has been initiated Action has been initiated Central Laboratory of the
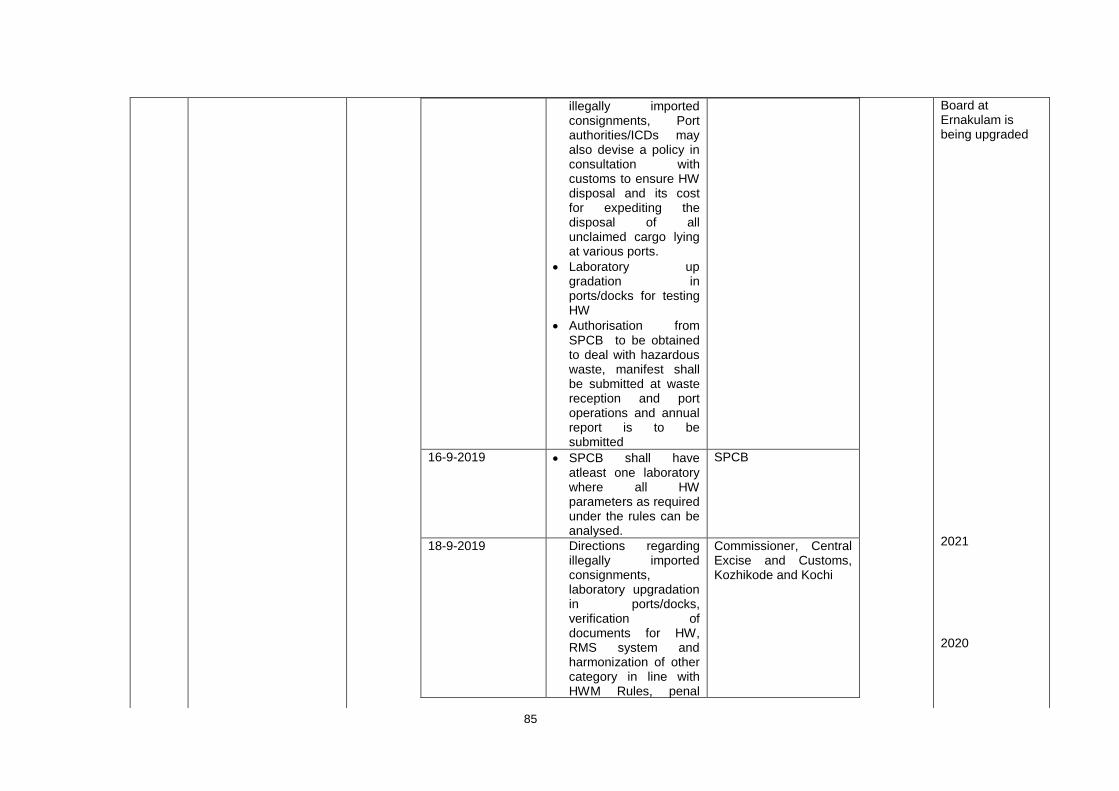
85
illegally imported consignments, Port authorities/ICDs may also devise a policy in consultation with customs to ensure HW disposal and its cost for expediting the disposal of all unclaimed cargo lying at various ports.
Laboratory up gradation in ports/docks for testing HW
Authorisation from SPCB to be obtained to deal with hazardous waste, manifest shall be submitted at waste reception and port operations and annual report is to be submitted
16-9-2019 SPCB shall have atleast one laboratory where all HW parameters as required under the rules can be analysed.
SPCB
18-9-2019 Directions regarding illegally imported consignments, laboratory upgradation in ports/docks, verification of documents for HW, RMS system and harmonization of other category in line with HWM Rules, penal
Commissioner, Central Excise and Customs, Kozhikode and Kochi
Board at Ernakulam is being upgraded 2021 2020
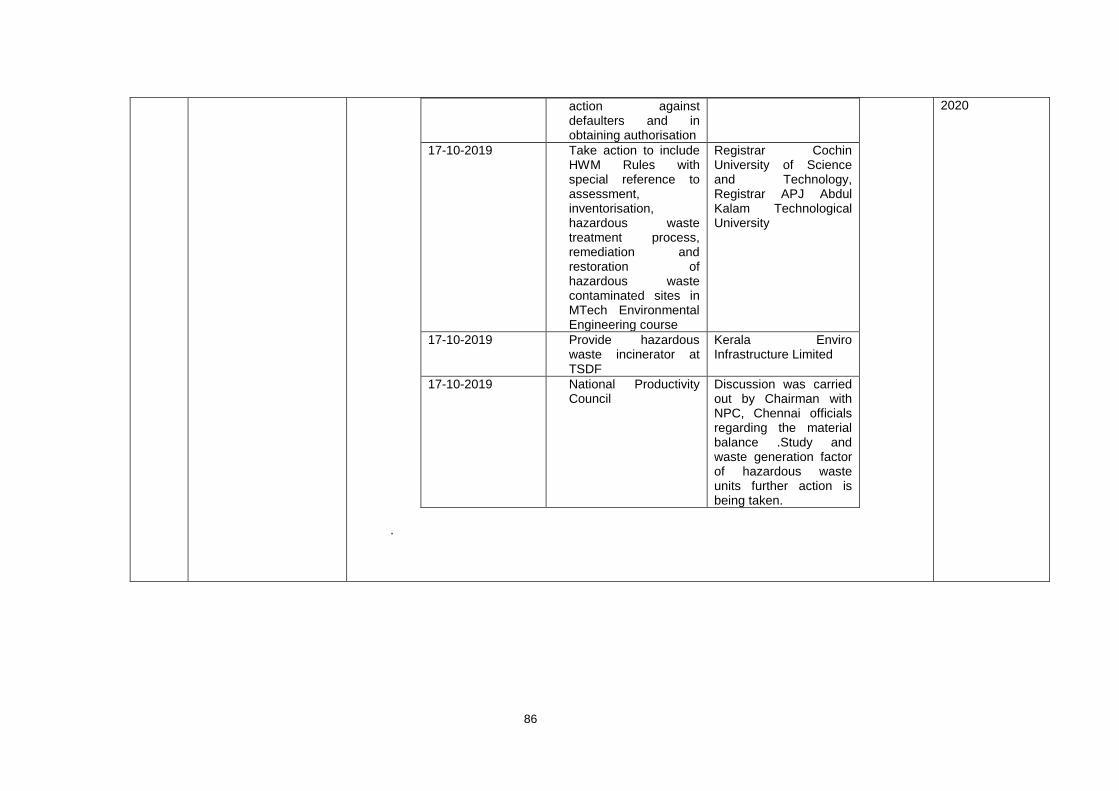
86
action against defaulters and in obtaining authorisation
17-10-2019 Take action to include HWM Rules with special reference to assessment, inventorisation, hazardous waste treatment process, remediation and restoration of hazardous waste contaminated sites in MTech Environmental Engineering course
Registrar Cochin University of Science and Technology, Registrar APJ Abdul Kalam Technological University
17-10-2019 Provide hazardous waste incinerator at TSDF
Kerala Enviro Infrastructure Limited
17-10-2019 National Productivity Council
Discussion was carried out by Chairman with NPC, Chennai officials regarding the material balance .Study and waste generation factor of hazardous waste units further action is being taken.
.
2020
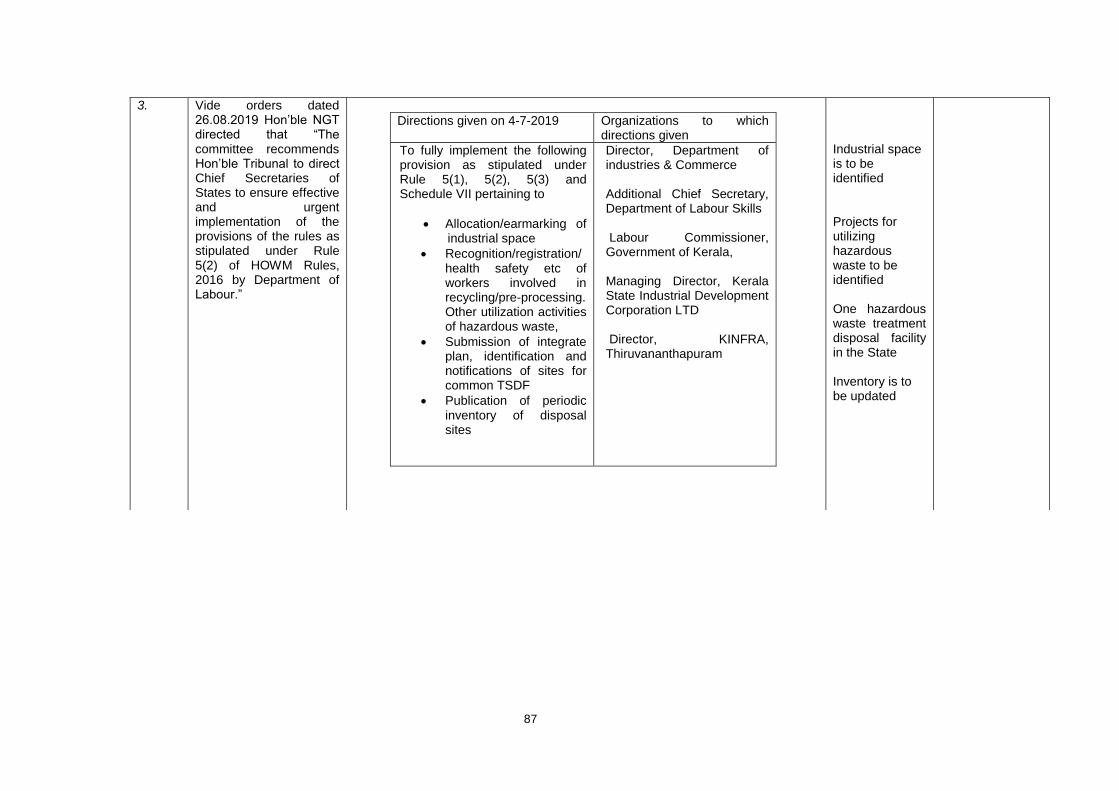
87
3. Vide orders dated 26.08.2019 Hon’ble NGT directed that “The committee recommends Hon’ble Tribunal to direct Chief Secretaries of States to ensure effective and urgent implementation of the provisions of the rules as stipulated under Rule 5(2) of HOWM Rules, 2016 by Department of Labour.”
Directions given on 4-7-2019 Organizations to which directions given
To fully implement the following provision as stipulated under Rule 5(1), 5(2), 5(3) and Schedule VII pertaining to
Allocation/earmarking of industrial space
Recognition/registration/health safety etc of workers involved in recycling/pre-processing. Other utilization activities of hazardous waste,
Submission of integrate plan, identification and notifications of sites for common TSDF
Publication of periodic inventory of disposal sites
Director, Department of industries & Commerce Additional Chief Secretary, Department of Labour Skills Labour Commissioner, Government of Kerala, Managing Director, Kerala State Industrial Development Corporation LTD Director, KINFRA, Thiruvananthapuram
Industrial space is to be identified Projects for utilizing hazardous waste to be identified
One hazardous waste treatment disposal facility in the State
Inventory is to be updated
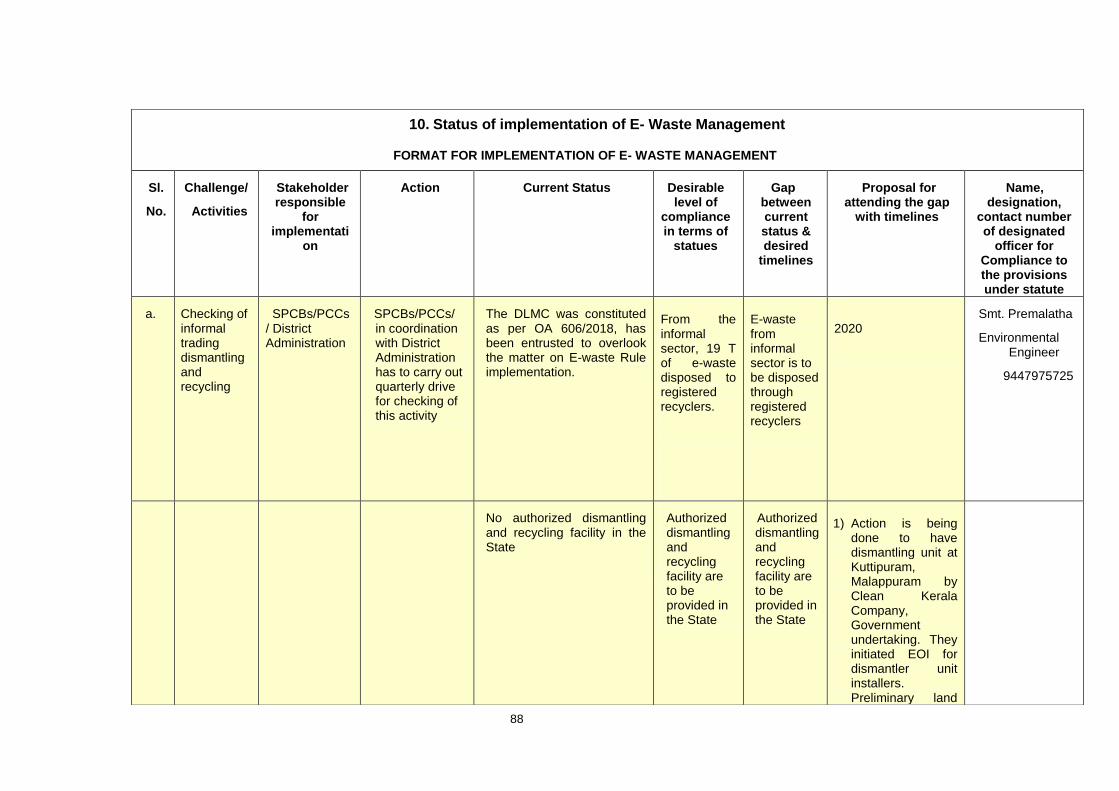
88
10. Status of implementation of E- Waste Management
FORMAT FOR IMPLEMENTATION OF E- WASTE MANAGEMENT
Sl.
No.
Challenge/
Activities
Stakeholder responsible
for implementati
on
Action Current Status Desirable level of
compliance in terms of
statues
Gap between current status & desired
timelines
Proposal for attending the gap
with timelines
Name, designation,
contact number of designated
officer for Compliance to the provisions under statute
a. Checking of informal trading dismantling and recycling
SPCBs/PCCs/ District Administration
SPCBs/PCCs/ in coordination with District Administration has to carry out quarterly drive for checking of this activity
The DLMC was constituted as per OA 606/2018, has been entrusted to overlook the matter on E-waste Rule implementation.
From the informal sector, 19 T of e-waste disposed to registered recyclers.
E-waste from informal sector is to be disposed through registered recyclers
2020
Smt. Premalatha
Environmental Engineer
9447975725
No authorized dismantling and recycling facility in the State
Authorized dismantling and recycling facility are to be provided in the State
Authorized dismantling and recycling facility are to be provided in the State
1) Action is being
done to have dismantling unit at Kuttipuram, Malappuram by Clean Kerala Company, Government undertaking. They initiated EOI for dismantler unit installers. Preliminary land
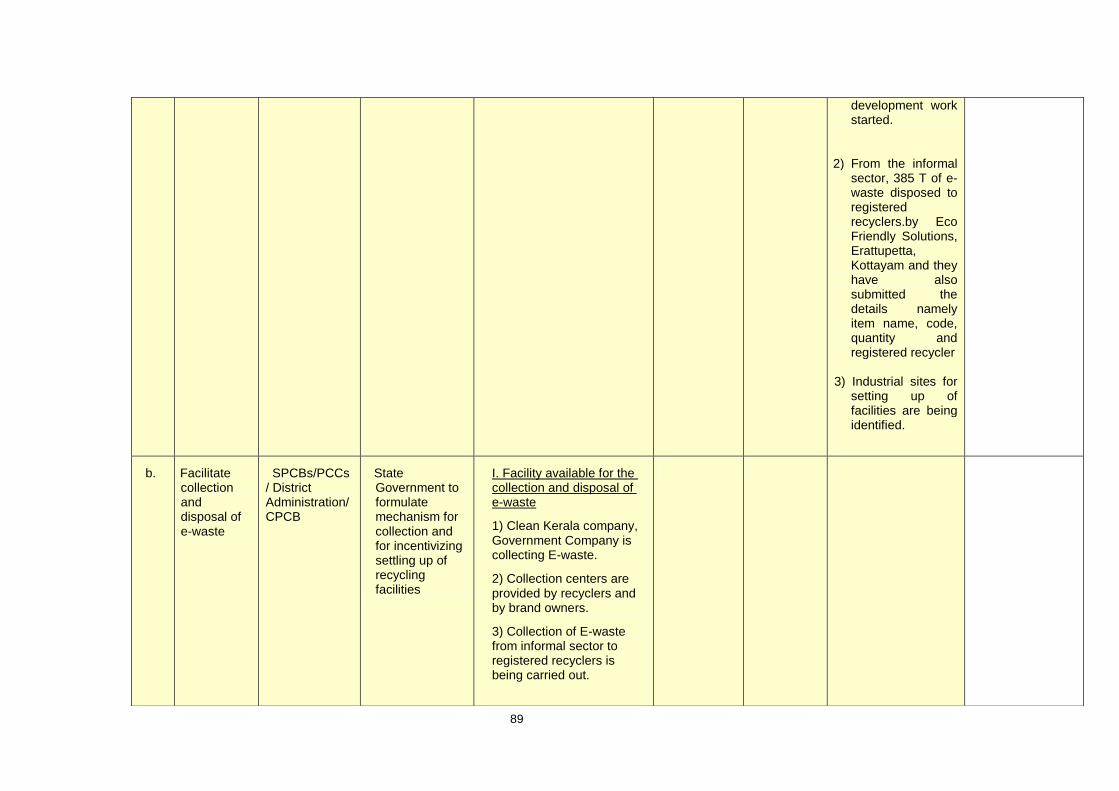
89
development work started.
2) From the informal sector, 385 T of e-waste disposed to registered recyclers.by Eco Friendly Solutions, Erattupetta, Kottayam and they have also submitted the details namely item name, code, quantity and registered recycler
3) Industrial sites for
setting up of facilities are being identified.
b. Facilitate collection and disposal of e-waste
SPCBs/PCCs/ District Administration/ CPCB
State Government to formulate mechanism for collection and for incentivizing settling up of recycling facilities
I. Facility available for the collection and disposal of e-waste
1) Clean Kerala company, Government Company is collecting E-waste.
2) Collection centers are provided by recyclers and by brand owners.
3) Collection of E-waste from informal sector to registered recyclers is being carried out.
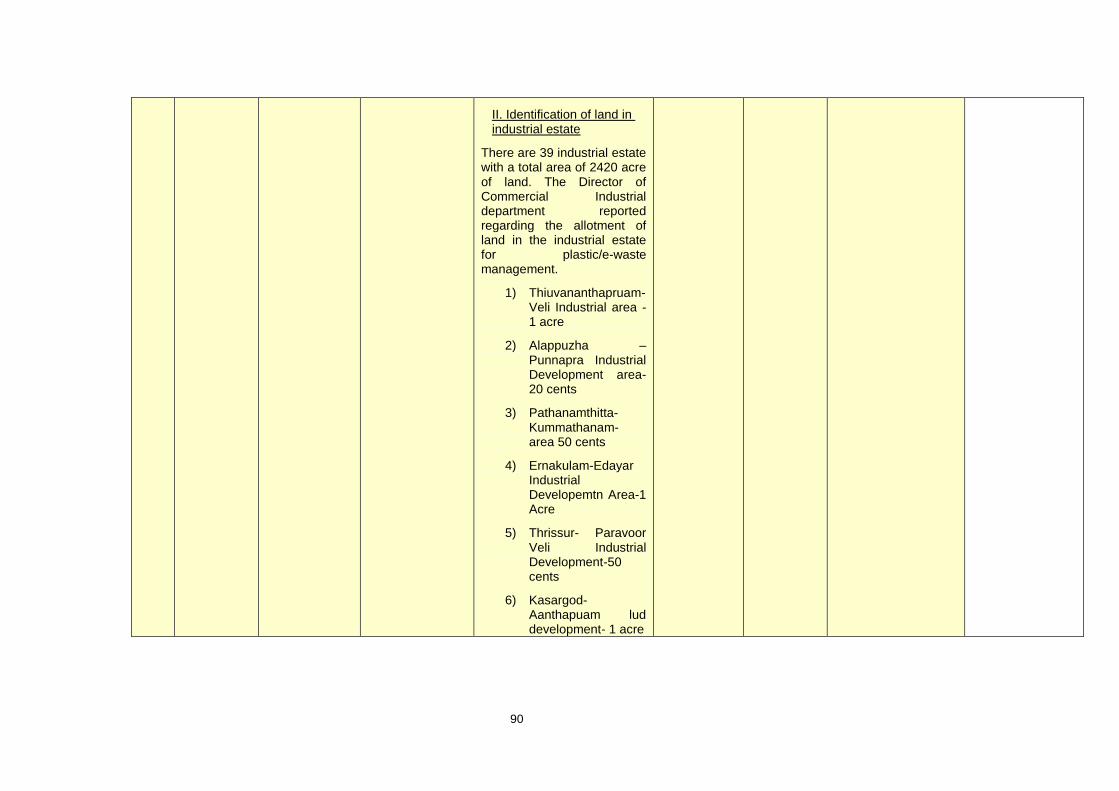
90
II. Identification of land in industrial estate
There are 39 industrial estate with a total area of 2420 acre of land. The Director of Commercial Industrial department reported regarding the allotment of land in the industrial estate for plastic/e-waste management.
1) Thiuvananthapruam-Veli Industrial area -1 acre
2) Alappuzha –Punnapra Industrial Development area-20 cents
3) Pathanamthitta-Kummathanam- area 50 cents
4) Ernakulam-Edayar Industrial Developemtn Area-1 Acre
5) Thrissur- Paravoor Veli Industrial Development-50 cents
6) Kasargod-Aanthapuam lud development- 1 acre
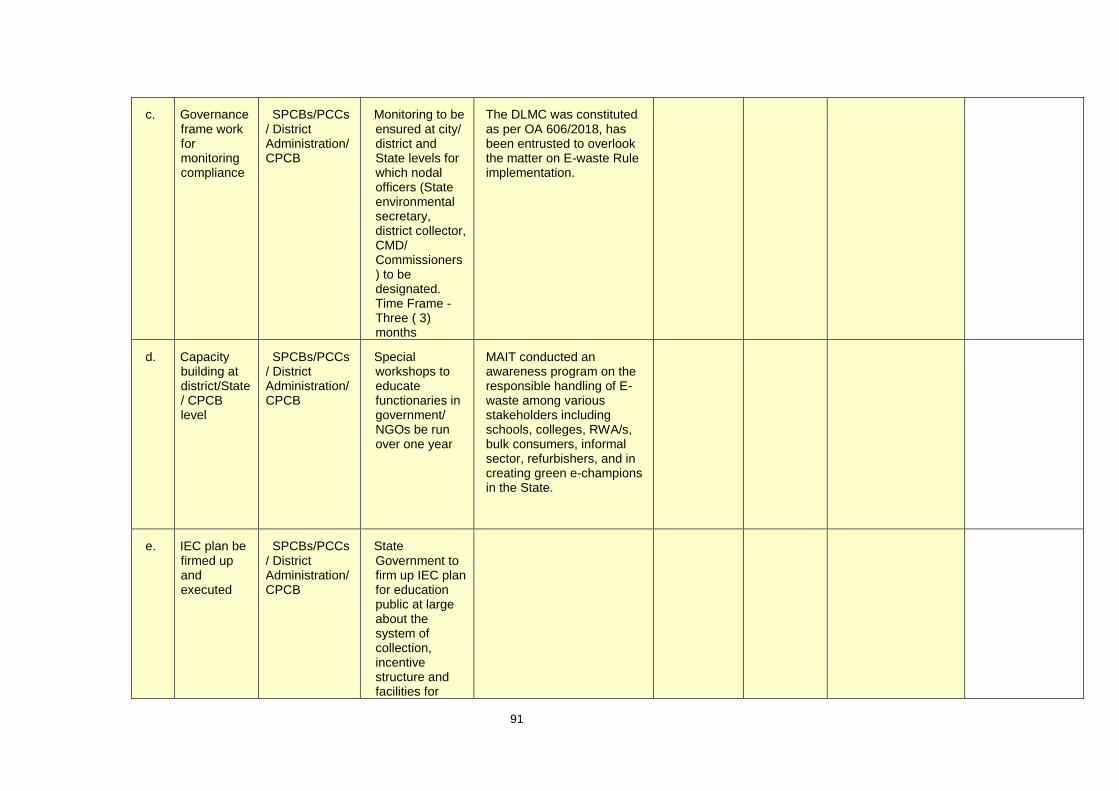
91
c. Governance frame work for monitoring compliance
SPCBs/PCCs/ District Administration/ CPCB
Monitoring to be ensured at city/ district and State levels for which nodal officers (State environmental secretary, district collector, CMD/ Commissioners) to be designated. Time Frame - Three ( 3) months
The DLMC was constituted as per OA 606/2018, has been entrusted to overlook the matter on E-waste Rule implementation.
d. Capacity building at district/State/ CPCB level
SPCBs/PCCs/ District Administration/ CPCB
Special workshops to educate functionaries in government/ NGOs be run over one year
MAIT conducted an awareness program on the responsible handling of E-waste among various stakeholders including schools, colleges, RWA/s, bulk consumers, informal sector, refurbishers, and in creating green e-champions in the State.
e. IEC plan be firmed up and executed
SPCBs/PCCs/ District Administration/ CPCB
State Government to firm up IEC plan for education public at large about the system of collection, incentive structure and facilities for

92
recycling. The IEC plan to be executed over one year
f. Strengthen system of enforcement
SPCBs/PCCs/ District Administration/ CPCB
Quarterly review of violations and enforcement actions at city/district/ state level and quarterly reports to be filed with CPCB.
Collection centers operated by various brand owners were inspected in Thiruvananthapuram district, based on the violation notices and reported to CPCB and subsequently CPCB revoked the EPR authorization issued. The matter is being followed up.
Brand owners/producers while applying for EPR authorization have to submit action plan. But the Urban Directorate in the State Government and State PCBs are not aware about the action plan. Hence the action plans have to be endorsed by the State Government. The EPR authorization re instated by CPCB.
Action plan by brand owners is to be endorsed by State Government and SPCB
Not submitted the action plan by producers/brand owners
Central Pollution Control Board is to instruct the producers in this regard. Notices issued to all EPR authorizers’ and from the replies received it is understood that the collection centers provided by the producers are not adequate to collect all their products from the users. The CPCB was addressed to introduce bye back/take back system with declared appreciable price to the returned goods at least by major brand owners.
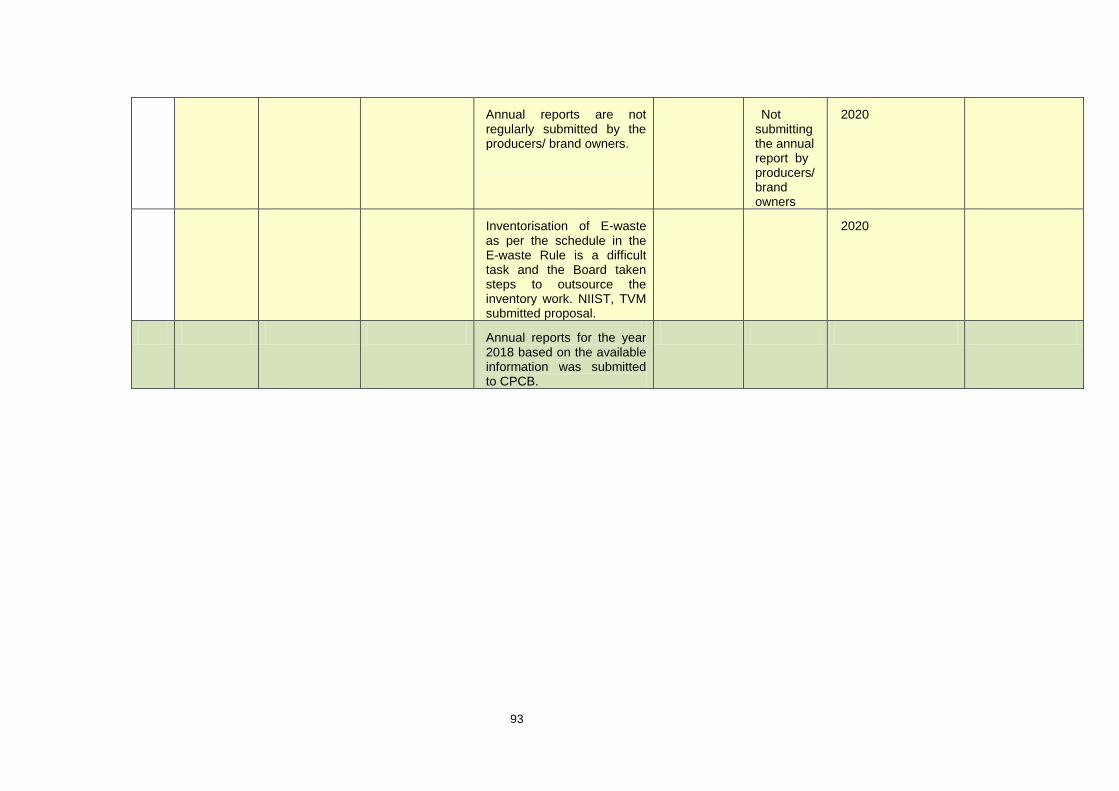
93
Annual reports are not regularly submitted by the producers/ brand owners.
Not submitting the annual report by producers/brand owners
2020
Inventorisation of E-waste as per the schedule in the E-waste Rule is a difficult task and the Board taken steps to outsource the inventory work. NIIST, TVM submitted proposal.
2020
Annual reports for the year 2018 based on the available information was submitted to CPCB.
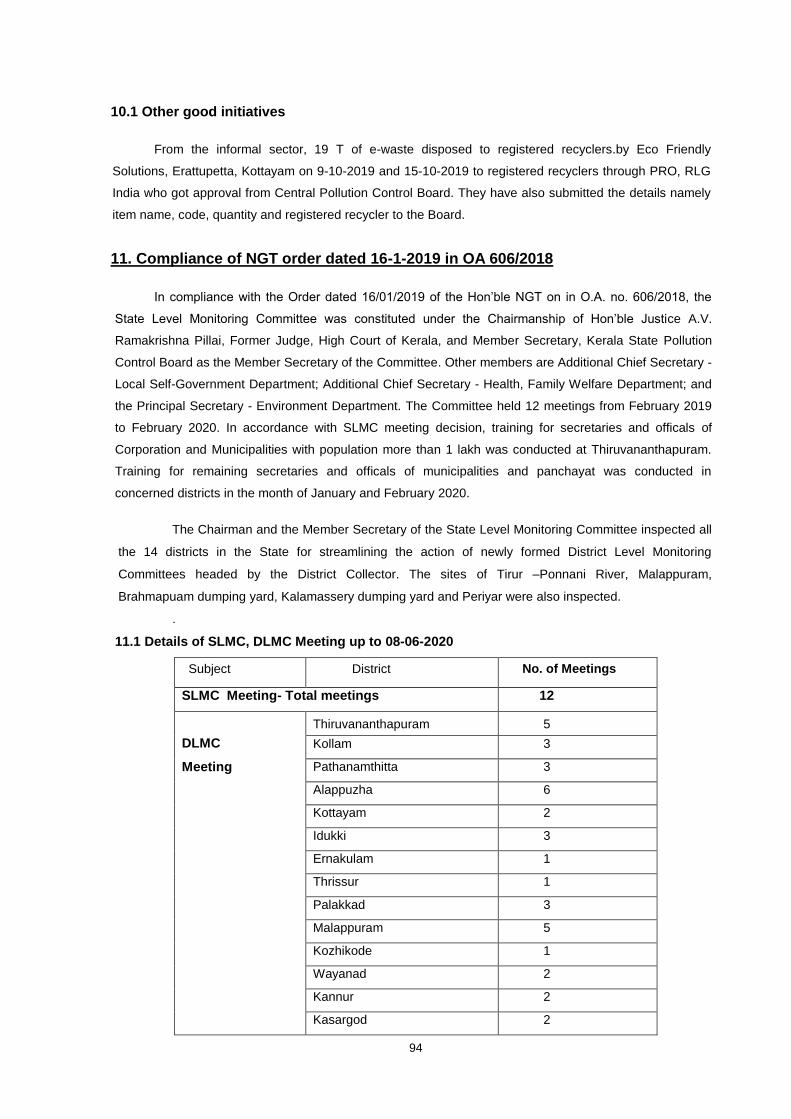
94
10.1 Other good initiatives
From the informal sector, 19 T of e-waste disposed to registered recyclers.by Eco Friendly
Solutions, Erattupetta, Kottayam on 9-10-2019 and 15-10-2019 to registered recyclers through PRO, RLG
India who got approval from Central Pollution Control Board. They have also submitted the details namely
item name, code, quantity and registered recycler to the Board.
11. Compliance of NGT order dated 16-1-2019 in OA 606/2018
In compliance with the Order dated 16/01/2019 of the Hon’ble NGT on in O.A. no. 606/2018, the
State Level Monitoring Committee was constituted under the Chairmanship of Hon’ble Justice A.V.
Ramakrishna Pillai, Former Judge, High Court of Kerala, and Member Secretary, Kerala State Pollution
Control Board as the Member Secretary of the Committee. Other members are Additional Chief Secretary -
Local Self-Government Department; Additional Chief Secretary - Health, Family Welfare Department; and
the Principal Secretary - Environment Department. The Committee held 12 meetings from February 2019
to February 2020. In accordance with SLMC meeting decision, training for secretaries and officals of
Corporation and Municipalities with population more than 1 lakh was conducted at Thiruvananthapuram.
Training for remaining secretaries and officals of municipalities and panchayat was conducted in
concerned districts in the month of January and February 2020.
The Chairman and the Member Secretary of the State Level Monitoring Committee inspected all
the 14 districts in the State for streamlining the action of newly formed District Level Monitoring
Committees headed by the District Collector. The sites of Tirur –Ponnani River, Malappuram,
Brahmapuam dumping yard, Kalamassery dumping yard and Periyar were also inspected.
.
11.1 Details of SLMC, DLMC Meeting up to 08-06-2020
Subject District No. of Meetings
SLMC Meeting- Total meetings 12
DLMC
Meeting
Thiruvananthapuram 5
Kollam 3
Pathanamthitta 3
Alappuzha 6
Kottayam 2
Idukki 3
Ernakulam 1
Thrissur 1
Palakkad 3
Malappuram 5
Kozhikode 1
Wayanad 2
Kannur 2
Kasargod 2
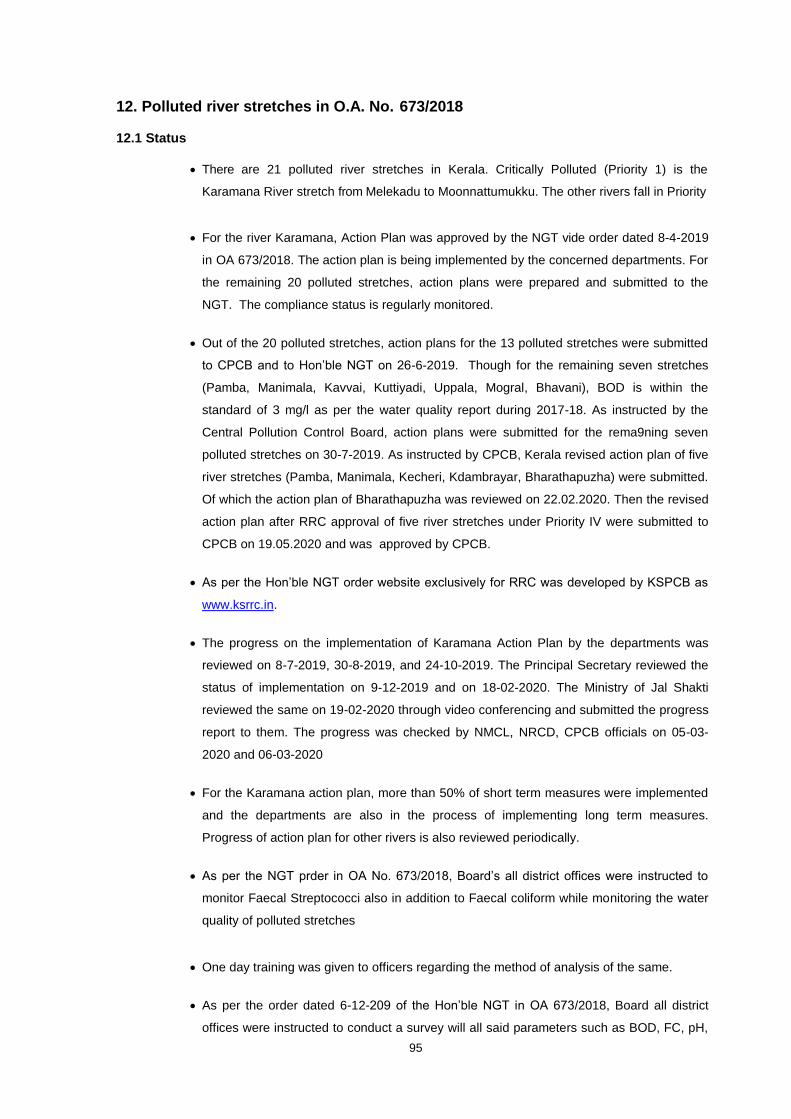
95
12. Polluted river stretches in O.A. No. 673/2018
12.1 Status
There are 21 polluted river stretches in Kerala. Critically Polluted (Priority 1) is the
Karamana River stretch from Melekadu to Moonnattumukku. The other rivers fall in Priority
For the river Karamana, Action Plan was approved by the NGT vide order dated 8-4-2019
in OA 673/2018. The action plan is being implemented by the concerned departments. For
the remaining 20 polluted stretches, action plans were prepared and submitted to the
NGT. The compliance status is regularly monitored.
Out of the 20 polluted stretches, action plans for the 13 polluted stretches were submitted
to CPCB and to Hon’ble NGT on 26-6-2019. Though for the remaining seven stretches
(Pamba, Manimala, Kavvai, Kuttiyadi, Uppala, Mogral, Bhavani), BOD is within the
standard of 3 mg/l as per the water quality report during 2017-18. As instructed by the
Central Pollution Control Board, action plans were submitted for the rema9ning seven
polluted stretches on 30-7-2019. As instructed by CPCB, Kerala revised action plan of five
river stretches (Pamba, Manimala, Kecheri, Kdambrayar, Bharathapuzha) were submitted.
Of which the action plan of Bharathapuzha was reviewed on 22.02.2020. Then the revised
action plan after RRC approval of five river stretches under Priority IV were submitted to
CPCB on 19.05.2020 and was approved by CPCB.
As per the Hon’ble NGT order website exclusively for RRC was developed by KSPCB as
www.ksrrc.in.
The progress on the implementation of Karamana Action Plan by the departments was
reviewed on 8-7-2019, 30-8-2019, and 24-10-2019. The Principal Secretary reviewed the
status of implementation on 9-12-2019 and on 18-02-2020. The Ministry of Jal Shakti
reviewed the same on 19-02-2020 through video conferencing and submitted the progress
report to them. The progress was checked by NMCL, NRCD, CPCB officials on 05-03-
2020 and 06-03-2020
For the Karamana action plan, more than 50% of short term measures were implemented
and the departments are also in the process of implementing long term measures.
Progress of action plan for other rivers is also reviewed periodically.
As per the NGT prder in OA No. 673/2018, Board’s all district offices were instructed to
monitor Faecal Streptococci also in addition to Faecal coliform while monitoring the water
quality of polluted stretches
One day training was given to officers regarding the method of analysis of the same.
As per the order dated 6-12-209 of the Hon’ble NGT in OA 673/2018, Board all district
offices were instructed to conduct a survey will all said parameters such as BOD, FC, pH,
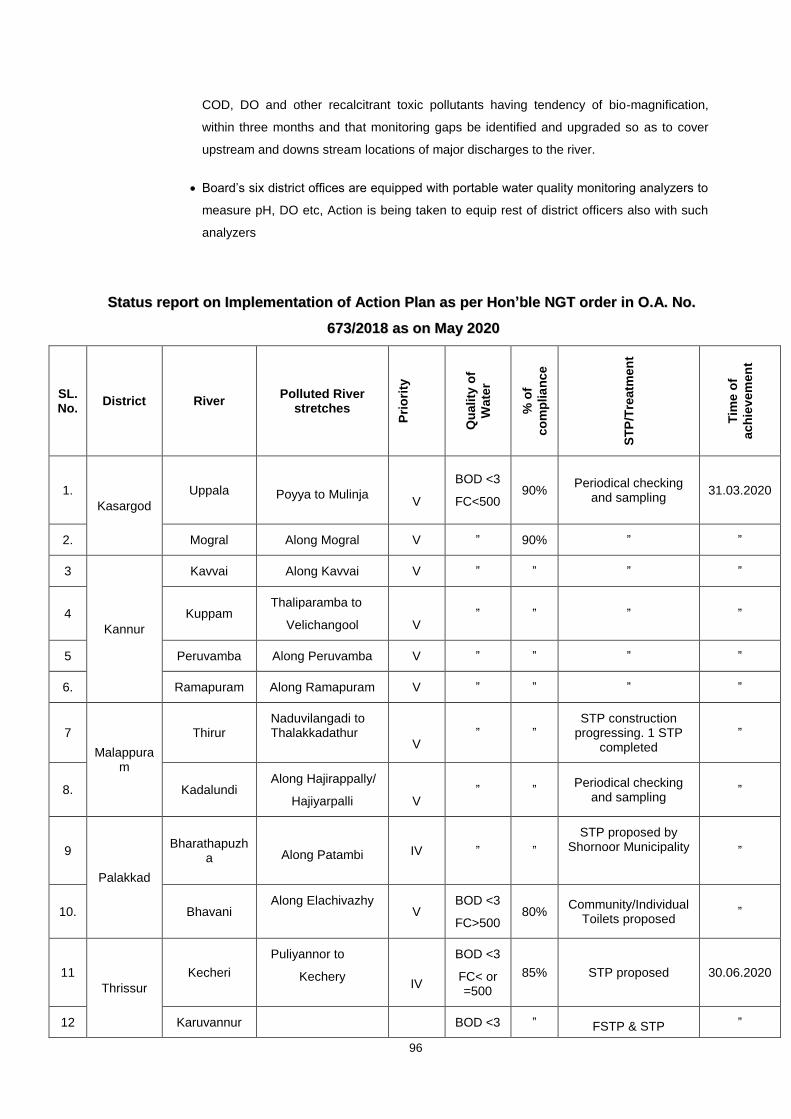
96
COD, DO and other recalcitrant toxic pollutants having tendency of bio-magnification,
within three months and that monitoring gaps be identified and upgraded so as to cover
upstream and downs stream locations of major discharges to the river.
Board’s six district offices are equipped with portable water quality monitoring analyzers to
measure pH, DO etc, Action is being taken to equip rest of district officers also with such
analyzers
SSttaattuuss rreeppoorrtt oonn IImmpplleemmeennttaattiioonn ooff AAccttiioonn PPllaann aass ppeerr HHoonn’’bbllee NNGGTT oorrddeerr iinn OO..AA.. NNoo..
667733//22001188 aass oonn MMaayy 22002200
SL. No.
District River Polluted River
stretches P
rio
rity
Qu
ality
of
Wate
r
% o
f
co
mp
lia
nce
ST
P/T
reatm
en
t
Tim
e o
f
ach
ievem
en
t
1.
Kasargod
Uppala
Poyya to Mulinja
V
BOD <3
FC<500 90%
Periodical checking and sampling
31.03.2020
2. Mogral Along Mogral V ” 90% ” ”
3
Kannur
Kavvai Along Kavvai V ” ” ” ”
4 Kuppam Thaliparamba to
Velichangool
V ” ” ” ”
5 Peruvamba Along Peruvamba V ” ” ” ”
6. Ramapuram Along Ramapuram V ” ” ” ”
7
Malappuram
Thirur Naduvilangadi to Thalakkadathur
V ” ”
STP construction progressing. 1 STP
completed ”
8. Kadalundi Along Hajirappally/
Hajiyarpalli
V ” ”
Periodical checking and sampling
”
9
Palakkad
Bharathapuzha
Along Patambi IV ” ”
STP proposed by Shornoor Municipality
”
10. Bhavani Along Elachivazhy
V BOD <3
FC>500 80%
Community/Individual Toilets proposed
”
11
Thrissur
Kecheri
Puliyannor to
Kechery
IV
BOD <3
FC< or =500
85% STP proposed 30.06.2020
12 Karuvannur BOD <3 ” FSTP & STP ”

97
SL. No.
District River Polluted River
stretches
Pri
ori
ty
Qu
ality
of
Wate
r
% o
f
co
mp
lia
nce
ST
P/T
reatm
en
t
Tim
e o
f
ach
ievem
en
t
Along Karuvannur V FC<500 proposed
13 Puzhakkal Olarikkara to
Puzhackal V ” ”
100 KLD & 360 KLD STP proposed
”
14
Ernakulam
Chithrapuzha Irumpanam to
Karingachira
V
BOD <3
FC>500 30% STP proposed 18.02.2021
15 Kadambrayar Manckakadavu to
Brahmapuram
IV ” ” ” ”
16 Periyar Alwaye-Eloor to
Kalamassery
V ” ” ” ”
17
Kozhikode
Kallayi Thekepuram to
Arakkinar
V
BOD <3
FC>500 40% STP proposed 18.02.2021
18 Kuttiyadi Along Kuttiyady V ” ” ” ”
19 Pathanam
thtitta Pamba
Mannar to
Thakazhy
IV
BOD <3
FC>500 70%
Minimal Treatment & Disinfection proposed
31.03.2020
20 Alappuzha Manimala Kalloopara to
Thondra
IV
BOD <3
FC>500 50% STP proposed 18.02.2021
21 Trivandru
m Karamana
Malekkdu to
Thiruvallam
I
BOD <3
FC>500
30%
(Shorterm>
50%)
STP proposed, Sewerline
31.03.2021
12.2 Other Projects
a) National Hydrology Project
Under the National Hydrology Project, a study is planned on 5 major rivers, namely Meenachil, Periyar,
Bharathapuzha, Kallai and Valapatnam.
b) Urban Regeneration and Integrated Water Transport System in Cochin
A project titled Urban Regeneration and Integrated Water Transport System in Cochin with a project outlay
of Rs 1365.16 crores has been appraised by KIIFB for funding. It is intended to regenerate the urban area
in and around the 5 canals in Kochi, rehabilitate the slum dwellers and make use of the commercial area
near the canal along with creation of tourism destinations and navigation through the canals. In principle,
approval has been given for KIIFB funding for Rs 566.51 crores for land acquisition and building
compensation in 2 Phases, namely Phase 1 for Rs 340.69 crores and Phase 2 for Rs 225.82 crores. Kochi
Metro Limited is the Special Purpose Vehicle for this project.
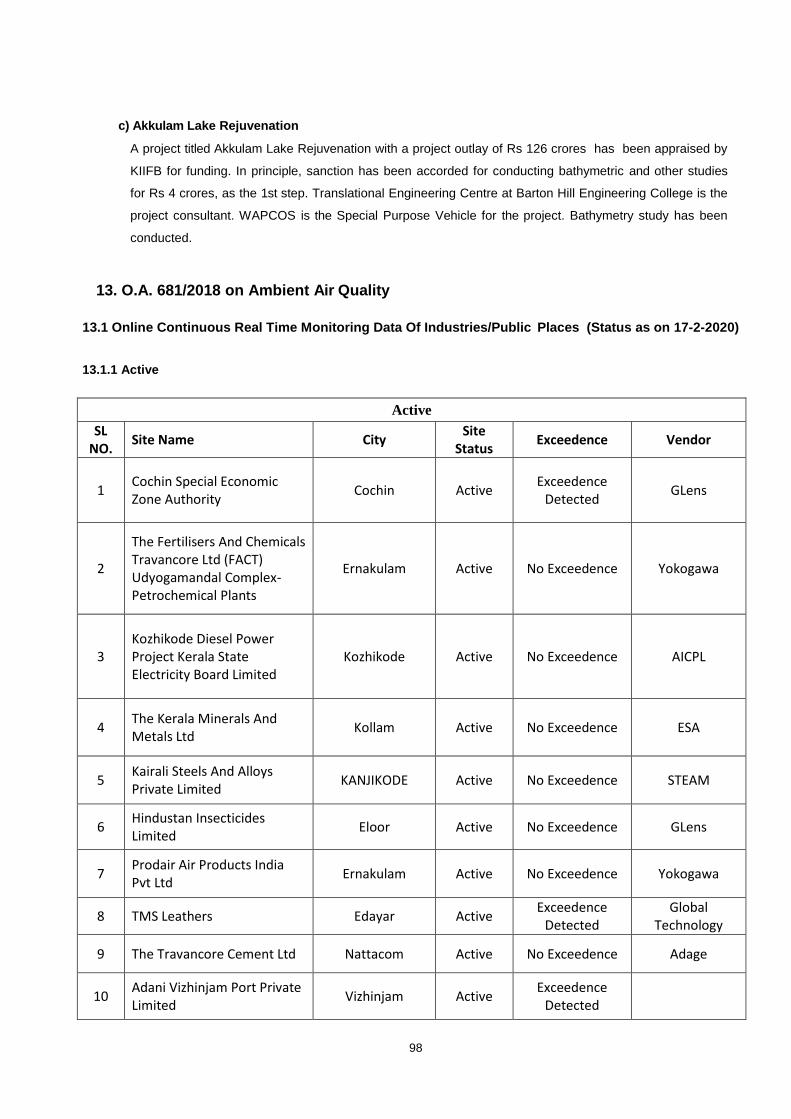
98
c) Akkulam Lake Rejuvenation
A project titled Akkulam Lake Rejuvenation with a project outlay of Rs 126 crores has been appraised by
KIIFB for funding. In principle, sanction has been accorded for conducting bathymetric and other studies
for Rs 4 crores, as the 1st step. Translational Engineering Centre at Barton Hill Engineering College is the
project consultant. WAPCOS is the Special Purpose Vehicle for the project. Bathymetry study has been
conducted.
13. O.A. 681/2018 on Ambient Air Quality
13.1 Online Continuous Real Time Monitoring Data Of Industries/Public Places (Status as on 17-2-2020)
13.1.1 Active
Active
SL NO.
Site Name City Site
Status Exceedence Vendor
1 Cochin Special Economic Zone Authority
Cochin Active Exceedence
Detected GLens
2
The Fertilisers And Chemicals Travancore Ltd (FACT) Udyogamandal Complex-Petrochemical Plants
Ernakulam Active No Exceedence Yokogawa
3 Kozhikode Diesel Power Project Kerala State Electricity Board Limited
Kozhikode Active No Exceedence AICPL
4 The Kerala Minerals And Metals Ltd
Kollam Active No Exceedence ESA
5 Kairali Steels And Alloys Private Limited
KANJIKODE Active No Exceedence STEAM
6 Hindustan Insecticides Limited
Eloor Active No Exceedence GLens
7 Prodair Air Products India Pvt Ltd
Ernakulam Active No Exceedence Yokogawa
8 TMS Leathers Edayar Active Exceedence
Detected Global
Technology
9 The Travancore Cement Ltd Nattacom Active No Exceedence Adage
10 Adani Vizhinjam Port Private Limited
Vizhinjam Active Exceedence
Detected
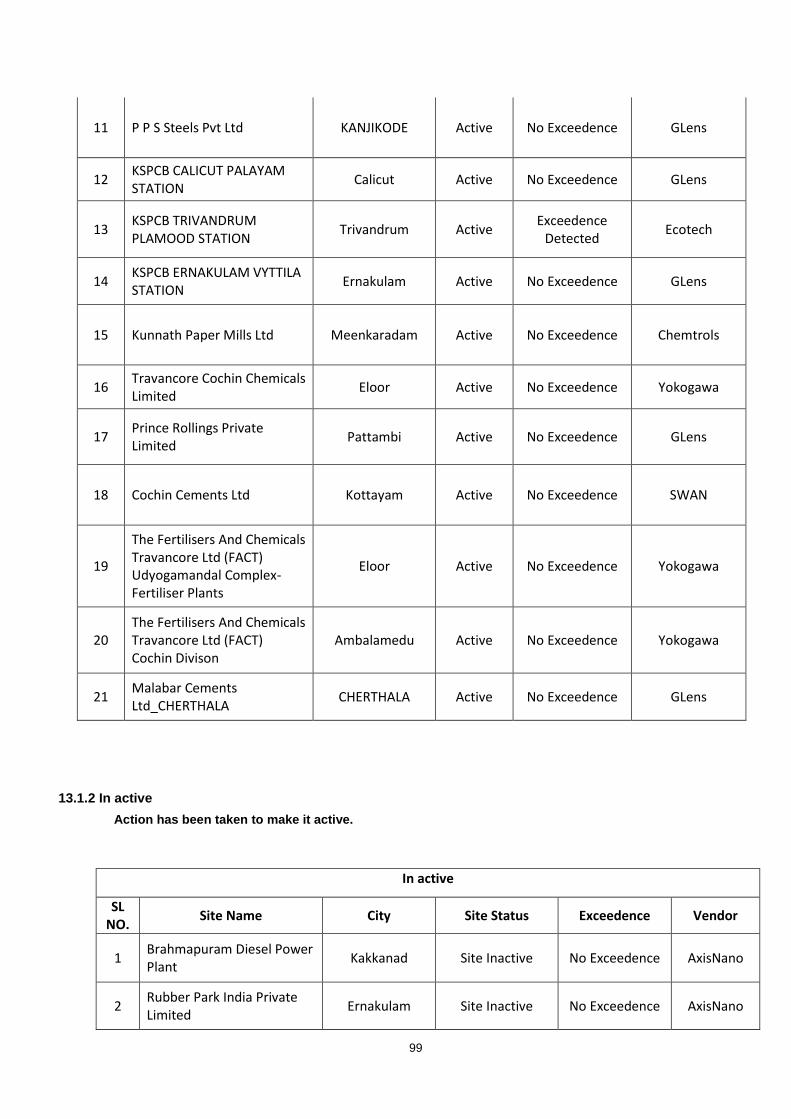
99
11 P P S Steels Pvt Ltd KANJIKODE Active No Exceedence GLens
12 KSPCB CALICUT PALAYAM STATION
Calicut Active No Exceedence GLens
13 KSPCB TRIVANDRUM PLAMOOD STATION
Trivandrum Active Exceedence
Detected Ecotech
14 KSPCB ERNAKULAM VYTTILA STATION
Ernakulam Active No Exceedence GLens
15 Kunnath Paper Mills Ltd Meenkaradam Active No Exceedence Chemtrols
16 Travancore Cochin Chemicals Limited
Eloor Active No Exceedence Yokogawa
17 Prince Rollings Private Limited
Pattambi Active No Exceedence GLens
18 Cochin Cements Ltd Kottayam Active No Exceedence SWAN
19
The Fertilisers And Chemicals Travancore Ltd (FACT) Udyogamandal Complex-Fertiliser Plants
Eloor Active No Exceedence Yokogawa
20 The Fertilisers And Chemicals Travancore Ltd (FACT) Cochin Divison
Ambalamedu Active No Exceedence Yokogawa
21 Malabar Cements Ltd_CHERTHALA
CHERTHALA Active No Exceedence GLens
13.1.2 In active
Action has been taken to make it active.
In active
SL NO.
Site Name City Site Status Exceedence Vendor
1 Brahmapuram Diesel Power Plant
Kakkanad Site Inactive No Exceedence AxisNano
2 Rubber Park India Private Limited
Ernakulam Site Inactive No Exceedence AxisNano
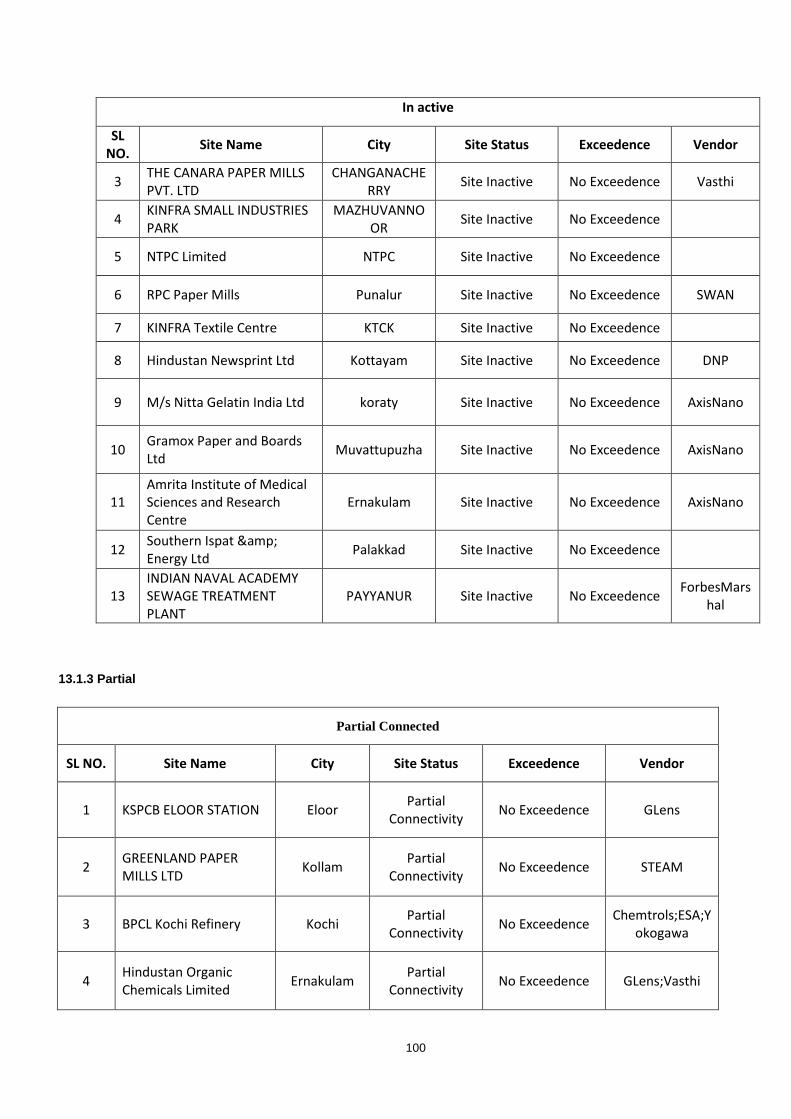
100
In active
SL NO.
Site Name City Site Status Exceedence Vendor
3 THE CANARA PAPER MILLS PVT. LTD
CHANGANACHERRY
Site Inactive No Exceedence Vasthi
4 KINFRA SMALL INDUSTRIES PARK
MAZHUVANNOOR
Site Inactive No Exceedence
5 NTPC Limited NTPC Site Inactive No Exceedence
6 RPC Paper Mills Punalur Site Inactive No Exceedence SWAN
7 KINFRA Textile Centre KTCK Site Inactive No Exceedence
8 Hindustan Newsprint Ltd Kottayam Site Inactive No Exceedence DNP
9 M/s Nitta Gelatin India Ltd koraty Site Inactive No Exceedence AxisNano
10 Gramox Paper and Boards Ltd
Muvattupuzha Site Inactive No Exceedence AxisNano
11 Amrita Institute of Medical Sciences and Research Centre
Ernakulam Site Inactive No Exceedence AxisNano
12 Southern Ispat & Energy Ltd
Palakkad Site Inactive No Exceedence
13 INDIAN NAVAL ACADEMY SEWAGE TREATMENT PLANT
PAYYANUR Site Inactive No Exceedence ForbesMars
hal
13.1.3 Partial
Partial Connected
SL NO. Site Name City Site Status Exceedence Vendor
1 KSPCB ELOOR STATION Eloor Partial
Connectivity No Exceedence GLens
2 GREENLAND PAPER MILLS LTD
Kollam Partial
Connectivity No Exceedence STEAM
3 BPCL Kochi Refinery Kochi Partial
Connectivity No Exceedence
Chemtrols;ESA;Yokogawa
4 Hindustan Organic Chemicals Limited
Ernakulam Partial
Connectivity No Exceedence GLens;Vasthi

101
5 Malabar Cements Ltd Pallakad Partial
Connectivity No Exceedence ESA
6 Apollo Tyres Limited Kalamassery Partial
Connectivity Exceedence
Detected GLens;Yokogaw
a
7 Indian Medical Association Goes Ecofriendly
Palakkad Partial
Connectivity No Exceedence Vasthi
8 KSPCB ERNAKULAM MG ROAD STATION
Opp Seematti MG Road Cochin
Partial Connectivity
No Exceedence GLens
13.2 Real time ambient air quality stations at public places
Ambient air quality data of 8 real time ambient monitoring stations in the State located at the following
places:
1. Thiruvananthapuram-Plamood (Capital of Kerala)
2. Thiruvananthapuram-Kariyavattom (University of Kerala)- connected to CPCB server
3. Ernakulam- Eloor (Industrial Hub of the State)
4. Ernakulam-MG Road (Ernakulum- Central City)
5. Ernakulam- Vytila Bus Stand (Ernakulum- Commercial Area)
6. Kozhikode Palayam Bus Stand (Kozhikode- Commercial Area)
7. Kollam,Polaythodu – connected to CPCB server
8. Kannur,Mini Civil Station – connected to CPCB server
13.3 Ambient air quality stations:
Apart from the real time ambient air quality monitoring stations, the Board monitors the ambient air quality
at prominent stations under the NAMP (National Ambient Air Quality Monitoring Programme) and SAMP
(State Ambient Air Quality Monitoring Programme). New SAMP station was established at Moovattupuzha
in Ernakulam district.
A. Ambient air quality stations under National Ambient Air Quality Programme
Sl.
No.
Location District
1. a) COSMO Politian Hospital, Pattom Thiruvananthapuram NAMP
2. b) SMV Govt. Model High School over bridge Thiruvananthapuram NAMP
3. c) Filatex, Veli Thiruvananthapuram NAMP
4. d) Kerala State Pollution Control Board, District Office, Plamood,
Thiruvananthapuram
Thiruvananthapuram NAMP
5. e) Krishna Leela Tower Kadapakkada Kollam Kollam NAMP
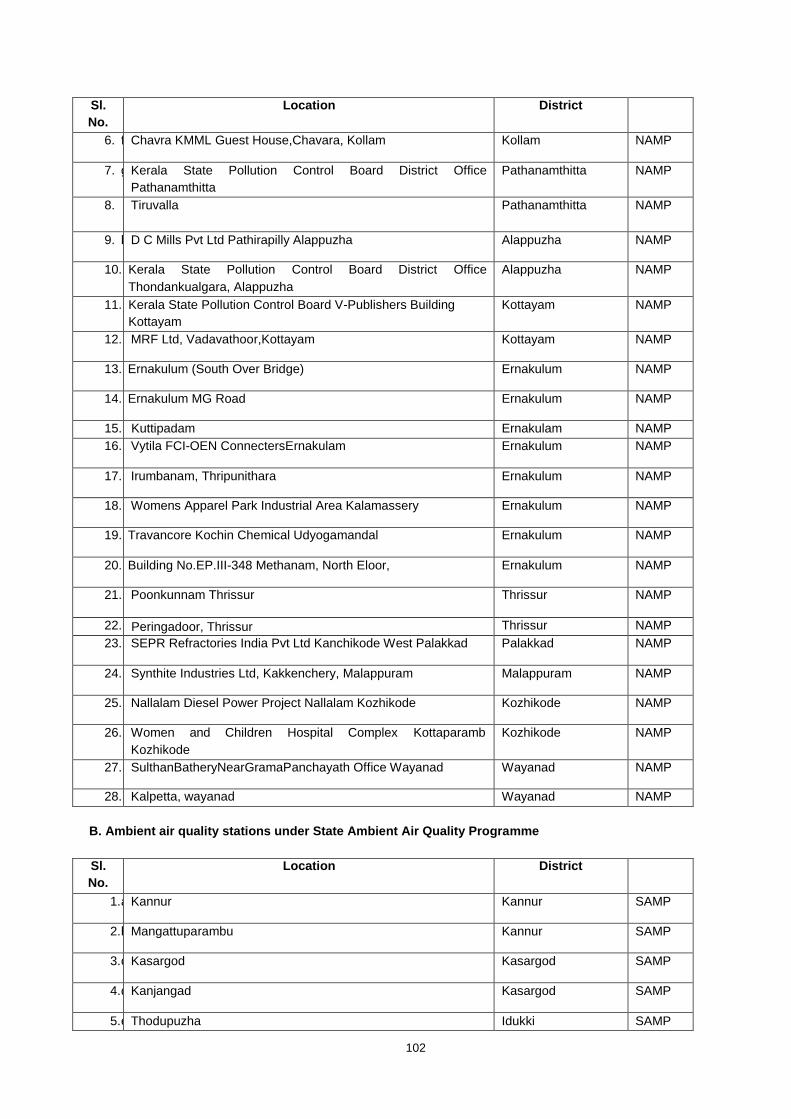
102
Sl.
No.
Location District
6. f) Chavra KMML Guest House,Chavara, Kollam Kollam NAMP
7. g) Kerala State Pollution Control Board District Office
Pathanamthitta
Pathanamthitta NAMP
8. Tiruvalla Pathanamthitta NAMP
9. h) D C Mills Pvt Ltd Pathirapilly Alappuzha Alappuzha NAMP
10. i) Kerala State Pollution Control Board District Office
Thondankualgara, Alappuzha
Alappuzha NAMP
11. j) Kerala State Pollution Control Board V-Publishers Building
Kottayam
Kottayam NAMP
12. k) MRF Ltd, Vadavathoor,Kottayam Kottayam NAMP
13. l) Ernakulum (South Over Bridge) Ernakulum NAMP
14. m) Ernakulum MG Road Ernakulum NAMP
15. Kuttipadam Ernakulam NAMP
16. n) Vytila FCI-OEN ConnectersErnakulam Ernakulum NAMP
17. o) Irumbanam, Thripunithara Ernakulum NAMP
18. p) Womens Apparel Park Industrial Area Kalamassery Ernakulum NAMP
19. q) Travancore Kochin Chemical Udyogamandal Ernakulum NAMP
20. r) Building No.EP.III-348 Methanam, North Eloor, Ernakulum NAMP
21. s) Poonkunnam Thrissur Thrissur NAMP
22. Peringadoor, Thrissur Thrissur NAMP
23. t) SEPR Refractories India Pvt Ltd Kanchikode West Palakkad Palakkad NAMP
24. u) Synthite Industries Ltd, Kakkenchery, Malappuram Malappuram NAMP
25. v) Nallalam Diesel Power Project Nallalam Kozhikode Kozhikode NAMP
26. w) Women and Children Hospital Complex Kottaparamb
Kozhikode
Kozhikode NAMP
27. x) SulthanBatheryNearGramaPanchayath Office Wayanad Wayanad NAMP
28. Kalpetta, wayanad Wayanad NAMP
B. Ambient air quality stations under State Ambient Air Quality Programme
Sl.
No.
Location District
1. a) Kannur Kannur SAMP
2. b) Mangattuparambu Kannur SAMP
3. c) Kasargod Kasargod SAMP
4. d) Kanjangad Kasargod SAMP
5. e Thodupuzha Idukki SAMP
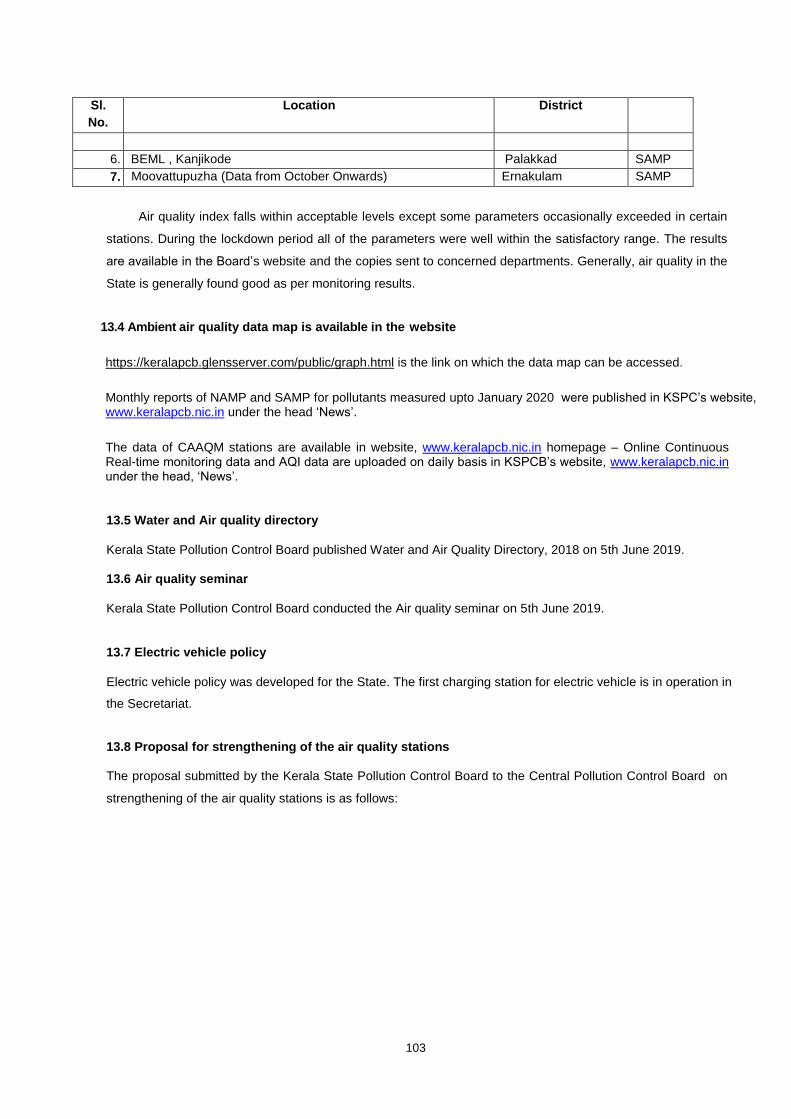
103
Sl.
No.
Location District
)
6. BEML , Kanjikode Palakkad SAMP
7. Moovattupuzha (Data from October Onwards) Ernakulam SAMP
Air quality index falls within acceptable levels except some parameters occasionally exceeded in certain
stations. During the lockdown period all of the parameters were well within the satisfactory range. The results
are available in the Board’s website and the copies sent to concerned departments. Generally, air quality in the
State is generally found good as per monitoring results.
13.4 Ambient air quality data map is available in the website
https://keralapcb.glensserver.com/public/graph.html is the link on which the data map can be accessed.
Monthly reports of NAMP and SAMP for pollutants measured upto January 2020 were published in KSPC’s website, www.keralapcb.nic.in under the head ‘News’.
The data of CAAQM stations are available in website, www.keralapcb.nic.in homepage – Online Continuous Real-time monitoring data and AQI data are uploaded on daily basis in KSPCB’s website, www.keralapcb.nic.in under the head, ‘News’.
13.5 Water and Air quality directory
Kerala State Pollution Control Board published Water and Air Quality Directory, 2018 on 5th June 2019. 13.6 Air quality seminar
Kerala State Pollution Control Board conducted the Air quality seminar on 5th June 2019.
13.7 Electric vehicle policy
Electric vehicle policy was developed for the State. The first charging station for electric vehicle is in operation in
the Secretariat.
13.8 Proposal for strengthening of the air quality stations
The proposal submitted by the Kerala State Pollution Control Board to the Central Pollution Control Board on
strengthening of the air quality stations is as follows:
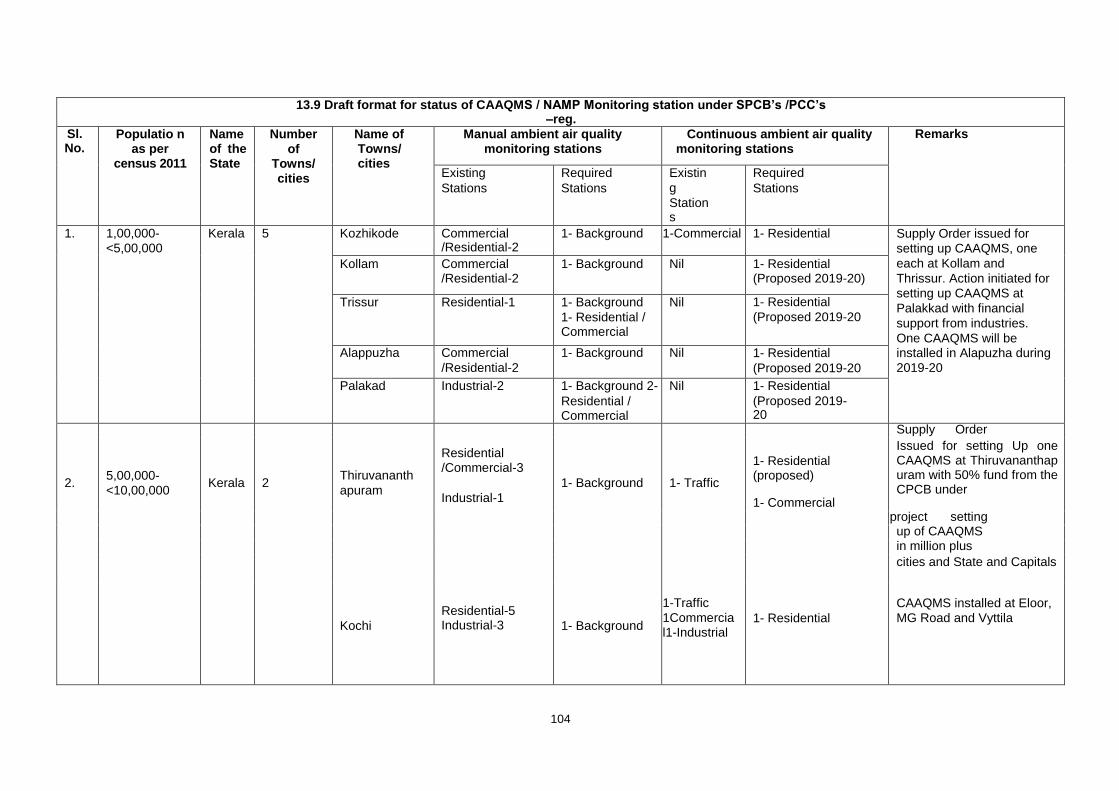
104
13.9 Draft format for status of CAAQMS / NAMP Monitoring station under SPCB’s /PCC’s –reg.
Sl. No.
Populatio n as per
census 2011
Name of the State
Number
of Towns/
cities
Name of Towns/ cities
Manual ambient air quality monitoring stations
Continuous ambient air quality monitoring stations
Remarks
Existing
Stations
Required
Stations
Existin
g
Station s
Required
Stations
1. 1,00,000-
<5,00,000
Kerala 5 Kozhikode Commercial /Residential-2
1- Background 1-Commercial 1- Residential Supply Order issued for
setting up CAAQMS, one
each at Kollam and
Thrissur. Action initiated for
setting up CAAQMS at
Palakkad with financial
support from industries.
One CAAQMS will be installed in Alapuzha during
2019-20
Kollam Commercial /Residential-2
1- Background Nil 1- Residential (Proposed 2019-20)
Trissur Residential-1 1- Background
1- Residential / Commercial
Nil 1- Residential
(Proposed 2019-20
Alappuzha Commercial
/Residential-2
1- Background Nil 1- Residential
(Proposed 2019-20
Palakad Industrial-2 1- Background 2-
Residential / Commercial
Nil 1- Residential
(Proposed 2019- 20
2.
5,00,000-
<10,00,000
Kerala
2
Supply Order
Thiruvananth
apuram
Residential /Commercial-3
Industrial-1
1- Background
1- Traffic
1- Residential (proposed)
1- Commercial
Issued for setting Up one CAAQMS at Thiruvananthap uram with 50% fund from the CPCB under
project setting up of CAAQMS in million plus
cities and State and Capitals
Kochi
Residential-5 Industrial-3
1- Background
1-Traffic
1Commercia l1-Industrial
1- Residential
CAAQMS installed at Eloor,
MG Road and Vyttila
105
14. Industrially Polluted clusters (OA 1038 of 2018)
The order dated 13.12.2018 in O.A.No. 1038 of 2018 by the Hon’ble NGT is based on the
CEPI score of Greater Cochin Area done in 2009. The CEPI assessment was done in 2009 by the
Central Pollution Control Board (CPCB) in collaboration with IIT Delhi as part of their
comprehensive environmental assessment of 88 industrial clusters in the Country.
Out of these 88 industrial clusters, 32 industrial clusters having CEPI score in between 60
and 70 were categorized as severely polluted area (SPA). Further, 43 industrial clusters in 16
states having CEPI score of 70 & above were identified as Critically Polluted Area(CPA). Greater
Kochi Area (GKA) was identified in Kerala. The CEPI score for the area as reported by Central
Pollution Control Board was 75.08, and the GKA subsequently termed as CPA.
During 2011, CPCB again estimated CEPI score as per the monitoring data of 2011 with
same criteria pollutants as considered by IIT Delhi and the score was 57.39 and the moratorium
imposed for developmental activities in the Greater Kochi Area as CPA was lifted vide office
memorandum No. J- 11013/5/2010-1A II (I) dated 23.05.2011 by Ministry of Environment and
Forest.
After lifting the moratorium, monitoring was conducted in the year 2013 by CPCB but not
published. The CEPI score using the third party monitoring data was 45.29 in the year 2013.
While CPCB had conducted monitoring in 2018, the Board also had engaged an accredited
agency as third party for the monitoring and the score obtained was 44.68 and comes under the
category of OPA (Other Polluted Area) and however action plan is being prepared.
15. Order dated 4-9-2018 in OA o. 173/2018 by Sudarsa Das Vs State of West Bengal and others
Not applicable
16. Total amount collected from erring industries on the basis of “Polluter Pays Principle” “Precautionary Principle and details of utilization of funds collected
15 Industries have been fined, INR 7.25 Crores have been collected.
Direction issued to Thrissur Corporation for environmental compensation of Rs. 4.5 Crore. Notice
issued to Thiruvananthapuram Corporation for giving environmental compensation of 14.59 crore.
Notice was also issued to Kochi Corporation, Municipalities namely Thrippunithura, Aluva, Angamaly,
and Kalamassery and Maradu panchayath for taking steps to provide biomethanation plant for the
food wastes generated.
Direction issued to the three hospitals and to DMO and Urban Directorate and Panchayath in Idukki
in OA 585/2018.
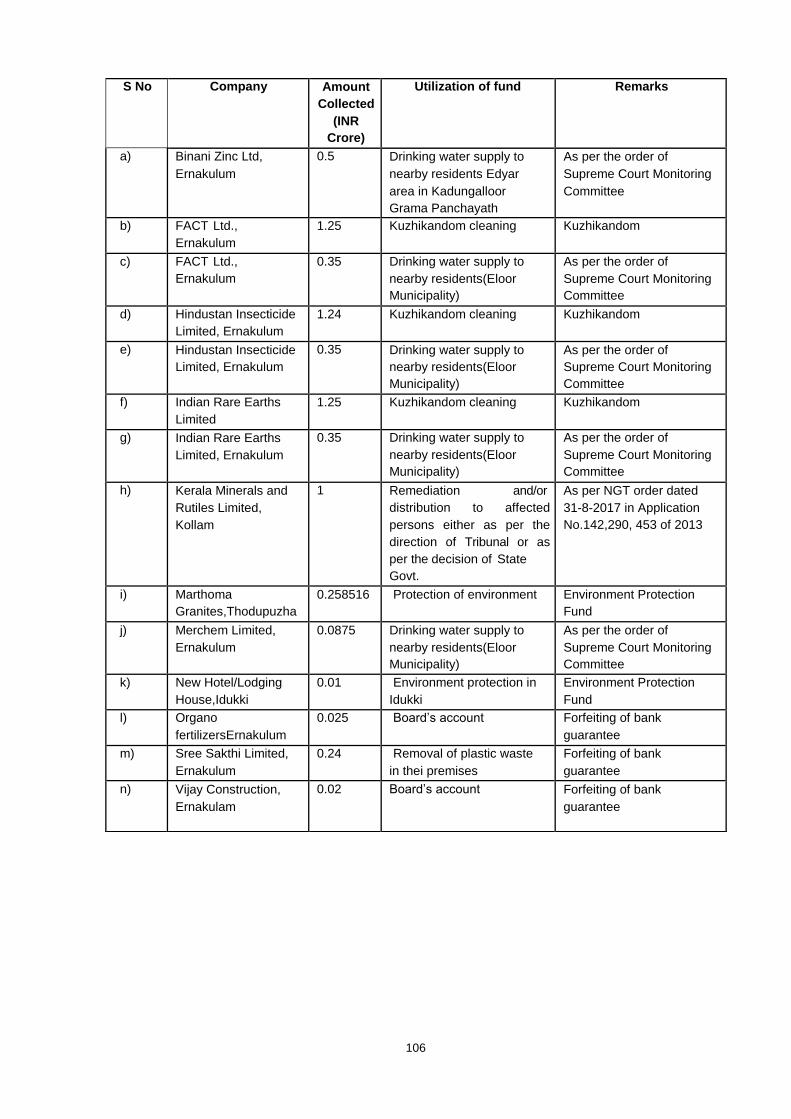
106
S No Company Amount
Collected
(INR
Crore)
Utilization of fund Remarks
a) Binani Zinc Ltd,
Ernakulum
0.5 Drinking water supply to
nearby residents Edyar
area in Kadungalloor
Grama Panchayath
As per the order of
Supreme Court Monitoring
Committee
b) FACT Ltd.,
Ernakulum
1.25 Kuzhikandom cleaning Kuzhikandom
c) FACT Ltd.,
Ernakulum
0.35 Drinking water supply to
nearby residents(Eloor
Municipality)
As per the order of
Supreme Court Monitoring
Committee
d) Hindustan Insecticide
Limited, Ernakulum
1.24 Kuzhikandom cleaning Kuzhikandom
e) Hindustan Insecticide
Limited, Ernakulum
0.35 Drinking water supply to
nearby residents(Eloor
Municipality)
As per the order of
Supreme Court Monitoring
Committee
f) Indian Rare Earths
Limited
1.25 Kuzhikandom cleaning Kuzhikandom
g) Indian Rare Earths
Limited, Ernakulum
0.35 Drinking water supply to
nearby residents(Eloor
Municipality)
As per the order of
Supreme Court Monitoring
Committee
h) Kerala Minerals and
Rutiles Limited,
Kollam
1 Remediation and/or
distribution to affected
persons either as per the
direction of Tribunal or as
per the decision of State
Govt.
As per NGT order dated
31-8-2017 in Application
No.142,290, 453 of 2013
i) Marthoma
Granites,Thodupuzha
0.258516 Protection of environment Environment Protection
Fund
j) Merchem Limited,
Ernakulum
0.0875 Drinking water supply to
nearby residents(Eloor
Municipality)
As per the order of
Supreme Court Monitoring
Committee
k) New Hotel/Lodging
House,Idukki
0.01 Environment protection in
Idukki
Environment Protection
Fund
l) Organo
fertilizersErnakulum
0.025 Board’s account Forfeiting of bank
guarantee
m) Sree Sakthi Limited,
Ernakulum
0.24 Removal of plastic waste
in thei premises
Forfeiting of bank
guarantee
n) Vijay Construction,
Ernakulam
0.02 Board’s account Forfeiting of bank
guarantee
107
17. Primary Effluent Treatment Plant as per order dated 19-2-2019 in O.A. No.593/2017
The report for the month up to December 2019 was submitted to Central Pollution
Control Board’s online web portal “E-Track”. As per the reports up to December, 2019, 5166
units require ETP. Of these, 129 were inspected and 5146 units have provided functional ETP.
20 units were found to be operating without ETP. 5114 units complied with the effluent
standards. Closure direction was issued to one unit. For the remaining 19 units, the Board has
taken action for its compliance. ,
Total no. of STP in the state is 2777 (including 2Municipal STPs), of these 2766 STPs
are complying with the standards. 11 STPs are found to be non-complying.
Due to outbreak of Covid-19, the details upto the previous month could not be updated.
The same will updated at the earliest.
18. Orders dated 17-9-2019 and 22-4-2020 in O.A. No. 829/2019
The Hon’ble Tribunal directed on 7-9-2019 in O. A. 829/209 that coastal and marine pollution
is to be included in the District Environment Plan by District Magistrate. The CPCB was directed
to submit status report. As instructed by the CPCB, The Board has vide letter No.
PCB/HO/EE3/OA 829/2019/3/2020 dated 2-3-2020 and vide letter No. PCB/HO/CPCB-
MRM/2019 dated 3-1-2020 submitted repot to the Central Pollution Control Board, a copy of
which is enclosed.
The Hon’ble Tribunal has directed all SPCBs of coastal states to give relevant information to
CPCB withi one month from today failing which defaulting states will liable to pay Rs. 10 lakhs
per month till compliance.
District Environment Plans were received for all districts.
19. Order dated 26-9-2019 in OA 360/2018
The Department of Environment of all States may collect such District Environment
Plans of their respective states and finalize the State Environment Plan covering the specific
thematic area in Para. 7 including the information as contained in Para-8 and template of model
by CPCB, The action for preparation of State’s Environment Plan shall be monitored by the
respective Chief Secretaries of the State.
District Environmental Plan was submitted by all districts. Action is being taken to prepare
State Environment Plan.
108
20. Order dated 10-5-2019 in OA 325/2015 All the States are directed to review the existing framework of restoration of all the
water bodies by preparing an appropriate action plan. Such action plan may be submitted within
three months and a report furnished to the CPCB. The Chief Secretaries of all the State in the
course of undertaking monitoring exercise in pursuance of order in OA 606/2018 may also
include restoration of water bodies. 1st phase report submitted. Action initiated for 2
nd phase
including field monitoring.
21. Utilization of consent funds - Order dated 05-11-2019 in OA 639/2018
There are total 433 employees out of which only 94 permanent employees working in
the Kerala State Pollution Control Board. An amount of 3 Crore (approx) is incurred as
monthly salary and other expenses.
Notification was issued on 26-12-2015 for appointment by Public Service Commission.
On 14-11-2019 the Kerala State Pollution Control Board rules 2019 was notified. The
Kerala State Pollution Control Board State/Subordinate services rules 1999 to be
considered and approved by the Kerala Public Service Commission and Government
and after that the Board can make permanent appointment in the Board.
The vacancies in the entry cadre have been filled up by appointing person on contract
basis. Steps are being initiated to make appointment in the cadre of Assistant
Environmental Engineer, Assistant Environmental Scientist on contract/deputation
basis.
Extra manpower (20 technical assistants) has been provided through PCB for
monitoring the compliance for the model city/town/villages and for other remaining local
bodies (additional 47 technical assistants).
Kerala is the first State which has taken initiative for the implementation of Anti
Microbial Resistance action plan. Kerala State Pollution Control Board is funding 2
projects namely (1) study on anti microbial resistance in waste water by College of
Engineering, Thiruvananthapuram (2) Surveillance of anti microbial resistance in
selected surface bodies of Trivandrum District by Department of Environmental
Science, University of Kerala. Total cost of these project is Rs. 23,62,000/- and the
same is met from the consent fund.
For the Annual maintenance Contract of CAAQMS and display system at 2 places.
For the setting up of 2 continuous ambient noise monitoring stations an amount of
15,00,000/- was sanctioned from non-plan fund. For the revamping of connectivity
between control room and CCTV an amount of Rs. 7,16,314/- was also sanctioned
under non-plan fund.
Based on judgment in W.P (C) No. 9155 of 2016 an amount of Rs. 35,14,026/-has been
sanctioned for the implementation of the project to install a model pollution control
facility in an identified plywood industry

109
The Board conducted a project, Hydrochemistry” of Vembanad backwaters with special
reference to pollution problems and management measures. 10% of the project amount
is sanctioned from the non-plan fund.
The Board is utilizing consent fund for the purchase/maintenance of
equipments/consumables for the proper working of laboratory. An amount of Rs.
1,14,69,874/- has been sanctioned for the purchase of equipments/consumables for the
proper working of laboratory.

STATUS REPORT ON SOLID WASTE MANAGEMENT AS ON May 2020 (Details submitted by localbodies)
A. Corporation A.1. Segregation and Collection
Name of District Thiruvanthapuram Kollam Ernakulam Thrissur Kozhikode Kannur
Name of Corporation Thiruvanthapuram
(Model city) Kollam Kochi
Thrissur
(Model city)
Kozhikode
(Model
city)
Kannur
Population (2011) 958000 397000 677000 317526 609000 356000
No of Wards 100 55 74 55 75 55
No of Household 2,72,820 88,332 1,67,935 86,604 1,26,100 68,059
No of Establishment 18,882 9,825 18,706 15,250 26,893 11,887
No of Household having segregation at
source
Dry 2,18,150 52,899 1,13,306 18,000 82,500 43,210
Wet 2,18,150 52,899 1,13,307
22,550 43,210
No of Establishment having segregation at
source
Dry 16,723 4,800 13,665 18,000 22,550 28,824
Wet 16,723 4,800 13,665
17,463 28,824
D2
D C
oll
ecti
on
Households
Number Dry 52,726 52,899 1,50,730 20,150 83,638 43,210
Wet NIL NIL 150730 716 50540 28824
Percentage Dry 19.4 59.9 89.8 23.3 66.4 63.5
Wet
89.8 0.9 40.1 42.4
Collection
Frequency
Dry WEEKLY ONCE WEEKLY
ONCE
Every 3
days Once in month Monthly Monthly
Wet NIL NIL Daily once in two
days Daily Daily
Establishments
Number Dry 17,382 4,800 11,175 3,000 18,632 10,613
Wet 17,382 NIL 11,175 2,500 9,292 7,517
Percentage Dry 92.1 48.9 59.8 19.7 69.3 89.3
Wet 92.1
59.8 16.4 34.6 63.3
Collection
Frequency
Dry DAILY WEEKLY
ONCE Daily
once in two
days
Twice in a
week Fortnightly
Wet WEEKLY ONCE NIL Every 3
days daily Daily Daily
No of collectors 25 SERVICE
PROVIDERS
124
(HKS) 1200 145 602 44
Annexure.1
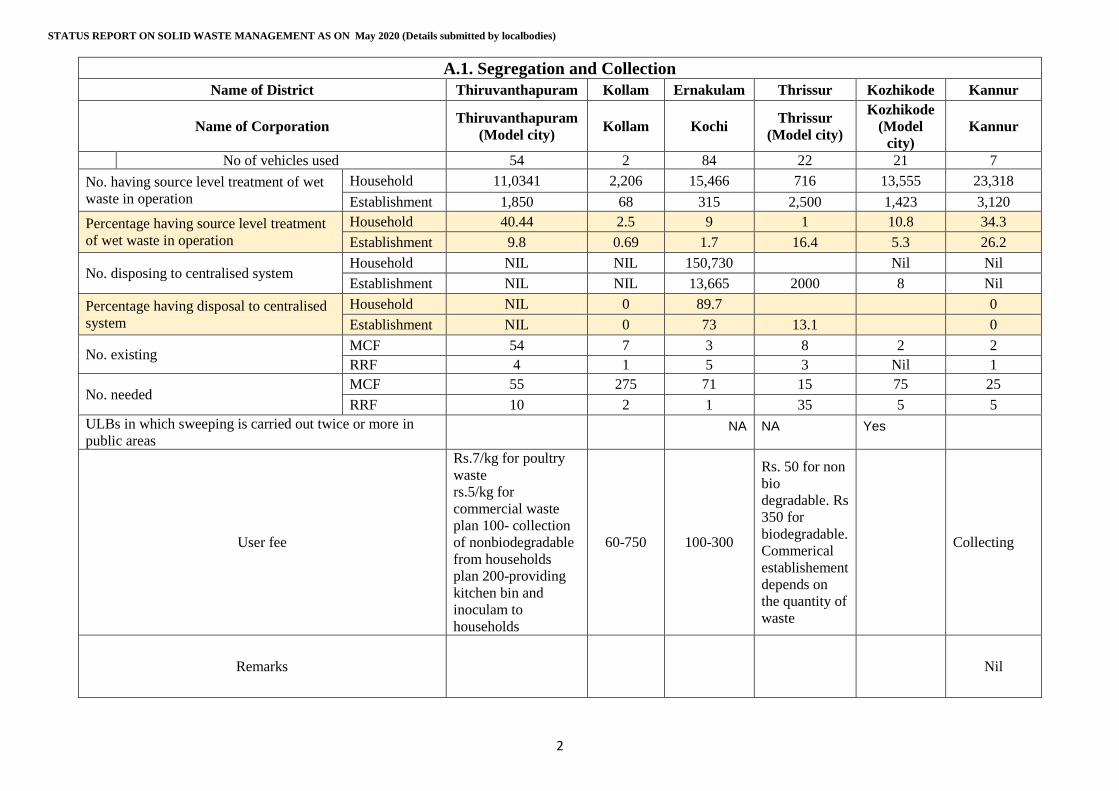
STATUS REPORT ON SOLID WASTE MANAGEMENT AS ON May 2020 (Details submitted by localbodies)
2
A.1. Segregation and Collection
Name of District Thiruvanthapuram Kollam Ernakulam Thrissur Kozhikode Kannur
Name of Corporation Thiruvanthapuram
(Model city) Kollam Kochi
Thrissur
(Model city)
Kozhikode
(Model
city)
Kannur
No of vehicles used 54 2 84 22 21 7
No. having source level treatment of wet
waste in operation
Household 11,0341 2,206 15,466 716 13,555 23,318
Establishment 1,850 68 315 2,500 1,423 3,120
Percentage having source level treatment
of wet waste in operation
Household 40.44 2.5 9 1 10.8 34.3
Establishment 9.8 0.69 1.7 16.4 5.3 26.2
No. disposing to centralised system Household NIL NIL 150,730
Nil Nil
Establishment NIL NIL 13,665 2000 8 Nil
Percentage having disposal to centralised
system
Household NIL 0 89.7
0
Establishment NIL 0 73 13.1
0
No. existing MCF 54 7 3 8 2 2
RRF 4 1 5 3 Nil 1
No. needed MCF 55 275 71 15 75 25
RRF 10 2 1 35 5 5
ULBs in which sweeping is carried out twice or more in
public areas
NA NA Yes
User fee
Rs.7/kg for poultry
waste
rs.5/kg for
commercial waste
plan 100- collection
of nonbiodegradable
from households
plan 200-providing
kitchen bin and
inoculam to
households
60-750 100-300
Rs. 50 for non
bio
degradable. Rs
350 for
biodegradable.
Commerical
establishement
depends on
the quantity of
waste
Collecting
Remarks
Nil
Annexure.1
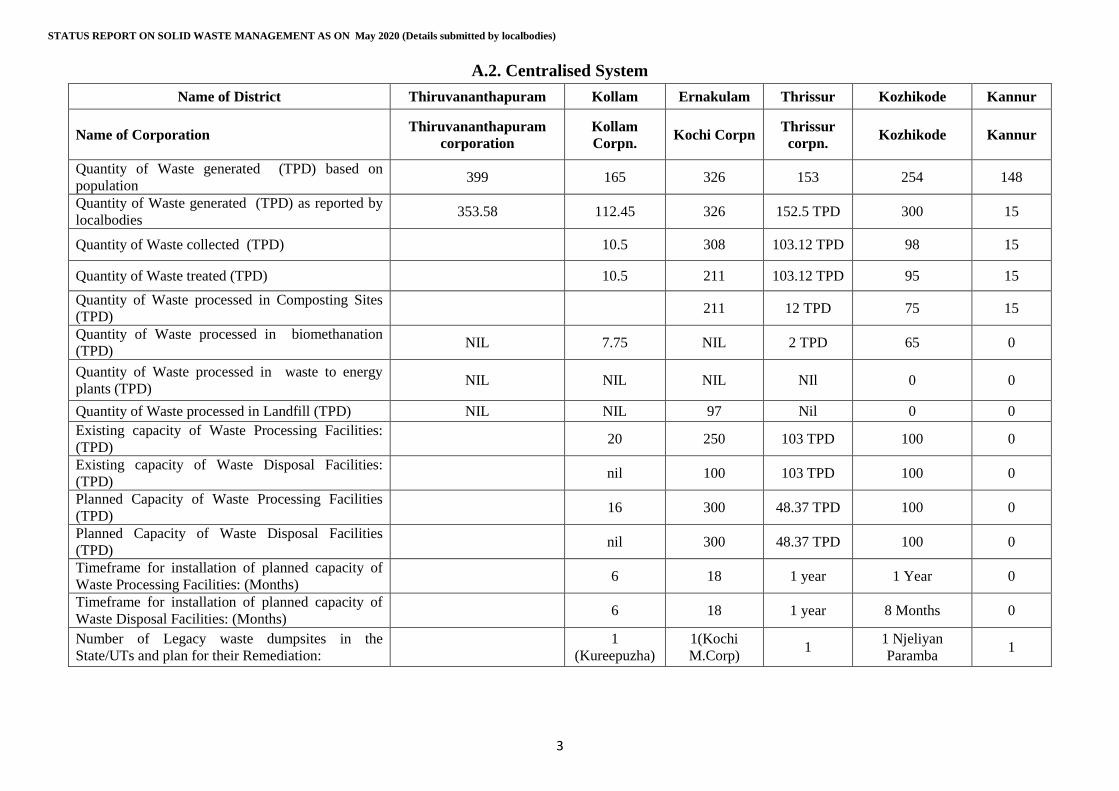
STATUS REPORT ON SOLID WASTE MANAGEMENT AS ON May 2020 (Details submitted by localbodies)
3
A.2. Centralised System
Name of District Thiruvananthapuram Kollam Ernakulam Thrissur Kozhikode Kannur
Name of Corporation Thiruvananthapuram
corporation
Kollam
Corpn. Kochi Corpn
Thrissur
corpn. Kozhikode Kannur
Quantity of Waste generated (TPD) based on
population 399 165 326 153 254 148
Quantity of Waste generated (TPD) as reported by
localbodies 353.58 112.45 326 152.5 TPD 300 15
Quantity of Waste collected (TPD) 10.5 308 103.12 TPD 98 15
Quantity of Waste treated (TPD) 10.5 211 103.12 TPD 95 15
Quantity of Waste processed in Composting Sites
(TPD) 211 12 TPD 75 15
Quantity of Waste processed in biomethanation
(TPD) NIL 7.75 NIL 2 TPD 65 0
Quantity of Waste processed in waste to energy
plants (TPD) NIL NIL NIL NIl 0 0
Quantity of Waste processed in Landfill (TPD) NIL NIL 97 Nil 0 0
Existing capacity of Waste Processing Facilities:
(TPD) 20 250 103 TPD 100 0
Existing capacity of Waste Disposal Facilities:
(TPD) nil 100 103 TPD 100 0
Planned Capacity of Waste Processing Facilities
(TPD) 16 300 48.37 TPD 100 0
Planned Capacity of Waste Disposal Facilities
(TPD) nil 300 48.37 TPD 100 0
Timeframe for installation of planned capacity of
Waste Processing Facilities: (Months) 6 18 1 year 1 Year 0
Timeframe for installation of planned capacity of
Waste Disposal Facilities: (Months) 6 18 1 year 8 Months 0
Number of Legacy waste dumpsites in the
State/UTs and plan for their Remediation:
1
(Kureepuzha)
1(Kochi
M.Corp) 1
1 Njeliyan
Paramba 1
Annexure.1
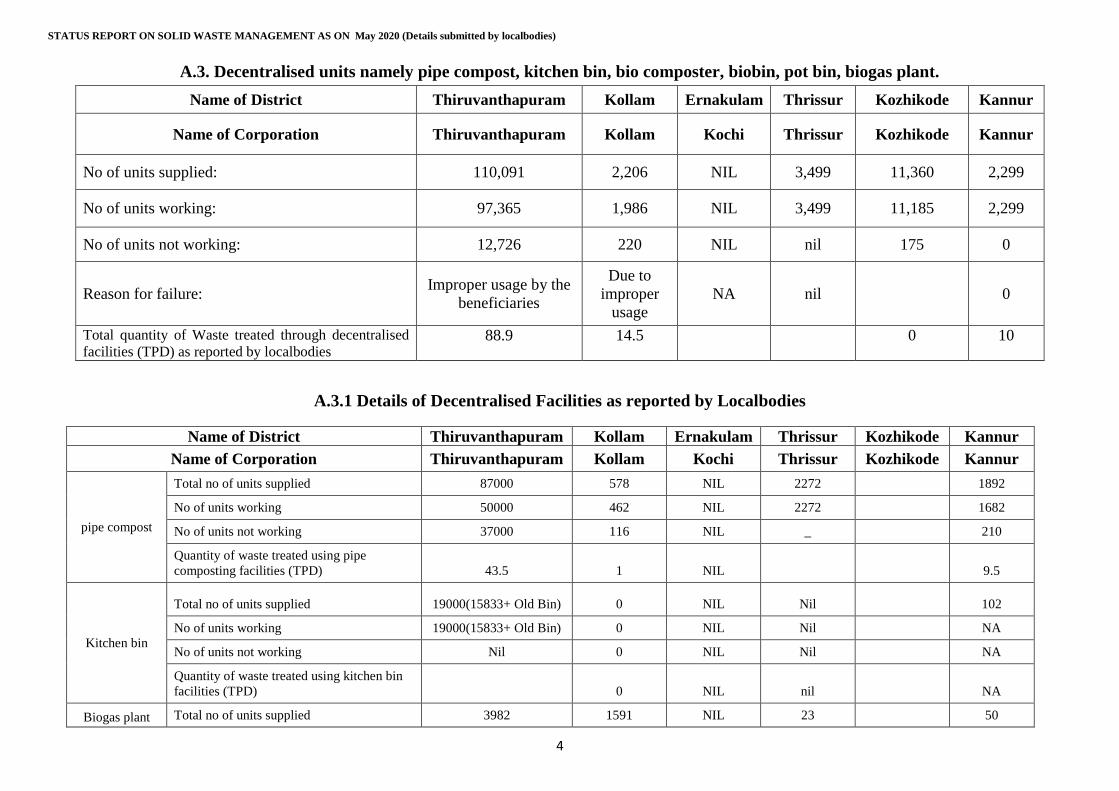
STATUS REPORT ON SOLID WASTE MANAGEMENT AS ON May 2020 (Details submitted by localbodies)
4
A.3. Decentralised units namely pipe compost, kitchen bin, bio composter, biobin, pot bin, biogas plant.
Name of District Thiruvanthapuram Kollam Ernakulam Thrissur Kozhikode Kannur
Name of Corporation Thiruvanthapuram Kollam Kochi Thrissur Kozhikode Kannur
No of units supplied: 110,091 2,206 NIL 3,499 11,360 2,299
No of units working: 97,365 1,986 NIL 3,499 11,185 2,299
No of units not working: 12,726 220 NIL nil 175 0
Reason for failure: Improper usage by the
beneficiaries
Due to
improper
usage
NA nil 0
Total quantity of Waste treated through decentralised
facilities (TPD) as reported by localbodies 88.9 14.5 0 10
A.3.1 Details of Decentralised Facilities as reported by Localbodies
Name of District Thiruvanthapuram Kollam Ernakulam Thrissur Kozhikode Kannur
Name of Corporation Thiruvanthapuram Kollam Kochi Thrissur Kozhikode Kannur
pipe compost
Total no of units supplied 87000 578 NIL 2272
1892
No of units working 50000 462 NIL 2272
1682
No of units not working 37000 116 NIL _
210
Quantity of waste treated using pipe
composting facilities (TPD) 43.5 1 NIL
9.5
Kitchen bin
Total no of units supplied 19000(15833+ Old Bin) 0 NIL Nil
102
No of units working 19000(15833+ Old Bin) 0 NIL Nil
NA
No of units not working Nil 0 NIL Nil
NA
Quantity of waste treated using kitchen bin
facilities (TPD)
0 NIL nil
NA
Biogas plant Total no of units supplied 3982 1591 NIL 23
50
Annexure.1
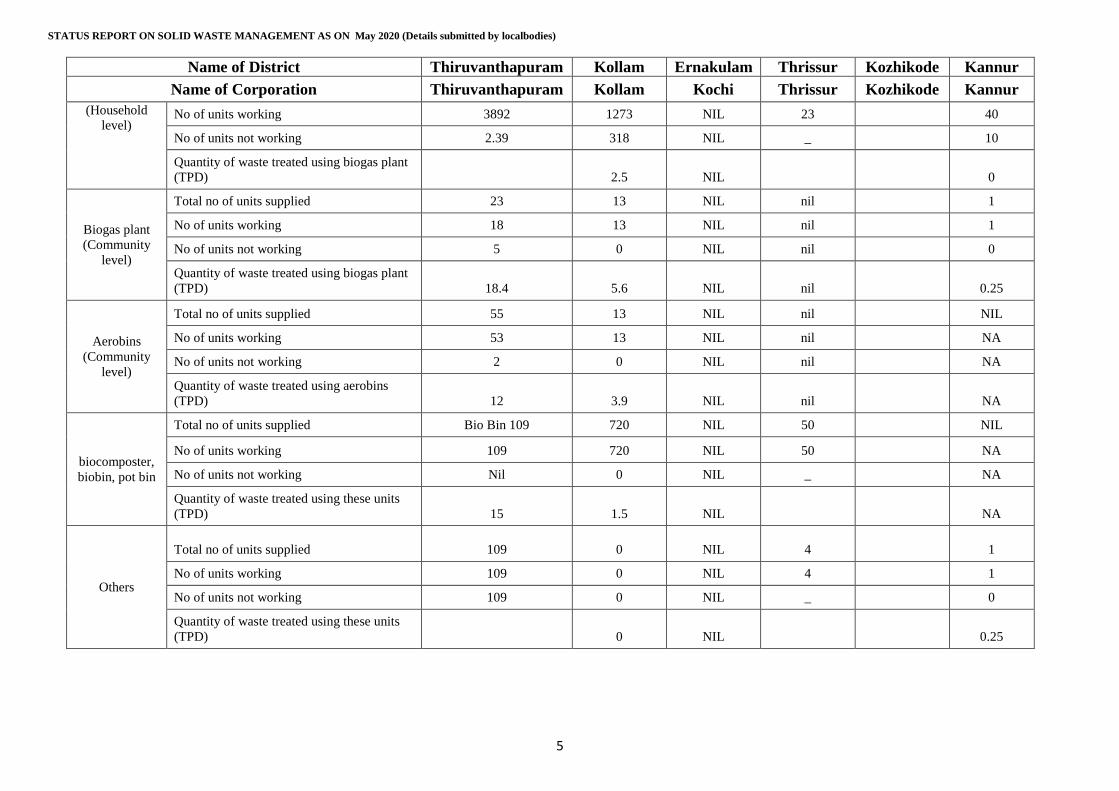
STATUS REPORT ON SOLID WASTE MANAGEMENT AS ON May 2020 (Details submitted by localbodies)
5
Name of District Thiruvanthapuram Kollam Ernakulam Thrissur Kozhikode Kannur
Name of Corporation Thiruvanthapuram Kollam Kochi Thrissur Kozhikode Kannur
(Household
level) No of units working 3892 1273 NIL 23
40
No of units not working 2.39 318 NIL _
10
Quantity of waste treated using biogas plant
(TPD)
2.5 NIL
0
Biogas plant
(Community
level)
Total no of units supplied 23 13 NIL nil
1
No of units working 18 13 NIL nil
1
No of units not working 5 0 NIL nil
0
Quantity of waste treated using biogas plant
(TPD) 18.4 5.6 NIL nil
0.25
Aerobins
(Community
level)
Total no of units supplied 55 13 NIL nil
NIL
No of units working 53 13 NIL nil
NA
No of units not working 2 0 NIL nil
NA
Quantity of waste treated using aerobins
(TPD) 12 3.9 NIL nil
NA
biocomposter,
biobin, pot bin
Total no of units supplied Bio Bin 109 720 NIL 50
NIL
No of units working 109 720 NIL 50
NA
No of units not working Nil 0 NIL _
NA
Quantity of waste treated using these units
(TPD) 15 1.5 NIL
NA
Others
Total no of units supplied 109 0 NIL 4
1
No of units working 109 0 NIL 4
1
No of units not working 109 0 NIL _
0
Quantity of waste treated using these units
(TPD)
0 NIL
0.25
Annexure.1
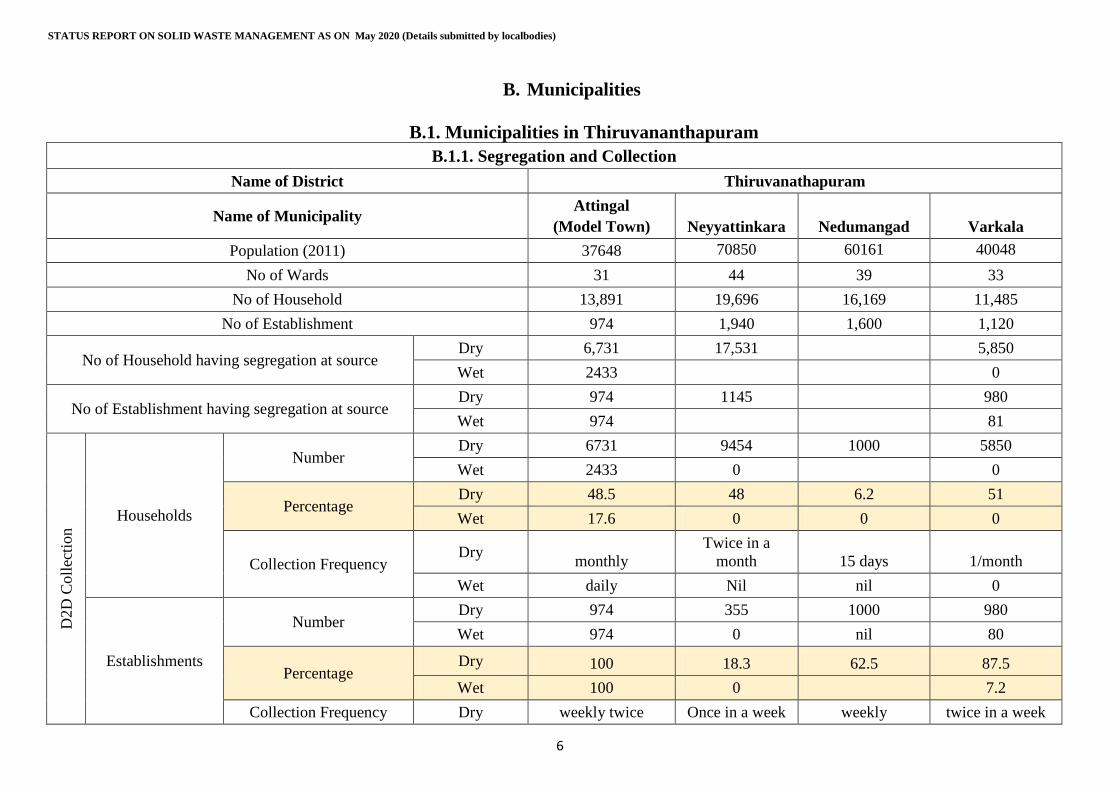
STATUS REPORT ON SOLID WASTE MANAGEMENT AS ON May 2020 (Details submitted by localbodies)
6
B. Municipalities
B.1. Municipalities in Thiruvananthapuram
B.1.1. Segregation and Collection
Name of District Thiruvanathapuram
Name of Municipality Attingal
(Model Town) Neyyattinkara Nedumangad Varkala
Population (2011) 37648 70850 60161 40048
No of Wards 31 44 39 33
No of Household 13,891 19,696 16,169 11,485
No of Establishment 974 1,940 1,600 1,120
No of Household having segregation at source Dry 6,731 17,531 5,850
Wet 2433 0
No of Establishment having segregation at source Dry 974 1145 980
Wet 974 81
D2D
Coll
ecti
on
Households
Number Dry 6731 9454 1000 5850
Wet 2433 0 0
Percentage Dry 48.5 48 6.2 51
Wet 17.6 0 0 0
Collection Frequency Dry
monthly
Twice in a
month 15 days 1/month
Wet daily Nil nil 0
Establishments
Number Dry 974 355 1000 980
Wet 974 0 nil 80
Percentage Dry 100 18.3 62.5 87.5
Wet 100 0 7.2
Collection Frequency Dry weekly twice Once in a week weekly twice in a week
Annexure.1
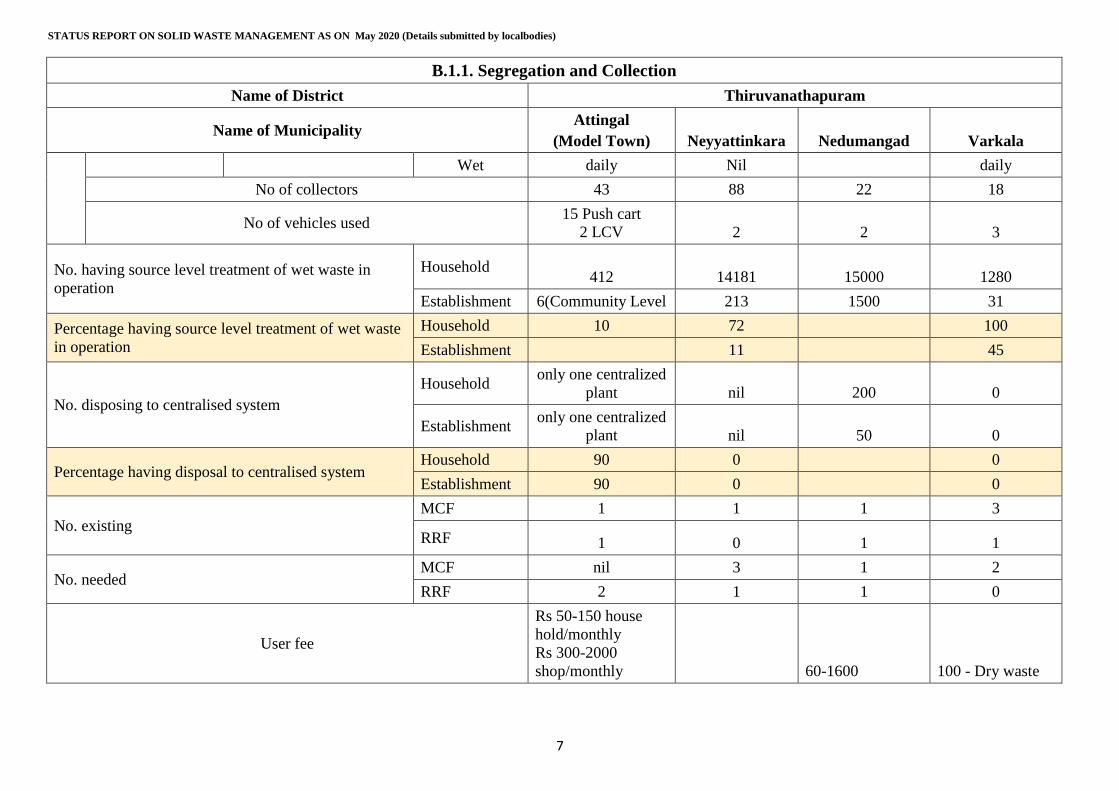
STATUS REPORT ON SOLID WASTE MANAGEMENT AS ON May 2020 (Details submitted by localbodies)
7
B.1.1. Segregation and Collection
Name of District Thiruvanathapuram
Name of Municipality Attingal
(Model Town) Neyyattinkara Nedumangad Varkala
Wet daily Nil daily
No of collectors 43 88 22 18
No of vehicles used 15 Push cart
2 LCV 2 2 3
No. having source level treatment of wet waste in
operation
Household 412 14181 15000 1280
Establishment 6(Community Level 213 1500 31
Percentage having source level treatment of wet waste
in operation
Household 10 72 100
Establishment
11 45
No. disposing to centralised system
Household only one centralized
plant nil 200 0
Establishment only one centralized
plant nil 50 0
Percentage having disposal to centralised system Household 90 0 0
Establishment 90 0 0
No. existing MCF 1 1 1 3
RRF 1 0 1 1
No. needed MCF nil 3 1 2
RRF 2 1 1 0
User fee
Rs 50-150 house
hold/monthly
Rs 300-2000
shop/monthly 60-1600 100 - Dry waste
Annexure.1
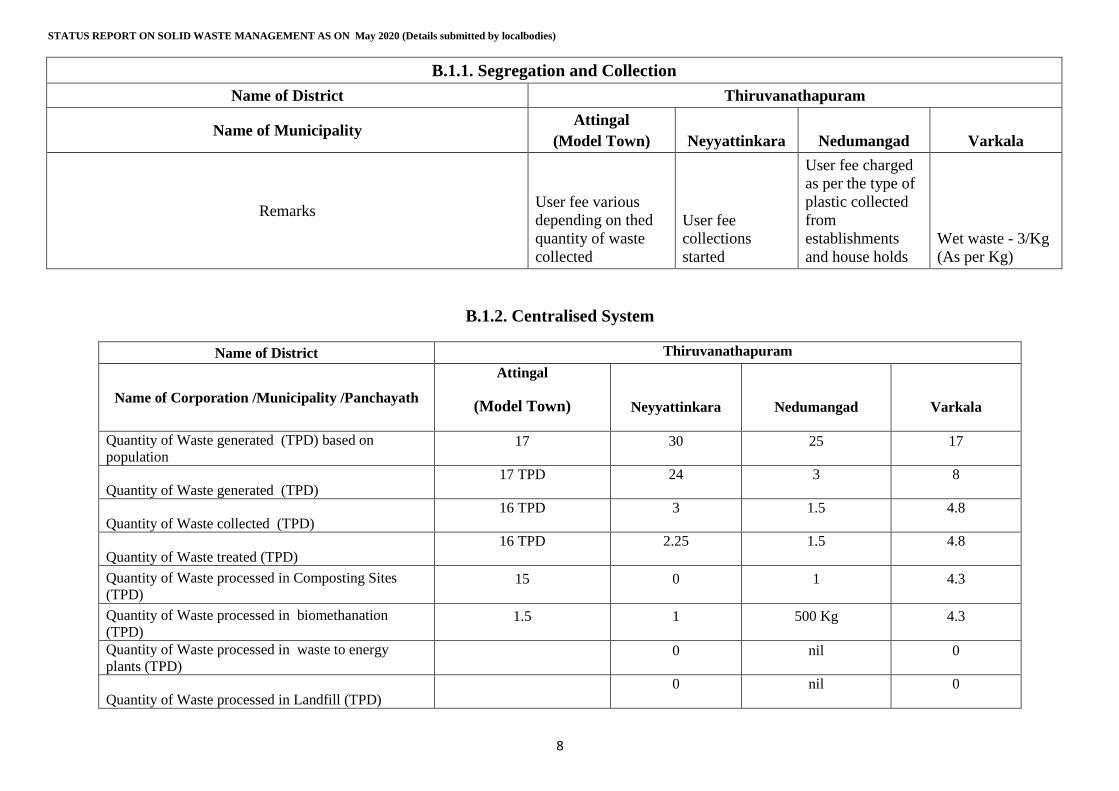
STATUS REPORT ON SOLID WASTE MANAGEMENT AS ON May 2020 (Details submitted by localbodies)
8
B.1.1. Segregation and Collection
Name of District Thiruvanathapuram
Name of Municipality Attingal
(Model Town) Neyyattinkara Nedumangad Varkala
Remarks User fee various
depending on thed
quantity of waste
collected
User fee
collections
started
User fee charged
as per the type of
plastic collected
from
establishments
and house holds
Wet waste - 3/Kg
(As per Kg)
B.1.2. Centralised System
Name of District Thiruvanathapuram
Name of Corporation /Municipality /Panchayath
Attingal
(Model Town) Neyyattinkara Nedumangad Varkala
Quantity of Waste generated (TPD) based on
population 17 30 25 17
Quantity of Waste generated (TPD) 17 TPD 24 3 8
Quantity of Waste collected (TPD) 16 TPD 3 1.5 4.8
Quantity of Waste treated (TPD) 16 TPD 2.25 1.5 4.8
Quantity of Waste processed in Composting Sites
(TPD) 15 0 1 4.3
Quantity of Waste processed in biomethanation
(TPD) 1.5 1 500 Kg 4.3
Quantity of Waste processed in waste to energy
plants (TPD) 0 nil 0
Quantity of Waste processed in Landfill (TPD) 0 nil 0
Annexure.1
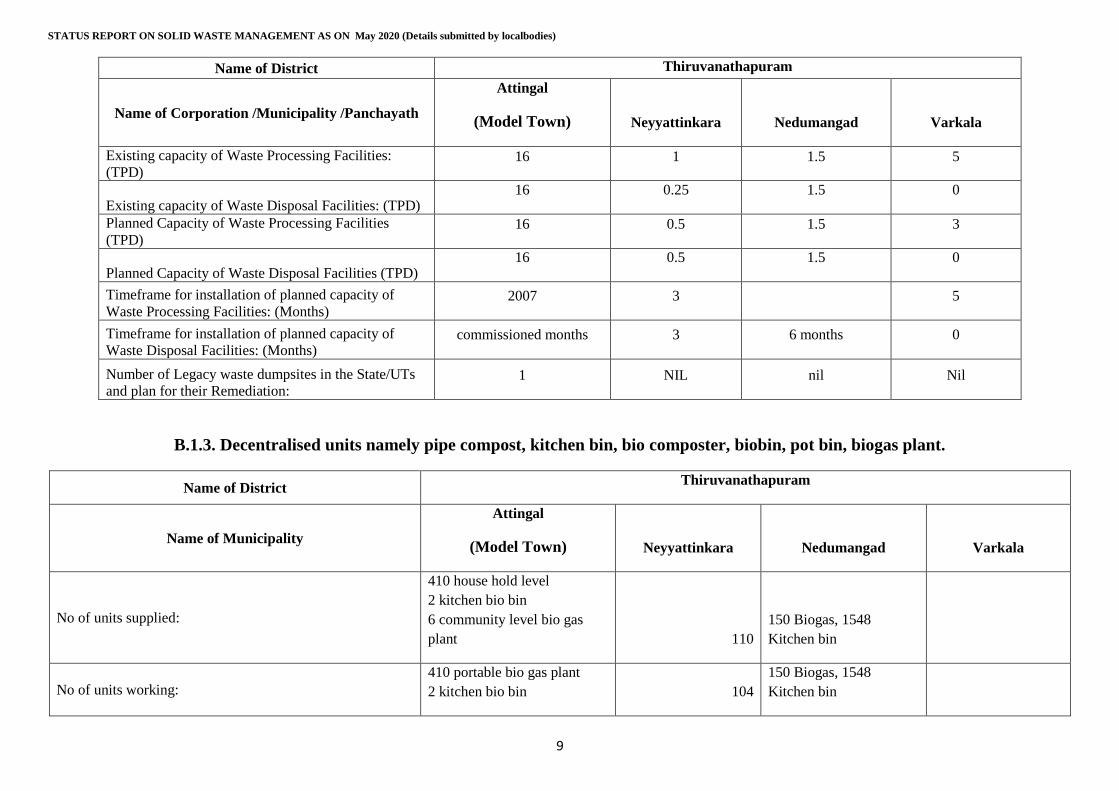
STATUS REPORT ON SOLID WASTE MANAGEMENT AS ON May 2020 (Details submitted by localbodies)
9
Name of District Thiruvanathapuram
Name of Corporation /Municipality /Panchayath
Attingal
(Model Town) Neyyattinkara Nedumangad Varkala
Existing capacity of Waste Processing Facilities:
(TPD) 16 1 1.5 5
Existing capacity of Waste Disposal Facilities: (TPD) 16 0.25 1.5 0
Planned Capacity of Waste Processing Facilities
(TPD) 16 0.5 1.5 3
Planned Capacity of Waste Disposal Facilities (TPD) 16 0.5 1.5 0
Timeframe for installation of planned capacity of
Waste Processing Facilities: (Months) 2007 3 5
Timeframe for installation of planned capacity of
Waste Disposal Facilities: (Months) commissioned months 3 6 months 0
Number of Legacy waste dumpsites in the State/UTs
and plan for their Remediation: 1 NIL nil Nil
B.1.3. Decentralised units namely pipe compost, kitchen bin, bio composter, biobin, pot bin, biogas plant.
Name of District Thiruvanathapuram
Name of Municipality
Attingal
(Model Town) Neyyattinkara Nedumangad Varkala
No of units supplied:
410 house hold level
2 kitchen bio bin
6 community level bio gas
plant 110
150 Biogas, 1548
Kitchen bin
No of units working:
410 portable bio gas plant
2 kitchen bio bin 104
150 Biogas, 1548
Kitchen bin
Annexure.1

STATUS REPORT ON SOLID WASTE MANAGEMENT AS ON May 2020 (Details submitted by localbodies)
10
Name of District Thiruvanathapuram
Name of Municipality
Attingal
(Model Town) Neyyattinkara Nedumangad Varkala
No of units not working: 2 bio gas plant 6 nil
Reason for failure: not proper maintain(O&M) Inproper Handling
All are maintainig
properly
Total quantity of Waste treated through decentralised
facilities (TPD) as reported by localbodies 1.7 1.5 0.074 0
B.1.3.1 Details of Decentralised Facilities as reported by Localbodies
Name of District Thiruvanthapuram
Name of Municipality
Attingal
(Model Town) Neyyattinkara Nedumangad Varkala
pipe compost
Total no of units supplied NIL - nil
No of units working - - nil
No of units not working - - nil
Quantity of waste treated using pipe composting facilities (TPD)
- nil
Kitchen bin
Total no of units supplied
NIL - 2617
No of units working - - 2617
No of units not working - - nil
Quantity of waste treated using kitchen bin facilities (TPD)
- - 3 Kg.
Biogas plant Total no of units supplied 412 110 200
Annexure.1
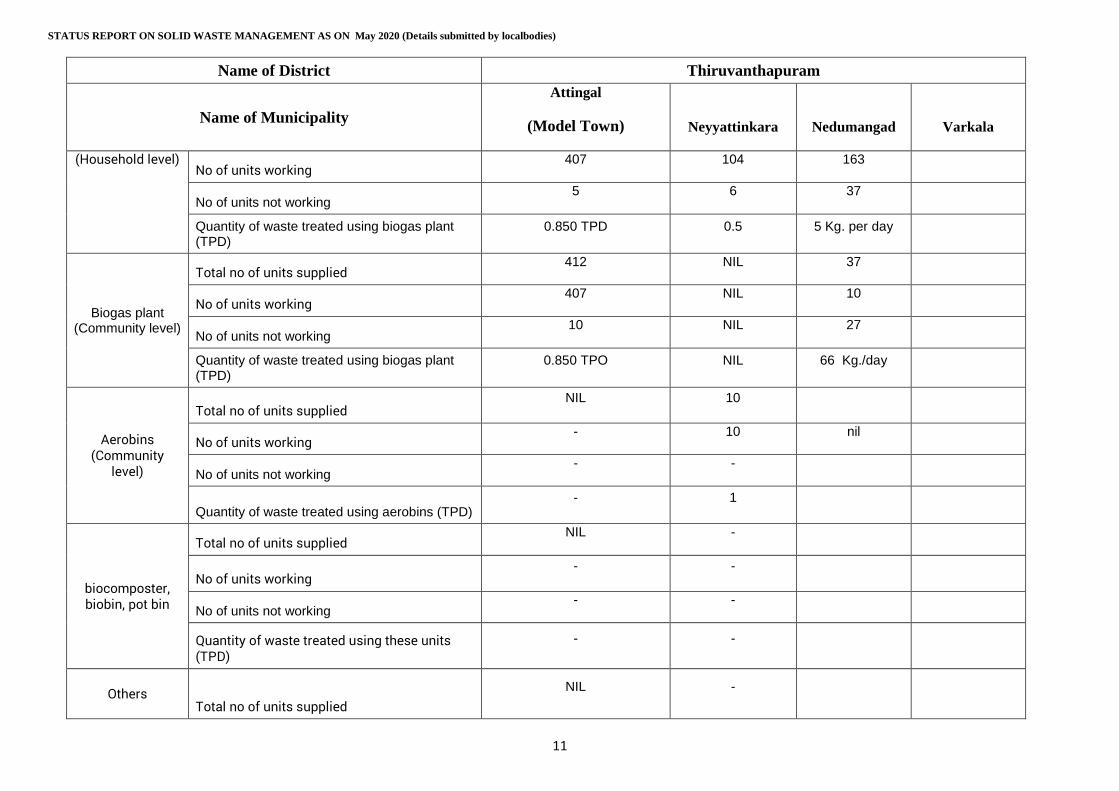
STATUS REPORT ON SOLID WASTE MANAGEMENT AS ON May 2020 (Details submitted by localbodies)
11
Name of District Thiruvanthapuram
Name of Municipality
Attingal
(Model Town) Neyyattinkara Nedumangad Varkala
(Household level) No of units working
407 104 163
No of units not working 5 6 37
Quantity of waste treated using biogas plant (TPD)
0.850 TPD 0.5 5 Kg. per day
Biogas plant (Community level)
Total no of units supplied 412 NIL 37
No of units working 407 NIL 10
No of units not working 10 NIL 27
Quantity of waste treated using biogas plant (TPD)
0.850 TPO NIL 66 Kg./day
Aerobins (Community
level)
Total no of units supplied NIL 10
No of units working - 10 nil
No of units not working - -
Quantity of waste treated using aerobins (TPD) - 1
biocomposter, biobin, pot bin
Total no of units supplied NIL -
No of units working - -
No of units not working - -
Quantity of waste treated using these units (TPD)
- -
Others Total no of units supplied
NIL -
Annexure.1
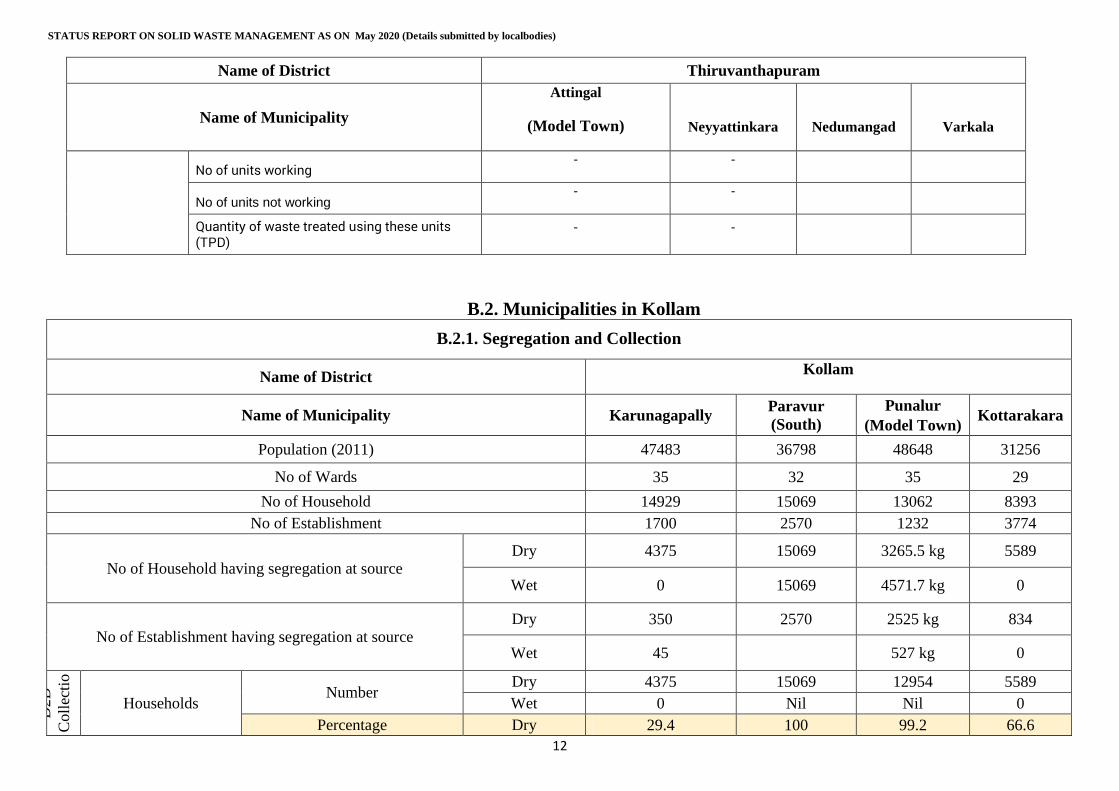
STATUS REPORT ON SOLID WASTE MANAGEMENT AS ON May 2020 (Details submitted by localbodies)
12
Name of District Thiruvanthapuram
Name of Municipality
Attingal
(Model Town) Neyyattinkara Nedumangad Varkala
No of units working - -
No of units not working - -
Quantity of waste treated using these units (TPD)
- -
B.2. Municipalities in Kollam
B.2.1. Segregation and Collection
Name of District Kollam
Name of Municipality Karunagapally Paravur
(South)
Punalur
(Model Town) Kottarakara
Population (2011) 47483 36798 48648 31256
No of Wards 35 32 35 29
No of Household 14929 15069 13062 8393
No of Establishment 1700 2570 1232 3774
No of Household having segregation at source Dry 4375 15069 3265.5 kg 5589
Wet 0 15069 4571.7 kg 0
No of Establishment having segregation at source Dry 350 2570 2525 kg 834
Wet 45 527 kg 0
D2D
Coll
ecti
o
n
Households Number
Dry 4375 15069 12954 5589
Wet 0 Nil Nil 0
Percentage Dry 29.4 100 99.2 66.6
Annexure.1
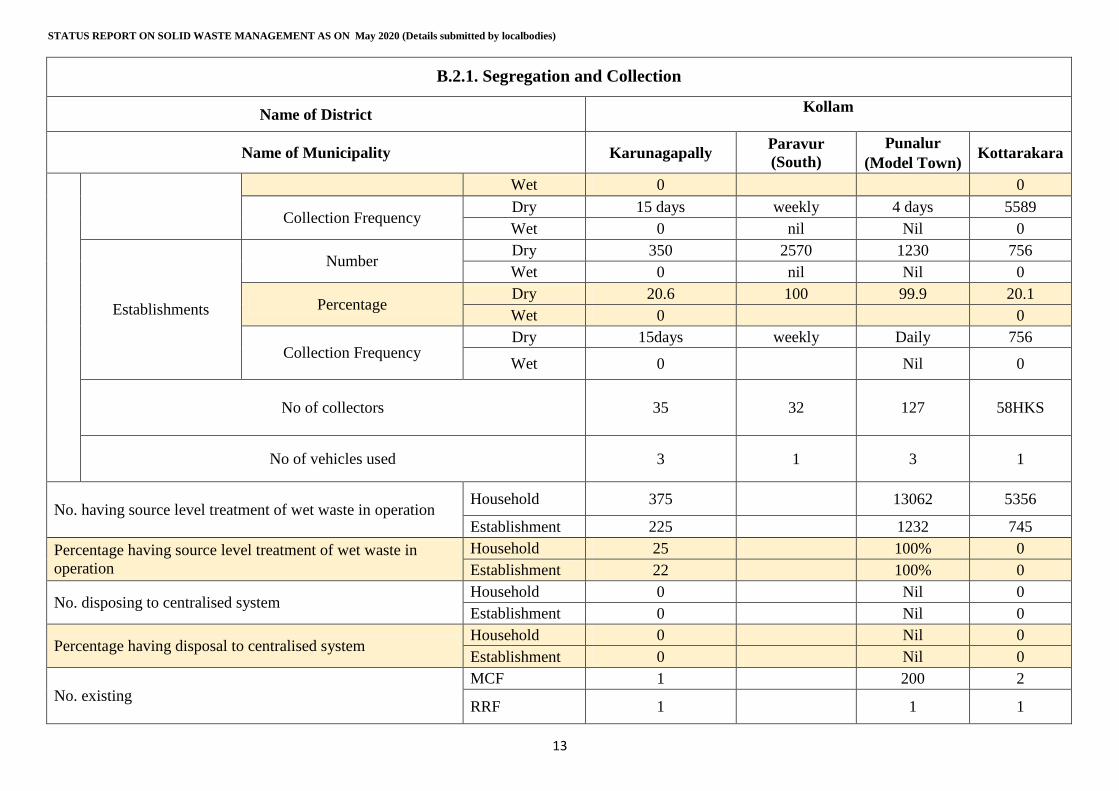
STATUS REPORT ON SOLID WASTE MANAGEMENT AS ON May 2020 (Details submitted by localbodies)
13
B.2.1. Segregation and Collection
Name of District Kollam
Name of Municipality Karunagapally Paravur
(South)
Punalur
(Model Town) Kottarakara
Wet 0 0
Collection Frequency Dry 15 days weekly 4 days 5589
Wet 0 nil Nil 0
Establishments
Number Dry 350 2570 1230 756
Wet 0 nil Nil 0
Percentage Dry 20.6 100 99.9 20.1
Wet 0 0
Collection Frequency Dry 15days weekly Daily 756
Wet 0 Nil 0
No of collectors 35 32 127 58HKS
No of vehicles used 3 1 3 1
No. having source level treatment of wet waste in operation Household 375 13062 5356
Establishment 225 1232 745
Percentage having source level treatment of wet waste in
operation
Household 25 100% 0
Establishment 22 100% 0
No. disposing to centralised system Household 0 Nil 0
Establishment 0 Nil 0
Percentage having disposal to centralised system Household 0 Nil 0
Establishment 0 Nil 0
No. existing MCF 1 200 2
RRF 1 1 1
Annexure.1
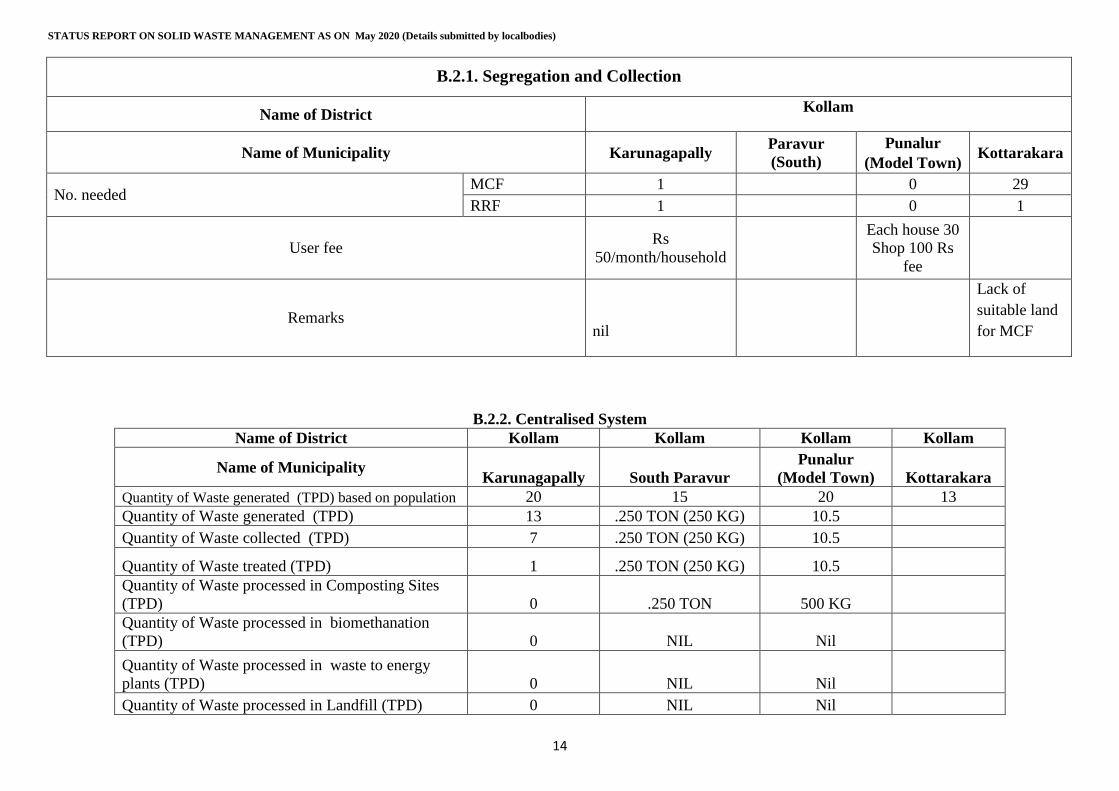
STATUS REPORT ON SOLID WASTE MANAGEMENT AS ON May 2020 (Details submitted by localbodies)
14
B.2.1. Segregation and Collection
Name of District Kollam
Name of Municipality Karunagapally Paravur
(South)
Punalur
(Model Town) Kottarakara
No. needed MCF 1 0 29
RRF 1 0 1
User fee Rs
50/month/household
Each house 30
Shop 100 Rs
fee
Remarks nil
Lack of
suitable land
for MCF
B.2.2. Centralised System
Name of District Kollam Kollam Kollam Kollam
Name of Municipality Karunagapally South Paravur
Punalur
(Model Town) Kottarakara
Quantity of Waste generated (TPD) based on population 20 15 20 13
Quantity of Waste generated (TPD) 13 .250 TON (250 KG) 10.5
Quantity of Waste collected (TPD) 7 .250 TON (250 KG) 10.5
Quantity of Waste treated (TPD) 1 .250 TON (250 KG) 10.5
Quantity of Waste processed in Composting Sites
(TPD) 0 .250 TON 500 KG
Quantity of Waste processed in biomethanation
(TPD) 0 NIL Nil
Quantity of Waste processed in waste to energy
plants (TPD) 0 NIL Nil
Quantity of Waste processed in Landfill (TPD) 0 NIL Nil
Annexure.1
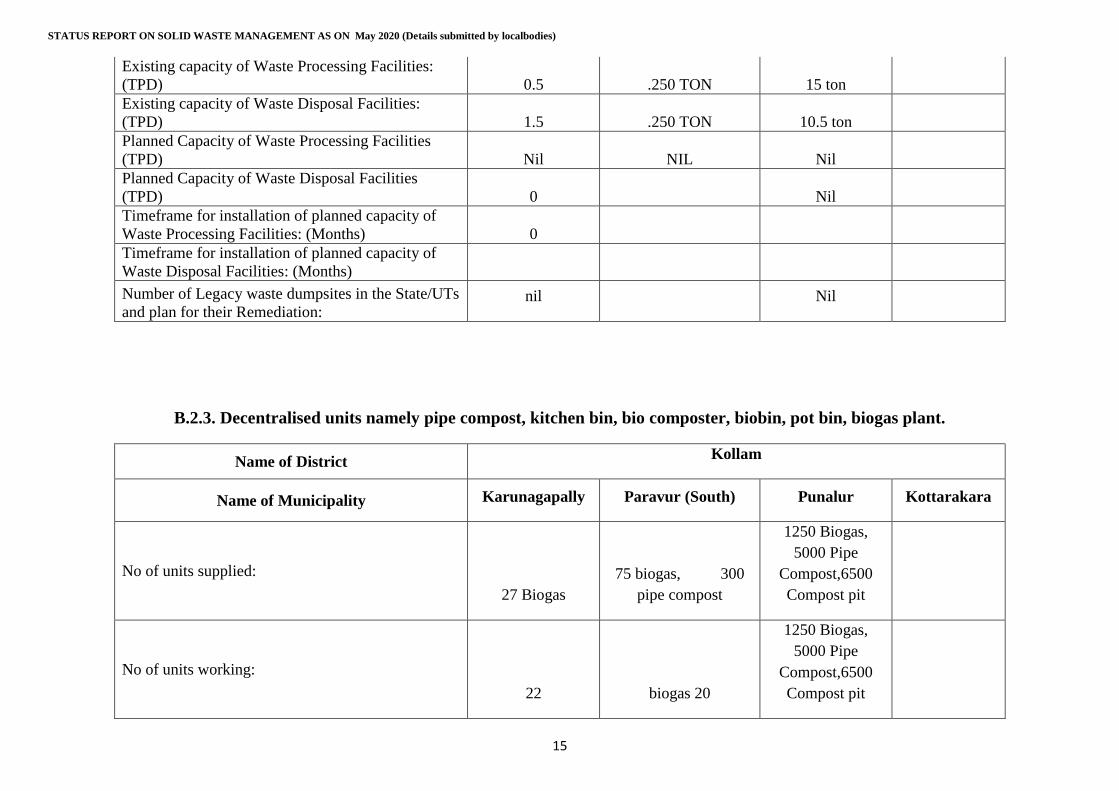
STATUS REPORT ON SOLID WASTE MANAGEMENT AS ON May 2020 (Details submitted by localbodies)
15
Existing capacity of Waste Processing Facilities:
(TPD) 0.5 .250 TON 15 ton
Existing capacity of Waste Disposal Facilities:
(TPD) 1.5 .250 TON 10.5 ton
Planned Capacity of Waste Processing Facilities
(TPD) Nil NIL Nil
Planned Capacity of Waste Disposal Facilities
(TPD) 0 Nil
Timeframe for installation of planned capacity of
Waste Processing Facilities: (Months) 0
Timeframe for installation of planned capacity of
Waste Disposal Facilities: (Months)
Number of Legacy waste dumpsites in the State/UTs
and plan for their Remediation: nil Nil
B.2.3. Decentralised units namely pipe compost, kitchen bin, bio composter, biobin, pot bin, biogas plant.
Name of District Kollam
Name of Municipality Karunagapally Paravur (South) Punalur Kottarakara
No of units supplied:
27 Biogas
75 biogas, 300
pipe compost
1250 Biogas,
5000 Pipe
Compost,6500
Compost pit
No of units working:
22 biogas 20
1250 Biogas,
5000 Pipe
Compost,6500
Compost pit
Annexure.1
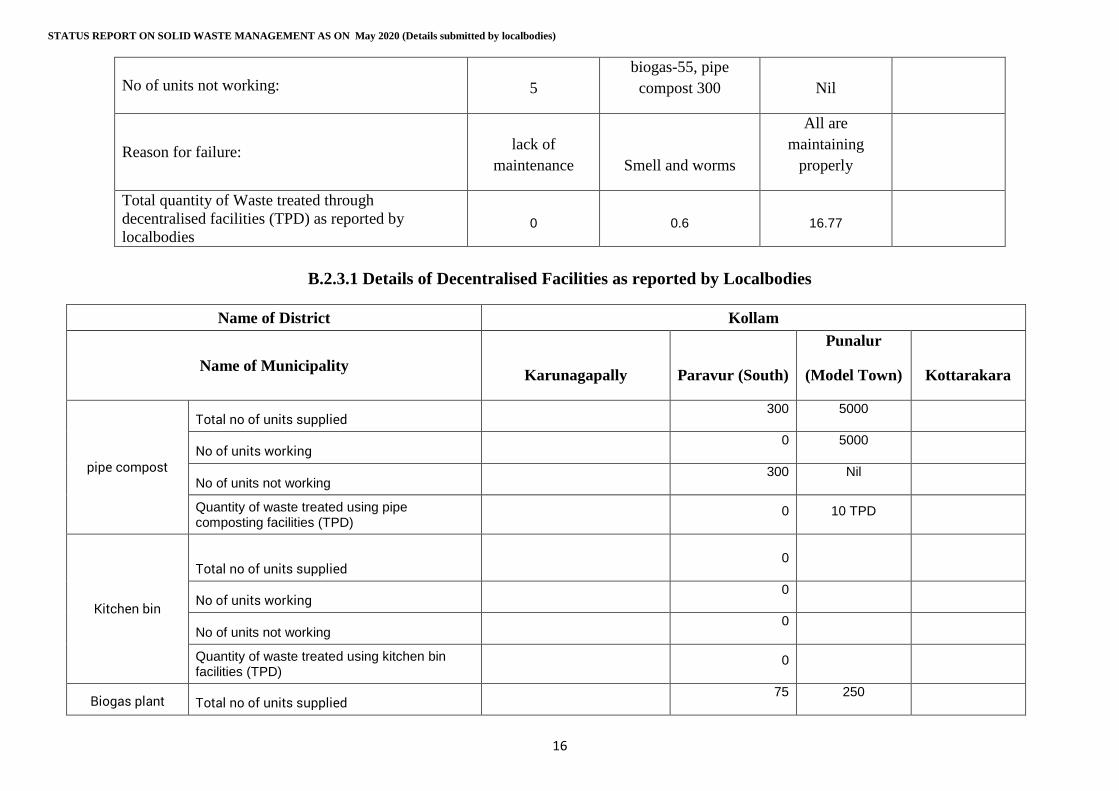
STATUS REPORT ON SOLID WASTE MANAGEMENT AS ON May 2020 (Details submitted by localbodies)
16
No of units not working: 5
biogas-55, pipe
compost 300 Nil
Reason for failure: lack of
maintenance Smell and worms
All are
maintaining
properly
Total quantity of Waste treated through
decentralised facilities (TPD) as reported by
localbodies 0 0.6 16.77
B.2.3.1 Details of Decentralised Facilities as reported by Localbodies
Name of District Kollam
Name of Municipality Karunagapally Paravur (South)
Punalur
(Model Town) Kottarakara
pipe compost
Total no of units supplied 300 5000
No of units working 0 5000
No of units not working 300 Nil
Quantity of waste treated using pipe composting facilities (TPD)
0 10 TPD
Kitchen bin
Total no of units supplied 0
No of units working 0
No of units not working 0
Quantity of waste treated using kitchen bin facilities (TPD)
0
Biogas plant Total no of units supplied 75 250
Annexure.1
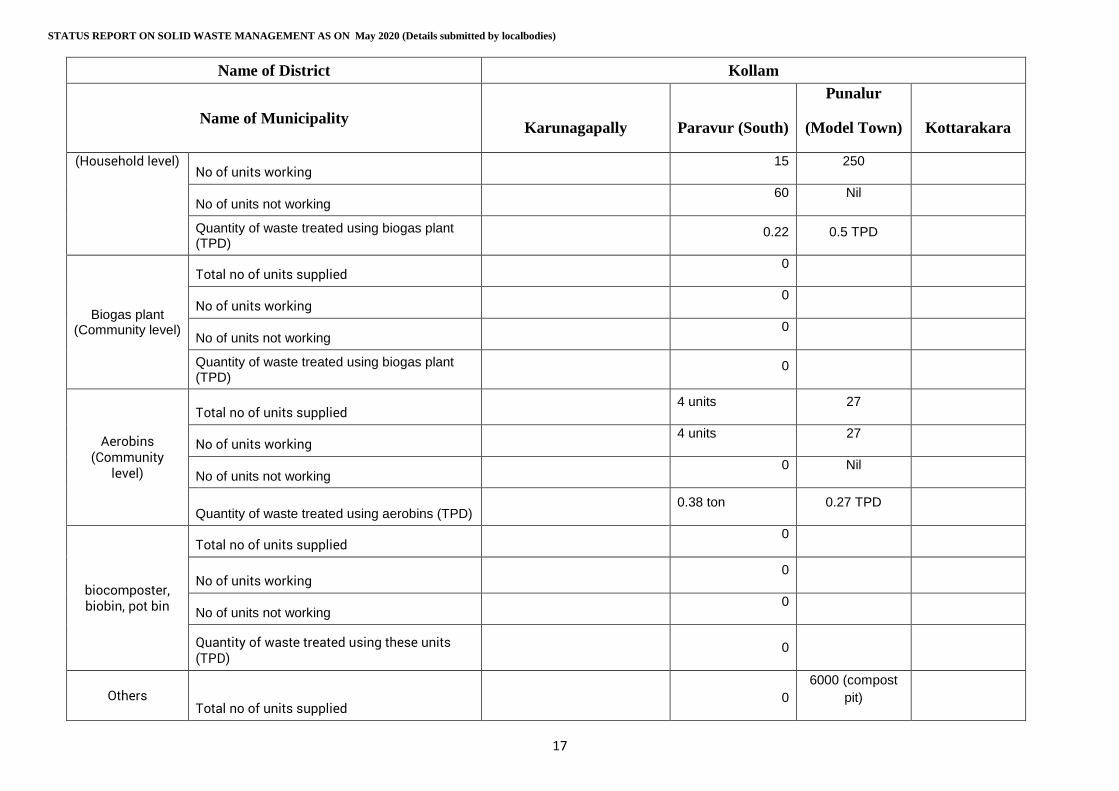
STATUS REPORT ON SOLID WASTE MANAGEMENT AS ON May 2020 (Details submitted by localbodies)
17
Name of District Kollam
Name of Municipality Karunagapally Paravur (South)
Punalur
(Model Town) Kottarakara
(Household level) No of units working
15 250
No of units not working 60 Nil
Quantity of waste treated using biogas plant (TPD)
0.22 0.5 TPD
Biogas plant (Community level)
Total no of units supplied 0
No of units working 0
No of units not working 0
Quantity of waste treated using biogas plant (TPD)
0
Aerobins (Community
level)
Total no of units supplied 4 units 27
No of units working 4 units 27
No of units not working 0 Nil
Quantity of waste treated using aerobins (TPD) 0.38 ton 0.27 TPD
biocomposter, biobin, pot bin
Total no of units supplied 0
No of units working 0
No of units not working 0
Quantity of waste treated using these units (TPD)
0
Others Total no of units supplied
0
6000 (compost
pit)
Annexure.1
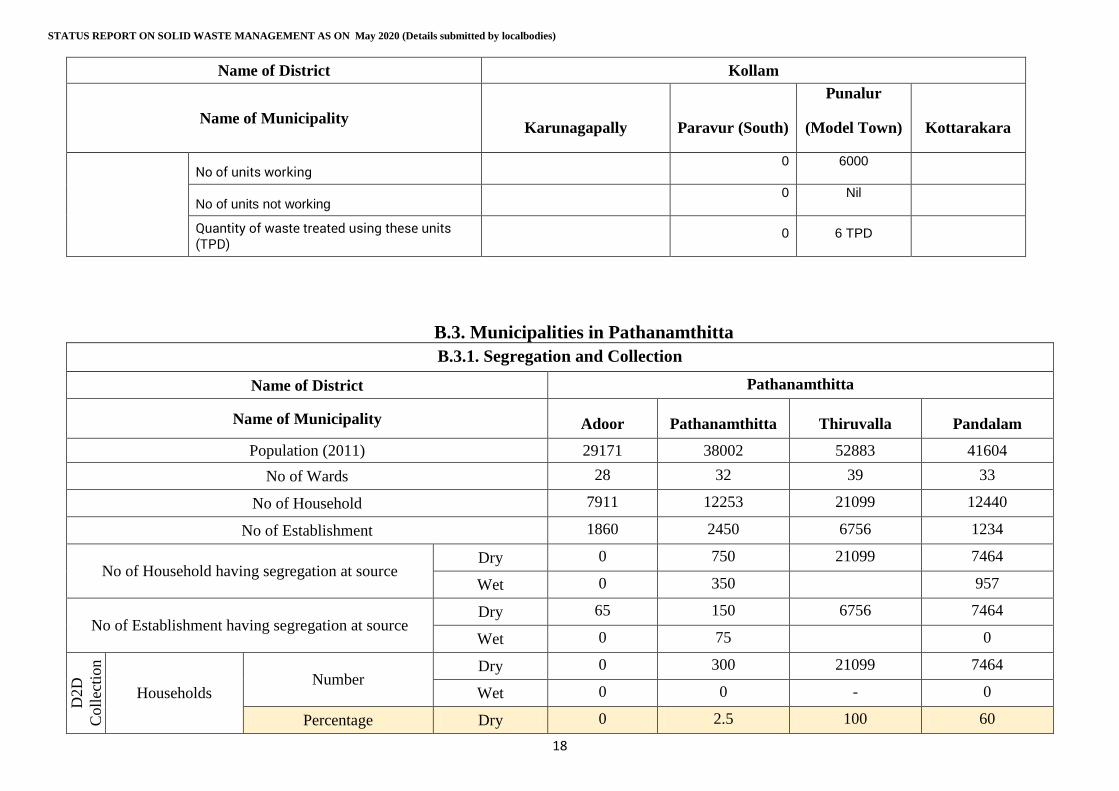
STATUS REPORT ON SOLID WASTE MANAGEMENT AS ON May 2020 (Details submitted by localbodies)
18
Name of District Kollam
Name of Municipality Karunagapally Paravur (South)
Punalur
(Model Town) Kottarakara
No of units working 0 6000
No of units not working 0 Nil
Quantity of waste treated using these units (TPD)
0 6 TPD
B.3. Municipalities in Pathanamthitta
B.3.1. Segregation and Collection
Name of District Pathanamthitta
Name of Municipality Adoor Pathanamthitta Thiruvalla Pandalam
Population (2011) 29171 38002 52883 41604
No of Wards 28 32 39 33
No of Household 7911 12253 21099 12440
No of Establishment 1860 2450 6756 1234
No of Household having segregation at source Dry 0 750 21099 7464
Wet 0 350 957
No of Establishment having segregation at source Dry 65 150 6756 7464
Wet 0 75 0
D2D
Coll
ecti
on
Households Number
Dry 0 300 21099 7464
Wet 0 0 - 0
Percentage Dry 0 2.5 100 60
Annexure.1
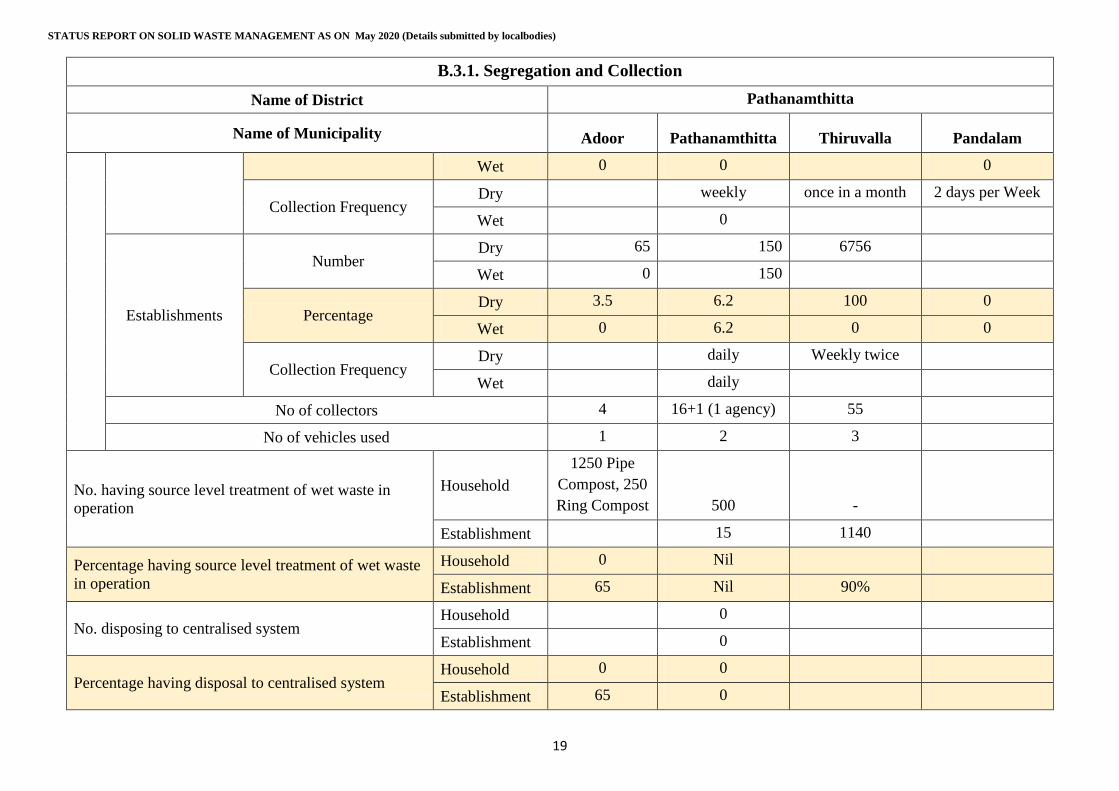
STATUS REPORT ON SOLID WASTE MANAGEMENT AS ON May 2020 (Details submitted by localbodies)
19
B.3.1. Segregation and Collection
Name of District Pathanamthitta
Name of Municipality Adoor Pathanamthitta Thiruvalla Pandalam
Wet 0 0 0
Collection Frequency Dry
weekly once in a month 2 days per Week
Wet
0
Establishments
Number Dry 65 150 6756
Wet 0 150
Percentage Dry 3.5 6.2 100 0
Wet 0 6.2 0 0
Collection Frequency Dry
daily Weekly twice
Wet
daily
No of collectors 4 16+1 (1 agency) 55
No of vehicles used 1 2 3
No. having source level treatment of wet waste in
operation
Household
1250 Pipe
Compost, 250
Ring Compost 500 -
Establishment
15 1140
Percentage having source level treatment of wet waste
in operation
Household 0 Nil
Establishment 65 Nil 90%
No. disposing to centralised system Household
0
Establishment
0
Percentage having disposal to centralised system Household 0 0
Establishment 65 0
Annexure.1
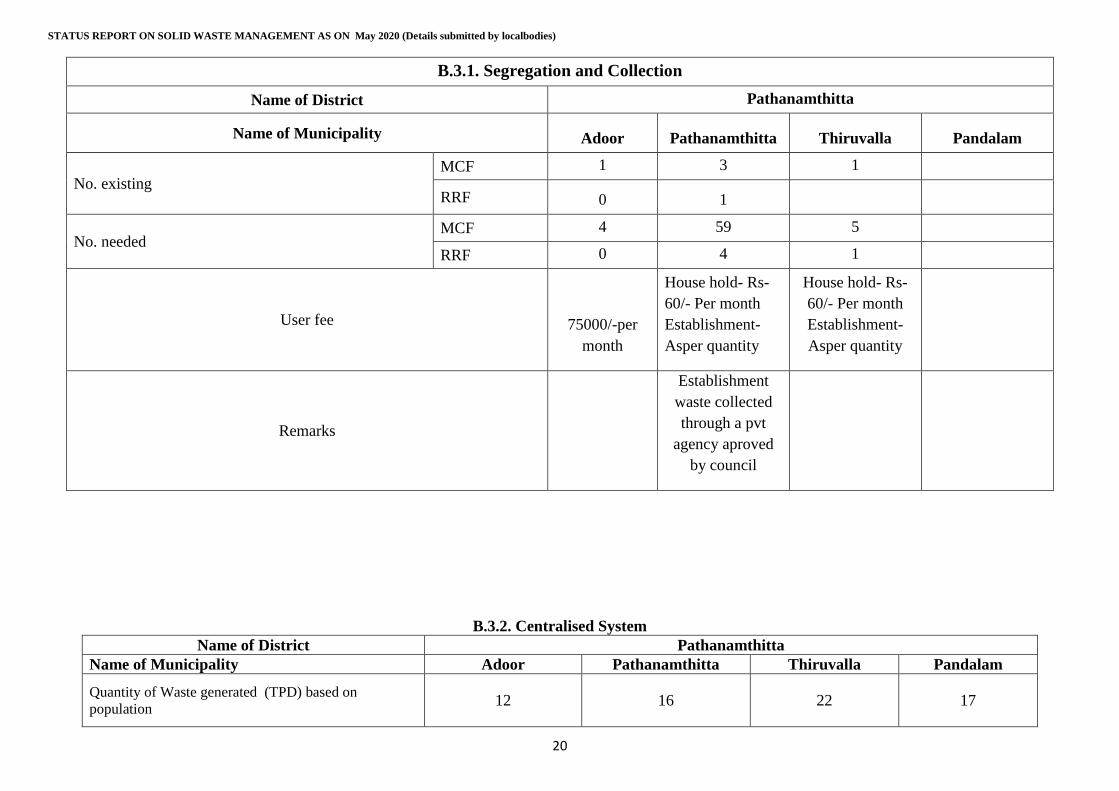
STATUS REPORT ON SOLID WASTE MANAGEMENT AS ON May 2020 (Details submitted by localbodies)
20
B.3.1. Segregation and Collection
Name of District Pathanamthitta
Name of Municipality Adoor Pathanamthitta Thiruvalla Pandalam
No. existing MCF 1 3 1
RRF 0 1
No. needed MCF 4 59 5
RRF 0 4 1
User fee 75000/-per
month
House hold- Rs-
60/- Per month
Establishment-
Asper quantity
House hold- Rs-
60/- Per month
Establishment-
Asper quantity
Remarks
Establishment
waste collected
through a pvt
agency aproved
by council
B.3.2. Centralised System
Name of District Pathanamthitta
Name of Municipality Adoor Pathanamthitta Thiruvalla Pandalam
Quantity of Waste generated (TPD) based on
population 12 16 22 17
Annexure.1
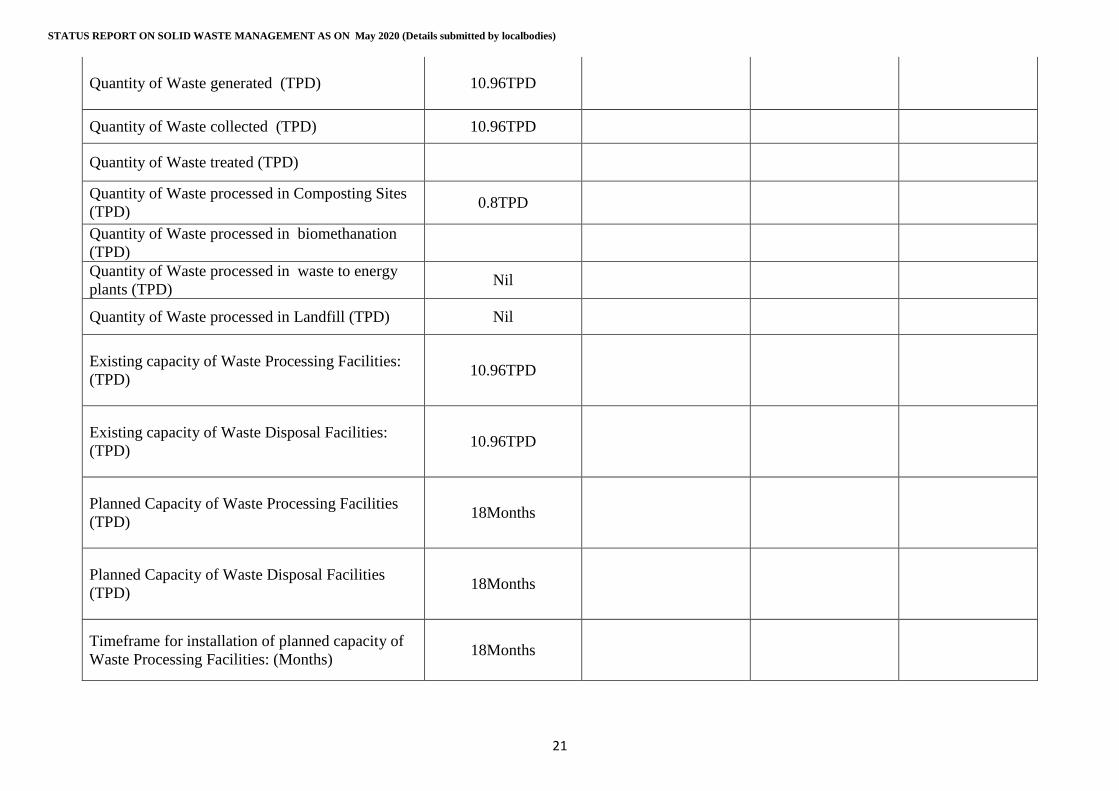
STATUS REPORT ON SOLID WASTE MANAGEMENT AS ON May 2020 (Details submitted by localbodies)
21
Quantity of Waste generated (TPD) 10.96TPD
Quantity of Waste collected (TPD) 10.96TPD
Quantity of Waste treated (TPD)
Quantity of Waste processed in Composting Sites
(TPD) 0.8TPD
Quantity of Waste processed in biomethanation
(TPD)
Quantity of Waste processed in waste to energy
plants (TPD) Nil
Quantity of Waste processed in Landfill (TPD) Nil
Existing capacity of Waste Processing Facilities:
(TPD) 10.96TPD
Existing capacity of Waste Disposal Facilities:
(TPD) 10.96TPD
Planned Capacity of Waste Processing Facilities
(TPD) 18Months
Planned Capacity of Waste Disposal Facilities
(TPD) 18Months
Timeframe for installation of planned capacity of
Waste Processing Facilities: (Months) 18Months
Annexure.1
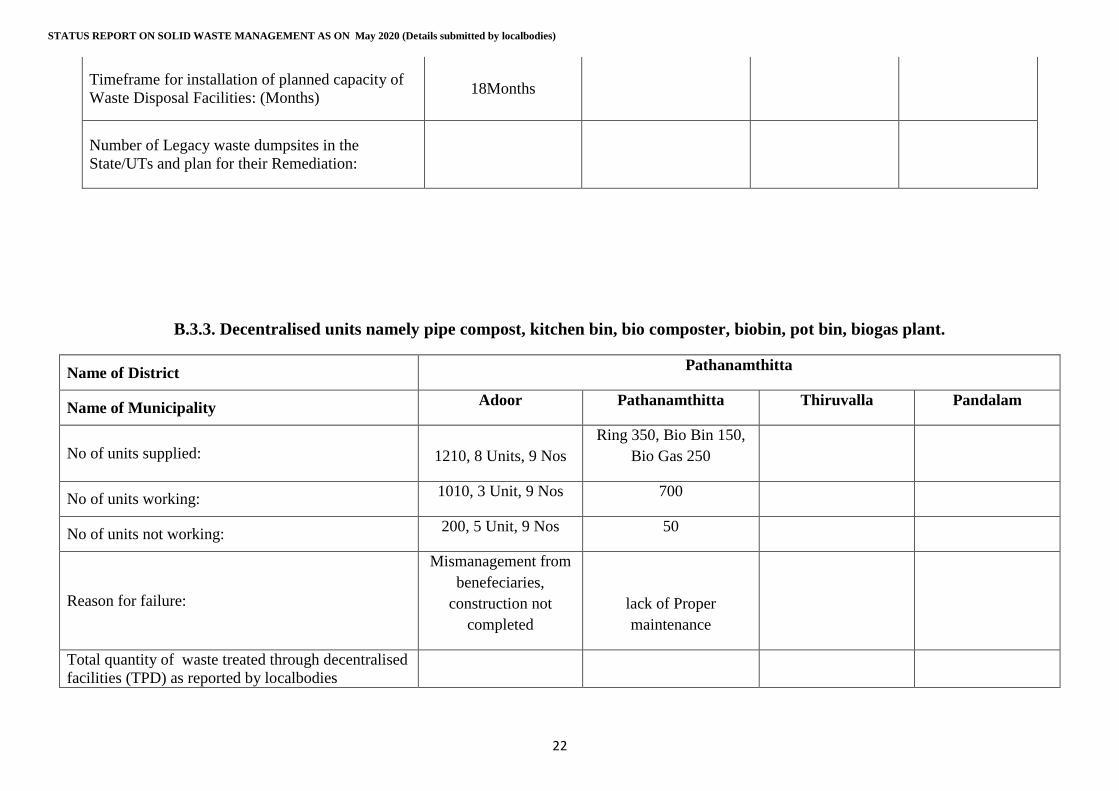
STATUS REPORT ON SOLID WASTE MANAGEMENT AS ON May 2020 (Details submitted by localbodies)
22
Timeframe for installation of planned capacity of
Waste Disposal Facilities: (Months) 18Months
Number of Legacy waste dumpsites in the
State/UTs and plan for their Remediation:
B.3.3. Decentralised units namely pipe compost, kitchen bin, bio composter, biobin, pot bin, biogas plant.
Name of District Pathanamthitta
Name of Municipality Adoor Pathanamthitta Thiruvalla Pandalam
No of units supplied: 1210, 8 Units, 9 Nos
Ring 350, Bio Bin 150,
Bio Gas 250
No of units working: 1010, 3 Unit, 9 Nos 700
No of units not working: 200, 5 Unit, 9 Nos 50
Reason for failure:
Mismanagement from
benefeciaries,
construction not
completed
lack of Proper
maintenance
Total quantity of waste treated through decentralised
facilities (TPD) as reported by localbodies
Annexure.1
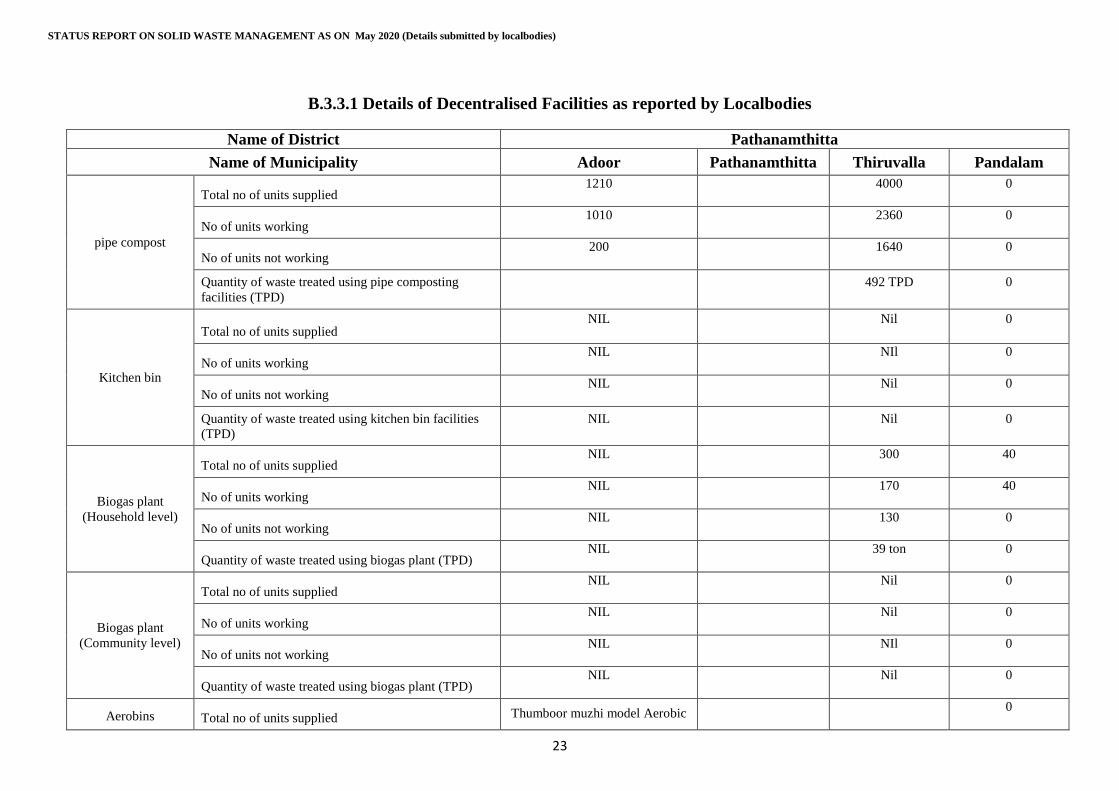
STATUS REPORT ON SOLID WASTE MANAGEMENT AS ON May 2020 (Details submitted by localbodies)
23
B.3.3.1 Details of Decentralised Facilities as reported by Localbodies
Name of District Pathanamthitta
Name of Municipality Adoor Pathanamthitta Thiruvalla Pandalam
pipe compost
Total no of units supplied 1210
4000 0
No of units working 1010
2360 0
No of units not working 200
1640 0
Quantity of waste treated using pipe composting
facilities (TPD)
492 TPD 0
Kitchen bin
Total no of units supplied NIL
Nil 0
No of units working NIL
NIl 0
No of units not working NIL
Nil 0
Quantity of waste treated using kitchen bin facilities
(TPD)
NIL
Nil 0
Biogas plant
(Household level)
Total no of units supplied NIL
300 40
No of units working NIL
170 40
No of units not working NIL
130 0
Quantity of waste treated using biogas plant (TPD) NIL
39 ton 0
Biogas plant
(Community level)
Total no of units supplied NIL
Nil 0
No of units working NIL
Nil 0
No of units not working NIL
NIl 0
Quantity of waste treated using biogas plant (TPD) NIL
Nil 0
Aerobins Total no of units supplied Thumboor muzhi model Aerobic
0
Annexure.1
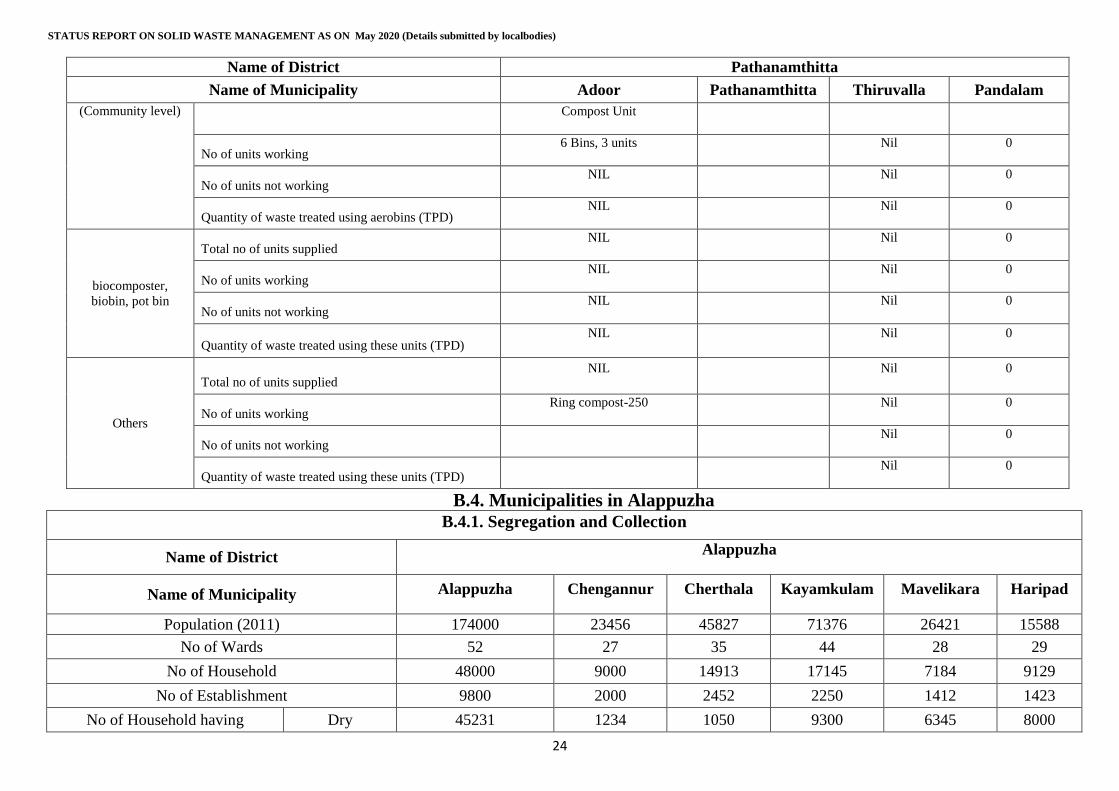
STATUS REPORT ON SOLID WASTE MANAGEMENT AS ON May 2020 (Details submitted by localbodies)
24
Name of District Pathanamthitta
Name of Municipality Adoor Pathanamthitta Thiruvalla Pandalam
(Community level) Compost Unit
No of units working 6 Bins, 3 units
Nil 0
No of units not working NIL
Nil 0
Quantity of waste treated using aerobins (TPD) NIL
Nil 0
biocomposter,
biobin, pot bin
Total no of units supplied NIL
Nil 0
No of units working NIL
Nil 0
No of units not working NIL
Nil 0
Quantity of waste treated using these units (TPD) NIL
Nil 0
Others
Total no of units supplied NIL
Nil 0
No of units working Ring compost-250
Nil 0
No of units not working
Nil 0
Quantity of waste treated using these units (TPD)
Nil 0
B.4. Municipalities in Alappuzha
B.4.1. Segregation and Collection
Name of District Alappuzha
Name of Municipality Alappuzha Chengannur Cherthala Kayamkulam Mavelikara Haripad
Population (2011) 174000 23456 45827 71376 26421 15588
No of Wards 52 27 35 44 28 29
No of Household 48000 9000 14913 17145 7184 9129
No of Establishment 9800 2000 2452 2250 1412 1423
No of Household having Dry 45231 1234 1050 9300 6345 8000
Annexure.1
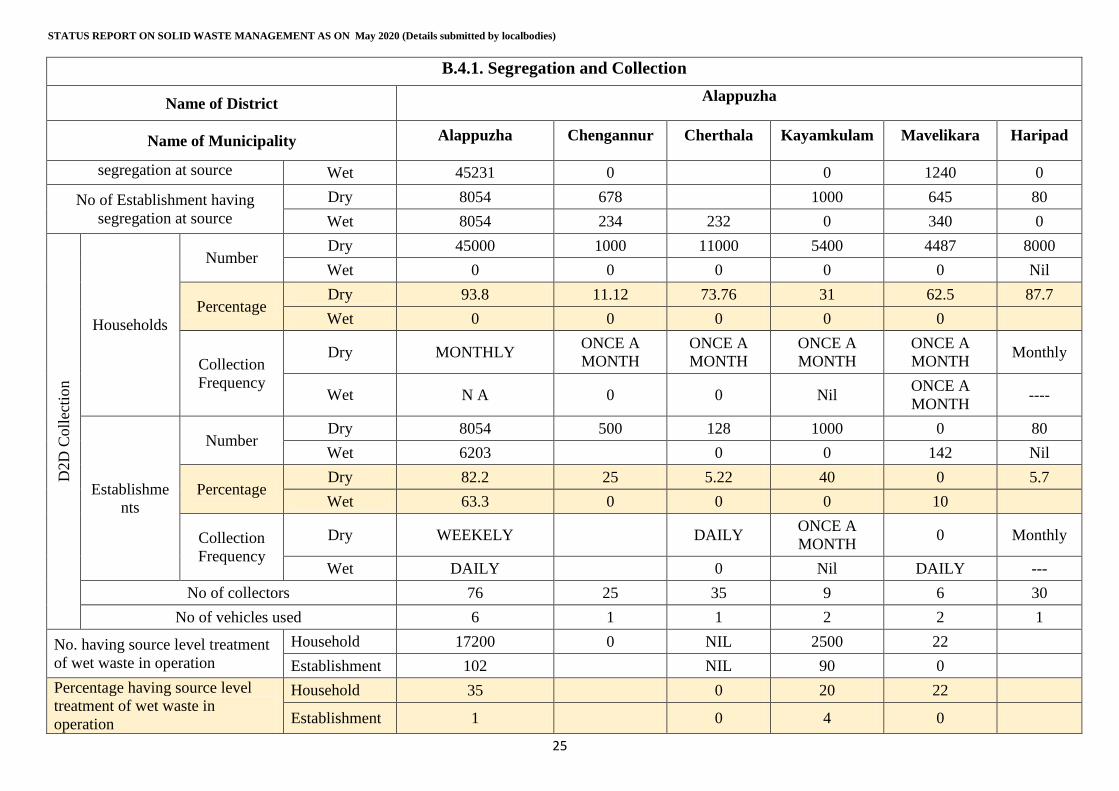
STATUS REPORT ON SOLID WASTE MANAGEMENT AS ON May 2020 (Details submitted by localbodies)
25
B.4.1. Segregation and Collection
Name of District Alappuzha
Name of Municipality Alappuzha Chengannur Cherthala Kayamkulam Mavelikara Haripad
segregation at source Wet 45231 0 0 1240 0
No of Establishment having
segregation at source
Dry 8054 678 1000 645 80
Wet 8054 234 232 0 340 0
D2D
Coll
ecti
on
Households
Number Dry 45000 1000 11000 5400 4487 8000
Wet 0 0 0 0 0 Nil
Percentage Dry 93.8 11.12 73.76 31 62.5 87.7
Wet 0 0 0 0 0
Collection
Frequency
Dry MONTHLY ONCE A
MONTH
ONCE A
MONTH
ONCE A
MONTH
ONCE A
MONTH Monthly
Wet N A 0 0 Nil ONCE A
MONTH ----
Establishme
nts
Number Dry 8054 500 128 1000 0 80
Wet 6203 0 0 142 Nil
Percentage Dry 82.2 25 5.22 40 0 5.7
Wet 63.3 0 0 0 10
Collection
Frequency
Dry WEEKELY DAILY ONCE A
MONTH 0 Monthly
Wet DAILY 0 Nil DAILY ---
No of collectors 76 25 35 9 6 30
No of vehicles used 6 1 1 2 2 1
No. having source level treatment
of wet waste in operation
Household 17200 0 NIL 2500 22
Establishment 102 NIL 90 0
Percentage having source level
treatment of wet waste in
operation
Household 35 0 20 22
Establishment 1 0 4 0
Annexure.1
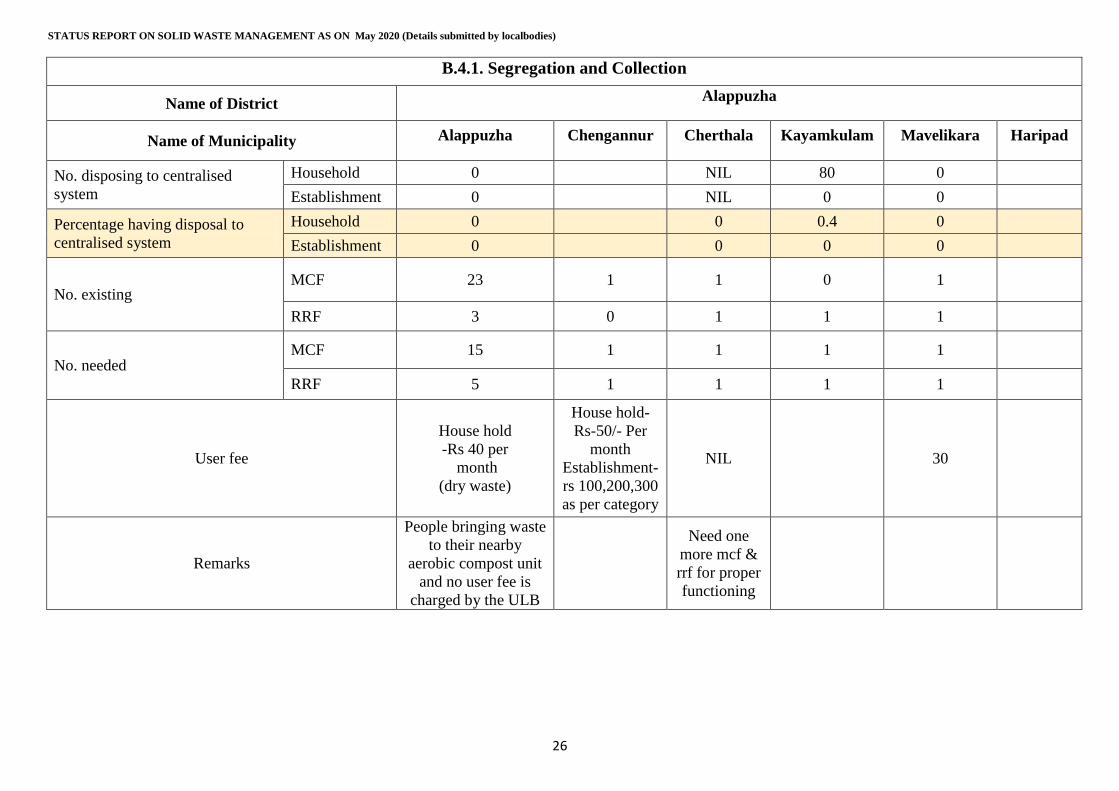
STATUS REPORT ON SOLID WASTE MANAGEMENT AS ON May 2020 (Details submitted by localbodies)
26
B.4.1. Segregation and Collection
Name of District Alappuzha
Name of Municipality Alappuzha Chengannur Cherthala Kayamkulam Mavelikara Haripad
No. disposing to centralised
system
Household 0 NIL 80 0
Establishment 0 NIL 0 0
Percentage having disposal to
centralised system
Household 0 0 0.4 0
Establishment 0 0 0 0
No. existing MCF 23 1 1 0 1
RRF 3 0 1 1 1
No. needed MCF 15 1 1 1 1
RRF 5 1 1 1 1
User fee
House hold
-Rs 40 per
month
(dry waste)
House hold-
Rs-50/- Per
month
Establishment-
rs 100,200,300
as per category
NIL 30
Remarks
People bringing waste
to their nearby
aerobic compost unit
and no user fee is
charged by the ULB
Need one
more mcf &
rrf for proper
functioning
Annexure.1
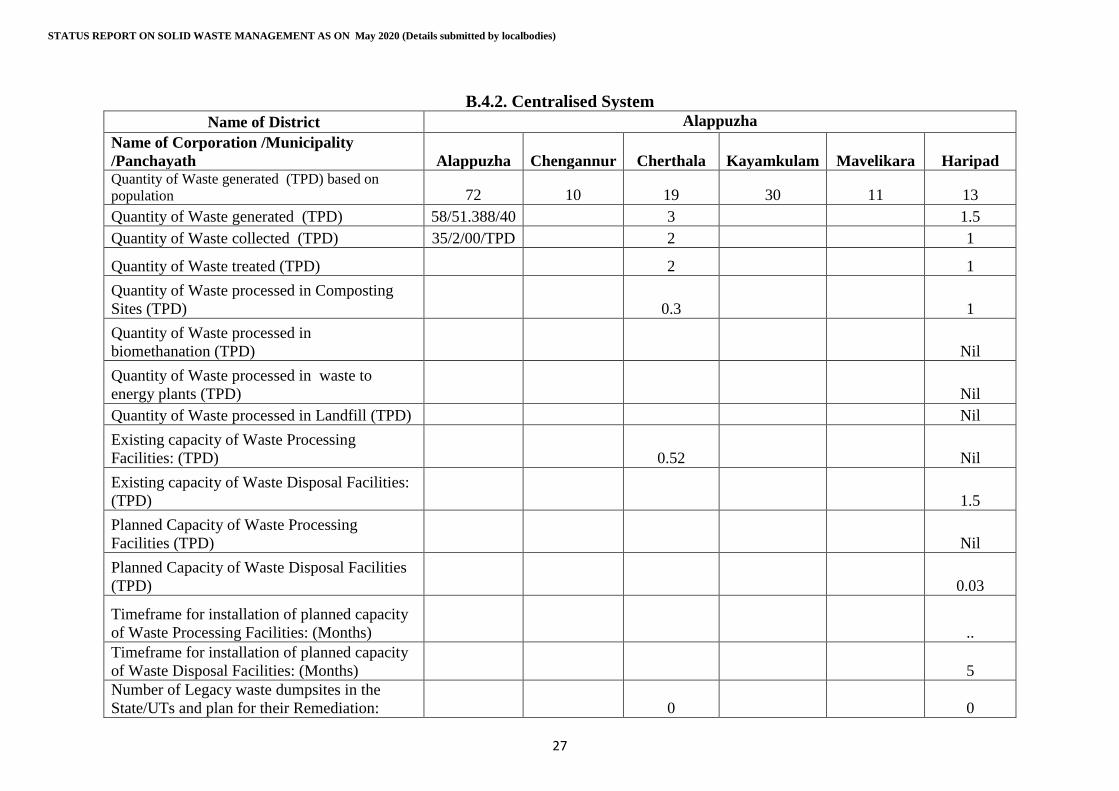
STATUS REPORT ON SOLID WASTE MANAGEMENT AS ON May 2020 (Details submitted by localbodies)
27
B.4.2. Centralised System
Name of District Alappuzha
Name of Corporation /Municipality
/Panchayath Alappuzha Chengannur Cherthala Kayamkulam Mavelikara Haripad Quantity of Waste generated (TPD) based on
population 72 10 19 30 11 13
Quantity of Waste generated (TPD) 58/51.388/40 3 1.5
Quantity of Waste collected (TPD) 35/2/00/TPD 2 1
Quantity of Waste treated (TPD) 2 1
Quantity of Waste processed in Composting
Sites (TPD) 0.3 1
Quantity of Waste processed in
biomethanation (TPD) Nil
Quantity of Waste processed in waste to
energy plants (TPD) Nil
Quantity of Waste processed in Landfill (TPD) Nil
Existing capacity of Waste Processing
Facilities: (TPD) 0.52 Nil
Existing capacity of Waste Disposal Facilities:
(TPD) 1.5
Planned Capacity of Waste Processing
Facilities (TPD) Nil
Planned Capacity of Waste Disposal Facilities
(TPD) 0.03
Timeframe for installation of planned capacity
of Waste Processing Facilities: (Months) ..
Timeframe for installation of planned capacity
of Waste Disposal Facilities: (Months) 5
Number of Legacy waste dumpsites in the
State/UTs and plan for their Remediation: 0 0
Annexure.1
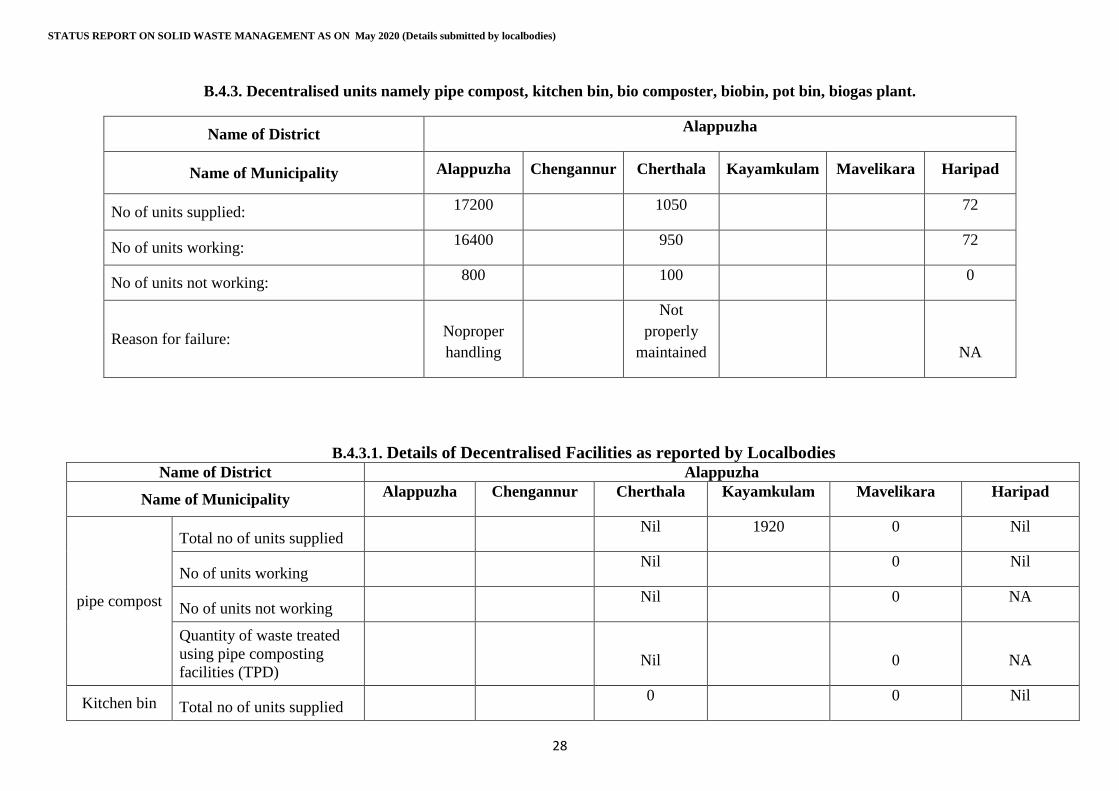
STATUS REPORT ON SOLID WASTE MANAGEMENT AS ON May 2020 (Details submitted by localbodies)
28
B.4.3. Decentralised units namely pipe compost, kitchen bin, bio composter, biobin, pot bin, biogas plant.
Name of District Alappuzha
Name of Municipality Alappuzha Chengannur Cherthala Kayamkulam Mavelikara Haripad
No of units supplied: 17200 1050 72
No of units working: 16400 950 72
No of units not working: 800 100 0
Reason for failure: Noproper
handling
Not
properly
maintained NA
B.4.3.1. Details of Decentralised Facilities as reported by Localbodies
Name of District Alappuzha
Name of Municipality Alappuzha Chengannur Cherthala Kayamkulam Mavelikara Haripad
pipe compost
Total no of units supplied
Nil 1920 0 Nil
No of units working
Nil
0 Nil
No of units not working
Nil
0 NA
Quantity of waste treated
using pipe composting
facilities (TPD)
Nil
0 NA
Kitchen bin Total no of units supplied
0
0 Nil
Annexure.1
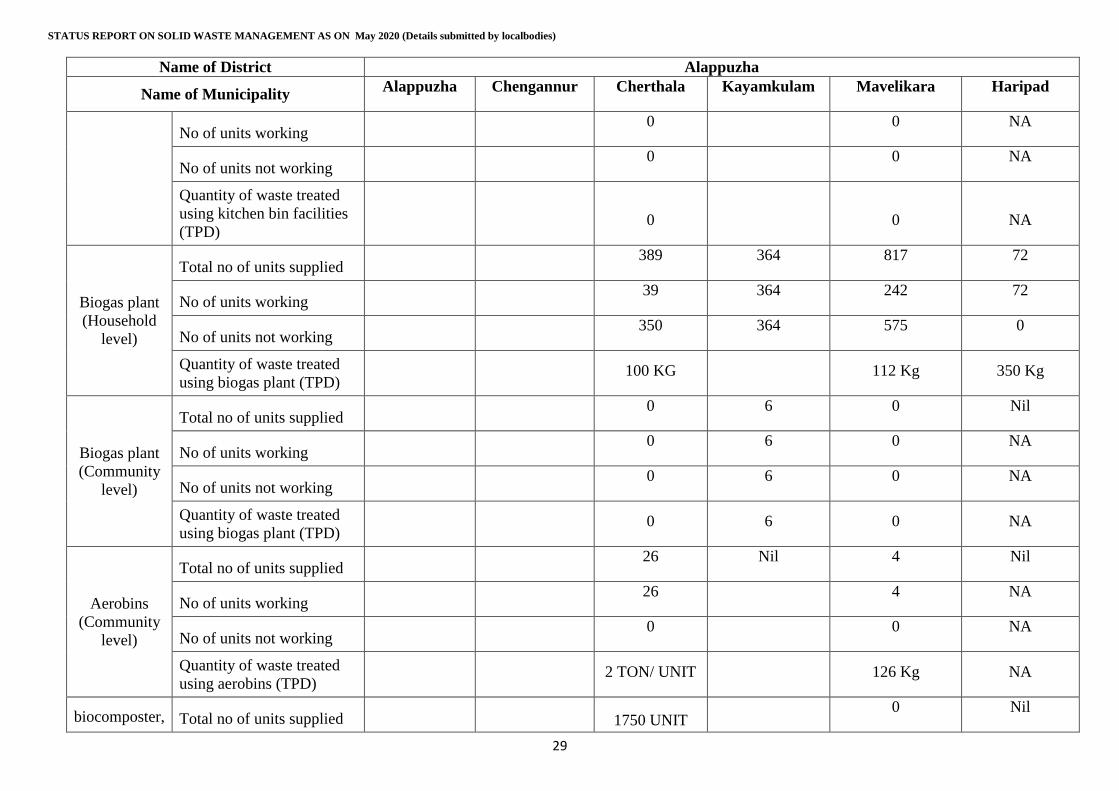
STATUS REPORT ON SOLID WASTE MANAGEMENT AS ON May 2020 (Details submitted by localbodies)
29
Name of District Alappuzha
Name of Municipality Alappuzha Chengannur Cherthala Kayamkulam Mavelikara Haripad
No of units working
0
0 NA
No of units not working
0
0 NA
Quantity of waste treated
using kitchen bin facilities
(TPD)
0
0 NA
Biogas plant
(Household
level)
Total no of units supplied
389 364 817 72
No of units working
39 364 242 72
No of units not working
350 364 575 0
Quantity of waste treated
using biogas plant (TPD)
100 KG
112 Kg 350 Kg
Biogas plant
(Community
level)
Total no of units supplied
0 6 0 Nil
No of units working
0 6 0 NA
No of units not working
0 6 0 NA
Quantity of waste treated
using biogas plant (TPD)
0 6 0 NA
Aerobins
(Community
level)
Total no of units supplied
26 Nil 4 Nil
No of units working
26
4 NA
No of units not working
0
0 NA
Quantity of waste treated
using aerobins (TPD)
2 TON/ UNIT
126 Kg NA
biocomposter, Total no of units supplied
1750 UNIT
0 Nil
Annexure.1

STATUS REPORT ON SOLID WASTE MANAGEMENT AS ON May 2020 (Details submitted by localbodies)
30
Name of District Alappuzha
Name of Municipality Alappuzha Chengannur Cherthala Kayamkulam Mavelikara Haripad
biobin, pot
bin
BIOBIN
No of units working
0
0 NA
No of units not working
0
0 NA
Quantity of waste treated
using these units (TPD)
0 Nil 0 NA
Others
Total no of units supplied
Nil Nil 0 Nil
No of units working
Nil
0 NA
No of units not working
Nil
0 NA
Quantity of waste treated
using these units (TPD)
Nil Nil
NA
Annexure.1
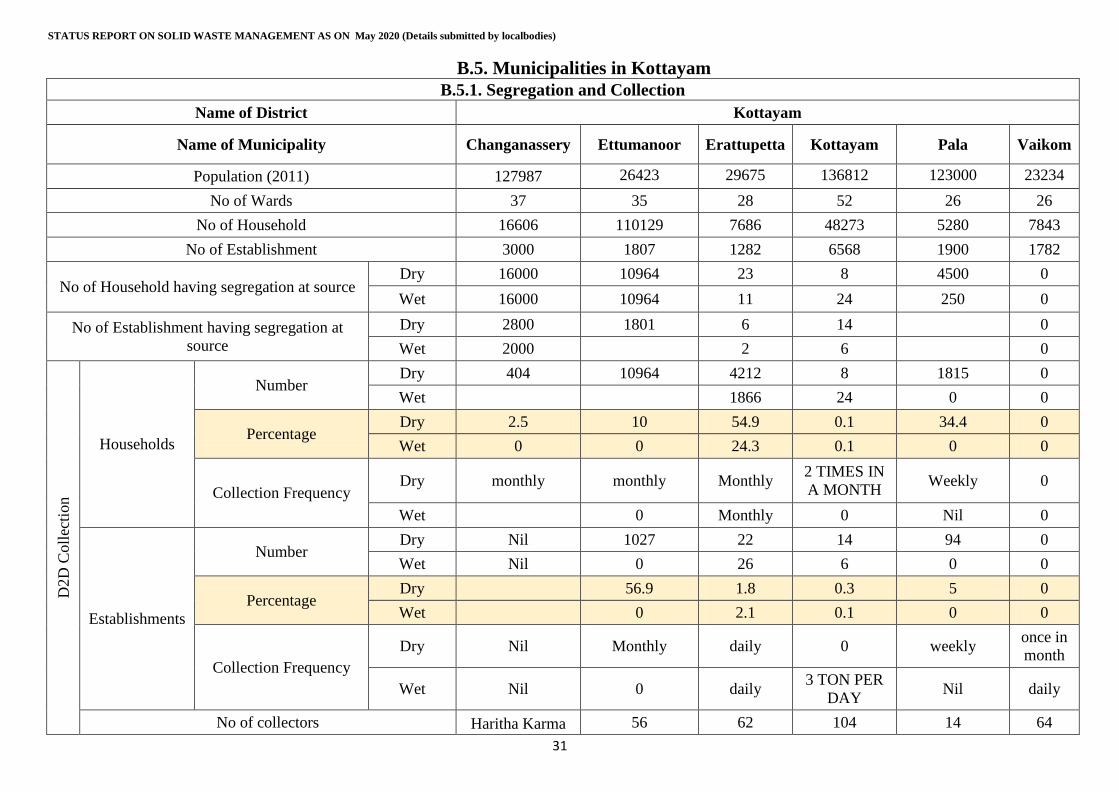
STATUS REPORT ON SOLID WASTE MANAGEMENT AS ON May 2020 (Details submitted by localbodies)
31
B.5. Municipalities in Kottayam
B.5.1. Segregation and Collection
Name of District Kottayam
Name of Municipality Changanassery Ettumanoor Erattupetta Kottayam Pala Vaikom
Population (2011) 127987 26423 29675 136812 123000 23234
No of Wards 37 35 28 52 26 26
No of Household 16606 110129 7686 48273 5280 7843
No of Establishment 3000 1807 1282 6568 1900 1782
No of Household having segregation at source Dry 16000 10964 23 8 4500 0
Wet 16000 10964 11 24 250 0
No of Establishment having segregation at
source
Dry 2800 1801 6 14 0
Wet 2000 2 6 0
D2D
Coll
ecti
on
Households
Number Dry 404 10964 4212 8 1815 0
Wet
1866 24 0 0
Percentage Dry 2.5 10 54.9 0.1 34.4 0
Wet 0 0 24.3 0.1 0 0
Collection Frequency Dry monthly monthly Monthly
2 TIMES IN
A MONTH Weekly 0
Wet
0 Monthly 0 Nil 0
Establishments
Number Dry Nil 1027 22 14 94 0
Wet Nil 0 26 6 0 0
Percentage Dry
56.9 1.8 0.3 5 0
Wet
0 2.1 0.1 0 0
Collection Frequency
Dry Nil Monthly daily 0 weekly once in
month
Wet Nil 0 daily 3 TON PER
DAY Nil daily
No of collectors Haritha Karma 56 62 104 14 64
Annexure.1

STATUS REPORT ON SOLID WASTE MANAGEMENT AS ON May 2020 (Details submitted by localbodies)
32
B.5.1. Segregation and Collection
Name of District Kottayam
Name of Municipality Changanassery Ettumanoor Erattupetta Kottayam Pala Vaikom
Sena
No of vehicles used
1 2 13 2 1
No. having source level treatment of wet
waste in operation
Household 2600 10964 5432 48273 5162 0
Establishment 70 118 Not started 250 0
Percentage having source level treatment
of wet waste in operation
Household 18% 100% 68 5162 0
Establishment 2.2 100% 250 0
No. disposing to centralised system Household 1200 Nil 0 0 1815 0
Establishment Nil 80 0 0 94 0
Percentage having disposal to centralised
system
Household 8% 0 0 0
Establishment 0 67% 0 0
No. existing MCF 1 1 1 1 1 1
RRF 1 1 1 1 0 0
No. needed MCF 28 35 7 15 0
RRF 28 1 1 15 0
User fee 100 Rs per
houses
50 for HH
150<for
Establishments
61 including
cess 60, 120 0
Remarks
60(for houses)
120(establishm
ents)
0
Annexure.1
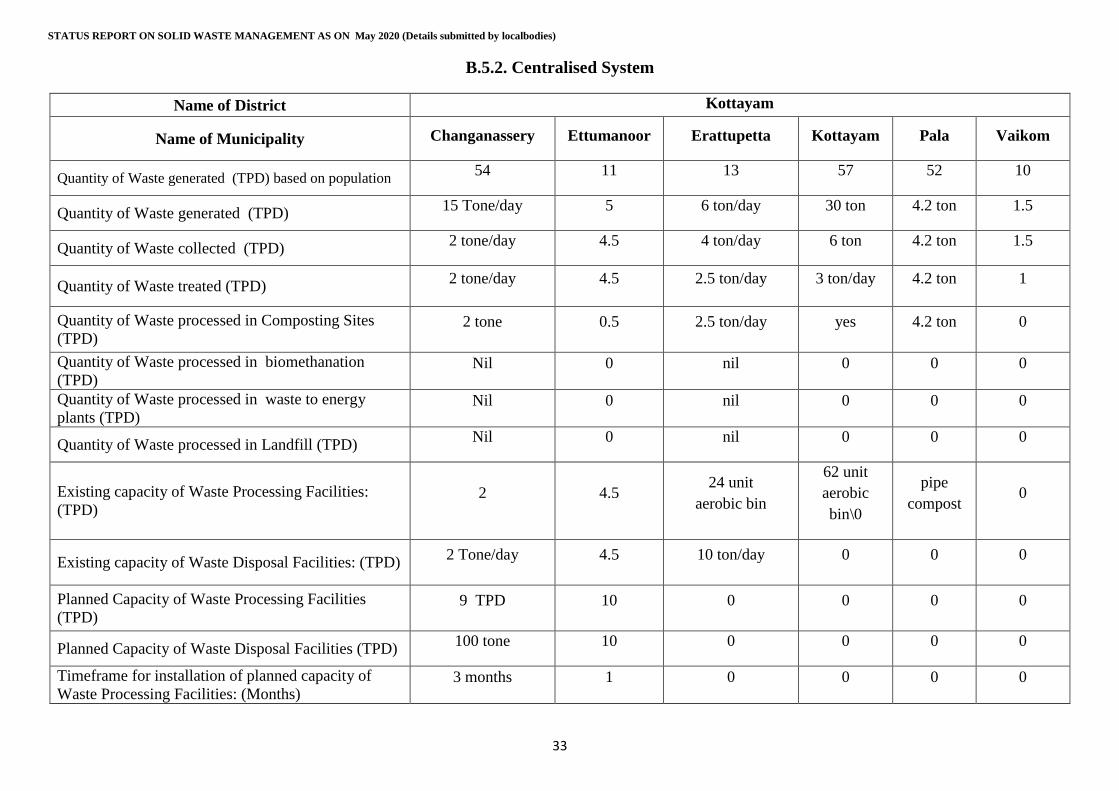
STATUS REPORT ON SOLID WASTE MANAGEMENT AS ON May 2020 (Details submitted by localbodies)
33
B.5.2. Centralised System
Name of District Kottayam
Name of Municipality Changanassery Ettumanoor Erattupetta Kottayam Pala Vaikom
Quantity of Waste generated (TPD) based on population 54 11 13 57 52 10
Quantity of Waste generated (TPD) 15 Tone/day 5 6 ton/day 30 ton 4.2 ton 1.5
Quantity of Waste collected (TPD) 2 tone/day 4.5 4 ton/day 6 ton 4.2 ton 1.5
Quantity of Waste treated (TPD) 2 tone/day 4.5 2.5 ton/day 3 ton/day 4.2 ton 1
Quantity of Waste processed in Composting Sites
(TPD) 2 tone 0.5 2.5 ton/day yes 4.2 ton 0
Quantity of Waste processed in biomethanation
(TPD) Nil 0 nil 0 0 0
Quantity of Waste processed in waste to energy
plants (TPD) Nil 0 nil 0 0 0
Quantity of Waste processed in Landfill (TPD) Nil 0 nil 0 0 0
Existing capacity of Waste Processing Facilities:
(TPD) 2 4.5
24 unit
aerobic bin
62 unit
aerobic
bin\0
pipe
compost 0
Existing capacity of Waste Disposal Facilities: (TPD) 2 Tone/day 4.5 10 ton/day 0 0 0
Planned Capacity of Waste Processing Facilities
(TPD) 9 TPD 10 0 0 0 0
Planned Capacity of Waste Disposal Facilities (TPD) 100 tone 10 0 0 0 0
Timeframe for installation of planned capacity of
Waste Processing Facilities: (Months) 3 months 1 0 0 0 0
Annexure.1
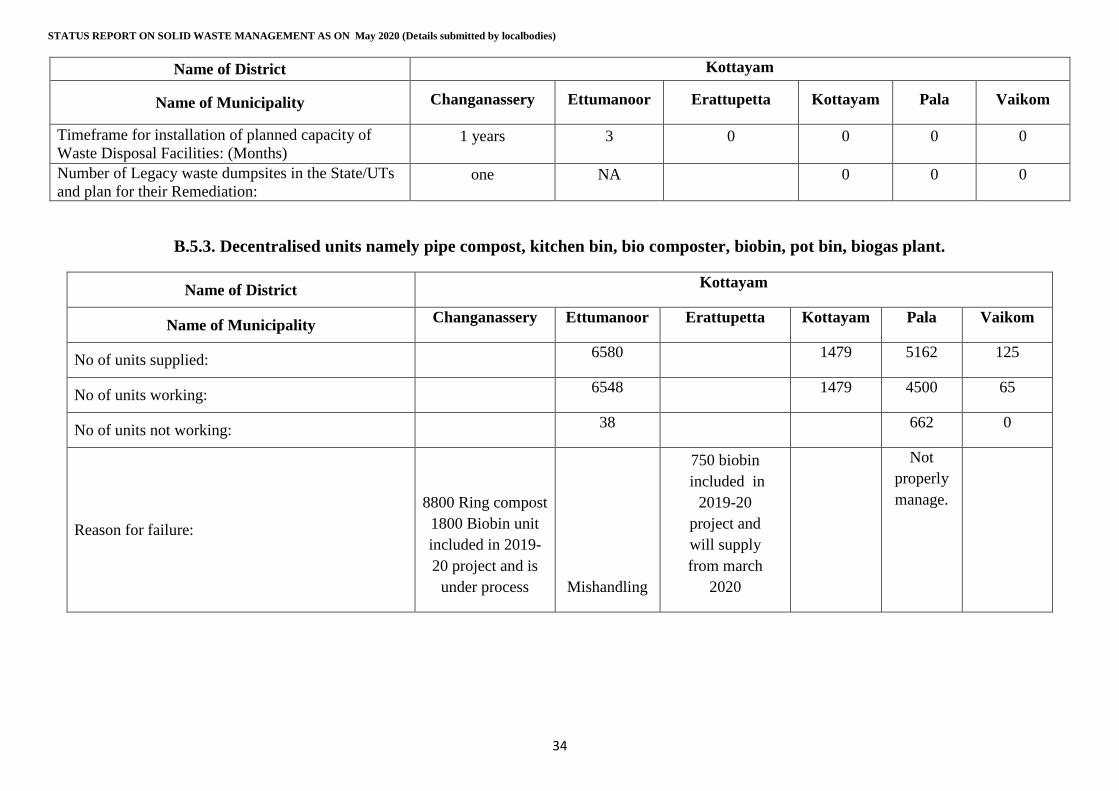
STATUS REPORT ON SOLID WASTE MANAGEMENT AS ON May 2020 (Details submitted by localbodies)
34
Name of District Kottayam
Name of Municipality Changanassery Ettumanoor Erattupetta Kottayam Pala Vaikom
Timeframe for installation of planned capacity of
Waste Disposal Facilities: (Months) 1 years 3 0 0 0 0
Number of Legacy waste dumpsites in the State/UTs
and plan for their Remediation: one NA 0 0 0
B.5.3. Decentralised units namely pipe compost, kitchen bin, bio composter, biobin, pot bin, biogas plant.
Name of District Kottayam
Name of Municipality Changanassery Ettumanoor Erattupetta Kottayam Pala Vaikom
No of units supplied: 6580 1479 5162 125
No of units working: 6548 1479 4500 65
No of units not working: 38 662 0
Reason for failure:
8800 Ring compost
1800 Biobin unit
included in 2019-
20 project and is
under process Mishandling
750 biobin
included in
2019-20
project and
will supply
from march
2020
Not
properly
manage.
Annexure.1
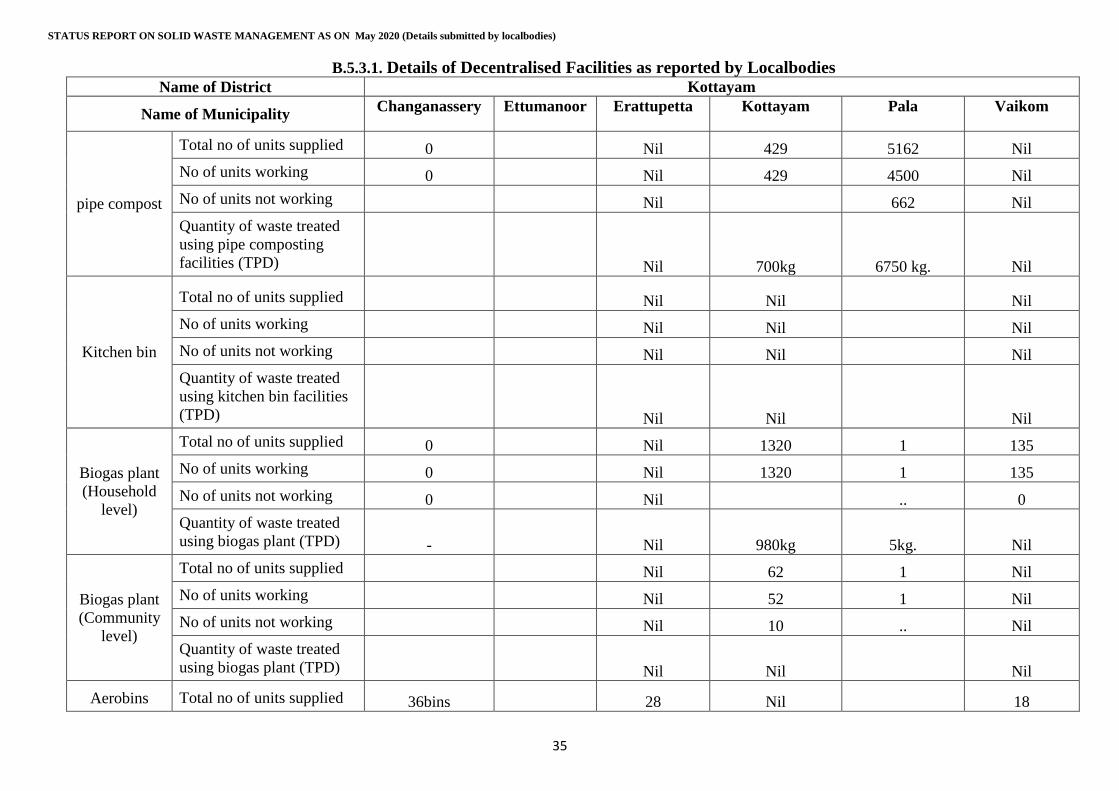
STATUS REPORT ON SOLID WASTE MANAGEMENT AS ON May 2020 (Details submitted by localbodies)
35
B.5.3.1. Details of Decentralised Facilities as reported by Localbodies Name of District Kottayam
Name of Municipality Changanassery Ettumanoor Erattupetta Kottayam Pala Vaikom
pipe compost
Total no of units supplied 0 Nil 429 5162 Nil
No of units working 0 Nil 429 4500 Nil
No of units not working
Nil
662 Nil
Quantity of waste treated
using pipe composting
facilities (TPD)
Nil 700kg 6750 kg. Nil
Kitchen bin
Total no of units supplied
Nil Nil
Nil
No of units working
Nil Nil
Nil
No of units not working
Nil Nil
Nil
Quantity of waste treated
using kitchen bin facilities
(TPD)
Nil Nil
Nil
Biogas plant
(Household
level)
Total no of units supplied 0 Nil 1320 1 135
No of units working 0 Nil 1320 1 135
No of units not working 0 Nil
.. 0
Quantity of waste treated
using biogas plant (TPD) - Nil 980kg 5kg. Nil
Biogas plant
(Community
level)
Total no of units supplied
Nil 62 1 Nil
No of units working
Nil 52 1 Nil
No of units not working
Nil 10 .. Nil
Quantity of waste treated
using biogas plant (TPD)
Nil Nil
Nil
Aerobins Total no of units supplied 36bins 28 Nil
18
Annexure.1
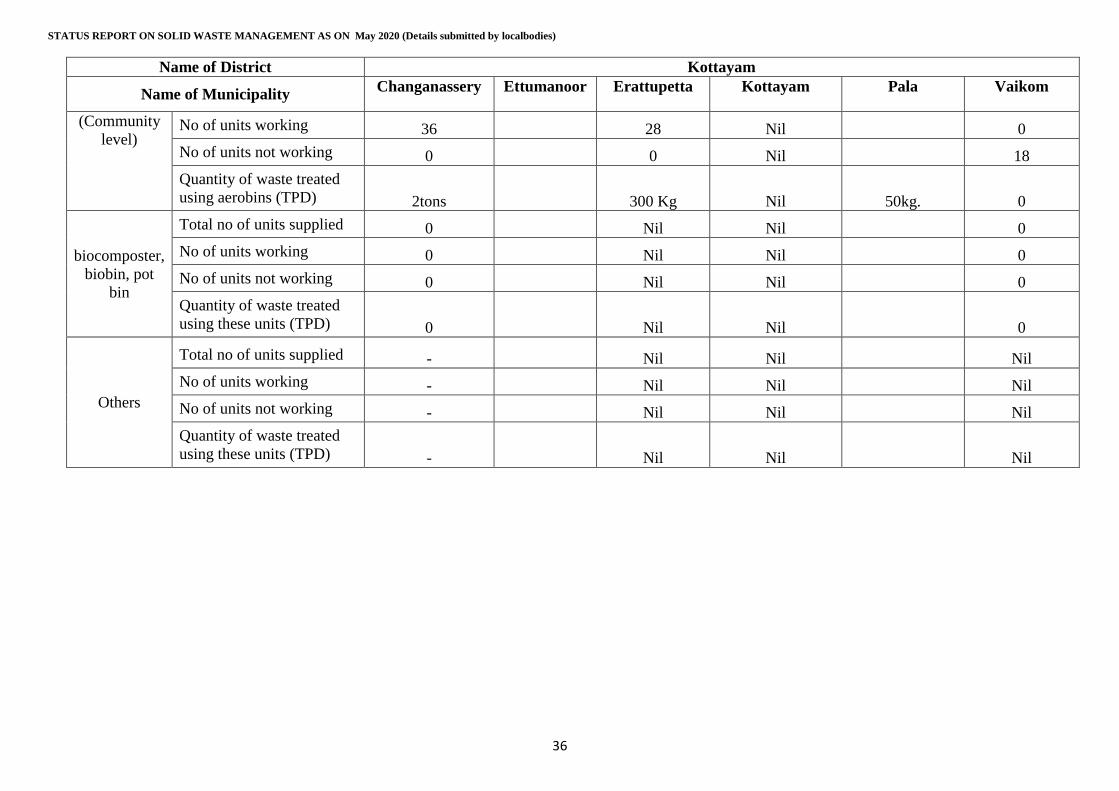
STATUS REPORT ON SOLID WASTE MANAGEMENT AS ON May 2020 (Details submitted by localbodies)
36
Name of District Kottayam
Name of Municipality Changanassery Ettumanoor Erattupetta Kottayam Pala Vaikom
(Community
level) No of units working 36 28 Nil
0
No of units not working 0 0 Nil
18
Quantity of waste treated
using aerobins (TPD) 2tons 300 Kg Nil 50kg. 0
biocomposter,
biobin, pot
bin
Total no of units supplied 0 Nil Nil
0
No of units working 0 Nil Nil
0
No of units not working 0 Nil Nil
0
Quantity of waste treated
using these units (TPD) 0 Nil Nil
0
Others
Total no of units supplied - Nil Nil
Nil
No of units working - Nil Nil
Nil
No of units not working - Nil Nil
Nil
Quantity of waste treated
using these units (TPD) - Nil Nil
Nil
Annexure.1
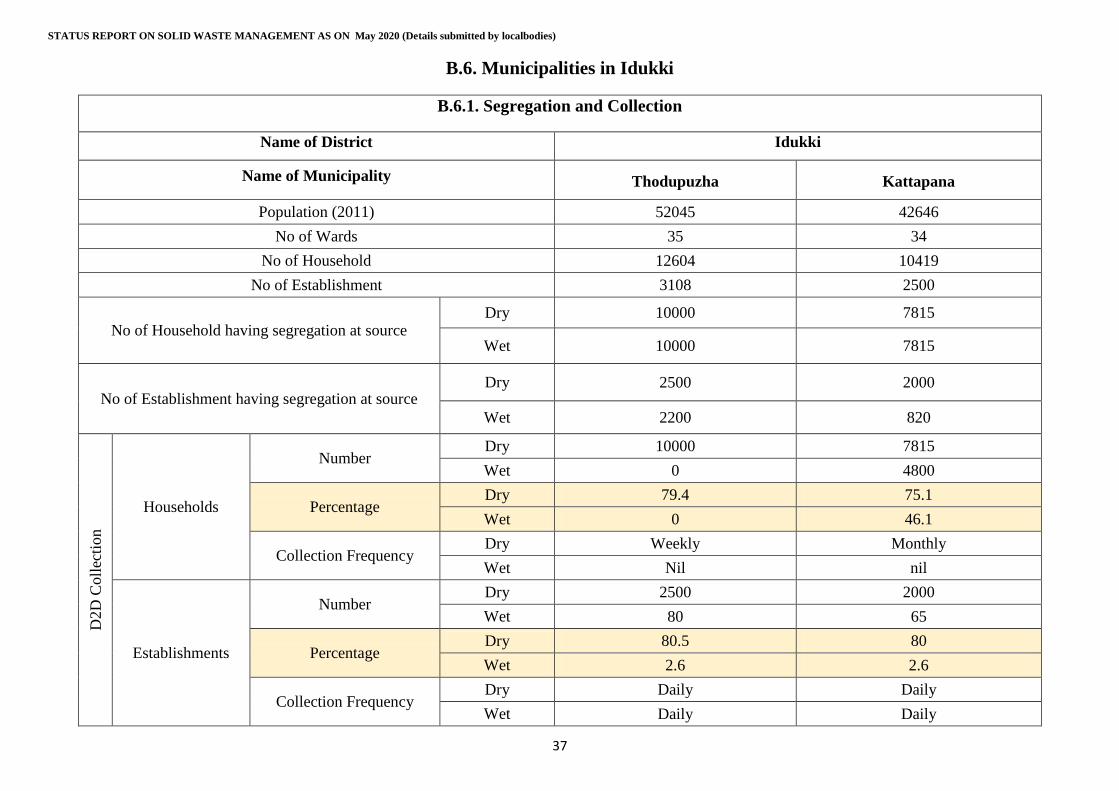
STATUS REPORT ON SOLID WASTE MANAGEMENT AS ON May 2020 (Details submitted by localbodies)
37
B.6. Municipalities in Idukki
B.6.1. Segregation and Collection
Name of District Idukki
Name of Municipality Thodupuzha Kattapana
Population (2011) 52045 42646
No of Wards 35 34
No of Household 12604 10419
No of Establishment 3108 2500
No of Household having segregation at source Dry 10000 7815
Wet 10000 7815
No of Establishment having segregation at source Dry 2500 2000
Wet 2200 820
D2D
Coll
ecti
on
Households
Number Dry 10000 7815
Wet 0 4800
Percentage Dry 79.4 75.1
Wet 0 46.1
Collection Frequency Dry Weekly Monthly
Wet Nil nil
Establishments
Number Dry 2500 2000
Wet 80 65
Percentage Dry 80.5 80
Wet 2.6 2.6
Collection Frequency Dry Daily Daily
Wet Daily Daily
Annexure.1
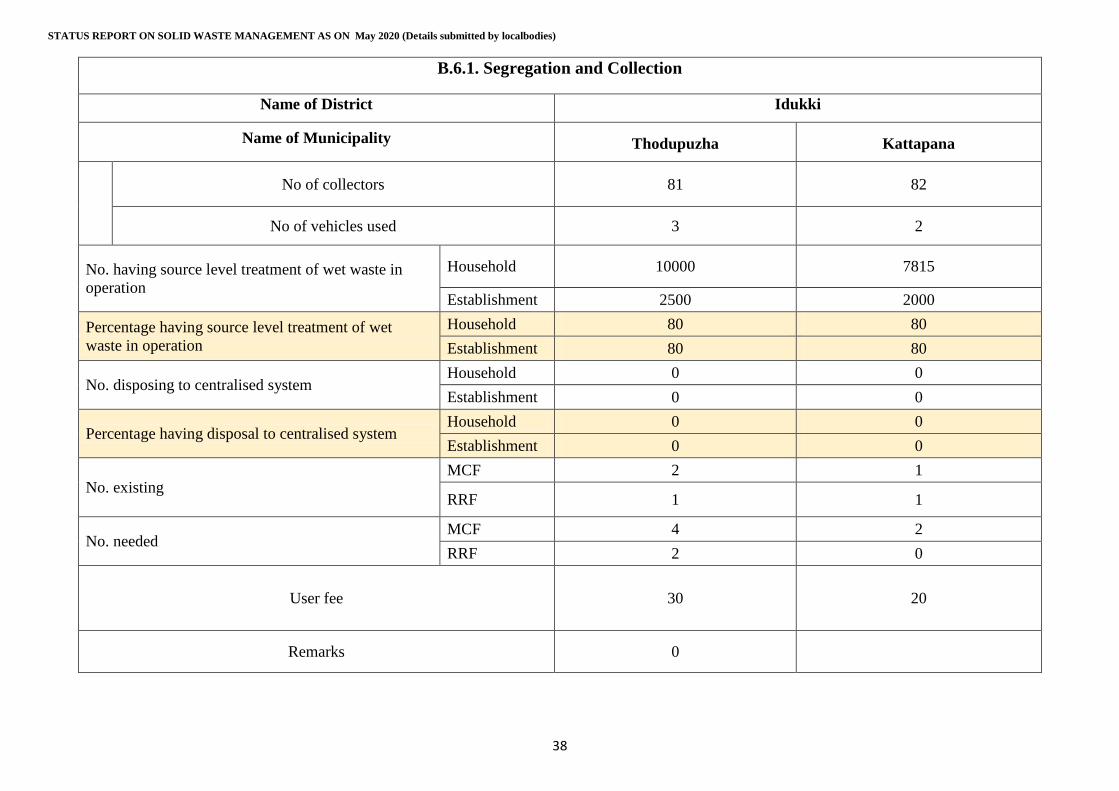
STATUS REPORT ON SOLID WASTE MANAGEMENT AS ON May 2020 (Details submitted by localbodies)
38
B.6.1. Segregation and Collection
Name of District Idukki
Name of Municipality Thodupuzha Kattapana
No of collectors 81 82
No of vehicles used 3 2
No. having source level treatment of wet waste in
operation
Household 10000 7815
Establishment 2500 2000
Percentage having source level treatment of wet
waste in operation
Household 80 80
Establishment 80 80
No. disposing to centralised system Household 0 0
Establishment 0 0
Percentage having disposal to centralised system Household 0 0
Establishment 0 0
No. existing MCF 2 1
RRF 1 1
No. needed MCF 4 2
RRF 2 0
User fee 30 20
Remarks 0
Annexure.1
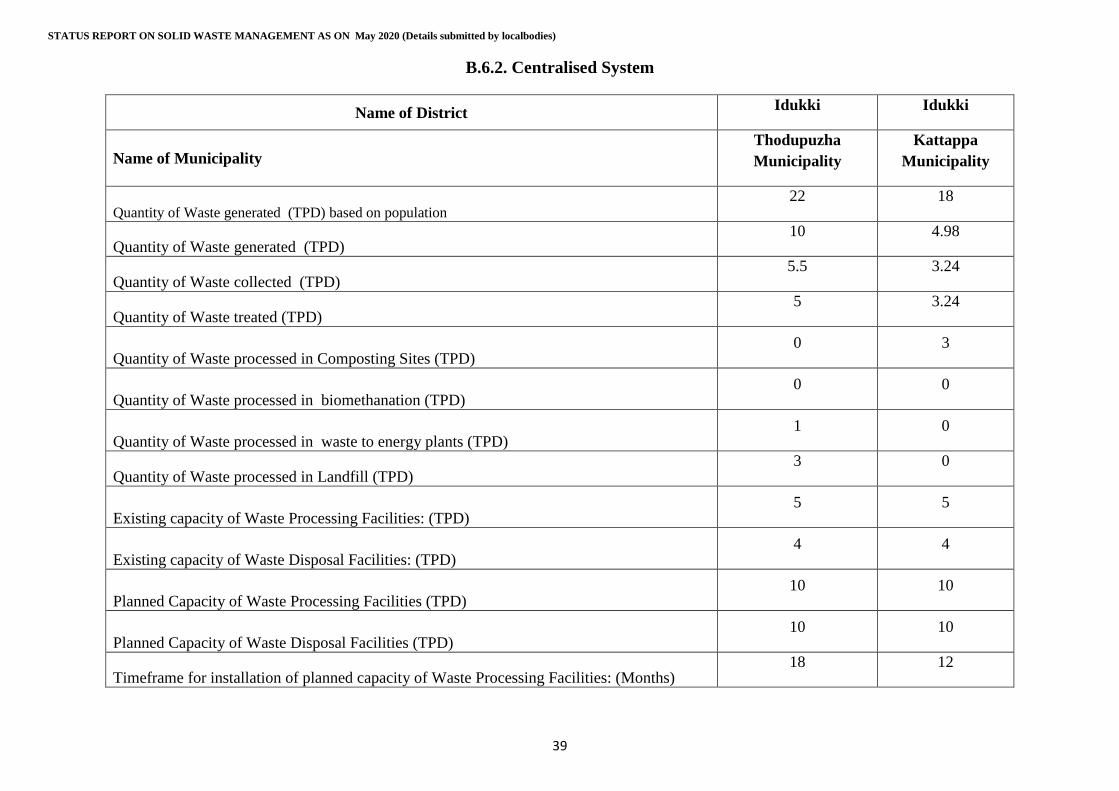
STATUS REPORT ON SOLID WASTE MANAGEMENT AS ON May 2020 (Details submitted by localbodies)
39
B.6.2. Centralised System
Name of District Idukki Idukki
Name of Municipality
Thodupuzha
Municipality
Kattappa
Municipality
Quantity of Waste generated (TPD) based on population 22 18
Quantity of Waste generated (TPD) 10 4.98
Quantity of Waste collected (TPD) 5.5 3.24
Quantity of Waste treated (TPD) 5 3.24
Quantity of Waste processed in Composting Sites (TPD) 0 3
Quantity of Waste processed in biomethanation (TPD) 0 0
Quantity of Waste processed in waste to energy plants (TPD) 1 0
Quantity of Waste processed in Landfill (TPD) 3 0
Existing capacity of Waste Processing Facilities: (TPD) 5 5
Existing capacity of Waste Disposal Facilities: (TPD) 4 4
Planned Capacity of Waste Processing Facilities (TPD) 10 10
Planned Capacity of Waste Disposal Facilities (TPD) 10 10
Timeframe for installation of planned capacity of Waste Processing Facilities: (Months) 18 12
Annexure.1
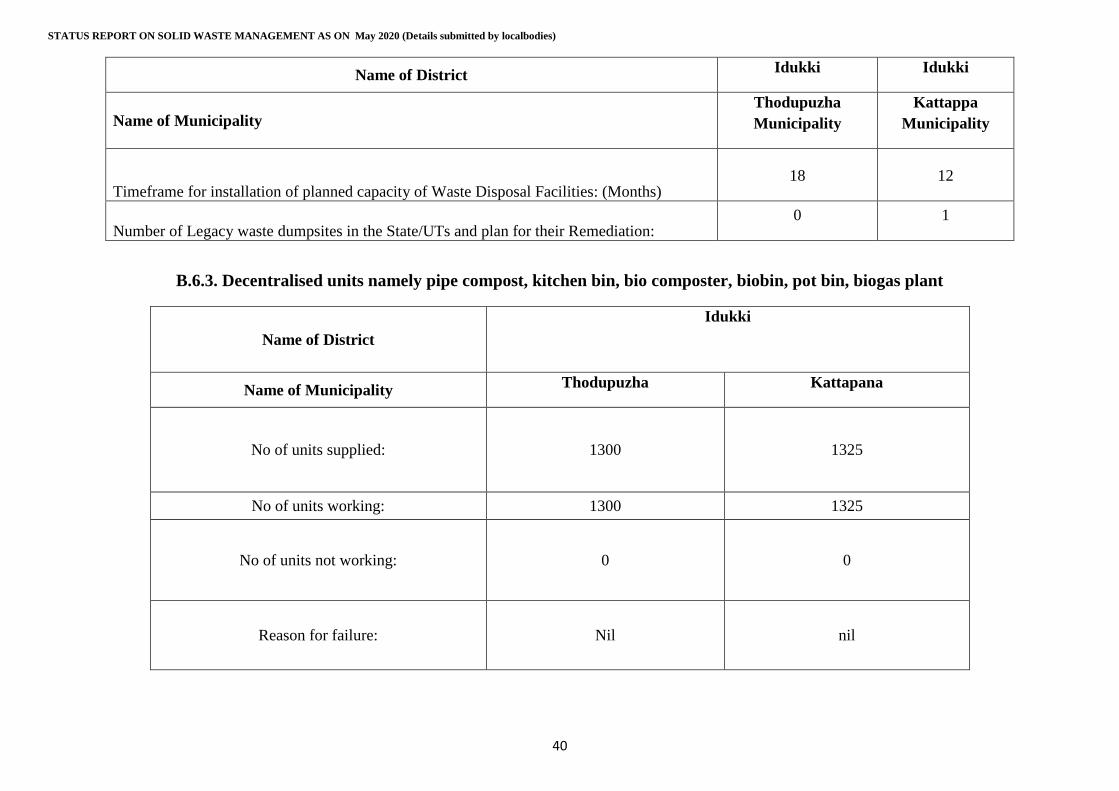
STATUS REPORT ON SOLID WASTE MANAGEMENT AS ON May 2020 (Details submitted by localbodies)
40
Name of District Idukki Idukki
Name of Municipality
Thodupuzha
Municipality
Kattappa
Municipality
Timeframe for installation of planned capacity of Waste Disposal Facilities: (Months) 18 12
Number of Legacy waste dumpsites in the State/UTs and plan for their Remediation: 0 1
B.6.3. Decentralised units namely pipe compost, kitchen bin, bio composter, biobin, pot bin, biogas plant
Name of District
Idukki
Name of Municipality Thodupuzha Kattapana
No of units supplied: 1300 1325
No of units working: 1300 1325
No of units not working: 0 0
Reason for failure: Nil nil
Annexure.1

STATUS REPORT ON SOLID WASTE MANAGEMENT AS ON May 2020 (Details submitted by localbodies)
41
B.6.3.1. Details of Decentralised Facilities as reported by Localbodies
Name of District Idukki
Name of Municipality Thodupuzha Thodupuzha
pipe compost
Total no of units supplied 69
No of units working 69
No of units not working Nil
Quantity of waste treated using pipe composting
facilities (TPD) 10 k g
Kitchen bin
Total no of units supplied 69
No of units working Nil
No of units not working Nil
Quantity of waste treated using kitchen bin facilities
(TPD) Nil
Biogas plant (Household
level)
Total no of units supplied 928
No of units working 928
No of units not working nil
Quantity of waste treated using biogas plant (TPD) 500 kg
Biogas plant (Community
level)
Total no of units supplied 2
No of units working 2
No of units not working nil
Quantity of waste treated using biogas plant (TPD) 1000 k g
Annexure.1
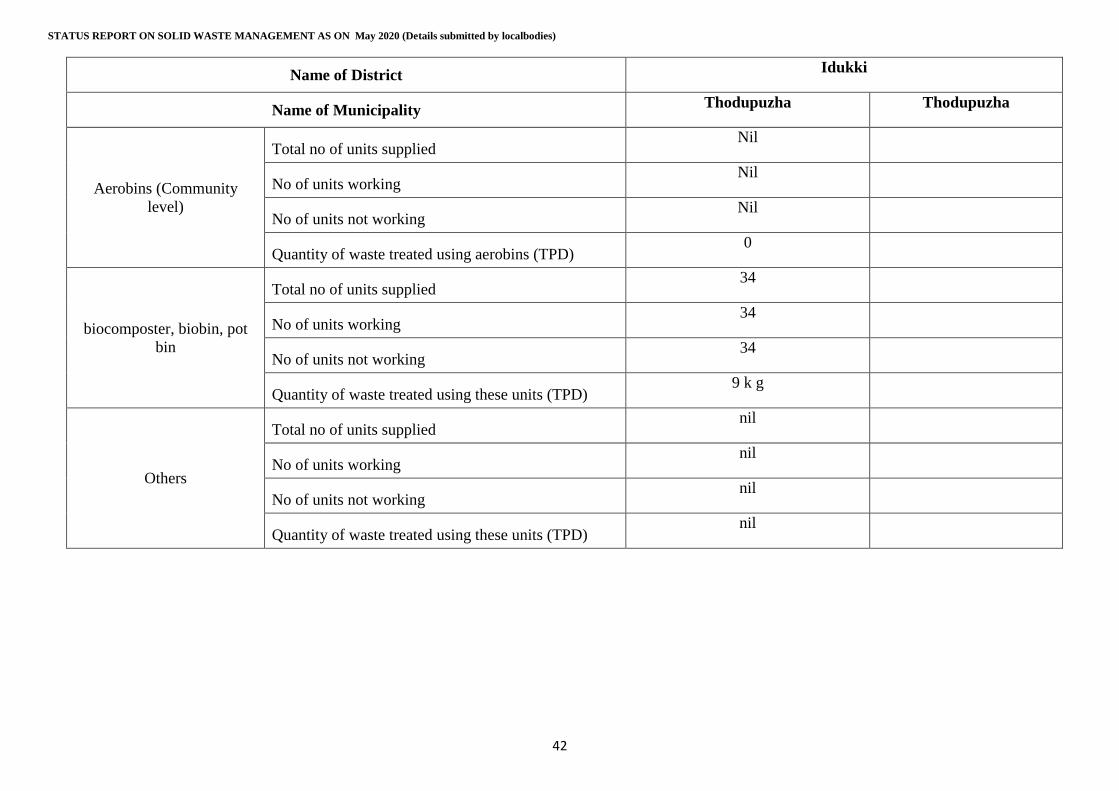
STATUS REPORT ON SOLID WASTE MANAGEMENT AS ON May 2020 (Details submitted by localbodies)
42
Name of District Idukki
Name of Municipality Thodupuzha Thodupuzha
Aerobins (Community
level)
Total no of units supplied Nil
No of units working Nil
No of units not working Nil
Quantity of waste treated using aerobins (TPD) 0
biocomposter, biobin, pot
bin
Total no of units supplied 34
No of units working 34
No of units not working 34
Quantity of waste treated using these units (TPD) 9 k g
Others
Total no of units supplied nil
No of units working nil
No of units not working nil
Quantity of waste treated using these units (TPD) nil
Annexure.1
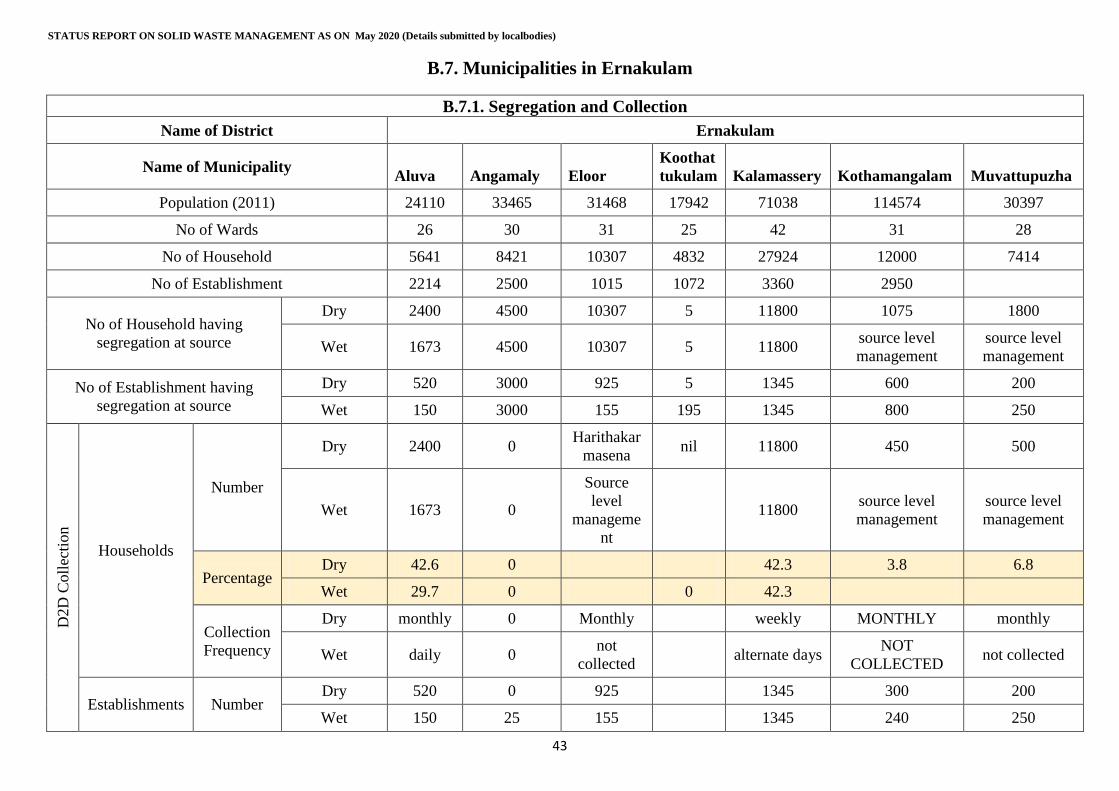
STATUS REPORT ON SOLID WASTE MANAGEMENT AS ON May 2020 (Details submitted by localbodies)
43
B.7. Municipalities in Ernakulam
B.7.1. Segregation and Collection
Name of District Ernakulam
Name of Municipality Aluva Angamaly Eloor
Koothat
tukulam Kalamassery Kothamangalam Muvattupuzha
Population (2011) 24110 33465 31468 17942 71038 114574 30397
No of Wards 26 30 31 25 42 31 28
No of Household 5641 8421 10307 4832 27924 12000 7414
No of Establishment 2214 2500 1015 1072 3360 2950
No of Household having
segregation at source
Dry 2400 4500 10307 5 11800 1075 1800
Wet 1673 4500 10307 5 11800 source level
management
source level
management
No of Establishment having
segregation at source
Dry 520 3000 925 5 1345 600 200
Wet 150 3000 155 195 1345 800 250
D2D
Coll
ecti
on
Households
Number
Dry 2400 0 Harithakar
masena nil 11800 450 500
Wet 1673 0
Source
level
manageme
nt
11800 source level
management
source level
management
Percentage Dry 42.6 0 42.3 3.8 6.8
Wet 29.7 0 0 42.3
Collection
Frequency
Dry monthly 0 Monthly weekly MONTHLY monthly
Wet daily 0 not
collected alternate days
NOT
COLLECTED not collected
Establishments Number Dry 520 0 925 1345 300 200
Wet 150 25 155 1345 240 250
Annexure.1
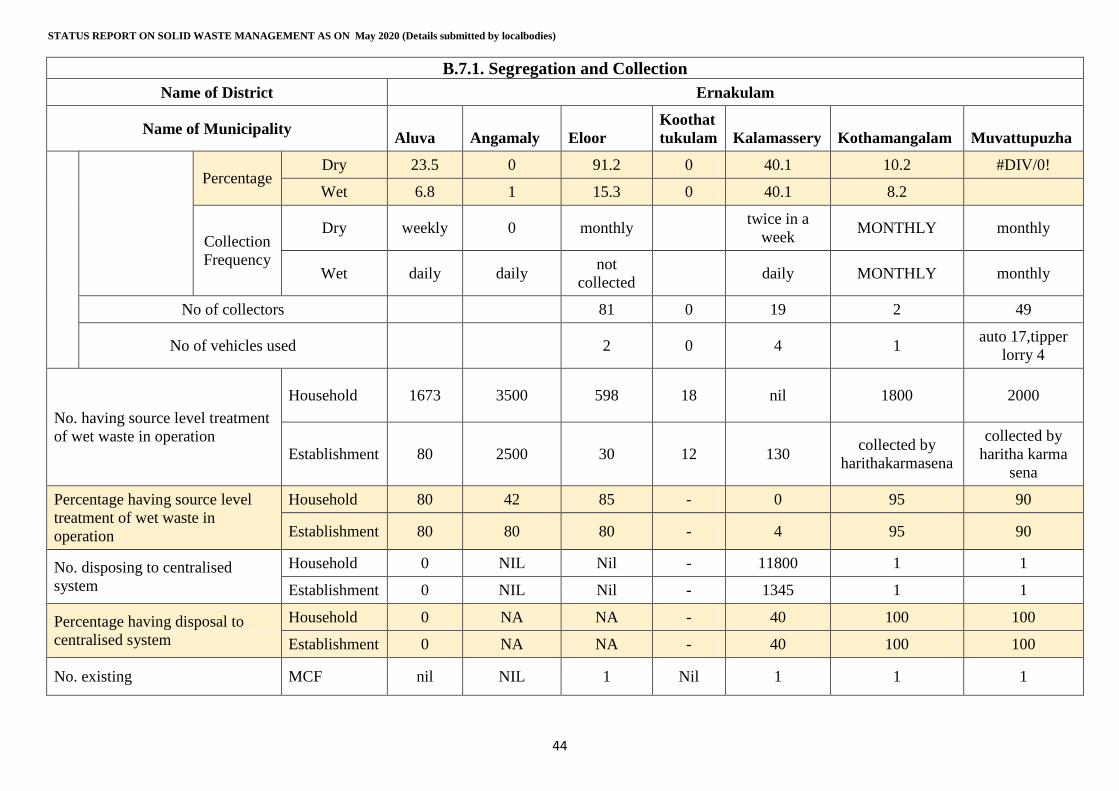
STATUS REPORT ON SOLID WASTE MANAGEMENT AS ON May 2020 (Details submitted by localbodies)
44
B.7.1. Segregation and Collection
Name of District Ernakulam
Name of Municipality Aluva Angamaly Eloor
Koothat
tukulam Kalamassery Kothamangalam Muvattupuzha
Percentage Dry 23.5 0 91.2 0 40.1 10.2 #DIV/0!
Wet 6.8 1 15.3 0 40.1 8.2
Collection
Frequency
Dry weekly 0 monthly twice in a
week MONTHLY monthly
Wet daily daily not
collected daily MONTHLY monthly
No of collectors
81 0 19 2 49
No of vehicles used
2 0 4 1 auto 17,tipper
lorry 4
No. having source level treatment
of wet waste in operation
Household 1673 3500 598 18 nil 1800 2000
Establishment 80 2500 30 12 130 collected by
harithakarmasena
collected by
haritha karma
sena
Percentage having source level
treatment of wet waste in
operation
Household 80 42 85 - 0 95 90
Establishment 80 80 80 - 4 95 90
No. disposing to centralised
system
Household 0 NIL Nil - 11800 1 1
Establishment 0 NIL Nil - 1345 1 1
Percentage having disposal to
centralised system
Household 0 NA NA - 40 100 100
Establishment 0 NA NA - 40 100 100
No. existing MCF nil NIL 1 Nil 1 1 1
Annexure.1
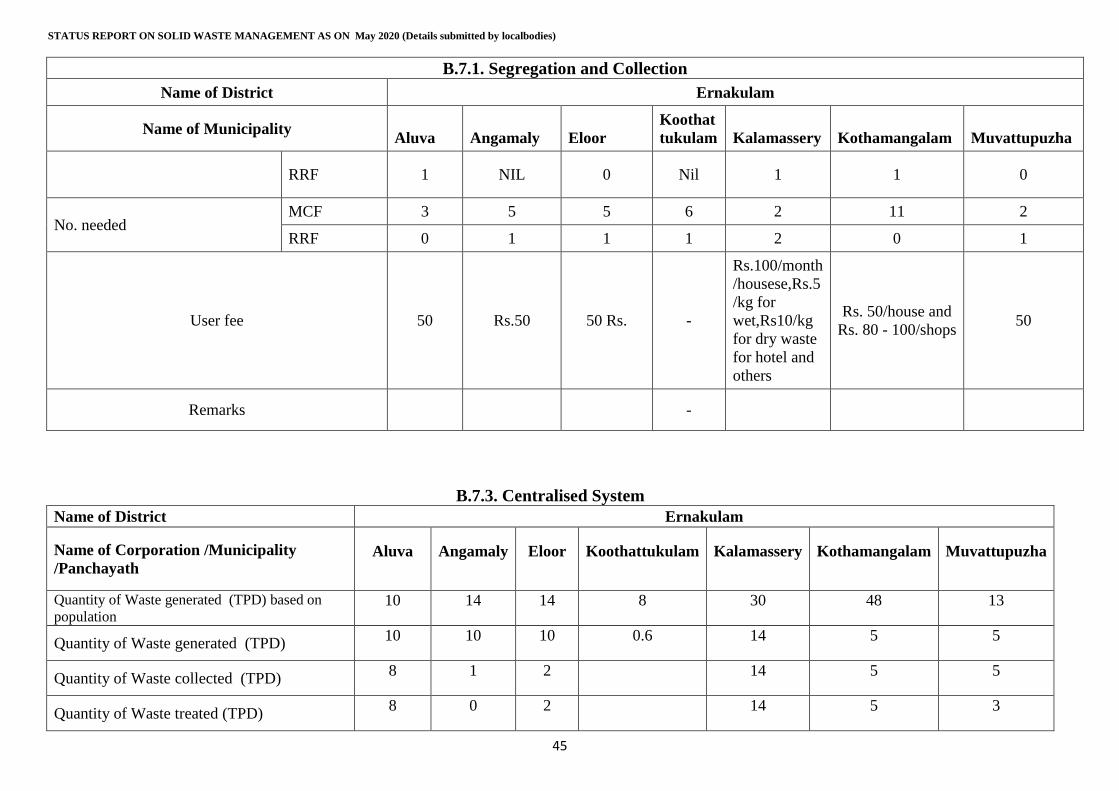
STATUS REPORT ON SOLID WASTE MANAGEMENT AS ON May 2020 (Details submitted by localbodies)
45
B.7.1. Segregation and Collection
Name of District Ernakulam
Name of Municipality Aluva Angamaly Eloor
Koothat
tukulam Kalamassery Kothamangalam Muvattupuzha
RRF 1 NIL 0 Nil 1 1 0
No. needed MCF 3 5 5 6 2 11 2
RRF 0 1 1 1 2 0 1
User fee 50 Rs.50 50 Rs. -
Rs.100/month
/housese,Rs.5
/kg for
wet,Rs10/kg
for dry waste
for hotel and
others
Rs. 50/house and
Rs. 80 - 100/shops 50
Remarks
-
B.7.3. Centralised System
Name of District Ernakulam
Name of Corporation /Municipality
/Panchayath Aluva Angamaly Eloor Koothattukulam Kalamassery Kothamangalam Muvattupuzha
Quantity of Waste generated (TPD) based on
population 10 14 14 8 30 48 13
Quantity of Waste generated (TPD) 10 10 10 0.6 14 5 5
Quantity of Waste collected (TPD) 8 1 2 14 5 5
Quantity of Waste treated (TPD) 8 0 2 14 5 3
Annexure.1
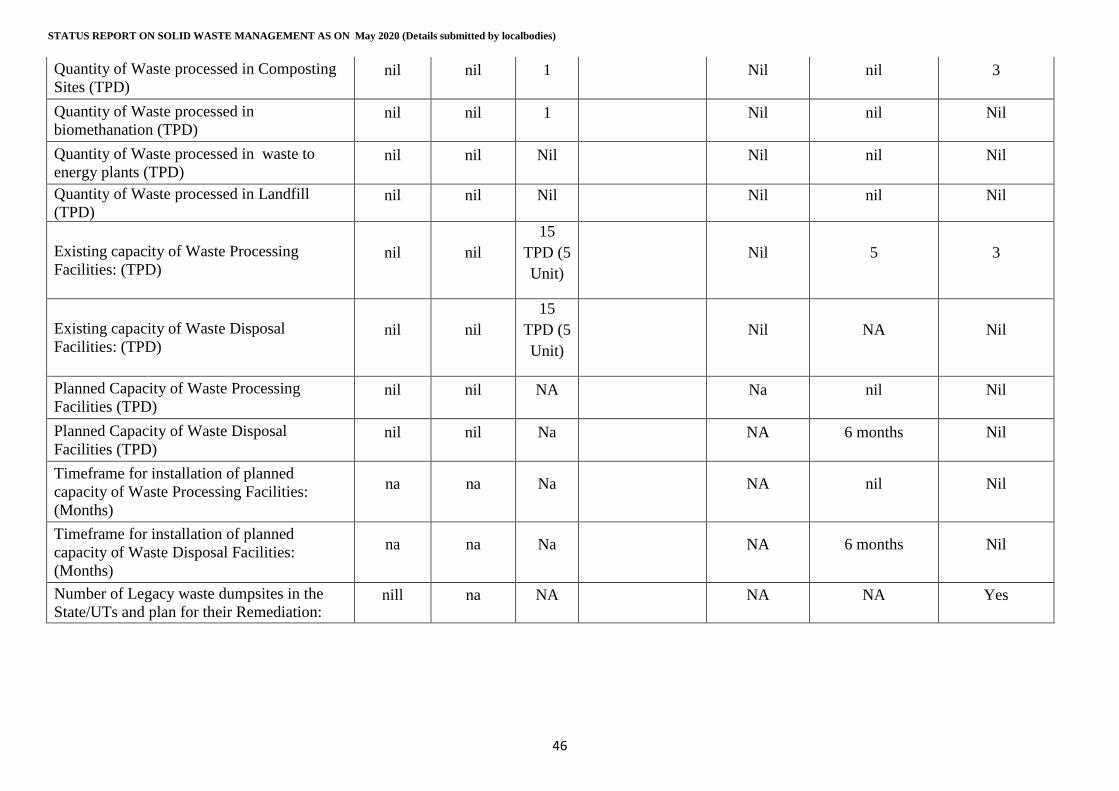
STATUS REPORT ON SOLID WASTE MANAGEMENT AS ON May 2020 (Details submitted by localbodies)
46
Quantity of Waste processed in Composting
Sites (TPD) nil nil 1 Nil nil 3
Quantity of Waste processed in
biomethanation (TPD) nil nil 1 Nil nil Nil
Quantity of Waste processed in waste to
energy plants (TPD) nil nil Nil Nil nil Nil
Quantity of Waste processed in Landfill
(TPD) nil nil Nil Nil nil Nil
Existing capacity of Waste Processing
Facilities: (TPD) nil nil
15
TPD (5
Unit)
Nil 5 3
Existing capacity of Waste Disposal
Facilities: (TPD) nil nil
15
TPD (5
Unit)
Nil NA Nil
Planned Capacity of Waste Processing
Facilities (TPD) nil nil NA Na nil Nil
Planned Capacity of Waste Disposal
Facilities (TPD) nil nil Na NA 6 months Nil
Timeframe for installation of planned
capacity of Waste Processing Facilities:
(Months)
na na Na NA nil Nil
Timeframe for installation of planned
capacity of Waste Disposal Facilities:
(Months)
na na Na NA 6 months Nil
Number of Legacy waste dumpsites in the
State/UTs and plan for their Remediation: nill na NA NA NA Yes
Annexure.1
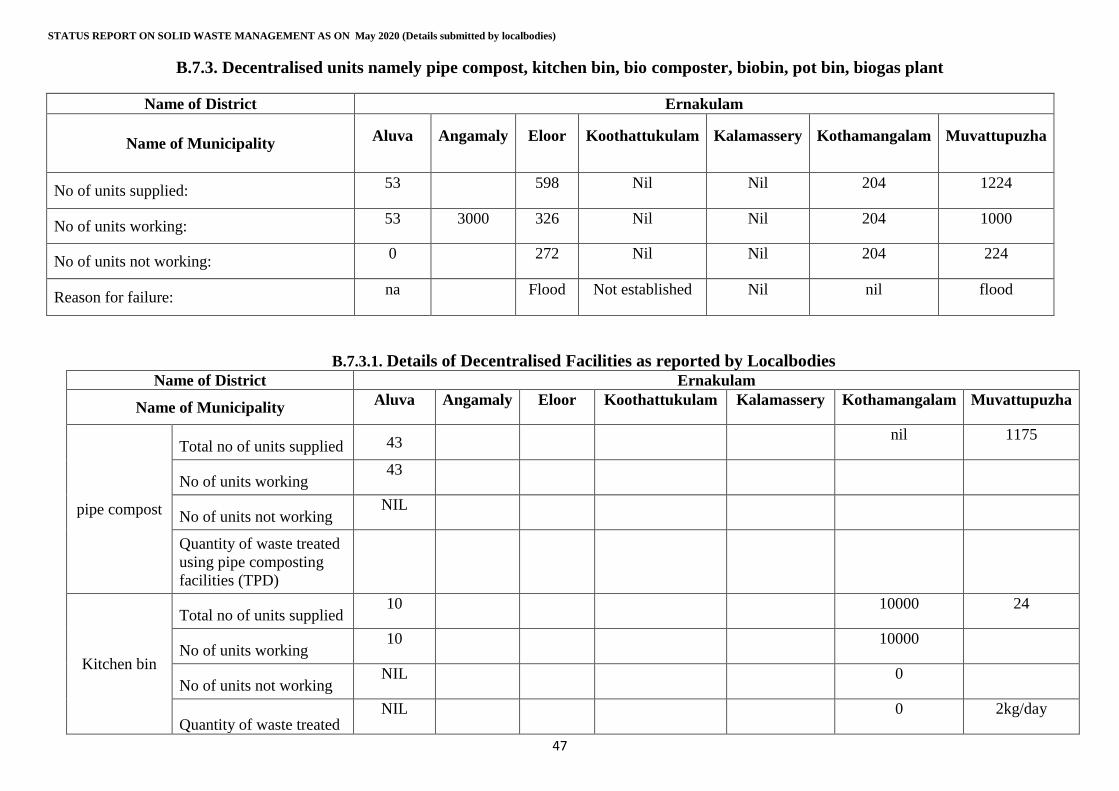
STATUS REPORT ON SOLID WASTE MANAGEMENT AS ON May 2020 (Details submitted by localbodies)
47
B.7.3. Decentralised units namely pipe compost, kitchen bin, bio composter, biobin, pot bin, biogas plant
Name of District Ernakulam
Name of Municipality Aluva Angamaly Eloor Koothattukulam Kalamassery Kothamangalam Muvattupuzha
No of units supplied: 53 598 Nil Nil 204 1224
No of units working: 53 3000 326 Nil Nil 204 1000
No of units not working: 0 272 Nil Nil 204 224
Reason for failure: na Flood Not established Nil nil flood
B.7.3.1. Details of Decentralised Facilities as reported by Localbodies Name of District Ernakulam
Name of Municipality Aluva Angamaly Eloor Koothattukulam Kalamassery Kothamangalam Muvattupuzha
pipe compost
Total no of units supplied 43
nil 1175
No of units working 43
No of units not working NIL
Quantity of waste treated
using pipe composting
facilities (TPD)
Kitchen bin
Total no of units supplied 10
10000 24
No of units working 10
10000
No of units not working NIL
0
Quantity of waste treated NIL
0 2kg/day
Annexure.1
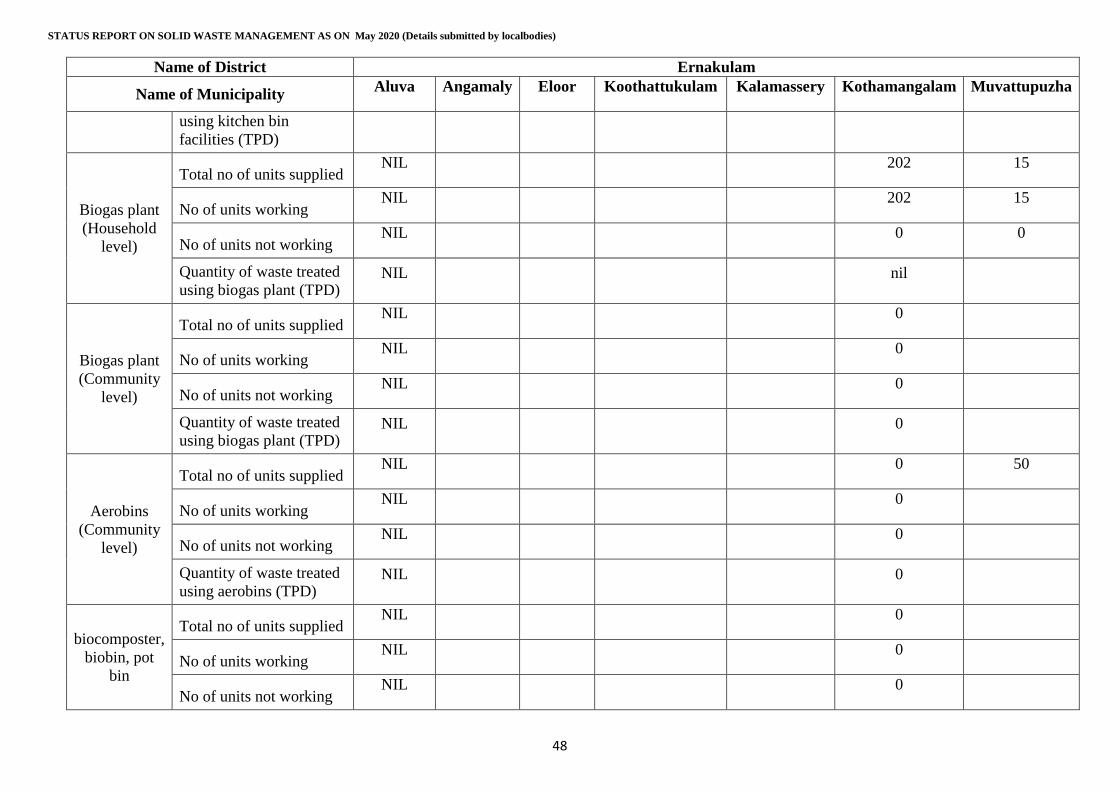
STATUS REPORT ON SOLID WASTE MANAGEMENT AS ON May 2020 (Details submitted by localbodies)
48
Name of District Ernakulam
Name of Municipality Aluva Angamaly Eloor Koothattukulam Kalamassery Kothamangalam Muvattupuzha
using kitchen bin
facilities (TPD)
Biogas plant
(Household
level)
Total no of units supplied NIL
202 15
No of units working NIL
202 15
No of units not working NIL
0 0
Quantity of waste treated
using biogas plant (TPD) NIL
nil
Biogas plant
(Community
level)
Total no of units supplied NIL
0
No of units working NIL
0
No of units not working NIL
0
Quantity of waste treated
using biogas plant (TPD) NIL
0
Aerobins
(Community
level)
Total no of units supplied NIL
0 50
No of units working NIL
0
No of units not working NIL
0
Quantity of waste treated
using aerobins (TPD) NIL
0
biocomposter,
biobin, pot
bin
Total no of units supplied NIL
0
No of units working NIL
0
No of units not working NIL
0
Annexure.1
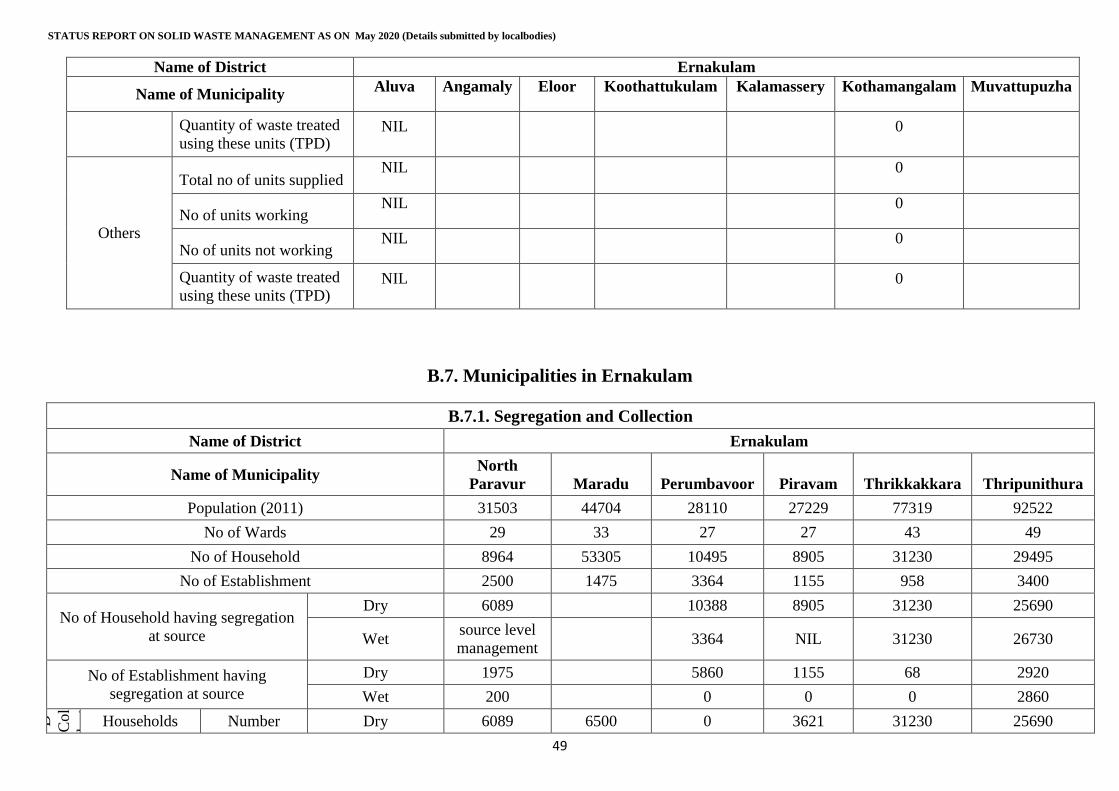
STATUS REPORT ON SOLID WASTE MANAGEMENT AS ON May 2020 (Details submitted by localbodies)
49
Name of District Ernakulam
Name of Municipality Aluva Angamaly Eloor Koothattukulam Kalamassery Kothamangalam Muvattupuzha
Quantity of waste treated
using these units (TPD) NIL
0
Others
Total no of units supplied NIL
0
No of units working NIL
0
No of units not working NIL
0
Quantity of waste treated
using these units (TPD) NIL
0
B.7. Municipalities in Ernakulam
B.7.1. Segregation and Collection
Name of District Ernakulam
Name of Municipality North
Paravur Maradu Perumbavoor Piravam Thrikkakkara Thripunithura
Population (2011) 31503 44704 28110 27229 77319 92522
No of Wards 29 33 27 27 43 49
No of Household 8964 53305 10495 8905 31230 29495
No of Establishment 2500 1475 3364 1155 958 3400
No of Household having segregation
at source
Dry 6089 10388 8905 31230 25690
Wet source level
management 3364 NIL 31230 26730
No of Establishment having
segregation at source
Dry 1975 5860 1155 68 2920
Wet 200 0 0 0 2860
D2
D
Col
lect
ion
Households Number Dry 6089 6500 0 3621 31230 25690
Annexure.1
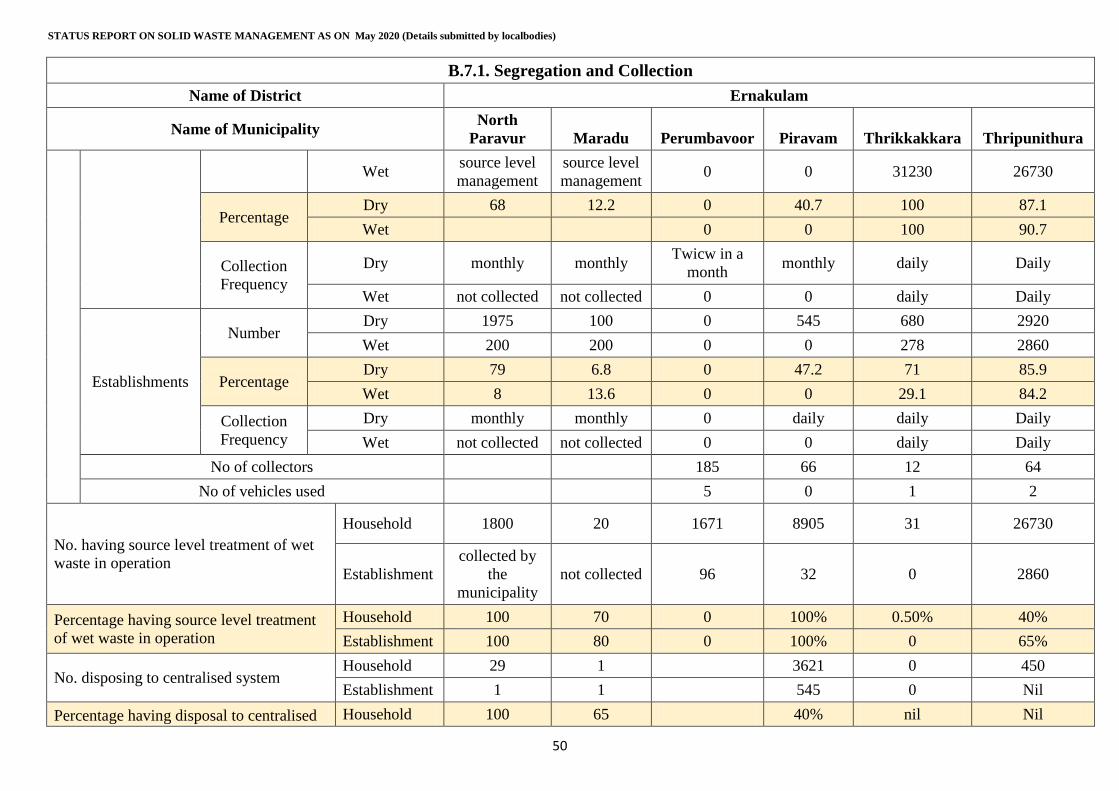
STATUS REPORT ON SOLID WASTE MANAGEMENT AS ON May 2020 (Details submitted by localbodies)
50
B.7.1. Segregation and Collection
Name of District Ernakulam
Name of Municipality North
Paravur Maradu Perumbavoor Piravam Thrikkakkara Thripunithura
Wet source level
management
source level
management 0 0 31230 26730
Percentage Dry 68 12.2 0 40.7 100 87.1
Wet
0 0 100 90.7
Collection
Frequency
Dry monthly monthly Twicw in a
month monthly daily Daily
Wet not collected not collected 0 0 daily Daily
Establishments
Number Dry 1975 100 0 545 680 2920
Wet 200 200 0 0 278 2860
Percentage Dry 79 6.8 0 47.2 71 85.9
Wet 8 13.6 0 0 29.1 84.2
Collection
Frequency
Dry monthly monthly 0 daily daily Daily
Wet not collected not collected 0 0 daily Daily
No of collectors
185 66 12 64
No of vehicles used
5 0 1 2
No. having source level treatment of wet
waste in operation
Household 1800 20 1671 8905 31 26730
Establishment
collected by
the
municipality
not collected 96 32 0 2860
Percentage having source level treatment
of wet waste in operation
Household 100 70 0 100% 0.50% 40%
Establishment 100 80 0 100% 0 65%
No. disposing to centralised system Household 29 1 3621 0 450
Establishment 1 1 545 0 Nil
Percentage having disposal to centralised Household 100 65 40% nil Nil
Annexure.1
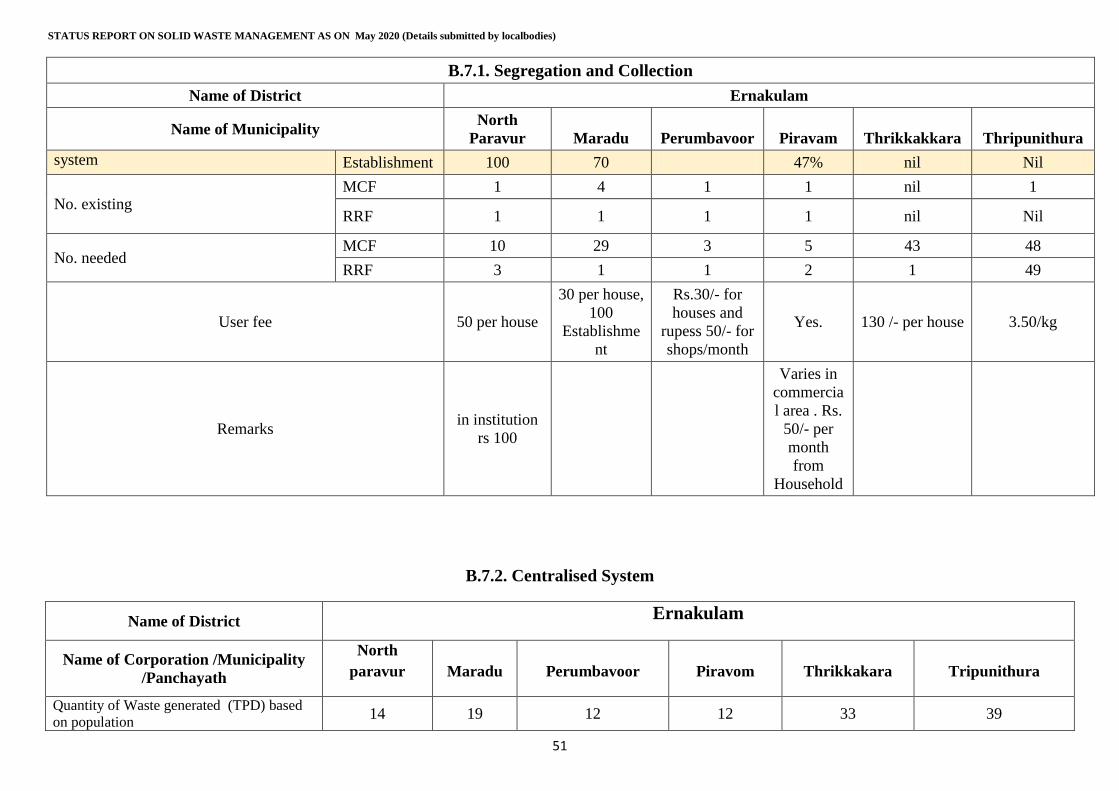
STATUS REPORT ON SOLID WASTE MANAGEMENT AS ON May 2020 (Details submitted by localbodies)
51
B.7.1. Segregation and Collection
Name of District Ernakulam
Name of Municipality North
Paravur Maradu Perumbavoor Piravam Thrikkakkara Thripunithura
system Establishment 100 70 47% nil Nil
No. existing MCF 1 4 1 1 nil 1
RRF 1 1 1 1 nil Nil
No. needed MCF 10 29 3 5 43 48
RRF 3 1 1 2 1 49
User fee 50 per house
30 per house,
100
Establishme
nt
Rs.30/- for
houses and
rupess 50/- for
shops/month
Yes. 130 /- per house 3.50/kg
Remarks in institution
rs 100
Varies in
commercia
l area . Rs.
50/- per
month
from
Household
B.7.2. Centralised System
Name of District Ernakulam
Name of Corporation /Municipality
/Panchayath
North
paravur Maradu Perumbavoor Piravom Thrikkakara Tripunithura
Quantity of Waste generated (TPD) based
on population 14 19 12 12 33 39
Annexure.1
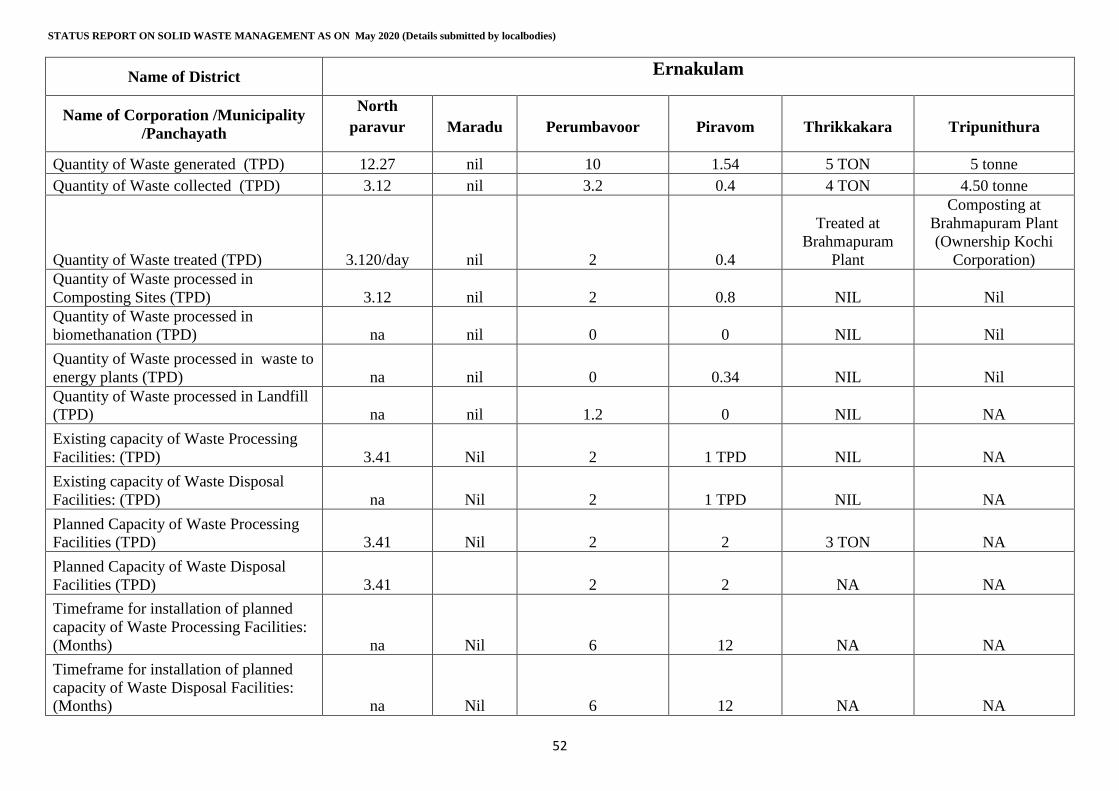
STATUS REPORT ON SOLID WASTE MANAGEMENT AS ON May 2020 (Details submitted by localbodies)
52
Name of District Ernakulam
Name of Corporation /Municipality
/Panchayath
North
paravur Maradu Perumbavoor Piravom Thrikkakara Tripunithura
Quantity of Waste generated (TPD) 12.27 nil 10 1.54 5 TON 5 tonne
Quantity of Waste collected (TPD) 3.12 nil 3.2 0.4 4 TON 4.50 tonne
Quantity of Waste treated (TPD) 3.120/day nil 2 0.4
Treated at
Brahmapuram
Plant
Composting at
Brahmapuram Plant
(Ownership Kochi
Corporation)
Quantity of Waste processed in
Composting Sites (TPD) 3.12 nil 2 0.8 NIL Nil
Quantity of Waste processed in
biomethanation (TPD) na nil 0 0 NIL Nil
Quantity of Waste processed in waste to
energy plants (TPD) na nil 0 0.34 NIL Nil
Quantity of Waste processed in Landfill
(TPD) na nil 1.2 0 NIL NA
Existing capacity of Waste Processing
Facilities: (TPD) 3.41 Nil 2 1 TPD NIL NA
Existing capacity of Waste Disposal
Facilities: (TPD) na Nil 2 1 TPD NIL NA
Planned Capacity of Waste Processing
Facilities (TPD) 3.41 Nil 2 2 3 TON NA
Planned Capacity of Waste Disposal
Facilities (TPD) 3.41 2 2 NA NA
Timeframe for installation of planned
capacity of Waste Processing Facilities:
(Months) na Nil 6 12 NA NA
Timeframe for installation of planned
capacity of Waste Disposal Facilities:
(Months) na Nil 6 12 NA NA
Annexure.1
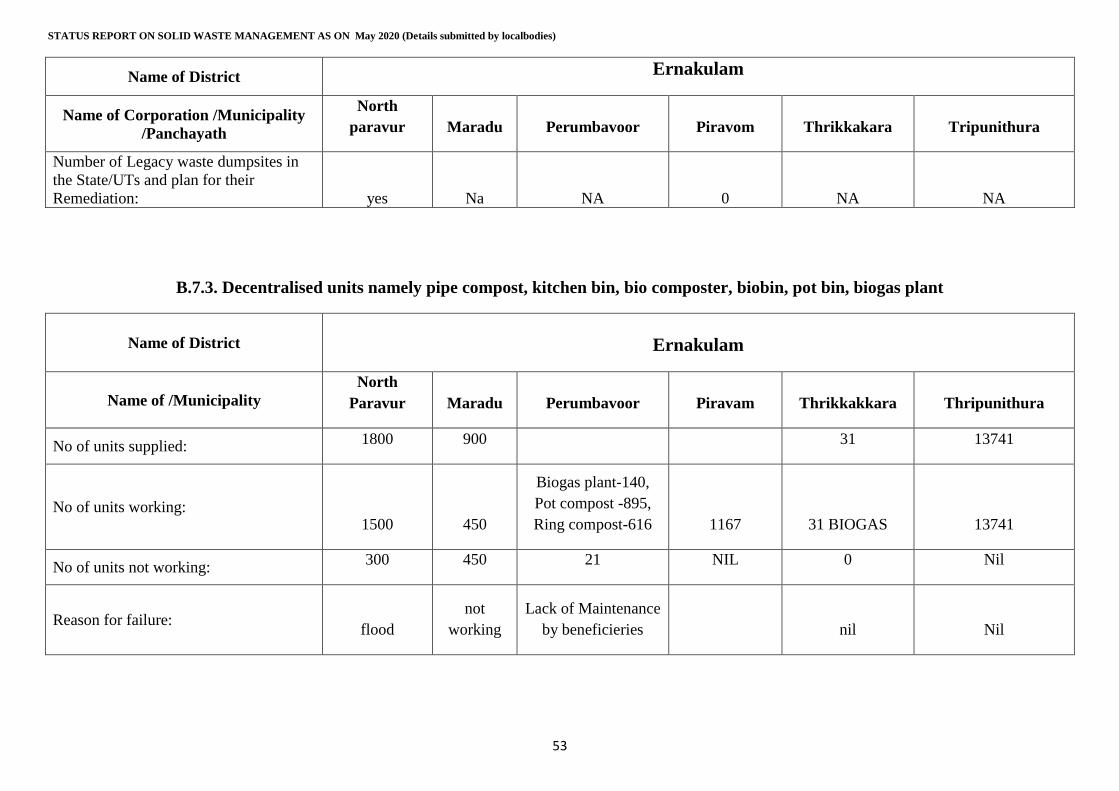
STATUS REPORT ON SOLID WASTE MANAGEMENT AS ON May 2020 (Details submitted by localbodies)
53
Name of District Ernakulam
Name of Corporation /Municipality
/Panchayath
North
paravur Maradu Perumbavoor Piravom Thrikkakara Tripunithura
Number of Legacy waste dumpsites in
the State/UTs and plan for their
Remediation: yes Na NA 0 NA NA
B.7.3. Decentralised units namely pipe compost, kitchen bin, bio composter, biobin, pot bin, biogas plant
Name of District Ernakulam
Name of /Municipality
North
Paravur Maradu Perumbavoor Piravam Thrikkakkara Thripunithura
No of units supplied: 1800 900 31 13741
No of units working: 1500 450
Biogas plant-140,
Pot compost -895,
Ring compost-616 1167 31 BIOGAS 13741
No of units not working: 300 450 21 NIL 0 Nil
Reason for failure: flood
not
working
Lack of Maintenance
by beneficieries nil Nil
Annexure.1
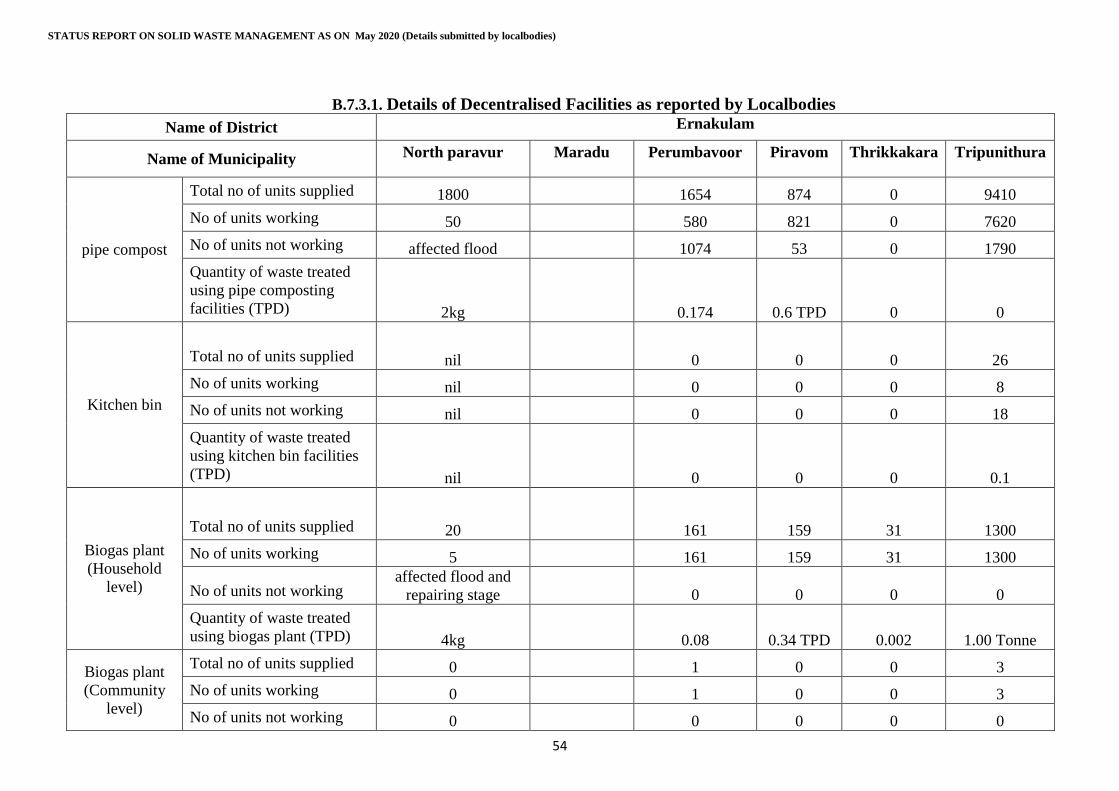
STATUS REPORT ON SOLID WASTE MANAGEMENT AS ON May 2020 (Details submitted by localbodies)
54
B.7.3.1. Details of Decentralised Facilities as reported by Localbodies
Name of District Ernakulam
Name of Municipality North paravur Maradu Perumbavoor Piravom Thrikkakara Tripunithura
pipe compost
Total no of units supplied 1800 1654 874 0 9410
No of units working 50 580 821 0 7620
No of units not working affected flood 1074 53 0 1790
Quantity of waste treated
using pipe composting
facilities (TPD) 2kg 0.174 0.6 TPD 0 0
Kitchen bin
Total no of units supplied nil 0 0 0 26
No of units working nil 0 0 0 8
No of units not working nil 0 0 0 18
Quantity of waste treated
using kitchen bin facilities
(TPD) nil 0 0 0 0.1
Biogas plant
(Household
level)
Total no of units supplied 20 161 159 31 1300
No of units working 5 161 159 31 1300
No of units not working affected flood and
repairing stage 0 0 0 0
Quantity of waste treated
using biogas plant (TPD) 4kg 0.08 0.34 TPD 0.002 1.00 Tonne
Biogas plant
(Community
level)
Total no of units supplied 0 1 0 0 3
No of units working 0 1 0 0 3
No of units not working 0 0 0 0 0
Annexure.1
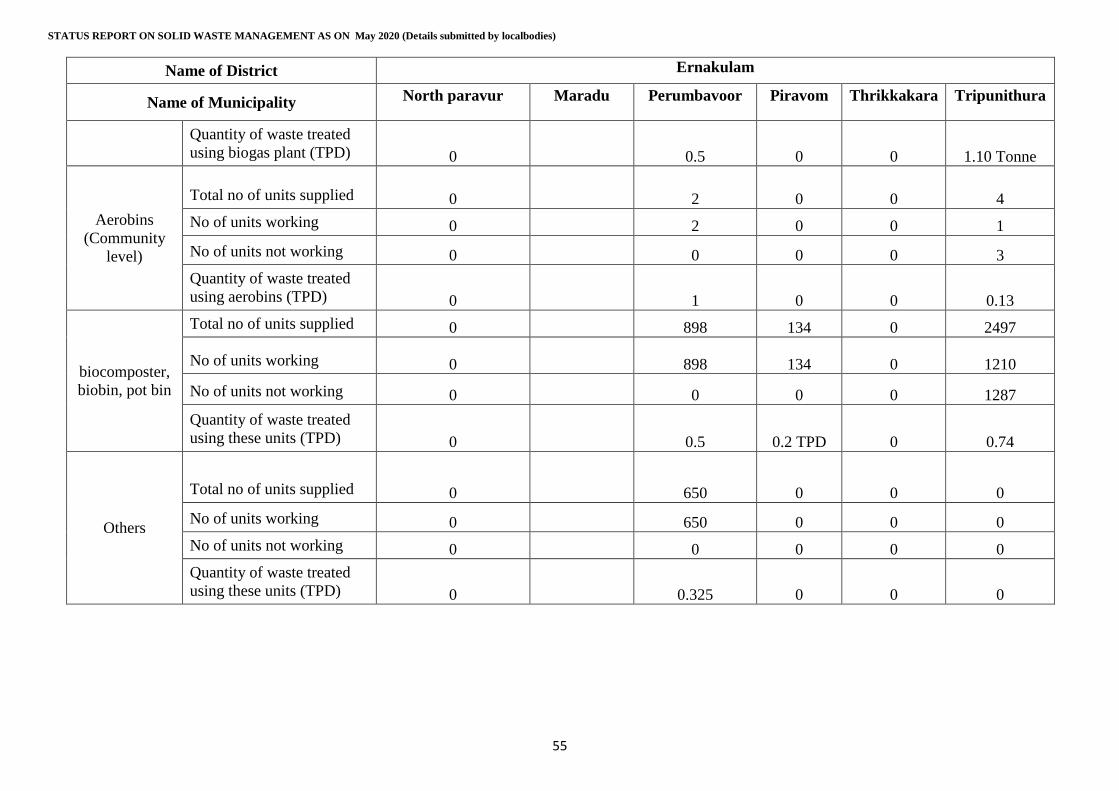
STATUS REPORT ON SOLID WASTE MANAGEMENT AS ON May 2020 (Details submitted by localbodies)
55
Name of District Ernakulam
Name of Municipality North paravur Maradu Perumbavoor Piravom Thrikkakara Tripunithura
Quantity of waste treated
using biogas plant (TPD) 0 0.5 0 0 1.10 Tonne
Aerobins
(Community
level)
Total no of units supplied 0 2 0 0 4
No of units working 0 2 0 0 1
No of units not working 0 0 0 0 3
Quantity of waste treated
using aerobins (TPD) 0 1 0 0 0.13
biocomposter,
biobin, pot bin
Total no of units supplied 0 898 134 0 2497
No of units working 0 898 134 0 1210
No of units not working 0 0 0 0 1287
Quantity of waste treated
using these units (TPD) 0 0.5 0.2 TPD 0 0.74
Others
Total no of units supplied 0 650 0 0 0
No of units working 0 650 0 0 0
No of units not working 0 0 0 0 0
Quantity of waste treated
using these units (TPD) 0 0.325 0 0 0
Annexure.1
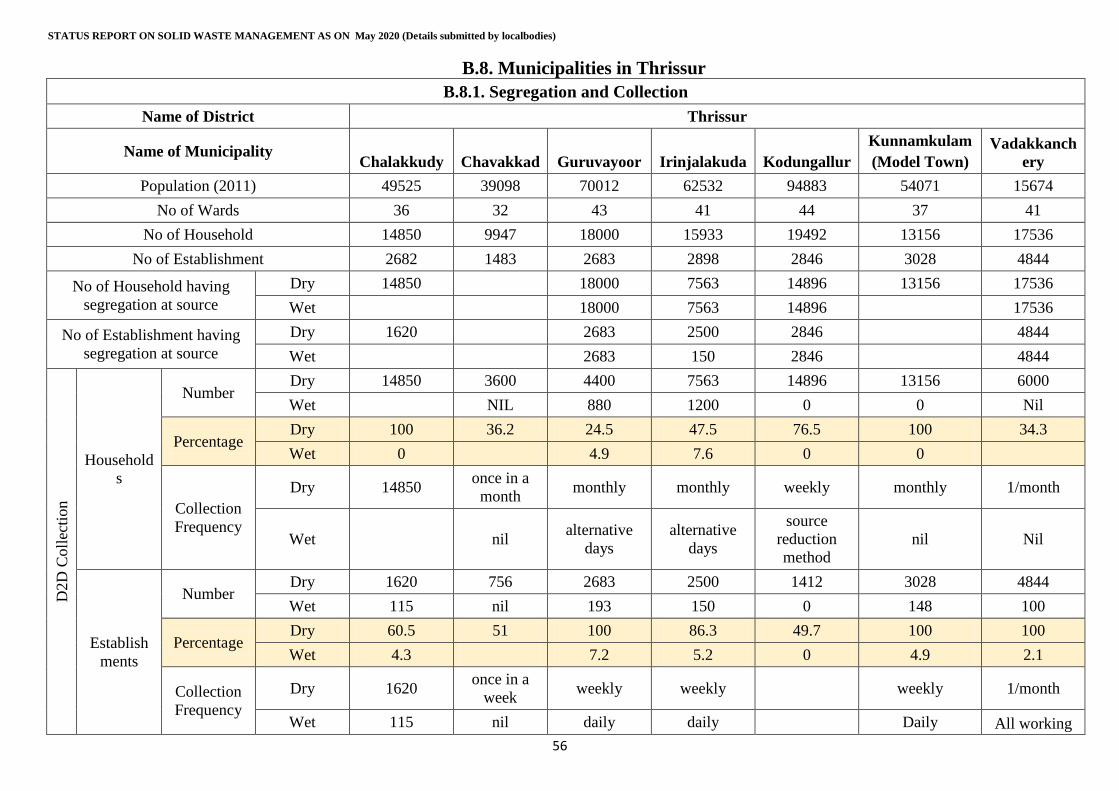
STATUS REPORT ON SOLID WASTE MANAGEMENT AS ON May 2020 (Details submitted by localbodies)
56
B.8. Municipalities in Thrissur
B.8.1. Segregation and Collection
Name of District Thrissur
Name of Municipality Chalakkudy Chavakkad Guruvayoor Irinjalakuda Kodungallur
Kunnamkulam
(Model Town)
Vadakkanch
ery
Population (2011) 49525 39098 70012 62532 94883 54071 15674
No of Wards 36 32 43 41 44 37 41
No of Household 14850 9947 18000 15933 19492 13156 17536
No of Establishment 2682 1483 2683 2898 2846 3028 4844
No of Household having
segregation at source
Dry 14850 18000 7563 14896 13156 17536
Wet
18000 7563 14896 17536
No of Establishment having
segregation at source
Dry 1620 2683 2500 2846 4844
Wet
2683 150 2846 4844
D2D
Coll
ecti
on
Household
s
Number Dry 14850 3600 4400 7563 14896 13156 6000
Wet
NIL 880 1200 0 0 Nil
Percentage Dry 100 36.2 24.5 47.5 76.5 100 34.3
Wet 0 4.9 7.6 0 0
Collection
Frequency
Dry 14850 once in a
month monthly monthly weekly monthly 1/month
Wet
nil alternative
days
alternative
days
source
reduction
method
nil Nil
Establish
ments
Number Dry 1620 756 2683 2500 1412 3028 4844
Wet 115 nil 193 150 0 148 100
Percentage Dry 60.5 51 100 86.3 49.7 100 100
Wet 4.3 7.2 5.2 0 4.9 2.1
Collection
Frequency
Dry 1620 once in a
week weekly weekly weekly 1/month
Wet 115 nil daily daily Daily All working
Annexure.1

STATUS REPORT ON SOLID WASTE MANAGEMENT AS ON May 2020 (Details submitted by localbodies)
57
B.8.1. Segregation and Collection
Name of District Thrissur
Name of Municipality Chalakkudy Chavakkad Guruvayoor Irinjalakuda Kodungallur
Kunnamkulam
(Model Town)
Vadakkanch
ery
days
No of collectors 54 31 58 130 84 6 40
No of vehicles used 3 2 6 7 2 5 2
No. having source level
treatment of wet waste in
operation
Household 1
1082
Municipalit
y is taken
action to
disribute
2600
kitchen bins
and 500 Bio
- gas plant
to promote
source level
treatment of
wet waste at
house hold
level. The
project
received
technical
sanction
and its
ready to
implement
with in two
weeks
13000 4600 6200 13156 17536
Establishme
nt 548 6 2400 1400 1350 13 4744
Annexure.1
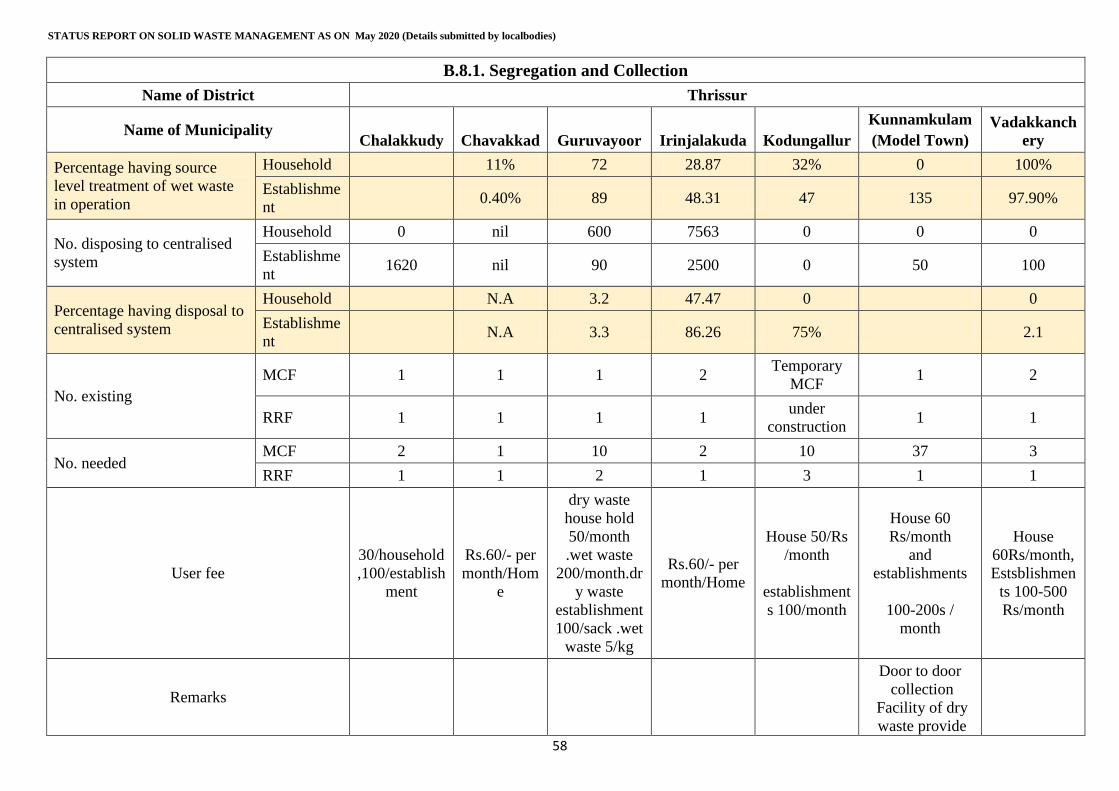
STATUS REPORT ON SOLID WASTE MANAGEMENT AS ON May 2020 (Details submitted by localbodies)
58
B.8.1. Segregation and Collection
Name of District Thrissur
Name of Municipality Chalakkudy Chavakkad Guruvayoor Irinjalakuda Kodungallur
Kunnamkulam
(Model Town)
Vadakkanch
ery
Percentage having source
level treatment of wet waste
in operation
Household
11% 72 28.87 32% 0 100%
Establishme
nt 0.40% 89 48.31 47 135 97.90%
No. disposing to centralised
system
Household 0 nil 600 7563 0 0 0
Establishme
nt 1620 nil 90 2500 0 50 100
Percentage having disposal to
centralised system
Household
N.A 3.2 47.47 0 0
Establishme
nt N.A 3.3 86.26 75% 2.1
No. existing
MCF 1 1 1 2 Temporary
MCF 1 2
RRF 1 1 1 1 under
construction 1 1
No. needed MCF 2 1 10 2 10 37 3
RRF 1 1 2 1 3 1 1
User fee
30/household
,100/establish
ment
Rs.60/- per
month/Hom
e
dry waste
house hold
50/month
.wet waste
200/month.dr
y waste
establishment
100/sack .wet
waste 5/kg
Rs.60/- per
month/Home
House 50/Rs
/month
establishment
s 100/month
House 60
Rs/month
and
establishments
100-200s /
month
House
60Rs/month,
Estsblishmen
ts 100-500
Rs/month
Remarks
Door to door
collection
Facility of dry
waste provide
Annexure.1
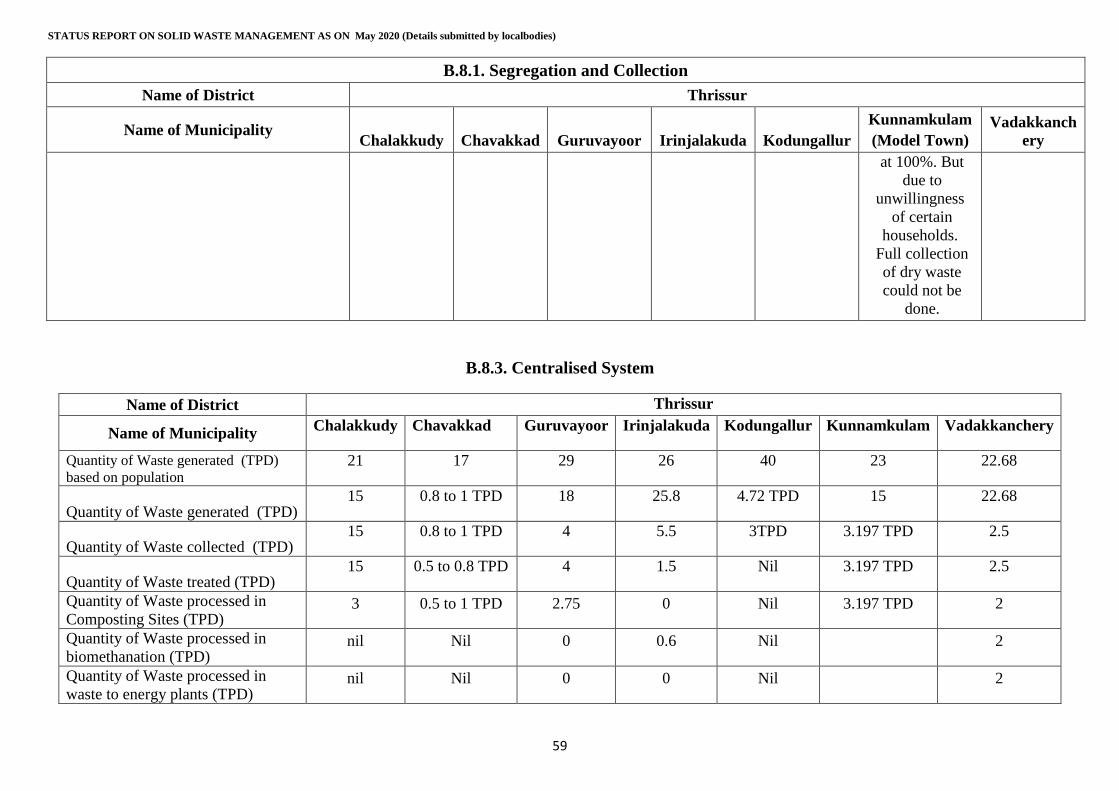
STATUS REPORT ON SOLID WASTE MANAGEMENT AS ON May 2020 (Details submitted by localbodies)
59
B.8.1. Segregation and Collection
Name of District Thrissur
Name of Municipality Chalakkudy Chavakkad Guruvayoor Irinjalakuda Kodungallur
Kunnamkulam
(Model Town)
Vadakkanch
ery
at 100%. But
due to
unwillingness
of certain
households.
Full collection
of dry waste
could not be
done.
B.8.3. Centralised System
Name of District Thrissur
Name of Municipality Chalakkudy Chavakkad Guruvayoor Irinjalakuda Kodungallur Kunnamkulam Vadakkanchery
Quantity of Waste generated (TPD)
based on population 21 17 29 26 40 23 22.68
Quantity of Waste generated (TPD) 15 0.8 to 1 TPD 18 25.8 4.72 TPD 15 22.68
Quantity of Waste collected (TPD) 15 0.8 to 1 TPD 4 5.5 3TPD 3.197 TPD 2.5
Quantity of Waste treated (TPD) 15 0.5 to 0.8 TPD 4 1.5 Nil 3.197 TPD 2.5
Quantity of Waste processed in
Composting Sites (TPD) 3 0.5 to 1 TPD 2.75 0 Nil 3.197 TPD 2
Quantity of Waste processed in
biomethanation (TPD) nil Nil 0 0.6 Nil 2
Quantity of Waste processed in
waste to energy plants (TPD) nil Nil 0 0 Nil 2
Annexure.1
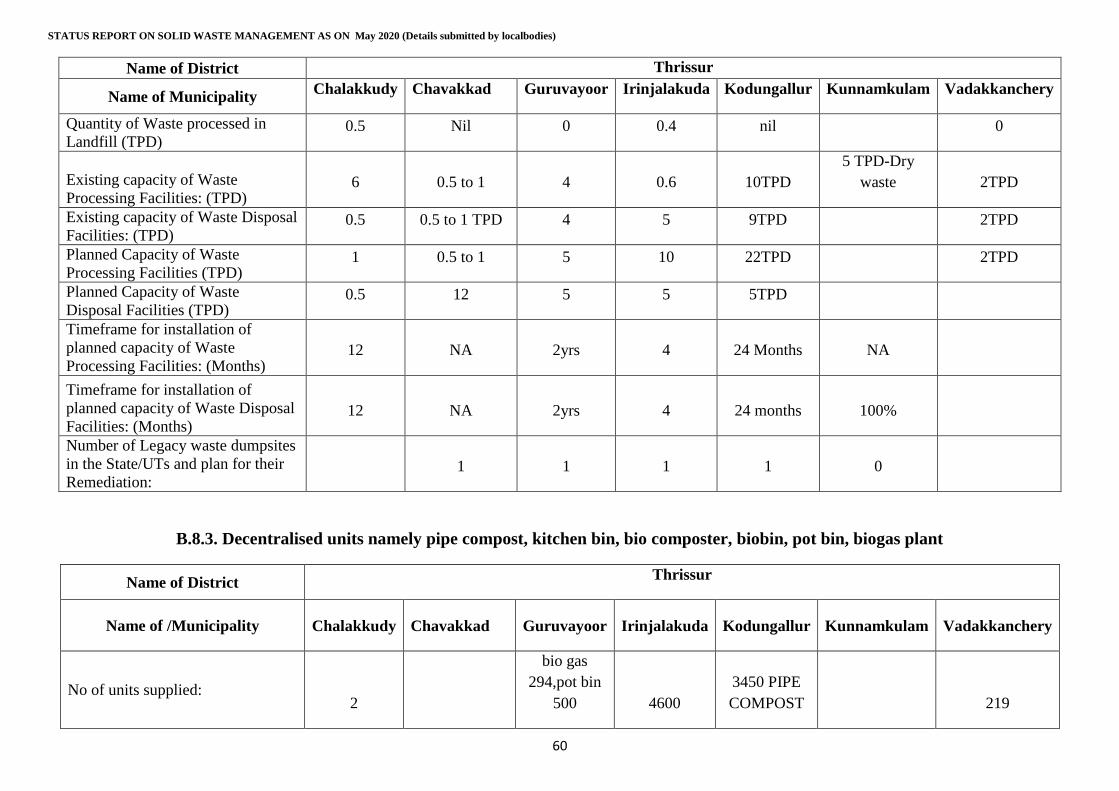
STATUS REPORT ON SOLID WASTE MANAGEMENT AS ON May 2020 (Details submitted by localbodies)
60
Name of District Thrissur
Name of Municipality Chalakkudy Chavakkad Guruvayoor Irinjalakuda Kodungallur Kunnamkulam Vadakkanchery
Quantity of Waste processed in
Landfill (TPD) 0.5 Nil 0 0.4 nil 0
Existing capacity of Waste
Processing Facilities: (TPD) 6 0.5 to 1 4 0.6 10TPD
5 TPD-Dry
waste 2TPD
Existing capacity of Waste Disposal
Facilities: (TPD) 0.5 0.5 to 1 TPD 4 5 9TPD 2TPD
Planned Capacity of Waste
Processing Facilities (TPD) 1 0.5 to 1 5 10 22TPD 2TPD
Planned Capacity of Waste
Disposal Facilities (TPD) 0.5 12 5 5 5TPD
Timeframe for installation of
planned capacity of Waste
Processing Facilities: (Months) 12 NA 2yrs 4 24 Months NA
Timeframe for installation of
planned capacity of Waste Disposal
Facilities: (Months) 12 NA 2yrs 4 24 months 100%
Number of Legacy waste dumpsites
in the State/UTs and plan for their
Remediation: 1 1 1 1 0
B.8.3. Decentralised units namely pipe compost, kitchen bin, bio composter, biobin, pot bin, biogas plant
Name of District Thrissur
Name of /Municipality Chalakkudy Chavakkad Guruvayoor Irinjalakuda Kodungallur Kunnamkulam Vadakkanchery
No of units supplied: 2
bio gas
294,pot bin
500 4600
3450 PIPE
COMPOST 219
Annexure.1
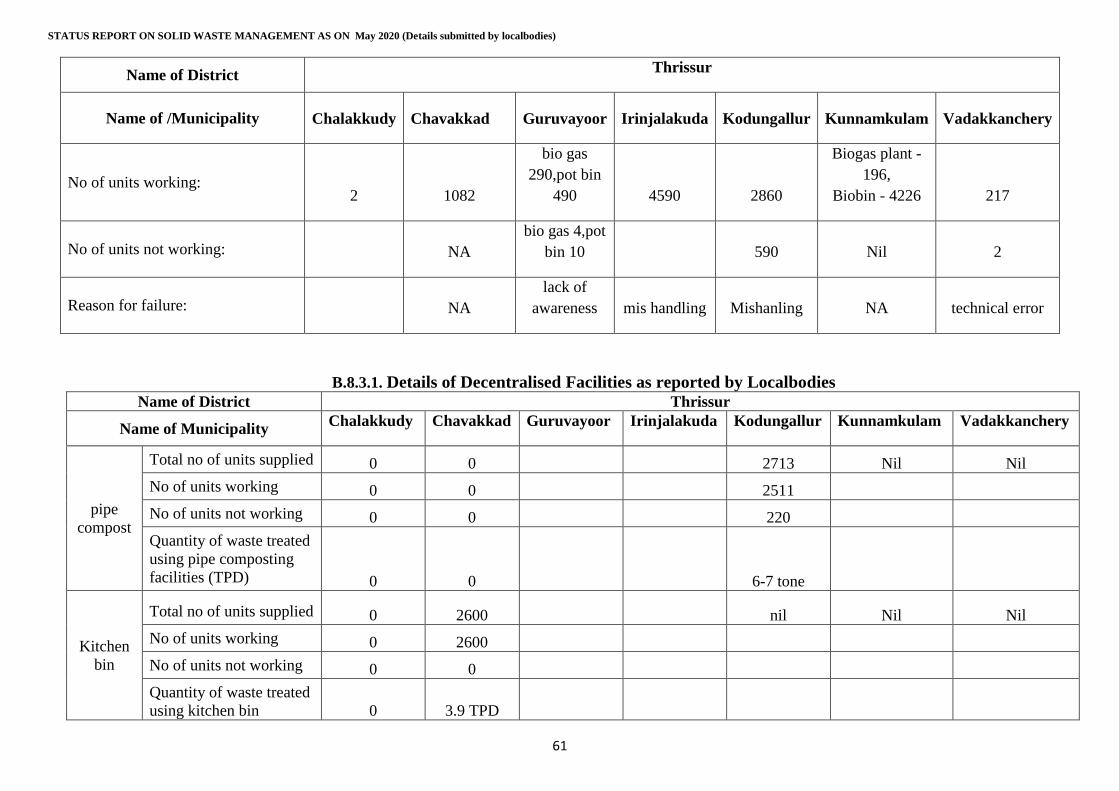
STATUS REPORT ON SOLID WASTE MANAGEMENT AS ON May 2020 (Details submitted by localbodies)
61
Name of District Thrissur
Name of /Municipality Chalakkudy Chavakkad Guruvayoor Irinjalakuda Kodungallur Kunnamkulam Vadakkanchery
No of units working: 2 1082
bio gas
290,pot bin
490 4590 2860
Biogas plant -
196,
Biobin - 4226 217
No of units not working: NA
bio gas 4,pot
bin 10 590 Nil 2
Reason for failure: NA
lack of
awareness mis handling Mishanling NA technical error
B.8.3.1. Details of Decentralised Facilities as reported by Localbodies Name of District Thrissur
Name of Municipality Chalakkudy Chavakkad Guruvayoor Irinjalakuda Kodungallur Kunnamkulam Vadakkanchery
pipe
compost
Total no of units supplied 0 0
2713 Nil Nil
No of units working 0 0
2511
No of units not working 0 0
220
Quantity of waste treated
using pipe composting
facilities (TPD) 0 0
6-7 tone
Kitchen
bin
Total no of units supplied 0 2600
nil Nil Nil
No of units working 0 2600
No of units not working 0 0
Quantity of waste treated
using kitchen bin 0 3.9 TPD
Annexure.1
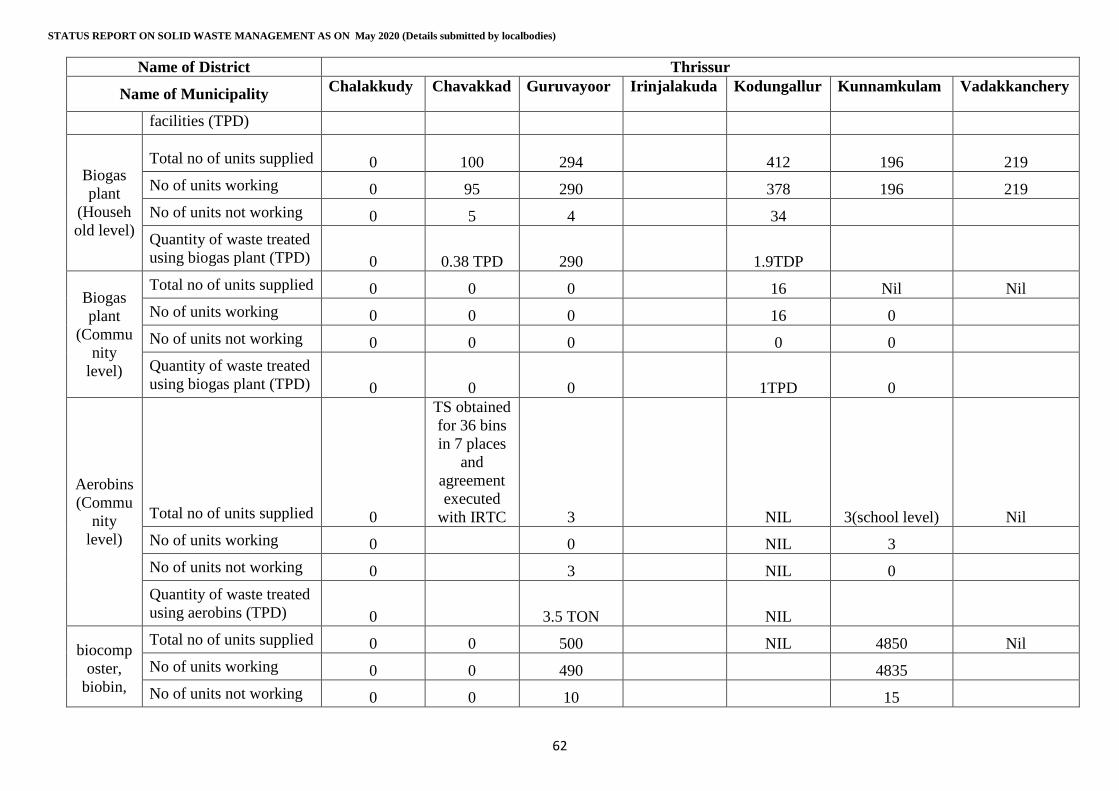
STATUS REPORT ON SOLID WASTE MANAGEMENT AS ON May 2020 (Details submitted by localbodies)
62
Name of District Thrissur
Name of Municipality Chalakkudy Chavakkad Guruvayoor Irinjalakuda Kodungallur Kunnamkulam Vadakkanchery
facilities (TPD)
Biogas
plant
(Househ
old level)
Total no of units supplied 0 100 294
412 196 219
No of units working 0 95 290
378 196 219
No of units not working 0 5 4
34
Quantity of waste treated
using biogas plant (TPD) 0 0.38 TPD 290
1.9TDP
Biogas
plant
(Commu
nity
level)
Total no of units supplied 0 0 0
16 Nil Nil
No of units working 0 0 0
16 0
No of units not working 0 0 0
0 0
Quantity of waste treated
using biogas plant (TPD) 0 0 0
1TPD 0
Aerobins
(Commu
nity
level)
Total no of units supplied 0
TS obtained
for 36 bins
in 7 places
and
agreement
executed
with IRTC 3
NIL 3(school level) Nil
No of units working 0 0
NIL 3
No of units not working 0 3
NIL 0
Quantity of waste treated
using aerobins (TPD) 0 3.5 TON
NIL
biocomp
oster,
biobin,
Total no of units supplied 0 0 500
NIL 4850 Nil
No of units working 0 0 490
4835
No of units not working 0 0 10
15
Annexure.1
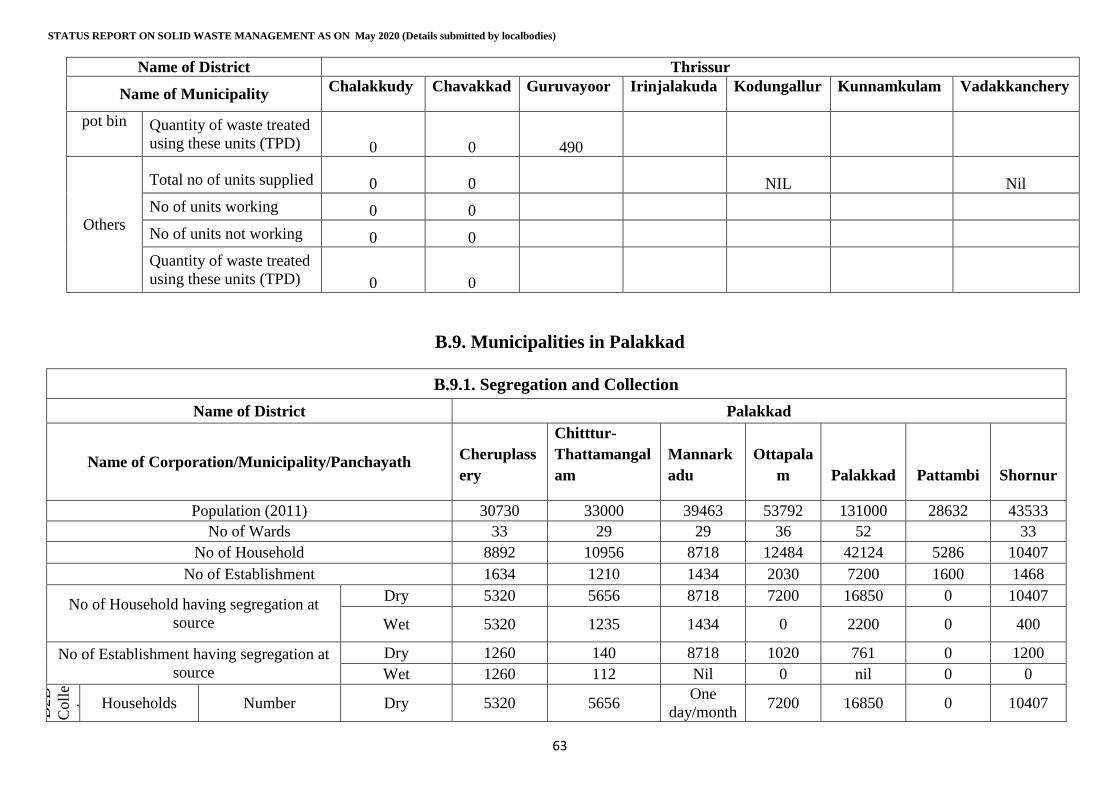
STATUS REPORT ON SOLID WASTE MANAGEMENT AS ON May 2020 (Details submitted by localbodies)
63
Name of District Thrissur
Name of Municipality Chalakkudy Chavakkad Guruvayoor Irinjalakuda Kodungallur Kunnamkulam Vadakkanchery
pot bin Quantity of waste treated
using these units (TPD) 0 0 490
Others
Total no of units supplied 0 0
NIL Nil
No of units working 0 0
No of units not working 0 0
Quantity of waste treated
using these units (TPD) 0 0
B.9. Municipalities in Palakkad
B.9.1. Segregation and Collection
Name of District Palakkad
Name of Corporation/Municipality/Panchayath Cheruplass
ery
Chitttur-
Thattamangal
am
Mannark
adu
Ottapala
m Palakkad Pattambi Shornur
Population (2011) 30730 33000 39463 53792 131000 28632 43533
No of Wards 33 29 29 36 52 33
No of Household 8892 10956 8718 12484 42124 5286 10407
No of Establishment 1634 1210 1434 2030 7200 1600 1468
No of Household having segregation at
source
Dry 5320 5656 8718 7200 16850 0 10407
Wet 5320 1235 1434 0 2200 0 400
No of Establishment having segregation at
source
Dry 1260 140 8718 1020 761 0 1200
Wet 1260 112 Nil 0 nil 0 0
D2D
Co
lle
ctio
n
Households Number Dry 5320 5656 One
day/month 7200 16850 0 10407
Annexure.1
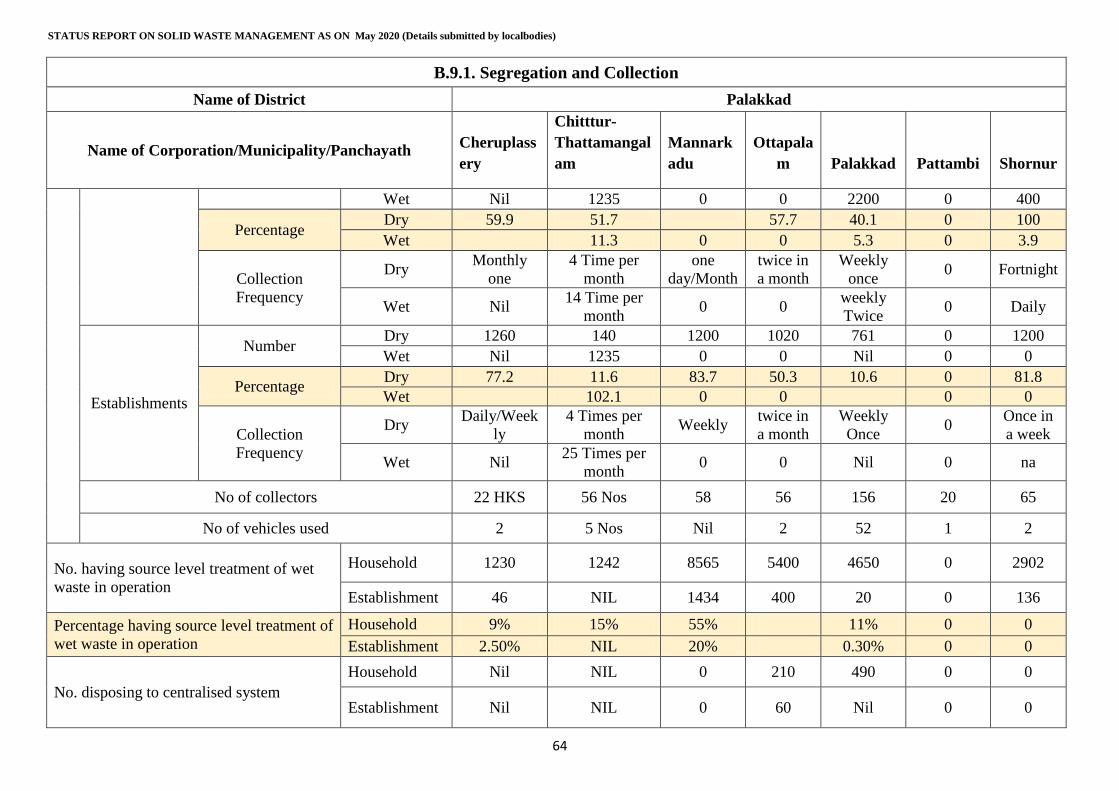
STATUS REPORT ON SOLID WASTE MANAGEMENT AS ON May 2020 (Details submitted by localbodies)
64
B.9.1. Segregation and Collection
Name of District Palakkad
Name of Corporation/Municipality/Panchayath Cheruplass
ery
Chitttur-
Thattamangal
am
Mannark
adu
Ottapala
m Palakkad Pattambi Shornur
Wet Nil 1235 0 0 2200 0 400
Percentage Dry 59.9 51.7 57.7 40.1 0 100
Wet
11.3 0 0 5.3 0 3.9
Collection
Frequency
Dry Monthly
one
4 Time per
month
one
day/Month
twice in
a month
Weekly
once 0 Fortnight
Wet Nil 14 Time per
month 0 0
weekly
Twice 0 Daily
Establishments
Number Dry 1260 140 1200 1020 761 0 1200
Wet Nil 1235 0 0 Nil 0 0
Percentage Dry 77.2 11.6 83.7 50.3 10.6 0 81.8
Wet
102.1 0 0 0 0
Collection
Frequency
Dry Daily/Week
ly
4 Times per
month Weekly
twice in
a month
Weekly
Once 0
Once in
a week
Wet Nil 25 Times per
month 0 0 Nil 0 na
No of collectors 22 HKS 56 Nos 58 56 156 20 65
No of vehicles used 2 5 Nos Nil 2 52 1 2
No. having source level treatment of wet
waste in operation
Household 1230 1242 8565 5400 4650 0 2902
Establishment 46 NIL 1434 400 20 0 136
Percentage having source level treatment of
wet waste in operation
Household 9% 15% 55% 11% 0 0
Establishment 2.50% NIL 20% 0.30% 0 0
No. disposing to centralised system
Household Nil NIL 0 210 490 0 0
Establishment Nil NIL 0 60 Nil 0 0
Annexure.1
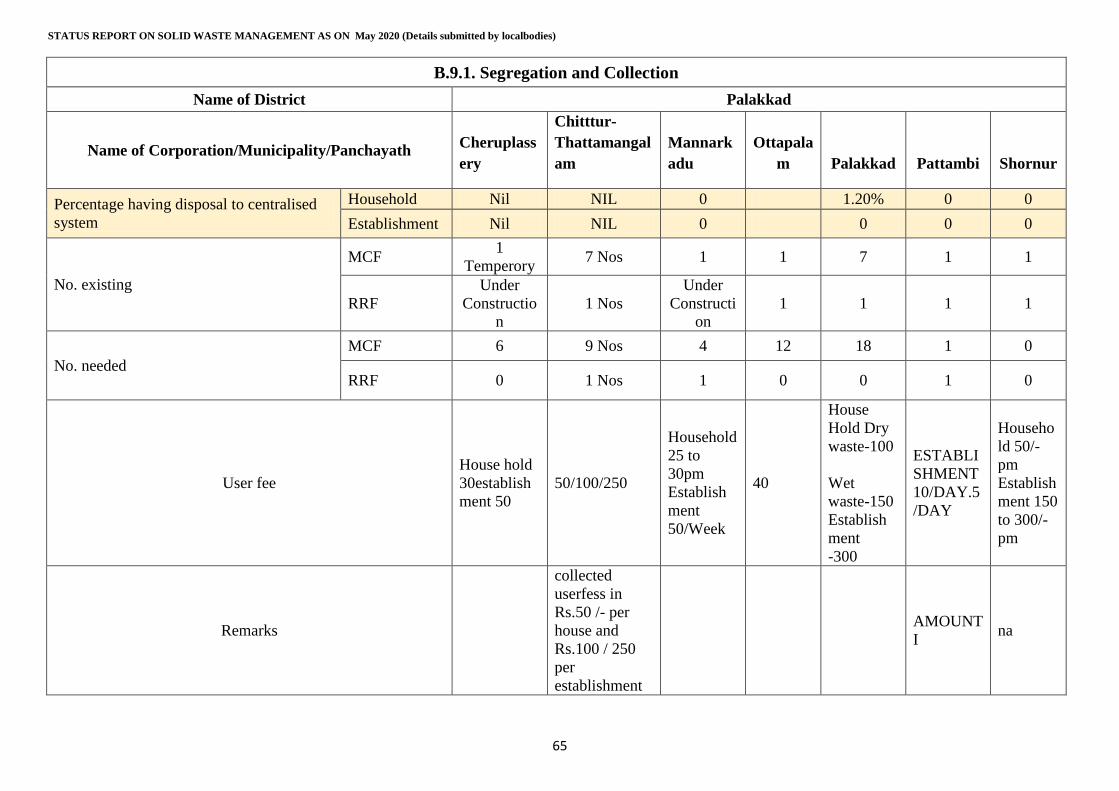
STATUS REPORT ON SOLID WASTE MANAGEMENT AS ON May 2020 (Details submitted by localbodies)
65
B.9.1. Segregation and Collection
Name of District Palakkad
Name of Corporation/Municipality/Panchayath Cheruplass
ery
Chitttur-
Thattamangal
am
Mannark
adu
Ottapala
m Palakkad Pattambi Shornur
Percentage having disposal to centralised
system
Household Nil NIL 0 1.20% 0 0
Establishment Nil NIL 0 0 0 0
No. existing
MCF 1
Temperory 7 Nos 1 1 7 1 1
RRF
Under
Constructio
n
1 Nos
Under
Constructi
on
1 1 1 1
No. needed
MCF 6 9 Nos 4 12 18 1 0
RRF 0 1 Nos 1 0 0 1 0
User fee
House hold
30establish
ment 50
50/100/250
Household
25 to
30pm
Establish
ment
50/Week
40
House
Hold Dry
waste-100
Wet
waste-150
Establish
ment
-300
ESTABLI
SHMENT
10/DAY.5
/DAY
Househo
ld 50/-
pm
Establish
ment 150
to 300/-
pm
Remarks
collected
userfess in
Rs.50 /- per
house and
Rs.100 / 250
per
establishment
AMOUNT
I na
Annexure.1

STATUS REPORT ON SOLID WASTE MANAGEMENT AS ON May 2020 (Details submitted by localbodies)
66
B.9.2. Centralised System
Name of District Palakkad
Name of Corporation /Municipality
/Panchayath Cheruplassery
Chitttur-
Thattamangalam Mannarkadu Ottapalam Palakkad Pattambi Shornur
Quantity of Waste generated (TPD) based
on population 13 14 17 23 55 12 19
Quantity of Waste generated (TPD) 9.7 Ton 2.6 1.4ton 42 3TPD 1.5
Quantity of Waste collected (TPD) 3 Ton 2 0.980ton 18 500KG 1.5
Quantity of Waste treated (TPD) 2.85 Ton 2 0.980ton 15 50KG 1.5
Quantity of Waste processed in
Composting Sites (TPD) 2.85 Ton Nil 880 ton 8 NA NIL
Quantity of Waste processed in
biomethanation (TPD) Nil 0 15 NA NIL
Quantity of Waste processed in waste to
energy plants (TPD) NIL Nil 0 nil NA NIL
Quantity of Waste processed in Landfill
(TPD) NIL Nil 0 Nil NA NIL
Existing capacity of Waste Processing
Facilities: (TPD) 4 Ton 2 1 ton 18 NA 3
Existing capacity of Waste Disposal
Facilities: (TPD) 2.85 Ton 2 0 18 NA 3
Planned Capacity of Waste Processing
Facilities (TPD) 2.85 Ton 2 1 ton 0.5 ton NA 3
Planned Capacity of Waste Disposal
Facilities (TPD) 2.85 Ton 2 NA 10 ton NA 3
Timeframe for installation of planned
capacity of Waste Processing Facilities:
(Months)
NA 12 Months 1 MONTH 2 ton NA 3
Annexure.1
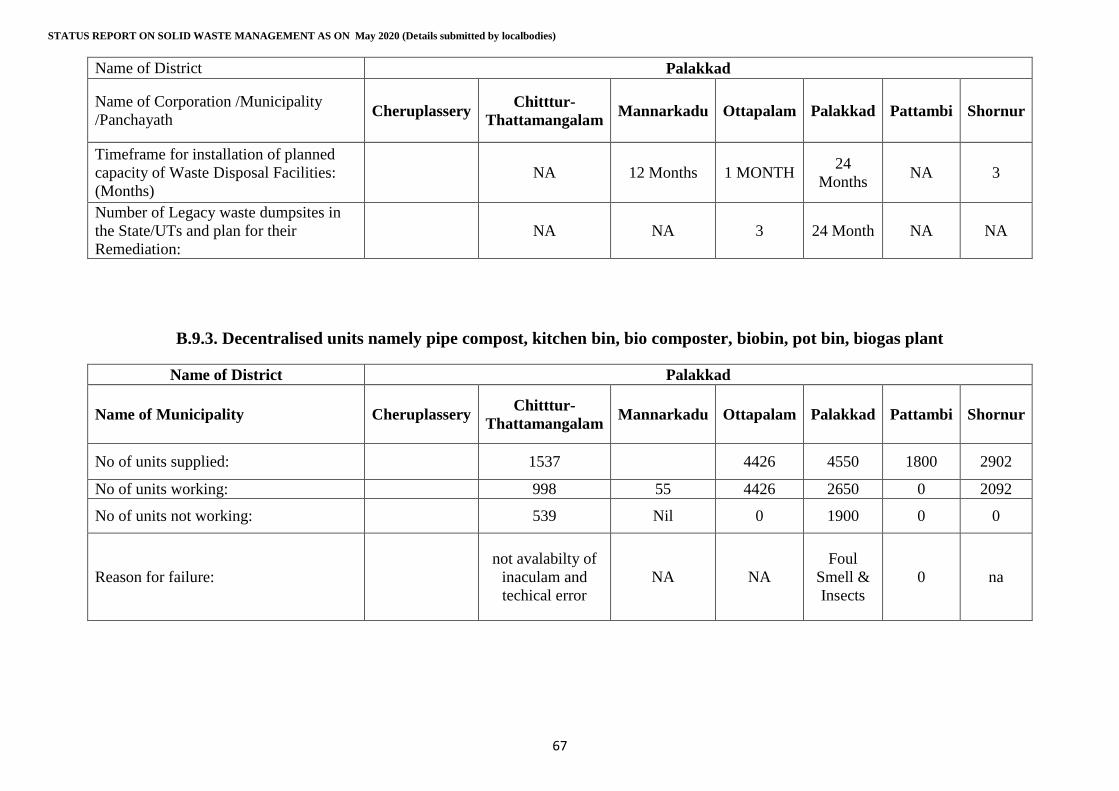
STATUS REPORT ON SOLID WASTE MANAGEMENT AS ON May 2020 (Details submitted by localbodies)
67
Name of District Palakkad
Name of Corporation /Municipality
/Panchayath Cheruplassery
Chitttur-
Thattamangalam Mannarkadu Ottapalam Palakkad Pattambi Shornur
Timeframe for installation of planned
capacity of Waste Disposal Facilities:
(Months)
NA 12 Months 1 MONTH 24
Months NA 3
Number of Legacy waste dumpsites in
the State/UTs and plan for their
Remediation:
NA NA 3 24 Month NA NA
B.9.3. Decentralised units namely pipe compost, kitchen bin, bio composter, biobin, pot bin, biogas plant
Name of District Palakkad
Name of Municipality Cheruplassery Chitttur-
Thattamangalam Mannarkadu Ottapalam Palakkad Pattambi Shornur
No of units supplied: 1537 4426 4550 1800 2902
No of units working: 998 55 4426 2650 0 2092
No of units not working: 539 Nil 0 1900 0 0
Reason for failure:
not avalabilty of
inaculam and
techical error
NA NA
Foul
Smell &
Insects
0 na
Annexure.1
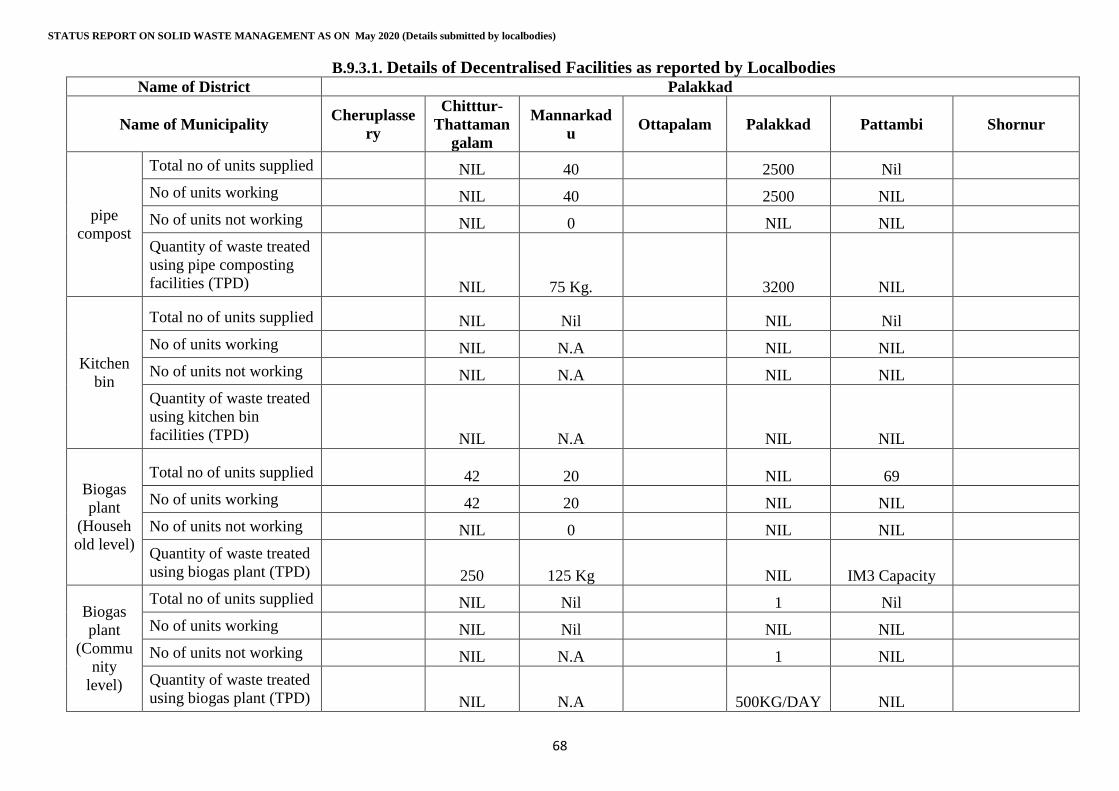
STATUS REPORT ON SOLID WASTE MANAGEMENT AS ON May 2020 (Details submitted by localbodies)
68
B.9.3.1. Details of Decentralised Facilities as reported by Localbodies Name of District Palakkad
Name of Municipality Cheruplasse
ry
Chitttur-
Thattaman
galam
Mannarkad
u Ottapalam Palakkad Pattambi Shornur
pipe
compost
Total no of units supplied
NIL 40
2500 Nil
No of units working
NIL 40
2500 NIL
No of units not working
NIL 0
NIL NIL
Quantity of waste treated
using pipe composting
facilities (TPD)
NIL 75 Kg.
3200 NIL
Kitchen
bin
Total no of units supplied
NIL Nil
NIL Nil
No of units working
NIL N.A
NIL NIL
No of units not working
NIL N.A
NIL NIL
Quantity of waste treated
using kitchen bin
facilities (TPD)
NIL N.A
NIL NIL
Biogas
plant
(Househ
old level)
Total no of units supplied
42 20
NIL 69
No of units working
42 20
NIL NIL
No of units not working
NIL 0
NIL NIL
Quantity of waste treated
using biogas plant (TPD)
250 125 Kg
NIL IM3 Capacity
Biogas
plant
(Commu
nity
level)
Total no of units supplied
NIL Nil
1 Nil
No of units working
NIL Nil
NIL NIL
No of units not working
NIL N.A
1 NIL
Quantity of waste treated
using biogas plant (TPD)
NIL N.A
500KG/DAY NIL
Annexure.1
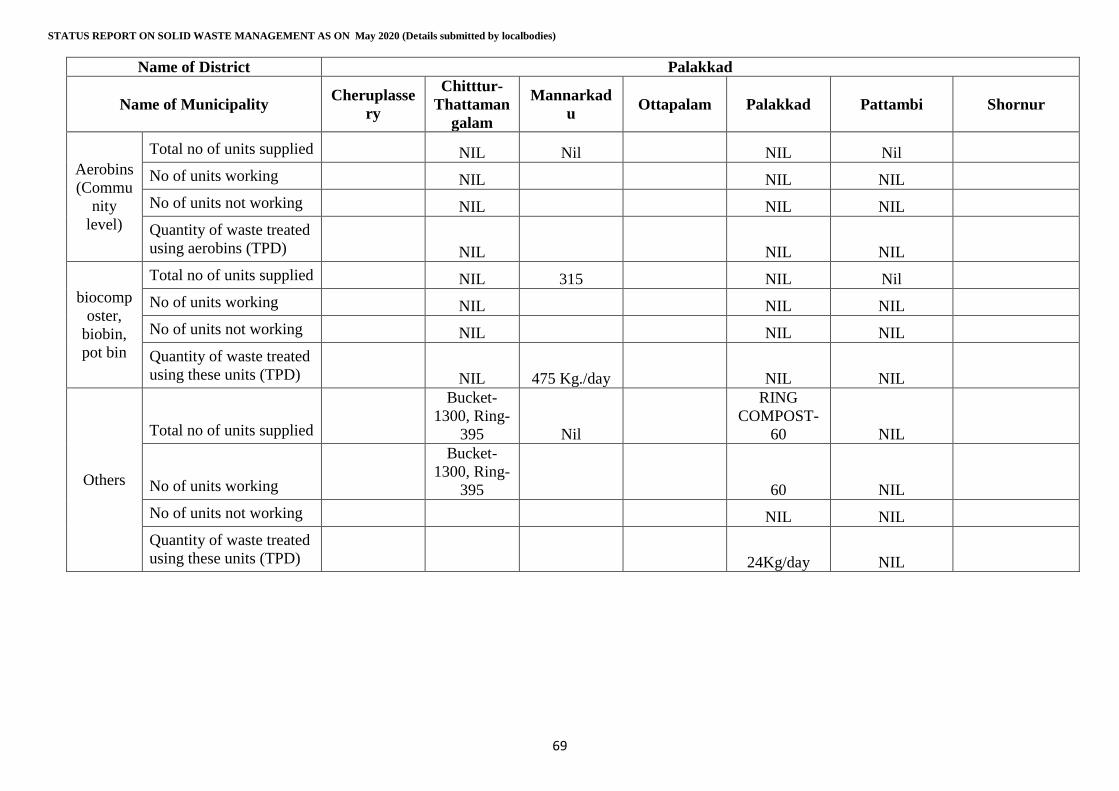
STATUS REPORT ON SOLID WASTE MANAGEMENT AS ON May 2020 (Details submitted by localbodies)
69
Name of District Palakkad
Name of Municipality Cheruplasse
ry
Chitttur-
Thattaman
galam
Mannarkad
u Ottapalam Palakkad Pattambi Shornur
Aerobins
(Commu
nity
level)
Total no of units supplied
NIL Nil
NIL Nil
No of units working
NIL
NIL NIL
No of units not working
NIL
NIL NIL
Quantity of waste treated
using aerobins (TPD)
NIL
NIL NIL
biocomp
oster,
biobin,
pot bin
Total no of units supplied
NIL 315
NIL Nil
No of units working
NIL
NIL NIL
No of units not working
NIL
NIL NIL
Quantity of waste treated
using these units (TPD)
NIL 475 Kg./day
NIL NIL
Others
Total no of units supplied
Bucket-
1300, Ring-
395 Nil
RING
COMPOST-
60 NIL
No of units working
Bucket-
1300, Ring-
395
60 NIL
No of units not working
NIL NIL
Quantity of waste treated
using these units (TPD)
24Kg/day NIL
Annexure.1

STATUS REPORT ON SOLID WASTE MANAGEMENT AS ON May 2020 (Details submitted by localbodies)
70
B.10. Municipalities in Malappuram
B.10.1. Segregation and Collection
Name of District Malappuram
Name of Municipality Kondotty Kottakkal Malappuram Manjeri Nilambur Parappanangadi
Population (2011) 28794 44382 101000 97104 46366 35243
No of Wards 40 32 40 50 33 45
No of Household 11807 11080 18889 19386 13685 18256
No of Establishment 1700 2020 3246 4809 1800 1155
No of Household having segregation at source Dry 600 9600 15112 9886 5135 8358
Wet 8000 0 2115 0 7250
No of Establishment having segregation at source Dry 1000 1500 876 1750 615
Wet 100 0 527
D2D
Coll
ecti
on
Households
Number Dry 9400 1480 15112 180 Ton 0 8358
Wet 590 0 NIL 0 7250
Percentage Dry 79.7 13.4 80.1 0 45.8
Wet 5 0 0 0 39.8
Collection Frequency Dry
Quarterly
Once in a
month
One time
in Month monthly
Wet Daily - Nil
Establishments
Number Dry 200 520 876 2100 Nil 615
Wet Nil 0 21 527
Percentage Dry 11.8 25.8 27 43.7 53.3
Wet
0 0 0 1.2 45.7
Collection Frequency Dry
quarterly
Once in a
week Daily weekly
Wet
- NIL Nil
No of collectors 160 15 24 16 29 90
No of vehicles used 1 Owned and
1 Hired 1 2 2 1 1
Annexure.1
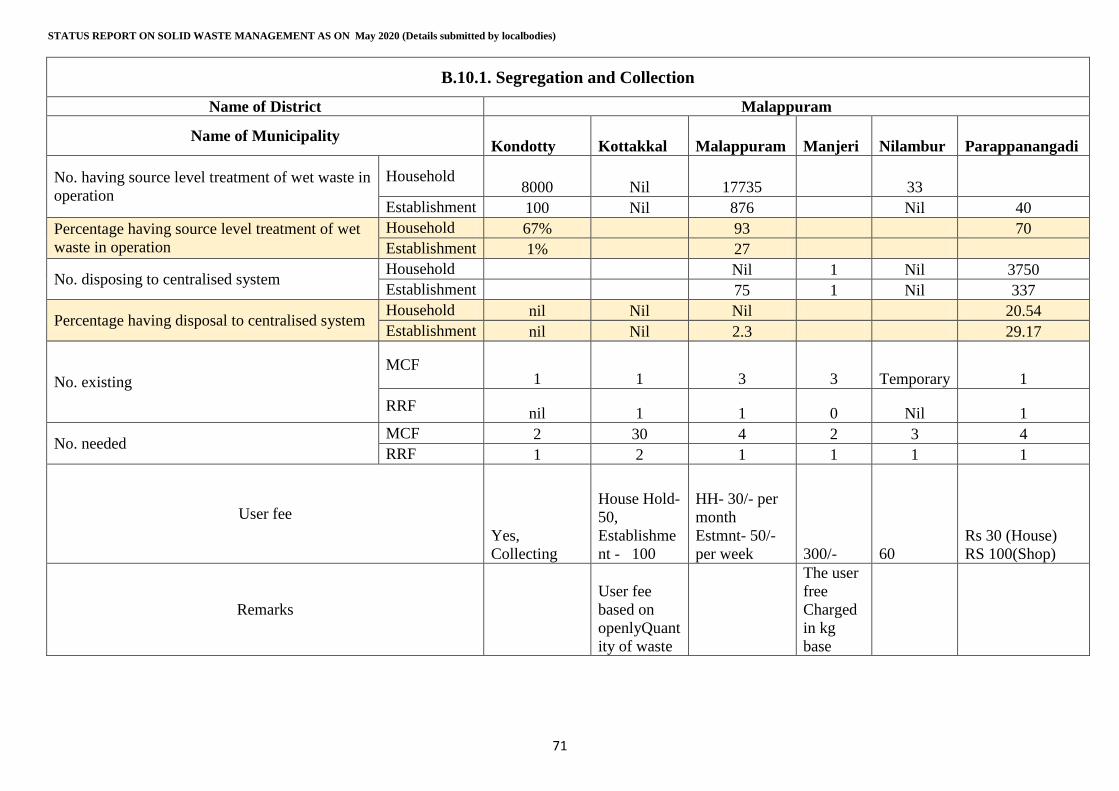
STATUS REPORT ON SOLID WASTE MANAGEMENT AS ON May 2020 (Details submitted by localbodies)
71
B.10.1. Segregation and Collection
Name of District Malappuram
Name of Municipality Kondotty Kottakkal Malappuram Manjeri Nilambur Parappanangadi
No. having source level treatment of wet waste in
operation
Household 8000 Nil 17735 33
Establishment 100 Nil 876 Nil 40
Percentage having source level treatment of wet
waste in operation
Household 67% 93 70
Establishment 1% 27
No. disposing to centralised system Household
Nil 1 Nil 3750
Establishment
75 1 Nil 337
Percentage having disposal to centralised system Household nil Nil Nil 20.54
Establishment nil Nil 2.3 29.17
No. existing MCF
1 1 3 3 Temporary 1
RRF nil 1 1 0 Nil 1
No. needed MCF 2 30 4 2 3 4
RRF 1 2 1 1 1 1
User fee
Yes,
Collecting
House Hold-
50,
Establishme
nt - 100
HH- 30/- per
month
Estmnt- 50/-
per week 300/- 60
Rs 30 (House)
RS 100(Shop)
Remarks
User fee
based on
openlyQuant
ity of waste
The user
free
Charged
in kg
base
Annexure.1

STATUS REPORT ON SOLID WASTE MANAGEMENT AS ON May 2020 (Details submitted by localbodies)
72
B.10.2. Centralised System Name of District Malappuram
Name of Municipality Kondotty Kottakkal Malappuram Manjeri Nilambur Parappanangadi
Quantity of Waste generated (TPD) based on
population 12 18 43 41 20 15
Quantity of Waste generated (TPD)
0.12 TPD(non
bio degradable 3.23 3 1/2 TPD 2
Quantity of Waste collected (TPD)
0.12 TDP(non
biodegradable) 2.2 2 TPD 1
Quantity of Waste treated (TPD) 0.12 TPD 2.2 1 1/2 TPD 1
Quantity of Waste processed in Composting
Sites (TPD) nil Nil 1 1/2 TPD
Quantity of Waste processed in
biomethanation (TPD) nil Nil Nil
Quantity of Waste processed in waste to
energy plants (TPD) nil Nil Nil
Quantity of Waste processed in Landfill (TPD) nil Nil Nil
Existing capacity of Waste Processing
Facilities: (TPD) 0.12 TPD Nil 1 TPD 1
Existing capacity of Waste Disposal Facilities:
(TPD) na Nil 0.5 TPD 1
Planned Capacity of Waste Processing
Facilities (TPD) na Nil 1 50
Planned Capacity of Waste Disposal Facilities
(TPD) 1.5 3
Timeframe for installation of planned capacity
of Waste Processing Facilities: (Months) 6 months 4 1 year
Timeframe for installation of planned capacity
of Waste Disposal Facilities: (Months) 6 months 4 2 year
Number of Legacy waste dumpsites in the
State/UTs and plan for their Remediation: NA 0 Nil
Annexure.1
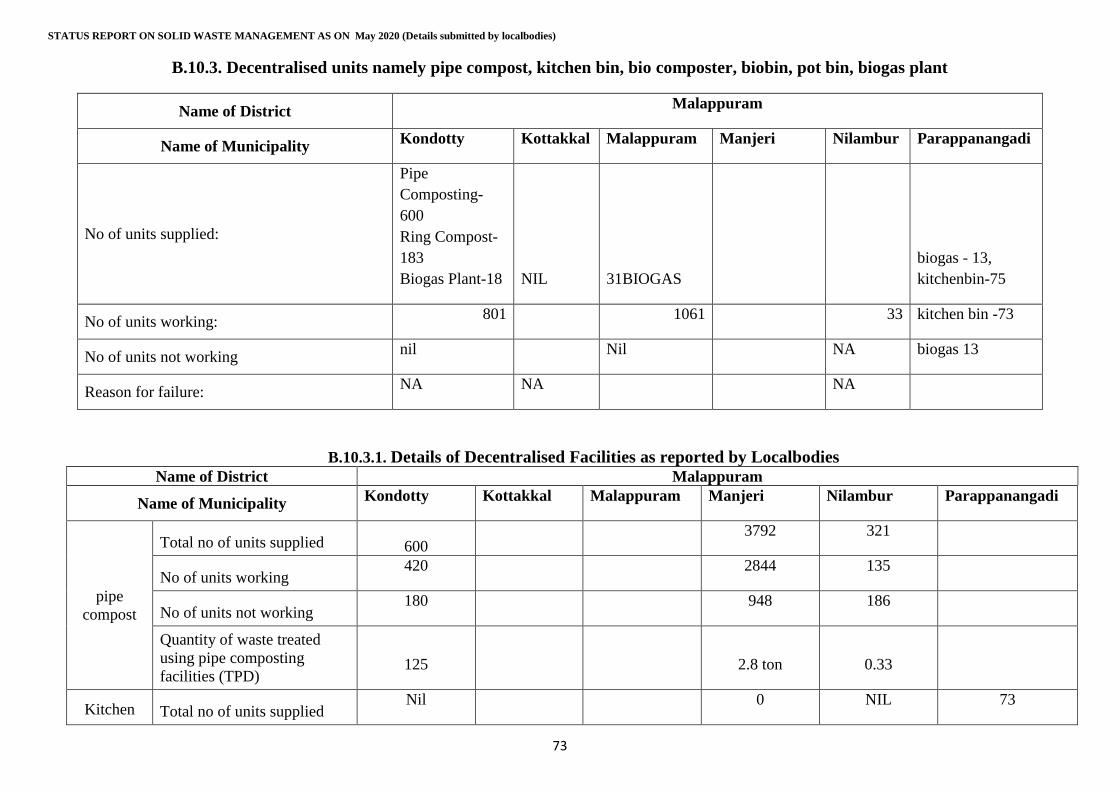
STATUS REPORT ON SOLID WASTE MANAGEMENT AS ON May 2020 (Details submitted by localbodies)
73
B.10.3. Decentralised units namely pipe compost, kitchen bin, bio composter, biobin, pot bin, biogas plant
Name of District Malappuram
Name of Municipality Kondotty Kottakkal Malappuram Manjeri Nilambur Parappanangadi
No of units supplied:
Pipe
Composting-
600
Ring Compost-
183
Biogas Plant-18 NIL 31BIOGAS
biogas - 13,
kitchenbin-75
No of units working: 801 1061 33 kitchen bin -73
No of units not working nil Nil NA biogas 13
Reason for failure: NA NA NA
B.10.3.1. Details of Decentralised Facilities as reported by Localbodies Name of District Malappuram
Name of Municipality Kondotty Kottakkal Malappuram Manjeri Nilambur Parappanangadi
pipe
compost
Total no of units supplied 600 3792 321
No of units working 420 2844 135
No of units not working 180 948 186
Quantity of waste treated
using pipe composting
facilities (TPD) 125 2.8 ton 0.33
Kitchen Total no of units supplied Nil 0 NIL 73
Annexure.1
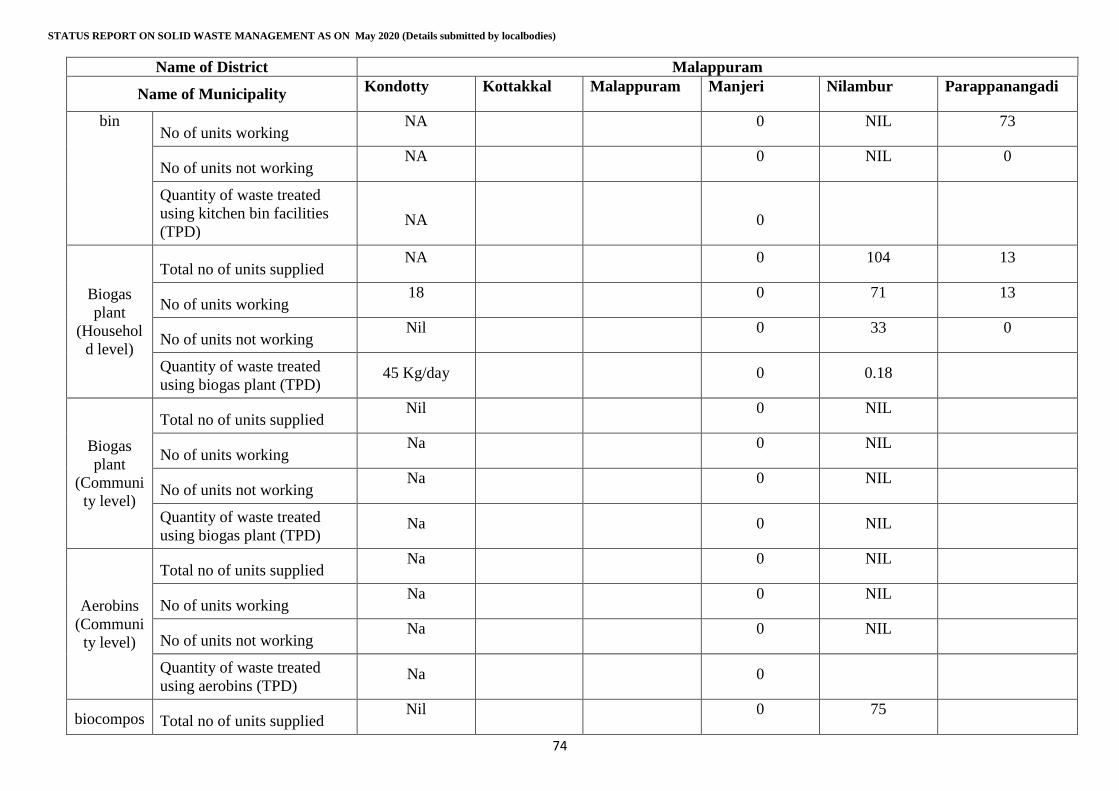
STATUS REPORT ON SOLID WASTE MANAGEMENT AS ON May 2020 (Details submitted by localbodies)
74
Name of District Malappuram
Name of Municipality Kondotty Kottakkal Malappuram Manjeri Nilambur Parappanangadi
bin No of units working
NA 0 NIL 73
No of units not working NA 0 NIL 0
Quantity of waste treated
using kitchen bin facilities
(TPD) NA 0
Biogas
plant
(Househol
d level)
Total no of units supplied NA 0 104 13
No of units working 18 0 71 13
No of units not working Nil 0 33 0
Quantity of waste treated
using biogas plant (TPD) 45 Kg/day 0 0.18
Biogas
plant
(Communi
ty level)
Total no of units supplied Nil 0 NIL
No of units working Na 0 NIL
No of units not working Na 0 NIL
Quantity of waste treated
using biogas plant (TPD) Na 0 NIL
Aerobins
(Communi
ty level)
Total no of units supplied Na 0 NIL
No of units working Na 0 NIL
No of units not working Na 0 NIL
Quantity of waste treated
using aerobins (TPD) Na 0
biocompos Total no of units supplied Nil 0 75
Annexure.1
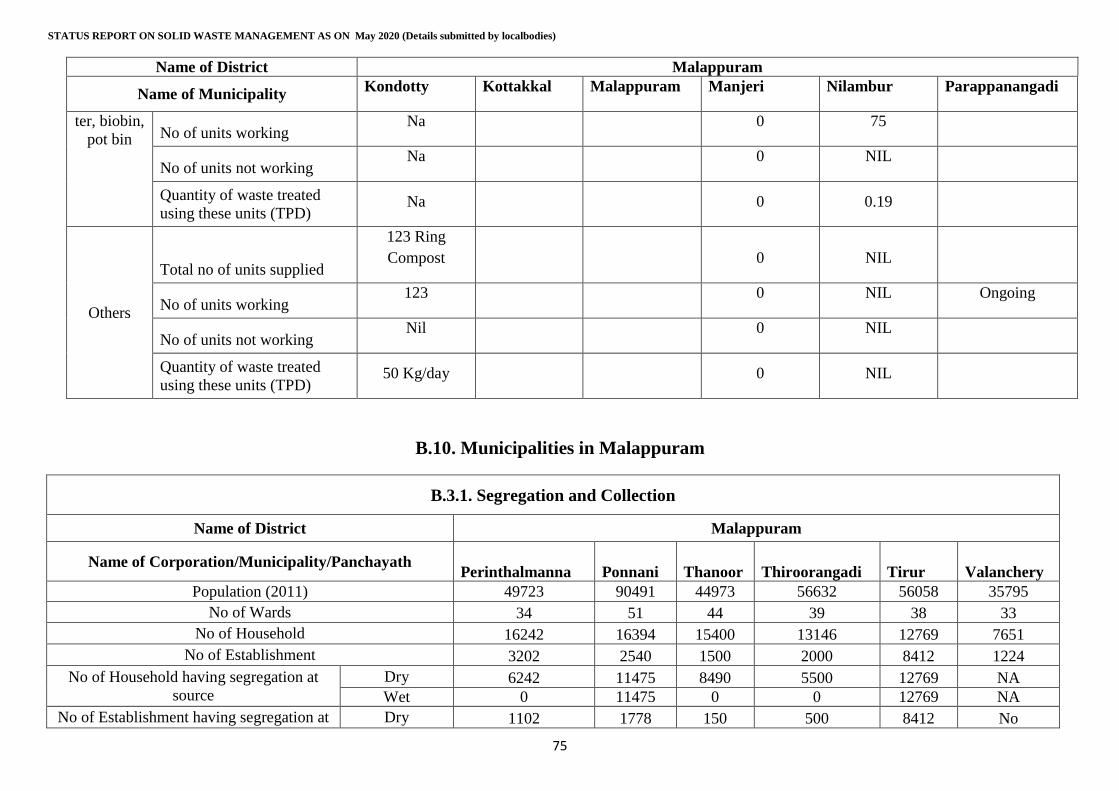
STATUS REPORT ON SOLID WASTE MANAGEMENT AS ON May 2020 (Details submitted by localbodies)
75
Name of District Malappuram
Name of Municipality Kondotty Kottakkal Malappuram Manjeri Nilambur Parappanangadi
ter, biobin,
pot bin No of units working Na 0 75
No of units not working Na 0 NIL
Quantity of waste treated
using these units (TPD) Na 0 0.19
Others
Total no of units supplied
123 Ring
Compost 0 NIL
No of units working 123 0 NIL Ongoing
No of units not working Nil 0 NIL
Quantity of waste treated
using these units (TPD) 50 Kg/day 0 NIL
B.10. Municipalities in Malappuram
B.3.1. Segregation and Collection
Name of District Malappuram
Name of Corporation/Municipality/Panchayath Perinthalmanna Ponnani Thanoor Thiroorangadi Tirur Valanchery
Population (2011) 49723 90491 44973 56632 56058 35795
No of Wards 34 51 44 39 38 33
No of Household 16242 16394 15400 13146 12769 7651
No of Establishment 3202 2540 1500 2000 8412 1224
No of Household having segregation at
source
Dry 6242 11475 8490 5500 12769 NA
Wet 0 11475 0 0 12769 NA
No of Establishment having segregation at Dry 1102 1778 150 500 8412 No
Annexure.1

STATUS REPORT ON SOLID WASTE MANAGEMENT AS ON May 2020 (Details submitted by localbodies)
76
B.3.1. Segregation and Collection
Name of District Malappuram
Name of Corporation/Municipality/Panchayath Perinthalmanna Ponnani Thanoor Thiroorangadi Tirur Valanchery
source Wet 193 1778 0 0 8412 No
D2D
Coll
ecti
on
Households
Number Dry 6242 11475 8490 5500 12769
Wet 0 0 0 0 0
Percentage Dry 38.5 70 55.2 41.9 100 0
Wet 0 0 0 0 0 0
Collection
Frequency
Dry
Monthly monthly
once in
month
once in every
three months
twice in
one
month
Once in a
month
Wet Nil Nil 0 Nil 0
Establishments
Number Dry 1102 1778 150 500 8412 Nil
Wet 193 0 0 0 0 Nil
Percentage Dry 34.5 70 10 25 100
Wet 6.1 0 0 0 0
Collection
Frequency
Dry
Daily
Twice/mo
nth
once in
week fortnightly
twice in
one
month Nil
Wet Daily nil 0 Nil 0 Nil
No of collectors 52 49 0 28 38 13
No of vehicles used 6 1 1 1 2 Nil
No. having source level treatment of wet
waste in operation
Household
1310 13115 8000 1912 12769 20%
Establishment 32 1905 1000 10 8412 Nil
Percentage having source level treatment
of wet waste in operation
Household
80 52 100 Nil
Establishment
75 67 100 Nil
No. disposing to centralised system Household Nil Nil 0 Nil nil Nil
Establishment Nil 2 0 Nil nil Nil
Percentage having disposal to centralised Household 0 0 0 Nil 0 Nil
Annexure.1
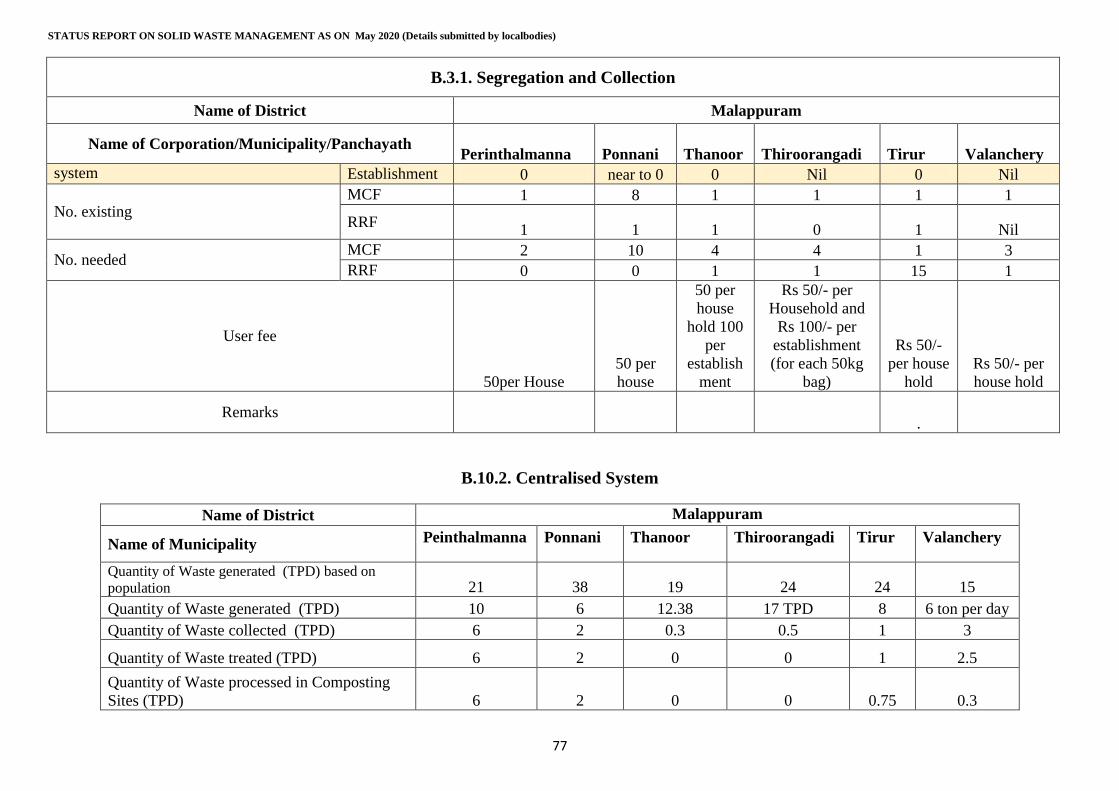
STATUS REPORT ON SOLID WASTE MANAGEMENT AS ON May 2020 (Details submitted by localbodies)
77
B.3.1. Segregation and Collection
Name of District Malappuram
Name of Corporation/Municipality/Panchayath Perinthalmanna Ponnani Thanoor Thiroorangadi Tirur Valanchery
system Establishment 0 near to 0 0 Nil 0 Nil
No. existing MCF 1 8 1 1 1 1
RRF 1 1 1 0 1 Nil
No. needed MCF 2 10 4 4 1 3
RRF 0 0 1 1 15 1
User fee
50per House
50 per
house
50 per
house
hold 100
per
establish
ment
Rs 50/- per
Household and
Rs 100/- per
establishment
(for each 50kg
bag)
Rs 50/-
per house
hold
Rs 50/- per
house hold
Remarks
.
B.10.2. Centralised System
Name of District Malappuram
Name of Municipality Peinthalmanna Ponnani Thanoor Thiroorangadi Tirur Valanchery
Quantity of Waste generated (TPD) based on
population 21 38 19 24 24 15
Quantity of Waste generated (TPD) 10 6 12.38 17 TPD 8 6 ton per day
Quantity of Waste collected (TPD) 6 2 0.3 0.5 1 3
Quantity of Waste treated (TPD) 6 2 0 0 1 2.5
Quantity of Waste processed in Composting
Sites (TPD) 6 2 0 0 0.75 0.3
Annexure.1
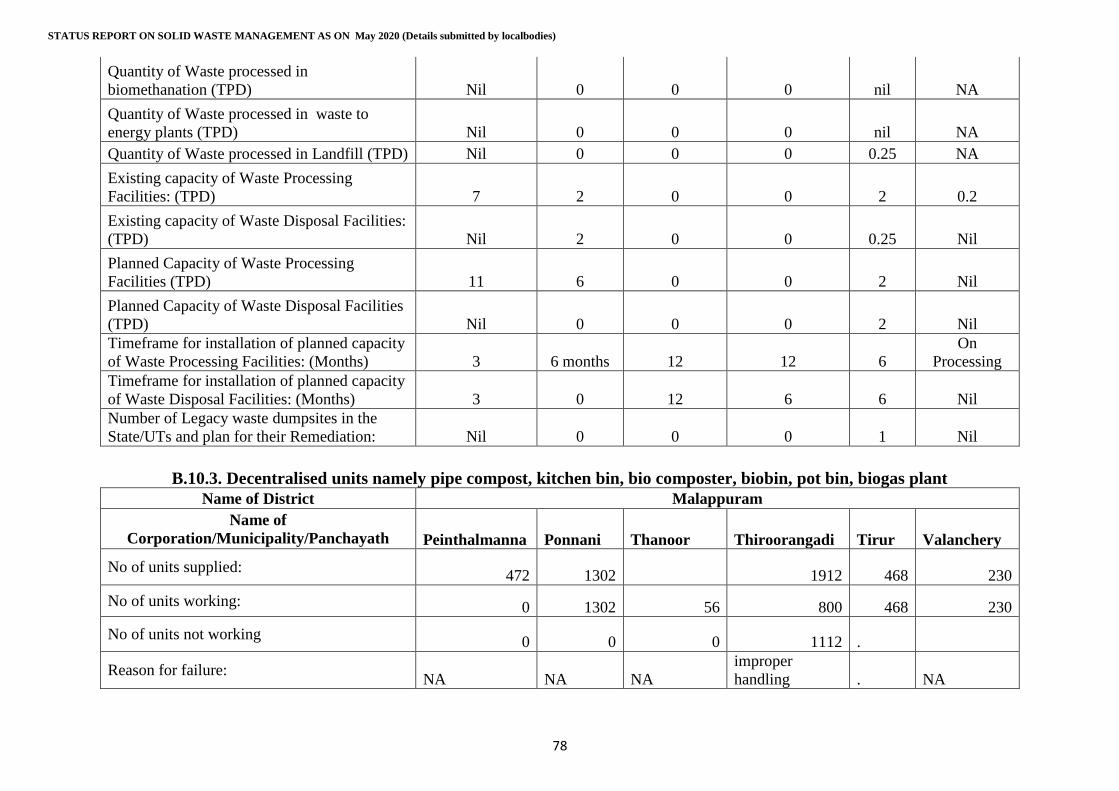
STATUS REPORT ON SOLID WASTE MANAGEMENT AS ON May 2020 (Details submitted by localbodies)
78
Quantity of Waste processed in
biomethanation (TPD) Nil 0 0 0 nil NA
Quantity of Waste processed in waste to
energy plants (TPD) Nil 0 0 0 nil NA
Quantity of Waste processed in Landfill (TPD) Nil 0 0 0 0.25 NA
Existing capacity of Waste Processing
Facilities: (TPD) 7 2 0 0 2 0.2
Existing capacity of Waste Disposal Facilities:
(TPD) Nil 2 0 0 0.25 Nil
Planned Capacity of Waste Processing
Facilities (TPD) 11 6 0 0 2 Nil
Planned Capacity of Waste Disposal Facilities
(TPD) Nil 0 0 0 2 Nil
Timeframe for installation of planned capacity
of Waste Processing Facilities: (Months) 3 6 months 12 12 6
On
Processing
Timeframe for installation of planned capacity
of Waste Disposal Facilities: (Months) 3 0 12 6 6 Nil
Number of Legacy waste dumpsites in the
State/UTs and plan for their Remediation: Nil 0 0 0 1 Nil
B.10.3. Decentralised units namely pipe compost, kitchen bin, bio composter, biobin, pot bin, biogas plant
Name of District Malappuram
Name of
Corporation/Municipality/Panchayath Peinthalmanna Ponnani Thanoor Thiroorangadi Tirur Valanchery
No of units supplied: 472 1302 1912 468 230
No of units working: 0 1302 56 800 468 230
No of units not working 0 0 0 1112 .
Reason for failure: NA NA NA
improper
handling . NA
Annexure.1
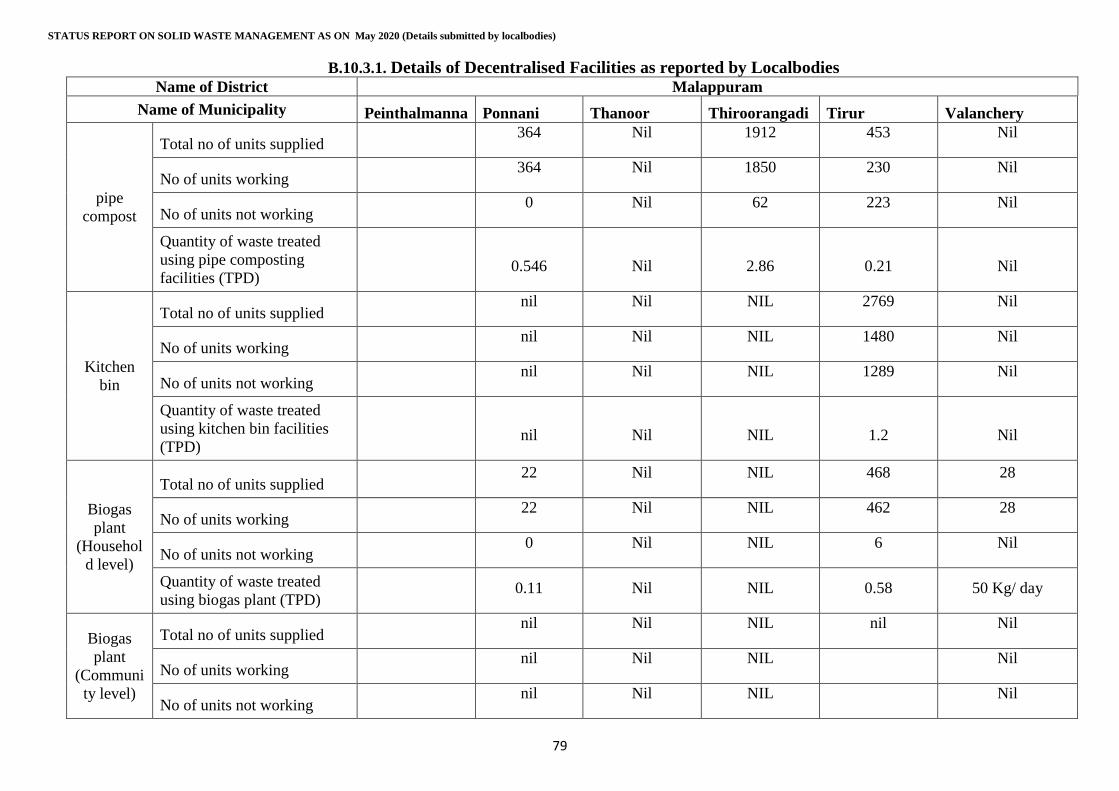
STATUS REPORT ON SOLID WASTE MANAGEMENT AS ON May 2020 (Details submitted by localbodies)
79
B.10.3.1. Details of Decentralised Facilities as reported by Localbodies Name of District Malappuram
Name of Municipality Peinthalmanna Ponnani Thanoor Thiroorangadi Tirur Valanchery
pipe
compost
Total no of units supplied
364 Nil 1912 453 Nil
No of units working
364 Nil 1850 230 Nil
No of units not working
0 Nil 62 223 Nil
Quantity of waste treated
using pipe composting
facilities (TPD)
0.546 Nil 2.86 0.21 Nil
Kitchen
bin
Total no of units supplied
nil Nil NIL 2769 Nil
No of units working
nil Nil NIL 1480 Nil
No of units not working
nil Nil NIL 1289 Nil
Quantity of waste treated
using kitchen bin facilities
(TPD)
nil Nil NIL 1.2 Nil
Biogas
plant
(Househol
d level)
Total no of units supplied
22 Nil NIL 468 28
No of units working
22 Nil NIL 462 28
No of units not working
0 Nil NIL 6 Nil
Quantity of waste treated
using biogas plant (TPD)
0.11 Nil NIL 0.58 50 Kg/ day
Biogas
plant
(Communi
ty level)
Total no of units supplied
nil Nil NIL nil Nil
No of units working
nil Nil NIL
Nil
No of units not working
nil Nil NIL
Nil
Annexure.1
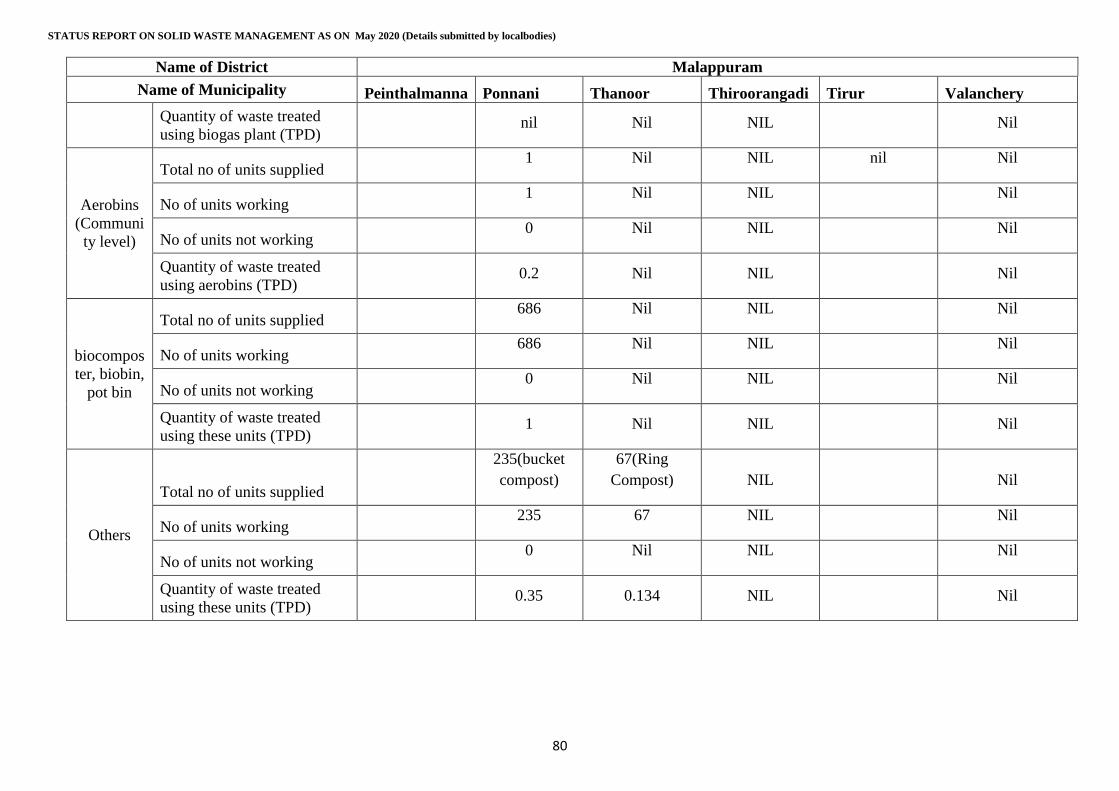
STATUS REPORT ON SOLID WASTE MANAGEMENT AS ON May 2020 (Details submitted by localbodies)
80
Name of District Malappuram
Name of Municipality Peinthalmanna Ponnani Thanoor Thiroorangadi Tirur Valanchery
Quantity of waste treated
using biogas plant (TPD)
nil Nil NIL
Nil
Aerobins
(Communi
ty level)
Total no of units supplied
1 Nil NIL nil Nil
No of units working
1 Nil NIL
Nil
No of units not working
0 Nil NIL
Nil
Quantity of waste treated
using aerobins (TPD)
0.2 Nil NIL
Nil
biocompos
ter, biobin,
pot bin
Total no of units supplied
686 Nil NIL
Nil
No of units working
686 Nil NIL
Nil
No of units not working
0 Nil NIL
Nil
Quantity of waste treated
using these units (TPD)
1 Nil NIL
Nil
Others
Total no of units supplied
235(bucket
compost)
67(Ring
Compost) NIL
Nil
No of units working
235 67 NIL
Nil
No of units not working
0 Nil NIL
Nil
Quantity of waste treated
using these units (TPD)
0.35 0.134 NIL
Nil
Annexure.1

STATUS REPORT ON SOLID WASTE MANAGEMENT AS ON May 2020 (Details submitted by localbodies)
81
B.11. Municipalities in Kozhikode
B.11.1. Segregation and Collection
Name of District Kozhikode
Name of Corporation Faroke Koduvally Koyilandy Mukkam Payyoli Ramanattukara Vadakara
Population (2011) 32122 48678 71873 40670 23576 35937 75295
No of Wards 38 36 44 33 36 31 47
No of Household 14562 10623 17086 8134 13800 10123 18000
No of Establishment 1750 1292 2860 2022 1400 1400 5938
No of Household having
segregation at source
Dry 6500 5300 10241 7315 6900 nil 16000
Wet 6500 310 12040 Nil 10400 Nil nil
No of Establishment
having segregation at
source
Dry 59 2520 1950 1836 840 NIl 4000
Wet 12 0 2100 Nil 1220 nil nil
D2D
Coll
ecti
on
Househol
ds
Number Dry 6500 - 10200 7315 Nil 16000
Wet 6500 - NIL nil Nil nil
Percentage Dry 44.7 59.7 90 0 88.9
Wet 44.7 0
Collection
Frequency
Dry once in a
month per month MONTHLY monthly nil 13500
Wet not collecting - NIL nil nil nil
Establish
ments
Number Dry 59 - 225 1836 nil 5938
Wet 12 - 225 nil nil nil
Percentage Dry 3.4 7.9 90.9 0 100
Wet 0.7 7.9 0
Collection
Frequency
Dry once in a
week - DAILY monthly Nil 4000
Wet daily - DAILY nil Nil nil
No of collectors 18 72 (Haritha
Karma Sena 100 38 Nil 63
No of vehicles used 1 one (on
contract) 1 1 Nil 3
Annexure.1
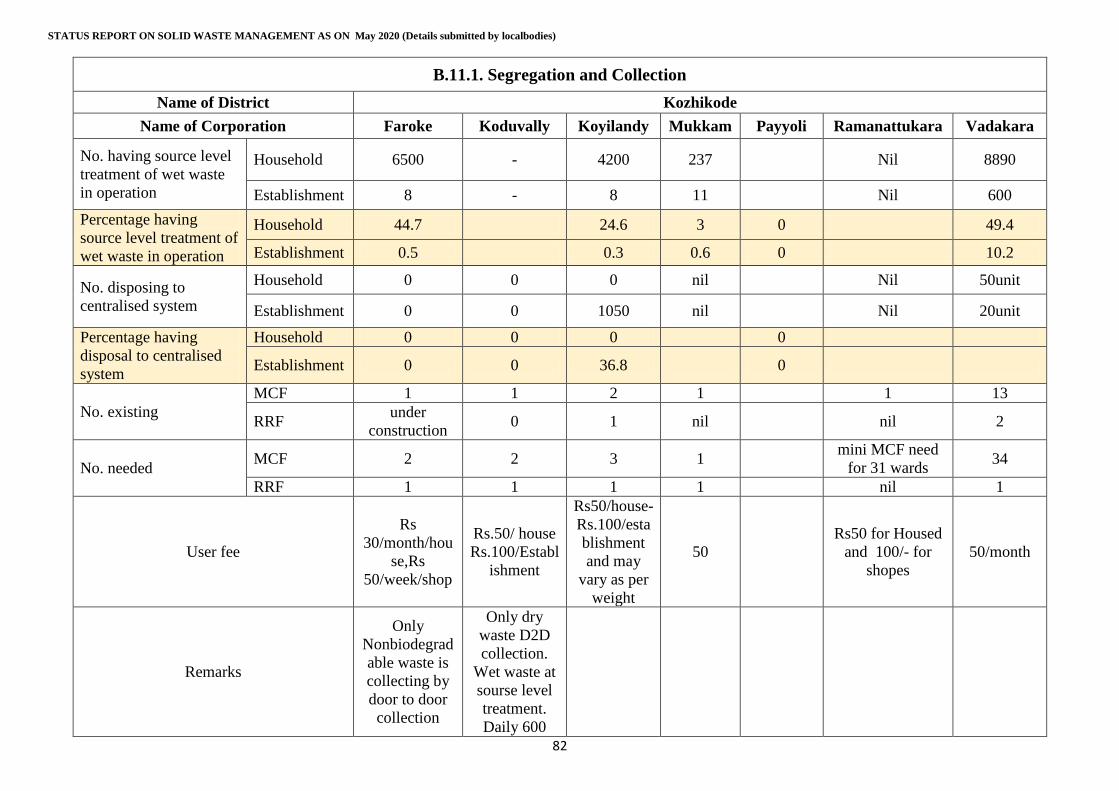
STATUS REPORT ON SOLID WASTE MANAGEMENT AS ON May 2020 (Details submitted by localbodies)
82
B.11.1. Segregation and Collection
Name of District Kozhikode
Name of Corporation Faroke Koduvally Koyilandy Mukkam Payyoli Ramanattukara Vadakara
No. having source level
treatment of wet waste
in operation
Household 6500 - 4200 237 Nil 8890
Establishment 8 - 8 11 Nil 600
Percentage having
source level treatment of
wet waste in operation
Household 44.7 24.6 3 0 49.4
Establishment 0.5 0.3 0.6 0 10.2
No. disposing to
centralised system
Household 0 0 0 nil Nil 50unit
Establishment 0 0 1050 nil Nil 20unit
Percentage having
disposal to centralised
system
Household 0 0 0 0
Establishment 0 0 36.8 0
No. existing
MCF 1 1 2 1 1 13
RRF under
construction 0 1 nil nil 2
No. needed MCF 2 2 3 1
mini MCF need
for 31 wards 34
RRF 1 1 1 1 nil 1
User fee
Rs
30/month/hou
se,Rs
50/week/shop
Rs.50/ house
Rs.100/Establ
ishment
Rs50/house-
Rs.100/esta
blishment
and may
vary as per
weight
50
Rs50 for Housed
and 100/- for
shopes
50/month
Remarks
Only
Nonbiodegrad
able waste is
collecting by
door to door
collection
Only dry
waste D2D
collection.
Wet waste at
sourse level
treatment.
Daily 600
Annexure.1
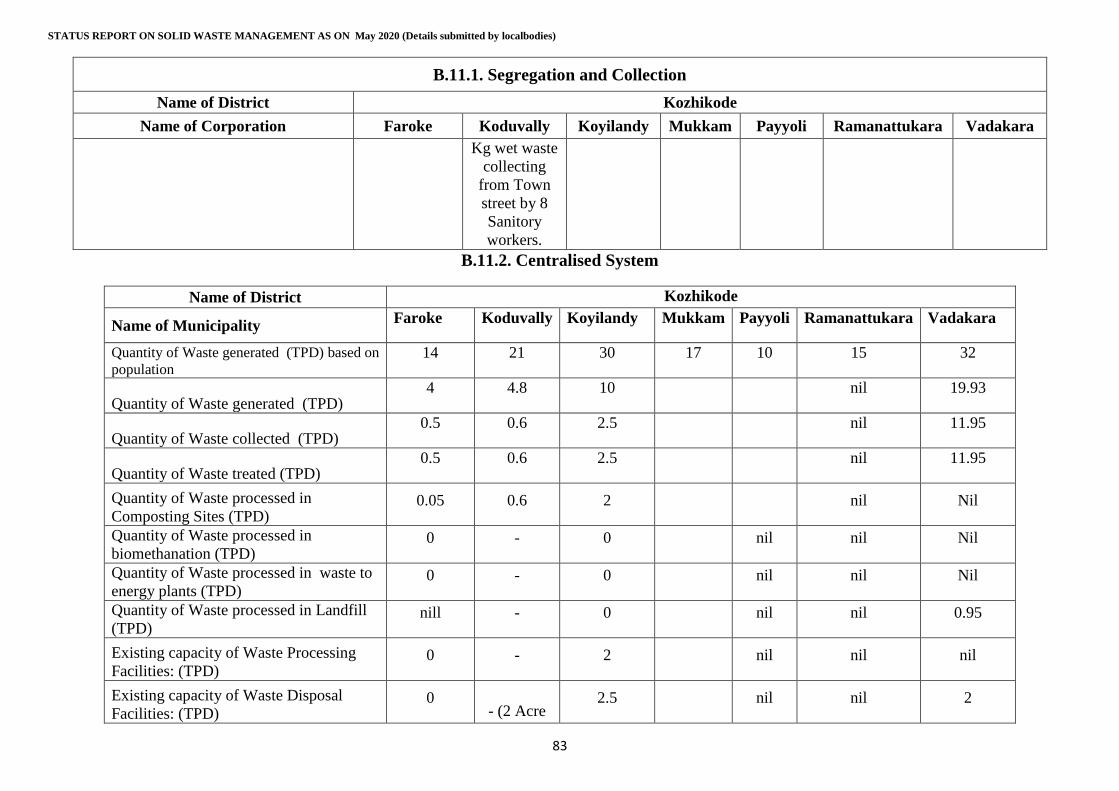
STATUS REPORT ON SOLID WASTE MANAGEMENT AS ON May 2020 (Details submitted by localbodies)
83
B.11.1. Segregation and Collection
Name of District Kozhikode
Name of Corporation Faroke Koduvally Koyilandy Mukkam Payyoli Ramanattukara Vadakara
Kg wet waste
collecting
from Town
street by 8
Sanitory
workers.
B.11.2. Centralised System
Name of District Kozhikode
Name of Municipality Faroke Koduvally Koyilandy Mukkam Payyoli Ramanattukara Vadakara
Quantity of Waste generated (TPD) based on
population 14 21 30 17 10 15 32
Quantity of Waste generated (TPD) 4 4.8 10 nil 19.93
Quantity of Waste collected (TPD) 0.5 0.6 2.5 nil 11.95
Quantity of Waste treated (TPD) 0.5 0.6 2.5 nil 11.95
Quantity of Waste processed in
Composting Sites (TPD) 0.05 0.6 2 nil Nil
Quantity of Waste processed in
biomethanation (TPD) 0 - 0 nil nil Nil
Quantity of Waste processed in waste to
energy plants (TPD) 0 - 0 nil nil Nil
Quantity of Waste processed in Landfill
(TPD) nill - 0 nil nil 0.95
Existing capacity of Waste Processing
Facilities: (TPD) 0 - 2 nil nil nil
Existing capacity of Waste Disposal
Facilities: (TPD) 0
- (2 Acre 2.5 nil nil 2
Annexure.1
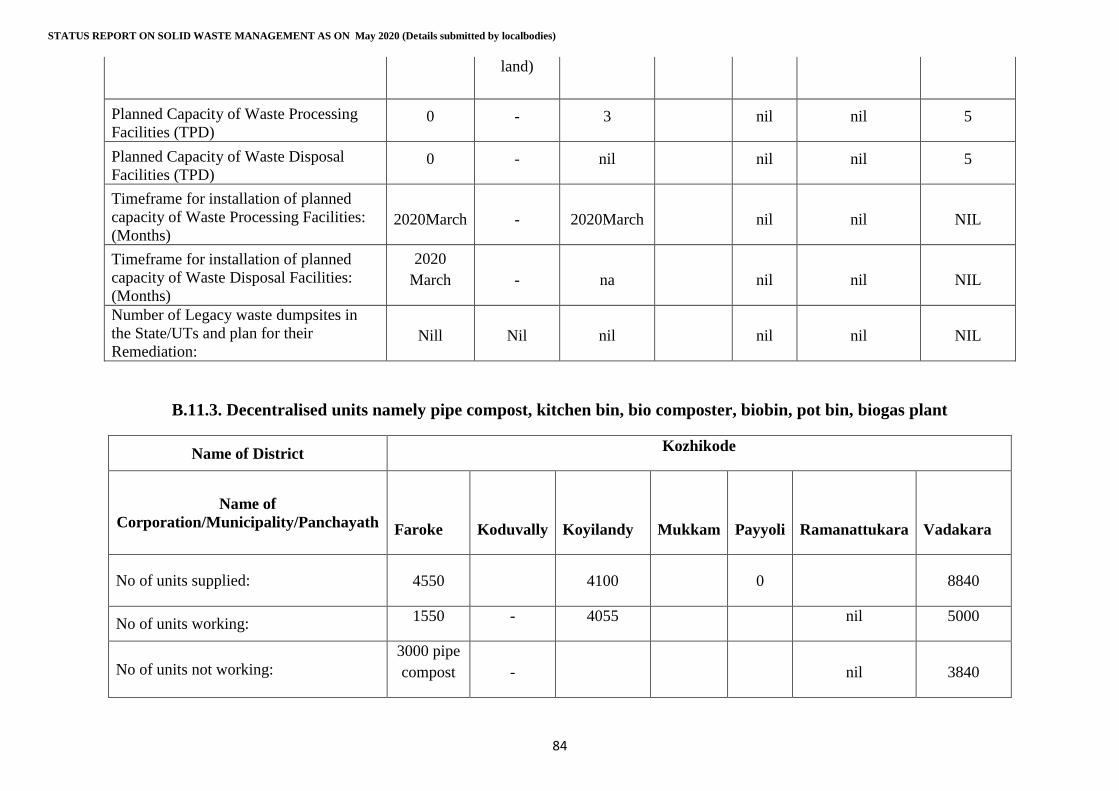
STATUS REPORT ON SOLID WASTE MANAGEMENT AS ON May 2020 (Details submitted by localbodies)
84
land)
Planned Capacity of Waste Processing
Facilities (TPD) 0 - 3 nil nil 5
Planned Capacity of Waste Disposal
Facilities (TPD) 0 - nil nil nil 5
Timeframe for installation of planned
capacity of Waste Processing Facilities:
(Months) 2020March - 2020March nil nil NIL
Timeframe for installation of planned
capacity of Waste Disposal Facilities:
(Months)
2020
March - na nil nil NIL
Number of Legacy waste dumpsites in
the State/UTs and plan for their
Remediation: Nill Nil nil nil nil NIL
B.11.3. Decentralised units namely pipe compost, kitchen bin, bio composter, biobin, pot bin, biogas plant
Name of District Kozhikode
Name of
Corporation/Municipality/Panchayath Faroke Koduvally Koyilandy Mukkam Payyoli Ramanattukara Vadakara
No of units supplied: 4550 4100 0 8840
No of units working: 1550 - 4055 nil 5000
No of units not working:
3000 pipe
compost - nil 3840
Annexure.1
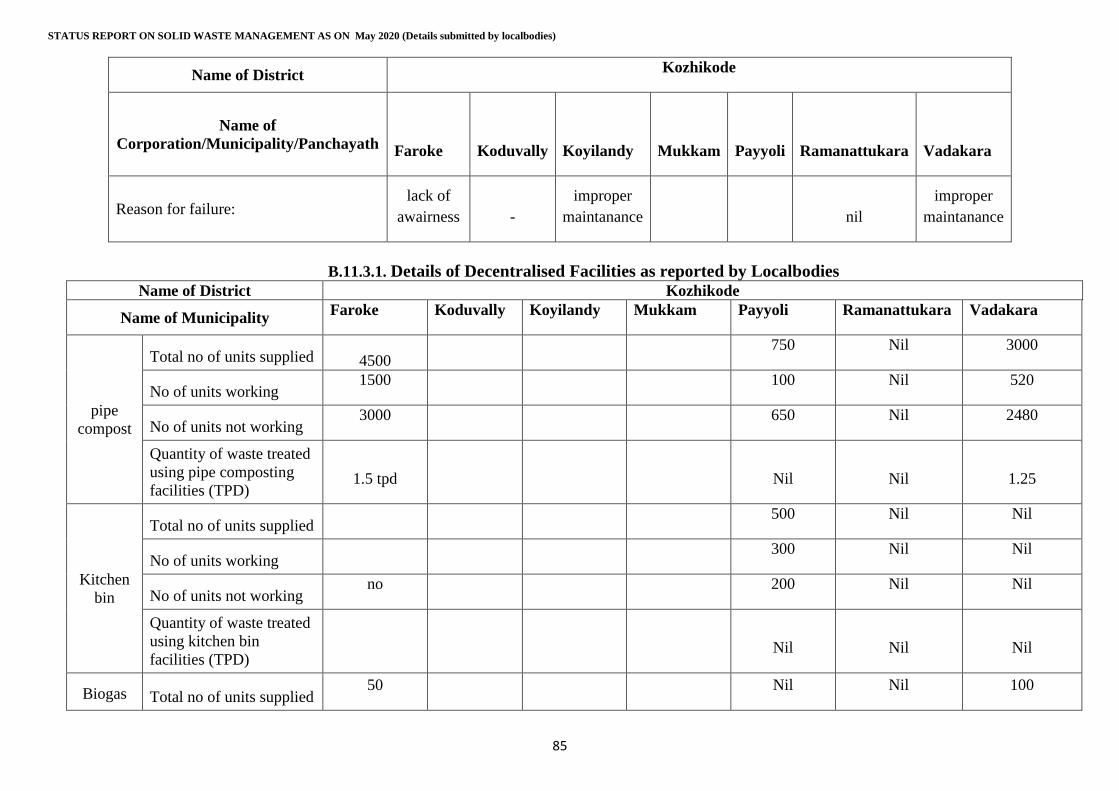
STATUS REPORT ON SOLID WASTE MANAGEMENT AS ON May 2020 (Details submitted by localbodies)
85
Name of District Kozhikode
Name of
Corporation/Municipality/Panchayath Faroke Koduvally Koyilandy Mukkam Payyoli Ramanattukara Vadakara
Reason for failure: lack of
awairness -
improper
maintanance nil
improper
maintanance
B.11.3.1. Details of Decentralised Facilities as reported by Localbodies Name of District Kozhikode
Name of Municipality Faroke Koduvally Koyilandy Mukkam Payyoli Ramanattukara Vadakara
pipe
compost
Total no of units supplied 4500
750 Nil 3000
No of units working 1500
100 Nil 520
No of units not working 3000
650 Nil 2480
Quantity of waste treated
using pipe composting
facilities (TPD) 1.5 tpd
Nil Nil 1.25
Kitchen
bin
Total no of units supplied
500 Nil Nil
No of units working
300 Nil Nil
No of units not working no
200 Nil Nil
Quantity of waste treated
using kitchen bin
facilities (TPD)
Nil Nil Nil
Biogas Total no of units supplied 50
Nil Nil 100
Annexure.1
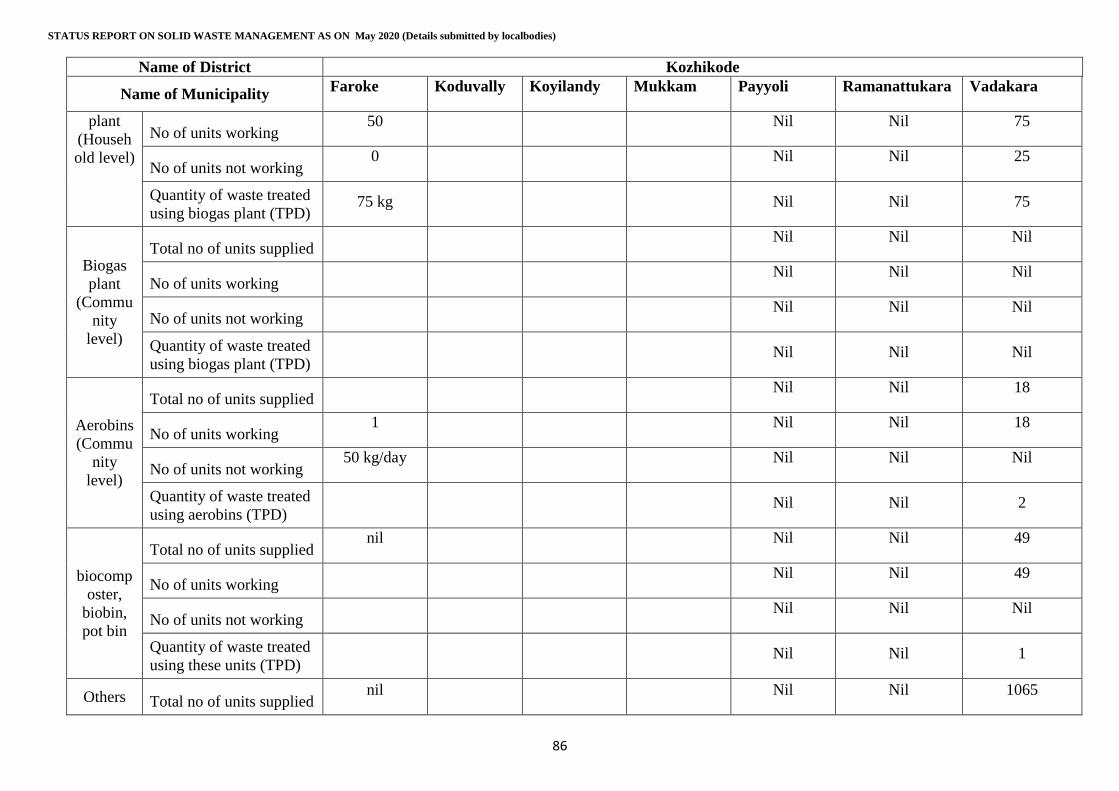
STATUS REPORT ON SOLID WASTE MANAGEMENT AS ON May 2020 (Details submitted by localbodies)
86
Name of District Kozhikode
Name of Municipality Faroke Koduvally Koyilandy Mukkam Payyoli Ramanattukara Vadakara
plant
(Househ
old level)
No of units working 50
Nil Nil 75
No of units not working 0
Nil Nil 25
Quantity of waste treated
using biogas plant (TPD) 75 kg
Nil Nil 75
Biogas
plant
(Commu
nity
level)
Total no of units supplied
Nil Nil Nil
No of units working
Nil Nil Nil
No of units not working
Nil Nil Nil
Quantity of waste treated
using biogas plant (TPD)
Nil Nil Nil
Aerobins
(Commu
nity
level)
Total no of units supplied
Nil Nil 18
No of units working 1
Nil Nil 18
No of units not working 50 kg/day
Nil Nil Nil
Quantity of waste treated
using aerobins (TPD)
Nil Nil 2
biocomp
oster,
biobin,
pot bin
Total no of units supplied nil
Nil Nil 49
No of units working
Nil Nil 49
No of units not working
Nil Nil Nil
Quantity of waste treated
using these units (TPD)
Nil Nil 1
Others Total no of units supplied nil
Nil Nil 1065
Annexure.1
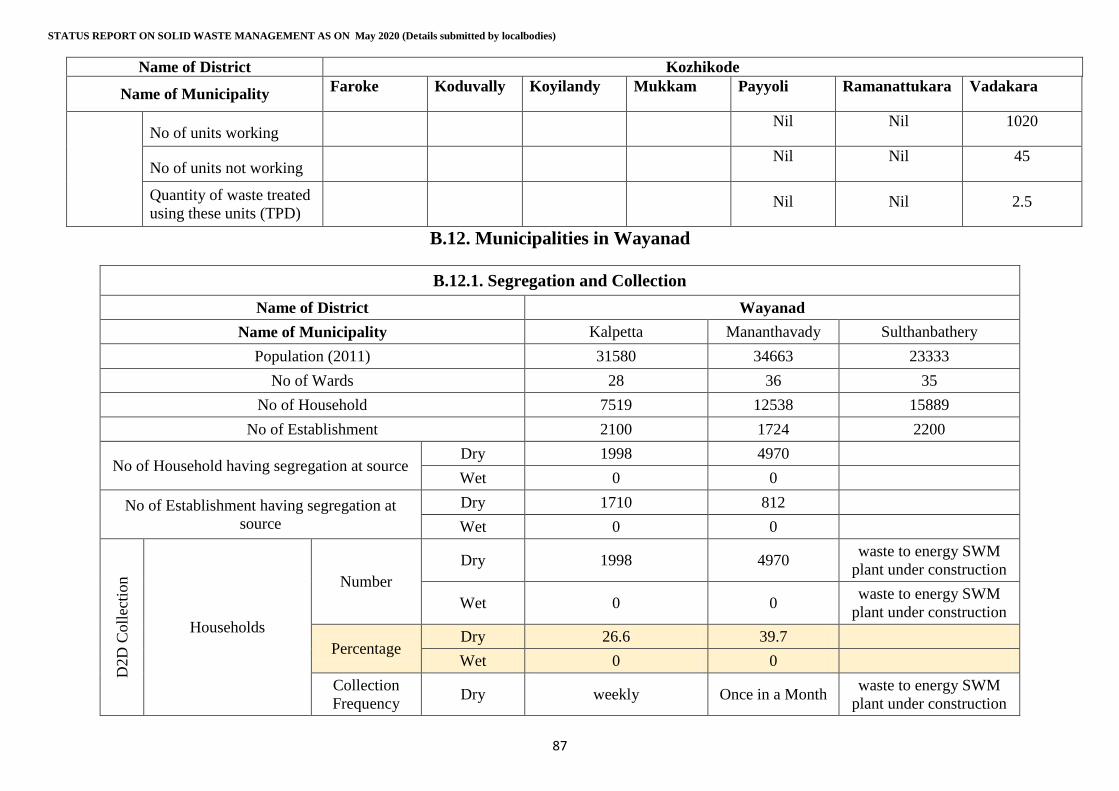
STATUS REPORT ON SOLID WASTE MANAGEMENT AS ON May 2020 (Details submitted by localbodies)
87
Name of District Kozhikode
Name of Municipality Faroke Koduvally Koyilandy Mukkam Payyoli Ramanattukara Vadakara
No of units working
Nil Nil 1020
No of units not working
Nil Nil 45
Quantity of waste treated
using these units (TPD)
Nil Nil 2.5
B.12. Municipalities in Wayanad
B.12.1. Segregation and Collection
Name of District Wayanad
Name of Municipality Kalpetta Mananthavady Sulthanbathery
Population (2011) 31580 34663 23333
No of Wards 28 36 35
No of Household 7519 12538 15889
No of Establishment 2100 1724 2200
No of Household having segregation at source Dry 1998 4970
Wet 0 0
No of Establishment having segregation at
source
Dry 1710 812
Wet 0 0
D2D
Coll
ecti
on
Households
Number
Dry 1998 4970 waste to energy SWM
plant under construction
Wet 0 0 waste to energy SWM
plant under construction
Percentage Dry 26.6 39.7
Wet 0 0
Collection
Frequency Dry weekly Once in a Month
waste to energy SWM
plant under construction
Annexure.1
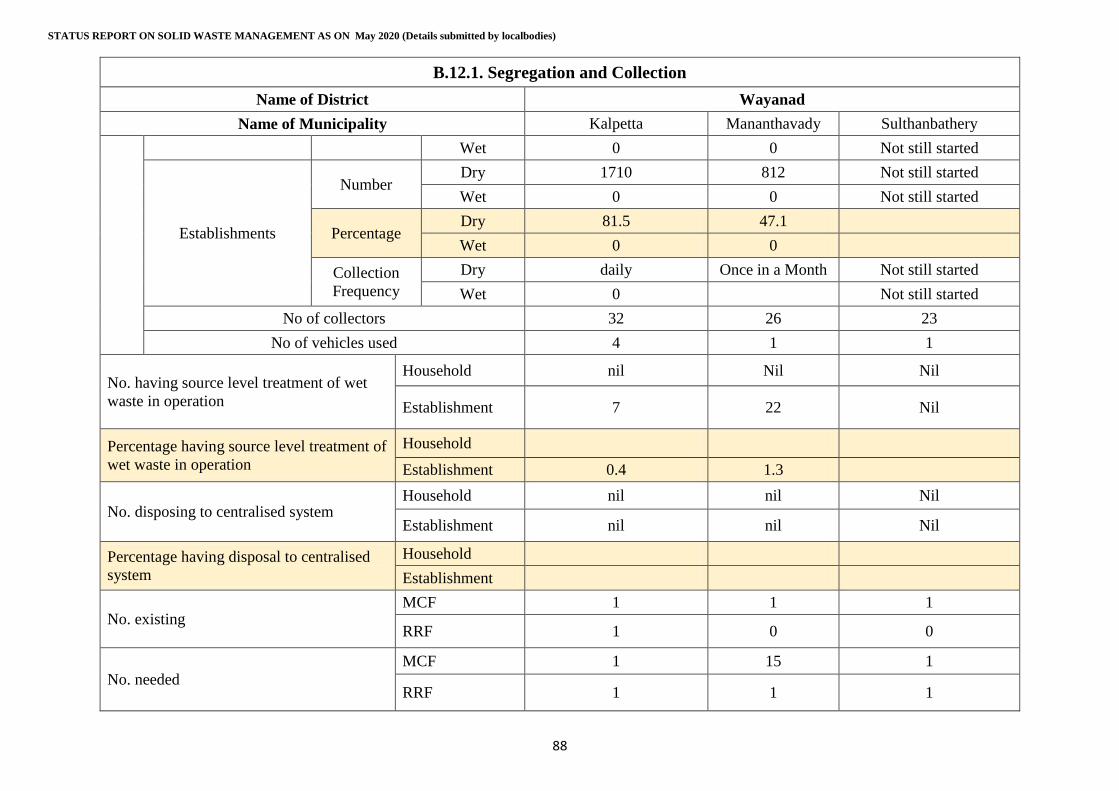
STATUS REPORT ON SOLID WASTE MANAGEMENT AS ON May 2020 (Details submitted by localbodies)
88
B.12.1. Segregation and Collection
Name of District Wayanad
Name of Municipality Kalpetta Mananthavady Sulthanbathery
Wet 0 0 Not still started
Establishments
Number Dry 1710 812 Not still started
Wet 0 0 Not still started
Percentage Dry 81.5 47.1
Wet 0 0
Collection
Frequency
Dry daily Once in a Month Not still started
Wet 0
Not still started
No of collectors 32 26 23
No of vehicles used 4 1 1
No. having source level treatment of wet
waste in operation
Household nil Nil Nil
Establishment 7 22 Nil
Percentage having source level treatment of
wet waste in operation
Household
Establishment 0.4 1.3
No. disposing to centralised system Household nil nil Nil
Establishment nil nil Nil
Percentage having disposal to centralised
system
Household
Establishment
No. existing MCF 1 1 1
RRF 1 0 0
No. needed
MCF 1 15 1
RRF 1 1 1
Annexure.1
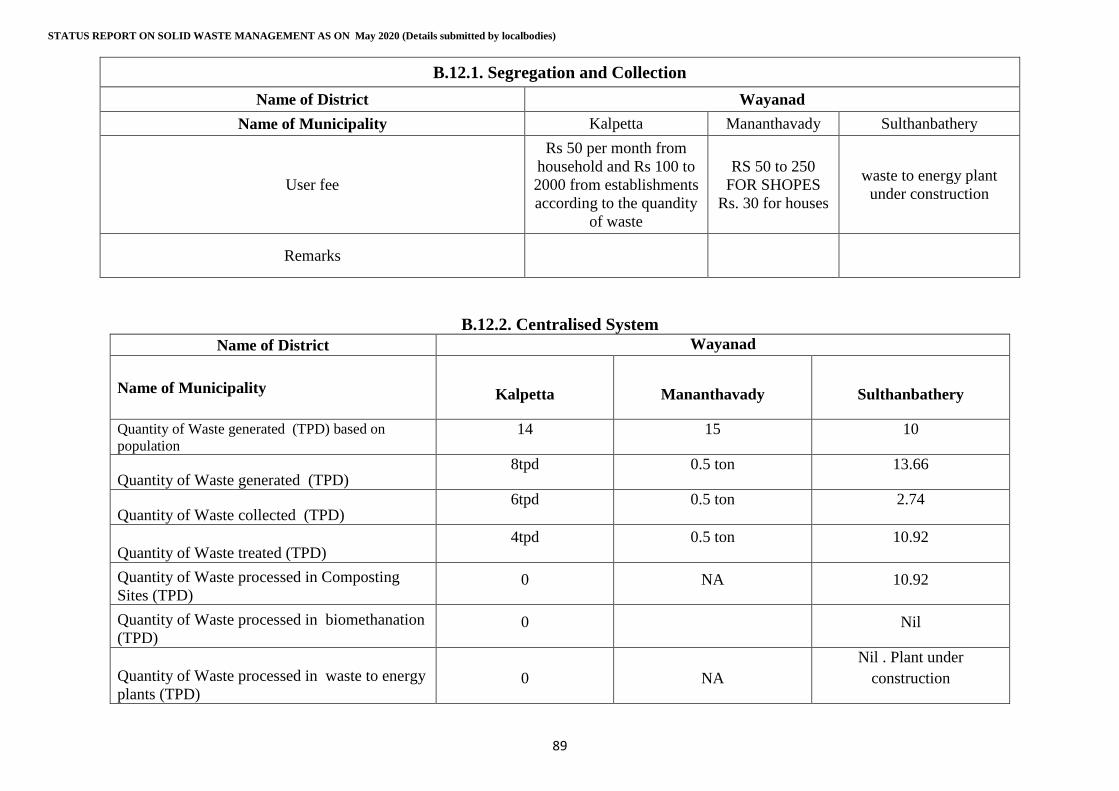
STATUS REPORT ON SOLID WASTE MANAGEMENT AS ON May 2020 (Details submitted by localbodies)
89
B.12.1. Segregation and Collection
Name of District Wayanad
Name of Municipality Kalpetta Mananthavady Sulthanbathery
User fee
Rs 50 per month from
household and Rs 100 to
2000 from establishments
according to the quandity
of waste
RS 50 to 250
FOR SHOPES
Rs. 30 for houses
waste to energy plant
under construction
Remarks
B.12.2. Centralised System
Name of District Wayanad
Name of Municipality Kalpetta Mananthavady Sulthanbathery
Quantity of Waste generated (TPD) based on
population 14 15 10
Quantity of Waste generated (TPD) 8tpd 0.5 ton 13.66
Quantity of Waste collected (TPD) 6tpd 0.5 ton 2.74
Quantity of Waste treated (TPD) 4tpd 0.5 ton 10.92
Quantity of Waste processed in Composting
Sites (TPD) 0 NA 10.92
Quantity of Waste processed in biomethanation
(TPD) 0 Nil
Quantity of Waste processed in waste to energy
plants (TPD) 0 NA
Nil . Plant under
construction
Annexure.1
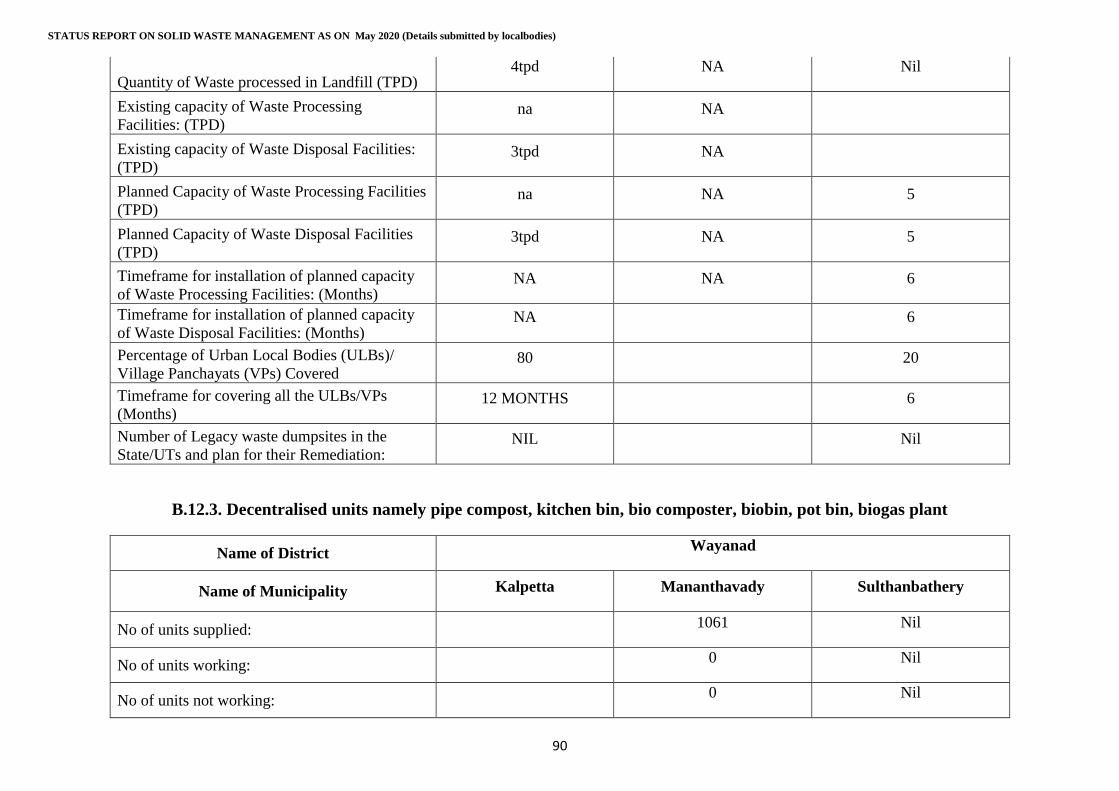
STATUS REPORT ON SOLID WASTE MANAGEMENT AS ON May 2020 (Details submitted by localbodies)
90
Quantity of Waste processed in Landfill (TPD) 4tpd NA Nil
Existing capacity of Waste Processing
Facilities: (TPD) na NA
Existing capacity of Waste Disposal Facilities:
(TPD) 3tpd NA
Planned Capacity of Waste Processing Facilities
(TPD) na NA 5
Planned Capacity of Waste Disposal Facilities
(TPD) 3tpd NA 5
Timeframe for installation of planned capacity
of Waste Processing Facilities: (Months) NA NA 6
Timeframe for installation of planned capacity
of Waste Disposal Facilities: (Months) NA 6
Percentage of Urban Local Bodies (ULBs)/
Village Panchayats (VPs) Covered 80 20
Timeframe for covering all the ULBs/VPs
(Months) 12 MONTHS 6
Number of Legacy waste dumpsites in the
State/UTs and plan for their Remediation: NIL Nil
B.12.3. Decentralised units namely pipe compost, kitchen bin, bio composter, biobin, pot bin, biogas plant
Name of District Wayanad
Name of Municipality Kalpetta Mananthavady Sulthanbathery
No of units supplied: 1061 Nil
No of units working: 0 Nil
No of units not working: 0 Nil
Annexure.1
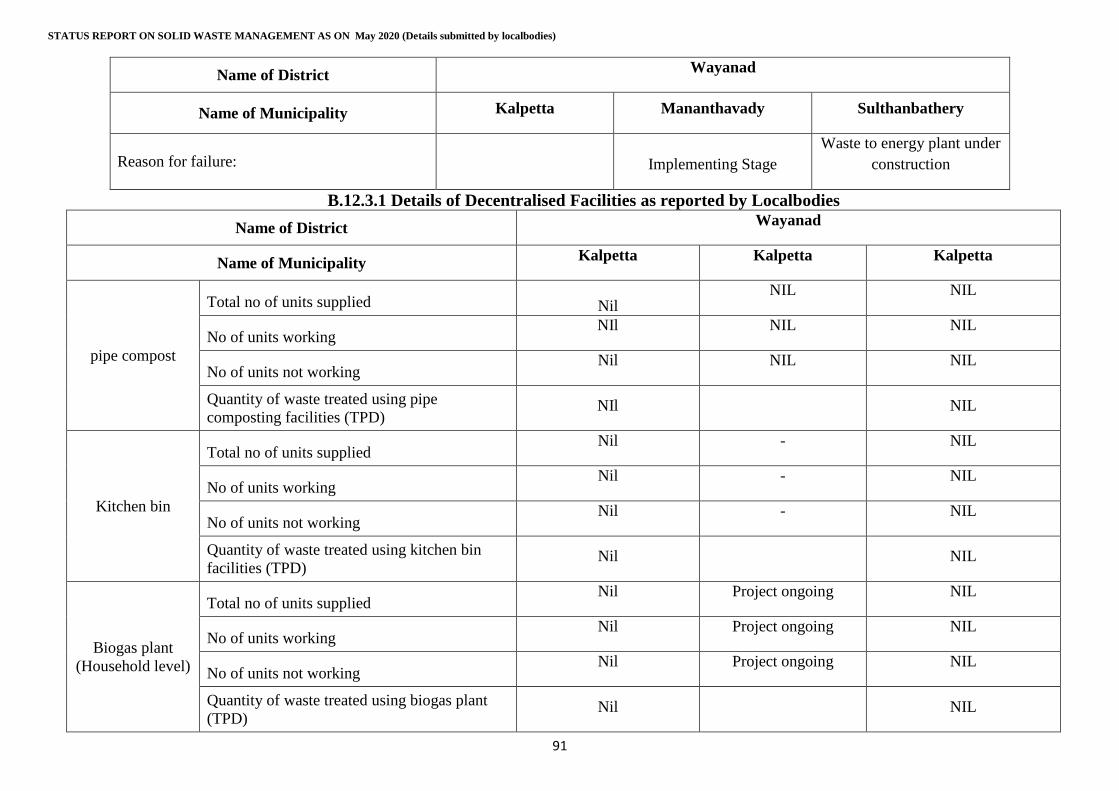
STATUS REPORT ON SOLID WASTE MANAGEMENT AS ON May 2020 (Details submitted by localbodies)
91
Name of District Wayanad
Name of Municipality Kalpetta Mananthavady Sulthanbathery
Reason for failure: Implementing Stage
Waste to energy plant under
construction
B.12.3.1 Details of Decentralised Facilities as reported by Localbodies
Name of District Wayanad
Name of Municipality Kalpetta Kalpetta Kalpetta
pipe compost
Total no of units supplied Nil NIL NIL
No of units working NIl NIL NIL
No of units not working Nil NIL NIL
Quantity of waste treated using pipe
composting facilities (TPD) NIl NIL
Kitchen bin
Total no of units supplied Nil - NIL
No of units working Nil - NIL
No of units not working Nil - NIL
Quantity of waste treated using kitchen bin
facilities (TPD) Nil NIL
Biogas plant
(Household level)
Total no of units supplied Nil Project ongoing NIL
No of units working Nil Project ongoing NIL
No of units not working Nil Project ongoing NIL
Quantity of waste treated using biogas plant
(TPD) Nil NIL
Annexure.1
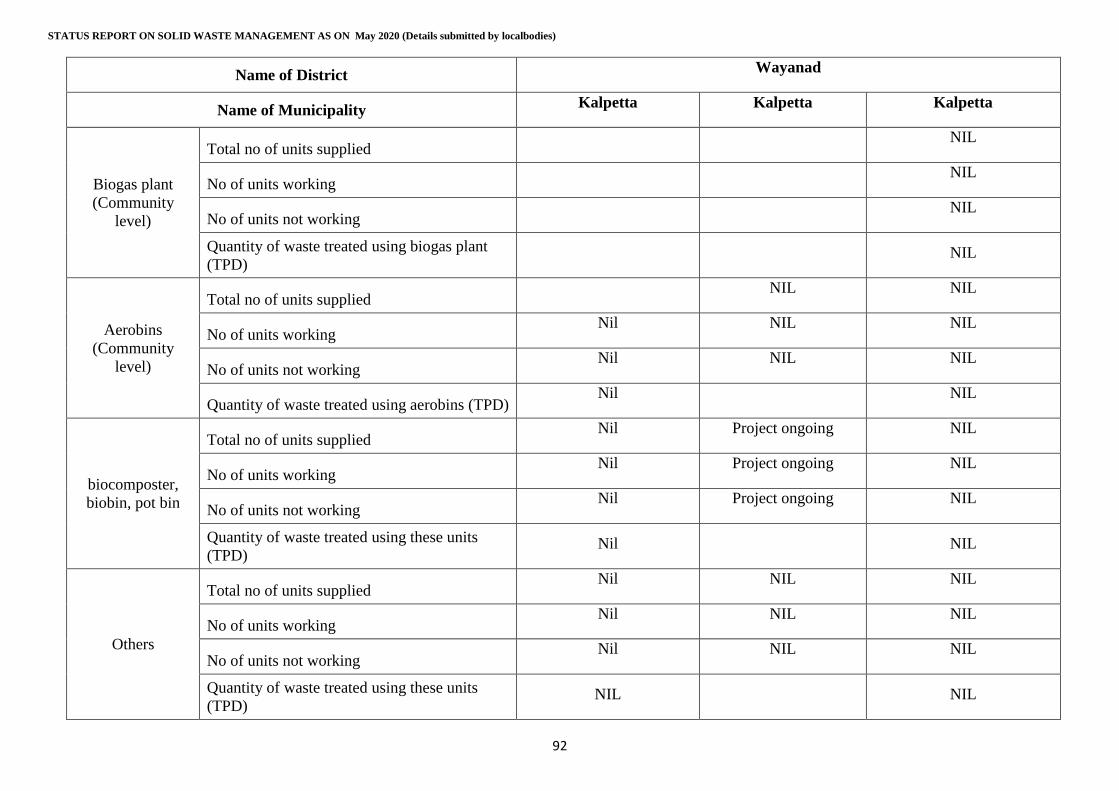
STATUS REPORT ON SOLID WASTE MANAGEMENT AS ON May 2020 (Details submitted by localbodies)
92
Name of District Wayanad
Name of Municipality Kalpetta Kalpetta Kalpetta
Biogas plant
(Community
level)
Total no of units supplied
NIL
No of units working
NIL
No of units not working
NIL
Quantity of waste treated using biogas plant
(TPD)
NIL
Aerobins
(Community
level)
Total no of units supplied
NIL NIL
No of units working Nil NIL NIL
No of units not working Nil NIL NIL
Quantity of waste treated using aerobins (TPD) Nil NIL
biocomposter,
biobin, pot bin
Total no of units supplied Nil Project ongoing NIL
No of units working Nil Project ongoing NIL
No of units not working Nil Project ongoing NIL
Quantity of waste treated using these units
(TPD) Nil NIL
Others
Total no of units supplied Nil NIL NIL
No of units working Nil NIL NIL
No of units not working Nil NIL NIL
Quantity of waste treated using these units
(TPD) NIL NIL
Annexure.1
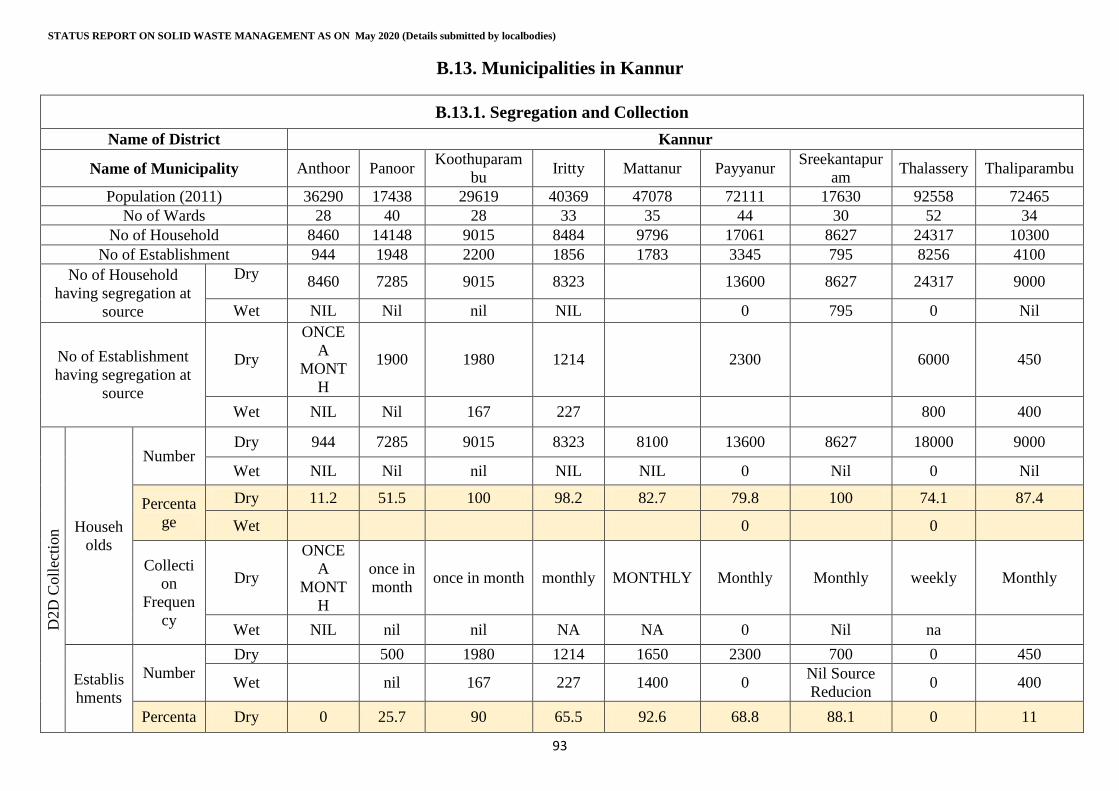
STATUS REPORT ON SOLID WASTE MANAGEMENT AS ON May 2020 (Details submitted by localbodies)
93
B.13. Municipalities in Kannur
B.13.1. Segregation and Collection
Name of District Kannur
Name of Municipality Anthoor Panoor Koothuparam
bu Iritty Mattanur Payyanur
Sreekantapur
am Thalassery Thaliparambu
Population (2011) 36290 17438 29619 40369 47078 72111 17630 92558 72465
No of Wards 28 40 28 33 35 44 30 52 34
No of Household 8460 14148 9015 8484 9796 17061 8627 24317 10300
No of Establishment 944 1948 2200 1856 1783 3345 795 8256 4100
No of Household
having segregation at
source
Dry 8460 7285 9015 8323 13600 8627 24317 9000
Wet NIL Nil nil NIL 0 795 0 Nil
No of Establishment
having segregation at
source
Dry
ONCE
A
MONT
H
1900 1980 1214 2300 6000 450
Wet NIL Nil 167 227 800 400
D2D
Coll
ecti
on
Househ
olds
Number Dry 944 7285 9015 8323 8100 13600 8627 18000 9000
Wet NIL Nil nil NIL NIL 0 Nil 0 Nil
Percenta
ge
Dry 11.2 51.5 100 98.2 82.7 79.8 100 74.1 87.4
Wet 0 0
Collecti
on
Frequen
cy
Dry
ONCE
A
MONT
H
once in
month once in month monthly MONTHLY Monthly Monthly weekly Monthly
Wet NIL nil nil NA NA 0 Nil na
Establis
hments
Number
Dry
500 1980 1214 1650 2300 700 0 450
Wet
nil 167 227 1400 0 Nil Source
Reducion 0 400
Percenta Dry 0 25.7 90 65.5 92.6 68.8 88.1 0 11
Annexure.1
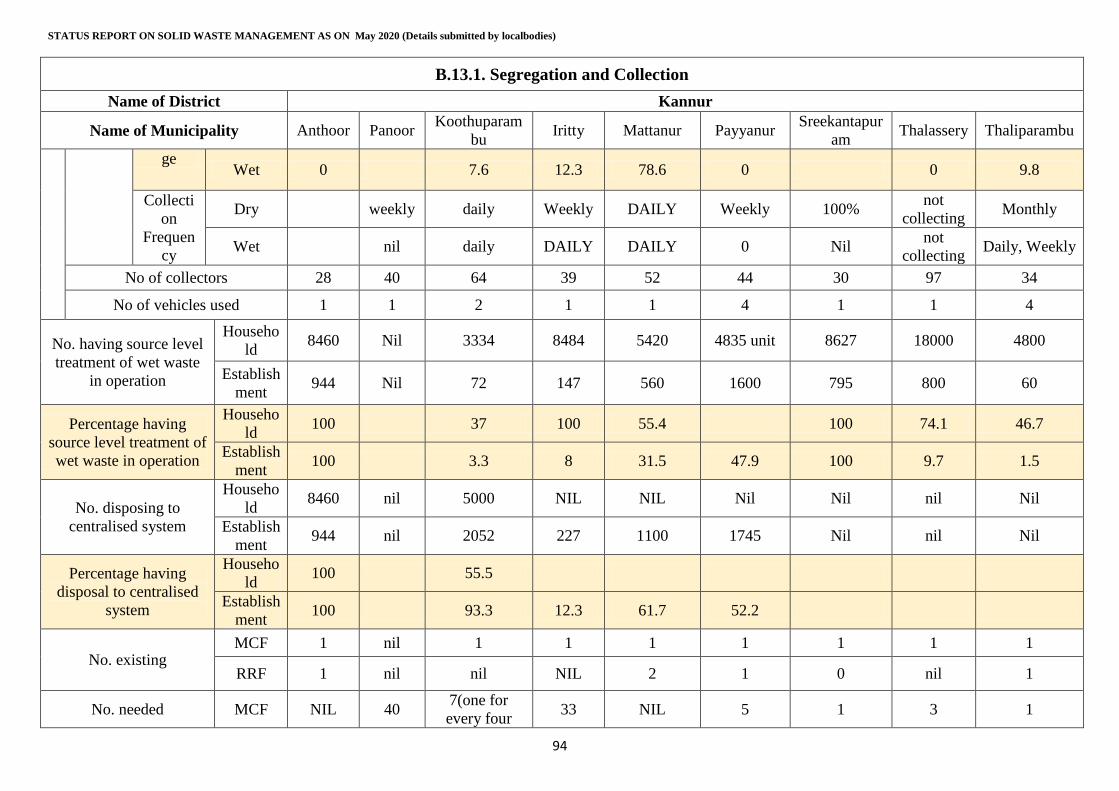
STATUS REPORT ON SOLID WASTE MANAGEMENT AS ON May 2020 (Details submitted by localbodies)
94
B.13.1. Segregation and Collection
Name of District Kannur
Name of Municipality Anthoor Panoor Koothuparam
bu Iritty Mattanur Payyanur
Sreekantapur
am Thalassery Thaliparambu
ge Wet 0 7.6 12.3 78.6 0 0 9.8
Collecti
on
Frequen
cy
Dry
weekly daily Weekly DAILY Weekly 100% not
collecting Monthly
Wet
nil daily DAILY DAILY 0 Nil not
collecting Daily, Weekly
No of collectors 28 40 64 39 52 44 30 97 34
No of vehicles used 1 1 2 1 1 4 1 1 4
No. having source level
treatment of wet waste
in operation
Househo
ld 8460 Nil 3334 8484 5420 4835 unit 8627 18000 4800
Establish
ment 944 Nil 72 147 560 1600 795 800 60
Percentage having
source level treatment of
wet waste in operation
Househo
ld 100 37 100 55.4 100 74.1 46.7
Establish
ment 100 3.3 8 31.5 47.9 100 9.7 1.5
No. disposing to
centralised system
Househo
ld 8460 nil 5000 NIL NIL Nil Nil nil Nil
Establish
ment 944 nil 2052 227 1100 1745 Nil nil Nil
Percentage having
disposal to centralised
system
Househo
ld 100 55.5
Establish
ment 100 93.3 12.3 61.7 52.2
No. existing MCF 1 nil 1 1 1 1 1 1 1
RRF 1 nil nil NIL 2 1 0 nil 1
No. needed MCF NIL 40 7(one for
every four 33 NIL 5 1 3 1
Annexure.1
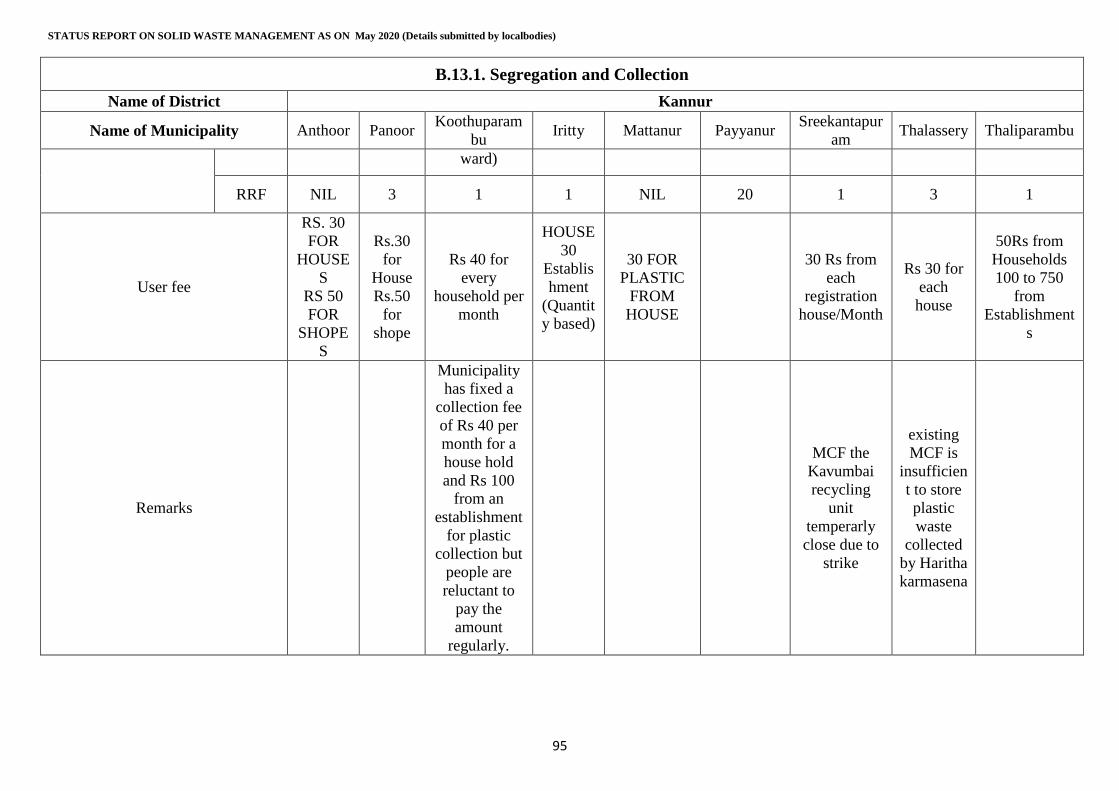
STATUS REPORT ON SOLID WASTE MANAGEMENT AS ON May 2020 (Details submitted by localbodies)
95
B.13.1. Segregation and Collection
Name of District Kannur
Name of Municipality Anthoor Panoor Koothuparam
bu Iritty Mattanur Payyanur
Sreekantapur
am Thalassery Thaliparambu
ward)
RRF NIL 3 1 1 NIL 20 1 3 1
User fee
RS. 30
FOR
HOUSE
S
RS 50
FOR
SHOPE
S
Rs.30
for
House
Rs.50
for
shope
Rs 40 for
every
household per
month
HOUSE
30
Establis
hment
(Quantit
y based)
30 FOR
PLASTIC
FROM
HOUSE
30 Rs from
each
registration
house/Month
Rs 30 for
each
house
50Rs from
Households
100 to 750
from
Establishment
s
Remarks
Municipality
has fixed a
collection fee
of Rs 40 per
month for a
house hold
and Rs 100
from an
establishment
for plastic
collection but
people are
reluctant to
pay the
amount
regularly.
MCF the
Kavumbai
recycling
unit
temperarly
close due to
strike
existing
MCF is
insufficien
t to store
plastic
waste
collected
by Haritha
karmasena
Annexure.1
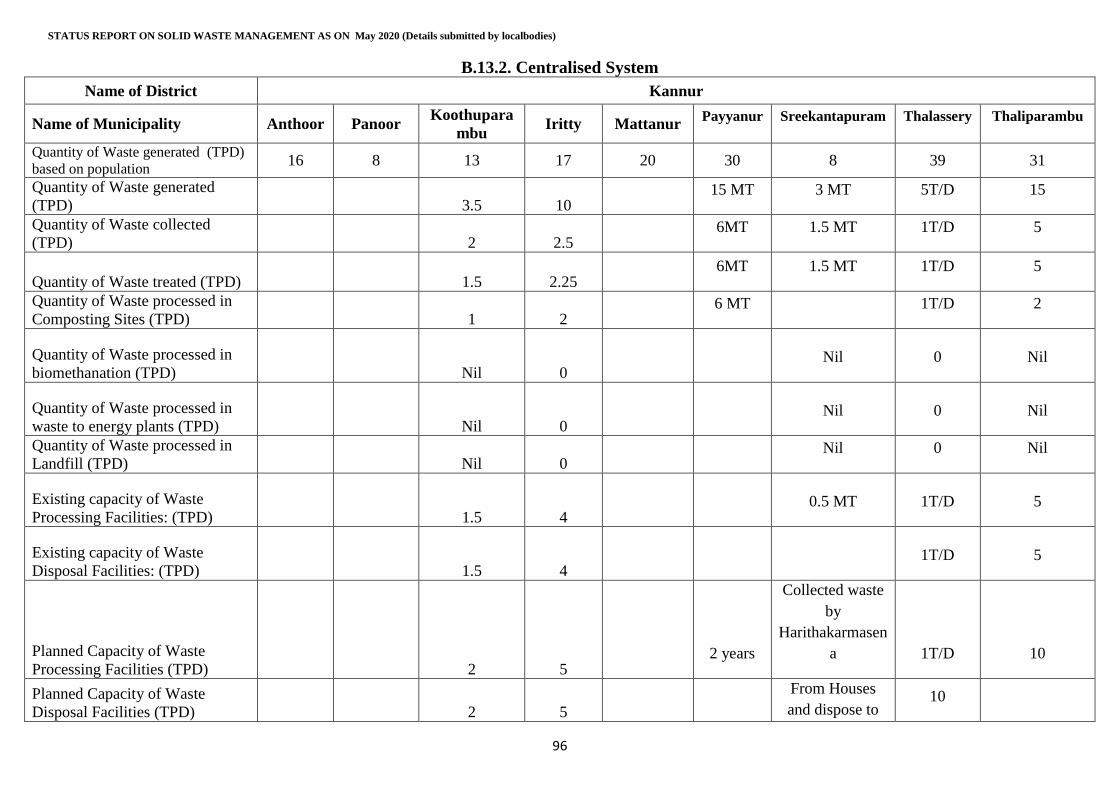
STATUS REPORT ON SOLID WASTE MANAGEMENT AS ON May 2020 (Details submitted by localbodies)
96
B.13.2. Centralised System
Name of District Kannur
Name of Municipality Anthoor Panoor Koothupara
mbu Iritty Mattanur
Payyanur Sreekantapuram Thalassery Thaliparambu
Quantity of Waste generated (TPD)
based on population 16 8 13 17 20 30 8 39 31
Quantity of Waste generated
(TPD) 3.5 10 15 MT 3 MT 5T/D 15
Quantity of Waste collected
(TPD) 2 2.5 6MT 1.5 MT 1T/D 5
Quantity of Waste treated (TPD) 1.5 2.25 6MT 1.5 MT 1T/D 5
Quantity of Waste processed in
Composting Sites (TPD) 1 2 6 MT 1T/D 2
Quantity of Waste processed in
biomethanation (TPD) Nil 0 Nil 0 Nil
Quantity of Waste processed in
waste to energy plants (TPD) Nil 0 Nil 0 Nil
Quantity of Waste processed in
Landfill (TPD) Nil 0 Nil 0 Nil
Existing capacity of Waste
Processing Facilities: (TPD) 1.5 4 0.5 MT 1T/D 5
Existing capacity of Waste
Disposal Facilities: (TPD) 1.5 4 1T/D 5
Planned Capacity of Waste
Processing Facilities (TPD) 2 5 2 years
Collected waste
by
Harithakarmasen
a 1T/D 10
Planned Capacity of Waste
Disposal Facilities (TPD) 2 5
From Houses
and dispose to 10
Annexure.1

STATUS REPORT ON SOLID WASTE MANAGEMENT AS ON May 2020 (Details submitted by localbodies)
97
Name of District Kannur
Name of Municipality Anthoor Panoor Koothupara
mbu Iritty Mattanur
Payyanur Sreekantapuram Thalassery Thaliparambu
MCF Unit
Timeframe for installation of
planned capacity of Waste
Processing Facilities: (Months) 24 months 12
As per
DPR
Timeframe for installation of
planned capacity of Waste
Disposal Facilities: (Months) 24 months 15
As per
DPR
Number of Legacy waste
dumpsites in the State/UTs and
plan for their Remediation: Nil NA `` NA NA
B.13.3. Decentralised units namely pipe compost, kitchen bin, bio composter, biobin, pot bin, biogas plant
Name of District Kannur
Name of /Municipality Anthoor Panoor Koothuparam
bu Iritty Mattanur
Payyanur Sreekantapuram Thalassery Thaliparambu
No of units supplied:
33
1200
(Ring
compost,
KichenBi
n)
341
(Ring
Compost) 5236 6661 4800
No of units working: 3471 1200 3014 341 5236
4835 NA 6661 4800
No of units not working: NIL 0 320 0 NIL
N il NA 0 Nil
Annexure.1
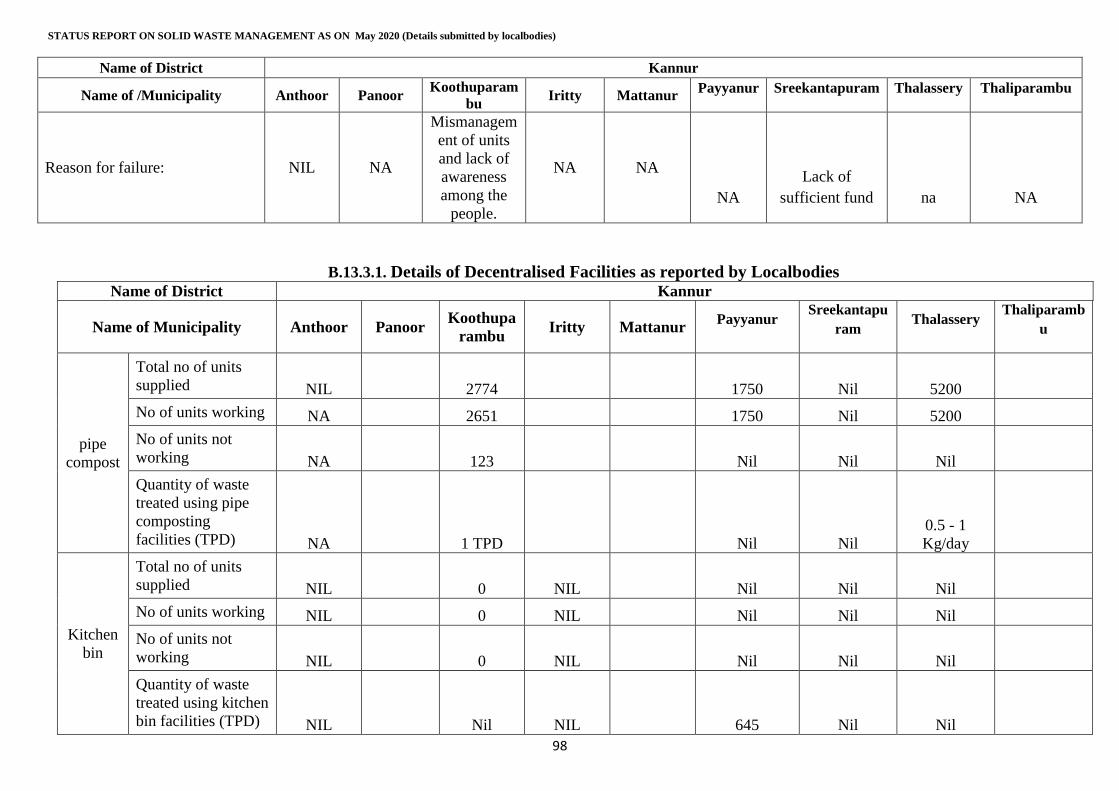
STATUS REPORT ON SOLID WASTE MANAGEMENT AS ON May 2020 (Details submitted by localbodies)
98
Name of District Kannur
Name of /Municipality Anthoor Panoor Koothuparam
bu Iritty Mattanur
Payyanur Sreekantapuram Thalassery Thaliparambu
Reason for failure: NIL NA
Mismanagem
ent of units
and lack of
awareness
among the
people.
NA NA
NA
Lack of
sufficient fund na NA
B.13.3.1. Details of Decentralised Facilities as reported by Localbodies Name of District Kannur
Name of Municipality Anthoor Panoor Koothupa
rambu Iritty Mattanur
Payyanur Sreekantapu
ram Thalassery
Thaliparamb
u
pipe
compost
Total no of units
supplied NIL 2774
1750 Nil 5200
No of units working NA 2651
1750 Nil 5200
No of units not
working NA 123
Nil Nil Nil
Quantity of waste
treated using pipe
composting
facilities (TPD) NA 1 TPD
Nil Nil
0.5 - 1
Kg/day
Kitchen
bin
Total no of units
supplied NIL 0 NIL
Nil Nil Nil
No of units working NIL 0 NIL
Nil Nil Nil
No of units not
working NIL 0 NIL
Nil Nil Nil
Quantity of waste
treated using kitchen
bin facilities (TPD) NIL Nil NIL
645 Nil Nil
Annexure.1
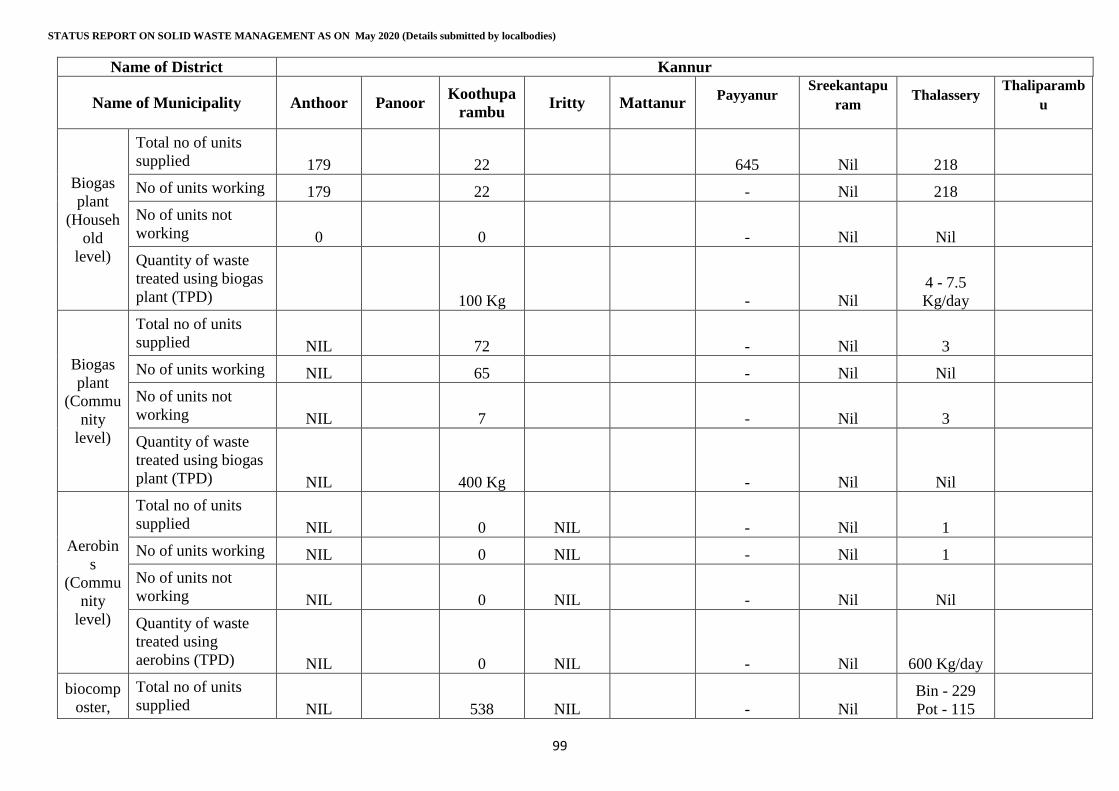
STATUS REPORT ON SOLID WASTE MANAGEMENT AS ON May 2020 (Details submitted by localbodies)
99
Name of District Kannur
Name of Municipality Anthoor Panoor Koothupa
rambu Iritty Mattanur
Payyanur Sreekantapu
ram Thalassery
Thaliparamb
u
Biogas
plant
(Househ
old
level)
Total no of units
supplied 179 22
645 Nil 218
No of units working 179 22
- Nil 218
No of units not
working 0 0
- Nil Nil
Quantity of waste
treated using biogas
plant (TPD)
100 Kg
- Nil
4 - 7.5
Kg/day
Biogas
plant
(Commu
nity
level)
Total no of units
supplied NIL 72
- Nil 3
No of units working NIL 65
- Nil Nil
No of units not
working NIL 7
- Nil 3
Quantity of waste
treated using biogas
plant (TPD) NIL 400 Kg
- Nil Nil
Aerobin
s
(Commu
nity
level)
Total no of units
supplied NIL 0 NIL
- Nil 1
No of units working NIL 0 NIL
- Nil 1
No of units not
working NIL 0 NIL
- Nil Nil
Quantity of waste
treated using
aerobins (TPD) NIL 0 NIL
- Nil 600 Kg/day
biocomp
oster,
Total no of units
supplied NIL 538 NIL
- Nil
Bin - 229
Pot - 115
Annexure.1
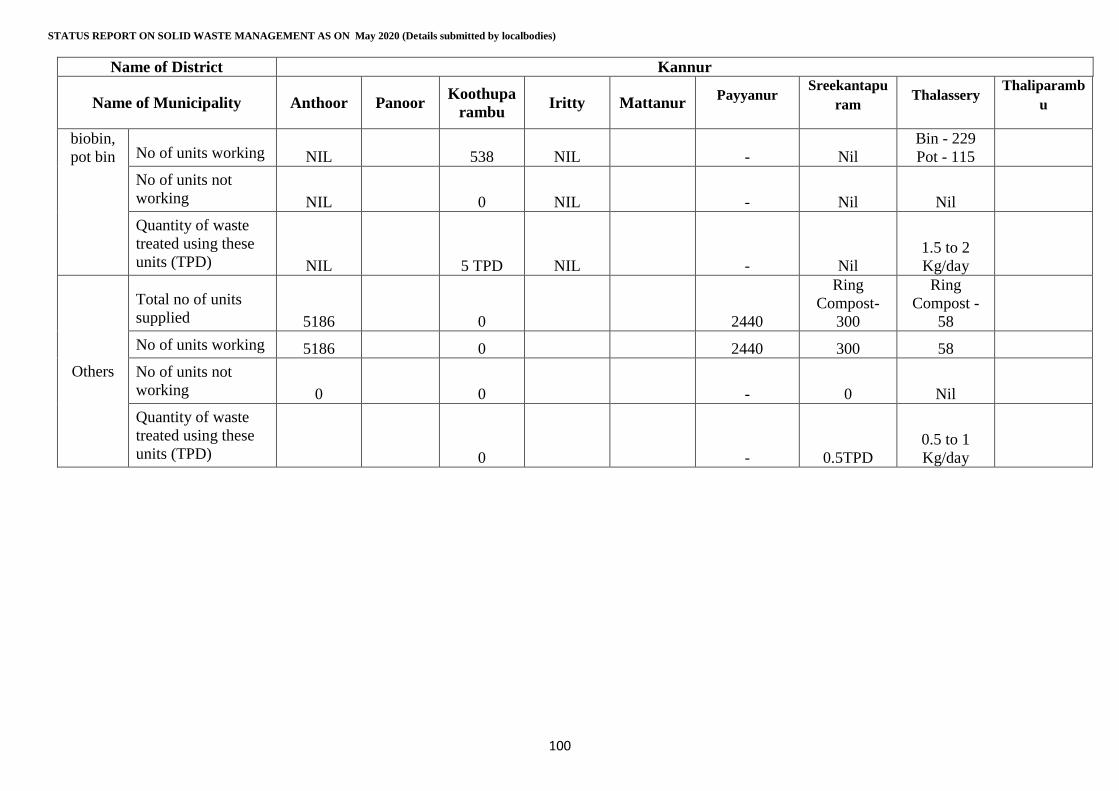
STATUS REPORT ON SOLID WASTE MANAGEMENT AS ON May 2020 (Details submitted by localbodies)
100
Name of District Kannur
Name of Municipality Anthoor Panoor Koothupa
rambu Iritty Mattanur
Payyanur Sreekantapu
ram Thalassery
Thaliparamb
u
biobin,
pot bin No of units working NIL 538 NIL
- Nil
Bin - 229
Pot - 115
No of units not
working NIL 0 NIL
- Nil Nil
Quantity of waste
treated using these
units (TPD) NIL 5 TPD NIL
- Nil
1.5 to 2
Kg/day
Others
Total no of units
supplied 5186 0
2440
Ring
Compost-
300
Ring
Compost -
58
No of units working 5186 0
2440 300 58
No of units not
working 0 0
- 0 Nil
Quantity of waste
treated using these
units (TPD)
0
- 0.5TPD
0.5 to 1
Kg/day
Annexure.1
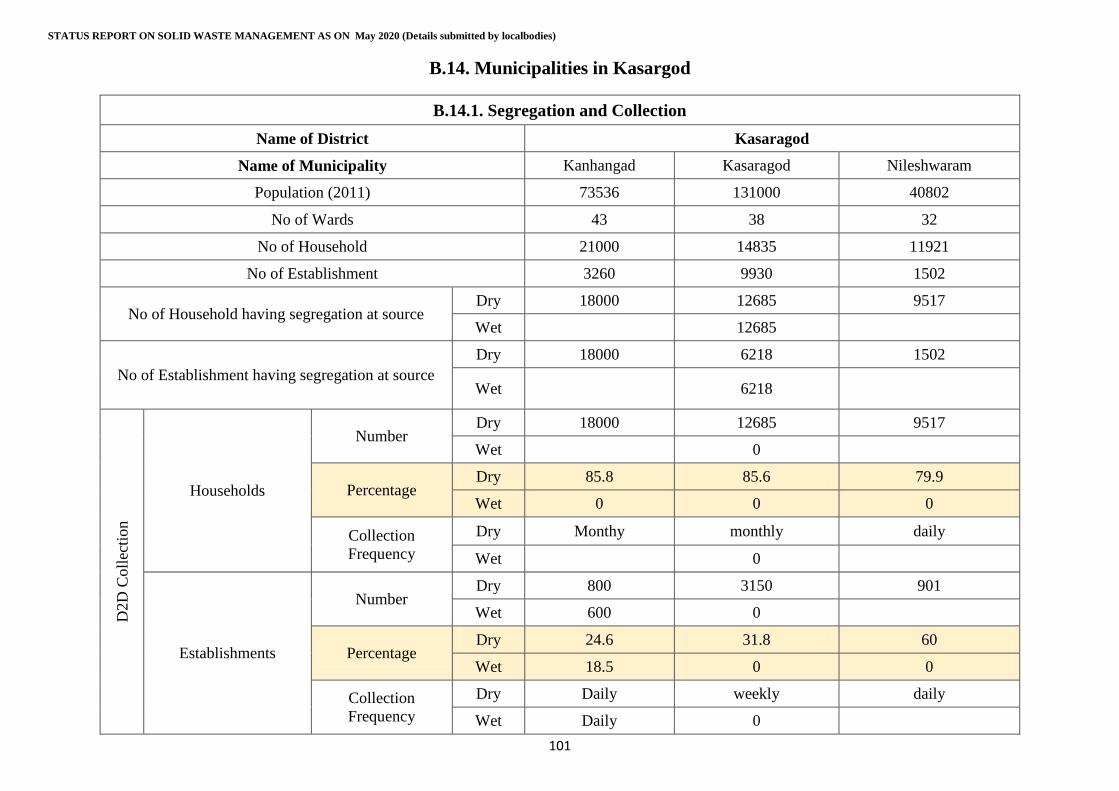
STATUS REPORT ON SOLID WASTE MANAGEMENT AS ON May 2020 (Details submitted by localbodies)
101
B.14. Municipalities in Kasargod
B.14.1. Segregation and Collection
Name of District Kasaragod
Name of Municipality Kanhangad Kasaragod Nileshwaram
Population (2011) 73536 131000 40802
No of Wards 43 38 32
No of Household 21000 14835 11921
No of Establishment 3260 9930 1502
No of Household having segregation at source Dry 18000 12685 9517
Wet
12685
No of Establishment having segregation at source
Dry 18000 6218 1502
Wet
6218
D2D
Coll
ecti
on
Households
Number Dry 18000 12685 9517
Wet
0
Percentage Dry 85.8 85.6 79.9
Wet 0 0 0
Collection
Frequency
Dry Monthy monthly daily
Wet
0
Establishments
Number Dry 800 3150 901
Wet 600 0
Percentage Dry 24.6 31.8 60
Wet 18.5 0 0
Collection
Frequency
Dry Daily weekly daily
Wet Daily 0
Annexure.1
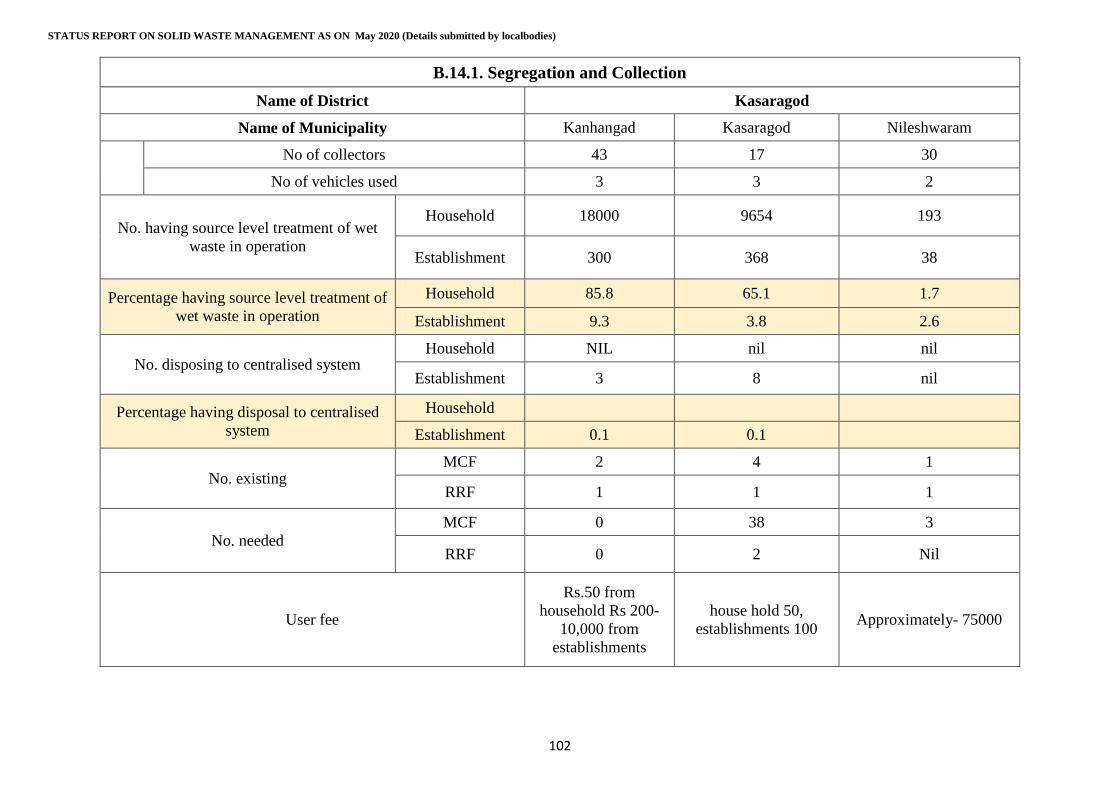
STATUS REPORT ON SOLID WASTE MANAGEMENT AS ON May 2020 (Details submitted by localbodies)
102
B.14.1. Segregation and Collection
Name of District Kasaragod
Name of Municipality Kanhangad Kasaragod Nileshwaram
No of collectors 43 17 30
No of vehicles used 3 3 2
No. having source level treatment of wet
waste in operation
Household 18000 9654 193
Establishment 300 368 38
Percentage having source level treatment of
wet waste in operation
Household 85.8 65.1 1.7
Establishment 9.3 3.8 2.6
No. disposing to centralised system Household NIL nil nil
Establishment 3 8 nil
Percentage having disposal to centralised
system
Household
Establishment 0.1 0.1
No. existing MCF 2 4 1
RRF 1 1 1
No. needed
MCF 0 38 3
RRF 0 2 Nil
User fee
Rs.50 from
household Rs 200-
10,000 from
establishments
house hold 50,
establishments 100 Approximately- 75000
Annexure.1
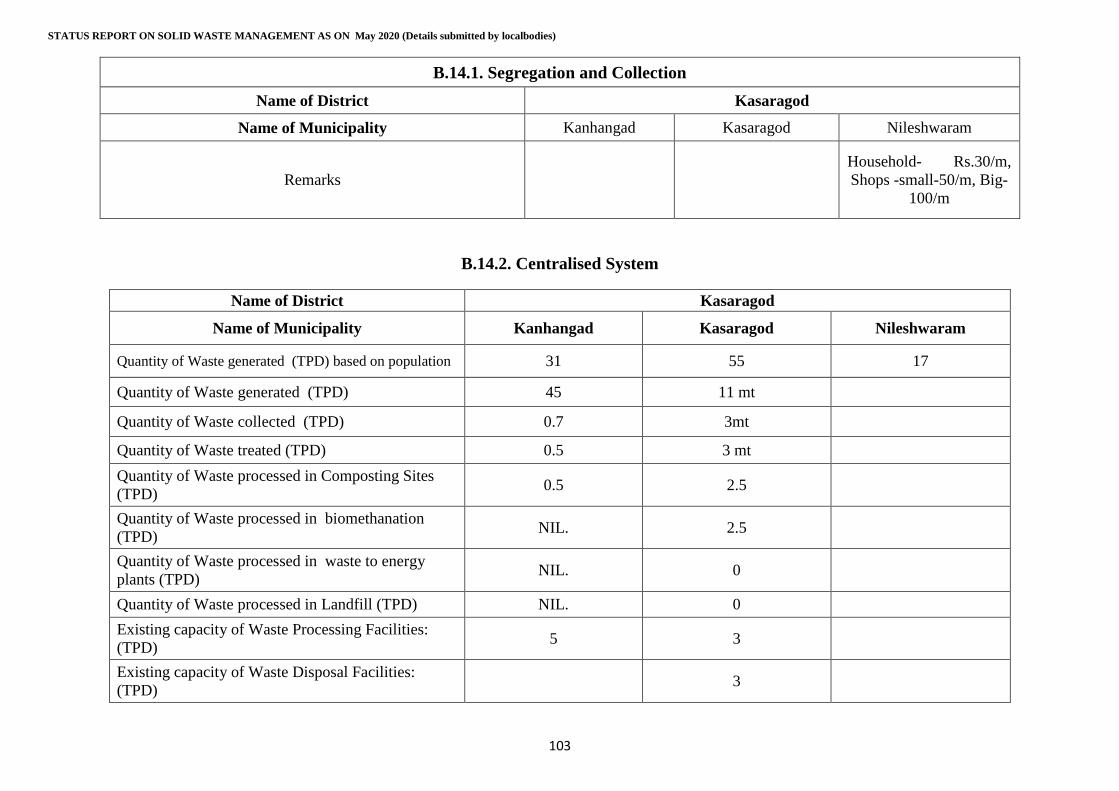
STATUS REPORT ON SOLID WASTE MANAGEMENT AS ON May 2020 (Details submitted by localbodies)
103
B.14.1. Segregation and Collection
Name of District Kasaragod
Name of Municipality Kanhangad Kasaragod Nileshwaram
Remarks
Household- Rs.30/m,
Shops -small-50/m, Big-
100/m
B.14.2. Centralised System
Name of District Kasaragod
Name of Municipality Kanhangad Kasaragod Nileshwaram
Quantity of Waste generated (TPD) based on population 31 55 17
Quantity of Waste generated (TPD) 45 11 mt
Quantity of Waste collected (TPD) 0.7 3mt
Quantity of Waste treated (TPD) 0.5 3 mt
Quantity of Waste processed in Composting Sites
(TPD) 0.5 2.5
Quantity of Waste processed in biomethanation
(TPD) NIL. 2.5
Quantity of Waste processed in waste to energy
plants (TPD) NIL. 0
Quantity of Waste processed in Landfill (TPD) NIL. 0
Existing capacity of Waste Processing Facilities:
(TPD) 5 3
Existing capacity of Waste Disposal Facilities:
(TPD) 3
Annexure.1
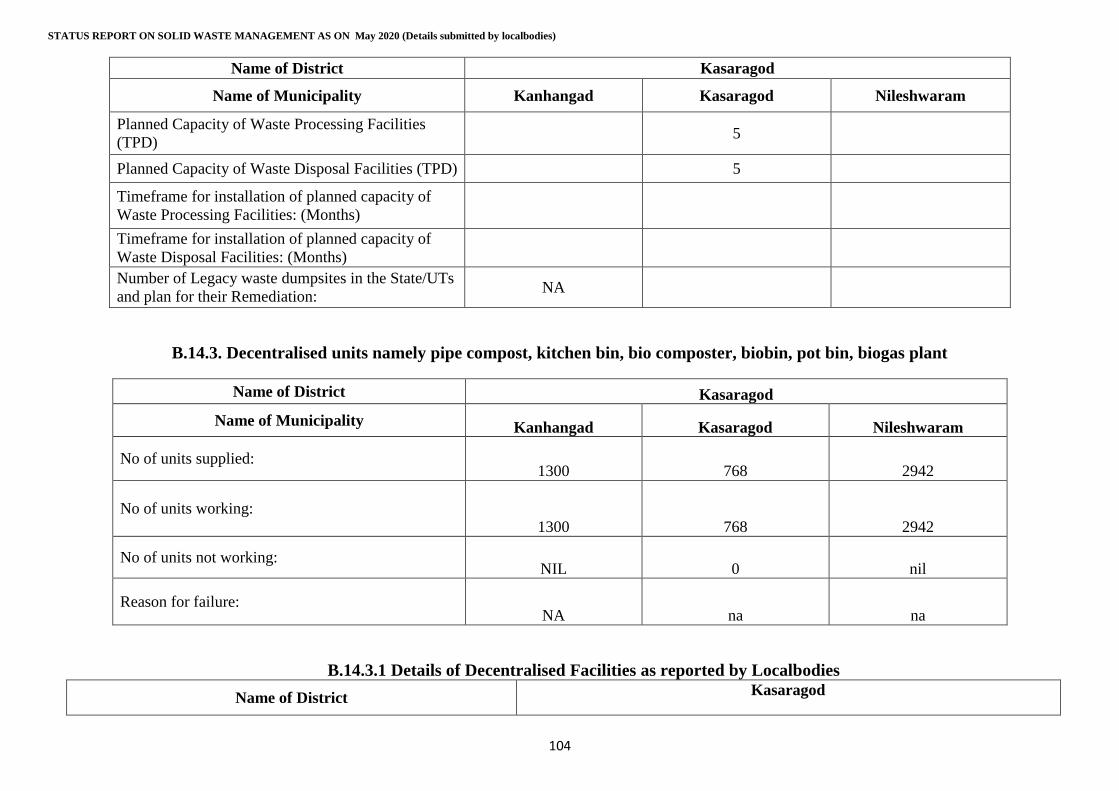
STATUS REPORT ON SOLID WASTE MANAGEMENT AS ON May 2020 (Details submitted by localbodies)
104
Name of District Kasaragod
Name of Municipality Kanhangad Kasaragod Nileshwaram
Planned Capacity of Waste Processing Facilities
(TPD) 5
Planned Capacity of Waste Disposal Facilities (TPD) 5
Timeframe for installation of planned capacity of
Waste Processing Facilities: (Months)
Timeframe for installation of planned capacity of
Waste Disposal Facilities: (Months)
Number of Legacy waste dumpsites in the State/UTs
and plan for their Remediation: NA
B.14.3. Decentralised units namely pipe compost, kitchen bin, bio composter, biobin, pot bin, biogas plant
Name of District Kasaragod
Name of Municipality Kanhangad Kasaragod Nileshwaram
No of units supplied: 1300 768 2942
No of units working:
1300 768 2942
No of units not working: NIL 0 nil
Reason for failure: NA na na
B.14.3.1 Details of Decentralised Facilities as reported by Localbodies
Name of District Kasaragod
Annexure.1
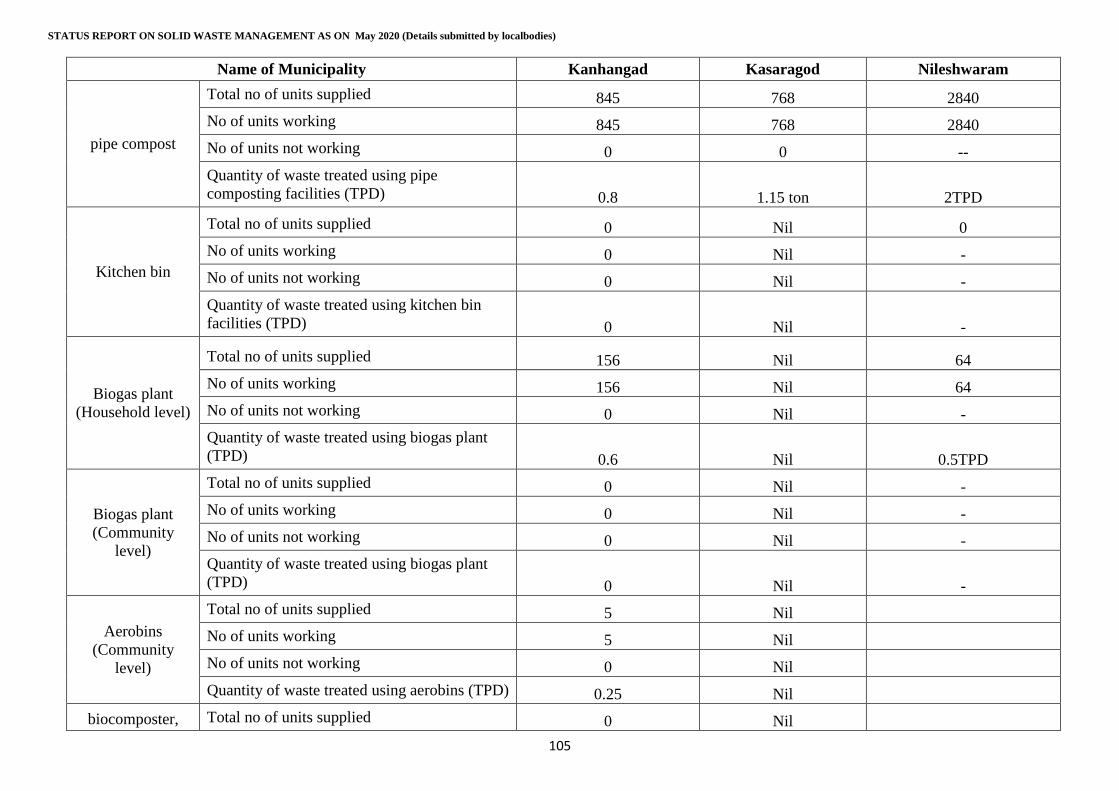
STATUS REPORT ON SOLID WASTE MANAGEMENT AS ON May 2020 (Details submitted by localbodies)
105
Name of Municipality Kanhangad Kasaragod Nileshwaram
pipe compost
Total no of units supplied 845 768 2840
No of units working 845 768 2840
No of units not working 0 0 --
Quantity of waste treated using pipe
composting facilities (TPD) 0.8 1.15 ton 2TPD
Kitchen bin
Total no of units supplied 0 Nil 0
No of units working 0 Nil -
No of units not working 0 Nil -
Quantity of waste treated using kitchen bin
facilities (TPD) 0 Nil -
Biogas plant
(Household level)
Total no of units supplied 156 Nil 64
No of units working 156 Nil 64
No of units not working 0 Nil -
Quantity of waste treated using biogas plant
(TPD) 0.6 Nil 0.5TPD
Biogas plant
(Community
level)
Total no of units supplied 0 Nil -
No of units working 0 Nil -
No of units not working 0 Nil -
Quantity of waste treated using biogas plant
(TPD) 0 Nil -
Aerobins
(Community
level)
Total no of units supplied 5 Nil
No of units working 5 Nil
No of units not working 0 Nil
Quantity of waste treated using aerobins (TPD) 0.25 Nil
biocomposter, Total no of units supplied 0 Nil
Annexure.1
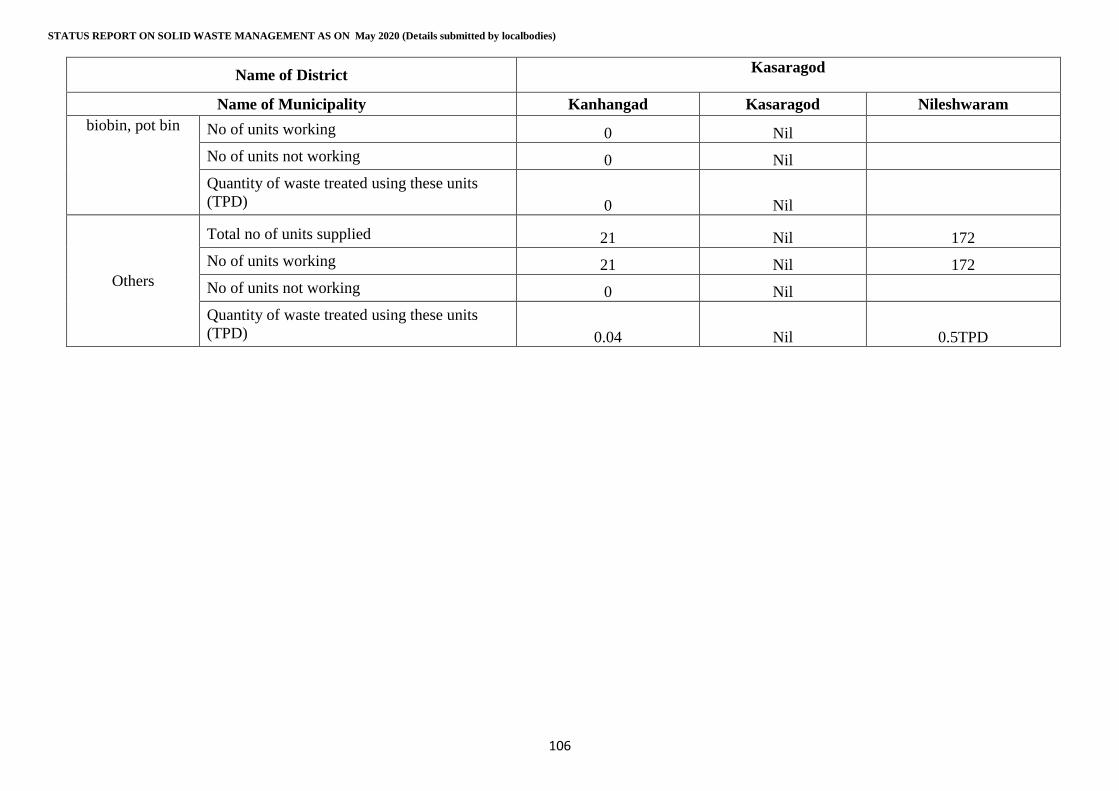
STATUS REPORT ON SOLID WASTE MANAGEMENT AS ON May 2020 (Details submitted by localbodies)
106
Name of District Kasaragod
Name of Municipality Kanhangad Kasaragod Nileshwaram
biobin, pot bin No of units working 0 Nil
No of units not working 0 Nil
Quantity of waste treated using these units
(TPD) 0 Nil
Others
Total no of units supplied 21 Nil 172
No of units working 21 Nil 172
No of units not working 0 Nil
Quantity of waste treated using these units
(TPD) 0.04 Nil 0.5TPD
Annexure.1
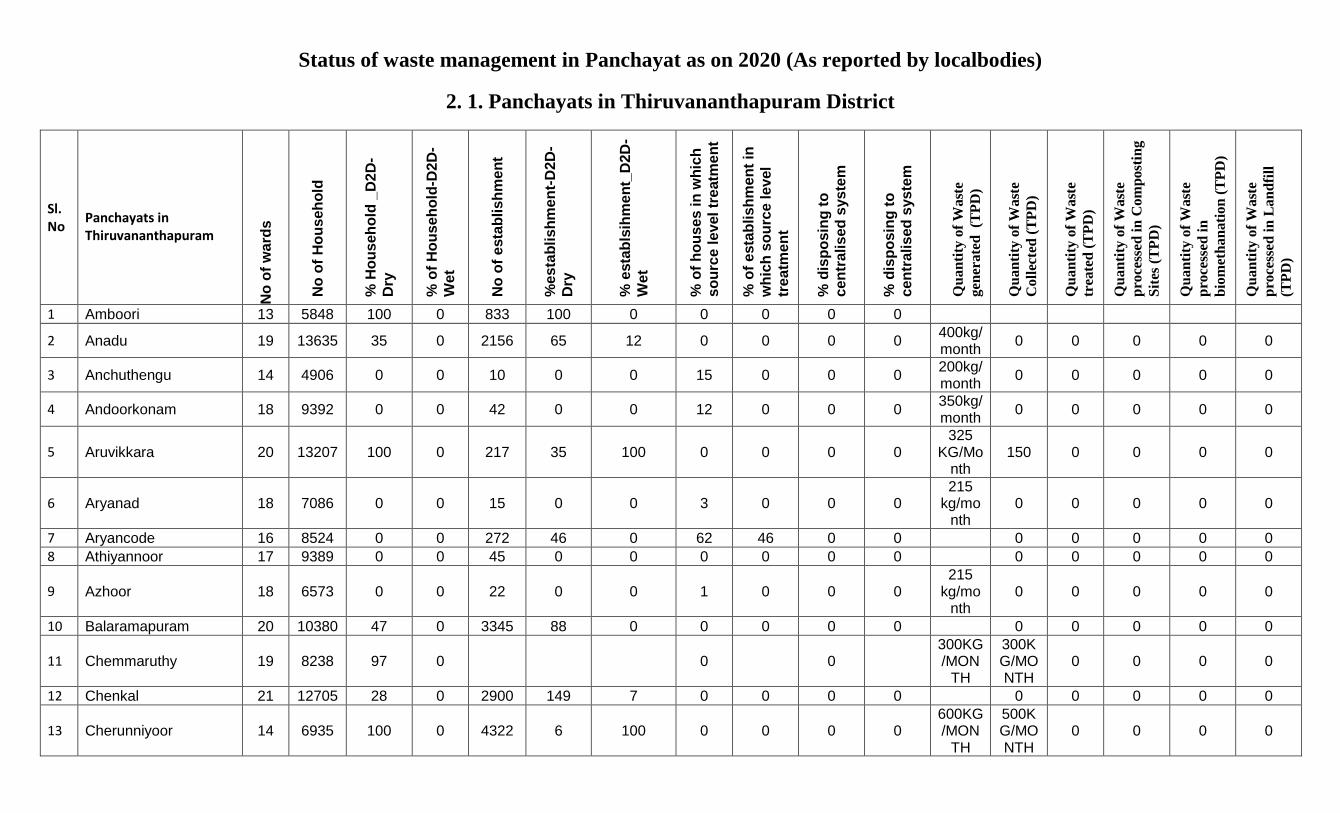
Status of waste management in Panchayat as on 2020 (As reported by localbodies)
2. 1. Panchayats in Thiruvananthapuram District
Sl. No
Panchayats in Thiruvananthapuram
No
of
wa
rds
No
of
Ho
us
eh
old
% H
ou
seh
old
_D
2D
-
Dry
% o
f H
ou
seh
old
-D2
D-
We
t
No
of
esta
blis
hm
en
t
%e
sta
bli
sh
me
nt-
D2
D-
Dry
% e
sta
bls
ihm
en
t_D
2D
-
We
t
% o
f h
ou
se
s i
n w
hic
h
so
urc
e l
evel tr
eatm
en
t
% o
f e
sta
blis
hm
en
t in
wh
ich
so
urc
e l
evel
tre
atm
en
t
% d
isp
osin
g t
o
cen
tra
lis
ed
sys
tem
% d
isp
osin
g t
o
cen
tra
lis
ed
sys
tem
Qu
an
tity
of
Wast
e
gen
erate
d (T
PD
)
Qu
an
tity
of
Wast
e
Coll
ecte
d (
TP
D)
Qu
an
tity
of
Wast
e
trea
ted
(T
PD
)
Qu
an
tity
of
Wast
e
pro
cess
ed
in
Com
post
ing
Sit
es (
TP
D)
Qu
an
tity
of
Wast
e
pro
cess
ed
in
bio
met
han
ati
on
(T
PD
)
Qu
an
tity
of
Wast
e
pro
cess
ed
in
Lan
dfi
ll
(TP
D)
1 Amboori 13 5848 100 0 833 100 0 0 0 0 0
2 Anadu 19 13635 35 0 2156 65 12 0 0 0 0 400kg/month
0 0 0 0 0
3 Anchuthengu 14 4906 0 0 10 0 0 15 0 0 0 200kg/month
0 0 0 0 0
4 Andoorkonam 18 9392 0 0 42 0 0 12 0 0 0 350kg/month
0 0 0 0 0
5 Aruvikkara 20 13207 100 0 217 35 100 0 0 0 0 325
KG/Month
150 0 0 0 0
6 Aryanad 18 7086 0 0 15 0 0 3 0 0 0 215
kg/month
0 0 0 0 0
7 Aryancode 16 8524 0 0 272 46 0 62 46 0 0 0 0 0 0 0
8 Athiyannoor 17 9389 0 0 45 0 0 0 0 0 0 0 0 0 0 0
9 Azhoor 18 6573 0 0 22 0 0 1 0 0 0 215
kg/month
0 0 0 0 0
10 Balaramapuram 20 10380 47 0 3345 88 0 0 0 0 0 0 0 0 0 0
11 Chemmaruthy 19 8238 97 0 0 0 300KG/MON
TH
300KG/MONTH
0 0 0 0
12 Chenkal 21 12705 28 0 2900 149 7 0 0 0 0 0 0 0 0 0
13 Cherunniyoor 14 6935 100 0 4322 6 100 0 0 0 0 600KG/MON
TH
500KG/MONTH
0 0 0 0
Annexure.1
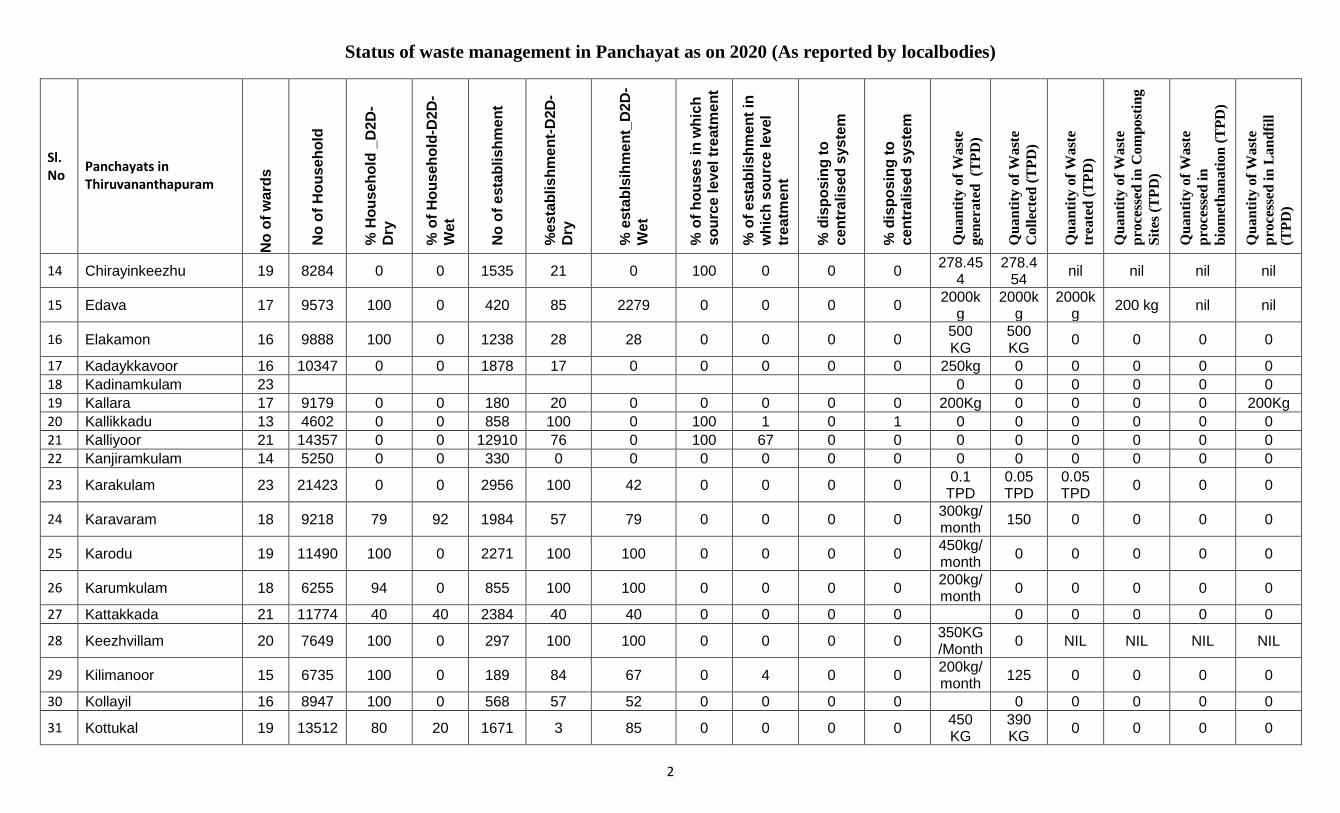
Status of waste management in Panchayat as on 2020 (As reported by localbodies)
2
Sl. No
Panchayats in Thiruvananthapuram
No
of
wa
rds
No
of
Ho
us
eh
old
% H
ou
seh
old
_D
2D
-
Dry
% o
f H
ou
seh
old
-D2
D-
We
t
No
of
esta
blis
hm
en
t
%e
sta
bli
sh
me
nt-
D2
D-
Dry
% e
sta
bls
ihm
en
t_D
2D
-
We
t
% o
f h
ou
se
s i
n w
hic
h
so
urc
e l
evel tr
eatm
en
t
% o
f e
sta
blis
hm
en
t in
wh
ich
so
urc
e l
evel
tre
atm
en
t
% d
isp
osin
g t
o
cen
tra
lis
ed
sys
tem
% d
isp
osin
g t
o
cen
tra
lis
ed
sys
tem
Qu
an
tity
of
Wast
e
gen
erate
d (T
PD
)
Qu
an
tity
of
Wast
e
Coll
ecte
d (
TP
D)
Qu
an
tity
of
Wast
e
trea
ted
(T
PD
)
Qu
an
tity
of
Wast
e
pro
cess
ed
in
Com
po
stin
g
Sit
es (
TP
D)
Qu
an
tity
of
Wast
e
pro
cess
ed
in
bio
met
han
ati
on
(T
PD
)
Qu
an
tity
of
Wast
e
pro
cess
ed
in
Lan
dfi
ll
(TP
D)
14 Chirayinkeezhu 19 8284 0 0 1535 21 0 100 0 0 0 278.45
4 278.4
54 nil nil nil nil
15 Edava 17 9573 100 0 420 85 2279 0 0 0 0 2000k
g 2000k
g 2000k
g 200 kg nil nil
16 Elakamon 16 9888 100 0 1238 28 28 0 0 0 0 500 KG
500 KG
0 0 0 0
17 Kadaykkavoor 16 10347 0 0 1878 17 0 0 0 0 0 250kg 0 0 0 0 0
18 Kadinamkulam 23 0 0 0 0 0 0
19 Kallara 17 9179 0 0 180 20 0 0 0 0 0 200Kg 0 0 0 0 200Kg
20 Kallikkadu 13 4602 0 0 858 100 0 100 1 0 1 0 0 0 0 0 0
21 Kalliyoor 21 14357 0 0 12910 76 0 100 67 0 0 0 0 0 0 0 0
22 Kanjiramkulam 14 5250 0 0 330 0 0 0 0 0 0 0 0 0 0 0 0
23 Karakulam 23 21423 0 0 2956 100 42 0 0 0 0 0.1
TPD 0.05 TPD
0.05 TPD
0 0 0
24 Karavaram 18 9218 79 92 1984 57 79 0 0 0 0 300kg/month
150 0 0 0 0
25 Karodu 19 11490 100 0 2271 100 100 0 0 0 0 450kg/month
0 0 0 0 0
26 Karumkulam 18 6255 94 0 855 100 100 0 0 0 0 200kg/month
0 0 0 0 0
27 Kattakkada 21 11774 40 40 2384 40 40 0 0 0 0 0 0 0 0 0
28 Keezhvillam 20 7649 100 0 297 100 100 0 0 0 0 350KG/Month
0 NIL NIL NIL NIL
29 Kilimanoor 15 6735 100 0 189 84 67 0 4 0 0 200kg/month
125 0 0 0 0
30 Kollayil 16 8947 100 0 568 57 52 0 0 0 0 0 0 0 0 0
31 Kottukal 19 13512 80 20 1671 3 85 0 0 0 0 450 KG
390 KG
0 0 0 0
Annexure.1
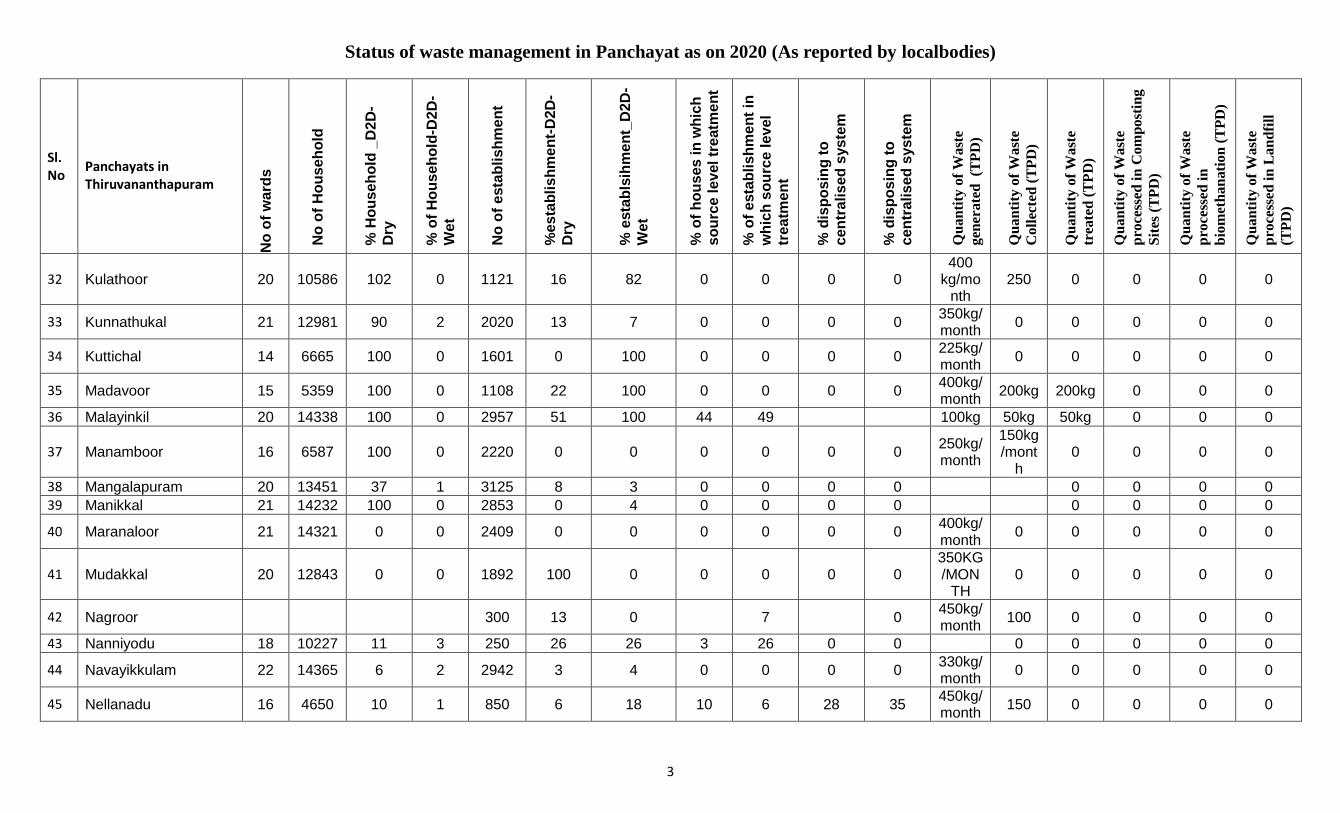
Status of waste management in Panchayat as on 2020 (As reported by localbodies)
3
Sl. No
Panchayats in Thiruvananthapuram
No
of
wa
rds
No
of
Ho
us
eh
old
% H
ou
seh
old
_D
2D
-
Dry
% o
f H
ou
seh
old
-D2
D-
We
t
No
of
esta
blis
hm
en
t
%e
sta
bli
sh
me
nt-
D2
D-
Dry
% e
sta
bls
ihm
en
t_D
2D
-
We
t
% o
f h
ou
se
s i
n w
hic
h
so
urc
e l
evel tr
eatm
en
t
% o
f e
sta
blis
hm
en
t in
wh
ich
so
urc
e l
evel
tre
atm
en
t
% d
isp
osin
g t
o
cen
tra
lis
ed
sys
tem
% d
isp
osin
g t
o
cen
tra
lis
ed
sys
tem
Qu
an
tity
of
Wast
e
gen
erate
d (T
PD
)
Qu
an
tity
of
Wast
e
Coll
ecte
d (
TP
D)
Qu
an
tity
of
Wast
e
trea
ted
(T
PD
)
Qu
an
tity
of
Wast
e
pro
cess
ed
in
Com
po
stin
g
Sit
es (
TP
D)
Qu
an
tity
of
Wast
e
pro
cess
ed
in
bio
met
han
ati
on
(T
PD
)
Qu
an
tity
of
Wast
e
pro
cess
ed
in
Lan
dfi
ll
(TP
D)
32 Kulathoor 20 10586 102 0 1121 16 82 0 0 0 0 400
kg/month
250 0 0 0 0
33 Kunnathukal 21 12981 90 2 2020 13 7 0 0 0 0 350kg/month
0 0 0 0 0
34 Kuttichal 14 6665 100 0 1601 0 100 0 0 0 0 225kg/month
0 0 0 0 0
35 Madavoor 15 5359 100 0 1108 22 100 0 0 0 0 400kg/month
200kg 200kg 0 0 0
36 Malayinkil 20 14338 100 0 2957 51 100 44 49 100kg 50kg 50kg 0 0 0
37 Manamboor 16 6587 100 0 2220 0 0 0 0 0 0 250kg/month
150kg/mont
h 0 0 0 0
38 Mangalapuram 20 13451 37 1 3125 8 3 0 0 0 0 0 0 0 0
39 Manikkal 21 14232 100 0 2853 0 4 0 0 0 0 0 0 0 0
40 Maranaloor 21 14321 0 0 2409 0 0 0 0 0 0 400kg/month
0 0 0 0 0
41 Mudakkal 20 12843 0 0 1892 100 0 0 0 0 0 350KG/MON
TH 0 0 0 0 0
42 Nagroor 300 13 0 7 0 450kg/ month
100 0 0 0 0
43 Nanniyodu 18 10227 11 3 250 26 26 3 26 0 0 0 0 0 0 0
44 Navayikkulam 22 14365 6 2 2942 3 4 0 0 0 0 330kg/month
0 0 0 0 0
45 Nellanadu 16 4650 10 1 850 6 18 10 6 28 35 450kg/month
150 0 0 0 0
Annexure.1
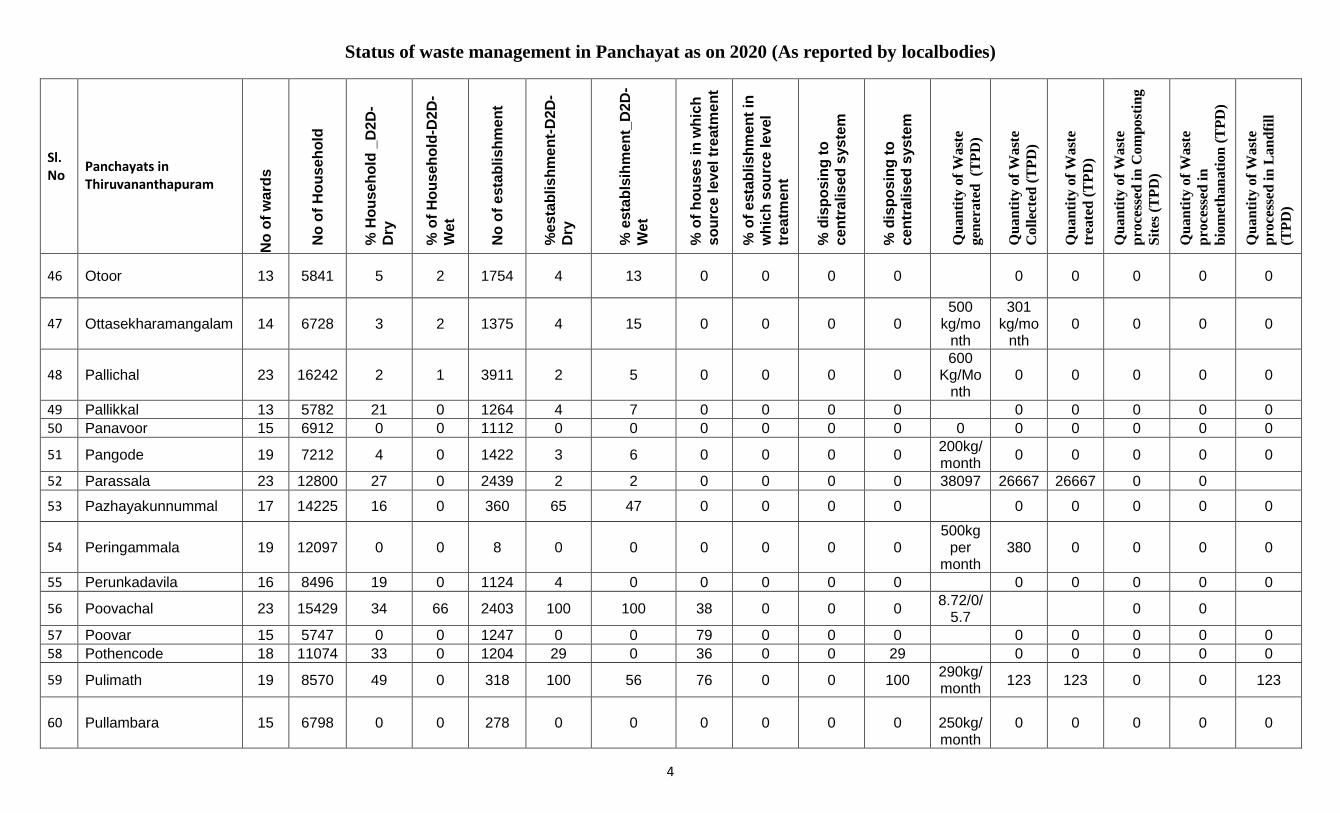
Status of waste management in Panchayat as on 2020 (As reported by localbodies)
4
Sl. No
Panchayats in Thiruvananthapuram
No
of
wa
rds
No
of
Ho
us
eh
old
% H
ou
seh
old
_D
2D
-
Dry
% o
f H
ou
seh
old
-D2
D-
We
t
No
of
esta
blis
hm
en
t
%e
sta
bli
sh
me
nt-
D2
D-
Dry
% e
sta
bls
ihm
en
t_D
2D
-
We
t
% o
f h
ou
se
s i
n w
hic
h
so
urc
e l
evel tr
eatm
en
t
% o
f e
sta
blis
hm
en
t in
wh
ich
so
urc
e l
evel
tre
atm
en
t
% d
isp
osin
g t
o
cen
tra
lis
ed
sys
tem
% d
isp
osin
g t
o
cen
tra
lis
ed
sys
tem
Qu
an
tity
of
Wast
e
gen
erate
d (T
PD
)
Qu
an
tity
of
Wast
e
Coll
ecte
d (
TP
D)
Qu
an
tity
of
Wast
e
trea
ted
(T
PD
)
Qu
an
tity
of
Wast
e
pro
cess
ed
in
Com
po
stin
g
Sit
es (
TP
D)
Qu
an
tity
of
Wast
e
pro
cess
ed
in
bio
met
han
ati
on
(T
PD
)
Qu
an
tity
of
Wast
e
pro
cess
ed
in
Lan
dfi
ll
(TP
D)
46 Otoor 13 5841 5 2 1754 4 13 0 0 0 0 0 0 0 0 0
47 Ottasekharamangalam 14 6728 3 2 1375 4 15 0 0 0 0 500
kg/month
301 kg/mo
nth 0 0 0 0
48 Pallichal 23 16242 2 1 3911 2 5 0 0 0 0 600
Kg/Month
0 0 0 0 0
49 Pallikkal 13 5782 21 0 1264 4 7 0 0 0 0 0 0 0 0 0
50 Panavoor 15 6912 0 0 1112 0 0 0 0 0 0 0 0 0 0 0 0
51 Pangode 19 7212 4 0 1422 3 6 0 0 0 0 200kg/month
0 0 0 0 0
52 Parassala 23 12800 27 0 2439 2 2 0 0 0 0 38097 26667 26667 0 0
53 Pazhayakunnummal 17 14225 16 0 360 65 47 0 0 0 0 0 0 0 0 0
54 Peringammala 19 12097 0 0 8 0 0 0 0 0 0 500kg
per month
380 0 0 0 0
55 Perunkadavila 16 8496 19 0 1124 4 0 0 0 0 0 0 0 0 0 0
56 Poovachal 23 15429 34 66 2403 100 100 38 0 0 0 8.72/0/
5.7 0 0
57 Poovar 15 5747 0 0 1247 0 0 79 0 0 0 0 0 0 0 0
58 Pothencode 18 11074 33 0 1204 29 0 36 0 0 29 0 0 0 0 0
59 Pulimath 19 8570 49 0 318 100 56 76 0 0 100 290kg/month
123 123 0 0 123
60 Pullambara 15 6798 0 0 278 0 0 0 0 0 0
250kg/month
0 0 0 0 0
Annexure.1
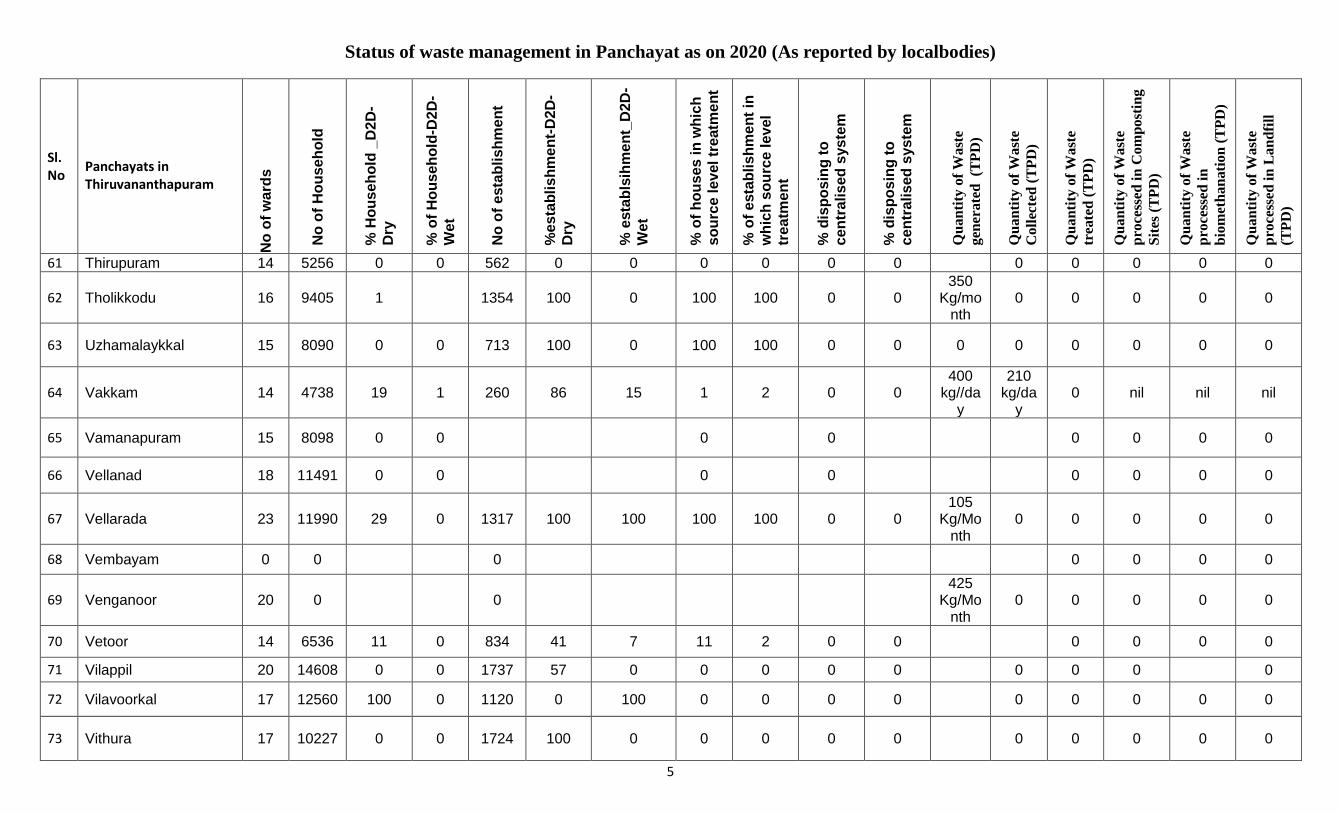
Status of waste management in Panchayat as on 2020 (As reported by localbodies)
5
Sl. No
Panchayats in Thiruvananthapuram
No
of
wa
rds
No
of
Ho
us
eh
old
% H
ou
seh
old
_D
2D
-
Dry
% o
f H
ou
seh
old
-D2
D-
We
t
No
of
esta
blis
hm
en
t
%e
sta
bli
sh
me
nt-
D2
D-
Dry
% e
sta
bls
ihm
en
t_D
2D
-
We
t
% o
f h
ou
se
s i
n w
hic
h
so
urc
e l
evel tr
eatm
en
t
% o
f e
sta
blis
hm
en
t in
wh
ich
so
urc
e l
evel
tre
atm
en
t
% d
isp
osin
g t
o
cen
tra
lis
ed
sys
tem
% d
isp
osin
g t
o
cen
tra
lis
ed
sys
tem
Qu
an
tity
of
Wast
e
gen
erate
d (T
PD
)
Qu
an
tity
of
Wast
e
Coll
ecte
d (
TP
D)
Qu
an
tity
of
Wast
e
trea
ted
(T
PD
)
Qu
an
tity
of
Wast
e
pro
cess
ed
in
Com
po
stin
g
Sit
es (
TP
D)
Qu
an
tity
of
Wast
e
pro
cess
ed
in
bio
met
han
ati
on
(T
PD
)
Qu
an
tity
of
Wast
e
pro
cess
ed
in
Lan
dfi
ll
(TP
D)
61 Thirupuram 14 5256 0 0 562 0 0 0 0 0 0 0 0 0 0 0
62 Tholikkodu 16 9405 1 1354 100 0 100 100 0 0 350
Kg/month
0 0 0 0 0
63 Uzhamalaykkal 15 8090 0 0 713 100 0 100 100 0 0 0 0 0 0 0 0
64 Vakkam 14 4738 19 1 260 86 15 1 2 0 0 400
kg//day
210 kg/da
y 0 nil nil nil
65 Vamanapuram 15 8098 0 0 0 0 0 0 0 0
66 Vellanad 18 11491 0 0 0 0 0 0 0 0
67 Vellarada 23 11990 29 0 1317 100 100 100 100 0 0 105
Kg/Month
0 0 0 0 0
68 Vembayam 0 0 0 0 0 0 0
69 Venganoor 20 0 0 425
Kg/Month
0 0 0 0 0
70 Vetoor 14 6536 11 0 834 41 7 11 2 0 0 0 0 0 0
71 Vilappil 20 14608 0 0 1737 57 0 0 0 0 0 0 0 0 0
72 Vilavoorkal 17 12560 100 0 1120 0 100 0 0 0 0 0 0 0 0 0
73 Vithura 17 10227 0 0 1724 100 0 0 0 0 0 0 0 0 0 0
Annexure.1
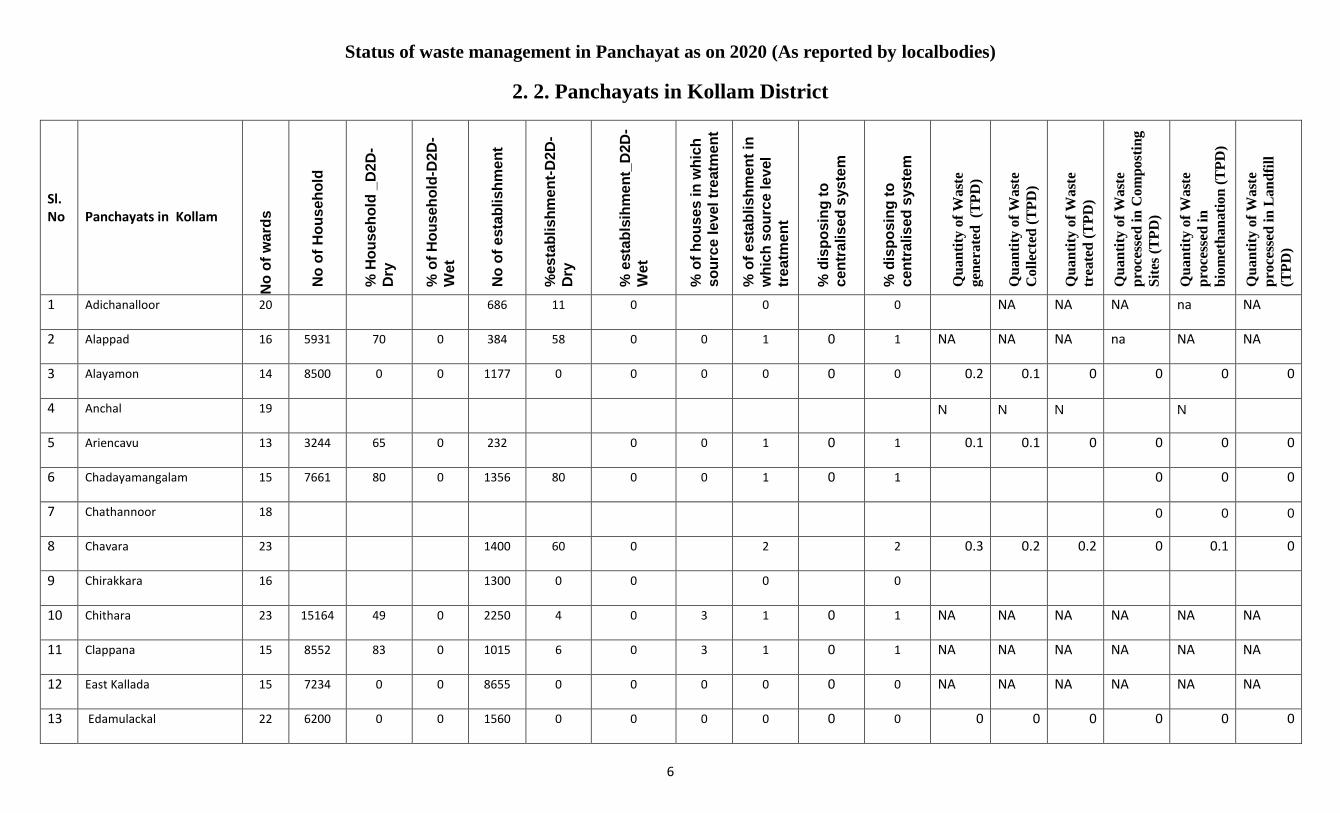
Status of waste management in Panchayat as on 2020 (As reported by localbodies)
6
2. 2. Panchayats in Kollam District
Sl. No
Panchayats in Kollam
No
of
wa
rds
No
of
Ho
us
eh
old
% H
ou
seh
old
_D
2D
-
Dry
% o
f H
ou
seh
old
-D2
D-
We
t
No
of
esta
blis
hm
en
t
%e
sta
bli
sh
me
nt-
D2
D-
Dry
% e
sta
bls
ihm
en
t_D
2D
-
We
t
% o
f h
ou
se
s i
n w
hic
h
so
urc
e l
evel tr
eatm
en
t
% o
f e
sta
blis
hm
en
t in
wh
ich
so
urc
e l
evel
tre
atm
en
t
% d
isp
osin
g t
o
cen
tra
lis
ed
sys
tem
% d
isp
osin
g t
o
cen
tra
lis
ed
sys
tem
Qu
an
tity
of
Wast
e
gen
erate
d (T
PD
)
Qu
an
tity
of
Wast
e
Coll
ecte
d (
TP
D)
Qu
an
tity
of
Wast
e
trea
ted
(T
PD
)
Qu
an
tity
of
Wast
e
pro
cess
ed
in
Com
post
ing
Sit
es (
TP
D)
Qu
an
tity
of
Wast
e
pro
cess
ed
in
bio
met
han
ati
on
(T
PD
)
Qu
an
tity
of
Wast
e
pro
cess
ed
in
Lan
dfi
ll
(TP
D)
1 Adichanalloor 20 686 11 0 0 0 NA NA NA na NA
2 Alappad 16 5931 70 0 384 58 0 0 1 0 1 NA NA NA na NA NA
3 Alayamon 14 8500 0 0 1177 0 0 0 0 0 0 0.2 0.1 0 0 0 0
4 Anchal 19 N N N N
5 Ariencavu 13 3244 65 0 232 0 0 1 0 1 0.1 0.1 0 0 0 0
6 Chadayamangalam 15 7661 80 0 1356 80 0 0 1 0 1 0 0 0
7 Chathannoor 18 0 0 0
8 Chavara 23 1400 60 0 2 2 0.3 0.2 0.2 0 0.1 0
9 Chirakkara 16 1300 0 0 0 0
10 Chithara 23 15164 49 0 2250 4 0 3 1 0 1 NA NA NA NA NA NA
11 Clappana 15 8552 83 0 1015 6 0 3 1 0 1 NA NA NA NA NA NA
12 East Kallada 15 7234 0 0 8655 0 0 0 0 0 0 NA NA NA NA NA NA
13 Edamulackal 22 6200 0 0 1560 0 0 0 0 0 0 0 0 0 0 0 0
Annexure.1
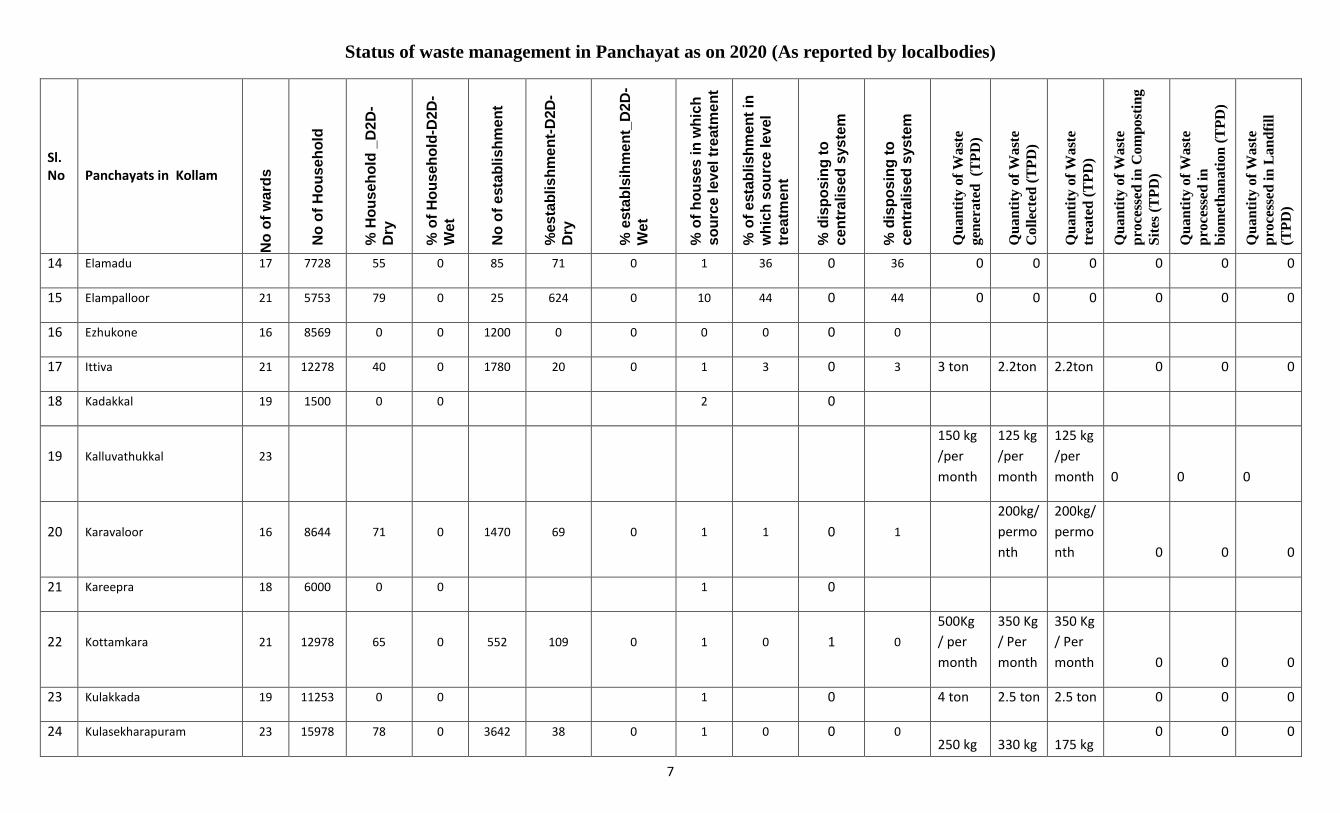
Status of waste management in Panchayat as on 2020 (As reported by localbodies)
7
Sl. No
Panchayats in Kollam
No
of
wa
rds
No
of
Ho
us
eh
old
% H
ou
seh
old
_D
2D
-
Dry
% o
f H
ou
seh
old
-D2
D-
We
t
No
of
esta
blis
hm
en
t
%e
sta
bli
sh
me
nt-
D2
D-
Dry
% e
sta
bls
ihm
en
t_D
2D
-
We
t
% o
f h
ou
se
s i
n w
hic
h
so
urc
e l
evel tr
eatm
en
t
% o
f e
sta
blis
hm
en
t in
wh
ich
so
urc
e l
evel
tre
atm
en
t
% d
isp
osin
g t
o
cen
tra
lis
ed
sys
tem
% d
isp
osin
g t
o
cen
tra
lis
ed
sys
tem
Qu
an
tity
of
Wast
e
gen
erate
d (T
PD
)
Qu
an
tity
of
Wast
e
Coll
ecte
d (
TP
D)
Qu
an
tity
of
Wast
e
trea
ted
(T
PD
)
Qu
an
tity
of
Wast
e
pro
cess
ed
in
Com
po
stin
g
Sit
es (
TP
D)
Qu
an
tity
of
Wast
e
pro
cess
ed
in
bio
met
han
ati
on
(T
PD
)
Qu
an
tity
of
Wast
e
pro
cess
ed
in
Lan
dfi
ll
(TP
D)
14 Elamadu 17 7728 55 0 85 71 0 1 36 0 36 0 0 0 0 0 0
15 Elampalloor 21 5753 79 0 25 624 0 10 44 0 44 0 0 0 0 0 0
16 Ezhukone 16 8569 0 0 1200 0 0 0 0 0 0
17 Ittiva 21 12278 40 0 1780 20 0 1 3 0 3 3 ton 2.2ton 2.2ton 0 0 0
18 Kadakkal 19 1500 0 0 2 0
19 Kalluvathukkal 23
150 kg
/per
month
125 kg
/per
month
125 kg
/per
month 0 0 0
20 Karavaloor 16 8644 71 0 1470 69 0 1 1 0 1
200kg/
permo
nth
200kg/
permo
nth 0 0 0
21 Kareepra 18 6000 0 0 1 0
22 Kottamkara 21 12978 65 0 552 109 0 1 0 1 0
500Kg
/ per
month
350 Kg
/ Per
month
350 Kg
/ Per
month 0 0 0
23 Kulakkada 19 11253 0 0 1 0 4 ton 2.5 ton 2.5 ton 0 0 0
24 Kulasekharapuram 23 15978 78 0 3642 38 0 1 0 0 0 250 kg 330 kg 175 kg
0 0 0
Annexure.1
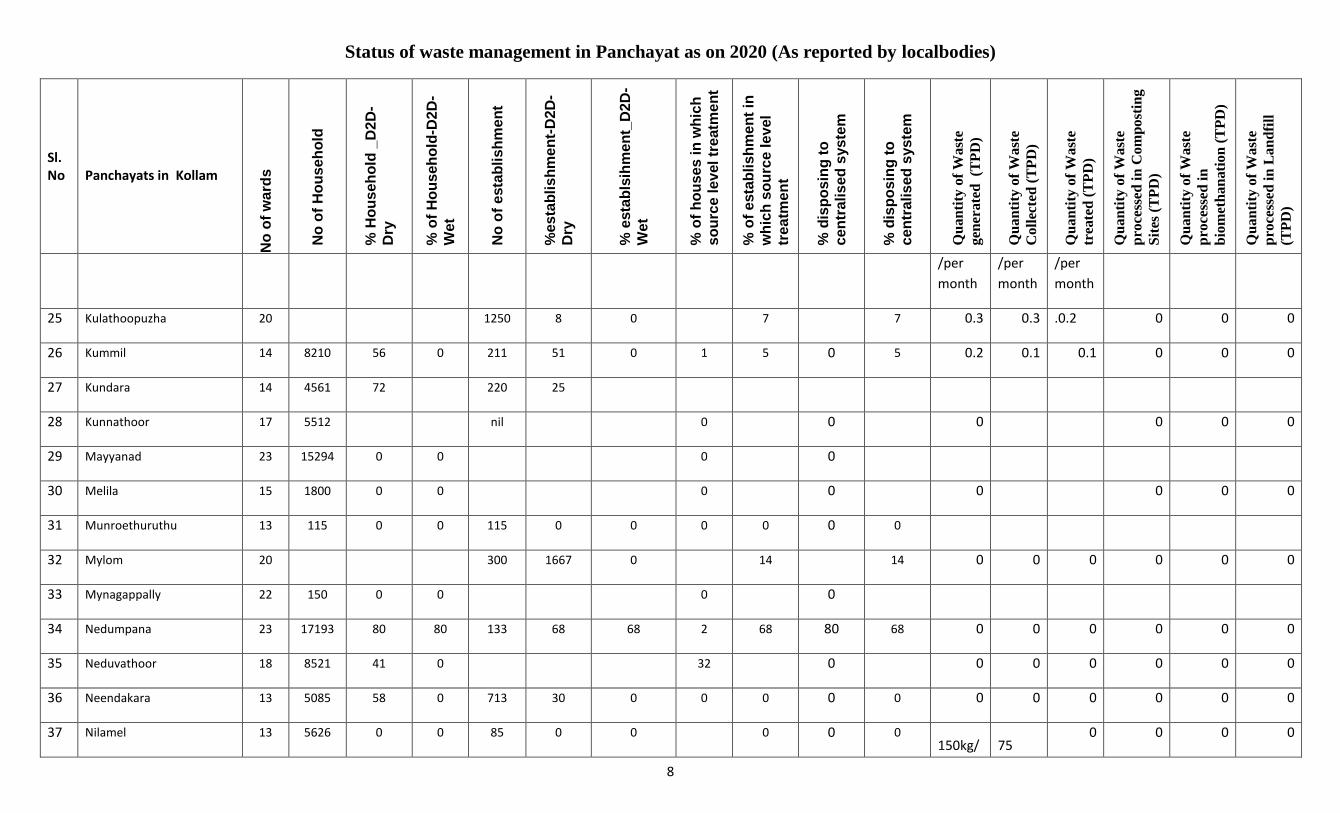
Status of waste management in Panchayat as on 2020 (As reported by localbodies)
8
Sl. No
Panchayats in Kollam
No
of
wa
rds
No
of
Ho
us
eh
old
% H
ou
seh
old
_D
2D
-
Dry
% o
f H
ou
seh
old
-D2
D-
We
t
No
of
esta
blis
hm
en
t
%e
sta
bli
sh
me
nt-
D2
D-
Dry
% e
sta
bls
ihm
en
t_D
2D
-
We
t
% o
f h
ou
se
s i
n w
hic
h
so
urc
e l
evel tr
eatm
en
t
% o
f e
sta
blis
hm
en
t in
wh
ich
so
urc
e l
evel
tre
atm
en
t
% d
isp
osin
g t
o
cen
tra
lis
ed
sys
tem
% d
isp
osin
g t
o
cen
tra
lis
ed
sys
tem
Qu
an
tity
of
Wast
e
gen
erate
d (T
PD
)
Qu
an
tity
of
Wast
e
Coll
ecte
d (
TP
D)
Qu
an
tity
of
Wast
e
trea
ted
(T
PD
)
Qu
an
tity
of
Wast
e
pro
cess
ed
in
Com
po
stin
g
Sit
es (
TP
D)
Qu
an
tity
of
Wast
e
pro
cess
ed
in
bio
met
han
ati
on
(T
PD
)
Qu
an
tity
of
Wast
e
pro
cess
ed
in
Lan
dfi
ll
(TP
D)
/per
month
/per
month
/per
month
25 Kulathoopuzha 20 1250 8 0 7 7 0.3 0.3 .0.2 0 0 0
26 Kummil 14 8210 56 0 211 51 0 1 5 0 5 0.2 0.1 0.1 0 0 0
27 Kundara 14 4561 72 220 25
28 Kunnathoor 17 5512 nil 0 0 0 0 0 0
29 Mayyanad 23 15294 0 0 0 0
30 Melila 15 1800 0 0 0 0 0 0 0 0
31 Munroethuruthu 13 115 0 0 115 0 0 0 0 0 0
32 Mylom 20 300 1667 0 14 14 0 0 0 0 0 0
33 Mynagappally 22 150 0 0 0 0
34 Nedumpana 23 17193 80 80 133 68 68 2 68 80 68 0 0 0 0 0 0
35 Neduvathoor 18 8521 41 0 32 0 0 0 0 0 0 0
36 Neendakara 13 5085 58 0 713 30 0 0 0 0 0 0 0 0 0 0 0
37 Nilamel 13 5626 0 0 85 0 0 0 0 0 150kg/ 75
0 0 0 0
Annexure.1
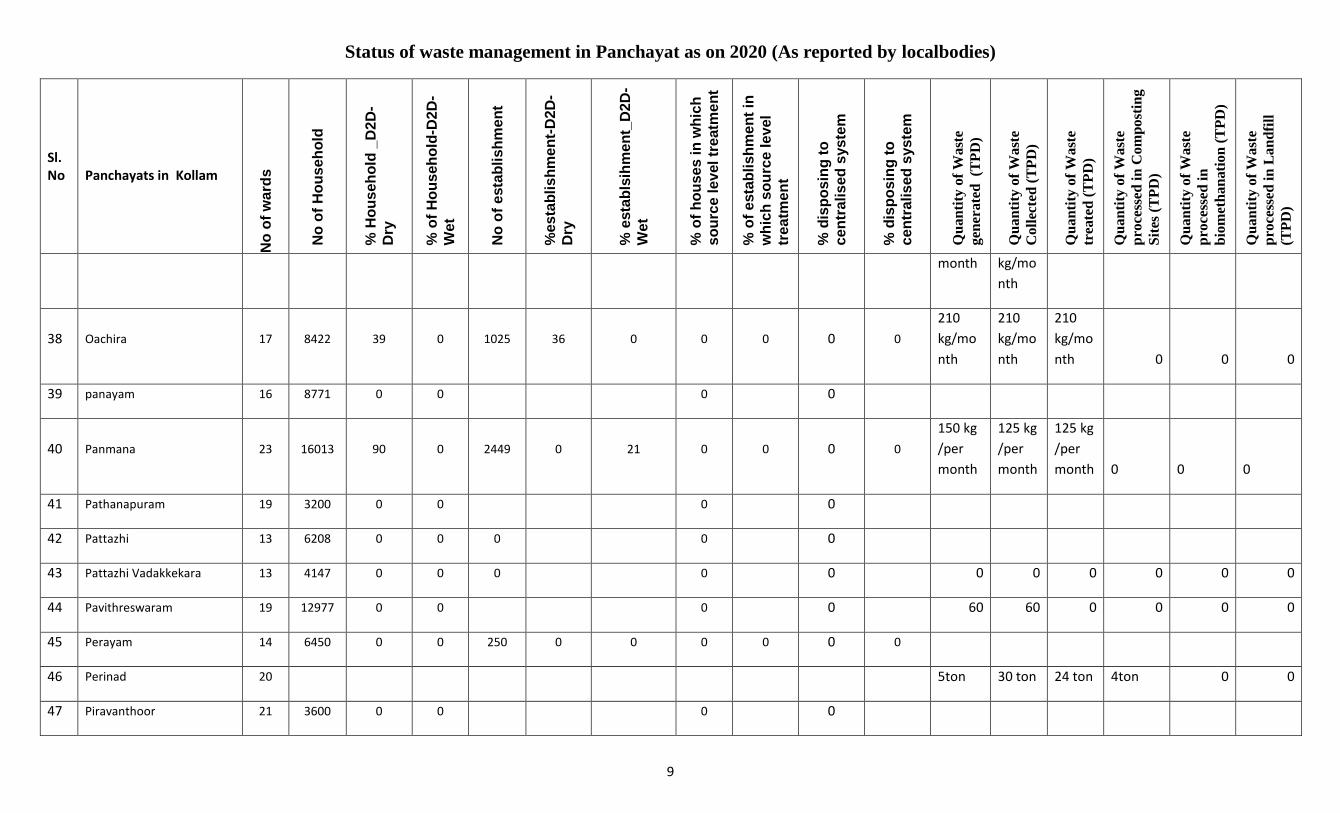
Status of waste management in Panchayat as on 2020 (As reported by localbodies)
9
Sl. No
Panchayats in Kollam
No
of
wa
rds
No
of
Ho
us
eh
old
% H
ou
seh
old
_D
2D
-
Dry
% o
f H
ou
seh
old
-D2
D-
We
t
No
of
esta
blis
hm
en
t
%e
sta
bli
sh
me
nt-
D2
D-
Dry
% e
sta
bls
ihm
en
t_D
2D
-
We
t
% o
f h
ou
se
s i
n w
hic
h
so
urc
e l
evel tr
eatm
en
t
% o
f e
sta
blis
hm
en
t in
wh
ich
so
urc
e l
evel
tre
atm
en
t
% d
isp
osin
g t
o
cen
tra
lis
ed
sys
tem
% d
isp
osin
g t
o
cen
tra
lis
ed
sys
tem
Qu
an
tity
of
Wast
e
gen
erate
d (T
PD
)
Qu
an
tity
of
Wast
e
Coll
ecte
d (
TP
D)
Qu
an
tity
of
Wast
e
trea
ted
(T
PD
)
Qu
an
tity
of
Wast
e
pro
cess
ed
in
Com
po
stin
g
Sit
es (
TP
D)
Qu
an
tity
of
Wast
e
pro
cess
ed
in
bio
met
han
ati
on
(T
PD
)
Qu
an
tity
of
Wast
e
pro
cess
ed
in
Lan
dfi
ll
(TP
D)
month kg/mo
nth
38 Oachira 17 8422 39 0 1025 36 0 0 0 0 0
210
kg/mo
nth
210
kg/mo
nth
210
kg/mo
nth 0 0 0
39 panayam 16 8771 0 0 0 0
40 Panmana 23 16013 90 0 2449 0 21 0 0 0 0
150 kg
/per
month
125 kg
/per
month
125 kg
/per
month 0 0 0
41 Pathanapuram 19 3200 0 0 0 0
42 Pattazhi 13 6208 0 0 0 0 0
43 Pattazhi Vadakkekara 13 4147 0 0 0 0 0 0 0 0 0 0 0
44 Pavithreswaram 19 12977 0 0 0 0 60 60 0 0 0 0
45 Perayam 14 6450 0 0 250 0 0 0 0 0 0
46 Perinad 20 5ton 30 ton 24 ton 4ton 0 0
47 Piravanthoor 21 3600 0 0 0 0
Annexure.1

Status of waste management in Panchayat as on 2020 (As reported by localbodies)
10
Sl. No
Panchayats in Kollam
No
of
wa
rds
No
of
Ho
us
eh
old
% H
ou
seh
old
_D
2D
-
Dry
% o
f H
ou
seh
old
-D2
D-
We
t
No
of
esta
blis
hm
en
t
%e
sta
bli
sh
me
nt-
D2
D-
Dry
% e
sta
bls
ihm
en
t_D
2D
-
We
t
% o
f h
ou
se
s i
n w
hic
h
so
urc
e l
evel tr
eatm
en
t
% o
f e
sta
blis
hm
en
t in
wh
ich
so
urc
e l
evel
tre
atm
en
t
% d
isp
osin
g t
o
cen
tra
lis
ed
sys
tem
% d
isp
osin
g t
o
cen
tra
lis
ed
sys
tem
Qu
an
tity
of
Wast
e
gen
erate
d (T
PD
)
Qu
an
tity
of
Wast
e
Coll
ecte
d (
TP
D)
Qu
an
tity
of
Wast
e
trea
ted
(T
PD
)
Qu
an
tity
of
Wast
e
pro
cess
ed
in
Com
po
stin
g
Sit
es (
TP
D)
Qu
an
tity
of
Wast
e
pro
cess
ed
in
bio
met
han
ati
on
(T
PD
)
Qu
an
tity
of
Wast
e
pro
cess
ed
in
Lan
dfi
ll
(TP
D)
48 Poothakkulam 18 9621 36 0 29 0 6 ton 3 ton 3 ton 0 0 0
49 Pooyappally 16 0 5 ton 1.5 ton 1.5 ton 0.5 ton 0 0
50 Poruvazhy 18 9581 47 0 1200 42 0 0 0 0 0 4 ton 0 0 0
51 Sasthamcotta 19 15243 0 0 0 0 4 ton 3 ton 2 ton 0 0 0
52 Sooranad North 18 9871 0 1935 0 0 0 0 0 0
53 Sooranad South 16 8228 70 0 1120 63 0 0 0 0 0 4 ton 3 ton 2.5 ton 0 0 0
54 Thalavoor 20 7200 0 0 0 0
55 Thazhava 22 11019 70 34 3256 50 30 2 6 0 6
56 Thekkumbhagom 13 5600 0 0 0 0
57 Thenmala 16 2320 0 0 0 0 NA NA NA NA NA NA
58 Thevalakkara 23 8000 0 0 0 0 0 0 0 0 0 0
59 Thodiyoor 23 14237 72 0 2224 82 0 1 2 0 2 5.5 ton 3.5 ton 0 0 0 0
60 Thrikkaruva 16 12238 0 0 2005 86 0 1 1 0 1 4.9ton 1.8ton 0 0 0 0
Annexure.1
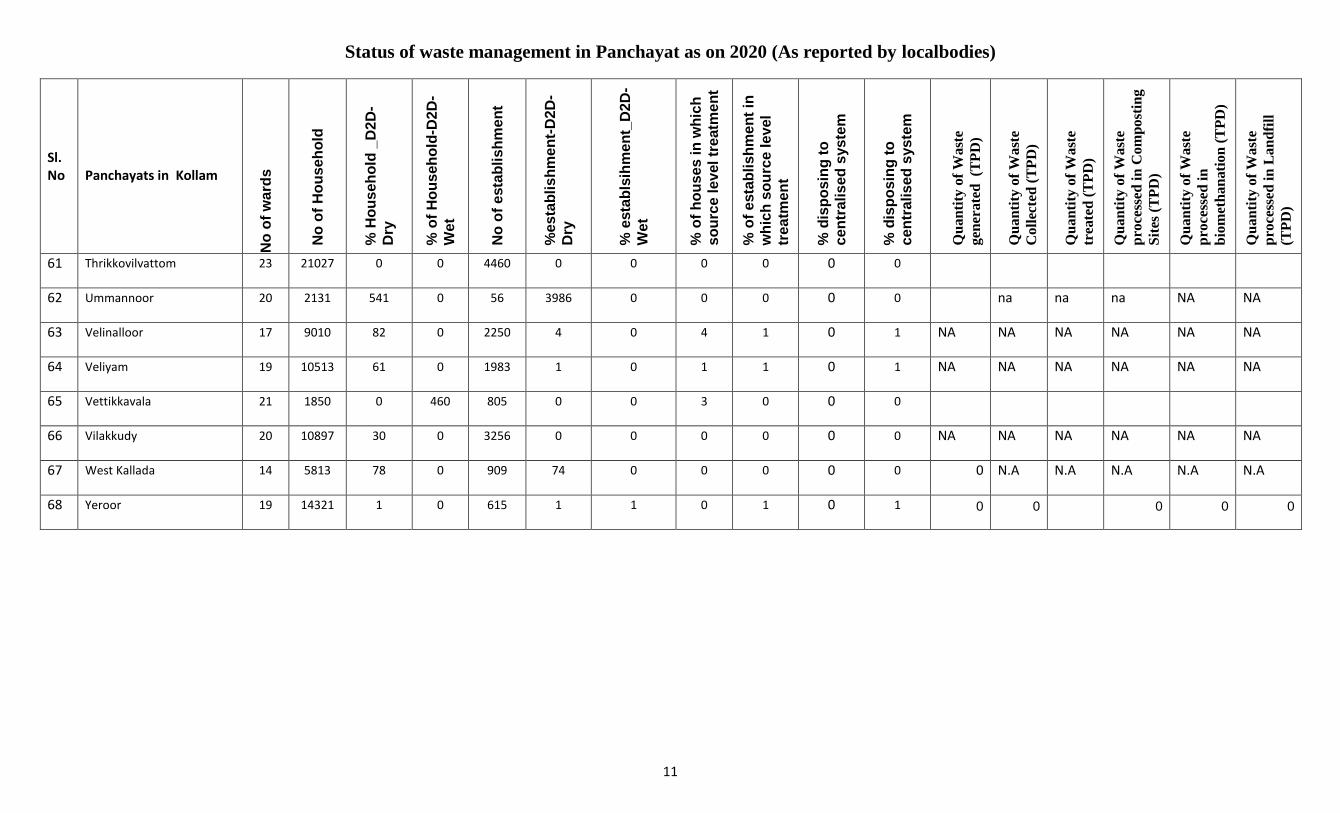
Status of waste management in Panchayat as on 2020 (As reported by localbodies)
11
Sl. No
Panchayats in Kollam
No
of
wa
rds
No
of
Ho
us
eh
old
% H
ou
seh
old
_D
2D
-
Dry
% o
f H
ou
seh
old
-D2
D-
We
t
No
of
esta
blis
hm
en
t
%e
sta
bli
sh
me
nt-
D2
D-
Dry
% e
sta
bls
ihm
en
t_D
2D
-
We
t
% o
f h
ou
se
s i
n w
hic
h
so
urc
e l
evel tr
eatm
en
t
% o
f e
sta
blis
hm
en
t in
wh
ich
so
urc
e l
evel
tre
atm
en
t
% d
isp
osin
g t
o
cen
tra
lis
ed
sys
tem
% d
isp
osin
g t
o
cen
tra
lis
ed
sys
tem
Qu
an
tity
of
Wast
e
gen
erate
d (T
PD
)
Qu
an
tity
of
Wast
e
Coll
ecte
d (
TP
D)
Qu
an
tity
of
Wast
e
trea
ted
(T
PD
)
Qu
an
tity
of
Wast
e
pro
cess
ed
in
Com
po
stin
g
Sit
es (
TP
D)
Qu
an
tity
of
Wast
e
pro
cess
ed
in
bio
met
han
ati
on
(T
PD
)
Qu
an
tity
of
Wast
e
pro
cess
ed
in
Lan
dfi
ll
(TP
D)
61 Thrikkovilvattom 23 21027 0 0 4460 0 0 0 0 0 0
62 Ummannoor 20 2131 541 0 56 3986 0 0 0 0 0 na na na NA NA
63 Velinalloor 17 9010 82 0 2250 4 0 4 1 0 1 NA NA NA NA NA NA
64 Veliyam 19 10513 61 0 1983 1 0 1 1 0 1 NA NA NA NA NA NA
65 Vettikkavala 21 1850 0 460 805 0 0 3 0 0 0
66 Vilakkudy 20 10897 30 0 3256 0 0 0 0 0 0 NA NA NA NA NA NA
67 West Kallada 14 5813 78 0 909 74 0 0 0 0 0 0 N.A N.A N.A N.A N.A
68 Yeroor 19 14321 1 0 615 1 1 0 1 0 1 0 0 0 0 0
Annexure.1
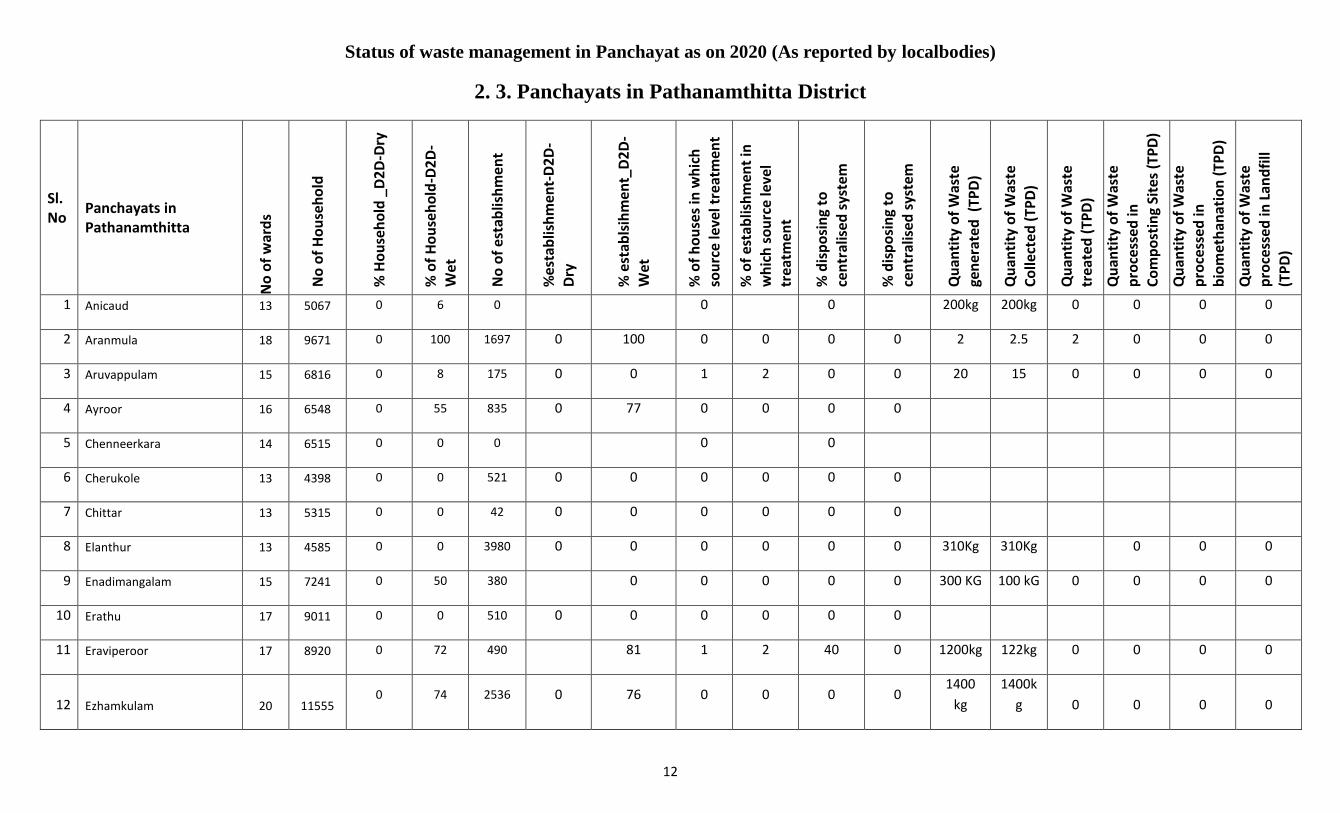
Status of waste management in Panchayat as on 2020 (As reported by localbodies)
12
2. 3. Panchayats in Pathanamthitta District
Sl. No
Panchayats in Pathanamthitta
No
of
war
ds
No
of
Ho
use
ho
ld
% H
ou
seh
old
_D
2D
-Dry
% o
f H
ou
seh
old
-D2
D-
Wet
No
of
esta
blis
hm
ent
%e
stab
lish
men
t-D
2D
-D
ry
% e
stab
lsih
men
t_D
2D
-
Wet
% o
f h
ou
ses
in w
hic
h
sou
rce
leve
l tre
atm
ent
% o
f es
tab
lish
men
t in
w
hic
h s
ou
rce
leve
l tr
eatm
ent
% d
isp
osi
ng
to
cen
tral
ise
d s
yste
m
% d
isp
osi
ng
to
cen
tral
ise
d s
yste
m
Qu
anti
ty o
f W
aste
ge
ner
ate
d (
TPD
)
Qu
anti
ty o
f W
aste
Co
llect
ed (
TPD
)
Qu
anti
ty o
f W
aste
tr
eate
d (
TPD
)
Qu
anti
ty o
f W
aste
p
roce
sse
d in
C
om
po
stin
g Si
tes
(TP
D)
Qu
anti
ty o
f W
aste
pro
cess
ed
in
bio
met
han
atio
n (
TPD
)
Qu
anti
ty o
f W
aste
p
roce
sse
d in
Lan
dfi
ll (T
PD
)
1 Anicaud 13 5067 0 6 0 0 0 200kg 200kg 0 0 0 0
2 Aranmula 18 9671 0 100 1697 0 100 0 0 0 0 2 2.5 2 0 0 0
3 Aruvappulam 15 6816 0 8 175 0 0 1 2 0 0 20 15 0 0 0 0
4 Ayroor 16 6548 0 55 835 0 77 0 0 0 0
5 Chenneerkara 14 6515 0 0 0 0 0
6 Cherukole 13 4398 0 0 521 0 0 0 0 0 0
7 Chittar 13 5315 0 0 42 0 0 0 0 0 0
8 Elanthur 13 4585 0 0 3980 0 0 0 0 0 0 310Kg 310Kg 0 0 0
9 Enadimangalam 15 7241 0 50 380 0 0 0 0 0 300 KG 100 kG 0 0 0 0
10 Erathu 17 9011 0 0 510 0 0 0 0 0 0
11 Eraviperoor 17 8920 0 72 490 81 1 2 40 0 1200kg 122kg 0 0 0 0
12 Ezhamkulam 20 11555 0 74 2536 0 76 0 0 0 0
1400
kg
1400k
g 0 0 0 0
Annexure.1
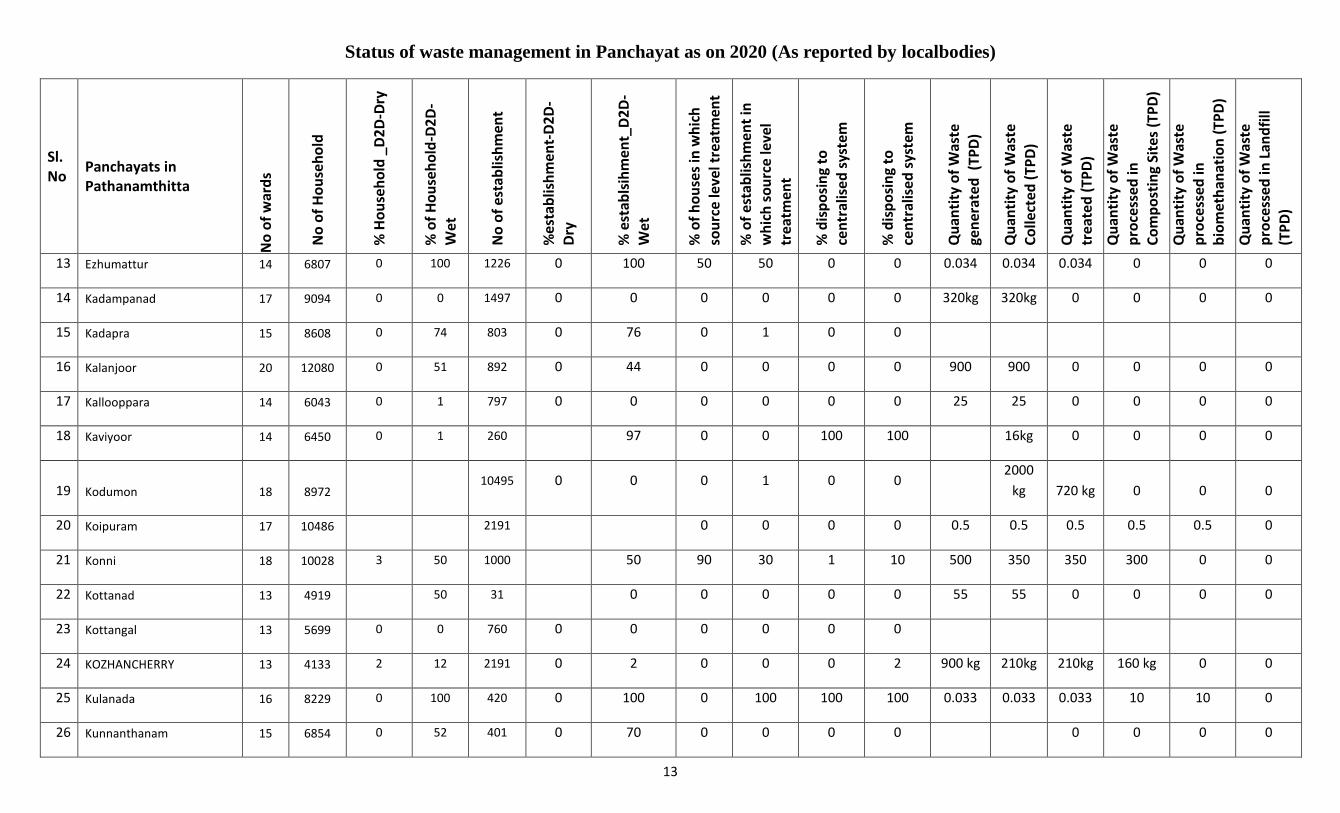
Status of waste management in Panchayat as on 2020 (As reported by localbodies)
13
Sl. No
Panchayats in Pathanamthitta
No
of
war
ds
No
of
Ho
use
ho
ld
% H
ou
seh
old
_D
2D
-Dry
% o
f H
ou
seh
old
-D2
D-
Wet
No
of
esta
blis
hm
ent
%e
stab
lish
men
t-D
2D
-D
ry
% e
stab
lsih
men
t_D
2D
-
Wet
% o
f h
ou
ses
in w
hic
h
sou
rce
leve
l tre
atm
ent
% o
f es
tab
lish
men
t in
w
hic
h s
ou
rce
leve
l tr
eatm
ent
% d
isp
osi
ng
to
cen
tral
ise
d s
yste
m
% d
isp
osi
ng
to
cen
tral
ise
d s
yste
m
Qu
anti
ty o
f W
aste
ge
ner
ate
d (
TPD
)
Qu
anti
ty o
f W
aste
Co
llect
ed (
TPD
)
Qu
anti
ty o
f W
aste
tr
eate
d (
TPD
)
Qu
anti
ty o
f W
aste
p
roce
sse
d in
C
om
po
stin
g Si
tes
(TP
D)
Qu
anti
ty o
f W
aste
pro
cess
ed
in
bio
met
han
atio
n (
TPD
)
Qu
anti
ty o
f W
aste
p
roce
sse
d in
Lan
dfi
ll (T
PD
)
13 Ezhumattur 14 6807 0 100 1226 0 100 50 50 0 0 0.034 0.034 0.034 0 0 0
14 Kadampanad 17 9094 0 0 1497 0 0 0 0 0 0 320kg 320kg 0 0 0 0
15 Kadapra 15 8608 0 74 803 0 76 0 1 0 0
16 Kalanjoor 20 12080 0 51 892 0 44 0 0 0 0 900 900 0 0 0 0
17 Kallooppara 14 6043 0 1 797 0 0 0 0 0 0 25 25 0 0 0 0
18 Kaviyoor 14 6450 0 1 260 97 0 0 100 100 16kg 0 0 0 0
19 Kodumon 18 8972 10495 0 0 0 1 0 0
2000
kg 720 kg 0 0 0
20 Koipuram 17 10486 2191 0 0 0 0 0.5 0.5 0.5 0.5 0.5 0
21 Konni 18 10028 3 50 1000 50 90 30 1 10 500 350 350 300 0 0
22 Kottanad 13 4919 50 31 0 0 0 0 0 55 55 0 0 0 0
23 Kottangal 13 5699 0 0 760 0 0 0 0 0 0
24 KOZHANCHERRY 13 4133 2 12 2191 0 2 0 0 0 2 900 kg 210kg 210kg 160 kg 0 0
25 Kulanada 16 8229 0 100 420 0 100 0 100 100 100 0.033 0.033 0.033 10 10 0
26 Kunnanthanam 15 6854 0 52 401 0 70 0 0 0 0
0 0 0 0
Annexure.1
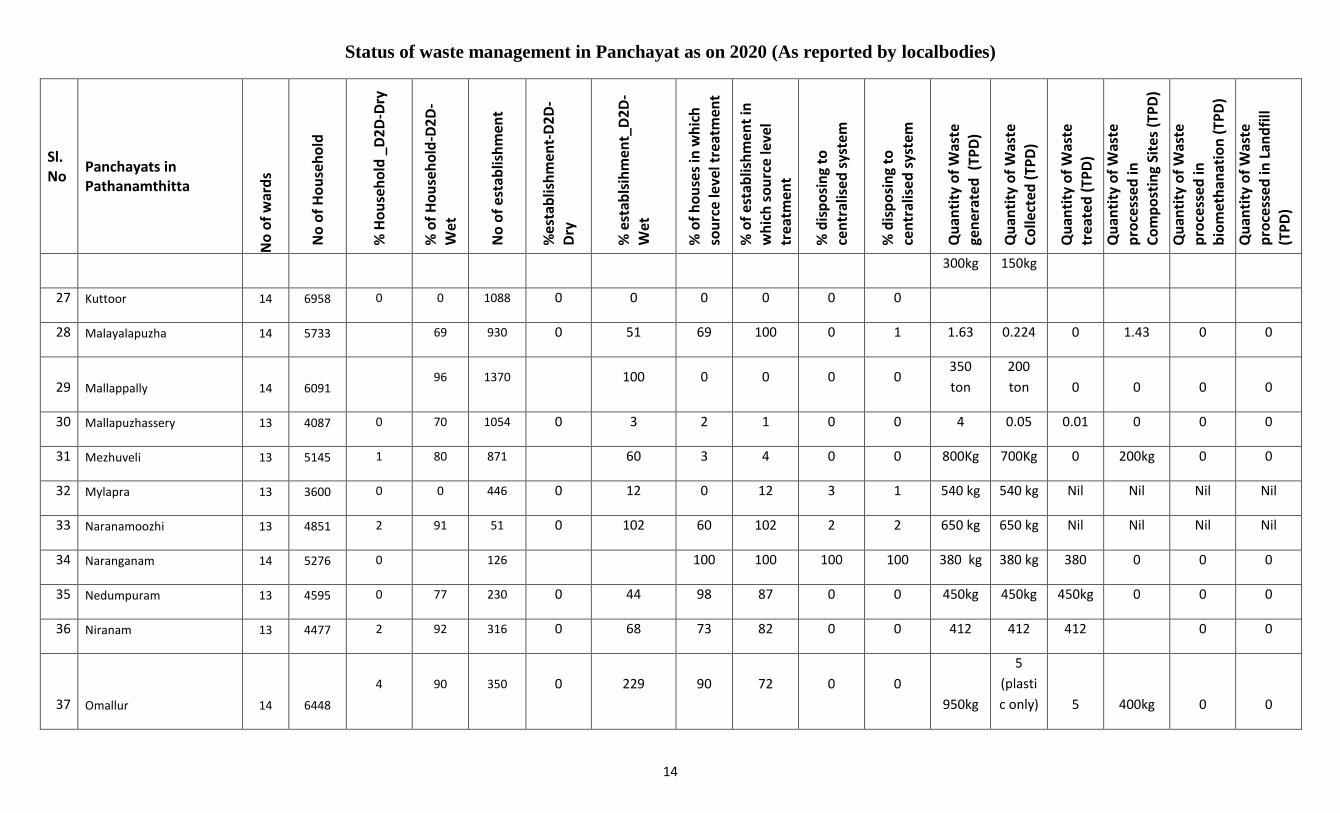
Status of waste management in Panchayat as on 2020 (As reported by localbodies)
14
Sl. No
Panchayats in Pathanamthitta
No
of
war
ds
No
of
Ho
use
ho
ld
% H
ou
seh
old
_D
2D
-Dry
% o
f H
ou
seh
old
-D2
D-
Wet
No
of
esta
blis
hm
ent
%e
stab
lish
men
t-D
2D
-D
ry
% e
stab
lsih
men
t_D
2D
-
Wet
% o
f h
ou
ses
in w
hic
h
sou
rce
leve
l tre
atm
ent
% o
f es
tab
lish
men
t in
w
hic
h s
ou
rce
leve
l tr
eatm
ent
% d
isp
osi
ng
to
cen
tral
ise
d s
yste
m
% d
isp
osi
ng
to
cen
tral
ise
d s
yste
m
Qu
anti
ty o
f W
aste
ge
ner
ate
d (
TPD
)
Qu
anti
ty o
f W
aste
Co
llect
ed (
TPD
)
Qu
anti
ty o
f W
aste
tr
eate
d (
TPD
)
Qu
anti
ty o
f W
aste
p
roce
sse
d in
C
om
po
stin
g Si
tes
(TP
D)
Qu
anti
ty o
f W
aste
pro
cess
ed
in
bio
met
han
atio
n (
TPD
)
Qu
anti
ty o
f W
aste
p
roce
sse
d in
Lan
dfi
ll (T
PD
)
300kg 150kg
27 Kuttoor 14 6958 0 0 1088 0 0 0 0 0 0
28 Malayalapuzha 14 5733 69 930 0 51 69 100 0 1 1.63 0.224 0 1.43 0 0
29 Mallappally 14 6091 96 1370 100 0 0 0 0
350
ton
200
ton 0 0 0 0
30 Mallapuzhassery 13 4087 0 70 1054 0 3 2 1 0 0 4 0.05 0.01 0 0 0
31 Mezhuveli 13 5145 1 80 871 60 3 4 0 0 800Kg 700Kg 0 200kg 0 0
32 Mylapra 13 3600 0 0 446 0 12 0 12 3 1 540 kg 540 kg Nil Nil Nil Nil
33 Naranamoozhi 13 4851 2 91 51 0 102 60 102 2 2 650 kg 650 kg Nil Nil Nil Nil
34 Naranganam 14 5276 0 126 100 100 100 100 380 kg 380 kg 380 0 0 0
35 Nedumpuram 13 4595 0 77 230 0 44 98 87 0 0 450kg 450kg 450kg 0 0 0
36 Niranam 13 4477 2 92 316 0 68 73 82 0 0 412 412 412 0 0
37 Omallur 14 6448
4 90 350 0 229 90 72 0 0
950kg
5
(plasti
c only) 5 400kg 0 0
Annexure.1
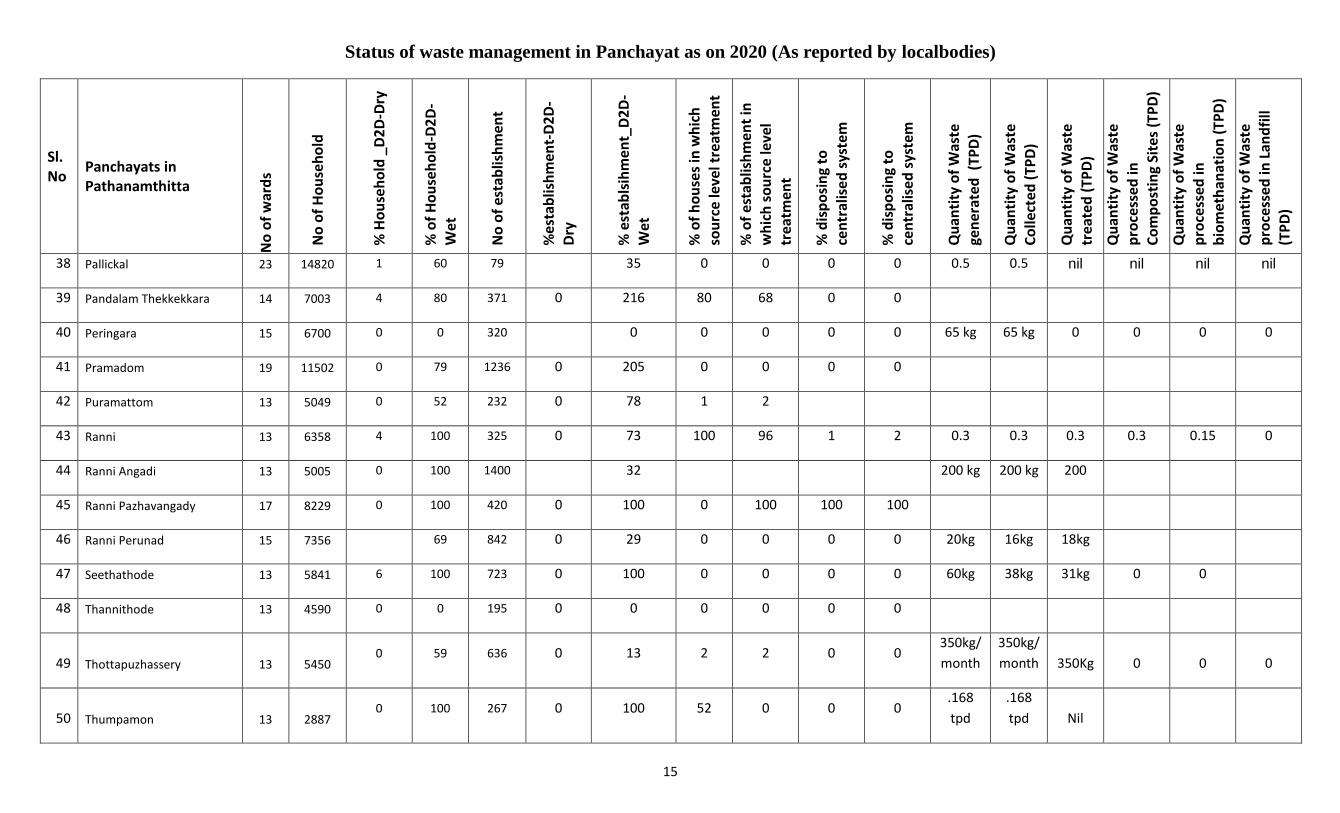
Status of waste management in Panchayat as on 2020 (As reported by localbodies)
15
Sl. No
Panchayats in Pathanamthitta
No
of
war
ds
No
of
Ho
use
ho
ld
% H
ou
seh
old
_D
2D
-Dry
% o
f H
ou
seh
old
-D2
D-
Wet
No
of
esta
blis
hm
ent
%e
stab
lish
men
t-D
2D
-D
ry
% e
stab
lsih
men
t_D
2D
-
Wet
% o
f h
ou
ses
in w
hic
h
sou
rce
leve
l tre
atm
ent
% o
f es
tab
lish
men
t in
w
hic
h s
ou
rce
leve
l tr
eatm
ent
% d
isp
osi
ng
to
cen
tral
ise
d s
yste
m
% d
isp
osi
ng
to
cen
tral
ise
d s
yste
m
Qu
anti
ty o
f W
aste
ge
ner
ate
d (
TPD
)
Qu
anti
ty o
f W
aste
Co
llect
ed (
TPD
)
Qu
anti
ty o
f W
aste
tr
eate
d (
TPD
)
Qu
anti
ty o
f W
aste
p
roce
sse
d in
C
om
po
stin
g Si
tes
(TP
D)
Qu
anti
ty o
f W
aste
pro
cess
ed
in
bio
met
han
atio
n (
TPD
)
Qu
anti
ty o
f W
aste
p
roce
sse
d in
Lan
dfi
ll (T
PD
)
38 Pallickal 23 14820 1 60 79 35 0 0 0 0 0.5 0.5 nil nil nil nil
39 Pandalam Thekkekkara 14 7003 4 80 371 0 216 80 68 0 0
40 Peringara 15 6700 0 0 320 0 0 0 0 0 65 kg 65 kg 0 0 0 0
41 Pramadom 19 11502 0 79 1236 0 205 0 0 0 0
42 Puramattom 13 5049 0 52 232 0 78 1 2
43 Ranni 13 6358 4 100 325 0 73 100 96 1 2 0.3 0.3 0.3 0.3 0.15 0
44 Ranni Angadi 13 5005 0 100 1400 32 200 kg 200 kg 200
45 Ranni Pazhavangady 17 8229 0 100 420 0 100 0 100 100 100
46 Ranni Perunad 15 7356 69 842 0 29 0 0 0 0 20kg 16kg 18kg
47 Seethathode 13 5841 6 100 723 0 100 0 0 0 0 60kg 38kg 31kg 0 0
48 Thannithode 13 4590 0 0 195 0 0 0 0 0 0
49 Thottapuzhassery 13 5450 0 59 636 0 13 2 2 0 0
350kg/
month
350kg/
month 350Kg 0 0 0
50 Thumpamon 13 2887 0 100 267 0 100 52 0 0 0
.168
tpd
.168
tpd Nil
Annexure.1
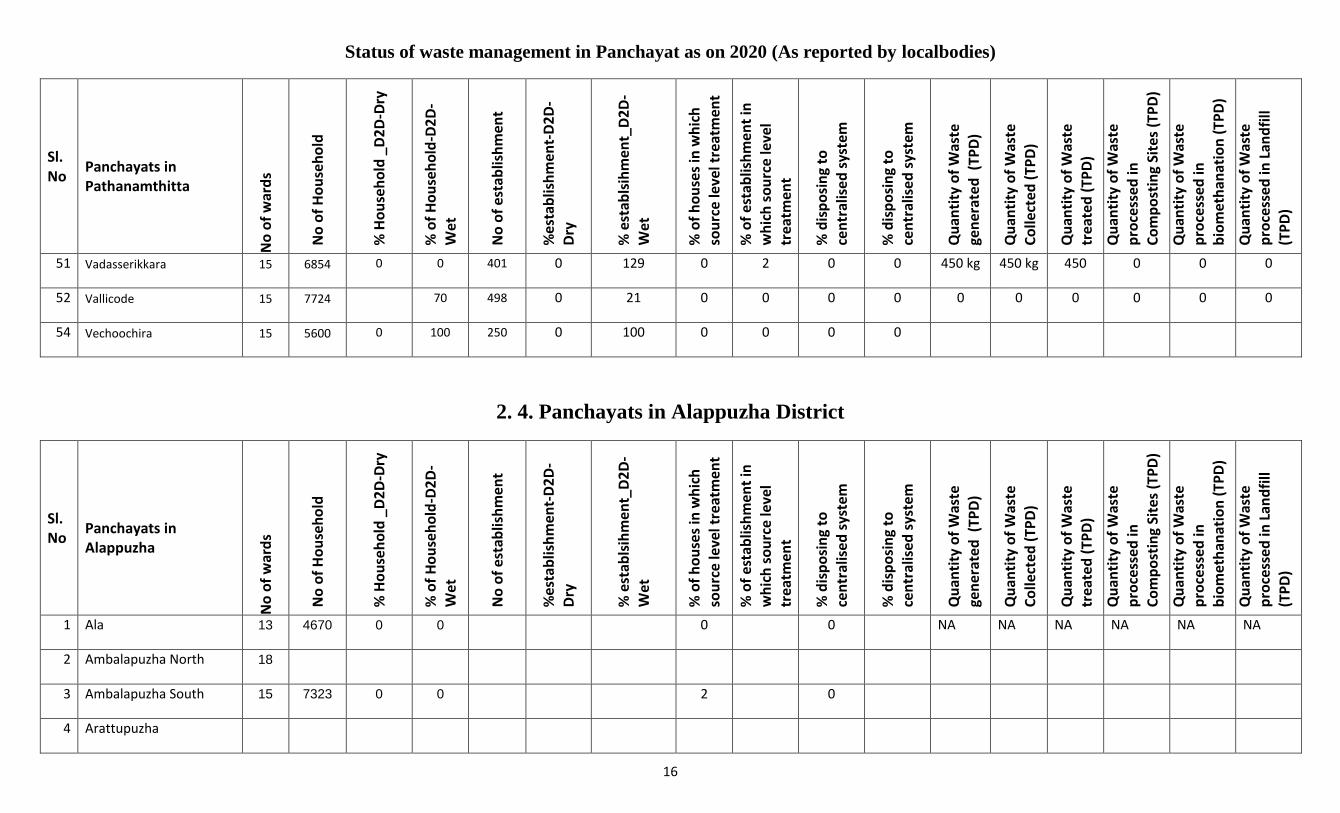
Status of waste management in Panchayat as on 2020 (As reported by localbodies)
16
Sl. No
Panchayats in Pathanamthitta
No
of
war
ds
No
of
Ho
use
ho
ld
% H
ou
seh
old
_D
2D
-Dry
% o
f H
ou
seh
old
-D2
D-
Wet
No
of
esta
blis
hm
ent
%e
stab
lish
men
t-D
2D
-D
ry
% e
stab
lsih
men
t_D
2D
-
Wet
% o
f h
ou
ses
in w
hic
h
sou
rce
leve
l tre
atm
ent
% o
f es
tab
lish
men
t in
w
hic
h s
ou
rce
leve
l tr
eatm
ent
% d
isp
osi
ng
to
cen
tral
ise
d s
yste
m
% d
isp
osi
ng
to
cen
tral
ise
d s
yste
m
Qu
anti
ty o
f W
aste
ge
ner
ate
d (
TPD
)
Qu
anti
ty o
f W
aste
Co
llect
ed (
TPD
)
Qu
anti
ty o
f W
aste
tr
eate
d (
TPD
)
Qu
anti
ty o
f W
aste
p
roce
sse
d in
C
om
po
stin
g Si
tes
(TP
D)
Qu
anti
ty o
f W
aste
pro
cess
ed
in
bio
met
han
atio
n (
TPD
)
Qu
anti
ty o
f W
aste
p
roce
sse
d in
Lan
dfi
ll (T
PD
)
51 Vadasserikkara 15 6854 0 0 401 0 129 0 2 0 0 450 kg 450 kg 450 0 0 0
52 Vallicode 15 7724 70 498 0 21 0 0 0 0 0 0 0 0 0 0
54 Vechoochira 15 5600 0 100 250 0 100 0 0 0 0
2. 4. Panchayats in Alappuzha District
Sl. No
Panchayats in Alappuzha
No
of
war
ds
No
of
Ho
use
ho
ld
% H
ou
seh
old
_D
2D
-Dry
% o
f H
ou
seh
old
-D2
D-
Wet
No
of
esta
blis
hm
ent
%e
stab
lish
men
t-D
2D
-D
ry
% e
stab
lsih
men
t_D
2D
-
Wet
% o
f h
ou
ses
in w
hic
h
sou
rce
leve
l tre
atm
ent
% o
f es
tab
lish
men
t in
w
hic
h s
ou
rce
leve
l tr
eatm
ent
% d
isp
osi
ng
to
cen
tral
ise
d s
yste
m
% d
isp
osi
ng
to
cen
tral
ise
d s
yste
m
Qu
anti
ty o
f W
aste
ge
ner
ate
d (
TPD
)
Qu
anti
ty o
f W
aste
Co
llect
ed (
TPD
)
Qu
anti
ty o
f W
aste
tr
eate
d (
TPD
)
Qu
anti
ty o
f W
aste
p
roce
sse
d in
C
om
po
stin
g Si
tes
(TP
D)
Qu
anti
ty o
f W
aste
pro
cess
ed
in
bio
met
han
atio
n (
TPD
)
Qu
anti
ty o
f W
aste
p
roce
sse
d in
Lan
dfi
ll (T
PD
)
1 Ala 13 4670 0 0 0 0 NA NA NA NA NA NA
2 Ambalapuzha North 18
3 Ambalapuzha South 15 7323 0 0 2 0
4 Arattupuzha
Annexure.1
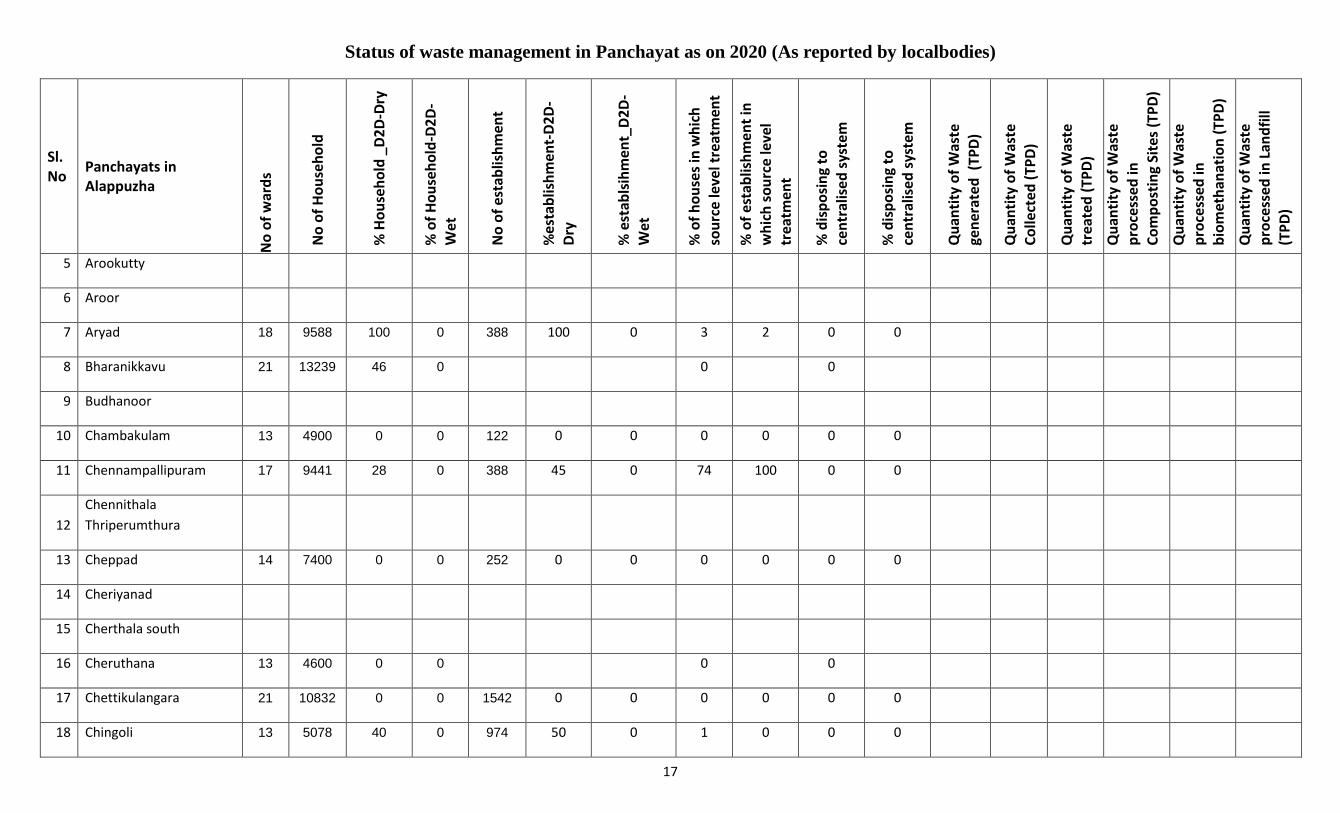
Status of waste management in Panchayat as on 2020 (As reported by localbodies)
17
Sl. No
Panchayats in Alappuzha
No
of
war
ds
No
of
Ho
use
ho
ld
% H
ou
seh
old
_D
2D
-Dry
% o
f H
ou
seh
old
-D2
D-
Wet
No
of
esta
blis
hm
ent
%e
stab
lish
men
t-D
2D
-D
ry
% e
stab
lsih
men
t_D
2D
-
Wet
% o
f h
ou
ses
in w
hic
h
sou
rce
leve
l tre
atm
ent
% o
f es
tab
lish
men
t in
w
hic
h s
ou
rce
leve
l tr
eatm
ent
% d
isp
osi
ng
to
cen
tral
ise
d s
yste
m
% d
isp
osi
ng
to
cen
tral
ise
d s
yste
m
Qu
anti
ty o
f W
aste
ge
ner
ate
d (
TPD
)
Qu
anti
ty o
f W
aste
Co
llect
ed (
TPD
)
Qu
anti
ty o
f W
aste
tr
eate
d (
TPD
)
Qu
anti
ty o
f W
aste
p
roce
sse
d in
C
om
po
stin
g Si
tes
(TP
D)
Qu
anti
ty o
f W
aste
pro
cess
ed
in
bio
met
han
atio
n (
TPD
)
Qu
anti
ty o
f W
aste
p
roce
sse
d in
Lan
dfi
ll (T
PD
)
5 Arookutty
6 Aroor
7 Aryad 18 9588 100 0 388 100 0 3 2 0 0
8 Bharanikkavu 21 13239 46 0 0 0
9 Budhanoor
10 Chambakulam 13 4900 0 0 122 0 0 0 0 0 0
11 Chennampallipuram 17 9441 28 0 388 45 0 74 100 0 0
12
Chennithala
Thriperumthura
13 Cheppad 14 7400 0 0 252 0 0 0 0 0 0
14 Cheriyanad
15 Cherthala south
16 Cheruthana 13 4600 0 0 0 0
17 Chettikulangara 21 10832 0 0 1542 0 0 0 0 0 0
18 Chingoli 13 5078 40 0 974 50 0 1 0 0 0
Annexure.1
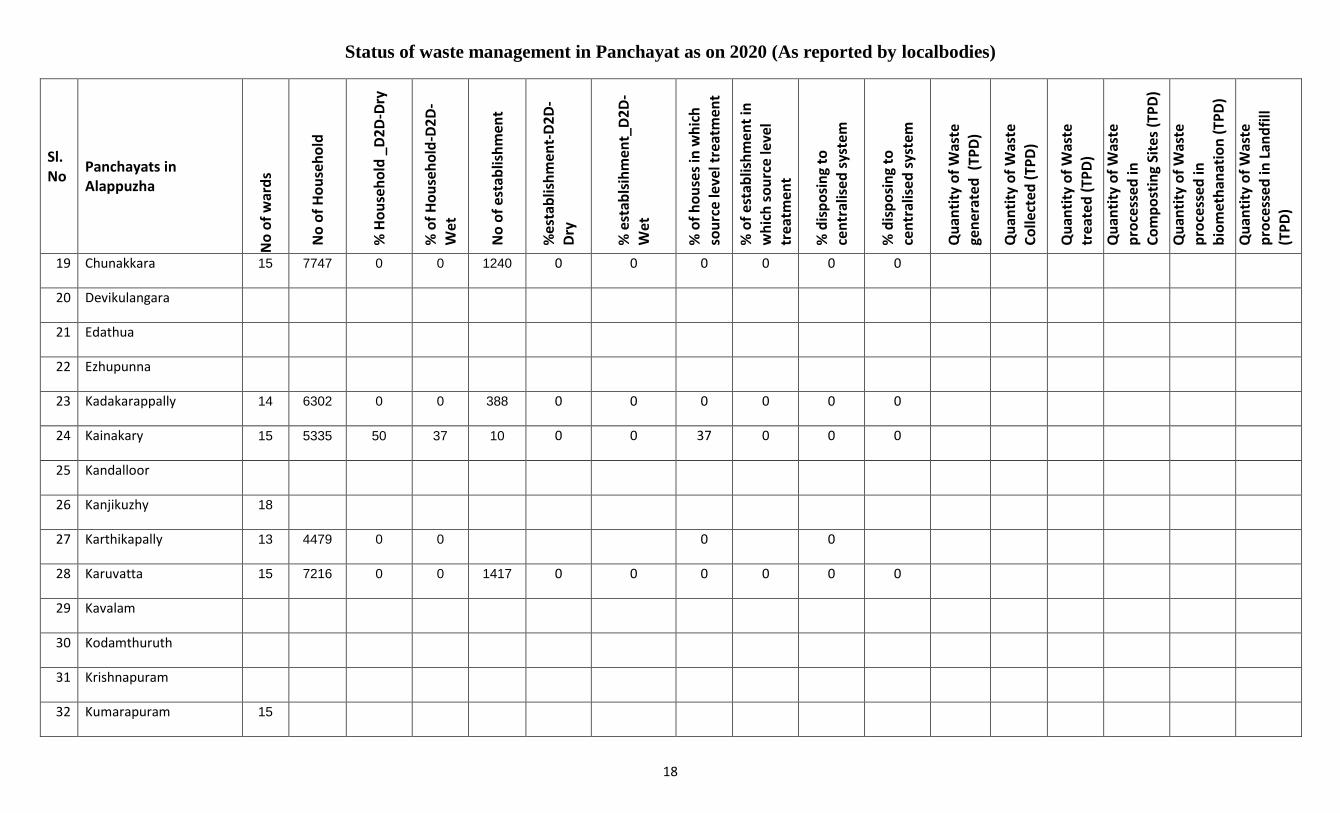
Status of waste management in Panchayat as on 2020 (As reported by localbodies)
18
Sl. No
Panchayats in Alappuzha
No
of
war
ds
No
of
Ho
use
ho
ld
% H
ou
seh
old
_D
2D
-Dry
% o
f H
ou
seh
old
-D2
D-
Wet
No
of
esta
blis
hm
ent
%e
stab
lish
men
t-D
2D
-D
ry
% e
stab
lsih
men
t_D
2D
-
Wet
% o
f h
ou
ses
in w
hic
h
sou
rce
leve
l tre
atm
ent
% o
f es
tab
lish
men
t in
w
hic
h s
ou
rce
leve
l tr
eatm
ent
% d
isp
osi
ng
to
cen
tral
ise
d s
yste
m
% d
isp
osi
ng
to
cen
tral
ise
d s
yste
m
Qu
anti
ty o
f W
aste
ge
ner
ate
d (
TPD
)
Qu
anti
ty o
f W
aste
Co
llect
ed (
TPD
)
Qu
anti
ty o
f W
aste
tr
eate
d (
TPD
)
Qu
anti
ty o
f W
aste
p
roce
sse
d in
C
om
po
stin
g Si
tes
(TP
D)
Qu
anti
ty o
f W
aste
pro
cess
ed
in
bio
met
han
atio
n (
TPD
)
Qu
anti
ty o
f W
aste
p
roce
sse
d in
Lan
dfi
ll (T
PD
)
19 Chunakkara 15 7747 0 0 1240 0 0 0 0 0 0
20 Devikulangara
21 Edathua
22 Ezhupunna
23 Kadakarappally 14 6302 0 0 388 0 0 0 0 0 0
24 Kainakary 15 5335 50 37 10 0 0 37 0 0 0
25 Kandalloor
26 Kanjikuzhy 18
27 Karthikapally 13 4479 0 0 0 0
28 Karuvatta 15 7216 0 0 1417 0 0 0 0 0 0
29 Kavalam
30 Kodamthuruth
31 Krishnapuram
32 Kumarapuram 15
Annexure.1
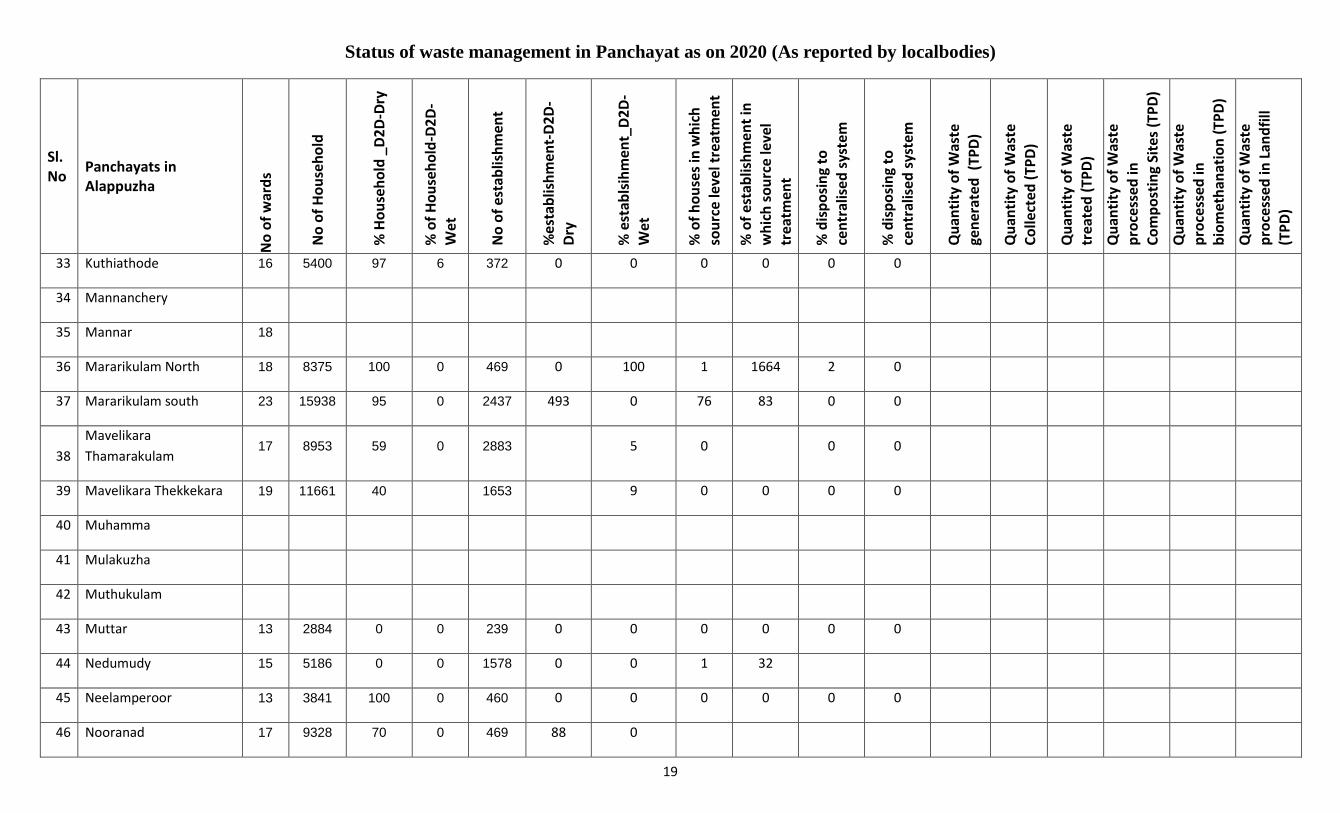
Status of waste management in Panchayat as on 2020 (As reported by localbodies)
19
Sl. No
Panchayats in Alappuzha
No
of
war
ds
No
of
Ho
use
ho
ld
% H
ou
seh
old
_D
2D
-Dry
% o
f H
ou
seh
old
-D2
D-
Wet
No
of
esta
blis
hm
ent
%e
stab
lish
men
t-D
2D
-D
ry
% e
stab
lsih
men
t_D
2D
-
Wet
% o
f h
ou
ses
in w
hic
h
sou
rce
leve
l tre
atm
ent
% o
f es
tab
lish
men
t in
w
hic
h s
ou
rce
leve
l tr
eatm
ent
% d
isp
osi
ng
to
cen
tral
ise
d s
yste
m
% d
isp
osi
ng
to
cen
tral
ise
d s
yste
m
Qu
anti
ty o
f W
aste
ge
ner
ate
d (
TPD
)
Qu
anti
ty o
f W
aste
Co
llect
ed (
TPD
)
Qu
anti
ty o
f W
aste
tr
eate
d (
TPD
)
Qu
anti
ty o
f W
aste
p
roce
sse
d in
C
om
po
stin
g Si
tes
(TP
D)
Qu
anti
ty o
f W
aste
pro
cess
ed
in
bio
met
han
atio
n (
TPD
)
Qu
anti
ty o
f W
aste
p
roce
sse
d in
Lan
dfi
ll (T
PD
)
33 Kuthiathode 16 5400 97 6 372 0 0 0 0 0 0
34 Mannanchery
35 Mannar 18
36 Mararikulam North 18 8375 100 0 469 0 100 1 1664 2 0
37 Mararikulam south 23 15938 95 0 2437 493 0 76 83 0 0
38
Mavelikara
Thamarakulam 17 8953 59 0 2883 5 0 0 0
39 Mavelikara Thekkekara 19 11661 40 1653 9 0 0 0 0
40 Muhamma
41 Mulakuzha
42 Muthukulam
43 Muttar 13 2884 0 0 239 0 0 0 0 0 0
44 Nedumudy 15 5186 0 0 1578 0 0 1 32
45 Neelamperoor 13 3841 100 0 460 0 0 0 0 0 0
46 Nooranad 17 9328 70 0 469 88 0
Annexure.1
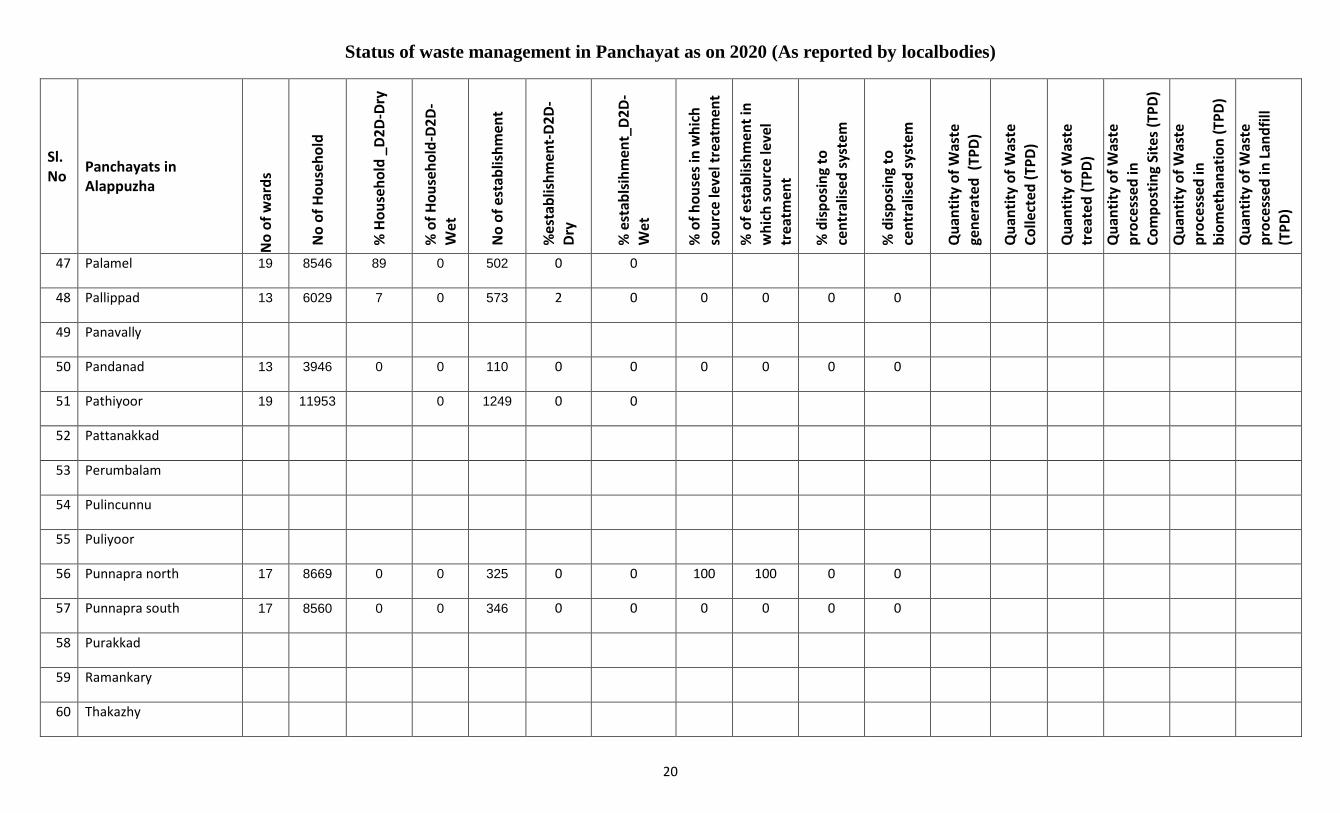
Status of waste management in Panchayat as on 2020 (As reported by localbodies)
20
Sl. No
Panchayats in Alappuzha
No
of
war
ds
No
of
Ho
use
ho
ld
% H
ou
seh
old
_D
2D
-Dry
% o
f H
ou
seh
old
-D2
D-
Wet
No
of
esta
blis
hm
ent
%e
stab
lish
men
t-D
2D
-D
ry
% e
stab
lsih
men
t_D
2D
-
Wet
% o
f h
ou
ses
in w
hic
h
sou
rce
leve
l tre
atm
ent
% o
f es
tab
lish
men
t in
w
hic
h s
ou
rce
leve
l tr
eatm
ent
% d
isp
osi
ng
to
cen
tral
ise
d s
yste
m
% d
isp
osi
ng
to
cen
tral
ise
d s
yste
m
Qu
anti
ty o
f W
aste
ge
ner
ate
d (
TPD
)
Qu
anti
ty o
f W
aste
Co
llect
ed (
TPD
)
Qu
anti
ty o
f W
aste
tr
eate
d (
TPD
)
Qu
anti
ty o
f W
aste
p
roce
sse
d in
C
om
po
stin
g Si
tes
(TP
D)
Qu
anti
ty o
f W
aste
pro
cess
ed
in
bio
met
han
atio
n (
TPD
)
Qu
anti
ty o
f W
aste
p
roce
sse
d in
Lan
dfi
ll (T
PD
)
47 Palamel 19 8546 89 0 502 0 0
48 Pallippad 13 6029 7 0 573 2 0 0 0 0 0
49 Panavally
50 Pandanad 13 3946 0 0 110 0 0 0 0 0 0
51 Pathiyoor 19 11953 0 1249 0 0
52 Pattanakkad
53 Perumbalam
54 Pulincunnu
55 Puliyoor
56 Punnapra north 17 8669 0 0 325 0 0 100 100 0 0
57 Punnapra south 17 8560 0 0 346 0 0 0 0 0 0
58 Purakkad
59 Ramankary
60 Thakazhy
Annexure.1
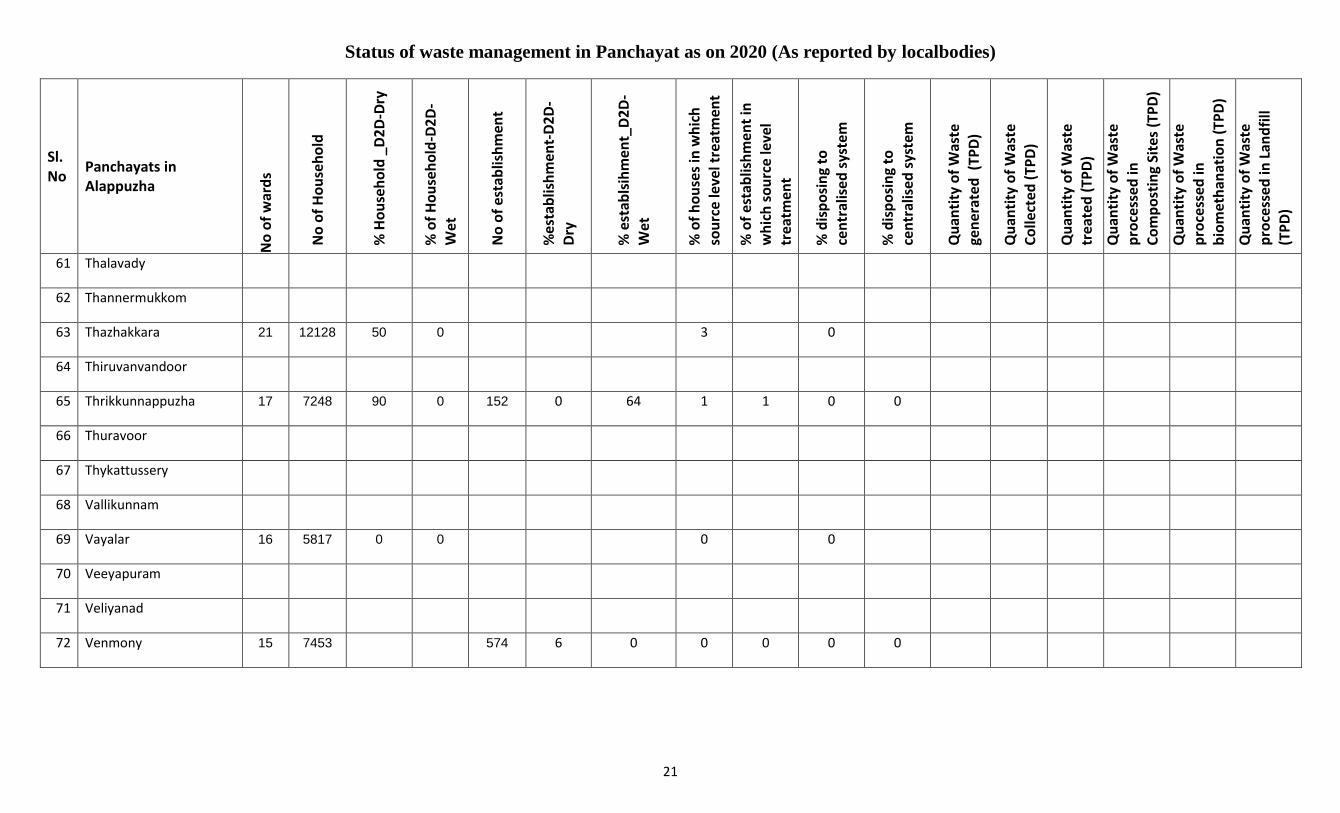
Status of waste management in Panchayat as on 2020 (As reported by localbodies)
21
Sl. No
Panchayats in Alappuzha
No
of
war
ds
No
of
Ho
use
ho
ld
% H
ou
seh
old
_D
2D
-Dry
% o
f H
ou
seh
old
-D2
D-
Wet
No
of
esta
blis
hm
ent
%e
stab
lish
men
t-D
2D
-D
ry
% e
stab
lsih
men
t_D
2D
-
Wet
% o
f h
ou
ses
in w
hic
h
sou
rce
leve
l tre
atm
ent
% o
f es
tab
lish
men
t in
w
hic
h s
ou
rce
leve
l tr
eatm
ent
% d
isp
osi
ng
to
cen
tral
ise
d s
yste
m
% d
isp
osi
ng
to
cen
tral
ise
d s
yste
m
Qu
anti
ty o
f W
aste
ge
ner
ate
d (
TPD
)
Qu
anti
ty o
f W
aste
Co
llect
ed (
TPD
)
Qu
anti
ty o
f W
aste
tr
eate
d (
TPD
)
Qu
anti
ty o
f W
aste
p
roce
sse
d in
C
om
po
stin
g Si
tes
(TP
D)
Qu
anti
ty o
f W
aste
pro
cess
ed
in
bio
met
han
atio
n (
TPD
)
Qu
anti
ty o
f W
aste
p
roce
sse
d in
Lan
dfi
ll (T
PD
)
61 Thalavady
62 Thannermukkom
63 Thazhakkara 21 12128 50 0 3 0
64 Thiruvanvandoor
65 Thrikkunnappuzha 17 7248 90 0 152 0 64 1 1 0 0
66 Thuravoor
67 Thykattussery
68 Vallikunnam
69 Vayalar 16 5817 0 0 0 0
70 Veeyapuram
71 Veliyanad
72 Venmony 15 7453 574 6 0 0 0 0 0
Annexure.1

Status of waste management in Panchayat as on 2020 (As reported by localbodies)
22
2. 5. Panchayats in Kottayam District
Sl. No
Panchayats in Kottayam
No
of
war
ds
No
of
Ho
use
ho
ld
No
of
Esta
blis
hm
ent
% H
ou
seh
old
_D2
D-D
ry
% o
f H
ou
seh
old
-D2
D-
Wet
%e
stab
lish
men
t-D
2D
-D
ry
% e
stab
lsih
men
t_D
2D
-W
et
% o
f h
ou
ses
in w
hic
h
sou
rce
leve
l tre
atm
ent
% o
f es
tab
lish
men
t in
w
hic
h s
ou
rce
leve
l tr
eatm
ent
% d
isp
osi
ng
to
cen
tral
ise
d s
yste
m
% d
isp
osi
ng
to
cen
tral
ise
d s
yste
m
Qu
anti
ty o
f W
aste
ge
ner
ate
d (
TPD
)
Qu
anti
ty o
f W
aste
colle
cted
(TP
D)
Qu
anti
ty o
f W
aste
tr
eate
d (
TPD
)
Qu
anti
ty o
f W
aste
p
roce
sse
d in
C
om
po
stin
g Si
tes
(TP
D)
Qu
anti
ty o
f W
aste
pro
cess
ed
in
bio
met
han
atio
n (
TPD
)
Qu
anti
ty o
f W
aste
p
roce
sse
d in
Lan
dfi
ll (T
PD
)
1 Akalakunnam 15 5580 436 74 0 70 0 67 64 0 0
2160
kg
2160
kg
2160k
g 40 kg 150 kg 0
2 Arpookara 16 6214 362 50 0 8 0 75 0 0 0 1200 0 0 1200 0 0
3 Athirampuzha 22 12380 2608 70 0 58 0 6 3 16 5 3 ton 500kg nil
4 Ayarkunnam 20 10445 1102 69 49 609 424 3 4 0 0
1579
kg
1579
kg
1579
kg 35 kg 110 kg NA
5 Aymanam 20 10522 1150 100 0 71 0 13 10 0 0
3230
kg
3230
kg
3230
kg 115 kg 0 0
6 Bharananganam
7 Chempu 15 6240 1444 73 0 49 0 13 4 0 0 2230 2230 2230 450 Kg 0 0
8 chirakkadavu 20 10986 3122 100 0 81 0 100 81 0 0 2000 2000 2000
9 Elikulam 16 7790 370 34 0 69 0 30 69 0 0
225KG
S
190KG
S 35KGS 0 0 0
10 Erumely 23 16843 2362 3 0 15 0 17 11 0 0 250 200 58
11 Kadanad 14 5717 1482 0 0 0 0 0 0 0 0
Annexure.1
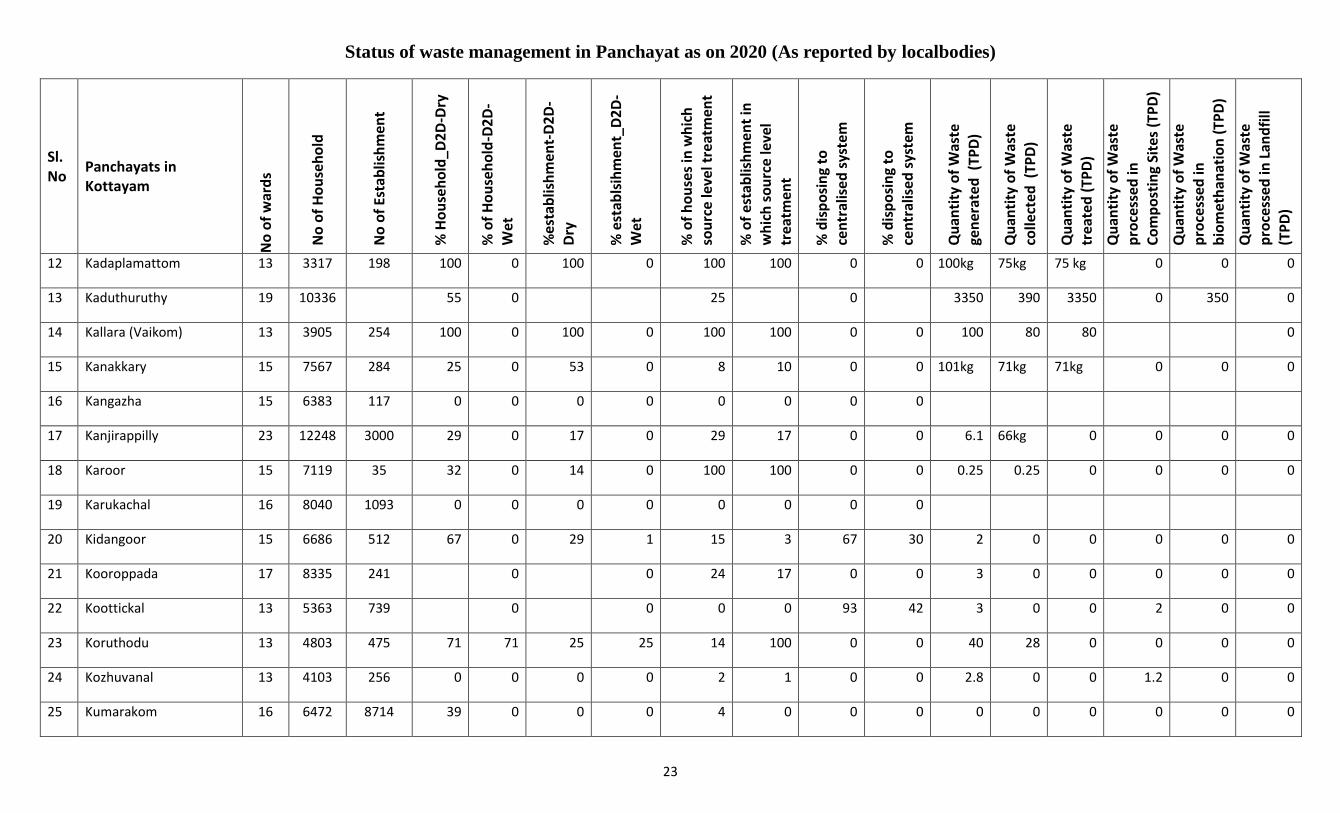
Status of waste management in Panchayat as on 2020 (As reported by localbodies)
23
Sl. No
Panchayats in Kottayam
No
of
war
ds
No
of
Ho
use
ho
ld
No
of
Esta
blis
hm
ent
% H
ou
seh
old
_D2
D-D
ry
% o
f H
ou
seh
old
-D2
D-
Wet
%e
stab
lish
men
t-D
2D
-D
ry
% e
stab
lsih
men
t_D
2D
-W
et
% o
f h
ou
ses
in w
hic
h
sou
rce
leve
l tre
atm
ent
% o
f es
tab
lish
men
t in
w
hic
h s
ou
rce
leve
l tr
eatm
ent
% d
isp
osi
ng
to
cen
tral
ise
d s
yste
m
% d
isp
osi
ng
to
cen
tral
ise
d s
yste
m
Qu
anti
ty o
f W
aste
ge
ner
ate
d (
TPD
)
Qu
anti
ty o
f W
aste
colle
cted
(TP
D)
Qu
anti
ty o
f W
aste
tr
eate
d (
TPD
)
Qu
anti
ty o
f W
aste
p
roce
sse
d in
C
om
po
stin
g Si
tes
(TP
D)
Qu
anti
ty o
f W
aste
pro
cess
ed
in
bio
met
han
atio
n (
TPD
)
Qu
anti
ty o
f W
aste
p
roce
sse
d in
Lan
dfi
ll (T
PD
)
12 Kadaplamattom 13 3317 198 100 0 100 0 100 100 0 0 100kg 75kg 75 kg 0 0 0
13 Kaduthuruthy 19 10336 55 0 25 0 3350 390 3350 0 350 0
14 Kallara (Vaikom) 13 3905 254 100 0 100 0 100 100 0 0 100 80 80 0
15 Kanakkary 15 7567 284 25 0 53 0 8 10 0 0 101kg 71kg 71kg 0 0 0
16 Kangazha 15 6383 117 0 0 0 0 0 0 0 0
17 Kanjirappilly 23 12248 3000 29 0 17 0 29 17 0 0 6.1 66kg 0 0 0 0
18 Karoor 15 7119 35 32 0 14 0 100 100 0 0 0.25 0.25 0 0 0 0
19 Karukachal 16 8040 1093 0 0 0 0 0 0 0 0
20 Kidangoor 15 6686 512 67 0 29 1 15 3 67 30 2 0 0 0 0 0
21 Kooroppada 17 8335 241 0 0 24 17 0 0 3 0 0 0 0 0
22 Koottickal 13 5363 739 0 0 0 0 93 42 3 0 0 2 0 0
23 Koruthodu 13 4803 475 71 71 25 25 14 100 0 0 40 28 0 0 0 0
24 Kozhuvanal 13 4103 256 0 0 0 0 2 1 0 0 2.8 0 0 1.2 0 0
25 Kumarakom 16 6472 8714 39 0 0 0 4 0 0 0 0 0 0 0 0 0
Annexure.1
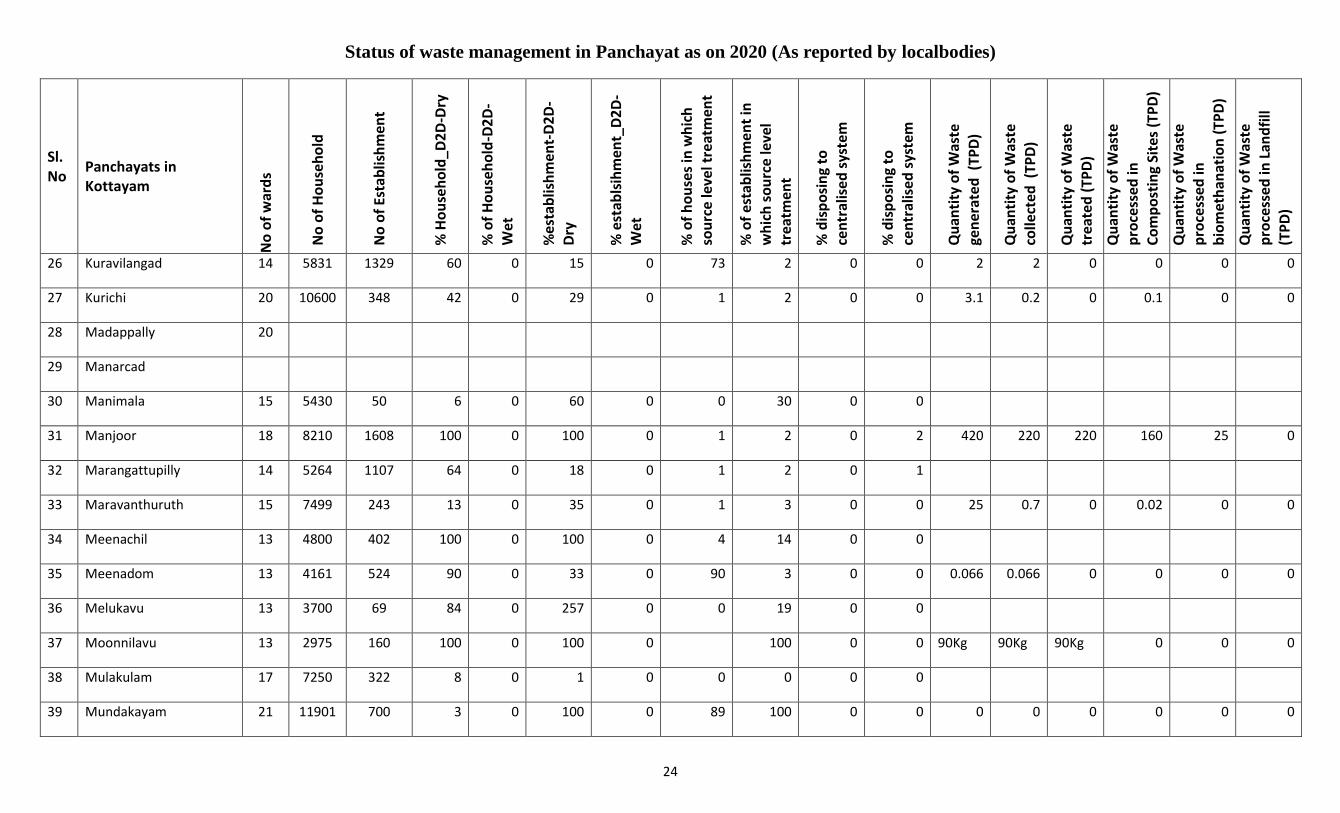
Status of waste management in Panchayat as on 2020 (As reported by localbodies)
24
Sl. No
Panchayats in Kottayam
No
of
war
ds
No
of
Ho
use
ho
ld
No
of
Esta
blis
hm
ent
% H
ou
seh
old
_D2
D-D
ry
% o
f H
ou
seh
old
-D2
D-
Wet
%e
stab
lish
men
t-D
2D
-D
ry
% e
stab
lsih
men
t_D
2D
-W
et
% o
f h
ou
ses
in w
hic
h
sou
rce
leve
l tre
atm
ent
% o
f es
tab
lish
men
t in
w
hic
h s
ou
rce
leve
l tr
eatm
ent
% d
isp
osi
ng
to
cen
tral
ise
d s
yste
m
% d
isp
osi
ng
to
cen
tral
ise
d s
yste
m
Qu
anti
ty o
f W
aste
ge
ner
ate
d (
TPD
)
Qu
anti
ty o
f W
aste
colle
cted
(TP
D)
Qu
anti
ty o
f W
aste
tr
eate
d (
TPD
)
Qu
anti
ty o
f W
aste
p
roce
sse
d in
C
om
po
stin
g Si
tes
(TP
D)
Qu
anti
ty o
f W
aste
pro
cess
ed
in
bio
met
han
atio
n (
TPD
)
Qu
anti
ty o
f W
aste
p
roce
sse
d in
Lan
dfi
ll (T
PD
)
26 Kuravilangad 14 5831 1329 60 0 15 0 73 2 0 0 2 2 0 0 0 0
27 Kurichi 20 10600 348 42 0 29 0 1 2 0 0 3.1 0.2 0 0.1 0 0
28 Madappally 20
29 Manarcad
30 Manimala 15 5430 50 6 0 60 0 0 30 0 0
31 Manjoor 18 8210 1608 100 0 100 0 1 2 0 2 420 220 220 160 25 0
32 Marangattupilly 14 5264 1107 64 0 18 0 1 2 0 1
33 Maravanthuruth 15 7499 243 13 0 35 0 1 3 0 0 25 0.7 0 0.02 0 0
34 Meenachil 13 4800 402 100 0 100 0 4 14 0 0
35 Meenadom 13 4161 524 90 0 33 0 90 3 0 0 0.066 0.066 0 0 0 0
36 Melukavu 13 3700 69 84 0 257 0 0 19 0 0
37 Moonnilavu 13 2975 160 100 0 100 0 100 0 0 90Kg 90Kg 90Kg 0 0 0
38 Mulakulam 17 7250 322 8 0 1 0 0 0 0 0
39 Mundakayam 21 11901 700 3 0 100 0 89 100 0 0 0 0 0 0 0 0
Annexure.1
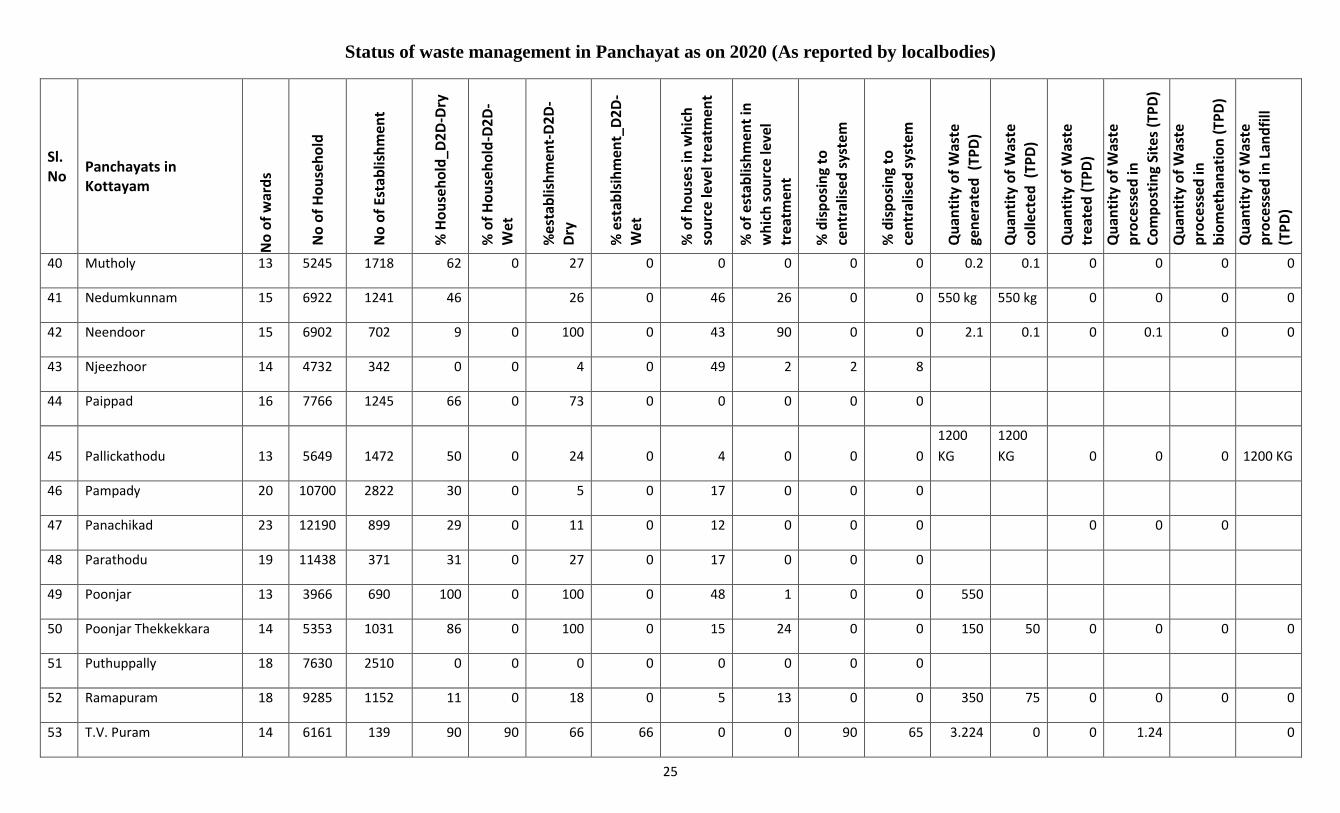
Status of waste management in Panchayat as on 2020 (As reported by localbodies)
25
Sl. No
Panchayats in Kottayam
No
of
war
ds
No
of
Ho
use
ho
ld
No
of
Esta
blis
hm
ent
% H
ou
seh
old
_D2
D-D
ry
% o
f H
ou
seh
old
-D2
D-
Wet
%e
stab
lish
men
t-D
2D
-D
ry
% e
stab
lsih
men
t_D
2D
-W
et
% o
f h
ou
ses
in w
hic
h
sou
rce
leve
l tre
atm
ent
% o
f es
tab
lish
men
t in
w
hic
h s
ou
rce
leve
l tr
eatm
ent
% d
isp
osi
ng
to
cen
tral
ise
d s
yste
m
% d
isp
osi
ng
to
cen
tral
ise
d s
yste
m
Qu
anti
ty o
f W
aste
ge
ner
ate
d (
TPD
)
Qu
anti
ty o
f W
aste
colle
cted
(TP
D)
Qu
anti
ty o
f W
aste
tr
eate
d (
TPD
)
Qu
anti
ty o
f W
aste
p
roce
sse
d in
C
om
po
stin
g Si
tes
(TP
D)
Qu
anti
ty o
f W
aste
pro
cess
ed
in
bio
met
han
atio
n (
TPD
)
Qu
anti
ty o
f W
aste
p
roce
sse
d in
Lan
dfi
ll (T
PD
)
40 Mutholy 13 5245 1718 62 0 27 0 0 0 0 0 0.2 0.1 0 0 0 0
41 Nedumkunnam 15 6922 1241 46 26 0 46 26 0 0 550 kg 550 kg 0 0 0 0
42 Neendoor 15 6902 702 9 0 100 0 43 90 0 0 2.1 0.1 0 0.1 0 0
43 Njeezhoor 14 4732 342 0 0 4 0 49 2 2 8
44 Paippad 16 7766 1245 66 0 73 0 0 0 0 0
45 Pallickathodu 13 5649 1472 50 0 24 0 4 0 0 0
1200
KG
1200
KG 0 0 0 1200 KG
46 Pampady 20 10700 2822 30 0 5 0 17 0 0 0
47 Panachikad 23 12190 899 29 0 11 0 12 0 0 0 0 0 0
48 Parathodu 19 11438 371 31 0 27 0 17 0 0 0
49 Poonjar 13 3966 690 100 0 100 0 48 1 0 0 550
50 Poonjar Thekkekkara 14 5353 1031 86 0 100 0 15 24 0 0 150 50 0 0 0 0
51 Puthuppally 18 7630 2510 0 0 0 0 0 0 0 0
52 Ramapuram 18 9285 1152 11 0 18 0 5 13 0 0 350 75 0 0 0 0
53 T.V. Puram 14 6161 139 90 90 66 66 0 0 90 65 3.224 0 0 1.24 0
Annexure.1
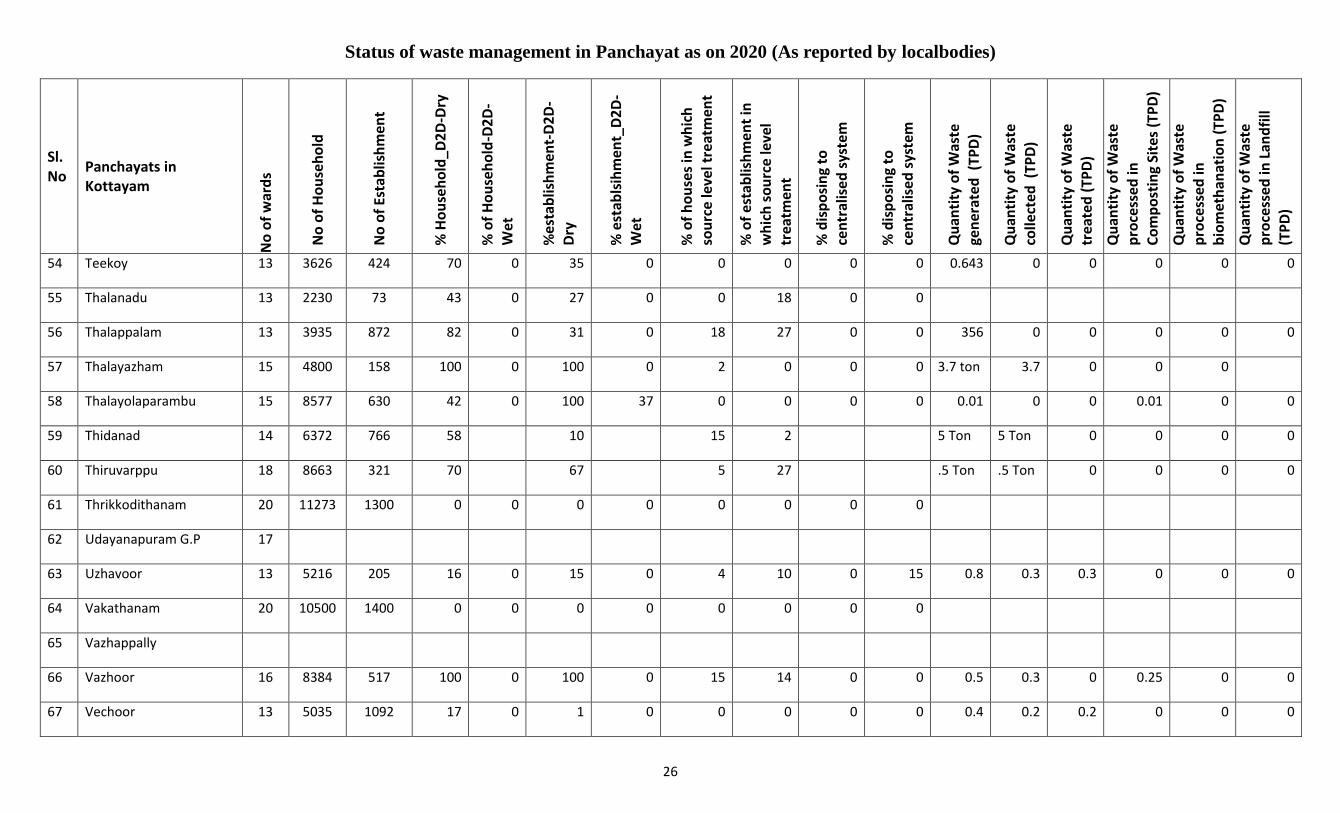
Status of waste management in Panchayat as on 2020 (As reported by localbodies)
26
Sl. No
Panchayats in Kottayam
No
of
war
ds
No
of
Ho
use
ho
ld
No
of
Esta
blis
hm
ent
% H
ou
seh
old
_D2
D-D
ry
% o
f H
ou
seh
old
-D2
D-
Wet
%e
stab
lish
men
t-D
2D
-D
ry
% e
stab
lsih
men
t_D
2D
-W
et
% o
f h
ou
ses
in w
hic
h
sou
rce
leve
l tre
atm
ent
% o
f es
tab
lish
men
t in
w
hic
h s
ou
rce
leve
l tr
eatm
ent
% d
isp
osi
ng
to
cen
tral
ise
d s
yste
m
% d
isp
osi
ng
to
cen
tral
ise
d s
yste
m
Qu
anti
ty o
f W
aste
ge
ner
ate
d (
TPD
)
Qu
anti
ty o
f W
aste
colle
cted
(TP
D)
Qu
anti
ty o
f W
aste
tr
eate
d (
TPD
)
Qu
anti
ty o
f W
aste
p
roce
sse
d in
C
om
po
stin
g Si
tes
(TP
D)
Qu
anti
ty o
f W
aste
pro
cess
ed
in
bio
met
han
atio
n (
TPD
)
Qu
anti
ty o
f W
aste
p
roce
sse
d in
Lan
dfi
ll (T
PD
)
54 Teekoy 13 3626 424 70 0 35 0 0 0 0 0 0.643 0 0 0 0 0
55 Thalanadu 13 2230 73 43 0 27 0 0 18 0 0
56 Thalappalam 13 3935 872 82 0 31 0 18 27 0 0 356 0 0 0 0 0
57 Thalayazham 15 4800 158 100 0 100 0 2 0 0 0 3.7 ton 3.7 0 0 0
58 Thalayolaparambu 15 8577 630 42 0 100 37 0 0 0 0 0.01 0 0 0.01 0 0
59 Thidanad 14 6372 766 58 10 15 2 5 Ton 5 Ton 0 0 0 0
60 Thiruvarppu 18 8663 321 70 67 5 27 .5 Ton .5 Ton 0 0 0 0
61 Thrikkodithanam 20 11273 1300 0 0 0 0 0 0 0 0
62 Udayanapuram G.P 17
63 Uzhavoor 13 5216 205 16 0 15 0 4 10 0 15 0.8 0.3 0.3 0 0 0
64 Vakathanam 20 10500 1400 0 0 0 0 0 0 0 0
65 Vazhappally
66 Vazhoor 16 8384 517 100 0 100 0 15 14 0 0 0.5 0.3 0 0.25 0 0
67 Vechoor 13 5035 1092 17 0 1 0 0 0 0 0 0.4 0.2 0.2 0 0 0
Annexure.1

Status of waste management in Panchayat as on 2020 (As reported by localbodies)
27
Sl. No
Panchayats in Kottayam
No
of
war
ds
No
of
Ho
use
ho
ld
No
of
Esta
blis
hm
ent
% H
ou
seh
old
_D2
D-D
ry
% o
f H
ou
seh
old
-D2
D-
Wet
%e
stab
lish
men
t-D
2D
-D
ry
% e
stab
lsih
men
t_D
2D
-W
et
% o
f h
ou
ses
in w
hic
h
sou
rce
leve
l tre
atm
ent
% o
f es
tab
lish
men
t in
w
hic
h s
ou
rce
leve
l tr
eatm
ent
% d
isp
osi
ng
to
cen
tral
ise
d s
yste
m
% d
isp
osi
ng
to
cen
tral
ise
d s
yste
m
Qu
anti
ty o
f W
aste
ge
ner
ate
d (
TPD
)
Qu
anti
ty o
f W
aste
colle
cted
(TP
D)
Qu
anti
ty o
f W
aste
tr
eate
d (
TPD
)
Qu
anti
ty o
f W
aste
p
roce
sse
d in
C
om
po
stin
g Si
tes
(TP
D)
Qu
anti
ty o
f W
aste
pro
cess
ed
in
bio
met
han
atio
n (
TPD
)
Qu
anti
ty o
f W
aste
p
roce
sse
d in
Lan
dfi
ll (T
PD
)
68 Veliyannoor 0.7 0.3 0.3 0 0 0
69 Vellavoor 13 6265 918 20 0 7 0 3 0 0 0
70 Velloor 16 6184 946 73 0 32 0 0 0 0 0
71 Vijayapuram 19 10741 1129 85 0 5 0 4 0 85 0 0.2 0.2 0.2 0 0 0
Annexure.1
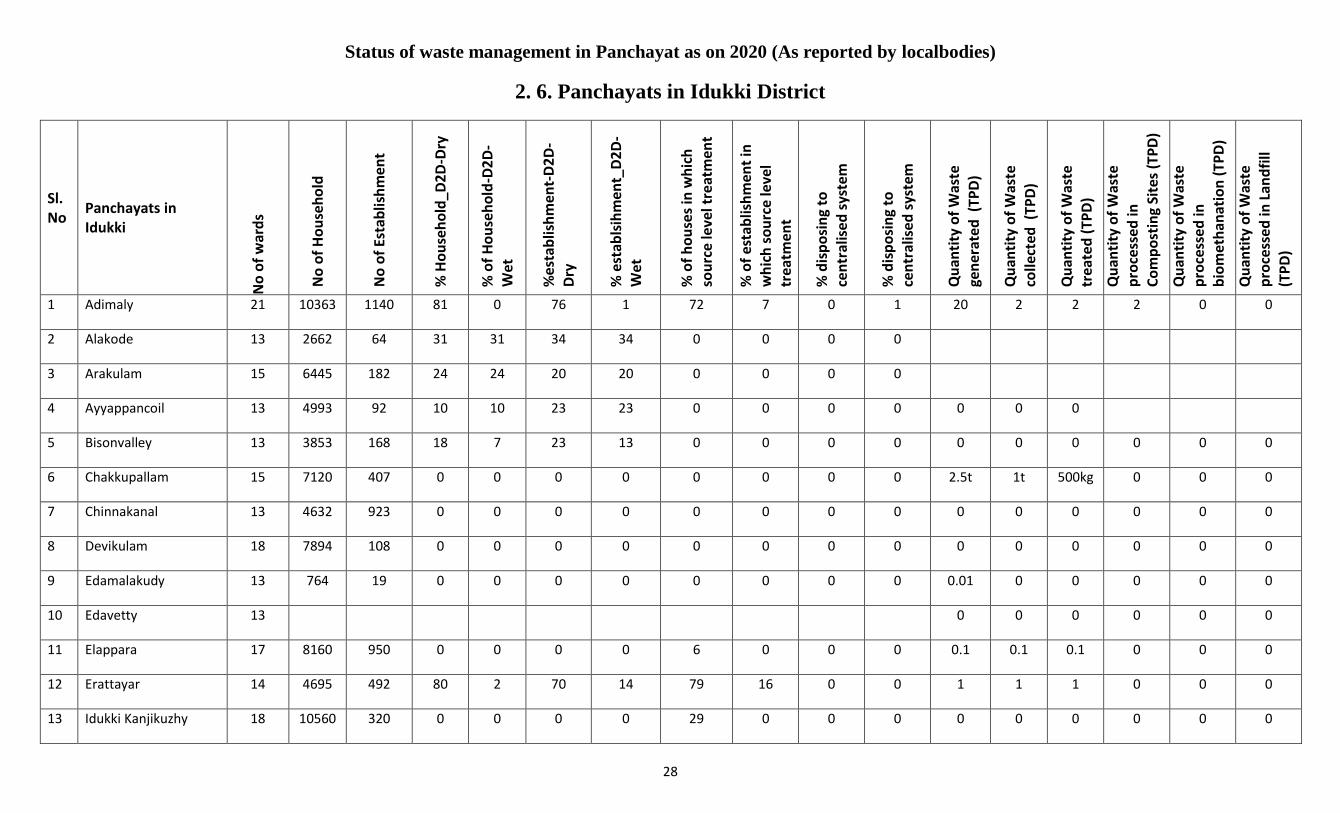
Status of waste management in Panchayat as on 2020 (As reported by localbodies)
28
2. 6. Panchayats in Idukki District
Sl. No
Panchayats in Idukki
No
of
war
ds
No
of
Ho
use
ho
ld
No
of
Esta
blis
hm
ent
% H
ou
seh
old
_D2
D-D
ry
% o
f H
ou
seh
old
-D2
D-
Wet
%e
stab
lish
men
t-D
2D
-D
ry
% e
stab
lsih
men
t_D
2D
-W
et
% o
f h
ou
ses
in w
hic
h
sou
rce
leve
l tre
atm
ent
% o
f es
tab
lish
men
t in
w
hic
h s
ou
rce
leve
l tr
eatm
ent
% d
isp
osi
ng
to
cen
tral
ise
d s
yste
m
% d
isp
osi
ng
to
cen
tral
ise
d s
yste
m
Qu
anti
ty o
f W
aste
ge
ner
ate
d (
TPD
)
Qu
anti
ty o
f W
aste
colle
cted
(TP
D)
Qu
anti
ty o
f W
aste
tr
eate
d (
TPD
)
Qu
anti
ty o
f W
aste
p
roce
sse
d in
C
om
po
stin
g Si
tes
(TP
D)
Qu
anti
ty o
f W
aste
pro
cess
ed
in
bio
met
han
atio
n (
TPD
)
Qu
anti
ty o
f W
aste
p
roce
sse
d in
Lan
dfi
ll (T
PD
)
1 Adimaly 21 10363 1140 81 0 76 1 72 7 0 1 20 2 2 2 0 0
2 Alakode 13 2662 64 31 31 34 34 0 0 0 0
3 Arakulam 15 6445 182 24 24 20 20 0 0 0 0
4 Ayyappancoil 13 4993 92 10 10 23 23 0 0 0 0 0 0 0
5 Bisonvalley 13 3853 168 18 7 23 13 0 0 0 0 0 0 0 0 0 0
6 Chakkupallam 15 7120 407 0 0 0 0 0 0 0 0 2.5t 1t 500kg 0 0 0
7 Chinnakanal 13 4632 923 0 0 0 0 0 0 0 0 0 0 0 0 0 0
8 Devikulam 18 7894 108 0 0 0 0 0 0 0 0 0 0 0 0 0 0
9 Edamalakudy 13 764 19 0 0 0 0 0 0 0 0 0.01 0 0 0 0 0
10 Edavetty 13 0 0 0 0 0 0
11 Elappara 17 8160 950 0 0 0 0 6 0 0 0 0.1 0.1 0.1 0 0 0
12 Erattayar 14 4695 492 80 2 70 14 79 16 0 0 1 1 1 0 0 0
13 Idukki Kanjikuzhy 18 10560 320 0 0 0 0 29 0 0 0 0 0 0 0 0 0
Annexure.1
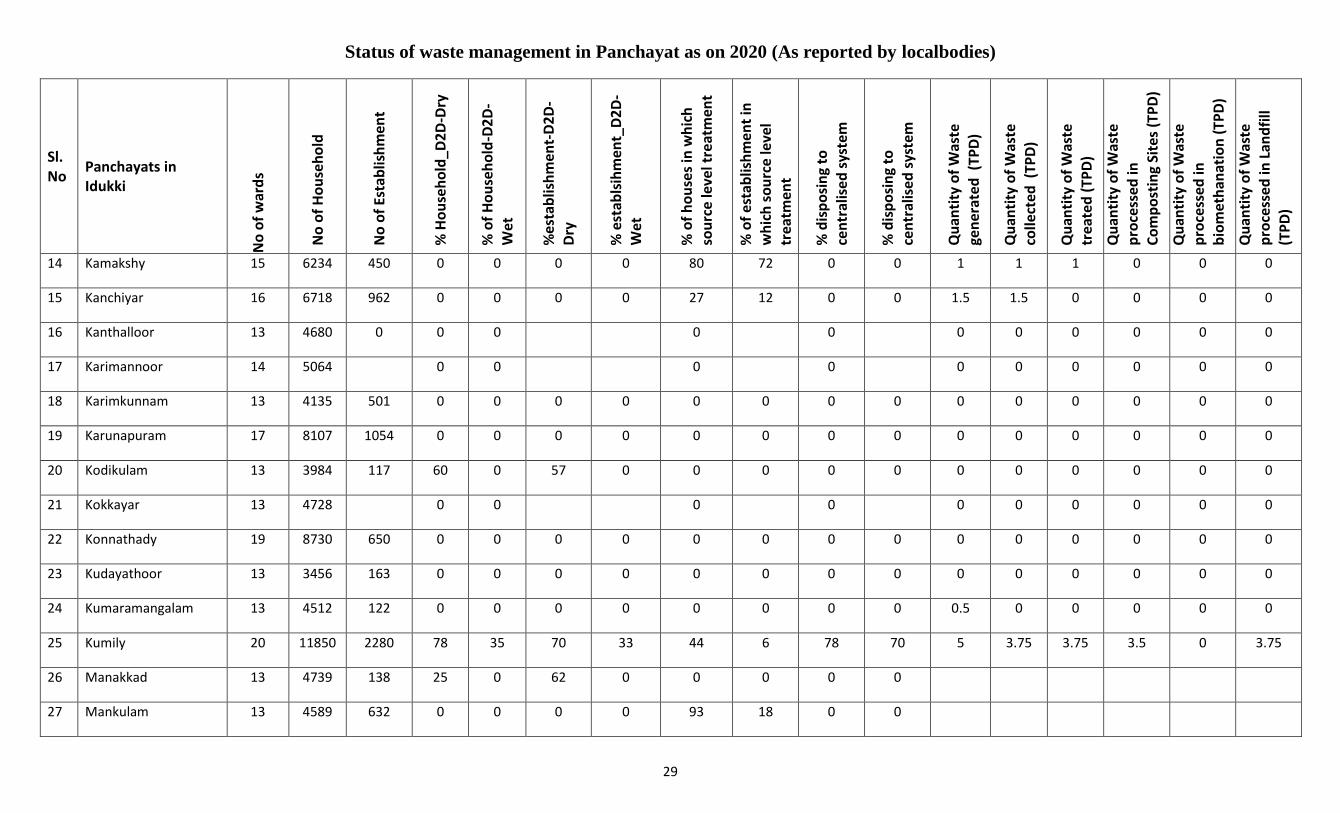
Status of waste management in Panchayat as on 2020 (As reported by localbodies)
29
Sl. No
Panchayats in Idukki
No
of
war
ds
No
of
Ho
use
ho
ld
No
of
Esta
blis
hm
ent
% H
ou
seh
old
_D2
D-D
ry
% o
f H
ou
seh
old
-D2
D-
Wet
%e
stab
lish
men
t-D
2D
-D
ry
% e
stab
lsih
men
t_D
2D
-W
et
% o
f h
ou
ses
in w
hic
h
sou
rce
leve
l tre
atm
ent
% o
f es
tab
lish
men
t in
w
hic
h s
ou
rce
leve
l tr
eatm
ent
% d
isp
osi
ng
to
cen
tral
ise
d s
yste
m
% d
isp
osi
ng
to
cen
tral
ise
d s
yste
m
Qu
anti
ty o
f W
aste
ge
ner
ate
d (
TPD
)
Qu
anti
ty o
f W
aste
colle
cted
(TP
D)
Qu
anti
ty o
f W
aste
tr
eate
d (
TPD
)
Qu
anti
ty o
f W
aste
p
roce
sse
d in
C
om
po
stin
g Si
tes
(TP
D)
Qu
anti
ty o
f W
aste
pro
cess
ed
in
bio
met
han
atio
n (
TPD
)
Qu
anti
ty o
f W
aste
p
roce
sse
d in
Lan
dfi
ll (T
PD
)
14 Kamakshy 15 6234 450 0 0 0 0 80 72 0 0 1 1 1 0 0 0
15 Kanchiyar 16 6718 962 0 0 0 0 27 12 0 0 1.5 1.5 0 0 0 0
16 Kanthalloor 13 4680 0 0 0 0 0 0 0 0 0 0 0
17 Karimannoor 14 5064 0 0 0 0 0 0 0 0 0 0
18 Karimkunnam 13 4135 501 0 0 0 0 0 0 0 0 0 0 0 0 0 0
19 Karunapuram 17 8107 1054 0 0 0 0 0 0 0 0 0 0 0 0 0 0
20 Kodikulam 13 3984 117 60 0 57 0 0 0 0 0 0 0 0 0 0 0
21 Kokkayar 13 4728 0 0 0 0 0 0 0 0 0 0
22 Konnathady 19 8730 650 0 0 0 0 0 0 0 0 0 0 0 0 0 0
23 Kudayathoor 13 3456 163 0 0 0 0 0 0 0 0 0 0 0 0 0 0
24 Kumaramangalam 13 4512 122 0 0 0 0 0 0 0 0 0.5 0 0 0 0 0
25 Kumily 20 11850 2280 78 35 70 33 44 6 78 70 5 3.75 3.75 3.5 0 3.75
26 Manakkad 13 4739 138 25 0 62 0 0 0 0 0
27 Mankulam 13 4589 632 0 0 0 0 93 18 0 0
Annexure.1
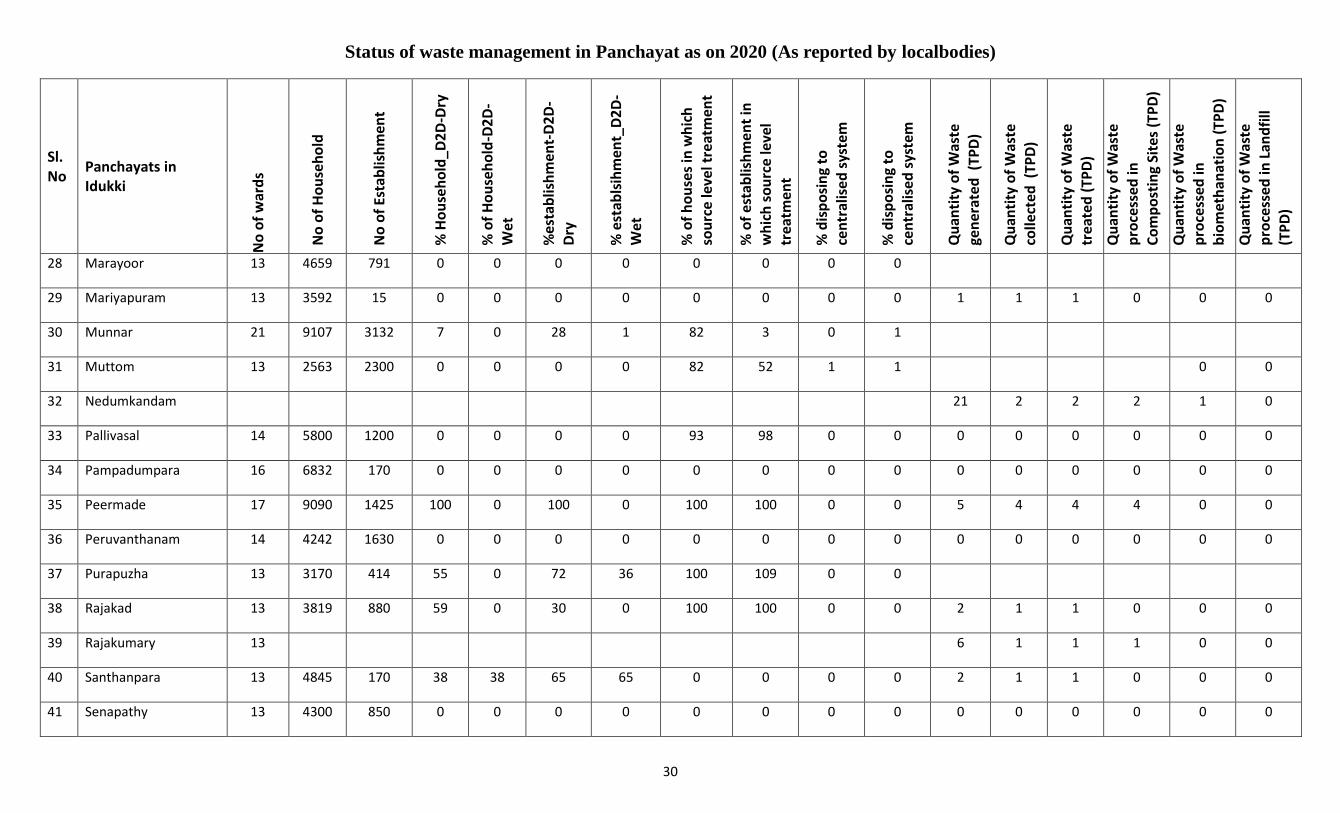
Status of waste management in Panchayat as on 2020 (As reported by localbodies)
30
Sl. No
Panchayats in Idukki
No
of
war
ds
No
of
Ho
use
ho
ld
No
of
Esta
blis
hm
ent
% H
ou
seh
old
_D2
D-D
ry
% o
f H
ou
seh
old
-D2
D-
Wet
%e
stab
lish
men
t-D
2D
-D
ry
% e
stab
lsih
men
t_D
2D
-W
et
% o
f h
ou
ses
in w
hic
h
sou
rce
leve
l tre
atm
ent
% o
f es
tab
lish
men
t in
w
hic
h s
ou
rce
leve
l tr
eatm
ent
% d
isp
osi
ng
to
cen
tral
ise
d s
yste
m
% d
isp
osi
ng
to
cen
tral
ise
d s
yste
m
Qu
anti
ty o
f W
aste
ge
ner
ate
d (
TPD
)
Qu
anti
ty o
f W
aste
colle
cted
(TP
D)
Qu
anti
ty o
f W
aste
tr
eate
d (
TPD
)
Qu
anti
ty o
f W
aste
p
roce
sse
d in
C
om
po
stin
g Si
tes
(TP
D)
Qu
anti
ty o
f W
aste
pro
cess
ed
in
bio
met
han
atio
n (
TPD
)
Qu
anti
ty o
f W
aste
p
roce
sse
d in
Lan
dfi
ll (T
PD
)
28 Marayoor 13 4659 791 0 0 0 0 0 0 0 0
29 Mariyapuram 13 3592 15 0 0 0 0 0 0 0 0 1 1 1 0 0 0
30 Munnar 21 9107 3132 7 0 28 1 82 3 0 1
31 Muttom 13 2563 2300 0 0 0 0 82 52 1 1 0 0
32 Nedumkandam 21 2 2 2 1 0
33 Pallivasal 14 5800 1200 0 0 0 0 93 98 0 0 0 0 0 0 0 0
34 Pampadumpara 16 6832 170 0 0 0 0 0 0 0 0 0 0 0 0 0 0
35 Peermade 17 9090 1425 100 0 100 0 100 100 0 0 5 4 4 4 0 0
36 Peruvanthanam 14 4242 1630 0 0 0 0 0 0 0 0 0 0 0 0 0 0
37 Purapuzha 13 3170 414 55 0 72 36 100 109 0 0
38 Rajakad 13 3819 880 59 0 30 0 100 100 0 0 2 1 1 0 0 0
39 Rajakumary 13 6 1 1 1 0 0
40 Santhanpara 13 4845 170 38 38 65 65 0 0 0 0 2 1 1 0 0 0
41 Senapathy 13 4300 850 0 0 0 0 0 0 0 0 0 0 0 0 0 0
Annexure.1

Status of waste management in Panchayat as on 2020 (As reported by localbodies)
31
Sl. No
Panchayats in Idukki
No
of
war
ds
No
of
Ho
use
ho
ld
No
of
Esta
blis
hm
ent
% H
ou
seh
old
_D2
D-D
ry
% o
f H
ou
seh
old
-D2
D-
Wet
%e
stab
lish
men
t-D
2D
-D
ry
% e
stab
lsih
men
t_D
2D
-W
et
% o
f h
ou
ses
in w
hic
h
sou
rce
leve
l tre
atm
ent
% o
f es
tab
lish
men
t in
w
hic
h s
ou
rce
leve
l tr
eatm
ent
% d
isp
osi
ng
to
cen
tral
ise
d s
yste
m
% d
isp
osi
ng
to
cen
tral
ise
d s
yste
m
Qu
anti
ty o
f W
aste
ge
ner
ate
d (
TPD
)
Qu
anti
ty o
f W
aste
colle
cted
(TP
D)
Qu
anti
ty o
f W
aste
tr
eate
d (
TPD
)
Qu
anti
ty o
f W
aste
p
roce
sse
d in
C
om
po
stin
g Si
tes
(TP
D)
Qu
anti
ty o
f W
aste
pro
cess
ed
in
bio
met
han
atio
n (
TPD
)
Qu
anti
ty o
f W
aste
p
roce
sse
d in
Lan
dfi
ll (T
PD
)
42 Udumbanchola 14 7607 248 0 0 0 0 60 343 0 0 1.5 1 1 0 0 1
43 Udumbannoor 16 6254 1115 0 0 0 0 0 0 0 0 0 0 0 0 0 0
44 Upputhara 18 8184 1211 0 0 0 0 134 110 0 0 0.1 0.1 0.1 0.1 0.1 0
45 Vandanmedu 18 7588 800 0 0 0 0 3 0 0 0 2 2 2 2 2 0
46 Vandiperiyar 23 13969 1011 0 0 0 0 50 59 0 0 0 0 0 0 0 0
47 Vannappuram 17 11001 1123 0 0 0 0 0 0 0 0 0.15 0.14 0.14 0.11
48 Vathikudy 18 10194 1412 50 53 0 0 0 0 0 0
49 Vattavada 13 2747 198 51 49 0 0 100 100 0 0
50 Vazhathope 14 4500 0 0 0 0 0.4 0.3 0.3 0 0 0
51 Vellathooval 17 4818 274 93 93 100 80 93 80 93 80 0.2 0.1 0.1 0.1 0.1 0
52 Velliyamattom 15 6970 1093 75 0 85 0 83 79 0 0 0.1 0.1 0.1 0.1 0.1 0
Annexure.1

Status of waste management in Panchayat as on 2020 (As reported by localbodies)
32
2. 7. Panchayats in Ernakulam District
Sl. No
Panchayats in Ernakulam
No
of
war
ds
No
of
Ho
use
ho
ld
No
of
Esta
blis
hm
ent
% H
ou
seh
old
_D2
D-D
ry
% o
f H
ou
seh
old
-D2
D-
Wet
%e
stab
lish
men
t-D
2D
-D
ry
% e
stab
lsih
men
t_D
2D
-W
et
% o
f h
ou
ses
in w
hic
h
sou
rce
leve
l tre
atm
ent
% o
f es
tab
lish
men
t in
w
hic
h s
ou
rce
leve
l tr
eatm
ent
% d
isp
osi
ng
to
cen
tral
ise
d s
yste
m
% d
isp
osi
ng
to
cen
tral
ise
d s
yste
m
Qu
anti
ty o
f W
aste
ge
ner
ate
d (
TPD
)
Qu
anti
ty o
f W
aste
colle
cted
(TP
D)
Qu
anti
ty o
f W
aste
tr
eate
d (
TPD
)
Qu
anti
ty o
f W
aste
p
roce
sse
d in
Co
mp
ost
ing
Site
s (T
PD
)
Qu
anti
ty o
f W
aste
pro
cess
ed
in
bio
met
han
atio
n (
TPD
)
Qu
anti
ty o
f W
aste
p
roce
sse
d in
Lan
dfi
ll (T
PD
)
1 Aikkaranadu 14 7889 1649 34 0 0 0 0 0 5.02 0.5 0.5 0 0 0
2 Alengadu 21 16317 0 0 0 0 0 4.12 0 0 0 0 0
3 Amballur 16 8454 1690 19 0 12 0 8 1 0 4 0.06 0.0012 0.00036 0.00012 0
4 Arakuzha 13 4965 189 0 0 0 0 0 0 0 0 0 0 0 0 0 0
5 Asamannur 14 6329 150 8 0 0 0 8 400 0 0 0 0 0 0 0 0
6 Avoli 14 6404 1638 0 0 0 0 1 10 0 0 0 0 0 0 0 0
7 Ayavana 14 6621 568 0 0 0 0 0 0 0 0 0 0 0 0 0 0
8 Ayyampuzha 13 5706 668 0 0 0 0 0 0 0 0 0 0 0 0 0 0
9 Chellanam 21 10535 62 0 0 0 0 0 0 0 0 0 0 0 0 0 0
10 Chendamangalam 18 9665 1108 56 0 4 0 49 19 0 0
11 Chengamanad 18 10566 468 100 0 64 0 95 75 0 0 6.99 6.99 6.99 0 0 0
12 Cheranallur 17 10832 568 74 0 67 0 74 67 0 67 3.7 3.7 3.7 0 0 0
13 Chittattukara 18 9583 412 16 0 0 0 99 58 0 0 4.5 3 1 0 0 1.5
Annexure.1
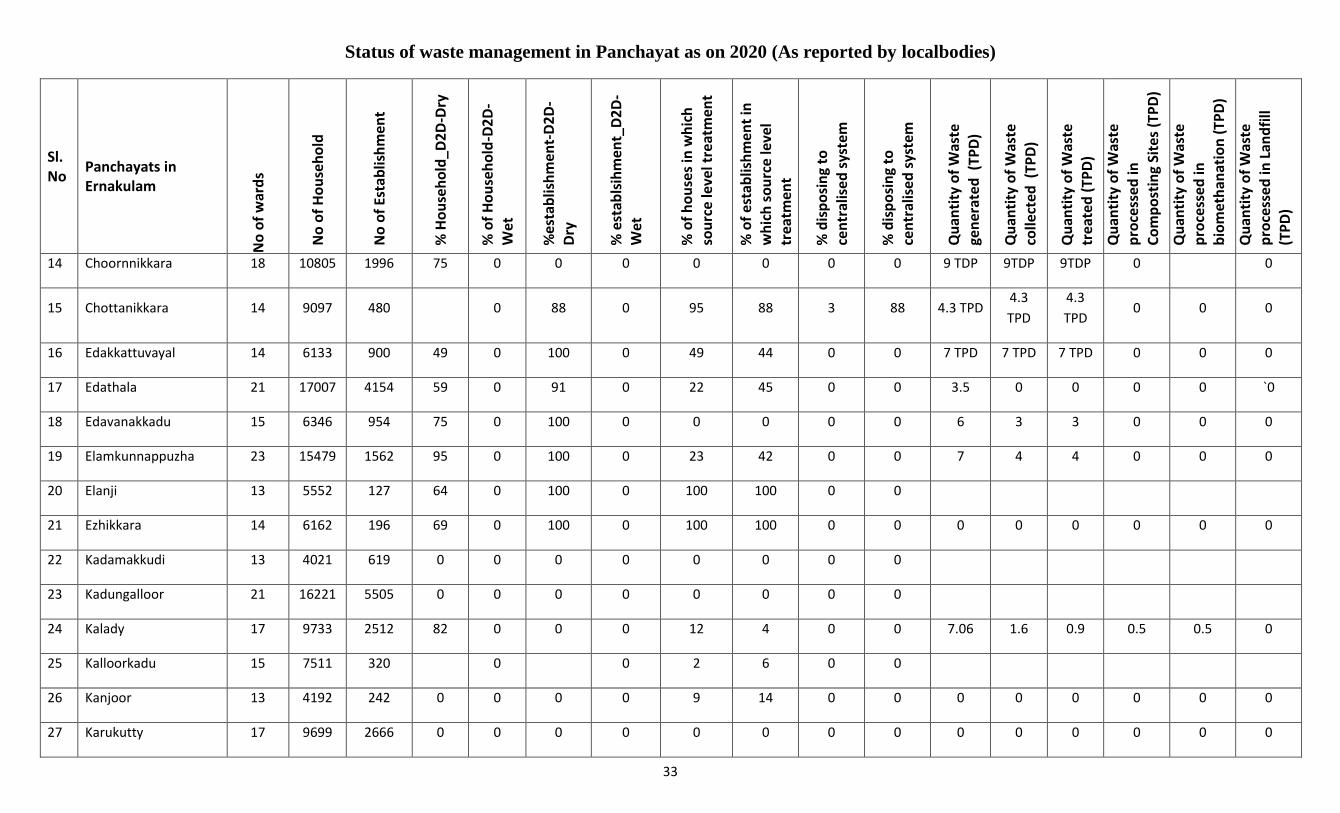
Status of waste management in Panchayat as on 2020 (As reported by localbodies)
33
Sl. No
Panchayats in Ernakulam
No
of
war
ds
No
of
Ho
use
ho
ld
No
of
Esta
blis
hm
ent
% H
ou
seh
old
_D2
D-D
ry
% o
f H
ou
seh
old
-D2
D-
Wet
%e
stab
lish
men
t-D
2D
-D
ry
% e
stab
lsih
men
t_D
2D
-W
et
% o
f h
ou
ses
in w
hic
h
sou
rce
leve
l tre
atm
ent
% o
f es
tab
lish
men
t in
w
hic
h s
ou
rce
leve
l tr
eatm
ent
% d
isp
osi
ng
to
cen
tral
ise
d s
yste
m
% d
isp
osi
ng
to
cen
tral
ise
d s
yste
m
Qu
anti
ty o
f W
aste
ge
ner
ate
d (
TPD
)
Qu
anti
ty o
f W
aste
colle
cted
(TP
D)
Qu
anti
ty o
f W
aste
tr
eate
d (
TPD
)
Qu
anti
ty o
f W
aste
p
roce
sse
d in
Co
mp
ost
ing
Site
s (T
PD
)
Qu
anti
ty o
f W
aste
pro
cess
ed
in
bio
met
han
atio
n (
TPD
)
Qu
anti
ty o
f W
aste
p
roce
sse
d in
Lan
dfi
ll (T
PD
)
14 Choornnikkara 18 10805 1996 75 0 0 0 0 0 0 0 9 TDP 9TDP 9TDP 0 0
15 Chottanikkara 14 9097 480 0 88 0 95 88 3 88 4.3 TPD 4.3
TPD
4.3
TPD 0 0 0
16 Edakkattuvayal 14 6133 900 49 0 100 0 49 44 0 0 7 TPD 7 TPD 7 TPD 0 0 0
17 Edathala 21 17007 4154 59 0 91 0 22 45 0 0 3.5 0 0 0 0 `0
18 Edavanakkadu 15 6346 954 75 0 100 0 0 0 0 0 6 3 3 0 0 0
19 Elamkunnappuzha 23 15479 1562 95 0 100 0 23 42 0 0 7 4 4 0 0 0
20 Elanji 13 5552 127 64 0 100 0 100 100 0 0
21 Ezhikkara 14 6162 196 69 0 100 0 100 100 0 0 0 0 0 0 0 0
22 Kadamakkudi 13 4021 619 0 0 0 0 0 0 0 0
23 Kadungalloor 21 16221 5505 0 0 0 0 0 0 0 0
24 Kalady 17 9733 2512 82 0 0 0 12 4 0 0 7.06 1.6 0.9 0.5 0.5 0
25 Kalloorkadu 15 7511 320 0 0 2 6 0 0
26 Kanjoor 13 4192 242 0 0 0 0 9 14 0 0 0 0 0 0 0 0
27 Karukutty 17 9699 2666 0 0 0 0 0 0 0 0 0 0 0 0 0 0
Annexure.1
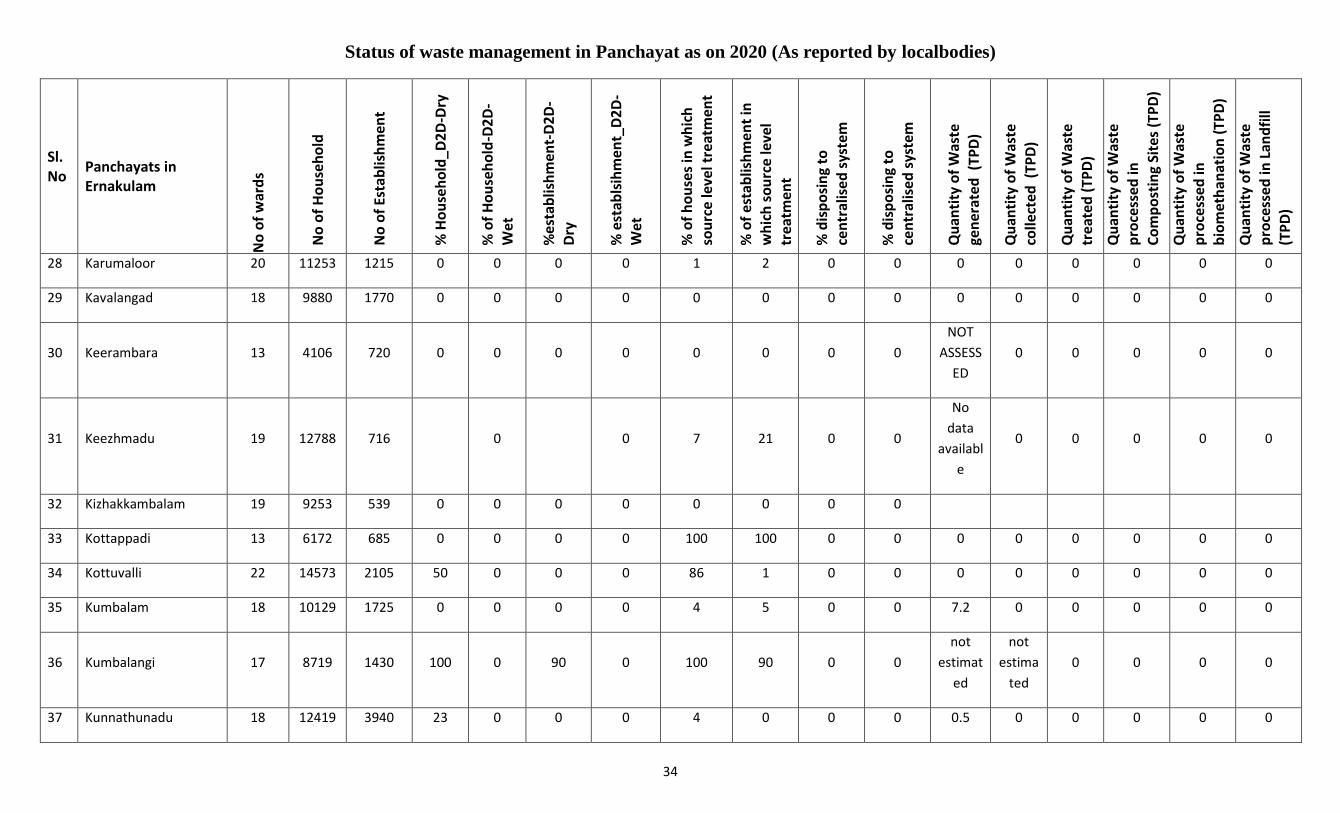
Status of waste management in Panchayat as on 2020 (As reported by localbodies)
34
Sl. No
Panchayats in Ernakulam
No
of
war
ds
No
of
Ho
use
ho
ld
No
of
Esta
blis
hm
ent
% H
ou
seh
old
_D2
D-D
ry
% o
f H
ou
seh
old
-D2
D-
Wet
%e
stab
lish
men
t-D
2D
-D
ry
% e
stab
lsih
men
t_D
2D
-W
et
% o
f h
ou
ses
in w
hic
h
sou
rce
leve
l tre
atm
ent
% o
f es
tab
lish
men
t in
w
hic
h s
ou
rce
leve
l tr
eatm
ent
% d
isp
osi
ng
to
cen
tral
ise
d s
yste
m
% d
isp
osi
ng
to
cen
tral
ise
d s
yste
m
Qu
anti
ty o
f W
aste
ge
ner
ate
d (
TPD
)
Qu
anti
ty o
f W
aste
colle
cted
(TP
D)
Qu
anti
ty o
f W
aste
tr
eate
d (
TPD
)
Qu
anti
ty o
f W
aste
p
roce
sse
d in
Co
mp
ost
ing
Site
s (T
PD
)
Qu
anti
ty o
f W
aste
pro
cess
ed
in
bio
met
han
atio
n (
TPD
)
Qu
anti
ty o
f W
aste
p
roce
sse
d in
Lan
dfi
ll (T
PD
)
28 Karumaloor 20 11253 1215 0 0 0 0 1 2 0 0 0 0 0 0 0 0
29 Kavalangad 18 9880 1770 0 0 0 0 0 0 0 0 0 0 0 0 0 0
30 Keerambara 13 4106 720 0 0 0 0 0 0 0 0
NOT
ASSESS
ED
0 0 0 0 0
31 Keezhmadu 19 12788 716 0 0 7 21 0 0
No
data
availabl
e
0 0 0 0 0
32 Kizhakkambalam 19 9253 539 0 0 0 0 0 0 0 0
33 Kottappadi 13 6172 685 0 0 0 0 100 100 0 0 0 0 0 0 0 0
34 Kottuvalli 22 14573 2105 50 0 0 0 86 1 0 0 0 0 0 0 0 0
35 Kumbalam 18 10129 1725 0 0 0 0 4 5 0 0 7.2 0 0 0 0 0
36 Kumbalangi 17 8719 1430 100 0 90 0 100 90 0 0
not
estimat
ed
not
estima
ted
0 0 0 0
37 Kunnathunadu 18 12419 3940 23 0 0 0 4 0 0 0 0.5 0 0 0 0 0
Annexure.1
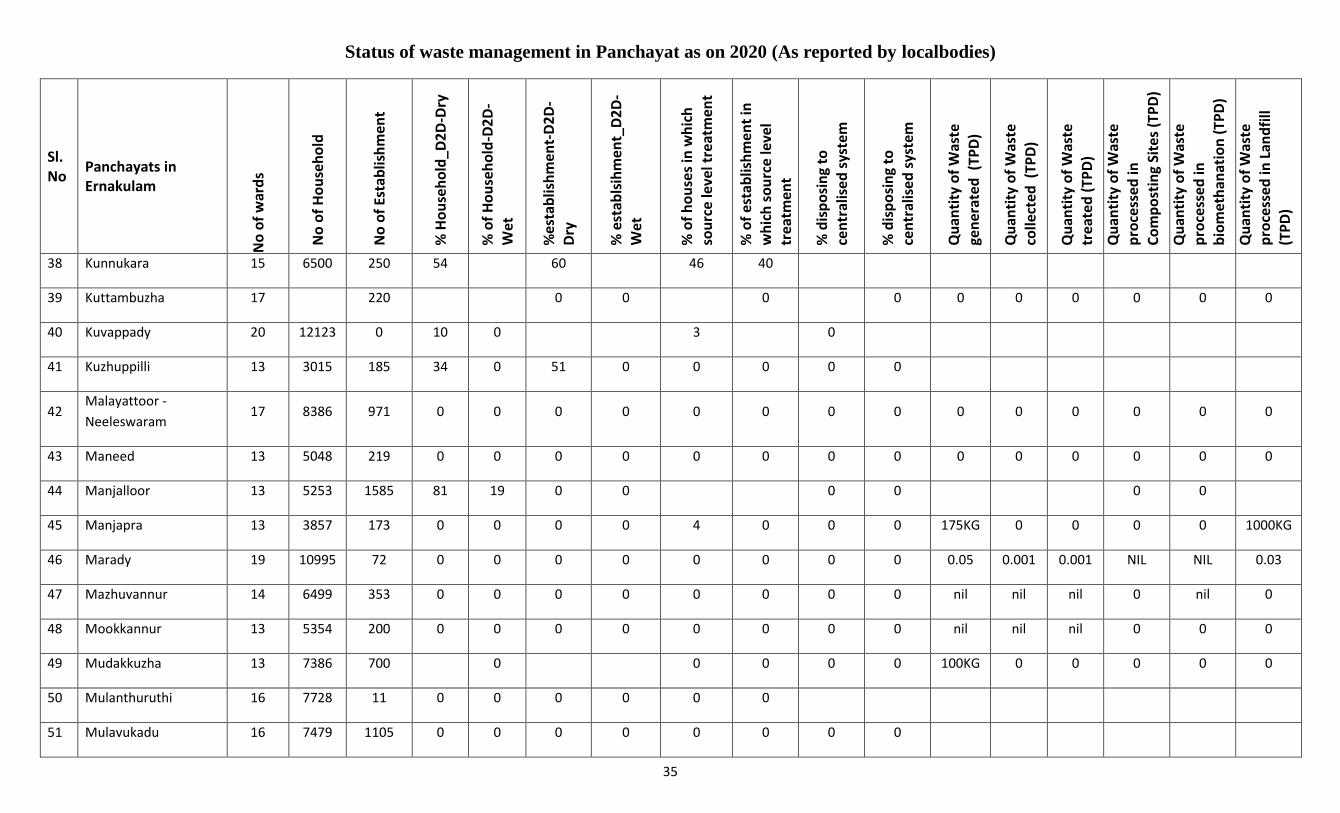
Status of waste management in Panchayat as on 2020 (As reported by localbodies)
35
Sl. No
Panchayats in Ernakulam
No
of
war
ds
No
of
Ho
use
ho
ld
No
of
Esta
blis
hm
ent
% H
ou
seh
old
_D2
D-D
ry
% o
f H
ou
seh
old
-D2
D-
Wet
%e
stab
lish
men
t-D
2D
-D
ry
% e
stab
lsih
men
t_D
2D
-W
et
% o
f h
ou
ses
in w
hic
h
sou
rce
leve
l tre
atm
ent
% o
f es
tab
lish
men
t in
w
hic
h s
ou
rce
leve
l tr
eatm
ent
% d
isp
osi
ng
to
cen
tral
ise
d s
yste
m
% d
isp
osi
ng
to
cen
tral
ise
d s
yste
m
Qu
anti
ty o
f W
aste
ge
ner
ate
d (
TPD
)
Qu
anti
ty o
f W
aste
colle
cted
(TP
D)
Qu
anti
ty o
f W
aste
tr
eate
d (
TPD
)
Qu
anti
ty o
f W
aste
p
roce
sse
d in
Co
mp
ost
ing
Site
s (T
PD
)
Qu
anti
ty o
f W
aste
pro
cess
ed
in
bio
met
han
atio
n (
TPD
)
Qu
anti
ty o
f W
aste
p
roce
sse
d in
Lan
dfi
ll (T
PD
)
38 Kunnukara 15 6500 250 54 60 46 40
39 Kuttambuzha 17 220 0 0 0 0 0 0 0 0 0 0
40 Kuvappady 20 12123 0 10 0 3 0
41 Kuzhuppilli 13 3015 185 34 0 51 0 0 0 0 0
42 Malayattoor -
Neeleswaram 17 8386 971 0 0 0 0 0 0 0 0 0 0 0 0 0 0
43 Maneed 13 5048 219 0 0 0 0 0 0 0 0 0 0 0 0 0 0
44 Manjalloor 13 5253 1585 81 19 0 0 0 0 0 0
45 Manjapra 13 3857 173 0 0 0 0 4 0 0 0 175KG 0 0 0 0 1000KG
46 Marady 19 10995 72 0 0 0 0 0 0 0 0 0.05 0.001 0.001 NIL NIL 0.03
47 Mazhuvannur 14 6499 353 0 0 0 0 0 0 0 0 nil nil nil 0 nil 0
48 Mookkannur 13 5354 200 0 0 0 0 0 0 0 0 nil nil nil 0 0 0
49 Mudakkuzha 13 7386 700 0 0 0 0 0 100KG 0 0 0 0 0
50 Mulanthuruthi 16 7728 11 0 0 0 0 0 0
51 Mulavukadu 16 7479 1105 0 0 0 0 0 0 0 0
Annexure.1
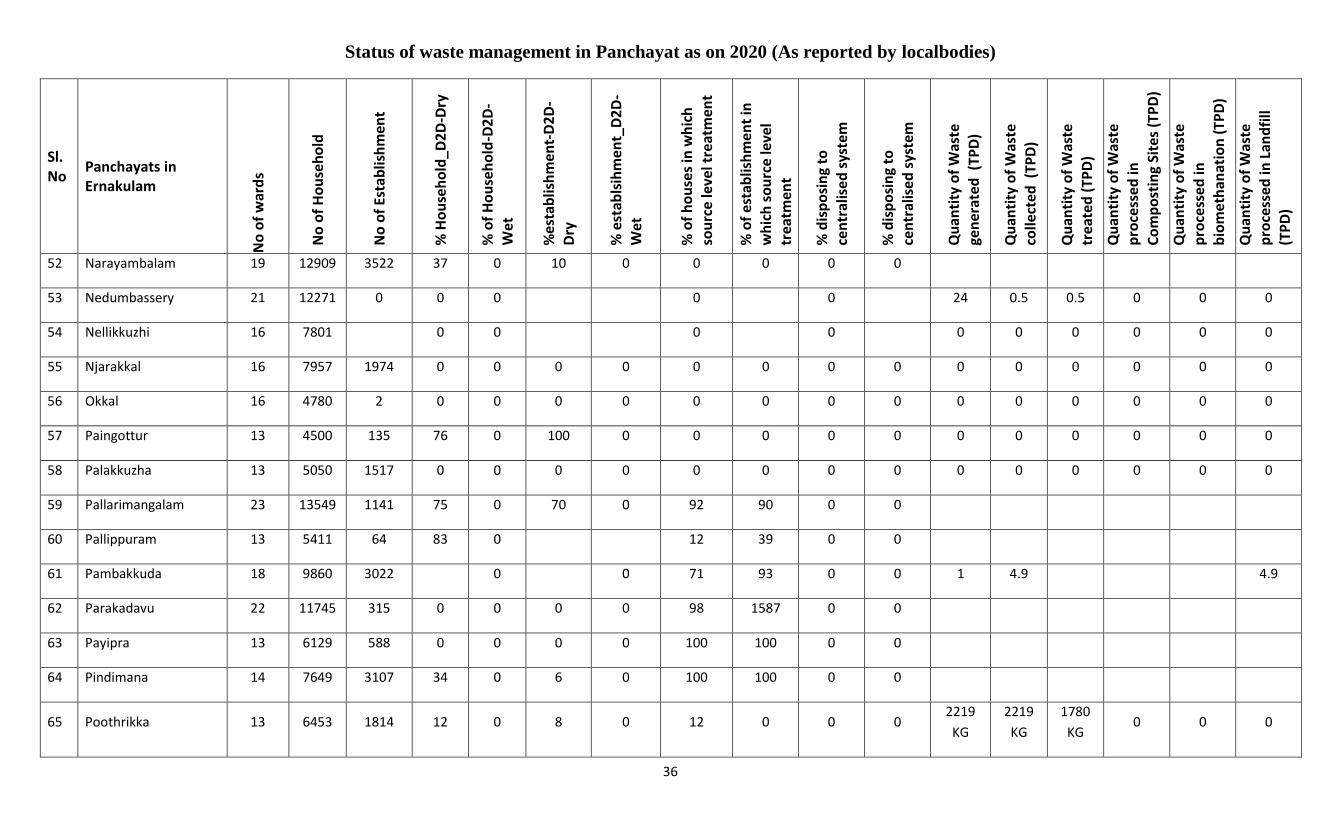
Status of waste management in Panchayat as on 2020 (As reported by localbodies)
36
Sl. No
Panchayats in Ernakulam
No
of
war
ds
No
of
Ho
use
ho
ld
No
of
Esta
blis
hm
ent
% H
ou
seh
old
_D2
D-D
ry
% o
f H
ou
seh
old
-D2
D-
Wet
%e
stab
lish
men
t-D
2D
-D
ry
% e
stab
lsih
men
t_D
2D
-W
et
% o
f h
ou
ses
in w
hic
h
sou
rce
leve
l tre
atm
ent
% o
f es
tab
lish
men
t in
w
hic
h s
ou
rce
leve
l tr
eatm
ent
% d
isp
osi
ng
to
cen
tral
ise
d s
yste
m
% d
isp
osi
ng
to
cen
tral
ise
d s
yste
m
Qu
anti
ty o
f W
aste
ge
ner
ate
d (
TPD
)
Qu
anti
ty o
f W
aste
colle
cted
(TP
D)
Qu
anti
ty o
f W
aste
tr
eate
d (
TPD
)
Qu
anti
ty o
f W
aste
p
roce
sse
d in
Co
mp
ost
ing
Site
s (T
PD
)
Qu
anti
ty o
f W
aste
pro
cess
ed
in
bio
met
han
atio
n (
TPD
)
Qu
anti
ty o
f W
aste
p
roce
sse
d in
Lan
dfi
ll (T
PD
)
52 Narayambalam 19 12909 3522 37 0 10 0 0 0 0 0
53 Nedumbassery 21 12271 0 0 0 0 0 24 0.5 0.5 0 0 0
54 Nellikkuzhi 16 7801 0 0 0 0 0 0 0 0 0 0
55 Njarakkal 16 7957 1974 0 0 0 0 0 0 0 0 0 0 0 0 0 0
56 Okkal 16 4780 2 0 0 0 0 0 0 0 0 0 0 0 0 0 0
57 Paingottur 13 4500 135 76 0 100 0 0 0 0 0 0 0 0 0 0 0
58 Palakkuzha 13 5050 1517 0 0 0 0 0 0 0 0 0 0 0 0 0 0
59 Pallarimangalam 23 13549 1141 75 0 70 0 92 90 0 0
60 Pallippuram 13 5411 64 83 0 12 39 0 0
61 Pambakkuda 18 9860 3022 0 0 71 93 0 0 1 4.9 4.9
62 Parakadavu 22 11745 315 0 0 0 0 98 1587 0 0
63 Payipra 13 6129 588 0 0 0 0 100 100 0 0
64 Pindimana 14 7649 3107 34 0 6 0 100 100 0 0
65 Poothrikka 13 6453 1814 12 0 8 0 12 0 0 0 2219
KG
2219
KG
1780
KG 0 0 0
Annexure.1
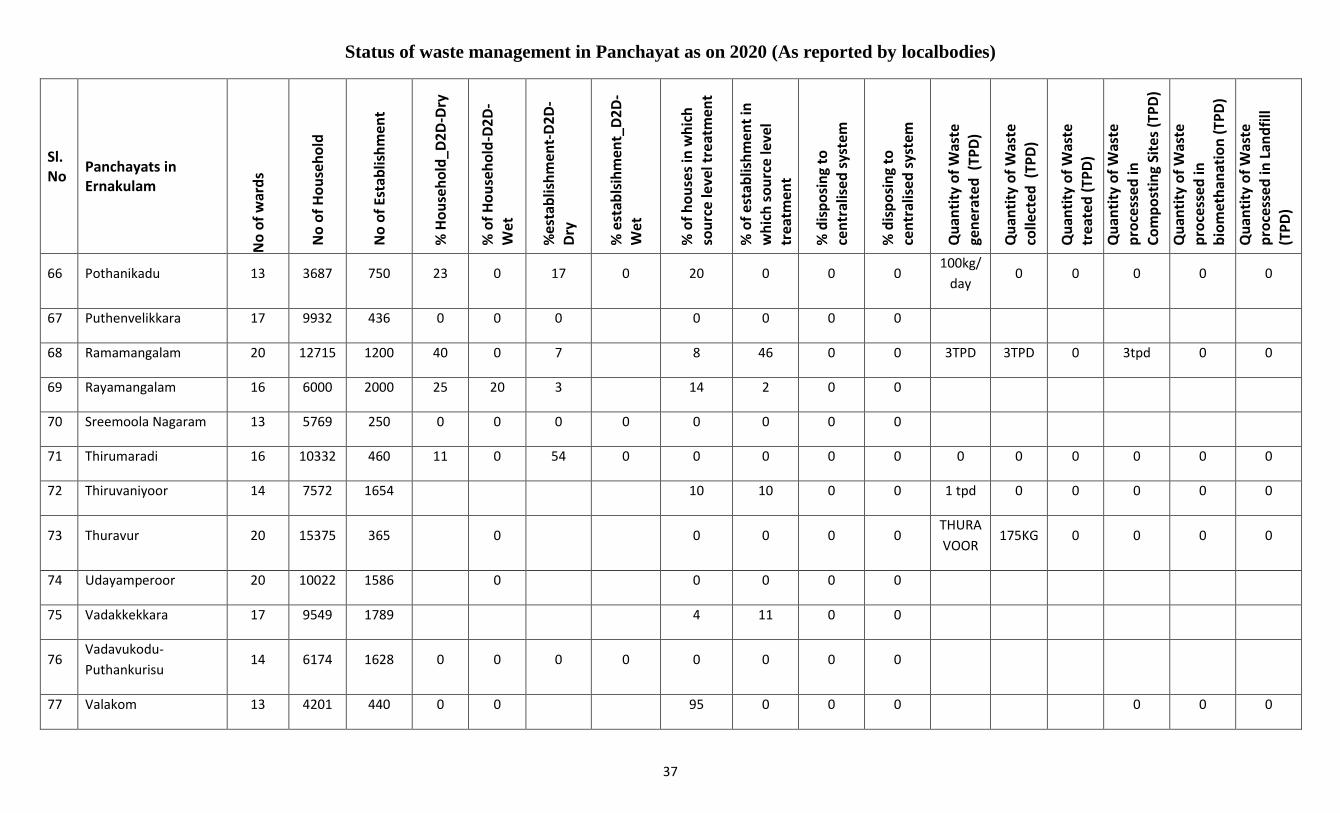
Status of waste management in Panchayat as on 2020 (As reported by localbodies)
37
Sl. No
Panchayats in Ernakulam
No
of
war
ds
No
of
Ho
use
ho
ld
No
of
Esta
blis
hm
ent
% H
ou
seh
old
_D2
D-D
ry
% o
f H
ou
seh
old
-D2
D-
Wet
%e
stab
lish
men
t-D
2D
-D
ry
% e
stab
lsih
men
t_D
2D
-W
et
% o
f h
ou
ses
in w
hic
h
sou
rce
leve
l tre
atm
ent
% o
f es
tab
lish
men
t in
w
hic
h s
ou
rce
leve
l tr
eatm
ent
% d
isp
osi
ng
to
cen
tral
ise
d s
yste
m
% d
isp
osi
ng
to
cen
tral
ise
d s
yste
m
Qu
anti
ty o
f W
aste
ge
ner
ate
d (
TPD
)
Qu
anti
ty o
f W
aste
colle
cted
(TP
D)
Qu
anti
ty o
f W
aste
tr
eate
d (
TPD
)
Qu
anti
ty o
f W
aste
p
roce
sse
d in
Co
mp
ost
ing
Site
s (T
PD
)
Qu
anti
ty o
f W
aste
pro
cess
ed
in
bio
met
han
atio
n (
TPD
)
Qu
anti
ty o
f W
aste
p
roce
sse
d in
Lan
dfi
ll (T
PD
)
66 Pothanikadu 13 3687 750 23 0 17 0 20 0 0 0 100kg/
day 0 0 0 0 0
67 Puthenvelikkara 17 9932 436 0 0 0 0 0 0 0
68 Ramamangalam 20 12715 1200 40 0 7 8 46 0 0 3TPD 3TPD 0 3tpd 0 0
69 Rayamangalam 16 6000 2000 25 20 3 14 2 0 0
70 Sreemoola Nagaram 13 5769 250 0 0 0 0 0 0 0 0
71 Thirumaradi 16 10332 460 11 0 54 0 0 0 0 0 0 0 0 0 0 0
72 Thiruvaniyoor 14 7572 1654 10 10 0 0 1 tpd 0 0 0 0 0
73 Thuravur 20 15375 365 0 0 0 0 0 THURA
VOOR 175KG 0 0 0 0
74 Udayamperoor 20 10022 1586 0 0 0 0 0
75 Vadakkekkara 17 9549 1789 4 11 0 0
76 Vadavukodu-
Puthankurisu 14 6174 1628 0 0 0 0 0 0 0 0
77 Valakom 13 4201 440 0 0 95 0 0 0 0 0 0
Annexure.1
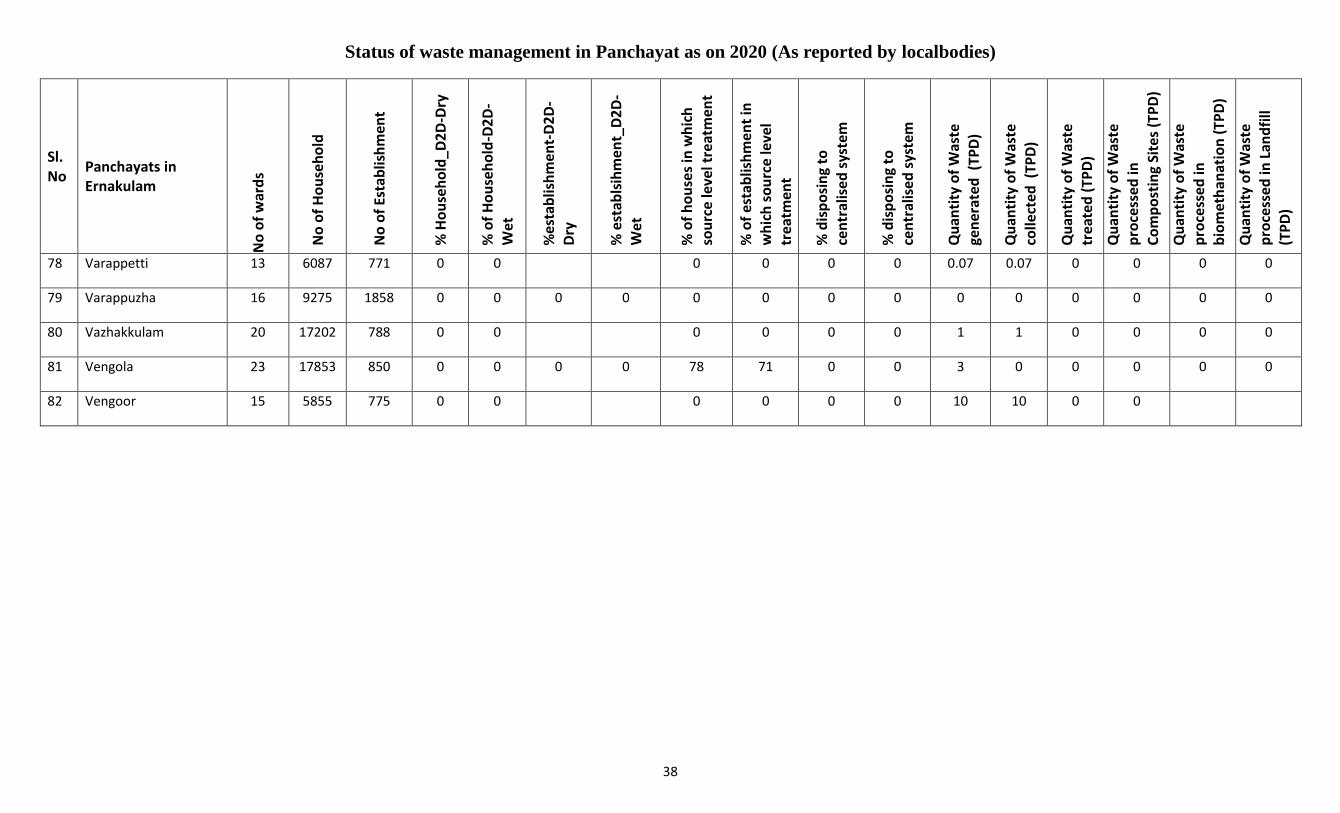
Status of waste management in Panchayat as on 2020 (As reported by localbodies)
38
Sl. No
Panchayats in Ernakulam
No
of
war
ds
No
of
Ho
use
ho
ld
No
of
Esta
blis
hm
ent
% H
ou
seh
old
_D2
D-D
ry
% o
f H
ou
seh
old
-D2
D-
Wet
%e
stab
lish
men
t-D
2D
-D
ry
% e
stab
lsih
men
t_D
2D
-W
et
% o
f h
ou
ses
in w
hic
h
sou
rce
leve
l tre
atm
ent
% o
f es
tab
lish
men
t in
w
hic
h s
ou
rce
leve
l tr
eatm
ent
% d
isp
osi
ng
to
cen
tral
ise
d s
yste
m
% d
isp
osi
ng
to
cen
tral
ise
d s
yste
m
Qu
anti
ty o
f W
aste
ge
ner
ate
d (
TPD
)
Qu
anti
ty o
f W
aste
colle
cted
(TP
D)
Qu
anti
ty o
f W
aste
tr
eate
d (
TPD
)
Qu
anti
ty o
f W
aste
p
roce
sse
d in
Co
mp
ost
ing
Site
s (T
PD
)
Qu
anti
ty o
f W
aste
pro
cess
ed
in
bio
met
han
atio
n (
TPD
)
Qu
anti
ty o
f W
aste
p
roce
sse
d in
Lan
dfi
ll (T
PD
)
78 Varappetti 13 6087 771 0 0 0 0 0 0 0.07 0.07 0 0 0 0
79 Varappuzha 16 9275 1858 0 0 0 0 0 0 0 0 0 0 0 0 0 0
80 Vazhakkulam 20 17202 788 0 0 0 0 0 0 1 1 0 0 0 0
81 Vengola 23 17853 850 0 0 0 0 78 71 0 0 3 0 0 0 0 0
82 Vengoor 15 5855 775 0 0 0 0 0 0 10 10 0 0
Annexure.1
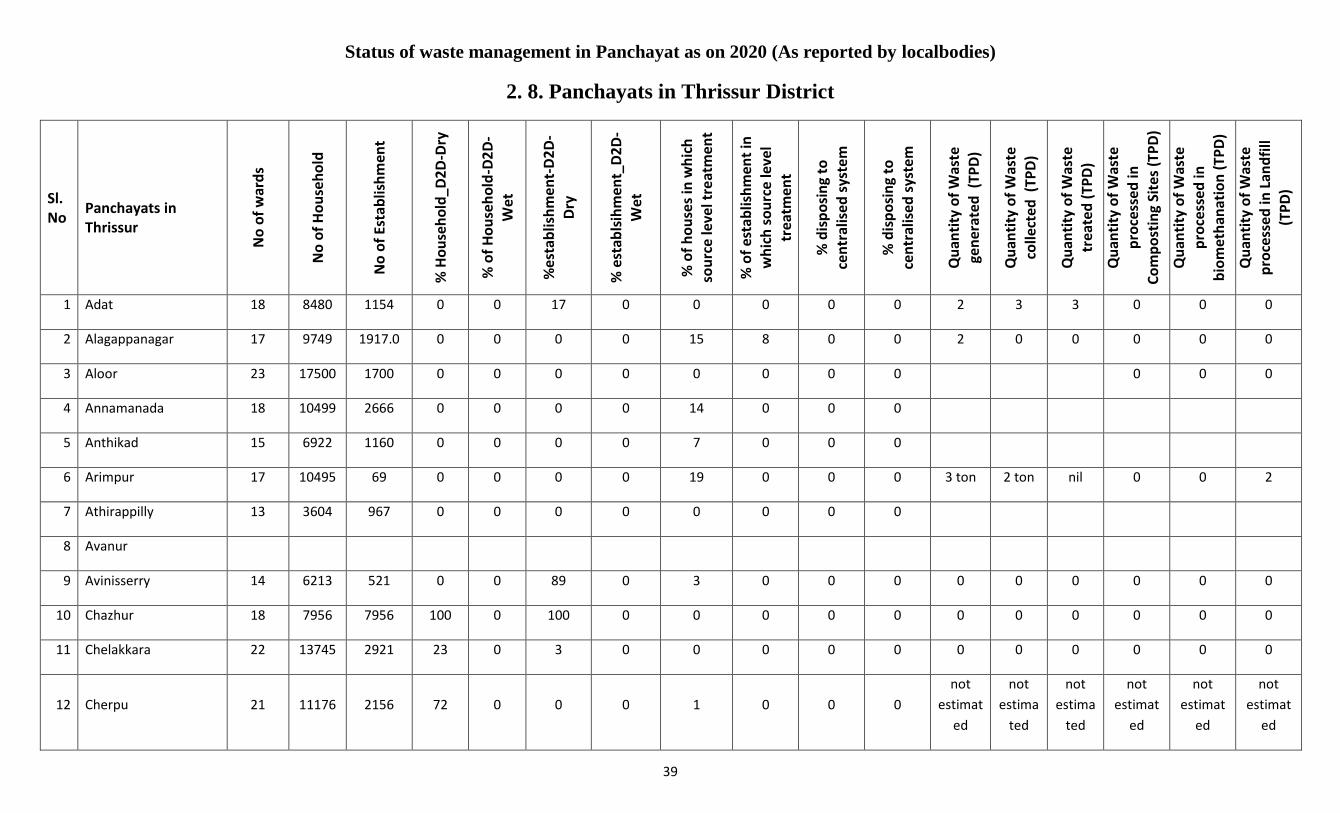
Status of waste management in Panchayat as on 2020 (As reported by localbodies)
39
2. 8. Panchayats in Thrissur District
Sl. No
Panchayats in Thrissur
No
of
war
ds
No
of
Ho
use
ho
ld
No
of
Esta
blis
hm
ent
% H
ou
seh
old
_D2
D-D
ry
% o
f H
ou
seh
old
-D2
D-
Wet
%e
stab
lish
men
t-D
2D
-D
ry
% e
stab
lsih
men
t_D
2D
-W
et
% o
f h
ou
ses
in w
hic
h
sou
rce
leve
l tre
atm
ent
% o
f es
tab
lish
men
t in
w
hic
h s
ou
rce
leve
l tr
eatm
ent
% d
isp
osi
ng
to
cen
tral
ise
d s
yste
m
% d
isp
osi
ng
to
cen
tral
ise
d s
yste
m
Qu
anti
ty o
f W
aste
ge
ner
ate
d (
TPD
)
Qu
anti
ty o
f W
aste
colle
cted
(TP
D)
Qu
anti
ty o
f W
aste
tr
eate
d (
TPD
)
Qu
anti
ty o
f W
aste
p
roce
sse
d in
Co
mp
ost
ing
Site
s (T
PD
)
Qu
anti
ty o
f W
aste
pro
cess
ed
in
bio
met
han
atio
n (
TPD
)
Qu
anti
ty o
f W
aste
p
roce
sse
d in
Lan
dfi
ll (T
PD
)
1 Adat 18 8480 1154 0 0 17 0 0 0 0 0 2 3 3 0 0 0
2 Alagappanagar 17 9749 1917.0 0 0 0 0 15 8 0 0 2 0 0 0 0 0
3 Aloor 23 17500 1700 0 0 0 0 0 0 0 0 0 0 0
4 Annamanada 18 10499 2666 0 0 0 0 14 0 0 0
5 Anthikad 15 6922 1160 0 0 0 0 7 0 0 0
6 Arimpur 17 10495 69 0 0 0 0 19 0 0 0 3 ton 2 ton nil 0 0 2
7 Athirappilly 13 3604 967 0 0 0 0 0 0 0 0
8 Avanur
9 Avinisserry 14 6213 521 0 0 89 0 3 0 0 0 0 0 0 0 0 0
10 Chazhur 18 7956 7956 100 0 100 0 0 0 0 0 0 0 0 0 0 0
11 Chelakkara 22 13745 2921 23 0 3 0 0 0 0 0 0 0 0 0 0 0
12 Cherpu 21 11176 2156 72 0 0 0 1 0 0 0
not
estimat
ed
not
estima
ted
not
estima
ted
not
estimat
ed
not
estimat
ed
not
estimat
ed
Annexure.1
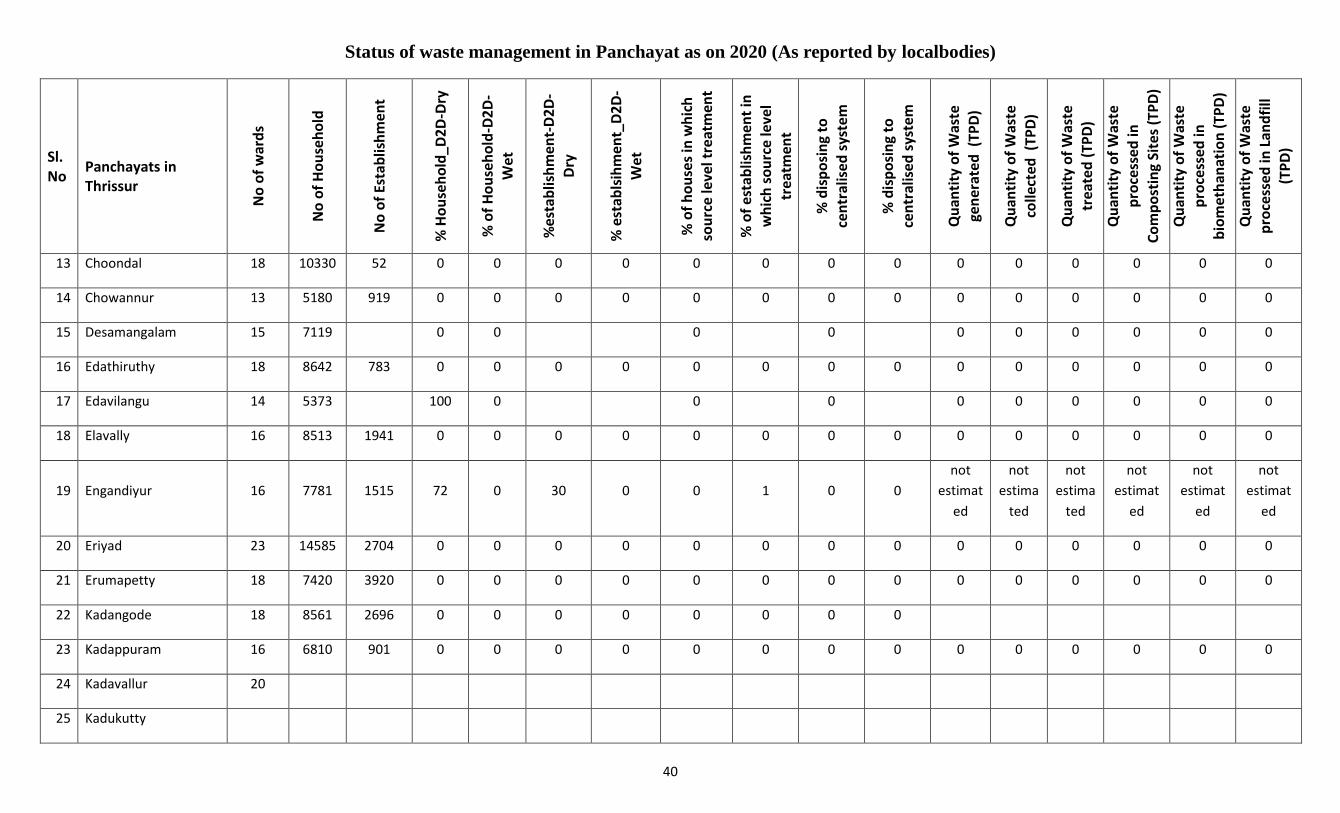
Status of waste management in Panchayat as on 2020 (As reported by localbodies)
40
Sl. No
Panchayats in Thrissur
No
of
war
ds
No
of
Ho
use
ho
ld
No
of
Esta
blis
hm
ent
% H
ou
seh
old
_D2
D-D
ry
% o
f H
ou
seh
old
-D2
D-
Wet
%e
stab
lish
men
t-D
2D
-D
ry
% e
stab
lsih
men
t_D
2D
-W
et
% o
f h
ou
ses
in w
hic
h
sou
rce
leve
l tre
atm
ent
% o
f es
tab
lish
men
t in
w
hic
h s
ou
rce
leve
l tr
eatm
ent
% d
isp
osi
ng
to
cen
tral
ise
d s
yste
m
% d
isp
osi
ng
to
cen
tral
ise
d s
yste
m
Qu
anti
ty o
f W
aste
ge
ner
ate
d (
TPD
)
Qu
anti
ty o
f W
aste
colle
cted
(TP
D)
Qu
anti
ty o
f W
aste
tr
eate
d (
TPD
)
Qu
anti
ty o
f W
aste
p
roce
sse
d in
Co
mp
ost
ing
Site
s (T
PD
)
Qu
anti
ty o
f W
aste
pro
cess
ed
in
bio
met
han
atio
n (
TPD
)
Qu
anti
ty o
f W
aste
p
roce
sse
d in
Lan
dfi
ll (T
PD
)
13 Choondal 18 10330 52 0 0 0 0 0 0 0 0 0 0 0 0 0 0
14 Chowannur 13 5180 919 0 0 0 0 0 0 0 0 0 0 0 0 0 0
15 Desamangalam 15 7119 0 0 0 0 0 0 0 0 0 0
16 Edathiruthy 18 8642 783 0 0 0 0 0 0 0 0 0 0 0 0 0 0
17 Edavilangu 14 5373 100 0 0 0 0 0 0 0 0 0
18 Elavally 16 8513 1941 0 0 0 0 0 0 0 0 0 0 0 0 0 0
19 Engandiyur 16 7781 1515 72 0 30 0 0 1 0 0
not
estimat
ed
not
estima
ted
not
estima
ted
not
estimat
ed
not
estimat
ed
not
estimat
ed
20 Eriyad 23 14585 2704 0 0 0 0 0 0 0 0 0 0 0 0 0 0
21 Erumapetty 18 7420 3920 0 0 0 0 0 0 0 0 0 0 0 0 0 0
22 Kadangode 18 8561 2696 0 0 0 0 0 0 0 0
23 Kadappuram 16 6810 901 0 0 0 0 0 0 0 0 0 0 0 0 0 0
24 Kadavallur 20
25 Kadukutty
Annexure.1
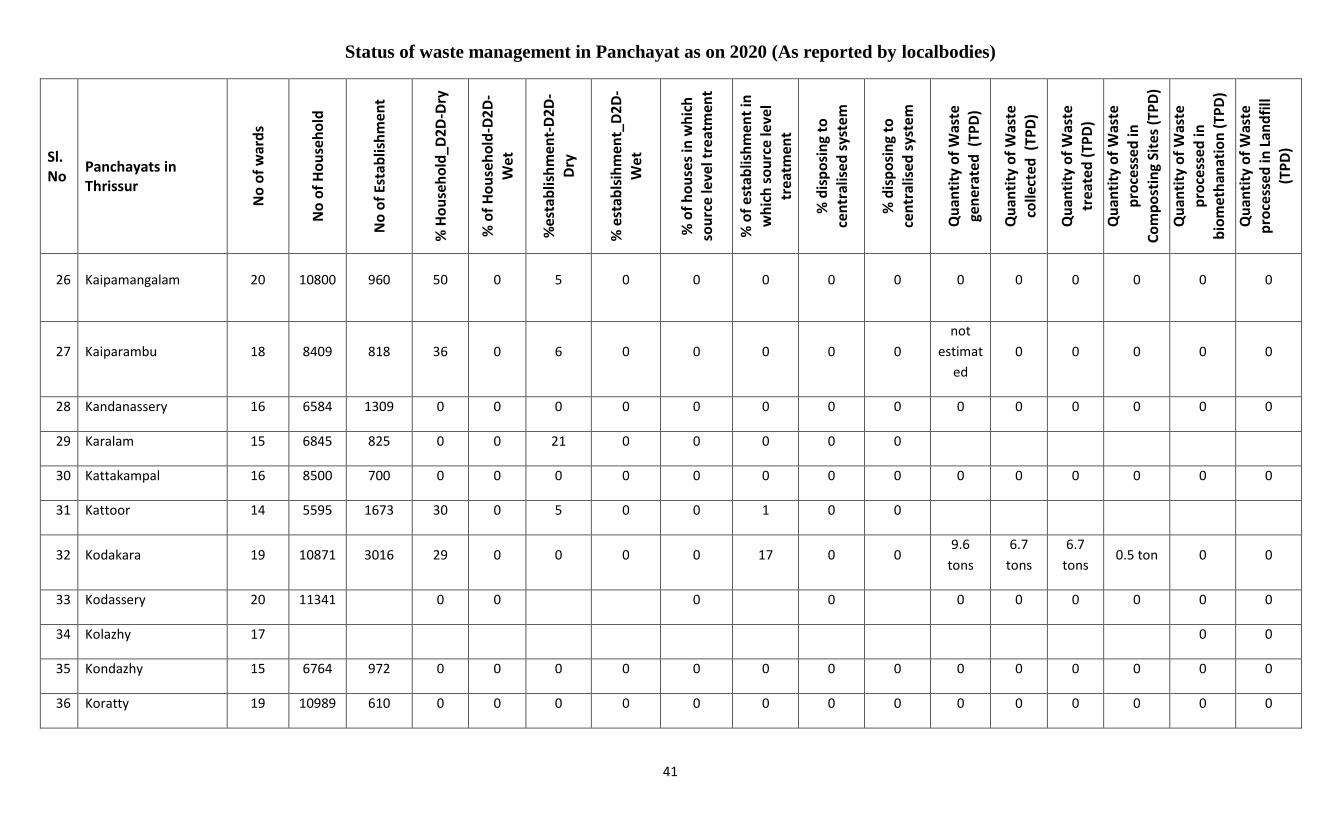
Status of waste management in Panchayat as on 2020 (As reported by localbodies)
41
Sl. No
Panchayats in Thrissur
No
of
war
ds
No
of
Ho
use
ho
ld
No
of
Esta
blis
hm
ent
% H
ou
seh
old
_D2
D-D
ry
% o
f H
ou
seh
old
-D2
D-
Wet
%e
stab
lish
men
t-D
2D
-D
ry
% e
stab
lsih
men
t_D
2D
-W
et
% o
f h
ou
ses
in w
hic
h
sou
rce
leve
l tre
atm
ent
% o
f es
tab
lish
men
t in
w
hic
h s
ou
rce
leve
l tr
eatm
ent
% d
isp
osi
ng
to
cen
tral
ise
d s
yste
m
% d
isp
osi
ng
to
cen
tral
ise
d s
yste
m
Qu
anti
ty o
f W
aste
ge
ner
ate
d (
TPD
)
Qu
anti
ty o
f W
aste
colle
cted
(TP
D)
Qu
anti
ty o
f W
aste
tr
eate
d (
TPD
)
Qu
anti
ty o
f W
aste
p
roce
sse
d in
Co
mp
ost
ing
Site
s (T
PD
)
Qu
anti
ty o
f W
aste
pro
cess
ed
in
bio
met
han
atio
n (
TPD
)
Qu
anti
ty o
f W
aste
p
roce
sse
d in
Lan
dfi
ll (T
PD
)
26 Kaipamangalam 20 10800 960 50 0 5 0 0 0 0 0 0 0 0 0 0 0
27 Kaiparambu 18 8409 818 36 0 6 0 0 0 0 0
not
estimat
ed
0 0 0 0 0
28 Kandanassery 16 6584 1309 0 0 0 0 0 0 0 0 0 0 0 0 0 0
29 Karalam 15 6845 825 0 0 21 0 0 0 0 0
30 Kattakampal 16 8500 700 0 0 0 0 0 0 0 0 0 0 0 0 0 0
31 Kattoor 14 5595 1673 30 0 5 0 0 1 0 0
32 Kodakara 19 10871 3016 29 0 0 0 0 17 0 0 9.6
tons
6.7
tons
6.7
tons 0.5 ton 0 0
33 Kodassery 20 11341 0 0 0 0 0 0 0 0 0 0
34 Kolazhy 17 0 0
35 Kondazhy 15 6764 972 0 0 0 0 0 0 0 0 0 0 0 0 0 0
36 Koratty 19 10989 610 0 0 0 0 0 0 0 0 0 0 0 0 0 0
Annexure.1

Status of waste management in Panchayat as on 2020 (As reported by localbodies)
42
Sl. No
Panchayats in Thrissur
No
of
war
ds
No
of
Ho
use
ho
ld
No
of
Esta
blis
hm
ent
% H
ou
seh
old
_D2
D-D
ry
% o
f H
ou
seh
old
-D2
D-
Wet
%e
stab
lish
men
t-D
2D
-D
ry
% e
stab
lsih
men
t_D
2D
-W
et
% o
f h
ou
ses
in w
hic
h
sou
rce
leve
l tre
atm
ent
% o
f es
tab
lish
men
t in
w
hic
h s
ou
rce
leve
l tr
eatm
ent
% d
isp
osi
ng
to
cen
tral
ise
d s
yste
m
% d
isp
osi
ng
to
cen
tral
ise
d s
yste
m
Qu
anti
ty o
f W
aste
ge
ner
ate
d (
TPD
)
Qu
anti
ty o
f W
aste
colle
cted
(TP
D)
Qu
anti
ty o
f W
aste
tr
eate
d (
TPD
)
Qu
anti
ty o
f W
aste
p
roce
sse
d in
Co
mp
ost
ing
Site
s (T
PD
)
Qu
anti
ty o
f W
aste
pro
cess
ed
in
bio
met
han
atio
n (
TPD
)
Qu
anti
ty o
f W
aste
p
roce
sse
d in
Lan
dfi
ll (T
PD
)
37 Kuzhur 14 6510 908 0 0 0 0 0 0 0 0
not
estimat
ed
0 0 0 0 0
38 Madakkathara 16 8860 1562 40 0 52 0 9 0 0 0 2.05
TON
2.05
TON
2.05
TON
0.25TO
N 1 TON 0
39 Mala 20 11856 4446 0 0 0 0 0 0 0 0 0
40 Manalur 19 9467 2312 100 100 100 100 90 9.86TO
N
9.86T
ON
9.86T
ON 05. TON 0 0
41 MATHILAKAM 17 7565 588 0 0 0 0 0 0 0 0 0 0 0 0 0 0
42 Mattathur 23 16245 2731 0 0 0 0 0 0 0 0
43 Meloor 17 6888 0 0 0 0 200kg 0 200kg 0 0 0
44 Mulakunnathukavu 14 7053 0 0 0 0
Mulank
unnath
ukavu
0 0 0 0 0
45 Mullassery 15 6753 67 0 0 0 0 0 0 0 0 0
46 Mullurkkara 60 5927 1383 36 0 4 0 0 0 0 0 0 0 0 0 0 0
47 Muriyad 17 9633 1180 100 1 100 0 0 0 0
Annexure.1
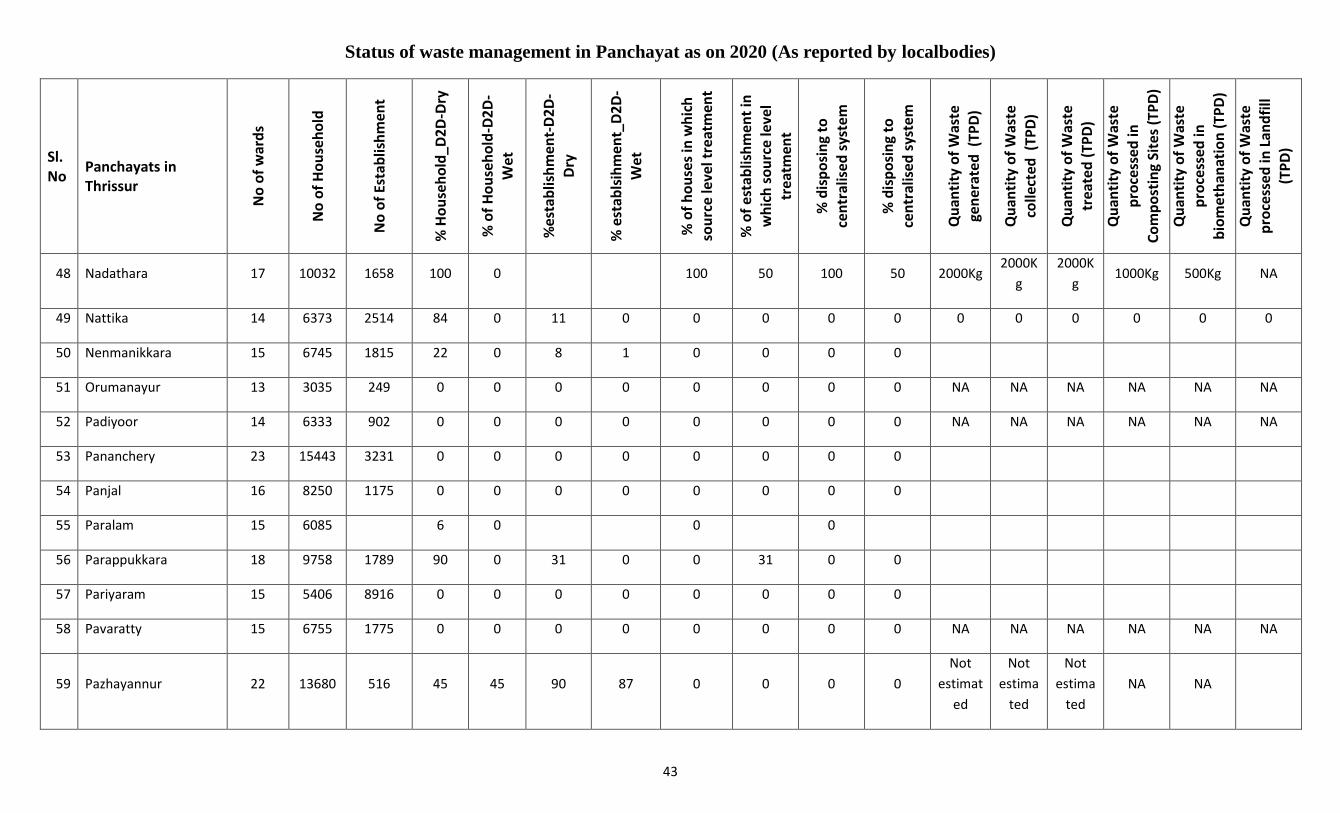
Status of waste management in Panchayat as on 2020 (As reported by localbodies)
43
Sl. No
Panchayats in Thrissur
No
of
war
ds
No
of
Ho
use
ho
ld
No
of
Esta
blis
hm
ent
% H
ou
seh
old
_D2
D-D
ry
% o
f H
ou
seh
old
-D2
D-
Wet
%e
stab
lish
men
t-D
2D
-D
ry
% e
stab
lsih
men
t_D
2D
-W
et
% o
f h
ou
ses
in w
hic
h
sou
rce
leve
l tre
atm
ent
% o
f es
tab
lish
men
t in
w
hic
h s
ou
rce
leve
l tr
eatm
ent
% d
isp
osi
ng
to
cen
tral
ise
d s
yste
m
% d
isp
osi
ng
to
cen
tral
ise
d s
yste
m
Qu
anti
ty o
f W
aste
ge
ner
ate
d (
TPD
)
Qu
anti
ty o
f W
aste
colle
cted
(TP
D)
Qu
anti
ty o
f W
aste
tr
eate
d (
TPD
)
Qu
anti
ty o
f W
aste
p
roce
sse
d in
Co
mp
ost
ing
Site
s (T
PD
)
Qu
anti
ty o
f W
aste
pro
cess
ed
in
bio
met
han
atio
n (
TPD
)
Qu
anti
ty o
f W
aste
p
roce
sse
d in
Lan
dfi
ll (T
PD
)
48 Nadathara 17 10032 1658 100 0 100 50 100 50 2000Kg 2000K
g
2000K
g 1000Kg 500Kg NA
49 Nattika 14 6373 2514 84 0 11 0 0 0 0 0 0 0 0 0 0 0
50 Nenmanikkara 15 6745 1815 22 0 8 1 0 0 0 0
51 Orumanayur 13 3035 249 0 0 0 0 0 0 0 0 NA NA NA NA NA NA
52 Padiyoor 14 6333 902 0 0 0 0 0 0 0 0 NA NA NA NA NA NA
53 Pananchery 23 15443 3231 0 0 0 0 0 0 0 0
54 Panjal 16 8250 1175 0 0 0 0 0 0 0 0
55 Paralam 15 6085 6 0 0 0
56 Parappukkara 18 9758 1789 90 0 31 0 0 31 0 0
57 Pariyaram 15 5406 8916 0 0 0 0 0 0 0 0
58 Pavaratty 15 6755 1775 0 0 0 0 0 0 0 0 NA NA NA NA NA NA
59 Pazhayannur 22 13680 516 45 45 90 87 0 0 0 0
Not
estimat
ed
Not
estima
ted
Not
estima
ted
NA NA
Annexure.1
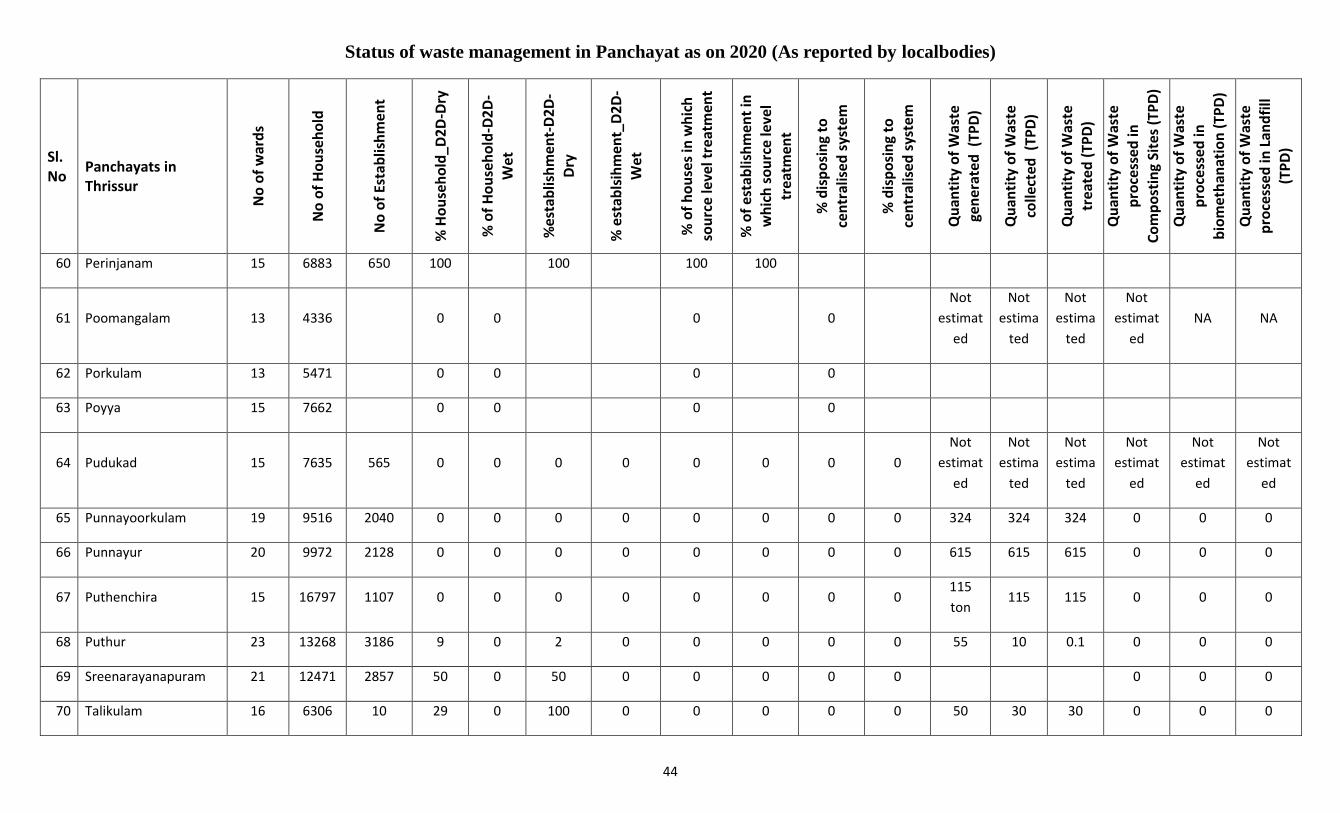
Status of waste management in Panchayat as on 2020 (As reported by localbodies)
44
Sl. No
Panchayats in Thrissur
No
of
war
ds
No
of
Ho
use
ho
ld
No
of
Esta
blis
hm
ent
% H
ou
seh
old
_D2
D-D
ry
% o
f H
ou
seh
old
-D2
D-
Wet
%e
stab
lish
men
t-D
2D
-D
ry
% e
stab
lsih
men
t_D
2D
-W
et
% o
f h
ou
ses
in w
hic
h
sou
rce
leve
l tre
atm
ent
% o
f es
tab
lish
men
t in
w
hic
h s
ou
rce
leve
l tr
eatm
ent
% d
isp
osi
ng
to
cen
tral
ise
d s
yste
m
% d
isp
osi
ng
to
cen
tral
ise
d s
yste
m
Qu
anti
ty o
f W
aste
ge
ner
ate
d (
TPD
)
Qu
anti
ty o
f W
aste
colle
cted
(TP
D)
Qu
anti
ty o
f W
aste
tr
eate
d (
TPD
)
Qu
anti
ty o
f W
aste
p
roce
sse
d in
Co
mp
ost
ing
Site
s (T
PD
)
Qu
anti
ty o
f W
aste
pro
cess
ed
in
bio
met
han
atio
n (
TPD
)
Qu
anti
ty o
f W
aste
p
roce
sse
d in
Lan
dfi
ll (T
PD
)
60 Perinjanam 15 6883 650 100 100 100 100
61 Poomangalam 13 4336 0 0 0 0
Not
estimat
ed
Not
estima
ted
Not
estima
ted
Not
estimat
ed
NA NA
62 Porkulam 13 5471 0 0 0 0
63 Poyya 15 7662 0 0 0 0
64 Pudukad 15 7635 565 0 0 0 0 0 0 0 0
Not
estimat
ed
Not
estima
ted
Not
estima
ted
Not
estimat
ed
Not
estimat
ed
Not
estimat
ed
65 Punnayoorkulam 19 9516 2040 0 0 0 0 0 0 0 0 324 324 324 0 0 0
66 Punnayur 20 9972 2128 0 0 0 0 0 0 0 0 615 615 615 0 0 0
67 Puthenchira 15 16797 1107 0 0 0 0 0 0 0 0 115
ton 115 115 0 0 0
68 Puthur 23 13268 3186 9 0 2 0 0 0 0 0 55 10 0.1 0 0 0
69 Sreenarayanapuram 21 12471 2857 50 0 50 0 0 0 0 0 0 0 0
70 Talikulam 16 6306 10 29 0 100 0 0 0 0 0 50 30 30 0 0 0
Annexure.1

Status of waste management in Panchayat as on 2020 (As reported by localbodies)
45
Sl. No
Panchayats in Thrissur
No
of
war
ds
No
of
Ho
use
ho
ld
No
of
Esta
blis
hm
ent
% H
ou
seh
old
_D2
D-D
ry
% o
f H
ou
seh
old
-D2
D-
Wet
%e
stab
lish
men
t-D
2D
-D
ry
% e
stab
lsih
men
t_D
2D
-W
et
% o
f h
ou
ses
in w
hic
h
sou
rce
leve
l tre
atm
ent
% o
f es
tab
lish
men
t in
w
hic
h s
ou
rce
leve
l tr
eatm
ent
% d
isp
osi
ng
to
cen
tral
ise
d s
yste
m
% d
isp
osi
ng
to
cen
tral
ise
d s
yste
m
Qu
anti
ty o
f W
aste
ge
ner
ate
d (
TPD
)
Qu
anti
ty o
f W
aste
colle
cted
(TP
D)
Qu
anti
ty o
f W
aste
tr
eate
d (
TPD
)
Qu
anti
ty o
f W
aste
p
roce
sse
d in
Co
mp
ost
ing
Site
s (T
PD
)
Qu
anti
ty o
f W
aste
pro
cess
ed
in
bio
met
han
atio
n (
TPD
)
Qu
anti
ty o
f W
aste
p
roce
sse
d in
Lan
dfi
ll (T
PD
)
71 Thanniyam 18 9782 5000 51 0 100 0 0 0 0 0 20 ton 20 20 0 0 0
72 Thekkumkara 18 5TON/
DAY 0 5/TON 0 0 0
73 Thiruvilwamala 17 NA NA
74 Tholur 13 4388 30 0 0 83 0 0 0 0 0 20 na na Na
75 Thrikkur 17 8552 1280 0 3 0 0 0 0 0 0 0 0 0 0 0
76 Vadakkekad 16 8320 980 0 0 5 0 0 0 0 0 0 0 0 na na Na
77 Valapad 20 10127 1767 4 0 0 0 1 1 0 0
not
estimat
ed
not
estima
ted
not
estima
ted
na na na
78 Vallachira 14 7320 670 0 0 0 0 0 0 0 0
not
estimat
ed
not
estima
ted
not
estima
ted
NA NA NA
79 Vallatholnagar 16 6378 1331 60 0 2 0 0 0 0 0
not
estimat
ed
not
estima
ted
not
estima
ted
na na na
80 Varandarappilly 22 13900 2601 0 0 0 0 5 0 0 0 not not not na na na
Annexure.1
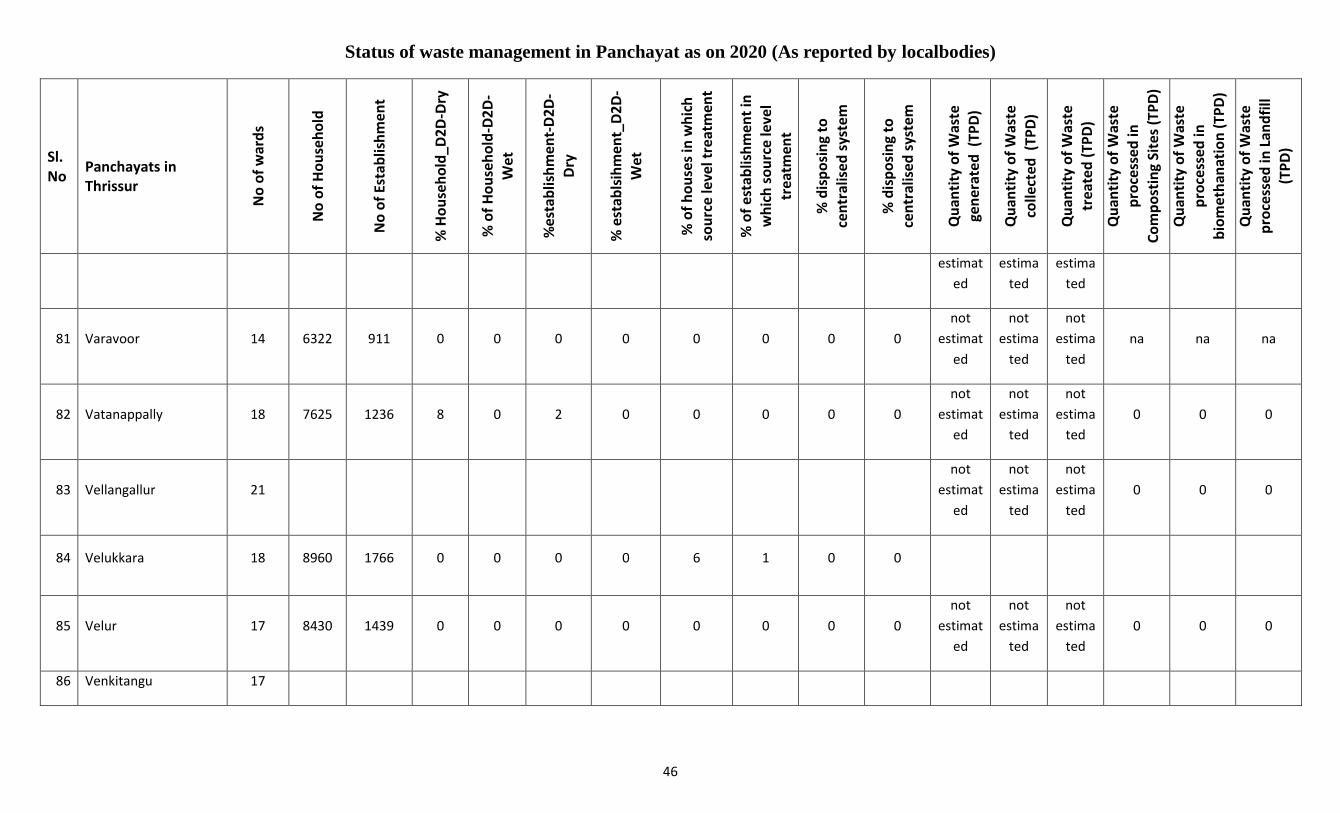
Status of waste management in Panchayat as on 2020 (As reported by localbodies)
46
Sl. No
Panchayats in Thrissur
No
of
war
ds
No
of
Ho
use
ho
ld
No
of
Esta
blis
hm
ent
% H
ou
seh
old
_D2
D-D
ry
% o
f H
ou
seh
old
-D2
D-
Wet
%e
stab
lish
men
t-D
2D
-D
ry
% e
stab
lsih
men
t_D
2D
-W
et
% o
f h
ou
ses
in w
hic
h
sou
rce
leve
l tre
atm
ent
% o
f es
tab
lish
men
t in
w
hic
h s
ou
rce
leve
l tr
eatm
ent
% d
isp
osi
ng
to
cen
tral
ise
d s
yste
m
% d
isp
osi
ng
to
cen
tral
ise
d s
yste
m
Qu
anti
ty o
f W
aste
ge
ner
ate
d (
TPD
)
Qu
anti
ty o
f W
aste
colle
cted
(TP
D)
Qu
anti
ty o
f W
aste
tr
eate
d (
TPD
)
Qu
anti
ty o
f W
aste
p
roce
sse
d in
Co
mp
ost
ing
Site
s (T
PD
)
Qu
anti
ty o
f W
aste
pro
cess
ed
in
bio
met
han
atio
n (
TPD
)
Qu
anti
ty o
f W
aste
p
roce
sse
d in
Lan
dfi
ll (T
PD
)
estimat
ed
estima
ted
estima
ted
81 Varavoor 14 6322 911 0 0 0 0 0 0 0 0
not
estimat
ed
not
estima
ted
not
estima
ted
na na na
82 Vatanappally 18 7625 1236 8 0 2 0 0 0 0 0
not
estimat
ed
not
estima
ted
not
estima
ted
0 0 0
83 Vellangallur 21
not
estimat
ed
not
estima
ted
not
estima
ted
0 0 0
84 Velukkara 18 8960 1766 0 0 0 0 6 1 0 0
85 Velur 17 8430 1439 0 0 0 0 0 0 0 0
not
estimat
ed
not
estima
ted
not
estima
ted
0 0 0
86 Venkitangu 17
Annexure.1
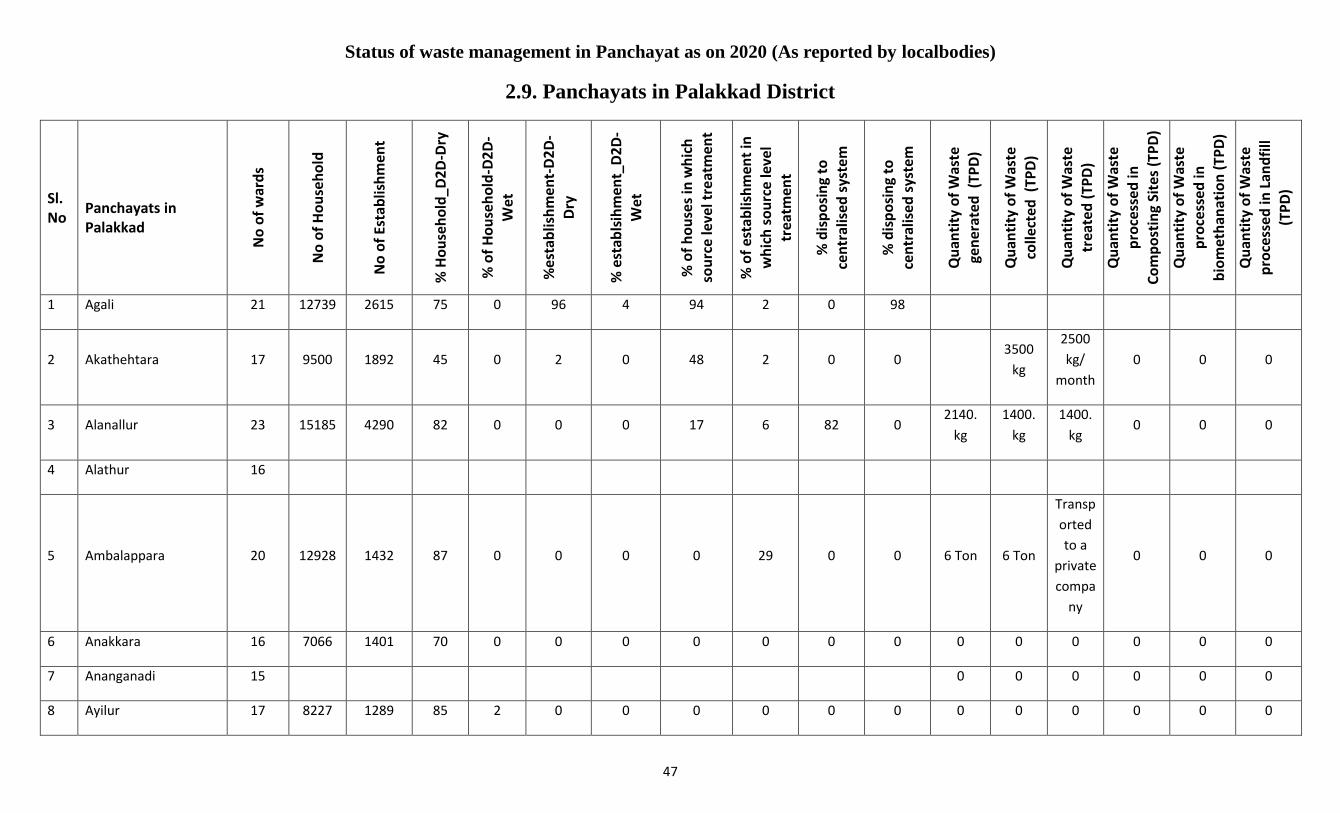
Status of waste management in Panchayat as on 2020 (As reported by localbodies)
47
2.9. Panchayats in Palakkad District
Sl. No
Panchayats in Palakkad
No
of
war
ds
No
of
Ho
use
ho
ld
No
of
Esta
blis
hm
ent
% H
ou
seh
old
_D2
D-D
ry
% o
f H
ou
seh
old
-D2
D-
Wet
%e
stab
lish
men
t-D
2D
-D
ry
% e
stab
lsih
men
t_D
2D
-W
et
% o
f h
ou
ses
in w
hic
h
sou
rce
leve
l tre
atm
ent
% o
f es
tab
lish
men
t in
w
hic
h s
ou
rce
leve
l tr
eatm
ent
% d
isp
osi
ng
to
cen
tral
ise
d s
yste
m
% d
isp
osi
ng
to
cen
tral
ise
d s
yste
m
Qu
anti
ty o
f W
aste
ge
ner
ate
d (
TPD
)
Qu
anti
ty o
f W
aste
colle
cted
(TP
D)
Qu
anti
ty o
f W
aste
tr
eate
d (
TPD
)
Qu
anti
ty o
f W
aste
p
roce
sse
d in
Co
mp
ost
ing
Site
s (T
PD
)
Qu
anti
ty o
f W
aste
pro
cess
ed
in
bio
met
han
atio
n (
TPD
)
Qu
anti
ty o
f W
aste
p
roce
sse
d in
Lan
dfi
ll (T
PD
)
1 Agali 21 12739 2615 75 0 96 4 94 2 0 98
2 Akathehtara 17 9500 1892 45 0 2 0 48 2 0 0 3500
kg
2500
kg/
month
0 0 0
3 Alanallur 23 15185 4290 82 0 0 0 17 6 82 0 2140.
kg
1400.
kg
1400.
kg 0 0 0
4 Alathur 16
5 Ambalappara 20 12928 1432 87 0 0 0 0 29 0 0 6 Ton 6 Ton
Transp
orted
to a
private
compa
ny
0 0 0
6 Anakkara 16 7066 1401 70 0 0 0 0 0 0 0 0 0 0 0 0 0
7 Ananganadi 15 0 0 0 0 0 0
8 Ayilur 17 8227 1289 85 2 0 0 0 0 0 0 0 0 0 0 0 0
Annexure.1
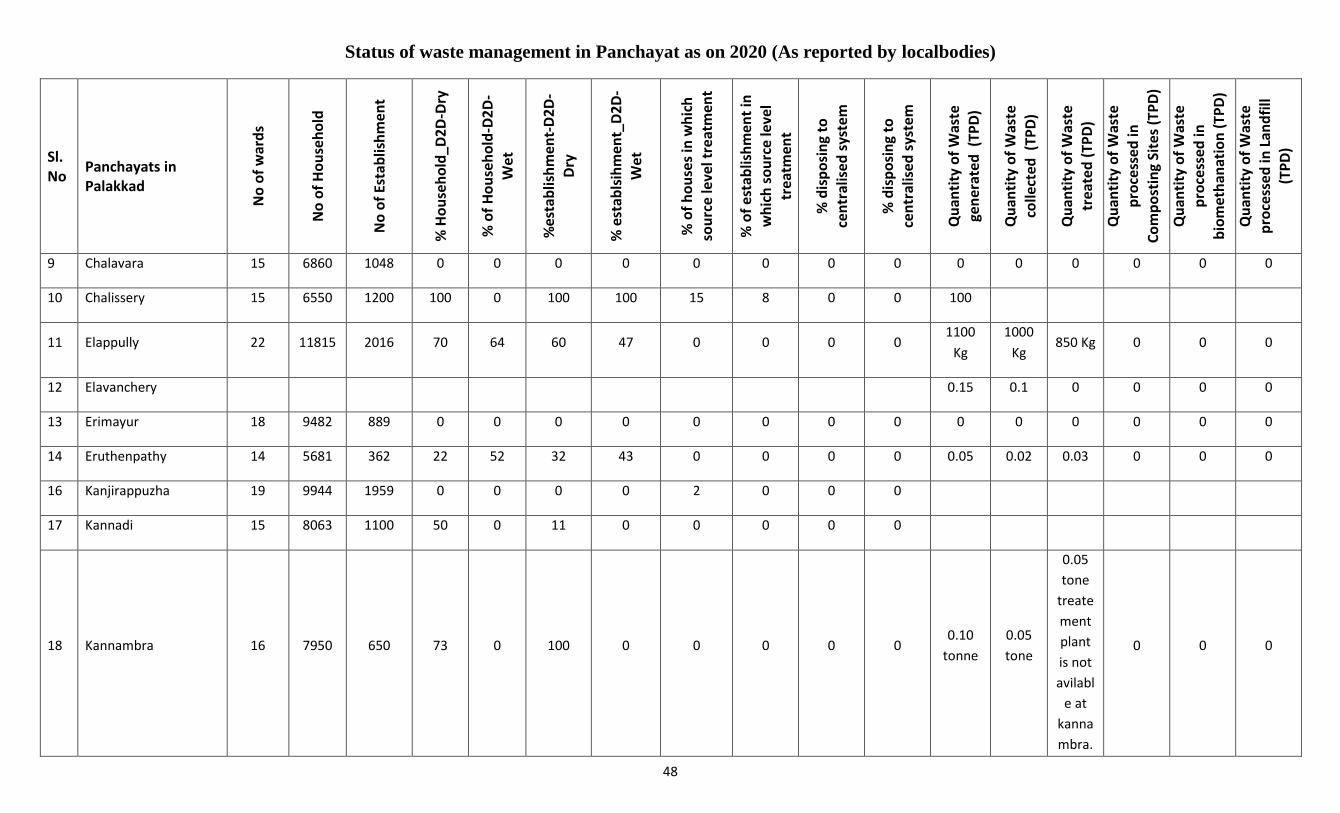
Status of waste management in Panchayat as on 2020 (As reported by localbodies)
48
Sl. No
Panchayats in Palakkad
No
of
war
ds
No
of
Ho
use
ho
ld
No
of
Esta
blis
hm
ent
% H
ou
seh
old
_D2
D-D
ry
% o
f H
ou
seh
old
-D2
D-
Wet
%e
stab
lish
men
t-D
2D
-D
ry
% e
stab
lsih
men
t_D
2D
-W
et
% o
f h
ou
ses
in w
hic
h
sou
rce
leve
l tre
atm
ent
% o
f es
tab
lish
men
t in
w
hic
h s
ou
rce
leve
l tr
eatm
ent
% d
isp
osi
ng
to
cen
tral
ise
d s
yste
m
% d
isp
osi
ng
to
cen
tral
ise
d s
yste
m
Qu
anti
ty o
f W
aste
ge
ner
ate
d (
TPD
)
Qu
anti
ty o
f W
aste
colle
cted
(TP
D)
Qu
anti
ty o
f W
aste
tr
eate
d (
TPD
)
Qu
anti
ty o
f W
aste
p
roce
sse
d in
Co
mp
ost
ing
Site
s (T
PD
)
Qu
anti
ty o
f W
aste
pro
cess
ed
in
bio
met
han
atio
n (
TPD
)
Qu
anti
ty o
f W
aste
p
roce
sse
d in
Lan
dfi
ll (T
PD
)
9 Chalavara 15 6860 1048 0 0 0 0 0 0 0 0 0 0 0 0 0 0
10 Chalissery 15 6550 1200 100 0 100 100 15 8 0 0 100
11 Elappully 22 11815 2016 70 64 60 47 0 0 0 0 1100
Kg
1000
Kg 850 Kg 0 0 0
12 Elavanchery 0.15 0.1 0 0 0 0
13 Erimayur 18 9482 889 0 0 0 0 0 0 0 0 0 0 0 0 0 0
14 Eruthenpathy 14 5681 362 22 52 32 43 0 0 0 0 0.05 0.02 0.03 0 0 0
16 Kanjirappuzha 19 9944 1959 0 0 0 0 2 0 0 0
17 Kannadi 15 8063 1100 50 0 11 0 0 0 0 0
18 Kannambra 16 7950 650 73 0 100 0 0 0 0 0 0.10
tonne
0.05
tone
0.05
tone
treate
ment
plant
is not
avilabl
e at
kanna
mbra.
0 0 0
Annexure.1
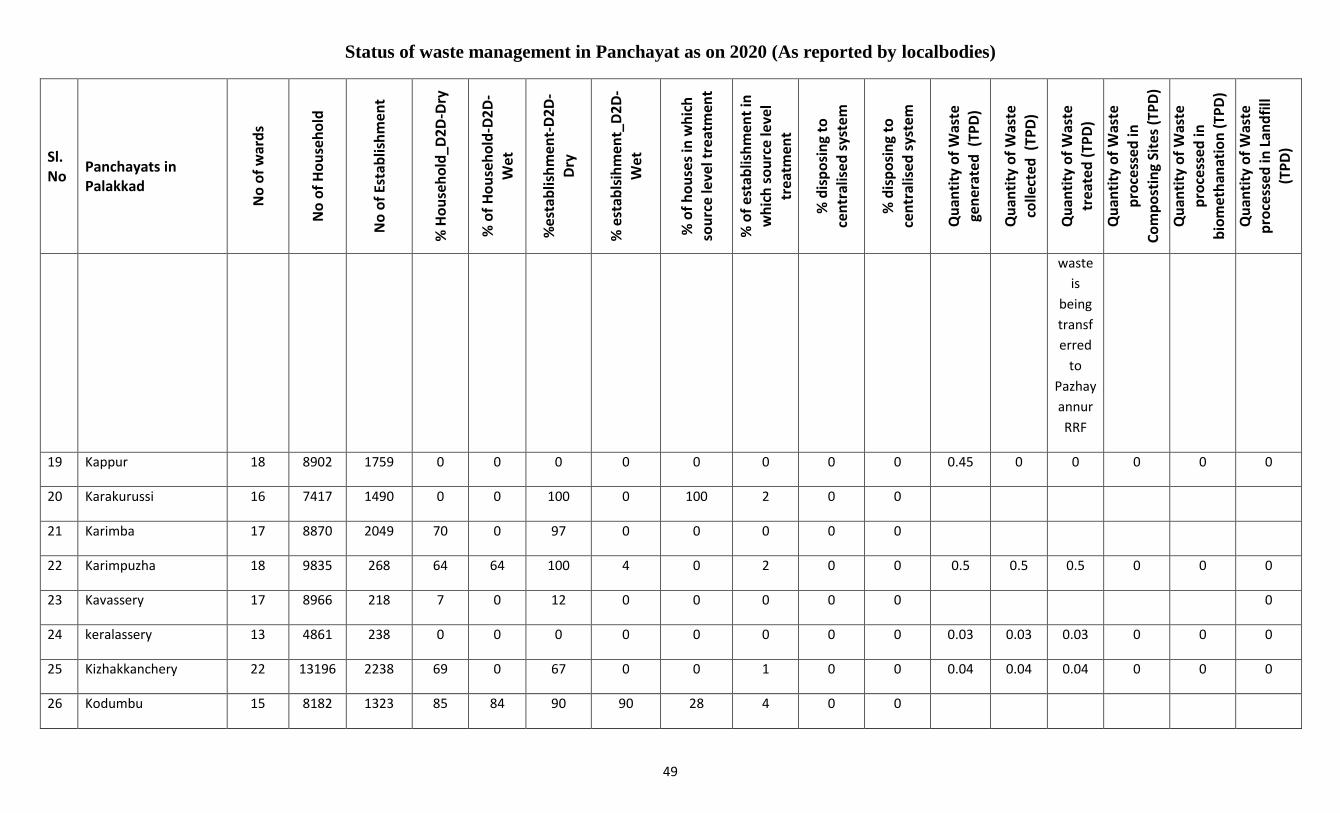
Status of waste management in Panchayat as on 2020 (As reported by localbodies)
49
Sl. No
Panchayats in Palakkad
No
of
war
ds
No
of
Ho
use
ho
ld
No
of
Esta
blis
hm
ent
% H
ou
seh
old
_D2
D-D
ry
% o
f H
ou
seh
old
-D2
D-
Wet
%e
stab
lish
men
t-D
2D
-D
ry
% e
stab
lsih
men
t_D
2D
-W
et
% o
f h
ou
ses
in w
hic
h
sou
rce
leve
l tre
atm
ent
% o
f es
tab
lish
men
t in
w
hic
h s
ou
rce
leve
l tr
eatm
ent
% d
isp
osi
ng
to
cen
tral
ise
d s
yste
m
% d
isp
osi
ng
to
cen
tral
ise
d s
yste
m
Qu
anti
ty o
f W
aste
ge
ner
ate
d (
TPD
)
Qu
anti
ty o
f W
aste
colle
cted
(TP
D)
Qu
anti
ty o
f W
aste
tr
eate
d (
TPD
)
Qu
anti
ty o
f W
aste
p
roce
sse
d in
Co
mp
ost
ing
Site
s (T
PD
)
Qu
anti
ty o
f W
aste
pro
cess
ed
in
bio
met
han
atio
n (
TPD
)
Qu
anti
ty o
f W
aste
p
roce
sse
d in
Lan
dfi
ll (T
PD
)
waste
is
being
transf
erred
to
Pazhay
annur
RRF
19 Kappur 18 8902 1759 0 0 0 0 0 0 0 0 0.45 0 0 0 0 0
20 Karakurussi 16 7417 1490 0 0 100 0 100 2 0 0
21 Karimba 17 8870 2049 70 0 97 0 0 0 0 0
22 Karimpuzha 18 9835 268 64 64 100 4 0 2 0 0 0.5 0.5 0.5 0 0 0
23 Kavassery 17 8966 218 7 0 12 0 0 0 0 0 0
24 keralassery 13 4861 238 0 0 0 0 0 0 0 0 0.03 0.03 0.03 0 0 0
25 Kizhakkanchery 22 13196 2238 69 0 67 0 0 1 0 0 0.04 0.04 0.04 0 0 0
26 Kodumbu 15 8182 1323 85 84 90 90 28 4 0 0
Annexure.1
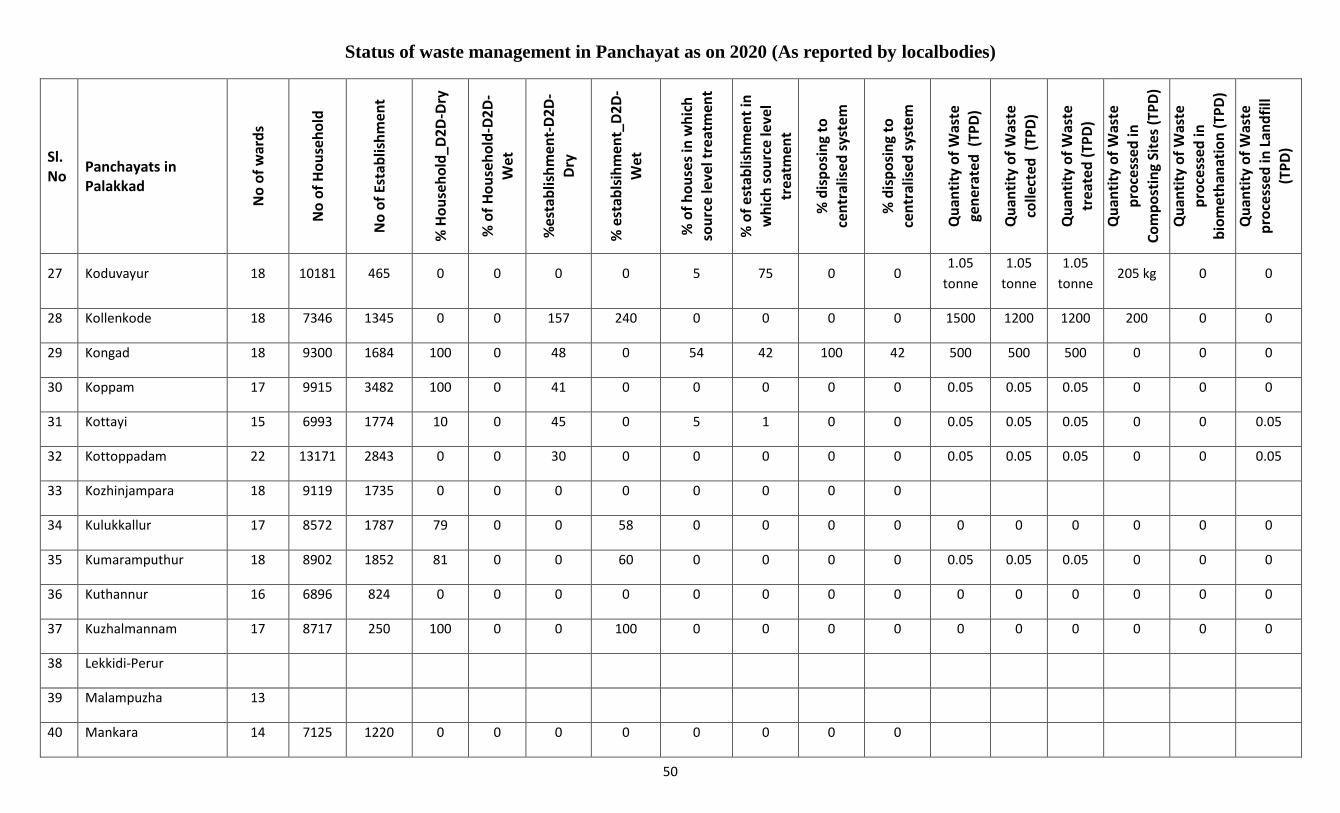
Status of waste management in Panchayat as on 2020 (As reported by localbodies)
50
Sl. No
Panchayats in Palakkad
No
of
war
ds
No
of
Ho
use
ho
ld
No
of
Esta
blis
hm
ent
% H
ou
seh
old
_D2
D-D
ry
% o
f H
ou
seh
old
-D2
D-
Wet
%e
stab
lish
men
t-D
2D
-D
ry
% e
stab
lsih
men
t_D
2D
-W
et
% o
f h
ou
ses
in w
hic
h
sou
rce
leve
l tre
atm
ent
% o
f es
tab
lish
men
t in
w
hic
h s
ou
rce
leve
l tr
eatm
ent
% d
isp
osi
ng
to
cen
tral
ise
d s
yste
m
% d
isp
osi
ng
to
cen
tral
ise
d s
yste
m
Qu
anti
ty o
f W
aste
ge
ner
ate
d (
TPD
)
Qu
anti
ty o
f W
aste
colle
cted
(TP
D)
Qu
anti
ty o
f W
aste
tr
eate
d (
TPD
)
Qu
anti
ty o
f W
aste
p
roce
sse
d in
Co
mp
ost
ing
Site
s (T
PD
)
Qu
anti
ty o
f W
aste
pro
cess
ed
in
bio
met
han
atio
n (
TPD
)
Qu
anti
ty o
f W
aste
p
roce
sse
d in
Lan
dfi
ll (T
PD
)
27 Koduvayur 18 10181 465 0 0 0 0 5 75 0 0 1.05
tonne
1.05
tonne
1.05
tonne 205 kg 0 0
28 Kollenkode 18 7346 1345 0 0 157 240 0 0 0 0 1500 1200 1200 200 0 0
29 Kongad 18 9300 1684 100 0 48 0 54 42 100 42 500 500 500 0 0 0
30 Koppam 17 9915 3482 100 0 41 0 0 0 0 0 0.05 0.05 0.05 0 0 0
31 Kottayi 15 6993 1774 10 0 45 0 5 1 0 0 0.05 0.05 0.05 0 0 0.05
32 Kottoppadam 22 13171 2843 0 0 30 0 0 0 0 0 0.05 0.05 0.05 0 0 0.05
33 Kozhinjampara 18 9119 1735 0 0 0 0 0 0 0 0
34 Kulukkallur 17 8572 1787 79 0 0 58 0 0 0 0 0 0 0 0 0 0
35 Kumaramputhur 18 8902 1852 81 0 0 60 0 0 0 0 0.05 0.05 0.05 0 0 0
36 Kuthannur 16 6896 824 0 0 0 0 0 0 0 0 0 0 0 0 0 0
37 Kuzhalmannam 17 8717 250 100 0 0 100 0 0 0 0 0 0 0 0 0 0
38 Lekkidi-Perur
39 Malampuzha 13
40 Mankara 14 7125 1220 0 0 0 0 0 0 0 0
Annexure.1

Status of waste management in Panchayat as on 2020 (As reported by localbodies)
51
Sl. No
Panchayats in Palakkad
No
of
war
ds
No
of
Ho
use
ho
ld
No
of
Esta
blis
hm
ent
% H
ou
seh
old
_D2
D-D
ry
% o
f H
ou
seh
old
-D2
D-
Wet
%e
stab
lish
men
t-D
2D
-D
ry
% e
stab
lsih
men
t_D
2D
-W
et
% o
f h
ou
ses
in w
hic
h
sou
rce
leve
l tre
atm
ent
% o
f es
tab
lish
men
t in
w
hic
h s
ou
rce
leve
l tr
eatm
ent
% d
isp
osi
ng
to
cen
tral
ise
d s
yste
m
% d
isp
osi
ng
to
cen
tral
ise
d s
yste
m
Qu
anti
ty o
f W
aste
ge
ner
ate
d (
TPD
)
Qu
anti
ty o
f W
aste
colle
cted
(TP
D)
Qu
anti
ty o
f W
aste
tr
eate
d (
TPD
)
Qu
anti
ty o
f W
aste
p
roce
sse
d in
Co
mp
ost
ing
Site
s (T
PD
)
Qu
anti
ty o
f W
aste
pro
cess
ed
in
bio
met
han
atio
n (
TPD
)
Qu
anti
ty o
f W
aste
p
roce
sse
d in
Lan
dfi
ll (T
PD
)
41 Mannur 14 5925 1300 48 0 19 0 0 0 0 0 0 0 0 0 0 0
42 Marutharoad 19 11926 2101 50 0 0 0 0 0 0 0
43 Mathur 16 7924 676 73 0 100 0 0 0 0 0 0 0 0 0 0 0
44 Melarkode 16 7043 0 0 0 0 0 0 0 0 0 0 0
45 Mundur 18 9593 1819 0 0 0 0 0 0 0 0 0 0 0 0 0 0
46 Muthalamada 20 9704 2110 0 0 0 0 0 0 0 0 0 0 0 0 0 0
47 Muthuthala 15 6945 175 100 0 100 0 18 42 0 0 539.25 323.55 323.55 200.15 100.5 25
48 Nagalassery 17 8507 590 100 0 100 0 45 25 0 0 0 0
49 Nallepilly 19 8095 448 100 0 100 0 0 0 0 0 0 0 0 0 0
50 Nellaya 19 10587 0 0 0 0 0
51 Nelliampathy 13 950 97 100 0 100 0 0 0 0 0 0 0 0 0 0 0
52 Nemmara 20 11815 2449 97 0 5 0 7 2 0 0 180 KG 172
KG 172 0 0 0
53 Ongallur 22 12811 3161 99 0 5 0 0 0 0 0 0 0 0 0 0 0
54 Pallassena 16 8433 268 93 0 17 0 6 0 0 0 0 0 0 0 0 0
Annexure.1
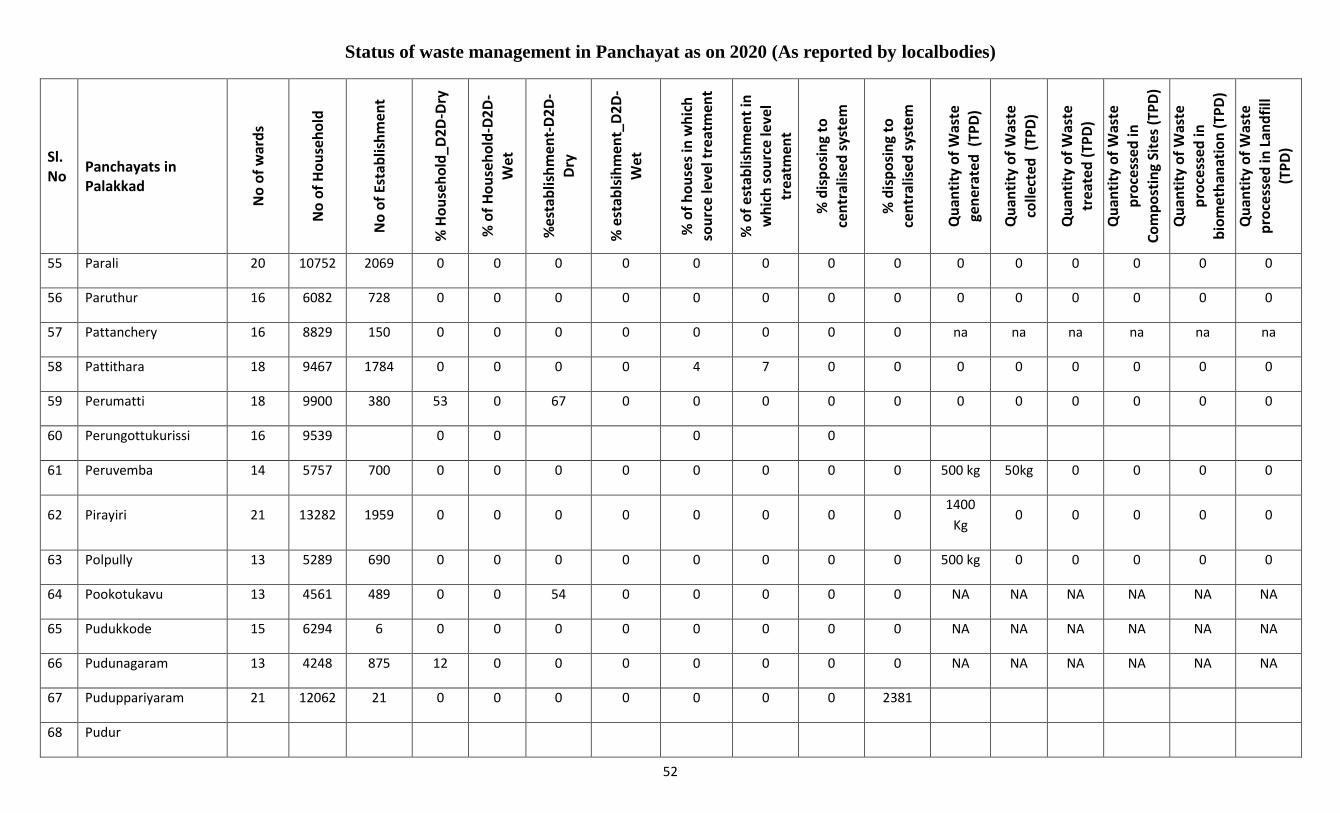
Status of waste management in Panchayat as on 2020 (As reported by localbodies)
52
Sl. No
Panchayats in Palakkad
No
of
war
ds
No
of
Ho
use
ho
ld
No
of
Esta
blis
hm
ent
% H
ou
seh
old
_D2
D-D
ry
% o
f H
ou
seh
old
-D2
D-
Wet
%e
stab
lish
men
t-D
2D
-D
ry
% e
stab
lsih
men
t_D
2D
-W
et
% o
f h
ou
ses
in w
hic
h
sou
rce
leve
l tre
atm
ent
% o
f es
tab
lish
men
t in
w
hic
h s
ou
rce
leve
l tr
eatm
ent
% d
isp
osi
ng
to
cen
tral
ise
d s
yste
m
% d
isp
osi
ng
to
cen
tral
ise
d s
yste
m
Qu
anti
ty o
f W
aste
ge
ner
ate
d (
TPD
)
Qu
anti
ty o
f W
aste
colle
cted
(TP
D)
Qu
anti
ty o
f W
aste
tr
eate
d (
TPD
)
Qu
anti
ty o
f W
aste
p
roce
sse
d in
Co
mp
ost
ing
Site
s (T
PD
)
Qu
anti
ty o
f W
aste
pro
cess
ed
in
bio
met
han
atio
n (
TPD
)
Qu
anti
ty o
f W
aste
p
roce
sse
d in
Lan
dfi
ll (T
PD
)
55 Parali 20 10752 2069 0 0 0 0 0 0 0 0 0 0 0 0 0 0
56 Paruthur 16 6082 728 0 0 0 0 0 0 0 0 0 0 0 0 0 0
57 Pattanchery 16 8829 150 0 0 0 0 0 0 0 0 na na na na na na
58 Pattithara 18 9467 1784 0 0 0 0 4 7 0 0 0 0 0 0 0 0
59 Perumatti 18 9900 380 53 0 67 0 0 0 0 0 0 0 0 0 0 0
60 Perungottukurissi 16 9539 0 0 0 0
61 Peruvemba 14 5757 700 0 0 0 0 0 0 0 0 500 kg 50kg 0 0 0 0
62 Pirayiri 21 13282 1959 0 0 0 0 0 0 0 0 1400
Kg 0 0 0 0 0
63 Polpully 13 5289 690 0 0 0 0 0 0 0 0 500 kg 0 0 0 0 0
64 Pookotukavu 13 4561 489 0 0 54 0 0 0 0 0 NA NA NA NA NA NA
65 Pudukkode 15 6294 6 0 0 0 0 0 0 0 0 NA NA NA NA NA NA
66 Pudunagaram 13 4248 875 12 0 0 0 0 0 0 0 NA NA NA NA NA NA
67 Puduppariyaram 21 12062 21 0 0 0 0 0 0 0 2381
68 Pudur
Annexure.1
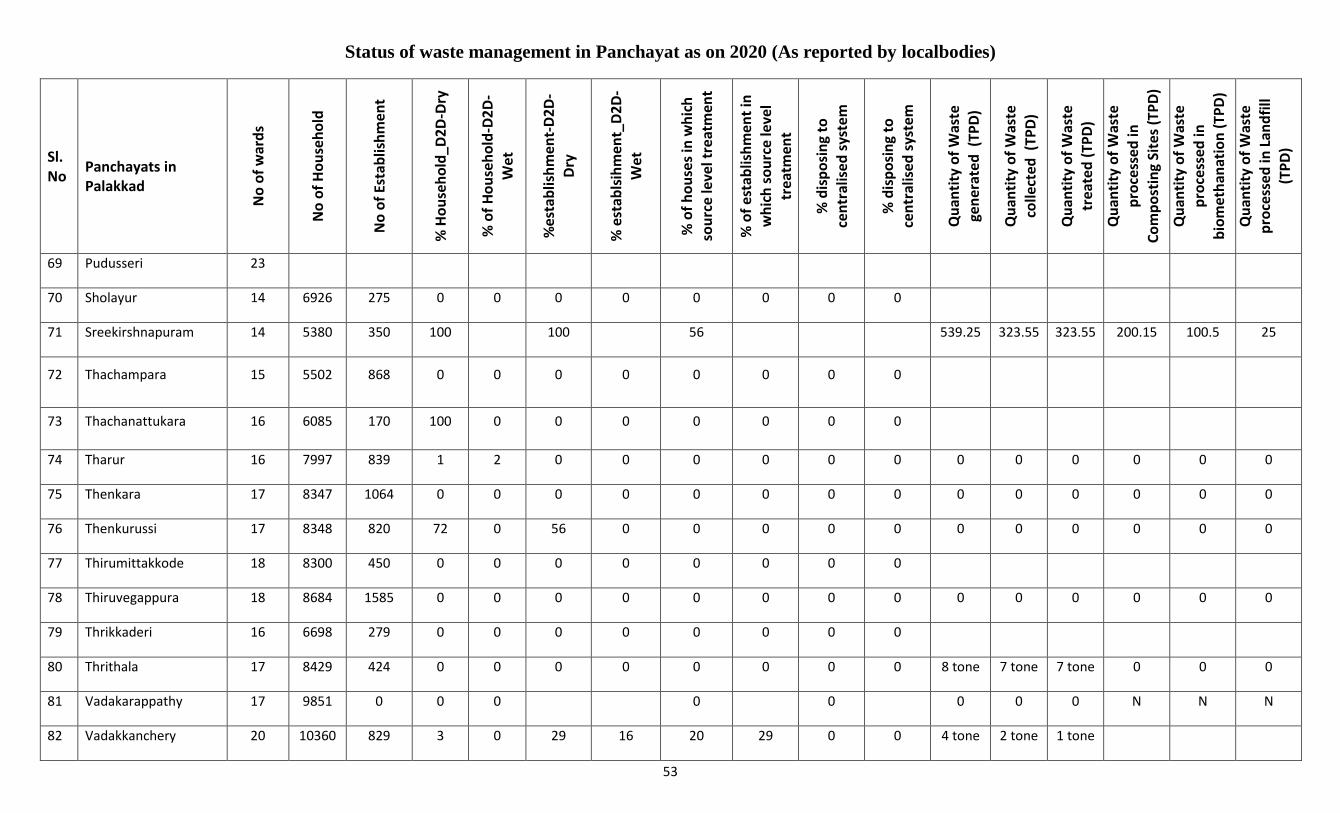
Status of waste management in Panchayat as on 2020 (As reported by localbodies)
53
Sl. No
Panchayats in Palakkad
No
of
war
ds
No
of
Ho
use
ho
ld
No
of
Esta
blis
hm
ent
% H
ou
seh
old
_D2
D-D
ry
% o
f H
ou
seh
old
-D2
D-
Wet
%e
stab
lish
men
t-D
2D
-D
ry
% e
stab
lsih
men
t_D
2D
-W
et
% o
f h
ou
ses
in w
hic
h
sou
rce
leve
l tre
atm
ent
% o
f es
tab
lish
men
t in
w
hic
h s
ou
rce
leve
l tr
eatm
ent
% d
isp
osi
ng
to
cen
tral
ise
d s
yste
m
% d
isp
osi
ng
to
cen
tral
ise
d s
yste
m
Qu
anti
ty o
f W
aste
ge
ner
ate
d (
TPD
)
Qu
anti
ty o
f W
aste
colle
cted
(TP
D)
Qu
anti
ty o
f W
aste
tr
eate
d (
TPD
)
Qu
anti
ty o
f W
aste
p
roce
sse
d in
Co
mp
ost
ing
Site
s (T
PD
)
Qu
anti
ty o
f W
aste
pro
cess
ed
in
bio
met
han
atio
n (
TPD
)
Qu
anti
ty o
f W
aste
p
roce
sse
d in
Lan
dfi
ll (T
PD
)
69 Pudusseri 23
70 Sholayur 14 6926 275 0 0 0 0 0 0 0 0
71 Sreekirshnapuram 14 5380 350 100 100 56 539.25 323.55 323.55 200.15 100.5 25
72 Thachampara 15 5502 868 0 0 0 0 0 0 0 0
73 Thachanattukara 16 6085 170 100 0 0 0 0 0 0 0
74 Tharur 16 7997 839 1 2 0 0 0 0 0 0 0 0 0 0 0 0
75 Thenkara 17 8347 1064 0 0 0 0 0 0 0 0 0 0 0 0 0 0
76 Thenkurussi 17 8348 820 72 0 56 0 0 0 0 0 0 0 0 0 0 0
77 Thirumittakkode 18 8300 450 0 0 0 0 0 0 0 0
78 Thiruvegappura 18 8684 1585 0 0 0 0 0 0 0 0 0 0 0 0 0 0
79 Thrikkaderi 16 6698 279 0 0 0 0 0 0 0 0
80 Thrithala 17 8429 424 0 0 0 0 0 0 0 0 8 tone 7 tone 7 tone 0 0 0
81 Vadakarappathy 17 9851 0 0 0 0 0 0 0 0 N N N
82 Vadakkanchery 20 10360 829 3 0 29 16 20 29 0 0 4 tone 2 tone 1 tone
Annexure.1
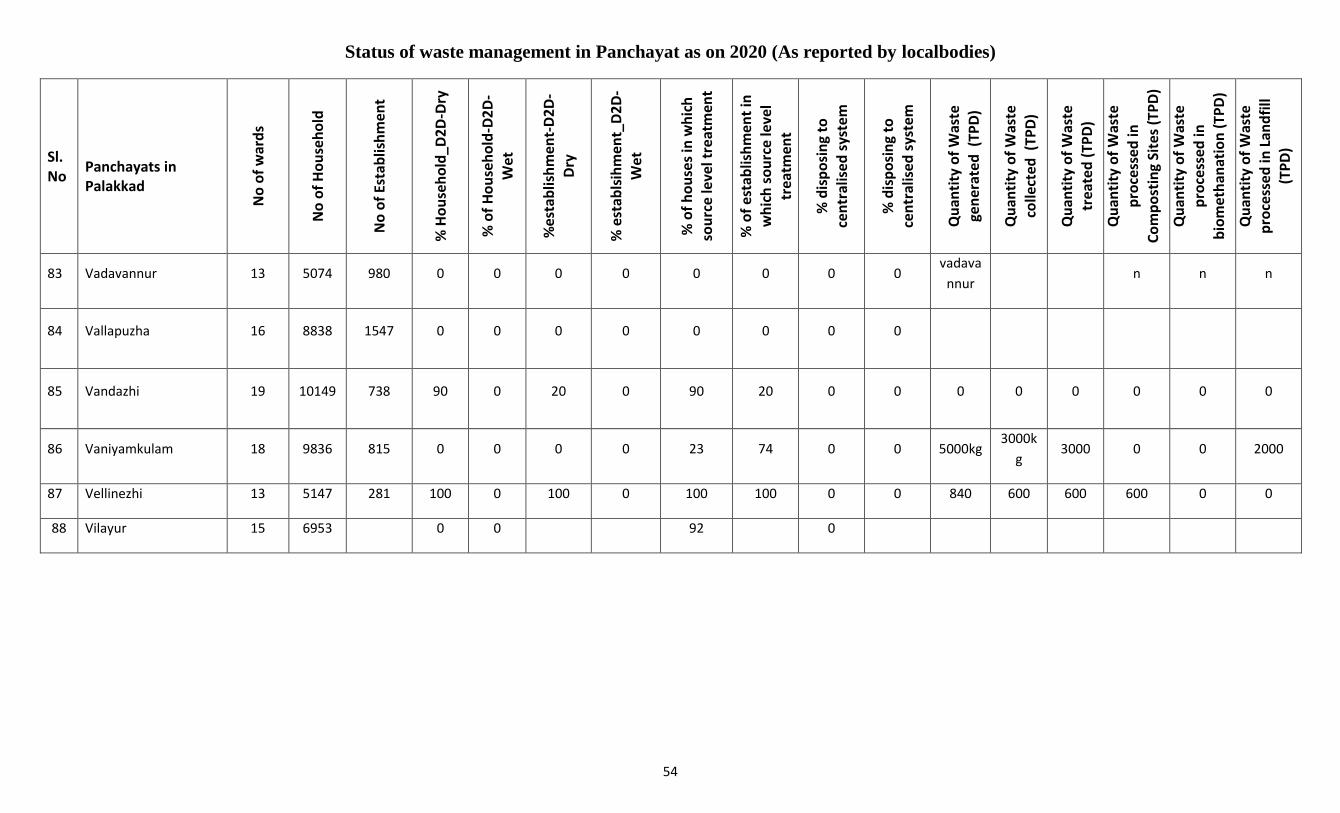
Status of waste management in Panchayat as on 2020 (As reported by localbodies)
54
Sl. No
Panchayats in Palakkad
No
of
war
ds
No
of
Ho
use
ho
ld
No
of
Esta
blis
hm
ent
% H
ou
seh
old
_D2
D-D
ry
% o
f H
ou
seh
old
-D2
D-
Wet
%e
stab
lish
men
t-D
2D
-D
ry
% e
stab
lsih
men
t_D
2D
-W
et
% o
f h
ou
ses
in w
hic
h
sou
rce
leve
l tre
atm
ent
% o
f es
tab
lish
men
t in
w
hic
h s
ou
rce
leve
l tr
eatm
ent
% d
isp
osi
ng
to
cen
tral
ise
d s
yste
m
% d
isp
osi
ng
to
cen
tral
ise
d s
yste
m
Qu
anti
ty o
f W
aste
ge
ner
ate
d (
TPD
)
Qu
anti
ty o
f W
aste
colle
cted
(TP
D)
Qu
anti
ty o
f W
aste
tr
eate
d (
TPD
)
Qu
anti
ty o
f W
aste
p
roce
sse
d in
Co
mp
ost
ing
Site
s (T
PD
)
Qu
anti
ty o
f W
aste
pro
cess
ed
in
bio
met
han
atio
n (
TPD
)
Qu
anti
ty o
f W
aste
p
roce
sse
d in
Lan
dfi
ll (T
PD
)
83 Vadavannur 13 5074 980 0 0 0 0 0 0 0 0 vadava
nnur n n n
84 Vallapuzha 16 8838 1547 0 0 0 0 0 0 0 0
85 Vandazhi 19 10149 738 90 0 20 0 90 20 0 0 0 0 0 0 0 0
86 Vaniyamkulam 18 9836 815 0 0 0 0 23 74 0 0 5000kg 3000k
g 3000 0 0 2000
87 Vellinezhi 13 5147 281 100 0 100 0 100 100 0 0 840 600 600 600 0 0
88 Vilayur 15 6953 0 0 92 0
Annexure.1
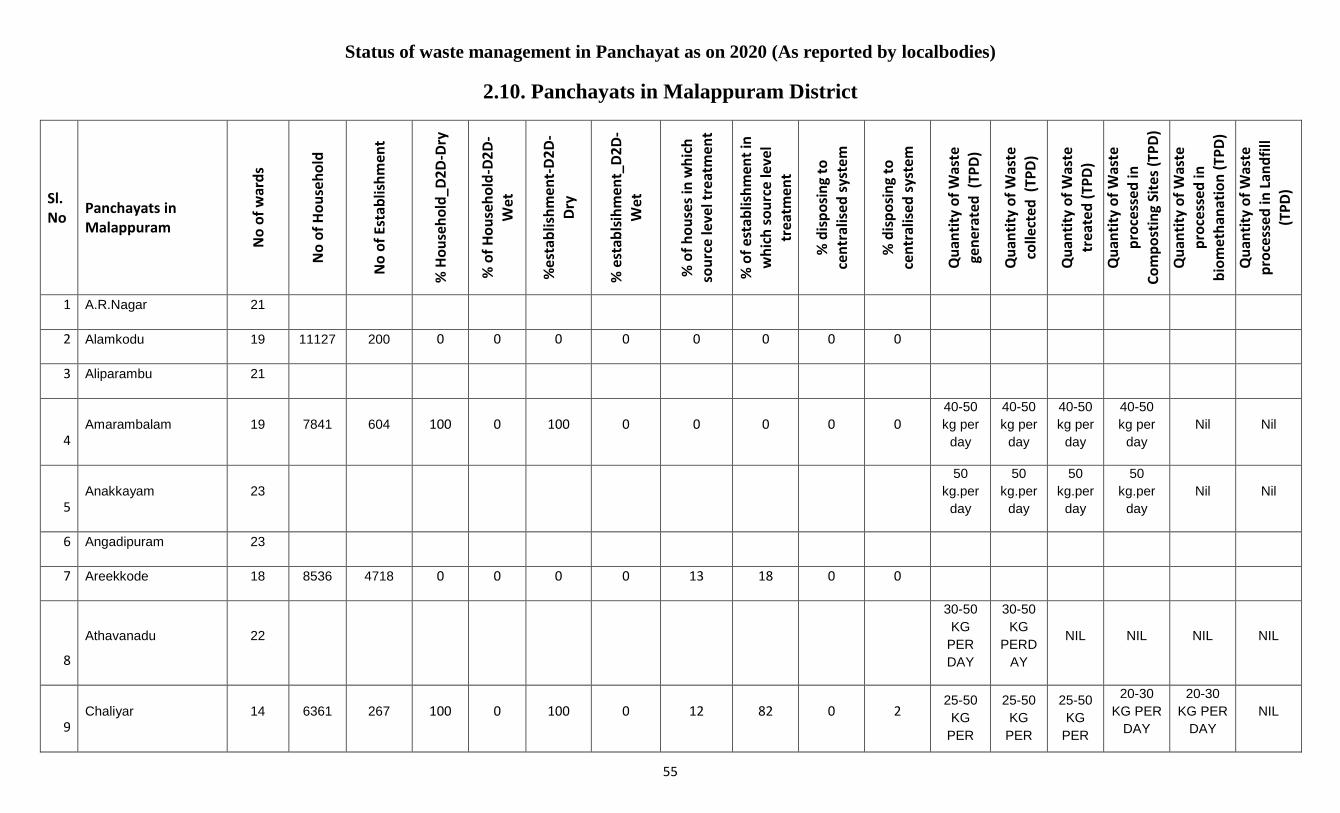
Status of waste management in Panchayat as on 2020 (As reported by localbodies)
55
2.10. Panchayats in Malappuram District
Sl. No
Panchayats in Malappuram
No
of
war
ds
No
of
Ho
use
ho
ld
No
of
Esta
blis
hm
ent
% H
ou
seh
old
_D2
D-D
ry
% o
f H
ou
seh
old
-D2
D-
Wet
%e
stab
lish
men
t-D
2D
-D
ry
% e
stab
lsih
men
t_D
2D
-W
et
% o
f h
ou
ses
in w
hic
h
sou
rce
leve
l tre
atm
ent
% o
f es
tab
lish
men
t in
w
hic
h s
ou
rce
leve
l tr
eatm
ent
% d
isp
osi
ng
to
cen
tral
ise
d s
yste
m
% d
isp
osi
ng
to
cen
tral
ise
d s
yste
m
Qu
anti
ty o
f W
aste
ge
ner
ated
(TP
D)
Qu
anti
ty o
f W
aste
colle
cted
(TP
D)
Qu
anti
ty o
f W
aste
tr
eate
d (
TPD
)
Qu
anti
ty o
f W
aste
p
roce
sse
d in
Co
mp
ost
ing
Site
s (T
PD
)
Qu
anti
ty o
f W
aste
pro
cess
ed
in
bio
met
han
atio
n (
TPD
)
Qu
anti
ty o
f W
aste
p
roce
sse
d in
Lan
dfi
ll (T
PD
)
1 A.R.Nagar 21
2 Alamkodu 19 11127 200 0 0 0 0 0 0 0 0
3 Aliparambu 21
4 Amarambalam 19 7841 604 100 0 100 0 0 0 0 0
40-50
kg per
day
40-50
kg per
day
40-50
kg per
day
40-50
kg per
day
Nil Nil
5 Anakkayam 23
50
kg.per
day
50
kg.per
day
50
kg.per
day
50
kg.per
day
Nil Nil
6 Angadipuram 23
7 Areekkode 18 8536 4718 0 0 0 0 13 18 0 0
8
Athavanadu 22
30-50
KG
PER
DAY
30-50
KG
PERD
AY
NIL NIL NIL NIL
9 Chaliyar 14 6361 267 100 0 100 0 12 82 0 2
25-50
KG
PER
25-50
KG
PER
25-50
KG
PER
20-30
KG PER
DAY
20-30
KG PER
DAY
NIL
Annexure.1
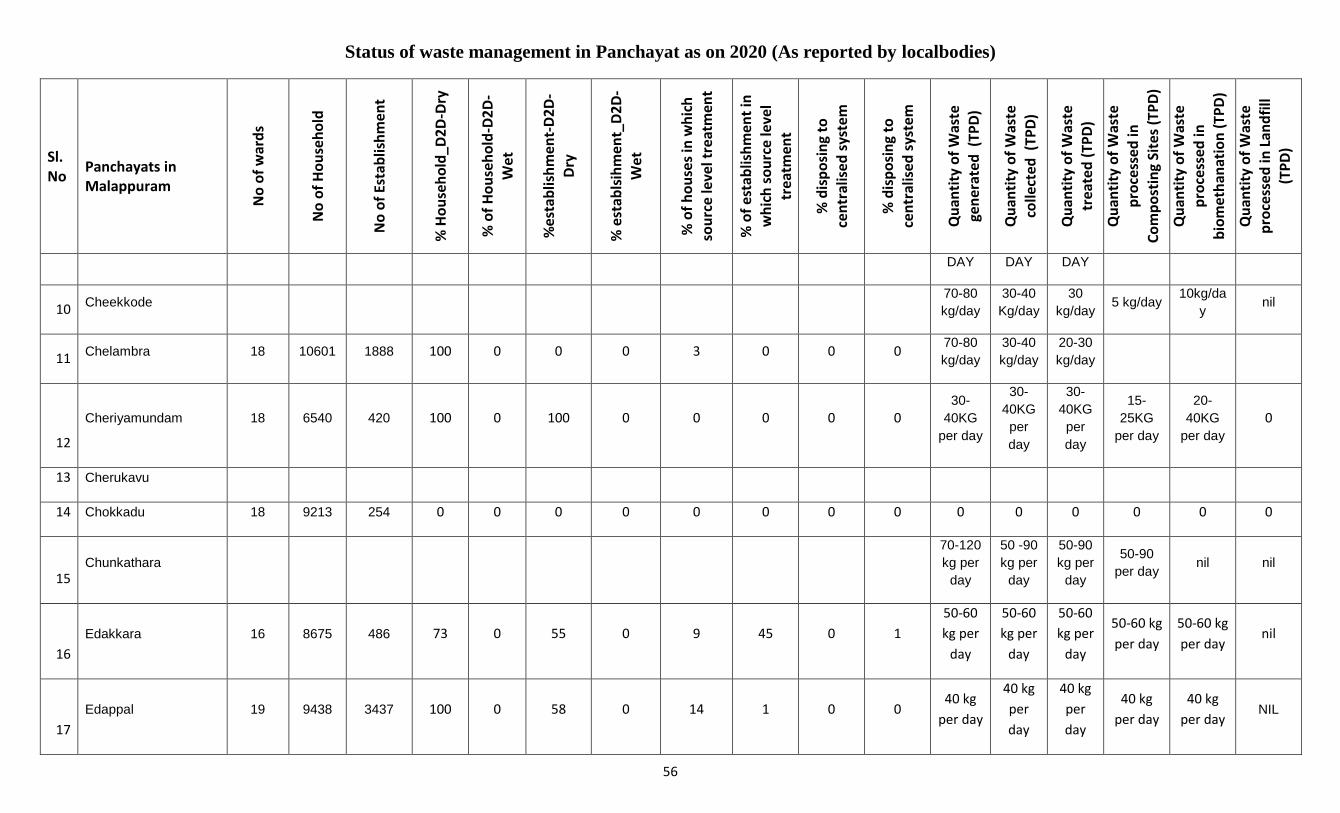
Status of waste management in Panchayat as on 2020 (As reported by localbodies)
56
Sl. No
Panchayats in Malappuram
No
of
war
ds
No
of
Ho
use
ho
ld
No
of
Esta
blis
hm
ent
% H
ou
seh
old
_D2
D-D
ry
% o
f H
ou
seh
old
-D2
D-
Wet
%e
stab
lish
men
t-D
2D
-D
ry
% e
stab
lsih
men
t_D
2D
-W
et
% o
f h
ou
ses
in w
hic
h
sou
rce
leve
l tre
atm
ent
% o
f es
tab
lish
men
t in
w
hic
h s
ou
rce
leve
l tr
eatm
ent
% d
isp
osi
ng
to
cen
tral
ise
d s
yste
m
% d
isp
osi
ng
to
cen
tral
ise
d s
yste
m
Qu
anti
ty o
f W
aste
ge
ner
ated
(TP
D)
Qu
anti
ty o
f W
aste
colle
cted
(TP
D)
Qu
anti
ty o
f W
aste
tr
eate
d (
TPD
)
Qu
anti
ty o
f W
aste
p
roce
sse
d in
Co
mp
ost
ing
Site
s (T
PD
)
Qu
anti
ty o
f W
aste
pro
cess
ed
in
bio
met
han
atio
n (
TPD
)
Qu
anti
ty o
f W
aste
p
roce
sse
d in
Lan
dfi
ll (T
PD
)
DAY DAY DAY
10 Cheekkode 70-80
kg/day
30-40
Kg/day
30
kg/day 5 kg/day
10kg/da
y nil
11 Chelambra 18 10601 1888 100 0 0 0 3 0 0 0 70-80
kg/day
30-40
kg/day
20-30
kg/day
12
Cheriyamundam 18 6540 420 100 0 100 0 0 0 0 0 30-
40KG
per day
30-
40KG
per
day
30-
40KG
per
day
15-
25KG
per day
20-
40KG
per day
0
13 Cherukavu
14 Chokkadu 18 9213 254 0 0 0 0 0 0 0 0 0 0 0 0 0 0
15 Chunkathara
70-120
kg per
day
50 -90
kg per
day
50-90
kg per
day
50-90
per day nil nil
16
Edakkara 16 8675 486 73 0 55 0 9 45 0 1
50-60
kg per
day
50-60
kg per
day
50-60
kg per
day
50-60 kg
per day
50-60 kg
per day nil
17
Edappal 19 9438 3437 100 0 58 0 14 1 0 0 40 kg
per day
40 kg
per
day
40 kg
per
day
40 kg
per day
40 kg
per day NIL
Annexure.1
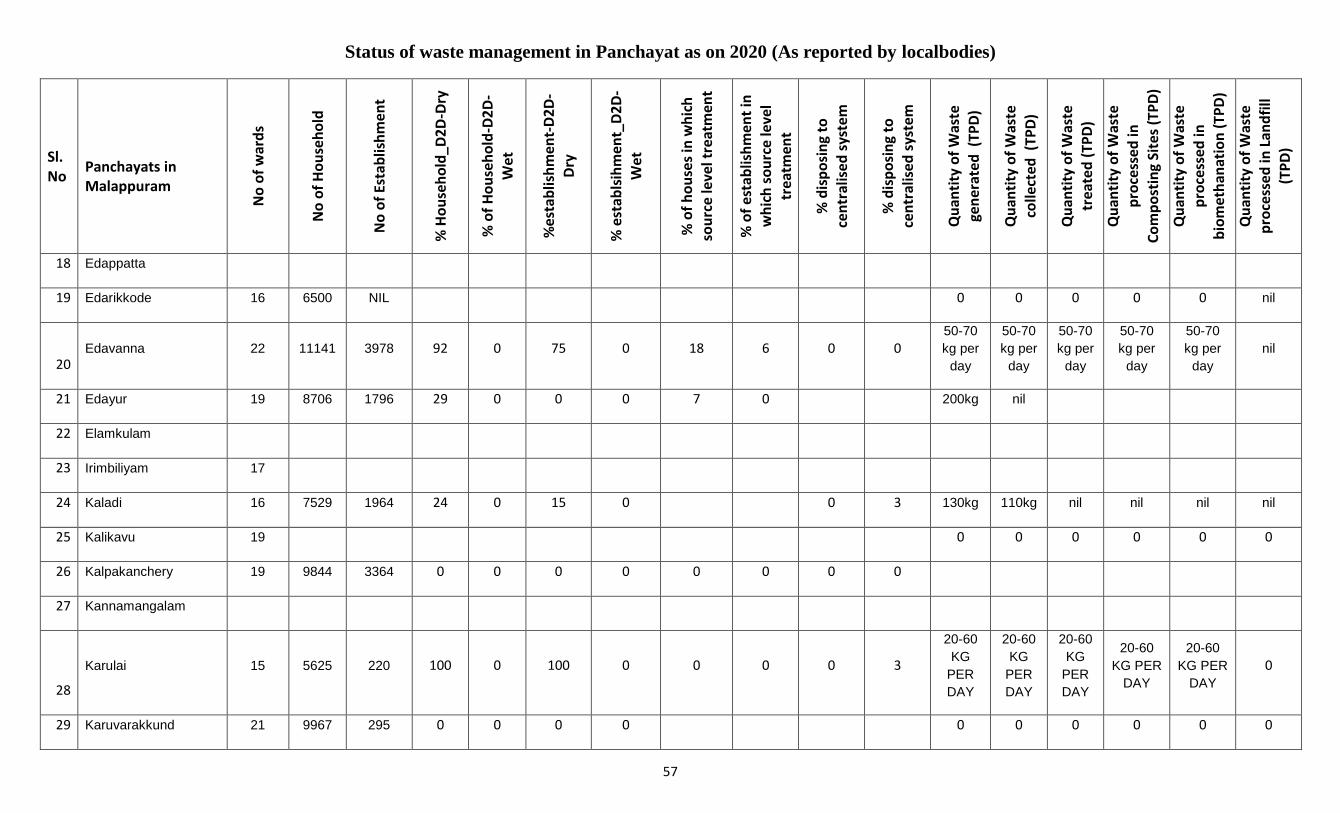
Status of waste management in Panchayat as on 2020 (As reported by localbodies)
57
Sl. No
Panchayats in Malappuram
No
of
war
ds
No
of
Ho
use
ho
ld
No
of
Esta
blis
hm
ent
% H
ou
seh
old
_D2
D-D
ry
% o
f H
ou
seh
old
-D2
D-
Wet
%e
stab
lish
men
t-D
2D
-D
ry
% e
stab
lsih
men
t_D
2D
-W
et
% o
f h
ou
ses
in w
hic
h
sou
rce
leve
l tre
atm
ent
% o
f es
tab
lish
men
t in
w
hic
h s
ou
rce
leve
l tr
eatm
ent
% d
isp
osi
ng
to
cen
tral
ise
d s
yste
m
% d
isp
osi
ng
to
cen
tral
ise
d s
yste
m
Qu
anti
ty o
f W
aste
ge
ner
ated
(TP
D)
Qu
anti
ty o
f W
aste
colle
cted
(TP
D)
Qu
anti
ty o
f W
aste
tr
eate
d (
TPD
)
Qu
anti
ty o
f W
aste
p
roce
sse
d in
Co
mp
ost
ing
Site
s (T
PD
)
Qu
anti
ty o
f W
aste
pro
cess
ed
in
bio
met
han
atio
n (
TPD
)
Qu
anti
ty o
f W
aste
p
roce
sse
d in
Lan
dfi
ll (T
PD
)
18 Edappatta
19 Edarikkode 16 6500 NIL 0 0 0 0 0 nil
20 Edavanna 22 11141 3978 92 0 75 0 18 6 0 0
50-70
kg per
day
50-70
kg per
day
50-70
kg per
day
50-70
kg per
day
50-70
kg per
day
nil
21 Edayur 19 8706 1796 29 0 0 0 7 0 200kg nil
22 Elamkulam
23 Irimbiliyam 17
24 Kaladi 16 7529 1964 24 0 15 0 0 3 130kg 110kg nil nil nil nil
25 Kalikavu 19 0 0 0 0 0 0
26 Kalpakanchery 19 9844 3364 0 0 0 0 0 0 0 0
27 Kannamangalam
28
Karulai 15 5625 220 100 0 100 0 0 0 0 3
20-60
KG
PER
DAY
20-60
KG
PER
DAY
20-60
KG
PER
DAY
20-60
KG PER
DAY
20-60
KG PER
DAY
0
29 Karuvarakkund 21 9967 295 0 0 0 0 0 0 0 0 0 0
Annexure.1
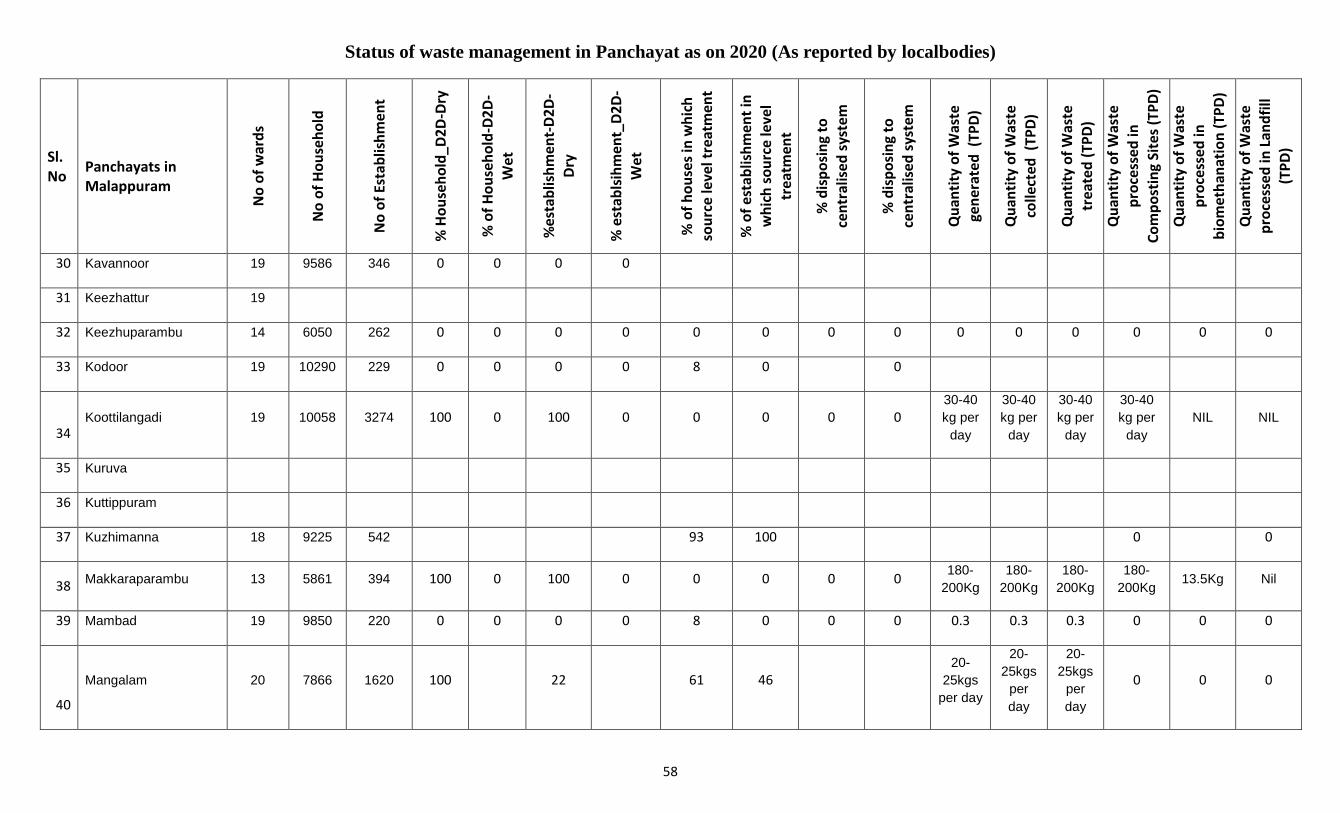
Status of waste management in Panchayat as on 2020 (As reported by localbodies)
58
Sl. No
Panchayats in Malappuram
No
of
war
ds
No
of
Ho
use
ho
ld
No
of
Esta
blis
hm
ent
% H
ou
seh
old
_D2
D-D
ry
% o
f H
ou
seh
old
-D2
D-
Wet
%e
stab
lish
men
t-D
2D
-D
ry
% e
stab
lsih
men
t_D
2D
-W
et
% o
f h
ou
ses
in w
hic
h
sou
rce
leve
l tre
atm
ent
% o
f es
tab
lish
men
t in
w
hic
h s
ou
rce
leve
l tr
eatm
ent
% d
isp
osi
ng
to
cen
tral
ise
d s
yste
m
% d
isp
osi
ng
to
cen
tral
ise
d s
yste
m
Qu
anti
ty o
f W
aste
ge
ner
ated
(TP
D)
Qu
anti
ty o
f W
aste
colle
cted
(TP
D)
Qu
anti
ty o
f W
aste
tr
eate
d (
TPD
)
Qu
anti
ty o
f W
aste
p
roce
sse
d in
Co
mp
ost
ing
Site
s (T
PD
)
Qu
anti
ty o
f W
aste
pro
cess
ed
in
bio
met
han
atio
n (
TPD
)
Qu
anti
ty o
f W
aste
p
roce
sse
d in
Lan
dfi
ll (T
PD
)
30 Kavannoor 19 9586 346 0 0 0 0
31 Keezhattur 19
32 Keezhuparambu 14 6050 262 0 0 0 0 0 0 0 0 0 0 0 0 0 0
33 Kodoor 19 10290 229 0 0 0 0 8 0 0
34 Koottilangadi 19 10058 3274 100 0 100 0 0 0 0 0
30-40
kg per
day
30-40
kg per
day
30-40
kg per
day
30-40
kg per
day
NIL NIL
35 Kuruva
36 Kuttippuram
37 Kuzhimanna 18 9225 542 93 100 0 0
38 Makkaraparambu 13 5861 394 100 0 100 0 0 0 0 0 180-
200Kg
180-
200Kg
180-
200Kg
180-
200Kg 13.5Kg Nil
39 Mambad 19 9850 220 0 0 0 0 8 0 0 0 0.3 0.3 0.3 0 0 0
40
Mangalam 20 7866 1620 100 22 61 46 20-
25kgs
per day
20-
25kgs
per
day
20-
25kgs
per
day
0 0 0
Annexure.1
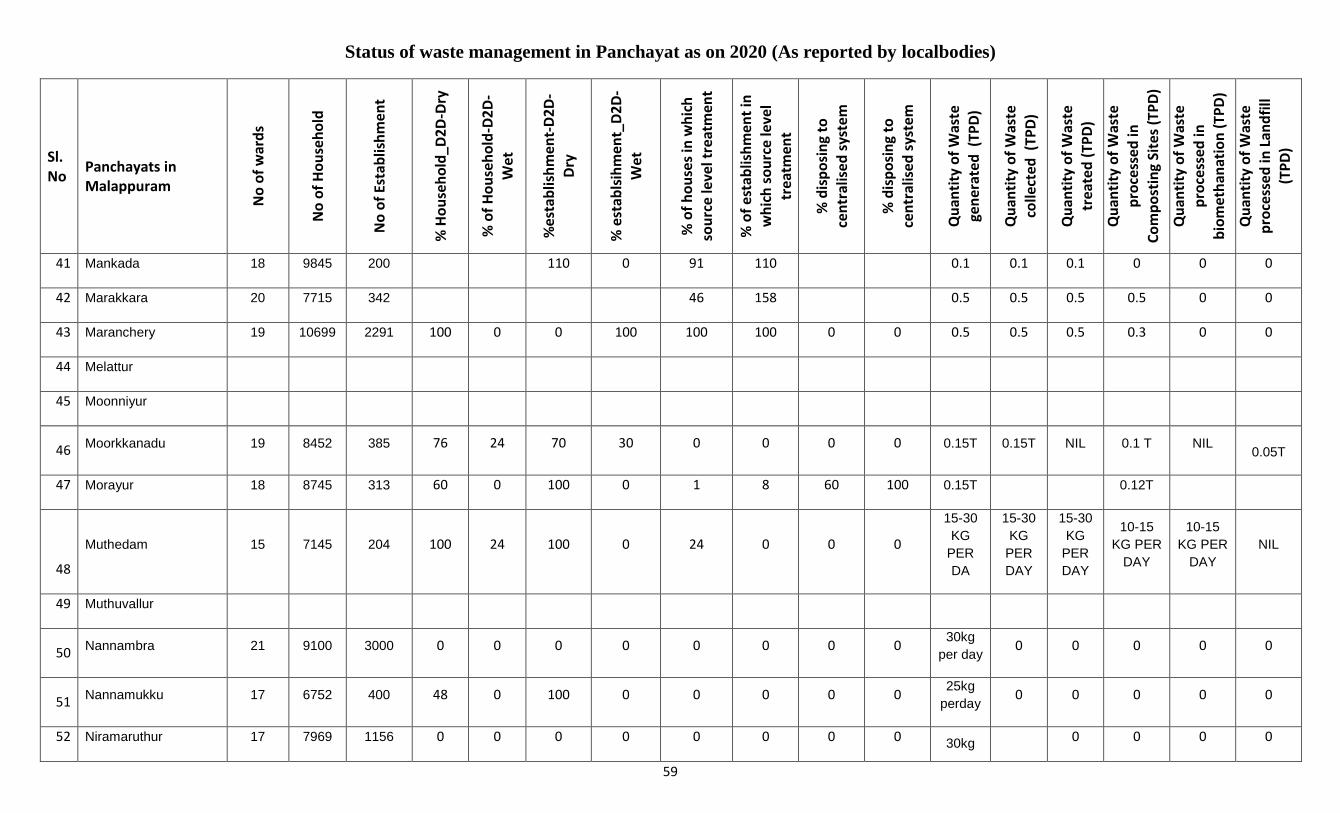
Status of waste management in Panchayat as on 2020 (As reported by localbodies)
59
Sl. No
Panchayats in Malappuram
No
of
war
ds
No
of
Ho
use
ho
ld
No
of
Esta
blis
hm
ent
% H
ou
seh
old
_D2
D-D
ry
% o
f H
ou
seh
old
-D2
D-
Wet
%e
stab
lish
men
t-D
2D
-D
ry
% e
stab
lsih
men
t_D
2D
-W
et
% o
f h
ou
ses
in w
hic
h
sou
rce
leve
l tre
atm
ent
% o
f es
tab
lish
men
t in
w
hic
h s
ou
rce
leve
l tr
eatm
ent
% d
isp
osi
ng
to
cen
tral
ise
d s
yste
m
% d
isp
osi
ng
to
cen
tral
ise
d s
yste
m
Qu
anti
ty o
f W
aste
ge
ner
ated
(TP
D)
Qu
anti
ty o
f W
aste
colle
cted
(TP
D)
Qu
anti
ty o
f W
aste
tr
eate
d (
TPD
)
Qu
anti
ty o
f W
aste
p
roce
sse
d in
Co
mp
ost
ing
Site
s (T
PD
)
Qu
anti
ty o
f W
aste
pro
cess
ed
in
bio
met
han
atio
n (
TPD
)
Qu
anti
ty o
f W
aste
p
roce
sse
d in
Lan
dfi
ll (T
PD
)
41 Mankada 18 9845 200 110 0 91 110 0.1 0.1 0.1 0 0 0
42 Marakkara 20 7715 342 46 158 0.5 0.5 0.5 0.5 0 0
43 Maranchery 19 10699 2291 100 0 0 100 100 100 0 0 0.5 0.5 0.5 0.3 0 0
44 Melattur
45 Moonniyur
46 Moorkkanadu 19 8452 385 76 24 70 30 0 0 0 0 0.15T 0.15T NIL 0.1 T NIL
0.05T
47 Morayur 18 8745 313 60 0 100 0 1 8 60 100 0.15T 0.12T
48
Muthedam 15 7145 204 100 24 100 0 24 0 0 0
15-30
KG
PER
DA
15-30
KG
PER
DAY
15-30
KG
PER
DAY
10-15
KG PER
DAY
10-15
KG PER
DAY
NIL
49 Muthuvallur
50 Nannambra 21 9100 3000 0 0 0 0 0 0 0 0
30kg
per day 0 0 0 0 0
51 Nannamukku 17 6752 400 48 0 100 0 0 0 0 0 25kg
perday 0 0 0 0 0
52 Niramaruthur 17 7969 1156 0 0 0 0 0 0 0 0 30kg
0 0 0 0
Annexure.1

Status of waste management in Panchayat as on 2020 (As reported by localbodies)
60
Sl. No
Panchayats in Malappuram
No
of
war
ds
No
of
Ho
use
ho
ld
No
of
Esta
blis
hm
ent
% H
ou
seh
old
_D2
D-D
ry
% o
f H
ou
seh
old
-D2
D-
Wet
%e
stab
lish
men
t-D
2D
-D
ry
% e
stab
lsih
men
t_D
2D
-W
et
% o
f h
ou
ses
in w
hic
h
sou
rce
leve
l tre
atm
ent
% o
f es
tab
lish
men
t in
w
hic
h s
ou
rce
leve
l tr
eatm
ent
% d
isp
osi
ng
to
cen
tral
ise
d s
yste
m
% d
isp
osi
ng
to
cen
tral
ise
d s
yste
m
Qu
anti
ty o
f W
aste
ge
ner
ated
(TP
D)
Qu
anti
ty o
f W
aste
colle
cted
(TP
D)
Qu
anti
ty o
f W
aste
tr
eate
d (
TPD
)
Qu
anti
ty o
f W
aste
p
roce
sse
d in
Co
mp
ost
ing
Site
s (T
PD
)
Qu
anti
ty o
f W
aste
pro
cess
ed
in
bio
met
han
atio
n (
TPD
)
Qu
anti
ty o
f W
aste
p
roce
sse
d in
Lan
dfi
ll (T
PD
)
per day
53 Orakam 17 7995 256 11 0 14 0 0 0 0 0
75 kg
per
day
0 0 0 0
54 Othukkungal 20
55 Ozhur 18 7996 252 0 0 0 0 0 0 0 0
20-
25Kg/d
ay
0 0 0 0 0
56 Pallikkal
57 Pandikkad 23 482 0 0 0 0
58 Parappur 19 9574 1919 0 5 0 0 0 0 0 0 0 0 0 0 0 0
59 Perumanna Klari
60 Perumpadappu 18 8127 1647 4 2 33 8 2 8 0 0 0 0 0 0 0 0
61 Peruvallur 19 9124 4 0 0 0
62 Ponmala 18 7237 1302 0 0 0 0 0 0 0 0 0 0 0 0 0 0
63 Ponmundam
Annexure.1

Status of waste management in Panchayat as on 2020 (As reported by localbodies)
61
Sl. No
Panchayats in Malappuram
No
of
war
ds
No
of
Ho
use
ho
ld
No
of
Esta
blis
hm
ent
% H
ou
seh
old
_D2
D-D
ry
% o
f H
ou
seh
old
-D2
D-
Wet
%e
stab
lish
men
t-D
2D
-D
ry
% e
stab
lsih
men
t_D
2D
-W
et
% o
f h
ou
ses
in w
hic
h
sou
rce
leve
l tre
atm
ent
% o
f es
tab
lish
men
t in
w
hic
h s
ou
rce
leve
l tr
eatm
ent
% d
isp
osi
ng
to
cen
tral
ise
d s
yste
m
% d
isp
osi
ng
to
cen
tral
ise
d s
yste
m
Qu
anti
ty o
f W
aste
ge
ner
ated
(TP
D)
Qu
anti
ty o
f W
aste
colle
cted
(TP
D)
Qu
anti
ty o
f W
aste
tr
eate
d (
TPD
)
Qu
anti
ty o
f W
aste
p
roce
sse
d in
Co
mp
ost
ing
Site
s (T
PD
)
Qu
anti
ty o
f W
aste
pro
cess
ed
in
bio
met
han
atio
n (
TPD
)
Qu
anti
ty o
f W
aste
p
roce
sse
d in
Lan
dfi
ll (T
PD
)
64 Porur 17 9076 672 0 0 0 0 0 0 0 0 0 0 0 0 0 0
65 Pothukallu 17 10427 726 0 0 0 0 0 0 0 0 0 0 0 0 0 0
66 Pukkottur 19 8785 689 0 0 0 0 0 0 0 0 0 0 0 0 0 0
67 Pulamanthol
68 Pulikkal 21 10949 5 0 0 0
15-30
kg/day
15-
30kg/d
ay
15-
30kg/d
ay
0 0 0
69 Pulpatta
70 Purathur 19 6959 1689 100 100 40 0 25 0 0 0
10-15
Kg /day
10-15
Kg
/day
10-15
Kg
/day
0 0 0
71 Puzhakkatteeri 17 9386 340 100 0 100 0 0 29 100 100 4 0 3.5 0 0 Nil
72 Thalakkadu
20kg/d
ay
15kg/d
ay 0 0 0 0
73 Thanalur
74 Thavannur 19 10047 800 100 0 100 0 64 40 0 0 0 0 0 0 0 0
Annexure.1
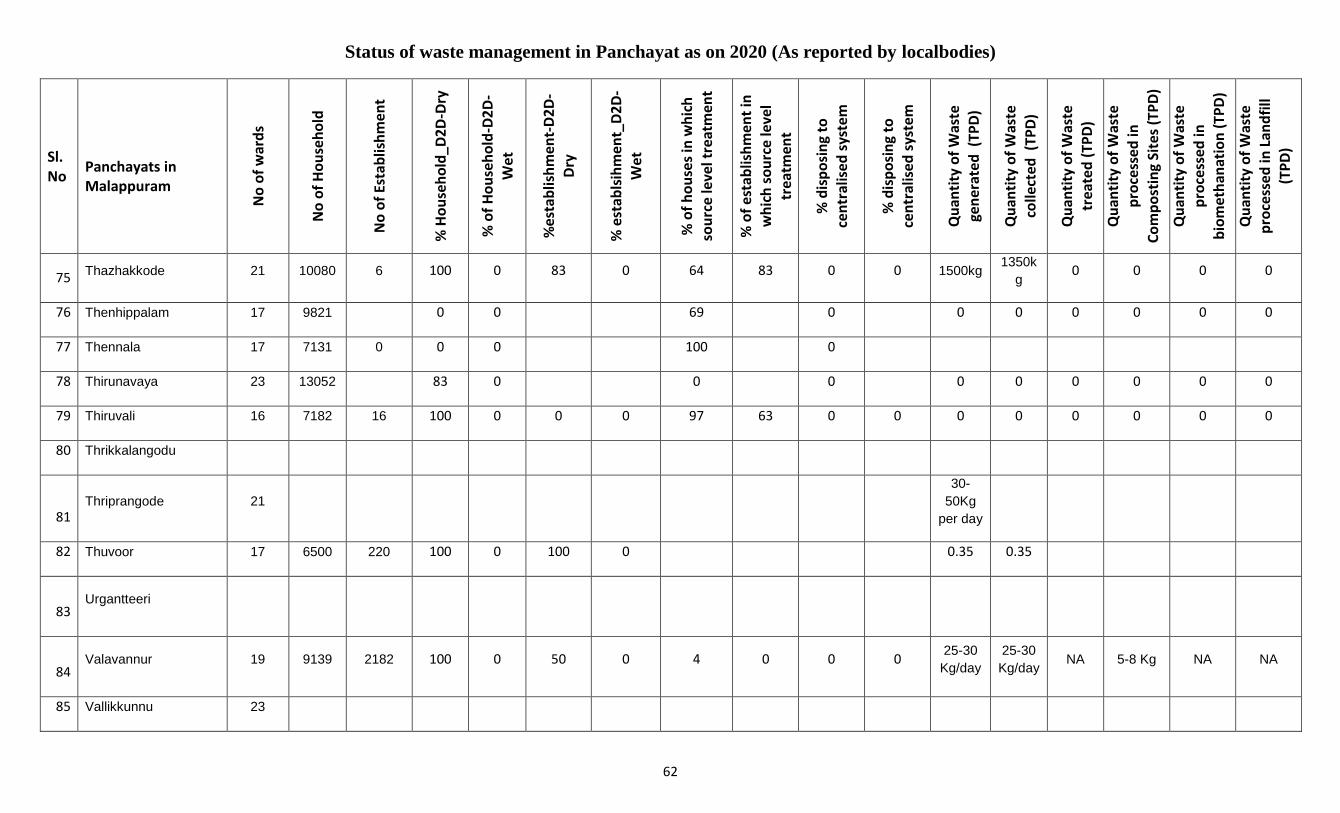
Status of waste management in Panchayat as on 2020 (As reported by localbodies)
62
Sl. No
Panchayats in Malappuram
No
of
war
ds
No
of
Ho
use
ho
ld
No
of
Esta
blis
hm
ent
% H
ou
seh
old
_D2
D-D
ry
% o
f H
ou
seh
old
-D2
D-
Wet
%e
stab
lish
men
t-D
2D
-D
ry
% e
stab
lsih
men
t_D
2D
-W
et
% o
f h
ou
ses
in w
hic
h
sou
rce
leve
l tre
atm
ent
% o
f es
tab
lish
men
t in
w
hic
h s
ou
rce
leve
l tr
eatm
ent
% d
isp
osi
ng
to
cen
tral
ise
d s
yste
m
% d
isp
osi
ng
to
cen
tral
ise
d s
yste
m
Qu
anti
ty o
f W
aste
ge
ner
ated
(TP
D)
Qu
anti
ty o
f W
aste
colle
cted
(TP
D)
Qu
anti
ty o
f W
aste
tr
eate
d (
TPD
)
Qu
anti
ty o
f W
aste
p
roce
sse
d in
Co
mp
ost
ing
Site
s (T
PD
)
Qu
anti
ty o
f W
aste
pro
cess
ed
in
bio
met
han
atio
n (
TPD
)
Qu
anti
ty o
f W
aste
p
roce
sse
d in
Lan
dfi
ll (T
PD
)
75 Thazhakkode 21 10080 6 100 0 83 0 64 83 0 0 1500kg 1350k
g 0 0 0 0
76 Thenhippalam 17 9821 0 0 69 0 0 0 0 0 0 0
77 Thennala 17 7131 0 0 0 100 0
78 Thirunavaya 23 13052 83 0 0 0 0 0 0 0 0 0
79 Thiruvali 16 7182 16 100 0 0 0 97 63 0 0 0 0 0 0 0 0
80 Thrikkalangodu
81 Thriprangode 21
30-
50Kg
per day
82 Thuvoor 17 6500 220 100 0 100 0 0.35 0.35
83 Urgantteeri
84 Valavannur 19 9139 2182 100 0 50 0 4 0 0 0
25-30
Kg/day
25-30
Kg/day NA 5-8 Kg NA NA
85 Vallikkunnu 23
Annexure.1
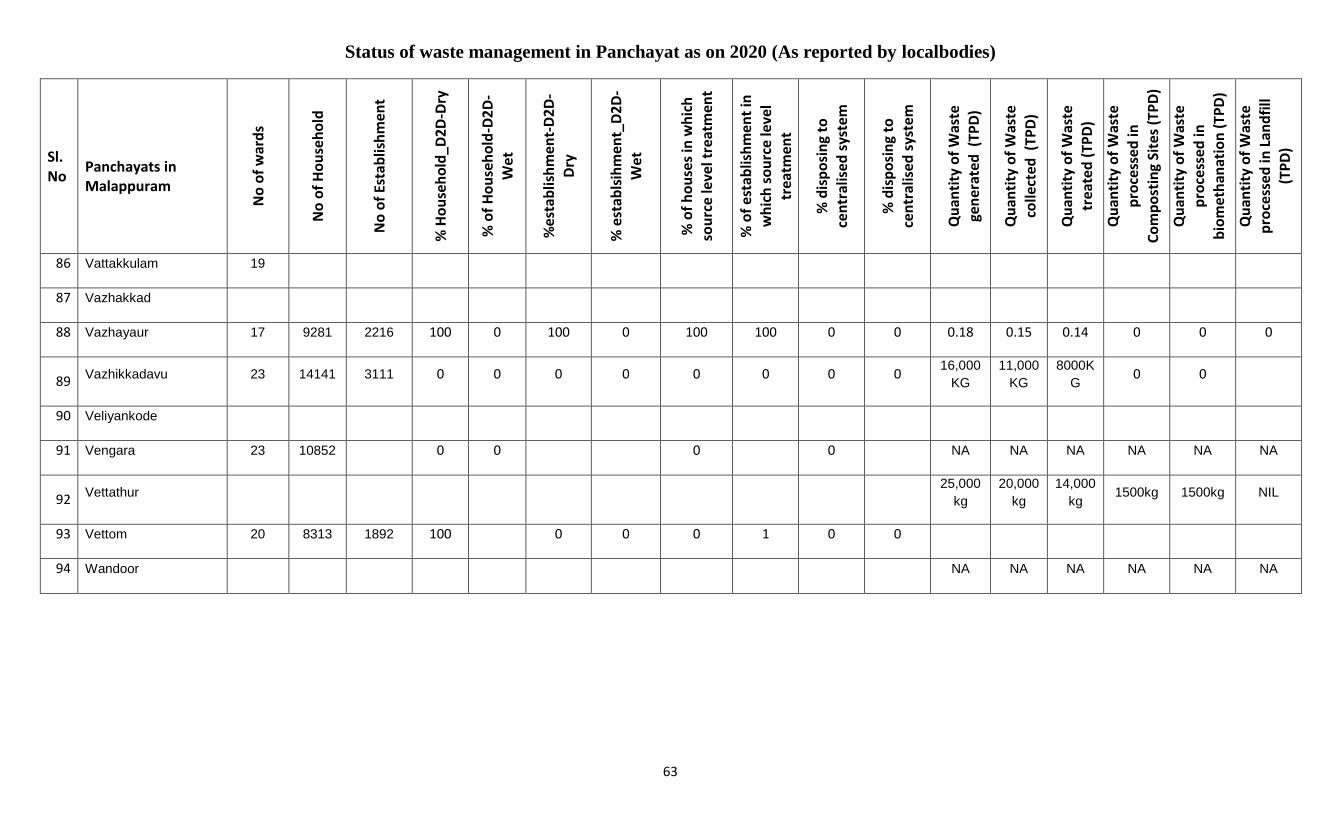
Status of waste management in Panchayat as on 2020 (As reported by localbodies)
63
Sl. No
Panchayats in Malappuram
No
of
war
ds
No
of
Ho
use
ho
ld
No
of
Esta
blis
hm
ent
% H
ou
seh
old
_D2
D-D
ry
% o
f H
ou
seh
old
-D2
D-
Wet
%e
stab
lish
men
t-D
2D
-D
ry
% e
stab
lsih
men
t_D
2D
-W
et
% o
f h
ou
ses
in w
hic
h
sou
rce
leve
l tre
atm
ent
% o
f es
tab
lish
men
t in
w
hic
h s
ou
rce
leve
l tr
eatm
ent
% d
isp
osi
ng
to
cen
tral
ise
d s
yste
m
% d
isp
osi
ng
to
cen
tral
ise
d s
yste
m
Qu
anti
ty o
f W
aste
ge
ner
ated
(TP
D)
Qu
anti
ty o
f W
aste
colle
cted
(TP
D)
Qu
anti
ty o
f W
aste
tr
eate
d (
TPD
)
Qu
anti
ty o
f W
aste
p
roce
sse
d in
Co
mp
ost
ing
Site
s (T
PD
)
Qu
anti
ty o
f W
aste
pro
cess
ed
in
bio
met
han
atio
n (
TPD
)
Qu
anti
ty o
f W
aste
p
roce
sse
d in
Lan
dfi
ll (T
PD
)
86 Vattakkulam 19
87 Vazhakkad
88 Vazhayaur 17 9281 2216 100 0 100 0 100 100 0 0 0.18 0.15 0.14 0 0 0
89 Vazhikkadavu 23 14141 3111 0 0 0 0 0 0 0 0 16,000
KG
11,000
KG
8000K
G 0 0
90 Veliyankode
91 Vengara 23 10852 0 0 0 0 NA NA NA NA NA NA
92 Vettathur
25,000
kg
20,000
kg
14,000
kg 1500kg 1500kg NIL
93 Vettom 20 8313 1892 100 0 0 0 1 0 0
94 Wandoor NA NA NA NA NA NA
Annexure.1
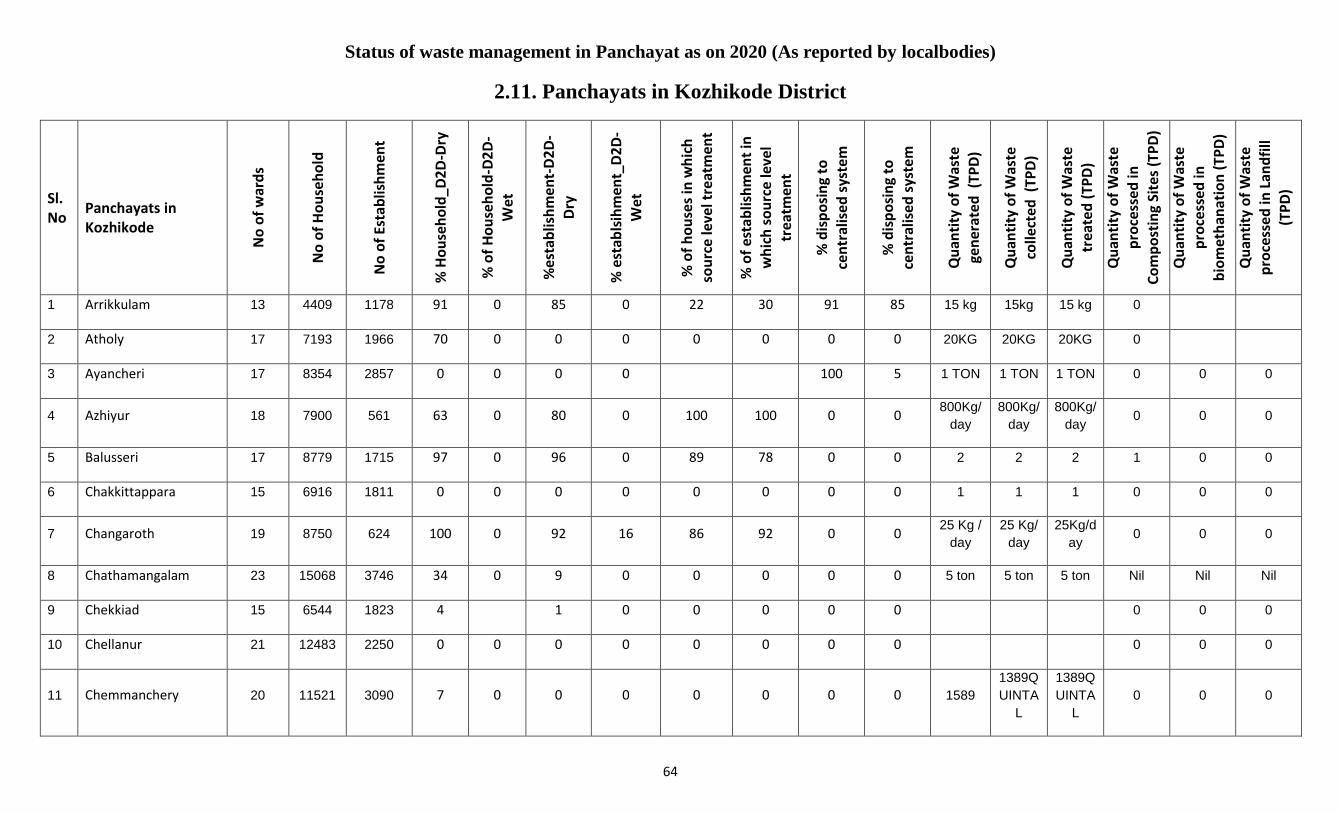
Status of waste management in Panchayat as on 2020 (As reported by localbodies)
64
2.11. Panchayats in Kozhikode District
Sl. No
Panchayats in Kozhikode
No
of
war
ds
No
of
Ho
use
ho
ld
No
of
Esta
blis
hm
ent
% H
ou
seh
old
_D2
D-D
ry
% o
f H
ou
seh
old
-D2
D-
Wet
%e
stab
lish
men
t-D
2D
-D
ry
% e
stab
lsih
men
t_D
2D
-W
et
% o
f h
ou
ses
in w
hic
h
sou
rce
leve
l tre
atm
ent
% o
f es
tab
lish
men
t in
w
hic
h s
ou
rce
leve
l tr
eatm
ent
% d
isp
osi
ng
to
cen
tral
ise
d s
yste
m
% d
isp
osi
ng
to
cen
tral
ise
d s
yste
m
Qu
anti
ty o
f W
aste
ge
ner
ate
d (
TPD
)
Qu
anti
ty o
f W
aste
colle
cted
(TP
D)
Qu
anti
ty o
f W
aste
tr
eate
d (
TPD
)
Qu
anti
ty o
f W
aste
p
roce
sse
d in
Co
mp
ost
ing
Site
s (T
PD
)
Qu
anti
ty o
f W
aste
pro
cess
ed
in
bio
met
han
atio
n (
TPD
)
Qu
anti
ty o
f W
aste
p
roce
sse
d in
Lan
dfi
ll (T
PD
)
1 Arrikkulam 13 4409 1178 91 0 85 0 22 30 91 85 15 kg 15kg 15 kg 0
2 Atholy 17 7193 1966 70 0 0 0 0 0 0 0 20KG 20KG 20KG 0
3 Ayancheri 17 8354 2857 0 0 0 0 100 5 1 TON 1 TON 1 TON 0 0 0
4 Azhiyur 18 7900 561 63 0 80 0 100 100 0 0 800Kg/
day
800Kg/
day
800Kg/
day 0 0 0
5 Balusseri 17 8779 1715 97 0 96 0 89 78 0 0 2 2 2 1 0 0
6 Chakkittappara 15 6916 1811 0 0 0 0 0 0 0 0 1 1 1 0 0 0
7 Changaroth 19 8750 624 100 0 92 16 86 92 0 0 25 Kg /
day
25 Kg/
day
25Kg/d
ay 0 0 0
8 Chathamangalam 23 15068 3746 34 0 9 0 0 0 0 0 5 ton 5 ton 5 ton Nil Nil Nil
9 Chekkiad 15 6544 1823 4 1 0 0 0 0 0 0 0 0
10 Chellanur 21 12483 2250 0 0 0 0 0 0 0 0 0 0 0
11 Chemmanchery 20 11521 3090 7 0 0 0 0 0 0 0 1589
1389Q
UINTA
L
1389Q
UINTA
L
0 0 0
Annexure.1
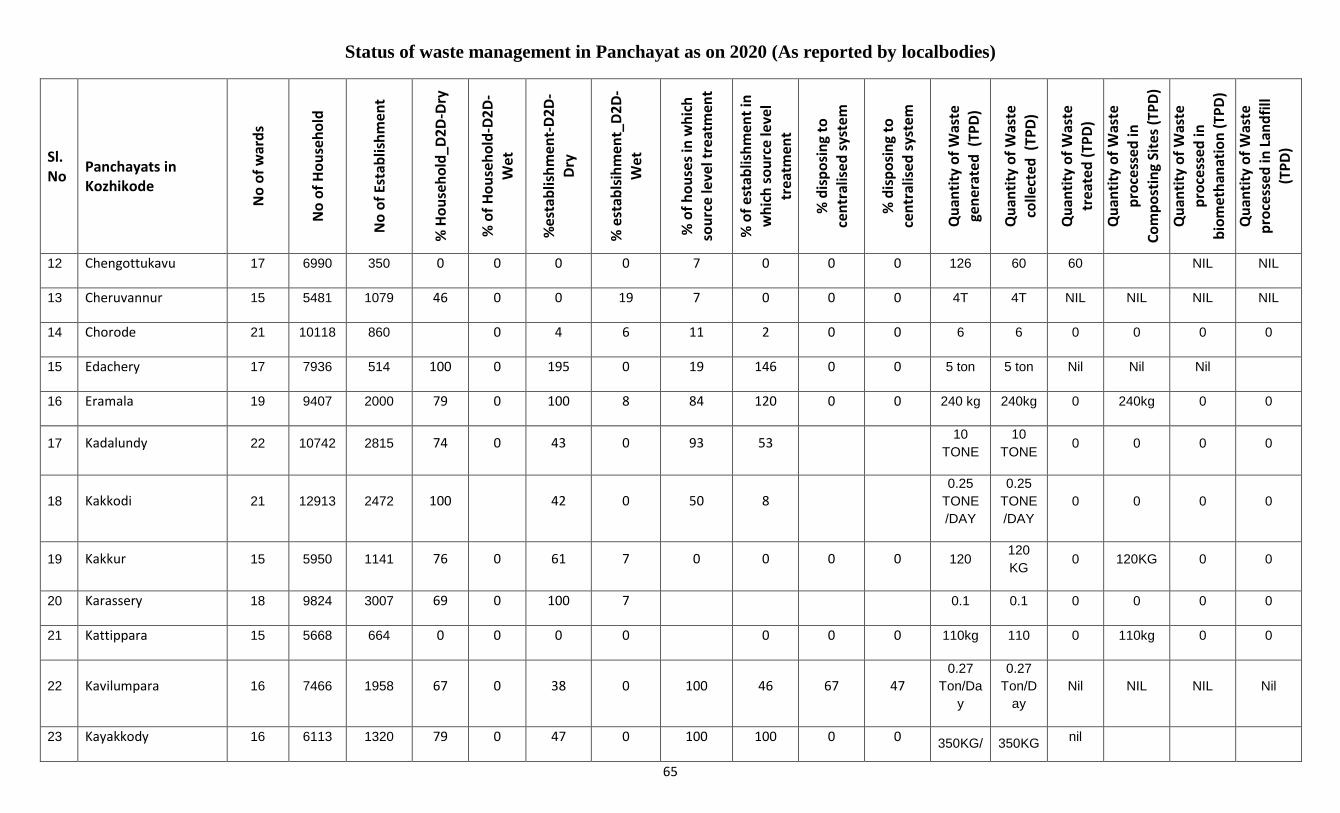
Status of waste management in Panchayat as on 2020 (As reported by localbodies)
65
Sl. No
Panchayats in Kozhikode
No
of
war
ds
No
of
Ho
use
ho
ld
No
of
Esta
blis
hm
ent
% H
ou
seh
old
_D2
D-D
ry
% o
f H
ou
seh
old
-D2
D-
Wet
%e
stab
lish
men
t-D
2D
-D
ry
% e
stab
lsih
men
t_D
2D
-W
et
% o
f h
ou
ses
in w
hic
h
sou
rce
leve
l tre
atm
ent
% o
f es
tab
lish
men
t in
w
hic
h s
ou
rce
leve
l tr
eatm
ent
% d
isp
osi
ng
to
cen
tral
ise
d s
yste
m
% d
isp
osi
ng
to
cen
tral
ise
d s
yste
m
Qu
anti
ty o
f W
aste
ge
ner
ate
d (
TPD
)
Qu
anti
ty o
f W
aste
colle
cted
(TP
D)
Qu
anti
ty o
f W
aste
tr
eate
d (
TPD
)
Qu
anti
ty o
f W
aste
p
roce
sse
d in
Co
mp
ost
ing
Site
s (T
PD
)
Qu
anti
ty o
f W
aste
pro
cess
ed
in
bio
met
han
atio
n (
TPD
)
Qu
anti
ty o
f W
aste
p
roce
sse
d in
Lan
dfi
ll (T
PD
)
12 Chengottukavu 17 6990 350 0 0 0 0 7 0 0 0 126 60 60 NIL NIL
13 Cheruvannur 15 5481 1079 46 0 0 19 7 0 0 0 4T 4T NIL NIL NIL NIL
14 Chorode 21 10118 860 0 4 6 11 2 0 0 6 6 0 0 0 0
15 Edachery 17 7936 514 100 0 195 0 19 146 0 0 5 ton 5 ton Nil Nil Nil
16 Eramala 19 9407 2000 79 0 100 8 84 120 0 0 240 kg 240kg 0 240kg 0 0
17 Kadalundy 22 10742 2815 74 0 43 0 93 53 10
TONE
10
TONE 0 0 0 0
18 Kakkodi 21 12913 2472 100 42 0 50 8 0.25
TONE
/DAY
0.25
TONE
/DAY
0 0 0 0
19 Kakkur 15 5950 1141 76 0 61 7 0 0 0 0 120 120
KG 0 120KG 0 0
20 Karassery 18 9824 3007 69 0 100 7 0.1 0.1 0 0 0 0
21 Kattippara 15 5668 664 0 0 0 0 0 0 0 110kg 110 0 110kg 0 0
22 Kavilumpara 16 7466 1958 67 0 38 0 100 46 67 47 0.27
Ton/Da
y
0.27
Ton/D
ay
Nil NIL NIL Nil
23 Kayakkody 16 6113 1320 79 0 47 0 100 100 0 0 350KG/ 350KG
nil
Annexure.1

Status of waste management in Panchayat as on 2020 (As reported by localbodies)
66
Sl. No
Panchayats in Kozhikode
No
of
war
ds
No
of
Ho
use
ho
ld
No
of
Esta
blis
hm
ent
% H
ou
seh
old
_D2
D-D
ry
% o
f H
ou
seh
old
-D2
D-
Wet
%e
stab
lish
men
t-D
2D
-D
ry
% e
stab
lsih
men
t_D
2D
-W
et
% o
f h
ou
ses
in w
hic
h
sou
rce
leve
l tre
atm
ent
% o
f es
tab
lish
men
t in
w
hic
h s
ou
rce
leve
l tr
eatm
ent
% d
isp
osi
ng
to
cen
tral
ise
d s
yste
m
% d
isp
osi
ng
to
cen
tral
ise
d s
yste
m
Qu
anti
ty o
f W
aste
ge
ner
ate
d (
TPD
)
Qu
anti
ty o
f W
aste
colle
cted
(TP
D)
Qu
anti
ty o
f W
aste
tr
eate
d (
TPD
)
Qu
anti
ty o
f W
aste
p
roce
sse
d in
Co
mp
ost
ing
Site
s (T
PD
)
Qu
anti
ty o
f W
aste
pro
cess
ed
in
bio
met
han
atio
n (
TPD
)
Qu
anti
ty o
f W
aste
p
roce
sse
d in
Lan
dfi
ll (T
PD
)
DAY /DAY
24 Kayanna 13 4430 624 78 0 100 0 100 100 0 0 85 85 nil
25 Keezhariyur 13 4558 590 0 0 0 0 0 0 150KG/
Day
150KG
/Day nil 0 0 0
26 Kizhakkoth 18 9183 3773 69 0 67 0 95 86
27 Kodenchery 21 10848 865 58 0 0 0 67 87 0 0 160 KG 160
KG Nil Nil Nil Nil
28 Kodiyathoor 16 8351 2310 37 0 0 0 100 61 0 0 210kg 200kg 130kg 0 0 0
29 Koodaranhi 14 6900 518 55 1 52 0 1 0 0 0 300
kg/day
210
kg/day 0 0 30 0
30 Koorachund 13 5601 1369 40 0 0 0 0 0 350 300 0 0 0 0
31 Koothali 13 5737 412 18 0 0 0 0 0 200 150 0 0 0 0
32 Kottur 19 7830 1050 70 51 48 33 100 100 0 0
33 Kunnamangalam 23 17474 5820 0 0 11 6 100 100 0 0 450
kg/day
425
kg/day
410
kg/day 0 0 0
34 Kunummal 13 5668 2124 100 0 100 0 100 100 0 0 160 Kg
/ Day
140 Kg
/ Day
140 Kg
/ Day 0 0 0
Annexure.1
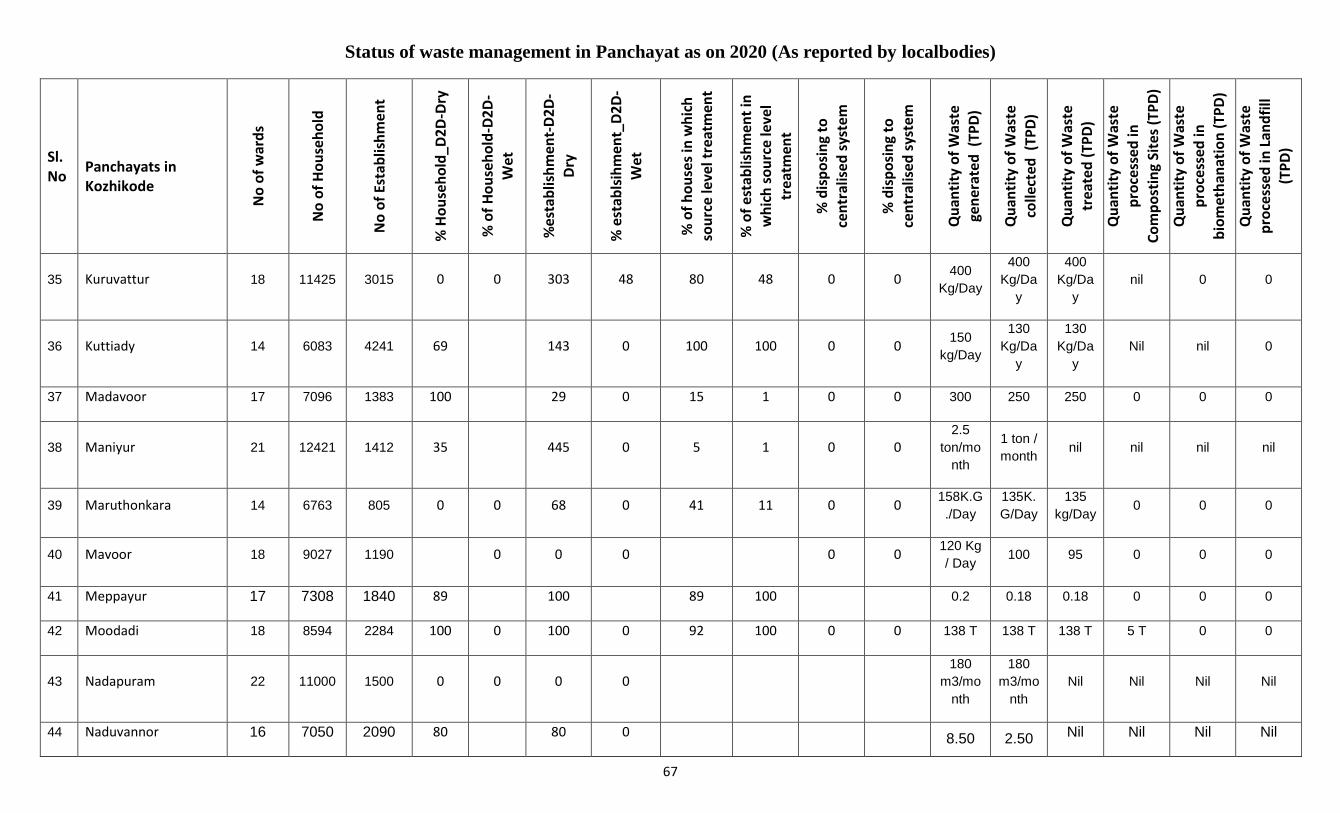
Status of waste management in Panchayat as on 2020 (As reported by localbodies)
67
Sl. No
Panchayats in Kozhikode
No
of
war
ds
No
of
Ho
use
ho
ld
No
of
Esta
blis
hm
ent
% H
ou
seh
old
_D2
D-D
ry
% o
f H
ou
seh
old
-D2
D-
Wet
%e
stab
lish
men
t-D
2D
-D
ry
% e
stab
lsih
men
t_D
2D
-W
et
% o
f h
ou
ses
in w
hic
h
sou
rce
leve
l tre
atm
ent
% o
f es
tab
lish
men
t in
w
hic
h s
ou
rce
leve
l tr
eatm
ent
% d
isp
osi
ng
to
cen
tral
ise
d s
yste
m
% d
isp
osi
ng
to
cen
tral
ise
d s
yste
m
Qu
anti
ty o
f W
aste
ge
ner
ate
d (
TPD
)
Qu
anti
ty o
f W
aste
colle
cted
(TP
D)
Qu
anti
ty o
f W
aste
tr
eate
d (
TPD
)
Qu
anti
ty o
f W
aste
p
roce
sse
d in
Co
mp
ost
ing
Site
s (T
PD
)
Qu
anti
ty o
f W
aste
pro
cess
ed
in
bio
met
han
atio
n (
TPD
)
Qu
anti
ty o
f W
aste
p
roce
sse
d in
Lan
dfi
ll (T
PD
)
35 Kuruvattur 18 11425 3015 0 0 303 48 80 48 0 0 400
Kg/Day
400
Kg/Da
y
400
Kg/Da
y
nil 0 0
36 Kuttiady 14 6083 4241 69 143 0 100 100 0 0 150
kg/Day
130
Kg/Da
y
130
Kg/Da
y
Nil nil 0
37 Madavoor 17 7096 1383 100 29 0 15 1 0 0 300 250 250 0 0 0
38 Maniyur 21 12421 1412 35 445 0 5 1 0 0 2.5
ton/mo
nth
1 ton /
month nil nil nil nil
39 Maruthonkara 14 6763 805 0 0 68 0 41 11 0 0 158K.G
./Day
135K.
G/Day
135
kg/Day 0 0 0
40 Mavoor 18 9027 1190 0 0 0 0 0 120 Kg
/ Day 100 95 0 0 0
41 Meppayur 17 7308 1840 89 100 89 100 0.2 0.18 0.18 0 0 0
42 Moodadi 18 8594 2284 100 0 100 0 92 100 0 0 138 T 138 T 138 T 5 T 0 0
43 Nadapuram 22 11000 1500 0 0 0 0 180
m3/mo
nth
180
m3/mo
nth
Nil Nil Nil Nil
44 Naduvannor 16 7050 2090 80 80 0 8.50 2.50 Nil Nil Nil Nil
Annexure.1

Status of waste management in Panchayat as on 2020 (As reported by localbodies)
68
Sl. No
Panchayats in Kozhikode
No
of
war
ds
No
of
Ho
use
ho
ld
No
of
Esta
blis
hm
ent
% H
ou
seh
old
_D2
D-D
ry
% o
f H
ou
seh
old
-D2
D-
Wet
%e
stab
lish
men
t-D
2D
-D
ry
% e
stab
lsih
men
t_D
2D
-W
et
% o
f h
ou
ses
in w
hic
h
sou
rce
leve
l tre
atm
ent
% o
f es
tab
lish
men
t in
w
hic
h s
ou
rce
leve
l tr
eatm
ent
% d
isp
osi
ng
to
cen
tral
ise
d s
yste
m
% d
isp
osi
ng
to
cen
tral
ise
d s
yste
m
Qu
anti
ty o
f W
aste
ge
ner
ate
d (
TPD
)
Qu
anti
ty o
f W
aste
colle
cted
(TP
D)
Qu
anti
ty o
f W
aste
tr
eate
d (
TPD
)
Qu
anti
ty o
f W
aste
p
roce
sse
d in
Co
mp
ost
ing
Site
s (T
PD
)
Qu
anti
ty o
f W
aste
pro
cess
ed
in
bio
met
han
atio
n (
TPD
)
Qu
anti
ty o
f W
aste
p
roce
sse
d in
Lan
dfi
ll (T
PD
)
ton ton
45 Nanminda 17 8780 1192 100 100 100 100 10.5
ton 8.5 ton Nil Nil Nil Nil
46 Narikkuni 15 6302 2909 0 0 217 0 112 ton 112ton NIL Nil Nil Nil
47 Narippatta 17 7609 1236 0 28 0 NOT
MEAS
URED
NOT
MEAS
URED
NOT
MEAS
URED
NOT
MEASU
RED
NOT
MEASU
RED
NO
48 Nochad 17 Not
messur
ed
3412k
g
3412
kg NA na no
49 Olavanna 23 18531 6560 0 0 0 0 Not
messur
ed
Not
messu
red
Not
messu
red
Not
messure
d
Not
messure
d
nil
50 Ommassery 19 10612 3516 57 0 0 Not
messur
ed
5.3
TON
5.3
TON nil nil nil
51 Onchiyam 17 6864 2236 103 18 0
52 Panangad 20 8916 1969 65 0 75 0 0 0 0 0
53 Perambra 19 9640 1450 0 0 0 52 34 0 0 not
measur5 ton 5ton nil nil nil
Annexure.1
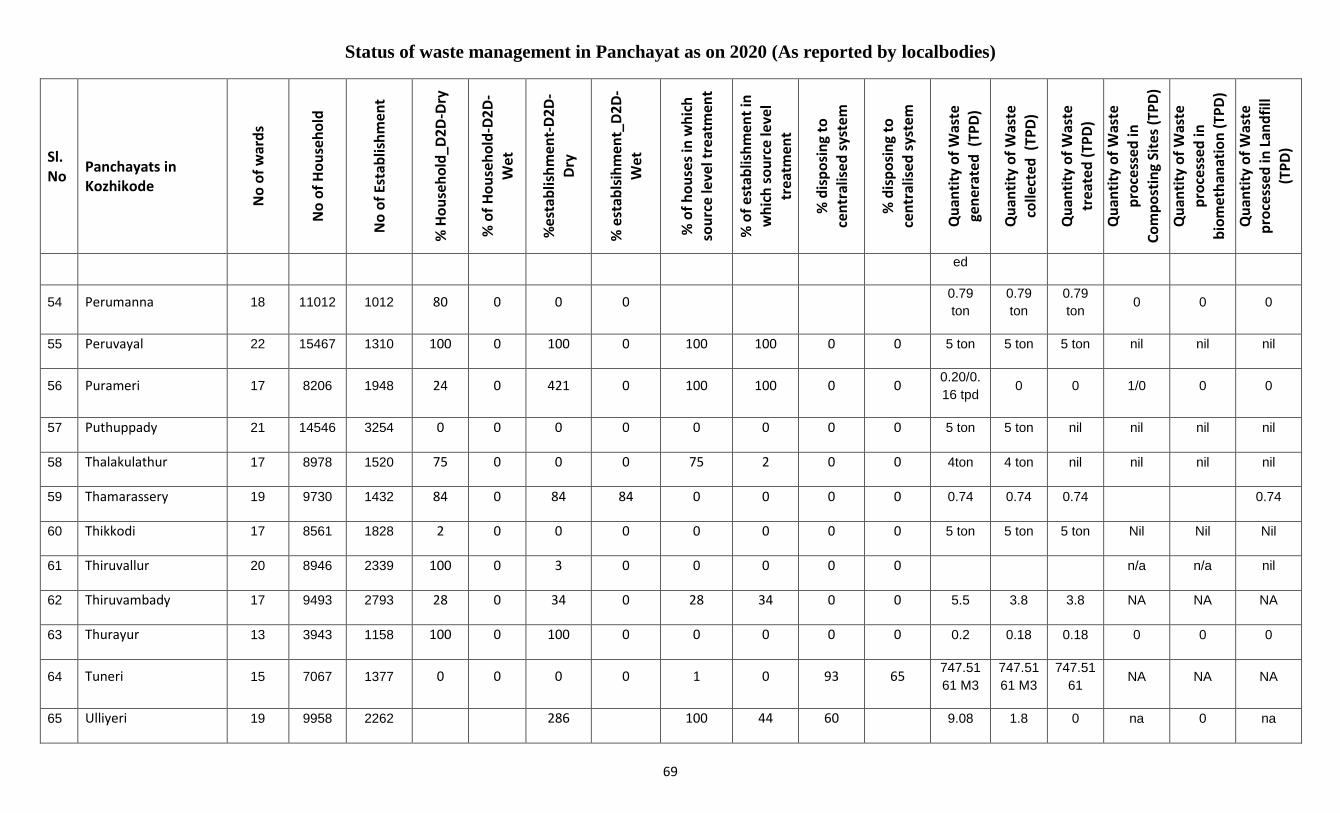
Status of waste management in Panchayat as on 2020 (As reported by localbodies)
69
Sl. No
Panchayats in Kozhikode
No
of
war
ds
No
of
Ho
use
ho
ld
No
of
Esta
blis
hm
ent
% H
ou
seh
old
_D2
D-D
ry
% o
f H
ou
seh
old
-D2
D-
Wet
%e
stab
lish
men
t-D
2D
-D
ry
% e
stab
lsih
men
t_D
2D
-W
et
% o
f h
ou
ses
in w
hic
h
sou
rce
leve
l tre
atm
ent
% o
f es
tab
lish
men
t in
w
hic
h s
ou
rce
leve
l tr
eatm
ent
% d
isp
osi
ng
to
cen
tral
ise
d s
yste
m
% d
isp
osi
ng
to
cen
tral
ise
d s
yste
m
Qu
anti
ty o
f W
aste
ge
ner
ate
d (
TPD
)
Qu
anti
ty o
f W
aste
colle
cted
(TP
D)
Qu
anti
ty o
f W
aste
tr
eate
d (
TPD
)
Qu
anti
ty o
f W
aste
p
roce
sse
d in
Co
mp
ost
ing
Site
s (T
PD
)
Qu
anti
ty o
f W
aste
pro
cess
ed
in
bio
met
han
atio
n (
TPD
)
Qu
anti
ty o
f W
aste
p
roce
sse
d in
Lan
dfi
ll (T
PD
)
ed
54 Perumanna 18 11012 1012 80 0 0 0 0.79
ton
0.79
ton
0.79
ton 0 0 0
55 Peruvayal 22 15467 1310 100 0 100 0 100 100 0 0 5 ton 5 ton 5 ton nil nil nil
56 Purameri 17 8206 1948 24 0 421 0 100 100 0 0 0.20/0.
16 tpd 0 0 1/0 0 0
57 Puthuppady 21 14546 3254 0 0 0 0 0 0 0 0 5 ton 5 ton nil nil nil nil
58 Thalakulathur 17 8978 1520 75 0 0 0 75 2 0 0 4ton 4 ton nil nil nil nil
59 Thamarassery 19 9730 1432 84 0 84 84 0 0 0 0 0.74 0.74 0.74 0.74
60 Thikkodi 17 8561 1828 2 0 0 0 0 0 0 0 5 ton 5 ton 5 ton Nil Nil Nil
61 Thiruvallur 20 8946 2339 100 0 3 0 0 0 0 0 n/a n/a nil
62 Thiruvambady 17 9493 2793 28 0 34 0 28 34 0 0 5.5 3.8 3.8 NA NA NA
63 Thurayur 13 3943 1158 100 0 100 0 0 0 0 0 0.2 0.18 0.18 0 0 0
64 Tuneri 15 7067 1377 0 0 0 0 1 0 93 65 747.51
61 M3
747.51
61 M3
747.51
61 NA NA NA
65 Ulliyeri 19 9958 2262 286 100 44 60 9.08 1.8 0 na 0 na
Annexure.1
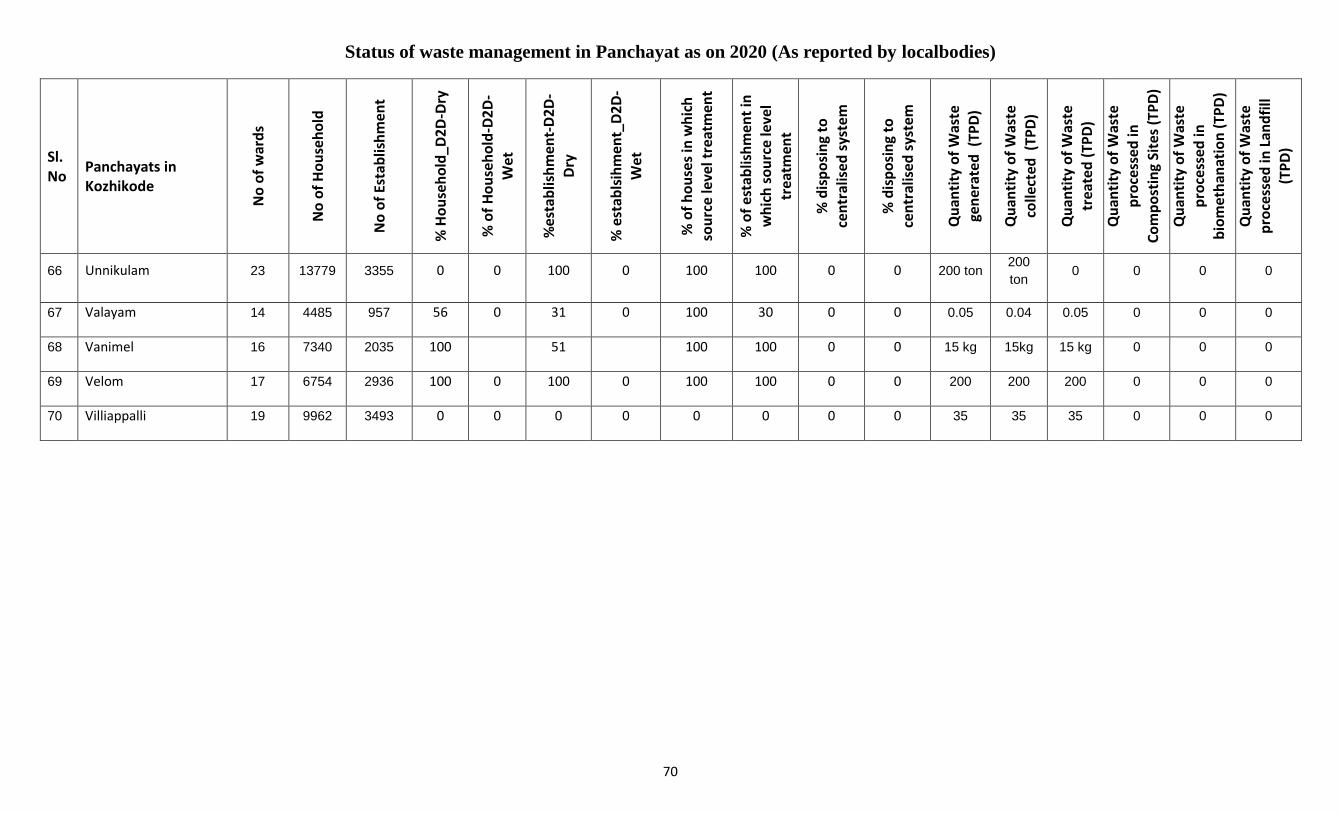
Status of waste management in Panchayat as on 2020 (As reported by localbodies)
70
Sl. No
Panchayats in Kozhikode
No
of
war
ds
No
of
Ho
use
ho
ld
No
of
Esta
blis
hm
ent
% H
ou
seh
old
_D2
D-D
ry
% o
f H
ou
seh
old
-D2
D-
Wet
%e
stab
lish
men
t-D
2D
-D
ry
% e
stab
lsih
men
t_D
2D
-W
et
% o
f h
ou
ses
in w
hic
h
sou
rce
leve
l tre
atm
ent
% o
f es
tab
lish
men
t in
w
hic
h s
ou
rce
leve
l tr
eatm
ent
% d
isp
osi
ng
to
cen
tral
ise
d s
yste
m
% d
isp
osi
ng
to
cen
tral
ise
d s
yste
m
Qu
anti
ty o
f W
aste
ge
ner
ate
d (
TPD
)
Qu
anti
ty o
f W
aste
colle
cted
(TP
D)
Qu
anti
ty o
f W
aste
tr
eate
d (
TPD
)
Qu
anti
ty o
f W
aste
p
roce
sse
d in
Co
mp
ost
ing
Site
s (T
PD
)
Qu
anti
ty o
f W
aste
pro
cess
ed
in
bio
met
han
atio
n (
TPD
)
Qu
anti
ty o
f W
aste
p
roce
sse
d in
Lan
dfi
ll (T
PD
)
66 Unnikulam 23 13779 3355 0 0 100 0 100 100 0 0 200 ton 200
ton 0 0 0 0
67 Valayam 14 4485 957 56 0 31 0 100 30 0 0 0.05 0.04 0.05 0 0 0
68 Vanimel 16 7340 2035 100 51 100 100 0 0 15 kg 15kg 15 kg 0 0 0
69 Velom 17 6754 2936 100 0 100 0 100 100 0 0 200 200 200 0 0 0
70 Villiappalli 19 9962 3493 0 0 0 0 0 0 0 0 35 35 35 0 0 0
Annexure.1
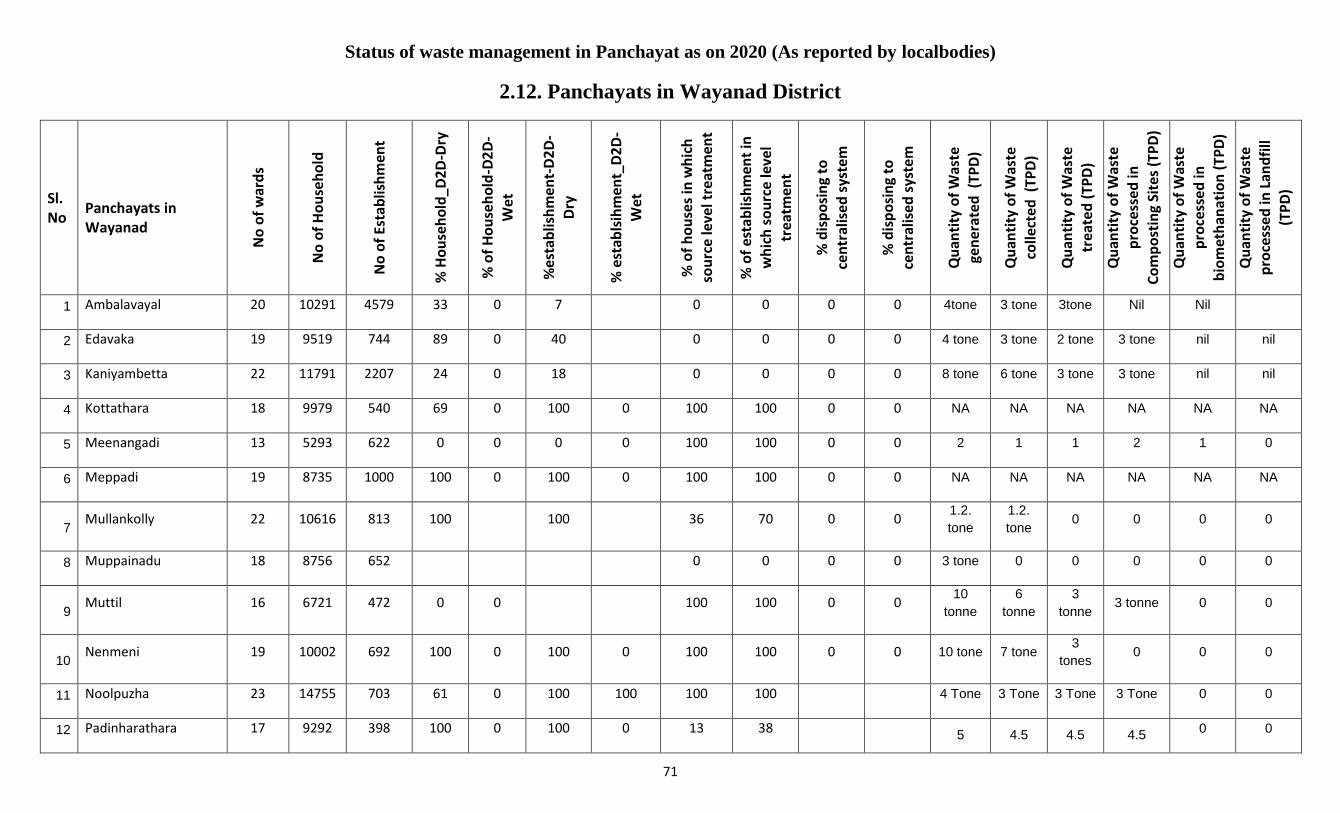
Status of waste management in Panchayat as on 2020 (As reported by localbodies)
71
2.12. Panchayats in Wayanad District
Sl. No
Panchayats in Wayanad
No
of
war
ds
No
of
Ho
use
ho
ld
No
of
Esta
blis
hm
ent
% H
ou
seh
old
_D2
D-D
ry
% o
f H
ou
seh
old
-D2
D-
Wet
%e
stab
lish
men
t-D
2D
-D
ry
% e
stab
lsih
men
t_D
2D
-W
et
% o
f h
ou
ses
in w
hic
h
sou
rce
leve
l tre
atm
ent
% o
f es
tab
lish
men
t in
w
hic
h s
ou
rce
leve
l tr
eatm
ent
% d
isp
osi
ng
to
cen
tral
ise
d s
yste
m
% d
isp
osi
ng
to
cen
tral
ise
d s
yste
m
Qu
anti
ty o
f W
aste
ge
ner
ate
d (
TPD
)
Qu
anti
ty o
f W
aste
colle
cted
(TP
D)
Qu
anti
ty o
f W
aste
tr
eate
d (
TPD
)
Qu
anti
ty o
f W
aste
p
roce
sse
d in
Co
mp
ost
ing
Site
s (T
PD
)
Qu
anti
ty o
f W
aste
pro
cess
ed
in
bio
met
han
atio
n (
TPD
)
Qu
anti
ty o
f W
aste
p
roce
sse
d in
Lan
dfi
ll (T
PD
)
1 Ambalavayal 20 10291 4579 33 0 7 0 0 0 0 4tone 3 tone 3tone Nil Nil
2 Edavaka 19 9519 744 89 0 40 0 0 0 0 4 tone 3 tone 2 tone 3 tone nil nil
3 Kaniyambetta 22 11791 2207 24 0 18 0 0 0 0 8 tone 6 tone 3 tone 3 tone nil nil
4 Kottathara 18 9979 540 69 0 100 0 100 100 0 0 NA NA NA NA NA NA
5 Meenangadi 13 5293 622 0 0 0 0 100 100 0 0 2 1 1 2 1 0
6 Meppadi 19 8735 1000 100 0 100 0 100 100 0 0 NA NA NA NA NA NA
7 Mullankolly 22 10616 813 100 100 36 70 0 0
1.2.
tone
1.2.
tone 0 0 0 0
8 Muppainadu 18 8756 652 0 0 0 0 3 tone 0 0 0 0 0
9 Muttil 16 6721 472 0 0 100 100 0 0
10
tonne
6
tonne
3
tonne 3 tonne 0 0
10 Nenmeni 19 10002 692 100 0 100 0 100 100 0 0 10 tone 7 tone
3
tones 0 0 0
11 Noolpuzha 23 14755 703 61 0 100 100 100 100 4 Tone 3 Tone 3 Tone 3 Tone 0 0
12 Padinharathara 17 9292 398 100 0 100 0 13 38 5 4.5 4.5 4.5
0 0
Annexure.1

Status of waste management in Panchayat as on 2020 (As reported by localbodies)
72
Sl. No
Panchayats in Wayanad
No
of
war
ds
No
of
Ho
use
ho
ld
No
of
Esta
blis
hm
ent
% H
ou
seh
old
_D2
D-D
ry
% o
f H
ou
seh
old
-D2
D-
Wet
%e
stab
lish
men
t-D
2D
-D
ry
% e
stab
lsih
men
t_D
2D
-W
et
% o
f h
ou
ses
in w
hic
h
sou
rce
leve
l tre
atm
ent
% o
f es
tab
lish
men
t in
w
hic
h s
ou
rce
leve
l tr
eatm
ent
% d
isp
osi
ng
to
cen
tral
ise
d s
yste
m
% d
isp
osi
ng
to
cen
tral
ise
d s
yste
m
Qu
anti
ty o
f W
aste
ge
ner
ate
d (
TPD
)
Qu
anti
ty o
f W
aste
colle
cted
(TP
D)
Qu
anti
ty o
f W
aste
tr
eate
d (
TPD
)
Qu
anti
ty o
f W
aste
p
roce
sse
d in
Co
mp
ost
ing
Site
s (T
PD
)
Qu
anti
ty o
f W
aste
pro
cess
ed
in
bio
met
han
atio
n (
TPD
)
Qu
anti
ty o
f W
aste
p
roce
sse
d in
Lan
dfi
ll (T
PD
)
TONE TONE TONE TONE
13 Panamaram 16 7244 347 83 83 69 0 83 0 0 0
14 Poothadi 23 13782 400 100 0 46 0 0 0 0 0 0.06 0.05 0.05 0 0 0
15 Pozhuthana 13 5783 2004 38 0 2 0 100 100 0 0 2 tone 1 tone 1 1 0.5 tone 0.5 tone
16 Pulppalli 20 10437 3147 30 0 33 0 11 0 0 0 3 3 2 1 0 0
17 Thariode 13 3671 740 100 0 100 0 0 0 NA NA NA NA NA NA
18 Thavinhal 22 10433 700 25 0 0 0 100 100 4 2 NIL NIL NIL NIL
19 Thirunelly 17 8620 1405 25 0 0 0 0 0 0 0
20 Thondernadu 15 7687 1320 42 0 30 0 0 0 0 0 2Tone 2Tone Nil Nil Nil Nil
21 Vellamunda 21 11620 1439 0 30 0 0 0 0 0 5.5 0 0 Nil Nil nil
22 Vengappalli 13 2730 195 69 0 100 0 0 0 1.5 1.5 0 0 0 0
23 Vythiri 14 6086 1582 100 0 100 0 100 100 100 100 50 kg 50 kg 50 kg 35 kg 0 0
Annexure.1

Status of waste management in Panchayat as on 2020 (As reported by localbodies)
73
2.13. Panchayats in Kannur District
Sl. No
Panchayats in Kannur
No
of
war
ds
No
of
Ho
use
ho
ld
No
of
Esta
blis
hm
ent
% H
ou
seh
old
_D2
D-D
ry
% o
f H
ou
seh
old
-D2
D-
Wet
%e
stab
lish
men
t-D
2D
-D
ry
% e
stab
lsih
men
t_D
2D
-W
et
% o
f h
ou
ses
in w
hic
h
sou
rce
leve
l tre
atm
ent
% o
f es
tab
lish
men
t in
w
hic
h s
ou
rce
leve
l tr
eatm
ent
% d
isp
osi
ng
to
cen
tral
ise
d s
yste
m
% d
isp
osi
ng
to
cen
tral
ise
d s
yste
m
Qu
anti
ty o
f W
aste
ge
ner
ate
d (
TPD
)
Qu
anti
ty o
f W
aste
colle
cted
(TP
D)
Qu
anti
ty o
f W
aste
tr
eate
d (
TPD
)
Qu
anti
ty o
f W
aste
p
roce
sse
d in
Co
mp
ost
ing
Site
s (T
PD
)
Qu
anti
ty o
f W
aste
pro
cess
ed
in
bio
met
han
atio
n (
TPD
)
Qu
anti
ty o
f W
aste
p
roce
sse
d in
Lan
dfi
ll (T
PD
)
1 Alakode 21 8850 924 100 0 100 0 100 87 0 0 0.98 0.3 0.64 0.4 0.175 0
2 Anjarakkandi
15 6114 739 100 0 100 0 100 84 0 0 0.7
0.01( Plastic wastes
) 0.01 0.1 0.1 0
3 Aralam 17 6887 412 100 0 100 0 4 4 0 0
0.4 TPD
0.4 TPD
0.25 TPD
0.02 TPD
0.15 TPD
4 Ayyankunnu 16 5146 405 100 0 100 0 100 25 0 0
0.8 TON .5 TON .5 TON 0.2 0.1 0.2
5 Azhikode 23 13930 3639 0 0 98 0 99 98 1 ton 800kg 800 kg NA NA NA
6 Chapparappadavu
7 Chembilode 19 10117 996 100 0 100 0 100 25 0 0
8 Chengalai 18 9684 1871 88 0 88 0 87 5 0 0 0.45 0.4 0.4 0.25 0.02 0.15
9 Cherukunnu 13 4549 526 92 0 37 0 98 23 .20 TPD 0 0 0 0
10 Cherupuzha 19 9513 1417 100 0 0 0 99 8 .30 TPD
.30 TPD 0 0 0 0.15
Annexure.1
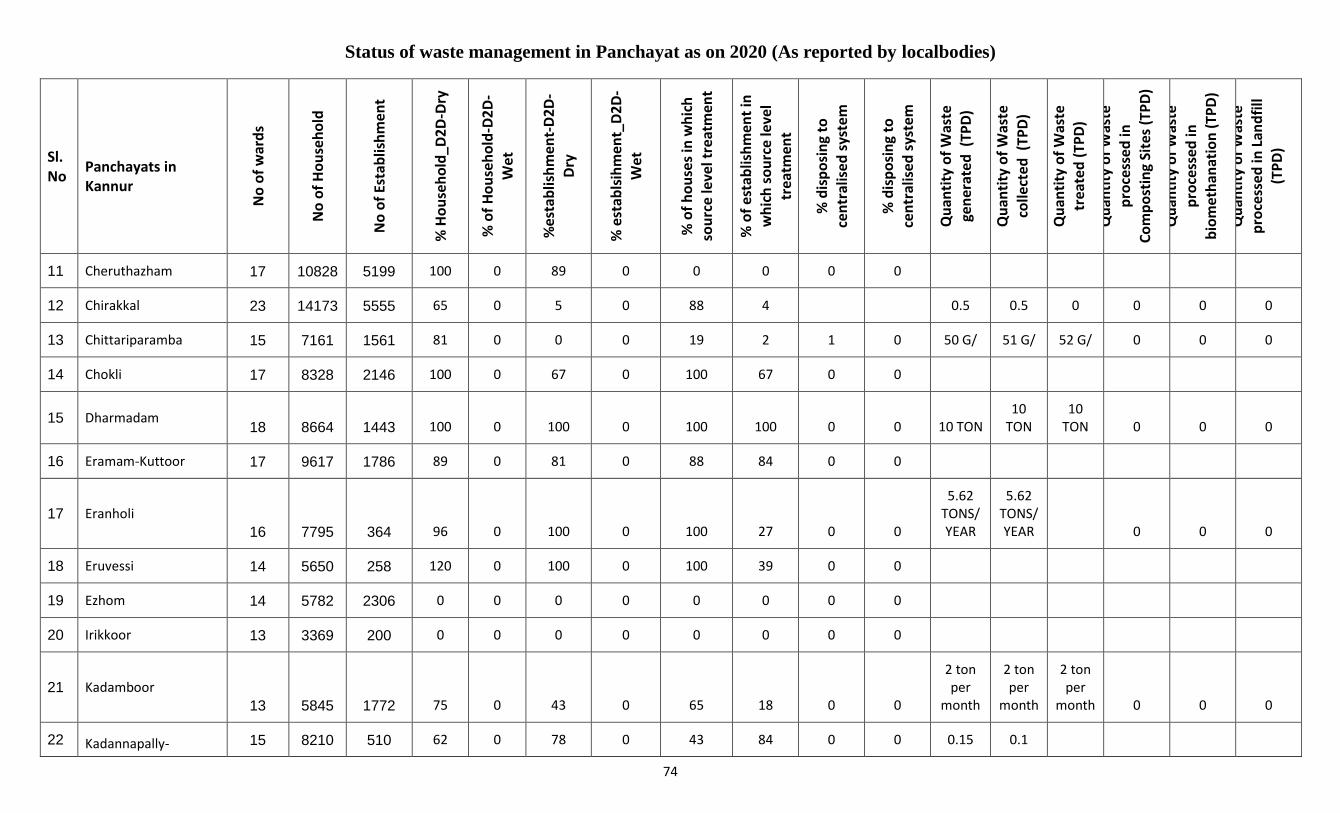
Status of waste management in Panchayat as on 2020 (As reported by localbodies)
74
Sl. No
Panchayats in Kannur
No
of
war
ds
No
of
Ho
use
ho
ld
No
of
Esta
blis
hm
ent
% H
ou
seh
old
_D2
D-D
ry
% o
f H
ou
seh
old
-D2
D-
Wet
%e
stab
lish
men
t-D
2D
-D
ry
% e
stab
lsih
men
t_D
2D
-W
et
% o
f h
ou
ses
in w
hic
h
sou
rce
leve
l tre
atm
ent
% o
f es
tab
lish
men
t in
w
hic
h s
ou
rce
leve
l tr
eatm
ent
% d
isp
osi
ng
to
cen
tral
ise
d s
yste
m
% d
isp
osi
ng
to
cen
tral
ise
d s
yste
m
Qu
anti
ty o
f W
aste
ge
ner
ate
d (
TPD
)
Qu
anti
ty o
f W
aste
colle
cted
(TP
D)
Qu
anti
ty o
f W
aste
tr
eate
d (
TPD
)
Qu
anti
ty o
f W
aste
p
roce
sse
d in
Co
mp
ost
ing
Site
s (T
PD
)
Qu
anti
ty o
f W
aste
pro
cess
ed
in
bio
met
han
atio
n (
TPD
)
Qu
anti
ty o
f W
aste
p
roce
sse
d in
Lan
dfi
ll (T
PD
)
11 Cheruthazham 17 10828 5199 100 0 89 0 0 0 0 0
12 Chirakkal 23 14173 5555 65 0 5 0 88 4 0.5 0.5 0 0 0 0
13 Chittariparamba 15 7161 1561 81 0 0 0 19 2 1 0 50 G/ 51 G/ 52 G/ 0 0 0
14 Chokli 17 8328 2146 100 0 67 0 100 67 0 0
15 Dharmadam 18 8664 1443 100 0 100 0 100 100 0 0 10 TON
10 TON
10 TON 0 0 0
16 Eramam-Kuttoor 17 9617 1786 89 0 81 0 88 84 0 0
17 Eranholi
16 7795 364 96 0 100 0 100 27 0 0
5.62 TONS/YEAR
5.62 TONS/YEAR 0 0 0
18 Eruvessi 14 5650 258 120 0 100 0 100 39 0 0
19 Ezhom 14 5782 2306 0 0 0 0 0 0 0 0
20 Irikkoor 13 3369 200 0 0 0 0 0 0 0 0
21 Kadamboor
13 5845 1772 75 0 43 0 65 18 0 0
2 ton per
month
2 ton per
month
2 ton per
month 0 0 0
22 Kadannapally- 15 8210 510 62 0 78 0 43 84 0 0 0.15 0.1
Annexure.1
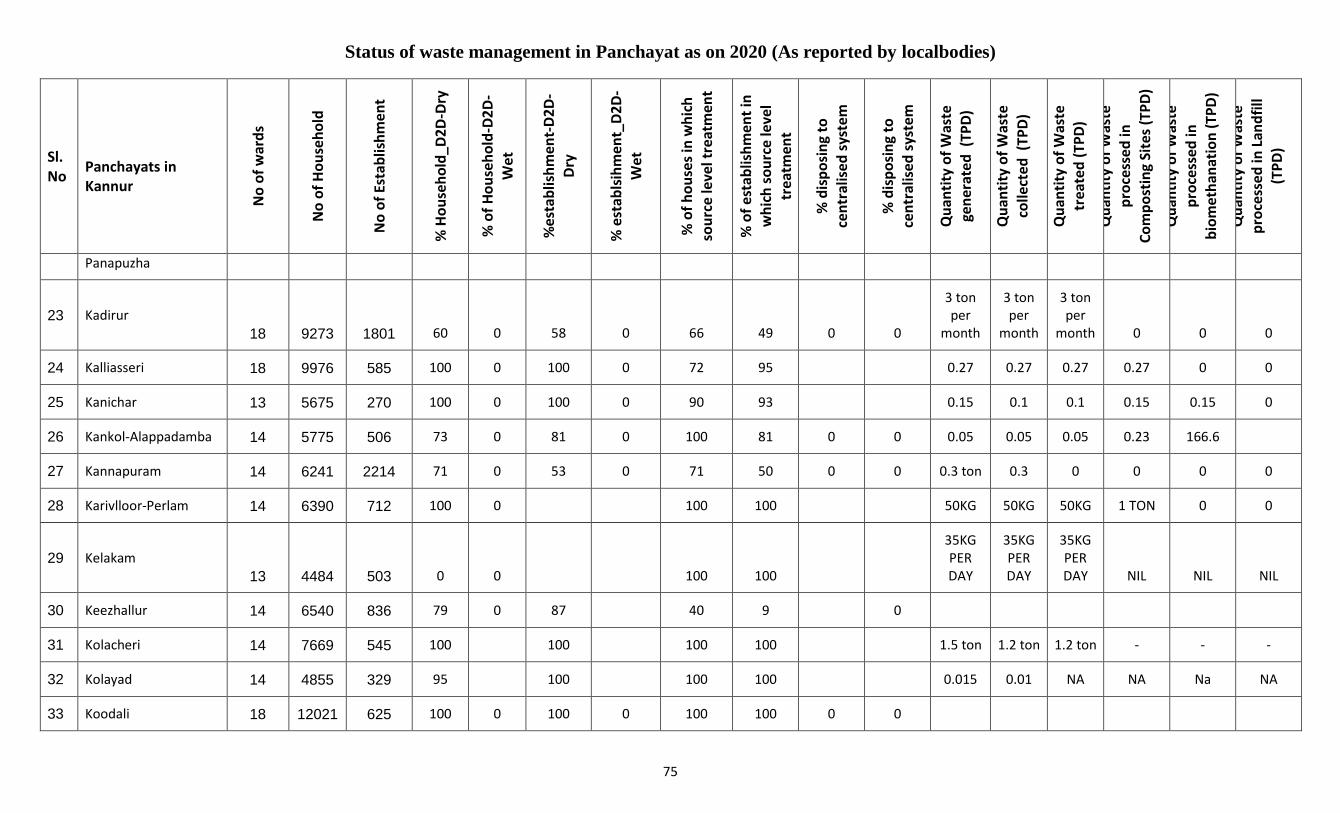
Status of waste management in Panchayat as on 2020 (As reported by localbodies)
75
Sl. No
Panchayats in Kannur
No
of
war
ds
No
of
Ho
use
ho
ld
No
of
Esta
blis
hm
ent
% H
ou
seh
old
_D2
D-D
ry
% o
f H
ou
seh
old
-D2
D-
Wet
%e
stab
lish
men
t-D
2D
-D
ry
% e
stab
lsih
men
t_D
2D
-W
et
% o
f h
ou
ses
in w
hic
h
sou
rce
leve
l tre
atm
ent
% o
f es
tab
lish
men
t in
w
hic
h s
ou
rce
leve
l tr
eatm
ent
% d
isp
osi
ng
to
cen
tral
ise
d s
yste
m
% d
isp
osi
ng
to
cen
tral
ise
d s
yste
m
Qu
anti
ty o
f W
aste
ge
ner
ate
d (
TPD
)
Qu
anti
ty o
f W
aste
colle
cted
(TP
D)
Qu
anti
ty o
f W
aste
tr
eate
d (
TPD
)
Qu
anti
ty o
f W
aste
p
roce
sse
d in
Co
mp
ost
ing
Site
s (T
PD
)
Qu
anti
ty o
f W
aste
pro
cess
ed
in
bio
met
han
atio
n (
TPD
)
Qu
anti
ty o
f W
aste
p
roce
sse
d in
Lan
dfi
ll (T
PD
)
Panapuzha
23 Kadirur
18 9273 1801 60 0 58 0 66 49 0 0
3 ton per
month
3 ton per
month
3 ton per
month 0 0 0
24 Kalliasseri 18 9976 585 100 0 100 0 72 95 0.27 0.27 0.27 0.27 0 0
25 Kanichar 13 5675 270 100 0 100 0 90 93 0.15 0.1 0.1 0.15 0.15 0
26 Kankol-Alappadamba 14 5775 506 73 0 81 0 100 81 0 0 0.05 0.05 0.05 0.23 166.6
27 Kannapuram 14 6241 2214 71 0 53 0 71 50 0 0 0.3 ton 0.3 0 0 0 0
28 Karivlloor-Perlam 14 6390 712 100 0 100 100 50KG 50KG 50KG 1 TON 0 0
29 Kelakam
13 4484 503 0 0 100 100
35KG PER DAY
35KG PER DAY
35KG PER DAY NIL NIL NIL
30 Keezhallur 14 6540 836 79 0 87 40 9 0
31 Kolacheri 14 7669 545 100 100 100 100 1.5 ton 1.2 ton 1.2 ton - - -
32 Kolayad 14 4855 329 95 100 100 100 0.015 0.01 NA NA Na NA
33 Koodali 18 12021 625 100 0 100 0 100 100 0 0
Annexure.1
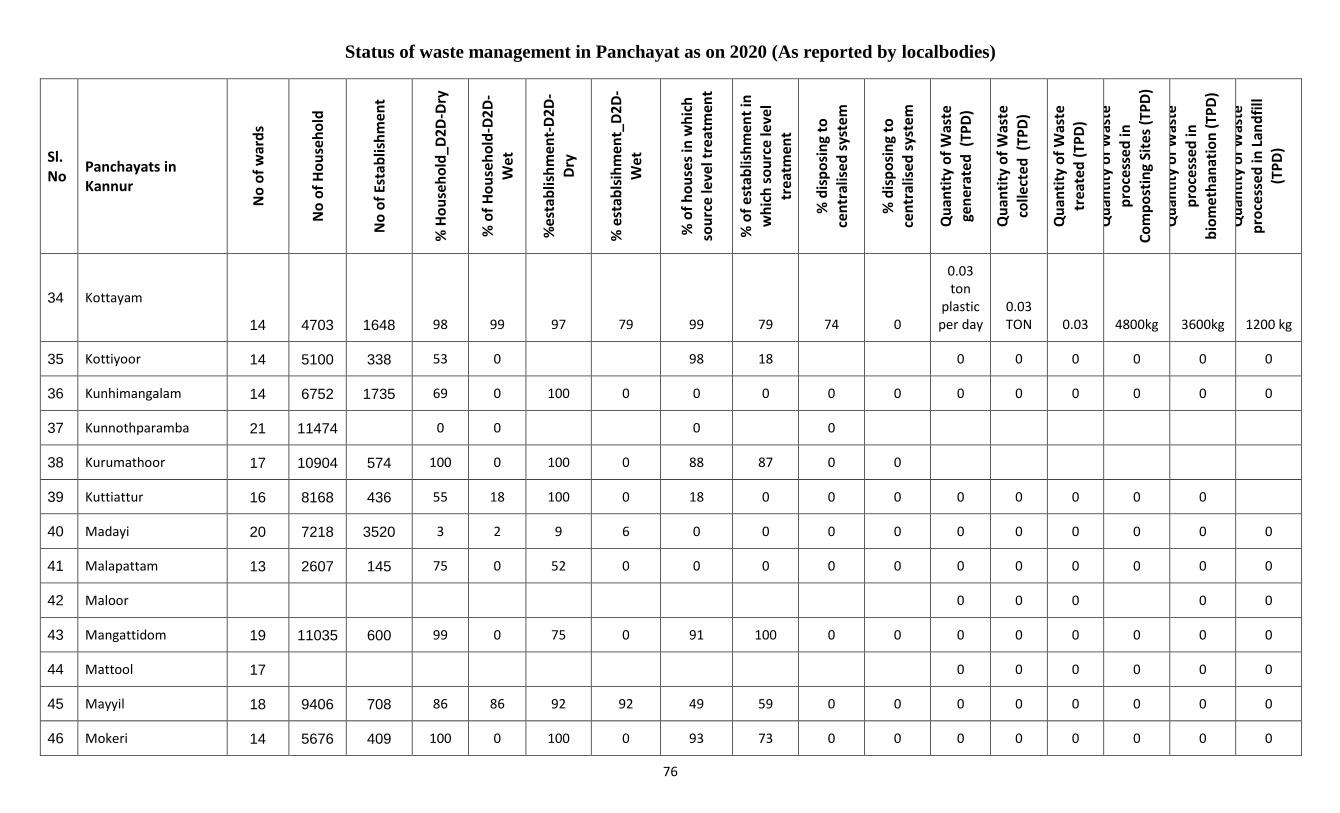
Status of waste management in Panchayat as on 2020 (As reported by localbodies)
76
Sl. No
Panchayats in Kannur
No
of
war
ds
No
of
Ho
use
ho
ld
No
of
Esta
blis
hm
ent
% H
ou
seh
old
_D2
D-D
ry
% o
f H
ou
seh
old
-D2
D-
Wet
%e
stab
lish
men
t-D
2D
-D
ry
% e
stab
lsih
men
t_D
2D
-W
et
% o
f h
ou
ses
in w
hic
h
sou
rce
leve
l tre
atm
ent
% o
f es
tab
lish
men
t in
w
hic
h s
ou
rce
leve
l tr
eatm
ent
% d
isp
osi
ng
to
cen
tral
ise
d s
yste
m
% d
isp
osi
ng
to
cen
tral
ise
d s
yste
m
Qu
anti
ty o
f W
aste
ge
ner
ate
d (
TPD
)
Qu
anti
ty o
f W
aste
colle
cted
(TP
D)
Qu
anti
ty o
f W
aste
tr
eate
d (
TPD
)
Qu
anti
ty o
f W
aste
p
roce
sse
d in
Co
mp
ost
ing
Site
s (T
PD
)
Qu
anti
ty o
f W
aste
pro
cess
ed
in
bio
met
han
atio
n (
TPD
)
Qu
anti
ty o
f W
aste
p
roce
sse
d in
Lan
dfi
ll (T
PD
)
34 Kottayam
14 4703 1648 98 99 97 79 99 79 74 0
0.03 ton
plastic per day
0.03 TON 0.03 4800kg 3600kg 1200 kg
35 Kottiyoor 14 5100 338 53 0 98 18 0 0 0 0 0 0
36 Kunhimangalam 14 6752 1735 69 0 100 0 0 0 0 0 0 0 0 0 0 0
37 Kunnothparamba 21 11474 0 0 0 0
38 Kurumathoor 17 10904 574 100 0 100 0 88 87 0 0
39 Kuttiattur 16 8168 436 55 18 100 0 18 0 0 0 0 0 0 0 0
40 Madayi 20 7218 3520 3 2 9 6 0 0 0 0 0 0 0 0 0 0
41 Malapattam 13 2607 145 75 0 52 0 0 0 0 0 0 0 0 0 0 0
42 Maloor 0 0 0 0 0
43 Mangattidom 19 11035 600 99 0 75 0 91 100 0 0 0 0 0 0 0 0
44 Mattool 17 0 0 0 0 0 0
45 Mayyil 18 9406 708 86 86 92 92 49 59 0 0 0 0 0 0 0 0
46 Mokeri 14 5676 409 100 0 100 0 93 73 0 0 0 0 0 0 0 0
Annexure.1
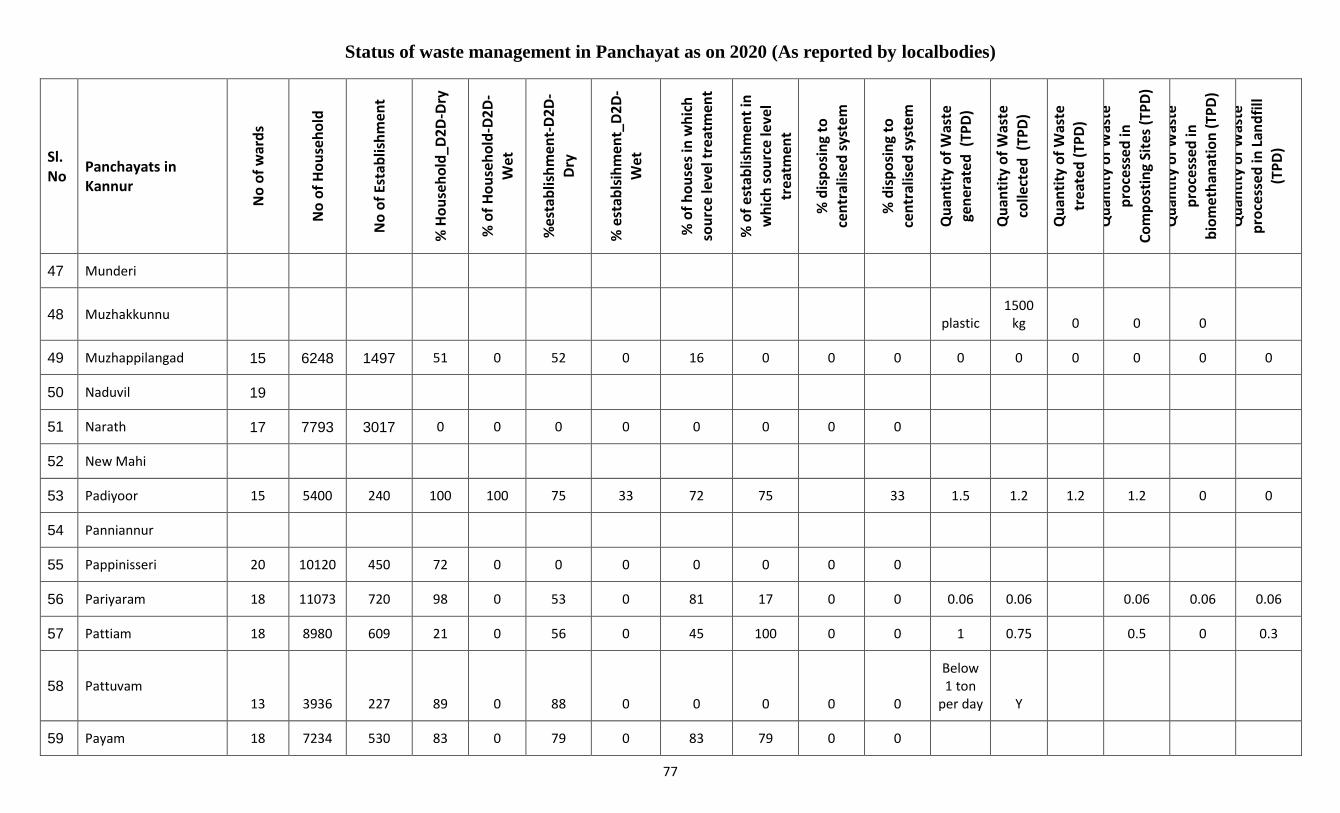
Status of waste management in Panchayat as on 2020 (As reported by localbodies)
77
Sl. No
Panchayats in Kannur
No
of
war
ds
No
of
Ho
use
ho
ld
No
of
Esta
blis
hm
ent
% H
ou
seh
old
_D2
D-D
ry
% o
f H
ou
seh
old
-D2
D-
Wet
%e
stab
lish
men
t-D
2D
-D
ry
% e
stab
lsih
men
t_D
2D
-W
et
% o
f h
ou
ses
in w
hic
h
sou
rce
leve
l tre
atm
ent
% o
f es
tab
lish
men
t in
w
hic
h s
ou
rce
leve
l tr
eatm
ent
% d
isp
osi
ng
to
cen
tral
ise
d s
yste
m
% d
isp
osi
ng
to
cen
tral
ise
d s
yste
m
Qu
anti
ty o
f W
aste
ge
ner
ate
d (
TPD
)
Qu
anti
ty o
f W
aste
colle
cted
(TP
D)
Qu
anti
ty o
f W
aste
tr
eate
d (
TPD
)
Qu
anti
ty o
f W
aste
p
roce
sse
d in
Co
mp
ost
ing
Site
s (T
PD
)
Qu
anti
ty o
f W
aste
pro
cess
ed
in
bio
met
han
atio
n (
TPD
)
Qu
anti
ty o
f W
aste
p
roce
sse
d in
Lan
dfi
ll (T
PD
)
47 Munderi
48 Muzhakkunnu plastic
1500 kg 0 0 0
49 Muzhappilangad 15 6248 1497 51 0 52 0 16 0 0 0 0 0 0 0 0 0
50 Naduvil 19
51 Narath 17 7793 3017 0 0 0 0 0 0 0 0
52 New Mahi
53 Padiyoor 15 5400 240 100 100 75 33 72 75 33 1.5 1.2 1.2 1.2 0 0
54 Panniannur
55 Pappinisseri 20 10120 450 72 0 0 0 0 0 0 0
56 Pariyaram 18 11073 720 98 0 53 0 81 17 0 0 0.06 0.06 0.06 0.06 0.06
57 Pattiam 18 8980 609 21 0 56 0 45 100 0 0 1 0.75 0.5 0 0.3
58 Pattuvam 13 3936 227 89 0 88 0 0 0 0 0
Below 1 ton
per day Y
59 Payam 18 7234 530 83 0 79 0 83 79 0 0
Annexure.1
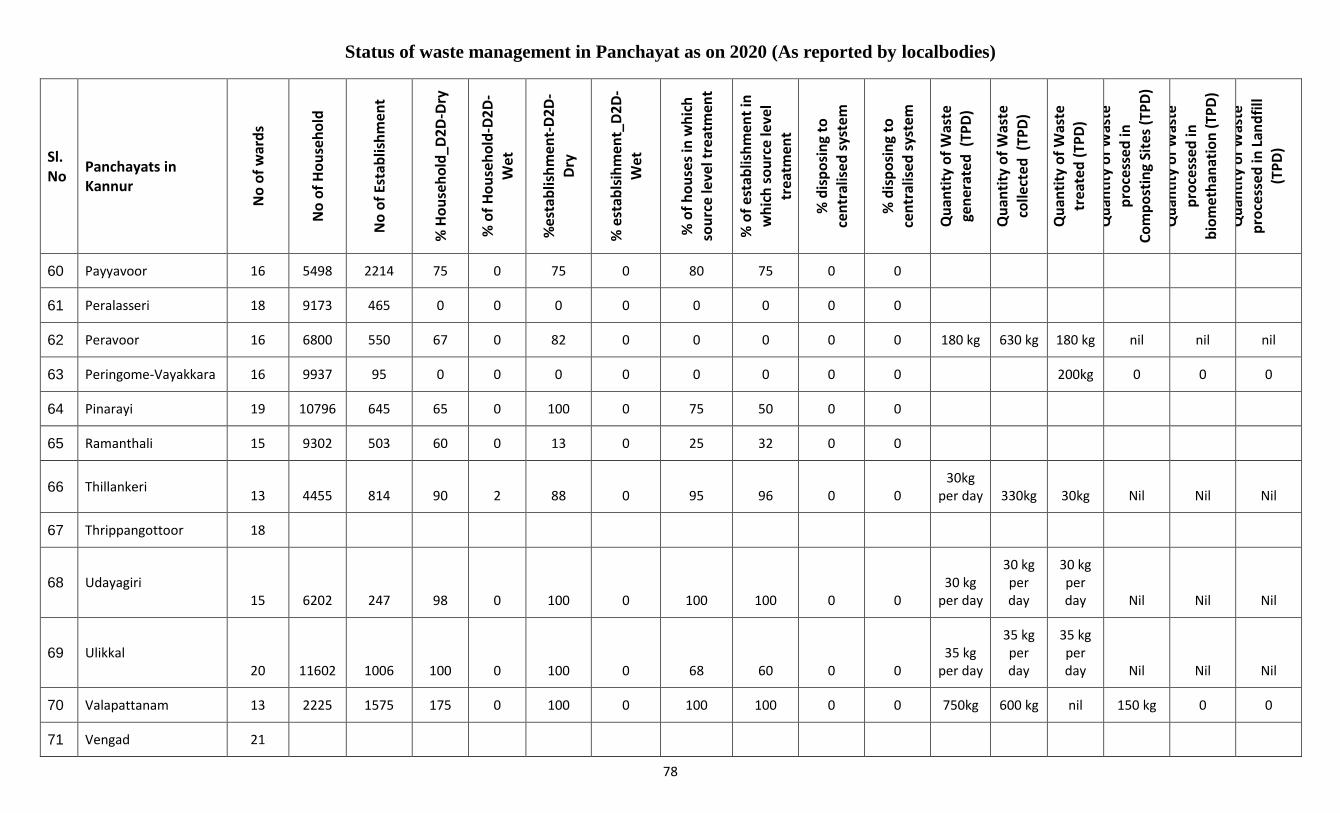
Status of waste management in Panchayat as on 2020 (As reported by localbodies)
78
Sl. No
Panchayats in Kannur
No
of
war
ds
No
of
Ho
use
ho
ld
No
of
Esta
blis
hm
ent
% H
ou
seh
old
_D2
D-D
ry
% o
f H
ou
seh
old
-D2
D-
Wet
%e
stab
lish
men
t-D
2D
-D
ry
% e
stab
lsih
men
t_D
2D
-W
et
% o
f h
ou
ses
in w
hic
h
sou
rce
leve
l tre
atm
ent
% o
f es
tab
lish
men
t in
w
hic
h s
ou
rce
leve
l tr
eatm
ent
% d
isp
osi
ng
to
cen
tral
ise
d s
yste
m
% d
isp
osi
ng
to
cen
tral
ise
d s
yste
m
Qu
anti
ty o
f W
aste
ge
ner
ate
d (
TPD
)
Qu
anti
ty o
f W
aste
colle
cted
(TP
D)
Qu
anti
ty o
f W
aste
tr
eate
d (
TPD
)
Qu
anti
ty o
f W
aste
p
roce
sse
d in
Co
mp
ost
ing
Site
s (T
PD
)
Qu
anti
ty o
f W
aste
pro
cess
ed
in
bio
met
han
atio
n (
TPD
)
Qu
anti
ty o
f W
aste
p
roce
sse
d in
Lan
dfi
ll (T
PD
)
60 Payyavoor 16 5498 2214 75 0 75 0 80 75 0 0
61 Peralasseri 18 9173 465 0 0 0 0 0 0 0 0
62 Peravoor 16 6800 550 67 0 82 0 0 0 0 0 180 kg 630 kg 180 kg nil nil nil
63 Peringome-Vayakkara 16 9937 95 0 0 0 0 0 0 0 0 200kg 0 0 0
64 Pinarayi 19 10796 645 65 0 100 0 75 50 0 0
65 Ramanthali 15 9302 503 60 0 13 0 25 32 0 0
66 Thillankeri 13 4455 814 90 2 88 0 95 96 0 0
30kg per day 330kg 30kg Nil Nil Nil
67 Thrippangottoor 18
68 Udayagiri 15 6202 247 98 0 100 0 100 100 0 0
30 kg per day
30 kg per day
30 kg per day Nil Nil Nil
69 Ulikkal 20 11602 1006 100 0 100 0 68 60 0 0
35 kg per day
35 kg per day
35 kg per day Nil Nil Nil
70 Valapattanam 13 2225 1575 175 0 100 0 100 100 0 0 750kg 600 kg nil 150 kg 0 0
71 Vengad 21
Annexure.1
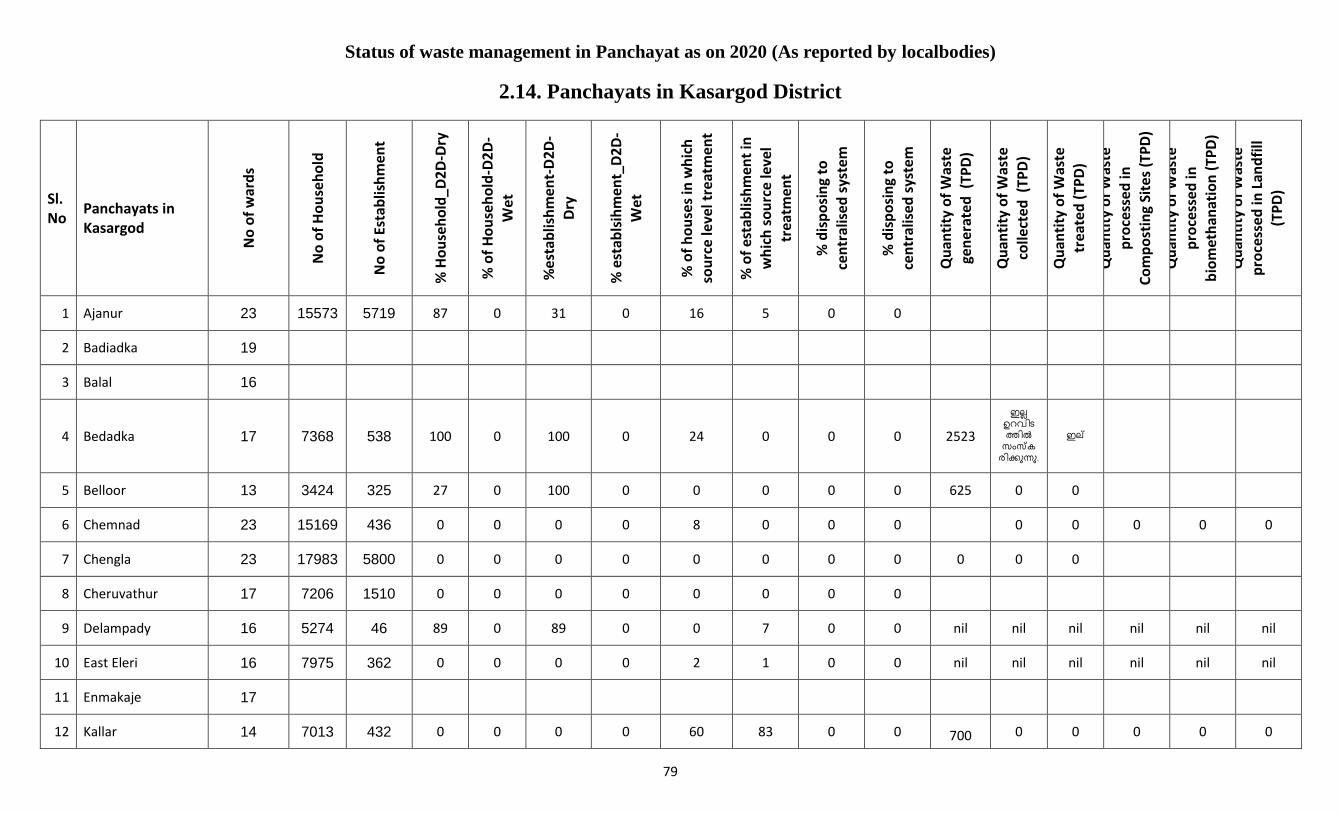
Status of waste management in Panchayat as on 2020 (As reported by localbodies)
79
2.14. Panchayats in Kasargod District
Sl. No
Panchayats in Kasargod
No
of
war
ds
No
of
Ho
use
ho
ld
No
of
Esta
blis
hm
ent
% H
ou
seh
old
_D2
D-D
ry
% o
f H
ou
seh
old
-D2
D-
Wet
%e
stab
lish
men
t-D
2D
-D
ry
% e
stab
lsih
men
t_D
2D
-W
et
% o
f h
ou
ses
in w
hic
h
sou
rce
leve
l tre
atm
ent
% o
f es
tab
lish
men
t in
w
hic
h s
ou
rce
leve
l tr
eatm
ent
% d
isp
osi
ng
to
cen
tral
ise
d s
yste
m
% d
isp
osi
ng
to
cen
tral
ise
d s
yste
m
Qu
anti
ty o
f W
aste
ge
ner
ate
d (
TPD
)
Qu
anti
ty o
f W
aste
colle
cted
(TP
D)
Qu
anti
ty o
f W
aste
tr
eate
d (
TPD
)
Qu
anti
ty o
f W
aste
p
roce
sse
d in
Co
mp
ost
ing
Site
s (T
PD
)
Qu
anti
ty o
f W
aste
pro
cess
ed
in
bio
met
han
atio
n (
TPD
)
Qu
anti
ty o
f W
aste
p
roce
sse
d in
Lan
dfi
ll (T
PD
)
1 Ajanur 23 15573 5719 87 0 31 0 16 5 0 0
2 Badiadka 19
3 Balal 16
4 Bedadka 17 7368 538 100 0 100 0 24 0 0 0 2523
.
5 Belloor 13 3424 325 27 0 100 0 0 0 0 0 625 0 0
6 Chemnad 23 15169 436 0 0 0 0 8 0 0 0 0 0 0 0 0
7 Chengla 23 17983 5800 0 0 0 0 0 0 0 0 0 0 0
8 Cheruvathur 17 7206 1510 0 0 0 0 0 0 0 0
9 Delampady 16 5274 46 89 0 89 0 0 7 0 0 nil nil nil nil nil nil
10 East Eleri 16 7975 362 0 0 0 0 2 1 0 0 nil nil nil nil nil nil
11 Enmakaje 17
12 Kallar 14 7013 432 0 0 0 0 60 83 0 0 700 0 0 0 0 0
Annexure.1
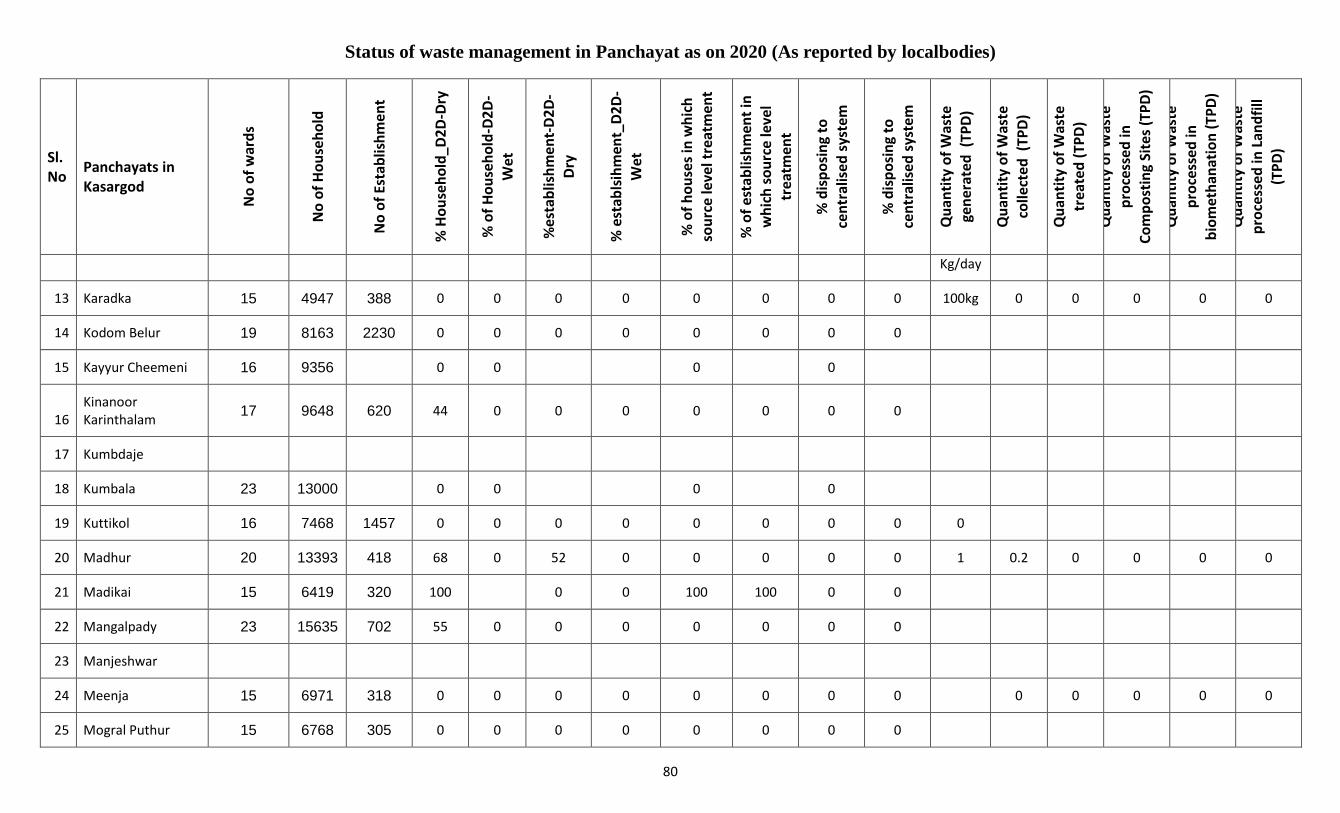
Status of waste management in Panchayat as on 2020 (As reported by localbodies)
80
Sl. No
Panchayats in Kasargod
No
of
war
ds
No
of
Ho
use
ho
ld
No
of
Esta
blis
hm
ent
% H
ou
seh
old
_D2
D-D
ry
% o
f H
ou
seh
old
-D2
D-
Wet
%e
stab
lish
men
t-D
2D
-D
ry
% e
stab
lsih
men
t_D
2D
-W
et
% o
f h
ou
ses
in w
hic
h
sou
rce
leve
l tre
atm
ent
% o
f es
tab
lish
men
t in
w
hic
h s
ou
rce
leve
l tr
eatm
ent
% d
isp
osi
ng
to
cen
tral
ise
d s
yste
m
% d
isp
osi
ng
to
cen
tral
ise
d s
yste
m
Qu
anti
ty o
f W
aste
ge
ner
ate
d (
TPD
)
Qu
anti
ty o
f W
aste
colle
cted
(TP
D)
Qu
anti
ty o
f W
aste
tr
eate
d (
TPD
)
Qu
anti
ty o
f W
aste
p
roce
sse
d in
Co
mp
ost
ing
Site
s (T
PD
)
Qu
anti
ty o
f W
aste
pro
cess
ed
in
bio
met
han
atio
n (
TPD
)
Qu
anti
ty o
f W
aste
p
roce
sse
d in
Lan
dfi
ll (T
PD
)
Kg/day
13 Karadka 15 4947 388 0 0 0 0 0 0 0 0 100kg 0 0 0 0 0
14 Kodom Belur 19 8163 2230 0 0 0 0 0 0 0 0
15 Kayyur Cheemeni 16 9356 0 0 0 0
16 Kinanoor Karinthalam
17 9648 620 44 0 0 0 0 0 0 0
17 Kumbdaje
18 Kumbala 23 13000 0 0 0 0
19 Kuttikol 16 7468 1457 0 0 0 0 0 0 0 0 0
20 Madhur 20 13393 418 68 0 52 0 0 0 0 0 1 0.2 0 0 0 0
21 Madikai 15 6419 320 100 0 0 100 100 0 0
22 Mangalpady 23 15635 702 55 0 0 0 0 0 0 0
23 Manjeshwar
24 Meenja 15 6971 318 0 0 0 0 0 0 0 0 0 0 0 0 0
25 Mogral Puthur 15 6768 305 0 0 0 0 0 0 0 0
Annexure.1
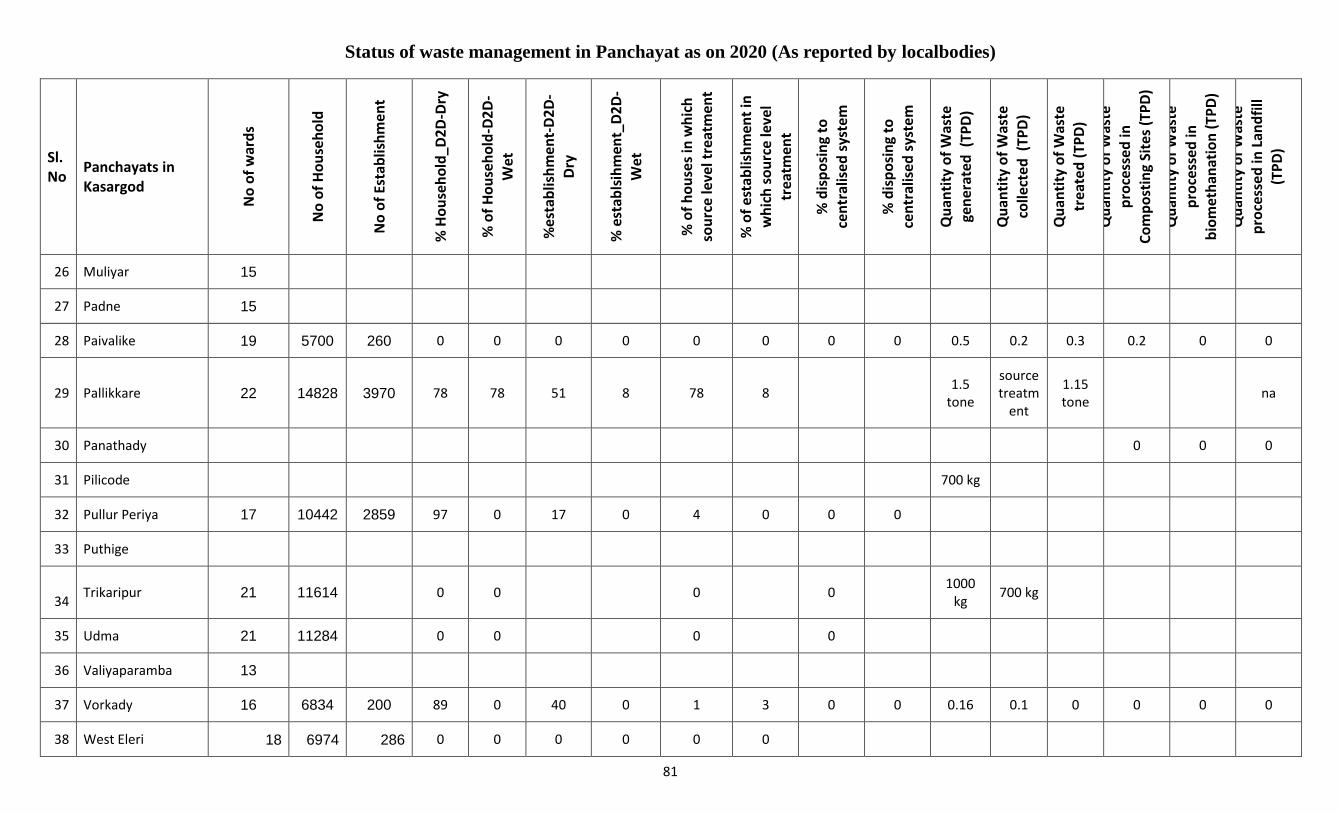
Status of waste management in Panchayat as on 2020 (As reported by localbodies)
81
Sl. No
Panchayats in Kasargod
No
of
war
ds
No
of
Ho
use
ho
ld
No
of
Esta
blis
hm
ent
% H
ou
seh
old
_D2
D-D
ry
% o
f H
ou
seh
old
-D2
D-
Wet
%e
stab
lish
men
t-D
2D
-D
ry
% e
stab
lsih
men
t_D
2D
-W
et
% o
f h
ou
ses
in w
hic
h
sou
rce
leve
l tre
atm
ent
% o
f es
tab
lish
men
t in
w
hic
h s
ou
rce
leve
l tr
eatm
ent
% d
isp
osi
ng
to
cen
tral
ise
d s
yste
m
% d
isp
osi
ng
to
cen
tral
ise
d s
yste
m
Qu
anti
ty o
f W
aste
ge
ner
ate
d (
TPD
)
Qu
anti
ty o
f W
aste
colle
cted
(TP
D)
Qu
anti
ty o
f W
aste
tr
eate
d (
TPD
)
Qu
anti
ty o
f W
aste
p
roce
sse
d in
Co
mp
ost
ing
Site
s (T
PD
)
Qu
anti
ty o
f W
aste
pro
cess
ed
in
bio
met
han
atio
n (
TPD
)
Qu
anti
ty o
f W
aste
p
roce
sse
d in
Lan
dfi
ll (T
PD
)
26 Muliyar 15
27 Padne 15
28 Paivalike 19 5700 260 0 0 0 0 0 0 0 0 0.5 0.2 0.3 0.2 0 0
29 Pallikkare 22 14828 3970 78 78 51 8 78 8 1.5
tone
source treatm
ent
1.15 tone
na
30 Panathady 0 0 0
31 Pilicode 700 kg
32 Pullur Periya 17 10442 2859 97 0 17 0 4 0 0 0
33 Puthige
34 Trikaripur 21 11614 0 0 0 0
1000 kg
700 kg
35 Udma 21 11284 0 0 0 0
36 Valiyaparamba 13
37 Vorkady 16 6834 200 89 0 40 0 1 3 0 0 0.16 0.1 0 0 0 0
38 West Eleri 18 6974 286 0 0 0 0 0 0
Annexure.1
Annexure 2
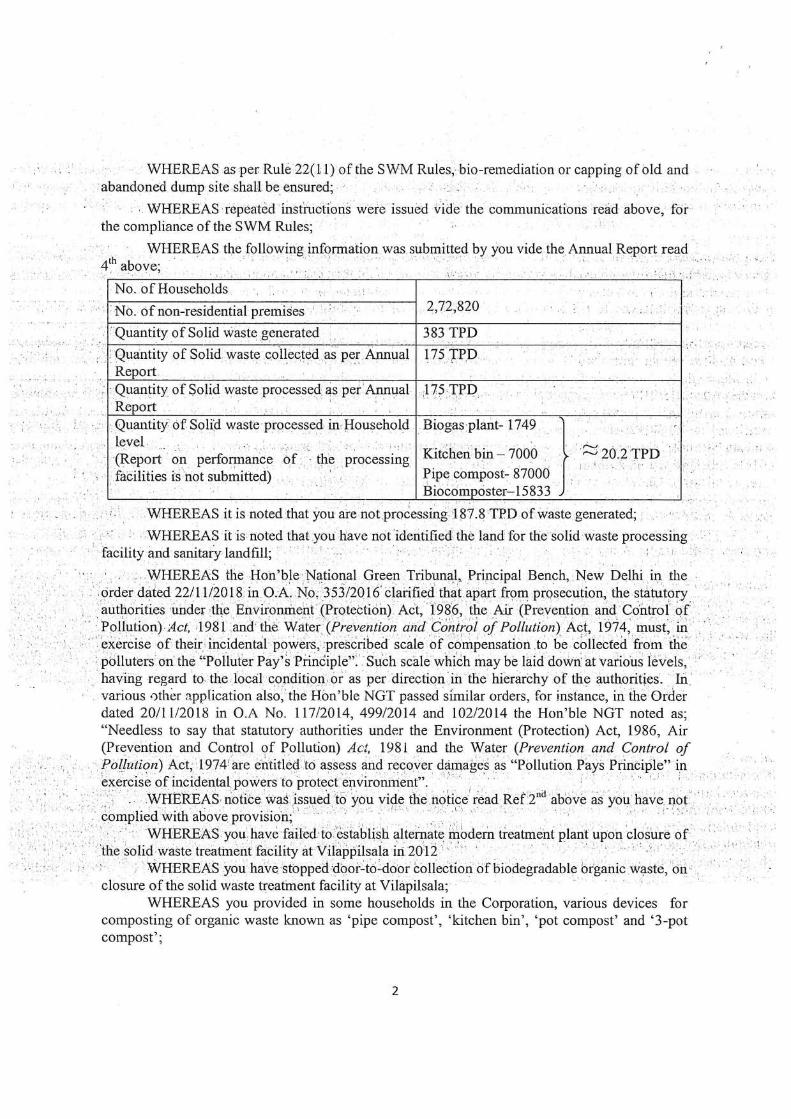
Annexure 2
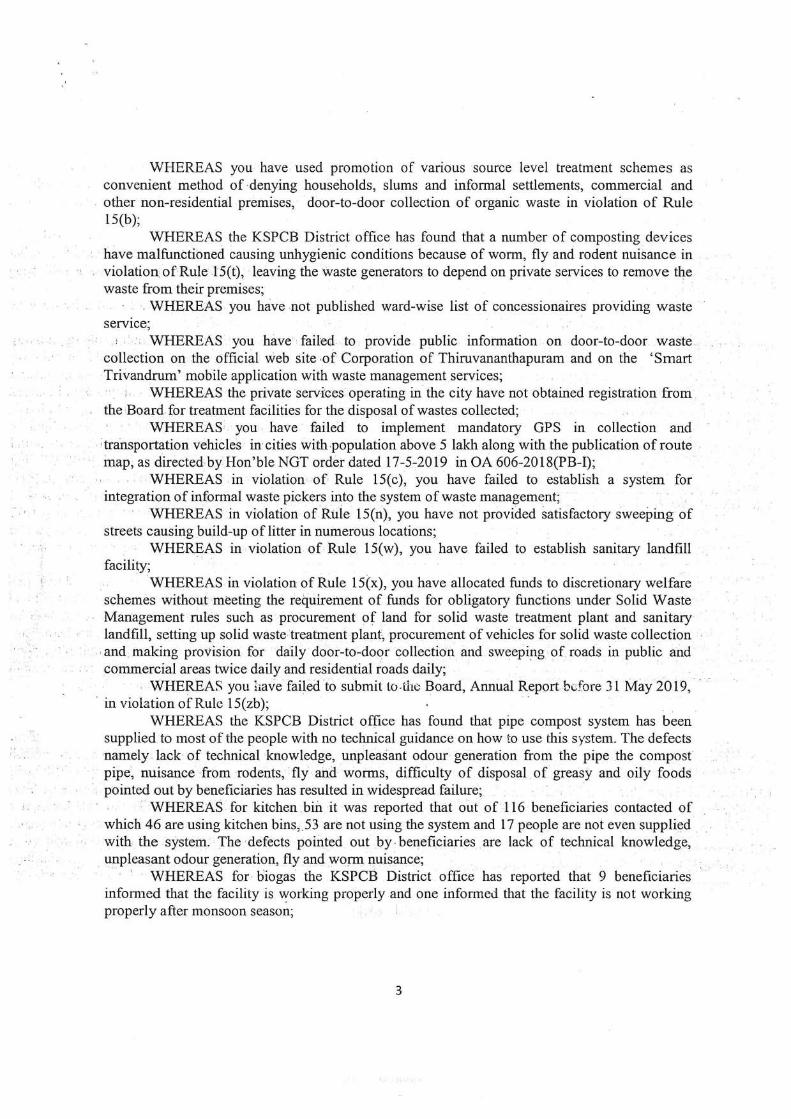
Annexure 2
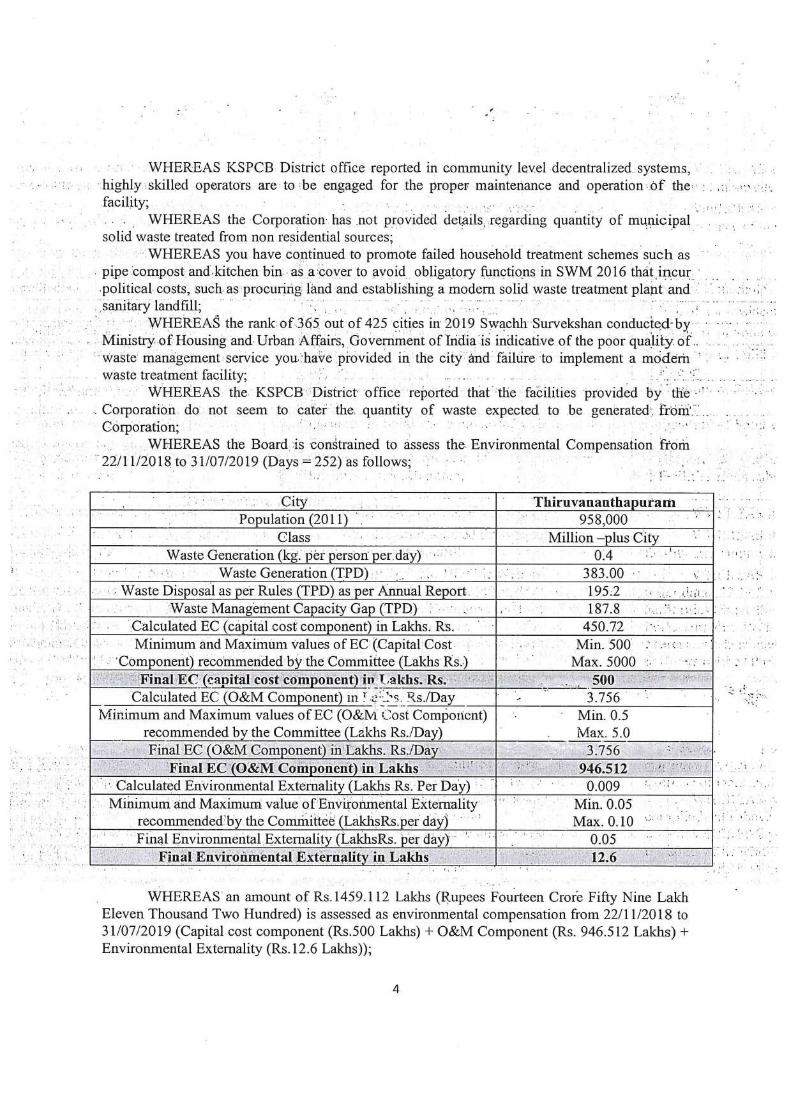
Annexure 2
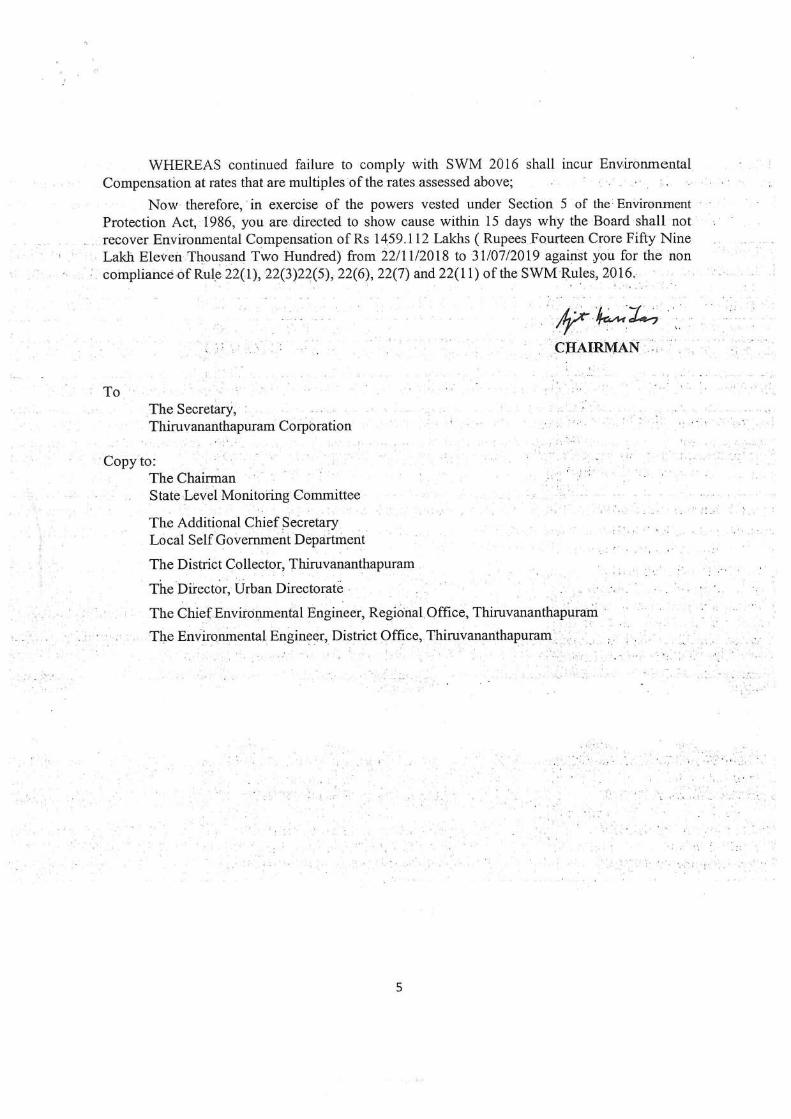
Annexure 2
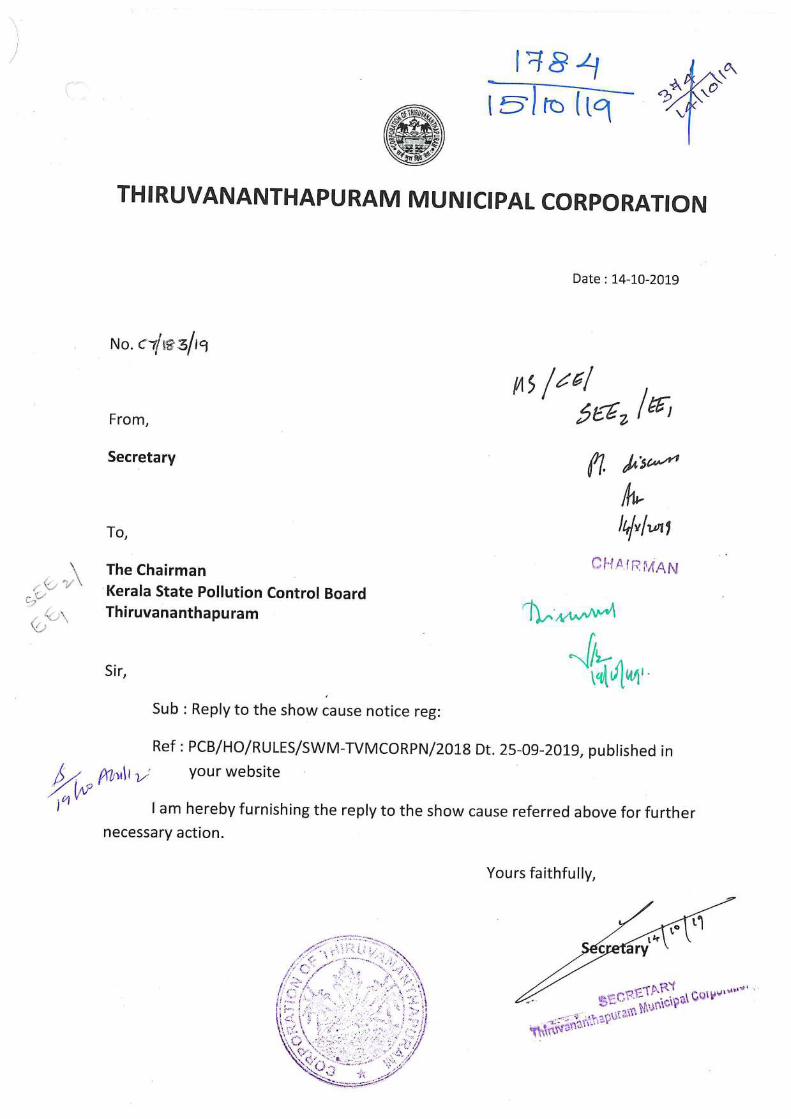
Annexure 3

Annexure 3

Annexure 3
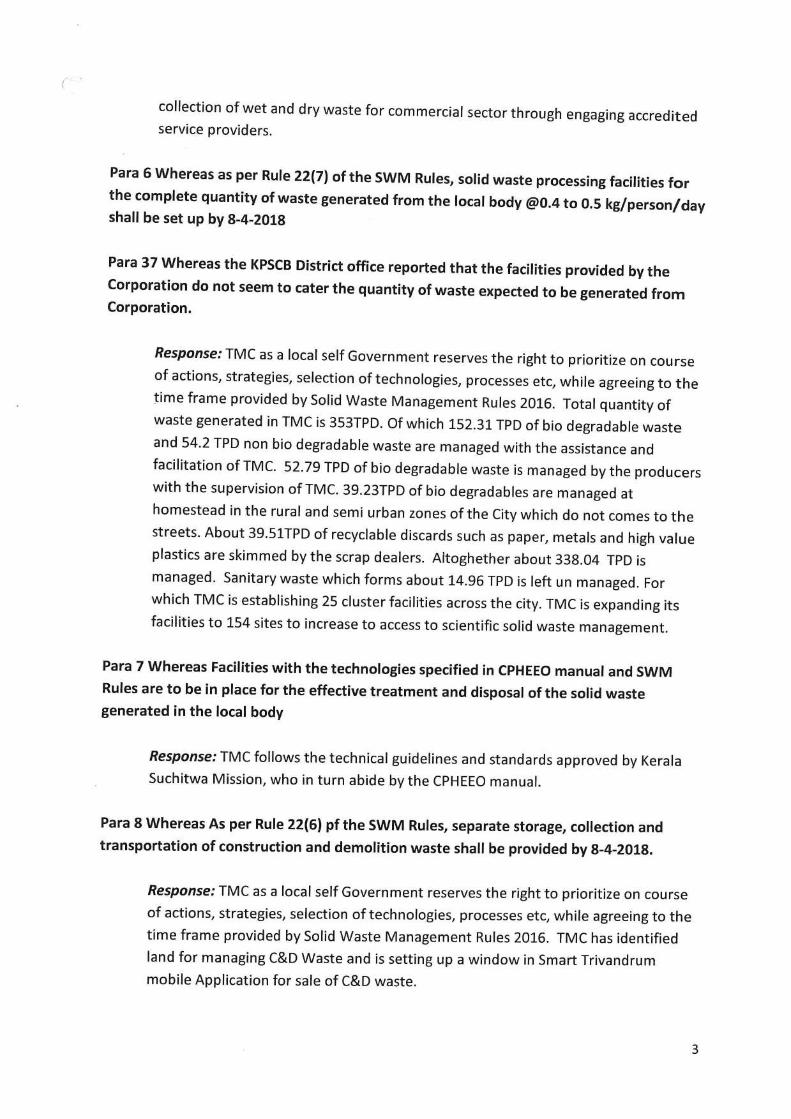
Annexure 3
Annexure 3
Annexure 3
Annexure 3
Annexure 3
Annexure 3
Annexure 3
Annexure 3
Annexure 3

Annexure 3
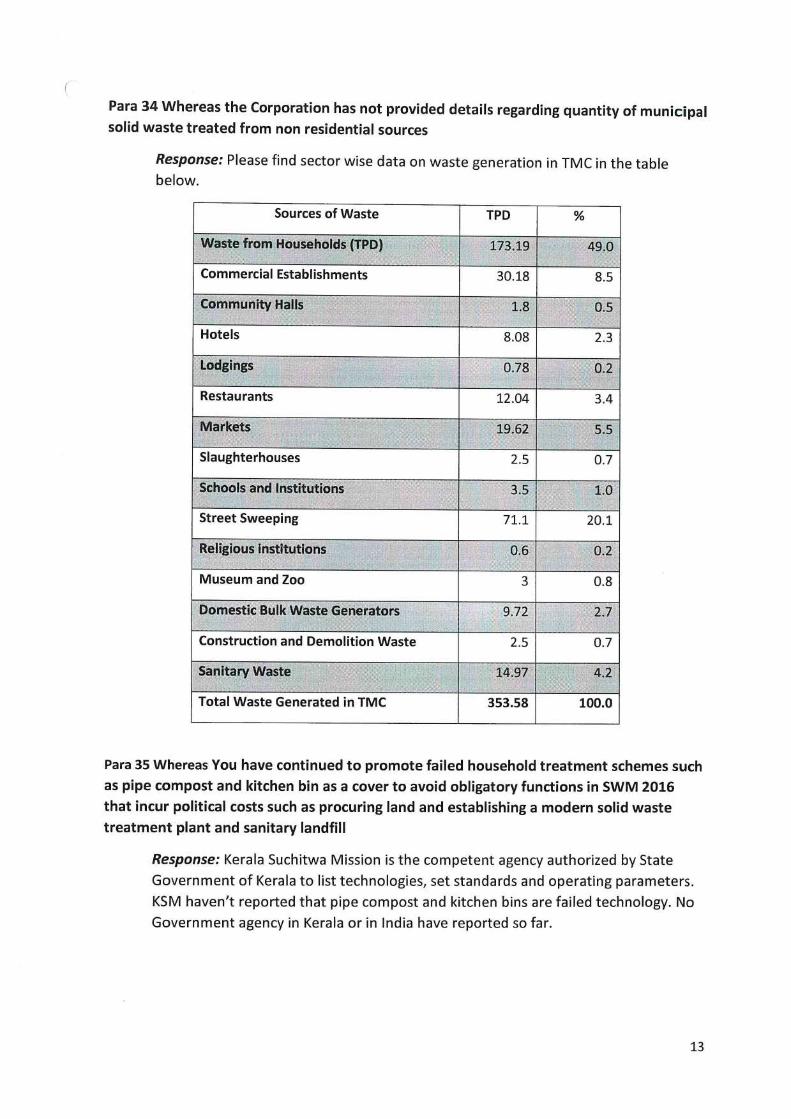
Annexure 3
Annexure 3
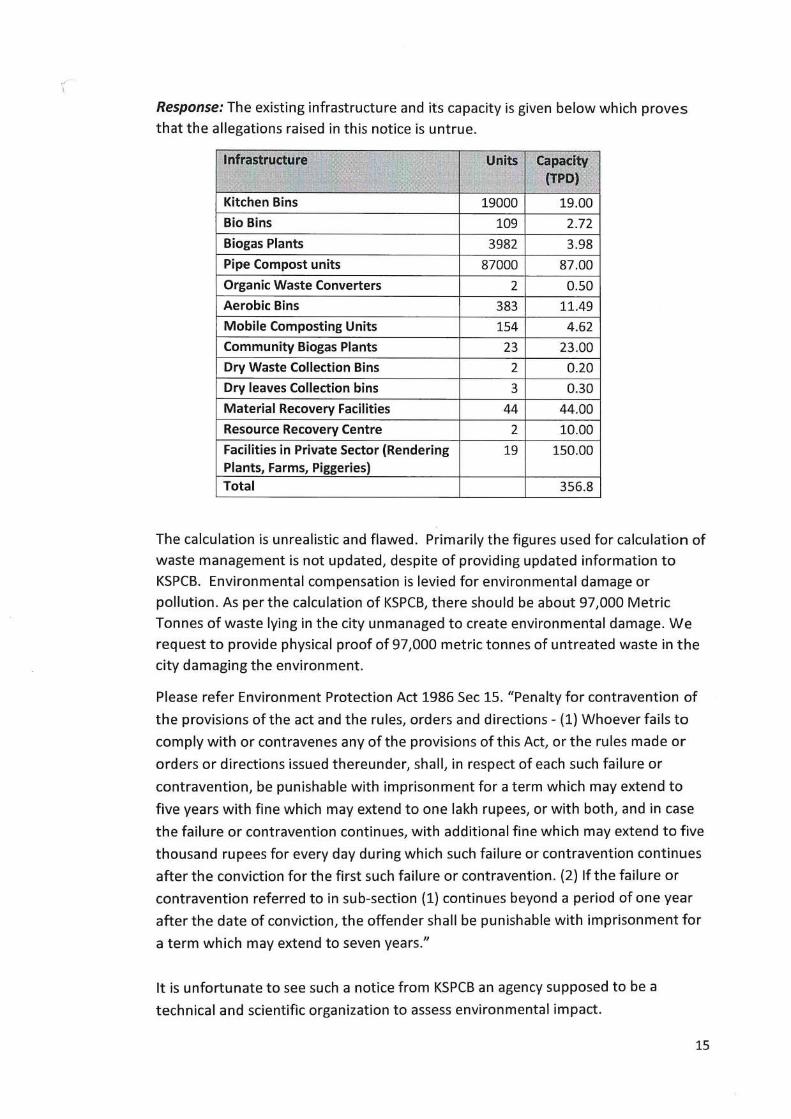
Annexure 3
Annexure 3
Annexure 3

Annexure 4
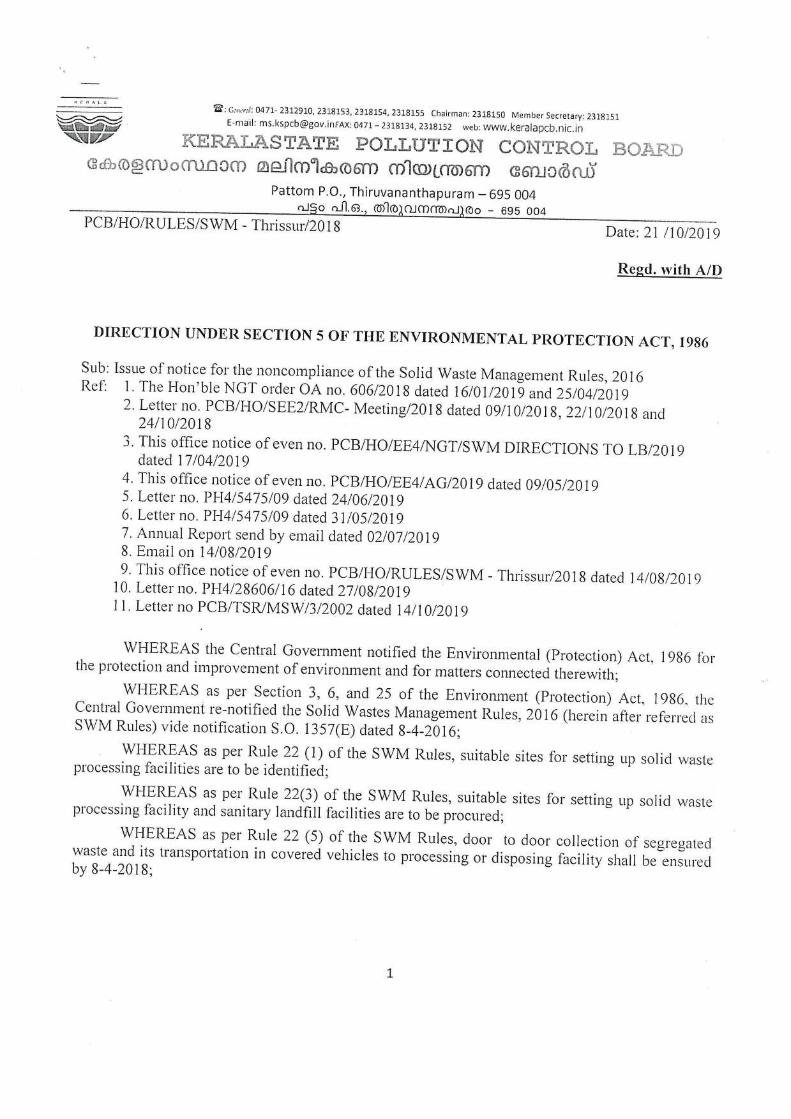
Annexure 5
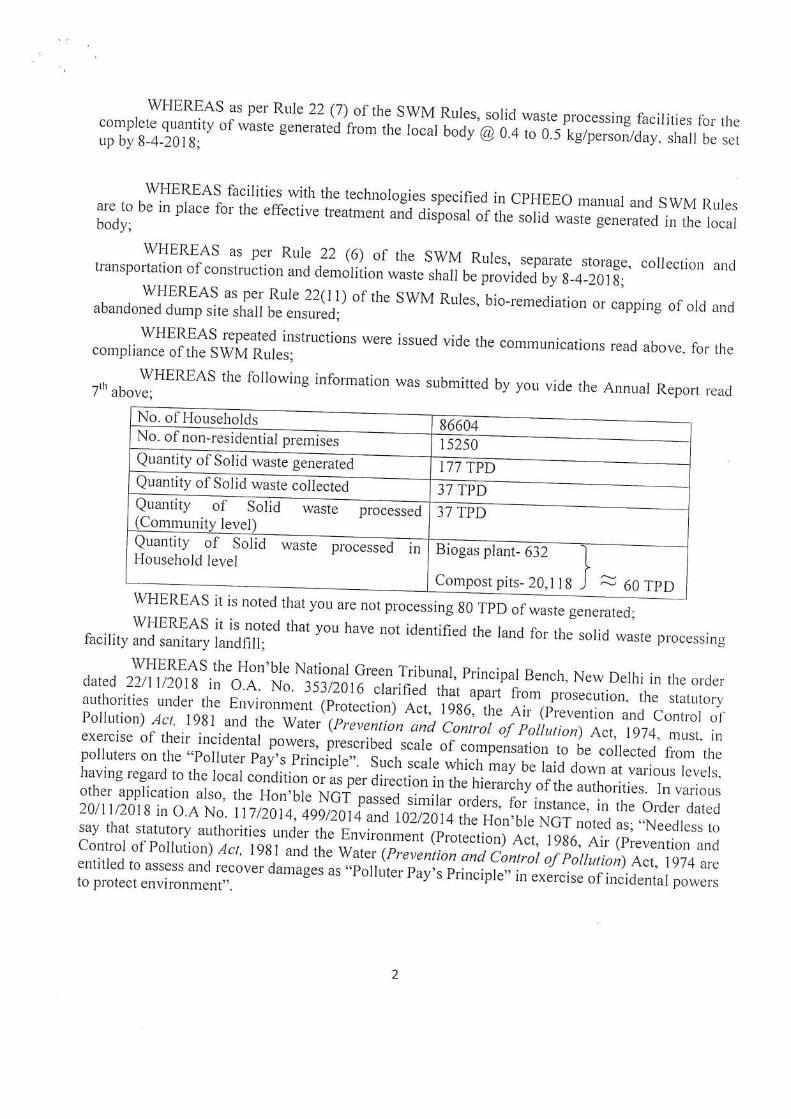
Annexure 5
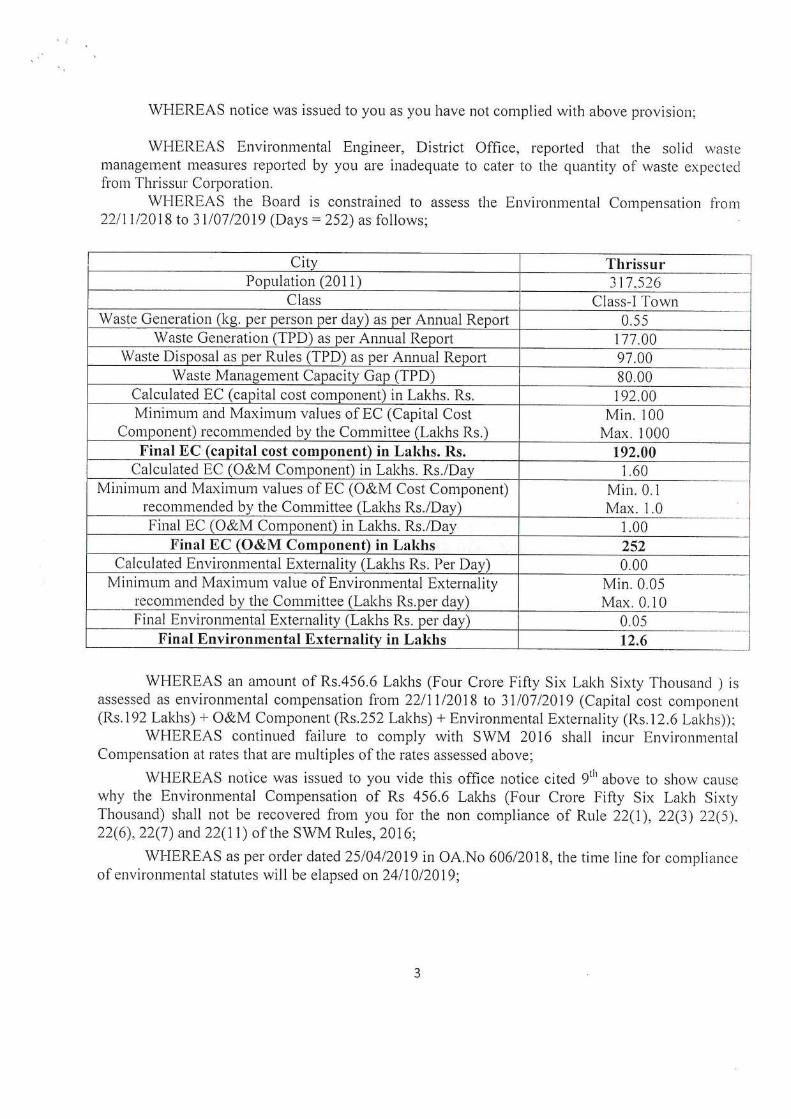
Annexure 5
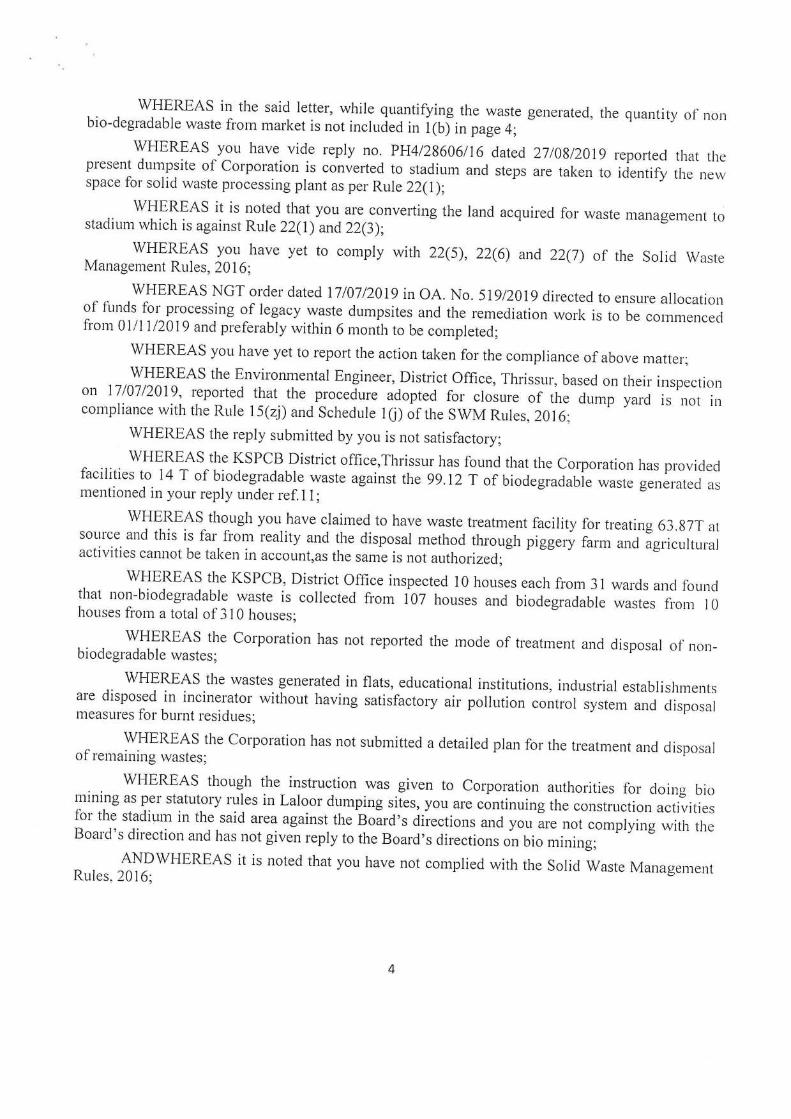
Annexure 5
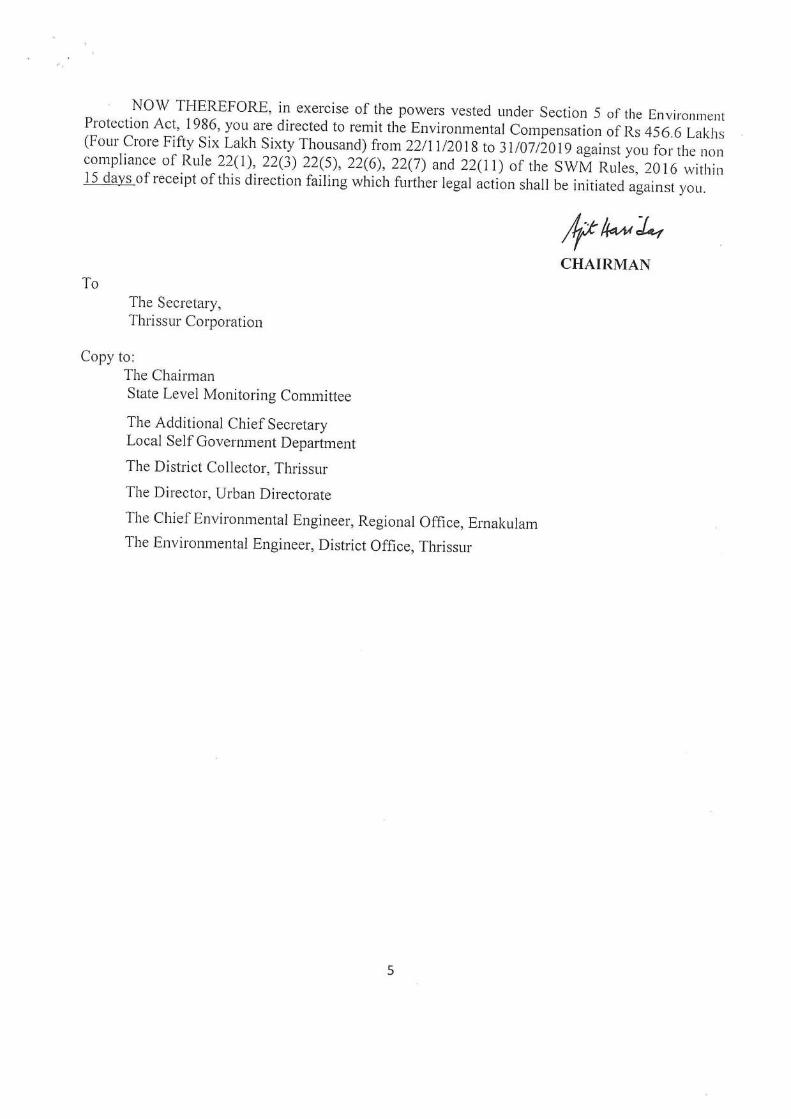
Annexure 5
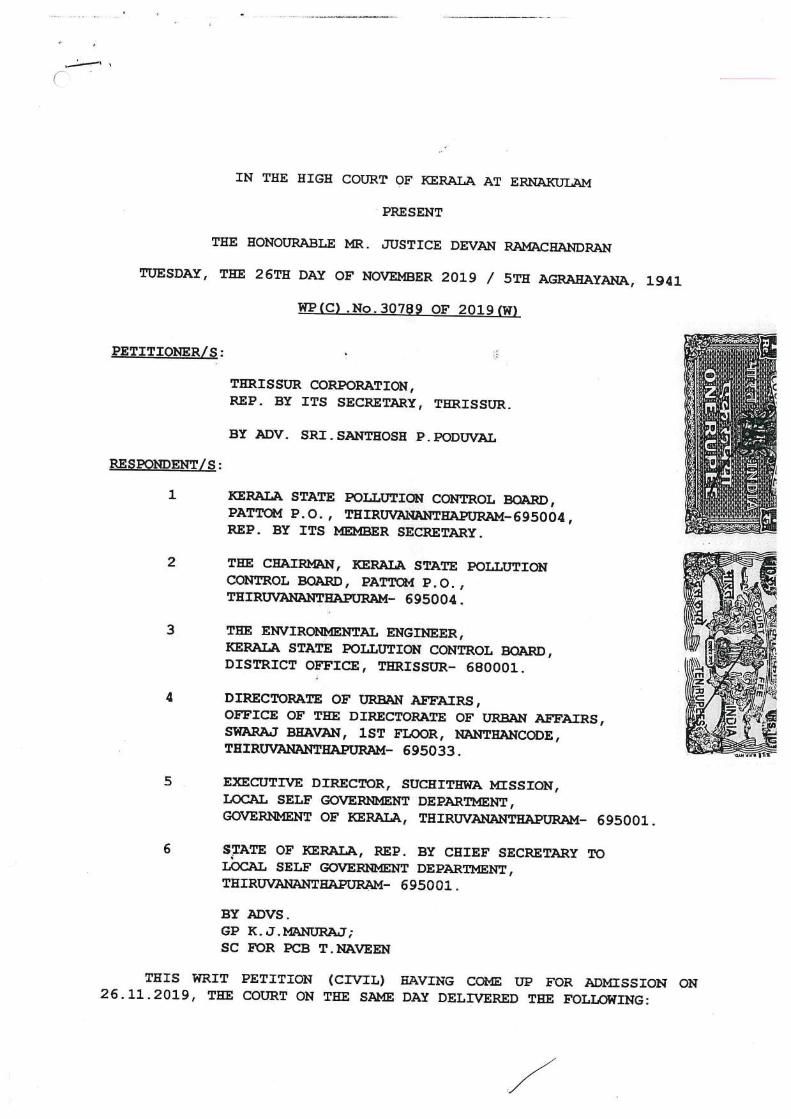
Annexure 6

Annexure 6
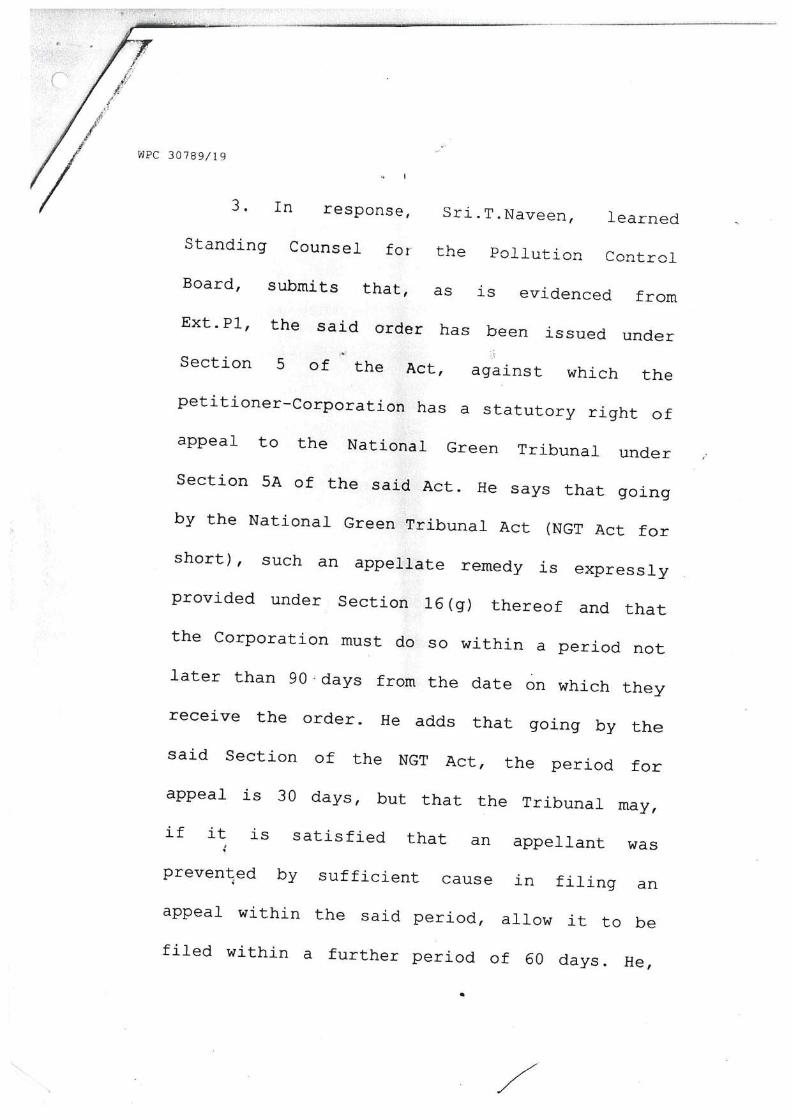
Annexure 6
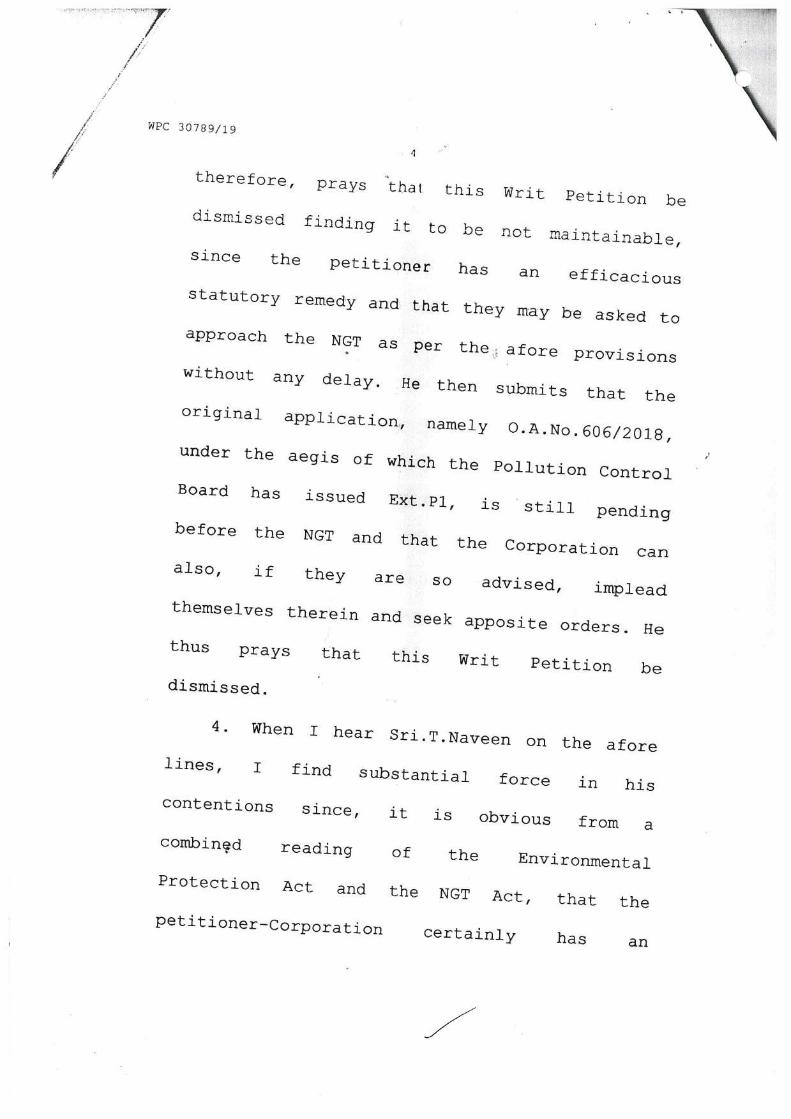
Annexure 6

Annexure 6
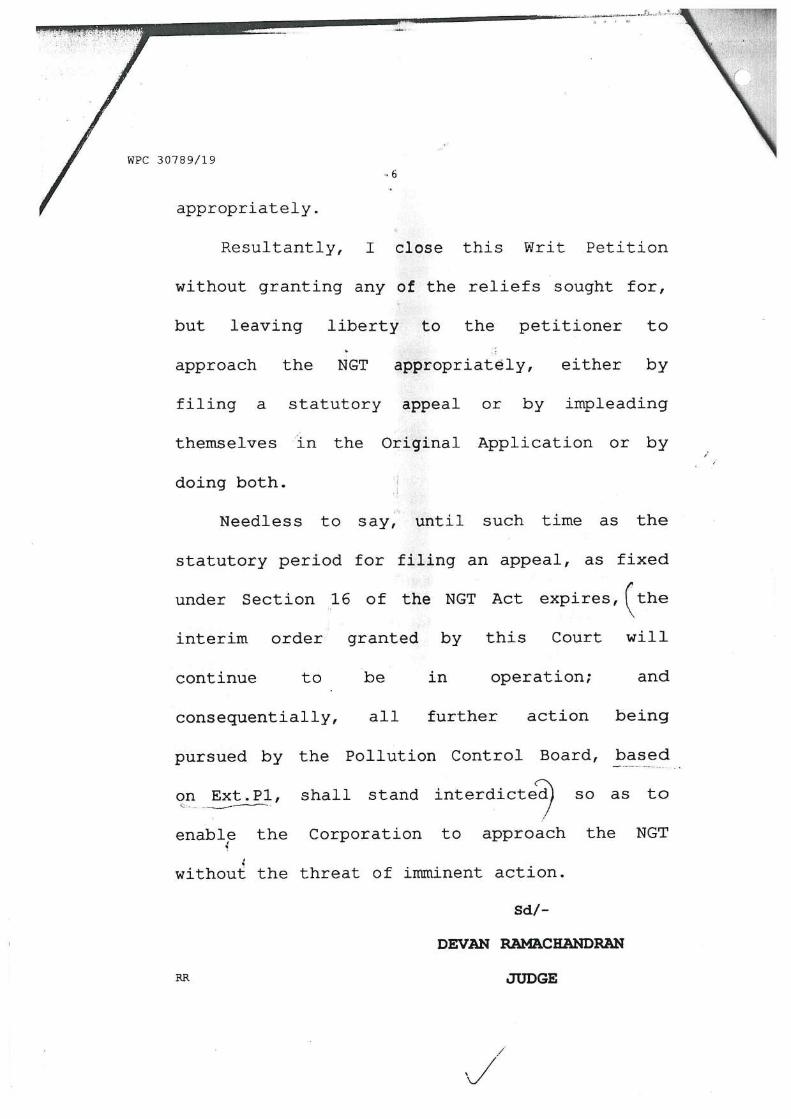
Annexure 6

Annexure 6
Annexure 6

Annexure 7
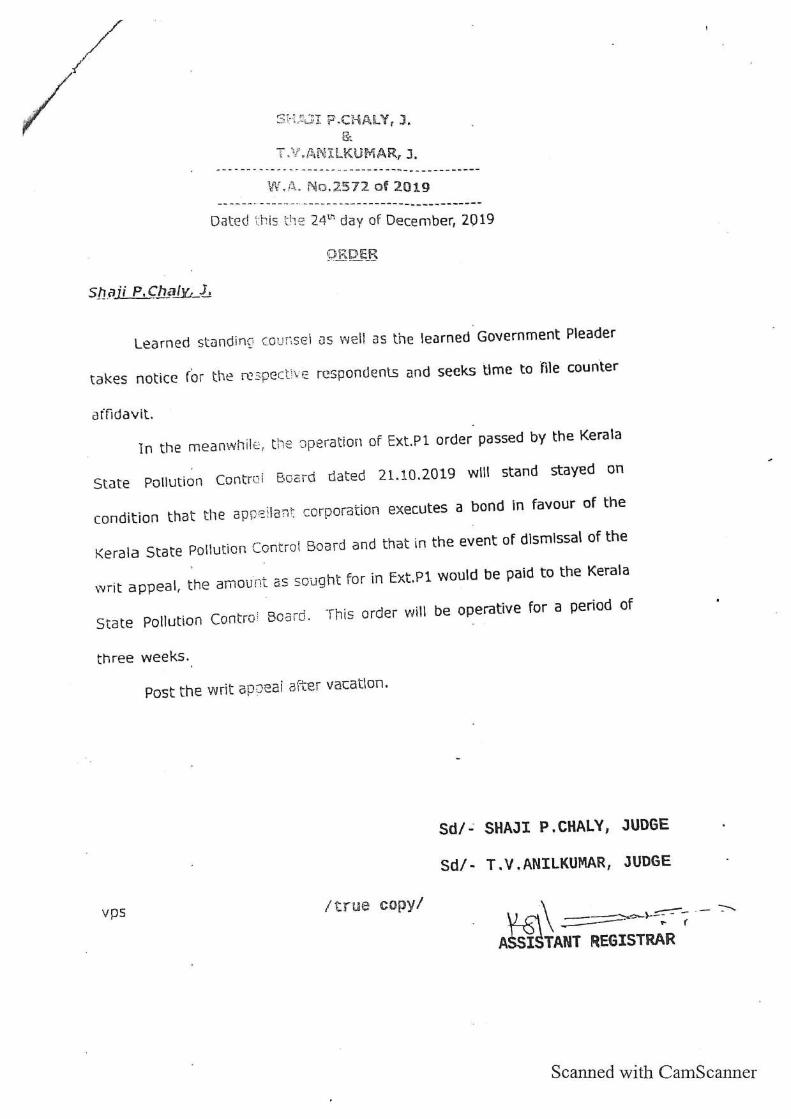
Annexure 7
Annexure 7
Annexure 8
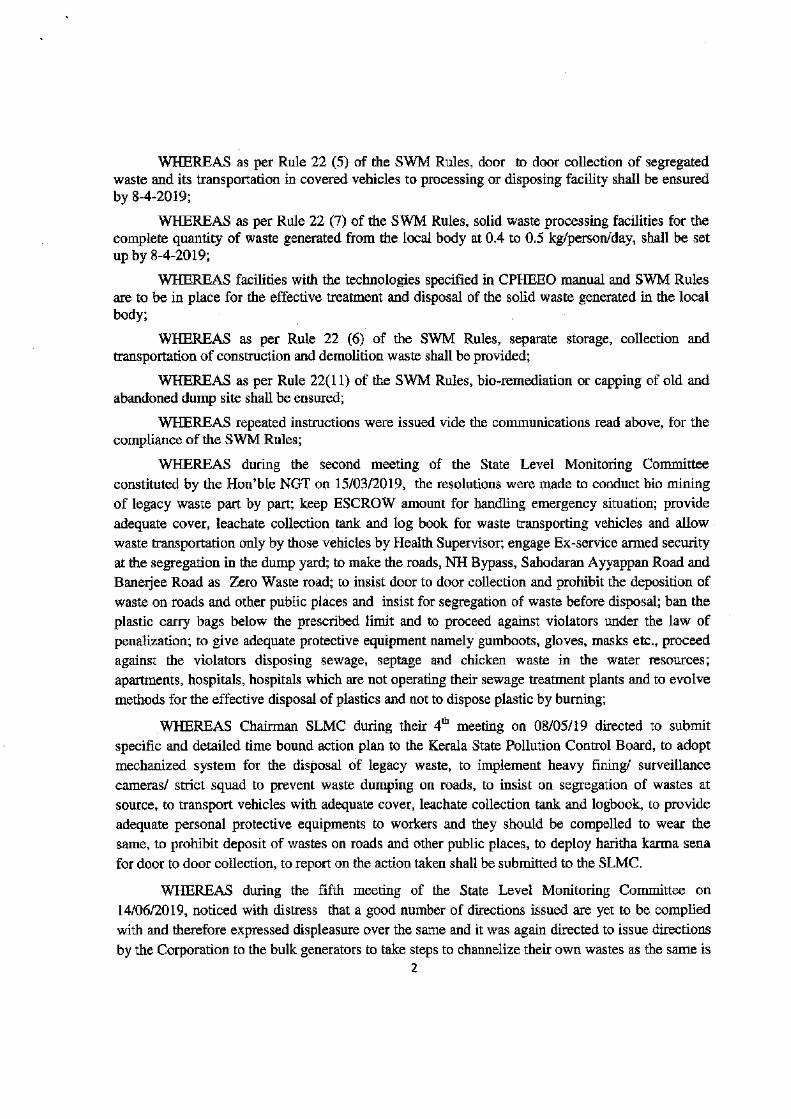
Annexure 8

Annexure 8
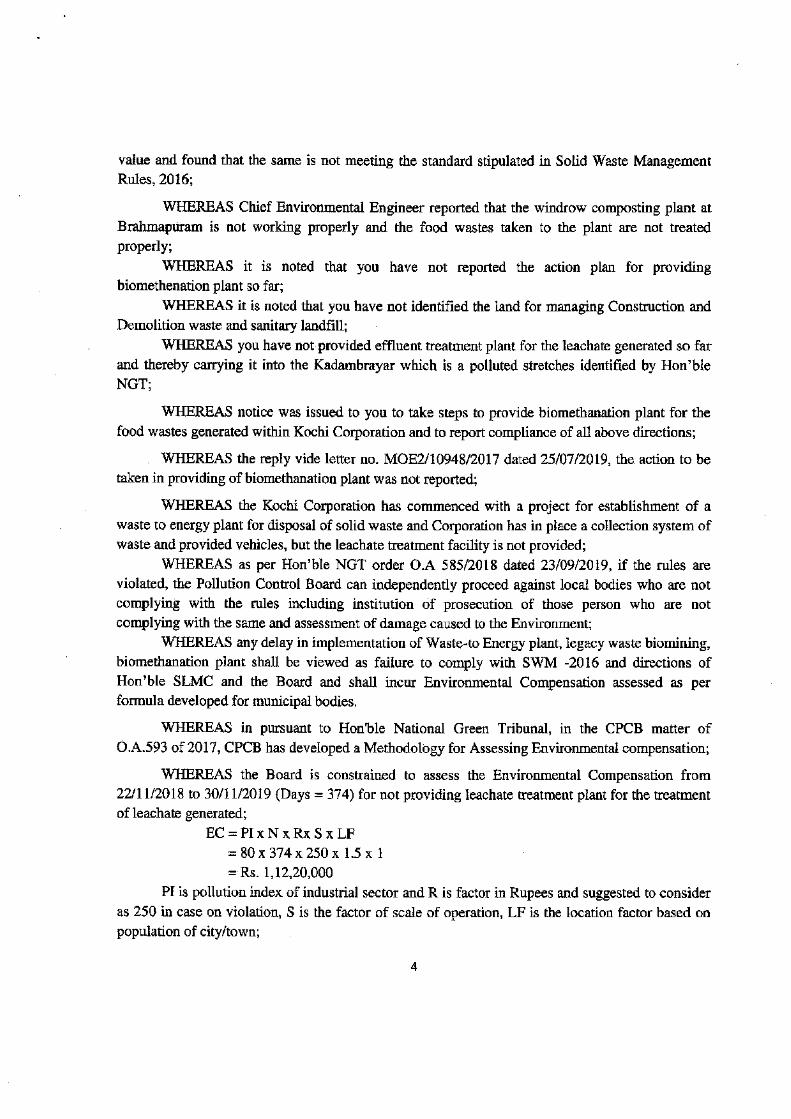
Annexure 8
Annexure 8
Annexure 9
Annexure 9
Annexure 9
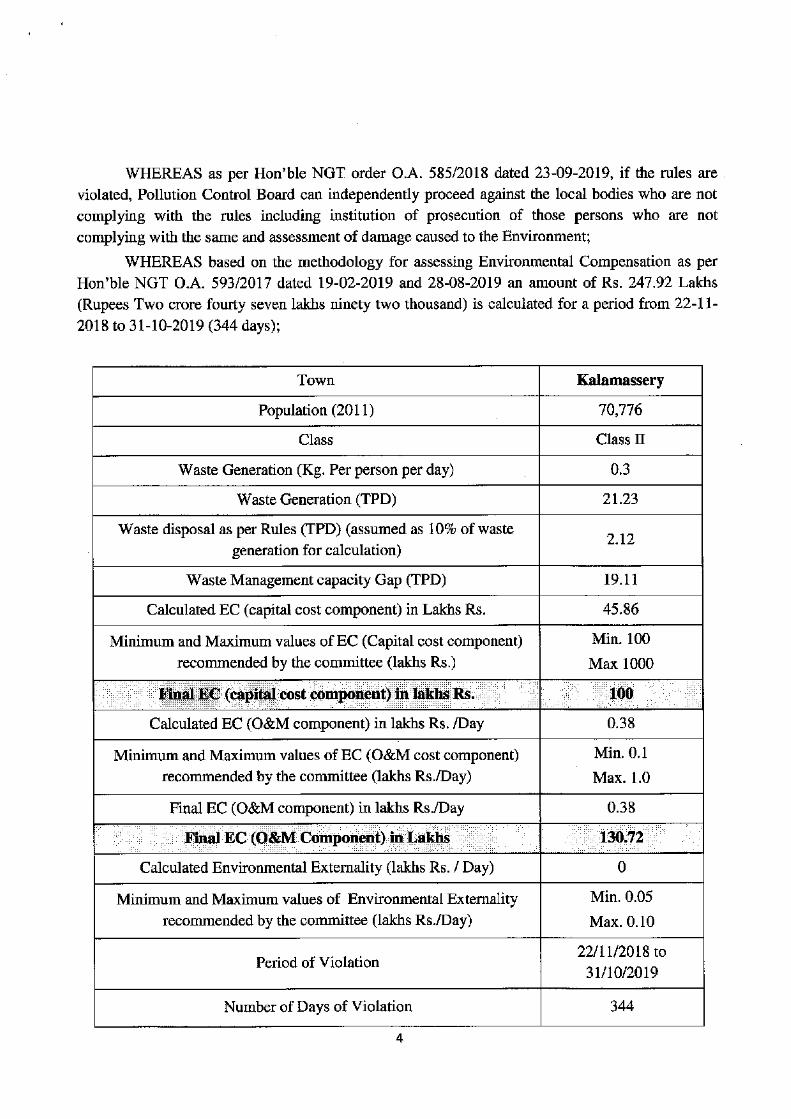
Annexure 9
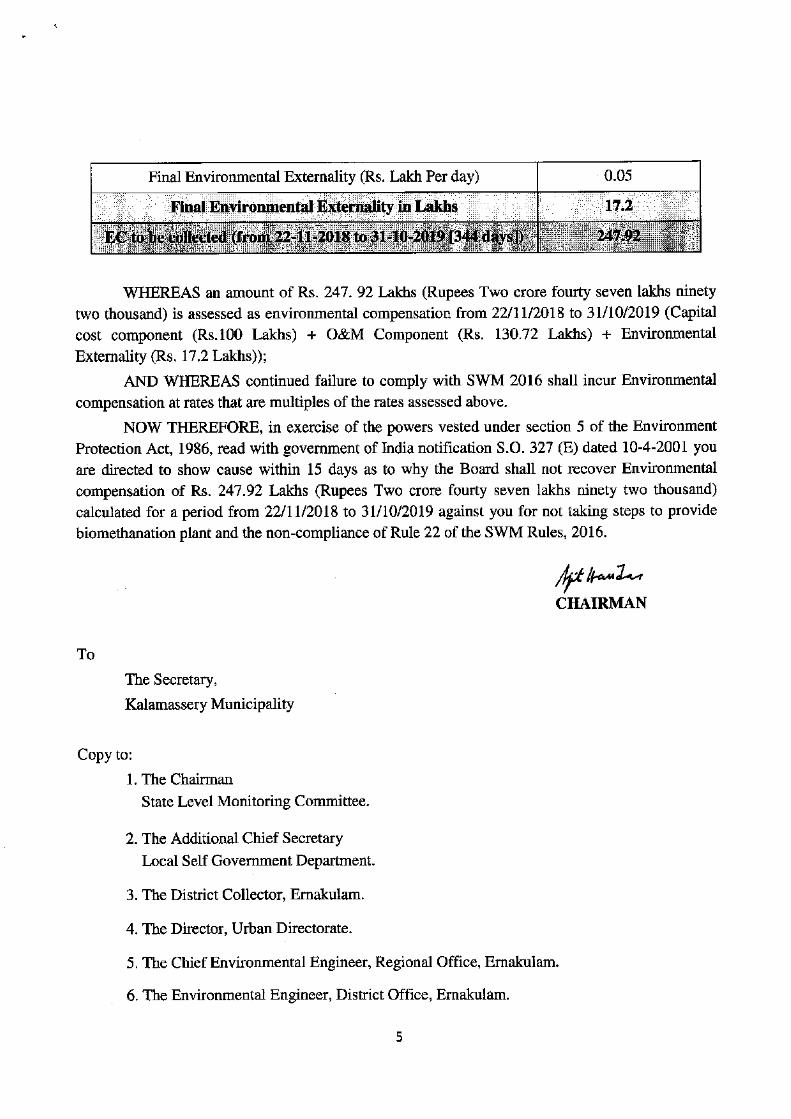
Annexure 9
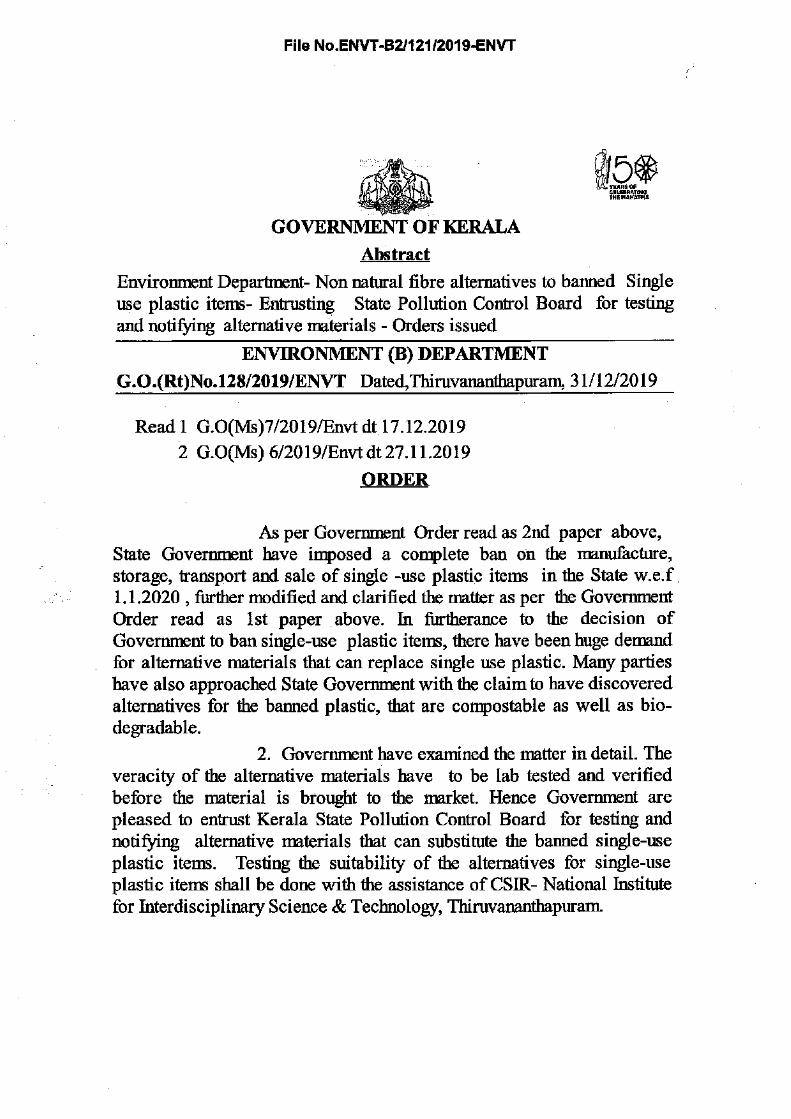
Annexure 10
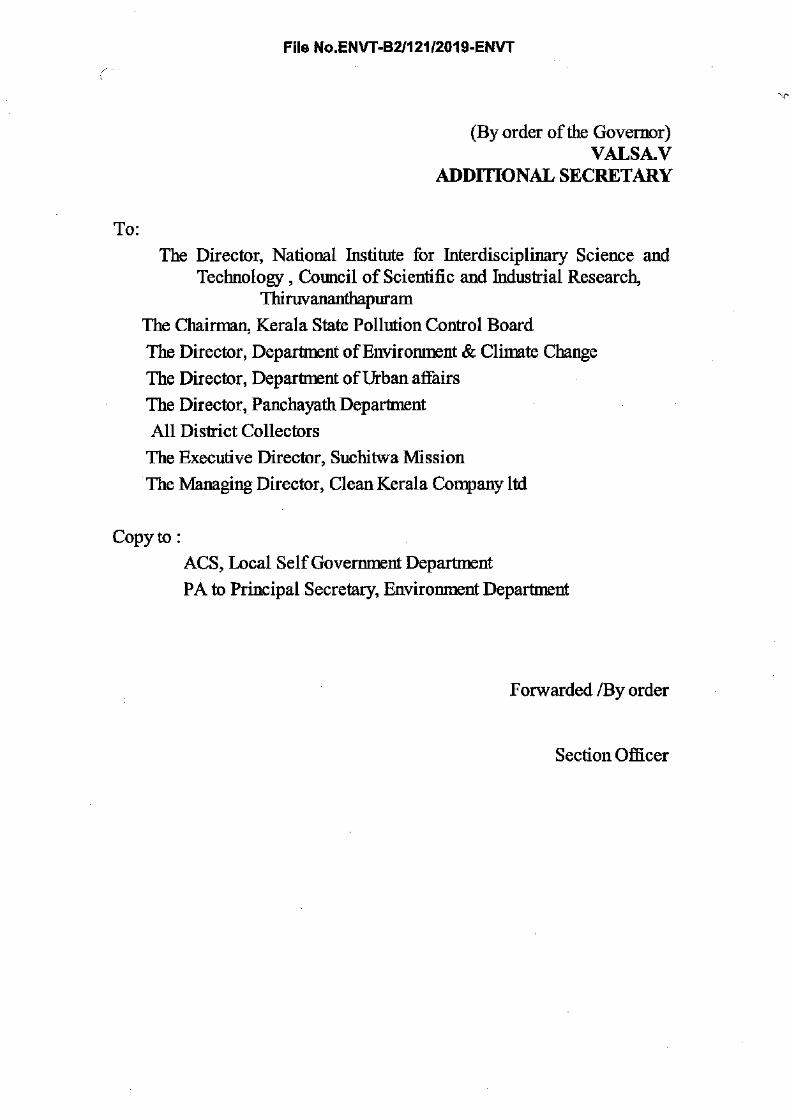
Annexure 10
Annexure 10
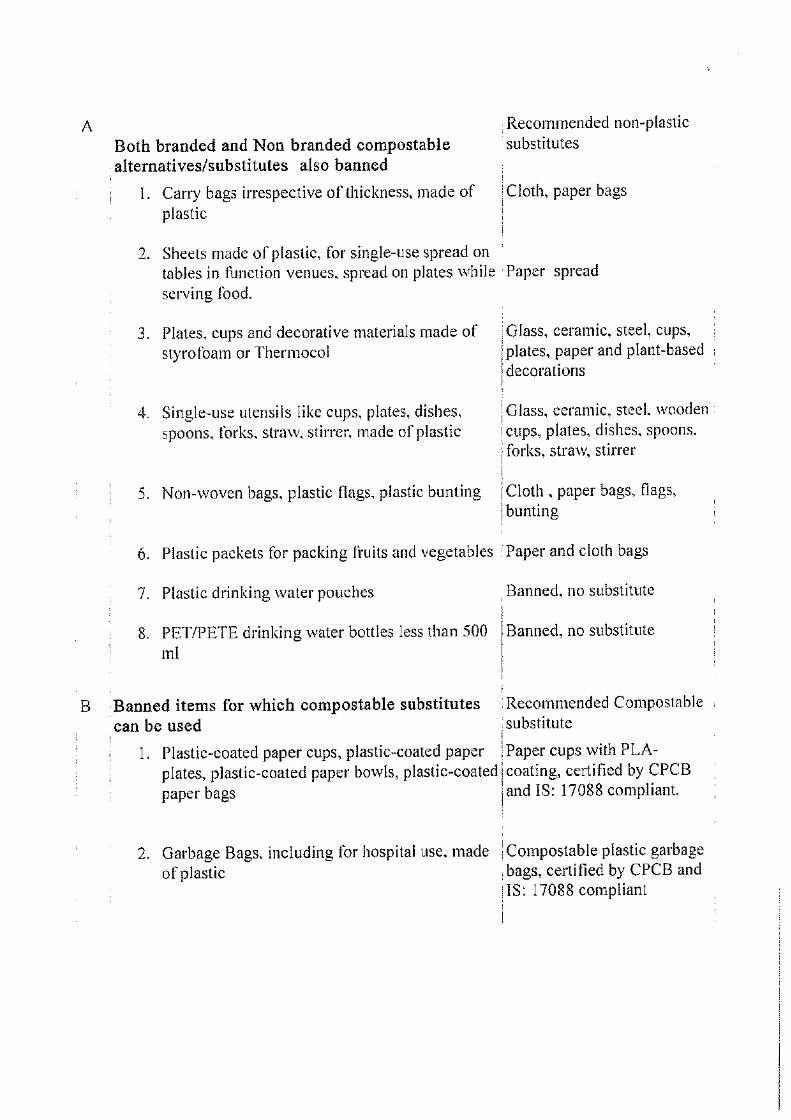
Annexure 10
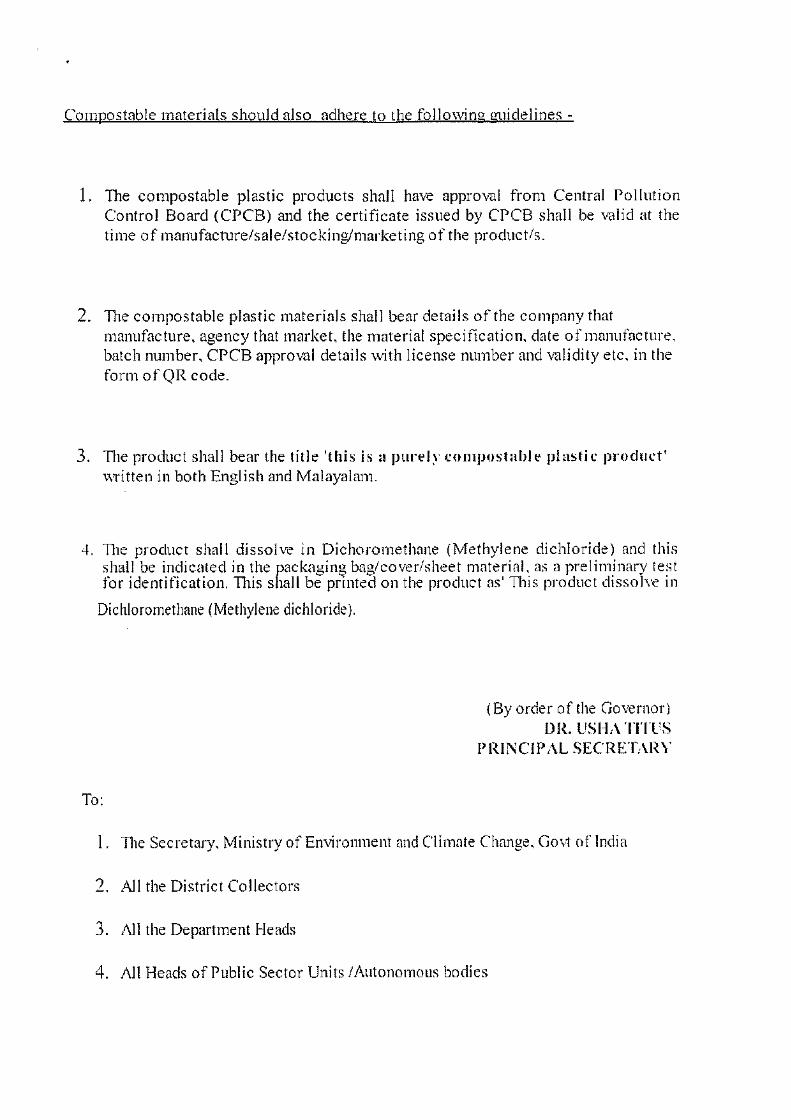
Annexure 10
Annexure 10
PROPOSAL FOR IMPLEMENTATION OF RULE 17(1) OF THE SOLID WASTE
MANAGEMENT RULES, 2016 BY PRODUCERS, BRAND OWNERS,
MANUFACTURERS AND IMPORTERS
Background
Solid Wastes Management Rules, 2016 in Rule 17(1) states that all manufacturers of
disposable products such as tin, glass, plastics packaging etc or brand owners who introduce
such products in the market shall provide necessary financial assistance to local authorities for
establishment of waste management system. Rule 17(2) states that all such brand owners who
sell or market their product in such packaging material which are non-biodegradable shall put in
place a system to collect back packaging waste generated due to their production. Though four
years was over, there is no compliance of these rules by the brand owners, producers,
manufacturers and importers. Majority brand owners are not taking back waste packaging from
Kerala and some brand owners have made some arrangements through PROs, the information on
quantity of packaging taken back have not been furnished to Kerala State Pollution Control
Board. Hence the Kerala State Pollution Control Board is unable to furnish the said details to
Hon’ble National Green Tribunal and to Central Pollution Control Board through statutory
annual reports under Solid Waste Management Rules, 2016 and Plastic Waste Management
rules, 2016
As per Solid Waste Management Rules, 2016, scientific collection, transport, treatment
and disposal of solid waste is to be implemented in the State. But there is failure in the
implementation especially of door- to-door collection mechanism due to paucity of funds for
giving wages to waste collectors. Door-to- door collection can be implemented by local
authorities and village panchayaths census towns and urban agglomeration effectively by giving
wages to waste collectors through user fee as well as EPR fund.
Objectives
The financial assistance by brand owners/producers/manufacturers/importers can be remitted in
the EPR fund and this fund can be utilized for meeting to the extent possible cost of door-to-
door collection.
Annexure 12
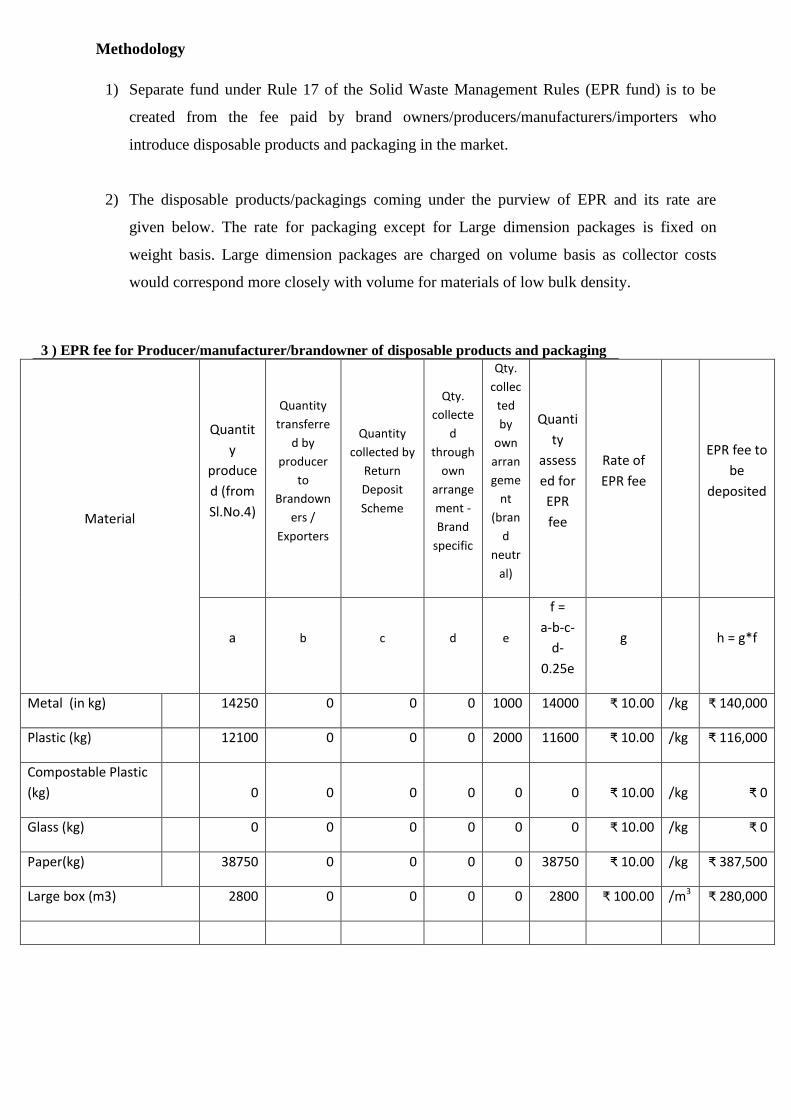
Methodology
1) Separate fund under Rule 17 of the Solid Waste Management Rules (EPR fund) is to be
created from the fee paid by brand owners/producers/manufacturers/importers who
introduce disposable products and packaging in the market.
2) The disposable products/packagings coming under the purview of EPR and its rate are
given below. The rate for packaging except for Large dimension packages is fixed on
weight basis. Large dimension packages are charged on volume basis as collector costs
would correspond more closely with volume for materials of low bulk density.
Material
Quantit
y
produce
d (from
Sl.No.4)
Quantity
transferre
d by
producer
to
Brandown
ers /
Exporters
Quantity
collected by
Return
Deposit
Scheme
Qty.
collecte
d
through
own
arrange
ment -
Brand
specific
Qty.
collec
ted
by
own
arran
geme
nt
(bran
d
neutr
al)
Quanti
ty
assess
ed for
EPR
fee
Rate of
EPR fee
EPR fee to
be
deposited
a b c d e
f =
a-b-c-
d-
0.25e
g h = g*f
Metal (in kg) 14250 0 0 0 1000 14000 ₹ 10.00 /kg ₹ 140,000
Plastic (kg) 12100 0 0 0 2000 11600 ₹ 10.00 /kg ₹ 116,000
Compostable Plastic
(kg) 0 0 0 0 0 0 ₹ 10.00 /kg ₹ 0
Glass (kg) 0 0 0 0 0 0 ₹ 10.00 /kg ₹ 0
Paper(kg) 38750 0 0 0 0 38750 ₹ 10.00 /kg ₹ 387,500
Large box (m3) 2800 0 0 0 0 2800 ₹ 100.00 /m3 ₹ 280,000
3 ) EPR fee for Producer/manufacturer/brandowner of disposable products and packaging
Annexure 12
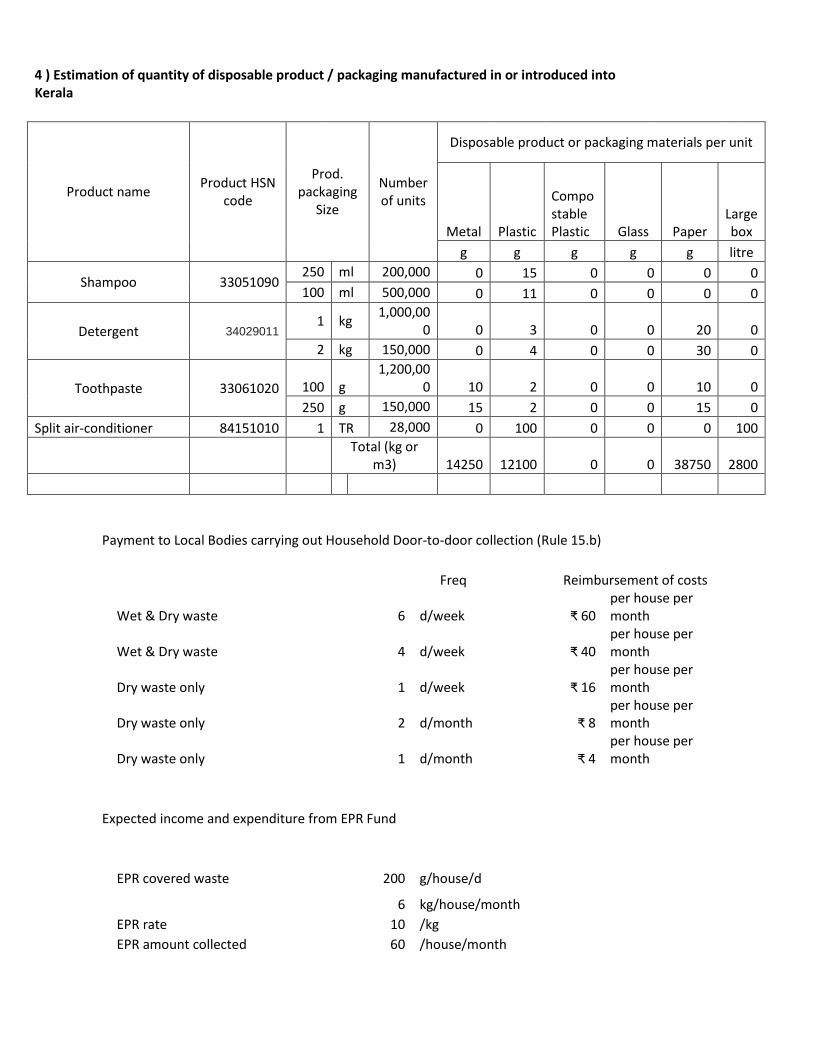
4 ) Estimation of quantity of disposable product / packaging manufactured in or introduced into Kerala
Product name Product HSN
code
Prod. packaging
Size
Number of units
Disposable product or packaging materials per unit
Metal Plastic
Compostable Plastic Glass Paper
Large box
g g g g g litre
Shampoo 33051090 250 ml 200,000 0 15 0 0 0 0
100 ml 500,000 0 11 0 0 0 0
Detergent 34029011 1 kg
1,000,000 0 3 0 0 20 0
2 kg 150,000 0 4 0 0 30 0
Toothpaste 33061020 100 g 1,200,00
0 10 2 0 0 10 0
250 g 150,000 15 2 0 0 15 0
Split air-conditioner 84151010 1 TR 28,000 0 100 0 0 0 100
Total (kg or
m3) 14250 12100 0 0 38750 2800
Payment to Local Bodies carrying out Household Door-to-door collection (Rule 15.b)
Freq Reimbursement of costs
Wet & Dry waste 6 d/week ₹ 60
per house per month
Wet & Dry waste 4 d/week ₹ 40
per house per month
Dry waste only 1 d/week ₹ 16
per house per month
Dry waste only 2 d/month ₹ 8
per house per month
Dry waste only 1 d/month ₹ 4
per house per month
Expected income and expenditure from EPR Fund
EPR covered waste
200 g/house/d
6 kg/house/month
EPR rate
10 /kg
EPR amount collected 60 /house/month
Annexure 12
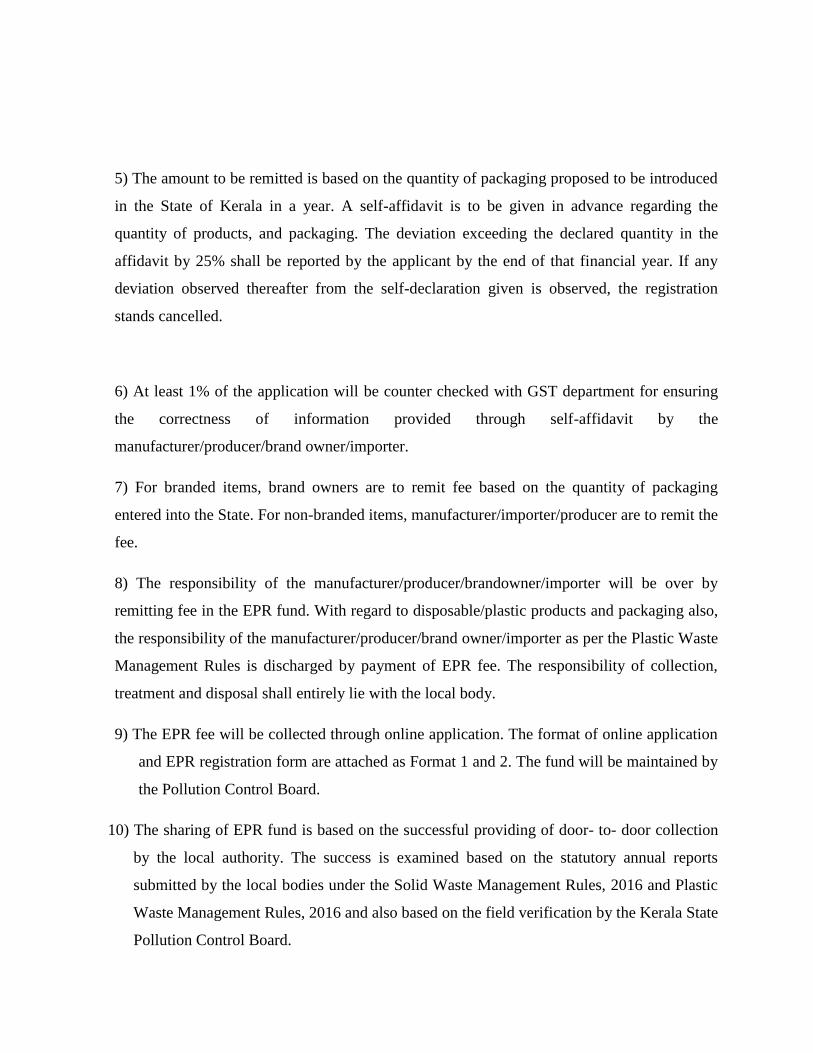
5) The amount to be remitted is based on the quantity of packaging proposed to be introduced
in the State of Kerala in a year. A self-affidavit is to be given in advance regarding the
quantity of products, and packaging. The deviation exceeding the declared quantity in the
affidavit by 25% shall be reported by the applicant by the end of that financial year. If any
deviation observed thereafter from the self-declaration given is observed, the registration
stands cancelled.
6) At least 1% of the application will be counter checked with GST department for ensuring
the correctness of information provided through self-affidavit by the
manufacturer/producer/brand owner/importer.
7) For branded items, brand owners are to remit fee based on the quantity of packaging
entered into the State. For non-branded items, manufacturer/importer/producer are to remit the
fee.
8) The responsibility of the manufacturer/producer/brandowner/importer will be over by
remitting fee in the EPR fund. With regard to disposable/plastic products and packaging also,
the responsibility of the manufacturer/producer/brand owner/importer as per the Plastic Waste
Management Rules is discharged by payment of EPR fee. The responsibility of collection,
treatment and disposal shall entirely lie with the local body.
9) The EPR fee will be collected through online application. The format of online application
and EPR registration form are attached as Format 1 and 2. The fund will be maintained by
the Pollution Control Board.
10) The sharing of EPR fund is based on the successful providing of door- to- door collection
by the local authority. The success is examined based on the statutory annual reports
submitted by the local bodies under the Solid Waste Management Rules, 2016 and Plastic
Waste Management Rules, 2016 and also based on the field verification by the Kerala State
Pollution Control Board.
Annexure 12
11) The list of unsuccessful local bodies will be transferred to the Director, Urban Affairs
Directorate and to the Director, Panchaayth Directorate for not giving theEPR share to
them.
12) The amount will be transferred to the Director, Urban Affairs Directorate and to the
Director, Panchayath Directorate for transferring fund to the successful local bodies.
13) 5% of the fund will be set apart as operation charges of Kerala State Pollution Control
Board namely creation and maintenance of online application for EPR fund, auditing, and
salary for staff deployed for implementation, monitoring and enforcement of SWM and
PWM 2016.
14 )The details regarding the applications received, EPR registration given, amount collected,
amount transferred to local bodies, status of door-to door collection, status of waste
management by local bodies etc., will be displayed on EPR online portal.
Annexure 12
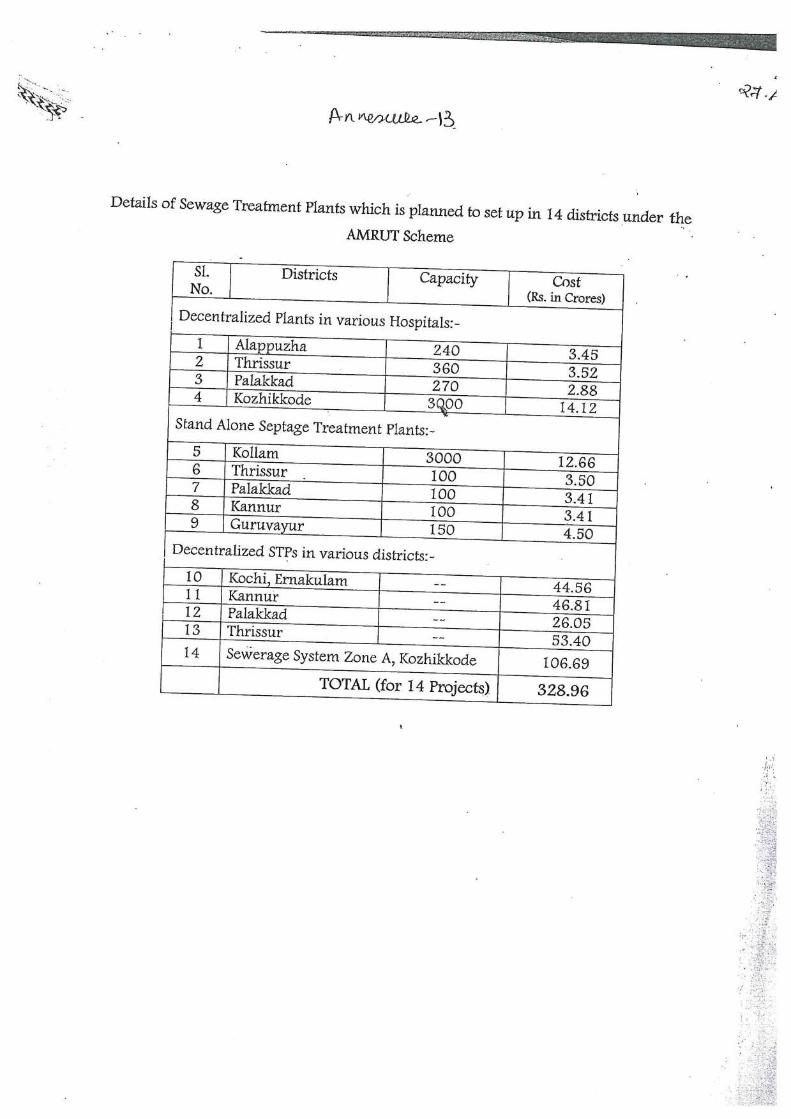
Annexure 13
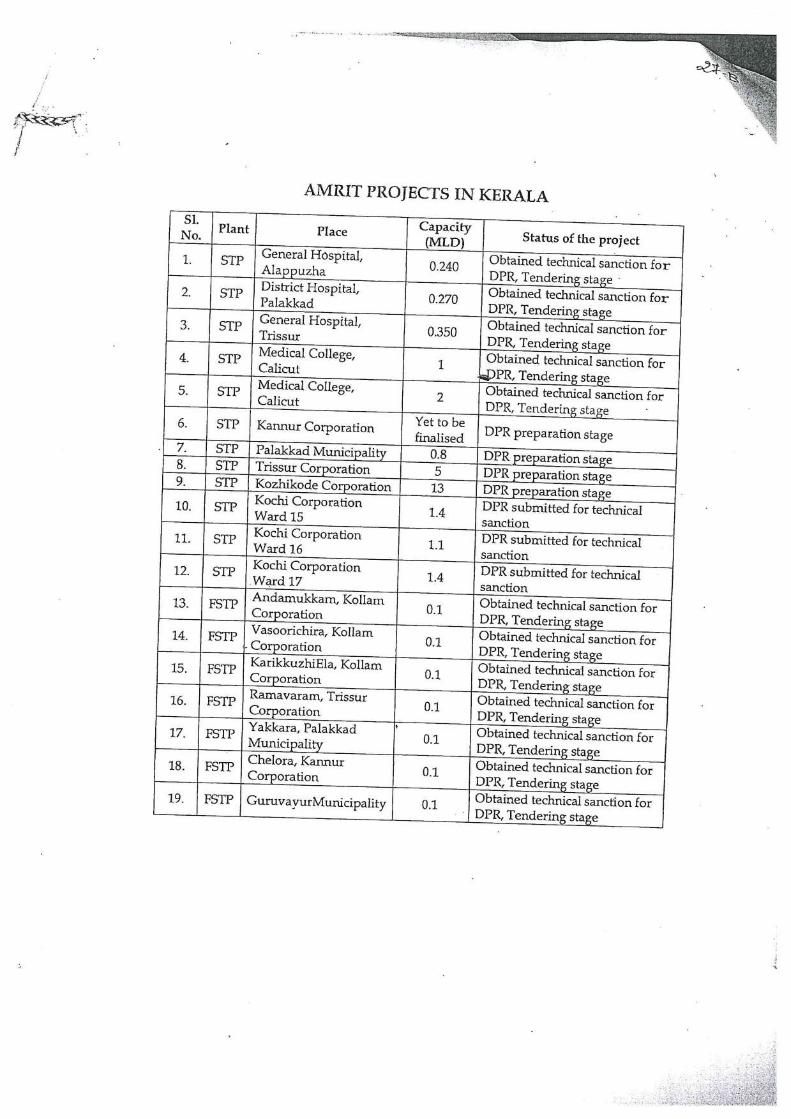
Annexure 13