Chief Patron Shri Suresh Jain, Hon'ble Chancellor ...
92
An International Journal of Management and Technology Chief Patron Shri Suresh Jain, Hon'ble Chancellor, Teerthanker Mahaveer University Patron Shri Manish Jain, Group Vice Chairman, Teerthanker Mahaveer University Editorial Advisory Board Chairperson Prof. R.K Mittal Vice Chancellor, Teerthanker Mahaveer University Editor Ms. Vaishali Dhingra Faculty Incharge, CMCA, Teerthanker Mahaveer University Technical Assistance, Ms. Gunjan Saxena Disclaimer: The articles contained in the journal carry the opinion and views of the contributors and not necessarily of the Editorial Board. The Editorial Board as such shall not be responsible for the authenticity and legality concerns regarding the submissions made in this journal. The entire responsibility shall lie with the author of the articles, research papers or case studies. Prof. A.C. Jesuraman, Mr. Akshay Randeva, Prof. D. P. Goyal, Prof. Madhu Vij Dr. Manjula Shyam Dr. M. Saeed, PhD, Dr Mrinalini Shah XLRI, Jamshedpur Director, Strategic Development, Qatar Financial Centre Authority, Qatar MDI, Gurgaon FMS, University of Delhi, Delhi (Retd Prof) Yale University, U.S.A Minot State University, USA IMT,Ghaziabad Mr. Paras Sachdeva Ms. Parul Randeva Prof. Prabal K. Sen Dr. R. K. Mudgal, Prof. Saji KB Nair Prof. Satyabhushan Dash Principal Consultant, Infosys Limited, U.S.A Qatar Finance and Business Academy, Qatar XLRI, Jamshedpur Registrar, TMU, Moradabad IIM, Lucknow IIM, Lucknow Director, Haryana Business School Guru Jambheshwar University of Science and Technology, Hisar, Haryana EAU, Canada National University Hospital, Singapore IIM, Lucknow IIT, Delhi Additional Director CMCA, Teerthanker Mahaveer University Prof. S.C. Kundu Dr. Stephen Gill, Dr. Subhash Kapur Prof. Sukumar Nandi, Prof. Sushil, Dr. Vipin Jain
-
Upload
khangminh22 -
Category
Documents
-
view
0 -
download
0
Transcript of Chief Patron Shri Suresh Jain, Hon'ble Chancellor ...

An International Journal of Management and Technology
Chief PatronShri Suresh Jain, Hon'ble Chancellor,
Teerthanker Mahaveer University
PatronShri Manish Jain, Group Vice Chairman,
Teerthanker Mahaveer University
Editorial Advisory BoardChairperson
Prof. R.K MittalVice Chancellor, Teerthanker Mahaveer University
Editor
Ms. Vaishali Dhingra
Faculty Incharge, CMCA,Teerthanker Mahaveer University
Technical Assistance, Ms. Gunjan Saxena
Disclaimer: The articles contained in the journal carry the opinion and views of the contributors and not necessarily of the Editorial Board.
The Editorial Board as such shall not be responsible for the authenticity and legality concerns regarding the submissions made in this journal.
The entire responsibility shall lie with the author of the articles, research papers or case studies.
Prof. A.C. Jesuraman,
Mr. Akshay Randeva,
Prof. D. P. Goyal,
Prof. Madhu Vij
Dr. Manjula Shyam
Dr. M. Saeed, PhD,
Dr Mrinalini Shah
XLRI, Jamshedpur
Director, Strategic Development,Qatar Financial Centre Authority, Qatar
MDI, Gurgaon
FMS, University of Delhi, Delhi
(Retd Prof) Yale University, U.S.A
Minot State University, USA
IMT,Ghaziabad
Mr. Paras Sachdeva
Ms. Parul Randeva
Prof. Prabal K. Sen
Dr. R. K. Mudgal,
Prof. Saji KB Nair
Prof. Satyabhushan Dash
Principal Consultant,Infosys Limited, U.S.A
Qatar Finance andBusiness Academy,Qatar
XLRI, Jamshedpur
Registrar, TMU, Moradabad
IIM, Lucknow
IIM, Lucknow
Director, Haryana Business School
Guru Jambheshwar University of
Science and Technology,
Hisar, Haryana
EAU, Canada
National University
Hospital, Singapore
IIM, Lucknow
IIT, Delhi
Additional Director
CMCA, Teerthanker Mahaveer University
Prof. S.C. Kundu
Dr. Stephen Gill,
Dr. Subhash Kapur
Prof. Sukumar Nandi,
Prof. Sushil,
Dr. Vipin Jain

Editorial
The day is not far when we will make our nation a lapis lazuli. What is required is not the efforts rather synchronized
efforts. According to Prof TN Srinivasan the origin of the term 'poverty line' can be owed to 1876 when Dada Bhai
Naroji provided the first set of poverty line. After so many years the moot point still revolves around the politically
contentious definition of poverty line. Unless we reach a consensus on the actual figure how can we start figuring out
the ways to eliminate it. Dr.APJAbdul Kalam appreciates the answer he got from a school kid (pointed out in his book
'Ignited Minds'), when asked 'who is our worst enemy, the school kid replied, 'poverty'.
Dr. Montek Singh Ahluwalia, along with the team need to solve the mystery by actually putting Rs. 32 in the pocket
and try to spend the day. Easy to set the limits perhaps!
That needs a bit of time perhaps. When our very dear finance minister is busy contesting the Presidential Elections, it
rather is difficult to work on such insignificant details. One good thing about the subject statistics is that the figures
can be projected the way you like. Our planning commission is making good use of the same. Sustaining merely on Rs.
32 (in case of urban population) is no joke. A destitute fellow will have to take heart in the theory of 'Karma', and
surrender to it. One will have to yield to one's circumstances and succumb to poverty.
The academicians world wide are researching on newer methods of poverty alleviation but the outcome is yet to be
reached.
A concrete resolution and very firm plan is required for the same otherwise it'll be a thing of parliamentarian
discussions only. We as academicians need to pay heed to the problems engulfing our nation and must try to find out a
real solution to them.
Vaishali Dhingra

CONTENTS
“Viewpoint” by M. M. Goel 1
1. Understanding Sustainability of Trade Balance in Singapore : 3
Empirical Evidence from Cointegration Analysis
2. Review of City Bus Transportation under JNNURM: 10
A Study of Lucknow City
3. Scanning the Business Environment in India: An Overview of Select 23
Multinational Companies in the Indian Marketplace
4. Leadership Analysis in an Organization: 35
A 360° Analysis to Determine the Behavior of the Leader
5. Challenges & Opportunities in Management Education in India 46
6. SWOT Analysis of Cash Based System of Accounting in Uttarakhand 50
7. A Study of New Technological Innovations in Digital Marketing and its 57
Awareness and Usage Level in Organizations at Delhi-NCR
8. Senior Citizens – Enjoy Your Old Age 66
Management Case 72
Dharitree Project: A Case Study on the Scope and Utilities of Information andCommunication Technology Project in Assam
BOOK REVIEWS 82
Vipin Jain and Janesh Sami
Ali Ghufran and Zeeshan Amir
James Ondracek, Andy Bertsch, M. Saeed and Carlan Taft
Neha Gupta
Sanchita and M. M. Goel
Amita Joshi, J.C Badola and Bhawana Goel
Palak Gupta
Vinod Kumar Chib
Uttam Kr. Pegu

M. M. Goel
Business without ethics is like eyes without sight. To
do business with morality and honesty of purpose is
the need of the day. This is necessary to cope up the
threats of panic and fear (false evidences appearing
real) of the so called global economic crisis by all the
stakeholders in any economy. To survive and exist in
present world of competition which is both healthy
and unhealthy, we need to do everything in the best,
efficient and effective way without ignoring the
ethics as a most important input. The business world
of profit maximization as the sole objective does
many kinds of immoral and unethical things. It is in
this context we need the subject of business ethics. It
should also be understood, analyzed, interpreted
that the basic purpose of human life is happiness and
not necessarily the acquisition of material wealth.
We are human beings by birth but to become human
capital, we need to utilise our existing spiritual
capacity to say no to selfishness.
It is a matter of great satisfaction that ethics has
become a popular subject of study in various
institutions and universities of the world including
India.
There are many theories of ethics for governance in
caring the cared less, using the used less manpower
with compassion which are necessary and sufficient
for achieving the objective of inclusive growth
meaning thereby to include the excluded segments
of society. The environmental ethics relevant to be
studied by not only the polluted minds but the so
called protagonist of environment to work more
forcefully for the great cause. The Indian ethos and
Gandhian ethics deserve attention of the world
leaders in business. Trusteeship of Mahatma
Gandhi' is more than a concept which needs
understanding, analysis, interpretation and adoption
by the entire world of corporate sector.
I believe that socio-economic development of
Indians in India is a distant dream without Sanaskar
Model flowing from 'Trusteeship' under corporate
social responsibility (CSR) towards the
disadvantaged sections of the society in a mission
mode with ten percent contribution at least from
their profits. Further, we need to convert Khadi and
Village Industries Commission (KVIC) in to a
multinational national corporation (MNC) capable
of solving the twin sister problems poverty and
unemployment of India. If Mahatma Gandhi could
have been alive today, he would have advocated
internationalization of Indianization through Khadi
which was more than clothing for him during
freedom movement as `swadeshi` for fetching the
fortunes of globalization under World Trade
Organization (WTO).
The politicians both in power and opposition should
wear the concave lens of the kind of Mahatma which
unites people instead of convex lens leadership
qualities dividing people on caste, religion,
language and regional basis. Indian Sanskar
management has contributed to the welfare, work
condition and happiness of employees Sanskar
management also has contributed to the sustainable
growth of Indian companies in the sense of turnover
and profits. Sanskar management has played an
important role in socio-economic development of
India as well as in the corporate social responsibility
in work and business. Thus, Sanskar management is
a very important strategy for the sustainable growth
of corporate sector as well as for the welfare and
happiness of its employees
The motto 'Not Me but You' is capable of giving new
meaning to rationality in economics which has
created selfish behaviour among the actors of the
economy including producers and consumers of all
.
.
1 • • January-June 2012Volume 3 • No. 1
Business Ethics and Good Governance :An Academic Perception

kinds and needs to be substituted with selflessness.
To lay the foundations of a new and just social order,
altruism- the principle of living and acting for the
interest of others need to be understood, analyzed,
interpreted and adopted in totality by Indian
corporate sector.
Let corporate sector in the modern World of today
learn from Mr. Bill Gates of Microsoft who
promotes ' Creative Capitalism' as a new avatar of '
Trusteeship' of the father of the nation Mahatma
Gandhi for improving, adopting and promoting
corporate social responsibility(CSR).
To become agents of progress, prosperity and peace,
the Indian corporate sector need to firmly establish
inner-net (not internet) based on inside –out
approach flowing from ancient Indian perspectives.
Willingness to do something for society which
means all minus myself is necessary and sufficient
condition for inclusive growth to include the
excluded. For the world of wisdom to exist, we need
to stop word war of blaming one another as
stakeholders and should be faithful to the intentions
of the will of people as advocated by Dr. B. R.
Ambedkar while identifying the functions of
Comptroller & Auditor General (CAG) in 1949. To
care for the cared less, we need to learn altruism as a
rational behaviour in consumption, production,
distribution and exchange activities in every
economy of the world including India.
The business sentiment around the world including
India can be improved by ensuring good governance
which means SMART (Simple , Moral ,
Accountable, Responsive and Transparent)
administration with SIMPLE attributes of human
development consisting of six activities such as
Spiritual quotient (SQ) development, Intuition
development, Mental level development, Love
yourself attitude development and Emotional
quotient (EQ) development. The synergy of these
six aspects is essential requirement of the desirable
human resources in corporate governance for facing
the challenges caused by the so called global
financial crisis.
In brief, I wish to emphasize that for every ill in
Indian system of governance in 21 century there are
Vedic pills and Bhagavad Gita is the panacea.
To create work culture in India, there is need of
converting holiday culture in to holy-day culture. It
is firmly believed by every Indian like me that the
rate of progress in spiritualism is faster than the rate
of progress in materialism, therefore, there is need of
accepting spiritually guided materialism making a
case for 'Needonomics' and not 'Greedonomics' as a
solution of various problems in every economy of
the world for all times to come. There is no doubt
that India will emerge as a super power of the world
on its spiritual strength only and not on the basis of
anything else. To make it happen we should adopt an
evolutionary approach and should not expect
miracles. This calls for accepting Bhagavad Gita as
a treatise on welfare economics and management
and as a sacro-secular epic for the entire humanity
including the most crucial manpower of good
governance at all levels of operation for the survival
of human race.
st
Dr. M.M. Goel is a Professor of Economics & Dean, Faculty of Social Sciences, Kurukshetra University,
Kurukshetra. He is the first ICCR Chair Professor of Indian Economy in South Korea at HUFS, SeoulAmbassador for
Peace recognition by Universal Peace Federation President Antarjyoti. The author can be reached at
2• • January-June 2012Volume 3 • No. 1

Introduction
Empirical Literature
In recent years, there has growing literature on exports-
imports nexus. The reasons for the growing literature
seems to be well justified on many grounds. Firstly,
existence of long run relationship between exports and
imports may be indicative of the efficacy of the
economy's economic policies such exchange rate,
monetary and fiscal policy in correcting trade deficits.
Furthermore, Arize (2002) noted, knowledge of
cointegration between exports and imports is
considered vital for formulation and evaluation of
present and future economic policies in correcting trade
imbalance. If exports and imports are cointegrated and
estimated slope coefficient is equal to 1, then this
implies that trade deficits or trade imbalance is short run
phenomena and in the long run macroeconomic policies
have been successful in bringing exports and imports
together, Herzer and Nowak-Lehman (2006).
Technically, it implies the country in question has not
violated the international budget constraint.
This paper we examine the issue of trade imbalance in
Singapore using unit root cointegration approach. The
present study differs from other studies in two novel
ways. Instead to relying to Augmented Dickey Fuller
(ADF) and Phillip-Perron unit root tests, we apply ERS
and KPSS unit root test to examine the stationary
properties of the variables. It is well known that ADF
and PP tests have low power in sample sizes DeJong
(1989),Diebold and Rudebusch(1990). Secondly to
investigate the existence of cointegration between
exports and imports , a newly developed bounds testing
procedure developed by Pesaran (2001) is
employed. For reasons of comparability and robustness,
we employ two additional single equation cointegration
techniques. This study differs from numerous other
studies, which have basically relied on one technique to
confirm cointegration between exports and imports.
Finally, contrary toArize (2002) and others, we measure
exports and imports without expressing them as fraction
of GDP.As Tang (2005), warns, that ratio of
imports/GDP and exports/GDP may not give accurate
picture of the trend the two variables because of changes
in GDP.
The rest of the paper is structured as follows, Section 2
present brief review of empirical literature. Section 3
provides a summarized version of economic model that
is estimated. Section 4 provide an overview of the
econometric methodology of the paper .Section 5 and 6
provides the discussion of empirical results and
conclusion respectively.
Following Hakkio and Rush (1991) and Husted (1992),
numerous studies have examined cointegration between
exports and imports using different econometric
techniques. Arize (2002) applied system approach of
Johansen (1995), dynamic ordinary least estimators
(DOLS) of Stock and Watson (1993) and fully modified
ordinary least squares (FMOLS) of Phillips and Hansen
(1990) and found evidence of cointegrating relationship
between exports and imports for 35 out of 50 countries.
Pender (2007) examined the relationship between
exports and imports for India and concluded that exports
and imports are cointegrated. Konya and Singh (2008)
re-examined cointegration between exports and importset al
Understanding Sustainability of Trade Balance in Singapore :Empirical Evidence from Cointegration Analysis
Vipin Jain & Janesh Sami
Trade imbalance can be considerable source of macroeconomic instability in an economy. In the recent years, a
number of studies have examined the relationship between exports and imports, in order to investigate sustainability
of trade deficits. Presence of an long run relationship between the two variables has been seen as success of
policymakers to bring exports and imports in equilibrium in the long run .It also indicates whether trade deficit is an
economy is sustainable or not . In this paper, we provide further evidence on sustainability of trade imbalance using
cointegration analysis using time series data from Singapore.
Exports, Imports, Current Account Imbalance, Cointegration.Key Words :
3 • • January-June 2012Volume 3 • No. 1

by employing system approach of Johansen (1995) and
Saikkonenn and Lütkepohl(2001a,2000b), concluding
that the two variables are related in the long run.Fountas
and Wu(1999) examine whether current account in USA
is sustainable in the long run or not and found the exports
and imports are not sustainable and therefore the current
account is not sustainable.
Bahmani-Oskoee (1994) examined the relationship
between exports and imports for Australia and found
that both variables are related in the long run and they
converge in the long run. Bahmani-Oskoee (1994) and
Rhee (1997) fail to find evidence to suggest exports and
imports are not cointegrated in the long run in
Korea.Irandoust and Ericsson (2004) applied Johansen
approach to examine if exports and imports converge in
the long run in selected industrial countries. He
concluded that in case of Germany, Sweden and USA,
exports and imports are cointegrated and trade
imbalances are merely short run phenomena. Herzer and
Lehmann (2005) found that despite the balance of
payment crisis, exports and imports in Chile are
cointegrated suggesting the efficacy of macroeconomic
policies.Keong, Choo and Yusop (2004) found evidence
of cointegrated relationship between exports and
imports in Malaysia.Naqvi and Murimune(2005) found
evidence that trade deficit in Pakistan is
sustainable.Tang and Alias (2005) examined the
relationship between exports and imports in OIC
member countries and found that exports and
imports are cointegrated for Benin, Burkina Faso,
Cameroon and Guyana. Tang(2002) found examined
the association between exports and imports in five
ASEAN economies and found evidence that exports and
imports are cointegrated only for Malaysia and
Singapore.Apergis(2000) examined the relationship
between exports and imports in Greece and concluded
that Greece current account deficit was sustainable.
Narayan and Narayan (2004) found the long run
association between exports and imports in Fiji and
PNG. Narayan and Narayan (2005) examined
cointegration between exports and imports for 22 least
developed countries and found that evidence of
cointegration for only six countries.
In order to examine current account sustainability, an
intertemporal balance model of Husted (1992) is used.
Husted (1992) has developed an empirical framework
which has been utilized in numerous studies.
Assume a representative consumer that resides in a small
open economy .Husted (1992) assumed that consumer
maximize their utility subject to their budget constraint.
The consumer is able to borrow and lend in international
market using one–period financial instruments at a
predetermined world interest rate. He further assumed
that the representative agent resources are made up of
endowment of output and redistributed profit from firms
and it used to finance consumption. The current period
budget constraint is then given as:
Where C is current period consumption;B is
international borrowing which can be positive or
negative;Y is output level;I is investment;r is the one
period world interest rate and(1+r )B is previous years
initial debt of the consumer , which is also equal to
country's external debt. Since equation (1) must hold for
each period, the inter-temporal budget for the entire
economy can be obtained by summing all individual's
budget constraint. Thus we have:
Where TB is defined as X -M (=Y -C -I ) indicates the
trade balance in period t(difference of income and
domestic absorption);X is current period exports while
Mt is is defined is the discount
factor and is equal to 1/(1+r ).Now if the last term equal
zero then the following must hold:
This implies that the country's borrowing(lending) is
equal to present value of the future trade
surplus(deficit).If this condition is not satisfied ,and B is
positive, then the country is bubble-financing its debt,
whereas negative B would imply that the country is
making pareto-inferior decisions and welfare can be
increased if the economy lends less. Further assuming
that the world interest rate is stationary with
unconditional mean r and letting Z =M +(r +r)B , an
empirical testable model can be stated as follows;
Economic Model
(1)
(2)
(3)
t t
t t t
t t-1
t t t t t t
t
0
t
t
t
t t t t-1
current period imports.φ
4• • January-June 2012Volume 3 • No. 1

(4)
(5)
(6)
(7)
(8)
et al
Following Hakkio and Rush (1991), the above equation
can be solved to:
∆
mports as well as interest payments (receipts) on net
foreign debts (assets).Now if X is subtracted from both
sides of equation (5) and then both sides are multiplied by
-1, the left hand side of the equation (5) becomes the
country's current account. Further assuming that X and Z
are non stationary in the levels but stationary in their first
difference i.e. I (1), then:
Where Ω and Ω are drift parameters and possibly equal
to zero and , are stationary processes, then
equation(5) can be re-expressed as;
Where MM =M +r B ; /r](Ω - Ω ); = (
).Assuming that the last term of equation(6) equals to
zero as j→∞ t can be easily shown that equation(6) will
be change into a standard regression equation such as the
following:
This model can be also written asArize(2002);
According to this model, two conditions are required for
an economy to uphold intertemporal budget constraint.
Exports and imports must be cointegrated (or have a long
run relationship), ie, the error term should be stationary.
If exports and imports are not cointegrated, then the
economy in question has failed to satisfy the
intertemporal budget constraint and it cannot fulfill its
foreign debt obligations. Another condition that needs to
be satisfied is that the estimated coefficient of exports or
imports should be statistically equal to 1.
All data utilized in this study was obtained from World
Development Indicators. Exports and Imports are both
measured in Singapore dollars. We used data from 1976-
2009.Two unit root tests are applied to examine the
stationary properties of the exports and imports variable.
All variables were converted into natural logarithm so as
overcome the problem of heteroscedasticity and obtain
elasticities. Instead of relying on standard Augmented
Dickey Fuller test and Phillip-Perron test ,this study
apply KPSS and ERS test as it well known that ADF and
PP test have low power to reject the null hypothesis and is
unable to differentiate pure series from near unit root
process (Shiller and Perron, 1985; Diebold and
Rudebusch, 1990).
KPSS unit root test is a widely used and proposed by
Kwiatkowski (1992) and has the null hypothesis of
stationarity.It is a test that can be employed to
investigate if the series is fractionally integrated, Lee
and Schmidt(1996).It relevant test statistic is given by
The second unit root test that is used to examine the
stationary properties of the series is ERS test
(1996).They propose a simple modification to the
standard ADF test in which data is detrended prior to
running the test regression. The ERS unit root test
involves estimating the following equation
The computed t-ratio follow Dickey –Fuller distribution
in the constant only case, but differs if one includes both
constant and trend.ERS(1996,Table 1, page 825)
provides the critical values of the test statistics. The null
hypothesis that there is unit root is rejected if the
computed test statistics falls below the critical value from
ERS (1996).It was found that both variables are I(1).
Where λ=1/ (1+r) and is the difference operator. The
left hand side of the equation (5) represents spending on
i
ε ε
δ=[(1+r) ε λ ε
ε
t
t t
0 1
0t 1t
t t t t-1 1 0 t 1t-
0t
2 j-1Ʃ
, i
Data Sources and Econometric Methodology
5 • • January-June 2012Volume 3 • No. 1
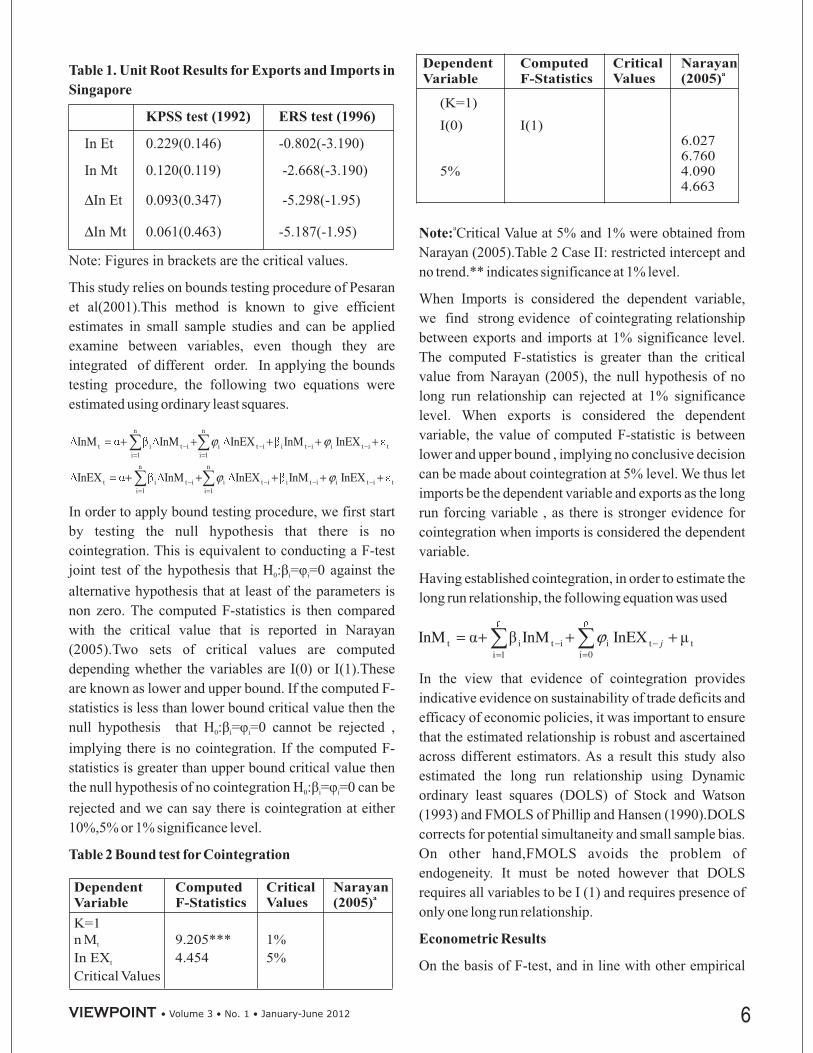
Table 1. Unit Root Results for Exports and Imports in
Singapore
KPSS test (1992) ERS test (1996)
In Et 0.229(0.146) -0.802(-3.190)
In Mt 0.120(0.119) -2.668(-3.190)
In Et 0.093(0.347) -5.298(-1.95)
In Mt 0.061(0.463) -5.187(-1.95)
Note: Figures in brackets are the critical values.
∆
∆
This study relies on bounds testing procedure of Pesaran
et al(2001).This method is known to give efficient
estimates in small sample studies and can be applied
examine between variables, even though they are
integrated of different order. In applying the bounds
testing procedure, the following two equations were
estimated using ordinary least squares.
In order to apply bound testing procedure, we first start
by testing the null hypothesis that there is no
cointegration. This is equivalent to conducting a F-test
joint test of the hypothesis that H : = =0 against the
alternative hypothesis that at least of the parameters is
non zero. The computed F-statistics is then compared
with the critical value that is reported in Narayan
(2005).Two sets of critical values are computed
depending whether the variables are I(0) or I(1).These
are known as lower and upper bound. If the computed F-
statistics is less than lower bound critical value then the
null hypothesis that H : = =0 cannot be rejected ,
implying there is no cointegration. If the computed F-
statistics is greater than upper bound critical value then
the null hypothesis of no cointegration H : = =0 can be
rejected and we can say there is cointegration at either
10%,5% or 1% significance level.
Critical Value at 5% and 1% were obtained from
Narayan (2005).Table 2 Case II: restricted intercept and
no trend.** indicates significance at 1% level.
When Imports is considered the dependent variable,
we find strong evidence of cointegrating relationship
between exports and imports at 1% significance level.
The computed F-statistics is greater than the critical
value from Narayan (2005), the null hypothesis of no
long run relationship can rejected at 1% significance
level. When exports is considered the dependent
variable, the value of computed F-statistic is between
lower and upper bound , implying no conclusive decision
can be made about cointegration at 5% level. We thus let
imports be the dependent variable and exports as the long
run forcing variable , as there is stronger evidence for
cointegration when imports is considered the dependent
variable.
Having established cointegration, in order to estimate the
long run relationship, the following equation was used
In the view that evidence of cointegration provides
indicative evidence on sustainability of trade deficits and
efficacy of economic policies, it was important to ensure
that the estimated relationship is robust and ascertained
across different estimators. As a result this study also
estimated the long run relationship using Dynamic
ordinary least squares (DOLS) of Stock and Watson
(1993) and FMOLS of Phillip and Hansen (1990).DOLS
corrects for potential simultaneity and small sample bias.
On other hand,FMOLS avoids the problem of
endogeneity. It must be noted however that DOLS
requires all variables to be I (1) and requires presence of
only one long run relationship.
On the basis of F-test, and in line with other empirical
0 i i
0 i i
0 i i
β φ
β φ
β φ
Table 2 Bound test for Cointegration
Note:
Econometric Results
a
6• • January-June 2012Volume 3 • No. 1

studies, we estimate the long run model using equation 2
with lag length of 2.The estimated relationship will
inform us on the estimated effect of exports on imports
in the long run and whether the relationship is
statistically significant at least at 10%.
In PanelA, the long run results are reported, when import
is estimated as a function of export using three separate
single equation estimators. In the long run, increase in
exports by 1% is associated will about 0.99% increase in
imports. The estimated coefficient of export is very close
to 1 .We also find evidence the relationship between
exports and imports is statistically significant at 1%
significance level. In other words, exports and imports
are cointegrated in Singapore. This is indicative of the
fact that higher export earnings finance imports in the
long run. Thus on the basis of the estimated value of
coefficient and its statistical significance we find
evidence that Singapore is not in violation of the
intertemporal budget constraint and trade deficits are a
short run phenomena. Pleasing to note, that the estimated
size of coefficient of exports is quite consistent across
different estimators, thus confirming on the robustness of
the relationship.
Turning on to Panel B, we obtain two interesting results.
Firstly, exports and imports are related even in the short
run. The relationship between exports and imports is
statistically significant at 1% significance in the short
run. Furthermore consistent with microeconomic theory,
the estimated short run elasticity is smaller than long run
elasticity. The second important result that can be readily
noted from Panel B is the estimated coefficient of ECM
is -0.488.This implies two important points. Firstly,
about 48% of disequilibrium in imports is corrected in a
year following shocks to exports. The statistical
significance of the lagged ECM also implies that exports
are imports are related in the long run.We proceed to
conduct diagnostic test to ensure that standard
assumptions are satisfied. The results are reported in
Panel D.The estimated adjusted coefficient of
determination was about
75% suggesting that estimated model fits the data well.
After estimating the short run and long run relationship is
was imported to evaluate the model. Consequently many
diagnostic tests were deployed to ensure that classical
assumptions of the model are satisfied. As shown in
Panel C, LM test for serial correlation was conducted to
ensure residuals were related. The computed probability
value was 0.210 suggesting the null hypothesis of no
serial correlation can be rejected at 5% significance level.
In order to ensure that estimated model does not suffer
from any mis-specification or incorrect function form,
Ramsey RESET test was conducted. We again obtain a p-
value that greater than 0.01 suggesting our model is
correctly specified and correct functional form has been
adopted. This however is at 1% significance level. To
examine whether the residual have Gaussian
distribution, Jarque-Bera test was conducted. The
resulting p-value was higher than 0.05, indicating that
residuals are Gaussian and not skewed in either direction.
White test for Heteroscedasticity suggest the variance of
error terms is constant and assumption of
homoscedasticity is satisfied.
This paper examined the issue of whether current account
imbalance is short run or long run phenomena in
Panel A: Estimated Long Run Relationship (Depen-
dent Variable In M )
Panel C: Diagnostic Tests
Conclusion
t
Note: Figures in brackets are the computed t-statistics and ***
indicate statistical significance at 1% level.
t-1
Note: Figures in brackets are computed p-values
7 • • January-June 2012Volume 3 • No. 1

Singapore. In order to do so, three single cointegration
techniques were employed utilizing time series data. Our
analysis has brought several important results. The
strong positive relationship between exports and imports
in Singapore in the short run as well long run .We find
evidence that higher exports in the long run is associated
will higher imports .Thus higher exports in the
encourages higher level of imports in the long run. Based
on this, we have some grounds to suggest that exports and
imports are cointegrated, when import is considered to be
the dependent variable. Bound testing procedure has
suggested exports depends upon imports in the long run.
Current account imbalance is short run issue and
Singapore's macroeconomic policies have been highly
successful in bring exports and imports into
equilibrium in the long run. The estimated relationship is
empirically valid as diagnostic tests indicate that
standard classical assumptions are satisfied and
estimated relationship is stable.
Our study represents a small but useful contribution to
understanding the exports-imports relationship in
Singapore and success of macroeconomic policies in
bring exports and imports together in the long run. Our
results are quite to Tang (2003), but perhaps most robust
as we established the robustness of the relation through
three cointegration approach and utilized a much larger
dataset. Future studies can extend this study by
examining the relationship using larger dataset and
correcting for structural break. Until then, applying
cointegration analyses suggest that exports and imports
are related in the long run and current account imbalance
is a short rather than long run phenomena.
4. Bahmani-Oskooee, Mohsen, (1994), “Are Imports
and Exports of Australia Cointegrated?”
December, pp. 525-533.
5. Dickey, D. A., and Fuller, W. A., (1981), “Likelihood
Ratio Statistics for Autoregressive Time Series with
a Unit Root,” , 49, pp.1057-72.
6. Hakkio, C. S., & Rush, M., (1991), “Cointegration:
How Short is the Long Run?,”
, 10, pp. 571–581.
7. Husted, S., (1992), The Emerging U.S. Current
Account Deficit in the 1980s: A Cointegration
Analysis,” , 74,
pp. 159–166.
10. Narayan, P. K., and Narayan, S., (2004-06), “Are
Exports And Imports Cointegrated? Evidence from
Two Pacific Island Countries ,
23.2, pp. 152-164.
References
Journal of
Economic Integration,
Econometrica
Journal of
International Money and Finance
Review of Economics and Statistics
,” Economic Papers
1. Arize, A. C., (2002), “Imports and Exports in 50
Countries: Tests of Cointegration and Structural
Breaks,”
,11, pp.101-115.
2. Apergis, W., Katrakilidis, K. P., Tabakis, N. M.,(
2000), “Current Account Deficit Sustainability: The
Case of Greece,” 7, pp.
599–603.
3. Baharumshah, A. Z., Lau, E., Fountas, S., (2003),
“On the Sustainability of Current Account Deficits:
Evidence from Four ASEAN Countries,”
14.3, pp. 465–487.
8. Hakkio, C.S., Rush, M., (1991), “Is the Budget
Deficit 'Too Large?,” 29, pp.
429–445.
9. Konya, L., and Singh, J. P, (2008), “Are Indian
Exports and Imports Cointegrated?,”
,8, pp.
177-186.
11. Pesaran, M. H., Shin, Y. and Smith, R. J., (2001),
“Bounds Testing Approaches to the Analysis of
Level Relationships,”
, 16, pp. 289–326.
12. Phillips, P. C. B. and Hansen, B. E., (1990), Statistical
Inference in Instrumental Variables Regression With
I(1) Processes,” 57, pp.
99–125.
13. Stock, J., Watson, M. W., (1993), “A Simple
Estimator of Cointegrating Vectors in Higher Order
International Review of Economics and
Finance
Applied Economics Letters,
Journal of
Asian Economics,
Economic Inquiry,
Applied
Econometrics and International Development
Journal of Applied
Econometrics
Review of Economic Studies,
8• • January-June 2012Volume 3 • No. 1

Integrated Systems,” 61, pp.
783–820.
Econometrica,
14. Fountas, S., & Wu, J.-L., (1999, Autumn), “Are the
U.S. Current Account Deficits Really Sustainable?”
, 13, pp. 51–58.
15. Upender, M., (2007), “Long Run Equilibrium
between India's Exports and Imports during 1949-
50-2004-5 ,”
, 7, pp.187-196.
International Economic Journal
Appl ied Econometr ics and
International Development
Dr. Vipin Jain
Janesh Sami
is Additional Director, CMCA, Teerthanker Mahaveer University, Moradabad. He has worked as
HOD, Dept of Economics, Finance and Banking in Fiji National University, Fiji. He is expertise in Security Analysis
& Portfolio Management and Financial derivatives. The author is PhD, ICWA, CS, MBA, M.Com, LLB, LIFA,
B.Com. There are seven books to his credit. The author can be reached at [email protected]
is a Lecturer in Economics at Fiji University. Assistant Professor in the Department of Economics,
Finance and Banking in Fiji National University, Fiji. The author can be reached at [email protected]
9 • • January-June 2012Volume 3 • No. 1

Introduction
Indian cities face a transport crisis characterized by levels
of congestion, noise, pollution, traffic fatalities and
injuries. India's transport crisis has been exacerbated by
the extremely rapid growth of India's large number of
cities in a context of low incomes, limited and outdated
transport infrastructure, rampant suburban sprawl,
sharply rising motor vehicle ownership and use,
deteriorating bus services, a wide range of motorized and
non-motorized transport modes sharing roadways, and
inadequate as well as uncoordinated land use and
transport planning. Public transportation plays a vital
role in the transportation system of an area and it also
helps to minimize traffic congestion and other traffic-
related externalities. The urban public transport system
operates in a very complex external environment, which
needs to be clearly understood. The level and phase of
development of public transport varies across Indian
cities. There is not one consistent model of urban public
transport system and improvement to this cannot be
carried out in isolation.
with an aim to
ULB's (Urban Local Bodies) /
following
highlights –
The Government of India has proposed substantial
assistance through the JNNURM over the seven-year
period which starts from 2005-06
encourage reforms and fast track planned development
of identified cities. Focus is to be on efficient in urban
infrastructure and service delivery mechanisms,
community participation. During this period, funds shall
be provided for proposals that would meet the mission's
requirements. Under JNNURM financial assistance will
be available to the
parastatal agencies that could deploy these funds for
implementing the projects themselves or through the
special purpose vehicles (SPVs) that may be expected to
be set up. Assistance under JNNURM is additional
central assistance, which provides 100 per cent central
grant to the implementing agencies. Further, assistance
from JNNURM is expected to facilitate further
investment in the urban sector. To this end, the
implementing agencies are expected to leverage the
sanctioned funds under JNNURM to attract greater
private sector investments through PPP (Public Private
Partnership) that enables sharing of risks between the
private and public sector. The total number of cities under
the JNNURM is around 60 which is categorised as A, B
and C based on the number of populations. Under
category B, 28 cities has been selected from across the
India having population of more than 1 million, out of
that, 3 cities Lucknow, Kanpur and Allahabad has been
selected in Uttar Pradesh for urban transportation under
JNNURM to jointly work with UPSRTC with
From traditional means of palanquins to modern means of transportation, the face of Indian transportation system
has progressed at a rapid pace since the inception of economic liberalization of the 1990s. India's public transports
systems which is rising by almost 10% a year are among the most heavily used in the world but the access to these
modes of transport has not been uniform and are still riddled with problems due to poor or outdated infrastructure and
lack of investment.
Ministry of Urban Development started project named JNNURM (Jawaharlal Nehru National Urban Renewal
Mission) with an aim to encourage reforms and fast track planned development of identified cities. The focus of the
project is on efficiency in urban infrastructure and service delivery mechanisms, community participation, and
accountability of ULB's (Urban Local Bodies) / parastatal agencies towards citizens. One of the major thrust areas of
this scheme is urban transport system under which UPSRTC (Uttar Pradesh State Road Transportation Corporation)
has been providing city bus financially supported by JNNURM in various selected cities of India. The present paper
provides an overview of city bus service in Lucknow city followed by attitude of passengers / commuters towards it.
Key Words: Transportation, JNNURM, UPSRTC, LCTSL, ULB, Passengers, Commuters
Review of City Bus Transportation under
JNNURM: A Study of Lucknow CityAli Ghufran & Zeeshan Amir
10• • January-June 2012Volume 3 • No. 1

!
!
!
!
!
!
!
!
!
!
Fastest service – Early destination
Halt at stop only
Time punctuality
No overloading
Less waiting time
Concessional pass facility
Unlimited travelling for the pass holders
anywhereacross the city within the day
timings
Direct special service for employees
Pollution free high quality Euro-II buses
Passenger road services in the state of Uttar Pradesh were
started in the year 1947 which rechristened to UPSRTC
in fourth five year plan. UPSRTC being a public sector
passenger road transport corporation providing services
in the state of Uttar Pradesh and other adjoining states in
North India. Presently JNNURM-UPSRTC buses in
Lucknow city, monitored by LCTSL (Lucknow City
Transport Services Limited) are running through 25
major routes. Some of the major routes are shown in
Figure 1, while the fare structure and concession rates
(Ordinary / NonAC bus) are shown in Table 1 and Table 2
respectively. The major work of LCTSLis to run buses on
the streets of Lucknow city and monitor Daily income /
KM record, Daily ticket sold position, Daily collection
record, Daily vehicle report, Daily ticket sale account as
well as bag room account, through Vehicle Tracking
system, Fleet Management system, Operation and
Revenue Management. Apart from this LCTSL also
invites tender for selection of an agency for sole
advertisement rights on the buses (Internal / External
panels) for a contract period of two years, extendable by
one year at a time for a maximum period of 3 years.
Figure 1: Major Routes of City Bus Service in Lucknow City
11 • • January-June 2012Volume 3 • No. 1

Table 1: Fare Structure
Distance Ordinary Bus Non AC Bus AC Bus
Table 2: Pass Rates / Month
Distance Students Up to Students Up to Senior Other
10 Class 10 Class / Citizens Adults
Below 21 Years
CONCESSION
Period Concession (%)
Upto 3 Kms Rs 4.00 Rs 6.00 Rs. 10.00
Between 3-5 Kms Rs 6.00 Rs 6.00 Rs. 10.00
Between 5-10 Kms Rs 10.00 Rs 10.00 Rs. 15.00
Between 10-15 Kms Rs 12.00 Rs 12.00 Rs. 20.00
Between 15-20 Kms Rs 15.00 Rs 15.00 Rs. 20.00
20 Kms and above Rs 20.00 Rs 20.00 Rs. 25.00
Up to 10 kms Rs 150.00 Rs 100.00 Rs 265.00 Rs 290.00
11 – 15 Kms Rs 180.00 Rs 210.00 Rs 340.00 Rs 360.00
Above 15 Kms Rs 220.00 Rs 240.00 Rs 410.00 Rs 435.00
All routes Rs 270.00 Rs 300.00 Rs 510.00 Rs 540.00
Two Months 8%
Three Months 10%
Six Months 15%
One Year 20%
th th
Objectives of the Study Research Methodology
Research Design
The present study focuses on following research
objectives: -
1) To study the awareness about the facilities
provided or likely to be provided by the
UPSRTC.
2) To study the attitude of passengers towards the
city bus service in Lucknow.
3) To study the passengers preference towards
available modes of transportation.
4) To study the problems faced by passengers/
commuters while travelling in city buses.
To determine the above objectives, primary data has been
collected with the help of questionnaire having
dichotomous closed ended questions. The independent
variable used in this study is overall satisfaction with
JNNURM-UPSRTC service. Dependent variables is
specific service quality attributes which consist of public
bus transport departure frequency, travel time, punctuality,
price, information, cleanliness, staff behaviour, bus
comfort, seat availability, bus stop security, safe from
accident, on board security, bus stop condition etc.
Research type : Conclusive (Descriptive)
research
Research approach : Survey method
12• • January-June 2012Volume 3 • No. 1

Research instrument : Questionnaire
Data collection method : Primary Sources
Sampling method : Non probability
(Convenience
sampling)
Sampling unit : Passengers / commuters
Sample size : 200
Sample area : Lucknow city
The distribution of sample for subject study can be
seen in below Table 3 depicting demographic variables
as well as percentage distribution of the respondents.
The analysis of the workable questionnaire reveals the
following trends:-
Daily 58 29
3-4 times a week 120 60
Once or twice a week 22 11
Table 4 and its associated bar chart 1 revealed that majority
of passengers (60%) agree that they travel 3-4 times a
week, while 29% agrees to travel daily while 11% use to
travel only once or twice a week. The majority of passenger
are frequent commuters, they travels in city bus because
they have direct service from their location to their work
place and they are also availing the MST (Monthly Season
Ticket) facility offered by city bus transportation.
Economic 124 62
Less Time Taking 8 4
Convenience 56 28
Safety 12 6
Table 3: Sample / Respondents profile
DataAnalysis
1. Frequency of travelling in city bus
Table 4
Showing frequency of travelling in city bus
Frequency No. of %
of Travel Respondents age
Total 200 100
Chart 1 Showing frequency of travelling in city bus
2. Preferred reason for using city bus service
Table 5
Showing preferred reason for using city bus service
Reason for using No. of %
City Bus Respondents age
Total 200 100
Chart 2
Showing preferred reason for using city bus service
13 • • January-June 2012Volume 3 • No. 1

Table 5 and its associated bar chart 2 revealed that 62%
of the passengers have given priority to the bus fare as
the most preferred option for using city bus service
followed by convenience (28%), where as safety and
time have no such importance for them. It seems that
economy of journey is prime factor for the commuters
due to hike in fuel and increasing distances in the city.
6 am – 9 am 24 12
9 am – 12 noon 64 32
12 noon – 3 pm 8 4
3 pm – 6 pm 60 30
6 pm – 9 pm 40 20
9 pm - midnight 4 2
It is revealed from Table 6 and its associated bar chart 3
that 32% of the passengers use the city bus service
during between 9-12 noon while 30% use the service in
the evening from 3-6 pm as this is the time where one
has to reach the office or their work site and return back
from the office or work site. For 6-9 am and 6-9 pm the
commuters shift to other modes preferably three
wheeler to avoid rush of the peak time. From 12-3 pm,
the traffic is less and from 9 pm to midnight there
would be few passengers on the road to aboard the bus
as during this time the bus frequency is reduced and the
passenger go for another option (three wheelers) instead of
bus as he has to reach his house in time.
As far as the opinion for bus fare (AC and non AC both) is
concerned, Table 7 and its associated bar chart 4 revealed
that a substantially great majority of passengers (88% for
AC bus and 85% for Non AC bus) agreed that the present
fare structure of city bus service is reasonable except the
minimum fare charge, which is Rs 4 in ordinary small
buses while for the same distance the big bus charge Rs 6,
which is 33% more than the ordinary bus fare. While
discussing this matter with one of the bus conductor the
researcher came to a conclusion that the big bus cost more
so the city bus corporation charge Rs 2 more for the same
initial distance to cover those expenses. Secondly only
12% of the passengers opined that the present fare structure
of both the buses are high, while there is only a meager
section of passengers who said that the present fare is high.
3. Travelling time of city bus
Table 6
Showing travelling time of city bus
Travelling No. of %
Time of Respondents age
City Bus
Total 200 100
Chart 3 Showing travelling time of city bus
4. City bus fare
Table 7 Showing city bus fares
Chart 4 Showing city bus fares
14• • January-June 2012Volume 3 • No. 1
5. Various facilities in city bus service
Chart 5 Showing facilities in city bus service
6.Availability of bus stoppage
Table 9 showing availability of bus stoppage
Availability of No. of %
Bus Stoppage Respondents age
Total 200 100
Chart 6 Showing availability of bus stoppage
7. Facilities at bus stop
Table 10
Showing facilities at bus stop
It is revealed from Table 8 and its associated bar chart 5
that majority of the passenger (97% for check drop,
95% for Telephone, 58% for GPS) have no idea about
the facilities providing by the local city transportation
or the facilities provided by city transportation in other
mega cities like Delhi, and Mumbai. For lighting the
response of the passengers is alright, but for
entertainment (audio-video aids like FM radio/TV) or
first aid box, their response is not satisfactory and they
said that that entertainment during travelling is not so
important but there must be first aid box with all the
bus crew so that in the case of minor accident they can
use it.
As far as the GPS (Global positioning system) is
concerned, 58% of the passengers have no idea, except
the passengers who are using the service of route no.
12, 33 or 23 that provide this facility. They even do not
know about the pay and call facility of telephone or
cheque drop facility offered by private sector banks in
other mega cities of India. In this one can drop his
cheque in the box provided and the same will be
collected by the bank employee at the end of the day.
Available 64 32
Not available 136 68
Table 9 and its associated bar chart 6 revealed that 68% of
the passenger claims that there is no proper bus stop facility
near their location and the driver stop the bus only when
there is large number of people to aboard. Apart from this,
no bus stop is having the bus route display board and also in
the absence of queue facility, it is very difficult for the old
persons and ladies to board in the bus. Contrary to this 32%
passengers agreed that there is a bus stop available near
their location.
15 • • January-June 2012Volume 3 • No. 1

Chart 7 Showing facilities at bus stop
8. Payment of money from conductor
Table 11
Showing payment of money from conductor
Chart 8
Showing payment of money from conductor
Table 12 Showing payment of balance
amount from conductor
Chart 9
Showing payment of balance amount from conductorAs far as the shelter and sitting facilities is concerned,
Table 10 and its associated bar chart 7 revealed that
84% and 98% of the passengers have agreed that there
must be proper sitting and shelter facilities
respectively at each bus stop so that people can take
rest and covered themselves from rain and scorching
heat, while waiting for the bus.
It is revealed from Table 11 and 12 and its associated
bar chart 8 and 9, that while travelling, most of the
passengers (83%) faced the problem of actual change,
as sometimes the conductor of the bus does not
provide actual change to the passenger and write
down the balance amount on the back side of the ticket
and tell them to collect it later. While in reality, in most
of the cases (78%) opined that despite having change
he deliberately does not give the actual balance
amount to the passengers as during rush hour mostly
passengers forgets to collect balance amount or it is
difficult to trace the conductor, hence that money
directly goes into the pocket of the conductor.
16• • January-June 2012Volume 3 • No. 1

9. Duties of conductor
Table 13 Showing duties of conductor
Chart 10Showing duties of conductor
10. Driving habit of city bus drivers
Table 14 Showing habit of city bus drivers
Chart 11 Showing habit of city bus drivers
11. Inconvenience caused by raid during travel
Table 15
Showing inconvenience caused by
raid during travel
Table 13 and its associated bar chart 10 revealed
that majority of the passenger's i.e. 87% complaint
that the conductor of the bus never informs them
about the next coming stoppage, while 73%
opined that when the bus stops at the concerned
stoppage, the outside passengers start entering
from the front door, which is meant for getting
down and the conductor never checks them not to
do so. As a result it leads to mishap at the door
ending up into quarrelsome argument among the
passengers.
As far as the driving of bus driver is concerned, Table
14 and its associated bar chart 11 revealed that
majority of the passenger (60%) agreed that there
driving is normal except in few cases where the driver
does not follow the traffic rules and wrongly overtake
to catch the passengers.
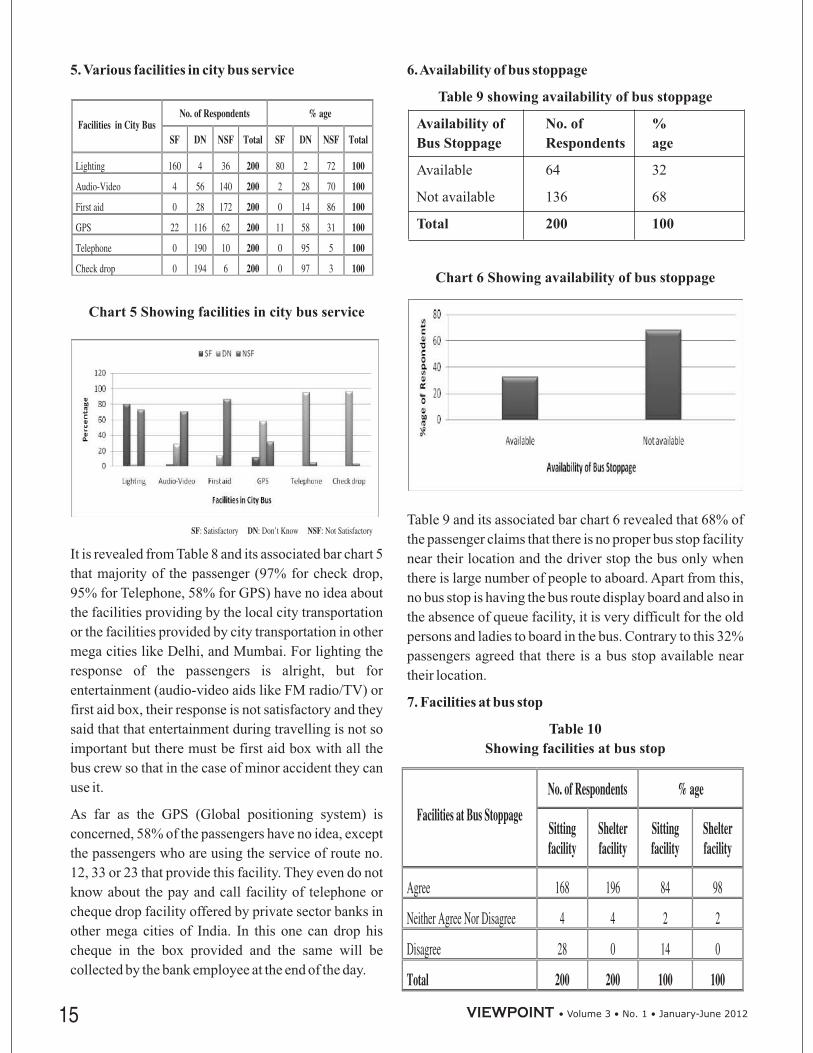
17 • • January-June 2012Volume 3 • No. 1
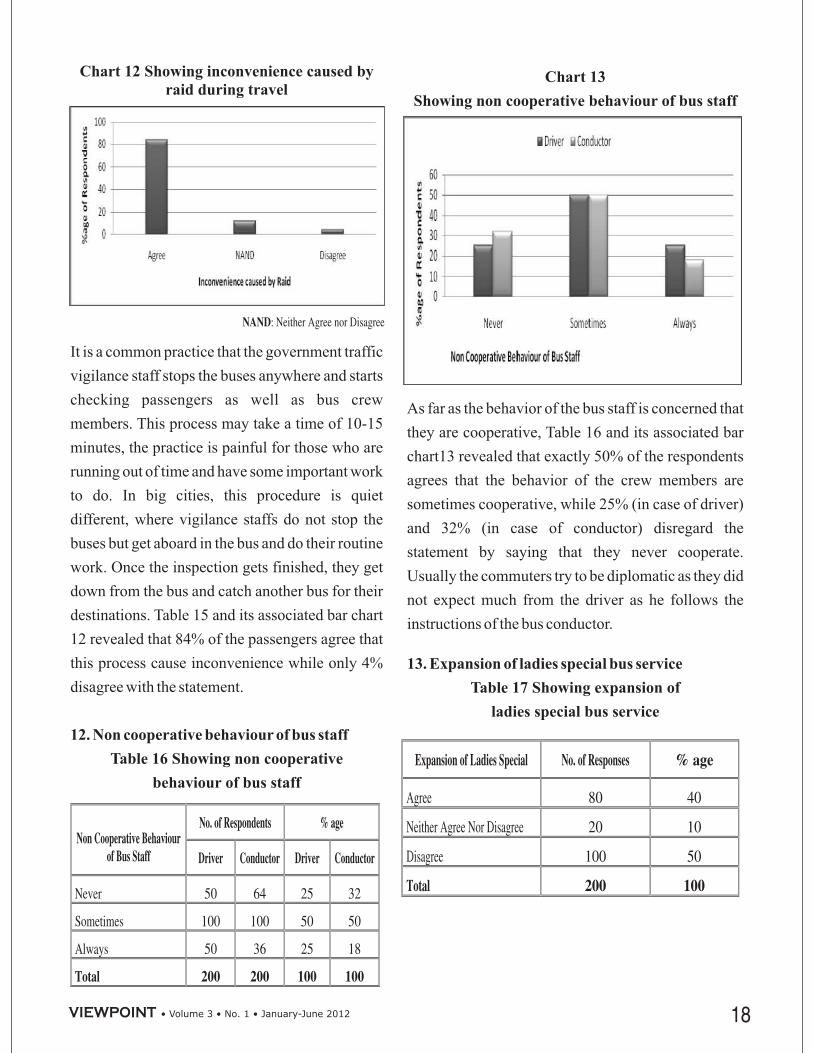
Chart 12 Showing inconvenience caused by
raid during travel
12. Non cooperative behaviour of bus staff
Table 16 Showing non cooperative
behaviour of bus staff
Chart 13
Showing non cooperative behaviour of bus staff
13. Expansion of ladies special bus service
Table 17 Showing expansion of
ladies special bus service
It is a common practice that the government traffic
vigilance staff stops the buses anywhere and starts
checking passengers as well as bus crew
members. This process may take a time of 10-15
minutes, the practice is painful for those who are
running out of time and have some important work
to do. In big cities, this procedure is quiet
different, where vigilance staffs do not stop the
buses but get aboard in the bus and do their routine
work. Once the inspection gets finished, they get
down from the bus and catch another bus for their
destinations. Table 15 and its associated bar chart
12 revealed that 84% of the passengers agree that
this process cause inconvenience while only 4%
disagree with the statement.
As far as the behavior of the bus staff is concerned that
they are cooperative, Table 16 and its associated bar
chart13 revealed that exactly 50% of the respondents
agrees that the behavior of the crew members are
sometimes cooperative, while 25% (in case of driver)
and 32% (in case of conductor) disregard the
statement by saying that they never cooperate.
Usually the commuters try to be diplomatic as they did
not expect much from the driver as he follows the
instructions of the bus conductor.
18• • January-June 2012Volume 3 • No. 1

Chart 14 Showing expansion of ladies specialbus service
14. Reasons for preferring three wheelers to
city bus
Table 18 Showing reasons for preferring
three wheelers to city bus
Chart 15 Showing reasons for preferring threewheelers to city bus
15. Problems due to transit advertising through
bus: -
Table 19 Showing problems due to transit
advertising through bus
Presently there are only few ladies special buses
(Sakhi) running on the roads of Lucknow. Table
17 and its associated bar chart 14 revealed that
40% of the passengers (mostly ladies) give green
signal to start more such buses to facilitate lady
commuters, 50% of the male passenger strongly
oppose the initiative as they are in favour of
general bus services. However in the first week of
May 2012 (Times of India, Lucknow edition),
government announce to launch 1000 buses to
facilitate the public of UPSRTC.
Despite having good city bus service, Table 18 and its
associated bar chart 15 revealed that 35% of the
passengers still preferred three wheelers because it is
frequently available while 47% said that the good
thing about three wheelers is and that one can easily
get down at the place of their choice. The major use of
three wheelers is in those areas where bus service is
not possible and people have no other option available
rather than to opt three wheelers without bothering
about its fare.
19 • • January-June 2012Volume 3 • No. 1

Chart 16 Showing problems due to transitadvertising through bus
16. Good quality of present city bus service
Table 20 Showing good quality
of present city bus service
Chart 17 showing good quality of present citybus service
17. Suggestions to improve city bus service
Table 21 Showing suggestions to improve city bus
service
Chart 18 Showing suggestions to
improve city bus service
Now a days it is a common practice to use the
whole bus body as an advertisement base for
advertising and generate revenue. Table 19 and its
associated bar chart 16 revealed that 73% of the
respondents agree that this may cause problem in
viewing the electronic route display indicator and
strongly oppose for it by saying that due to this
there is a chance that the passenger may miss the
bus.
It is revealed from Table 20 and its associated bar chart
17 that 66% of the respondents do not agree to the
good quality of the bus service while 34% are satisfied
with the service given to the passengers. This means
that still there is a room for improvement in city bus
services.
Table 21 and its associated bar chart 18 revealed that
as regards to the submission of suggestions, 48% of
respondents have shown the priority in favour of
increased frequency of availability of buses on a
specific route, while 36% seek to have the measures to
reduce overcrowding in the buses.
20• • January-June 2012Volume 3 • No. 1

Conclusion and Policy Implications
Cities play a vital role in promoting economic growth
and prosperity. The development of cities largely
depends upon their physical, social, and institutional
infrastructure. Transport systems are among the
various factors affecting the quality of life and safe
movement in a city. India is only 30% urbanized at
present, however, is expected to double its urban
population in the next twenty years. Since urban
transport and urbanization are closely interlinked,
therefore planning for urban transport starts at
understanding the urbanization process which affects
the quality of life and safety in city.
The JNNURM has been projected to enhance the
quality of bus services with passenger's friendly
ambience inside and supportive move outside. On the
basis of this analytical study it is suggested to have the
following measures.
1. Due to more and more workforce coming to
the urban area from remote places; it is
advisable to have proportionally higher
number of buses to make it convenient for the
natives especially during peak hours to avoid
overcrowding.
2. There should be uniformity in the frequency of
buses adherence to strict timings is required to
maintain service quality.
3. Proper maintenance of buses and bus stands
are required to retain the existing passengers
and attracting the new ones. It is very
necessary for the survival of public sector
transport in the times to come.
4. Bus drivers should stop the bus close to the bus
stop and not in the middle of the road causing
hindrance to public.
5. All buses can have light radio/ music system
or provision for video to be played so that the
passengers don't feel the stressed and they may
enjoy their trip.
6. Covered bus stop should be built up to adjust
the climatic extreme conditions.
7. There should be proper first aid facility
provided in every bus to meet any emergency.
8. Conductor should carry more coins to avoid
the in returning the balance amount of fare.
9. Conductors and drivers need to be given proper
behavioral trainings as to how to deal with the
passengers and make them satisfied.
10. GPS (Global Positioning System) and DLF (Data
Logger Facilities) to be installed over the buses
which would record latitude, longitude, fuel
consumption data, with time stamp so as to be able
to facilitate computation of stoppage data, speed
data, distance covered, route deviation, stoppage
deviation, skipping of scheduled stoppages, and
provide passenger information like next bus queue
shelter, expected time to arrive at next bus queue
shelter, etc.,
11. LED (Light Emitting Diode) display in vehicles
capable of providing information of current
location of bus and the next stop and having a
visibility of about 10 meters with naked eye.
12. Automated announcement facilities on the bus to
inform the current position of the bus, next
stoppage and time left to reach next stoppage.
13. There must be arrival and departure times at each
bus stop.
14. The conductor and driver must wear dresses
having their names and employee number
mentioned on it.
15. There is a need to introduce special city bus to
provide special service for female passenger.
Conclusively, we can deduce that majority of the
respondents are not satisfied with the service quality of the
present city bus. Moreover it is also found that passengers /
commuters are not aware of the mandatory services to be
given by the city buses. The researcher has tried to touch
upon the minimum expectations of the commuting class.
The suggestions are made on the basis of the interactive
discussions with commuters; which could be incorporated
into policy decisions of JNNURM-UPSRTC management.
The successful implementation and sustenance could be
reached through following measures having inclusive
approach.
i. Formation of joint monitoring committee having
the representatives from public and private both.
ii. Awareness generation programme involving NGO
21 • • January-June 2012Volume 3 • No. 1
(Non Government Organization), CBO's
(Community Based Organisation's).
iii. Advertising campaign for image building
Ultimately, all the stake holders have to share the
responsibility of making the transport system efficient
and effective.
1. Tiwari, G., (2009), “Public Transport
Research Challenges in India,”
, Indian
Institute of Technology, Delhi.
2. Marsden, G., (2009), “Good Practice in the
Exploitation of Innovative Strategies in
Sustainable Urban Transport: City Interview
Synthesis,” .
3. Pucher, J., Korattyswaropam, N., et al., (2005),
“Urban Transport Crisis in India,” ,
Transport Policy 12, <www.elsevier.com/
locate/tranpol (online journal)>.
4. “Jawaharlal Nehru National Urban Renewal
Mission Overview,”
Review of Urban
Transportation in India,”
Indian Institute of
Technology, Delhi.
6. <http://jnnurm.nic.in>
7. http://upsrtc.com
References
Department of
Civil Engineering & Transportation Research
and Injury Prevention Programme
University of Leeds
Elsevier
Ministry of Urban
Development, Government of India.
5. Singh, K. S., (2005), “
Journal of Public
Transportation, 8.1,
22• • January-June 2012Volume 3 • No. 1
Dr.Ali Ghufran
Prof. Dr. ZeeshanAmir
did his PhD in Business Management in the year 2002 fromAligarh Muslim University and presently
serving as an Assistant Professor in the Department of Business Management, Faculty of Management and Research,
Integral University, Lucknow. Besides, he is also shouldering the responsibilities of Director- Distance Education and
Joint Editor Integral Review - A Journal of Management at Integral University, Lucknow. He is having a blend of
academic and corporate experience in India as well as in abroad. The author can be reached at
was the first lady teacher to have been appointed in the Business Management Department of
AMU. She was associated with the university for over 10 years teaching and guiding Post Graduate students. Besides
her academic pursuits, she has been proactively involved in the NGO sector. She has worked as the Coordinator, for the
Women Empowerment Project for an NGO funded by World Literacy of Canada. She was short listed for the USA
based Eisenhower Scholarship in 2006 and has received Vocational Award by the District Rotary Club, in recognition
of her contribution towards education and empowerment of women.At present, she is working as Professor and Dean,
in the Faculty of Management and Research, Integral University, Lucknow. Besides, she is also shouldering the
responsibility of Editor-in Chief of Integral Review – A Journal of Management. The author can be reached at

James Ondracek, Andy Bertsch, M. Saeed & Carlan Taft
Scanning the Business Environment in India: An Overview ofSelect Multinational Companies in the Indian Marketplace
Introduction
Historical Backdrop
Political Backdrop
In today's world, business must compete on a much wider
playing field, no longer confined within national borders.
Post-liberalization in 1991, India has undergone a
paradigm shift owing to its competitive stand in the
world. The Indian economy is on a robust growth
trajectory and boasts of a stable annual growth rate, rising
foreign exchange reserves and booming capital markets
among others. Today, India is the fourth largest economy
in the world by GDP and PPP (purchasing power parity)
and there is ample reason for India's viability as a
destination for foreign investment. In addition to the
above-mentioned macroeconomic indicators, higher
disposable incomes, emerging middle class, low-cost
competitive workforce, investment-friendly policies and
progressive reform process all contribute towards India
being an appropriate choice for investors.
India has a stable democratic political system, a huge
middle-class population and has seen many years of high
economic growth (Schaffer, 2005). While India is now a
“Sovereign, Socialist, Secular, Democratic Republic”
with a parliamentary system of government
(http://india.gov.in/govt.php) that supports its companies
and global integration, it was not always that way.
The over-all impression in international circles is that the
India's government immediately after independence was
initially against the thought of innovation and
globalization of its businesses. There was resistance
against mechanization, automation as well as
globalization in many circles of power and influence for
several years. The Industries Act of 1951 is a prime
example, as it required all businesses to get a license from
the government before they could launch, expand, or
change their products (Staley, 2006). They also imposed
tariffs and other methods to discourage international
trade. These restrictions stunted India and between 1950
and 1987 their economy grew at a very meager rate
relative to other nations such as South Korea, China,
Hong Kong, and Taiwan.
It was not until the 1980's that India's government finally
woke up due to a growing budget deficit and foreign
exchange crisis. The government did a complete turn
around and started actively encouraging foreign
investment (Staley, 2006, page 2).
During this time growth continued. Initially, Indian
companies acted as subcontractors to more sophisticated
multinational companies. Eventually however, they
realized that they did not need the other companies and
began to generate new technologies on their own. This
allowed them to tap into the global marketplace (Staley,
2006, page 2).
India's political control has mainly been by the Indian
National Congress. The party was formed in 1885 while
India was being ruled by Britain and they had a major part
in protesting British rule and being declared an
independent nation in 1947 (“Indian National
Congress,” 2009). They have traditionally supported
socialist economic policies and in the 1990's they
India is rapidly becoming an international entity that cannot and should not be ignored. There is more and more
emphasis about what India can provide to the rest of the globe. This paper scans and reviews India's historical
backdrop and current views on foreign trade, growing economy, amazing information technology, cultural
characteristics, and what the future may hold. Included are brief and interesting discussions surrounding
multinational companies that have played a part in getting India to where it is now. It is endeavored to provide insight
into whether India has what it takes to offer global business players in its land.
Post - liberalization, Globalization, Hofstede's Dimensions, Foreign Trade & Investment ,
Information Technology, Societal and Cultural Dimensions.
Key Words:
23 • • January-June 2012Volume 3 • No. 1

endorsed market reforms, which included privatization
and the deregulation of the economy. The Indian
National Congress also supports equal rights for all
citizens, regardless of what caste they are in.
Nonalignment was their stance throughout the Cold War,
which called for them to form ties with the West and
communist countries but to avoid formal alliances with
either (“Indian National Congress,” 2009).
From 1998-2004 the Bharatiya Janta Party (BJP)
governed India (Schaffer, 2005). The BJP political party
was formed in 1980 from a split within the previous
political group, the Janta Party (“Bharatiya Janta Party,”
2009). They are perceived as an ethnocentric as well as
nationalistic political party and they sought to define
their culture in terms of ancient and traditional Indian
values (“Bharatiya Janta Party,” 2009). The major
supporters of this party have been conventionally the
higher-caste members and the Northern Indians however
they have sought to attract support from the lower castes
by appointing several lower-caste members to prominent
positions (“Indian National Congress,” 2009)
In 2004, the Indian National Congress came back into
power and remains the guiding force behind India's
current political and economic scenarios, including in
particular the focus on globalization.
The Indian Peninsula and parts of mainlandAsia make up
the country of India. It is slightly more than 1/3 of the
size of the US and has a diverse geography ranging from
upper plains, rolling plains, deserts, and the Himalayan
Mountains. The waters of the Indian Ocean make up its
vast shoreline and give the country access to important
trade routes. The country's natural resources include the
4 largest coal reserve in the world, minerals, petroleum
and arable land. India has several environmental issues
including deforestation, air pollution, water pollution
and a large growing population. India's agricultural
industry produces rice, wheat, oilseed, and cotton as well
as sheep, goats, poultry and fish. Textiles, chemicals,
pharmaceuticals and petroleum are some of the
industries in India (CIAWorld Factbook – India 2011).
In 2009, Indian Railways carried almost 20 million
passengers and 2.4 million tons of freight a day.As one of
the world's largest employers, it is also the world's largest
railways under single management. Freight costs in
India are much higher than other countries due to the
subsidizing of passenger travel through freight tariffs
(World Bank 2011).
The Indian Ocean provides the ports that India needs to
improve foreign trade. India has 13 major and 199 minor
ports along its coastline and has enjoyed a 10% increase
in port cargo volume in the last ten years. Unfortunately,
India's ports are at 60% capacity and will need to be made
more efficient to meet the anticipated economic growth
(World Bank 2011).
India has 15 international airports which handled 142
million passengers in 2010 and 2011 and 1.6 million tons
of cargo. US investment in the airline industry will need
to be close to $30 million USD in order to keep up with
the growing increase in air traffic (World Bank 2011).
Against the world- class standards, most of India's roads
are in poor shape, congested and consist mostly of two
lanes or less, and yet they carry 85% of the passenger
traffic and 60% of the country's freight. Roads are
important resources in the development of the rural areas
where 33% of the villages have no access to roads during
the monsoon season. Several government plans contain
measures for increased public funding for roads and
other methods of transportation including the National
Highway Development Program, the Central Road Fund,
the National Railway Development Program, and the
National Maritime Development Program (World Bank
2011).
With the world's largest democracy (BBC News 2011)
and the 2 most populous country in the world, India has
a population estimated to be over 1 billion with an annual
growth rate of 1.3% (CIAWorld Factbook – India 2011).
India has one of the largest school-age population in the
world and has a literacy rate of 74.04% (male: 82.1%,
female: 65.5%). It has a well-established education
system with more than 1.6 million schools enrolling in
excess of 130 million students. For higher education,
India has more than 500 universities, as well as more than
25,000 colleges and 7,000 technical institutions with
approximately 13 million students (Provisional
Population Totals India).
30% of India's population is urban with New Delhi, the
capital, housing almost 22 million people and the city of
Geographical Backdrop
Transportation System:An Overview
Societal Dimension
rd
th
nd
24• • January-June 2012Volume 3 • No. 1

Mumbai with close to 20 million. India is a young
country with a low median age of 26.2 years - more than
ten years younger than the median age in the United
States. (CIAWorld Factbook – India 2011).
India is very diverse in its languages, religions, and
cultures (BBC News 2011). Hindi is the language that
40% of the country uses but there are also major
languages like Bengali, Telugu, Marathi and Tamil.
Surprisingly, English is the language commonly used for
national, political, and commercial communication.
Hinduism is the predominant religious affiliation with
over 80% of India's population practicing. Islam ranks
2 at 13.4% of the total population (CIAWorld Factbook
– India 2011). Though there have been some unfortunate
historic events and episodes, India - on the whole -
presents a picture of communal harmony and national
integration; and majority of Indian subscribe to the
philosophy of non violence and peaceful co-existence .
India is rated high for degree of risk for infectious
diseases and has the largest burden of tuberculosis in the
world. Programs such as the National TB control
program have successfully met worldwide targets in
detection and treatment rates since 2009 (World Bank
2011). 43.5% of India's children under 5 years old are
underweight. (CIAWorld Factbook – India 2011).
Most of India's population are employed in agriculture
but the services sector is steadily gaining at 34% as of
2009 (CIA World Factbook – India 2011). As stated
earlier, over 1.6 million Indians are employed by the
Indian Railways, making it the largest employer in the
country (Coface 2012).
By using the Geert Hofstede 5-D Model, a comparison
can be made between the drivers of the American culture
and India's. The MAS (Masculinity) and UAI
(Uncertainty, Avoidance) are very similar. Both
countries received a mid-range score (Geert Hofstede
2011) indicating their societies are not defined by
traditional male and female roles but rather lean toward a
balance of gender and skill. The UAI measures the
anxiety in unknown situations. The US and India scored
46 and 40 respectively (Geert Hofstede 2011), an
indication that conducting business with an Indian
company would be similar to a US company in terms of
the formality of business meetings and expectations
(taking into consideration the cultural differences). The
biggest differences in the 5-D Model were the PDI
(Power Distance) and IDV (Individualism) scores. The
US has a high IDV (Geert Hofstede 2011) indicating a
high degree of individualism, whereas India's score
indicates a more group cohesion and loyalty to others.
India has a much higher PDI score (Geert Hofstede 2011)
which might indicate their acceptance of inequality and
the caste system (Taylor 2012). In contrast, the US has a
lower PDI – an acceptance of shared power and the view
that all members are equal.
Indian women have made major strides in improving
gender equality. The improvement of girls' education,
women's ownership of assets and lower fertility levels
have contributed to smart economics – creating
opportunities and better conditions for women and girls
which in turn increase the development prospects for all
Indians. There are still concerns about female mortality
in India where 1 million of the world's 3.9 million
“missing women” deaths happen. (Missing deaths are
those that take place before birth, in infancy and early
childhood, or in the reproductive years). In India, one
quarter of the poorest 40% of the population still marries
before the age of 18 and some of the poorest women are
not allowed to take major marital decisions influencing
their lives (The World Bank 2011).
Due to a surge in violence against protestors, India's civil
liberties rating declined from 4 to 5 (Freedom House).
Also affecting the decline were the live ammunition used
in the enforcement of curfews enforced on those civilians
who were opposing the increase in militarization in the
region (Freedom House 2011).
The Indian government has made some efforts to combat
corruption but it remains an important factor in India's
human rights story. Reports of high government officials
not being prosecuted for corruption have left citizens
wary of reporting or filing complaints. As a case in point,
after resigning in 2008, when he was charged with
receiving a bribe, the Education Minister was allowed to
rejoin the cabinet in 2009 (World Bank 2011).
Journalists use some degree of self-censorship after
many were threatened or kidnapped by militant groups.
Academic and religious freedoms are honored by
authorities but these groups risk the attacks of militant
factions (Freedom House 2011).
nd
Hofstede's Five Dimensions
Human Rights: Issues & Challenges
25 • • January-June 2012Volume 3 • No. 1

Cultural Dimension
Economic Backdrop
India is a diverse and complex society and there are not
standard rules for doing business there.Abusiness person
may have to consider the region, religion, and caste when
dealing with Indian businesses. Business etiquette
depends on whom you are talking with and the reason for
the conversation (World Bank 2011).
Hierarchy plays a major role in the Indian business
culture as Indian society defines a person's role, status
and social order. It is important to always greet the most
senior person first (World Bank 2011).
English is the language for doing business in India. A
meeting in India requires a handshake however; using the
Namaste (palms together at chest level and a slight head
bow) would be recognition of Indian etiquette. Always
use his/her formal title (Doctor, Mr., Mrs.) when
addressing an Indian and exchange business cards at the
first meeting remembering to put the card away
respectfully and not in your pocket (World Bank 2011).
Doing business in India requires relationship building.
Negotiations can sometimes be slow and call for
patience. Keep in mind that anger and frustration or not
acceptable behavior (World Bank 2011). Business
lunches are preferred and be aware that Hindus do not eat
beef and Muslims do not eat pork (International Business
Center 2011). Majority of Indians are either totally or
mainly vegetarians.
According to the International Monetary Fund, as of
2011, the Indian economy is nominally worth US$1.843
trillion; it is the tenth-largest economy by market
exchange rates, and is, at US$4.469 trillion, the third-
largest by purchasing power parity, or PPP (IMF, 2011).
With its average annual GDP growth rate of 5.8% over
the past two decades, and reaching 10.4% during 2010
(Olson 2009, p. 16). India is one of the world's fastest-
growing economies (International Monetary Fund 2011,
p. 2). However, the country ranks 138th in the world in
nominal GDP per capita and 129th in GDP per capita at
PPP.[IMF, 2011] Until 1991, all Indian government
agencies, enterprises and establishments followed
protectionist policies that were influenced by socialist
economics. Widespread state intervention and regulation
largely walled the economy off from the outside world
(IMF, 2011).An acute balance of payments crisis in 1991
forced the nation to liberalize its economy (Nayak,
Goldar & Agrawal 2010, p. xxv); since then it has slowly
moved towards a free-market system (Wolpert 2003, p.
xiv) by emphasizing both foreign trade and direct
investment inflows. According to Gargan (1992) India's
recent economic model is largely capitalist (OECD,
2007).
India is today one of the three largest Asian economies in
terms of purchasing power parity. The median age of
India's population is about 25, which in comparison to
other Asian countries, puts India in a very favorable
demographic position. The United Nations predicts that
India's working age population (15-64 years) will
increase by 135 million in one decade, that is, by 2020. So
while most countries such as those in Europe, China and
the US will witness a decrease in workforce in the
coming decades, India's position is strengthening: this is
a product of its high birth rate, which will last until
around 2050. A young, eager and well educated
workforce is the key to India's future prosperity.
(Chandabhoy & Jassoobhoy, 2011)
With the 467-million workers, the Indian labor force is
the world's second-largest. According to Central
Intelligence Agency, the service sector makes up 54% of
GDP, the agricultural sector 28%, and the industrial
sector 18%. Major agricultural products include rice,
wheat, oilseed, cotton, jute, tea, sugarcane, and potatoes.
Major industries include textiles, telecommunications,
chemicals, food processing, steel, transport equipment,
cement, mining, petroleum, machinery, and software
(Pylee & 2003 b, p. 314). In 2006, the share of external
trade in India's GDP stood at 24%, up from 6% in 1985
(Wolpert 2003, p. xiv). In 2008, India's share of world
trade was 1.68% (Alamgir 2008, pp. 23, 97); India was
the world's fifteenth-largest importer in 2009 and the
eighteenth-largest exporter (The Times of India, 2009).
Major exports include petroleum products, textile goods,
jewelry, software, engineering goods, chemicals, and
leather manufactures (Pylee & 2003 b, p. 314). Major
imports include crude oil, machinery, gems, fertilizer,
and chemicals. (Pylee & 2003 b, p. 314). Between 2001
and 2011, the contribution of petrochemical and
engineering goods to total exports grew from 14% to
42% (World Trade Organization 2010).
The Bombay Stock Exchange is Asia's oldest and India's
largest bourse by market capitalization. Averaging an
26• • January-June 2012Volume 3 • No. 1

economic growth rate of 7.5% during the last few years
(Wolpert, 2003), India has more than doubled its hourly
wage rates during the last decade (Economist 2011).
Some 431 million Indians have left poverty since 1985;
India's middle classes are projected to number around
580 million by 2030 (Bonner, 2010). Though ranking
51st in global competitiveness, India ranks 17th in
financial market sophistication, 24th in the banking
sector, 44th in business sophistication, and 39th in
innovation, ahead of several advanced economies
(Farrell & Beinhocker 2007). With 7 of the world's top 15
information technology outsourcing companies based in
India, the country is viewed as the second-most favorable
outsourcing destination after the United States (Schwab
2010). India's consumer market, currently the world's
thirteenth-largest, is expected to become fifth-largest by
2030 (Bonner, 2010). Its telecommunication industry,
the world's fastest-growing, added 227 million
subscribers during the period 2010–11(Sheth, 2009). Its
automotive industry, the world's second fastest growing,
increased domestic sales by 26% during 2009–10,
(Telecom Regulatory Authority, 2011) and exports by
36% during 2008–09 (Business Lines, 2010). Power
capacity is 250 gigawatts, of which 8% is renewable
(Express India, 2010).
The FDI (Foreign Direct Investment) regime has been
progressively liberalized during the course of the 1990s
(particularly after 2000). A number of restrictions on
foreign investment have been removed and procedures
are now much more simplified. With limited exceptions,
foreigners can invest directly in India, either on their own
or as joint venture industries where foreign investment is
prohibited. Moreover, investment ceilings, which are
applicable in certain cases, are gradually being phased
out. India has witnessed a steady increase of foreign
inflows over the years. (PricewaterhouseCoopers,2011).
Major share in FDI, country-wise in the last two years has
been as follows: (Chandabhoy & Jassoobhoy, 2011)
FDI net inflows have grown at a rate of over 30%
compounded annually over the last decade. In 2009-10
India received FDI worth US$20 billion up 11% over the
previous year. There has however, been a dip of 23% in
FDI net inflows in the first half of 2010-11 to US$13.5
billion owing to the ongoing global uncertainty
stemming from the global financial crisis and sovereign
debt crisis in the Euro-zone countries. This has prompted
growing risk averseness and unwillingness among the
part of global investors to make long-term commitments.
FII (Foreign Institutional Investment) inflows in
contrast, have surged by 46% in H1 2010-11 to US$51
billion as institutional investors have sought to make
quick gains from India's higher interest rate environment,
strong domestic growth recovery and rise of protectionist
measures instituted by other Asian economies to deal
with the copious flows entering the region
(PricewaterhouseCoopers,2011).
The rise of the Information Technology industry in India
is due in part by the dynamic role of the Indian
government. The national level goal is to have India
become an Information Technology superpower and one
of the largest generators and exporters of software in the
world. In order to pursue this goal, a National Task Force
on IT and Software Development was set up in 1998 and
closely monitored by the Ministry of Information
Technology (http://www1.american.edu/initeb/
mk5916a/egov.htm). It can be said that the national goal
has come true as today India has over 1,600 tech
companies, and 5 of the top 10 information technology
organizations in the world, including billion-dollar
multinationals Infosys and Wipro (Staley, 2006). India is
able to provide us with exactly what we needed, low-cost,
high-quality products and services. They are also poised
to be an even larger contributor in the future as the have
320 million children between the ages of 6 and 16 who
will enter the global work force in the next decade and a
half. (Haley, 2008)
Foreign Trade and InvestmentInformation Technology
27 • • January-June 2012Volume 3 • No. 1

Current Issues: The Other Side of the Coin
Multinational Companies in the Indian Marketplace
METRO
Despite impressive economic growth during recent
decades, India continues to face socio-economic
challenges. India contains the largest concentration of
people living below the World Bank's international
poverty line of US$1.25 per day (Yep, 2011), the
proportion having decreased from 60% in 1981 to 42% in
2005 (World Bank, 2006). Half of the children in India
are underweight, and 46% of children under the age of
three suffer from malnutrition (World Bank, 2006). The
Mid-Day Meal Scheme attempts to lower these rates
(World Bank, 2006). Since 1991, economic inequality
between India's states has consistently grown: the per-
capita net state domestic product of the richest states in
2007 was 3.2 times that of the poorest (Drèze & Goyal
2008, p. 46).
Inflation continues to be a cause for concern. The year-
on-year WPI inflation that started trending up in
December 2009 continued through the current fiscal. The
financial year 2010-11 started with a double-digit
headline inflation of 11% in April 2010. After remaining
in double digits from April to July 2010, the headline
inflation came down to single digits and stood at 8.8% in
August 2010. Headline inflation in November 2010 was
7.5%. However, the trend reversed and in December
2010, it was 8.4%. Presently, inflation is in the range of 8-
9%. (Chandabhoy & Jassoobhoy, 2011)
Corruption in India is perceived to have increased
significantly (Pal & Ghosh 2007), with one report
estimating the illegal capital flows since independence to
be US$462 billion (Transparency International 2010).
Driven by growth, India's nominal GDP per capita has
steadily increased from US$329 in 1991, when economic
liberalization began, to US$1,265 in 2010, and is
estimated to increase to US$2,110 by 2016; however, it
has always remained lower than those of other Asian
developing countries such as Indonesia, Iran, Malaysia,
Philippines, Sri Lanka, and Thailand, and is expected to
remain so in the near future (BBC, 2010).
While India is poised to become a global power, they also
have challenges that need to be addressed. They have
several structural issues, which have resulted in a
difference in the growth among states. While India's
South and West have seen excellent growth, the North
and East are falling well behind. One of the main factors
that is involved with the difference is the quality and
effectiveness of state and local government (Schaffer,
2005, Page 4). Regional disparity presents a real
challenge for all stakeholders.
According to a 2011 PricewaterhouseCoopers report,
India's GDP at purchasing power parity could overtake
that of the United States by 2045 (International Monetary
Fund, 2011). During the next four decades, Indian GDPis
expected to grow at an annualized average of 8%, making
it potentially the world's fastest-growing major economy
until 2050 (International Monetary Fund, 2011) The
report highlights key growth factors: a young and rapidly
growing working-age population; growth in the
manufacturing sector due to rising education and
engineering skill levels; and sustained growth of the
consumer market driven by a rapidly growing middle
class (International Monetary Fund, 2011). The World
Bank cautions that, for India to achieve its economic
potential, it must continue to focus on public sector
reform, transport infrastructure, agricultural and rural
development, removal of labor regulations, education,
energy security, and public health and nutrition
(PricewaterhouseCoopers, 2011).
India's economy has strong fundamentals and is host to
several eminent global corporate giants that are leaders in
their respective fields. According to the Global
Competitiveness Report 2010–11, India ranks at 51
among 139 countries. In order to demonstrate this, five
companies from various sectors have been identified.
These companies had anticipated the business
opportunities to expand their operations in India and had
tapped the markets with their products and services.
The METRO Cash & Carry success story began in 1964
with the opening of the first wholesale outlet in Germany.
Today the company is represented in 30 countries with
METRO and MAKRO Cash & Carry stores at 544
locations - and offers its commercial customers up to
50,000 different products from a single source
(www.metro.co.in)
METRO Cash & Carry started operations in India in
2003 with two Distribution Centers in Bangalore. With
this METRO introduced the concept of Cash & Carry to
India. These Centers offer the benefit of quality products
at the best wholesale price to over 150,000 businesses in
l
28• • January-June 2012Volume 3 • No. 1

Bangalore. METRO offers assortment of over 18000
articles across food and nonfood at the best wholesale
prices to business customers such as Hotels, Restaurants,
Caterers, Food and Non-food Traders, Institutional
buyers and professionals.
The first METRO Cash & Carry wholesale center in
India opened in Bangalore in 2003. Currently there are 7
wholesale centers in operation, two in Bangalore
(www.metro.co.in/stores/Bangalore.asp) and two in
Hyderabad, (www.metro.co.in/stores/hyderabad) of
which one was opened on 30 November 2006. The first
Mumbai store was opened in 2008 at Bhandup
(www.metro.co.in/stores/mumbai) and the Kolkata store
located at Kalikapur, EM Bypass in 2008.The metro
Cash & Carry store was opened at Ludhiana city in
Punjab on Jallundhar bye pass road in the first week of
September 2011. It has now opened its second store in
Mumbai near Western Express Highway, Borivli on 17
November 2011. Metro in India are into vigorous
expansion plans with similar investments in the states of
Delhi, Andhra Pradesh, Tamil Nadu, Punjab, West
Bengal (www.metro.co.in)
METRO today is poised to extend its concept of Business
to Business (B2B) Wholesale to other cities in the
country. Its business concept is targeted towards
professional customers rather than end consumers. The
cash-and-carry concept is based around self-service and
bulk buying. METRO Cash & Carry serves to registered
customers only. Core customer groups are hotels,
restaurants, caterers, traders and other business
professionals (www.metro.co.in)
IBM has been present in India since 1992 with a Tata
joint-venture, named Tata Information Systems Ltd. Its
business interest in India was still focused on product
sales. In 1997, IBM Global Services was set up. India
Research Lab was set up in the IIT Delhi campus in 1998.
In 1999, IBM bought out Tata's stake in the company and
IBM India became a fully owned subsidiary of IBM
Corporation. Since its inception, IBM has expanded its
operations in India considerably with regional
headquarters in Bangalore and offices in fourteen cities
including New Delhi, Mumbai, Chennai and Kolkata
(www.ibm.com/in). Between 2003 and 2007, IBM's head
count in India has grown by almost 800%, from 9,000 in
2003(http://www.accessnorthga.com) to nearly 74,000
in 2007(www.ibm.com). Since 2006, IBM has been the
multinational with the largest number of employees in
India (Business Week, June 2006). More than one quarter
of IBM's employees are from India and is expected to
grow. It is expected that in 2011, IBM will recruit
approximately 24,000 more employees taking it to a total
of nearly 154,000 employees from India. Over the last
decade, IBM has made significant investments towards
setting up some world class R&D and innovation
oriented facilities in India including India research
laboratory, software innovation centre, IBM innovation
centre for business partners, Linux solution centre and
Linux competency centre.
IBM India has now grown to an extent where it poses a
stiff challenge to homegrown Software companies of
India in IT global delivery and manpower
attraction/retention. It now operates the following
business lines from India which contributes to worldwide
IBM in a global delivery framework: India Software
Labs (ISL), India Research Lab (IRL), Linux Technology
Center, Global Business Services(GBS), Global
Technology Services (GTS) formerly known as ITD-GD
(Information Technology Delivery - Global Delivery) ,
Global Business Solutions Center (GBSC), Sales &
Distribution (S&D), Integrated Technology Services
(ITS) (www.ibm.com/in).
On March 2, 2012 it was reported that IBM India wants to
open sales office in around 40 Tier-I and Tier-II cities of
India in year 2012-2013 (The Hindu Business Line,
2011)
Daimler entered the Indian market and set up Mercedes-
Benz India Ltd in 1994. The company was later renamed
DaimlerChrysler India Private Ltd after the merger of
parent company Daimler with Chrysler. After
DaimlerChrysler sold off most of its equity interests in
Chrysler in 2007, it changed its name to Daimler AG. As
a result, DaimlerChrysler India was renamed Mercedes-
Benz India once again (www.mercedes-benz.co.in)
Mercedes-Benz India is a 100%-owned subsidiary of
Daimler AG. Daimler has a commercial vehicle plant
outside of Chennai which it is currently upgrading with
an investment of 700 million Euros. The passenger cars
manufacturing plant is located in Pune (Economic Times,
2009). Mercedes-Benz India has been delighting
customers with strong brands and a wide range of
l IBM India
Daimler-Chrysler Indial
29 • • January-June 2012Volume 3 • No. 1

products equipped with the latest in automotive
technology. The company has been the pioneer of the
luxury car segment in India with its inception way back in
1995. It is the only luxury car maker in India to have such
a wide range of cars. The different ranges available today
are the C-Class, CL-Class, CLS-Class, E-Class Saloon,
E-Class Coupe, E-Class Cabriolet, GL-Class, M-Class,
R-Class, S-Class, SL-Class, SLK-Class, and the
Maybach. We have also already introduced our high
performance AMG cars in India off late like the G 55
AMG and the SLSAMG (www.mercedes-benz.co.in)
The depth of choices within these ranges is also extensive
with different petrol and diesel engines. The time
difference between the global and Indian launch of its
latest models is constantly optimized. They strive to
make them available in the shortest time possible.
Mercedes-Benz reached the top 100 most trusted brands
of India published by The Brand Trust Report and also
won the Best Brand Award by Auto India Best Brand
Awards 2011. Daimler Chrysler India is a 100 percent
subsidiary of Daimler Chrysler group and is one of the
first joint ventures set up in India. The company rides on
the economic growth of India in general and future
potential of the Indian automobile market in particular.
The company is targeting 25 percent of the total turnover
from Asia and counts on Daimler Chrysler India to play
a definite role in the strategic forays in this part of the
globe (Carwale.com)
Aviva India is a joint venture between one of the
country's oldest and largest groups, Dabur, and Aviva
Group, one of the UK's largest insurance group, whose
association with India dates back to 1834. Aviva is UK's
largest and the world's fifth largest insurance Group. The
company entered India in 2002 as a joint venture with
Dabur group of India to form Aviva India. In a short span
of three years since commencing its operations in the
country,Aviva has emerged as one of the leading players
in the Indian private sector life insurance market. With
a wide distribution network of 140 branches and strong
Bancassurance partnerships, AVIVA is spread across
nearly 3,000 towns and cities in India.
AVIVA's vision is to be amongst India's leading life
insurers with a quality business model, focused on
sustainable growth. AVIVA seeks to build a robust
product portfolio meeting all customer lifecycle needs
related to – Protection, Retirement, Savings and
Investments (www.avivaindia.com).
With a strong sales force of over 20,000 Financial
Planning Advisers (FPAs), they have initiated and
pioneered many innovative sales approaches, including
the concept of Bancassurance and Financial Health
Check services. AVIVA is amongst the first companies to
introduce the contemporary unit-linked products.
Keeping with its commitment of social responsibility,
AVIVA has been successful in reaching out to the
underprivileged strata through its Micro insurance
initiatives (www.avivaindia.com).
Aviva India won a Bronze at the Effies 2010 for theAviva
Great Wall of Education, part of Aviva's Street to School
Program. The Effies are among the top award platforms
for the advertising community in India and worldwide.
Aviva Great Wall of Education was awarded this elite
recognition for the marketing effectiveness displayed
during this campaign (www.avivaindia.com).
Aviva India has won the "Corporate Social
Responsibility Award" at the prestigious Asia Insurance
Industry Awards 2010 for its corporate social
responsibility program – 'Street to School' for
demonstrating how corporate social responsibility can be
closely and successfully tied with business strategy.
Aviva Life Insurance India was selected from a number
of high profile companies competing for the honor of
receiving the award (www.avivaindia.com).
Aviva India has won two major awards, at the 'CMOAsia
Awards' held in Singapore– 'Excellence in Branding and
Marketing' in Banking and Financial services, and Social
Marketing. Aviva India was selected for the two
prestigious awards from among more than 200
nominations from acrossAsia (www.avivaindia.com).
Aviva has been felicitated with the "Bronze Award for
Excellence in People Management" by Grow Talent
Company Limited and Businessworld. This honor was
given based on our ranking amongst the top 25
companies as per the Grate Place to Work survey in the
last four years (www.avivaindia.com).
Amway India is a wholly owned subsidiary of US $ 10.9
billion Amway Corporation, Ada, Michigan, USA.
Amway Corporation is one of the largest Direct Selling
companies in the world. It has a presence in 80 countries
l
l
AVIVA
AMWAYIndia
30• • January-June 2012Volume 3 • No. 1
& territories (www.amway.in).
Established in 1995, Amway India commenced
commercial operations in May 1998 and has emerged as
the largest Direct Selling FMCG Company. The
Company has its headquarters in the National Capital
Region of India - New Delhi (www.amway.in).
Amway has invested in excess of Rs. 200 Crore in India
of this; Rs. 22 Crore is in the form of direct foreign
investment. Amway India has 500 full time employees
and has generated indirect employment for 2000 persons
at al l the contract manufacturer locat ions
(www.amway.in).
The Company has provided income-generating
opportunities to over 550,000 active independent
Amway Business Owners. Amway India provides free
and unlimited training to all its distributors to help them
grow their business. Amway India conducts over 20,000
training sessions during an average 12-month period
with an attendance of over 1.5 million Amway Business
Owners and prospects (www.amway.in).
Amway India recorded a sales turnover of over Rs. 2130
Crore in 2011, up from Rs.1790 Crores in 2010. Amway
India is a member of the Confederation of Indian
Industries (CII) and Federation of Indian Chambers of
Commerce (FICCI). The World Blind Union presented
an award and citation to Amway India in 2003, for its
peerless work for the blind child (www.amway.in).
In thirteen years of commercial operation, Amway India
has established a nation-wide presence of over 135
offices and 55 city warehouses and four regional mother
warehouses. The distribution and home delivery network
set up with the support of independent logistics partners
is spread across over 5500 locations (www.amway.in).
Almost all Amway India products are manufactured in
the country through the third party contract
manufacturers. To bring the identified contract
manufacturers' production facilities and skills to
international standard,Amway has invested in transfer of
state-of-the-art, world-class technology to the contract
manufacturers free of cost (www.amway.in).
At present, Amway India offers over 130 products in five
categories. They are Personal care category, Home Care
category, Nutrition & Wellness category, Cosmetics and
Great Value Products. With the exception of Cosmetics
range (Artistry) and some products in Nutrition and
Wellness category, all Amway India products and bottles
are manufactured in India (www.amway.in).
India has great future potential as Phatak (2009) calls
India an, “Emerging Economic Giant”. India is steeped
deep with tradition and diversity, which will be essential
in helping them survive and thrive in today's global
workforce. The most important step is that India's
management is now embracing the importance of foreign
trade and the global marketplace. They have realized
that managing by autocratic process, formal authority
and charisma might not be the best approach and is open
to emphasizing democratic processes in the workplace
(Phatak, 2009). They are also leaders and pioneers of
innovation and key player in the Information Technology
sector. The evolution of India as a global force is
emerging now and by 2020, the impact will be clearly
visible in the labor force. (Schaffer, 2005).
1. “About 1 in 5 IBM Employees Now in India”,
December 27, 2007. Retrieved 24 March 2012
<http://www.accessnorthga.com/detail.php?n=2052
30>.
2. Alamgir, J.,(2008), “India's Open-Economy Policy:
Globalism, Rivalry, Continuity, Taylor & Francis,”
ISBN 978-0415776844, Retrieved 25 March 2012.
3. “India Lost $462bn in illegal Capital Flows, Says
Report. November 18, 2010, Retrieved 5 April 2012
<http://www.bbc.co.uk/news/world-south-asia-
11782795>.
4. BBC News, "India Lost $462bn in Illegal Capital
Flows, Says Report", 18 November 2010,
Retrieved 23 March 2012.
5. Bharatiya Janta Party. (2009). In Encyclopedia
Britannica. Retrieved online from <>
6. Bonner, B., (2010), “Make Way, World. India is on
the Move, Christian Science Monitor,” Retrieved 23
March 2012.
7. Business Line, "India Second Fastest Growing Auto
Market After China", 9 April 2010, Retrieved 23
March 2012.
Conclusion
References
31 • • January-June 2012Volume 3 • No. 1

8. Business Week, IBM's India Pep Rally, 6 June
2006, Retrieved 3 April 2012
<http://www.businessweek.com/globalbiz/content/j
un2006/gb20060606_283521.htm>
9. "Mercedes-Benz India Record 94% Sales Growth -
CarWale News". 7 July 2010. <www.Carwale.com>
Retrieved 4April 2012.
10. Census India “Provisional Population Totals India,”
Census of India website, Retrieved 28 March 2012
<http://www.censusindia.gov.in/2011-prov-
results/prov_results_paper1_india.html, accessed
14 June 2011>
11. Chandabhoy & Jassoobhoy, “Doing Business in
India,” September 2011, retrieved 31 March 2012.
12. Drèze, J. and Goyal, A., (2009), "The Future of Mid-
Day Meals in Baru, R. V., School Health.”
13. Express India, "Indian Car Exports Surge 36%", 13
October 2009, Retrieved 9April 2012
14. Economic Times, "Mercedes to Invest e700 m in
Chennai Plant". 2009-08-04. Retrieved 28 March
2012.
15. Farrell, D. and Beinhocker, E., (2007), “Next Big
Spenders: India's Middle Class,” McKinsey &
Company, Retrieved 2April 2012
16. Freedom House.
<http://www.unhcr.org/refworld/
docid/4e565c5f33.html> (Retrieved 20 January
2012)
17. Gargan, E. A., “India Stumbles in Rush to a Free
Market Economy,” The New York Times, 15 August
1992 retrieved 22 March 2012
18. H o f s t e d e , G . , ( 2 0 1 2 ) , < h t t p : / / g e e r t -
hofstede.com/india.html> Retrieved 19 January
2012
19. Indian National Congress . (2009). In Encyclopedia
B r i t a n n i c a . R e t r i e v e d O n l i n e f r o m
http://www.britannica.com
20. “India's Reliance Industries Joins the Oil Club,” 22
September 2008 , Retrieved
July 12, 2009, from Academic Search Premier
database
21. I n t e r n a t i o n a l C a r e e r s . ( 2 0 1 2 )
<http://international.careers.org/india (Accessed 19
January 2012)>
22. International Monetary Fund, “World Economic
Outlook Update”, June 2011, retrieved 22 March
2012
23. International Monetary Fund, Report for Selected
Countries and Subjects: India, Indonesia, Islamic
Republic of Iran, Malaysia, Philippines, Sri Lanka,
Thailand,April 2011, Retrieved 4April 2012
24. Kumar, G. S., (2010), “Remarks at the USA India
Business Summit 2010”
<http://trade.gov/press/speeches/2010/kumar_0510
10.asp (Accessed 19 January 2012)>
25. Nayak, P. B., Goldar, B. and Agrawal, P., (2010),
“India's Economy and Growth: Essays in Honor of V.
K. R. V. Rao,” SAGE Publications, ISBN 978-
8132104520.
26. Olson, R. G., (2009), "Technology and Science in
Ancient Civilizations," Praeger Series on theAncient
World (Praeger), ISBN 978-0275989361.
27. Organization for Economic Co-operation and
Development, Economic Survey of India 2007:
Policy Brief, October 2007, Retrieved 4April 2012.
28. Simhan, R., “IBM foraying in big way in smaller
cities,” March 2, 2011. Retrieved 6 April 2012
<http://www.thehindubusinessline.com/industry-
and-economy/info-
tech/article2953367.ece?homepage=true>
29. Pal, P. and Ghosh, J., (2007), "Inequality in India: A
Survey of Recent Trends" (PDF), Economic and
Social Affairs: DESAWorking Paper No. 45 (United
Nations), Retrieved 4April 2012
30. Phatak, A. V., Bhagat, R. S. and Kashlak, R. J.,
(2009), “International Management Managing in a
Diverse and Dynamic Global Environment,” (2
ed.), NewYork, NY: McGraw-Hill/Irwin
Freedom in the World 2011 –
Kashmir (India)
Business Week Online
nd
32• • January-June 2012Volume 3 • No. 1

31. PricewaterhouseCoopers, “The World in 2050: The
Accelerating Shift of Global Economic Power:
Challenges and Opportunities”, January2011,
retrieved 2April 2012
32. Pylee, M. V., (2003), "The Longest Constitutional
Document," Constitutional Government in India
(2nd ed.), S. Chand, ISBN 978-8121922036
33. Schwab, K., (2010) (PDF), The Global
Competitiveness Report 2010–2011, World
Economic Forum, Retrieved 2April 2012
34. Sheth, N., (2009), "Outlook for Outsourcing
Spending Brightens," The Wall Street Journal,
Retrieved 3April 2012
35. Staley, S., (2006), “The Rise and Fall of Indian
Socialism,” , (2), 44-Retrieved July 12,
2009, fromAcademic Search Premier database.
36. Schaffer, T., (16 December 2005), India as a Global
Power?
37. Taylor, S., (2012), Geert Hofstede Analysis for India
<http://www.cyborlink.com/besite/ india.htm>
(Retrieved 19 January 2012)
38. T r a v e l D o c u m e n t S y s t e m s . , ( 2 0 1 2 ) .
<http://www.traveldocs.com/index/php?page=
India> (Retrieved 21 January 2012)
39. TSC Aims to Make BPO a $3 Billion Business.
(2009, July 19) . <ht tp : / /www.business-
standard.com/india/news/tsc-aims-to-make-bpo3-
billion-business/364301>
40. Telecom Regulatory Authority of India, Information
Note to the Press (Press Release No.29 /2011), 6
April 2011, Retrieved 3April 2012
41. The Economist, “India's Economy: Not Just Rubies
and Polyester Shirts,” 8 October 2011, Retrieved 4
April 2012
42. The Times of India, “Exporters Get Wider Market
Reach,” 28August 2009, Retrieved 3April 2012
43. The World Bank, “New Global Poverty
Estimates—What It Means for India,” Retrieved 3
April 2012
44. The World Bank, "India: Undernourished
Children—ACall for Reform andAction," Retrieved
3April 2012
45. The World Bank, “Inclusive Growth and Service
Delivery: Building on India's Success,” 29 May
2006, Retrieved 3April 2012
46. The World Bank, “India Country Overview”
September 2010, September 2010, Retrieved 3 April
2012
47. The World Bank, (2011), “Gender Equality: The
Right and Smart Thing to Do – World”
48. ht tp : / /go .wor ldbank.org/
YL66JZ85A0> (Retrieved 21 January 2012)
49. The World Bank, (2011), “ ”
<h t tp : / / go .wor ldbank .o rg /YL66JZ85A0>
(Retrieved 21 January 2012)
50. The World Bank, (2008), “The World Bank in India,”
<http: / /go.worldbank.org/OQ25M3AW80>
(Retrieved 19 January 2012)
51. The World Bank, (2012),
<http: / /go.worldbank.org/OQ25M3AW80>
(Retrieved 19 January 2012)
52. Transparency International, Corruption Perception
Index 2010—India Continues to be Corrupt, 26
October 2011, Retrieved 3April 2012
53. Wolpert, S. (25 December 2003), “A New History of
India” (7th ed.), Oxford University Press, ISBN 978-
0195166781
54. World Trade Organization, (2011), International
Trade Statistics 2011 <www.wto.org/statistics>
(Retrieved 21 January 2012)
55. World Economic Outlook Update, International
Monetary Fund, June 2011, Retrieved 22 March
2012
56. World Economic Forum website, The Global
Competitiveness Report 2010-2011,” Retrieved 25
March 2012,
<http://www3.weforum.org/docs/WEF_GlobalCo
mpetitivenessReport_2010-11.pdf>
Reason 38
Deutsche Bank Research.
Bank Report , <
Transportation: India
World Bank India
33 • • January-June 2012Volume 3 • No. 1

57. World Trade Organization, Trade to Expand by 9.5%
in 2010 After a Dismal 2009, WTO Reports, 26
March 2010, Retrieved 5April 2012
58. Yep, E. (27 September 2011), “Renew Wind Power
Gets $201 Million Goldman Investment,” The Wall
Street Journal, Retrieved 27 March 2012.
James Ondracek
Andy Bertsch
M. Saeed
Carlan Taft
is a Professor, Minot State University, USA. He holds a Ph.D. in Strategic Management (primary
area) and International Business (secondary area) from the University of South Carolina. He is an active researcher,
and grant writer. His areas of interests are span strategy, international business, and entrepreneurship. Dr. Ondracek
has traveled, lived, or worked in over 35 countries.
is a Associate Professor, Minot State University, USA. He holds a Doctor of Business Administration
(DBA) degree from the Henley Management College in England (now known as Henley Business School). He has
over 25 years of experience in entrepreneurship, consultancy, executive management, and research. His research
interests include cross-cultural studies and leadership.
is a Professor, Minot State University, USA. He has over 40 years of teaching experience at the university
level. He has conducted numerous researches, and published 20 books, besides having more than 100 articles
published in international journals and refereed conference proceedings. The author can be reached at
is a Research Associate. He has completed Master of Science – Management degree from Minot State
University.
34• • January-June 2012Volume 3 • No. 1
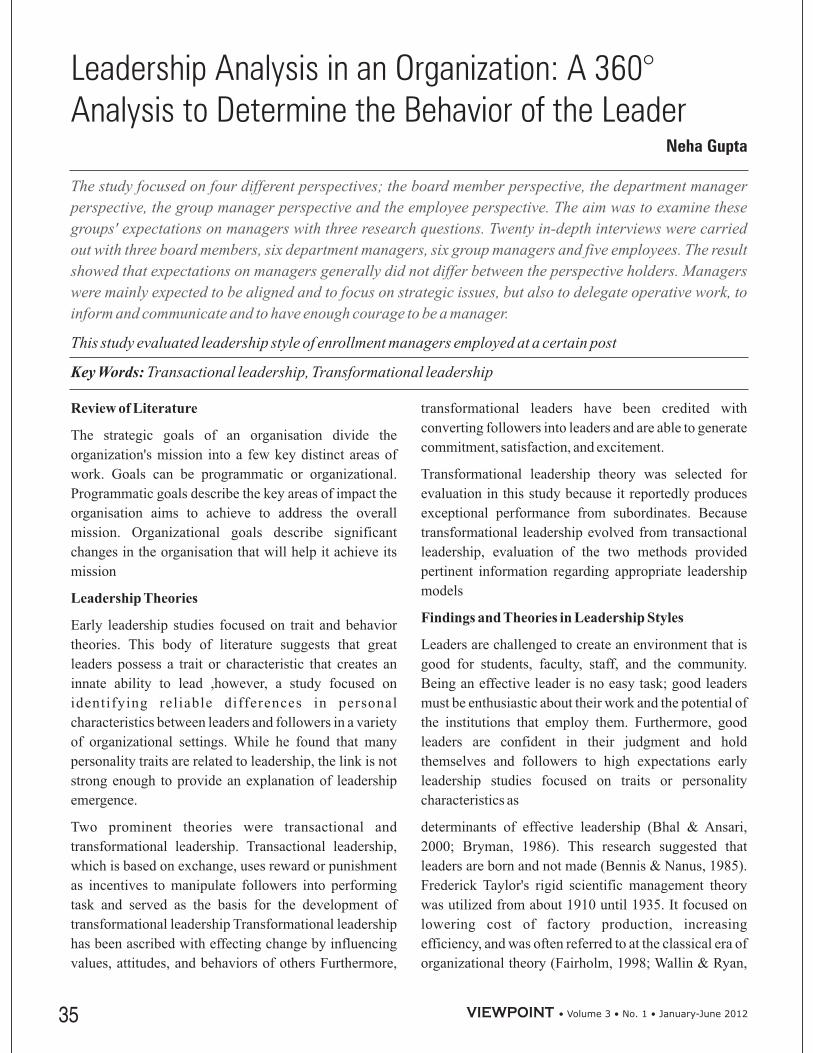
Review of Literature
Leadership Theories
Findings and Theories in Leadership Styles
The strategic goals of an organisation divide the
organization's mission into a few key distinct areas of
work. Goals can be programmatic or organizational.
Programmatic goals describe the key areas of impact the
organisation aims to achieve to address the overall
mission. Organizational goals describe significant
changes in the organisation that will help it achieve its
mission
Early leadership studies focused on trait and behavior
theories. This body of literature suggests that great
leaders possess a trait or characteristic that creates an
innate ability to lead ,however, a study focused on
identifying reliable differences in personal
characteristics between leaders and followers in a variety
of organizational settings. While he found that many
personality traits are related to leadership, the link is not
strong enough to provide an explanation of leadership
emergence.
Two prominent theories were transactional and
transformational leadership. Transactional leadership,
which is based on exchange, uses reward or punishment
as incentives to manipulate followers into performing
task and served as the basis for the development of
transformational leadership Transformational leadership
has been ascribed with effecting change by influencing
values, attitudes, and behaviors of others Furthermore,
transformational leaders have been credited with
converting followers into leaders and are able to generate
commitment, satisfaction, and excitement.
Transformational leadership theory was selected for
evaluation in this study because it reportedly produces
exceptional performance from subordinates. Because
transformational leadership evolved from transactional
leadership, evaluation of the two methods provided
pertinent information regarding appropriate leadership
models
Leaders are challenged to create an environment that is
good for students, faculty, staff, and the community.
Being an effective leader is no easy task; good leaders
must be enthusiastic about their work and the potential of
the institutions that employ them. Furthermore, good
leaders are confident in their judgment and hold
themselves and followers to high expectations early
leadership studies focused on traits or personality
characteristics as
determinants of effective leadership (Bhal & Ansari,
2000; Bryman, 1986). This research suggested that
leaders are born and not made (Bennis & Nanus, 1985).
Frederick Taylor's rigid scientific management theory
was utilized from about 1910 until 1935. It focused on
lowering cost of factory production, increasing
efficiency, and was often referred to at the classical era of
organizational theory (Fairholm, 1998; Wallin & Ryan,
The study focused on four different perspectives; the board member perspective, the department manager
perspective, the group manager perspective and the employee perspective. The aim was to examine these
groups' expectations on managers with three research questions. Twenty in-depth interviews were carried
out with three board members, six department managers, six group managers and five employees. The result
showed that expectations on managers generally did not differ between the perspective holders. Managers
were mainly expected to be aligned and to focus on strategic issues, but also to delegate operative work, to
inform and communicate and to have enough courage to be a manager.
This study evaluated leadership style of enrollment managers employed at a certain post
Transactional leadership, Transformational leadershipKey Words:
Neha Gupta
Leadership Analysis in an Organization: A 360°
Analysis to Determine the Behavior of the Leader
35 • • January-June 2012Volume 3 • No. 1

1994). Effective leadership was associated with effective
management (Fairholm, 1998).
The mid 1930s through the 1950s saw human relations
infiltrate the world of leadership. Human and
interpersonal factors were introduced into management
theories as leaders sought to boost employee satisfaction,
dedication and performance
Early studies analyzed leadership based on hereditary
attributes (Bass, 1990) and compared traits of leaders
with those of followers. Trait theory argued that
psychological or physiological characteristics
determined leadership style and leaders shaped an
organization according to their ability (Lipham, 1973).
By identifying specific traits or characteristics of leaders,
one could distinguish a leader from a follower (Bryman,
1986).
General Archibald Wavell (1941), as cited in Bryman
(1986), summed up the foundation of trait leadership
with the following comment, “No amount of learning
will make a man a leader unless he has the natural
qualities of one
That behavior of the leader impacted work and follower
effectiveness. This era of research focused on leadership
behavior as a means of identifying the best way to lead.
The Managerial Grid, conceived by Blake & Mouton
(1964) and reported in
Bryman (1986), is an approach to organizational
development and is one of the best known in the
literature. The foundation of the theory is a contrast
between two approaches to the managerial role: (a)
concern for production and (b) concern for people
(Bryman, 1986). Blake and Mouton believe that both
concerns are essential ingredients of effective
management and each is conceptualized as a nine-point
scale, thus producing eighty-one possible combinations
of managerial behavior.
The grid is composed of five categories that are based on
concern for production and concern for people (Bryman,
1986). The categories are:
1. is characterized by low
scores on both dimensions, a context in which conflict is
likely. The leader maintains low involvement with
people and minimal communication.
2. has a high concern for
people and a low concern for production. Emphasis is on
maintaining friendly relationships within a harmonious
work environment.
3. is concerned with production and
views employees as suppliers of labor who must be
controlled and directed.
4. is concerned with
both people and production; it is possible to balance work
and morale.
5. promotes a high degree of concern
for both people and production. Followers are involved
in the planning and execution of work..
The most recent model of transformational leadership is
the full range theory. This model has the potential to
explain leadership and its multidimensional nature and to
empirically measure behaviors that can be used to predict
leadership outcomes (Antonakis & House, 2002). The
full-range model has been deemed more successful in
determining effective leadership because it is an
integrative theory that (a) has been widely accepted in
leadership literatures, (b) is supported by empirical
research and (c) is integrative
Strategic leaders are generally responsible for large
organizations and may influence several thousand to
Trait Theory
Behavioral Leadership Proposed
Managerial Grid
Full-Range Leadership Theory
Strategic Leadership
Impoverished management
Country club management
Task management
Middle-of-the-road management
Team management
36• • January-June 2012Volume 3 • No. 1

hundreds of thousands of people. They establish
organizational structure, allocate resources, and
communicate strategic vision.
Strategic leaders work in an uncertain environment on
highly complex problems that affect and are affected by
events and organizations outside their own.
Strategic leaders apply many of the same leadership
skills and actions they mastered as direct and
organizational leaders; however, strategic leadership
requires others that are more complex and indirectly
applied.
Strategic leaders, like direct and organizational leaders,
process information quickly, assess alternatives based on
incomplete data, make decisions, and generate support.
However, strategic leaders' decisions affect more people,
commit more resources, and have wider-ranging
consequences in both space and time than do decisions of
organizational and direct leaders.
Strategic leaders often do not see their ideas come to
fruition during their "watch" and their initiatives may
take years to plan, prepare, and execute. In-process
reviews (IPRs) might not even begin until after the leader
has left the job. This has important implications for long-
range planning. On the other hand, some strategic
decisions may become a front-page headline of the next
morning's newspaper.
Perhaps of paramount importance—because they exert
influence primarily through subordinates—strategic
leaders must develop strong skills in picking and
developing good second-tier leaders.
This is often considered the classical approach. It is one
in which the manager retains as much power and
decision-making authority as possible. The manager
does not consult employees, nor are they allowed to give
any input. Employees are expected to obey orders
without receiving any explanations. The motivation
environment is produced by creating a structured set of
rewards and punishments.
This leadership style has been greatly criticized during
the past 30 years. Some studies say that organizations
with many autocratic leaders have higher turnover and
absenteeism than other organizations. Certainly Gen X
employees have proven to be highly resistant to this
management style.
Bureaucratic leadership is where the manager manages
“by the book¨ Everything must be done according to
procedure or policy. If it isn't covered by the book, the
manager refers to the next level above him or her. This
manager is really more of a police officer than a leader.
He or she enforces the rules.
(Participative
leadership)
The democratic leadership style is also called the
participative style as it encourages employees to be a part
of the decision making. The democratic manager keeps
his or her employees informed about everything that
affects their work and shares decision making and
problem solving responsibilities. This style requires the
leader to be a coach who has the final say, but gathers
information from staff members before making a
decision.
Democratic leadership can produce high quality and high
quantity work for long periods of time. Many employees
like the trust they receive and respond with cooperation,
team spirit, and high morale.
The laissez-faire leadership style is also known as the
“hands-off¨ style. It is one in which the manager provides
little or no direction and gives employees as much
freedom as possible.All authority or power is given to the
employees and they must determine goals, make
decisions, and resolve problems on their own.
While the proper leadership style depends on the
situation, there are three other factors that also influence
which leadership style to use.
1. The manager's personal background. What
personality, knowledge, values, ethics, and
experiences does the manager have. What does he or
she think will work?
2. The employees being supervised. Employees are
individuals with different personalities and
backgrounds. The leadership style managers use will
vary depending upon the individual employee and
Leadership Styles
Autocratic Leadership Style
Bureaucratic Leadership Style
Democratic Leadership Style
Laissez-Faire Leadership Style
Varying Leadership Style
37 • • January-June 2012Volume 3 • No. 1

what he or she will respond best to.
3. The company. The traditions, values, philosophy, and
concerns of the company will influence how a
manager acts.
Since in the strategic environment we want to study the
behavior of the leader with the goals of the organization
we will thereby keep our study confined to the two types
of leadership styles.
Transformational
Transactional
As transformational leadership is described by the
modern management system and transactional
leadership is evolvement of the traditional theory. Let us
take the other factors to be invariable and the fact that
strategic alignment and behavior of the leader can be
studied by focusing upon these two types of leaderships.
Therefore the alignment of managers will be studied to be
more if he is a transformational leader i.e. more aligned
for the concern towards people
And alignment of strategic objectives will be less if more
association is found towards concern for task.
is a leadership style that
defines as leadership that creates voluble and positive
change in the followers. A transformational leader
focuses on "transforming" others to help each other, to
look out for each other, be encouraging, harmonious, and
look out for the organization as a whole. In this
leadership, the leader enhances the motivation, moral
and performance of his follower group.
The full range of leadership introduces four elements of a
transformational leader:
1. - the degree to which
the leader attends to each follower's needs, acts as a
or to the follower and listens to the
follower's concerns and needs. The leader gives empathy
and support, keeps on open communication and place
challenges to the followers. This also encompasses the
need to respect and celebrate the individual contribution
that each follower can make to the team. The followers
have a will and aspirations for self development and have
an intrinsic motivation for their tasks.
2. -The degree to which the
leader challenges assumptions, takes risks and solicits
followers' ideas. Leaders with this trait stimulate and
encourage in their followers. they nurture and
develop people who think independently. For such leader
Learning is a value and un expected satiations are seen as
opportunities to learn. The followers ask questions, think
deeply about things and figure on better ways to execute
their tasks.
3. - the degree to which the
leader articulates a vision that is appealing and inspiring
to followers. Leaders with inspirational motivation
challenge followers with high standards, communicate
optimism about future goals, and provide meaning for the
task at hand. Followers need to have a strong sense of
purpose if they are to be motivated to act. Purpose and
meaning provide the energy that drives a group forward.
The visionary aspect of leadership is supported by
communication skills that make it precise and powerful.
The followers are willing to invest more effort in their
tasks, they are encouraged and optimistic about the future
and believe in their abilities.
4. – the highest level of
transformation leadership. The leader provides
communal design of vision and purpose, values and
norms that gives meaning to the work. The leader plants
pride and feelings of mission within the stakeholders,
enhancing their performance capabilities and providing
personal example. The followers trust and emulate this
leader, identifying with the goals. They internalize the
attitudes and goals and act in this "spirit" even when the
leader is not around.
When researching this construct, the MLQ questionnaire
is used. This is a multifactor leadership questionnaire that
measures deferent factors of transformation and
transactional leadership (Bass, 1985). The scales in the
questionnaire are based on an initial factor analysis and
latter versions.
The preliminary research of transformational leadership
was limited, because the knowledge in this area was too
primitive in order to find good examples for the items in
the questionnaire.
Another weakness in the first versions of the MLQ relates
to the wording of items. Most items in the scale of
charismatic and intellectual arousals described the result
Managerial Concern with Leadership.
Transformational Leadership
Individualized consideration
Intellectual stimulation
Inspirational motivation
Role and Identification Model
Research in theArea
!
!
mentor coach
creativity
38• • January-June 2012Volume 3 • No. 1

of leadership, instead of specific actions of the leader'
that can be observed that, in turn, bring to the results.
In response to the critics, Bass and his colleagues(1990)
included in the revised version many more items that
describe leadership actions that are observed directly
The researcher Yukl (1994) draws some tips for
transformational leadership :
1. Develop a challenging and attractive vision, together
with the employees.
2. Hook the vision with the strategy for its achieving.
3. Develop the vision, specify and translate it to actions.
4. Express confidence, decisiveness and optimism
about the vision and its implement.
5. Realise the vision through small planed steps and
small successes in the path for its full
implementation
is a term used to classify a
group leadership theories that inquire the interactions
between leaders and followers. A transactional leader
focuses more on a series of "transactions". This person is
interested in looking out for oneself, having exchange
benefits with their subordinates and clarify a sense of
duty with rewards and punishments to reach goals.
1. P e o p l e a r e m o t i v a t e d b y r e w a r d a n d
punishment.
2. Social systems work best with a clear chain of
command.
3. When people have agreed to do a job, a part of the
deal is that they cede all authority to their
manager.
4. The prime purpose of a subordinate is to do what
their manager tells them to do.
The transactional leader works through creating clear
structures whereby it is clear what is required of their
subordinates, and the rewards that they get for following
orders. Punishments are not always mentioned, but they
are also well-understood and formal systems of
discipline are usually in place. The early stage of
Transactional Leadership is in negotiating the contract
whereby the subordinate is given a salary and other
benefits, and the company (and by implication the
subordinate's manager) gets authority over the
subordinate.
When the Transactional Leader allocates work to a
subordinate, they are considered to be fully responsible
for it, whether or not they have the resources or capability
to carry it out. When things go wrong, then the
subordinate is considered to be personally at fault, and is
punished for their failure (just as they are rewarded for
succeeding).
The transactional leader often uses management by
exception, working on the principle that if something is
operating to defined (and hence expected) performance
then it does not need attention. Exceptions to expectation
require praise and reward for exceeding expectation,
whilst some kind of corrective action is applied for
performance below expectation.
Transactional leadership is based in contingency, in that
reward or punishment is cont ingent upon
performance.
Despite much research that highlights its limitations,
Transactional Leadership is still a popular approach with
many managers. Indeed, in the Leadership vs.
Management spectrum, it is very much towards the
management end of the scale
The purpose of my study is to see if the behavior
observed w.r.t people in an organization if is different
than the behavior they are expected to practice.
People in organization are expected to practice
transformational leadership but mostly to achieve the
targets people tend to lose concern for people over
concern for task.
Every employee helps us to score the type of leadership
being practiced around them and w.r.t. themselves.
The expectation of the organizational members is
completely in sync with the behavior of the manager.
H = Null Hypothesis
Implications for managers
Transactional leadership
Transactional leadership
Assumptions Objectives
Hypothesis
[4]
Statistical hypothesis
0
39 • • January-June 2012Volume 3 • No. 1

There is no significant difference between the expected
behavior of manager and the observed behavior of
manager
The purpose of this study was to identify that the
behavior of the leader supports the strategic goals of the
organization Furthermore; the leadership style of the
enrollment manager was compared to the type of
employing institution and the participant's gender, level
of education, and number of years of supervisory
experience.
The Multifactor Leadership Questionnaire (MLQ) by
Avolio and Bass, which categorizes leaders into either
transformational or transactional leadership styles, was
used to determine the alignment of goals to behavior
To protect the confidentiality of participants, no one
other than the researcher had been collected via surveys.
However no identifying information was included.
Because this research proposal required participation of
human subjects so proper permission from the
organization has to be taken
3 Departments of the organization were taken for study.
Each department has 20 employees in every slot there
are:
Three board members-decision makers in terms of Talent
acquisition
Six department managers- Superiors of various
departments
Six group managers- Laterally of same level but different
departments.
Five employees- Subordinates.
Thus my sample size has been chosen in a way that helps
me to take a 360 approach
Research questionnaire
Level of significance=0.05 in order to reduce the
error
Type I – “rejecting a null hypothesis when in fact it is
true”
Type II – “retaining a null hypothesis when in fact it
is false”
false
The sample type taken here is in specific strata's as
the complete sample size has been divided into 3
departments each of which is of a different vertical or
segment.
Basic assumptions of this statistical measure include:
(1) Independent data,
(2) Equal standard deviations between groups
(3) The mean of the data follow a normal distribution
The people may be biased to give opinion about their
immediate superior.
Sample size is small
Everyone may not have a clear understanding of the
strategic objectives.
Personal biasness and perception may change the
feedback.
Research carried out in a single company as the
employee is working in this company
The instrument produces similar results when
administered to various individuals.
N= 100
Response rate 60 (60%)
Alpha = .05 or 5% level of significance
36 transactional (60%)
24 transformational (40%)
Female 27 (%)
Male 33 (%)
Methodology & Instrumentation
Reliability, Validity and Confidentiality
Sample Size
Statistical Tools
Assumptions & Limitations
Leadership styles calculated by questionnaire:
Gender wise response rate
0
!
!
!
!
!
!
!
!
!
!
!
!
!
!
!
!
!
!
!
!
The level of significance (α = .05) was selected after
evaluating the consequences of both Type I and Type
II errors. Because this study seeks to identify the
alignment of leadership to that of objectives, it is
important to reject a null hypothesis if is
40• • January-June 2012Volume 3 • No. 1
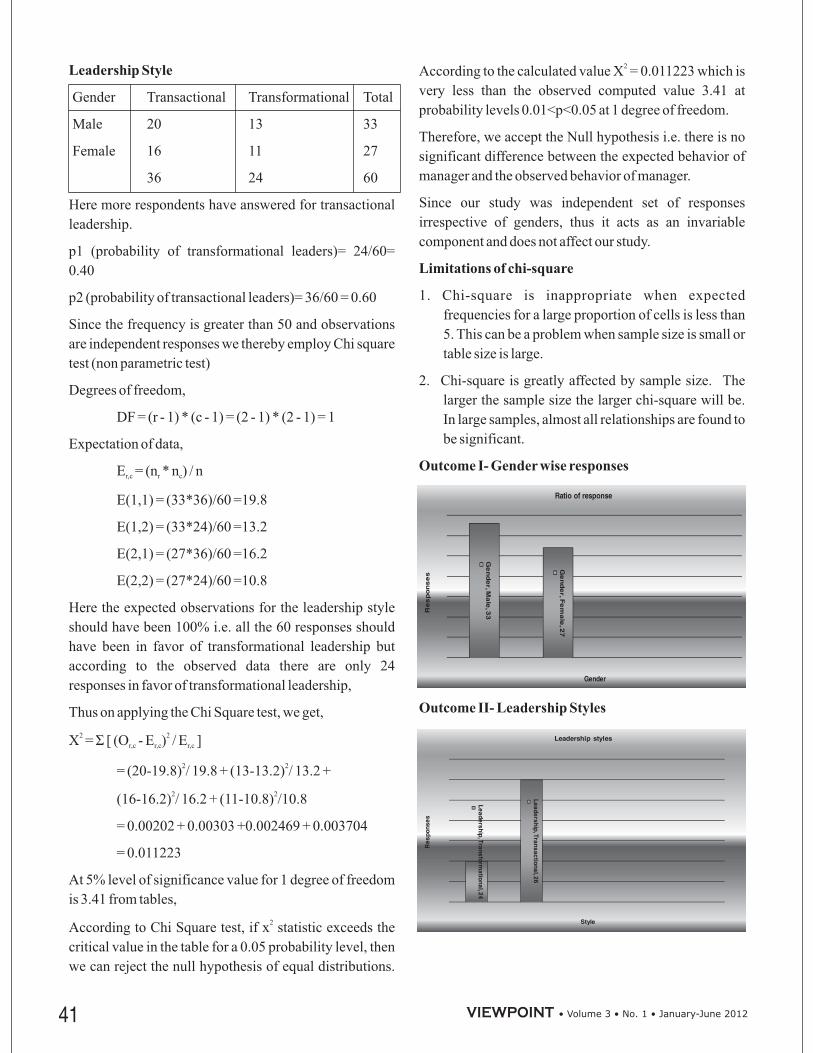
Leadership Style
Limitations of chi-square
Outcome I- Gender wise responses
Outcome II- Leadership Styles
Gender Transactional Transformational Total
Male 20 13 33
Female 16 11 27
36 24 60
Here more respondents have answered for transactional
leadership.
p1 (probability of transformational leaders)= 24/60=
0.40
p2 (probability of transactional leaders)= 36/60 = 0.60
Since the frequency is greater than 50 and observations
are independent responses we thereby employ Chi square
test (non parametric test)
Degrees of freedom,
DF = (r - 1) * (c - 1) = (2 - 1) * (2 - 1) = 1
Expectation of data,
E = (n * n ) / n
E(1,1) = (33*36)/60 =19.8
E(1,2) = (33*24)/60 =13.2
E(2,1) = (27*36)/60 =16.2
E(2,2) = (27*24)/60 =10.8
Here the expected observations for the leadership style
should have been 100% i.e. all the 60 responses should
have been in favor of transformational leadership but
according to the observed data there are only 24
responses in favor of transformational leadership,
Thus on applying the Chi Square test, we get,
= - E ) / E ]
= (20-19.8) / 19.8 + (13-13.2) / 13.2 +
(16-16.2) / 16.2 + (11-10.8) /10.8
= 0.00202 + 0.00303 +0.002469 + 0.003704
= 0.011223
At 5% level of significance value for 1 degree of freedom
is 3.41 from tables,
According to Chi Square test, if x statistic exceeds the
critical value in the table for a 0.05 probability level, then
we can reject the null hypothesis of equal distributions.
According to the calculated value X = 0.011223 which is
very less than the observed computed value 3.41 at
probability levels 0.01<p<0.05 at 1 degree of freedom.
Therefore, we accept the Null hypothesis i.e. there is no
significant difference between the expected behavior of
manager and the observed behavior of manager.
Since our study was independent set of responses
irrespective of genders, thus it acts as an invariable
component and does not affect our study.
1. Chi-square is inappropriate when expected
frequencies for a large proportion of cells is less than
5. This can be a problem when sample size is small or
table size is large.
2. Chi-square is greatly affected by sample size. The
larger the sample size the larger chi-square will be.
In large samples, almost all relationships are found to
be significant.
r,c r c
r,c r,c r,cΧ Σ [ (O2 2
2 2
2 2
2
2
41 • • January-June 2012Volume 3 • No. 1

Outcome III- Transformational leadership
Outcome IV- Transactional Leadership Findings and Conclusion
Limitations andAssumptions for Complete Study
Now according to the test there are more number of
transactional leaders prevailing in the company than
transformational leaders.
Thus concern for the completion of task prevails more
than the concern for people in the organization.
Also, Autocratic form of leadership prevails in the
organization subjected for research.
In research the ratio of male participants was more likely
to be labeled as transformational leaders with ratio of
59% and female
But our study is to find out the behavior of the leaders
irrespective of their gender so we will take this as an
invariable component that does not affect or alter our
study
According to the research that was conducted in the
organization maximum no. of opinions for the officials
subjected to study resulted into the favor of transactional
leadership than that of transformational leadership, Thus
it reflected that the strategic leaders of modern scenario
are not autocratic in nature .
Autocratic leadership is an extreme form of transactional
leadership, where a leader exerts high levels of power
over his or her employees or team members. People
within the team are given few opportunities for making
suggestions, even if these would be in the team's or
organization's interest.
Most people tend to resent being treated like this.
Because of this, autocratic leadership usually leads to
high levels of absenteeism and staff turnover. Also, the
team's output does not benefit from the creativity and
experience of all team members, so many of the benefits
of teamwork are lost.
For some routine and unskilled jobs, however, this style
can remain effective where the advantages of control
outweigh the disadvantages.
Sample size taken was quite small only 60
respondents
Study was restricted to only 1 organization
It was assumed that the gender of leadership was
invariable to the leadership style
The opinions may be biased due to threat of
!
!
!
!
42• • January-June 2012Volume 3 • No. 1
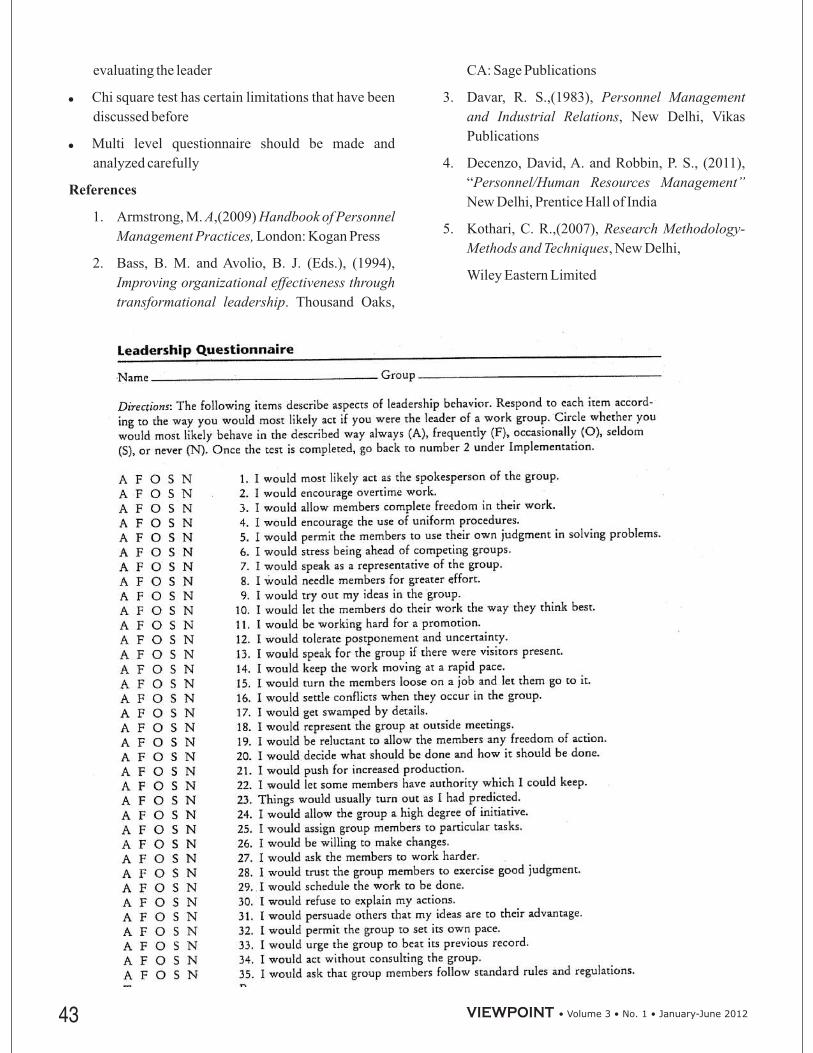
evaluating the leader
Chi square test has certain limitations that have been
discussed before
Multi level questionnaire should be made and
analyzed carefully
1. Armstrong, M. ,(2009)
London: Kogan Press
2. Bass, B. M. and Avolio, B. J. (Eds.), (1994),
. Thousand Oaks,
CA: Sage Publications
3. Davar, R. S.,(1983),
, New Delhi, Vikas
Publications
4. Decenzo, David, A. and Robbin, P. S., (2011),
“
New Delhi, Prentice Hall of India
5. Kothari, C. R.,(2007),
, New Delhi,
Wiley Eastern Limited
!
!
References
A Handbook of Personnel
Management Practices,
Improving organizational effectiveness through
transformational leadership
Personnel Management
and Industrial Relations
Personnel/Human Resources Management”
Research Methodology-
Methods and Techniques
43 • • January-June 2012Volume 3 • No. 1

Evaluating scheme
44• • January-June 2012Volume 3 • No. 1

Type of leadership practiced as an outcome
Neha Gupta is an Assistant Professor in Jagannath International Management School, Kalkaji under GGSIP
University. She has Qualified NET with JRF and is taking subjects related to her specialization Human Resource
Management, Organizational Behavior, Entrepreneurship, Management, Communication skills. She holds excellent
academic record and has industry experience in various multinationals where she has got several certificates and
recommendations for her work and corporate communication. She has attended various Conferences, FDP's and
MDP's including some of them being AICTE and MSMEDI sponsored. The author can be reached at
45 • • January-June 2012Volume 3 • No. 1
Indian economy is going to emerge as a knowledge
economy with third largest technical manpower in the
world after US and China. However, compared to our
population (1210.19 miliion-2011 census) it is not
significant and there is a tremendous potential and scope
of ensuring efficiency, sufficiency and equity. In India,
the emphasis has been on general education, with
vocational education at the receiving end. This has
resulted in large number of educated people remaining
unemployed which justifies the rationale for
vocationalisation of education. In the new knowledge
economy, to achieve professional, managerial,
operational, behavioural, inter personal and inter
functional skills, India needs flexible education and
training system that will provide the foundation for
learning to develop required competencies with morality,
credibility and accountability (MCA) through
spirituality- the science of soul which can make us
superior to anyone in the World. By changing the tracks
of our thoughts we can turn the tides in our favour. We
need to open the windows of the mind and spirit by
spiritual revolution above religious differences. We need
to transmit the Indian wisdom flowing from our epics
with mental superiority to material reality. We are
required to promote spiritual mathematics 1 (Soul) +1
(GOD) = 1(One) with a smile of anticipation for bright
future. To forge ahead with morality, opulence, victory
and empowerment (MOVE), we need to believe worship
is work and vice versa. Spiritual, humanitarian existence
of a human being is capable of removing all kind of
inequality (gender disparity) which is a social reality
existing in India.
To become a prosperous global economy within first five
ranks, we have to qualitatively strengthen our education,
especially higher and management education. .Due to
efforts and initiatives taken during successive Five Year
Plans and particularly due to policy changes in the
eighties to allow participation of private and voluntary
organizations in the setting up of management
institutions on self-financing basis, the growth of
management education has been phenomenal. Presently,
there are several management education institutions
playing crucial role in converting the human resources
into human capital 'by creating skilled manpower,
enhancing industrial productivity and improving the
quality of life'. There are11 IIMs and almost all the
universities have Dept. of management.
A significant growth has taken place in various programs
of management education over the period of time. The
total number of management institutions has grown at the
considerable compound growth rate.
We have noted that there is a considerable increase in
total number of seats in different programs in
management education throughout the country.
Quality of higher education including management
education can be best judged by one of the important
indicator viz. magnitude of public expenditure. Public
Management Education in India
In this paper, we have examined the present status of management education in India. The key issues have been
identified for bringing efficiency, sufficiency and equity in the over all system of higher education including
management education. Abilities of head and heart, skills and knowledge (ASK) are the engines of economic growth
and human development of any economy like India. In reality we are responding more effectively and promptly to
challenges and opportunities of globalization which means internationalization of Indianization for all of us. It has
created avenues for jobs for skilled professional in management. According to Economic Survey 2011-12, India is
going to be the youngest nation with largest work force in the world which possesses the potential to become an
economic superpower. Future technologies call for cusp of a revolutionary change in management education for
meeting the growing requirements of the industry.
Management Education, Policy Formulation, Knowledge-Oriented Paradigm of DevelopmentKey Words:
Sanchita & M. M. Goel
Challenges & Opportunities in
Management Education in India
46• • January-June 2012Volume 3 • No. 1
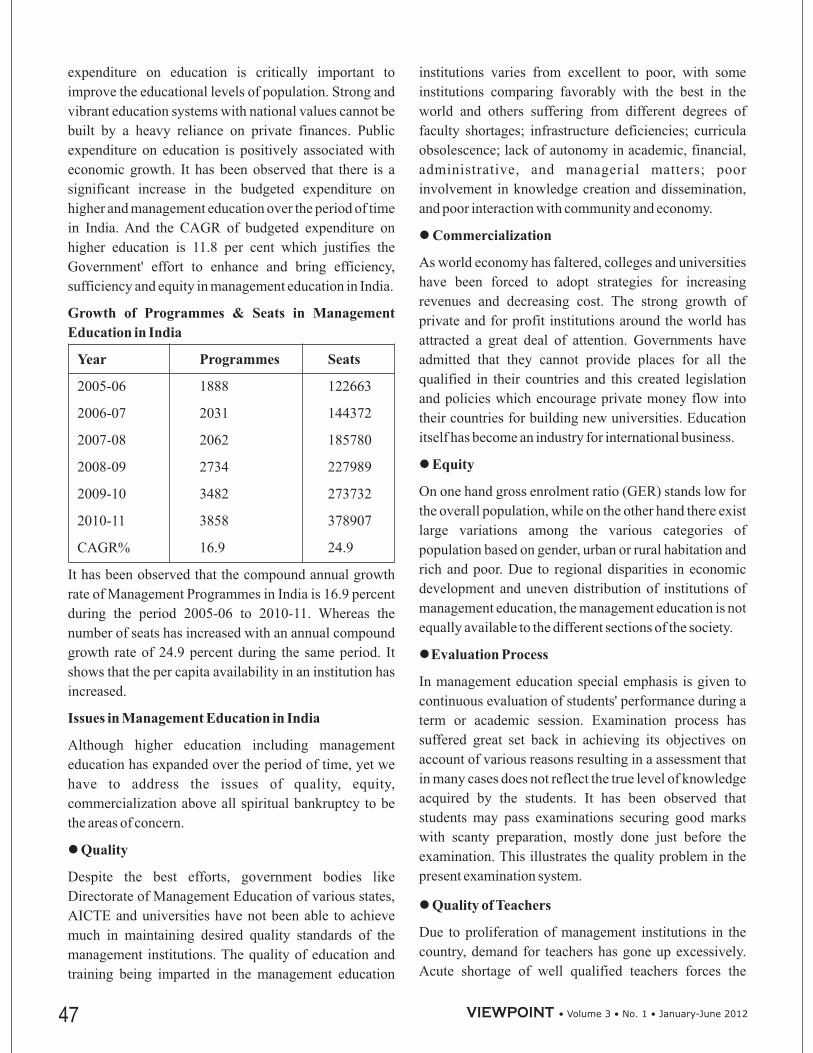
expenditure on education is critically important to
improve the educational levels of population. Strong and
vibrant education systems with national values cannot be
built by a heavy reliance on private finances. Public
expenditure on education is positively associated with
economic growth. It has been observed that there is a
significant increase in the budgeted expenditure on
higher and management education over the period of time
in India. And the CAGR of budgeted expenditure on
higher education is 11.8 per cent which justifies the
Government' effort to enhance and bring efficiency,
sufficiency and equity in management education in India.
2005-06 1888 122663
2006-07 2031 144372
2007-08 2062 185780
2008-09 2734 227989
2009-10 3482 273732
2010-11 3858 378907
CAGR% 16.9 24.9
It has been observed that the compound annual growth
rate of Management Programmes in India is 16.9 percent
during the period 2005-06 to 2010-11. Whereas the
number of seats has increased with an annual compound
growth rate of 24.9 percent during the same period. It
shows that the per capita availability in an institution has
increased.
Although higher education including management
education has expanded over the period of time, yet we
have to address the issues of quality, equity,
commercialization above all spiritual bankruptcy to be
the areas of concern.
Despite the best efforts, government bodies like
Directorate of Management Education of various states,
AICTE and universities have not been able to achieve
much in maintaining desired quality standards of the
management institutions. The quality of education and
training being imparted in the management education
institutions varies from excellent to poor, with some
institutions comparing favorably with the best in the
world and others suffering from different degrees of
faculty shortages; infrastructure deficiencies; curricula
obsolescence; lack of autonomy in academic, financial,
administrative, and managerial matters; poor
involvement in knowledge creation and dissemination,
and poor interaction with community and economy.
As world economy has faltered, colleges and universities
have been forced to adopt strategies for increasing
revenues and decreasing cost. The strong growth of
private and for profit institutions around the world has
attracted a great deal of attention. Governments have
admitted that they cannot provide places for all the
qualified in their countries and this created legislation
and policies which encourage private money flow into
their countries for building new universities. Education
itself has become an industry for international business.
On one hand gross enrolment ratio (GER) stands low for
the overall population, while on the other hand there exist
large variations among the various categories of
population based on gender, urban or rural habitation and
rich and poor. Due to regional disparities in economic
development and uneven distribution of institutions of
management education, the management education is not
equally available to the different sections of the society.
In management education special emphasis is given to
continuous evaluation of students' performance during a
term or academic session. Examination process has
suffered great set back in achieving its objectives on
account of various reasons resulting in a assessment that
in many cases does not reflect the true level of knowledge
acquired by the students. It has been observed that
students may pass examinations securing good marks
with scanty preparation, mostly done just before the
examination. This illustrates the quality problem in the
present examination system.
Due to proliferation of management institutions in the
country, demand for teachers has gone up excessively.
Acute shortage of well qualified teachers forces the
Growth of Programmes & Seats in Management
Education in India
Year Programmes Seats
Issues in Management Education in India
Quality
Commercialization
Equity
Evaluation Process
Quality of Teachers
l
l
l
l
l
47 • • January-June 2012Volume 3 • No. 1

management to appoint even fresh engineering graduates
as faculty who are required to engage classes
immediately after joining the institution without being
given any training and preparation time. Similarly,
institutes are engaged in appointing new faculty member
on low salaries and heavy teaching time load which
further deteriorate their quality and they are left with no
time for further development, and involving part time
faculty which had little or no involvement with the
institutes. This causes the decline in quality of teaching in
these management institutions. Poor quality teachers and
poor quality students form very good team and jointly
encourage indiscipline and bad work culture in the
institution.
Government funding on higher including management
education has been diminishing continuously for more
than one decade. In the view of withdrawal of
government support to finance higher education private
institutions has been allowed to take over the
responsibility of imparting education to all. Further, in
government aided institutions the model of self financing
and self sustaining institutions has been introduced. All
these developments have added to the cost of education in
a considerable manner. Though, the education loan has
been made easy to facilitate higher and management
education still the terms and conditions imposed by banks
in terms of guarantee and criteria of minimum income of
family restricts the talent coming from the poor families
to go for higher education as well as management
education.
Management Education system is dynamic in nature. It
faces many challenges in responding to societal,
technological and economic changes in the local and
global environment. The issue today is not so much about
the value and role of management education in the social
and economic development of a nation. Management
education is widely recognized as an important part of the
total education and training system. India being a
signatory of WTO is bound to open up its market for trade
in services including education but it does not have a
clear policy for strengthening its education sector to
compete with the giants in the world.
Thus, it is the need of the hour to free the higher
management education system from unnecessary
constraints and provide academic and administrative
system which is accountable, transparent and equitable.
It can safely be concluded that management education
has grown significantly over the period of time. But still,
there are challenges to face in management education,
which need to be addressed through appropriate policy
formulation and its effective implementation. To develop
India as an education hub for becoming a prosperous
partner in global economy, we have to strengthen higher
education in general and management education in
particular with research and development in terms of
balancing quality and quantity.
There is a logic and rationale for broadening our vision,
developing skill and integrating all those aspects which
have their direct or indirect bearing or human resource
development to meet the challenges of higher and
management education. In order to respond to the global
challenges more strongly than ever before, India today
needs a knowledge-oriented paradigm of development to
give the country a competitive advantage in all field of
knowledge. National Knowledge Commission's (NKC)
overarching aim is to transform India into a vibrant
knowledge economy. The present system of higher and
management education produced some degree holders
with mere knowledge and information in a particular
area, but it has failed to develop general employability
skills needed for entry level employee. Hence, it is high
time for us to ponder over it and make necessary reforms
in the course and strategies so that employability skills
can be developed among the students. We need job led
growth and for this, the thrust should be on quality and
vocational/management education. India has
demographic advantage in the form of huge number of
young people. To make the best, these young minds need
to be provided opportunities for accessing quality higher
management education, only quality human resource will
ensure emergence of a true knowledge society which will
ultimately enhance the country's competitiveness in the
global economy. The cause of concern for the gaps in the
demand and supply of management manpower in India is
the imbalance between quality and quantity without
manpower planning. To utilize the human capital of India
in an effective manner calls for manpower planning for
matching demand and supply of skilled personnel,
l
l
Cost of Education
Global Competition
Conclusion & Policy Implications
48• • January-June 2012Volume 3 • No. 1

training of manpower for reducing mismatch between the
abilities and the jobs on offer and above all mechanism by
pairing people with jobs through information network
(WWW).
To research the ways and means of solving
unemployment problem, there is an intellectual debt on
the economists and policy makers of India. For providing
ROTI (Bread) and employment to the management
manpower, we need to increase returns on training
investment (ROTI). To attain efficiency, sufficiency and
equity in overall system of education, we need to
understand and adopt SMART & SIMPLE models of
human resource development developed by the author
elsewhere.
1. Goel, M. M., (2011), Economics of Human
Resource Development in India, VK Global
Publications Pvt. Ltd., New Delhi, ISBN No 978- 93-
5058-014-1.
2 Goel, M. M., and Walia, S., (2011), “Education and
Economic Growth in Haryana (India): Using
Granger Causality Approach,"
, (17.1).
3. Goel, M. M., and Walia, S., (2011), “Higher
Education: an Engine of Economic Growth in Post
Reform India,” ,
Punjab University, Chandigarh, 19.3, ISSN-0251-
348 .
4 Goel, M. M., (2011), Education and Skill
Development in India: A Review,
, Special Issue on Enhancing
Human Resources for Inclusive Growth,
Employment and Welfare, December 2011X.
References
Journal of South
Asian Studies
Research Journal Social Sciences
The Indian
Economic Journal
Dr. Sanchita
Dr. M.M. Goel
is an Assistant Professor of Management, University School of Management, Guru Gobind Singh
Indraprastha University School, Sector-16 C, Dwarka, Delhi.
is Professor of Economics & Dean, Faculty of Social Sciences, Kurukshetra University, Kurukshetra.
The author can be reached at [email protected]
49 • • January-June 2012Volume 3 • No. 1

Introduction
The Indian government accounts are on a cash basis. In
this system of accounting, followed by the central and
state governments, transactions are recorded when there
is actual flow of cash. Revenue is recognized when cash
is received and expenses are recognized when payment
is made”. No consideration is given to the “due” fact of
transactions and the information regarding the future
payments or receivables is not shown. Revenues earned
but not collected during the financial period, as well as
expenses incurred but not yet paid, do not get recorded.
Movements in the government cash balance kept with
RBI as a result of such payments and receipts are also
simultaneously recorded in the accounts books. Thus the
government accounts are a record of cash flows into and
out of consolidated fund and public account, and the
effect of these cash flows reflect on government's
liquidity position.
This system of accounting is simple and as such needs
less skill on the part of the accountants. Its whole focus is
on cash management. The recognition trigger is simply
the flow of cash. Budgetary and legislative compliance is
easier under this system as budgets are also on cash basis.
The system of government accounting based on cash-
system has been a fairly sound system based on rules.
The Accounts code, the financial code, the treasury
codes and the departmental Accounting rules all form an
elaborate structure of a well established accounting
system and there is no denying the fact that this system
has been functioning efficiently in different departments
of central and state government and union territories.
Despite, there has been no systematic evaluation of
government activities through performance indicators;
neither is there any attempt to hold government
employees accountable for what they are expected to do.
The system of accounting does not serve the needs of the
government either from the perspective of the
information needed for decision-making or for reflecting
accountability.
Thus, there is a strong case in favour of shifting of cash
based accounting system towards accrual accounting
system which is characterized by adequate procedures
for book-keeping, systematic reporting of transactions,
adequate security and systematic comparison with
banking statements. It helps setting performance
standards and provides the government stockholders
1
Traditionally, cash based accounting system is followed in India for budgeting, accounting and financial reporting.
The system has also served the basic requirement of financial accountability of government to parliament. However,
cash based system of accounting is not the most informative way of presenting government accounts. Therefore present
study was done to examine the strength and weakness of the cash based accounting system in the state of Uttarakhand
along with the prospects of accrual accounting in government. In order to understand this through readings of relevant
reading was made. Data collection was made through observation, personal interview and well structured
questionnaire. LIKERT scale was used to evaluate the opinion of govt. officers. For analyzing the results of survey
mean, standard deviation, mean p-value and t-test were used. Results of this study concluded that cash based
accounting system is easy, it is a tool for budget and legislative compliances as the budget is cash based. Apart from
having these advantages cash based accounting system is non-accountable, it does not provide complete picture of the
financial position, financial reporting does not help in the assessment of financial performance, under this accounting
against future liability such as pension is not available or disclosed. Thus, keeping all these points in mind present
study suggest that there is a persistent need of shifting of cash accounting system towards accrual accounting system
which is characterized by adequate procedure for book keeping, systematic representation of transactions, adequate
security and systematic comparison with budgeting statement etc.
SWOT analysis, Cash based accounting, Accrual accountingKey Words:
Amita Joshi, J.C Badola and Bhawana Goel
SWOT Analysis of Cash Based System of
Accounting in Uttarakhand
50• • January-June 2012Volume 3 • No. 1

with reliable information. Besides, it safeguards the
public treasury by preventing and detecting corruption
and draft, by sound financial management. With this
point in mind present study has been planned with
following objective in mind:
1. To examine the strengths and weaknesses of the
cash base system of accounting in Uttarakhand
Vis–a-Vis a better accounting system.
Data collection was done by using three methods i.e.
Observation method, Questionnaire method and
interview schedule method. A plethora of literature on
accounting systems was thoroughly studied and detailed
descriptive questionnaire was designed. Questions were
distributed amongst officers of different levels in both
central and state government.
Total number of respondents including male and female
were 63.These respondents were Probationers
(Accounting), Probationers (Non-Accounting), Officers
(Non-Accounting) and Officers (Accounting). Detailed
of respondents are given in table1.
Before eliciting responses on the questionnaire, the same
was tested on government officers on the basis of
representativeness, homogeneity and independence with
a view to find out draw backs of the questionnaires and to
have an idea of non-response. Another objective of
conducting the pilot study was to achieve
purposefulness, simplicity and standardization.
Subsequently, ambiguities and defects found in the
questionnaire were removed and a final questionnaire
was framed. The responses were scrutinized and
reorganize with a view to achieve consistency, accuracy
and homogeneity. This was followed by the classification
and consolidation of the data. The findings were
summarized and tabulated for identification, implication
and presentation purposes.
A five point scale which is also known as LIKERT type
scale was used to evaluate the opinion of Government
officers. The scale consists of a series of statements to
which the respondents give their responses. The
feedback indicates degree of agreement or disagreement.
Each response is given a numerical value. The scale
developed for the present study has options like strongly
agree (+1), agree (+2), cannot say (0), disagree (4),
strongly disagree (5). The respondents were asked to
indicate their choice to each question by putting a tick
mark against the most appropriate scale of their choice.
For analyzing the result of survey: Mean, Standard
deviation, Standard error of Mean P-Value and t-value
test has been used.
because it needs less skill on the part of
accountants. It is easy to learn and carry out. It requires
care but no special skills. There is no need for the
governments to employ professionally trained accounts.
The responses on this issue were obtained and the result
is presented in table 1. The mean value is 2.159 (less
than 3) meaning there by that the response is in
agreement with the statement. The standard deviation is
1.11indicating a very low variation in the responses. The
P-value is 0.000 which is significant at 1%.
Materials and Methods
Research Instrument
The Sample
Table: 1 Respondents detail
Organizing and Presentation of a Questionnaire
Development of Scale
DataAnalysis
Results and Discussion
Cash based system of accounting is relatively simple
to understand
Table 1 Simplicity of cash based
system of accounting
51 • • January-June 2012Volume 3 • No. 1

The cash system of accounting is easier
Table 2 Cash based system of accounting is easy
Table 3: Easier cash management
Table 4: Objectivity of cash
based system of accounting
Table 5: Cash based system of accounting- A tool
for budget and legislative compliance
The cash system of accounting is non-accountal
since
transactions are accounted for only when cash is received
or paid within the reporting period. The cash method
recognizes revenue when payment is received, and
recognizes expenses when cash is paid out. “The cash
basis of accounting measures the flow of cash resources.
It recognizes transactions and events only when cash is
received or paid”.1 Financial statements produced under
the cash basis of accounting cover cash receipts, cash
disbursements, and opening and closing cash balances.
The responses obtained on this issue are shown in Table2.
The mean value is 1.905( significantly less than 3) with a
standard deviation of 0.777 indicating that the response is
in agreement with the statement and a very low variation
in the responses. The P-value is 0.000 which is
significant at 1%.
As compared to accrual system of accounting cash
system of accounting makes cash management easy. The
responses are shown in Table 3. The mean value is 3.048
which approximates 3 with a standard deviation of 1.184
.This indicates that the respondents are in a dilemma;
neither agreeing nor disagreeing with the statement.
Variation to the responses is also very low. The P-value is
0.000 which is which is significant at 1%.
The cash system of accounting is objective. The
responses are shown in Table 4. The mean value is 2.905
with a standard deviation of 0.228, again indicating that
the respondents are not convinced; the variation to the
responses is also insignificant. The P-value 0.000 is
which is significant at 1%.
The advantage of cash system of accounting is that it is a
tool for budget and legislative compliance as the budget
is cash- based. A cash-based budget is a budget where
most of the appropriations are on a cash basis. Therefore,
in a cash-based budget, appropriations define limits for
payment and annual commitment, that is, financial
obligations met within the fiscal year and the annual
tranche of multiyear commitments. A cash budget fits
well the need for compliance and expenditure control.
Commitments and payments are controlled on the basis
of the authorizations of the Parliament. Macroeconomic
objectives, such as the cash deficit, are directly linked to
the appropriations. The responses were obtained and the
result is shown in Table 5. The mean value is 2.242(less
than 3) with a standard deviation of 0.986 meaning there
by that the response is more or less in agreement with the
statement; the variation to the responses is also
insignificant. The P-value 0.000 is which is significant at
1%.
.
Transactions where no cash has been paid or received are
not recorded, even if value has been received or a liability
has been contracted. A cash accounting method only
counts income when money is received, and it does not
keep track of Accounts Receivable. The responses are
shown in Table 6. The mean value is 2.175( less than
12
52• • January-June 2012Volume 3 • No. 1

3)with a standard deviation of 1.040 meaning there by
that the response is in agreement with the statement. The
variation to the responses is also very low. The P-value
0.000 is which is significant at 1%.
i.e.
information on Government's assets (land, building,
machineries, heritage assets), and liabilities (pensionary
commitments, interest due, bills payable, depreciation
for replacement of assets etc.) Cash accounting
recognize revenues and expenditures only when cash is
received or paid. Financial results of a period indicate the
different between cash received and cash disbursed and
provide information on cash balance at a reporting date.
The responses were compiled and presented in Table 7.
The mean value to the response is 1.556 which is less than
3 with a standard deviation of 0.911. this shows that the
responses are in agreement with the statement with little
variation. The P-value 0.000 is which is significant at 1%.
The system is primarily focused on
inputs, at the exclusion of outcomes. Payments made for
inventories treated as expenditure though large quantities
may be lying in stock at the end of the year). Cash-based
accounting recognizes expenditure and not the expenses.
Therefore, these reports are for short term financial
purposes and not for economic or equity reporting
purposes. Since focus of measurement is on cash
balances and changes there in the reporting frameworks
in cash accounting system can only be categorized as
current financial resources. Total assets and equity
amounts are not reported and the system does not provide
for costing of physical assets at current valuation.
Without these details in a statement of financial position
one cannot evaluate the governments overall financial
condition and changes therein. The responses are shown
in Table 8. The mean value is 1.794 with a standard
deviation of 0.864 meaning there by that the response is
in agreement with the statement; the variation to the
responses is also insignificant. The P-value 0.000 is
which is significant at 1%.
The pension to be paid to retired civil
servants in future is not recorded .A conceptual issue
which highlights some of the difficulties in determining
the appropriate content of financial reports of
governments is whether pension and other welfare
entitlements should be treated as liabilities in the same
way as employee superannuation entitlements. Both
represent a government commitment to make payments
in the future and so are relevant to assessing financial
position. Including the cost of future pension
entitlements in financial reports could provide
information on whether the current budgetary position
allows for the future cost of providing these pensions.
The reports could also incorporate the expected effects of
an ageing population, thus providing an indication of
intergenerational equity. The response is shown in Table
9. The mean value is 2.095 with a standard deviation of
1.132. This indicates that the response is in agreement
with the statement. Moreover the variation to the
responses is also low. The P-value 0.000 is which is
significant at 1%.
Table 6- Non- accountable nature of the cash
based system of accounting
The cash system of accounting does not provide
complete picture of the financial position
Table 7 Financial position of the government
Under the cash system of accounting financial
reporting does not help in the assessment of financial
performance.
Table 8: Cash system – not a good indicator
financial performance of the government
Under the cash system of accounting provisions
against future liability such as pension is not available
or disclosed.
53 • • January-June 2012Volume 3 • No. 1

Table 9: Non- availability of provisions against
future liability
Under the cash system of accounting cost and total
cost of services provided by the Government
Departments is not available
Table 10: Non- availability of cost of services by
the government departments
The cash system of accounting gives a wrong picture
of income received and expenditure incurred
Table 11: Wrong picture of income received and
expenditure incurred
The cash system tends to understate liabilities and
commitments leading to issues of inter-generational
equity and lack of transparency
Table 12: Lack of transparency
Under the cash system of accounting no disclosure is
made about contingent assets and contingent
liabilities.
Table 13: Lack of disclosures
The Finance Accounts is a complex document and at
the same time it does not contain all relevant
information.
Table 14: The finance accounts-complex
and non- revelatory
as only costs actually
incurred in cash are taken into account. The responses
were obtained and presented in the Table 10below. The
mean value is 2.127 with a standard deviation of 0.907
meaning there by that the response is in agreement with
the statement; the variation to the responses is also
insignificant. The P-value 0.000 is which is significant at
1%.
as
advance tax receipts are recognized as income and
outstanding liability for expenditure is not accounted.
Prepaid expense is also not recognized. The responses
are shown in Table 11. The mean value is 1.794 with a
standard deviation of 0.699.This means that the
respondents agree with the statement and their responses
do not vary from the mean value. The P-value is 0.000
which is significant at 1%.
. The responses were
collected and the resultant is shown in Table 12. The
mean value is 1.857 with a standard deviation of 0.715.
This indicates that the response is in agreement with the
statement with very low variation from the mean value.
The P-value is 0.000 which is significant at 1%.
The same may turn into committed one's on
account of guarantees given or letter of comforts issued
by the Government. The responses are shown in Table 13.
The mean value is 1.873 with a standard deviation of
0.707 meaning there by that the response is in strong
agreement with the statement; the variation to the
responses is also insignificant. The P-value is 0.000
which is significant at 1%.
The response is shown in Table 14. The
mean value is 2.317 with a standard deviation of 0.981
meaning there by that the response is in agreement with
the statement. The P-value is 0.000 which is significant at
1%.
54• • January-June 2012Volume 3 • No. 1

The Appropriation Account appears to be less of
accounting nature and more in the nature of a
document that can be used for control purpose
.
Table 15: The appropriation account- a tool for
control purpose
While any informed individual can draw reasonable
conclusions from a company's Balance-Sheet and
Profit and Loss Account, this is not always possible
from Government financial statements under the
cash system of accounting.
Table 16: Government financial statements
non-informatory
Under the cash system of accounting major fiscal
risks such as variations in economic assumptions or
financial restructuring are not identified
Table 17:Non-revelatory as regards
economic Assumptions
The cash system of accounting fails to serve as a tool
for the Government to make informed decisions.
Table 18: Useless for making informed decisions
Under the cash system of accounting there are no
disclosures of accounting policies.
Table 19: Non-disclosure of accounting policies.
Under the cash system of accounting compliance with
International Standards is difficult.
. The
response is shown in Table 15. The mean value is 2.222
with a standard deviation of 0.906. This shows that the
respondents agree with the proposition The P-value is
0.000 which is significant at 1%.
The responses were
collected and presented as shown in Table 16. The mean
value is 1.952 which approaches the value 2 indicating
that the respondents agree with the statement. The
standard deviation from mean is 0.869 which is
insignificant. The P-value is 0.000 which is significant at
1%.
The
responses are shown in Table 17. The mean value is 2.095
with a standard deviation of 0.893. This indicates that the
response is in agreement with the statement. The P-value
is 0.000 which is significant at 1%.
The
responses were obtained and given statistical treatment.
The results are shown in Table 18. The mean value is
2.269 which is less than 3 indicating that the response is
in agreement with the statement. The P-value is 0.000
which is significant at 1%.
The responses are
shown in Table 19. The mean value is 2.349 with a
standard deviation of 1.138 meaning there by that the
response is in agreement with the statement. The P-value
is 0.000 which is significant at 1%.
The responses
were obtained and presented in Table 20. The mean value
is 2.129 with a standard deviation of 1.063.the results are
in agreement with the statement. The P-value is 0.000
which is significant at 1%.
55 • • January-June 2012Volume 3 • No. 1

Table 20: Compliance with international
Standards difficult.
Conclusion
References
The cash system of accounting is easier since
transactions are accounted for only when cash is received
or paid within the reporting period. As compared to
accrual system of accounting cash system of accounting
makes cash management easy. The advantage of cash
system of accounting is that it is a tool for budget and
legislative compliance as the budget is cash-based. A
cash-based budget is a budget where most of the
appropriations are on a cash basis. Therefore, in a cash-
based budget, appropriations define limits for payment
and annual commitment, that is, financial obligations
met within the fiscal year and the annual tranche of
multiyear commitments. The cash system of accounting
is non-accountable. Transactions where no cash has been
paid or received are not recorded, even if value has been
received or a liability has been contracted. The cash
system of accounting does not provide complete picture
of the financial position i.e. information on
Government's assets (land, building, machineries,
heritage assets), and liabilities (pensionary
commitments, interest due, bills payable, depreciation
for replacement of assets etc.).Cash accounting
recognize revenues and expenditures only when cash is
received or paid. Under the cash system of accounting
financial reporting does not help in the assessment of
financial performance. The system is primarily focused
on inputs, at the exclusion of outcomes. Payments made
for inventories treated as expenditure though large
quantities may be lying in stock at the end of the year. The
finding of present study suggest that switching from cash
based accounting to accrual accounting does not mean
that recording cash-flows is not important. In fact
accounting for cash flows is part of the accrual
accounting framework. Preparation for switchover to
accrual accounting needs to be planned. The most
successful systems are those that have been tailored to
meet specific country needs.
1. Holmes, J. W., and Wileman, T., (2001), “
2. Premchand, A., (1995), “
,
Washington DC.
3. Kaushik, K. P., (2006), “Government Accounting:
Recent Trends and Direction for India,”
.
4. Tiron, A., “
Towards
Better Governance-Public Service Reforms in New
Zealand (1984-94)”.
Effective Government
Accounting,” International Monetary Fund
The
Chartered Accountant, New Delhi
The Reform of the Romanian Local
Public Governments Accounting in the context of
the European Integration”
Dr.Amita Joshi
Dr. Jagdish Chandra Badola
Dr. Bhawana Goel
is the Finance Comptroller in Sarve Sikhsha Abhiyan,Govt. of Uttarakhand. Dehradun. India. The
author can be reached at [email protected]
is the Deputy Comptroller and Academic Counselor in the College of Agri Business
Management G. B.P.U.A. &T. Pantnagar, India. The author can be reached at [email protected]
is a Senior Research Fellow in the Department of Extension Education SAMETI-Uttarakhand, G.
B.P.U.A. &T. Pantnagar, India. The author can be reached at [email protected]
56• • January-June 2012Volume 3 • No. 1

Introduction
Traditional Marketing Vs Digital Marketing
Digital marketing is the use of digital sources like
Internet, digital media as radio, television, mobile phones
and digital display advertising for promotion of products
and brands to consumers. It may cover Direct Marketing
but in a digital fashion. It binds technical and creative
aspects of the Internet, including design, development,
advertising and sales [Leland and Bob, 2009]. It allows
sending email messages for acquiring new customers or
convincing them to purchase something immediately or
enhance the business-customer relationship to promote
and smoothen customer loyalty and repeat business. It
facilitates adding advertisements to email messages thus
attracting huge mass towards the business. Companies
through effective and impressive ads can connect to mass
audience easily and trace consumer needs, attitudes and
feelings towards specific products and services [Will
Rowan, 2002].
Digital Marketing is the pratice of promoting products
and services using database-driven online distribution
channels so as to reach consumers in a timely, personal,
relevant, and cost-effective manner [Jared Reitzin,
2007]. Marketing concept is undergoing a shift from the
exchange of goods to interactivity, services, connectivity
and ongoing relationships [Vargo and Lusch, 2004]. This
shift is facilitated by technological innovations,
changing media environments and new channels
[Bhattacharya and Bolton, 2000] which are making firms
to search and implement ways to attract potential
customers. There is remarkable cost difference between
traditional communication media as sales forces,
television etc. and electronic media as Web and email
[Reinartz et al. 2005]. The interactivity and cost
efficiency of digital channels generate an ongoing
dialogue between the customer and the enterprise
[Deighton and Barwise, 2000] enabling marketers to be
in touch with their customers more frequently and
increase interactivity and personalization with reduced
cost [Peppers and Rogers, 2004].
Traditional marketing is the process of performing
advertising and marketing research to sell goods and
services in a way which catches the eyes of customers
whereas, digital marketing uses digital tools to create
targeted, integrated and measurable communications
helping to acquire customers while building deep
relationships with them. Digital marketing uses all the
channels available in the digital media like print,
television, mobiles and radio to get information to
customers, and it does not limit itself to the Internet
[Sukhdeep, 2010]. Traditional marketing involves usage
of billboards, magazines, TV, newspapers, radio etc. but
digital marketing uses technology of mobile marketing,
direct mails, bulk SMS, Search engine marketing and
Digital marketing is fast gaining popularity over traditional marketing due to enhanced level of speed, efficiency, cost
effectiveness and greater focus on customer. Consumers and businesses are increasingly shifting their attention from
traditional marketing media like television, radio, and print publications to the digital marketing media like Internet,
wireless devices and search engine optimization. Issues such as methods of attracting customers using e-newsletters
and pay per click advertising, designing an effective website to gain online success, and others that increase customer
conversion rates, writing online advertisements with higher click through rates are the need of the hour..
The main area of research of this paper would be on latest information technology enabled tools, technologies and
softwares to support digital marketing and how are they helping marketing executives and managers in increasing
business base of their organizations in Delhi-NCR region. Random Sample of 100 executives of almost 28
organizations was taken to study the awareness of new IT softwares for digital marketing and analysis is done by
ANOVA test using SPSS.
Social Media Tools, Customer Conversion Rates, Digital Innovation, Digital Strategy, ANOVA TestKey Words:
!"#
57 • • January-June 2012Volume 3 • No. 1

display advertising. Traditional marketing uses offline
medium to target masses through announcement and
brand conscience of new products whereas, digital
marketing uses mobile and online medium to focus on
target segments and make suitable strategies to retain
them.
The digital marketing sector uses different digital
marketing channels such as-
Video emails
Banner ads on affiliate websites
Cell phone Short Message Service (SMS) text
messages
Voice Broadcast
Really Simple Syndication (RSS) feeds
Outdoor digital displays
Websites, Blogs and Broadcasts
( S o u r c e h t t p : / / w w w. b o l d e n d e a v o u r s . c o m
/191/Digital_Marketing.html)
The Internet can be used both to “pull” content serving a
banner ad and Pay Per Click search terms, as well as push
a message to someone like email, IM, RSS, or voice
broadcast [Megan, 2011] which are as follows-
In this, the marketer sends the content to the customer as
in email, text messages, digital advertisements, cell
phone calls and web feeds involving both the marketer
and recipients. It has the advantage of message
personalization, high conversation rate and detailed
tracking of customer choices but has disadvantage in
requiring Can Spam Act 2003 compliance failing which
it blocks most customers [Godfrey Parkin, 2009].
In this, the consumer seeks marketing content through
web searches as blogs, websites, streaming audio and
video media. It requires web browser technology to
maintain static content along with additional internet
marketing technologies like search engine optimization
to attract the desired customer demographic.
To hop into the online business bandwagon, the first
aspect is developing/ hosting of the website then any one
or all of the internet marketing techniques mentioned
here can be used [Tarun Gupta, 2006]
- it improves
website or webpage appearance in search engines
through “un-paid or natural” search results.
-
advertisements for brands, goods and services is
done only on predecided websites which in turn
helps in generating leads for companies.
- It makes use of
online communities, social networks, blogs and
online channels like Orkut, Twitter, You Tube,
Facebook, LinkedIn etc. for marketing and sale
activities.
in this you can pay your way up on
to the natural listings of search engines.
Digital marketing is promoting the brand through
interactive advertisements on Internet using any of the
following ways [Ajit Vijay Kumar, 2012]:
It involves placing the
company's advertisement on any third party website.
It is an inexpensive means of online marketing
targeting potential customers towards the business
site.
It involves the use of
interactive media applications like text, images,
Flash animations, AV clips to promote products
online.
By submitting in various
directories like Ezine and Go articles, the company
Digital Marketing Media
Figure 1 Digital Marketing
Types of Digital Marketing
1) Push Digital Marketing
2) Pull Digital Marketing
Other Digital Marketing Techniques
Search Engine Optimization (SEO)
Pay Per Click/ Impression (PPC/I)
Social Media Marketing (SMM)
Paid Inclusion -
Banner Advertising:
Interactive Advertising:
Blog/ Article marketing:
58• • January-June 2012Volume 3 • No. 1
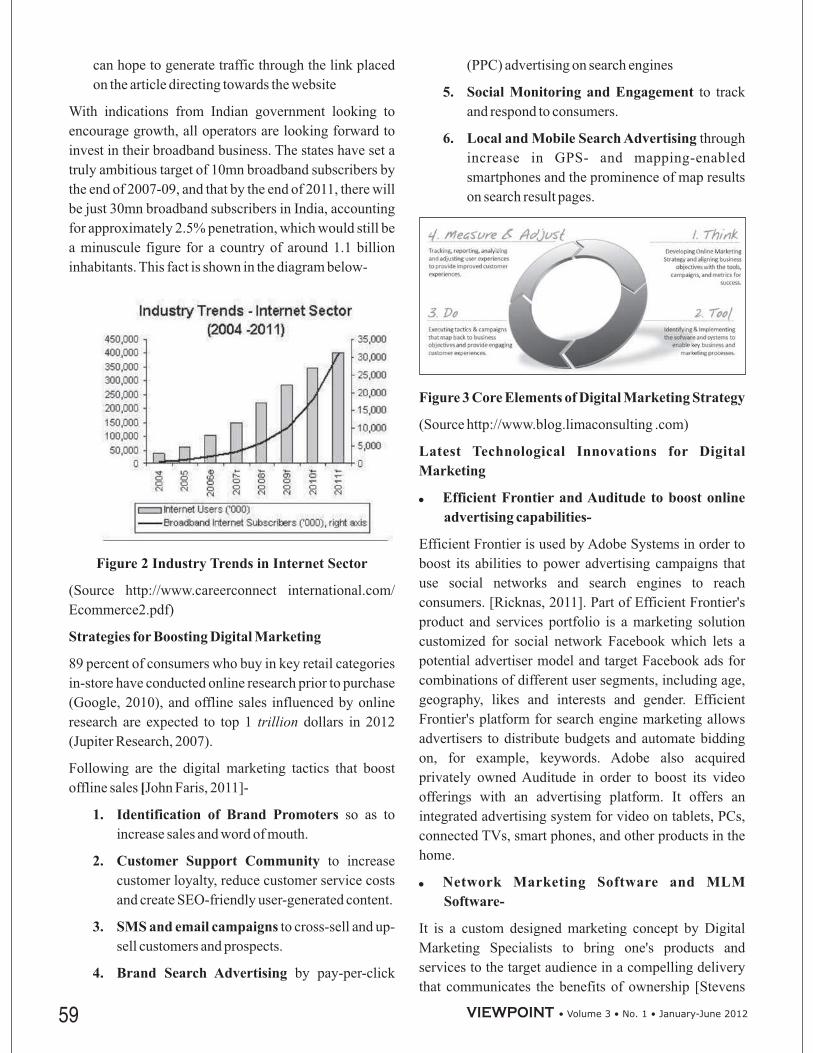
can hope to generate traffic through the link placed
on the article directing towards the website
With indications from Indian government looking to
encourage growth, all operators are looking forward to
invest in their broadband business. The states have set a
truly ambitious target of 10mn broadband subscribers by
the end of 2007-09, and that by the end of 2011, there will
be just 30mn broadband subscribers in India, accounting
for approximately 2.5% penetration, which would still be
a minuscule figure for a country of around 1.1 billion
inhabitants. This fact is shown in the diagram below-
(Source http://www.careerconnect international.com/
Ecommerce2.pdf)
89 percent of consumers who buy in key retail categories
in-store have conducted online research prior to purchase
(Google, 2010), and offline sales influenced by online
research are expected to top 1 dollars in 2012
(Jupiter Research, 2007).
Following are the digital marketing tactics that boost
offline sales John Faris, 2011]-
so as to
increase sales and word of mouth.
to increase
customer loyalty, reduce customer service costs
and create SEO-friendly user-generated content.
to cross-sell and up-
sell customers and prospects.
by pay-per-click
(PPC) advertising on search engines
to track
and respond to consumers.
through
increase in GPS- and mapping-enabled
smartphones and the prominence of map results
on search result pages.
(Source http://www.blog.limaconsulting .com)
Efficient Frontier is used by Adobe Systems in order to
boost its abilities to power advertising campaigns that
use social networks and search engines to reach
consumers. [Ricknas, 2011]. Part of Efficient Frontier's
product and services portfolio is a marketing solution
customized for social network Facebook which lets a
potential advertiser model and target Facebook ads for
combinations of different user segments, including age,
geography, likes and interests and gender. Efficient
Frontier's platform for search engine marketing allows
advertisers to distribute budgets and automate bidding
on, for example, keywords. Adobe also acquired
privately owned Auditude in order to boost its video
offerings with an advertising platform. It offers an
integrated advertising system for video on tablets, PCs,
connected TVs, smart phones, and other products in the
home.
It is a custom designed marketing concept by Digital
Marketing Specialists to bring one's products and
services to the target audience in a compelling delivery
that communicates the benefits of ownership [Stevens
Figure 2 Industry Trends in Internet Sector
Strategies for Boosting Digital Marketing
[
1. Identification of Brand Promoters
2. Customer Support Community
3. SMS and email campaigns
4. Brand Search Advertising
5. Social Monitoring and Engagement
6. Local and Mobile Search Advertising
Figure 3 Core Elements of Digital Marketing Strategy
Latest Technological Innovations for Digital
Marketing
Efficient Frontier and Auditude to boost online
advertising capabilities-
Network Marketing Software and MLM
Software-
trillion
59 • • January-June 2012Volume 3 • No. 1

and Rhinelander, 2011]. Professional Marketing
Services are as follows-
Streamlined customer service response systems
Digital warehouse tracking
International Pay Card systems and Online digital
signature applications
Custom DesktopApplications
iPhoneApplications
Web Design Consulting
Internet optimized flash and video and Search engine
optimization solutions
It is a digital marketing software company that engineers
technology solutions for social media, search marketing,
and online advertising. Advertisers, agencies and
marketing providers use Kenshoo Enterprise, Kenshoo
Local and Kenshoo Social. It provides following
facilities-
RealTime Campaigns: dynamic updation of search
ads based on real-time inventory and merchandising
and retargeting customers back to your site
Kenshoo Universal Platform: delivering business
intelligence and scale across all channels via
integration with 50+ third party data sources from ad
serving to web analytics.
Global Scale: complete currency, language, and
search engine compatibility (Google, Yahoo, Bing
AOL) with dedicated customer support in every
major region.
Kenshoo Editor: it is a powerful desktop application
to manage campaigns across channels offline,
anytime, in no time.
Ektron's Consulting Services help customers and
partners speed implementation, ensure success and
accelerate their return on investment. It assists customers
and partners in identifying business objectives, planning
their web strategy, and providing subject matter expertise
for integrating. It provides features as Digital Experience
Hub, Web Content Management, Marketing
Optimization and Social Collaboration and Community.
It is an Enterprise level Email Marketing Solution of
CommuniGator which integrates seamlessly with market
leading CRM solutions, including MS Dynamics CRM,
Sage CRM, SalesLogix andACT offering effective CRM
email marketing solutions. It provides following
features-
Social Media Integration and Triggered emails
Basic Spam Score Check and Unsubscribe and
Bounce Management
CRM Integration and Dynamic Content
Advanced Inbox Checker andArticle Management
Sending Identity with Domain Mapping
It caters to following digital marketing solutions-
Pay-Per-Click (PPC) Marketing- in this, no payment
is made for Ads shown on the Search engines but
only when a visitor clicks on your Ads Charges are
derived based on Competition for the keywords and
Ad Campaign's Quality score.
Social Media Marketing (SMM)- Its Analysis &
Reporting system enables to determine number of
messages sent and user Behavior .
eMail & SMS Marketing- It can be sent anytime - 24
hours a day and anywhere to all the potential
customers and includes Promotional messages,
Seminar/Event information, New Brand/Product
awareness campaigns and attractive offers and many
more.
It is a unique solution by New Media Gateway providing
a scalable, robust & integrated outbound marketing
platform for any sized organization. The Digital
Marketing Center gives marketers the ability to provide
more flexibility for the sales staff, to populate the system
with customizable marketing collateral and free up
marketers to be able to build and execute strategies to
reach more targets. Its potential advantages are as
follows-
Hours saving by allowing sales staff to customize
dynamic, high-impact presentations in mere minutes
in contrast to days, utilizing audience specific
messaging
Network Marketing Software and MLM Software
Kenshoo Digital Marketing Software-
Ektron Digital Marketing Software-
GatorMail Software-
Edugems Soft Solutions
Digital Marketing Center
60• • January-June 2012Volume 3 • No. 1

Campaign automation across multiple levels (both
digital and print) based on set recipient activity,
orchestrated via a "business rule artificial
intelligence" system
Complete administrative control to analyze the
utilization and effectiveness of all sales and
marketing collateral
It is a customized, sophisticated and scalable solution by
Media Sphere Communications used for Paid Search
Marketing, Social Media Marketing & Display
Marketing on various Ad Exchanges. It provides
launching campaigns globally with at least 30% more
efficiency and 80% lower operational overheads. It
offers services as-
Social Media Marketing
DigitalAgency Offering
Search Marketing
Universal Tracking Platform
1. To know the awareness level of marketing
executives about digital marketing.
2. To know the various tools and techniques used
by companies for marketing and advertisement
now-a-days in the Delhi- NCR region.
3. To know the awareness level amongst the male
and female executives.
4. To know the awareness level on the basis of
designation or managerial level.
A sample of 100 marketing executives of 28
organisations was taken to test and know awareness level
of digital marketing and its new innovations adopted by
them in the Delhi NCR region. A close ended
questionnaire was designed and convenience sampling
method used to complete the survey during the
December and January month with the help of post
graduate students of my college. SPSS 19 is used for
Cross tabulation,ANOVAand percentage analysis.
1. Awareness level of marketing executives is not up to
the mark.
2. Very few firms are utilising the latest Digital
marketing tools and techniques.
3. Digital marketing techniques are costly.
4. There is no difference in the awareness level between
male and female employees.
5. There is no difference in the awareness level amongst
the managerial scale.
Graduation 36 36
Post Graduation 24 24
Professional Qualification 40 40
Total 100 100.0
20-30 years 12 12.0
30-40 years 38 38.0
40-50 years 36 36.0
above 50 years 14 14.0
Total 100 100
Male 66 66
Female 34 34
Total 100 100.0
Lower Level Management 54 54
Middle Level Management 34 34
Top Level Management 12 12
IT 28 28
Retail 32 32
Banking 12 12
Insurance 18 18
Consultancy 10 10
Sokrati
Objectives of the Paper
Research Methodology
Hypothesis
Analysis and Interpretations
Table: 1 Demographic profile of Employees
Demographic Frequency Percent
Parameters
Educational Qualifications
Age Group
Gender
Managerial Level
Type of organisation
61 • • January-June 2012Volume 3 • No. 1
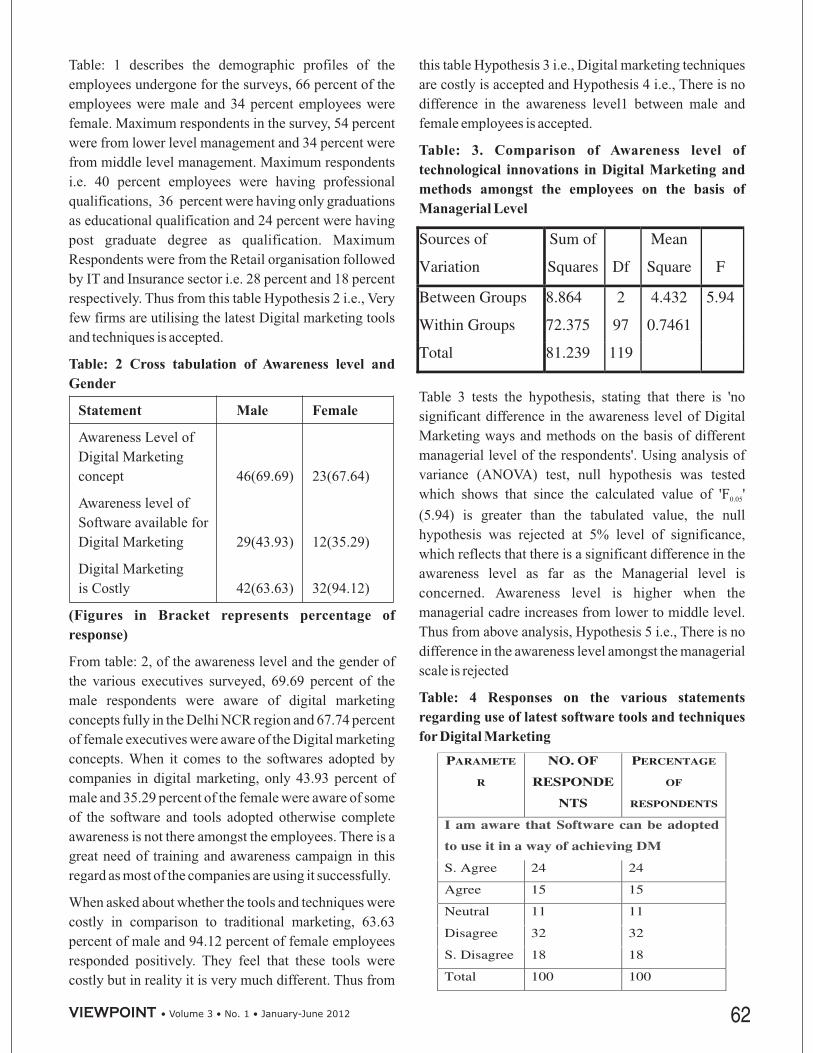
Table: 1 describes the demographic profiles of the
employees undergone for the surveys, 66 percent of the
employees were male and 34 percent employees were
female. Maximum respondents in the survey, 54 percent
were from lower level management and 34 percent were
from middle level management. Maximum respondents
i.e. 40 percent employees were having professional
qualifications, 36 percent were having only graduations
as educational qualification and 24 percent were having
post graduate degree as qualification. Maximum
Respondents were from the Retail organisation followed
by IT and Insurance sector i.e. 28 percent and 18 percent
respectively. Thus from this table Hypothesis 2 i.e., Very
few firms are utilising the latest Digital marketing tools
and techniques is accepted.
Awareness Level of
Digital Marketing
concept 46(69.69) 23(67.64)
Awareness level of
Software available for
Digital Marketing 29(43.93) 12(35.29)
Digital Marketing
is Costly 42(63.63) 32(94.12)
From table: 2, of the awareness level and the gender of
the various executives surveyed, 69.69 percent of the
male respondents were aware of digital marketing
concepts fully in the Delhi NCR region and 67.74 percent
of female executives were aware of the Digital marketing
concepts. When it comes to the softwares adopted by
companies in digital marketing, only 43.93 percent of
male and 35.29 percent of the female were aware of some
of the software and tools adopted otherwise complete
awareness is not there amongst the employees. There is a
great need of training and awareness campaign in this
regard as most of the companies are using it successfully.
When asked about whether the tools and techniques were
costly in comparison to traditional marketing, 63.63
percent of male and 94.12 percent of female employees
responded positively. They feel that these tools were
costly but in reality it is very much different. Thus from
this table Hypothesis 3 i.e., Digital marketing techniques
are costly is accepted and Hypothesis 4 i.e., There is no
difference in the awareness level1 between male and
female employees is accepted.
Table 3 tests the hypothesis, stating that there is 'no
significant difference in the awareness level of Digital
Marketing ways and methods on the basis of different
managerial level of the respondents'. Using analysis of
variance (ANOVA) test, null hypothesis was tested
which shows that since the calculated value of 'F '
(5.94) is greater than the tabulated value, the null
hypothesis was rejected at 5% level of significance,
which reflects that there is a significant difference in the
awareness level as far as the Managerial level is
concerned. Awareness level is higher when the
managerial cadre increases from lower to middle level.
Thus from above analysis, Hypothesis 5 i.e., There is no
difference in the awareness level amongst the managerial
scale is rejected
Table: 2 Cross tabulation of Awareness level and
Gender
Statement Male Female
(Figures in Bracket represents percentage of
response)
Table: 3. Comparison of Awareness level of
technological innovations in Digital Marketing and
methods amongst the employees on the basis of
Managerial Level
Table: 4 Responses on the various statements
regarding use of latest software tools and techniques
for Digital Marketing
0.05
62• • January-June 2012Volume 3 • No. 1
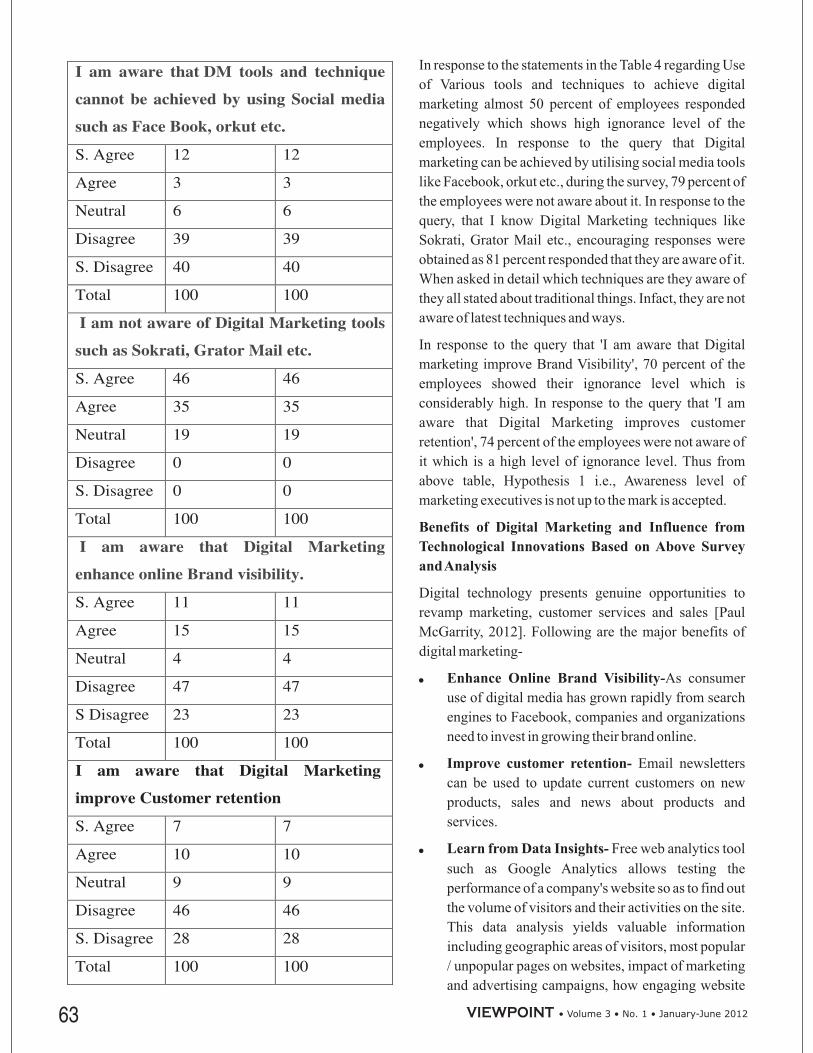
In response to the statements in the Table 4 regarding Use
of Various tools and techniques to achieve digital
marketing almost 50 percent of employees responded
negatively which shows high ignorance level of the
employees. In response to the query that Digital
marketing can be achieved by utilising social media tools
like Facebook, orkut etc., during the survey, 79 percent of
the employees were not aware about it. In response to the
query, that I know Digital Marketing techniques like
Sokrati, Grator Mail etc., encouraging responses were
obtained as 81 percent responded that they are aware of it.
When asked in detail which techniques are they aware of
they all stated about traditional things. Infact, they are not
aware of latest techniques and ways.
In response to the query that 'I am aware that Digital
marketing improve Brand Visibility', 70 percent of the
employees showed their ignorance level which is
considerably high. In response to the query that 'I am
aware that Digital Marketing improves customer
retention', 74 percent of the employees were not aware of
it which is a high level of ignorance level. Thus from
above table, Hypothesis 1 i.e., Awareness level of
marketing executives is not up to the mark is accepted.
Digital technology presents genuine opportunities to
revamp marketing, customer services and sales [Paul
McGarrity, 2012]. Following are the major benefits of
digital marketing-
As consumer
use of digital media has grown rapidly from search
engines to Facebook, companies and organizations
need to invest in growing their brand online.
Email newsletters
can be used to update current customers on new
products, sales and news about products and
services.
Free web analytics tool
such as Google Analytics allows testing the
performance of a company's website so as to find out
the volume of visitors and their activities on the site.
This data analysis yields valuable information
including geographic areas of visitors, most popular
/ unpopular pages on websites, impact of marketing
and advertising campaigns, how engaging website
Benefits of Digital Marketing and Influence from
Technological Innovations Based on Above Survey
andAnalysis
Enhance Online Brand Visibility-
Improve customer retention-
Learn from Data Insights-
·
63 • • January-June 2012Volume 3 • No. 1
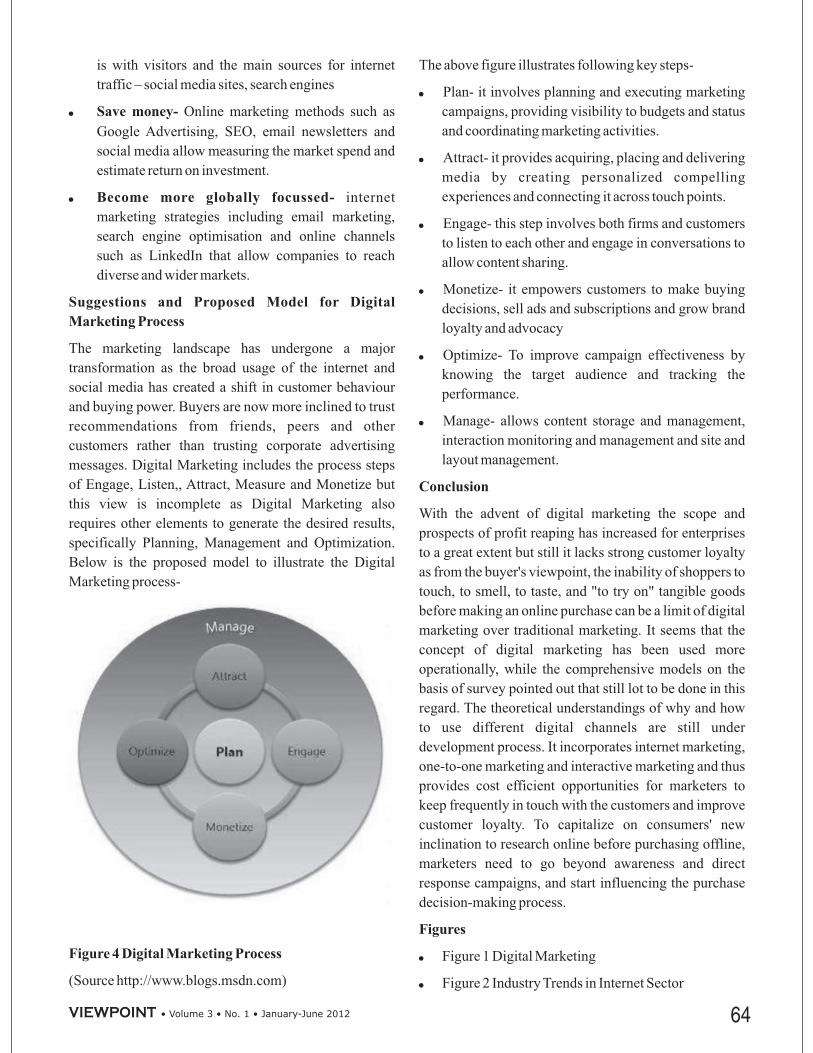
is with visitors and the main sources for internet
traffic – social media sites, search engines
Online marketing methods such as
Google Advertising, SEO, email newsletters and
social media allow measuring the market spend and
estimate return on investment.
internet
marketing strategies including email marketing,
search engine optimisation and online channels
such as LinkedIn that allow companies to reach
diverse and wider markets.
The marketing landscape has undergone a major
transformation as the broad usage of the internet and
social media has created a shift in customer behaviour
and buying power. Buyers are now more inclined to trust
recommendations from friends, peers and other
customers rather than trusting corporate advertising
messages. Digital Marketing includes the process steps
of Engage, Listen,, Attract, Measure and Monetize but
this view is incomplete as Digital Marketing also
requires other elements to generate the desired results,
specifically Planning, Management and Optimization.
Below is the proposed model to illustrate the Digital
Marketing process-
(Source http://www.blogs.msdn.com)
The above figure illustrates following key steps-
Plan- it involves planning and executing marketing
campaigns, providing visibility to budgets and status
and coordinating marketing activities.
Attract- it provides acquiring, placing and delivering
media by creating personalized compelling
experiences and connecting it across touch points.
Engage- this step involves both firms and customers
to listen to each other and engage in conversations to
allow content sharing.
Monetize- it empowers customers to make buying
decisions, sell ads and subscriptions and grow brand
loyalty and advocacy
Optimize- To improve campaign effectiveness by
knowing the target audience and tracking the
performance.
Manage- allows content storage and management,
interaction monitoring and management and site and
layout management.
With the advent of digital marketing the scope and
prospects of profit reaping has increased for enterprises
to a great extent but still it lacks strong customer loyalty
as from the buyer's viewpoint, the inability of shoppers to
touch, to smell, to taste, and "to try on" tangible goods
before making an online purchase can be a limit of digital
marketing over traditional marketing. It seems that the
concept of digital marketing has been used more
operationally, while the comprehensive models on the
basis of survey pointed out that still lot to be done in this
regard. The theoretical understandings of why and how
to use different digital channels are still under
development process. It incorporates internet marketing,
one-to-one marketing and interactive marketing and thus
provides cost efficient opportunities for marketers to
keep frequently in touch with the customers and improve
customer loyalty. To capitalize on consumers' new
inclination to research online before purchasing offline,
marketers need to go beyond awareness and direct
response campaigns, and start influencing the purchase
decision-making process.
Figure 1 Digital Marketing
Figure 2 Industry Trends in Internet Sector
· Save money-
Become more globally focussed-
Suggestions and Proposed Model for Digital
Marketing Process
Figure 4 Digital Marketing Process
Conclusion
Figures
64• • January-June 2012Volume 3 • No. 1

· Figure 3 Core Elements of Digital Marketing
Strategy
Figure 4 Digital Marketing Process
Table 1 Demographic profile of Employees
Table 2 Cross tabulation of Awareness level and
Gender
Table 3 Comparison of Awareness level of
technological innovations in Digital Marketing and
methods amongst the employees on the basis of
Managerial Level
Table 4 Responses on the various statements
regarding use of latest software tools and techniques
for Digital Marketing
1. Bhattachrya, C. B and Ruth, N. B., (2000),
“Relationship Marketing in Mass Markets”, in
Handbook of Relationship Marketing Eds. Sheth, J.
N. and Parvatiyar, A., London U.K.:
, pp. 327-354.
2. Deighton, J. and Patrick, B., (2000), “Digital
Marketing Communication, Future Media Working
Paper, No.00-801, London Business School
3. Faris., J, (2011), “7 Digital Marketing Tactics that
Boost Offline Sales,” retrieved from Media
Connection on September 14
4. Gupta, T, (2006), “Scope of Internet Marketing in
India” retrieved from EzineArticles.com on
December 12
5. Leland, H., and Bob, H., (2009), “Digital
Engagement: Internet Marketing that Captures
Customers and Builds Intense Brand Loyalty,”
6. Megan, H., (2011), “Technology and the B-to-B
Marketer: 5 Actions to Take Now for Better ROI
Later,”
7. Paul, M., (2012), “Making a Business Case for
Digital Marketing 57,” retrieved from HubPages
8. Godfrey, P., (2009), “Digital Marketing: Strategies
for Online Success”, New Holland
9. Peppers, D., and Rogers, M., (2004),
,
New Jersey: John Wiley and Sons Inc.
10. Reitzin, J., (2007), “What is Digital Marketing,”
retrieved from Mobile Storm onApril 26
11. Reinartz, W., Thomas, J. S., and Kumar, V., (2005),
“Balancing Acquisition and Retention Resources to
Maximize Customer Profitability,”
69.1, pp. 63-79
12. Mikael, R., (2011), “Adobe Buys Efficient Frontier
to Boost its Online Advertising Capabilities,”
retrieved from InfoWorld, IDG News on November
30 .
13. Will, R., (2002), “Digital Marketing: Using New
Technologies to Get Closer to Your Customers,”
Kogan Page Publishers
14. Singh, S., (2010), “Online Marketing,” WordPress
retrieved on September 10.
15. Stevens, S., Rhinelander, S., (2011), “Network
Marketing Software and MLM Software,”
LLC. 130.
16. Vargo, S. L., and Lusch, F. R., (2004), “Evolving to a
New Dominant Logic for Marketing,”
68.1, pp. 1-17.
17. Ajit, V. K., (2012), “Scope of Internet Marketing in
India…Is the Hype for Real?,” Retrieved from
1888articles.com on January 04
18. <http://www.digitalmarketingspecialists.com/>
19. <http://www.kenshoo.com/>
20. <http://www.ektron.com/>
21. <http://www.communigator.co.uk/>
22. <http://www.edugems.com/>
23. <http://www.newmediagateway.com/ marketing-
software/dmc>
24. <http://www.sokrati.com/>
25. <http://www.boldendeavours.com/191/ Digital
_Marketing.html>
26. <http://www.blog.limaconsulting .com>
27. <http://www.blogs.msdn.com>
28. <http://www.boldendeavours.com>
29. <ht tp : / /www.careerconnec t in te rna t iona l .
com/Ecommerce2.pdf>
Tables
References
Sage
Publications
Amacom Publications
Chief Marketer
Managing
Customer Relationships: A Strategic Framework
Journal of
Marketing,
Digital
Marketing Specialists
Journal of
Marketing,
Palak Gupta is an Assistant Professor in Jagannath International Management School Kalkaji, New Delhi. She has a
rich experience of industry of eight years. The author can be reached at [email protected]
65 • • January-June 2012Volume 3 • No. 1

Genesis
You are 60 plus, ageing, retired and unable to manage
your day to day life and medical expenses? Your sons
never look back and do not support you at this age? If you
own a house in your/spouse name, reverse mortgage is
the ray of hope to live peacefully in your remaining life.
With a word of caution, let us first understand the modus
operandi of Reverse mortgage.
Reverse mortgage is the scheme of providing money to a
house owner against the security of the house. It is
intended for senior citizens, aged 60 or more, with
maximum loan tenure of 15 years. The loan need not be
repaid until the term is completed. If the senior citizen
dies before the term, the lender would sell the house and
recover the loan. The surplus of the sale proceeds after
extinguishing the loan would be passed on to the heirs. If
the senior citizen survives the term, the entire
outstanding would be treated as a corpus and interest
alone would accumulate until the death of the owner.
Reverse mortgage can be defined as an agreement by
which a home owner borrows against the equity in his
home and receives regular tax free payments from the
lender, while still retaining title and ownership of the
property. Each individual on the property title must be an
occupant of the home as a principal residence. A reverse
mortgage does not have to be paid back until the last
surviving borrower sells the property, moves out or
passes away. Here equity is the value of the property.
Thus reverse mortgage is a contract between a
homeowner and a financier which enables the
homeowner to receive a stream of income, especially in
retirement, from the future realizable value of the home.
In reverse mortgage, the capital value of a home is
converted into an annuity over the homeowner's lifetime.
The period of such payments is not in specified number
of years, but 'the remaining life time of the owner (and
his/her spouse) of the property. Simply speaking, reverse
mortgage is a life annuity to support higher standards of
living, better access to health care and higher life
expectancy.
The amount you can borrow with a reverse mortgage
depends on the type of reverse mortgage, the current
With the better living standards and improved medical facilities, the average life expectancy of the Indian population
has reached about 70 years of age. This is the time when person is ageing, already retired and unable to manage their
day to day life and medical expenses. Their wards never look back and do not support them at this age. At this stage,
they need their children's support physically, morally and financially. If they own a house in their/spouse name,
reverse mortgage is the ray of hope to live peacefully in their remaining life. Reverse mortgage is a contract between a
homeowner and a financier which enables the homeowner to receive a stream of income, with a right to stay in their
home, till death. Despite mortgaging, the house owner retains the ownership. The older they are and the more equity
they hold in the home, the more they can borrow.
At the same time, Reverse mortgage is a time bomb for the borrowers, living and surviving longer, than expected. If the
borrower outlives the tenure of the loan, the bomb could even explode, leading to financial problems, at the age when
they wish to put their feet up and live in peace. For many seniors, the desire to leave an inheritance to children or
grandchildren is quite strong. Seniors, who have this goal and whose largest asset is their home, clearly will perceive
that a reverse mortgage runs directly counter to their strong inheritance motive.
Today, the reverse mortgage process is picking up fast in metros and big cities. But, the fear of not leaving an
inheritance, fear of financial complexity and unethical reverse mortgage terms make senior citizens think twice for
reverse mortgage options. Various reverse mortgage scams are raising doubts about the success of the scheme. This
paper is an attempt to create awareness among academicians, to help understand reverse mortgage and remove myths
from the mindset of the public and seniors citizens at large.
Senior Citizens, Old Age Financial Needs, Housing Property, Survival, Reverse MortgageKey Words:
Senior Citizens Enjoy Your Old AgeVinod Kumar Chib
66• • January-June 2012Volume 3 • No. 1

interest rates, location of your home, your age and many
other factors. Each reverse mortgage is different. The
total amount owed at the end of the reverse mortgage
loan equals all the cash advances the borrower has
received to date including interest. Instead, the loan must
be repaid when you die, sell your home or no longer live
there as your principal residence. Reverse mortgages can
help homeowners who are house-rich but cash-poor;
they have become an important resource to our senior
population. The older you are and the more equity you
hold in the home, the more you can borrow.
In the normal mortgage process, the borrower takes a
loan to buy a house and in return, makes regular
payments in the form of Equated Monthly Installments (
EMI ) to the lender. The EMI consists of return of
principal amount with accrued interest, divided with the
time frame and duration of the loan.
But, in the reverse mortgage, the process is reverse. The
borrower receives the fund from the lender against the
valuations of his home. Generally, the borrower does not
have to pay it back to the lender, as long as he lives in his
home. In the reverse mortgage process, the capital value
of the home is converted into an installment during the
lifetime of the borrower. The borrower can use the loan
amount for personal uses like self livelihood, medical or
emergency expenses or various purposes like
maintenance/renovation of the house. There is a clause
in reverse mortgage is that the borrower will not use the
funds for business, trading or speculative purposes.
The lender will recover the loan amount along with the
accumulated interest by selling the house, after the death
of the borrower. The same procedure will be followed if
the borrower leaves the mortgaged house permanently,
as per his wish. In both the cases, the excess amount
(value realised on sale of the property minus
accumulated liability ) will be remitted to the borrower
or his legal heirs. Before putting the house under sell or
hammer, the preference is given to the borrower or his
legal heirs to pay the outstanding loan amount, with
interest. Under the circumstances, the mortgaged
property is released back to the borrower or legal heirs.
The amount received is considered as loan and not an
income, which does not attract any tax liability for the
borrower.
The most interesting feature of the reverse mortgage
scheme is the benefits to the borrower in such a manner
that despite mortgaging the house, the borrower retains
the ownership of the house in his/spouse name. They
remain entitled to live in their own hard earned dream
house throughout their lifetime. At the same time, they
have clear access to the regular income from the lender,
which helps them in their daily need. This way, reverse
mortgage is getting developed as an instrument of social
security funding. The lender sanctions the loan on
certain criteria, as following:
1. The age of the borrower/spouse
2. Market value of the house
3. Interest rate
4. Payment method selected by the borrower
Under the guidelines, the maximum mortgage tenure for
the scheme is 15 years. If the borrower outlives the
tenure of 15 years, he can continue to stay in his own
house. Under the reverse mortgage, the lagal heirs are
not entitled to take charge of the mortgaged house,
without clearing the outstanding loan against the
property. They are required to first pay the loan amount
with interest, to raise claim on the property.
Embedded in the structure of a reverse mortgage is a
time bomb. The longer the borrower survives, the louder
the bomb will tick. If the borrower outlives the tenure of
the loan, the bomb could even explode. Though reverse
mortgage appears to offer prima-facie a sense of
financial independence to the elders, it is likely to crush
them down with financial problems, at an age when they
wish to live in peace.
The concept of repayment itself is dangerously
structured. What happens when the mortgagee survives
the tenure of the loan? The entire outstanding
comprising the principal and interest would be treated as
corpus and the interest meter starts ticking on the corpus.
Suppose bank provides Rs.8000.00 per month to the
mortgagee, up to 15 years. Hence, a loan of Rs.14.4 lakh
@45% of the present market price of Rs.32 lakh taken,
when the house owner is 62 becomes Rs.35.8 Lakh at the
end of 15 years at 12% rate of interest. Thus, at the age of
82 of the mortgagee, the total outstanding would be
staggering Rs.63 lakh. If the mortgagee survives another
5 years, this outstanding would become Rs.111 lakh. In
terms of valuation, property valued at Rs.32 lakh after 25
years must have a value at least Rs.111 lakh otherwise
the borrower is in deep trouble.
How Reverse Mortgage Functions
67 • • January-June 2012Volume 3 • No. 1

Some Inherent Fears
Giving-up a Goal:
Financial Complexity:
Loss of Inheritance:
Future Flexibility:
Reverse Mortgage Frauds
There are some inherent fears in the heart of the
homeowners, when they learn and plan about reverse
mortgage. These fears differ from person to person,
depending upon their own state of mind, perception and
very personal problems. These fears haunt them every
moment, as more and more facts about the scheme are
revealed, till they makeup their mind to go ahead for the
plan.
Most elderly homeowners have
spent their working lives focussed on the goal of “paying
off the mortgage.” Taking out a reverse mortgage is a
decision to do a complete turnabout and initiate the
process of growing a new mortgage. For some seniors,
this just doesn't make sense, no matter how rational the
decision to trade-in home equity for better living
standards in later life may appear to a detached observer.
There is no question that
reverse mortgages are complex financial tools.
Moreover, by their very nature, they run counter to many
of the golden financial management rules that senior
homeowners have strived to abide by over their adult
lives i.e. reduce debt, avoid high transaction fees and
grow your home equity etc. Because of the complexity,
National Housing Board ( NHB ) requires all institutions
to participate in counselling sessions to ensure they have
full understanding of the reverse mortgage process and
the other alternatives that may be available. Yet, while
necessary and well-intended, the counselling
requirement itself may scare-off some potential
applicants who feel that they just won't be capable of
digesting all the new information presented.
For many seniors, the desire to
leave an inheritance to children or grandchildren is quite
strong, even to the point of accepting a more modest than
necessary lifestyle to ensure that an estate survives them.
Seniors, who have this goal and whose largest asset is
their home, clearly will perceive that a reverse mortgage
runs directly counter to their strong inheritance motive.
To be a sensible financial decision, a
reverse mortgage should equate to a conscious decision
by the homeowner for the long term minimally 5-7 years
and ideally, for the rest of the homeowner's lives.
Obviously, this commitment is especially difficult for
the elderly homeowner. Death, long-term illness or
incapacity and similar issues weigh heavily on the minds
of many seniors and make long-term housing
commitments especially stressful.
To a large extent, further growth in the reverse mortgage
area will depend on the success of efforts to educate the
target population. Some observers feel that the next
generation of retirees i.e. baby boomers will enter their
retirement years with a far greater understanding of
financial matters and with less aversion to indebtedness.
This may prove true but the reverse mortgage concept is
so fundamentally different from what people are used to
that overcoming the fears of potential borrowers will
remain a challenge.
Reverse mortgages are gaining in popularity as more
seniors start looking for ways to supplement their
retirement incomes. Many seniors are finding that they
have lost thousands of their hard earned money to these
reverse mortgages frauds. Since reverse mortgage
typically involve borrower's largest asset (the home),
this type of fraud can have a serious negative impact on
their retirement. The following reverse mortgage fraud
information will help them avoid becoming a victim of a
reverse mortgage fraud.
As the popularity of reverse mortgages will increase, so
will the cases of reverse mortgage frauds? Let us look
out at possible frauds:
Reverse mortgages can use up all or some of the equity in
their home, leaving fewer assets for the borrower and its
heirs. Because borrower retains title to the home, he
remains responsible for property taxes, Mortgage
Insurance Premium, utilities, fuel, maintenance and
other expenses. Interest on reverse mortgages is not
deductible on income tax returns until the loan is paid off
in part or whole.
There are several types of reverse mortgage frauds that
can end up costing borrower in equity in their home if
they become a victim. It can start with the unethical
reverse mortgage terms and charges.
Typically institutions charge for informations as part of
an estate planning programme. Seniors that sign up for
these programmes are unaware that these firms are
collecting thousands by charging a hefty fee on the total
amount borrowed.
Some lenders slip in excessive fees and terms into their
contracts. These terms can have a serious effect on a
68• • January-June 2012Volume 3 • No. 1
senior's equity. In some cases, lenders have used shared
equity or shared appreciation terms, which gives the
lender the right to collect a portion of the appreciation
when the home is sold or refinanced. The cost of these
type provisions can run into the tens of thousands as the
home appreciates. These rising cost provisions eat up
equity without providing any additional benefit to the
homeowner.
Hazard is a condition that may create or increase the
chances of loss. Factors that influence the outcome are
referred to as hazards. It relates to the human aspects that
influence the outcome. It refers to the dishonest attitudes
of the insured to attempt or defraud the insurance
company and vice-versa.
Hence, any dishonest attitude of the lender will be a
fraud towards the borrower. The institution's agent or
officer may attempt so to achieve his business targets, by
pushing a wrong plan to the borrower.
One of the major moral hazard will lie with the borrower
regarding the end use of funds provided to him. What
happens when the money so borrowed is used up for
purposes other than what it was intended? The
guidelines do mention end-use as a pre-requisite. But,
these are prescriptive and it would be left to individual
lender/institution to do due diligence.
If you are looking into reverse mortgages, there are
several things that you can do to protect yourself from
falling victim to these types of frauds.
Talk to the reverse mortgage lender's counsellor. The
counsellor will help you understand reverse
mortgages and help you evaluate your situation.
Obtain several offers from different reverse
mortgage lenders in order to compare different
options. The rule of thumb is to get at least three
separate offers so that you have a good comparison
of the terms offered.
Make sure you understand all the terms and
conditions within the reverse mortgage contracts.
Your reverse mortgage counsellor can guide you
through the contracts.
Most homeowners have gone through the mortgage
process at least a few times by the time they get to
retirement age. But mention a reverse mortgage and
most homeowner, regardless of their experience with
refinances, will give you a crazy look. Well, the reverse
mortgage process is relatively straightforward and you
will have plenty of help along the way.
As with any financial decision, the first step in the
reverse mortgage process is to educate you about the
product. Congratulations, if you're reading this, you
have already taken the first step! There is plenty of great
information available and the lender will help you in
your learning process. Make sure to seek advice from
trusted friends or others who have gone through the
process. Having gone through the reverse mortgage
process, their perspective can be invaluable.
The next step is to find a trusted lender who can assist
you with your needs. But do not just take the words for
granted, do your own research and make sure you ask
your lender plenty of questions. Do they have
testimonials from other customers? The reverse
mortgage process is highly regulated by the government
to ensure that older borrowers do not put themselves in
danger of losing their home.
Start the reverse mortgage process by submitting an
application to a trusted lender. Once you have been
approved by their reverse mortgage underwriting
department, they will be able to give you the proposed
terms of the loan. Be sure to review these carefully and
clarify every doubt about your payments, fees and other
amounts. Always keep in mind that you are not
committed to the loan until you sign the closing papers.
Remember that this is your money, your home and your
personal finances, so do not hesitate to ask even dumb
questions.
Once you have been approved by underwriting and have
chance to review the proposed loan terms, you will need
to decide whether or not you want the loan. By this time,
this should not be a difficult decision. If you have
followed all the steps in the reverse mortgage process,
you should be able to move forward with confidence. If
you do not feel comfortable, you might want to repeat
your steps and figure out what is missing. Once you have
decided to move forward, the lender will take you
through the ordering appraisals, title examinations and
surveys, gathering personal documentation and
preparing the loan papers.
Before you can move further in the process, your lender
Moral Hazards
Know the Reverse Mortgage Process
!
!
!
69 • • January-June 2012Volume 3 • No. 1
will direct you to government sponsored counseling.
This is one of the most important steps in the reverse
mortgage process. The counseling must be administered
by an independent, certified third-party agency,
approved and certified by NHB and they will take you
through the dangers and risks potentially posed by
getting a reverse mortgage. They will explain the
reverse mortgage process with you and will make sure
that you didn't miss anything along the way.
You are almost through the reverse mortgage process!
The next step is the loan closing. The lender will
schedule a closing time, date and location that is suitable
for you and all you need to do is show up and sign
papers. Make sure to read the papers as you sign and
confirm that the actual terms of the papers you are
signing are exactly what you had agreed to with the
lender. If there's a discrepancy, simply ask the lender to
explain. The last step in the reverse mortgage process is
to receive your funds, with which you can do anything
you like. The reverse mortgage process is
straightforward and you get plenty of help along the
way.
Financial institutions/lenders are in the business to make
money, not for charity. Hence, reverse mortgage lending
involves fee at every stage of approval of loan. Finally,
there is the finer print that would add on a basket of costs.
Processing charges, legal opinions and registration of
mortgage, valuations at sanctions and after every 5 years
- all would act as an invisible cost. Majority of the costs
paid by someone to get a home purchase loan, existing
mortgage refinancing are the same fees paid in reverse
mortgages. In most cases, capping and financing these
fees and costs can be done as part of the reverse
mortgage. Following is an exhaustive list of each type of
fee.
– File fee of the lender.
urrent market valuation and
ensuring the soundness of the home.
for title search.
final papers
of the mortgage and other records.
he mortgage lien is registered
with the District Registrar's Office.
rotection for the lender
against property ownership disputes.
In the old age, the regular sources of income dry up and
consequently dependency on others increases. With
healthcare expenses on rise with no income, becomes a
challenge for the senior citizens. In the reverse mortgage
process, the owned house becomes a liquid asset,
providing a source of regular income with a permission
to enjoy stay in the own house, is bringing a ray of hope
for seniors. One needs not to pay the loan and live
happily in the last years of his life. State Bank of India
has already launched the scheme in the name of Loan for
the Welfare of Senior Citizens of India. Punjab National
Bank and many other banks have rolled out Reverse
Mortgage Loan, a product for senior citizens, above the
age of 60 years, which will allow senior citizens to avail
funds by mortgaging their houses.
The reverse mortgage process is nascent in our country.
It has to go a long way, to become an instrument of old
age security. It will not only provide financial funding in
the odd phase of the life, it will also bring more financial
activity and liquidity in the housing sector.
There is a need to educate and bring awareness in the
public at large, especially the seniors, to avail the
benefits of reverse mortgage, in case, they are not
supported by their children. At the same time, great care
needs to be exercised, to understand the complexity of
the scheme. They should not fall prey to the scheme,
without giving a serious thought on the consequences.
1. Business Standard, dated 26.8.2011
2. Chidambaram P., ( 2008 ), Union Budget, Govt. of
India 2008-09
3. Economic Survey, 2007-08, Government of India,
Ministry of Finance, Oxford University Press, pp
105-108
4. Harrington, N., (1999),
McGraw Hill International Editions, pp.
571-590
for Details of “Reverse Mortgage”
6.3, February 2008, p. 17
6. LICHFL, (2009), “Reverse Mortgage Loan
Scheme : Highlights,” <www.lichousing.com>
7. Nachane, D. M., India Development Report 2011,
Reverse Mortgage Loan and Fee
1. Origination Fee
2. Appraisal Fee - C
3. Credit Report Fee - Fee
4. Document Preparation Fee – Fee for
5. Registration Fee - T
6. Title Insurance Fee - P
Conclusion
Further Implications
References
Risk Management and
Insurance,
5. IRDA Journals
70• • January-June 2012Volume 3 • No. 1

Oxford University Press, pp. 136-139, 142
8. NHB (2008), “Reverse Mortgage Operational
Guidelines,” <www.nhb.org.in>
9. PNB (2007), “Reverse Mortgage Loan – PNB
Baghban,” <www.pnbindia.in>
10. <www.sbi.co.in>
11. The Economic Times , dated 16.11.2011 and
18.01.2012
12. The Times of India , dated 16.09.2011 and
16.01.2012
Prof. Vinod kumar Chib is teaching at Jaipuria Institute of Management, Lucknow. He has worked for 7 years in
MNC Britannia Industries Limited as Standards and Production Manager and for 12 years in General Insurance
Industry. He has been a panelist and Lead-Speaker in various conferences and seminars. The author can be reached at
71 • • January-June 2012Volume 3 • No. 1

Introduction
Objectives and Methodology
IT boom which emerged in the 1990's opened new vistas
of interactive communication between governments and
citizens. It acts as an enabling tool to increase efficiency,
enhance transparency, collect more revenue and facilitate
public sector reform. While e-governance is not a
panacea that can improve the performance of the public
sector, it is a powerful enabling tool that has aided
governments achieve some of their development and
administrative reform goals (Bhatnagar, 2004). E-
governance has its roots in many countries to 'modernize'
government in response to perceived citizen
dissatisfaction or disengagement. It has enabled
governments to deliver services to citizens much faster.
Although there is a growing feeling that Information and
Communication Technology (ICT) in governance offers
almost limitless possibilities like evolving new forms of
citizenship, the technologies have not been fully
harnessed even in the country's leading the global e-
governance scenario. The notable fact is that the
literature on e-governance is always much ahead of the
actual achievements (Sinha, 2006)
Historically, it was in Chile that e-governance initiative
was taken up as early as in 1972, when IT applications
were unheard of in government and were limited even in
business. They used techniques of IT not just to make
government paperless but to perform government work
efficiently (Prabhu, 2004). Developments in ICT have
been taking place at a rapid pace. India with its e-literate
resources is fast emerging as a major initiator in e-
governance adoption. This is despite the challenges
arising out of conditions related to awareness, literacy,
basic infrastructure, bandwidth issues and multi-lingual
and cultural issues (Panneervel, 2005). India is
transforming into a transparent society. It is essential that
government functions which have interfaces or
interactions with the public especially where state and
central functionaries have to serve or support, or even
correct, citizens be done through the tools of ICT (Kalam,
2005). In India the concept of "e-governance" began with
National Informatics Center's efforts to connect all
district headquarters through computers in the 1980s.
The impact of ICT on governance and public
administration, therefore, is revolutionary. ICT based e-
governance initiatives entail a reinvention of government
in terms of the relocation of artifacts for provision of
utilities and services to the point of direct contact with
citizens and lateral integration of official records making
them available for users.
This survey examines the scope and utilities of Dharitree
(E-governance) project implemented in Sonitpur district
ofAssam. The main objectives of the study are:
1. to examine the nature and scope of e-governance
2. to assess the prospects and hindrances of
utilization in e-governance
'Multi method research technique' which includes case
studies, field notes, in-depth interviews and survey
techniques has been adopted for collecting primary
The paper explores the emancipatory and transformative potentials of ICT in e-governance endeavour. ICT which
become increasingly important in the conduct of governance has transformed the way government functions today.
One of the changes it has brought about is in the conduct of public administration where new technologies are
transforming the way public officials interact and communicate with each other. ICT can provide networking
structures transcending borders, languages and cultures, and foster empowerment amongst every citizen particularly
the socially disadvantaged groups. It has re-conceptualized the entire administrative machinery by reinforcing
current processes of democratization in many parts of the country. The paper examines: (i) how ICT has brought in
new and challenging ways for citizens to communicate and participate in administrative processes and ii) the scope
and utilities of Dharitree project of Sonitpur district in Assam and iii) Finally, this paper assesses the dissemination,
propagation and accessibility of e-governance in Assam.
ICT, Governance, Citizens, AdministrationKey Words:
Dharitree Project: A Case Study on the Scope and Utilities ofInformation and Communication Technology Project in Assam Uttam Kr. Pegu
72• • January-June 2012Volume 3 • No. 1

data. The perceptions of these methodologies have been
given equal weightage which is substantiated in the
findings of the study.
Statistical Package for Social Science has been used for
analyzing the data. Cross tabulations of some of the
variables have also been done to obtain an
understanding of a cross-sectional analysis. A total of
200 respondents including 50 officials and 150
beneficiaries are considered for the study in Tezpur,
Bishwanath Chariali, Naduar and Dekhiajuli blocks of
Sonitpur district. Separate questionnaire for the
officials and beneficiaries have been prepared on a 5-
point Likert scale with responses strongly disagree,
disagree, neutral, agree and strongly agree. Analysis on
variance (ANOVA) and co-relation tests of both
categories of respondents have been done. In both the
cases education has been considered as the factor for
doing the test. Comparative account of ANOVA and
Co-relation test of both the officials and beneficiaries
has been presented in the different tables. The 5-point
Likert scale has been re-coded into different variable
having ranges 5-11, 12-18 and 19-25 with new values 1,
2 and 3. In order to find out the co-relation it has been
redefined as Low, Moderate and High having values of
1, 2 and 3 respectively and a cross-tabulation has been
calculated accordingly.
In this section questions pertaining to nature and scope of
e-governance were asked to the officials. Responses are
measured on a 5 point Likert scale for which the
respondents were asked to indicate the extent to which
they agree or disagree to certain statements. It was found
that for:
1. Provides faster delivery of service than the earlier
mode
Disagree 8%, Neutral 30%, agree 52%, and strongly
agree 10%
2. The delivery outlets are hasslesome
Disagree 14%, Neutral 10%, agree 38%, and
strongly agree 38%
3. Facilitates two-way communication process
between govt. to citizen and vice versa
Disagree 4%, Neutral 20%, agree 44%, and strongly
agree 32%
4. Provides prompt and timely services throughout
Strongly disagree 4%, disagree 6%. Neutral 12%,
agree 50%, strongly agree 28%
5. Circle offices are adequately equipped in terms of
personnel and skills required in electronic delivery
of services
Strongly disagree 12%, disagree 8%. Neutral 10%,
agree 28%, strongly agree 42%
Responses given by the beneficiaries on the same set of
questions are:
1. Strongly disagree 18.7%, Disagree 35.3%, Neutral
38.7% and agree 7.3%
2. Disagree 19.3%, Neutral 4.6%, agree 34.7%
3. Disagree 20.7%, Neutral 38%, agree 36.7%, and
strongly agree 4.7%
4. Disagree 22.7%, Neutral 44% and agree 25.3%,
strongly agree 8.7%
5. Strongly disagree 24.7%, Disagree 59.3%, Neutral
2%, agree 11.3, and strongly agree 2.7%
Officials were asked to indicate the extent to
which they agree or disagree on the nature and scope of e-
governance on a 5-point Likert Scale. Analysis on
Variance (ANOVA) has been done to assess the degree of
variance in significance in the different variables.
Education has been considered as a factor in doing the
analysis.
The 'F' and Significance values for both between and
within the groups have been presented in Table 1. The
significance i.e. 'P' value in all the variables varies from
0.946 to 0.882 which is > than 0.05. Hence, the 'P' value
could be considered insignificant.
It has been done to find out whether
education has a co-relation to the extent which the
officials agree or disagree on the nature and scope of e-
governance. The 5-point Likert scale has been recoded
into different variables having ranges 5-11, 12-18 and 19-
25 with new values 1, 2 and 3. The responses have been
redefined as Low, Moderate and High having values of 1,
2 and 3 respectively. Table 2 shows the cross-tabulation
analysis.
It has been observed that the extent to which the officials
DataAnalysis and Interpretation
A. Nature and Scope of e-governance
ANOVA:
Co-relation Test:
Table 1
73 • • January-June 2012Volume 3 • No. 1
agree or disagree on statements relating to nature and
scope of e-governance among the different educational
groups is High having percentages 60%, 65.5% and 70%.
Analysis on Variance (ANOVA) has been
done to assess the degree of variance in significance in
the different variables. Education has been considered as
a factor in doing the analysis.
The 'F' and Significance values for both between and
within the groups have been presented in Table 3. The
significance i.e. 'P' value in all the variables varies from
0.0 to 0.011 which is < than 0.05. Hence, the 'P' value
could be considered significant.
Cross-tabulation has been done to find
out whether education has a co-relation to the extent
which the officials agree or disagree on the nature and
scope of e-governance. The 5-point Likert scale has been
recoded having ranges 5-11, 12-18 and 19-25 with new
values 1, 2 and 3. The responses have been redefined as
Low, Moderate and High having values of 1, 2 and 3
respectively.
It has been observed that the extent to which the officials
agree or disagree on statements relating to nature and
scope of e-governance among the different educational
groups is highest in the Moderate category having
percentages 84.4%, 72.6% and 69%.
In this section questions pertaining to prospects in
utilization of e-governance were asked to the officials
and beneficiaries. Responses are measured on a 5 point
Likert scale for which the respondents were asked to
indicate the extent to which they agree or disagree to
certain statements. The following is the result.
1. Provides accountability in administration
Strongly disagree 8%, disagree 12%, Neutral 18%,
agree 46%, strongly agree 16%
2. Ensures greater transparency through web- enabled
database
Strongly disagree 2%, disagree 6%, Neutral 24%,
agree 40%, strongly agree 28%
3. Ensures improvement in speed and quality of
services to citizens
Disagree 12%, Neutral 24%, agree 36%, and
strongly agree 28%
4. Reduces manual work by replacing the old manual
records with a computerized database
Disagree 10%, Neutral 34%, agree 28%, and
strongly agree 28%
5. Provides effective decentralization in decision
making
Strongly disagree 6%, disagree 4%, Neutral 20%,
agree 36%,strongly agree 34%.
Responses given by the beneficiaries on the same set of
questions are:
1. Strongly disagree 2.7%, Disagree 34%, Neutral 54%
and agree 9.3%
2. Disagree 14%, Neutral 44.7%, agree 28.7%, and
strongly agree 12.7
3. Disagree 25.3%, Neutral 36.7%, agree 34%, and
strongly agree 4%
4. Strong disagree 6.7%, disagree 28.7%, Neutral
17.3%, agree 29.3%, strongly agree 18%
5. Strongly disagree 6.7%, Disagree 22%, Neutral 54.7,
agree 13.3%, and strongly agree 3.3%
In this section questions pertaining to hindrance in
utilization of e-governance were asked to the officials
and beneficiaries. Responses are measured on a 5 point
Likert scale for which the respondents were asked to
indicate the extent to which they agree or disagree to
certain statements. The following is the result.
1. Lack of digitized govt. information on related
matters
Disagree 12%, Neutral 26%, agree 56%, and
strongly agree 14%
2. Insufficient operating knowledge among employees
Disagree 6%, Neutral 14%, agree 48%, and strongly
agree 32%
3. Lack of proper infrastructure
Strongly disagree 2%, disagree 4%, Neutral 34%,
agree 28%, strongly agree 32%
4. Lack of proper understanding on e-governance
Strongly disagree 2%, disagree 4%, Neutral 14%,
Beneficiaries:
Co-relation Test:
B. Prospects and Hindrances in
Utilization of e-governance
a) Prospects
b) Hindrances
• • January-June 2012Volume 3 • No. 1

agree 42%, strongly agree 38%
5. Low levels of IT Literacy
Strongly disagree 16%, Neutral 16%, agree 38%, and
strongly agree 30%
Responses given by the beneficiaries on the same set of
questions are:
1. Disagree 14.7%, Neutral 51.3% and agree 34%
2. Disagree 8.7%, Neutral 39.3%, agree 36.7%, and
strongly agree 15.3%
3. Strongly disagree 9.3, disagree 16.7%, Neutral 30%,
agree 32.7%, strongly agree 11.3%
4. Strong disagree 5.3%, disagree 15.3%, Neutral 24%,
agree 34.7%, strongly agree 20.7%
5. Strongly disagree 4.7%, Disagree 18.7%, Neutral
22.7%, agree 29.3%, and strongly agree 24.7%
Respondents were asked to indicate the extent
to which they agree or disagree on the prospects in
utilisation of e-governance in a 5-point Likert Scale.
Analysis on Variance (ANOVA) has been done to assess
the degree of variance in significance. Education has
been considered as a factor in doing the analysis. The
results are presented in Table 5.
The 'F' and Significance values for both between and
within the groups have been presented in Table 5. The
significance i.e. 'P' value in all the variables are 0.327,
0.099, 0.300, 0.238 and 0.323 which is > than 0.05. 'P'
value is insignificant.
Cross-tabulation was done to find out
whether education has a co-relation to the extent which
the officials agree or disagree on prospects in utilization
of e-governance. The 5-point Likert scale has been re-
grouped having ranges 5-11, 12-18 and 19-25 with new
values 1, 2 and 3. The responses have been redefined as
Low, Moderate and High having values of 1, 2 and 3
respectively.
It has been observed that the extent to which the officials
agree or disagree on statements relating to prospects and
hindrances in utilization of e-governance among the
different educational groups is highest in the High
category having percentages 40%, 70% and 60%.
Analysis on Variance (ANOVA) has been
done to assess the degree of variance in significance on
prospects in utilisation of e-governance. Education has
been considered as a factor in doing the analysis.
The 'F' and Significance values for both between and
within the groups have been presented in Table 7. The
significance i.e. 'P' value in all the variables are 0.027,
0.0, 0.001 and 0.008 which is < than 0.05. Hence, 'P'
value is significant.
Cross-tabulation was done to find out
whether education has a co-relation to the extent which
the officials agree or disagree on prospects in utilization
of e-governance. The 5-point Likert scale has been re-
grouped having ranges 5-11, 12-18 and 19-25 with new
values 1, 2 and 3. The responses have been redefined as
Low, Moderate and High having values of 1, 2 and 3
respectively and a cross-tabulation of the different
variables have been calculated which is presented in
Table 8.
It has been observed that the extent to which the officials
agree or disagree on statements relating to prospects and
hindrances in utilization of e-governance among the
different educational groups is highest in the Moderate
category having percentages 93.5%, 93.5% and 42.9%
respectively.
Both categories of respondents i.e. the
officials and beneficiaries were asked to indicate the
extent to which they agree or disagree on hindrances in
utilisation of e-governance on a 5-point Likert Scale.
Analysis on Variance (ANOVA) has been done to assess
the degree of variance in significance. Education has
been considered as a factor in doing the analysis. The
results are presented in Table 9.
The 'F' and Significance values for both between and
within the groups have been presented in Table 9. The
significance i.e. 'P' value in all the variables are 0.437,
0.326, 0.579, 0.068 and 0.066 are > than 0.05. The 'P'
value is insignificant.
It was done to find out whether
education has a co-relation to the extent which the
officials agree or disagree on hindrances in utilization of
e-governance. The 5-point Likert scale has been re-
grouped having ranges 5-11, 12-18 and 19-25 with new
values 1, 2 and 3. The responses have been redefined as
Low, Moderate and High having values of 1, 2 and 3
respectively and a cross-tabulation of the different
variables have been calculated which is presented in
Table 10.
ANOVA:
Co-relation Test:
Beneficiaries
a) Prospects:
Co-relation Test:
b) Hindrance:
Co-relation Test:
75 • • January-June 2012Volume 3 • No. 1

It has been observed that the extent to which the officials
agree or disagree on statements relating to prospects and
hindrances in utilization of e-governance among the
different educational groups is highest in the High
category having percentages 40%, 90% and 55%.
Analysis on Variance (ANOVA) has
been done to assess the degree of variance in significance
in the different variables of this section on hindrances in
utilisation of e-governance. Education has been
considered as a factor in doing the analysis. The result is
shown in Table 11.
The 'F' and Significance values for both between and
within the groups have been presented in Table 11. The
significance i.e. 'P' value in all the variables are 0.002,
0.0, 0.075, 0.124, 0.006 of which 0.002, 0.0, and 0.006
are < than 0.05. Hence, 'P' value of these variables could
be considered significant.
It was done to find out whether
education has a co-relation to the extent which the
officials agree or disagree on hindrances in utilization of
e-governance. The 5-point Likert scale has been re-
grouped having ranges 5-11, 12-18 and 19-25 with new
values 1, 2 and 3. The responses have been redefined as
Low, Moderate and High having values of 1, 2 and 3
respectively and a cross-tabulation of the different
variables have been calculated which is presented in
Table 12.
It has been observed that the extent to which the officials
agree or disagree on statements relating to prospects and
hindrances in utilization of e-governance among the
different educational groups is highest in the Moderate
category having percentages 76.1%, 50% and 52%
respectively.
On the nature and scope of e-governance respondents
were asked to indicate the extent to which they agree or
disagree to certain statements. They were asked if e-
governance provides faster delivery of service than the
earlier mode and responses are agree 52% and disagree
8%. On being asked if delivery outlets are hasslesome
14% disagree and 38% agrees. Regarding if e-
governance facilitates two-way communication process
between govt. to citizen and
disagree 4% and agree 44%. 50% agree and 6% disagree
that e-governance provides prompt and timely services.
28% agree and 8% disagree that circle offices are
adequately equipped in terms of personnel and skills
required in electronic delivery of services.
On the same set of question responses of the
beneficiaries' reveals that 18.7% strongly disagree and
7.3% agree that e-governance provides faster delivery of
service than the earlier mode. While 34.7% agree and
19.3% disagree that delivery outlets are hasslesome.
36.7% agree and 20.7% disagree that e-governance
facilitates two-way communication process between
govt. to citizen and 25.3% agree and 22.7%
disagree that e-governance provides prompt and timely
services. While 11.3 % agree and 59.3% disagree that e-
governance facilitates two-way communication process
between govt. to citizen and
the 'F' and Significance values for
both between and within the groups have been presented
in Table 1. The significance i.e. 'P' value in all the
variables varies from 0.946 to 0.882 which is > than 0.05.
Hence, the 'P' value could be considered insignificant.
shows the extent to which the officials
agree or disagree on statements relating to nature and
scope of e-governance among the different educational
groups is High having percentages 60%, 65.5% and 70 %
(Table 2).
the 'F' and Significance
values for both between and within the groups have been
presented in Table 3. The significance i.e. 'P' value in all
the variables varies from 0.0 to 0.011 which is < than
0.05. Hence, 'P' value could be considered significant.
the extent to which the officials
agree or disagree on statements relating to nature and
scope of e-governance among the different educational
groups is highest in the Moderate category having
percentages 84.4%, 72.6% and 69% (Table 4).
Prospects in utilization of e-governance were asked to
the officials for which the respondents were asked to
indicate the extent to which they agree or disagree to
certain statements. 46% agree that e-governance
provides accountability in administration while 12%
disagrees to this. 40% opines that e-gov ensures greater
transparency through web- enabled database and 6% do
Beneficiaries
b) Hindrances:
Co-relation Test:
Summary of Findings
A. Nature and Scope of e-governance
For officialsANOVA,
Co-relation Test
For beneficiaries ANOVA,
Co-relation Test reveals
B. Prospects and Hindrances in Utilization of e-
Governance
vice versa it was found that
vice versa.
vice versa.
76• • January-June 2012Volume 3 • No. 1
not agree to this. 36% agree that it ensures improvement
in speed and quality of services to citizens while 12% do
not agree. 28% feels that it reduces manual work by
replacing the old manual records with a computerized
database while 10% disagrees to this. While 36% opine
that e-gov provides effective decentralization in decision
making while 4% disagrees.
Responses given by the beneficiaries on the same set of
question vary from 9.3% agreeing that e-governance
provides accountability in administration while 34%
disagrees to this. 28.7% agree that e-gov ensures greater
transparency through web- enabled database while 14%
disagrees. 34% opines that it ensures improvement in
speed and quality of services to citizens while 25.3 % do
not agree. 29.3% feels that it reduces manual work by
replacing the old manual records with a computerized
database while 28.7% disagrees to this. While 13.3%
opines that e-gov provides effective decentralization in
decision making while 22% disagrees.
Questions pertaining to hindrance in utilization of e-
governance were asked to the officials and beneficiaries
for whom the respondents were asked to indicate the
extent to which they agree or disagree to certain
statements. It was found that for lack of digitized govt.
information on related matters the response varies from
disagree 12% to agree 56%. 48% of the respondents feel
that there in insufficient operating knowledge among
employees while 6% disagrees to this. 28% agrees that
there is lack of proper infrastructure while 4% do not
agree to this. That there is lack of proper understanding
on e-governance it could be seen in their response where
42% agree and 4% disagree. 30% of the respondents
strongly agree that there is a low level of IT literacy while
16% strongly disagree to this.
Among the beneficiaries 34 % agrees that there is lack of
digitized govt. information on related matters while
14.7% do not agree to this. 36.7% of the respondents feel
that there in insufficient operating knowledge among
employees while 8.7% disagrees to this. 32.7% agrees
that there is lack of proper infrastructure while 16.7% do
not agree to this. That there is lack of proper
understanding on e-governance it could be seen in their
response where 34.7% agree and15.3% disagree. 29.3%
of the respondents agree that there is a low level of IT
literacy while 18.7% disagree to this.
he 'F' and Significance values for
both between and within the groups have been presented
in Table 5. The significance i.e. 'P' value in all the
variables are 0.327, 0.099, 0.300, 0.238 and 0.323 which
is > than 0.05. Hence, the 'P' value could be considered
insignificant. the extent to
which the officials agree or disagree on statements
relating to prospects and hindrances in utilization of e-
governance among the different educational groups is
highest in the High category having percentages 40%,
70% and 60% (Table 6).
For beneficiaries ANOVA, the 'F' and Significance
values for both between and within the groups have been
presented in Table 7. The significance i.e. 'P' value in all
the variables are 0.027, 0.0, 0.001 and 0 .008 which is <
than 0.05. Hence, 'P' value could be considered
significant. Co-relation test shows that the extent to
which the officials agree or disagree on statements
relating to prospects and hindrances in utilization of e-
governance among the different educational groups is
highest in the Moderate category having percentages
93.5%, 93.5% and 42.9% respectively (Table 8).
the 'F' and Significance values for
both between and within the groups have been presented
in Table 9. The significance i.e. 'P' values in all the
variables are 0.437, 0.326, 0.579, 0.068 and 0.066 is >
than 0.05. Hence, 'P' value could be considered
insignificant. extent to
which the officials agree or disagree on statements
relating to prospects and hindrances in utilization of e-
governance among the different educational groups is
highest in the High category having percentages 40%,
90% and 55% (Table 10)
For beneficiaries ANOVA the 'F' and Significance values
for both between and within the groups have been
presented in Table 10. The significance i.e. 'P' value in all
the variables are 0.002, 0.0, 0.075, 0.124, 0.006 of which
0.002, 0.0, 0.006 are < than 0.05 (Table 11). Therefore, 'P'
values of these variables are significant.
reveals the extent to which the officials agree or
disagree on statements relating to prospects and
hindrances in utilization of e-governance among the
different educational groups is highest in the Moderate
category having percentages 76.1%, 50% and 52%
respectively (Table 12).Prospects
For officialsANOVA, t
Co-relation Test shows
Hindrance
For officials ANOVA
Co-relation Test reveals the
Co-relation
Test
77 • • January-June 2012Volume 3 • No. 1

Dharitree project is aimed at bringing governance and
citizen centric facilities at the doorstep of the people.
However, there are problems facing the project. Some of
them are errors in documents, repeated visit to circle
offices for collecting or enquiring about services. Apart
from this lack of proper funding, adequate infrastructures
were some other loopholes that needed attention. Lack
of awareness among the people regarding the project is a
major drawback. It has been observed that the new means
have also brought about a change in the power equation.
This has created problems in acceptability of innovation
amongst the officials themselves as is evident from the
survey. In the survey it was also found that many of the
people agree that e-governance has changed the
administrative machinery. This is because of conversion
of all work into the electronic system.
It was also found during the survey that frequent
technical failures, lack of sufficient bandwidth for data
transfer; difficulties in internet connectivity were some
of the major problems facing the project. From the
official's perspective, it was found that the main
problems for delay in issuance of certificates is because
of technical failures, lack of proper documents and lack
of absence of adequate employees. It was also found that
in most cases circle offices are unable to cater the citizen
services due to poor network connectivity. Again when
speaking about the brighter side of the project, it was
found that the new system facilitates corruption free e-
services. When asked if they had payed any bribe, it was
found that there was no such case of bribery. This shows
the transparency of the service and its accountability.
Information and Communication Technology has no
doubt unleashed a new system of governance, but we are
yet to achieve the desired level of IT adoption in most
parts of the country. Given the fact that accessibility and
affordability affect the deployment of technology it is felt
that utmost importance should be given to the socially
and economically backward communities. The service
delivery mechanisms should be located in the areas
convenient to them. It is also necessary that government
functionaries should be trained on the changed e-
governance environment. Functionaries attempting to
design e-governance applications must have adequate
experience to design, implement and manage ICT
applications. Therefore, it is desirable that special
training programmes are organized which could provide
greater understanding on the planning and
implementation of ICT applications. Government should
re-engineer the existing processes to improvise the
delivery of services by emulating some of the successful
e-governance projects. Needless to reiterate that ICT
adoption has not reached its zenith of success owing
largely to unresolved issues surrounding its applicability.
Nevertheless, ICT has tremendous potential to facilitate
in administration as it can deliver timely and accessible
services in a more effective manner.
Conclusion
78• • January-June 2012Volume 3 • No. 1
Table 1
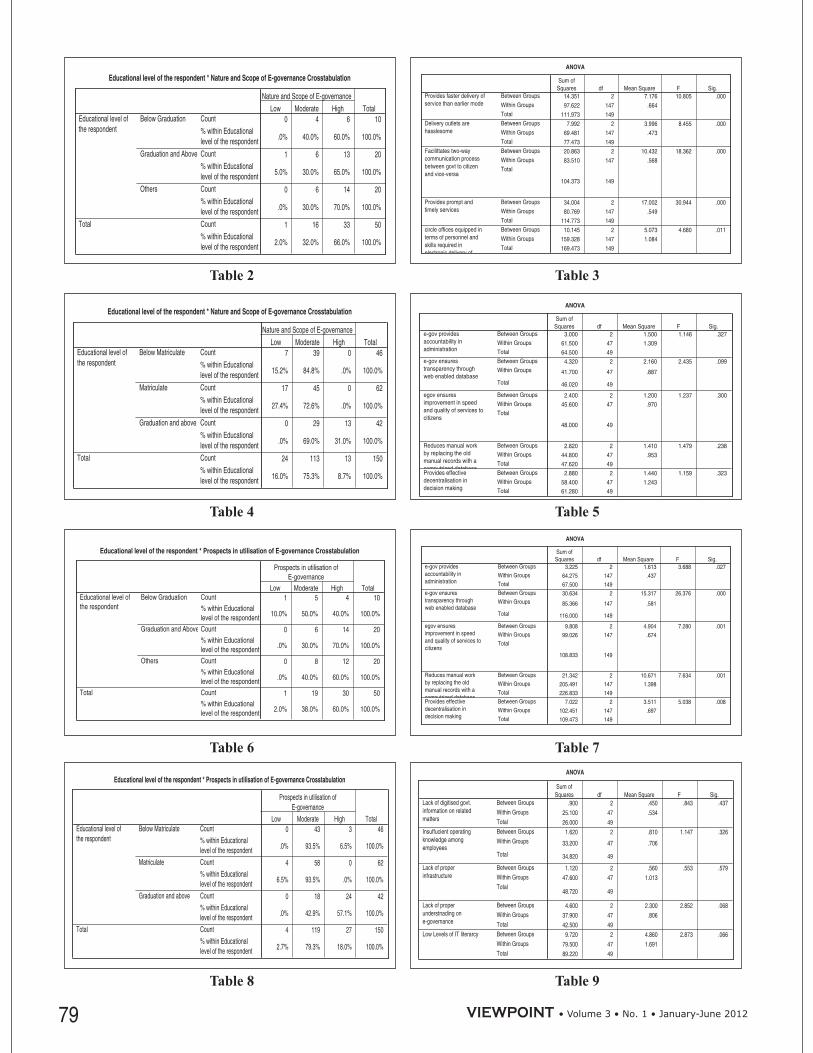
Table 9Table 8
Table 7Table 6
Table 5Table 4
Table 3Table 2
79 • • January-June 2012Volume 3 • No. 1

Table 12
Table 11
Table 10
80• • January-June 2012Volume 3 • No. 1

Uttam Kr. Pegu is an Assistant Professor in the Department of Mass Communication and Journalism, Tezpur
University, Assam. He has submitted his doctoral thesis on 'Information and Communication Technology
Implications' atAJK, Mass Communication Research Center, Jamia Millia Islamia, New Delhi. His research interests
include ICT implications, Film Studies, Science Communication and Media Analysis etc. The author can be reached
References
1. Calder, A. and Watkins, S., (2006), “IT Governance:
AManager's Guide,” Kogan Page, 3rd edition.
2. Agarwal, A., (2007), “Governance: Case Studies,”
Computer Society of India and University Press.
3. Babbie, E., 7th ed.,
Wadsworth Publishing Company, ITP-An
International Thompson Publishing Company.
4. Bhatnagar, S., (2004),
, New Delhi, Sage Publications.
5. Baddeley, S., (1997),
, NewYork and
London: Routledge.
6. Chaturvedi, T. N, , Edited
Volume, Indian Institute of Public Administration,
New Delhi, 1999.
7. Chowdary, T. H., (1998), “Information Technology
and Village Development,”
, 7.9, pp 19-24.
8. Dossani, R., & Misra, D. C., (2005),
Published by
Shorenstein,APARC/National Informatics Centre.
9. The Economist, (2002),
, Profile
Books Ltd, London.
10. Kenniston, K. and Kumar, D., (2004),
, New Delhi,
Sage Publications.
11. Khosla, A. and Rana, S., (2000), “TARAhaat has
Arrived: Connecting Rural India to the Global
Village,” Development Alternatives, 10.12 ,
December, pp 1-4.
12. Mathur, R. R., Baggapa, R. K. and Keniston, K.,
(2005), , Sage
Publication.
13. Nicole, C., .
Published by Association for Progressive
Communications.
14. Norris, P., (2001),
,
Cambridge University Press.
15. Prabhu, C. S. R., (2009),
, Vikas Publication House Pvt Ltd
16. Panneervel, P., (2005),
, Jaipur, Prem Rawat Publications.
17. Preston, P., Reshaping Communications Technology,
Information and Social Change. New Delhi, SAGE
Publications London, Thousand Oaks.
18. Pegu, U, (2012), “Information and Communication
Technology Implications: An Analysis of the Impact
and Adoption of E-Governance in India,” in the
1.4, ISSN 2231-3303
19. McKenzie, B, R., (2003),
, Praeger Publishers, London
20. Sinha, R. P., (2006),
, in Collaboration With Center
for Public Policy and Governance, Institute of
Applied Manpower Research, New Delhi, Concept
Publishing House.
21. Sahay, S., (1997), “Implementation of Information
Technology: A Time-Space Perspective,”
Organization Studies, 18.2, pp. 229-260.
22. Srivastava, A., (2002), “ICT-Human Development
Interface: Charting the Growth Path in Madhya
Pradesh,” 31.1 and
31.2, pp. 135-40.
The Practice of Social Research,
E-Government: From Vision
to Implementation: A Practical Guide with Case
Studies
Governmentality - In Loader, B.
Ed. The Governance of Cyber Space: Politics,
Technology and Global Restructuring
Towards Good Governance
Journal of the Centre for
Telecom Management and Studies
Enabling ICT
for Rural Indi-Evidence Report
E-Trends Making Sense of
the Electronic Communications Revolution
IT Experience
in India: Bridging the Digital Divide
The State, IT and Development
ICT Policy-A beginners Handbook
Digital Divide: Civic Engagement,
Information Poverty and the Internet Worldwide
E-governance: Concepts
and Case Studies
E-Governance: A Change
Management Tool
International Journal of Management & Computing
Sciences (IJMCS),
Digital Economics: How
Information Technology has Transformed Business
Thinking
E-Governance in India:
Initiatives and Issues
ASCI Journal of Management,
81 • • January-June 2012Volume 3 • No. 1

82• • January-June 2012Volume 3 • No. 1
Book ReviewsDonald H. Sheldon
J. Ross Publishing, APICS (The
Educational Society for Resource Management),
Price: $54.95, 293 pp.
ISBN-10: 1932159347, ISBN-13: 978-1932159349
Rashmi Jha, Visiting Assistant Professor, Delhi
University, New Delhi
Prof. Anil K. Saini, Professor, USMS, GGS
Indraprastha University, New Delhi
Class A ERP Implementation: Integrating Lean and
Six Sigma,
Today every organization strives to optimize its
operations, further based on the type of problems,
combining Lean and/or Six Sigma tools with traditional
project management techniques for ERP Implementation
can be a powerful combination for ERPSustainability for
all types of Enterprises. With the increasing demand for
process integration, both within and across
organizational and industry boundaries, this quest has
gained further momentum with the concept of Class A
ERP Implementation. “Class A ERP
Implementation: Integrating Lean and Six Sigma”
facilitates detailed understanding of Class A ERP in a
"how to" approachable format which describes how ERP,
Lean and Six Sigma can be combined to create the perfect
environment for continuous improvement. It presents
comprehensive coverage on all aspects of ERP including
top management planning, cost planning, Sales and
Operations Planning (S&OP), master scheduling,
execution planning, procurement process planning,
supply chain management, shop floor control and
customer service. It exemplifies audit criteria for
confirmation of Class A performance and offers valued
insights into management systems and accountability
infrastructures allowing more employee involvement
and successful sharing of business goals through the use
of ERPdisciplines.
I chapter lays the ground work to provide a common
understanding of ERP: what it is and why organizations
would want to do it. ERPis the spinal cord but without the
skillful and disciplined execution, the tools alone would
not get the job done to a high-performance standard.
II chapter clarifies the focus areas of Class A ERP
standard defined by metric definition and performance
levels within those measures, roles of process owners,
project management, accountability infrastructure and
customer service levels. ClassACertification requires to
show sustainability. While Class A ERP may not be the
definition of world class performance, it is impossible for
any organization to achieve Class A ERP performance
without being a high performance company.
The III Chapter is on Business planning. The business
planning process sets the business up properly. Once
management has established the vision, objectives met
and financial results happen through management and
metric system.
Chapter 4 continues to give the reader glimpses of solid
handshake between the demand process and the
operation side of the business. Demand Planning is a
monthly metric. This plan of record renewed each month.
This forecast is locked at the S&OP (Sales & Operation
Planning) each month and is measured for monthly
accuracy.
Chapter 7 is based on Master Scheduling, Chapter 8, 9
and 10 are on ERP. Here the focus shifts to the inputs of
the material planning process. When MRP and lean are
integrated, the possibilities of powerful supply chain
management and lean efficient customer draw on
inventory and process support Class A ERP and the
resulting high performance.
Chapter 14 covers issues around management systems
for high performance business through better project
management. In most business, the root causes today are
the same ones that existed two weeks ago and are the
same ones that existed two years ago. Hence it uses the
tools of monthly and weekly performance review for
setting effective policies and making decisions about the
direction and tactics for all management levels of
organizations.
The book
Donald H. Sheldon has divided this book into 20
Chapters with two Appendixes A and B that make up the
ERP Business Model. Each chapter deals with the
objectives, implementation, required actions, metrics for
performance and management system elements for each
of these elements. Class A ERP is often misunderstood
and confused with software tools and implementations
but is actually a management system for continuous
improvement. It just ensures that whatever you want to
do, it gets done – accurately and on time. A valuable
basic trait for any business!

83 • • January-June 2012Volume 3 • No. 1
In Chapter 19, the author presents valuable insights how
ERP, Lean and Six Sigma can be combined to create the
perfect environment for continuous improvement and
why ERP disciplines are the prerequisite to achieving
maximum results.
The last chapter provides glimpses of the World Class
ERP Consulting, that is, of course pricey. Using experts
simply helps the process faster. Areas of payback
expected from a Class A ERP implementation include
improvements in schedule stability leading to less
expediting support required, less priority freight, fewer
missed shipments to customer and less inventory
required as plans become more robust. It is not unusual
to see returns of 200-300 percent in the first year, making
the process easily self-funding.
Overall this is an excellent guidebook for any
organization looking to implement an ERP system. It
provides valuable, tried and true methods of keeping the
project under or within budget. I believe that students,
academicians and professional will welcome this book as
a comprehensive text on achieving Class A performance
in a reasonable timeframe.
To face the challenges of globalization consisting of
competition, human resource development (HRD) is the
need of the day. The transformation of human beings in to
human capital is known as HRD. No country can achieve
sustainable economic development without investment
in human beings. This book provides multi-layered
holistic analysis of HRD and its economics in India. It
deals with all facets of human beings such as education,
health, environment, tourism, urbanization, migration,
housing, food-security and women empowerment. This
book, which is authored by the known scholar and expert
of Economics, Professor M. M. Goel, is an appreciable
attempt made in South Korea where he was First ICCR
Chair Professor of Indian Economy at Hankuk
University of Foreign Studies, Seoul. It consists of 15
chapters that explore systematic and exhaustive
discussion on various aspects which lie in the domain of
HRD and its economics with latest data including Union
Budget 2011-12 and Economic Survey 2010-11.
The first Chapter of the book provides “Introduction”
wherein the author has explained all the activities of
HRD in India.
Chapter 2 presents the various characteristics of Indian
population with its demographic dividend according to
provisional data of latest census 2011. It also discusses
various measures including rhythmic methods to control
population and to achieve quality of life.
Chapter 3 includes the various concepts and their
measures of HRD such as HRM, HDI, GDI, GEM and
PQLI, Which are very necessary to understand all facets
of HRD. In order to achieve high rank in above said
measures India needs to ensure HRD and quality of life to
his citizens.
Chapter 4 looks on the importance of education to
develop human resources in India. It also describes the
various efforts i.e. Sarva Shiksha Abhiyan (SSA), Mid-
day Meal etc. made by Govt. at all levels of education to
create India as a knowledge economy.
Chapter 5 deals with the health, nutrition, sanitation and
water supply as essential activities of human resource
development in India. Health is a state of complete
physical, mental, spiritual and social well-being and not
merely an absence of disease and infirmity and
availability of health infrastructure is key requirement
for healthy human resources.
Chapter 6 highlights the importance of environment and
climate change in human resource development. To
maintain the nature of Nature and to attain sustainable
development, this chapter emphasizes on the need to
understand the relationship between nature and human
beings in all aspects.
Chapter7 is an attempt to reveal the importance of
tourism as a human resource development activity in
India. The author tries to make a case to increase the
tourism activity in India and to develop the country as a
tourism hub.
Chapter 8 discusses the trends of urbanization as a human
resource development activity in India. The chapter
highlights the problems and Govt. efforts (SJSRY, Social
Protection Programme, JNNURM, AHIP, RAY)
regarding urbanization.
Chapter 9 explores the importance of growing mobility
Dr. M.M. Goel
(Edition: 2011-12), VK Global Publications Pvt. Ltd.
Price : INR 300, 244 pp.,
ISBN No 978-93-5058-014-1
Vaishali Dhingra. Faculty Incharge, CMCA,
Teerthanker Mahaveer University
Economics of Human Resource Development in India
84• • January-June 2012Volume 3 • No. 1
of labour in a global economy, consequent population
and demographic impacts, coupled with enhanced
security concerns. In this chapter, importance of good
migration management policies is also highlighted, to
transform international migration into an efficient,
orderly and humane process.
Chapter 10 makes a case to include social security in the
domain of human resource development in India. The
success of Social Security schemes however requires the
active support and involvement of employees and
employers This chapter seeks to address the problems of
those along with their social security needs and attempts
to design a policy of social security for them
Chapter11 emphasizes on the women empowerment for
human resource development in India. This chapter also
describes the importance of gender budgeting, with its
dual dimension of equity and efficiency, as an effective
instrument to attain the objective of women
empowerment.
Chapter 12 concentrates on the significance of food
security as a component of human resource development.
Eradicating food insecurity and hunger in India is a
necessary and attainable goal. To achieve better position
in Global Hunger Index (GHI) and to attain food self-
sufficiency and food security, various measures are
highlighted in this chapter.
Chapter 13 focuses on housing as a human resource
development activity. Housing fulfills physical as well
psychological needs by providing security and shelter
and providing a sense of personal space and privacy. The
chapter describes initiatives i.e. AHIP and RAY, taken by
the Government to provide adequate housing and also
highlights the dimensions of the Indian housing problem.
Chapter 14 throws light on the role of international
organizations i.e. UNDP, WHO, UNESCO and UNICEF
in human resource development in India. It also describes
the various programmes running by these organizations
in collaboration with Government of India for the
development of human resources.
In chapter 15, an attempt has been made to describe the
rationale & issues of good governance and to develop
essentials for manpower in good governance. Good
governance is the cry of the day. We need good
governance at all levels of operation in the Indian
economy because we have been suffering from poor
governance. Vedic pills and Bhagwad Gita is the panacea
to remove every ill in Indian system of governance. The
author is right in observing that the flow of the Sarasvati
river knowledge require understanding and analysis of
HRD which cannot be maintained without political will
and good governance which means SMART( Simple,
Moral, Action Oriented, Responsive and Transparent)
and SIMPLE( Spirituality, Intuition, Mental
development, Physical development, Love your soul
attitude and above all Emotional Quotient development).
Politicians (both in power and opposition) need to be
faithful to the intentions of the will of the people.
To target happiness in the life of every human being on
the earth, we need to ensure peace which cannot be
purchased in the market on any price. To move with
confidence for morality, opulence, victory and
empowerment (MOVE), we need to understand
spirituality as spirit to know actuality of the science of
soul which the author promotes forcefully in the book.
The book ends with a cover note containing contributions
of Professor M.M. Goel in the field of Economics. Since
the book deals with all the aspects of HRD in holistic
sense, it is an immensely useful for researchers,
economists, policy makers as well as students. It
deserves to be on the bookshelf of institutional libraries
within and outside India. Finally, the author deserves a
word of appreciation with credit of bringing out a quality
of work on the holistic concept of HRD which is in the
concurrent list of the Government of India. But, sadly no
State Government out of 28 has a ministry of HRD. Let
the author keep his promise by updating it every year
with latest data.
Let us change our looks, actions and words (LAW) for
making it the law for HRD in India.
Mathematics by Dr. Rajiv Verma, Reader, CMCA,
Teerthanker Mahaveer University, Moradabad
published by Kedar Nath Ram Nath Publication, Meerut,
is unique in itself. It puts forth 24 chapters for the students
of BCA Semester-1 of MJPR University, Bareilly. The
book is rich in many aspects. The book has solved
numerical problems asked in the last year papers. Solved
examples covering problems from all chapters add
Dr. Rajiv Verma
Mathematics, Kedar Nath Ram Nath Publication,
Meerut
Dr. Mosam Sinha, CMCA, Teerthanker Mahaveer
University, Moradabad

85 • • January-June 2012Volume 3 • No. 1
beauty to the book. It makes a comprehensive description
of all problems. The last few pages of the book have a
model paper with solutions. Diagrams, Pictures, Graphs
are added whenever needed. Explanation of the
equations is in simple language. The cover page of the
book is attractive. A set of exercises is given at the end of
each chapter so that the students may have enough
practice in the subject. To distinguish the topics, the
author has used capital letter for the main headings with
large fonts. In short it can be said that the book is quite
useful for the students. Noteworthy element of the book
is that this book is even useful for teachers teaching the
subject.
Quality that too 'World-class' is must to satisfy the needs
of consumer in today's global economy and diverse
global markets. The quality in an objective manner plays
a key role in any manufacturing business that too when
the products are of art, style, gift and fashion ware. The
world-wide business schools have also accepted the
importance of the objective and applied concepts of
'Quality' in their curricula at post-graduate or
undergraduate level, so introduced the courses like
'Quality Management' and 'Total Quality Management'.
Similarly industry has also realized the importance of
quality to survive and prosper in its business. The quality
in products and services, thinking, decision making and
strategic planning has provided a competitive edge to
Handicraft Sector.
The book 'Managing Quality in Handicraft Sector' is the
result of amalgamation of vast industrial, research and
academic experience of the author in this field.
The author, Prof Ajay K. Garg, Ph. D. (Quality and
Operations Management and International Business),
MBA(Operations Management), and B. Sc. (Mechanical
Engineering, Hons.), is a Professor- Operations and
Quality Management in Fairleigh Dickinson University-
Vancouver (the US varsity) and University Canada West,
Vancouver, Canada. He has about 14 years of industry
experience in the area of operations and international
business. He has completed various academic and
industrial assignments in more than 22 countries. He has
to his credit one more text book on 'Production and
Operations Management' published by McGraw Hill
Publishers and several research papers in the cross
functional areas of quality, operations and finance
published in various international journals of repute. . He
has been a member of the advisory committee on
'Assessment of Waste and Pattern of Occupational
Hazards in Plastic Industry' set up by the Ministry of
Science and Technology, Government of India. He has
been an independent member in theAdvisory Committee
of SWISO, an ISO certifying company for auditing their
system of granting ISO certification.
This book is an attempt of bridging the gap between
theory and practice. It is an outcome of innovative ideas
emerged out of theoretical studies; real research on the
handicraft firms and practical industrial exposure, which
further resulted into latest quality model to boost the
growth and reach to the pinnacle on the performance
parameter. The results pointed out in this book have
already been appreciated by international researchers
and experts. The organization of the book itself has been
made in unique style. The whole book has been spread
into five chapters and organized in a flow with a rhythm
and continuity. The most updated material related to
quality has been added to keep abreast in the global
scenario.
The book focuses on the quality aspects in the
organization and management decision-making in the
cottage and small-scale units of handcrafted artware and
giftware industry in India. It has attempted to build a
viable model of quality-oriented management for
handicraft industry based on a comprehensive analysis of
primary data collected on dominant variables from 106
handicraft cottage and small scale units in selected
pockets in northern India. The quality parameters
identified in this model are those which have been found
to be crucial for bridging the gap between the current
performance levels and the projected potential of Indian
handicrafts industry in the international markets. This is
corroborated by the empirical data compared across three
different handicraft manufacturing pockets included in
the study.'
'Managing Quality in Handicraft Sector' has been
authored to meet the increasing requirements of
Ajay K. Garg
Readworthy Publications,
ISBN 13: 978-93-50181-65-2
Manish Dhingra, Head of the Department,
Mechanical Engineering, College of Engineering,
Teerthanker Mahaveer University, Moradabad,
India.
Managing Quality in Indian Handicraft Industry
Price : 695 INR, (HBD); $34.99, xvii+166 pp.,
86• • January-June 2012Volume 3 • No. 1
handicraft industry, professionals, researchers, planners
and students involved in this sector to fill the gap between
the potential and actual performance in international
business. The present book is an attempt to provide
insights related to quality in handicraft industry. The
impact of implementation of quality dimensions in the
routine working of an enterprise has also been analyzed.
The main objective of the book to provide the
understanding of quality concepts, which matter to the
actual performance of this sector, has been very well
achieved. This book can prove to be of great help and can
serve the purpose of reference book to Export Promotion
for Handicrafts, World Trade and directly to the firms'
management professionals, researchers and planners for
an enhanced performance in global business, if followed
in its true spirit.

CALL FOR PAPERS
Viewpoint- An International Journal of Management and Technology
VIEWPOINT- An International Journal of Management and Technology
Viewpoint:Research:
ase Study:Book Reviews:
solicits contributions from academicians, researchscholars, industrialists and corporate executives on all aspects of management thought, research and practice. The journalwelcomes innovative and preferably research-based articles in any functional area of management. We also look forward topractical case studies from the practicing corporate executives and managers.
Articles contributed must be relevant to management theory as well as practice. Submissions should indicate an understanding ofthe relevant literature and the contribution of the submissions to the body of research. Empirical articles should have anappropriate methodology and be able to relate their findings to the existing literature in the area.
Each paper at Viewpoint is refereed and the process of review is thorough.Articles sent to us will be initially screened by the editorfor relevance and overall quality and thereafter will be sent for formal review. Inappropriate or imitated submissions will not beforwarded for a formal review. Those considered appropriate will be subject to a blind review process that may take 1-2 months.Authors may be asked to revise and resubmit a manuscript based on the referees' comments.
View Point comprises of the following sections:
Perspective on emerging issues that call for immediate attention of the corporate sector or government.research articles
C based on practical real life situations in the industries.book reviews are welcome on the latest publications in the area of management and IT.
The following details of style and other requirements for submission to View Point must be strictly adhered to by the contributors:of the paper for consideration for publication should be e-mailed to
One hard copy of the contribution along with a declaration assuming the responsibility of authenticity and that the paper/ articlehave not been published anywhere else should be sent onA4 size paper addressed to:
1 Manuscript should be a word file with 1.5 line spacing with 1 and 1/2" wide margin on the left and 1/2" on the right.
Font size for headings should be 14, for sub- headings and text should be 12. Times New Roman font should be
preferred.
2. Manuscripts should not exceed 5,000 words (about 18 to 20 A-4 size pages. The cover page of the manuscript must containthe title of the paper, author's name, mailing address, email address, professional affiliation, and acknowledgments, if any.The first page of the paper must also provide the title of the paper.
3. Every manuscript must include a 100-150 words abstract and 4-6 key words.
4. All notes must be serially numbered. These should be given at the bottom of the page as footnotes.
5. Professionally drawn graphs and diagrams must be provided wherever necessary along with the manuscript. Tables andfigures should be numbered as Table 1, Table 2, etc and should be given on a separate page at the end of the paper.
References should be given separately at the end of the paper and arranged alphabetically. The list should include only work
that the author/s has cited.
Joiner, T. E. and Schmidt, N. B., (1995). “Dimensions of Perfectionism, Life Stress and Depressed and Anxious
Symptoms,” , Vol: 22, pp. 195 – 200.
Randy L. Haupt, and Sue Ellen Haupt, (2004), , John-Wiley & Sons, pp. 22.
7. Along with the manuscript, the author is requested to submit his/her brief biographical sketch.
Guidelines forAuthors
Asoft copy
The Editor,
College of Management and Computer ApplicationsTeerthanker Mahaveer UniversityDelhi Road, Moradabad- 244001
: 0591-2487111, 222, 333 Fax: 2484244
E-mail:
View Point-An International Journal of Management and Technology
Contact
.
6.
?
?
Journal of Social and Clinical Psychology
Practical Genetic Algorithms
Inviting articles for the next issue of Viewpoint scheduled to be published in the month of December 2012. The
contribution may be sent latest by 30 October, 2012 on the given email ID [email protected]
89

STATEMENT OF OWNERSHIP
FORM IV (Rule 8)
VIEWPOINTAn International Journal of Management and Technology
1. Place of Publication Moradabad
2. Periodicity of its Publication Bi-annual
3. Printer's Name & Address Mr. Amit Jain, Arihant Graphics,
X/2376, Lane 6A, 2 Raghubar Pura No. 2
Gandhi Nagar, Delhi-110031
Nationality Indian
4. Publisher's Name & Address Dr. R. K. Mudgal, Registrar
Teerthanker Mahaveer University
Moradabad- 244001
Nationality Indian
5. Editor's name & Address Ms. Vaishali Dhingra, CMCA
Teerthanker Mahaveer University
Moradabad- 244001
Nationality Indian
Registrar,
I, Dr. R. K. Mudgal hereby declare that the particulars given are true to the best of my
knowledge and belief.
Sd/-
Dr. R. K. Mudgal
Teerthanker Mahaveer University
87
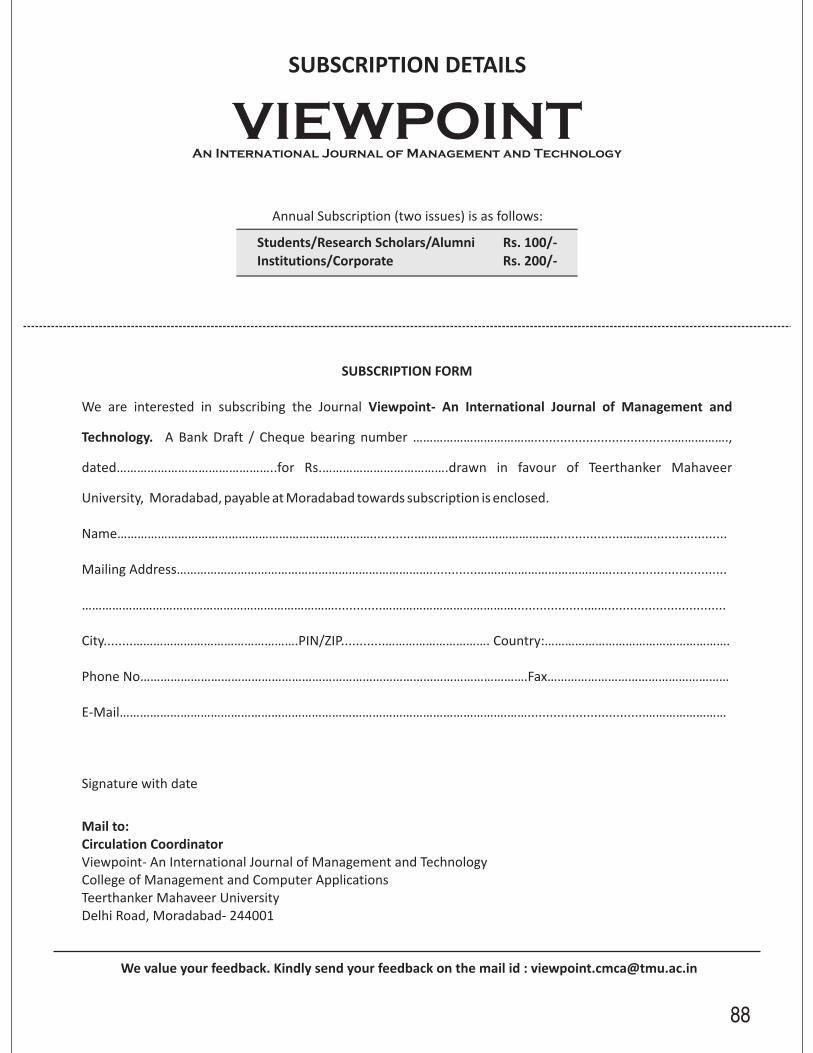
An International Journal of Management and Technology
SUBSCRIPTION DETAILS
Annual Subscription (two issues) is as follows:
Students/Research Scholars/Alumni
Institutions/Corporate
Rs. 100/-
Rs. 200/-
SUBSCRIPTION FORM
Viewpoint- An International Journal of Management and
Technology.
We are interested in subscribing the Journal
A Bank Draft / Cheque bearing number ………………………………......................................…………….,
dated………………………………………..for Rs.……………………………….drawn in favour of Teerthanker Mahaveer
University, Moradabad, payable at Moradabad towards subscription is enclosed.
Name………………………………………………………………….............…………………………………....................………....................
Mailing Address………………………………………………………………….............…………………………………................................
………………………………………………………………….............…………………………………....................……................................
City........………………………………………….PIN/ZIP............…………………………. Country:……………………………………………….
Phone No…………………………………………………………………………………………………….Fax………………………………………………
E-Mail…………………………………………………………………………………………………….……................................……………………
Signature with date
Mail to:
Circulation Coordinator
Viewpoint- An International Journal of Management and Technology
College of Management and Computer Applications
Teerthanker Mahaveer University
Delhi Road, Moradabad- 244001
88
We value your feedback. Kindly send your feedback on the mail id : [email protected]


![2,4,6,8-tetrakis(4-flurophenyl)-3,7-diazabicyclo[3.3.1]nonan-9-one S. Natarajan, V. Sudhapriya, V. Vijayakumar, N. Shoba, J. Suresh and P.L. Nilantha Laksman, Acta Cryst., 2008, E64,](https://static.fdokumen.com/doc/165x107/631b1b9380cc3e944005acdd/2468-tetrakis4-flurophenyl-37-diazabicyclo331nonan-9-one-s-natarajan.jpg)