Wireline Bulletin July 2015
17
1 W W A A 1 Bo ve un re de va do Th an m co so im m ac Th du ch ge in Ve dr op W W I I R R E E BIMONTH ND MINER Borehol The forg . Overvie oreholes dev ertically but nimportant, equired. Man escribe rock alue is some oes not know he deviation nd normally easurement omplex. Cost ome degree. mproved dra easurement cceptable tol he other goo uplication of heck...the d enerated by stance. ery often, t riller's multi ptions? He m E E L L I I N N HLY BULLET RAL EXPLO le navigat gotten son e ew ‐ bo r r viate. Whate many are particularly ny of the log formations ewhat comp w where thes of a boreh y is, but options, ts vary a lot The good ne amatically ov s are usu erance, if ca od news is f measurem driller's nav y an acoust the geologis ‐shot meas might ask his N N E E W W TIN FOR W RATION tion techn nde (form r rehole n a a ever the pr not) its ac in very shal s discussed in great de promised if se rocks are. hole should there are some sim and all are ews is that t ver the rec ally reliable alibrated and that there ent that all igation log tic televiewe st relies en urements. W s logging con W W O O R R WIRELINE L niques mation dip a avigatio n n escribed pat tual directio llow holes, o in this bullet etail but the the geolog be measure a range mple, othe inaccurate echnology h cent past an e, within a d run correct is often som ows a quali versus on er sonde, f ntirely on th What are h ntractor to ru R R K K S S H H OGGERS A meter) n n th and end on will dev or it might b tin eir ist ed, of ers to as nd an ly. me ity ne for he his un H H O O P P AND GEOSC point of a b iate from t be critical, w CIENTISTS borehole (m hat target. where definit Issue 12 – ENGAGED most are dril This deviat tion of a de – July 2015 D IN MININ lled nomina tion might eep orebody NG lly be is
-
Upload
independent -
Category
Documents
-
view
2 -
download
0
Transcript of Wireline Bulletin July 2015

1
WWA A
11
Boveunredevado
ThanmcosoimmacThduchgein
Vedrop
WWIIRREEBIMONTHND MINER
Borehol
The forg
.. OOvveerrvviieoreholes devertically but nimportant, equired. Manescribe rock alue is someoes not know
he deviationnd normallyeasurementomplex. Costome degree. mproved draeasurementcceptable tolhe other goouplication ofheck...the denerated bystance.
ery often, triller's multiptions? He m
EELLIINNHLY BULLETRAL EXPLO
le navigat
gotten son
eeww ‐‐ bboorr
viate. Whatemany are particularly ny of the logformations
ewhat compw where thes
of a borehy is, but options, ts vary a lotThe good neamatically ovs are usuerance, if caod news is f measuremdriller's navy an acoust
the geologis‐shot meas
might ask his
NNEE WWTIN FOR WRATION
tion techn
nde (form
rreehhoollee nnaa
ever the prnot) its acin very shals discussed in great de
promised if se rocks are.
hole should there are some sim
and all are ews is that tver the recally reliablealibrated andthat there ent that alligation log tic televiewe
st relies enurements. Ws logging con
WWOORRWIRELINE L
niques
mation dip
aavviiggaattiioonn
escribed pattual directiollow holes, oin this bulletetail but thethe geolog
be measurea range
mple, otheinaccurate echnology hcent past ane, within ad run correctis often somows a qualiversus on
er sonde, f
ntirely on thWhat are hntractor to ru
RRKKSSHHOGGERS A
meter)
nn
th and endon will devor it might btin eir ist
ed, of ers to as nd an ly. me ity ne for
he his un
HHOOPP AND GEOSC
point of a biate from tbe critical, w
CIENTISTS
borehole (mhat target. where definit
Issue 12 –
ENGAGED
most are drilThis deviattion of a de
– July 2015
D IN MININ
lled nomination might eep orebody
NG
lly be is

2
a magnetometer‐based verticality sonde over the open‐hole section of a borehole and one of these could be attached to, or part of, an acoustic or optical televiewer that was being run anyway. So, in a sense, it's free of charge. For really accurate surveys, a gyroscope can be logged through the drill string from surface.
There are two important distinctions between driller's surveys and the logger's version. The driller will take several measurements during the drilling process whereas, most often, the logger describes the final borehole path. The driller takes point measurements whose spatial relationship must be estimated by means of a trajectory algorithm, whereas the logger can make a measurement every few millimetres. The gyro is undoubtedly the most accurate option but even that must be run properly.
Boreholes tend to deviate to a path normal to bedding. So strata dipping towards the north will usually cause a borehole to deviate to the south.
Case study ‐ gyro logging
The client intended to develop a vertical shaft through steeply dipping strata in a deep gold mine. A large diameter pilot borehole was being drilled from within a specially developed cubby and its progress monitored by a Humphrey (rotor) gyro sonde, which was run as each 50 metres of depth had been drilled. The sonde was further expected to lock onto the directional drill motor, via a mating sub, and determine its orientation so that corrections to borehole direction could be made. The borehole was required to stay within the projected shaft diameter. If a good connection was achieved with the motor, it would make a mark on a soft lead slug within the sonde's locator assembly. This was called a "tell‐tale" slug. The navigation log was orientated with respect to a surveyed mark on the wall of the cubby.
A certain logger managed to fit the gun sight to the sonde head incorrectly...180 degrees out (yes, you're right, that should be impossible, but he managed it). As a result, the driller pointed his drill motor in the wrong direction. The error was noticed during data processing the next day but, by then, the borehole was 20 metres deeper and leaving the shaft. Cap in hand, the logger's boss (the writer of this sorry tale) went to explain all to the client, foolishly offering to go down the mine himself to relog the borehole.
A logger underground with 'modular' equipment
The borehole collar was at 3600 metres below ground, reached via main and sub‐vertical shafts and a walk of about half a mile (it's best not to think too much about where you are when you are down there). On arrival at the very warm site, the logger and his helper were told that the overhead gearbox on the rig was broken, so lots of oil was raining down onto the pair, as they assembled the sonde on a make‐up plate, drenching them both. The gyro log was set up and run down the borehole, with drift checks every 8 minutes. The motor orientation was noted and the sonde returned to surface. Another oil shower, some checks and closure, then the bad news that there was no mark visible on the tell‐tale. The run would have to be repeated. It was two o'clock in the morning, the loggers were tired, it was hot and they were soaked in oil. The work was repeated, successfully this time with the tell tale mark in place (the sonde clattered into the mating sub, risking the gyro mechanism...a rotor gyro is surprisingly robust). The loggers went to wait for the next cage to the surface. Facing icy air‐conditioning from the shaft, in overalls that would not dry out, for two hours, completed the day perfectly. It's sometimes a hard way to make a living!
Drillers use a variety of single or, mostly, multi‐shot devices to determine a borehole's orientation. If the wireline logger is called in to log borehole deviation, his client should consider which system is best suited to the job. Gyroscopes are always applicable but can be expensive and are not offered by all logging contractors. If the formation is not magnetic or is magnetic in only small discrete zones then a magnetometer‐based log should do

3
the job perfectly well. As mentioned earlier, that measurement might anyway be part of another tool run such as acoustic televiewer or dipmeter. Most logging companies offer acoustic televiewer and a simple borehole verticality system based on inclinometers and magnetometers.
Terminology
Borehole tilt The angle, in degrees and tenths of a degree, between vertical (by gravity) and the borehole path or the tangent to a curved path (also called inclination). 0 degrees is vertical. 90 degrees is horizontal.
Borehole azimuth The angle in the horizontal plane, counting clockwise, between north (magnetic or true north) and the borehole path. Usually, logs are captured with respect to magnetic north and converted to true north by addition of a constant (which may be a negative value).
Magnetic north North, as measured by a compass, described by the local magnetic field lines. The direction of these will change slightly over time.
True north The north reference used in map‐making that is the direction of the north pole. Lines of longitude meet at the north and south poles. Final navigation logs are usually plotted wrt true north.
Magnetic declination
The angle between today's measure of magnetic north and true north. This varies over time and its value should be agreed before log processing (various internet sites will provide the magnetic declination of a point on the Earth's surface).
Borehole dip Usually meaning the angle between the horizontal and the path of the borehole. 90 degrees is vertical. Wireline loggers do not normally use this term.
Dipmeter A tool that measures dip and direction of strata ‐ it does not, primarily, measure deviation of a borehole although that is a secondary product of the system.
Borehole verticality sondes
In non‐magnetic, open‐hole environments, the standard wireline verticality sub is an inexpensive and effective tool for measuring borehole deviation.
The tool comprises a triaxial (X, Y and Z) magnetometer monitoring the orientation of an aligned pair of liquid level cells or, more commonly nowadays, a triaxial set of accelerometers.
The traditional gravity level cell version can be thought of as an orientated spirit level. A set of magnetometers orientates a liquid level cell set, which is similar in principle to the spirit level used by a builder. The liquid level cell has an angle (from vertical) limit and is no longer the preferred technology for wireline navigation systems.
The latest accelerometer systems have the advantage of being very compact, solid state, devices (smaller than liquid level cells) and comparatively robust. In triaxial arrangement, they are able to measure any angle, so allow the logging of horizontal boreholes, for instance.
An accelerometer measures small changes in acceleration, therefore movement, after gravitational force has been deducted. Tiny crystals compress as a result of acceleration and generate a voltage, in much the same way as a ceramic transducer in a sonic sonde responds to compression. The measurement is in one direction or, triaxially, in the X, Y or Z planes. It does not respond to rotation, hence the need for the magnetometer set to complete the overall verticality logging device. The two components are aligned.

4
Sensor alignment is important. There was a time when the logger was required to set up his sonde before calibration. He would loosen mounting screws so that level cells could be rotated. One would be required to be at its centre count rate when the other was at its minimum or maximum. Both were aligned with the magnetometer set which was locked to a marker on the sonde body. It was not unusual for misalignment to occur during logging, resulting in, for instance, the logs of tilt and azimuth describing sine waves instead of more believable straight lines. This type of artefact can still be seen in wireline navigation data and, in the case of verticality logs, tool rotation is welcomed because it allows us to check for a straight borehole log regardless of spin.
A verticality set‐up plate
In the log below, the tilt and azimuth curves are plotted at a large depth scale (2000:1) as a quality check. This is good practice, before calculation of borehole coordinates. The tilt and azimuth curves are describing sine waves, either due to poor calibration inputs or misalignment of tool components. There is serious magnetic disturbance as well. The analyst has been forced to manually draw replacement curves through the data. This is not ideal and there will certainly be an error, hopefully small in this case.
Verticality data compromised by magnetic rocks and tool set up errors
Quality assurance is impossible in the example shown but small magnetic anomalies, of just a few metres in thickness, may be drawn out of the data with much more confidence. The sine wave effect becomes problematic where the sonde does not rotate and the log appears to be good because it describes a believable curve. There is some need for an on‐site jig rotation test to check for this type of error.
It's a recurring theme in this bulletin: All measurements, no matter how sophisticated, require quality assurance. Normally, in deeper boreholes at least, there is more than one measurement of borehole verticality. It is important to compare them. Sometimes a log can be completely wrong. It has been known for the pressure housing of an acoustic televiewer sonde to become magnetised due to it being transported next to a magnetic CCL tool (slid in and out of an adjacent tube) for instance. Anything can happen.

5
Final verticality log products include log sections and the plan‐view bull's‐eye plot. The plot below describes the plan view of a typical borehole path, curving in a clockwise direction due to bit rotation.
Bull's‐eye plot of borehole verticality data
Another common phenomenon is for an angled borehole to dive downwards towards the vertical as a result of the effect of gravity.
A well calibrated magnetometer‐based verticality sonde will produce accurate results if the borehole does not intersect magnetic formations or if the effect of these can be edited out of the data.
The log may not be captured in steel casing and the driller must withdraw his rods before logging can commence...these are significant limitations.
Gyro deviation sondes
An alternative to the magnetometer‐based sonde is one based on a gyroscope. The gyro deviation log (the author uses this term to differentiate from the borehole verticality log) in mineral applications is normally derived from triaxial accelerometers orientated by a single gyroscope rather than a magnetometer set. This tool may be run quickly, from surface to TD and back, through drill rods. The instrument can be expensive so there is little point of risking it in an open hole if the drilling rig is on site.
There are several types of gyro system in the marketplace. The traditional rotor or spinning mass gyro is commonly used and is very accurate but it suffers from component wear over time (requiring routine servicing). It looks like this type of mechanical gyroscope will gradually be replaced by other, smaller, lighter and more robust, laser, fibre optic or vibrating (micro electro‐mechanical systems or MEMS) solid state devices, assuming that these achieve similar accuracy.
The rotor gyro comprises a spinning wheel or disk mounted on a gimbal so that its axis is free to point in any direction. When spun at very high speed, due to the law of conservation of angular momentum, the axis remains pointed at its original target. Over time the Earth rotates but the gyro's axis keeps pointing in a fixed direction, so appears, to an observer on the Earth, to rotate completely once every 24 hours, averaging 15 degrees per hour. The fixed position of the gyro axis is an ideal reference to measure any movement, by the body of a sonde, happening around it. This movement is calculated after the effect of the Earth's rotation, called drift, is deducted. The rate of drift varies somewhat and requires checking during a logging run. The traditional rotor gyro is accurate, subject to proper drift checks.
If the gyro axis happens to point to true north, parallel to lines of longitude, it will not appear to move at all to an observer on Earth. This is a useful phenomenon and the basis of the north‐seeking version of the instrument.
The solid state MEMS Coriolis vibratory gyroscope or CVG is part of a range of measurement sensors, usually about the size of a microchip, that use vibration rather than rotation. The vibration occurs in one plane whose orientation remains constant as its support rotates.

6
In their simplest form, laser and fibre optic gyro systems rely on the speed of light being constant. Two laser or light beams travel in opposite directs around a circuit, either via mirrors (square or triangular path) or within an optical fibre or a coiled optical fibre (enclosed loop). If the platform rotates, the light travelling in one direction around the circuit will arrive back at its starting point before the other. The difference in arrival time is proportional to the platform's rotation.
The solid state gyro systems are small and offer a very constant measurement...they do not suffer from friction wear and subsequent drift or the cost of servicing like the rotor gyroscope. For these reasons and because unit cost of solid state component production is likely to fall, there is an expectation that rotor gyros will gradually be phased out of mineral wireline logging applications.
Choose a method
The geologist will want to know the path of his borehole if it is deep or targeted at an orebody. In many cases, mainly in nominally vertical boreholes, some checks by the driller are confirmed, after the fact, by means of a borehole verticality log (often from a televiewer sonde) or a gyro deviation log (always run independently). The latter is considered superior because it may be run through casing or drill pipe and the geologist gets a log from surface that is unaffected by magnetic formations. The standard verticality measurement is perfectly alright (and often free of charge) in magnetically clean formations.
If the boreholes path is controlled by the driller, he will require intermittent measurements of its orientation. In this case, it is most cost effective to run in his own single or multi‐shot device, but, in this scenario, it is usually prudent to confirm the driller's point measurement integration by means of a continuous wireline log. Again, this log is run after the fact, but valuable nonetheless.
2. Guest Article North Seeking Fibre Optic Gyro (FOG) Sonde
A borehole deviation measurement
It is often essential to know how vertical a borehole is or whether it is has been drilled in the intended dip and direction. These parameters can be measured as a means of confirmation after drilling or as a means of control and confirmation while drilling is in progress. There are a number of techniques available, including the use of wireline logging tools. Logging is usually seen as a fast and economical means of data acquisition.
Borehole trajectory logging tools come in two categories, depending on whether they employ magnetometer type sensors or gyroscope type sensors.
Logging sondes that are fitted with good three axis magnetometer type sensors (MDEV) are perfectly adequate in boreholes without any magnetic disturbances. However, they cannot be used reliably in environments where magnetic interference is present like for example inside casing, drill pipe and magnetically disturbed ground. In these circumstances, sondes with gyroscopic type sensors must be used instead.
There are mainly three types of gyroscope sensors, including the spinning mass gyros, the solid state MEMS gyros and the fibre optic gyro (FOG).
In borehole direction logging applications, the gimbal mounted spinning mass gyro is a high maintenance sensor which has been around for many years. It also tends not to cope well with highly inclined boreholes. The solid state MEMs gyro is relatively more modern and with lower maintenance requirements but its performance in the context of borehole direction surveys is still under question. The FOG is proving to be a good alternative. The FOG transducer has no moving parts, lower power consumption, longer lifetime and does not need spinning up and pointing in an initial direction. Furthermore, With the FOG, there is no sensor drift accumulation. Each measurement is obtained from its own parameters, independent of any previous measurement.
The FOG sensor works on the principle of the Sagnac laser interferometer where the angular velocity of the apparatus causes a corresponding phase difference in two interfering identical light beams. In the case of the FOG, this phase difference allows for the measurement of the angular velocity of Earth. The sensor inside the sonde measures the components of the Earth’s rotation with reference to the sonde’s X, Y and Z axes. The 3D vector that is produced from these vector components is parallel to the axis of Earth’s rotation and therefore

7
will point North. This data, together with the sonde accelerometer data and the site’s latitude, is then used to calculate the direction the sonde is pointing with respect to (Geographic) North.
The North seeking FOG sonde can be deployed in highly inclined boreholes, and it is run in multi‐shot mode where the sonde has to be held stationary at regular depth intervals to perform a measuring cycle. The sonde is simple to operate and does not require any calibration unless uncharacteristic reading values are observed. To check for this, it is recommended to have a permanent fixture in which the sonde can be regularly placed in exactly the same position and its readings checked.
In short, the North Seeking FOG is a practical sonde, with many desirable operational features, including:
No need for initial setting to a reference at surface. It finds its reference at each station.
No need to record drift station
Operated in highly inclined boreholes
No influence by magnetic environment
Solid state sensors.
As stated in this Bulletin, there seems to be a move away from the rotor or rotating mass type of gyroscope sonde design. New solid state alternatives are appearing in the marketplace. The fibre optic system should play a major part in mineral exploration in the future.
Contributed by Seghir Messamah Geovista Ltd
33.. MMeeaassuurreemmeenntt FFooccuuss
A review of one wireline log measurement
The Formation Dipmeter ‐ the forgotten sonde
Descriptions of stratigraphy, offered by logs of gamma, density, sonic etc, may be used to estimate structural changes across a coal basin, for instance. Cross‐hole correlation involves pattern recognition, hole to hole.
Cross‐hole correlation of the Sousa Pinto coal seam in Mozambique
The structural complexity of some sedimentary basins makes this approach inadequate for confident mapping of the various subsurfaces. It would be a great help if one knew the dip and direction of surfaces at the elevations of borehole intersections. The Formation Dipmeter sonde offers a continuous, quick and objective measurement of dip and direction of strata intersected by a borehole.
8
A projection based on cross‐hole correlation might indicate a gentle 10‐degree dip, from one borehole to another, but, if the dipmeter describes horizontal bedding in both boreholes, the presence of a fault is inferred. When a borehole intersects a fault, the log might well describe a lithological boundary, block rotation, frictional drag and even the orientation of the fault plane.
The dipmeter describes sedimentary formations. It is not normally used to log igneous rocks.
Dipmeter log data (orientated tadpole plots) are, in many cases, immediately available from the logging truck. Real‐time data processing is available from some mineral logging contractors...a big advantage.
This is all great stuff but, sadly perhaps, the dipmeter is rarely used in today's exploration projects. It has been largely displaced by the expensive, slower to process but more informative acoustic televiewer sonde. Many logging contractors will have sonde racks holding dipmeter sondes that have not seen a borehole for years.
The dipmeter measurement is based on a formation's resistance to electric current. The very first dipmeters,
designed by Schlumberger, employed variations in SP but logs of electrical resistance soon supplanted this
technique. The dipmeter plot is a series of point measurements of dip and direction of a plane. Surfaces
described by three or four logs of formation resistance from around the borehole wall are mathematically
compared so that an identified and correlated event will be located at different depths. This is illustrated two‐
dimensionally on the right.
Correlation and depth difference of two resistance curve intervals
Each uncalibrated resistance log is produced in a very similar
way to the focussed resistivity log discussed in a previous
bulletin (November 2014).
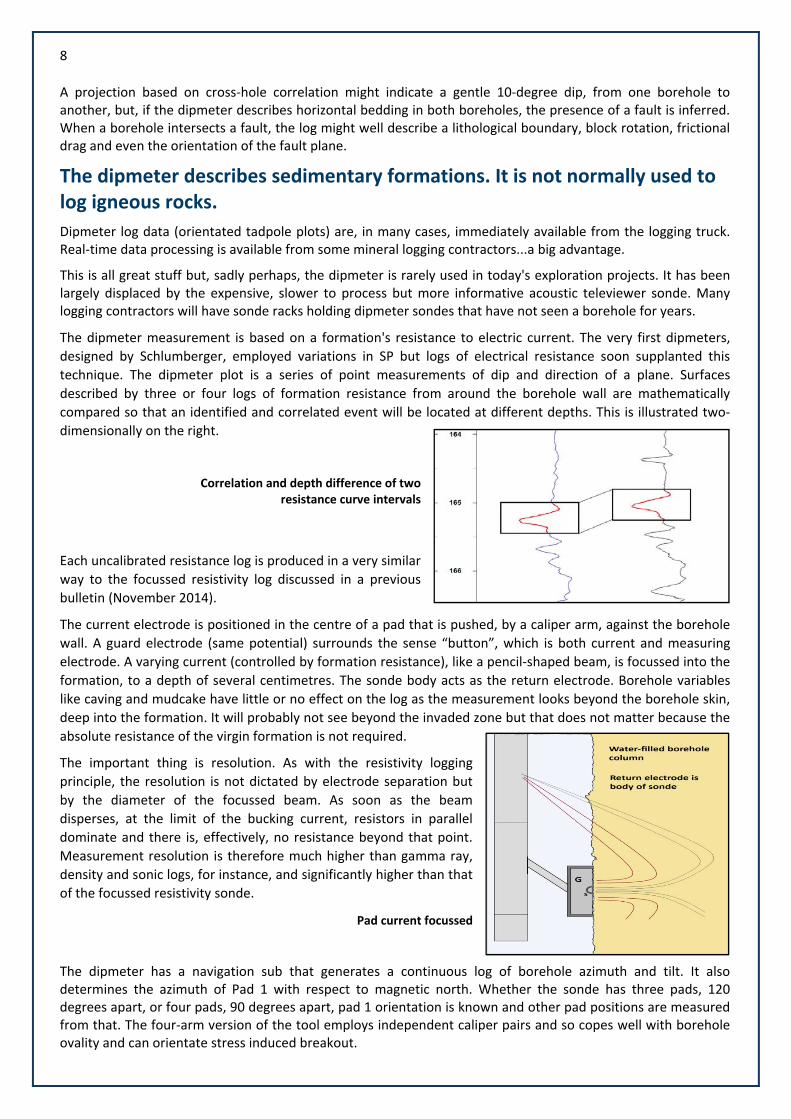
The current electrode is positioned in the centre of a pad that is pushed, by a caliper arm, against the borehole
wall. A guard electrode (same potential) surrounds the sense “button”, which is both current and measuring
electrode. A varying current (controlled by formation resistance), like a pencil‐shaped beam, is focussed into the
formation, to a depth of several centimetres. The sonde body acts as the return electrode. Borehole variables
like caving and mudcake have little or no effect on the log as the measurement looks beyond the borehole skin,
deep into the formation. It will probably not see beyond the invaded zone but that does not matter because the
absolute resistance of the virgin formation is not required.
The important thing is resolution. As with the resistivity logging
principle, the resolution is not dictated by electrode separation but
by the diameter of the focussed beam. As soon as the beam
disperses, at the limit of the bucking current, resistors in parallel
dominate and there is, effectively, no resistance beyond that point.
Measurement resolution is therefore much higher than gamma ray,
density and sonic logs, for instance, and significantly higher than that
of the focussed resistivity sonde.
Pad current focussed
The dipmeter has a navigation sub that generates a continuous log of borehole azimuth and tilt. It also determines the azimuth of Pad 1 with respect to magnetic north. Whether the sonde has three pads, 120 degrees apart, or four pads, 90 degrees apart, pad 1 orientation is known and other pad positions are measured from that. The four‐arm version of the tool employs independent caliper pairs and so copes well with borehole ovality and can orientate stress induced breakout.

9
Thbolit
Thfoan
Thinttridededi
Thmcobo
he caliper logorehole diamhology and d
he log belowur “pad tracnd 106 metre
here is a Padterference oigonometry aescriptors reegrees of dippping events
he dipmetereasurementompromised oreholes, wh
g is calibratemeter, whichdepth match
w is a typical ces” are plotes. Note that
d 1 azimuth ior data transand orientatesembling a p from horizs. A linear gr
r tool will s through caby magnetishere the pad
ed and so, d is used in dhing purpose
presentatiotted togethet both gamm
in track 1, shsmission errotion, is in trababy frog. Tzontal. In thrid is preferre
A four‐
only work asing (steel sm. The sondd calipers are
agreThfo
That30
A If
espite its ratip calculatios.
on. The ploter in track 3. ma and resist
howing rotators. The struck 2. This is The tadpolehis log a noned when dip
‐arm dipmete
in a fluidor PVC). Thede must be ce only partiagainst the esistance mhis is parormations.
hree tadpolest 10 degrees, 0 degrees.
dipmeter loone or mo
ther blunt can. The sonde
is framed byThere is a cance logs sh
tion, as well ucture log, threferred to as are plotten‐linear grid s exceed 45
r log
‐filled boree sonde’s nacentralised. ally extendedhigh side easurement rticularly tr
s, from the tosouth‐west a
og is only as gore pads fail
aliper tips (te will norma
y gamma oncoal seam (loow a change
as a Field Mhe result of as a tadpole d on a grid is used whidegrees.
hole. It caavigation sysIn some highd, little forceof the boris adverse
rue in tig
op: bedding dit 20 degrees
good as the l or lack pro
he pads), it lly include a
n the left andow pad coune in characte
Magnitude locomputationplot, due to that is scaleich enhance
nnot make stem will be h angle slim e is exerted rehole and ly affected. ght/resistive
ipping east and north at
resistance coper contac
produces a gamma det
d caliper on nts) describer above the
og, confirminn of pad trathe shape oed normallyes the presen
urves on wht with the b
log of nomintector for ba
the right. Ted between coal seam.
g no magnece correlatiof the structuy from 0 to ntation of lo
hich it is baseborehole wa
nal sic
he 90
tic on, ure 90 ow
ed. all,

10
correlation will not produce true data (although the four‐arm tool offers more redundancy in this regard). False correlations will dominate the log. Pad contact is a bigger factor in resistive environments, in angled boreholes, in oval boreholes (in the case of the three‐arm tool), in conductive borehole fluids and where oily deposits collect on the pads. The user of the dipmeter log should look hard at the resistance curves during data capture and confirm that they (visually) correlate.
Case study ‐ dipmeter logs from deep meta‐sediments
During the South African gold exploration boom of the 1980s and 90s, boreholes were drilled to great depths in order to intersect the ancient Witwatersrand sedimentary basin. Diamond‐drilled boreholes extending to depths exceeding 4,000 metres were expensive and the geologist had the difficult task of interpreting a complex and heavily faulted structure from a limited number of intersections. Natural gamma logs were routinely employed to describe very hard quartzites and shales and periodic conglomerate "reefs" whose high energy depositional regimes had delivered uranium and associated gold into the basin.
The deepest borehole logged was 5,115 metres in length, which is probably a world record for mineral borehole logging (??). Rock temperature at that depth in the Wits basin is only about 85 degrees C. It is a relatively cool place in geological terms.
Understanding the structural regime was critical. Mine shafts of over 2,000 metres in depth are expensive to develop. There must have been some sleepless nights.
Running a dipmeter tool was an obvious solution but results were always very poor due to the rather resistive rocks and borehole walls coated with a type of black grease. This essential lubricant became hard and compacted over months of drilling.
Stripping chemicals were developed to clean boreholes and, before logging commenced, the borehole fluid was replaced by municipal tap water. This resistive water in the borehole column resulted in a lower contrast between fluid and formation, which began to accept an electric current. Loggers started to capture reasonable dipmeter logs. Improvements in tool design, the Reeves high‐contrast dipmeter in particular, made dipmeter logging routine and availed loggers of the possibility of trying other measurements to describe the formation.
A three‐arm dipmeter log from the Witwatersrand basin
On this occasion, it was the dipmeter that was the key measurement, not density. Subsequently, on the arrival of the acoustic televiewer, borehole images were logged in Witwatersrand sediments. Remarkably, no bedding

11
was visible, only some tight fractures. The rock had metamorphosed to the point where there was no variation in hardness but there remained substantial variation in resistivity, albeit in the 1,000 to 10,000 ohm metres range. So the dipmeter is still king in the Wits.
Why has the dipmeter been largely displaced by the acoustic televiewer sonde? The latter provides both tadpoles and a borehole image. The image describes things that interest geologists rather well...bedding, coal seams, fractures, faults and breakout. The dipmeter describes bedding orientation, it does not describe fractures well. It lacks an image.
That situation is changing as the formation micro‐scanner becomes smaller and less expensive. The micro‐scanner measurement is important to any project that requires large diameter boreholes to be logged. It will be discussed more fully in a later issue of this bulletin.
The author well remembers a debate with a Canadian oilfield technician in a meeting in Calgary. He insisted that acoustic televiewer images have higher resolution that micro‐scanner images. The Canadian insisted that the reverse was true. In fact, both arguments were correct.
In small diameter holes filled with water, the televiewer offers higher resolution than the micro‐scanner but in a large diameter mud‐filled oil well or a CBM well, the micro‐scanner, having direct contact with the formation, produces higher resolution logs than the centralised televiewer, whose image is blurred by the acoustic signals' dispersal during the long journey to and from the borehole wall.
The dipmeter tool offers some advantages over the acoustic televiewer sonde:
It produces better results in large diameter boreholes
It produces better results where mud is required to support the borehole wall
It is less expensive than the televiewer to run and process
It may be run more quickly than the televiewer (if necessary, at least four times faster)
Its logs are available on site
Its logs are more objective and tend to describe flat lying features more clearly
It can measure some hard metamorphosed rocks better than the televiewer
It measures a different parameter ‐ formation moisture content rather than hardness
It should be said that advances in automatic picking of acoustic images is nullifying some of these advantages. Perhaps the way to sell the dipmeter is to make it smaller, less of a brute to operate, so that it is seen in the same light as a neutron tool or a resistivity tool. Reverting to the simpler three‐arm version might allow less expensive construction, quicker operation, lower cost and so more routine logging. There are advantages in running both televiewer and dipmeter in some circumstances.
44.. TThhee llooggggeerr oonn ssiittee A few important pointers to radiation safety
Handling the density sonde
While the activity of the typical density logging source is relatively low (about 100mCi or 3.7GBq or a mere 3.7 billion disintegrations per second), it makes sense to minimise ones personal radiation dose by adhering to one or two simple rules.

12
Term Meaning
Collimator The larger diameter lower part of an assembled sonde with lead shielding on one side.
Source A pellet or bead of radioactive material housed in a stainless steel capsule.
Source holder The collimated extension, which contains the source, that is attached to the sonde.
Source shield The heavy lead container (or pig) in which the source holder is stored or transported.
A message to the logger
Firstly, you should know that doubling your distance from a source of radiation reduces your dose by more than halving the time spent at the original distance. In other words distance is more important than time. The "inverse square of the distance rule", as it is known, can confuse but it is based on the exponential increase in the surface area of a sphere as it grows away from a point (the sphere's surface area is 4πr2 where r is the distance from its centre). An easy way to calculate increases in dose with proximity is to use fractions of the distance and, according to the rule, square the denominator. Starting at 1 metre from the source...
If you halve your distance, move to 50cm from the source: results in 22 and so 4 times the original dose.
If you move to 20cm from the source: results in 52 and so 25 times the original dose.
If you move your hand to 1 cm from the source: results in 1002 and so 10,000 times the original dose.
The obvious thing to avoid is picking up a dropped source holder, which would result in a substantial dose being endured by your hand. In all these examples, doubling the time would result in just 2 times the dose.
It is better to take a little longer to place the sonde into a borehole, making sure that you maximise you distance from the source.
Secondly, you should know the "front to back ratio" of your sonde. Its mandrel and source holder are both collimators, they limit the size and angle of the spread of radiation from the source by means of lead shielding. This results in the back of the holder emitting far fewer gamma rays than the front, face or borehole wall contact side. If you place your sonde on the ground on its side, you can use a radiation monitor to compare counts at 1 metre behind and 1 metre in front. Switch on the audio signal for best effect. You might be surprised. In a recent test, one commonly used sonde produced 60 times more radiation on the face side than the back or caliper side. Its front to back ratio is therefore 60:1. It makes a lot of sense to point the "windowed" source of radiation away from your person.
Always keep the caliper arm towards your body when handling the density sonde.
If you take a little more time, position your feet well, maintain a reasonable distance from the source (at least 20cm) and keep the caliper arm towards your body, you can reduce your radiation dose.
If you do the opposite, as many loggers do, through ignorance rather than intent, you should expect to enjoy about 200 times more radiation than you need to, every time you log a borehole.

13
55.. WWiirreelliinnee ddaattaa pprroocceessssiinngg aanndd aannaallyyssiiss
How to get the best from the logs
Processing dipmeter data
The four‐arm dipmeter sonde, with independent caliper axes, provides a measure of breakout (and, indeed, that was how stress‐induced breakout was first discovered from North American oilfield logs). Good quality dipmeter processing software will generate an orientated curve whenever the difference between the two caliper measurements exceeds a prescribed threshold.
Breakout orientation from a dipmeter sonde ‐ centre right (Weatherford)
Data processing of dipmeter data is usually done automatically by the data capture software. There is
sometimes an option to manually compare and correlate particular events on the pad traces but this approach is
rarely used. The processing routine requires the selection of certain constants. Different constants will generate
different results so must be fully understood by the logger. The constants include magnetic declination (if the
log is required to be with respect to true north) and a choice of caliper or bit size for the borehole diameter
component (bit size works well enough if, for some reason, the caliper data are unreliable). Important decisions
are required for Step, Interval and Search angle.
Step: the frequency of correlation attempts (usually every 0.50 metres). When the correlation routine is applied,
the program will, in this case, generate a result every 50 centimetres along the plot. The log will have three
components; dip, azimuth and correlation coefficient. Results with poor correlation values are considered
dubious and not plotted. If every correlation exceeds the prescribed quality threshold, a tadpole will appear at
every 0.50 metres of the log.
Interval: the length of resistance curve correlated at each step. A long interval will result in lower correlation
coefficient since the likelihood of a perfect match is reduced as the log sample gets longer. Long interval
correlations that exceed the prescribed quality cut‐off provide higher confidence in the resulting tadpole.
Search angle: the maximum correlated dip angle, with respect to the borehole trajectory, allowed by the
program. If a correlation with a high coefficient exceeds the maximum dip threshold, another result replaces it,
even if the latter event’s correlation quality is lower. The restriction is applied to prevent the program searching
so far up and down the pad curves that a coincidentally acceptable but false correlation is achieved.
The selection of the three input parameters listed above can be very simple, using a default of, for instance, 0.50 metre step, 1.00 metre interval and 60 degree search angle. If the structures are low angle and resistance log quality is good with well‐defined bedding, this set up will produce a perfectly good tadpole plot.

14
Dipmeter log processing parameter selection is never perfect. It is always a trade‐off between resolution and fidelity.
Using the default described above as a starting point, one can modify the parameters to change resolution. If the processor requires a high‐resolution log, he might reduce the step to 0.20 metres and the interval to 0.40 metres. The sample of pad trace to be correlated becomes short (simple) enough for false correlations to occur, especially if the search angle remains at 60 degrees.
In the following examples, a three‐arm dipmeter log is used for simplicity.
In the representation on the right, the short interval results in at least two possible solutions for the correlation process. A simple shape will have many facsimiles if the program looks far enough up and down the log.
Short interval
A false high‐angle structure might well result if the search angle is not reduced. Unfortunately, there will often be cases where the search angle is required to be high. In fact, such situations, of structural complexity, are where dipmeter logs are most needed.
Poor correlations due to short interval and high search angle
If a high search angle is required, it is usually necessary to sacrifice some resolution by increasing the log interval to be correlated. However, retention of the short step with a long interval results in presentational problems. One significant event within the long interval might dominate the correlation result so that there is a repetition of the same tadpole at each short step. In a 1.00‐metre interval, there will be five steps. The processed result is “hairbrushes”.
Hairbrushes
Repetition of the same event multiple times does not increase knowledge. It is unsightly (ugly in fact) and reduces log resolution.
The objective is to achieve fidelity with the maximum resolution. The approach should be to, firstly, process a data set using a high search angle (75 degrees) and long interval (1.20 metres). The result should allow the selection of the minimum practical search angle. This will often be less than maximum dip angle on the log due to the tendency of the borehole to divert perpendicular to bedding. At the same time, the search angle should allow for events of higher angle than bedding, such as fault‐induced drag features. Two presentations are often necessary in order to generate the required knowledge from the data.

15
As soon as the search angle has been determined, the processor can tighten up the resolution by reducing the interval and reprocessing. False correlation tadpoles will start to appear at high angles. This is perfectly acceptable but at a further reduction, the false correlations will start to dominate the data so the processor settles for a compromise. This can be a rather subjective process and experience is important.
An increase in correlation frequency, shorter step, can then be attempted if higher resolution is required. As soon as the hairbrushes start to appear (three or more identical tadpoles together) the shortening should be discontinued.
Processing becomes more complex when one or more of the pad traces are of poor quality. The processor might reprocess multiple times using different parameter sets in order to achieve the best possible log.
The effect of random fractures on a log correlation, designed to describe bedding orientations only, can be minimised by smoothing the pad curves with a short median filter before processing.
It should be apparent, looking at the logs, that small changes in formation dip are easy to spot on the tadpole plot. Small rotations of formation dip azimuth, less than 20 degrees, are less easy to identify using the standard tadpole display.
There are various ways of presenting the structure log that allow easier analysis of rotation. One of these is the rose diagram (pictured here). The problem with the rose diagram is in the prescribing depth ranges. They do not
naturally fall on fault block boundaries or point of rotation. A regular selection of a diagram every 20 metres, for instance, is helpful but does not pick the boundary. Another approach is to produce a second gridded track of azimuth only. This allows better selection of boundaries before rose and polar plots are generated. That type of display is shown on page 10 of this bulletin.
Stereographic plots (polar plots) and azimuth vector plots are also useful in the analysis. The object is to define fault block boundaries.
The orientation of the fault plane (fracture) is not always possible from dip data because the boundary might not be described by the resistance logs. There could be a low resistance spike at an open fracture. There might also be a definable surface where the character
of the pad traces changes. If a definitive artefact is visible on the pad traces but not correlated by the program, the analyst can resort to manual picking.
A manual pick
In the log on the right, the analyst has defined an event at 1050 metres and picked the surface manually.
There is no low resistance spike, no fracture is indicated, so this might not a be a fault. It could be a depositional boundary or, more likely (given the rotation), the base of a channel or flood event.
Reference to core or image data is indicated.

16
Major faults that seriously affect the mining operation will often cause distortion or “drag”.
A normal fault with associated drag
Drag distortion results in the basic dipmeter log pattern described on the right. The tadpole at the apex of the drag feature often results from the fracture itself. When the event is a normal fault, the apex tadpole points in the same direction as the shoulders of the drag feature, in this case south‐west. If the event is a reverse fault, the apex tadpole points in the opposite direction to the drag, north‐east.
The drag phenomenon occurs in both hard rock and soft rock environments. The log below was captured in metamorphosed sediments of the Witwatersrand gold basin. Note the block boundary described by the pad traces (shaded to best effect). This was a three‐arm dipmeter sonde. The three‐arm configuration allows very slim tool dimensions. The sonde's lightweight design helps its arms to centralise in high angle bores. There is little disadvantage in using a three‐arm device in hard rock, where borehole ovality is uncommon.
A probable reverse fault
Drag features are structural events over‐printed on the general tectonic setting or regional dip. If the regional dip is deducted from the tadpole display within a fault block, the residual patterns are caused mainly by sedimentary deposition. The orientation of the dip of cross bedding is an indication of the current direction during deposition. The direction of either wind or water flow affects the orientation of cross beds.
Formation of cross beds
The dip direction will be the same as flow direction. The diagram on the right shows a depositional situation where three “master beds” contain cross beds that were deposited under

17
similar flow (in this case wind) conditions. The master beds are compacted during long‐term burial so dips will not be as steep as they appear here.
66.. SSuummmmaarryy
Two case studies from the Witwatersrand Basin illustrated the importance of borehole navigation and structural logs to the geologist and mining engineer.
Magnetometer‐based borehole verticality logs are run routinely and excellent measurements are often available from televiewer data sets.
The very accurate rotor gyro may be run during drilling operations (without the need to withdraw rods) or after the fact as a final reference. It is gradually being displaced by more recent solid state gyroscopes.
The dipmeter is not a geotechnical tool. It is for basin analysis. It generally ignores fractures but describes bedding and bedding distortion. It has major advantages in large diameter boreholes.
Dipmeter data may be processed real‐time using default constants that will be applicable to most situations. Sometimes secondary, more complex, log processing is required to extract all the available knowledge from a dipmeter data set.
NNeexxtt IIssssuuee::
Our two‐year anniversary bumper issue.
A review of all the measurements.
MMaarrccuuss CChhaattffiieelldd –– JJuullyy 22001155
CCooppyyrriigghhttss aappppllyy ((wwwwww..wwiirreelliinneewwoorrkksshhoopp..ccoomm))
AAccttiinngg eeddiittoorr//ccoonnttaacctt:: wwiillnnaa@@wwiirreelliinneewwoorrkksshhoopp..ccoomm
FFoorr bbaacckk ccooppiieess,, ggoo ttoo:: wwwwww..wwiirreelliinneewwoorrkksshhoopp..ccoomm//bbuulllleettiinn aanndd cclliicckk oonn ""PPrreevviioouuss IIssssuueess""..