trai audit wireline report – bihar/jharkhand circle
372
EAST ZONE TRAI AUDIT WIRELINE REPORT – BIHAR/JHARKHAND CIRCLE - AUDIT OF AMJ QUARTER, 2016
-
Upload
khangminh22 -
Category
Documents
-
view
5 -
download
0
Transcript of trai audit wireline report – bihar/jharkhand circle

TRAI Audit Wireline Report-Assam Circle AMJ Quarter-2015
1
EAST
ZONE
TRAI AUDIT WIRELINE REPORT –
BIHAR/JHARKHAND CIRCLE - AUDIT OF
AMJ QUARTER, 2016

TRAI Audit Wireline Report- BIHAR/JHARKHAND Circle AMJ Quarter-2016
2
TABLE OF CONTENTS
1 Introduction .................................................................................................................................................. 5
1.1 About TRAI .......................................................................................................................................... 5
1.2 Objectives ............................................................................................................................................ 5
1.3 Coverage ............................................................................................................................................... 6
1.4 Audit Process ....................................................................................................................................... 6
1.5 Framework Used ................................................................................................................................. 7
1.5.1 PMR Reports - Significance and Methodology ............................................................................ 7
1.5.2 Live Calling - Significance and Methodology .............................................................................. 9
1.5.3 Audit Methodology........................................................................................................................ 13
1.5.4 Measurement Methodology ......................................................................................................... 14
1.6 Sampling Methodology ..................................................................................................................... 15
1.7 Colour Code to read the report ........................................................................................................ 15
2 Executive Summary ..................................................................................................................................... 16
2.1 PMR (Performance Monitoring Report) Data – AMJ’16 ................................................................. 16
2.1.1 Fault Incidence / Clearance Statistics.......................................................................................... 16
2.1.2 POI (Point of Interconnection) Congestion ............................................................................... 17
2.1.3 Metering and Billing Credibility .................................................................................................. 17
2.1.4 Resolution of Billing Complaints ................................................................................................. 17
2.1.5 Period of Applying Credit/ Waiver .............................................................................................. 17
2.1.6 Closure within 7 Days.................................................................................................................... 17
2.1.7 Response time to customer for assistance .................................................................................. 17
2.1.8 Refund of deposit within 60 days from closure .......................................................................... 17
2.2 3 Day Live Measurement ................................................................................................................... 18
2.2.1 POI (Point of Interconnection) Congestion ............................................................................... 18
2.3 Live Calling ......................................................................................................................................... 18
2.3.1 Faults Repair/ Clearance ............................................................................................................... 18
2.3.2 Resolution of billing complaint .................................................................................................... 18
2.3.3 Response time to customer for assistance .................................................................................. 19

TRAI Audit Wireline Report- BIHAR/JHARKHAND Circle AMJ Quarter-2016
3
2.3.4 Level 1 Services ............................................................................................................................... 19
3 Critical Findings - AMJ’16 .......................................................................................................................... 20
4 Parameter Explanation and Detailed Findings - Comparison Between PMR and Live Calling/
Measurement Data .............................................................................................................................................. 21
4.1 Fault Incidence/ Clearance Related Services .................................................................................. 21
4.1.1 Parameter Explanation .................................................................................................................. 21
4.1.2 Detailed Findings - Fault Incidence ............................................................................................ 23
4.1.3 Detailed Findings - Fault repair by next day (Urban) ............................................................... 23
4.1.1 Detailed Findings - Fault repair by next day (Rural) ................................................................ 24
4.1.2 Findings - Fault repair within five working days (Urban) ........................................................ 24
4.1.1 Findings - Fault repair within Seven working days (Rural) ...................................................... 25
4.1.2 Detailed Findings - Mean time to repair .................................................................................... 25
4.2 Metering and billing credibility ....................................................................................................... 26
4.2.1 Parameter Explanation ................................................................................................................. 26
4.3 Response Time to Customer ............................................................................................................. 31
4.3.1 Parameter Explanation .................................................................................................................. 31
4.3.2 Calls Getting Connected and Answered ..................................................................................... 32
4.3.3 Call Answered by Operator within 90 Seconds ......................................................................... 32
4.4 Customer Care Promptness ............................................................................................................. 33
4.4.1 Parameter Explanation ................................................................................................................. 33
4.4.2 Findings - Closure Request Attended in 7 days ......................................................................... 33
4.5 Time taken to refund deposit after closure .................................................................................... 34
4.5.1 Parameter Explanation ................................................................................................................. 34
4.5.2 Findings - Refund of deposit after closure within 60 days ....................................................... 34
5 Annexure – AMJ’16...................................................................................................................................... 35
5.1 Fault Incidence / Clearance Statistic .............................................................................................. 35
5.2 POI Congestion ................................................................................................................................. 36
5.3 Metering and Billing credibility ....................................................................................................... 37
5.4 Response time to the customer for assistance ............................................................................... 38
5.5 Customer Care - Promptness in attending customer request ...................................................... 38

TRAI Audit Wireline Report- BIHAR/JHARKHAND Circle AMJ Quarter-2016
4
5.6 Time taken for refund of deposits after closure ............................................................................. 39
5.7 Live Calling for Level 1 Services ....................................................................................................... 39
5.8 Exchange capacity and Subscribers – Sample Exchanges ............................................................. 44
5.9 SDCA selected as per sampling plan – BSNL ................................................................................. 44
5.10 Sample List of SDCA wise Exchanges (Jharkhand)........................................................................ 45
5.11 Sample List of SDCA wise Exchanges (Bihar) ................................................................................ 49
5.12 Abbreviations .................................................................................................................................... 54

TRAI Audit Wireline Report- BIHAR/JHARKHAND Circle AMJ Quarter-2016
5
1 INTRODUCTION
1.1 About TRAI
TRAI's mission is to create and nurture conditions for growth of telecommunications in the country in a
manner and at a pace that will enable India to play a leading role in the emerging global information
society. One of the main objectives of TRAI is to provide a fair and transparent policy environment
which promotes a level playing field and facilitates fair competition.
In pursuance of above objective, TRAI has been issuing regulations, order and directives to deal with
the issues or complaints raised by the operators as well as the consumers. These regulations, order and
directives have helped to nurture the growth of multi operator multi service - an open competitive
market from a government owned monopoly. Also, the directions, orders and regulations issued cover a
wide range of subjects including tariff, interconnection and quality of service as well as governance of
the Authority.
TRAI initiated a regulation - The Standards of Quality of Service of Basic Telephone Service (Wire line)
and Cellular Mobile Telephone Service Regulations, 2009 (7 of 2009) dated 20thMarch, 2009, the
"Standards of Quality of Service for Wireless Data Services Regulations, 2012 dated 4th
March 2012, and
the "Quality of Service of Broadband Service Regulations", 2006 (11 of 2006) dated 6th January, 2006 that
provide the benchmarks for the parameters on customer perception of service to be achieved by service
provider.
In order to assess the above regulations, TRAI has commissioned a third party agency to conduct the
audit of the service providers and check the performance of the operators on the various benchmarks
set by Telecom Regulatory Authority of India (TRAI).
1.2 OBJECTIVES
The primary objective of the Audit module is to -
Audit and Assess the Quality of Services being rendered by Basic (Wireline), Cellular Mobile
(Wireless), and Broadband service against the parameters notified by TRAI. (The parameters of
Quality of Services (QoS) have been specified by in the respective regulations published by
TRAI).

TRAI Audit Wireline Report- BIHAR/JHARKHAND Circle AMJ Quarter-2016
6
1.3 COVERAGE
The wireline audit was conducted in BIHAR/JHARKHAND circle (excluding BIHAR/JHARKHAND). For
BSNL, geographical spread among SDCAs and exchanges was maintained. For other operators (BSNL),
the audit was conducted for all exchanges at overall level.
Image Source: BSNL website
1.4 AUDIT PROCESS
As per TRAI guidelines, the Wireline Audit for a circle is conducted for one quarter once every year.
The operators have been assimilated as per TRAI guidelines given in QoS tender document
2015 and latest list of licensees provided by TRAI.
IMRB auditors contacted the following wireline operators to conduct the audit in
BIHAR/JHARKHAND for the AMJ 2016 quarter.
o BSNL
o Reliance
o TATA
o Vodafone
The PMR was generated from the raw data pertaining to April, May and June 2016 (AMJ’16),
which was collected from the operator during the audit conducted in the month of July 2016.
Live calling and 3 day live measurement activity was carried out during the month of June 2016.
The data considered for live calling was for the month prior to the month in which the live
calling activity was being conducted. For example, data of May 2016 was considered for live
calling activity conducted in June 2016.

TRAI Audit Wireline Report- BIHAR/JHARKHAND Circle AMJ Quarter-2016
7
1.5 FRAMEWORK USED
1.5.1 PMR REPORTS - SIGNIFICANCE AND METHODOLOGY
The significance of PMR or Performance Monitoring Reports is to assess the various Quality of Service
(QoS) parameters involved in the Basic (Wireline) telephone services, which indicate the overall health
of service for an operator. The operators submit these PMR reports to TRAI time to time as per
instructions from TRAI.
To verify the QoS performance of the operators, TRAI has appointed IMRB as their auditor in East Zone
to conduct QoS audit of operators. The steps involved in the audit have been given below.
Audit Actvities
PMR Reports
Quarterly PMR
3 Day Live Measurement
Live Calling
Fault incidence/ repair
Billing Complaints
Level 1 Services
Customer Care Response time
The newly generated PMR reports are then taken in hard copy, duly signed by the competent authority of operators. IMRB auditors also sign the same report.
All the calculations are done by IMRB auditors to generate a new PMR report from that raw data.
During TRAI audit, raw data is extracted from the operator’s server/ NOC/ exchange/ OMC/ customer service center/ billing center etc. by the IMRB auditor with assistance from the operator personnel in order to generate PMR reports (Network/ Fault/ Billing /Customer
Service).
The IMRB auditors inform the operators about the audit schedule in advance. Accordingly, the auditors visit the operator premises to conduct the audit.
TRAI Audit Wireline Report- BIHAR/JHARKHAND Circle AMJ Quarter-2016
8
The raw data extracted is then used to generate PMR reports in the following formats.
Quarterly PMR
3 Day Live Measurement Data
Let us understand these formats in detail.
1.5.1.1 QUARTERLY PMR REPORT – PARAMETERS REVIEWED
The main purpose of quarterly PMR report is to verify the following key QoS parameters on quarterly basis as per the methodology stated above in section 1.4
Fault incidence/clearance related statistic
Mean Time to Repair (MTTR)
POI (Point of Interconnection) Congestion
Metering and billing credibility
Resolution of billing complaints
Customer care promptness
Time taken to refund of deposits after closure
1.5.1.2 3 DAY LIVE MEASUREMENT – METHODOLOGY AND PARAMETERS REVIEWED
The main purpose of 3 day live measurement is to evaluate the following parameters on intraday basis.
The auditors visit the sample exchanges (in case of BSNL) and main exchanges (in case of other
operators) to collect the 3 day live data for the following parameters
POI (Point of Interconnection) Congestion
While the quarterly PMR report provides an overall view of the performance of QoS parameters, the 3
day live data helps looking at intraday performance on the above given parameters. All the calculations
are then done on the basis of that raw data of 3 days.
1.5.1.3 TCBH – SIGNIFICANCE AND SELECTION METHODOLOGY
As per QoS regulations 2009 (7 of 2009), Time Consistent Busy Hour” or “TCBH” means the one hour
period starting at the same time each day for which the average traffic of the resource group concerned
is greatest over the days under consideration and such Time Consistent Busy Hour shall be established
on the basis of analysis of traffic data for a period of ninety days.
Step by step procedure to identify TCBH for an operator:
TRAI Audit Wireline Report- BIHAR/JHARKHAND Circle AMJ Quarter-2016
9
During audit, the auditors identified from the raw data that the TCBH for the operators in AMJ’16 was
the time period as given below.
1.5.2 LIVE CALLING - SIGNIFICANCE AND METHODOLOGY
The main purpose of live calling is to verify the performance of following parameters by doing test calls
to the subscribers/ specific numbers.
Fault clearance
Resolution of billing complaints
Response time to the customer for assistance
Level 1 services
The process of conducting live calling has been stated below.
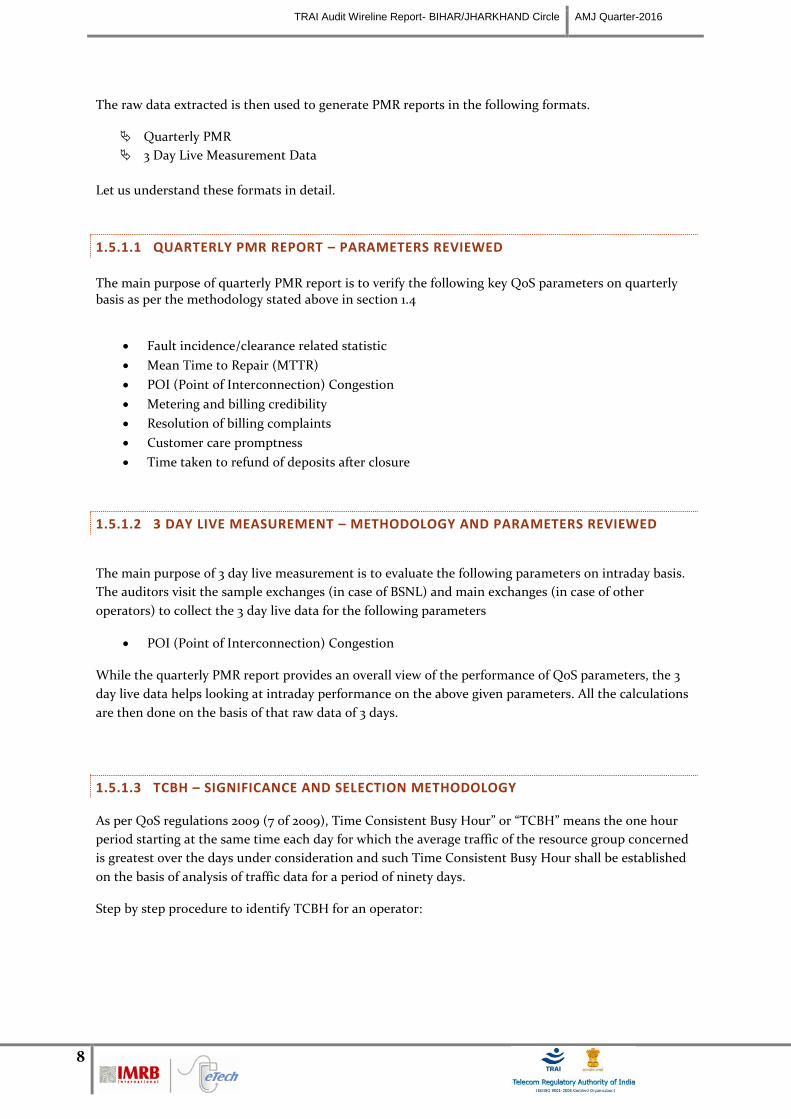
Day wise raw data is fetched from the operator's OMCR and kept in a readable format (preferably MS-Excel). Data for a period of 90 days is used to identify TCBH.
The 90 day period is decided upon the basis of month of audit. For example, for audit of June 2016, the 90 day period data used to identify TCBH would be the data of April, May & June 2016.
For each day, the hour in which average traffic of the resource group concerned is greatest for the day will be the 'Busy Hour' for the operator.
The modal frequency of the busy hour is calculated for 90 days period and the hour with highest modal frequency will be considered as TCBH for the operator.

TRAI Audit Wireline Report- BIHAR/JHARKHAND Circle AMJ Quarter-2016
10
Let us now discuss the methodology of live calling for each parameter in detail.
1.5.2.1 FAULT CLEARANCE
Live calling for fault clearance is done to verify the following.
Fault repair by next working day - for both Urban and Rural Exchanges
Fault repair within 5 working days – Urban Exchanges
Fault repair within 7 working days – Rural Exchanges
Auditors request the operator to provide the database of all the subscribers who reported Faults
in one month prior to IMRB auditor visit
Calls are made to up to 10% or 100 complainants, whichever is less, per service provider or in
case of BSNL, if there are more than 1 SDCAs selected for the sample, 10% or 30 complainants
per sample SDCA by randomly selecting from the list provided by operator.
Auditors check and record whether the fault was corrected within the timeframes as mentioned
in the benchmark
Benchmark:
Fault repair by next working day (Urban Exchanges): =>85%
Fault repair by next working day (Rural Exchanges): =>75%
Fault repair within 5 working days (Urban Exchanges): =100%
Fault repair within 7 working days (Rural Exchanges): =100%
The auditors also verify the performance of call center and level 1 services by calling the numbers using operator's wireline network
IMRB auditors then make live calls to a random sample of subscribers from the raw data provided to verify the resolution of complaints
The IMRB auditor visits the operator premises such as main exchanges/ OMC/ customer service center etc. to do live calling. The operators provide the raw data of customer complaints (billing) from the preceding month and also the list of customer service numbers to be verified through
live calling

TRAI Audit Wireline Report- BIHAR/JHARKHAND Circle AMJ Quarter-2016
11
1.5.2.2 RESOLUTION OF BILLING COMPLAINTS
Live calling is done to verify Resolution of billing complaints within stipulated time. The process for this
parameter is stated below.
Auditors collected the data from operators system of all the subscribers who reported billing
complaints in one month prior to IMRB auditor visit. In case of BSNL, data for the complaints
from the subscribers belonging to the sample exchanges is requested specifically
A sample of 10% or 100 complainants, whichever is less, is selected randomly from the list
provided by operator
Calls are made by auditors to the sample of subscribers to check and record whether the
complaint was resolved within the timeframes as mentioned in the benchmark.
Benchmark:
98% complaints resolved within 4 weeks, 100% complaints resolved within 6 weeks
1.5.2.3 RESPONSE TIME TO CUSTOMER FOR ASSISTANCE
Live calling is done to verify response time for customer assistance is done to verify the performance of
call center in terms of
Calls getting connected and answered:
% age of calls answered by operator / voice to voice) within 90 seconds: In 95% of the cases or
more
The process for this parameter is stated below.
Overall sample size is 100 calls per service provider per circle at different points of time, evenly
distributed across the selected exchanges – 50 calls between 1000 HRS to 1300 HRS and 50 calls
between 1500 HRS to 1700 HRS.
Time to answer the call by the operator was assessed from the time interviewer pressed the
requisite button for being assisted by the operator.
All the supplementary services that have any kind of human intervention are to be covered
here. It also includes the IVR assisted services.
1.5.2.4 LEVEL 1 SERVICE
Level 1 is used for accessing special services like emergency services, supplementary services, inquiry
and operator-assisted services. Level 1 Services include services such as police, fire, ambulance
(Emergency services). Test calls were made from operator network to test the accessibility and
efficiency of Level 1 services on an operator’s network.
A minimum of 300 test calls were made per service provider in the quarter. In case of BSNL, calls were
equally distributed among SDCAs (Short Distance Charging Area) visited for the purpose of live calling.

TRAI Audit Wireline Report- BIHAR/JHARKHAND Circle AMJ Quarter-2016
12
In AMJ’16, IMRB has conducted the live calling to the list of Level 1 services provided by TRAI as per the
NNP (National Numbering Plan).
1.5.2.4.1 PROCESS TO TEST LEVEL 1 SERVICES
On visiting the operator’s premises (Exchange/Central Server etc.), auditors ask the operator authorized personnel to provide a list of Level 1 services being active in their service. The list should contain a description of the numbers along with dialing code.
Operators might provide a long list of L1 services. To identify emergency L1 service numbers, auditors check if there is any number that starts with code ‘10’ in that list. If auditors find any emergency number in addition to the below list, that number is also tested during live calling.
On receiving the list, auditors verify it if the below given list of numbers are active in the service provider’s network.
If there are any other additional numbers provided by the operator, auditors also do live calling on those numbers along with below list.
If any of these numbers is not active, then we would write the same in our report, auditors write in the report.
Post verifying the list, auditors do live calling by equally distributing the calls among the various numbers and update the results in the live calling sheet.

TRAI Audit Wireline Report- BIHAR/JHARKHAND Circle AMJ Quarter-2016
13
1.5.3 AUDIT METHODOLOGY
As per audit tender, following table explains the audit methodology for Basic (Wireline) services. Here, a YES signifies that the mentioned parameter gets audited by the given audit method (PMR/ Live Measurement/ Live Calling).
Sl. No.
Parameters PMR Live measurement Live calling
1 Fault incidence/clearance related statistic
YES
1.1 - Total number of faults registered per month
YES
1.2 - Fault repair by next working day (Urban and Rural)
YES YES
1.3.1 - Fault repair within 5 working days (Urban)
YES YES
1.3.2 - Fault repair within 7 working days (Rural)
YES YES
1.4 Mean Time to Repair (MTTR)
YES
4 POI Congestion
YES YES
5 Metering and billing credibility – postpaid
YES YES
5.1 Metering and billing credibility – prepaid
YES YES
6 Customer service promptness
YES
6.1 Processing closure request
YES
7 Response time to customer
YES
7.1 While call is getting connected and answered
YES YES
7.2 While call is answered by operator (voice to voice)
YES YES
8 Level 1 Services YES
9 Time taken to refund of deposits after closure
YES
The audit methodology for each parameter has been explained along with the findings of same.

TRAI Audit Wireline Report- BIHAR/JHARKHAND Circle AMJ Quarter-2016
14
1.5.4 MEASUREMENT METHODOLOGY
As per audit tender, following table explains the measurement methodology in terms of time period consideration for various parameters involved in audit of Basic (Wireline) services.
Sl. No.
Parameters Averaged over a period
1 Fault incidence One Quarter
1.1 Total number of faults registered per month
One Quarter
1.2 Fault repair by next working day (Urban and Rural)
One Quarter
1.3.1 Fault repair within 5 working days (Urban)
One Quarter
1.3.2 Fault repair within 7 working days (Rural)
One Quarter
1.4 Mean Time to Repair (MTTR)
One Quarter
4 POI Congestion One Month
5 Metering and billing credibility – postpaid
One Billing Cycle
5.1 Metering and billing credibility – prepaid
One Quarter
6 Customer care promptness
One Quarter
6.1 Processing closure request
One Quarter
7 Response time to customer
One Quarter
7.1 While call is getting connected and answered
One Quarter
7.2 While call is answered by operator (voice to voice) within 90 seconds
One Quarter
8 Time taken to refund of deposits after closure
One Quarter

TRAI Audit Wireline Report- BIHAR/JHARKHAND Circle AMJ Quarter-2016
15
1.6 SAMPLING METHODOLOGY
For BSNL, sampling include all exchanges, including rural and urban exchanges, in 10% of
SDCAs in the licensed service area or 10 SDCAs, whichever is more for the purpose of audit, live
calling and live measurement.
For Reliance, Tata and Vodafone audit was conducted in centralized exchange.
The sampling plan for BSNL was finalized as per TRAI guidelines. The details of exchange list
are given below
Audit for BSNL has been conducted on the basis of data pertaining to sample SDCAs and exchanges.
1.6.1.1 SDCA SELECTED AS PER SAMPLING PLAN – BSNL
Bihar Jharkhand SDCA Rev. District SDCA Rev. District
Ara Bhojpur Bokaro Bokaro
Bhagalpur Bhagalpur Deoghar Deoghar
Chapra Saran Dhanbad Dhanbad
Samastipur Samastipur Giridih Giridih
Darbhanga Darbhanga Hazaribag Hazaribag
Aurangabad Aurangabad Jamshedpur East Singhbhum
Gaya Gaya Ramgarh Ramgarh
Muzaffarpur Muzaffarpur Ranchi Ranchi
Hajipur Vaishali
Danapur Patna
Patna Patna
1.7 COLOUR CODE TO READ THE REPORT
Not Meeting the benchmark

TRAI Audit Wireline Report- BIHAR/JHARKHAND Circle AMJ Quarter-2016
16
2 EXECUTIVE SUMMARY
The objective assessment of Quality of Service (QoS) carried out by IMRB gives an insight into the
overall performance of various operators in the BIHAR/JHARKHAND circle, with a parameter wise
performance evaluation as compared to TRAI benchmark.
2.1 PMR (PERFORMANCE MONITORING REPORT) DATA – AMJ’16
NA: Not Applicable
2.1.1 FAULT INCIDENCE / CLEARANCE STATISTICS
All the operators met the benchmark for fault incidence.
All the operators met the benchmark of fault repair within next day in urban areas.
All the operators met the benchmark for the Mean time to repair (MTTR).
Rent rebate not applicable as all faults were repaired within stipulated time for the operators.
Note: - Reliance did not receive any fault complaint during the audit period

TRAI Audit Wireline Report- BIHAR/JHARKHAND Circle AMJ Quarter-2016
17
2.1.2 POI (POINT OF INTERCONNECTION) CONGESTION
All operators met the benchmark by reporting 0% POIs with congestion.
NA: In case of POI for Vodafone, there is no direct POI from Wireline MSC. All Calls are getting routed
via Inter MSC TGs with GSM MSCs. So, Total number of working POI is not present in the wireline
system of Vodafone. The operator system is not equipped to provide the POI data separately for
wireline.
2.1.3 METERING AND BILLING CREDIBILITY
All the operators met the benchmark for metering and billing credibility.
2.1.4 RESOLUTION OF BILLING COMPLAINTS
All operators met the benchmark for resolution of billing complaints within 4 weeks and for resolution
of billing complaints within 6 weeks. There were no complaints registered in this period.
2.1.5 PERIOD OF APPLYING CREDIT/ WAIVER
NA: No cases where credit/ waiver were required during the audit period.
2.1.6 CLOSURE WITHIN 7 DAYS
All operators met the benchmark for the parameter..
2.1.7 RESPONSE TIME TO CUSTOMER FOR ASSISTANCE
NP: BSNL did not submit data during Audit AMJ’16.
All operators met the TRAI benchmark in terms of number of IVR calls being connected and answered.
The benchmark of 95% of voice to voice calls answered within stipulated time of 90 seconds for all
operators.
2.1.8 REFUND OF DEPOSIT WITHIN 60 DAYS FROM CLOSURE
BSNL met the benchmark for refund of deposit within 60 days from closure.
NA: Did not have any closure request during the audit period. No refunds applicable.

TRAI Audit Wireline Report- BIHAR/JHARKHAND Circle AMJ Quarter-2016
18
2.2 3 DAY LIVE MEASUREMENT
2.2.1 POI (POINT OF INTERCONNECTION) CONGESTION
NA: In case of POI for Vodafone, there is no direct POI from Wireline MSC. All Calls are getting routed
via Inter MSC TGs with GSM MSCs. So, Total number of working POI is not present in the wireline
system of Vodafone. The operator system is not equipped to provide the POI data separately for
wireline.
2.3 LIVE CALLING
2.3.1 FAULTS REPAIR/ CLEARANCE
All operators met the benchmark of fault repair within next day and within 5 days in urban areas.
NA: Reliance, TATA and Vodafone do not have presence in rural areas.
2.3.2 RESOLUTION OF BILLING COMPLAINT
During live calling, for BSNL, Reliance, TATA and Vodafone were not conducted as there were no
complaints reported for the operator in the audit period.

TRAI Audit Wireline Report- BIHAR/JHARKHAND Circle AMJ Quarter-2016
19
2.3.3 RESPONSE TIME TO CUSTOMER FOR ASSISTANCE
During live calling, it was observed that BSNL failed to meet the benchmark of %age calls answered by
operators in 90 seconds.
2.3.4 LEVEL 1 SERVICES
BSNL failed to meet the benchmark for Level 1 services. The details of live calling have been provided in
the annexure.

TRAI Audit Wireline Report-Assam Circle AMJ Quarter-2015
20
3 CRITICAL FINDINGS - AMJ’16
Fault Incidence/ Clearance Statistic/ POI
All the operators met the benchmark for fault incidence.
All the operators met the benchmark of fault repair within next day in urban areas.
All the operators met the benchmark for the Mean time to repair (MTTR).
Rent rebate not applicable as all faults were repaired within stipulated time for the operators.
All operators met the benchmark by reporting 0% POIs with congestion.
NA: In case of POI for Vodafone, there is no direct POI from Wireline MSC. All Calls are getting
routed via Inter MSC TGs with GSM MSCs. So, Total number of working POI is not present in the
wireline system of Vodafone. The operator system is not equipped to provide the POI data
separately for wireline.
All the operators met the benchmark for metering and billing credibility.
Resolution of Billing Complaints
There were no complaints registered during the audit period for billing complaints.
NA: No cases where credit/ waiver were required during the audit period.
Response time for customer assistance
NP: BSNL did not submit the data during Audit AMJ’16.
All operators met the TRAI benchmark in terms of number of IVR calls being connected and
answered.
The benchmark of 95% of voice to voice calls answered within stipulated time of 90 seconds for
all operators.
Refund of deposit within 60 days from closure
BSNL met the benchmark for refund of deposit within 60 days from closure
NA: Tata and Vodafone did not have any closure request during the audit period.
.
Live Calling
All operators met the benchmark of fault repair within next day and within 5 days in urban
areas.
During live calling, for BSNL, Reliance, TATA and Vodafone was not conducted as there were
no complaints reported for the operator in the audit period.
During live calling, it was observed that BSNL failed to meet the benchmark of %age calls
answered by operators in 90 seconds.
BSNL failed to meet the benchmark for Level 1 services. The details of live calling have been
provided in the annexure.
NA: Reliance, TATA and Vodafone do not have presence in rural areas.

TRAI Audit Wireline Report-Assam Circle AMJ Quarter-2015
21
4 PARAMETER EXPLANATION AND DETAILED FINDINGS - COMPARISON BETWEEN PMR AND LIVE CALLING/ MEASUREMENT DATA
4.1 FAULT INCIDENCE/ CLEARANCE RELATED SERVICES
4.1.1 PARAMETER EXPLANATION
4.1.1.1 DEFINITION
Fault Incidence: This parameter quantifies the number of faults registered per 100 subscribers/ per
month for a wireline service provider in a quarter.
Fault Clearance/Repair: This parameter quantifies the number of faults repaired within a stipulated
period of time (within a day, within 5 days – urban, within 7 days – rural) in the quarter
Mean Time to Repair (MTTR): It is the average of total time taken to repair for all faults reported in a
quarter
4.1.1.2 AUDIT PROCEDURE
IMRB Auditors to verify and collect data pertaining to number of fault received and also number of
faults cleared at the service provider’s level in the following time frames:-
Number of faults cleared within 24 hours (Urban & Rural)
Number of cleared in more than 1 day but less than 5 days (Urban)
Number of cleared in more than 5 days but less than 7 days (Urban)
Number of cleared in more than 1 day but less than 7 days (Rural)
Number of cleared in more than 7 days but less than 15 days (Urban & Rural)
Number of cleared in more than 15 days (Urban & Rural)
The mean time to repair (in hours) is also calculated by averaging the total time of repair for each
customer.
Live calling: -
Live calling was done to verify the following
o Fault repair by next working day - for both Urban and Rural Exchanges
o Fault repair within 5 working days – Urban Exchanges
o Fault repair within 7 working days – Rural Exchanges
Auditors ensured that the operator provided a list of all the subscribers who reported Faults in
one month prior to IMRB auditor visit

TRAI Audit Wireline Report- BIHAR/JHARKHAND Circle AMJ Quarter-2016
22
Calls are made to up to 10% or 100 complainants, whichever is less, per service provider or in
case of BSNL, if there are more than 1 SDCAs selected for the sample, 10% or 30 complainants
per sample SDCA by randomly selecting from the list provided by operator.
Auditors checked and recorded whether the fault was corrected within the timeframes as
mentioned in the benchmark
4.1.1.3 COMPUTATIONAL METHODOLOGY
The calculation methodology (given below) as per QoS regulations 2009 (7 of 2009) was followed for
calculating fault related parameters.
Fault Incidence:
Here, DEL or Direct Exchange Line would be the subscribers of wireline services.
MTTR (Mean Time to Repair):
4.1.1.4 BENCHMARK
Total number of faults registered per month: <=5 complaints per 100 subscribers
Fault repair:
o Fault repair by next working day (Urban Exchanges): >=85%
o Fault repair by next working day (Rural Exchanges): >=75%
o Fault repair within 5 working days (Urban Exchanges): =100%
o Fault repair within 7 working days (Rural Exchanges): =100%
Mean Time to Repair: <=10 hours

TRAI Audit Wireline Report- BIHAR/JHARKHAND Circle AMJ Quarter-2016
23
4.1.2 DETAILED FINDINGS - FAULT INCIDENCE
5.22NA 2
7
0.0
5.0
10.0
15.0
BSNL Reliance TATA vodafoneNo
. o
f fa
ult
s p
er
10
0 s
ub
scri
be
rs p
er
mo
nth
Fault incidence
BSNL RelianceTATA vodafone
TRAI Benchmark ≤ 7
Data Source: Operations and Maintenance Center (OMC) of the operators
All operators met the benchmark for fault incidence.
4.1.3 DETAILED FINDINGS - FAULT REPAIR BY NEXT DAY (URBAN)
95.79%
NA
97.18% 100.00%100%
NA
90.00%100.00%
0%10%20%30%40%50%60%70%80%90%
100%
BSNL Reliance TATA vodafone
Pe
rce
nta
ge f
ault
s re
par
ed
by
ne
xt
wo
rkin
g d
ay
Fault repair by next working day - Urban
Audit Results for Fault repair Live calling for fault repair
TRAI Benchmark ≥ 85%
Data Source: Operations and Maintenance Center (OMC) of the operators
All operators met the benchmark of fault repair within next day in urban areas as per audit.
TRAI Audit Wireline Report- BIHAR/JHARKHAND Circle AMJ Quarter-2016
24
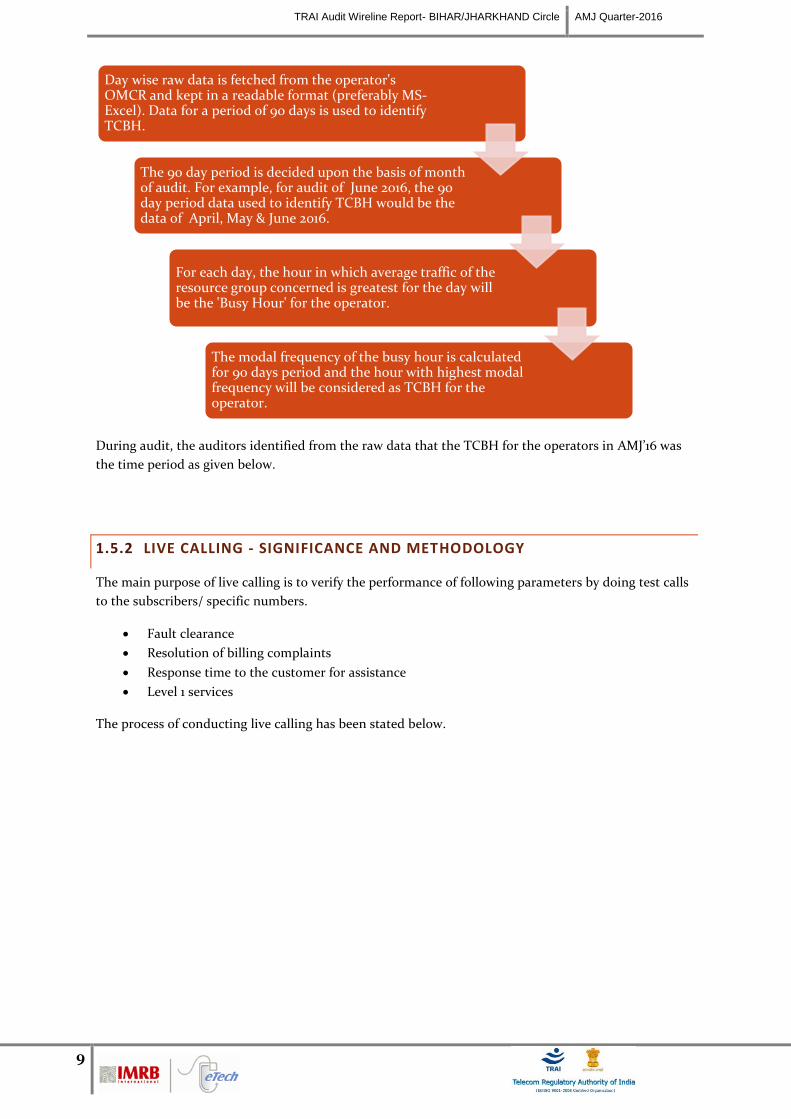
4.1.1 DETAILED FINDINGS - FAULT REPAIR BY NEXT DAY (RURAL)
80.56%
NA NA NA
100%
NA NA NA0%
20%
40%
60%
80%
100%
120%
BSNL Reliance TATA vodafone
Pe
rce
nta
ge f
ault
s re
par
ed
by
ne
xt
wo
rkin
g d
ayFault repair by next working day (Rural)
Audit Results for Fault repair Live calling for fault repair
TRAI Benchmark ≥ 75%
Data Source: Operations and Maintenance Center (OMC) of the operators
BSNL met the TRAI benchmark for fault repair by next working day in rural area.
NA: Does not have network presence in rural and hilly areas.
4.1.2 FINDINGS - FAULT REPAIR WITHIN FIVE WORKING DAYS (URBAN)
100%
NA
100.00% 100.00%
100%
NA
100.00% 100.00%
0%
20%
40%
60%
80%
100%
BSNL Reliance TATA vodafone
Pe
rce
nta
ge f
ault
s re
pai
red
w
ith
in f
ive
wo
rkin
g d
ays
Fault repair within five working days day - Urban
Audit Results for Fault repair Live calling for fault repair
TRAI Benchmark = 100%
Data Source: Operations and Maintenance Center (OMC) of the operators
All operators met the benchmark.

TRAI Audit Wireline Report- BIHAR/JHARKHAND Circle AMJ Quarter-2016
25
4.1.1 FINDINGS - FAULT REPAIR WITHIN SEVEN WORKING DAYS (RURAL)
100%
NA NA NA
100%
NA NA NA0%
20%
40%
60%
80%
100%
BSNL Reliance TATA vodafone
Pe
rce
nta
ge f
ault
s re
pai
red
wit
hin
se
ven
w
ork
ing
day
sFault repair within seven working days (Rural)
Audit Results for Fault repair Live calling for fault repair
TRAI Benchmark = 100%
Data Source: Operations and Maintenance Center (OMC) of the operators
NA: Does not have network presence in rural and hilly areas.
4.1.2 DETAILED FINDINGS - MEAN TIME TO REPAIR
6.37
2.70 2.68 2.45
0.001.002.003.004.005.006.007.008.009.00
10.00
BSNL Reliance TATA vodafone
MTT
R
Mean time to repair
BSNL Reliance
TATA vodafone
TRAI Benchmark ≤ 10 hrs
Data Source: Operations and Maintenance Center (OMC) of the operators
All operators met the benchmark for the parameter.

TRAI Audit Wireline Report- BIHAR/JHARKHAND Circle AMJ Quarter-2016
26
4.2 METERING AND BILLING CREDIBILITY
4.2.1 PARAMETER EXPLANATION
All the complaints related to billing as per clause 3.7.2 of QoS regulation of 20th
March, 2009 were
covered. The types of billing complaints covered are listed below.
Payments made and not credited to the subscriber account
Payment made on time but late payment charge levied wrongly
Double charges
Charging for toll free services
Local calls charged/billed as STD/ISD or vice versa
Calls made disputed
Credit agreed to be given in resolution of complaint, but not accounted in the bill
Charging for services provided without consent
Charging not as per tariff plans
Overcharging or undercharging
In addition to the above, any billing complaint which leads to billing error, waiver, refund, credit, or any
adjustment is also considered as a valid billing complaint for calculating the number of disputed bills.
4.2.1.1 AUDIT PROCEDURE
IMRB Auditors to verify and collect data pertaining to –
Number of Billing complaints received at the service provider’s level
Last billing cycle stated should be such that due date for payment of bills must be beyond the
date when this form is filled.
Include all types of bills generated for customers. This could include online as well as other
forms of bills presentation including printed bills
Billing complaint is any of written complaint/ personal visit/ telephonic complaint related to:
Excess metering/ wrong tariff scheme charged, Payment made in time but charged penalty/ not
reflected in next bill, Last payment not reflected in bill, Adjustment/ waiver not done, Anything
else related to bills, Toll free numbers charged etc.
Billing complaints resolution database, with opening and closing date of complaint to identify
the time taken to resolve a complaint

TRAI Audit Wireline Report- BIHAR/JHARKHAND Circle AMJ Quarter-2016
27
Live calling:
Auditors request the operator provided the database of all the subscribers who reported billing
complaints in one month prior to IMRB auditor visit. In case of BSNL, data for the complaints
from the subscribers belonging to the sample exchanges is requested specifically
A sample of 10% or 100 complainants, whichever is less, is selected randomly from the list
provided by operator
Calls are made by auditors to the sample of subscribers to check and record whether the
complaint was resolved within the timeframes as mentioned in the benchmark.
Benchmarks:
98% complaints resolved within 4 weeks, 100% complaints resolved within 6 weeks
4.2.1.2 COMPUTATIONAL METHODOLOGY – METERING AND BILLING CREDIBILITY
The calculation methodology (given below) as per QoS regulations 2009 (7 of 2009) was followed to
calculate incidence of billing complaints.
*Operator to include all types of bills generated for customers. This would include
printed bills, online bills and any other forms of bills generated
**Billing complaints here shall include only dispute related issues (including those that
may arise because of a lack of awareness at the subscribers’ end). It does not include
any provisional issues (such as delayed dispatch of billing statements, etc.) in which
the operator has opened a ticket internally.
TRAI Benchmark: <= 0.1%

TRAI Audit Wireline Report- BIHAR/JHARKHAND Circle AMJ Quarter-2016
28
4.2.1.3 METERING AND BILLING CREDIBILITY – AUDIT FINDINGS
0.00% 0.00% 0.00% 0.00%0.00%
0.01%
0.02%
0.03%
0.04%
0.05%
0.06%
0.07%
0.08%
0.09%
0.10%
BSNL Reliance TATA vodafone
Pe
rce
nta
ge b
ills
dis
pu
ted
Metering and Billing Credibility
Audit Results for Billing performance
TRAI Benchmark ≤ 0.1%
Data Source: Billing Center of the operators
All operators met the benchmark for the parameter.
4.2.1.4 COMPUTATIONAL METHODOLOGY – RESOLUTION OF BILLING COMPLAINTS
Calculation of Percentage resolution of billing complaints
The calculation methodology (given below) as per QoS regulations 2009 (7 of 2009) and TRAI
guidelines (Received on Sep 08, 2016) was followed to calculate resolution of billing complaints.
Resolution of billing complaints within 4 weeks:

TRAI Audit Wireline Report- BIHAR/JHARKHAND Circle AMJ Quarter-2016
29
Resolution of billing complaints within 6 weeks:
o **Billing complaints here shall include only dispute related issues (including those that
may arise because of a lack of awareness at the subscribers’ end). It does not include
any provisional issues (such as delayed dispatch of billing statements, etc.) in which
the operator has opened a ticket internally. Complaints raised by the consumers to
operator are only considered as part of the calculation.
*** Date of resolution in this case would refer to the date when a communication has taken
place from the operator’s end to inform the complainant about the final resolution of the issue
/ dispute.
Benchmark: 98% complaints resolved within 4 weeks, 100% within 6 weeks.
4.2.1.5 RESOLUTION OF BILLING COMPLAINTS – AUDIT FINDINGS
NA NA NA NANA NA NA NA0%
25%
50%
75%
100%
BSNL Reliance TATA vodafone
Pe
rce
nta
ge c
ase
s re
solv
ed
in
4 w
ee
ks
Resolution of billing complaints-4 Weeks
Audit Results for Billing performance Live calling results for resolution of billing complaints
TRAI Benchmark =98%
NA: Not Applicable: Zero complaints

TRAI Audit Wireline Report- BIHAR/JHARKHAND Circle AMJ Quarter-2016
30
NA NA NA NANA NA NA NA0%
25%
50%
75%
100%
BSNL Reliance TATA vodafone
Pe
rce
nta
ge c
ase
s re
solv
ed
in
6
we
eks
Resolution of billing complaints-6 weeks
Audit Results for Billing performance Live calling results for resolution of billing complaints
TRAI Benchmark =100%
NA: Not Applicable: Zero complaints
4.2.1.6 COMPUTATION METHODOLOFY - PERIOD OF APPLYING CREDIT WAIVER
This parameter measures whether all refunds in the form of credit/ waiver/ adjustment are made within
7 days from the date of resolution of complaint.
Computational Methodology:
Period of applying credit waiver = (number of cases where credit waiver is applied
within 7 days/ total number of cases eligible for credit waiver) * 100
TRAI Benchmark:
Period of applying credit waiver within 7 days: 100%
Audit Procedure:
Operator to provide details of:-
Dates of applying credit waiver to all the eligible cases.
Dates of lodging the request for applying credit waiver for all eligible
cases

TRAI Audit Wireline Report- BIHAR/JHARKHAND Circle AMJ Quarter-2016
31
4.3 RESPONSE TIME TO CUSTOMER
4.3.1 PARAMETER EXPLANATION
Following two sub-parameters are covered for this parameter:
Accessibility of Call Centre: The percentage of calls getting connected and answered by the call
center. Not more than 5% calls shall encounter busy signal, no reply or any other failure in
getting connected to the IVR.
% age of calls answered by operators (voice to voice) within stipulated time: Not more than 5%
calls shall encounter busy signal, no reply or any other failure in getting connected to the call
center executive.
4.3.1.1 AUDIT PROCEDURE
IMRB auditors collect the data for time taken to connect a customer’s call both to the IVR as
well as to a customer care executive.
All the supplementary services that have any kind of human intervention are to be covered
here. It also includes the IVR assisted services.
Live calling:
Overall sample size was 100 calls per service provider per circle at different points of time,
evenly distributed across the selected exchanges – 50 calls between 1000 HRS to 1300 HRS and
50 calls between 1500 HRS to 1700 HRS.
Time to answer the call by the operator was assessed from the time interviewer pressed the
requisite button for being assisted by the operator.
All the supplementary services that have any kind of human intervention are to be covered
here. It also includes the IVR assisted services.
4.3.1.2 COMPUTATIONAL METHODOLOGY
Percentage of calls answered in a specified time = (Total no. of calls answered within
that specified time / Total no. of calls dialed for a particular service)*100
4.3.1.3 BENCHMARK
% age of calls getting connected and answered: In 95% of the cases or more.
% age of calls answered by operator / voice to voice) within 90 seconds: In 95% of the cases or
more

TRAI Audit Wireline Report- BIHAR/JHARKHAND Circle AMJ Quarter-2016
32
4.3.2 CALLS GETTING CONNECTED AND ANSWERED
NP
96.76% 97.12% 100.00%
100.00% 100.00% 100.00% 100.00%
0%
10%
20%
30%
40%
50%
60%
70%
80%
90%
100%
BSNL Reliance TATA vodafone
Pe
rce
nta
ge c
alls
an
swe
red
Calls getting connected and answered
Audit results for customer care Live calling results for customer care
TRAI Benchmark ≥ 95%
Data Source: Customer Service Center of the operators
NP: BSNL did not submit the data during Audit of PMR.
All operators met the TRAI benchmark in terms of number of IVR calls being connected and answered.
4.3.3 CALL ANSWERED BY OPERATOR WITHIN 90 SECONDS
NP
95.51% 100.00% 100.00%
80.00%
98.00% 95.00%100.00%
0%10%20%30%40%50%60%70%80%90%
100%
BSNL Reliance TATA vodafone
Pe
rce
nta
ge c
alls
an
swe
red
in
60
se
con
ds
Call Answered by Operator within 90 seconds
Audit results for customer care Live calling results for customer care (Voice to Voice)
TRAI Benchmark ≥ 95%TRAI Benchmark ≥ 95%
Data Source: Customer Service Center of the operators
NP: BSNL did not submit the data during Audit of PMR.
The benchmark of getting 95% of voice to voice calls answered within stipulated time of 90 seconds was
not met by BSNL during live calling.

TRAI Audit Wireline Report- BIHAR/JHARKHAND Circle AMJ Quarter-2016
33
4.4 CUSTOMER CARE PROMPTNESS
4.4.1 PARAMETER EXPLANATION
4.4.1.1 AUDIT PROCEDURE
IMRB Auditors collected and verified data pertaining to -
Processing of closure request (Following key points were taken care of while verifying the data)
The operator includes all Requests for volunteer Permanent Closure and External (shifts to
other exchanges) Shift requests received at their exchange.
DNP (due to Non – payment) cases are excluded.
All holidays are excluded for calculating 7 days.
Closure requests attended in the previous months are excluded
The period for closure starts from the time of submission of application by the subscriber.
4.4.1.2 BENCHMARK
Processing of closure request: Less than 7 days
4.4.2 FINDINGS - CLOSURE REQUEST ATTENDED IN 7 DAYS
100% 100.00%
NA NA0%
10%
20%
30%
40%
50%
60%
70%
80%
90%
100%
BSNL Reliance TATA vodafone
Pe
rce
nta
ge r
eq
ue
sts
atte
nd
ed
Closure Request Attended in 7 daysTRAI Benchmark = 100%TRAI Benchmark ≥ 95%TRAI Benchmark ≥ 95%
Data Source: Customer Service Center of the operators
NA: The parameter is not applicable for TATA and Vodafone as there were no closure requests made during the audit period.
TRAI Audit Wireline Report- BIHAR/JHARKHAND Circle AMJ Quarter-2016
34
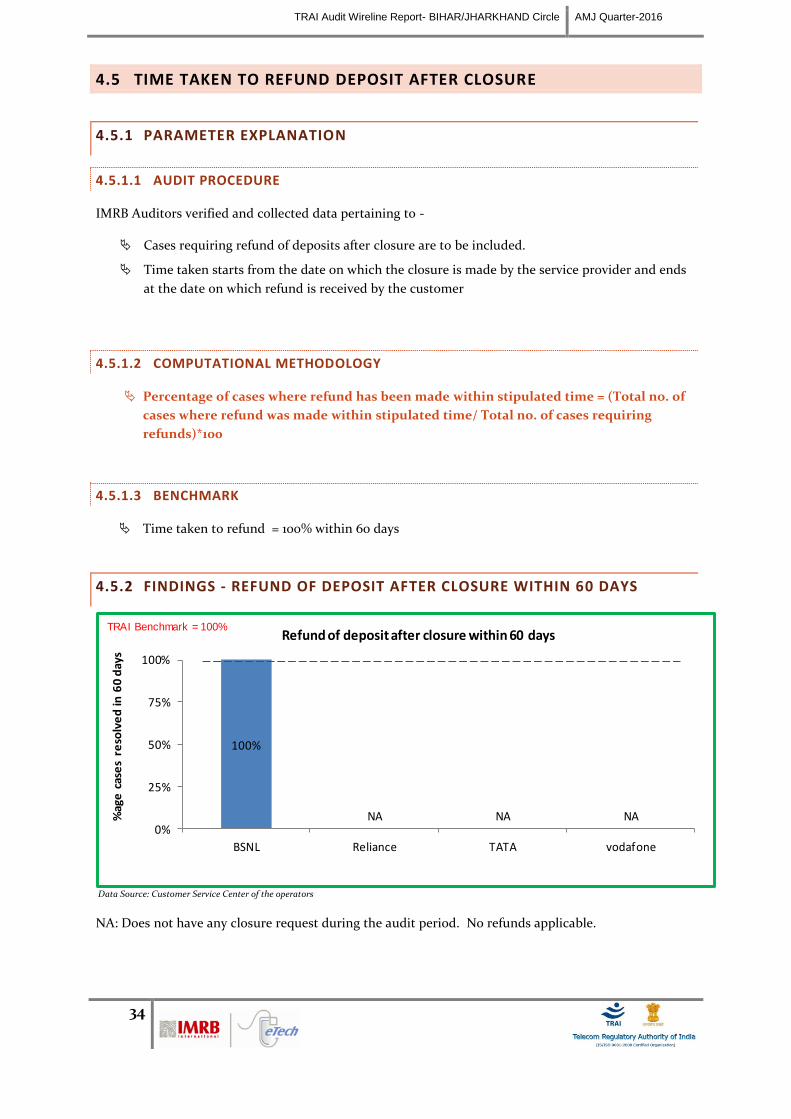
4.5 TIME TAKEN TO REFUND DEPOSIT AFTER CLOSURE
4.5.1 PARAMETER EXPLANATION
4.5.1.1 AUDIT PROCEDURE
IMRB Auditors verified and collected data pertaining to -
Cases requiring refund of deposits after closure are to be included.
Time taken starts from the date on which the closure is made by the service provider and ends
at the date on which refund is received by the customer
4.5.1.2 COMPUTATIONAL METHODOLOGY
Percentage of cases where refund has been made within stipulated time = (Total no. of
cases where refund was made within stipulated time/ Total no. of cases requiring
refunds)*100
4.5.1.3 BENCHMARK
Time taken to refund = 100% within 60 days
4.5.2 FINDINGS - REFUND OF DEPOSIT AFTER CLOSURE WITHIN 60 DAYS
100%
NA NA NA0%
25%
50%
75%
100%
BSNL Reliance TATA vodafone
%ag
e c
ase
s re
solv
ed
in 6
0 d
ays
Refund of deposit after closure within 60 daysTRAI Benchmark = 100%
Data Source: Customer Service Center of the operators
NA: Does not have any closure request during the audit period. No refunds applicable.

TRAI Audit Wireline Report- BIHAR/JHARKHAND Circle AMJ Quarter-2016
35
5 ANNEXURE – AMJ’16
5.1 FAULT INCIDENCE / CLEARANCE STATISTIC
Data Source: Operations and Maintenance Center (OMC) of the operators
Data Source: Live calls made by auditors from operator’s network
NA: Reliance, Tata and Vodafone do not have network presence in rural and hilly areas.

TRAI Audit Wireline Report- BIHAR/JHARKHAND Circle AMJ Quarter-2016
36
5.2 POI CONGESTION
Data Source: Network Operations Center (NOC) of the operators
Data Source: Network Operations Center (NOC) of the operators
NA: In case of POI for Vodafone, there is no direct POI from Wireline MSC. All Calls are getting routed
via Inter MSC TGs with GSM MSCs. So, Total number of working POI is not present in the wireline
system of Vodafone. The operator system is not equipped to provide the POI data separately for
wireline.

TRAI Audit Wireline Report- BIHAR/JHARKHAND Circle AMJ Quarter-2016
37
5.3 METERING AND BILLING CREDIBILITY
Data Source: Billing Center of the operators
Data Source: Billing Center of the operators
NA: - Not applicable, there were no complaint received during the period of audit.

TRAI Audit Wireline Report- BIHAR/JHARKHAND Circle AMJ Quarter-2016
38
5.4 RESPONSE TIME TO THE CUSTOMER FOR ASSISTANCE
Data Source: Customer Service Center of the operators
Data Source: Live calls made by auditors from operator’s network
5.5 CUSTOMER CARE - PROMPTNESS IN ATTENDING CUSTOMER REQUEST
Data Source: Customer Service Center of the operators

TRAI Audit Wireline Report- BIHAR/JHARKHAND Circle AMJ Quarter-2016
39
5.6 TIME TAKEN FOR REFUND OF DEPOSITS AFTER CLOSURE
Data Source: Billing Center of the operators
5.7 LIVE CALLING FOR LEVEL 1 SERVICES
Data Source: Live calling conducted by auditors from operator’s network
BSNL
Level 1 Number Type of Service Working Not
Working Calls
Made Calls
Connected
100 Police Y 18 18
101 Fire N
102 Ambulance Y 18 17
104 Health Information Helpline Y 18 17
108 Emergency and Disaster Management Helpline
N
138 All India Helpline for Passengers Y 18 17
149 Public Road Transport Utility Service
N
181 Chief Minister Helpline N
182 Indian Railway Security Helpline Y 17 17
1033 Road Accident Management Service Y 18 18
1037 Public Grievance Cell DoT Hq as 'Telecom Consumer Grievance Redressal Helpline'
N
1056 Emergency Medical Services N
106X State of the Art Hospitals N
1063 Public Grievance Cell DoT Hq N
1064 Anti Corruption Helpline N
1070 Relief Commission for Natural Calamities
Y 18 18
1071 Air Accident Helpline Y 18 17
1072 Rail Accident Helpline Y 17 17
1073 Road Accident Helpline N
1077 Control Room for District Collector N
TRAI Audit Wireline Report- BIHAR/JHARKHAND Circle AMJ Quarter-2016
40
1090 Call Alert ( Crime Branch) Y 17 17
1091 Women Helpline Y 17 17
1097 National AIDS Helpline to NACO Y 18 17
1099 Central Accident and Trauma Services (CATS)
N
10580 Educational & Vocational Guidance and Counselling
N
10589 Mother and Child Tracking ( MCTH) N
10740 Central Pollution Control Board Y 18 18
10741 Pollution Control Board N
1511 Police Related Service for all Metro Railway Project
N
1512 Prevention of Crime in Railway Y 17 17
1514 National Career Service(NCS) N
15100 Free Legal Service Helpline Y 18 17
155304 Municipal Corporations N
155214 Labour Helpline N
1903 Sashastra Seema Bal (SSB) N
1909 National Do Not Call Registry Y 17 17
1912 Complaint of Electricity N
1916 Drinking Water Supply N
1950 Election Commission of India Y 18 17
Reliance
Level 1 Number Type of Service Working Not
Working Calls
Made Calls
Connected
100 Police Y 19 8
101 Fire N
102 Ambulance N
104 Health Information Helpline Y 19 7
108 Emergency and Disaster Management Helpline
Y 19 7
138 All India Helpline for Passengers N
149 Public Road Transport Utility Service
N
181 Chief Minister Helpline N
182 Indian Railway Security Helpline Y 19 8
1033 Road Accident Management Service Y 19 7
1037 Public Grievance Cell DoT Hq as 'Telecom Consumer Grievance Redressal Helpline'
N
1056 Emergency Medical Services N
106X State of the Art Hospitals N
1063 Public Grievance Cell DoT Hq Y 19 8
1064 Anti-Corruption Helpline N

TRAI Audit Wireline Report- BIHAR/JHARKHAND Circle AMJ Quarter-2016
41
1070 Relief Commission for Natural Calamities
N
1071 Air Accident Helpline N
1072 Rail Accident Helpline Y 19 7
1073 Road Accident Helpline Y 19 7
1077 Control Room for District Collector N
1090 Call Alert ( Crime Branch) Y 19 8
1091 Women Helpline N
1097 National AIDS Helpline to NACO Y 19 7
1099 Central Accident and Trauma Services (CATS)
N
10580 Educational & Vocational Guidance and Counselling
N
10589 Mother and Child Tracking ( MCTH) N
10740 Central Pollution Control Board Y 18 7
10741 Pollution Control Board N
1511 Police Related Service for all Metro Railway Project
Y 19 7
1512 Prevention of Crime in Railway Y 19 7
1514 National Career Service(NCS) N
15100 Free Legal Service Helpline Y 18 7
155304 Municipal Corporations N
155214 Labour Helpline N
1903 Sashastra Seema Bal (SSB) N
1909 National Do Not Call Registry N
1912 Complaint of Electricity Y 18 7
1916 Drinking Water Supply N
1950 Election Commission of India Y 18 7
TATA
Level 1 Number Type of Service Working Not
Working Calls
Made Calls
Connected
100 Police Y 20 16
101 Fire Y 20 15
102 Ambulance N
104 Health Information Helpline Y 20 16
108 Emergency and Disaster Management Helpline
N
138 All India Helpline for Passengers Y 20 16
149 Public Road Transport Utility Service
Y 20 15
181 Chief Minister Helpline Y 20 16
182 Indian Railway Security Helpline N
1033 Road Accident Management Service N

TRAI Audit Wireline Report- BIHAR/JHARKHAND Circle AMJ Quarter-2016
42
1037 Public Grievance Cell DoT Hq as 'Telecom Consumer Grievance Redressal Helpline'
N
1056 Emergency Medical Services Y 20 15
106X State of the Art Hospitals N
1063 Public Grievance Cell DoT Hq N
1064 Anti Corruption Helpline Y 20 15
1070 Relief Commission for Natural Calamities
N
1071 Air Accident Helpline N
1072 Rail Accident Helpline N
1073 Road Accident Helpline Y 20 16
1077 Control Room for District Collector N
10120 Call Alert ( Crime Branch) Y 20 16
1091 Women Helpline Y 20 15
1097 National AIDS Helpline to NACO N
1099 Central Accident and Trauma Services (CATS)
N
10580 Educational & Vocational Guidance and Counselling
N
10589 Mother and Child Tracking ( MCTH) N
10740 Central Pollution Control Board N
10741 Pollution Control Board Y 20 15
1511 Police Related Service for all Metro Railway Project
N
1512 Prevention of Crime in Railway N
1514 National Career Service(NCS) N
15100 Free Legal Service Helpline Y 20 16
155304 Municipal Corporations N
155214 Labour Helpline Y 20 16
1903 Sashastra Seema Bal (SSB) N
1909 National Do Not Call Registry N
1912 Complaint of Electricity Y 20 15
1916 Drinking Water Supply N
1950 Election Commission of India N
Vodafone
Level 1 Number Type of Service Working Not
Working Calls
Made Calls
Connected
100 Police Y 20 19
101 Fire Y 20 18
102 Ambulance N
104 Health Information Helpline N
108 Emergency and Disaster Management Helpline
N
138 All India Helpline for Passengers Y 20 19

TRAI Audit Wireline Report- BIHAR/JHARKHAND Circle AMJ Quarter-2016
43
149 Public Road Transport Utility Service
N
181 Chief Minister Helpline N
182 Indian Railway Security Helpline Y 20 19
1033 Road Accident Management Service N
1037 Public Grievance Cell DoT Hq as 'Telecom Consumer Grievance Redressal Helpline'
N
1056 Emergency Medical Services N
106X State of the Art Hospitals N
1063 Public Grievance Cell DoT Hq N
1064 Anti-Corruption Helpline N
1070 Relief Commission for Natural Calamities
Y 20 19
1071 Air Accident Helpline Y 20 18
1072 Rail Accident Helpline N
1073 Road Accident Helpline Y 20 19
1077 Control Room for District Collector N
10120 Call Alert ( Crime Branch) Y 20 19
1091 Women Helpline Y 20 19
1097 National AIDS Helpline to NACO N
1099 Central Accident and Trauma Services (CATS)
N
10580 Educational & Vocational Guidance and Counselling
N
10589 Mother and Child Tracking ( MCTH) N
10740 Central Pollution Control Board Y 20 18
10741 Pollution Control Board N
1511 Police Related Service for all Metro Railway Project
N
1512 Prevention of Crime in Railway Y 20 19
1514 National Career Service(NCS) Y 20 19
15100 Free Legal Service Helpline N
155304 Municipal Corporations N
155214 Labour Helpline N
1903 Sashastra Seema Bal (SSB) N
1909 National Do Not Call Registry Y 20 19
1912 Complaint of Electricity Y 20 19
1916 Drinking Water Supply N
1950 Election Commission of India Y 20 19

TRAI Audit Wireline Report- BIHAR/JHARKHAND Circle AMJ Quarter-2016
44
5.8 EXCHANGE CAPACITY AND SUBSCRIBERS – SAMPLE EXCHANGES
Data Source: Operations and Maintenance Center (OMC) of the operators
5.9 SDCA SELECTED AS PER SAMPLING PLAN – BSNL
Bihar Jharkhand SDCA Rev. District SDCA Rev. District
Ara Bhojpur Bokaro Bokaro
Bhagalpur Bhagalpur Deoghar Deoghar
Chapra Saran Dhanbad Dhanbad
Samastipur Samastipur Giridih Giridih
Darbhanga Darbhanga Hazaribag Hazaribag
Aurangabad Aurangabad Jamshedpur East Singhbhum
Gaya Gaya Ramgarh Ramgarh
Muzaffarpur Muzaffarpur Ranchi Ranchi
Hajipur Vaishali
Danapur Patna
Patna Patna

TRAI Audit Wireline Report- BIHAR/JHARKHAND Circle AMJ Quarter-2016
45
5.10 SAMPLE LIST OF SDCA WISE EXCHANGES (JHARKHAND)
S N Exchange SDCA Station District SSA AREA TYPE
1 Balidih Bokaro Balidih Bokaro Dhanbad U EWSD RSU
2 Bhojudih Bokaro Bhojudih Bokaro Dhanbad R EWSD RSU
3 Chandan Kiyari Bokaro Chandan Kiyari Bokaro Dhanbad R AN-RAX
4 Chas Bazar Bokaro Chas Bazar Bokaro Dhanbad U EWSD RSU
5 Chas Iti Bokaro Chas Iti Bokaro Dhanbad U EWSD RSU
6 Ewsd Bokaro. Bokaro Ewsd Bokaro Bokaro Dhanbad U EWSD M
7 Jaina More Bokaro Jaina More Bokaro Dhanbad R EWSD RSU
8 K.K. Singh Colony Bokaro K.K. Singh
Colony Bokaro Dhanbad U EWSD RSU
9 Makdumpur Bokaro Makdumpur Bokaro Dhanbad U DLC
10 Sec.-V Bokaro Sec.-V Bokaro Dhanbad U EWSD RSU
11 Sector - Viii Bokaro Sector - Viii Bokaro Dhanbad U EWSD RSU
12 Sector -Iv Bokaro Sector -Iv Bokaro Dhanbad U EWSD RSU
13 Sector -Xii Bokaro Sector -Xii Bokaro Dhanbad U EWSD RSU
14 Deoghar B.Pur Deoghar Deoghar Deoghar Dumka U C RSU
15 Deoghar Bilasi Deoghar Deoghar Deoghar Dumka U AN-RAX X 2
16 Deoghar N.P Deoghar Deoghar Deoghar Dumka U MAX-XL
17 Deoghar N.P Deoghar Deoghar Deoghar Dumka U EWSD M
18 Deoghar N.P Deoghar Deoghar Deoghar Dumka U DLC
19 Deoghar Old Deoghar Deoghar Deoghar Dumka U C RSU
20 Deoghar Old Deoghar Deoghar Deoghar Dumka U EWSD RSU
21 Jasidih Deoghar Jasidih Deoghar Dumka U C RSU
22 Mohanpur Deoghar Mohanpur Deoghar Dumka R AN-RAX
23 Sarwan Deoghar Sarwan Deoghar Dumka R AN-RAX
24 Baghmara Dhanbad Baghmara Dhanbad Dhanbad R AN-RAX
25 Baliapur Dhanbad Baliapur Dhanbad Dhanbad U AN-RAX
26 Bansjora Dhanbad Bansjora Dhanbad Dhanbad U AN-RAX
27 Barora Dhanbad Barora Dhanbad Dhanbad U E10B RLU
28 Barwadda Dhanbad Barwadda Dhanbad Dhanbad U OCB RSU
29 Bastacola Dhanbad Bastacola Dhanbad Dhanbad U E10B RLU
30 Bhuli Nagar Dhanbad Bhuli Nagar Dhanbad Dhanbad U OCB RSU
31 Cfri Dhanbad Cfri Dhanbad Dhanbad U OCB RSU
32 Chasnala Dhanbad Chasnala Dhanbad Dhanbad U OCB RSU
33 Cmri Dhanbad Cmri Dhanbad Dhanbad U OCB RSU
34 District Board Dhanbad District Board Dhanbad Dhanbad U OCB RSU
35 Drm Office Dhanbad Drm Office Dhanbad Dhanbad U E10B RLU
36 Ewsd P.Bazar Dhanbad Ewsd P.Bazar Dhanbad Dhanbad U EWSD M
37 Gomoh Dhanbad Gomoh Dhanbad Dhanbad R C RSU
38 Hirapur Dhanbad Hirapur Dhanbad Dhanbad U OCB RSU
39 Ism Dhanbad Ism Dhanbad Dhanbad U DLC
40 Jairampur More Dhanbad Jairampur More Dhanbad Dhanbad U AN-RAX
41 Jamadoba Dhanbad Jamadoba Dhanbad Dhanbad U OCB RSU
42 Jharia Dhanbad Jharia Dhanbad Dhanbad U OCB RSU

TRAI Audit Wireline Report- BIHAR/JHARKHAND Circle AMJ Quarter-2016
46
43 Kandra Dhanbad Kandra Dhanbad Dhanbad R AN-RAX
44 Katras Dhanbad Katras Dhanbad Dhanbad U OCB RSU
45 Koyla Bhawan Dhanbad Koyla Bhawan Dhanbad Dhanbad U E10B RLU
46 Kusum Vihar Dhanbad Kusum Vihar Dhanbad Dhanbad U E10B RLU
47 Kusum Vihar Dhanbad Kusum Vihar Dhanbad Dhanbad U OCB RSU
48 Loyabad Dhanbad Loyabad Dhanbad Dhanbad U OCB RSU
49 Mahuda Dhanbad Mahuda Dhanbad Dhanbad R E10B RLU
50 Moko Dhanbad Moko Dhanbad Dhanbad R AN-RAX
51 Moonidih Dhanbad Moonidih Dhanbad Dhanbad U E10B RLU
52 Ocb, Saraidhela Dhanbad Ocb,Saraidhela Dhanbad Dhanbad U OCB M
53 Ocb,Purana Bazar Dhanbad Ocb,Purana
Bazar Dhanbad Dhanbad U OCB M
54 Rajganj Dhanbad Rajganj Dhanbad Dhanbad R E10B RLU
55 Saraidhela Dhanbad Saraidhela Dhanbad Dhanbad U E10B RLU
56 Sindri Dhanbad Sindri Dhanbad Dhanbad U OCB RSU
57 Sindri Dhanbad Sindri Dhanbad Dhanbad U OCB RSU
58 Sinidih Dhanbad Sinidih Dhanbad Dhanbad R OCB RSU
59 Topchanchi Dhanbad Topchanchi Dhanbad Dhanbad R AN-RAX
60 Bengabad Giridih Bengabad Giridih Hazaribag R AN RAX
61 Bhorandiha Giridih Bhorandiha Giridih Hazaribag R AN RAX x 2
62 Chapuadih Giridih Chapuadih Giridih Hazaribag R AN RAX
63 Gandey Giridih Gandey Giridih Hazaribag R AN RAX
64 Giridih Giridih Giridih Giridih Hazaribag U MAX-XL
65 Giridih Giridih Giridih Giridih Hazaribag U OCB M
66 Giridih Giridih Giridih Giridih Hazaribag U DLC
67 Hirodih Giridih Hirodih Giridih Hazaribag R AN RAX x 2
68 Maheshmunda Giridih Mahesh Munda Giridih Hazaribag U AN RAX
69 Taratand Giridih Taratand Giridih Hazaribag R AN RAX
70 Bisnugarh Hazaribag Bishnugarh Hazaribag Hazaribag R C RSU
71 Charhee Hazaribag Charhee Hazaribag Hazaribag R C RSU
72 Churchu Hazaribag Churchu Hazaribag Hazaribag R AN RAX
73 Daru Hazaribag Daru Hazaribag Hazaribag R AN RAX x 2
74 Demotand Hazaribag Demotand Hazaribag Hazaribag R AN RAX x 2
75 Giddi Hazaribag Giddi Hazaribag Hazaribag U C RSU
76 Hazaribag New Exch Hazaribag Hazaribag Hazaribag Hazaribag U MAX-XL
77 Hazaribag New Exch Hazaribag Hazaribag Hazaribag Hazaribag U EWSD M
78 Hazaribag Old Exch Hazaribag Hazaribag Hazaribag Hazaribag U MAX-XL
79 Hazaribag Old Exch Hazaribag Hazaribag Hazaribag Hazaribag U EWSD RSU
80 Jalima Hazaribag Jalima Hazaribag Hazaribag R AN RAX
81 Jhumra Hazaribag Jhumra Hazaribag Hazaribag R AN-RAX X2
82 Kadma Hazaribag Kadma Hazaribag Hazaribag R C RSU
83 Konar Dam Hazaribag Konardam Hazaribag Hazaribag R AN RAX
84 Meru Hazaribag Meru Hazaribag Hazaribag U C RSU
85 Padma Hazaribag Padma Hazaribag Hazaribag R AN RAX x 2
86 Parej Hazaribag Parej Hazaribag Hazaribag R AN RAX x 2

TRAI Audit Wireline Report- BIHAR/JHARKHAND Circle AMJ Quarter-2016
47
87 Tati Jharia Hazaribag Tatijharia Hazaribag Hazaribag R AN RAX
88 Ashiana Sun City Jamshedpur Jamshedpur East Singhbhum Jamshedpur U EWSD RSU
89 Azad Nagar Jamshedpur Jamshedpur East Singhbhum Jamshedpur U EWSD RSU
90 Baradwari Jamshedpur Jamshedpur East Singhbhum Jamshedpur U OCB RSU
91 Fadalugora Jamshedpur Jamshedpur East Singhbhum Jamshedpur U OCB RSU
92 Golmuri Jamshedpur Jamshedpur East Singhbhum Jamshedpur U EWSD RSU
93 Govindpur Jamshedpur Jamshedpur East Singhbhum Jamshedpur U OCB RSU
94 Haldipokhar Jamshedpur Haldipokhar East Singhbhum Jamshedpur R AN-RAX x 2
95 Jadugoda Jamshedpur Jadugoda East Singhbhum Jamshedpur U EWSD RSU
96 Jamshedpur Jamshedpur Jamshedpur East Singhbhum Jamshedpur U OCB M
97 Kadma Jamshedpur Jamshedpur East Singhbhum Jamshedpur U EWSD M
98 Kalikapur Jamshedpur Kalikapur East Singhbhum Jamshedpur R AN-RAX
99 Katin Jamshedpur Katin East Singhbhum Jamshedpur R AN-RAX
100 Kharkai Link Jamshedpur Jamshedpur East Singhbhum Jamshedpur U OCB RSU
101 Lic Bistupur Jamshedpur Jamshedpur East Singhbhum Jamshedpur U EWSD RSU
102 Lsbf Dlc Jamshedpur Jamshedpur East Singhbhum Jamshedpur U DLC
103 Mango Jamshedpur Jamshedpur East Singhbhum Jamshedpur U EWSD RSU
104 Manifit Jamshedpur Jamshedpur East Singhbhum Jamshedpur U OCB RSU
105 Narwapahar Jamshedpur Narwapahar East Singhbhum Jamshedpur R EWSD RSU
106 Nit Adityapur Dlc Jamshedpur Jamshedpur Seraikela-
Kharsawan Jamshedpur U EWSD RSU
107 Nml Agrico Jamshedpur Jamshedpur East Singhbhum Jamshedpur U EWSD RSU
108 Nml Burmamines Jamshedpur Jamshedpur East Singhbhum Jamshedpur U EWSD RSU
109 Nml Tuiladungri Jamshedpur Jamshedpur East Singhbhum Jamshedpur U EWSD RSU
110 Pandey Colony Dlc Jamshedpur Jamshedpur East Singhbhum Jamshedpur U OCB RSU
111 Parsudih Jamshedpur Jamshedpur East Singhbhum Jamshedpur U OCB RSU
112 Patamda Jamshedpur Patamda East Singhbhum Jamshedpur R AN-RAX
113 Potka Jamshedpur Potka East Singhbhum Jamshedpur R AN-RAX
114 River View Jamshedpur Jamshedpur East Singhbhum Jamshedpur U OCB RSU
115 Shankosai Jamshedpur Jamshedpur East Singhbhum Jamshedpur U OCB RSU
116 Sidhgora Jamshedpur Jamshedpur East Singhbhum Jamshedpur U OCB RSU
117 Sonari(Brindavan) Jamshedpur Jamshedpur East Singhbhum Jamshedpur U EWSD RSU
118 Tatanagar Jamshedpur Jamshedpur East Singhbhum Jamshedpur U OCB RSU
119 Telco Jamshedpur Jamshedpur East Singhbhum Jamshedpur U OCB RSU
120 Tinplate Jamshedpur Jamshedpur East Singhbhum Jamshedpur U EWSD RSU
121 Tisco Dlc Jamshedpur Jamshedpur East Singhbhum Jamshedpur U DLC
122 Turamdih Jamshedpur Jamshedpur East Singhbhum Jamshedpur U EWSD RSU
123 Vijaya Garden Jamshedpur Jamshedpur East Singhbhum Jamshedpur U EWSD RSU
124 Vijaya Heritage Jamshedpur Jamshedpur East Singhbhum Jamshedpur U EWSD RSU
125 Argada Ramgarh Argada Ramgarh Hazaribag R E10B RLU
126 Barkakana Ramgarh Barkakana Ramgarh Hazaribag U E10B RLU
127 Bhurkunda Ramgarh Bhurkunda Ramgarh Hazaribag R E10B RLU
128 Chhatramandu Ramgarh Chhatar Mandu Ramgarh Hazaribag R E10B RLU
129 Gola Ramgarh Gola Ramgarh Hazaribag R E10B RLU
130 Magan Pur Ramgarh Maganpur Ramgarh Hazaribag R AN RAX x 2
131 Rajrappa Ramgarh Ramgarh Ramgarh Hazaribag R E10B RLU
132 Ramgarh Ramgarh Ramgarh Ramgarh Hazaribag U OCB M
133 Ramgarh Ramgarh Ramgarh Ramgarh Hazaribag U E10B RLU

TRAI Audit Wireline Report- BIHAR/JHARKHAND Circle AMJ Quarter-2016
48
134 River Side
Bhurkunda Ramgarh River Side Ramgarh Hazaribag R AN RAX x 3
135 Saoundadih Ramgarh Saunda 'D' Ramgarh Hazaribag R AN RAX x 2
136 Sayal Ramgarh Sayal Ramgarh Hazaribag R E10B RLU
137 A.Nagar Ranchi Ranchi Ranchi Ranchi U EWSD RSU
138 Bariatu Ranchi Ranchi Ranchi Ranchi U OCB M
139 Bit Ranchi Ranchi Ranchi Ranchi U EWSD RSU
140 Ccl Ranchi Ranchi Ranchi Ranchi U OCB RSU
141 Chutia Ranchi Ranchi Ranchi Ranchi U EWSD RSU
142 Cmpdil Ranchi Ranchi Ranchi Ranchi U EWSD RSU
143 Devi Mandap Ranchi Ranchi Ranchi Ranchi U EWSD RSU
144 Dhurwa Ranchi Ranchi Ranchi Ranchi U E10B RLU
145 Dhurwa Ranchi Ranchi Ranchi Ranchi U EWSD RSU
146 Dhurwa Bus St. Ranchi Ranchi Ranchi Ranchi U EWSD RSU
147 Dhurwa Bus Stand Ranchi Ranchi Ranchi Ranchi U E10B RLU
148 Dhurwa/Sect-Ii Ranchi Ranchi Ranchi Ranchi U EWSD M
149 Govt Polytech Ranchi Ranchi Ranchi Ranchi U EWSD RSU
150 Harmu Ranchi Ranchi Ranchi Ranchi U EWSD RSU
151 Hinoo Ranchi Ranchi Ranchi Ranchi U E10B RLU
152 Hinoo Ranchi Ranchi Ranchi Ranchi U EWSD RSU
153 Kadru Ranchi Ranchi Ranchi Ranchi U EWSD RSU
154 Kanke Ranchi Ranchi Ranchi Ranchi U OCB RSU
155 Kantatoli Ranchi Ranchi Ranchi Ranchi U OCB RSU
156 Kathal More Ranchi Ranchi Ranchi Ranchi U EWSD RSU
157 Khelgaon Ranchi Ranchi Ranchi Ranchi U EWSD RSU
158 Kokar Ranchi Ranchi Ranchi Ranchi U OCB RSU
159 Lalpur Ranchi Ranchi Ranchi Ranchi U OCB RSU
160 Mecon Ranchi Ranchi Ranchi Ranchi U EWSD RSU
161 Mesra Ranchi Ranchi Ranchi Ranchi U EWSD RSU
162 Morabadi Ranchi Ranchi Ranchi Ranchi U EWSD RSU
163 Nagri Ranchi Nagri Ranchi Ranchi R AN RAX x 2
164 Namkum Ranchi Ranchi Ranchi Ranchi U EWSD RSU
165 Nayasarai Ranchi Nayasarai Ranchi Ranchi R AN RAX x 2
166 Nepal House Ranchi Ranchi Ranchi Ranchi U EWSD RSU
167 Nifft Ranchi Ranchi Ranchi Ranchi U EWSD RSU
168 Ormanjhi Ranchi Ormanjhi Ranchi Ranchi R EWSD RSU
169 P& T Colony Ranchi Ranchi Ranchi Ranchi U OCB RSU
170 Pandra Ranchi Ranchi Ranchi Ranchi U OCB RSU
171 Pithoria Ranchi Pithoria Ranchi Ranchi R AN RAX x 2
172 Ranchi Ranchi Ranchi Ranchi Ranchi U EWSD M
173 Ranibagan Ranchi Ranchi Ranchi Ranchi U OCB RSU
174 Ratu Ranchi Ratu Ranchi Ranchi U EWSD RSU
175 Ratu Road Ranchi Ranchi Ranchi Ranchi U EWSD RSU
176 Rttc Ranchi Ranchi Ranchi Ranchi U EWSD RSU
177 Sainik Market Ranchi Ranchi Ranchi Ranchi U EWSD RSU
178 Shyamali Ranchi Ranchi Ranchi Ranchi U EWSD RSU
179 Tatisilwai Ranchi Ranchi Ranchi Ranchi U EWSD RSU
180 Tupudana Ranchi Ranchi Ranchi Ranchi U EWSD RSU

TRAI Audit Wireline Report- BIHAR/JHARKHAND Circle AMJ Quarter-2016
49
5.11 SAMPLE LIST OF SDCA WISE EXCHANGES (BIHAR)
S.N. NAME OF EXCH. CDR CODE SDCA AREA TECH. SWITCH EXCH.CAT.
1 Akhgaon Arhakg Ara Rural C-DOT ANRAX
2 Azimabad Arhazb Ara Rural C-DOT ANRAX
3 Babura Arhbab Ara Rural C-DOT ANRAX
4 Barhara Arhbrh Ara Rural C-DOT ANRAX
5 Dhobha Bazar Arhdbh Ara Rural C-DOT ANRAX
6 Jamalpur Arhjml Ara Rural C-DOT ANRAX
7 Pawna Arhpwn Ara Rural C-DOT ANRAX
8 Sahar Arhshr Ara Rural C-DOT ANRAX
9 Saraiya Arhsry Ara Rural C-DOT ANRAX
10 Udwant Nagar Arhudn Ara Rural C-DOT ANRAX
11 Ara Arharh Ara Urban EWSD MAIN
12 Maharaja Hata Arharm Ara Urban EWSD RSU
13 Ara Kachhery Arharo Ara Urban EWSD RSU
14 Sapana Cinema Arhars Ara Urban EWSD RSU
15 Narhi Chandi Arhchd Ara Rural EWSD RSU
16 Gidha Arhgha Ara Rural EWSD RSU
17 Gajrajganj Arhgjr Ara Rural EWSD RSU
18 Koilwar Arhkwa Ara Urban EWSD RSU
19 Narainpur Arhnyr Ara Rural EWSD RSU
20 Sandesh Arhsnd Ara Rural EWSD RSU
21 Dariyapur Bgpdrp Bhagalpur Rural C-DOT AN RAX
22 Fatehpur Bgpftp Bhagalpur Rural C-DOT AN RAX
23 Khiribandh Bgpkbd Bhagalpur Rural OCB AN RAX
24 Kodanda Bgpkdn Bhagalpur Rural C-DOT AN RAX
25 Pithna Bgpptn Bhagalpur Rural OCB AN RAX
26 Raghuchak Bgprgk Bhagalpur Rural C-DOT AN RAX
27 Shahkund Bgpskd Bhagalpur Rural C-DOT AN RAX
28 Tilkamanjhi Bgptmj Bhagalpur Urban NGN LMG
29 Zero Mile Bgpzme Bhagalpur Rural C-DOT AN RAX
30 Kajraili Bgpkaj Bhagalpur Rural C-DOT AN RAX
31 Bhagalpur-1 Bgpbgp Bhagalpur Urban OCB MAIN
32 Akabarnagar Bgpakb Bhagalpur Rural C-DOT AN RAX
33 Mirjanhat Bgpmht Bhagalpur Urban OCB RSU
34 Nath Nagar Bgpnth Bhagalpur Urban OCB RSU
35 Puraini Bgpprn Bhagalpur Rural OCB RSU
36 Sarai Bgpsar Bhagalpur Urban C-DOT RSU
37 Sabour Bgpsbr Bhagalpur Rural OCB RSU
38 Sultanganj Bgpstg Bhagalpur Urban OCB RSU
39 Doriganj Chpdrj Chapra Rural C-DOT AN RAX
40 Gudari Chpgdi Chapra Rural OCB AN RAX
41 Garkha Chpgka Chapra Rural C-DOT AN RAX
42 Khairah Chpkha Chapra Rural C-DOT AN RAX
43 Kopa Chpkop Chapra Rural C-DOT AN RAX
44 Maker Chpmkr Chapra Rural C-DOT AN RAX
45 Naini Chpnni Chapra Rural C-DOT AN RAX
46 Parsa Chppsa Chapra Rural C-DOT AN RAX
47 Revilganj Chprvj Chapra Rural C-DOT AN RAX
48 Sarha Dhala Chpsdh Chapra Rural OCB AN RAX

TRAI Audit Wireline Report- BIHAR/JHARKHAND Circle AMJ Quarter-2016
50
49 Bheldi Chpbdi Chapra Rural C-DOT C-RSU
50 Chapra Chpchp Chapra Urban OCB MAIN
51 Chapra-1 Chapra Urban C-DOT MAIN
52 Basant Chpbsn Chapra Rural OCB RSU
53 Andama Dbnand Darbhanga Rural C-DOT AN RAX
54 Baghoul Dbnbgl Darbhanga Rural C-DOT AN RAX
55 Baghant Dbnbgt Darbhanga Rural C-DOT AN RAX
56 Bairampur Dbnbmp Darbhanga Rural C-DOT AN RAX
57 Bhuskaul Dbnbsk Darbhanga Rural C-DOT AN RAX
58 Hathauri Dbnhtr Darbhanga Rural C-DOT AN RAX
59 Kansi Dbnkns Darbhanga Rural C-DOT AN RAX
60 Khutwara Dbnktw Darbhanga Rural C-DOT AN RAX
61 Manigachi Dbnmgc Darbhanga Rural C-DOT AN RAX
62 Nehra Dbnnhr Darbhanga Rural C-DOT AN RAX
63 Paghari Dbnpgi Darbhanga Rural C-DOT AN RAX
64 Purkhopatty Dbnppi Darbhanga Rural C-DOT AN RAX
65 Sakatpur Dbnskp Darbhanga Rural C-DOT AN RAX
66 T. Sarai Dbntar Darbhanga Rural C-DOT AN RAX
67 Ughara Dbnuga Darbhanga Rural C-DOT AN RAX
68 Ujan Dbnujn Darbhanga Rural C-DOT AN RAX
69 Kusothar Dbnkus Darbhanga Rural C-DOT CRSU
70 Darbhanga-Ewsd Dbndbn Darbhanga Urban EWSD MAIN
71 Baheri Dbnbhr Darbhanga Rural EWSD RSU
72 Bhalpatty Dbnbpt Darbhanga Rural EWSD RSU
73 Bithauli Dbnbtl Darbhanga Rural EWSD RSU
74 Surhachhati Dbnsci Darbhanga Rural EWSD RSU
75 Bela Darbhanga Urban EWSD RSU
76 Laheriasarai Darbhanga Urban EWSD RSU
77 Laxmisagar Darbhanga Urban EWSD RSU
78 Barhi Dbnbrh Darbhanga Rural EWSD RSU
79 Sonki Dbnski Darbhanga Rural C-DOT AN RAX
80 Barun Gyabrn Aurangabad Rural C-DOT AN RAX
81 Bharthauli Gyabtl Aurangabad Rural C-DOT AN RAX
82 Deo Gyadeo Aurangabad Rural C-DOT AN RAX
83 Jamhore Gyajmr Aurangabad Rural C-DOT AN RAX
84 Pawai Gyapwi Aurangabad Rural C-DOT AN RAX
85 Siris Gyasrs Aurangabad Rural C-DOT AN RAX
86 Aurangabad Gyaaud Aurangabad Urban C-DOT MAIN
87 Anti Gyaati Gaya Rural C-DOT AN RAX
88 Chakand Gyackd Gaya Urban OCB AN RAX
89 Cherki Bazar Gyacki Gaya Rural C-DOT AN RAX
90 Delha Gyadlh Gaya Urban C-DOT AN RAX
91 G.Mahal Gaya Gyagml Gaya Rural C-DOT AN RAX
92 Guraru Gyagra Gaya Rural C-DOT AN RAX
93 Jamune Gyajmn Gaya Urban C-DOT AN RAX
94 Konch Gyaknh Gaya Rural C-DOT AN RAX
95 Mau Gyamow Gaya Rural C-DOT AN RAX
96 Paibigha Gyapba Gaya Rural C-DOT AN RAX
97 Paraiya Gyapra Gaya Rural C-DOT AN RAX
98 Tekari Gyatkr Gaya Rural C-DOT AN RAX
99 Maranpur Gaya Gyamrp Gaya Rural C-DOT AN RAX
100 Gaya, Ocb Gyagya Gaya Urban OCB MAIN
101 Bodh Gaya Gyabgy Gaya Urban OCB RSU

TRAI Audit Wireline Report- BIHAR/JHARKHAND Circle AMJ Quarter-2016
51
102 Belaganj Gyablj Gaya Rural OCB RSU
103 Anmch,Gaya Gyamgy Gaya Urban OCB RSU
104 Manpur Gyamnp Gaya Urban NGN LMG
105 Maranpur Gyamrp Gaya Rural
106 Madarna Hajmdn Hajipur Rural C-DOT VAISHALI
107 Malang Hajmlg Hajipur Rural C-DOT VAISHALI
108 Husaina Ragho Hajhur Hajipur Rural C-DOT VAISHALI
109 Sirs Ram Rai Hajsrr Hajipur Rural C-DOT VAISHALI
110 Hajipur Main Hajhzp Hajipur Urban OCB VAISHALI
111 Belsar Hajbel Hajipur Rural OCB VAISHALI
112 Bhagwanpur Hajbgw Hajipur Rural OCB VAISHALI
113 Ghataro Hajgtr Hajipur Rural OCB VAISHALI
114 Lalganj Hajlgi Hajipur Rural OCB VAISHALI
115 Fulhara Hajplr Hajipur Rural OCB VAISHALI
116 Sarai Hajsri Hajipur Rural OCB VAISHALI
117 Vaishali Hajvsl Hajipur Rural OCB VAISHALI
118 Hajipur Sbi Hajipur Urban OCB VAISHALI
119 Hajipur Bzrs Hajipur Urban OCB VAISHALI
120 Muzaffarpur-1 Mzpmze Muzaffarpur Urban NGN LMG
121 Ratwara Mzprtw Muzaffarpur Urban OCB MAIN
122 Aurai Mzpari Muzaffarpur Rural OCB RSU
123 Baghi Mzpbag Muzaffarpur Rural C-DOT RSU
124 Benibad Mzpbbd Muzaffarpur Rural C-DOT RSU
125 Bochahan Mzpboc Muzaffarpur Rural C-DOT RSU
126 Berai Mzpbri Muzaffarpur Rural C-DOT RSU
127 Dubha Mzpdbh Muzaffarpur Rural C-DOT RSU
128 Dholi Mzpdli Muzaffarpur Rural OCB RSU
129 Dardha Mzpdrd Muzaffarpur Rural C-DOT RSU
130 Gaighat Mzpght Muzaffarpur Rural C-DOT RSU
131 Jajuar Mzpjaj Muzaffarpur Rural C-DOT RSU
132 Jamalabad Mzpjam Muzaffarpur Rural C-DOT RSU
133 Janaar Mzpjnr Muzaffarpur Rural C-DOT RSU
134 Kerma Mzpkrm Muzaffarpur Rural C-DOT RSU
135 Katra Mzpktr Muzaffarpur Rural C-DOT RSU
136 Kurhani Mzpkur Muzaffarpur Rural C-DOT RSU
137 Mit Muz Mzpmit Muzaffarpur Urban OCB RSU
138 Minapur Mzpmnp Muzaffarpur Rural OCB RSU
139 Mithanpura Mzpmth Muzaffarpur Urban NGN LMG
140 Narma Mzpnrm Muzaffarpur Rural C-DOT RSU
141 Pachdahi Mzppdh Muzaffarpur Rural C-DOT RSU
142 Piar Mzpper Muzaffarpur Rural C-DOT RSU
143 Ramnagar Mzprmn Muzaffarpur Rural C-DOT RSU
144 Sarfuddinpur Mzpsfp Muzaffarpur Rural OCB RSU
145 Siho Mzpsih Muzaffarpur Rural C-DOT RSU
146 Tengraha Mzptng Muzaffarpur Rural C-DOT RSU
147 Tengrari Mzptrr Muzaffarpur Rural C-DOT RSU
148 Turki Mzptur Muzaffarpur Rural C-DOT RSU
149 Bhagwanpur Mz Mzpmbg Muzaffarpur Urban C-DOT RSU
150 Ahiyapur Mzpmza Muzaffarpur Urban OCB RSU
151 Cdot Main Mzp Mzpmzm Muzaffarpur Urban CDOT MAIN
152 Budhkara Mzpbud Muzaffarpur Rural
153 Airforce Bihta Patafb Danapur Rural C-DOT AN RAX
154 Neora Patneo Danapur Rural CDOT ANRAX

TRAI Audit Wireline Report- BIHAR/JHARKHAND Circle AMJ Quarter-2016
52
155 Danapur Patdnr Danapur Urban EWSD MAIN
156 Bihta Patbta Danapur Rural EWSD RSU
157 Dayalchak Patdac Danapur Rural C-DOT AN RAX
158 Khagaul Patkhg Danapur Urban EWSD RSU
159 Lai Patlai Danapur Rural C-DOT AN RAX
160 Maner Patmnr Danapur Urban EWSD RSU
161 Painal Patpnl Danapur Rural C-DOT AN RAX
162 Ranjan Path Patrjp Danapur Urban EWSD RSU
163 Sherpur Patsrp Danapur Rural EWSD RSU
164 Beldarichak Patbdc Patna Rural C-DOT AN RAX
165 Dhanurwa Patdhr Patna Rural C-DOT AN RAX
166 Faridpur Patfrp Patna Rural C-DOT AN RAX
167 Nadaul Patndl Patna Rural C-DOT AN RAX
168 Simra Patsim Patna Rural C-DOT AN RAX
169 Sonmai Patson Patna Rural C-DOT AN RAX
170 Kankarbagh Patkhb Patna Urban OCB MAIN
171 Patliputra Patphc Patna Urban OCB MAIN
172 Patel Nagar Patpnr Patna Urban EWSD MAIN
173 Patna City Patptc Patna Urban EWSD MAIN
174 Patna Patptm Patna Urban EWSD MAIN
175 Rajendra Nagar Patrnr Patna Urban EWSD MAIN
176 Patna-1 Patna Urban OCB MAIN
177 Antaghat Patagt Patna Urban EWSD RSU
178 Ah Complex Patahc Patna Urban OCB RSU
179 Ashok Nagar Patakn Patna Urban OCB RSU
180 Anishabad Patanb Patna Urban OCB RSU
181 Asiana Nagar Patasn Patna Urban OCB RSU
182 Bahadurpur Hc Patbhc Patna Urban OCB RSU
183 Digha Patdig Patna Urban OCB RSU
184 Daniawan Patdnw Patna Rural EWSD RSU
185 Fatuha Patftw Patna Urban EWSD RSU
186 Govind Mitra Rd. Patgmr Patna Urban EWSD RSU
187 Gardanibagh Patgnb Patna Urban NGN LMG
188 Gandhi Setu Patgst Patna Urban EWSD RSU
189 Gulzarbagh Patgzb Patna Urban OCB RSU
190 Harding Road,38 Pathdr Patna Urban C-DOT AN RAX
191 Hanumannagar Pathmn Patna Urban OCB RSU
192 Kidwaipuri Patkdi Patna Urban OCB RSU
193 Khajpura Patkhj Patna Urban OCB RSU
194 Khemnichak Patkmk Patna Urban EWSD RSU
195 Khetan Market Patktm Patna Urban EWSD RSU
196 Katra Patktr Patna Urban EWSD RSU
197 Khusrupur Patkuu Patna Urban EWSD RSU
198 Laxmi Nurshing Home
Patlnh Patna Urban OCB RSU
199 Mahendru Patmhd Patna Urban EWSD RSU
200 Masaurhi Patmrh Patna Urban EWSD RSU
201 Mithapur Patmtp Patna Urban EWSD RSU
202 N.P.Centre Patnpc Patna Urban EWSD RSU
203 Nala Road Patnrd Patna Urban EWSD RSU
204 Punaichak Patpck Patna Urban EWSD RSU
205 Phulwarisharif Patphl Patna Urban OCB RSU
206 Punpun Patpnp Patna Rural EWSD RSU
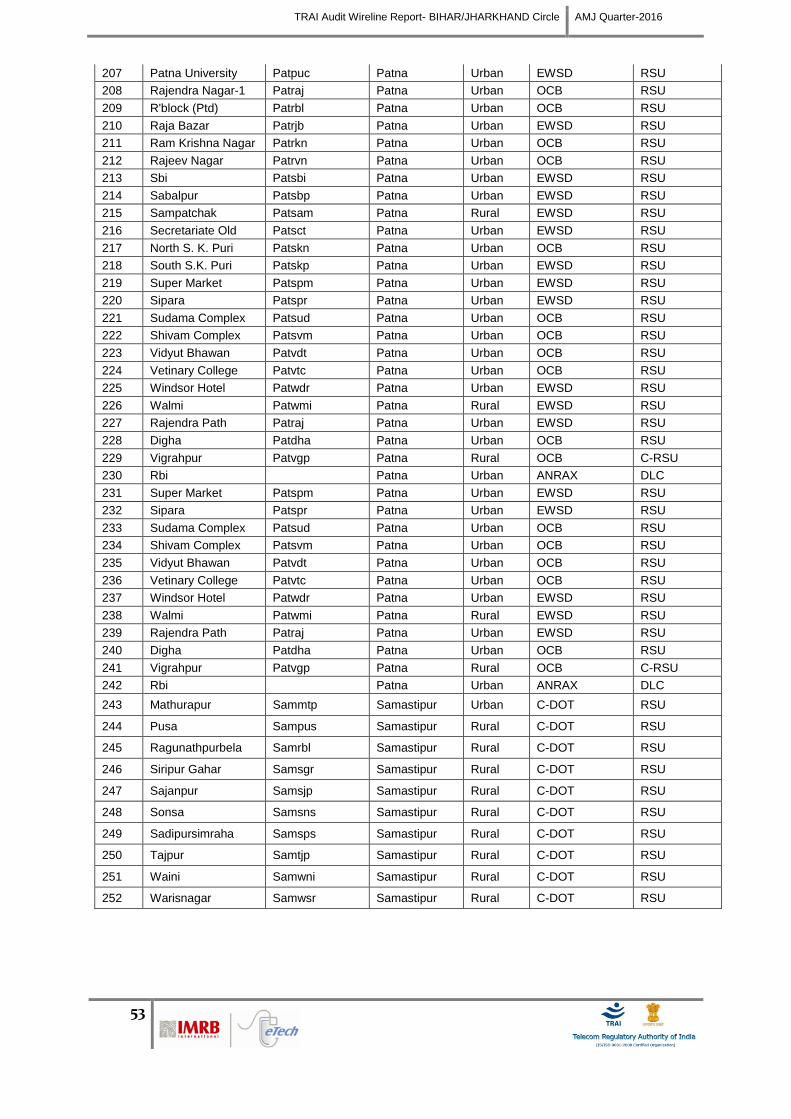
TRAI Audit Wireline Report- BIHAR/JHARKHAND Circle AMJ Quarter-2016
53
207 Patna University Patpuc Patna Urban EWSD RSU
208 Rajendra Nagar-1 Patraj Patna Urban OCB RSU
209 R'block (Ptd) Patrbl Patna Urban OCB RSU
210 Raja Bazar Patrjb Patna Urban EWSD RSU
211 Ram Krishna Nagar Patrkn Patna Urban OCB RSU
212 Rajeev Nagar Patrvn Patna Urban OCB RSU
213 Sbi Patsbi Patna Urban EWSD RSU
214 Sabalpur Patsbp Patna Urban EWSD RSU
215 Sampatchak Patsam Patna Rural EWSD RSU
216 Secretariate Old Patsct Patna Urban EWSD RSU
217 North S. K. Puri Patskn Patna Urban OCB RSU
218 South S.K. Puri Patskp Patna Urban EWSD RSU
219 Super Market Patspm Patna Urban EWSD RSU
220 Sipara Patspr Patna Urban EWSD RSU
221 Sudama Complex Patsud Patna Urban OCB RSU
222 Shivam Complex Patsvm Patna Urban OCB RSU
223 Vidyut Bhawan Patvdt Patna Urban OCB RSU
224 Vetinary College Patvtc Patna Urban OCB RSU
225 Windsor Hotel Patwdr Patna Urban EWSD RSU
226 Walmi Patwmi Patna Rural EWSD RSU
227 Rajendra Path Patraj Patna Urban EWSD RSU
228 Digha Patdha Patna Urban OCB RSU
229 Vigrahpur Patvgp Patna Rural OCB C-RSU
230 Rbi Patna Urban ANRAX DLC
231 Super Market Patspm Patna Urban EWSD RSU
232 Sipara Patspr Patna Urban EWSD RSU
233 Sudama Complex Patsud Patna Urban OCB RSU
234 Shivam Complex Patsvm Patna Urban OCB RSU
235 Vidyut Bhawan Patvdt Patna Urban OCB RSU
236 Vetinary College Patvtc Patna Urban OCB RSU
237 Windsor Hotel Patwdr Patna Urban EWSD RSU
238 Walmi Patwmi Patna Rural EWSD RSU
239 Rajendra Path Patraj Patna Urban EWSD RSU
240 Digha Patdha Patna Urban OCB RSU
241 Vigrahpur Patvgp Patna Rural OCB C-RSU
242 Rbi Patna Urban ANRAX DLC
243 Mathurapur Sammtp Samastipur Urban C-DOT RSU
244 Pusa Sampus Samastipur Rural C-DOT RSU
245 Ragunathpurbela Samrbl Samastipur Rural C-DOT RSU
246 Siripur Gahar Samsgr Samastipur Rural C-DOT RSU
247 Sajanpur Samsjp Samastipur Rural C-DOT RSU
248 Sonsa Samsns Samastipur Rural C-DOT RSU
249 Sadipursimraha Samsps Samastipur Rural C-DOT RSU
250 Tajpur Samtjp Samastipur Rural C-DOT RSU
251 Waini Samwni Samastipur Rural C-DOT RSU
252 Warisnagar Samwsr Samastipur Rural C-DOT RSU

TRAI Audit Wireline Report- BIHAR/JHARKHAND Circle AMJ Quarter-2016
54
5.12 ABBREVIATIONS
The following terms/abbreviations have been commonly used in this report. This section provides
meaning of the abbreviations used in the report.
1. TRAI – Telecom Regulatory Authority of India
2. QoS – Quality of Service
3. AMJ’16 – Refers to the quarter of April, May and June 2016
4. IMRB – Refers to IMRB International, the audit agency for this report
5. NOC – Network Operation Center
6. OMC – Operations and Maintenance Center
7. SDCA – Short Distance Charging Area
8. PMR – Performance Monitoring Reports
9. MTTR - Mean Time to Repair faults
10. TCBH – Time Consistent Busy Hour
11. NA – Not Applicable
12. NC – Non Compliance
13. POI – Point of Interconnection
14. IVR – Interactive Voice Response
15. DEL – Direct Exchange Line
16. STD – Standard Trunk Dialing
17. ISD – International Subscriber Dialing

TRAI Audit Wireline Report- BIHAR/JHARKHAND Circle AMJ Quarter-2016
55
SCO 47, 5th
Floor, Old Judicial Complex, Sector 15
Part 1, Gurgaon, Haryana – 122001
+91 (124) 4217300
www.imrbint.com

TRAI Audit Wireless
Report for Bihar &
Jharkhand Circle
EAST ZONE
Prepared by:
`
Submitted to:
QE June 2016

TRAI Audit Wireless Report-Bihar & Jharkhand Circle AMJ Quarter-2016
1
1 TABLE OF CONTENTS
2 Introduction .................................................................................................................................................. 7
2.1 About TRAI .......................................................................................................................................... 7
2.2 Objectives ............................................................................................................................................ 7
2.3 Coverage ............................................................................................................................................... 8
2.4 Framework used .................................................................................................................................. 8
2.4.1 PMR Reports ................................................................................................................................... 8
2.4.2 Live Calling .................................................................................................................................... 22
2.4.3 Voice Drive Test – 2G & 3G .......................................................................................................... 25
2.4.4 Wireless Data Drive Test – 2G & 3G ........................................................................................... 28
2.5 Operators Covered 2G and 3G ......................................................................................................... 32
2.6 Colour Codes to read the report ...................................................................................................... 32
3 Executive Summary-2G .............................................................................................................................. 33
3.1 PMR Data – 3 Months- Consolidated for 2G .................................................................................. 33
3.1.1 PMR Data - April for 2G ............................................................................................................... 35
3.1.2 PMR Data – May for 2G ................................................................................................................ 35
3.1.3 PMR Data - June for 2G ................................................................................................................ 36
3.2 3 Day Data – Consolidated for 2G ................................................................................................... 37
3.2.1 3 Day Data - April for 2G .............................................................................................................. 39
3.2.2 3 Day Data – May for 2G .............................................................................................................. 39
3.2.3 3 Day Data - June for 2G ............................................................................................................... 40
3.3 PMR Data – 3 Months- Consolidated for 3G ................................................................................... 41
3.3.1 PMR Data - April for 3G ............................................................................................................... 43
3.3.2 PMR Data – May for 3G ................................................................................................................ 43
3.3.3 PMR Data - June for 3G ................................................................................................................ 43
3.4 3 Day Data – Consolidated for 3G.................................................................................................... 44
3.4.1 3 Day Data - April for 3G .............................................................................................................. 45
3.4.2 3 Day Data – May for 3G .............................................................................................................. 45
3.4.3 3 Day Data - June for 3G ............................................................................................................... 45
3.5 Wireless data PMR & 3 Day Live – Consolidated for 2G ............................................................... 46

TRAI Audit Wireless Report-Bihar & Jharkhand Circle AMJ Quarter-2016
2
3.6 Wireless data PMR & 3 Day Live – Consolidated for 3G ............................................................... 47
3.7 Live Calling Data - Consolidated ..................................................................................................... 48
3.8 Billing and customer care - Consolidated ...................................................................................... 49
3.9 Inter Operator Call Assessment - Consolidated ............................................................................ 50
3.10 Comparison between IMRB and Operator’s data for 2G ............................................................... 51
3.11 Comparison between IMRB and Operator’s data for 23G .............................................................. 51
4 Critical Findings.......................................................................................................................................... 52
5 Parameter Description & Detailed Findings - Comparison Between PMR Data, 3 Day Live Data and Live Calling Data for 2G ..................................................................................................................................... 55
5.1 BTS Accumulated Downtime ........................................................................................................... 55
5.1.1 Parameter Description ................................................................................................................. 55
5.1.2 Key Findings - Consolidated ........................................................................................................ 56
5.2 Worst Affected BTS due to downtime ............................................................................................ 59
5.2.1 Parameter Description ................................................................................................................. 59
5.2.2 Key Findings – Consolidated ....................................................................................................... 60
5.3 Call Set Up Success Rate................................................................................................................... 63
5.3.1 Parameter Description ................................................................................................................. 63
5.3.2 Key Findings - Consolidated ........................................................................................................ 64
5.4 Network Channel Congestion- Paging Channel /TCH Congestion/POI .................................... 66
5.4.1 Parameter Description ................................................................................................................. 66
5.4.2 Key Findings - SDCCH/Paging Channel Congestion (Consolidated) ..................................... 67
5.4.3 Key Findings – TCH Congestion (Consolidated)....................................................................... 70
5.4.4 Key Findings – POI Congestion (Consolidated) – Average of 3 months ................................. 72
5.5 Call Drop Rate ................................................................................................................................... 76
5.5.1 Parameter Description ................................................................................................................. 76
5.5.2 Key Findings - Consolidated ........................................................................................................ 77
5.6 Cells having greater than 3% TCH drop ......................................................................................... 79
5.6.1 Parameter Description ................................................................................................................. 79
5.6.2 Key Findings - Consolidated ........................................................................................................ 79
5.7 Voice Quality ..................................................................................................................................... 82
5.7.1 Parameter Description ................................................................................................................. 82
TRAI Audit Wireless Report-Bihar & Jharkhand Circle AMJ Quarter-2016
3
5.7.2 Key Findings .................................................................................................................................. 83
6 Parameter Description & Detailed Findings - Comparison Between PMR Data, 3 Day Live Data and Live Calling Data for 3G ..................................................................................................................................... 85
6.1 Node Bs downtime ............................................................................................................................ 85
6.1.1 Parameter Description ................................................................................................................. 85
6.1.2 Key Findings - Consolidated ........................................................................................................ 86
6.2 Worst affected Node Bs due to downtime ..................................................................................... 89
6.2.1 Parameter Description ................................................................................................................. 89
6.2.2 Key Findings – Consolidated ....................................................................................................... 90
6.3 Call Set Up Success Rate................................................................................................................... 93
6.3.1 Parameter Description ................................................................................................................. 93
6.3.2 Key Findings - Consolidated ........................................................................................................ 94
6.4 Network Channel Congestion- RRC Congestion/ Circuit Switched RAB Congestion ............... 97
6.4.1 Parameter Description ................................................................................................................. 97
6.4.2 Key Findings - RRC Congestion (Consolidated) ........................................................................ 99
6.4.3 Key Findings – Circuit Switched RAB Congestion (Consolidated) ........................................ 101
6.4.4 Key Findings – POI Congestion (Consolidated) – Average of 3 months ................................ 103
6.5 Circuit Switched Voice Drop Rate .................................................................................................. 107
6.5.1 Parameter Description ................................................................................................................ 107
6.5.2 Key Findings - Consolidated ...................................................................................................... 108
6.6 Worst affected cells having more than 3% Circuit Switched Voice Drop Rate ......................... 110
6.6.1 Parameter Description ................................................................................................................ 110
6.6.2 Key Findings - Consolidated ........................................................................................................ 111
6.7 Circuit Switch Voice Quality ........................................................................................................... 113
6.7.1 Parameter Description ................................................................................................................. 113
6.7.2 Key Findings ................................................................................................................................. 114
7 Parameter Description & Detailed Findings - Wireless Data Services (2G & 3G) ............................... 116
7.1 Service Activation /Provisioning for 2G & 3G ............................................................................... 116
7.1.1 Parameter Description ................................................................................................................ 116
7.1.2 Key Findings .................................................................................................................................. 117
7.2 PDP Context Activation Success Rate for 2G & 3G ....................................................................... 118

TRAI Audit Wireless Report-Bihar & Jharkhand Circle AMJ Quarter-2016
4
7.2.1 Parameter Description ................................................................................................................ 118
7.2.2 Key Findings ................................................................................................................................. 119
7.3 Drop rate for 2G & 3G ...................................................................................................................... 120
7.3.1 Parameter Description ................................................................................................................ 120
7.3.2 Key Findings ................................................................................................................................. 120
8 Parameter Description and Detailed Findings – Non-Network Parameters ....................................... 122
8.1 Metering and billing credibility ...................................................................................................... 122
8.1.1 Parameter Description ................................................................................................................ 122
8.1.2 Key Findings – Metering and billing credibility (Postpaid) .................................................... 124
8.1.3 Key Findings - Metering and billing credibility (Prepaid) ...................................................... 125
8.2 Resolution of Billing/ Charging Complaints ................................................................................. 126
8.2.1 Parameter Description ................................................................................................................ 126
8.2.2 Key Findings - within 4 weeks .................................................................................................... 127
8.2.3 Key Findings within 6 weeks ...................................................................................................... 128
8.3 Period of Applying Credit/Wavier ................................................................................................. 129
8.3.1 Parameter Description ................................................................................................................ 129
8.3.2 Key Findings ................................................................................................................................. 130
8.4 Call Centre Performance-IVR .......................................................................................................... 131
8.4.1 Parameter Description ................................................................................................................. 131
8.4.2 Key Findings ................................................................................................................................. 132
8.5 Call Centre Performance-Voice to Voice ....................................................................................... 133
8.5.1 Parameter Description ................................................................................................................ 133
8.5.2 Key Findings ................................................................................................................................. 134
8.6 Termination/Closure of Service ...................................................................................................... 135
8.6.1 Parameter Description ................................................................................................................ 135
8.6.2 Key Findings ................................................................................................................................. 136
8.7 Refund of Deposits After closure .................................................................................................... 137
8.7.1 Parameter Description ................................................................................................................ 137
8.7.2 Key Findings ................................................................................................................................. 138
9 DETAILED FINDINGS - DRIVE TEST DATA .......................................................................................... 139
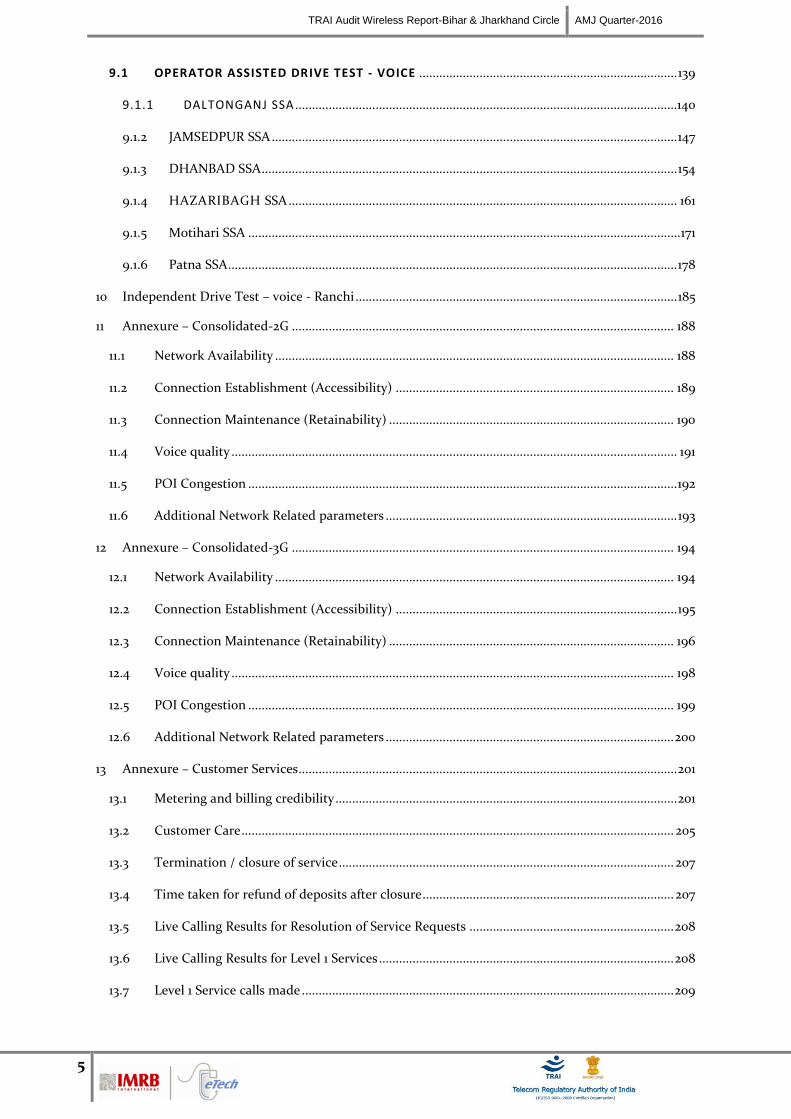
TRAI Audit Wireless Report-Bihar & Jharkhand Circle AMJ Quarter-2016
5
9.1 OPERATOR ASSISTED DRIVE TEST - VOICE ............................................................................. 139
9.1.1 DALTONGANJ SSA ..................................................................................................................140
9.1.2 JAMSEDPUR SSA ......................................................................................................................... 147
9.1.3 DHANBAD SSA ............................................................................................................................ 154
9.1.4 HAZARIBAGH SSA .................................................................................................................... 161
9.1.5 Motihari SSA ................................................................................................................................. 171
9.1.6 Patna SSA ...................................................................................................................................... 178
10 Independent Drive Test – voice - Ranchi ................................................................................................ 185
11 Annexure – Consolidated-2G .................................................................................................................. 188
11.1 Network Availability ....................................................................................................................... 188
11.2 Connection Establishment (Accessibility) ................................................................................... 189
11.3 Connection Maintenance (Retainability) ..................................................................................... 190
11.4 Voice quality ..................................................................................................................................... 191
11.5 POI Congestion ................................................................................................................................ 192
11.6 Additional Network Related parameters ....................................................................................... 193
12 Annexure – Consolidated-3G .................................................................................................................. 194
12.1 Network Availability ....................................................................................................................... 194
12.2 Connection Establishment (Accessibility) .................................................................................... 195
12.3 Connection Maintenance (Retainability) ..................................................................................... 196
12.4 Voice quality .................................................................................................................................... 198
12.5 POI Congestion ............................................................................................................................... 199
12.6 Additional Network Related parameters ...................................................................................... 200
13 Annexure – Customer Services ................................................................................................................. 201
13.1 Metering and billing credibility ...................................................................................................... 201
13.2 Customer Care ................................................................................................................................. 205
13.3 Termination / closure of service .................................................................................................... 207
13.4 Time taken for refund of deposits after closure ........................................................................... 207
13.5 Live Calling Results for Resolution of Service Requests ............................................................. 208
13.6 Live Calling Results for Level 1 Services ........................................................................................ 208
13.7 Level 1 Service calls made ............................................................................................................... 209
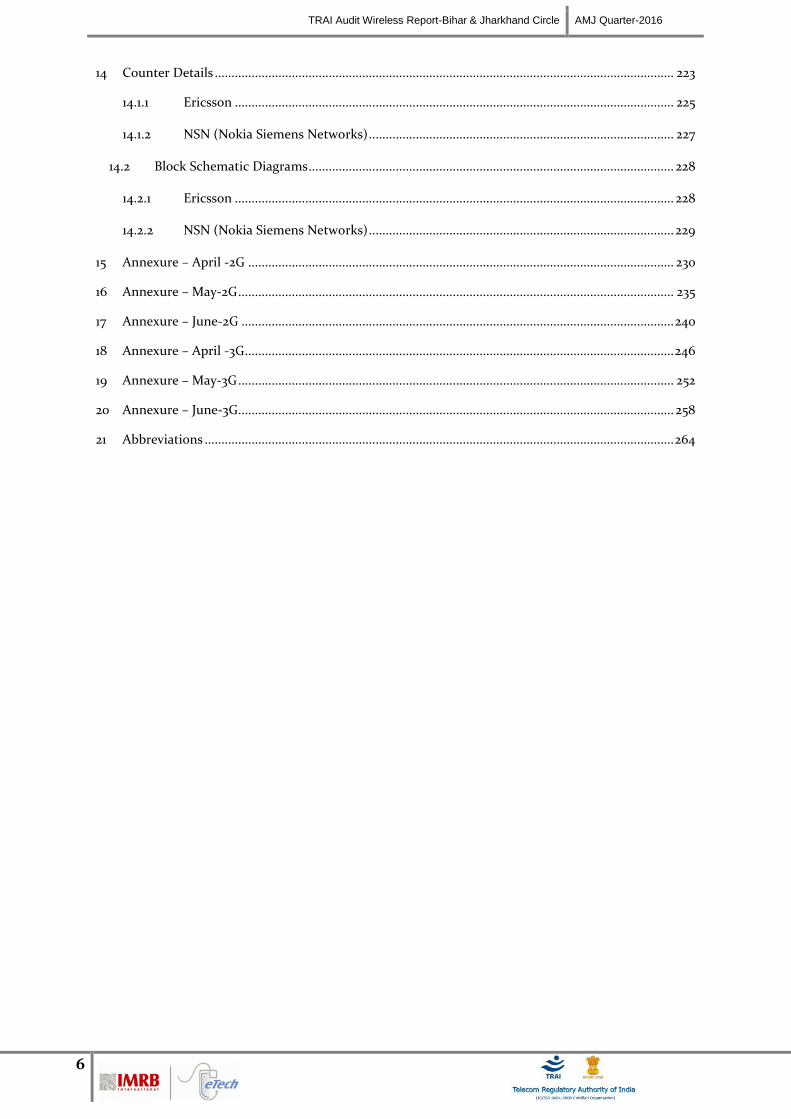
TRAI Audit Wireless Report-Bihar & Jharkhand Circle AMJ Quarter-2016
6
14 Counter Details ......................................................................................................................................... 223
14.1.1 Ericsson ................................................................................................................................... 225
14.1.2 NSN (Nokia Siemens Networks) ........................................................................................... 227
14.2 Block Schematic Diagrams ............................................................................................................. 228
14.2.1 Ericsson ................................................................................................................................... 228
14.2.2 NSN (Nokia Siemens Networks) ........................................................................................... 229
15 Annexure – April -2G ............................................................................................................................... 230
16 Annexure – May-2G .................................................................................................................................. 235
17 Annexure – June-2G ................................................................................................................................. 240
18 Annexure – April -3G ................................................................................................................................ 246
19 Annexure – May-3G .................................................................................................................................. 252
20 Annexure – June-3G.................................................................................................................................. 258
21 Abbreviations ............................................................................................................................................ 264

TRAI Audit Wireless Report-Bihar & Jharkhand Circle AMJ Quarter-2016
7
2 INTRODUCTION
2.1 ABOUT TRAI
TRAI's mission is to create and nurture conditions for growth of telecommunications in the country in a
manner and at a pace that will enable India to play a leading role in the emerging global information
society. One of the main objectives of TRAI is to provide a fair and transparent policy environment
which promotes a level playing field and facilitates fair competition.
In pursuance of above objective, TRAI has been issuing regulations, order and directives to deal with
the issues or complaints raised by the operators as well as the consumers. These regulations, order and
directives have helped to nurture the growth of multi operator multi service - an open competitive
market from a government owned monopoly. Also, the directions, orders and regulations issued cover a
wide range of subjects including tariff, interconnection and quality of service as well as governance of
the Authority.
TRAI initiated a regulation - The Standard of Quality of Service of Basic Telephone Service (Wireline)
and Cellular Mobile Telephone Service regulations, 2009 (7 of 2009) dated December 20, 2009 and
Quality of Service of Broadband Service Regulations, 2006 (11 of 2006) dated October 6, 2006 that
provide the benchmarks for the parameters on customer perception of service to be achieved by service
provider.
In order to assess the above regulations, TRAI has commissioned a third party agency to conduct the
audit of the service providers and check the performance of the operators on the various benchmarks
set by Telecom Regulatory Authority of India (TRAI).
2.2 OBJECTIVES
The primary objective of the Audit module is to-
Audit and Assess the Quality of Services being rendered by Basic (Wireline), Cellular Mobile
(Wireless), and Broadband service against the parameters notified by TRAI. (The parameters of
Quality of Services (QoS) have been specified by in the respective regulations published by
TRAI).
This report covers the audit results of the audit conducted for Cellular Mobile (Wireless)
services in Bihar & Jharkhand circle.

TRAI Audit Wireless Report-Bihar & Jharkhand Circle AMJ Quarter-2016
8
2.3 COVERAGE
The audit was conducted in Bihar & Jharkhand circle covering all the SSAs (Secondary Switching Areas).
Image Source: BSNL website
2.4 FRAMEWORK USED
Let’s discuss each of the activity in detail and the methodology adopted for each of the module.
2.4.1 PMR REPORTS
2.4.1.1 SIGNIFICANCE AND METHODOLOGY
PMR or Performance Monitoring Reports are generated to assess the various Quality of Service
parameters involved in the mobile telephony service, which indicate the overall health of service for an
operator.
Audit Actvities
PMR Reports
Monthly PMR
3 Day Live Data
Customer Service
Drive Test
Operator Assisted
Independent
Live Calling
Billing Complaints
Service Requests
Level 1 Service
Customer Care
Inter Operator call

TRAI Audit Wireless Report-Bihar & Jharkhand Circle AMJ Quarter-2016
9
The PMR report for network parameters is taken for each month of the audit quarter and is extracted
and verified in the first week of the subsequent month of the audit month. For example, April 2016
audit data was collected in the month of May 2016.
The PMR report for customer service parameters is extracted from Customer Service Center and verified
once every quarter in the subsequent month of the last month of the quarter. For example, data for
quarter ending June 2016 (AMJ’16) was collected in the month of July 2016.
The raw data extracted from operator’s systems is used to create PMR in the following three formats.
Monthly PMR (Network Parameters & Wireless Data Services) – 2G & 3G
3 Day Live Measurement Data (Network Parameters & Wireless Data Services) – 2G & 3G
Customer Service Data
Let us understand these formats in detail.
2.4.1.2 MONTHLY PMR 2G
This involved calculation of the various 2G Quality of Service network parameters through monthly
Performance Monitoring Reports (PMR). The PMR reports were generated from the data extracted from
operator’s systems by the IMRB representative with the assistance of the operator at the operator’s
premises for the month of April, May and June 2016. The performance of operators on various
parameters was assessed against the benchmarks. Parameters include-
The newly generated PMR reports are then taken in hard copy, duly signed by the competent authority of operators. IMRB auditors also sign the same report.
All the calculations are done by IMRB auditors to generate a new PMR report from that raw data.
During TRAI audit, raw data is extracted from the operator’s server/ NOC/ exchange/ OMC/ customer service center/ billing center etc. by the IMRB auditor
with assistance from the operator personnel in order to generate PMR reports (Network/ Billing /Customer Service etc).
The IMRB auditors inform the operators about the audit schedule in advance. Accordingly, the auditors visit the operator premises to conduct the audit.

TRAI Audit Wireless Report-Bihar & Jharkhand Circle AMJ Quarter-2016
10
All the parameters have been described in detail along with key findings of the parameters in section 5
of the report. The benchmark values for each parameter have been given in the table below.
• BTS accumulated downtime
• Worst affected BTS due to downtime
Network Availability
• Call Set Up success Rate (CSSR)
Connection Establishment (Accessibility)
• SDCCH/Paging Channel Congestion
• TCH Congestion
• Point of Interconnection
Network Congestion Parameters
• Call Drop rate
• Worst affected cells having more than 3% TCH drop
Connection Maintenance
• % Connections with good voice quality
Voice Quality
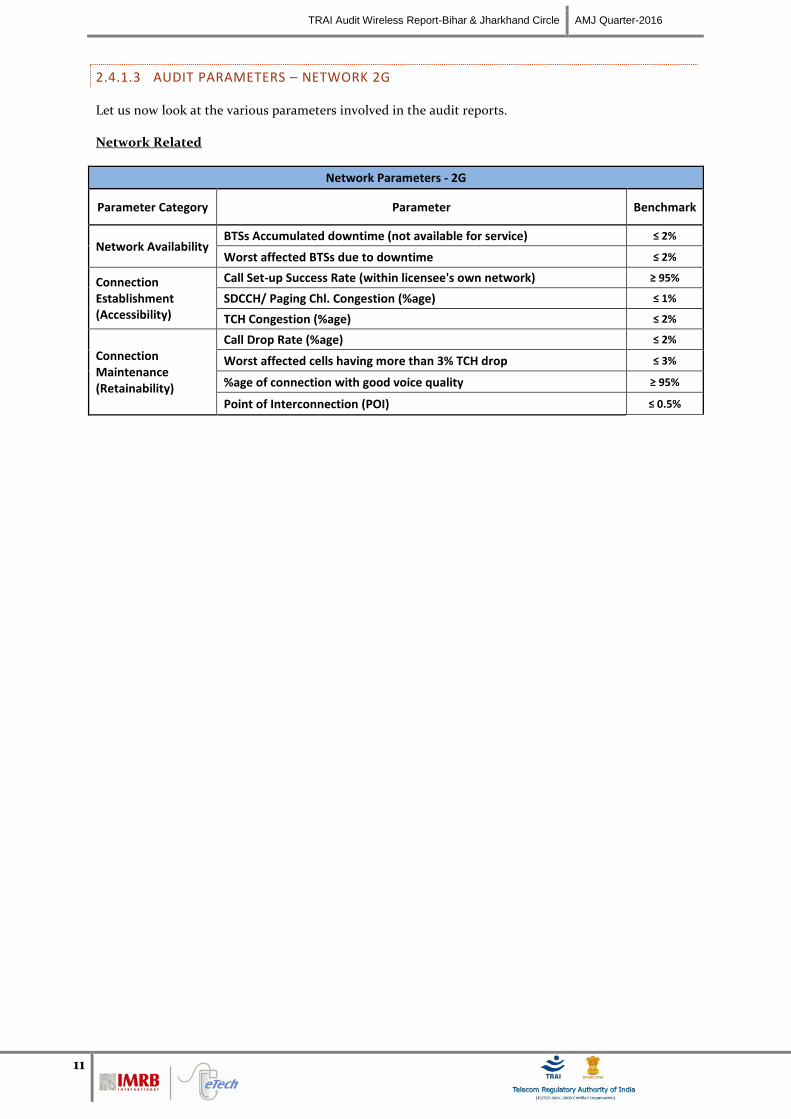
TRAI Audit Wireless Report-Bihar & Jharkhand Circle AMJ Quarter-2016
11
2.4.1.3 AUDIT PARAMETERS – NETWORK 2G
Let us now look at the various parameters involved in the audit reports.
Network Related
Network Parameters - 2G
Parameter Category Parameter Benchmark
Network Availability BTSs Accumulated downtime (not available for service) ≤ 2%
Worst affected BTSs due to downtime ≤ 2%
Connection Establishment (Accessibility)
Call Set-up Success Rate (within licensee's own network) ≥ 95%
SDCCH/ Paging Chl. Congestion (%age) ≤ 1%
TCH Congestion (%age) ≤ 2%
Connection Maintenance (Retainability)
Call Drop Rate (%age) ≤ 2%
Worst affected cells having more than 3% TCH drop ≤ 3%
%age of connection with good voice quality ≥ 95%
Point of Interconnection (POI) ≤ 0.5%

TRAI Audit Wireless Report-Bihar & Jharkhand Circle AMJ Quarter-2016
12
2.4.1.4 MONTHLY PMR 3G
This involved calculation of the various 3G Quality of Service network parameters through monthly
Performance Monitoring Reports (PMR). The PMR reports were generated from the data extracted from
operator’s systems by the IMRB representative with the assistance of the operator at the operator’s
premises for the month of April, May and June 2016. The performance of operators on various
parameters was assessed against the benchmarks. Parameters include-
All the parameters have been described in detail along with key findings of the parameters in section 5
of the report. The benchmark values for each parameter have been given in the table below.
• Node Bs accumulated downtime
• Worst affected Node Bs due to downtime
Network Availability
• Call Set Up success Rate (CSSR)
Connection Establishment (Accessibility)
• RRC Congestion
• Circuit Switched RAB Congestion
• Point of Interconnection
Network Congestion Parameters
• Circuit Switched Voice Drop rate
• Worst affected cells having more than 3% Circuit switched Voice drop rate
Connection Maintenance
• % Connections with good Circuit Switched Voice Quality
Voice Quality

TRAI Audit Wireless Report-Bihar & Jharkhand Circle AMJ Quarter-2016
13
2.4.1.5 AUDIT PARAMETERS – NETWORK 3G
Let us now look at the various parameters involved in the audit reports.
Network Related
Network Parameters - 3G
Network Availability Node Bs downtime (not available for service) ≤ 2%
Worst affected Node Bs due to downtime ≤ 2%
Connection Establishment (Accessibility)
Call Set-up Success Rate (within licensee's own network) ≥ 95%
RRC Congestion ≤ 1%
Circuit Switched RAB Congestion ≤ 2%
Connection Maintenance (Retainability)
Circuit Switched voice drop rate ≤ 2%
Worst affected cells having more than 3% Circuit switched voice drop rate
≤ 3%
%age of connection with good circuit switched voice quality ≥ 95%
Point of Interconnection (POI) 0.5%
2.4.1.6 MONTHLY PMR – WIRELESS DATA SERVICES (2G & 3G)
The PMR report for wireless data service (2G and 3G) is extracted at the operator premises and verified
every month of the quarter. This includes three parameters-
Services Activation/ provisioning:- Activation done within 4 hours ≥ 95%
PDP Context activation success rate:- PDP Context activation success rate ≥ 95%
Drop Rate:- Drop Rate ≤ 5%
2.4.1.7 AUDIT PARAMETERS – WIRELESS DATA SERVICES (2G & 3G)
Wireless Data Service
Service Activation Activation done within 4 hours ≥ 95%
PDP Context activation success rate
PDP Context activation success rate ≥ 95%
Drop Rate Drop Rate ≤ 5%

TRAI Audit Wireless Report-Bihar & Jharkhand Circle AMJ Quarter-2016
14
2.4.1.8 POINT OF DATA EXTRACTION
The data is extracted from a terminal/computer connected to OMCR & OSS on the operator network.

TRAI Audit Wireless Report-Bihar & Jharkhand Circle AMJ Quarter-2016
15
2.4.1.9 STEP BY STEP AUDIT PROCEDURE
The key steps followed for extraction of reports at the operator premises are given below.
Data has been extracted and calculated as per the counter details provided by the operators. The details
of counters have been provided in section 8.15 of the report. The calculation methodology for each
parameter has been stated in the table given below.
The final audit or PMR sheet is signed by the operator person in-charge along with authorized stamp.
IMRB auditors validate the values with raw data and also provide their comments, wherever required.
IMRB auditors then prepare a PMR report from the extracted data with assistance from the operator.
The extracted data is validated and verfied by the IMRB auditors.
IMRB auditors visit the operator's server/exchange/central NOC to extract data from operator's systems. Operator personnel assist the auditor in extraction process.
Audit formats and schedule is shared with the operators in advance. Details include day of the visit and date of 3 day data collection and other requirements.
Tender document and latest list of licensees as per TRAI are taken as a reference document for assimilating the presence of operators. The wireless operators are then
contacted for the audit.

TRAI Audit Wireless Report-Bihar & Jharkhand Circle AMJ Quarter-2016
16
2.4.1.10 CALCULATION METHODOLOGY – NETWORK PARAMETERS 2G
Parameter Calculation Methodology
BTS Accumulated Downtime
Sum of downtime of BTSs in a month in hours i.e.
total outage time of all BTSs in hours during a month
/ (24 x Number of days in a month x Number of BTSs
in the network in licensed service area) x 100
Worst Affected BTS Due to Downtime
(Number of BTSs having accumulated downtime
greater than 24 hours in a month / Number of BTS in
Licensed Service Area) * 100
Call Setup Success Rate (Calls Established / Total Call Attempts) * 100
SDCCH/ Paging Channel Congestion
SDCCH / TCH Congestion% = [(A1 x C1) + (A2 x C2)
+…….+ (An x Cn)] / (A1 + A2 +…+ An)
Where:
A1 = Number of attempts to establish SDCCH / TCH
made on day 1
C1 = Average SDCCH / TCH Congestion % on day 1
A2 = Number of attempts to establish SDCCH / TCH
made on day 2
C2 = Average SDCCH / TCH Congestion % on day 2
An = Number of attempts to establish SDCCH / TCH
made on day n
Cn = Average SDCCH / TCH Congestion % on day n
TCH Congestion
POI Congestion
POI Congestion% = [(A1 x C1) + (A2 x C2) +…….+ (An
x Cn)] / (A1 + A2 +…+ An)
Where:
A1 = POI traffic offered on all POIs (no. of calls) on
day 1
C1 = Average POI Congestion % on day 1
A2 = POI traffic offered on all POIs (no. of calls) on
day 2
C2 = Average POI Congestion % on day 2
An = POI traffic offered on all POIs (no. of calls) on
day n
Cn = Average POI Congestion % on day n
Call Drop Rate Total Calls Dropped / Total Calls Established x 100
Worst Affected Cells having more than 3%
TCH drop
Total number of cells having more than 3% TCH drop
during CBBH/ Total number of cells in the LSA x 100
Connections with good voice quality No. of voice samples with good voice quality / Total
number of samples x 100

TRAI Audit Wireless Report-Bihar & Jharkhand Circle AMJ Quarter-2016
17
2.4.1.11 CALCULATION METHODOLOGY – NETWORK PARAMETERS 3G
Parameter Calculation Methodology
Node Bs Accumulated Downtime
Sum of downtime of Node Bs in a month in hours i.e.
total outage time of all Node Bs in hours during a
month / (24 x Number of days in a month x Number
of Node Bs in the network in licensed service area) x
100
Worst Affected Node Bs Due to Downtime
(Number of Node Bs having accumulated downtime
greater than 24 hours in a month / Number of Node
B in Licensed Service Area) * 100
Call Setup Success Rate (RRC Established / Total RRC Attempts) * 100
RRC Congestion
RRC / RAB Congestion% = [(A1 x C1) + (A2 x C2)
+…….+ (An x Cn)] / (A1 + A2 +…+ An)
Where:
A1 = Number of attempts to establish RRC/ RAB
made on day 1
C1 = Average RRC/ RAB Congestion % on day 1
A2 = Number of attempts to establish RRC/ RAB
made on day 2
C2 = Average RRC/ RAB Congestion % on day 2
An = Number of attempts to establish RRC/ RAB
made on day n
Cn = Average RRC/ RAB Congestion % on day n
Circuit Switched RAB Congestion
POI Congestion
POI Congestion% = [(A1 x C1) + (A2 x C2) +…….+ (An
x Cn)] / (A1 + A2 +…+ An)
Where:
A1 = POI traffic offered on all POIs (no. of calls) on
day 1
C1 = Average POI Congestion % on day 1
A2 = POI traffic offered on all POIs (no. of calls) on
day 2
C2 = Average POI Congestion % on day 2
An = POI traffic offered on all POIs (no. of calls) on
day n
Cn = Average POI Congestion % on day n
Circuit Switched Voice Drop Rate
No. of voice RAB normally released / (No. of voice
RAB normally released + RAB abnormally released) x
100
Worst Affected Cells having more than 3%
Circuit Switched Voice Drop Rate
Number of cells having CSV drop rate > 3% during
CBBH in a month / Total number of cells in the
licensed area) x 100
Connections with good Circuit switched
voice quality
1- ( Number of Faulty Transport Blocks In Uplink
downlink After Selection Combining Speech / Total
number of Transport Blocks In Uplink downlink
After Selection Combining Speech)) x 100

TRAI Audit Wireless Report-Bihar & Jharkhand Circle AMJ Quarter-2016
18
2.4.1.12 3 DAY LIVE DATA
The main purpose of 3 day live measurement is to evaluate the network parameters on intraday basis.
While the monthly PMR report provides an overall view of the performance of QoS parameters, the 3
day live data helps looking at intraday performance on the network parameters discussed earlier. All the
calculations are done on the basis of that raw data of 3 days.
The 3 day live data provides a sample of 9 days in a quarter (3 days each month of a quarter) with hourly
performance, which enables the auditor to identify and validate intraday issues for an operator on the
Q0S network parameters. For example, network congestion being faced by an operator during
busy/peak hours.
Network related parameters were evaluated for a period of 3 days in each month. 3 day live audit was
conducted for 3 consecutive weekdays for each month. The data was extracted from each operator’s
server/ NOC etc. at the end of the 3rd
day. The extracted data is then used to create a report (similar to
PMR report) to assess the various QoS parameters.
The 3 day live measurement was conducted for network parameters (2G & 3G) and wireless data
services (2G & 3G).
2.4.1.13 TCBH – SIGNIFICANCE AND SELECTION METHODOLOGY
As per QoS regulations 2009 (7 of 2009), Time Consistent Busy Hour” or “TCBH” means the one hour
period starting at the same time each day for which the average traffic of the resource group concerned
is greatest over the days under consideration and such Time Consistent Busy Hour shall be established
on the basis of analysis of traffic data for a period of ninety days.
Step by step procedure to identify TCBH for an operator:
Day wise raw data is fetched from the operator's OMCR and kept in a readable format (preferably MS-Excel). Data for a period of 90 days is used to identify TCBH.
The 90 day period is decided upon the basis of month of audit. For example, for audit of Aug 2015, the 90 day period data used to identify TCBH would be the data of Jun, Jul and Aug 2015
For each day, the hour in which average traffic of the resource group concerned is greatest for the day will be the 'Busy Hour' for the operator.
The modal frequency of the busy hour is calculated for 90 days period and the hour with highest modal frequency will be considered as TCBH for the operator

TRAI Audit Wireless Report-Bihar & Jharkhand Circle AMJ Quarter-2016
19
2.4.1.14 CBBH – SIGNIFICANCE AND SELECTION METHODOLOGY
As per QoS regulations 2009 (7 of 2009), Cell Bouncing Busy Hour (CBBH) means the one hour period
in a day during which a cell in cellular mobile telephone network experiences the maximum traffic.
Step by step procedure to identify CBBH for an operator:
2.4.1.15 CUSTOMER SERVICE PARAMETERS
The data to generate PMR report for customer service parameters is extracted at the operator premises
and verified once every quarter in the subsequent month of the last month of the quarter. For example,
data for quarter ending June 2016 (AMJ’16) was collected in the month of July 2016. To extract the data
for customer service parameters for the purpose of audit, IMRB auditors primarily visit the following
locations/ departments/ offices at the operator’s end.
Central Billing Center
Central Customer Service Center
The operators are duly informed in advance about the audit schedule.
The Customer Service Quality Parameters include the following:
Metering and billing credibility (postpaid and prepaid)
Resolution of billing/charging complaints
Period of applying credit/waiver/adjustment to customer’s account
Response time to the customer for assistance
Termination/closure of service
Time taken for refund of security deposit after closures.
Most of the customer service parameters were calculated by averaging over the quarter; however billing
parameters were calculated by averaging over one billing cycle for a quarter.
Day wise raw data is fetched from the operator's OMCR and kept in a readable format (preferably MS-Excel). Data for a period of 90 days is used to identify CBBH.
For each day, the hour in which a cell in cellular mobile telephone network experiences maximum traffic for the day will be the 'Busy Hour' for the operator.
The 90 day period is decided upon the basis of month of audit. For example, for audit of Aug 2015, the 90 day period data used to identify CBBH would be the data of Jun, Jul and Aug 2015
The modal frequency of the busy hour is calculated for 90 days period and the hour with highest modal frequency will be considered as CBBH for the operator

TRAI Audit Wireless Report-Bihar & Jharkhand Circle AMJ Quarter-2016
20
All the parameters have been described in detail along with key findings of the parameter in section 6 of
the report. The benchmark values for each parameter have been given in the table below.
2.4.1.16 AUDIT PARAMETERS – CUSTOMER SERVICE

TRAI Audit Wireless Report-Bihar & Jharkhand Circle AMJ Quarter-2016
21
2.4.1.17 CALCULATION METHODOLOGY – CUSTOMER SERVICE PARAMETERS
Parameter Calculation Methodology
Metering and billing credibility - Postpaid
Total billing complaints received during the
relevant billing cycle / Total bills generated
during the relevant billing cycle *100
Metering and billing credibility – Prepaid
Total charging complaints received during the
quarter/ Total number of subscribers reported
by the operator at the end of the quarter * 100
Resolution of billing/ charging complaints
(Postpaid + Prepaid)
There are two benchmarks involved here:
Billing or Charging Complaints resolved in 4
weeks from date of receipt / Total billing or
charging complaints received during the
quarter) x 100
Billing or Charging Complaints resolved in 6
weeks from date of receipt / Total billing or
charging complaints received during the
quarter) x 100
Period of applying credit waiver
Number of cases where credit waiver is applied
within 7 days/ total number of cases eligible for
credit waiver * 100
Call centre performance IVR (Calling getting
connected and answered by IVR)
Number of calls connected and answered by
IVR/ All calls attempted to IVR * 100
Call centre performance (Voice to Voice)
Call centre performance Voice to Voice =
(Number of calls answered by operator within
90 seconds/ All calls attempted to connect to
the operator) * 100
The calculation excludes the calls dropped
before 90 seconds
Time taken for termination/ closure of service Number of closures done within 7 days/ total
number of closure requests * 100
Time taken for refund for deposit after closures
Number of cases of refund after closure done
within 60 days/ total number of cases of refund
after closure * 100

TRAI Audit Wireless Report-Bihar & Jharkhand Circle AMJ Quarter-2016
22
2.4.2 LIVE CALLING
2.4.2.1 SIGNIFICANCE AND METHODOLOGY
The main purpose of live calling is to verify the performance of various customer service parameters by
doing test calls to the subscribers/ specific numbers. Below is a step wise procedure of live calling.
Live calling activity was carried out during the period of June 2016. The data considered for live calling
was for the month prior to the month in which the live calling activity was being conducted. In this
case, data of May 2016 was considered for live calling activity conducted in June 2016.
A detailed explanation of each parameter is explained below.
2.4.2.2 BILLING COMPLAINTS
Live calling is done to verify Resolution of billing complaints within stipulated time. The process for this
parameter is stated below.
Auditors request the operator provided the database of all the subscribers who reported billing
complaints in one month prior to IMRB auditor visit. In case of BSNL, data for the complaints
from the subscribers belonging to the sample exchanges is requested specifically
A sample of 10% or 100 complainants, whichever is less, is selected randomly from the list
provided by operator
Calls are made by auditors to the sample of subscribers to check and record whether the complaint was
resolved within the timeframes as mentioned in the benchmark.
Using operator SIM, the auditors also make test calls to subscribers of other operators to assess the inter-operator call connectivity in the same licensed service area
The auditors also verify the performance of call center, level 1 services by calling the numbers using operator SIM. The list of call center numbers is provided by the operator. The process followed to test Level 1 services has been stated below.
IMRB auditors then make live calls using operator SIM to a random sample of subscribers from the raw data provided to verify the resolution of complaints
The IMRB auditor visits each operator premises to do live calling. The operators provide the raw data of customer complaints (billing & service) and also the list of
customer service numbers to be verified through live calling

TRAI Audit Wireless Report-Bihar & Jharkhand Circle AMJ Quarter-2016
23
All the complaints related to billing as per clause 3.7.2 of QoS regulation of 20th
December, 2009 were
considered as population for selection of samples. A complete list of the same has been provided in
Section 6.1.1.
TRAI benchmark-
Resolution of billing/ charging complaints - 98% within 4 weeks, 100% within 6 weeks
2.4.2.3 SERVICE COMPLAINTS REQUESTS
“Service request” means a request made to a service provider by its consumer pertaining to his account,
and includes.
A request for change of tariff plan
A request for activation or deactivation of a value added service or a supplementary
service or a special pack
A request for activation of any service available on the service provider’s network
A request for shift or closure or termination of service or for billing details
All the complaints other than billing were covered. A total of 100 calls per service provider for each
service in licensed service area were done by the IMRB auditors.
2.4.2.4 LEVEL 1 SERVICE
Level 1 is used for accessing special services like emergency services, supplementary services, inquiry
and operator-assisted services.
Level 1 Services include services such as police, fire, ambulance (Emergency services). Test calls were
made from operator SIMs. A total of 300 test calls were made per service provider in the quarter.
In AMJ’16, IMRB has tried contacting the list of Level 1 services provided by TRAI as per the NNP
(National Numbering Plan).
2.4.2.4.1 PROCESS TO TEST LEVEL 1 SERVICES
On visiting the operator’s premises (Exchange/Central Server etc.), auditors ask the operator authorized personnel to provide a list of Level 1 services being active in their service. The list should contain a description of the numbers along with dialing code.
Operators might provide a long list of L1 services. To identify emergency L1 service numbers, auditors check if there is any number that starts with code ‘10’ in that list. If auditors find any emergency number in addition to the below list, that number is also tested during live calling.
On receiving the list, auditors verify it if the below given list of numbers are active in the service provider’s network.
If there are any other additional numbers provided by the operator, auditors also do live calling on those numbers along with below list.
If any of these numbers is not active, then we would write the same in our report, auditors write in the report.
Post verifying the list, auditors do live calling by equally distributing the calls among the various numbers and update the results in the live calling sheet.

TRAI Audit Wireless Report-Bihar & Jharkhand Circle AMJ Quarter-2016
24
2.4.2.5 CUSTOMER CARE
Live calling is done to verify response time for customer assistance is done to verify the performance of
call center in terms of
Calls getting connected and answered by operator’s IVR.
% age of calls answered by operator / voice to voice) within 90 seconds: In 95% of the cases or
more
The process for this parameter is stated below.

TRAI Audit Wireless Report-Bihar & Jharkhand Circle AMJ Quarter-2016
25
Overall sample size is 100 calls per service provider per circle at different points of time, evenly
distributed across the selected exchanges – 50 calls between 1100 HRS to 1400 HRS and 50 calls
between 1600 HRS to 1900 HRS.
Time to answer the call by the operator was assessed from the time interviewer pressed the
requisite button for being assisted by the operator.
All the supplementary services that have any kind of human intervention are to be covered
here. It also includes the IVR assisted services.
2.4.2.6 INTER OPERATOR CALL ASSESEMENT
A total of 100 calls per service provider to all the other service providers in a licensed service area were
done for the purpose of audit.
2.4.3 VOICE DRIVE TEST – 2G & 3G
2.4.3.1 SIGNIFICANCE AND METHODOLOGY
Drive test, as the name suggests, is conducted to measure the performance of an operator in a moving
vehicle in a specified network coverage area.
The main purpose of the drive test is to check the health of the mobile network of various operators in
the area in terms of coverage (signal strength), voice quality, call drop rate, call set up success rate etc.
To assess the indoor coverage, the test is also conducted at two static indoor locations in each SSA, such
as Malls, office buildings, shopping complexes, government buildings etc.
IMRB conducted two types of drive tests as mentioned below.
Operator Assisted Drive Test
Independent Drive Test
The main difference between the two is that in the operator assisted, operators participate in the drive
test along with their hardware, software, phones etc. while in the independent drive test IMRB conducts
the drive test on solitary basis and uses its own hardware. Operators generally do not have any
knowledge of the drive test being conducted.
A detailed explanation of the two methodologies has been provided below.
2.4.3.2 OPERATOR ASSISTED DRIVE TEST – VOICE 2G & 3G
SSAs are selected according to the total no. of SSAs on that region and audited as per TRAI instructions;
it depends on the total no. of drive on that circle. The drive tests were conducted for all operators in the
circle, for both 2G and 3G voice services. As per TRAI instructions, the 2G drive was done in 2G only
mode, while 3G drive test was conducted in dual mode (3G on priority).
As per the new directive given by TRAI headquarters, drive test in the quarter were conducted at a SSA
level. SSAs have been defined in two categories by TRAI as per the criticality of the SSA.

TRAI Audit Wireless Report-Bihar & Jharkhand Circle AMJ Quarter-2016
26
1. Normal SSA
2. Difficult SSA
During the drive test in normal SSA, the methodology adopted for the drive test is:
3 consecutive days were selected for drive test in selected SSA. SSAs were defined as per BSNL
and SSA list was finalized by regional TRAI office.
On an average, a minimum of 80 kilometers was covered each day, covering a minimum
distance of 250kms in 3 days.
Route map was designed in such a way that all the major roads, highways and all the important
towns and villages were covered as part of audit.
Special emphasis was given to those areas where the number of complaints received were on
the higher side, if provided by TRAI.
The route is defined in a way that we cover maximum area in the SSA and try to cover
maximum villages and cities within the SSA. The route is designed such that there is no overlap
of roads (if possible).
The route was classified as-
o With In city
o Major Roads
o Highways
o Shopping complex/ Mall
o Office Complex/ Government Building
There were no fixed calls which we need to do for within city, major roads and highways, but a
minimum of 30 calls in each route, i.e., within city, major roads and highways on each day. For
indoors, 20 calls each for shopping and office complex each day preferably in relatively bigger
city.
The drive test covered selected cities and adjoining towns/rural areas where the service
provider has commenced service, including congested areas and indoor sites.
The drive test of each mobile network was conducted between 10 am and 8 pm on weekdays.
The Vehicle used in the drive tests was equipped with the test tool that automatically generates
calls on the mobile telephone networks.
The speed of the vehicle was kept at around 30-50 km/hr.
The holding period of each test call was 120 seconds.
A test call was generated 10 seconds after the previous test call is completed. For 3G, the gap
between two calls was 30 seconds.
Height of the antenna was kept uniform in case of all service providers.
In drive test for difficult SSAs, the methodology adopted for the drive test is:-
Drive test was conducted for 6 consecutive days in selected SSAs; SSAs are defined as per BSNL
and SSA list was finalized by regional TRAI office.
On an average, a minimum of 80 kilometers was covered each day, covering a minimum
distance of 500kms in 6 days.
Rest of the activities for drive test in difficult SSAs are same as drive test for normal SSAs.
2.4.3.3 INDEPENDENT DRIVE TEST – 2G & 3G
The number of independent drive tests to be conducted and their locations are decided basis TRAI
recommendation.

TRAI Audit Wireless Report-Bihar & Jharkhand Circle AMJ Quarter-2016
27
A minimum of 80 kilometers was traversed during the independent drive test in a SSA on each
day. The SSAs were defined as per BSNL and SSA list was finalized by regional TRAI office.
Route map was designed in such a way that all the major roads, highways and all the important
towns and villages were covered as part of audit.
Special emphasis was given to those areas where the number of complaints received were on
the higher side, if provided by TRAI.
The route is defined in a way that we cover maximum area in the SSA and try to cover
maximum villages and cities within the SSA. The route is designed such that there is no overlap
of roads (if possible).
The route was classified as-
o With In city
o Major Roads
o Highways
o Shopping complex/ Mall
o Office Complex/ Government Building
There were no fixed calls which we need to do for within city, major roads and highways, but a
minimum of 30 calls in each route, i.e., within city, major roads and highways on each day. For
indoors, 20 calls each for shopping and office complex each day preferably in relatively bigger
city.
The drive test covered selected cities and adjoining towns/rural areas where the service
provider has commenced service, including congested areas and indoor sites.
The drive test of each mobile network was conducted between 10 am and 8 pm on weekdays.
The Vehicle used in the drive tests was equipped with the test tool that automatically generates
calls on the mobile telephone networks.
The speed of the vehicle was kept at around 30-50 km/hr.
The holding period of each test call was 120 seconds.
A test call was generated 10 seconds after the previous test call is completed. For 3G, the gap
between two calls was 30 seconds.
Height of the antenna was kept uniform in case of all service providers.
2.4.3.4 PARAMETERS EVALUATED DURING VOICE DRIVE TEST – 2G & 3G
The parameters which were captured during the drive test include. Below are the parameters which are
captured for the GSM and CDMA operators.
Coverage-Signal strength (GSM)
Total calls made (A)
Number of calls with signal strength between 0 to -75 dBm
Number of calls with signal strength between 0 to -85 dBm
Number of calls with signal strength between 0 to -95 dBm
Coverage-Signal strength (CDMA)
Total Ec/Io BINS (A)
Total Ec/Io BINS with less than –15 (B)
Low Interference = [1 - (B/A)] x 100
Voice quality (GSM)
Total RxQual Samples– A
RxQual samples with 0-5 value – B
%age samples with good voice quality = B/A x 100
Voice quality (CDMA)
Total FER BINs (forward FER) – A

TRAI Audit Wireless Report-Bihar & Jharkhand Circle AMJ Quarter-2016
28
FER BINs with 0-2 value (forward FER) – B
FER BINs with 0-4 value (forward FER) – C
%age samples with FER bins having 0-2 value (forward FER) = B/A x 100
%age samples with FER bins having 0-4 value (forward FER) = C/A x 100
No. of FER samples with value > 4 = [A-C]
Call setup success rate
Total number of call attempts – A
Total Calls successfully established – B
Call success rate (%age) = (B/A) x 100
Blocked calls
100% - Call Set up Rate
Call drop rate
Total Calls successfully established – A
Total calls dropped after being established – B
Call Drop Rate (%age) = (B/A) x 100
2.4.4 WIRELESS DATA DRIVE TEST – 2G & 3G
The data drive test is conducted at stationary places called hotspots in a SSA for all the days the voice
drive test is conducted in the same SSA.
2.4.4.1 METHODOLOGY
The measurement setup is used to conduct test calls for measuring successful data transmission
download and upload attempts, minimum download speed, average throughput and latency is given in
figure given below.
The basic measurement set-up consists of a Test-Device and a Test-Server with specified software and
hardware. Test calls are established between the Test-Device and Test-Server and measurements are
made for the respective QoS parameters. These parameters are measured in a stationary mode. Service
Activation/Provisioning, PDP Context Activation Success Rate and Drop rate are reported from the
actual network counters/database.
To assess the quality of the connection between an end user and an Internet Service Provider
(ISP), ideally the Test-Server is placed as near as possible to the gateway providing the
interconnection between access network and ISP network. The location of the test-server is as
near as possible to the gateway providing the interconnection between access network and ISP
network implies that the measurements will not reflect the influence in the QoS of the ISP
network, between that gateway and the gateway interconnecting with the Internet.

TRAI Audit Wireless Report-Bihar & Jharkhand Circle AMJ Quarter-2016
29
Figure for Measurement set-up
2.4.4.2 REQUIREMENTS FOR THE TEST-SERVER
For all tests, a dedicated test server is used as a well-defined reference. The test server may be located
centrally for all the licensed service areas (LSA) or for a number of LSAs or in each LSA (not more than
one in each LSA). Under no circumstances a commercial server (e.g. www.yahoo.com) is used, since the
test conditions for such a server may change over time making later reproduction of the results
impossible. The test server is identified by an IP address and not by its fully qualified Domain Name
(FQDN) in order to avoid issues with Domain Name Server (DNS) lookup and including the DNS
caching strategies of the used operating system into the measurement.
The Transmission Control Protocol (TCP) settings of the server tested against, is also recorded.
Since the number of host operating systems for internet servers is larger than on the client side,
no detailed recommendation concerning the TCP settings of the server is given.
However, the TCP stack of the reference server should at least be capable of the following:
o Maximum Segment Size between 1380 Bytes and 1460 Bytes.
o TCP RX Window Size > 4096 Bytes
o SACK (Selective Acknowledgement) enabled.
o TCP Fast Retransmit.
o TCP Fast Recovery enabled.
o Delayed ACK enabled (200ms).
2.4.4.3 TEST FILES
The test file consist of incompressible data i.e. a data file that is already compressed, e.g. like a zip or jpg
file. The test file has at least twice the size (in Kbit) of the theoretically maximum data transmission rate
per second (in Kbit/s) of the Internet access under consideration.

TRAI Audit Wireless Report-Bihar & Jharkhand Circle AMJ Quarter-2016
30
2.4.4.4 REPRESENTATIVENESS OR NUMBER OF TEST CALLS
The choice of adequate test calls, i.e. geographical locations of origin and destination of calls as
well as traffic variations, is a crucial point with respect to the comparability and validation of
the statistics are calculated for the measured parameters. For each parameter, it is ensured that
the samples are aggregated over all classes of customers for fairness in reflecting the QoS
actually perceived by the user and the statistics are preserved to substantiate the same.
The necessary number of samples (test calls) are 1067 for each of the category “A” and “Metro”
licensed service area (LSA), 600 for each of the category “B” LSA and 384 for each of the
category “C” LSA for all the parameters.
2.4.4.5 PARAMETERS EVALUATED DURING DATA DRIVE TEST AT HOTSPOTS
2.4.4.5.1 SUCCESSFUL DATA TRANSMISSIONS DOWNLOAD ATTEMPTS
The successful data download attempts is defined as the ratio of successful data downloads to the total
number of data download attempts in a specified time period. A data transmission is successful if a test
file is downloaded completely and with no errors.
Measurement:
The percentage that is the sum total of successful data downloads, divided by the sum total of all
attempts to download a test file is provided. The statistics are calculated from test calls made according
to the measurement set-up and taking into account the representativeness requirements. The successful
data download is measured by downloading a test file. An attempt to transmit the test file is considered
unsuccessful if it takes longer than 60 seconds.
Successful data transmission download attempts =
Total Successful download attempts ×100
Total download attempts
2.4.4.5.2 SUCCESSFUL DATA TRANSMISSION UPLOAD ATTEMPTS
The successful data upload attempts is defined as the ratio of successful data uploads to the total
number of data upload attempts in a specified time period. A data upload is successful if a test file is
uploaded completely and with no errors.
Measurement:
The percentage that is the sum total of successful data uploads, divided by the sum total of all attempts
to upload a test file should be provided. The statistics are calculated from test calls made according to
the measurement set-up and taking into account the representativeness requirements. The successful
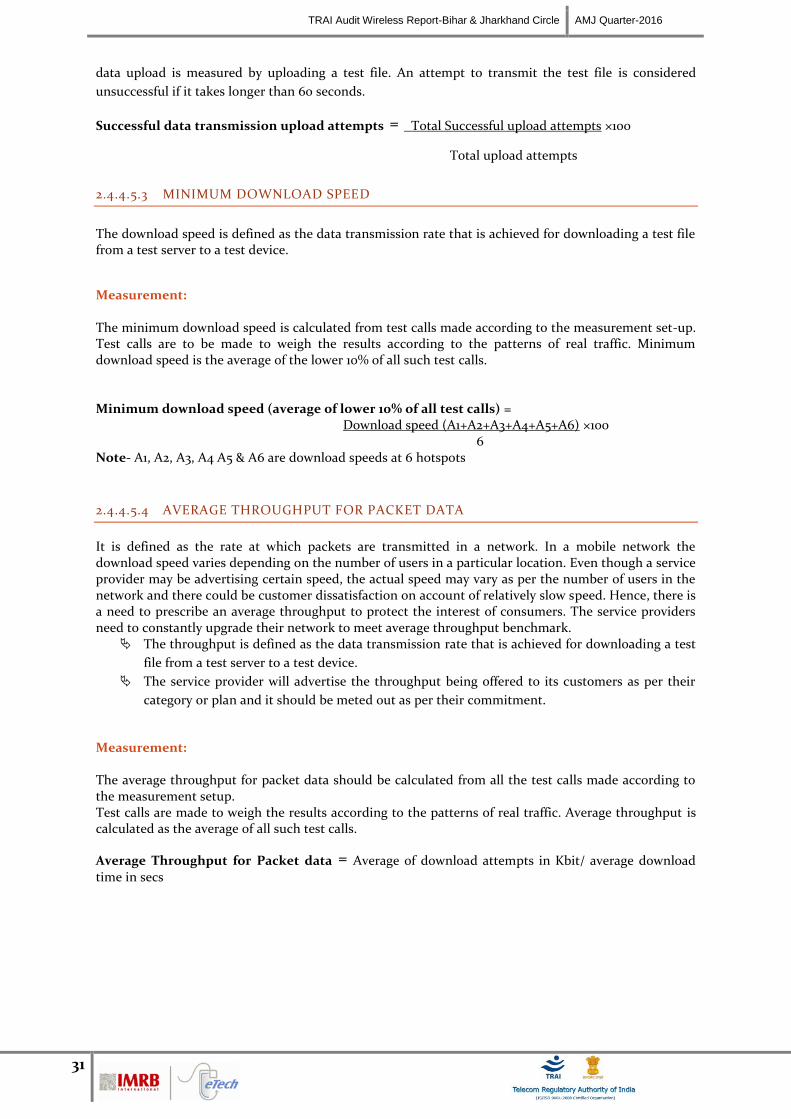
TRAI Audit Wireless Report-Bihar & Jharkhand Circle AMJ Quarter-2016
31
data upload is measured by uploading a test file. An attempt to transmit the test file is considered
unsuccessful if it takes longer than 60 seconds.
Successful data transmission upload attempts = Total Successful upload attempts ×100
Total upload attempts
2.4.4.5.3 MINIMUM DOWNLOAD SPEED
The download speed is defined as the data transmission rate that is achieved for downloading a test file from a test server to a test device.
Measurement: The minimum download speed is calculated from test calls made according to the measurement set-up. Test calls are to be made to weigh the results according to the patterns of real traffic. Minimum download speed is the average of the lower 10% of all such test calls. Minimum download speed (average of lower 10% of all test calls) = Download speed (A1+A2+A3+A4+A5+A6) ×100 6 Note- A1, A2, A3, A4 A5 & A6 are download speeds at 6 hotspots
2.4.4.5.4 AVERAGE THROUGHPUT FOR PACKET DATA
It is defined as the rate at which packets are transmitted in a network. In a mobile network the download speed varies depending on the number of users in a particular location. Even though a service provider may be advertising certain speed, the actual speed may vary as per the number of users in the network and there could be customer dissatisfaction on account of relatively slow speed. Hence, there is a need to prescribe an average throughput to protect the interest of consumers. The service providers need to constantly upgrade their network to meet average throughput benchmark.
The throughput is defined as the data transmission rate that is achieved for downloading a test
file from a test server to a test device.
The service provider will advertise the throughput being offered to its customers as per their
category or plan and it should be meted out as per their commitment.
Measurement: The average throughput for packet data should be calculated from all the test calls made according to the measurement setup. Test calls are made to weigh the results according to the patterns of real traffic. Average throughput is calculated as the average of all such test calls.
Average Throughput for Packet data = Average of download attempts in Kbit/ average download time in secs

TRAI Audit Wireless Report-Bihar & Jharkhand Circle AMJ Quarter-2016
32
2.4.4.5.5 LATENCY
Latency is the amount of time taken by a packet to reach the receiving endpoint after being transmitted from the sending point. This time period is termed the "end-to-end delay" occurring along the transmission path. Latency generally refers to network conditions, such as congestion, that may affect the overall time required for transit.
Measurement: Latency is measured with the test server for ping connected directly to the server on the same Intranet domain. Latency (Percentage of successful pinged) = Total number of successful ping ×100 Total number of ping sent to the Test Server
2.5 OPERATORS COVERED 2G AND 3G
June’16 VLR data was considered for the number of subscribers.
2.6 COLOUR CODES TO READ THE REPORT
Not Meeting the benchmark Best Performing Operator

TRAI Audit Wireless Report-Bihar & Jharkhand Circle AMJ Quarter-2016
33
3 EXECUTIVE SUMMARY-2G
The objective assessment of Quality of Service (QoS) carried out by IMRB gives an insight into the
overall performance of various operators in the Bihar & Jharkhand circle, with a parameter wise
performance evaluation as compared to TRAI benchmark.
3.1 PMR DATA – 3 MONTHS- CONSOLIDATED FOR 2G
NA: SDCCH/ Paging channel congestion not applicable for CDMA operators. Hence, it has been
reported as NA for Reliance CDMA and Tata CDMA.
Following are the parameter wise observations for wireless operators for Bihar & Jharkhand circle:
BTSs Accumulated Downtime:
All operators met the benchmark. Minimum BTS Accumulated downtime was recorded for Airtel at
0.06%.
Worst Affected BTSs Due to Downtime:
Aircel failed to meet the benchmark. Minimum worst affected BTSs due to downtime was recorded for
TATA GSM & CDMA at 0.00%.
Call Set-up Success Rate (CSSR):
Aircel (DWL), BSNL Bihar/ Jharkhand failed to meet the benchmark for CSSR. The maximum CSSR was
observed for Vodafone with 99.22%.

TRAI Audit Wireless Report-Bihar & Jharkhand Circle AMJ Quarter-2016
34
SDCCH/ Paging Chl. Congestion:
Aircel, BSNL Bihar/ Jharkhand and Telenor failed to meet the benchmark on SDCCH / Paging Channel
Congestion. Vodafone recorded the best SDCCH / Paging Channel Congestion at 0.35%
TCH Congestion:
Aircel(DWL), Reliance CDMA and Telenor failed to meet the benchmark for TCH congestion, while
TATA CDMA performed the best on TCH congestion at 0.61%
Call Drop Rate:
All operators met the benchmark for the parameter. Minimum call drop rate was recorded for Reliance
CDMA at 0.25%
Worst Affected Cells Having More than 3% TCH Drop:
Aircel(DWL), Telenor and BSNL Bihar/ Jharkhand failed to meet the benchmark. Best performance was
recorded for Reliance CDMA at 0.68%.
Voice Quality
All operators met the benchmark for the parameter. Best performance was recorded for TATA CDMA at
98.25%.
All the service providers were measuring this parameter as per the TRAI guidelines that have been
stated in parameter description section.

Below are the month wise summary tables for each network parameter basis PMR data.
3.1.1 PMR DATA - APRIL FOR 2G
3.1.2 PMR DATA – MAY FOR 2G

TRAI Audit Wireless Report-Bihar & Jharkhand Circle AMJ Quarter-2016
36
3.1.3 PMR DATA - JUNE FOR 2G

TRAI Audit Wireless Report-Bihar & Jharkhand Circle AMJ Quarter-2016
37
3.2 3 DAY DATA – CONSOLIDATED FOR 2G
A three day live measurement was conducted to measure the QoS provided by the operators. The table
provided below gives a snapshot of the performance of all operators during live measurement.
NA: SDCCH/ Paging channel congestion not applicable for CDMA operators.
BTSs Accumulated Downtime:
All operators met the benchmark. Minimum BTS Accumulated downtime was recorded for Airtel at
0.06%
Worst Affected BTSs Due to Downtime:
All operators met the benchmark worst affected BTSs due to downtime.
Call Set-up Success Rate (CSSR):
Aircel (DWL) and BSNL Bihar/ Jharkhand failed to meet the benchmark for CSSR. The maximum CSSR
was observed for Vodafone with 99.44%
SDCCH/ Paging Chl. Congestion:
Aircel (DWL), BSNL Bihar/ Jharkhand, Idea and Telenor failed to meet the benchmark on SDCCH /
Paging Channel Congestion. Vodafone recorded the best SDCCH / Paging Channel Congestion at 0.48%

TRAI Audit Wireless Report-Bihar & Jharkhand Circle AMJ Quarter-2016
38
TCH Congestion:
Aircel(DWL), BSNL Bihar/ Jharkhand and Telenor failed to meet the benchmark for TCH congestion,
while TATA CDMA performed the best on TCH congestion at 0.13%
Call Drop Rate:
All operators met the benchmark for the parameter. Minimum call drop rate was recorded for Tata
CDMA at 0.33%
Worst Affected Cells Having More than 3% TCH Drop:
Aircel (DWL), Telenor, TATA CDMA and BSNL Bihar/ Jharkhand failed to meet the benchmark. Best
performance was recorded for Tata GSM at 0.13%
Voice Quality
All operators met the benchmark for the parameter. Best performance was recorded for Vodafone at
98.32%
All the service providers were measuring this parameter as per the TRAI guidelines that have been
stated in parameter description section.

39
Below are the month wise summary tables for each network parameter basis 3 day live data.
3.2.1 3 DAY DATA - APRIL FOR 2G
3.2.2 3 DAY DATA – MAY FOR 2G

TRAI Audit Wireless Report-Bihar & Jharkhand Circle AMJ Quarter-2016
40
3.2.3 3 DAY DATA - JUNE FOR 2G

TRAI Audit Wireless Report-Bihar & Jharkhand Circle AMJ Quarter-2016
41
3.3 PMR DATA – 3 MONTHS- CONSOLIDATED FOR 3G
Following are the parameter wise observations for wireless operators for Bihar & Jharkhand circle:
Node Bs downtime:
All operators met the benchmark for Node Bs downtime. Minimum Node Bs downtime was recorded
for Airtel 3G at 0.03%
Worst affected Node Bs due to downtime:
Aircel 3G failed to meet the benchmark for worst affected Node Bs due to downtime. Minimum Worst
affected Node Bs due to downtime was recorded for Airtel 3G at 0.17%
Call Set-up Success Rate (CSSR):
BSNL Bihar/ Jharkhand failed to meet the benchmark for CSSR. Maximum CSSR was recorded for
Airtel 3G at 99.19%
RRC Congestion:
BSNL Bihar/ Jharkhand 3G failed to meet the TRAI benchmark for RRC Congestion. Minimum RRC
congestion was recorded for Reliance 3G at 0.02%
Circuit Switched RAB Congestion:
All operators met the TRAI benchmark for Circuit Switched RAB Congestion. Minimum Circuit
Switched RAB congestion was recorded for Reliance 3G at 0.02%
Circuit Switched Voice Call Drop Rate:
All operators met the benchmark for Circuit Switched Voice Call Drop Rate. Minimum Circuit
Switched Voice Call Drop Rate was recorded for Reliance 3G at 0.01%
Worst affected cells having more than 3% Circuit switched voice drop rate:
Aircel 3G failed to meet the benchmark for worst affected cells having more than 3% Circuit switched
voice drop rate. Minimum Worst affected cells having more than 3 % Circuit switched voice drop rate
was recorded for Reliance 3G at 0.51%

TRAI Audit Wireless Report-Bihar & Jharkhand Circle AMJ Quarter-2016
42
Circuit Switch Voice Quality:
All operators met the benchmark for Circuit Switch Voice Quality. Highest Circuit Switch Voice Quality
was recorded for Reliance 3G at 99.86%
All the service providers were measuring this parameter as per the TRAI guidelines that have been
stated in parameter description section.

43
Below are the month wise summary tables for each network parameter basis PMR data.
3.3.1 PMR DATA - APRIL FOR 3G
3.3.2 PMR DATA – MAY FOR 3G
3.3.3 PMR DATA - JUNE FOR 3G

44
3.4 3 DAY DATA – CONSOLIDATED FOR 3G
A three day live measurement was conducted to measure the QoS provided by the operators. The table
provided below gives a snapshot of the performance of all operators during live measurement.
Node Bs downtime:
All operators met the benchmark for Node Bs downtime. Minimum Node Bs downtime was recorded
for Airtel 3G at 0.02%
Worst affected Node Bs due to downtime:
All operators met the benchmark for worst affected Node Bs due to downtime. Minimum was recorded
for Aircel 3G at 0.00%
Call Set-up Success Rate (CSSR):
All operators met the benchmark as per the parameter. Maximum was recorded for Airtel at 99.15%
RRC Congestion:
BSNL Bihar/ Jharkhand 3G failed to meet the TRAI benchmark for RRC Congestion. Minimum RRC
Congestion was recorded for Airtel 3G at 0.03%
Circuit Switched RAB Congestion:
All operators met the TRAI benchmark for Circuit Switched RAB Congestion. Minimum Circuit
Switched RAB Congestion was recorded for Airtel 3G at 0.10%
Circuit Switched Voice Call Drop Rate:
All operators met the benchmark for Circuit Switched Voice Call Drop Rate. Minimum Circuit Switched
Voice Call Drop Rate was recorded for Airtel 3G at 0.53%
Worst affected cells having more than 3% Circuit switched voice drop rate:
Aircel 3G failed to meet the benchmark for worst affected cells having more than 3% Circuit switched
voice drop rate. Minimum Worst affected cells having more than 3% circuit switched voice drop rate
was recorded for BSNL Bihar/ Jharkhand at 0.60%
Circuit Switch Voice Quality:
All operators met the benchmark for Circuit Switch Voice Quality. Maximum Circuit Switched Voice
Quality was recorded for Aircel 3G at 98.85%

TRAI Audit Wireless Report-Bihar & Jharkhand Circle AMJ Quarter-2016
45
Below are the month wise summary tables for each network parameter basis 3 day live data.
3.4.1 3 DAY DATA - APRIL FOR 3G
3.4.2 3 DAY DATA – MAY FOR 3G
3.4.3 3 DAY DATA - JUNE FOR 3G
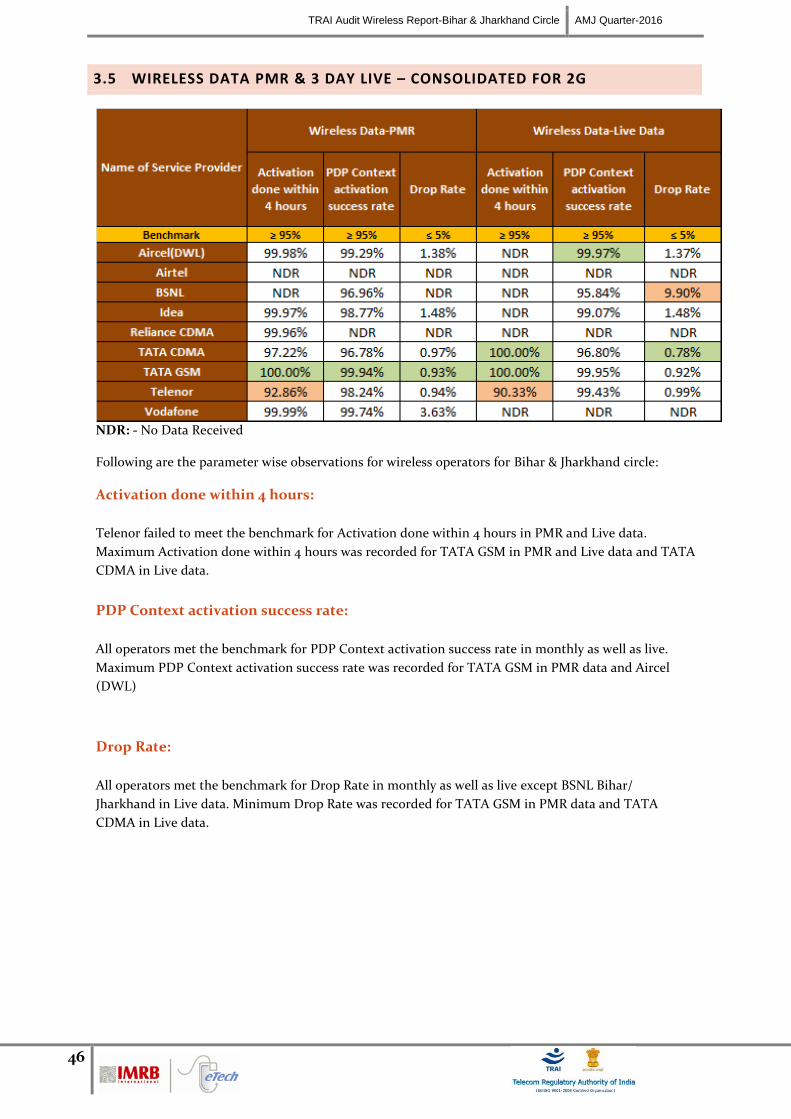
TRAI Audit Wireless Report-Bihar & Jharkhand Circle AMJ Quarter-2016
46
3.5 WIRELESS DATA PMR & 3 DAY LIVE – CONSOLIDATED FOR 2G
NDR: - No Data Received
Following are the parameter wise observations for wireless operators for Bihar & Jharkhand circle:
Activation done within 4 hours:
Telenor failed to meet the benchmark for Activation done within 4 hours in PMR and Live data.
Maximum Activation done within 4 hours was recorded for TATA GSM in PMR and Live data and TATA
CDMA in Live data.
PDP Context activation success rate:
All operators met the benchmark for PDP Context activation success rate in monthly as well as live.
Maximum PDP Context activation success rate was recorded for TATA GSM in PMR data and Aircel
(DWL)
Drop Rate:
All operators met the benchmark for Drop Rate in monthly as well as live except BSNL Bihar/
Jharkhand in Live data. Minimum Drop Rate was recorded for TATA GSM in PMR data and TATA
CDMA in Live data.

47
3.6 WIRELESS DATA PMR & 3 DAY LIVE – CONSOLIDATED FOR 3G
Following are the parameter wise observations for wireless operators for Bihar & Jharkhand circle:
Activation done within 4 hours:
All operators met the benchmark for Activation done within 4 hours in monthly as well as live.
Maximum Activation done within 4 hours was recorded for Aircel 3G for PMR as well as live.
PDP Context activation success rate:
All operators met the benchmark for PDP Context activation success rate for PMR as well as Live data.
Maximum PDP Context activation success rate was recorded for Aircel 3G in PMR as well as Live data.
Drop Rate:
BSNL Bihar/ Jharkhand 3G failed to meet the benchmark for Drop Rate in PMR as well as in live audit.
Minimum Drop Rate was recorded for Aircel 3G in PMR as well as Live data.

48
Below are the month wise summary tables for each network parameter basis PMR and Live data.
3.7 LIVE CALLING DATA - CONSOLIDATED
Resolution of billing complaints
As per the consumers (live calling exercise) none of the operators was able to meet the benchmark of
resolving 98% complaints within 4 weeks and 100% complaints within 6 weeks.
Accessibility of Call Centre/Customer Care-IVR
For the IVR aspect, all operators met the TRAI benchmark of 95% with all the operators recording 100%
for the parameter.
Customer Care / Helpline Assessment (voice to voice)
BSNL Bihar/ Jharkhand and Idea failed to meet the benchmark for Customer Care / Helpline
Assessment (voice to voice). Maximum Customer care/ Helpline Assessment (Voice to Voice) was
recorded for TATA CDMA & TATA GSM at 100.00%
Level 1 Service
As per the live calling results all operators failed to meet the TRAI benchmark for level 1 service with
calls being answered. The details of live calling done for the level 1 service have been provided in the
annexure for each operator.
Complaint/Request Attended to Satisfaction
All operators performed satisfactorily in terms of satisfaction of the customers for service requests. Idea
recorded the best performance at 93.00%.
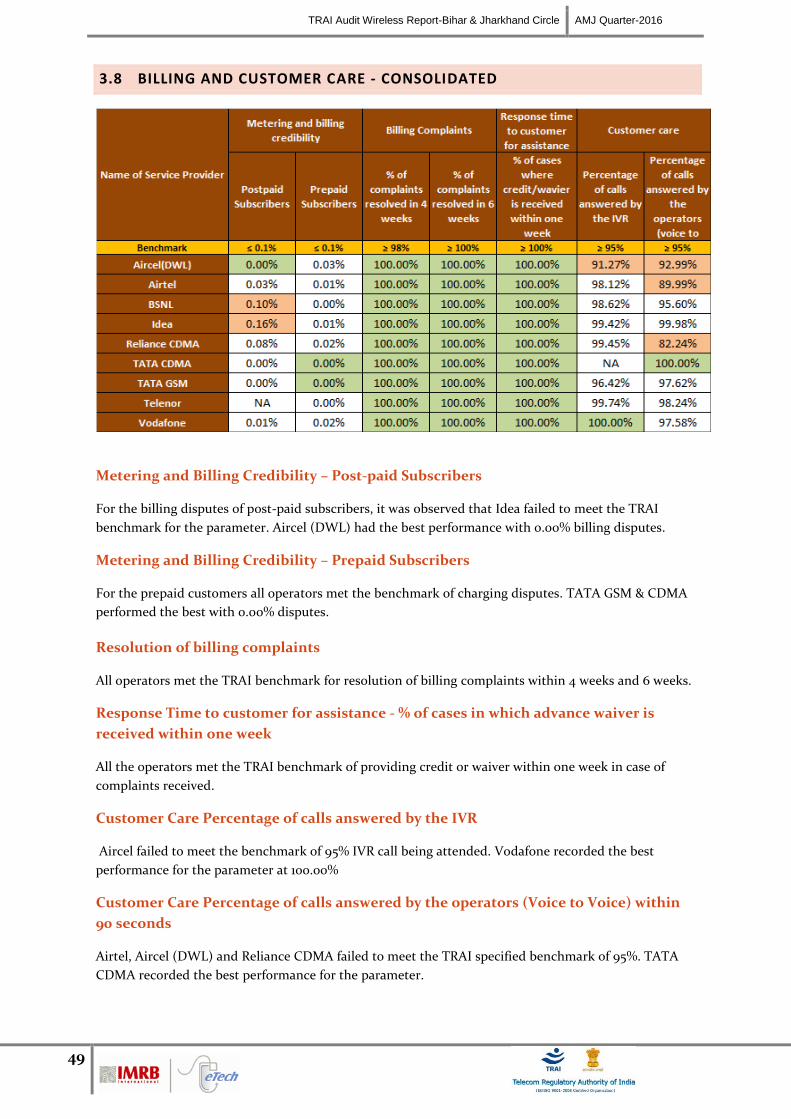
TRAI Audit Wireless Report-Bihar & Jharkhand Circle AMJ Quarter-2016
49
3.8 BILLING AND CUSTOMER CARE - CONSOLIDATED
Metering and Billing Credibility – Post-paid Subscribers
For the billing disputes of post-paid subscribers, it was observed that Idea failed to meet the TRAI
benchmark for the parameter. Aircel (DWL) had the best performance with 0.00% billing disputes.
Metering and Billing Credibility – Prepaid Subscribers
For the prepaid customers all operators met the benchmark of charging disputes. TATA GSM & CDMA
performed the best with 0.00% disputes.
Resolution of billing complaints
All operators met the TRAI benchmark for resolution of billing complaints within 4 weeks and 6 weeks.
Response Time to customer for assistance - % of cases in which advance waiver is
received within one week
All the operators met the TRAI benchmark of providing credit or waiver within one week in case of
complaints received.
Customer Care Percentage of calls answered by the IVR
Aircel failed to meet the benchmark of 95% IVR call being attended. Vodafone recorded the best
performance for the parameter at 100.00%
Customer Care Percentage of calls answered by the operators (Voice to Voice) within
90 seconds
Airtel, Aircel (DWL) and Reliance CDMA failed to meet the TRAI specified benchmark of 95%. TATA
CDMA recorded the best performance for the parameter.

50
3.9 INTER OPERATOR CALL ASSESSMENT - CONSOLIDATED
In the inter-operator call assessment, most of the operators faced problems in connecting to other operators.
Maximum Problem faced by the calling operator to other operator. The orange colour denotes performance below circle average.

TRAI Audit Wireless Report-Bihar & Jharkhand Circle AMJ Quarter-2016
51
3.10 COMPARISON BETWEEN IMRB AND OPERATOR’S DATA FOR 2G
3.11 COMPARISON BETWEEN IMRB AND OPERATOR’S DATA FOR 23G

52
4 CRITICAL FINDINGS
PMR Consolidated (Network Parameters) for 2G
Aircel failed to meet the benchmark for worst affected BTSs due to downtime and it has very
high value as 14.20%.
Aircel and BSNL failed to meet the benchmark for CSSR
Aircel, BSNL and Telenor failed to meet the benchmark on SDCCH / Paging Channel
Congestion
Aircel (16.01%), Reliance CDMA and Telenor failed to meet the benchmark for TCH congestion
Aircel, Telenor and BSNL failed to meet the benchmark for worst affected cells having more
than 3% TCH drop rate, in which Aircel has very high value as 13.67%.
3 Day Live Measurement (Network Parameters)
Aircel and BSNL failed to meet the benchmark for CSSR
Aircel, BSNL, Idea and Telenor failed to meet the benchmark on SDCCH / Paging Channel
Congestion
Aircel, BSNL and Telenor failed to meet the benchmark for TCH congestion, in which Aircel
has very high value as 14.77%.
Aircel, Tata CDMA, Telenor and BSNL failed to meet the benchmark for worst affected cells
having more than 3% TCH drop rate, in which Aircel has very high value as 13.47%.
PMR & 3Days live Consolidated (Network Parameters) for 3G
Aircel 3G (12.78%) failed to meet the benchmark for worst affected Node Bs due to downtime in
PMR audit.
BSNL 3G failed to meet the benchmark for CSSR
Aircel 3G and BSNL 3G failed to meet the benchmark for RRC Congestion in PMR as well as
3days live audit.
Aircel 3G failed to meet the benchmark for worst affected cells having more than 3% Circuit
switched voice drop rate in PMR and live audit. During PMR the value was 8.73% and during
live audit it was 9.30%
Wireless data services for 2G and 3G
Telenor 2G failed to meet the benchmark for Activation done within 4 hours in PMR audit as
well as live audit.
BSNL 3G failed to meet the benchmark for Drop Rate in PMR as well as 3days, however BSNL
2G failed in live audit.
Live Calling
As per the consumers (live calling exercise) none of the operators was able to meet the
benchmark of resolving 98% complaints within 4 weeks and 100% complaints within 6 weeks.
BSNL and Idea failed to meet the benchmark for Customer Care / Helpline Assessment (voice
to voice).
As per the live calling results all operators failed to meet the TRAI benchmark for level 1 service
with calls being answered.

TRAI Audit Wireless Report-Bihar & Jharkhand Circle AMJ Quarter-2016
53
Metering and billing credibility
For the billing disputes of post-paid subscribers, it was observed that Idea failed to meet the
TRAI benchmark for the parameter.
Aircel failed to meet the benchmark of 95% IVR call being attended.
Aircel, Airtel and Reliance CDMA failed to meet the TRAI specified benchmark of Customer
Care Percentage of calls answered by the operators (Voice to Voice) within 90 seconds.
Drive Test Voice 2G
In Daltonganj SSA Reliance CDMA, TATA CDMA & GSM did not meet the TRAI benchmark for
voice quality in outdoor locations and BSNL did not meet the TRAI benchmark in indoor as
well as outdoor location.
In Daltonganj SSA Aircel, BSNL, Reliance CDMA, TATA CDMA & GSM failed to meet the
benchmark for CSSR in outdoor locations.
In Daltonganj SSA BSNL, Reliance CDMA and TATA GSM failed to meet the benchmark for call
drop rate in outdoor locations.
In Jamshedpur SSA BSNL failed to meet the benchmark for voice quality in indoor as well as
outdoor locations. Reliance CDMA, TATA CDMA & GSM and Telenor did not meet the
benchmark in outdoor locations.
In Jamshedpur SSA Aircel, BSNL, Reliance CDMA, TATA GSM failed to meet the benchmark for
CSSR in outdoor locations.
In Jamshepur Aircel, Reliance CDMA and TATA GSM failed to meet the benchmark for call
drop rate in outdoor locations and BSNL failed to meet the benchmark for Call Drop Rate in
both Indoor and outdoor locations.
In Dhanbad SSA Reliance CDMA and Telenor failed to meet the benchmark for voice quality in
outdoor locations.
In Dhanbad SSA Aircel and Reliance CDMA failed to meet the benchmark for CSSR in outdoor
locations.
In Dhanbad SSA Aircel and Reliance CDMA failed to meet the benchmark for call drop rate in
outdoor locations.
In Hazaribagh SSA Reliance CDMA failed to meet the benchmark for voice quality in indoor as
well as outdoor locations.
In Hazaribagh SSA Reliance CDMA failed to meet the benchmark for CSSR in outdoor
locations.
In Hazaribagh SSA Reliance CDMA failed to meet the benchmark for call drop rate in outdoor
locations.
In Motihari SSA, Aircel failed to meet the benchmark in outdoor locations. TATA GSM did not
meet the benchmark in indoor as well as outdoor locations.
In Motihari SSA, TATA GSM failed to meet the benchmark for CSSR in outdoor locations.
In Motihari SSA, ATA GSM failed to meet the benchmark for call drop rate in outdoor
locations.
In Patna SSA, Aircel, BSNL and TATA GSM failed to meet the benchmark for voice quality in
outdoor as well as indoor locations. TATA CDMA did not meet the benchmark in outdoor
locations.
In Patna SSA, BSNL, TATA CDMA and TATA GSM failed to meet the benchmark for CSSR in
outdoor locations.
In Patna SSA, BSNL, TATA CDMA and TATA GSM failed to meet the benchmark for call drop
rate in outdoor locations.
Note: - BSNL 2G was not participated in Dhanbad, Hazaribagh and Motihari drive test activity

TRAI Audit Wireless Report-Bihar & Jharkhand Circle AMJ Quarter-2016
54
Drive Test Voice 3G
In Daltonganj SSA Aircel failed to meet the benchmark for Voice Quality in outdoor locations
and BSNL failed to meet the benchmark in outdoor as well as indoor location.
In Daltonganj SSA BSNL failed to meet the benchmark for Call Set Success Rate in outdoor
location.
In Daltonganj SSA BSNL failed to meet the benchmark for Call Drop Rate in outdoor locations.
In Jamshedpur SSA Reliance 3G failed to meet the benchmark CSSR in outdoor locations.
In Jamshepur SSA Aircel 3G and Reliance 3G failed to meet the benchmark for drop rate in
outdoor locations.
In Dhanbad SSA Aircel 3G failed to meet the benchmark for Voice quality in outdoor as well as
indoor locations.
In Dhanbad SSA Reliance 3G failed to meet the benchmark for CSSR in outdoor locations.
In Dhanbad SSA Aircel 3G and Reliance 3G failed to meet the benchmark for drop rate in
outdoor locations.
In Hazaribagh SSA Aircel 3G failed to meet the benchmark for Voice quality in outdoor as well
as indoor locations.
In Hazaribagh SSA Reliance 3G failed to meet the benchmark for CSSR in outdoor locations.
In Hazaribagh SSA Reliance 3G failed to meet the benchmark in outdoor location.
In Motihari SSA, Aircel 3G failed to meet the benchmark for voice quality in outdoor as well as
indoor locations.
In Patna SSA, Aircel 3G failed to meet the benchmark for voice quality in outdoor as well as
indoor locations.
In Patna SSA, BSNL, Reliance 3G failed to meet the benchmark for CSSR in outdoor locations.
In Patna SSA, Reliance 3G failed to meet the benchmark for call drop rate in outdoor locations.
Note: - BSNL 3G was not participated in drive test in Jamshedpur, Dhanbad, Hazaribagh and Motihari
Note: - BSNL 3G in Patna SSA and Reliance 3G in Jamshedpur, Dhanbad, Hazaribagh and Patna did not
submitted voice quality data.
Independent Drive test Voice - Ranchi
Most of the operators met the Call Setup Success Rate benchmark of >=95% except Aircel 2G,
Airtel 2G & 3G, BSNL 2G & 3G and Telenor 2G.
Most of the operators failed to meet the Call Drop Rate benchmark of <=2% except Telenor 2G
Most of operators failed to meet the Rx Quality benchmark of >=95% except Airtel 3G and
BSNL 3G

55
5 PARAMETER DESCRIPTION & DETAILED FINDINGS - COMPARISON BETWEEN PMR DATA, 3 DAY LIVE DATA AND LIVE CALLING
DATA FOR 2G
5.1 BTS ACCUMULATED DOWNTIME
5.1.1 PARAMETER DESCRIPTION
The parameter of network availability would be measured from following sub-parameters
1. BTSs Accumulated downtime (not available for service)
2. Worst affected BTSs due to downtime
1. Definition - BTSs (Base Transceiver Station) accumulated downtime (not available for service) shall basically measure the downtime of the BTSs,
including its transmission links/circuits during the period of a month, but excludes all planned service downtime for any maintenance or software up
gradation. For measuring the performance against the benchmark for this parameter the downtime of each BTS lasting more than 1 hour at a time in a day
during the period of a month were considered.
2. Computation Methodology –
BTS accumulated downtime (not available for service) = Sum of downtime of BTSs in a month in hours i.e. total outage time of all BTSs in hours
during a month / (24 x Number of days in a month x Number of BTSs in the network in licensed service area) x 100
3. TRAI Benchmark –
a. BTSs Accumulated downtime (not available for service) ≤ 2%
4. Audit Procedure –
The fault alarm details at the OMC (MSC) for the network outages (due to own network elements and infrastructure service provider end
outages) was audited
All the BTS in service area were considered. Planned outages due to network up gradation, routine maintenance were not considered.

TRAI Audit Wireless Report-Bihar & Jharkhand Circle AMJ Quarter-2016
56
Any outage as a result of force majeure were not considered at the time of calculation
Data is extracted from system log of the server of the operator. This data is in raw format which is further processed to arrive at the
cumulative values.
List of operating sites with cell details and ids are taken from the operator.
When there is any outage a performance report gets generated in line with that cell resulting and master base of the Accumulated
downtime and worst affected BTS due to downtime.
5.1.2 KEY FINDINGS - CONSOLIDATED
1.9
7%
0.0
6%
1.7
7%
0.8
8%
0.1
5%
No
Ser
vice
0.2
8%
0.1
8%
0.3
7%
0.4
7%
1.4
8%
0.0
6%
0.8
2%
1.1
3%
Serv
er i
ssu
e
No
Ser
vice
0.2
3%
0.1
6%
0.3
6%
0.5
7%
0.0%
0.5%
1.0%
1.5%
2.0%
2.5%
Aircel(DWL) Airtel BSNL Idea Reliance CDMA Reliance GSM TATA CDMA TATA GSM Telenor Vodafone% B
TSs
accu
mu
late
d d
ow
nti
me
BTSs accumulated downtime - Consolidated
PMR Data Live Data
TRAI Benchmark ≤ 2%
Data Source: Operations and Maintenance Center (OMC) of the operators
All operators met the benchmark on aspect of BTS accumulated downtime as per audit/PMR data.

TRAI Audit Wireless Report-Bihar & Jharkhand Circle AMJ Quarter-2016
57
5.1.2.1 KEY FINDINGS – MONTH 1
2.29
%
0.06
%
1.82
%
0.82
%
0.12
%
No
Serv
ice
0.27
%
0.15
%
0.35
%
0.43
%
0.41
%
0.06
%
1.12
%
0.91
%
serv
er is
sue
No
Serv
ice
0.24
%
0.15
%
0.30
%
0.49
%
0.0%
0.5%
1.0%
1.5%
2.0%
2.5%
Aircel(DWL) Airtel BSNL Idea Reliance CDMA Reliance GSM TATA CDMA TATA GSM Telenor Vodafone% B
TSs
accu
mul
ated
dow
ntim
e BTSs accumulated downtime - Month 1
PMR Data Live Data
TRAI Benchmark ≤ 2%
Data Source: Operations and Maintenance Center (OMC) of the operators
5.1.2.2 KEY FINDINGS – MONTH 2
2.04
%
0.06
%
1.73
%
0.92
%
0.18
%
No
Serv
ice
0.25
%
0.15
%
0.38
%
0.51
%
2.10
%
0.07
% 0.63
% 0.97
%
serv
er is
sue
No
Serv
ice
0.24
%
0.15
%
0.43
%
0.58
%
0.0%
0.5%
1.0%
1.5%
2.0%
2.5%
Aircel(DWL) Airtel BSNL Idea Reliance CDMA Reliance GSM TATA CDMA TATA GSM Telenor Vodafone% B
TSs
accu
mul
ated
dow
ntim
e
BTSs accumulated downtime - Month 2
PMR Data Live Data
TRAI Benchmark ≤ 2%
Data Source: Operations and Maintenance Center (OMC) of the operators

TRAI Audit Wireless Report-Bihar & Jharkhand Circle AMJ Quarter-2016
58
5.1.2.3 KEY FINDINGS – MONTH 3
1.6
6%
0.0
6%
1.7
9%
0.9
3%
0.1
7%
No
Ser
vice
0.3
2%
0.2
4%
0.3
8%
0.4
9%
1.9
3%
0.0
6%
0.6
4%
1.5
1%
serv
er i
ssu
e
No
Ser
vice
0.2
2%
0.1
8%
0.3
5%
0.6
5%
0.0%
0.5%
1.0%
1.5%
2.0%
2.5%
Aircel(DWL) Airtel BSNL Idea Reliance CDMA Reliance GSM TATA CDMA TATA GSM Telenor Vodafone
% B
TSs
accu
mu
late
d d
ow
nti
me
BTSs accumulated downtime - Month 3
PMR Data Live Data
TRAI Benchmark ≤ 2%
Data Source: Operations and Maintenance Center (OMC) of the operators

TRAI Audit Wireless Report-Bihar & Jharkhand Circle AMJ Quarter-2016
59
5.2 WORST AFFECTED BTS DUE TO DOWNTIME
5.2.1 PARAMETER DESCRIPTION
Definition – Worst Affected BTS due to downtime shall basically measure percentage of BTS having downtime greater than 24 hours in a month. Planned
outages were not considered as part while computing.
For measuring the parameter “Percentage of worst affected BTSs due to downtime" the downtime of each BTS lasting for more than 1 hour at a time in a day
during the period of a month was considered.
Computation Methodology –
Worst affected BTSs due to downtime = (Number of BTSs having accumulated downtime greater than 24 hours in a month / Number of BTS in
Licensed Service Area) * 100
TRAI Benchmark –
a. Worst affected BTSs due to downtime ≤ 2%
Audit Procedure –
i. The fault alarm details at the OMC (MSC) for the network outages (due to own network elements and infrastructure service provider end
outages) was audited
ii. All the BTS in service area were considered. Planned outages due to network up gradation, routine maintenance were not considered.
iii. Data is extracted from system log of the server of the operator. This data is in raw format which is further processed to arrive at the
cumulative values.
iv. Any outage as a result of force majeure was not considered at the time of calculation.
v. List of operating sites with cell details and ids are taken from the operator.
vi. All the BTS having down time greater than 24 hours is assessed and values of BTS accumulated downtime is computed in accordance.

TRAI Audit Wireless Report-Bihar & Jharkhand Circle AMJ Quarter-2016
60
5.2.2 KEY FINDINGS – CONSOLIDATED
14.2
0%
0.16
% 1.93
%
1.83
%
1.13
%
No
Serv
ice
0.00
%
0.00
%
1.03
%
1.78
%
0.00
%
0.02
%
0.60
%
0.10
%
Serv
er i
ssue
No
Serv
ice
0.00
%
0.00
%
0.00
%
0.00
%
0.0%
2.0%
4.0%
6.0%
8.0%
10.0%
12.0%
14.0%
16.0%
Aircel(DWL) Airtel BSNL Idea Reliance CDMA Reliance GSM TATA CDMA TATA GSM Telenor Vodafone
% W
orst
aff
ecte
d BT
Ss d
ue t
o do
wnt
ime
Worst affected BTSs-Consolidated
PMR Data Live Data
TRAI Benchmark ≤ 2%
Data Source: Operations and Maintenance Center (OMC) of the operators
Aircel failed to meet the benchmark for worst affected BTSs due to downtime as per audit/PMR data.
Significant difference was observed between PMR & live measurement data for Aircel, Vodafone, Idea and BSNL. The possible reason for the variation could be the
difference in time frame of data as PMR data is for 30 days and live measurement data is for three days.

TRAI Audit Wireless Report-Bihar & Jharkhand Circle AMJ Quarter-2016
61
5.2.2.1 KEY FINDINGS – MONTH 1
16.1
7%
0.16
%
1.90
%
1.83
%
0.79
%
No
Serv
ice
0.00
%
0.00
%
0.73
%
1.58
%
0.00
%
0.04
%
0.93
%
0.05
%
serv
er is
sue
No
Serv
ice
0.00
%
0.00
%
0.00
%
0.00
%
0.0%
5.0%
10.0%
15.0%
20.0%
Aircel(DWL) Airtel BSNL Idea Reliance CDMA Reliance GSM TATA CDMA TATA GSM Telenor Vodafone
% W
orst
aff
ecte
d BT
Ss d
ue t
o do
wnt
ime
Worst affected BTSs-Month 1
PMR Data Live Data
TRAI Benchmark ≤ 2%
5.2.2.2 KEY FINDINGS – MONTH 2
14
.47
%
0.1
4%
1.8
9%
1.8
7%
1.4
9%
No
Ser
vice
0.0
0%
0.0
0%
1.0
1%
1.9
3%
0.0
0%
0.0
2%
0.0
0%
0.0
4%
serv
er i
ssu
e
No
Ser
vice
0.0
0%
0.0
0%
0.0
0%
0.0
0%
0.0%
2.0%
4.0%
6.0%
8.0%
10.0%
12.0%
14.0%
16.0%
Aircel(DWL) Airtel BSNL Idea Reliance CDMA Reliance GSM TATA CDMA TATA GSM Telenor Vodafone
% W
ors
t af
fect
ed
BTS
s d
ue
to
d
ow
nti
me
Worst affected BTSs-Month 2
PMR Data Live Data
TRAI Benchmark ≤ 2%

TRAI Audit Wireless Report-Bihar & Jharkhand Circle AMJ Quarter-2016
62
5.2.2.3 KEY FINDINGS – MONTH 3
11
.98
%
0.1
7% 1.9
9%
1.8
0%
1.0
9%
No
Ser
vice
0.0
0%
0.0
0%
1.3
4%
1.8
2%
0.0
0%
0.0
0%
0.6
8%
0.2
2%
serv
er i
ssu
e
No
Ser
vice
0.0
0%
0.0
0%
0.0
0%
0.0
0%
0.0%
2.0%
4.0%
6.0%
8.0%
10.0%
12.0%
14.0%
Aircel(DWL) Airtel BSNL Idea Reliance CDMA Reliance GSM TATA CDMA TATA GSM Telenor Vodafone
% W
ors
t af
fect
ed
BTS
s d
ue
to
d
ow
nti
me
Worst affected BTSs-Month 3
PMR Data Live Data
TRAI Benchmark ≤ 2%
Data Source: Operations and Maintenance Center (OMC) of the operators

TRAI Audit Wireless Report-Bihar & Jharkhand Circle AMJ Quarter-2016
63
5.3 CALL SET UP SUCCESS RATE
5.3.1 PARAMETER DESCRIPTION
1. Definition: The ratio of successful calls established to total calls is known as Call Set-Up Success Rate (CSSR).
2. Computation Methodology-
(Calls Established / Total Call Attempts) * 100
Call Established means the following events have happened in call setup:-
call attempt is made
the TCH is allocated
the call is routed to the outward path of the concerned MSC
3. TRAI Benchmark ≥ 95%
4. Audit Procedure –
The cell-wise data generated through counters/ MMC available in the switch for traffic measurements
CSSR calculation should be measured using OMC generated data only
Measurement should be only in Time Consistent Busy Hour (CBBH) period for all days of the week
Counter data is extracted from the NOC of the operators.
Total calls established include all calls established excluding Signaling blocking, TCH Drop and TCH blocking.
The numerator and denominator values are derived from adding the counter values from the MSC.

TRAI Audit Wireless Report-Bihar & Jharkhand Circle AMJ Quarter-2016
64
5.3.2 KEY FINDINGS - CONSOLIDATED
83.6
2%
95.5
9%
90.8
2%
96.6
3%
95.5
0%
No
Serv
ice
97.7
7%
97.8
3%
95.8
1%
99.2
2%
84.8
6%
95.5
1%
91.3
3%
98.0
1%
Serv
er i
ssue
No
Serv
ice
98.3
0%
98.6
1%
95.7
9%
99.4
4%
96.5
2%
100.
00%
43.2
7%
100.
00%
93.8
4%
No
Serv
ice
95.4
1%
92.7
7%
99.6
5%
100.
00%
0%
20%
40%
60%
80%
100%
Aircel(DWL) Airtel BSNL Idea Reliance CDMA Reliance GSM TATA CDMA TATA GSM Telenor Vodafone
% C
SSR
Call Set Up Success Rate-Consolidated
PMR Data Live Data Drive Test Data
TRAI Benchmark ≥ 95%
Data Source: Network Operations Center (NOC) of the operators
Aircel, BSNL failed to meet the TRAI benchmark as per audit/PMR data, live data and during drive test BSNL, Reliance CDMA and TATA GSM failed.
5.3.2.1 KEY FINDINGS – MONTH 1
82.2
7%
95.6
3%
97.0
1%
97.0
1%
96.2
3%
No
Serv
ice
97.7
5%
97.9
1%
95.1
6%
99.2
2%
85.6
9%
95.5
3%
97.0
3%
97.0
3%
serv
er is
sue
No
Serv
ice
98.4
3%
98.6
5%
94.6
5%
99.4
6%
96.5
2%
100.
00%
43.2
7%
100.
00%
93.8
4%
No
Serv
ice
95.4
1%
92.7
7%
99.6
5%
100.
00%
0%
20%
40%
60%
80%
100%
Aircel(DWL) Airtel BSNL Idea Reliance CDMA Reliance GSM TATA CDMA TATA GSM Telenor Vodafone
% C
SSR
Call Set Up Success Rate-Month 1
PMR Data Live Data Drive Test Data
TRAI Benchmark ≥ 95%

TRAI Audit Wireless Report-Bihar & Jharkhand Circle AMJ Quarter-2016
65
5.3.2.2 KEY FINDINGS – MONTH 2
83.3
8%
95.6
2%
85.0
3%
96.6
2%
93.3
4%
No
Serv
ice
97.7
9%
97.9
1%
96.0
1%
99.0
8%
82.9
9%
95.7
4%
86.5
7%
99.0
4%
serv
er is
sue
No
Serv
ice
98.2
8%
98.6
5%
96.2
7%
99.4
8%
96.7
9%
100.
00%
Not
par
tici
pate
d
100.
00%
89.5
6%
No
Serv
ice
94.6
2%
94.0
7%
99.5
9%
99.7
8%
0%
20%
40%
60%
80%
100%
Aircel(DWL) Airtel BSNL Idea Reliance CDMA Reliance GSM TATA CDMA TATA GSM Telenor Vodafone
% C
SSR
Call Set Up Success Rate-Month 2
PMR Data Live Data Drive Test Data
TRAI Benchmark ≥ 95%
Data Source: Network Operations Center (NOC) of the operators
5.3.2.3 KEY FINDINGS – MONTH 3
85
.20
%
95
.53
%
90
.41
%
96
.25
%
96
.93
%
No
Ser
vice
97
.78
%
97
.66
%
96
.25
%
99
.38
%
85
.91
%
95
.27
%
90
.39
%
97
.95
%
serv
er i
ssu
e
No
Ser
vice
98
.20
%
98
.52
%
96
.45
%
99
.37
%
96
.55
%
10
0.0
0%
92
.97
%
10
0.0
0%
Clo
sed
No
Ser
vice
24
.55
%
86
.74
%
99
.44
%
99
.91
%
0%
20%
40%
60%
80%
100%
Aircel(DWL) Airtel BSNL Idea Reliance CDMA Reliance GSM TATA CDMA TATA GSM Telenor Vodafone
% C
SSR
Call Set Up Success Rate-Month 3
PMR Data Live Data Drive Test Data
TRAI Benchmark ≥ 95%
Data Source: Network Operations Center (NOC) of the operators

TRAI Audit Wireless Report-Bihar & Jharkhand Circle AMJ Quarter-2016
66
5.4 NETWORK CHANNEL CONGESTION- PAGING CHANNEL /TCH CONGESTION/POI
5.4.1 PARAMETER DESCRIPTION
1. Definition: It means a call is not connected because there is no free channel to serve the call attempt. This parameter represents congestion in the network.
It happens at three levels:
SDCCH Level: Stand-alone dedicated control channel
TCH Level: Traffic Channel
POI Level: Point of Interconnect
2. Computational Methodology:
SDCCH / TCH Congestion% = [(A1 x C1) + (A2 x C2) +…….+ (An x Cn)] / (A1 + A2 +…+ An)
Where:-A1 = Number of attempts to establish SDCCH / TCH made on day 1
C1 = Average SDCCH / TCH Congestion % on day 1
A2 = Number of attempts to establish SDCCH / TCH made on day 2
C2 = Average SDCCH / TCH Congestion % on day 2
An = Number of attempts to establish SDCCH / TCH made on day n
Cn = Average SDCCH / TCH Congestion % on day n
POI Congestion% = [(A1 x C1) + (A2 x C2) +…….+ (An x Cn)] / (A1 + A2 +…+ An)
Where:-A1 = POI traffic offered on all POIs (no. of calls) on day 1
C1 = Average POI Congestion % on day 1
A2 = POI traffic offered on all POIs (no. of calls) on day 2
C2 = Average POI Congestion % on day 2

TRAI Audit Wireless Report-Bihar & Jharkhand Circle AMJ Quarter-2016
67
An = POI traffic offered on all POIs (no. of calls) on day n
Cn = Average POI Congestion % on day n
3. Benchmark:
SDCCH Congestion: ≤ 1%, TCH Congestion: ≤ 2%, POI Congestion: ≤ 0.5%
4. Audit Procedure –
Audit of the details of SDCCH and TCH congestion percentages computed by the operator (using OMC–Switch data only) would be
conducted
The operator should be measuring this parameter during Time consistent busy hour (TCBH) only SDCCH
5.4.2 KEY FINDINGS - SDCCH/PAGING CHANNEL CONGESTION (CONSOLIDATED)
3.37
%
0.83
% 2.93
%
0.89
%
NA
No
Serv
ice
NA 0.
77%
1.71
%
0.35
%2.95
%
0.81
%
10.3
5%
1.15
%
Serv
er i
ssue
No
Serv
ice
NA 0.
61%
1.91
%
0.48
%
0.0%
2.0%
4.0%
6.0%
8.0%
10.0%
12.0%
Aircel(DWL) Airtel BSNL Idea Reliance CDMA Reliance GSM TATA CDMA TATA GSM Telenor Vodafone
% c
onge
stio
n
SDCCH/Paging Channel Congestion-Consolidated
PMR Data Live Data
TRAI Benchmark ≤ 1%
Data Source: Network Operations Center (NOC) of the operators
Aircel, BSNL and Telenor failed to meet the benchmark as per PMR & Live audit and Idea failed to meet benchmark as per Live audit only.
NA: SDCCH/ Paging channel congestion not applicable for CDMA operators.

TRAI Audit Wireless Report-Bihar & Jharkhand Circle AMJ Quarter-2016
68
5.4.2.1 KEY FINDINGS – MONTH 1
4.64
%
0.82
%
0.91
%
0.91
%
NA
No
Serv
ice
NA 0.
60% 1.
81%
0.46
%
4.70
%
0.81
%
0.90
%
0.90
%
serv
er is
sue
No
Serv
ice
NA 0.
46% 1.
51%
0.57
%
0.0%
1.0%
2.0%
3.0%
4.0%
5.0%
Aircel(DWL) Airtel BSNL Idea Reliance CDMA Reliance GSM TATA CDMA TATA GSM Telenor Vodafone
% c
onge
stio
n SDCCH/Paging Channel Congestion-Month 1
PMR Data Live Data
TRAI Benchmark ≤ 1%
Data Source: Network Operations Center (NOC) of the operators
5.4.2.2 KEY FINDINGS – MONTH 2
3.59
%
0.82
%
0.80
%
0.90
%
NA
No
Serv
ice
NA
0.60
%
1.65
%
0.33
%
2.51
%
0.80
%
NA
1.04
%
serv
er is
sue
No
Serv
ice
NA 0.
46% 1.
18%
0.45
%
0.0%0.5%1.0%1.5%2.0%2.5%3.0%3.5%4.0%
Aircel(DWL) Airtel BSNL Idea Reliance CDMA Reliance GSM TATA CDMA TATA GSM Telenor Vodafone
% c
onge
stio
n
SDCCH/Paging Channel Congestion-Month 2
PMR Data Live Data
TRAI Benchmark ≤ 1%

TRAI Audit Wireless Report-Bihar & Jharkhand Circle AMJ Quarter-2016
69
5.4.2.3 KEY FINDINGS – MONTH 3
1.8
7%
0.8
4%
7.1
0%
0.8
7%
NA
No
Ser
vice
NA 1.1
0%
1.6
7%
0.2
6%
1.6
6%
0.8
1%
19
.79
%
1.5
0%
serv
er i
ssu
e
No
Ser
vice
NA 0.9
2%
3.0
4%
0.4
2%
0.0%
5.0%
10.0%
15.0%
20.0%
25.0%
Aircel(DWL) Airtel BSNL Idea Reliance CDMA Reliance GSM TATA CDMA TATA GSM Telenor Vodafone
% c
on
gest
ion
SDCCH/Paging Channel Congestion-Month 3
PMR Data Live Data
TRAI Benchmark ≤ 1%
Data Source: Network Operations Center (NOC) of the operators

TRAI Audit Wireless Report-Bihar & Jharkhand Circle AMJ Quarter-2016
70
5.4.3 KEY FINDINGS – TCH CONGESTION (CONSOLIDATED)
16.0
1%
1.49
%
1.90
%
1.86
%
2.08
%
No S
ervi
ce
0.61
%
0.77
% 3.39
%
0.78
%
14.7
7%
1.44
%
2.15
%
1.14
%
Serv
er is
sue
No S
ervi
ce
0.13
%
0.31
% 3.31
%
0.56
%
0.0%
5.0%
10.0%
15.0%
20.0%
Aircel(DWL) Airtel BSNL Idea Reliance CDMA Reliance GSM TATA CDMA TATA GSM Telenor Vodafone
% T
CH c
onge
stio
n TCH Congestion-Consolidated
PMR Data Live Data
TRAI Benchmark ≤ 2%
Data Source: Network Operations Center (NOC) of the operators
Aircel, Reliance CDMA and Telenor failed to meet the benchmark as per audit/PMR report and BSNL failed to meet the benchmark as per audit/ Live Data.
Significant difference was observed between PMR & live measurement data for Aircel, BSNL and Telenor. The possible reason for the variation could be the difference
in time frame of data as PMR data is for 30 days and live measurement data is for three days.
5.4.3.1 KEY FINDINGS – MONTH 1
17.2
9%
1.14
%
1.78
%
1.78
%
1.34
%
No
Serv
ice
0.60
%
0.77
% 3.83
%
0.78
%
13.4
7%
1.13
%
1.77
%
1.77
%
serv
er is
sue
No
Serv
ice
0.09
%
0.31
% 4.36
%
0.54
%
0.0%
5.0%
10.0%
15.0%
20.0%
Aircel(DWL) Airtel BSNL Idea Reliance CDMA Reliance GSM TATA CDMA TATA GSM Telenor Vodafone
% T
CH c
onge
stio
n
TCH Congestion-Month 1
PMR Data Live Data
TRAI Benchmark ≤ 2%

TRAI Audit Wireless Report-Bihar & Jharkhand Circle AMJ Quarter-2016
71
5.4.3.2 KEY FINDINGS – MONTH 2
16.2
5%
1.61
%
1.81
%
1.91
%
3.90
%
No S
ervi
ce
0.62
%
0.77
% 3.22
%
0.92
%
17.1
5%
1.57
%
NA 0.52
%
serv
er is
sue
No S
ervi
ce
0.16
%
0.31
% 2.67
%
0.52
%
0.0%
5.0%
10.0%
15.0%
20.0%
Aircel(DWL) Airtel BSNL Idea Reliance CDMA Reliance GSM TATA CDMA TATA GSM Telenor Vodafone
% T
CH c
onge
stio
n TCH Congestion-Month 2
PMR Data Live Data
TRAI Benchmark ≤ 2%
5.4.3.3 KEY FINDINGS – MONTH 3
14.4
8%
1.71
%
2.11
%
1.89
%
1.01
%
No
Serv
ice
0.61
%
0.77
% 3.11
%
0.62
%
13.6
9%
1.62
%
2.52
%
1.11
%
serv
er is
sue
No
Serv
ice
0.13
%
0.29
% 2.90
%
0.63
%
0.0%1.0%2.0%3.0%4.0%5.0%6.0%7.0%8.0%9.0%
10.0%11.0%12.0%13.0%14.0%15.0%16.0%
Aircel(DWL) Airtel BSNL Idea Reliance CDMA Reliance GSM TATA CDMA TATA GSM Telenor Vodafone
% T
CH c
onge
stio
n
TCH Congestion-Month 3
PMR Data Live Data
TRAI Benchmark ≤ 2%
Data Source: Network Operations Center (NOC) of the operators

72
5.4.4 KEY FINDINGS – POI CONGESTION (CONSOLIDATED) – AVERAGE OF 3 MONTHS
Data Source: Network Operations Center (NOC) of the operators
All operators met the benchmark of POI Congestion as per PMR/audit Data.

TRAI Audit Wireless Report-Bihar & Jharkhand Circle AMJ Quarter-2016
73
5.4.4.1 KEY FINDINGS – MONTH 1
Data Source: Network Operations Center (NOC) of the operators

TRAI Audit Wireless Report-Bihar & Jharkhand Circle AMJ Quarter-2016
74
5.4.4.2 KEY FINDINGS – MONTH 2
Data Source: Network Operations Center (NOC) of the operators

TRAI Audit Wireless Report-Bihar & Jharkhand Circle AMJ Quarter-2016
75
5.4.4.3 KEY FINDINGS – MONTH 3
Data Source: Network Operations Center (NOC) of the operators
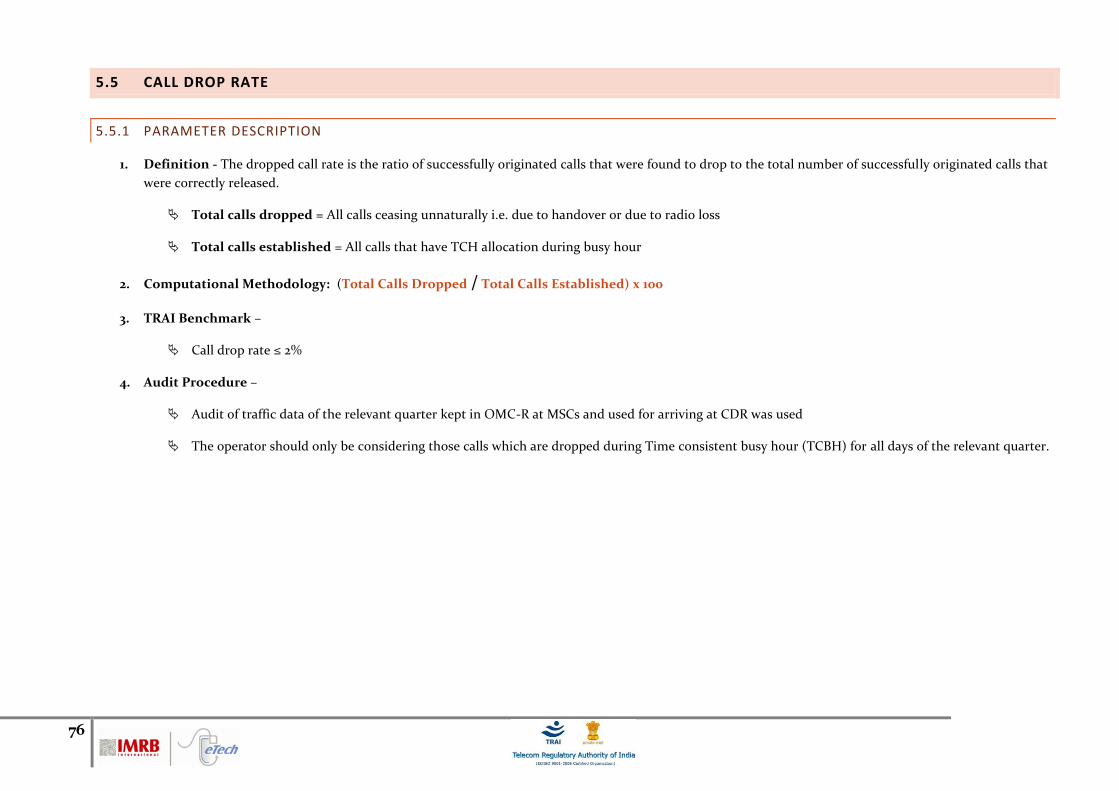
76
5.5 CALL DROP RATE
5.5.1 PARAMETER DESCRIPTION
1. Definition - The dropped call rate is the ratio of successfully originated calls that were found to drop to the total number of successfully originated calls that
were correctly released.
Total calls dropped = All calls ceasing unnaturally i.e. due to handover or due to radio loss
Total calls established = All calls that have TCH allocation during busy hour
2. Computational Methodology: (Total Calls Dropped / Total Calls Established) x 100
3. TRAI Benchmark –
Call drop rate ≤ 2%
4. Audit Procedure –
Audit of traffic data of the relevant quarter kept in OMC-R at MSCs and used for arriving at CDR was used
The operator should only be considering those calls which are dropped during Time consistent busy hour (TCBH) for all days of the relevant quarter.

TRAI Audit Wireless Report-Bihar & Jharkhand Circle AMJ Quarter-2016
77
5.5.2 KEY FINDINGS - CONSOLIDATED
1.89
%
1.49
%
0.83
%
0.84
%
0.25
%
No
Serv
ice
0.39
%
0.55
%
1.15
%
0.75
%
1.86
%
1.45
%
0.36
%
0.79
%
Serv
er i
ssue
No
Serv
ice
0.33
%
0.51
%
1.15
%
0.72
%
1.64
%
0.00
%
9.81
%
0.00
%
7.55
%
No
Serv
ice
1.05
%
1.34
%
0.00
%
0.00
%
0.0%
2.0%
4.0%
6.0%
8.0%
10.0%
12.0%
Aircel(DWL) Airtel BSNL Idea Reliance CDMA Reliance GSM TATA CDMA TATA GSM Telenor Vodafone
% C
all D
rop
Rate
Call Drop Rate-Consolidated
PMR Data Live Data Drive Test Data
TRAI Benchmark ≤ 2%
Data Source: Network Operations Center (NOC) of the operators
All operators met the benchmark for call drop rate during the PMR audit. During drive test BSNL and Reliance CDMA failed to meet the benchmark.
5.5.2.1 KEY FINDINGS – MONTH 1
2.08
%
1.45
%
0.86
%
0.80
%
0.22
%
No
Serv
ice
0.37
%
0.53
%
1.17
%
0.71
%
1.96
%
1.44
%
0.45
%
0.94
%
serv
er is
sue
No
Serv
ice
0.30
%
0.51
%
1.25
%
0.66
%
1.64
%
0.00
%
9.81
%
0.00
%
7.55
%
No
Serv
ice
1.05
%
1.34
%
0.00
%
0.00
%
0.0%
2.0%
4.0%
6.0%
8.0%
10.0%
12.0%
Aircel(DWL) Airtel BSNL Idea Reliance CDMA Reliance GSM TATA CDMA TATA GSM Telenor Vodafone
% C
all D
rop
Rate
Call Drop Rate-Month 1
PMR Data Live Data Drive Test Data
TRAI Benchmark ≤ 2%
Data Source: Network Operations Center (NOC) of the operators

TRAI Audit Wireless Report-Bihar & Jharkhand Circle AMJ Quarter-2016
78
5.5.2.2 KEY FINDINGS – MONTH 2
1.84
%
1.53
%
NA 0.
79%
0.29
%
No
Serv
ice
0.38
%
0.53
%
1.09
%
0.77
%
1.68
%
1.46
%
NA 0.
65%
serv
er is
sue
No
Serv
ice
0.34
%
0.51
%
1.10
%
0.69
%
0.63
%
0.00
%
Not
par
tici
pate
d
0.00
%
11.8
1%
No
Serv
ice
1.43
%
2.36
%
0.00
%
0.22
%
0.0%2.0%4.0%6.0%8.0%
10.0%12.0%14.0%
Aircel(DWL) Airtel BSNL Idea Reliance CDMA Reliance GSM TATA CDMA TATA GSM Telenor Vodafone
% C
all D
rop
Rate
Call Drop Rate-Month 2
PMR Data Live Data Drive Test Data
TRAI Benchmark ≤ 2%
Data Source: Network Operations Center (NOC) of the operators
5.5.2.3 KEY FINDINGS – MONTH 3
1.7
6%
1.4
7%
0.8
7%
0.9
4%
0.2
6%
No
Ser
vice
0.4
2%
0.5
9%
1.1
8%
0.7
6%
1.9
5%
1.4
7%
0.4
6%
0.9
2%
serv
er i
ssu
e
No
Ser
vice
0.3
6%
0.5
2%
1.1
1%
0.8
3%
0.3
7%
0.0
0% 5
.52
%
0.0
0%
Clo
sed
No
Ser
vice
18
.52
%
2.6
0%
0.0
0%
0.0
0%
0.0%
5.0%
10.0%
15.0%
20.0%
Aircel(DWL) Airtel BSNL Idea Reliance CDMA Reliance GSM TATA CDMA TATA GSM Telenor Vodafone
% C
all
Dro
p R
ate
Call Drop Rate-Month 3
PMR Data Live Data Drive Test Data
TRAI Benchmark ≤ 2%
Data Source: Network Operations Center (NOC) of the operators

TRAI Audit Wireless Report-Bihar & Jharkhand Circle AMJ Quarter-2016
79
5.6 CELLS HAVING GREATER THAN 3% TCH DROP
5.6.1 PARAMETER DESCRIPTION
1. Definition- Worst Affected Cells having more than 3% TCH drop shall measure the ratio of total number of cells in the network to the ratio of cells
having more than 3% TCH drop.
2. Computational Methodology: (Total number of cells having more than 3% TCH drop during CBBH/ Total number of cells in the network) x 100
3. TRAI Benchmark –
Worst affected cells having more than 3% TCH drop rate ≤ 3%
4. Audit Procedure –
Audit of traffic data of the relevant quarter kept in OMC-R at MSCs and used for arriving at CDR would be conducted.
The operator should only be considering those calls which are dropped during Cell Bouncing Busy hour (CBBH) for all days of the relevant quarter.
5.6.2 KEY FINDINGS - CONSOLIDATED
13.6
7%
2.47
%
3.41
%
2.67
%
0.68
%
No S
ervi
ce
1.93
%
2.96
% 6.12
%
2.77
%
13.4
7%
2.42
%
3.54
%
2.54
%
Serv
er is
sue
No S
ervi
ce
3.11
%
0.13
%
6.23
%
2.77
%
0.0%2.0%4.0%6.0%8.0%
10.0%12.0%14.0%16.0%
Aircel(DWL) Airtel BSNL Idea Reliance CDMA Reliance GSM TATA CDMA TATA GSM Telenor Vodafone
%ag
e ca
lls d
ropp
ed
Cells having >3% TCH Drop -Consolidated
PMR Data Live Data
TRAI Benchmark ≤ 3%
Data Source: Network Operations Center (NOC) of the operators
Aircel, BSNL and Telenor failed to meet the benchmark for Audit PMR. However Aircel, BSNL, Tata CDMA and Telenor failed during live audit.

TRAI Audit Wireless Report-Bihar & Jharkhand Circle AMJ Quarter-2016
80
5.6.2.1 KEY FINDINGS – MONTH 1
15.1
5%
2.27
%
2.15
%
2.63
%
0.83
%
No
Serv
ice
1.58
%
2.89
% 6.19
%
2.71
%
14.7
3%
2.22
% 5.24
%
2.57
%
serv
er is
sue
No
Serv
ice 7.
83%
0.13
%
7.01
%
2.71
%
0.0%2.0%4.0%6.0%8.0%
10.0%12.0%14.0%16.0%
Aircel(DWL) Airtel BSNL Idea Reliance CDMA Reliance GSM TATA CDMA TATA GSM Telenor Vodafone
%ag
e ca
lls d
ropp
edCells having >3% TCH Drop-Month 1
PMR Data Live Data
TRAI Benchmark ≤ 3%
Data Source: Network Operations Center (NOC) of the operators
5.6.2.2 KEY FINDINGS – MONTH 2
12
.51
%
2.4
8% 5
.78
%
2.6
7%
0.7
3%
No
Ser
vice
1.9
9%
2.8
9% 5
.60
%
2.7
7%
10
.23
%
2.3
9%
2.3
7%
2.5
0%
serv
er i
ssu
e
No
Ser
vice
2.3
6%
0.1
3%
5.7
9%
2.7
3%
0.0%
2.0%
4.0%
6.0%
8.0%
10.0%
12.0%
14.0%
Aircel(DWL) Airtel BSNL Idea Reliance CDMA Reliance GSM TATA CDMA TATA GSM Telenor Vodafone
%ag
e c
alls
dro
pp
ed
Cells having >3% TCH Drop-Month 2
PMR Data Live Data
TRAI Benchmark ≤ 3%
Data Source: Network Operations Center (NOC) of the operators

TRAI Audit Wireless Report-Bihar & Jharkhand Circle AMJ Quarter-2016
81
5.6.2.3 KEY FINDINGS – MONTH 3
13.3
2%
2.67
% 5.95
%
2.72
%
0.48
%
No
Serv
ice
2.23
%
3.11
% 6.58
%
2.84
%
15.4
3%
2.66
%
2.73
%
2.54
%
serv
er is
sue
No
Serv
ice
2.39
%
0.14
%
5.89
%
2.86
%
0.0%
5.0%
10.0%
15.0%
20.0%
Aircel(DWL) Airtel BSNL Idea Reliance CDMA Reliance GSM TATA CDMA TATA GSM Telenor Vodafone
%ag
e ca
lls d
ropp
edCells having >3% TCH Drop-Month 3
PMR Data Live Data
TRAI Benchmark ≤ 3%
Data Source: Network Operations Center (NOC) of the operators
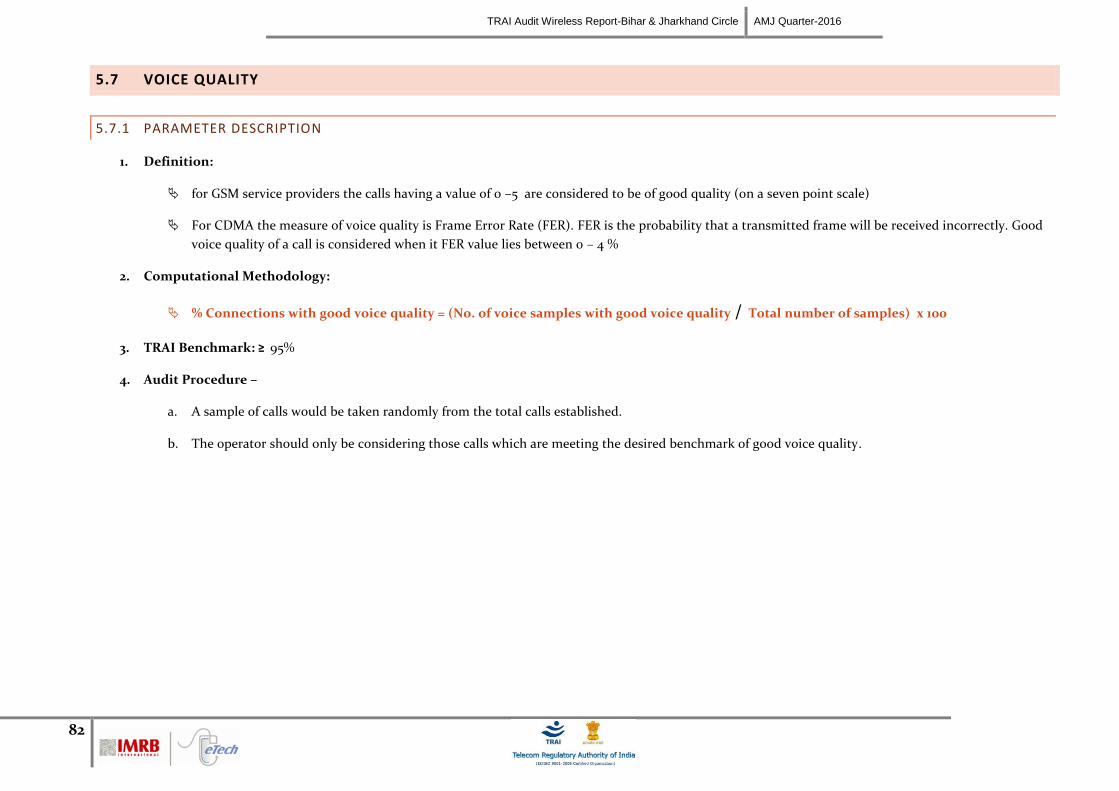
TRAI Audit Wireless Report-Bihar & Jharkhand Circle AMJ Quarter-2016
82
5.7 VOICE QUALITY
5.7.1 PARAMETER DESCRIPTION
1. Definition:
for GSM service providers the calls having a value of 0 –5 are considered to be of good quality (on a seven point scale)
For CDMA the measure of voice quality is Frame Error Rate (FER). FER is the probability that a transmitted frame will be received incorrectly. Good
voice quality of a call is considered when it FER value lies between 0 – 4 %
2. Computational Methodology:
% Connections with good voice quality = (No. of voice samples with good voice quality / Total number of samples) x 100
3. TRAI Benchmark: ≥ 95%
4. Audit Procedure –
a. A sample of calls would be taken randomly from the total calls established.
b. The operator should only be considering those calls which are meeting the desired benchmark of good voice quality.

TRAI Audit Wireless Report-Bihar & Jharkhand Circle AMJ Quarter-2016
83
5.7.2 KEY FINDINGS
95.0
8%
95.8
8%
96.5
9%
96.8
9%
97.2
4%
No
Serv
ice
98.2
5%
97.3
5%
95.5
1%
98.1
5%
95.2
6%
95.9
2%
96.3
2%
97.1
4%
Serv
er i
ssue
No
Serv
ice
98.2
5%
97.2
8%
95.2
7%
98.3
2%
98.8
6%
96.5
0%
90.8
5%
98.5
4%
NA
No
Serv
ice
87.6
4%
93.5
2%
95.8
1%
96.1
2%
0%
20%
40%
60%
80%
100%
Aircel(DWL) Airtel BSNL Idea Reliance CDMA Reliance GSM TATA CDMA TATA GSM Telenor Vodafone
%a
voi
ce q
ualit
yVoice Quality-Consolidated
PMR Data Live Data Drive Test Data
TRAI Benchmark ≥ 95%
Data Source: Network Operations Center (NOC) of the operators
BSNL, TATA GSM, TATA CDMA and TATA GSM failed to meet the benchmark for Voice quality during drive test.
5.7.2.1 KEY FINDINGS – MONTH 1
95.2
5%
96.0
3%
96.6
7%
96.8
4%
97.4
2%
No
Serv
ice
98.2
5%
97.3
9%
95.9
3%
98.1
9%
95.8
2%
96.0
6%
95.5
6%
96.7
6%
serv
er is
sue
No
Serv
ice
98.2
5%
96.6
6%
95.0
3%
97.9
2%
98.8
6%
96.5
0%
90.8
5%
98.5
4%
96.6
6%
No
Serv
ice
87.6
4%
93.5
2%
95.8
1%
96.1
2%
0%
20%
40%
60%
80%
100%
Aircel(DWL) Airtel BSNL Idea Reliance CDMA Reliance GSM TATA CDMA TATA GSM Telenor Vodafone
%a
voi
ce q
ualit
y
Voice Quality-Month 1
PMR Data Live Data Drive Test Data
TRAI Benchmark ≥ 95%
Data Source: Network Operations Center (NOC) of the operators

TRAI Audit Wireless Report-Bihar & Jharkhand Circle AMJ Quarter-2016
84
5.7.2.2 KEY FINDINGS – MONTH 2
95.0
9%
95.9
2%
NA
97.0
4%
95.9
2%
No
Serv
ice
98.2
5%
97.3
9%
95.2
7%
98.1
6%
95.2
1%
96.0
6%
NA
97.9
3%
serv
er is
sue
No
Serv
ice
98.2
5%
97.6
9%
95.4
1%
98.6
1%
97.0
2%
96.3
0%
Not
par
tici
pate
d
96.9
9%
94.7
2%
No
Serv
ice
30.7
8% 57.0
4%
95.2
6%
96.7
2%
0%
20%
40%
60%
80%
100%
Aircel(DWL) Airtel BSNL Idea Reliance CDMA Reliance GSM TATA CDMA TATA GSM Telenor Vodafone
%a
voi
ce q
ualit
yVoice Quality-Month 2
PMR Data Live Data Drive Test Data
TRAI Benchmark ≥ 95%
Data Source: Network Operations Center (NOC) of the operators
5.7.2.3 KEY FINDINGS – MONTH 3
94
.92
%
95
.77
%
96
.52
%
96
.78
%
97
.89
%
No
Ser
vice
98
.25
%
97
.27
%
95
.36
%
98
.10
%
94
.82
%
95
.72
%
97
.11
%
95
.98
%
serv
er i
ssu
e
No
Ser
vice
98
.25
%
97
.58
%
95
.37
%
98
.39
%
94
.93
%
96
.02
%
78
.41
%
96
.34
%
Clo
sed
No
Ser
vice 39
.59
%
78
.60
%
96
.37
%
97
.80
%
0%
20%
40%
60%
80%
100%
Aircel(DWL) Airtel BSNL Idea Reliance CDMA Reliance GSM TATA CDMA TATA GSM Telenor Vodafone
%a
voi
ce q
ualit
y
Voice Quality-Month 3
PMR Data Live Data Drive Test Data
TRAI Benchmark ≥ 95%
Data Source: Network Operations Center (NOC) of the operators

TRAI Audit Wireless Report-Bihar & Jharkhand Circle AMJ Quarter-2016
85
6 PARAMETER DESCRIPTION & DETAILED FINDINGS - COMPARISON BETWEEN PMR DATA, 3 DAY LIVE DATA AND LIVE CALLING
DATA FOR 3G
6.1 NODE BS DOWNTIME
6.1.1 PARAMETER DESCRIPTION
The parameter of network availability would be measured from following sub-parameters
1. Node Bs downtime (not available for service)
2. Worst affected Node Bs due to downtime
Definition - Node Bs downtime (not available for service): In the case of 3G networks, instead of BTS the nomenclature is Node B. The
measurement methodology for the parameter Node B Accumulated downtime (not available for service) will be similar to the existing
parameter for BTSs Accumulated downtime (not available for service).
Data Extraction/collection methodology - Data extraction to be done from appropriate counters. Auditors should be aware of counter
details and definitions for each operator.
Source of Data: Network Operation Center (NOC) or a Central Server
Computation Methodology –
Node Bs downtime (not available for service) = Sum of downtime of Node Bs in a month in hours i.e. total outage time of all Node
Bs in hours during a month / (24 x Number of days in a month x Number of Node Bs in the network in licensed service area) x 100
3. TRAI Benchmark –
a. Node Bs downtime (not available for service) ≤ 2%
4. Audit Procedure –
The fault alarm details at the OMC (MSC) for the network outages (due to own network elements and infrastructure service provider end outages)
was audited

TRAI Audit Wireless Report-Bihar & Jharkhand Circle AMJ Quarter-2016
86
All the Node Bs in service area was considered. Planned outages due to network up gradation, routine maintenance were not considered.
Any outage as a result of force majeure were not considered at the time of calculation
Data is extracted from system log of the server of the operator. This data is in raw format which is further processed to arrive at the cumulative
values.
List of operating sites with cell details and ids are taken from the operator.
When there is any outage a performance report gets generated in line with that cell resulting and master base of the Node Bs downtime and
worst affected Node Bs due to downtime.
6.1.2 KEY FINDINGS - CONSOLIDATED
1.8
9%
0.0
3%
0.7
1%
0.0
7%
1.7
3%
0.0
2% 0
.38
%
ND
R
0.0%
2.0%
Aircel 3G Airtel 3G BSNL 3G Reliance 3G
% N
od
e B
s d
ow
nti
me
Node Bs downtime - Consolidated
PMR Data Live Data
TRAI Benchmark ≤ 2%
Data Source: Operations and Maintenance Center (OMC) of the operators
All operators met the benchmark for Node B downtime.

TRAI Audit Wireless Report-Bihar & Jharkhand Circle AMJ Quarter-2016
87
6.1.2.1 KEY FINDINGS – MONTH 1
1.88
%
0.03
%
1.92
%
0.01
%
1.38
%
0.02
% 0.75
%
serv
er is
sue
0.0%
2.0%
4.0%
Aircel 3G Airtel 3G BSNL 3G Reliance 3G
% N
ode
Bs d
ownt
ime
Node Bs downtime - Month 1
PMR Data Live Data
TRAI Benchmark ≤ 2%
Data Source: Operations and Maintenance Center (OMC) of the operators
6.1.2.2 KEY FINDINGS – MONTH 2
1.92
%
0.03
%
0.00
%
0.08
%
1.63
%
0.00
%
0.00
%
serv
er is
sue
0.0%
2.0%
4.0%
Aircel 3G Airtel 3G BSNL 3G Reliance 3G
% N
ode
Bs d
ownt
ime
Node Bs downtime - Month 2
PMR Data Live Data
TRAI Benchmark ≤ 2%
Data Source: Operations and Maintenance Center (OMC) of the operators

TRAI Audit Wireless Report-Bihar & Jharkhand Circle AMJ Quarter-2016
88
6.1.2.3 KEY FINDINGS – MONTH 3
1.87
%
0.04
%
0.10
%
0.11
%
2.18
%
0.02
%
0.32
%
serv
er is
sue
0.0%
2.0%
4.0%
Aircel 3G Airtel 3G BSNL 3G Reliance 3G
% N
ode
Bs d
ownt
ime
Node Bs downtime - Month 3
PMR Data Live Data
TRAI Benchmark ≤ 2%
Data Source: Operations and Maintenance Center (OMC) of the operators

TRAI Audit Wireless Report-Bihar & Jharkhand Circle AMJ Quarter-2016
89
6.2 WORST AFFECTED NODE BS DUE TO DOWNTIME
6.2.1 PARAMETER DESCRIPTION
Definition – Worst Affected Node Bs due to downtime shall basically measure percentage of Node Bs having downtime greater than 24 hours in a month.
Planned outages were not considered as part while computing.
For measuring the parameter “Percentage of worst affected Node Bs due to downtime" the downtime of each Node B lasting for more than 1 hour at a time in
a day during the period of a month was considered.
Computation Methodology –
Worst affected Node Bs due to downtime = (Number of Node Bs having accumulated downtime greater than 24 hours in a month / Number of
Node Bs in Licensed Service Area) * 100
TRAI Benchmark –
b. Worst affected Node Bss due to downtime ≤ 2%
Audit Procedure –
i. The fault alarm details at the OMC (MSC) for the network outages (due to own network elements and infrastructure service provider end
outages) was audited
ii. All the Node Bs in service area were considered. Planned outages due to network up gradation, routine maintenance were not considered.
iii. Data is extracted from system log of the server of the operator. This data is in raw format which is further processed to arrive at the
cumulative values.
iv. Any outage as a result of force majeure was not considered at the time of calculation.
v. List of operating sites with cell details and ids are taken from the operator.
vi. All the Node Bs having down time greater than 24 hours is assessed and values of Node Bs accumulated downtime is computed in
accordance.

TRAI Audit Wireless Report-Bihar & Jharkhand Circle AMJ Quarter-2016
90
6.2.2 KEY FINDINGS – CONSOLIDATED
12
.78
%
0.1
7%
1.3
6%
0.4
3%
0.0
0%
0.0
1%
1.3
6%
ND
R
0.0%
2.0%
4.0%
6.0%
8.0%
10.0%
12.0%
14.0%
Aircel 3G Airtel 3G BSNL 3G Reliance 3G
% W
ors
t af
fect
ed
No
de
Bs
du
e t
o
do
wn
tim
eWorst affected Node Bs due to downtime-Consolidated
PMR Data Live Data
TRAI Benchmark ≤ 2%
Data Source: Operations and Maintenance Center (OMC) of the operators
Aircel failed to meet the benchmark for worst affected BTSs due to downtime as per audit/PMR data.
Significant difference was observed between PMR & live measurement data for Aircel. The possible reason for the variation could be the difference in time frame of
data as PMR data is for 30 days and live measurement data is for three days.

TRAI Audit Wireless Report-Bihar & Jharkhand Circle AMJ Quarter-2016
91
6.2.2.1 KEY FINDINGS – MONTH 1
11
.13
%
0.14
% 1.8
8%
0.4
0%
0.00
%
0.0
2% 1.
88%
serv
er is
sue
0.0%
2.0%
4.0%
6.0%
8.0%
10.0%
12.0%
Aircel 3G Airtel 3G BSNL 3G Reliance 3G
% W
ors
t af
fect
ed
No
de
Bs
du
e t
o
dow
ntim
eWorst affected Node Bs due to downtime-Month 1
PMR Data Live Data
TRAI Benchmark ≤ 2%
6.2.2.2 KEY FINDINGS – MONTH 2
14
.06
%
0.1
5%
0.0
0%
0.5
2%
0.0
0%
0.0
0%
0.0
0%
serv
er i
ssu
e
0.0%
2.0%
4.0%
6.0%
8.0%
10.0%
12.0%
14.0%
16.0%
Aircel 3G Airtel 3G BSNL 3G Reliance 3G
% W
ors
t af
fect
ed
No
de
Bs
du
e t
o
do
wn
tim
e
Worst affected Node Bs due to downtime-Month 2
PMR Data Live Data
TRAI Benchmark ≤ 2%
Data Source: Operations and Maintenance Center (OMC) of the operators

TRAI Audit Wireless Report-Bihar & Jharkhand Circle AMJ Quarter-2016
92
6.2.2.3 KEY FINDINGS – MONTH 3
13.1
9%
0.21
% 1.99
%
0.39
%
0.00
%
0.02
% 1.99
%
serv
er is
sue
0.0%
2.0%
4.0%
6.0%
8.0%
10.0%
12.0%
14.0%
Aircel 3G Airtel 3G BSNL 3G Reliance 3G
% W
orst
aff
ecte
d N
ode
Bs d
ue t
o do
wnt
ime
Worst affected Node Bs due to downtime-Month 3
PMR Data Live Data
TRAI Benchmark ≤ 2%
Data Source: Operations and Maintenance Center (OMC) of the operators
TRAI Audit Wireless Report-Bihar & Jharkhand Circle AMJ Quarter-2016
93
6.3 CALL SET UP SUCCESS RATE
6.3.1 PARAMETER DESCRIPTION
1. Definition: This parameter is same for 2G Networks as well as 3G Networks. However, the network elements involved in both the networks are
different. Call Set-up Success Rate is defined as the ratio of Established Calls to Call Attempts. For establishing a call in 3G Networks, User
Equipment (UE) accesses the Universal Terrestrial Radio Access Network (UTRAN) and establishes an RRC connection. Once RRC connection
is established the Non Access Stratum (NAS) messages are exchanged between the UE and the Core Network (CN). The last step of the call
setup is the establishment of a Radio Access Bearer (RAB) between the CN and the UE. However, any RAB abnormal release after RAB
Assignment Response or Alerting/Connect message is to be considered as a dropped call.
2. Data Extraction/collection methodology - Data extraction to be done from appropriate counters. Auditors should be aware of counter
details and definitions for each operator.
3. Source of Data: Network Operation Center (NOC) or a Central Server
4. Computation Methodology-
(RRC Established / Total RRC Attempts) * 100
RRC Established means the following events have happened in RRC setup:-
RRC attempt is made
The RRC established
The RRC is routed to the outward path of the concerned MSC
5. TRAI Benchmark ≥ 95%
6. Audit Procedure –
The cell-wise data generated through counters/ MMC available in the switch for traffic measurements

TRAI Audit Wireless Report-Bihar & Jharkhand Circle AMJ Quarter-2016
94
CSSR calculation should be measured using OMC generated data only
Measurement should be only in Time Consistent Busy Hour (CBBH) period for all days of the week
Counter data is extracted from the NOC of the operators.
Total calls established include all calls established excluding RAB congestion.
The numerator and denominator values are derived from adding the counter values from the MSC.
6.3.2 KEY FINDINGS - CONSOLIDATED 9
5.9
8%
99
.19
%
94
.08
%
95
.82
%
96
.75
%
99
.15
%
95
.04
%
ND
R
10
0.0
0%
84
.82
%
67
.83
%
91
.61
%
0%
20%
40%
60%
80%
100%
Aircel 3G Airtel 3G BSNL 3G Reliance 3G
% C
SSR
Call Set Up Success Rate-Consolidated
PMR Data Live Data Drive Test Data
TRAI Benchmark ≥ 95%
Data Source: Network Operations Center (NOC) of the operators
BSNL failed to meet the TRAI benchmark as per audit/PMR data. During drive test Airtel 3G, BSNL 3G and Reliance 3G failed to meet the TRAI benchmark.

TRAI Audit Wireless Report-Bihar & Jharkhand Circle AMJ Quarter-2016
95
6.3.2.1 KEY FINDINGS – MONTH 1
96.4
5%
99.0
7%
95.9
3%
96.8
7%
97.7
0%
99.4
1%
96.9
2%
serv
er is
sue
100.
00%
100.
00%
97.0
8%
85.9
8%
0%
20%
40%
60%
80%
100%
Aircel 3G Airtel 3G BSNL 3G Reliance 3G
% C
SSR
Call Set Up Success Rate-Month 1
PMR Data Live Data Drive Test Data
TRAI Benchmark ≥ 95%
Data Source: Network Operations Center (NOC) of the operators
6.3.2.2 KEY FINDINGS – MONTH 2
95
.98
%
99
.45
%
92
.43
%
93
.28
%
95
.52
%
99
.50
%
92
.43
%
serv
er i
ssu
e
10
0.0
0%
58
.52
%
No
t p
art
icip
ate
d 9
2.4
6%
0%
20%
40%
60%
80%
100%
Aircel 3G Airtel 3G BSNL 3G Reliance 3G
% C
SSR
Call Set Up Success Rate-Month 2
PMR Data Live Data Drive Test Data
TRAI Benchmark ≥ 95%
Data Source: Network Operations Center (NOC) of the operators

TRAI Audit Wireless Report-Bihar & Jharkhand Circle AMJ Quarter-2016
96
6.3.2.3 KEY FINDINGS – MONTH 3
95
.50
%
99
.05
%
93
.87
%
97
.30
%
97
.01
%
98
.55
%
95
.76
%
serv
er i
ssu
e
10
0.0
0%
10
0.0
0%
62
.50
% 93
.93
%
0%
20%
40%
60%
80%
100%
Aircel 3G Airtel 3G BSNL 3G Reliance 3G
% C
SSR
Call Set Up Success Rate-Month 3
PMR Data Live Data Drive Test Data
TRAI Benchmark ≥ 95%
Data Source: Network Operations Center (NOC) of the operators

TRAI Audit Wireless Report-Bihar & Jharkhand Circle AMJ Quarter-2016
97
6.4 NETWORK CHANNEL CONGESTION- RRC CONGESTION/ CIRCUIT SWITCHED RAB CONGESTION
6.4.1 PARAMETER DESCRIPTION
1. Definition (RRC Congestion): This parameter has been amended to include RRC Congestion in 3G Networks.
2. Definition (Circuit Switched RAB congestion): Circuit Switched RAB congestion is similar to Traffic Channel Congestion. Therefore, the
existing parameter has been amended to include RAB congestion in 3G Networks.
3. Point of Interconnection (POI) Congestion: This parameter denotes congestion at the outgoing traffic between two networks and is
equally applicable for 2G networks and 3G networks.
RRC Level: Stand-alone dedicated control channel
RAB Level: Traffic Channel
POI Level: Point of Interconnect
4. Data Extraction/collection methodology - Data extraction to be done from appropriate counters. Auditors should be aware of counter
details and definitions for each operator.
5. Source of Data: Network Operation Center (NOC) or a Central Server
6. Computational Methodology:
RRC / RAB Congestion% = [(A1 x C1) + (A2 x C2) +…….+ (An x Cn)] / (A1 + A2 +…+ An)
Where:-A1 = Number of attempts to establish RRC/ RAB made on day 1
C1 = Average RRC / RAB Congestion % on day 1
A2 = Number of attempts to establish RRC / RAB made on day 2
C2 = Average RRC / RAB Congestion % on day 2
An = Number of attempts to establish RRC / RAB made on day n
Cn = Average RRC / RAB Congestion % on day n

TRAI Audit Wireless Report-Bihar & Jharkhand Circle AMJ Quarter-2016
98
POI Congestion% = [(A1 x C1) + (A2 x C2) +…….+ (An x Cn)] / (A1 + A2 +…+ An)
Where:-A1 = POI traffic offered on all POIs (no. of calls) on day 1
C1 = Average POI Congestion % on day 1
A2 = POI traffic offered on all POIs (no. of calls) on day 2
C2 = Average POI Congestion % on day 2
An = POI traffic offered on all POIs (no. of calls) on day n
Cn = Average POI Congestion % on day n
7. Benchmark:
RRC Congestion: ≤ 1%, RAB Congestion: ≤ 2%, POI Congestion: ≤ 0.5%
8. Audit Procedure –
Audit of the details of RRC and RAB congestion percentages computed by the operator (using OMC–Switch data only) would be conducted
The operator should be measuring this parameter during Time consistent busy hour (TCBH) only RRC

TRAI Audit Wireless Report-Bihar & Jharkhand Circle AMJ Quarter-2016
99
6.4.2 KEY FINDINGS - RRC CONGESTION (CONSOLIDATED)
0.72
%
0.03
%
3.24
%
0.02
%
0.42
%
0.03
%
3.70
%
ND
R
0.0%
1.0%
2.0%
3.0%
4.0%
5.0%
Aircel 3G Airtel 3G BSNL 3G Reliance 3G
% R
RC C
onge
stio
n RRC Congestion -Consolidated
PMR Data Live Data
TRAI Benchmark ≤ 1%
Data Source: Network Operations Center (NOC) of the operators
BSNL 3G failed to meet the TRAI benchmark for RRC congestion.
6.4.2.1 KEY FINDINGS – MONTH 1
0.82
%
0.02
%
1.14
%
0.02
%0.30
%
0.04
%
1.82
%
serv
er is
sue
0.0%
1.0%
2.0%
Aircel 3G Airtel 3G BSNL 3G Reliance 3G
% R
RC C
onge
stio
n
RRC Congestion -Month 1
PMR Data Live Data
TRAI Benchmark ≤ 1%
Data Source: Network Operations Center (NOC) of the operators

TRAI Audit Wireless Report-Bihar & Jharkhand Circle AMJ Quarter-2016
100
6.4.2.2 KEY FINDINGS – MONTH 2
0.48
%
0.02
%
5.08
%
0.02
%
0.49
%
0.01
%
6.19
%
serv
er is
sue
0.0%
1.0%
2.0%
3.0%
4.0%
5.0%
Aircel 3G Airtel 3G BSNL 3G Reliance 3G
% R
RC C
onge
stio
n RRC Congestion -Month 2
PMR Data Live Data
TRAI Benchmark ≤ 1%
Data Source: Network Operations Center (NOC) of the operators
6.4.2.3 KEY FINDINGS – MONTH 3
0.88
%
0.04
%
3.49
%
0.03
%
0.47
%
0.03
%
3.09
%
serv
er is
sue
0.0%0.5%1.0%1.5%2.0%2.5%3.0%3.5%4.0%
Aircel 3G Airtel 3G BSNL 3G Reliance 3G
% R
RC C
onge
stio
n
RRC Congestion -Month 3
PMR Data Live Data
TRAI Benchmark ≤ 1%
Data Source: Network Operations Center (NOC) of the operators

TRAI Audit Wireless Report-Bihar & Jharkhand Circle AMJ Quarter-2016
101
6.4.3 KEY FINDINGS – CIRCUIT SWITCHED RAB CONGESTION (CONSOLIDATED)
0.29
%
0.11
%
1.14
%
0.02
%
0.22
%
0.10
%
1.01
%
ND
R
0.0%
1.0%
2.0%
Aircel 3G Airtel 3G BSNL 3G Reliance 3G
% C
ircui
t Sw
itche
d RA
B Co
nges
tion Circuit Switched RAB Congestion-Consolidated
PMR Data Live Data
TRAI Benchmark ≤ 2%
Data Source: Network Operations Center (NOC) of the operators
All operators met the benchmark as per audit/PMR report and Live data.
6.4.3.1 KEY FINDINGS – MONTH 1
0.42
%
0.08
% 0.37
%
0.02
%
0.20
%
0.12
%
0.24
%
serv
er is
sue
0.0%
2.0%
Aircel 3G Airtel 3G BSNL 3G Reliance 3G
% C
ircu
it S
wit
ched
RA
B Co
nges
tion
Circuit Switched RAB Congestion-Month 1
PMR Data Live Data
TRAI Benchmark ≤ 2%
Data Source: Network Operations Center (NOC) of the operators

TRAI Audit Wireless Report-Bihar & Jharkhand Circle AMJ Quarter-2016
102
6.4.3.2 KEY FINDINGS – MONTH 2
0.26
%
0.08
%
1.84
%
0.02
%
0.23
%
0.07
%
1.84
%
serv
er is
sue
0.0%
1.0%
2.0%
Aircel 3G Airtel 3G BSNL 3G Reliance 3G
% C
ircu
it S
wit
ched
RA
B Co
nges
tion
Circuit Switched RAB Congestion-Month 2
PMR Data Live Data
TRAI Benchmark ≤ 2%
Data Source: Network Operations Center (NOC) of the operators
6.4.3.3 KEY FINDINGS – MONTH 3
0.19
%
0.16
%
1.20
%
0.03
%
0.24
%
0.10
%
0.94
%
serv
er is
sue
0.0%
1.0%
2.0%
Aircel 3G Airtel 3G BSNL 3G Reliance 3G
% C
ircu
it S
wit
ched
RA
B Co
nges
tion
Circuit Switched RAB Congestion-Month 3
PMR Data Live Data
TRAI Benchmark ≤ 2%
Data Source: Network Operations Center (NOC) of the operators
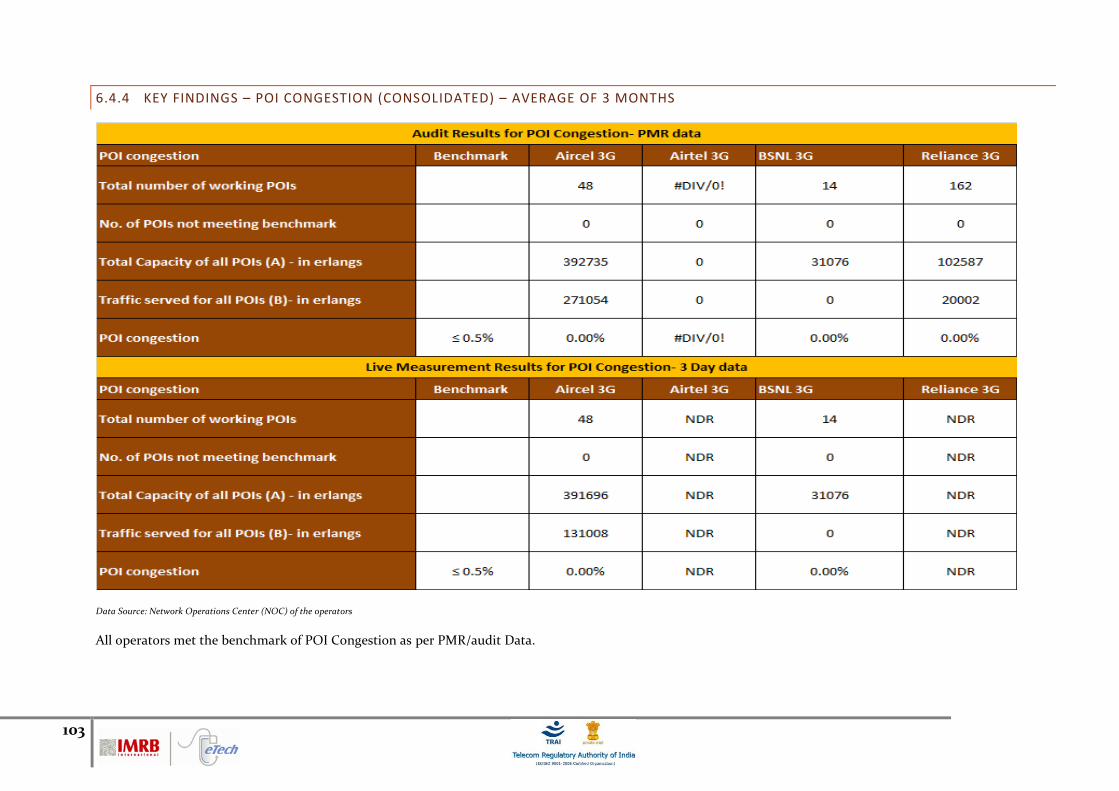
103
6.4.4 KEY FINDINGS – POI CONGESTION (CONSOLIDATED) – AVERAGE OF 3 MONTHS
Data Source: Network Operations Center (NOC) of the operators
All operators met the benchmark of POI Congestion as per PMR/audit Data.

TRAI Audit Wireless Report-Bihar & Jharkhand Circle AMJ Quarter-2016
104
6.4.4.1 KEY FINDINGS – MONTH 1
Data Source: Network Operations Center (NOC) of the operators

TRAI Audit Wireless Report-Bihar & Jharkhand Circle AMJ Quarter-2016
105
6.4.4.2 KEY FINDINGS – MONTH 2
Data Source: Network Operations Center (NOC) of the operators

TRAI Audit Wireless Report-Bihar & Jharkhand Circle AMJ Quarter-2016
106
6.4.4.3 KEY FINDINGS – MONTH 3
Data Source: Network Operations Center (NOC) of the operators

107
6.5 CIRCUIT SWITCHED VOICE DROP RATE
6.5.1 PARAMETER DESCRIPTION
1. Definition - The Call Drop Rate measures the inability of Network to maintain a call and is defined as the ratio of abnormal speech disconnects with respect
to all speech disconnects (both normal and abnormal). In 3G Networks, a normal disconnect is initiated from the Mobile Switching Centre (MSC) at
completion of the call by a RAB Disconnect message. An abnormal RAB disconnect can be initiated by either UTRAN or CN and includes Radio Link Failures,
Uplink (UL) or Downlink (DL) interference or any other reason.
Total No. of voice RAB abnormally released = All calls ceasing unnaturally i.e. due to handover or due to radio loss
No. of voice RAB normally released = All calls that have RAB allocation during busy hour
2. Data Extraction/collection methodology - Data extraction to be done from appropriate counters. Auditors should be aware of counter
details and definitions for each operator.
3. Source of Data: Network Operation Center (NOC) or a Central Server
4. Computational Methodology: (No. of voice RAB normally released / (No. of voice RAB normally released + RAB abnormally released )x 100
Key Performance Indicator Term Definition
#RAB Normal Release(CSV) Number of voice RAB normally Released
#RAB Abnormal Release(CSV) Number of voice RAB abnormally Released
5. TRAI Benchmark –
Circuit switched voice drop rate ≤ 2%
6. Audit Procedure –
Audit of traffic data of the relevant quarter kept in OMC-R at MSCs and used for arriving at CDR was used
The operator should only be considering those calls which are dropped during Time consistent busy hour (TCBH) for all days of the relevant quarter.

TRAI Audit Wireless Report-Bihar & Jharkhand Circle AMJ Quarter-2016
108
6.5.2 KEY FINDINGS - CONSOLIDATED
0.99
%
0.62
%
1.81
%
0.01
%0.96
%
0.53
%
1.85
%
NDR
1.19
%
0.00
%
2.07
% 3.16
%
0.0%0.5%1.0%1.5%2.0%2.5%3.0%3.5%
Aircel 3G Airtel 3G BSNL 3G Reliance 3G
% C
all D
rop
Rate
Circuit Switched Voice Drop Rate-Consolidated
PMR Data Live Data Drive Test Data
TRAI Benchmark ≤ 2%
Data Source: Network Operations Center (NOC) of the operators
All operators met the benchmark for call drop rate during audit. During drive test BSNL 3G and Reliance 3G failed to meet the TRAI benchmark.
6.5.2.1 KEY FINDINGS – MONTH 1
0.8
5%
0.6
2%
0.9
5%
0.0
2%0.6
4%
0.5
5%
0.4
2%
serv
er i
ssu
e1.8
4%
0.0
0%
3.0
1%
2.1
6%
0.0%0.5%1.0%1.5%2.0%2.5%3.0%3.5%
Aircel 3G Airtel 3G BSNL 3G Reliance 3G
% C
all
Dro
p R
ate
Circuit Switched Voice Drop Rate-Month 1
PMR Data Live Data Drive Test Data
TRAI Benchmark ≤ 2%
Data Source: Network Operations Center (NOC) of the operators

TRAI Audit Wireless Report-Bihar & Jharkhand Circle AMJ Quarter-2016
109
6.5.2.2 KEY FINDINGS – MONTH 2
1.09
%
0.63
% 1.87
%
0.01
%1.23
%
0.61
% 1.87
%
serv
er is
sue
1.46
%
0.00
%
Not
par
tici
pate
d 4.03
%
0.0%
1.0%
2.0%
3.0%
4.0%
5.0%
Aircel 3G Airtel 3G BSNL 3G Reliance 3G
% C
all D
rop
Rate
Circuit Switched Voice Drop Rate-Month 2
PMR Data Live Data Drive Test Data
TRAI Benchmark ≤ 2%
Data Source: Network Operations Center (NOC) of the operators
6.5.2.3 KEY FINDINGS – MONTH 3
0.9
7%
0.5
8%
1.7
9%
0.0
1%
1.0
2%
0.5
3%
1.6
3%
serv
er i
ssu
e
0.5
1%
0.0
0%
0.0
0%
2.2
4%
0.0%
0.5%
1.0%
1.5%
2.0%
2.5%
Aircel 3G Airtel 3G BSNL 3G Reliance 3G
% C
all
Dro
p R
ate
Circuit Switched Voice Drop Rate-Month 3
PMR Data Live Data Drive Test Data
TRAI Benchmark ≤ 2%
Data Source: Network Operations Center (NOC) of the operators

TRAI Audit Wireless Report-Bihar & Jharkhand Circle AMJ Quarter-2016
110
6.6 WORST AFFECTED CELLS HAVING MORE THAN 3% CIRCUIT SWITCHED VOICE DROP RATE
6.6.1 PARAMETER DESCRIPTION
1. Definition- Cells having more than 3% circuit switch voice quality: The existing parameter has been amended to cover 3G Networks to
assess worst affected cells having more than 3% CSV Drop Rate.
2. Data Extraction/collection methodology - Data extraction to be done from appropriate counters. Auditors should be aware of counter
details and definitions for each operator.
3. Source of Data: Network Operation Center (NOC) or a Central Server
4. Computational Methodology: (Number of cells having CSV drop rate > 3% during CBBH in a month / Total number of cells in the licensed area) x
100
5. TRAI Benchmark –
Worst affected cells having CSV drop rate > 3% during CBBH in a month ≤ 3%
6. Audit Procedure –
Audit of traffic data of the relevant quarter kept in OMC-R at MSCs and used for arriving at CDR would be conducted.
The operator should only be considering those calls which are dropped during Cell Bouncing Busy hour (CBBH) for all days of the relevant quarter.

TRAI Audit Wireless Report-Bihar & Jharkhand Circle AMJ Quarter-2016
111
6.6.2 KEY FINDINGS - CONSOLIDATED
8.73
%
2.47
%
2.57
%
0.51
%
9.30
%
2.31
%
0.60
%
ND
R
0.0%
2.0%
4.0%
6.0%
8.0%
10.0%
Aircel 3G Airtel 3G BSNL 3G Reliance 3G
%ag
e ca
lls d
ropp
edWorst affected cells having more than 3% Circuit switched-Consolidated
PMR Data Live Data
TRAI Benchmark ≤ 3%
Data Source: Network Operations Center (NOC) of the operators
Aircel 3G failed to meet the benchmark during audit.
6.6.2.1 KEY FINDINGS – MONTH 1
8.31
%
2.60
% 4.32
%
0.05
%
7.29
%
2.35
%
0.91
%
serv
er is
sue
0.0%
2.0%
4.0%
6.0%
8.0%
10.0%
Aircel 3G Airtel 3G BSNL 3G Reliance 3G
%ag
e ca
lls d
ropp
ed
Worst affected cells having more than 3% Circuit switched -Month 1
PMR Data Live Data
TRAI Benchmark ≤ 3%
Data Source: Network Operations Center (NOC) of the operators

TRAI Audit Wireless Report-Bihar & Jharkhand Circle AMJ Quarter-2016
112
6.6.2.2 KEY FINDINGS – MONTH 2
9.21
%
2.42
%
0.00
%
0.78
%
11.7
4%
2.24
%
0.00
%
serv
er is
sue
0.0%
2.0%
4.0%
6.0%
8.0%
10.0%
12.0%
14.0%
Aircel 3G Airtel 3G BSNL 3G Reliance 3G
%ag
e ca
lls d
ropp
edWorst affected cells having more than 3% Circuit switched -Month 2
PMR Data Live Data
TRAI Benchmark ≤ 3%
Data Source: Network Operations Center (NOC) of the operators
6.6.2.3 KEY FINDINGS – MONTH 3
8.6
4%
2.4
0%
3.0
0%
0.6
9%
8.8
2%
2.3
5%
0.7
9%
serv
er i
ssu
e
0.0%
2.0%
4.0%
6.0%
8.0%
10.0%
Aircel 3G Airtel 3G BSNL 3G Reliance 3G
%ag
e c
alls
dro
pped
Worst affected cells having more than 3% Circuit switched -Month 3
PMR Data Live Data
TRAI Benchmark ≤ 3%
Data Source: Network Operations Center (NOC) of the operators

TRAI Audit Wireless Report-Bihar & Jharkhand Circle AMJ Quarter-2016
113
6.7 CIRCUIT SWITCH VOICE QUALITY
6.7.1 PARAMETER DESCRIPTION
5. Definition:
for GSM service providers the calls having a value of 0 –5 are considered to be of good quality (on a seven point scale)
For CDMA the measure of voice quality is Frame Error Rate (FER). FER is the probability that a transmitted frame will be received incorrectly. Good
voice quality of a call is considered when it FER value lies between 0 – 4 %
6. Computational Methodology:
% Connections with good voice quality = (No. of voice samples with good voice quality / Total number of samples) x 100
7. TRAI Benchmark: ≥ 95%
8. Audit Procedure –
a. A sample of calls would be taken randomly from the total calls established.
b. The operator should only be considering those calls which are meeting the desired benchmark of good voice quality.

TRAI Audit Wireless Report-Bihar & Jharkhand Circle AMJ Quarter-2016
114
6.7.2 KEY FINDINGS
98.8
6%
99.2
5%
95.1
8%
99.8
6%
98.8
5%
99.1
9%
96.6
0%
NA
67.1
6%
98.4
2%
35.3
3%
NA
0%
20%
40%
60%
80%
100%
Aircel 3G Airtel 3G BSNL 3G Reliance 3G
%a
voi
ce q
ualit
yCircuit Switched Voice Quality-Consolidated
PMR Data Live Data Drive Test Data
TRAI Benchmark ≥ 95%
Data Source: Network Operations Center (NOC) of the operators
All operators met the TRAI benchmark as per PMR audit. During drive test Aircel 3G and BSNL 3G failed to meet the TRAI benchmark.
6.7.2.1 KEY FINDINGS – MONTH 1
98.9
4%
99.4
7%
95.2
4%
99.8
6%
98.9
5%
99.4
1%
96.5
5%
serv
er is
sue
71.9
5% 98.4
3%
35.3
3%
NA
0%
20%
40%
60%
80%
100%
Aircel 3G Airtel 3G BSNL 3G Reliance 3G
%a
voi
ce q
ualit
y
Circuit Switched Voice Quality-Month 1
PMR Data Live Data Drive Test Data
TRAI Benchmark ≥ 95%
Data Source: Network Operations Center (NOC) of the operators

TRAI Audit Wireless Report-Bihar & Jharkhand Circle AMJ Quarter-2016
115
6.7.2.2 KEY FINDINGS – MONTH 2
98.8
9%
99.4
7%
NA
NA
98.9
2%
99.4
8%
NA
serv
er is
sue
70.3
2% 98.5
4%
Not
par
tici
pate
d
NA
0%
20%
40%
60%
80%
100%
Aircel 3G Airtel 3G BSNL 3G Reliance 3G
%a
voi
ce q
ualit
yCircuit Switched Voice Quality-Month 2
PMR Data Live Data Drive Test Data
TRAI Benchmark ≥ 95%
Data Source: Network Operations Center (NOC) of the operators
6.7.2.3 KEY FINDINGS – MONTH 3
98.8
1%
98.8
1%
95.1
2%
99.8
6%
98.7
5%
98.6
9%
96.6
4%
serv
er is
sue61
.02%
98.2
6%
NA
NA
0%
20%
40%
60%
80%
100%
Aircel 3G Airtel 3G BSNL 3G Reliance 3G
%a
voi
ce q
ualit
y
Circuit Switched Voice Quality-Month 3
PMR Data Live Data Drive Test Data
TRAI Benchmark ≥ 95%
Data Source: Network Operations Center (NOC) of the operators

TRAI Audit Wireless Report-Bihar & Jharkhand Circle AMJ Quarter-2016
116
7 PARAMETER DESCRIPTION & DETAILED FINDINGS - WIRELESS DATA SERVICES (2G & 3G)
7.1 SERVICE ACTIVATION /PROVISIONING FOR 2G & 3G
7.1.1 PARAMETER DESCRIPTION
This refers to the activation of services after activation of the SIM. This involves programming the various databases with the customer's information and any
gateways to standard Internet chat or mail services or any data services. The service provider typically sends these settings to the subscriber's handset using SMS or
WAP.
% activation done within 4 hours = Total Time Taken for Activation ×100 Total request time made
Benchmark :- >=95%

TRAI Audit Wireless Report-Bihar & Jharkhand Circle AMJ Quarter-2016
117
7.1.2 KEY FINDINGS
99.9
8%
ND
R
ND
R
99.9
7%
99.9
6%
99.9
9%
97.2
2%
99.9
4%
92.8
6%
99.9
9%
ND
R
ND
R
ND
R
ND
R
ND
R
ND
R
100.
00%
100.
00%
90.3
3%
ND
R
0.0%10.0%20.0%30.0%40.0%50.0%60.0%70.0%80.0%90.0%
100.0%
Aircel(DWL) Airtel BSNL Idea Reliance CDMA Reliance GSM TATA CDMA TATA GSM Telenor Vodafone% a
ctiv
atio
n do
ne w
ithi
n 4
hour
s Activation done within 4 hours - Consolidated-2G
PMR Data Live Data
TRAI Benchmark ≥ 95%
99.9
8%
ND
R
ND
R
ND
R
ND
R
ND
R
ND
R
ND
R
0.0%
20.0%
40.0%
60.0%
80.0%
100.0%
Aircel 3G Airtel 3G BSNL Bihar/Jharkand 3G Reliance 3G% a
ctiv
atio
n do
ne w
ithi
n 4
hour
s
Activation done within 4 hours - Consolidated-3G
PMR Data Live Data
TRAI Benchmark ≥ 95%
Telenor failed to meet the benchmark during audit for 2G in both PMR and Live data and all operators met the benchmark during audit for 3G in
PMR Data.

TRAI Audit Wireless Report-Bihar & Jharkhand Circle AMJ Quarter-2016
118
7.2 PDP CONTEXT ACTIVATION SUCCESS RATE FOR 2G & 3G
7.2.1 PARAMETER DESCRIPTION
A Packet Data Protocol (PDP) context specifies access to an external packet-switching network. The data associated with the PDP context contains information such
as the type of packet-switching network, the Mobile Station PDP (MS PDP) address that is the IP address, the reference of Gateway GPRS Support Node (GGSN), and
the requested QoS. A PDP context is handled by the MS, Serving GPRS Support Node (SGSN) and GGSN and is identified by a mobile's PDP address within these
entities. Several PDP contexts can be activated at the same time within a given MS.
Measurement
This measurement provides the number of successfully completed PDP context activations. For these context activations, the GGSN is updated successfully and a
report of PDP context activation success is generated at GGSN.
PDP Context Activation Success Rate (%) =
Number of successfully completed PDP context activations ×100 Total attempts of context activation
Benchmark: >=95%
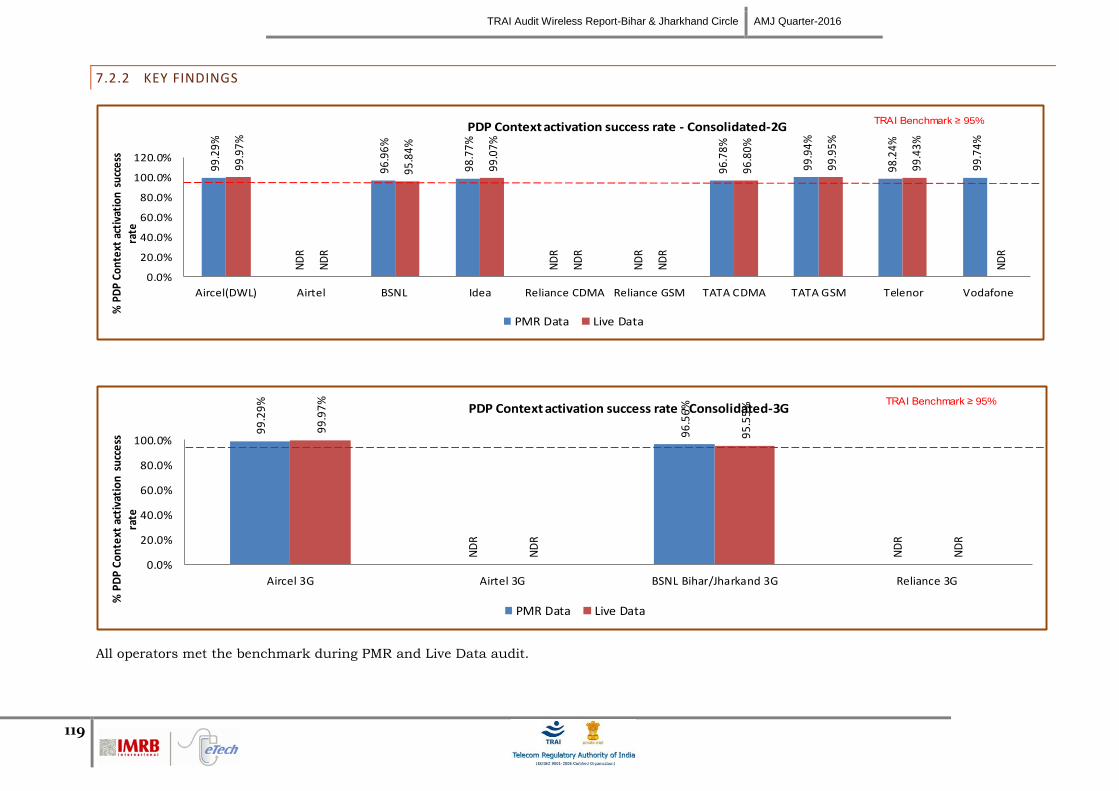
TRAI Audit Wireless Report-Bihar & Jharkhand Circle AMJ Quarter-2016
119
7.2.2 KEY FINDINGS
99.2
9%
ND
R
96.9
6%
98.7
7%
ND
R
ND
R
96.7
8%
99.9
4%
98.2
4%
99.7
4%
99.9
7%
ND
R
95.8
4%
99.0
7%
ND
R
ND
R
96.8
0%
99.9
5%
99.4
3%
ND
R
0.0%
20.0%
40.0%
60.0%
80.0%
100.0%
120.0%
Aircel(DWL) Airtel BSNL Idea Reliance CDMA Reliance GSM TATA CDMA TATA GSM Telenor Vodafone
% P
DP
Cont
ext
acti
vati
on s
ucce
ss
rate
PDP Context activation success rate - Consolidated-2G
PMR Data Live Data
TRAI Benchmark ≥ 95%
99
.29
%
ND
R
96
.56
%
ND
R
99
.97
%
ND
R
95
.55
%
ND
R
0.0%
20.0%
40.0%
60.0%
80.0%
100.0%
Aircel 3G Airtel 3G BSNL Bihar/Jharkand 3G Reliance 3G
% P
DP
Co
nte
xt a
ctiv
atio
n s
ucc
ess
ra
te
PDP Context activation success rate - Consolidated-3G
PMR Data Live Data
TRAI Benchmark ≥ 95%
All operators met the benchmark during PMR and Live Data audit.

TRAI Audit Wireless Report-Bihar & Jharkhand Circle AMJ Quarter-2016
120
7.3 DROP RATE FOR 2G & 3G
7.3.1 PARAMETER DESCRIPTION
It measures the inability of Network to maintain a connection and is defined as the ratio of abnormal disconnects w.r.t. all disconnects (both normal and abnormal).
An abnormal disconnect may happen because of Radio Link Failures, Uplink (UL) or Downlink (DL) interference, bad coverage, unsuccessful handovers or any other
reason. The drop rate is to be measured for all generations of the technologies separately.
Drop rate = No. of Dropped data Calls ×100
No. of Successful data calls
Benchmark: <=5%
7.3.2 KEY FINDINGS
1.38
%
ND
R
ND
R
1.48
%
ND
R
ND
R
0.97
%
0.93
%
0.94
%
3.63
%
1.37
%
ND
R
9.90
%
1.48
%
ND
R
ND
R 0.78
%
0.92
%
0.99
%
ND
R
0.0%
1.0%
2.0%
3.0%
4.0%
5.0%
Aircel(DWL) Airtel BSNL Idea Reliance CDMA Reliance GSM TATA CDMA TATA GSM Telenor Vodafone
% D
rop
rate
Drop Rate - Consolidated-2G
PMR Data Live Data
TRAI Benchmark ≤ 5%
BSNL 2G failed to meet the benchmark during audit.

TRAI Audit Wireless Report-Bihar & Jharkhand Circle AMJ Quarter-2016
121
1.3
3%
ND
R
9.1
2%
ND
R1.3
6%
ND
R
8.0
1%
ND
R
0.0%1.0%2.0%3.0%4.0%5.0%6.0%7.0%8.0%9.0%
10.0%
Aircel 3G Airtel 3G BSNL Bihar/Jharkand 3G Reliance 3G
% D
rop
rat
e
Drop Rate - Consolidated-3G
PMR Data Live Data
TRAI Benchmark ≤ 5%
BSNL 3G failed to meet the benchmark during audit for PMR and Live.

TRAI Audit Wireless Report-Bihar & Jharkhand Circle AMJ Quarter-2016
122
8 PARAMETER DESCRIPTION AND DETAILED FINDINGS – NON-NETWORK PARAMETERS
8.1 METERING AND BILLING CREDIBILITY
The billing complaints for postpaid are calculated by averaging over one billing cycle in a quarter. For example, there are three billing cycles in a quarter, the data for
each billing cycle is calculated separately and then averaged over.
The charging complaints for prepaid are calculated by taking all complaints in a quarter.
8.1.1 PARAMETER DESCRIPTION
All the complaints related to billing/ charging as per clause 3.7.2 of QoS regulation of 20th
December, 2009 were covered. The types of billing complaints covered are
listed below.
Payments made and not credited to the subscriber account
Payment made on time but late payment charge levied wrongly
Wrong roaming charges
Double charges
Charging for toll free services
Local calls charged/billed as STD/ISD or vice versa
Calls or messages made disputed
Validity related complaints
Credit agreed to be given in resolution of complaint, but not accounted in the bill
Charging for services provided without consent
Charging not as per tariff plans or top up vouchers/ special packs etc.
Overcharging or undercharging

TRAI Audit Wireless Report-Bihar & Jharkhand Circle AMJ Quarter-2016
123
In addition to the above, any billing complaint which leads to billing error, waiver, refund, credit, or any adjustment is also considered as valid billing complaint for calculating the number of disputed bills.
Computational Methodology:
Billing complaints per 100 bills issued (Postpaid) = (Total billing complaints** received during the relevant billing cycle / Total bills generated*
during the relevant billing cycle)*100
*Operator to include all types of bills generated for customers. This would include printed bills, online bills and any other forms of bills generated
**Billing complaints here shall include only dispute related issues (including those that may arise because of a lack of awareness at the subscribers’
end). It does not include any provisional issues (such as delayed dispatch of billing statements, etc.) in which the operator has opened a ticket
internally.
Charging complaints per 100 subscribers (Prepaid) = (Total charging complaints received during the quarter/ Total number of subscribers
reported by the operator at the end of the quarter) * 100
TRAI Benchmark: <= 0.1%
Audit Procedure:
Audit of billing complaint details for the complaints received during the quarter and used for arriving at the benchmark reported to TRAI would be
conducted
For Postpaid, the total billing complaints would be audited by averaging over billing cycles in a quarter
For Prepaid, the data of total charging complaints in a quarter would be taken for the purpose of audit

TRAI Audit Wireless Report-Bihar & Jharkhand Circle AMJ Quarter-2016
124
8.1.2 KEY FINDINGS – METERING AND BILLING CREDIBILITY (POSTPAID)
0.00
% 0.03
%
0.10
%
0.16
%
0.08
%
0.09
%
0.00
%
0.00
%
NA 0.
01%
0.00%
0.02%
0.04%
0.06%
0.08%
0.10%
0.12%
0.14%
0.16%
0.18%
Aircel(DWL) Airtel BSNL Idea Reliance CDMA Reliance GSM TATA CDMA TATA GSM Telenor VodafonePerc
enta
ge b
ills d
ispu
ted
Metering and billing credibility - Postpaid
Audit Results for Billing performance Postpaid-Consolidated
TRAI Benchmark ≤ 0.1%
Data Source: Billing Center of the operators
Idea failed to meet the benchmark of 0.1% post-paid metering and billing credibility.
0.00
% 0.03
%
0.09
%
0.11
%
0.09
%
0.09
%
0.00
%
0.00
%
NA
0.01
%
0.00
% 0.02
%
0.11
%
0.17
%
0.07
%
0.08
%
0.01
%
0.00
%
NA
0.01
%
0.00
% 0.02
%
NA
0.19
%
0.09
%
0.09
%
0.00
%
0.01
%
NA 0.01
%
0.00%
0.02%
0.04%
0.06%
0.08%
0.10%
0.12%
0.14%
0.16%
0.18%
0.20%
Aircel(DWL) Airtel BSNL Idea Reliance CDMA Reliance GSM TATA CDMA TATA GSM Telenor Vodafone
Perc
enta
ge b
ills d
ispu
ted
Metering and billing credibility - Postpaid (Billing cycle wise)
April May June
=
TRAI Benchmark ≤ 0.1%
Data Source: Billing Center of the operators

TRAI Audit Wireless Report-Bihar & Jharkhand Circle AMJ Quarter-2016
125
8.1.3 KEY FINDINGS - METERING AND BILLING CREDIBILITY (PREPAID)
0.03
%
0.01
%
0.00
%
0.01
%
0.02
%
0.03
%
0.00
%
0.00
%
0.00
%
0.02
%
0.00%
0.01%
0.01%
0.02%
0.02%
0.03%
0.03%
0.04%
Aircel(DWL) Airtel BSNL Idea Reliance CDMA Reliance GSM TATA CDMA TATA GSM Telenor VodafonePerc
enta
ge b
ills d
ispu
ted
Metering and billing credibility - Prepaid
Percentage of charging complaints disputed
TRAI Benchmark ≤ 0.1%
Data
Source: Billing Center of the operators
All operators met the benchmark for metering and billing credibility of prepaid subscribers.
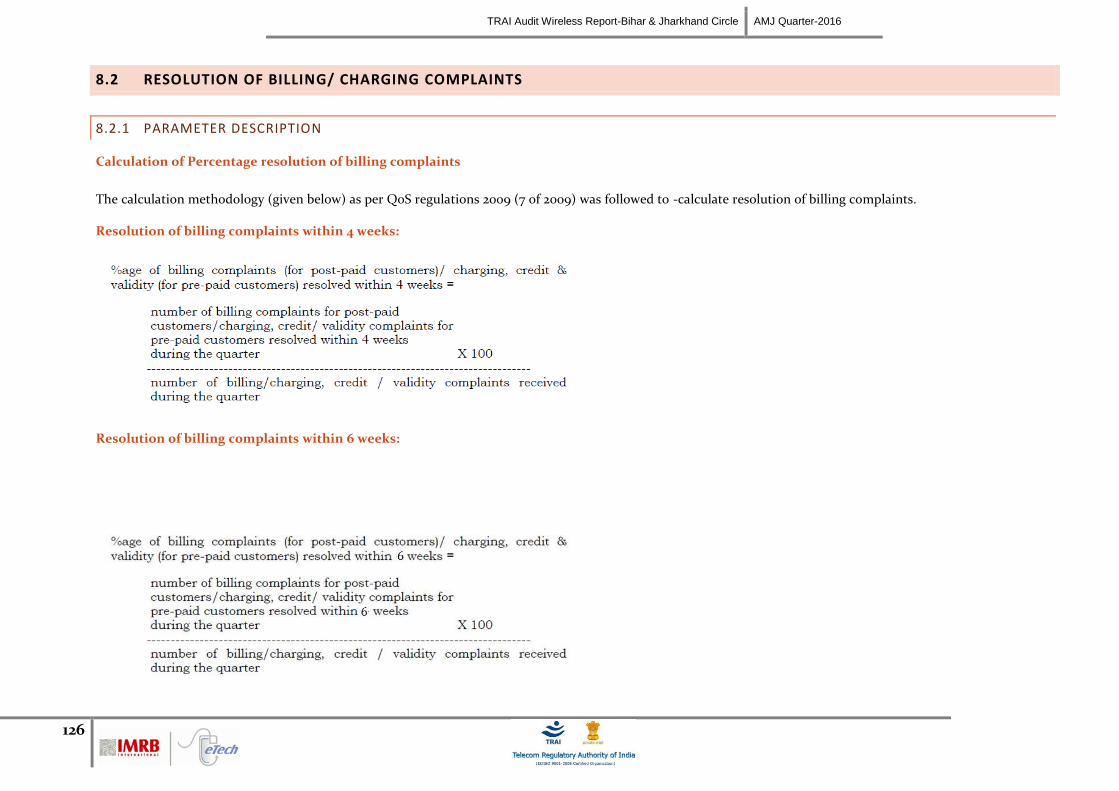
TRAI Audit Wireless Report-Bihar & Jharkhand Circle AMJ Quarter-2016
126
8.2 RESOLUTION OF BILLING/ CHARGING COMPLAINTS
8.2.1 PARAMETER DESCRIPTION
Calculation of Percentage resolution of billing complaints
The calculation methodology (given below) as per QoS regulations 2009 (7 of 2009) was followed to -calculate resolution of billing complaints.
Resolution of billing complaints within 4 weeks:
Resolution of billing complaints within 6 weeks:

TRAI Audit Wireless Report-Bihar & Jharkhand Circle AMJ Quarter-2016
127
**Billing complaints here shall include only dispute related issues (including those that may arise because of a lack of awareness at the subscribers’
end). It does not include any provisional issues (such as delayed dispatch of billing statements, etc.) in which the operator has opened a ticket
internally. Complaints raised by the consumers to operator are only considered as part of the calculation.
The complaints that get marked as invalid by the operator are not considered for calculation as those complaints cannot be considered as resolved by
the operator.
*** Date of resolution in this case would refer to the date when a communication has taken place from the operator’s end to inform the complainant
about the final resolution of the issue / dispute.
Benchmark: 98% complaints resolved within 4 weeks, 100% within 6 weeks.
8.2.2 KEY FINDINGS - WITHIN 4 WEEKS
10
0.0
0%
10
0.0
0%
10
0.0
0%
10
0.0
0%
10
0.0
0%
10
0.0
0%
10
0.0
0%
10
0.0
0%
10
0.0
0%
10
0.0
0%
80
.00
%
77
.00
%
75
.00
%
91
.00
%
No
Ser
vice
86
.00
%
NA
NA
NA
86
.00
%
0%
20%
40%
60%
80%
100%
Aircel(DWL) Airtel BSNL Idea Reliance CDMA Reliance GSM TATA CDMA TATA GSM Telenor Vodafone
Pe
rce
nta
ge c
ase
s re
solv
ed
w
ee
ks
Resolution of billing complaints 4 Weeks
Percentage cases resolved in 4 weeks:Audit results Percentage cases resolved in 4 weeks:Live calling
TRAI Benchmark =98%
Data Source: Billing Center of the operators

TRAI Audit Wireless Report-Bihar & Jharkhand Circle AMJ Quarter-2016
128
8.2.3 KEY FINDINGS WITHIN 6 WEEKS
100.
00%
100.
00%
100.
00%
100.
00%
100.
00%
100.
00%
100.
00%
100.
00%
100.
00%
100.
00%
82.0
0%
77.0
0%
83.0
0%
91.0
0%
No
Serv
ice
86.0
0%
NA
NA
NA
89.0
0%
0%
20%
40%
60%
80%
100%
Aircel(DWL) Airtel BSNL Idea Reliance CDMA Reliance GSM TATA CDMA TATA GSM Telenor Vodafone
Perc
enta
ge ca
ses r
esol
ved
eek
sResolution of billing complaints 6 Weeks
Percentage complaints resolved within 6 weeks Percentage cases resolved in 6 weeks
TRAI Benchmark =100%
Data Source: Billing Center of the operators
All operators met the TRAI benchmark of resolution of billing complaints within 6 weeks. However, as per live calling done to customers, the performance of all
operators was observed to be much below the benchmark.

TRAI Audit Wireless Report-Bihar & Jharkhand Circle AMJ Quarter-2016
129
8.3 PERIOD OF APPLYING CREDIT/WAVIER
8.3.1 PARAMETER DESCRIPTION
Computational Methodology:
Period of applying credit waiver = (number of cases where credit waiver is applied within 7 days/ total number of cases eligible for credit waiver) * 100
TRAI Benchmark:
Period of applying credit waiver within 7 days: 100%
Audit Procedure:
Operator to provide details of:-
List of all eligible cases along with
Date of applying credit waiver to all the eligible cases.
Date of resolution of complaint for all eligible cases

TRAI Audit Wireless Report-Bihar & Jharkhand Circle AMJ Quarter-2016
130
8.3.2 KEY FINDINGS
100.
00%
100.
00%
100.
00%
100.
00%
100.
00%
100.
00%
100.
00%
100.
00%
100.
00%
100.
00%
0%
20%
40%
60%
80%
100%
Aircel(DWL) Airtel BSNL Idea Reliance CDMA Reliance GSM TATA CDMA TATA GSM Telenor Vodafone
Perc
enta
ge ca
ses
cred
it/w
aive
r ap
plie
d w
ithi
n 1
wee
kPeriod of applying credit/waiver
Percentage cases credit/waiver applied within 1 week
TRAI Benchmark =100%
Data Source: Billing Center of the operators
All operators met the benchmark for this parameter.

TRAI Audit Wireless Report-Bihar & Jharkhand Circle AMJ Quarter-2016
131
8.4 CALL CENTRE PERFORMANCE-IVR
8.4.1 PARAMETER DESCRIPTION
Computational Methodology:
Call centre performance IVR = (Number of calls connected and answered by IVR/ All calls attempted to IVR) * 100
TRAI Benchmark: >= 95%
Audit Procedure:
Operators provide details of the following from their central call centre/ customer service database:
Total calls connected and answered by IVR
Total calls attempted to IVR
Also live calling is done to test the calls connected and answered by IVR

TRAI Audit Wireless Report-Bihar & Jharkhand Circle AMJ Quarter-2016
132
8.4.2 KEY FINDINGS
91
.27
%
98
.12
%
98
.62
%
99
.42
%
99
.45
%
99
.54
%
NA
96
.42
%
99
.74
%
10
0.0
0%
10
0.0
0%
10
0.0
0%
10
0.0
0%
10
0.0
0%
No
Ser
vice
10
0.0
0%
10
0.0
0%
10
0.0
0%
10
0.0
0%
10
0.0
0%
0%10%20%30%40%50%60%70%80%90%
100%
Aircel(DWL) Airtel BSNL Idea Reliance CDMA Reliance GSM TATA CDMA TATA GSM Telenor Vodafone%ag
e c
alls
co
nn
ect
ed
an
d
answ
ere
dCalls connected and answered
Percentage calls conncted and answered:Three month data Percentage calls connected and answered:Live calling
TRAI Benchmark ≥95%
Data Source: Customer Service Center of the operators
As per PMR data, Aircel failed to meet the TRAI benchmark.

TRAI Audit Wireless Report-Bihar & Jharkhand Circle AMJ Quarter-2016
133
8.5 CALL CENTRE PERFORMANCE-VOICE TO VOICE
8.5.1 PARAMETER DESCRIPTION
Computational Methodology:
Call centre performance Voice to Voice = (Number of calls answered by operator within 90 seconds/ All calls attempted to connect to the operator) *
100
Audit Procedure:
Operators provide details of the following from their central call centre/ customer service database:
Total calls connected and answered by operator within 90 seconds
Total calls attempted to connect to the operator
Also live calling was done to test the calls answered within 90 seconds by the operator
Benchmark: 95% calls to be answered within 90 seconds

TRAI Audit Wireless Report-Bihar & Jharkhand Circle AMJ Quarter-2016
134
8.5.2 KEY FINDINGS
92
.99
%
89
.99
%
95
.60
%
99
.98
%
82
.24
%
91
.73
%
10
0.0
0%
97
.62
%
98
.24
%
97
.58
%
96
.00
%
96
.00
%
87
.50
%
56
.00
%
No
Ser
vice
90
.00
%
10
0.0
0%
10
0.0
0%
98
.00
%
95
.00
%
0%10%20%30%40%50%60%70%80%90%
100%
Aircel(DWL) Airtel BSNL Idea Reliance CDMA Reliance GSM TATA CDMA TATA GSM Telenor Vodafone
%ag
e c
alls
an
swe
red
in 9
0 se
con
ds
Calls answered in 90 seconds (Voice to Voice)
Percentage calls answered within 90 seconds (Avg of 3 months) Live Calling Percentage calls getting connected and answered
TRAI Benchmark ≥ 95%
Data Source: Customer Service Center of the operators
Airtel, Aircel, Reliance CDMA & GSM failed to meet the benchmark as per audit/ Percentage calls answered within 90 seconds (Avg. of 3 months). However, as per
live calling done to customers, the performance of BSNL, Idea and Reliance GSM failed to meet the benchmark.

TRAI Audit Wireless Report-Bihar & Jharkhand Circle AMJ Quarter-2016
135
8.6 TERMINATION/CLOSURE OF SERVICE
8.6.1 PARAMETER DESCRIPTION
Computational Methodology:
Time taken for closure of service = (number of closures done within 7 days/ total number of closure requests) * 100
TRAI Benchmark:
Termination/Closure of Service: <=7 days
Audit Procedure:
Operator provide details of the following from their central billing/CS database:
Date of lodging the closure request (all requests in given period)
Date of closure of service

TRAI Audit Wireless Report-Bihar & Jharkhand Circle AMJ Quarter-2016
136
8.6.2 KEY FINDINGS
100.
00%
100.
00%
NA
100.
00%
100.
00%
100.
00%
100.
00%
100.
00%
NA
100.
00%
0%
20%
40%
60%
80%
100%
Aircel(DWL) Airtel BSNL Idea Reliance CDMA Reliance GSM TATA CDMA TATA GSM Telenor Vodafone
Perc
enta
ge ca
ses
clos
ure
atte
nded
wit
hin
7 da
ysTermination/Closure of service
Percentage cases closure done within 7 days
TRAI Benchmark =100%
Data Source: Customer Service Center of the operators
All operators met the TRAI benchmark for the parameter.

TRAI Audit Wireless Report-Bihar & Jharkhand Circle AMJ Quarter-2016
137
8.7 REFUND OF DEPOSITS AFTER CLOSURE
8.7.1 PARAMETER DESCRIPTION
Computational Methodology:
Time taken for refund for deposit after closures = (number of cases of refund after closure done within 60 days/ total number of cases of
refund after closure) * 100
Any case where the operators need to return the amount back to consumers post closure of service in form of cheque/cash is considered to be refund.
TRAI Benchmark:
Time taken for refund for deposit after closures: 100% within 60 days
Audit Procedure:
Operator provide details of the following from their central billing/refund database:
Dates of completion of all ‘closure requests’ resulting in requirement of a refund by the operator.
Dates of refund pertaining to all closure request received during the relevant quarter

TRAI Audit Wireless Report-Bihar & Jharkhand Circle AMJ Quarter-2016
138
8.7.2 KEY FINDINGS
100.
00%
100.
00%
NA
100.
00%
NA
NA
100.
00%
100.
00%
NA
100.
00%
0%
20%
40%
60%
80%
100%
Aircel(DWL) Airtel BSNL Idea Reliance CDMA Reliance GSM TATA CDMA TATA GSM Telenor Vodafone
Perc
enta
ge ca
ses
refu
nd
prov
ided
wit
hin
60 d
ays
Refund of deposts after closure
Percentage cases closure done within 7 days
TRAI Benchmark =100%
Data Source: Customer Service Center of the operators
Aircel failed to meet the TRAI benchmark for the parameter.

TRAI Audit Wireless Report-Bihar & Jharkhand Circle AMJ Quarter-2016
139
9 DETAILED FINDINGS - DRIVE TEST DATA
9.1 OPERATOR ASSISTED DRIVE TEST - VOICE
The drive test was conducted simultaneously for all the operators present in the Kolkata circle. As per the new directive given by TRAI headquarters, drive test in the
quarter were conducted at a SSA level. SSAs have been defined in two categories by TRAI as per the criticality of the SSA.
3. Normal SSA
4. Difficult SSA
The drive test in Normal SSA was conducted for three days with minimum distance of 250 kilometers over three days. The drive test in difficult SSAs was conducted
for six days with minimum distance of 500 kilometers over six days. The selection of routes ensured that the maximum towns, villages, highways are covered as part of
drive test. The routes were selected post discussion with TRAI regional teams. The holding period for all test calls was 120 seconds and gap between calls was 10
seconds.
For measuring voice quality RxQual samples for GSM operators and Frame Error Rate (FERs) for CDMA service providers were measured. RxQual greater than 5
meant that the sample was not of appropriate voice quality and for CDMA operators FERs of more than 4 were considered bad. Call drops were measured by the
number of calls that were dropped to the total number of calls established during the drive test. Similarly CSSR was measured as the ratio of total calls established to
the total call attempts made. Signal strength was measured in Dbm with strength > -75 dbm for indoor, -85 dbm for in-vehicle and > -95 dbm outdoor routes.
The schedule and operators involved in the operator assisted drive test for Bihar circle are given below.

TRAI Audit Wireless Report-Bihar & Jharkhand Circle AMJ Quarter-2016
140
9.1.1 DALTONGANJ SSA
9.1.1.1 Route Details - DALTONGANJ SSA
The route maps given in the report are provided for the purpose of identifying the routes traversed during the drive tests. We observe three different colours
(Red/Green/Yellow) of the lines, which signify signal strength; however these maps are for a single operator and have not been referred to any findings in this report.
IMRB submits detailed operator wise Drive Test reports separately.

TRAI Audit Wireless Report-Bihar & Jharkhand Circle AMJ Quarter-2016
141
9.1.1.2 Route Map - DALTONGANJ DAY 1

TRAI Audit Wireless Report-Bihar & Jharkhand Circle AMJ Quarter-2016
142
9.1.1.3 Route Map - DALTONGANJ DAY 2

TRAI Audit Wireless Report-Bihar & Jharkhand Circle AMJ Quarter-2016
143
9.1.1.4 Route Map - DALTONGANJ DAY 3

TRAI Audit Wireless Report-Bihar & Jharkhand Circle AMJ Quarter-2016
144
9.1.1.5 Drive Test Results - DALTONGANJ SSA-2G
Data Source: Drive test reports submitted by operators to auditors
Voice Quality
BSNL, Reliance CDMA and TATA CDMA & GSM did not meet the TRAI benchmark in outdoor locations and BSNL did not meet the TRAI benchmark in indoor as
well as outdoor location.
Call Set Success Rate (CSSR)
Aircel, Reliance CDMA and TATA CDMA & GSM failed to meet the benchmark for CSSR in outdoor locations.
Call Drop Rate
BSNL, Reliance CDMA and TATA GSM failed to meet the benchmark for call drop rate in outdoor locations.

TRAI Audit Wireless Report-Bihar & Jharkhand Circle AMJ Quarter-2016
145
9.1.1.6 DRIVE TEST RESULTS - DALTONGANJ SSA-3G
Voice Quality
Aircel 3G, BSNL 3G failed to meet the benchmark for Voice Quality in outdoor locations and BSNL 3G failed to meet the benchmark in outdoor as well as indoor
location.
Call Set Success Rate (CSSR)
BSNL 3G failed to meet the benchmark for Call Set Success Rate in outdoor location.
Call Drop Rate
BSNL 3G failed to meet the benchmark for Call Drop Rate in outdoor locations.

TRAI Audit Wireless Report-Bihar & Jharkhand Circle AMJ Quarter-2016
146
9.1.1.1 Drive Test Results - DALTONGANJ SSA-DATA- 2G
All the parameters met the TRAI benchmark.
9.1.1.2 Drive Test Results - DALTONGANJ SSA-DATA- 3G
All the parameters met the TRAI benchmark.

TRAI Audit Wireless Report-Bihar & Jharkhand Circle AMJ Quarter-2016
147
9.1.2 JAMSEDPUR SSA
9.1.2.1 ROUTE DETAILS - JAMSEDPUR SSA
The route maps given in the report are provided for the purpose of identifying the routes traversed during the drive tests. We observe three different colours
(Red/Green/Yellow) of the lines, which signify signal strength; however these maps are for a single operator and have not been referred to any findings in this report.
IMRB submits detailed operator wise Drive Test reports separately.

TRAI Audit Wireless Report-Bihar & Jharkhand Circle AMJ Quarter-2016
148
9.1.2.2 Route Map - JAMSEDPUR DAY 1

TRAI Audit Wireless Report-Bihar & Jharkhand Circle AMJ Quarter-2016
149
9.1.2.3 Route Map - JAMSEDPUR DAY 2

TRAI Audit Wireless Report-Bihar & Jharkhand Circle AMJ Quarter-2016
150
9.1.2.4 Route Map - JAMSEDPUR DAY 3

TRAI Audit Wireless Report-Bihar & Jharkhand Circle AMJ Quarter-2016
151
9.1.2.5 Drive Test Results - JAMSEDPUR SSA-2G
Data Source: Drive test reports submitted by operators to auditors
Voice Quality
BSNL failed to meet the benchmark for voice quality in indoor as well as outdoor locations. Reliance CDMA, TATA CDMA & GSM and Telenor did not meet the
benchmark in outdoor locations.
Call Set Success Rate (CSSR)
Aircel, BSNL, Reliance CDMA and TATA GSM failed to meet the benchmark for CSSR in outdoor locations.
Call Drop Rate
Aircel, Reliance CDMA and TATA GSM failed to meet the benchmark for call drop rate in outdoor locations and BSNL failed to meet the benchmark for Call Drop
Rate in both Indoor and outdoor locations.

TRAI Audit Wireless Report-Bihar & Jharkhand Circle AMJ Quarter-2016
152
9.1.2.6 DRIVE TEST RESULTS - JAMSEDPUR SSA-3G
Note: - BSNL did not participate and Reliance 3G not submitted voice quality data.
Voice Quality
Aircel failed to meet the benchmark for voice quality in indoor as well as outdoor locations.
Call Set Success Rate (CSSR)
Reliance 3G failed to meet the benchmark for CSSR in outdoor locations.
Call Drop Rate
Aircel 3G and Reliance 3G failed to meet the benchmark for call drop rate in outdoor locations.

TRAI Audit Wireless Report-Bihar & Jharkhand Circle AMJ Quarter-2016
153
9.1.2.7 Drive Test Results - JAMSEDPUR SSA-DATA- 2G
Note: BSNL, Telenor did not submit the data.
All the parameters met the TRAI benchmark.
9.1.2.8 Drive Test Results - JAMSEDPUR SSA-DATA- 3G
Note: BSNL did not submit the data.
All the parameters met the TRAI benchmark.

TRAI Audit Wireless Report-Bihar & Jharkhand Circle AMJ Quarter-2016
154
9.1.3 DHANBAD SSA
9.1.3.1 Route Details - DHANBAD SSA
The route maps given in the report are provided for the purpose of identifying the routes traversed during the drive tests. We observe three different colours
(Red/Green/Yellow) of the lines, which signify signal strength; however these maps are for a single operator and have not been referred to any findings in this report.
IMRB submits detailed operator wise Drive Test reports separately.
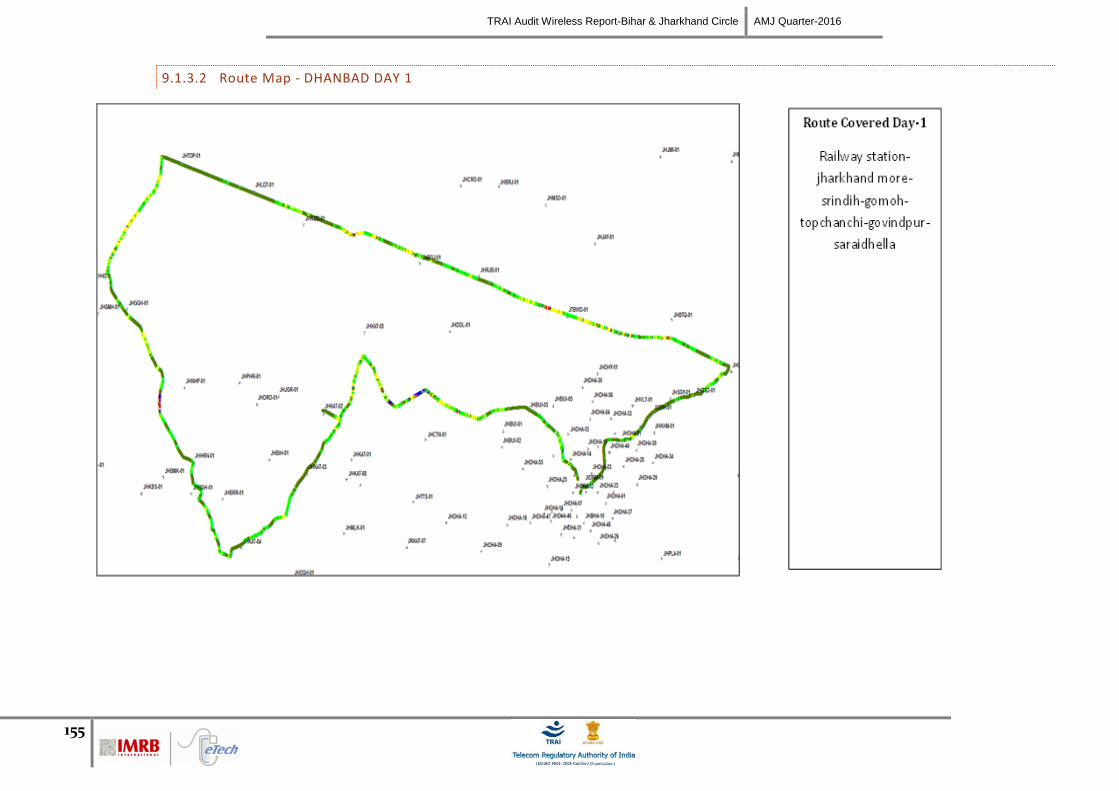
TRAI Audit Wireless Report-Bihar & Jharkhand Circle AMJ Quarter-2016
155
9.1.3.2 Route Map - DHANBAD DAY 1

TRAI Audit Wireless Report-Bihar & Jharkhand Circle AMJ Quarter-2016
156
9.1.3.3 Route Map - DHANBAD DAY 2
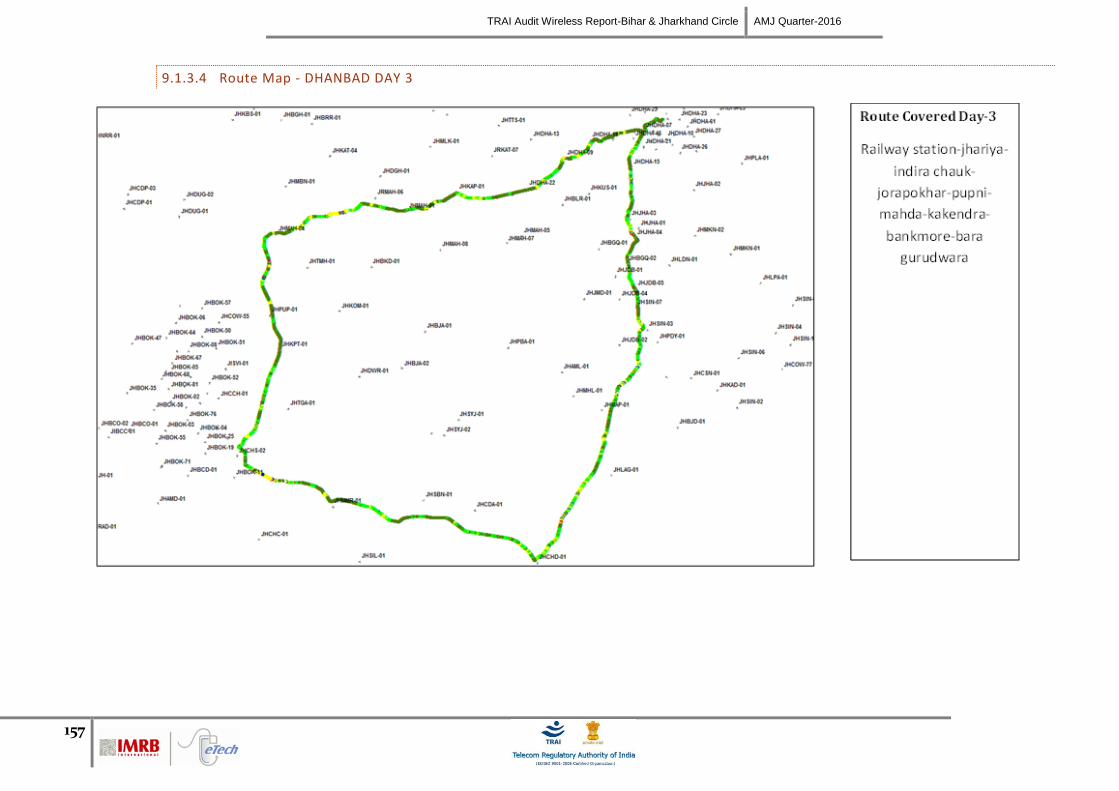
TRAI Audit Wireless Report-Bihar & Jharkhand Circle AMJ Quarter-2016
157
9.1.3.4 Route Map - DHANBAD DAY 3

TRAI Audit Wireless Report-Bihar & Jharkhand Circle AMJ Quarter-2016
158
9.1.3.5 Drive Test Results - DHANBAD SSA-2G
Data Source: Drive test reports submitted by operators to auditors
Note: - BSNL did not participate
Voice Quality
Reliance CDMA, Tata CDMA & GSM and Telenor failed to meet the benchmark for voice quality in outdoor locations.
Call Set Success Rate (CSSR)
Aircel and Reliance CDMA failed to meet the benchmark for CSSR in outdoor locations.
Call Drop Rate
Aircel, Reliance CDMA and Tata GSM failed to meet the benchmark for call drop rate in outdoor locations.

TRAI Audit Wireless Report-Bihar & Jharkhand Circle AMJ Quarter-2016
159
9.1.3.6 DRIVE TEST RESULTS - DHANBAD SSA-3G
Note: - BSNL 3G did not participate and Reliance 3G not submitted voice quality data.
Voice Quality
Aircel 3G failed to meet the benchmark for Voice quality in outdoor as well as indoor locations.
Call Set Success Rate (CSSR)
Reliance 3G failed to meet the benchmark for CSSR in outdoor locations.
Call Drop Rate
Aircel 3G and Reliance 3G failed to meet the benchmark for drop rate in outdoor locations.

TRAI Audit Wireless Report-Bihar & Jharkhand Circle AMJ Quarter-2016
160
9.1.3.7 Drive Test Results - DHANBAD SSA-DATA- 2G
All the parameters met the TRAI benchmark.
9.1.3.8 Drive Test Results - DHANBAD SSA-DATA- 3G
All the parameters met the TRAI benchmark.

TRAI Audit Wireless Report-Bihar & Jharkhand Circle AMJ Quarter-2016
161
9.1.4 HAZARIBAGH SSA
9.1.4.1 Route Details - HAZARIBAGH SSA
The route maps given in the report are provided for the purpose of identifying the routes traversed during the drive tests. We observe three different colours
(Red/Green/Yellow) of the lines, which signify signal strength; however these maps are for a single operator and have not been referred to any findings in this report.
IMRB submits detailed operator wise Drive Test reports separately.

TRAI Audit Wireless Report-Bihar & Jharkhand Circle AMJ Quarter-2016
162
9.1.4.2 Route Map - HAZARIBAGH DAY 1

TRAI Audit Wireless Report-Bihar & Jharkhand Circle AMJ Quarter-2016
163
9.1.4.3 Route Map - HAZARIBAGH DAY 2

TRAI Audit Wireless Report-Bihar & Jharkhand Circle AMJ Quarter-2016
164
9.1.4.4 Route Map - HAZARIBAGH DAY 3

TRAI Audit Wireless Report-Bihar & Jharkhand Circle AMJ Quarter-2016
165
9.1.4.5 ROUTE MAP - HAZARIBAGH DAY 4

TRAI Audit Wireless Report-Bihar & Jharkhand Circle AMJ Quarter-2016
166
9.1.4.6 Route Map - HAZARIBAGH DAY 5

TRAI Audit Wireless Report-Bihar & Jharkhand Circle AMJ Quarter-2016
167
9.1.4.7 Route Map - HAZARIBAGH DAY 6

TRAI Audit Wireless Report-Bihar & Jharkhand Circle AMJ Quarter-2016
168
9.1.4.8 Drive Test Results - HAZARIBAGH SSA-2G
Data Source: Drive test reports submitted by operators to auditors
Note: - BSNL did not participate
Voice Quality
Reliance CDMA failed to meet the benchmark for voice quality in indoor as well as outdoor locations. TATA CDMA & GSM did not meet the benchmark in outdoor
locations.
Call Set Success Rate (CSSR)
Reliance CDMA and Tata CDMA & GSM failed to meet the benchmark for CSSR in outdoor locations.
Call Drop Rate
Reliance CDMA and Tata CDMA & GSM failed to meet the benchmark for call drop rate in outdoor locations.

TRAI Audit Wireless Report-Bihar & Jharkhand Circle AMJ Quarter-2016
169
9.1.4.9 DRIVE TEST RESULTS - HAZARIBAGH SSA-3G
Note: - BSNL did not participate and Reliance 3G not submitted voice quality data.
Voice Quality
Aircel 3G failed to meet the benchmark for Voice quality in outdoor as well as indoor locations.
Call Set Success Rate (CSSR)
Reliance 3G failed to meet the benchmark for CSSR in outdoor locations.
Call Drop Rate
Reliance 3G failed to meet the benchmark for Call Drop Rate in outdoor location.

TRAI Audit Wireless Report-Bihar & Jharkhand Circle AMJ Quarter-2016
170
9.1.4.10 Drive Test Results - HAZARIBAGH SSA-DATA- 2G
All the parameters met the TRAI benchmark.
9.1.4.11 Drive Test Results - HAZARIBAGH SSA-DATA- 3G
All the parameters met the TRAI benchmark.

TRAI Audit Wireless Report-Bihar & Jharkhand Circle AMJ Quarter-2016
171
9.1.5 MOTIHARI SSA
9.1.5.1 Route Details - MOTIHARI SSA
The route maps given in the report are provided for the purpose of identifying the routes traversed during the drive tests. We observe three different colours
(Red/Green/Yellow) of the lines, which signify signal strength; however these maps are for a single operator and have not been referred to any findings in this report.
IMRB submits detailed operator wise Drive Test reports separately.

TRAI Audit Wireless Report-Bihar & Jharkhand Circle AMJ Quarter-2016
172
9.1.5.2 Route Map - MOTIHARI DAY 1

TRAI Audit Wireless Report-Bihar & Jharkhand Circle AMJ Quarter-2016
173
9.1.5.3 Route Map - MOTIHARI DAY 2

TRAI Audit Wireless Report-Bihar & Jharkhand Circle AMJ Quarter-2016
174
9.1.5.4 Route Map - MOTIHARI DAY 3

TRAI Audit Wireless Report-Bihar & Jharkhand Circle AMJ Quarter-2016
175
9.1.5.5 Drive Test Results - MOTIHARI SSA-2G
Data Source: Drive test reports submitted by operators to auditors
Note: - BSNL did not participate
Voice Quality
Aircel failed to meet the benchmark for voice quality in outdoor locations. TATA GSM did not meet the benchmark in indoor as well as outdoor locations.
Call Set Success Rate (CSSR)
TATA GSM failed to meet the benchmark for CSSR in outdoor locations.
Call Drop Rate
TATA GSM failed to meet the benchmark for call drop rate in outdoor locations.

TRAI Audit Wireless Report-Bihar & Jharkhand Circle AMJ Quarter-2016
176
9.1.5.6 DRIVE TEST RESULTS - MOTIHARI SSA-3G
Note: - BSNL 3G did not participate
Voice Quality
Aircel 3G failed to meet the benchmark in outdoor as well as indoor locations.
Call Set Success Rate (CSSR)
All the parameters met the TRAI benchmark for CSSR.
Call Drop Rate
All the parameters met the TRAI benchmark for call drop rate.

TRAI Audit Wireless Report-Bihar & Jharkhand Circle AMJ Quarter-2016
177
9.1.5.7 Drive Test Results - MOTIHARI SSA-DATA- 2G
All the parameters met the TRAI benchmark.
9.1.5.8 Drive Test Results - MOTIHARI SSA-DATA- 3G
All the parameters met the TRAI benchmark.
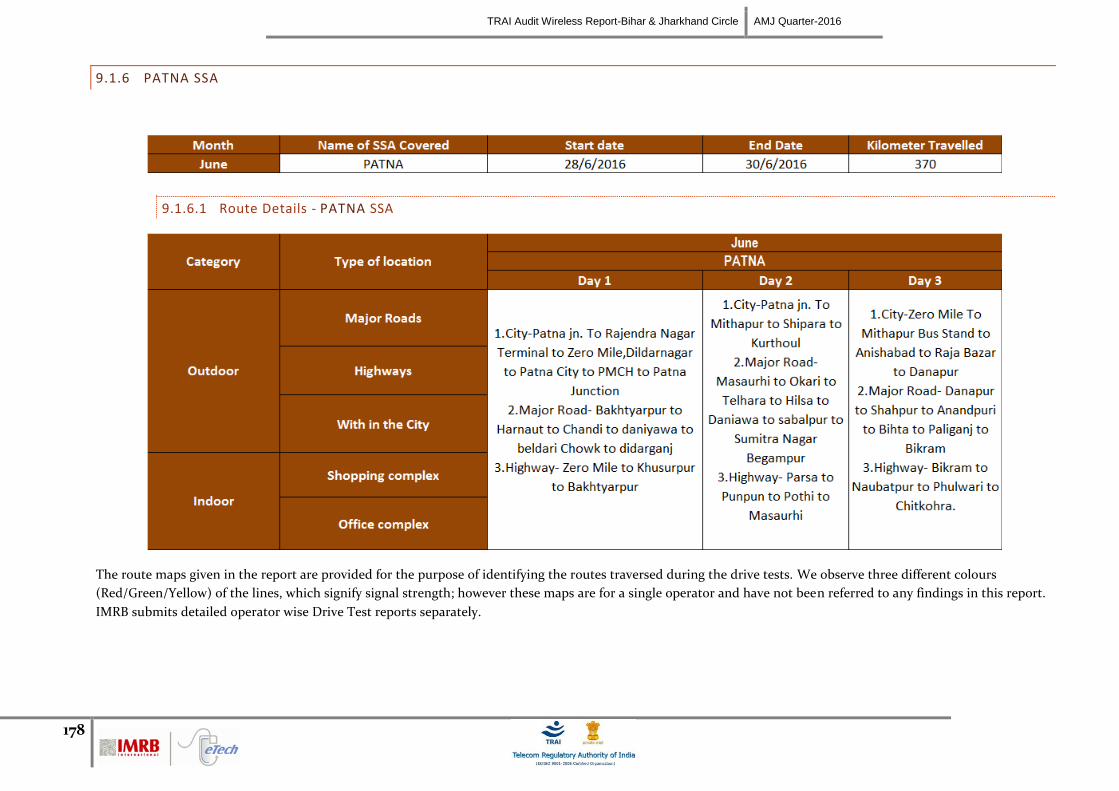
TRAI Audit Wireless Report-Bihar & Jharkhand Circle AMJ Quarter-2016
178
9.1.6 PATNA SSA
9.1.6.1 Route Details - PATNA SSA
The route maps given in the report are provided for the purpose of identifying the routes traversed during the drive tests. We observe three different colours
(Red/Green/Yellow) of the lines, which signify signal strength; however these maps are for a single operator and have not been referred to any findings in this report.
IMRB submits detailed operator wise Drive Test reports separately.
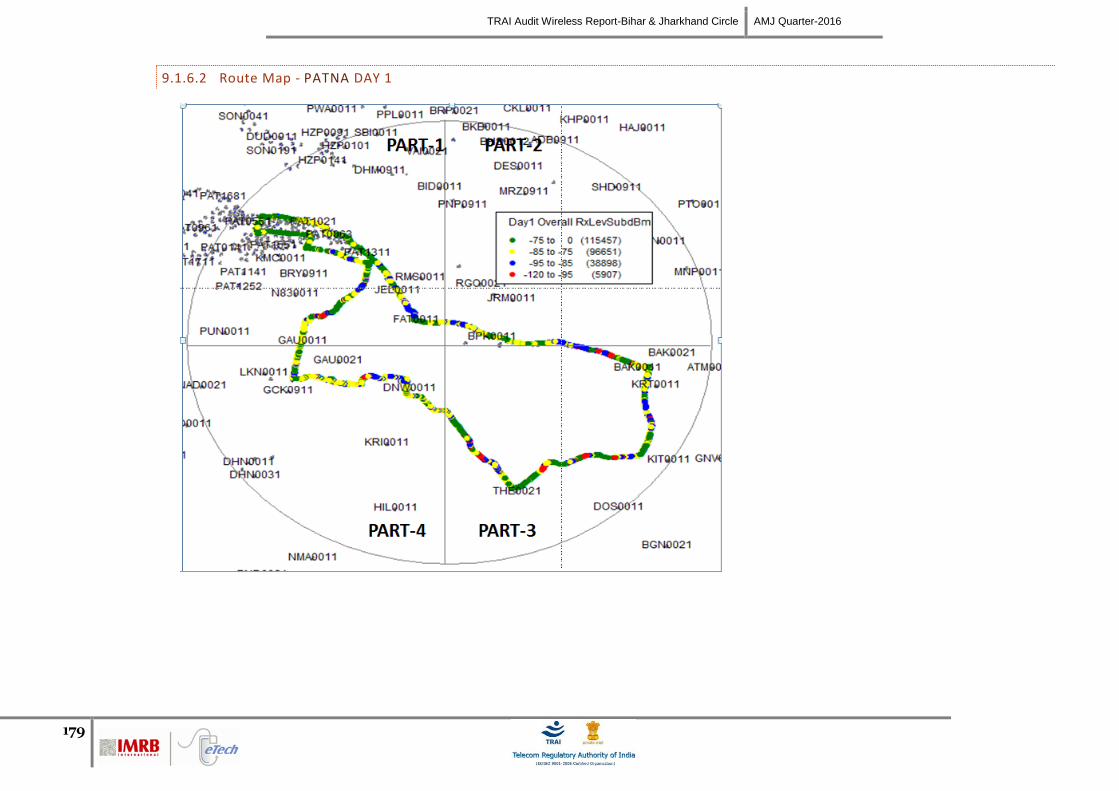
TRAI Audit Wireless Report-Bihar & Jharkhand Circle AMJ Quarter-2016
179
9.1.6.2 Route Map - PATNA DAY 1

TRAI Audit Wireless Report-Bihar & Jharkhand Circle AMJ Quarter-2016
180
9.1.6.3 Route Map - PATNA DAY 2

TRAI Audit Wireless Report-Bihar & Jharkhand Circle AMJ Quarter-2016
181
9.1.6.4 Route Map - PATNA DAY 3

TRAI Audit Wireless Report-Bihar & Jharkhand Circle AMJ Quarter-2016
182
9.1.6.5 Drive Test Results - PATNA SSA-2G
Data Source: Drive test reports submitted by operators to auditors
Voice Quality
Aircel, BSNL and TATA GSM failed to meet the benchmark for voice quality in outdoor as well as indoor locations. TATA CDMA did not meet the benchmark in
outdoor locations.
Call Set Success Rate (CSSR)
BSNL, TATA CDMA and TATA GSM failed to meet the benchmark for CSSR in outdoor locations.
Call Drop Rate
BSNL, TATA CDMA and TATA GSM failed to meet the benchmark for call drop rate in outdoor locations.

TRAI Audit Wireless Report-Bihar & Jharkhand Circle AMJ Quarter-2016
183
9.1.6.6 DRIVE TEST RESULTS - Patna SSA-3G
Note: - BSNL 3G and Reliance 3G were not submitted the voice quality data.
Voice Quality
Aircel3G failed to meet the benchmark for voice quality in outdoor as well as indoor locations.
Call Set Success Rate (CSSR)
BSNL 3G and Reliance 3G failed to meet the benchmark for CSSR in outdoor locations.
Call Drop Rate
Reliance 3G failed to meet the benchmark for call drop rate in outdoor locations.

TRAI Audit Wireless Report-Bihar & Jharkhand Circle AMJ Quarter-2016
184
9.1.6.7 Drive Test Results - PATNA SSA-DATA- 2G
Note: TATA CDMA & GSM did not participate in data drive.
All the parameters met the TRAI benchmark.
9.1.6.8 Drive Test Results - PATNA SSA-DATA- 3G
All the parameters met the TRAI benchmark.

TRAI Audit Wireless Report-Bihar & Jharkhand Circle AMJ Quarter-2016
185
10 INDEPENDENT DRIVE TEST – VOICE - RANCHI
Month Name of SSA Covered Start date End Date Kilometer Travelled
June Ranchi 01/6/2016 03/6/2016 320
10.1.1.1 Route Details - RANCHI
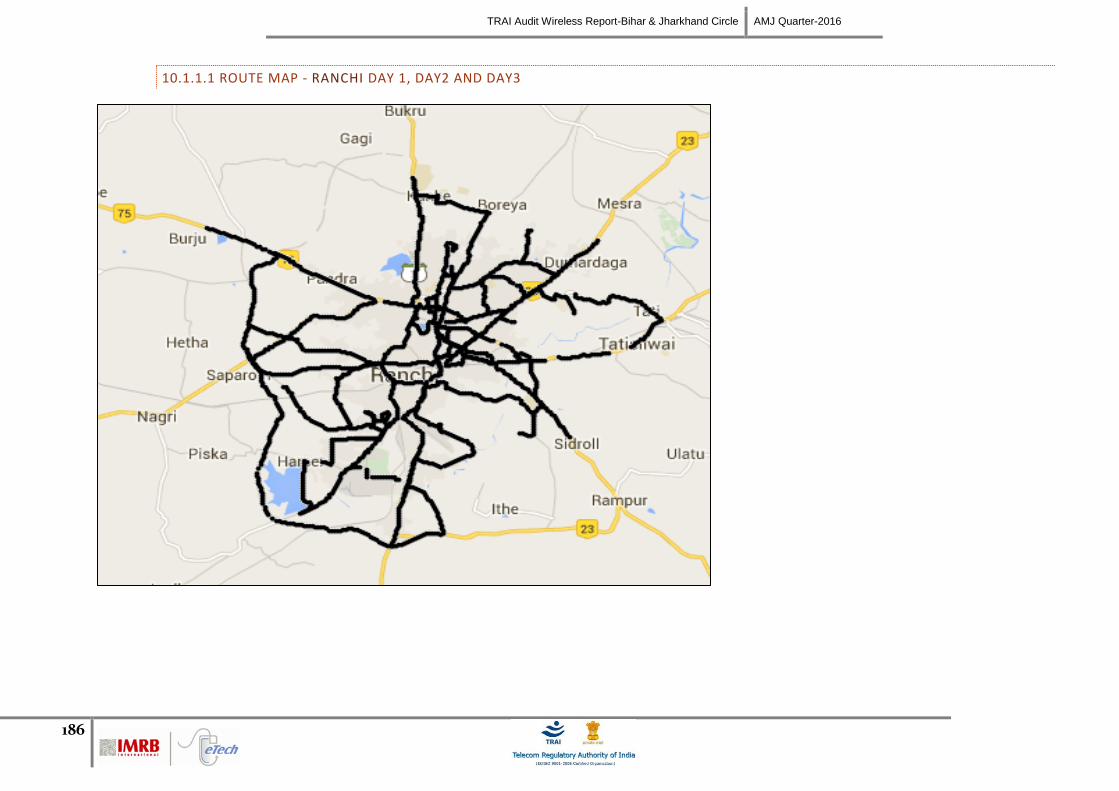
TRAI Audit Wireless Report-Bihar & Jharkhand Circle AMJ Quarter-2016
186
10.1.1.1 ROUTE MAP - RANCHI DAY 1, DAY2 AND DAY3

TRAI Audit Wireless Report-Bihar & Jharkhand Circle AMJ Quarter-2016
187
10.1.1.2 Drive Test Results - Ranchi
Call Events
Operators Summary
Aircel Airtel BSNL IDEA RCOM TATA Telenor Vodafone
2G 3G 2G 3G 2G 3G 2G 3G CDMA 2G CDMA 2G 2G
Call Attempt (June-16)
430 396 389 331 373 321 406 288 404 407 422 468 403
Blocked Call Rate (June-16)
10.47% 4.80% 6.17% 5.44% 6.43% 5.30% 2.71% 3.13% 0.50% 4.18% 2.37% 9.40% 1.49%
CSSR (Accessibility) (June-16)
89.53% 95.20% 93.83% 94.56% 93.57% 94.70% 97.29% 96.88% 99.50% 95.82% 97.63% 90.60% 98.51%
Dropped Call Rate (June-16)
4.16% 7.96% 5.21% 7.35% 14.04% 17.11% 2.78% 5.02% 16.42% 5.38% 13.59% 1.65% 3.27%
Mobility HOSR (June-16)
94.56% 99.59% 94.54% 99.90% 97.14% 99.70% 91.92% 100.00% 100.00% 95.77% 100.00% 91.98% 94.21%
Rx Quality (June-16)
92.13% 94.12% 89.26% 95.48% 83.40% 96.18% 92.13% 90.24% 82.64% 90.54% 84.89% 86.94% 92.33%
Call Set Success Rate (CSSR)
Most of the operators met the Call Setup Success Rate benchmark of >=95% except Aircel 2G, Airtel 2G & 3G, BSNL 2G & 3G and Telenor 2G.
Call Drop Rate
Most of the operators failed to meet the Call Drop Rate benchmark of <=2% except Telenor 2G
Voice Quality
Most of operators failed to meet the Rx Quality benchmark of >=95% except Airtel 3G and BSNL 3G

188
11 ANNEXURE – CONSOLIDATED-2G
11.1 NETWORK AVAILABILITY
Data Source: Operations and Maintenance Center (OMC) of the operators

TRAI Audit Wireless Report-Bihar & Jharkhand Circle AMJ Quarter-2016
189
11.2 CONNECTION ESTABLISHMENT (ACCESSIBILITY)
Data Source: Network Operations Center (NOC) of the operators and Data Source: Drive test reports submitted by operators to auditors

TRAI Audit Wireless Report-Bihar & Jharkhand Circle AMJ Quarter-2016
190
11.3 CONNECTION MAINTENANCE (RETAINABILITY)
Data Source: Network Operations Center (NOC) of the operators and Drive test reports submitted by operators to auditors

TRAI Audit Wireless Report-Bihar & Jharkhand Circle AMJ Quarter-2016
191
11.4 VOICE QUALITY
Data Source: Network Operations Center (NOC) of the operators and Drive test reports submitted by operators to auditors
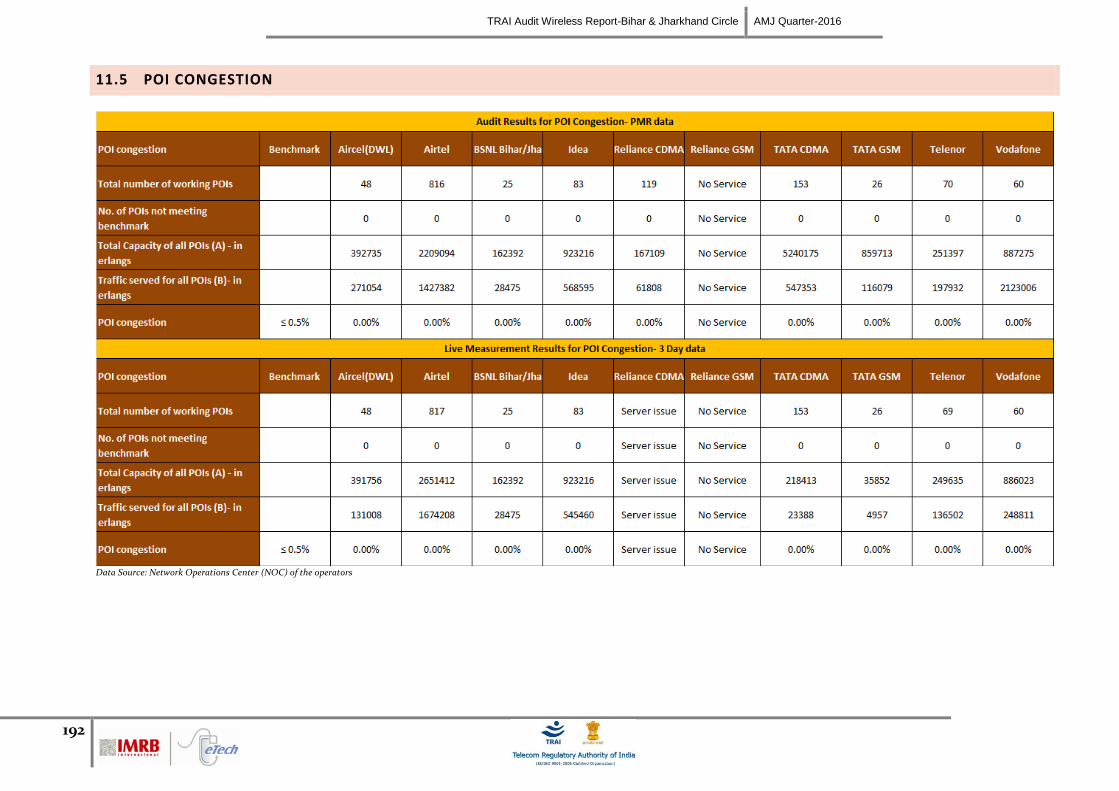
TRAI Audit Wireless Report-Bihar & Jharkhand Circle AMJ Quarter-2016
192
11.5 POI CONGESTION
Data Source: Network Operations Center (NOC) of the operators

TRAI Audit Wireless Report-Bihar & Jharkhand Circle AMJ Quarter-2016
193
11.6 ADDITIONAL NETWORK RELATED PARAMETERS
Data Source: Network Operations Center (NOC) of the operators

TRAI Audit Wireless Report-Bihar & Jharkhand Circle AMJ Quarter-2016
194
12 ANNEXURE – CONSOLIDATED-3G
12.1 NETWORK AVAILABILITY
Data Source: Operations and Maintenance Center (OMC) of the operators

TRAI Audit Wireless Report-Bihar & Jharkhand Circle AMJ Quarter-2016
195
12.2 CONNECTION ESTABLISHMENT (ACCESSIBILITY)
Data Source: Network Operations Center (NOC) of the operators and Data Source: Drive test reports submitted by operators to auditors

TRAI Audit Wireless Report-Bihar & Jharkhand Circle AMJ Quarter-2016
196
12.3 CONNECTION MAINTENANCE (RETAINABILITY)

TRAI Audit Wireless Report-Bihar & Jharkhand Circle AMJ Quarter-2016
197
Data Source: Network Operations Center (NOC) of the operators and Drive test reports submitted by operators to auditors

TRAI Audit Wireless Report-Bihar & Jharkhand Circle AMJ Quarter-2016
198
12.4 VOICE QUALITY

TRAI Audit Wireless Report-Bihar & Jharkhand Circle AMJ Quarter-2016
199
Data Source: Network Operations Center (NOC) of the operators and Drive test reports submitted by operators to auditors
12.5 POI CONGESTION
Data Source: Network Operations Center (NOC) of the operators

TRAI Audit Wireless Report-Bihar & Jharkhand Circle AMJ Quarter-2016
200
12.6 ADDITIONAL NETWORK RELATED PARAMETERS
Data Source: Network Operations Center (NOC) of the operators

TRAI Audit Wireless Report-Bihar & Jharkhand Circle AMJ Quarter-2016
201
13 ANNEXURE – CUSTOMER SERVICES
13.1 METERING AND BILLING CREDIBILITY
Data Source: Billing Center of the operators

TRAI Audit Wireless Report-Bihar & Jharkhand Circle AMJ Quarter-2016
202
Data Source: Billing Center of the operators
Data Source: Billing Center of the operators

TRAI Audit Wireless Report-Bihar & Jharkhand Circle AMJ Quarter-2016
203
Data Source: Billing Center of the operators

TRAI Audit Wireless Report-Bihar & Jharkhand Circle AMJ Quarter-2016
204
Data Source: Billing Center of the operators
Data Source: Live calling made to customers

TRAI Audit Wireless Report-Bihar & Jharkhand Circle AMJ Quarter-2016
205
13.2 CUSTOMER CARE

TRAI Audit Wireless Report-Bihar & Jharkhand Circle AMJ Quarter-2016
206
Data Source: Customer Service Center of the operators

TRAI Audit Wireless Report-Bihar & Jharkhand Circle AMJ Quarter-2016
207
13.3 TERMINATION / CLOSURE OF SERVICE
Data Source: Customer Service Center of the operators
13.4 TIME TAKEN FOR REFUND OF DEPOSITS AFTER CLOSURE
Data Source: Billing Center of the operators
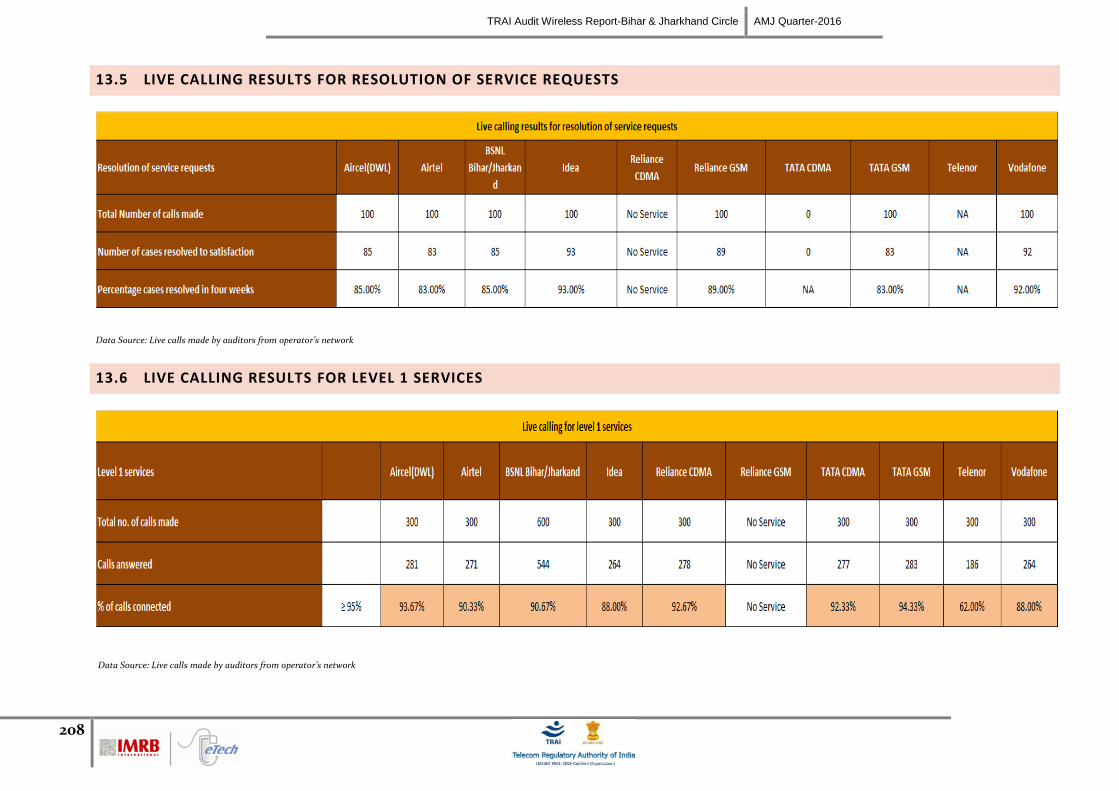
TRAI Audit Wireless Report-Bihar & Jharkhand Circle AMJ Quarter-2016
208
13.5 LIVE CALLING RESULTS FOR RESOLUTION OF SERVICE REQUESTS
Data Source: Live calls made by auditors from operator’s network
13.6 LIVE CALLING RESULTS FOR LEVEL 1 SERVICES
Data Source: Live calls made by auditors from operator’s network

TRAI Audit Wireless Report-Bihar & Jharkhand Circle AMJ Quarter-2016
209
13.7 LEVEL 1 SERVICE CALLS MADE
All the numbers given in mandatory list in Section 2.4.2.4.1 were tested. The following table provides the numbers that are activated for each operator. A tick () for
an operator signifies that the number was active for the operator.
Live calls were made to the active numbers to test the calls answered. The details of the same have been given below for each operator.
Aircel
Level 1 Number Type of Service Working Not
Working Calls
Made Calls
Connected
100 Police y 17 16
101 Fire y 17 16
102 Ambulance y 16 16
104 Health Information Helpline y 17 15
108 Emergency and Disaster Management Helpline
y 17 16
138 All India Helpline for Passengers N
149 Public Road Transport Utility Service N
181 Chief Minister Helpline N
182 Indian Railway Security Helpline y 17 15
1033 Road Accident Management Service y 17 16
1037 Public Grievance Cell DoT Hq as 'Telecom Consumer Grievance Redressal Helpline'
N
1056 Emergency Medical Services N
106X State of the Art Hospitals N
1063 Public Grievance Cell DoT Hq N
1064 Anti-Corruption Helpline N
1070 Relief Commission for Natural Calamities y 17 16
1071 Air Accident Helpline y 16 16
1072 Rail Accident Helpline N

TRAI Audit Wireless Report-Bihar & Jharkhand Circle AMJ Quarter-2016
210
1073 Road Accident Helpline N
1077 Control Room for District Collector y 17 16
1090 Call Alert ( Crime Branch) y 17 16
1091 Women Helpline N
1097 National AIDS Helpline to NACO y 16 15
1099 Central Accident and Trauma Services (CATS)
y 17 15
10580 Educational & Vocational Guidance and Counselling
N
10589 Mother and Child Tracking ( MCTH) N
10740 Central Pollution Control Board N
10741 Pollution Control Board N
1511 Police Related Service for all Metro Railway Project
N
1512 Prevention of Crime in Railway y 17 16
1514 National Career Service(NCS) N
15100 Free Legal Service Helpline y 17 15
155304 Municipal Corporations N
155214 Labour Helpline N
1903 Sashastra Seema Bal (SSB) y 16 16
1909 National Do Not Call Registry N
1912 Complaint of Electricity y 16 15
1916 Drinking Water Supply y 16 15
1950 Election Commission of India N
Airtel
Level 1 Number Type of Service Working Not
Working Calls
Made Calls
Connected
100 Police y 12 10
101 Fire y 12 10
102 Ambulance y 12 10
104 Health Information Helpline y 11 10

TRAI Audit Wireless Report-Bihar & Jharkhand Circle AMJ Quarter-2016
211
108 Emergency and Disaster Management Helpline
y 11 10
138 All India Helpline for Passengers y 11 10
149 Public Road Transport Utility Service y 12 10
181 Chief Minister Helpline y 12 10
182 Indian Railway Security Helpline y 12 10
1033 Road Accident Management Service y 12 10
1037 Public Grievance Cell DoT Hq as 'Telecom Consumer Grievance Redressal Helpline'
N
1056 Emergency Medical Services N
106X State of the Art Hospitals N
1063 Public Grievance Cell DoT Hq N
1064 Anti-Corruption Helpline y 11 10
1070 Relief Commission for Natural Calamities y 11 10
1071 Air Accident Helpline N
1072 Rail Accident Helpline y 12 10
1073 Road Accident Helpline y 12 10
1077 Control Room for District Collector y 12 10
1090 Call Alert ( Crime Branch) N
1091 Women Helpline N
1097 National AIDS Helpline to NACO y 11 10
1099 Central Accident and Trauma Services (CATS)
y 12 10
10580 Educational & Vocational Guidance and Counselling
N
10589 Mother and Child Tracking ( MCTH) N
10740 Central Pollution Control Board y 12 10
10741 Pollution Control Board N
1511 Police Related Service for all Metro Railway Project
N
1512 Prevention of Crime in Railway y 11 10

TRAI Audit Wireless Report-Bihar & Jharkhand Circle AMJ Quarter-2016
212
1514 National Career Service(NCS) N
15100 Free Legal Service Helpline y 11 10
155304 Municipal Corporations N
155214 Labour Helpline y 12 12
1903 Sashastra Seema Bal (SSB) y 12 12
1909 National Do Not Call Registry y 11 12
1912 Complaint of Electricity y 11 11
1916 Drinking Water Supply y 11 12
1950 Election Commission of India y 11 12
BSNL
Level 1 Number Type of Service Working Not
Working Calls
Made Calls
Connected
100 Police y 29 26
101 Fire y 29 26
102 Ambulance y 29 26
104 Health Information Helpline y 28 26
108 Emergency and Disaster Management Helpline
y 29 26
138 All India Helpline for Passengers y 29 26
149 Public Road Transport Utility Service N
181 Chief Minister Helpline N
182 Indian Railway Security Helpline y 29 26
1033 Road Accident Management Service y 29 26
1037 Public Grievance Cell DoT Hq as 'Telecom Consumer Grievance Redressal Helpline'
N
1056 Emergency Medical Services N
106X State of the Art Hospitals N
1063 Public Grievance Cell DoT Hq N
1064 Anti-Corruption Helpline N
1070 Relief Commission for Natural Calamities y 28 26
1071 Air Accident Helpline y 28 26

TRAI Audit Wireless Report-Bihar & Jharkhand Circle AMJ Quarter-2016
213
1072 Rail Accident Helpline y 29 26
1073 Road Accident Helpline N
1077 Control Room for District Collector N
1090 Call Alert ( Crime Branch) N
1091 Women Helpline y 29 25
1097 National AIDS Helpline to NACO y 29 26
1099 Central Accident and Trauma Services (CATS)
y 29 26
10580 Educational & Vocational Guidance and Counselling
N
10589 Mother and Child Tracking ( MCTH) N
10740 Central Pollution Control Board N
10741 Pollution Control Board N
1511 Police Related Service for all Metro Railway Project
N
1512 Prevention of Crime in Railway y 28 26
1514 National Career Service(NCS) N
15100 Free Legal Service Helpline y 28 26
155304 Municipal Corporations N
155214 Labour Helpline N
1903 Sashastra Seema Bal (SSB) y 29 26
1909 National Do Not Call Registry y 28 26
1912 Complaint of Electricity y 28 26
1916 Drinking Water Supply y 28 26
1950 Election Commission of India y 28 26
Idea
Level 1 Number Type of Service Working Not
Working Calls
Made Calls
Connected
100 Police y 17 15
101 Fire y 16 14
102 Ambulance y 16 15
104 Health Information Helpline N

TRAI Audit Wireless Report-Bihar & Jharkhand Circle AMJ Quarter-2016
214
108 Emergency and Disaster Management Helpline
y 17 15
138 All India Helpline for Passengers y 17 14
149 Public Road Transport Utility Service N
181 Chief Minister Helpline y 16 14
182 Indian Railway Security Helpline y 16 15
1033 Road Accident Management Service N
1037 Public Grievance Cell DoT Hq as 'Telecom Consumer Grievance Redressal Helpline'
N
1056 Emergency Medical Services N
106X State of the Art Hospitals N
1063 Public Grievance Cell DoT Hq N
1064 Anti-Corruption Helpline y 16 14
1070 Relief Commission for Natural Calamities N
1071 Air Accident Helpline N
1072 Rail Accident Helpline y 17 14
1073 Road Accident Helpline N
1077 Control Room for District Collector y 16 14
1090 Call Alert ( Crime Branch) N
1091 Women Helpline N
1097 National AIDS Helpline to NACO y 17 15
1099 Central Accident and Trauma Services (CATS)
y 17 15
10580 Educational & Vocational Guidance and Counselling
N
10589 Mother and Child Tracking ( MCTH) N
10740 Central Pollution Control Board N
10741 Pollution Control Board N
1511 Police Related Service for all Metro Railway Project
N
1512 Prevention of Crime in Railway y 17 15

TRAI Audit Wireless Report-Bihar & Jharkhand Circle AMJ Quarter-2016
215
1514 National Career Service(NCS) N
15100 Free Legal Service Helpline y 17 15
155304 Municipal Corporations N
155214 Labour Helpline N
1903 Sashastra Seema Bal (SSB) y 17 15
1909 National Do Not Call Registry y 17 15
1912 Complaint of Electricity y 17 15
1916 Drinking Water Supply N
1950 Election Commission of India y 17 15
Reliance CDMA
Level 1 Number Type of Service Working Not
Working Calls
Made Calls
Connected
100 Police y 18 17
101 Fire y 17 16
102 Ambulance y 18 17
104 Health Information Helpline y 17 17
108 Emergency and Disaster Management Helpline
N
138 All India Helpline for Passengers y 18 17
149 Public Road Transport Utility Service N
181 Chief Minister Helpline y 18 16
182 Indian Railway Security Helpline y 18 16
1033 Road Accident Management Service y 18 17
1037 Public Grievance Cell DoT Hq as 'Telecom Consumer Grievance Redressal Helpline'
N
1056 Emergency Medical Services N
106X State of the Art Hospitals N
1063 Public Grievance Cell DoT Hq N
1064 Anti-Corruption Helpline N
1070 Relief Commission for Natural Calamities y 17 17
1071 Air Accident Helpline y 17 16

TRAI Audit Wireless Report-Bihar & Jharkhand Circle AMJ Quarter-2016
216
1072 Rail Accident Helpline N
1073 Road Accident Helpline N
1077 Control Room for District Collector y 18 16
1090 Call Alert ( Crime Branch) N
1091 Women Helpline N
1097 National AIDS Helpline to NACO y 18 16
1099 Central Accident and Trauma Services (CATS)
y 18 16
10580 Educational & Vocational Guidance and Counselling
N
10589 Mother and Child Tracking ( MCTH) N
10740 Central Pollution Control Board N
10741 Pollution Control Board N
1511 Police Related Service for all Metro Railway Project
N
1512 Prevention of Crime in Railway N
1514 National Career Service(NCS) N
15100 Free Legal Service Helpline y 18 16
155304 Municipal Corporations N
155214 Labour Helpline N
1903 Sashastra Seema Bal (SSB) y 17 16
1909 National Do Not Call Registry y 18 16
1912 Complaint of Electricity N
1916 Drinking Water Supply N
1950 Election Commission of India y 17 16
TATA CDMA
Level 1 Number Type of Service Working Not
Working Calls
Made Calls
Connected
100 Police y 17 16
101 Fire y 17 15
102 Ambulance y 16 16
104 Health Information Helpline y 17 15

TRAI Audit Wireless Report-Bihar & Jharkhand Circle AMJ Quarter-2016
217
108 Emergency and Disaster Management Helpline
y 16 16
138 All India Helpline for Passengers N
149 Public Road Transport Utility Service N
181 Chief Minister Helpline y 17 16
182 Indian Railway Security Helpline y 17 16
1033 Road Accident Management Service N
1037 Public Grievance Cell DoT Hq as 'Telecom Consumer Grievance Redressal Helpline'
N
1056 Emergency Medical Services N
106X State of the Art Hospitals N
1063 Public Grievance Cell DoT Hq N
1064 Anti-Corruption Helpline N
1070 Relief Commission for Natural Calamities y 17 16
1071 Air Accident Helpline y 16 15
1072 Rail Accident Helpline y 17 16
1073 Road Accident Helpline y 17 15
1077 Control Room for District Collector y 16 15
1090 Call Alert ( Crime Branch) N
1091 Women Helpline N
1097 National AIDS Helpline to NACO y 17 15
1099 Central Accident and Trauma Services (CATS)
N
10580 Educational & Vocational Guidance and Counselling
N
10589 Mother and Child Tracking ( MCTH) N
10740 Central Pollution Control Board N
10741 Pollution Control Board N
1511 Police Related Service for all Metro Railway Project
N
1512 Prevention of Crime in Railway y 16 15
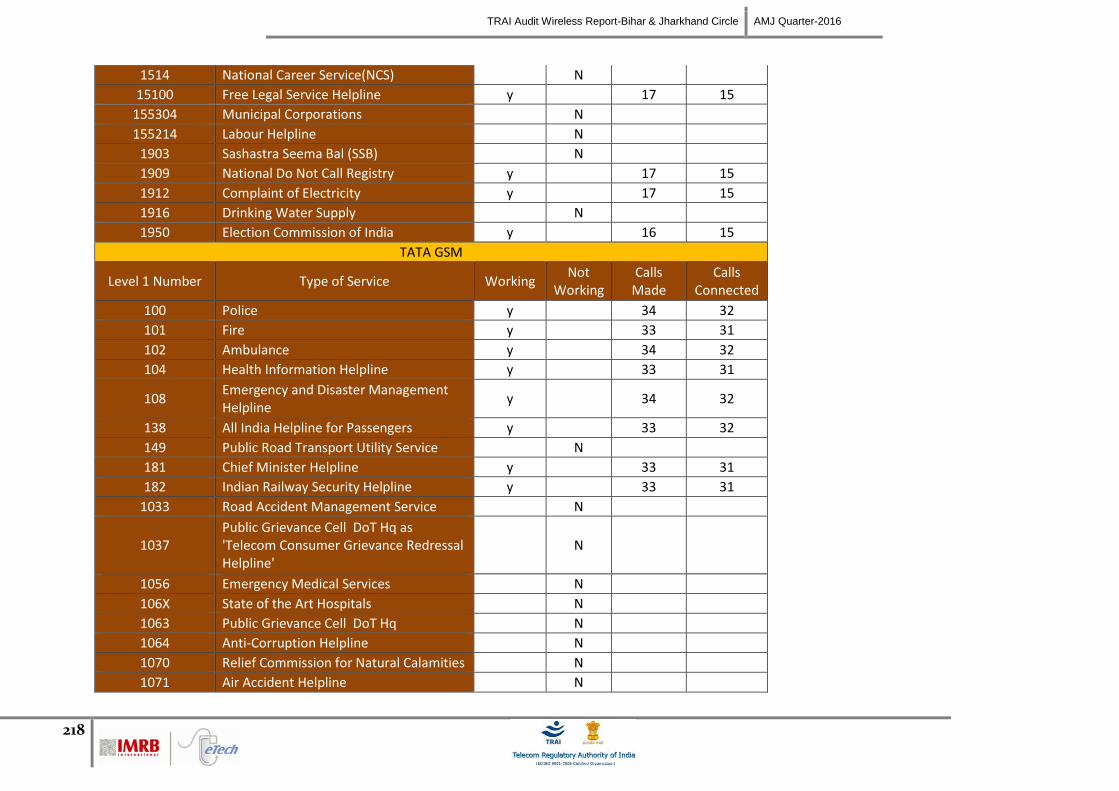
TRAI Audit Wireless Report-Bihar & Jharkhand Circle AMJ Quarter-2016
218
1514 National Career Service(NCS) N
15100 Free Legal Service Helpline y 17 15
155304 Municipal Corporations N
155214 Labour Helpline N
1903 Sashastra Seema Bal (SSB) N
1909 National Do Not Call Registry y 17 15
1912 Complaint of Electricity y 17 15
1916 Drinking Water Supply N
1950 Election Commission of India y 16 15
TATA GSM
Level 1 Number Type of Service Working Not
Working Calls
Made Calls
Connected
100 Police y 34 32
101 Fire y 33 31
102 Ambulance y 34 32
104 Health Information Helpline y 33 31
108 Emergency and Disaster Management Helpline
y 34 32
138 All India Helpline for Passengers y 33 32
149 Public Road Transport Utility Service N
181 Chief Minister Helpline y 33 31
182 Indian Railway Security Helpline y 33 31
1033 Road Accident Management Service N
1037 Public Grievance Cell DoT Hq as 'Telecom Consumer Grievance Redressal Helpline'
N
1056 Emergency Medical Services N
106X State of the Art Hospitals N
1063 Public Grievance Cell DoT Hq N
1064 Anti-Corruption Helpline N
1070 Relief Commission for Natural Calamities N
1071 Air Accident Helpline N

TRAI Audit Wireless Report-Bihar & Jharkhand Circle AMJ Quarter-2016
219
1072 Rail Accident Helpline N
1073 Road Accident Helpline N
1077 Control Room for District Collector N
1090 Call Alert ( Crime Branch) N
1091 Women Helpline N
1097 National AIDS Helpline to NACO N
1099 Central Accident and Trauma Services (CATS)
N
10580 Educational & Vocational Guidance and Counselling
N
10589 Mother and Child Tracking ( MCTH) N
10740 Central Pollution Control Board N
10741 Pollution Control Board N
1511 Police Related Service for all Metro Railway Project
N
1512 Prevention of Crime in Railway N
1514 National Career Service(NCS) N
15100 Free Legal Service Helpline N
155304 Municipal Corporations N
155214 Labour Helpline N
1903 Sashastra Seema Bal (SSB) N
1909 National Do Not Call Registry N
1912 Complaint of Electricity y 33 31
1916 Drinking Water Supply N
1950 Election Commission of India N
Telenor
Level 1 Number Type of Service Working Not
Working Calls
Made Calls
Connected
100 Police y 38 23
101 Fire y 38 24
102 Ambulance y 37 23
104 Health Information Helpline N

TRAI Audit Wireless Report-Bihar & Jharkhand Circle AMJ Quarter-2016
220
108 Emergency and Disaster Management Helpline
y 37 24
138 All India Helpline for Passengers y 37 23
149 Public Road Transport Utility Service N
181 Chief Minister Helpline N
182 Indian Railway Security Helpline N
1033 Road Accident Management Service N
1037 Public Grievance Cell DoT Hq as 'Telecom Consumer Grievance Redressal Helpline'
N
1056 Emergency Medical Services N
106X State of the Art Hospitals N
1063 Public Grievance Cell DoT Hq N
1064 Anti-Corruption Helpline N
1070 Relief Commission for Natural Calamities N
1071 Air Accident Helpline N
1072 Rail Accident Helpline N
1073 Road Accident Helpline N
1077 Control Room for District Collector N
1090 Call Alert ( Crime Branch) N
1091 Women Helpline N
1097 National AIDS Helpline to NACO y 37 23
1099 Central Accident and Trauma Services (CATS)
N
10580 Educational & Vocational Guidance and Counselling
N
10589 Mother and Child Tracking ( MCTH) N
10740 Central Pollution Control Board N
10741 Pollution Control Board N
1511 Police Related Service for all Metro Railway Project
N
1512 Prevention of Crime in Railway y 38 23

TRAI Audit Wireless Report-Bihar & Jharkhand Circle AMJ Quarter-2016
221
1514 National Career Service(NCS) N
15100 Free Legal Service Helpline N
155304 Municipal Corporations N
155214 Labour Helpline N
1903 Sashastra Seema Bal (SSB) N
1909 National Do Not Call Registry y 37 23
1912 Complaint of Electricity N
1916 Drinking Water Supply N
1950 Election Commission of India N
Vodafone
Level 1 Number Type of Service Working Not
Working Calls
Made Calls
Connected
100 Police y 15 14
101 Fire y 15 13
102 Ambulance y 15 14
104 Health Information Helpline y 15 13
108 Emergency and Disaster Management Helpline
y 15 14
138 All India Helpline for Passengers y 15 14
149 Public Road Transport Utility Service
181 Chief Minister Helpline y 15 13
182 Indian Railway Security Helpline y 15 13
1033 Road Accident Management Service y 15 13
1037 Public Grievance Cell DoT Hq as 'Telecom Consumer Grievance Redressal Helpline'
N
1056 Emergency Medical Services N
106X State of the Art Hospitals N
1063 Public Grievance Cell DoT Hq N
1064 Anti-Corruption Helpline N
1070 Relief Commission for Natural Calamities y 15 13
1071 Air Accident Helpline y 15 13

TRAI Audit Wireless Report-Bihar & Jharkhand Circle AMJ Quarter-2016
222
1072 Rail Accident Helpline N
1073 Road Accident Helpline N
1077 Control Room for District Collector y 15 13
1090 Call Alert ( Crime Branch) N
1091 Women Helpline N
1097 National AIDS Helpline to NACO y 15 13
1099 Central Accident and Trauma Services (CATS)
y 15 13
10580 Educational & Vocational Guidance and Counselling
N
10589 Mother and Child Tracking ( MCTH) N
10740 Central Pollution Control Board N
10741 Pollution Control Board N
1511 Police Related Service for all Metro Railway Project
N
1512 Prevention of Crime in Railway N
1514 National Career Service(NCS) N
15100 Free Legal Service Helpline y 15 13
155304 Municipal Corporations N
155214 Labour Helpline y 15 13
1903 Sashastra Seema Bal (SSB) y 15 13
1909 National Do Not Call Registry y 15 13
1912 Complaint of Electricity y 15 13
1916 Drinking Water Supply N
1950 Election Commission of India y 15 13
Data Source: Live calls made by auditors from operator’s network

TRAI Audit Wireless Report-Bihar & Jharkhand Circle AMJ Quarter-2016
223
14 COUNTER DETAILS
Sl No. KPI Formula with Counter Description
1 CSSR= (No of established Calls / No of Attempted
Calls)%
No of established Calls = ([Assignment Requests]-([Failed Assignments (Signaling Channel)]+[Failed Assignments during MOC on the A Interface (Including Directed Retry)]+[Failed Assignments during MTC on the A Interface (Including Directed Retry)]+[Failed Assignments during Emergency Call on the A Interface (Including Directed Retry)] +[Failed Assignments during Call Re-establishment on the A Interface (Including Directed Retry)]+[Failed Mode
Modify Attempts (MOC) (TCHF)]+[Failed Mode Modify Attempts (MTC) (TCHF)]+[Failed Mode Modify Attempts (Emergency Call) (TCHF)]+[Failed Mode Modify Attempts (Call Re-establishment) (TCHF)]+[Failed Mode Modify Attempts (MOC) (TCHH)]+[Failed Mode Modify Attempts (MTC) (TCHH)]+[Failed
Mode Modify Attempts (Call Re-establishment) (TCHH)]))/No of Attempted Calls = ([Assignment Requests (Signaling Channel) (TCH)] + [Assignment Requests (Signaling Channel) (SDCCH)] + [Assignment Requests (TCHF Only)] + [Assignment Requests (TCHH Only)] + [Assignment Requests (TCHF
Preferred, Channel Type Unchangeable)] + [Assignment Requests (TCHH Preferred, Channel Type Unchangeable)] + [Assignment Requests (TCHF or TCHH, Channel Type Unchangeable)] + [Assignment Requests (TCHF Preferred, Channel Type Changeable)] + [Assignment Requests (TCHH Preferred, Channel
Type Changeable)] + [Assignment Requests (TCHF or TCHH, Channel Type Changeable)])
2 SDCCH congestion=
(SDCCH Failure/SDCCH attempts)%
SDCCH Failure= ([Channel Assignment Failures (All Channels Busy or Channels Unconfigured) in Immediate Assignment Procedure (SDCCH)] + [Failed Internal Intra-Cell Handovers (No Channel Available) (SDCCH)] + [Number of Unsuccessful Incoming Internal Inter-Cell Handovers (No Channel Available)
(SDCCH)] + [Failed Incoming External Inter-Cell Handovers (No Channel Available) (SDCCH)])/SDCCH attempts = ([Channel Assignment Requests in Immediate Assignment Procedure (SDCCH)] + [Internal Intra-Cell Handover Requests (SDCCH)] + [Number of Incoming Internal Inter-Cell Handover Requests (SDCCH) (900/850/810-900/850/810)] + [Number of Incoming Internal Inter-Cell Handover Requests (SDCCH) (1800/1900-1800/1900)] +
[Number of Incoming Internal Inter-Cell Handover Requests (SDCCH) (900/850/810-1800/1900)] + [Number of Incoming Internal Inter-Cell Handover Requests (SDCCH) (1800/1900-900/850/810)] + [Incoming External Inter-Cell Handover Requests (SDCCH) (900/850/810-900/850/810)] + [Incoming External Inter-Cell Handover Requests (SDCCH) (1800/1900-1800/1900)] + [Incoming External Inter-Cell Handover Requests (SDCCH) (900/850/810-
1800/1900)] + [Incoming External Inter-Cell Handover Requests (SDCCH) (1800/1900-900/850/810)])
3 TCH congestion= (TCH
Failures /TCH Attempts)%
TCH Failures= ((Failed TCH Seizures due to Busy TCH (Signaling Channel)+([Failed Assignments (First Assignment, No Channel Available in Assignment Procedure)]+[Failed Assignments (First Assignment, No Channel Available in Directed Retry Procedure)]+[Failed Assignments (Reconnection to Old
Channels, No Channel Available in Assignment)]+[Failed Assignments (Reconnection to Old Channels, No Channel Available in Directed Retry)])/TCH Attempts = ([Assignment Requests (Signaling Channel) (TCH)] + [Assignment Requests (Signaling Channel) (SDCCH)] + [Assignment Requests (TCHF Only)] + [Assignment Requests (TCHH Only)] + [Assignment Requests (TCHF Preferred, Channel Type Unchangeable)] + [Assignment Requests (TCHH Preferred, Channel Type Unchangeable)] + [Assignment Requests (TCHF or TCHH, Channel Type Unchangeable)] + [Assignment Requests (TCHF Preferred, Channel
Type Changeable)] + [Assignment Requests (TCHH Preferred, Channel Type Changeable)] + [Assignment Requests (TCHF or TCHH, Channel Type

TRAI Audit Wireless Report-Bihar & Jharkhand Circle AMJ Quarter-2016
224
4
Call Drop Rate= (The total no of dropped
calls*100)/Total no of calls successfully
established (where traffic channel is allotted)
The total no of dropped calls= ([Call Drops on Radio Interface in Stable State (Traffic Channel)] + [Call Drops on Radio Interface in Handover State (Traffic Channel)] + [Call Drops Due to No MR from MS for a Long Time (Traffic Channel)] + [Call Drops due to Abis Terrestrial Link Failure (Traffic Channel)] + [Call
Drops due to Equipment Failure (Traffic Channel)] + [Call Drops due to Forced Handover (Traffic Channel)] + [Call Drops due to local switching Start Failure] + [Call Drops due to Failures to Return to Normal Call from local switching])/Total no of calls successfully established (where traffic channel is allotted) = ([Assignment Requests]-([Failed Assignments (Signaling Channel)]+[Failed Assignments during MOC on the A Interface (Including Directed Retry)]+[Failed Assignments during MTC on the A Interface (Including Directed Retry)]+[Failed Assignments during Emergency Call on the A Interface
(Including Directed Retry)] +[Failed Assignments during Call Re-establishment on the A Interface (Including Directed Retry)]+[Failed Mode Modify Attempts (MOC) (TCHF)]+[Failed Mode Modify Attempts (MTC) (TCHF)]+[Failed Mode Modify Attempts (Emergency Call) (TCHF)]+[Failed Mode Modify Attempts (Call Re-establishment) (TCHF)]+[Failed Mode Modify Attempts (MOC) (TCHH)]+[Failed Mode Modify Attempts (MTC) (TCHH)]+[Failed Mode
Modify Attempts (Call Re-establishment) (TCHH)])
5
Call Drop Rate= (No of cells having call drop rate
>3% during CBBH in a month*100)/Total no of
cells in the licensed service area
Above formula with counters being used in CBBH.
6
Connection with good quality voice= (Connection
with good quality voice/Total voice
samples)%
Connection with good quality voice = ((Number of MRs on Downlink TCHF (Receive Quality Rank 0)+Number of MRs on Downlink TCHF (Receive Quality Rank 1)+Number of MRs on Downlink TCHF (Receive Quality Rank 2)+Number of MRs on Downlink TCHF (Receive Quality Rank 3)+Number of MRs on
Downlink TCHF (Receive Quality Rank 4)+Number of MRs on Downlink TCHF (Receive Quality Rank 5)+Number of MRs on Downlink TCHH (Receive Quality Rank 0)+Number of MRs on Downlink TCHH (Receive Quality Rank 1)+Number of MRs on Downlink TCHH (Receive Quality Rank 2)+Number of
MRs on Downlink TCHH (Receive Quality Rank 3)+Number of MRs on Downlink TCHH (Receive Quality Rank 4)+Number of MRs on Downlink TCHH (Receive Quality Rank 5)) /Total voice samples= ((Number of MRs on Downlink TCHF (Receive Quality Rank 0)+Number of MRs on Downlink TCHF (Receive Quality Rank 1)+Number of MRs on Downlink TCHF (Receive Quality Rank 2)+Number of MRs on Downlink TCHF (Receive Quality Rank 3)+Number of MRs on Downlink TCHF (Receive Quality Rank 4)+Number of MRs on Downlink TCHF (Receive Quality Rank 5)+Number of MRs on
Downlink TCHF (Receive Quality Rank 6)+Number of MRs on Downlink TCHF (Receive Quality Rank 7)+Number of MRs on Downlink TCHH (Receive Quality Rank 0)+:Number of MRs on Downlink TCHH (Receive Quality Rank 1)+Number of MRs on Downlink TCHH (Receive Quality Rank 2)+Number of
MRs on Downlink TCHH (Receive Quality Rank 3)+Number of MRs on Downlink TCHH (Receive Quality Rank 4)+Number of MRs on Downlink TCHH (Receive Quality Rank 5)+Number of MRs on Downlink TCHH (Receive Quality Rank 6)+Number of MRs on Downlink TCHH (Receive Quality Rank 7))

TRAI Audit Wireless Report-Bihar & Jharkhand Circle AMJ Quarter-2016
225
14.1.1 ERICSSON
Ericsson provides network support to Aircel, Airtel, Idea, BSNL and Reliance GSM in the circle.
Sl No. KPI Ericsson
1 CSSR= (No of established Calls / No of Attempted Calls)%
CSSR (No of established Calls / No of Attempted Calls)=(TCASSALL/TASSALL)*100
2 SDCCH congestion= (SDCCH Failure/SDCCH attempts)%
SDCCH congestion (SDCCH Failure/SDCCH attempts)% = (CCONGS/CCALLS)*100
3 TCH congestion= (TCH Failures /TCH Attempts)%
TCH congestion (TCH Failures /TCH Attempts)%= (CNRELCONG+TNRELCONG)/TASSALL)*100
4
Call Drop Rate= (The total no of dropped calls*100)/Total no of calls successfully established (where traffic channel is allotted)
Call Drop Rate (Total no dropped calls/No of established calls)%= (TNDROP)/TCASSALL*100
5
Call Drop Rate= (No of cells having call drop rate >3% during CBBH in a month*100)/Total no of cells in the licensed service area
Above formula with counters being used in CBBH.
6
Connection with good quality voice= (Connection with good quality voice/Total voice samples)%
Connection with good quality voice (Connection with good quality voice samples 0-5 /Total voice samples)= 100 * (QUAL50DL + QUAL40DL + QUAL30DL + QUAL20DL + QUAL10DL + QUAL00DL) / (QUAL70DL + QUAL60DL + QUAL50DL + QUAL40DL + QUAL30DL + QUAL20DL + QUAL10DL + QUAL00DL)
Ericsson Counters
Counter Counter Description
TCASSALL Number of assignment complete messages on TCH for all MS classes
TASSALL Number of first assignment attempts on TCH for all MS classes.
CNRELCONG Number of released connections on SDCCH due to TCH or Transcoder (TRA) congestion.
TNRELCONG Number of released TCH signalling connections due to transcoder resource congestion during immediate assignment on TCH
CCONGS Congestion counter for SDCCH. Stepped per congested allocation attempt.
CCALLS Channel allocation attempt counter on SDCCH.

TRAI Audit Wireless Report-Bihar & Jharkhand Circle AMJ Quarter-2016
226
TNDROP The total number of dropped TCH Connections.
QUAL00DL Number of quality 0 reported on downlink.
QUAL10DL Number of quality 1 reported on downlink.
QUAL20DL Number of quality 2 reported on downlink.
QUAL30DL Number of quality 3 reported on downlink.
QUAL40DL Number of quality 4 reported on downlink.
QUAL50DL Number of quality 5 reported on downlink.
QUAL60DL Number of quality 6 reported on downlink.
QUAL70DL Number of quality 7 reported on downlink.

TRAI Audit Wireless Report-Bihar & Jharkhand Circle AMJ Quarter-2016
227
14.1.2 NSN (NOKIA SIEMENS NETWORKS)
NSN provides network support to Vodafone in the circle.
Sl No.
KPI NSN
1 CSSR= (No of established Calls / No of
Attempted Calls)%
CSSR= 100-100*((SDCCH_BUSY_ATT)-(TCH_SEIZ_DUE_SDCCH_CON) + (SDCCH_RADIO_FAIL)+(SDCCH_RF_OLD_HO)+(SDCCH_USER_ACT)+(SDCCH_BCSU_RESET)+(SDCCH_NETW_ACT)+(SDCCH_BTS_FAIL)+(SDCCH_LAPD_FAIL)+ (BLCK_8I_NOM)/ {(CH_REQ_MSG_REC)+(PACKET_CH_REQ)}-
{(GHOST_CCCH_RES)-(REJ_SEIZ_ATT_DUE_DIST)}
2 SDCCH congestion= (SDCCH Failure/SDCCH attempts)%
SDCCH congestion = (sdcch_busy_att - .tch_seiz_due_sdcch_con)/{(CH_REQ_MSG_REC)+(PACKET_CH_REQ)}-{(GHOST_CCCH_RES)-(REJ_SEIZ_ATT_DUE_DIST)}
3 TCH congestion= (TCH Failures /TCH
Attempts)% TCH congestion = BLCK_8I_NOM / {(TCH_NORM_SEIZ)+(MSC_I_SDCCH_TCH_AT)+(BSC_I_SDCCH_TCH_AT)}
4
Call Drop Rate= (The total no of dropped calls*100)/Total no of calls successfully
established (where traffic channel is allotted)
TCH Drop = ( drop_after_tch_assign)-(tch_re_est_release) / {(TCH_NORM_SEIZ)+(MSC_I_SDCCH_TCH_AT)+(BSC_I_SDCCH_TCH_AT)}
5
Call Drop Rate= (No of cells having call drop rate >3% during CBBH in a
month*100)/Total no of cells in the licensed service area
Above formula with counters being used in CBBH.
6 Connection with good quality voice=
(Connection with good quality voice/Total voice samples)%
Connection with good quality voice= (FREQ_DL_QUAL0+FREQ_DL_QUAL1+FREQ_DL_QUAL2+FREQ_DL_QUAL3+FREQ_DL_QUAL4+FREQ_DL_QUAL
5) / (FREQ_DL_QUAL0+FREQ_DL_QUAL1+FREQ_DL_QUAL2+FREQ_DL_QUAL3+FREQ_DL_QUAL4+FREQ_DL_QUAL
5+FREQ_DL_QUAL6+FREQ_DL_QUAL7)

228
14.2 BLOCK SCHEMATIC DIAGRAMS
14.2.1 ERICSSON
Ericsson provides network support to Aircel, Airtel, Idea, BSNL and Reliance GSM in the circle.
Ericsson
Mobile
BTS
BSS
MSC/GMSC
HLR
AUC
SIR
OGW
Server
Data to Auditor
OSS/OMCR
Base Transition
System
Base Station Sub
System
7 Days Storage
BTS BTS
FTP Server

TRAI Audit Wireless Report-Bihar & Jharkhand Circle AMJ Quarter-2016
229
14.2.2 NSN (NOKIA SIEMENS NETWORKS)
NSN provides network support to Vodafone in the circle.
NSN
Mobile
BTS
BSS
MSC/GMSC
HLR
AUC
SIR
OGW
Storage/PM
Application
Data to Auditor
OSS: Operating
Sub System
FTP Server (Used only to
maintain processed reports
for internal purpose)
Base Transition
System
Base Station Sub
System
Performance
Management

230
15 ANNEXURE – APRIL -2G

TRAI Audit Wireless Report-Bihar & Jharkhand Circle AMJ Quarter-2016
231

TRAI Audit Wireless Report-Bihar & Jharkhand Circle AMJ Quarter-2016
232

TRAI Audit Wireless Report-Bihar & Jharkhand Circle AMJ Quarter-2016
233

TRAI Audit Wireless Report-Bihar & Jharkhand Circle AMJ Quarter-2016
234
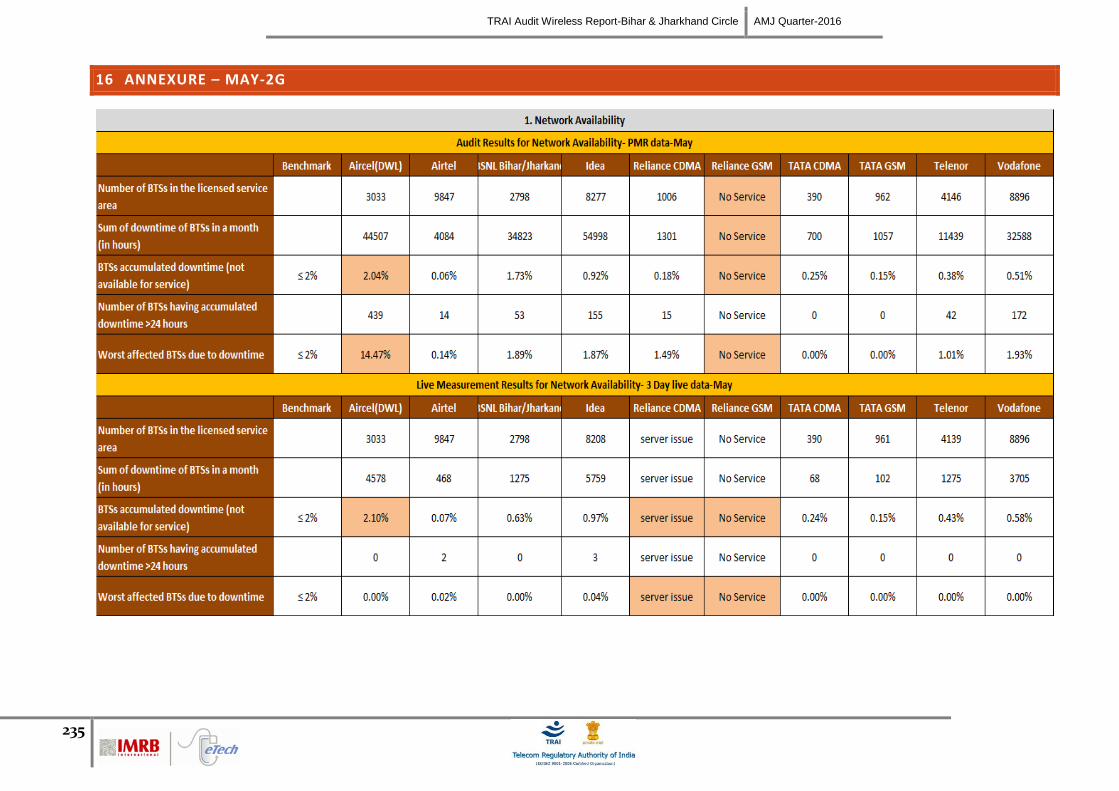
TRAI Audit Wireless Report-Bihar & Jharkhand Circle AMJ Quarter-2016
235
16 ANNEXURE – MAY-2G

TRAI Audit Wireless Report-Bihar & Jharkhand Circle AMJ Quarter-2016
236

TRAI Audit Wireless Report-Bihar & Jharkhand Circle AMJ Quarter-2016
237

TRAI Audit Wireless Report-Bihar & Jharkhand Circle AMJ Quarter-2016
238

TRAI Audit Wireless Report-Bihar & Jharkhand Circle AMJ Quarter-2016
239

TRAI Audit Wireless Report-Bihar & Jharkhand Circle AMJ Quarter-2016
240
17 ANNEXURE – JUNE-2G

TRAI Audit Wireless Report-Bihar & Jharkhand Circle AMJ Quarter-2016
241

TRAI Audit Wireless Report-Bihar & Jharkhand Circle AMJ Quarter-2016
242

TRAI Audit Wireless Report-Bihar & Jharkhand Circle AMJ Quarter-2016
243

TRAI Audit Wireless Report-Bihar & Jharkhand Circle AMJ Quarter-2016
244

TRAI Audit Wireless Report-Bihar & Jharkhand Circle AMJ Quarter-2016
245

TRAI Audit Wireless Report-Bihar & Jharkhand Circle AMJ Quarter-2016
246
18 ANNEXURE – APRIL -3G

TRAI Audit Wireless Report-Bihar & Jharkhand Circle AMJ Quarter-2016
247

TRAI Audit Wireless Report-Bihar & Jharkhand Circle AMJ Quarter-2016
248

TRAI Audit Wireless Report-Bihar & Jharkhand Circle AMJ Quarter-2016
249

TRAI Audit Wireless Report-Bihar & Jharkhand Circle AMJ Quarter-2016
250

TRAI Audit Wireless Report-Bihar & Jharkhand Circle AMJ Quarter-2016
251

TRAI Audit Wireless Report-Bihar & Jharkhand Circle AMJ Quarter-2016
252
19 ANNEXURE – MAY-3G

TRAI Audit Wireless Report-Bihar & Jharkhand Circle AMJ Quarter-2016
253

TRAI Audit Wireless Report-Bihar & Jharkhand Circle AMJ Quarter-2016
254
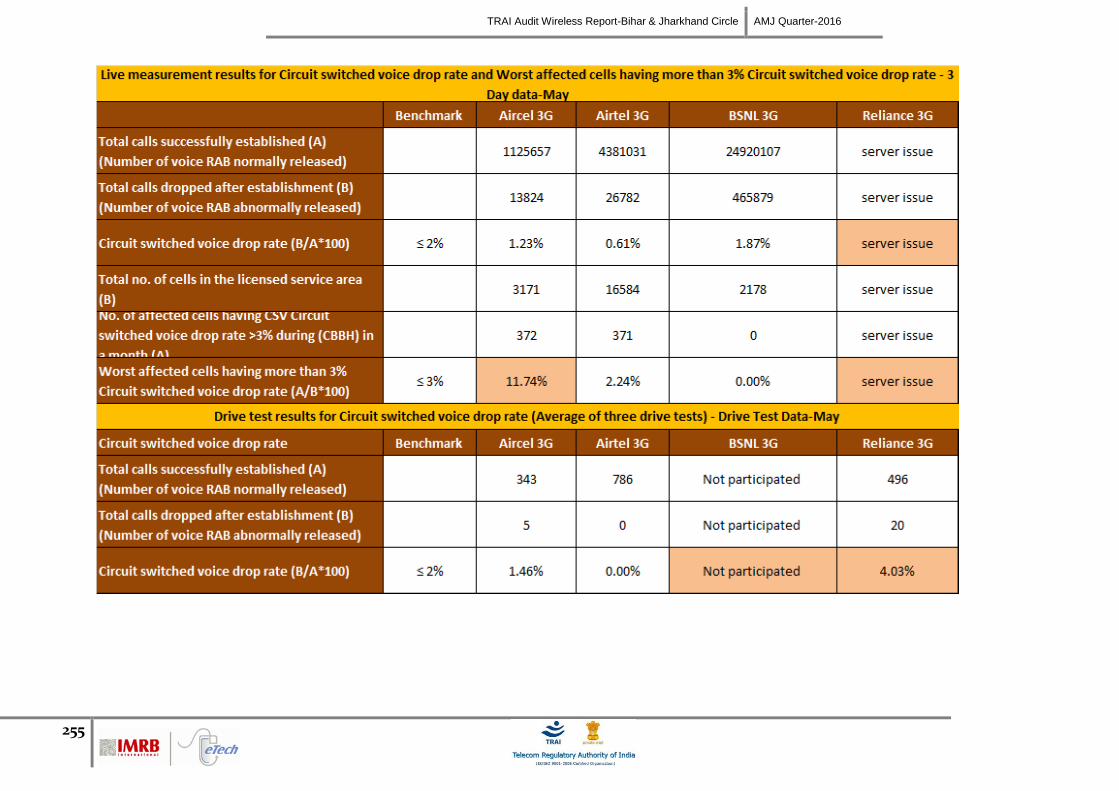
TRAI Audit Wireless Report-Bihar & Jharkhand Circle AMJ Quarter-2016
255

TRAI Audit Wireless Report-Bihar & Jharkhand Circle AMJ Quarter-2016
256

TRAI Audit Wireless Report-Bihar & Jharkhand Circle AMJ Quarter-2016
257

TRAI Audit Wireless Report-Bihar & Jharkhand Circle AMJ Quarter-2016
258
20 ANNEXURE – JUNE-3G

TRAI Audit Wireless Report-Bihar & Jharkhand Circle AMJ Quarter-2016
259

TRAI Audit Wireless Report-Bihar & Jharkhand Circle AMJ Quarter-2016
260

TRAI Audit Wireless Report-Bihar & Jharkhand Circle AMJ Quarter-2016
261

TRAI Audit Wireless Report-Bihar & Jharkhand Circle AMJ Quarter-2016
262

TRAI Audit Wireless Report-Bihar & Jharkhand Circle AMJ Quarter-2016
263

264
21 ABBREVIATIONS
Following terms/abbreviations have been used in this report. This section provides meaning of the
abbreviations used in the report.
1. TRAI – Telecom Regulatory Authority of India
2. QoS – Quality of Service
3. AMJ’16 – Refers to the quarter of April , May and June 2016
4. IMRB – Refers to IMRB International, the audit agency for this report
5. SSA – Secondary Switching Area
6. NOC – Network Operation Center
7. OMC – Operations and Maintenance Center
8. MSC – Mobile Switching Center
9. PMR – Performance Monitoring Reports
10. TCBH – Time Consistent Busy Hour
11. CBBH - Cell Bouncing Busy Hour
12. BTS – Base Transceiver Station
13. CSSR – Call Setup Success Rate
14. TCH – Traffic Channel
15. SDCCH – Standalone Dedicated Control Channel
16. CDR – Call Drop Rate
17. FER – Frame Error Rate
18. SIM – Subscriber Identity Module
19. GSM – Global System for Mobile
20. CDMA – Code Division Multiple Access
21. NA – Not Applicable
22. NC – Non Compliance
23. POI – Point of Interconnection
24. IVR – Interactive Voice Response
25. STD – Standard Trunk Dialing
26. ISD – International Subscriber Dialing

265
SCO 47, 5th
Floor, Old Judicial Complex, Sector 15
Part 1, Gurgaon, Haryana – 122001
+91 (124) 4217300
www.imrbint.com

TRAI Audit Broadband Report-Bihar-Jharkhand JFM Quarter-2015
1
EAST
ZONE
TRAI AUDIT BROADBAND REPORT –
BIHAR/JHARKHAND - AUDIT OF AMJ
QUARTER, 2016

TRAI Audit Broadband Report- BIHAR/JHARKHAND AMJ Quarter-2016
2
TABLE OF CONTENTS
1. Introduction .................................................................................................................................................. 5
1.1 About TRAI .......................................................................................................................................... 5
1.2 Objectives ............................................................................................................................................ 5
1.3 Coverage ............................................................................................................................................... 6
1.4 Audit Process and operator selection ............................................................................................... 6
1.5 Framework Used ................................................................................................................................. 7
1.5.1 PMR Reports - Significance and Methodology ............................................................................ 8
1.5.2 Live Calling - Significance and Methodology ............................................................................. 10
1.6 Sampling Methodology ..................................................................................................................... 12
1.6.1 Sampling Plan - BSNL ................................................................................................................... 12
1.7 Colour Code to read the report ........................................................................................................ 13
1.8 Audit Methodology ............................................................................................................................ 14
2. Executive Summary ..................................................................................................................................... 15
2.1 PMR Quarterly Data – JFM’2016 ....................................................................................................... 15
2.1.1 Service Provisioning/ Activation Time ........................................................................................ 15
2.1.2 Fault Repair/ Restoration .............................................................................................................. 16
2.1.3 Billing Performance ....................................................................................................................... 16
2.1.4 Response time to customer for assistance .................................................................................. 16
2.1.5 Bandwidth Utilization and Throughput...................................................................................... 16
2.1.6 Network Latency ............................................................................................................................ 16
2.2 Live Measurement .............................................................................................................................. 17
2.2.1 Bandwidth Utilization and Throughput...................................................................................... 17
2.2.2 Network Latency ............................................................................................................................ 17
2.3 Live Calling ......................................................................................................................................... 18
2.3.1 Service Provisioning/ Activation Times ...................................................................................... 18
2.3.2 Fault Repair/ Restoration .............................................................................................................. 18
2.3.3 Billing Performance ....................................................................................................................... 18
2.3.4 Response time to customer for assistance .................................................................................. 18

TRAI Audit Broadband Report- BIHAR/JHARKHAND AMJ Quarter-2016
3
3. CRITICAL FINDINGS .................................................................................................................................. 19
4. Detailed Findings - Comparison between PMR Data and Live Measurement/ Calling Data ............. 20
4.1 Service Provisioning/ Activation Time ........................................................................................... 20
4.1.1 Parameter Explanation ................................................................................................................. 20
4.1.2 Detailed Findings - Service Provisoning...................................................................................... 21
4.2 Fault Repair/ Restoration Time ........................................................................................................ 21
4.2.1 Parameter Explanation .................................................................................................................. 21
4.2.2 Detailed Findings - Fault Repair within Next Working Day .................................................... 22
4.2.3 Detailed Findings - Fault Repair within 3 Working Days ......................................................... 23
4.3 Metering and Billing Credibility ...................................................................................................... 23
4.3.1 Parameter Explanation – billing complaints .............................................................................. 23
4.4 Time Taken to Refund after Closure ............................................................................................... 27
4.4.1 Parameter Explanation ................................................................................................................. 27
4.4.2 Detailed Findings - Refund of Deposits ..................................................................................... 27
4.5 Response Time to Customer for Assistance ................................................................................... 28
4.5.1 Parameter Explanation ................................................................................................................. 28
4.5.2 Detailed Findings - Call Answered within 60 Seconds ............................................................. 28
4.5.3 Detailed Findings - Call Answered within 90 Seconds ............................................................. 29
4.6 Bandwidth Utilization & Download Speed .................................................................................... 29
4.6.1 Parameter Explanation – Bandwidth Utilization ...................................................................... 29
4.6.2 Detailed findings – Bandwidth Utilization ................................................................................ 30
4.6.3 Parameter Explanation - Broadband Download Speed ............................................................. 31
4.6.4 Detailed findings – Broadband Download Speed ...................................................................... 32
4.7 Service Availability/Uptime ............................................................................................................. 32
4.7.2 Detailed Findings - Service Availability...................................................................................... 33
4.8 Network Latency & Packet Loss ...................................................................................................... 33
4.8.1 Parameter Explanation - Network Latency ................................................................................ 33
4.8.2 Parameter Explanation – Packet Loss ......................................................................................... 34
4.8.3 Detailed Findings - Network Latency / Packet Loss ................................................................. 35
5. Annexure – JFM’2016 .................................................................................................................................. 36

TRAI Audit Broadband Report- BIHAR/JHARKHAND AMJ Quarter-2016
4
5.1 Service Provisioning .......................................................................................................................... 36
5.2 Fault Repair/ Restoration ................................................................................................................. 36
5.3 Billing Performance – Metering and billing credibility ................................................................. 37
5.4 Response Time to the Customer for Assistance............................................................................. 38
5.5 Bandwidth Utilization ...................................................................................................................... 39
5.6 Broadband Download Speed ............................................................................................................ 40
5.7 Service Availability/ Uptime ............................................................................................................ 40
5.8 Network Latency / Packet Loss ........................................................................................................ 41
5.9 Total Capacity and Subscribers ........................................................................................................ 41

TRAI Audit Broadband Report- BIHAR/JHARKHAND AMJ Quarter-2016
5
1. INTRODUCTION
1.1 About TRAI
TRAI's mission is to create and nurture conditions for growth of telecommunications in the country in a
manner and at a pace that will enable India to play a leading role in the emerging global information
society. One of the main objectives of TRAI is to provide a fair and transparent policy environment
which promotes a level playing field and facilitates fair competition.
In pursuance of above objective, TRAI has been issuing regulations, order and directives to deal with
the issues or complaints raised by the operators as well as the consumers. These regulations, order and
directives have helped to nurture the growth of multi operator multi service - an open competitive
market from a government owned monopoly. Also, the directions, orders and regulations issued cover a
wide range of subjects including tariff, interconnection and quality of service as well as governance of
the Authority.
TRAI initiated a regulation - The Standards of Quality of Service of Basic Telephone Service (Wire line)
and Cellular Mobile Telephone Service Regulations, 2009 (7 of 2009) dated 20thMarch, 2009, the
"Standards of Quality of Service for Wireless Data Services Regulations, 2012 dated 4th December 2012,
and the "Quality of Service of Broadband Service Regulations", 2006 (11 of 2006) dated 6th October,
2006 that provide the benchmarks for the parameters on customer perception of service to be achieved
by service provider.
In order to assess the above regulations, TRAI has commissioned a third party agency to conduct the
audit of the service providers and check the performance of the operators on the various benchmarks
set by Telecom Regulatory Authority of India (TRAI).
1.2 OBJECTIVES
The primary objective of the Audit module is to:
Audit and Assess the Quality of Services being rendered by Basic (Wireline), Cellular Mobile
(Wireless), and Broadband service against the parameters notified by TRAI. (The parameters of
Quality of Services (QoS) have been specified by in the respective regulations published by
TRAI).

TRAI Audit Broadband Report- BIHAR/JHARKHAND AMJ Quarter-2016
6
1.3 COVERAGE
The broadband audit was conducted in BIHAR/JHARKHAND circle (excluding BIHAR/JHARKHAND).
For BSNL, a geographical spread among the SDCAs and POPs was maintained. For other operators, the
audit was conducted for all SDCAs at overall level.
Image Source: BSNL web site
Operators audited during the audit period
BSNL
Pacenet
Reliance
Siti Cable
TATA (TTSL)
1.4 AUDIT PROCESS AND OPERATOR SELECTION
As per TRAI guidelines, the Broadband Audit for a circle is conducted once every year.
The operators have been assimilated as per TRAI guidelines given in QoS tender document
2016 and latest list of licensees (with more than 10,000 subscriber in their LSAs) provided by
TRAI.
To conduct the audit, IMRB auditors contacted the broadband operators given in the list below
to conduct the audit in BIHAR/JHARKHAND circle for the AMJ 2016 quarter.
The PMR was generated from the raw data pertaining to April, May and June 2016 (AMJ’16),
which was extracted by auditor from the operator’s systems during the audit conducted in the
month of July 2016.
Live calling activity was carried out during the period of June 2016. The data considered for live
calling was for the month prior to the live calling month. In this round of audit, May 2016 data
was considered for live calling for all operators whereas live measurement was carried out at
the centralized operation centres of the operators, as per tender document.
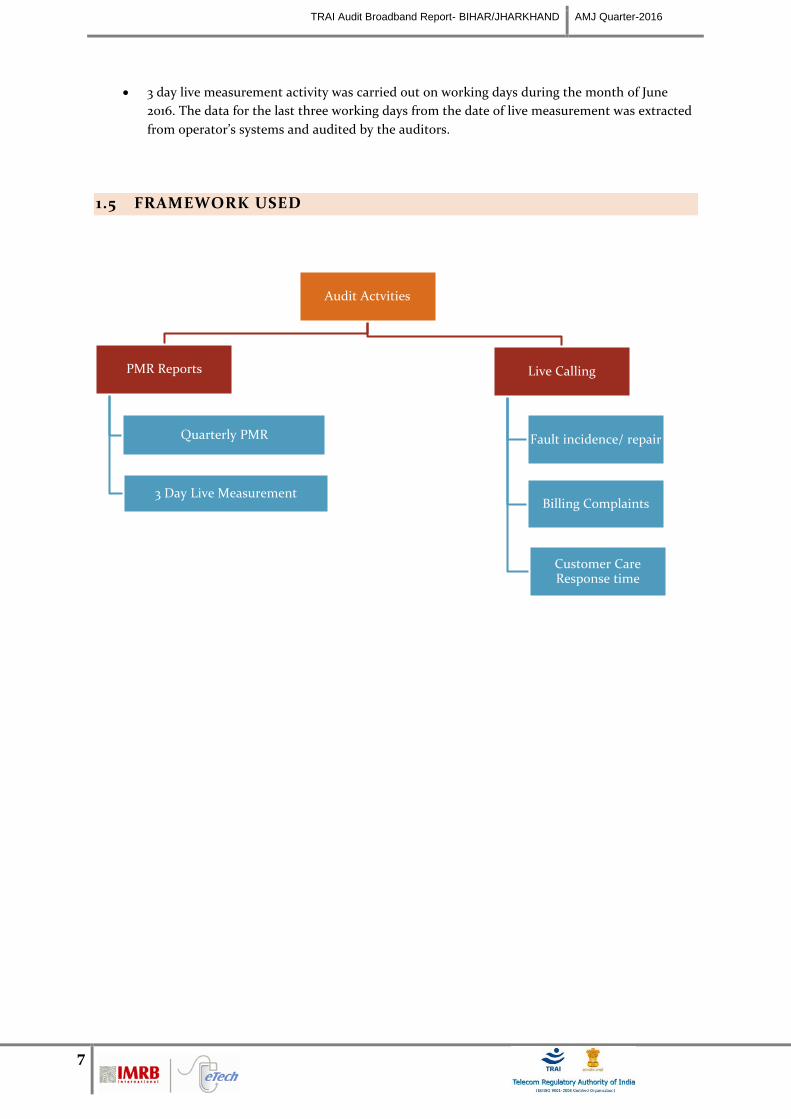
TRAI Audit Broadband Report- BIHAR/JHARKHAND AMJ Quarter-2016
7
3 day live measurement activity was carried out on working days during the month of June
2016. The data for the last three working days from the date of live measurement was extracted
from operator’s systems and audited by the auditors.
1.5 FRAMEWORK USED
Audit Actvities
PMR Reports
Quarterly PMR
3 Day Live Measurement
Live Calling
Fault incidence/ repair
Billing Complaints
Customer Care Response time

TRAI Audit Broadband Report- BIHAR/JHARKHAND AMJ Quarter-2016
8
1.5.1 PMR REPORTS - SIGNIFICANCE AND METHODOLOGY
The significance of PMR or Performance Monitoring Reports is to assess the various Quality of Service
(QoS) parameters involved in the Broadband services, which indicate the overall health of service for an
operator.
To verify the QoS performance of the operators, TRAI has appointed IMRB as their auditor in East Zone
to conduct QoS audit of operators. The steps involved in the audit have been given below.
The raw data extracted is then used to generate PMR reports in the following formats.
Quarterly PMR
3 Day Live Measurement Data
Let us understand these formats in detail.
This report has been prepared from the raw data extracted for the period of AMJ’16 during July 2016.
1.5.1.1 QUARTERLY PMR REPORT – PARAMETERS REVIEWED
The main purpose of quarterly PMR report is to verify the following key QoS parameters on quarterly
basis as per the methodology stated above in section 1.4.
Service Provisioning
Fault incidence/clearance related statistic
Billing Performance (Metering and billing credibility)
Resolution of billing complaints
Response time to customer for assistance
Bandwidth Utilization
Broadband download speed
The newly generated PMR reports are then taken in hard copy, duly signed by the competent authority of operators. IMRB auditors also sign the same report.
All the calculations are done by IMRB auditors to generate a new PMR report from that raw data.
During TRAI audit, raw data is extracted from the operator’s server/ NOC/ exchange/ OMC/ customer service center/ billing center etc. by the IMRB auditor with assistance from the operator personnel in order to generate PMR reports (Network/ Fault/ Billing
/Customer Service).
The IMRB auditors inform the operators about the audit schedule in advance. Accordingly, the auditors visit the operator premises to conduct the audit.

TRAI Audit Broadband Report- BIHAR/JHARKHAND AMJ Quarter-2016
9
Service Availability/ Uptime
Network Latency/ Packet Loss
1.5.1.2 3 DAY LIVE MEASUREMENT - SIGNIFICANCE AND METHODOLOGY
The main purpose of 3 day live measurement is to evaluate the following parameters on intraday basis.
The auditors visit the sample exchanges (in case of BSNL) and main exchanges (in case of other
operators) to collect the 3 day live data for the following parameters.
Bandwidth Utilization
Broadband download speed
Service Availability/ Uptime
Network Latency/ Packet Loss
While the quarterly PMR report provides an overall view of the performance of QoS parameters, the 3
day live data helps looking at intraday performance on the above given parameters. All the calculations
are then done on the basis of that raw data of 3 days.
1.5.1.3 TCBH – SIGNIFICANCE AND SELECTION METHODOLOGY
As per QoS regulations 2006 (11 of 2006), Time Consistent Busy Hour” or “TCBH” means the one hour
period starting at the same time each day for which the average traffic of the resource group concerned
is greatest over the days under consideration and such Time Consistent Busy Hour shall be established
on the basis of analysis of traffic data for a period of ninety days.
Step by step procedure to identify TCBH for an operator:
During audit, the auditors identified following TCBHs from the raw data collected from the operators
for the quarter of AMJ’16.
Day wise raw data is fetched from the operator's OMCR and kept in a readable format (preferably MS-Excel). Data for a period of 90 days is used to identify TCBH.
The 90 day period is decided upon the basis of month of audit. For example, for audit of June 2016, the 90 day period data used to identify TCBH would be the data of, April, May & June 2016
For each day, the hour in which average traffic of the resource group concerned is greatest for the day will be the 'Busy Hour' for the operator.
The modal frequency of the busy hour is calculated for 90 days period and the hour with highest modal frequency will be considered as TCBH for the operator

TRAI Audit Broadband Report- BIHAR/JHARKHAND AMJ Quarter-2016
10
The data for network parameters has been taken as per the TCBH identified by the auditor for the
operators.
1.5.2 LIVE CALLING - SIGNIFICANCE AND METHODOLOGY
The main purpose of live calling is to verify the performance of following parameters by doing test calls
to the subscribers/ specific numbers.
Service Provisioning
Fault incidence/clearance related statistic
Resolution of billing complaints
Response time to customer for assistance
The process of conducting live calling has been stated below.
Let us now discuss the methodology of live calling for each parameter in detail.
1.5.2.1 SERVICE PROVISIONING
Live calling for service provisioning is done to verify the following.
Number of connections provided in 15 days from customer request
Live Calling Process:
Auditors request the operator to provide the database of all the subscribers who requested for a
new connection in one month prior to IMRB auditor visit
The auditors also verify the performance of call center by calling the numbers using operator's wireline network
IMRB auditors then make live calls to a random sample of subscribers from the raw data provided to verify the resolution of complaints
The IMRB auditor visits the operator premises such as main exchanges/ OMC/ customer service center etc. to do live calling. The auditors take the raw data of service provisioning, fault repair, customer complaints (billing) from the the operator's system for the preceding month and also
the list of customer service numbers to be verified through live calling

TRAI Audit Broadband Report- BIHAR/JHARKHAND AMJ Quarter-2016
11
100 Calls per service provider are made to customers or in case of BSNL, 10% or 30 per SDCA by
randomly selecting from the database provided by operator
Auditors check and record whether the connection was provided to customers within the
timeframes as mentioned in the benchmark
Benchmark:
New connections provided within 15 days: 100%
1.5.2.2 FAULT CLEARANCE
Live calling for fault clearance is done to verify the following.
Fault repair by next working day
Fault repair within 3 working days
Live Calling Process:
Auditors request the operator to provide the database of all the subscribers who reported Faults
in one month prior to IMRB auditor visit
Calls are made to up to 10% or 100 complainants, whichever is less, per service provider or in
case of BSNL, if there are more than 1 SDCAs selected for the sample, 10% or 30 complainants
per sample SDCA by randomly selecting from the list provided by operator.
Auditors check and record whether the fault was corrected within the timeframes as mentioned
in the benchmark
Benchmarks:
Fault repair by next working day: =>90%
Fault repair within 3 working days: =>99%
1.5.2.3 RESOLUTION OF BILLING COMPLAINTS
Live calling is done to verify Resolution of billing complaints within stipulated time. The process for this
parameter is stated below.
Auditors request the operator provided the database of all the subscribers who reported billing
complaints in one month prior to IMRB auditor visit. In case of BSNL, data for the complaints
from the subscribers belonging to the sample exchanges is requested specifically
A sample of 10% or 100 complainants, whichever is less, is selected randomly from the list
provided by operator
Calls are made by auditors to the sample of subscribers to check and record whether the
complaint was resolved within the timeframes as mentioned in the benchmark.
Benchmarks:
100% complaints resolved within 4 weeks.

TRAI Audit Broadband Report- BIHAR/JHARKHAND AMJ Quarter-2016
12
1.5.2.4 RESPONSE TIME TO CUSTOMER FOR ASSISTANCE
Live calling is done to verify response time for customer assistance is done to verify the performance of
call center in terms of
% age of calls answered by operator ( voice to voice) within 60 seconds: In 60% of the cases or
more
% age of calls answered by operator (voice to voice) within 90 seconds: In 80% of the cases or
more
The process for this parameter is stated below.
Overall sample size was 100 calls per service provider per circle at different points of time,
evenly distributed across the selected exchanges – 50 calls between 1000 HRS to 1300 HRS and
50 calls between 1500 HRS to 1700 HRS.
Time to answer the call by the operator was assessed from the time interviewer pressed the
requisite button for being assisted by the operator.
All the supplementary services that have any kind of human intervention are to be covered
here. It also includes the IVR assisted services.
1.6 SAMPLING METHODOLOGY
As per audit tender regulations, to conduct the Broadband audit for BSNL, auditors need to
devise a sampling plan as given below
o A minimum sample of 10% Point of Presence (POP) of ISP should be spread across at
least 10% of SDCA’s in the telecom circle
o As per TRAI instructions, a DSLAM site was considered as a point of presence for the
operator.
The sampling plan was finalized as per TRAI guidelines. The POP details have been provided
below in section 1.6.1 of the report,
As per tender guidelines, no sampling activity was required in case of operators other than
BSNL. Hence, the audit for operators other than BSNL has been conducted by taking the data
for entire circle (all exchanges/ POPs combined).
Audit for BSNL has been conducted for the data pertaining to selected POPs in the sampling plan.
1.6.1 SAMPLING PLAN - BSNL
As per sampling criteria, at least 10% POPs to be selected for audit. However, to maintain a geographical
spread and due to presence of multiple DSLAM sites at one exchange, the auditors have selected from
each SDCA.
Total SDCAs present in the circle: 184 (Bihar – 106, Jharkhand – 78)
As per sampling criteria, 10% SDCAs selected for audit: 19
A list of the SDCAs selected for audit has been given below.
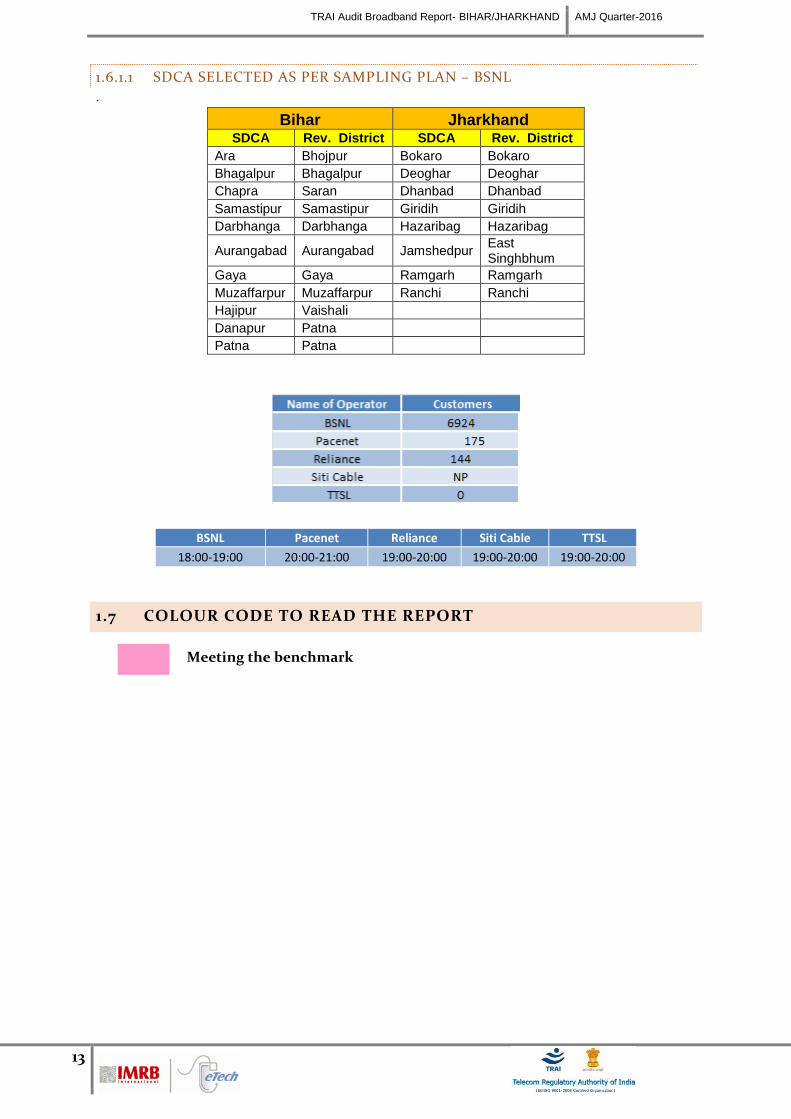
TRAI Audit Broadband Report- BIHAR/JHARKHAND AMJ Quarter-2016
13
1.6.1.1 SDCA SELECTED AS PER SAMPLING PLAN – BSNL
.
Bihar Jharkhand SDCA Rev. District SDCA Rev. District
Ara Bhojpur Bokaro Bokaro
Bhagalpur Bhagalpur Deoghar Deoghar
Chapra Saran Dhanbad Dhanbad
Samastipur Samastipur Giridih Giridih
Darbhanga Darbhanga Hazaribag Hazaribag
Aurangabad Aurangabad Jamshedpur East Singhbhum
Gaya Gaya Ramgarh Ramgarh
Muzaffarpur Muzaffarpur Ranchi Ranchi
Hajipur Vaishali
Danapur Patna
Patna Patna
BSNL Pacenet Reliance Siti Cable TTSL
18:00-19:00 20:00-21:00 19:00-20:00 19:00-20:00 19:00-20:00
1.7 COLOUR CODE TO READ THE REPORT
Not Meeting the benchmark

TRAI Audit Broadband Report- BIHAR/JHARKHAND AMJ Quarter-2016
14
1.8 AUDIT METHODOLOGY
As per audit tender, following table explains the audit methodology for Broadband services. Here, a YES
signifies that the mentioned parameter gets audited by the given audit method (PMR/ Live
Measurement/ Live Calling).
Parameters Quarterly PMR
Data 3 day live
measurement Live
calling
1 Service Provisioning/ Activation time YES YES
2 Fault Repair/ Restoration Time YES YES
3 Billing Performance
(i) Billing Complaints per 100 Bills issued YES
(ii) %age of billing complaints resolved in four weeks
YES Yes
(iii) Refund of deposits after closure within 60 days
YES
4 Response time to the customer for assistance(Voice to Voice)
(i) Within 60 seconds > 60% YES YES
(ii) Within 90 seconds > 80% YES YES
5 Bandwidth Utilization/ Throughput:
A) Bandwidth Utilization
- POP to ISP gateway Node [Intra – network] Links
YES YES
- ISP Gateway Node to IGSP / NIXI Node upstream Link(s) for international connectivity
YES YES
B) Broadband Connection Speed (Download)
YES YES
6 Service Availability/Uptime YES YES
7 Packet Loss YES YES
8 Network Latency for wired broadband access)
(i) User reference point at POP / ISP Gateway Note to International Gateway (IGSP/NIXI)
YES YES
(ii) User reference point at ISP Gateway Node to International nearest NAP port abroad ( Satellite)
YES YES
(iii) User reference point at ISP Gateway Node to International nearest NAP port abroad ( Satellite)
YES YES

TRAI Audit Broadband Report-Bihar-Jharkhand JFM Quarter-2015
15
2. EXECUTIVE SUMMARY
2.1 PMR QUARTERLY DATA – JFM’2016
The objective assessment of Quality of Service (QoS) carried out by IMRB gives an insight into the
overall broadband performance of various operators with a parameter wise performance evaluation as
compared to TRAI benchmark.
NA: Parameters not applicable for the operators.
Audit of BSNL at its NOC for Bandwidth Utilization and Network Latency is yet to be conducted.
Auditors have not received any cooperation from BSNL in helping the auditors to conduct the audit.
Following are the parameter wise observations for the operators in BIHAR/JHARKHAND circle.
2.1.1 SERVICE PROVISIONING/ ACTIVATION TIME
As per audit, all operators met the benchmark for providing new connections within 15 days.

TRAI Audit Broadband Report- BIHAR/JHARKHAND AMJ Quarter-2016
16
2.1.2 FAULT REPAIR/ RESTORATION
The benchmark of repairing 90% faults within the next day and 99% faults within next three days of
receiving complaints was met by all operators.
2.1.3 BILLING PERFORMANCE
As per audit, all operators met the benchmark for metering and billing credibility. BSNL met the
benchmark for resolution of billing complaints within 4 weeks
NA: Subscribers of Broadband BSNL, Pacenet, Siti and Reliance did not log any billing complaints.
Hence, resolution of billing complaints is not applicable for the operators.
None of the operators had any billing dispute that required a refund.
2.1.4 RESPONSE TIME TO CUSTOMER FOR ASSISTANCE
All operators met the benchmark for answering 60% calls within 60 seconds and 80% calls within 90
seconds as per audit.
2.1.5 BANDWIDTH UTILIZATION AND THROUGHPUT
All operators met the benchmark for bandwidth utilized on upstream links during audit.
BSNL did not meet the benchmark for broadband download speed.
All operators met the benchmark for service availability time as per audit.
NP: Not Participated, BSNL and TATA did not submit the data during Audit for Bandwidth
utilization/throughput and packet loss.
2.1.6 NETWORK LATENCY
All operators met the benchmark for Network Latency parameters.
NP: Not Participated, BSNL and TATA did not submit the data during Audit for AMJ’2016.

TRAI Audit Broadband Report- BIHAR/JHARKHAND AMJ Quarter-2016
17
2.2 LIVE MEASUREMENT
NP: Not Participated, BSNL, Siti Cable and TATA did not submit the data during Audit for
AMJ’2016.
NP: Not Participated. Audit of BSNL at its NOC for Bandwidth Utilization and Network Latency is yet to
be conducted. In both cases, auditors have not received any cooperation from the operators in helping
the auditors to conduct the audit.
2.2.1 BANDWIDTH UTILIZATION AND THROUGHPUT
All operators met the benchmark for bandwidth utilized on upstream links during live measurement.
BSNL failed to meet the benchmark for broadband download speed
All operators met the benchmark for service availability time as per audit.
NP: Not Participated, BSNL, Siti Cable and TATA did not submit the data during Audit for
AMJ’2016.
2.2.2 NETWORK LATENCY
During live measurement, Broadband Pacenet and Reliance met the benchmark for network latency
parameters.
NP: Not Participated, BSNL, Siti Cable and TATA did not submit the data during Audit for
AMJ’2016.

TRAI Audit Broadband Report- BIHAR/JHARKHAND AMJ Quarter-2016
18
2.3 LIVE CALLING
NA: Parameters not applicable for the operators.
2.3.1 SERVICE PROVISIONING/ ACTIVATION TIMES
All operators met the benchmark of providing 100% new connections within the TRAI stipulated
timeline of 15 days, except BSNL and Siti.
2.3.2 FAULT REPAIR/ RESTORATION
All operators met the benchmark of repairing 90% faults within next working day as well repairing 99%
faults within 3 days whereas BSNL failed to meet for repairing 90% faults, BSNL and Siti cable failed to
meet the benchmark for 99% faults within 3 working days.
2.3.3 BILLING PERFORMANCE
NA: Live calling for BSNL, Pacenet, Reliance and TATA for ‘resolution of billing complaints’ has not
been conducted due to very low/ zero base of billing complaints for the operators.
Note: -Siti cable is in prepaid service
2.3.4 RESPONSE TIME TO CUSTOMER FOR ASSISTANCE
As per live calling, all operators met the benchmarks of customer care for %age call answered within 60
seconds and 90 seconds.

TRAI Audit Broadband Report- BIHAR/JHARKHAND AMJ Quarter-2016
19
3. CRITICAL FINDINGS
Service Provisioning/ Activation Time
As per audit, all operators met the benchmark for providing new connections within 15 days
during PMR audit, however during live calling BSNL and Siti failed to meet the TRAI
benchmark.
Fault Repair/ Restoration
The benchmark of repairing 90% faults within the next day and 99% faults within next three
days of receiving complaints was met by all operators in PMR audit. During live calling BSNL
failed to meet the benchmark for fault repair within next working day, however BSNL and Siti
cable failed to meet the benchmark for fault repair within three working days.
Billing Performance
As per audit, all operators met the benchmark for metering and billing credibility.
NA: Subscribers of Broadband BSNL, Pacenet and Reliance did not log any billing complaints. Hence,
resolution of billing complaints is not applicable for the operators.
None of the operators had any billing dispute that required a refund.
Note: - Siti cable is in prepaid service.
Response time to customer for assistance
All operators met the benchmark for answering 60% calls within 60 seconds and 80% calls
within 90 seconds as per PMR audit as well as live calling.
Bandwidth Utilization and Throughput
All operators met the benchmark for bandwidth utilized on upstream links during audit.
BSNL did not meet the benchmark for broadband download speed during PMR audit as well as
during live measurement.
All operators met the benchmark for service availability time as per audit for PMR and live
measurement.
NP: Not Participated, BSNL, and TATA did not submit the data during Audit for Bandwidth
utilization/throughput and packet loss.
Network Latency
All operators met the benchmark for Network Latency parameters.
NP: Not Participated, BSNL and TATA did not submit the data during Audit.

TRAI Audit Broadband Report-Bihar-Jharkhand JFM Quarter-2015
20
4. DETAILED FINDINGS - COMPARISON BETWEEN PMR DATA
AND LIVE MEASUREMENT/ CALLING DATA
4.1 SERVICE PROVISIONING/ ACTIVATION TIME
4.1.1 PARAMETER EXPLANATION
4.1.1.1 AUDIT PROCEDURE
IMRB Auditors verified and collected data pertaining to number of applications received at the service
provider’s level in the following time frames:-
Number of applications received at the service provider’s level
Number of connections provided within 15 days
Number of connections provided after 15 days
Live Calling: -
At least 10% of the subscribers who had requested for new connections in month prior to Audit
were called to check whether connection was provided in 15 days
Data for the parameter was extracted from OMC (Operations and Maintenance Center) of the
operators.
4.1.1.2 COMPUTATIONAL METHODOLOGY
Technically Non Feasible (TNF) cases such as unavailability of Broadband infrastructure/
equipment in the Area or Spare Capacity i.e. Broadband Ports including equipment to be
installed at the customer premises for activating Broadband connection were excluded from the
calculation of this parameter.
Also, problems relating to customer owned equipment such as PC, LAN Card/ USB Port and
internal wiring or non-availability of such equipment were excluded from the calculation of this
parameter.
Percentage connections provided within X working days = No of connections provided within X
working days/ Total number of connections registered during the period * 100
4.1.1.3 BENCHMARK
100 % cases in =<15 working days.
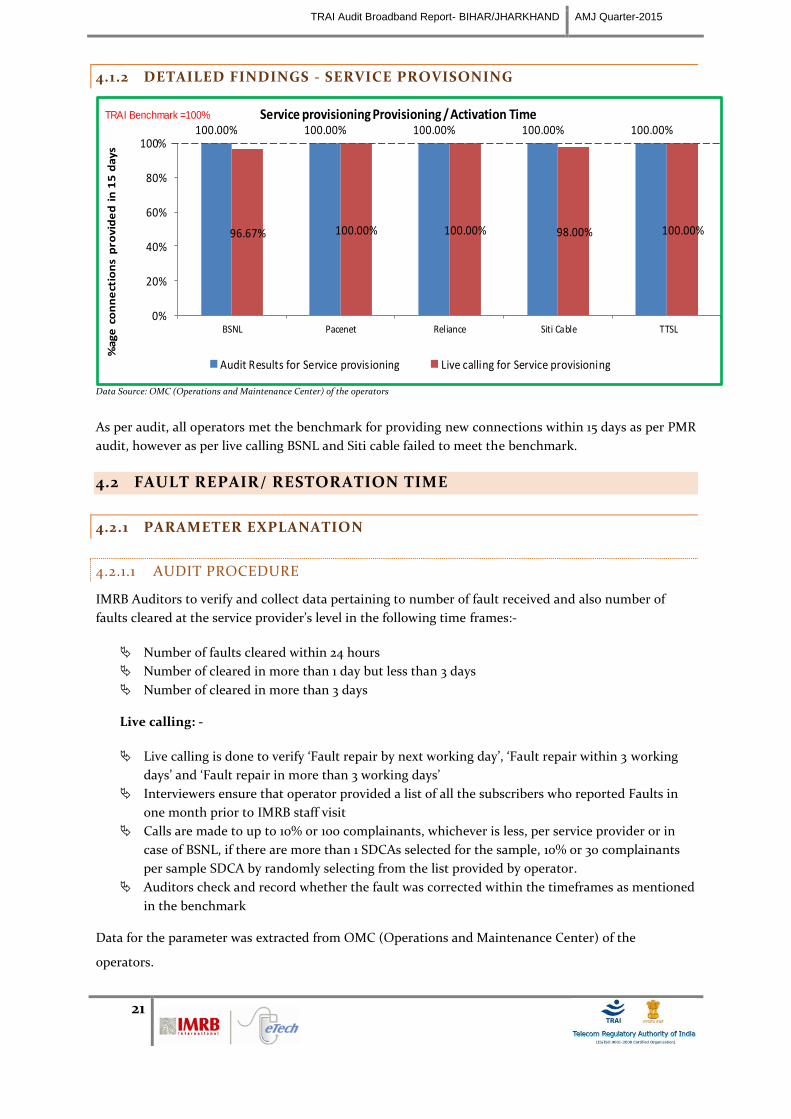
TRAI Audit Broadband Report- BIHAR/JHARKHAND AMJ Quarter-2015
21
4.1.2 DETAILED FINDINGS - SERVICE PROVISONING
100.00% 100.00% 100.00% 100.00% 100.00%
96.67% 100.00% 100.00% 98.00% 100.00%
0%
20%
40%
60%
80%
100%
BSNL Pacenet Reliance Siti Cable TTSL
%a
ge
co
nn
ect
ion
s p
rov
ide
d i
n 1
5 d
ay
sService provisioning Provisioning / Activation Time
Audit Results for Service provisioning Live calling for Service provisioning
TRAI Benchmark =100%
Data Source: OMC (Operations and Maintenance Center) of the operators
As per audit, all operators met the benchmark for providing new connections within 15 days as per PMR
audit, however as per live calling BSNL and Siti cable failed to meet the benchmark.
4.2 FAULT REPAIR/ RESTORATION TIME
4.2.1 PARAMETER EXPLANATION
4.2.1.1 AUDIT PROCEDURE
IMRB Auditors to verify and collect data pertaining to number of fault received and also number of
faults cleared at the service provider’s level in the following time frames:-
Number of faults cleared within 24 hours
Number of cleared in more than 1 day but less than 3 days
Number of cleared in more than 3 days
Live calling: -
Live calling is done to verify ‘Fault repair by next working day’, ‘Fault repair within 3 working
days’ and ‘Fault repair in more than 3 working days’
Interviewers ensure that operator provided a list of all the subscribers who reported Faults in
one month prior to IMRB staff visit
Calls are made to up to 10% or 100 complainants, whichever is less, per service provider or in
case of BSNL, if there are more than 1 SDCAs selected for the sample, 10% or 30 complainants
per sample SDCA by randomly selecting from the list provided by operator.
Auditors check and record whether the fault was corrected within the timeframes as mentioned
in the benchmark
Data for the parameter was extracted from OMC (Operations and Maintenance Center) of the
operators.

TRAI Audit Broadband Report- BIHAR/JHARKHAND AMJ Quarter-2015
22
4.2.1.2 COMPUTATIONAL METHODOLOGY
The time period for fault repair starts from the time when the fault is reported to the service
provider either through customer care help line or in person by the subscriber
Only the complaints registered till the close of the business hours of the day are to be taken
into account. All the complaints registered after the business hours are to be considered as
being registered in the next day business hours
Fault incidence = (Total no of faults repaired in X working days /Total number of faults
reported during the period)*100
4.2.1.3 BENCHMARK
By next working day: > 90% and within 3 working days: 99%.
4.2.2 DETAILED FINDINGS - FAULT REPAIR WITHIN NEXT WORKING DAY
92.07%100.00%
NA
92.38% 90.09%
13.28%
100.00%
NA
90.00% 97.00%
0%
10%
20%
30%
40%
50%
60%
70%
80%
90%
100%
BSNL Pacenet Reliance Siti Cable TTSL
Pe
rce
nta
ge
fa
ult
s re
pa
red
by
ne
xt
wo
rkin
g d
ay
Fault repair by next working day
Audit Results for Fault repair Live calling for fault repair
TRAI Benchmark > 90%
Data Source: OMC (Operations and Maintenance Center) of the operators
The benchmark of repairing 90% faults within the next day of receiving complaints was met by all
operators as per audit. However, as per live calls made to subscribers, BSNL remained short of the
benchmark for the parameter.
NA: No faults Registered.

TRAI Audit Broadband Report- BIHAR/JHARKHAND AMJ Quarter-2015
23
4.2.3 DETAILED FINDINGS - FAULT REPAIR WITHIN 3 WORKING DAYS
99.55% 100.00%
NA
98.96% 97.79%
53.91%
100.00%
NA
93.33% 100.00%
0%
20%
40%
60%
80%
100%
BSNL Pacenet Reliance Siti Cable TTSL
Pe
rce
nta
ge
fa
ult
s re
pa
ire
d w
ith
in t
hre
e
wo
rkin
g d
ay
sFault repair within three working days
Audit Results for Fault repair Live calling for fault repair
TRAI Benchmark > 99%
Data Source: OMC (Operations and Maintenance Center) of the operators
All operators met the benchmark for repairing 99% faults within three working days as per audit data,
except BSNL and Siti cable. However, as per live calls made to subscribers, BSNL and Siti cable
remained short of the benchmark for the parameter.
NA: No faults Registered.
4.3 METERING AND BILLING CREDIBILITY
4.3.1 PARAMETER EXPLANATION – BILLING COMPLAINTS
All the complaints related to billing as per clause 3.7.2 of QoS regulation of 20th
March, 2009 were
covered. The types of billing complaints covered are listed below.
Payments made and not credited to the subscriber account
Payment made on time but late payment charge levied wrongly
Double charges
Credit agreed to be given in resolution of complaint, but not accounted in the bill
Charging for services provided without consent
Charging not as per tariff plans
Overcharging or undercharging
In addition to the above, any billing complaint which leads to billing error, waiver, refund, credit, or any
adjustment is also considered as a billing complaint for calculating the number of disputed bills.

TRAI Audit Broadband Report- BIHAR/JHARKHAND AMJ Quarter-2015
24
4.3.1.1 AUDIT PROCEDURE
IMRB Auditors to verify and collect data pertaining to –
Number of Billing complaints received at the service provider’s level
Last billing cycle stated should be such that due date for payment of bills must be beyond the
date when this form is filled.
Include all types of bills generated for customers. This could include online as well as other
forms of bills presentation including printed bills
Billing complaint is any of written complaint/ personal visit/ telephonic complaint related to:
Excess metering/ wrong tariff scheme charged, Payment made in time but charged penalty/ not
reflected in next bill, Last payment not reflected in bill, Adjustment/ waiver not done, Anything
else related to bills, Toll free numbers charged etc.
Billing complaints resolution database, with opening and closing date of complaint to identify
the time taken to resolve a complaint
Live calling:
Auditors request the operator provided the database of all the subscribers who reported billing
complaints in one month prior to IMRB auditor visit. In case of BSNL, data for the complaints
from the subscribers belonging to the sample exchanges is requested specifically. In case the
sample data is too low to fulfill the target calls, auditors may call subscribers whose complaints
got resolved in other months of the same audit period.
A sample of 10% or 100 complainants, whichever is less, is selected randomly from the list
provided by operator
Calls are made by auditors to the sample of subscribers to check and record whether the
complaint was resolved within the timeframes as mentioned in the benchmark.
Raw data for the parameter was extracted from central billing center of the operators.

TRAI Audit Broadband Report- BIHAR/JHARKHAND AMJ Quarter-2015
25
4.3.1.2 COMPUTATIONAL METHODOLOGY – METERING AND BILLING
CREDIBILITY
The calculation methodology (given below) as per QoS regulations 2009 (7 of 2009) was followed to
calculate incidence of billing complaints.
*Operator to include all types of bills generated for customers. This would include
printed bills, online bills and any other forms of bills generated
**Billing complaints here shall include only dispute related issues (including those that
may arise because of a lack of awareness at the subscribers’ end). It does not include
any provisional issues (such as delayed dispatch of billing statements, etc.) in which
the operator has opened a ticket internally.
TRAI Benchmark: <= 2%
4.3.1.3 METERING AND BILLING CREDIBILITY – AUDIT FINDINGS
0.00% 0.00% 0.00% 0.0% 0.07%0%
1%
2%
3%
BSNL Pacenet Reliance Siti Cable TTSL
Perc
enta
ge b
ills d
ispute
d
Metering and billing credibility
Audit Results for Billing performance
TRAI Benchmark < 2%
Data Source: Billing Center of the operators
All operators met the benchmark for the parameter.

TRAI Audit Broadband Report- BIHAR/JHARKHAND AMJ Quarter-2015
26
4.3.1.4 COMPUTATIONAL METHODOLOGY – RESOLUTION OF BILLING
COMPLAINTS
Calculation of Percentage resolution of billing complaints
The calculation methodology (given below) as per QoS regulations 2009 (7 of 2009) and TRAI
guidelines (Received on Sep 08, 2014) was followed to calculate resolution of billing complaints.
Resolution of billing complaints within 4 weeks:
o **Billing complaints here shall include only dispute related issues (including those that
may arise because of a lack of awareness at the subscribers’ end). It does not include
any provisional issues (such as delayed dispatch of billing statements, etc.) in which
the operator has opened a ticket internally. Complaints raised by the consumers to
operator are only considered as part of the calculation.
*** Date of resolution in this case would refer to the date when a communication has taken
place from the operator’s end to inform the complainant about the final resolution of the issue
/ dispute.
Benchmark: 100% complaints resolved within 4 weeks.
4.3.1.5 RESOLUTION OF BILLING COMPLAINTS – AUDIT FINDINGS
NA NA NP 100.00%NA NA NA NA NA0%
25%
50%
75%
100%
BSNL Pacenet Reliance Siti Cable TTSL
Pe
rce
nta
ge c
ases
res
olv
ed i
n 4
wee
ks
Resolution of billing complaints (within 4 weeks)
Audit Results for Billing performance Live calling results for resolution of billing complaints
TRAI Benchmark 98%
Data Source: Billing Center of the operators

TRAI Audit Broadband Report- BIHAR/JHARKHAND AMJ Quarter-2015
27
NA: Subscribers of Broadband BSNL, Pacenet and Reliance did not log any billing complaints. Hence,
resolution of billing complaints is not applicable for the operators. Also, live calling for resolution of
billing complaints for BSNL, Reliance, Pacenet, Tata and Siti have not been conducted due to low/ zero
base billing complaints for the operators.
4.4 TIME TAKEN TO REFUND AFTER CLOSURE
4.4.1 PARAMETER EXPLANATION
4.4.1.1 AUDIT PROCEDURE
IMRB Auditors collected and verified data pertaining to -
Number of cases requiring refund of deposits
Number of cases where refund was made within 60 days
%age cases where refund was made within 60 days.
Data for the parameter was extracted from central billing center of the operators.
4.4.1.2 COMPUTATIONAL METHODOLOGY
Date of closure is considered to be the date on which the connection is discontinued in the
service provider database of active customers
Time taken to refund = Date of refund – Date of closure
4.4.1.3 BENCHMARK
100% cases in less than 60 days
4.4.2 DETAILED FINDINGS - REFUND OF DEPOSITS
NA NA NA NA NA0%
20%
40%
60%
80%
100%
BSNL Pacenet Reliance Siti Cable TTSL
Re
fun
ds
wit
hin
g 6
0 d
ays
Refund of deposits
Audit Results for Billing performance
TRAI Benchmark 100%
NA: No cases where a refund was applicable.

TRAI Audit Broadband Report- BIHAR/JHARKHAND AMJ Quarter-2015
28
4.5 RESPONSE TIME TO CUSTOMER FOR ASSISTANCE
4.5.1 PARAMETER EXPLANATION
4.5.1.1 AUDIT PROCEDURE
IMRB Auditors collected and verified data pertaining to
Number of calls received by the operator
Number and percentage calls answered within 60 seconds
Number and percentage calls answered within 80 seconds
Live calling:
Overall 100 number of live calls at different points of time were made in a licensed service
area/circle for each service provider to assess the efficiency of the call center
Data for the parameter was extracted from central customer service center of the operators.
4.5.1.2 COMPUTATIONAL METHODOLOGY
%age of calls answered by operator (voice to voice) within n seconds = (Number of calls where
time taken for operator to respond* >= n sec / Total number of calls where an attempt to route
to the operator was made) x 100)*.
Time taken for operator to respond = Time when an operator responds to a call – Time when
the relevant code to reach the operator is dialled
4.5.1.3 BENCHMARK
Calls answered within 60 seconds > 60 %
Calls answered within 90 seconds > 80%
4.5.2 DETAILED FINDINGS - CALL ANSWERED WITHIN 60 SECONDS
100.00%90.91%
94.75%
72.37%
85.60%
100.00% 97.00% 100.00%
75.00%
100.00%
0%
20%
40%
60%
80%
100%
BSNL Pacenet Reliance Siti Cable TTSL%ag
e ca
lls a
nsw
ered
in 6
0 se
cond
s
Calls answered in 60 seconds
Audit results for customer care (Voice to Voice) Live calling results for customer care (Voice to Voice)
TRAI Benchmark >60%
Data Source: Customer Service Center of the operator
All operators met the TRAI benchmark.
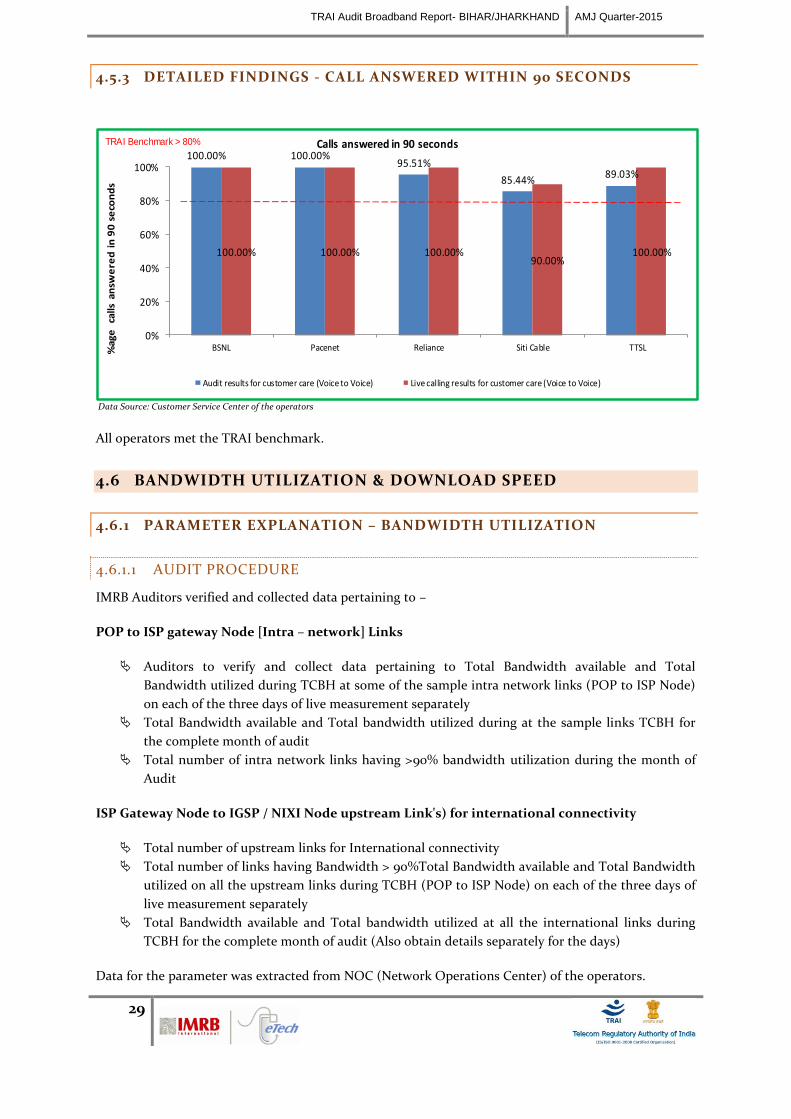
TRAI Audit Broadband Report- BIHAR/JHARKHAND AMJ Quarter-2015
29
4.5.3 DETAILED FINDINGS - CALL ANSWERED WITHIN 90 SECONDS
100.00% 100.00%95.51%
85.44%89.03%
100.00% 100.00% 100.00%90.00%
100.00%
0%
20%
40%
60%
80%
100%
BSNL Pacenet Reliance Siti Cable TTSL%ag
e
calls
an
swe
red
in
90
se
con
ds
Calls answered in 90 seconds
Audit results for customer care (Voice to Voice) Live calling results for customer care (Voice to Voice)
TRAI Benchmark > 80%
Data Source: Customer Service Center of the operators
All operators met the TRAI benchmark.
4.6 BANDWIDTH UTILIZATION & DOWNLOAD SPEED
4.6.1 PARAMETER EXPLANATION – BANDWIDTH UTILIZATION
4.6.1.1 AUDIT PROCEDURE
IMRB Auditors verified and collected data pertaining to –
POP to ISP gateway Node [Intra – network] Links
Auditors to verify and collect data pertaining to Total Bandwidth available and Total
Bandwidth utilized during TCBH at some of the sample intra network links (POP to ISP Node)
on each of the three days of live measurement separately
Total Bandwidth available and Total bandwidth utilized during at the sample links TCBH for
the complete month of audit
Total number of intra network links having >90% bandwidth utilization during the month of
Audit
ISP Gateway Node to IGSP / NIXI Node upstream Link's) for international connectivity
Total number of upstream links for International connectivity
Total number of links having Bandwidth > 90%Total Bandwidth available and Total Bandwidth
utilized on all the upstream links during TCBH (POP to ISP Node) on each of the three days of
live measurement separately
Total Bandwidth available and Total bandwidth utilized at all the international links during
TCBH for the complete month of audit (Also obtain details separately for the days)
Data for the parameter was extracted from NOC (Network Operations Center) of the operators.

TRAI Audit Broadband Report- BIHAR/JHARKHAND AMJ Quarter-2015
30
4.6.1.2 COMPUTATIONAL METHODOLOGY
Percentage Bandwidth available on the link = Total Bandwidth* utilised in TCBH for the period/
Total Bandwidth Available during the period*100
4.6.1.3 BENCHMARK
< 80% link(s)/route bandwidth utilization during peak hours (TCBH).
If on any link(s)/route bandwidth utilization exceeds 90%, then network is considered to have
congestion. For this additional provisioning of bandwidth on immediate basis, but not later
than one month is mandated.
4.6.2 DETAILED FINDINGS – BANDWIDTH UTILIZATION
Data Source: Network Operations Center (NOC) of the operators
NP: Not Participated, BSNL, Siti Cable and TTSL did not submit the data during Audit for
AMJ’2016.
NP: No data received. Audit of BSNL at its NOC for Bandwidth Utilization is yet to be conducted.
Auditors have contacted the NOC of BSNL, however, the operator is yet to provide an appointment to
IMRB auditors to conduct audit at BSNL NOC.

TRAI Audit Broadband Report- BIHAR/JHARKHAND AMJ Quarter-2015
31
4.6.3 PARAMETER EXPLANATION - BROADBAND DOWNLOAD SPEED
4.6.3.1 AUDIT PROCEDURE
Auditors collected and verified the following information from the operator’s system.
Total committed download speed to the all subscribers (In Mbps) (A)
Total average download speed observed during TCBH (In Mbps)
Live Calling/ Measurement:
Details of live customers were obtained from the service providers
Overall 50 numbers of live calls at were made during peak hours (TCBH) in a licensed service
area/circle for each service provider to assess the download speed available to subscribers. A
download measurement software tool provided by the service providers was used for the same
Details of total committed download speed and speed available to the users were recorded for
each of the subscriber
4.6.3.2 COMPUTATIONAL METHODOLOGY
The download speed for one customer is calculated by the download speed measurement
software using the formula provided below:
Data Download Speed = Size of test file (data) in ISP server/ Transmission time required for
error free transfer of the entire data
Percentage download speed available was calculated as = Sum of total speed available for 50
customers/Total committed download speed for 50 customers*100
4.6.3.3 BENCHMARK
Subscribed broadband connection speed to be met >= 80% from ISP Node to user
Data for the parameter was taken from “Download measurement software” installed in the server at ISP
Node of the operators.

TRAI Audit Broadband Report- BIHAR/JHARKHAND AMJ Quarter-2015
32
4.6.4 DETAILED FINDINGS – BROADBAND DOWNLOAD SPEED
Data Source: Download measurement software installed in the server at ISP Node of the operators
NP: Not Participated, Siti Cable and TTSL did not submit the data during Audit for AMJ’2016.
All operators met the benchmark of providing committed broadband download speed as per audit.
However, BSNL failed to meet the benchmark during live measurement.
4.7 SERVICE AVAILABILITY/UPTIME
4.7.1.1 AUDIT PROCEDURE
IMRB Auditors verified and collected data pertaining to –
Total operational hrs.
Total downtime hrs.
The above mentioned data was obtained and verified separately for three days in which the live
measurement was carried out, Month in which audit was carried out.
Data for the parameter was extracted from OMC (Operations and Maintenance Center) of the
operators.
4.7.1.2 COMPUTATIONAL METHODOLOGY
Total downtime for all users, including the LAN switches, Routers, Servers, etc. at ISP Node and
connectivity to upstream service provider are to be included
Planned outages for routine maintenance of the system are excluded from the calculation of
service availability/uptime
Service availability/Uptime = (Total operational hours – Total Downtime hrs)*100 / Total
operational hours
4.7.1.3 BENCHMARK
98% with effect from quarter ending September 2007 and onwards

TRAI Audit Broadband Report- BIHAR/JHARKHAND AMJ Quarter-2015
33
4.7.2 DETAILED FINDINGS - SERVICE AVAILABILITY
98.56% 99.86% 100.00% 99%
NP
100.00% 99.86% 100.00% 99%
NP0%
20%
40%
60%
80%
100%
BSNL Pacenet Reliance Siti Cable TTSL
%a
ge
se
rvic
e a
va
ila
bil
ity
Service Availability/Uptime
Audit results for service availability Live measurement results for service availability
TRAI Benchmark >98%
Data Source: Operations and Maintenance Center (OMC) of the operators
NP: Not Participated, TTSL did not submit the data during Audit for AMJ’2016.
All operators met the benchmark for service availability time as per audit.
4.8 NETWORK LATENCY & PACKET LOSS
4.8.1 PARAMETER EXPLANATION - NETWORK LATENCY
Network Latency: Network Latency is the measure of duration of a round trip for a data packet between
specific source and destination Router Port/ Customer Premises Equipment (CPE).
4.8.1.1 AUDIT PROCEDURE
IMRB Auditors verified and collected data pertaining to:
Records maintained for ping tests conducted during the period
Smoked ping test (wherever available) results for the period
Results of live ping tests conducted during three day live measurement and month of Audit
(During peak hours)
Live ping tests were conducting by selecting a minimum of three user reference test points at
POP/ISP Node in each circle
Data for the parameter was extracted from NOC (Network Operations Center) of the operators.
4.8.1.2 COMPUTATIONAL METHODOLOGY
Latency is the measure of duration of a round trip for a data packet between specific source and
destination Router Port/Customer Premises Equipment (CPE). The round trip delay for the
ping packets from ISP premises to the IGSP premises to the IGSP/NIXI gateway and to the

TRAI Audit Broadband Report- BIHAR/JHARKHAND AMJ Quarter-2015
34
nearest NAP port abroad are measured by computing delay for 1000 pings of 64 bytes each
(Pings are to be sent subsequent to acknowledgement received for the same for previous ping)
Service provider needs to carry out such tests daily during Time Consistent Busy Hour(TCBH)
and report the average results for the month in the performance monitoring report to TRAI
Minimum sample reference points for each service area shall be three in number or multiple
reference points if required
Hence the formula for network latency would be Network latency for X days= Total round
trip time for all the ping packets transmitted in X days /No of days during the period
4.8.1.3 BENCHMARK
< 120 msec from user reference point at POP/ISP Node to International Gateway
< 350 msec from User reference point at ISP Gateway Node to International nearest NAP port
(Terrestrial)
< 800 msec from User reference point at ISP Gateway Node to International nearest Nap port
(Satellite)
4.8.2 PARAMETER EXPLANATION – PACKET LOSS
Packet Loss: Packet loss is the percentage of packets lost to the total packets transmitted between two
designated CPE/ Router Ports.
4.8.2.1 AUDIT PROCEDURE
IMRB Auditors verified and collected data pertaining to –
Records maintained for ping tests conducted during the period
Smoked ping test (wherever available) results for the period
Results of live ping tests conducted during three day live measurement and month of Audit
(During TCBH)
Live ping tests were conducting by selecting a minimum of three user reference test points at
POP/ISP Node in each circle
Data for the parameter was extracted from NOC (Network Operations Center) of the operators.
4.8.2.2 COMPUTATIONAL METHODOLOGY
Packet loss is the percentage of packets lost to total packets transmitted between two
designated Customer Premises Equipment’s/Router ports. It is the measurement of packet lost
from the broadband customer (User) configuration/User reference point at POP/ISP Node to
IGSP/NIXI Gateway and to the nearest NAP port abroad
The packet loss is measured by computing the percent packet loss of 1000 pings of 64 byte
packet each.
Service provider needs to carry out such tests daily during Time Consistent Busy Hour(TCBH)
and report the average results for the month in the performance monitoring report to TRAI
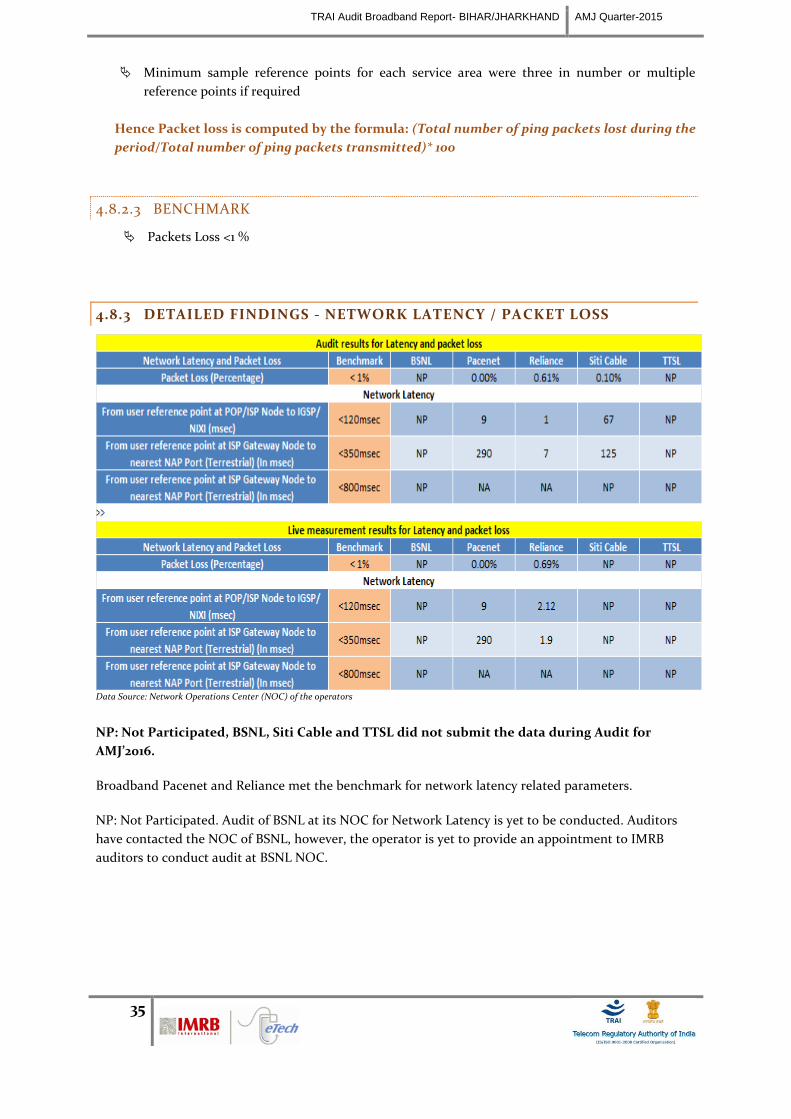
TRAI Audit Broadband Report- BIHAR/JHARKHAND AMJ Quarter-2015
35
Minimum sample reference points for each service area were three in number or multiple
reference points if required
Hence Packet loss is computed by the formula: (Total number of ping packets lost during the
period/Total number of ping packets transmitted)* 100
4.8.2.3 BENCHMARK
Packets Loss <1 %
4.8.3 DETAILED FINDINGS - NETWORK LATENCY / PACKET LOSS
Data Source: Network Operations Center (NOC) of the operators
NP: Not Participated, BSNL, Siti Cable and TTSL did not submit the data during Audit for
AMJ’2016.
Broadband Pacenet and Reliance met the benchmark for network latency related parameters.
NP: Not Participated. Audit of BSNL at its NOC for Network Latency is yet to be conducted. Auditors
have contacted the NOC of BSNL, however, the operator is yet to provide an appointment to IMRB
auditors to conduct audit at BSNL NOC.

TRAI Audit Broadband Report-Bihar-Jharkhand JFM Quarter-2015
36
5. ANNEXURE – JFM’2016
5.1 SERVICE PROVISIONING
Data Source: Operations and Maintenance Center (OMC) of the operators
5.2 FAULT REPAIR/ RESTORATION
Data Source: Operations and Maintenance Center (OMC) of the operators and live calls conducted by the auditors from operator’s network

TRAI Audit Broadband Report- BIHAR/JHARKHAND AMJ Quarter-2015
37
5.3 BILLING PERFORMANCE – METERING AND BILLING CREDIBILITY
Data Source: Billing Center of the operators
Data Source: Live calls conducted by the auditors from operator’s network

TRAI Audit Broadband Report- BIHAR/JHARKHAND AMJ Quarter-2015
38
5.4 RESPONSE TIME TO THE CUSTOMER FOR ASSISTANCE
Data Source: Customer Service Center of the operators
Data Source: Live calls conducted by the auditors from operator’s network

TRAI Audit Broadband Report- BIHAR/JHARKHAND AMJ Quarter-2015
39
5.5 BANDWIDTH UTILIZATION
Data Source: Network Operations Center (NOC) of the operators

TRAI Audit Broadband Report- BIHAR/JHARKHAND AMJ Quarter-2015
40
5.6 BROADBAND DOWNLOAD SPEED
Data Source: Download measurement software installed in the server at ISP Node of the operators
5.7 SERVICE AVAILABILITY/ UPTIME
Data Source: Operations and Maintenance Center (OMC) of the operators

TRAI Audit Broadband Report- BIHAR/JHARKHAND AMJ Quarter-2015
41
5.8 NETWORK LATENCY / PACKET LOSS
Data Source: Network Operations Center (NOC) of the operators
5.9 TOTAL CAPACITY AND SUBSCRIBERS
Data Source: Operations and Maintenance Center (OMC) of the operators

TRAI Audit Broadband Report- BIHAR/JHARKHAND AMJ Quarter-2015
42
5.10 SAMPLE LIST OF SDCA WISE EXCHANGES (JHARKHAND)
S N Exchange SDCA Station District SSA AREA TYPE
1 Balidih Bokaro Balidih Bokaro Dhanbad U EWSD RSU
2 Bhojudih Bokaro Bhojudih Bokaro Dhanbad R EWSD RSU
3 Chandan Kiyari Bokaro Chandan Kiyari Bokaro Dhanbad R AN-RAX
4 Chas Bazar Bokaro Chas Bazar Bokaro Dhanbad U EWSD RSU
5 Chas Iti Bokaro Chas Iti Bokaro Dhanbad U EWSD RSU
6 Ewsd Bokaro. Bokaro Ewsd Bokaro Bokaro Dhanbad U EWSD M
7 Jaina More Bokaro Jaina More Bokaro Dhanbad R EWSD RSU
8 K.K. Singh Colony Bokaro K.K. Singh
Colony Bokaro Dhanbad U EWSD RSU
9 Makdumpur Bokaro Makdumpur Bokaro Dhanbad U DLC
10 Sec.-V Bokaro Sec.-V Bokaro Dhanbad U EWSD RSU
11 Sector - Viii Bokaro Sector - Viii Bokaro Dhanbad U EWSD RSU
12 Sector -Iv Bokaro Sector -Iv Bokaro Dhanbad U EWSD RSU
13 Sector -Xii Bokaro Sector -Xii Bokaro Dhanbad U EWSD RSU
14 Deoghar B.Pur Deoghar Deoghar Deoghar Dumka U C RSU
15 Deoghar Bilasi Deoghar Deoghar Deoghar Dumka U AN-RAX X 2
16 Deoghar N.P Deoghar Deoghar Deoghar Dumka U MAX-XL
17 Deoghar N.P Deoghar Deoghar Deoghar Dumka U EWSD M
18 Deoghar N.P Deoghar Deoghar Deoghar Dumka U DLC
19 Deoghar Old Deoghar Deoghar Deoghar Dumka U C RSU
20 Deoghar Old Deoghar Deoghar Deoghar Dumka U EWSD RSU
21 Jasidih Deoghar Jasidih Deoghar Dumka U C RSU
22 Mohanpur Deoghar Mohanpur Deoghar Dumka R AN-RAX
23 Sarwan Deoghar Sarwan Deoghar Dumka R AN-RAX
24 Baghmara Dhanbad Baghmara Dhanbad Dhanbad R AN-RAX
25 Baliapur Dhanbad Baliapur Dhanbad Dhanbad U AN-RAX
26 Bansjora Dhanbad Bansjora Dhanbad Dhanbad U AN-RAX
27 Barora Dhanbad Barora Dhanbad Dhanbad U E10B RLU
28 Barwadda Dhanbad Barwadda Dhanbad Dhanbad U OCB RSU
29 Bastacola Dhanbad Bastacola Dhanbad Dhanbad U E10B RLU
30 Bhuli Nagar Dhanbad Bhuli Nagar Dhanbad Dhanbad U OCB RSU
31 Cfri Dhanbad Cfri Dhanbad Dhanbad U OCB RSU
32 Chasnala Dhanbad Chasnala Dhanbad Dhanbad U OCB RSU
33 Cmri Dhanbad Cmri Dhanbad Dhanbad U OCB RSU
34 District Board Dhanbad District Board Dhanbad Dhanbad U OCB RSU
35 Drm Office Dhanbad Drm Office Dhanbad Dhanbad U E10B RLU
36 Ewsd P.Bazar Dhanbad Ewsd P.Bazar Dhanbad Dhanbad U EWSD M
37 Gomoh Dhanbad Gomoh Dhanbad Dhanbad R C RSU
38 Hirapur Dhanbad Hirapur Dhanbad Dhanbad U OCB RSU
39 Ism Dhanbad Ism Dhanbad Dhanbad U DLC
40 Jairampur More Dhanbad Jairampur More Dhanbad Dhanbad U AN-RAX
41 Jamadoba Dhanbad Jamadoba Dhanbad Dhanbad U OCB RSU
42 Jharia Dhanbad Jharia Dhanbad Dhanbad U OCB RSU

TRAI Audit Broadband Report- BIHAR/JHARKHAND AMJ Quarter-2015
43
43 Kandra Dhanbad Kandra Dhanbad Dhanbad R AN-RAX
44 Katras Dhanbad Katras Dhanbad Dhanbad U OCB RSU
45 Koyla Bhawan Dhanbad Koyla Bhawan Dhanbad Dhanbad U E10B RLU
46 Kusum Vihar Dhanbad Kusum Vihar Dhanbad Dhanbad U E10B RLU
47 Kusum Vihar Dhanbad Kusum Vihar Dhanbad Dhanbad U OCB RSU
48 Loyabad Dhanbad Loyabad Dhanbad Dhanbad U OCB RSU
49 Mahuda Dhanbad Mahuda Dhanbad Dhanbad R E10B RLU
50 Moko Dhanbad Moko Dhanbad Dhanbad R AN-RAX
51 Moonidih Dhanbad Moonidih Dhanbad Dhanbad U E10B RLU
52 Ocb, Saraidhela Dhanbad Ocb,Saraidhela Dhanbad Dhanbad U OCB M
53 Ocb,Purana Bazar Dhanbad Ocb,Purana
Bazar Dhanbad Dhanbad U OCB M
54 Rajganj Dhanbad Rajganj Dhanbad Dhanbad R E10B RLU
55 Saraidhela Dhanbad Saraidhela Dhanbad Dhanbad U E10B RLU
56 Sindri Dhanbad Sindri Dhanbad Dhanbad U OCB RSU
57 Sindri Dhanbad Sindri Dhanbad Dhanbad U OCB RSU
58 Sinidih Dhanbad Sinidih Dhanbad Dhanbad R OCB RSU
59 Topchanchi Dhanbad Topchanchi Dhanbad Dhanbad R AN-RAX
60 Bengabad Giridih Bengabad Giridih Hazaribag R AN RAX
61 Bhorandiha Giridih Bhorandiha Giridih Hazaribag R AN RAX x 2
62 Chapuadih Giridih Chapuadih Giridih Hazaribag R AN RAX
63 Gandey Giridih Gandey Giridih Hazaribag R AN RAX
64 Giridih Giridih Giridih Giridih Hazaribag U MAX-XL
65 Giridih Giridih Giridih Giridih Hazaribag U OCB M
66 Giridih Giridih Giridih Giridih Hazaribag U DLC
67 Hirodih Giridih Hirodih Giridih Hazaribag R AN RAX x 2
68 Maheshmunda Giridih Mahesh Munda Giridih Hazaribag U AN RAX
69 Taratand Giridih Taratand Giridih Hazaribag R AN RAX
70 Bisnugarh Hazaribag Bishnugarh Hazaribag Hazaribag R C RSU
71 Charhee Hazaribag Charhee Hazaribag Hazaribag R C RSU
72 Churchu Hazaribag Churchu Hazaribag Hazaribag R AN RAX
73 Daru Hazaribag Daru Hazaribag Hazaribag R AN RAX x 2
74 Demotand Hazaribag Demotand Hazaribag Hazaribag R AN RAX x 2
75 Giddi Hazaribag Giddi Hazaribag Hazaribag U C RSU
76 Hazaribag New Exch Hazaribag Hazaribag Hazaribag Hazaribag U MAX-XL
77 Hazaribag New Exch Hazaribag Hazaribag Hazaribag Hazaribag U EWSD M
78 Hazaribag Old Exch Hazaribag Hazaribag Hazaribag Hazaribag U MAX-XL
79 Hazaribag Old Exch Hazaribag Hazaribag Hazaribag Hazaribag U EWSD RSU
80 Jalima Hazaribag Jalima Hazaribag Hazaribag R AN RAX
81 Jhumra Hazaribag Jhumra Hazaribag Hazaribag R AN-RAX X2
82 Kadma Hazaribag Kadma Hazaribag Hazaribag R C RSU
83 Konar Dam Hazaribag Konardam Hazaribag Hazaribag R AN RAX
84 Meru Hazaribag Meru Hazaribag Hazaribag U C RSU
85 Padma Hazaribag Padma Hazaribag Hazaribag R AN RAX x 2
86 Parej Hazaribag Parej Hazaribag Hazaribag R AN RAX x 2
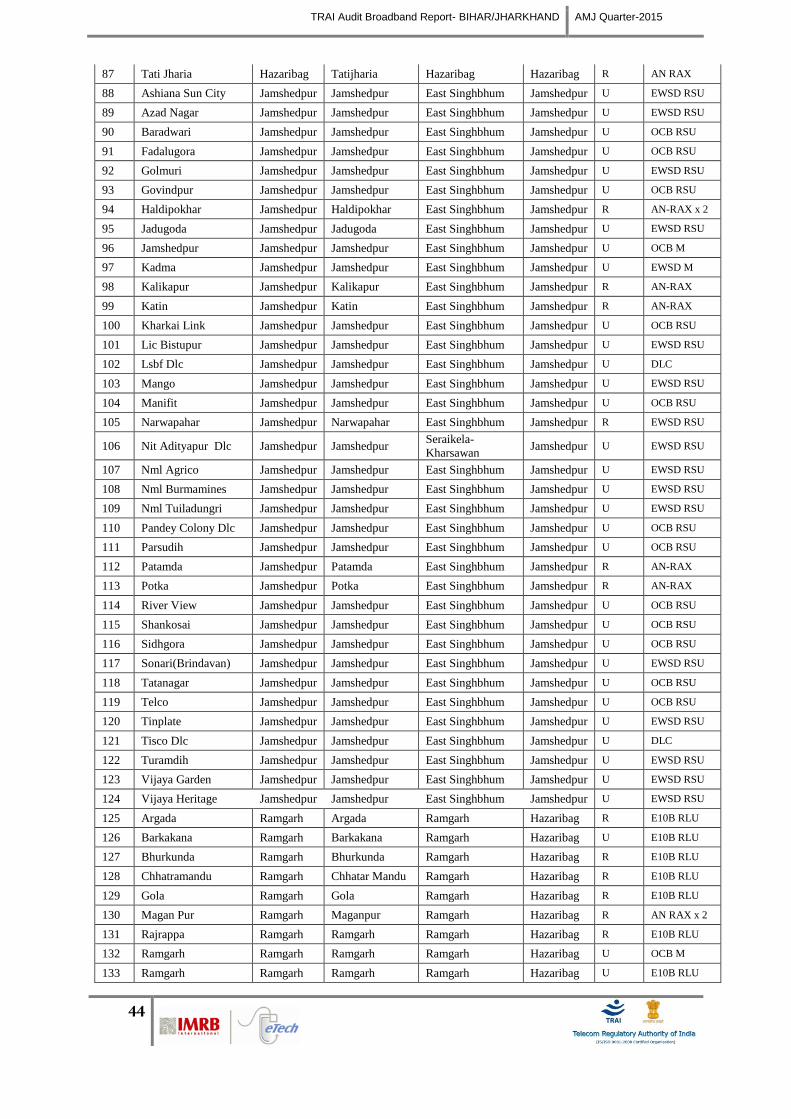
TRAI Audit Broadband Report- BIHAR/JHARKHAND AMJ Quarter-2015
44
87 Tati Jharia Hazaribag Tatijharia Hazaribag Hazaribag R AN RAX
88 Ashiana Sun City Jamshedpur Jamshedpur East Singhbhum Jamshedpur U EWSD RSU
89 Azad Nagar Jamshedpur Jamshedpur East Singhbhum Jamshedpur U EWSD RSU
90 Baradwari Jamshedpur Jamshedpur East Singhbhum Jamshedpur U OCB RSU
91 Fadalugora Jamshedpur Jamshedpur East Singhbhum Jamshedpur U OCB RSU
92 Golmuri Jamshedpur Jamshedpur East Singhbhum Jamshedpur U EWSD RSU
93 Govindpur Jamshedpur Jamshedpur East Singhbhum Jamshedpur U OCB RSU
94 Haldipokhar Jamshedpur Haldipokhar East Singhbhum Jamshedpur R AN-RAX x 2
95 Jadugoda Jamshedpur Jadugoda East Singhbhum Jamshedpur U EWSD RSU
96 Jamshedpur Jamshedpur Jamshedpur East Singhbhum Jamshedpur U OCB M
97 Kadma Jamshedpur Jamshedpur East Singhbhum Jamshedpur U EWSD M
98 Kalikapur Jamshedpur Kalikapur East Singhbhum Jamshedpur R AN-RAX
99 Katin Jamshedpur Katin East Singhbhum Jamshedpur R AN-RAX
100 Kharkai Link Jamshedpur Jamshedpur East Singhbhum Jamshedpur U OCB RSU
101 Lic Bistupur Jamshedpur Jamshedpur East Singhbhum Jamshedpur U EWSD RSU
102 Lsbf Dlc Jamshedpur Jamshedpur East Singhbhum Jamshedpur U DLC
103 Mango Jamshedpur Jamshedpur East Singhbhum Jamshedpur U EWSD RSU
104 Manifit Jamshedpur Jamshedpur East Singhbhum Jamshedpur U OCB RSU
105 Narwapahar Jamshedpur Narwapahar East Singhbhum Jamshedpur R EWSD RSU
106 Nit Adityapur Dlc Jamshedpur Jamshedpur Seraikela-
Kharsawan Jamshedpur U EWSD RSU
107 Nml Agrico Jamshedpur Jamshedpur East Singhbhum Jamshedpur U EWSD RSU
108 Nml Burmamines Jamshedpur Jamshedpur East Singhbhum Jamshedpur U EWSD RSU
109 Nml Tuiladungri Jamshedpur Jamshedpur East Singhbhum Jamshedpur U EWSD RSU
110 Pandey Colony Dlc Jamshedpur Jamshedpur East Singhbhum Jamshedpur U OCB RSU
111 Parsudih Jamshedpur Jamshedpur East Singhbhum Jamshedpur U OCB RSU
112 Patamda Jamshedpur Patamda East Singhbhum Jamshedpur R AN-RAX
113 Potka Jamshedpur Potka East Singhbhum Jamshedpur R AN-RAX
114 River View Jamshedpur Jamshedpur East Singhbhum Jamshedpur U OCB RSU
115 Shankosai Jamshedpur Jamshedpur East Singhbhum Jamshedpur U OCB RSU
116 Sidhgora Jamshedpur Jamshedpur East Singhbhum Jamshedpur U OCB RSU
117 Sonari(Brindavan) Jamshedpur Jamshedpur East Singhbhum Jamshedpur U EWSD RSU
118 Tatanagar Jamshedpur Jamshedpur East Singhbhum Jamshedpur U OCB RSU
119 Telco Jamshedpur Jamshedpur East Singhbhum Jamshedpur U OCB RSU
120 Tinplate Jamshedpur Jamshedpur East Singhbhum Jamshedpur U EWSD RSU
121 Tisco Dlc Jamshedpur Jamshedpur East Singhbhum Jamshedpur U DLC
122 Turamdih Jamshedpur Jamshedpur East Singhbhum Jamshedpur U EWSD RSU
123 Vijaya Garden Jamshedpur Jamshedpur East Singhbhum Jamshedpur U EWSD RSU
124 Vijaya Heritage Jamshedpur Jamshedpur East Singhbhum Jamshedpur U EWSD RSU
125 Argada Ramgarh Argada Ramgarh Hazaribag R E10B RLU
126 Barkakana Ramgarh Barkakana Ramgarh Hazaribag U E10B RLU
127 Bhurkunda Ramgarh Bhurkunda Ramgarh Hazaribag R E10B RLU
128 Chhatramandu Ramgarh Chhatar Mandu Ramgarh Hazaribag R E10B RLU
129 Gola Ramgarh Gola Ramgarh Hazaribag R E10B RLU
130 Magan Pur Ramgarh Maganpur Ramgarh Hazaribag R AN RAX x 2
131 Rajrappa Ramgarh Ramgarh Ramgarh Hazaribag R E10B RLU
132 Ramgarh Ramgarh Ramgarh Ramgarh Hazaribag U OCB M
133 Ramgarh Ramgarh Ramgarh Ramgarh Hazaribag U E10B RLU

TRAI Audit Broadband Report- BIHAR/JHARKHAND AMJ Quarter-2015
45
134 River Side
Bhurkunda Ramgarh River Side Ramgarh Hazaribag R AN RAX x 3
135 Saoundadih Ramgarh Saunda 'D' Ramgarh Hazaribag R AN RAX x 2
136 Sayal Ramgarh Sayal Ramgarh Hazaribag R E10B RLU
137 A.Nagar Ranchi Ranchi Ranchi Ranchi U EWSD RSU
138 Bariatu Ranchi Ranchi Ranchi Ranchi U OCB M
139 Bit Ranchi Ranchi Ranchi Ranchi U EWSD RSU
140 Ccl Ranchi Ranchi Ranchi Ranchi U OCB RSU
141 Chutia Ranchi Ranchi Ranchi Ranchi U EWSD RSU
142 Cmpdil Ranchi Ranchi Ranchi Ranchi U EWSD RSU
143 Devi Mandap Ranchi Ranchi Ranchi Ranchi U EWSD RSU
144 Dhurwa Ranchi Ranchi Ranchi Ranchi U E10B RLU
145 Dhurwa Ranchi Ranchi Ranchi Ranchi U EWSD RSU
146 Dhurwa Bus St. Ranchi Ranchi Ranchi Ranchi U EWSD RSU
147 Dhurwa Bus Stand Ranchi Ranchi Ranchi Ranchi U E10B RLU
148 Dhurwa/Sect-Ii Ranchi Ranchi Ranchi Ranchi U EWSD M
149 Govt Polytech Ranchi Ranchi Ranchi Ranchi U EWSD RSU
150 Harmu Ranchi Ranchi Ranchi Ranchi U EWSD RSU
151 Hinoo Ranchi Ranchi Ranchi Ranchi U E10B RLU
152 Hinoo Ranchi Ranchi Ranchi Ranchi U EWSD RSU
153 Kadru Ranchi Ranchi Ranchi Ranchi U EWSD RSU
154 Kanke Ranchi Ranchi Ranchi Ranchi U OCB RSU
155 Kantatoli Ranchi Ranchi Ranchi Ranchi U OCB RSU
156 Kathal More Ranchi Ranchi Ranchi Ranchi U EWSD RSU
157 Khelgaon Ranchi Ranchi Ranchi Ranchi U EWSD RSU
158 Kokar Ranchi Ranchi Ranchi Ranchi U OCB RSU
159 Lalpur Ranchi Ranchi Ranchi Ranchi U OCB RSU
160 Mecon Ranchi Ranchi Ranchi Ranchi U EWSD RSU
161 Mesra Ranchi Ranchi Ranchi Ranchi U EWSD RSU
162 Morabadi Ranchi Ranchi Ranchi Ranchi U EWSD RSU
163 Nagri Ranchi Nagri Ranchi Ranchi R AN RAX x 2
164 Namkum Ranchi Ranchi Ranchi Ranchi U EWSD RSU
165 Nayasarai Ranchi Nayasarai Ranchi Ranchi R AN RAX x 2
166 Nepal House Ranchi Ranchi Ranchi Ranchi U EWSD RSU
167 Nifft Ranchi Ranchi Ranchi Ranchi U EWSD RSU
168 Ormanjhi Ranchi Ormanjhi Ranchi Ranchi R EWSD RSU
169 P& T Colony Ranchi Ranchi Ranchi Ranchi U OCB RSU
170 Pandra Ranchi Ranchi Ranchi Ranchi U OCB RSU
171 Pithoria Ranchi Pithoria Ranchi Ranchi R AN RAX x 2
172 Ranchi Ranchi Ranchi Ranchi Ranchi U EWSD M
173 Ranibagan Ranchi Ranchi Ranchi Ranchi U OCB RSU
174 Ratu Ranchi Ratu Ranchi Ranchi U EWSD RSU
175 Ratu Road Ranchi Ranchi Ranchi Ranchi U EWSD RSU
176 Rttc Ranchi Ranchi Ranchi Ranchi U EWSD RSU
177 Sainik Market Ranchi Ranchi Ranchi Ranchi U EWSD RSU
178 Shyamali Ranchi Ranchi Ranchi Ranchi U EWSD RSU
179 Tatisilwai Ranchi Ranchi Ranchi Ranchi U EWSD RSU
180 Tupudana Ranchi Ranchi Ranchi Ranchi U EWSD RSU

TRAI Audit Broadband Report- BIHAR/JHARKHAND AMJ Quarter-2015
46
5.11 SAMPLE LIST OF SDCA WISE EXCHANGES (BIHAR)
S.N. NAME OF EXCH. CDR CODE SDCA AREA TECH. SWITCH EXCH.CAT.
1 Akhgaon Arhakg Ara Rural C-DOT ANRAX
2 Azimabad Arhazb Ara Rural C-DOT ANRAX
3 Babura Arhbab Ara Rural C-DOT ANRAX
4 Barhara Arhbrh Ara Rural C-DOT ANRAX
5 Dhobha Bazar Arhdbh Ara Rural C-DOT ANRAX
6 Jamalpur Arhjml Ara Rural C-DOT ANRAX
7 Pawna Arhpwn Ara Rural C-DOT ANRAX
8 Sahar Arhshr Ara Rural C-DOT ANRAX
9 Saraiya Arhsry Ara Rural C-DOT ANRAX
10 Udwant Nagar Arhudn Ara Rural C-DOT ANRAX
11 Ara Arharh Ara Urban EWSD MAIN
12 Maharaja Hata Arharm Ara Urban EWSD RSU
13 Ara Kachhery Arharo Ara Urban EWSD RSU
14 Sapana Cinema Arhars Ara Urban EWSD RSU
15 Narhi Chandi Arhchd Ara Rural EWSD RSU
16 Gidha Arhgha Ara Rural EWSD RSU
17 Gajrajganj Arhgjr Ara Rural EWSD RSU
18 Koilwar Arhkwa Ara Urban EWSD RSU
19 Narainpur Arhnyr Ara Rural EWSD RSU
20 Sandesh Arhsnd Ara Rural EWSD RSU
21 Dariyapur Bgpdrp Bhagalpur Rural C-DOT AN RAX
22 Fatehpur Bgpftp Bhagalpur Rural C-DOT AN RAX
23 Khiribandh Bgpkbd Bhagalpur Rural OCB AN RAX
24 Kodanda Bgpkdn Bhagalpur Rural C-DOT AN RAX
25 Pithna Bgpptn Bhagalpur Rural OCB AN RAX
26 Raghuchak Bgprgk Bhagalpur Rural C-DOT AN RAX
27 Shahkund Bgpskd Bhagalpur Rural C-DOT AN RAX
28 Tilkamanjhi Bgptmj Bhagalpur Urban NGN LMG
29 Zero Mile Bgpzme Bhagalpur Rural C-DOT AN RAX
30 Kajraili Bgpkaj Bhagalpur Rural C-DOT AN RAX
31 Bhagalpur-1 Bgpbgp Bhagalpur Urban OCB MAIN
32 Akabarnagar Bgpakb Bhagalpur Rural C-DOT AN RAX
33 Mirjanhat Bgpmht Bhagalpur Urban OCB RSU
34 Nath Nagar Bgpnth Bhagalpur Urban OCB RSU
35 Puraini Bgpprn Bhagalpur Rural OCB RSU
36 Sarai Bgpsar Bhagalpur Urban C-DOT RSU
37 Sabour Bgpsbr Bhagalpur Rural OCB RSU
38 Sultanganj Bgpstg Bhagalpur Urban OCB RSU
39 Doriganj Chpdrj Chapra Rural C-DOT AN RAX
40 Gudari Chpgdi Chapra Rural OCB AN RAX
41 Garkha Chpgka Chapra Rural C-DOT AN RAX
42 Khairah Chpkha Chapra Rural C-DOT AN RAX
43 Kopa Chpkop Chapra Rural C-DOT AN RAX
44 Maker Chpmkr Chapra Rural C-DOT AN RAX
45 Naini Chpnni Chapra Rural C-DOT AN RAX
46 Parsa Chppsa Chapra Rural C-DOT AN RAX
47 Revilganj Chprvj Chapra Rural C-DOT AN RAX
48 Sarha Dhala Chpsdh Chapra Rural OCB AN RAX

TRAI Audit Broadband Report- BIHAR/JHARKHAND AMJ Quarter-2015
47
49 Bheldi Chpbdi Chapra Rural C-DOT C-RSU
50 Chapra Chpchp Chapra Urban OCB MAIN
51 Chapra-1 Chapra Urban C-DOT MAIN
52 Basant Chpbsn Chapra Rural OCB RSU
53 Andama Dbnand Darbhanga Rural C-DOT AN RAX
54 Baghoul Dbnbgl Darbhanga Rural C-DOT AN RAX
55 Baghant Dbnbgt Darbhanga Rural C-DOT AN RAX
56 Bairampur Dbnbmp Darbhanga Rural C-DOT AN RAX
57 Bhuskaul Dbnbsk Darbhanga Rural C-DOT AN RAX
58 Hathauri Dbnhtr Darbhanga Rural C-DOT AN RAX
59 Kansi Dbnkns Darbhanga Rural C-DOT AN RAX
60 Khutwara Dbnktw Darbhanga Rural C-DOT AN RAX
61 Manigachi Dbnmgc Darbhanga Rural C-DOT AN RAX
62 Nehra Dbnnhr Darbhanga Rural C-DOT AN RAX
63 Paghari Dbnpgi Darbhanga Rural C-DOT AN RAX
64 Purkhopatty Dbnppi Darbhanga Rural C-DOT AN RAX
65 Sakatpur Dbnskp Darbhanga Rural C-DOT AN RAX
66 T. Sarai Dbntar Darbhanga Rural C-DOT AN RAX
67 Ughara Dbnuga Darbhanga Rural C-DOT AN RAX
68 Ujan Dbnujn Darbhanga Rural C-DOT AN RAX
69 Kusothar Dbnkus Darbhanga Rural C-DOT CRSU
70 Darbhanga-Ewsd Dbndbn Darbhanga Urban EWSD MAIN
71 Baheri Dbnbhr Darbhanga Rural EWSD RSU
72 Bhalpatty Dbnbpt Darbhanga Rural EWSD RSU
73 Bithauli Dbnbtl Darbhanga Rural EWSD RSU
74 Surhachhati Dbnsci Darbhanga Rural EWSD RSU
75 Bela Darbhanga Urban EWSD RSU
76 Laheriasarai Darbhanga Urban EWSD RSU
77 Laxmisagar Darbhanga Urban EWSD RSU
78 Barhi Dbnbrh Darbhanga Rural EWSD RSU
79 Sonki Dbnski Darbhanga Rural C-DOT AN RAX
80 Barun Gyabrn Aurangabad Rural C-DOT AN RAX
81 Bharthauli Gyabtl Aurangabad Rural C-DOT AN RAX
82 Deo Gyadeo Aurangabad Rural C-DOT AN RAX
83 Jamhore Gyajmr Aurangabad Rural C-DOT AN RAX
84 Pawai Gyapwi Aurangabad Rural C-DOT AN RAX
85 Siris Gyasrs Aurangabad Rural C-DOT AN RAX
86 Aurangabad Gyaaud Aurangabad Urban C-DOT MAIN
87 Anti Gyaati Gaya Rural C-DOT AN RAX
88 Chakand Gyackd Gaya Urban OCB AN RAX
89 Cherki Bazar Gyacki Gaya Rural C-DOT AN RAX
90 Delha Gyadlh Gaya Urban C-DOT AN RAX
91 G.Mahal Gaya Gyagml Gaya Rural C-DOT AN RAX
92 Guraru Gyagra Gaya Rural C-DOT AN RAX
93 Jamune Gyajmn Gaya Urban C-DOT AN RAX
94 Konch Gyaknh Gaya Rural C-DOT AN RAX
95 Mau Gyamow Gaya Rural C-DOT AN RAX
96 Paibigha Gyapba Gaya Rural C-DOT AN RAX
97 Paraiya Gyapra Gaya Rural C-DOT AN RAX
98 Tekari Gyatkr Gaya Rural C-DOT AN RAX
99 Maranpur Gaya Gyamrp Gaya Rural C-DOT AN RAX
100 Gaya, Ocb Gyagya Gaya Urban OCB MAIN
101 Bodh Gaya Gyabgy Gaya Urban OCB RSU

TRAI Audit Broadband Report- BIHAR/JHARKHAND AMJ Quarter-2015
48
102 Belaganj Gyablj Gaya Rural OCB RSU
103 Anmch,Gaya Gyamgy Gaya Urban OCB RSU
104 Manpur Gyamnp Gaya Urban NGN LMG
105 Maranpur Gyamrp Gaya Rural
106 Madarna Hajmdn Hajipur Rural C-DOT VAISHALI
107 Malang Hajmlg Hajipur Rural C-DOT VAISHALI
108 Husaina Ragho Hajhur Hajipur Rural C-DOT VAISHALI
109 Sirs Ram Rai Hajsrr Hajipur Rural C-DOT VAISHALI
110 Hajipur Main Hajhzp Hajipur Urban OCB VAISHALI
111 Belsar Hajbel Hajipur Rural OCB VAISHALI
112 Bhagwanpur Hajbgw Hajipur Rural OCB VAISHALI
113 Ghataro Hajgtr Hajipur Rural OCB VAISHALI
114 Lalganj Hajlgi Hajipur Rural OCB VAISHALI
115 Fulhara Hajplr Hajipur Rural OCB VAISHALI
116 Sarai Hajsri Hajipur Rural OCB VAISHALI
117 Vaishali Hajvsl Hajipur Rural OCB VAISHALI
118 Hajipur Sbi Hajipur Urban OCB VAISHALI
119 Hajipur Bzrs Hajipur Urban OCB VAISHALI
120 Muzaffarpur-1 Mzpmze Muzaffarpur Urban NGN LMG
121 Ratwara Mzprtw Muzaffarpur Urban OCB MAIN
122 Aurai Mzpari Muzaffarpur Rural OCB RSU
123 Baghi Mzpbag Muzaffarpur Rural C-DOT RSU
124 Benibad Mzpbbd Muzaffarpur Rural C-DOT RSU
125 Bochahan Mzpboc Muzaffarpur Rural C-DOT RSU
126 Berai Mzpbri Muzaffarpur Rural C-DOT RSU
127 Dubha Mzpdbh Muzaffarpur Rural C-DOT RSU
128 Dholi Mzpdli Muzaffarpur Rural OCB RSU
129 Dardha Mzpdrd Muzaffarpur Rural C-DOT RSU
130 Gaighat Mzpght Muzaffarpur Rural C-DOT RSU
131 Jajuar Mzpjaj Muzaffarpur Rural C-DOT RSU
132 Jamalabad Mzpjam Muzaffarpur Rural C-DOT RSU
133 Janaar Mzpjnr Muzaffarpur Rural C-DOT RSU
134 Kerma Mzpkrm Muzaffarpur Rural C-DOT RSU
135 Katra Mzpktr Muzaffarpur Rural C-DOT RSU
136 Kurhani Mzpkur Muzaffarpur Rural C-DOT RSU
137 Mit Muz Mzpmit Muzaffarpur Urban OCB RSU
138 Minapur Mzpmnp Muzaffarpur Rural OCB RSU
139 Mithanpura Mzpmth Muzaffarpur Urban NGN LMG
140 Narma Mzpnrm Muzaffarpur Rural C-DOT RSU
141 Pachdahi Mzppdh Muzaffarpur Rural C-DOT RSU
142 Piar Mzpper Muzaffarpur Rural C-DOT RSU
143 Ramnagar Mzprmn Muzaffarpur Rural C-DOT RSU
144 Sarfuddinpur Mzpsfp Muzaffarpur Rural OCB RSU
145 Siho Mzpsih Muzaffarpur Rural C-DOT RSU
146 Tengraha Mzptng Muzaffarpur Rural C-DOT RSU
147 Tengrari Mzptrr Muzaffarpur Rural C-DOT RSU
148 Turki Mzptur Muzaffarpur Rural C-DOT RSU
149 Bhagwanpur Mz Mzpmbg Muzaffarpur Urban C-DOT RSU
150 Ahiyapur Mzpmza Muzaffarpur Urban OCB RSU
151 Cdot Main Mzp Mzpmzm Muzaffarpur Urban CDOT MAIN
152 Budhkara Mzpbud Muzaffarpur Rural
153 Airforce Bihta Patafb Danapur Rural C-DOT AN RAX
154 Neora Patneo Danapur Rural CDOT ANRAX

TRAI Audit Broadband Report- BIHAR/JHARKHAND AMJ Quarter-2015
49
155 Danapur Patdnr Danapur Urban EWSD MAIN
156 Bihta Patbta Danapur Rural EWSD RSU
157 Dayalchak Patdac Danapur Rural C-DOT AN RAX
158 Khagaul Patkhg Danapur Urban EWSD RSU
159 Lai Patlai Danapur Rural C-DOT AN RAX
160 Maner Patmnr Danapur Urban EWSD RSU
161 Painal Patpnl Danapur Rural C-DOT AN RAX
162 Ranjan Path Patrjp Danapur Urban EWSD RSU
163 Sherpur Patsrp Danapur Rural EWSD RSU
164 Beldarichak Patbdc Patna Rural C-DOT AN RAX
165 Dhanurwa Patdhr Patna Rural C-DOT AN RAX
166 Faridpur Patfrp Patna Rural C-DOT AN RAX
167 Nadaul Patndl Patna Rural C-DOT AN RAX
168 Simra Patsim Patna Rural C-DOT AN RAX
169 Sonmai Patson Patna Rural C-DOT AN RAX
170 Kankarbagh Patkhb Patna Urban OCB MAIN
171 Patliputra Patphc Patna Urban OCB MAIN
172 Patel Nagar Patpnr Patna Urban EWSD MAIN
173 Patna City Patptc Patna Urban EWSD MAIN
174 Patna Patptm Patna Urban EWSD MAIN
175 Rajendra Nagar Patrnr Patna Urban EWSD MAIN
176 Patna-1 Patna Urban OCB MAIN
177 Antaghat Patagt Patna Urban EWSD RSU
178 Ah Complex Patahc Patna Urban OCB RSU
179 Ashok Nagar Patakn Patna Urban OCB RSU
180 Anishabad Patanb Patna Urban OCB RSU
181 Asiana Nagar Patasn Patna Urban OCB RSU
182 Bahadurpur Hc Patbhc Patna Urban OCB RSU
183 Digha Patdig Patna Urban OCB RSU
184 Daniawan Patdnw Patna Rural EWSD RSU
185 Fatuha Patftw Patna Urban EWSD RSU
186 Govind Mitra Rd. Patgmr Patna Urban EWSD RSU
187 Gardanibagh Patgnb Patna Urban NGN LMG
188 Gandhi Setu Patgst Patna Urban EWSD RSU
189 Gulzarbagh Patgzb Patna Urban OCB RSU
190 Harding Road,38 Pathdr Patna Urban C-DOT AN RAX
191 Hanumannagar Pathmn Patna Urban OCB RSU
192 Kidwaipuri Patkdi Patna Urban OCB RSU
193 Khajpura Patkhj Patna Urban OCB RSU
194 Khemnichak Patkmk Patna Urban EWSD RSU
195 Khetan Market Patktm Patna Urban EWSD RSU
196 Katra Patktr Patna Urban EWSD RSU
197 Khusrupur Patkuu Patna Urban EWSD RSU
198 Laxmi Nurshing Home
Patlnh Patna Urban OCB RSU
199 Mahendru Patmhd Patna Urban EWSD RSU
200 Masaurhi Patmrh Patna Urban EWSD RSU
201 Mithapur Patmtp Patna Urban EWSD RSU
202 N.P.Centre Patnpc Patna Urban EWSD RSU
203 Nala Road Patnrd Patna Urban EWSD RSU
204 Punaichak Patpck Patna Urban EWSD RSU
205 Phulwarisharif Patphl Patna Urban OCB RSU
206 Punpun Patpnp Patna Rural EWSD RSU

TRAI Audit Broadband Report- BIHAR/JHARKHAND AMJ Quarter-2015
50
207 Patna University Patpuc Patna Urban EWSD RSU
208 Rajendra Nagar-1 Patraj Patna Urban OCB RSU
209 R'block (Ptd) Patrbl Patna Urban OCB RSU
210 Raja Bazar Patrjb Patna Urban EWSD RSU
211 Ram Krishna Nagar Patrkn Patna Urban OCB RSU
212 Rajeev Nagar Patrvn Patna Urban OCB RSU
213 Sbi Patsbi Patna Urban EWSD RSU
214 Sabalpur Patsbp Patna Urban EWSD RSU
215 Sampatchak Patsam Patna Rural EWSD RSU
216 Secretariate Old Patsct Patna Urban EWSD RSU
217 North S. K. Puri Patskn Patna Urban OCB RSU
218 South S.K. Puri Patskp Patna Urban EWSD RSU
219 Super Market Patspm Patna Urban EWSD RSU
220 Sipara Patspr Patna Urban EWSD RSU
221 Sudama Complex Patsud Patna Urban OCB RSU
222 Shivam Complex Patsvm Patna Urban OCB RSU
223 Vidyut Bhawan Patvdt Patna Urban OCB RSU
224 Vetinary College Patvtc Patna Urban OCB RSU
225 Windsor Hotel Patwdr Patna Urban EWSD RSU
226 Walmi Patwmi Patna Rural EWSD RSU
227 Rajendra Path Patraj Patna Urban EWSD RSU
228 Digha Patdha Patna Urban OCB RSU
229 Vigrahpur Patvgp Patna Rural OCB C-RSU
230 Rbi Patna Urban ANRAX DLC
231 Super Market Patspm Patna Urban EWSD RSU
232 Sipara Patspr Patna Urban EWSD RSU
233 Sudama Complex Patsud Patna Urban OCB RSU
234 Shivam Complex Patsvm Patna Urban OCB RSU
235 Vidyut Bhawan Patvdt Patna Urban OCB RSU
236 Vetinary College Patvtc Patna Urban OCB RSU
237 Windsor Hotel Patwdr Patna Urban EWSD RSU
238 Walmi Patwmi Patna Rural EWSD RSU
239 Rajendra Path Patraj Patna Urban EWSD RSU
240 Digha Patdha Patna Urban OCB RSU
241 Vigrahpur Patvgp Patna Rural OCB C-RSU
242 Rbi Patna Urban ANRAX DLC
243 Mathurapur Sammtp Samastipur Urban C-DOT RSU
244 Pusa Sampus Samastipur Rural C-DOT RSU
245 Ragunathpurbela Samrbl Samastipur Rural C-DOT RSU
246 Siripur Gahar Samsgr Samastipur Rural C-DOT RSU
247 Sajanpur Samsjp Samastipur Rural C-DOT RSU
248 Sonsa Samsns Samastipur Rural C-DOT RSU
249 Sadipursimraha Samsps Samastipur Rural C-DOT RSU
250 Tajpur Samtjp Samastipur Rural C-DOT RSU
251 Waini Samwni Samastipur Rural C-DOT RSU
252 Warisnagar Samwsr Samastipur Rural C-DOT RSU

TRAI Audit Broadband Report- BIHAR/JHARKHAND AMJ Quarter-2015
51
SCO 47, 5th
Floor, Old Judicial Complex, Sector 15
Part 1, Gurgaon, Haryana – 122001
+91 (124) 4217300
www.imrbint.com