Winter 2011 Gems & Gemology - GIA
102
VOLUME XLVII Dyed Purple Ethiopian Opal Garnet Composition from Gem Properties Symmetry Boundaries for Round Brilliants Odontolite in Antique Jewelry Safety of Irradiated Blue Topaz WINTER 2011 THE QUARTERLY JOURNAL OF THE GEMOLOGICAL INSTITUTE OF AMERICA W 2011 PAGES 259–336 VOLUME 47 NO. 4 GEMS & GEMOLOGY
-
Upload
khangminh22 -
Category
Documents
-
view
0 -
download
0
Transcript of Winter 2011 Gems & Gemology - GIA

VOLUME XLVII
Dyed Purple Ethiopian Opal
Garnet Composition from Gem Properties
Symmetry Boundaries for Round Brilliants
Odontolite in Antique Jewelry
Safety of Irradiated Blue Topaz
WINTER 2011
THE QUARTERLY JOURNAL OF THE GEMOLOGICAL INSTITUTE OF AMERICA
WIN
TER
2011PAGES259–336
VOLU
ME47
NO.4
GEM
S & G
EMO
LOG
Y

®
REGULAR FEATURES
Lab NotesFancy Vivid purple diamond • Strongly purple-colored black diamond • HPHT-treated diamondwith the fluorescence pattern of an HPHT-grown synthetic • Type IIb diamond with long phospho-rescence • Clarity-enhanced opal with artificial matrix • Ethiopian black opal • Coated bead-cul-tured freshwater pearls • Tenebrescent zircon
Gem News InternationalChondrodite from Tanzania • Blue dolomite from Colombia • Fluorite from Namibia • Common opalfrom Western Australia • A bicolor, bi-pattern hydrophane opal • Chatoyant quartz with cinnabarinclusions • Quartz with acicular emerald inclusions • Quartz with izoklakeite inclusions • Ruby andsapphire mining in Pakistan • Color-change sphene from Pakistan/Afghanistan • Cobalt blue–colored spinel from Vietnam • Trapiche spinel from Mogok, Myanmar • Non-nacreous “cat’s-eyepearls” • Large synthetic quartz • Sugar-acid treatment of opal from Wollo, Ethiopia • Conferencereports
Book Reviews/Gemological Abstracts Online Listing
pg. 262
pg. 287
Volume 47, No. 4Winter 2011
308
316
336
pg. 312
EDITORIAL
Great ExpectationsJan Iverson
FEATURE ARTICLES
Dyed Purple Hydrophane OpalNathan Renfro and Shane F. McClureEvidence indicates that opal with a vivid purple bodycolor, reportedly from anew deposit in Mexico, is actually dyed hydrophane from Ethiopia.
Determining Garnet Composition from Magnetic Susceptibility And Other PropertiesDonald B. HooverGarnet compositions derived from measurements of physical properties correspond closely with results obtained using chemical data.
GIA’s Symmetry Grading Boundaries for Round Brilliant Cut DiamondsRon H. Geurts, Ilene M. Reinitz, Troy Blodgett, and Al M. GilbertsonGIA’s boundary limits for 10 symmetry parameters, measured by optical scanners, will improve consistency in the symmetry grading of round brilliants.
NOTES & NEW TECHNIQUES
A Historic Turquoise Jewelry Set Containing Fossilized Dentine(Odontolite) and GlassMichael S. Krzemnicki, Franz Herzog, and Wei ZhouInvestigation of six antique brooches identifed most of their “turquoise” cabochons as odontolite.
RAPID COMMUNICATIONS
The Radioactive Decay Pattern of Blue Topaz Treated by Neutron IrradiationJian Zhang, Taijin Lu, Manjun Wang, and Hua ChenSome “London Blue” topaz contains radioactive trace impurities that may requireseveral years to reach a safe level.
Carat Points
272
286
296
302
260
259

Editor-in-Chief Editor and Technical Specialist Associate EditorJan Iverson Brendan M. Laurs Stuart D. [email protected] [email protected] [email protected]
Senior Manager, Editor, Gemological Abstracts Editors, Lab NotesCommunications Brendan M. Laurs Thomas M. MosesAmanda Luke Shane F. McClure
Editor, Gem News Contributing Editor Editors, Book ReviewsInternational James E. Shigley Susan B. JohnsonBrendan M. Laurs Jana E. Miyahira-Smith
Circulation Coordinator Editor-in-Chief EmeritusMartha Rivera Alice S. Keller(760) 603-4000, ext. [email protected]
EDITORIALSTAFF
SUBSCRIPTIONS
MANUSCRIPTSUBMISSIONS
COPYRIGHTAND REPRINTPERMISSIONS
Copies of the current issue may be purchased for $29.95 plus shipping. Online subscriptions are $74.95 for one year (4 issues).Combination print + online subscriptions are $139.95 in the U.S. and $160 elsewhere for one year. Canadian subscribers shouldadd GST. Discounts are available for group subscriptions, renewals, GIA alumni, and current GIA students. For institutionalrates, contact the Associate Editor. Subscriptions include G&G’s monthly gemological e-newsletter, the G&G eBrief.To purchase subscriptions and single issues (print or PDF), visit store.gia.edu or contact the Circulation Coordinator.PDF versions of individual articles and sections from Spring 1981 forward can be purchased at gia.metapress.com for $12each. Visit gia.edu/gandg for free online access to the 1934–2010 subject and author index and all 1934–1980 issues.
Gems & Gemology’s five-year impact factor (for 2005–2009) is 1.737, according to the 2010 Thomson Reuters JournalCitation Reports (issued June 2011). Gems & Gemology is abstracted in Thomson Reuters products (Current Contents:Physical, Chemical & Earth Sciences and Science Citation Index—Expanded, including the Web of Knowledge) and otherdatabases. For a complete list of sources abstracting G&G, go to gia.edu/gandg.
Gems & Gemology welcomes the submission of articles on all aspects of the field. Please see the Guidelines for Authors atgia.edu/gandg or contact the Editor. Letters on articles published in Gems & Gemology are also welcome.
Abstracting is permitted with credit to the source. Libraries are permitted to photocopy beyond the limits of U.S. copyright lawfor private use of patrons. Instructors are permitted to photocopy isolated articles for noncommercial classroom use withoutfee. Copying of the photographs by any means other than traditional photocopying techniques (Xerox, etc.) is prohibited with-out the express permission of the photographer (where listed) or author of the article in which the photo appears (where no pho-tographer is listed). For other copying, reprint, or republication permission, please contact the Editor.
Gems & Gemology is published quarterly by the Gemological Institute of America, a nonprofit educational organiza-tion for the gem and jewelry industry.Postmaster: Return undeliverable copies of Gems & Gemology to GIA, The Robert Mouawad Campus, 5345 Armada Drive,Carlsbad, CA 92008. Our Canadian goods and service registration number is 126142892RT.Any opinions expressed in signed articles are understood to be opinions of the authors and not of the publisher.
Ahmadjan AbduriyimTokyo, Japan
Shigeru AkamatsuTokyo, Japan
Edward W. BoehmChattanooga, Tennessee
James E. ButlerWashington, DC
Alan T. CollinsLondon, UK
John L. EmmettBrush Prairie, Washington
Emmanuel Fritsch Nantes, France
Jaroslav HyršlPrague, Czech Republic
A. J. A. (Bram) JansePerth, Australia
E. Alan JobbinsCaterham, UK
Mary L. JohnsonSan Diego, California
Anthony R. KampfLos Angeles, California
Robert E. KaneHelena, Montana
Lore KiefertLucerne, Switzerland
Michael S. KrzemnickiBasel, Switzerland
Thomas M. MosesNew York, New York
Mark NewtonCoventry, UK
George R. RossmanPasadena, California
Kenneth ScarrattBangkok, Thailand
James E. ShigleyCarlsbad, California
Christopher P. SmithNew York, New York
Wuyi WangNew York, New York
Christopher M. WelbournReading, UK
PRODUCTIONSTAFF
EDITORIALREVIEW BOARD
Art Director Image Specialist G&G Online: Nanette Newbry Kevin Schumacher gia.metapress.comStudio 2055
The recent appearance of purple play-of-color opal, reportedly from a new deposit in Mexico, has heightened interest inthe origin and nature of this material. In this issue, Nathan Renfro and Shane McClure offer gemological and spectro-scopic evidence that this opal is actually dyed hydrophane from Ethiopia’s Wollo Province. The fine untreated Wolloopals on the cover consist of a 35.32 ct oval cabochon in the center courtesy of William Larson (Palagems.com,Fallbrook, California) surrounded by two pieces of rough (8.16 and 12.78 g) and four polished stones (6.95–32.55 ct)that are courtesy of David Artinian (Clear Cut Inc., Poway, California). Photos by Robert Weldon.
Color separations for Gems & Gemology are by Pacific Plus, Carlsbad, California. Printing is by Allen Press, Lawrence, Kansas.
GIA World Headquarters The Robert Mouawad Campus 5345 Armada Drive Carlsbad, CA 92008 USA
© 2011 Gemological Institute of America All rights reserved. ISSN 0016-626X
ABOUTTHE COVER
DATABASECOVERAGE
www.gia.edu/gandg

W e all have great expectations for 2012. I’ve gone a step furtherwith my New Year’s resolutions by creating a “goals” book.Not only do I write down my goals, but I also add details suchas how and when I will achieve them, and include pictures to
make it more visual.
So, what new things can you expect from Gems & Gemology in the yearahead? Our goal is to create an enhanced digital journal, one that offers amore interactive experience for our online audience, in support of what wealready do. Digital is changing the way information is consumed, and it pro-vides a unique opportunity to reinvent the way we engage with you, ourreaders. Digital is beyond relevant: It is the future.
But first we finish 2011. Our final issue of the year includes a report by GIAresearchers on a new purple opal that’s been hitting the market. Although itwas reportedly natural material from Mexico, gemological investigation identified it as dyed opal
from Ethiopia. Because this hydro-phane opal can be very absorbent,we can expect to see many othertreatments applied to it.
Another piece by GIA researchersexamines symmetry parameters indiamond grading. Thanks to improve-
ments in measuring round brilliants with optical scanners, GIA can now evaluate symmetry moreconsistently. This measurement-based procedure will complement the visual assessment of symmetry,which is one of the components of GIA’s diamond cut grade.
We also feature a set of six antique brooches, apparently from the early- to mid-19th century, setwith light blue cabochons that were once thought to be turquoise. Analysis revealed that most ofthe supposed turquoise cabochons are actually fossilized dentine, also known as odontolite.
In this issue, we also highlight neutron-irradiated “London Blue” topaz. Some trace impurities inthis topaz become radioactive after neutron irradiation. The authors foundthat irradiated samples from China contained up to four of these radioac-tive impurities. Most of the samples were safe to handle 95 days after irra-diation, but others will require several years to reach a safe level.
I suspect that many of us, when we were younger, thought we’d be flyingaround in space pods by now instead of driving cars. Yet when the futurearrives, we find that technology never changes as fast as our minds imag-ined it! As we progress in our digital offerings, we are going to keep it sim-ple by delivering relevant content in innovative ways.
In 2012, I hope you achieve your goals and meet your expectations.
Cheers,
EDITORIAL GEMS & GEMOLOGY WINTER 2011 259
GREAT EXPECTATIONS
Our goal is to create an enhanced digital journal, onethat offers a more interactive experience for our onlineaudience, in support of what we already do.
Jan Iverson | Editor-in-Chief | [email protected]

Nathan Renfro and Shane F. McClure
260 DYED PURPLE OPAL GEMS & GEMOLOGY WINTER 2011
See end of article for About the Authors and Acknowledgments.GEMS & GEMOLOGY, Vol. 47, No. 4, pp. 260–270,http://dx.doi.org/10.5741/GEMS.47.4.260.© 2011 Gemological Institute of America
DYED PURPLE HYDROPHANE OPAL
Opals with an unusual purple bodycolor and strong play-of-color have recently appeared in themarket. Reportedly from a new deposit in Mexico, they have a vivid bodycolor unlike that of anynatural play-of-color opal seen in the trade so far. This alone was enough to raise suspicion, andgemological and spectroscopic evidence indicates that the purple coloration is artificial. A com-parison of this purple opal with numerous samples from Ethiopia’s Wollo Province strongly sug-gests that it is actually dyed hydrophane opal from those deposits. Several previously undocu-mented characteristics of Wollo opals are described, including zeolite mineral inclusions.
Not often is a significant new deposit discov-ered of a well-known gem material. The1994 discovery of play-of-color opal in
Ethiopia’s Shewa Province sparked the industry’sattention. Unfortunately, much of this opal turnedout to be unstable, and spontaneous fracturing ren-dered it largely unusable for jewelry (Johnson et al.,1996). In 2008, another large Ethiopian deposit wasfound in the province of Wollo. While similar inappearance to some of the Shewa material, this opalappears to be much more stable than its predecessor(Rondeau et al., 2010). The 2011 Tucson show sawan abundant influx of beautiful and relatively inex-pensive opal from the Wollo deposit.
The new Ethiopian material displayed a propertynot often seen in opal. Much of the opal is hydro-phane, meaning it is very porous and easily absorbswater (or other liquids), often turning translucent ortransparent in the process. The degree to whichthese stones show this property varies, but someabsorb water so readily that the tiny bubbles escap-ing from their surface give the impression of efferves-cence. This property, while interesting to watch, also
has an important implication: Any gem materialthat absorbs liquids so easily has the potential to betreated by methods such as dyeing or impregnation.Recognizing this possibility, we performed severalexperiments to determine the effect of such treat-ments on this opal, before they appeared in the mar-ket. These experiments—which were surprisinglysuccessful—led us to believe that it would only be amatter of time until we encountered such treatedmaterial in the trade.
Indeed, in October 2011, we were presented withseveral samples of hydrophane opal that had a brightpurple bodycolor (not known to occur naturally inplay-of-color opal; e.g., figure 1), and our suspicionswere immediately raised (Renfro and McClure, 2011).In addition, these opals were said to be from a newsource in Mexico, but everything about them exceptthe color reminded us of Ethiopian opal from Wollo.
Purple opal has been reported from several locali-ties, including Mexico. However, all of the materialexamined to date was opaque (or at best translucent)and did not possess play-of-color. The purple in thesecommon opals has been attributed to inclusions offluorite (Fritsch et al., 2002).
While the color of the new play-of-color sampleswas said to be natural, the authenticity of any gemmaterial can only be proven through scientific analy-sis and observation. Our goal in this study is to

DYED PURPLE OPAL GEMS & GEMOLOGY WINTER 2011 261
answer two fundamental questions: Is this purpleopal naturally colored, and is it actually from a newdeposit in Mexico? This article also reports theresults of an experiment on the dyeing of hydro-phane opal from Wollo Province.
MATERIALS AND METHODSNine purple opal cabochons ranging from 4.13 to15.25 ct, and nine rough opal samples between 0.66and 1.96 g, were submitted for testing at GIA’sCarlsbad laboratory. Seven of the rough opals had apurple bodycolor of varying intensity, but one had adistinct green-blue bodycolor (0.76 g) and anotherwas light blue (0.93 g). Client permission wasobtained for potentially destructive testing on thesestones, as hydrophane opal will occasionally crackwhen soaked in liquid (author NR’s personal experi-ence). To expand our sample base, we subsequentlyborrowed 22 rough opals (0.57–3.96 g) from the samesource that submitted the purple cabochons. Theseranged from light to very dark purple, except forthree samples showing no visible purple color. Twoof the 22 samples also showed an amber color zone.We also examined approximately 2 kg of rough natu-ral hydrophane opal from Wollo (loaned from tworeputable sources who obtained them in Ethi opia)for comparison with the purple opal.
We performed standard gemological characteriza-tion of all cut samples (both dyed and natural) with aDuplex II refractometer, a desk-model spectroscope,a long- and short-wave 4 watt UV lamp, and a gemo-logical microscope. Inclusions were identified with aRenishaw InVia Raman microscope using a 514 nmargon-ion laser at a resolution of 1 cm−1.
Visible spectroscopy measurements were madeby soaking one purple opal cabochon and the green-blue piece of rough opal in acetone (with the client’spermission) for 54 hours, and then placing the ace-tone in standard 1 cm glass cuvettes for analysiswith a Perkin Elmer Lambda 950 spectrometer. Weused a data interval and slit width of 1 nm, and base-line correction was accomplished using a 1 cm glasscuvette filled with pure acetone. Spectroscopy wasnot performed directly on the opals themselves, inorder to eliminate interference from light scatter andthe intrinsic opal spectrum that would prevent usfrom making baseline-corrected measurements ofany dye present in the samples. Such measurementswere necessary for color analysis, as describedbelow.
From the absorption spectrum of the acetonesolutions, we calculated color space coordinates to
visually verify that the spectra collected were indeedresponsible for the samples’ coloration. Because ofthe very low absorption values of the solutions, theyneeded to be concentrated to visually resolve color.Since we could not physically concentrate our solu-tions and still have enough volume to fill thecuvettes, this was done artificially by multiplyingthe absorption values by a factor of 15. This methodis equivalent to a solute (dye) concentration 15 timesgreater than that in the original solutions due to thelinearity of absorption. The absorption values of theartificially “concentrated” acetone solutions wereconverted to transmission spectra using GRAMSspectroscopy software by Thermo; CIE L∗a∗b∗ colorspace coordinates were calculated using the GRAMScolor analysis application. These coordinates wereimported into Adobe Photoshop to produce colorsamples.
Figure 1. The purple bodycolor of this new opal, report-edly from Mexico, raised concerns about the origin ofthe material. Shown here are three rough samples rang-ing from 1.28 to 3.09 g and five cabochons weighing5.31–9.32 ct. Photo by Robert Weldon.
262 DYED PURPLE OPAL GEMS & GEMOLOGY WINTER 2011
Chemical analysis of 15 samples (seven untreatedwhite Wollo opals and eight purple samples) wasperformed using a Thermo X Series II ICP-MS with aNew Wave Research UP-213 laser ablation samplingsystem and a frequency-quintupled Nd:YAG laser(213 nm wavelength) with a 4 ns pulse width. Weused 55-µm-diameter ablation spots, a fluence ofaround 10 J/cm2, and a 7 Hz repetition rate. Quali -tative chemical analysis of two rough samples (onetreated and one untreated) showing black surfacematerial was also performed with a Thermo ARLQuant-X EDXRF system in a vacuum, utilizing nofilter at 4 kV and 1.98 mA, and a cellulose filter at 8kV and 1.98 mA.
As noted above, given the hydrophane characterof Wollo opal, it should be amenable to dyeing. Totest this, eight rough (0.17–1.42 g) and three cabo-chons (1.65–3.55 ct) of hydrophane opal from thepersonal collection of author NR were immersed invariously colored solutions prepared from Sharpiepermanent markers and acetone. The samples weresoaked for anywhere from several minutes to severalhours, depending on how rapidly the solution was
absorbed. After removal from the solution, the sam-ples were dried under a tensor lamp for several hoursuntil the acetone had completely evaporated.
RESULTS AND DISCUSSIONGemological Properties. All the opals provided by ourclient were clearly hydrophane, as they tended to feelsticky when handled, a result of the opal trying todraw moisture from the skin. The spot RI measure-ments of the nine purple opal cabochons ranged from1.37 to 1.41. The SG was between 1.70 and 1.77, asmeasured hydrostatically before allowing the stonesto completely soak full of water. All samples showeda very weak blue reaction to long- and short-waveUV radiation. A broadband absorption was seen inthe desk-model spectroscope from ~550 to 600 nm.
Magnification revealed octahedral to irregularlyshaped dark crystals of pyrite, tube-like inclusionsthat resembled fossilized plant matter, and cellularplay-of-color referred to as a “digit pattern” becauseof its resemblance to fingers (figure 2; Rondeau et al.,2010). The pattern consists of relatively large roundedcells separated by a thin network of potch (common
Figure 2. The purple opal (left, image width 7.8 mm) displayed a “digit” pattern of play-of-color anda cellular pattern of potch that had a greenish cast, much like natural Wollo opal (right, imagewidth 4.3 mm). Photomicrographs by S. F. McClure.
Figure 3. In many of thepurple opals, color con-
centrations were evidentin surface pits (left,
image width 2.2 mm),and on unpolished areas
(right, image width 2.4mm). Photomicrographs
by S. F. McClure.

DYED PURPLE OPAL GEMS & GEMOLOGY WINTER 2011 263
opal without play-of-color) that has a slightly green-ish appearance. Also seen in some samples were sub-tle purple color concentrations around pits, scratches,surface-reaching fractures, and sometimes on unpol-ished surfaces (figure 3). Some surface-reaching inclu-sions were also purple (figure 4). However, not all ofthe samples showed color concentrations.
Gem materials are often immersed in a liquid ofsimilar refractive index to see subtle internal fea-tures such as color zoning. This is particularly help-
ful with rough material. With opal, water serves asan adequate immersion liquid. One of the roughstones in the initial group had a light blue bodycolorand did not appear to be treated. We were quite sur-prised when immersion revealed a blue zone alongthe surface of the stone (figure 5). This type of sur-face-conformal coloration is indicative of color treat-ment in many gem materials, including beryllium-and titanium-diffused corundum, smoke-treatedopal, and dyed agate.
Spectroscopy of the Dye. No color was observed inthe acetone after soaking the purple sample for up
to 16 hours. After 54 hours, the acetone solutionappeared very light purple. Spectroscopy of thissample revealed a broad asymmetrical feature withan apparent maximum located at about 594 nm anda shoulder close to 557 nm (figure 6, top). This fea-ture was consistent with the broadband absorptionobserved in the desk-model spectroscope.
The CIE L∗a∗b∗ coordinates calculated usingGRAMS and Adobe Photoshop software yielded apurple color (figure 6, center), consistent with thebodycolor of the opal. This proved that the coloringagent of the purple opal can be partially removedwith acetone, and since we know of no naturallyoccurring coloring agent showing this behavior, weconcluded that the opals are colored by an artificiallyintroduced dye.
NEED TO KNOW
• In late 2011, purple opal showing strong play-of-color appeared in the market, reportedly from a new deposit in Mexico.
• The presence of a dye was indicated by soaking the opal in acetone for an extended period (54 hours), followed by spectroscopic processing of the solution that yielded a purple color consis-tent with the opal’s bodycolor.
• Physical, chemical, and microscopic properties of the purple opal overlap those of hydrophane opal from Ethiopia’s Wollo Province, except for the purple color.
• Dye experiments on Wollo hydrophane opal produced vivid bodycolors.
• Multiple lines of evidence indicate that the pur-ple opal is actually dyed Wollo hydrophane.
Figure 4. Surface-reaching inclusions in the purpleopals sometimes had a purple color. Those shown hereprobably consist of fossilized plant matter. Photo -micro graph by S. F. McClure; image width 3.1 mm.
Figure 5. Immersion of this light blue rough opal inwater showed a surface-conformal color layer, whichis indicative of treatment. Photomicrograph by N. Renfro; image width 9.5 mm.

264 DYED PURPLE OPAL GEMS & GEMOLOGY WINTER 2011
To better understand the absorption spectrum ofthe purple dye, we used the peak fitting applicationof GRAMS to resolve the individual features fromthe asymmetric absorption (figure 6, bottom). Thefull width at half maximum (FWHM) of the 557 nmfeature was 72 nm, and the FWHM of the 594 nmfeature was 36 nm. Processing of these componentspectra showed that the 557 nm feature was respon-sible for a purplish pink component, while the 594nm band contributed a blue component. The combi-nation of these purplish pink and blue features isresponsible for the purple color.
This dye extraction procedure was also applied tothe green-blue piece of rough (figure 7, inset). Afterthe opal had soaked in acetone for several hours, wemeasured the solution’s visible absorption. A broadband was recorded at 627 nm (figure 7); the calculat-ed color was again consistent with the opal’s body-color.
Comparison of Dyed Purple Opal to Wollo Hydro -phane. We compared the physical appearance, gemo-logical properties, and other analytical results for thedyed material with opals from Wollo Province toassess the original source of the treated opal and helpinvestigate claims of Mexican origin.
Gemological Properties. The RI and SG values of thedyed opal were virtually identical to those of Wolloopal. This is notable because both properties are par-
WAVELENGTH (nm)
AB
SOR
BAN
CE
(a.u
.)
VISIBLE ABSORPTION SPECTRUM
WAVELENGTH (nm)
% T
RA
NSM
ITTA
NC
E
TRANSMISSION SPECTRUM
500400 600 7000
20
40
60
80
100
557594
500 600 700400
0.01
0
0.02
0.03
0.04
0.05
0.06
0.07
557
594
WAVELENGTH (nm)
% T
RA
NSM
ITTA
NC
E
TRANSMISSION SPECTRUM
Red component
Blue component
500 600 700400
20
0
40
60
80
100
594
557
Figure 6. After a purple opal was soaked in acetone,the solution’s visible-range spectrum revealed a broadasymmetrical absorption feature (top). The absorptionfrom the artificially “concentrated” dye (center, trans-mission spectrum) generated a CIE L*a*b* colorspace coordinate consistent with the opal’s purplebodycolor. Two color components of the purple dyewere resolved from the transmission spectrum (bot-tom). The 557 nm feature produced the purplish pinkcomponent, and the 594 nm feature contributed theblue one.
WAVELENGTH (nm)
AB
SOR
BAN
CE
(a.u
.)VISIBLE ABSORPTION SPECTRUM
500 600 700400
0.2
0
0.4
0.6
0.8
1.2
1.0
627
Figure 7. A green-blue opal was also soaked in ace-tone, and spectroscopy of the solution revealed abroad absorption feature centered at 627 nm. The cor-responding color space coordinates yielded a colorsample consistent with the bodycolor of the sample.Inset photo by Robison McMurtry.

DYED PURPLE OPAL GEMS & GEMOLOGY WINTER 2011 265
ticularly low for play-of-color opal (Webster, 1996).Ultraviolet fluorescence was also very similarbetween the two (see also Rondeau et al., 2010).
Most opal is porous to a minor degree, but it isquite unusual for it to be so porous as to qualify ashydrophane. Both Wollo opal and the purple opal dis-play this property—sometimes it is so prominentthat the transparency can be seen to improve as itsoaks up water. Mexican hydrophane opal is known,but to our knowledge it is opaque and light pink orbrown (with or without play-of-color).
The structure of the play-of-color is also notewor-thy. Wollo opal sometimes displays an unusual“digit pattern” to its play-of-color that many consid-er unique to Ethiopian material (Rondeau et al.,2010). We observed this same pattern in some of the
purple opal. A similar pattern has been reported insome opal from Virgin Valley, Nevada, but it wassmaller and had a slightly different appearance(Gübelin and Koivula, 2005).
Inclusions. Microscopic characteristics are essentialto any comparison of gem materials. All of the fea-tures described in this section were seen in both theuntreated Wollo samples and the purple opals.Among those reported previously in Ethiopian opalare small black octahedral crystals that have beensuggested to be pyrite (Johnson et al., 1996; Rondeauet al., 2010; figure 8) and irregular tubular inclusionswith a cellular structure that are probably fossilizedplant matter (Rondeau et al., 2011; figure 9). Thoughneither can be considered unique to Ethiopia, pyrite
Figure 8. Both the Wollo (left) and dyed purple (right) opals showed irregular to octahedral black-appearing crystalsof pyrite. Photomicrographs by N. Renfro (left, image width 0.8 mm) and S. F. McClure (right, image width 1.7 mm).
Figure 9. Irregular tube-like inclusions that appear to be fossilized plant matter occurred in both the Wollo opal (left,image width 4.4 mm) and the dyed opal (right, image width 5.0 mm) samples. Photomicro graphs by S. F. McClure.

266 DYED PURPLE OPAL GEMS & GEMOLOGY WINTER 2011
octahedra are certainly rare in gem opal. Plant mat-ter is found included in opal from a number of otherdeposits.
We discovered another type of inclusion that tothe best of our knowledge has not been reported inopal: a zeolite mineral, possibly chabazite. It formednumerous small, transparent, colorless, euhedralpseudo-cubic crystals (figure 10). They were presentonly in rough material, at or near the surface, butalways included within the opal, whether the naturalWollo or dyed purple material. The crystals appear tohave been growing on the matrix before it wasengulfed by the opal.
Also found in the rough opal samples, either at orjust below the surface, was a flat round brown materialwith a radial structure (figure 11). These were typicallyseen along fracture surfaces. We were unable to matchtheir Raman spectra to anything in our database.
Surface Characteristics. Because we examinednumerous rough samples of both natural Wollo anddyed purple opal, we noted some surface featuresthat would not be visible on cut stones.
Layers of a dark brown to black opaque materialwere present on many of the natural Wollo samples.The same material was found on the surface of therough purple opal we examined—the only differencebeing that it was distinctly purplish (figure 12). Wewere unable to obtain a conclusive Raman spectrumfrom this material, but the spectra did indicate the pres-ence of amorphous carbon. EDXRF analysis detectedconsiderable Mn. Previous studies of Ethiopian opalhave identified such material as a manganese oxide(Johnson et al., 1996; Rondeau et al., 2010).
The rough Ethiopian opal we examined some-times had a brownish pink to pink opaque materialon the surface that was very friable and had a matte
Figure 10. Pseudo-cubic crystalsof a zeolite mineral (possiblychabazite) were found in bothWollo opal (left, image width2.0 mm) and the dyed purpleopal (right, image width 4.3mm). We believe this is the firstreport of this mineral as aninclusion in opal. Photomicro-graphs by S. F. McClure.
Figure 11. Surface to subsur-face circular radiating browninclusions were occasionallyvisible in both Wollo opal (left,image width 2.0 mm) and thedyed purple material (right,image width 6.5 mm). Photo -micrographs by S. F. McClure.
Figure 12. Black to brownishblack surface coatings were pres -ent on rough pieces of both theWollo (left) and purple (right)opals, the only difference beingthe purplish cast of the coating onthe dyed material. Photo micro -graphs by S. F. McClure; imagewidth 6.7 mm.

DYED PURPLE OPAL GEMS & GEMOLOGY WINTER 2011 267
Figure 15. Some of the etched quartzattached to the matrix of both kindsof opals contained identical inclu-sions of a translucent green materialand a black mineral (too small toidentify with Raman analysis).Photo micrographs by S. F. McClure;image width 1.4 mm (left, Wolloopal; right, dyed purple opal).
Figure 13. Some Wollo opals dis-played opaque material on thesurface that may be a type of com-mon opal (left, image width 8.0mm). Some of the purple samplesshowed similar material, exceptthat it was purplish gray (right,image width 5.9 mm). Photo -micro graphs by S. F. McClure.
Figure 14. Well-formed quartzcrystals with very short prismfaces were visible in the matrixof both Wollo opal (left, imagewidth 2.3 mm) and the dyedpurple material (right, imagewidth 1.4 mm). Photomicro -graphs by S. F. McClure.
or dull fracture luster (figure 13, left). Raman spec-troscopy gave a poor unidentifiable signal, and LA-ICP-MS analysis showed it was composed primarilyof Si. We suspect it is some kind of highly disorderedcommon opal. This same material was found on thesurface of some of the rough purple opal, the onlydifference being the color: It was mostly dark grayand uneven, with much darker fractures and anoften purplish cast (figure 13, right).
Matrix. Many of the rough samples, both naturalWollo and dyed purple, still had matrix attached tothem. The matrix was typically beige, though sever-al pieces of the dyed opal had matrix that was verydark purplish gray. In all cases, it was a soft clay-likematerial that contained numerous mineral grains.These matrix-hosted mineral grains were found inboth the Wollo and the purple opal, and consisted of:
(1) transparent light brown hexagonal crystals ofquartz with very short prism faces (figure 14), someof which showed dissolution features and containedrounded light green and black inclusions (figure 15);(2) prismatic colorless to light yellow crystals of K-feldspar; and (3) dark green prismatic fractured crys-tals of aegirine, a pyroxene (figure 16). The quartzand feldspar were common, but we observed onlyone example of the aegirine in a Wollo opal and onein a purple sample.
One question that arises is how the purple opalcan be dyed if the matrix of some pieces is still thenatural beige color. Digging into an area of dark pur-plish gray matrix with a needle probe showed thenormal beige color just below the surface (figure 17).This indicates that the dye did not penetrate thematrix very deeply. Therefore, one possible explana-tion for the natural-colored matrix on the purple

opal is that the top layer of matrix was removedafter the stones were dyed. The softness of thematrix would make this easy to do.
Chemical Composition. We suspected that chemi-cal analysis would provide important clues to theorigin of the purple opal. Gaillou et al. (2008) foundthat opal from the initial Ethiopian deposits atShewa was easily distinguished by its high Ca con-tent (>1000 ppmw), combined with the presence ofNb. That study found high Ca in orange to brownopals only—white Ethiopian opals were not dis-cussed. Two years later, in a report on Wollo opal,Rondeau et al. (2010) noted a high Ba content (>100ppmw) in white opals. This was based on a verysmall sample base, and the article acknowledgedthat further analyses were necessary.
The small number of samples (15 total) analyzedfor this study makes it difficult to detect meaningfulchemical trends. Overall, the Ca content of all sam-ples was much higher than the threshold reported byGaillou et al. (2008): 8,000–10,000 ppmw or higher.Additionally, all the samples contained trace amountsof Nb. The Ba content of the purple opals tended to belower (80–155 ppmw) but reached 475 ppmw. The Bacontent of the untreated Wollo opal was higher over-all (175–285 ppmw), but ranged from 65 to 1400ppmw. There are several possible explanations forthis, one of which is that we do not know the startingcolor of the dyed opal. It could have been yellowish ororangy, in which case it would be expected to have alower Ba content, as reported by Rondeau et al. (2010).None of the other elements showed any meaningfultrends. Clearly, further investigation is necessary toassess the compositional range of these opals.
Dyeing Ethiopian Hydrophane. Vivid bodycolorswere produced in our dye experiments (figure 18),and they show how easy it is to artificially colorEthiopian hydrophane opal. We also noted dye con-centrations around fine scratches and pits in the sur-face, implying that the dye transport mechanism is afunction of surface area. As scratches represent local-ized zones of high surface area, it is reasonable toconclude that the transport of a mobile fluid in theopal is driven by capillarity.
To support this hypothesis, we scratched “GIA”on one white Ethiopian opal cabochon and im mersedit in our blue dye solution for several seconds. Thedye penetrated the stone much deeper in the areaimmediately surrounding the scratched letters (figure19, left and center). Very fine scratches on the cabo-chon were also visibly colored by the blue dye. Wethen tested the stability of the dyed color by soakingthe stone in pure acetone. After several hours, theacetone turned slightly blue and the stone becamemore uniformly colored and lighter (figure 19, right).
268 DYED PURPLE OPAL GEMS & GEMOLOGY WINTER 2011
Figure 16. Aegirine crys-tals were found in thematrix of one Wollo (left,image width 2.2 mm)and one dyed purple opal(right, image width 1.9mm). Photo micrographsby S. F. McClure.
Figure 17. In some instances, areas of matrix stillattached to the rough purple opal had a dark pur-plish gray color. When scratched with a probe, thematrix under the surface displayed the normal beigecolor. Photomicrograph by S. F. McClure; imagewidth 5.9 mm.

DYED PURPLE OPAL GEMS & GEMOLOGY WINTER 2011 269
Figure 19. This 1.75 ct Wollo opal with “GIA” scratched onto the surface shows how dye transport isfaster in localized regions with a high surface area, such as pits and scratches (left and center). After theopal was soaked in pure acetone for several hours, the blue dye was homogeneously distributed, elimi-nating visible dye concentrations (right). Photos by N. Renfro; center image width is 3.8 mm.
A second dyed blue opal was soaked in water formore than a week with no observable change in thecolor of the opal or the water. The stability of thedye is therefore largely dependent on the type of sol-vent to which it is exposed.
Interestingly, the client discovered that soakingthe purple opals in hydrogen peroxide would decol-orize them. With the client’s permission, we demon-strated this on a 0.57 g piece of rough purple opal,soaking it in a 3% solution of hydrogen peroxide for72 hours. A significant amount of color was lost fromthe stone, which had a light purplish gray appearanceafter soaking (figure 20). An absorption spectrum col-lected on the hydrogen peroxide after soaking thepurple opal was featureless. This suggests that thedye was not necessarily removed from the opal or dis-solved into the hydrogen peroxide solution; instead,the dye molecules were chemically altered into acompound that does not absorb visible light, orbleached. This technique may be effective in decol-orizing some dyed opal, but it would be highly depen-dent on the type of dye used.
Identification and Origin of Dyed Purple Opal.Purple color has never been reported for naturalplay-of-color opals. Microscopic examinationstrongly suggested the presence of a dyeing agent inthe purple sample we examined: color concentra-tions in fractures and surface pits, patches of purplecolor on the surface, surface-reaching inclusionsthat were purple, and certain characteristics on thesurface of the rough such as opaque material withdark purplish gray fractures and layers of a darkbrown to black material with a purple cast. Proof ofdye treatment was that the color could be partially
removed with acetone. The purported Mexican origin of the purple opal
can be dismissed. Instead, the purple material pre-sents all the characteristics of opals from the Wollodeposit in Ethiopia. Both opals are hydrophane,sometimes showing a cellular play-of-color separatedby greenish internal potch. Some contain tiny octa-
Figure 18. A variety of vivid colors were easily pro-duced by dyeing white Wollo opals with solutionsprepared from permanent marker ink and acetone.The cabochon in the center was submitted by a clientand weighs 8.77 ct. The rough samples weigh0.17–1.42 ct; photo by C. D. Mengason.

hedral inclusions of pyrite and rod- or tube-likeinclusions that are probably fossilized plant matter.They have similar RI, SG, and UV fluorescencecharacteristics, as well as surface layers of man-ganese oxide. In addition to these properties, weobserved some unusual inclusions in both Wolloand dyed purple samples that have not been report-ed previously, such as transparent pseudo-cubiccrystals of a zeolite mineral (probably chabazite)and flat radial brown inclusions.
CONCLUSIONThe evidence presented in this study indicates that
the purple samples examined by GIA were dyedopals from Ethiopia. The distinct hydrophanenature of Ethiopian opal makes it susceptible tomany kinds of treatment—dyeing is just one.Smoke treatment of this opal to turn it black wasrecently described (Williams and Williams, 2011),as was sugar treatment (see the Gem NewsInternational entry on pp. 333–334 of this issue).Dyeing this material to more believable colors,such as the orange of Mexican fire opal, may posenew identification challenges, and we can expect tosee more treatments applied to this hydrophaneopal in the future.
270 DYED PURPLE OPAL GEMS & GEMOLOGY WINTER 2011
ABOUT THE AUTHORSMr. Renfro ([email protected]) is staff gemologist,and Mr. McClure is director of Identification Services, atGIA’s laboratory in Carlsbad.
ACKNOWLEDGMENTSThe authors are grateful to David Artinian (Clear Cut Inc.,
Poway, California) for supplying untreated samples ofWollo opal. Hussain Rezayee (Rare Gems & Minerals,Beverly Hills, California) provided additional samples.We thank Evan Caplan for his insights and informa-tion, and Dr. James Shigley for his assistance with themanuscript.
REFERENCESFritsch E., Ostrooumov M., Rondeau B., Barreau A., Albertini D.,
Marie A.-M., Lasnier B., Wery J. (2002) Mexican gem opals—Nano and micro structure, origin of colour, and comparisonwith other common opals of gemological significance.Australian Gemmologist, Vol. 21, No. 6, pp. 230–233.
Gaillou E., Delaunay A., Rondeau B., Bouhnik-le-Coz M., FritschE., Cornen G., Monnier C. (2008) The geochemistry of gemopals as evidence of their origin. Ore Geology Reviews, Vol. 34,pp. 113–126, http://dx.doi.org/10.1016/j.oregeorev.2007.07.004.
Gübelin E., Koivula J. (2005) Photoatlas of Inclusions inGemstones, Vol. 2. Opinio Publishers, Basel, Switzerland.
Johnson M.L., Kammerling R.C., DeGhionno D.G., Koivula J.I.(1996) Opal from Shewa Province, Ethiopia. G&G, Vol. 32, No.2, pp. 112–120, http://dx.doi.org/10.5741/GEMS.32.2.112.
Renfro N., McClure S. (2011) A new dyed purple opal. News from
Research, Sept. 26, www.gia.edu/research-resources/news-from-research/Dyed%20Purple%20Opal%201004.pdf.
Rondeau B., Fritsch E., Mazzero F., Gauthier J., Cenki-Tok B.,Bekele E., Gaillou E. (2010) Play-of-color opal from WegelTena, Wollo Province, Ethiopia. G&G, Vol. 46, No. 2, pp.90–105, http://dx.doi.org/10.5741/GEMS.46.2.90.
Rondeau B., Fritsch E., Bodeur Y., Mazzero F., Cenki T., Bekele E.,Ayalew D., Cenki-Tok B., Gauthier J.-P. (2011) Wollo opals—Apowerful source from Ethiopia. InColor, No. 17 (Summer), pp.24–35.
Webster R. (1996) Gems: Their Sources, Descriptions and Identi -fication, 5th ed. Butterworth-Heinemann Ltd., Oxford, UK.
Williams B., Williams C. (2011) Smoke treatment in Wollo opal.www.stonegrouplabs.com/SmokeTreatmentinWolloOpal.pdf[date accessed: Sept. 22, 2011].
Figure 20. This 0.57 g roughpiece of opal is shown before(left) and after (right) its purplecolor was removed by soakingin hydrogen peroxide for 72hours. Photos by RobisonMcMurtry.
Spring 2007Pink-to-Red Coral: Determining Origin of ColorSerenity Coated Colored DiamondsTrapiche Tourmaline from Zambia
Summer 2007Global Rough Diamond Production since 1870Durability Testing of Filled DiamondsChinese Freshwater Pearl CultureYellowish Green Diopside and Tremolite from
TanzaniaPolymer-Impregnated Turquoise
Fall 2007The Transformation of the Cultured Pearl IndustryNail-head Spicule Inclusions in Natural GemstonesCopper-Bearing Tourmalines from New Deposits
in Paraíba State, BrazilType Ia Diamond with Green-Yellow Color Due to Ni
Winter 2007Latest CVD Synthetic Diamonds from Apollo
Diamond Inc.Yellow Mn-Rich Tourmaline from ZambiaFluorescence Spectra of Colored DiamondsAn Examination of the Napoleon Diamond Necklace
Spring 2008Copper-Bearing (Paraíba-type)
Tourmaline from MozambiqueA History of Diamond TreatmentsNatural-Color Purple Diamonds from Siberia
Summer 2008Emeralds from Byrud (Eidsvoll), NorwayCreating a Model of the Koh-i-Noor DiamondCoated TanzaniteColoring of Topaz by Coating and
Diffusion Processes
Fall 2008Identification of Melee-Size Synthetic
Yellow DiamondsAquamarine, Maxixe-Type Beryl, and
Hydrothermal Synthetic Blue BerylA New Type of Synthetic Fire Opal:
MexifireThe Color Durability of “Chocolate Pearls”
Winter 2008Color Grading “D-to-Z” Diamonds at the GIA
LaboratoryRubies and Sapphires from Winza, TanzaniaThe Wittelsbach Blue
Spring 2009The French Blue and the Hope: New Data
from the Discovery of a Historical Lead CastGray-Blue-Violet Hydrogen-Rich Diamonds
from the Argyle MineHackmanite/Sodalite from Myanmar and
AfghanistanPink Color Surrounding Growth Tubes and
Cracks in Tourmalines from MozambiqueIdentification of the Endangered Pink-to-Red
Stylaster Corals by Raman Spectroscopy
Summer 2009Celebrating 75 Years of Gems & GemologyThe “Type” Classification System of DiamondsSpectral Differentiation Between Copper and Iron
Colorants in Gem TourmalinesAndalusite from BrazilPeridot from Sardinia, Italy
Fall 2009Characterization of “Green Amber” Crystallographic Analysis of the
Tavernier Blue“Fluorescence Cage”: Visual Identification
of HPHT-Treated Type I DiamondsAmmolite Update Polymer-Filled AquamarineYellow-Green Haüyne from TanzaniaAquamarine from Masino-Bregaglia Massif, Italy
Winter 2009 (PDF only)Ruby and Sapphire Production and Distribution:
A Quarter Century of ChangeCutting Diffraction Gratings to Improve
Dispersion (“Fire”) in DiamondsChrysoprase and Prase Opal from Haneti,
Central TanzaniaDemantoid from Val Malenco, Italy
Spring 2010Strongly Colored Pink CVD Lab-Grown
DiamondsColor Alterations in CVD Synthetic Diamond
with Heat and UV ExposurePossible “Sister” Stones of the Hope DiamondConfocal Micro-Raman SpectroscopyBastnäsite-(Ce) and Parisite-(Ce) from Malawi
Summer 2010The Wittelsbach-Graff and Hope Diamonds:
Not Cut from the Same RoughPlay-of-Color Opal from EthiopiaA New Type of Composite TurquoiseFire Opal from MadagascarX-ray Computed Microtomography
Applied to PearlsHibonite: A New Gem Mineral
Fall 2010An Era of Sweeping Change in Diamond and
Colored Stone Production and MarketsGem Localities of the 2000sGemstone Enhancement and Its Detection
in the 2000sDevelopments in Gemstone Analysis Techniques
and Instrumentation During the 2000s
Winter 2010Synthetic Gem Materials in the 2000sYellow Scapolite from MadagascarPietersite from Namibia and ChinaUpdate on Mexifire Synthetic Fire OpalGems in a Ciborium from Einsiedeln Abbey
Order Back Issues (Print and PDF)at store.gia.eduor Call Toll Free 800-421-7250 ext. 7142or 760-603-4000 ext. 7142Fax 760-603-4070
E-mail [email protected] write toGems & Gemology PO Box 9022, Carlsbad, CA 92018-9022, USA
Complete volumes of 1992–2011 print back issues (except 2009) are available, as are limited issues from 1985–1991.
10% discount for GIA Alumni and activeGIA students.
For a complete list of articles from 1981 forward, visit gia.edu/gandg.
Spring–Winter 2010
Electronic (PDF) versions of all articles fromSpring 1981 forward are available as part ofGems & Gemology Online.
Get PDF Articles atgia.metapress.com
Now AvailableOnline:All Articles and Issues 1981–2011

272 MAGNETIC SUSCEPTIBILITY OF GARNET GEMS & GEMOLOGY WINTER 2011
See end of article for About the Author and Acknowledgments.GEMS & GEMOLOGY, Vol. 47, No. 4, pp. 272–285,http://dx.doi.org/10.5741/GEMS.47.4.272.© 2011 Gemological Institute of America
Donald B. Hoover
DETERMINING GARNET COMPOSITIONFROM MAGNETIC SUSCEPTIBILITY
AND OTHER PROPERTIES
Quantitative measurements of magnetic susceptibility combined with RI or SG data can providean easy and inexpensive way of inferring garnet composition. At the time this technique was firstapplied to faceted garnets (Hoover et al., 2008), a reference set of samples with well-character-ized compositions was not available. GIA subsequently provided 28 garnets and their chemicaldata determined by electron microprobe for a comparison with end-member compositions calcu-lated from magnetic susceptibility measurements and other properties. The results show that end-member compositions based on microprobe data have error margins similar to most of thosederived from directly measured properties.
Garnet is a diverse gem material showing an attractive palette of colors (e.g., figure 1) and incorporating a variety of chemical compo-
nents that are responsible for widely ranging values ofphysical properties. The several end-member speciesmay occur as nearly pure compositions or, more com-monly, complex assem blages. The principal species(table 1) are pyrope, almandine, and spessartine (pyral-spite garnets), and grossular, andradite and minoruvarovite (ugran dite garnets). Other end-memberspecies, including goldmanite (vanadium rich), knor-ringite (chromium rich), and schorlomite (titaniumrich) also may be present in small amounts, and theseare mainly important for their effect on garnet col-oration.
In the past, gemologists have been limited intheir ability to determine garnet composition byonly having RI and possibly SG data as quantitative
measures, in combination with color and spectro-scopic data, to infer a garnet composition that ismost probable. These compositions were limited toone or two end members; for garnets in which threeor more end members were important, gemologistshad no effective recourse.
In recent years, with the availability of verystrong rare-earth magnets, gemologists have startedto apply magnetic attraction as a tool for gem identi-fication (see, e.g., http://gemstonemagnetism.com).Although all materials respond to an applied mag-netic field in some way (box A), it is the transitionelements in garnet that give rise to a measureablemagnetic attraction (reported here as the volumemagnetic susceptibility) if they are present as princi-pal components. Recently, Hoover and Williams(2007) developed a simple, inexpensive apparatus tomeasure volume susceptibility on cut gems (box B).Hoover et al. (2008) derived garnet composition fromplots of RI versus susceptibility, and followed theconventional characterization of Stockton andManson (1985) in defining garnet varieties (pyrope,pyrope-almandine, almandine, almandine-spessar-

MAGNETIC SUSCEPTIBILITY OF GARNET GEMS & GEMOLOGY WINTER 2011 273
tine, etc.). Furthermore, the magnetic susceptibilitytechnique permitted a quantitative measure of gar-net composition consisting of three end members,not two, when RI was the only other data available.Unfortunately, Hoover et al. (2008) did not have gar-net samples of known composition to test how wellthe technique agreed with quantitative chemicalanalysis. Using selected samples from the largegroup studied by Manson and Stockton, this articlecompares garnet compositions from GIA’s electronmicroprobe data to those inferred from the GIA-measured properties that were combined with theauthor’s measured magnetic susceptibilities. The
accuracy of garnet compositions derived from thevarious properties is assessed.
MATERIALS AND METHODSMaterials. GIA initially supplied data for 539 garnetsthat included color, carat weight, RI, SG, cell con-stant, and variety, although the data set was incom-plete for a number of the stones. The author thenborrowed 28 of the samples for magnetic susceptibili-ty measurements (see figure 1 table 2) that wereselected to cover the full range of compositions andRI values. An additional constraint was that eachstone be large enough for good susceptibility mea-
25867
2486
11090
1258826620
1311311089
26767
996
27352
2211
79
342911568 27257
4967 1323412487
25000
198
2342489
27423 4912491
13047
5821
77
Figure 1. Thisphoto shows the28 GIA garnetsamples used inthis study(0.18–9.82 ct).Photo by RobertWeldon.
TABLE 1. Silicate garnet end-member species and their properties.a
Cell Volume susceptibilityconstant (Å) (×10−4 SI)
Pyrope Prp Mg3Al2Si3O12 1.714 3.58 11.459 −0.2Almandine Alm Fe3Al2Si3O12 1.829 4.32 11.528 40.7Spessartine Sps Mn3Al2Si3O12 1.799 4.20 11.614 47.5Grossular Grs Ca3Al2Si3O12 1.734 3.59 11.851 −0.2Andradite Adr Ca3Fe2Si3O12 1.887 3.86 12.048 30.8Uvarovite Uv Ca3Cr2Si3O12 1.865 3.85 11.996 12.9Goldmanite Go Ca3V2Si3O12 1.834 3.77 12.070 6.9Knorringite Kn Mg3Cr2Si3O12 1.875 3.84 11.622 13.7
a See text for sources of data.
End member Symbol Formula RI SG

TABLE 2. Garnet samples used in this study, their measured and calculated properties, and their compositions.a
Measured Calculated (Locock)
Cell Volume Cell VolumeRI SG constant susceptibility Composition RI SG constant susceptibility Compositionc
(Å) (×10−4 SI) (Å) (×10−4 SI)
77 Rhodolite 2.42 1.752 3.83 11.493 16.0 Prp63Alm22Sps15 1.752 3.83 11.494 13.5 Prp63Alm32Grs3Sps1
79 Color-change 1.88 1.751 3.85 11.583 16.4 Prp63Sps20Alm17 1.752 3.82 11.571 15.9 Prp48Sps23Grs15Alm12Uv1(pyralspite)
198 Mint green 2.73 1.735 3.61 11.850 0.4 Grs99Adr1 1.736 3.60 11.850 0 Grs94Prp1Adr1Go1grossular
234 Malaya 2.27 1.765 3.91 11.549 24.6 Prp47Sps32Alm21 1.766 3.93 11.545 23.7 Prp43Sps34Alm18Grs4Adr1
491 Malaya 1.53 1.762 3.90 11.555 24.7 Prp47Sps46Alm7 1.759 3.88 11.558 21.8 Prp45Sps38Alm8Grs7Adr1
996 Almandine- 6.78 1.810 4.22 11.580 44.9 Sps63Alm37 1.811 4.24 11.580 44.4 Sps57Alm40Grs1spessartine
2211 Pyrope- 2.14 1.762 3.87 11.530 16.2 Prp52Alm40Grs8 1.763 3.88 11.529 16.5 Prp50Alm39Grs9Adr1Sps1almandine
2486 Rhodolite 2.20 1.762 3.85 11.509 15.7 Prp52Alm36Grs12 1.759 3.86 11.508 15.3 Prp57Alm36Grs4Sps1Adr1
2489 Hessonite 1.25 1.755 3.65 11.889 5.8 Grs83Adr9Alm1 or 1.760 3.64 11.882 5.0 Grs80Adr16Prp1Grs41Prp40Adr19
2491 Demantoid 1.45 1.881 3.84 — 29.7 Adr96Grs4 1.887 3.86 12.048 30.8 Adr96
3429 Pyrope- 3.55 1.784 4.02 11.508 22.9 Alm57Grs33Prp10 1.781 4.00 11.510 23.6 Alm55Prp40Sps2Grs2almandine
4967 Pyrope- 3.18 1.750 3.82 11.534 12.1 Prp66Alm30Grs4 1.751 3.80 11.529 11.8 Prp59Alm28Grs11Adr1almandine
5821 Almandine- 2.52 1.810 4.19 — 46.6 (Outside the 1.804 4.22 11.601 46.3 Sps83Alm16spessartine ternaries)
11089 Chrome- 1.96 1.744 3.70 11.537 6.2 Grs57Prp27Alm16 1.740 3.70 11.521 6.8 Prp72Alm14Grs7Uv6Adr1Sps1pyrope
11090 Chrome- 5.37 1.742 3.72 — 8.0 Prp58Grs22Alm20 1.742 3.71 11.533 6.9 Prp71Alm14Grs7Uv6Adr1Sps1pyrope
11568 Pyrope- 3.39 1.807 4.15 — 31.3 Alm77Grs19Prp4 1.804 4.16 11.525 32.4 Alm74Prp19Sps4Grs2almandine
12487 Spessartine 1.41 1.800d 4.23 — 47.0 Sps97Alm3 1.805 4.22 11.580 45.6 Sps72Alm26
12588 Almandine- 1.62 1.812 4.26 — 44.3 Sps53Alm47 1.812 4.25 11.560 43.3 Alm52Sps47Grs1spessartine
13047 Spessartine 1.91 1.800d 4.20 — 52.3 (Outside the 1.805 4.22 11.581 45.4 Sps72Alm26ternaries)
13113 Chrome- 1.08 1.732e 3.74 11.535 8.0 Prp58Grs22Alm20 1.744 3.73 11.530 7.9 Pyp69Alm17Grs7Uv5Adr1Sps1pyrope
13234 Demantoid 1.79 1.882 3.87 — 28.8 Adr90Uv7Grs3 1.887 3.86 12.048 30.8 Adr98
25000 Pyrope 1.27 1.744 3.77 11.492 10.9 Prp74Alm25Sps1 1.745 3.77 11.495 10.2 Prp68Alm24Grs3Adr1(35A)25867 Pyrope 0.18 1.730 — — 4.5 Prp79Alm12Grs9 1.733 3.68 11.512 5.3 Prp77Alm12Grs8Adr1Uv1(4097D)26620 Almandine 3.06 1.791 4.13 11.534 27.8 Alm64Prp32Sps4 1.795 4.10 11.531 28.8 Alm67Prp24Grs5Sps3(5544A)26767 Almandine 0.52 1.793 4.10 11.513 25.3 Alm62Grs35Prp3 1.798 4.13 11.513 30.4 Alm73Prp24(6673F)27257 Spessartine 1.42 1.800d 4.25 — 46.6 Sps97Alm3 1.805 4.22 11.580 45.4 Sps69Alm26(12822A)27352 Hessonite 9.82 1.754 3.64 — 4.3 Grs87Adr13 1.757 3.64 11.875 4.8 Grs84Adr12Alm1Sps1(13122A)27423 Hessonite 9.10 1.755 3.65 — 3.9 Grs86Adr14 1.752 3.63 11.872 3.4 Grs86Adr12(13167A)
a Data that was not available from GIA is indicated by “–”.b Numbers in parentheses are the former catalog numbers.c Note that calculations from the oxide chemistry seldom give end-member compositions that add to 100%. d These RI values are problematic; see text.e This RI was rechecked by the author and determined to be 1.742.
274 MAGNETIC SUSCEPTIBILITY OF GARNET GEMS & GEMOLOGY WINTER 2011
surements (e.g., >1 ct was preferred). When available,samples with measured SG and cell constant datawere used; color was not part of the selection process.
Determination of End-Member Compositions. Sili -cate garnets have the general formula X3
2+Y23+Si3O12,
where X is commonly Ca2+, Mn2+, Fe2+, and/orMg2+, and Y is commonly Al3+, Fe3+, Cr3+, and/orV3+. Because garnets form an isomorphous series,the X and Y positions can hold any combination ofthe respective ions listed; substitutions may alsooccur for Si.
Sample Weightno.b Variety (ct)

MAGNETIC SUSCEPTIBILITY OF GARNET GEMS & GEMOLOGY WINTER 2011 275
There are two basic ways to determine the end-member composition of garnets: calculation fromchemical data and derivation from measured proper-ties. Chemical data (such as from an electron micro-probe or wet chemical analysis) are typicallyexpressed as wt.% oxides, and there are numerous(non equivalent) ways to calculate end-membercompositions from such data. A commonly usedprocedure from Rickwood (1968) was slightly modi-fied by Manson and Stockton (1981). Rickwood(1968) discussed the variations that can arise fromthe different calculation methods, using a commonmetamorphic garnet composition of Prp44Alm42Grs17as an example, in which the pyrope content canvary by 3.4%, the almandine by 3.4%, and thegrossular by 5.2%, depending on how the calcula-tions are done. A more recent procedure by Locock(2008) incorporated advances in the understandingof the crystal chemistry of natural garnets through a
measure of the quality of the analysis. For thispaper, the author used the Locock procedure to
NEED TO KNOW
• Combined with RI or SG data, magnetic suscep-tibility is one more measureable property that is useful toward inferring garnet composition.
• Magnetic susceptibility of faceted gemstones canbe measured nondestructively with a relatively simple apparatus.
• Susceptibility measurements are plotted against other properties on modified Winchell diagrams to derive garnet composition.
• A comparison of garnet compositions derived from measured properties versus chemical data showed a fairly good correlation.
All material substances react to the presence of a magnetic field: They develop an induced
magnetic field in response to the applied field.The ratio of the induced field to the applied fieldis called the volume susceptibility (k) of the sub-stance. It is a simple dimensionless ratio.
Materials react to a magnetic field in threedifferent ways. Most materials are very weaklyrepelled, or diamagnetic. In this case, k is nega-tive. A material with a sufficient number ofatoms of the transition elements (Fe, Mn, Cu, Cr,etc.) or the rare-earth elements—depending ontheir valence state—may overcome the diamag-netic effects of the other atoms and be attractedto a magnet. For these materials, k is positive. Ifthe value of k is independent of the strength ofthe applied field, the material is called paramag-netic. Here, k will be positive and of small tointermediate magnitude. If k changes with thestrength of the applied magnetic field, the materi-al is ferromagnetic, and k can be very large.Ferromagnetic materials are further divided intotrue ferromagnetic, ferrimagnetic, antiferromag-netic, and canted antiferromagnetic. These varia-tions in behavior are due to interactions betweenthe electrons in the material and the formation ofwhat are called magnetic domains.
Of greatest interest to gemology are the para-magnetic materials and their susceptibilities,which can have some diagnostic value. By con-trast, diamagnetic susceptibilities have littlediagnostic value. Ferromagnetic materials, whenpresent as inclusions in gems, can give anoma-lously high values of magnetic susceptibility forthe host material.
Physicists have defined several different kindsof magnetic susceptibility. Although volumemagnetic susceptibility is dimensionless, thenumeric value will differ with the system of unitsbeing used, changing by a factor of 4π, or 12.57.Thus the system of units needs to be stated, evenfor this dimensionless number. This article usesthe International System of Units (SI), which maybe a possible source for confusion if one is notfamiliar with this peculiarity in some electromag-netic measurements. Another commonly usedproperty is mass magnetic susceptibility, alsocalled specific susceptibility. This measure hasdimensions of inverse density (e.g., cubic cen-timeters per gram), and again one needs to beaware of a multiplier of 4π when other units ofmeasurement are used. Molar magnetic suscepti-bility may also be expressed in units of cubic cen-timeters per mol, or their equivalent.
BOX A: MAGNETIC MATERIALS
obtain the end-member compositions from the GIAoxide chemical data.
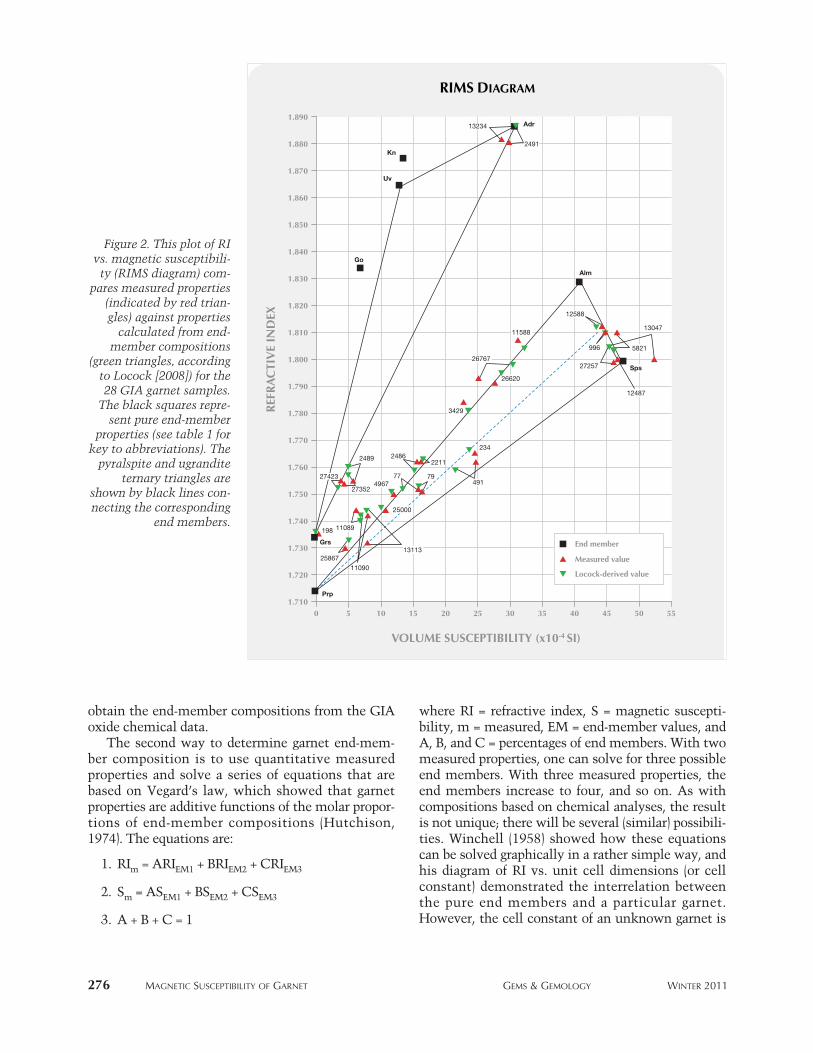
The second way to determine garnet end-mem-ber composition is to use quantitative measuredproperties and solve a series of equations that arebased on Vegard’s law, which showed that garnetproperties are additive functions of the molar propor-tions of end-member compositions (Hutchison,1974). The equations are:
1. RIm = ARIEM1 + BRIEM2 + CRIEM3
2. Sm = ASEM1 + BSEM2 + CSEM3
3. A + B + C = 1
where RI = refractive index, S = magnetic suscepti-bility, m = measured, EM = end-member values, andA, B, and C = percentages of end members. With twomeasured properties, one can solve for three possibleend members. With three measured properties, theend members increase to four, and so on. As withcompositions based on chemical analyses, the resultis not unique; there will be several (similar) possibili-ties. Winchell (1958) showed how these equationscan be solved graphically in a rather simple way, andhis diagram of RI vs. unit cell dimensions (or cellconstant) demonstrated the interrelation betweenthe pure end members and a particular garnet.However, the cell constant of an unknown garnet is
276 MAGNETIC SUSCEPTIBILITY OF GARNET GEMS & GEMOLOGY WINTER 2011
RIMS DIAGRAM
01.710
1.720
1.730
1.740
1.750
1.760
1.770
1.780
1.790
1.800
1.810
1.820
1.830
1.840
1.850
1.860
1.870
1.880
1.890
5 10 15 20 25 30 35 40 45 50 55
VOLUME SUSCEPTIBILITY (x10-4 SI)
REF
RA
CTI
VE
IND
EX
End member
Measured value
Locock-derived value
Prp
Grs
27352
11089198
25000
13113
77
24862211
27257
12487
13047
5821
12588
2491
13234
2489
274234967
1109025867
79491
234
3429
26767
11588
26620
996
Sps
Alm
Adr
Kn
Uv
Go
Figure 2. This plot of RIvs. magnetic susceptibili-ty (RIMS diagram) com-
pares measured properties(indicated by red trian-gles) against properties
calculated from end-member compositions
(green triangles, accordingto Locock [2008]) for the28 GIA garnet samples.
The black squares repre-sent pure end-member
properties (see table 1 forkey to abbreviations). The
pyralspite and ugranditeternary triangles are
shown by black lines con-necting the corresponding
end members.

MAGNETIC SUSCEPTIBILITY OF GARNET GEMS & GEMOLOGY WINTER 2011 277
not easily obtained by the gemologist because X-raydiffraction data is required, so Hoover et al. (2008)modified the Winchell diagram so that the composi-tion of an unknown garnet can be determined—according to three or four end members—from quan-titative measurements of properties such as magnet-ic susceptibility, RI, and SG. Box B describes howmagnetic susceptibility was measured, both in thisstudy and by Hoover et al. (2008).
Figure 2 is the modified Winchell diagram plot-ting RI vs. magnetic susceptibility (RIMS). Eight gar-net end members of gemological importance (blacksquares) are shown on the diagram. The garnetternaries pyralspite (pyrope, almandine, and spessar-tine) and ugrandite (uvarovite, grossular, and andra-dite) are shown as triangles outlined in black thatconnect each of the three corresponding end mem-bers. Other end members shown are goldmanite and
W hile there are several ways to quantitative-ly measure magnetic susceptibility, vol-
ume susceptibility is routinely measured with aGouy balance or the similar Evans balance (seewww.geneq.com/catalog/en/msbalance.html).Susceptibility is measured by placing a sample onone arm of a laboratory balance and subjecting itto a strong magnetic field gradient. The weightloss or gain is measured and converted to suscepti-bility. Unfortunately, the sample must be in theform of a cylinder. In practice, the sample is oftenground to a powder and placed in a cylindricalsample holder. This obviously is not practical forgem materials.
Hoover and Williams (2007) showed that if avery strong permanent magnet is used, and itspole face is smaller than the table (or other flatfacet) of the gem to be measured, then the force ofattraction between the magnet’s pole face and thefacet will be proportional to the gem’s volumesusceptibility. To calculate the gem’s susceptibili-ty, the magnet only needs to be calibrated with amaterial of known susceptibility. The apparatusused by Hoover and Williams (2007), Hoover et al.(2008), and in this study consisted of a biologicalmicroscope with the optics removed (figure B-1).In place of the optics, a small iron rod was fixedvertically to hold a variety of small (1⁄16 in. to 1⁄4 in.diameter) cylindrical rare-earth magnets. Theimportant components are the fine focus mecha-nism (for precise control of the magnet’s verticalposition) and the moveable X-Y stage that is usedto align the gem’s table with the magnet’s poleface. A small digital scale was placed on themicroscope stage, and a gem was placed on apedestal in the weighing dish. The magnet’s poleface was brought just into contact and parallel
with the gem’s table. The gem was then slightlyseparated from the magnet to obtain a maximumchange in weight (i.e., weight loss for a paramag-netic gem).
The procedure is no more complex than mea-suring specific gravity—and takes about as muchtime. The apparatus can be constructed at low costusing a surplus microscope.
BOX B: MEASUREMENT OF MAGNETIC SUSCEPTIBILITY
Figure B-1. This instrument was designed byHoover and Williams (2007) for taking magneticsusceptibility measurements, and was used inthe current study. Photo by Bear Williams.
Sample
MagnetMagnet
X-Y stage
Digital scale
Focus adjustment

278 MAGNETIC SUSCEPTIBILITY OF GARNET GEMS & GEMOLOGY WINTER 2011
knorringite. (Schorlomite is not shown because end-member property values are not available in themineralogical literature, and in gem garnets thiscomponent may be present in only very small quan-tities.) The positions of all the garnets obtained forthis study are also plotted: the green triangles repre-sent the compositions calculated from microprobeanalyses (using the Locock procedure), and the redtriangles plot the RI and susceptibility data. The var-ious garnet compositions can be recognized by theirposition with respect to the end members.
The process to determine the composition of thethree garnet end members from any data point issimple. For example, for the green triangle represent-ing the Locock five end-member composition ofsample no. 234, which is plotted with an RI of 1.766and a susceptibility of 23.7 × 10⁻⁴ SI:
• From the pyrope apex of the pyralspite ternary,draw a line through the center of the data pointto intercept the opposite base of the triangle,shown by the blue dashed line.
• Next, measure the total length of the line, andthen the length from the data point to the baseof the triangle.
• Divide the line length from the data point tothe base by the total length, which will give thepercentage of pyrope end member.
For sample no. 234, the result is 47%. The pro-cess can be repeated for the other two apices, but itis simpler to measure the relative proportions ofalmandine and spessartine on the almandine-spes-sartine join where the blue line crosses it, and pro-portion them to the remaining percentage (53% forthis example). Here it is at 60% spessartine, whichyields 32% for spessartine and 21% for almandine,or Prp47Sps32Alm21. By comparison, the Locock tech-nique characterizes this stone, rounding to the near-est 1%, as Prp43Sps34Alm18Grs4Adr1.
End-Member Properties. The properties of each gar-net end member (table 1) are required to plot theirpositions in the various modified Winchell diagrams.For every end member but knorringite, the RI, SG,and cell constant used were reported by Meagher(1982). For knorringite, the calculated data fromMcConnell (table 50 in Deer et al., 1982) were usedby Hoover et al. (2008), but the data do not agreewell with the RI and cell dimension data measured
on synthetic samples by Ringwood (1977), or withthe data presented by Nixon and Hornung (1968),who first defined knorringite. The McConnell datawill continue to be used in this article, with theunderstanding that knorringite end-member valuesare subject to change.
Magnetic susceptibility values are not wellknown, either. Pure grossular and pyrope have notransition elements in their composition and are thusdiamagnetic. Their susceptibilities are very small andslightly negative; they were assigned by Hoover et al.(2008) values of −0.2 × 10⁻⁴ SI, typical of diamagneticmaterials. The other six end members are less easy todefine. Frost (1960) measured the mass, or specific,susceptibilities of andradite, almandine, and spessar-tine, which (when converted to volume susceptibili-ty) are 23.8, 36.9, and 42.7 × 10⁻⁴ SI, respectively. Butthe data are not robust. The four almandine-spessar-tine garnets Frost measured, ranging from Alm65Sps35to Alm10Sps87, all had the same mass susceptibility.Nathan et al. (1965) measured spessartine’s volumesusceptibility as 44.3 × 10⁻⁴ SI, but the author’s ownmeasurements on spessartine suggested that this wasslightly low. Hoover et al. (2008) were unable to findmeasured susceptibilities for the other three garnetend members. Approximate values, however, werecalculated based on the magneton numbers of theconstituent transition element ions present (Kittel,1956), using the Langevin equation. This is howHoover et al. (2008) obtained the values shown in thefigures—30.8, 40.7, 47.5, 12.9, 6.9, and 13.7 × 10⁻⁴ SI,respectively—for andradite, almandine, spessartine,uvarovite, goldmanite, and knorringite.
Measured Properties. Except for the magnetic suscep-tibility measurements, all properties for the 28 studysamples were supplied by GIA from the Manson-Stockton research. The volume susceptibility mea-surements were taken by the author, using the appa-ratus described in box B, with cobalt chloride as a sus-ceptibility standard (described by Hoover et al., 2008).
RESULTSRI vs. Magnetic Susceptibility Diagram. In the RIMSdiagram (figure 2), the gem ugrandites plot on or verynear the line joining grossular and andradite. Thesingle mint green grossular (sample no. 198) is veryclose to the grossular end member. The three hes-sonites (2489, 27352, and 27423) are about 14%toward andradite. The two demantoids (2491 and13234) are close to the andradite end member. For

MAGNETIC SUSCEPTIBILITY OF GARNET GEMS & GEMOLOGY WINTER 2011 279
the pyralspite garnets, a mixed almandine-spessar-tine group (996, 5821, and 12588) plots along thealmandine-spessartine join, quite distinct from therest. Spessartine samples (12487, 13047, and 27257)plot near their end-member composition. Threestones, consisting of two malaya (234 and 491) andone color-change garnet (79), are positioned withinthe pyralspite ternary. The rest of the garnets arearrayed near the pyrope-almandine join, or withinthe grossular-pyrope-almandine ternary; threechrome-pyropes (11089, 11090, and 13113) areincluded in the latter group.
Comparing the measured and calculated end-member data for most samples shows fair agreement(figure 2 and table 2). The variations between the twotechniques are about what one would expect due tomeasurement error and some uncertainty in end-member properties. Not including sample 13113, forwhich the originally measured RI was incorrect, theaverage difference between measured and calculatedRI values is 0.003. For volume susceptibility, there is adifference of 0.5 × 10⁻⁴ SI, if one disregards samples13047 and 26767, which are anomalous. For specificgravity (figure 3), the average difference is 0.01.
SGMS DIAGRAM
03.55
3.65
3.75
3.85
3.95
4.05
4.15
4.25
4.35
5 10 15 20 25 30 35 40 45 50 55
VOLUME SUSCEPTIBILITY (x10-4 SI)
SPEC
IFIC
GR
AV
ITY
End member
Measured value
Locock-derived value
Prp
13113
77
792491
13234
2468
2211
26620
26767
3429
234
491
11588 5821
99613047
12487
2725712588
Grs
Sps
Adr
Go
Kn
Uv
Alm
Figure 3. This plot showsSG vs. magnetic suscep-tibility (SGMS diagram)for the 27 GIA garnetsfor which the data wereavailable. However,sample numbers are notshown for those samplesthat plot toward thepyrope and grossular endmembers, which overlapon this diagram.

280 MAGNETIC SUSCEPTIBILITY OF GARNET GEMS & GEMOLOGY WINTER 2011
To give a sense of how these variations arereflected in terms of garnet composition, let usassume a 3% difference in end-member compositionof a Pyr50Alm50 garnet. This would produce a changeof 0.004 in RI, 1.22 × 10⁻⁴ SI in volume susceptibili-ty, and 0.02 in SG. Thus the average differencebetween these three measured properties and thosecalculated from the Locock procedure represents lessthan 3% compositional change in a mid-rangepyrope-almandine. It is important to remember thatsuch a derived composition will not be unique, andthat any additional information, such as absorptionspectra, may further reduce uncertainties in deter-mining garnet composition.
The RIMS diagram shows the advantage of suchplots in evaluating how accurate our property mea-surements need to be. Consider the various joins inthe illustration. Those between pyrope or grossularand the other end members are relatively long, andtherefore span a wide range in refractive index andsusceptibility. A difference of a few percentagepoints in composition will have a measurable effecton these properties. By comparison, the almandine-spessartine join is quite short: a larger percentagechange in composition is needed to produce a mea-surable change in properties.
Regarding the two samples with anomalous sus-ceptibilities, no. 26767 had a small chip on the tablebelow the magnet, which probably was responsiblefor its lower susceptibility. Sample 13047, a spessar-tine, had a high susceptibility. In the author’s collec-tion, a Brazilian spessartine shows a similarly highsusceptibility. Neither shows evidence of ferromag-netic inclusions, such as magnetite, that couldexplain their anomalous susceptibilities. The authorsuspects that these are yttrium-bearing spessartines,with relatively enriched rare-earth contents that areresponsible for their high susceptibilities. Note thatsample 13047, in this property space, falls wellbeyond the expected measurement error from anyternary triangle using the eight more-common gar-net end members.
Chrome-pyrope 13113 originally had an anoma-lously low measured RI, 1.732, compared to a calcu-lated value of 1.744. Yet the other measured valuesof SG, cell constant, and susceptibility agreed wellwith calculated values. The refractive index is clear-ly questionable, which illustrates the utility ofWinchell diagrams in checking the consistencybetween measured properties and chemical data.The sample’s RI was rechecked by the author andfound to be 1.742. The RIs of the three spessartines
(13047, 12487, and 27257) may also have been mea-sured incorrectly. Each had a reported RI of 1.800from the Manson-Stockton data set, and each had avery similar end-member composition. The calculat-ed RIs are all 1.805. GIA, however, remeasured theRI of sample 13047 as >1.810, or above the index ofthe refractometer liquid. The author checked thesevalues with an experimental deviation angle refrac-tometer and found all three to be 1.809, but the errorrange of the instrument is no better than 0.004.These stones remain problematic.
SG vs. Magnetic Susceptibility Diagram. Anothermodified Winchell diagram, plotting specific gravityvs. magnetic susceptibility (SGMS), holds somepromise. This diagram (figure 3) shows the 27 gar-nets for which SG data were available. Stockton andManson (1985) did not consider specific gravity intheir characterization of garnet, though they mea-sured it for many of the samples:
There is so much overlap in specific gravity rangesfor the various types of garnets that the usefulness ofthis property is questionable. Moreover the difficultyof accurately measuring density as well as the consid-erable variability introduced by the presence of inclu-sions suggests that this is not a reliable characteristicfor the identification and classification of gems.(Stock ton and Manson, 1985, p. 212)
However, figure 3 suggests otherwise. Note thepositions of samples 996, 11588, 26767, 26620, 3429,234, 491, 2211, and 2486 with respect to the pyral-spite ternary in this figure, compared to their posi-tions in figure 1. They indicate very similar chemicalcomposition, whether RI or specific gravity is usedwith magnetic susceptibility. Of particular impor-tance for the practicing gemologist is that RI valuesthat cannot be obtained on a conventional refrac-tometer can now be measured by substituting SG forRI to infer composition in a manner similar to usinga RIMS plot. This possibility was suggested byHoover et al. (2008), assuming SG values were accu-rate enough. The Manson-Stockton data clearlydemonstrate the usefulness of SG data for stones thatare not too included. For example, metamorphic gar-nets of high almandine content can be easily distin-guished from typical pegmatitic almandine-spessar-tine compositions.
Unfortunately, the SGMS plot also shows thatthe specific gravity and magnetic susceptibility ofpyrope and grossular are almost identical, and thatthe pyrope and grossular ends of the pyralspite and
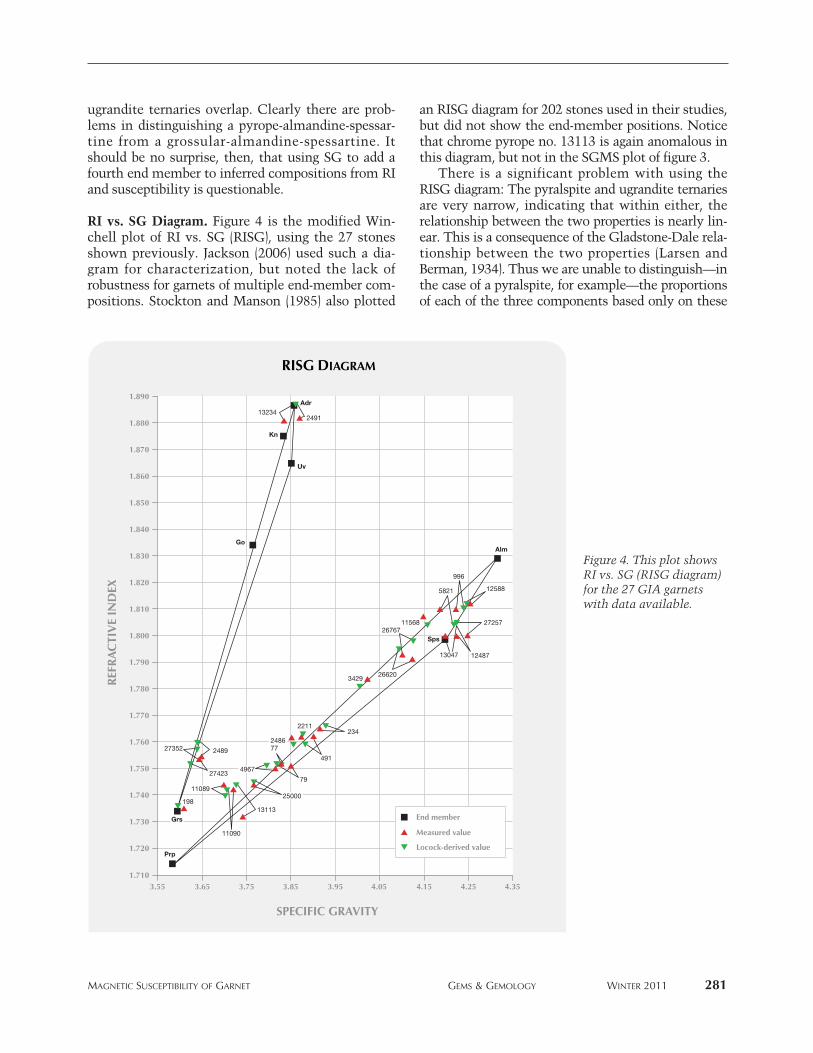
MAGNETIC SUSCEPTIBILITY OF GARNET GEMS & GEMOLOGY WINTER 2011 281
Figure 4. This plot showsRI vs. SG (RISG diagram)for the 27 GIA garnetswith data available.
RISG DIAGRAM
3.551.710
1.720
1.730
1.740
1.750
1.760
1.770
1.780
1.790
1.800
1.810
1.820
1.830
1.840
1.850
1.860
1.870
1.880
1.890
3.65 3.75 3.85 3.95 4.05 4.15 4.25 4.35
SPECIFIC GRAVITY
REF
RA
CTI
VE
IND
EX
End member
Measured value
Locock-derived value
Grs
Prp
Kn
Adr
249113234
Alm
Uv
Sps
Go
248927352
274234967
11089
19813113
25000
79
772486
2211
491
234
342926620
2676711568
5821
996
12588
27257
1248713047
11090
ugrandite ternaries overlap. Clearly there are prob-lems in distinguishing a pyrope-almandine-spessar-tine from a grossular-almandine-spessartine. Itshould be no surprise, then, that using SG to add afourth end member to inferred compositions from RIand susceptibility is questionable.
RI vs. SG Diagram. Figure 4 is the modified Win -chell plot of RI vs. SG (RISG), using the 27 stonesshown previously. Jackson (2006) used such a dia-gram for characterization, but noted the lack ofrobustness for garnets of multiple end-member com-positions. Stockton and Manson (1985) also plotted
an RISG diagram for 202 stones used in their studies,but did not show the end-member positions. Noticethat chrome pyrope no. 13113 is again anomalous inthis diagram, but not in the SGMS plot of figure 3.
There is a significant problem with using theRISG diagram: The pyralspite and ugrandite ternariesare very narrow, indicating that within either, therelationship between the two properties is nearly lin-ear. This is a consequence of the Gladstone-Dale rela-tionship between the two properties (Larsen andBerman, 1934). Thus we are unable to distinguish—inthe case of a pyralspite, for example—the proportionsof each of the three components based only on these

282 MAGNETIC SUSCEPTIBILITY OF GARNET GEMS & GEMOLOGY WINTER 2011
two properties, unless we have extremely accuratemeasurements of both properties. It is interesting tonote that for these particular stones, the measured RIand SG values agree reasonably well with the calcu-lated values. This is further evidence that Mansonand Stockton were able to measure SG adequately toprovide useful data for Winchell-type diagrams.
Multiple End Members and Compositional Possi -bilities. A few garnet varieties, such as tsavorite anddemantoid, are often characterized by a single endmember, but most other garnets require more.Figures 2 and 3 show that the malaya (nos. 234 and491) and color-change (no. 79) garnets are the onlypyralspites studied that plot well within the pyral-spite ternary. The others are either close to thealmandine-spessartine or pyrope-almandine joins, orwithin the grossular-pyrope-almandine ternary. Themalaya and color-change garnets are best describedby a combination of the pyralspite end members,plus significant grossular. Thus they are very usefulfor comparing the inferred three or four end mem-bers by applying Winchell diagrams to the micro-probe composition.
Sample no. 79 is particularly useful because ofits relatively high grossular component. The Locockprocedure yields a composition of Prp48Sps23Grs15Alm12Uv1, with less than 1% consisting of othercomponents. From figure 2 the composition can bederived as (1) Prp63Sps20Alm17 or (2) Sps35Grs34Prp31.Either of these compositions gives an RI of 1.751and a susceptibility of 16.4 × 10⁻⁴ SI. Note that nei-ther PrpGrsAlm nor GrsAlmSps fits the two proper-ties. The calculated SGs from these two composi-
tions are 3.83 and 3.80, respectively, a difference ofless than 1%, which is very slight for such a largedifference in composition. The measured SG for this1.88 ct stone is 3.85. Clearly, this value does not fit,so one cannot calculate a mixed PrpSpsGrsAlm gar-net from these measured data. For this stone, arather accurate SG (of 3.817) is needed to derive afour end-member composition obtained with theLocock method. This example demonstrates theproblem with adding SG to determine a fourth endmember for distinguishing between some pyralspitegarnets. A photo of sample no. 79 is shown in figure5, along with no. 25000 and a hessonite that resem-bles the latter in color.
Garnet no. 25000 is also an interesting stone.From the Locock procedure, its composition isPrp68Alm24Grs3Adr1. GIA had classified it as apyrope. Interestingly, the stone’s color matches thatof many hessonites. But its measured susceptibilityis close to its calculated properties, and the stone isclearly not hessonite (figure 2). The measured prop-erties indicate Pyp75Alm25, if it is assumed to haveonly py rope and almandine components, and thiscomposition would have RI and SG values of 1.743and 3.77, respectively. However, this sample canalso be fit with a composition of Grs51Prp26Sps23 andRI and SG values of 1.744 and 3.77, respectively.These properties fall within the measurement errorof Prp75Alm25. This example shows that very minordifferences in measured properties may tip the com-position to one side or the other of the pyrope-almandine join. The author suspects there are othersuch pyropes that could masquerade as hessonites.
RI vs. Cell Constant Diagram. While Manson andStockton did not use cell constant in their articles,they did measure it for a number of their samples.This makes it possible to compare the modifiedWinchell RIMS plot against a standard Winchellplot of RI vs. cell constant (RICC), as well as fourother variations, when four quantitatively measur-able properties are available.
Figure 6 shows a conventional Winchell plot for16 of the 28 GIA samples for which cell constantwas measured. Note that the differences betweenthe calculated and measured values are about thesame as those shown for the RIMS plots in figure2. Comparing these two plots shows distinct dif-ferences in the positioning of some stones withinthe pyralspite ternaries.
Consider the stones arrayed near the pyrope-almandine join. In figure 2 they are positioned, on
Figure 5. These garnets show similar color but havedifferent compositions. From left to right: GIA sam-ple nos. 79 (pyralspite), 37369 (hessonite), and 25000(pyrope-almandine). Photo by Robert Weldon.

MAGNETIC SUSCEPTIBILITY OF GARNET GEMS & GEMOLOGY WINTER 2011 283
average, slightly to the left of the join (nos. 26767,3429, 2211, 2486, 77, and 25000). In figure 6 they arewithin the pyralspite ternary. But the malaya (no.491) and color-change (79) garnets are outside thepyralspite ternary. These differences reflect theeffects of end members other than pyralspite’s on themeasured properties. If the composition of a garnet ispurely pyralspite, its position within the ternarywould not change according to the particular
Winchell diagram used. In these cases, the differ-ences are due to grossular and/or uvarovite compo-nents. Note that in the RICC plot the ugranditeternary is very narrow, indicating that a ugranditewith all three end members as major componentscannot be well characterized by this type of diagram.
Usefulness of Modified Winchell Diagrams. Thesediagrams provide a simple but powerful demonstra-
RICC DIAGRAM
11.41.710
1.720
1.730
1.740
1.750
1.760
1.770
1.780
1.790
1.800
1.810
1.820
1.830
1.840
1.850
1.860
1.870
1.880
1.890
11.5 11.6 11.7 11.8 11.9 12.0 12.1
CELL CONSTANT (Å)
REF
RA
CTI
VE
IND
EX
End member
Measured value
Locock-derived valuePrp
13113198
2489
11089
4967
79
491
234
77
25000
2486
3429
26767
26620
2211
Grs
Sps
996
Alm
Kn
Uv
Adr
Go
Figure 6. This con-ventional Winchellplot shows the RI vs.cell constant (RICCdiagram) for 16 GIAgarnet samples.

284 MAGNETIC SUSCEPTIBILITY OF GARNET GEMS & GEMOLOGY WINTER 2011
tion of the relationship between garnet propertiesand composition. Any garnet with properties thatplot near an end member will have a preponderanceof that end member in its composition. A samplepositioned toward the center of a given ternary willbe composed of similar quantities of each end mem-ber. One can also estimate the effect that adding orsubtracting any end member will have on the variousproperties. The effect on properties is directly relatedto the garnet’s distance from the end member.
In addition to offering compositional informa-tion, the modified Winchell diagrams can also pro-vide insights into garnet paragenesis. Figure 7 is aRIMS plot of data from Wright (1938) showing theaverage compositions of garnets from various rock
types. The RIs and susceptibilities were calculatedfrom Wright’s average compositions. The plot showsthat garnets associated with felsic igneous rocks(nos. 1, 2, and 3) such as the granitic pegmatites areessentially almandine and spessartine. Metamorphicgarnets (nos. 4, 5, and 6) show higher pyrope/grossu-lar as the metamorphic grade increases (blue arrows),with the highest grade (eclogitic; no. 6) approachingthe composition of peridotitic garnet (no. 7). The redline shows the change in properties of an averageperidotitic pyrope toward the knorringite compo-nent as chromium is added. Comparing figure 7with figure 2, correlations are evident between manyof the garnet samples and their probable genetic ori-gins. Malaya and color-change garnets are not repre-sented in the Wright data, but the present authorsuspects they represent metamorphosed, subducted,high-Mn oceanic sediments.
CONCLUSIONGem garnets (e.g., figure 8) encompass a broad rangeof compositions and properties. Because mostgemologists lack the capability to obtain quantita-tive chemical data, garnet composition must beinferred from measured/observed properties. In thepast, RI and possibly SG were the only quantitativemeasures for deriving chemical composition. Yetthese properties are not sufficiently independent ofeach other for such determinations. By measuringmagnetic susceptibilities on selected garnets withwell characterized compositions, the author hasdemonstrated a technique for inferring garnet com-position from measurements of two or more quanti-tative properties.
Inferring chemical composition in this wayshould not be considered equivalent to the resultsobtained from a microprobe or other chemical anal-ysis. While chemical data typically give the percent-ages of oxides in a sample, these data are not ofprime interest to the gemologist, who seeks the pro-portion of ideal end members. This proportion maybe obtained from either oxide chemistry or garnetproperties, but neither method gives unique results.When oxide percentages are used, the number ofideal end members will vary according to the num-ber of elements analyzed. Using garnet properties toinfer end-member composition limits the numberof end members to one more than the number ofproperties measured. Using RI and magnetic suscep-tibility, then, we can infer a three end-membercomposition.
RIMS DIAGRAM
01.710
1.720
1.730
1.740
1.750
1.760
1.770
1.780
1.790
1.800
1.810
1.820
1.830
1.840
1.850
1.860
1.870
1.880
1.890
5 10 15 20 25 30 35 40 45 50
VOLUME SUSCEPTIBILITY (x10-4 SI)
REF
RA
CTI
VE
IND
EX
1. Pegmatites2. Granites3. Contact-altered Si-rich Rocks4. Biotite Schists5. Amphibole Schists6. Eclogites7. Kimberlite & Peridotites8. Various Basic Rocks9. Calcareous Contact Rocks
Prp
Grs
6
7
8
5
94
12
3
Sps
Alm
Adr
Kn
Uv
Go
Figure 7. This RIMS diagram shows the average gar-net compositions from various rock associations, asgiven by Wright (1938). The RI and susceptibilitydata are plotted from compositions that include theaverage proportions of five major garnet end mem-bers. The blue arrows show the compositionalchange for metamorphic garnets as the metamor-phic grade increases.
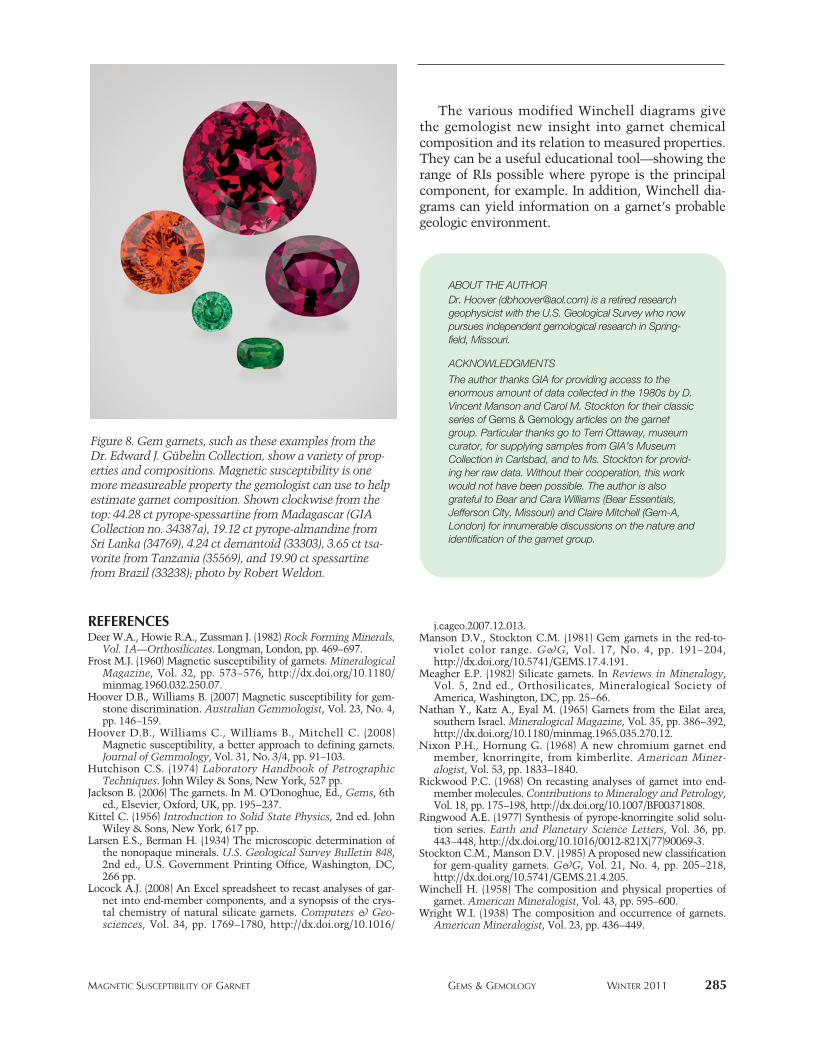
MAGNETIC SUSCEPTIBILITY OF GARNET GEMS & GEMOLOGY WINTER 2011 285
ABOUT THE AUTHORDr. Hoover ([email protected]) is a retired researchgeophysicist with the U.S. Geological Survey who nowpursues independent gemological research in Spring -field, Missouri.
ACKNOWLEDGMENTS
The author thanks GIA for providing access to theenormous amount of data collected in the 1980s by D.Vincent Manson and Carol M. Stockton for their classicseries of Gems & Gemology articles on the garnetgroup. Particular thanks go to Terri Ottaway, museumcurator, for supplying samples from GIA’s MuseumCollection in Carlsbad, and to Ms. Stockton for provid-ing her raw data. Without their cooperation, this workwould not have been possible. The author is alsograteful to Bear and Cara Williams (Bear Essentials,Jefferson City, Missouri) and Claire Mitchell (Gem-A,London) for innumerable discussions on the nature andidentification of the garnet group.
The various modified Winchell diagrams givethe gemologist new insight into garnet chemicalcomposition and its relation to measured properties.They can be a useful educational tool—showing therange of RIs possible where pyrope is the principalcomponent, for example. In addition, Winchell dia-grams can yield information on a garnet’s probablegeologic environment.
Figure 8. Gem garnets, such as these examples from theDr. Edward J. Gübelin Collection, show a variety of prop-erties and compositions. Magnetic susceptibility is onemore measureable property the gemologist can use to helpestimate garnet composition. Shown clockwise from thetop: 44.28 ct pyrope-spessartine from Madagascar (GIACollection no. 34387a), 19.12 ct pyrope-almandine fromSri Lanka (34769), 4.24 ct demantoid (33303), 3.65 ct tsa-vorite from Tanzania (35569), and 19.90 ct spessartinefrom Brazil (33238); photo by Robert Weldon.
REFERENCESDeer W.A., Howie R.A., Zussman J. (1982) Rock Forming Minerals,
Vol. 1A—Orthosilicates. Longman, London, pp. 469–697.Frost M.J. (1960) Magnetic susceptibility of garnets. Mineralogical
Magazine, Vol. 32, pp. 573–576, http://dx.doi.org/10.1180/minmag.1960.032.250.07.
Hoover D.B., Williams B. (2007) Magnetic susceptibility for gem-stone discrimination. Australian Gemmologist, Vol. 23, No. 4,pp. 146–159.
Hoover D.B., Williams C., Williams B., Mitchell C. (2008)Magnetic susceptibility, a better approach to defining garnets.Journal of Gemmology, Vol. 31, No. 3/4, pp. 91–103.
Hutchison C.S. (1974) Laboratory Handbook of PetrographicTechniques. John Wiley & Sons, New York, 527 pp.
Jackson B. (2006) The garnets. In M. O’Donoghue, Ed., Gems, 6thed., Elsevier, Oxford, UK, pp. 195–237.
Kittel C. (1956) Introduction to Solid State Physics, 2nd ed. JohnWiley & Sons, New York, 617 pp.
Larsen E.S., Berman H. (1934) The microscopic determination ofthe nonopaque minerals. U.S. Geological Survey Bulletin 848,2nd ed., U.S. Government Printing Office, Washington, DC,266 pp.
Locock A.J. (2008) An Excel spreadsheet to recast analyses of gar-net into end-member components, and a synopsis of the crys-tal chemistry of natural silicate garnets. Computers & Geo -sciences, Vol. 34, pp. 1769–1780, http://dx.doi.org/10.1016/
j.cageo.2007.12.013.Manson D.V., Stockton C.M. (1981) Gem garnets in the red-to-
violet color range. G&G, Vol. 17, No. 4, pp. 191–204,http://dx.doi.org/10.5741/GEMS.17.4.191.
Meagher E.P. (1982) Silicate garnets. In Reviews in Mineralogy,Vol. 5, 2nd ed., Orthosilicates, Mineralogical Society ofAmerica, Washington, DC, pp. 25–66.
Nathan Y., Katz A., Eyal M. (1965) Garnets from the Eilat area,southern Israel. Mineralogical Magazine, Vol. 35, pp. 386–392,http://dx.doi.org/10.1180/minmag.1965.035.270.12.
Nixon P.H., Hornung G. (1968) A new chromium garnet endmember, knorringite, from kimberlite. American Miner -alogist, Vol. 53, pp. 1833–1840.
Rickwood P.C. (1968) On recasting analyses of garnet into end-member molecules. Contributions to Mineralogy and Petro logy,Vol. 18, pp. 175–198, http://dx.doi.org/10.1007/BF00371808.
Ringwood A.E. (1977) Synthesis of pyrope-knorringite solid solu-tion series. Earth and Planetary Science Letters, Vol. 36, pp.443–448, http://dx.doi.org/10.1016/0012-821X(77)90069-3.
Stockton C.M., Manson D.V. (1985) A proposed new classificationfor gem-quality garnets. G&G, Vol. 21, No. 4, pp. 205–218,http://dx.doi.org/10.5741/GEMS.21.4.205.
Winchell H. (1958) The composition and physical properties ofgarnet. American Mineralogist, Vol. 43, pp. 595–600.
Wright W.I. (1938) The composition and occurrence of garnets.American Mineralogist, Vol. 23, pp. 436–449.

286 SYMMETRY GRADING FOR ROUND BRILLIANTS GEMS & GEMOLOGY WINTER 2011
ations during planning and cutting. Likewise, mak-ers of non-contact optical scanners have been inter-ested in guidelines for how measurable symmetryparameters affect the GIA symmetry grade. Thegrade boundaries presented here offer a substantiveestimate of the symmetry grade for any round bril-liant cut diamond.
In GIA’s laboratory, polished diamonds are mea-sured with a non-contact optical scanner early in thegrading process. Later, polish and symmetry are eval-uated visually at 10× magnification, using a standardprocedure. As described in Gillen et al. (2005), specif-ic parameter- and facet-related features are consid-ered in grading symmetry. This article presentsnumerical grade limits for 10 important symmetryparameters that can be measured accurately enoughto support visual symmetry grading. Although mea-sured values have been available to graders as a guidefor several years, beginning in 2012 GIA will usemeasured values and apply these boundary limitsstrictly when grading symmetry for round brilliantcut diamonds. Facet-related symmetry features, andthe manner in which multiple features combine,may also affect the symmetry grade, and theseaspects will continue to be evaluated visually, asthey are presently beyond reproducible instrumentmeasurement.
Compared to visual assessment, instrumentalmeasurements provide a more consistent way ofestablishing a symmetry grade, especially when a dia-mond has very subtle symmetry deviations. Figure 1shows a diamond with several symmetry flaws: awavy and uneven girdle (resulting in an unevencrown height), a table not parallel to the girdle, anduneven bezel facets. In the past, the only means of
Since 2006, GIA has used certain proportion mea-surements obtained with non-contact opticalscanners to grade the cut of round brilliant dia-
monds. Improvements in the operation and accuracyof these instruments now enable us to also measuresome symmetry parameters during the grading pro-cess. Although both Excellent and Very Good sym-metry grades meet GIA’s criteria for an Excellent cutgrade (Moses et al., 2004), there is a premium forwhat the trade calls a “triple Excellent”: anExcellent grade for cut, polish, and symmetry.Therefore, many diamond manufacturers would liketo be able to predict GIA symmetry grades frommeasurement data, so they can apply these consider-
See end of article for About the Authors.GEMS & GEMOLOGY, Vol. 47, No. 4, pp. 286–295, http://dx.doi.org/10.5741.GEMS.47.4.286.© 2011 Gemological Institute of America
Ron H. Geurts, Ilene M. Reinitz, Troy Blodgett, and Al M. Gilbertson
Grade boundary limits are presented for 10 symmetry parameters of the round brilliant cutdiamond. Starting in early 2012, these valueswill be used to support and constrain visual symmetry grading on GIA diamond reports. For manufacturers, the boundaries provide useful predictions of symmetry grades. Othersymmetry features of faceted diamonds will continue to be evaluated visually.
GIA’S SYMMETRY GRADING BOUNDARIESFOR ROUND BRILLIANT CUT DIAMONDS
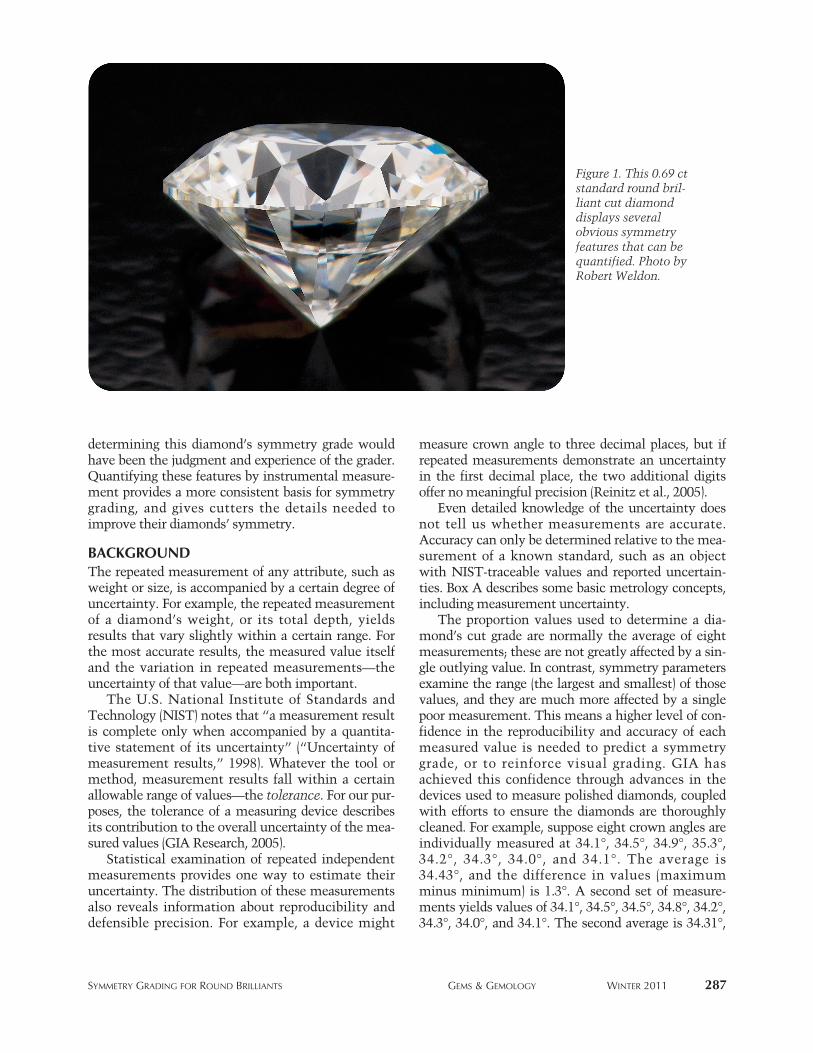
SYMMETRY GRADING FOR ROUND BRILLIANTS GEMS & GEMOLOGY WINTER 2011 287
determining this diamond’s symmetry grade wouldhave been the judgment and experience of the grader.Quantifying these features by instrumental measure-ment provides a more consistent basis for symmetrygrading, and gives cutters the details needed toimprove their diamonds’ symmetry.
BACKGROUNDThe repeated measurement of any attribute, such asweight or size, is accompanied by a certain degree ofuncertainty. For example, the repeated measurementof a diamond’s weight, or its total depth, yieldsresults that vary slightly within a certain range. Forthe most accurate results, the measured value itselfand the variation in repeated measurements—theuncertainty of that value—are both important.
The U.S. National Institute of Standards andTech nology (NIST) notes that “a measurement resultis complete only when accompanied by a quantita-tive statement of its uncertainty” (“Uncertainty ofmeasurement results,” 1998). Whatever the tool ormethod, measurement results fall within a certainallowable range of values—the tolerance. For our pur-poses, the tolerance of a measuring device describesits contribution to the overall uncertainty of the mea-sured values (GIA Research, 2005).
Statistical examination of repeated independentmeasurements provides one way to estimate theiruncertainty. The distribution of these measurementsalso reveals information about reproducibility anddefensible precision. For example, a device might
measure crown angle to three decimal places, but ifrepeated measurements demonstrate an uncertaintyin the first decimal place, the two additional digitsoffer no meaningful precision (Reinitz et al., 2005).
Even detailed knowledge of the uncertainty doesnot tell us whether measurements are accurate.Accuracy can only be determined relative to the mea-surement of a known standard, such as an objectwith NIST-traceable values and reported uncertain-ties. Box A describes some basic metrology concepts,including measurement uncertainty.
The proportion values used to determine a dia-mond’s cut grade are normally the average of eightmeasurements; these are not greatly affected by a sin-gle outlying value. In contrast, symmetry parametersexamine the range (the largest and smallest) of thosevalues, and they are much more affected by a singlepoor measurement. This means a higher level of con-fidence in the reproducibility and accuracy of eachmeasured value is needed to predict a symmetrygrade, or to reinforce visual grading. GIA hasachieved this confidence through advances in thedevices used to measure polished diamonds, coupledwith efforts to ensure the diamonds are thoroughlycleaned. For example, suppose eight crown angles areindividually measured at 34.1°, 34.5°, 34.9°, 35.3°,34.2°, 34.3°, 34.0°, and 34.1°. The average is34.43°, and the difference in values (maximumminus minimum) is 1.3°. A second set of measure-ments yields values of 34.1°, 34.5°, 34.5°, 34.8°, 34.2°,34.3°, 34.0°, and 34.1°. The second average is 34.31°,
Figure 1. This 0.69 ctstandard round bril-liant cut diamonddisplays severalobvious symmetryfeatures that can bequantified. Photo byRobert Weldon.
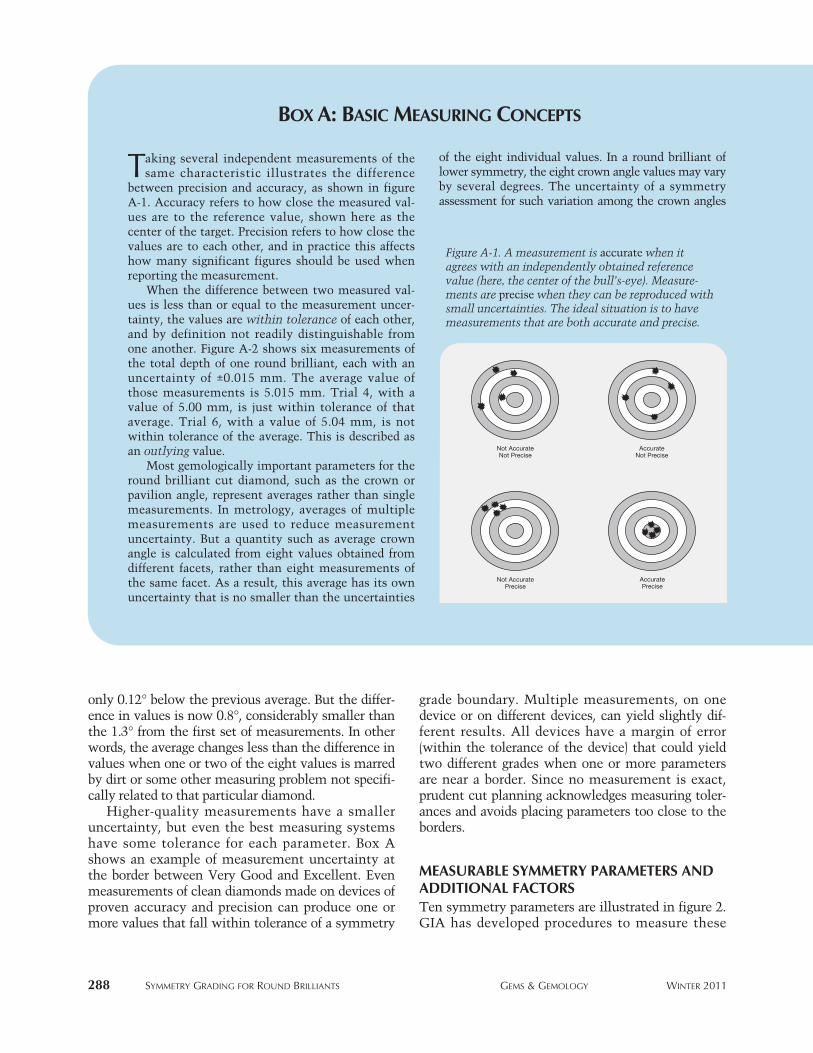
288 SYMMETRY GRADING FOR ROUND BRILLIANTS GEMS & GEMOLOGY WINTER 2011
only 0.12° below the previous average. But the differ-ence in values is now 0.8°, considerably smaller thanthe 1.3° from the first set of measurements. In otherwords, the average changes less than the difference invalues when one or two of the eight values is marredby dirt or some other measuring problem not specifi-cally related to that particular diamond.
Higher-quality measurements have a smalleruncertainty, but even the best measuring systemshave some tolerance for each parameter. Box Ashows an example of measurement uncertainty atthe border between Very Good and Excellent. Evenmeasurements of clean diamonds made on devices ofproven accuracy and precision can produce one ormore values that fall within tolerance of a symmetry
grade boundary. Multiple measurements, on onedevice or on different devices, can yield slightly dif-ferent results. All devices have a margin of error(within the tolerance of the device) that could yieldtwo different grades when one or more parametersare near a border. Since no measurement is exact,prudent cut planning acknowledges measuring toler-ances and avoids placing parameters too close to theborders.
MEASURABLE SYMMETRY PARAMETERS ANDADDITIONAL FACTORSTen symmetry parameters are illustrated in figure 2.GIA has developed procedures to measure these
Taking several independent measurements of thesame characteristic illustrates the difference
between precision and accuracy, as shown in figureA-1. Accuracy refers to how close the measured val-ues are to the reference value, shown here as thecenter of the target. Precision refers to how close thevalues are to each other, and in practice this affectshow many significant figures should be used whenreporting the measurement.
When the difference between two measured val-ues is less than or equal to the measurement uncer-tainty, the values are within tolerance of each other,and by definition not readily distinguishable fromone another. Figure A-2 shows six measurements ofthe total depth of one round brilliant, each with anuncertainty of ±0.015 mm. The average value ofthose measurements is 5.015 mm. Trial 4, with avalue of 5.00 mm, is just within tolerance of thataverage. Trial 6, with a value of 5.04 mm, is notwithin tolerance of the average. This is described asan outlying value.
Most gemologically important parameters for theround brilliant cut diamond, such as the crown orpavilion angle, represent averages rather than singlemeasurements. In metrology, averages of multiplemeasurements are used to reduce measurementuncertainty. But a quantity such as average crownangle is calculated from eight values obtained fromdifferent facets, rather than eight measurements ofthe same facet. As a result, this average has its ownuncertainty that is no smaller than the uncertainties
of the eight individual values. In a round brilliant oflower symmetry, the eight crown angle values may varyby several degrees. The uncertainty of a symmetryassessment for such variation among the crown angles
BOX A: BASIC MEASURING CONCEPTS
Not AccurateNot Precise
AccurateNot Precise
Not AccuratePrecise
AccuratePrecise
Figure A-1. A measurement is accurate when itagrees with an independently obtained referencevalue (here, the center of the bull’s-eye). Measure-ments are precise when they can be reproduced withsmall uncertainties. The ideal situation is to havemeasurements that are both accurate and precise.
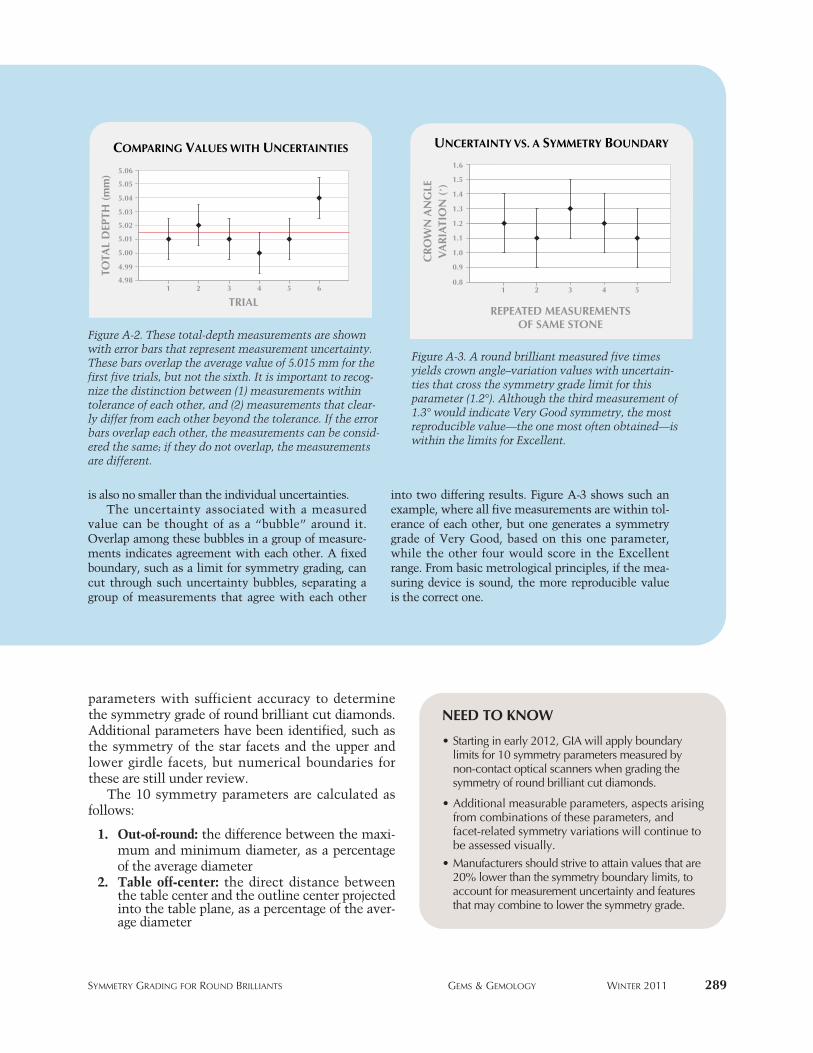
parameters with sufficient accuracy to determinethe symmetry grade of round brilliant cut diamonds.Additional parameters have been identified, such asthe symmetry of the star facets and the upper andlower girdle facets, but numerical boundaries forthese are still under review.
The 10 symmetry parameters are calculated asfollows:
1. Out-of-round: the difference between the maxi-mum and minimum diameter, as a percentageof the average diameter
2. Table off-center: the direct distance betweenthe table center and the outline center projectedinto the table plane, as a percentage of the aver-age diameter
SYMMETRY GRADING FOR ROUND BRILLIANTS GEMS & GEMOLOGY WINTER 2011 289
NEED TO KNOW
• Starting in early 2012, GIA will apply boundarylimits for 10 symmetry parameters measured bynon-contact optical scanners when grading thesymmetry of round brilliant cut diamonds.
• Additional measurable parameters, aspects arisingfrom combinations of these parameters, and facet-related symmetry variations will continue to be assessed visually.
• Manufacturers should strive to attain values that are20% lower than the symmetry boundary limits, toaccount for measurement uncertainty and featuresthat may combine to lower the symmetry grade.
COMPARING VALUES WITH UNCERTAINTIES
4.98
4.99
5.00
5.01
5.02
5.03
5.04
5.05
5.06
1 3 4 5 6
TRIAL
TOTA
L D
EPTH
(m
m)
2
UNCERTAINTY VS. A SYMMETRY BOUNDARY
0.8
0.9
1.0
1.1
1.2
1.3
1.4
1.5
1.6
1 3 4 5
REPEATED MEASUREMENTSOF SAME STONE
CR
OW
N A
NG
LEV
AR
IATI
ON
(˚)
2
Figure A-3. A round brilliant measured five timesyields crown angle–variation values with uncertain-ties that cross the symmetry grade limit for thisparameter (1.2°). Although the third measurement of1.3° would indicate Very Good symmetry, the mostreproducible value—the one most often obtained—iswithin the limits for Excellent.
Figure A-2. These total-depth measurements are shownwith error bars that represent measurement uncertainty.These bars overlap the average value of 5.015 mm for thefirst five trials, but not the sixth. It is important to recog-nize the distinction between (1) measurements withintolerance of each other, and (2) measurements that clear-ly differ from each other beyond the tolerance. If the errorbars overlap each other, the measurements can be consid-ered the same; if they do not overlap, the measurementsare different.
is also no smaller than the individual uncertainties. The uncertainty associated with a measured
value can be thought of as a “bubble” around it.Overlap among these bubbles in a group of measure-ments indicates agreement with each other. A fixedboundary, such as a limit for symmetry grading, cancut through such uncertainty bubbles, separating agroup of measurements that agree with each other
into two differing results. Figure A-3 shows such anexample, where all five measurements are within tol-erance of each other, but one generates a symmetrygrade of Very Good, based on this one parameter,while the other four would score in the Excellentrange. From basic metrological principles, if the mea-suring device is sound, the more reproducible valueis the correct one.

290 SYMMETRY GRADING FOR ROUND BRILLIANTS GEMS & GEMOLOGY WINTER 2011
QUANTIFIED SYMMETRY FEATURES
Out-of-round: deviation from the circular shape of a round diamond
Table off-center: deviation of the table from the central position on the crown
Culet off-center: deviation of the culet from the central position on the pavilion
Table/culet alignment: displacement of the table facet and culet in opposite directions
Table size variation: differing table size measurments indicating non-octagonal table
Girdle thickness variation: variation of the girdle thickness at bezel positions
Crown height variation: differing crown height measurements indicating a wavy girdle or table/girdle not parallel
Crown angle variation: crown angles are unequal; typically related to table off-center
Pavilion depth variation: differing pavilion depth measurements indicating a wavy girdle
Pavilion angle variation: pavilion angles are unequal; typically related to culet off-center
Figure 2. These 10 symmetry features can be measured reliably enough by non-contact optical scanners to determine the symmetry grade of round brilliant cut diamonds.

SYMMETRY GRADING FOR ROUND BRILLIANTS GEMS & GEMOLOGY WINTER 2011 291
Figure 3. Three vertical lengths (A1–A3)in this close-up of the 0.69 ct diamond infigure 1 illustrate girdle thickness differ-ences. Region B (green circle) showswhere the facet edges of the upper andlower girdle do not meet (crown andpavilion misalignment). Region C (yel-low circle) shows the junction wherethree facets fail to meet (pointingfault). Photo by Robert Weldon.
3. Culet off-center: the direct distance betweenthe culet center and the outline center project-ed into any horizontal plane such as the tableplane, as a percentage of the average diameter
4. Table/culet alignment: the direct distancebetween the table center and the culet centerprojected into the table plane, as a percentage ofthe average diameter
5. Crown height variation: the difference betweenthe maximum and minimum crown height val-ues, as a percentage of the average diameter
6. Crown angle variation: the difference betweenthe maximum and minimum crown angle val-ues, in degrees
7. Pavilion depth variation: the differencebetween the maximum and minimum paviliondepth values, as a percentage of the averagediameter
8. Pavilion angle variation: the difference betweenthe maximum and minimum pavilion anglevalues, in degrees
9. Girdle thickness variation: the differencebetween the maximum and minimum girdlethickness values, as a percentage of the averagediameter, measured at the bezel-main junctions(see also features A1–A3 in figure 3)
10. Table size variation: the difference between themaximum and minimum table size values, as apercentage of the average diameter
Because the facets of a round brilliant are con-nected to each other, these symmetry features fre-quently occur in combination. All of the symmetryfeatures combine to produce a general face-up visualimpression, so the symmetry grade is established bylooking at the face-up diamond. Depending onwhere they occur, and how they combine, differentsymmetry features can visually amplify or compen-sate for one another, as discussed in box B. This
interaction plays a large role in determining theoverall symmetry grade for round brilliants withlower symmetry. But for those with high symmetry,the magnitude of a single feature may dominate theevaluation.
Facet-related symmetry features also play a role indetermining the symmetry grade (e.g., figure 3, fea-tures B and C), but they are not part of the grading pro-cedure described here. A full description of facet-relat-ed symmetry features can be found in Blodgett et al.(2009). Open or short facets (non-pointing), misalign-ment between the bezels and pavilion mains, andprominent naturals or extra facets are readilyobserved, but they may occur independently of the 10measurable symmetry parameters listed above.Misshapen or uneven facets usually relate to a combi-nation of the 10 parameters, but the relationships canbe complex.
RECOMMENDED SYMMETRY BOUNDARIESThe limits given below were derived from a statisti-cal comparison of measured values for the 10 param-eters and the final symmetry grades assigned to thediamonds. This comparison was repeated four timesover a period of 10 years, each time on newlyacquired data sets from several thousand diamonds.Each analysis examined several sets of limits for the10 parameters to identify robust matches with visualsymmetry grading.
Table 1 presents the ranges of allowed values forindividual symmetry features, measured in percent-age or degrees, that GIA uses to support and con-strain visual symmetry grading. The limits dividingFair from Poor symmetry are not presented herebecause of the small number of round brilliants withsuch low symmetry. Measured values should berounded to the indicated precision, if necessary,before calculating the differences. If the value for anyone parameter falls into a range associated with alower grade, the overall symmetry grade will be low-
B

292 SYMMETRY GRADING FOR ROUND BRILLIANTS GEMS & GEMOLOGY WINTER 2011
T he red dashed lines in the drawings in figure B-1show the position of the table center, and the
blue dot shows the center of the stone outline.Consider two round brilliants, each with a 4% off-center table and culet (cases B and C). The measuredvalues for table and culet being off center are equal,and each feature would be easily noticed individual-ly, in profile as well as face-up. When the culet andtable are off center in the same direction (case B), thetwo symmetry features compensate for each othervisually. But when the table and culet are shifted offcenter in different directions (case C), the negativevisual impression is amplified considerably.
When uneven crown height and girdle thick-
ness are added to the off-center table and culet, thevisual difference between various combinations ofthese features becomes even more pronounced. Infigure B-2 (top), the table and culet are off center inthe same direction, and the girdle and crown heightare uneven along this same A-B axis. Arranged inthis way, these features tend to compensate eachother visually, particularly in the face-up view. Incontrast, figure B-2 (bottom) shows a table andculet that are off center in opposite directions, andthe girdle thickness and crown height are unevenin a different direction (along the G-H axis). Thiscombination amplifies the visual impression ofasymmetry.
BOX B: COMBINATIONS OF SYMMETRY FEATURES
A B C
Culet and table centered Culet and table off center4% in same direction
Culet and table off-center4% in opposite direction
Figure B-1. A culet andtable that are off center in
different directions producea more asymmetrical
appearance (case C) thanwhen they are off center in
the same direction (case B).Note that the degree ofasymmetry is extreme,down to the Fair range.
ered accordingly. Combinations of symmetry fea-tures, as well as facet-related features that are notmeasured, will still be evaluated visually, whichmay also contribute to a lower symmetry grade.
For example, if nine of the parameters are withinthe Excellent range but the table is off-center by0.7%, the best possible symmetry grade is VeryGood. If all 10 parameters are within the Excellentrange, the expected symmetry grade would beExcellent. But consider a round brilliant that is outof round by 0.7%, with crown angle variation of 1.1°and girdle thickness variation of 1.1%. Even thoughall three parameters are within the limits for
TABLE 1. Limits used by GIA to grade the symmetry of round brilliant cut diamonds.
Parameter Excellent Very Good Good
Out-of-round (%) 0–0.9 1.0–1.8 1.9–3.6Table off-center (%) 0–0.6 0.7–1.2 1.3–2.4Culet off-center (%) 0–0.6 0.7–1.2 1.3–2.4Table/culet alignment (%) 0–0.9 1.0–1.8 1.9–3.6Crown height variation (%) 0–1.2 1.3–2.4 2.5–4.8Crown angle variation (°) 0–1.2 1.3–2.4 2.5–4.8Pavilion depth variation (%) 0–1.2 1.3–2.4 2.5–4.8Pavilion angle variation (°) 0–0.9 1.0–1.8 1.9–3.6Girdle thickness variation (%) 0–1.2 1.3–2.4 2.5–4.8Table size variation (%) 0–1.2 1.3–2.4 2.5–4.8

SYMMETRY GRADING FOR ROUND BRILLIANTS GEMS & GEMOLOGY WINTER 2011 293
Figure B-2. These two round brilliants have multiple measurable symmetry faults that limit them tono better than a Good symmetry grade. Although both stones have equal culet off-center values, theappearance of overall symmetry is different because of the relative placement of the various symmetryfaults. The green crosshair indicates the center of the outline, blue is the center of the table, and reddenotes the center of the culet. When the faults are aligned, the asymmetry appears less pronounced(top). By comparison, when symmetry faults occur in different directions, the visual impression ofasymmetry is amplified (bottom). In either combination, these displacements are considerably moresubtle than those shown in figure B-1.
Excellent, the combination of these three symmetryfeatures (and any others found on the diamond) mayresult in either an Excellent or a Very Good symme-try grade, depending on the visual assessment.
Because every measurement contains uncertain-ty, and symmetry features may combine to lowerthe symmetry grade, we recommend a “safety mar-gin” for the trade to use in estimating the symmetrygrade. Accordingly, the values shown in table 2 are20% lower than those in table 1. When the valuesfor all 10 parameters fall within these narrower rec-ommended borders, there is a strong likelihood thatthe visual symmetry assessment will agree with the
TABLE 2. Recommended limits for estimating the symmetry grade of round brilliant cut diamonds.
Parameter Excellent Very Good Good
Out-of-round (%) 0–0.7 0.8–1.4 1.5–2.8Table off-center (%) 0–0.5 0.6–1.0 1.1–1.9Culet off-center (%) 0–0.5 0.6–1.0 1.1–1.9Table/culet alignment (%) 0–0.7 0.8–1.4 1.5–2.8Crown height variation (%) 0–1.0 1.1–2.0 2.1–3.9Crown angle variation (°) 0–1.0 1.1–2.0 2.1–3.9Pavilion depth variation (%) 0–1.0 1.1–2.0 2.1–3.9Pavilion angle variation (°) 0–0.7 0.8–1.4 1.5–2.8Girdle thickness variation (%) 0–1.0 1.1–2.0 2.1–3.9Table size variation (%) 0–1.0 1.1–2.0 2.1–3.9

measurement. Within these recommended limits, itis unlikely that a combination of measurable sym-metry features would lead to a lower symmetrygrade. Note that the second example in the previousparagraph exceeds two of these recommended limits.
The boundary values presented for these 10 sym-metry features are most useful along theExcellent–Very Good symmetry border, where a sin-gle feature often dominates the final grade determi-nation. These individual parameter limits are alsorelevant for the border between Very Good andGood. When symmetry problems become severe,
though, it is more likely that multiple symmetryfeatures will limit the grade, because the interac-tions among symmetry factors become more pro-nounced (again, see box B). Because combinations ofminor symmetry features can create a significantvisual impact, the limits in the tables must beviewed only as a guide.
DISCUSSIONDuring the analysis of laboratory grading results, weobserved some variation in how strictly symmetrywas evaluated by our graders, particularly for mea-
294 SYMMETRY GRADING FOR ROUND BRILLIANTS GEMS & GEMOLOGY WINTER 2011
A
C
B
Figure 4. These threeround brilliants each dis-play a combination ofsymmetry faults. (A) Thetable of this 1.00 ct dia-mond (Fair symmetry) isnot an octagon (6.1%table size variation, asshown by the blue andyellow lines) and the tableis off-center by 2.5%. Theasymmetry of the table isassociated with crownangle variations anduneven bezels (markedred). (B) The culet of this0.83 ct diamond (Fairsymmetry) is off-center by2.9% (red dot). The tableis also off-center in anopposing direction (greendot), yielding a value fortable/culet alignment of3.4%. These symmetryfaults are associated withuneven bezels (markedred) and pavilion mains.Unlike the diamond in A,the nearly equal quad-rants defined by the yel-low lines show that thetable is octagonal. (C) Inthis 0.69 ct diamond (alsoshown in figures 1 and 3;Good symmetry), the gir-dle is wavy and not paral-lel to the table. Photos byGIA (A and B) and RobertWeldon (C).

SYMMETRY GRADING FOR ROUND BRILLIANTS GEMS & GEMOLOGY WINTER 2011 295
REFERENCESBlodgett T., Geurts R., Gilbertson A., Lucas A., Pay D., Reinitz I.,
Shigley J., Yantzer K., Zink C. (2009) Finish, culet size and gir-dle thickness; Categories of the GIA Diamond Cut GradingSystem. www.gia.edu/diamondcut/pdf/poster_finish_culet_girdle_highres.pdf [date accessed: June 14, 2011].
GIA Research (2005) Measurement tolerances: Accuracy and pre-cision in the gem industry. Rapaport Diamond Report, Vol.28, No. 13, pp. 183–185, www.gia.edu/diamondcut/pdf/4_05_RDR_pg183_185.pdf.
Gillen D.B., Lanzl B.F., Yantzer P.M. (2005) Polish and symmetry.Rapaport Diamond Report, Vol. 28, No. 39, pp. 80–87,www.gia.edu/diamondcut/pdf/polish_and_symmetry.pdf.
Moses T.M., Johnson M.L., Green B., Blodgett T., Cino K., GeurtsR.H., Gilbertson A.M., Hemphill T.S., King J.M., Kornylak L.,Reinitz I.M., Shigley J.E. (2004) A foundation for grading the over-all cut quality of round brilliant cut diamonds. G&G, Vol. 40,No. 3, pp. 202–228, http://dx.doi.org/10.5741.GEMS.40.4.202.
Reinitz I., Yantzer K., Johnson M., Blodgett T., Geurts R.,Gilbertson A. (2005) Proportion measurement: Tolerances forthe GIA Diamond Cut Grading System. Rapaport DiamondReport, Vol. 28, No. 30, pp. 34–39, www.gia.edu/diamondcut/pdf/0805_pg34_39.pdf.
Uncertainty of measurement results (1998) The NIST Referenceon Constants and Uncertainty. http://physics.nist.gov/cuu/Uncertainty/international1.html [date accessed: June 14, 2011].
ABOUT THE AUTHORSMr. Geurts is a manager of research and development at GIAin Antwerp. Dr. Reinitz is a project manager at GIA in NewYork. Dr. Blodgett is a research scientist, and Mr. Gilbertson aresearch associate, at GIA in Carlsbad.
sured features near the border between Excellent andVery Good. A common set of fixed numerical limitsfor these parameters can only improve the consisten-cy of symmetry grading for such stones. Diamondswith at least one parameter beyond the limits shownin table 1 will receive the lower symmetry grade.Symmetry features not captured by these 10 param-eters will continue to be evaluated visually. If theseadditional facet-related features are sufficientlyprominent—an extra facet polished at the corner ofthe table, for instance—they will reduce the sym-metry grade even if all measured parameters fallwithin the narrower limits in table 2. Visual sym-metry observations cannot raise a symmetry grade,but they can reveal instances when a cleaner, morecorrect measurement of the diamond is needed.
Measured values can be of great help for dia-monds with multiple symmetry faults, such as thethree shown in figure 4. In such cases, some of thesymmetry features are more easily noticed visual-ly, while others are captured more accurately bymeasurement. In figure 4A, the asymmetry of thetable leads to variation in crown angles anduneven bezel facets. In other cases, similar faultswith the table might be associated with a wavygirdle that takes up the uneven aspects of the crownand allows little variation in the crown angles. Underboth sets of circumstances, the uneven bezels are aprominent feature that does not describe the underly-ing symmetry faults as clearly as the measured valuesfor crown angle variation, crown height variation, andgirdle thickness variation.
In figure 4B, the off-center culet and table leadto uneven bezels and pavilion mains. The displace-ment between the table center and the culet
emphasizes the visual impact of the off-centerculet (again, see box B), but the measured values—that is, Good for table-culet alignment, but Fair fortable off-center—provide a context for evaluatingthe severity of the combination. In figure 4C, themost prominent symmetry fault is displayed forthe diamond shown in figure 3. The table and gir-dle are not parallel, a fault that is more severe thanthe uneven girdle thickness or the facet-relatedsymmetry features.
CONCLUSIONMeasurement is a process full of inherent uncertain-ties, but GIA’s efforts to achieve smaller uncertain-ties have been successful. Starting in early 2012, themeasurable values presented in table 1 will be usedto attain greater consistency than is possiblethrough visual assessment alone. Additional mea-surable parameters, aspects arising from combina-tions of these parameters, and facet-related symme-try variations will continue to be assessed visually.A more restrictive set of limits is recommended formanufacturers, to help ensure that the final symme-try grade will not be undermined by combinationeffects or measuring tolerances.

296 NOTES AND NEW TECHNIQUES GEMS & GEMOLOGY WINTER 2011
Cu(Al,Fe3+)6(PO4)4(OH)8•4H2O, has been known
since prehistoric times. It has been widely used injewelry in the Middle East (Egypt and Persia), the FarEast (Tibet, Mongolia, and China), and by nativeNorth Americans (Ahmed, 1999; Chalker et al.,2004). Yet turquoise was once very fashionable inEurope, especially during the 18th and 19th cen-turies (Bennett and Mascetti, 2003), so it is not sur-prising that imitations were used when genuineturquoise was not available. The wide range ofturquoise imitations includes secondary mineralsfrom copper deposits such as chrysocolla, dyed min-erals such as magnesite or howlite, and artificialmaterials such as glass or sintered products (Arnouldand Poirot, 1975; Lind et al., 1983; Fryer, 1983; Kane,1985; Hurwit, 1988; Salanne, 2009).
In this study, we report on a historic turquoisesubstitute—fossilized dentine, also known as odon-tolite, ivory turquoise, bone turquoise, or Frenchturquoise. Much of this material consists of fos-silized mastodon ivory from Miocene-age (13–16million years old) sedimentary rocks of the GersDistrict between the Aquitaine and Languedocregions of southwestern France (Reiche et al., 2001).The tusks are hosted by alluvial sediments (molassealternating with fine sand and clay facies) that accu-mulated in basins during the erosion of the nearbyPyrenees Mountains (Crouzel, 1957; Antoine et al.,1997). The fossilized dentine consists mainly of fluo-rapatite, Ca5(PO4)3F; since medieval times, localCistercian monks have used a heating process toturn the material light blue (de La Brosse, 1626;Réaumur, 1715; Fischer, 1819), which they thoughtto be turquoise. These “stones” were originally setin medieval religious artifacts, but came into fashionin the early to mid-19th century (Brown, 2007),
The Swiss Gemmological Institute SSEF recent-ly received a set of six antique brooches foridentification (figure 1). These same pieces had
already been presented in Bennett and Mascetti(2003, p. 102) as turquoise jewelry. They were setwith numerous small rose-cut diamonds and a fewlarger old-cut diamonds, but most prominent were anumber of light blue to greenish blue cabochons thatappeared to be turquoise. Visual examination quick-ly revealed otherwise. Considering the historic back-ground of these brooches, we were interested inexamining the blue gems in greater detail to shedlight on early turquoise imitations.
Turquoise, a copper-bearing hydrated alu-minophosphate with the chemical formula
See end of article for About the Authors and Acknowledgment.GEMS & GEMOLOGY, Vol. 47, No. 4, pp. 296–301, http://dx.doi.org/10.5741.GEMS.47.4.296.© 2011 Gemological Institute of America
Michael S. Krzemnicki, Franz Herzog, and Wei Zhou
A set of six antique brooches, set with diamondsand light blue cabochons, was investigated withmicroscopy, Raman analysis, and EDXRF spec-troscopy. Most of the cabochons proved to befossilized dentine, also known as odontolite(mineralogically, fluorapatite). The brooches also contained turquoise and artificial glass.
NOTES & NEW TECHNIQUES
A HISTORIC TURQUOISE JEWELRY SET CONTAININGFOSSILIZED DENTINE (ODONTOLITE) AND GLASS

when fossilized dentine was recovered commerciallyin southwestern France.
A similar set of brooches containing odontolitewas described by Crowningshield (1993). The pre-sent study offers further data on this material. Odon -to lite is rarely encountered in the market today,although it is occasionally present in historic jewelsfrom private collections or museums. Gemologistsseldom have the opportunity to test this material inthe laboratory.
MATERIALS AND METHODSSix brooches, all of very similar style (figure 1), wereinvestigated. Their ornamental patterns of foldedand knotted bands are characteristic of early to mid-19th century design (Bennett and Mascetti, 2003).Several French assay marks were seen on the metalmounting. In total, the brooches contained 313opaque light blue cabochons from approximately 2to 11 mm long, set with numerous small rose-cutdiamonds and three old-cut diamond center-stones.The brooches rangedfrom approximately 2.5to 14 cm long and from6.6 to 53.6 g in weight.
All of the pieceswere observed micro-scopically with 10–50×magnification. A fewstones were very diffi-cult to investigate dueto the complexity ofthe mounting. Many ofthe cabochons werealso examined at high
magnification (200×) using an Olympus microscopecoupled with our Renishaw Raman system. For iden-tification, Raman spectra were taken on a large num-ber of stones, using a 514 nm argon-ion laser (Hänniet al., 1998). The spectra were collected from 1800 to100 cm–1 Raman shift, to include the vibrationalrange of organic compounds, such as wax and artifi-cial resin, used for turquoise impregnation. In a fewcases, spectra were collected up to 5000 cm–1 tocheck for OH bands in the dentine.
We also conducted semiquantitative energy-dis-persive X-ray fluorescence (EDXRF) chemical analy-sis of two cabochons, using a Thermo FisherScientific Quant’X unit. These analyses, carried outusing a series of excitation energies from 4 to 25 kV,covered a large range of elements, from Na to thosewith high atomic number.
RESULTSThe 313 light blue cabochons in the brooches (table1) were categorized into three groups: odontolite (288
NOTES AND NEW TECHNIQUES GEMS & GEMOLOGY WINTER 2011 297
Figure 1. These sixbrooches are set with313 light blue stones,the majority of whichproved to be fossilizeddentine (odontolite),mixed with a fewturquoise and glasscabochons. Photo byLuc Phan, SwissGemmologicalInstitute SSEF.
TABLE 1. Gems identified in the historic “turquoise” brooches.
Brooch Location in No. No. analyzed figure 1 cabochons by Raman
A Top left 94 88 87 7 0B Center 59 52 57 0 2C Top right 57 52 52 0 5D Bottom right 54 44 52 0 2E Bottom left 24 24 21 1 2F Bottom center 25 24 19 2 4
Total 313 284 288 10 15
a Due to the mountings, a few of the odontolites could only be identified by microscopic examination; these are also included here.
Odontolitea Turquoise Glass

298 NOTES AND NEW TECHNIQUES GEMS & GEMOLOGY WINTER 2011
stones), turquoise (10), and artificial silica glass (15). The odontolite cabochons all showed a micro-
granular surface covered with a dense pattern ofmicropores. These very tiny pores were either round-ed in outline (figure 2) or occurred as longitudinalchannels, depending on how they were intersectedby the curved surface of the cabochon. On a macroscale, these cabochons often showed weak banding(figure 3), and in some cases a very distinct pattern ofcurved intersection banding (figure 4), described as
characteristic for elephant, mammoth, and masto -don ivory (Campbell Pedersen, 2010).
The Raman spectra of the odontolite revealed adistinct peak at 964 cm–1 and smaller peaks at about1090, 580, and 430 cm–1 Raman shift (figure 5), andonly a weak, broad OH band at about 3540 cm–1.This pattern showed a perfect correlation with fluo-rapatite spectra taken from the SSEF reference min-eral collection and with the published literature(Reiche et al., 2000; Campillo et al., 2010). EDXRFanalyses of two cabochons confirmed their identityas apatite, revealing Ca and P as major elements andlow concentrations of S, Cl, Sr, and Mn. Both analy-ses also revealed traces of Cu.
The turquoise cabochons showed a smoothly pol-
NEED TO KNOW
• Odontolite is fossilized dentine (mastodon ivory)from France that has been heat treated to pro-duce its blue coloration.
• This historic turquoise substitute was identified ina set of six antique brooches set with diamonds.
• A combination of microscopic observation andRaman spectroscopy was effective for separatingodontolite from the turquoise and artificial silicaglass also present in the brooches.
Figure 3. The odontolite displayed weak banding.Photomicrograph by M. S. Krzemnicki; magnified 15×.
Figure 2. Micropores were observed on the surface ofthe odontolite cabochons. Photomicrograph by M. S.Krzemnicki; magnified 30×.
Figure 4. Characteristic curved intersection bandswere visible on several of the odontolite cabochons.Photomicrograph by M. S. Krzemnicki; magnified 20×.

ished surface and even color; some also had fineirregular brown veins (figure 6). They had a slightlymore greenish blue color than the odontolite. TheirRaman spectra were characterized by a generalincrease in Raman signal, with a distinct doublet at~1040 cm–1 Raman shift and a series of smallerpeaks between 650 and 200 cm–1, typical forturquoise. We found no peak in the 1800–1400 cm–1
range that would be expected for turquoise treatedwith wax and/or stabilized with artificial resin(Kiefert et al., 1999).
The silica glass cabochons showed a smooth sur-face, with some scratches and small but distinctlyspherical gas bubbles (figure 7). They revealed only avery weak, indistinct Raman signal characterized bythree broad bands at about 1060, 985, and 830 cm–1,attributable to the Si-O vibrational modes of silicaglass (McMillan, 1984).
DISCUSSIONThe brooches exemplify the fashionable use of odon-tolite as a turquoise imitation in mid-19th centuryperiod jewelry. This was especially true in France,the source of the material.
Figure 8 shows the distribution of odontolite andturquoise in the largest brooch. It contained onlyseven pieces of turquoise, together with 87 odonto-lite cabochons. The turquoise specimens were smalland rather hidden, whereas the odontolite occupiedthe most prominent positions. In contrast to theother brooches, we found no silica glass in this item.In general, the distribution of turquoise cabochons inthe brooches seemed rather random, and three of the
pieces did not contain any turquoise at all.Bennett and Mascetti (2003, p. 89) pictured an
antique brooch set with diamonds and blue cabo-chons described as odontolite and turquoise. One ofthe cabochons in the photo shows a distinctly green-ish blue color, suggesting to the present authors thatit is turquoise, mixed with seven odontolite cabo-chons. We presume that mixing of these similar-looking materials was common at that time. It is notclear how much the jewelers actually knew aboutthe materials they were using.
NOTES AND NEW TECHNIQUES GEMS & GEMOLOGY WINTER 2011 299
Figure 7. A gas bubble is apparent in this glass cabo-chon in one of the brooches. Photomicrograph by M.S. Krzemnicki; magnified 25×.
Figure 6. Fine brown veins are visible in this turquoisespecimen. The two neighboring cabochons are odontolite.Photomicrograph by M. S. Krzemnicki; magnified 15×.
RAMAN SHIFT (cm-1)
CO
UN
TS
RAMAN SPECTRA
GlassTurquoiseOdontolite
1400 10001200 800 600 400 2001600
1086
964
582 428
1041
644420
244
9851056 831
Figure 5. Raman spectra are shown for odontolite,turquoise, and blue silica glass.

300 NOTES AND NEW TECHNIQUES GEMS & GEMOLOGY WINTER 2011
Based on its appearance and historical availabili-ty, we presume that the turquoise in this jewelryoriginated from classical sources in the Middle East,such as Persia. They showed no indications of anytreatment (waxing, stabilization, or dyeing), asexpected for the time period of the jewelry.
With its attractive light blue color, odontolite hasbeen used as a turquoise simulant since the MiddleAges (Reiche et al., 2001). Although the heat-induced coloration was described in the early 18thcentury (Réaumur, 1715; Fischer, 1819), the cause ofthe blue color has been a subject of debate. Reiche etal. (2000, 2001) only recently showed that the oxida-tion of manganese traces within the fluorapatite dur-ing a heating process is responsible for the blue hueof the originally light gray odontolite. Using X-rayabsorption spectroscopy, these authors found thatheating to about 600°C under oxidizing conditionstransforms octahedrally coordinated Mn2+ into tetra-hedrally coordinated Mn5+, which substitutes forphosphorous in the fluorapatite (Reiche et al., 2002).
The traces of Cu that we detected in the twoodontolite cabochons using EDXRF spectroscopymay result from contamination during polishing.
There was no visual indication on any of the investi-gated samples of artificial blue color concentrations,as would be expected for dyeing with a copper-bear-ing solution (e.g., copper sulfate).
The glass imitations were uncommon in thesebrooches. Whether they were set during the craftingor during subsequent repair is not known. Similarglass, however, has a long history as a substitute(Hänni et al., 1998), and is often found in fashionjewelry from the 19th century.
CONCLUSIONSWhat started as routine testing of a set of broochesultimately shed light on the widespread use of a rareturquoise imitation—odontolite—in mid-19th cen-tury jewelry that was much in fashion in WesternEurope. The odontolite cabochons were mixed withturquoise and also set with glass either at the manu-facturing stage or during subsequent repair. Themost useful approach to identifying these materialsis a combination of microscopic observation andRaman spectroscopy. Both methods are fully nonde-structive so they can be readily applied to valuablehistoric objects.
ACKNOWLEDGMENTThe authors thank Thomas and Ida Fä rber (Färber Collection,Geneva) for loaning these brooches for our research, and forfruitful discussions about these historic jewels.
Figure 8. Thelargest brooch
(~14 cm long) con-tained mostly
odontolite witha few turquoise
cabochons.Photo by M. S.
Krzemnicki.
ABOUT THE AUTHORSDr. Krzemnicki ([email protected]) is director, Dr. Herzog isanalytical technician, and Dr. Zhou is a gemologist at SwissGemmological Institute SSEF, Basel, Switzerland.

NOTES AND NEW TECHNIQUES GEMS & GEMOLOGY WINTER 2011 301
REFERENCESAhmed A. (1999) Türkis aus dem ägyptischen Sinai. extraLapis
No. 16: Türkise—Der Edelstein mit der Farbe des Himmels,Christian Weise Verlag, Munich, Germany, pp. 76–81.
Antoine P-O., Duranthon F., Tassy P. (1997) L’apport des grandesmammifères (Rinocérotides, Suoïdes, Proboscidiens) à la con-naissance des gisements du Miocène d’Aquitaine (France). In J.-P. Aguilar, S. Legendre., and J. Michaux, Eds., Actes du CongrèsBiochoM’97, Mémoires Travaux E.P.H.E., Institut Montpeillier,Vol. 21, pp. 581–591.
Arnould H., Poirot J-.P. (1975) Infra-red reflection spectra ofturquoise (natural and synthetic) and its substitutes. Journal ofGemmology, Vol. 14, pp. 375–377.
Bennett D., Mascetti D. (2003) Understanding Jewellery. AntiqueCollectors Club Ltd., Woodbridge, Suffolk, England, 494 pp.
Brown G. (2007) Rare ivories—Challenging identifications.Lecture presented at the Federal Conference of the Gemmo -logical Association of Australia, Hobart, Tasmania, May 19,www.australiangemmologist.com.au/images/rareivories.pdf.
Campbell Pedersen M. (2010) Gem and Ornamental Materials ofOrganic Origin. NAG Press, London.
Campillo M., Lacharmoise P.D., Reparaz J.S., Goni A.R., ValienteM. (2010) On the assessment of hydroxyapatite fluoridationby means of Raman scattering. Journal of Chemical Physics,Vol. 132, No. 24, article no. 244501 [5 pp.], http://dx.doi.org/10.1063/1.3428556.
Chalker K., Dubin L.S., Whiteley P.M. (2004) Totems toTurquoise: Native North American Jewelry Arts of the North -west and Southwest. Published in association with theAmerican Museum of Natural History by Harry N. Abrams,New York, 224 pp.
Crouzel F. (1957) Le Miocène continental du Bassin d’Aquitaine.Bulletin du Service de la Carte Géologique de la France, Vol.54, No. 248, 264 pp.
Crowningshield G.R. (1993) Gem Trade Lab Notes: Odontolite.G&G, Vol. 29, No. 2, p. 127.
de La Brosse G. (1626) Livre sur la Nature, vertu et Utilité desPlantes. Bibliothèque Interuniversitaire de Médecine et d’Odon -tologie, Paris.
Fischer G. (1819) Essay on the turquoise and the calcite. In T.Thomson, Ed., Annals of Philosophy, Vol. 14, pp. 406–420.
Fryer C.W. (1983) Gem Trade Lab Notes: Turquoise imitation.
G&G, Vol. 19, No. 2, p. 117.Hänni H.A., Schubiger B., Kiefert L., Häberli S. (1998) Raman
investigations on two historical objects from Basel Cathedral:The Reliquary cross and Dorothy monstrance. G&G, Vol. 34,No. 2, pp. 102–113, http://dx.doi.org/10.5741/GEMS.34.2.102.
Hurwit K.N. (1988) Gem Trade Lab Notes: Imitation turquoise with“veins” and pyrite. G&G, Vol. 24, No. 1, p. 52.
Kane R.E. (1985) Gem Trade Lab Notes: Turquoise simulant, dyedmagnesite. G&G, Vol. 21, No. 1, pp. 47–48.
Kiefert L., Hänni H.A., Chalain J.-P., Weber W. (1999)Identification of filler substances in emeralds by infrared andRaman spectroscopy. Journal of Gemmology, Vol. 26, No. 8,pp. 501–520.
Lind T., Schmetzer K., Bank H. (1983) The identification ofturquoise by infrared spectroscopy and X-ray powder diffrac-tion. G&G, Vol. 19, No. 3, pp. 164–168, http://dx.doi.org/10.5741/GEMS.19.3.164.
McMillan P. (1984) Structural studies of silicate glasses andmelts—Applications and limitations of Raman spectroscopy.Ameri can Mineralogist, Vol. 69, pp. 622–644.
Réaumur R. (1715) Observations sur les mines de turquoises duroyaume; sur la nature de la matière qu’on y trouve, et sur lamatière dont on lui donne la couleur. Memoires de l’Aca démieRoyale des Sciences, pp. 174–202.
Reiche I., Vignaud C., Menu M. (2000) Heat induced transforma-tion of fossil mastodon ivory into turquoise ‘odontolite’: Struc -tural and elemental characterisation. Solid State Sciences, Vol.2, No. 6, pp. 625–636, http://dx.doi.org/10.1016/S1293-2558(00)01067-0.
Reiche I., Vignaud C., Champagnon B., Panczer G., Brouder C.,Morin G., Solé V.A., Charlet L., Menu M. (2001) Frommastodon ivory to gemstone: The origin of turquoise color inodontolite. American Mineralogist, Vol. 86, pp. 1519–1524.
Reiche I., Morin G., Brouder C., Solé V.A., Petit P.-E., Vignaudi C.,Calligaro T., Menu M. (2002) Manganese accommodation infossilised mastodon ivory and heat-induced colour transforma-tion: Evidence by EXAFS. European Journal of Mineralogy,Vol. 14, pp. 1069–1073, http://dx.doi.org/10.1127/0935-1221/2002/0014-10693.
Salanne C. (2009) Etude de la Turquoise, de ses Traitements etImitations. Diplôme d’Université de Gemmologie, Universityof Nantes, France, 88 pp.

302 RAPID COMMUNICATIONS GEMS & GEMOLOGY WINTER 2011
Radioactivity is one of the most discussed topics sur-rounding blue topaz (figure 1), which is commonly treated by irradiation from near-colorless starting
material. To maintain consumer confidence, it is impor-tant to ensure that these gems do not contain dangerouslevels of residual radioactivity. Three major irradiationmethods are used: gamma (γ), neutron, and electron-beamirradiation (Nassau, 1985; Ashbaugh, 1988). Of these, neu-tron irradiation creates perhaps the most beautiful medi-
um blue color, called “London Blue.” Unfortunately, thistreatment also produces radioactivity from the nuclides oftrace-element impurities in topaz (Crowningshield, 1981;Ashbaugh, 1988), such as Fe, Mn, Co, Zn, Sb, Ta, Cs, Sc,and Tb (Foord et al., 1988; Northrup and Reeder, 1994).These radioactive nuclides, which have various half-lives(table 1), may emit γ-rays and beta (β) particles of varyingradiation intensity (Ashbaugh, 1991; Nelson, 1991). Whilea high dose of γ-rays and β-particles poses danger, a verylow dose is not harmful. Therefore, blue topaz colored byneutron irradiation requires a quarantine period to allowthe residual radioactivity to reach a safe level (referred to,e.g., as the exemption level) of less than 74 becquerels pergram (Bq/g) or 2 nanocuries per gram (nCi/g; Ashbaugh,1988).
Investigations of blue topaz have focused mainly onirradiation methods and the cause of the coloration, withless emphasis on the detection of residual radioactivity.Ashbaugh (1988) discussed the radioactivity of coloredstones treated by irradiation, as well as potential healthhazards and government regulations. Based on these find-ings, GIA offered testing services for irradiated gems from1991 through 2006. However, that article did not addressblue topaz treated by neutron irradiation. Guo et al. (2000)measured the specific activity of the total alpha (α) and βradioactivity of crushed blue topaz after irradiation usingan FJ-2603 low-level α- and β-radiation measuring deviceand a BH1216A low-background measuring instrument.While that effort was helpful in exploring the radioactivedecay of irradiated blue topaz, the specific nuclidesinvolved were not determined. Helal et al. (2006) analyzedthe trace elements in topaz samples before and after neu-tron irradiation using ICP-MS and a high-purity germani-um (HPGe) detector. This study proved that radioactivityin blue topaz colored by neutron irradiation is related tovariations in the trace elements in the topaz. However, thedecay pattern of the radionuclides was unclear. This arti-cle studies the residual radioactivity in blue topaz treatedby neutron irradiation, identifies the specific radionuclides
THE RADIOACTIVE DECAY PATTERN OF BLUE TOPAZTREATED BY NEUTRON IRRADIATION
Jian Zhang, Taijin Lu, Manjun Wang, and Hua Chen
A systematic study of 15 neutron-irradiatedblue topaz samples was conducted usinghigh-purity germanium (HPGe) digitalgamma-ray spectroscopy. The specificactivity of the detected radionuclides (134Cs,182Ta, 46Sc, and/or 160Tb) was measured,and the decay pattern of the irradiatedtopaz was determined. Based on the timeelapsed since their removal from the nucle-ar reactor, the amount of time required forthe residual radioactivity to decay to safelevels was calculated. Most of the sampleswere safe at the time of the first measure-ment (95 days after irradiation), but higherconcentrations of radionuclide impurities insome samples will require them to be quar-antined for several years.
See end of article for About the Authors and Acknowledgments.GEMS & GEMOLOGY, Vol. 47, No. 4, pp. 302–307,http://dx.doi.org/10.5741/GEMS.47.4.302.© 2011 Gemological Institute of America
Rapid Communications

RAPID COMMUNICATIONS GEMS & GEMOLOGY WINTER 2011 303
involved, and calculates quarantine periods for the mosthighly radioactive samples to reach the exemption level.
MATERIALS AND METHODSFifteen samples of cut but unpolished near-colorless topaz(weighing 0.75 to ~2.0 g) of pegmatite origin from China’sGuangdong Province were studied. EDXRF chemical analy -
sis was performed on all 15 samples (after irradiation) andon one additional untreated sample from the same locality,using an ARL Quant'X spectrometer at the NationalGemstone Testing Center in Beijing.
The important color centers in topaz are produced after12 hours of irradiation at 1.2 × 10¹⁹ neutrons/(cm2 × sec).These conditions were used in this study to produce thecolors shown in figure 2. The irradiation was conducted ina “light water” (ordinary water) nuclear reactor at theChina Institute of Atomic Energy in Beijing. The sampleswere placed in cadmium-lined containers to reduce theamount of the thermal neutrons caused by absorption, andalso to increase the amount of the fast, color-producingneutrons.
A GEM-30185-Plus Despec HPGe digital gamma-rayspectrometer (figure 3) was used to measure the residualradioactivity of the irradiated blue topaz. The Ge semicon-ductor detector had a relative efficiency of 25%, an energyresolution of 1.96 keV at 1332.5 keV for 60Co, and a peakratio of 48. The values measured represent the combinedradioactivity of specific nuclides in the process of decay.The measurements were semiquantitative, obtained for40,000 seconds of active time.
TABLE 1. Half-lives of radioactive nuclides in irradiated blue topaz.
Radionuclide Half-life (days)
59Fe 44.51124Sb 60.20160Tb 72.3046Sc 83.81182Ta 114.465Zn 243.854Mn 312.2134Cs 753.760Co 1,924
Figure 1. Most bluetopaz on the market isirradiated to enhanceits color. These stones(~4–10 ct) were treatedby neutron irradiation.Photo by J. Zhang.
Figure 2. These irradiatedtopaz samples (weighing0.75 to ~2.0 g) were used inthis study. From left to right,the top row shows samplesnumbered Topaz-1 to Topaz-7, and the bottom rowshows Topaz-8 to Topaz-15.Photo by J. Zhang.

304 RAPID COMMUNICATIONS GEMS & GEMOLOGY WINTER 2011
To explore the decay pattern of the irradiated bluetopaz, we conducted four measurements of the residualradioactivity in the 15 samples. The samples wereremoved from the reactor on September 28, 2005, andgamma-ray spectroscopy was subsequently performed onJanuary 1, 2006 (day 95); March 14 (day 167); April 19(day 203); and November 30 (day 428). We tested all sam-ples at day 95, and then focused on four samples (figure 4)with residual radioactivity higher than the exemptionvalue (74 Bq/g).
RESULTS AND DISCUSSIONEDXRF spectroscopy showed traces of Mg, Ca, Na, K, andCl in all samples, while Fe, Cs, Sr, Sc, Ta, and Tb weredetected in some of them. Gamma-ray spectroscopyrevealed the variable presence of four radionuclides in theirradiated topaz: 134Cs, 182Ta, 46Sc, and/or 160Tb (table 2).When the samples were first tested 95 days after irradia-tion, four of them showed residual radioactivity above theexemption level. The residual radioactivity of the other 11samples had decayed below the exemption level or thedetection limit of the spectrometer.
The goal of studying the decay pattern of irradiatedblue topaz is to determine the time needed for the residualradioactivity to decay to a safe level (Miraglia, 1986;Mirag lia and Cunningham, 1988). The half-life decay for-mula of radioactive nuclides is necessary for these calcula-tions. De Soete et al. (1972) defined the formula as follows:If the probability of decay for radioactive elements in unittime is 1/τ, and if the number of radioactive elements is N,then the number of decayed radioactive elements in thetime span of dt should be dN, where
dN/N = −1/τ dt (1)
In formula (1), the negative sign indicates a reductionin the number of subatomic particles that constitute ioniz-ing radiation. Integrating both sides of the equation yields:
N = N0e−t/τ (2)
In formula (2), N0 is the original value of radioactivityfrom a given nuclide, and τ represents the decay time con-stant, after which the element has been reduced to e−1 ofthe original value of radioactivity. The relationshipbetween τ and half-life (T1/2) can be expressed as:
T1/2 = 0.693τ (3)
Applying formula (3) to formula (2), we can derive thehalf-life decay formula of radioactive nuclides:
N = N0e−0.693t/T1/2 (4)
NEED TO KNOW
• Neutron irradiation is commonly used to createan attractive “London Blue” color in near-color-less topaz.
• Topaz may contain trace impurities that becomeradioactive after neutron irradiation.
• Gamma-ray spectroscopy showed that irradiatedtopaz samples from China contained up to fourradionuclides.
• Most of the samples were safe to handle whenmeasured 95 days after irradiation, but some willrequire several years to “cool down.”
TABLE 2. Residual radioactivity (Bq/g) of irradiated blue topaz samples after four periods of decay.a
Decay time (days)
95 167 203 428
Topaz-8 134Cs 417.6 392.1 379.2 309.3182Ta 19,800 12,800 10,290 2,668
Total 20,218 13,192 10,669 2,977
Topaz-9 134Cs 1,617 1,512 1,462 1,18746Sc 296.3 162.1 120.7 18.4182Ta 495.9 321.1 258.1 66.8
Total 2,409 1,996 1,840 1,273
Topaz-10 182Ta 195,000 125,800 100,800 25,750
Total 195,000 125,800 100,800 25,750
Topaz-15 134Cs 106.2 100.2 96.5 78.746Sc 237.9 132.1 98.6 15.0160Tb 3,909 1,961 1,389 160.5
Total 4,253 2,193 1,585 254.2
a Although Fe was detected in the samples by EDXRF analysis, noiron radionuclides were detected by gamma-ray spectroscopy.
Figure 3. The HPGe digital spectrometer at the ChinaInstitute of Atomic Energy in Beijing was used in thisstudy. Photo by J. Zhang.
NuclideSampleno.

RAPID COMMUNICATIONS GEMS & GEMOLOGY WINTER 2011 305
In formula (4), N0 is the initial value of radioactivityand N is the unknown value of radioactivity, expressed inunits of Bq. T1/2 is the half-life of the nuclide, and t is itsdecay time.
The specific activity of each radionuclide present in agiven sample was calculated. The values obtained at thefirst stage of radiation detection (after 95 days) can be setas the initial values. Values for each subsequent stage canthen be calculated and compared with the detected values,as shown in table 3. In addition, the radioactivity of thesamples upon their removal from the reactor (day 0) can be
calculated. Most importantly, the time required for theresidual radioactivity to decay below the exemption level(74 Bq/g) can be derived using the formula; these times areshown in table 4 for the four samples.
CONCLUSIONSBlue topaz (e.g., figure 5) typically takes two to three yearsto decay below the exemption level after neutron irradia-tion. The actual quarantine time necessary for specificsamples depends on several factors. There are three scenar-ios that can contribute to high levels of residual radioactiv-ity in irradiated gems.
The first is the presence of activated impurities with along half-life (i.e., a comparatively slow rate of decay). Forexample, 134Cs has a half-life of 2.06 years. This radionu-clide was present in three of the four topaz samples show-ing residual radioactivity, and for Topaz-9 the time requiredto decay below the exemption level was calculated at 3,440days (~9.4 years).
Second, high concentrations of activated impurities(even those that do not have a long half-life) may producehigh residual radioactivity. Sample Topaz-10, for example,contained a large amount of 182Ta (half-life of 114 days).Conse quently, the sample’s radioactivity upon removalfrom the reactor was 347,600 Bq/g, and it took 1,391 days(~3.8 years) for the sample to decay below the exemptionlevel.
The third scenario contributing to high levels of residual
Figure 4. These four samples (9.5–16.5 mm long) hadresidual radioactivity higher than the exemptionlevel when initially measured after 95 days. From leftto right: Topaz-8, Topaz-9, Topaz-10, and Topaz-15.Photo by J. Zhang.
TABLE 3. Detected and calculated specific activity (Bq/g) of radionuclides in irradiated blue topaz.
Decay time (days)
0 95 167 203 428
Topaz-8 134Cs Detected 417.6 392.1 379.2 309.3Calculated 455.8 390.8 378.0 307.2
182Ta Detected 19,800 12,800 10,290 2,668Calculated 35,280 12,780 10,270 2,664
Topaz-9 134Cs Detected 1,617 1,512 1,462 1,187Calculated 1,764 1,513 1,464 1,190
46Sc Detected 296.3 162.1 120.7 18.4Calculated 650.0 163.4 121.3 18.9
182Ta Detected 495.9 321.1 258.1 66.8Calculated 877.7 320.1 257.2 66.5
Topaz-10 182Ta Detected 195,000 125,800 100,800 25,750Calculated 347,600 125,900 101,100 25,770
Topaz-15 134Cs Detected 106.2 100.2 96.5 78.7Calculated 115.7 99.2 96.0 78.0
46Sc Detected 237.9 132.1 98.6 15.0Calculated 521.8 131.1 97.4 15.1
160Tb Detected 3,909 1,961 1,389 160.5Calculated 9,717 1,960 1,388 160.6
Sample no. Nuclide Method

TABLE 4. Decay time needed for irradiated blue topaz samples to reach the exemption level of 74 Bq/g.
Decay time (days)
Topaz-8 134Cs 455.8 417.6 309.3 238.4 139.8 73.8182Ta 35,280 19,800 2,668 491.5 14.5 0.2Total 35,736 20,218 2,997.3 729.9 154.3 74.0
Topaz-9 134Cs 1,764 1,617 1,187.3 922.5 540.7 285.6 74.046Sc 650.0 296.3 18.4 1.9 0 0 0182Ta 877.7 495.9 66.8 12.2 0.4 0 0Total 3,291 2,409 1,272 936.6 541.1 285.6 74.0
Topaz-10 182Ta 347,600 195,000 25,750 4,843 73.9Total 347,600 195,000 25,750 4,843 73.9
Topaz-15 134Cs 115.7 106.2 78.7 60.546Sc 521.8 237.9 15.0 1.6160Tb 9,717 3,909 160.5 11.5Total 10,350 3,434 254.2 73.6
306 RAPID COMMUNICATIONS GEMS & GEMOLOGY WINTER 2011
0 95 428 703 1,391 1,975 3,440
radioactivity is the presence of activatedimpurities with a long half-life combinedwith relatively high concentrations.
The Chinese topaz studied for this articleshould be assumed to contain differenttrace-element impurities than startingmaterial from other sources (e.g., Brazil), andtherefore the decay times presented in thisstudy are not representative of all neutron-irradiated topaz on the market. Still, theprocedure and data presented here provideuseful information for evaluating the residu-al radioactivity in topaz treated by neutronirradiation, regardless of locality.
Figure 5. Treated blue topaz (here,85.79–243.66 ct) is commonly encoun-tered in the global gem market, andneutron-irradiated samples mustundergo appropriate safeguards toensure that they do not contain danger-ous levels of residual radioactivity.Photo by Robert Weldon; from top tobottom, GIA Collection nos. 16203,30886, 31942, 30889, and 31947.
Sample no. Nuclide

RAPID COMMUNICATIONS GEMS & GEMOLOGY WINTER 2011 307
ABOUT THE AUTHORSMr. Zhang ([email protected]) is an engineer, Dr. Lu ischief researcher, Ms. Wang is a professor, and Ms.Chen is director of the research department, at theNational Gems & Jewellery Technology AdministrativeCenter, in Beijing, China.
REFERENCESAshbaugh C.E. (1988) Gemstone irradiation and radioactivity.
G&G, Vol. 24, No. 4, pp. 196–213, http://dx.doi.org/10.5741/GEMS.24.4.196.
Ashbaugh C.E. III (1991) Radioactive and radiation treated gem-stones. Radioactivity & Radiochemistry, Vol. 2, No. 1, pp.42–57.
Crowningshield R. (1981) Irradiated topaz and radioactivity.G&G, Vol. 17, No. 4, pp. 215–217, http://dx.doi.org/10.5741/GEMS.17.4.215.
Foord E.E., Jackson L.L., Taggart J.E., Crock J.G., King T.V.V.(1988) Topaz: Environments of crystallization, crystal chem-istry, and infrared spectra. Mineralogical Record, Vol. 26, pp.69–70.
Guo Y.C., Liu X.L., Huang J.Z. (2000) Radioactivity and decay pat-tern of topaz colored by neutron radiation. China Occu -pational Medicine, Vol. 27, No. 2, pp. 19–21 [in Chinese].
Helal A.I., Zahran N.F., Gomaa M.A.M., Salama S. (2006)
Irradiated topaz in the reactor. VIII Radiation Physics &Protection Conference, Beni Suef - Fayoum, Egypt, November13–15, pp. 447–451.
Miraglia F.J. (1986) Distribution of Products Irradiated in ResearchReactors. U.S. Nuclear Regulatory Commission GenericLetter 86-11, June 25.
Miraglia F.J., Cunningham R.E. (1988) Distribution of GemsIrradiated in Research Reactors. U.S. Nuclear RegulatoryCommission Generic Letter 88-04, February 23.
Nassau K. (1985) Altering the color of topaz. G&G, Vol. 21, No. 1,pp. 26–34, http://dx.doi.org/10.5741/GEMS.21.1.26.
Nelson K.L. (1991) Health Risk Assessment of Irradiated Topaz.Unpublished PhD thesis, University of Minnesota.
Northrup P.A., Reeder R.J. (1994) Evidence for the importance ofgrowth-surface structure to trace element incorporation intopaz. American Mineralogist, Vol. 79, pp. 1167–1175.
de Soete D., Gijbels R., Hoste J. (1972) Neutron Activation Analy -sis. John Wiley & Sons, New York.
GEMS & GEMOLOGY requires that all articlesundergo a peer review process in which eachmanuscript is evaluated by at least three experts in the field. This process is vital to theaccuracy and readability of the published article.Because members of our Editorial ReviewBoard cannot have expertise in every area, wesometimes call on other experts to share theirintellect and insight. In addition to the membersof our Editorial Review Board, we extend aheartfelt thanks to the following individuals whoreviewed manuscripts for G&G in 2010–2011.
Dr. Ilaria Adamo ❁ Dr. VladimirBalitsky ❁ Dudley Blauwet ❁ BillBoyajian ❁ Dr. Christopher M.Breeding ❁ Maggie Campbell-Pedersen❁ Dr. Francois Farges ❁ Dr. DavidFisher ❁ Dr. Harald Gabasch ❁ Dr.Eloïse Gaillou ❁ Rui Galopim deCarvalho ❁ Al Gilbertson ❁ Dr.Gaston Giuliani ❁ Dr. Lee Groat ❁Dr. John Gurney ❁ Thomas Hain-schwang ❁ Hertz Hasenfeld ❁
Richard Hughes ❁ Dr. StefanosKarampelas ❁ John King ❁ WilliamLarson ❁ Elise Misiorowski ❁
Vincent Pardieu ❁ Dr. Adolf Peretti ❁Dr. Federico Pezzotta ❁ John Pollard❁ Dr. Ilene Reinitz ❁ Dr. BenjaminRondeau ❁ Dr. Andy Shen ❁ RussellShor ❁ Elisabeth Strack ❁ CarolStockton ❁ Ursula Wehrmeister
ACKNOWLEDGMENTSThe authors thank Ms. Xiuqing Gao for irradiatingthe topaz samples, and Mr. Yongbao Gao for per-forming the gamma-ray spectroscopy; both arelocated at the China Institute of Atomic Energy inBeijing.

308 LAB NOTES GEMS & GEMOLOGY WINTER 2011
DIAMOND
A Rare Fancy Vivid Purple DiamondIn GIA’s colored diamond grading sys-tem, predominantly purple diamondscan occur in the red-purple, reddishpurple, and purple hue ranges. Whilenone of these are common, diamondsin the unmodified purple range arethe rarest.
GIA first encountered purple dia-monds in the 1970s. Their color is dueto plastic deformation of the crystalstructure that occurred during theirgeologic history, resulting in parallelglide planes (referred to as graining).This graining exhibits pink andbrown dichroism, observed undermagnification (see S. Titkov et al.,“Natural-color purple diamonds fromSiberia,” Spring 2008 G&G, pp.56–63). It is extremely rare to see apure purple hue resulting from suchplastic deformation.
The New York laboratory recentlyhad the opportunity to examine a 0.81ct purple diamond with unusuallystrong color (figure 1). The cut-cor-nered rectangular modified brilliantwas faceted so the graining reflectedthe purple color throughout the stone,maximizing its intensity. With mag-nification and diffused lighting, well-defined parallel glide planes were vis-
ible through the pavilion (figure 2).These planes showed a strong concen-tration of purple color, while the sur-rounding area appeared nearly color-less. The stone fluoresced weak yel-low to long-wave UV radiation andwas inert to short-wave UV. Underthe very strong short-wave UV of theDiamondView, the glide planes dis-played clear green fluorescence,which is attributed to the localizeddistribution of the H3 optical center.The H3 center was also present in theUV-Vis absorption spectrum taken atliquid-nitrogen temperature, alongwith a strong absorption band cen-tered at ~550 nm, which clearly con-tributed to the predominantly purple
color. FTIR spectroscopy showed thediamond was a type IaA with a veryhigh concentration of aggregatednitrogen, predominantly in the Aform. We also noted a very weakabsorption at 3107 cm−1, attributed tohydrogen.
The outstanding feature of thisdiamond was its depth of color, whichplaced it in the Fancy Vivid range. Onthe rare occasions the lab has seenpurple diamonds, they typically havea dark or unsaturated color, resultingin color grades modified by “gray” or“grayish.” It is unusual for GIA toencounter more than a handful of pur-ple diamonds, regardless of theirdepth of color, in any given year. Therarity is exponentially greater for adiamond with a very strong purplehue.
Jason Darley, Paul Johnson, andJohn King
© 2011 Gemological Institute of America
GEMS & GEMOLOGY, Vol. 47, No. 4, pp. 308–315,http://dx.doi.org/10.5741/GEMS.47.4.308.
Editors’ note: All items were written by staffmembers of the GIA Laboratory.
EDITORS
Thomas M. Moses Shane F. McClure | GIA Laboratory
Figure 1. This extremely rare 0.81ct diamond was color gradedFancy Vivid purple.
Figure 2. The purple colorationin the diamond was concentrat-ed along parallel glide planes.Magnified 60×.

LAB NOTES GEMS & GEMOLOGY WINTER 2011 309
A Strongly Purple-Colored Black Diamond
Hydrogen-rich diamonds with gray toblue to violet colors are rare, but theyare well documented in the literature(see, e.g., C. H. van der Bogert et al.,“Gray-to-blue-to-violet hydrogen-richdiamonds from the Argyle mine,
Australia,” Spring 2009 G&G, pp.20–37). The New York lab recentlytested such a diamond with an unusu-ally dark tone.
The 0.85 ct type Ia heart shape(figure 3, left) showed extremelystrong hydrogen-related features (e.g.,3107 cm−1) in its mid-infrared absorp-tion spectrum. The high concentra-
tion of hydrogen produced such a darkappearance that the diamond receiveda Fancy black color grade.
We compared this heart shape to a0.20 ct modified pear shape (figure 3,right) with similar overall spectro-scopic properties, also type Ia, thatreceived a Fancy grayish blue colorgrade. In this diamond, however, thehydrogen impurity did not cause sucha strong absorption. The differencebetween the two stones was alsoclearly displayed in their Vis-NIRabsorption spectra in the 400–900 nmrange. Both showed typical absorp-tions for gray to blue to violet dia-monds, such as bands near 500 and700 nm, attributed to hydrogen. Themuch stronger absorption in the heartshape blocked most of the lightreturn, making it appear virtuallyblack. Its spectrum was very noisybecause of the absorbance, and thespectrometer detected only a veryweak signal (figure 4). Only with mag-nification and fiber-optic illumina-tion could we observe fine cloudsassociated with hydrogen in such dia-monds (figure 5); the stone’s true deeppurple bodycolor was also seen.
This rare diamond provides a goodexample of an extreme end of thecolor range of hydrogen-rich dia-monds, in which the purple color wasso deep that the stone appeared black.
Paul Johnson
Figure 3. These two diamonds, a 0.85 ct Fancy black heart shape (left)and a 0.20 ct Fancy grayish blue modified pear shape (right), had similarhydrogen-related spectroscopic properties but dramatically different color.
VIS-NIR ABSORPTION SPECTRUM
WAVELENGTH (nm)
400 500 600 700 800 900
AB
SOR
BAN
CE
Figure 4. The Vis-NIR absorption spectrum of the Fancy black heart shapeshowed a weak signal and significant noise.
Figure 5. With magnification andfiber-optic illumination, theheart-shaped diamond’s deep pur-ple bodycolor became apparent.

310 LAB NOTES GEMS & GEMOLOGY WINTER 2011
HPHT-Treated Diamond with theFluorescence Pattern of an HPHT-Grown SyntheticSynthetic diamonds grown at high-pressure, high-temperature (HPHT)conditions are no longer rare in themarket. One method to distinguishthem from natural diamonds is imag-ing their growth patterns with ultra-violet-activated fluorescence, such aswith the DiamondView instrument.
The growth structure of HPHTsynthetics is typically quite distinc-tive and, in most cases, eloquentlydisplayed in their fluorescenceimages. Because HPHT synthetic dia-monds form under different condi-tions than their natural counterparts,the growth rates of their various crys-tal faces are generally quite different.The resulting morphology of HPHTproducts is typically cubo-octahedral,whereas natural diamonds grow asoctahedra. The overwhelming majori-ty of HPHT synthetics show a diag-nostic cross shape in their lumines-cence pattern. Sometimes, however,natural diamonds exhibit four-foldsymmetry that may be confused withthis cross pattern.
One such instance was seenrecently in the Carlsbad laboratory. A0.99 ct F-color type IIa round brilliantunderwent advanced testing to deter-mine if it was natural, treated, or syn-thetic. The stone’s DiamondViewimage (figure 6, left) showed a config-uration resembling the cross pattern(figure 6, right), and its photolumi-nescence (PL) spectra indicated the
sample had been subjected to HPHTconditions, therefore suggesting itwas an HPHT-grown synthetic.Never the less, microscopic examina-tion with crossed polarizers revealeda mottled strain pattern typical ofnatural type IIa diamonds (figure 7),and additional peaks in the PL spec-tra confirmed it was an HPHT-treat-ed natural diamond.
DiamondView imaging can bediagnostic for synthetic diamonds,particularly those of HPHT origin.But careful consideration of bothDiamondView images and spectraldata (particularly PL) is usually neces-sary to definitively identify natural orsynthetic origin. The cross-shapedgrowth pattern in the present dia-mond may be due to formation underdifferent conditions (i.e., lower tem-peratures) than those typically experi-enced by natural diamonds, which led
to its altered morphology. The factthat this diamond was chosen forHPHT treatment was an interestingcoincidence.
Sally Eaton-Magaña
Type IIb Diamond with LongPhosphorescenceIt is well known that type II syntheticdiamonds and some natural diamonds(including type IIb) are phosphores-cent. In natural diamonds the effectusually lasts for only a few seconds.However, a 4.23 ct emerald cut (figure8) recently submitted to the Carlsbadlaboratory proved to be an exception.Identified as an untreated type IIb dia-mond with D color and IF clarity, it
Figure 6. In the DiamondView, this 0.99 ct HPHT-treated diamond (left)shows four-fold symmetry that appears similar to the cross pattern typi-cally encountered in HPHT synthetics (right, 1.00 ct).
Figure 7. The HPHT-treated dia-mond’s mottled strain patternindicated natural origin. Imagewidth: 4.35 mm.
Figure 8. This 4.23 ct type IIb diamond is shown before (left) and after(right) exposure to short-wave UV radiation for 10 seconds. The photo onthe right shows the diamond’s strong blue phosphorescence.

LAB NOTES GEMS & GEMOLOGY WINTER 2011 311
displayed very weak to weak greenishblue fluorescence to long- and short-wave UV radiation. During UV expo-sure, the fluorescence appeared tointensify due to the sample’s strongphosphorescence. After 5 seconds ofexposure to short-wave UV radiation,the diamond displayed bright bluephosphorescence (see video in theG&G Data Depository at gia.edu/gandg), and it continued to luminescefor several minutes.
Phosphorescence spectroscopyrevealed a band at 500 nm (also docu-mented in type IIb diamonds by S.Eaton-Magaña et al., “Luminescenceof the Hope diamond and other bluediamonds,” Fall 2006 G&G, pp.95–96) that was responsible for theblue phosphorescence. Figure 9 showsthe spectra collected over a period of60 seconds in a three-dimensionalplot. At the end of 60 seconds, the 500nm phosphorescence band was stillvisible. The calculated half-life of thisband was 8.4 seconds. By comparison,the Hope diamond’s 500 nm bandhalf-life is only 1.8 seconds (S. Eaton-
Magaña et al., “Using phosphores-cence as a fingerprint for the Hope
and other blue diamonds,” Geology,Vol. 36, No. 1, 2008, pp. 83–86).Figure 10 shows the relationshipbetween apparent bodycolor andphosphorescence half-life in 300 natu-ral type IIb diamonds examined in theGIA laboratory. The present dia-mond’s 500 nm band had a muchlonger half-life and a stronger intensi-ty than most natural type IIb dia-monds; this combination producedthe unusually long phosphorescence.
This diamond also exhibited ther-moluminescence, as described in theSpring 2011 Lab Notes (pp. 50–51). Itwas immersed in a liquid-nitrogenbath (–196ºC) and simultaneouslyexposed to short-wave UV. Afterremoval from the bath, it warmed uprapidly and displayed a flash of bluethermoluminescence. After a few sec-onds of additional warming, it exhib-ited the long-lasting phosphorescencedescribed above. A second video doc-umenting both luminescence behav-iors is available in the G&G DataDepository.
Andy H. Shen and Sally Eaton-Magaña
PHOSPHORESCENCE SPECTRUM
WAVELENGTH (nm)
TIM
E (se
c)
500 600 700
40
60
20
0
4000
8000
400
INTE
NSI
TY (
coun
ts)
Figure 9. The three-dimensional spectral plot for the diamond in figure 8shows its long-lasting phosphorescence corresponding to the 500 nm band.The diamond was exposed to UV radiation for 20 seconds and data werecollected over one second intervals.
HALF-LIFE VS. BODYCOLOR
VERY LIGHT toFANCY LIGHT
BLUED-Z
FANCY VIVID toFANCY DEEP
BLUE
FANCY INTENSEBLUE
FANCY BLUE0
2
4
6
8
10
12
AV
ERA
GE
CA
LCU
LATE
D H
ALF
-LIF
E (s
ec)
Average 660 nm band half-life
Average 500 nm band half-life
COLORLESS
14
16
18
Figure 10. Data compiled for 300 natural type IIb diamonds show varia-tions in the average half-life of phosphorescence bands (with error barsshowing standard deviations) at 500 and 660 nm according to their body-color. Colorless type IIb diamonds generally do not show a red phospho-rescence band at 660 nm, and their blue 500 nm band has a long half-life.Type IIb diamonds with stronger blue coloration have both 500 and 660nm bands, and the half-life of their blue phosphorescence is much shorter.

312 LAB NOTES GEMS & GEMOLOGY WINTER 2011
OPAL
Clarity-Enhanced, with Artificial MatrixThe Carlsbad laboratory recentlyreceived a 67.17 ct opal cabochon (fig-ure 11) for identification. The stoneshowed an orangy yellow bodycolorand moderate play-of-color. It also hadan unusual mottled gray “matrix” onthe back and felt slightly greasy to thetouch. In reflected light, a network offine lines on the surface revealed alarge amount of crazing, but theselines were not easily seen upon initialexamination.
Gemological examination pro-duced measurements consistent with
natural opal. The refractive index was1.45, but we did not test specific grav-ity because of the presence of the“matrix.” The sample was inert tolong-wave UV radiation and gave aweak greenish yellow reaction toshort-wave UV. Notably, the fracturesfluoresced weak yellow to both long-and short-wave UV.
Microscopic examination revealeda somewhat columnar structure andbodycolor similar to material fromWollo Province, Ethiopia. A dense net-work of very low-relief fractures wasalso seen throughout the stone; theirsubtle appearance immediately sug-gested clarity enhancement. Closerexamination showed flattened gasbubbles in many of the fractures fromincomplete filling (figure 12, left).When exposed to a relatively low tem-perature thermal probe, the fracturesbegan to sweat (figure 12, right).Because of the mobile nature of theclarity enhancing substance, we con-cluded that the stone was treated withsome variety of oil rather than anepoxy resin.
The “matrix” on the back of thecabochon consisted of a hard grayresin-like material that showed swirlmarks and also some grinding marks,indicating it had been applied duringor after the lapidary process. Thislayer added significant weight andlikely helped hold the highly frac-tured stone together.
While we do not know for certainif this stone was from the Wollo
deposit, this seems likely given itsappearance and the high volume ofmaterial recently mined there.Although this opal did not showhydrophane character, in one ofthese contributors’ (NR) experience,not all Wollo opal is hydrophanetype. In addition, some of the orangyyellow Wollo opal seems to be proneto crazing.
As with any new source, artificial-ly enhanced lesser-quality materialwill eventually make its way to themarket as treatments are developed tocreate salable products. Even thoughvery high-quality untreated Ethiopianopal is readily available, buyers shouldbe aware that an increasing amount oftreated material is appearing in thetrade, including clarity-enhanced sam-ples such as this one and others sub-jected to forms of color modification(see, e.g., N. Renfro and S. F. McClure,“A new dyed purple opal,” www.gia.edu/research-resources/news-from-research). As with all treatments,these are acceptable as long as properdisclosure is given to the buyer.
Nathan Renfro and Phil York
Ethiopian Black OpalThe Carlsbad laboratory recentlyexamined a 10.67 ct black opal (figure13), reportedly from the WolloProvince of Ethiopia. Because black isnot a common bodycolor for opalfrom this important locality, andthere are increasing reports of thismaterial being treated (e.g., the articleby N. Renfro and S. F. McClure in thisissue, pp. 260–270), we sought todetermine the cause of color in thissample. Also submitted was anapproximately 1 kg parcel of opal nod-ules, on which the client permitteddestructive testing to investigate thecause of the bodycolor.
Standard gemological propertiesfrom the cabochon were consistentwith those expected for opal, includ-ing an RI of 1.45 and a hydrostatic SGof 2.05. It was inert to long- and short-wave UV radiation. Microscopicexamination revealed small browndendritic inclusions, a “digit-pattern”
Figure 11. This 67.17 ct opal wasclarity enhanced with some typeof oil.
Figure 12. Low-relief fractures were seen throughout the opal, many ofwhich showed flattened gas bubbles near the surface (left). Droplets ofoil readily sweated out of the fractures when exposed to low temperatureheat from a thermal probe (right, reflected light). Magnified 40×.

LAB NOTES GEMS & GEMOLOGY WINTER 2011 313
columnar structure, and nonphenom-enal potch areas with a greenish cast.These microscopic observations andphysical properties are consistentwith features seen in other colors ofWollo opal.
The rough material had the samegeneral appearance and gemologicalproperties as the cabochon, exceptthat the nodules displayed color zon-ing. One of the rough pieces wassliced in half, revealing a dark brownto black core with a light brown tonear-colorless perimeter (figure 14).This structure suggested naturalcolor, as the reverse pattern (darkperimeter with light core) would beexpected if the dark color had beenartificially introduced.
We performed LA-ICP-MS chemi-cal analysis of one slice, and Mn wasthe only element that showed distinctvariations between the dark core(average 261 ppmw) and light rim(average 23 ppmw). The elevated Mnin the core is consistent with the darkcolor, as black manganese oxides havebeen observed on Wollo opal. If Mnwas present during opal formation, itis reasonable to conclude that man-
ganese oxides would be incorporatedinto the opal and impart a dark body-color. Qualitative analysis by EDXRFalso showed relatively high levels ofMn when compared to a white opalfrom Wollo.
While treated black Ethiopianmaterial has been documented (e.g.,www.stonegrouplabs.com/SmokeTreatmentinWolloOpal.pdf), opal en -thu siasts will certainly appreciatethese natural-color gems from theWollo Province.
Nathan Renfro
Coated Bead-Cultured Freshwater PEARLSIn September 2011, a strand of unusu-ally large white baroque “pearls” wassubmitted to the New York laborato-ry for identification. The 17 piecesmeasured 22.43 × 17.60 × 14.17 mmto 29.46 × 19.64 × 16.50 mm. Theyhad a noticeably unnatural color andsurface appearance, yet their baroqueshape was typical of some freshwatercultured pearls seen in the market-place (figure 15).
Microscopic inspection revealed asurface structure that lacked the char-acteristic platelet structure of nacre-ous pearls. Instead, the surfaces had a“glittery” painted appearance andunnaturally distributed orient, fea-
Figure 13. This 10.67 ct opalcabochon is reportedly from theWollo Province of Ethiopia. Theblack bodycolor is caused bynatural manganese oxides incor-porated during formation.
Figure 14. This 8.37 ct slice froma black opal nodule shows a darkcore with a near-colorless to lightbrown perimeter, suggestive ofnatural color. LA-ICP-MS analy-sis of the core revealed high con-centrations of Mn, which isresponsible for the bodycolor.
Figure 15. This strand contains 17 large (up to 29.46 mm), coated,baroque-shaped, bead-cultured freshwater pearls.

314 LAB NOTES GEMS & GEMOLOGY WINTER 2011
tures commonly found in imitationpearls. Also, air bubbles were trappedin the folds and crevices throughoutthe strand (e.g., figure 16, left).Puckering at the drill holes, as well asnoticeable chipping and peeling, fur-ther indicated a pearl imitation. Inaddition, some of the drill holesrevealed an underlying nacreous layer(figure 16, right). These observationssuggested the strand consisted ofnacreous pearls with a thick coating,which would explain their organic-appearing shape despite their artificialappearance.
Most of the samples showed obvi-ous uniformly round bulges like thoseseen in baroque bead-cultured pearls.Examination of these areas with fiber-optic lighting showed distinct band-ing that is typical of shell beads. X-radiography revealed that the entirestrand was indeed bead cultured (fig-ure 17). No distinct boundarybetween the very thin nacre and thecoating could be observed in the X-rayimages.
The long-wave UV reaction wasrelatively inert across the body of thecultured pearls but strong bluishwhite along the narrower areas wherethe coating was most concentrated.When exposed to X-rays, the strandshowed moderate yellow lumines-cence (which was visible through thecoating), typical of a freshwater ori-gin. This was confirmed by LA-ICP-
MS chemical analysis of an exposednacreous layer, which showed highconcentrations of Mn and Sr. BothEDXRF and LA-ICP-MS detected sig-nificant amounts of bismuth in thecoating. Bismuth is often used in arti-ficial coatings to create a pearlescentappearance (J. V. Koleske, Ed., Paintand Coating Testing Manual: 14th
Edition of the Gardner-Sward Hand -book, American Society for Testingand Materials, Philadelphia, 1995, pp.229–230). Natural saltwater pearlswith a bismuth-bearing coating werereported in a Fall 2005 Gem NewsInternational entry (pp. 272–273).
This strand proved unusual fortwo reasons: Bead-cultured freshwa-ter pearls are not common in the mar-ket, and the pearl coatings we haveexamined have tended to consist ofclear silicone polymers applied toimprove luster or protect the underly-ing nacre (see Lab Notes: Spring 2000,p. 65; Spring 2002, pp. 83–84). Thecoating on the present strand createdthe illusion of thick, luminous nacre,and was probably applied to reinforcethe precariously thin nacre layer onthese cultured pearls.
Akira Hyatt
Tenebrescent ZIRCONOnly a few gem varieties are knownto exhibit reversible photochromism,also known as tenebrescence. Thisphenomenon is most notable in hack-manite a variety of sodalite. Recentlywe learned about another gem show-ing tenebrescence: zircon. Our sourceindicated that five such stones hadbeen discovered approximately 25years ago in central Australia. Whenleft in the dark for a few hours, thespecimens reportedly turned orange,which would fade to near-colorlesswithin a few minutes of exposure tolight (figure 18).
Two of the Australian sampleswere provided for examination inSeptember, 2011: a 3.07 ct piece ofrough and a 1.80 ct faceted round bril-liant. Both samples had fairly typicalproperties for zircon: RI—over thelimits of the refractometer (>1.81);SG—4.72; and fluorescence—veryweak orange to long-wave UV radia-tion, and moderate orangy yellow toshort-wave UV. Microscopic exami-nation revealed reflective disk-likeinclusions. LA-ICP-MS chemicalanalysis did not show anything out ofthe ordinary for zircon.
When first taken out of the darkenvironment, the stones were orange.
Figure 16. Microscopic examination of the cultured pearls reveals air bubblestrapped in folds within the surface (left, magnified 20×). A close-up of a drillhole shows puckering and peeling of the outer surface, as well as the underly-ing nacreous surface of the cultured pearl (right, magnified 20×).
Figure 17. X-radiography of thestrand reveals a bead-culturedstructure and very thin nacre lay-ers around the beads.
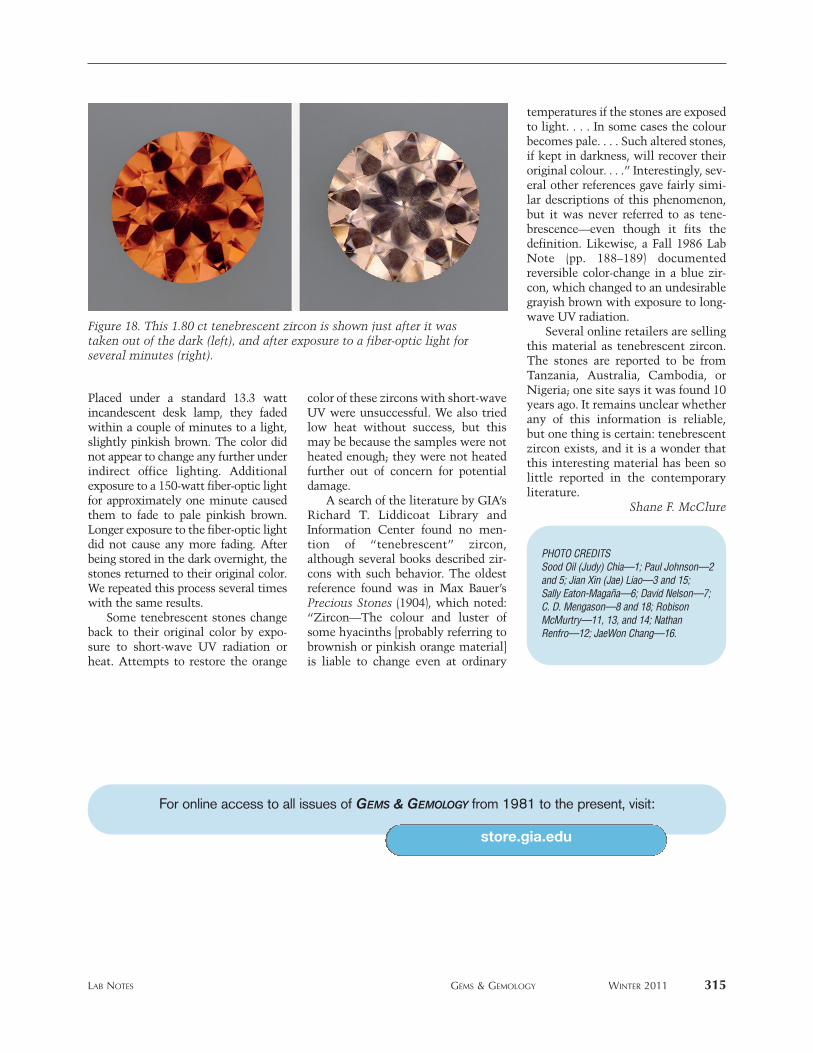
LAB NOTES GEMS & GEMOLOGY WINTER 2011 315
Placed under a standard 13.3 wattincandescent desk lamp, they fadedwithin a couple of minutes to a light,slightly pinkish brown. The color didnot appear to change any further underindirect office lighting. Additionalexposure to a 150-watt fiber-optic lightfor approximately one minute causedthem to fade to pale pinkish brown.Longer exposure to the fiber-optic lightdid not cause any more fading. Afterbeing stored in the dark overnight, thestones returned to their original color.We repeated this process several timeswith the same results.
Some tenebrescent stones changeback to their original color by expo-sure to short-wave UV radiation orheat. Attempts to restore the orange
color of these zircons with short-waveUV were unsuccessful. We also triedlow heat without success, but thismay be because the samples were notheated enough; they were not heatedfurther out of concern for potentialdamage.
A search of the literature by GIA’sRichard T. Liddicoat Library andInformation Center found no men-tion of “tenebrescent” zircon,although several books described zir-cons with such behavior. The oldestreference found was in Max Bauer’sPrecious Stones (1904), which noted:“Zircon—The colour and luster ofsome hya cinths [probably referring tobrownish or pinkish orange material]is liable to change even at ordinary
temperatures if the stones are exposedto light. . . . In some cases the colourbecomes pale. . . . Such altered stones,if kept in darkness, will recover theiroriginal colour. . . .” Interestingly, sev-eral other references gave fairly simi-lar descriptions of this phenomenon,but it was never referred to as tene-brescence—even though it fits thedefinition. Likewise, a Fall 1986 LabNote (pp. 188–189) documentedreversible color-change in a blue zir-con, which changed to an undesirablegrayish brown with exposure to long-wave UV radiation.
Several online retailers are sellingthis material as tenebrescent zircon.The stones are reported to be fromTanzania, Australia, Cambodia, orNi geria; one site says it was found 10years ago. It remains unclear whetherany of this information is reliable,but one thing is certain: tenebrescentzircon exists, and it is a wonder thatthis interesting material has been solittle reported in the contemporaryliterature.
Shane F. McClure
Figure 18. This 1.80 ct tenebrescent zircon is shown just after it wastaken out of the dark (left), and after exposure to a fiber-optic light forseveral minutes (right).
PHOTO CREDITSSood Oil (Judy) Chia—1; Paul Johnson—2and 5; Jian Xin (Jae) Liao—3 and 15; Sally Eaton-Magaña—6; David Nelson—7;C. D. Mengason—8 and 18; RobisonMcMurtry—11, 13, and 14; NathanRenfro—12; JaeWon Chang—16.
store.gia.edu
For online access to all issues of GEMS & GEMOLOGY from 1981 to the present, visit:

316 GEM NEWS INTERNATIONAL GEMS & GEMOLOGY WINTER 2011
COLORED STONES AND ORGANIC MATERIALSChondrodite from Mahenge, Tanzania. At the 2011Tucson gem shows, Dudley Blauwet (Dudley BlauwetGems, Louisville, Colorado) showed GIA some samples ofchondrodite that were found near Mahenge, Tanzania, inearly 2010. Chondrodite, (Mg,Fe2+)5(SiO4)2(F,OH)2, is a fair-ly rare monoclinic silicate mineral that typically occursas small grains ranging from yellow to red and brown;well-formed crystals and gem-quality material are rare.Faceted chondrodite was previously reported fromTanzania, though from a different locality, Sumbawanga(see Winter 2007 Gem News International [GNI], pp.377–378).
Mr. Blauwet was aware of ~100 g of rough materialbeing produced at Mahenge, which consisted of smallwaterworn pebbles and larger broken fragments. Hebought a few small samples in 2010, and the cut stonesfrom this parcel yielded 121 pieces totaling 19.06 carats.Later, during the 2011 Tucson shows, he purchased about50 g of clean rough. This parcel produced 99 cut stonestotaling 55.57 carats. It included five gems weighing >1.5ct; the largest one was ~2.0 ct.
Gemological examination by GIA in Tucson yieldedthe following properties from a 0.34 ct faceted sample (fig-ure 1, left): RI—nα= 1.594, nβ = 1.602, nγ = 1.621; birefrin-gence—0.027; optic character—biaxial positive; pleochro-ism—weak yellow to near colorless; UV fluorescence—inert to long-wave, and slightly chalky yellow to short-wave UV; and no lines visible with the desk-model spec-
troscope. Inclusions consisted of numerous transparentreflective particles and fine oriented short needles, someappearing rusty orange. Compared to the Sumbawangachondrodite, the Mahenge material had a slightly higherRI, but the same birefringence. The needle-like inclusionswere not seen in the Sumbawanga material.
Mr. Blauwet reported that, to his knowledge, no addi-tional gem-quality chondrodite has been produced fromMahenge since 2010.
Thomas W. Overton ([email protected])Carlsbad, California
Blue dolomite from Colombia. Dolomite, a calcium-mag-nesium carbonate [CaMg(CO3)2], is the second mostimportant carbonate mineral after calcite. Althoughdolomite is sometimes used as an ornamental stone, it israrely seen as a gem due to its low hardness (Mohs 3½–4)and lack of transparency. However, in late 2010, GIA wasinformed by Farooq Hashmi (Intimate Gems, Glen Cove,New York) about a new find of gem-quality blue dolomitefrom the famous Muzo emerald mine in Colombia. The
Editor’s note: Interested contributors should send informa-tion and illustrations to Brendan Laurs at [email protected] orGIA, The Robert Mouawad Campus, 5345 Armada Drive,Carlsbad, CA 92008. Original photos will be returned afterconsideration or publication.
GEMS & GEMOLOGY, Vol. 47, No. 4, pp. 316–335,http://dx.doi.org/10.5471.GEMS.47.4.316.© 2011 Gemological Institute of America
EditorBrendan M. Laurs ([email protected])
Contributing EditorsEmmanuel Fritsch, CNRS, Team 6502, Institut des Matériaux Jean Rouxel (IMN), University of Nantes, France ([email protected])Michael S. Krzemnicki, Swiss Gemmological Institute SSEF, Basel, Switzerland ([email protected])Franck Notari, GGTL GemLab–GemTechLab, Geneva, Switzerland ([email protected])Kenneth Scarratt, GIA, Bangkok, Thailand ([email protected])
Figure 1. These chondrodites (left, 0.34 ct) are fromMahenge, Tanzania. Photo by Robert Weldon.

GEM NEWS INTERNATIONAL GEMS & GEMOLOGY WINTER 2011 317
material was reportedly produced in mid-2010 from veinsin black shale. Less than 2 kg of gem-quality rough werefound, as crystals up to 2.5 cm across (mostly ~1 cm). Mr.Hashmi arranged for some of the rough material to bedonated to GIA by Greg Turner (Sacred Earth Minerals,Asheville, North Carolina), and Brad Payne (The GemTrader, Surprise, Arizona) also loaned a 1.13 ct oval bril-liant (figure 2) for examination.
All of the samples were transparent light blue withoutany color zoning. Their gemological properties were con-sistent with dolomite, which was confirmed by Ramananalysis. Microscopic observation revealed two- and three-
phase inclusions with jagged edges (figure 3, left), alongwith other fluid and transparent crystalline inclusions.Healed feathers containing tiny crystals were found inmost samples. A wavy strain pattern was observed withcross-polarized light. Dolomite’s high birefringence (0.180)was evident from the strong doubling. An albite inclusion,identified by Raman and LA-ICP-MS analysis, broke thesurface of one rough sample (figure 3, right). Pyrite, com-monly associated with dolomite at Muzo, was also seenon the surface of a few rough samples, all of which wererhombohedral twinned aggregates with reentrant corners.The surfaces also showed numerous etch features. Onecrystal contained three large, flat fractures parallel torhombic faces, consistent with the perfect rhombohedralcleavage of dolomite.
A UV-Vis spectrum of the cut stone revealed Fe3+
absorption bands at 450, 460, and 470 nm, along with a largebroad band centered at ~580 nm. Qualitative EDXRF spec-troscopy detected Ca and Mg, as well as traces of Fe andMn. LA-ICP-MS analysis revealed many additional traceelements, including Sc, Ti, V, Cr, Ni, Zn, Sr, Y, and rare-earth elements. A pure dolomite crystal is expected to becolorless, and the blue color shown by this Colombianmaterial may be due to natural radiation. Blue color in car-bonate minerals (i.e., calcite) that contain twinning and dis-locations is thought to be related to natural radiation (T.Calderon et al., “Relationship between blue color and radia-tion damage in calcite,” Radiation Effects, Vol. 76, 1983, pp.187–191, http://dx.doi.org/10.1080/01422448308209660).
Transparent (colorless) dolomite has been documentedfrom Spain (see M. O’Donoghue, Ed., Gems, 6th ed.,Butterworth-Heinemann, Oxford, UK, 2006, p. 406), but
Figure 2. This 1.13 ct oval brilliant is a rare bluedolomite from the Muzo mine, Colombia. Photo byBrad Payne.
Figure 3. The dolomite contained tiny jagged three-phase inclusions associated with other fluid inclusions(left, magnified 110×). An albite inclusion broke the surface of one rough dolomite sample (right, magnified80×). Photomicrographs by K. S. Moe.
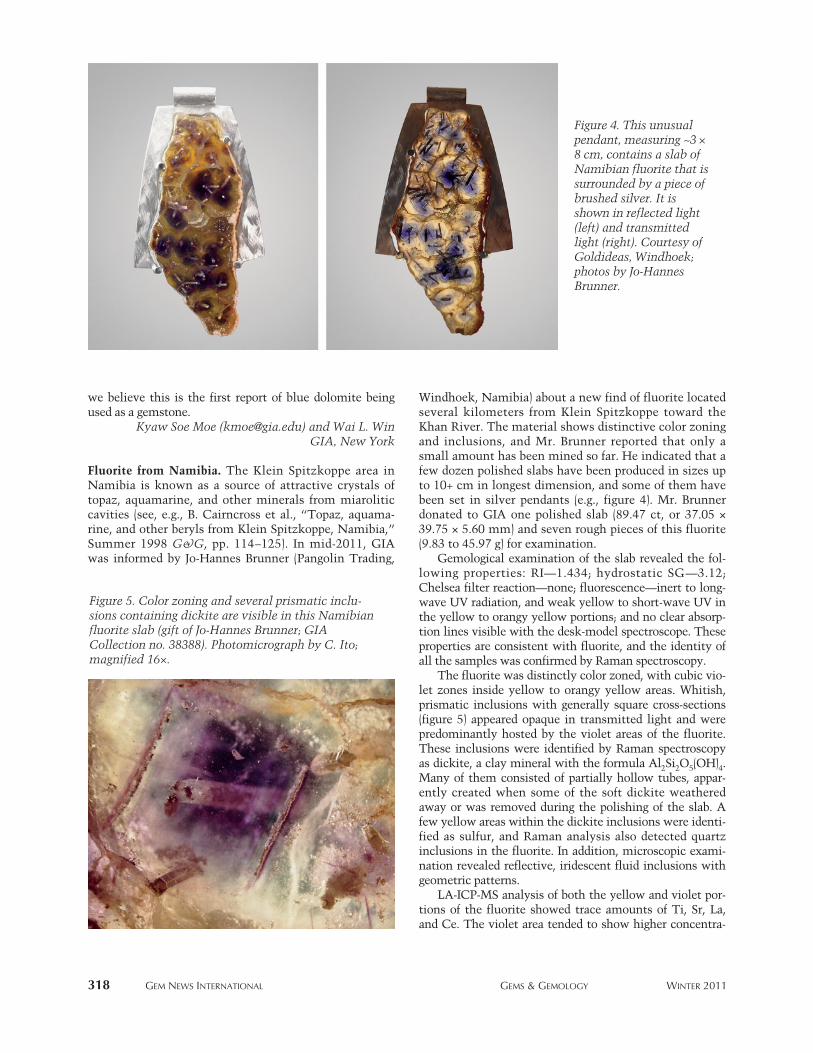
318 GEM NEWS INTERNATIONAL GEMS & GEMOLOGY WINTER 2011
we believe this is the first report of blue dolomite beingused as a gemstone.
Kyaw Soe Moe ([email protected]) and Wai L. WinGIA, New York
Fluorite from Namibia. The Klein Spitzkoppe area inNamibia is known as a source of attractive crystals oftopaz, aquamarine, and other minerals from miaroliticcavities (see, e.g., B. Cairncross et al., “Topaz, aquama-rine, and other beryls from Klein Spitzkoppe, Namibia,”Sum mer 1998 G&G, pp. 114–125). In mid-2011, GIAwas informed by Jo-Hannes Brunner (Pangolin Trading,
Wind hoek, Namibia) about a new find of fluorite locatedseveral kilometers from Klein Spitzkoppe toward theKhan River. The material shows distinctive color zoningand inclusions, and Mr. Brunner reported that only asmall amount has been mined so far. He indicated that afew dozen polished slabs have been produced in sizes upto 10+ cm in longest dimension, and some of them havebeen set in silver pendants (e.g., figure 4). Mr. Brunnerdonated to GIA one polished slab (89.47 ct, or 37.05 ×39.75 × 5.60 mm) and seven rough pieces of this fluorite(9.83 to 45.97 g) for examination.
Gemological examination of the slab revealed the fol-lowing properties: RI—1.434; hydrostatic SG—3.12;Chelsea filter reaction—none; fluorescence—inert to long-wave UV radiation, and weak yellow to short-wave UV inthe yellow to orangy yellow portions; and no clear absorp-tion lines visible with the desk-model spectroscope. Theseproperties are consistent with fluorite, and the identity ofall the samples was confirmed by Raman spectroscopy.
The fluorite was distinctly color zoned, with cubic vio-let zones inside yellow to orangy yellow areas. Whitish,prismatic inclusions with generally square cross-sections(figure 5) appeared opaque in transmitted light and werepredominantly hosted by the violet areas of the fluorite.These inclusions were identified by Raman spectroscopyas dickite, a clay mineral with the formula Al2Si2O5(OH)4.Many of them consisted of partially hollow tubes, appar-ently created when some of the soft dickite weatheredaway or was removed during the polishing of the slab. Afew yellow areas within the dickite inclusions were identi-fied as sulfur, and Raman analysis also detected quartzinclusions in the fluorite. In addition, microscopic exami-nation revealed reflective, iridescent fluid inclusions withgeometric patterns.
LA-ICP-MS analysis of both the yellow and violet por-tions of the fluorite showed trace amounts of Ti, Sr, La,and Ce. The violet area tended to show higher concentra-
Figure 4. This unusualpendant, measuring ~3 ×8 cm, contains a slab ofNamibian fluorite that issurrounded by a piece ofbrushed silver. It isshown in reflected light(left) and transmittedlight (right). Courtesy ofGoldideas, Windhoek;photos by Jo-HannesBrunner.
Figure 5. Color zoning and several prismatic inclu-sions containing dickite are visible in this Namibianfluorite slab (gift of Jo-Hannes Brunner; GIACollection no. 38388). Photomicrograph by C. Ito;magnified 16×.

tions of these elements, as well as trace amounts of addi-tional rare-earth elements.
UV-Vis-NIR spectroscopy of a yellow portion of theslab showed a broad band at 434 nm, while a violet sectiondisplayed a 306 nm peak with broad bands at approximate-ly 410 and 570 nm. The band in the yellow region is con-sistent with the “yellow center” attributed to an O3
– ionreplacing two adjacent F– ions (H. Bill and G. Calas, “Colorcenters, associated rare-earth ions and the origin of col-oration in natural fluorites,” Physics and Chemistry ofMinerals, Vol. 3, 1978, pp. 117–131). The violet portionshowed an absorption spectrum similar to those of purplefluorites in that article, with a 570–580 nm band (possiblyattributed to colloidal calcium) and other possible Y- orCe-associated F-center features.
Absorption spectra of the fluorite and Raman spectra ofthe inclusions are available in the G&G Data Depositoryat gia.edu/gandg. The delicate color patterns and interest-ing inclusion scene displayed by this fluorite makes it anattractive option for jewelry use when cut as slabs.
Claire Ito ([email protected])GIA, New York
Common opal from Laverton, Western Australia. In early2011, Peter Piromanski from Holdfast Exploration Pty.Ltd., Wannero, Western Australia, showed this contributorsome attractive potch opals (e.g., figure 6), to be marketedas Piroman Opal, that were reportedly from a new deposit31 km north of the town of Laverton, near the Great
Central Road at coordinates 28°22′10′′ S, 122°35′59′′ E.According to local geologic maps, this region consistsmainly of weathered biotite monzogranite or kaolinizedgranites. The opal seam appears to be associated with afault trending northeast/southwest. In September 2008,Holdfast Explo ration was granted a five-year explorationlicense, and prospecting has been carried out sinceNovember 2008. Pits were excavated up to about 1.5 mdeep in six different areas using mainly hand tools, a jack-hammer, and an excavator.
Samples of opal in host rock, loose pieces of rough, andfaceted stones were donated to GIA in December 2010.Eight samples weighing 0.49–4.39 ct studied for this reportrepresented the color range of the Laverton material: tworough specimens (yellow and brownish orange) and sixfaceted stones (two colorless, two yellow, and two brown-ish orange). Some of the matrix specimens contained col-orless, yellow, and brownish orange opal within the samepiece. Most of the opal in matrix showed some unhealedsurface-reaching fissures that were present before thestones were brought to GIA. Observations over an 11-month period showed some evidence of crazing in one ofthem, the colorless round brilliant shown in figure 6.
Gemological properties of the opal are summarized intable 1. Most of the samples showed some turbidity andflow patterns. One of the two colorless pieces containedclusters of minute crystals (figure 7, top left). In most of theyellow material, small spheres were seen individually (fig-ure 7, top right) or in groups (figure 7, bottom left). In the
GEM NEWS INTERNATIONAL GEMS & GEMOLOGY WINTER 2011 319
Figure 6. Shown hereare rough and cutopals from Laverton,Western Australia.The faceted stonesweigh 0.50–4.39 ct.Photo by V. Pardieu.

320 GEM NEWS INTERNATIONAL GEMS & GEMOLOGY WINTER 2011
brownish orange opal, the most common inclusions weretiny angular, often reddish crystals associated with ran-domly oriented reflective (sometimes iridescent) discoidtension fissures, reminiscent of the “lily pads” seen in peri-dot (figure 7, bottom right). We have been unable to identi-fy any of these inclusions with Raman microspectroscopy.
EDXRF analysis of five opals (colorless, yellow, andbrownish orange) showed traces of Cu and Zr in all sam-ples, while Ca, Fe, and Sr were detected in all but the color-less pieces. The three darker brownish orange stones con-tained the highest Fe contents, as expected from the litera-ture (E. Fritsch et al., “Découvertes récentes sur l’opale,”
Revue de Gemmologie, No. 138–139, 1999, pp. 34–40).Raman spectroscopy of the same five samples showed arather broad asymmetric band centered at about 350 cm−1
with smaller bands at 1220, 1075, 965, and 780 cm−1. Suchspectra are typical of opal-CT (M. Ostrooumov et al.,“Spectres Raman des opales: Aspect diagnostique et aide àla classification,” European Journal of Mineralogy, Vol. 11,1999, pp. 899–908), which is usually found in a volcanicsetting.
The discovery of fire opal in Western Australia, a partof the country not usually associated with opal, is an inter-esting development. Prospecting is ongoing, and updatesand additional information on this opal will be posted atwww.piromanopal.com.au. These attractive gems couldmake a welcome addition to Australian opal production.
Vincent Pardieu ([email protected])GIA, Bangkok
A bicolor, bi-pattern hydrophane opal. The LaboratoireFrançais de Gemmologie in Paris recently examined anunusual 17.15 ct opal cabochon, measuring approximately20.95 × 15.96 × 11.69 mm. Play-of-color in the full rain-bow of hues was visible throughout the stone (figure 8,left), but the bodycolor was not even. One end of the cabo-chon was medium brown, while the rest of the gem had atranslucent whitish color (figure 8, right). The colorboundary formed a well-defined line along the base of thestone. Such a zoning pattern has been occasionally seen incommon opal but is unusual for play-of-color opal.
To better characterize the opal, we weighed it after 12
Figure 7. Inclusions seenin the Laverton opalsincluded a cluster of
minute unknown crys-tals (top left) and tiny
spherical inclusions (topright), which sometimesoccurred in clusters (bot -tom left). Randomly ori-ented crystals associated
with lily pad–like ten -sion fissures were also
seen (bottom right).Photo micrographs by V.
Pardieu, magnified ~40×.
TABLE 1. Properties of opal from Laverton, Western Australia.
Color Colorless to saturated yellow and brownish orange. Some stones showed orange and colorless color zoning.
Diaphaneity Transparent to translucentRI 1.40–1.44SG 1.99–2.01Mohs hardness 5–6 UV fluorescence Yellow and brownish orange opal: inert
Colorless opal: strong white (with 2–3 seconds of phosphorescence) to short-wave UV
Spectroscope spectrum Colorless to yellow opal: no featuresBrownish orange opal: strong absorptionin the blue region

GEM NEWS INTERNATIONAL GEMS & GEMOLOGY WINTER 2011 321
hours of drying in air in the laboratory, and again afterimmersion in water. Water fills the pores of opals thatshow hydrophane character. After immersion the stoneweighed 17.99 ct, which clearly indicated a hydrophanecharacter, but its appearance remained unaltered.
To avoid introducing foreign substances into theporous opal, we did not test for RI or SG. The gem emitteda weak whitish fluorescence to long-wave UV radiation,with a slightly less intense reaction to short-wave UV. Theemission was zoned, with the brown portion nearly inert.The cap of the white zone at the top of the cabochon had a
stronger fluorescence than the rest of the opal.Another peculiarity was that the two color zones
showed different patterns in their play-of-color. The brownzone had fairly large patches and a striated appearance,sometimes referred to as a “straw” or “chaff” pattern (fig-ure 9). This feature is due to polysynthetic twinning of thenetwork of silica spheres found in many opals, particularlythose from Ethiopia. This pattern was absent from thelight-colored portion, which had smaller patches, less-visi-ble borders, and somewhat “rolling” color flashes.
The base of the cabochon showed a cellular pattern of
Figure 9. The “straw” or “chaff”pattern in the brown zone is dueto polysynthetic twinning of thenetwork of silica spheres consti-tuting the opal. Photomicro graphby A. Droux; magnified 55×.
Figure 8. This 17.15 ct bicolor, bi-pattern opal is likely from Ethiopia’s Wollo Province. The opal’s color zon-ing is best viewed from the side. One end has a translucent whitish color, and the other is medium brown.Photos by A. Droux.

322 GEM NEWS INTERNATIONAL GEMS & GEMOLOGY WINTER 2011
well-formed “digits” that is typical of some opals fromWollo, Ethiopia, along with the abundance of twinning inthe brown portion of the stone. Whitish play-of-color opalis common from Wollo but not from Ethiopia’s Shewaarea. We concluded that this gem is likely from the Wollodeposits.
Alexandre DrouxLaboratoire Français de Gemmologie, Paris
Emmanuel Fritsch
Chatoyant quartz with cinnabar inclusions. While on abuying trip to Jaipur, India, one of these contributors (TP)purchased a 4.56 ct cabochon of what appeared to bequartz with iron oxide inclusions, such as those seen in“strawberry” quartz from Kazakhstan. The cabochon mea-sured 10.4 × 8.7 × 6.8 mm and had a vitreous luster (figure10). Its spot RI of ~1.54, SG of 2.64, and inert reaction tolong- and short-wave UV were all consistent with quartz.The gem was vivid red under reflected light except for anarrow linear near-colorless band. Most interestingly, itdisplayed chatoyancy in fiber-optic light, appearing as afour-rayed star in some positions. Microscopic examina-tion revealed that the phenomenon was due to numerousred inclusions. These were short (<1 mm) acicular crystalsoriented mainly along four directions (figure 11). Whenviewed with a scanning electron microscope (SEM), theyshowed a euhedral shape, with six-fold symmetry in cross-section, and were about 3 µm wide in narrowest dimen-sion (figure 12). Since their morphology did not resemblethat of iron oxide, we investigated them further.
Chemical analysis of surface-reaching inclusions usinga JEOL 5800 SEM equipped with an energy-dispersive spec-trometer detected only mercury and sulfur, a compositionconsistent with cinnabar. This identification is also consis-tent with their hexagonal symmetry. Cinnabar inclusionsin quartz have been documented previously, especially inmaterial from China (J. Hyršl and G. Niedermayr, MagicWorld: Inclusions in Quartz, Bode Verlag, Haltern, Ger -many, 2003, p. 53; E. J. Gübelin and J. I. Koivula, Photo -atlas of Inclusions in Gemstones, Vol. 3, Opinio Verlag,Basel, Switzerland, 2005, pp. 592, 627). To the best of our
Figure 12. This surface-reaching cinnabar inclusionshows a six-fold euhedral shape in cross-section. Theupper left portion of the inclusion has broken away,and the original trace is outlined. Image by B. Rondeau.
Figure 10. This 4.56 ct quartz cabochon displayedvivid red coloration and subtle chatoyancy. Photo byB. Rondeau.
Figure 11. The chatoyancy or star effect in the quartzis due to numerous oriented short needles of cinnabar.Photo micrograph by B. Rondeau; magnified 50×.
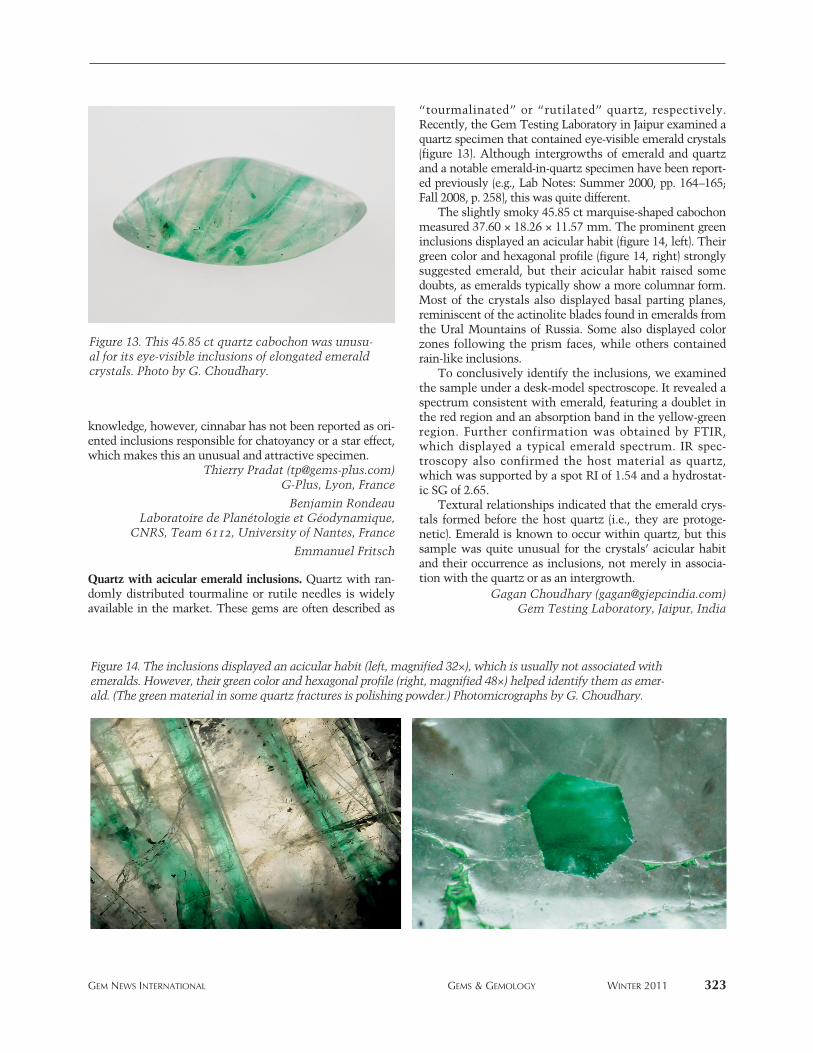
knowledge, however, cinnabar has not been reported as ori-ented inclusions responsible for chatoyancy or a star effect,which makes this an unusual and attractive specimen.
Thierry Pradat ([email protected])G-Plus, Lyon, France
Benjamin RondeauLaboratoire de Planétologie et Géodynamique,
CNRS, Team 6112, University of Nantes, France
Emmanuel Fritsch
Quartz with acicular emerald inclusions. Quartz with ran-domly distributed tourmaline or rutile needles is widelyavailable in the market. These gems are often described as
“tourmalinated” or “rutilated” quartz, respectively.Recently, the Gem Testing Laboratory in Jaipur examined aquartz specimen that contained eye-visible emerald crystals(figure 13). Although intergrowths of emerald and quartzand a notable emerald-in-quartz specimen have been report-ed previously (e.g., Lab Notes: Summer 2000, pp. 164–165;Fall 2008, p. 258), this was quite different.
The slightly smoky 45.85 ct marquise-shaped cabochonmeasured 37.60 × 18.26 × 11.57 mm. The prominent greeninclusions displayed an acicular habit (figure 14, left). Theirgreen color and hexagonal profile (figure 14, right) stronglysuggested emerald, but their acicular habit raised somedoubts, as emeralds typically show a more columnar form.Most of the crystals also displayed basal parting planes,remi niscent of the actinolite blades found in emeralds fromthe Ural Mountains of Russia. Some also displayed colorzones following the prism faces, while others containedrain-like inclusions.
To conclusively identify the inclusions, we examinedthe sample under a desk-model spectroscope. It revealed aspectrum consistent with emerald, featuring a doublet inthe red region and an absorption band in the yellow-greenregion. Further confirmation was obtained by FTIR,which displayed a typical emerald spectrum. IR spec-troscopy also confirmed the host material as quartz,which was supported by a spot RI of 1.54 and a hydrostat-ic SG of 2.65.
Textural relationships indicated that the emerald crys-tals formed before the host quartz (i.e., they are protoge-netic). Emerald is known to occur within quartz, but thissample was quite unusual for the crystals’ acicular habitand their occurrence as inclusions, not merely in associa-tion with the quartz or as an intergrowth.
Gagan Choudhary ([email protected])Gem Testing Laboratory, Jaipur, India
GEM NEWS INTERNATIONAL GEMS & GEMOLOGY WINTER 2011 323
Figure 13. This 45.85 ct quartz cabochon was unusu-al for its eye-visible inclusions of elongated emeraldcrystals. Photo by G. Choudhary.
Figure 14. The inclusions displayed an acicular habit (left, magnified 32×), which is usually not associated withemeralds. However, their green color and hexagonal profile (right, magnified 48×) helped identify them as emer-ald. (The green material in some quartz fractures is polishing powder.) Photomicrographs by G. Choudhary.

324 GEM NEWS INTERNATIONAL GEMS & GEMOLOGY WINTER 2011
Quartz carving with inclusions of izoklakeite. These con-tributors recently examined a life-size quartz skull (figure15) carved by noted gem photographer and lapidary HaroldVan Pelt (Los Angeles). The hollowed skull contained twoarticulated pieces and a jaw hinge that opened and closed.Starting with a 250 lb. colorless quartz crystal, Mr. VanPelt produced this 6.5 lb. (2.9 kg) sculpture.
One of the carving’s interesting features was its abun-dance of conspicuous submetallic silver-gray inclusions(e.g., figure 16). These were initially believed to bejamesonite, a lead-iron-antimony sulfide mineral oftenfound in fibrous form. Initial analyses with a scanning elec-tron microscope (SEM) quickly determined otherwise. Noiron was detected, which meant the fibers consisted of adifferent material.
A more detailed SEM and electron microprobe investi-gation at Caltech revealed a lead-antimony-bismuth sulfidewith a minor amount of copper. Its formula was initiallydetermined as (Pb2.65Cu0.25)(Sb1.14,Bi0.95)S6. Areas of some ofthe fibers also consisted of several alteration products: gale-na (PbS), bismuthinite (B2S3), some CuPb(Sb,Bi)S3 minerals,and small amounts of native bismuth.
To identify the original lead-antimony-bismuth sul-fide, we obtained a ~1 cm3 piece of the quartz from whichthe skull was originally carved. It was cooled in liquidnitrogen to make it brittle and immediately shattered in a
percussion mortar. This freed numerous fragments of thesilver-gray included crystals. Powder X-ray diffractionanalysis at the Natural History Museum of Los Ange lesCounty pointed to either izoklakeite or giessenite, and anelectron back-scattered diffraction pattern done at Caltech,
Figure 15. This life-sizequartz skull carving con-tains inclusions of the raremineral izoklakeite.Courtesy of Harold Van Pelt;photo by Erica Van Pelt.
Figure 16. Izoklakeite and possibly other sulfidesform these inclusions in the quartz used in the carv-ing from figure 15. Photomicrograph by G. R.Rossman; image width 3.2 mm.

GEM NEWS INTERNATIONAL GEMS & GEMOLOGY WINTER 2011 325
together with the chemical analyses, confirmed that thephase was izoklakeite.
Izoklakeite is the antimony member of a solid-solutionseries with giessenite, the bismuth-dominant member. Itwas first described from a sulfide body near Izok Lake,Canada (D. C. Harris et al., “Izoklakeite, a new mineralspecies from Izok Lake, Northwest Territories,” CanadianMiner alogist, Vol. 24, 1986, pp. 1–5). The mineral waslater found in Sweden and as inclusions in quartz crystalsfrom Switzerland. Its ideal chemical formula isCu4Pb54Sb38S114.
The quartz skull, named “Izok” in honor of its unusualinclusions, is part of an exhibit of Harold Van Pelt’s carv-ings on display at the Houston Museum of NaturalScience through October 2012.
George R. Rossman ([email protected]) and Chi MaCalifornia Institute of Technology
Pasadena, California
Anthony R. KampfNatural History Museum of Los Angeles County
Update on ruby and sapphire mining in Pakistan. InAugust and September 2011, these contributors visitedPakistan to collect reference samples for GIA’s laboratory.With the support of gem merchant Syed Iftikhar Hussein
(Syed Trading Co., Peshawar, Pakistan), we traveled first tonorthern Pakistan to visit ruby deposits near Hunza andBisil. Author VP, with assistance from Zulfiqar Ali Abbas(Kashmir Gems Ltd., Abbottabad, Pakistan), then proceed-ed to the ruby and sapphire deposits in the Kaghan Valleynear Batakundi. This report provides an update on themining and production at some of the Pakistani depositsdescribed in the Fall 2007 (pp. 263–264) and Winter 2010(pp. 319–320) GNI entries.
About 100 miners and local dealers were involved withruby mining and trading around the Hunza Valley, at sev-eral deposits that initially started producing in the 1960sand 1980s. The rubies are found in marbles, sometimesassociated with mica and blue and pink spinel. Thedeposits are located north of the valley, from Datum -baresho (figure 17) in the northwest to the Aliabad andKarimabad areas (Bajoring, Gharei Chhar, Phudan Daar,Gafinas), Altit, Ahmedabad, and Dong-e-Das (also knownas Ganesh) in the east. Most of the workings are located500–1,000 m above the villages at an elevation around3,000 m (nearly 10,000 feet), and they are difficult toaccess because of the steep terrain. The color of the rubygenerally ranges from deep red at Datumbaresho to pink-ish red at Aliabad/Karimabad to pinkish and bluish redaround Dong-e-Das. The size of the stones appears to
Figure 17. A Pakistani miner breaks marble to collect rubies at Datumbaresho, in the Hunza Valley.Photo by V. Pardieu.

326 GEM NEWS INTERNATIONAL GEMS & GEMOLOGY WINTER 2011
increase in that same direction, from <0.4 g to 20+ g. MostHunza ruby is cabochon quality at best, though mineralspecimens are also important. Much of the region’s pro-duction is apparently exported to China.
The Bisil ruby deposit is located near 35°52′53′′ N,75°23′52′′ E, in the Basha Valley north of Skardu. It wasdiscovered in 2003 by a local prospector. Rubies from Bisil(figure 18) are also found in marble, within veins or pods,typically in association with diopside and mica. We sawabout 10 mining pits, up to 20 m deep. The depositsappear to extend from just above Bisil village (elevation~2,800 m) to the top of the mountains at an elevationabove 3,500 m, and may extend more than 10 km in aneast-west direction. About 15 miners were working thearea using simple tools, jackhammers, and dynamite.Small stones ranging from pink to deep red are minedyear-round, but production is very limited.
The Batakundi ruby deposit is located in the KaghanValley at 34°52′41′′ N, 73°48′05′′ E, at an elevation of 4,190m. Marble-hosted rubies, most of them small and deepred, have been recovered there since 2000. Rough stoneslarger than 0.6 g are very rare, with most of the productionsmaller than 0.2 g. A group of seven miners led by HaiderAli have been working in the current area since 2006. Asat Bisil, the miners use a jackhammer, dynamite, and hand
tools; production is extremely limited.Also in the Batakundi area, the Besar (also known as
Basil or Besel) sapphire mines were being worked by about50 miners using jackhammers and explosives at two sites,located at 35°02′41′′ N, 73°52′56′′ E, and 35°02′58′′ N,73°53′19′′ E (e.g., figure 19). The elevation of these sites is4,020 m and 3,780 m, respectively. Several kilograms ofpink to purple sapphires were being extracted from thegraphite-rich veins on a daily basis; less than 5% was ofgem quality.
The overall ruby production from Pakistan is verylow compared to other primary-type deposits in Asia andAfrica. Most of the ruby production in Central Asiacomes from the Murgab area in eastern Tajikistan andfrom Jegdalek, Afghanistan. Pakistani rubies are typicallymore included and smaller. Although Pakistan’s rubymines are rarely affected by the political instability andsecurity issues present elsewhere in the country, thedeposits are located high in mountainous areas that aredifficult to access.
Vincent Pardieu
Stephane JacquatPiat Co., Bangkok
Figure 18. These rubies are from the Bisil area, in theBasha Valley of Pakistan. The largest piece, on the farright, is ~1 cm long. Photo by V. Pardieu.
Figure 19. At the Besar deposits, in the Batakundiarea of Pakistan’s Kaghan Valley, several miners usejackhammers and explosives to break the hard rockin search of sapphires. Photo by V. Pardieu.

GEM NEWS INTERNATIONAL GEMS & GEMOLOGY WINTER 2011 327
Vanadium-bearing color-change sphene from Pakistan/Afghanistan. Recently seen in the Carlsbad laboratorywas a parcel of rough and cut sphene (e.g., figure 20)loaned for examination by Eric Braunwart (ColumbiaGem House, Vancouver, Washington). According to him,the sphene originated near the Pakistan/Afghanistan bor-der. The most interesting feature of this material was thatmany of the stones showed a slight to moderate colorchange. In daylight-equivalent lighting, the sphene wasdominantly vivid green to yellowish green, changing tobrownish orange or brown under incandescent light(again, see figure 20). However, strong pleochroism wasresponsible for the multiple colors seen in the facetedstones.
The rough consisted of well-formed blade-like crys-tals, so it is apparent that the material was mined from aprimary deposit. Rough production as of July 2011 wasestimated by Mr. Braunwart to be around 600 g, fromwhich approximately 200 carats of finished material havebeen produced. The cut stones ranged from calibratedsizes as small as 3 mm in diameter up to larger stonesweighing several carats. The largest faceted stone fromthe production so far was a 5.45 ct oval brilliant.
Gemological properties of the material were consis-tent with sphene. The RI was over-the-limit of the refrac-tometer, and the average SG (measured hydrostatically)was 3.54. A strong red reaction was observed with aChelsea filter. Microscopic observation revealed strongdoubling and numerous included crystals. These wereidentified by Raman microspectroscopy as transparentnear-colorless apatite and dark elongated needle-like crys-tals of an amphibole mineral (figure 21). Several stonesalso contained fluid “fingerprints.” A few rough piecesshowed prominent zoning, and the color change was lessapparent across these zoned areas.
EDXRF spectroscopy of all samples showed majoramounts of Ca, Ti, and Si that are expected for sphene, aswell as traces of V, but no Cr. LA-ICP-MS measurementsof several spots on a faceted sample detected an average of
more than 2400 ppmw V (and no Cr), which is presum-ably the cause of the color change. The visible spectrumshowed a broad absorption feature centered at approxi-mately 603 nm (figure 22). Transmission windows oneither side of this broad band are consistent with the spec-trum expected for a color-change gem.
The coloration of this sphene is much different fromthe typically “golden” orange material previouslydescribed from Pakistan’s North West Frontier Province(Spring 2006 GNI, pp. 68–69), and also from the yellowsphene known from Badakhshan, Afghanistan (Summer2006 GNI, pp. 180–182).
Nathan Renfro ([email protected])GIA, Carlsbad
Figure 21. The most notable inclusions in the sphenewere crystals of near-colorless apatite and dark elon-gated amphibole. Also present were numerous fluidfingerprints. Photomicrograph by N. Renfro; magni-fied 35×.
Figure 20. Sphene from the Pakistan/Afghanistan border area may contain a significant amount of V, which ispresumably responsible for its color-change behavior. The oval gem on the left (2.76 ct) shows a noticeablecolor change from mainly yellowish green in daylight-equivalent lighting (left) to brownish orange in incandes-cent light (right). Photos by Robert Weldon.

328 GEM NEWS INTERNATIONAL GEMS & GEMOLOGY WINTER 2011
Cobalt blue–colored spinel from Khuoi Ngan, Vietnam.Blue spinel has been reported from several localities in theAn Phu–Luc Yen area of northern Vietnam, though highlysaturated material is quite rare (e.g., C. P. Smith et al., “Acloser look at Vietnamese spinel,” InColor, Spring 2008,pp. 11–13; J. B. Senoble, “Beauty and rarity—A quest forVietnamese blue spinel,” InColor, Summer 2010, pp.18–23; Spring 2011 GNI, pp. 60–61). Testing has shownthat the blue color is due to various amounts of cobalt andiron impurities (Smith et al., 2008).
Gem and mineral dealer Dudley Blauwet recently vis-ited one of the Vietnamese blue spinel deposits and pro-vided some information on the mining and production ofthis material. The site was located just east of the villageof Khuoi Ngan and approximately 2.5 km southeast of AnPhu, where a few local villagers were mining secondarydeposits in shallow pits along the edges of rice paddies (fig-ure 23). Work at the site began in 2008, and a number ofpits were excavated with hand tools to a depth of 2–3 m.The gem-bearing material was taken to a nearby area forwashing and hand picking (figure 24).
The spinel rough was quite small but intensely col-ored. Mr. Blauwet obtained four small parcels rangingfrom 0.4 to 5 g over the course of four days in Luc Yen. Inaddition, he purchased a fifth lot of rough in An Phu onthe day that he visited Khuoi Ngan. The individual piecesof rough were mostly <0.2 ct but suitable for cuttingmelee because of the high color saturation. All of the lotswere said to be from Khuoi Ngan, except one that wasreportedly from Bai Ruong (which may be an alternative
name for Khuoi Ngan, as it refers to the same area of ricefields). The largest piece of rough Mr. Blauwet purchasedyielded a faceted oval weighing 0.80 ct (figure 25). Duringhis latest visit to Vietnam, in November 2011, he reportedvery limited production of the intense blue spinel fromKhuoi Ngan, in small sizes that would cut stones expectedto weigh <0.15 ct.
Mr. Blauwet mentioned that buyers continue to seeglass and synthetics in rough and cut gem parcels in Viet -nam. After receiving his first shipment of blue spinels fromthe cutting factory, a 0.26 ct sample was found to be glass.Such imitations can be difficult to identify in the fieldsince the rough material commonly has been tumbled togive the appearance of alluvial pebbles, which also disguis-es any obvious bubbles or swirl marks. He reported that aChelsea filter is helpful in such situations: Co-bearingspinel appears pink to red, while glass shows no reaction.
Three faceted samples of Mr. Blauwet’s intense blue
VISIBLE ABSORPTION SPECTRUM
0.2
0.1
0.3
0.4
0.5
600
WAVELENGTH (nm)
AB
SOR
BAN
CE
(a.u
.)
400 500 700
603
Figure 22. The visible spectrum of the color-changesphene showed a broad absorption feature centeredat 603 nm that is presumably due to V, as this wasthe only significant trace element detected by LA-ICP-MS analysis.
Figure 23. At Khuoi Ngan, near An Phu in northernVietnam, bright blue spinel is mined from shallowpits by local villagers. Photo by Dudley Blauwet.

GEM NEWS INTERNATIONAL GEMS & GEMOLOGY WINTER 2011 329
Khuoi Ngan spinel (0.24–0.80 ct) were examined at GIA’sCarlsbad laboratory. SG values ranged from 3.50 to 3.57,and the RI of the largest stone was 1.716. LA-ICP-MS anal-yses showed 60–290 ppmw Co. Iron was 7,400–10,500ppmw, and significant traces of Zn, Ga, Ni, Mn, V, and Lialso were recorded. As expected, all three samplesappeared red in the Chelsea filter.
Thomas W. Overton
Andy H. ShenGIA, Carlsbad
Trapiche spinel from Mogok, Myanmar. Trapiche growthstructure, most commonly observed in emerald, has alsobeen seen in ruby, sapphire, tourmaline, quartz, andandalusite. In January 2011, Bill Larson (Palagems.com,Fall brook, California) loaned five samples to GIA that wererepresented as trapiche spinel from Mogok, Myanmar.They were polished into round tablets that ranged from 1.2to 3.0 cm, and all showed a subtle radiating texture thatwas more visible with transmitted light. Two pieces (3.64and 6.76 ct) were characterized by this contributor for thisreport.
The samples were translucent and ranged from pink-ish orange to red with “arms” that were dark gray (e.g.,figure 26). Gemo logical properties of both samples were
consistent with spinel, except for an inert reaction to UVradiation. Raman spectroscopy confirmed the spinel iden-tification. Six arms were easily recognized in each tablet,though the trapiche structure was not well defined.Rather than a core, the 3.64 ct sample contained a pointwhere the arms intersected. The 6.76 ct tablet had an
Figure 24. The spinel-bearing soil from Khuoi Ngan is washed and carefully sorted by hand to extract the smallpieces of spinel. Photo by Dudley Blauwet.
Figure 25. These spinels from Khuoi Ngan weigh upto 0.80 ct. Photo by Robert Weldon.
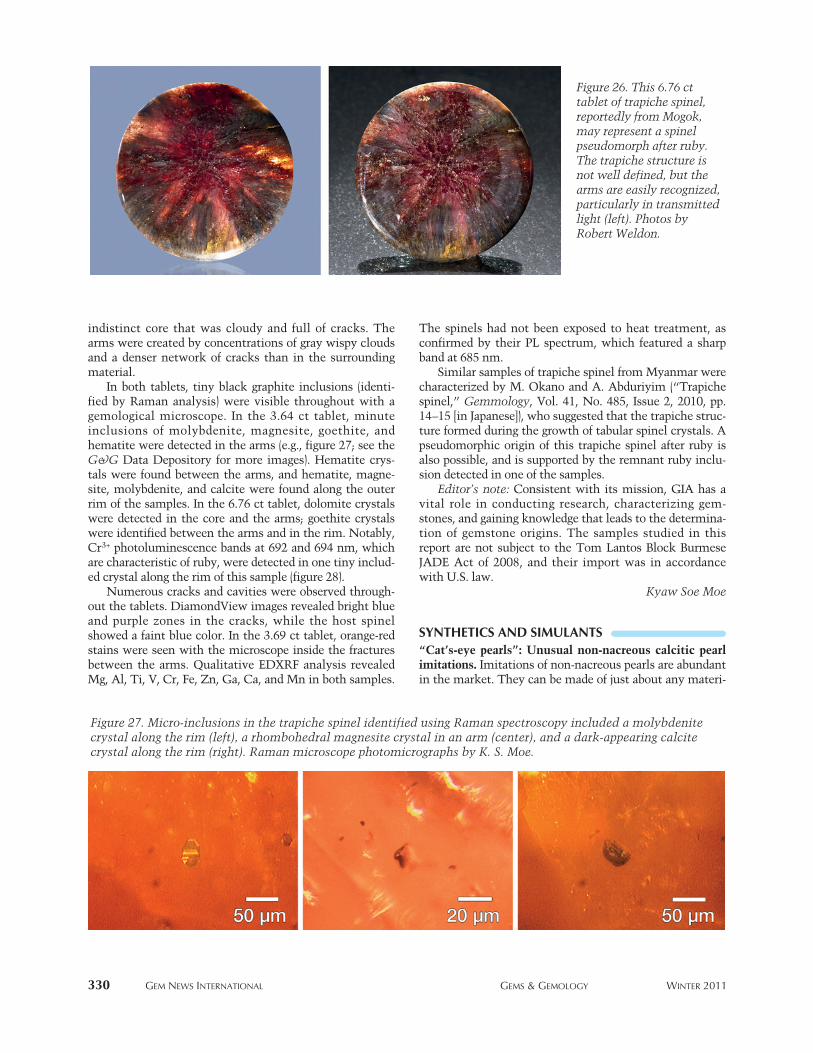
indistinct core that was cloudy and full of cracks. Thearms were created by concentrations of gray wispy cloudsand a denser network of cracks than in the surroundingmaterial.
In both tablets, tiny black graphite inclusions (identi-fied by Raman analysis) were visible throughout with agemological microscope. In the 3.64 ct tablet, minuteinclusions of molybdenite, magnesite, goethite, andhematite were detected in the arms (e.g., figure 27; see theG&G Data Depository for more images). Hematite crys-tals were found between the arms, and hematite, magne-site, molybdenite, and calcite were found along the outerrim of the samples. In the 6.76 ct tablet, dolomite crystalswere detected in the core and the arms; goethite crystalswere identified between the arms and in the rim. Notably,Cr3+ photoluminescence bands at 692 and 694 nm, whichare characteristic of ruby, were detected in one tiny includ-ed crystal along the rim of this sample (figure 28).
Numerous cracks and cavities were observed through-out the tablets. DiamondView images revealed bright blueand purple zones in the cracks, while the host spinelshowed a faint blue color. In the 3.69 ct tablet, orange-redstains were seen with the microscope inside the fracturesbetween the arms. Qualitative EDXRF analysis revealedMg, Al, Ti, V, Cr, Fe, Zn, Ga, Ca, and Mn in both samples.
The spinels had not been exposed to heat treatment, asconfirmed by their PL spectrum, which featured a sharpband at 685 nm.
Similar samples of trapiche spinel from Myanmar werecharacterized by M. Okano and A. Abduriyim (“Trapichespinel,” Gemmology, Vol. 41, No. 485, Issue 2, 2010, pp.14–15 [in Japanese]), who suggested that the trapiche struc-ture formed during the growth of tabular spinel crystals. Apseudomorphic origin of this trapiche spinel after ruby isalso possible, and is supported by the remnant ruby inclu-sion detected in one of the samples.
Editor’s note: Consistent with its mission, GIA has avital role in conducting research, characterizing gem-stones, and gaining knowledge that leads to the determina-tion of gemstone origins. The samples studied in thisreport are not subject to the Tom Lantos Block BurmeseJADE Act of 2008, and their import was in accordancewith U.S. law.
Kyaw Soe Moe
SYNTHETICS AND SIMULANTS“Cat’s-eye pearls”: Unusual non-nacreous calcitic pearlimitations. Imitations of non-nacreous pearls are abundantin the market. They can be made of just about any materi-
330 GEM NEWS INTERNATIONAL GEMS & GEMOLOGY WINTER 2011
Figure 26. This 6.76 cttablet of trapiche spinel,reportedly from Mogok,may represent a spinelpseudomorph after ruby.The trapiche structure isnot well defined, but thearms are easily recognized,particularly in transmittedlight (left). Photos byRobert Weldon.
Figure 27. Micro-inclusions in the trapiche spinel identified using Raman spectroscopy included a molybdenitecrystal along the rim (left), a rhombohedral magnesite crystal in an arm (center), and a dark-appearing calcitecrystal along the rim (right). Raman microscope photomicrographs by K. S. Moe.

GEM NEWS INTERNATIONAL GEMS & GEMOLOGY WINTER 2011 331
Figure 29. Represented asnon-nacreous naturalpearls, these sculptedpieces of shell (2.52–10.26ct) exhibit distinct chatoy-ancy. Photo by T.Hainschwang.
al but are usually sculpted from shell. Shells thick enoughto yield such pearl imitations are rather common, thoughgenerally they are restricted to aragonitic mollusks such asStrombus sp., Tridacna sp., and Cassis sp. Calcitic shells,including those of Pinna sp. and Atrina sp., tend to be thinand are therefore not suitable. Shell imitations show a lay-ered structure when viewed with strong transmitted light,
making them easy to identify. This contributor recently received for testing six
unusual black “pearls” (figure 29) from two differentclients. Represented as non-nacreous natural pearls, thepieces weighed between 2.52 and 10.26 ct and exhibitedchatoyancy when illuminated with an intense lightsource. The chatoyancy was displayed all around the
Figure 28. Photolumi-nescence spectroscopydetected remnants ofruby in the 6.76 cttrapiche spinel. In theRaman microscopeimage (inset, by K. S.Moe), the light reflect-ed from region A isslightly different fromregion B. Interestingly,region A showed rubyPL bands at 692 and694 nm in addition tospinel PL bands at685, 687, and 689 nm;region B showed onlyspinel PL bands, asrecorded at severalother spots on thesample.
PHOTOLUMINESCENCE SPECTROSCOPY
WAVELENGTH (nm)
INTE
NSI
TY
740660640 680 700 720
685
687
689
692
694
a
b
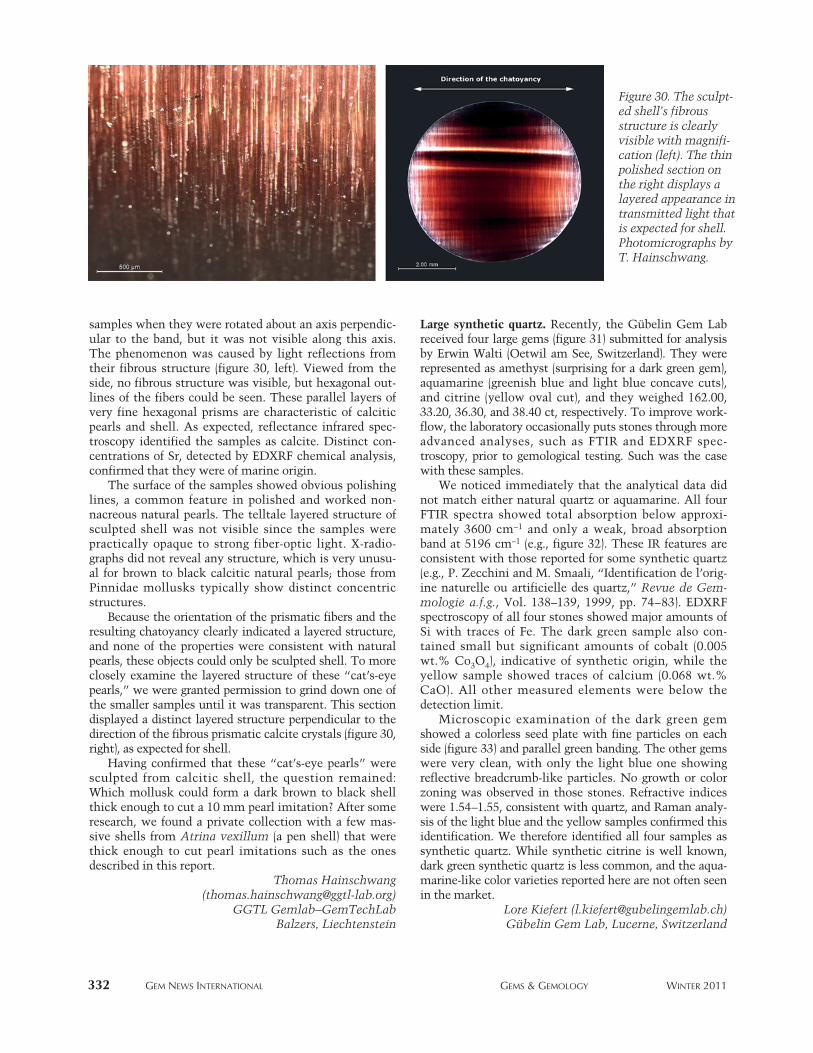
samples when they were rotated about an axis perpendic-ular to the band, but it was not visible along this axis.The phenomenon was caused by light reflections fromtheir fibrous structure (figure 30, left). Viewed from theside, no fibrous structure was visible, but hexagonal out-lines of the fibers could be seen. These parallel layers ofvery fine hexagonal prisms are characteristic of calciticpearls and shell. As expected, reflectance infrared spec-troscopy identified the samples as calcite. Distinct con-centrations of Sr, detected by EDXRF chemical analysis,confirmed that they were of marine origin.
The surface of the samples showed obvious polishinglines, a common feature in polished and worked non-nacreous natural pearls. The telltale layered structure ofsculpted shell was not visible since the samples werepractically opaque to strong fiber-optic light. X-radio-graphs did not reveal any structure, which is very unusu-al for brown to black calcitic natural pearls; those fromPinnidae mollusks typically show distinct concentricstructures.
Because the orientation of the prismatic fibers and theresulting chatoyancy clearly indicated a layered structure,and none of the properties were consistent with naturalpearls, these objects could only be sculpted shell. To moreclosely examine the layered structure of these “cat’s-eyepearls,” we were granted permission to grind down one ofthe smaller samples until it was transparent. This sectiondisplayed a distinct layered structure perpendicular to thedirection of the fibrous prismatic calcite crystals (figure 30,right), as expected for shell.
Having confirmed that these “cat’s-eye pearls” weresculpted from calcitic shell, the question remained:Which mollusk could form a dark brown to black shellthick enough to cut a 10 mm pearl imitation? After someresearch, we found a private collection with a few mas-sive shells from Atrina vexillum (a pen shell) that werethick enough to cut pearl imitations such as the onesdescribed in this report.
Thomas Hainschwang ([email protected])
GGTL Gemlab–GemTechLabBalzers, Liechtenstein
Large synthetic quartz. Recently, the Gübelin Gem Labreceived four large gems (figure 31) submitted for analysisby Erwin Walti (Oetwil am See, Switzerland). They wererepresented as amethyst (surprising for a dark green gem),aquamarine (greenish blue and light blue concave cuts),and citrine (yellow oval cut), and they weighed 162.00,33.20, 36.30, and 38.40 ct, respectively. To improve work-flow, the laboratory occasionally puts stones through moreadvanced analyses, such as FTIR and EDXRF spec-troscopy, prior to gemological testing. Such was the casewith these samples.
We noticed immediately that the analytical data didnot match either natural quartz or aquamarine. All fourFTIR spectra showed total absorption below approxi-mately 3600 cm−1 and only a weak, broad absorptionband at 5196 cm−1 (e.g., figure 32). These IR features areconsistent with those reported for some synthetic quartz(e.g., P. Zecchini and M. Smaali, “Identification de l’orig-ine naturelle ou artificielle des quartz,” Revue de Gem -mologie a.f.g., Vol. 138–139, 1999, pp. 74–83). EDXRFspectroscopy of all four stones showed major amounts ofSi with traces of Fe. The dark green sample also con-tained small but significant amounts of cobalt (0.005wt.% Co3O4), indicative of synthetic origin, while theyellow sample showed traces of calcium (0.068 wt.%CaO). All other measured elements were below thedetection limit.
Microscopic examination of the dark green gemshowed a colorless seed plate with fine particles on eachside (figure 33) and parallel green banding. The other gemswere very clean, with only the light blue one showingreflective breadcrumb-like particles. No growth or colorzoning was observed in those stones. Refractive indiceswere 1.54–1.55, consistent with quartz, and Raman analy-sis of the light blue and the yellow samples confirmed thisidentification. We therefore identified all four samples assynthetic quartz. While synthetic citrine is well known,dark green synthetic quartz is less common, and the aqua-marine-like color varieties reported here are not often seenin the market.
Lore Kiefert ([email protected])Gübelin Gem Lab, Lucerne, Switzerland
332 GEM NEWS INTERNATIONAL GEMS & GEMOLOGY WINTER 2011
Figure 30. The sculpt-ed shell’s fibrousstructure is clearlyvisible with magnifi-cation (left). The thinpolished section onthe right displays alayered appearance intransmitted light thatis expected for shell.Photomicro graphs byT. Hainschwang.

GEM NEWS INTERNATIONAL GEMS & GEMOLOGY WINTER 2011 333
TREATMENTSSugar-acid treatment of opal from Wollo, Ethiopia. Severalgemological laboratories have recently identified “black”opals from Ethiopia’s Wollo Province as smoke treated(e.g., www.stonegrouplabs.com/SmokeTreatmentinWolloOpal.pdf). The effectiveness of the smoke treatment isprobably related to the hydrophane character that is com-monly shown by Wollo opal. The porosity allows thesmoke to penetrate the opal structure deep enough to cre-ate a dark bodycolor. Accordingly, one of us (FM) investi-gated the possibility of treating Wollo opal using a sugar-
acid process similar to that used for matrix opal fromAndamooka, Australia.
For this experiment, we chose 12 mostly low-grade
Figure 33. A close-up view of the dark green sampleshows a seed plate (defined by arrows) and numerousfine particles. Photomicrograph by Lore Kiefert, © Gübelin Gem Lab; magnified 20×.
Figure 31. These largefaceted samples, submit-ted as amethyst (eventhough dark green),aquamarine, and citrine,proved to consist of syn-thetic quartz. The largestweighs 162 ct. Photo byEvelyne Murer, ©Gübelin Gem Lab.
IR ABSORPTION SPECTRUM
1
2
3
5000 4000
WAVENUMBER (cm-1)
AB
SOR
BAN
CE
60007000 3000
5196
Figure 32. This FTIR spectrum of the synthetic citrineis representative of all the synthetic quartz samples.It shows a cutoff at ~3600 cm−1 and a small band at5196 cm−1.

opals tumbled as irregular pebbles, with a white to yellow-ish white bodycolor typical for opals from Wollo (figure34, left). The samples were first heated at 90°C for 2 hoursin a solution containing 25% sugar by weight. Next theywere heated at 100°C for 3 hours in a 60% solution ofhydro chloric acid. All the opals turned a darker color (fig-ure 34, right). Some acquired a homogeneous, opaque,black bodycolor, while others darkened unevenly fromgrayish brown to gray. The play-of-color became moreintense in some samples and less vivid in others. Two ofthe opals were broken open, revealing that the dark col-oration penetrated only a few millimeters into the stones.The samples with the greatest hydrophane character (asindicated by their ability to stick to the tongue) showedthe darkest colors after treatment. Conversely, the moretransparent and least hydrophane-like opals were leastaffected by the treatment (e.g., inner portion of the upper-right sample in figure 34). As expected, the hydrophanecharacter appears to have facilitated the penetration of thesugar and acid solutions into the opal.
Even darker coloration in hydrophane opal may beattainable by varying the carbon source and its concentra-tion, the nature of the acid and its concentration, and final-ly the temperature and duration of heating in both solu-tions. Such experiments are in progress, and the results willgive gemologists a better idea of what to expect for futuretreatments of this prolific type of opal.
Benjamin Rondeau ([email protected])
Emmanuel Fritsch
Francesco MazzeroOpalinda, Paris
Jean-Pierre GauthierCentre de Recherches Gemmologiques, Nantes, France
CONFERENCE REPORTS32nd International Gemmological Conference. The bien-nial IGC was held July 13–17, 2011, in Interlaken, Switzer -
land. More than 70 gemologists from 31 countries gath-ered to discuss developments in the field. The organizingcommittee was led by Dr. Michael Krzemnicki, in collab-oration with colleagues at the Swiss Gemmological Insti -tute SSEF, the Swiss Gemmological Society, George andAnne Bosshart, and Dr. Henry A. Hänni. The conferencefeatured 12 sessions on topics ranging from colored stonesto pearls and diamonds, analytical methods and gem treat-ments, and special sessions on Canadian gems, rarestones, and organic materials. The 48 talks and 14 interac-tive poster presentations covered a wide range of topicsand regions. The conference proceedings and excursionguides are available at www.igc2011.org; some of the pre-sentations are summarized below.
Dr. Thomas Armbruster (University of Bern, Switzer -land) delivered the opening keynote address on gemology’sposition at the interface of mineralogy and crystallography.Using the beryl group as an example, he demonstrated thesimilarities and differences in the crystal structures withinthis group of minerals. Dr. Karl Schmetzer (Peters hausen,Germany) described chemical zoning in trapiche tourma-line from Zambia, which is characterized by a strong nega-tive correlation between Ca and Na. Dr. Jürgen Schnellrath(Centro de Tecnologia Mineral, Rio de Janeiro) discussedunusual fiber distribution patterns in Brazilian cat’s-eyequartz. Dr. Shang-i Liu (Hong Kong Institute of Gem -mology) presented results of a study on Cs- and Li-richberyl from Madagascar, using electron microprobe, LA-ICP-MS, FTIR, Raman analysis, and electron paramagneticresonance spectroscopy.
The pearl session included presentations by Dr.Michael S. Krzemnicki on formation models for Tokkicultured pearls, which form as attachments to larger bead-ed cultured pearls; Nick Sturman (GIA, Bangkok) on sepa-rating natural from cultured Queen conch pearls (Strom -bus gigas); and Federico Bärlocher (Farlang, Cernobbio,Italy) on the production and trade of Melo pearls fromMyanmar.
334 GEM NEWS INTERNATIONAL GEMS & GEMOLOGY WINTER 2011
Figure 34. These opals from Wollo, Ethiopia, are shown before (left) and after (right) sugar-acid treatment.Darker bodycolors were produced in samples with a greater hydrophane character. The broken opals (center-right and bottom-left) show the shallow penetration depth of the treatment. The samples measure from 13 × 9× 7 mm (lower right) to 29 × 16 × 10 mm (upper left). Photos by F. Mazzero.

GEM NEWS INTERNATIONAL GEMS & GEMOLOGY WINTER 2011 335
Walter Balmer (Department of Geology, Chula long -korn University, Bangkok) addressed the characterizationof rubies from marble deposits in Myanmar (Mogok),Viet nam (Luc Yen) and Tanzania (Morogoro and UluguruMoun tains) using UV-Vis spectroscopy. John Koivula(GIA, Carlsbad) showed how high-temperature fusion ofcorundum mimics residues in heat-treated rubies and sap-phires. Terry Coldham (Sapphex, Sydney) advocatedgreater cooperation between researchers and producers inshedding light on the genesis of basaltic sapphires.Edward Boehm (RareSource, Chattanooga, Tennessee)offered insight into current colored stone market trends,and Brad Wilson (Alpine Gems, Kingston, Canada)described a wide variety of recent finds on Baffin Island,Canada.
Dr. Thomas Pettke (University of Bern) gave the con-ference’s second keynote talk, in which he reviewed LA-ICP-MS applications and offered an outlook on the poten-tial of this method in gemology. The poster sessions gaveinsights into current research, including presentations onjadeite trading in China (Elizabeth Su, DuaSun Collection,Shanghai) and rare-earth coloration in bastnäsite (Dr. FranzHerzog, Swiss Gemmological Institute SSEF, Basel).
The conference was preceded by excursions to theNatural History Museum in Bern and mineral localities inthe Ticino Alps. A three-day trip to the Binn Valley andZermatt immediately followed the conference. Both tourstook participants to areas of mineralogical and geologicalinterest in Switzerland. Adopting Dr. Nguyen Ngoc Khoi’sproposal, the delegates unanimously decided to hold the2013 IGC in Vietnam.
Laurent Cartier ([email protected])Swiss Gemmological Institute SSEF, Basel
2011 NAG Institute of Registered Valuers Conference.The National Association of Goldsmiths IRV 23rd annualconference took place September 24–26 at its usual venue,Loughborough University, Leicestershire, UK. Approxi -mately 150 delegates attended the various presentations,including hands-on workshop sessions.
Market trends and industry issues were discussed byRichard Drucker of Gemworld International (Glenview,Illinois). He explained how the market is changing locallyand internationally with China and India now becoming
the predominant buyers, and how these global influencesare pushing some diamond and gem prices to new heights.A round-up of the auction market, including informationon commissions and insurance, as well as recommenda-tions on how to best work in the auction world, was pre-sented by Stephen Whittaker of Fellows & Sons(Birmingham, UK). He also explained the use and costs oftechnology in the auction business.
The focal point of the conference was introducing anew valuation qualification, CAT (Certificate of AppraisalTheory), which was presented by Heather McPherson, aFellow of the NAG Institute of Registered Valuers (Coal -ville, UK). This training program is intended to replace theJET (Jewellery Edu cation & Training) valuation course andwill be launched by spring 2012 as a new requirement tobecome an Institute Registered Valuer.
Harry Levy, president of the London Diamond Bourse,explained the valuation of diamonds and colored stones,with information on nomenclature, treatments, and ori-gins. The importance of treatment disclosure was themain theme of his presentation. Steve Bennett of GemsTV(Worcestershire, UK) described how education, training,and vertical integration have been the key factors in hisfamily-run business.
Mehdi Saadian ([email protected])GIA, London
ERRATA1. For figure 1 of the Fall 2011 CVD synthetic diamond
article by B. Willems et al. (pp. 202–207), the correctphotographer of the images in this composite photowas Jian Xin (Jae) Liao.
2. Figure 18 of the Fall 2011 Vietnamese corundum articleby N. N. Khoi et al. (pp. 182–195) shows the absorptionspec trum of a sapphire, rather than a ruby. G&G thanksNathan Renfro for this correction.
3. The Fall 2011 GNI entry by D. Beaton (pp. 247–248)should have indicated that the strong absorption peaksat 376 and 386 nm were attributed to Fe3+ pairs (376nm) and Fe3+ (386 nm). G&G apologizes for introducingerrors in the peak assignments, and thanks NathanRenfro for the correction.

BOOK REVIEWS GEMS & GEMOLOGY WINTER 2011 S1
The Diamond Compendium By DeeDee Cunningham, 888 pp.,illus., publ. by NAG Press, London,2011. US$225.00
This hardcover tome of nearly 900pages is filled with pertinent illustra-tions. The book is comprised of 20chapters divided into sections thatcover all aspects of diamonds: origin,crystallography, global occurrences,exploration, mining methods, cutting,polishing, grading, and identification.Simulants and synthetic diamondsare also reviewed. The compendium is not meant to
be read cover to cover; it is a referencework to be consulted on specific top-ics, some of which are explored ingreater scientific depth. As expectedfrom a highly skilled gemologist andjeweler, the sections on crystallogra-phy, physical properties, cutting, pol-ishing, and grading are the strongest,while the text on global occurrencescontains a few inaccuracies. Forinstance:
• The Lomonosov kimberlite cluster,100 km north of Arkhangelsk innorth western Russia, is not close tothe Finnish border but 500 km tothe east of it.• The Golconda alluvial diamondfield is not located near the ancientGolconda fortress but at least 250km to the southeast.• No kimberlites or other primarydiamondiferous rocks have everbeen found in Guyana, and certain-ly not the 14 kimberlites quoted onpage 119.
There is also a slight problem onpage 207, in the paragraph on airborneprospecting. Most airborne prospect-ing is carried out to detect local differ-ences in the earth’s magnetic fieldcaused by mineral deposits (such asurvey is shown in photo 5.1). Thetwo sentences about Falcon technolo-
gy for airborne gravity gradient sur-veying are out of place and should bereworked to avoid confusion withmagnetic surveying. Apart from theseitems, the information is wellresearched and clearly written.The author takes great care in pre-
senting the correct terminology. Sheexplains the different meanings ofform and habit in crystallography, andwhy lonsdaleite (a hexagonal poly-morph of diamond) is not a kind ofdiamond but a different mineral. Thechapters on evaluating carat weight,clarity, color, and cut offer useful tipson how to hold and angle the diamondfor best results. The chapter on colorexamines how color is perceived,while others review color treatmentsand recutting to enhance brilliance.The chapters on identification of natu-ral diamond, simulants, and syntheticdiamond are very good.
The Diamond Compendium tookseven years to compile, and the infor-mation is up to date to 2007. The widerange of topics makes it an importantreference source and handbook withpractical tips for use in gemology.
A. J. A. (BRAM) JANSEArchon Exploration
Carine, Western Australia
Precious Objects: A Story ofDiamonds, Family, and a Way of Life By Alicia Oltuski, 370 pp., publ. byScribner, New York, 2011. US$24.00
Book editors often say every story hasbeen told before, so the secret of agood book lies in the telling. Cer -tainly, the past two decades have seennumerous books describing how dia-monds are formed deep within theearth, how De Beers gained control ofrough diamond production, howstones are bought and sold, and their
role in the corridors of luxury—and incivil conflict. But Ms. Oltuski, whosefather and grandfather were both dia-mond dealers, understands the bookeditors’ maxim and manages to cap-ture all of these topics honestly and ina deeply personal way to create anengaging, well-written work. Ms. Oltuski is a skilled writer
who can transform the everyday deal-ings of a diamond office into enter-taining stories, without resorting tothe sensationalist tales of chasingmultimillion dollar stones and dodg-ing international jewel thieves thatother authors have created to packdrama into an essentially mundanebuy-and-sell world. The result is arealistic account of New York’s dia-mond community, down to the duct-taped jewelry cases. The early chapters focus on the art
of the deal. Stories are told of herfather’s negotiations with clients(who’s fibbing and who’s really offer-ing genuine prices), her mother’s stopsto help with stone deliveries on theway to her own job, the weight hergrandparents’ reputation still carriedyears later, and a childhood wheresecurity and secrecy came home fromthe office. In the middle chapters she artfully
weaves in personal anecdotes andobservations to transform the oft-toldclichés about New York’s diamondindustry into fresh, appealing reading.The accounts of how diamonds areformed deep beneath the earth, theworkings of De Beers’s sight system(albeit a bit out of date in today’smulti-source environment), the moresof the Hasidic Jewish community, and47th Street’s love-hate relationshipwith Martin Rapaport’s price list—they are all here, but in a new dress. Her portrait of her grandfather
Yankel (“Jack” to the New Yorkers) isan intimate account of how diamondfamilies came into being after the
EDITORSSusan B. JohnsonJana E. Miyahira-Smith

S2 BOOK REVIEWS GEMS & GEMOLOGY WINTER 2011
upheavals of World War II. Yankelwas a natural trader, scratching a liv-ing in post-war Europe by scroungingscarce items and swapping them formerchandise he could swap for evenmore goods. That led him to dia-monds. Yankel’s story is one of sur-vival, like that of many New Yorkersfrom his generation who had comethere to begin life anew and raise afamily. The stories of those whoexperienced the horrors of war, theHolo caust, and mass displacementscannot be told often enough beforethey pass on. In the end, Ms. Oltuski’s book is
an honest look at the diamond trade.And in telling this story, it becomesobvious that the book’s real preciousobjects are not the gemstones, but herfamily members and the other menand (few) women who inhabit NewYork’s diamond district.
RUSSELL SHORGemological Institute of America
Carlsbad, California
Diamonds in Nature: A Guide to Rough DiamondsBy Ralf and Michelle C. Tappert,142 pp., illus., publ. by SpringerVerlag, Heidelberg, Germany, 2011.US$60.00
Husband-and-wife team Ralf andMichelle Tappert offer a prime exam-ple of how a scientific text should bewritten and illustrated. The subjectmatter is handled in clear, concisesentences accompanied by Mr.Tappert’s superb photographs. As itsays in the foreword, there are manybooks that discuss diamond’s optical,physical, and gemological properties,but few on rough diamonds and howthey appear in nature. Diamonds inNature does exactly this and does itadmirably well. This book is not for the general
reader but for diamond gemologistsand geologists. It gives a comprehen-sive account of every feature of roughdiamonds, including their origin, mor-phology, colors, surface textures, and
mineral inclusions. The glossy text isaccompanied by photos and diagrams,more than 300 references, and a help-ful index. The authors avoid confusingand excruciating detail and providereferences to relevant literature forfurther particulars. Everything gets a mention. The
“Origin” chapter, for instance, dis-cusses cratons, diamonds from litho-spheric mantle roots to upper parts ofthe lower mantle, types of diamond,diamonds in metamorphic crustalrocks from Kokchetav to Jack Hills,diamonds in impact structures andmeteors, and presolar specimens. The“Morphology” chapter recognizesthree major types: monocrystalline,fibrous, and polycrystalline (includingtypes of carbonado). Habits are divid-ed into regular, irregular, twins, andmacles, and photos show representa-tive crystals. In the “Colors” chapterthere are details on colorless, yellow,blue, brown, pink, purple, green, andbrown-spotted diamonds. Well-cho-sen photos in the “Surface Textures”chap ter show various surface featuresoccurring preferentially on certaincrystal faces, such as terraces, hill -ocks, micro-disks and micro-pits,frosting, ruts, edge abrasion, scratch-es, and percussion marks. The “Inclu -sions” chapter recognizes three typesby origin (protogenetic, syngenetic,and epigenetic) and four types by min-eralogy (peridotitic and eclogiticsuites as lithospheric inclusions, anasthenosphere/transition zone suite,and a lower mantle suite as sublitho-spheric inclusions). The volume also contains a list of
unconfirmed and rare mineral inclu-sions, with a selected reference foreach. Mineral inclusions of all typesare covered in the text, accompaniedby beautiful color illustrations. Car -bon isotopes and the sources of car-bon (organic, mantle, or carbonates)are discussed briefly, as are the ages ofdiamonds. In summary, I recommend this
thoroughly informative text to allreaders interested in the subject ofrough diamonds.
A. J. A. (BRAM) JANSE
MEDIA REVIEWWhat’s Hot in Tucson 2010. DVD(three discs), approx. 6 hours, releasedby Blue Cap Productions [www.bluecapproductions.com], Marina delRey, CA, 2011. $39.95What’s Hot in Tucson 2010—Gems& Jewelry. DVD, approx. 2 hours,released by Blue Cap Productions[www.bluecapproductions.com],Marina del Rey, CA, 2011. $24.99
What’s Hot in Tucson 2010 is thefourth in Blue Cap’s series of videosthat take viewers behind the scenes ofthe city’s major mineral shows. Thethree DVDs, cohosted by DavidWilber and Bob Jones, provide hoursof interviews with mineral dealers atfive different venues: the InnSuiteshotel, the Pueblo Inn Gem & MineralShow, the Fine Minerals Internationalhouse, the Westward Look resort, andthe TGMS Main Show at the TucsonConvention Center. The program highlights the
newest and finest minerals in the mar-ket, showing superb examples of exot-ic and classic mineral specimens. Thecohosts are subject experts, and theinterviews provide valuable informa-tion about the specimens, such aslocality, formation, and mining tech-niques. The production values arehigh, allowing the viewer to appreci-ate the minerals’ beauty and details. This video series also includes the
first installment of What’s Hot inTucson—Gems & Jewelry, whichoffers an insider’s look at the Ameri -can Gem Trade Associ ation show atthe Tucson Con vention Center. TheAGTA GemFair is where many of theyear’s trends and new products debut.This segment is hosted by DelphineLeblanc, who conducts interviews onthe floor with some of the biggestnames at the show, including cutters,designers, and dealers in estate jewel-ry, specialty colored gemstones,pearls, and colored diamonds. From novice to expert, there is
something for everyone in this eight-hour DVD package.
MICHELE KELLEYMonmouth Beach, New Jersey

GEMOLOGICAL ABSTRACTS GEMS & GEMOLOGY WINTER 2011 S3
COLORED STONES AND ORGANIC MATERIALSGeographical origin classification of gem corundum using
elemental fingerprint analysis by laser ablation induc-tively coupled plasma mass spectrometry. M.-M.Pornwilard, R. Hansawek, J. Shiowatana, and A.Siripinyanond [[email protected]], InternationalJournal of Mass Spec trometry, Vol. 306, No. 1, 2011, pp.57–62, http://dx.doi.org/10.1016/j.ijms.2011.06.010.
Various market sectors are increasingly asking for origin identi-fication of rubies and sapphires. Because the chemical composi-tion of corundum reflects its geographic origin, fingerprintingtechniques based on trace-element analysis are of great inter-est. Several methods have been used—particle-induced X-rayemission/proton-induced gamma-ray emission (PIXE/PIGE),micro-PIXE, laser-induced breakdown spectrometry (LIBS), andenergy-dispersive X-ray fluorescence (EDXRF) analysis—butthese techniques are either time-consuming or provide insuffi-cient detection limits.
This study employed laser ablation–inductively coupledplasma–mass spectrometry (LA-ICP-MS), combined with mul-tivariate data analysis, to classify the origin of 58 gem corun-dum samples. Trace-element concentrations were analyzed byLA-ICP-MS to construct a data matrix, with columns repre-senting the concentration of 10 elements (B, Si, Zn, Ga, Sn,Mg, Ti, V, Cr, and Fe) in each stone. Two multivariate statisti-cal techniques—principal-component analysis from factoranalysis and linear discriminant analysis (LDA)—wereemployed to differentiate and classify the samples.
This approach identified the geographic origin of bothhomogenously colored and multicolored corundum samplesfrom six countries. LDA provided good differentiation betweenrubies from Southeast Asia and Africa, as well as blue sapphires
This section is designed to provide as complete a record aspractical of the recent literature on gems and gemology. Articlesare selected for abstracting solely at the discretion of the sectioneditors and their abstractors, and space limitations may requirethat we include only those articles that we feel will be of greatestinterest to our readership.
Requests for reprints of articles abstracted must be addressed tothe author or publisher of the original material.
The abstractor of each article is identified by his or her initials atthe end of each abstract. Guest abstractors are identified by theirfull names. Opinions expressed in an abstract belong to the abstrac-tor and in no way reflect the position of Gems & Gemology or GIA.
© 2011 Gemological Institute of America
EDITORBrendan M. Laurs
REVIEW BOARD
Edward R. BlomgrenOwl’s Head, New York
Annette BuckleyAustin, Texas
Jo Ellen ColeVista, California
R. A. HowieRoyal Holloway, University of London
Edward JohnsonGIA, London
Michele KelleyMonmouth Beach, New Jersey
Guy LalousAcademy for Mineralogy, Antwerp, Belgium
Kyaw Soe MoeGIA, New York
Keith A. MychalukCalgary, Alberta, Canada
Joshua ShebyNew York, New York
James E. ShigleyGIA, Carlsbad
Russell ShorGIA, Carlsbad
Jennifer Stone-SundbergPortland, Oregon
Rolf Tatje Duisburg, Germany
Dennis A. ZwigartState College, Pennsylvania

S4 GEMOLOGICAL ABSTRACTS GEMS & GEMOLOGY WINTER 2011
from Madagascar and Nigeria. LDA mapping, with the useof a normalization factor, identified the origin of variouslycolored corundum with 80% accuracy. ERB
Nomenclature of the tourmaline-supergroup minerals. D.J. Henry, M. Novak, F. C. Hawthorne, A. Ertl, B. L.Dutrow, P. Uher, and F. Pezzotta, American Miner -alogist, Vol. 96, 2011, pp. 895–913, http://dx.doi.org/10.2138/am.2011.3636.
Tourmaline is a chemically complex mineral group thatpresents challenges for both chemical analysis and miner-alogical classification. Tourmalines are typically not differ-entiated according to mineral species by gemologistsbecause they cannot be distinguished by normal gem test-ing methods (and in many cases, gem tourmalines areelbaites). This mineral supergroup is comprised of 18species currently recognized by the International Miner -alogical Association, represented by the generalized struc-tural formula XY3Z6(T6O18)(BO3)3V3W. The most commonconstituents of each site are:
X = Na+, Ca2+, K+, vacancyY = Fe2+, Mg2+, Mn2+, Al3+, Li+, Fe3+, Cr3+
Z = Al3+, Fe3+, Mg2+, Cr3+
T = Si4+, Al3+, B3+
B = B3+
V = OH–, O2–
W = OH–, F–, O2–
The tourmaline supergroup can be divided into severalgroups and subgroups. Alkali, calcic, and X-vacant primarygroups are recognized on the basis of their X-site occupan-cy. Because cations with different valence states can occu-py the same site, coupled substitutions of particular cationsare required to relate the compositions of the groups.Within a relevant site, the dominant ion of the dominantvalence state is used as the basis of nomenclature.
The article describes the major tourmaline groups andthe recognized and prospective mineral species theyencompass. It defines the concepts central to tourmalineclassification and provides a hierarchical approach todetermining species nomenclature according to theamount of information available on a specimen’s chemicalcomposition. Finally, the authors discuss each of the rec-ognized tourmaline species, providing lists of color-basedvarietal names as well as obsolete, discredited, or misiden-tified species. JES
Organic gems protected by CITES. S. Karampelas and L.Kiefert, InColor, No. 15, Fall/Winter 2010, pp. 20–23.
Organic gems, defined as those formed through biologicalprocesses, are often the product of endangered animal orplant substances. Among numerous conventions andtreaties governing the local, national, and internationaltrade in endangered species materials, the most widely rec-ognized is the Convention on International Trade inEndangered Species of Wild Fauna and Flora (CITES). Three
appendices in the CITES regulations organize and list thespecies. Appendix I covers species that are greatly threat-ened with extinction. Materials from these species (e.g.,tortoise shell) can only be traded for exceptional purposes,such as scientific research. Appendix II species are not nec-essarily facing extinction, but their trade must be con-trolled to avoid threatening their survival. Elephant ivory isan example of an Appendix II material, and some argue thatit should be listed in Appendix I. To meet CITES require-ments for legal trade, Appendix II species require a certifi-cate issued by an authority of the country or state ofexport/import. Species listed in Appendix III are protectedin at least one country that has requested other CITES par-ties’ assistance in controlling the trade of that species.
As countries become more familiar with these regula-tions, many gemological laboratories are seeing anincrease in organic gems submitted to determine if theyare protected. The distinction can sometimes be made justby using magnification. The presence of Schreger (alsoknown as “engine turn”) lines indicates either elephant ormammoth ivory. Mammoth ivory is not protected byCITES because the animal is already extinct, and the angleat which the Schreger lines intersect can be diagnostic forseparating it from elephant ivory. The lines are not alwaysapparent under magnification, and more sophisticated (andexpensive) instruments such as X-ray computed microto-mography can be used for more challenging ivory/mam-moth separations. Similar distinctions are needed betweenCorallium vs. Stylaster red or pink corals. Growth struc-tures observed with magnification are diagnostic, butthese are not always visible. Raman spectroscopy is usefulfor making this separation.
A large percentage of the protected species currentlyused as gem materials can be easily identified by well-equipped gemological laboratories. The addition of otherspecies to the CITES appendices will require the use ofmore sophisticated nondestructive testing methods to sep-arate them. JEC
The role of matrix proteins in the control of nacreous layerdeposition during pearl formation. X. J. Liu, J. Li, L.Xiang, J. Sun, G. L. Zheng, G. Y. Zhang, H. Z. Wang,L. P. Xie, and R. Q. Zhang, Proceedings of the RoyalSociety B, 2011, pp. 1–8, http://dx.doi.org/10.1098/rspb.2011.1661.
Formed by a biomineralization process, pearl nacre is com-posed of aragonite platelets and biological macromolecules.The platelets are arranged in continuous parallel layers sep-arated by interlamellar organic sheets and intercrystallineorganic membranes. This study focused on the depositionof the platelets on pearl nuclei, and the gene expression offive nacre matrix proteins in the pearl sac during earlystages of formation. The authors found that pearls beginforming with irregular CaCO3 deposition on the nucleus,followed by further deposition that becomes more andmore regular until the mature nacreous layer has formed.

GEMOLOGICAL ABSTRACTS GEMS & GEMOLOGY WINTER 2011 S5
The low-level expression of matrix proteins during theirregular CaCO3 deposition suggests that the process maynot be initially controlled by the organic matrix. Instead,significant expression of matrix proteins in the pearl sacwas detected 30–35 days after nucleus implantation. Thiswas accompanied by a change in aragonite deposition fromlarge, irregular crystals to smaller, ordered crystals. Thisordered deposition was controlled by the organic matrix.
These results suggest that the bioactivities of matrixproteins are critical for nacre formation and pearl develop-ment, by controlling the shape, size, nucleation, andaggregation of CaCO3 crystals. JES
Study of structural and valence state of Cr and Fe inchrysoberyl and alexandrite with EPR and Möss -bauer spectroscopy. V. S. Urasov, N. A. Gromalova,S. V. Vyatkin, V. S. Rusakov, V. V. Maltsev, and N.N. Eremin, Moscow University Geology Bulletin,Vol. 66, No. 2, 2011, pp. 102–107.
The authors investigated the valence and structural distri-butions of chromium and iron in chrysoberyl. The sam-ples consisted of alexandrite from the Ural Mountains andan unknown deposit, chrysoberyl from Tanzania, and syn-thetic alexandrite produced by Czochralski, flux, andhydrothermal methods. EPR and Mössbauer spectroscopywere used to determine the valence states, and limitedannealing studies in air and argon were performed to deter-mine their impact on structural distributions.
The two Al3+ sites in the chrysoberyl structure, M1and M2, are slightly distorted octahedral voids with differ-ing symmetries and volumes. The authors cite earlierstudies to establish that Fe3+ cations substitute for Al3+
ions in the (larger) M2 sites exclusively. The present workshows that while Fe2+ enters the chrysoberyl structure,only some Fe3+ enters the structure and the balance existsin other phases such as Fe2O3. The wide range of Fe
2+ toFe3+ ratios in the various samples indicates crystal forma-tion under a variety of redox conditions.
From the annealing studies, the authors suggest thatthe proportion of Cr3+ occupancy between the M1 and M2sites is dependent in part on the crystallization tempera-ture. At higher temperatures such as those achieved withsynthetic growth techniques or annealing, the ratio of M2to M1 occupancy increases. One possible rationale theauthors propose is thermal diffusion of Cr3+ from the M1site to the M2 site. JS-S
Tourmaline: The kaleidoscopic gemstone. F. Pezzotta[[email protected]] and B. M. Laurs, Elements,Vol. 7, No. 5, 2011, pp. 333–338, http://dx.doi.org/10.2113/gselements.7.5.333.
This article examines one of the most popular and spectac-ular colored stones (and this abstractor’s favorite gem).Tourmalines are found in virtually every color of the rain-bow, including complex and beautifully zoned and occa-sionally chatoyant crystals. The gem is well suited for a
broad commercial market because it combines beauty,durability, rarity, a variety of sizes and shapes, and anattractive range of price points.
The authors provide a list of tourmaline colors, causesof color, varietal names, and probable species. Due to tour-maline’s pronounced and variable dichroism, optimal coloris achieved during the cutting process. Further influencingcolor is natural or laboratory irradiation of some pale tour-malines, which commonly produces vivid pink and redstones, and heat treatment of dark blue or green stones tolighten or intensify their color. Interestingly, gem tourma-line has not yet been synthesized, probably due to itschemical complexity.
Copper-bearing gem tourmaline was discovered in the1980s in the Brazilian state of Paraíba, and has become oneof the world’s most desirable gems, largely due to its vivid“neon” blue-to-green and purple hues. The articleoverviews the geographic locales, coloring mechanisms,and absorption spectra of this tourmaline variety, whichcan rival diamonds in cost.
Gem tourmalines form in magmatic, pegmatitic envi-ronments and in metamorphic rock, with variable geolog-ical ages—as recent as 6 million years to between 100 and550 million years ago. Inclusions mainly consist oftrapped fluids, randomly arranged capillary-like tubes,partially healed fractures, and occasional growth tubes.
The article touches on the gem’s distinguished and col-orful history, including its role in the jewels of royalty. Ofparticular note are a huge “ruby” (actually red tourmaline)in the great Czech crown of Saint Wenceslas, the specimensin the Kremlin’s Treasure Room, and the Dowager EmpressTz’u Hsi’s passion for carved pink tourmaline. ERB
On the words used as names for ruby and sapphire. L. A.Lytvynov, Functional Materials, Vol. 18, No. 2,2011, pp. 274–277.
This article examines the trade names of ruby and sap-phire from different cultures and historical periods. In fact,many names that contain the noun “ruby” preceded by anadjective are not rubies at all, but other varieties of miner-als. The author gives the etymology of many of these tradenames and a comprehensive chart. JS
DIAMONDSBistable N2-H complexes: The first proposed structure of a
H-related colour-causing defect in diamond. J. P.Goss, C. P. Ewels, P. R. Briddon, and E. Fritsch,Diamond and Related Materials, Vol. 20, No. 7,2011, pp. 896–901, http://dx.doi.org/0.1016/j.diamond.2011.05.004.
For some time, scientists have thought that hydrogen-relat-ed defects in diamond, detectable by spectroscopy, mightcontribute to their coloration, but the exact nature of thesedefects has remained unclear. The hydrogen content of dia-monds varies widely. In this article, the authors propose a
S6 GEMOLOGICAL ABSTRACTS GEMS & GEMOLOGY WINTER 2011
model for a hydrogenated substitutional nitrogen pairdefect (N2-H), which they predict will exhibit opticalabsorption above 600 nm and thus contribute to diamondcoloration. They suggest that this defect is one of a familyof nitrogen-hydrogen defects, which due to covalent nitro-gen-hydrogen bonding might explain several absorptionsobserved in the spectra of diamonds. This defect could existin both neutral and negative charge states. Structural differ-ences associated with these states may also contribute tothe thermochromic and photochromic behavior exhibitedby so-called chameleon diamonds. JES
Deep mantle cycling of oceanic crust: Evidence from dia-monds and their mineral inclusions. M. J. Walter, S.C. Kohn, D. Araujo, G. P. Bulanova, C. B. Smith, E.Gaillou, J. Wang, A. Steele, and S. B. Shirey,Sciencexpress, Vol. 334, No. 6052, 2011, pp. 54–57,http://dx.doi.org/10.1126/science.1209300.
In plate tectonics, basaltic oceanic crust subducts onlithospheric slabs into the mantle. Seismological studiesextend this subduction process down into the lower man-tle (>600 km depth), and geochemical observations indi-cate the return of some subducted oceanic crustal materi-al to the upper mantle (~200–500 km depth) in convectivemantle plumes. On the basis of their mineral inclusions,geologists believe that most diamonds found at theearth’s surface originated in the lithosphere at depths ofless than 200 km.
In this article, the authors analyzed mineral inclusionsin “superdeep” type IIa diamonds from the Juina-5 kim-berlite in Mato Grosso, Brazil. These unusual diamondshost inclusions with compositions comprising the entireassemblage of mineral phases expected to crystallize frombasalt in the lower mantle. Mineralogical evidence indi-cates that originally homogeneous silicate phases (trappedin the diamonds as inclusions during growth) exsolvedinto composite mineral assemblages. This unmixing isinterpreted as having occurred at a later time during theconvective ascent of the diamonds from the lower to theupper mantle. These diamonds record a history of upwardtransport on the order of 500–1,000 km in the mantle,long before being sampled by kimberlite magmas andbrought to the surface. Since the carbon isotopic signatureof these superdeep diamonds is consistent with a surface-derived source of carbon, the authors conclude that thedeep carbon cycle extends all the way from the crust tothe lower mantle. JES
Diamond resorption: Link to metasomatic events in themantle or record of magmatic fluid in kimberliticmagma? Y. Fedortchouk and Z. H. Zhang, CanadianMineralogist, Vol. 49, No. 3, 2011, pp. 707–719,http://dx.doi.org/10.3749/canmin.49.3.707.
Because of their lengthy and complex history of growthand dissolution in the earth, diamond crystals display atremendous variation in their morphology and surface fea-
tures. Based on a study of 330 gem-quality crystals fromthe Ekati mine in the Northwest Territories of Canada,the authors developed a methodology to distinguishbetween dissolution events that took place in the mantleversus those occurring in the ascending kimberliticmagma. The authors inferred that the majority of the sam-ples (~72%) exhibited resorption features produced withinkimberlite. Approximately 13% experienced resorption inthe mantle, while the remainder displayed resorption fea-tures produced in both environments.
The diamonds with mantle-generated resorption fea-tures had a different thermal history, as evidenced by theirlower nitrogen content and greater degree of nitrogen aggre-gation. The diamonds with kimberlite-induced resorptioncould be subdivided into two categories: resorption in thepresence of either an aqueous fluid or kimberlitic magma.The authors provide photos of diamond crystals that illus-trate the various resorption styles. They suggest that dia-monds from kimberlite pipes (even those separated by geo-logic space or time) would be expected to have similar man-tle-generated resorption, but might display different magma-generated resorption features depending on the retention orloss of aqueous fluid from the ascending magma. JES
Nano and sub-micro inclusions as probes into the originand history of natural diamonds. J. Purushothaman,P. R. Sajanlal, M. Ponnavaikko, and T. Pradeep,Diamond and Related Materials, Vol. 20, No. 7,2011, pp. 1050–1055, http://dx.doi.org/10.1016/j.diamond.2011.06.003.
Of five diamonds examined, one contained a group ofmicro-inclusions. Non-diamond Raman peaks at 514,510, and 490 cm–1 were detected in different areas ofthe stone, suggesting a group of micro-inclusions withvarious constituents. This was confirmed by a Ramanintensity image, which showed bright and dark zonesin the range from 750 to 100 cm–1. Energy-dispersivechemical analysis gave the composition of a pyroxene(Fe, Mg, and Ca silicate) with a ternary perovskitestructure. It also detected uneven distributions of Cr,Ru, Nb, Co, and Ni throughout the micro-inclusionassemblage. Fe and Cr were clearly observed in massspectra using laser desorption ionization–mass spec-trometry (LDI-MS).
The authors concluded that this diamond was ofperidotitic origin, as evidenced by the presence of ferro-magnesian pyroxene minerals and Cr, and the absenceof aluminum, alkalis, and rare-earth elements. Thisnondestructive micro-inclusions study showed poten-tial for defining the genesis of not only diamonds butalso of other gem materials. KSM
Seismic architecture of the Archean North Americanmantle and its relationship to diamondiferous kim-berlite fields. S. Faure, S. Godey, F. Fallara, and S.Trépanier, Economic Geology, Vol. 106, No. 2,

GEMOLOGICAL ABSTRACTS GEMS & GEMOLOGY WINTER 2011 S7
2011, pp. 223–240, http://dx.doi.org/10.2113/econ-geo.106.2.223.
The architecture of the base of the lithosphere beneathcratons in Canada and the United States has been definedfor the first time in three dimensions using a high-resolu-tion, Rayleigh wave-phase-velocity, tomographic model ofthe upper mantle (30–250 km depth). There is remarkableagreement between data obtained from mantle xenolithsand the lithospheric base obtained from this geophysicalmodel. The inferred base also corresponds to the petrologicdefinition of the boundary between the lithosphere andthe asthenosphere.
An important conclusion of this study is that diamondif-erous kimberlites are not located over the deepest parts ofthe cratonic roots (~180–240 km). Rather, they seem to occurmost often over the sloping edges of the lithosphere-astheno-sphere boundary that surround the deepest part of the craton-ic root zone. The starting point for kimberlite magma ascen-sion to the surface originates from these areas at depths of160–200 km. This depth interval delineates the region of theupper mantle where diamonds should have been stable sincethe Archean, and over which all known existing and poten-tial future diamond mines in Canada are located. JES
A secondary ion mass spectrometry (SIMS) re-evaluationof B and Li isotopic compositions of Cu-bearingelbaite from three global localities. T. Ludwig, H. R.Marschall, P. A. E. Pogge von Strandmann, B. M.Shabaga, M. Fayek, and F. C. Hawthorne, Miner -alogical Magazine, Vol. 75, No. 4, 2011, pp.2485–2494.
Copper-bearing elbaites are recovered from pegmatite-relat-ed deposits in Brazil, Mozambique, and Nigeria. Chemicalanalyses of 10 samples from these three geographic sourcesusing the SIMS technique revealed distinct differences inboron and lithium isotope compositions, which offer valu-able tourmaline provenance information. The isotopic com-positions for these two elements are relatively homogeneouseven across chemical- and color-zoned samples. The two iso-topes are also within the range of previously published datafor granitic and pegmatitic tourmalines. JES
Spectroscopic research on ultrahigh pressure (UHP)macrodiamond at Copeton and Bingara NSW, east-ern Australia. L. Barron, T. P. Mernagh, B. J. Barron,and R. Pogson, Spectrochimica Acta A, Vol. 80, No.1, 2011, pp. 112–118, http://dx.doi.org/10.1016/j.saa.2011.03.003.
Since the 19th century, an estimated one million carats ofdiamonds (average weight ~0.25 ct) have been mined fromnumerous secondary placer deposits along the eastern coastof Australia, the vast majority from the Copeton-Bingaraarea of New South Wales. Most were recovered between1867 and 1922. The absence of typical indicator minerals inthese sedimentary deposits has hampered geologists’ effortsto identify the primary sources of the diamonds. Unlike
deposits in other parts of the world, these diamonds appar-ently did not originate from the subcratonic lithosphere.
Approximately 3,000 diamonds were characterized forthis study. Raman spectroscopy of mineral inclusions indi-cates the diamonds formed under high-pressure conditionsin the lower mantle at the termination of subduction ofoceanic crust by continental collision. Using IR spec-troscopy, the authors distinguished two groups of diamondsaccording to their nitrogen abundance and aggregation state.They suggest that these two groups originated from differ-ent mantle sources and propose the following deliverymechanism. After subduction, the eclogitic host rocks werestranded for a period in the lower mantle under high-pres-sure conditions where diamond formation took place, andwere then exhumed to the upper mantle/lower crust. Atsome later time, diamonds (along with garnet and pyroxene)were transported to the surface by alkali basaltic intrusions.
The diamonds exhibit evidence of pervasive deforma-tion during growth, resulting in crystal imperfections,strongly aggregated nitrogen, a reduction of the second-orderRaman peak that normally would be more intense, andexceptional durability in industrial applications. JES
Start of the Wilson cycle at 3 Ga shown by diamonds fromthe subcontinental mantle. S. B. Shirey and S. H.Richardson, Science, Vol. 333, No. 6041, 2011, pp.434–436, http://dx.doi.org/10.1126/science.1206275.
The Wilson cycle describes the set of major plate tecton-ic processes whereby continental plates were dispersedand then reassembled on the earth’s surface. These pro-cesses are associated with crustal growth, mountainbuilding, and the occurrence of ore deposits. This multi-stage cycle has repeated itself throughout geologic time,and its operation since the Precambrian is apparent inthe geologic record of crustal rocks. The timing of thestart of this cycle has been uncertain, however. Mineralinclusions, encapsulated in diamonds billions of yearsago during their formation in the subcontinental litho-sphere, may provide information on this fundamentalgeologic event.
The authors analyzed existing data on 4,287 silicateand 112 sulfide inclusions in diamonds recovered fromancient cratons in Australia, southern Africa, and Siberia.These inclusions were classified, on the basis of theirchemical composition, as either peridotitic or eclogitic.Only peridotitic inclusions formed prior to 3.2 billionyears ago (Ga), while diamonds with eclogitic inclusionsbecame more prevalent after 3.0 Ga. The researchers con-cluded that the change in inclusion mineralogy at thistime resulted from the capture of eclogite and diamond-forming fluids in the subcontinental mantle due to sub-duction and continental collision associated with theonset of plate tectonics. The start of the Wilson cycle at3.0 Ga marked a change from crustal modification by recy-cling and other near-surface processes to plate tectonics, ashift that has continued to the present day. JES

S8 GEMOLOGICAL ABSTRACTS GEMS & GEMOLOGY WINTER 2011
GEM LOCALITIESDifferent origins of Thai area sapphire and ruby, derived
from mineral inclusions and co-existing minerals.S. Saminpanya and F. L. Sutherland, EuropeanJournal of Mineralogy, Vol. 23, No. 4, 2011, pp.683–694, http://dx.doi.org/10.1127/0935-1221/2011/0023-2123.
The authors used SEM-EDS analysis to identify and mea-sure the chemical composition of mineral inclusions ingem corundum from Thailand. The mineral phases in thesapphires included alkali feldspar (sanidine), nepheline, zir-con, and spinel (hercynite and magnetite-hercynite). Thoseidentified in rubies included pyrope, diopside (fassaite), andsapphirine.
Based on the composition of these inclusions, theauthors conclude that Thai rubies crystallized in the uppermantle in high-pressure metamorphic rocks of ultra maficor mafic composition (they suggest a garnet pyroxenite orgranulite). The sapphires had higher Ga, Ti, Fe, Ta, Nb,and Sn contents than the rubies. The authors suggest thatthe sapphires crystallized in high-grade metamorphicrocks (gneisses), or from magmas of highly alkaline com-position, at shallower levels in the lithosphere than therocks that hosted the rubies. JES
Distinction of gem spinels from the Himalayan mountainbelt. A. Malsy ([email protected]) and L.Klemm, CHIMIA International Journal for Chem i s try,Vol. 64, No 10, 2010, pp. 741–746, http://dx.doi.org/10.2533/chimia.2010.741.
Gem spinel deposits in Myanmar (Mogok), Vietnam(Luc Yen), and Tajikistan formed in association withHima layan orogenesis. Samples from these depositswere investigated by standard gemological testing andLA-ICP-MS. In most of the Mogok spinels, microscopicexamination identified apatite and calcite inclusionstogether with octahedral negative crystals. Dislocationsystems and sphene inclusions distinguished samplesfrom Luc Yen. A yellow surface fluorescence to short-wave UV radiation was observed only in samples fromTajikistan. Due to their similar formation conditions,spinels from these sources display few origin-specificcharacteristics in their trace-element pattern, but Ti,Fe, Ni, Zn, Zr, and Sn differ slightly. The highest Znconcentrations were observed in Mogok material,while samples from Luc Yen had the highest Fe con-tent. Spinels from these deposits can therefore be dis-tinguished by trace-element chemistry. This is espe-cially helpful for gems that show few or no inclusionfeatures. GL
Emeralds from South America—Brazil and Colombia. D.Schwarz ([email protected]), J. C.Mendes, L. Klemm, and P. H. S. Lopes, InColor, No.16, Spring 2011, pp. 36–46.
Brazil’s emerald mines are located in the states of MinasGerais, Bahia, Goiás, and Tocantins. Most deposits of eco-nomic interest are hosted by mica schists. The emeralds’gemological properties directly reflect the geological-min-eralogical environment in which they formed. The geolog-ic conditions in the various Brazilian deposits have manysimilarities, so the emeralds’ properties may also overlap.Colombian emeralds have distinctive three-phase inclu-sions and growth structures, while mica inclusions(biotite-phlogopite) are the most common solid inclusionsfound in Brazilian stones. Growth phenomena are normal-ly not well developed in Brazilian emeralds.
Chemical analyses of Brazilian and Colombian speci-mens were acquired by LA-ICP-MS, and several elements(Cr, V, Fe, Na, Mg, Ga, and Cs) are discussed. The V/Crratio provides a reliable indication of the origin of color.The absorption spectra of Colombian emeralds normallyshow variable contributions from both Cr3+ and V3+.Colombian specimens contain very little iron and gener-ally do not contain bands related to Fe3+. Brazilian emer-alds have “combination spectra” composed of (Cr3+ + V3+)and Fe3+-related features, as their iron concentration ismoderate to high. GL
Host rock characteristics and source of chromium andberyllium for emerald mineralization in the ophi-olitic rocks of the Indus Suture Zone in Swat, NWPakistan. M. Arif, D. J. Henry, and C. J. Moon, OreGeology Reviews, Vol. 39, No. 1/2, 2011, pp. 1–20,http://dx.doi.org/10.1016/j.oregeorev.2010.11.006.
The Swat Valley region of northern Pakistan has been animportant source of emeralds for the past five decades. Thestones have been reported from a number of localities inthis area, with the main deposits near Mingora and GujarKili. The emeralds are hosted by magnesite-talc-quartz-dolomite assemblages that form part of the extensivesequence of metamorphosed sedimentary and igneous rocksalong the tectonic collision zone between the Asian andIndian continental plates. These magnesite-rich rocks aremostly distributed along contacts between serpentinizedultramafic rocks and carbonate±graphite-bearing metasedi-mentary rocks. From their field association and petrographicevidence, they apparently resulted from alteration by car-bonate-bearing metamorphic fluids. Late-stage hydrother-mal activity in the fissile magnesite-rich rocks producedquartz veins that locally contain emerald, Cr-tourmaline,and Cr,Ni-rich muscovite. Petrographic and mineralogicalanalysis suggests that the Cr, Ni, and Mg in these mineralswere derived by alteration of the original ultramafic rocks.In contrast, the Be and B appear to have been introduced byhydrothermal solutions of igneous origin that invaded themagnesite-rich host rocks. JES
Laos: Land of a million elephants . . . and sapphires. R.Hughes, A. Ishmale, F. Isatelle, and P. Wang,InColor, No. 16, Spring 2011, pp. 12–19.

GEMOLOGICAL ABSTRACTS GEMS & GEMOLOGY WINTER 2011 S9
Near the infamous Golden Triangle, the point where Laos,Myanmar, and Thailand meet, lies the Ban Huay Xai sap-phire deposit. The deposit has been a point of geologicinterest since 1890, and it saw a brief surge of activity inthe 1960s as various mining companies took a passinginterest in recovering its small rough material.
In 2006, though, the Lao government partnered withSino Resources Mining Co., which staked a handful ofclaims and is now obtaining 200 kg of rough sapphires permonth. Mining is done on a shallow level, with moststones uncovered beneath 30 cm of topsoil and 1–1.5 m ofoverburden. The majority of the stones are small (<3mm), but their color is exceptional.
Sino Resources is aware that its open-pit mining canbe destructive for the environment and the primarilyfarming-based community. The company has adopted astance of stewardship and is restoring mined land to itsnatural state, negotiating with farmers, and investing intraining and employing the local community for morethan 95% of its labor force. AB
Microstructure and origin of colour of chrysoprase fromHaneti (Tanzania). H. A. Graetsch [[email protected]], Neues Jahrbuch für Mineralogie, Abhand lun -gen, 2011, Vol. 182, No. 2, pp. 111–117, http://dx.doi.org/10.1127/0077-7757/2011/0187.
The green color of chrysoprase is known to originate froma Ni-containing compound incorporated within the micro-crystalline structure of chalcedony. However, the nature ofthe admixed Ni-containing phase is not known precisely,due to the lack of direct evidence from X-ray diffraction ormicroscopy.
To address this issue, the authors studied chrysoprasefrom the Haneti-Itiso area in central Tanzania, and com-parison samples from Poland and Australia, using opticalreflectance spectroscopy, near-infrared absorptionspectros copy, and powder X-ray diffraction. The resultsshowed that the green color of Haneti chrysoprase iscaused by the incorporation of trace amounts of gaspeite (aNi-carbonate mineral) in the micro structure of the chal-cedony. Chrysoprase samples from the comparisonsources did not show any gaspeite diffraction peaks; theircolor seems to originate from a different pigment (i.e.,inclusions of poor crystallinity). The Haneti chrysoprasehas a higher crystallinity of both the microcrystallinequartz matrix and the gaspeite pigment. ERB
Mines and minerals of the Southern California pegmatiteprovince. J. Fisher, Rocks & Minerals, Vol. 86, No.1, 2011, pp. 14–34, http://dx.doi.org/10.1080/00357529.2011.537167.
Granitic pegmatites in Southern California have long yield-ed a variety of gems, including some notable recent discov-eries. This nontechnical summary provides an excellentmining history of the region. It is liberally illustrated withimpressive specimens of tourmaline, beryl (morganite),
topaz, garnet (spessartine), and spodumene (kunzite).Although much has been written about the district and itslegendary discoveries, this article reports on recent findsrivaling those of bygone decades. In particular, considerablegem rough and mineral specimens have emerged from theCyro-Genie and Oceanview mines in the past 10 years. Theregion clearly is not depleted, though production is typical-ly cyclical with long intervals of inactivity. KAM
Oscillatory zoned liddicoatite from Anjanabonoina, cen-tral Madagascar. II. Compositional variation andmechanisms of substitution. A. J. Lussier and F. C.Hawthorne, Canadian Mineralogist, Vol. 49, No. 1,2011, pp. 89–104, http://dx.doi.org/10.3749/canmin.49.1.89.
For more than a century, granitic pegmatites at Anjana -bonoina (~60 km west of Antsirabe) have produced excep-tional color-zoned crystals of liddicoatite tourmaline.Slices of these crystals cut perpendicular to the c-axis thatexhibit banded, triangular-shaped, or other color zoningpatterns are much sought-after by both mineral collectorsand jewelry manufacturers. This study was undertaken toanalyze by electron microprobe one of these tourmalineslices from core to rim to better understand the changes inchemical composition that accompany the color zoning.
Over the bulk of the crystal, the compositional varia-tion corresponds to two substitution mechanisms:
1. XNa + YM*Æ
XCa + YLi2. YM* + YM*
ÆYLi + YAl
where M* = Fe + Mg + Mn, and X and Y represent differentcrystallographic sites in the tourmaline structure.
The analyses reveal a smooth monotonic variation in theconcentrations of the principal constituents of the tourma-line, and a superimposed oscillatory variation in several ele-ments—particularly Fe, Mg, Mn, Na, and Ca. This oscilla-tion is manifested as a decrease in the amount of an elementuntil a color zone boundary is reached, at which the concen-tration rises abruptly, with this same pattern repeated ateach boundary. The compositional and color variations aredifferent in the pyramidal and prismatic growth sectors. Theauthors suggest specific chemical substitutions based on thetwo mechanisms shown above to explain the observed varia-tions in chemical composition. They conclude that currentmodels for oscillatory zoning in minerals do not fully explainthe internal color patterns seen in this tourmaline, and amore appropriate model needs to be developed. JES
Raman microspectroscopy of organic inclusions in spo-dumenes from Nilaw (Nuristan, Afghanistan). A.Weselucha-Birczyn�ska ([email protected].),M. Słowakiewicz, L. Natkaniec-Nowak, and L.M. Proniewicz, Spectrochimica Acta Part A: Molec -ular and Biomolecular Spectroscopy, Vol. 79, No. 4,2011, pp. 789–796, http://dx.doi.org/10.1016/j.saa.2010.08.054.
S10 GEMOLOGICAL ABSTRACTS GEMS & GEMOLOGY WINTER 2011
Spodumene crystals from the Nuristan region are amongthe finest examples of this mineral ever found. Gem spo-dumene occurs in two main color varieties in Afghanistan:pink to violet (kunzite) and yellowish green. Samples fromthe Nilaw mine were investigated by microthermometryand Raman spectroscopy. Microthermometry of the pri-mary fluid inclusions indicated crystallization ranges of300–650°C and 1.5–2.5 kbar. The brine concentration inthe fluid inclusions varied from 4.3 to 6.6 wt.% NaClequivalent salinity. Raman spectra of selected fluid, organ-ic, and solid inclusions were collected in linear or rectan-gular arrays as well as depth profiles to study their size andcontents. The phases documented were calcite, beryl,topaz, and spodumene accompanied by fluid and/or organ-ic inclusions (liquid and gas hydrocarbons) with bands at2900 cm-1 (C2H6-CH3), 2550 cm
-1 (H2S), and 2350 cm-1
(CO2, N2). Also confirmed was the presence of carbona-ceous matter (D-band at ~1320 cm-1 and/or G-band at~1600 cm-1), which developed in the course of transforma-tion of the original hydrocarbons. GL
INSTRUMENTS AND TECHNIQUESUse of the Raman spectrometer in gemological laborato-
ries: Review. L. Kiefert and S. Karampelas ([email protected]), Spectrochimica Acta PartA: Molecular and Biomolecular Spectroscopy, Vol.80, No. 1, 2011, pp. 119–124, http://dx.doi.org/10.1016/j.saa.2011.03.004.
The Raman effect was first reported in 1928, and fordecades it was used mainly in physics and chemistry.With the availability of Raman microscopes in the mid-1970s, the technique became better suited for geosciences,including gemology. In the 1990s, Raman spectrometersbecame smaller, more sensitive, and more affordable,expanding their use in gemological laboratories. The tech-nique is now routinely used to establish the identity of anunknown gem, study inclusions, identify treatments, andcharacterize natural or artificial color in pearls and corals.
Raman spectroscopy offers a nondestructive means ofgem identification that does not require any contact withthe sample. Identification of subsurface inclusions is alsopossible in some cases. In the area of gem treatments, themethod is used for the detection of emerald fillers; the iden-tification of lead-, barium-, or zirconium-rich glass-fillings(or the presence of fluxes) in corundum; and the detection ofheat-treated corundum and HPHT-annealed diamonds.
The authors conclude that Raman spectroscopy hasbecome an indispensable tool for gemological laboratories,and that many new applications are waiting to be found.Future possibilities include the use of the Raman photolu-minescence spectroscopy for characterizing colored dia-monds and studying the role of rare-earth elements in col-ored stones. DAZ
JEWELRY HISTORYEmeralds, sapphires, pearls and other gemmological mate-
rials from the Preslav gold treasure (X century) inBulgaria. E. Strack ([email protected]) and R. I.Kostov, Bulgarian Academy of Sciences, BulgarianMineralogical Society, Vol. 48, 2010, pp. 103–123.
The Preslav gold treasure was found in 1978 near the townof Veliki Preslav, the second Bulgarian capital during theend of the First Bulgarian Kingdom. The 10th-century trea-sure belonged to a female member of the royal family andis believed to be of Byzantine origin. Among the gem mate-rials identified are emerald, violet sapphire, pearl, reddishviolet garnet, rock crystal, amethyst, and carnelian. Theaverage dimensions of the emeralds in two medallionswere 0.5 cm long and 0.6 cm wide; their origin is suspectedto be Egyptian or Austrian based on the deposits known atthe time and similarities in their morphology, internal fea-tures, and inclusions. Fine rutile silk inclusions were iden-tified in the sapphire. As the Indian subcontinent was themain source of gem corundum in antiquity and EarlyMedieval times, it can be assumed that the sapphires in thePreslav treasure are of an Indian or Sri Lankan origin. Thebarrel- and baroque-shaped saltwater pearls (average 0.4 cmlong and 0.5 cm in diameter), some of them partly decom-posed, are thought to originate from the Persian Gulf andthe coastal areas of the Indian Ocean. GL
JEWELRY RETAILINGWatches and jewellery retailing, executive summary – UK –
September 2011.Mintel, www.mintel.com, 10 pp.This report, available only to Mintel subscribers, forecastssales of watches and jewelry (not including costume jewel-ry) in the UK at £4.2 billion (US$6.6 billion) in 2011, agrowth of 3% since 2006. The value of the market shrankby 1% between 2007 and 2009. Mintel suggests that saleswill increase by 8% between 2011 and 2016 to reach £4.6billion (US$7.2 billion), but there are challenges for boththe watch and jewelry sectors.
The watch market faces competition from portableelectronic devices that display the time. Based on theirconsumer research, Mintel calculates the average pricepeople would spend on a watch for themselves in 2011 is£87, a notable 17% decline from £102 in 2010.
The precious metal jewelry market, which accountsfor three-quarters of market value, is affected by the soar-ing gold price, which has decreased volume sales. Thevolatile price of gold is the main reason behind a 77%reduction in the weight of gold pieces hallmarked in UKassay offices between 2001 and 2010.
Marriages have ebbed to the lowest rate since recordsbegan nearly 150 years ago, according to the UK’s Officeof National Statistics. Demand for engagement and wed-ding rings have therefore dropped. But gift giving and
GEMOLOGICAL ABSTRACTS GEMS & GEMOLOGY WINTER 2011 S11
receiving remains popular, and the permanence of watch-es and jewelry will continue to drive sales. EJ
PRECIOUS METALSDetermination of gold in jewellery alloys via potentiomet-
ric titration: Procedure standardization and resultsbench marking. G. Pezzatini, M. Caneschi, M. Inno -centi, S. Bellandi, E. Lastraioli, L. Romualdi, and S.Capo rali, Current Analytical Chemistry, Vol. 7, No.4, 2011, pp. 277–285, http://dx.doi.org/10.2174/157341111797183065.
Potentiometric titration is a volumetric method in whichthe electrical potential between two solutions is measuredas a function of the added reagent volume. The authorsrecommend this method for the accurate determination ofthe gold content of jewelry alloys rather than traditionalcupellation (i.e., fire assay), which presents serious healthand environmental risks.
A wide variety of gold jewelry alloys were dissolved inacid, and the resulting solutions were used in an optimizedtitration procedure developed by the authors. To evaluatethe proposed method, the authors performed experiments inthree different laboratories. The results were consistentwith data obtained by cupellation, demonstrating thatpotentiometric titration is a robust and affordable alterna-tive to classic fire assay for testing gold alloy jewelry.
JES
Microstructure analysis of selected platinum alloys. P. Batta -ini, Platinum Metals Review, Vol. 55, No. 2, 2011, pp.74–83, http://dx.doi.org/10.1595/147106711X554008.
Optical metallography involves the microscopic examina-tion of polished or etched surfaces of metal. The techniquecan be employed to describe a metal’s microstructures bothqualitatively and quantitatively. It is often supplementedby other methods, such as SEM-EDS analysis, to more fullycharacterize a material. In this article, the author describesthe metallographic analysis of the internal microstructureof platinum metal alloys similar to those used for jewelryand industrial applications. A number of examples illus-trate the visual distinction between these various alloys,and whether the alloy sample was merely crystallized (“ascast”) or had been work-hardened and annealed. JES
MISCELLANEOUSGemstone mining as a development cluster: A study of
Brazil’s emerald mines. J. A. Puppin de Oliveira, S.Ali, Resources Policy, Vol. 36, 2011, pp. 132–141.
Most Brazilian emerald mining is clustered in three areaswithin the country. The vast majority of mining is small
scale, bringing little direct benefit to local government,while environmental damage and the effects of overpopula-tion during an emerald “rush” can create lasting problems.And without tax revenues from mining, local governmentshave no incentive to offer improved health and living stan-dards to miners. The authors propose several solutions tomitigate these conditions, including: (1) bringing in outsideinvestors who are accountable to international standards,and possess technology for more efficient and less destruc-tive mining; (2) introducing corporate governance stan-dards; (3) encouraging miners’ cooperatives that will paytaxes and provide incentive for governments to create ser-vices; and (4) developing local markets to realize higherreturns. RS
Potential for modernization of small-scale gemstone min-ers—The case of the tsavorite mines in southeastKenya. C. Simonet, InColor, No. 16, Spring 2011,pp. 22–27.
The exact location of colored stone mineralization ishard to predict, even by applying drilling methods. Thusit is extremely difficult to mechanize the mining of col-ored stones, especially for primary deposits. The lowpercentage of high-grade material produced from mostdeposits also contributes to the inability to sustainmechanized mining. Thus, gem miners are still usingcrude methods that do not meet international standards.
Kenya is one of the leading producers of tsavorite.Mining is mostly done with basic equipment, such ascompressors and jackhammers. Challenges include thelack of technical knowledge, the irregularly spaced tsa-vorite concentrations, and the steeply dipping mineral-ized zones, resulting in a series of narrow tunnels. As aconsequence, gem production is unpredictable and theprices are low. Kenya has many tsavorite deposits withsimilar structural geometry and geologic characteristics,and this presents a good opportunity to modernizesmall-scale mining. This initiative would require stan-dard mining procedures, properly defined equipment,and detailed geologic surveys using remote sensing, geo-physics, and geochemistry. Other aspects include train-ing miners; providing expertise from geologists, gemolo-gists, and mine engineers; improving access to funding;and branding. Modernization of tsavorite mining wouldpromote market stability and compliance with properhealth, safety, and environmental standards.
In recent years, two major gem mining companieshave been listed on stock exchanges. This ensured theircompliance with international standards of scientificwork, mining methods, planning, and governance,including publication of resource estimates and techni-cal studies. This trend is an encouraging sign for themodernization of the colored stone mining industry.
KSM

S12 ANNUAL INDEX GEMS & GEMOLOGY WINTER 2011
SUBJECT INDEXThis index gives the first author (in parentheses), issue, and inclusive pages of the article in which the subject occurs for all featurearticles, Notes & New Techniques, and Rapid Communications that appeared in Volume 47 of Gems & Gemology. Also includedare abstracts of presentations from the Summer 2011 (S11) issue, the proceedings of the Fifth International GemologicalSymposium. For the Gem News International (GNI) and Lab Notes (LN) sections, inclusive pages are given for the item. The BookReviews section is available only as an online supplement, with the page numbers preceded by S. The Author Index (p. S19) pro-vides the full title and coauthors of the articles cited.
AAfghanistan
afghanite from Badakhshan(GNI)F11:235
emerald mining in (GNI)F11:238-239sapphire from, beryllium- and tungsten-bearing (LN)Sp11:53-54
scapolite from (GNI)Sp11:65-66sphene from border area with Pakistan,color-change (GNI)W11:327-328
Afghanitefrom Afghanistan (GNI)F11:235
Agatedendritic, in jewelry (GNI)Sp11:62-63and reconstituted turquoise doublet,marketed as Coral Sea (GNI)Sp11:62
Amethystseparation from synthetic, usinginfrared spectroscopy(Karampelas)F11:196-201
from southern Brazil(Juchem)Su11:137-138
Amethyst, syntheticseparation from natural, using infraredspectroscopy (Karampelas)F11:196-201
Ametrine [amethyst-citrine]from Bolivia, Anahí mine(Weldon)Su11:163-164
Ammoniteiridescent, from Madagascar(GNI)F11:235-236
Analytical techniques [general]to characterize gem materials(Rossman)Su11:124-125
Andesinereportedly from Tibet (Rossman)Sp11:16-30, (Abduriyim)Su11:167-180
Andraditedemantoid from northern Madagascar(Pezzotta)Sp11:2-14
Annealing, see Diamond treatmentAquamarine
from Thanh Hoa, Vietnam(Huong)Sp11:42-48, (GNI)F11:236-237
Aquamarine simulantssynthetic quartz (GNI)W11:332-333
Argon isotope analysis of andesine, from Tibet and otherclaimed localities (Rossman)Sp11:16-300
Argyle diamond minecolored diamonds from(Chapman)Su11:130
Assembled gem materialsagate and reconstituted turquoise dou-blet, marketed as Coral Sea agate(GNI)Sp11:62
corundum and lead-glass triplet(GNI)F11:251-252
glass triplet imitation of “mystic”treated topaz (GNI)F11:252-253
opal with artificial matrix(LN)W11:312
Asterismartificial (Steinbach)Su11:152-153in quartz, caused by cinnabar inclu-sions (GNI)W11:322-323
Auctionsof luxury jewelry (Luke)Su11:100-102
Australiacolored diamonds from Argyle(Chapman)Su11:130
opal from—Laverton, WesternAustralia (GNI)W11:319-320;nomenclature and characterization(Beattie)Su11:116
zircon from, exhibiting tenebrescence(LN)W11:314-315
BBeryl, see Aquamarine, EmeraldBeryllium
natural, in blue sapphire—(LN)F11:232-233; from Afghanistan (LN)Sp11:53-54
Beryllium diffusion, see Diffusion treatmentBolivia
ametrine from the Anahí mine(Weldon)Su11:163-164
Book reviews Collectors Guide to GranitePegmatites (King)F11:S4
Collectors Guide to Silicate CrystalStructures (Lauf)F11:S4
Colour of Paradise: The Emerald in theAge of Gunpowder Empires(Lane)Sp11:S2-S3
The Diamond Compendium(Cunningham)W11:S1
Diamond Math (Glasser)F11:S4Diamonds in Nature: A Guide toRough Diamonds (Tappert andTappert)W11:S2
The Extraordinary World of Diamonds(Norman)F11:S1-S2
Gems and Gemology in Pakistan(Khan and Kausar)F11:S4
Jewellery from the Orient: Treasuresfrom the Bir Collection(Siewert)Sp11:S3
Living Jewels: Masterpieces fromNature (Peltason)F11:S1
Mineral Treasures of the World (TheGeological Museum of China andThe Collector’s Edge MineralsInc.)F11:S4
Pearls (Bari and Lam)Sp11:S1Precious Objects: A Story ofDiamonds, Family, and a Way ofLife (Oltuski)W11:S1-S2
Terra Spinel Terra Firma (Yavorsky andHughes)Sp11:S1-S2
Twentieth-Century Jewellery: From ArtNouveau to Contemporary Design inEurope and the United States(Cappellieri)Sp11:S3
What’s Hot in Tucson 2010 (Blue CapProductions)W11:S2
The Workbench Guide to JewelryTechniques (Young)F11:S2
World Hallmarks, Volume I: Europe,19th to 21st Centuries, 2nd ed.(Whetstone, Niklewicz, andMatula)F11:S3-S4
Boxes [article sidebars]andesine from Tibet and other claimedlocalities—feldspar nomenclature(Rossman)Sp11:16-30; samples and
Volume 47
ANNUAL INDEX GEMS & GEMOLOGY WINTER 2011 S13
experimental details(Rossman)Sp11:16-30
diamond symmetry—basic measuringconcepts (Geurts)W11:286-295; com-binations of symmetry features(Geurts)W11:286-295
magnetic susceptibility—and magneticmaterials (Hoover)W11:272-285; mea-surement of (Hoover)W11:272-285
Brazildiamond from, black, nature of col-oration (Vasilyev)Su11:135
gemstones from southern(Juchem)Su11:137-138
opal (or cristobalite?) from, blue(Schnellrath)Su11:142
spodumene from, green cat’s-eye(GNI)F11:249-250
tourmaline from Pederneira, MinasGerais (Pezzotta)Su11:141-142
Burma, see Myanmar
CCalifornia, see United StatesCanada
diamonds from (Stachel)Su11:112-114Carving, see Lapidary artsCat’s-eye, see Chatoyancy“Cat’s-eye pearls”
non-nacreous calcitic pearl imitations(GNI)W11:330-332
Cavansitefaceted (GNI)Sp11:56-57
Chalcedonypurplish blue and red-brown, from Peru(GNI)F11:237-238
“Challenge,” see Gems & Gemology
Chatoyancyin quartz—caused by tourmaline needleinclusions (GNI)F11:245-246; withcinnabar inclusions (GNI)W11:322-323
in spodumene, green (GNI)F11:249-250Chemical composition
of andesine, reportedly from Tibet(Rossman)Sp11:16-30,(Abduriyim)Su11:167-180
of demantoid from northernMadagascar (Pezzotta)Sp11:2-14
of garnet—(Henderson)Su11:148; deter-mined using magnetic susceptibility(Hoover)W11:272-285
of zircon, brownish red, from China(Chen)Sp11:36-41
Chemical vapor deposition [CVD], seeDiamond, synthetic
Chemometricsof corundum, in determining geograph-ic origin (Yetter)Su11:157
Chinaandesine, reportedly from Tibet(Rossman)Sp11:16-30,(Abduriyim)Su11:167-180
development and tax policy of gemindustry in (Jia)Su11:159-160
freshwater cultured pearls from—bead-ed with baroque freshwater culturedpearls (GNI)F11:244-245; with exoticmetallic colors (Beavers)Su11:144;treatments and their detection(Strack)Su11:120
nephrite from, natural and treated(Zhang)Su11:122
sapphire, blue and pink, from Muling(Chen)Su11:136-137
topaz, neutron-irradiated blue, fromGuangdong (Zhang)W11:302-307
zircon, brownish red, from Muling(Chen)Sp11:36-41
Chondroditefrom Tanzania (GNI)W11:316
Chrysocolla, see ChalcedonyCitrine simulants
large synthetic quartz (GNI)W11:332-333
Clinohumiteunusually large (LN)F11:222-223
Coatingon bead-cultured freshwater pearls(LN)W11:313-314
on diamond—black (LN)F11:223-224;with spectroscopic features of a natu-ral-color pink (LN)F11:224-225
Colombiadolomite, blue, from Muzo(GNI)W11:316-318
Color, cause ofin natural-color and treated colorlessand colored diamonds(Epelboym)Su11:133
in tanzanite (Smith)Su11:119-120in tourmaline from Mt. Marie, Maine(GNI)Sp11:67-68
Color change sphene, vanadium-bearing, fromPakistan/Afghanistan (GNI)W11:327-328
Color gradingof diamond, nomenclature(Tashey)Su11:163
dual integrating sphere spectrometerwith artificial intelligence(Liu)Su11:154
Color zoningin andesine, reportedly from Tibet(Rossman)Sp11:16-30,(Abduriyim)Su11:167-180
in low-grade diamonds (Kwon)Su11:134in opal, bicolored (GNI)W11:320-322in topaz, yellowish to greenish brown(GNI)F11:250-251
Colored stonesfrom Brazil, southern(Juchem)Su11:137-138
discriminant analysis for identifyinggeographic origin of(Blodgett)Su11:145
examined at the Gem TestingLaboratory in Jaipur, India
(Choudhary)Su11:145-146market for (Drucker)Su11:158-159marketing of (Overlin)Su11:97-99from Mexico, review of(Ostrooumov)Su11:141
world production of (Yager)Su11:142-143Conch pearl
large (LN)F11:230-231Conferences
ICA Congress 2011 (GNI)F11:253-254International GemmologicalConference (GNI)W11:334-335
International Gemological Symposium(Proceedings issue)Su11:79-166
NAG Institute of Registered ValuersConference (GNI)W11:335
Scottish Gemmological Conference2011 (GNI)F11:254
Sinkankas Symposium 2011—Diamond (GNI)F11:254-255
Conflict diamondsdebate on (Symposium DebateCenter)Su11:126-128
Congo, Democratic Republic of the andesine reportedly from(Rossman)Sp11:16-30
Conoscopytechnique for identifying interferencefigures in gem materials(Gumpesberger)Su11:147
Coralconservation of (Carmona)Su11:158
Coral Sea agateagate and reconstituted turquoise dou-blet (GNI)Sp11:62
Corundummining in Pakistan (GNI)W11:325-326triplet with lead glass (GNI)F11:251-252
see also Ruby, SapphireCountry of origin, see Geographic originCristobalite
or blue opal(?) from Brazil(Schnellrath)Su11:142
Cultured pearl, see Pearl, culturedCVD [chemical vapor deposition]-grownsynthetic diamonds, see Diamond,synthetic
DDemantoid, see AndraditeDentine, see OdontoliteDiamond
brooch from September 11 attacks(GNI)F11:255-256
cleaning technology (Vins)Su11:136color grading of, nomenclature(Tashey)Su11:163
color origin, determination of(Epelboym)Su11:133
color zoning in low-grade diamonds(Kwon)Su11:134
crystal descriptions, for use in explo-

S14 ANNUAL INDEX GEMS & GEMOLOGY WINTER 2011
ration (Klettke)Su11:139inclusions in low-grade diamonds(Kwon)Su11:134
length-to-width ratios among fancy-shapes (Blodgett)Su11:129
localities, alluvial (Janse)Su11:110with luminescent cleavage(LN)F11:226-227
marketing of (Overlin)Su11:97-99mining of—(Coopersmith)Su11:108; inCanada (Stachel)Su11:112-114; inLiberia (GNI)Sp11:63-64
phosphorescence, long-lasting(LN)W11:310-311
polished supplies from secondary mar-ket sources (Shor)Su11:163
postage stamp collection(Overlin)F11:214-219
from Russia’s Nurbinskaya pipe, min-eralogical characteristics of(Solodova)Su11:134-135
strain in colorless untreated(LN)F11:224-225
symmetry grading of—assessments andmetrics (Caspi)Su11:153-154; GIAboundaries (Geurts)W11:286-295
thermoluminescence in type IaB(LN)Sp11:50
with 3H and H3 defects resulting fromradiation damage (Choi)Su11:131
from Zimbabwe, naturally irradiated(Breeding)Su11:129-130,(Crepin)Su11:105
see also Diamond, colored; Diamond,cuts and cutting of; Diamond, inclu-sions in; Diamond, synthetic;Diamond treatment; DiamondViewimaging
Diamond, coloredfrom the Argyle mine, studies of(Chapman)Su11:130
black—from Brazil, nature of coloration(Vasilyev)Su11:135; coated(LN)F11:223-224; colored by strongplastic deformation (LN)F11:223;strongly purple-colored (LN)W11:309
color grading of, nomenclature(Tashey)Su11:163
color origin, determination of(Epelboym)Su11:133
Fancy Vivid purple (LN)W11:308greenish brown, with a color shift(LN)F11:234-235
see also Diamond, synthetic; Diamondtreatment
Diamond, cuts and cutting ofto exhibit inclusions (LN)Sp11:50-52preferences in length-to-width ratios(Blodgett)Su11:129
Diamond, inclusions inin low-grade diamonds (Kwon)Su11:134manufactured to exhibit (GNI)Sp11:50-523D mapping systems (Caspi)Su11:153
Diamond, syntheticchemical vapor deposition [CVD]—from Gemesis (LN)F11:227-228;luminescent regions in
(Willems)F11:202-207; optical proper-ties of silicon-related defects(D’Haenens-Johansson)Su11:131-132
HPHT-grown—donor nitrogen aggrega-tion in (Vins)Su11:135-136; pink(Johnson)Su11:133-134
marketing of (Overlin)Su11:97-99treated, with pink color intensified byfluorescence (LN)F11:228-229
Diamond treatmentcharacterization of (Epelboym)Su11:133coating—black (LN)F11:223-224; withspectroscopic features of a natural-color pink (LN)F11:224-225
HPHT—discriminant analysis in dis-tinguishing (Blodgett)Su11:145; withfluorescence pattern of an HPHT-grown synthetic (LN)W11:310; largebrownish yellowish orange(LN)Sp11:49; large colorless(LN)Sp11:49-50; large pink(LN)F11:227; observation of strain indetecting (Eaton-Magaña)Su11:132;subtle color enhancement(LN)F11:225-226
irradiation, producing green and orangybrown spots (Nasdala)Su11:105-106
of synthetics—donor nitrogen aggrega-tion in (Vins)Su11:135-136; pink(Johnson)Su11:133-134; (LN)F11:228-229
DiamondView imagingof CVD-grown synthetic diamonds,luminescent regions in(Willems)F11:202-207
of HPHT-grown pink synthetic dia-monds (Johnson)Su11:133-134
of HPHT-treated diamond with fluores-cence pattern of an HPHT-grownsynthetic (LN)W11:310
Diffusion treatmentexperiments performed on andesine(Rossman)Sp11:16-30,(Abduriyim)Su11:167-180
of sapphire with Be—durability andsafety testing (Sutthirat)Su11:121;experiments (Wathanakul)Su11:153;pink (LN)F11:232
Discriminant analysisof andesine, reportedly from Tibet(Abduriyim)Su11:167-180
to identify geographic origin of coloredstones and HPHT treatment in dia-monds (Blodgett)Su11:145
Dolomiteblue, from Colombia (GNI)W11:316-318
Doublets, see Assembled gem materialsDurability
of Be-diffused sapphire(Sutthirat)Su11:121
of lead-glass-filled ruby(Sutthirat)Su11:121
Dyeingof Chinese freshwater cultured pearls,detection of (Strack)Su11:120
of opal from Ethiopia, purple(Renfro)W11:260-270
EEconomy
global, GIA Symposium keynoteaddress on (Overlin)Su11:80-82
Editorials“GIA Symposium 2011: Advancing theScience and Business of Gems”(Kimmel and Keller)Su11:79
“Great Expectations” (Iverson)W11:259“New Beginnings” (Iverson)F11:181
EDXRF, see Spectroscopy, energy-disper-sive X-ray fluorescence
Electron-microprobe analysis of andesine from various claimed local-ities (Rossman)Sp11:16-30
of aquamarine from Vietnam(Huong)Sp11:42-48
of demantoid from northernMadagascar (Pezzotta)Sp11:2-14
of ruby and sapphire from Vietnam(Khoi)F11:182-195
of zircon, brownish red, from China(Chen)Sp11:36-41
see also Chemical compositionEmerald
from Afghanistan, mining update(GNI)F11:238-239
formation of (Giuliani)Su11:108-110geographic origin of (de Corte)Su11:147inclusions in quartz (GNI)W11:323market for (Drucker)Su11:158-159separation from synthetic (deCorte)Su11:147
from Zambia, mining of (GNI)Sp11:63-65Emerald simulants
plastic-coated quartz (GNI)Sp11:71-72trapiche (GNI)Sp11:68-69
Emerald, syntheticseparation from natural (deCorte)Su11:147
Enhancement, see Coating; Diamond treat-ment; Diffusion treatment; Dyeing;Filling, fracture or cavity; Heat treat-ment; Irradiation; Treatment; specificgem materials
EPR, see Spectroscopy, electron paramag-netic resonance
Erratato “CVD synthetic diamond lumines-cent regions” (Willems)F11:202-207—incorrect photographer (GNI)W11:335
to “Extreme conoscopy”(Gumpesberger)Su11:147—incorrectcaption (GNI)F11:256
to “Gem treatments retrospective”(McClure)F10:218-240—descriptionof topaz treatment methods(GNI)Sp11:73
to “Natural-color tanzanite”(Smith)Su11:119—incorrect caption(GNI)F11:256
to “Sapphire and zircon from Ethiopia”(GNI)F11:247-248—errors in absorp-tion peak assignments (GNI)W11:335
to “Vietnamese ruby and sapphire”

ANNUAL INDEX GEMS & GEMOLOGY WINTER 2011 S15
(Khoi)F11:182-195—incorrect caption(GNI)W11:335
Ethicsdebate on (Symposium DebateCenter)Su11:126-128
Ethiopiaopal from Wollo—black (LN)W11:312-313; dyed purple (Renfro)W11:260-270; play-of-color(Rondeau)Su11:112; sugar-acid treat-ment of (GNI)W11:333-334
sapphire from (GNI)F11:247-248zircon from (GNI)F11:247-248
FFaceting, see Diamond, cuts and cutting ofFair trade practices
debate on (Symposium DebateCenter)Su11:126-128
examples and case studies(Luke)Su11:103-104
Fakes, see specific gem materials simulatedFeldspar
sunstone from Oregon, comparison oftwo deposits (McClure)Su11:150-151
see also AndesineFilling, fracture or cavity
of ruby with a lead glass—durabilityand safety testing (Sutthirat)Su11:121; trapiche (GNI)Sp11:72
Fluorescence, ultraviolet [UV]applications in gemology(Taylor)Su11:125
of an HPHT-treated diamond, with pat-tern resembling an HPHT-grownsynthetic diamond (LN)W11:310
Fluoritefrom Namibia (GNI)W11:318-319
Franceodontolite (fossilized mastodon ivory)from (Krzemnicki)W11:296-301
Fuchsitedeep green rock (GNI)F11:239-240
GGarnet
chemical composition, determinationof—using Raman spectroscopy(Henderson)Su11:148; using magneticsusceptibility (Hoover)W11:272-285
color-change, from Tanzania(GNI)F11:240-241
hydrogrossular, green cabochon resem-bling jadeite (LN)Sp11:52-53
see also Andradite, GrossularGemesis
CVD-grown synthetic diamonds(LN)F11:227-228
Gemological Institute of AmericaGübelin gem collection, onlineresource (Shigley)Su11:151-152
Symposium 2011 (Kimmel andKeller)Su11:79
Gems & Gemology“Challenge”—Sp11:75-76; winners andanswers F11:220
Edward J. Gübelin Most ValuableArticle Award Sp11:1-2
Geographic originof colored gemstones, determination of(Abduriyim)Su11:114-116
of corundum, determination using LIBSand advanced chemometrics(Yetter)Su11:157
discriminant analysis, application of indetermining—(Blodgett)Su11:145; ofandesine (Abduriyim)Su11:167-180;of emerald (de Corte)Su11:147
Materialytics Sequencing System(McManus)Su11:155-156
of peridot (Thoresen)Su11:121-122Geology
of Canadian diamond deposits(Stachel)Su11:112-114
Glasstriplet imitation of “mystic” treatedtopaz (GNI)F11:252-253
Grossulargreen, from Tanzania (GNI)Sp11:57-58
Guatemalajadeite from, lavender (Harlow)Su11:116
Gübelin gem collectiononline resource of (Shigley)Su11:151-152
HHalite
submitted for identification(LN)Sp11:52-53
Hallmarkingof precious metals, benefits of(Niklewicz)Su11:160-161
Heat treatmentof Chinese freshwater cultured pearls,detection of (Strack)Su11:120
of odontolite, blue, in antique brooches(Krzemnicki)W11:296-301
of ruby, pretreatment (Lee)Su11:148-149of zircon, brownish red, from China(Chen)Sp11:36-41
High-pressure, high-temperature [HPHT]synthesis, see Diamond, synthetic
High-pressure, high-temperature [HPHT]treatment, see Diamond treatment
Historyof diamonds, in themed postage stampcollection (Overlin)F11:214-219
Hydrogrossular, see GarnetHydrophane
bicolor, bi-pattern opal (GNI)W11:320-322
dyed purple opal from Wollo, Ethiopia(Renfro)W11:260-270
IIllumination methods
in the buying, selling, and grading of
gemstones (Eickhorst)Su11:123Imitations, see specific gem materials
imitatedInclusions
in andesine, reportedly from Tibet(Rossman)Sp11:16-30,(Abduriyim)Su11:167-180
of cinnabar in chatoyant quartz(GNI)W11:322-323
in dyed purple opal from Ethiopia(Renfro)W11:260-270
of emerald in quartz (GNI)W11:323and geographic origin of colored gem-stones (Abduriyim)Su11:114-116
of izoklakeite in quartz skull carving(GNI)W11:324-325
of spessartine in quartz (GNI)F11:245of tourmaline in cat’s-eye quartz(GNI)F11:245-246
of trolleite and lazulite in blue quartz(GNI)Sp11:57-58
see also Diamond, inclusions inIndia
agate from, dendritic (GNI)Sp11:62-63Gem Testing Laboratory in Jaipur,remarkable gems encountered at(Choudhary)Su11:145-146
quartz from, with spectral interference(GNI)Sp11:58-59
scapolite from (GNI)Sp11:59Infrared spectroscopy, see Spectroscopy,
infraredInstruments
dual integrating sphere for color gradingand measurement (Liu)Su11:154
inclusion mapping system for dia-monds (Caspi)Su11:153
spectral analysis, automated real-time(Magaña)Su11:154-155
symmetry grading system for diamonds(Caspi)Su11:153-154
ultra-deep diamond cleaning technolo-gy (Vins)Su11:136
see also Argon isotope analysis;Chemometrics; Conoscopy;DiamondView imaging; Electron-microprobe analysis; Fluorescence,ultraviolet; Illumination methods;Magnetic susceptibility; Microscopy;Oxygen isotope analysis; Scanningelectron microscopy; Spectralysis;Spectrometer; Spectrometry [vari-ous]; Spectroscopy [various]; X-radio-graphy; X-ray diffraction
Interferencespectral, in quartz from India(GNI)Sp11:58-59
International Gemological Symposium,5th [2011]proceedings of (Kimmel andKeller)Su11:79
Internetand jewelry retailing (Overlin)Su11:95-96
Irradiationof diamond—producing green andorangy brown spots on surface(Nasdala)Su11:105-106; producing 3H

S16 ANNUAL INDEX GEMS & GEMOLOGY WINTER 2011
and H3 defects (Choi)Su11:131natural, of diamonds from Zimbabwe—(Crepin)Su11:105; hydrogen-rich(Breeding)Su11:129-130
of sapphire, with electron-beam(Seo)Su11:151
of topaz, blue (Zhang)W11:302-307Isotopes, see Argon isotope analysis,
Oxygen isotope analysisIvory
mastodon, fossilized (odontolite), heat-ed blue (Krzemnicki)W11:296-301
Izoklakeite inclusions in quartz skull carving(GNI)W11:324-325
JJade, see Jadeite, NephriteJadeite
green cabochon (LN)Sp11:52-53lavender, from Myanmar, Guatemala,and Japan (Harlow)Su11:116
sales at the 2010 Myanmar GemEmporium (GNI)Sp11:72-73
Japanjadeite from, lavender (Harlow)Su11:116
Jewelryantique and estate, selling of(Luke)Su11:100-102
design overview (Luke)Su11:92-94luxury trends (Overlin)Su11:89-91
LLA-ICP-MS, see Spectrometry, laser abla-
tion–inductively coupled plasma–mass[LA-ICP-MS]
Lapidary artsquartz skull carving with inclusions ofizoklakeite (GNI)W11:324-325
rhodochrosite carving of ancient Indiansage (GNI)F11:246-247
see also Diamond, cuts and cutting ofLiberia
diamond mining in (GNI)Sp11:63-64ruby from (Kiefert)Su11:138
LIBS, see Spectroscopy, laser-inducedbreakdown
Lightingand the buying, selling, and grading ofgemstones (Eickhorst)Su11:123
Luminescenceof gem materials (Fritsch)Su11:123,(Rossman)Su11:124-125
see also DiamondView imaging;Fluorescence, ultraviolet [UV]
MMadagascar
ammonite from, iridescent(GNI)F11:235-236
demantoid and topazolite fromAntetezambato (Pezzotta)Sp11:2-14
tourmaline from, correlation of man-ganese and iron (Ahn)Su11:143-144
Magnetic susceptibilityas a means of determining garnet com-position (Hoover)W11:272-285
Maine, see United StatesMarketing and distribution
abbreviated jewelry descriptions(Root)Su11:161-162
of ametrine from the Anahí mine,Bolivia (Weldon)Su11:163-164
and China’s gem industry(Jia)Su11:159-160
of colored stones (Drucker)Su11:158-159, (Overlin)Su11:97-99
of coral jewelry (Carmona)Su11:158of cultured pearls (Overlin)Su11:97-99of diamonds—(Overlin)Su11:97-99;color grading (Tashey)Su11:163; fromsecondary market sources(Shor)Su11:163
digital-age (Overlin)Su11:95-96hallmarking of precious metals, bene-fits of (Niklewicz)Su11:160-161
lectures, gem and jewelry (Serras-Herman)Su11:162
in the mineral collector market(Johnson)Su11:160
of ruby—perception of rarity(Robertson)Su11:161; “pigeon’sblood” (Atichat)Su11:157-158
Materialytics Sequencing Systemquantitative process to determine geo-graphic origin of gem materials(McManus)Su11:155-156
MauritaniaNuummite from (GNI)F11:242-243
Measurementconcepts and uncertainty of(Geurts)W11:286-295
Meteoritespallasite with gem-quality peridot—(Shen)F11:208-213; mounted in jew-elry (GNI)F11:243-244
Mexicocolored gemstones from, review of(Ostrooumov)Su11:141
opal, blue, from Sinaloa (GNI)F11:243Microscopy
polarized light and fluorescence, toestablish origin of color in naturaldiamonds (Epelboym)Su11:133
Mining and explorationof colored gemstones worldwide(Yager)Su11:142-143
concrete mixer to sort gem-bearinggravels (Limsuwan)Su11:139
of corundum in Pakistan(GNI)W11:325-326
for diamond—(Coopersmith)Su11:108;in Canada (Stachel)Su11:112-114; inLiberia (GNI)Sp11:63-64
for emerald—(Giuliani)Su11:108-110;in Afghanistan (GNI)F11:238-239; inZambia (GNI)Sp11:63-65
for sapphire in Sri Lanka (GNI)F11:248-249
Moissanite, syntheticwith crystalline silicon intergrowth(LN)Sp11:54-55
Moonstonesynthetic star spinel imitation of(LN)Sp11:54-55
Most valuable article, see Gems &Gemology
Myanmarcolorless gems from (GNI)F11:241-242gem sales and production(GNI)Sp11:72-73, (GNI)F11:256
jadeite from, lavender(Harlow)Su11:116
ruby overgrowth on painite, fromMogok (Nissinboim)Su11:140-141
spinel, trapiche, from Mogok(GNI)W11:329-330
NNamibia
fluorite from Klein Spitzkoppe region(GNI)W11:318-319
Nassau, Kurtobituary (GNI)Sp11:73
Nephritefrom China, natural and treated(Zhang)Su11:122
rough, imitation of (GNI)Sp11:69-70Neutron irradiation, see IrradiationNomenclature and classification
abbreviated jewelry descriptions(Root)Su11:161-162
of diamond—color grades(Tashey)Su11:163; crystals, for use in geology and exploration(Klettke)Su11:139
“pigeon’s blood” ruby, standards for(Atichat)Su11:157-158
“royal blue” sapphire, standards for(Atichat)Su11:157-158
of ruby, effect on perception of rarity(Robertson)Su11:161
Nuummitefrom Mauritania (GNI)F11:242-243
OObituary
Kurt Nassau (GNI)Sp11:73Odontolite
fossilized dentine (mastodon ivory),blue, identified in antique brooches(Krzemnicki)W11:296-301
Oilingof opal with artificial matrix(LN)W11:312
Omphacitegreen cabochon resembling jadeite(LN)Sp11:52-53
Opalfrom Australia—common(GNI)W11:319-320; nomenclatureand characterization

ANNUAL INDEX GEMS & GEMOLOGY WINTER 2011 S17
(Beattie)Su11:116bicolor, bi-pattern hydrophane(GNI)W11:320-322
blue—(or cristobalite?) from Brazil(Schnellrath)Su11:142; from Mexico(GNI)F11:243
clarity-enhanced, with artificial matrix(LN)W11:312
from Ethiopia—black (LN)W11:312-313; dyed purple (Renfro)W11:260-270; play-of-color (Rondeau)Su11:112
sugar-acid treatment of, from Wollo,Ethiopia (GNI)W11:333-334
Oregon, see United StatesOxygen isotope analysis
to characterize gem materials(Rossman)Su11:124-125
PPainite
from Myanmar, with ruby overgrowth(Nissinboim)Su11:140-141
Pakistancorundum mining in (GNI)W11:325-326
sphene from border area withAfghanistan, color-change(GNI)W11:327-328
Pallasite, see PeridotPargasite
from Tanzania (GNI)Sp11:65Pearl
identification of (Scarratt)Su11:117-119non-nacreous, from Tridacna gigas(Bidwell)Su11:144-145
Pearl, culturedcharacterization of, using analyticaltechniques (Lu)Su11:149-150
Chinese freshwater—beaded withbaroque freshwater cultured pearls(GNI)F11:244-245; with exotic metal-lic colors (Beavers)Su11:144; treat-ments and their detection(Strack)Su11:120
coated bead-cultured freshwater(LN)W11:313-314
grafting methods (Ito)Su11:148identification of (Scarratt)Su11:117-119marketing of (Overlin)Su11:97-99from P. margaritifera, absorption fea-tures of (Karampelas)Sp11:31-35
with plastic bead nuclei (LN)F11:229-230quality factors of (Ito)Su11:148sales at the 2010 Myanmar GemEmporium (GNI)Sp11:72-73
separation of natural-color saltwater,from P. margaritifera and P. sterna,using spectral differentiation(Karampelas)Su11:117
treatments and their detection(Strack)Su11:120
Pearl, non-nacreousimitation—calcitic “cat’s-eye pearls”(GNI)W11:330-332; skillfully crafted(GNI)Sp11:70-71
natural, from Tridacna gigas(Bidwell)Su11:144-145
Pearl simulantsnon-nacreous—(GNI)Sp11:70-71; cal-citic “cat’s-eye pearls”(GNI)W11:330-332
Pegmatitesgem pockets in (Lyckberg)Su11:111-112Pederneira, in Minas Gerais, Brazil(Pezzotta)Su11:141-142
Stewart, in Pala, California(Morton)Su11:140
Peridotfrom pallasitic meteorites—identifica-tion of (Shen)F11:208-213; jewelry(GNI)F11:243-244
from Zabargad, history of(Thoresen)Su11:121-122
Peruvariscite from (GNI)F11:251
Phosphorescencein diamond, long-lasting (LN)W11:310-311
Photoluminescence spectroscopy, seeSpectroscopy, photoluminescence
Plagioclase, see Andesine, FeldsparPlastic
coating of quartz, imitating emerald(GNI)Sp11:68-69
Play-of-color, see OpalPostage stamps
diamond-themed collection(Overlin)F11:214-219
QQuartz
blue, with trolleite and lazulite inclu-sions (GNI)Sp11:57-58
carving of skull, with inclusions ofizoklakeite (GNI)W11:324-325
chatoyant—with cinnabar inclusions(GNI)W11:322-323; pink, with tour-maline needle inclusions(GNI)F11:245-246
with emerald inclusions (GNI)W11:323from India, spectral interference in(GNI)Sp11:58-59
plastic-coated, imitating emerald(GNI)Sp11:71-72
spectroscopic differentiation of naturaland synthetic (Choudhary)Su11:146-147
with spessartine inclusions (GNI)F11:245see also Amethyst; Ametrine[amethyst-citrine]; Quartz, synthetic
Quartz, syntheticlarge, represented as amethyst, aquama-rine, and citrine (GNI)W11:332-333
RRadioactivity
of blue topaz, neutron-irradiated(Zhang)W11:302-307
Rhodochrositecarving of ancient Indian sage(GNI)F11:246-247
Rockfuchsite-rich, deep green (GNI)F11:239-240
Rubygeographic origin of (Yetter)Su11:157lead-glass-filled—durability and safetytesting (Sutthirat)Su11:121; trapiche(GNI)Sp11:72-73
from Liberia (Kiefert)Su11:138market for (Drucker)Su11:158-159from Myanmar—color similarity toVan Gogh’s The Night Café(Dubinsky)Su11:159; overgrowth onpainite (Nissinboim)Su11:140-141
from Pakistan, mining of(GNI)W11:325-326
“pigeon’s blood,” standards for(Atichat)Su11:157-158
rarity of, with regard to treatment andnomenclature (Robertson)Su11:161
from Vietnam, northern (Khoi)F11:182-195
Russiadiamonds from the Nurbinskaya pipe,mineralogical characteristics of(Solodova)Su11:134-135
SSt. John’s Island, see ZabargadSapphire
from Afghanistan, beryllium- and tung-sten-bearing (LN)Sp11:53-54
from China, blue and pink(Chen)Su11:136-137
blue, with natural Be—(LN)F11:232-233;from Afghanistan (LN)Sp11:53-54
diffusion-treated with Be—blue, experi-ments on (Wathanakul)Su11:153;pink (LN)F11:232; safety and durabil-ity testing of (Sutthirat)Su11:121
from Ethiopia (GNI)F11:247-248geographic origin of (Yetter)Su11:157green, distinct color caused by iron(LN)F11:231-232
irradiation of, electron-beam(Seo)Su11:151
market for (Drucker)Su11:158-159from Pakistan, mining of(GNI)W11:325-326
“royal blue,” standards for(Atichat)Su11:157-158
from Sri Lanka, mining of(GNI)F11:248-249
star, with blue color similar to VanGogh’s The Starry Night(Dubinsky)Su11:159
from Vietnam, northern (Khoi)F11:182-195
Sapphire, syntheticgreen, distinct color caused by cobalt(LN)F11:231-232
recent advances in growth of (Stone-Sundberg)Su11:156

S18 ANNUAL INDEX GEMS & GEMOLOGY WINTER 2011
Scanning electron microscopy [SEM]of andesine, reportedly from Tibet(Rossman)Sp11:16-30,(Abduriyim)Su11:167-180
Scapolitefrom Afghanistan (GNI)Sp11:65-66from India (GNI)Sp11:59
Simulants, see specific gem materialssimulated
Social mediaand jewelry retailing (Overlin)Su11:95-96
Spectralysisautomated real-time spectral analysissystem (Magaña)Su11:154-155
Spectrometerdual integrating sphere, for color grad-ing and measurement (Liu)Su11:154
Spectrometry, laser ablation–inductivelycoupled plasma–mass [LA-ICP-MS]of andesine, reportedly from Tibet(Abduriyim)Su11:167-180
of aquamarine from Vietnam(Huong)Sp11:42-48
of colored gemstones, and country oforigin determination—(Abduriyim)Su11:114-116; and appli-cation of discriminant analysis(Blodgett)Su11:145
of cultured pearls (Lu)Su11:149-150of demantoid from northernMadagascar (Pezzotta)Sp11:2-14
of gem materials (Rossman)Su11:124-125 of lavender jadeite from Myanmar,Guatemala, and Japan(Harlow)Su11:116
of peridot from meteorites, identifica-tion of (Shen)F11:208-213
of ruby, filled with lead glass(Sutthirat)Su11:121
of sapphire—Be-diffused(Sutthirat)Su11:121; green, distinctcolor caused by iron (LN)F11:231-232
of synthetic sapphire, green(LN)F11:231-232
of zircon, brownish red, from China(Chen)Sp11:36-41
see also Chemical compositionSpectroscopy, electron paramagnetic reso-nance [EPR]to characterize gem materials(Rossman)Su11:124-125
Spectroscopy, energy-dispersive X-ray fluo-rescence [EDXRF]of cultured pearls (Lu)Su11:149-150
Spectroscopy, gamma rayof topaz, neutron-irradiated blue(Zhang)W11:302-307
Spectroscopy, infraredof aquamarine from Vietnam(Huong)Sp11:42-48
of diamonds, low-grade, with distinc-tive color zoning and inclusions(Kwon)Su11:134
of emerald, natural and synthetic (deCorte)Su11:147
of quartz, natural and synthetic—
(Choudhary)Su11:146-147; amethyst(Karampelas)F11:196-201
reflectance, of saltwater cultured pearlsfrom P. margaritifera(Karampelas)Sp11:31-35
of tourmaline from Madagascar, spec-tral correlation of manganese andiron (Ahn)Su11:143-144
Spectroscopy, laser-induced breakdown[LIBS]of corundum (Yetter)Su11:157of gem materials (Rossman)Su11:124-125
Spectroscopy, phosphorescenceof a diamond with long-lasting phos-phorescence (LN)W11:310-311
Spectroscopy, photoluminescenceof cultured pearls, natural-color, P.margaritifera and P. sterna(Karampelas)Su11:117
of diamond—to establish origin of color(Epelboym)Su11:133; HPHT-treated,to identify strain (Eaton-Magaña)Su11:132
Spectroscopy, Ramanof aquamarine from Vietnam(Huong)Sp11:42-48
of garnet (Henderson)Su11:148of odontolite in antique brooches(Krzemnicki)W11:296-301
of pearls—Chinese freshwater cultured(Strack)Su11:120; natural and cul-tured (Scarratt)Su11:117-119
of zircon, brownish red, from China(Chen)Sp11:36-41
Spectroscopy, UV-Vis-NIRof andesine (Rossman)Sp11:16-30of colored gemstones, and country oforigin determination(Abduriyim)Su11:114-116
of diamond, strongly purple-coloredblack (LN)W11:309
of emerald, natural and synthetic (deCorte)Su11:147
of garnet, color-change, from Tanzania(GNI)F11:240-241
of ruby from Vietnam (Khoi)F11:182-195 [erratum W11:335]
of tourmaline—(Sriprasert)Su11:152;from Madagascar, spectral correla-tion of manganese and iron(Ahn)Su11:143-144
of zircon, brownish red, from China(Chen)Sp11:36-41
Spessartineinclusions in quartz (GNI)F11:245
Sphene [titanite]color-change, from Pakistan/Afghanistan (GNI)W11:327-328
Spineltrapiche, from Mogok, Myanmar(GNI)W11:329-330
from Vietnam—(GNI)Sp11:60-61;cobalt blue (GNI)W11:328-329
Spinel, syntheticstar, imitation of moonstone(LN)Sp11:54-55
Spodumenegreen cat’s-eye, from Brazil(GNI)F11:249-250
Sri Lankasapphire from, mining update(GNI)F11:248-249
Strainin colorless untreated diamonds(LN)F11:224-225
in HPHT-treated diamonds (Eaton-Magaña)Su11:132
Sunstone, see FeldsparSustainability
Anahí ametrine mine, Bolivia(Weldon)Su11:163-164
of coral jewelry (Carmona)Su11:158Symmetry grading
assessments and metrics for polisheddiamonds (Caspi)Su11:153-154
GIA boundaries for round brilliant dia-monds (Geurts)W11:286-295
Synthetics, see specific gem materials
TTanzania
chondrodite from Mahenge(GNI)W11:316
garnet from—color-change(GNI)F11:240-241; green grossular(GNI)Sp11:57-58
gems from Tunduru(Limsuwan)Su11:110-111
pargasite from (GNI)Sp11:65see also Tanzanite
Tanzanitenatural-color, identification of(Smith)Su11:119-120
Tenebrescencein zircon from Australia (LN)W11:314-315
Thermoluminescencein type IaB diamonds (LN)Sp11:50
Tibetandesine reportedly from (Rossman)Sp11:16-30, (Abduriyim)Su11:167-180
Titanite, see SpheneTopaz
color-zoned, yellowish to greenishbrown (GNI)F11:250-251
imitation of “mystic” treated topaz(GNI)F11:252-253
neutron-irradiated blue, radioactivedecay pattern of (Zhang)W11:302-307
Topazolitefrom northern Madagascar(Pezzotta)Sp11:2-14
Tourmalinefrom Brazil, Pederneira pegmatite(Pezzotta)Su11:141-142
inclusions in cat’s-eye quartz(GNI)F11:245-246
from Madagascar, spectral correlationof manganese and iron(Ahn)Su11:143-144

ANNUAL INDEX GEMS & GEMOLOGY WINTER 2011 S19
spectroscopic characteristics of(Sriprasert)Su11:152
from the United States—California,Stewart pegmatite (Morton)Su11:140;Maine (GNI)Sp11:66-68
Trapicheemerald imitation (GNI)Sp11:68-69ruby, lead-glass-filled (GNI)Sp11:72-73spinel, from Mogok, Myanmar(GNI)W11:329-330
Treatmentancient (Lule)Su11:150irradiation of blue topaz(Zhang)W11:302-307
lead-glass-filling of ruby—and corun-dum triplet (GNI)F11:251-252;trapiche (GNI)Sp11:72-73
pretreatment and heat treatment ofruby (Lee)Su11:148-149
sugar-acid, of opal from Ethiopia(GNI)W11:333-334
see also Coating; Diamond treatment;Diffusion treatment; Dyeing; Filling,fracture or cavity; Heat treatment;Irradiation; specific gem materials
Tucson gem showshighlights of (GNI)Sp11:56-63
Turquoise simulantsodontolite, in set of antique brooches(Krzemnicki)W11:296-301
UUltraviolet fluorescence, see Fluorescence,
ultraviolet [UV]
United StatesStewart pegmatite, Pala, California(Morton)Su11:140
sunstone from Oregon, comparison oftwo deposits (McClure)Su11:150-151
tourmaline from Mt. Marie, Maine—(GNI)Sp11:66-68; origin of color(GNI)Sp11:67-68
VVariscite
from Peru (GNI)F11:251Vietnam
aquamarine from Thanh Hoa(Huong)Sp11:42-48, (GNI)F11:236-237
ruby and sapphire from TanHuong–Truc Lau (Khoi)F11:182-195
spinel from—cobalt blue, from KhuoiNgan (GNI)W11:328-329; northernVietnam (GNI)Sp11:60-61
WWinchell diagrams
use in determining garnet composition(Hoover)W11:272-285
XX-radiography
of coated bead-cultured freshwaterpearl (LN)W11:313-314
of pearls, natural and cultured(Scarratt)Su11:117-119
X-ray diffractionof andesine, reportedly from Tibet(Abduriyim)Su11:167-180
ZZabargad [St. John’s Island]
peridot from, history of(Thoresen)Su11:121-122
Zaire, see Congo, Democratic Republic of the
Zambiaemerald mining at Kagem(GNI)Sp11:63-65
Zektzeritegem (GNI)Sp11:61
Zimbabwediamonds from, naturally irradiated—(Crepin)Su11:105; hydrogen-rich(Breeding)Su11:129-130
Zirconbrownish red, from China(Chen)Sp11:36-41
from Ethiopia (GNI)F11:247-248tenebrescent, from Australia(LN)W11:314-315
Zoisite, see TanzaniteZoning, see Color zoning; specific gem
materials
AAbduriyim A.: Geographic origin determi-nation of colored gemstones, 114-116(Summer)
Abduriyim A., McClure S.F., RossmanG.R., Leelawatanasuk T., Hughes R.W.,Laurs B.M., Lu R., Isatelle F., Scarratt K.,Dubinsky E.V., Douthit T.R., EmmettJ.L.: Research on gem feldspar from theShigatse region of Tibet, 167-180(Summer)
Abduriyim A., see also Choi H.-M.Adamo I., see Pezzotta F.Ahn Y.-K., Seo J.-G., Park J.-W.: Spectralcorrelation of manganese and iron intourmalines from Madagascar, 143-144(Summer)
Ahn Y.-K., see also Kwon S.-R., Seo J.G.
Ai H., see Chen T.Amorim H.S., see Schnellrath J.Anthonis A., see Crepin N.Atichat W., Chandayot P., Saejoo S.,Leelawatanasook T., Sriprasert B.,Pisutha-Arnond V., Wathanakul P.,Sutthirat C.: “Pigeon’s blood” ruby and“royal blue” sapphire: Color standardsfor the gem trade, 157-158 (Summer)
Atichat W., see also Huong L.T.-T.,Wathanakul P.
Ayalew D., see Rondeau B.
BBalinskas S., see Magaña Q.Barjon J., see Willems B.Beattie R.A., Blackman K.N., Levonis H.:
Australian opal nomenclature andassessment, 116 (Summer)
Beavers B., Shepherd J.: Chinese freshwatercultured pearls with exotic metallic col-ors, 144 (Summer)
Benzel W., see Morton D.Berger B., see Morton D.Bidwell D., DelRe N., Widemann A.,Epelboym M.: Natural non-nacreouspearls from the giant clam Tridacnagigas, 144-145 (Summer)
Blackman K.N., see Beattie R.A.Blodgett T., Gilbertson A., Geurts R.,Goedert B.: Length-to-width ratiosamong fancy shape diamonds, 129(Summer)
Blodgett T., Shen A.: Application of dis-criminant analysis in gemology:Country-of-origin separation in colored
AUTHOR INDEXThis index lists, in alphabetical order, the authors of all feature articles, Notes & New Techniques, and Rapid Communications thatappeared in the four issues of Volume 47 of Gems & Gemology, together with the full title and inclusive page numbers of each arti-cle and the issue (in parentheses). Full citation is given under the first author only, with reference made from coauthors. Also includ-ed are presenters whose abstracts were published in the Summer 2011 (S11) issue, the proceedings of the Fifth InternationalGemological Symposium.

S20 ANNUAL INDEX GEMS & GEMOLOGY WINTER 2011
stones and distinguishing HPHT-treateddiamonds, 145 (Summer)
Blodgett T., see also Geurts R.H.Bodeur Y., see Rondeau B.Breeding C.M.: Hydrogen-rich diamondsfrom Zimbabwe with natural radiationfeatures, 129-130 (Summer)
de Brum T.M.M., see Juchem P.L.,Schnellrath J.
Buckley S., see McManus C.
CCarmona C., Cole J.E., Marks J.: “Too pre-cious to wear”: The role of the jewelryindustry in coral conservation, 158(Summer)
Caspi A.: Inclusion mapping in diamonds,153 (Summer)
Caspi A., Kerner A.: Symmetry: Fromassessments to metrics, 153-154(Summer)
Chandayot P., see Atichat W.Chapman J.: Recent studies of colored dia-monds from Argyle, 130 (Summer)
Chen H., see Zhang B., Zhang J.Chen T., Ai H., Yang M., Zheng S., Liu Y.:Brownish red zircon from Muling,China, 36-41 (Spring)
Chen T., Yang M., Ai H.: Blue and pinksapphires from Muling, northeasternChina, 136-137 (Summer)
Chodur N.L., see Juchem P.L.Choi H.-M., Kim Y.-C., Kim S.-K.,Abduriyim A.: Evidence of an interstitial3H-related optical center at 540.7 nm innatural diamond, 131 (Summer)
Choi K.-M., see Lee B.-H.Choudhary G.: Remarkable gems encoun-tered at the Gem Testing Laboratory,Jaipur, India, 145-146 (Summer)
Choudhary G., Fernandes S.: Spectroscopicexamination of commercially availablequartz varieties: A gemological perspec-tive, 146-147 (Summer)
Clanin J.C.: The fundamentals in miningfor colored gemstones and mineral speci-mens, 107-108 (Summer)
Cole J.E., see Carmona C.Coopersmith H.G.: The making of a dia-mond mine: Why everyone cannot haveone, 108 (Summer)
de Corte K., Van Meerbeeck M.: IR andUV-Vis spectroscopy of gem emeralds—A tool to differentiate natural and syn-thetic stones, as well as geographic ori-gin? 147 (Summer)
Crepin N., Anthonis A., Willems B.: A casestudy of naturally irradiated diamondsfrom Zimbabwe, 105 (Summer)
DD’Haenens-Johansson U.F.S., EdmondsA.M., Green B., Newton M.E., Mar -tineau P.M., Khan R.U.A.: Optical prop-
erties of silicon-related defects in CVDsynthetic diamond, 131-132 (Summer)
Danisi R.M., see Pezzotta F.DelRe N., see Bidwell D., Epelboym M.Diella V., see Pezzotta F.Dobrinets I., see Epelboym M.Donaldson C.H., see Taylor R.P.Douman M., see Kiefert L.Douthit T.R., see Abduriyim A.Dowe J., see McManus C.Downs R.T., see Henderson R.R.Drucker R.B.: Market trends in a changingglobal economy, 158-159 (Summer)
Dubinsky E., King J., Zucker B.: Gemstonecolor as nature’s palette: Van Gogh’s com-mentary on a 111 ct star sapphire andother gem-quality corundum, 159(Summer)
Dubinsky E., see also Abduriyim A.
EEaton-Magaña S.C.: Observation of strainthrough photoluminescence peaks indiamonds, 132 (Summer)
Edmonds A.M., see D’Haenens-JohanssonU.F.S.
Eickhorst M.: The impact of the choice ofillumination in the wholesale buying,selling, and grading of gemstones, 123(Summer)
Emmett J.L., see Abduriyim A.Epelboym M., DelRe N., Widemann A.,Zaitsev A., Dobrinets I.: Characteri zationof some natural and treated colorless andcolored diamonds, 133 (Summer)
Epelboym M., see also Bidwell D.
FFallick A.E., see Giuliani G.Feneyrol J., see Giuliani G.Fernandes S., see Choudhary G.Finch A.A., see Taylor R.P.Fleck R., see Morton D.Fritsch E., Massuyeau F., Rondeau B.,Segura O., Hainschwang T.: Advancingthe understanding of luminescence ingem materials, 123 (Summer)
Fritsch E., see also Karampelas S., Rondeau B.
GGasanov M., see Solodova Y.Gatta G.D., see Pezzotta F.Gauthier J.-P., see Karampelas S.Geurts R.H., Reinitz I.M., Blodgett T.,Gilbertson A.M.: GIA’s symmetry grad-ing boundaries for round brilliant cutdiamonds, 286-295 (Winter)
Geurts R., see also Blodgett T.Gilbertson A.M., see Blodgett T., Geurts R.H.Giuliani G., Ohnenstetter D., Fallick A.E.,Feneyrol J.: State of the art in the forma-
tion of high-value colored stones, 108-110 (Summer)
Goedert B., see Blodgett T., Shigley J.E.Grambole D., see Nasdala L.Green B., see D’Haenens-Johansson U.F.S.Grizenko A.G., see Vins V.G.Groover K., see Morton D.Gumpesberger S.M.: Extreme conoscopy,147 (Summer)
HHäger T., see Huong L.T.-T.Hainschwang T., see Fritsch E.,Karampelas S.
Harlow G.E., Shi G.-H.: An LA-ICP-MSstudy of lavender jadeite from Myanmar,Guatemala, and Japan, 116-117 (Summer)
Harlow G.E., see also Nissinboim A.Harrell J.A., see Thoresen L.Harris J.W., see Nasdala L.Henderson R.R., Downs R.T., La Sure J.:Determining the chemical compositionof garnets using Raman spectroscopy,148 (Summer)
Herzog F., see Krzemnicki M.S.Hofmeister W., see Huong L.T.-T., Nasdala L.Hoover D.B.: Determining garnet composi-tion from magnetic susceptibility andother properties, 272-285 (Winter)
Hughes R.W., see Abduriyim A.Huong L.T.-T., Hofmeister W., Häger T.,Khoi N.N., Nhung N.T., Atichat W.,Pisutha-Arnond V.: Aquamarine fromthe Thuong Xuan District, Thanh HoaProvince, Vietnam, 42-48 (Spring)
IIsatelle F., see Abduriyim A.Ito M.: Circle and spot formation mecha-nisms and changes in luster, color, androundness of cultured pearls by graftingmethods in Pinctada margaritifera, 148(Summer)
Iverson J.: Great expectations, 259 (Winter)New beginnings, 181 (Fall)
JJanse B.: Mystery diamonds—From alluvialdeposits, 110 (Summer)
Jia Q.: An analysis of the development andtax policy of China’s gem industry, 159-160 (Summer)
Johnson M.: Mineral collectors—An over-looked gem market, 160 (Summer)
Johnson P.: Pink HPHT synthetic dia-monds—A new coloration technique,133 (Summer)
Juchem P.L., de Brum T.M.M., ChodurN.L., Liccardo A.: Gem materials in thesouth of Brazil, 137-138 (Summer)
Juchem P.L., see also Schnellrath J.

ANNUAL INDEX GEMS & GEMOLOGY WINTER 2011 S21
KKarampelas S., Fritsch E., Gauthier J.-P.,Hainschwang T.: UV-Vis-NIRreflectance spectroscopy of natural-colorsaltwater cultured pearls from Pinctadamargaritifera, 31-35 (Spring)
Karampelas S., Fritsch E., Hainschwang T.,Gauthier J.-P.: Spectral differentiation ofnatural-color saltwater cultured pearlsfrom Pinctada margaritifera and Pteriasterna, 117 (Summer)
Karampelas S., Fritsch E., Zorba T.,Paraskevopoulos K.M.: Infrared spec-troscopy of natural vs. syntheticamethyst: An update, 196-201 (Fall)
Ke J., see Zhang B.Keller A., see Kimmel K.Kerner A., see Caspi A.Khan R.U.A., see D’Haenens-JohanssonU.F.S.
Khoi N.N., Sutthirat C., Tuan D.A., NamN.V., Thuyet N.T.M., Nhung N.T.:Ruby and sapphire from the TanHuong–Truc Lau Area, Yen BaiProvince, northern Vietnam, 182-195(Fall)
Khoi N.N., see also Huong L.T.-T.Kiefert L., Douman M.: Ruby from Liberia,138 (Summer)
Kim K.Y., see Seo J.G.Kim S.-K., see Choi H.-M.Kim Y.-C., see Choi H.-M., Lee B.-H.Kimbrough D., see Morton D.Kimmel K., Keller A.: GIA Symposium2011: Advancing the science and busi-ness of gems, 79 (Summer)
King J., see Dubinsky E.Kistler R., see Morton D.Klettke J.A.: Systematic diamond descrip-tions for use in geology and exploration,139 (Summer)
Koivula J.I., see Shen A.Kozlov A.V., see Vasilyev E.Krzemnicki M.S., Herzog F., Zhou W.: Ahistoric turquoise jewelry set containingfossilized dentine (odontolite) and glass,296-301 (Winter)
Krzemnicki M.S., see also Strack E.Kurbatov K., see Solodova Y.Kwon S.-R., Seo J.-G., Ahn Y.-K., Park J.-W.: Characterization of distinctive colorzoning and various inclusions in low-grade diamonds, 134 (Summer)
LLa Sure J., see Henderson R.R.Laurs B.M., see Abduriyim A.Lee B.-H., Choi K.-M., Kim Y.C., Yon S.-J.:The observation of defects after the pre-treatment and simple heat treatment ofruby, 148-149 (Summer)
Lee C.-T., see Morton D.Leelawatanasuk T., see Abduriyim A.,Atichat W., Wathanakul P.
Levonis H., see Beattie R.A.Lhuaamporn T., see Wathanakul P.Liccardo A., see Juchem P.L.Likes T., see McManus C., Yetter K.Limsuwan R., Sakimoto T.: Geology,exploration, mining, and processing ofgems and gold from placer deposits onthe Muhuwesi River, Tunduru,Tanzania, 110-111 (Summer)
Limsuwan R., Sakimoto T.: Using a con-crete mixer to sort gem-bearing gravelsfor artisanal and small-scale mining, 139(Summer)
Lithgow G., see McManus C.Liu Yan: Instrumental color measurementand grading of faceted gemstones, 154(Summer)
Liu Yungui, see Chen T.Lu R., Zhou C.-H., Sturman N.:Operational considerations of EDXRF,LA-ICP-MS, and photoluminescencetechniques in the analysis of pearls, 149-150 (Summer)
Lu R., see also Abduriyim A.Lu T., see Zhang B., Zhang J.Luke A.: Everything old is new again: The appealof the auction, estate, and vintagemarkets, 100-102 (Summer)
Jewelry design: From the masses tomuseums, 92-94 (Summer)
Playing a bigger game: Better businessfor a better world, 103-104 (Summer)
Lule C.: Experiments on ancient gem treat-ment techniques, 150 (Summer)
Lyckberg P.: Gem pockets in pegmatites—A worldwide study and comparison,111-112 (Summer)
MMagaña Q., Balinskas S.: Automated real-time spectral analysis for gemstones,154-155 (Summer)
Marks J., see Carmona C.Martineau P.M., see D’Haenens-JohanssonU.F.S.
Massuyeau F., see Fritsch E.Matula L., see Niklewicz D.Mazzero F., see Rondeau B.McClure S.F.: A gemological comparisonof the two major Oregon sunstonedeposits, 150-151 (Summer)
McClure S.F., see also Abduriyim A.,Renfro N.
McManus C., Likes T., McMillan N.,Yetter K., Dowe J., Wise M., Buckley S.,Lithgow G., Stipes C., Torrione P.:Determining the provenance of gem-stones using the MaterialyticsSequencing System (M2S), 155-156(Summer)
McManus C., see also Yetter K.McMillan N., see McManus C., Yetter K.Miceli R.S.D., see Schnellrath J.Morton D., Sheppard B., Lee C.-T.,
Kimbrough D., Berger B., Fleck R., KistlerR., Benzel W., Snee L., Groover K.:Petrogenesis of the Li-bearing Stewartpegmatite, Pala, California, 140 (Summer)
Mosselmans F.J., see Taylor R.P.
NNam N.V., see Khoi N.N.Nasdala L., Grambole D., Harris J.W.,Schulze D.J., Hofmeister W.: Radio-col-oration of diamond, 105-106 (Summer)
Newton M.E.: Treated diamond identifica-tion, 106 (Summer)
Newton M.E., see also D’Haenens-Johansson U.F.S.
Nhung N.T., see Huong L.T.-T., Khoi N.N.Niklewicz D., Whetstone W., Matula L.:Hallmarking: A powerful benefit to theconsumer, retailer, and internationaltrade, 160-161 (Summer)
Nissinboim A., Harlow G.E.: A study ofruby on painite from the Mogok StoneTract, 140-141 (Summer)
OOhnenstetter D., see Giuliani G.Ostrooumov M.: Gemstones fromMexico—A review, 141 (Summer)
Ottaway T.L., see Shigley J.E.Overlin S.D.: Digital age marketing: Are you still par-tying like it’s 1999?, 95-96 (Summer)
The future of gemstones and gemstonesof the future, 97-99 (Summer)
A history of diamonds through philately:The Frank Friedman collection, 214-219 (Fall)
Navigating the current economy for busi-ness growth and success, 80-82(Summer)
Shipwrecked! 126-128 (Summer)Where is luxury in this brave newworld? 89-91 (Summer)
PParaskevopoulos K.M., see Karampelas S.Park J.-W., see Ahn Y.-K., Kwon S.-R., Seo J.G.Petrovsky V.A., see Vasilyev E.Pezzotta F., Adamo I., Diella V.:Demantoid and topazolite fromAntetezambato, northern Madagascar:Review and new data, 2-14 (Spring)
Pezzotta F., Adamo I., Diella V., GattaG.D., Danisi R.M.: The Pederneira peg-matite, Minas Gerais, Brazil: Geologyand gem tourmaline, 141-142 (Summer)
Pisutha-Arnond V., see Atichat W., HuongL.T.-T., Wathanakul P.
RReinitz I.M., see Geurts R.H.

S22 ANNUAL INDEX GEMS & GEMOLOGY WINTER 2011
Renfro N., McClure S.F.: Dyed purplehydrophane opal, 260-270 (Winter)
Robertson S.: A case study in the percep-tion of rarity—Ruby, 161 (Summer)
Rondeau B., Fritsch E., Mazzero F., AyalewD., Bodeur Y.: Amazing play-of-coloropals from Wollo, Ethiopia—Toward agenetic model, 112 (Summer)
Rondeau B., see also Fritsch E.Root C.K.: Abbreviated jewelry descrip-tions—A uniform standard, 161-162(Summer)
Rossman G.R.: Advanced gem characterization, 124-125(Summer)
The Chinese red feldspar controversy:Chronology of research through July2009, 16-30 (Spring)
Rossman G.R., see also Abduriyim A.
SSaejoo S., see Atichat W.Sakimoto T., see Limsuwan R.Samosorov G., see Solodova Y.Scarratt K.: Pearl identification—A practi-tioner’s perspective, 117-119 (Summer)
Scarratt K., see also Abduriyim A.Schnellrath J., Amorim H.S., Juchem P.L.,de Brum T.M.M., Miceli R.S.D.: Blue“opal” (or cristobalite?) from Rio Grandedo Sul, Brazil, 142 (Summer)
Schulze D.J., see Nasdala L.Sedova E., see Solodova Y.Segura O., see Fritsch E.Seo J.-G., Kim K.Y., Ahn Y.K., Park J.-W.:Changes in color and optical propertiesof various sapphires by electron-beamirradiation, 151 (Summer)
Seo J.-G., see also Ahn Y.-K., Kwon S.-R.Serras-Herman H., Herman A.: Lectures—An inspirational way for artists to com-municate, 162 (Summer)
Shen A., Koivula J.I., Shigley J.E.:Identification of extraterrestrial peridotby trace elements, 208-213 (Fall)
Shen A., see also Blodgett T.Shepherd J., see Beavers B.Sheppard B., see Morton D.Shi G.-H., see Harlow G.E.Shigley J.E., Goedert B., Ottaway T.L.: TheGIA Gem Project—An online resourceof information on gemstones, 151-152(Summer)
Shigley J.E., see also Shen A.Shor R.: Polished diamond supplies fromsecondary market sources, 163(Summer)
Smith C.P.: Natural-color tanzanite, 119-120 (Summer)
Snee L., see Morton D.Solodova Y., Sedova E., Gasanov M., Samo -sorov G., Kurbatov K.: Miner alogical char-acteristics of diamonds from the Nurbin -skaya pipe, Yakutian diamond-bearingprovince, Russia, 134-135 (Summer)
Sriprasert B.: Spectroscopic characteristicsof some gem tourmalines, 152(Summer)
Sriprasert B., see also Atichat W.,Wathanakul P.
Stachel T.: Diamonds and cratons—Doesthe relationship hold for the Canadiandeposits? 112-114 (Summer)
Steinbach M.P.: New artificially asteriatedgemstones, 152-153 (Summer)
Stipes C., see McManus C.Stone-Sundberg J.: Recent advances in syn-thetic sapphire growth, 156 (Summer)
Strack E., Krzemnicki M.S.: Experimentaltreatments involving dye and heat forChinese freshwater cultured pearls, andtheir detection with Raman spectros copy,120 (Summer)
Sturman N., see Lu R.Sukharev A., see Vasilyev E.Sutthirat C.: Durability and safety testingof lead glass–treated ruby and beryllium-treated sapphire, and environmentalimpact assessments, 121 (Summer)
Sutthirat C., see also Atichat W., Khoi N.N.
TTallaire A., see Willems B.Tashey T.E.: Recommendations for advanc-ing the color science of gemology, 163(Summer)
Tawornmongkolkij M., see Wathanakul P.Taylor R.P., Finch A.A., Donaldson C.H.,Mosselmans F.J.: Applications of fluores-cence in gemology, 125 (Summer)
Thoresen L., Harrell J.A.: Archaeo -gemology of peridot, 121-122 (Summer)
Thuyet N.T.M., see Khoi N.N.Torrione P., see McManus C.Tuan D.A., see Khoi N.N.
VVan Meerbeeck M., see de Corte K.Vasilyev E., Petrovsky V.A., Kozlov A.V.,Sukharev A.: The nature of black col-oration in gem-quality diamonds fromBrazil, 135 (Summer)
Vins V.G.: New ultra-deep diamond clean-ing technology, 136 (Summer)
Vins V.G., Yelisseyev A.P., Grizenko A.G.:Donor nitrogen aggregation in syntheticdiamonds annealed in the graphite sta-bility field, 135-136 (Summer)
WWang M., see Zhang J.Wang W.: A review of diamond color treat-ment and its identification, 107(Summer)
Wathanakul P., Wongkokua W., Lhuaam -porn T., Tawornmongkolkij M., Leela -wa tanasuk T., Atichat W., Pisutha-Arnond V., Sutthirat C., Sriprasert B.:
Experiments on heating of blue sap-phires with beryllium, 153 (Summer)
Wathanakul P., see also Atichat W.Weldon R.: The Anahí ametrine mine: Amodel for gemstone sustainability, 163-164 (Summer)
Whetstone W., see Niklewicz D.Widemann A., see Bidwell D., Epelboym M.Willems B., Tallaire A., Barjon J.:Exploring the origin and nature of lumi-nescent regions in CVD synthetic dia-mond, 202-207 (Fall)
Willems B., see also Crepin N.Wise M., see McManus C.Wongkokua W., see Wathanakul P.
YYager T.R.: Recent trends in world coloredgem production, 142-143 (Summer)
Yang M., see Chen T.Yelisseyev A.P., see Vins V.G.Yetter K., McMillan N.J., McManus C.,Likes T.: Provenance of rubies and sap-phires: an application of laser-inducedbreakdown spectroscopy (LIBS) andadvanced chemometrics for the gemindustry, 157 (Summer)
Yetter K., see also McManus C.Yon S.J., see Lee B.-H.
ZZaitsev A., see Epelboym M.Zhang B., Lu T., Chen H., Ke J.: Researchand identification of natural and treatednephrite in China, 122 (Summer)
Zhang J., Lu T., Wang M., Chen H.: Theradioactive decay pattern of blue topaztreated by neutron irradiation, 302-307(Winter)
Zheng S., see Chen T.Zhou C.-H., see Lu R.Zhou W., see Krzemnicki M.S.Zorba T., see Karampelas S.Zucker B., see Dubinsky E.